
UNITED STATES
SECURITIES AND EXCHANGE COMMISSION
Washington, D.C. 20549
FORM N-CSRS
CERTIFIED SHAREHOLDER REPORT OF REGISTERED
MANAGEMENT INVESTMENT COMPANIES
Investment Company Act file number: 811-09253
Wells Fargo Funds Trust
(Exact name of registrant as specified in charter)
525 Market St., San Francisco, CA 94105
(Address of principal executive offices) (Zip code)
C. David Messman
Wells Fargo Funds Management, LLC
525 Market St., San Francisco, CA 94105
(Name and address of agent for service)
Registrant’s telephone number, including area code: 800-222-8222
Date of fiscal year end: Registrant is making a filing for 17 of its series, Wells Fargo Advantage Growth Balanced Fund, Wells Fargo Advantage Moderate Balanced Fund, Wells Fargo Advantage C&B Large Cap Value Fund, Wells Fargo Advantage Diversified Equity Fund, Wells Fargo Advantage Emerging Growth Fund, Wells Fargo Advantage Index Fund, Wells Fargo Advantage International Value Fund, Wells Fargo Advantage Small Company Growth Fund, Wells Fargo Advantage Small Company Value Fund, Wells Fargo Advantage Core Bond Fund, Wells Fargo Advantage Inflation-Protected Bond Fund, Wells Fargo Advantage WealthBuilder Conservative Allocation Portfolio, Wells Fargo Advantage WealthBuilder Moderate Balanced Portfolio, Wells Fargo Advantage WealthBuilder Growth Balanced Portfolio, Wells Fargo Advantage WealthBuilder Growth Allocation Portfolio, Wells Fargo Advantage WealthBuilder Equity Portfolio, and Wells Fargo Advantage WealthBuilder Tactical Equity Portfolio. Each series had a May 31 fiscal year end.
Date of reporting period: November 30, 2013
| ITEM 1. | REPORT TO STOCKHOLDERS |

Wells Fargo Advantage Allocation Funds

Semi-Annual Report
November 30, 2013
| n | | Wells Fargo Advantage Growth Balanced Fund |
| n | | Wells Fargo Advantage Moderate Balanced Fund |

Reduce clutter. Save trees.
Sign up for electronic delivery of prospectuses and shareholder reports at wellsfargo.com/advantagedelivery
Contents
The views expressed and any forward-looking statements are as of November 30, 2013, unless otherwise noted, and are those of the Fund managers and/or Wells Fargo Funds Management, LLC. Discussions of individual securities, or the markets generally, or any Wells Fargo Advantage Fund are not intended as individual recommendations. Future events or results may vary significantly from those expressed in any forward-looking statements; the views expressed are subject to change at any time in response to changing circumstances in the market. Wells Fargo Funds Management, LLC and the Funds disclaim any obligation to publicly update or revise any views expressed or forward-looking statements.
NOT FDIC INSURED ¡ NO BANK GUARANTEE ¡ MAY LOSE VALUE
| | | | |
| 2 | | Wells Fargo Advantage Allocation Funds | | Letter to shareholders (unaudited) |

Karla M. Rabusch
President
Wells Fargo Advantage Funds
Equity returns were bolstered by positive economic growth and accommodative monetary policies in many countries. Many fixed-income returns were modestly positive because interest rates stabilized and credit conditions were favorable, enabling lower-quality bonds to do well.
Dear Valued Shareholder:
We are pleased to offer you this semi-annual report for the Wells Fargo Advantage Allocation Funds for the six-month period that ended November 30, 2013. Equity returns were bolstered by positive economic growth and accommodative monetary policies in many countries. Many fixed-income returns were modestly positive because interest rates stabilized and credit conditions were favorable, enabling lower-quality bonds to do well.
Economic growth was no longer a negative for investors.
Fears of a stalling U.S. economy, a eurozone recession, and a hard landing in China were largely erased. The U.S. economy grew modestly during the past six months. Broadly speaking, the U.S. saw gains in business investment and housing alongside some drag from government spending. Employment trended in the right direction, with the unemployment rate declining, though still higher than satisfactory levels. Meanwhile, monetary policy remained accommodative throughout the period. At the end of November 2013, the federal funds rate remained near zero and the quantitative easing program continued at the rate of $85 billion per month.
In other parts of the world, the eurozone ended its recession and began registering positive growth. While Germany was the healthiest of the eurozone economies, many of the troubled southern countries—such as Spain and Portugal—began growing again or showed significantly improved growth trends. Another sign of healing was that yields on government debt in Europe’s peripheral countries declined. Japan, meanwhile, continued its recovery. Emerging markets growth was mixed, but China’s growth appeared to stabilize. Meanwhile, the European Central Bank kept its monetary policy accommodative, lowering its short-term interest rates from 0.50% to 0.25% in November 2013.
Investor optimism resulted in positive equity returns.
Investor confidence grew during the period as economic concerns lessened. Stock markets also benefited from easy monetary policies and resolutions of political problems, such as the end of the U.S. government shutdown. As a result, the S&P 500 Index1 returned 11.91% for the six-month period that ended November 30, 2013. The index also managed to end higher than 1,800, a level typically considered a threshold for investor optimism. Meanwhile, the MSCI ACWI ex USA (Net)2, a measure of non-U.S. developed country equities, returned 9.37% during the six-month period that ended November 30, 2013.
Bond markets struggled to return to positive territory.
During the six months ended November 30, 2013, most categories of non-U.S. Treasury bonds managed to earn positive returns. However, it was a volatile path to positive results, and U.S. Treasury bonds did not manage to claw back into positive territory. June 2013 was a difficult month for bonds because yields increased in response to Federal Reserve Chairman Bernanke’s comments about the scaling back of its bond-buying program. Interest rates then stabilized, and
| 1. | The S&P 500 Index consists of 500 stocks chosen for market size, liquidity, and industry group representation. It is a market-value-weighted index with each stock’s weight in the index proportionate to its market value. You cannot invest directly in an index. |
| 2. | The Morgan Stanley Capital International All Country World Index ex USA (Net) (MSCI ACWI ex USA (Net)) is a free float-adjusted market capitalization weighted index that is designed to measure the equity market performance of developed and emerging markets. You cannot invest directly in an index. Source: MSCI. MSCI makes no express or implied warranties or representations and shall have no liability whatsoever with respect to any MSCI data contained herein. The MSCI data may not be further redistributed or used as a basis for other indexes or any securities or financial products. This report is not approved, reviewed or produced by MSCI. |
| | | | | | |
| Letter to shareholders (unaudited) | | Wells Fargo Advantage Allocation Funds | | | 3 | |
investment-grade and high-yield bond markets began generating positive returns. U.S. Treasury bonds bore the brunt of the interest-rate increase, while bonds in lower-tier credit categories benefited from a yield cushion and investor appetite for equity-correlated returns.
Don’t let short-term uncertainty derail long-term investment goals.
Periods of uncertainty can present challenges, but experience has taught us that maintaining long-term investment goals can be an effective way to plan for the future. To help you create a sound strategy based on your personal goals and risk tolerance, Wells Fargo Advantage Funds offers more than 100 mutual funds and other investments spanning a wide range of asset classes and investment styles. Although diversification cannot guarantee an investment profit or prevent losses, we believe it can be an effective way to manage investment risk and potentially smooth out overall portfolio performance. We encourage investors to know their investments and to understand that appropriate levels of risk-taking may unlock opportunities.
Thank you for choosing to invest with Wells Fargo Advantage Funds. We appreciate your confidence in us and remain committed to helping you meet your financial needs. For current information about your fund investments, contact your investment professional, visit our website at wellsfargoadvantagefunds.com, or call us directly at 1-800-222-8222. We are available 24 hours a day, 7 days a week.
Sincerely,

Karla M. Rabusch
President
Wells Fargo Advantage Funds
Periods of uncertainty can present challenges, but experience has taught us that maintaining long-term investment goals can be an effective way to plan for the future.
| | | | |
| 4 | | Wells Fargo Advantage Allocation Funds | | Performance highlights (unaudited) |
Wells Fargo Advantage Growth Balanced Fund1
Investment objective
The Fund seeks total return, consisting of capital appreciation and current income.
Adviser
Wells Fargo Funds Management, LLC
Subadviser
Wells Capital Management Incorporated
Subadvisers for master portfolios
Artisan Partners Limited Partnership
Cooke & Bieler, L.P.
Galliard Capital Management, Inc.
Golden Capital Management, LLC
LSV Asset Management
Peregrine Capital Management, Inc.
Phocas Financial Corporation
Wells Capital Management Incorporated
Portfolio managers
Kandarp R. Acharya, CFA, FRM
Thomas C. Biwer, CFA
Christian L. Chan, CFA
Andrew Owen, CFA
Erik J. Sens, CFA
Average annual total returns (%) as of November 30, 2013
| | | | | | | | | | | | | | | | | | | | | | | | | | | | | | | | | | |
| | | | | Including sales charge | | | Excluding sales charge | | | Expense ratios2 (%) | |
| | | Inception date | | 1 year | | | 5 year | | | 10 year | | | 1 year | | | 5 year | | | 10 year | | | Gross | | | Net3 | |
| Class A (WFGBX) | | 10-14-1998 | | | 16.69 | | | | 13.78 | | | | 5.49 | | | | 23.81 | | | | 15.14 | | | | 6.12 | | | | 1.39 | | | | 1.20 | |
| Class B (NVGRX)* | | 10-1-1998 | | | 17.89 | | | | 14.04 | | | | 5.56 | | | | 22.89 | | | | 14.28 | | | | 5.56 | | | | 2.14 | | | | 1.95 | |
| Class C (WFGWX) | | 10-1-1998 | | | 21.93 | | | | 14.29 | | | | 5.32 | | | | 22.93 | | | | 14.29 | | | | 5.32 | | | | 2.14 | | | | 1.95 | |
| Administrator Class (NVGBX) | | 11-11-1994 | | | – | | | | – | | | | – | | | | 24.17 | | | | 15.43 | | | | 6.39 | | | | 1.23 | | | | 0.95 | |
| Growth Balanced Composite Index4 | | – | | | – | | | | – | | | | – | | | | 18.59 | | | | 13.62 | | | | 7.16 | | | | – | | | | – | |
| Barclays U.S. Aggregate Bond Index5 | | – | | | – | | | | – | | | | – | | | | (1.61 | ) | | | 5.33 | | | | 4.71 | | | | – | | | | – | |
| MSCI EAFE Index (Net) (USD)6 | | – | | | – | | | | – | | | | – | | | | 24.84 | | | | 13.42 | | | | 7.56 | | | | – | | | | – | |
| Russell 1000® Growth Index7 | | – | | | – | | | | – | | | | – | | | | 29.74 | | | | 20.14 | | | | 7.89 | | | | – | | | | – | |
| Russell 1000® Value Index8 | | – | | | – | | | | – | | | | – | | | | 31.92 | | | | 16.40 | | | | 7.96 | | | | – | | | | – | |
| Russell 2000® Index9 | | – | | | – | | | | – | | | | – | | | | 40.99 | | | | 20.97 | | | | 9.08 | | | | – | | | | – | |
| S&P 500 Index10 | | – | | | – | | | | – | | | | – | | | | 30.30 | | | | 17.60 | | | | 7.69 | | | | – | | | | – | |
| * | | Class B shares are closed to investment, except in connection with the reinvestment of any distributions and permitted exchanges. |
Figures quoted represent past performance, which is no guarantee of future results, and do not reflect taxes that a shareholder may pay on fund distributions or the redemption of fund shares. Investment return and principal value of an investment will fluctuate so that an investor’s shares, when redeemed, may be worth more or less than their original cost. Performance shown without sales charges would be lower if sales charges were reflected. Current performance may be lower or higher than the performance data quoted, which assumes the reinvestment of dividends and capital gains. Current month-end performance is available on the Fund’s website, wellsfargoadvantagefunds.com.
Index returns do not include transaction costs associated with buying and selling securities, any mutual fund fees or expenses, or any taxes. It is not possible to invest directly in an index.
For Class A shares, the maximum front-end sales charge is 5.75%. For Class B shares, the maximum contingent deferred sales charge is 5.00%. For Class C shares, the maximum contingent deferred sales charge is 1.00%. Performance including sales charge assumes the sales charge for the corresponding time period. Administrator Class shares are sold without a front-end sales charge or contingent deferred sales charge.
Balanced funds may invest in stocks and bonds. Stock values fluctuate in response to the activities of individual companies and general market and economic conditions. Bond values fluctuate in response to the financial condition of individual issuers, general market and economic conditions, and changes in interest rates. In general, when interest rates rise, bond values fall and investors may lose principal value. The use of derivatives may reduce returns and/or increase volatility. Certain investment strategies tend to increase the total risk of an investment (relative to the broader market). The Fund is exposed to foreign investment risk, mortgage- and asset-backed securities risk, and smaller-company securities risk. Consult the Fund’s prospectus for additional information on these and other risks.
Please see footnotes on page 5.
| | | | | | |
| Performance highlights (unaudited) | | Wells Fargo Advantage Allocation Funds | | | 5 | |
Wells Fargo Advantage Growth Balanced Fund (continued)
| | | | |
| Ten largest long-term holdings11 (%) as of November 30, 2013 | |
Apple Incorporated | | | 1.14 | |
Google Incorporated | | | 1.06 | |
Exxon Mobil Corporation | | | 0.81 | |
Johnson & Johnson | | | 0.64 | |
Amazon.com, Incorporated | | | 0.63 | |
FNMA, 6.25%, 5-25-2042 | | | 0.59 | |
Bank of America Corporation | | | 0.57 | |
FNMA, 3.50%, 9-1-2032 | | | 0.56 | |
JPMorgan Chase & Company | | | 0.56 | |
FNMA, 5.25%, 5-25-2020 | | | 0.55 | |
| | |
| Neutral target allocation12 as of November 30, 2013 |
|
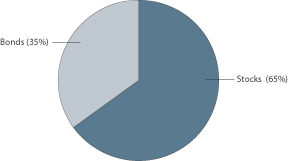
|
| | |
| Current target allocation12 as of November 30, 2013 |
|
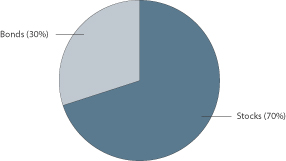
|
| 1. | The Fund is a gateway blended fund that invests all of its assets in two or more master portfolios of the Wells Fargo Master Trust in varying proportions. References to the investment activities of the Fund are intended to refer to the investment activities of the master portfolios in which it invests. |
| 2. | Reflects the expense ratios as stated in the most recent prospectuses. |
| 3. | The Adviser has committed through September 30, 2014, to waive fees and/or reimburse expenses to the extent necessary to cap the Fund’s Total Annual Fund Operating Expenses After Fee Waiver, excluding certain expenses, at the amounts shown. Brokerage commissions, stamp duty fees, interest, taxes, acquired fund fees and expenses, and extraordinary expenses are excluded from the cap. Fees from the underlying master portfolios are included in the cap. Without this cap, the Fund’s returns would have been lower. |
| 4. | Source: Wells Fargo Funds Management, LLC. The Growth Balanced Composite Index is weighted 35% in the Barclays U.S. Aggregate Bond Index, 16.25% in the Russell 1000® Value Index, 16.25% in the S&P 500 Index, 16.25% in the Russell 1000® Growth Index, 9.75% in the MSCI EAFE Index (Net) (USD), and 6.50% in the Russell 2000® Index. You cannot invest directly in an index. |
| 5. | The Barclays U.S. Aggregate Bond Index is composed of the Barclays U.S. Government/Credit Index and the Barclays U.S. Mortgage-Backed Securities Index and includes U.S. Treasury issues, agency issues, corporate bond issues, and mortgage-backed securities. You cannot invest directly in an index. |
| 6. | The Morgan Stanley Capital International Europe, Australasia, and Far East (MSCI EAFE) Index (Net) (USD) is an unmanaged group of securities widely regarded by investors to be representations of the stock markets of Europe, Australasia, and the Far East. Calculations for EAFE use net dividends, which reflect the deduction of withholding taxes. You cannot invest directly in an index. |
| 7. | The Russell 1000® Growth Index measures the performance of those Russell 1000 companies with higher price/book ratios and higher forecasted growth values. You cannot invest directly in an index. |
| 8. | The Russell 1000® Value Index measures the performance of those Russell 1000 companies with lower price/book ratios and lower forecasted growth values. You cannot invest directly in an index. |
| 9. | The Russell 2000® Index measures the performance of the 2,000 smallest companies in the Russell 3000® Index, which represents approximately 8% of the total market capitalization of the Russell 3000 Index. You cannot invest directly in an index. |
| 10. | The S&P 500 Index consists of 500 stocks chosen for market size, liquidity, and industry group representation. It is a market value weighted index with each stock’s weight in the index proportionate to its market value. You cannot invest directly in an index. |
| 11. | The ten largest long-term holdings are calculated based on the value of the securities of the master portfolios allocable to the Fund divided by the total net assets of the Fund. Holdings are subject to change and may have changed since the date specified. |
| 12. | Target allocations are subject to change. Cash and cash equivalents are not reflected in the calculations of target allocations. Neutral target allocation is the target allocation of the Fund as stated in the Fund’s prospectus. Current target allocation is the current allocation of the Fund based on the Tactical Asset Allocation (TAA) Model as of the date specified. |
| | | | |
| 6 | | Wells Fargo Advantage Allocation Funds | | Performance highlights (unaudited) |
Wells Fargo Advantage Moderate Balanced Fund1
Investment objective
The Fund seeks total return, consisting of current income and capital appreciation.
Adviser
Wells Fargo Funds Management, LLC
Subadviser
Wells Capital Management Incorporated
Subadvisers for master portfolios
Artisan Partners Limited Partnership
Cooke & Bieler, L.P.
Galliard Capital Management, Inc.
Golden Capital Management, LLC
LSV Asset Management
Peregrine Capital Management, Inc.
Phocas Financial Corporation
Wells Capital Management Incorporated
Portfolio managers
Kandarp R. Acharya, CFA, FRM
Thomas C. Biwer, CFA
Christian L. Chan, CFA
Andrew Owen, CFA
Erik J. Sens, CFA
Average annual total returns2 (%) as of November 30, 2013
| | | | | | | | | | | | | | | | | | | | | | | | | | | | | | | | | | |
| | | | | Including sales charge | | | Excluding sales charge | | | Expense ratios3 (%) | |
| | | Inception date | | 1 year | | | 5 year | | | 10 year | | | 1 year | | | 5 year | | | 10 year | | | Gross | | | Net4 | |
| Class A (WFMAX) | | 1-30-2004 | | | 7.74 | | | | 10.27 | | | | 4.66 | | | | 14.32 | | | | 11.58 | | | | 5.28 | | | | 1.36 | | | | 1.15 | |
| Class B (WMOBX)* | | 1-30-2004 | | | 8.49 | | | | 10.48 | | | | 4.72 | | | | 13.49 | | | | 10.74 | | | | 4.72 | | | | 2.11 | | | | 1.90 | |
| Class C (WFBCX) | | 1-30-2004 | | | 12.47 | | | | 10.74 | | | | 4.49 | | | | 13.47 | | | | 10.74 | | | | 4.49 | | | | 2.11 | | | | 1.90 | |
| Administrator Class (NVMBX) | | 11-11-1994 | | | – | | | | – | | | | – | | | | 14.64 | | | | 11.86 | | | | 5.54 | | | | 1.20 | | | | 0.90 | |
| Moderate Balanced Composite Index5 | | – | | | – | | | | – | | | | – | | | | 10.76 | | | | 9.76 | | | | 5.95 | | | | – | | | | – | |
| Barclays Short Treasury: 9-12 Months Index6 | | – | | | – | | | | – | | | | – | | | | 0.27 | | | | 0.58 | | | | 2.09 | | | | – | | | | – | |
| Barclays U.S. Aggregate Bond Index7 | | – | | | – | | | | – | | | | – | | | | (1.61 | ) | | | 5.33 | | | | 4.71 | | | | – | | | | – | |
| MSCI EAFE Index (Net) (USD)8 | | – | | | – | | | | – | | | | – | | | | 24.84 | | | | 13.42 | | | | 7.56 | | | | – | | | | – | |
| Russell 1000® Growth Index9 | | – | | | – | | | | – | | | | – | | | | 29.74 | | | | 20.14 | | | | 7.89 | | | | – | | | | – | |
| Russell 1000® Value Index10 | | – | | | – | | | | – | | | | – | | | | 31.92 | | | | 16.40 | | | | 7.96 | | | �� | – | | | | – | |
| Russell 2000® Index11 | | – | | | – | | | | – | | | | – | | | | 40.99 | | | | 20.97 | | | | 9.08 | | | | – | | | | – | |
| S&P 500 Index12 | | – | | | – | | | | – | | | | – | | | | 30.30 | | | | 17.60 | | | | 7.69 | | | | – | | | | – | |
| * | | Class B shares are closed to investment, except in connection with the reinvestment of any distributions and permitted exchanges. |
Figures quoted represent past performance, which is no guarantee of future results, and do not reflect taxes that a shareholder may pay on fund distributions or the redemption of fund shares. Investment return and principal value of an investment will fluctuate so that an investor’s shares, when redeemed, may be worth more or less than their original cost. Performance shown without sales charges would be lower if sales charges were reflected. Current performance may be lower or higher than the performance data quoted, which assumes the reinvestment of dividends and capital gains. Current month-end performance is available on the Fund’s website, wellsfargoadvantagefunds.com.
Index returns do not include transaction costs associated with buying and selling securities, any mutual fund fees or expenses, or any taxes. It is not possible to invest directly in an index.
For Class A shares, the maximum front-end sales charge is 5.75%. For Class B shares, the maximum contingent deferred sales charge is 5.00%. For Class C shares, the maximum contingent deferred sales charge is 1.00%. Performance including sales charge assumes the sales charge for the corresponding time period. Administrator Class shares are sold without a front-end sales charge or contingent deferred sales charge.
Balanced funds may invest in stocks and bonds. Stock values fluctuate in response to the activities of individual companies and general market and economic conditions. Bond values fluctuate in response to the financial condition of individual issuers, general market and economic conditions, and changes in interest rates. In general, when interest rates rise, bond values fall and investors may lose principal value. The use of derivatives may reduce returns and/or increase volatility. Certain investment strategies tend to increase the total risk of an investment (relative to the broader market). The Fund is exposed to mortgage- and asset-backed securities risk. Consult the Fund’s prospectus for additional information on these and other risks.
Please see footnotes on page 7.
| | | | | | |
| Performance highlights (unaudited) | | Wells Fargo Advantage Allocation Funds | | | 7 | |
Wells Fargo Advantage Moderate Balanced Fund (continued)
| | | | |
| Ten largest long-term holdings13 (%) as of November 30, 2013 | |
FHLMC, 7.50%, 9-25-2043 | | | 1.00 | |
FNMA, 6.25%, 5-25-2042 | | | 0.77 | |
FNMA, 3.50%, 9-1-2032 | | | 0.73 | |
FNMA, 5.25%, 5-25-2020 | | | 0.72 | |
U.S. Treasury Bill, 0.06%, 2-27-2014 | | | 0.70 | |
Apple Incorporated | | | 0.70 | |
Google Incorporated | | | 0.65 | |
U.S. Treasury Bond, 4.25%, 11-15-2040 | | | 0.61 | |
U.S. Treasury Bond, 1.75%, 5-15-2023 | | | 0.60 | |
FHLMC, 7.00%, 3-25-2043 | | | 0.51 | |
| | |
| Neutral target allocation14 as of November 30, 2013 |
|
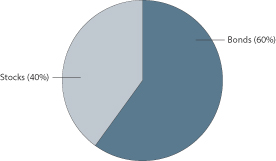
|
| | |
| Current target allocation14 as of November 30, 2013 |
|

|
| 1. | The Fund is a gateway blended fund that invests all of its assets in two or more master portfolios of the Wells Fargo Master Trust in varying proportions. References to the investment activities of the Fund are intended to refer to the investment activities of the master portfolios in which it invests. |
| 2. | Historical performance shown for Class A, Class B, and Class C shares prior to their inception reflects the performance of Administrator Class shares, adjusted to reflect the higher expenses applicable to Class A, Class B, and Class C shares. |
| 3. | Reflects the expense ratios as stated in the most recent prospectuses. |
| 4. | The Adviser has committed through September 30, 2014, to waive fees and/or reimburse expenses to the extent necessary to cap the Fund’s Total Annual Fund Operating Expenses After Fee Waiver, excluding certain expenses, at the amounts shown. Brokerage commissions, stamp duty fees, interest, taxes, acquired fund fees and expenses, and extraordinary expenses are excluded from the cap. Fees from the underlying master portfolios are included in the cap. Without this cap, the Fund’s returns would have been lower. |
| 5. | Source: Wells Fargo Funds Management, LLC. The Moderate Balanced Composite Index is weighted 45% in the Barclays U.S. Aggregate Bond Index, 15% in the Barclays Short Treasury: 9-12 Months Index, 10% in the S&P 500 Index, 10% in the Russell 1000® Growth Index, 10% in the Russell 1000® Value Index, 6% in the MSCI EAFE Index (Net) (USD), and 4% in the Russell 2000® Index. You cannot invest directly in an index. |
| 6. | The Barclays Short Treasury: 9–12 Months Index is an unmanaged index that includes aged U.S. Treasury bills, notes, and bonds with a remaining maturity from 9 up to (but not including) 12 months. It excludes zero-coupon STRIPS. You cannot invest directly in an index. |
| 7. | The Barclays U.S. Aggregate Bond Index is composed of the Barclays U.S. Government/Credit Index and the Barclays U.S. Mortgage-Backed Securities Index and includes U.S. Treasury issues, agency issues, corporate bond issues, and mortgage-backed securities. You cannot invest directly in an index. |
| 8. | The Morgan Stanley Capital International Europe, Australasia, and Far East (MSCI EAFE) Index (Net) (USD) is an unmanaged group of securities widely regarded by investors to be representations of the stock markets of Europe, Australasia, and the Far East. Calculations for EAFE use net dividends, which reflect the deduction of withholding taxes. You cannot invest directly in an index. |
| 9. | The Russell 1000® Growth Index measures the performance of those Russell 1000 companies with higher price/book ratios and higher forecasted growth values. You cannot invest directly in an index. |
| 10. | The Russell 1000® Value Index measures the performance of those Russell 1000 companies with lower price/book ratios and lower forecasted growth values. You cannot invest directly in an index. |
| 11. | The Russell 2000® Index measures the performance of the 2,000 smallest companies in the Russell 3000® Index, which represents approximately 8% of the total market capitalization of the Russell 3000 Index. You cannot invest directly in an index. |
| 12. | The S&P 500 Index consists of 500 stocks chosen for market size, liquidity, and industry group representation. It is a market value weighted index with each stock’s weight in the index proportionate to its market value. You cannot invest directly in an index. |
| 13. | The ten largest long-term holdings are calculated based on the value of the securities of the master portfolios allocable to the Fund divided by the total net assets of the Fund. Holdings are subject to change and may have changed since the date specified. |
| 14. | Target allocations are subject to change. Cash and cash equivalents are not reflected in the calculations of target allocations. Neutral target allocation is the target allocation of the Fund as stated in the Fund’s prospectus. Current target allocation is the current allocation of the Fund based on the Tactical Asset Allocation (TAA) Model as of the date specified. |
| | | | |
| 8 | | Wells Fargo Advantage Allocation Funds | | Fund expenses (unaudited) |
As a shareholder of the Fund, you incur two types of costs: (1) transaction costs, including sales charges (loads) on purchase payments and contingent deferred sales charges (if any) on redemptions and (2) ongoing costs, including management fees, distribution (12b-1) and/or shareholder service fees, and other Fund expenses. This example is intended to help you understand your ongoing costs (in dollars) of investing in the Fund and to compare these costs with the ongoing costs of investing in other mutual funds.
The example is based on an investment of $1,000 invested at the beginning of the six-month period and held for the entire period from June 1, 2013 to November 30, 2013.
Actual expenses
The “Actual” line of the table below provides information about actual account values and actual expenses. You may use the information in this line, together with the amount you invested, to estimate the expenses that you paid over the period. Simply divide your account value by $1,000 (for example, an $8,600 account value divided by $1,000 = 8.6), then multiply the result by the number in the “Actual” line under the heading entitled “Expenses paid during period” for your applicable class of shares to estimate the expenses you paid on your account during this period.
Hypothetical example for comparison purposes
The “Hypothetical” line of the table below provides information about hypothetical account values and hypothetical expenses based on the Fund’s actual expense ratio and an assumed rate of return of 5% per year before expenses, which is not the Fund’s actual return. The hypothetical account values and expenses may not be used to estimate the actual ending account balance or expenses you paid for the period. You may use this information to compare the ongoing costs of investing in the Fund and other funds. To do so, compare this 5% hypothetical example with the 5% hypothetical examples that appear in the shareholder reports of the other funds.
Please note that the expenses shown in the table are meant to highlight your ongoing costs only and do not reflect any transactional costs, such as sales charges (loads) and contingent deferred sales charges. Therefore, the “Hypothetical” line of the table is useful in comparing ongoing costs only and will not help you determine the relative total costs of owning different funds. In addition, if these transactional costs were included, your costs would have been higher.
| | | | | | | | | | | | | | | | |
| Wells Fargo Advantage Growth Balanced Fund | | Beginning
account value
6-1-2013 | | | Ending
account value
11-30-2013 | | | Expenses
paid during
the period¹ | | | Net annual
expense ratio | |
Class A | | | | | | | | | | | | | | | | |
Actual | | $ | 1,000.00 | | | $ | 1,101.35 | | | $ | 6.32 | | | | 1.20 | % |
Hypothetical (5% return before expenses) | | $ | 1,000.00 | | | $ | 1,019.05 | | | $ | 6.07 | | | | 1.20 | % |
Class B | | | | | | | | | | | | | | | | |
Actual | | $ | 1,000.00 | | | $ | 1,097.19 | | | $ | 10.25 | | | | 1.95 | % |
Hypothetical (5% return before expenses) | | $ | 1,000.00 | | | $ | 1,015.29 | | | $ | 9.85 | | | | 1.95 | % |
Class C | | | | | | | | | | | | | | | | |
Actual | | $ | 1,000.00 | | | $ | 1,097.01 | | | $ | 10.25 | | | | 1.95 | % |
Hypothetical (5% return before expenses) | | $ | 1,000.00 | | | $ | 1,015.29 | | | $ | 9.85 | | | | 1.95 | % |
Administrator Class | | | | | | | | | | | | | | | | |
Actual | | $ | 1,000.00 | | | $ | 1,102.71 | | | $ | 5.01 | | | | 0.95 | % |
Hypothetical (5% return before expenses) | | $ | 1,000.00 | | | $ | 1,020.31 | | | $ | 4.81 | | | | 0.95 | % |
| Wells Fargo Advantage Moderate Balanced Fund | | | | | | | | | | | | |
Class A | | | | | | | | | | | | | | | | |
Actual | | $ | 1,000.00 | | | $ | 1,060.79 | | | $ | 5.94 | | | | 1.15 | % |
Hypothetical (5% return before expenses) | | $ | 1,000.00 | | | $ | 1,019.30 | | | $ | 5.82 | | | | 1.15 | % |
Class B | | | | | | | | | | | | | | | | |
Actual | | $ | 1,000.00 | | | $ | 1,057.41 | | | $ | 9.80 | | | | 1.90 | % |
Hypothetical (5% return before expenses) | | $ | 1,000.00 | | | $ | 1,015.54 | | | $ | 9.60 | | | | 1.90 | % |
Class C | | | | | | | | | | | | | | | | |
Actual | | $ | 1,000.00 | | | $ | 1,056.77 | | | $ | 9.80 | | | | 1.90 | % |
Hypothetical (5% return before expenses) | | $ | 1,000.00 | | | $ | 1,015.54 | | | $ | 9.60 | | | | 1.90 | % |
Administrator Class | | | | | | | | | | | | | | | | |
Actual | | $ | 1,000.00 | | | $ | 1,062.27 | | | $ | 4.65 | | | | 0.90 | % |
Hypothetical (5% return before expenses) | | $ | 1,000.00 | | | $ | 1,020.56 | | | $ | 4.56 | | | | 0.90 | % |
| 1. | Expenses paid is equal to the annualized expense ratio of each class multiplied by the average account value over the period, multiplied by the number of days in the most recent fiscal half-year divided by the number of days in the fiscal year (to reflect the one-half-year period). |
| | | | | | |
| Portfolio of investments—November 30, 2013 (unaudited) | | Wells Fargo Advantage Allocation Funds | | | 9 | |
GROWTH BALANCED FUND
| | | | | | | | | | | | | | | | | | |
| Security name | | | | | | | | | | | | | Value | |
| | | | | | | | | | | | | | | | | | |
| | | | | |
Investment Companies: 99.67% | | | | | | | | | | | | | | | | | | |
| | | | | |
| Affiliated Master Portfolios: 99.67% | | | | | | | | | | | | | | | | | | |
Wells Fargo Advantage C&B Large Cap Value Portfolio | | | | | | | | | | | | | | | | $ | 13,900,692 | |
Wells Fargo Advantage Core Bond Portfolio | | | | | | | | | | | | | | | | | 17,596,443 | |
Wells Fargo Advantage Diversified Large Cap Growth Portfolio | | | | | | | | | | | | | | | | | 41,891,458 | |
Wells Fargo Advantage Emerging Growth Portfolio | | | | | | | | | | | | | | | | | 4,158,662 | |
Wells Fargo Advantage Index Portfolio | | | | | | | | | | | | | | | | | 41,769,959 | |
Wells Fargo Advantage Inflation-Protected Bond Portfolio | | | | | | | | | | | | | | | | | 8,794,762 | |
Wells Fargo Advantage International Growth Portfolio | | | | | | | | | | | | | | | | | 12,572,536 | |
Wells Fargo Advantage International Value Portfolio | | | | | | | | | | | | | | | | | 12,368,803 | |
Wells Fargo Advantage Large Company Value Portfolio | | | | | | | | | | | | | | | | | 27,789,118 | |
Wells Fargo Advantage Managed Fixed Income Portfolio | | | | | | | | | | | | | | | | | 61,630,495 | |
Wells Fargo Advantage Small Company Growth Portfolio | | | | | | | | | | | | | | | | | 4,174,189 | |
Wells Fargo Advantage Small Company Value Portfolio | | | | | | | | | | | | | | | | | 8,410,403 | |
| | | | | |
Total Investment Companies (Cost $222,142,051) | | | | | | | | | | | | | | | | | 255,057,520 | |
| | | | | | | | | | | | | | | | | | |
| | | | | |
| | | | | Yield | | | Maturity date | | | Principal | | | | |
| | | | | |
Short-Term Investments: 0.38% | | | | | | | | | | | | | | | | | | |
| | | | | |
| U.S. Treasury Securities: 0.38% | | | | | | | | | | | | | | | | | | |
U.S. Treasury Bill (z)# | | | | | 0.01 | % | | | 12-26-2013 | | | $ | 963,000 | | | | 962,964 | |
| | | | | | | | | | | | | | | | | | |
| | | | | |
Total Short-Term Investments (Cost $962,964) | | | | | | | | | | | | | | | | | 962,964 | |
| | | | | | | | | | | | | | | | | | |
| | | | | | | | |
Total investments in securities (Cost $223,105,015) * | | | 100.05 | % | | | 256,020,484 | |
Other assets and liabilities, net | | | (0.05 | ) | | | (122,189 | ) |
| | | | | | | | |
| Total net assets | | | 100.00 | % | | $ | 255,898,295 | |
| | | | | | | | |
| (z) | Zero coupon security. Rate represents yield to maturity at time of purchase. |
| # | All or a portion of this security is segregated as collateral for investments in derivative instruments. |
| * | Cost for federal income tax purposes is $224,608,421 and unrealized appreciation (depreciation) consists of: |
| | | | |
Gross unrealized appreciation | | $ | 31,412,063 | |
Gross unrealized depreciation | | | 0 | |
| | | | |
Net unrealized appreciation | | $ | 31,412,063 | |
The accompanying notes are an integral part of these financial statements.
| | | | |
| 10 | | Wells Fargo Advantage Allocation Funds | | Portfolio of investments—November 30, 2013 (unaudited) |
MODERATE BALANCED FUND
| | | | | | | | | | | | | | | | | | |
| Security name | | | | | | | | | | | | | Value | |
| | | | | | | | | | | | | | | | | | |
| | | | | |
Investment Companies: 99.65% | | | | | | | | | | | | | | | | | | |
| | | | | |
| Affiliated Master Portfolios: 99.65% | | | | | | | | | | | | | | | | | | |
Wells Fargo Advantage C&B Large Cap Value Portfolio | | | | | | | | | | | | | | | | $ | 5,804,095 | |
Wells Fargo Advantage Core Bond Portfolio | | | | | | | | | | | | | | | | | 15,455,358 | |
Wells Fargo Advantage Diversified Large Cap Growth Portfolio | | | | | | | | | | | | | | | | | 17,444,608 | |
Wells Fargo Advantage Emerging Growth Portfolio | | | | | | | | | | | | | | | | | 1,742,727 | |
Wells Fargo Advantage Index Portfolio | | | | | | | | | | | | | | | | | 17,427,694 | |
Wells Fargo Advantage Inflation-Protected Bond Portfolio | | | | | | | | | | | | | | | | | 7,716,655 | |
Wells Fargo Advantage International Growth Portfolio | | | | | | | | | | | | | | | | | 5,226,088 | |
Wells Fargo Advantage International Value Portfolio | | | | | | | | | | | | | | | | | 5,140,251 | |
Wells Fargo Advantage Large Company Value Portfolio | | | | | | | | | | | | | | | | | 11,603,099 | |
Wells Fargo Advantage Managed Fixed Income Portfolio | | | | | | | | | | | | | | | | | 54,116,672 | |
Wells Fargo Advantage Small Company Growth Portfolio | | | | | | | | | | | | | | | | | 1,748,318 | |
Wells Fargo Advantage Small Company Value Portfolio | | | | | | | | | | | | | | | | | 3,494,367 | |
Wells Fargo Advantage Stable Income Portfolio | | | | | | | | | | | | | | | | | 25,737,326 | |
| | | | | |
Total Investment Companies (Cost $159,474,218) | | | | | | | | | | | | | | | | | 172,657,258 | |
| | | | | | | | | | | | | | | | | | |
| | | | | |
| | | | | Yield | | | Maturity date | | | Principal | | | | |
| | | | | |
Short-Term Investments: 0.38% | | | | | | | | | | | | | | | | | | |
| | | | | |
| U.S. Treasury Securities: 0.38% | | | | | | | | | | | | | | | | | | |
U.S. Treasury Bill #(z) | | | | | 0.01 | % | | | 12-26-2013 | | | $ | 660,000 | | | | 659,975 | |
| | | | | | | | | | | | | | | | | | |
| | | | | |
Total Short-Term Investments (Cost $659,975) | | | | | | | | | | | | | | | | | 659,975 | |
| | | | | | | | | | | | | | | | | | |
| | | | | | | | |
Total investments in securities (Cost $160,134,193) * | | | 100.03 | % | | | 173,317,233 | |
Other assets and liabilities, net | | | (0.03 | ) | | | (48,987 | ) |
| | | | | | | | |
| Total net assets | | | 100.00 | % | | $ | 173,268,246 | |
| | | | | | | | |
| # | All or a portion of this security is segregated as collateral for investments in derivative instruments. |
| (z) | Zero coupon security. Rate represents yield to maturity at time of purchase. |
| * | Cost for federal income tax purposes is $159,535,615 and unrealized appreciation (depreciation) consists of: |
| | | | |
Gross unrealized appreciation | | $ | 13,781,618 | |
Gross unrealized depreciation | | | 0 | |
| | | | |
Net unrealized appreciation | | $ | 13,781,618 | |
The accompanying notes are an integral part of these financial statements.
| | | | | | |
| Statements of assets and liabilities—November 30, 2013 (unaudited) | | Wells Fargo Advantage Allocation Funds | | | 11 | |
| | | | | | | | |
| | | Growth
Balanced Fund | | | Moderate
Balanced Fund | |
| | |
Assets | | | | | | | | |
Investments | | | | | | | | |
In affiliated Master Portfolios, at value (see cost below) | | $ | 255,057,520 | | | $ | 172,657,258 | |
In unaffiliated securities, at value (see cost below) | | | 962,964 | | | | 659,975 | |
| | | | | | | | |
Total investments, at value (see cost below) | | | 256,020,484 | | | | 173,317,233 | |
Receivable for Fund shares sold | | | 108,935 | | | | 214,445 | |
Receivable from adviser | | | 0 | | | | 4,621 | |
Prepaid expenses and other assets | | | 37,284 | | | | 23,645 | |
| | | | | | | | |
Total assets | | | 256,166,703 | | | | 173,559,944 | |
| | | | | | | | |
| | |
Liabilities | | | | | | | | |
Payable for Fund shares redeemed | | | 141,478 | | | | 208,440 | |
Payable for daily variation margin on open futures contracts | | | 1,450 | | | | 1,000 | |
Advisory fee payable | | | 493 | | | | 0 | |
Distribution fees payable | | | 7,623 | | | | 2,631 | |
Due to other related parties | | | 42,053 | | | | 24,699 | |
Shareholder servicing fees payable | | | 53,942 | | | | 36,619 | |
Accrued expenses and other liabilities | | | 21,369 | | | | 18,309 | |
| | | | | | | | |
Total liabilities | | | 268,408 | | | | 291,698 | |
| | | | | | | | |
Total net assets | | $ | 255,898,295 | | | $ | 173,268,246 | |
| | | | | | | | |
| | |
NET ASSETS CONSIST OF | | | | | | | | |
Paid-in capital | | $ | 387,028,001 | | | $ | 159,703,530 | |
Undistributed net investment income | | | 2,422,121 | | | | 2,205,940 | |
Accumulated net realized losses on investments | | | (167,328,387 | ) | | | (2,418,480 | ) |
Net unrealized gains on investments | | | 33,776,560 | | | | 13,777,256 | |
| | | | | | | | |
Total net assets | | $ | 255,898,295 | | | $ | 173,268,246 | |
| | | | | | | | |
| | |
COMPUTATION OF NET ASSET VALUE AND OFFERING PRICE PER SHARE1 | | | | | | | | |
Net assets – Class A | | $ | 60,084,350 | | | $ | 16,283,344 | |
Shares outstanding – Class A | | | 1,635,707 | | | | 723,416 | |
Net asset value per share – Class A | | | $36.73 | | | | $22.51 | |
Maximum offering price per share – Class A2 | | | $38.97 | | | | $23.88 | |
Net assets – Class B | | $ | 852,932 | | | $ | 514,683 | |
Shares outstanding – Class B | | | 26,052 | | | | 22,910 | |
Net asset value per share – Class B | | | $32.74 | | | | $22.47 | |
Net assets – Class C | | $ | 11,318,783 | | | $ | 3,694,531 | |
Shares outstanding – Class C | | | 351,172 | | | | 166,763 | |
Net asset value per share – Class C | | | $32.23 | | | | $22.15 | |
Net assets – Administrator Class | | $ | 183,642,230 | | | $ | 152,775,688 | |
Shares outstanding – Administrator Class | | | 5,572,223 | | | | 6,734,204 | |
Net asset value per share – Administrator Class | | | $32.96 | | | | $22.69 | |
| | |
Investments in affiliated Master Portfolios, at cost | | $ | 222,142,051 | | | $ | 159,474,218 | |
| | | | | | | | |
Investments in unaffiliated securities, at cost | | $ | 962,964 | | | $ | 659,975 | |
| | | | | | | | |
Total investments, at cost | | $ | 223,105,015 | | | $ | 160,134,193 | |
| | | | | | | | |
| 1. | Each Fund has an unlimited number of authorized shares. |
| 2. | Maximum offering price is computed as 100/94.25 of net asset value. On investments of $50,000 or more, the offering price is reduced. |
The accompanying notes are an integral part of these financial statements.
| | | | |
| 12 | | Wells Fargo Advantage Allocation Funds | | Statements of operations—six months ended November 30, 2013 (unaudited) |
| | | | | | | | |
| | | Growth
Balanced Fund | | | Moderate
Balanced Fund | |
| | |
Investment income | | | | | | | | |
Interest allocated from affiliated Master Portfolios** | | $ | 1,373,409 | | | $ | 1,427,243 | |
Dividends allocated from affiliated Master Portfolios* | | | 1,257,018 | | | | 534,801 | |
Securities lending income allocated from affiliated Master Portfolios | | | 22,018 | | | | 10,000 | |
Interest | | | 332 | | | | 165 | |
Expenses allocated from affiliated Master Portfolios | | | (681,139 | ) | | | (453,835 | ) |
Waivers allocated from affiliated Master Portfolios | | | 52,298 | | | | 67,916 | |
| | | | | | | | |
Total investment income | | | 2,023,936 | | | | 1,586,290 | |
| | | | | | | | |
| | |
Expenses | | | | | | | | |
Advisory fee | | | 307,598 | | | | 207,162 | |
Administration fees | | | | | | | | |
Fund level | | | 61,520 | | | | 41,432 | |
Class A | | | 74,361 | | | | 16,425 | |
Class B | | | 1,157 | | | | 731 | |
Class C | | | 13,204 | | | | 4,084 | |
Administrator Class | | | 88,915 | | | | 74,696 | |
Shareholder servicing fees | | | | | | | | |
Class A | | | 71,501 | | | | 15,793 | |
Class B | | | 1,113 | | | | 703 | |
Class C | | | 12,696 | | | | 3,927 | |
Administrator Class | | | 221,985 | | | | 186,255 | |
Distribution fees | | | | | | | | |
Class B | | | 3,339 | | | | 2,108 | |
Class C | | | 38,088 | | | | 11,781 | |
Custody and accounting fees | | | 5,604 | | | | 3,561 | |
Professional fees | | | 16,283 | | | | 14,864 | |
Registration fees | | | 23,808 | | | | 20,458 | |
Shareholder report expenses | | | 25,119 | | | | 20,079 | |
Trustees’ fees and expenses | | | 5,036 | | | | 5,094 | |
Other fees and expenses | | | 6,204 | | | | 5,026 | |
| | | | | | | | |
Total expenses | | | 977,531 | | | | 634,179 | |
Less: Fee waivers and/or expense reimbursements | | | (310,764 | ) | | | (240,002 | ) |
| | | | | | | | |
Net expenses | | | 666,767 | | | | 394,177 | |
| | | | | | | | |
Net investment income | | | 1,357,169 | | | | 1,192,113 | |
| | | | | | | | |
| | |
REALIZED AND UNREALIZED GAINS (LOSSES) ON INVESTMENTS | | | | | | | | |
| | |
Net realized gains (losses) on: | | | | | | | | |
Securities transactions allocated from affiliated Master Portfolios | | | 4,297,867 | | | | 1,328,081 | |
Futures transactions | | | 4,976,320 | | | | 2,230,080 | |
| | | | | | | | |
Net realized gains on investments | | | 9,274,187 | | | | 3,558,161 | |
| | | | | | | | |
| | |
Net change in unrealized gains (losses) on: | | | | | | | | |
Securities transactions allocated from affiliated Master Portfolios | | | 14,674,059 | | | | 5,702,515 | |
Futures transactions | | | (1,231,336 | ) | | | (322,556 | ) |
| | | | | | | | |
Net change in unrealized gains (losses) on investments | | | 13,442,723 | | | | 5,379,959 | |
| | | | | | | | |
Net realized and unrealized gains (losses) on investments | | | 22,716,910 | | | | 8,938,120 | |
| | | | | | | | |
Net increase in net assets resulting from operations | | $ | 24,074,079 | | | $ | 10,130,233 | |
| | | | | | | | |
| | |
** Net of foreign interest withholding taxes allocated from affiliated Master Portfolios in the amount of | | | $138 | | | | $120 | |
* Net of foreign dividend withholding taxes allocated from affiliated Master Portfolios in the amount of | | | $20,350 | | | | $10,648 | |
The accompanying notes are an integral part of these financial statements.
| | | | | | |
| Statements of changes in net assets | | Wells Fargo Advantage Allocation Funds | | | 13 | |
| | | | | | | | | | | | | | | | |
| | | Growth Balanced Fund | |
| | | Six months ended November 30, 2013 (unaudited) | | | Year ended May 31, 2013 | |
| | | | |
Operations | | | | | | | | | | | | | | | | |
Net investment income | | | | | | $ | 1,357,169 | | | | | | | $ | 3,291,127 | |
Net realized gains on investments | | | | | | | 9,274,187 | | | | | | | | 22,185,874 | |
Net change in unrealized gains (losses) on investments | | | | | | | 13,442,723 | | | | | | | | 21,087,053 | |
| | | | | | | | | | | | | | | | |
Net increase in net assets resulting from operations | | | | | | | 24,074,079 | | | | | | | | 46,564,054 | |
| | | | | | | | | | | | | | | | |
| | | | |
Distributions to shareholders from | | | | | | | | | | | | | | | | |
Net investment income | | | | | | | | | | | | | | | | |
Class A | | | | | | | 0 | | | | | | | | (790,330 | ) |
Class B | | | | | | | 0 | | | | | | | | (6,107 | ) |
Class C | | | | | | | 0 | | | | | | | | (78,360 | ) |
Administrator Class | | | | | | | 0 | | | | | | | | (3,056,559 | ) |
| | | | | | | | | | | | | | | | |
Total distributions to shareholders | | | | | | | 0 | | | | | | | | (3,931,356 | ) |
| | | | | | | | | | | | | | | | |
| | | | |
Capital share transactions | | | Shares | | | | | | | | Shares | | | | | |
Proceeds from shares sold | | | | | | | | | | | | | | | | |
Class A | | | 89,843 | | | | 3,123,792 | | | | 252,844 | | | | 7,707,814 | |
Class B | | | 1,371 | | | | 42,627 | | | | 1,720 | | | | 47,281 | |
Class C | | | 45,651 | | | | 1,392,594 | | | | 55,670 | | | | 1,517,079 | |
Administrator Class | | | 303,986 | | | | 9,484,928 | | | | 682,034 | | | | 18,741,686 | |
| | | | | | | | | | | | | | | | |
| | | | | | | 14,043,941 | | | | | | | | 28,013,860 | |
| | | | | | | | | | | | | | | | |
Reinvestment of distributions | | | | | | | | | | | | | | | | |
Class A | | | 0 | | | | 0 | | | | 26,105 | | | | 783,165 | |
Class B | | | 0 | | | | 0 | | | | 227 | | | | 6,107 | |
Class C | | | 0 | | | | 0 | | | | 2,921 | | | | 77,436 | |
Administrator Class | | | 0 | | | | 0 | | | | 112,461 | | | | 3,019,584 | |
| | | | | | | | | | | | | | | | |
| | | | | | | 0 | | | | | | | | 3,886,292 | |
| | | | | | | | | | | | | | | | |
Payment for shares redeemed | | | | | | | | | | | | | | | | |
Class A | | | (126,400 | ) | | | (4,404,342 | ) | | | (385,427 | ) | | | (11,789,241 | ) |
Class B | | | (7,819 | ) | | | (240,492 | ) | | | (38,181 | ) | | | (1,038,792 | ) |
Class C | | | (11,944 | ) | | | (362,269 | ) | | | (53,297 | ) | | | (1,442,155 | ) |
Administrator Class | | | (591,564 | ) | | | (18,426,906 | ) | | | (3,759,086 | ) | | | (97,832,397 | ) |
| | | | | | | | | | | | | | | | |
| | | | | | | (23,434,009 | ) | | | | | | | (112,102,585 | ) |
| | | | | | | | | | | | | | | | |
Net decrease in net assets resulting from capital share transactions | | | | | | | (9,390,068 | ) | | | | | | | (80,202,433 | ) |
| | | | | | | | | | | | | | | | |
Total increase (decrease) in net assets | | | | | | | 14,684,011 | | | | | | | | (37,569,735 | ) |
| | | | | | | | | | | | | | | | |
| | | | |
Net assets | | | | | | | | | | | | | | | | |
Beginning of period | | | | | | | 241,214,284 | | | | | | | | 278,784,019 | |
| | | | | | | | | | | | | | | | |
End of period | | | | | | $ | 255,898,295 | | | | | | | $ | 241,214,284 | |
| | | | | | | | | | | | | | | | |
Undistributed net investment income | | | | | | $ | 2,422,121 | | | | | | | $ | 1,064,952 | |
| | | | | | | | | | | | | | | | |
The accompanying notes are an integral part of these financial statements.
| | | | |
| 14 | | Wells Fargo Advantage Allocation Funds | | Statements of changes in net assets |
| | | | | | | | | | | | | | | | |
| | | Moderate Balanced Fund | |
| | | Six months ended November 30, 2013 (unaudited) | | | Year ended May 31, 2013 | |
| | | | |
Operations | | | | | | | | | | | | | | | | |
Net investment income | | | | | | $ | 1,192,113 | | | | | | | $ | 2,729,351 | |
Net realized gains on investments | | | | | | | 3,558,161 | | | | | | | | 12,235,693 | |
Net change in unrealized gains (losses) on investments | | | | | | | 5,379,959 | | | | | | | | 7,981,882 | |
| | | | | | | | | | | | | | | | |
Net increase in net assets resulting from operations | | | | | | | 10,130,233 | | | | | | | | 22,946,926 | |
| | | | | | | | | | | | | | | | |
| | | | |
Distributions to shareholders from | | | | | | | | | | | | | | | | |
Net investment income | | | | | | | | | | | | | | | | |
Class A | | | | | | | 0 | | | | | | | | (174,454 | ) |
Class B | | | | | | | 0 | | | | | | | | (6,037 | ) |
Class C | | | | | | | 0 | | | | | | | | (26,366 | ) |
Administrator Class | | | | | | | 0 | | | | | | | | (2,930,711 | ) |
| | | | | | | | | | | | | | | | |
Total distributions to shareholders | | | | | | | 0 | | | | | | | | (3,137,568 | ) |
| | | | | | | | | | | | | | | | |
| | | | |
Capital share transactions | | | Shares | | | | | | | | Shares | | | | | |
Proceeds from shares sold | | | | | | | | | | | | | | | | |
Class A | | | 315,387 | | | | 6,863,509 | | | | 106,892 | | | | 2,150,751 | |
Class B | | | 3,260 | | | | 69,860 | | | | 6,379 | | | | 129,702 | |
Class C | | | 47,925 | | | | 1,022,921 | | | | 32,118 | | | | 642,068 | |
Administrator Class | | | 387,599 | | | | 8,451,544 | | | | 644,259 | | | | 13,114,398 | |
| | | | | | | | | | | | | | | | |
| | | | | | | 16,407,834 | | | | | | | | 16,036,919 | |
| | | | | | | | | | | | | | | | |
Reinvestment of distributions | | | | | | | | | | | | | | | | |
Class A | | | 0 | | | | 0 | | | | 8,688 | | | | 172,200 | |
Class B | | | 0 | | | | 0 | | | | 271 | | | | 5,404 | |
Class C | | | 0 | | | | 0 | | | | 1,191 | | | | 23,401 | |
Administrator Class | | | 0 | | | | 0 | | | | 144,213 | | | | 2,874,170 | |
| | | | | | | | | | | | | | | | |
| | | | | | | 0 | | | | | | | | 3,075,175 | |
| | | | | | | | | | | | | | | | |
Payment for shares redeemed | | | | | | | | | | | | | | | | |
Class A | | | (79,560 | ) | | | (1,721,774 | ) | | | (155,234 | ) | | | (3,093,238 | ) |
Class B | | | (9,182 | ) | | | (198,191 | ) | | | (20,626 | ) | | | (416,879 | ) |
Class C | | | (4,064 | ) | | | (87,458 | ) | | | (34,884 | ) | | | (701,338 | ) |
Administrator Class | | | (524,174 | ) | | | (11,523,622 | ) | | | (3,018,081 | ) | | | (60,096,397 | ) |
| | | | | | | | | | | | | | | | |
| | | | | | | (13,531,045 | ) | | | | | | | (64,307,852 | ) |
| | | | | | | | | | | | | | | | |
Net increase (decrease) in net assets resulting from capital share transactions | | | | | | | 2,876,789 | | | | | | | | (45,195,758 | ) |
| | | | | | | | | | | | | | | | |
Total increase (decrease) in net assets | | | | | | | 13,007,022 | | | | | | | | (25,386,400 | ) |
| | | | | | | | | | | | | | | | |
| | | | |
Net assets | | | | | | | | | | | | | | | | |
Beginning of period | | | | | | | 160,261,224 | | | | | | | | 185,647,624 | |
| | | | | | | | | | | | | | | | |
End of period | | | | | | $ | 173,268,246 | | | | | | | $ | 160,261,224 | |
| | | | | | | | | | | | | | | | |
Undistributed net investment income | | | | | | $ | 2,205,940 | | | | | | | $ | 1,013,827 | |
| | | | | | | | | | | | | | | | |
The accompanying notes are an integral part of these financial statements.
This page is intentionally left blank.
| | | | |
| 16 | | Wells Fargo Advantage Allocation Funds | | Financial highlights |
| | | | | | | | | | | | | | | | |
| | | Beginning
net asset
value per
share | | | Net
investment
income1 | | | Net realized
and unrealized
gains (losses)
on investments | | | Distributions
from net
investment
income | |
| | | | |
Growth Balanced Fund | | | | | | | | | | | | | | | | |
Class A | | | | | | | | | | | | | | | | |
June 1, 2013 to November 30, 2013 (unaudited) | | $ | 33.35 | | | | 0.15 | | | | 3.23 | | | | 0.00 | |
June 1, 2012 to May 31, 2013 | | $ | 27.77 | | | | 0.32 | | | | 5.70 | | | | (0.44 | ) |
June 1, 2011 to May 31, 2012 | | $ | 29.34 | | | | 0.39 | 4 | | | (1.73 | ) | | | (0.23 | ) |
October 1, 2010 to May 31, 20115 | | $ | 25.89 | | | | 0.23 | | | | 4.11 | | | | (0.89 | ) |
October 1, 2009 to September 30, 2010 | | $ | 24.12 | | | | 0.40 | 4 | | | 1.75 | | | | (0.38 | ) |
October 1, 2008 to September 30, 2009 | | $ | 25.63 | | | | 0.41 | 4 | | | (1.32 | ) | | | (0.52 | ) |
October 1, 2007 to September 30, 2008 | | $ | 36.21 | | | | 0.63 | | | | (7.32 | ) | | | (0.63 | ) |
Class B | | | | | | | | | | | | | | | | |
June 1, 2013 to November 30, 2013 (unaudited) | | $ | 29.84 | | | | 0.03 | 4 | | | 2.87 | | | | 0.00 | |
June 1, 2012 to May 31, 2013 | | $ | 24.80 | | | | 0.12 | 4 | | | 5.05 | | | | (0.13 | ) |
June 1, 2011 to May 31, 2012 | | $ | 26.17 | | | | 0.15 | 4 | | | (1.52 | ) | | | 0.00 | |
October 1, 2010 to May 31, 20115 | | $ | 23.07 | | | | 0.12 | 4 | | | 3.62 | | | | (0.64 | ) |
October 1, 2009 to September 30, 2010 | | $ | 21.46 | | | | 0.22 | 4 | | | 1.53 | | | | (0.14 | ) |
October 1, 2008 to September 30, 2009 | | $ | 22.70 | | | | 0.22 | 4 | | | (1.13 | ) | | | (0.25 | ) |
October 1, 2007 to September 30, 2008 | | $ | 32.51 | | | | 0.36 | | | | (6.52 | ) | | | (0.39 | ) |
Class C | | | | | | | | | | | | | | | | |
June 1, 2013 to November 30, 2013 (unaudited) | | $ | 29.38 | | | | 0.03 | 4 | | | 2.82 | | | | 0.00 | |
June 1, 2012 to May 31, 2013 | | $ | 24.52 | | | | 0.13 | 4 | | | 4.98 | | | | (0.25 | ) |
June 1, 2011 to May 31, 2012 | | $ | 25.94 | | | | 0.16 | 4 | | | (1.53 | ) | | | (0.05 | ) |
October 1, 2010 to May 31, 20115 | | $ | 22.93 | | | | 0.12 | 4 | | | 3.60 | | | | (0.71 | ) |
October 1, 2009 to September 30, 2010 | | $ | 21.42 | | | | 0.19 | 4 | | | 1.56 | | | | (0.24 | ) |
October 1, 2008 to September 30, 2009 | | $ | 22.77 | | | | 0.23 | 4 | | | (1.17 | ) | | | (0.33 | ) |
October 1, 2007 to September 30, 2008 | | $ | 32.60 | | | | 0.36 | 4 | | | (6.54 | ) | | | (0.39 | ) |
Administrator Class | | | | | | | | | | | | | | | | |
June 1, 2013 to November 30, 2013 (unaudited) | | $ | 29.89 | | | | 0.22 | 4 | | | 2.85 | | | | 0.00 | |
June 1, 2012 to May 31, 2013 | | $ | 24.93 | | | | 0.65 | 4 | | | 4.82 | | | | (0.51 | ) |
June 1, 2011 to May 31, 2012 | | $ | 26.39 | | | | 0.41 | 4 | | | (1.57 | ) | | | (0.30 | ) |
October 1, 2010 to May 31, 20115 | | $ | 23.39 | | | | 0.31 | 4 | | | 3.64 | | | | (0.95 | ) |
October 1, 2009 to September 30, 2010 | | $ | 21.81 | | | | 0.46 | 4 | | | 1.55 | | | | (0.43 | ) |
October 1, 2008 to September 30, 2009 | | $ | 23.29 | | | | 0.41 | 4 | | | (1.21 | ) | | | (0.60 | ) |
October 1, 2007 to September 30, 2008 | | $ | 33.29 | | | | 0.64 | 4 | | | (6.67 | ) | | | (0.71 | ) |
| | | | |
Moderate Balanced Fund | | | | | | | | | | | | | | | | |
Class A | | | | | | | | | | | | | | | | |
June 1, 2013 to November 30, 2013 (unaudited) | | $ | 21.21 | | | | 0.13 | 4 | | | 1.17 | | | | 0.00 | |
June 1, 2012 to May 31, 2013 | | $ | 18.84 | | | | 0.21 | | | | 2.50 | | | | (0.34 | ) |
June 1, 2011 to May 31, 2012 | | $ | 19.64 | | | | 0.32 | | | | (0.54 | ) | | | (0.58 | ) |
October 1, 2010 to May 31, 20115 | | $ | 17.97 | | | | 0.28 | | | | 1.80 | | | | (0.41 | ) |
October 1, 2009 to September 30, 2010 | | $ | 17.12 | | | | 0.38 | 4 | | | 1.03 | | | | (0.56 | ) |
October 1, 2008 to September 30, 2009 | | $ | 17.85 | | | | 0.38 | | | | (0.36 | ) | | | (0.57 | ) |
October 1, 2007 to September 30, 2008 | | $ | 22.76 | | | | 0.55 | | | | (3.34 | ) | | | (0.61 | ) |
Class B | | | | | | | | | | | | | | | | |
June 1, 2013 to November 30, 2013 (unaudited) | | $ | 21.25 | | | | 0.05 | 4 | | | 1.17 | | | | 0.00 | |
June 1, 2012 to May 31, 2013 | | $ | 18.86 | | | | 0.13 | 4 | | | 2.43 | | | | (0.17 | ) |
June 1, 2011 to May 31, 2012 | | $ | 19.58 | | | | 0.18 | 4 | | | (0.53 | ) | | | (0.37 | ) |
October 1, 2010 to May 31, 20115 | | $ | 17.85 | | | | 0.14 | 4 | | | 1.84 | | | | (0.25 | ) |
October 1, 2009 to September 30, 2010 | | $ | 16.99 | | | | 0.30 | | | | 0.97 | | | | (0.41 | ) |
October 1, 2008 to September 30, 2009 | | $ | 17.67 | | | | 0.26 | 4 | | | (0.34 | ) | | | (0.42 | ) |
October 1, 2007 to September 30, 2008 | | $ | 22.53 | | | | 0.42 | | | | (3.34 | ) | | | (0.43 | ) |
Please see footnotes on page 18.
The accompanying notes are an integral part of these financial statements.
| | | | | | |
| Financial highlights | | Wells Fargo Advantage Allocation Funds | | | 17 | |
| | | | | | | | | | | | | | | | | | | | | | | | | | | | | | |
Distributions
from net
realized gains | | | Ending
net asset value per
share | | | Ratio to average net assets (annualized) | | | Total
return2 | | | Portfolio
turnover
rate3 | | | Net assets at
end of period
(000s omitted) | |
| | |
| Net investment
income1 |
| |
| Gross
expenses1 |
| |
| Net
expenses1 |
| | | |
| | | | | | | |
| | | | | | | | | | | | | | | | | | | | | | | | | | | | | | | |
| | | | | | | | | | | | | | | | | | | | | | | | | | | | | | |
| | 0.00 | | | $ | 36.73 | | | | 0.96 | % | | | 1.39 | % | | | 1.20 | % | | | 10.13 | % | | | 39 | % | | $ | 60,084 | |
| | 0.00 | | | $ | 33.35 | | | | 1.23 | % | | | 1.39 | % | | | 1.20 | % | | | 21.85 | % | | | 80 | % | | $ | 55,777 | |
| | 0.00 | | | $ | 27.77 | | | | 1.40 | % | | | 1.36 | % | | | 1.20 | % | | | (4.53 | )% | | | 107 | % | | $ | 49,403 | |
| | 0.00 | | | $ | 29.34 | | | | 1.43 | % | | | 1.35 | % | | | 1.20 | % | | | 17.02 | % | | | 70 | % | | $ | 60,055 | |
| | 0.00 | | | $ | 25.89 | | | | 1.61 | % | | | 1.38 | % | | | 1.20 | % | | | 9.00 | % | | | 94 | % | | $ | 55,284 | |
| | (0.08 | ) | | $ | 24.12 | | | | 1.95 | % | | | 1.32 | % | | | 1.20 | % | | | (2.95 | )% | | | 105 | % | | $ | 55,318 | |
| | (3.26 | ) | | $ | 25.63 | | | | 2.09 | % | | | 1.34 | % | | | 1.20 | % | | | (20.42 | )% | | | 80 | % | | $ | 55,626 | |
| | | | | | | | | | | | | | | | | | | | | | | | | | | | | | |
| | 0.00 | | | $ | 32.74 | | | | 0.20 | % | | | 2.13 | % | | | 1.95 | % | | | 9.72 | % | | | 39 | % | | $ | 853 | |
| | 0.00 | | | $ | 29.84 | | | | 0.45 | % | | | 2.12 | % | | | 1.95 | % | | | 20.91 | % | | | 80 | % | | $ | 970 | |
| | 0.00 | | | $ | 24.80 | | | | 0.61 | % | | | 2.10 | % | | | 1.95 | % | | | (5.23 | )% | | | 107 | % | | $ | 1,704 | |
| | 0.00 | | | $ | 26.17 | | | | 0.62 | % | | | 2.09 | % | | | 1.95 | % | | | 16.43 | % | | | 70 | % | | $ | 4,163 | |
| | 0.00 | | | $ | 23.07 | | | | 0.96 | % | | | 2.12 | % | | | 1.95 | % | | | 8.19 | % | | | 94 | % | | $ | 6,924 | |
| | (0.08 | ) | | $ | 21.46 | | | | 1.21 | % | | | 2.08 | % | | | 1.95 | % | | | (3.66 | )% | | | 105 | % | | $ | 13,869 | |
| | (3.26 | ) | | $ | 22.70 | | | | 1.31 | % | | | 2.09 | % | | | 1.95 | % | | | (21.02 | )% | | | 80 | % | | $ | 31,892 | |
| | | | | | | | | | | | | | | | | | | | | | | | | | | | | | |
| | 0.00 | | | $ | 32.23 | | | | 0.21 | % | | | 2.14 | % | | | 1.95 | % | | | 9.70 | % | | | 39 | % | | $ | 11,319 | |
| | 0.00 | | | $ | 29.38 | | | | 0.48 | % | | | 2.14 | % | | | 1.95 | % | | | 20.97 | % | | | 80 | % | | $ | 9,326 | |
| | 0.00 | | | $ | 24.52 | | | | 0.65 | % | | | 2.11 | % | | | 1.95 | % | | | (5.26 | )% | | | 107 | % | | $ | 7,656 | |
| | 0.00 | | | $ | 25.94 | | | | 0.68 | % | | | 2.10 | % | | | 1.95 | % | | | 16.45 | % | | | 70 | % | | $ | 8,388 | |
| | 0.00 | | | $ | 22.93 | | | | 0.84 | % | | | 2.12 | % | | | 1.95 | % | | | 8.20 | % | | | 94 | % | | $ | 7,665 | |
| | (0.08 | ) | | $ | 21.42 | | | | 1.21 | % | | | 2.06 | % | | | 1.95 | % | | | (3.69 | )% | | | 105 | % | | $ | 7,738 | |
| | (3.26 | ) | | $ | 22.77 | | | | 1.33 | % | | | 2.08 | % | | | 1.95 | % | | | (21.02 | )% | | | 80 | % | | $ | 9,588 | |
| | | | | | | | | | | | | | | | | | | | | | | | | | | | | | |
| | 0.00 | | | $ | 32.96 | | | | 1.21 | % | | | 1.23 | % | | | 0.95 | % | | | 10.27 | % | | | 39 | % | | $ | 183,642 | |
| | 0.00 | | | $ | 29.89 | | | | 1.47 | % | | | 1.22 | % | | | 0.95 | % | | | 22.18 | % | | | 80 | % | | $ | 175,142 | |
| | 0.00 | | | $ | 24.93 | | | | 1.64 | % | | | 1.20 | % | | | 0.95 | % | | | (4.30 | )% | | | 107 | % | | $ | 220,021 | |
| | 0.00 | | | $ | 26.39 | | | | 1.66 | % | | | 1.19 | % | | | 0.95 | % | | | 17.19 | % | | | 70 | % | | $ | 273,174 | |
| | 0.00 | | | $ | 23.39 | | | | 2.04 | % | | | 1.19 | % | | | 0.95 | % | | | 9.32 | % | | | 94 | % | | $ | 287,073 | |
| | (0.08 | ) | | $ | 21.81 | | | | 2.18 | % | | | 1.14 | % | | | 0.95 | % | | | (2.68 | )% | | | 105 | % | | $ | 861,399 | |
| | (3.26 | ) | | $ | 23.29 | | | | 2.32 | % | | | 1.16 | % | | | 0.95 | % | | | (20.25 | )% | | | 80 | % | | $ | 1,161,210 | |
| | | | | | | |
| | | | | | | | | | | | | | | | | | | | | | | | | | | | | | | |
| | | | | | | | | | | | | | | | | | | | | | | | | | | | | | |
| | 0.00 | | | $ | 22.51 | | | | 1.23 | % | | | 1.36 | % | | | 1.15 | % | | | 6.08 | % | | | 45 | % | | $ | 16,283 | |
| | 0.00 | | | $ | 21.21 | | | | 1.41 | % | | | 1.36 | % | | | 1.15 | % | | | 14.57 | % | | | 86 | % | | $ | 10,344 | |
| | 0.00 | | | $ | 18.84 | | | | 1.68 | % | | | 1.33 | % | | | 1.15 | % | | | (0.93 | )% | | | 115 | % | | $ | 9,935 | |
| | 0.00 | | | $ | 19.64 | | | | 1.89 | % | | | 1.34 | % | | | 1.15 | % | | | 11.72 | % | | | 70 | % | | $ | 10,702 | |
| | 0.00 | | | $ | 17.97 | | | | 2.42 | % | | | 1.37 | % | | | 1.15 | % | | | 8.41 | % | | | 103 | % | | $ | 7,992 | |
| | (0.18 | ) | | $ | 17.12 | | | | 2.47 | % | | | 1.31 | % | | | 1.15 | % | | | 0.94 | % | | | 116 | % | | $ | 8,669 | |
| | (1.51 | ) | | $ | 17.85 | | | | 2.88 | % | | | 1.31 | % | | | 1.15 | % | | | (13.39 | )% | | | 89 | % | | $ | 8,524 | |
| | | | | | | | | | | | | | | | | | | | | | | | | | | | | | |
| | 0.00 | | | $ | 22.47 | | | | 0.47 | % | | | 2.10 | % | | | 1.90 | % | | | 5.74 | % | | | 45 | % | | $ | 515 | |
| | 0.00 | | | $ | 21.25 | | | | 0.65 | % | | | 2.11 | % | | | 1.90 | % | | | 13.65 | % | | | 86 | % | | $ | 613 | |
| | 0.00 | | | $ | 18.86 | | | | 0.94 | % | | | 2.08 | % | | | 1.90 | % | | | (1.66 | )% | | | 115 | % | | $ | 807 | |
| | 0.00 | | | $ | 19.58 | | | | 1.11 | % | | | 2.09 | % | | | 1.90 | % | | | 11.16 | % | | | 70 | % | | $ | 1,097 | |
| | 0.00 | | | $ | 17.85 | | | | 1.65 | % | | | 2.12 | % | | | 1.90 | % | | | 7.58 | % | | | 103 | % | | $ | 1,257 | |
| | (0.18 | ) | | $ | 16.99 | | | | 1.72 | % | | | 2.06 | % | | | 1.90 | % | | | 0.19 | % | | | 116 | % | | $ | 1,720 | |
| | (1.51 | ) | | $ | 17.67 | | | | 2.13 | % | | | 2.06 | % | | | 1.90 | % | | | (14.06 | )% | | | 89 | % | | $ | 2,177 | |
Please see footnotes on page 18.
The accompanying notes are an integral part of these financial statements.
| | | | |
| 18 | | Wells Fargo Advantage Allocation Funds | | Financial highlights |
| | | | | | | | | | | | | | | | |
| | | Beginning
net asset
value per
share | | | Net
investment
income1 | | | Net realized
and unrealized
gains (losses)
on investments | | | Distributions
from net
investment
income | |
| | | | |
Moderate Balanced Fund (continued) | | | | | | | | | | | | | | | | |
Class C | | | | | | | | | | | | | | | | |
June 1, 2013 to November 30, 2013 (unaudited) | | $ | 20.96 | | | | 0.05 | 4 | | | 1.14 | | | | 0.00 | |
June 1, 2012 to May 31, 2013 | | $ | 18.63 | | | | 0.11 | | | | 2.42 | | | | (0.20 | ) |
June 1, 2011 to May 31, 2012 | | $ | 19.45 | | | | 0.18 | 4 | | | (0.53 | ) | | | (0.47 | ) |
October 1, 2010 to May 31, 20115 | | $ | 17.77 | | | | 0.14 | 4 | | | 1.83 | | | | (0.29 | ) |
October 1, 2009 to September 30, 2010 | | $ | 16.96 | | | | 0.28 | 4 | | | 0.99 | | | | (0.46 | ) |
October 1, 2008 to September 30, 2009 | | $ | 17.64 | | | | 0.26 | 4 | | | (0.34 | ) | | | (0.42 | ) |
October 1, 2007 to September 30, 2008 | | $ | 22.52 | | | | 0.41 | | | | (3.33 | ) | | | (0.45 | ) |
Administrator Class | | | | | | | | | | | | | | | | |
June 1, 2013 to November 30, 2013 (unaudited) | | $ | 21.36 | | | | 0.17 | | | | 1.16 | | | | 0.00 | |
June 1, 2012 to May 31, 2013 | | $ | 18.96 | | | | 0.41 | | | | 2.38 | | | | (0.39 | ) |
June 1, 2011 to May 31, 2012 | | $ | 19.77 | | | | 0.40 | | | | (0.58 | ) | | | (0.63 | ) |
October 1, 2010 to May 31, 20115 | | $ | 18.11 | | | | 0.29 | | | | 1.83 | | | | (0.46 | ) |
October 1, 2009 to September 30, 2010 | | $ | 17.23 | | | | 0.52 | 4 | | | 0.95 | | | | (0.59 | ) |
October 1, 2008 to September 30, 2009 | | $ | 17.98 | | | | 0.42 | 4 | | | (0.37 | ) | | | (0.62 | ) |
October 1, 2007 to September 30, 2008 | | $ | 22.90 | | | | 0.60 | | | | (3.36 | ) | | | (0.65 | ) |
| 1. | Includes net expenses allocated from the affiliated Master Portfolios in which the Fund invests. |
| 2. | Total return calculations do not include any sales charges. Returns for periods of less than one year are not annualized. |
| 3. | Portfolio turnover rate is calculated by aggregating the results of multiplying the Fund’s investment percentage in the respective affiliated Master Portfolio by the corresponding affiliated Master Portfolio’s portfolio turnover rate. |
| 4. | Calculated based upon average shares outstanding |
| 5. | For the eight months ended May 31, 2011. The Fund changed its fiscal year end from September 30 to May 31, effective May 31, 2011. |
The accompanying notes are an integral part of these financial statements.
| | | | | | |
| Financial highlights | | Wells Fargo Advantage Allocation Funds | | | 19 | |
| | | | | | | | | | | | | | | | | | | | | | | | | | | | | | |
Distributions
from net
realized gains | | | Ending
net asset value per
share | | | Ratio to average net assets (annualized) | | | Total
return2 | | | Portfolio
turnover
rate3 | | | Net assets at
end of period
(000s omitted) | |
| | |
| Net investment
income1 |
| |
| Gross
expenses1 |
| |
| Net
expenses1 |
| | | |
| | | | | | | |
| | | | | | | | | | | | | | | | | | | | | | | | | | | | | | | |
| | | | | | | | | | | | | | | | | | | | | | | | | | | | | | |
| | 0.00 | | | $ | 22.15 | | | | 0.49 | % | | | 2.11 | % | | | 1.90 | % | | | 5.68 | % | | | 45 | % | | $ | 3,695 | |
| | 0.00 | | | $ | 20.96 | | | | 0.66 | % | | | 2.11 | % | | | 1.90 | % | | | 13.65 | % | | | 86 | % | | $ | 2,576 | |
| | 0.00 | | | $ | 18.63 | | | | 0.92 | % | | | 2.08 | % | | | 1.90 | % | | | (1.67 | )% | | | 115 | % | | $ | 2,319 | |
| | 0.00 | | | $ | 19.45 | | | | 1.16 | % | | | 2.09 | % | | | 1.90 | % | | | 11.17 | % | | | 70 | % | | $ | 2,364 | |
| | 0.00 | | | $ | 17.77 | | | | 1.59 | % | | | 2.12 | % | | | 1.90 | % | | | 7.58 | % | | | 103 | % | | $ | 1,726 | |
| | (0.18 | ) | | $ | 16.96 | | | | 1.72 | % | | | 2.05 | % | | | 1.90 | % | | | 0.21 | % | | | 116 | % | | $ | 1,445 | |
| | (1.51 | ) | | $ | 17.64 | | | | 2.13 | % | | | 2.05 | % | | | 1.90 | % | | | (14.05 | )% | | | 89 | % | | $ | 1,677 | |
| | | | | | | | | | | | | | | | | | | | | | | | | | | | | | |
| | 0.00 | | | $ | 22.69 | | | | 1.48 | % | | | 1.20 | % | | | 0.90 | % | | | 6.23 | % | | | 45 | % | | $ | 152,776 | |
| | 0.00 | | | $ | 21.36 | | | | 1.66 | % | | | 1.20 | % | | | 0.90 | % | | | 14.81 | % | | | 86 | % | | $ | 146,729 | |
| | 0.00 | | | $ | 18.96 | | | | 1.92 | % | | | 1.17 | % | | | 0.90 | % | | | (0.66 | )% | | | 115 | % | | $ | 172,587 | |
| | 0.00 | | | $ | 19.77 | | | | 2.14 | % | | | 1.18 | % | | | 0.90 | % | | | 11.93 | % | | | 70 | % | | $ | 192,305 | |
| | 0.00 | | | $ | 18.11 | | | | 3.06 | % | | | 1.18 | % | | | 0.90 | % | | | 8.65 | % | | | 103 | % | | $ | 176,179 | |
| | (0.18 | ) | | $ | 17.23 | | | | 2.72 | % | | | 1.13 | % | | | 0.90 | % | | | 1.14 | % | | | 116 | % | | $ | 330,340 | |
| | (1.51 | ) | | $ | 17.98 | | | | 3.13 | % | | | 1.13 | % | | | 0.90 | % | | | (13.17 | )% | | | 89 | % | | $ | 407,829 | |
The accompanying notes are an integral part of these financial statements.
| | | | |
| 20 | | Wells Fargo Advantage Allocation Funds | | Notes to financial statements (unaudited) |
1. ORGANIZATION
Wells Fargo Funds (the “Trust”), a Delaware statutory trust organized on March 10, 1999, is an open-end management investment company registered under the Investment Company Act of 1940, as amended (the “1940 Act”). These financial statements report on the following funds: the Wells Fargo Advantage Growth Balanced Fund (“Growth Balanced Fund”) and the Wells Fargo Advantage Moderate Balanced Fund (“Moderate Balanced Fund” ) (each, a “Fund”, collectively, the “Funds”). Each Fund is a diversified series of the Trust.
The Funds each seek to achieve their investment objective by investing primarily all investable assets in two or more separate diversified portfolios (each, an “affiliated Master Portfolio”, collectively, the “affiliated Master Portfolios”) of Wells Fargo Master Trust, a registered open-end management investment company. Each affiliated Master Portfolio directly acquires portfolio securities, and a Fund investing in an affiliated Master Portfolio acquires an indirect interest in those securities. Each Fund accounts for its investment in the affiliated Master Portfolios as partnership investments and records on a daily basis its share of the affiliated Master Portfolio’s income, expenses and realized and unrealized gains and losses. The financial statements of the affiliated Master Portfolios for the six months ended November 30, 2013 are included in this report and should be read in conjunction with each Fund’s financial statements. As of November 30, 2013, the Funds own the following percentages of the affiliated Master Portfolios:
| | | | | | | | |
| | | Growth Balanced Fund | | | Moderate Balanced Fund | |
Wells Fargo Advantage C&B Large Cap Value Portfolio | | | 4 | % | | | 2 | % |
Wells Fargo Advantage Core Bond Portfolio | | | 1 | | | | 1 | |
Wells Fargo Advantage Diversified Large Cap Growth Portfolio | | | 27 | | | | 11 | |
Wells Fargo Advantage Emerging Growth Portfolio | | | 0 | * | | | 0 | * |
Wells Fargo Advantage Index Portfolio | | | 1 | | | | 1 | |
Wells Fargo Advantage Inflation-Protected Bond Portfolio | | | 16 | | | | 14 | |
Wells Fargo Advantage International Growth Portfolio | | | 8 | | | | 3 | |
Wells Fargo Advantage International Value Portfolio | | | 3 | | | | 1 | |
Wells Fargo Advantage Large Company Value Portfolio | | | 27 | | | | 11 | |
Wells Fargo Advantage Managed Fixed Income Portfolio | | | 53 | | | | 47 | |
Wells Fargo Advantage Small Company Growth Portfolio | | | 2 | | | | 1 | |
Wells Fargo Advantage Small Company Value Portfolio | | | 4 | | | | 2 | |
Wells Fargo Advantage Stable Income Portfolio | | | N/A | | | | 100 | |
| * | The amount invested is less than 1%. |
2. SIGNIFICANT ACCOUNTING POLICIES
The following significant accounting policies, which are consistently followed in the preparation of the financial statements of each Fund, are in conformity with U.S. generally accepted accounting principles which require management to make estimates and assumptions that affect the reported amounts of assets and liabilities, disclosure of contingent assets and liabilities at the date of the financial statements, and the reported amounts of revenues and expenses during the reporting period. Actual results could differ from those estimates.
Securities valuation
All investments are valued each business day as of the close of regular trading on the New York Stock Exchange (generally 4 p.m. Eastern Time).
Investments in the affiliated Master Portfolios are valued daily based on each Fund’s proportionate share of each affiliated Master Portfolio’s net assets, which are also valued daily. Securities held in the affiliated Master Portfolios are valued as discussed in the Notes to Financial Statements of the affiliated Master Portfolios, which are included elsewhere in this report.
Futures that are listed on a foreign or domestic exchange or market are valued at the official closing price.
Short-term securities, with maturities of 60 days or less at time of purchase, generally are valued at amortized cost which approximates fair value. The amortized cost method involves valuing a security at its cost, plus accretion of discount or minus amortization of premium over the period until maturity.
| | | | | | |
| Notes to financial statements (unaudited) | | Wells Fargo Advantage Allocation Funds | | | 21 | |
Investments which are not valued using any of the methods discussed above are valued at their fair value, as determined in good faith by the Board of Trustees of the Funds. The Board of Trustees has established a Valuation Committee comprised of the Trustees and has delegated to it the authority to take any actions regarding the valuation of portfolio securities that the Valuation Committee deems necessary or appropriate, including determining the fair value of portfolio securities, unless the determination has been delegated to the Management Valuation Team of Wells Fargo Funds Management, LLC (“Funds Management”). The Board of Trustees retains the authority to make or ratify any valuation decisions or approve any changes to the Valuation Procedures as it deems appropriate. On a quarterly basis, the Board of Trustees receives reports on any valuation actions taken by the Valuation Committee or the Management Valuation Team which may include items for ratification.
Valuations of fair valued securities are compared to the next actual sales price when available, or other appropriate market values, to assess the continued appropriateness of the fair valuation methodologies used. These securities are fair valued on a day-to-day basis, taking into consideration changes to appropriate market information and any significant changes to the inputs considered in the valuation process until there is a readily available price provided on an exchange or by an independent pricing service. Valuations received from an independent pricing service or independent broker-dealer quotes are periodically validated by comparisons to most recent trades and valuations provided by other independent pricing services in addition to the review of prices by the adviser and/or subadviser. Unobservable inputs used in determining fair valuations are identified based on the type of security, taking into consideration factors utilized by market participants in valuing the investment, knowledge about the issuer and the current market environment.
Futures contracts
Each Fund may be subject to interest rate risk and equity price risk in the normal course of pursuing its investment objectives. Each Fund may buy and sell futures contracts in order to gain exposure to, or protect against, changes in security values and interest rates. The primary risks associated with the use of futures contracts are the imperfect correlation between changes in market values of securities held by each Fund and the prices of futures contracts, and the possibility of an illiquid market.
Futures contracts are valued based upon their quoted daily settlement prices when available. The aggregate principal amounts of the contracts are not recorded in the financial statements. Fluctuations in the value of the contracts are recorded in the Statements of Assets and Liabilities as an asset or liability and in the Statements of Operations as unrealized gains or losses until the contracts are closed, at which point they are recorded as net realized gains or losses on futures contracts. With futures contracts, there is minimal counterparty risk to each Fund since futures are exchange traded and the exchange’s clearinghouse, as counterparty to all exchange traded futures, guarantees the futures against default.
Security transactions and income recognition
Securities transactions are recorded on a trade date basis in by each Fund and each affiliated Master Portfolio. Realized gains or losses are recorded on the basis of identified cost by each Fund and each affiliated Master Portfolio.
Interest income is accrued daily and bond discounts are accreted and premiums are amortized daily based on the effective interest method by each Fund and each affiliated Master Portfolio. To the extent debt obligations are placed on non-accrual status, any related interest income may be reduced by writing off interest receivables when the collection of all or a portion of interest has become doubtful based on consistently applied procedures. If the issuer subsequently resumes interest payments or when the collectability of interest is reasonably assured, the debt obligation is removed from non-accrual status.
Dividend income in each affiliated Master Portfolio is recognized on the ex-dividend date, except for certain dividends from foreign securities, which are recorded as soon as the affiliated Master Portfolio is informed of the ex-dividend date.
Income from foreign securities in each affiliated Master Portfolio is recorded net of foreign taxes withheld where recovery of such taxes is not assured.
Each Fund records daily its proportionate share of each affiliated Master Portfolio’s interest and dividend income and realized and unrealized gains or losses.
Distributions to shareholders
Distributions to shareholders from net investment income and net realized gains, if any, are recorded on the ex-dividend date. Such distributions are determined in conformity with federal income tax regulations, which may differ in amount or character from net investment income and realized gains recognized for purposes of U.S. generally accepted accounting principles.
| | | | |
| 22 | | Wells Fargo Advantage Allocation Funds | | Notes to financial statements (unaudited) |
Federal and other taxes
Each Fund is treated as a separate entity for federal income tax purposes. Each Fund intends to continue to qualify as a regulated investment company by distributing substantially all of its investment company taxable income and any net realized capital gains (after reduction for capital loss carryforwards) sufficient to relieve it from all, or substantially all, federal income taxes. Accordingly, no provision for federal income taxes was required.
Each Fund’s income and federal excise tax returns and all financial records supporting those returns for the prior three fiscal years are subject to examination by the federal and Delaware revenue authorities. Management has analyzed each Fund’s tax positions taken on federal, state, and foreign tax returns for all open tax years and does not believe that there are any uncertain tax positions that require recognition of a tax liability.
At May 31, 2013, capital loss carryforwards available to offset future net realized capital gains were as follows through the indicated expiration dates:
| | | | | | | | | | | | |
| | | 2016 | | | 2017 | | | 2018 | |
Growth Balanced Fund | | $ | 11,249,610 | | | $ | 79,417,787 | | | $ | 82,578,227 | |
Moderate Balanced Fund | | | 0 | | | | 0 | | | | 5,730,209 | |
Class allocations
The separate classes of shares offered by each Fund differ principally in applicable sales charges, distribution, shareholder servicing, and administration fees. Shareholders of each class bear certain expenses that pertain to that particular class. All shareholders bear the common expenses of a Fund, earn income from the portfolio, and are allocated unrealized gains and losses pro rata based on the average daily net assets of each class, without distinction between share classes. Dividends are determined separately for each class based on income and expenses allocable to each class. Realized gains and losses are allocated to each class pro rata based upon the net assets of each class on the date realized. Differences in per share dividend rates generally result from the relative weightings of pro rata income and realized gain allocations and from differences in separate class expenses, including distribution, shareholder servicing, and administration fees.
3. FAIR VALUATION MEASUREMENTS
Fair value measurements of investments are determined within a framework that has established a fair value hierarchy based upon the various data inputs utilized in determining the value of each Fund’s investments. The three-level hierarchy gives the highest priority to unadjusted quoted prices in active markets for identical assets or liabilities (Level 1) and the lowest priority to significant unobservable inputs (Level 3). Each Fund’s investments are classified within the fair value hierarchy based on the lowest level of input that is significant to the fair value measurement. The inputs are summarized into three broad levels as follows:
| n | | Level 1 – quoted prices in active markets for identical securities |
| n | | Level 2 – other significant observable inputs (including quoted prices for similar securities, interest rates, prepayment speeds, credit risk, use of amortized cost, etc.) |
| n | | Level 3 – significant unobservable inputs (including the Fund’s own assumptions in determining the fair value of investments) |
The inputs or methodologies used for valuing investments in securities are not necessarily an indication of the risk associated with investing in those securities.
As of November 30, 2013, the inputs used in valuing investments in securities were as follows:
| | | | | | | | | | | | | | | | |
| Investments in securities | | Quoted prices (Level 1) | | | Other significant
observable inputs (Level 2) | | | Significant unobservable inputs (Level 3) | | | Total | |
Growth Balanced Fund | | | | | | | | | | | | | | | | |
| | | | |
Equity securities | | | | | | | | | | | | | | | | |
Investment companies | | $ | 0 | | | $ | 255,057,520 | | | $ | 0 | | | $ | 255,057,520 | |
| | | | |
Short-term investments | | | | | | | | | | | | | | | | |
U.S. Treasury securities | | | 0 | | | | 962,964 | | | | 0 | | | | 962,964 | |
| | | $ | 0 | | | $ | 256,020,484 | | | $ | 0 | | | $ | 256,020,484 | |
| | | | | | |
| Notes to financial statements (unaudited) | | Wells Fargo Advantage Allocation Funds | | | 23 | |
| | | | | | | | | | | | | | | | |
| Investments in securities | | Quoted prices (Level 1) | | | Other significant
observable inputs (Level 2) | | | Significant unobservable inputs (Level 3) | | | Total | |
Moderate Balanced Fund | | | | | | | | | | | | | | | | |
| | | | |
Equity securities | | | | | | | | | | | | | | | | |
Investment companies | | $ | 0 | | | $ | 172,657,258 | | | $ | 0 | | | $ | 172,657,258 | |
| | | | |
Short-term investments | | | | | | | | | | | | | | | | |
U.S. Treasury securities | | | 0 | | | | 659,975 | | | | 0 | | | | 659,975 | |
| | | $ | 0 | | | $ | 173,317,233 | | | $ | 0 | | | $ | 173,317,233 | |
As of November 30, 2013, the inputs used in valuing each Fund’s other financial instruments were as follows:
| | | | | | | | | | | | | | | | |
| Futures contracts | | Quoted prices (Level 1) | | | Other significant
observable inputs (Level 2) | | | Significant unobservable inputs (Level 3) | | | Total | |
Growth Balanced Fund | | $ | 861,091+ | | | $ | 0 | | | $ | 0 | | | $ | 861,091 | |
Moderate Balanced Fund | | | 594,216+ | | | | 0 | | | | 0 | | | | 594,216 | |
| + | Amount represents the net unrealized gains. |
Transfers in and transfers out are recognized at the end of the reporting period. For the six months ended November 30, 2013, the Funds did not have any transfers into/out of Level 1, Level 2, or Level 3.
4. TRANSACTIONS WITH AFFILIATES AND OTHER EXPENSES
Advisory fee
The Trust has entered into an advisory contract with Funds Management, an indirect wholly owned subsidiary of Wells Fargo & Company (“Wells Fargo”). The adviser is responsible for implementing investment policies and guidelines and for supervising the subadviser, who is responsible for day-to-day portfolio management of the Funds.
Funds Management is entitled to receive an annual advisory fee starting at 0.25% and declining to 0.19% as the average daily net assets of each Fund increase. For the six months ended November 30, 2013, the advisory fee was equivalent to an annual rate of 0.25% of each Fund’s average daily net assets.
Funds Management has retained the services of a subadviser to provide daily portfolio management to the Funds. The fee for subadvisory services is borne by Funds Management. Wells Capital Management Incorporated, an affiliate of Funds Management and an indirect, wholly owned subsidiary of Wells Fargo, is the subadviser to each Fund and is entitled to receive a fee from Funds Management at an annual rate starting at 0.10% and declining to 0.05% as the average daily net assets of each Fund increase.
Funds Management also serves as the adviser to each affiliated Master Portfolio and is entitled to receive a fee from each affiliated Master Portfolio for those services.
Administration and transfer agent fees
The Trust has entered into an administration agreement with Funds Management. Under this agreement, for providing administrative services, which includes paying fees and expenses for services provided by the transfer agent, sub-transfer agents, omnibus account servicers and record-keepers, Funds Management is entitled to receive from each Fund an annual fund level administration fee starting at 0.05% and declining to 0.03% as the average daily net assets of each Fund increase and a class level administration fee which is calculated based on the average daily net assets of each class as follows:
| | | | |
| | | Class level
administration fee | |
Class A, Class B, Class C | | | 0.26 | % |
Administrator Class | | | 0.10 | |
| | | | |
| 24 | | Wells Fargo Advantage Allocation Funds | | Notes to financial statements (unaudited) |
Funds Management has contractually waived and/or reimbursed advisory and administration fees to the extent necessary to maintain certain net operating expense ratios for the Funds. Waiver of fees and/or reimbursement of expenses by Funds Management were made first from fund level expenses on a proportionate basis and then from class specific expenses. Funds Management has committed to waive fees and/or reimburse expenses to the extent necessary to cap each Fund’s expenses as follows:
| | | | | | | | | | | | | | | | | | | | |
| | | Expiration date | | | Class A | | | Class B | | | Class C | | | Administrator Class | |
Growth Balanced Fund | | | 9-30-2014 | | | | 1.20 | % | | | 1.95 | % | | | 1.95 | % | | | 0.95 | % |
Moderate Balanced Fund | | | 9-30-2014 | | | | 1.15 | | | | 1.90 | | | | 1.90 | | | | 0.90 | |
Distribution fees
The Trust has adopted a Distribution Plan for Class B and Class C shares of the applicable Funds pursuant to Rule 12b-1 under the 1940 Act. Distribution fees are charged to the Class B and Class C shares and paid to Wells Fargo Funds Distributor, LLC, the principal underwriter of each Fund, at an annual rate of 0.75% of the average daily net assets of Class B and Class C shares.
For the six months ended November 30, 2013, Wells Fargo Funds Distributor, LLC received the following amounts in front-end sales charges and contingent deferred sales charges.
| | | | | | | | | | | | |
| | |
| | | Front-end
sales charges | | | Contingent deferred sales charges | |
| | | Class A | | | Class B | | | Class C | |
Growth Balanced Fund | | $ | 9,386 | | | $ | 9 | | | $ | 141 | |
Moderate Balanced Fund | | | 4,489 | | | | 0 | | | | 0 | |
Shareholder servicing fees
The Trust has entered into contracts with one or more shareholder servicing agents, whereby Class A, Class B, Class C, and Administrator Class of each applicable Fund is charged a fee at an annual rate of 0.25% of the average daily net assets of each respective class.
A portion of these total shareholder servicing fees were paid to affiliates of Wells Fargo.
5. INVESTMENT PORTFOLIO TRANSACTIONS
Purchases and sales of investments, excluding short-term securities, for the six months ended November 30, 2013 were as follows:
| | | | | | | | | | | | | | | | |
| | | Purchases at cost* | | | Sales proceeds* | |
| | | U.S.
government | | | Non-U.S.
government | | | U.S.
government | | | Non-U.S.
government | |
Growth Balanced Fund | | $ | 62,913,040 | | | $ | 46,629,664 | | | $ | 62,733,790 | | | $ | 52,857,705 | |
Moderate Balanced Fund | | | 55,256,323 | | | | 29,722,370 | | | | 55,097,897 | | | | 30,652,923 | |
| * | The Funds seek to achieve their investment objective by investing some or all of their investable assets in one or more affiliated Master Portfolios. Purchases and sales related to these investments have been calculated by aggregating the results of multiplying each Fund’s ownership percentage of the respective affiliated Master Portfolio by the corresponding affiliated Master Portfolio’s purchases and sales. Purchases and sales of unaffiliated securities in which the Funds invest are actual purchases and sale of those securities. |
6. DERIVATIVE TRANSACTIONS
During the six months ended November 30, 2013, the Funds entered into futures contracts to gain market exposure to certain asset classes consistent with an active asset allocation strategy.
At November 30, 2013, the Funds had long and short futures contracts outstanding as follows:
| | | | | | | | | | | | | | | | |
| | | Expiration
date | | | Contracts | | Type | | Contract value at
November 30, 2013 | | | Unrealized
gains (losses) | |
Growth Balanced Fund | | | 12-19-2013 | | | 29 Long | | S&P 500 Index | | $ | 13,079,725 | | | $ | 883,644 | |
| | | 3-20-2014 | | | 95 Short | | U.S. Treasury Bonds | | | 12,421,250 | | | | (22,553 | ) |
Moderate Balanced Fund | | | 12-19-2013 | | | 20 Long | | S&P 500 Index | | | 9,020,500 | | | | 609,410 | |
| | | 3-20-2014 | | | 64 Short | | U.S. Treasury Bonds | | | 8,368,000 | | | | (15,194 | ) |
| | | | | | |
| Notes to financial statements (unaudited) | | Wells Fargo Advantage Allocation Funds | | | 25 | |
The Funds had an average notional amounts in futures contracts outstanding during the six months ended November 30, 2013, as follows:
| | | | | | | | |
| | | Long contracts | | | Short contracts | |
Growth Balanced Fund | | $ | 27,991,147 | | | $ | 29,116,686 | |
Moderate Balanced Fund | | | 13,421,101 | | | | 13,902,729 | |
A summary of derivative instruments by primary risk exposure is outlined in the following tables.
The fair value of derivative instruments as of November 30, 2013 was as follows for Growth Balanced Fund:
| | | | | | | | | | | | | | |
| | | Asset derivatives | | | | | Liability derivatives | |
| | | Statements of Assets and
Liabilities location | | Fair value | | | | | Statements of Assets and
Liabilities location | | Fair value | |
Interest rate contracts | | Net assets – Net unrealized gains on investments | | $ | 0 | | | Interest rate contracts | | Net assets – Net unrealized gains on investments | | $ | 22,553 | * |
Equity contracts | | Net assets – Net unrealized gains on investments | | | 883,644 | * | | Equity contracts | | Net assets – Net unrealized gains on investments | | | 0 | |
| | | | $ | 883,644 | | | | | | | $ | 22,553 | |
| * | Amount represents cumulative unrealized gains/losses on futures contracts. Only the payable for variation margin as of November 30, 2013, which represents the current day’s variation margin, is reported separately on the Statements of Assets and Liabilities. |
The effect of derivative instruments on the Statements of Operations for the six months ended November 30, 2013 was as follows for Growth Balanced Fund:
| | | | | | | | |
| | | Amount of realized
gains on
derivatives | | | Change in unrealized
gains (losses) on
derivatives | |
Interest rate contracts | | $ | 1,528,216 | | | $ | (1,145,154 | ) |
Equity contracts | | | 3,448,104 | | | | (86,182 | ) |
| | | $ | 4,976,320 | | | $ | (1,231,336 | ) |
The fair value of derivative instruments as of November 30, 2013 was as follows for Moderate Balanced Fund:
| | | | | | | | | | | | | | |
| | | Asset derivatives | | | | | Liability derivatives | |
| | | Statements of Assets and
Liabilities location | | Fair value | | | | | Statements of Assets and
Liabilities location | | Fair value | |
Interest rate contracts | | Net assets – Net unrealized gains on investments | | $ | 0 | | | Interest rate contracts | | Net assets – Net unrealized gains on investments | | $ | 15,194 | * |
Equity contracts | | Net assets – Net unrealized gains on investments | | | 609,410 | * | | Equity contracts | | Net assets – Net unrealized gains on investments | | | 0 | |
| | | | $ | 609,410 | | | | | | | $ | 15,194 | |
| * | Amount represents cumulative unrealized gains/losses on futures contracts. Only the payable for variation margin as of November 30, 2013, which represents the current day’s variation margin, is reported separately on the Statements of Assets and Liabilities. |
The effect of derivative instruments on the Statements of Operations for the six months ended November 30, 2013 was as follows for Moderate Balanced Fund:
| | | | | | | | |
| | | Amount of realized
gains on
derivatives | | | Change in unrealized
gains (losses) on
derivatives | |
Interest rate contracts | | $ | 700,653 | | | $ | (42,942 | ) |
Equity contracts | | | 1,529,427 | | | | (279,614 | ) |
| | | $ | 2,230,080 | | | $ | (322,556 | ) |
| | | | |
| 26 | | Wells Fargo Advantage Allocation Funds | | Notes to financial statements (unaudited) |
For certain types of derivative transactions, the Funds have entered into International Swaps and Derivatives Association, Inc. master agreements (“ISDA Master Agreements”) or similar agreements with approved counterparties. The ISDA Master Agreements or similar agreements may have requirements to deliver/deposit securities or cash to/with an exchange or broker-dealer as collateral and allows each Fund to offset, with each counterparty, certain derivative financial instrument’s assets and/or liabilities with collateral held or pledged. Collateral requirements differ by type of derivative. Collateral or margin requirements are set by the broker or exchange clearing house for exchange traded derivatives while collateral terms are contract specific for over-the-counter traded. Cash collateral that has been pledged to cover obligations of each Fund under derivative contracts, if any, will be reported separately in the Statements of Assets and Liabilities. Securities pledged as collateral, if any, for the same purpose are noted in each Portfolio of Investments. With respect to balance sheet offsetting, absent an event of default by the counterparty or a termination of the agreement, the reported amounts of financial assets and financial liabilities in the Statements of Assets and Liabilities are not offset across transactions between each Fund and the applicable counterparty. As of November 30, 2013, the Funds have transactions subject to enforceable master netting agreements. A reconciliation of the gross amounts on the Statements of Assets and Liabilities to the net amounts by derivative type, including any collateral exposure, is as follows:
| | | | | | | | | | | | | | | | | | |
| | | | | Gross amounts
of liabilities in the
Statements of
Assets and
Liabilities | | | Amounts
subject to
netting
agreements | | | Collateral | | | Net
amount
(not less
than $0) | |
Growth Balanced Fund | | Futures – variation margin | | $ | 1,450 | | | $ | 0 | | | $ | 962,964 | | | $ | 0 | |
Moderate Balanced Fund | | Futures – variation margin | | | 1,000 | | | | 0 | | | | 659,975 | | | | 0 | |
7. BANK BORROWINGS
Each Fund and certain funds in the Trust are party to a $25,000,000 revolving credit agreement with the Bank of New York Mellon, whereby the Funds are permitted to use bank borrowings for temporary or emergency purposes, such as to fund shareholder redemption requests. Interest under the credit agreement is charged to each Fund based on a borrowing rate equal to the higher of the Federal Funds rate in effect on that day plus 1.25% or the overnight LIBOR rate in effect on that day plus 1.25%. In addition, an annual commitment fee equal to 0.15% of the unused balance is allocated to each participating fund. For the six months ended November 30, 2013, the Funds paid the following amounts in commitment fees:
| | | | |
| | | Commitment fee | |
Growth Balanced Fund | | $ | 324 | |
Moderate Balanced Fund | | | 166 | |
For the six months ended November 30, 2013, there were no borrowings by the Funds under the agreement.
8. INDEMNIFICATION
Under the Trust’s organizational documents, the officers and directors are indemnified against certain liabilities that may arise out of performance of their duties to the Trust. Additionally, in the normal course of business, the Trust may enter into contracts with service providers that contain a variety of indemnification clauses. The Trust’s maximum exposure under these arrangements is dependent on future claims that may be made against the Funds and, therefore, cannot be estimated.
9. SUBSEQUENT DISTRIBUTIONS
On December 19, 2013, the Fund’s declared distributions from net investment income to shareholders of record on December 18, 2013. The per share amounts payable on December 20, 2013 were as follows:
| | | | | | | | |
| | | Growth
Balanced
Fund | | | Moderate
Balanced
Fund | |
Net investment income | | | | | | | | |
Class A | | $ | 0.33544 | | | $ | 0.13352 | |
Class B | | | 0.04467 | | | | 0.03222 | |
Class C | | | 0.15339 | | | | 0.08502 | |
Administrator Class | | | 0.42265 | | | | 0.14881 | |
These distributions are not reflected in the accompanying financial statements. The final determination of the source of all distributions is subject to change and made after the tax year-end of each Fund.
| | | | | | |
| Portfolio of investments—November 30, 2013 (unaudited) | | Wells Fargo Advantage Allocation Funds | | | 27 | |
C&B LARGE CAP VALUE PORTFOLIO
| | | | | | | | | | | | |
| Security name | | | | | | Shares | | | Value | |
| | | | | | | | | | | | |
| | | | |
Common Stocks: 94.70% | | | | | | | | | | | | |
| | | | |
Consumer Discretionary: 14.00% | | | | | | | | | | | | |
| | | | |
| Hotels, Restaurants & Leisure: 4.40% | | | | | | | | | | | | |
Carnival Corporation | | | | | | | 211,600 | | | $ | 7,640,876 | |
McDonald’s Corporation | | | | | | | 80,300 | | | | 7,818,811 | |
| | | | |
| | | | | | | | | | | 15,459,687 | |
| | | | | | | | | | | | |
| | | | |
| Household Durables: 2.40% | | | | | | | | | | | | |
NVR Incorporated † | | | | | | | 8,670 | | | | 8,409,727 | |
| | | | | | | | | | | | |
| | | | |
| Media: 5.14% | | | | | | | | | | | | |
Omnicom Group Incorporated | | | | | | | 154,700 | | | | 11,053,315 | |
Twenty-First Century Fox Incorporated | | | | | | | 209,200 | | | | 7,006,108 | |
| | | | |
| | | | | | | | | | | 18,059,423 | |
| | | | | | | | | | | | |
| | | | |
| Multiline Retail: 2.06% | | | | | | | | | | | | |
Kohl’s Corporation | | | | | | | 130,600 | | | | 7,219,568 | |
| | | | | | | | | | | | |
| | | | |
Consumer Staples: 11.94% | | | | | | | | | | | | |
| | | | |
| Beverages: 2.45% | | | | | | | | | | | | |
Coca-Cola Enterprises Incorporated | | | | | | | 106,700 | | | | 4,474,998 | |
Diageo plc ADR | | | | | | | 32,300 | | | | 4,123,741 | |
| | | | |
| | | | | | | | | | | 8,598,739 | |
| | | | | | | | | | | | |
| | | | |
| Food Products: 1.97% | | | | | | | | | | | | |
Unilever NV ADR | | | | | | | 176,300 | | | | 6,921,538 | |
| | | | | | | | | | | | |
| | | | |
| Household Products: 4.61% | | | | | | | | | | | | |
Colgate-Palmolive Company | | | | | | | 80,600 | | | | 5,304,286 | |
Henkel AG & Company KGaA ADR | | | | | | | 61,200 | | | | 6,077,001 | |
Procter & Gamble Company | | | | | | | 57,000 | | | | 4,800,540 | |
| | | | |
| | | | | | | | | | | 16,181,827 | |
| | | | | | | | | | | | |
| | | | |
| Personal Products: 1.12% | | | | | | | | | | | | |
Avon Products Incorporated | | | | | | | 219,700 | | | | 3,917,251 | |
| | | | | | | | | | | | |
| | | | |
| Tobacco: 1.79% | | | | | | | | | | | | |
Philip Morris International | | | | | | | 73,600 | | | | 6,295,744 | |
| | | | | | | | | | | | |
| | | | |
Energy: 5.62% | | | | | | | | | | | | |
| | | | |
| Oil, Gas & Consumable Fuels: 5.62% | | | | | | | | | | | | |
Chevron Corporation | | | | | | | 45,700 | | | | 5,595,508 | |
Devon Energy Corporation | | | | | | | 128,900 | | | | 7,813,918 | |
Exxon Mobil Corporation | | | | | | | 67,600 | | | | 6,319,248 | |
| | | | |
| | | | | | | | | | | 19,728,674 | |
| | | | | | | | | | | | |
| | | | |
Financials: 23.71% | | | | | | | | | | | | |
| | | | |
| Capital Markets: 5.15% | | | | | | | | | | | | |
Charles Schwab Corporation | | | | | | | 208,800 | | | | 5,111,424 | |
State Street Corporation | | | | | | | 178,600 | | | | 12,968,146 | |
| | | | |
| | | | | | | | | | | 18,079,570 | |
| | | | | | | | | | | | |
| | | | |
| Commercial Banks: 1.99% | | | | | | | | | | | | |
PNC Financial Services Group Incorporated | | | | | | | 90,900 | | | | 6,994,755 | |
| | | | | | | | | | | | |
The accompanying notes are an integral part of these financial statements.
| | | | |
| 28 | | Wells Fargo Advantage Allocation Funds | | Portfolio of investments—November 30, 2013 (unaudited) |
C&B LARGE CAP VALUE PORTFOLIO
| | | | | | | | | | | | |
| Security name | | | | | | Shares | | | Value | |
| | | | | | | | | | | | |
| | | | |
| Consumer Finance: 2.81% | | | | | | | | | | | | |
American Express Company | | | | | | | 114,800 | | | $ | 9,849,840 | |
| | | | | | | | | | | | |
| | | | |
| Diversified Financial Services: 6.79% | | | | | | | | | | | | |
Bank of America Corporation | | | | | | | 355,800 | | | | 5,628,756 | |
Berkshire Hathaway Incorporated Class B † | | | | | | | 59,100 | | | | 6,886,923 | |
JPMorgan Chase & Company | | | | | | | 197,800 | | | | 11,318,116 | |
| | | | |
| | | | | | | | | | | 23,833,795 | |
| | | | | | | | | | | | |
| | | | |
| Insurance: 6.97% | | | | | | | | | | | | |
Axis Capital Holdings Limited | | | | | | | 128,150 | | | | 6,296,010 | |
RenaissanceRe Holdings Limited | | | | | | | 80,500 | | | | 7,623,350 | |
The Progressive Corporation | | | | | | | 184,800 | | | | 5,161,464 | |
Willis Group Holdings plc | | | | | | | 120,300 | | | | 5,387,034 | |
| | | | |
| | | | | | | | | | | 24,467,858 | |
| | | | | | | | | | | | |
| | | | |
Health Care: 12.55% | | | | | | | | | | | | |
| | | | |
| Health Care Equipment & Supplies: 3.37% | | | | | | | | | | | | |
Baxter International Incorporated | | | | | | | 113,500 | | | | 7,769,075 | |
Becton Dickinson & Company | | | | | | | 37,400 | | | | 4,061,266 | |
| | | | |
| | | | | | | | | | | 11,830,341 | |
| | | | | | | | | | | | |
| | | | |
| Health Care Providers & Services: 6.70% | | | | | | | | | | | | |
Cardinal Health Incorporated | | | | | | | 140,600 | | | | 9,082,760 | |
Quest Diagnostics Incorporated | | | | | | | 131,600 | | | | 8,019,704 | |
UnitedHealth Group Incorporated | | | | | | | 86,000 | | | | 6,405,280 | |
| | | | |
| | | | | | | | | | | 23,507,744 | |
| | | | | | | | | | | | |
| | | | |
| Pharmaceuticals: 2.48% | | | | | | | | | | | | |
Johnson & Johnson | | | | | | | 92,000 | | | | 8,708,720 | |
| | | | | | | | | | | | |
| | | | |
Industrials: 10.77% | | | | | | | | | | | | |
| | | | |
| Aerospace & Defense: 1.03% | | | | | | | | | | | | |
Raytheon Company | | | | | | | 40,900 | | | | 3,627,012 | |
| | | | | | | | | | | | |
| | | | |
| Air Freight & Logistics: 1.53% | | | | | | | | | | | | |
United Parcel Service Incorporated Class B | | | | | | | 52,300 | | | | 5,354,474 | |
| | | | | | | | | | | | |
| | | | |
| Commercial Services & Supplies: 1.97% | | | | | | | | | | | | |
Cintas Corporation | | | | | | | 124,900 | | | | 6,931,950 | |
| | | | | | | | | | | | |
| | | | |
| Industrial Conglomerates: 2.85% | | | | | | | | | | | | |
3M Company | | | | | | | 74,900 | | | | 9,999,899 | |
| | | | | | | | | | | | |
| | | | |
| Machinery: 3.39% | | | | | | | | | | | | |
Illinois Tool Works Incorporated | | | | | | | 69,300 | | | | 5,514,894 | |
Parker Hannifin Corporation | | | | | | | 54,100 | | | | 6,375,144 | |
| | | | |
| | | | | | | | | | | 11,890,038 | |
| | | | | | | | | | | | |
| | | | |
Information Technology: 8.13% | | | | | | | | | | | | |
| | | | |
| Electronic Equipment, Instruments & Components: 1.00% | | | | | | | | | | | | |
TE Connectivity Limited | | | | | | | 67,000 | | | | 3,532,240 | |
| | | | | | | | | | | | |
The accompanying notes are an integral part of these financial statements.
| | | | | | |
| Portfolio of investments—November 30, 2013 (unaudited) | | Wells Fargo Advantage Allocation Funds | | | 29 | |
C&B LARGE CAP VALUE PORTFOLIO
| | | | | | | | | | | | | | |
| Security name | | | | | | | Shares | | | Value | |
| | | | | | | | | | | | | | |
| | | | |
| IT Services: 4.16% | | | | | | | | | | | | | | |
Fiserv Incorporated † | | | | | | | | | 66,800 | | | $ | 7,340,652 | |
Western Union Company | | | | | | | | | 436,100 | | | | 7,269,787 | |
| | | | |
| | | | | | | | | | | | | 14,610,439 | |
| | | | | | | | | | | | | | |
| | | | |
| Semiconductors & Semiconductor Equipment: 1.42% | | | | | | | | | | | | | | |
Lam Research Corporation † | | | | | | | | | 95,600 | | | | 4,981,716 | |
| | | | | | | | | | | | | | |
| | | | |
| Software: 1.55% | | | | | | | | | | | | | | |
Microsoft Corporation | | | | | | | | | 142,500 | | | | 5,433,525 | |
| | | | | | | | | | | | | | |
| | | | |
Materials: 6.58% | | | | | | | | | | | | | | |
| | | | |
| Containers & Packaging: 6.58% | | | | | | | | | | | | | | |
Ball Corporation | | | | | | | | | 190,700 | | | | 9,531,186 | |
Crown Holdings Incorporated † | | | | | | | | | 160,100 | | | | 7,066,814 | |
Rock-Tenn Company Class A | | | | | | | | | 69,100 | | | | 6,524,422 | |
| | | | |
| | | | | | | | | | | | | 23,122,422 | |
| | | | | | | | | | | | | | |
| | | | |
Utilities: 1.40% | | | | | | | | | | | | | | |
| | | | |
| Electric Utilities: 1.40% | | | | | | | | | | | | | | |
Entergy Corporation | | | | | | | | | 79,300 | | | | 4,907,877 | |
| | | | | | | | | | | | | | |
| | | | |
Total Common Stocks (Cost $229,197,778) | | | | | | | | | | | | | 332,456,393 | |
| | | | | | | | | | | | | | |
| | | | |
| | | | | Dividend yield | | | | | | | |
| | | | |
Preferred Stocks: 0.44% | | | | | | | | | | | | | | |
| | | | |
Consumer Staples: 0.44% | | | | | | | | | | | | | | |
| | | | |
| Household Products: 0.44% | | | | | | | | | | | | | | |
Henkel AG & Company KGaA ADR ± | | | | | 1.09 | % | | | 13,600 | | | | 1,545,244 | |
| | | | | | | | | | | | | | |
| | | | |
Total Preferred Stocks (Cost $597,017) | | | | | | | | | | | | | 1,545,244 | |
| | | | | | | | | | | | | | |
| | | | |
| | | | | Yield | | | | | | | |
| | | | |
Short-Term Investments: 4.71% | | | | | | | | | | | | | | |
| | | | |
| Investment Companies: 4.71% | | | | | | | | | | | | | | |
Wells Fargo Advantage Cash Investment Money Market Fund, Select Class (l)(u) | | | | | 0.08 | | | | 16,519,640 | | | | 16,519,640 | |
| | | | | | | | | | | | | | |
| | | | |
Total Short-Term Investments (Cost $16,519,640) | | | | | | | | | | | | | 16,519,640 | |
| | | | | | | | | | | | | | |
| | | | | | | | |
| Total investments in securities | | | | | | | | |
| (Cost $246,314,435) * | | | 99.85 | % | | | 350,521,277 | |
Other assets and liabilities, net | | | 0.15 | | | | 528,363 | |
| | | | | | | | |
| Total net assets | | | 100.00 | % | | $ | 351,049,640 | |
| | | | | | | | |
| † | Non-income-earning security |
| ± | Variable rate investment. The rate shown is the rate in effect at period end. |
| (l) | Investment in an affiliate |
| (u) | Rate shown is the 7-day annualized yield at period end. |
| * | Cost for federal income tax purposes is $255,710,903 and unrealized appreciation (depreciation) consists of: |
| | | | |
Gross unrealized appreciation | | $ | 105,190,272 | |
Gross unrealized depreciation | | | (10,379,898 | ) |
| | | | |
Net unrealized appreciation | | $ | 94,810,374 | |
The accompanying notes are an integral part of these financial statements.
| | | | |
| 30 | | Wells Fargo Advantage Allocation Funds | | Portfolio of investments—November 30, 2013 (unaudited) |
DIVERSIFIED LARGE CAP GROWTH PORTFOLIO
| | | | | | | | | | | | |
| Security name | | | | | | Shares | | | Value | |
| | | | | | | | | | | | |
| | | | |
Common Stocks: 99.30% | | | | | | | | | | | | |
| | | | |
Consumer Discretionary: 24.69% | | | | | | | | | | | | |
| | | | |
| Auto Components: 0.66% | | | | | | | | | | | | |
Delphi Automotive plc | | | | | | | 17,370 | | | $ | 1,017,014 | |
| | | | | | | | | | | | |
| | | | |
| Distributors: 0.22% | | | | | | | | | | | | |
LKQ Corporation † | | | | | | | 10,160 | | | | 336,804 | |
| | | | | | | | | | | | |
| | | | |
| Hotels, Restaurants & Leisure: 4.22% | | | | | | | | | | | | |
Chipotle Mexican Grill Incorporated † | | | | | | | 3,000 | | | | 1,571,580 | |
Marriott International Incorporated Class A | | | | | | | 11,890 | | | | 559,068 | |
Starbucks Corporation | | | | | | | 43,701 | | | | 3,559,883 | |
Wynn Resorts Limited | | | | | | | 4,700 | | | | 779,589 | |
| | | | |
| | | | | | | | | | | 6,470,120 | |
| | | | | | | | | | | | |
| | | | |
| Internet & Catalog Retail: 4.99% | | | | | | | | | | | | |
Amazon.com Incorporated † | | | | | | | 11,610 | | | | 4,569,928 | |
Netflix Incorporated † | | | | | | | 2,660 | | | | 973,028 | |
priceline.com Incorporated † | | | | | | | 1,770 | | | | 2,110,424 | |
| | | | |
| | | | | | | | | | | 7,653,380 | |
| | | | | | | | | | | | |
| | | | |
| Media: 3.17% | | | | | | | | | | | | |
CBS Corporation Class B | | | | | | | 13,250 | | | | 775,920 | |
Discovery Communications Incorporated Class A † | | | | | | | 13,730 | | | | 1,198,217 | |
Liberty Global plc Class C † | | | | | | | 16,210 | | | | 1,320,305 | |
Sirius XM Holdings Incorporated | | | | | | | 274,060 | | | | 1,033,206 | |
Twenty-First Century Fox Incorporated | | | | | | | 13,760 | | | | 460,822 | |
Walt Disney Company | | | | | | | 1,100 | | | | 77,594 | |
| | | | |
| | | | | | | | | | | 4,866,064 | |
| | | | | | | | | | | | |
| | | | |
| Multiline Retail: 2.85% | | | | | | | | | | | | |
Dollar General Corporation † | | | | | | | 6,030 | | | | 343,348 | |
Dollar Tree Incorporated † | | | | | | | 47,150 | | | | 2,623,898 | |
Nordstrom Incorporated | | | | | | | 22,610 | | | | 1,406,568 | |
| | | | |
| | | | | | | | | | | 4,373,814 | |
| | | | | | | | | | | | |
| | | | |
| Specialty Retail: 5.36% | | | | | | | | | | | | |
Bed Bath & Beyond Incorporated † | | | | | | | 3,150 | | | | 245,795 | |
Best Buy Company Incorporated | | | | | | | 23,540 | | | | 954,547 | |
Cabela’s Incorporated † | | | | | | | 6,900 | | | | 422,625 | |
CarMax Incorporated † | | | | | | | 33,150 | | | | 1,669,103 | |
GNC Holdings Incorporated Class A | | | | | | | 3,030 | | | | 182,345 | |
Home Depot Incorporated | | | | | | | 11,700 | | | | 943,839 | |
O’Reilly Automotive Incorporated † | | | | | | | 5,100 | | | | 637,296 | |
Ross Stores Incorporated | | | | | | | 7,970 | | | | 609,386 | |
TJX Companies Incorporated | | | | | | | 18,920 | | | | 1,189,690 | |
Tractor Supply Company | | | | | | | 10,880 | | | | 796,525 | |
Ulta Salon Cosmetics & Fragrance Incorporated † | | | | | | | 4,440 | | | | 563,614 | |
| | | | |
| | | | | | | | | | | 8,214,765 | |
| | | | | | | | | | | | |
The accompanying notes are an integral part of these financial statements.
| | | | | | |
| Portfolio of investments—November 30, 2013 (unaudited) | | Wells Fargo Advantage Allocation Funds | | | 31 | |
DIVERSIFIED LARGE CAP GROWTH PORTFOLIO
| | | | | | | | | | | | |
| Security name | | | | | | Shares | | | Value | |
| | | | | | | | | | | | |
| | | | |
| Textiles, Apparel & Luxury Goods: 3.22% | | | | | | | | | | | | |
lululemon athletica incorporated † | | | | | | | 14,990 | | | $ | 1,045,103 | |
Michael Kors Holdings Limited † | | | | | | | 21,765 | | | | 1,774,936 | |
Nike Incorporated Class B | | | | | | | 11,430 | | | | 904,570 | |
Under Armour Incorporated Class A † | | | | | | | 6,140 | | | | 495,498 | |
VF Corporation | | | | | | | 3,050 | | | | 715,469 | |
| | | | |
| | | | | | | | | | | 4,935,576 | |
| | | | | | | | | | | | |
| | | | |
Consumer Staples: 5.47% | | | | | | | | | | | | |
| | | | |
| Beverages: 1.49% | | | | | | | | | | | | |
Constellation Brands Incorporated Class A † | | | | | | | 26,530 | | | | 1,867,977 | |
The Coca-Cola Company | | | | | | | 10,320 | | | | 414,761 | |
| | | | |
| | | | | | | | | | | 2,282,738 | |
| | | | | | | | | | | | |
| | | | |
| Food & Staples Retailing: 3.49% | | | | | | | | | | | | |
Costco Wholesale Corporation | | | | | | | 12,290 | | | | 1,541,535 | |
Sprouts Farmers Market Incorporated † | | | | | | | 3,819 | | | | 144,511 | |
Walgreen Company | | | | | | | 12,500 | | | | 740,000 | |
Whole Foods Market Incorporated | | | | | | | 51,710 | | | | 2,926,786 | |
| | | | |
| | | | | | | | | | | 5,352,832 | |
| | | | | | | | | | | | |
| | | | |
| Household Products: 0.12% | | | | | | | | | | | | |
Colgate-Palmolive Company | | | | | | | 2,900 | | | | 190,849 | |
| | | | | | | | | | | | |
| | | | |
| Personal Products: 0.37% | | | | | | | | | | | | |
Estee Lauder Companies Incorporated Class A | | | | | | | 7,510 | | | | 562,950 | |
| | | | | | | | | | | | |
| | | | |
Energy: 4.15% | | | | | | | | | | | | |
| | | | |
| Energy Equipment & Services: 0.73% | | | | | | | | | | | | |
National Oilwell Varco Incorporated | | | | | | | 5,765 | | | | 469,848 | |
Schlumberger Limited | | | | | | | 7,300 | | | | 645,466 | |
| | | | |
| | | | | | | | | | | 1,115,314 | |
| | | | | | | | | | | | |
| | | | |
| Oil, Gas & Consumable Fuels: 3.42% | | | | | | | | | | | | |
Antero Resources Corporation †« | | | | | | | 4,576 | | | | 251,222 | |
Concho Resources Incorporated † | | | | | | | 15,790 | | | | 1,641,055 | |
Continental Resources Incorporated †« | | | | | | | 3,810 | | | | 409,613 | |
EOG Resources Incorporated | | | | | | | 400 | | | | 66,000 | |
Pioneer Natural Resources Company | | | | | | | 16,220 | | | | 2,883,105 | |
| | | | |
| | | | | | | | | | | 5,250,995 | |
| | | | | | | | | | | | |
| | | | |
Financials: 6.06% | | | | | | | | | | | | |
| | | | |
| Capital Markets: 2.10% | | | | | | | | | | | | |
Affiliated Managers Group Incorporated † | | | | | | | 4,270 | | | | 855,068 | |
Ameriprise Financial Incorporated | | | | | | | 5,010 | | | | 542,333 | |
Northern Trust Corporation | | | | | | | 5,210 | | | | 307,338 | |
TD Ameritrade Holding Corporation | | | | | | | 52,750 | | | | 1,518,145 | |
| | | | |
| | | | | | | | | | | 3,222,884 | |
| | | | | | | | | | | | |
The accompanying notes are an integral part of these financial statements.
| | | | |
| 32 | | Wells Fargo Advantage Allocation Funds | | Portfolio of investments—November 30, 2013 (unaudited) |
DIVERSIFIED LARGE CAP GROWTH PORTFOLIO
| | | | | | | | | | | | |
| Security name | | | | | | Shares | | | Value | |
| | | | | | | | | | | | |
| | | | |
| Consumer Finance: 1.86% | | | | | | | | | | | | |
American Express Company | | | | | | | 16,614 | | | $ | 1,425,481 | |
Discover Financial Services | | | | | | | 26,910 | | | | 1,434,303 | |
| | | | |
| | | | | | | | | | | 2,859,784 | |
| | | | | | | | | | | | |
| | | | |
| Diversified Financial Services: 1.30% | | | | | | | | | | | | |
CME Group Incorporated | | | | | | | 3,360 | | | | 275,352 | |
Intercontinental Exchange Incorporated † | | | | | | | 8,020 | | | | 1,710,586 | |
| | | | |
| | | | | | | | | | | 1,985,938 | |
| | | | | | | | | | | | |
| | | | |
| Insurance: 0.70% | | | | | | | | | | | | |
Aon plc | | | | | | | 13,210 | | | | 1,078,464 | |
| | | | | | | | | | | | |
| | | | |
| REITs: 0.10% | | | | | | | | | | | | |
American Tower Corporation | | | | | | | 2,000 | | | | 155,540 | |
| | | | | | | | | | | | |
| | | | |
Health Care: 16.03% | | | | | | | | | | | | |
| | | | |
| Biotechnology: 9.27% | | | | | | | | | | | | |
Alexion Pharmaceuticals Incorporated † | | | | | | | 20,940 | | | | 2,607,030 | |
Biogen Idec Incorporated † | | | | | | | 8,820 | | | | 2,566,355 | |
BioMarin Pharmaceutical Incorporated † | | | | | | | 3,990 | | | | 280,816 | |
Celgene Corporation † | | | | | | | 19,580 | | | | 3,167,457 | |
Gilead Sciences Incorporated † | | | | | | | 53,800 | | | | 4,024,778 | |
Medivation Incorporated † | | | | | | | 1,500 | | | | 94,515 | |
Quintiles Transnational Holdings Incorporated † | | | | | | | 5,383 | | | | 232,492 | |
Regeneron Pharmaceuticals Incorporated † | | | | | | | 3,280 | | | | 963,861 | |
Vertex Pharmaceuticals Incorporated † | | | | | | | 4,050 | | | | 281,151 | |
| | | | |
| | | | | | | | | | | 14,218,455 | |
| | | | | | | | | | | | |
| | | | |
| Health Care Equipment & Supplies: 1.35% | | | | | | | | | | | | |
Boston Scientific Corporation † | | | | | | | 80,530 | | | | 932,537 | |
Covidien plc | | | | | | | 16,780 | | | | 1,145,403 | |
| | | | |
| | | | | | | | | | | 2,077,940 | |
| | | | | | | | | | | | |
| | | | |
| Health Care Providers & Services: 1.92% | | | | | | | | | | | | |
AmerisourceBergen Corporation | | | | | | | 17,823 | | | | 1,257,056 | |
Catamaran Corporation † | | | | | | | 19,120 | | | | 872,446 | |
Envision Healthcare Holdings Incorporated † | | | | | | | 5,875 | | | | 174,018 | |
Express Scripts Holding Company † | | | | | | | 9,480 | | | | 638,478 | |
| | | | |
| | | | | | | | | | | 2,941,998 | |
| | | | | | | | | | | | |
| | | | |
| Health Care Technology: 0.93% | | | | | | | | | | | | |
Cerner Corporation † | | | | | | | 24,950 | | | | 1,433,877 | |
| | | | | | | | | | | | |
| | | | |
| Life Sciences Tools & Services: 0.37% | | | | | | | | | | | | |
Mettler-Toledo International Incorporated † | | | | | | | 2,280 | | | | 562,180 | |
| | | | | | | | | | | | |
| | | | |
| Pharmaceuticals: 2.19% | | | | | | | | | | | | |
Actavis plc † | | | | | | | 6,540 | | | | 1,066,478 | |
Allergan Incorporated | | | | | | | 2,550 | | | | 247,478 | |
The accompanying notes are an integral part of these financial statements.
| | | | | | |
| Portfolio of investments—November 30, 2013 (unaudited) | | Wells Fargo Advantage Allocation Funds | | | 33 | |
DIVERSIFIED LARGE CAP GROWTH PORTFOLIO
| | | | | | | | | | | | |
| Security name | | | | | | Shares | | | Value | |
| | | | | | | | | | | | |
| | | | |
| Pharmaceuticals (continued) | | | | | | | | | | | | |
Bristol-Myers Squibb Company | | | | | | | 1,500 | | | $ | 77,070 | |
Mallinckrodt plc † | | | | | | | 1,332 | | | | 69,211 | |
Merck & Company Incorporated | | | | | | | 2,100 | | | | 104,643 | |
Mylan Laboratories Incorporated † | | | | | | | 1,400 | | | | 61,782 | |
Perrigo Company « | | | | | | | 6,940 | | | | 1,081,877 | |
Shire plc ADR | | | | | | | 2,440 | | | | 331,376 | |
Zoetis Incorporated | | | | | | | 10,130 | | | | 315,550 | |
| | | | |
| | | | | | | | | | | 3,355,465 | |
| | | | | | | | | | | | |
| | | | |
Industrials: 10.63% | | | | | | | | | | | | |
| | | | |
| Aerospace & Defense: 3.23% | | | | | | | | | | | | |
Precision Castparts Corporation | | | | | | | 9,683 | | | | 2,502,571 | |
The Boeing Company | | | | | | | 7,810 | | | | 1,048,493 | |
United Technologies Corporation | | | | | | | 12,720 | | | | 1,410,139 | |
| | | | |
| | | | | | | | | | | 4,961,203 | |
| | | | | | | | | | | | |
| | | | |
| Air Freight & Logistics: 0.65% | | | | | | | | | | | | |
United Parcel Service Incorporated Class B | | | | | | | 9,780 | | | | 1,001,276 | |
| | | | | | | | | | | | |
| | | | |
| Airlines: 0.76% | | | | | | | | | | | | |
Delta Air Lines Incorporated | | | | | | | 37,540 | | | | 1,087,909 | |
Southwest Airlines Company | | | | | | | 4,000 | | | | 74,360 | |
| | | | |
| | | | | | | | | | | 1,162,269 | |
| | | | | | | | | | | | |
| | | | |
| Building Products: 0.17% | | | | | | | | | | | | |
Fortune Brands Home & Security Incorporated | | | | | | | 5,920 | | | | 258,112 | |
| | | | | | | | | | | | |
| | | | |
| Electrical Equipment: 0.62% | | | | | | | | | | | | |
Eaton Corporation plc | | | | | | | 13,160 | | | | 956,206 | |
| | | | | | | | | | | | |
| | | | |
| Industrial Conglomerates: 0.73% | | | | | | | | | | | | |
Danaher Corporation | | | | | | | 15,020 | | | | 1,123,496 | |
| | | | | | | | | | | | |
| | | | |
| Machinery: 0.33% | | | | | | | | | | | | |
Flowserve Corporation | | | | | | | 6,330 | | | | 451,835 | |
Pentair Limited | | | | | | | 700 | | | | 49,504 | |
| | | | |
| | | | | | | | | | | 501,339 | |
| | | | | | | | | | | | |
| | | | |
| Professional Services: 0.24% | | | | | | | | | | | | |
Verisk Analytics Incorporated Class A † | | | | | | | 5,630 | | | | 366,569 | |
| | | | | | | | | | | | |
| | | | |
| Road & Rail: 3.35% | | | | | | | | | | | | |
CSX Corporation | | | | | | | 10,000 | | | | 272,700 | |
Genesee & Wyoming Incorporated † | | | | | | | 500 | | | | 48,100 | |
J.B. Hunt Transport Services Incorporated | | | | | | | 1,730 | | | | 130,079 | |
Kansas City Southern | | | | | | | 19,070 | | | | 2,307,851 | |
Norfolk Southern Corporation | | | | | | | 9,350 | | | | 819,902 | |
Union Pacific Corporation | | | | | | | 9,660 | | | | 1,565,306 | |
| | | | |
| | | | | | | | | | | 5,143,938 | |
| | | | | | | | | | | | |
The accompanying notes are an integral part of these financial statements.
| | | | |
| 34 | | Wells Fargo Advantage Allocation Funds | | Portfolio of investments—November 30, 2013 (unaudited) |
DIVERSIFIED LARGE CAP GROWTH PORTFOLIO
| | | | | | | | | | | | |
| Security name | | | | | | Shares | | | Value | |
| | | | | | | | | | | | |
| | | | |
| Trading Companies & Distributors: 0.55% | | | | | | | | | | | | |
W.W. Grainger Incorporated | | | | | | | 3,250 | | | $ | 838,240 | |
| | | | | | | | | | | | |
| | | | |
Information Technology: 28.75% | | | | | | | | | | | | |
| | | | |
| Communications Equipment: 1.38% | | | | | | | | | | | | |
F5 Networks Incorporated † | | | | | | | 2,500 | | | | 205,650 | |
QUALCOMM Incorporated | | | | | | | 25,961 | | | | 1,910,210 | |
| | | | |
| | | | | | | | | | | 2,115,860 | |
| | | | | | | | | | | | |
| | | | |
| Computers & Peripherals: 3.13% | | | | | | | | | | | | |
Apple Incorporated | | | | | | | 8,641 | | | | 4,805,001 | |
| | | | | | | | | | | | |
| | | | |
| Electronic Equipment, Instruments & Components: 0.02% | | | | | | | | | | | | |
Trimble Navigation Limited † | | | | | | | 800 | | | | 25,520 | |
| | | | | | | | | | | | |
| | | | |
| Internet Software & Services: 10.20% | | | | | | | | | | | | |
Akamai Technologies Incorporated † | | | | | | | 7,050 | | | | 315,276 | |
Baidu Incorporated ADR † | | | | | | | 3,270 | | | | 544,684 | |
eBay Incorporated † | | | | | | | 50,040 | | | | 2,528,021 | |
Facebook Incorporated Class A † | | | | | | | 52,900 | | | | 2,486,829 | |
Google Incorporated Class A † | | | | | | | 6,774 | | | | 7,177,663 | |
LinkedIn Corporation Class A † | | | | | | | 5,410 | | | | 1,212,002 | |
MercadoLibre Incorporated « | | | | | | | 4,880 | | | | 540,265 | |
Pandora Media Incorporated † | | | | | | | 4,800 | | | | 136,320 | |
Rackspace Hosting Incorporated †« | | | | | | | 18,510 | | | | 707,267 | |
| | | | |
| | | | | | | | | | | 15,648,327 | |
| | | | | | | | | | | | |
| | | | |
| IT Services: 8.29% | | | | | | | | | | | | |
Accenture plc | | | | | | | 9,680 | | | | 749,910 | |
Alliance Data Systems Corporation † | | | | | | | 11,470 | | | | 2,778,722 | |
Cognizant Technology Solutions Corporation Class A † | | | | | | | 19,730 | | | | 1,852,450 | |
MasterCard Incorporated Class A | | | | | | | 4,596 | | | | 3,496,683 | |
Vantiv Incorporated Class A † | | | | | | | 30,470 | | | | 923,241 | |
Visa Incorporated Class A | | | | | | | 14,280 | | | | 2,905,409 | |
| | | | |
| | | | | | | | | | | 12,706,415 | |
| | | | | | | | | | | | |
| | | | |
| Semiconductors & Semiconductor Equipment: 2.75% | | | | | | | | | | | | |
ARM Holdings plc | | | | | | | 22,210 | | | | 1,108,279 | |
ASML Holding NV | | | | | | | 10,480 | | | | 978,622 | |
Avago Technologies Limited | | | | | | | 6,670 | | | | 298,349 | |
Linear Technology Corporation | | | | | | | 5,170 | | | | 219,984 | |
Microchip Technology Incorporated « | | | | | | | 33,010 | | | | 1,429,003 | |
Xilinx Incorporated | | | | | | | 4,150 | | | | 184,385 | |
| | | | |
| | | | | | | | | | | 4,218,622 | |
| | | | | | | | | | | | |
| | | | |
| Software: 2.98% | | | | | | | | | | | | |
Adobe Systems Incorporated † | | | | | | | 16,730 | | | | 949,929 | |
Fortinet Incorporated † | | | | | | | 13,140 | | | | 224,694 | |
NetSuite Incorporated † | | | | | | | 2,620 | | | | 251,730 | |
Salesforce.com Incorporated † | | | | | | | 42,404 | | | | 2,208,824 | |
The accompanying notes are an integral part of these financial statements.
| | | | | | |
| Portfolio of investments—November 30, 2013 (unaudited) | | Wells Fargo Advantage Allocation Funds | | | 35 | |
DIVERSIFIED LARGE CAP GROWTH PORTFOLIO
| | | | | | | | | | | | | | |
| Security name | | | | | | | Shares | | | Value | |
| | | | | | | | | | | | | | |
| | | | |
| Software (continued) | | | | | | | | | | | | | | |
ServiceNow Incorporated † | | | | | | | | | 17,690 | | | $ | 939,516 | |
| | | | |
| | | | | | | | | | | | | 4,574,693 | |
| | | | | | | | | | | | | | |
| | | | |
Materials: 3.52% | | | | | | | | | | | | | | |
| | | | |
| Chemicals: 3.52% | | | | | | | | | | | | | | |
Airgas Incorporated | | | | | | | | | 2,970 | | | | 322,631 | |
Ecolab Incorporated | | | | | | | | | 6,200 | | | | 664,452 | |
Monsanto Company | | | | | | | | | 22,750 | | | | 2,578,253 | |
Praxair Incorporated | | | | | | | | | 14,470 | | | | 1,826,982 | |
| | | | |
| | | | | | | | | | | | | 5,392,318 | |
| | | | | | | | | | | | | | |
| | | | |
Total Common Stocks (Cost $104,838,269) | | | | | | | | | | | | | 152,315,144 | |
| | | | | | | | | | | | | | |
| | | | |
| | | Yield | | | | | | | | | |
| | | | |
Short-Term Investments: 3.41% | | | | | | | | | | | | | | |
| | | | |
| Investment Companies: 3.41% | | | | | | | | | | | | | | |
Wells Fargo Advantage Cash Investment Money Market Fund, Select Class (l)(u) | | | 0.08 | % | | | | | 1,076,336 | | | | 1,076,336 | |
Wells Fargo Securities Lending Cash Investments, LLC (l)(u)(r)(v) | | | 0.08 | | | | | | 4,148,421 | | | | 4,148,421 | |
| | | | |
Total Short-Term Investments (Cost $5,224,757) | | | | | | | | | | | | | 5,224,757 | |
| | | | | | | | | | | | | | |
| | | | | | | | |
| Total investments in securities | | | | | | | | |
| (Cost $110,063,026)* | | | 102.71 | % | | | 157,539,901 | |
Other assets and liabilities, net | | | (2.71 | ) | | | (4,154,017 | ) |
| | | | | | | | |
| Total net assets | | | 100.00 | % | | $ | 153,385,884 | |
| | | | | | | | |
| † | Non-income-earning security |
| « | All or a portion of this security is on loan. |
| (l) | Investment in an affiliate |
| (u) | Rate shown is the 7-day annualized yield at period end. |
| (r) | The investment company is exempt from registration under Section 3(c)(7) of the Investment Company Act of 1940, as amended. |
| (v) | Security represents investment of cash collateral received from securities on loan. |
| * | Cost for federal income tax purposes is $110,318,822 and unrealized appreciation (depreciation) consists of: |
| | | | |
Gross unrealized appreciation | | $ | 47,759,364 | |
Gross unrealized depreciation | | | (538,285 | ) |
| | | | |
Net unrealized appreciation | | $ | 47,221,079 | |
The accompanying notes are an integral part of these financial statements.
| | | | |
| 36 | | Wells Fargo Advantage Allocation Funds | | Portfolio of investments—November 30, 2013 (unaudited) |
EMERGING GROWTH PORTFOLIO
| | | | | | | | | | | | |
| Security name | | | | | | Shares | | | Value | |
| | | | | | | | | | | | |
| | | | |
Common Stocks: 98.95% | | | | | | | | | | | | |
| | | | |
Consumer Discretionary: 15.23% | | | | | | | | | | | | |
| | | | |
| Auto Components: 0.42% | | | | | | | | | | | | |
Fox Factory Holding Corporation † | | | | | | | 282,500 | | | $ | 5,192,350 | |
| | | | | | | | | | | | |
| | | | |
| Diversified Consumer Services: 1.85% | | | | | | | | | | | | |
Grand Canyon Education Incorporated † | | | | | | | 255,100 | | | | 11,617,254 | |
LifeLock Incorporated † | | | | | | | 642,800 | | | | 11,069,016 | |
| | | | |
| | | | | | | | | | | 22,686,270 | |
| | | | | | | | | | | | |
| | | | |
| Hotels, Restaurants & Leisure: 2.87% | | | | | | | | | | | | |
Fiesta Restaurant Group Incorporated † | | | | | | | 392,965 | | | | 19,243,496 | |
Multimedia Games Holding Company † | | | | | | | 555,500 | | | | 16,109,500 | |
| | | | |
| | | | | | | | | | | 35,352,996 | |
| | | | | | | | | | | | |
| | | | |
| Internet & Catalog Retail: 3.83% | | | | | | | | | | | | |
HomeAway Incorporated † | | | | | | | 505,945 | | | | 18,466,993 | |
RetailMeNot Incorporated † | | | | | | | 162,450 | | | | 4,657,442 | |
Shutterfly Incorporated † | | | | | | | 506,485 | | | | 23,921,287 | |
| | | | |
| | | | | | | | | | | 47,045,722 | |
| | | | | | | | | | | | |
| | | | |
| Media: 2.16% | | | | | | | | | | | | |
IMAX Corporation †« | | | | | | | 863,010 | | | | 26,606,598 | |
| | | | | | | | | | | | |
| | | | |
| Specialty Retail: 4.10% | | | | | | | | | | | | |
Asbury Automotive Group Incorporated † | | | | | | | 131,100 | | | | 6,806,712 | |
Conn’s Incorporated † | | | | | | | 79,800 | | | | 4,814,334 | |
DSW Incorporated Class A | | | | | | | 547,500 | | | | 24,544,425 | |
Five Below Incorporated † | | | | | | | 268,797 | | | | 14,289,249 | |
| | | | |
| | | | | | | | | | | 50,454,720 | |
| | | | | | | | | | | | |
| | | | |
Consumer Staples: 3.00% | | | | | | | | | | | | |
| | | | |
| Food & Staples Retailing: 1.59% | | | | | | | | | | | | |
The Fresh Market Incorporated † | | | | | | | 264,270 | | | | 10,758,432 | |
United Natural Foods Incorporated † | | | | | | | 127,500 | | | | 8,778,375 | |
| | | | |
| | | | | | | | | | | 19,536,807 | |
| | | | | | | | | | | | |
| | | | |
| Food Products: 1.41% | | | | | | | | | | | | |
Annie’s Incorporated † | | | | | | | 377,000 | | | | 17,323,150 | |
| | | | | | | | | | | | |
| | | | |
Energy: 5.68% | | | | | | | | | | | | |
| | | | |
| Oil, Gas & Consumable Fuels: 5.68% | | | | | | | | | | | | |
Athlon Energy Incorporated † | | | | | | | 166,105 | | | | 5,418,345 | |
Bonanza Creek Energy Incorporated † | | | | | | | 401,900 | | | | 18,435,153 | |
Diamondback Energy Incorporated † | | | | | | | 315,157 | | | | 15,675,909 | |
Kodiak Oil & Gas Corporation † | | | | | | | 518,100 | | | | 5,875,254 | |
Laredo Petroleum Holdings Incorporated † | | | | | | | 318,831 | | | | 8,605,249 | |
Oasis Petroleum Incorporated † | | | | | | | 343,300 | | | | 15,836,429 | |
| | | | |
| | | | | | | | | | | 69,846,339 | |
| | | | | | | | | | | | |
The accompanying notes are an integral part of these financial statements.
| | | | | | |
| Portfolio of investments—November 30, 2013 (unaudited) | | Wells Fargo Advantage Allocation Funds | | | 37 | |
EMERGING GROWTH PORTFOLIO
| | | | | | | | | | | | |
| Security name | | | | | | Shares | | | Value | |
| | | | | | | | | | | | |
| | | | |
Financials: 8.20% | | | | | | | | | | | | |
| | | | |
| Capital Markets: 2.59% | | | | | | | | | | | | |
Financial Engines Incorporated | | | | | | | 471,030 | | | $ | 31,912,283 | |
| | | | | | | | | | | | |
| | | | |
| Consumer Finance: 2.72% | | | | | | | | | | | | |
Encore Capital Group Incorporated † | | | | | | | 103,300 | | | | 4,926,377 | |
Portfolio Recovery Associates Incorporated † | | | | | | | 489,800 | | | | 28,604,319 | |
| | | | |
| | | | | | | | | | | 33,530,696 | |
| | | | | | | | | | | | |
| | | | |
| Diversified Financial Services: 2.89% | | | | | | | | | | | | |
MarketAxess Holdings Incorporated | | | | | | | 504,651 | | | | 35,512,291 | |
| | | | | | | | | | | | |
| | | | |
Health Care: 23.24% | | | | | | | | | | | | |
| | | | |
| Biotechnology: 2.25% | | | | | | | | | | | | |
Aegerion Pharmaceuticals Incorporated † | | | | | | | 14,347 | | | | 1,017,633 | |
Exact Sciences Corporation † | | | | | | | 344,753 | | | | 4,233,567 | |
Hyperion Therapeutics Incorporated † | | | | | | | 102,923 | | | | 2,628,653 | |
Ligand Pharmaceuticals Incorporated †« | | | | | | | 81,900 | | | | 4,560,192 | |
NPS Pharmaceuticals Incorporated † | | | | | | | 485,900 | | | | 12,832,619 | |
Onconova Therapeutics Incorporated †« | | | | | | | 162,698 | | | | 2,386,780 | |
| | | | |
| | | | | | | | | | | 27,659,444 | |
| | | | | | | | | | | | |
| | | | |
| Health Care Equipment & Supplies: 9.88% | | | | | | | | | | | | |
Align Technology Incorporated † | | | | | | | 146,900 | | | | 8,026,616 | |
Cardiovascular Systems Incorporated † | | | | | | | 283,758 | | | | 9,420,766 | |
Cynosure Incorporated Class A † | | | | | | | 710,778 | | | | 18,402,042 | |
DexCom Incorporated † | | | | | | | 756,070 | | | | 25,018,356 | |
Endologix Incorporated † | | | | | | | 1,169,794 | | | | 20,904,219 | |
Novadaq Technologies Incorporated † | | | | | | | 213,524 | | | | 3,555,175 | |
NxStage Medical Incorporated † | | | | | | | 685,960 | | | | 7,003,652 | |
Spectranetics Corporation † | | | | | | | 641,214 | | | | 14,914,638 | |
Tandem Diabetes Care Incorporated † | | | | | | | 245,137 | | | | 5,395,465 | |
TearLab Corporation †« | | | | | | | 488,037 | | | | 4,572,907 | |
Veracyte Incorporated † | | | | | | | 337,325 | | | | 4,378,479 | |
| | | | |
| | | | | | | | | | | 121,592,315 | |
| | | | | | | | | | | | |
| | | | |
| Health Care Providers & Services: 4.36% | | | | | | | | | | | | |
Acadia Healthcare Company Incorporated † | | | | | | | 594,200 | | | | 27,452,040 | |
ExamWorks Group Incorporated † | | | | | | | 60,200 | | | | 1,776,502 | |
MWI Veterinary Supply Incorporated † | | | | | | | 58,500 | | | | 10,656,945 | |
Team Health Holdings Incorporated † | | | | | | | 295,000 | | | | 13,785,350 | |
| | | | |
| | | | | | | | | | | 53,670,837 | |
| | | | | | | | | | | | |
| | | | |
| Health Care Technology: 2.32% | | | | | | | | | | | | |
Medidata Solutions Incorporated † | | | | | | | 240,600 | | | | 28,609,746 | |
| | | | | | | | | | | | |
| | | | |
| Life Sciences Tools & Services: 1.10% | | | | | | | | | | | | |
Cambrex Corporation † | | | | | | | 190,100 | | | | 3,706,950 | |
ICON plc ADR † | | | | | | | 257,400 | | | | 9,817,236 | |
| | | | |
| | | | | | | | | | | 13,524,186 | |
| | | | | | | | | | | | |
The accompanying notes are an integral part of these financial statements.
| | | | |
| 38 | | Wells Fargo Advantage Allocation Funds | | Portfolio of investments—November 30, 2013 (unaudited) |
EMERGING GROWTH PORTFOLIO
| | | | | | | | | | | | |
| Security name | | | | | | Shares | | | Value | |
| | | | | | | | | | | | |
| | | | |
| Pharmaceuticals: 3.33% | | | | | | | | | | | | |
AcelRx Pharmaceuticals Incorporated †« | | | | | | | 545,130 | | | $ | 5,331,371 | |
Akorn Incorporated † | | | | | | | 830,235 | | | | 21,378,551 | |
Jazz Pharmaceuticals plc † | | | | | | | 96,180 | | | | 11,245,366 | |
Lannett Company Incorporated † | | | | | | | 101,800 | | | | 3,007,172 | |
| | | | |
| | | | | | | | | | | 40,962,460 | |
| | | | | | | | | | | | |
| | | | |
Industrials: 13.79% | | | | | | | | | | | | |
| | | | |
| Building Products: 1.24% | | | | | | | | | | | | |
A.O. Smith Corporation | | | | | | | 282,500 | | | | 15,297,375 | |
| | | | | | | | | | | | |
| | | | |
| Electrical Equipment: 0.90% | | | | | | | | | | | | |
Power Solutions International Incorporated † | | | | | | | 80,799 | | | | 6,043,765 | |
Powersecure International Incorporated † | | | | | | | 282,500 | | | | 4,963,525 | |
| | | | |
| | | | | | | | | | | 11,007,290 | |
| | | | | | | | | | | | |
| | | | |
| Machinery: 4.28% | | | | | | | | | | | | |
Chart Industries Incorporated † | | | | | | | 196,785 | | | | 19,147,181 | |
Proto Labs Incorporated † | | | | | | | 125,755 | | | | 9,343,597 | |
The ExOne Company † | | | | | | | 26,100 | | | | 1,393,740 | |
The Middleby Corporation † | | | | | | | 103,150 | | | | 22,779,646 | |
| | | | |
| | | | | | | | | | | 52,664,164 | |
| | | | | | | | | | | | |
| | | | |
| Professional Services: 4.75% | | | | | | | | | | | | |
Corporate Executive Board Company | | | | | | | 251,800 | | | | 18,540,034 | |
On Assignment Incorporated † | | | | | | | 865,013 | | | | 29,436,391 | |
Wageworks Incorporated † | | | | | | | 181,850 | | | | 10,420,005 | |
| | | | |
| | | | | | | | | | | 58,396,430 | |
| | | | | | | | | | | | |
| | | | |
| Road & Rail: 0.98% | | | | | | | | | | | | |
Roadrunner Transportation Systems Incorporated † | | | | | | | 442,400 | | | | 12,112,912 | |
| | | | | | | | | | | | |
| | | | |
| Trading Companies & Distributors: 1.64% | | | | | | | | | | | | |
DXP Enterprises Incorporated † | | | | | | | 206,116 | | | | 20,195,246 | |
| | | | | | | | | | | | |
| | | | |
Information Technology: 29.81% | | | | | | | | | | | | |
| | | | |
| Computers & Peripherals: 0.42% | | | | | | | | | | | | |
Stratasys Limited † | | | | | | | 43,600 | | | | 5,134,772 | |
| | | | | | | | | | | | |
| | | | |
| Electronic Equipment, Instruments & Components: 0.66% | | | | | | | | | | | | |
Methode Electronics Incorporated | | | | | | | 281,925 | | | | 8,156,090 | |
| | | | | | | | | | | | |
| | | | |
| Internet Software & Services: 10.21% | | | | | | | | | | | | |
CoStar Group Incorporated † | | | | | | | 120,900 | | | | 22,516,416 | |
Demandware Incorporated † | | | | | | | 241,200 | | | | 13,668,804 | |
Envestnet Incorporated † | | | | | | | 624,992 | | | | 24,843,432 | |
MercadoLibre Incorporated « | | | | | | | 26,430 | | | | 2,926,065 | |
OpenTable Incorporated † | | | | | | | 117,600 | | | | 9,827,832 | |
Pandora Media Incorporated † | | | | | | | 230,600 | | | | 6,549,040 | |
SciQuest Incorporated † | | | | | | | 513,218 | | | | 14,349,575 | |
SPS Commerce Incorporated † | | | | | | | 470,732 | | | | 30,960,043 | |
| | | | |
| | | | | | | | | | | 125,641,207 | |
| | | | | | | | | | | | |
The accompanying notes are an integral part of these financial statements.
| | | | | | |
| Portfolio of investments—November 30, 2013 (unaudited) | | Wells Fargo Advantage Allocation Funds | | | 39 | |
EMERGING GROWTH PORTFOLIO
| | | | | | | | | | | | | | |
| Security name | | | | | | | Shares | | | Value | |
| | | | | | | | | | | | | | |
| | | | |
| IT Services: 2.92% | | | | | | | | | | | | | | |
InterXion Holding NV † | | | | | | | | | 580,900 | | | $ | 13,076,059 | |
Maximus Incorporated | | | | | | | | | 273,400 | | | | 12,439,700 | |
Wex Incorporated † | | | | | | | | | 105,421 | | | | 10,464,088 | |
| | | | |
| | | | | | | | | | | | | 35,979,847 | |
| | | | | | | | | | | | | | |
| | | | |
| Software: 15.60% | | | | | | | | | | | | | | |
Aspen Technology Incorporated † | | | | | | | | | 331,100 | | | | 13,088,383 | |
Ellie Mae Incorporated † | | | | | | | | | 526,500 | | | | 14,847,300 | |
Fleetmatics Group plc † | | | | | | | | | 641,820 | | | | 24,838,434 | |
Fortinet Incorporated † | | | | | | | | | 296,300 | | | | 5,066,730 | |
Guidewire Software Incorporated † | | | | | | | | | 278,601 | | | | 13,297,626 | |
Imperva Incorporated † | | | | | | | | | 479,191 | | | | 21,554,011 | |
Infoblox Incorporated † | | | | | | | | | 397,021 | | | | 12,617,327 | |
Proofpoint Incorporated † | | | | | | | | | 550,700 | | | | 16,796,350 | |
PROS Holdings Incorporated † | | | | | | | | | 409,722 | | | | 15,790,686 | |
Rally Software Development Corporation † | | | | | | | | | 225,315 | | | | 5,542,749 | |
SolarWinds Incorporated † | | | | | | | | | 59,626 | | | | 1,993,893 | |
Synchronoss Technologies Incorporated † | | | | | | | | | 438,101 | | | | 13,900,945 | |
Tyler Technologies Incorporated † | | | | | | | | | 167,325 | | | | 17,169,218 | |
Ultimate Software Group Incorporated † | | | | | | | | | 98,170 | | | | 15,382,257 | |
| | | | |
| | | | | | | | | | | | | 191,885,909 | |
| | | | | | | | | | | | | | |
| | | | |
Total Common Stocks (Cost $798,977,657) | | | | | | | | | | | | | 1,217,490,452 | |
| | | | | | | | | | | | | | |
| | | | |
| | | Yield | | | | | | | | | |
| Short-Term Investments: 3.66% | | | | | | | | | | | | | | |
| | | | |
| Investment Companies: 3.66% | | | | | | | | | | | | | | |
Wells Fargo Advantage Cash Investment Money Market Fund, Select Class (l)(u) | | | 0.08 | % | | | | | 13,303,139 | | | | 13,303,139 | |
Wells Fargo Securities Lending Cash Investments, LLC (v)(r)(l)(u) | | | 0.08 | | | | | | 31,741,350 | | | | 31,741,350 | |
| | | | |
Total Short-Term Investments (Cost $45,044,489) | | | | | | | | | | | | | 45,044,489 | |
| | | | | | | | | | | | | | |
| | | | | | | | |
Total investments in securities (Cost $844,022,146) * | | | 102.61 | % | | | 1,262,534,941 | |
Other assets and liabilities, net | | | (2.61 | ) | | | (32,080,878 | ) |
| | | | | | | | |
| Total net assets | | | 100.00 | % | | $ | 1,230,454,063 | |
| | | | | | | | |
| † | Non-income-earning security |
| « | All or a portion of this security is on loan. |
| (l) | Investment in an affiliate |
| (u) | Rate shown is the 7-day annualized yield at period end. |
| (v) | Security represents investment of cash collateral received from securities on loan. |
| (r) | The investment company is exempt from registration under Section 3(c)(7) of the Investment Company Act of 1940, as amended. |
| * | Cost for federal income tax purposes is $845,075,916 and unrealized appreciation (depreciation) consists of: |
| | | | |
Gross unrealized appreciation | | $ | 431,737,779 | |
Gross unrealized depreciation | | | (14,278,754 | ) |
| | | | |
Net unrealized appreciation | | $ | 417,459,025 | |
The accompanying notes are an integral part of these financial statements.
| | | | |
| 40 | | Wells Fargo Advantage Allocation Funds | | Summary portfolio of investments—November 30, 2013 (unaudited) |
INDEX PORTFOLIO
The Summary Portfolio of Investments shows the 50 largest portfolio holdings in unaffiliated issuers and any holdings exceeding 1% of the total net assets as of the report date. The remaining securities held are grouped as “Other securities” in each category. You can request a complete schedule of portfolio holdings as of the report date, free of charge, by accessing the following website: http://a584.g.akamai.net/f/584/1326/1d/www.wellsfargoadvantagefunds.com/pdf/semi/holdings/index.pdf or by calling Wells Fargo Advantage Funds at 1-800-222-8222. This complete schedule, filed on Form N-CSRS, is also available on the SEC’s website at sec.gov.
| | | | | | | | | | | | | | | | |
| Security name | | | | | | Shares | | | Value | | | Percent of net assets | |
| | | | | | | | | | | | | | | | |
| | | | | |
Common Stocks: 98.53% | | | | | | | | | | | | | | | | |
| | | | | |
Consumer Discretionary: 12.42% | | | | | | | | | | | | | | | | |
| | | | | |
| Auto Components: 0.42% | | | | | | | | | | | | | | | | |
Other securities | | | | | | | | | | $ | 12,028,001 | | | | 0.42 | % |
| | | | | | | | | | | | | | | | |
| | | | | |
| Automobiles: 0.73% | | | | | | | | | | | | | | | | |
Other securities | | | | | | | | | | | 20,741,902 | | | | 0.73 | |
| | | | | | | | | | | | | | | | |
| | | | | |
| Distributors: 0.08% | | | | | | | | | | | | | | | | |
Other securities | | | | | | | | | | | 2,241,816 | | | | 0.08 | |
| | | | | | | | | | | | | | | | |
| | | | | |
| Diversified Consumer Services: 0.05% | | | | | | | | | | | | | | | | |
Other securities | | | | | | | | | | | 1,334,788 | | | | 0.05 | |
| | | | | | | | | | | | | | | | |
| | | | | |
| Hotels, Restaurants & Leisure: 1.75% | | | | | | | | | | | | | | | | |
McDonald’s Corporation | | | | | | | 174,692 | | | | 17,009,760 | | | | 0.60 | |
Other securities | | | | | | | | | | | 32,769,719 | | | | 1.15 | |
| | | | | |
| | | | | | | | | | | 49,779,479 | | | | 1.75 | |
| | | | | | | | | | | | | | | | |
| | | | | |
| Household Durables: 0.33% | | | | | | | | | | | | | | | | |
Other securities | | | | | | | | | | | 9,571,743 | | | | 0.33 | |
| | | | | | | | | | | | | | | | |
| | | | | |
| Internet & Catalog Retail: 1.50% | | | | | | | | | | | | | | | | |
Amazon.com Incorporated † | | | | | | | 64,672 | | | | 25,456,193 | | | | 0.89 | |
Other securities | | | | | | | | | | | 17,414,750 | | | | 0.61 | |
| | | | | |
| | | | | | | | | | | 42,870,943 | | | | 1.50 | |
| | | | | | | | | | | | | | | | |
| | | | | |
| Leisure Equipment & Products: 0.14% | | | | | | | | | | | | | | | | |
Other securities | | | | | | | | | | | 3,871,881 | | | | 0.14 | |
| | | | | | | | | | | | | | | | |
| | | | | |
| Media: 3.61% | | | | | | | | | | | | | | | | |
Comcast Corporation Class A | | | | | | | 457,062 | | | | 22,793,682 | | | | 0.80 | |
Walt Disney Company | | | | | | | 290,334 | | | | 20,480,160 | | | | 0.72 | |
Other securities | | | | | | | | | | | 59,662,600 | | | | 2.09 | |
| | | | | |
| | | | | | | | | | | 102,936,442 | | | | 3.61 | |
| | | | | | | | | | | | | | | | |
| | | | | |
| Multiline Retail: 0.71% | | | | | | | | | | | | | | | | |
Other securities | | | | | | | | | | | 20,256,710 | | | | 0.71 | |
| | | | | | | | | | | | | | | | |
| | | | | |
| Specialty Retail: 2.25% | | | | | | | | | | | | | | | | |
Home Depot Incorporated | | | | | | | 250,324 | | | | 20,193,637 | | | | 0.71 | |
Other securities | | | | | | | | | | | 43,896,649 | | | | 1.54 | |
| | | | | |
| | | | | | | | | | | 64,090,286 | | | | 2.25 | |
| | | | | | | | | | | | | | | | |
The accompanying notes are an integral part of these financial statements.
| | | | | | |
| Summary portfolio of investments—November 30, 2013 (unaudited) | | Wells Fargo Advantage Allocation Funds | | | 41 | |
INDEX PORTFOLIO
| | | | | | | | | | | | | | | | |
| Security name | | | | | | Shares | | | Value | | | Percent of net assets | |
| | | | | | | | | | | | | | | | |
| | | | | |
| Textiles, Apparel & Luxury Goods: 0.85% | | | | | | | | | | | | | | | | |
Other securities | | | | | | | | | | $ | 24,229,309 | | | | 0.85 | % |
| | | | | | | | | | | | | | | | |
| | | | | |
Consumer Staples: 9.91% | | | | | | | | | | | | | | | | |
| | | | | |
| Beverages: 2.18% | | | | | | | | | | | | | | | | |
PepsiCo Incorporated | | | | | | | 269,507 | | | | 22,762,561 | | | | 0.80 | |
The Coca-Cola Company | | | | | | | 666,250 | | | | 26,776,588 | | | | 0.94 | |
Other securities | | | | | | | | | | | 12,475,103 | | | | 0.44 | |
| | | | | |
| | | | | | | | | | | 62,014,252 | | | | 2.18 | |
| | | | | | | | | | | | | | | | |
| | | | | |
| Food & Staples Retailing: 2.40% | | | | | | | | | | | | | | | | |
CVS Caremark Corporation | | | | | | | 214,662 | | | | 14,373,768 | | | | 0.50 | |
Wal-Mart Stores Incorporated | | | | | | | 284,451 | | | | 23,043,376 | | | | 0.81 | |
Other securities | | | | | | | | | | | 30,964,082 | | | | 1.09 | |
| | | | | |
| | | | | | | | | | | 68,381,226 | | | | 2.40 | |
| | | | | | | | | | | | | | | | |
| | | | | |
| Food Products: 1.55% | | | | | | | | | | | | | | | | |
Other securities | | | | | | | | | | | 44,250,487 | | | | 1.55 | |
| | | | | | | | | | | | | | | | |
| | | | | |
| Household Products: 2.10% | | | | | | | | | | | | | | | | |
Procter & Gamble Company | | | | | | | 478,608 | | | | 40,308,366 | | | | 1.41 | |
Other securities | | | | | | | | | | | 19,565,908 | | | | 0.69 | |
| | | | | |
| | | | | | | | | | | 59,874,274 | | | | 2.10 | |
| | | | | | | | | | | | | | | | |
| | | | | |
| Personal Products: 0.16% | | | | | | | | | | | | | | | | |
Other securities | | | | | | | | | | | 4,700,649 | | | | 0.16 | |
| | | | | | | | | | | | | | | | |
| | | | | |
| Tobacco: 1.52% | | | | | | | | | | | | | | | | |
Altria Group Incorporated | | | | | | | 350,278 | | | | 12,953,280 | | | | 0.45 | |
Philip Morris International | | | | | | | 282,847 | | | | 24,194,732 | | | | 0.85 | |
Other securities | | | | | | | | | | | 6,145,152 | | | | 0.22 | |
| | | | | |
| | | | | | | | | | | 43,293,164 | | | | 1.52 | |
| | | | | | | | | | | | | | | | |
| | | | | |
Energy: 10.14% | | | | | | | | | | | | | | | | |
| | | | | |
| Energy Equipment & Services: 1.89% | | | | | | | | | | | | | | | | |
Schlumberger Limited | | | | | | | 231,231 | | | | 20,445,445 | | | | 0.72 | |
Other securities | | | | | | | | | | | 33,403,915 | | | | 1.17 | |
| | | | | |
| | | | | | | | | | | 53,849,360 | | | | 1.89 | |
| | | | | | | | | | | | | | | | |
| | | | | |
| Oil, Gas & Consumable Fuels: 8.25% | | | | | | | | | | | | | | | | |
Chevron Corporation | | | | | | | 337,628 | | | | 41,339,172 | | | | 1.45 | |
ConocoPhillips Company | | | | | | | 213,725 | | | | 15,559,180 | | | | 0.55 | |
Exxon Mobil Corporation | | | | | | | 769,201 | | | | 71,904,909 | | | | 2.52 | |
Occidental Petroleum Corporation | | | | | | | 140,810 | | | | 13,371,318 | | | | 0.47 | |
Other securities | | | | | | | | | | | 92,841,347 | | | | 3.26 | |
| | | | | |
| | | | | | | | | | | 235,015,926 | | | | 8.25 | |
| | | | | | | | | | | | | | | | |
The accompanying notes are an integral part of these financial statements.
| | | | |
| 42 | | Wells Fargo Advantage Allocation Funds | | Summary portfolio of investments—November 30, 2013 (unaudited) |
INDEX PORTFOLIO
| | | | | | | | | | | | | | | | |
| Security name | | | | | | Shares | | | Value | | | Percent of net assets | |
| | | | | | | | | | | | | | | | |
| | | | | |
Financials: 16.04% | | | | | | | | | | | | | | | | |
| | | | | |
| Capital Markets: 2.18% | | | | | | | | | | | | | | | | |
Other securities | | | | | | | | | | $ | 61,981,692 | | | | 2.18 | % |
| | | | | | | | | | | | | | | | |
| | | | | |
| Commercial Banks: 2.76% | | | | | | | | | | | | | | | | |
Wells Fargo & Company (l) | | | | | | | 844,392 | | | | 37,170,136 | | | | 1.31 | |
Other securities | | | | | | | | | | | 41,356,674 | | | | 1.45 | |
| | | | | |
| | | | | | | | | | | 78,526,810 | | | | 2.76 | |
| | | | | | | | | | | | | | | | |
| | | | | |
| Consumer Finance: 0.97% | | | | | | | | | | | | | | | | |
American Express Company | | | | | | | 162,140 | | | | 13,911,612 | | | | 0.49 | |
Other securities | | | | | | | | | | | 13,864,651 | | | | 0.48 | |
| | | | | |
| | | | | | | | | | | 27,776,263 | | | | 0.97 | |
| | | | | | | | | | | | | | | | |
| | | | | |
| Diversified Financial Services: 5.24% | | | | | | | | | | | | | | | | |
Bank of America Corporation | | | | | | | 1,877,399 | | | | 29,700,452 | | | | 1.04 | |
Berkshire Hathaway Incorporated Class B † | | | | | | | 314,543 | | | | 36,653,696 | | | | 1.29 | |
Citigroup Incorporated | | | | | | | 531,430 | | | | 28,123,276 | | | | 0.99 | |
JPMorgan Chase & Company | | | | | | | 657,807 | | | | 37,639,717 | | | | 1.32 | |
Other securities | | | | | | | | | | | 17,232,780 | | | | 0.60 | |
| | | | | |
| | | | | | | | | | | 149,349,921 | | | | 5.24 | |
| | | | | | | | | | | | | | | | |
| | | | | |
| Insurance: 3.02% | | | | | | | | | | | | | | | | |
American International Group Incorporated | | | | | | | 257,998 | | | | 12,835,401 | | | | 0.45 | |
Other securities | | | | | | | | | | | 73,222,629 | | | | 2.57 | |
| | | | | |
| | | | | | | | | | | 86,058,030 | | | | 3.02 | |
| | | | | | | | | | | | | | | | |
| | | | | |
| Real Estate Management & Development: 0.04% | | | | | | | | | | | | | | | | |
Other securities | | | | | | | | | | | 1,174,525 | | | | 0.04 | |
| | | | | | | | | | | | | | | | |
| | | | | |
| REITs: 1.77% | | | | | | | | | | | | | | | | |
Other securities | | | | | | | | | | | 50,498,845 | | | | 1.77 | |
| | | | | | | | | | | | | | | | |
| | | | | |
| Thrifts & Mortgage Finance: 0.06% | | | | | | | | | | | | | | | | |
Other securities | | | | | | | | | | | 1,625,483 | | | | 0.06 | |
| | | | | | | | | | | | | | | | |
| | | | | |
Health Care: 13.02% | | | | | | | | | | | | | | | | |
| | | | | |
| Biotechnology: 2.45% | | | | | | | | | | | | | | | | |
Amgen Incorporated | | | | | | | 131,652 | | | | 15,018,860 | | | | 0.53 | |
Gilead Sciences Incorporated † | | | | | | | 267,482 | | | | 20,010,328 | | | | 0.70 | |
Other securities | | | | | | | | | | | 34,797,090 | | | | 1.22 | |
| | | | | |
| | | | | | | | | | | 69,826,278 | | | | 2.45 | |
| | | | | | | | | | | | | | | | |
| | | | | |
| Health Care Equipment & Supplies: 2.04% | | | | | | | | | | | | | | | | |
Other securities | | | | | | | | | | | 58,188,290 | | | | 2.04 | |
| | | | | | | | | | | | | | | | |
| | | | | |
| Health Care Providers & Services: 2.07% | | | | | | | | | | | | | | | | |
UnitedHealth Group Incorporated | | | | | | | 177,672 | | | | 13,233,011 | | | | 0.46 | |
Other securities | | | | | | | | | | | 45,817,066 | | | | 1.61 | |
| | | | | |
| | | | | | | | | | | 59,050,077 | | | | 2.07 | |
| | | | | | | | | | | | | | | | |
The accompanying notes are an integral part of these financial statements.
| | | | | | |
| Summary portfolio of investments—November 30, 2013 (unaudited) | | Wells Fargo Advantage Allocation Funds | | | 43 | |
INDEX PORTFOLIO
| | | | | | | | | | | | | | | | |
| Security name | | | | | | Shares | | | Value | | | Percent of net assets | |
| | | | | | | | | | | | | | | | |
| | | | | |
| Health Care Technology: 0.10% | | | | | | | | | | | | | | | | |
Other securities | | | | | | | | | | $ | 2,963,441 | | | | 0.10 | % |
| | | | | | | | | | | | | | | | |
| | | | | |
| Life Sciences Tools & Services: 0.49% | | | | | | | | | | | | | | | | |
Other securities | | | | | | | | | | | 13,961,340 | | | | 0.49 | |
| | | | | | | | | | | | | | | | |
| | | | | |
| Pharmaceuticals: 5.87% | | | | | | | | | | | | | | | | |
Abbvie Incorporated | | | | | | | 277,059 | | | | 13,423,509 | | | | 0.47 | |
Bristol-Myers Squibb Company | | | | | | | 287,701 | | | | 14,782,077 | | | | 0.52 | |
Johnson & Johnson | | | | | | | 492,468 | | | | 46,617,021 | | | | 1.64 | |
Merck & Company Incorporated | | | | | | | 511,394 | | | | 25,482,763 | | | | 0.89 | |
Pfizer Incorporated | | | | | | | 1,156,921 | | | | 36,709,103 | | | | 1.29 | |
Other securities | | | | | | | | | | | 30,160,740 | | | | 1.06 | |
| | | | | |
| | | | | | | | | | | 167,175,213 | | | | 5.87 | |
| | | | | | | | | | | | | | | | |
| | | | | |
Industrials: 10.69% | | | | | | | | | | | | | | | | |
| | | | | |
| Aerospace & Defense: 2.73% | | | | | | | | | | | | | | | | |
Boeing Company | | | | | | | 121,294 | | | | 16,283,720 | | | | 0.57 | |
United Technologies Corporation | | | | | | | 147,511 | | | | 16,353,069 | | | | 0.57 | |
Other securities | | | | | | | | | | | 45,205,205 | | | | 1.59 | |
| | | | | |
| | | | | | | | | | | 77,841,994 | | | | 2.73 | |
| | | | | | | | | | | | | | | | |
| | | | | |
| Air Freight & Logistics: 0.82% | | | | | | | | | | | | | | | | |
United Parcel Service Incorporated Class B | | | | | | | 126,255 | | | | 12,925,987 | | | | 0.45 | |
Other securities | | | | | | | | | | | 10,402,390 | | | | 0.37 | |
| | | | | |
| | | | | | | | | | | 23,328,377 | | | | 0.82 | |
| | | | | | | | | | | | | | | | |
| | | | | |
| Airlines: 0.23% | | | | | | | | | | | | | | | | |
Other securities | | | | | | | | | | | 6,639,219 | | | | 0.23 | |
| | | | | | | | | | | | | | | | |
| | | | | |
| Building Products: 0.05% | | | | | | | | | | | | | | | | |
Other securities | | | | | | | | | | | 1,398,492 | | | | 0.05 | |
| | | | | | | | | | | | | | | | |
| | | | | |
| Commercial Services & Supplies: 0.49% | | | | | | | | | | | | | | | | |
Other securities | | | | | | | | | | | 14,048,313 | | | | 0.49 | |
| | | | | | | | | | | | | | | | |
| | | | | |
| Construction & Engineering: 0.17% | | | | | | | | | | | | | | | | |
Other securities | | | | | | | | | | | 4,696,034 | | | | 0.17 | |
| | | | | | | | | | | | | | | | |
| | | | | |
| Electrical Equipment: 0.75% | | | | | | | | | | | | | | | | |
Other securities | | | | | | | | | | | 21,483,385 | | | | 0.75 | |
| | | | | | | | | | | | | | | | |
| | | | | |
| Industrial Conglomerates: 2.47% | | | | | | | | | | | | | | | | |
3M Company | | | | | | | 113,467 | | | | 15,148,979 | | | | 0.53 | |
General Electric Company | | | | | | | 1,779,651 | | | | 47,445,496 | | | | 1.67 | |
Other securities | | | | | | | | | | | 7,819,293 | | | | 0.27 | |
| | | | | |
| | | | | | | | | | | 70,413,768 | | | | 2.47 | |
| | | | | | | | | | | | | | | | |
| | | | | |
| Machinery: 1.72% | | | | | | | | | | | | | | | | |
Other securities | | | | | | | | | | | 48,877,693 | | | | 1.72 | |
| | | | | | | | | | | | | | | | |
The accompanying notes are an integral part of these financial statements.
| | | | |
| 44 | | Wells Fargo Advantage Allocation Funds | | Summary portfolio of investments—November 30, 2013 (unaudited) |
INDEX PORTFOLIO
| | | | | | | | | | | | | | | | |
| Security name | | | | | | Shares | | | Value | | | Percent of net assets | |
| | | | | | | | | | | | | | | | |
| | | | | |
| Professional Services: 0.18% | | | | | | | | | | | | | | | | |
Other securities | | | | | | | | | | $ | 5,062,350 | | | | 0.18 | % |
| | | | | | | | | | | | | | | | |
| | | | | |
| Road & Rail: 0.90% | | | | | | | | | | | | | | | | |
Union Pacific Corporation | | | | | | | 81,058 | | | | 13,134,638 | | | | 0.46 | |
Other securities | | | | | | | | | | | 12,605,290 | | | | 0.44 | |
| | | | | |
| | | | | | | | | | | 25,739,928 | | | | 0.90 | |
| | | | | | | | | | | | | | | | |
| | | | | |
| Trading Companies & Distributors: 0.18% | | | | | | | | | | | | | | | | |
Other securities | | | | | | | | | | | 5,008,641 | | | | 0.18 | |
| | | | | | | | | | | | | | | | |
| | | | | |
| Information Technology: 17.64% | | | | | | | | | | | | | | | | |
| | | | | |
| Communications Equipment: 1.73% | | | | | | | | | | | | | | | | |
Cisco Systems Incorporated | | | | | | | 936,950 | | | | 19,910,188 | | | | 0.70 | |
QUALCOMM Incorporated | | | | | | | 299,777 | | | | 22,057,592 | | | | 0.77 | |
Other securities | | | | | | | | | | | 7,354,501 | | | | 0.26 | |
| | | | | |
| | | | | | | | | | | 49,322,281 | | | | 1.73 | |
| | | | | | | | | | | | | | | | |
| | | | | |
| Computers & Peripherals: 4.10% | | | | | | | | | | | | | | | | |
Apple Incorporated | | | | | | | 158,763 | | | | 88,283,341 | | | | 3.10 | |
Other securities | | | | | | | | | | | 28,543,584 | | | | 1.00 | |
| | | | | |
| | | | | | | | | | | 116,826,925 | | | | 4.10 | |
| | | | | | | | | | | | | | | | |
| | | | | |
| Electronic Equipment, Instruments & Components: 0.45% | | | | | | | | | | | | | | | | |
Other securities | | | | | | | | | | | 12,849,328 | | | | 0.45 | |
| | | | | | | | | | | | | | | | |
| | | | | |
| Internet Software & Services: 2.49% | | | | | | | | | | | | | | | | |
Google Incorporated Class A † | | | | | | | 48,885 | | | | 51,798,057 | | | | 1.82 | |
Other securities | | | | | | | | | | | 19,151,520 | | | | 0.67 | |
| | | | | |
| | | | | | | | | | | 70,949,577 | | | | 2.49 | |
| | | | | | | | | | | | | | | | |
| | | | | |
| IT Services: 3.43% | | | | | | | | | | | | | | | | |
International Business Machines Corporation | | | | | | | 179,944 | | | | 32,332,338 | | | | 1.13 | |
MasterCard Incorporated | | | | | | | 18,128 | | | | 13,791,964 | | | | 0.48 | |
Visa Incorporated Class A | | | | | | | 90,207 | | | | 18,353,516 | | | | 0.64 | |
Other securities | | | | | | | | | | | 33,169,122 | | | | 1.18 | |
| | | | | |
| | | | | | | | | | | 97,646,940 | | | | 3.43 | |
| | | | | | | | | | | | | | | | |
| | | | | |
| Office Electronics: 0.08% | | | | | | | | | | | | | | | | |
Other securities | | | | | | | | | | | 2,304,063 | | | | 0.08 | |
| | | | | | | | | | | | | | | | |
| | | | | |
| Semiconductors & Semiconductor Equipment: 1.96% | | | | | | | | | | | | | | | | |
Intel Corporation | | | | | | | 870,622 | | | | 20,755,628 | | | | 0.73 | |
Other securities | | | | | | | | | | | 34,997,584 | | | | 1.23 | |
| | | | | |
| | | | | | | | | | | 55,753,212 | | | | 1.96 | |
| | | | | | | | | | | | | | | | |
The accompanying notes are an integral part of these financial statements.
| | | | | | |
| Summary portfolio of investments—November 30, 2013 (unaudited) | | Wells Fargo Advantage Allocation Funds | | | 45 | |
INDEX PORTFOLIO
| | | | | | | | | | | | | | | | |
| Security name | | | | | | Shares | | | Value | | | Percent of net assets | |
| | | | | | | | | | | | | | | | |
| | | | | |
| Software: 3.40% | | | | | | | | | | | | | | | | |
Microsoft Corporation | | | | | | | 1,324,677 | | | $ | 50,509,934 | | | | 1.77 | % |
Oracle Corporation | | | | | | | 623,122 | | | | 21,989,975 | | | | 0.77 | |
Other securities | | | | | | | | | | | 24,559,684 | | | | 0.86 | |
| | | | | |
| | | | | | | | | | | 97,059,593 | | | | 3.40 | |
| | | | | | | | | | | | | | | | |
| | | | | |
Materials: 3.40% | | | | | | | | | | | | | | | | |
| | | | | |
| Chemicals: 2.49% | | | | | | | | | | | | | | | | |
Other securities | | | | | | | | | | | 70,897,607 | | | | 2.49 | |
| | | | | | | | | | | | | | | | |
| | | | | |
| Construction Materials: 0.04% | | | | | | | | | | | | | | | | |
Other securities | | | | | | | | | | | 1,280,219 | | | | 0.04 | |
| | | | | | | | | | | | | | | | |
| | | | | |
| Containers & Packaging: 0.21% | | | | | | | | | | | | | | | | |
Other securities | | | | | | | | | | | 5,943,804 | | | | 0.21 | |
| | | | | | | | | | | | | | | | |
| | | | | |
| Metals & Mining: 0.53% | | | | | | | | | | | | | | | | |
Other securities | | | | | | | | | | | 15,060,297 | | | | 0.53 | |
| | | | | | | | | | | | | | | | |
| | | | | |
| Paper & Forest Products: 0.13% | | | | | | | | | | | | | | | | |
Other securities | | | | | | | | | | | 3,635,574 | | | | 0.13 | |
| | | | | | | | | �� | | | | | | | |
| | | | | |
Telecommunication Services: 2.34% | | | | | | | | | | | | | | | | |
| | | | | |
| Diversified Telecommunication Services: 2.19% | | | | | | | | | | | | | | | | |
AT&T Incorporated | | | | | | | 928,116 | | | | 32,678,964 | | | | 1.15 | |
Verizon Communications Incorporated | | | | | | | 500,083 | | | | 24,814,118 | | | | 0.87 | |
Other securities | | | | | | | | | | | 4,876,218 | | | | 0.17 | |
| | | | | |
| | | | | | | | | | | 62,369,300 | | | | 2.19 | |
| | | | | | | | | | | | | | | | |
| | | | | |
| Wireless Telecommunication Services: 0.15% | | | | | | | | | | | | | | | | |
Other securities | | | | | | | | | | | 4,269,932 | | | | 0.15 | |
| | | | | | | | | | | | | | | | |
| | | | | |
Utilities: 2.93% | | | | | | | | | | | | | | | | |
| | | | | |
| Electric Utilities: 1.61% | | | | | | | | | | | | | | | | |
Other securities | | | | | | | | | | | 46,030,341 | | | | 1.61 | |
| | | | | | | | | | | | | | | | |
| | | | | |
| Gas Utilities: 0.11% | | | | | | | | | | | | | | | | |
Other securities | | | | | | | | | | | 3,056,989 | | | | 0.11 | |
| | | | | | | | | | | | | | | | |
| | | | | |
| Independent Power Producers & Energy Traders: 0.11% | | | | | | | | | | | | | | | | |
Other securities | | | | | | | | | | | 3,060,395 | | | | 0.11 | |
| | | | | | | | | | | | | | | | |
| | | | | |
| Multi-Utilities: 1.10% | | | | | | | | | | | | | | | | |
Other securities | | | | | | | | | | | 31,383,171 | | | | 1.10 | |
| | | | | | | | | | | | | | | | |
| | | | | |
Total Common Stocks (Cost $1,688,319,423) | | | | | | | | | | | 2,807,726,588 | | | | 98.53 | |
| | | | | | | | | | | | | | | | |
The accompanying notes are an integral part of these financial statements.
| | | | |
| 46 | | Wells Fargo Advantage Allocation Funds | | Summary portfolio of investments—November 30, 2013 (unaudited) |
INDEX PORTFOLIO
| | | | | | | | | | | | | | | | | | | | |
| Security name | | Yield | | | | | | Shares | | | Value | | | Percent of net assets | |
| | | | | | | | | | | | | | | | | | | | |
| | | | | |
Short-Term Investments: 1.56% | | | | | | | | | | | | | | | | | | | | |
| | | | | |
| Investment Companies: 1.47% | | | | | | | | | | | | | | | | | | | | |
Wells Fargo Advantage Cash Investment Money Market Fund, Select Class (l)(u) | | | 0.08 | % | | | | | | | 32,725,140 | | | $ | 32,725,140 | | | | 1.15 | % |
Wells Fargo Securities Lending Cash Investments, LLC (l)(u)(v)(r) | | | 0.08 | | | | | | | | 9,164,555 | | | | 9,164,555 | | | | 0.32 | |
| | | | | |
| | | | | | | | | | | | | | | 41,889,695 | | | | 1.47 | |
| | | | | | | | | | | | | | | | | | | | |
| | | | | |
| | | | | | Maturity date | | | Principal | | | | | | | |
| | | | | |
| U.S. Treasury Securities: 0.09% | | | | | | | | | | | | | | | | | | | | |
U.S. Treasury Bill (z)# | | | 0.01 | | | | 1-2-2014 | | | $ | 700,000 | | | | 699,994 | | | | 0.03 | |
U.S. Treasury Bill (z)# | | | 0.07 | | | | 4-10-2014 | | | | 1,750,000 | | | | 1,749,561 | | | | 0.06 | |
| | | | | |
| | | | | | | | | | | | | | | 2,449,555 | | | | 0.09 | |
| | | | | | | | | | | | | | | | | | | | |
| | | | | |
Total Short-Term Investments (Cost $44,339,250) | | | | | | | | | | | | | | | 44,339,250 | | | | 1.56 | |
| | | | | | | | | | | | | | | | | | | | |
| Total investments in securities | | | | | | | | | | | | | | | | | | | | |
| (Cost $1,732,658,673) * | | | | | | | | | | | | | | | 2,852,065,838 | | | | 100.09 | % |
Other assets and liabilities, net | | | | | | | | | | | | | | | (2,592,238 | ) | | | (0.09 | ) |
| | | | | | | | | | | | | | | | | | | | |
| Total net assets | | | | | | | | | | | | | | $ | 2,849,473,600 | | | | 100.00 | % |
| | | | | | | | | | | | | | | | | | | | |
| † | Non-income-earning security |
| (l) | Investment in an affiliate |
| (u) | Rate shown is the 7-day annualized yield at period end. |
| (v) | Security represents investment of cash collateral received from securities on loan. |
| (r) | The investment company is exempt from registration under Section 3(c)(7) of the Investment Company Act of 1940, as amended. |
| (z) | Zero coupon security. Rate represents yield to maturity at time of purchase. |
| # | All or a portion of this security is segregated as collateral for investments in derivative instruments. |
| * | Cost for federal income tax purposes is $1,836,348,596 and unrealized appreciation (depreciation) consists of: |
| | | | |
Gross unrealized appreciation | | $ | 1,158,532,327 | |
Gross unrealized depreciation | | | (142,815,085 | ) |
| | | | |
Net unrealized appreciation | | $ | 1,015,717,242 | |
The accompanying notes are an integral part of these financial statements.
| | | | | | |
| Portfolio of investments—November 30, 2013 (unaudited) | | Wells Fargo Advantage Allocation Funds | | | 47 | |
INTERNATIONAL GROWTH PORTFOLIO
| | | | | | | | | | | | |
| Security name | | | | | | Shares | | | Value | |
| | | | | | | | | | | | |
| | | | |
Common Stocks: 94.72% | | | | | | | | | | | | |
| | | | |
| Belgium: 4.12% | | | | | | | | | | | | |
Anheuser-Busch InBev NV (Consumer Staples, Beverages) | | | | | | | 37,003 | | | $ | 3,777,683 | |
Telenet Group Holding NV (Consumer Discretionary, Media) | | | | | | | 22,559 | | | | 1,241,179 | |
UCB SA (Health Care, Pharmaceuticals) | | | | | | | 19,886 | | | | 1,334,412 | |
| | | | |
| | | | | | | | | | | 6,353,274 | |
| | | | | | | | | | | | |
| | | | |
| Brazil: 0.25% | | | | | | | | | | | | |
BM&F Bovespa SA (Financials, Diversified Financial Services) | | | | | | | 76,800 | | | | 380,696 | |
| | | | | | | | | | | | |
| | | | |
| Canada: 0.80% | | | | | | | | | | | | |
Canadian Pacific Railway Limited (Industrials, Road & Rail) | | | | | | | 7,998 | | | | 1,230,732 | |
| | | | | | | | | | | | |
| | | | |
| China: 6.46% | | | | | | | | | | | | |
Baidu Incorporated ADR (Information Technology, Internet Software & Services) † | | | | | | | 39,488 | | | | 6,577,516 | |
China Resources Land Limited (Financials, Real Estate Management & Development) | | | | | | | 524,500 | | | | 1,444,419 | |
Tencent Holdings Limited (Information Technology, Internet Software & Services) | | | | | | | 33,800 | | | | 1,954,934 | |
| | | | |
| | | | | | | | | | | 9,976,869 | |
| | | | | | | | | | | | |
| | | | |
| Denmark: 0.37% | | | | | | | | | | | | |
Rockwool International AS B Shares (Industrials, Building Products) | | | | | | | 3,303 | | | | 577,163 | |
| | | | | | | | | | | | |
| | | | |
| France: 6.93% | | | | | | | | | | | | |
LVMH Moet Hennessy Louis Vuitton SA (Consumer Discretionary, Textiles, Apparel & Luxury Goods) « | | | | | | | 4,023 | | | | 758,303 | |
Pernod-Ricard SA (Consumer Staples, Beverages) | | | | | | | 15,019 | | | | 1,702,248 | |
Schneider Electric SA (Industrials, Electrical Equipment) | | | | | | | 37,947 | | | | 3,212,143 | |
Unibail-Rodamco SE (Financials, REITs) | | | | | | | 7,996 | | | | 2,090,501 | |
Zodiac Aerospace SA (Industrials, Aerospace & Defense) | | | | | | | 17,330 | | | | 2,939,319 | |
| | | | |
| | | | | | | | | | | 10,702,514 | |
| | | | | | | | | | | | |
| | | | |
| Germany: 17.38% | | | | | | | | | | | | |
Allianz AG (Financials, Insurance) | | | | | | | 7,242 | | | | 1,257,821 | |
Axel Springer AG (Consumer Discretionary, Media) | | | | | | | 2,569 | | | | 154,432 | |
Bayer AG (Health Care, Pharmaceuticals) | | | | | | | 42,389 | | | | 5,654,892 | |
Beiersdorf AG (Consumer Staples, Personal Products) | | | | | | | 23,968 | | | | 2,433,248 | |
Deutsche Post AG (Industrials, Air Freight & Logistics) | | | | | | | 120,799 | | | | 4,271,665 | |
Heidelbergcement AG (Materials, Construction Materials) | | | | | | | 25,189 | | | | 1,970,003 | |
Linde AG (Materials, Chemicals) | | | | | | | 29,438 | | | | 6,010,726 | |
MTU Aero Engines AG (Industrials, Aerospace & Defense) | | | | | | | 20,344 | | | | 1,911,950 | |
Muenchener Rueckversicherungs-Gesellschaft AG (Financials, Insurance) | | | | | | | 14,459 | | | | 3,162,451 | |
| | | | |
| | | | | | | | | | | 26,827,188 | |
| | | | | | | | | | | | |
| | | | |
| Hong Kong: 5.89% | | | | | | | | | | | | |
AIA Group Limited (Financials, Insurance) | | | | | | | 989,600 | | | | 5,016,514 | |
Beijing Enterprises Holdings Limited (Industrials, Industrial Conglomerates) | | | | | | | 269,000 | | | | 2,408,028 | |
Hong Kong Land Holdings Limited (Financials, Real Estate Management & Development) | | | | | | | 115,966 | | | | 685,359 | |
Sands China Limited (Consumer Discretionary, Hotels, Restaurants & Leisure) | | | | | | | 130,400 | | | | 986,496 | |
| | | | |
| | | | | | | | | | | 9,096,397 | |
| | | | | | | | | | | | |
The accompanying notes are an integral part of these financial statements.
| | | | |
| 48 | | Wells Fargo Advantage Allocation Funds | | Portfolio of investments—November 30, 2013 (unaudited) |
INTERNATIONAL GROWTH PORTFOLIO
| | | | | | | | | | | | |
| Security name | | | | | | Shares | | | Value | |
| | | | | | | | | | | | |
| | | | |
| India: 0.21% | | | | | | | | | | | | |
Coal India Limited (Energy, Oil, Gas & Consumable Fuels) | | | | | | | 75,394 | | | $ | 328,107 | |
| | | | | | | | | | | | |
| | | | |
| Indonesia: 0.57% | | | | | | | | | | | | |
PT Bank Rakyat Indonesia Tbk (Financials, Commercial Banks) | | | | | | | 1,405,000 | | | | 875,005 | |
| | | | | | | | | | | | |
| | | | |
| Ireland: 2.43% | | | | | | | | | | | | |
Covidien plc (Health Care, Health Care Equipment & Supplies) | | | | | | | 54,988 | | | | 3,753,481 | |
| | | | | | | | | | | | |
| | | | |
| Japan: 11.19% | | | | | | | | | | | | |
Denso Corporation (Consumer Discretionary, Auto Components) | | | | | | | 6,300 | | | | 315,538 | |
Honda Motor Company Limited (Consumer Discretionary, Automobiles) | | | | | | | 93,600 | | | | 3,956,925 | |
Ishikawajima-Harima Heavy Industries Company Limited (Industrials, Machinery) | | | | | | | 376,000 | | | | 1,571,179 | |
Japan Tobacco Incorporated (Consumer Staples, Tobacco) | | | | | | | 72,300 | | | | 2,442,353 | |
NGK Insulators Limited (Industrials, Machinery) | | | | | | | 167,000 | | | | 3,057,115 | |
Ono Pharmaceutical Company Limited (Health Care, Pharmaceuticals) | | | | | | | 14,900 | | | | 1,128,865 | |
ORIX Corporation (Financials, Diversified Financial Services) | | | | | | | 40,800 | | | | 742,905 | �� |
Takeda Pharmaceutical Company Limited (Health Care, Pharmaceuticals) | | | | | | | 16,700 | | | | 811,155 | |
Toyota Motor Corporation (Consumer Discretionary, Automobiles) | | | | | | | 52,100 | | | | 3,245,282 | |
| | | | |
| | | | | | | | | | | 17,271,317 | |
| | | | | | | | | | | | |
| | | | |
| Mexico: 1.29% | | | | | | | | | | | | |
Grupo Televisa SAB ADR (Consumer Discretionary, Media) | | | | | | | 65,247 | | | | 1,990,686 | |
| | | | | | | | | | | | |
| | | | |
| Netherlands: 3.81% | | | | | | | | | | | | |
Nielsen Holdings NV (Industrials, Professional Services) | | | | | | | 2,334 | | | | 100,718 | |
Unilever NV (Consumer Staples, Food Products) « | | | | | | | 107,080 | | | | 4,218,577 | |
Ziggo NV (Telecommunication Services, Diversified Telecommunication Services) | | | | | | | 36,504 | | | | 1,564,090 | |
| | | | |
| | | | | | | | | | | 5,883,385 | |
| | | | | | | | | | | | |
| | | | |
| Nigeria: 0.49% | | | | | | | | | | | | |
Nigerian Breweries plc (Consumer Staples, Beverages) | | | | | | | 712,597 | | | | 762,308 | |
| | | | | | | | | | | | |
| | | | |
| Singapore: 0.50% | | | | | | | | | | | | |
Global Logistic Properties Limited (Financials, Real Estate Management & Development) | | | | | | | 330,000 | | | | 775,666 | |
| | | | | | | | | | | | |
| | | | |
| South Korea: 0.59% | | | | | | | | | | | | |
Samsung Electronics Company Limited (Information Technology, Semiconductors & Semiconductor Equipment) | | | | | | | 640 | | | | 903,487 | |
| | | | | | | | | | | | |
| | | | |
| Spain: 0.62% | | | | | | | | | | | | |
Grifols SA (Health Care, Biotechnology) | | | | | | | 20,038 | | | | 916,144 | |
Grifols SA Class B (Health Care, Biotechnology) | | | | | | | 1,237 | | | | 42,205 | |
| | | | |
| | | | | | | | | | | 958,349 | |
| | | | | | | | | | | | |
| | | | |
| Switzerland: 9.28% | | | | | | | | | | | | |
Actelion Limited (Health Care, Biotechnology) | | | | | | | 8,180 | | | | 681,328 | |
Nestle SA (Consumer Staples, Food Products) | | | | | | | 65,507 | | | | 4,784,118 | |
Roche Holdings AG (Health Care, Pharmaceuticals) | | | | | | | 15,708 | | | | 4,379,074 | |
Swatch Group AG Class B (Consumer Discretionary, Textiles, Apparel & Luxury Goods) | | | | | | | 1,956 | | | | 1,281,774 | |
Swiss Reinsurance AG (Financials, Insurance) | | | | | | | 15,694 | | | | 1,396,350 | |
UBS AG (Financials, Capital Markets) | | | | | | | 94,916 | | | | 1,809,420 | |
| | | | |
| | | | | | | | | | | 14,332,064 | |
| | | | | | | | | | | | |
The accompanying notes are an integral part of these financial statements.
| | | | | | |
| Portfolio of investments—November 30, 2013 (unaudited) | | Wells Fargo Advantage Allocation Funds | | | 49 | |
INTERNATIONAL GROWTH PORTFOLIO
| | | | | | | | | | | | | | |
| Security name | | | | | | | Shares | | | Value | |
| | | | | | | | | | | | | | |
| | | | |
| United Kingdom: 20.56% | | | | | | | | | | | | | | |
Diageo plc (Consumer Staples, Beverages) | | | | | | | | | 24,665 | | | $ | 785,633 | |
HSBC Holdings plc (Financials, Commercial Banks) | | | | | | | | | 200,197 | | | | 2,234,467 | |
Imperial Tobacco Group plc (Consumer Staples, Tobacco) | | | | | | | | | 88,097 | | | | 3,351,143 | |
Intercontinental Hotels Group plc (Consumer Discretionary, Hotels, Restaurants & Leisure) | | | | | | | | | 28,258 | | | | 880,189 | |
Johnson Matthey plc (Materials, Chemicals) | | | | | | | | | 38,520 | | | | 1,998,671 | |
Land Securities Group plc (Financials, REITs) | | | | | | | | | 133,950 | | | | 2,089,447 | |
Liberty Global plc Class A (Consumer Discretionary, Media) † | | | | | | | | | 31,095 | | | | 2,668,262 | |
Liberty Global plc Class C (Consumer Discretionary, Media) † | | | | | | | | | 2,512 | | | | 204,602 | |
Meggitt plc (Industrials, Aerospace & Defense) | | | | | | | | | 167,653 | | | | 1,369,603 | |
Prudential plc (Financials, Insurance) | | | | | | | | | 58,079 | | | | 1,242,483 | |
Rolls-Royce Holdings plc (Industrials, Aerospace & Defense) | | | | | | | | | 216,156 | | | | 4,369,483 | |
Rolls-Royce Holdings plc Class C Preference Shares (Industrials, Aerospace & Defense)†(a) | | | | | | | | | 15,559,894 | | | | 25,468 | |
Royal Mail plc (Industrials, Air Freight & Logistics) † | | | | | | | | | 116,473 | | | | 1,058,069 | |
SABMiller plc (Consumer Staples, Beverages) | | | | | | | | | 73,992 | | | | 3,818,603 | |
Tesco plc (Consumer Staples, Food & Staples Retailing) | | | | | | | | | 251,762 | | | | 1,433,846 | |
Vodafone Group plc (Telecommunication Services, Wireless Telecommunication Services) | | | | | | | | | 535,205 | | | | 1,986,822 | |
WPP plc (Consumer Discretionary, Media) | | | | | | | | | 100,479 | | | | 2,221,910 | |
| | | | |
| | | | | | | | | | | | | 31,738,701 | |
| | | | | | | | | | | | | | |
| | | | |
| United States: 0.98% | | | | | | | | | | | | | | |
Schlumberger Limited (Energy, Energy Equipment & Services) | | | | | | | | | 17,120 | | | | 1,513,750 | |
| | | | | | | | | | | | | | |
| | | | |
Total Common Stocks (Cost $111,347,427) | | | | | | | | | | | | | 146,231,139 | |
| | | | | | | | | | | | | | |
| | | | |
Participatory Notes: 0.37% | | | | | | | | | | | | | | |
HSBC Bank plc | | | | | | | | | 68,500 | | | | 573,788 | |
| | | | | | | | | | | | | | |
| | | | |
Total Participatory Notes (Cost $537,051) | | | | | | | | | | | | | 573,788 | |
| | | | | | | | | | | | | | |
| | | | |
| | | | | Dividend yield | | | | | | | |
| | | | |
Preferred Stocks: 1.46% | | | | | | | | | | | | | | |
| | | | |
| Germany: 1.46% | | | | | | | | | | | | | | |
Henkel AG & Company KGaA (Consumer Staples, Household Products) ± | | | | | 1.10 | % | | | 19,848 | | | | 2,250,105 | |
| | | | | | | | | | | | | | |
| | | | |
Total Preferred Stocks (Cost $1,503,116) | | | | | | | | | | | | | 2,250,105 | |
| | | | | | | | | | | | | | |
| | | | |
| | | | | Yield | | | Shares | | | | |
| | | | |
Short-Term Investments: 4.44% | | | | | | | | | | | | | | |
| | | | |
| Investment Companies: 4.44% | | | | | | | | | | | | | | |
Wells Fargo Advantage Cash Investment Money Market Fund, Select Class (l)(u) | | | | | 0.08 | | | | 6,093,828 | | | | 6,093,828 | |
Wells Fargo Securities Lending Cash Investments, LLC (r)(v)(l)(u) | | | | | 0.08 | | | | 765,419 | | | | 765,419 | |
| | | | | | | | | | | | | | |
| | | | |
Total Short-Term Investments (Cost $6,859,247) | | | | | | | | | | | | | 6,859,247 | |
| | | | | | | | | | | | | | |
| | | | | | | | |
| Total investments in securities | | | | | | | | |
| (Cost $120,246,841) * | | | 100.99 | % | | | 155,914,279 | |
Other assets and liabilities, net | | | (0.99 | ) | | | (1,527,178 | ) |
| | | | | | | | |
| Total net assets | | | 100.00 | % | | $ | 154,387,101 | |
| | | | | | | | |
The accompanying notes are an integral part of these financial statements.
| | | | |
| 50 | | Wells Fargo Advantage Allocation Funds | | Portfolio of investments—November 30, 2013 (unaudited) |
INTERNATIONAL GROWTH PORTFOLIO
| « | All or a portion of this security is on loan. |
| † | Non-income-earning security |
| (a) | Security is fair valued by the Management Valuation Team, and in certain instances by the Board of Trustees, in accordance with procedures approved by the Board of Trustees. |
| ± | Variable rate investment. The rate shown is the rate in effect at period end. |
| (l) | Investment in an affiliate |
| (u) | Rate shown is the 7-day annualized yield at period end. |
| (r) | The investment company is exempt from registration under Section 3(c)(7) of the Investment Company Act of 1940, as amended. |
| (v) | Security represents investment of cash collateral received from securities on loan. |
| * | Cost for federal income tax purposes is $120,170,471 and unrealized appreciation (depreciation) consists of: |
| | | | |
Gross unrealized appreciation | | $ | 36,464,160 | |
Gross unrealized depreciation | | | (720,352 | ) |
| | | | |
Net unrealized appreciation | | $ | 35,743,808 | |
The following table shows the percent of total long-term investments by sector as of November 30, 2013:
| | | | |
Consumer Staples | | | 21.31 | % |
Industrials | | | 18.85 | |
Financials | | | 17.29 | |
Consumer Discretionary | | | 13.35 | |
Health Care | | | 12.55 | |
Materials | | | 6.70 | |
Information Technology | | | 6.33 | |
Telecommunication Services | | | 2.38 | |
Energy | | | 1.24 | |
| | | | |
| | | 100.00 | % |
| | | | |
The accompanying notes are an integral part of these financial statements.
| | | | | | |
| Portfolio of investments—November 30, 2013 (unaudited) | | Wells Fargo Advantage Allocation Funds | | | 51 | |
INTERNATIONAL VALUE PORTFOLIO
| | | | | | | | | | | | |
| Security name | | | | | | Shares | | | Value | |
| | | | | | | | | | | | |
| | | | |
Common Stocks: 96.98% | | | | | | | | | | | | |
| | | | |
| Australia: 5.94% | | | | | | | | | | | | |
Arrium Limited (Materials, Metals & Mining) | | | | | | | 1,531,700 | | | $ | 2,197,841 | |
Bendigo Bank Limited (Financials, Commercial Banks) | | | | | | | 272,500 | | | | 2,795,419 | |
Boart Longyear Group Limited (Energy, Energy Equipment & Services) « | | | | | | | 199,991 | | | | 54,661 | |
Cabcharge Australia Limited (Industrials, Commercial Services & Supplies) « | | | | | | | 207,386 | | | | 748,198 | |
Challenger Financial Services Group Limited (Financials, Diversified Financial Services) | | | | | | | 475,400 | | | | 2,607,340 | |
Downer EDI Limited (Industrials, Commercial Services & Supplies) | | | | | | | 518,900 | | | | 2,250,260 | |
Leighton Holdings Limited (Industrials, Construction & Engineering) « | | | | | | | 77,400 | | | | 1,146,578 | |
Lend Lease Corporation Limited (Financials, Real Estate Management & Development) | | | | | | | 350,500 | | | | 3,528,518 | |
Metcash Limited (Consumer Staples, Food & Staples Retailing) | | | | | | | 785,500 | | | | 2,182,670 | |
Mincor Resources NL (Materials, Metals & Mining) (i) | | | | | | | 570,994 | | | | 260,102 | |
Myer Holdings Limited (Consumer Discretionary, Multiline Retail) « | | | | | | | 577,400 | | | | 1,499,214 | |
Primary Health Care Limited (Health Care, Health Care Providers & Services) | | | | | | | 339,000 | | | | 1,544,229 | |
Rio Tinto Limited (Materials, Metals & Mining) | | | | | | | 66,800 | | | | 4,020,287 | |
Sally Malay Mining Limited (Materials, Metals & Mining) | | | | | | | 368,800 | | | | 80,639 | |
Seven Network Limited (Industrials, Trading Companies & Distributors) | | | | | | | 165,800 | | | | 1,093,617 | |
Toll Holdings Limited (Industrials, Air Freight & Logistics) | | | | | | | 283,600 | | | | 1,477,897 | |
United Construction Group Limited (Industrials, Construction & Engineering) | | | | | | | 152,800 | | | | 897,894 | |
| | | | |
| | | | | | | | | | | 28,385,364 | |
| | | | | | | | | | | | |
| | | | |
| Austria: 1.40% | | | | | | | | | | | | |
OMV AG (Energy, Oil, Gas & Consumable Fuels) | | | | | | | 41,100 | | | | 2,012,828 | |
RHI AG (Materials, Construction Materials) (i) | | | | | | | 64,721 | | | | 2,314,146 | |
Voestalpine AG (Materials, Metals & Mining) | | | | | | | 47,700 | | | | 2,372,020 | |
| | | | |
| | | | | | | | | | | 6,698,994 | |
| | | | | | | | | | | | |
| | | | |
| Belgium: 1.12% | | | | | | | | | | | | |
Delhaize Group SA (Consumer Staples, Food & Staples Retailing) | | | | | | | 39,400 | | | | 2,295,951 | |
KBC Groep NV (Financials, Commercial Banks) | | | | | | | 53,400 | | | | 3,046,844 | |
| | | | |
| | | | | | | | | | | 5,342,795 | |
| | | | | | | | | | | | |
| | | | |
| Brazil: 1.25% | | | | | | | | | | | | |
Banco do Brasil SA (Financials, Commercial Banks) | | | | | | | 196,000 | | | | 2,141,980 | |
Companhia de Saneamento Basico do Estado de Sao Paulo SA (Utilities, Water Utilities) | | | | | | | 253,200 | | | | 2,657,619 | |
Companhia de Saneamento de Minas Gerais SA (Utilities, Water Utilities) | | | | | | | 72,400 | | | | 1,192,255 | |
| | | | |
| | | | | | | | | | | 5,991,854 | |
| | | | | | | | | | | | |
| | | | |
| Canada: 2.38% | | | | | | | | | | | | |
Magna International Incorporated Class A (Consumer Discretionary, Auto Components) « | | | | | | | 65,800 | | | | 5,365,726 | |
Metro Incorporated (Consumer Staples, Food & Staples Retailing) | | | | | | | 48,400 | | | | 2,851,321 | |
WestJet Airlines Limited (Industrials, Airlines) | | | | | | | 120,000 | | | | 3,155,635 | |
| | | | |
| | | | | | | | | | | 11,372,682 | |
| | | | | | | | | | | | |
| | | | |
| China: 2.18% | | | | | | | | | | | | |
China BlueChemical Limited (Materials, Chemicals) | | | | | | | 1,984,000 | | | | 1,346,100 | |
China Communications Services Corporation Limited (Telecommunication Services, Diversified
Telecommunication Services) | | | | | | | 2,836,000 | | | | 1,858,317 | |
China Petroleum & Chemical Corporation (Energy, Oil, Gas & Consumable Fuels) | | | | | | | 6,116,500 | | | | 5,254,447 | |
The accompanying notes are an integral part of these financial statements.
| | | | |
| 52 | | Wells Fargo Advantage Allocation Funds | | Portfolio of investments—November 30, 2013 (unaudited) |
INTERNATIONAL VALUE PORTFOLIO
| | | | | | | | | | | | |
| Security name | | | | | | Shares | | | Value | |
| | | | | | | | | | | | |
| | | | |
| China (continued) | | | | | | | | | | | | |
China Railway Construction Corporation Limited (Industrials, Construction & Engineering) | | | | | | | 1,747,500 | | | $ | 1,958,785 | |
| | | | |
| | | | | | | | | | | 10,417,649 | |
| | | | | | | | | | | | |
| | | | |
| Czech Republic: 0.33% | | | | | | | | | | | | |
CEZ AS (Utilities, Electric Utilities) | | | | | | | 57,500 | | | | 1,595,965 | |
| | | | | | | | | | | | |
| | | | |
| Finland: 0.87% | | | | | | | | | | | | |
Kesko Oyj (Consumer Staples, Food & Staples Retailing) | | | | | | | 63,800 | | | | 2,380,888 | |
TietoEnator Oyj (Information Technology, IT Services) | | | | | | | 82,700 | | | | 1,780,715 | |
| | | | |
| | | | | | | | | | | 4,161,603 | |
| | | | | | | | | | | | |
| | | | |
| France: 9.10% | | | | | | | | | | | | |
Alstom SA (Industrials, Machinery) | | | | | | | 56,900 | | | | 2,088,996 | |
AXA SA (Financials, Insurance) | | | | | | | 132,200 | | | | 3,463,465 | |
BNP Paribas SA (Financials, Commercial Banks) | | | | | | | 49,100 | | | | 3,685,305 | |
Compagnie Generale des Etablissements Michelin SCA Class B (Consumer Discretionary, Auto Components) | | | | | | | 24,000 | | | | 2,606,690 | |
Credit Agricole SA (Financials, Commercial Banks) † | | | | | | | 219,328 | | | | 2,750,144 | |
Renault SA (Consumer Discretionary, Automobiles) | | | | | | | 40,500 | | | | 3,592,207 | |
Sanofi-Aventis SA (Health Care, Pharmaceuticals) | | | | | | | 61,400 | | | | 6,492,782 | |
SCOR SE (Financials, Insurance) | | | | | | | 109,700 | | | | 3,838,202 | |
Societe Generale SA (Financials, Commercial Banks) | | | | | | | 39,000 | | | | 2,242,972 | |
Thales SA (Industrials, Aerospace & Defense) | | | | | | | 59,100 | | | | 3,606,909 | |
Total SA (Energy, Oil, Gas & Consumable Fuels) | | | | | | | 93,700 | | | | 5,676,562 | |
Vivendi SA (Telecommunication Services, Diversified Telecommunication Services) | | | | | | | 134,746 | | | | 3,422,165 | |
| | | | |
| | | | | | | | | | | 43,466,399 | |
| | | | | | | | | | | | |
| | | | |
| Germany: 8.63% | | | | | | | | | | | | |
Allianz AG (Financials, Insurance) | | | | | | | 35,700 | | | | 6,200,527 | |
BASF SE (Materials, Chemicals) | | | | | | | 46,500 | | | | 4,965,182 | |
Daimler AG (Consumer Discretionary, Automobiles) | | | | | | | 69,300 | | | | 5,742,787 | |
Deutsche Bank AG (Financials, Capital Markets) | | | | | | | 41,200 | | | | 1,986,382 | |
E.ON SE (Utilities, Multi-Utilities) | | | | | | | 87,200 | | | | 1,677,411 | |
Gildemeister AG (Industrials, Machinery) | | | | | | | 74,500 | | | | 2,298,945 | |
Hannover Rueckversicherung AG (Financials, Insurance) | | | | | | | 31,000 | | | | 2,581,136 | |
Metro AG (Consumer Staples, Food & Staples Retailing) | | | | | | | 49,800 | | | | 2,495,730 | |
Muenchener Rueckversicherungs-Gesellschaft AG (Financials, Insurance) | | | | | | | 19,700 | | | | 4,308,754 | |
Norddeutsche Affinerie AG (Materials, Metals & Mining) | | | | | | | 25,900 | | | | 1,527,563 | |
RWE AG (Utilities, Multi-Utilities) | | | | | | | 40,900 | | | | 1,570,200 | |
Volkswagen AG (Consumer Discretionary, Automobiles) | | | | | | | 22,600 | | | | 5,884,057 | |
| | | | |
| | | | | | | | | | | 41,238,674 | |
| | | | | | | | | | | | |
| | | | |
| Hong Kong: 1.08% | | | | | | | | | | | | |
Johnson Electric Holdings Limited (Industrials, Electrical Equipment) | | | | | | | 1,133,500 | | | | 1,023,457 | |
Kingboard Laminates Holdings Limited (Information Technology, Electronic Equipment, Instruments & Components) (i) | | | | | | | 2,204,000 | | | | 955,214 | |
Wheelock & Company Limited (Financials, Real Estate Management & Development) | | | | | | | 379,000 | | | | 1,845,466 | |
Yue Yuen Industrial Holdings Limited (Consumer Discretionary, Textiles, Apparel & Luxury Goods) | | | | | | | 429,500 | | | | 1,343,460 | |
| | | | |
| | | | | | | | | | | 5,167,597 | |
| | | | | | | | | | | | |
The accompanying notes are an integral part of these financial statements.
| | | | | | |
| Portfolio of investments—November 30, 2013 (unaudited) | | Wells Fargo Advantage Allocation Funds | | | 53 | |
INTERNATIONAL VALUE PORTFOLIO
| | | | | | | | | | | | |
| Security name | | | | | | Shares | | | Value | |
| | | | | | | | | | | | |
| | | | |
| India: 1.06% | | | | | | | | | | | | |
Gail Limited (Utilities, Gas Utilities) (i) | | | | | | | 26,700 | | | $ | 821,292 | |
Tata Motors Limited ADR (Consumer Discretionary, Automobiles) | | | | | | | 83,800 | | | | 2,720,986 | |
Tata Steel Limited GDR (Industrials, Machinery) | | | | | | | 245,900 | | | | 1,540,564 | |
| | | | |
| | | | | | | | | | | 5,082,842 | |
| | | | | | | | | | | | |
| | | | |
| Indonesia: 0.15% | | | | | | | | | | | | |
PT Japfa Comfeed Indonesia Tbk (Consumer Staples, Food Products) | | | | | | | 6,962,500 | | | | 721,714 | |
| | | | | | | | | | | | |
| | | | |
| Ireland: 0.65% | | | | | | | | | | | | |
Irish Life & Permanent Group Holdings plc (Financials, Insurance) † | | | | | | | 111,500 | | | | 6,847 | |
Smurfit Kappa Group plc (Materials, Containers & Packaging) | | | | | | | 130,200 | | | | 3,095,342 | |
| | | | |
| | | | | | | | | | | 3,102,189 | |
| | | | | | | | | | | | |
| | | | |
| Israel: 1.07% | | | | | | | | | | | | |
Bank Hapoalim Limited (Financials, Commercial Banks) | | | | | | | 542,900 | | | | 3,026,126 | |
Teva Pharmaceutical Industries Limited (Health Care, Pharmaceuticals) | | | | | | | 51,404 | | | | 2,080,378 | |
| | | | |
| | | | | | | | | | | 5,106,504 | |
| | | | | | | | | | | | |
| | | | |
| Italy: 1.43% | | | | | | | | | | | | |
Enel SpA (Utilities, Electric Utilities) | | | | | | | 688,400 | | | | 3,131,021 | |
ENI SpA (Energy, Oil, Gas & Consumable Fuels) | | | | | | | 153,300 | | | | 3,688,250 | |
| | | | |
| | | | | | | | | | | 6,819,271 | |
| | | | | | | | | | | | |
| | | | |
| Japan: 18.89% | | | | | | | | | | | | |
Adeka Corporation (Materials, Chemicals) | | | | | | | 203,200 | | | | 2,259,651 | |
Aisin Seiki Company Limited (Consumer Discretionary, Auto Components) | | | | | | | 46,400 | | | | 1,866,419 | |
Aoyama Trading Company Limited (Consumer Discretionary, Specialty Retail) | | | | | | | 73,100 | | | | 1,963,369 | |
Aozora Bank Limited (Financials, Commercial Banks) | | | | | | | 588,000 | | | | 1,693,532 | |
Chiba Bank Limited (Financials, Commercial Banks) | | | | | | | 329,000 | | | | 2,287,020 | |
DCM Japan Holdings Company Limited (Consumer Discretionary, Specialty Retail) | | | | | | | 143,100 | | | | 972,395 | |
Eizo Nanao Corporation (Information Technology, Computers & Peripherals) | | | | | | | 63,300 | | | | 1,661,837 | |
Fukuoka Financial Group Incorporated (Financials, Commercial Banks) | | | | | | | 378,000 | | | | 1,693,942 | |
Hitachi Capital Corporation (Financials, Consumer Finance) | | | | | | | 57,700 | | | | 1,662,977 | |
Itochu Corporation (Industrials, Trading Companies & Distributors) | | | | | | | 200,700 | | | | 2,531,651 | |
JX Holdings Incorporated (Energy, Oil, Gas & Consumable Fuels) | | | | | | | 408,000 | | | | 2,123,154 | |
Kaken Pharmaceutical Company Limited (Health Care, Pharmaceuticals) | | | | | | | 101,000 | | | | 1,529,422 | |
KDDI Corporation (Telecommunication Services, Wireless Telecommunication Services) | | | | | | | 120,000 | | | | 7,533,317 | |
Kyorin Company Limited (Health Care, Pharmaceuticals) | | | | | | | 99,000 | | | | 2,045,243 | |
Maeda Road Construction Company Limited (Industrials, Construction & Engineering) | | | | | | | 148,000 | | | | 2,274,367 | |
Marubeni Corporation (Industrials, Trading Companies & Distributors) | | | | | | | 516,000 | | | | 3,743,110 | |
Miraca Holdings Incorporated (Health Care, Health Care Providers & Services) | | | | | | | 25,100 | | | | 1,166,473 | |
Mitsubishi Corporation (Industrials, Trading Companies & Distributors) | | | | | | | 35,500 | | | | 698,389 | |
Mitsui & Company Limited (Industrials, Trading Companies & Distributors) | | | | | | | 260,300 | | | | 3,606,206 | |
Mizuho Financial Group Incorporated (Financials, Commercial Banks) | | | | | | | 1,831,300 | | | | 3,844,076 | |
Nichirei Corporation (Consumer Staples, Food Products) | | | | | | | 265,000 | | | | 1,402,294 | |
Nippon Electric Glass Company Limited (Information Technology, Electronic Equipment, Instruments & Components) | | | | | | | 107,000 | | | | 575,611 | |
Nippon Telegraph & Telephone Corporation (Telecommunication Services, Diversified Telecommunication Services) | | | | | | | 92,700 | | | | 4,651,970 | |
Nissan Motor Company Limited (Consumer Discretionary, Automobiles) | | | | | | | 151,400 | | | | 1,383,553 | |
The accompanying notes are an integral part of these financial statements.
| | | | |
| 54 | | Wells Fargo Advantage Allocation Funds | | Portfolio of investments—November 30, 2013 (unaudited) |
INTERNATIONAL VALUE PORTFOLIO
| | | | | | | | | | | | |
| Security name | | | | | | Shares | | | Value | |
| | | | | | | | | | | | |
| | | | |
| Japan (continued) | | | | | | | | | | | | |
NTT DoCoMo Incorporated (Telecommunication Services, Wireless Telecommunication Services) | | | | | | | 180,000 | | | $ | 2,899,683 | |
Otsuka Holdings Company Limited (Health Care, Pharmaceuticals) | | | | | | | 133,900 | | | | 3,911,436 | |
Rengo Company Limited (Materials, Containers & Packaging) | | | | | | | 208,000 | | | | 1,118,946 | |
Resona Holdings Incorporated (Financials, Commercial Banks) | | | | | | | 598,500 | | | | 2,968,396 | |
Ryosan Company Limited (Information Technology, Electronic Equipment, Instruments & Components) | | | | | | | 16,200 | | | | 335,151 | |
Saizeriya Company Limited (Consumer Discretionary, Hotels, Restaurants & Leisure) | | | | | | | 99,800 | | | | 1,167,297 | |
Sankyu Incorporated (Industrials, Road & Rail) | | | | | | | 313,000 | | | | 1,182,631 | |
Shionogi & Company Limited (Health Care, Pharmaceuticals) | | | | | | | 79,300 | | | | 1,743,555 | |
Sojitz Corporation (Industrials, Trading Companies & Distributors) | | | | | | | 678,000 | | | | 1,251,081 | |
Sumitomo Corporation (Industrials, Trading Companies & Distributors) | | | | | | | 285,000 | | | | 3,525,458 | |
Sumitomo Mitsui Financial Group Incorporated (Financials, Commercial Banks) | | | | | | | 100,400 | | | | 4,969,763 | |
The Keiyo Bank Limited (Financials, Commercial Banks) | | | | | | | 62,000 | | | | 308,108 | |
Toshiba TEC Corporation (Information Technology, Office Electronics) | | | | | | | 234,000 | | | | 1,484,989 | |
Toyo Tire & Rubber Company Limited (Consumer Discretionary, Auto Components) | | | | | | | 325,000 | | | | 1,919,697 | |
Tsuruha Holdings Incorporated (Consumer Staples, Food & Staples Retailing) | | | | | | | 13,500 | | | | 1,242,909 | |
West Japan Railway Company (Industrials, Road & Rail) | | | | | | | 45,400 | | | | 1,985,765 | |
Yokohama Rubber Company Limited (Consumer Discretionary, Auto Components) | | | | | | | 297,000 | | | | 3,073,664 | |
| | | | |
| | | | | | | | | | | 90,258,507 | |
| | | | | | | | | | | | |
| | | | |
| Liechtenstein: 0.17% | | | | | | | | | | | | |
Verwaltungs-und Privat-Bank AG (Financials, Capital Markets) (i) | | | | | | | 7,800 | | | | 795,962 | |
| | | | | | | | | | | | |
| | | | |
| Malaysia: 0.50% | | | | | | | | | | | | |
Tenaga Nasional Berhad (Utilities, Electric Utilities) | | | | | | | 772,000 | | | | 2,361,750 | |
| | | | | | | | | | | | |
| | | | |
| Netherlands : 2.35% | | | | | | | | | | | | |
Aegon NV (Financials, Insurance) | | | | | | | 334,000 | | | | 2,966,999 | |
ING Groep NV (Financials, Diversified Financial Services) † | | | | | | | 237,100 | | | | 3,078,635 | |
Koninklijke Ahold NV (Consumer Staples, Food & Staples Retailing) | | | | | | | 285,600 | | | | 5,199,034 | |
| | | | |
| | | | | | | | | | | 11,244,668 | |
| | | | | | | | | | | | |
| | | | |
| Norway: 1.50% | | | | | | | | | | | | |
Atea ASA (Information Technology, IT Services) | | | | | | | 84,900 | | | | 823,902 | |
DnB Nor ASA (Financials, Commercial Banks) | | | | | | | 148,800 | | | | 2,630,772 | |
Statoil ASA (Energy, Oil, Gas & Consumable Fuels) | | | | | | | 61,700 | | | | 1,392,747 | |
Yara International ASA (Materials, Chemicals) | | | | | | | 53,600 | | | | 2,336,763 | |
| | | | |
| | | | | | | | | | | 7,184,184 | |
| | | | | | | | | | | | |
| | | | |
| Poland: 0.64% | | | | | | | | | | | | |
Asseco Poland SA (Information Technology, Software) | | | | | | | 101,800 | | | | 1,681,152 | |
KGHM Polska Miedz SA (Materials, Metals & Mining) | | | | | | | 36,500 | | | | 1,396,951 | |
| | | | |
| | | | | | | | | | | 3,078,103 | |
| | | | | | | | | | | | |
| | | | |
| Russia: 1.49% | | | | | | | | | | | | |
Gazprom Neft Sponsored ADR (Energy, Oil, Gas & Consumable Fuels) (i) | | | | | | | 150,900 | | | | 3,405,671 | |
Lukoil ADR (Energy, Oil, Gas & Consumable Fuels) | | | | | | | 60,400 | | | | 3,729,881 | |
| | | | |
| | | | | | | | | | | 7,135,552 | |
| | | | | | | | | | | | |
The accompanying notes are an integral part of these financial statements.
| | | | | | |
| Portfolio of investments—November 30, 2013 (unaudited) | | Wells Fargo Advantage Allocation Funds | | | 55 | |
INTERNATIONAL VALUE PORTFOLIO
| | | | | | | | | | | | |
| Security name | | | | | | Shares | | | Value | |
| | | | | | | | | | | | |
| | | | |
| Singapore: 0.39% | | | | | | | | | | | | |
United Overseas Bank Limited (Financials, Commercial Banks) | | | | | | | 113,000 | | | $ | 1,883,558 | |
| | | | | | | | | | | | |
| | | | |
| South Africa: 0.26% | | | | | | | | | | | | |
Barclays Africa Group Limited (Financials, Commercial Banks) « | | | | | | | 92,100 | | | | 1,227,880 | |
| | | | | | | | | | | | |
| | | | |
| South Korea: 2.42% | | | | | | | | | | | | |
E-MART Company Limited (Consumer Staples, Food & Staples Retailing) | | | | | | | 8,500 | | | | 2,164,556 | |
Industrial Bank of Korea (Financials, Commercial Banks) | | | | | | | 192,500 | | | | 2,082,703 | |
SK Telecom Company Limited (Telecommunication Services, Wireless Telecommunication Services) | | | | | | | 22,300 | | | | 4,762,166 | |
Woori Finance Holdings Company Limited (Financials, Commercial Banks) | | | | | | | 212,200 | | | | 2,536,455 | |
| | | | |
| | | | | | | | | | | 11,545,880 | |
| | | | | | | | | | | | |
| | | | |
| Spain: 2.12% | | | | | | | | | | | | |
Banco Bilbao Vizcaya Argentaria SA (Financials, Commercial Banks) | | | | | | | 185,200 | | | | 2,212,519 | |
Banco Santander Central Hispano SA (Financials, Commercial Banks) | | | | | | | 429,681 | | | | 3,819,291 | |
Repsol YPF SA (Energy, Oil, Gas & Consumable Fuels) | | | | | | | 123,800 | | | | 3,250,964 | |
Telefonica SA (Telecommunication Services, Diversified Telecommunication Services) | | | | | | | 52,400 | | | | 862,055 | |
| | | | |
| | | | | | | | | | | 10,144,829 | |
| | | | | | | | | | | | |
| | | | |
| Sweden: 1.49% | | | | | | | | | | | | |
Boliden AB (Materials, Metals & Mining) | | | | | | | 169,300 | | | | 2,477,763 | |
Nordea Bank AB (Financials, Commercial Banks) | | | | | | | 177,300 | | | | 2,291,956 | |
Saab AB (Industrials, Aerospace & Defense) | | | | | | | 113,500 | | | | 2,338,885 | |
| | | | |
| | | | | | | | | | | 7,108,604 | |
| | | | | | | | | | | | |
| | | | |
| Switzerland: 5.71% | | | | | | | | | | | | |
Baloise Holding AG (Financials, Insurance) | | | | | | | 28,800 | | | | 3,399,636 | |
Credit Suisse Group AG (Financials, Capital Markets) | | | | | | | 184,595 | | | | 5,494,372 | |
Georg Fischer AG (Industrials, Machinery) | | | | | | | 3,000 | | | | 2,068,509 | |
Novartis AG (Health Care, Pharmaceuticals) | | | | | | | 48,000 | | | | 3,794,142 | |
Roche Holdings AG (Health Care, Pharmaceuticals) | | | | | | | 12,300 | | | | 3,428,992 | |
Swiss Reinsurance AG (Financials, Insurance) | | | | | | | 48,500 | | | | 4,315,213 | |
Zurich Financial Services AG (Financials, Insurance) | | | | | | | 17,100 | | | | 4,770,908 | |
| | | | |
| | | | | | | | | | | 27,271,772 | |
| | | | | | | | | | | | |
| | | | |
| Taiwan: 0.26% | | | | | | | | | | | | |
Powertech Technology Incorporated (Information Technology, Semiconductors &
Semiconductor Equipment) | | | | | | | 794,000 | | | | 1,227,462 | |
| | | | | | | | | | | | |
| | | | |
| Thailand: 0.74% | | | | | | | | | | | | |
Bangchak Petroleum PCL (Energy, Oil, Gas & Consumable Fuels) | | | | | | | 2,188,900 | | | | 2,266,612 | |
Thanachart Capital PCL (Financials, Commercial Banks) | | | | | | | 1,251,600 | | | | 1,276,546 | |
| | | | |
| | | | | | | | | | | 3,543,158 | |
| | | | | | | | | | | | |
| | | | |
| United Kingdom: 19.41% | | | | | | | | | | | | |
Alent plc (Materials, Chemicals) | | | | | | | 145,400 | | | | 804,409 | |
AMEC plc (Energy, Energy Equipment & Services) | | | | | | | 120,300 | | | | 2,228,988 | |
Amlin plc (Financials, Insurance) | | | | | | | 279,000 | | | | 2,055,003 | |
AstraZeneca plc (Health Care, Pharmaceuticals) | | | | | | | 150,200 | | | | 8,637,850 | |
Aviva plc (Financials, Insurance) | | | | | | | 314,900 | | | | 2,212,734 | |
BAE Systems plc (Industrials, Aerospace & Defense) | | | | | | | 684,100 | | | | 4,785,748 | |
Barclays plc (Financials, Commercial Banks) | | | | | | | 715,000 | | | | 3,179,721 | |
The accompanying notes are an integral part of these financial statements.
| | | | |
| 56 | | Wells Fargo Advantage Allocation Funds | | Portfolio of investments—November 30, 2013 (unaudited) |
INTERNATIONAL VALUE PORTFOLIO
| | | | | | | | | | | | | | |
| Security name | | | | | | | Shares | | | Value | |
| | | | | | | | | | | | | | |
| | | | |
| United Kingdom (continued) | | | | | | | | | | | | | | |
BP plc (Energy, Oil, Gas & Consumable Fuels) | | | | | | | | | 844,300 | | | $ | 6,661,002 | |
BT Group plc (Telecommunication Services, Diversified Telecommunication Services) | | | | | | | | | 1,124,900 | | | | 6,862,290 | |
Carillion plc (Industrials, Construction & Engineering) | | | | | | | | | 261,500 | | | | 1,289,634 | |
Centrica plc (Utilities, Gas Utilities) | | | | | | | | | 524,600 | | | | 2,904,866 | |
Chemring Group plc (Industrials, Aerospace & Defense) | | | | | | | | | 247,200 | | | | 861,834 | |
Debenhams plc (Consumer Discretionary, Media) | | | | | | | | | 1,238,200 | | | | 1,960,819 | |
Firstgroup plc (Industrials, Road & Rail) | | | | | | | | | 254,700 | | | | 476,509 | |
GlaxoSmithKline plc (Health Care, Pharmaceuticals) | | | | | | | | | 57,700 | | | | 1,528,566 | |
Home Retail Group plc (Consumer Discretionary, Internet & Catalog Retail) | | | | | | | | | 290,000 | | | | 906,149 | |
Inchcape plc (Consumer Discretionary, Distributors) | | | | | | | | | 255,800 | | | | 2,491,227 | |
J Sainsbury plc (Consumer Staples, Food & Staples Retailing) | | | | | | | | | 706,400 | | | | 4,710,505 | |
Darty plc (Consumer Discretionary, Specialty Retail) (i) | | | | | | | | | 679,100 | | | | 972,607 | |
Marston’s plc (Consumer Discretionary, Hotels, Restaurants & Leisure) | | | | | | | | | 558,800 | | | | 1,369,222 | |
Old Mutual plc (Financials, Insurance) | | | | | | | | | 982,800 | | | | 3,202,817 | |
Pace plc (Consumer Discretionary, Household Durables) | | | | | | | | | 374,800 | | | | 1,937,347 | |
Premier Foods plc (Consumer Staples, Food Products) † | | | | | | | | | 31,510 | | | | 62,793 | |
Royal & Sun Alliance Insurance Group plc (Financials, Insurance) | | | | | | | | | 443,900 | | | | 773,077 | |
Royal Dutch Shell plc Class A (Energy, Oil, Gas & Consumable Fuels) | | | | | | | | | 14,300 | | | | 478,379 | |
Royal Dutch Shell plc Class B (Energy, Oil, Gas & Consumable Fuels) | | | | | | | | | 264,000 | | | | 9,266,713 | |
Tesco plc (Consumer Staples, Food & Staples Retailing) | | | | | | | | | 655,700 | | | | 3,734,374 | |
Tullett Prebon plc (Financials, Capital Markets) | | | | | | | | | 279,500 | | | | 1,532,577 | |
Vesuvius plc (Industrials, Machinery) | | | | | | | | | 145,400 | | | | 1,156,159 | |
Vodafone Group plc (Telecommunication Services, Wireless Telecommunication Services) | | | | | | | | | 1,962,500 | | | | 7,285,317 | |
WH Smith plc (Consumer Discretionary, Specialty Retail) | | | | | | | | | 223,600 | | | | 3,465,912 | |
William Morrison Supermarkets plc (Consumer Staples, Food & Staples Retailing) | | | | | | | | | 679,700 | | | | 2,953,802 | |
| | | | |
| | | | | | | | | | | | | 92,748,950 | |
| | | | | | | | | | | | | | |
| | | | |
Total Common Stocks (Cost $426,952,922) | | | | | | | | | | | | | 463,432,915 | |
| | | | | | | | | | | | | | |
| | | | |
| | | Dividend yield | | | | | | | | | |
| | | | |
Preferred Stocks: 0.65% | | | | | | | | | | | | | | |
| | | | |
| Brazil: 0.65% | | | | | | | | | | | | | | |
Banco do Estado do Rio Grande do Sul SA (Financials, Commercial Banks) ± | | | 5.57 | % | | | | | 173,300 | | | | 1,000,735 | |
Companhia Energetica de Minas Gerais SA (Energy, Oil, Gas & Consumable Fuels) ± | | | 18.81 | | | | | | 83,399 | | | | 692,939 | |
Companhia Vale Do Rio Doce Class A (Materials, Metals & Mining) ± | | | 5.41 | | | | | | 100,100 | | | | 1,402,454 | |
| | | | |
Total Preferred Stocks (Cost $4,315,406) | | | | | | | | | | | | | 3,096,128 | |
| | | | | | | | | | | | | | |
| | | | |
| | | Yield | | | | | | | | | |
| Short-Term Investments: 2.53% | | | | | | | | | | | | | | |
| | | | |
| Investment Companies: 2.53% | | | | | | | | | | | | | | |
Wells Fargo Advantage Cash Investment Money Market Fund, Select Class (l)(u) | | | 0.08 | | | | | | 2,748,860 | | | | 2,748,860 | |
Wells Fargo Securities Lending Cash Investments, LLC (l)(r)(u)(v) | | | 0.08 | | | | | | 9,341,704 | | | | 9,341,704 | |
| | | | | | | | | | | | | | |
| | | | |
Total Short-Term Investments (Cost $12,090,564) | | | | | | | | | | | | | 12,090,564 | |
| | | | | | | | | | | | | | |
| | | | | | | | |
Total investments in securities (Cost $443,358,892) * | | | 100.16 | % | | | 478,619,607 | |
Other assets and liabilities, net | | | (0.16 | ) | | | (786,528 | ) |
| | | | | | | | |
| Total net assets | | | 100.00 | % | | $ | 477,833,079 | |
| | | | | | | | |
The accompanying notes are an integral part of these financial statements.
| | | | | | |
| Portfolio of investments—November 30, 2013 (unaudited) | | Wells Fargo Advantage Allocation Funds | | | 57 | |
INTERNATIONAL VALUE PORTFOLIO
| « | All or a portion of this security is on loan. |
| ± | Variable rate investment. The rate shown is the rate in effect at period end. |
| † | Non-income-earning security |
| (l) | Investment in an affiliate |
| (u) | Rate shown is the 7-day annualized yield at period end. |
| (r) | The investment company is exempt from registration under Section 3(c)(7) of the Investment Company Act of 1940, as amended. |
| (v) | Security represents investment of cash collateral received from securities on loan. |
| * | Cost for federal income tax purposes is $444,667,949 and unrealized appreciation (depreciation) consists of: |
| | | | |
Gross unrealized appreciation | | $ | 81,293,138 | |
Gross unrealized depreciation | | | (47,341,530 | ) |
| | | | |
Net unrealized appreciation | | $ | 33,951,608 | |
The following table shows the percent of total long-term investments by sector as of November 30, 2013:
| | | | |
Financials | | | 27.49 | % |
Industrials | | | 12.23 | |
Consumer Discretionary | | | 11.62 | |
Energy | | | 11.04 | |
Telecommunication Services | | | 8.60 | |
Health Care | | | 8.12 | |
Consumer Staples | | | 7.37 | |
Materials | | | 7.28 | |
Utilities | | | 3.99 | |
Information Technology | | | 2.26 | |
| | | | |
| | | 100.00 | % |
The accompanying notes are an integral part of these financial statements.
| | | | |
| 58 | | Wells Fargo Advantage Allocation Funds | | Portfolio of investments—November 30, 2013 (unaudited) |
LARGE COMPANY VALUE PORTFOLIO
| | | | | | | | | | | | |
| Security name | | | | | | Shares | | | Value | |
| | | | | | | | | | | | |
| | | | |
Common Stocks: 97.64% | | | | | | | | | | | | |
| | | | |
Consumer Discretionary: 8.77% | | | | | | | | | | | | |
| | | | |
| Automobiles: 1.72% | | | | | | | | | | | | |
General Motors Company † | | | | | | | 45,392 | | | $ | 1,758,032 | |
| | | | | | | | | | | | |
| | | | |
| Hotels, Restaurants & Leisure: 1.03% | | | | | | | | | | | | |
Norwegian Cruise Line Holdings Limited † | | | | | | | 30,660 | | | | 1,045,506 | |
| | | | | | | | | | | | |
| | | | |
| Household Durables: 2.85% | | | | | | | | | | | | |
Harman International Industries Incorporated | | | | | | | 12,170 | | | | 986,257 | |
Newell Rubbermaid Incorporated | | | | | | | 63,295 | | | | 1,921,003 | |
| | | | |
| | | | | | | | | | | 2,907,260 | |
| | | | | | | | | | | | |
| | | | |
| Media: 2.21% | | | | | | | | | | | | |
Lamar Advertising Company Class A † | | | | | | | 27,401 | | | | 1,367,858 | |
Walt Disney Company | | | | | | | 12,553 | | | | 885,489 | |
| | | | |
| | | | | | | | | | | 2,253,347 | |
| | | | | | | | | | | | |
| | | | |
| Specialty Retail: 0.96% | | | | | | | | | | | | |
Bed Bath & Beyond Incorporated † | | | | | | | 12,479 | | | | 973,736 | |
| | | | | | | | | | | | |
| | | | |
Consumer Staples: 4.89% | | | | | | | | | | | | |
| | | | |
| Food & Staples Retailing: 2.32% | | | | | | | | | | | | |
CVS Caremark Corporation | | | | | | | 35,314 | | | | 2,364,625 | |
| | | | | | | | | | | | |
| | | | |
| Household Products: 1.40% | | | | | | | | | | | | |
Procter & Gamble Company | | | | | | | 16,902 | | | | 1,423,486 | |
| | | | | | | | | | | | |
| | | | |
| Personal Products: 1.17% | | | | | | | | | | | | |
Herbalife Limited « | | | | | | | 17,166 | | | | 1,196,127 | |
| | | | | | | | | | | | |
| | | | |
Energy: 13.34% | | | | | | | | | | | | |
| | | | |
| Energy Equipment & Services: 0.96% | | | | | | | | | | | | |
Baker Hughes Incorporated | | | | | | | 17,235 | | | | 981,706 | |
| | | | | | | | | | | | |
| | | | |
| Oil, Gas & Consumable Fuels: 12.38% | | | | | | | | | | | | |
Chevron Corporation | | | | | | | 13,274 | | | | 1,625,269 | |
ConocoPhillips Company | | | | | | | 18,151 | | | | 1,321,393 | |
Denbury Resources Incorporated † | | | | | | | 73,783 | | | | 1,230,700 | |
EnCana Corporation | | | | | | | 66,349 | | | | 1,273,237 | |
Exxon Mobil Corporation | | | | | | | 31,166 | | | | 2,913,398 | |
Marathon Oil Corporation | | | | | | | 55,250 | | | | 1,991,210 | |
Valero Energy Corporation | | | | | | | 18,823 | | | | 860,588 | |
Whiting Petroleum Corporation † | | | | | | | 23,110 | | | | 1,395,844 | |
| | | | |
| | | | | | | | | | | 12,611,639 | |
| | | | | | | | | | | | |
| | | | |
Financials: 31.20% | | | | | | | | | | | | |
| | | | |
| Capital Markets: 1.35% | | | | | | | | | | | | |
Goldman Sachs Group Incorporated | | | | | | | 8,139 | | | | 1,375,003 | |
| | | | | | | | | | | | |
The accompanying notes are an integral part of these financial statements.
| | | | | | |
| Portfolio of investments—November 30, 2013 (unaudited) | | Wells Fargo Advantage Allocation Funds | | | 59 | |
LARGE COMPANY VALUE PORTFOLIO
| | | | | | | | | | | | |
| Security name | | | | | | Shares | | | Value | |
| | | | | | | | | | | | |
| | | | |
| Commercial Banks: 6.76% | | | | | | | | | | | | |
First Republic Bank Corporation | | | | | | | 36,349 | | | $ | 1,857,434 | |
KeyCorp | | | | | | | 129,016 | | | | 1,644,954 | |
SVB Financial Group † | | | | | | | 16,992 | | | | 1,720,270 | |
Synovus Financial Corporation | | | | | | | 476,436 | | | | 1,662,762 | |
| | | | |
| | | | | | | | | | | 6,885,420 | |
| | | | | | | | | | | | |
| | | | |
| Consumer Finance: 1.25% | | | | | | | | | | | | |
SLM Corporation | | | | | | | 47,671 | | | | 1,270,432 | |
| | | | | | | | | | | | |
| | | | |
| Diversified Financial Services: 7.06% | | | | | | | | | | | | |
Bank of America Corporation | | | | | | | 185,565 | | | | 2,935,638 | |
Citigroup Incorporated | | | | | | | 50,481 | | | | 2,671,455 | |
JPMorgan Chase & Company | | | | | | | 27,844 | | | | 1,593,234 | |
| | | | |
| | | | | | | | | | | 7,200,327 | |
| | | | | | | | | | | | |
| | | | |
| Insurance: 8.61% | | | | | | | | | | | | |
ACE Limited | | | | | | | 9,789 | | | | 1,006,113 | |
American International Group Incorporated | | | | | | | 44,026 | | | | 2,190,294 | |
MetLife Incorporated | | | | | | | 37,028 | | | | 1,932,491 | |
The Hartford Financial Services Group Incorporated | | | | | | | 65,234 | | | | 2,324,287 | |
The Travelers Companies Incorporated | | | | | | | 14,597 | | | | 1,324,532 | |
| | | | |
| | | | | | | | | | | 8,777,717 | |
| | | | | | | | | | | | |
| | | | |
| Real Estate Management & Development: 0.99% | | | | | | | | | | | | |
Realogy Holdings Corporation † | | | | | | | 21,244 | | | | 1,006,753 | |
| | | | | | | | | | | | |
| | | | |
| REITs: 5.18% | | | | | | | | | | | | |
American Tower Corporation | | | | | | | 22,300 | | | | 1,734,271 | |
Realty Income Corporation « | | | | | | | 36,255 | | | | 1,381,678 | |
Vornado Realty Trust | | | | | | | 11,650 | | | | 1,024,385 | |
Weyerhaeuser Company | | | | | | | 37,711 | | | | 1,136,232 | |
| | | | |
| | | | | | | | | | | 5,276,566 | |
| | | | | | | | | | | | |
| | | | |
Health Care: 10.94% | | | | | | | | | | | | |
| | | | |
| Health Care Equipment & Supplies: 2.51% | | | | | | | | | | | | |
Medtronic Incorporated | | | | | | | 18,368 | | | | 1,052,854 | |
Stryker Corporation | | | | | | | 20,232 | | | | 1,505,665 | |
| | | | |
| | | | | | | | | | | 2,558,519 | |
| | | | | | | | | | | | |
| | | | |
| Health Care Providers & Services: 1.73% | | | | | | | | | | | | |
Cigna Corporation | | | | | | | 20,170 | | | | 1,763,867 | |
| | | �� | | | | | | | | | |
| | | | |
| Pharmaceuticals: 6.70% | | | | | | | | | | | | |
Johnson & Johnson | | | | | | | 24,126 | | | | 2,283,767 | |
Merck & Company Incorporated | | | | | | | 21,599 | | | | 1,076,278 | |
Novartis AG ADR | | | | | | | 20,476 | | | | 1,620,061 | |
Pfizer Incorporated | | | | | | | 58,190 | | | | 1,846,369 | |
| | | | |
| | | | | | | | | | | 6,826,475 | |
| | | | | | | | | | | | |
The accompanying notes are an integral part of these financial statements.
| | | | |
| 60 | | Wells Fargo Advantage Allocation Funds | | Portfolio of investments—November 30, 2013 (unaudited) |
LARGE COMPANY VALUE PORTFOLIO
| | | | | | | | | | | | |
| Security name | | | | | | Shares | | | Value | |
| | | | | | | | | | | | |
| | | | |
Industrials: 11.92% | | | | | | | | | | | | |
| | | | |
| Airlines: 1.54% | | | | | | | | | | | | |
United Continental Holdings Incorporated † | | | | | | | 39,988 | | | $ | 1,569,529 | |
| | | | | | | | | | | | |
| | | | |
| Construction & Engineering: 1.02% | | | | | | | | | | | | |
URS Corporation | | | | | | | 19,922 | | | | 1,035,346 | |
| | | | | | | | | | | | |
| | | | |
| Electrical Equipment: 1.90% | | | | | | | | | | | | |
Eaton Corporation plc | | | | | | | 26,600 | | | | 1,932,756 | |
| | | | | | | | | | | | |
| | | | |
| Industrial Conglomerates: 1.74% | | | | | | | | | | | | |
General Electric Company | | | | | | | 66,322 | | | | 1,768,145 | |
| | | | | | | | | | | | |
| | | | |
| Machinery: 2.09% | | | | | | | | | | | | |
Dover Corporation | | | | | | | 13,881 | | | | 1,259,562 | |
Stanley Black & Decker Incorporated | | | | | | | 10,740 | | | | 874,129 | |
| | | | |
| | | | | | | | | | | 2,133,691 | |
| | | | | | | | | | | | |
| | | | |
| Road & Rail: 1.66% | | | | | | | | | | | | |
Hertz Global Holdings Incorporated † | | | | | | | 69,933 | | | | 1,696,575 | |
| | | | | | | | | | | | |
| | | | |
| Trading Companies & Distributors: 1.97% | | | | | | | | | | | | |
WESCO International Incorporated † | | | | | | | 23,374 | | | | 2,009,697 | |
| | | | | | | | | | | | |
| | | | |
Information Technology: 6.94% | | | | | | | | | | | | |
| | | | |
| Communications Equipment: 0.75% | | | | | | | | | | | | |
JDS Uniphase Corporation † | | | | | | | 63,385 | | | | 769,494 | |
| | | | | | | | | | | | |
| | | | |
| Computers & Peripherals: 2.55% | | | | | | | | | | | | |
Apple Incorporated | | | | | | | 2,127 | | | | 1,182,761 | |
EMC Corporation | | | | | | | 59,180 | | | | 1,411,443 | |
| | | | |
| | | | | | | | | | | 2,594,204 | |
| | | | | | | | | | | | |
| | | | |
| Semiconductors & Semiconductor Equipment: 2.35% | | | | | | | | | | | | |
Maxim Integrated Products Incorporated | | | | | | | 28,115 | | | | 800,715 | |
Skyworks Solutions Incorporated † | | | | | | | 60,034 | | | | 1,596,304 | |
| | | | |
| | | | | | | | | | | 2,397,019 | |
| | | | | | | | | | | | |
| | | | |
| Software: 1.29% | | | | | | | | | | | | |
Symantec Corporation | | | | | | | 58,318 | | | | 1,311,572 | |
| | | | | | | | | | | | |
| | | | |
Materials: 3.04% | | | | | | | | | | | | |
| | | | |
| Chemicals: 3.04% | | | | | | | | | | | | |
Ashland Incorporated | | | | | | | 13,885 | | | | 1,264,646 | |
Huntsman Corporation | | | | | | | 43,658 | | | | 1,001,078 | |
Westlake Chemical Corporation | | | | | | | 7,360 | | | | 828,589 | |
| | | | |
| | | | | | | | | | | 3,094,313 | |
| | | | | | | | | | | | |
The accompanying notes are an integral part of these financial statements.
| | | | | | |
| Portfolio of investments—November 30, 2013 (unaudited) | | Wells Fargo Advantage Allocation Funds | | | 61 | |
LARGE COMPANY VALUE PORTFOLIO
| | | | | | | | | | | | | | |
| Security name | | | | | | | Shares | | | Value | |
| | | | | | | | | | | | | | |
| | | | |
Telecommunication Services: 2.34% | | | | | | | | | | | | | | |
| | | | |
| Diversified Telecommunication Services: 2.34% | | | | | | | | | | | | | | |
AT&T Incorporated | | | | | | | | | 24,373 | | | $ | 858,170 | |
Verizon Communications Incorporated | | | | | | | | | 30,653 | | | | 1,521,002 | |
| | | | |
| | | | | | | | | | | | | 2,379,172 | |
| | | | | | | | | | | | | | |
| | | | |
Utilities: 4.26% | | | | | | | | | | | | | | |
| | | | |
| Electric Utilities: 1.22% | | | | | | | | | | | | | | |
Portland General Electric Company | | | | | | | | | 41,532 | | | | 1,238,069 | |
| | | | | | | | | | | | | | |
| | | | |
| Independent Power Producers & Energy Traders: 1.96% | | | | | | | | | | | | | | |
AES Corporation | | | | | | | | | 137,333 | | | | 2,000,942 | |
| | | | | | | | | | | | | | |
| | | | |
| Water Utilities: 1.08% | | | | | | | | | | | | | | |
Aqua America Incorporated | | | | | | | | | 45,800 | | | | 1,102,406 | |
| | | | | | | | | | | | | | |
| | | | |
| | | Yield | | | | | | | | | |
| Total Common Stocks (Cost $82,169,991) | | | | | | | | | | | | | 99,489,473 | |
| | | | | | | | | | | | | | |
| | | | |
Short-Term Investments: 4.81% | | | | | | | | | | | | | | |
| | | | |
| Investment Companies: 4.81% | | | | | | | | | | | | | | |
Wells Fargo Advantage Cash Investment Money Market Fund, Select Class (l)(u) | | | 0.08 | % | | | | | 2,329,957 | | | | 2,329,957 | |
Wells Fargo Securities Lending Cash Investments, LLC (l)(u)(r)(v) | | | 0.08 | | | | | | 2,575,400 | | | | 2,575,400 | |
| | | | | | | | | | | | | | |
| | | | |
Total Short-Term Investments (Cost $4,905,357) | | | | | | | | | | | | | 4,905,357 | |
| | | | | | | | | | | | | | |
| | | | | | | | |
Total investments in securities (Cost $87,075,348) * | | | 102.45 | % | | | 104,394,830 | |
Other assets and liabilities, net | | | (2.45 | ) | | | (2,497,243 | ) |
| | | | | | | | |
| Total net assets | | | 100.00 | % | | $ | 101,897,587 | |
| | | | | | | | |
| † | Non-income-earning security |
| (u) | Rate shown is the 7-day annualized yield at period end. |
| (l) | Investment in an affiliate |
| « | All or a portion of this security is on loan. |
| (v) | Security represents investment of cash collateral received from securities on loan. |
| (r) | The investment company is exempt from registration under Section 3(c)(7) of the Investment Company Act of 1940, as amended. |
| * | Cost for federal income tax purposes is $87,920,090 and unrealized appreciation (depreciation) consists of: |
| | | | |
Gross unrealized appreciation | | $ | 18,065,178 | |
Gross unrealized depreciation | | | (1,590,438 | ) |
| | | | |
Net unrealized appreciation | | $ | 16,474,740 | |
The accompanying notes are an integral part of these financial statements.
| | | | |
| 62 | | Wells Fargo Advantage Allocation Funds | | Portfolio of investments — November 30, 2013 (unaudited) |
SMALL COMPANY GROWTH PORTFOLIO
| | | | | | | | | | | | |
| Security name | | | | | | Shares | | | Value | |
| | | | | | | | | | | | |
| | | | |
Common Stocks: 95.63% | | | | | | | | | | | | |
| | | | |
Consumer Discretionary: 14.66% | | | | | | | | | | | | |
| | | | |
| Auto Components: 0.93% | | | | | | | | | | | | |
Tower International Incorporated † | | | | | | | 104,840 | | | $ | 2,253,013 | |
| | | | | | | | | | | | |
| | | | |
| Diversified Consumer Services: 0.61% | | | | | | | | | | | | |
LifeLock Incorporated † | | | | | | | 85,540 | | | | 1,472,999 | |
| | | | | | | | | | | | |
| | | | |
| Hotels, Restaurants & Leisure: 1.48% | | | | | | | | | | | | |
Brinker International Incorporated | | | | | | | 43,340 | | | | 2,038,273 | |
Del Frisco’s Restaurant Group Incorporated † | | | | | | | 72,380 | | | | 1,532,285 | |
| | | | |
| | | | | | | | | | | 3,570,558 | |
| | | | | | | | | | | | |
| | | | |
| Household Durables: 0.62% | | | | | | | | | | | | |
Ethan Allen Interiors Incorporated | | | | | | | 48,440 | | | | 1,496,796 | |
| | | | | | | | | | | | |
| | | | |
| Media: 1.64% | | | | | | | | | | | | |
IMAX Corporation †« | | | | | | | 59,540 | | | | 1,835,618 | |
Lions Gate Entertainment Corporation † | | | | | | | 67,610 | | | | 2,139,180 | |
| | | | |
| | | | | | | | | | | 3,974,798 | |
| | | | | | | | | | | | |
| | | | |
| Specialty Retail: 4.76% | | | | | | | | | | | | |
Bebe Stores Incorporated | | | | | | | 207,120 | | | | 1,219,937 | |
Chico’s FAS Incorporated | | | | | | | 87,800 | | | | 1,640,982 | |
Dick’s Sporting Goods Incorporated | | | | | | | 41,760 | | | | 2,360,275 | |
GNC Holdings Incorporated Class A | | | | | | | 40,670 | | | | 2,447,521 | |
Pier 1 Imports Incorporated | | | | | | | 89,350 | | | | 1,991,612 | |
Sonic Automotive Incorporated | | | | | | | 78,950 | | | | 1,872,694 | |
| | | | |
| | | | | | | | | | | 11,533,021 | |
| | | | | | | | | | | | |
| | | | |
| Textiles, Apparel & Luxury Goods: 4.62% | | | | | | | | | | | | |
Deckers Outdoor Corporation † | | | | | | | 24,050 | | | | 1,987,492 | |
Hanesbrands Incorporated | | | | | | | 53,920 | | | | 3,779,792 | |
Movado Group Incorporated | | | | | | | 29,050 | | | | 1,322,356 | |
Skechers U.S.A. Incorporated Class A † | | | | | | | 69,420 | | | | 2,333,900 | |
Tumi Holdings Incorporated † | | | | | | | 73,380 | | | | 1,761,120 | |
| | | | |
| | | | | | | | | | | 11,184,660 | |
| | | | | | | | | | | | |
| | | | |
Consumer Staples: 0.89% | | | | | | | | | | | | |
| | | | |
| Food Products: 0.89% | | | | | | | | | | | | |
Whitewave Foods Company † | | | | | | | 101,040 | | | | 2,149,121 | |
| | | | | | | | | | | | |
| | | | |
Energy: 6.42% | | | | | | | | | | | | |
| | | | |
| Energy Equipment & Services: 1.56% | | | | | | | | | | | | |
Pacific Drilling SA † | | | | | | | 141,010 | | | | 1,593,413 | |
Tidewater Incorporated | | | | | | | 38,210 | | | | 2,179,498 | |
| | | | |
| | | | | | | | | | | 3,772,911 | |
| | | | | | | | | | | | |
The accompanying notes are an integral part of these financial statements.
| | | | | | |
| Portfolio of investments—November 30, 2013 (unaudited) | | Wells Fargo Advantage Allocation Funds | | | 63 | |
SMALL COMPANY GROWTH PORTFOLIO
| | | | | | | | | | | | |
| Security name | | | | | | Shares | | | Value | |
| | | | | | | | | | | | |
| | | | |
| Oil, Gas & Consumable Fuels: 4.86% | | | | | | | | | | | | |
Delek US Holdings Incorporated | | | | | | | 82,770 | | | $ | 2,504,620 | |
Diamondback Energy Incorporated † | | | | | | | 29,480 | | | | 1,466,335 | |
GasLog Limited | | | | | | | 82,990 | | | | 1,322,031 | |
Gulfport Energy Corporation † | | | | | | | 32,280 | | | | 1,886,120 | |
Oasis Petroleum Incorporated † | | | | | | | 53,580 | | | | 2,471,645 | |
Rosetta Resources Incorporated † | | | | | | | 41,810 | | | | 2,114,332 | |
| | | | |
| | | | | | | | | | | 11,765,083 | |
| | | | | | | | | | | | |
| | | | |
Financials: 10.58% | | | | | | | | | | | | |
| | | | |
| Capital Markets: 4.25% | | | | | | | | | | | | |
Evercore Partners Incorporated Class A | | | | | | | 55,780 | | | | 3,059,533 | |
LPL Financial Holdings Incorporated | | | | | | | 58,330 | | | | 2,500,607 | |
Stifel Financial Corporation † | | | | | | | 50,970 | | | | 2,281,927 | |
Virtus Investment Partners Incorporated † | | | | | | | 11,760 | | | | 2,443,728 | |
| | | | |
| | | | | | | | | | | 10,285,795 | |
| | | | | | | | | | | | |
| | | | |
| Commercial Banks: 2.52% | | | | | | | | | | | | |
CapitalSource Incorporated | | | | | | | 151,150 | | | | 2,125,169 | |
Signature Bank † | | | | | | | 14,570 | | | | 1,548,063 | |
SVB Financial Group † | | | | | | | 23,990 | | | | 2,428,748 | |
| | | | |
| | | | | | | | | | | 6,101,980 | |
| | | | | | | | | | | | |
| | | | |
| Consumer Finance: 0.81% | | | | | | | | | | | | |
Encore Capital Group Incorporated † | | | | | | | 41,015 | | | | 1,956,005 | |
| | | | | | | | | | | | |
| | | | |
| Insurance: 1.16% | | | | | | | | | | | | |
Argo Group International Holdings Limited | | | | | | | 59,542 | | | | 2,815,741 | |
| | | | | | | | | | | | |
| | | | |
| REITs: 0.81% | | | | | | | | | | | | |
QTS Realty Trust Incorporated Class A † | | | | | | | 94,030 | | | | 1,957,705 | |
| | | | | | | | | | | | |
| | | | |
| Thrifts & Mortgage Finance: 1.03% | | | | | | | | | | | | |
Essent Group Limited † | | | | | | | 114,570 | | | | 2,490,752 | |
| | | | | | | | | | | | |
| | | | |
Health Care: 19.43% | | | | | | | | | | | | |
| | | | |
| Biotechnology: 4.11% | | | | | | | | | | | | |
Alnylam Pharmaceuticals Incorporated † | | | | | | | 32,280 | | | | 1,975,536 | |
Exelixis Incorporated †« | | | | | | | 222,430 | | | | 1,296,767 | |
Insys Therapeutics Incorporation † | | | | | | | 24,980 | | | | 1,101,618 | |
InterMune Incorporated † | | | | | | | 104,740 | | | | 1,448,554 | |
Intrexon Corporation †« | | | | | | | 34,170 | | | | 782,151 | |
Portola Pharmaceuticals Incorporation † | | | | | | | 49,770 | | | | 1,244,250 | |
Seattle Genetics Incorporated † | | | | | | | 26,160 | | | | 1,074,914 | |
Theravance Incorporated † | | | | | | | 27,250 | | | | 1,028,960 | |
| | | | |
| | | | | | | | | | | 9,952,750 | |
| | | | | | | | | | | | |
The accompanying notes are an integral part of these financial statements.
| | | | |
| 64 | | Wells Fargo Advantage Allocation Funds | | Portfolio of investments—November 30, 2013 (unaudited) |
SMALL COMPANY GROWTH PORTFOLIO
| | | | | | | | | | | | |
| Security name | | | | | | Shares | | | Value | |
| | | | | | | | | | | | |
| | | | |
| Health Care Equipment & Supplies: 7.87% | | | | | | | | | | | | |
Accuray Incorporated †« | | | | | | | 213,560 | | | $ | 1,704,209 | |
ArthroCare Corporation † | | | | | | | 49,420 | | | | 1,864,122 | |
Atricure Incorporated † | | | | | | | 84,510 | | | | 1,323,427 | |
Cerus Corporation †« | | | | | | | 281,570 | | | | 1,883,703 | |
DexCom Incorporated † | | | | | | | 79,850 | | | | 2,642,237 | |
Endologix Incorporated † | | | | | | | 106,371 | | | | 1,900,850 | |
Insulet Corporation † | | | | | | | 50,730 | | | | 1,878,025 | |
Oxford Immunotec Global plc † | | | | | | | 73,920 | | | | 1,170,893 | |
Spectranetics Corporation † | | | | | | | 115,060 | | | | 2,676,296 | |
Sunshine Heart Incorporated †« | | | | | | | 95,650 | | | | 866,589 | |
Veracyte Incorporated † | | | | | | | 87,110 | | | | 1,130,688 | |
| | | | |
| | | | | | | | | | | 19,041,039 | |
| | | | | | | | | | | | |
| | | | |
| Health Care Providers & Services: 2.38% | | | | | | | | | | | | |
Capital Senior Living Corporation † | | | | | | | 57,980 | | | | 1,294,693 | |
Ensign Group Incorporated | | | | | | | 57,050 | | | | 2,576,949 | |
LifePoint Hospitals Incorporated † | | | | | | | 36,830 | | | | 1,886,801 | |
| | | | |
| | | | | | | | | | | 5,758,443 | |
| | | | | | | | | | | | |
| | | | |
| Health Care Technology: 0.83% | | | | | | | | | | | | |
Medidata Solutions Incorporated † | | | | | | | 12,000 | | | | 1,426,920 | |
Omnicell Incorporated † | | | | | | | 23,890 | | | | 579,333 | |
| | | | |
| | | | | | | | | | | 2,006,253 | |
| | | | | | | | | | | | |
| | | | |
| Life Sciences Tools & Services: 2.47% | | | | | | | | | | | | |
Cambrex Corporation † | | | | | | | 106,280 | | | | 2,072,460 | |
Fluidigm Corporation † | | | | | | | 44,690 | | | | 1,420,248 | |
ICON plc ADR † | | | | | | | 65,330 | | | | 2,491,686 | |
| | | | |
| | | | | | | | | | | 5,984,394 | |
| | | | | | | | | | | | |
| | | | |
| Pharmaceuticals: 1.77% | | | | | | | | | | | | |
AcelRx Pharmaceuticals Incorporated †« | | | | | | | 131,060 | | | | 1,281,767 | |
Akorn Incorporated † | | | | | | | 68,930 | | | | 1,774,948 | |
Pacira Pharmaceuticals Incorporated † | | | | | | | 22,370 | | | | 1,234,600 | |
| | | | |
| | | | | | | | | | | 4,291,315 | |
| | | | | | | | | | | | |
| | | | |
Industrials: 16.45% | | | | | | | | | | | | |
| | | | |
| Aerospace & Defense: 0.73% | | | | | | | | | | | | |
Esterline Technologies Corporation † | | | | | | | 20,080 | | | | 1,767,442 | |
| | | | | | | | | | | | |
| | | | |
| Air Freight & Logistics: 1.12% | | | | | | | | | | | | |
Hub Group Incorporated Class A † | | | | | | | 72,080 | | | | 2,712,370 | |
| | | | | | | | | | | | |
| | | | |
| Airlines: 0.42% | | | | | | | | | | | | |
Spirit Airlines Incorporated † | | | | | | | 22,330 | | | | 1,024,277 | |
| | | | | | | | | | | | |
| | | | |
| Building Products: 1.14% | | | | | | | | | | | | |
A.O. Smith Corporation | | | | | | | 51,010 | | | | 2,762,192 | |
| | | | | | | | | | | | |
The accompanying notes are an integral part of these financial statements.
| | | | | | |
| Portfolio of investments—November 30, 2013 (unaudited) | | Wells Fargo Advantage Allocation Funds | | | 65 | |
SMALL COMPANY GROWTH PORTFOLIO
| | | | | | | | | | | | |
| Security name | | | | | | Shares | | | Value | |
| | | | | | | | | | | | |
| | | | |
| Commercial Services & Supplies: 2.20% | | | | | | | | | | | | |
ACCO Brands Corporation † | | | | | | | 178,660 | | | $ | 1,075,533 | |
Copart Incorporated † | | | | | | | 61,392 | | | | 2,113,727 | |
Kar Auction Services Incorporated | | | | | | | 76,890 | | | | 2,121,395 | |
| | | | |
| | | | | | | | | | | 5,310,655 | |
| | | | | | | | | | | | |
| | | | |
| Construction & Engineering: 1.17% | | | | | | | | | | | | |
Tutor Perini Corporation † | | | | | | | 115,450 | | | | 2,827,371 | |
| | | | | | | | | | | | |
| | | | |
| Machinery: 2.02% | | | | | | | | | | | | |
Actuant Corporation Class A | | | | | | | 52,970 | | | | 2,070,068 | |
Wabash National Corporation † | | | | | | | 232,490 | | | | 2,822,429 | |
| | | | |
| | | | | | | | | | | 4,892,497 | |
| | | | | | | | | | | | |
| | | | |
| Professional Services: 2.01% | | | | | | | | | | | | |
On Assignment Incorporated † | | | | | | | 106,630 | | | | 3,628,619 | |
RPX Corporation † | | | | | | | 75,110 | | | | 1,240,817 | |
| | | | |
| | | | | | | | | | | 4,869,436 | |
| | | | | | | | | | | | |
| | | | |
| Road & Rail: 2.52% | | | | | | | | | | | | |
Genesee & Wyoming Incorporated † | | | | | | | 17,290 | | | | 1,663,298 | |
Roadrunner Transportation Systems Incorporated † | | | | | | | 77,470 | | | | 2,121,129 | |
Swift Transportation Company †« | | | | | | | 99,740 | | | | 2,308,981 | |
| | | | |
| | | | | | | | | | | 6,093,408 | |
| | | | | | | | | | | | |
| | | | |
| Trading Companies & Distributors: 3.12% | | | | | | | | | | | | |
Beacon Roofing Supply Incorporated † | | | | | | | 63,600 | | | | 2,364,648 | |
MRC Global Incorporated † | | | | | | | 61,020 | | | | 1,866,602 | |
MSC Industrial Direct Company | | | | | | | 16,420 | | | | 1,261,877 | |
United Rentals Incorporated † | | | | | | | 30,070 | | | | 2,066,711 | |
| | | | |
| | | | | | | | | | | 7,559,838 | |
| | | | | | | | | | | | |
| | | | |
Information Technology: 22.19% | | | | | | | | | | | | |
| | | | |
| Communications Equipment: 1.97% | | | | | | | | | | | | |
Infinera Corporation † | | | | | | | 143,430 | | | | 1,333,899 | |
Palo Alto Networks Incorporated † | | | | | | | 40,310 | | | | 2,013,485 | |
Riverbed Technology Incorporated † | | | | | | | 82,790 | | | | 1,432,267 | |
| | | | |
| | | | | | | | | | | 4,779,651 | |
| | | | | | | | | | | | |
| | | | |
| Electronic Equipment, Instruments & Components: 1.84% | | | | | | | | | | | | |
InvenSense Incorporated †« | | | | | | | 89,410 | | | | 1,545,899 | |
OSI Systems Incorporated † | | | | | | | 38,040 | | | | 2,917,668 | |
| | | | |
| | | | | | | | | | | 4,463,567 | |
| | | | | | | | | | | | |
| | | | |
| Internet Software & Services: 1.03% | | | | | | | | | | | | |
Endurance International Group Holdings †« | | | | | | | 105,590 | | | | 1,508,881 | |
Zillow Incorporated Class A †« | | | | | | | 12,490 | | | | 981,964 | |
| | | | |
| | | | | | | | | | | 2,490,845 | |
| | | | | | | | | | | | |
The accompanying notes are an integral part of these financial statements.
| | | | |
| 66 | | Wells Fargo Advantage Allocation Funds | | Portfolio of investments—November 30, 2013 (unaudited) |
SMALL COMPANY GROWTH PORTFOLIO
| | | | | | | | | | | | |
| Security name | | | | | | Shares | | | Value | |
| | | | | | | | | | | | |
| | | | |
| IT Services: 2.43% | | | | | | | | | | | | |
EVERTEC Incorporated | | | | | | | 92,330 | | | $ | 2,037,723 | |
InterXion Holding NV † | | | | | | | 55,580 | | | | 1,251,106 | |
Vantiv Incorporated Class A † | | | | | | | 85,260 | | | | 2,583,378 | |
| | | | |
| | | | | | | | | | | 5,872,207 | |
| | | | | | | | | | | | |
| | | | |
| Semiconductors & Semiconductor Equipment: 4.46% | | | | | | | | | | | | |
Advanced Energy Industries Incorporated † | | | | | | | 89,070 | | | | 2,121,647 | |
Applied Micro Circuits Corporation † | | | | | | | 85,940 | | | | 1,078,547 | |
Microsemi Corporation † | | | | | | | 73,040 | | | | 1,784,367 | |
Semtech Corporation † | | | | | | | 68,500 | | | | 2,035,820 | |
Spansion Incorporated Class A † | | | | | | | 125,590 | | | | 1,556,060 | |
Teradyne Incorporated † | | | | | | | 130,780 | | | | 2,227,183 | |
| | | | |
| | | | | | | | | | | 10,803,624 | |
| | | | | | | | | | | | |
| | | | |
| Software: 10.46% | | | | | | | | | | | | |
Bottomline Technologies Incorporated † | | | | | | | 58,650 | | | | 2,027,531 | |
BroadSoft Incorporated † | | | | | | | 29,880 | | | | 793,912 | |
Cadence Design Systems Incorporated † | | | | | | | 158,240 | | | | 2,096,680 | |
Concur Technologies Incorporated † | | | | | | | 14,642 | | | | 1,421,592 | |
Infoblox Incorporated † | | | | | | | 28,910 | | | | 918,760 | |
Jive Software Incorporated †« | | | | | | | 159,940 | | | | 1,773,735 | |
PTC Incorporated † | | | | | | | 69,170 | | | | 2,250,792 | |
Rally Software Development Corporation † | | | | | | | 65,070 | | | | 1,600,722 | |
Realpage Incorporated † | | | | | | | 71,770 | | | | 1,608,366 | |
Silver Spring Networks Incorporated †« | | | | | | | 142,620 | | | | 2,950,808 | |
SS&C Technologies Holdings † | | | | | | | 83,320 | | | | 3,591,925 | |
Synchronoss Technologies Incorporated † | | | | | | | 43,510 | | | | 1,380,572 | |
Tangoe Incorporated † | | | | | | | 85,720 | | | | 1,349,233 | |
Ultimate Software Group Incorporated † | | | | | | | 9,830 | | | | 1,540,263 | |
| | | | |
| | | | | | | | | | | 25,304,891 | |
| | | | | | | | | | | | |
| | | | |
Materials: 5.01% | | | | | | | | | | | | |
| | | | |
| Chemicals: 1.58% | | | | | | | | | | | | |
Calgon Carbon Corporation † | | | | | | | 108,400 | | | | 2,244,964 | |
Methanex Corporation | | | | | | | 25,750 | | | | 1,581,050 | |
| | | | |
| | | | | | | | | | | 3,826,014 | |
| | | | | | | | | | | | |
| | | | |
| Containers & Packaging: 0.82% | | | | | | | | | | | | |
Graphic Packaging Holding Company † | | | | | | | 219,980 | | | | 1,975,420 | |
| | | | | | | | | | | | |
| | | | |
| Metals & Mining: 1.76% | | | | | | | | | | | | |
Constellium NV Class A † | | | | | | | 121,870 | | | | 2,634,829 | |
Steel Dynamics Incorporated | | | | | | | 89,540 | | | | 1,631,419 | |
| | | | |
| | | | | | | | | | | 4,266,248 | |
| | | | | | | | | | | | |
| | | | |
| Paper & Forest Products: 0.85% | | | | | | | | | | | | |
Boise Cascade Company † | | | | | | | 79,630 | | | | 2,043,306 | |
| | | | | | | | | | | | |
| | | | |
Total Common Stocks (Cost $166,366,873) | | | | | | | | | | | 231,460,391 | |
| | | | | | | | | | | | |
The accompanying notes are an integral part of these financial statements.
| | | | | | |
| Portfolio of investments—November 30, 2013 (unaudited) | | Wells Fargo Advantage Allocation Funds | | | 67 | |
SMALL COMPANY GROWTH PORTFOLIO
| | | | | | | | | | | | | | |
| Security name | | Yield | | | | | Shares | | | Value | |
| | | | | | | | | | | | | | |
| | | | |
Short-Term Investments: 9.20% | | | | | | | | | | | | | | |
| | | | |
| Investment Companies: 9.20% | | | | | | | | | | | | | | |
Wells Fargo Advantage Cash Investment Money Market Fund, Select Class (u)(l) | | | 0.08 | % | | | | | 9,672,711 | | | $ | 9,672,711 | |
Wells Fargo Securities Lending Cash Investments, LLC (r)(v)(u)(l) | | | 0.08 | | | | | | 12,598,600 | | | | 12,598,600 | |
| | | | |
Total Short-Term Investments (Cost $22,271,311) | | | | | | | | | | | | | 22,271,311 | |
| | | | | | | | | | | | | | |
| | | | | | | | |
Total investments in securities (Cost $188,638,184) * | | | 104.83 | % | | | 253,731,702 | |
Other assets and liabilities, net | | | (4.83 | ) | | | (11,689,750 | ) |
| | | | | | | | |
| Total net assets | | | 100.00 | % | | $ | 242,041,952 | |
| | | | | | | | |
| † | Non-income-earning security |
| « | All or a portion of this security is on loan. |
| (u) | Rate shown is the 7-day annualized yield at period end. |
| (l) | Investment in an affiliate |
| (r) | The investment company is exempt from registration under Section 3(c)(7) of the Investment Company Act of 1940, as amended. |
| (v) | Security represents investment of cash collateral received from securities on loan. |
| * | Cost for federal income tax purposes is $189,718,823 and unrealized appreciation (depreciation) consists of: |
| | | | |
Gross unrealized appreciation | | $ | 66,559,918 | |
Gross unrealized depreciation | | | (2,547,039 | ) |
| | | | |
Net unrealized appreciation | | $ | 64,012,879 | |
The accompanying notes are an integral part of these financial statements.
| | | | |
| 68 | | Wells Fargo Advantage Allocation Funds | | Portfolio of investments—November 30, 2013 (unaudited) |
SMALL COMPANY VALUE PORTFOLIO
| | | | | | | | | | | | |
| Security name | | | | | | Shares | | | Value | |
| | | | | | | | | | | | |
| | | | |
Common Stocks: 97.30% | | | | | | | | | | | | |
| | | | |
Consumer Discretionary: 14.82% | | | | | | | | | | | | |
| | | | |
| Auto Components: 2.29% | | | | | | | | | | | | |
American Axle & Manufacturing Holdings Incorporated † | | | | | | | 137,365 | | | $ | 2,747,300 | |
Dana Holding Corporation | | | | | | | 98,799 | | | | 2,003,644 | |
| | | | |
| | | | | | | | | | | 4,750,944 | |
| | | | | | | | | | | | |
| | | |
| Distributors: 0.99% | | | | | | | | | | |
Core Mark Holding Company Incorporated | | | | | | | 27,763 | | | | 2,049,465 | |
| | | | | | | | | | | | |
| | | |
| Diversified Consumer Services: 2.70% | | | | | | | | | | |
Apollo Group Incorporated Class A † | | | | | | | 102,438 | | | | 2,693,095 | |
Houghton Mifflin Harcourt Company † | | | | | | | 75,690 | | | | 1,313,978 | |
Steiner Leisure Limited † | | | | | | | 27,113 | | | | 1,604,005 | |
| | | | |
| | | | | | | | | | | 5,611,078 | |
| | | | | | | | | | | | |
| | | |
| Hotels, Restaurants & Leisure: 1.88% | | | | | | | | | | |
Bob Evans Farms Incorporated | | | | | | | 34,188 | | | | 1,900,511 | |
ClubCorp Holdings Incorporated † | | | | | | | 120,800 | | | | 2,007,696 | |
| | | | |
| | | | | | | | | | | 3,908,207 | |
| | | | | | | | | | | | |
| | | |
| Leisure Equipment & Products: 0.71% | | | | | | | | | | |
Arctic Cat Incorporated | | | | | | | 26,215 | | | | 1,475,118 | |
| | | | | | | | | | | | |
| | | |
| Media: 0.78% | | | | | | | | | | |
Scholastic Corporation | | | | | | | 53,010 | | | | 1,618,925 | |
| | | | | | | | | | | | |
| | | |
| Specialty Retail: 2.98% | | | | | | | | | | |
Asbury Automotive Group Incorporated † | | | | | | | 53,503 | | | | 2,777,876 | |
Rent-A-Center Incorporated | | | | | | | 41,318 | | | | 1,407,291 | |
Zumiez Incorporated † | | | | | | | 72,327 | | | | 2,008,521 | |
| | | | |
| | | | | | | | | | | 6,193,688 | |
| | | | | | | | | | | | |
| | | |
| Textiles, Apparel & Luxury Goods: 2.49% | | | | | | | | | | |
G-III Apparel Group Limited † | | | | | | | 41,890 | | | | 2,523,873 | |
Vera Bradley Incorporated †« | | | | | | | 105,200 | | | | 2,642,624 | |
| | | | |
| | | | | | | | | | | 5,166,497 | |
| | | | | | | | | | | | |
| | | |
Consumer Staples: 1.83% | | | | | | | | | | |
| | | |
| Food Products: 1.83% | | | | | | | | | | |
Dean Foods Company | | | | | | | 92,450 | | | | 1,662,251 | |
Post Holdings Incorporated † | | | | | | | 42,096 | | | | 2,132,162 | |
| | | | |
| | | | | | | | | | | 3,794,413 | |
| | | | | | | | | | | | |
| | | |
Energy: 3.83% | | | | | | | | | | |
| | | |
| Energy Equipment & Services: 1.89% | | | | | | | | | | |
Basic Energy Services Incorporated † | | | | | | | 115,737 | | | | 1,642,308 | |
Key Energy Services Incorporated † | | | | | | | 291,414 | | | | 2,284,686 | |
| | | | |
| | | | | | | | | | | 3,926,994 | |
| | | | | | | | | | | | |
The accompanying notes are an integral part of these financial statements.
| | | | | | |
| Portfolio of investments—November 30, 2013 (unaudited) | | Wells Fargo Advantage Allocation Funds | | | 69 | |
SMALL COMPANY VALUE PORTFOLIO
| | | | | | | | | | | | |
| Security name | | | | | | Shares | | | Value | |
| | | | | | | | | | | | |
| | | |
| Oil, Gas & Consumable Fuels: 1.94% | | | | | | | | | | |
Rex Energy Corporation † | | | | | | | 106,300 | | | $ | 2,038,834 | |
Sanchez Energy Corporation † | | | | | | | 77,775 | | | | 1,996,484 | |
| | | | |
| | | | | | | | | | | 4,035,318 | |
| | | | | | | | | | | | |
| | | | |
Financials: 37.39% | | | | | | | | | | | | |
| | | | |
| Capital Markets: 2.01% | | | | | | | | | | | | |
Greenhill & Company Incorporated | | | | | | | 38,605 | | | | 2,112,080 | |
Stifel Financial Corporation † | | | | | | | 46,174 | | | | 2,067,210 | |
| | | | |
| | | | | | | | | | | 4,179,290 | |
| | | | | | | | | | | | |
| | | | |
| Commercial Banks: 16.42% | | | | | | | | | | | | |
Associated Banc-Corp | | | | | | | 134,553 | | | | 2,319,694 | |
BancorpSouth Incorporated | | | | | | | 130,211 | | | | 3,113,345 | |
Banner Corporation | | | | | | | 48,215 | | | | 2,095,424 | |
City National Corporation | | | | | | | 31,669 | | | | 2,418,245 | |
FirstMerit Corporation | | | | | | | 108,890 | | | | 2,500,114 | |
IBERIABANK Corporation | | | | | | | 41,041 | | | | 2,573,271 | |
MB Financial Incorporated | | | | | | | 51,300 | | | | 1,672,893 | |
Old National Bancorp | | | | | | | 104,300 | | | | 1,621,865 | |
Pacwest Bancorp « | | | | | | | 48,969 | | | | 2,014,585 | |
PrivateBancorp Incorporated | | | | | | | 99,000 | | | | 2,745,270 | |
Umpqua Holdings Corporation « | | | | | | | 87,407 | | | | 1,609,163 | |
ViewPoint Financial Group Incorporated | | | | | | | 80,400 | | | | 2,040,552 | |
Webster Financial Corporation | | | | | | | 71,292 | | | | 2,101,688 | |
Western Alliance Bancorp † | | | | | | | 136,439 | | | | 3,168,114 | |
Wintrust Financial Corporation | | | | | | | 46,351 | | | | 2,102,481 | |
| | | | |
| | | | | | | | | | | 34,096,704 | |
| | | | | | | | | | | | |
| | | | |
| Insurance: 7.09% | | | | | | | | | | | | |
Amtrust Financial Services Incorporated « | | | | | | | 68,366 | | | | 2,858,382 | |
CNO Financial Group Incorporated | | | | | | | 184,061 | | | | 3,114,312 | |
Employers Holdings Incorporated | | | | | | | 83,034 | | | | 2,710,230 | |
OneBeacon Insurance Group Limited | | | | | | | 104,501 | | | | 1,661,566 | |
Primerica Incorporated | | | | | | | 50,997 | | | | 2,194,401 | |
Selective Insurance Group Incorporated | | | | | | | 77,617 | | | | 2,188,023 | |
| | | | |
| | | | | | | | | | | 14,726,914 | |
| | | | | | | | | | | | |
| | | | |
| Real Estate Management & Development: 0.80% | | | | | | | | | | | | |
Alexander & Baldwin Incorporated | | | | | | | 43,980 | | | | 1,662,004 | |
| | | | | | | | | | | | |
| | | | |
| REITs: 9.29% | | | | | | | | | | | | |
Ashford Hospitality Prime Incorporated † | | | | | | | 36,423 | | | | 745,215 | |
Ashford Hospitality Trust | | | | | | | 182,117 | | | | 1,495,181 | |
Campus Crest Communities Incorporated | | | | | | | 194,096 | | | | 1,931,255 | |
Corporate Office Properties Trust | | | | | | | 70,300 | | | | 1,562,769 | |
Cousins Properties Incorporated | | | | | | | 182,797 | | | | 1,957,756 | |
Education Realty Trust Incorporated | | | | | | | 223,700 | | | | 1,946,190 | |
LaSalle Hotel Properties | | | | | | | 64,396 | | | | 2,016,883 | |
Pebblebrook Hotel Trust | | | | | | | 64,011 | | | | 1,941,454 | |
The accompanying notes are an integral part of these financial statements.
| | | | |
| 70 | | Wells Fargo Advantage Allocation Funds | | Portfolio of investments—November 30, 2013 (unaudited) |
SMALL COMPANY VALUE PORTFOLIO
| | | | | | | | | | | | |
| Security name | | | | | | Shares | | | Value | |
| | | | | | | | | | | | |
| | | | |
| REITs (continued) | | | | | | | | | | | | |
Sabra Health Care REIT Incorporated | | | | | | | 64,528 | | | $ | 1,721,607 | |
STAG Industrial Incorporated | | | | | | | 94,800 | | | | 2,055,264 | |
Sunstone Hotel Investors Incorporated | | | | | | | 147,221 | | | | 1,924,178 | |
| | | | |
| | | | | | | | | | | 19,297,752 | |
| | | | | | | | | | | | |
| | | | |
| Thrifts & Mortgage Finance: 1.78% | | | | | | | | | | | | |
BankUnited Incorporated | | | | | | | 66,646 | | | | 2,151,333 | |
Washington Federal Incorporated | | | | | | | 66,426 | | | | 1,553,704 | |
| | | | |
| | | | | | | | | | | 3,705,037 | |
| | | | | | | | | | | | |
| | | | |
Health Care: 5.38% | | | | | | | | | | | | |
| | | | |
| Health Care Equipment & Supplies: 1.13% | | | | | | | | | | | | |
Alere Incorporated † | | | | | | | 71,943 | | | | 2,353,975 | |
| | | | | | | | | | | | |
| | | | |
| Health Care Providers & Services: 3.01% | | | | | | | | | | | | |
Ensign Group Incorporated | | | | | | | 35,864 | | | | 1,619,977 | |
LifePoint Hospitals Incorporated † | | | | | | | 38,191 | | | | 1,956,525 | |
WellCare Health Plans Incorporated † | | | | | | | 35,880 | | | | 2,665,884 | |
| | | | |
| | | | | | | | | | | 6,242,386 | |
| | | | | | | | | | | | |
| | | | |
| Health Care Technology: 1.24% | | | | | | | | | | | | |
Medassets Incorporated † | | | | | | | 119,297 | | | | 2,569,657 | |
| | | | | | | | | | | | |
| | | | |
Industrials: 11.50% | | | | | | | | | | | | |
| | | | |
| Air Freight & Logistics: 1.46% | | | | | | | | | | | | |
Air Transport Services Group † | | | | | | | 138,038 | | | | 1,073,936 | |
Atlas Air Worldwide Holdings Incorporated † | | | | | | | 50,989 | | | | 1,957,978 | |
| | | | |
| | | | | | | | | | | 3,031,914 | |
| | | | | | | | | | | | |
| | | | |
| Commercial Services & Supplies: 1.57% | | | | | | | | | | | | |
ACCO Brands Corporation † | | | | | | | 268,340 | | | | 1,615,407 | |
Quad Graphics Incorporated | | | | | | | 62,877 | | | | 1,637,946 | |
| | | | |
| | | | | | | | | | | 3,253,353 | |
| | | | | | | | | | | | |
| | | | |
| Construction & Engineering: 2.03% | | | | | | | | | | | | |
Great Lakes Dredge & Dock Company | | | | | | | 212,722 | | | | 1,895,353 | |
Tutor Perini Corporation † | | | | | | | 94,941 | | | | 2,325,105 | |
| | | | |
| | | | | | | | | | | 4,220,458 | |
| | | | | | | | | | | | |
| | | | |
| Machinery: 3.02% | | | | | | | | | | | | |
Briggs & Stratton Corporation | | | | | | | 70,394 | | | | 1,423,367 | |
Global Brass & Copper Holdings Incorporated | | | | | | | 72,663 | | | | 1,198,940 | |
Kadant Incorporated | | | | | | | 48,452 | | | | 2,006,882 | |
Wabash National Corporation † | | | | | | | 134,999 | | | | 1,638,888 | |
| | | | |
| | | | | | | | | | | 6,268,077 | |
| | | | | | | | | | | | |
| | | | |
| Professional Services: 1.02% | | | | | | | | | | | | |
FTI Consulting Incorporated † | | | | | | | 47,191 | | | | 2,119,348 | |
| | | | | | | | | | | | |
The accompanying notes are an integral part of these financial statements.
| | | | | | |
| Portfolio of investments—November 30, 2013 (unaudited) | | Wells Fargo Advantage Allocation Funds | | | 71 | |
SMALL COMPANY VALUE PORTFOLIO
| | | | | | | | | | | | |
| Security name | | | | | | Shares | | | Value | |
| | | | | | | | | | | | |
| | | | |
| Road & Rail: 1.48% | | | | | | | | | | | | |
Quality Distribution Incorporated † | | | | | | | 139,900 | | | $ | 1,710,977 | |
Ryder System Incorporated | | | | | | | 19,506 | | | | 1,362,299 | |
| | | | |
| | | | | | | | | | | 3,073,276 | |
| | | | | | | | | | | | |
| | | | |
| Trading Companies & Distributors: 0.92% | | | | | | | | | | | | |
Titan Machinery Incorporated †« | | | | | | | 107,533 | | | | 1,915,163 | |
| | | | | | | | | | | | |
| | | | |
Information Technology: 13.12% | | | | | | | | | | | | |
| | | | |
| Communications Equipment: 1.89% | | | | | | | | | | | | |
ARRIS Group Incorporated † | | | | | | | 120,850 | | | | 2,479,842 | |
Black Box Corporation | | | | | | | 51,946 | | | | 1,455,007 | |
| | | | |
| | | | | | | | | | | 3,934,849 | |
| | | | | | | | | | | | |
| | | | |
| Computers & Peripherals: 0.82% | | | | | | | | | | | | |
QLogic Corporation † | | | | | | | 137,730 | | | | 1,709,229 | |
| | | | | | | | | | | | |
| | | | |
| Electronic Equipment, Instruments & Components: 3.34% | | | | | | | | | | | | |
Itron Incorporated † | | | | | | | 36,310 | | | | 1,537,729 | |
Multi-Fineline Electronix Incorporated † | | | | | | | 71,135 | | | | 1,004,426 | |
Plexus Corporation † | | | | | | | 55,319 | | | | 2,233,228 | |
Sanmina Corporation † | | | | | | | 139,545 | | | | 2,160,157 | |
| | | | |
| | | | | | | | | | | 6,935,540 | |
| | | | | | | | | | | | |
| | | | |
| Internet Software & Services: 0.89% | | | | | | | | | | | | |
EarthLink Incorporated | | | | | | | 338,242 | | | | 1,843,419 | |
| | | | | | | | | | | | |
| | | | |
| Semiconductors & Semiconductor Equipment: 5.59% | | | | | | | | | | | | |
Cirrus Logic Incorporated †« | | | | | | | 106,590 | | | | 2,150,986 | |
Integrated Silicon Solution Incorporated † | | | | | | | 148,163 | | | | 1,754,250 | |
Kulicke & Soffa Industries Incorporated † | | | | | | | 186,646 | | | | 2,355,473 | |
MagnaChip Semiconductor Corporation † | | | | | | | 98,976 | | | | 2,009,213 | |
OmniVision Technologies Incorporated † | | | | | | | 90,984 | | | | 1,458,474 | |
Photronics Incorporated † | | | | | | | 217,754 | | | | 1,881,395 | |
| | | | |
| | | | | | | | | | | 11,609,791 | |
| | | | | | | | | | | | |
| | | | |
| Software: 0.59% | | | | | | | | | | | | |
EPIQ Systems Incorporated | | | | | | | 72,582 | | | | 1,214,297 | |
| | | | | | | | | | | | |
| | | | |
Materials: 5.33% | | | | | | | | | | | | |
| | | | |
| Chemicals: 1.66% | | | | | | | | | | | | |
Kraton Performance Polymers Incorporated † | | | | | | | 85,391 | | | | 1,988,756 | |
Zep Incorporated | | | | | | | 75,616 | | | | 1,456,364 | |
| | | | |
| | | | | | | | | | | 3,445,120 | |
| | | | | | | | | | | | |
| | | | |
| Metals & Mining: 3.67% | | | | | | | | | | | | |
A.M. Castle & Company † | | | | | | | 56,966 | | | | 796,954 | |
Commercial Metals Company | | | | | | | 115,670 | | | | 2,246,311 | |
Horsehead Holding Corporation † | | | | | | | 149,262 | | | | 2,234,452 | |
Suncoke Energy Incorporated † | | | | | | | 103,939 | | | | 2,356,297 | |
| | | | |
| | | | | | | | | | | 7,634,014 | |
| | | | | | | | | | | | |
The accompanying notes are an integral part of these financial statements.
| | | | |
| 72 | | Wells Fargo Advantage Allocation Funds | | Portfolio of investments—November 30, 2013 (unaudited) |
SMALL COMPANY VALUE PORTFOLIO
| | | | | | | | | | | | | | | | |
| Security name | | | | | | | | Shares | | | Value | |
| | | | | | | | | | | | | | | | |
| | | | |
Telecommunication Services: 0.80% | | | | | | | | | | | | | | | | |
| | | | |
| Diversified Telecommunication Services: 0.80% | | | | | | | | | | | | | | | | |
Iridium Communications Incorporated † | | | | | | | | | | | 270,575 | | | $ | 1,664,036 | |
| | | | | | | | | | | | | | | | |
| | | | |
Utilities: 3.30% | | | | | | | | | | | | | | | | |
| | | | |
| Electric Utilities: 3.30% | | | | | | | | | | | | | | | | |
El Paso Electric Company | | | | | | | | | | | 63,350 | | | | 2,282,501 | |
PNM Resources Incorporated | | | | | | | | | | | 86,704 | | | | 2,017,602 | |
Portland General Electric Company | | | | | | | | | | | 85,697 | | | | 2,554,624 | |
| | | | |
| | | | | | | | | | | | | | | 6,854,727 | |
| | | | | | | | | | | | | | | | |
| | | | |
Total Common Stocks (Cost $147,320,398) | | | | | | | | | | | | | | | 202,090,977 | |
| | | | | | | | | | | | | | | | |
| | | | |
| | | | | | Expiration date | | | | | | | |
| | | | |
Warrants: 0.01% | | | | | | | | | | | | | | | | |
| | | | |
Health Care: 0.01% | | | | | | | | | | | | | | | | |
| | | | |
| Health Care Equipment & Supplies: 0.01% | | | | | | | | | | | | | | | | |
EnteroMedics Incorporated †(a) | | | | | | | 5-14-2016 | | | | 9,104 | | | | 10,778 | |
| | | | | | | | | | | | | | | | |
| | | | |
Total Warrants (Cost $0) | | | | | | | | | | | | | | | 10,778 | |
| | | | | | | | | | | | | | | | |
| | | | |
| | | Yield | | | | | | | | | | |
| | | | |
Short-Term Investments: 7.42% | | | | | | | | | | | | | | | | |
| | | | |
| Investment Companies: 7.42% | | | | | | | | | | | | | | | | |
Wells Fargo Advantage Cash Investment Money Market Fund, Select Class (l)(u) | | | 0.08 | % | | | | | | | 6,438,413 | | | | 6,438,413 | |
Wells Fargo Securities Lending Cash Investments, LLC (l)(u)(r)(v) | | | 0.08 | | | | | | | | 8,987,147 | | | | 8,987,147 | |
| | | | |
Total Short-Term Investments (Cost $15,425,560) | | | | | | | | | | | | | | | 15,425,560 | |
| | | | | | | | | | | | | | | | |
| | | | | | | | |
| Total investments in securities | | | | | | | | |
| (Cost $162,745,958) * | | | 104.73 | % | | | 217,527,315 | |
Other assets and liabilities, net | | | (4.73 | ) | | | (9,829,453 | ) |
| | | | | | | | |
| Total net assets | | | 100.00 | % | | $ | 207,697,862 | |
| | | | | | | | |
| † | Non-income-earning security |
| « | All or a portion of this security is on loan. |
| (a) | Security is fair valued by the Management Valuation Team, and in certain instances by the Board of Trustees, in accordance with procedures approved by the Board of Trustees. |
| (l) | Investment in an affiliate |
| (u) | Rate shown is the 7-day annualized yield at period end. |
| (r) | The investment company is exempt from registration under Section 3(c)(7) of the Investment Company Act of 1940, as amended. |
| (v) | Security represents investment of cash collateral received from securities on loan. |
| * | Cost for federal income tax purposes is $164,900,485 and unrealized appreciation (depreciation) consists of: |
| | | | |
Gross unrealized appreciation | | $ | 58,250,533 | |
Gross unrealized depreciation | | | (5,623,703 | ) |
| | | | |
Net unrealized appreciation | | $ | 52,626,830 | |
The accompanying notes are an integral part of these financial statements.
| | | | | | |
| Summary portfolio of investments—November 30, 2013 (unaudited) | | Wells Fargo Advantage Allocation Funds | | | 73 | |
CORE BOND PORTFOLIO
The Summary Portfolio of Investments shows the 50 largest portfolio holdings in unaffiliated issuers and any holdings exceeding 1% of the total net assets as of the report date. The remaining securities held are grouped as “Other securities” in each category. You can request a complete schedule of portfolio holdings as of the report date, free of charge, by accessing the following website:
http://a584.g.akamai.net/f/584/1326/1d/www.wellsfargoadvantagefunds.com/pdf/semi/holdings/corebond.pdf or by calling
Wells Fargo Advantage Funds at 1-800-222-8222. This complete schedule, filed on Form N-CSRS, is also available on the SEC’s website at sec.gov.
| | | | | | | | | | | | | | | | | | | | |
| Security name | | Interest rate | | | Maturity date | | | Principal | | | Value | | | Percent of
net assets | |
| | | | | |
Agency Securities: 35.37% | | | | | | | | | | | | | | | | | | | | |
FHLMC | | | 0.87-7.50 | % | | | 8-1-2017 to 3-25-2044 | | | $ | 173,924,636 | | | $ | 181,042,032 | | | | 6.19 | % |
FHLMC ± | | | 2.24 | | | | 7-1-2043 | | | | 23,278,559 | | | | 23,569,893 | | | | 0.81 | |
FHLMC | | | 2.50 | | | | 5-1-2028 | | | | 12,513,622 | | | | 12,531,467 | | | | 0.43 | |
FHLMC | | | 4.00 | | | | 6-1-2042 | | | | 40,489,966 | | | | 41,785,852 | | | | 1.43 | |
FHLMC | | | 5.00 | | | | 8-1-2039 | | | | 18,018,076 | | | | 19,889,238 | | | | 0.68 | |
FHLMC | | | 5.00 | | | | 8-1-2041 | | | | 20,249,431 | | | | 22,158,409 | | | | 0.76 | |
FNMA ± | | | 1.98 | | | | 4-1-2043 | | | | 11,467,494 | | | | 11,522,648 | | | | 0.39 | |
FNMA | | | 1.99-7.50 | | | | 9-1-2016 to 1-1-2044 | | | | 255,764,291 | | | | 263,240,752 | | | | 9.00 | |
FNMA ± | | | 2.07 | | | | 7-1-2043 | | | | 13,681,802 | | | | 13,704,305 | | | | 0.47 | |
FNMA | | | 2.50 | | | | 10-1-2027 | | | | 11,804,385 | | | | 11,825,510 | | | | 0.41 | |
FNMA | | | 2.50 | | | | 11-1-2027 | | | | 15,003,607 | | | | 15,067,957 | | | | 0.52 | |
FNMA %% | | | 2.50 | | | | 12-1-2028 | | | | 22,400,000 | | | | 22,360,625 | | | | 0.77 | |
FNMA %% | | | 2.50 | | | | 1-1-2029 | | | | 15,100,000 | | | | 15,038,656 | | | | 0.52 | |
FNMA | | | 3.00 | | | | 1-1-2043 | | | | 16,293,677 | | | | 15,525,375 | | | | 0.53 | |
FNMA | | | 3.00 | | | | 3-1-2043 | | | | 17,551,721 | | | | 16,724,636 | | | | 0.57 | |
FNMA %% | | | 3.00 | | | | 12-1-2043 | | | | 31,500,000 | | | | 30,376,581 | | | | 1.04 | |
FNMA | | | 3.50 | | | | 9-1-2042 | | | | 31,802,633 | | | | 31,653,947 | | | | 1.08 | |
FNMA | | | 3.50 | | | | 2-1-2043 | | | | 14,478,427 | | | | 14,410,778 | | | | 0.49 | |
FNMA %% | | | 3.50 | | | | 1-1-2044 | | | | 29,300,000 | | | | 29,456,800 | | | | 1.01 | |
FNMA | | | 4.00 | | | | 6-1-2042 | | | | 13,523,103 | | | | 14,000,446 | | | | 0.48 | |
FNMA | | | 5.00 | | | | 7-1-2041 | | | | 13,374,316 | | | | 14,796,750 | | | | 0.51 | |
FNMA | | | 6.00 | | | | 3-1-2034 | | | | 24,451,502 | | | | 27,287,807 | | | | 0.93 | |
FNMA Series 416 Class A350 | | | 3.50 | | | | 11-25-2042 | | | | 13,576,515 | | | | 13,724,095 | | | | 0.47 | |
FNMA Series 2012-130 Class DC | | | 3.00 | | | | 12-25-2042 | | | | 37,626,024 | | | | 36,009,045 | | | | 1.23 | |
FNMA Series 2013-121 Class LB (a) | | | 3.00 | | | | 12-25-2043 | | | | 13,276,000 | | | | 13,707,588 | | | | 0.47 | |
GNMA | | | 2.50-8.05 | | | | 7-15-2019 to 1-1-2044 | | | | 21,098,033 | | | | 21,373,197 | | | | 0.71 | |
GNMA %% | | | 3.50 | | | | 12-1-2043 | | | | 12,200,000 | | | | 12,436,375 | | | | 0.43 | |
GNMA %% | | | 4.00 | | | | 12-1-2043 | | | | 10,800,000 | | | | 11,385,141 | | | | 0.39 | |
GNMA %% | | | 4.00 | | | | 1-1-2044 | | | | 41,600,000 | | | | 43,717,376 | | | | 1.50 | |
GNMA %% | | | 4.50 | | | | 12-1-2043 | | | | 31,200,000 | | | | 33,518,063 | | | | 1.15 | |
| | | | | | | | | | | | | | | | | | | | |
| | | | | |
Total Agency Securities (Cost $1,043,435,825) | | | | | | | | | | | | | | | 1,033,841,344 | | | | 35.37 | |
| | | | | | | | | | | | | | | | | | | | |
| | | | | |
Asset-Backed Securities: 14.85% | | | | | | | | | | | | | | | | | | | | |
Ally Auto Receivables Trust | | | 0.74-2.23 | | | | 5-15-2015 to 2-15-2018 | | | | 46,207,266 | | | | 46,379,568 | | | | 1.58 | |
American Express Credit Corporation | | | 0.45-0.60 | | | | 2-15-2019 to 5-17-2021 | | | | 21,262,000 | | | | 21,262,196 | | | | 0.73 | |
AmeriCredit Automobile Receivables Trust Series 2013-3 Class A2 | | | 0.68 | | | | 10-11-2016 | | | | 11,156,000 | | | | 11,163,084 | | | | 0.38 | |
Bank of America Credit Card Trust Series 2007-A10 Class A10 ± | | | 0.24 | | | | 12-15-2016 | | | | 8,216,000 | | | | 8,215,482 | | | | 0.28 | |
Capital Auto Receivables Asset Trust | | | 0.79-1.68 | | | | 9-20-2016 to 7-20-2018 | | | | 33,057,000 | | | | 33,151,544 | | | | 1.13 | |
Capital One Multi-Asset Execution Trust Series 2007-A1 Class A1 ± | | | 0.22 | | | | 11-15-2019 | | | | 11,267,000 | | | | 11,166,127 | | | | 0.38 | |
Citibank Credit Card Issuance Trust Series 2013-A10 Class A10 | | | 0.73 | | | | 2-7-2018 | | | | 17,764,000 | | | | 17,787,040 | | | | 0.61 | |
The accompanying notes are an integral part of these financial statements.
| | | | |
| 74 | | Wells Fargo Advantage Allocation Funds | | Summary portfolio of investments—November 30, 2013 (unaudited) |
CORE BOND PORTFOLIO
| | | | | | | | | | | | | | | | | | | | |
| Security name | | Interest rate | | | Maturity date | | | Principal | | | Value | | | Percent of
net assets | |
| | | | | |
Asset-Backed Securities (continued) | | | | | | | | | | | | | | | | | | | | |
Nelnet Student Loan Trust | | | 0.25-0.97 | % | | | 11-27-2018 to 4-25-2046 | | | $ | 34,927,980 | | | $ | 33,944,288 | | | | 1.16 | % |
Nelnet Student Loan Trust Series 2006-2 Class A4 ± | | | 0.32 | | | | 10-26-2026 | | | | 10,721,284 | | | | 10,689,795 | | | | 0.37 | |
Nelnet Student Loan Trust Series 2007-2A
Class A3L ±144A | | | 0.60 | | | | 3-25-2026 | | | | 17,148,000 | | | | 16,939,995 | | | | 0.58 | |
Santander Drive Auto Receivables Trust Series 2013-2 Class A3 | | | 0.70 | | | | 9-15-2017 | | | | 10,752,000 | | | | 10,761,107 | | | | 0.37 | |
SLM Student Loan Trust | | | 0.34-3.42 | | | | 9-25-2019 to 6-15-2045 | | | | 99,920,959 | | | | 99,775,371 | | | | 3.42 | |
SLM Student Loan Trust Series 2012-E
Class A1 ±144A | | | 0.92 | | | | 10-16-2023 | | | | 12,018,631 | | | | 12,027,813 | | | | 0.41 | |
SLM Student Loan Trust Series 2013-B
Class A2A 144A | | | 1.85 | | | | 6-17-2030 | | | | 11,683,000 | | | | 11,382,058 | | | | 0.39 | |
Other securities | | | | | | | | | | | | | | | 89,478,754 | | | | 3.06 | |
| | | | | | | | | | | | | | | | | | | | |
| | | | | |
Total Asset-Backed Securities
(Cost $433,125,939) | | | | | | | | | | | | | | | 434,124,222 | | | | 14.85 | |
| | | | | | | | | | | | | | | | | | | | |
| | | | | |
Corporate Bonds and Notes: 18.99% | | | | | | | | | | | | | | | | | | | | |
| | | | | |
Consumer Discretionary: 2.19% | | | | | | | | | | | | | | | | | | | | |
| | | | | |
| Auto Components: 0.13% | | | | | | | | | | | | | | | | | | | | |
Other securities | | | | | | | | | | | | | | | 3,865,788 | | | | 0.13 | |
| | | | | | | | | | | | | | | | | | | | |
| | | | | |
| Automobiles: 1.23% | | | | | | | | | | | | | | | | | | | | |
Other securities | | | | | | | | | | | | | | | 36,016,466 | | | | 1.23 | |
| | | | | | | | | | | | | | | | | | | | |
| | | | | |
| Media: 0.64% | | | | | | | | | | | | | | | | | | | | |
Other securities | | | | | | | | | | | | | | | 18,773,746 | | | | 0.64 | |
| | | | | | | | | | | | | | | | | | | | |
| | | | | |
| Specialty Retail: 0.19% | | | | | | | | | | | | | | | | | | | | |
Other securities | | | | | | | | | | | | | | | 5,453,067 | | | | 0.19 | |
| | | | | | | | | | | | | | | | | | | | |
| | | | | |
Consumer Staples: 1.10% | | | | | | | | | | | | | | | | | | | | |
| | | | | |
| Beverages: 0.29% | | | | | | | | | | | | | | | | | | | | |
Other securities | | | | | | | | | | | | | | | 8,516,732 | | | | 0.29 | |
| | | | | | | | | | | | | | | | | | | | |
| | | | | |
| Food Products: 0.72% | | | | | | | | | | | | | | | | | | | | |
Other securities | | | | | | | | | | | | | | | 20,984,102 | | | | 0.72 | |
| | | | | | | | | | | | | | | | | | | | |
| | | | | |
| Tobacco: 0.09% | | | | | | | | | | | | | | | | | | | | |
Other securities | | | | | | | | | | | | | | | 2,650,156 | | | | 0.09 | |
| | | | | | | | | | | | | | | | | | | | |
| | | | | |
Energy: 1.70% | | | | | | | | | | | | | | | | | | | | |
| | | | | |
| Energy Equipment & Services: 0.24% | | | | | | | | | | | | | | | | | | | | |
Other securities | | | | | | | | | | | | | | | 7,109,207 | | | | 0.24 | |
| | | | | | | | | | | | | | | | | | | | |
| | | | | |
| Oil, Gas & Consumable Fuels: 1.46% | | | | | | | | | | | | | | | | | | | | |
Other securities | | | | | | | | | | | | | | | 42,589,480 | | | | 1.46 | |
| | | | | | | | | | | | | | | | | | | | |
The accompanying notes are an integral part of these financial statements.
| | | | | | |
| Summary portfolio of investments—November 30, 2013 (unaudited) | | Wells Fargo Advantage Allocation Funds | | | 75 | |
CORE BOND PORTFOLIO
| | | | | | | | | | | | | | | | | | | | |
| Security name | | Interest rate | | | Maturity date | | | Principal | | | Value | | | Percent of
net assets | |
| | | | | |
Financials: 8.11% | | | | | | | | | | | | | | | | | | | | |
| | | | | |
| Capital Markets: 1.15% | | | | | | | | | | | | | | | | | | | | |
Morgan Stanley | | | 5.00-5.50 | % | | | 10-15-2015 to 11-24-2025 | | | $ | 9,048,000 | | | $ | 9,648,808 | | | | 0.33 | % |
Other securities | | | | | | | | | | | | | | | 24,025,225 | | | | 0.82 | |
| | | | | |
| | | | | | | | | | | | | | | 33,674,033 | | | | 1.15 | |
| | | | | | | | | | | | | | | | | | | | |
| | | | | |
| Commercial Banks: 0.34% | | | | | | | | | | | | | | | | | | | | |
Other securities | | | | | | | | | | | | | | | 9,878,938 | | | | 0.34 | |
| | | | | | | | | | | | | | | | | | | | |
| | | | | |
| Consumer Finance: 0.60% | | | | | | | | | | | | | | | | | | | | |
American Express Credit Corporation | | | 1.75 | | | | 6-12-2015 | | | | 7,664,000 | | | | 7,798,220 | | | | 0.27 | |
Other securities | | | | | | | | | | | | | | | 9,787,403 | | | | 0.33 | |
| | | | | |
| | | | | | | | | | | | | | | 17,585,623 | | | | 0.60 | |
| | | | | | | | | | | | | | | | | | | | |
| | | | | |
| Diversified Financial Services: 3.32% | | | | | | | | | | | | | | | | | | | | |
Bank of America Corporation | | | 1.13 | | | | 11-14-2016 | | | | 12,070,000 | | | | 12,097,025 | | | | 0.41 | |
Bank of America Corporation | | | 1.50 | | | | 10-9-2015 | | | | 12,066,000 | | | | 12,186,624 | | | | 0.42 | |
Bank of America Corporation | | | 2.60-6.00 | | | | 9-1-2017 to 7-24-2023 | | | | 20,880,000 | | | | 21,593,445 | | | | 0.74 | |
JPMorgan Chase & Company | | | 3.20-6.00 | | | | 10-1-2017 to 5-1-2023 | | | | 13,928,000 | | | | 14,748,855 | | | | 0.51 | |
Other securities | | | | | | | | | | | | | | | 36,529,117 | | | | 1.24 | |
| | | | | |
| | | | | | | | | | | | | | | 97,155,066 | | | | 3.32 | |
| | | | | | | | | | | | | | | | | | | | |
| | | | | |
| Insurance: 1.39% | | | | | | | | | | | | | | | | | | | | |
Other securities | | | | | | | | | | | | | | | 40,527,858 | | | | 1.39 | |
| | | | | | | | | | | | | | | | | | | | |
| | | | | |
| REITs: 1.31% | | | | | | | | | | | | | | | | | | | | |
Other securities | | | | | | | | | | | | | | | 38,198,247 | | | | 1.31 | |
| | | | | | | | | | | | | | | | | | | | |
| | | | | |
Health Care: 1.31% | | | | | | | | | | | | | | | | | | | | |
| | | | | |
| Biotechnology: 0.34% | | | | | | | | | | | | | | | | | | | | |
Other securities | | | | | | | | | | | | | | | 9,801,121 | | | | 0.34 | |
| | | | | | | | | | | | | | | | | | | | |
| | | | | |
| Health Care Equipment & Supplies: 0.13% | | | | | | | | | | | | | | | | | | | | |
Other securities | | | | | | | | | | | | | | | 3,920,985 | | | | 0.13 | |
| | | | | | | | | | | | | | | | | | | | |
| | | | | |
| Health Care Providers & Services: 0.36% | | | | | | | | | | | | | | | | | | | | |
Other securities | | | | | | | | | | | | | | | 10,457,193 | | | | 0.36 | |
| | | | | | | | | | | | | | | | | | | | |
| | | | | |
| Pharmaceuticals: 0.48% | | | | | | | | | | | | | | | | | | | | |
Other securities | | | | | | | | | | | | | | | 14,080,601 | | | | 0.48 | |
| | | | | | | | | | | | | | | | | | | | |
| | | | | |
Industrials: 0.46% | | | | | | | | | | | | | | | | | | | | |
| | | | | |
| Aerospace & Defense: 0.26% | | | | | | | | | | | | | | | | | | | | |
Other securities | | | | | | | | | | | | | | | 7,673,912 | | | | 0.26 | |
| | | | | | | | | | | | | | | | | | | | |
| | | | | |
| Machinery: 0.06% | | | | | | | | | | | | | | | | | | | | |
Other securities | | | | | | | | | | | | | | | 1,797,252 | | | | 0.06 | |
| | | | | | | | | | | | | | | | | | | | |
| | | | | |
| Road & Rail: 0.14% | | | | | | | | | | | | | | | | | | | | |
Other securities | | | | | | | | | | | | | | | 3,887,234 | | | | 0.14 | |
| | | | | | | | | | | | | | | | | | | | |
The accompanying notes are an integral part of these financial statements.
| | | | |
| 76 | | Wells Fargo Advantage Allocation Funds | | Summary portfolio of investments—November 30, 2013 (unaudited) |
CORE BOND PORTFOLIO
| | | | | | | | | | | | | | | | | | | | |
| Security name | | Interest rate | | | Maturity date | | | Principal | | | Value | | | Percent of
net assets | |
| | | | | |
Information Technology: 0.64% | | | | | | | | | | | | | | | | | | | | |
| | | | | |
| Computers & Peripherals: 0.17% | | | | | | | | | | | | | | | | | | | | |
Other securities | | | | | | | | | | | | | | $ | 4,905,887 | | | | 0.17 | % |
| | | | | | | | | | | | | | | | | | | | |
| | | | | |
| Semiconductors & Semiconductor Equipment: 0.08% | | | | | | | | | | | | | | | | | | | | |
Other securities | | | | | | | | | | | | | | | 2,275,988 | | | | 0.08 | |
| | | | | | | | | | | | | | | | | | | | |
| | | | | |
| Software: 0.39% | | | | | | | | | | | | | | | | | | | | |
Other securities | | | | | | | | | | | | | | | 11,586,202 | | | | 0.39 | |
| | | | | | | | | | | | | | | | | | | | |
| | | | | |
Materials: 0.08% | | | | | | | | | | | | | | | | | | | | |
| | | | | |
| Chemicals: 0.08% | | | | | | | | | | | | | | | | | | | | |
Other securities | | | | | | | | | | | | | | | 2,435,967 | | | | 0.08 | |
| | | | | | | | | | | | | | | | | | | | |
| | | | | |
| Telecommunication Services: 1.34% | | | | | | | | | | | | | | | | | | | | |
| | | | | |
| Diversified Telecommunication Services: 1.34% | | | | | | | | | | | | | | | | | | | | |
Verizon Communications Incorporated | | | 2.50-6.55 | % | | | 9-15-2016 to 9-15-2043 | | | $ | 31,063,000 | | | | 33,544,785 | | | | 1.15 | |
Other securities | | | | | | | | | | | | | | | 5,667,726 | | | | 0.19 | |
| | | | | |
| | | | | | | | | | | | | | | 39,212,511 | | | | 1.34 | |
| | | | | | | | | | | | | | | | | | | | |
| | | | | |
Utilities: 2.06% | | | | | | | | | | | | | | | | | | | | |
| | | | | |
| Electric Utilities: 0.96% | | | | | | | | | | | | | | | | | | | | |
Other securities | | | | | | | | | | | | | | | 28,034,317 | | | | 0.96 | |
| | | | | | | | | | | | | | | | | | | | |
| | | | | |
| Gas Utilities: 0.25% | | | | | | | | | | | | | | | | | | | | |
Other securities | | | | | | | | | | | | | | | 7,265,579 | | | | 0.25 | |
| | | | | | | | | | | | | | | | | | | | |
| | | | | |
| Multi-Utilities: 0.85% | | | | | | | | | | | | | | | | | | | | |
Other securities | | | | | | | | | | | | | | | 24,797,766 | | | | 0.85 | |
| | | | | | | | | | | | | | | | | | | | |
| | | | | |
Total Corporate Bonds and Notes
(Cost $552,322,555) | | | | | | | | | | | | | | | 555,111,024 | | | | 18.99 | |
| | | | | | | | | | | | | | | | | | | | |
| | | | | |
Municipal Obligations: 1.01% | | | | | | | | | | | | | | | | | | | | |
| | | | | |
| California: 0.26% | | | | | | | | | | | | | | | | | | | | |
Other securities | | | | | | | | | | | | | | | 7,679,498 | | | | 0.26 | |
| | | | | | | | | | | | | | | | | | | | |
| | | | | |
| Illinois: 0.13% | | | | | | | | | | | | | | | | | | | | |
Other securities | | | | | | | | | | | | | | | 3,887,469 | | | | 0.13 | |
| | | | | | | | | | | | | | | | | | | | |
| | | | | |
| Nevada: 0.14% | | | | | | | | | | | | | | | | | | | | |
Other securities | | | | | | | | | | | | | | | 3,927,132 | | | | 0.14 | |
| | | | | | | | | | | | | | | | | | | | |
| | | | | |
| New Jersey: 0.17% | | | | | | | | | | | | | | | | | | | | |
Other securities | | | | | | | | | | | | | | | 5,006,252 | | | | 0.17 | |
| | | | | | | | | | | | | | | | | | | | |
| | | | | |
| New York: 0.13% | | | | | | | | | | | | | | | | | | | | |
Other securities | | | | | | | | | | | | | | | 3,625,999 | | | | 0.13 | |
| | | | | | | | | | | | | | | | | | | | |
The accompanying notes are an integral part of these financial statements.
| | | | | | |
| Summary portfolio of investments—November 30, 2013 (unaudited) | | Wells Fargo Advantage Allocation Funds | | | 77 | |
CORE BOND PORTFOLIO
| | | | | | | | | | | | | | | | | | | | |
| Security name | | Interest rate | | | Maturity date | | | Principal | | | Value | | | Percent of
net assets | |
| | | | | |
| Ohio: 0.04% | | | | | | | | | | | | | | | | | | | | |
Other securities | | | | | | | | | | | | | | $ | 1,093,618 | | | | 0.04 | % |
| | | | | | | | | | | | | | | | | | | | |
| | | | | |
| Texas: 0.14% | | | | | | | | | | | | | | | | | | | | |
Other securities | | | | | | | | | | | | | | | 4,209,590 | | | | 0.14 | |
| | | | | | | | | | | | | | | | | | | | |
| | | | | |
Total Municipal Obligations (Cost $25,833,149) | | | | | | | | | | | | | | | 29,429,558 | | | | 1.01 | |
| | | | | | | | | | | | | | | | | | | | |
| | | | |
Non-Agency Mortgage Backed Securities: 7.34% | | | | | | | | | | | | | | | | | |
Commercial Mortgage Trust | | | 1.30-4.26 | % | | | 12-10-2044 to 10-10-2046 | | | $ | 29,294,531 | | | | 30,254,358 | | | | 1.04 | |
Impact Funding LLC Series 2010-1 Class A1 144A | | | 5.31 | | | | 8-25-2024 | | | | 10,957,525 | | | | 12,268,286 | | | | 0.42 | |
JPMorgan Chase & Company | | | 1.08-5.72 | | | | 11-15-2017 to 5-15-2047 | | | | 58,205,792 | | | | 60,994,764 | | | | 2.08 | |
Morgan Stanley | | | 0.28-4.97 | | | | 4-14-2040 to 2-25-2047 | | | | 34,507,225 | | | | 35,043,949 | | | | 1.20 | |
Other securities | | | | | | | | | | | | | | | 75,906,523 | | | | 2.60 | |
| | | | | | | | | | | | | | | | | | | | |
| | | | | |
Total Non-Agency Mortgage Backed Securities
(Cost $213,464,578) | | | | | | | | | | | | | | | 214,467,880 | | | | 7.34 | |
| | | | | | | | | | | | | | | | | | | | |
| | | | | |
U.S. Treasury Securities: 18.95% | | | | | | | | | | | | | | | | | | | | |
U.S. Treasury Bond | | | 2.75-3.75 | | | | 11-15-2041 to 11-15-2043 | | | | 16,780,000 | | | | 14,859,189 | | | | 0.50 | |
U.S. Treasury Bond | | | 3.13 | | | | 2-15-2043 | | | | 22,362,000 | | | | 19,601,679 | | | | 0.67 | |
U.S. Treasury Bond | | | 3.63 | | | | 8-15-2043 | | | | 18,809,000 | | | | 18,174,196 | | | | 0.62 | |
U.S. Treasury Note | | | 0.25 | | | | 9-30-2015 | | | | 24,408,000 | | | | 24,404,192 | | | | 0.84 | |
U.S. Treasury Note | | | 0.25 | | | | 10-31-2015 | | | | 28,464,000 | | | | 28,451,760 | | | | 0.97 | |
U.S. Treasury Note | | | 0.38 | | | | 8-31-2015 | | | | 71,293,000 | | | | 71,443,357 | | | | 2.45 | |
U.S. Treasury Note ## | | | 0.63 | | | | 8-15-2016 | | | | 33,136,000 | | | | 33,270,598 | | | | 1.14 | |
U.S. Treasury Note | | | 0.63 | | | | 10-15-2016 | | | | 59,869,000 | | | | 60,037,352 | | | | 2.06 | |
U.S. Treasury Note ## | | | 0.63 | | | | 11-15-2016 | | | | 131,711,000 | | | | 132,009,457 | | | | 4.52 | |
U.S. Treasury Note | | | 1.25-2.50 | | | | 11-30-2018 to 8-15-2023 | | | | 21,221,000 | | | | 20,946,724 | | | | 0.71 | |
U.S. Treasury Note | | | 2.38 | | | | 7-31-2017 | | | | 22,264,000 | | | | 23,479,815 | | | | 0.80 | |
U.S. Treasury Note | | | 2.75 | | | | 11-15-2023 | | | | 23,517,000 | | | | 23,524,337 | | | | 0.81 | |
U.S. Treasury Note ## | | | 3.13 | | | | 4-30-2017 | | | | 77,368,000 | | | | 83,551,405 | | | | 2.86 | |
| | | | | | | | | | | | | | | | | | | | |
| | | | | |
Total U.S. Treasury Securities
(Cost $553,760,297) | | | | | | | | | | | | | | | 553,754,061 | | | | 18.95 | |
| | | | | | | | | | | | | | | | | | | | |
| | | | |
Yankee Corporate Bonds and Notes: 6.54% | | | | | | | | | | | | | | | | | |
| | | | | |
Consumer Discretionary: 0.19% | | | | | | | | | | | | | | | | | | | | |
| | | | |
| Textiles, Apparel & Luxury Goods: 0.19% | | | | | | | | | | | | | | | | | |
Other securities | | | | | | | | | | | | | | | 5,525,338 | | | | 0.19 | |
| | | | | | | | | | | | | | | | | | | | |
| | | | | |
Consumer Staples: 0.37% | | | | | | | | | | | | | | | | | | | | |
| | | | | |
| Beverages: 0.37% | | | | | | | | | | | | | | | | | | | | |
Other securities | | | | | | | | | | | | | | | 10,836,652 | | | | 0.37 | |
| | | | | | | | | | | | | | | | | | | | |
| | | | | |
Energy: 1.45% | | | | | | | | | | | | | | | | | | | | |
| | | |
| Energy Equipment & Services: 0.10% | | | | | | | | | | | | | |
Other securities | | | | | | | | | | | | | | | 2,869,841 | | | | 0.10 | |
| | | | | | | | | | | | | | | | | | | | |
The accompanying notes are an integral part of these financial statements.
| | | | |
| 78 | | Wells Fargo Advantage Allocation Funds | | Summary portfolio of investments—November 30, 2013 (unaudited) |
CORE BOND PORTFOLIO
| | | | | | | | | | | | | | | | | | | | |
| Security name | | Interest rate | | | Maturity date | | | Principal | | | Value | | | Percent of
net assets | |
| | | | | |
| Oil, Gas & Consumable Fuels: 1.35% | | | | | | | | | | | | | | | | | | | | |
Other securities | | | | | | | | | | | | | | $ | 39,615,086 | | | | 1.35 | % |
| | | | | | | | | | | | | | | | | | | | |
| | | | | |
Financials: 2.21% | | | | | | | | | | | | | | | | | | | | |
| | | | | |
| Commercial Banks: 1.64% | | | | | | | | | | | | | | | | | | | | |
Norddeutsche Landesbank Pfandbriefe 144A | | | 2.00 | % | | | 2-5-2019 | | | $ | 13,100,000 | | | | 13,107,860 | | | | 0.45 | |
Other securities | | | | | | | | | | | | | | | 34,684,019 | | | | 1.19 | |
| | | | | |
| | | | | | | | | | | | | | | 47,791,879 | | | | 1.64 | |
| | | | | | | | | | | | | | | | | | | | |
| | | | | |
| Diversified Financial Services: 0.51% | | | | | | | | | | | | | | | | | | | | |
Other securities | | | | | | | | | | | | | | | 14,877,582 | | | | 0.51 | |
| | | | | | | | | | | | | | | | | | | | |
| | | | | |
| Insurance: 0.06% | | | | | | | | | | | | | | | | | | | | |
Other securities | | | | | | | | | | | | | | | 1,802,651 | | | | 0.06 | |
| | | | | | | | | | | | | | | | | | | | |
| | | | | |
Health Care: 0.49% | | | | | | | | | | | | | | | | | | | | |
| | | | | |
| Health Care Equipment & Supplies: 0.18% | | | | | | | | | | | | | | | | | | | | |
Other securities | | | | | | | | | | | | | | | 5,335,196 | | | | 0.18 | |
| | | | | | | | | | | | | | | | | | | | |
| | | | | |
| Pharmaceuticals: 0.31% | | | | | | | | | | | | | | | | | | | | |
Other securities | | | | | | | | | | | | | | | 8,935,823 | | | | 0.31 | |
| | | | | | | | | | | | | | | | | | | | |
| | | | | |
Information Technology: 0.12% | | | | | | | | | | | | | | | | | | | | |
| | | | | |
| Internet Software & Services: 0.12% | | | | | | | | | | | | | | | | | | | | |
Other securities | | | | | | | | | | | | | | | 3,405,058 | | | | 0.12 | |
| | | | | | | | | | | | | | | | | | | | |
| | | | | |
Materials: 0.66% | | | | | | | | | | | | | | | | | | | | |
| | | | | |
| Chemicals: 0.10% | | | | | | | | | | | | | | | | | | | | |
Other securities | | | | | | | | | | | | | | | 2,934,996 | | | | 0.10 | |
| | | | | | | | | | | | | | | | | | | | |
| | | | | |
| Metals & Mining: 0.56% | | | | | | | | | | | | | | | | | | | | |
Other securities | | | | | | | | | | | | | | | 16,450,232 | | | | 0.56 | |
| | | | | | | | | | | | | | | | | | | | |
| | | | | |
Telecommunication Services: 0.93% | | | | | | | | | | | | | | | | | | | | |
| | | | | |
Diversified Telecommunication
Services: 0.20% | | | | | | | | | | | | | | | | | | | | |
Other securities | | | | | | | | | | | | | | | 5,759,677 | | | | 0.20 | |
| | | | | | | | | | | | | | | | | | | | |
| | | | | |
| Wireless Telecommunication Services: 0.73% | | | | | | | | | | | | | | | | | | | | |
Other securities | | | | | | | | | | | | | | | 21,299,889 | | | | 0.73 | |
| | | | | | | | | | | | | | | | | | | | |
| | | | | |
Utilities: 0.12% | | | | | | | | | | | | | | | | | | | | |
| | | | | |
| Electric Utilities: 0.12% | | | | | | | | | | | | | | | | | | | | |
Other securities | | | | | | | | | | | | | | | 3,560,152 | | | | 0.12 | |
| | | | | | | | | | | | | | | | | | | | |
| | | | |
Total Yankee Corporate Bonds and Notes (Cost $193,375,955) | | | | | | | | | | | | 191,000,052 | | | | 6.54 | |
| | | | | | | | | | | | | | | | | | | | |
| | | | | |
Yankee Government Bonds: 2.00% | | | | | | | | | | | | | | | | | | | | |
Other securities | | | | | | | | | | | | | | | 58,409,823 | | | | 2.00 | |
| | | | | | | | | | | | | | | | | | | | |
| | | | |
Total Yankee Government Bonds (Cost $60,183,937) | | | | | | | | | | | | 58,409,823 | | | | 2.00 | |
| | | | | | | | | | | | | | | | | | | | |
The accompanying notes are an integral part of these financial statements.
| | | | | | |
| Summary portfolio of investments—November 30, 2013 (unaudited) | | Wells Fargo Advantage Allocation Funds | | | 79 | |
CORE BOND PORTFOLIO
| | | | | | | | | | | | | | | | | | |
| Security name | | Yield | | | Maturity date | | Shares | | | Value | | | Percent of
net assets | |
| | | | | |
Short-Term Investments: 2.31% | | | | | | | | | | | | | | | | | | |
| | | | | |
| Investment Companies: 2.31% | | | | | | | | | | | | | | | | | | |
Wells Fargo Advantage Cash Investment Money Market Fund, Select Class (l)(u) | | | 0.08 | % | | | | | 67,603,250 | | | $ | 67,603,250 | | | | 2.31 | % |
| | | | | | | | | | | | | | | | | | |
| | | | | |
Total Short-Term Investments (Cost $67,603,250) | | | | | | | | | | | | | 67,603,250 | | | | 2.31 | |
| | | | | | | | | | | | | | | | | | |
| Total investments in securities | | | | | | | | | | | | | | | | | | |
| (Cost $3,143,105,485) * | | | | | | | | | | | | | 3,137,741,214 | | | | 107.36 | % |
Other assets and liabilities, net | | | | | | | | | | | | | (215,149,848 | ) | | | (7.36 | ) |
| | | | | | | | | | | | | | | | | | |
| Total net assets | | | | | | | | | | | | $ | 2,922,591,366 | | | | 100.00 | % |
| | | | | | | | | | | | | | | | | | |
| ± | Variable rate investment. The rate shown is the rate in effect at period end. |
| %% | Security issued on a when-issued basis |
| (a) | Security is fair valued by the Management Valuation Team, and in certain instances by the Board of Trustees, in accordance with procedures approved by the Board of Trustees. |
| 144A | Security that may be resold to “qualified institutional buyers” under Rule 144A or security offered pursuant to Section 4(2) of the Securities Act of 1933, as amended. |
| ## | All or a portion of this security has been segregated for when-issued securities. |
| (l) | Investment in an affiliate |
| (u) | Rate shown is the 7-day annualized yield at period end. |
| * | Cost for federal income tax purposes is $3,149,708,027 and unrealized appreciation (depreciation) consists of: |
| | | | |
Gross unrealized appreciation | | $ | 30,693,980 | |
Gross unrealized depreciation | | | (42,660,793 | ) |
| | | | |
Net unrealized depreciation | | $ | (11,966,813 | ) |
The accompanying notes are an integral part of these financial statements.
| | | | |
| 80 | | Wells Fargo Advantage Allocation Funds | | Portfolio of investments—November 30, 2013 (unaudited) |
INFLATION-PROTECTED BOND PORTFOLIO
| | | | | | | | | | | | | | | | |
| Security name | | Interest rate | | | Maturity date | | | Principal | | | Value | |
| | | | |
U.S. Treasury Securities: 98.98% | | | | | | | | | | | | | | | | |
TIPS | | | 0.13 | % | | | 4-15-2016 | | | $ | 2,917,173 | | | $ | 2,991,925 | |
TIPS | | | 0.13 | | | | 4-15-2017 | | | | 3,097,855 | | | | 3,196,115 | |
TIPS | | | 0.13 | | | | 4-15-2018 | | | | 445,689 | | | | 459,617 | |
TIPS | | | 0.13 | | | | 1-15-2022 | | | | 3,253,597 | | | | 3,183,950 | |
TIPS | | | 0.13 | | | | 7-15-2022 | | | | 2,703,321 | | | | 2,634,681 | |
TIPS | | | 0.13 | | | | 1-15-2023 | | | | 2,145,477 | | | | 2,060,832 | |
TIPS | | | 0.38 | | | | 7-15-2023 | | | | 1,116,827 | | | | 1,095,799 | |
TIPS | | | 0.50 | | | | 4-15-2015 | | | | 1,010,230 | | | | 1,028,936 | |
TIPS | | | 0.63 | | | | 7-15-2021 | | | | 2,701,114 | | | | 2,791,645 | |
TIPS | | | 0.63 | | | | 2-15-2043 | | | | 1,135,549 | | | | 894,068 | |
TIPS | | | 0.75 | | | | 2-15-2042 | | | | 1,367,837 | | | | 1,124,939 | |
TIPS | | | 1.13 | | | | 1-15-2021 | | | | 2,756,229 | | | | 2,947,227 | |
TIPS | | | 1.25 | | | | 7-15-2020 | | | | 2,243,949 | | | | 2,442,223 | |
TIPS | | | 1.38 | | | | 7-15-2018 | | | | 1,672,178 | | | | 1,834,955 | |
TIPS | | | 1.38 | | | | 1-15-2020 | | | | 1,629,599 | | | | 1,778,554 | |
TIPS | | | 1.63 | | | | 1-15-2015 | | | | 1,097,503 | | | | 1,127,684 | |
TIPS | | | 1.63 | | | | 1-15-2018 | | | | 1,207,094 | | | | 1,325,541 | |
TIPS | | | 1.75 | | | | 1-15-2028 | | | | 1,067,384 | | | | 1,165,617 | |
TIPS | | | 1.88 | | | | 7-15-2015 | | | | 1,390,377 | | | | 1,461,417 | |
TIPS | | | 1.88 | | | | 7-15-2019 | | | | 1,118,552 | | | | 1,262,741 | |
TIPS | | | 2.00 | | | | 1-15-2016 | | | | 1,350,791 | | | | 1,439,014 | |
TIPS | | | 2.00 | | | | 1-15-2026 | | | | 1,232,818 | | | | 1,392,314 | |
TIPS | | | 2.13 | | | | 1-15-2019 | | | | 1,183,290 | | | | 1,339,799 | |
TIPS | | | 2.13 | | | | 2-15-2040 | | | | 498,327 | | | | 570,896 | |
TIPS | | | 2.13 | | | | 2-15-2041 | | | | 785,877 | | | | 900,566 | |
TIPS | | | 2.38 | �� | | | 1-15-2017 | | | | 1,079,804 | | | | 1,194,281 | |
TIPS | | | 2.38 | | | | 1-15-2025 | | | | 1,726,644 | | | | 2,025,029 | |
TIPS | | | 2.38 | | | | 1-15-2027 | | | | 1,027,556 | | | | 1,207,138 | |
TIPS | | | 2.50 | | | | 7-15-2016 | | | | 1,234,793 | | | | 1,357,789 | |
TIPS | | | 2.50 | | | | 1-15-2029 | | | | 992,437 | | | | 1,188,443 | |
TIPS | | | 2.63 | | | | 7-15-2017 | | | | 587,475 | | | | 665,086 | |
TIPS | | | 3.38 | | | | 4-15-2032 | | | | 481,490 | | | | 654,450 | |
TIPS | | | 3.63 | | | | 4-15-2028 | | | | 1,042,337 | | | | 1,404,954 | |
TIPS | | | 3.88 | | | | 4-15-2029 | | | | 1,046,875 | | | | 1,462,272 | |
| | | | |
Total U.S. Treasury Securities (Cost $52,182,123) | | | | | | | | | | | | | | | 53,610,497 | |
| | | | | | | | | | | | | | | | |
| | | | |
| | | Yield | | | | | | Shares | | | | |
| | | | |
Short-Term Investments: 0.70% | | | | | | | | | | | | | | | | |
| | | | |
| Investment Companies: 0.70% | | | | | | | | | | | | | | | | |
Wells Fargo Advantage Government Money Market Fund, Institutional Class (l)(u) | | | 0.01 | | | | | | | | 378,253 | | | | 378,253 | |
| | | | |
Total Short-Term Investments (Cost $378,253) | | | | | | | | | | | | | | | 378,253 | |
| | | | | | | | | | | | | | | | |
| | | | | | | | |
| Total investments in securities | | | | | | | | |
| (Cost $52,560,376) * | | | 99.68 | % | | | 53,988,750 | |
Other assets and liabilities, net | | | 0.32 | | | | 173,717 | |
| | | | | | | | |
| Total net assets | | | 100.00 | % | | $ | 54,162,467 | |
| | | | | | | | |
| (l) | Investment in an affiliate |
| (u) | Rate shown is the 7-day annualized yield at period end. |
| * | Cost for federal income tax purposes is $52,560,376 and unrealized appreciation (depreciation) consists of: |
| | | | |
Gross unrealized appreciation | | $ | 2,688,880 | |
Gross unrealized depreciation | | | (1,260,506 | ) |
| | | | |
Net unrealized appreciation | | $ | 1,428,374 | |
The accompanying notes are an integral part of these financial statements.
| | | | | | |
| Portfolio of investments—November 30, 2013 (unaudited) | | Wells Fargo Advantage Allocation Funds | | | 81 | |
MANAGED FIXED INCOME PORTFOLIO
| | | | | | | | | | | | | | | | |
| Security name | | Interest rate | | | Maturity date | | | Principal | | | Value | |
| | | | |
Agency Securities: 29.15% | | | | | | | | | | | | | | | | |
FHLMC | | | 3.50 | % | | | 9-1-2032 | | | $ | 1,341,737 | | | $ | 1,367,377 | |
FHLMC Series K701 ± | | | 3.88 | | | | 11-25-2017 | | | | 1,200,000 | | | | 1,302,940 | |
FHLMC Series K712 | | | 1.87 | | | | 11-25-2019 | | | | 850,000 | | | | 833,307 | |
FHLMC Series T-20 Class A6 | | | 7.99 | | | | 9-25-2029 | | | | 158,409 | | | | 175,408 | |
FHLMC Series T-58 Class 4A | | | 7.50 | | | | 9-25-2043 | | | | 1,394,258 | | | | 1,655,309 | |
FNMA %% | | | 2.50 | | | | 12-1-2028 | | | | 500,000 | | | | 499,121 | |
FNMA | | | 2.57 | | | | 9-1-2019 | | | | 548,694 | | | | 561,861 | |
FNMA | | | 2.57 | | | | 9-1-2019 | | | | 548,734 | | | | 562,548 | |
FNMA | | | 2.78 | | | | 10-1-2020 | | | | 550,000 | | | | 552,283 | |
FNMA | | | 3.00 | | | | 12-1-2032 | | | | 92,234 | | | | 92,253 | |
FNMA | | | 3.50 | | | | 9-1-2032 | | | | 2,672,669 | | | | 2,718,634 | |
FNMA | | | 3.50 | | | | 10-1-2032 | | | | 1,204,332 | | | | 1,225,050 | |
FNMA | | | 3.50 | | | | 11-1-2042 | | | | 464,496 | | | | 468,976 | |
FNMA | | | 3.50 | | | | 11-1-2042 | | | | 728,043 | | | | 734,876 | |
FNMA | | | 3.50 | | | | 2-1-2043 | | | | 365,712 | | | | 369,144 | |
FNMA | | | 5.00 | | | | 9-1-2033 | | | | 485,521 | | | | 529,365 | |
FNMA | | | 5.50 | | | | 2-1-2036 | | | | 1,201,063 | | | | 1,275,994 | |
FNMA Grantor Trust Series 2002-T4 Class A2 | | | 7.00 | | | | 12-25-2041 | | | | 274,831 | | | | 315,895 | |
FNMA Grantor Trust Series 2004-T2 Class 1A1 | | | 6.00 | | | | 11-25-2043 | | | | 1,121,253 | | | | 1,268,198 | |
FNMA Grantor Trust Series 2004-T3 Class A1 | | | 6.00 | | | | 2-25-2044 | | | | 1,600,273 | | | | 1,836,431 | |
FNMA Series 2002-90 Class A2 | | | 6.50 | | | | 11-25-2042 | | | | 570,679 | | | | 654,484 | |
FNMA Series 2002-W4 Class A4 | | | 6.25 | | | | 5-25-2042 | | | | 2,557,660 | | | | 2,878,436 | |
FNMA Series 2003-86 Class PT | | | 4.50 | | | | 9-25-2018 | | | | 609,053 | | | | 646,903 | |
FNMA Series 2003-97 Class CA | | | 5.00 | | | | 10-25-2018 | | | | 1,078,532 | | | | 1,156,041 | |
FNMA Series 2003-W4 Class 3A ± | | | 6.64 | | | | 10-25-2042 | | | | 478,401 | | | | 554,066 | |
FNMA Series 2004-W1 Class 2A2 | | | 7.00 | | | | 12-25-2033 | | | | 261,754 | | | | 302,857 | |
FNMA Series 2004-W11 Class 1A3 | | | 7.00 | | | | 5-25-2044 | | | | 1,419,554 | | | | 1,703,681 | |
FNMA Series 2004-W8 Class 3A | | | 7.50 | | | | 6-25-2044 | | | | 663,287 | | | | 783,984 | |
FNMA Series 2006-M2 Class A2F ± | | | 5.26 | | | | 5-25-2020 | | | | 2,373,621 | | | | 2,680,794 | |
GNMA | | | 6.50 | | | | 10-15-2023 | | | | 51,195 | | | | 57,085 | |
GNMA | | | 6.50 | | | | 11-15-2023 | | | | 25,900 | | | | 28,867 | |
GNMA | | | 6.50 | | | | 11-15-2023 | | | | 26,556 | | | | 29,607 | |
GNMA | | | 6.50 | | | | 12-15-2023 | | | | 33,514 | | | | 37,370 | |
GNMA | | | 6.50 | | | | 1-15-2024 | | | | 74,945 | | | | 83,550 | |
GNMA | | | 7.00 | | | | 8-15-2027 | | | | 153,077 | | | | 180,757 | |
SBA Participation Certificates Series 2006-20B Class 1 | | | 5.35 | | | | 2-1-2026 | | | | 1,123,113 | | | | 1,222,732 | |
SBA Participation Certificates Series 2006-20H Class 1 | | | 5.70 | | | | 8-1-2026 | | | | 557,706 | | | | 614,652 | |
SBA Participation Certificates Series 2007-20J Class 1 | | | 5.57 | | | | 10-1-2027 | | | | 1,089,151 | | | | 1,207,620 | |
SBA Participation Certificates Series 2013-20A Class 1 | | | 2.13 | | | | 1-1-2033 | | | | 611,848 | | | | 575,137 | |
| | | | |
Total Agency Securities (Cost $32,116,515) | | | | | | | | | | | | | | | 33,743,593 | |
| | | | | | | | | | | | | | | | |
| | | | |
Asset-Backed Securities: 0.21% | | | | | | | | | | | | | | | | |
Green Tree Financial Corporation Series 1997-7 Class A8 ± | | | 6.86 | | | | 7-15-2028 | | | | 178,650 | | | | 182,814 | |
GSAMP Trust Series 2005-SEA1 Class A ±144A | | | 0.51 | | | | 1-25-2035 | | | | 58,159 | | | | 58,018 | |
| | | | | | | | | | | | | | | | |
| | | | |
Total Asset-Backed Securities (Cost $236,731) | | | | | | | | | | | | | | | 240,832 | |
| | | | | | | | | | | | | | | | |
The accompanying notes are an integral part of these financial statements.
| | | | |
| 82 | | Wells Fargo Advantage Allocation Funds | | Portfolio of investments—November 30, 2013 (unaudited) |
MANAGED FIXED INCOME PORTFOLIO
| | | | | | | | | | | | | | | | |
| Security name | | Interest rate | | | Maturity date | | | Principal | | | Value | |
| | | | |
Corporate Bonds and Notes: 29.29% | | | | | | | | | | | | | | | | |
| | | | |
Consumer Discretionary: 2.87% | | | | | | | | | | | | | | | | |
| | | | |
| Automobiles: 0.58% | | | | | | | | | | | | | | | | |
Daimler Finance North America LLC 144A | | | 2.38 | % | | | 8-1-2018 | | | $ | 260,000 | | | $ | 261,400 | |
General Motors Corporation 144A | | | 4.88 | | | | 10-2-2023 | | | | 400,000 | | | | 402,500 | |
| | | | |
| | | | | | | | | | | | | | | 663,900 | |
| | | | | | | | | | | | | | | | |
| | | | |
| Diversified Consumer Services: 1.82% | | | | | | | | | | | | | | | | |
Dartmouth College | | | 4.75 | | | | 6-1-2019 | | | | 440,000 | | | | 500,369 | |
Massachusetts Institute of Technology | | | 7.25 | | | | 11-2-2096 | | | | 500,000 | | | | 647,399 | |
Pepperdine University | | | 5.45 | | | | 8-1-2019 | | | | 600,000 | | | | 676,051 | |
President and Fellows of Harvard College | | | 3.53 | | | | 10-1-2031 | | | | 250,000 | | | | 222,550 | |
Stewart Enterprises Incorporated | | | 6.50 | | | | 4-15-2019 | | | | 60,000 | | | | 63,600 | |
| | | | |
| | | | | | | | | | | | | | | 2,109,969 | |
| | | | | | | | | | | | | | | | |
| | | | |
| Media: 0.47% | | | | | | | | | | | | | | | | |
DIRECTV Holdings LLC | | | 2.40 | | | | 3-15-2017 | | | | 400,000 | | | | 408,992 | |
Time Warner Incorporated | | | 3.40 | | | | 6-15-2022 | | | | 140,000 | | | | 136,587 | |
| | | | |
| | | | | | | | | | | | | | | 545,579 | |
| | | | | | | | | | | | | | | | |
| | | | |
Consumer Staples: 2.40% | | | | | | | | | | | | | | | | |
| | | | |
| Food & Staples Retailing: 0.69% | | | | | | | | | | | | | | | | |
SABMiller Holdings Incorporated 144A | | | 3.75 | | | | 1-15-2022 | | | | 500,000 | | | | 506,408 | |
Wal-Mart Stores Incorporated | | | 5.80 | | | | 2-15-2018 | | | | 250,000 | | | | 292,428 | |
| | | | |
| | | | | | | | | | | | | | | 798,836 | |
| | | | | | | | | | | | | | | | |
| | | | |
| Food Products: 1.71% | | | | | | | | | | | | | | | | |
Archer-Daniels-Midland Company | | | 4.48 | | | | 3-1-2021 | | | | 400,000 | | | | 427,578 | |
Cargill Incorporated 144A | | | 4.31 | | | | 5-14-2021 | | | | 419,000 | | | | 440,527 | |
Kellogg Company | | | 4.00 | | | | 12-15-2020 | | | | 500,000 | | | | 525,764 | |
Kraft Foods Group Incorporated | | | 3.50 | | | | 6-6-2022 | | | | 300,000 | | | | 293,162 | |
McCormick & Company Incorporated | | | 5.75 | | | | 12-15-2017 | | | | 250,000 | | | | 288,517 | |
| | | | |
| | | | | | | | | | | | | | | 1,975,548 | |
| | | | | | | | | | | | | | | | |
| | | | |
Energy: 2.04% | | | | | | | | | | | | | | | | |
| | | | |
| Energy Equipment & Services: 0.27% | | | | | | | | | | | | | | | | |
Halliburton Company | | | 3.25 | | | | 11-15-2021 | | | | 315,000 | | | | 315,077 | |
| | | | | | | | | | | | | | | | |
| | | | |
| Oil, Gas & Consumable Fuels: 1.77% | | | | | | | | | | | | | | | | |
Apache Corporation | | | 3.25 | | | | 4-15-2022 | | | | 250,000 | | | | 248,250 | |
Chevron Corporation | | | 3.19 | | | | 6-24-2023 | | | | 250,000 | | | | 243,445 | |
ConocoPhillips Company | | | 6.00 | | | | 1-15-2020 | | | | 300,000 | | | | 353,289 | |
Devon Energy Corporation | | | 1.88 | | | | 5-15-2017 | | | | 300,000 | | | | 303,359 | |
EQT Corporation | | | 8.13 | | | | 6-1-2019 | | | | 400,000 | | | | 491,874 | |
Phillips 66 | | | 2.95 | | | | 5-1-2017 | | | | 390,000 | | | | 407,495 | |
| | | | |
| | | | | | | | | | | | | | | 2,047,712 | |
| | | | | | | | | | | | | | | | |
The accompanying notes are an integral part of these financial statements.
| | | | | | |
| Portfolio of investments—November 30, 2013 (unaudited) | | Wells Fargo Advantage Allocation Funds | | | 83 | |
MANAGED FIXED INCOME PORTFOLIO
| | | | | | | | | | | | | | | | |
| Security name | | Interest rate | | | Maturity date | | | Principal | | | Value | |
| | | | |
Financials: 12.11% | | | | | | | | | | | | | | | | |
| | | | |
| Capital Markets: 0.95% | | | | | | | | | | | | | | | | |
Charles Schwab Corporation | | | 4.45 | % | | | 7-22-2020 | | | $ | 100,000 | | | $ | 109,060 | |
Charles Schwab Corporation | | | 6.38 | | | | 9-1-2017 | | | | 250,000 | | | | 289,602 | |
Goldman Sachs Capital II ± | | | 4.00 | | | | 12-31-2049 | | | | 115,000 | | | | 83,950 | |
Goldman Sachs Group Incorporated | | | 5.75 | | | | 1-24-2022 | | | | 200,000 | | | | 225,635 | |
Morgan Stanley | | | 5.50 | | | | 7-24-2020 | | | | 350,000 | | | | 394,971 | |
| | | | |
| | | | | | | | | | | | | | | 1,103,218 | |
| | | | | | | | | | | | | | | | |
| | | | |
| Commercial Banks: 4.28% | | | | | | | | | | | | | | | | |
Chase Capital VI ± | | | 0.87 | | | | 8-1-2028 | | | | 1,000,000 | | | | 810,000 | |
CoreStates Capital Trust II ±144A | | | 0.89 | | | | 1-15-2027 | | | | 750,000 | | | | 622,500 | |
Manufacturers & Traders Trust Company ± | | | 5.59 | | | | 12-28-2020 | | | | 758,000 | | | | 779,613 | |
National Capital Commerce Incorporated ±(i) | | | 1.23 | | | | 4-1-2027 | | | | 400,000 | | | | 324,000 | |
National City Bank ± | | | 0.63 | | | | 6-7-2017 | | | | 500,000 | | | | 493,459 | |
NTC Capital Trust Series A ± | | | 0.76 | | | | 1-15-2027 | | | | 450,000 | | | | 371,813 | |
Regions Financial Corporation | | | 5.75 | | | | 6-15-2015 | | | | 760,000 | | | | 812,079 | |
UBS Preferred Funding Trust V Series 1 ±« | | | 6.24 | | | | 5-29-2049 | | | | 700,000 | | | | 743,750 | |
| | | | |
| | | | | | | | | | | | | | | 4,957,214 | |
| | | | | | | | | | | | | | | | |
| | | | |
| Consumer Finance: 0.13% | | | | | | | | | | | | | | | | |
Caterpillar Financial Services Corporation | | | 3.75 | | | | 11-24-2023 | | | | 150,000 | | | | 150,666 | |
| | | | | | | | | | | | | | | | |
| | | | |
| Diversified Financial Services: 3.08% | | | | | | | | | | | | | | | | |
ABB Treasury Center (USA) Incorporated 144A | | | 4.00 | | | | 6-15-2021 | | | | 510,000 | | | | 529,143 | |
Bank of America Corporation | | | 2.60 | | | | 1-15-2019 | | | | 155,000 | | | | 156,617 | |
Citigroup Incorporated | | | 6.13 | | | | 11-21-2017 | | | | 435,000 | | | | 506,259 | |
Deutsche Bank Capital Funding Trust VII ±144A« | | | 5.63 | | | | 12-31-2049 | | | | 500,000 | | | | 518,750 | |
General Electric Capital Corporation ± | | | 0.62 | | | | 5-5-2026 | | | | 450,000 | | | | 409,578 | |
Toll Road Investors Partnership II LP 144A¤ | | | 0.00 | | | | 2-15-2015 | | | | 1,500,000 | | | | 1,440,702 | |
| | | | |
| | | | | | | | | | | | | | | 3,561,049 | |
| | | | | | | | | | | | | | | | |
| | | | |
| Insurance: 1.18% | | | | | | | | | | | | | | | | |
Minnesota Life Insurance Company 144A | | | 8.25 | | | | 9-15-2025 | | | | 650,000 | | | | 796,532 | |
NLV Financial Corporation 144A | | | 7.50 | | | | 8-15-2033 | | | | 565,000 | | | | 569,803 | |
| | | | |
| | | | | | | | | | | | | | | 1,366,335 | |
| | | | | | | | | | | | | | | | |
| | | | |
| REITs: 2.49% | | | | | | | | | | | | | | | | |
AvalonBay Communities Incorporated | | | 2.95 | | | | 9-15-2022 | | | | 190,000 | | | | 176,329 | |
AvalonBay Communities Incorporated | | | 3.63 | | | | 10-1-2020 | | | | 40,000 | | | | 40,812 | |
Boston Properties LP | | | 3.70 | | | | 11-15-2018 | | | | 180,000 | | | | 191,639 | |
Boston Properties LP | | | 5.88 | | | | 10-15-2019 | | | | 200,000 | | | | 232,541 | |
Duke Realty LP | | | 3.88 | | | | 10-15-2022 | | | | 150,000 | | | | 143,772 | |
Duke Realty LP | | | 6.75 | | | | 3-15-2020 | | | | 250,000 | | | | 290,143 | |
ERP Operation LP | | | 4.63 | | | | 12-15-2021 | | | | 470,000 | | | | 501,915 | |
Liberty Property LP | | | 6.63 | | | | 10-1-2017 | | | | 400,000 | | | | 462,310 | |
Potlatch Corporation | | | 7.50 | | | | 11-1-2019 | | | | 160,000 | | | | 180,800 | |
Realty Income Corporation | | | 4.65 | | | | 8-1-2023 | | | | 130,000 | | | | 132,817 | |
Simon Property Group LP | | | 2.15 | | | | 9-15-2017 | | | | 250,000 | | | | 256,069 | |
UDR Incorporated | | | 4.63 | | | | 1-10-2022 | | | | 260,000 | | | | 270,389 | |
| | | | |
| | | | | | | | | | | | | | | 2,879,536 | |
| | | | | | | | | | | | | | | | |
The accompanying notes are an integral part of these financial statements.
| | | | |
| 84 | | Wells Fargo Advantage Allocation Funds | | Portfolio of investments—November 30, 2013 (unaudited) |
MANAGED FIXED INCOME PORTFOLIO
| | | | | | | | | | | | | | | | |
| Security name | | Interest rate | | | Maturity date | | | Principal | | | Value | |
| | | | |
Health Care: 0.34% | | | | | | | | | | | | | | | | |
| | | | |
| Health Care Providers & Services: 0.34% | | | | | | | | | | | | | | | | |
Howard Hughes Medical Institute | | | 3.50 | % | | | 9-1-2023 | | | $ | 120,000 | | | $ | 119,342 | |
Roche Holdings Incorporated 144A | | | 6.00 | | | | 3-1-2019 | | | | 228,000 | | | | 271,506 | |
| | | | |
| | | | | | | | | | | | | | | 390,848 | |
| | | | | | | | | | | | | | | | |
| | | | |
Industrials: 3.08% | | | | | | | | | | | | | | | | |
| | | | |
| Aerospace & Defense: 0.62% | | | | | | | | | | | | | | | | |
Lockheed Martin Corporation | | | 4.25 | | | | 11-15-2019 | | | | 500,000 | | | | 545,405 | |
United Technologies Corporation | | | 3.10 | | | | 6-1-2022 | | | | 180,000 | | | | 176,746 | |
| | | | |
| | | | | | | | | | | | | | | 722,151 | |
| | | | | | | | | | | | | | | | |
| | | | |
| Commercial Services & Supplies: 0.32% | | | | | | | | | | | | | | | | |
Black & Decker | | | 5.75 | | | | 11-15-2016 | | | | 325,000 | | | | 366,707 | |
| | | | | | | | | | | | | | | | |
| | | | |
| Machinery: 0.52% | | | | | | | | | | | | | | | | |
Caterpillar Incorporated | | | 1.50 | | | | 6-26-2017 | | | | 170,000 | | | | 170,929 | |
Caterpillar Incorporated | | | 3.90 | | | | 5-27-2021 | | | | 100,000 | | | | 104,920 | |
Deere & Company | | | 2.60 | | | | 6-8-2022 | | | | 340,000 | | | | 321,583 | |
| | | | |
| | | | | | | | | | | | | | | 597,432 | |
| | | | | | | | | | | | | | | | |
| | | | |
| Road & Rail: 1.29% | | | | | | | | | | | | | | | | |
Burlington Northern Santa Fe LLC | | | 3.05 | | | | 9-1-2022 | | | | 100,000 | | | | 94,560 | |
Burlington Northern Santa Fe LLC | | | 3.45 | | | | 9-15-2021 | | | | 250,000 | | | | 249,040 | |
Burlington Northern Santa Fe LLC | | | 5.65 | | | | 5-1-2017 | | | | 200,000 | | | | 227,673 | |
Norfolk Southern Corporation | | | 3.00 | | | | 4-1-2022 | | | | 500,000 | | | | 478,699 | |
Union Pacific Corporation | | | 2.95 | | | | 1-15-2023 | | | | 250,000 | | | | 234,743 | |
Union Pacific Corporation | | | 7.88 | | | | 1-15-2019 | | | | 171,000 | | | | 212,145 | |
| | | | |
| | | | | | | | | | | | | | | 1,496,860 | |
| | | | | | | | | | | | | | | | |
| | | | |
| Transportation Infrastructure: 0.33% | | | | | | | | | | | | | | | | |
Vessel Management Service | | | 3.43 | | | | 8-15-2036 | | | | 391,000 | | | | 379,996 | |
| | | | | | | | | | | | | | | | |
| | | | |
Information Technology: 1.45% | | | | | | | | | | | | | | | | |
| | | | |
| Electronic Equipment, Instruments & Components: 0.25% | | | | | | | | | | | | | | | | |
Jabil Circuit Incorporated | | | 8.25 | | | | 3-15-2018 | | | | 250,000 | | | | 296,250 | |
| | | | | | | | | | | | | | | | |
| | | | |
| IT Services: 1.06% | | | | | | | | | | | | | | | | |
Fiserv Incorporated | | | 3.13 | | | | 10-1-2015 | | | | 500,000 | | | | 518,955 | |
Fiserv Incorporated | | | 4.75 | | | | 6-15-2021 | | | | 100,000 | | | | 102,891 | |
IBM Corporation | | | 1.88 | | | | 8-1-2022 | | | | 680,000 | | | | 601,059 | |
| | | | |
| | | | | | | | | | | | | | | 1,222,905 | |
| | | | | | | | | | | | | | | | |
| | | | |
| Software: 0.14% | | | | | | | | | | | | | | | | |
Oracle Corporation | | | 2.38 | | | | 1-15-2019 | | | | 160,000 | | | | 162,571 | |
| | | | | | | | | | | | | | | | |
The accompanying notes are an integral part of these financial statements.
| | | | | | |
| Portfolio of investments—November 30, 2013 (unaudited) | | Wells Fargo Advantage Allocation Funds | | | 85 | |
MANAGED FIXED INCOME PORTFOLIO
| | | | | | | | | | | | | | | | |
| Security name | | Interest rate | | | Maturity date | | | Principal | | | Value | |
| | | | |
Materials: 1.42% | | | | | | | | | | | | | | | | |
| | | | |
| Chemicals: 1.05% | | | | | | | | | | | | | | | | |
Praxair Incorporated | | | 4.05 | % | | | 3-15-2021 | | | $ | 400,000 | | | $ | 421,477 | |
Valspar Corporation | | | 5.10 | | | | 8-1-2015 | | | | 750,000 | | | | 792,488 | |
| | | | |
| | | | | | | | | | | | | | | 1,213,965 | |
| | | | | | | | | | | | | | | | |
| | | | |
| Metals & Mining: 0.09% | | | | | | | | | | | | | | | | |
International Steel Group | | | 6.50 | | | | 4-15-2014 | | | | 100,000 | | | | 101,498 | |
| | | | | | | | | | | | | | | | |
| | | | |
| Paper & Forest Products: 0.28% | | | | | | | | | | | | | | | | |
Georgia Pacific LLC 144A | | | 3.73 | | | | 7-15-2023 | | | | 340,000 | | | | 330,540 | |
| | | | | | | | | | | | | | | | |
| | | | |
Telecommunication Services: 0.61% | | | | | | | | | | | | | | | | |
| | | | |
| Diversified Telecommunication Services: 0.61% | | | | | | | | | | | | | | | | |
AT&T Incorporated | | | 1.60 | | | | 2-15-2017 | | | | 330,000 | | | | 331,618 | |
Verizon Communications Incorporated | | | 5.15 | | | | 9-15-2023 | | | | 350,000 | | | | 373,347 | |
| | | | |
| | | | | | | | | | | | | | | 704,965 | |
| | | | | | | | | | | | | | | | |
| | | | |
Utilities: 2.97% | | | | | | | | | | | | | | | | |
| | | | |
| Electric Utilities: 2.77% | | | | | | | | | | | | | | | | |
Atlantic City Electric Company | | | 7.75 | | | | 11-15-2018 | | | | 255,000 | | | | 319,058 | |
Connecticut Light & Power | | | 5.38 | | | | 3-1-2017 | | | | 250,000 | | | | 279,336 | |
Duke Energy Ohio Incorporated | | | 3.80 | | | | 9-1-2023 | | | | 330,000 | | | | 335,199 | |
Duke Energy Progress Incorporated | | | 3.00 | | | | 9-15-2021 | | | | 220,000 | | | | 218,539 | |
Entergy Texas Incorporated | | | 7.13 | | | | 2-1-2019 | | | | 250,000 | | | | 297,978 | |
Great River Energy 144A | | | 5.83 | | | | 7-1-2017 | | | | 535,657 | | | | 570,662 | |
Kentucky Utilities Company | | | 3.25 | | | | 11-1-2020 | | | | 250,000 | | | | 255,496 | |
Monongahela Power Company 144A | | | 4.10 | | | | 4-15-2024 | | | | 380,000 | | | | 379,811 | |
Otter Tail Corporation (i) | | | 9.00 | | | | 12-15-2016 | | | | 350,000 | | | | 421,031 | |
Public Service Company of New Hampshire | | | 3.50 | | | | 11-1-2023 | | | | 90,000 | | | | 89,060 | |
Wisconsin Electric Power Company | | | 2.95 | | | | 9-15-2021 | | | | 50,000 | | | | 49,394 | |
| | | | |
| | | | | | | | | | | | | | | 3,215,564 | |
| | | | | | | | | | | | | | | | |
| | | | |
| Multi-Utilities: 0.20% | | | | | | | | | | | | | | | | |
Black Hills Corporation | | | 4.25 | | | | 11-30-2023 | | | | 230,000 | | | | 230,055 | |
| | | | | | | | | | | | | | | | |
| | | | |
Total Corporate Bonds and Notes (Cost $32,791,736) | | | | | | | | | | | | | | | 33,906,946 | |
| | | | | | | | | | | | | | | | |
| | | | |
Municipal Obligations: 8.32% | | | | | | | | | | | | | | | | |
| | | | |
| Arizona: 0.79% | | | | | | | | | | | | | | | | |
Maricopa County AZ Elementary School District #28 Kyrene Elementary Build America Bonds Series D (GO) | | | 5.38 | | | | 7-1-2019 | | | | 800,000 | | | | 909,416 | |
| | | | | | | | | | | | | | | | |
| | | | |
| California: 0.20% | | | | | | | | | | | | | | | | |
California Build America Bonds (GO) | | | 6.88 | | | | 11-1-2026 | | | | 200,000 | | | | 234,742 | |
| | | | | | | | | | | | | | | | |
| | | | |
| Georgia: 0.49% | | | | | | | | | | | | | | | | |
Cherokee County GA School System Build America Bonds (GO) | | | 5.87 | | | | 8-1-2028 | | | | 500,000 | | | | 565,155 | |
| | | | | | | | | | | | | | | | |
The accompanying notes are an integral part of these financial statements.
| | | | |
| 86 | | Wells Fargo Advantage Allocation Funds | | Portfolio of investments—November 30, 2013 (unaudited) |
MANAGED FIXED INCOME PORTFOLIO
| | | | | | | | | | | | | | | | |
| Security name | | Interest rate | | | Maturity date | | | Principal | | | Value | |
| | | | |
| Indiana: 0.35% | | | | | | | | | | | | | | | | |
Indiana Housing & CDA Series A-2 (Housing Revenue, GNMA/FNMA Insured) | | | 5.51 | % | | | 1-1-2039 | | | $ | 390,000 | | | $ | 403,244 | |
| | | | | | | | | | | | | | | | |
| | | | |
| Kentucky: 0.23% | | | | | | | | | | | | | | | | |
Kentucky Housing Corporation Series D (Housing Revenue) | | | 5.75 | | | | 7-1-2037 | | | | 265,000 | | | | 271,190 | |
| | | | | | | | | | | | | | | | |
| | | | |
| Maryland: 0.23% | | | | | | | | | | | | | | | | |
Baltimore County MD (GO) | | | 3.57 | | | | 8-1-2032 | | | | 300,000 | | | | 266,079 | |
| | | | | | | | | | | | | | | | |
| | | | |
| Massachusetts: 0.79% | | | | | | | | | | | | | | | | |
Boston MA Series C Qualified School Construction Bonds (GO) | | | 4.40 | | | | 4-1-2026 | | | | 400,000 | | | | 425,772 | |
Massachusetts Build America Bonds Series D (GO) | | | 4.50 | | | | 8-1-2031 | | | | 500,000 | | | | 486,885 | |
| | | | |
| | | | | | | | | | | | | | | 912,657 | |
| | | | | | | | | | | | | | | | |
| | | | |
| Minnesota: 0.25% | | | | | | | | | | | | | | | | |
Minnesota Housing Finance Agency Series H (Housing Revenue) | | | 5.85 | | | | 7-1-2036 | | | | 35,000 | | | | 35,052 | |
Minnetonka MN Independent School District #276 Series E (GO) | | | 2.55 | | | | 1-1-2024 | | | | 290,000 | | | | 256,479 | |
| | | | |
| | | | | | | | | | | | | | | 291,531 | |
| | | | | | | | | | | | | | | | |
| | | | |
| Missouri: 0.46% | | | | | | | | | | | | | | | | |
Missouri Higher Education Loan Authority Notes Class A-1 (Education Revenue) ± | | | 1.09 | | | | 8-27-2029 | | | | 523,369 | | | | 529,095 | |
| | | | | | | | | | | | | | | | |
| | | | |
| New Hampshire: 0.39% | | | | | | | | | | | | | | | | |
New Hampshire HFA SFMR Series D (Housing Revenue) | | | 5.53 | | | | 7-1-2037 | | | | 445,000 | | | | 451,341 | |
| | | | | | | | | | | | | | | | |
| | | | |
| New Jersey: 1.03% | | | | | | | | | | | | | | | | |
Hudson County NJ Improvement Authority Hudson County Lease Project (Lease Revenue, FSA Insured) | | | 7.40 | | | | 12-1-2025 | | | | 1,030,000 | | | | 1,197,736 | |
| | | | | | | | | | | | | | | | |
| | | | |
| North Carolina: 0.30% | | | | | | | | | | | | | | | | |
Duke University North Carolina Series A (Education Revenue) | | | 5.85 | | | | 4-1-2037 | | | | 300,000 | | | | 349,029 | |
| | | | | | | | | | | | | | | | |
| | | | |
| Ohio: 0.35% | | | | | | | | | | | | | | | | |
Ohio Housing Finance Agency Series O (Housing Revenue, GNMA/FNMA Insured) | | | 5.47 | | | | 9-1-2025 | | | | 395,000 | | | | 410,938 | |
| | | | | | | | | | | | | | | | |
| | | | |
| Oregon: 0.29% | | | | | | | | | | | | | | | | |
Oregon University Series D (GO) | | | 2.03 | | | | 8-1-2020 | | | | 350,000 | | | | 333,890 | |
| | | | | | | | | | | | | | | | |
| | | | |
| Texas: 0.73% | | | | | | | | | | | | | | | | |
Clear Creek TX Independent School District Taxable Refunding Series B (GO) | | | 3.40 | | | | 2-15-2022 | | | | 375,000 | | | | 373,789 | |
Harris County TX Taxable Refunding Permanent Improvement Series B (GO) | | | 2.12 | | | | 10-1-2021 | | | | 500,000 | | | | 465,895 | |
| | | | |
| | | | | | | | | | | | | | | 839,684 | |
| | | | | | | | | | | | | | | | |
| | | | |
| Washington: 0.60% | | | | | | | | | | | | | | | | |
King County WA Build America Bonds Recovery Zone Economic Development
Taxable Series C (GO) | | | 5.03 | | | | 12-1-2023 | | | | 230,000 | | | | 254,171 | |
King County WA School District #210 Federal Way Build America Bonds (GO) | | | 4.90 | | | | 12-1-2022 | | | | 400,000 | | | | 436,504 | |
| | | | |
| | | | | | | | | | | | | | | 690,675 | |
| | | | | | | | | | | | | | | | |
The accompanying notes are an integral part of these financial statements.
| | | | | | |
| Portfolio of investments—November 30, 2013 (unaudited) | | Wells Fargo Advantage Allocation Funds | | | 87 | |
MANAGED FIXED INCOME PORTFOLIO
| | | | | | | | | | | | | | | | |
| Security name | | Interest rate | | | Maturity date | | | Principal | | | Value | |
| | | | |
| West Virginia: 0.43% | | | | | | | | | | | | | | | | |
Ohio County WV Special District Excise Tax Series A (Tax Revenue) | | | 8.25 | % | | | 3-1-2035 | | | $ | 500,000 | | | $ | 498,630 | |
| | | | | | | | | | | | | | | | |
| | | | |
| Wisconsin: 0.41% | | | | | | | | | | | | | | | | |
Wisconsin Housing & EDA Home Ownership Revenue Series F (Housing Revenue) | | | 5.73 | | | | 9-1-2037 | | | | 465,000 | | | | 475,267 | |
| | | | | | | | | | | | | | | | |
| | | | |
Total Municipal Obligations (Cost $9,436,955) | | | | | | | | | | | | | | | 9,630,299 | |
| | | | | | | | | | | | | | | | |
| | | | |
Non-Agency Mortgage Backed Securities: 8.84% | | | | | | | | | | | | | | | | |
Credit Suisse First Boston Commercial Mortgage Trust Series 2004-AR5 Class 10A1 ± | | | 2.54 | | | | 6-25-2034 | | | | 926,744 | | | | 928,182 | |
Credit Suisse Mortgage Trust Series 2007-C1 Class AAB | | | 5.34 | | | | 2-15-2040 | | | | 1,229,514 | | | | 1,265,375 | |
GS Mortgage Securities Trust Series 2011-GC3 Class A4 144A | | | 4.75 | | | | 3-10-2044 | | | | 500,000 | | | | 550,025 | |
JPMorgan Chase Commercial Mortgage Securities Trust Series 2006-LDP7 Class ASB ± | | | 6.06 | | | | 4-15-2045 | | | | 1,094,024 | | | | 1,138,695 | |
JPMorgan Chase Commercial Mortgage Securities Trust Series 2013-C12 Class ASB | | | 3.16 | | | | 7-15-2045 | | | | 550,000 | | | | 558,021 | |
Nomura Asset Acceptance Corporation Series 2004-R2 Class A1 ±144A | | | 6.50 | | | | 10-25-2034 | | | | 1,315,826 | | | | 1,345,917 | |
Sequoia Mortgage Trust Series 10 Class 1A ± | | | 0.97 | | | | 10-20-2027 | | | | 441,898 | | | | 423,819 | |
Small Business Administration Series 2013-10B Class1 | | | 3.64 | | | | 9-10-2023 | | | | 1,000,000 | | | | 1,034,171 | |
Structured Asset Securities Corporation Series 2007-RM1 Class A1 ±144A | | | 0.45 | | | | 5-25-2047 | | | | 2,384,788 | | | | 1,378,169 | |
Wachovia Bank Commercial Mortgage Trust Series 2005-C16 Class A4 ± | | | 4.85 | | | | 10-15-2041 | | | | 1,475,000 | | | | 1,519,753 | |
Washington Mutual Commercial Mortgage Securities Trust Series 2007-SL3
Class A1 ±144A | | | 6.10 | | | | 3-23-2045 | | | | 88,921 | | | | 88,747 | |
| | | | |
Total Non-Agency Mortgage Backed Securities (Cost $11,100,441) | | | | | | | | | | | | | | | 10,230,874 | |
| | | | | | | | | | | | | | | | |
| | | | |
Term Loans: 0.02% | | | | | | | | | | | | | | | | |
Aramark Corporation | | | 1.88 | | | | 1-26-2014 | | | | 26,337 | | | | 26,353 | |
| | | | | | | | | | | | | | | | |
| | | | |
Total Term Loans (Cost $26,337) | | | | | | | | | | | | | | | 26,353 | |
| | | | | | | | | | | | | | | | |
| | | | |
U.S. Treasury Securities: 11.97% | | | | | | | | | | | | | | | | |
TIPS | | | 0.63 | | | | 2-15-2043 | | | | 1,273,038 | | | | 1,002,318 | |
TIPS | | | 0.75 | | | | 2-15-2042 | | | | 1,267,322 | | | | 1,042,273 | |
U.S. Treasury Bond | | | 2.75 | | | | 11-15-2042 | | | | 350,000 | | | | 283,336 | |
U.S. Treasury Bond | | | 2.88 | | | | 5-15-2043 | | | | 1,250,000 | | | | 1,036,719 | |
U.S. Treasury Bond | | | 3.13 | | | | 2-15-2043 | | | | 764,000 | | | | 669,693 | |
U.S. Treasury Bond | | | 3.88 | | | | 8-15-2040 | | | | 375,000 | | | | 383,672 | |
U.S. Treasury Bond | | | 4.25 | | | | 11-15-2040 | | | | 2,105,000 | | | | 2,291,490 | |
U.S. Treasury Bond | | | 4.50 | | | | 2-15-2036 | | | | 500,000 | | | | 567,344 | |
U.S. Treasury Note | | | 0.88 | | | | 1-31-2018 | | | | 575,000 | | | | 570,643 | |
U.S. Treasury Note | | | 1.25 | | | | 10-31-2018 | | | | 1,045,000 | | | | 1,040,428 | |
U.S. Treasury Note | | | 1.75 | | | | 10-31-2020 | | | | 1,045,000 | | | | 1,022,957 | |
U.S. Treasury Note | | | 1.75 | | | | 5-15-2023 | | | | 2,450,000 | | | | 2,255,722 | |
U.S. Treasury Note | | | 2.00 | | | | 2-15-2023 | | | | 675,000 | | | | 639,720 | |
U.S. Treasury Note | | | 2.75 | | | | 11-15-2023 | | | | 1,045,000 | | | | 1,045,326 | |
| | | | |
Total U.S. Treasury Securities (Cost $14,393,317) | | | | | | | | | | | | | | | 13,851,641 | |
| | | | | | | | | | | | | | | | |
| | | | |
Yankee Corporate Bonds and Notes: 5.24% | | | | | | | | | | | | | | | | |
| | | | |
Consumer Discretionary: 0.32% | | | | | | | | | | | | | | | | |
| | | | |
| Media: 0.32% | | | | | | | | | | | | | | | | |
Pearson Dollar Finance Two plc 144A | | | 6.25 | | | | 5-6-2018 | | | | 325,000 | | | | 374,358 | |
| | | | | | | | | | | | | | | | |
The accompanying notes are an integral part of these financial statements.
| | | | |
| 88 | | Wells Fargo Advantage Allocation Funds | | Portfolio of investments—November 30, 2013 (unaudited) |
MANAGED FIXED INCOME PORTFOLIO
| | | | | | | | | | | | | | | | |
| Security name | | Interest rate | | | Maturity date | | | Principal | | | Value | |
| | | | |
Energy: 1.78% | | | | | | | | | | | | | | | | |
| | | | |
| Energy Equipment & Services: 0.70% | | | | | | | | | | | | | | | | |
Ensco plc | | | 4.70 | % | | | 3-15-2021 | | | $ | 200,000 | | | $ | 213,227 | |
Schlumberger Norge AS 144A | | | 4.20 | | | | 1-15-2021 | | | | 380,000 | | | | 405,333 | |
Weatherford International Limited | | | 4.50 | | | | 4-15-2022 | | | | 190,000 | | | | 191,978 | |
| | | | |
| | | | | | | | | | | | | | | 810,538 | |
| | | | | | | | | | | | | | | | |
| | | | |
| Oil, Gas & Consumable Fuels: 1.08% | | | | | | | | | | | | | | | | |
BP Capital Markets plc | | | 4.50 | | | | 10-1-2020 | | | | 350,000 | | | | 381,352 | |
Petroleos Mexicanos | | | 2.29 | | | | 2-15-2024 | | | | 275,000 | | | | 274,955 | |
Petroleos Mexicanos | | | 2.83 | | | | 2-15-2024 | | | | 575,000 | | | | 590,730 | |
| | | | |
| | | | | | | | | | | | | | | 1,247,037 | |
| | | | | | | | | | | | | | | | |
| | | | |
Financials: 1.54% | | | | | | | | | | | | | | | | |
| | | | |
| Commercial Banks: 0.28% | | | | | | | | | | | | | | | | |
RaboBank Nederland | | | 4.50 | | | | 1-11-2021 | | | | 300,000 | | | | 319,367 | |
| | | | | | | | | | | | | | | | |
| | | | |
| Diversified Financial Services: 1.26% | | | | | | | | | | | | | | | | |
Shell International Finance BV | | | 3.40 | | | | 8-12-2023 | | | | 370,000 | | | | 363,791 | |
Siemens Financieringsmaatschappij NV 144A | | | 5.75 | | | | 10-17-2016 | | | | 250,000 | | | | 283,328 | |
Total Capital International SA | | | 2.88 | | | | 2-17-2022 | | | | 190,000 | | | | 182,691 | |
Total Capital International SA | | | 3.70 | | | | 1-15-2024 | | | | 200,000 | | | | 199,724 | |
Tyco Electronics Group SA | | | 3.50 | | | | 2-3-2022 | | | | 450,000 | | | | 431,521 | |
| | | | |
| | | | | | | | | | | | | | | 1,461,055 | |
| | | | | | | | | | | | | | | | |
| | | | |
Industrials: 0.43% | | | | | | | | | | | | | | | | |
| | | | |
| Aerospace & Defense: 0.43% | | | | | | | | | | | | | | | | |
BAE Systems plc 144A | | | 4.75 | | | | 10-11-2021 | | | | 470,000 | | | | 492,038 | |
| | | | | | | | | | | | | | | | |
| | | | |
Information Technology: 0.32% | | | | | | | | | | | | | | | | |
| | | | |
| Semiconductors & Semiconductor Equipment: 0.32% | | | | | | | | | | | | | | | | |
TSMC Global Limited 144A | | | 1.63 | | | | 4-3-2018 | | | | 380,000 | | | | 368,375 | |
| | | | | | | | | | | | | | | | |
| | | | |
Materials: 0.53% | | | | | | | | | | | | | | | | |
| | | | |
| Metals & Mining: 0.53% | | | | | | | | | | | | | | | | |
Rio Tinto Finance (USA) Limited | | | 3.75 | | | | 9-20-2021 | | | | 370,000 | | | | 371,818 | |
Teck Resources Limited | | | 3.00 | | | | 3-1-2019 | | | | 240,000 | | | | 239,851 | |
| | | | |
| | | | | | | | | | | | | | | 611,669 | |
| | | | | | | | | | | | | | | | |
| | | | |
Telecommunication Services: 0.32% | | | | | | | | | | | | | | | | |
| | | | |
| Wireless Telecommunication Services: 0.32% | | | | | | | | | | | | | | | | |
Rogers Communications Incorporated | | | 4.10 | | | | 10-1-2023 | | | | 370,000 | | | | 374,277 | |
| | | | | | | | | | | | | | | | |
| | | | |
Total Yankee Corporate Bonds and Notes (Cost $5,975,966) | | | | | | | | | | | | | | | 6,058,714 | |
| | | | | | | | | | | | | | | | |
| | | | |
| Yankee Government Bonds: 0.41% | | | | | | | | | | | | | | | | |
Hashemite Kingdom of Jordan | | | 2.50 | | | | 10-30-2020 | | | | 475,000 | | | | 473,509 | |
| | | | | | | | | | | | | | | | |
| | | | |
Total Yankee Government Bonds (Cost $475,000) | | | | | | | | | | | | | | | 473,509 | |
| | | | | | | | | | | | | | | | |
The accompanying notes are an integral part of these financial statements.
| | | | | | |
| Portfolio of investments—November 30, 2013 (unaudited) | | Wells Fargo Advantage Allocation Funds | | | 89 | |
MANAGED FIXED INCOME PORTFOLIO
| | | | | | | | | | | | | | |
| Security name | | Yield | | | | | Shares | | | Value | |
| | | | |
Short-Term Investments: 7.23% | | | | | | | | | | | | | | |
| | | | |
| Investment Companies: 7.23% | | | | | | | | | | | | | | |
Wells Fargo Advantage Cash Investment Money Market Fund, Select Class (l)(u) | | | 0.08 | % | | | | | 7,207,312 | | | $ | 7,207,312 | |
Wells Fargo Securities Lending Cash Investments, LLC (l)(u)(r)(v) | | | 0.08 | | | | | | 1,165,688 | | | | 1,165,688 | |
| | | | |
Total Short-Term Investments (Cost $8,373,000) | | | | | | | | | | | | | 8,373,000 | |
| | | | | | | | | | | | | | |
| | | | | | | | |
| Total investments in securities | | | | | | | | |
| (Cost $114,925,998) * | | | 100.68 | % | | | 116,535,761 | |
Other assets and liabilities, net | | | (0.68 | ) | | | (788,595 | ) |
| | | | | | | | |
| Total net assets | | | 100.00 | % | | $ | 115,747,166 | |
| | | | | | | | |
| ± | Variable rate investment. The rate shown is the rate in effect at period end. |
| %% | Security issued on a when-issued basis. |
| 144A | Security that may be resold to “qualified institutional buyers” under Rule 144A or security offered pursuant to Section 4(2) of the Securities Act of 1933, as amended. |
| « | All or a portion of this security is on loan. |
| ¤ | Security issued in zero coupon form with no periodic interest payments. |
| (l) | Investment in an affiliate |
| (u) | Rate shown is the 7-day annualized yield at period end. |
| (r) | The investment company is exempt from registration under Section 3(c)(7) of the Investment Company Act of 1940, as amended. |
| (v) | Security represents investment of cash collateral received from securities on loan. |
| * | Cost for federal income tax purposes is $114,925,998 and unrealized appreciation (depreciation) consists of: |
| | | | |
Gross unrealized appreciation | | $ | 4,943,971 | |
Gross unrealized depreciation | | | (3,334,208 | ) |
| | | | |
Net unrealized appreciation | | $ | 1,609,763 | |
The accompanying notes are an integral part of these financial statements.
| | | | |
| 90 | | Wells Fargo Advantage Allocation Funds | | Portfolio of investments—November 30, 2013 (unaudited) |
STABLE INCOME PORTFOLIO
| | | | | | | | | | | | | | | | |
| Security name | | Interest rate | | | Maturity date | | | Principal | | | Value | |
| | | | |
Agency Securities: 39.86% | | | | | | | | | | | | | | | | |
FHLMC | | | 6.00 | % | | | 7-1-2017 | | | $ | 62,628 | | | $ | 65,803 | |
FHLMC | | | 7.50 | | | | 7-17-2017 | | | | 61,587 | | | | 64,694 | |
FHLMC Series T-54 Class 4A ± | | | 3.02 | | | | 2-25-2043 | | | | 575,008 | | | | 604,620 | |
FHLMC Series T-57 Class 1A2 | | | 7.00 | | | | 7-25-2043 | | | | 666,819 | | | | 774,840 | |
FHLMC Series T-63 Class 1A1 ± | | | 1.35 | | | | 2-25-2045 | | | | 494,393 | | | | 507,004 | |
FHLMC Structured Pass-Through Securities Series T-54 Class 3A | | | 7.00 | | | | 2-25-2043 | | | | 501,180 | | | | 583,754 | |
FHLMC Structured Pass-Through Securities Series T-55 Class 1A2 | | | 7.00 | | | | 3-25-2043 | | | | 796,049 | | | | 899,032 | |
FHLMC Structured Pass-Through Securities Series T-58 Class 4A | | | 7.50 | | | | 9-25-2043 | | | | 819,126 | | | | 972,494 | |
FNMA ± | | | 1.35 | | | | 10-1-2034 | | | | 327,968 | | | | 333,509 | |
FNMA ± | | | 1.35 | | | | 4-1-2044 | | | | 239,361 | | | | 243,386 | |
FNMA ± | | | 1.35 | | | | 10-1-2044 | | | | 314,553 | | | | 319,970 | |
FNMA ± | | | 1.36 | | | | 4-1-2037 | | | | 282,249 | | | | 293,520 | |
FNMA ± | | | 1.75 | | | | 9-1-2033 | | | | 202,083 | | | | 208,391 | |
FNMA ± | | | 1.78 | | | | 10-1-2033 | | | | 546,472 | | | | 569,540 | |
FNMA ± | | | 1.95 | | | | 6-1-2033 | | | | 426,470 | | | | 454,354 | |
FNMA ± | | | 2.09 | | | | 6-1-2033 | | | | 300,437 | | | | 315,615 | |
FNMA ± | | | 2.11 | | | | 12-1-2033 | | | | 318,460 | | | | 335,717 | |
FNMA ± | | | 2.16 | | | | 8-1-2035 | | | | 396,288 | | | | 417,200 | |
FNMA ± | | | 2.20 | | | | 4-1-2034 | | | | 455,919 | | | | 479,930 | |
FNMA ± | | | 2.27 | | | | 1-1-2036 | | | | 225,851 | | | | 239,706 | |
FNMA ± | | | 2.33 | | | | 7-1-2035 | | | | 239,635 | | | | 254,009 | |
FNMA ± | | | 2.72 | | | | 7-1-2017 | | | | 19,057 | | | | 19,413 | |
FNMA | | | 5.50 | | | | 2-1-2017 | | | | 116,426 | | | | 123,268 | |
FNMA | | | 6.50 | | | | 12-1-2015 | | | | 11,057 | | | | 11,190 | |
FNMA Series 2003-W4 Class 3A ± | | | 6.64 | | | | 10-25-2042 | | | | 399,730 | | | | 462,953 | |
FNMA Series 2004-W2 Class 2A2 | | | 7.00 | | | | 2-25-2044 | | | | 301,964 | | | | 353,474 | |
FNMA Series 2007-88 Class HC ± | | | 2.41 | | | | 9-25-2037 | | | | 350,419 | | | | 362,797 | |
| | | | |
Total Agency Securities (Cost $9,658,649) | | | | | | | | | | | | | | | 10,270,183 | |
| | | | | | | | | | | | | | | | |
| | | | |
Asset-Backed Securities: 9.53% | | | | | | | | | | | | | | | | |
Ally Auto Receivables Trust Series 2013-2 Class A3 | | | 0.79 | | | | 1-15-2018 | | | | 115,000 | | | | 115,176 | |
AmeriCredit Automobile Receivables Trust Series 2012-4 Class A3 | | | 0.67 | | | | 6-8-2017 | | | | 175,000 | | | | 175,015 | |
AmeriCredit Automobile Receivables Trust Series 2013-5 Class A3 | | | 0.90 | | | | 9-10-2018 | | | | 116,000 | | | | 116,200 | |
Ford Credit Auto Owner Trust Series 2013-B Class A3 | | | 0.76 | | | | 9-15-2016 | | | | 114,000 | | | | 114,130 | |
Ford Credit Auto Owner Trust Series 2013-A Class A3 | | | 0.55 | | | | 7-15-2017 | | | | 100,000 | | | | 100,082 | |
GSAMP Trust Series 2005-SEA2 Class A1 ±144A | | | 0.52 | | | | 1-25-2045 | | | | 353,664 | | | | 340,723 | |
Honda Auto Receivables Owner Trust Series 2012-4 Class A3 | | | 0.52 | | | | 8-18-2016 | | | | 100,000 | | | | 100,148 | |
Honda Auto Receivables Owner Trust Series 2013-4 Class A3 | | | 0.69 | | | | 9-18-2017 | | | | 110,000 | | | | 110,136 | |
Household Home Equity Loan Trust Series 2006-1 Class A1 ± | | | 0.33 | | | | 1-20-2036 | | | | 581,904 | | | | 566,301 | |
Hyundai Auto Receivables Trust Series 2013-C Class A3 | | | 1.01 | | | | 2-15-2018 | | | | 125,000 | | | | 126,060 | |
M&T Bank Auto Receivables Trust Series 2013-1A Class A3 144A | | | 1.06 | | | | 11-15-2017 | | | | 130,000 | | | | 130,765 | |
Mercedes Benz Auto Receivables Trust Series 2013-B Class A3 | | | 0.62 | | | | 7-15-2016 | | | | 115,000 | | | | 114,994 | |
Santander Drive Auto Receivables Trust Series 2013-5 Class A2A | | | 0.64 | | | | 4-17-2017 | | | | 120,000 | | | | 120,023 | |
Toyota Auto Receivables Owner Trust Series 2013-B Class A3 | | | 0.89 | | | | 7-17-2017 | | | | 125,000 | | | | 125,792 | |
World Omni Automobile Receivables Securitization Series 2013-A Class A2A | | | 0.73 | | | | 5-16-2016 | | | | 100,000 | | | | 100,144 | |
| | | | |
Total Asset-Backed Securities (Cost $2,479,796) | | | | | | | | | | | | | | | 2,455,689 | |
| | | | | | | | | | | | | | | | |
The accompanying notes are an integral part of these financial statements.
| | | | | | |
| Portfolio of investments—November 30, 2013 (unaudited) | | Wells Fargo Advantage Allocation Funds | | | 91 | |
STABLE INCOME PORTFOLIO
| | | | | | | | | | | | | | | | |
| Security name | | Interest rate | | | Maturity date | | | Principal | | | Value | |
| | | | |
Corporate Bonds and Notes: 21.08% | | | | | | | | | | | | | | | | |
| | | | |
Consumer Discretionary: 0.83% | | | | | | | | | | | | | | | | |
| | | | |
| Automobiles: 0.59% | | | | | | | | | | | | | | | | |
Daimler Finance North America LLC 144A | | | 1.88 | % | | | 9-15-2014 | | | $ | 150,000 | | | $ | 151,495 | |
| | | | | | | | | | | | | | | | |
| | | | |
| Diversified Consumer Services: 0.24% | | | | | | | | | | | | | | | | |
Yale University | | | 2.90 | | | | 10-15-2014 | | | | 60,000 | | | | 61,237 | |
| | | | | | | | | | | | | | | | |
| | | | |
Consumer Staples: 3.97% | | | | | | | | | | | | | | | | |
| | | | |
| Beverages: 1.69% | | | | | | | | | | | | | | | | |
Anheuser-Busch Companies Incorporated | | | 5.00 | | | | 1-15-2015 | | | | 80,000 | | | | 84,019 | |
Brown-Forman Corporation | | | 2.50 | | | | 1-15-2016 | | | | 70,000 | | | | 72,568 | |
Coca-Cola Company | | | 0.75 | | | | 3-13-2015 | | | | 100,000 | | | | 100,441 | |
PepsiCo Americas Incorporated | | | 4.38 | | | | 2-15-2014 | | | | 177,000 | | | | 178,430 | |
| | | | |
| | | | | | | | | | | | | | | 435,458 | |
| | | | | | | | | | | | | | | | |
| | | | |
| Food Products: 2.28% | | | | | | | | | | | | | | | | |
Campbell Soup Company | | | 3.38 | | | | 8-15-2014 | | | | 250,000 | | | | 255,220 | |
General Mills Incorporated | | | 5.20 | | | | 3-17-2015 | | | | 150,000 | | | | 158,820 | |
Ingredion Incorporated | | | 3.20 | | | | 11-1-2015 | | | | 70,000 | | | | 72,670 | |
Kraft Foods Group Incorporated | | | 1.63 | | | | 6-4-2015 | | | | 100,000 | | | | 101,449 | |
| | | | |
| | | | | | | | | | | | | | | 588,159 | |
| | | | | | | | | | | | | | | | |
| | | | |
Energy: 0.14% | | | | | | | | | | | | | | | | |
| | | | |
| Oil, Gas & Consumable Fuels: 0.14% | | | | | | | | | | | | | | | | |
Devon Energy Corporation | | | 5.63 | | | | 1-15-2014 | | | | 35,000 | | | | 35,209 | |
| | | | | | | | | | | | | | | | |
| | | | |
Financials: 7.81% | | | | | | | | | | | | | | | | |
| | | | |
| Capital Markets: 0.38% | | | | | | | | | | | | | | | | |
Goldman Sachs Group Incorporated | | | 5.35 | | | | 1-15-2016 | | | | 90,000 | | | | 98,073 | |
| | | | | | | | | | | | | | | | |
| | | | |
| Commercial Banks: 2.30% | | | | | | | | | | | | | | | | |
Ally Bank | | | 0.90 | | | | 9-18-2015 | | | | 74,000 | | | | 73,973 | |
Branch Banking & Trust Company ± | | | 0.57 | | | | 9-13-2016 | | | | 250,000 | | | | 248,086 | |
HSBC USA Incorporated | | | 2.38 | | | | 2-13-2015 | | | | 100,000 | | | | 102,210 | |
KeyBank NA | | | 4.95 | | | | 9-15-2015 | | | | 157,000 | | | | 167,417 | |
| | | | |
| | | | | | | | | | | | | | | 591,686 | |
| | | | | | | | | | | | | | | | |
| | | | |
| Consumer Finance: 2.94% | | | | | | | | | | | | | | | | |
American Honda Finance Corporation | | | 1.13 | | | | 10-7-2016 | | | | 50,000 | | | | 50,304 | |
BMW Bank of North America | | | 1.00 | | | | 7-18-2014 | | | | 245,000 | | | | 245,667 | |
Discover Bank | | | 0.85 | | | | 9-25-2015 | | | | 125,000 | | | | 124,825 | |
Sallie Mae Bank | | | 0.85 | | | | 10-30-2015 | | | | 175,000 | | | | 174,616 | |
Unilever Capital Corporation | | | 3.65 | | | | 2-15-2014 | | | | 160,000 | | | | 161,024 | |
| | | | |
| | | | | | | | | | | | | | | 756,436 | |
| | | | | | | | | | | | | | | | |
| | | | |
| Diversified Financial Services: 1.59% | | | | | | | | | | | | | | | | |
Bank of America Corporation | | | 4.50 | | | | 4-1-2015 | | | | 80,000 | | | | 83,879 | |
Citigroup Incorporated | | | 4.59 | | | | 12-15-2015 | | | | 90,000 | | | | 96,336 | |
The accompanying notes are an integral part of these financial statements.
| | | | |
| 92 | | Wells Fargo Advantage Allocation Funds | | Portfolio of investments—November 30, 2013 (unaudited) |
STABLE INCOME PORTFOLIO
| | | | | | | | | | | | | | | | |
| Security name | | Interest rate | | | Maturity date | | | Principal | | | Value | |
| | | | |
| Diversified Financial Services (continued) | | | | | | | | | | | | | | | | |
General Electric Capital Corporation ± | | | 0.89 | % | | | 7-12-2016 | | | $ | 50,000 | | | $ | 50,324 | |
JPMorgan Chase & Company | | | 4.65 | | | | 6-1-2014 | | | | 175,000 | | | | 178,611 | |
| | | | |
| | | | | | | | | | | | | | | 409,150 | |
| | | | | | | | | | | | | | | | |
| | | | |
| REITs: 0.60% | | | | | | | | | | | | | | | | |
ERP Operating LP | | | 5.25 | | | | 9-15-2014 | | | | 150,000 | | | | 155,400 | |
| | | | | | | | | | | | | | | | |
| | | | |
Health Care: 1.07% | | | | | | | | | | | | | | | | |
| | | | |
| Life Sciences Tools & Services: 0.72% | | | | | | | | | | | | | | | | |
Thermo Fisher Scientific Incorporated | | | 5.00 | | | | 6-1-2015 | | | | 175,000 | | | | 185,224 | |
| | | | | | | | | | | | | | | | |
| | | | |
| Pharmaceuticals: 0.35% | | | | | | | | | | | | | | | | |
AbbVie Incorporated | | | 1.20 | | | | 11-6-2015 | | | | 90,000 | | | | 90,836 | |
| | | | | | | | | | | | | | | | |
| | | | |
Industrials: 1.98% | | | | | | | | | | | | | | | | |
| | | | |
| Aerospace & Defense: 0.74% | | | | | | | | | | | | | | | | |
BAE Systems Holdings Incorporated 144A | | | 4.95 | | | | 6-1-2014 | | | | 75,000 | | | | 76,595 | |
United Technologies Corporation | | | 4.88 | | | | 5-1-2015 | | | | 108,000 | | | | 114,666 | |
| | | | |
| | | | | | | | | | | | | | | 191,261 | |
| | | | | | | | | | | | | | | | |
| | | | |
| Industrial Conglomerates: 0.24% | | | | | | | | | | | | | | | | |
General Electric Company | | | 0.85 | | | | 10-9-2015 | | | | 60,000 | | | | 60,327 | |
| | | | | | | | | | | | | | | | |
| | | | |
| Machinery: 0.41% | | | | | | | | | | | | | | | | |
Caterpillar Incorporated | | | 4.63 | | | | 6-1-2015 | | | | 100,000 | | | | 105,980 | |
| | | | | | | | | | | | | | | | |
| | | | |
| Road & Rail: 0.59% | | | | | | | | | | | | | | | | |
Union Pacific Corporation | | | 5.38 | | | | 5-1-2014 | | | | 150,000 | | | | 152,902 | |
| | | | | | | | | | | | | | | | |
| | | | |
Materials: 1.71% | | | | | | | | | | | | | | | | |
| | | | |
| Chemicals: 1.22% | | | | | | | | | | | | | | | | |
Ecolab Incorporated | | | 2.38 | | | | 12-8-2014 | | | | 65,000 | | | | 66,213 | |
Ecolab Incorporated | | | 4.88 | | | | 2-15-2015 | | | | 125,000 | | | | 131,113 | |
Sherwin-Williams Company | | | 3.13 | | | | 12-15-2014 | | | | 115,000 | | | | 118,012 | |
| | | | |
| | | | | | | | | | | | | | | 315,338 | |
| | | | | | | | | | | | | | | | |
| | | | |
| Metals & Mining: 0.49% | | | | | | | | | | | | | | | | |
Alcan Incorporated | | | 5.20 | | | | 1-15-2014 | | | | 125,000 | | | | 125,701 | |
| | | | | | | | | | | | | | | | |
| | | | |
Utilities: 3.57% | | | | | | | | | | | | | | | | |
| | | | |
| Electric Utilities: 2.37% | | | | | | | | | | | | | | | | |
Monongahela Power Company 144A | | | 7.95 | | | | 12-15-2013 | | | | 85,000 | | | | 85,182 | |
PECO Energy Company | | | 5.00 | | | | 10-1-2014 | | | | 160,000 | | | | 165,832 | |
Southern California Edison Company | | | 4.15 | | | | 9-15-2014 | | | | 61,000 | | | | 62,788 | |
Westar Energy Incorporated | | | 6.00 | | | | 7-1-2014 | | | | 140,000 | | | | 144,422 | |
Wisconsin Electric Power Company | | | 6.00 | | | | 4-1-2014 | | | | 150,000 | | | | 152,680 | |
| | | | |
| | | | | | | | | | | | | | | 610,904 | |
| | | | | | | | | | | | | | | | |
The accompanying notes are an integral part of these financial statements.
| | | | | | |
| Portfolio of investments—November 30, 2013 (unaudited) | | Wells Fargo Advantage Allocation Funds | | | 93 | |
STABLE INCOME PORTFOLIO
| | | | | | | | | | | | | | | | |
| Security name | | Interest rate | | | Maturity date | | | Principal | | | Value | |
| | | | |
| Gas Utilities: 1.20% | | | | | | | | | | | | | | | | |
Atmos Energy Corporation | | | 4.95 | % | | | 10-15-2014 | | | $ | 125,000 | | | $ | 129,551 | |
MidAmerican Energy Company | | | 4.65 | | | | 10-1-2014 | | | | 100,000 | | | | 103,502 | |
Questar Corporation | | | 2.75 | | | | 2-1-2016 | | | | 74,000 | | | | 76,601 | |
| | | | |
| | | | | | | | | | | | | | | 309,654 | |
| | | | | | | | | | | | | | | | |
| | | | |
Total Corporate Bonds and Notes (Cost $5,412,014) | | | | | | | | | | | | | | | 5,430,430 | |
| | | | | | | | | | | | | | | | |
| | | | |
Municipal Obligations: 2.96% | | | | | | | | | | | | | | | | |
| | | | |
| Colorado: 0.40% | | | | | | | | | | | | | | | | |
Colorado Build America Bonds Building Excellent Schools Series E
(Miscellaneous Revenue) | | | 3.73 | | | | 3-15-2015 | | | | 100,000 | | | | 103,189 | |
| | | | | | | | | | | | | | | | |
| | | | |
| Illinois: 0.78% | | | | | | | | | | | | | | | | |
Cook County Ill School District #135 Series A (GO, National/FGIC Insured) | | | 4.75 | | | | 5-1-2014 | | | | 100,000 | | | | 100,261 | |
Illinois (GO) | | | 4.07 | | | | 1-1-2014 | | | | 100,000 | | | | 100,317 | |
| | | | |
| | | | | | | | | | | | | | | 200,578 | |
| | | | | | | | | | | | | | | | |
| | | | |
| Maine: 0.76% | | | | | | | | | | | | | | | | |
Lewiston ME Series C (GO) | | | 3.00 | | | | 4-1-2015 | | | | 190,000 | | | | 195,373 | |
| | | | | | | | | | | | | | | | |
| | | | |
| Texas: 1.02% | | | | | | | | | | | | | | | | |
Austin TX Independent School District Series B (GO) | | | 0.44 | | | | 8-1-2014 | | | | 105,000 | | | | 105,213 | |
Brazos TX Higher Education Authority Incorporated Series 2011-2 Class A1
(Education Revenue) ± | | | 0.79 | | | | 1-27-2020 | | | | 7,785 | | | | 7,790 | |
Brazos TX Higher Education Authority Incorporated Series 2005-1 (Education Revenue) ± | | | 0.35 | | | | 12-26-2018 | | | | 49,910 | | | | 49,855 | |
Galveston County TX Build America Bonds (GO) | | | 3.01 | | | | 2-1-2014 | | | | 100,000 | | | | 100,501 | |
| | | | |
| | | | | | | | | | | | | | | 263,359 | |
| | | | | | | | | | | | | | | | |
| | | | |
Total Municipal Obligations (Cost $762,138) | | | | | | | | | | | | | | | 762,499 | |
| | | | | | | | | | | | | | | | |
| | | | |
Non-Agency Mortgage Backed Securities: 5.16% | | | | | | | | | | | | | | | | |
Bear Stearns Commercial Mortgage Securities Incorporated Series 2005-PWR8 Class A4 | | | 4.67 | | | | 6-11-2041 | | | | 123,319 | | | | 128,619 | |
CIT Equipment Series 2013-VT1 Class A2 144A | | | 0.65 | | | | 3-21-2016 | | | | 116,000 | | | | 115,993 | |
CNH Equipment Trust Series 2012-C Class A3 | | | 0.57 | | | | 12-15-2017 | | | | 175,000 | | | | 175,126 | |
GE Equipment LLC Series 2012-1 Class A3 | | | 0.60 | | | | 5-23-2016 | | | | 150,000 | | | | 149,947 | |
GE Equipment LLC Series 2012-2 Class A2 | | | 0.47 | | | | 4-24-2015 | | | | 114,528 | | | | 114,516 | |
GE Equipment LLC Series 2013-1 Class A2 | | | 0.64 | | | | 3-22-2016 | | | | 110,000 | | | | 110,081 | |
GE Equipment LLC Series 2013-2 Class A2 | | | 0.61 | | | | 6-24-2016 | | | | 115,000 | | | | 115,050 | |
GE Equipment LLC Series 2013-2 Class A3 | | | 0.92 | | | | 9-25-2017 | | | | 120,000 | | | | 120,195 | |
SLMA Series 2012-7 Class A1 ± | | | 0.33 | | | | 2-27-2017 | | | | 101,571 | | | | 101,480 | |
Structured Asset Securities Corporation Series 2006-RF3 Class 1A1 144A | | | 6.00 | | | | 10-25-2036 | | | | 198,405 | | | | 199,081 | |
| | | | |
Total Non-Agency Mortgage Backed Securities (Cost $1,330,664) | | | | | | | | | | | | | | | 1,330,088 | |
| | | | | | | | | | | | | | | | |
| | | | |
Yankee Corporate Bonds and Notes: 2.41% | | | | | | | | | | | | | | | | |
| | | | |
Consumer Staples: 0.44% | | | | | | | | | | | | | | | | |
| | | | |
| Beverages: 0.44% | | | | | | | | | | | | | | | | |
SABMiller plc 144A | | | 6.50 | | | | 7-1-2016 | | | | 100,000 | | | | 113,514 | |
| | | | | | | | | | | | | | | | |
The accompanying notes are an integral part of these financial statements.
| | | | |
| 94 | | Wells Fargo Advantage Stable Income Portfolio | | Portfolio of investments—November 30, 2013 (unaudited) |
STABLE INCOME PORTFOLIO
| | | | | | | | | | | | | | | | |
| Security name | | Interest rate | | | Maturity date | | | Principal | | | Value | |
| | | | |
Energy: 1.27% | | | | | | | | | | | | | | | | |
| | | | |
| Oil, Gas & Consumable Fuels: 1.27% | | | | | | | | | | | | | | | | |
BP Capital Markets plc | | | 3.63 | % | | | 5-8-2014 | | | $ | 45,000 | | | $ | 45,641 | |
Schlumberger SA 144A | | | 2.65 | | | | 1-15-2016 | | | | 100,000 | | | | 103,791 | |
Shell International Finance BV | | | 4.00 | | | | 3-21-2014 | | | | 175,000 | | | | 176,931 | |
| | | | |
| | | | | | | | | | | | | | | 326,363 | |
| | | | | | | | | | | | | | | | |
| | | | |
Financials: 0.39% | | | | | | | | | | | | | | | | |
| | | | |
| Commercial Banks: 0.39% | | | | | | | | | | | | | | | | |
Royal Bank of Canada | | | 0.80 | | | | 10-30-2015 | | | | 100,000 | | | | 100,127 | |
| | | | | | | | | | | | | | | | |
| | | | |
Health Care: 0.31% | | | | | | | | | | | | | | | | |
| | | | |
| Health Care Equipment & Supplies: 0.31% | | | | | | | | | | | | | | | | |
Covidien International Finance SA | | | 1.35 | | | | 5-29-2015 | | | | 80,000 | | | | 80,752 | |
| | | | | | | | | | | | | | | | |
| | | | |
Total Yankee Corporate Bonds and Notes (Cost $619,371) | | | | | | | | | | | | | | | 620,756 | |
| | | | | | | | | | | | | | | | |
| | | Yield | | | | | | Shares | | | | |
| | | | |
Short-Term Investments: 18.16% | | | | | | | | | | | | | | | | |
| | | | |
| Investment Companies: 13.40% | | | | | | | | | | | | | | | | |
Wells Fargo Advantage Cash Investment Money Market Fund, Select Class (l)(u) | | | 0.08 | | | | | | | | 3,452,523 | | | | 3,452,523 | |
| | | | | | | | | | | | | | | | |
| | | | |
| | | | | | | | | Principal | | | | |
| U.S. Treasury Securities: 4.76% | | | | | | | | | | | | | | | | |
U.S. Treasury Bill (z) | | | 0.06 | | | | 2-27-2014 | | | $ | 1,225,000 | | | | 1,224,822 | |
| | | | | | | | | | | | | | | | |
| | | | |
Total Short-Term Investments (Cost $4,677,354) | | | | | | | | | | | | | | | 4,677,345 | |
| | | | | | | | | | | | | | | | |
| | | | | | | | |
Total investments in securities (Cost $24,939,986) * | | | 99.16 | % | | | 25,546,990 | |
Other assets and liabilities, net | | | 0.84 | | | | 215,495 | |
| | | | | | | | |
| Total net assets | | | 100.00 | % | | $ | 25,762,485 | |
| | | | | | | | |
| ± | Variable rate investment. The rate shown is the rate in effect at period end. |
| 144A | Security that may be resold to “qualified institutional buyers” under Rule 144A or security offered pursuant to Section 4(2) of the Securities Act of 1933, as amended. |
| (l) | Investment in an affiliate |
| (u) | Rate shown is the 7-day annualized yield at period end. |
| (z) | Zero coupon security. Rate represents yield to maturity at time of purchase. |
| * | Cost for federal income tax purposes is $24,940,666 and unrealized appreciation (depreciation) consists of: |
| | | | |
Gross unrealized appreciation | | $ | 642,336 | |
Gross unrealized depreciation | | | (36,012 | ) |
| | | | |
Net unrealized appreciation | | $ | 606,324 | |
The accompanying notes are an integral part of these financial statements.
This page is intentionally left blank.
| | | | |
| 96 | | Wells Fargo Advantage Allocation Funds | | Statements of assets and liabilities—November 30, 2013 (unaudited) |
| | | | | | | | |
| | | C&B Large Cap
Value Portfolio | | | Diversified Large
Cap Growth
Portfolio | |
| | |
Assets | | | | | | | | |
Investments | | | | | | | | |
In unaffiliated securities (including securities on loan), at value (see cost below) | | $ | 334,001,637 | | | $ | 152,315,144 | |
In affiliated securities, at value (see cost below) | | | 16,519,640 | | | | 5,224,757 | |
| | | | | | | | |
Total investments, at value (see cost below) | | | 350,521,277 | | | | 157,539,901 | |
Cash | | | 0 | | | | 0 | |
Foreign currency, at value (see cost below) | | | 0 | | | | 0 | |
Receivable for investments sold | | | 0 | | | | 210,527 | |
Receivable for dividends | | | 735,986 | | | | 128,954 | |
Receivable for securities lending income | | | 3,790 | | | | 1,130 | |
Prepaid expenses and other assets | | | 1,817 | | | | 788 | |
| | | | | | | | |
Total assets | | | 351,262,870 | | | | 157,881,300 | |
| | | | | | | | |
| | |
Liabilities | | | | | | | | |
Payable for investments purchased | | | 0 | | | | 249,277 | |
Payable upon receipt of securities loaned | | | 0 | | | | 4,148,421 | |
Payable for daily variation margin on open futures contracts | | | 0 | | | | 0 | |
Advisory fee payable | | | 191,820 | | | | 72,151 | |
Professional fees payable | | | 16,632 | | | | 19,112 | |
Contingent tax liability | | | 0 | | | | 0 | |
Accrued expenses and other liabilities | | | 4,778 | | | | 6,455 | |
| | | | | | | | |
Total liabilities | | | 213,230 | | | | 4,495,416 | |
| | | | | | | | |
Total net assets | | $ | 351,049,640 | | | $ | 153,385,884 | |
| | | | | | | | |
| | |
Investments in unaffiliated securities (including securities on loan), at cost | | $ | 229,794,795 | | | $ | 104,838,269 | |
| | | | | | | | |
Investments in affiliated securities, at cost | | $ | 16,519,640 | | | $ | 5,224,757 | |
| | | | | | | | |
Total investments, at cost | | $ | 246,314,435 | | | $ | 110,063,026 | |
| | | | | | | | |
Securities on loan, at value | | $ | 0 | | | $ | 4,055,923 | |
| | | | | | | | |
Foreign currency, at cost | | $ | 0 | | | $ | 0 | |
| | | | | | | | |
The accompanying notes are an integral part of these financial statements.
| | | | | | |
| Statements of assets and liabilities—November 30, 2013 (unaudited) | | Wells Fargo Advantage Allocation Funds | | | 97 | |
| | | | | | | | | | | | | | | | | | | | | | | | | | |
Emerging Growth
Portfolio | | | Index Portfolio | | | International
Growth Portfolio | | | International Value
Portfolio | | | Large Company
Value Portfolio | | | Small Company
Growth Portfolio | | | Small Company
Value Portfolio | |
| | | | | | |
| | | | | | | | | | | | | | | | | | | | | | | | | | |
| | | | | | | | | | | | | | | | | | | | | | | | | | |
| $ | 1,217,490,452 | | | $ | 2,773,006,007 | | | $ | 149,055,032 | | | $ | 466,529,043 | | | $ | 99,489,473 | | | $ | 231,460,391 | | | $ | 202,101,755 | |
| | 45,044,489 | | | | 79,059,831 | | | | 6,859,247 | | | | 12,090,564 | | | | 4,905,357 | | | | 22,271,311 | | | | 15,425,560 | |
| | | | | | | | | | | | | | | | | | | | | | | | | | |
| | 1,262,534,941 | | | | 2,852,065,838 | | | | 155,914,279 | | | | 478,619,607 | | | | 104,394,830 | | | | 253,731,702 | | | | 217,527,315 | |
| | 0 | | | | 24,610 | | | | 0 | | | | 0 | | | | 0 | | | | 68,396 | | | | 0 | |
| | 0 | | | | 0 | | | | 114,497 | | | | 7,563,642 | | | | 0 | | | | 0 | | | | 0 | |
| | 5,072,716 | | | | 687,657 | | | | 1,216,929 | | | | 0 | | | | 0 | | | | 3,250,935 | | | | 71,635 | |
| | 1,018 | | | | 6,084,107 | | | | 163,571 | | | | 1,321,318 | | | | 155,945 | | | | 64,718 | | | | 115,502 | |
| | 104,730 | | | | 4,536 | | | | 7,239 | | | | 16,945 | | | | 1,732 | | | | 11,503 | | | | 13,602 | |
| | 10,524 | | | | 14,289 | | | | 1,924 | | | | 13,359 | | | | 1,761 | | | | 2,034 | | | | 2,912 | |
| | | | | | | | | | | | | | | | | | | | | | | | | | |
| | 1,267,723,929 | | | | 2,858,881,037 | | | | 157,418,439 | | | | 487,534,871 | | | | 104,554,268 | | | | 257,129,288 | | | | 217,730,966 | |
| | | | | | | | | | | | | | | | | | | | | | | | | | |
| | | | | | |
| | | | | | | | | | | | | | | | | | | | | | | | | | |
| | 4,704,890 | | | | 0 | | | | 2,068,091 | | | | 0 | | | | 0 | | | | 2,301,740 | | | | 879,783 | |
| | 31,741,350 | | | | 9,164,555 | | | | 765,419 | | | | 9,341,704 | | | | 2,575,400 | | | | 12,598,600 | | | | 8,987,147 | |
| | 0 | | | | 4,430 | | | | 0 | | | | 0 | | | | 0 | | | | 0 | | | | 0 | |
| | 802,493 | | | | 200,707 | | | | 109,465 | | | | 341,611 | | | | 55,975 | | | | 157,968 | | | | 138,030 | |
| | 10,510 | | | | 13,867 | | | | 16,685 | | | | 18,477 | | | | 17,825 | | | | 18,817 | | | | 18,704 | |
| | 0 | | | | 0 | | | | 45,316 | | | | 0 | | | | 0 | | | | 0 | | | | 0 | |
| | 10,623 | | | | 23,878 | | | | 26,362 | | | | 0 | | | | 7,481 | | | | 10,211 | | | | 9,440 | |
| | | | | | | | | | | | | | | | | | | | | | | | | | |
| | 37,269,866 | | | | 9,407,437 | | | | 3,031,338 | | | | 9,701,792 | | | | 2,656,681 | | | | 15,087,336 | | | | 10,033,104 | |
| | | | | | | | | | | | | | | | | | | | | | | | | | |
| $ | 1,230,454,063 | | | $ | 2,849,473,600 | | | $ | 154,387,101 | | | $ | 477,833,079 | | | $ | 101,897,587 | | | $ | 242,041,952 | | | $ | 207,697,862 | |
| | | | | | | | | | | | | | | | | | | | | | | | | | |
| | | | | | |
| $ | 798,977,657 | | | $ | 1,662,832,574 | | | $ | 113,387,594 | | | $ | 431,268,328 | | | $ | 82,169,991 | | | $ | 166,366,873 | | | $ | 147,320,398 | |
| | | | | | | | | | | | | | | | | | | | | | | | | | |
| $ | 45,044,489 | | | $ | 69,826,099 | | | $ | 6,859,247 | | | $ | 12,090,564 | | | $ | 4,905,357 | | | $ | 22,271,311 | | | $ | 15,425,560 | |
| | | | | | | | | | | | | | | | | | | | | | | | | | |
| $ | 844,022,146 | | | $ | 1,732,658,673 | | | $ | 120,246,841 | | | $ | 443,358,892 | | | $ | 87,075,348 | | | $ | 188,638,184 | | | $ | 162,745,958 | |
| | | | | | | | | | | | | | | | | | | | | | | | | | |
| $ | 30,955,510 | | | $ | 8,899,585 | | | $ | 730,218 | | | $ | 8,854,230 | | | $ | 2,516,705 | | | $ | 12,245,453 | | | $ | 8,776,029 | |
| | | | | | | | | | | | | | | | | | | | | | | | | | |
| $ | 0 | | | $ | 0 | | | $ | 114,739 | | | $ | 7,562,268 | | | $ | 0 | | | $ | 0 | | | $ | 0 | |
| | | | | | | | | | | | | | | | | | | | | | | | | | |
The accompanying notes are an integral part of these financial statements.
| | | | |
| 98 | | Wells Fargo Advantage Allocation Funds | | Statements of assets and liabilities—November 30, 2013 (unaudited) |
| | | | | | | | |
| | | Core Bond Portfolio | | | Inflation-Protected
Bond Portfolio | |
| | |
Assets | | | | | | | | |
Investments | | | | | | | | |
In unaffiliated securities (including securities on loan), at value (see cost below) | | $ | 3,070,137,964 | | | $ | 53,610,497 | |
In affiliated securities, at value (see cost below) | | | 67,603,250 | | | | 378,253 | |
| | | | | | | | |
Total investments, at value (see cost below) | | | 3,137,741,214 | | | | 53,988,750 | |
Cash | | | 165,867 | | | | 0 | |
Segregated cash | | | 0 | | | | 0 | |
Receivable for investments sold | | | 534,915,288 | | | | 0 | |
Principal paydown receivable | | | 139,908 | | | | 0 | |
Receivable for interest | | | 12,556,704 | | | | 209,205 | |
Receivable for daily variation margin on open futures contracts | | | 0 | | | | 0 | |
Receivable for securities lending income | | | 284 | | | | 0 | |
Prepaid expenses and other assets | | | 12,113 | | | | 1,842 | |
| | | | | | | | |
Total assets | | | 3,685,531,378 | | | | 54,199,797 | |
| | | | | | | | |
| | |
Liabilities | | | | | | | | |
Payable for investments purchased | | | 762,001,229 | | | | 0 | |
Payable upon receipt of securities loaned | | | 0 | | | | 0 | |
Advisory fee payable | | | 837,632 | | | | 14,246 | |
Shareholder report expenses payable | | | 6,925 | | | | 2,707 | |
Custodian and accounting fees payable | | | 58,006 | | | | 3,191 | |
Professional fees payable | | | 36,220 | | | | 16,035 | |
Accrued expenses and other liabilities | | | 0 | | | | 1,151 | |
| | | | | | | | |
Total liabilities | | | 762,940,012 | | | | 37,330 | |
| | | | | | | | |
Total net assets | | $ | 2,922,591,366 | | | $ | 54,162,467 | |
| | | | | | | | |
| | |
Investments in unaffiliated securities (including securities on loan), at cost | | $ | 3,075,502,235 | | | $ | 52,182,123 | |
| | | | | | | | |
Investments in affiliated securities, at cost | | $ | 67,603,250 | | | $ | 378,253 | |
| | | | | | | | |
Total investments, at cost | | $ | 3,143,105,485 | | | $ | 52,560,376 | |
| | | | | | | | |
Securities on loan, at value | | $ | 0 | | | $ | 0 | |
| | | | | | | | |
The accompanying notes are an integral part of these financial statements.
| | | | | | |
| Statements of assets and liabilities—November 30, 2013 (unaudited) | | Wells Fargo Advantage Allocation Funds | | | 99 | |
| | | | | | |
Managed Fixed
Income Portfolio | | | Stable Income
Portfolio | |
| |
| | | | | | |
| | | | | | |
| $ | 108,162,761 | | | $ | 22,094,467 | |
| | 8,373,000 | | | | 3,452,523 | |
| | | | | | |
| | 116,535,761 | | | | 25,546,990 | |
| | 0 | | | | 0 | |
| | 0 | | | | 18,000 | |
| | 112,536 | | | | 115,063 | |
| | 0 | | | | 0 | |
| | 820,951 | | | | 101,553 | |
| | 0 | | | | 1,094 | |
| | 859 | | | | 0 | |
| | 3,561 | | | | 3,882 | |
| | | | | | |
| | 117,473,668 | | | | 25,786,582 | |
| | | | | | |
| |
| | | | | | |
| | 499,149 | | | | 0 | |
| | 1,165,688 | | | | 0 | |
| | 30,091 | | | | 1,357 | |
| | 2,137 | | | | 492 | |
| | 5,212 | | | | 4,677 | |
| | 24,225 | | | | 16,860 | |
| | 0 | | | | 711 | |
| | | | | | |
| | 1,726,502 | | | | 24,097 | |
| | | | | | |
| $ | 115,747,166 | | | $ | 25,762,485 | |
| | | | | | |
| |
| $ | 106,552,998 | | | $ | 21,487,463 | |
| | | | | | |
| $ | 8,373,000 | | | $ | 3,452,523 | |
| | | | | | |
| $ | 114,925,998 | | | $ | 24,939,986 | |
| | | | | | |
| $ | 1,141,600 | | | $ | 0 | |
| | | | | | |
The accompanying notes are an integral part of these financial statements.
| | | | |
| 100 | | Wells Fargo Advantage Allocation Funds | | Statements of operations—six months ended November 30, 2013 (unaudited) |
| | | | | | | | | | | | | | | | |
| | | C&B Large Cap Value Portfolio | | | Diversified Large Cap Growth
Portfolio | | | Emerging Growth
Portfolio | | | Index Portfolio | |
| | | | |
Investment income | | | | | | | | | | | | | | | | |
Dividends* | | $ | 3,520,363 | | | $ | 607,305 | | | $ | 612,385 | | | $ | 28,228,572 | |
Income from affiliated securities | | | 7,017 | | | | 492 | | | | 6,574 | | | | 16,633 | |
Securities lending income, net | | | 6,223 | | | | 7,309 | | | | 387,518 | | | | 31,800 | |
Interest | | | 0 | | | | 0 | | | | 0 | | | | 612 | |
| | | | | | | | | | | | | | | | |
Total investment income | | | 3,533,603 | | | | 615,106 | | | | 1,006,477 | | | | 28,277,617 | |
| | | | | | | | | | | | | | | | |
| | | | |
Expenses | | | | | | | | | | | | | | | | |
Advisory fee | | | 1,104,441 | | | | 484,377 | | | | 4,453,275 | | | | 1,129,369 | |
Custody and accounting fees | | | 12,835 | | | | 12,716 | | | | 34,439 | | | | 71,777 | |
Professional fees | | | 23,928 | | | | 23,046 | | | | 30,372 | | | | 38,378 | |
Shareholder report expenses | | | 790 | | | | 2,877 | | | | 970 | | | | 5,411 | |
Trustees’ fees and expenses | | | 5,547 | | | | 5,243 | | | | 5,287 | | | | 5,030 | |
Other fees and expenses | | | 5,868 | | | | 3,796 | | | | 12,801 | | | | 29,732 | |
| | | | | | | | | | | | | | | | |
Total expenses | | | 1,153,409 | | | | 532,055 | | | | 4,537,144 | | | | 1,279,697 | |
Less: Fee waivers and/or expense reimbursements | | | 0 | | | | (68,470 | ) | | | 0 | | | | 0 | |
| | | | | | | | | | | | | | | | |
Net expenses | | | 1,153,409 | | | | 463,585 | | | | 4,537,144 | | | | 1,279,697 | |
| | | | | | | | | | | | | | | | |
Net investment income (loss) | | | 2,380,194 | | | | 151,521 | | | | (3,530,667 | ) | | | 26,997,920 | |
| | | | | | | | | | | | | | | | |
| | | | |
REALIZED AND UNREALIZED GAINS (LOSSES) ON INVESTMENTS | | | | | | | | | | | | | | | | |
| | | | |
Net realized gains (losses) on: | | | | | | | | | | | | | | | | |
Unaffiliated securities | | | 21,465,517 | | | | 6,521,085 | | | | 89,132,120 | | | | (13,212,779 | ) |
Affiliated securities | | | 0 | | | | 0 | | | | 0 | | | | (5,489,503 | ) |
Futures transactions | | | 0 | | | | 0 | | | | 0 | | | | 6,192,875 | |
| | | | | | | | | | | | | | | | |
Net realized gain (losses) on investments | | | 21,465,517 | | | | 6,521,085 | | | | 89,132,120 | | | | (12,509,407 | ) |
| | | | | | | | | | | | | | | | |
Net change in unrealized gains (losses) on: | | | | | | | | | | | | | | | | |
Unaffiliated securities | | | 13,685,125 | | | | 17,953,571 | | | | 184,460,846 | | | | 283,715,260 | |
Affiliated securities | | | 0 | | | | 0 | | | | 0 | | | | 8,471,069 | |
Futures transactions | | | 0 | | | | 0 | | | | 0 | | | | (1,487,605 | ) |
| | | | | | | | | | | | | | | | |
Net change in unrealized gains (losses) on investments | | | 13,685,125 | | | | 17,953,571 | | | | 184,460,846 | | | | 290,698,724 | |
| | | | | | | | | | | | | | | | |
Net realized and unrealized gains (losses) on investments | | | 35,150,642 | | | | 24,474,656 | | | | 273,592,966 | | | | 278,189,317 | |
| | | | | | | | | | | | | | | | |
Net increase in net assets resulting from operations | | $ | 37,530,836 | | | $ | 24,626,177 | | | $ | 270,062,299 | | | $ | 305,187,237 | |
| | | | | | | | | | | | | | | | |
| | | | |
* Net of foreign dividend withholding taxes in the amount of | | | $4,015 | | | | $0 | | | | $0 | | | | $8,705 | |
The accompanying notes are an integral part of these financial statements.
| | | | | | |
| Statements of operations—six months ended November 30, 2013 (unaudited) | | Wells Fargo Advantage Allocation Funds | | | 101 | |
| | | | | | | | | | | | | | | | | | |
International
Growth Portfolio | | | International Value
Portfolio | | | Large Company
Value Portfolio | | | Small Company
Growth Portfolio | | | Small Company
Value Portfolio | |
| | | | |
| | | | | | | | | | | | | | | | | | |
| $ | 971,778 | | | $ | 5,514,111 | | | $ | 835,741 | | | $ | 319,211 | | | $ | 2,042,480 | |
| | 1,739 | | | | 1,456 | | | | 779 | | | | 3,472 | | | | 2,669 | |
| | 22,359 | | | | 150,739 | | | | 12,873 | | | | 178,893 | | | | 90,742 | |
| | 0 | | | | 418 | | | | 0 | | | | 0 | | | | 0 | |
| | | | | | | | | | | | | | | | | | |
| | 995,876 | | | | 5,666,724 | | | | 849,393 | | | | 501,576 | | | | 2,135,891 | |
| | | | | | | | | | | | | | | | | | |
| | | | |
| | | | | | | | | | | | | | | | | | |
| | 611,832 | | | | 1,895,654 | | | | 322,545 | | | | 858,468 | | | | 829,713 | |
| | 82,746 | | | | 69,717 | | | | 5,634 | | | | 12,831 | | | | 17,363 | |
| | 23,378 | | | | 26,252 | | | | 22,561 | | | | 21,886 | | | | 22,580 | |
| | 211 | | | | 2,783 | | | | 1,895 | | | | 824 | | | | 3,030 | |
| | 4,419 | | | | 4,244 | | | | 3,767 | | | | 5,071 | | | | 4,399 | |
| | 15,338 | | | | 22,677 | | | | 3,230 | | | | 4,176 | | | | 4,704 | |
| | | | | | | | | | | | | | | | | | |
| | 737,924 | | | | 2,021,327 | | | | 359,632 | | | | 903,256 | | | | 881,789 | |
| | 0 | | | | 0 | | | | 0 | | | | 0 | | | | 0 | |
| | | | | | | | | | | | | | | | | | |
| | 737,924 | | | | 2,021,327 | | | | 359,632 | | | | 903,256 | | | | 881,789 | |
| | | | | | | | | | | | | | | | | | |
| | 257,952 | | | | 3,645,397 | | | | 489,761 | | | | (401,680 | ) | | | 1,254,102 | |
| | | | | | | | | | | | | | | | | | |
| | | | |
| | | | | | | | | | | | | | | | | | |
| | | | |
| | | | | | | | | | | | | | | | | | |
| | 3,220,646 | | | | 4,561,826 | | | | 5,946,885 | | | | 14,912,362 | | | | 15,007,141 | |
| | 0 | | | | 0 | | | | 0 | | | | 0 | | | | 0 | |
| | 0 | | | | 0 | | | | 0 | | | | 0 | | | | 0 | |
| | | | | | | | | | | | | | | | | | |
| | 3,220,646 | | | | 4,561,826 | | | | 5,946,885 | | | | 14,912,362 | | | | 15,007,141 | |
| | | | | | | | | | | | | | | | | | |
| | | | | | | | | | | | | | | | | | |
| | 14,254,583 | 1 | | | 45,940,372 | | | | 6,127,552 | | | | 25,744,178 | | | | 13,426,498 | |
| | 0 | | | | 0 | | | | 0 | | | | 0 | | | | 0 | |
| | 0 | | | | 0 | | | | 0 | | | | 0 | | | | 0 | |
| | | | | | | | | | | | | | | | | | |
| | 14,254,583 | | | | 45,940,372 | | | | 6,127,552 | | | | 25,744,178 | | | | 13,426,498 | |
| | | | | | | | | | | | | | | | | | |
| | 17,475,229 | | | | 50,502,198 | | | | 12,074,437 | | | | 40,656,540 | | | | 28,433,639 | |
| | | | | | | | | | | | | | | | | | |
| $ | 17,733,181 | | | $ | 54,147,595 | | | $ | 12,564,198 | | | $ | 40,254,860 | | | $ | 29,687,741 | |
| | | | | | | | | | | | | | | | | | |
| | | | |
| | $59,849 | | | | $568,387 | | | | $5,309 | | | | $2,926 | | | | $0 | |
| 1. | Net of foreign capital gains tax in the amount of $39,316. |
The accompanying notes are an integral part of these financial statements.
| | | | |
| 102 | | Wells Fargo Advantage Allocation Funds | | Statements of operations—six months ended November 30, 2013 (unaudited) |
| | | | | | | | |
| | | Core Bond
Portfolio | | | Inflation-Protected
Bond Portfolio | |
| | |
Investment income | | | | | | | | |
Interest** | | $ | 34,469,823 | | | $ | 488,200 | |
Income from affiliated securities | | | 36,697 | | | | 16 | |
Securities lending income, net | | | 10,228 | | | | 0 | |
| | | | | | | | |
Total investment income | | | 34,516,748 | | | | 488,216 | |
| | | | | | | | |
| | |
Expenses | | | | | | | | |
Advisory fee | | | 5,436,799 | | | | 116,720 | |
Custody and accounting fees | | | 98,169 | | | | 4,878 | |
Professional fees | | | 39,272 | | | | 20,475 | |
Shareholder report expenses | | | 5,786 | | | | 921 | |
Trustees’ fees and expenses | | | 5,029 | | | | 5,760 | |
Other fees and expenses | | | 31,103 | | | | 4,349 | |
| | | | | | | | |
Total expenses | | | 5,616,158 | | | | 153,103 | |
Less: Fee waivers and/or expense reimbursements | | | (373,637 | ) | | | (25,119 | ) |
| | | | | | | | |
Net expenses | | | 5,242,521 | | | | 127,984 | |
| | | | | | | | |
Net investment income | | | 29,274,227 | | | | 360,232 | |
| | | | | | | | |
| | |
REALIZED AND UNREALIZED GAINS (LOSSES) ON INVESTMENTS | | | | | | | | |
| | |
Net realized gains (losses) on: | | | | | | | | |
Unaffiliated securities | | | (41,557,005 | ) | | | 471,728 | |
Futures transactions | | | 0 | | | | (16,061 | ) |
TBA sale commitments | | | 75,320 | | | | 0 | |
| | | | | | | | |
Net realized gain (losses) on investments | | | (41,481,685 | ) | | | 455,667 | |
| | | | | | | | |
| | |
Net change in unrealized gains (losses) on: | | | | | | | | |
Unaffiliated securities | | | (8,824,874 | ) | | | (3,349,091 | ) |
Futures transactions | | | 0 | | | | 0 | |
TBA sale commitments | | | 46,020 | | | | 0 | |
| | | | | | | | |
Net change in unrealized gains (losses) on investments | | | (8,778,854 | ) | | | (3,349,091 | ) |
| | | | | | | | |
Net realized and unrealized gains (losses) on investments | | | (50,260,539 | ) | | | (2,893,424 | ) |
| | | | | | | | |
Net increase (decrease) in net assets resulting from operations | | $ | (20,986,312 | ) | | $ | (2,533,192 | ) |
| | | | | | | | |
| | |
** Net of foreign interest withholding taxes in the amount of | | | $10,617 | | | | $0 | |
The accompanying notes are an integral part of these financial statements.
| | | | | | |
| Statements of operations—six months ended November 30, 2013 (unaudited) | | Wells Fargo Advantage Allocation Funds | | | 103 | |
| | | | | | |
Managed Fixed
Income Portfolio | | | Stable Income
Portfolio | |
| |
| | | | | | |
| $ | 2,065,340 | | | $ | 227,959 | |
| | 3,399 | | | | 1,462 | |
| | 3,339 | | | | 0 | |
| | | | | | |
| | 2,072,078 | | | | 229,421 | |
| | | | | | |
| |
| | | | | | |
| | 221,625 | | | | 37,865 | |
| | 8,890 | | | | 5,244 | |
| | 28,066 | | | | 28,080 | |
| | 1,210 | | | | 308 | |
| | 5,027 | | | | 5,797 | |
| | 3,393 | | | | 3,335 | |
| | | | | | |
| | 268,211 | | | | 80,629 | |
| | (52,793 | ) | | | (30,683 | ) |
| | | | | | |
| | 215,418 | | | | 49,946 | |
| | | | | | |
| | 1,856,660 | | | | 179,475 | |
| | | | | | |
| |
| | | | | | |
| |
| | | | | | |
| | (2,082,998 | ) | | | 12,747 | |
| | 0 | | | | (1,723 | ) |
| | 0 | | | | 0 | |
| | | | | | |
| | (2,082,998 | ) | | | 11,024 | |
| | | | | | |
| |
| | | | | | |
| | (525,012 | ) | | | (5,693 | ) |
| | 0 | | | | (4,063 | ) |
| | 0 | | | | 0 | |
| | | | | | |
| | (525,012 | ) | | | (9,756 | ) |
| | | | | | |
| | (2,608,010 | ) | | | 1,268 | |
| | | | | | |
| $ | (751,350 | ) | | $ | 180,743 | |
| | | | | | |
| |
| | $162 | | | | $0 | |
The accompanying notes are an integral part of these financial statements.
| | | | |
| 104 | | Wells Fargo Advantage Allocation Funds | | Statements of changes in net assets |
| | | | | | | | |
| | | C&B Large Cap Value Portfolio | |
| | | Six months ended
November 30, 2013
(unaudited) | | | Year ended
May 31, 2013 | |
| | |
Operations | | | | | | | | |
Net investment income | | $ | 2,380,194 | | | $ | 5,797,743 | |
Net realized gains on investments | | | 21,465,517 | | | | 25,557,380 | |
Net change in unrealized gains (losses) on investments | | | 13,685,125 | | | | 54,634,553 | |
| | | | | | | | |
Net increase in net assets resulting from operations | | | 37,530,836 | | | | 85,989,676 | |
| | | | | | | | |
| | |
Capital share transactions | | | | | | | | |
Transactions in investors’ beneficial interests | | | | | | | | |
Contributions | | | 20,925,715 | | | | 19,812,149 | |
Withdrawals | | | (54,561,450 | ) | | | (83,570,402 | ) |
| | | | | | | | |
Net decrease in net assets resulting from capital share transactions | | | (33,635,735 | ) | | | (63,758,253 | ) |
| | | | | | | | |
Total increase in net assets | | | 3,895,101 | | | | 22,231,423 | |
| | | | | | | | |
| | |
Net assets | | | | | | | | |
Beginning of period | | | 347,154,539 | | | | 324,923,116 | |
| | | | | | | | |
End of period | | $ | 351,049,640 | | | $ | 347,154,539 | |
| | | | | | | | |
The accompanying notes are an integral part of these financial statements.
| | | | | | |
| Statements of changes in net assets | | Wells Fargo Advantage Allocation Funds | | | 105 | |
| | | | | | | | | | | | |
| | | Diversified Large Cap Growth Portfolio | |
| | | Six months ended
November 30, 2013
(unaudited) | | | Year ended May 31, 2013 | |
| | | | |
Operations | | | | | | | | | | | | |
Net investment income | | | | $ | 151,521 | | | | | $ | 768,223 | |
Net realized gains on investments | | | | | 6,521,085 | | | | | | 15,571,692 | |
Net change in unrealized gains (losses) on investments | | | | | 17,953,571 | | | | | | 11,859,205 | |
| | | | | | | | | | | | |
Net increase in net assets resulting from operations | | | | | 24,626,177 | | | | | | 28,199,120 | |
| | | | | | | | | | | | |
| | | | |
Capital share transactions | | | | | | | | | | | | |
Transactions in investors’ beneficial interests | | | | | | | | | | | | |
Contributions | | | | | 922,518 | | | | | | 4,046,616 | |
Withdrawals | | | | | (20,008,204 | ) | | | | | (42,558,624 | ) |
| | | | | | | | | | | | |
Net decrease in net assets resulting from capital share transactions | | | | | (19,085,686 | ) | | | | | (38,512,008 | ) |
| | | | | | | | | | | | |
Total increase (decrease) in net assets | | | | | 5,540,491 | | | | | | (10,312,888 | ) |
| | | | | | | | | | | | |
| | | | |
Net assets | | | | | | | | | | | | |
Beginning of period | | | | | 147,845,393 | | | | | | 158,158,281 | |
| | | | | | | | | | | | |
End of period | | | | $ | 153,385,884 | | | | | $ | 147,845,393 | |
| | | | | | | | | | | | |
The accompanying notes are an integral part of these financial statements.
| | | | |
| 106 | | Wells Fargo Advantage Allocation Funds | | Statements of changes in net assets |
| | | | | | | | |
| | | Emerging Growth Portfolio | |
| | | Six months ended
November 30, 2013
(unaudited) | | | Year ended
May 31, 2013 | |
| | |
Operations | | | | | | | | |
Net investment loss | | $ | (3,530,667 | ) | | $ | (4,657,230 | ) |
Net realized gains on investments | | | 89,132,120 | | | | 8,468,821 | |
Net change in unrealized gains (losses) on investments | | | 184,460,846 | | | | 182,265,995 | |
| | | | | | | | |
Net increase in net assets resulting from operations | | | 270,062,299 | | | | 186,077,586 | |
| | | | | | | | |
| | |
Capital share transactions | | | | | | | | |
Transactions in investors’ beneficial interests | | | | | | | | |
Contributions | | | 30,984,030 | | | | 43,331,221 | |
Withdrawals | | | (116,464,343 | ) | | | (182,428,836 | ) |
| | | | | | | | |
Net decrease in net assets resulting from capital share transactions | | | (85,480,313 | ) | | | (139,097,615 | ) |
| | | | | | | | |
Total increase in net assets | | | 184,581,986 | | | | 46,979,971 | |
| | | | | | | | |
| | |
Net assets | | | | | | | | |
Beginning of period | | | 1,045,872,077 | | | | 998,892,106 | |
| | | | | | | | |
End of period | | $ | 1,230,454,063 | | | $ | 1,045,872,077 | |
| | | | | | | | |
The accompanying notes are an integral part of these financial statements.
| | | | | | |
| Statements of changes in net assets | | Wells Fargo Advantage Allocation Funds | | | 107 | |
| | | | | | | | |
| | | Index Portfolio | |
| | | Six months ended
November 30, 2013
(unaudited) | | | Year ended
May 31, 2013 | |
| | |
Operations | | | | | | | | |
Net investment income | | $ | 26,997,920 | | | $ | 55,499,759 | |
Net realized gains (losses) on investments | | | (12,509,407 | ) | | | 84,257,080 | |
Net change in unrealized gains (losses) on investments | | | 290,698,724 | | | | 466,355,999 | |
| | | | | | | | |
Net increase in net assets resulting from operations | | | 305,187,237 | | | | 606,112,838 | |
| | | | | | | | |
| | |
Capital share transactions | | | | | | | | |
Transactions in investors’ beneficial interests | | | | | | | | |
Contributions | | | 58,471,795 | | | | 103,522,576 | |
Withdrawals | | | (127,074,546 | ) | | | (480,245,028 | ) |
| | | | | | | | |
Net decrease in net assets resulting from capital share transactions | | | (68,602,751 | ) | | | (376,722,452 | ) |
| | | | | | | | |
Total increase in net assets | | | 236,584,486 | | | | 229,390,386 | |
| | | | | | | | |
| | |
Net assets | | | | | | | | |
Beginning of period | | | 2,612,889,114 | | | | 2,383,498,728 | |
| | | | | | | | |
End of period | | $ | 2,849,473,600 | | | $ | 2,612,889,114 | |
| | | | | | | | |
The accompanying notes are an integral part of these financial statements.
| | | | |
| 108 | | Wells Fargo Advantage Allocation Funds | | Statements of changes in net assets |
| | | | | | | | |
| | | International Growth Portfolio | |
| | | Six months ended
November 30, 2013
(unaudited) | | | Year ended May 31, 2013 | |
| | |
Operations | | | | | | | | |
Net investment income | | $ | 257,952 | | | $ | 1,895,888 | |
Net realized gains on investments | | | 3,220,646 | | | | 8,384,099 | |
Net change in unrealized gains (losses) on investments | | | 14,254,583 | | | | 20,174,725 | |
| | | | | | | | |
Net increase in net assets resulting from operations | | | 17,733,181 | | | | 30,454,712 | |
| | | | | | | | |
| | |
Capital share transactions | | | | | | | | |
Transactions in investors’ beneficial interests | | | | | | | | |
Contributions | | | 8,194,851 | | | | 29,169,783 | 1 |
Withdrawals | | | (9,935,671 | ) | | | (29,751,222 | ) |
| | | | | | | | |
Net decrease in net assets resulting from capital share transactions | | | (1,740,820 | ) | | | (581,439 | ) |
| | | | | | | | |
Total increase in net assets | | | 15,992,361 | | | | 29,873,273 | |
| | | | | | | | |
| | |
Net assets | | | | | | | | |
Beginning of period | | | 138,394,740 | | | | 108,521,467 | |
| | | | | | | | |
End of period | | $ | 154,387,101 | | | $ | 138,394,740 | |
| | | | | | | | |
| 1. | Amount includes $22,586,786 related to an acquisition during the period. See Notes to Financial Statements for a discussion of the acquisition. |
The accompanying notes are an integral part of these financial statements.
| | | | | | |
| Statements of changes in net assets | | Wells Fargo Advantage Allocation Funds | | | 109 | |
| | | | | | | | |
| | | International Value Portfolio | |
| | | Six months ended
November 30, 2013
(unaudited) | | | Year ended May 31, 2013 | |
| | |
Operations | | | | | | | | |
Net investment income | | $ | 3,645,397 | | | $ | 11,001,522 | |
Net realized gains (losses) on investments | | | 4,561,826 | | | | (3,085,904 | ) |
Net change in unrealized gains (losses) on investments | | | 45,940,372 | | | | 80,132,934 | |
| | | | | | | | |
Net increase in net assets resulting from operations | | | 54,147,595 | | | | 88,048,552 | |
| | | | | | | | |
| | |
Capital share transactions | | | | | | | | |
Transactions in investors’ beneficial interests | | | | | | | | |
Contributions | | | 12,384,981 | | | | 74,737,541 | 1 |
Withdrawals | | | (11,430,349 | ) | | | (29,346,621 | ) |
| | | | | | | | |
Net increase in net assets resulting from capital share transactions | | | 954,632 | | | | 45,390,920 | |
| | | | | | | | |
Total increase in net assets | | | 55,102,227 | | | | 133,439,472 | |
| | | | | | | | |
| | |
Net assets | | | | | | | | |
Beginning of period | | | 422,730,852 | | | | 289,291,380 | |
| | | | | | | | |
End of period | | $ | 477,833,079 | | | $ | 422,730,852 | |
| | | | | | | | |
| 1. | Amount includes $22,429,789 related to an acquisition during the period. See Notes to Financial Statements for a discussion of the acquisition. |
The accompanying notes are an integral part of these financial statements.
| | | | |
| 110 | | Wells Fargo Advantage Allocation Funds | | Statements of changes in net assets |
| | | | | | | | |
| | | Large Company Value Portfolio | |
| | | Six months ended
November 30, 2013
(unaudited) | | | Year ended
May 31, 2013 | |
| | |
Operations | | | | | | | | |
Net investment income | | $ | 489,761 | | | $ | 848,345 | |
Net realized gains on investments | | | 5,946,885 | | | | 8,490,528 | |
Net change in unrealized gains (losses) on investments | | | 6,127,552 | | | | 6,509,832 | |
| | | | | | | | |
Net increase in net assets resulting from operations | | | 12,564,198 | | | | 15,848,705 | |
| | | | | | | | |
| | |
Capital share transactions | | | | | | | | |
Transactions in investors’ beneficial interests | | | | | | | | |
Contributions | | | 552,049 | | | | 51,038,318 | 1 |
Withdrawals | | | (9,624,252 | ) | | | (21,361,580 | ) |
| | | | | | | | |
Net increase (decrease) in net assets resulting from capital share transactions | | | (9,072,203 | ) | | | 29,676,738 | |
| | | | | | | | |
Total increase in net assets | | | 3,491,995 | | | | 45,525,443 | |
| | | | | | | | |
| | |
Net assets | | | | | | | | |
Beginning of period | | | 98,405,592 | | | | 52,880,149 | |
| | | | | | | | |
End of period | | $ | 101,897,587 | | | $ | 98,405,592 | |
| | | | | | | | |
| 1. | Amount includes $50,059,057 related to an acquisition during the period. See Notes to Financial Statements for a discussion of the acquisition. |
The accompanying notes are an integral part of these financial statements.
| | | | | | |
| Statements of changes in net assets | | Wells Fargo Advantage Allocation Funds | | | 111 | |
| | | | | | | | |
| | | Small Company Growth Portfolio | |
| | | Six months ended November 30, 2013
(unaudited) | | | Year ended
May 31, 2013 | |
| | |
Operations | | | | | | | | |
Net investment loss | | $ | (401,680 | ) | | $ | (28,119 | ) |
Net realized gains on investments | | | 14,912,362 | | | | 14,699,969 | |
Net change in unrealized gains (losses) on investments | | | 25,744,178 | | | | 28,484,637 | |
| | | | | | | | |
Net increase in net assets resulting from operations | | | 40,254,860 | | | | 43,156,487 | |
| | | | | | | | |
| | |
Capital share transactions | | | | | | | | |
Transactions in investors’ beneficial interests | | | | | | | | |
Contributions | | | 36,159,000 | | | | 64,117,058 | |
Withdrawals | | | (30,857,904 | ) | | | (73,747,010 | ) |
| �� | | | | | | | |
Net increase (decrease) in net assets resulting from capital share transactions | | | 5,301,096 | | | | (9,629,952 | ) |
| | | | | | | | |
Total increase in net assets | | | 45,555,956 | | | | 33,526,535 | |
| | | | | | | | |
| | |
Net assets | | | | | | | | |
Beginning of period | | | 196,485,996 | | | | 162,959,461 | |
| | | | | | | | |
End of period | | $ | 242,041,952 | | | $ | 196,485,996 | |
| | | | | | | | |
The accompanying notes are an integral part of these financial statements.
| | | | |
| 112 | | Wells Fargo Advantage Allocation Funds | | Statements of changes in net assets |
| | | | | | | | |
| | | Small Company Value Portfolio | |
| | | Six months ended November 30, 2013
(unaudited) | | | Year ended
May 31, 2013 | |
| | |
Operations | | | | | | | | |
Net investment income | | $ | 1,254,102 | | | $ | 1,093,425 | |
Net realized gains on investments | | | 15,007,141 | | | | 13,278,991 | |
Net change in unrealized gains (losses) on investments | | | 13,426,498 | | | | 36,327,755 | |
| | | | | | | | |
Net increase in net assets resulting from operations | | | 29,687,741 | | | | 50,700,171 | |
| | | | | | | | |
| | |
Capital share transactions | | | | | | | | |
Transactions in investors’ beneficial interests | | | | | | | | |
Contributions | | | 10,845,252 | | | | 40,236,818 | 1 |
Withdrawals | | | (36,672,386 | ) | | | (86,362,160 | ) |
| | | | | | | | |
Net decrease in net assets resulting from capital share transactions | | | (25,827,134 | ) | | | (46,125,342 | ) |
| | | | | | | | |
Total increase in net assets | | | 3,860,607 | | | | 4,574,829 | |
| | | | | | | | |
| | |
Net assets | | | | | | | | |
Beginning of period | | | 203,837,255 | | | | 199,262,426 | |
| | | | | | | | |
End of period | | $ | 207,697,862 | | | $ | 203,837,255 | |
| | | | | | | | |
| 1. | Amount includes $14,416,889 related to an acquisition during the period. See Notes to Financial Statements for a discussion of the acquisition. |
The accompanying notes are an integral part of these financial statements.
| | | | | | |
| Statements of changes in net assets | | Wells Fargo Advantage Allocation Funds | | | 113 | |
| | | | | | | | |
| | | Core Bond Portfolio | |
| | | Six months ended November 30, 2013
(unaudited) | | | Year ended
May 31, 2013 | |
| | |
Operations | | | | | | | | |
Net investment income | | $ | 29,274,227 | | | $ | 65,763,655 | |
Net realized gains (losses) on investments | | | (41,481,685 | ) | | | 129,092,808 | |
Net change in unrealized gains (losses) on investments | | | (8,778,854 | ) | | | (90,545,176 | ) |
| | | | | | | | |
Net increase (decrease) in net assets resulting from operations | | | (20,986,312 | ) | | | 104,311,287 | |
| | | | | | | | |
| | |
Capital share transactions | | | | | | | | |
Transactions in investors’ beneficial interests | | | | | | | | |
Contributions | | | 92,659,414 | | | | 720,766,231 | |
Withdrawals | | | (497,518,530 | ) | | | (1,290,176,868 | ) |
| | | | | | | | |
Net decrease in net assets resulting from capital share transactions | | | (404,859,116 | ) | | | (569,410,637 | ) |
| | | | | | | | |
Total decrease in net assets | | | (425,845,428 | ) | | | (465,099,350 | ) |
| | | | | | | | |
| | |
Net assets | | | | | | | | |
Beginning of period | | | 3,348,436,794 | | | | 3,813,536,144 | |
| | | | | | | | |
End of period | | $ | 2,922,591,366 | | | $ | 3,348,436,794 | |
| | | | | | | | |
The accompanying notes are an integral part of these financial statements.
| | | | |
| 114 | | Wells Fargo Advantage Allocation Funds | | Statements of changes in net assets |
| | | | | | | | |
| | | Inflation-Protected Bond Portfolio | |
| | | Six months ended
November 30, 2013
(unaudited) | | | Year ended
May 31, 2013 | |
| | |
Operations | | | | | | | | |
Net investment income | | $ | 360,232 | | | $ | 1,198,434 | |
Net realized gains on investments | | | 455,667 | | | | 3,992,715 | |
Net change in unrealized gains (losses) on investments | | | (3,349,091 | ) | | | (6,233,421 | ) |
| | | | | | | | |
Net decrease in net assets resulting from operations | | | (2,533,192 | ) | | | (1,042,272 | ) |
| | | | | | | | |
| | |
Capital share transactions | | | | | | | | |
Transactions in investors’ beneficial interests | | | | | | | | |
Contributions | | | 3,860,948 | | | | 14,419,386 | |
Withdrawals | | | (13,797,507 | ) | | | (30,194,206 | ) |
| | | | | | | | |
Net decrease in net assets resulting from capital share transactions | | | (9,936,559 | ) | | | (15,774,820 | ) |
| | | | | | | | |
Total decrease in net assets | | | (12,469,751 | ) | | | (16,817,092 | ) |
| | | | | | | | |
| | |
Net assets | | | | | | | | |
Beginning of period | | | 66,632,218 | | | | 83,449,310 | |
| | | | | | | | |
End of period | | $ | 54,162,467 | | | $ | 66,632,218 | |
| | | | | | | | |
The accompanying notes are an integral part of these financial statements.
| | | | | | |
| Statements of changes in net assets | | Wells Fargo Advantage Allocation Funds | | | 115 | |
| | | | | | | | |
| | | Managed Fixed Income Portfolio | |
| | | Six months ended
November 30, 2013
(unaudited) | | | Year ended
May 31, 2013 | |
| | |
Operations | | | | | | | | |
Net investment income | | $ | 1,856,660 | | | $ | 4,255,294 | |
Net realized gains (losses) on investments | | | (2,082,998 | ) | | | 1,250,409 | |
Net change in unrealized gains (losses) on investments | | | (525,012 | ) | | | 638,890 | |
| | | | | | | | |
Net increase (decrease) in net assets resulting from operations | | | (751,350 | ) | | | 6,144,593 | |
| | | | | | | | |
| | |
Capital share transactions | | | | | | | | |
Transactions in investors’ beneficial interests | | | | | | | | |
Contributions | | | 14,330,164 | | | | 33,069,218 | |
Withdrawals | | | (7,094,803 | ) | | | (71,853,951 | ) |
| | | | | | | | |
Net increase (decrease) in net assets resulting from capital share transactions | | | 7,235,361 | | | | (38,784,733 | ) |
| | | | | | | | |
Total increase (decrease) in net assets | | | 6,484,011 | | | | (32,640,140 | ) |
| | | | | | | | |
| | |
Net assets | | | | | | | | |
Beginning of period | | | 109,263,155 | | | | 141,903,295 | |
| | | | | | | | |
End of period | | $ | 115,747,166 | | | $ | 109,263,155 | |
| | | | | | | | |
The accompanying notes are an integral part of these financial statements.
| | | | |
| 116 | | Wells Fargo Advantage Allocation Funds | | Statements of changes in net assets |
| | | | | | | | |
| | | Stable Income Portfolio | |
| | | Six months ended
November 30, 2013
(unaudited) | | | Year ended
May 31, 2013 | |
| | |
Operations | | | | | | | | |
Net investment income | | $ | 179,475 | | | $ | 515,102 | |
Net realized gains (losses) on investments | | | 11,024 | | | | (477,986 | ) |
Net change in unrealized gains (losses) on investments | | | (9,756 | ) | | | 937,982 | |
| | | | | | | | |
Net increase in net assets resulting from operations | | | 180,743 | | | | 975,098 | |
| | | | | | | | |
| | |
Capital share transactions | | | | | | | | |
Transactions in investors’ beneficial interests | | | | | | | | |
Contributions | | | 2,716,214 | | | | 5,341,489 | |
Withdrawals | | | (1,198,679 | ) | | | (19,993,019 | ) |
| | | | | | | | |
Net increase (decrease) in net assets resulting from capital share transactions | | | 1,517,535 | | | | (14,651,530 | ) |
| | | | | | | | |
Total increase (decrease) in net assets | | | 1,698,278 | | | | (13,676,432 | ) |
| | | | | | | | |
| | |
Net assets | | | | | | | | |
Beginning of period | | | 24,064,207 | | | | 37,740,639 | |
| | | | | | | | |
End of period | | $ | 25,762,485 | | | $ | 24,064,207 | |
| | | | | | | | |
The accompanying notes are an integral part of these financial statements.
| | | | | | |
| Financial highlights | | Wells Fargo Advantage Allocation Funds | | | 117 | |
| | | | | | | | | | | | | | | | | | | | |
| | | Ratio to average net assets (annualized) | | | Total
return1 | | | Portfolio turnover
rate | |
| | | Net investment
income (loss) | | | Gross
expenses | | | Net
expenses | | | |
| | | | | |
C&B Large Cap Value Portfolio | | | | | | | | | | | | | | | | | | | | |
June 1, 2013 to November 30, 2013 (unaudited) | | | 1.40 | % | | | 0.68 | % | | | 0.68 | % | | | 11.52 | % | | | 11 | % |
June 1, 2012 to May 31, 2013 | | | 1.73 | % | | | 0.68 | % | | | 0.68 | % | | | 29.30 | % | | | 18 | % |
June 1, 2011 to May 31, 2012 | | | 1.81 | % | | | 0.68 | % | | | 0.68 | % | | | (4.61 | )% | | | 21 | % |
October 1, 2010 to May 31, 20112 | | | 1.27 | % | | | 0.67 | % | | | 0.67 | % | | | 18.08 | % | | | 17 | % |
October 1, 2009 to September 30, 2010 | | | 1.40 | % | | | 0.70 | % | | | 0.68 | % | | | 7.49 | % | | | 13 | % |
October 1, 2008 to September 30, 2009 | | | 2.19 | % | | | 0.73 | % | | | 0.64 | % | | | (5.53 | )% | | | 28 | % |
October 1, 2007 to September 30, 2008 | | | 1.71 | % | | | 0.73 | % | | | 0.68 | % | | | (20.18 | )% | | | 21 | % |
| | | | | |
Diversified Large Cap Growth Portfolio | | | | | | | | | | | | | | | | | | | | |
June 1, 2013 to November 30, 2013 (unaudited) | | | 0.20 | % | | | 0.71 | % | | | 0.62 | % | | | 17.80 | % | | | 28 | % |
June 1, 2012 to May 31, 2013 | | | 0.51 | % | | | 0.71 | % | | | 0.62 | % | | | 20.30 | % | | | 56 | % |
June 1, 2011 to May 31, 2012 | | | 0.24 | % | | | 0.71 | % | | | 0.62 | % | | | 1.26 | % | | | 79 | % |
October 1, 2010 to May 31, 20112,3 | | | 0.40 | % | | | 0.69 | % | | | 0.62 | % | | | 22.78 | % | | | 101 | % |
October 1, 2009 to September 30, 20103 | | | 0.66 | % | | | 0.70 | % | | | 0.62 | % | | | 7.51 | % | | | 11 | % |
October 1, 2008 to September 30, 20093 | | | 0.97 | % | | | 0.70 | % | | | 0.62 | % | | | 3.31 | % | | | 13 | % |
October 1, 2007 to September 30, 20083 | | | 0.48 | % | | | 0.68 | % | | | 0.67 | % | | | (22.59 | )% | | | 7 | % |
| | | | | |
Emerging Growth Portfolio | | | | | | | | | | | | | | | | | | | | |
June 1, 2013 to November 30, 2013 (unaudited) | | | (0.62 | )% | | | 0.80 | % | | | 0.80 | % | | | 27.20 | % | | | 33 | % |
June 1, 2012 to May 31, 2013 | | | (0.47 | )% | | | 0.80 | % | | | 0.80 | % | | | 20.53 | % | | | 65 | % |
June 1, 2011 to May 31, 2012 | | | (0.57 | )% | | | 0.80 | % | | | 0.80 | % | | | (4.83 | )% | | | 75 | % |
October 1, 2010 to May 31, 20112 | | | (0.77 | )% | | | 0.94 | % | | | 0.91 | % | | | 37.91 | % | | | 59 | % |
October 1, 2009 to September 30, 2010 | | | (0.66 | )% | | | 1.02 | % | | | 0.94 | % | | | 20.49 | % | | | 97 | % |
October 1, 2008 to September 30, 2009 | | | (0.53 | )% | | | 0.94 | % | | | 0.91 | % | | | (5.70 | )% | | | 147 | % |
October 1, 2007 to September 30, 2008 | | | (0.49 | )% | | | 0.93 | % | | | 0.92 | % | | | (30.95 | )% | | | 191 | % |
October 1, 2007 to September 30, 2008 | | | (0.49 | )% | | | 0.93 | % | | | 0.92 | % | | | (30.95 | )% | | | 191 | % |
| | | | | |
Index Portfolio | | | | | | | | | | | | | | | | | | | | |
June 1, 2013 to November 30, 2013 (unaudited) | | | 2.02 | % | | | 0.10 | % | | | 0.10 | % | | | 11.86 | % | | | 3 | % |
June 1, 2012 to May 31, 2013 | | | 2.20 | % | | | 0.09 | % | | | 0.09 | % | | | 27.22 | % | | | 4 | % |
June 1, 2011 to May 31, 2012 | | | 2.09 | % | | | 0.10 | % | | | 0.10 | % | | | 0.52 | % | | | 9 | % |
October 1, 2010 to May 31, 20112 | | | 1.93 | % | | | 0.10 | % | | | 0.10 | % | | | 19.39 | % | | | 3 | % |
October 1, 2009 to September 30, 2010 | | | 2.01 | % | | | 0.10 | % | | | 0.10 | % | | | 9.97 | % | | | 22 | % |
October 1, 2008 to September 30, 2009 | | | 2.61 | % | | | 0.12 | % | | | 0.10 | % | | | (7.00 | )% | | | 10 | % |
October 1, 2007 to September 30, 2008 | | | 2.07 | % | | | 0.11 | % | | | 0.11 | % | | | (22.28 | )% | | | 5 | % |
| | | | | |
International Growth Portfolio | | | | | | | | | | | | | | | | | | | | |
June 1, 2013 to November 30, 2013 (unaudited) | | | 0.36 | % | | | 1.03 | % | | | 1.03 | % | | | 12.75 | % | | | 22 | % |
June 1, 2012 to May 31, 2013 | | | 1.63 | % | | | 1.04 | % | | | 1.04 | % | | | 30.34 | % | | | 46 | % |
June 1, 2011 to May 31, 2012 | | | 2.04 | % | | | 0.97 | % | | | 0.90 | % | | | (9.44 | )% | | | 69 | % |
October 1, 2010 to May 31, 20112 | | | 1.62 | % | | | 1.10 | % | | | 1.10 | % | | | 14.50 | % | | | 53 | % |
October 1, 2009 to September 30, 2010 | | | 0.89 | % | | | 1.42 | % | | | 1.20 | % | | | 3.25 | % | | | 89 | % |
October 1, 2008 to September 30, 2009 | | | 1.71 | % | | | 1.14 | % | | | 1.11 | % | | | 6.23 | % | | | 95 | % |
October 1, 2007 to September 30, 2008 | | | 1.17 | % | | | 1.08 | % | | | 1.05 | % | | | (28.68 | )% | | | 57 | % |
| | | | | |
International Value Portfolio | | | | | | | | | | | | | | | | | | | | |
June 1, 2013 to November 30, 2013 (unaudited) | | | 1.63 | % | | | 0.91 | % | | | 0.91 | % | | | 12.69 | % | | | 6 | % |
June 1, 2012 to May 31, 2013 | | | 3.04 | % | | | 0.91 | % | | | 0.91 | % | | | 29.45 | % | | | 16 | % |
June 1, 2011 to May 31, 2012 | | | 3.44 | % | | | 0.91 | % | | | 0.85 | % | | | (21.07 | )% | | | 9 | % |
October 1, 2010 to May 31, 20112 | | | 3.14 | % | | | 0.94 | % | | | 0.94 | % | | | 14.00 | % | | | 16 | % |
October 1, 2009 to September 30, 2010 | | | 2.41 | % | | | 1.20 | % | | | 1.06 | % | | | 0.92 | % | | | 27 | % |
October 1, 2008 to September 30, 2009 | | | 2.72 | % | | | 1.08 | % | | | 1.03 | % | | | 5.26 | % | | | 41 | % |
October 1, 2007 to September 30, 2008 | | | 3.68 | % | | | 1.07 | % | | | 1.01 | % | | | (34.21 | )% | | | 23 | % |
Please see footnotes on page 118.
The accompanying notes are an integral part of these financial statements.
| | | | |
| 118 | | Wells Fargo Advantage Allocation Funds | | Financial highlights |
| | | | | | | | | | | | | | | | | | | | |
| | | Ratio to average net assets (annualized) | | | Total
return1 | | | Portfolio turnover
rate | |
| | | Net investment
income (loss) | | | Gross
expenses | | | Net
expenses | | | |
| | | | | |
Large Company Value Portfolio | | | | | | | | | | | | | | | | | | | | |
June 1, 2013 to November 30, 2013 (unaudited) | | | 0.99 | % | | | 0.72 | % | | | 0.72 | % | | | 13.38 | % | | | 36 | % |
June 1, 2012 to May 31, 2013 | | | 1.49 | % | | | 0.78 | % | | | 0.74 | % | | | 28.91 | % | | | 95 | % |
June 1, 2011 to May 31, 2012 | | | 1.67 | % | | | 0.77 | % | | | 0.74 | % | | | (6.06 | )% | | | 104 | % |
October 1, 2010 to May 31, 20112 | | | 1.58 | % | | | 0.78 | % | | | 0.74 | % | | | 21.46 | % | | | 38 | % |
October 1, 2009 to September 30, 2010 | | | 1.73 | % | | | 0.73 | % | | | 0.72 | % | | | 7.02 | % | | | 46 | % |
October 1, 2008 to September 30, 2009 | | | 2.69 | % | | | 0.75 | % | | | 0.69 | % | | | (9.66 | )% | | | 11 | % |
October 1, 2007 to September 30, 2008 | | | 2.16 | % | | | 0.75 | % | | | 0.57 | % | | | (23.18 | )% | | | 8 | % |
| | | | | |
Small Company Growth Portfolio | | | | | | | | | | | | | | | | | | | | |
June 1, 2013 to November 30, 2013 (unaudited) | | | (0.37 | )% | | | 0.84 | % | | | 0.84 | % | | | 20.63 | % | | | 51 | % |
June 1, 2012 to May 31, 2013 | | | (0.02 | )% | | | 0.86 | % | | | 0.86 | % | | | 31.39 | % | | | 109 | % |
June 1, 2011 to May 31, 2012 | | | (0.12 | )% | | | 0.83 | % | | | 0.83 | % | | | (10.75 | )% | | | 107 | % |
October 1, 2010 to May 31, 20112 | | | (0.42 | )% | | | 0.83 | % | | | 0.83 | % | | | 39.64 | % | | | 70 | % |
October 1, 2009 to September 30, 2010 | | | (0.48 | )% | | | 0.87 | % | | | 0.86 | % | | | 15.25 | % | | | 129 | % |
October 1, 2008 to September 30, 2009 | | | (0.53 | )% | | | 0.89 | % | | | 0.87 | % | | | 1.75 | % | | | 169 | % |
October 1, 2007 to September 30, 2008 | | | (0.53 | )% | | | 0.89 | % | | | 0.89 | % | | | (27.50 | )% | | | 150 | % |
| | | | | |
Small Company Value Portfolio | | | | | | | | | | | | | | | | | | | | |
June 1, 2013 to November 30, 2013 (unaudited) | | | 1.21 | % | | | 0.85 | % | | | 0.85 | % | | | 15.59 | % | | | 25 | % |
June 1, 2012 to May 31, 2013 | | | 0.58 | % | | | 0.85 | % | | | 0.85 | % | | | 30.76 | % | | | 57 | % |
June 1, 2011 to May 31, 2012 | | | 0.69 | % | | | 0.84 | % | | | 0.84 | % | | | (7.17 | )% | | | 60 | % |
October 1, 2010 to May 31, 20112 | | | 1.60 | % | | | 0.84 | % | | | 0.84 | % | | | 26.72 | % | | | 47 | % |
October 1, 2009 to September 30, 2010 | | | 0.31 | % | | | 0.89 | % | | | 0.89 | % | | | 16.38 | % | | | 60 | % |
October 1, 2008 to September 30, 2009 | | | 1.16 | % | | | 0.90 | % | | | 0.88 | % | | | (6.28 | )% | | | 99 | % |
October 1, 2007 to September 30, 2008 | | | 1.02 | % | | | 0.90 | % | | | 0.89 | % | | | (22.01 | )% | | | 82 | % |
| 1. | Returns for periods of less than one year are not annualized. |
| 2. | For the eight months ended May 31, 2011. The Portfolio changed its fiscal year end from September 30 to May 31, effective May 31, 2011. |
| 3. | After the close of business on January 28, 2011, the Diversified Large Cap Growth Portfolio acquired the net assets of Wells Fargo Advantage Disciplined Growth Portfolio, Wells Fargo Advantage Large Cap Appreciation Portfolio and Wells Fargo Advantage Large Company Growth Portfolio. Wells Fargo Advantage Large Company Growth Portfolio became the accounting and performance survivor in the transaction. The information for the periods prior to January 31, 2011 is that of the Wells Fargo Advantage Large Company Growth Portfolio. |
The accompanying notes are an integral part of these financial statements.
| | | | | | |
| Financial highlights | | Wells Fargo Advantage Allocation Funds | | | 119 | |
| | | | | | | | | | | | | | | | | | | | |
| | | Ratio to average net assets (annualized) | | | Total
Return1 | | | Portfolio turnover
rate | |
| | | Net investment
income | | | Gross
expenses | | | Net
expenses | | | |
| | | | | |
Core Bond Portfolio | | | | | | | | | | | | | | | | | | | | |
June 1, 2013 to November 30, 2013 (unaudited) | | | 1.95 | % | | | 0.37 | % | | | 0.35 | % | | | (0.56 | )% | | | 342 | % |
June 1, 2012 to May 31, 2013 | | | 1.75 | % | | | 0.37 | % | | | 0.35 | % | | | 2.61 | % | | | 547 | % |
June 1, 2011 to May 31, 2012 | | | 2.33 | % | | | 0.37 | % | | | 0.35 | % | | | 8.20 | % | | | 803 | % |
June 1, 2010 to May 31, 2011 | | | 2.99 | % | | | 0.37 | % | | | 0.35 | % | | | 7.02 | % | | | 789 | % |
June 1, 2009 to May 31, 2010 | | | 3.78 | % | | | 0.38 | % | | | 0.34 | % | | | 10.87 | % | | | 638 | % |
June 1, 2008 to May 31, 2009 | | | 4.92 | % | | | 0.40 | % | | | 0.39 | % | | | 6.58 | % | | | 633 | % |
| | | | | |
Inflation-Protected Bond Portfolio | | | | | | | | | | | | | | | | | | | | |
June 1, 2013 to November 30, 2013 (unaudited) | | | 1.23 | % | | | 0.52 | % | | | 0.44 | % | | | (3.91 | )% | | | 4 | % |
June 1, 2012 to May 31, 2013 | | | 1.52 | % | | | 0.50 | % | | | 0.44 | % | | | (1.86 | )% | | | 15 | % |
June 1, 2011 to May 31, 2012 | | | 3.00 | % | | | 0.48 | % | | | 0.44 | % | | | 12.62 | % | | | 23 | % |
June 1, 2010 to May 31, 2011 | | | 3.25 | % | | | 0.44 | % | | | 0.43 | % | | | 8.19 | % | | | 19 | % |
June 1, 2009 to May 31, 2010 | | | 3.53 | % | | | 0.45 | % | | | 0.44 | % | | | 8.28 | % | | | 31 | % |
June 1, 2008 to May 31, 2009 | | | 1.70 | % | | | 0.45 | % | | | 0.37 | % | | | (1.33 | )% | | | 53 | % |
| | | | | |
Managed Fixed Income Portfolio | | | | | | | | | | | | | | | | | | | | |
June 1, 2013 to November 30, 2013 (unaudited) | | | 3.35 | % | | | 0.48 | % | | | 0.39 | % | | | (0.80 | )% | | | 10 | % |
June 1, 2012 to May 31, 2013 | | | 3.42 | % | | | 0.47 | % | | | 0.39 | % | | | 4.81 | % | | | 49 | % |
June 1, 2011 to May 31, 2012 | | | 3.83 | % | | | 0.46 | % | | | 0.39 | % | | | 6.97 | % | | | 51 | % |
June 1, 2010 to May 31, 2011 | | | 3.97 | % | | | 0.45 | % | | | 0.39 | % | | | 8.84 | % | | | 104 | % |
June 1, 2009 to May 31, 2010 | | | 3.64 | % | | | 0.42 | % | | | 0.38 | % | | | 14.58 | % | | | 59 | % |
June 1, 2008 to May 31, 2009 | | | 5.09 | % | | | 0.43 | % | | | 0.34 | % | | | (1.72 | )% | | | 132 | % |
| | | | | |
Stable Income Portfolio | | | | | | | | | | | | | | | | | | | | |
June 1, 2013 to November 30, 2013 (unaudited) | | | 1.46 | % | | | 0.65 | % | | | 0.41 | % | | | 0.79 | % | | | 17 | % |
June 1, 2012 to May 31, 2013 | | | 1.50 | % | | | 0.58 | % | | | 0.41 | % | | | 2.78 | % | | | 20 | % |
June 1, 2011 to May 31, 2012 | | | 1.76 | % | | | 0.59 | % | | | 0.41 | % | | | 1.71 | % | | | 11 | % |
June 1, 2010 to May 31, 2011 | | | 2.02 | % | | | 0.54 | % | | | 0.40 | % | | | 2.97 | % | | | 14 | % |
June 1, 2009 to May 31, 2010 | | | 1.90 | % | | | 0.43 | % | | | 0.40 | % | | | 9.94 | % | | | 10 | % |
June 1, 2008 to May 31, 2009 | | | 3.74 | % | | | 0.43 | % | | | 0.42 | % | | | (2.73 | )% | | | 7 | % |
| 1. | Returns for periods of less than one year are not annualized. |
The accompanying notes are an integral part of these financial statements.
| | | | |
| 120 | | Wells Fargo Advantage Allocation Funds | | Notes to financial statements (unaudited) |
1. ORGANIZATION
Wells Fargo Master Trust (the “Trust”), a Delaware statutory trust organized on March 10, 1999, is an open-end management investment company registered under the Investment Company Act of 1940, as amended (the “1940 Act”). These financial statements report on the following portfolios: the Wells Fargo Advantage C&B Large Cap Value Portfolio (“C&B Large Cap Value Portfolio”), the Wells Fargo Advantage Diversified Large Cap Growth Portfolio (“Diversified Large Cap Growth Portfolio”), the Wells Fargo Advantage Emerging Growth Portfolio (“Emerging Growth Portfolio”), the Wells Fargo Advantage Index Portfolio (“Index Portfolio”), the Wells Fargo Advantage International Growth Portfolio (“International Growth Portfolio”), the Wells Fargo Advantage International Value Portfolio (“International Value Portfolio”), the Wells Fargo Advantage Large Company Value Portfolio (“Large Company Value Portfolio”), the Wells Fargo Advantage Small Company Growth Portfolio (“Small Company Growth Portfolio”), the Wells Fargo Advantage Small Company Value Portfolio (“Small Company Value Portfolio”), the Wells Fargo Advantage Core Bond Portfolio (“Core Bond Portfolio”), the Wells Fargo Advantage Inflation-Protected Bond Portfolio (“Inflation-Protected Bond Portfolio”), the Wells Fargo Advantage Managed Fixed Income Portfolio (“Managed Fixed Income Portfolio”), and the Wells Fargo Advantage Stable Income Portfolio (“Stable Income Portfolio”) (each, a “Portfolio”, collectively, the “Portfolios”). Each Portfolio is a diversified series of the Trust.
The Portfolios, which are master portfolios in a master/feeder structure, offer their shares to multiple feeder funds and other master portfolios rather than directly to the public.
2. SIGNIFICANT ACCOUNTING POLICIES
The following significant accounting policies, which are consistently followed in the preparation of the financial statements of each Portfolio, are in conformity with U.S. generally accepted accounting principles which require management to make estimates and assumptions that affect the reported amounts of assets and liabilities, disclosure of contingent assets and liabilities at the date of the financial statements, and the reported amounts of revenues and expenses during the reporting period. Actual results could differ from those estimates.
Securities valuation
All investments are valued each business day as of the close of regular trading on the New York Stock Exchange (generally 4 p.m. Eastern Time).
Equity securities and futures that are listed on a foreign or domestic exchange or market are valued at the official closing price or, if none, the last sales price. If no sale occurs on the primary exchange or market for the security that day, the prior day’s price will be deemed “stale” and fair values will be determined in accordance with the Portfolios’ Valuation Procedures.
The values of securities denominated in foreign currencies will be converted to U.S. dollars at rates provided by an independent foreign currency pricing source at a time each business day specified by the Management Valuation Team of Wells Fargo Funds Management, LLC (“Funds Management”).
Many securities markets and exchanges outside the U.S. close prior to the close of the New York Stock Exchange and therefore may not fully reflect trading or events that occur after the close of the principal exchange in which the foreign securities are traded, but before the close of the New York Stock Exchange. If such trading or events are expected to materially affect the value of such securities, then fair value pricing procedures approved by the Board of Trustees of the Portfolios are applied. These procedures take into account multiple factors including movements in U.S. securities markets after foreign exchanges close. Foreign securities that are fair valued under these procedures are categorized as Level 2 and the application of these procedures may result in transfers between Level 1 and Level 2. Depending on market activity, such fair valuations may be frequent. Such fair value pricing may result in NAVs that are higher or lower than NAVs based on the last reported sales price or latest quoted bid price. On November 30, 2013, such fair value pricing was not used in pricing foreign securities.
Fixed income securities acquired with maturities exceeding 60 days are valued based on evaluated bid prices provided by an independent pricing service which may utilize both transaction data and market information such as yield, quality, coupon rate, maturity, type of issue, trading characteristics and other market data. If prices are not available from the independent pricing service or prices received are deemed not representative of market value, prices will be obtained from an independent broker-dealer or otherwise determined based on the Portfolios’ Valuation Procedures.
Short-term securities, with maturities of 60 days or less at time of purchase, generally are valued at amortized cost which approximates fair value. The amortized cost method involves valuing a security at its cost, plus accretion of discount or minus amortization of premium over the period until maturity.
Investments in registered open-end investment companies are valued at net asset value. Non-registered investment vehicles are fair valued at net asset value.
| | | | | | |
| Notes to financial statements (unaudited) | | Wells Fargo Advantage Allocation Funds | | | 121 | |
Investments which are not valued using any of the methods discussed above are valued at their fair value, as determined in good faith by the Board of Trustees. The Board of Trustees has established a Valuation Committee comprised of the Trustees and has delegated to it the authority to take any actions regarding the valuation of portfolio securities that the Valuation Committee deems necessary or appropriate, including determining the fair value of portfolio securities, unless the determination has been delegated to the Management Valuation Team. The Board of Trustees retains the authority to make or ratify any valuation decisions or approve any changes to the Valuation Procedures as it deems appropriate. On a quarterly basis, the Board of Trustees receives reports on any valuation actions taken by the Valuation Committee or the Management Valuation Team which may include items for ratification.
Valuations of fair valued securities are compared to the next actual sales price when available, or other appropriate market values, to assess the continued appropriateness of the fair valuation methodologies used. These securities are fair valued on a day-to-day basis, taking into consideration changes to appropriate market information and any significant changes to the inputs considered in the valuation process until there is a readily available price provided on an exchange or by an independent pricing service. Valuations received from an independent pricing service or independent broker-dealer quotes are periodically validated by comparisons to most recent trades and valuations provided by other independent pricing services in addition to the review of prices by the adviser and/or subadviser. Unobservable inputs used in determining fair valuations are identified based on the type of security, taking into consideration factors utilized by market participants in valuing the investment, knowledge about the issuer and the current market environment.
Foreign currency translation
The accounting records of the Portfolios are maintained in U.S. dollars. The value of other assets and liabilities denominated in foreign currencies will be converted to U.S. dollars at rates provided by an independent foreign currency pricing source at a time each business day specified by the Management Valuation Team. Purchases and sales of securities, and income and expenses are converted at the rate of exchange on the respective dates of such transactions. Reported net realized foreign exchange gains or losses arise from sales of foreign currencies, currency gains or losses realized between the trade and settlement dates on securities transactions, and the difference between the amounts of dividends, interest and foreign withholding taxes recorded and the U.S. dollar equivalent of the amounts actually paid or received. Net unrealized foreign exchange gains and losses arise from changes in the fair value of assets and liabilities other than investments in securities resulting from changes in exchange rates.
The changes in net assets arising from changes in exchange rates and the changes in net assets resulting from changes in market prices of securities are not separately presented. Such changes are recorded with net realized and unrealized gains or losses from investments. Gains and losses from certain foreign currency transactions are treated as ordinary income for U.S. federal income tax purposes.
Security loans
The Portfolios may lend their securities from time to time in order to earn additional income in the form of fees or interest on securities received as collateral or the investment of any cash received as collateral. The Portfolios continue to receive interest or dividends on the securities loaned. The Portfolios receive collateral in the form of cash or securities with a value at least equal to the value of the securities on loan. The value of the loaned securities is determined at the close of each business day and any additional required collateral is delivered to the Portfolios on the next business day. In a securities lending transaction, the net asset value of the Portfolios will be affected by an increase or decrease in the value of the securities loaned and by an increase or decrease in the value of the instrument in which collateral is invested. The amount of securities lending activity undertaken by the Portfolios fluctuate from time to time, In the event of default or bankruptcy by the borrower, the Portfolios may be prevented from recovering the loaned securities or gaining access to the collateral or may experience delays or costs in doing so. In addition, the investment of any cash collateral received may lose all or part of its value. The Portfolios have the right under the lending agreement to recover the securities from the borrower on demand.
The Portfolios lend their securities through an unaffiliated securities lending agent. Cash collateral received in connection with its securities lending transactions is invested in Wells Fargo Securities Lending Cash Investments, LLC (the “Securities Lending Fund”). The Securities Lending Fund is exempt from registration under Section 3(c)(7) of the 1940 Act and is managed by Funds Management and is subadvised by Wells Capital Management Incorporated (“WellsCap”). Funds Management receives an advisory fee starting at 0.05% and declining to 0.01% as the average daily net assets of the Securities Lending Fund increase. All of the fees received by Funds Management are paid to WellsCap for its services as subadviser. The Securities Lending Fund seeks to provide a positive return compared to the daily Fed Funds Open rate by investing in high-quality, U.S. dollar-denominated short-term money market instruments. Securities Lending Fund investments are fair valued based upon the amortized cost valuation technique. Income earned from investment in the Securities Lending Fund is included in securities lending income on the Statements of Operations.
| | | | |
| 122 | | Wells Fargo Advantage Allocation Funds | | Notes to financial statements (unaudited) |
When-issued transactions
Each Portfolio may purchase securities on a forward commitment or when-issued basis. A Portfolio records a when-issued transaction on the trade date and will segregate assets in an amount at least equal in value to the Portfolio’s commitment to purchase when-issued securities. Securities purchased on a when-issued basis are marked-to-market daily and the Portfolio begins earning interest on the settlement date. Losses may arise due to changes in the market value of the underlying securities or if the counterparty does not perform under the contract.
Term loans
Each Portfolio may invest in term loans. The Portfolio begins earning interest when the loans are funded. The loans pay interest at rates which are periodically reset by reference to a base lending rate plus a spread. The Portfolio assumes the credit risk of the borrower and there could be potential loss to the Portfolio in the event of default by the borrower.
Futures contracts
Each Portfolio may be subject to interest rate risk and equity price risk in the normal course of pursuing its investment objectives. The Portfolio may buy and sell futures contracts in order to gain exposure to, or protect against, changes in security values and interest rates. The primary risks associated with the use of futures contracts are the imperfect correlation between changes in market values of securities held by the Portfolio and the prices of futures contracts, and the possibility of an illiquid market.
Futures contracts are valued based upon their quoted daily settlement prices when available. The aggregate principal amounts of the contracts are not recorded in the financial statements. Fluctuations in the value of the contracts are recorded in the Statements of Assets and Liabilities as an asset or liability and in the Statements of Operations as unrealized gains or losses until the contracts are closed, at which point they are recorded as net realized gains or losses on futures contracts. With futures contracts, there is minimal counterparty risk to the Portfolio since futures are exchange traded and the exchange’s clearinghouse, as counterparty to all exchange traded futures, guarantees the futures against default.
TBA sale commitments
Each Portfolio may enter into To Be Announced (“TBA”) sale commitments to hedge its portfolio positions or to sell mortgage-backed securities it owns under delayed delivery arrangements. Proceeds of TBA sale commitments are not received until the contractual settlement date. During the time a TBA sale commitment is outstanding, equivalent deliverable securities or offsetting TBA purchase commitments, which are deliverable on or before the sale commitment date, are held as “cover” for the transaction. Unsettled TBA sale commitments are valued at the current market value of the underlying securities, generally according to the procedures described under “Securities valuation”. The contract is marked-to-market daily and the change in market value is recorded by the Portfolio as an unrealized gain or loss. If the TBA sale commitment is closed through the acquisition of an offsetting purchase commitment, the Portfolio realizes a gain or loss. If the Portfolio delivers securities under the commitment, the Portfolio realizes a gain or a loss from the sale of the securities based upon the unit price established at the date the commitment was entered into.
Inflation-indexed bonds and TIPS
Each Portfolio may invest in inflation-indexed bonds, including Treasury inflation-protected securities (TIPS). Inflation-indexed bonds are fixed income securities whose principal value is periodically adjusted according to the rate of inflation. If the index measuring inflation falls, the principal value of inflation-indexed bonds (other than municipal inflation indexed bonds and certain corporate inflation-indexed bonds) will be adjusted downward, and consequently the interest payable on these securities (calculated with respect to a smaller principal amount) will be reduced. Repayment of the original bond principal upon maturity (as adjusted for inflation) is guaranteed in the case of U.S. Treasury inflation-indexed bonds. For bonds that do not provide a similar guarantee, the adjusted principal value of the bond repaid at maturity may be less than the original principal. The value of inflation-indexed bonds is expected to change in response to changes in real interest rates. Real interest rates are tied to the relationship between nominal interest rates and the rate of inflation. If nominal interest rates increase at a faster rate than inflation, real interest rates may rise, leading to a decrease in value of inflation-indexed bonds. Inflation-indexed bonds, including TIPS, decline in value when real interest rates rise. In certain interest rate environments, such as when real interest rates are rising faster than nominal interest rates, inflation-indexed bonds may experience greater losses than other fixed income securities with similar durations.
Credit default swaps
Each Portfolio may be subject to credit risk in the normal course of pursuing its investment objectives. The Portfolio may enter into credit default swap contracts for hedging or speculative purposes to provide or receive a measure of protection against default on a referenced entity, obligation or index or for investment gains. Credit default swaps involve an exchange of a stream of payments for protection against the loss in value of an underlying security or index.
| | | | | | |
| Notes to financial statements (unaudited) | | Wells Fargo Advantage Allocation Funds | | | 123 | |
Under the terms of the swap, one party acts as a guarantor (referred to as the seller of protection) and receives a periodic stream of payments, provided that there is no credit event, from another party (referred to as the buyer of protection) that is a fixed percentage applied to a notional principal amount over the term of the swap. An index credit default swap references all the names in the index, and if a credit event is triggered, the credit event is settled based on that name’s weight in the index. A credit event includes bankruptcy, failure to pay, obligation default, obligation acceleration, repudiation/moratorium, and restructuring. The Portfolio may enter into credit default swaps as either the seller of protection or the buyer of protection. As the seller of protection, the Portfolio is subject to investment exposure on the notional amount of the swap and has assumed the risk of default of the underlying security or index. As the buyer of protection, the Portfolio could be exposed to risks if the seller of the protection defaults on its obligation to perform, or if there are unfavorable changes in the fluctuation of interest rates. The maximum potential amount of future payments (undiscounted) that the Portfolio as the seller of protection could be required to make under the credit default swap contract would be an amount equal to the notional amount of the swap contract. The Portfolio’s maximum risk of loss from counterparty risk, either as the protection seller or as the protection buyer, is the fair value of the contract. This risk is mitigated by having a master netting arrangement between the Portfolio and the counterparty and by having the counterparty post collateral to cover the Portfolio’s exposure to the counterparty.
If the Portfolio is the seller of protection and a credit event occurs, as defined under the terms of that particular swap agreement, the Portfolio will pay to the buyer of protection the notional amount of the swap and take delivery of the referenced obligation or underlying securities comprising the referenced index. If the Portfolio is the buyer of protection and a credit event occurs, as defined under the terms of that particular swap agreement, the Portfolio will receive from the seller of protection the notional amount of the swap and deliver the referenced obligation or underlying securities comprising the referenced index.
Any premiums paid or received on the transactions are recorded as an asset or liability on the Statements of Assets and Liabilities and amortized. The value of the swap contract is marked-to-market daily based on quotations from an independent pricing service or market makers and any change in value is recorded as an unrealized gain or loss. Periodic payments made or received are recorded as realized gains or losses. In addition, payments received or made as a result of a credit event or termination of the contract are recognized as realized gains or losses.
Certain credit default swap contracts entered into by the Portfolio provide for conditions that result in events of default or termination that enable the counterparty to the agreement to cause an early termination of the transactions under those agreements. Any election by the counterparty to terminate early may impact the amounts reported on the financial statements.
Mortgage dollar roll transactions
Each Portfolio may engage in mortgage dollar roll transactions through TBA mortgage-backed securities issued by Government National Mortgage Association (GNMA), Federal National Mortgage Association (FNMA) and Federal Home Loan Mortgage Corporation (FHLMC). In a mortgage dollar roll transaction, a Portfolio sells a mortgage-backed security to a financial institution, such as a bank or broker-dealer and simultaneously agrees to repurchase a substantially similar security from the institution at a later date at an agreed upon price. The mortgage-backed securities that are repurchased will bear the same interest rate as those sold, but generally will be collateralized by different pools of mortgages with different pre-payment histories. During the roll period, a Portfolio foregoes principal and interest paid on the securities. A Portfolio is compensated by the difference between the current sales price and the forward price for the future purchase as well as by the earnings on the cash proceeds of the initial sale. Mortgage dollar rolls may be renewed without physical delivery of the securities subject to the contract. The Portfolios account for TBA dollar roll transactions as purchases and sales.
Security transactions and income recognition
Securities transactions are recorded on a trade date basis. Realized gains or losses are recorded on the basis of identified cost.
Interest income is accrued daily and bond discounts are accreted and premiums are amortized daily based on the effective interest method. To the extent debt obligations are placed on non-accrual status, any related interest income may be reduced by writing off interest receivables when the collection of all or a portion of interest has become doubtful based on consistently applied procedures. If the issuer subsequently resumes interest payments or when the collectability of interest is reasonably assured, the debt obligation is removed from non-accrual status.
Dividend income is recognized on the ex-dividend date, except for certain dividends from foreign securities, which are recorded as soon as the Portfolio is informed of the ex-dividend date.
Income from foreign securities is recorded net of foreign taxes withheld where recovery of such taxes is not assured.
| | | | |
| 124 | | Wells Fargo Advantage Allocation Funds | | Notes to financial statements (unaudited) |
Federal and other taxes
Each Portfolio is treated as a separate entity for federal income tax purposes. The Portfolios are not required to pay federal income taxes on their net investment income and net capital gain as they are treated as partnerships for federal income tax purposes. All interest, dividends, gains and losses of a Portfolio are deemed to have been “passed through” to the interestholders in proportion to their holdings of the Portfolio regardless of whether such interest, dividends and gains have been distributed by the Portfolio.
Each Portfolio’s income tax returns and all financial records supporting those returns for the prior three fiscal years are subject to examination by the federal revenue authority. Management has analyzed each Portfolio’s tax positions taken on federal, state, and foreign tax returns for all open tax years and does not believe that there are any uncertain tax positions that require recognition of a tax liability.
3. FAIR VALUATION MEASUREMENTS
Fair value measurements of investments are determined within a framework that has established a fair value hierarchy based upon the various data inputs utilized in determining the value of each Portfolio’s investments. The three-level hierarchy gives the highest priority to unadjusted quoted prices in active markets for identical assets or liabilities (Level 1) and the lowest priority to significant unobservable inputs (Level 3). Each Portfolio’s investments are classified within the fair value hierarchy based on the lowest level of input that is significant to the fair value measurement. The inputs are summarized into three broad levels as follows:
| n | | Level 1 – quoted prices in active markets for identical securities |
| n | | Level 2 – other significant observable inputs (including quoted prices for similar securities, interest rates, prepayment speeds, credit risk, use of amortized cost, etc.) |
| n | | Level 3 – significant unobservable inputs (including the Portfolio’s own assumptions in determining the fair value of investments) |
The inputs or methodologies used for valuing investments in securities are not necessarily an indication of the risk associated with investing in those securities.
As of November 30, 2013, the inputs used in valuing investments in securities were as follows:
| | | | | | | | | | | | | | | | |
| Investments in securities | | Quoted prices
(Level 1) | | | Other significant
observable inputs
(Level 2) | | | Significant
unobservable inputs
(Level 3) | | | Total | |
C&B Large Cap Value Portfolio | | | | | | | | | | | | | | | | |
| | | | |
Equity securities | | | | | | | | | | | | | | | | |
Common stocks | | $ | 326,379,392 | | | $ | 6,077,001 | | | $ | 0 | | | $ | 332,456,393 | |
Preferred stocks | | | 0 | | | | 1,545,244 | | | | 0 | | | | 1,545,244 | |
| | | | |
Short-term investments | | | | | | | | | | | | | | | | |
Investment companies | | | 16,519,640 | | | | 0 | | | | 0 | | | | 16,519,640 | |
Total | | $ | 342,899,032 | | | $ | 7,622,245 | | | $ | 0 | | | $ | 350,521,277 | |
Diversified Large Cap Growth Portfolio | | | | | | | | | | | | | | | | |
| | | | |
Equity securities | | | | | | | | | | | | | | | | |
Common stocks | | $ | 152,315,144 | | | $ | 0 | | | $ | 0 | | | $ | 152,315,144 | |
| | | | |
Short-term investments | | | | | | | | | | | | | | | | |
Investment companies | | | 1,076,336 | | | | 4,148,421 | | | | 0 | | | | 5,224,757 | |
Total | | $ | 153,391,480 | | | $ | 4,148,421 | | | $ | 0 | | | $ | 157,539,901 | |
Emerging Growth Portfolio | | | | | | | | | | | | | | | | |
| | | | |
Equity securities | | | | | | | | | | | | | | | | |
Common stocks | | $ | 1,217,490,452 | | | $ | 0 | | | $ | 0 | | | $ | 1,217,490,452 | |
| | | | |
Short-term investments | | | | | | | | | | | | | | | | |
Investment companies | | | 13,303,139 | | | | 31,741,350 | | | | 0 | | | $ | 45,044,489 | |
Total | | $ | 1,230,793,591 | | | $ | 31,741,350 | | | $ | 0 | | | $ | 1,262,534,941 | |
| | | | | | |
| Notes to financial statements (unaudited) | | Wells Fargo Advantage Allocation Funds | | | 125 | |
| | | | | | | | | | | | | | | | |
| Investments in securities | | Quoted prices
(Level 1) | | | Other significant
observable inputs
(Level 2) | | | Significant
unobservable inputs
(Level 3) | | | Total | |
Index Portfolio | | | | | | | | | | | | | | | | |
| | | | |
Equity securities | | | | | | | | | | | | | | | | |
Common stocks | | $ | 2,807,726,588 | | | $ | 0 | | | $ | 0 | | | $ | 2,807,726,588 | |
| | | | |
Short-term investments | | | | | | | | | | | | | | | | |
Investment companies | | | 32,725,140 | | | | 9,164,555 | | | | 0 | | | | 41,889,695 | |
U.S. Treasury securities | | | 699,994 | | | | 1,749,561 | | | | 0 | | | | 2,449,555 | |
Total | | $ | 2,841,151,722 | | | $ | 10,914,116 | | | $ | 0 | | | $ | 2,852,065,838 | |
International Growth Portfolio | | | | | | | | | | | | | | | | |
| | | | |
Equity securities | | | | | | | | | | | | | | | | |
Common stocks | | $ | 146,205,671 | | | $ | 25,468 | | | $ | 0 | | | $ | 146,231,139 | |
Participatory notes | | | 0 | | | | 573,788 | | | | 0 | | | | 573,788 | |
Preferred stocks | | | 2,250,105 | | | | 0 | | | | 0 | | | | 2,250,105 | |
| | | | |
Short-term investments | | | | | | | | | | | | | | | 0 | |
Investment companies | | | 6,093,828 | | | | 765,419 | | | | 0 | | | | 6,859,247 | |
Total | | $ | 154,549,604 | | | $ | 1,364,675 | | | $ | 0 | | | $ | 155,914,279 | |
International Value Portfolio | | | | | | | | | | | | | | | | |
| | | | |
Equity securities | | | | | | | | | | | | | | | | |
Common stocks | | $ | 458,406,633 | | | $ | 5,026,282 | | | $ | 0 | | | $ | 463,432,915 | |
Preferred stocks | | | 3,096,128 | | | | 0 | | | | 0 | | | | 3,096,128 | |
| | | | |
Short-term investments | | | | | | | | | | | | | | | | |
Investment companies | | | 2,748,860 | | | | 9,341,704 | | | | 0 | | | | 12,090,564 | |
Total | | $ | 464,251,621 | | | $ | 14,367,986 | | | $ | 0 | | | $ | 478,619,607 | |
Large Company Value Portfolio | | | | | | | | | | | | | | | | |
| | | | |
Equity securities | | | | | | | | | | | | | | | | |
Common stocks | | $ | 99,489,473 | | | $ | 0 | | | $ | 0 | | | $ | 99,489,473 | |
| | | | |
Short-term investments | | | | | | | | | | | | | | | | |
Investment companies | | | 2,329,957 | | | | 2,575,400 | | | | 0 | | | | 4,905,357 | |
Total | | $ | 101,819,430 | | | $ | 2,575,400 | | | $ | 0 | | | $ | 104,394,830 | |
Small Company Growth Portfolio | | | | | | | | | | | | | | | | |
| | | | |
Equity securities | | | | | | | | | | | | | | | | |
Common stocks | | $ | 231,460,391 | | | $ | 0 | | | $ | 0 | | | $ | 231,460,391 | |
| | | | |
Short-term investments | | | | | | | | | | | | | | | | |
Investment companies | | | 9,672,711 | | | | 12,598,600 | | | | 0 | | | | 22,271,311 | |
Total | | $ | 241,133,102 | | | $ | 12,598,600 | | | $ | 0 | | | $ | 253,731,702 | |
Small Company Value Portfolio | | | | | | | | | | | | | | | | |
| | | | |
Equity securities | | | | | | | | | | | | | | | | |
Common stocks | | $ | 202,090,977 | | | $ | 0 | | | $ | 0 | | | $ | 202,090,977 | |
Warrants | | | 0 | | | | 10,778 | | | | 0 | | | | 10,778 | |
| | | | |
Short-term investments | | | | | | | | | | | | | | | | |
Investment companies | | | 6,438,413 | | | | 8,987,147 | | | | 0 | | | | 15,425,560 | |
Total | | $ | 208,529,390 | | | $ | 8,997,925 | | | $ | 0 | | | $ | 217,527,315 | |
| | | | |
| 126 | | Wells Fargo Advantage Allocation Funds | | Notes to financial statements (unaudited) |
| | | | | | | | | | | | | | | | |
| Investments in securities | | Quoted prices
(Level 1) | | | Other significant
observable inputs
(Level 2) | | | Significant
unobservable inputs
(Level 3) | | | Total | |
Core Bond Portfolio | | | | | | | | | | | | | | | | |
| | | | |
Agency securities | | $ | 0 | | | $ | 1,033,841,344 | | | $ | 0 | | | $ | 1,033,841,344 | |
| | | | |
Asset-backed securities | | | 0 | | | | 434,124,222 | | | | 0 | | | | 434,124,222 | |
| | | | |
Corporate bonds and notes | | | 0 | | | | 555,111,024 | | | | 0 | | | | 555,111,024 | |
| | | | |
Municipal obligations | | | 0 | | | | 29,429,558 | | | | 0 | | | | 29,429,558 | |
| | | | |
Non-agency mortgage backed securities | | | 0 | | | | 214,467,880 | | | | 0 | | | | 214,467,880 | |
| | | | |
U.S. Treasury securities | | | 553,754,061 | | | | 0 | | | | 0 | | | | 553,754,061 | |
| | | | |
Yankee corporate bonds and notes | | | 0 | | | | 191,000,052 | | | | 0 | | | | 191,000,052 | |
| | | | |
Yankee government bonds | | | 0 | | | | 58,409,823 | | | | 0 | | | | 58,409,823 | |
| | | | |
Short-term investments | | | | | | | | | | | | | | | | |
Investment companies | | | 67,603,250 | | | | 0 | | | | 0 | | | | 67,603,250 | |
Total | | $ | 621,357,311 | | | $ | 2,516,383,903 | | | $ | 0 | | | $ | 3,137,741,214 | |
Inflation-Protected Bond Portfolio | | | | | | | | | | | | | | | | |
| | | | |
U.S. Treasury securities | | $ | 53,610,497 | | | $ | 0 | | | $ | 0 | | | $ | 53,610,497 | |
| | | | |
Short-term investments | | | | | | | | | | | | | | | | |
Investment companies | | | 378,253 | | | | 0 | | | | 0 | | | | 378,253 | |
Total | | $ | 53,988,750 | | | $ | 0 | | | $ | 0 | | | $ | 53,988,750 | |
Managed Fixed Income Portfolio | | | | | | | | | | | | | | | | |
| | | | |
Agency securities | | $ | 0 | | | $ | 33,743,593 | | | $ | 0 | | | $ | 33,743,593 | |
| | | | |
Asset-backed securities | | | 0 | | | | 240,832 | | | | 0 | | | | 240,832 | |
| | | | |
Corporate bonds and notes | | | 0 | | | | 33,906,946 | | | | 0 | | | | 33,906,946 | |
| | | | |
Municipal obligations | | | 0 | | | | 9,630,299 | | | | 0 | | | | 9,630,299 | |
| | | | |
Non-agency mortgage backed securities | | | 0 | | | | 8,852,705 | | | | 1,378,169 | | | | 10,230,874 | |
| | | | |
Term loans | | | 0 | | | | 26,353 | | | | 0 | | | | 26,353 | |
| | | | |
U.S. Treasury securities | | | 10,742,930 | | | | 3,108,711 | | | | 0 | | | | 13,851,641 | |
| | | | |
Yankee corporate bonds and notes | | | 0 | | | | 6,058,714 | | | | 0 | | | | 6,058,714 | |
| | | | |
Yankee government bonds | | | 0 | | | | 473,509 | | | | 0 | | | | 473,509 | |
| | | | |
Short-term investments | | | | | | | | | | | | | | | | |
Investment companies | | | 7,207,312 | | | | 1,165,688 | | | | 0 | | | | 8,373,000 | |
Total | | $ | 17,950,242 | | | $ | 97,207,350 | | | $ | 1,378,169 | | | $ | 116,535,761 | |
Stable Income Portfolio | | | | | | | | | | | | | | | | |
| | | | |
Agency securities | | $ | 0 | | | $ | 10,270,183 | | | $ | 0 | | | $ | 10,270,183 | |
| | | | |
Asset-backed securities | | | 0 | | | | 2,455,689 | | | | 0 | | | | 2,455,689 | |
| | | | |
Corporate bonds and notes | | | 0 | | | | 5,430,430 | | | | 0 | | | | 5,430,430 | |
| | | | |
Municipal obligations | | | 0 | | | | 762,499 | | | | 0 | | | | 762,499 | |
| | | | |
Non-agency mortgage backed securities | | | 0 | | | | 1,330,088 | | | | 0 | | | | 1,330,088 | |
| | | | |
Yankee corporate bonds and notes | | | 0 | | | | 620,756 | | | | 0 | | | | 620,756 | |
| | | | |
Short-term investments | | | | | | | | | | | | | | | | |
Investment companies | | | 3,452,523 | | | | 0 | | | | 0 | | | | 3,452,523 | |
U.S. Treasury securities | | | 1,224,822 | | | | 0 | | | | 0 | | | | 1,224,822 | |
Total | | $ | 4,677,345 | | | $ | 20,869,645 | | | $ | 0 | | | $ | 25,546,990 | |
| | | | | | |
| Notes to financial statements (unaudited) | | Wells Fargo Advantage Allocation Funds | | | 127 | |
As of November 30, 2013, the inputs used in valuing each Portfolio’s other financial instruments, which are carried at fair value, were as follows:
| | | | | | | | | | | | | | | | |
| Future contracts | | Quoted prices
(Level 1) | | | Other significant
observable inputs
(Level 2) | | | Significant
unobservable inputs
(Level 3) | | | Total | |
Index Portfolio | | $ | 1,280,490 | + | | $ | 0 | | | $ | 0 | | | $ | 1,280,490 | |
Stable Income Portfolio | | | (978 | )+ | | | 0 | | | | 0 | | | | (978 | ) |
| + | Amount represents the net unrealized gains (losses). |
Transfers in and transfers out are recognized at the end of the reporting period. For the six months ended November 30, 2013, the Portfolios did not have any transfers into/out of Level 1 or Level 2.
The following is a reconciliation of assets in which significant unobservable inputs (Level 3) were used in determining fair value:
| | | | |
| | | Managed Fixed
Income Portfolio | |
| | Non-agency
mortgage
backed
securities | |
Balance as of May 31, 2013 | | $ | 1,482,769 | |
Accrued discounts (premiums) | | | 0 | |
Realized gains (losses) | | | 0 | |
Change in unrealized gains (losses) | | | 67,110 | |
Purchases | | | 0 | |
Sales | | | (171,710 | ) |
Transfers into Level 3 | | | 0 | |
Transfers out of Level 3 | | | 0 | |
Balance as of November 30, 2013 | | $ | 1,378,169 | |
Change in unrealized gains (losses) relating to securities still held at November 30, 2013 | | $ | (5,008 | ) |
The investment type categorized above was valued using indicative broker quotes and are therefore considered Level 3 inputs. Quantitative unobservable inputs used by the brokers are often proprietary and not provided to the Portfolio and therefore the disclosure that would address these inputs is not included above.
4. TRANSACTIONS WITH AFFILIATES AND OTHER EXPENSES
Advisory fee
The Trust has entered into an advisory contract with Funds Management, an indirect wholly owned subsidiary of Wells Fargo & Company (“Wells Fargo”). The adviser is responsible for implementing investment policies and guidelines and for supervising the subadvisers, who are responsible for day-to-day portfolio management of the Portfolios.
Funds Management has retained the services of certain subadvisers to provide daily portfolio management for the Portfolios. Funds Management has engaged WellsCap (an affiliate of Funds Management and an indirect wholly on subsidiary of Wells Fargo), Peregrine Capital Management, Inc. (an affiliate of Funds Management and an indirect wholly on subsidiary of Wells Fargo), Artisan Partners Limited Partnership, Cooke & Bieler, L.P., Galliard Capital Management, Inc. (an affiliate of Funds Management and an indirect wholly on subsidiary of Wells Fargo), Golden Capital Management, LLC (an affiliate of Funds Management), LSV Asset Management and Phocas Financial Corporation as subadvisers.
| | | | |
| 128 | | Wells Fargo Advantage Allocation Funds | | Notes to financial statements (unaudited) |
The fees for sub-advisory services are borne by Funds Management. The subadvisers are each entitled to receive from Funds Management an annual subadvisory fee which is calculated based on the average daily net assets of each subadvisers’ portion the Portfolio.
The annual advisory and subadvisory fee rates for each Portfolio is as follows:
| | | | | | | | | | | | | | | | | | | | |
| | | Advisory fee | | | Effective rate for
the six months ended November 30, 2013 | | | Subadviser | | Subadvisory fee | |
| | | starting at | | | declining to | | | | | starting at | | declining to | |
C&B Large Cap Value Portfolio | | | 0.65 | % | | | 0.55 | % | | | 0.65 | % | | Cooke & Bieler, L.P. | | 0.38% | | | 0.30 | % |
Diversified Large Cap Growth Portfolio | | | 0.65 | % | | | 0.55 | % | | | 0.65 | % | | WellsCap | | 0.30% | | | 0.20 | % |
Emerging Growth Portfolio | | | 0.80 | %1 | | | 0.68 | %1 | | | 0.78 | % | | WellsCap | | 0.55% | | | 0.40 | % |
Index Portfolio | | | 0.10 | % | | | 0.05 | % | | | 0.08 | % | | Golden Capital Management, LLC | | 0.05% | | | 0.02 | % |
International Growth Portfolio | | | 0.85 | % | | | 0.70 | % | | | 0.85 | % | | Artisan Partners Limited Partnership | | 0.80% | | | 0.50 | % |
International Value Portfolio | | | 0.85 | % | | | 0.70 | % | | | 0.85 | % | | LSV Asset Management | | 0.35% | | | 0.30 | % |
Large Company Value Portfolio | | | 0.65 | % | | | 0.55 | % | | | 0.65 | % | | Phocas Financial Corporation | | 0.29% | | | 0.20 | % |
Small Company Growth Portfolio | | | 0.80 | %1 | | | 0.68 | %1 | | | 0.80 | % | | Peregrine Capital Management, Inc. | | 0.50% | | | 0.45 | % |
Small Company Value Portfolio | | | 0.80 | %1 | | | 0.68 | %1 | | | 0.80 | % | | Peregrine Capital Management, Inc. | | 0.45% | | | 0.40 | % |
Core Bond Portfolio | | | 0.40 | % | | | 0.30 | % | | | 0.36 | % | | WellsCap | | 0.20% | | | 0.10 | % |
Inflation-Protected Bond Portfolio | | | 0.40 | % | | | 0.30 | % | | | 0.40 | % | | WellsCap | | 0.20% | | | 0.10 | % |
Managed Fixed Income Portfolio | | | 0.40 | % | | | 0.30 | % | | | 0.40 | % | | Galliard Capital Management, Inc. | | 0.20% | | | 0.10 | % |
Stable Income Portfolio | | | 0.30 | %2 | | | 0.225 | %2 | | | 0.31 | % | | Galliard Capital Management, Inc. | | 0.15% | | | 0.05 | % |
| 1. | Prior to July 1, 2013, Funds Management received an annual advisory fee which started at 0.80% and declined to 0.70% as the average daily net assets of the Portfolio increased. |
| 2. | Prior to July 1, 2013, Funds Management received an annual advisory fee which started at 0.35% and declined to 0.25% as the average daily net assets of the Portfolio increased. |
Funds Management has voluntarily waived its advisory fee and/or reimbursed expenses to the extent necessary to maintain certain net operating expense ratios for the Portfolios.
5. INVESTMENT PORTFOLIO TRANSACTIONS
Purchases and sales of investments, excluding short-term securities, for the six months ended November 30, 2013 were as follows:
| | | | | | | | | | | | | | | | |
| | | Purchases at cost | | | Sales proceeds | |
| | | U.S. government | | | Non-U.S.
government | | | U.S. government | | | Non-U.S.
government | |
C&B Large Cap Value Portfolio | | $ | 0 | | | $ | 36,671,105 | | | $ | 0 | | | $ | 80,038,855 | |
Diversified Large Cap Growth Portfolio | | | 0 | | | | 41,688,955 | | | | 0 | | | | 60,426,571 | |
Emerging Growth Portfolio | | | 0 | | | | 367,162,900 | | | | 0 | | | | 451,967,497 | |
Index Portfolio | | | 0 | | | | 67,375,415 | | | | 0 | | | | 74,393,351 | |
International Growth Portfolio | | | 0 | | | | 30,252,427 | | | | 0 | | | | 32,416,207 | |
International Value Portfolio | | | 0 | | | | 32,477,956 | | | | 0 | | | | 25,273,270 | |
Large Company Value Portfolio | | | 0 | | | | 34,846,395 | | | | 0 | | | | 44,214,455 | |
Small Company Growth Portfolio | | | 0 | | | | 107,828,070 | | | | 0 | | | | 104,700,905 | |
Small Company Value Portfolio | | | 0 | | | | 50,499,950 | | | | 0 | | | | 76,509,569 | |
Core Bond Portfolio | | | 9,502,705,522 | | | | 1,281,586,707 | | | | 9,499,008,748 | | | | 1,347,369,267 | |
Inflation-Protected Bond Portfolio | | | 2,452,437 | | | | 0 | | | | 11,910,032 | | | | 0 | |
Managed Fixed Income Portfolio | | | 9,954,909 | | | | 13,401,605 | | | | 6,775,863 | | | | 4,131,371 | |
Stable Income Portfolio | | | 0 | | | | 3,429,927 | | | | 0 | | | | 3,858,273 | |
| | | | | | |
| Notes to financial statements (unaudited) | | Wells Fargo Advantage Allocation Funds | | | 129 | |
6. DERIVATIVE TRANSACTIONS
During the six months ended November 30, 2013, Index Portfolio used uninvested cash to enter into futures contracts to gain market exposure. During the six months ended November 30, 2013, Inflation-Protected Bond Portfolio and Stable Income Portfolio entered into futures contracts to speculate on interest rates and to help manage the duration of each portfolio.
At November 30, 2013, the Portfolios had long and short futures contracts outstanding as follows:
| | | | | | | | | | | | | | |
| | | Expiration date | | Contracts | | Type | | Contract value at
November 30, 2013 | | | Unrealized gains (losses) | |
Index Portfolio | | 12-19-2013 | | 92 Long | | S&P 500 Index | | $ | 41,494,300 | | | $ | 1,280,490 | |
Stable Income Portfolio | | 3-31-2014 | | 20 Short | | 5 Year U.S. Treasury Notes | | | 2,418,438 | | | | (978 | ) |
At November 30, 2013, Inflation-Protected Bond Portfolio did not have any open futures contracts.
At November 30, 2013, Stable Income Portfolio had segregated $18,000 as cash collateral for open futures contracts.
The Portfolios had average notional amounts in futures contracts outstanding during the six months ended November 30, 2013 as follows:
| | | | | | | | |
| | | Long contracts | | | Short contracts | |
Index Portfolio | | $ | 45,194,517 | | | $ | 0 | |
Inflation-Protected Bond Portfolio | | | 21,268 | | | | 0 | |
Stable Income Portfolio | | | 0 | | | | 2,436,632 | |
The receivable/payable for daily variation margin on open futures contracts reflected in the Statements of Assets and Liabilities only represents the current day’s variation margin. The realized gains or losses and change in unrealized gains or losses on derivative instruments are reflected in the Statements of Operations.
For certain types of derivative transactions, the Portfolios have entered into International Swaps and Derivatives Association, Inc. master agreements (“ISDA Master Agreements”) or similar agreements with approved counterparties. The ISDA Master Agreements or similar agreements may have requirements to deliver/deposit securities or cash to/with an exchange or broker-dealer as collateral and allows each Portfolio to offset, with each counterparty, certain derivative financial instrument’s assets and/or liabilities with collateral held or pledged. Collateral requirements differ by type of derivative. Collateral or margin requirements are set by the broker or exchange clearing house for exchange traded derivatives while collateral terms are contract specific for over-the-counter traded. Cash collateral that has been pledged to cover obligations of each Portfolio under derivative contracts, if any, will be reported separately in the Statements of Assets and Liabilities. Securities pledged as collateral, if any, for the same purpose are noted in each Portfolio of Investments. With respect to balance sheet offsetting, absent an event of default by the counterparty or a termination of the agreement, the reported amounts of financial assets and financial liabilities in the Statements of Assets and Liabilities are not offset across transactions between each Portfolio and the applicable counterparty. As of November 30, 2013, the Portfolios have transactions subject to enforceable master netting agreements. A reconciliation of the gross amounts on the Statements of Assets and Liabilities to the net amounts by derivative type, including any collateral exposure, is as follows:
| | | | | | | | | | | | | | | | |
| | | | | Gross amounts of
assets in the
Statements of
Assets and
Liabilities | | | Amounts
subject to
netting
arrangements | | Collateral | | | Net amount
(not less
than $0) | |
Stable Income Portfolio | | Futures – variation margin | | $ | 1,094 | | | $0 | | $ | 18,000 | | | $ | 0 | |
| | | | | Gross amounts of
liabilities in the
Statements of
Assets and
Liabilities | | | Amounts
subject to
netting
arrangements | | Collateral | | | Net amount
(not less
than $0) | |
Index Portfolio | | Futures – variation margin | | $ | 4,430 | | | $0 | | $ | 2,449,555 | | | $ | 0 | |
| | | | |
| 130 | | Wells Fargo Advantage Allocation Funds | | Notes to financial statements (unaudited) |
7. ACQUISITIONS
After the close of business on April 19, 2013, International Growth Portfolio acquired the net assets of Wells Fargo Advantage International Index Portfolio. The purpose of the transaction was to combine two funds with similar investment objectives and strategies. The investment portfolio of Wells Fargo Advantage International Index Portfolio with a fair value of $22,535,457, identified cost of $21,854,655, and unrealized gains of $680,802 at April 19, 2013 were the principal assets acquired by International Growth Portfolio. For financial reporting purposes, assets received by International Growth Portfolio was recorded at fair value; however, the cost basis of the investments received from Wells Fargo Advantage International Index Portfolio was carried forward to align ongoing reporting of International Growth Portfolio’s realized and unrealized gains and losses with amounts distributable to shareholders for tax purposes.
Assuming the acquisition had been completed June 1, 2012, the beginning of the annual reporting period for International Growth Portfolio, the pro forma results of operations for the year ended May 31, 2013 would have been:
| | | | |
Net investment income | | $ | 2,276,123 | |
Net realized and unrealized gains (losses) on investments | | $ | 31,301,977 | |
Net increase in net assets resulting from operations | | $ | 33,578,100 | |
After the close of business on April 19, 2013, International Value Portfolio acquired the net assets of Wells Fargo Advantage International Equity Portfolio. The purpose of the transaction was to combine two funds with similar investment objectives and strategies. The investment portfolio of Wells Fargo Advantage International Equity Portfolio with a fair value of $22,369,294, identified cost of $22,824,592 and unrealized losses of $455,298 at April 19, 2013 were the principal assets acquired by International Value Portfolio. For financial reporting purposes, assets received by International Value Portfolio were recorded at fair value; however, the cost basis of the investments received from Wells Fargo Advantage International Equity Portfolio was carried forward to align ongoing reporting of International Value Portfolio’s realized and unrealized gains and losses with amounts distributable to shareholders for tax purposes.
Assuming the acquisition had been completed June 1, 2012, the beginning of the annual reporting period for International Value Portfolio, the pro forma results of operations for the year ended May 31, 2013 would have been:
| | | | |
Net investment income | | $ | 21,429,816 | |
Net realized and unrealized gains (losses) on investments | | $ | 71,515,531 | |
Net increase in net assets resulting from operations | | $ | 92,945,347 | |
After the close of business on April 19, 2013, Large Company Value Portfolio acquired the net assets of Wells Fargo Advantage Equity Value Portfolio. The purpose of the transaction was to combine two funds with similar investment objectives and strategies. The investment portfolio of Wells Fargo Advantage Equity Value Portfolio with a fair value of $49,782,607, identified cost of $48,925,675 and unrealized gains of $856,932 at April 19, 2013 were the principal assets acquired by Large Company Value Portfolio. For financial reporting purposes, assets received by Large Company Value Portfolio were recorded at fair value; however, the cost basis of the investments received from Wells Fargo Advantage Equity Value Portfolio was carried forward to align ongoing reporting of Large Company Value Portfolio’s realized and unrealized gains and losses with amounts distributable to shareholders for tax purposes.
Assuming the acquisition had been completed June 1, 2012, the beginning of the annual reporting period for Large Company Value Portfolio, the pro forma results of operations for the year ended May 31, 2013 would have been:
| | | | |
Net investment loss | | $ | (3,466,147 | ) |
Net realized and unrealized gains (losses) on investments | | $ | 21,864,877 | |
Net increase in net assets resulting from operations | | $ | 18,218,730 | |
After the close of business on April 19, 2013, Small Company Value Portfolio acquired the net assets of Wells Fargo Advantage Small Cap Value Portfolio. The purpose of the transaction was to combine two funds with similar investment objectives and strategies. The investment portfolio of Wells Fargo Advantage Small Cap Value Portfolio with a fair value of $14,404,707, identified cost of $14,875,954 and unrealized losses of $471,247 at April 19, 2013 were the principal assets acquired by Small Company Value Portfolio. For financial reporting purposes, assets received by Small Company Value Portfolio were recorded at fair value; however, the cost basis of the investments received from Wells Fargo Advantage Small Cap Value Portfolio was carried forward to align ongoing reporting of Small Company Value Portfolio’s realized and unrealized gains and losses with amounts distributable to shareholders for tax purposes.
| | | | | | |
| Notes to financial statements (unaudited) | | Wells Fargo Advantage Allocation Funds | | | 131 | |
Assuming the acquisitions had been completed June 1, 2012, the beginning of the annual reporting period for Small Company Value Portfolio, the pro forma results of operations for the year ended May 31, 2013 would have been
| | | | |
Net investment income | | $ | 1,370,856 | |
Net realized and unrealized gains (losses) on investments | | $ | 53,680,718 | |
Net increase in net assets resulting from operations | | $ | 55,051,574 | |
8. CONCENTRATION RISK
Concentration risks result from exposure to a limited number of sectors. Portfolios that invest a substantial portion of their assets in a sector may be more affected by changes in that sector than would be a fund whose investments are not heavily weighted in any sector.
9. INDEMNIFICATION
Under the Trust’s organizational documents, the officers and directors are indemnified against certain liabilities that may arise out of performance of their duties to the Trust. Additionally, in the normal course of business, the Trust may enter into contracts with service providers that contain a variety of indemnification clauses. The Trust’s maximum exposure under these arrangements is dependent on future claims that may be made against the Portfolios and, therefore, cannot be estimated.
| | | | |
| 132 | | Wells Fargo Advantage Allocation Funds | | Other information (unaudited) |
PROXY VOTING INFORMATION
A description of the policies and procedures used to determine how to vote proxies relating to portfolio securities is available without charge, upon request, by calling 1-800-222-8222, visiting our website at wellsfargoadvantagefunds.com, or visiting the SEC website at sec.gov. Information regarding how the proxies related to portfolio securities were voted during the most recent 12-month period ended June 30 is available without charge on the website at wellsfargoadvantagefunds.com or by visiting the SEC website at sec.gov.
PORTFOLIO HOLDINGS INFORMATION
The complete portfolio holdings are publicly available on the website (wellsfargoadvantagefunds.com) on a monthly, 30-day or more delayed basis. In addition, top ten holdings information is publicly available on the website on a monthly, seven-day or more delayed basis. Each Fund and Portfolio files its complete schedule of portfolio holdings with the SEC for the first and third quarters of each fiscal year on Form N-Q, which is available without charge by visiting the SEC website at sec.gov. In addition, each Form N-Q may be reviewed and copied at the SEC’s Public Reference Room in Washington, DC, and at regional offices in New York City, at 233 Broadway, and in Chicago, at 175 West Jackson Boulevard, Suite 900. Information about the Public Reference Room may be obtained by calling 1-800-SEC-0330.
| | | | | | |
| Other information (unaudited) | | Wells Fargo Advantage Allocation Funds | | | 133 | |
BOARD OF TRUSTEES AND OFFICERS
Each of the Trustees and Officers listed in the table below acts in identical capacities for each fund in the Wells Fargo Advantage family of funds, which consists of 131 mutual funds1 comprising the Wells Fargo Funds Trust, Wells Fargo Variable Trust, Wells Fargo Master Trust and four closed-end funds (collectively the “Fund Complex”). This table should be read in conjunction with the Prospectus and the Statement of Additional Information2. All of the Trustees are also Members of the Audit and Governance Committees of each Trust in the Fund Complex. The mailing address of each Trustee and Officer is 525 Market Street, 12th Floor, San Francisco, CA 94105. Each Trustee and Officer serves an indefinite term, however, each Trustee serves such term until reaching the mandatory retirement age established by the Trustees.
Independent Trustees
| | | | | | |
Name and
year of birth | | Position held and
length of service* | | Principal occupations during past five years | | Other
directorships during
past five years |
Peter G. Gordon
(Born 1942) | | Trustee, since 1998; Chairman, since 2005 | | Co-Founder, Retired Chairman, President and CEO of Crystal Geyser Water Company. Trustee Emeritus, Colby College. | | Asset Allocation Trust |
Isaiah Harris, Jr.
(Born 1952) | | Trustee, since 2009 | | Retired. Prior thereto, President and CEO of BellSouth Advertising and Publishing Corp. from 2005 to 2007, President and CEO of BellSouth Enterprises from 2004 to 2005 and President of BellSouth Consumer Services from 2000 to 2003. Emeritus member of the Iowa State University Foundation Board of Governors. Emeritus Member of the Advisory Board of Iowa State University School of Business. Advisory Board Member, Palm Harbor Academy (charter school). Mr. Harris is a certified public accountant. | | CIGNA Corporation; Deluxe Corporation; Asset Allocation Trust |
Judith M. Johnson
(Born 1949) | | Trustee, since 2008;
Audit Committee Chairman, since 2008 | | Retired. Prior thereto, Chief Executive Officer and Chief Investment Officer of Minneapolis Employees Retirement Fund from 1996 to 2008. Ms. Johnson is an attorney, certified public accountant and a certified managerial accountant. | | Asset Allocation Trust |
Leroy Keith, Jr.
(Born 1939) | | Trustee, since 2010 | | Chairman, Bloc Global Services (development and construction). Trustee of the Evergreen Funds from 1983 to 2010. Former Managing Director, Almanac Capital Management (commodities firm), former Partner, Stonington Partners, Inc. (private equity fund), former Director, Obagi Medical Products Co. and former Director, Lincoln Educational Services. | | Trustee, Virtus Fund Complex (consisting of 48 portfolios as of 1/31/2013); Asset Allocation Trust |
David F. Larcker
(Born 1950) | | Trustee, since 2009 | | James Irvin Miller Professor of Accounting at the Graduate School of Business, Stanford University, Morgan Stanley Director of the Center for Leadership Development and Research and Senior Faculty of The Rock Center for Corporate Governance since 2006. From 2005 to 2008, Professor of Accounting at the Graduate School of Business, Stanford University. Prior thereto, Ernst & Young Professor of Accounting at The Wharton School, University of Pennsylvania from 1985 to 2005. | | Asset Allocation Trust |
Olivia S. Mitchell
(Born 1953) | | Trustee, since 2006 | | International Foundation of Employee Benefit Plans Professor, Wharton School of the University of Pennsylvania since 1993. Director of Wharton’s Pension Research Council and Boettner Center on Pensions & Retirement Research, and Research Associate at the National Bureau of Economic Research. Previously, Cornell University Professor from 1978 to 1993. | | Asset Allocation Trust |
Timothy J. Penny
(Born 1951) | | Trustee, since 1996 | | President and CEO of Southern Minnesota Initiative Foundation, a non-profit organization, since 2007 and Senior Fellow at the Humphrey Institute Policy Forum at the University of Minnesota since 1995. Member of the Board of Trustees of NorthStar Education Finance, Inc., a non-profit organization, since 2007. | | Asset Allocation Trust |
| | | | |
| 134 | | Wells Fargo Advantage Allocation Funds | | Other information (unaudited) |
| | | | | | |
Name and
year of birth | | Position held and
length of service* | | Principal occupations during past five years | | Other
directorships during
past five years |
Michael S. Scofield
(Born 1943) | | Trustee, since 2010 | | Served on the Investment Company Institute’s Board of Governors and Executive Committee from 2008-2011 as well the Governing Council of the Independent Directors Council from 2006-2011 and the Independent Directors Council Executive Committee from 2008-2011. Chairman of the IDC from 2008-2010. Institutional Investor (Fund Directions) Trustee of Year in 2007. Trustee of the Evergreen Funds (and its predecessors) from 1984 to 2010. Chairman of the Evergreen Funds from 2000-2010. Former Trustee of the Mentor Funds. Retired Attorney, Law Offices of Michael S. Scofield. | | Asset Allocation Trust |
Donald C. Willeke
(Born 1940) | | Trustee, since 1996 | | Principal of the law firm of Willeke & Daniels. General Counsel of the Minneapolis Employees Retirement Fund from 1984 until its consolidation into the Minnesota Public Employees Retirement Association on June 30, 2010. Director and Vice Chair of The Tree Trust (non-profit corporation). Director of the American Chestnut Foundation (non-profit corporation). | | Asset Allocation Trust |
| * | Length of service dates reflect the Trustee’s commencement of service with the Trust’s predecessor entities, where applicable. |
Officers
| | | | | | |
Name and
year of birth | | Position held and
length of service | | Principal occupations during past five years | | |
Karla M. Rabusch
(Born 1959) | | President, since 2003 | | Executive Vice President of Wells Fargo Bank, N.A. and President of Wells Fargo Funds Management, LLC since 2003. | | |
Jeremy DePalma1
(Born 1974) | | Treasurer, since 2012 | | Senior Vice President of Wells Fargo Funds Management, LLC since 2009. Senior Vice President of Evergreen Investment Management Company, LLC from 2008 to 2010. Vice President, Evergreen Investment Services, Inc. from 2004 to 2007. Head of the Fund Reporting and Control Team within Fund Administration from 2005 to 2010. | | |
Nancy Wiser1
(Born 1967) | | Treasurer, since 2012 | | Executive Vice President of Wells Fargo Funds Management, LLC since 2011. Chief Operating Officer and Chief Compliance Officer at LightBox Capital Management LLC, from 2008 to 2011. Owned and operated a consulting business providing services to various hedge funds including acting as Chief Operating Officer and Chief Compliance Officer for a hedge fund from 2007 to 2008. Chief Operating Officer and Chief Compliance Officer of GMN Capital LLC from 2006 to 2007. | | |
C. David Messman
(Born 1960) | | Secretary, since 2000; Chief Legal Officer, since 2003 | | Senior Vice President and Secretary of Wells Fargo Funds Management, LLC since 2001. Vice President and Managing Counsel of Wells Fargo Bank, N.A. since 1996. | | |
Debra Ann Early
(Born 1964) | | Chief Compliance Officer, since 2007 | | Chief Compliance Officer of Wells Fargo Funds Management, LLC since 2007. Chief Compliance Officer of Parnassus Investments from 2005 to 2007. Chief Financial Officer of Parnassus Investments from 2004 to 2007. | | |
David Berardi
(Born 1975) | | Assistant Treasurer, since 2009 | | Vice President of Wells Fargo Funds Management, LLC since 2009. Vice President of Evergreen Investment Management Company, LLC from 2008 to 2010. Assistant Vice President of Evergreen Investment Services, Inc. from 2004 to 2008. Manager of Fund Reporting and Control for Evergreen Investment Management Company, LLC from 2004 to 2010. | | |
| 1. | Jeremy DePalma acts as Treasurer of Growth Balanced Fund, Moderate Balanced Fund, International Growth Portfolio, and International Value Portfolio and Assistant Treasurer of the remaining funds in this shareholder report. In addition, Jeremy DePalma acts as Treasurer of 54 other funds and Assistant Treasurer of 62 other funds in the Fund Complex. Nancy Wiser serves as Treasurer of the remaining funds in this shareholder report as well as 62 other funds in the Fund Complex. |
| 2. | The Statement of Additional Information includes additional information about the Trustees and is available, without charge, upon request, by calling 1-800-222-8222 or by visiting the website at wellsfargoadvantagefunds.com. |
| | | | | | |
| List of abbreviations | | Wells Fargo Advantage Allocation Funds | | | 135 | |
The following is a list of common abbreviations for terms and entities that may have appeared in this report.
| ACA | — ACA Financial Guaranty Corporation |
| ADR | — American depositary receipt |
| ADS | — American depositary shares |
| AGC | — Assured Guaranty Corporation |
| AGM | — Assured Guaranty Municipal |
| Ambac | — Ambac Financial Group Incorporated |
| AMT | — Alternative minimum tax |
| BAN | — Bond anticipation notes |
| BHAC | — Berkshire Hathaway Assurance Corporation |
| CAB | — Capital appreciation bond |
| CCAB | — Convertible capital appreciation bond |
| CDA | — Community Development Authority |
| CDO | — Collateralized debt obligation |
| DRIVER | — Derivative inverse tax-exempt receipts |
| DW&P | — Department of Water & Power |
| DWR | — Department of Water Resources |
| ECFA | — Educational & Cultural Facilities Authority |
| EDA | — Economic Development Authority |
| EDFA | — Economic Development Finance Authority |
| ETF | — Exchange-traded fund |
| FDIC | — Federal Deposit Insurance Corporation |
| FFCB | — Federal Farm Credit Banks |
| FGIC | — Financial Guaranty Insurance Corporation |
| FHA | — Federal Housing Administration |
| FHLB | — Federal Home Loan Bank |
| FHLMC | — Federal Home Loan Mortgage Corporation |
| FICO | — The Financing Corporation |
| FNMA | — Federal National Mortgage Association |
| GDR | — Global depositary receipt |
| GNMA | — Government National Mortgage Association |
| HCFR | — Healthcare facilities revenue |
| HEFA | — Health & Educational Facilities Authority |
| HEFAR | — Higher education facilities authority revenue |
| HFA | — Housing Finance Authority |
| HFFA | — Health Facilities Financing Authority |
| HUD | — Department of Housing and Urban Development |
| IDA | — Industrial Development Authority |
| IDAG | — Industrial Development Agency |
| KRW | — Republic of Korea won |
| LIBOR | — London Interbank Offered Rate |
| LLC | — Limited liability company |
| LLP | — Limited liability partnership |
| MBIA | — Municipal Bond Insurance Association |
| MFHR | — Multifamily housing revenue |
| MSTR | — Municipal securities trust receipts |
| MUD | — Municipal Utility District |
| National | — National Public Finance Guarantee Corporation |
| PCFA | — Pollution Control Financing Authority |
| PCL | — Public Company Limited |
| PCR | — Pollution control revenue |
| PFA | — Public Finance Authority |
| PFFA | — Public Facilities Financing Authority |
| PFOTER | — Puttable floating option tax-exempt receipts |
| plc | — Public limited company |
| PUTTER | — Puttable tax-exempt receipts |
| R&D | — Research & development |
| Radian | — Radian Asset Assurance |
| RAN | — Revenue anticipation notes |
| RDA | — Redevelopment Authority |
| RDFA | — Redevelopment Finance Authority |
| REIT | — Real estate investment trust |
| ROC | — Reset option certificates |
| SAVRS | — Select auction variable rate securities |
| SBA | — Small Business Authority |
| SFHR | — Single-family housing revenue |
| SFMR | — Single-family mortgage revenue |
| SPA | — Standby purchase agreement |
| SPDR | — Standard & Poor’s Depositary Receipts |
| STRIPS | — Separate trading of registered interest and principal securities |
| TAN | — Tax anticipation notes |
| TIPS | — Treasury inflation-protected securities |
| TRAN | — Tax revenue anticipation notes |
| TTFA | — Transportation Trust Fund Authority |
| TVA | — Tennessee Valley Authority |
This page is intentionally left blank.


For more information
More information about Wells Fargo Advantage Funds is available free upon request. To obtain literature, please write, email, visit the Fund’s website, or call:
Wells Fargo Advantage Funds
P.O. Box 8266
Boston, MA 02266-8266
Email: wfaf@wellsfargo.com
Website: wellsfargoadvantagefunds.com
Individual investors: 1-800-222-8222
Retail investment professionals: 1-888-877-9275
Institutional investment professionals: 1-866-765-0778
This report and the financial statements contained herein are submitted for the general information of the shareholders of Wells Fargo Advantage Funds. If this report is used for promotional purposes, distribution of the report must be accompanied or preceded by a current prospectus. For a current prospectus and, if available, a summary prospectus containing more complete information, including charges and expenses, call 1-800-222-8222 or visit the Fund’s website at wellsfargoadvantagefunds.com. Please consider the investment objectives, risks, charges, and expenses of the investment carefully before investing. This and other information about Wells Fargo Advantage Funds can be found in the current prospectus. Read the prospectus carefully before you invest or send money.
Wells Fargo Funds Management, LLC, a wholly owned subsidiary of Wells Fargo & Company, provides investment advisory and administrative services for Wells Fargo Advantage Funds. Other affiliates of Wells Fargo & Company provide subadvisory and other services for the Funds. The Funds are distributed by Wells Fargo Funds Distributor, LLC, Member FINRA/SIPC, an affiliate of Wells Fargo & Company.
NOT FDIC INSURED ¡ NO BANK GUARANTEE ¡ MAY LOSE VALUE
© 2013 Wells Fargo Funds Management, LLC. All rights reserved.
| | |
 | | 221299 01-14 SAAFNLD/SAR109 11-13 |

Wells Fargo Advantage Equity Gateway Funds

Semi-Annual Report
November 30, 2013
| n | | Wells Fargo Advantage C&B Large Cap Value Fund |
| n | | Wells Fargo Advantage Diversified Equity Fund |
| n | | Wells Fargo Advantage Emerging Growth Fund |
| n | | Wells Fargo Advantage Index Fund |
| n | | Wells Fargo Advantage International Value Fund |
| n | | Wells Fargo Advantage Small Company Growth Fund |
| n | | Wells Fargo Advantage Small Company Value Fund |

Reduce clutter. Save trees.
Sign up for electronic delivery of prospectuses and shareholder reports at wellsfargo.com/advantagedelivery
Contents
The views expressed and any forward-looking statements are as of November 30, 2013, unless otherwise noted, and are those of the Fund managers and/or Wells Fargo Funds Management, LLC. Discussions of individual securities, or the markets generally, or any Wells Fargo Advantage Fund are not intended as individual recommendations. Future events or results may vary significantly from those expressed in any forward-looking statements; the views expressed are subject to change at any time in response to changing circumstances in the market. Wells Fargo Funds Management, LLC and the Funds disclaim any obligation to publicly update or revise any views expressed or forward-looking statements.
NOT FDIC INSURED ¡ NO BANK GUARANTEE ¡ MAY LOSE VALUE
| | | | |
| 2 | | Wells Fargo Advantage Equity Gateway Funds | | Letter to shareholders (unaudited) |

Karla M. Rabusch
President
Wells Fargo Advantage Funds
Major central banks continued to inject liquidity into the banks and the markets through various quantitative easing policies.
Dear Valued Shareholder:
We are pleased to offer you this semi-annual report for the Wells Fargo Advantage Equity Gateway Funds for the six-month period that ended November 30, 2013. Much of the period was marked by monetary easing by global central banks. Investor concerns that the U.S. Federal Reserve (Fed) would end its bond-buying program initially led to higher interest rates, resulting in losses for bond indexes and volatility for global stock indexes. These fears dissipated in late September 2013 but were soon followed by concerns about a shutdown of the U.S. government. Nonetheless, increased confidence that the global economy was staging a fragile recovery resulted in double-digit returns for domestic and foreign developed stock market indexes for the six-month reporting period.
Central banks continued to provide stimulus.
Major central banks continued to inject liquidity into the banks and the markets through various quantitative easing policies. Throughout the reporting period, the Federal Open Market Committee (FOMC)—the Fed’s monetary policymaking body—kept its key interest rate near zero in order to support the economy and the financial system. Well before the reporting period began, after its September 2012 meeting, the FOMC announced its intention to keep interest rates low until at least mid-2015 and to make open-ended purchases of $40 billion per month in mortgage-backed securities to support the housing market. In December 2012, the Fed increased its quantitative easing program by adding purchases of $45 billion per month in long-term U.S. Treasuries. In May 2013, just before the start of the reporting period, indications that the FOMC might reduce (or taper) its bond-buying program caused a rise in interest rates and a subsequent sell-off in both stocks and bonds that depressed market returns through August 2013. After its September 2013 meeting, however, the FOMC surprisingly signaled that tapering would be delayed, resulting in a stock and bond market rally that lasted through the end of the reporting period.
European markets continued to benefit from the European Central Bank’s (ECB’s) earlier announcement that it would purchase an unlimited amount of one- to three-year sovereign debt from countries that had formally applied for a bailout. Just prior to the beginning of the reporting period, in May 2013, the ECB cut its key rate to a historic low of 0.5%. The ECB’s aggressive actions helped ease investor worries about a eurozone sovereign debt default. Given the substantial ties between the U.S. and Europe, the improved sentiment about the eurozone helped provide a tailwind for U.S. markets.
Finally, prodded by Prime Minister Shinzo Abe to aggressively fight Japan’s long-lived deflation, the Bank of Japan announced an aggressive bond-buying program aimed at achieving a 2% annual inflation rate.
U.S. and developed foreign market stocks benefited from improving economic news.
For most of the period, U.S. economic data remained moderately positive. Reported gross domestic product growth came in at a solid 2.5% annualized rate in the second quarter of 2013 and an even better 4.1% annualized rate in the third quarter. The most significant negative effect was the ongoing fight in Washington, D.C. over the federal budget and debt limit. The Budget Control Act of 2011, which was passed to resolve a previous fight over the federal debt ceiling, mandated budget sequestration that took effect on March 1, 2013, and was an overhang on economic growth throughout the reporting period. Most recently, Congress was unable to pass a resolution to continue to fund the federal government, and thus the federal government underwent a partial shutdown from September 30, 2013,
| | | | | | |
| Letter to shareholders (unaudited) | | Wells Fargo Advantage Equity Gateway Funds | | | 3 | |
through October 16, 2013. The government reopened after the president and Congress reached a deal that funded the government through January 15, 2014, and raised the debt limit through February 7, 2014.
Despite political headwinds, the relatively positive outlook for the U.S. economy contributed to a strong domestic stock market for much of the reporting period. Economically sensitive sectors, such as industrials and consumer discretionary, outperformed. Judging by various Russell indexes, small-cap stocks outperformed large-cap stocks, and growth stocks outperformed value stocks.
Overseas, European economies gained on strength in northern economies, such as Germany and the United Kingdom, and on signs of a fragile recovery in southern European economies, such as Spain. Meanwhile, the Japanese economy responded favorably to a series of aggressive actions that included both monetary and fiscal stimulus. The MSCI EAFE Index1, which measures developed market stocks, ended the period with a double-digit return.
Don’t let short-term uncertainty derail long-term investment goals.
Periods of uncertainty can present challenges, but experience has taught us that maintaining long-term investment goals can be an effective way to plan for the future. Although diversification cannot guarantee an investment profit or prevent losses, we believe it can be an effective way to manage investment risk and potentially smooth out overall portfolio performance. We encourage investors to know their investments and to understand that appropriate levels of risk-taking may unlock opportunities.
Thank you for choosing to invest with Wells Fargo Advantage Funds. We appreciate your confidence in us and remain committed to helping you meet your financial needs. For current information about your fund investments, contact your investment professional, visit our website at wellsfargoadvantagefunds.com, or call us directly at 1-800-222-8222. We are available 24 hours a day, 7 days a week.
Sincerely,

Karla M. Rabusch
President
Wells Fargo Advantage Funds
Economically sensitive sectors, such as industrials and consumer discretionary, outperformed.
Notice to shareholders of Wells Fargo Advantage Emerging Growth Fund (the “Emerging Growth Fund”)
At its November 18-20, 2013 meeting, the Board of Trustees unanimously approved a change to the Emerging Growth Fund’s definition of small-capitalization companies. Effective April 1, 2014, the Emerging Growth Fund will consider small-capitalization companies to be those with market capitalizations within the range of the Russell 2000® Index2.
Please contact your investment professional or call us directly at 1-800-222-8222 if you have any questions on this Notice to Shareholders.
| 1. | The Morgan Stanley Capital International Europe, Australasia, and Far East (MSCI EAFE) Index is an unmanaged group of securities widely regarded by investors to be representations of the stock markets of Europe, Australasia, and the Far East. You cannot invest directly in an index. Source: MSCI. MSCI makes no express or implied warranties or representations and shall have no liability whatsoever with respect to any MSCI data contained herein. The MSCI data may not be further redistributed or used as a basis for other indexes or any securities or financial products. This report is not approved, reviewed, or produced by MSCI. |
| 2. | The Russell 2000® Index measures the performance of the 2,000 smallest companies in the Russell 3000® Index, which represents approximately 8% of the total market capitalization of the Russell 3000 Index. You cannot invest directly in an index. |
| | | | |
| 4 | | Wells Fargo Advantage Equity Gateway Funds | | Performance highlights (unaudited) |
Wells Fargo Advantage C&B Large Cap Value Fund1
Investment objective
The Fund seeks maximum long-term total return (current income and capital appreciation), consistent with minimizing risk to principal.
Adviser
Wells Fargo Funds Management, LLC
Subadviser for master portfolio
Cooke & Bieler, L.P.
Portfolio managers
Daren C. Heitman, CFA
Steve Lyons, CFA
Michael M. Myers, CFA
Edward W. O’Connor, CFA
R. James O’Neil, CFA
Mehul Trivedi, CFA
William Weber, CFA
Average annual total returns2 (%) as of November 30, 2013
| | | | | | | | | | | | | | | | | | | | | | | | | | | | | | | | | | |
| | | | | Including sales charge | | | Excluding sales charge | | | Expense ratios3 (%) | |
| | | Inception date | | 1 year | | | 5 year | | | 10 year | | | 1 year | | | 5 year | | | 10 year | | | Gross | | | Net4 | |
| Class A (CBEAX) | | 7-26-2004 | | | 26.74 | | | | 15.64 | | | | 6.02 | | | | 34.49 | | | | 17.00 | | | | 6.65 | | | | 1.30 | | | | 1.15 | |
| Class B (CBEBX)* | | 7-26-2004 | | | 28.45 | | | | 15.91 | | | | 6.11 | | | | 33.45 | | | | 16.13 | | | | 6.11 | | | | 2.05 | | | | 1.90 | |
| Class C (CBECX) | | 7-26-2004 | | | 32.44 | | | | 16.14 | | | | 5.86 | | | | 33.44 | | | | 16.14 | | | | 5.86 | | | | 2.05 | | | | 1.90 | |
| Administrator Class (CBLLX) | | 7-26-2004 | | | – | | | | – | | | | – | | | | 34.74 | | | | 17.24 | | | | 6.86 | | | | 1.14 | | | | 0.95 | |
| Institutional Class (CBLSX) | | 7-26-2004 | | | | | | | | | | | | | | | 35.05 | | | | 17.52 | | | | 7.13 | | | | 0.87 | | | | 0.70 | |
| Investor Class (CBEQX) | | 5-15-1990 | | | – | | | | – | | | | – | | | | 34.38 | | | | 16.98 | | | | 6.63 | | | | 1.36 | | | | 1.20 | |
| Russell 1000® Value Index5 | | – | | | – | | | | – | | | | – | | | | 31.92 | �� | | | 16.40 | | | | 7.96 | | | | – | | | | – | |
| * | | Class B shares are closed to investment, except in connection with the reinvestment of any distributions and permitted exchanges. |
Figures quoted represent past performance, which is no guarantee of future results, and do not reflect taxes that a shareholder may pay on fund distributions or the redemption of fund shares. Investment return and principal value of an investment will fluctuate so that an investor’s shares, when redeemed, may be worth more or less than their original cost. Performance shown without sales charges would be lower if sales charges were reflected. Current performance may be lower or higher than the performance data quoted, which assumes the reinvestment of dividends and capital gains. Current month-end performance is available on the Fund’s website, wellsfargoadvantagefunds.com.
Index returns do not include transaction costs associated with buying and selling securities, any mutual fund fees or expenses, or any taxes. It is not possible to invest directly in an index.
For Class A shares, the maximum front-end sales charge is 5.75%. For Class B shares, the maximum contingent deferred sales charge is 5.00%. For Class C shares, the maximum contingent deferred sales charge is 1.00%. Performance including sales charge assumes the sales charge for the corresponding time period. Administrator Class, Institutional Class, and Investor Class shares are sold without a front-end sales charge or contingent deferred sales charge.
Please keep in mind that high double-digit returns were primarily achieved during favorable market conditions. You should not expect that such favorable returns can be consistently achieved. A Fund’s performance, especially for very short time periods, should not be the sole factor in making your investment decision.
Stock values fluctuate in response to the activities of individual companies and general market and economic conditions. Consult the Fund’s prospectus for additional information on these and other risks.
Please see footnotes on page 5.
| | | | | | |
| Performance highlights (unaudited) | | Wells Fargo Advantage Equity Gateway Funds | | | 5 | |
Wells Fargo Advantage C&B Large Cap Value Fund (continued)
| | | | |
| Ten largest equity holdings6 (%) as of November 30, 2013 | |
State Street Corporation | | | 3.70 | |
JPMorgan Chase & Company | | | 3.23 | |
Omnicom Group Incorporated | | | 3.15 | |
3M Company | | | 2.85 | |
American Express Company | | | 2.81 | |
Ball Corporation | | | 2.72 | |
Cardinal Health Incorporated | | | 2.59 | |
Johnson & Johnson | | | 2.48 | |
NVR Incorporated | | | 2.40 | |
Quest Diagnostics Incorporated | | | 2.29 | |
|
| Sector distribution7 as of November 30, 2013 |
|
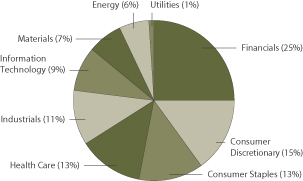
|
| 1. | The Fund is a gateway feeder fund that invests all of its assets in a single master portfolio of the Wells Fargo Master Trust with a substantially similar investment objective and substantially similar investment strategies. References to the investment activities of the Fund are intended to refer to the investment activities of the master portfolio in which it invests. |
| 2. | Historical performance shown for Class A, Class B, and Class C shares prior to their inception reflects the performance of Investor Class shares, adjusted to reflect the higher expenses applicable to Class A, Class B, and Class C shares. Historical performance shown for Administrator and Institutional Class shares prior to their inception reflects the performance of Investor Class shares, and includes the higher expenses applicable to Investor Class shares. If these expenses had not been included, returns would be higher. Effective June 20, 2008, Class D was renamed Investor Class and modified to assume the features and attributes of the Investor Class. |
| 3. | Reflects the expense ratios as stated in the most recent prospectuses. |
| 4. | The Adviser has committed through September 30, 2014, to waive fees and/or reimburse expenses to the extent necessary to cap the Fund’s Total Annual Fund Operating Expenses After Fee Waiver, excluding certain expenses, at the amounts shown. Brokerage commissions, stamp duty fees, interest, taxes, acquired fund fees and expenses, and extraordinary expenses are excluded from the cap. Fees from the underlying master portfolio are included in the cap. Without this cap, the Fund’s returns would have been lower. |
| 5. | The Russell 1000® Value Index measures the performance of those Russell 1000 companies with lower price-to-book ratios and lower forecasted growth values. You cannot invest directly in an index. |
| 6. | The ten largest equity holdings are calculated based on the value of the securities of the master portfolio allocable to the Fund divided by the total net assets of the Fund. Holdings are subject to change and may have changed since the date specified. |
| 7. | Sector distribution is subject to change and represents the sector distribution of the master portfolio which is calculated based on total long-term investment of the master portfolio. |
| | | | |
| 6 | | Wells Fargo Advantage Equity Gateway Funds | | Performance highlights (unaudited) |
Wells Fargo Advantage Diversified Equity Fund1
Investment objective
The Fund seeks long-term capital appreciation.
Adviser
Wells Fargo Funds Management, LLC
Subadvisers for master portfolios
| | |
Artisan Partners Limited Partnership Cooke & Bieler, L.P. Golden Capital Management, LLC LSV Asset Management | | Peregrine Capital Management, Inc. Phocas Financial Corporation Wells Capital Management Incorporated |
Portfolio managers
Thomas C. Biwer, CFA
Andrew Owen, CFA
Erik Sens, CFA
Average annual total returns (%) as of November 30, 2013
| | | | | | | | | | | | | | | | | | | | | | | | | | | | | | | | | | |
| | | | | Including sales charge | | | Excluding sales charge | | | Expense ratios2 (%) | |
| | | Inception date | | 1 year | | | 5 year | | | 10 year | | | 1 year | | | 5 year | | | 10 year | | | Gross | | | Net3 | |
| Class A (NVDAX) | | 5-2-1996 | | | 23.63 | | | | 15.70 | | | | 6.08 | | | | 31.17 | | | | 17.07 | | | | 6.71 | | | | 1.42 | | | | 1.25 | |
| Class B (NVDBX)* | | 5-6-1996 | | | 25.21 | | | | 15.97 | | | | 6.16 | | | | 30.21 | | | | 16.20 | | | | 6.16 | | | | 2.17 | | | | 2.00 | |
| Class C (WFDEX) | | 10-1-1998 | | | 29.19 | | | | 16.19 | | | | 5.91 | | | | 30.19 | | | | 16.19 | | | | 5.91 | | | | 2.17 | �� | | | 2.00 | |
| Administrator Class (NVDEX) | | 11-11-1994 | | | – | | | | – | | | | – | | | | 31.47 | | | | 17.36 | | | | 6.98 | | | | 1.26 | | | | 1.00 | |
| Diversified Equity Composite Index4 | | – | | | – | | | | – | | | | – | | | | 30.85 | | | | 17.74 | | | | 8.03 | | | | – | | | | – | |
| MSCI EAFE Index (Net) (USD)5 | | – | | | – | | | | – | | | | – | | | | 24.84 | | | | 13.42 | | | | 7.56 | | | | – | | | | – | |
| Russell 1000® Growth Index6 | | – | | | – | | | | – | | | | – | | | | 29.74 | | | | 20.14 | | | | 7.89 | | | | – | | | | – | |
| Russell 1000® Value Index7 | | – | | | – | | | | – | | | | – | | | | 31.92 | | | | 16.40 | | | | 7.96 | | | | – | | | | – | |
| Russell 2000® Index8 | | – | | | – | | | | – | | | | – | | | | 40.99 | | | | 20.97 | | | | 9.08 | | | | – | | | | – | |
| S&P 500 Index9 | | – | | | – | | | | – | | | | – | | | | 30.30 | | | | 17.60 | | | | 7.69 | | | | – | | | | – | |
| * | | Class B shares are closed to investment, except in connection with the reinvestment of any distributions and permitted exchanges. |
Figures quoted represent past performance, which is no guarantee of future results, and do not reflect taxes that a shareholder may pay on fund distributions or the redemption of fund shares. Investment return and principal value of an investment will fluctuate so that an investor’s shares, when redeemed, may be worth more or less than their original cost. Performance shown without sales charges would be lower if sales charges were reflected. Current performance may be lower or higher than the performance data quoted, which assumes the reinvestment of dividends and capital gains. Current month-end performance is available on the Fund’s website, wellsfargoadvantagefunds.com.
Index returns do not include transaction costs associated with buying and selling securities, any mutual fund fees or expenses, or any taxes. It is not possible to invest directly in an index.
For Class A shares, the maximum front-end sales charge is 5.75%. For Class B shares, the maximum contingent deferred sales charge is 5.00%. For Class C shares, the maximum contingent deferred sales charge is 1.00%. Performance including sales charge assumes the sales charge for the corresponding time period. Administrator Class shares are sold without a front-end sales charge or contingent deferred sales charge.
Please keep in mind that high double-digit returns were primarily achieved during favorable market conditions. You should not expect that such favorable returns can be consistently achieved. A Fund’s performance, especially for very short time periods, should not be the sole factor in making your investment decision.
Please see footnotes on page 7.
| | | | | | |
| Performance highlights (unaudited) | | Wells Fargo Advantage Equity Gateway Funds | | | 7 | |
Wells Fargo Advantage Diversified Equity Fund (continued)
Stock values fluctuate in response to the activities of individual companies and general market and economic conditions. The use of derivatives may reduce returns and/or increase volatility. Certain investment strategies tend to increase the total risk of an investment (relative to the broader market). The Fund is exposed to foreign investment risk and smaller-company securities risk. Consult the Fund’s prospectus for additional information on these and other risks.
| | | | |
| Ten largest equity holdings10 (%) as of November 30, 2013 | |
Apple Incorporated | | | 1.75 | |
Google Incorporated | | | 1.63 | |
Exxon Mobil Corporation | | | 1.26 | |
Johnson & Johnson | | | 0.99 | |
Amazon.com Incorporated | | | 0.97 | |
Bank of America Corporation | | | 0.87 | |
JPMorgan Chase & Company | | | 0.86 | |
Gilead Sciences Incorporated | | | 0.83 | |
Chevron Corporation | | | 0.76 | |
General Electric Company | | | 0.71 | |
|
| Sector distribution11 as of November 30, 2013 |
|
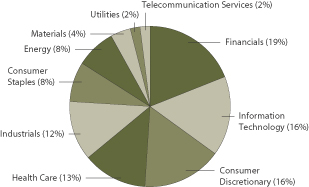
|
| 1. | The Fund is a gateway blended fund that invests all of its assets in two or more master portfolios of the Wells Fargo Master Trust in varying proportions. References to the investment activities of the Fund are intended to refer to the investment activities of the master portfolios in which it invests. |
| 2. | Reflects the expense ratios as stated in the most recent prospectuses. |
| 3. | The Adviser has committed through September 30, 2014, to waive fees and/or reimburse expenses to the extent necessary to cap the Fund’s Total Annual Fund Operating Expenses After Fee Waiver, excluding certain expenses, at the amounts shown. Brokerage commissions, stamp duty fees, interest, taxes, acquired fund fees and expenses, and extraordinary expenses are excluded from the cap. Fees from the underlying master portfolios are included in the cap. Without this cap, the Fund’s returns would have been lower. |
| 4. | Source: Wells Fargo Funds Management, LLC. The Diversified Equity Composite Index is weighted 25% in the Russell 1000® Value Index, 25% in the S&P 500 Index, 25% in the Russell 1000® Growth Index, 15% in the MSCI EAFE Index (Net) (USD), and 10% in the Russell 2000® Index. You cannot invest directly in an index. |
| 5. | The Morgan Stanley Capital International Europe, Australasia, and Far East (MSCI EAFE) Index (Net) (USD) is an unmanaged group of securities widely regarded by investors to be representations of the stock markets of Europe, Australasia, and the Far East. Calculations for EAFE use net dividends, which reflect the deduction of withholding taxes. You cannot invest directly in an index. |
| 6. | The Russell 1000® Growth Index measures the performance of those Russell 1000 companies with higher price/book ratios and higher forecasted growth values. You cannot invest directly in an index. |
| 7. | The Russell 1000® Value Index measures the performance of those Russell 1000 companies with lower price/book ratios and lower forecasted growth values. You cannot invest directly in an index. |
| 8. | The Russell 2000® Index measures the performance of the 2,000 smallest companies in the Russell 3000® Index, which represents approximately 8% of the total market capitalization of the Russell 3000 Index. You cannot invest directly in an index. |
| 9. | The S&P 500 Index consists of 500 stocks chosen for market size, liquidity, and industry group representation. It is a market-value weighted index with each stock’s weight in the index proportionate to its market value. You cannot invest directly in an index. |
| 10. | The ten largest equity holdings are calculated based on the value of the securities of the master portfolios allocable to the Fund divided by the total net assets of the Fund. Holdings are subject to change and may have changed since the date specified. |
| 11. | Sector distribution is subject to change and represents the sector distribution of the master portfolios which is calculated based on total long-term investments of the master portfolios. |
| | | | |
| 8 | | Wells Fargo Advantage Equity Gateway Funds | | Performance highlights (unaudited) |
Wells Fargo Advantage Emerging Growth Fund1
The Fund is closed to new investors2.
Investment objective
The Fund seeks long-term capital appreciation.
Adviser
Wells Fargo Funds Management, LLC
Subadviser for master portfolio
Wells Capital Management Incorporated
Portfolio managers
Joseph M. Eberhardy, CFA, CPA
Thomas C. Ognar, CFA
Bruce C. Olson, CFA
Average annual total returns3 (%) as of November 30, 2013
| | | | | | | | | | | | | | | | | | | | | | | | | | | | | | | | | | |
| | | | | Including sales charge | | | Excluding sales charge | | | Expense ratios4 (%) | |
| | | Inception date | | 1 year | | | 5 year | | | Since
Inception | | | 1 year | | | 5 year | | | Since
Inception | | | Gross | | | Net5 | |
| Class A (WEMAX) | | 3-31-2008 | | | 41.92 | | | | 23.64 | | | | 8.92 | | | | 50.58 | | | | 25.11 | | | | 9.86 | | | | 1.40 | | | | 1.37 | |
| Class C (WEMCX) | | 3-31-2008 | | | 48.51 | | | | 24.19 | | | | 9.06 | | | | 49.51 | | | | 24.19 | | | | 9.06 | | | | 2.15 | | | | 2.12 | |
| Administrator Class (WFGDX) | | 1-31-2007 | | | – | | | | – | | | | – | | | | 50.82 | | | | 25.39 | | | | 10.12 | | | | 1.24 | | | | 1.20 | |
| Institutional Class (WEMIX) | | 3-31-2008 | | | | | | | | | | | | | | | 51.31 | | | | 25.74 | | | | 10.37 | | | | 0.97 | | | | 0.90 | |
| Investor Class (WFGTX) | | 1-31-2007 | | | – | | | | – | | | | – | | | | 50.54 | | | | 25.09 | | | | 9.85 | | | | 1.46 | | | | 1.43 | |
| Russell 2000® Growth Index6 | | – | | | – | | | | – | | | | – | | | | 44.47 | | | | 23.38 | | | | 8.55 | | | | – | | | | – | |
Figures quoted represent past performance, which is no guarantee of future results, and do not reflect taxes that a shareholder may pay on fund distributions or the redemption of fund shares. Investment return and principal value of an investment will fluctuate so that an investor’s shares, when redeemed, may be worth more or less than their original cost. Performance shown without sales charges would be lower if sales charges were reflected. Current performance may be lower or higher than the performance data quoted, which assumes the reinvestment of dividends and capital gains. Current month-end performance is available on the Fund’s website, wellsfargoadvantagefunds.com.
Index returns do not include transaction costs associated with buying and selling securities, any mutual fund fees or expenses, or any taxes. It is not possible to invest directly in an index.
For Class A shares, the maximum front-end sales charge is 5.75%. For Class C shares, the maximum contingent deferred sales charge is 1.00%. Performance including sales charge assumes the sales charge for the corresponding time period. Administrator Class, Institutional Class, and Investor Class shares are sold without a front-end sales charge or contingent deferred sales charge.
Please keep in mind that high double-digit returns were primarily achieved during favorable market conditions. You should not expect that such favorable returns can be consistently achieved. A Fund’s performance, especially for very short time periods, should not be the sole factor in making your investment decision.
Stock values fluctuate in response to the activities of individual companies and general market and economic conditions. Smaller-company stocks tend to be more volatile and less liquid than those of larger companies. Certain investment strategies tend to increase the total risk of an investment (relative to the broader market). The fund is exposed to foreign investment risk. Consult the Fund’s prospectus for additional information on these and other risks.
Please see footnotes on page 9.
| | | | | | |
| Performance highlights (unaudited) | | Wells Fargo Advantage Equity Gateway Funds | | | 9 | |
Wells Fargo Advantage Emerging Growth Fund (continued)
| | | | |
| Ten largest equity holdings7 (%) as of November 30, 2013 | |
MarketAxess Holdings Incorporated | | | 2.88 | |
Financial Engines Incorporated | | | 2.59 | |
SPS Commerce Incorporated | | | 2.51 | |
On Assignment Incorporated | | | 2.39 | |
Medidata Solutions Incorporated | | | 2.32 | |
Portfolio Recovery Associates Incorporated | | | 2.32 | |
Acadia Healthcare Company Incorporated | | | 2.23 | |
IMAX Corporation | | | 2.16 | |
DexCom Incorporated | | | 2.03 | |
Envestnet Incorporated | | | 2.02 | |
|
| Sector distribution8 as of November 30, 2013 |
|
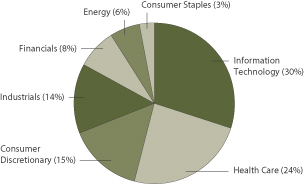
|
| 1. | The Fund is a gateway feeder fund that invests all of its assets in a single master portfolio of the Wells Fargo Master Trust with a substantially similar investment objective and substantially similar investment strategies. References to the investment activities of the Fund are intended to refer to the investment activities of the master portfolio in which it invests. |
| 2. | Please see the Fund’s current Statement of Additional Information for further details. |
| 3. | Historical performance shown for Class A shares prior to their inception reflects the performance of Investor Class shares, and includes the higher expenses applicable to Investor Class shares. If these expenses had not been included, returns would be higher. Historical performance shown for Class C shares prior to their inception reflects the performance of Investor Class shares, adjusted to reflect the higher expenses applicable to Class C shares. Historical performance shown for Institutional Class shares prior to their inception reflects the performance of Administrator Class shares, and includes the higher expenses applicable to Administrator Class shares. If these expenses had not been included, returns would be higher. |
| 4. | Reflects the expense ratios as stated in the most recent prospectuses. |
| 5. | The Adviser has committed through September 30, 2014, to waive fees and/or reimburse expenses to the extent necessary to cap the Fund’s Total Annual Fund Operating Expenses After Fee Waiver, excluding certain expenses, at the amounts shown. Brokerage commissions, stamp duty fees, interest, taxes, acquired fund fees and expenses, and extraordinary expenses are excluded from the cap. Fees from the underlying master portfolio are included in the cap. Without this cap, the Fund’s returns would have been lower. |
| 6. | The Russell 2000® Growth Index measures the performance of those Russell 2000® companies with higher price-to-book ratios and higher forecasted growth values. You cannot invest directly in an index. |
| 7. | The ten largest equity holdings are calculated based on the value of the securities of the master portfolio allocable to the Fund divided by the total net assets of the Fund. Holdings are subject to change and may have changed since the date specified. |
| 8. | Sector distribution is subject to change and represents the sector distribution of the master portfolio which is calculated based on total long-term investment of the master portfolio. |
| | | | |
| 10 | | Wells Fargo Advantage Equity Gateway Funds | | Performance highlights (unaudited) |
Wells Fargo Advantage Index Fund1
Investment objective
The Fund seeks to replicate the total return of S&P 500 Index, before fees and expenses.
Adviser
Wells Fargo Funds Management, LLC
Subadviser for master portfolio
Golden Capital Management, LLC
Portfolio managers
John R. Campbell, CFA
Justin Carr, CFA
David Neal, CFA
Average annual total returns2 (%) as of November 30, 2013
| | | | | | | | | | | | | | | | | | | | | | | | | | | | | | | | | | |
| | | | | Including sales charge | | | Excluding sales charge | | | Expense ratios3 (%) | |
| | | Inception date | | 1 year | | | 5 year | | | 10 year | | | 1 year | | | 5 year | | | 10 year | | | Gross | | | Net4 | |
| Class A (WFILX)* | | 11-4-1998 | | | 22.16 | | | | 15.63 | | | | 6.49 | | | | 29.60 | | | | 17.01 | | | | 7.12 | | | | 0.66 | | | | 0.56 | |
| Class B (WFIMX)* | | 11-3-1998 | | | 23.62 | | | | 15.91 | | | | 6.56 | | | | 28.62 | | | | 16.13 | | | | 6.56 | | | | 1.41 | | | | 1.31 | |
| Class C (WFINX)* | | 4-30-1999 | | | 27.64 | | | | 16.13 | | | | 6.32 | | | | 28.64 | | | | 16.13 | | | | 6.32 | | | | 1.41 | | | | 1.31 | |
| Administrator Class (WFIOX) | | 2-14-1985 | | | – | | | | – | | | | – | | | | 30.01 | | | | 17.35 | | | | 7.42 | | | | 0.35 | | | | 0.25 | |
| Investor Class (WFIRX) | | 7-16-2010 | | | – | | | | – | | | | – | | | | 29.73 | | | | 17.08 | | | | 7.18 | | | | 0.72 | | | | 0.45 | |
| S&P 500 Index5 | | – | | | – | | | | – | | | | – | | | | 30.30 | | | | 17.60 | | | | 7.69 | | | | – | | | | – | |
| *Class | | A, B, and C are closed to new investors. Please see the Fund’s current Statement of Additional Information for further details. |
Figures quoted represent past performance, which is no guarantee of future results, and do not reflect taxes that a shareholder may pay on fund distributions or the redemption of fund shares. Investment return and principal value of an investment will fluctuate so that an investor’s shares, when redeemed, may be worth more or less than their original cost. Performance shown without sales charges would be lower if sales charges were reflected. Current performance may be lower or higher than the performance data quoted, which assumes the reinvestment of dividends and capital gains. Current month-end performance is available on the Fund’s website, wellsfargoadvantagefunds.com.
Index returns do not include transaction costs associated with buying and selling securities, any mutual fund fees or expenses, or any taxes. It is not possible to invest directly in an index.
For Class A shares, the maximum front-end sales charge is 5.75%. For Class B shares, the maximum contingent deferred sales charge is 5.00%. For Class C shares, the maximum contingent deferred sales charge is 1.00%. Performance including sales charge assumes the sales charge for the corresponding time period. Administrator Class and Investor Class shares are sold without a front-end sales charge or contingent deferred sales charge.
Please keep in mind that high double-digit returns were primarily achieved during favorable market conditions. You should not expect that such favorable returns can be consistently achieved. A Fund’s performance, especially for very short time periods, should not be the sole factor in making your investment decision.
Stock values fluctuate in response to the activities of individual companies and general market and economic conditions. The use of derivatives may reduce returns and/or increase volatility. Consult the Fund’s prospectus for additional information on these and other risks.
Please see footnotes on page 11.
| | | | | | |
| Performance highlights (unaudited) | | Wells Fargo Advantage Equity Gateway Funds | | | 11 | |
Wells Fargo Advantage Index Fund (continued)
| | | | |
| Ten largest equity holdings6 (%) as of November 30, 2013 | |
Apple Incorporated | | | 3.10 | |
Exxon Mobil Corporation | | | 2.52 | |
Google Incorporated Class A | | | 1.82 | |
Microsoft Corporation | | | 1.77 | |
General Electric Company | | | 1.66 | |
Johnson & Johnson | | | 1.64 | |
Chevron Corporation | | | 1.45 | |
Procter & Gamble Company | | | 1.41 | |
JPMorgan Chase & Company | | | 1.32 | |
Wells Fargo & Company | | | 1.30 | |
| | |
| Sector distribution7 as of November 30, 2013 |
|
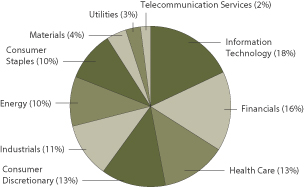
|
| 1. | The Fund is a gateway feeder fund that invests all of its assets in a single master portfolio of the Wells Fargo Master Trust with a substantially similar investment objective and substantially similar investment strategies. References to the investment activities of the Fund are intended to refer to the investment activities of the master portfolio in which it invests. |
| 2. | Historical performance shown for Investor Class shares prior to their inception reflects the performance of Administrator Class shares, adjusted to reflect the higher expenses applicable to Investor Class shares. Historical performance shown for all classes of the Fund prior to July 19, 2010, is based on the performance of the Fund’s predecessor, Evergreen Equity Index Fund. |
| 3. | Reflects the expense ratios as stated in the most recent prospectuses. |
| 4. | The Adviser has committed through September 30, 2014, to waive fees and/or reimburse expenses to the extent necessary to cap the Fund’s Total Annual Fund Operating Expenses After Fee Waiver, excluding certain expenses, at the amounts shown. Brokerage commissions, stamp duty fees, interest, taxes, acquired fund fees and expenses, and extraordinary expenses are excluded from the cap. Fees from the underlying master portfolio are included in the cap. Without this cap, the Fund’s returns would have been lower. |
| 5. | The S&P 500 Index consists of 500 stocks chosen for market size, liquidity, and industry group representation. It is a market-value weighted index with each stock’s weight in the index proportionate to its market value. You cannot invest directly in an index. |
| 6. | The ten largest equity holdings are calculated based on the value of the securities of the master portfolio allocable to the Fund divided by the total net assets of the Fund. Holdings are subject to change and may have changed since the date specified. |
| 7. | Sector distribution is subject to change and represents the sector distribution of the master portfolio which is calculated based on total long-term investment of the master portfolio. |
| | | | |
| 12 | | Wells Fargo Advantage Equity Gateway Funds | | Performance highlights (unaudited) |
Wells Fargo Advantage International Value Fund1
Investment objective
The Fund seeks long-term capital appreciation.
Adviser
Wells Fargo Funds Management, LLC
Subadviser for master portfolio
LSV Asset Management
Portfolio managers
Josef Lakonishok
Puneed Mansharamani, CFA
Menno Vermeulen, CFA
Average annual total returns2 (%) as of November 30, 2013
| | | | | | | | | | | | | | | | | | | | | | | | | | | | | | | | | | |
| | | | | Including sales charge | | | Excluding sales charge | | | Expense ratios3 (%) | |
| | | Inception date | | 1 year | | | 5 year | | | 10 year | | | 1 year | | | 5 year | | | 10 year | | | Gross | | | Net4 | |
| Class A (WFFAX) | | 10-31-2003 | | | 16.68 | | | | 11.58 | | | | 5.90 | | | | 23.80 | | | | 12.91 | | | | 6.53 | | | | 1.51 | | | | 1.50 | |
| Class B (WFVBX)* | | 4-8-2005 | | | 17.85 | | | | 11.77 | | | | 5.96 | | | | 22.85 | | | | 12.03 | | | | 5.96 | | | | 2.26 | | | | 2.25 | |
| Class C (WFVCX) | | 4-8-2005 | | | 21.82 | | | | 12.02 | | | | 5.71 | | | | 22.82 | | | | 12.02 | | | | 5.71 | | | | 2.26 | | | | 2.25 | |
| Administrator Class (WFVDX) | | 4-8-2005 | | | – | | | | – | | | | – | | | | 24.16 | | | | 13.14 | | | | 6.73 | | | | 1.35 | | | | 1.25 | |
| Institutional Class (WFVIX) | | 8-31-2006 | | | | | | | | | | | | | | | 24.42 | | | | 13.37 | | | | 6.89 | | | | 1.08 | | | | 1.05 | |
| MSCI EAFE Value Index (Net)5 | | – | | | – | | | | – | | | | – | | | | 26.20 | | | | 12.92 | | | | 7.52 | | | | – | | | | – | |
| * | | Class B shares are closed to investment, except in connection with the reinvestment of any distributions and permitted exchanges. |
Figures quoted represent past performance, which is no guarantee of future results, and do not reflect taxes that a shareholder may pay on fund distributions or the redemption of fund shares. Investment return and principal value of an investment will fluctuate so that an investor’s shares, when redeemed, may be worth more or less than their original cost. Performance shown without sales charges would be lower if sales charges were reflected. Current performance may be lower or higher than the performance data quoted, which assumes the reinvestment of dividends and capital gains. Current month-end performance is available on the Fund’s website, wellsfargoadvantagefunds.com.
Index returns do not include transaction costs associated with buying and selling securities, any mutual fund fees or expenses, or any taxes. It is not possible to invest directly in an index.
For Class A shares, the maximum front-end sales charge is 5.75%. For Class B shares, the maximum contingent deferred sales charge is 5.00%. For Class C shares, the maximum contingent deferred sales charge is 1.00%. Performance including sales charge assumes the sales charge for the corresponding time period. Administrator Class and Institutional Class shares are sold without a front-end sales charge or contingent deferred sales charge.
Stock values fluctuate in response to the activities of individual companies and general market and economic conditions. Foreign investments are especially volatile and can rise or fall dramatically due to differences in the political and economic conditions of the host country. These risks are generally intensified in emerging markets. The use of derivatives may reduce returns and/or increase volatility. Certain investment strategies tend to increase the total risk of an investment (relative to the broader market). The Fund is exposed to smaller-company securities risk. Consult the Fund’s prospectus for additional information on these and other risks.
Please see footnotes on page 13.
| | | | | | |
| Performance highlights (unaudited) | | Wells Fargo Advantage Equity Gateway Funds | | | 13 | |
Wells Fargo Advantage International Value Fund (continued)
| | | | |
| Ten largest equity holdings6 (%) as of November 30, 2013 | |
Royal Dutch Shell plc Class B | | | 1.94 | |
AstraZeneca plc | | | 1.81 | |
KDDI Corporation | | | 1.57 | |
Vodafone Group plc | | | 1.52 | |
BT Group plc | | | 1.43 | |
BP plc | | | 1.39 | |
Sanofi-Aventis SA | | | 1.36 | |
Allianz AG | | | 1.30 | |
Volkswagen AG | | | 1.23 | |
Daimler AG | | | 1.20 | |
| | |
| Sector distribution7 as of November 30, 2013 |
|
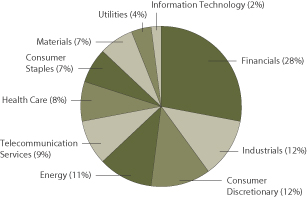
|
| 1. | The Fund is a gateway feeder fund that invests all of its assets in a single master portfolio of the Wells Fargo Master Trust with a substantially similar investment objective and substantially similar investment strategies. References to the investment activities of the Fund are intended to refer to the investment activities of the master portfolio in which it invests. |
| 2. | Historical performance shown for Class B and Class C shares prior to their inception reflects the performance of Class A shares, adjusted to reflect the higher expenses applicable to Class B and C shares. Historical performance shown for Institutional Class shares prior to their inception reflects the performance of Administrator Class shares, and includes the higher expenses applicable to Administrator Class shares. If these expenses had not been included, returns would be higher. Historical performance shown for Administrator Class shares prior to their inception reflects the performance of Class A shares, and includes the higher expenses applicable to Class A shares. If these expenses had not been included, returns would be higher. |
| 3. | Reflects the expense ratios as stated in the most recent prospectuses. |
| 4. | The Adviser has committed through September 30, 2014, to waive fees and/or reimburse expenses to the extent necessary to cap the Fund’s Total Annual Fund Operating Expenses After Fee Waiver, excluding certain expenses, at the amounts shown. Brokerage commissions, stamp duty fees, interest, taxes, acquired fund fees and expenses, and extraordinary expenses are excluded from the cap. Fees from the underlying master portfolio are included in the cap. Without this cap, the Fund’s returns would have been lower. |
| 5. | The Morgan Stanley Capital International Europe, Australasia, and Far East Value Index (Net) (MSCI EAFE Value Index (Net)) is an unmanaged market capitalization index designed to measure the performance of value securities within developed equity markets, excluding the United States and Canada. Source: MSCI. MSCI makes no express or implied warranties or representations and shall have no liability whatsoever with respect to any MSCI data contained herein. The MSCI data may not be further redistributed or used as a basis for other indexes or any securities or financial products. This report is not approved, reviewed or produced by MSCI. You cannot invest directly in an index. |
| 6. | The ten largest equity holdings are calculated based on the value of the securities of the master portfolio allocable to the Fund divided by the total net assets of the Fund. Holdings are subject to change and may have changed since the date specified. |
| 7. | Sector distribution is subject to change and represents the sector distribution of the master portfolio which is calculated based on total long-term investment of the master portfolio. |
| | | | |
| 14 | | Wells Fargo Advantage Equity Gateway Funds | | Performance highlights (unaudited) |
Wells Fargo Advantage Small Company Growth Fund1
Investment objective
The Fund seeks long-term capital appreciation.
Adviser
Wells Fargo Funds Management, LLC
Subadviser for master portfolio
Peregrine Capital Management, Inc.
Portfolio managers
William A. Grierson, CFA
Daniel J. Hagen, CFA
Robert B. Mersky, CFA
James P. Ross, CFA
Paul E. von Kuster, CFA
Average annual total returns2 (%) as of November 30, 2013
| | | | | | | | | | | | | | | | | | | | | | | | | | | | | | | | | | |
| | | | | Including sales charge | | | Excluding sales charge | | | Expense ratios3 (%) | |
| | | Inception date | | 1 year | | | 5 year | | | 10 year | | | 1 year | | | 5 year | | | 10 year | | | Gross | | | Net4 | |
| Class A (WFSAX) | | 1-30-2004 | | | 37.71 | | | | 25.50 | | | | 8.37 | | | | 46.11 | | | | 27.00 | | | | 9.01 | | | | 1.53 | | | | 1.40 | |
| Class B (WFSBX)* | | 1-30-2004 | | | 40.03 | | | | 25.90 | | | | 8.45 | | | | 45.03 | | | | 26.06 | | | | 8.45 | | | | 2.28 | | | | 2.15 | |
| Class C (WSMCX) | | 1-30-2004 | | | 44.06 | | | | 26.09 | | | | 8.29 | | | | 45.06 | | | | 26.09 | | | | 8.29 | | | | 2.28 | | | | 2.15 | |
| Administrator Class (NVSCX) | | 11-11-1994 | | | – | | | | – | | | | – | | | | 46.45 | | | | 27.34 | | | | 9.29 | | | | 1.37 | | | | 1.20 | |
| Institutional Class (WSCGX) | | 3-31-2008 | | | | | | | | | | | | | | | 46.83 | | | | 27.64 | | | | 9.44 | | | | 1.10 | | | | 0.95 | |
| Russell 2000® Growth Index5 | | – | | | – | | | | – | | | | – | | | | 44.47 | | | | 23.38 | | | | 9.23 | | | | – | | | | – | |
| * | | Class B shares are closed to investment, except in connection with the reinvestment of any distributions and permitted exchanges. |
Figures quoted represent past performance, which is no guarantee of future results, and do not reflect taxes that a shareholder may pay on fund distributions or the redemption of fund shares. Investment return and principal value of an investment will fluctuate so that an investor’s shares, when redeemed, may be worth more or less than their original cost. Performance shown without sales charges would be lower if sales charges were reflected. Current performance may be lower or higher than the performance data quoted, which assumes the reinvestment of dividends and capital gains. Current month-end performance is available on the Fund’s website, wellsfargoadvantagefunds.com.
Index returns do not include transaction costs associated with buying and selling securities, any mutual fund fees or expenses, or any taxes. It is not possible to invest directly in an index.
For Class A shares, the maximum front-end sales charge is 5.75%. For Class B shares, the maximum contingent deferred sales charge is 5.00%. For Class C shares, the maximum contingent deferred sales charge is 1.00%. Performance including sales charge assumes the sales charge for the corresponding time period. Administrator Class and Institutional Class shares are sold without a front-end sales charge or contingent deferred sales charge.
Please keep in mind that high double-digit returns were primarily achieved during favorable market conditions. You should not expect that such favorable returns can be consistently achieved. A Fund’s performance, especially for very short time periods, should not be the sole factor in making your investment decision.
Stock values fluctuate in response to the activities of individual companies and general market and economic conditions. Smaller-company stocks tend to be more volatile and less liquid than those of larger companies. Certain investment strategies tend to increase the total risk of an investment (relative to the broader market). The Fund is exposed to foreign investment risk. Consult the Fund’s prospectus for additional information on these and other risks.
Please see footnotes on page 15.
| | | | | | |
| Performance highlights (unaudited) | | Wells Fargo Advantage Equity Gateway Funds | | | 15 | |
Wells Fargo Advantage Small Company Growth Fund (continued)
| | | | |
| Ten largest equity holdings6 (%) as of November 30, 2013 | |
Hanesbrands Incorporated | | | 1.55 | |
On Assignment Incorporated | | | 1.49 | |
SS&C Technologies Holdings | | | 1.48 | |
Evercore Partners Incorporated Class A | | | 1.26 | |
Silver Spring Networks Incorporated | | | 1.22 | |
OSI Systems Incorporated | | | 1.20 | |
Argo Group International Holdings Limited | | | 1.16 | |
Tutor Prini Corporation | | | 1.16 | |
Wabash National Corporation | | | 1.16 | |
A.O. Smith Corporation | | | 1.13 | |
| | |
| Sector distribution7 as of November 30, 2013 |
|
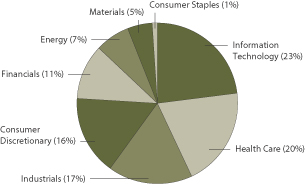
|
| 1. | The Fund is a gateway feeder fund that invests all of its assets in a single master portfolio of the Wells Fargo Master Trust with a substantially similar investment objective and substantially similar investment strategies. References to the investment activities of the Fund are intended to refer to the investment activities of the master portfolio in which it invests. |
| 2. | Historical performance shown for Class A, Class B, and Class C shares prior to their inception reflects the performance of Administrator Class shares, adjusted to reflect the higher expenses applicable to Class A, Class B, and Class C shares. Historical performance shown for Institutional Class shares prior to their inception reflects the performance of Administrator Class shares, and includes the higher expenses applicable to Administrator Class shares. If these expenses had not been included, returns would be higher. |
| 3. | Reflects the expense ratios as stated in the most recent prospectuses. |
| 4. | The Adviser has committed through September 30, 2014, to waive fees and/or reimburse expenses to the extent necessary to cap the Fund’s Total Annual Fund Operating Expenses After Fee Waiver, excluding certain expenses, at the amounts shown. Brokerage commissions, stamp duty fees, interest, taxes, acquired fund fees and expenses, and extraordinary expenses are excluded from the cap. Fees from the underlying master portfolio are included in the cap. Without this cap, the Fund’s returns would have been lower. |
| 5. | The Russell 2000® Growth Index measures the performance shown of those Russell 2000 companies with higher price-to-book ratios and higher forecasted growth values. You cannot invest directly in an index. |
| 6. | The ten largest equity holdings are calculated based on the value of the securities of the master portfolio allocable to the Fund divided by the total net assets of the Fund. Holdings are subject to change and may have changed since the date specified. |
| 7. | Sector distribution is subject to change and represents the sector distribution of the master portfolio which is calculated based on total long-term investment of the master portfolio. |
| | | | |
| 16 | | Wells Fargo Advantage Equity Gateway Funds | | Performance highlights (unaudited) |
Wells Fargo Advantage Small Company Value Fund1
Investment objective
The Fund seeks long-term capital appreciation.
Adviser
Wells Fargo Funds Management, LLC
Subadviser for master portfolio
Peregrine Capital Management, Inc.
Portfolio managers
Jason R. Ballsrud, CFA
Tasso H. Coin, Jr., CFA
Douglas G. Pugh, CFA
Average annual total returns2 (%) as of November 30, 2013
| | | | | | | | | | | | | | | | | | | | | | | | | | | | | | | | | | |
| | | | | Including sales charge | | | Excluding sales charge | | | Expense ratios3 (%) | |
| | | Inception date | | 1 year | | | 5 year | | | 10 year | | | 1 year | | | 5 year | | | 10 year | | | Gross | | | Net4 | |
| Class A (SCVAX) | | 1-31-2002 | | | 32.41 | | | | 23.09 | | | | 7.95 | | | | 40.48 | | | | 24.56 | | | | 8.59 | | | | 1.56 | | | | 1.40 | |
| Class B (SCVBX)* | | 1-31-2002 | | | 34.32 | | | | 23.48 | | | | 8.05 | | | | 39.32 | | | | 23.66 | | | | 8.05 | | | | 2.31 | | | | 2.15 | |
| Class C (SCVFX) | | 8-30-2002 | | | 38.32 | | | | 23.66 | | | | 7.80 | | | | 39.32 | | | | 23.66 | | | | 7.80 | | | | 2.31 | | | | 2.15 | |
| Administrator Class (SCVIX) | | 1-31-2002 | | | – | | | | – | | | | – | | | | 40.71 | | | | 24.90 | | | | 8.88 | | | | 1.40 | | | | 1.20 | |
| Institutional Class (SCVNX) | | 7-30-2010 | | | | | | | | | | | | | | | 41.06 | | | | 25.07 | | | | 8.96 | | | | 1.13 | | | | 1.00 | |
| Russell 2000® Value Index5 | | – | | | – | | | | – | | | | – | | | | 37.60 | | | | 18.61 | | | | 8.79 | | | | – | | | | – | |
| * | | Class B shares are closed to investment, except in connection with the reinvestment of any distributions and permitted exchanges. |
Figures quoted represent past performance, which is no guarantee of future results, and do not reflect taxes that a shareholder may pay on fund distributions or the redemption of fund shares. Investment return and principal value of an investment will fluctuate so that an investor’s shares, when redeemed, may be worth more or less than their original cost. Performance shown without sales charges would be lower if sales charges were reflected. Current performance may be lower or higher than the performance data quoted, which assumes the reinvestment of dividends and capital gains. Current month-end performance is available on the Fund’s website, wellsfargoadvantagefunds.com.
Index returns do not include transaction costs associated with buying and selling securities, any mutual fund fees or expenses, or any taxes. It is not possible to invest directly in an index.
For Class A shares, the maximum front-end sales charge is 5.75%. For Class B shares, the maximum contingent deferred sales charge is 5.00%. For Class C shares, the maximum contingent deferred sales charge is 1.00%. Performance including sales charge assumes the sales charge for the corresponding time period. Administrator Class and Institutional Class shares are sold without a front-end sales charge or contingent deferred sales charge.
Please keep in mind that high double-digit returns were primarily achieved during favorable market conditions. You should not expect that such favorable returns can be consistently achieved. A Fund’s performance, especially for very short time periods, should not be the sole factor in making your investment decision.
Stock values fluctuate in response to the activities of individual companies and general market and economic conditions. Smaller-company stocks tend to be more volatile and less liquid than those of larger companies. Certain investment strategies tend to increase the total risk of an investment (relative to the broader market). The Fund is exposed to foreign investment risk. Consult the Fund’s prospectus for additional information on these and other risks.
Please see footnotes on page 17.
| | | | | | |
| Performance highlights (unaudited) | | Wells Fargo Advantage Equity Gateway Funds | | | 17 | |
Wells Fargo Advantage Small Company Value Fund (continued)
| | | | |
| Ten largest equity holdings6 (%) as of November 30, 2013 | |
Western Alliance Bancorp | | | 1.52 | |
CNO Financial Group Incorporated | | | 1.50 | |
BancorpSouth Incorporated | | | 1.50 | |
Amtrust Financial Services Incorporated | | | 1.37 | |
Asbury Automotive Group Incorporated | | | 1.33 | |
American Axle & Manufacturing Holdings Incorporated | | | 1.32 | |
PrivateBancorp Incorporated | | | 1.32 | |
Employers Holdings Incorporated | | | 1.30 | |
Apollo Group Incorporated Class A | | | 1.29 | |
WellCare Health Plans Incorporated | | | 1.28 | |
| | |
| Sector distribution7 as of November 30, 2013 |
|
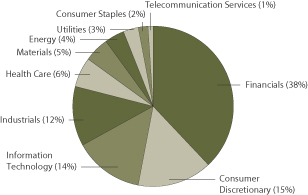
|
| 1. | The Fund is a gateway feeder fund that invests all of its assets in a single master portfolio of the Wells Fargo Master Trust with a substantially similar investment objective and substantially similar investment strategies. References to the investment activities of the Fund are intended to refer to the investment activities of the master portfolio in which it invests. |
| 2. | Historical performance shown for Institutional Class shares prior to their inception reflects the performance of Administrator Class shares and includes the higher expenses applicable to Administrator Class shares. If these expenses had not been included, returns would be higher. |
| 3. | Reflects the expense ratios as stated in the most recent prospectuses. |
| 4. | The Adviser has committed through September 30, 2014, to waive fees and/or reimburse expenses to the extent necessary to cap the Fund’s Total Annual Fund Operating Expenses After Fee Waiver, excluding certain expenses, at the amounts shown. Brokerage commissions, stamp duty fees, interest, taxes, acquired fund fees and expenses, and extraordinary expenses are excluded from the cap. Fees from the underlying master portfolio are included in the cap. Without this cap, the Fund’s returns would have been lower. |
| 5. | The Russell 2000® Value Index measures the performance of those Russell 2000® companies with lower price-to- book ratios and lower forecasted growth values. You cannot invest directly in an index. |
| 6. | The ten largest equity holdings are calculated based on the value of the securities of the master portfolio allocable to the Fund divided by the total net assets of the Fund. Holdings are subject to change and may have changed since the date specified. |
| 7. | Sector distribution is subject to change and represents the sector distribution of the master portfolio which is calculated based on total long-term investment of the master portfolio. |
| | | | |
| 18 | | Wells Fargo Advantage Equity Gateway Funds | | Fund expenses (unaudited) |
As a shareholder of the Fund, you incur two types of costs: (1) transaction costs, including sales charges (loads) on purchase payments and contingent deferred sales charges (if any) on redemptions and (2) ongoing costs, including management fees, distribution (12b-1) and/or shareholder service fees, and other Fund expenses. This example is intended to help you understand your ongoing costs (in dollars) of investing in the Fund and to compare these costs with the ongoing costs of investing in other mutual funds.
The example is based on an investment of $1,000 invested at the beginning of the six-month period and held for the entire period from June 1, 2013 to November 30, 2013.
Actual expenses
The “Actual” line of the table below provides information about actual account values and actual expenses. You may use the information in this line, together with the amount you invested, to estimate the expenses that you paid over the period. Simply divide your account value by $1,000 (for example, an $8,600 account value divided by $1,000 = 8.6), then multiply the result by the number in the “Actual” line under the heading entitled “Expenses paid during period” for your applicable class of shares to estimate the expenses you paid on your account during this period.
Hypothetical example for comparison purposes
The “Hypothetical” line of the table below provides information about hypothetical account values and hypothetical expenses based on the Fund’s actual expense ratio and an assumed rate of return of 5% per year before expenses, which is not the Fund’s actual return. The hypothetical account values and expenses may not be used to estimate the actual ending account balance or expenses you paid for the period. You may use this information to compare the ongoing costs of investing in the Fund and other funds. To do so, compare this 5% hypothetical example with the 5% hypothetical examples that appear in the shareholder reports of the other funds.
Please note that the expenses shown in the table are meant to highlight your ongoing costs only and do not reflect any transactional costs, such as sales charges (loads) and contingent deferred sales charges. Therefore, the “Hypothetical” line of the table is useful in comparing ongoing costs only and will not help you determine the relative total costs of owning different funds. In addition, if these transactional costs were included, your costs would have been higher.
| | | | | | | | | | | | | | | | |
| Wells Fargo Advantage C&B Large Cap Value Fund | | Beginning
account vlue
6-1-2013 | | | Ending
account value
11-30-2013 | | | Expenses
paid during
the period¹ | | | Net annual
expense ratio | |
Class A | | | | | | | | | | | | | | | | |
Actual | | $ | 1,000.00 | | | $ | 1,113.37 | | | $ | 6.09 | | | | 1.15 | % |
Hypothetical (5% return before expenses) | | $ | 1,000.00 | | | $ | 1,019.30 | | | $ | 5.82 | | | | 1.15 | % |
Class B | | | | | | | | | | | | | | | | |
Actual | | $ | 1,000.00 | | | $ | 1,109.30 | | | $ | 10.05 | | | | 1.90 | % |
Hypothetical (5% return before expenses) | | $ | 1,000.00 | | | $ | 1,015.54 | | | $ | 9.60 | | | | 1.90 | % |
Class C | | | | | | | | | | | | | | | | |
Actual | | $ | 1,000.00 | | | $ | 1,108.84 | | | $ | 10.04 | | | | 1.90 | % |
Hypothetical (5% return before expenses) | | $ | 1,000.00 | | | $ | 1,015.54 | | | $ | 9.60 | | | | 1.90 | % |
Administrator Class | | | | | | | | | | | | | | | | |
Actual | | $ | 1,000.00 | | | $ | 1,114.34 | | | $ | 5.04 | | | | 0.95 | % |
Hypothetical (5% return before expenses) | | $ | 1,000.00 | | | $ | 1,020.31 | | | $ | 4.81 | | | | 0.95 | % |
Institutional Class | | | | | | | | | | | | | | | | |
Actual | | $ | 1,000.00 | | | $ | 1,115.94 | | | $ | 3.71 | | | | 0.70 | % |
Hypothetical (5% return before expenses) | | $ | 1,000.00 | | | $ | 1,021.56 | | | $ | 3.55 | | | | 0.70 | % |
Investor Class | | | | | | | | | | | | | | | | |
Actual | | $ | 1,000.00 | | | $ | 1,112.29 | | | $ | 6.35 | | | | 1.20 | % |
Hypothetical (5% return before expenses) | | $ | 1,000.00 | | | $ | 1,019.05 | | | $ | 6.07 | | | | 1.20 | % |
Please see footnote on page 20.
| | | | | | |
| Fund expenses (unaudited) | | Wells Fargo Advantage Equity Gateway Funds | | | 19 | |
| | | | | | | | | | | | | | | | |
| Wells Fargo Advantage Diversified Equity Fund | | Beginning
account value
6-1-2013 | | | Ending
account value
11-30-2013 | | | Expenses
paid during
the period¹ | | | Net annual
expense ratio | |
Class A | | | | | | | | | | | | | | | | |
Actual | | $ | 1,000.00 | | | $ | 1,141.27 | | | $ | 6.71 | | | | 1.25 | % |
Hypothetical (5% return before expenses) | | $ | 1,000.00 | | | $ | 1,018.80 | | | $ | 6.33 | | | | 1.25 | % |
Class B | | | | | | | | | | | | | | | | |
Actual | | $ | 1,000.00 | | | $ | 1,137.00 | | | $ | 10.71 | | | | 2.00 | % |
Hypothetical (5% return before expenses) | | $ | 1,000.00 | | | $ | 1,015.04 | | | $ | 10.10 | | | | 2.00 | % |
Class C | | | | | | | | | | | | | | | | |
Actual | | $ | 1,000.00 | | | $ | 1,136.97 | | | $ | 10.71 | | | | 2.00 | % |
Hypothetical (5% return before expenses) | | $ | 1,000.00 | | | $ | 1,015.04 | | | $ | 10.10 | | | | 2.00 | % |
Administrator Class | | | | | | | | | | | | | | | | |
Actual | | $ | 1,000.00 | | | $ | 1,142.35 | | | $ | 5.37 | | | | 1.00 | % |
Hypothetical (5% return before expenses) | | $ | 1,000.00 | | | $ | 1,020.05 | | | $ | 5.06 | | | | 1.00 | % |
| Wells Fargo Advantage Emerging Growth Fund | | | | | | | | | | | | |
Class A | | | | | | | | | | | | | | | | |
Actual | | $ | 1,000.00 | | | $ | 1,268.09 | | | $ | 7.79 | | | | 1.37 | % |
Hypothetical (5% return before expenses) | | $ | 1,000.00 | | | $ | 1,018.20 | | | $ | 6.93 | | | | 1.37 | % |
Class C | | | | | | | | | | | | | | | | |
Actual | | $ | 1,000.00 | | | $ | 1,262.73 | | | $ | 12.03 | | | | 2.12 | % |
Hypothetical (5% return before expenses) | | $ | 1,000.00 | | | $ | 1,014.44 | | | $ | 10.71 | | | | 2.12 | % |
Administrator Class | | | | | | | | | | | | | | | | |
Actual | | $ | 1,000.00 | | | $ | 1,268.91 | | | $ | 6.83 | | | | 1.20 | % |
Hypothetical (5% return before expenses) | | $ | 1,000.00 | | | $ | 1,019.05 | | | $ | 6.07 | | | | 1.20 | % |
Institutional Class | | | | | | | | | | | | | | | | |
Actual | | $ | 1,000.00 | | | $ | 1,271.22 | | | $ | 5.12 | | | | 0.90 | % |
Hypothetical (5% return before expenses) | | $ | 1,000.00 | | | $ | 1,020.56 | | | $ | 4.56 | | | | 0.90 | % |
Investor Class | | | | | | | | | | | | | | | | |
Actual | | $ | 1,000.00 | | | $ | 1,267.81 | | | $ | 8.13 | | | | 1.43 | % |
Hypothetical (5% return before expenses) | | $ | 1,000.00 | | | $ | 1,017.90 | | | $ | 7.23 | | | | 1.43 | % |
| Wells Fargo Advantage Index Fund | | | | | | | | | | | | |
Class A | | | | | | | | | | | | | | | | |
Actual | | $ | 1,000.00 | | | $ | 1,115.93 | | | $ | 2.97 | | | | 0.56 | % |
Hypothetical (5% return before expenses) | | $ | 1,000.00 | | | $ | 1,022.26 | | | $ | 2.84 | | | | 0.56 | % |
Class B | | | | | | | | | | | | | | | | |
Actual | | $ | 1,000.00 | | | $ | 1,111.78 | | | $ | 6.94 | | | | 1.31 | % |
Hypothetical (5% return before expenses) | | $ | 1,000.00 | | | $ | 1,018.50 | | | $ | 6.63 | | | | 1.31 | % |
Class C | | | | | | | | | | | | | | | | |
Actual | | $ | 1,000.00 | | | $ | 1,111.95 | | | $ | 6.94 | | | | 1.31 | % |
Hypothetical (5% return before expenses) | | $ | 1,000.00 | | | $ | 1,018.50 | | | $ | 6.63 | | | | 1.31 | % |
Administrator Class | | | | | | | | | | | | | | | | |
Actual | | $ | 1,000.00 | | | $ | 1,117.78 | | | $ | 1.33 | | | | 0.25 | % |
Hypothetical (5% return before expenses) | | $ | 1,000.00 | | | $ | 1,023.82 | | | $ | 1.27 | | | | 0.25 | % |
Investor Class | | | | | | | | | | | | | | | | |
Actual | | $ | 1,000.00 | | | $ | 1,116.51 | | | $ | 2.39 | | | | 0.45 | % |
Hypothetical (5% return before expenses) | | $ | 1,000.00 | | | $ | 1,022.81 | | | $ | 2.28 | | | | 0.45 | % |
Please see footnote on page 20.
| | | | |
| 20 | | Wells Fargo Advantage Equity Gateway Funds | | Fund expenses (unaudited) |
| | | | | | | | | | | | | | | | |
| Wells Fargo Advantage International Value Fund | | Beginning
account value
6-1-2013 | | | Ending
account value
11-30-2013 | | | Expenses
paid during
the period¹ | | | Net annual
expense ratio | |
Class A | | | | | | | | | | | | | | | | |
Actual | | $ | 1,000.00 | | | $ | 1,123.88 | | | $ | 7.99 | | | | 1.50 | % |
Hypothetical (5% return before expenses) | | $ | 1,000.00 | | | $ | 1,017.55 | | | $ | 7.59 | | | | 1.50 | % |
Class B | | | | | | | | | | | | | | | | |
Actual | | $ | 1,000.00 | | | $ | 1,119.14 | | | $ | 11.95 | | | | 2.25 | % |
Hypothetical (5% return before expenses) | | $ | 1,000.00 | | | $ | 1,013.79 | | | $ | 11.36 | | | | 2.25 | % |
Class C | | | | | | | | | | | | | | | | |
Actual | | $ | 1,000.00 | | | $ | 1,119.12 | | | $ | 11.95 | | | | 2.25 | % |
Hypothetical (5% return before expenses) | | $ | 1,000.00 | | | $ | 1,013.79 | | | $ | 11.36 | | | | 2.25 | % |
Administrator Class | | | | | | | | | | | | | | | | |
Actual | | $ | 1,000.00 | | | $ | 1,125.47 | | | $ | 6.66 | | | | 1.25 | % |
Hypothetical (5% return before expenses) | | $ | 1,000.00 | | | $ | 1,018.80 | | | $ | 6.33 | | | | 1.25 | % |
Institutional Class | | | | | | | | | | | | | | | | |
Actual | | $ | 1,000.00 | | | $ | 1,126.78 | | | $ | 5.60 | | | | 1.05 | % |
Hypothetical (5% return before expenses) | | $ | 1,000.00 | | | $ | 1,019.80 | | | $ | 5.32 | | | | 1.05 | % |
| Wells Fargo Advantage Small Company Growth Fund | | | | | | | | | | | | |
Class A | | | | | | | | | | | | | | | | |
Actual | | $ | 1,000.00 | | | $ | 1,201.58 | | | $ | 7.89 | | | | 1.43 | % |
Hypothetical (5% return before expenses) | | $ | 1,000.00 | | | $ | 1,017.90 | | | $ | 7.23 | | | | 1.43 | % |
Class B | | | | | | | | | | | | | | | | |
Actual | | $ | 1,000.00 | | | $ | 1,197.46 | | | $ | 12.01 | | | | 2.18 | % |
Hypothetical (5% return before expenses) | | $ | 1,000.00 | | | $ | 1,014.14 | | | $ | 11.01 | | | | 2.18 | % |
Class C | | | | | | | | | | | | | | | | |
Actual | | $ | 1,000.00 | | | $ | 1,197.43 | | | $ | 12.01 | | | | 2.18 | % |
Hypothetical (5% return before expenses) | | $ | 1,000.00 | | | $ | 1,014.14 | | | $ | 11.01 | | | | 2.18 | % |
Administrator Class | | | | | | | | | | | | | | | | |
Actual | | $ | 1,000.00 | | | $ | 1,202.96 | | | $ | 6.63 | | | | 1.20 | % |
Hypothetical (5% return before expenses) | | $ | 1,000.00 | | | $ | 1,019.05 | | | $ | 6.07 | | | | 1.20 | % |
Institutional Class | | | | | | | | | | | | | | | | |
Actual | | $ | 1,000.00 | | | $ | 1,204.46 | | | $ | 5.25 | | | | 0.95 | % |
Hypothetical (5% return before expenses) | | $ | 1,000.00 | | | $ | 1,020.31 | | | $ | 4.81 | | | | 0.95 | % |
| Wells Fargo Advantage Small Company Value Fund | | | | | | | | | | | | |
Class A | | | | | | | | | | | | | | | | |
Actual | | $ | 1,000.00 | | | $ | 1,152.63 | | | $ | 7.72 | | | | 1.43 | % |
Hypothetical (5% return before expenses) | | $ | 1,000.00 | | | $ | 1,017.90 | | | $ | 7.23 | | | | 1.43 | % |
Class B | | | | | | | | | | | | | | | | |
Actual | | $ | 1,000.00 | | | $ | 1,148.03 | | | $ | 11.79 | | | | 2.19 | % |
Hypothetical (5% return before expenses) | | $ | 1,000.00 | | | $ | 1,014.09 | | | $ | 11.06 | | | | 2.19 | % |
Class C | | | | | | | | | | | | | | | | |
Actual | | $ | 1,000.00 | | | $ | 1,147.96 | | | $ | 11.74 | | | | 2.18 | % |
Hypothetical (5% return before expenses) | | $ | 1,000.00 | | | $ | 1,014.14 | | | $ | 11.01 | | | | 2.18 | % |
Administrator Class | | | | | | | | | | | | | | | | |
Actual | | $ | 1,000.00 | | | $ | 1,153.27 | | | $ | 6.48 | | | | 1.20 | % |
Hypothetical (5% return before expenses) | | $ | 1,000.00 | | | $ | 1,019.05 | | | $ | 6.07 | | | | 1.20 | % |
Institutional Class | | | | | | | | | | | | | | | | |
Actual | | $ | 1,000.00 | | | $ | 1,154.73 | | | $ | 5.40 | | | | 1.00 | % |
Hypothetical (5% return before expenses) | | $ | 1,000.00 | | | $ | 1,020.05 | | | $ | 5.06 | | | | 1.00 | % |
| 1. | Expenses paid is equal to the annualized expense ratio of each class multiplied by the average account value over the period, multiplied by the number of days in the most recent fiscal half-year divided by the number of days in the fiscal year (to reflect the one-half-year period). |
| | | | | | |
| Portfolio of investments—November 30, 2013 (unaudited) | | Wells Fargo Advantage Equity Gateway Funds | | | 21 | |
C&B LARGE CAP VALUE FUND
| | | | | | | | | | |
| Security name | | | | | | | | Value | |
| | | | | | | | | | |
| | | | |
Investment Companies: 100.07% | | | | | | | | | | |
| | | | |
| Affiliated Master Portfolios: 100.07% | | | | | | | | | | |
Wells Fargo Advantage C&B Large Cap Value Portfolio | | | | | | | | $ | 300,101,321 | |
| | | | | | | | | | |
| | | | |
Total Investment Companies (Cost $211,181,220) | | | | | | | | | 300,101,321 | |
| | | | | | | | | | |
| | | | | | | | |
| Total investments in securities | | | | | | | | |
| (Cost $211,181,220) * | | | 100.07 | % | | | 300,101,321 | |
Other assets and liabilities, net | | | (0.07 | ) | | | (204,735 | ) |
| | | | | | | | |
| Total net assets | | | 100.00 | % | | $ | 299,896,586 | |
| | | | | | | | |
| * | Cost for federal income tax purposes is $218,628,673 and unrealized appreciation (depreciation) consists of: |
| | | | |
Gross unrealized appreciation | | $ | 81,472,648 | |
Gross unrealized depreciation | | | 0 | |
| | | | |
Net unrealized appreciation | | $ | 81,472,648 | |
The accompanying notes are an integral part of these financial statements.
| | | | |
| 22 | | Wells Fargo Advantage Equity Gateway Funds | | Portfolio of investments—November 30, 2013 (unaudited) |
DIVERSIFIED EQUITY FUND
| | | | | | | | | | |
| Security name | | | | | | | | Value | |
| | | | |
Investment Companies: 100.13% | | | | | | | | | | |
| | | | |
| Affiliated Master Portfolios: 100.13% | | | | | | | | | | |
Wells Fargo Advantage C&B Large Cap Value Portfolio | | | | | | | | $ | 31,242,861 | |
Wells Fargo Advantage Diversified Large Cap Growth Portfolio | | | | | | | | | 94,049,819 | |
Wells Fargo Advantage Emerging Growth Portfolio | | | | | | | | | 9,409,376 | |
Wells Fargo Advantage Index Portfolio | | | | | | | | | 93,958,633 | |
Wells Fargo Advantage International Growth Portfolio | | | | | | | | | 28,295,342 | |
Wells Fargo Advantage International Value Portfolio | | | | | | | | | 27,903,347 | |
Wells Fargo Advantage Large Company Value Portfolio | | | | | | | | | 62,505,370 | |
Wells Fargo Advantage Small Company Growth Portfolio | | | | | | | | | 9,425,776 | |
Wells Fargo Advantage Small Company Value Portfolio | | | | | | | | | 18,839,324 | |
| | | | |
Total Investment Companies (Cost $298,475,886) | | | | | | | | | 375,629,848 | |
| | | | | | | | | | |
| | | | | | | | |
| Total investments in securities | | | | | | | | |
| (Cost $298,475,886) * | | | 100.13 | % | | | 375,629,848 | |
Other assets and liabilities, net | | | (0.13 | ) | | | (487,180 | ) |
| | | | | | | | |
| Total net assets | | | 100.00 | % | | $ | 375,142,668 | |
| | | | | | | | |
| * | Cost for federal income tax purposes is $306,920,842 and unrealized appreciation (depreciation) consists of: |
| | | | |
Gross unrealized appreciation | | $ | 77,153,962 | |
Gross unrealized depreciation | | | (8,444,956 | ) |
| | | | |
Net unrealized appreciation | | $ | 68,709,006 | |
The accompanying notes are an integral part of these financial statements.
| | | | | | |
| Portfolio of investments—November 30, 2013 (unaudited) | | Wells Fargo Advantage Equity Gateway Funds | | | 23 | |
EMERGING GROWTH FUND
| | | | | | | | | | |
| Security name | | | | | | | | Value | |
| | | | |
Investment Companies: 99.95% | | | | | | | | | | |
| | | | |
| Affiliated Master Portfolios: 99.95% | | | | | | | | | | |
Wells Fargo Advantage Emerging Growth Portfolio | | | | | | | | $ | 1,148,967,131 | |
| | | | | | | | | | |
| | | | |
Total Investment Companies (Cost $774,906,435) | | | | | | | | | 1,148,967,131 | |
| | | | | | | | | | |
| | | | | | | | |
| Total investments in securities | | | | | | | | |
| (Cost $774,906,435) * | | | 99.95 | % | | | 1,148,967,131 | |
Other assets and liabilities, net | | | 0.05 | | | | 539,410 | |
| | | | | | | | |
| Total net assets | | | 100.00 | % | | $ | 1,149,506,541 | |
| | | | | | | | |
| * | Cost for federal income tax purposes is $773,551,991 and unrealized appreciation (depreciation) consists of: |
| | | | |
Gross unrealized appreciation | | $ | 375,415,140 | |
Gross unrealized depreciation | | | 0 | |
| | | | |
Net unrealized appreciation | | $ | 375,415,140 | |
The accompanying notes are an integral part of these financial statements.
| | | | |
| 24 | | Wells Fargo Advantage Equity Gateway Funds | | Portfolio of investments—November 30, 2013 (unaudited) |
INDEX FUND
| | | | | | | | | | |
| Security name | | | | | | | | Value | |
| | | | |
Investment Companies: 99.98% | | | | | | | | | | |
| | | | |
| Affiliated Master Portfolios: 99.98% | | | | | | | | | | |
Wells Fargo Advantage Index Portfolio | | | | | | | | $ | 2,696,317,314 | |
| | | | | | | | | | |
| | | | |
Total Investment Companies (Cost $1,423,507,797) | | | | | | | | | 2,696,317,314 | |
| | | | | | | | | | |
| | | | | | | | |
| Total investments in securities | | | | | | | | |
| (Cost $1,423,507,797) * | | | 99.98 | % | | | 2,696,317,314 | |
Other assets and liabilities, net | | | 0.02 | | | | 661,095 | |
| | | | | | | | |
| Total net assets | | | 100.00 | % | | $ | 2,696,978,409 | |
| | | | | | | | |
| * | Cost for federal income tax purposes is $1,512,480,783 and unrealized appreciation (depreciation) consists of: |
| | | | |
Gross unrealized appreciation | | $ | 1,183,836,531 | |
Gross unrealized depreciation | | | 0 | |
| | | | |
Net unrealized appreciation | | $ | 1,183,836,531 | |
The accompanying notes are an integral part of these financial statements.
| | | | | | |
| Portfolio of investments—November 30, 2013 (unaudited) | | Wells Fargo Advantage Equity Gateway Funds | | | 25 | |
INTERNATIONAL VALUE FUND
| | | | | | | | | | |
| Security name | | | | | | | | Value | |
| | | | |
Investment Companies: 99.90% | | | | | | | | | | |
| | | | |
| Affiliated Master Portfolios: 99.90% | | | | | | | | | | |
Wells Fargo Advantage International Value Portfolio | | | | | | | | $ | 432,420,678 | |
| | | | | | | | | | |
| | | | |
Total Investment Companies (Cost $399,911,235) | | | | | | | | | 432,420,678 | |
| | | | | | | | | | |
| | | | | | | | |
| Total investments in securities | | | | | | | | |
| (Cost $399,911,235) * | | | 99.90 | % | | | 432,420,678 | |
Other assets and liabilities, net | | | 0.10 | | | | 449,843 | |
| | | | | | | | |
| Total net assets | | | 100.00 | % | | $ | 432,870,521 | |
| | | | | | | | |
| * | Cost for federal income tax purposes is $400,827,377 and unrealized appreciation (depreciation) consists of: |
| | | | |
Gross unrealized appreciation | | $ | 31,593,301 | |
Gross unrealized depreciation | | | 0 | |
| | | | |
Net unrealized appreciation | | $ | 31,593,301 | |
The accompanying notes are an integral part of these financial statements.
| | | | |
| 26 | | Wells Fargo Advantage Equity Gateway Funds | | Portfolio of investments—November 30, 2013 (unaudited) |
SMALL COMPANY GROWTH FUND
| | | | | | | | | | |
| Security name | | | | | | | | Value | |
| | | | |
Investment Companies: 99.56% | | | | | | | | | | |
| | | | |
| Affiliated Master Portfolios: 99.56% | | | | | | | | | | |
Wells Fargo Advantage Small Company Growth Portfolio | | | | | | | | $ | 226,693,669 | |
| | | | | | | | | | |
| | | | |
Total Investment Companies (Cost $208,676,836) | | | | | | | | | 226,693,669 | |
| | | | | | | | | | |
| | | | | | | | |
| Total investments in securities | | | | | | | | |
| (Cost $208,676,836) * | | | 99.56 | % | | | 226,693,669 | |
Other assets and liabilities, net | | | 0.44 | | | | 997,202 | |
| | | | | | | | |
| Total net assets | | | 100.00 | % | | $ | 227,690,871 | |
| | | | | | | | |
| * | Cost for federal income tax purposes is $208,414,682 and unrealized appreciation (depreciation) consists of: |
| | | | |
Gross unrealized appreciation | | $ | 18,278,987 | |
Gross unrealized depreciation | | | 0 | |
| | | | |
Net unrealized appreciation | | $ | 18,278,987 | |
The accompanying notes are an integral part of these financial statements.
| | | | | | |
| Portfolio of investments—November 30, 2013 (unaudited) | | Wells Fargo Advantage Equity Gateway Funds | | | 27 | |
SMALL COMPANY VALUE FUND
| | | | | | | | | | | | |
| Security name | | | | | | | | | | Value | |
| | | | | |
Investment Companies: 99.80% | | | | | | | | | | | | |
| | | | | |
| Affiliated Master Portfolios: 99.80% | | | | | | | | | | | | |
Wells Fargo Advantage Small Company Value Portfolio | | | | | | | | | | $ | 109,960,038 | |
| | | | | | | | | | | | |
| | | | | |
Total Investment Companies (Cost $85,652,138) | | | | | | | | | | | 109,960,038 | |
| | | | | | | | | | | | |
| | | | | | | | |
| Total investments in securities | | | | | | | | |
| (Cost $85,652,138) * | | | 99.80 | % | | | 109,960,038 | |
Other assets and liabilities, net | | | 0.20 | | | | 223,170 | |
| | | | | | | | |
| Total net assets | | | 100.00 | % | | $ | 110,183,208 | |
| | | | | | | | |
| * | Cost for federal income tax purposes is $91,699,698 and unrealized appreciation (depreciation) consists of: |
| | | | |
Gross unrealized appreciation | | $ | 18,260,340 | |
Gross unrealized depreciation | | | 0 | |
| | | | |
Net unrealized appreciation | | $ | 18,260,340 | |
The accompanying notes are an integral part of these financial statements.
| | | | |
| 28 | | Wells Fargo Advantage Equity Gateway Funds | | Statements of assets and liabilities—November 30, 2013 (unaudited) |
| | | | | | | | |
| | | C&B Large Cap
Value Fund | | | Diversified
Equity Fund | |
| | |
Assets | | | | | | | | |
Investments in affiliated Master Portfolio(s), at value (see cost below) | | $ | 300,101,321 | | | $ | 375,629,848 | |
Receivable for Fund shares sold | | | 113,155 | | | | 430,908 | |
Receivable from administrator | | | 42,912 | | | | 0 | |
Prepaid expenses and other assets | | | 34,504 | | | | 28,957 | |
| | | | | | | | |
Total assets | | | 300,291,892 | | | | 376,089,713 | |
| | | | | | | | |
| | |
Liabilities | | | | | | | | |
Payable for Fund shares redeemed | | | 260,375 | | | | 760,806 | |
Advisory fee payable | | | N/A | | | | 550 | |
Distribution fees payable | | | 4,765 | | | | 3,837 | |
Due to other related parties | | | 54,877 | | | | 59,314 | |
Shareholder report expenses payable | | | 29,826 | | | | 27,648 | |
Shareholder servicing fees payable | | | 35,366 | | | | 78,663 | |
Professional fees payable | | | 9,951 | | | | 10,412 | |
Accrued expenses and other liabilities | | | 146 | | | | 5,815 | |
| | | | | | | | |
Total liabilities | | | 395,306 | | | | 947,045 | |
| | | | | | | | |
Total net assets | | $ | 299,896,586 | | | $ | 375,142,668 | |
| | | | | | | | |
| | |
NET ASSETS CONSIST OF | | | | | | | | |
Paid-in capital | | $ | 270,373,812 | | | $ | 266,366,065 | |
Undistributed (accumulated) net investment income (loss) | | | 2,898,312 | | | | 1,805,015 | |
Accumulated net realized gains (losses) on investments | | | (62,295,639 | ) | | | 29,817,626 | |
Net unrealized gains on investments | | | 88,920,101 | | | | 77,153,962 | |
| | | | | | | | |
Total net assets | | $ | 299,896,586 | | | $ | 375,142,668 | |
| | | | | | | | |
| | |
COMPUTATION OF NET ASSET VALUE AND OFFERING PRICE PER SHARE1 | | | | | | | | |
Net assets – Class A | | $ | 28,672,400 | | | $ | 82,512,875 | |
Shares outstanding – Class A | | | 2,495,818 | | | | 2,359,042 | |
Net asset value per share – Class A | | | $11.49 | | | | $34.98 | |
Maximum offering price per share – Class A2 | | | $12.19 | | | | $37.11 | |
Net assets – Class B | | $ | 909,840 | | | $ | 1,470,273 | |
Shares outstanding – Class B | | | 78,669 | | | | 45,313 | |
Net asset value per share – Class B | | | $11.57 | | | | $32.45 | |
Net assets – Class C | | $ | 6,667,015 | | | $ | 4,632,937 | |
Shares outstanding – Class C | | | 584,308 | | | | 139,886 | |
Net asset value per share – Class C | | | $11.41 | | | | $33.12 | |
Net assets – Administrator Class | | $ | 57,836,353 | | | $ | 286,526,583 | |
Shares outstanding – Administrator Class | | | 5,031,388 | | | | 8,169,032 | |
Net asset value per share – Administrator Class | | | $11.50 | | | | $35.07 | |
Net assets – Institutional Class | | $ | 128,335,525 | | | | N/A | |
Shares outstanding – Institutional Class | | | 11,114,199 | | | | N/A | |
Net asset value per share – Institutional Class | | | $11.55 | | | | N/A | |
Net assets – Investor Class | | $ | 77,475,453 | | | | N/A | |
Shares outstanding – Investor Class | | | 6,741,827 | | | | N/A | |
Net asset value per share – Investor Class | | | $11.49 | | | | N/A | |
| | |
Investments in affiliated Master Portfolio(s), at cost | | $ | 211,181,220 | | | $ | 298,475,886 | |
| | | | | | | | |
| 1. | Each Fund has an unlimited number of authorized shares. |
| 2. | Maximum offering price is computed as 100/94.25 of net asset value. On investments of $50,000 or more, the offering price is reduced. |
The accompanying notes are an integral part of these financial statements.
| | | | | | |
| Statements of assets and liabilities—November 30, 2013 (unaudited) | | Wells Fargo Advantage Equity Gateway Funds | | | 29 | |
| | | | | | | | | | | | | | | | | | |
Emerging
Growth Fund | | | Index Fund | | | International
Value Fund | | | Small Company
Growth Fund | | | Small Company
Value Fund | |
| | | | |
| | | | | | | | | | | | | | | | | | |
| $ | 1,148,967,131 | | | $ | 2,696,317,314 | | | $ | 432,420,678 | | | $ | 226,693,669 | | | $ | 109,960,038 | |
| | 1,163,965 | | | | 3,100,690 | | | | 1,218,814 | | | | 1,110,662 | | | | 364,257 | |
| | 37,707 | | | | 276,312 | | | | 32,651 | | | | 14,023 | | | | 16,539 | |
| | 28,257 | | | | 60,902 | | | | 27,378 | | | | 28,186 | | | | 32,517 | |
| | | | | | | | | | | | | | | | | | |
| | 1,150,197,060 | | | | 2,699,755,218 | | | | 433,699,521 | | | | 227,846,540 | | | | 110,373,351 | |
| | | | | | | | | | | | | | | | | | |
| | | | |
| | | | | | | | | | | | | | | | | | |
| | 360,439 | | | | 1,901,143 | | | | 655,775 | | | | 59,677 | | | | 120,380 | |
| | N/A | | | | N/A | | | | N/A | | | | N/A | | | | N/A | |
| | 3,740 | | | | 51,424 | | | | 566 | | | | 3,074 | | | | 1,410 | |
| | 162,507 | | | | 441,235 | | | | 55,572 | | | | 29,699 | | | | 17,232 | |
| | 59,567 | | | | 28,842 | | | | 16,028 | | | | 24,376 | | | | 22,382 | |
| | 90,298 | | | | 312,795 | | | | 88,842 | | | | 25,970 | | | | 20,438 | |
| | 9,573 | | | | 9,072 | | | | 11,011 | | | | 9,382 | | | | 8,288 | |
| | 4,395 | | | | 32,298 | | | | 1,206 | | | | 3,491 | | | | 13 | |
| | | | | | | | | | | | | | | | | | |
| | 690,519 | | | | 2,776,809 | | | | 829,000 | | | | 155,669 | | | | 190,143 | |
| | | | | | | | | | | | | | | | | | |
| $ | 1,149,506,541 | | | $ | 2,696,978,409 | | | $ | 432,870,521 | | | $ | 227,690,871 | | | $ | 110,183,208 | |
| | | | | | | | | | | | | | | | | | |
| | | | |
| | | | | | | | | | | | | | | | | | |
| $ | 699,012,535 | | | $ | 1,418,756,606 | | | $ | 443,983,749 | | | $ | 192,398,455 | | | $ | 184,174,797 | |
| | (7,824,580 | ) | | | 39,778,537 | | | | 8,535,652 | | | | (943,824 | ) | | | 395,592 | |
| | 84,257,890 | | | | (34,366,251 | ) | | | (52,158,323 | ) | | | 18,219,407 | | | | (98,695,081 | ) |
| | 374,060,696 | | | | 1,272,809,517 | | | | 32,509,443 | | | | 18,016,833 | | | | 24,307,900 | |
| | | | | | | | | | | | | | | | | | |
| $ | 1,149,506,541 | | | $ | 2,696,978,409 | | | $ | 432,870,521 | | | $ | 227,690,871 | | | $ | 110,183,208 | |
| | | | | | | | | | | | | | | | | | |
| | | | |
| | | | | | | | | | | | | | | | | | |
| $ | 155,715,779 | | | $ | 439,474,581 | | | $ | 6,521,345 | | | $ | 22,611,938 | | | $ | 26,999,137 | |
| | 8,706,525 | | | | 7,293,000 | | | | 433,077 | | | | 549,743 | | | | 1,369,881 | |
| | $17.88 | | | | $60.26 | | | | $15.06 | | | | $41.13 | | | | $19.71 | |
| | $18.97 | | | | $63.94 | | | | $15.98 | | | | $43.64 | | | | $20.91 | |
| | N/A | | | $ | 4,459,101 | | | $ | 65,967 | | | $ | 204,421 | | | $ | 123,834 | |
| | N/A | | | | 73,500 | | | | 4,389 | | | | 5,411 | | | | 6,854 | |
| | N/A | | | | $60.67 | | | | $15.03 | | | | $37.78 | | | | $18.07 | |
| $ | 5,967,910 | | | $ | 77,251,954 | | | $ | 826,966 | | | $ | 4,842,823 | | | $ | 2,149,119 | |
| | 348,724 | | | | 1,281,414 | | | | 56,054 | | | | 126,752 | | | | 119,391 | |
| | $17.11 | | | | $60.29 | | | | $14.75 | | | | $38.21 | | | | $18.00 | |
| $ | 233,875,262 | | | $ | 2,003,000,416 | | | $ | 423,136,663 | | | $ | 100,871,188 | | | $ | 70,156,587 | |
| | 12,906,842 | | | | 32,978,251 | | | | 28,255,091 | | | | 2,386,659 | | | | 3,491,858 | |
| | $18.12 | | | | $60.74 | | | | $14.98 | | | | $42.26 | | | | $20.09 | |
| $ | 706,318,251 | | | | N/A | | | $ | 2,319,580 | | | $ | 99,160,501 | | | $ | 10,754,531 | |
| | 38,354,821 | | | | N/A | | | | 154,462 | | | | 2,321,708 | | | | 533,761 | |
| | $18.42 | | | | N/A | | | | $15.02 | | | | $42.71 | | | | $20.15 | |
| $ | 47,629,339 | | | $ | 172,792,357 | | | | N/A | | | | N/A | | | | N/A | |
| | 2,676,275 | | | | 2,857,411 | | | | N/A | | | | N/A | | | | N/A | |
| | $17.80 | | | | $60.47 | | | | N/A | | | | N/A | | | | N/A | |
| | | | |
| $ | 774,906,435 | | | $ | 1,423,507,797 | | | $ | 399,911,235 | | | $ | 208,676,836 | | | $ | 85,652,138 | |
| | | | | | | | | | | | | | | | | | |
The accompanying notes are an integral part of these financial statements.
| | | | |
| 30 | | Wells Fargo Advantage Equity Gateway Funds | | Statements of operations—six months ended November 30, 2013 (unaudited) |
| | | | | | | | |
| | | C&B Large Cap
Value Fund | | | Diversified
Equity Fund | |
| | |
Investment income | | | | | | | | |
Dividends allocated from affiliated Master Portfolio(s)* | | $ | 3,013,917 | | | $ | 2,919,357 | |
Securities lending income allocated from affiliated Master Portfolio(s) | | | 5,322 | | | | 46,874 | |
Interest allocated from affiliated Master Portfolio(s) | | | 0 | | | | 231 | |
Expenses allocated from affiliated Master Portfolio(s) | | | (985,188 | ) | | | (1,122,661 | ) |
Waivers allocated from affiliated Master Portfolio(s) | | | 0 | | | | 42,526 | |
| | | | | | | | |
Total investment income (loss) | | | 2,034,051 | | | | 1,886,327 | |
| | | | | | | | |
| | |
Expenses | | | | | | | | |
Advisory fee | | | N/A | | | | 461,593 | |
Administration fees | | | | | | | | |
Fund level | | | 72,555 | | | | 92,319 | |
Class A | | | 33,265 | | | | 101,378 | |
Class B | | | 1,143 | | | | 2,179 | |
Class C | | | 8,211 | | | | 4,770 | |
Administrator Class | | | 30,073 | | | | 142,973 | |
Institutional Class | | | 50,165 | | | | N/A | |
Investor Class | | | 115,008 | | | | N/A | |
Shareholder servicing fees | | | | | | | | |
Class A | | | 31,986 | | | | 97,479 | |
Class B | | | 1,099 | | | | 2,095 | |
Class C | | | 7,895 | | | | 4,587 | |
Administrator Class | | | 72,797 | | | | 356,353 | |
Investor Class | | | 89,850 | | | | N/A | |
Distribution fees | | | | | | | | |
Class B | | | 3,296 | | | | 6,286 | |
Class C | | | 23,684 | | | | 13,759 | |
Custody and accounting fees | | | 6,401 | | | | 7,901 | |
Professional fees | | | 15,856 | | | | 14,527 | |
Registration fees | | | 29,051 | | | | 18,744 | |
Shareholder report expenses | | | 32,687 | | | | 22,741 | |
Trustees’ fees and expenses | | | 5,029 | | | | 5,058 | |
Other fees and expenses | | | 8,328 | | | | 6,241 | |
| | | | | | | | |
Total expenses | | | 638,379 | | | | 1,360,983 | |
Less: Fee waivers and/or expense reimbursements | | | (252,166 | ) | | | (470,540 | ) |
| | | | | | | | |
Net expenses | | | 386,213 | | | | 890,443 | |
| | | | | | | | |
Net investment income (loss) | | | 1,647,838 | | | | 995,884 | |
| | | | | | | | |
| | |
REALIZED AND UNREALIZED GAINS (LOSSES) ON INVESTMENTS | | | | | | | | |
Net realized gains (losses) on securities transaction allocated from Master Portfolio(s) | | | 18,367,782 | | | | 12,661,395 | |
Net change in unrealized gains (losses) on securities transactions allocated from Master Portfolio(s) | | | 11,657,204 | | | | 35,627,427 | |
| | | | | | | | |
Net realized and unrealized gains (losses) on investments | | | 30,024,986 | | | | 48,288,822 | |
| | | | | | | | |
Net increase in net assets resulting from operations | | $ | 31,672,824 | | | $ | 49,284,706 | |
| | | | | | | | |
| | |
* Net of foreign dividend withholding taxes allocated from affiliated Master Portfolio(s) in the amount of | | | $3,396 | | | | $46,736 | |
The accompanying notes are an integral part of these financial statements.
| | | | | | |
| Statements of operations—six months ended November 30, 2013 (unaudited) | | Wells Fargo Advantage Equity Gateway Funds | | | 31 | |
| | | | | | | | | | | | | | | | | | |
Emerging
Growth Fund | | | Index Fund | | | International
Value Fund | | | Small Company
Growth Fund | | | Small Company
Value Fund | |
| | | | |
| | | | | | | | | | | | | | | | | | |
| $ | 566,551 | | | $ | 26,678,872 | | | $ | 4,955,168 | | | $ | 300,330 | | | $ | 1,015,714 | |
| | 356,673 | | | | 30,030 | | | | 135,739 | | | | 166,218 | | | | 43,731 | |
| | 0 | | | | 579 | | | | 376 | | | | 0 | | | | 0 | |
| | (4,165,965 | ) | | | (1,208,710 | ) | | | (1,820,619 | ) | | | (840,715 | ) | | | (425,463 | ) |
| | 0 | | | | 0 | | | | 0 | | | | 0 | | | | 0 | |
| | | | | | | | | | | | | | | | | | |
| | (3,242,741 | ) | | | 25,500,771 | | | | 3,270,664 | | | | (374,167 | ) | | | 633,982 | |
| | | | | | | | | | | | | | | | | | |
| | | | |
| | | | | | | | | | | | | | | | | | |
| | N/A | | | | N/A | | | | N/A | | | | N/A | | | | N/A | |
| | | | | | | | | | | | | | | | | | |
| | 261,235 | | | | 632,803 | | | | 100,528 | | | | 50,039 | | | | 24,995 | |
| | 183,596 | | | | 537,882 | | | | 7,937 | | | | 17,788 | | | | 31,447 | |
| | N/A | | | | 6,143 | | | | 89 | | | | 229 | | | | 216 | |
| | 7,046 | | | | 94,402 | | | | 916 | | | | 4,499 | | | | 2,580 | |
| | 110,590 | | | | 941,066 | | | | 196,562 | | | | 50,160 | | | | 32,181 | |
| | 253,543 | | | | N/A | | | | 845 | | | | 33,007 | | | | 3,711 | |
| | 69,210 | | | | 252,768 | | | | N/A | | | | N/A | | | | N/A | |
| | | | | | | | | | | | | | | | | | |
| | 176,534 | | | | 517,194 | | | | 7,632 | | | | 17,103 | | | | 30,238 | |
| | N/A | | | | 5,907 | | | | 86 | | | | 221 | | | | 207 | |
| | 6,775 | | | | 90,771 | | | | 881 | | | | 4,326 | | | | 2,481 | |
| | 265,888 | | | | 940,132 | | | | 474,278 | | | | 124,709 | | | | 79,909 | |
| | 54,070 | | | | 195,161 | | | | N/A | | | | N/A | | | | N/A | |
| | | | | | | | | | | | | | | | | | |
| | N/A | | | | 17,721 | | | | 257 | | | | 661 | | | | 622 | |
| | 20,324 | | | | 272,313 | | | | 2,643 | | | | 12,977 | | | | 7,443 | |
| | 20,499 | | | | 48,368 | | | | 7,540 | | | | 3,929 | | | | 2,686 | |
| | 16,238 | | | | 16,746 | | | | 14,791 | | | | 15,521 | | | | 15,611 | |
| | 72,736 | | | | 46,841 | | | | 33,841 | | | | 17,029 | | | | 31,214 | |
| | 96,212 | | | | 70,709 | | | | 22,532 | | | | 16,127 | | | | 19,900 | |
| | 5,069 | | | | 7,060 | | | | 6,270 | | | | 5,665 | | | | 5,674 | |
| | 16,759 | | | | 32,330 | | | | 7,713 | | | | 3,660 | | | | 5,082 | |
| | | | | | | | | | | | | | | | | | |
| | 1,636,324 | | | | 4,726,317 | | | | 885,341 | | | | 377,650 | | | | 296,197 | |
| | (288,708 | ) | | | (1,561,799 | ) | | | (183,363 | ) | | | (87,242 | ) | | | (92,421 | ) |
| | | | | | | | | | | | | | | | | | |
| | 1,347,616 | | | | 3,164,518 | | | | 701,978 | | | | 290,408 | | | | 203,776 | |
| | | | | | | | | | | | | | | | | | |
| | (4,590,357 | ) | | | 22,336,253 | | | | 2,568,686 | | | | (664,575 | ) | | | 430,206 | |
| | | | | | | | | | | | | | | | | | |
| | | | |
| | | | | | | | | | | | | | | | | | |
| | 81,616,745 | | | | (11,812,277 | ) | | | 4,002,856 | | | | 13,909,932 | | | | 7,130,599 | |
| | 169,148,979 | | | | 274,731,537 | | | | 41,404,077 | | | | 23,904,528 | | | | 6,894,421 | |
| | | | | | | | | | | | | | | | | | |
| | 250,765,724 | | | | 262,919,260 | | | | 45,406,933 | | | | 37,814,460 | | | | 14,025,020 | |
| | | | | | | | | | | | | | | | | | |
| $ | 246,175,367 | | | $ | 285,255,513 | | | $ | 47,975,619 | | | $ | 37,149,885 | | | $ | 14,455,226 | |
| | | | | | | | | | | | | | | | | | |
| | | | |
| | $0 | | | | $8,226 | | | | $509,326 | | | | $2,723 | | | | $0 | |
The accompanying notes are an integral part of these financial statements.
| | | | |
| 32 | | Wells Fargo Advantage Equity Gateway Funds | | Statements of changes in net assets |
| | | | | | | | | | | | | | | | |
| | | C&B Large Cap Value Fund | |
| | | Six months ended November 30, 2013 (unaudited) | | | Year ended May 31, 2013 | |
| | | | |
Operations | | | | | | | | | | | | | | | | |
Net investment income | | | | | | $ | 1,647,838 | | | | | | | $ | 4,133,617 | |
Net realized gains on investments | | | | | | | 18,367,782 | | | | | | | | 21,701,070 | |
Net change in unrealized gains (losses) on investments | | | | | | | 11,657,204 | | | | | | | | 46,268,197 | |
| | | | | | | | | | | | | | | | |
Net increase in net assets resulting from operations | | | | | | | 31,672,824 | | | | | | | | 72,102,884 | |
| | | | | | | | | | | | | | | | |
| | | | |
Distributions to shareholders from | | | | | | | | | | | | | | | | |
Net investment income | | | | | | | | | | | | | | | | |
Class A | | | | | | | 0 | | | | | | | | (309,062 | ) |
Class C | | | | | | | 0 | | | | | | | | (37,733 | ) |
Administrator Class | | | | | | | 0 | | | | | | | | (1,427,995 | ) |
Institutional Class | | | | | | | 0 | | | | | | | | (1,883,492 | ) |
Investor Class | | | | | | | 0 | | | | | | | | (824,601 | ) |
| | | | | | | | | | | | | | | | |
Total distributions to shareholders | | | | | | | 0 | | | | | | | | (4,482,883 | ) |
| | | | | | | | | | | | | | | | |
| | | | |
| | | Shares | | | | | | Shares | | | | |
Capital share transactions | | | | | | | | | | | | | | | | |
Proceeds from shares sold | | | | | | | | | | | | | | | | |
Class A | | | 435,065 | | | | 4,715,565 | | | | 291,674 | | | | 2,637,491 | |
Class B | | | 27,207 | | | | 302,706 | | | | 2,312 | | | | 22,667 | |
Class C | | | 54,414 | | | | 572,380 | | | | 27,383 | | | | 252,547 | |
Administrator Class | | | 863,890 | | | | 9,270,346 | | | | 1,105,606 | | | | 9,867,121 | |
Institutional Class | | | 1,041,712 | | | | 10,989,441 | | | | 3,790,042 | | | | 34,607,927 | |
Investor Class | | | 935,982 | | | | 9,962,192 | | | | 469,858 | | | | 4,381,044 | |
| | | | | | | | | | | | | | | | |
| | | | | | | 35,812,630 | | | | | | | | 51,768,797 | |
| | | | | | | | | | | | | | | | |
Reinvestment of distributions | | | | | | | | | | | | | | | | |
Class A | | | 0 | | | | 0 | | | | 35,129 | | | | 304,920 | |
Class C | | | 0 | | | | 0 | | | | 4,280 | | | | 37,152 | |
Administrator Class | | | 0 | | | | 0 | | | | 161,899 | | | | 1,403,666 | |
Institutional Class | | | 0 | | | | 0 | | | | 50,013 | | | | 434,613 | |
Investor Class | | | 0 | | | | 0 | | | | 92,192 | | | | 801,146 | |
| | | | | | | | | | | | | | | | |
| | | | | | | 0 | | | | | | | | 2,981,497 | |
| | | | | | | | | | | | | | | | |
Payment for shares redeemed | | | | | | | | | | | | | | | | |
Class A | | | (223,260 | ) | | | (2,407,495 | ) | | | (670,989 | ) | | | (6,052,714 | ) |
Class B | | | (60,464 | ) | | | (644,815 | ) | | | (186,755 | ) | | | (1,648,260 | ) |
Class C | | | (35,647 | ) | | | (386,981 | ) | | | (147,478 | ) | | | (1,340,767 | ) |
Administrator Class | | | (2,688,195 | ) | | | (28,404,201 | ) | | | (4,494,794 | ) | | | (41,391,366 | ) |
Institutional Class | | | (2,489,186 | ) | | | (26,706,224 | ) | | | (3,123,096 | ) | | | (28,416,440 | ) |
Investor Class | | | (616,369 | ) | | | (6,653,133 | ) | | | (2,005,819 | ) | | | (17,887,686 | ) |
| | | | | | | | | | | | | | | | |
| | | | | | | (65,202,849 | ) | | | | | | | (96,737,233 | ) |
| | | | | | | | | | | | | | | | |
Net decrease in net assets resulting from capital share transactions | | | | | | | (29,390,219 | ) | | | | | | | (41,986,939 | ) |
| | | | | | | | | | | | | | | | |
Total increase in net assets | | | | | | | 2,282,605 | | | | | | | | 25,633,062 | |
| | | | | | | | | | | | | | | | |
| | | | |
Net assets | | | | | | | | | | | | | | | | |
Beginning of period | | | | | | | 297,613,981 | | | | | | | | 271,980,919 | |
| | | | | | | | | | | | | | | | |
End of period | | | | | | $ | 299,896,586 | | | | | | | $ | 297,613,981 | |
| | | | | | | | | | | | | | | | |
Undistributed net investment income | | | | | | $ | 2,898,312 | | | | | | | $ | 1,250,474 | |
| | | | | | | | | | | | | | | | |
The accompanying notes are an integral part of these financial statements.
| | | | | | |
| Statements of changes in net assets | | Wells Fargo Advantage Equity Gateway Funds | | | 33 | |
| | | | | | | | | | | | | | | | |
| | | Diversified Equity Fund | |
| | | Six months ended
November 30, 2013
(unaudited) | | | Year ended May 31, 2013 | |
| | | | |
Operations | | | | | | | | | | | | | | | | |
Net investment income | | | | | | $ | 995,884 | | | | | | | $ | 3,846,204 | |
Net realized gains on investments | | | | | | | 12,661,395 | | | | | | | | 38,777,269 | |
Net change in unrealized gains (losses) on investments | | | | | | | 35,627,427 | | | | | | | | 45,510,158 | |
| | | | | | | | | | | | | | | | |
Net increase in net assets resulting from operations | | | | | | | 49,284,706 | | | | | | | | 88,133,631 | |
| | | | | | | | | | | | | | | | |
| | | | |
Distributions to shareholders from | | | | | | | | | | | | | | | | |
Net investment income | | | | | | | | | | | | | | | | |
Class A | | | | | | | 0 | | | | | | | | (629,304 | ) |
Class C | | | | | | | 0 | | | | | | | | (5,554 | ) |
Administrator Class | | | | | | | 0 | | | | | | | | (3,351,609 | ) |
Net realized gains | | | | | | | | | | | | | | | | |
Class A | | | | | | | 0 | | | | | | | | (3,927,968 | ) |
Class B | | | | | | | 0 | | | | | | | | (139,177 | ) |
Class C | | | | | | | 0 | | | | | | | | (152,475 | ) |
Administrator Class | | | | | | | 0 | | | | | | | | (15,928,177 | ) |
| | | | | | | | | | | | | | | | |
Total distributions to shareholders | | | | | | | 0 | | | | | | | | (24,134,264 | ) |
| | | | | | | | | | | | | | | | |
| | | | |
| | | Shares | | | | | | Shares | | | | |
Capital share transactions | | | | | | | | | | | | | | | | |
Proceeds from shares sold | | | | | | | | | | | | | | | | |
Class A | | | 43,579 | | | | 1,396,290 | | | | 81,715 | | | | 2,335,295 | |
Class B | | | 208 | | | | 6,166 | | | | 3,935 | | | | 110,645 | |
Class C | | | 55,742 | | | | 1,710,262 | | | | 8,570 | | | | 234,020 | |
Administrator Class | | | 329,724 | | | | 10,669,307 | | | | 988,350 | | | | 27,984,640 | |
| | | | | | | | | | | | | | | | |
| | | | | | | 13,782,025 | | | | | | | | 30,664,600 | |
| | | | | | | | | | | | | | | | |
Reinvestment of distributions | | | | | | | | | | | | | | | | |
Class A | | | 0 | | | | 0 | | | | 168,023 | | | | 4,528,687 | |
Class B | | | 0 | | | | 0 | | | | 5,575 | | | | 139,160 | |
Class C | | | 0 | | | | 0 | | | | 6,091 | | | | 155,536 | |
Administrator Class | | | 0 | | | | 0 | | | | 705,389 | | | | 19,060,534 | |
| | | | | | | | | | | | | | | | |
| | | | | | | 0 | | | | | | | | 23,883,917 | |
| | | | | | | | | | | | | | | | |
Payment for shares redeemed | | | | | | | | | | | | | | | | |
Class A | | | (152,329 | ) | | | (4,917,628 | ) | | | (686,991 | ) | | | (19,541,360 | ) |
Class B | | | (25,967 | ) | | | (769,289 | ) | | | (58,405 | ) | | | (1,536,261 | ) |
Class C | | | (7,399 | ) | | | (224,912 | ) | | | (23,579 | ) | | | (656,254 | ) |
Administrator Class | | | (1,607,814 | ) | | | (52,358,108 | ) | | | (3,499,737 | ) | | | (101,535,999 | ) |
| | | | | | | | | | | | | | | | |
| | | | | | | (58,269,937 | ) | | | | | | | (123,269,874 | ) |
| | | | | | | | | | | | | | | | |
Net decrease in net assets resulting from capital share transactions | | | | | | | (44,487,912 | ) | | | | | | | (68,721,357 | ) |
| | | | | | | | | | | | | | | | |
Total increase (decrease) in net assets | | | | | | | 4,796,794 | | | | | | | | (4,721,990 | ) |
| | | | | | | | | | | | | | | | |
| | | | |
Net assets | | | | | | | | | | | | | | | | |
Beginning of period | | | | | | | 370,345,874 | | | | | | | | 375,067,864 | |
| | | | | | | | | | | | | | | | |
End of period | | | | | | $ | 375,142,668 | | | | | | | $ | 370,345,874 | |
| | | | | | | | | | | | | | | | |
Undistributed net investment income | | | | | | $ | 1,805,015 | | | | | | | $ | 809,131 | |
| | | | | | | | | | | | | | | | |
The accompanying notes are an integral part of these financial statements.
| | | | |
| 34 | | Wells Fargo Advantage Equity Gateway Funds | | Statements of changes in net assets |
| | | | | | | | | | | | | | | | |
| | | Emerging Growth Fund | |
| | | Six months ended November 30, 2013 (unaudited) | | | Year ended May 31, 2013 | |
| | | | |
Operations | | | | | | | | | | | | | | | | |
Net investment loss | | | | | | $ | (4,590,357 | ) | | | | | | $ | (6,480,293 | ) |
Net realized gains on investments | | | | | | | 81,616,745 | | | | | | | | 7,867,171 | |
Net change in unrealized gains (losses) on investments | | | | | | | 169,148,979 | | | | | | | | 164,230,293 | |
| | | | | | | | | | | | | | | | |
Net increase in net assets resulting from operations | | | | | | | 246,175,367 | | | | | | | | 165,617,171 | |
| | | | | | | | | | | | | | | | |
| | | | |
Distributions to shareholders from | | | | | | | | | | | | | | | | |
Net realized gains | | | | | | | | | | | | | | | | |
Class A | | | | | | | 0 | | | | | | | | (6,258,070 | ) |
Class C | | | | | | | 0 | | | | | | | | (253,161 | ) |
Administrator Class | | | | | | | 0 | | | | | | | | (9,461,964 | ) |
Institutional Class | | | | | | | 0 | | | | | | | | (26,267,527 | ) |
Investor Class | | | | | | | 0 | | | | | | | | (1,868,319 | ) |
| | | | | | | | | | | | | | | | |
Total distributions to shareholders | | | | | | | 0 | | | | | | | | (44,109,041 | ) |
| | | | | | | | | | | | | | | | |
| | | | |
| | | Shares | | | | | | Shares | | | | |
Capital share transactions | | | | | | | | | | | | | | | | |
Proceeds from shares sold | | | | | | | | | | | | | | | | |
Class A | | | 634,447 | | | | 10,408,180 | | | | 789,069 | | | | 10,141,118 | |
Class C | | | 16,873 | | | | 279,380 | | | | 11,685 | | | | 144,196 | |
Administrator Class | | | 1,749,708 | | | | 28,730,843 | | | | 3,186,127 | | | | 41,409,579 | |
Institutional Class | | | 4,862,274 | | | | 81,971,631 | | | | 8,997,601 | | | | 118,146,813 | |
Investor Class | | | 132,788 | | | | 2,108,886 | | | | 157,979 | | | | 2,045,724 | |
| | | | | | | | | | | | | | | | |
| | | | | | | 123,498,920 | | | | | | | | 171,887,430 | |
| | | | | | | | | | | | | | | | |
Reinvestment of distributions | | | | | | | | | | | | | | | | |
Class A | | | 0 | | | | 0 | | | | 519,089 | | | | 6,099,290 | |
Class C | | | 0 | | | | 0 | | | | 19,371 | | | | 219,472 | |
Administrator Class | | | 0 | | | | 0 | | | | 601,763 | | | | 7,154,974 | |
Institutional Class | | | 0 | | | | 0 | | | | 2,093,490 | | | | 25,226,558 | |
Investor Class | | | 0 | | | | 0 | | | | 154,248 | | | | 1,804,703 | |
| | | | | | | | | | | | | | | | |
| | | | | | | 0 | | | | | | | | 40,504,997 | |
| | | | | | | | | | | | | | | | |
Payment for shares redeemed | | | | | | | | | | | | | | | | |
Class A | | | (795,930 | ) | | | (12,827,882 | ) | | | (2,497,741 | ) | | | (32,288,795 | ) |
Class C | | | (28,259 | ) | | | (437,720 | ) | | | (94,896 | ) | | | (1,167,202 | ) |
Administrator Class | | | (2,861,449 | ) | | | (47,051,663 | ) | | | (4,554,854 | ) | | | (59,197,036 | ) |
Institutional Class | | | (6,461,878 | ) | | | (104,182,110 | ) | | | (12,620,896 | ) | | | (166,587,989 | ) |
Investor Class | | | (150,027 | ) | | | (2,408,901 | ) | | | (581,498 | ) | | | (7,469,569 | ) |
| | | | | | | | | | | | | | | | |
| | | | | | | (166,908,276 | ) | | | | | | | (266,710,591 | ) |
| | | | | | | | | | | | | | | | |
Net decrease in net assets resulting from capital share transactions | | | | | | | (43,409,356 | ) | | | | | | | (54,318,164 | ) |
| | | | | | | | | | | | | | | | |
Total increase in net assets | | | | | | | 202,766,011 | | | | | | | | 67,189,966 | |
| | | | | | | | | | | | | | | | |
| | | | |
Net assets | | | | | | | | | | | | | | | | |
Beginning of period | | | | | | | 946,740,530 | | | | | | | | 879,550,564 | |
| | | | | | | | | | | | | | | | |
End of period | | | | | | $ | 1,149,506,541 | | | | | | | $ | 946,740,530 | |
| | | | | | | | | | | | | | | | |
Accumulated net investment loss | | | | | | $ | (7,824,580 | ) | | | | | | $ | (3,234,223 | ) |
| | | | | | | | | | | | | | | | |
The accompanying notes are an integral part of these financial statements.
| | | | | | |
| Statements of changes in net assets | | Wells Fargo Advantage Equity Gateway Funds | | | 35 | |
| | | | | | | | | | | | | | | | |
| | | Index Fund | |
| | | Six months ended November 30, 2013 (unaudited) | | | Year ended May 31, 2013 | |
| | | | |
Operations | | | | | | | | | | | | | | | | |
Net investment income | | | | | | $ | 22,336,253 | | | | | | | $ | 46,222,520 | |
Net realized gains (losses) on investments | | | | | | | (11,812,277 | ) | | | | | | | 79,008,299 | |
Net change in unrealized gains (losses) on investments | | | | | | | 274,731,537 | | | | | | | | 438,217,865 | |
| | | | | | | | | | | | | | | | |
Net increase in net assets resulting from operations | | | | | | | 285,255,513 | | | | | | | | 563,448,684 | |
| | | | | | | | | | | | | | | | |
| | | | |
Distributions to shareholders from | | | | | | | | | | | | | | | | |
Net investment income | | | | | | | | | | | | | | | | |
Class A | | | | | | | 0 | | | | | | | | (6,284,365 | ) |
Class B | | | | | | | 0 | | | | | | | | (36,909 | ) |
Class C | | | | | | | 0 | | | | | | | | (595,173 | ) |
Administrator Class | | | | | | | 0 | | | | | | | | (36,647,876 | ) |
Investor Class | | | | | | | 0 | | | | | | | | (2,381,555 | ) |
Net realized gains | | | | | | | | | | | | | | | | |
Class A | | | | | | | 0 | | | | | | | | (7,020,039 | ) |
Class B | | | | | | | 0 | | | | | | | | (128,054 | ) |
Class C | | | | | | | 0 | | | | | | | | (1,252,243 | ) |
Administrator Class | | | | | | | 0 | | | | | | | | (34,676,378 | ) |
Investor Class | | | | | | | 0 | | | | | | | | (2,490,608 | ) |
| | | | | | | | | | | | | | | | |
Total distributions to shareholders | | | | | | | 0 | | | | | | | | (91,513,200 | ) |
| | | | | | | | | | | | | | | | |
| | | | |
| | | Shares | | | | | | Shares | | | | |
Capital share transactions | | | | | | | | | | | | | | | | |
Proceeds from shares sold | | | | | | | | | | | | | | | | |
Class A | | | 216,085 | | | | 12,148,739 | | | | 470,958 | | | | 23,153,090 | |
Class B | | | 373 | | | | 20,882 | | | | 2,282 | | | | 113,844 | |
Class C | | | 38,873 | | | | 2,193,869 | | | | 39,777 | | | | 1,970,230 | |
Administrator Class | | | 2,701,225 | | | | 152,888,982 | | | | 6,677,445 | | | | 330,495,644 | |
Investor Class | | | 280,735 | | | | 15,845,762 | | | | 482,667 | | | | 23,784,938 | |
| | | | | | | | | | | | | | | | |
| | | | | | | 183,098,234 | | | | | | | | 379,517,746 | |
| | | | | | | | | | | | | | | | |
Reinvestment of distributions | | | | | | | | | | | | | | | | |
Class A | | | 0 | | | | 0 | | | | 275,383 | | | | 13,007,883 | |
Class B | | | 0 | | | | 0 | | | | 3,197 | | | | 152,083 | |
Class C | | | 0 | | | | 0 | | | | 23,012 | | | | 1,090,765 | |
Administrator Class | | | 0 | | | | 0 | | | | 1,430,770 | | | | 67,984,649 | |
Investor Class | | | 0 | | | | 0 | | | | 101,258 | | | | 4,796,474 | |
| | | | | | | | | | | | | | | | |
| | | | | | | 0 | | | | | | | | 87,031,854 | |
| | | | | | | | | | | | | | | | |
Payment for shares redeemed | | | | | | | | | | | | | | | | |
Class A | | | (470,366 | ) | | | (26,247,956 | ) | | | (1,049,374 | ) | | | (51,117,695 | ) |
Class B | | | (26,811 | ) | | | (1,495,827 | ) | | | (104,714 | ) | | | (5,096,345 | ) |
Class C | | | (54,352 | ) | | | (3,068,167 | ) | | | (234,919 | ) | | | (11,352,488 | ) |
Administrator Class | | | (3,445,798 | ) | | | (195,535,310 | ) | | | (12,182,766 | ) | | | (604,079,226 | ) |
Investor Class | | | (186,331 | ) | | | (10,496,975 | ) | | | (501,758 | ) | | | (24,783,891 | ) |
| | | | | | | | | | | | | | | | |
| | | | | | | (236,844,235 | ) | | | | | | | (696,429,645 | ) |
| | | | | | | | | | | | | | | | |
Net decrease in net assets resulting from capital share transactions | | | | | | | (53,746,001 | ) | | | | | | | (229,880,045 | ) |
| | | | | | | | | | | | | | | | |
Total increase in net assets | | | | | | | 231,509,512 | | | | | | | | 242,055,439 | |
| | | | | | | | | | | | | | | | |
| | | | |
Net assets | | | | | | | | | | | | | | | | |
Beginning of period | | | | | | | 2,465,468,897 | | | | | | | | 2,223,413,458 | |
| | | | | | | | | | | | | | | | |
End of period | | | | | | $ | 2,696,978,409 | | | | | | | $ | 2,465,468,897 | |
| | | | | | | | | | | | | | | | |
Undistributed net investment income | | | | | | $ | 39,778,537 | | | | | | | $ | 17,442,284 | |
| | | | | | | | | | | | | | | | |
The accompanying notes are an integral part of these financial statements.
| | | | |
| 36 | | Wells Fargo Advantage Equity Gateway Funds | | Statements of changes in net assets |
| | | | | | | | | | | | | | | | |
| | | International Value Fund | |
| | | Six months ended November 30, 2013 (unaudited) | | | Year ended May 31, 2013 | |
| | | | |
Operations | | | | | | | | | | | | | | | | |
Net investment income | | | | | | $ | 2,568,686 | | | | | | | $ | 8,954,013 | |
Net realized gains (losses) on investments | | | | | | | 4,002,856 | | | | | | | | (1,707,272 | ) |
Net change in unrealized gains (losses) on investments | | | | | | | 41,404,077 | | | | | | | | 73,178,617 | |
| | | | | | | | | | | | | | | | |
Net increase in net assets resulting from operations | | | | | | | 47,975,619 | | | | | | | | 80,425,358 | |
| | | | | | | | | | | | | | | | |
| | | | |
Distributions to shareholders from | | | | | | | | | | | | | | | | |
Net investment income | | | | | | | | | | | | | | | | |
Class A | | | | | | | 0 | | | | | | | | (115,858 | ) |
Class B | | | | | | | 0 | | | | | | | | (595 | ) |
Class C | | | | | | | 0 | | | | | | | | (7,526 | ) |
Administrator Class | | | | | | | 0 | | | | | | | | (7,826,405 | ) |
Institutional Class | | | | | | | 0 | | | | | | | | (46,009 | ) |
| | | | | | | | | | | | | | | | |
Total distributions to shareholders | | | | | | | 0 | | | | | | | | (7,996,393 | ) |
| | | | | | | | | | | | | | | | |
| | | | |
| | | Shares | | | | | | Shares | | | | |
Capital share transactions | | | | | | | | | | | | | | | | |
Proceeds from shares sold | | | | | | | | | | | | | | | | |
Class A | | | 44,135 | | | | 628,212 | | | | 159,600 | | | | 1,914,960 | |
Class B | | | 0 | | | | 0 | | | | 306 | | | | 4,003 | |
Class C | | | 12,129 | | | | 168,081 | | | | 12,328 | | | | 148,805 | |
Administrator Class | | | 2,996,222 | | | | 41,908,964 | | | | 8,384,637 | | | | 103,370,617 | |
Institutional Class | | | 11,741 | | | | 162,992 | | | | 13,271 | | | | 166,106 | |
| | | | | | | | | | | | | | | | |
| | | | | | | 42,868,249 | | | | | | | | 105,604,491 | |
| | | | | | | | | | | | | | | | |
Reinvestment of distributions | | | | | | | | | | | | | | | | |
Class A | | | 0 | | | | 0 | | | | 9,132 | | | | 114,428 | |
Class B | | | 0 | | | | 0 | | | | 47 | | | | 592 | |
Class C | | | 0 | | | | 0 | | | | 552 | | | | 6,827 | |
Administrator Class | | | 0 | | | | 0 | | | | 620,383 | | | | 7,717,567 | |
Institutional Class | | | 0 | | | | 0 | | | | 3,696 | | | | 46,009 | |
| | | | | | | | | | | | | | | | |
| | | | | | | 0 | | | | | | | | 7,885,423 | |
| | | | | | | | | | | | | | | | |
Payment for shares redeemed | | | | | | | | | | | | | | | | |
Class A | | | (52,927 | ) | | | (746,760 | ) | | | (172,652 | ) | | | (2,133,267 | ) |
Class B | | | (810 | ) | | | (11,589 | ) | | | (5,574 | ) | | | (67,421 | ) |
Class C | | | (1,196 | ) | | | (16,523 | ) | | | (9,912 | ) | | | (120,268 | ) |
Administrator Class | | | (2,699,672 | ) | | | (37,872,195 | ) | | | (5,646,981 | ) | | | (69,477,366 | ) |
Institutional Class | | | (2,809 | ) | | | (40,252 | ) | | | (13,641 | ) | | | (174,211 | ) |
| | | | | | | | | | | | | | | | |
| | | | | | | (38,687,319 | ) | | | | | | | (71,972,533 | ) |
| | | | | | | | | | | | | | | | |
Net increase in net assets resulting from capital share transactions | | | | | | | 4,180,930 | | | | | | | | 41,517,381 | |
| | | | | | | | | | | | | | | | |
Total increase in net assets | | | | | | | 52,156,549 | | | | | | | | 113,946,346 | |
| | | | | | | | | | | | | | | | |
| | | | |
Net assets | | | | | | | | | | | | | | | | |
Beginning of period | | | | | | | 380,713,972 | | | | | | | | 266,767,626 | |
| | | | | | | | | | | | | | | | |
End of period | | | | | | $ | 432,870,521 | | | | | | | $ | 380,713,972 | |
| | | | | | | | | | | | | | | | |
Undistributed net investment income | | | | | | $ | 8,535,652 | | | | | | | $ | 5,966,966 | |
| | | | | | | | | | | | | | | | |
The accompanying notes are an integral part of these financial statements.
| | | | | | |
| Statements of changes in net assets | | Wells Fargo Advantage Equity Gateway Funds | | | 37 | |
| | | | | | | | | | | | | | | | |
| | | Small Company Growth Fund | |
| | | Six months ended November 30, 2013 (unaudited) | | | Year ended May 31, 2013 | |
| | | | |
Operations | | | | | | | | | | | | | | | | |
Net investment loss | | | | | | $ | (664,575 | ) | | | | | | $ | (420,859 | ) |
Net realized gains on investments | | | | | | | 13,909,932 | | | | | | | | 12,668,016 | |
Net change in unrealized gains (losses) on investments | | | | | | | 23,904,528 | | | | | | | | 23,943,421 | |
| | | | | | | | | | | | | | | | |
Net increase in net assets resulting from operations | | | | | | | 37,149,885 | | | | | | | | 36,190,578 | |
| | | | | | | | | | | | | | | | |
| | | | |
Distributions to shareholders from | | | | | | | | | | | | | | | | |
Net investment income | | | | | | | | | | | | | | | | |
Administrator Class | | | | | | | 0 | | | | | | | | (205,578 | ) |
Institutional Class | | | | | | | 0 | | | | | | | | (67,592 | ) |
| | | | | | | | | | | | | | | | |
Total distributions to shareholders | | | | | | | 0 | | | | | | | | (273,170 | ) |
| | | | | | | | | | | | | | | | |
| | | | |
| | | Shares | | | | | | Shares | | | | |
Capital share transactions | | | | | | | | | | | | | | | | |
Proceeds from shares sold | | | | | | | | | | | | | | | | |
Class A | | | 304,069 | | | | 11,809,385 | | | | 103,921 | | | | 3,276,612 | |
Class B | | | 1,373 | | | | 47,023 | | | | 1,450 | | | | 42,974 | |
Class C | | | 60,735 | | | | 2,141,372 | | | | 17,766 | | | | 517,792 | |
Administrator Class | | | 280,595 | | | | 11,018,619 | | | | 505,748 | | | | 16,294,917 | |
Institutional Class | | | 511,891 | | | | 19,994,414 | | | | 1,543,651 | | | | 50,360,099 | |
| | | | | | | | | | | | | | | | |
| | | | | | | 45,010,813 | | | | | | | | 70,492,394 | |
| | | | | | | | | | | | | | | | |
Reinvestment of distributions | | | | | | | | | | | | | | | | |
Administrator Class | | | 0 | | | | 0 | | | | 6,412 | | | | 187,042 | |
Institutional Class | | | 0 | | | | 0 | | | | 1,707 | | | | 50,198 | |
| | | | | | | | | | | | | | | | |
| | | | | | | 0 | | | | | | | | 237,240 | |
| | | | | | | | | | | | | | | | |
Payment for shares redeemed | | | | | | | | | | | | | | | | |
Class A | | | (27,712 | ) | | | (1,057,219 | ) | | | (76,600 | ) | | | (2,327,179 | ) |
Class B | | | (1,156 | ) | | | (37,891 | ) | | | (4,182 | ) | | | (113,538 | ) |
Class C | | | (9,395 | ) | | | (324,866 | ) | | | (8,467 | ) | | | (231,544 | ) |
Administrator Class | | | (696,384 | ) | | | (27,143,496 | ) | | | (1,344,959 | ) | | | (41,596,358 | ) |
Institutional Class | | | (202,086 | ) | | | (7,614,950 | ) | | | (191,557 | ) | | | (6,279,267 | ) |
| | | | | | | | | | | | | | | | |
| | | | | | | (36,178,422 | ) | | | | | | | (50,547,886 | ) |
| | | | | | | | | | | | | | | | |
Net asset value of shares issued in acquisition
Institutional Class | | | 0 | | | | 0 | | | | 301,128 | | | | 9,870,350 | |
| | | | | | | | | | | | | | | | |
Net increase in net assets resulting from capital share transactions | | | | | | | 8,832,391 | | | | | | | | 30,052,098 | |
| | | | | | | | | | | | | | | | |
Total increase in net assets | | | | | | | 45,982,276 | | | | | | | | 65,969,506 | |
| | | | | | | | | | | | | | | | |
| | | | |
Net assets | | | | | | | | | | | | | | | | |
Beginning of period | | | | | | | 181,708,595 | | | | | | | | 115,739,089 | |
| | | | | | | | | | | | | | | | |
End of period | | | | | | $ | 227,690,871 | | | | | | | $ | 181,708,595 | |
| | | | | | | | | | | | | | | | |
Accumulated net investment loss | | | | | | $ | (943,824 | ) | | | | | | $ | (279,249 | ) |
| | | | | | | | | | | | | | | | |
The accompanying notes are an integral part of these financial statements.
| | | | |
| 38 | | Wells Fargo Advantage Equity Gateway Funds | | Statements of changes in net assets |
| | | | | | | | | | | | | | | | |
| | | Small Company Value Fund | |
| | | Six months ended November 30, 2013 (unaudited) | | | Year ended May 31, 2013 | |
| | | | |
Operations | | | | | | | | | | | | | | | | |
Net investment income | | | | | | $ | 430,206 | | | | | | | $ | 130,320 | |
Net realized gains on investments | | | | | | | 7,130,599 | | | | | | | | 6,000,704 | |
Net change in unrealized gains (losses) on investments | | | | | | | 6,894,421 | | | | | | | | 16,292,369 | |
| | | | | | | | | | | | | | | | |
Net increase in net assets resulting from operations | | | | | | | 14,455,226 | | | | | | | | 22,423,393 | |
| | | | | | | | | | | | | | | | |
| | | | |
Distributions to shareholders from | | | | | | | | | | | | | | | | |
Net investment income | | | | | | | | | | | | | | | | |
Administrator Class | | | | | | | 0 | | | | | | | | (51,523 | ) |
Institutional Class | | | | | | | 0 | | | | | | | | (4,542 | ) |
| | | | | | | | | | | | | | | | |
Total distributions to shareholders | | | | | | | 0 | | | | | | | | (56,065 | ) |
| | | | | | | | | | | | | | | | |
| | | | |
| | | Shares | | | | | | Shares | | | | |
Capital share transactions | | | | | | | | | | | | | | | | |
Proceeds from shares sold | | | | | | | | | | | | | | | | |
Class A | | | 229,476 | | | | 4,202,882 | | | | 254,500 | | | | 3,825,267 | |
Class B | | | 221 | | | | 3,721 | | | | 560 | | | | 7,860 | |
Class C | | | 12,758 | | | | 212,563 | | | | 24,528 | | | | 327,523 | |
Administrator Class | | | 324,274 | | | | 6,029,177 | | | | 592,211 | | | | 9,067,170 | |
Institutional Class | | | 96,635 | | | | 1,804,448 | | | | 502,808 | | | | 7,911,700 | |
| | | | | | | | | | | | | | | | |
| | | | | | | 12,252,791 | | | | | | | | 21,139,520 | |
| | | | | | | | | | | | | | | | |
Reinvestment of distributions | | | | | | | | | | | | | | | | |
Administrator Class | | | 0 | | | | 0 | | | | 3,523 | | | | 51,372 | |
Institutional Class | | | 0 | | | | 0 | | | | 311 | | | | 4,542 | |
| | | | | | | | | | | | | | | | |
| | | | | | | 0 | | | | | | | | 55,914 | |
| | | | | | | | | | | | | | | | |
Payment for shares redeemed | | | | | | | | | | | | | | | | |
Class A | | | (125,656 | ) | | | (2,306,096 | ) | | | (401,296 | ) | | | (5,883,056 | ) |
Class B | | | (5,908 | ) | | | (98,885 | ) | | | (28,979 | ) | | | (373,574 | ) |
Class C | | | (9,071 | ) | | | (151,776 | ) | | | (36,792 | ) | | | (487,296 | ) |
Administrator Class | | | (309,155 | ) | | | (5,765,948 | ) | | | (1,625,401 | ) | | | (24,888,529 | ) |
Institutional Class | | | (31,955 | ) | | | (600,304 | ) | | | (38,697 | ) | | | (589,477 | ) |
| | | | | | | | | | | | | | | | |
| | | | | | | (8,923,009 | ) | | | | | | | (32,221,932 | ) |
| | | | | | | | | | | | | | | | |
Net increase (decrease) in net assets resulting from capital share transactions | | | | | | | 3,329,782 | | | | | | | | (11,026,498 | ) |
| | | | | | | | | | | | | | | | |
Total increase in net assets | | | | | | | 17,785,008 | | | | | | | | 11,340,830 | |
| | | | | | | | | | | | | | | | |
| | | | |
Net assets | | | | | | | | | | | | | | | | |
Beginning of period | | | | | | | 92,398,200 | | | | | | | | 81,057,370 | |
| | | | | | | | | | | | | | | | |
End of period | | | | | | $ | 110,183,208 | | | | | | | $ | 92,398,200 | |
| | | | | | | | | | | | | | | | |
Undistributed (overdistributed) net investment income | | | | | | $ | 395,592 | | | | | | | $ | (34,614 | ) |
| | | | | | | | | | | | | | | | |
The accompanying notes are an integral part of these financial statements.
This page is intentionally left blank.
| | | | |
| 40 | | Wells Fargo Advantage Equity Gateway Funds | | Financial highlights |
| | | | | | | | | | | | | | | | | | | | |
| | | Beginning
net asset
value per
share | | | Net
investment
income1 | | | Net realized
and unrealized
gains (losses)
on investments | | |
Distributions
from net
investment
income | | | Distributions
from net
realized gains | |
| | | | | |
C&B Large Cap Value Fund | | | | | | | | | | | | | | | | | | | | |
Class A | | | | | | | | | | | | | | | | | | | | |
June 1, 2013 to November 30, 2013 (unaudited) | | $ | 10.32 | | | | 0.05 | 5 | | | 1.12 | | | | 0.00 | | | | 0.00 | |
June 1, 2012 to May 31, 2013 | | $ | 8.13 | | | | 0.12 | | | | 2.20 | | | | (0.13 | ) | | | 0.00 | |
June 1, 2011 to May 31, 2012 | | $ | 8.70 | | | | 0.12 | | | | (0.58 | ) | | | (0.11 | ) | | | 0.00 | |
October 1, 2010 to May 31, 20114 | | $ | 7.48 | | | | 0.06 | | | | 1.26 | | | | (0.10 | ) | | | 0.00 | |
October 1, 2009 to September 30, 2010 | | $ | 7.06 | | | | 0.08 | | | | 0.42 | | | | (0.08 | ) | | | 0.00 | |
October 1, 2008 to September 30, 2009 | | $ | 7.69 | | | | 0.10 | 5 | | | (0.60 | ) | | | (0.13 | ) | | | (0.00 | )6 |
October 1, 2007 to September 30, 2008 | | $ | 10.19 | | | | 0.11 | 5 | | | (2.12 | ) | | | (0.09 | ) | | | (0.40 | ) |
Class B | | | | | | | | | | | | | | | | | | | | |
June 1, 2013 to November 30, 2013 (unaudited) | | $ | 10.43 | | | | 0.01 | | | | 1.13 | | | | 0.00 | | | | 0.00 | |
June 1, 2012 to May 31, 2013 | | $ | 8.16 | | | | 0.05 | 5 | | | 2.22 | | | | 0.00 | | | | 0.00 | |
June 1, 2011 to May 31, 2012 | | $ | 8.68 | | | | 0.05 | 5 | | | (0.56 | ) | | | (0.01 | ) | | | 0.00 | |
October 1, 2010 to May 31, 20114 | | $ | 7.44 | | | | 0.01 | | | | 1.26 | | | | (0.03 | ) | | | 0.00 | |
October 1, 2009 to September 30, 2010 | | $ | 7.02 | | | | 0.03 | | | | 0.42 | | | | (0.03 | ) | | | 0.00 | |
October 1, 2008 to September 30, 2009 | | $ | 7.61 | | | | 0.05 | 5 | | | (0.58 | ) | | | (0.06 | ) | | | (0.00 | )6 |
October 1, 2007 to September 30, 2008 | | $ | 10.08 | | | | 0.04 | 5 | | | (2.11 | ) | | | 0.00 | | | | (0.40 | ) |
Class C | | | | | | | | | | | | | | | | | | | | |
June 1, 2013 to November 30, 2013 (unaudited) | | $ | 10.29 | | | | 0.01 | | | | 1.11 | | | | 0.00 | | | | 0.00 | |
June 1, 2012 to May 31, 2013 | | $ | 8.11 | | | | 0.04 | | | | 2.20 | | | | (0.06 | ) | | | 0.00 | |
June 1, 2011 to May 31, 2012 | | $ | 8.66 | | | | 0.05 | | | | (0.56 | ) | | | (0.04 | ) | | | 0.00 | |
October 1, 2010 to May 31, 20114 | | $ | 7.43 | | | | 0.00 | 6 | | | 1.27 | | | | (0.04 | ) | | | 0.00 | |
October 1, 2009 to September 30, 2010 | | $ | 7.02 | | | | 0.02 | �� | | | 0.42 | | | | (0.03 | ) | | | 0.00 | |
October 1, 2008 to September 30, 2009 | | $ | 7.60 | | | | 0.05 | 5 | | | (0.57 | ) | | | (0.06 | ) | | | (0.00 | )6 |
October 1, 2007 to September 30, 2008 | | $ | 10.08 | | | | 0.04 | 5 | | | (2.11 | ) | | | (0.01 | ) | | | (0.40 | ) |
Administrator Class | | | | | | | | | | | | | | | | | | | | |
June 1, 2013 to November 30, 2013 (unaudited) | | $ | 10.32 | | | | 0.06 | | | | 1.12 | | | | 0.00 | | | | 0.00 | |
June 1, 2012 to May 31, 2013 | | $ | 8.13 | | | | 0.13 | 5 | | | 2.21 | | | | (0.15 | ) | | | 0.00 | |
June 1, 2011 to May 31, 2012 | | $ | 8.69 | | | | 0.13 | 5 | | | (0.56 | ) | | | (0.13 | ) | | | 0.00 | |
October 1, 2010 to May 31, 20114 | | $ | 7.47 | | | | 0.05 | 5 | | | 1.28 | | | | (0.11 | ) | | | 0.00 | |
October 1, 2009 to September 30, 2010 | | $ | 7.06 | | | | 0.08 | 5 | | | 0.42 | | | | (0.09 | ) | | | 0.00 | |
October 1, 2008 to September 30, 2009 | | $ | 7.70 | | | | 0.11 | 5 | | | (0.60 | ) | | | (0.15 | ) | | | (0.00 | )6 |
October 1, 2007 to September 30, 2008 | | $ | 10.22 | | | | 0.13 | 5 | | | (2.13 | ) | | | (0.12 | ) | | | (0.40 | ) |
Institutional Class | | | | | | | | | | | | | | | | | | | | |
June 1, 2013 to November 30, 2013 (unaudited) | | $ | 10.35 | | | | 0.08 | | | | 1.12 | | | | 0.00 | | | | 0.00 | |
June 1, 2012 to May 31, 2013 | | $ | 8.16 | | | | 0.17 | | | | 2.19 | | | | (0.17 | ) | | | 0.00 | |
June 1, 2011 to May 31, 2012 | | $ | 8.73 | | | | 0.14 | | | | (0.56 | ) | | | (0.15 | ) | | | 0.00 | |
October 1, 2010 to May 31, 20114 | | $ | 7.51 | | | | 0.07 | | | | 1.28 | | | | (0.13 | ) | | | 0.00 | |
October 1, 2009 to September 30, 2010 | | $ | 7.09 | | | | 0.11 | 5 | | | 0.42 | | | | (0.11 | ) | | | 0.00 | |
October 1, 2008 to September 30, 2009 | | $ | 7.75 | | | | 0.12 | 5 | | | (0.61 | ) | | | (0.17 | ) | | | (0.00 | )6 |
October 1, 2007 to September 30, 2008 | | $ | 10.27 | | | | 0.15 | 5 | | | (2.13 | ) | | | (0.14 | ) | | | (0.40 | ) |
Investor Class | | | | | | | | | | | | | | | | | | | | |
June 1, 2013 to November 30, 2013 (unaudited) | | $ | 10.33 | | | | 0.05 | | | | 1.11 | | | | 0.00 | | | | 0.00 | |
June 1, 2012 to May 31, 2013 | | $ | 8.14 | | | | 0.10 | | | | 2.21 | | | | (0.12 | ) | | | 0.00 | |
June 1, 2011 to May 31, 2012 | | $ | 8.70 | | | | 0.10 | | | | (0.56 | ) | | | (0.10 | ) | | | 0.00 | |
October 1, 2010 to May 31, 20114 | | $ | 7.46 | | | | 0.04 | | | | 1.28 | | | | (0.08 | ) | | | 0.00 | |
October 1, 2009 to September 30, 2010 | | $ | 7.04 | | | | 0.06 | | | | 0.44 | | | | (0.08 | ) | | | 0.00 | |
October 1, 2008 to September 30, 2009 | | $ | 7.68 | | | | 0.09 | 5 | | | (0.59 | ) | | | (0.14 | ) | | | (0.00 | )6 |
October 1, 2007 to September 30, 20087 | | $ | 10.19 | | | | 0.11 | 5 | | | (2.13 | ) | | | (0.09 | ) | | | (0.40 | ) |
Please see footnotes on page 50.
The accompanying notes are an integral part of these financial statements.
| | | | | | |
| Financial highlights | | Wells Fargo Advantage Equity Gateway Funds | | | 41 | |
| | | | | | | | | | | | | | | | | | | | | | | | | | |
Ending
net asset
value
per
share | | | Ratio to average net assets (annualized) | | | Total
return2 | | | Portfolio
turnover
rate3 | | | Net assets at
end of period
(000s omitted) | |
| | Net investment
income1 | | | Gross
expenses1 | | | Net
expenses1 | | | | |
| | | | | | | |
| | | | | | | | | | | | | | | | | | | | | | | | | | | |
| | | | | | | | | | | | | | | | | | | | | | | | | | |
| $ | 11.49 | | | | 0.91 | % | | | 1.31 | % | | | 1.15 | % | | | 11.34 | % | | | 11 | % | | $ | 28,672 | |
| $ | 10.32 | | | | 1.25 | % | | | 1.30 | % | | | 1.15 | % | | | 28.82 | % | | | 18 | % | | $ | 23,571 | |
| $ | 8.13 | | | | 1.33 | % | | | 1.30 | % | | | 1.15 | % | | | (5.23 | )% | | | 21 | % | | $ | 21,380 | |
| $ | 8.70 | | | | 0.78 | % | | | 1.31 | % | | | 1.15 | % | | | 17.73 | % | | | 17 | % | | $ | 25,912 | |
| $ | 7.48 | | | | 0.96 | % | | | 1.32 | % | | | 1.15 | % | | | 7.14 | % | | | 13 | % | | $ | 31,038 | |
| $ | 7.06 | | | | 1.66 | % | | | 1.30 | % | | | 1.15 | % | | | (6.05 | )% | | | 28 | % | | $ | 33,784 | |
| $ | 7.69 | | | | 1.20 | % | | | 1.32 | % | | | 1.19 | % | | | (20.51 | )% | | | 21 | % | | $ | 40,157 | |
| | | | | | | | | | | | | | | | | | | | | | | | | | |
| $ | 11.57 | | | | 0.20 | % | | | 2.06 | % | | | 1.90 | % | | | 10.93 | % | | | 11 | % | | $ | 910 | |
| $ | 10.43 | | | | 0.57 | % | | | 2.03 | % | | | 1.89 | % | | | 27.82 | % | | | 18 | % | | $ | 1,167 | |
| $ | 8.16 | | | | 0.61 | % | | | 2.05 | % | | | 1.90 | % | | | (5.84 | )% | | | 21 | % | | $ | 2,418 | |
| $ | 8.68 | | | | 0.04 | % | | | 2.06 | % | | | 1.90 | % | | | 17.15 | % | | | 17 | % | | $ | 6,607 | |
| $ | 7.44 | | | | 0.20 | % | | | 2.07 | % | | | 1.90 | % | | | 6.36 | % | | | 13 | % | | $ | 6,951 | |
| $ | 7.02 | | | | 0.91 | % | | | 2.04 | % | | | 1.90 | % | | | (6.73 | )% | | | 28 | % | | $ | 8,773 | |
| $ | 7.61 | | | | 0.43 | % | | | 2.07 | % | | | 1.94 | % | | | (21.19 | )% | | | 21 | % | | $ | 13,461 | |
| | | | | | | | | | | | | | | | | | | | | | | | | | |
| $ | 11.41 | | | | 0.16 | % | | | 2.06 | % | | | 1.90 | % | | | 10.88 | % | | | 11 | % | | $ | 6,667 | |
| $ | 10.29 | | | | 0.51 | % | | | 2.05 | % | | | 1.90 | % | | | 27.76 | % | | | 18 | % | | $ | 5,818 | |
| $ | 8.11 | | | | 0.58 | % | | | 2.05 | % | | | 1.90 | % | | | (5.81 | )% | | | 21 | % | | $ | 5,524 | |
| $ | 8.66 | | | | 0.05 | % | | | 2.07 | % | | | 1.90 | % | | | 17.15 | % | | | 17 | % | | $ | 7,046 | |
| $ | 7.43 | | | | 0.21 | % | | | 2.07 | % | | | 1.90 | % | | | 6.29 | % | | | 13 | % | | $ | 6,607 | |
| $ | 7.02 | | | | 0.90 | % | | | 2.04 | % | | | 1.90 | % | | | (6.62 | )% | | | 28 | % | | $ | 6,852 | |
| $ | 7.60 | | | | 0.44 | % | | | 2.06 | % | | | 1.94 | % | | | (21.21 | )% | | | 21 | % | | $ | 9,424 | |
| | | | | | | | | | | | | | | | | | | | | | | | | | |
| $ | 11.50 | | | | 1.13 | % | | | 1.14 | % | | | 0.95 | % | | | 11.43 | % | | | 11 | % | | $ | 57,836 | |
| $ | 10.32 | | | | 1.48 | % | | | 1.13 | % | | | 0.95 | % | | | 29.09 | % | | | 18 | % | | $ | 70,727 | |
| $ | 8.13 | | | | 1.54 | % | | | 1.13 | % | | | 0.95 | % | | | (4.90 | )% | | | 21 | % | | $ | 81,999 | |
| $ | 8.69 | | | | 1.00 | % | | | 1.15 | % | | | 0.95 | % | | | 17.74 | % | | | 17 | % | | $ | 120,613 | |
| $ | 7.47 | | | | 1.13 | % | | | 1.13 | % | | | 0.95 | % | | | 7.33 | % | | | 13 | % | | $ | 114,664 | |
| $ | 7.06 | | | | 1.89 | % | | | 1.11 | % | | | 0.95 | % | | | (5.83 | )% | | | 28 | % | | $ | 222,489 | |
| $ | 7.70 | | | | 1.43 | % | | | 1.13 | % | | | 0.95 | % | | | (20.42 | )% | | | 21 | % | | $ | 260,883 | |
| | | | | | | | | | | | | | | | | | | | | | | | | | |
| $ | 11.55 | | | | 1.40 | % | | | 0.88 | % | | | 0.70 | % | | | 11.59 | % | | | 11 | % | | $ | 128,336 | |
| $ | 10.35 | | | | 1.68 | % | | | 0.87 | % | | | 0.70 | % | | | 29.32 | % | | | 18 | % | | $ | 130,015 | |
| $ | 8.16 | | | | 1.78 | % | | | 0.87 | % | | | 0.70 | % | | | (4.72 | )% | | | 21 | % | | $ | 96,653 | |
| $ | 8.73 | | | | 1.25 | % | | | 0.88 | % | | | 0.70 | % | | | 18.16 | % | | | 17 | % | | $ | 110,061 | |
| $ | 7.51 | | | | 1.48 | % | | | 0.88 | % | | | 0.70 | % | | | 7.51 | % | | | 13 | % | | $ | 95,466 | |
| $ | 7.09 | | | | 2.11 | % | | | 0.85 | % | | | 0.70 | % | | | (5.62 | )% | | | 28 | % | | $ | 26,582 | |
| $ | 7.75 | | | | 1.68 | % | | | 0.87 | % | | | 0.70 | % | | | (20.10 | )% | | | 21 | % | | $ | 27,494 | |
| | | | | | | | | | | | | | | | | | | | | | | | | | |
| $ | 11.49 | | | | 0.86 | % | | | 1.37 | % | | | 1.20 | % | | | 11.23 | % | | | 11 | % | | $ | 77,475 | |
| $ | 10.33 | | | | 1.21 | % | | | 1.36 | % | | | 1.20 | % | | | 28.68 | % | | | 18 | % | | $ | 66,315 | |
| $ | 8.14 | | | | 1.29 | % | | | 1.37 | % | | | 1.20 | % | | | (5.17 | )% | | | 21 | % | | $ | 64,007 | |
| $ | 8.70 | | | | 0.75 | % | | | 1.39 | % | | | 1.20 | % | | | 17.77 | % | | | 17 | % | | $ | 86,624 | |
| $ | 7.46 | | | | 0.87 | % | | | 1.41 | % | | | 1.20 | % | | | 7.15 | % | | | 13 | % | | $ | 85,256 | |
| $ | 7.04 | | | | 1.62 | % | | | 1.40 | % | | | 1.20 | % | | | (6.06 | )% | | | 28 | % | | $ | 199,654 | |
| $ | 7.68 | | | | 1.20 | % | | | 1.35 | % | | | 1.20 | % | | | (20.59 | )% | | | 21 | % | | $ | 153,917 | |
Please see footnotes on page 50.
The accompanying notes are an integral part of these financial statements.
| | | | |
| 42 | | Wells Fargo Advantage Equity Gateway Funds | | Financial highlights |
| | | | | | | | | | | | | | | | | | | | |
| | |
Beginning
net asset
value per
share | | | Net
investment
income (loss)1 | | | Net realized
and unrealized
gains (losses)
on investments | | | Distributions
from net
investment
income | | | Distributions
from net
realized gains | |
| | | | | |
Diversified Equity Fund | | | | | | | | | | | | | | | | | | | | |
Class A | | | | | | | | | | | | | | | | | | | | |
June 1, 2013 to November 30, 2013 (unaudited) | | $ | 30.65 | | | | 0.06 | 5 | | | 4.27 | | | | 0.00 | | | | 0.00 | |
June 1, 2012 to May 31, 2013 | | $ | 26.08 | | | | 0.23 | 5 | | | 6.14 | | | | (0.24 | ) | | | (1.56 | ) |
June 1, 2011 to May 31, 2012 | | $ | 29.71 | | | | 0.15 | | | | (2.01 | ) | | | (0.18 | ) | | | (1.59 | ) |
October 1, 2010 to May 31, 20114 | | $ | 24.89 | | | | 0.12 | | | | 4.85 | | | | (0.15 | ) | | | 0.00 | |
October 1, 2009 to September 30, 2010 | | $ | 23.41 | | | | 0.18 | | | | 1.66 | | | | (0.36 | ) | | | 0.00 | |
October 1, 2008 to September 30, 2009 | | $ | 27.70 | | | | 0.23 | 5 | | | (2.30 | ) | | | (0.26 | ) | | | (1.96 | ) |
October 1, 2007 to September 30, 2008 | | $ | 42.92 | | | | 0.27 | 5 | | | (9.47 | ) | | | (0.25 | ) | | | (5.77 | ) |
Class B | | | | | | | | | | | | | | | | | | | | |
June 1, 2013 to November 30, 2013 (unaudited) | | $ | 28.54 | | | | (0.06 | )5 | | | 3.97 | | | | 0.00 | | | | 0.00 | |
June 1, 2012 to May 31, 2013 | | $ | 24.36 | | | | 0.01 | 5 | | | 5.73 | | | | 0.00 | | | | (1.56 | ) |
June 1, 2011 to May 31, 2012 | | $ | 27.87 | | | | (0.01 | )5 | | | (1.91 | ) | | | 0.00 | | | | (1.59 | ) |
October 1, 2010 to May 31, 20114 | | $ | 23.35 | | | | (0.05 | )5 | | | 4.57 | | | | 0.00 | | | | 0.00 | |
October 1, 2009 to September 30, 2010 | | $ | 21.96 | | | | (0.01 | )5 | | | 1.57 | | | | (0.17 | ) | | | 0.00 | |
October 1, 2008 to September 30, 2009 | | $ | 26.00 | | | | 0.08 | 5 | | | (2.16 | ) | | | 0.00 | | | | (1.96 | ) |
October 1, 2007 to September 30, 2008 | | $ | 40.68 | | | | 0.01 | 5 | | | (8.92 | ) | | | 0.00 | | | | (5.77 | ) |
Class C | | | | | | | | | | | | | | | | | | | | |
June 1, 2013 to November 30, 2013 (unaudited) | | $ | 29.13 | | | | (0.06 | )5 | | | 4.05 | | | | 0.00 | | | | 0.00 | |
June 1, 2012 to May 31, 2013 | | $ | 24.88 | | | | 0.02 | 5 | | | 5.84 | | | | (0.05 | ) | | | (1.56 | ) |
June 1, 2011 to May 31, 2012 | | $ | 28.43 | | | | (0.59 | ) | | | (1.37 | ) | | | 0.00 | | | | (1.59 | ) |
October 1, 2010 to May 31, 20114 | | $ | 23.81 | | | | (0.04 | )5 | | | 4.66 | | | | 0.00 | | | | 0.00 | |
October 1, 2009 to September 30, 2010 | | $ | 22.43 | | | | (0.01 | )5 | | | 1.60 | | | | (0.21 | ) | | | 0.00 | |
October 1, 2008 to September 30, 2009 | | $ | 26.53 | | | | 0.08 | 5 | | | (2.20 | ) | | | (0.02 | ) | | | (1.96 | ) |
October 1, 2007 to September 30, 2008 | | $ | 41.38 | | | | 0.02 | 5 | | | (9.10 | ) | | | 0.00 | | | | (5.77 | ) |
Administrator Class | | | | | | | | | | | | | | | | | | | | |
June 1, 2013 to November 30, 2013 (unaudited) | | $ | 30.70 | | | | 0.10 | 5 | | | 4.27 | | | | 0.00 | | | | 0.00 | |
June 1, 2012 to May 31, 2013 | | $ | 26.12 | | | | 0.30 | 5 | | | 6.15 | | | | (0.31 | ) | | | (1.56 | ) |
June 1, 2011 to May 31, 2012 | | $ | 29.78 | | | | 0.33 | | | | (2.13 | ) | | | (0.27 | ) | | | (1.59 | ) |
October 1, 2010 to May 31, 20114 | | $ | 24.98 | | | | 0.14 | 5 | | | 4.89 | | | | (0.23 | ) | | | 0.00 | |
October 1, 2009 to September 30, 2010 | | $ | 23.47 | | | | 0.20 | 5 | | | 1.70 | | | | (0.39 | ) | | | 0.00 | |
October 1, 2008 to September 30, 2009 | | $ | 27.79 | | | | 0.28 | 5 | | | (2.32 | ) | | | (0.32 | ) | | | (1.96 | ) |
October 1, 2007 to September 30, 2008 | | $ | 43.03 | | | | 0.36 | 5 | | | (9.49 | ) | | | (0.34 | ) | | | (5.77 | ) |
| | | | | |
Emerging Growth Fund | | | | | | | | | | | | | | | | | | | | |
Class A | | | | | | | | | | | | | | | | | | | | |
June 1, 2013 to November 30, 2013 (unaudited) | | $ | 14.10 | | | | (0.10 | ) | | | 3.88 | | | | 0.00 | | | | 0.00 | |
June 1, 2012 to May 31, 2013 | | $ | 12.44 | | | | (0.15 | ) | | | 2.49 | | | | 0.00 | | | | (0.68 | ) |
June 1, 2011 to May 31, 2012 | | $ | 13.12 | | | | (0.14 | )5 | | | (0.54 | ) | | | 0.00 | | | | 0.00 | |
October 1, 2010 to May 31, 20114 | | $ | 9.50 | | | | (0.11 | )5 | | | 3.73 | | | | 0.00 | | | | 0.00 | |
October 1, 2009 to September 30, 2010 | | $ | 7.93 | | | | (0.12 | ) | | | 1.69 | | | | 0.00 | | | | 0.00 | |
October 1, 2008 to September 30, 2009 | | $ | 8.51 | | | | (0.07 | )5 | | | (0.51 | ) | | | 0.00 | | | | 0.00 | |
March 31, 20088 to September 30, 2008 | | $ | 9.43 | | | | (0.05 | ) | | | (0.87 | ) | | | 0.00 | | | | 0.00 | |
Class C | | | | | | | | | | | | | | | | | | | | |
June 1, 2013 to November 30, 2013 (unaudited) | | $ | 13.55 | | | | (0.16 | ) | | | 3.72 | | | | 0.00 | | | | 0.00 | |
June 1, 2012 to May 31, 2013 | | $ | 12.06 | | | | (0.27 | ) | | | 2.44 | | | | 0.00 | | | | (0.68 | ) |
June 1, 2011 to May 31, 2012 | | $ | 12.81 | | | | (0.23 | )5 | | | (0.52 | ) | | | 0.00 | | | | 0.00 | |
October 1, 2010 to May 31, 20114 | | $ | 9.32 | | | | (0.16 | )5 | | | 3.65 | | | | 0.00 | | | | 0.00 | |
October 1, 2009 to September 30, 2010 | | $ | 7.85 | | | | (0.16 | )5 | | | 1.63 | | | | 0.00 | | | | 0.00 | |
October 1, 2008 to September 30, 2009 | | $ | 8.48 | | | | (0.12 | )5 | | | (0.51 | ) | | | 0.00 | | | | 0.00 | |
March 31, 20088 to September 30, 2008 | | $ | 9.43 | | | | (0.09 | )5 | | | (0.86 | ) | | | 0.00 | | | | 0.00 | |
Please see footnotes on page 50.
The accompanying notes are an integral part of these financial statements.
| | | | | | |
| Financial highlights | | Wells Fargo Advantage Equity Gateway Funds | | | 43 | |
| | | | | | | | | | | | | | | | | | | | | | | | | | |
Ending
net asset
value
per
share | | | Ratio to average net assets (annualized) | | | Total
return2 | | | Portfolio
turnover
rate3 | | | Net assets at
end of period
(000s omitted) | |
| | Net investment
income (loss)1 | | | Gross
expenses1 | | | Net
expenses1 | | | | |
| | | | | | | |
| | | | | | | | | | | | | | | | | | | | | | | | | | | |
| | | | | | | | | | | | | | | | | | | | | | | | | | |
| $ | 34.98 | | | | 0.36 | % | | | 1.44 | % | | | 1.25 | % | | | 14.13 | % | | | 20 | % | | $ | 82,513 | |
| $ | 30.65 | | | | 0.81 | % | | | 1.43 | % | | | 1.25 | % | | | 25.42 | % | | | 44 | % | | $ | 75,640 | |
| $ | 26.08 | | | | 0.74 | % | | | 1.41 | % | | | 1.25 | % | | | (5.91 | )% | | | 57 | % | | $ | 75,751 | |
| $ | 29.71 | | | | 0.59 | % | | | 1.40 | % | | | 1.25 | % | | | 20.04 | % | | | 48 | % | | $ | 95,532 | |
| $ | 24.89 | | | | 0.71 | % | | | 1.48 | % | | | 1.25 | % | | | 7.90 | % | | | 44 | % | | $ | 85,735 | |
| $ | 23.41 | | | | 1.16 | % | | | 1.43 | % | | | 1.25 | % | | | (5.33 | )% | | | 48 | % | | $ | 85,504 | |
| $ | 27.70 | | | | 0.81 | % | | | 1.42 | % | | | 1.25 | % | | | (24.44 | )% | | | 37 | % | | $ | 90,444 | |
| | | | | | | | | | | | | | | | | | | | | | | | | | |
| $ | 32.45 | | | | (0.41 | )% | | | 2.18 | % | | | 2.00 | % | | | 13.70 | % | | | 20 | % | | $ | 1,470 | |
| $ | 28.54 | | | | 0.04 | % | | | 2.18 | % | | | 2.00 | % | | | 24.48 | % | | | 44 | % | | $ | 2,029 | |
| $ | 24.36 | | | | (0.05 | )% | | | 2.16 | % | | | 2.00 | % | | | (6.61 | )% | | | 57 | % | | $ | 2,922 | |
| $ | 27.87 | | | | (0.20 | )% | | | 2.15 | % | | | 2.00 | % | | | 19.36 | % | | | 48 | % | | $ | 5,754 | |
| $ | 23.35 | | | | (0.04 | )% | | | 2.23 | % | | | 2.00 | % | | | 7.15 | % | | | 44 | % | | $ | 7,825 | |
| $ | 21.96 | | | | 0.43 | % | | | 2.18 | % | | | 1.99 | % | | | (6.03 | )% | | | 48 | % | | $ | 10,839 | |
| $ | 26.00 | | | | 0.03 | % | | | 2.17 | % | | | 2.00 | % | | | (25.01 | )% | | | 37 | % | | $ | 19,054 | |
| | | | | | | | | | | | | | | | | | | | | | | | | | |
| $ | 33.12 | | | | (0.38 | )% | | | 2.19 | % | | | 2.00 | % | | | 13.70 | % | | | 20 | % | | $ | 4,633 | |
| $ | 29.13 | | | | 0.07 | % | | | 2.18 | % | | | 2.00 | % | | | 24.50 | % | | | 44 | % | | $ | 2,667 | |
| $ | 24.88 | | | | (0.02 | )% | | | 2.16 | % | | | 2.00 | % | | | (6.62 | )% | | | 57 | % | | $ | 2,499 | |
| $ | 28.43 | | | | (0.17 | )% | | | 2.15 | % | | | 2.00 | % | | | 19.40 | % | | | 48 | % | | $ | 3,383 | |
| $ | 23.81 | | | | (0.05 | )% | | | 2.23 | % | | | 2.00 | % | | | 7.10 | % | | | 44 | % | | $ | 3,280 | |
| $ | 22.43 | | | | 0.41 | % | | | 2.17 | % | | | 2.00 | % | | | (6.02 | )% | | | 48 | % | | $ | 2,958 | |
| $ | 26.53 | | | | 0.05 | % | | | 2.15 | % | | | 2.00 | % | | | (25.00 | )% | | | 37 | % | | $ | 3,491 | |
| | | | | | | | | | | | | | | | | | | | | | | | | | |
| $ | 35.07 | | | | 0.61 | % | | | 1.27 | % | | | 1.00 | % | | | 14.23 | % | | | 20 | % | | $ | 286,527 | |
| $ | 30.70 | | | | 1.06 | % | | | 1.27 | % | | | 1.00 | % | | | 25.75 | % | | | 44 | % | | $ | 290,011 | |
| $ | 26.12 | | | | 0.99 | % | | | 1.25 | % | | | 1.00 | % | | | (5.67 | )% | | | 57 | % | | $ | 293,895 | |
| $ | 29.78 | | | | 0.84 | % | | | 1.24 | % | | | 1.00 | % | | | 20.22 | % | | | 48 | % | | $ | 386,429 | |
| $ | 24.98 | | | | 0.83 | % | | | 1.29 | % | | | 1.00 | % | | | 8.18 | % | | | 44 | % | | $ | 359,109 | |
| $ | 23.47 | | | | 1.41 | % | | | 1.25 | % | | | 1.00 | % | | | (5.09 | )% | | | 48 | % | | $ | 596,298 | |
| $ | 27.79 | | | | 1.05 | % | | | 1.24 | % | | | 1.00 | % | | | (24.24 | )% | | | 37 | % | | $ | 678,818 | |
| | | | | | |
| | | | | | | | | | | | | | | | | | | | | | | | | | | |
| | | | | | | | | | | | | | | | | | | | | | | | | | |
| $ | 17.88 | | | | (1.19 | )% | | | 1.40 | % | | | 1.37 | % | | | 26.81 | % | | | 33 | % | | $ | 155,716 | |
| $ | 14.10 | | | | (1.04 | )% | | | 1.40 | % | | | 1.37 | % | | | 19.89 | % | | | 65 | % | | $ | 125,070 | |
| $ | 12.44 | | | | (1.13 | )% | | | 1.41 | % | | | 1.37 | % | | | (5.18 | )% | | | 75 | % | | $ | 125,113 | |
| $ | 13.12 | | | | (1.32 | )% | | | 3.03 | % | | | 1.45 | % | | | 38.11 | % | | | 59 | % | | $ | 3,425 | |
| $ | 9.50 | | | | (1.17 | )% | | | 4.65 | % | | | 1.46 | % | | | 19.80 | % | | | 97 | % | | $ | 142 | |
| $ | 7.93 | | | | (1.09 | )% | | | 8.23 | % | | | 1.45 | % | | | (6.82 | )% | | | 147 | % | | $ | 44 | |
| $ | 8.51 | | | | (1.05 | )% | | | 4.16 | % | | | 1.45 | % | | | (9.76 | )% | | | 191 | % | | $ | 14 | |
| | | | | | | | | | | | | | | | | | | | | | | | | | |
| $ | 17.11 | | | | (1.94 | )% | | | 2.15 | % | | | 2.12 | % | | | 26.27 | % | | | 33 | % | | $ | 5,968 | |
| $ | 13.55 | | | | (1.79 | )% | | | 2.15 | % | | | 2.12 | % | | | 19.09 | % | | | 65 | % | | $ | 4,878 | |
| $ | 12.06 | | | | (1.89 | )% | | | 2.17 | % | | | 2.12 | % | | | (5.85 | )% | | | 75 | % | | $ | 5,114 | |
| $ | 12.81 | | | | (2.05 | )% | | | 3.83 | % | | | 2.20 | % | | | 37.30 | % | | | 59 | % | | $ | 516 | |
| $ | 9.32 | | | | (1.93 | )% | | | 5.40 | % | | | 2.22 | % | | | 18.85 | % | | | 97 | % | | $ | 58 | |
| $ | 7.85 | | | | (1.84 | )% | | | 7.93 | % | | | 2.20 | % | | | (7.43 | )% | | | 147 | % | | $ | 8 | |
| $ | 8.48 | | | | (1.82 | )% | | | 4.85 | % | | | 2.20 | % | | | (10.07 | )% | | | 191 | % | | $ | 9 | |
Please see footnotes on page 50.
The accompanying notes are an integral part of these financial statements.
| | | | |
| 44 | | Wells Fargo Advantage Equity Gateway Funds | | Financial highlights |
| | | | | | | | | | | | | | | | | | | | |
| | | Beginning
net asset
value per
share | | | Net
investment
income (loss)1 | | | Net realized
and unrealized
gains (losses)
on investments | | | Distributions
from net
investment
income | | | Distributions
from net
realized gains | |
| | | | | |
Emerging Growth Fund (continued) | | | | | | | | | | | | | | | | | | | | |
Administrator Class | | | | | | | | | | | | | | | | | | | | |
June 1, 2013 to November 30, 2013 (unaudited) | | $ | 14.28 | | | | (0.08 | )5 | | | 3.92 | | | | 0.00 | | | | 0.00 | |
June 1, 2012 to May 31, 2013 | | $ | 12.56 | | | | (0.12 | ) | | | 2.52 | | | | 0.00 | | | | (0.68 | ) |
June 1, 2011 to May 31, 2012 | | $ | 13.22 | | | | (0.12 | )5 | | | (0.54 | ) | | | 0.00 | | | | 0.00 | |
October 1, 2010 to May 31, 20114 | | $ | 9.56 | | | | (0.09 | )5 | | | 3.75 | | | | 0.00 | | | | 0.00 | |
October 1, 2009 to September 30, 2010 | | $ | 8.08 | | | | (0.01 | ) | | | 1.49 | | | | 0.00 | | | | 0.00 | |
October 1, 2008 to September 30, 2009 | | $ | 8.53 | | | | (0.05 | )5 | | | (0.40 | ) | | | 0.00 | | | | 0.00 | |
October 1, 2007 to September 30, 2008 | | $ | 12.40 | | | | (0.07 | ) | | | (3.70 | ) | | | 0.00 | | | | (0.06 | ) |
Institutional Class | | | | | | | | | | | | | | | | | | | | |
June 1, 2013 to November 30, 2013 (unaudited) | | $ | 14.49 | | | | (0.06 | ) | | | 3.99 | | | | 0.00 | | | | 0.00 | |
June 1, 2012 to May 31, 2013 | | $ | 12.70 | | | | (0.08 | ) | | | 2.55 | | | | 0.00 | | | | (0.68 | ) |
June 1, 2011 to May 31, 2012 | | $ | 13.33 | | | | (0.08 | )5 | | | (0.55 | ) | | | 0.00 | | | | 0.00 | |
October 1, 2010 to May 31, 20114 | | $ | 9.62 | | | | (0.07 | )5 | | | 3.78 | | | | 0.00 | | | | 0.00 | |
October 1, 2009 to September 30, 2010 | | $ | 8.00 | | | | (0.07 | ) | | | 1.69 | | | | 0.00 | | | | 0.00 | |
October 1, 2008 to September 30, 2009 | | $ | 8.53 | | | | (0.04 | )5 | | | (0.49 | ) | | | 0.00 | | | | 0.00 | |
March 31, 20088 to September 30, 2008 | | $ | 9.43 | | | | (0.03 | ) | | | (0.87 | ) | | | 0.00 | | | | 0.00 | |
Investor Class | | | | | | | | | | | | | | | | | | | | |
June 1, 2013 to November 30, 2013 (unaudited) | | $ | 14.04 | | | | (0.10 | ) | | | 3.86 | | | | 0.00 | | | | 0.00 | |
June 1, 2012 to May 31, 2013 | | $ | 12.39 | | | | (0.16 | ) | | | 2.49 | | | | 0.00 | | | | (0.68 | ) |
June 1, 2011 to May 31, 2012 | | $ | 13.07 | | | | (0.15 | )5 | | | (0.53 | ) | | | 0.00 | | | | 0.00 | |
October 1, 2010 to May 31, 20114 | | $ | 9.47 | | | | (0.11 | )5 | | | 3.71 | | | | 0.00 | | | | 0.00 | |
October 1, 2009 to September 30, 2010 | | $ | 7.91 | | | | (0.09 | ) | | | 1.65 | | | | 0.00 | | | | 0.00 | |
October 1, 2008 to September 30, 2009 | | $ | 8.49 | | | | (0.07 | )5 | | | (0.51 | ) | | | 0.00 | | | | 0.00 | |
October 1, 2007 to September 30, 2008 | | $ | 12.38 | | | | (0.13 | ) | | | (3.66 | ) | | | 0.00 | | | | (0.06 | ) |
| | | | | |
Index Fund | | | | | | | | | | | | | | | | | | | | |
Class A | | | | | | | | | | | | | | | | | | | | |
June 1, 2013 to November 30, 2013 (unaudited) | | $ | 54.00 | | | | 0.45 | | | | 5.81 | | | | 0.00 | | | | 0.00 | |
June 1, 2012 to May 31, 2013 | | $ | 44.25 | | | | 0.86 | | | | 10.66 | | | | (0.83 | ) | | | (0.94 | ) |
June 1, 2011 to May 31, 2012 | | $ | 47.17 | | | | 0.73 | | | | (1.35 | ) | | | (0.65 | ) | | | (1.65 | ) |
August 1, 2010 to May 31, 20119 | | $ | 40.42 | | | | 0.56 | | | | 8.77 | | | | (0.70 | ) | | | (1.88 | ) |
August 1, 2009 to July 31, 201010 | | $ | 41.72 | | | | 0.64 | | | | 4.89 | | | | (0.63 | ) | | | (6.20 | ) |
August 1, 2008 to July 31, 200910 | | $ | 56.53 | | | | 0.91 | | | | (12.80 | ) | | | (0.91 | ) | | | (2.01 | ) |
August 1, 2007 to July 31, 200810 | | $ | 65.01 | | | | 1.04 | | | | (8.50 | ) | | | (1.02 | ) | | | 0.00 | |
Class B | | | | | | | | | | | | | | | | | | | | |
June 1, 2013 to November 30, 2013 (unaudited) | | $ | 54.57 | | | | 0.22 | 5 | | | 5.88 | | | | 0.00 | | | | 0.00 | |
June 1, 2012 to May 31, 2013 | | $ | 44.53 | | | | 0.47 | 5 | | | 10.78 | | | | (0.27 | ) | | | (0.94 | ) |
June 1, 2011 to May 31, 2012 | | $ | 47.23 | | | | 0.38 | 5 | | | (1.29 | ) | | | (0.14 | ) | | | (1.65 | ) |
August 1, 2010 to May 31, 20119 | | $ | 40.32 | | | | 0.29 | 5 | | | 8.76 | | | | (0.26 | ) | | | (1.88 | ) |
August 1, 2009 to July 31, 201010 | | $ | 41.63 | | | | 0.28 | | | | 4.88 | | | | (0.27 | ) | | | (6.20 | ) |
August 1, 2008 to July 31, 200910 | | $ | 56.42 | | | | 0.63 | 5 | | | (12.82 | ) | | | (0.59 | ) | | | (2.01 | ) |
August 1, 2007 to July 31, 200810 | | $ | 64.86 | | | | 0.57 | 5 | | | (8.48 | ) | | | (0.53 | ) | | | 0.00 | |
Class C | | | | | | | | | | | | | | | | | | | | |
June 1, 2013 to November 30, 2013 (unaudited) | | $ | 54.22 | | | | 0.22 | 5 | | | 5.85 | | | | 0.00 | | | | 0.00 | |
June 1, 2012 to May 31, 2013 | | $ | 44.41 | | | | 0.48 | 5 | | | 10.71 | | | | (0.44 | ) | | | (0.94 | ) |
June 1, 2011 to May 31, 2012 | | $ | 47.27 | | | | 0.39 | 5 | | | (1.31 | ) | | | (0.29 | ) | | | (1.65 | ) |
August 1, 2010 to May 31, 20119 | | $ | 40.32 | | | | 0.27 | | | | 8.78 | | | | (0.22 | ) | | | (1.88 | ) |
August 1, 2009 to July 31, 201010 | | $ | 41.62 | | | | 0.30 | | | | 4.88 | | | | (0.28 | ) | | | (6.20 | ) |
August 1, 2008 to July 31, 200910 | | $ | 56.36 | | | | 0.59 | | | | (12.76 | ) | | | (0.56 | ) | | | (2.01 | ) |
August 1, 2007 to July 31, 200810 | | $ | 64.80 | | | | 0.55 | | | | (8.44 | ) | | | (0.55 | ) | | | 0.00 | |
Please see footnotes on page 50.
The accompanying notes are an integral part of these financial statements.
| | | | | | |
| Financial highlights | | Wells Fargo Advantage Equity Gateway Funds | | | 45 | |
| | | | | | | | | | | | | | | | | | | | | | | | | | | | | | |
Distributions
from
tax basis
return
of capital | | | Ending
net asset
value
per
share | | | Ratio to average net assets (annualized) | | | Total
return2 | | | Portfolio
turnover
rate3 | | | Net assets at
end of period
(000s omitted) | |
| | | Net investment
income (loss)1 | | | Gross
expenses1 | | | Net
expenses1 | | | | |
| | | | | | | | |
| | | | | | | | | | | | | | | | | | | | | | | | | | | | | | | |
| | | | | | | | | | | | | | | | | | | | | | | | | | | | | | |
| | 0.00 | | | $ | 18.12 | | | | (1.02 | )% | | | 1.23 | % | | | 1.20 | % | | | 26.89 | % | | | 33 | % | | $ | 233,875 | |
| | 0.00 | | | $ | 14.28 | | | | (0.87 | )% | | | 1.23 | % | | | 1.20 | % | | | 20.19 | % | | | 65 | % | | $ | 200,140 | |
| | 0.00 | | | $ | 12.56 | | | | (0.95 | )% | | | 1.22 | % | | | 1.19 | % | | | (4.99 | )% | | | 75 | % | | $ | 185,744 | |
| | 0.00 | | | $ | 13.22 | | | | (1.08 | )% | | | 2.41 | % | | | 1.20 | % | | | 38.28 | % | | | 59 | % | | $ | 1,915 | |
| | 0.00 | | | $ | 9.56 | | | | (0.78 | )% | | | 4.54 | % | | | 1.20 | % | | | 19.95 | % | | | 97 | % | | $ | 51 | |
| | 0.00 | | | $ | 8.08 | | | | (0.79 | )% | | | 6.89 | % | | | 1.20 | % | | | (5.28 | )% | | | 147 | % | | $ | 17 | |
| | (0.04 | ) | | $ | 8.53 | | | | (0.76 | )% | | | 3.87 | % | | | 1.20 | % | | | (30.63 | )% | | | 191 | % | | $ | 59 | |
| | | | | | | | | | | | | | | | | | | | | | | | | | | | | | |
| | 0.00 | | | $ | 18.42 | | | | (0.72 | )% | | | 0.97 | % | | | 0.90 | % | | | 27.12 | % | | | 33 | % | | $ | 706,318 | |
| | 0.00 | | | $ | 14.49 | | | | (0.57 | )% | | | 0.97 | % | | | 0.90 | % | | | 20.52 | % | | | 65 | % | | $ | 578,841 | |
| | 0.00 | | | $ | 12.70 | | | | (0.67 | )% | | | 0.98 | % | | | 0.90 | % | | | (4.73 | )% | | | 75 | % | | $ | 526,865 | |
| | 0.00 | | | $ | 13.33 | | | | (0.82 | )% | | | 1.98 | % | | | 0.95 | % | | | 38.57 | % | | | 59 | % | | $ | 8,170 | |
| | 0.00 | | | $ | 9.62 | | | | (0.67 | )% | | | 4.32 | % | | | 0.95 | % | | | 20.40 | % | | | 97 | % | | $ | 10 | |
| | 0.00 | | | $ | 8.00 | | | | (0.58 | )% | | | 6.74 | % | | | 0.95 | % | | | (6.33 | )% | | | 147 | % | | $ | 8 | |
| | 0.00 | | | $ | 8.53 | | | | (0.56 | )% | | | 3.64 | % | | | 0.95 | % | | | (9.54 | )% | | | 191 | % | | $ | 9 | |
| | | | | | | | | | | | | | | | | | | | | | | | | | | | | | |
| | 0.00 | | | $ | 17.80 | | | | (1.25 | )% | | | 1.46 | % | | | 1.43 | % | | | 26.78 | % | | | 33 | % | | $ | 47,629 | |
| | 0.00 | | | $ | 14.04 | | | | (1.10 | )% | | | 1.46 | % | | | 1.43 | % | | | 19.89 | % | | | 65 | % | | $ | 37,812 | |
| | 0.00 | | | $ | 12.39 | | | | (1.21 | )% | | | 1.52 | % | | | 1.45 | % | | | (5.20 | )% | | | 75 | % | | $ | 36,715 | |
| | 0.00 | | | $ | 13.07 | | | | (1.35 | )% | | | 3.20 | % | | | 1.49 | % | | | 38.01 | % | | | 59 | % | | $ | 15,626 | |
| | 0.00 | | | $ | 9.47 | | | | (1.22 | )% | | | 4.85 | % | | | 1.50 | % | | | 19.72 | % | | | 97 | % | | $ | 3,705 | |
| | 0.00 | | | $ | 7.91 | | | | (1.11 | )% | | | 7.23 | % | | | 1.49 | % | | | (6.83 | )% | | | 147 | % | | $ | 2,862 | |
| | (0.04 | ) | | $ | 8.49 | | | | (1.05 | )% | | | 3.92 | % | | | 1.49 | % | | | (30.84 | )% | | | 191 | % | | $ | 3,665 | |
| | | | | | | |
| | | | | | | | | | | | | | | | | | | | | | | | | | | | | | | |
| | | | | | | | | | | | | | | | | | | | | | | | | | | | | | |
| | 0.00 | | | $ | 60.26 | | | | 1.55 | % | | | 0.67 | % | | | 0.56 | % | | | 11.59 | % | | | 3 | % | | $ | 439,475 | |
| | 0.00 | | | $ | 54.00 | | | | 1.72 | % | | | 0.67 | % | | | 0.56 | % | | | 26.63 | % | | | 4 | % | | $ | 407,533 | |
| | 0.00 | | | $ | 44.25 | | | | 1.63 | % | | | 0.68 | % | | | 0.56 | % | | | (0.95 | )% | | | 9 | % | | $ | 347,412 | |
| | 0.00 | | | $ | 47.17 | | | | 1.53 | % | | | 0.67 | % | | | 0.56 | % | | | 23.66 | % | | | 3 | % | | $ | 388,113 | |
| | 0.00 | | | $ | 40.42 | | | | 1.49 | % | | | 1.00 | % | | | 0.60 | % | | | 13.29 | % | | | 7 | % | | $ | 358,953 | |
| | 0.00 | | | $ | 41.72 | | | | 2.22 | % | | | 1.05 | % | | | 0.52 | % | | | (20.30 | )% | | | 6 | % | | $ | 172,687 | |
| | 0.00 | | | $ | 56.53 | | | | 1.64 | % | | | 0.90 | % | | | 0.50 | % | | | (11.60 | )% | | | 7 | % | | $ | 262,336 | |
| | | | | | | | | | | | | | | | | | | | | | | | | | | | | | |
| | 0.00 | | | $ | 60.67 | | | | 0.79 | % | | | 1.42 | % | | | 1.31 | % | | | 11.18 | % | | | 3 | % | | $ | 4,459 | |
| | 0.00 | | | $ | 54.57 | | | | 0.95 | % | | | 1.42 | % | | | 1.31 | % | | | 25.66 | % | | | 4 | % | | $ | 5,453 | |
| | 0.00 | | | $ | 44.53 | | | | 0.85 | % | | | 1.43 | % | | | 1.31 | % | | | (1.68 | )% | | | 9 | % | | $ | 8,869 | |
| | 0.00 | | | $ | 47.23 | | | | 0.78 | % | | | 1.42 | % | | | 1.31 | % | | | 22.90 | % | | | 3 | % | | $ | 19,894 | |
| | 0.00 | | | $ | 40.32 | | | | 0.69 | % | | | 1.76 | % | | | 1.35 | % | | | 12.44 | % | | | 7 | % | | $ | 26,295 | |
| | 0.00 | | | $ | 41.63 | | | | 1.51 | % | | | 1.79 | % | | | 1.26 | % | | | (20.91 | )% | | | 6 | % | | $ | 28,008 | |
| | 0.00 | | | $ | 56.42 | | | | 0.89 | % | | | 1.66 | % | | | 1.26 | % | | | (12.26 | )% | | | 7 | % | | $ | 68,025 | |
| | | | | | | | | | | | | | | | | | | | | | | | | | | | | | |
| | 0.00 | | | $ | 60.29 | | | | 0.80 | % | | | 1.42 | % | | | 1.31 | % | | | 11.20 | % | | | 3 | % | | $ | 77,252 | |
| | 0.00 | | | $ | 54.22 | | | | 0.97 | % | | | 1.42 | % | | | 1.31 | % | | | 25.67 | % | | | 4 | % | | $ | 70,322 | |
| | 0.00 | | | $ | 44.41 | | | | 0.87 | % | | | 1.43 | % | | | 1.31 | % | | | (1.67 | )% | | | 9 | % | | $ | 65,245 | |
| | 0.00 | | | $ | 47.27 | | | | 0.78 | % | | | 1.42 | % | | | 1.31 | % | | | 22.89 | % | | | 3 | % | | $ | 80,981 | |
| | 0.00 | | | $ | 40.32 | | | | 0.68 | % | | | 1.76 | % | | | 1.35 | % | | | 12.44 | % | | | 7 | % | | $ | 81,848 | |
| | 0.00 | | | $ | 41.62 | | | | 1.48 | % | | | 1.80 | % | | | 1.27 | % | | | (20.91 | )% | | | 6 | % | | $ | 89,159 | |
| | 0.00 | | | $ | 56.36 | | | | 0.89 | % | | | 1.65 | % | | | 1.25 | % | | | (12.25 | )% | | | 7 | % | | $ | 137,044 | |
Please see footnotes on page 50.
The accompanying notes are an integral part of these financial statements.
| | | | |
| 46 | | Wells Fargo Advantage Equity Gateway Funds | | Financial highlights |
| | | | | | | | | | | | | | | | | | | | |
| | | Beginning
net asset
value per
share | | | Net
investment
income1 | | | Net realized
and unrealized
gains (losses)
on investments | | | Distributions
from net
investment
income | | | Distributions
from net
realized gains | |
| | | | | |
Index Fund (continued) | | | | | | | | | | | | | | | | | | | | |
Administrator Class | | | | | | | | | | | | | | | | | | | | |
June 1, 2013 to November 30, 2013 (unaudited) | | $ | 54.34 | | | | 0.54 | | | | 5.86 | | | | 0.00 | | | | 0.00 | |
June 1, 2012 to May 31, 2013 | | $ | 44.52 | | | | 1.02 | | | | 10.71 | | | | (0.97 | ) | | | (0.94 | ) |
June 1, 2011 to May 31, 2012 | | $ | 47.45 | | | | 0.83 | | | | (1.32 | ) | | | (0.79 | ) | | | (1.65 | ) |
August 1, 2010 to May 31, 20119 | | $ | 40.56 | | | | 0.67 | | | | 8.82 | | | | (0.72 | ) | | | (1.88 | ) |
August 1, 2009 to July 31, 201010 | | $ | 41.88 | | | | 0.87 | 5 | | | 4.76 | | | | (0.75 | ) | | | (6.20 | ) |
August 1, 2008 to July 31, 200910 | | $ | 56.88 | | | | 1.02 | 5 | | | (12.90 | ) | | | (1.11 | ) | | | (2.01 | ) |
August 1, 2007 to July 31, 200810 | | $ | 65.42 | | | | 1.20 | 5 | | | (8.54 | ) | | | (1.20 | ) | | | 0.00 | |
Investor Class | | | | | | | | | | | | | | | | | | | | |
June 1, 2013 to November 30, 2013 (unaudited) | | $ | 54.16 | | | | 0.45 | | | | 5.86 | | | | 0.00 | | | | 0.00 | |
June 1, 2012 to May 31, 2013 | | $ | 44.38 | | | | 0.90 | | | | 10.70 | | | | (0.88 | ) | | | (0.94 | ) |
June 1, 2011 to May 31, 2012 | | $ | 47.30 | | | | 0.77 | | | | (1.33 | ) | | | (0.71 | ) | | | (1.65 | ) |
August 1, 2010 to May 31, 20119 | | $ | 40.48 | | | | 0.60 | | | | 8.80 | | | | (0.70 | ) | | | (1.88 | ) |
July 16, 20108,11 to July 31, 2010 | | $ | 39.19 | | | | 0.03 | | | | 1.26 | | | | 0.00 | | | | 0.00 | |
| | | | | |
International Value Fund | | | | | | | | | | | | | | | | | | | | |
Class A | | | | | | | | | | | | | | | | | | | | |
June 1, 2013 to November 30, 2013 (unaudited) | | $ | 13.40 | | | | 0.08 | | | | 1.58 | | | | 0.00 | | | | 0.00 | |
June 1, 2012 to May 31, 2013 | | $ | 10.64 | | | | 0.31 | | | | 2.71 | | | | (0.26 | ) | | | 0.00 | |
June 1, 2011 to May 31, 2012 | | $ | 14.03 | | | | 0.34 | | | | (3.36 | ) | | | (0.37 | ) | | | 0.00 | |
October 1, 2010 to May 31, 20114 | | $ | 12.58 | | | | 0.22 | 5 | | | 1.46 | | | | (0.23 | ) | | | 0.00 | |
October 1, 2009 to September 30, 2010 | | $ | 12.67 | | | | 0.23 | 5 | | | (0.17 | ) | | | (0.15 | ) | | | 0.00 | |
October 1, 2008 to September 30, 2009 | | $ | 12.66 | | | | 0.23 | 5 | | | 0.22 | | | | (0.44 | ) | | | 0.00 | |
October 1, 2007 to September 30, 2008 | | $ | 20.21 | | | | 0.51 | 5 | | | (7.24 | ) | | | (0.36 | ) | | | (0.46 | ) |
Class B | | | | | | | | | | | | | | | | | | | | |
June 1, 2013 to November 30, 2013 (unaudited) | | $ | 13.43 | | | | 0.02 | 5 | | | 1.58 | | | | 0.00 | | | | 0.00 | |
June 1, 2012 to May 31, 2013 | | $ | 10.60 | | | | 0.17 | 5 | | | 2.76 | | | | (0.10 | ) | | | 0.00 | |
June 1, 2011 to May 31, 2012 | | $ | 13.94 | | | | 0.21 | 5 | | | (3.29 | ) | | | (0.26 | ) | | | 0.00 | |
October 1, 2010 to May 31, 20114 | | $ | 12.42 | | | | 0.11 | 5 | | | 1.49 | | | | (0.08 | ) | | | 0.00 | |
October 1, 2009 to September 30, 2010 | | $ | 12.57 | | | | 0.12 | 5 | | | (0.14 | ) | | | (0.13 | ) | | | 0.00 | |
October 1, 2008 to September 30, 2009 | | $ | 12.42 | | | | 0.14 | 5 | | | 0.25 | | | | (0.24 | ) | | | 0.00 | |
October 1, 2007 to September 30, 2008 | | $ | 19.82 | | | | 0.38 | 5 | | | (7.11 | ) | | | (0.21 | ) | | | (0.46 | ) |
Class C | | | | | | | | | | | | | | | | | | | | |
June 1, 2013 to November 30, 2013 (unaudited) | | $ | 13.18 | | | | 0.02 | 5 | | | 1.55 | | | | 0.00 | | | | 0.00 | |
June 1, 2012 to May 31, 2013 | | $ | 10.47 | | | | 0.19 | | | | 2.70 | | | | (0.18 | ) | | | 0.00 | |
June 1, 2011 to May 31, 2012 | | $ | 13.79 | | | | 0.23 | 5 | | | (3.28 | ) | | | (0.27 | ) | | | 0.00 | |
October 1, 2010 to May 31, 20114 | | $ | 12.33 | | | | 0.15 | 5 | | | 1.44 | | | | (0.13 | ) | | | 0.00 | |
October 1, 2009 to September 30, 2010 | | $ | 12.51 | | | | 0.15 | | | | (0.18 | ) | | | (0.15 | ) | | | 0.00 | |
October 1, 2008 to September 30, 2009 | | $ | 12.44 | | | | 0.15 | 5 | | | 0.23 | | | | (0.31 | ) | | | 0.00 | |
October 1, 2007 to September 30, 2008 | | $ | 19.90 | | | | 0.38 | 5 | | | (7.13 | ) | | | (0.25 | ) | | | (0.46 | ) |
Administrator Class | | | | | | | | | | | | | | | | | | | | |
June 1, 2013 to November 30, 2013 (unaudited) | | $ | 13.31 | | | | 0.09 | | | | 1.58 | | | | 0.00 | | | | 0.00 | |
June 1, 2012 to May 31, 2013 | | $ | 10.57 | | | | 0.33 | 5 | | | 2.70 | | | | (0.29 | ) | | | 0.00 | |
June 1, 2011 to May 31, 2012 | | $ | 13.95 | | | | 0.35 | | | | (3.33 | ) | | | (0.40 | ) | | | 0.00 | |
October 1, 2010 to May 31, 20114 | | $ | 12.52 | | | | 0.24 | 5 | | | 1.46 | | | | (0.27 | ) | | | 0.00 | |
October 1, 2009 to September 30, 2010 | | $ | 12.68 | | | | 0.25 | | | | (0.15 | ) | | | (0.26 | ) | | | 0.00 | |
October 1, 2008 to September 30, 2009 | | $ | 12.69 | | | | 0.25 | 5 | | | 0.20 | | | | (0.46 | ) | | | 0.00 | |
October 1, 2007 to September 30, 2008 | | $ | 20.23 | | | | 0.58 | 5 | | | (7.27 | ) | | | (0.39 | ) | | | (0.46 | ) |
Please see footnotes on page 50.
The accompanying notes are an integral part of these financial statements.
| | | | | | |
| Financial highlights | | Wells Fargo Advantage Equity Gateway Funds | | | 47 | |
| | | | | | | | | | | | | | | | | | | | | | | | | | |
Ending
net asset
value
per
share | | | Ratio to average net assets (annualized) | | | Total
return2 | | | Portfolio
turnover
rate3 | | | Net assets at
end of period
(000s omitted) | |
| | Net investment
income1 | | | Gross
expenses1 | | | Net
expenses1 | | | | |
| | | | | | | |
| | | | | | | | | | | | | | | | | | | | | | | | | | | |
| | | | | | | | | | | | | | | | | | | | | | | | | | |
| $ | 60.74 | | | | 1.86 | % | | | 0.36 | % | | | 0.25 | % | | | 11.78 | % | | | 3 | % | | $ | 2,003,000 | |
| $ | 54.34 | | | | 2.03 | % | | | 0.36 | % | | | 0.25 | % | | | 27.02 | % | | | 4 | % | | $ | 1,832,524 | |
| $ | 44.52 | | | | 1.94 | % | | | 0.37 | % | | | 0.25 | % | | | (0.63 | )% | | | 9 | % | | $ | 1,682,905 | |
| $ | 47.45 | | | | 1.84 | % | | | 0.37 | % | | | 0.25 | % | | | 23.98 | % | | | 3 | % | | $ | 1,709,455 | |
| $ | 40.56 | | | | 1.94 | % | | | 0.63 | % | | | 0.31 | % | | | 13.55 | % | | | 7 | % | | $ | 1,404,098 | |
| $ | 41.88 | | | | 2.49 | % | | | 0.80 | % | | | 0.27 | % | | | (20.09 | )% | | | 6 | % | | $ | 115,745 | |
| $ | 56.88 | | | | 1.89 | % | | | 0.65 | % | | | 0.25 | % | | | (11.37 | )% | | | 7 | % | | $ | 212,661 | |
| | | | | | | | | | | | | | | | | | | | | | | | | | |
| $ | 60.47 | | | | 1.66 | % | | | 0.73 | % | | | 0.45 | % | | | 11.65 | % | | | 3 | % | | $ | 172,792 | |
| $ | 54.16 | | | | 1.83 | % | | | 0.73 | % | | | 0.45 | % | | | 26.77 | % | | | 4 | % | | $ | 149,637 | |
| $ | 44.38 | | | | 1.74 | % | | | 0.75 | % | | | 0.45 | % | | | (0.82 | )% | | | 9 | % | | $ | 118,982 | |
| $ | 47.30 | | | | 1.64 | % | | | 0.74 | % | | | 0.45 | % | | | 23.78 | % | | | 3 | % | | $ | 131,141 | |
| $ | 40.48 | | | | 2.13 | % | | | 0.79 | % | | | 0.45 | % | | | 3.29 | % | | | 7 | % | | $ | 111,126 | |
| | | | | | |
| | | | | | | | | | | | | | | | | | | | | | | | | | | |
| | | | | | | | | | | | | | | | | | | | | | | | | | |
| $ | 15.06 | | | | 1.04 | % | | | 1.51 | % | | | 1.50 | % | | | 12.39 | % | | | 6 | % | | $ | 6,521 | |
| $ | 13.40 | | | | 2.35 | % | | | 1.51 | % | | | 1.50 | % | | | 28.58 | % | | | 16 | % | | $ | 5,922 | |
| $ | 10.64 | | | | 2.81 | % | | | 1.46 | % | | | 1.46 | % | | | (21.53 | )% | | | 9 | % | | $ | 4,742 | |
| $ | 14.03 | | | | 2.41 | % | | | 1.55 | % | | | 1.47 | % | | | 13.55 | % | | | 16 | % | | $ | 6,213 | |
| $ | 12.58 | | | | 1.92 | % | | | 1.69 | % | | | 1.46 | % | | | 0.52 | % | | | 27 | % | | $ | 6,792 | |
| $ | 12.67 | | | | 2.28 | % | | | 1.68 | % | | | 1.50 | % | | | 4.82 | % | | | 41 | % | | $ | 8,769 | |
| $ | 12.66 | | | | 3.04 | % | | | 1.74 | % | | | 1.50 | % | | | (34.48 | )% | | | 23 | % | | $ | 16,903 | |
| | | | | | | | | | | | | | | | | | | | | | | | | | |
| $ | 15.03 | | | | 0.30 | % | | | 2.26 | % | | | 2.25 | % | | | 11.91 | % | | | 6 | % | | $ | 66 | |
| $ | 13.43 | | | | 1.34 | % | | | 2.26 | % | | | 2.25 | % | | | 27.69 | % | | | 16 | % | | $ | 70 | |
| $ | 10.60 | | | | 1.79 | % | | | 2.21 | % | | | 2.21 | % | | | (22.15 | )% | | | 9 | % | | $ | 110 | |
| $ | 13.94 | | | | 1.28 | % | | | 2.32 | % | | | 2.22 | % | | | 12.97 | % | | | 16 | % | | $ | 194 | |
| $ | 12.42 | | | | 0.99 | % | | | 2.44 | % | | | 2.21 | % | | | (0.16 | )% | | | 27 | % | | $ | 339 | |
| $ | 12.57 | | | | 1.39 | % | | | 2.44 | % | | | 2.25 | % | | | 3.82 | % | | | 41 | % | | $ | 581 | |
| $ | 12.42 | | | | 2.24 | % | | | 2.49 | % | | | 2.25 | % | | | (34.97 | )% | | | 23 | % | | $ | 951 | |
| | | | | | | | | | | | | | | | | | | | | | | | | | |
| $ | 14.75 | | | | 0.29 | % | | | 2.26 | % | | | 2.25 | % | | | 11.91 | % | | | 6 | % | | $ | 827 | |
| $ | 13.18 | | | | 1.67 | % | | | 2.26 | % | | | 2.25 | % | | | 27.67 | % | | | 16 | % | | $ | 595 | |
| $ | 10.47 | | | | 1.96 | % | | | 2.21 | % | | | 2.21 | % | �� | | (22.14 | )% | | | 9 | % | | $ | 441 | |
| $ | 13.79 | | | | 1.75 | % | | | 2.30 | % | | | 2.22 | % | | | 13.00 | % | | | 16 | % | | $ | 665 | |
| $ | 12.33 | | | | 1.11 | % | | | 2.45 | % | | | 2.21 | % | | | (0.21 | )% | | | 27 | % | | $ | 665 | |
| $ | 12.51 | | | | 1.56 | % | | | 2.43 | % | | | 2.25 | % | | | 3.90 | % | | | 41 | % | | $ | 791 | |
| $ | 12.44 | | | | 2.29 | % | | | 2.46 | % | | | 2.25 | % | | | (34.99 | )% | | | 23 | % | | $ | 799 | |
| | | | | | | | | | | | | | | | | | | | | | | | | | |
| $ | 14.98 | | | | 1.28 | % | | | 1.34 | % | | | 1.25 | % | | | 12.55 | % | | | 6 | % | | $ | 423,137 | |
| $ | 13.31 | | | | 2.67 | % | | | 1.34 | % | | | 1.25 | % | | | 28.90 | % | | | 16 | % | | $ | 372,187 | |
| $ | 10.57 | | | | 3.04 | % | | | 1.29 | % | | | 1.25 | % | | | (21.37 | )% | | | 9 | % | | $ | 259,969 | |
| $ | 13.95 | | | | 2.84 | % | | | 1.38 | % | | | 1.25 | % | | | 13.73 | % | | | 16 | % | | $ | 313,423 | |
| $ | 12.52 | | | | 2.26 | % | | | 1.53 | % | | | 1.21 | % | | | 0.80 | % | | | 27 | % | | $ | 259,768 | |
| $ | 12.68 | | | | 2.50 | % | | | 1.50 | % | | | 1.25 | % | | | 4.89 | % | | | 41 | % | | $ | 231,537 | |
| $ | 12.69 | | | | 3.50 | % | | | 1.56 | % | | | 1.25 | % | | | (34.30 | )% | | | 23 | % | | $ | 206,603 | |
Please see footnotes on page 50.
The accompanying notes are an integral part of these financial statements.
| | | | |
| 48 | | Wells Fargo Advantage Equity Gateway Funds | | Financial highlights |
| | | | | | | | | | | | | | | | | | | | |
| | | Beginning
net asset
value per
share | | | Net
investment
income (loss)1 | | | Net realized
and unrealized
gains (losses)
on investments | | | Distributions
from net
investment
income | | | Distributions
from net
realized gains | |
| | | | | |
International Value Fund (continued) | | | | | | | | | | | | | | | | | | | | |
Institutional Class | | | | | | | | | | | | | | | | | | | | |
June 1, 2013 to November 30, 2013 (unaudited) | | $ | 13.34 | | | | 0.10 | | | | 1.58 | | | | 0.00 | | | | 0.00 | |
June 1, 2012 to May 31, 2013 | | $ | 10.58 | | | | 0.35 | | | | 2.73 | | | | (0.32 | ) | | | 0.00 | |
June 1, 2011 to May 31, 2012 | | $ | 13.98 | | | | 0.36 | | | | (3.33 | ) | | | (0.43 | ) | | | 0.00 | |
October 1, 2010 to May 31, 20114 | | $ | 12.58 | | | | 0.28 | | | | 1.44 | | | | (0.32 | ) | | | 0.00 | |
October 1, 2009 to September 30, 2010 | | $ | 12.71 | | | | 0.32 | | | | (0.20 | ) | | | (0.25 | ) | | | 0.00 | |
October 1, 2008 to September 30, 2009 | | $ | 12.72 | | | | 0.28 | 5 | | | 0.20 | | | | (0.49 | ) | | | 0.00 | |
October 1, 2007 to September 30, 2008 | | $ | 20.28 | | | | 0.62 | 5 | | | (7.31 | ) | | | (0.41 | ) | | | (0.46 | ) |
| | | | | |
Small Company Growth Fund | | | | | | | | | | | | | | | | | | | | |
Class A | | | | | | | | | | | | | | | | | | | | |
June 1, 2013 to November 30, 2013 (unaudited) | | $ | 34.23 | | | | (0.19 | )5 | | | 7.09 | | | | 0.00 | | | | 0.00 | |
June 1, 2012 to May 31, 2013 | | $ | 26.21 | | | | (0.15 | ) | | | 8.17 | | | | 0.00 | | | | 0.00 | |
June 1, 2011 to May 31, 2012 | | $ | 29.53 | | | | (0.18 | )5 | | | (3.14 | ) | | | 0.00 | | | | 0.00 | |
October 1, 2010 to May 31, 20114 | | $ | 21.23 | | | | (0.15 | ) | | | 8.45 | | | | 0.00 | | | | 0.00 | |
October 1, 2009 to September 30, 2010 | | $ | 18.56 | | | | (0.21 | )5 | | | 2.88 | | | | 0.00 | | | | 0.00 | |
October 1, 2008 to September 30, 2009 | | $ | 18.38 | | | | (0.17 | )5 | | | 0.35 | | | | 0.00 | | | | 0.00 | |
October 1, 2007 to September 30, 2008 | | $ | 30.20 | | | | (0.24 | )5 | | | (7.24 | ) | | | 0.00 | | | | (4.17 | ) |
Class B | | | | | | | | | | | | | | | | | | | | |
June 1, 2013 to November 30, 2013 (unaudited) | | $ | 31.55 | | | | (0.30 | )5 | | | 6.53 | | | | 0.00 | | | | 0.00 | |
June 1, 2012 to May 31, 2013 | | $ | 24.35 | | | | (0.36 | )5 | | | 7.56 | | | | 0.00 | | | | 0.00 | |
June 1, 2011 to May 31, 2012 | | $ | 27.63 | | | | (0.37 | )5 | | | (2.91 | ) | | | 0.00 | | | | 0.00 | |
October 1, 2010 to May 31, 20114 | | $ | 19.97 | | | | (0.29 | )5 | | | 7.95 | | | | 0.00 | | | | 0.00 | |
October 1, 2009 to September 30, 2010 | | $ | 17.58 | | | | (0.34 | )5 | | | 2.73 | | | | 0.00 | | | | 0.00 | |
October 1, 2008 to September 30, 2009 | | $ | 17.55 | | | | (0.25 | )5 | | | 0.28 | | | | 0.00 | | | | 0.00 | |
October 1, 2007 to September 30, 2008 | | $ | 29.24 | | | | (0.40 | )5 | | | (6.95 | ) | | | 0.00 | | | | (4.17 | ) |
Class C | | | | | | | | | | | | | | | | | | | | |
June 1, 2013 to November 30, 2013 (unaudited) | | $ | 31.91 | | | | (0.30 | )5 | | | 6.60 | | | | 0.00 | | | | 0.00 | |
June 1, 2012 to May 31, 2013 | | $ | 24.62 | | | | (0.37 | )5 | | | 7.66 | | | | 0.00 | | | | 0.00 | |
June 1, 2011 to May 31, 2012 | | $ | 27.95 | | | | (0.36 | )5 | | | (2.97 | ) | | | 0.00 | | | | 0.00 | |
October 1, 2010 to May 31, 20114 | | $ | 20.19 | | | | (0.30 | )5 | | | 8.06 | | | | 0.00 | | | | 0.00 | |
October 1, 2009 to September 30, 2010 | | $ | 17.77 | | | | (0.34 | )5 | | | 2.76 | | | | 0.00 | | | | 0.00 | |
October 1, 2008 to September 30, 2009 | | $ | 17.73 | | | | (0.26 | )5 | | | 0.30 | | | | 0.00 | | | | 0.00 | |
October 1, 2007 to September 30, 2008 | | $ | 29.49 | | | | (0.39 | )5 | | | (7.03 | ) | | | 0.00 | | | | (4.17 | ) |
Administrator Class | | | | | | | | | | | | | | | | | | | | |
June 1, 2013 to November 30, 2013 (unaudited) | | $ | 35.13 | | | | (0.14 | )5 | | | 7.27 | | | | 0.00 | | | | 0.00 | |
June 1, 2012 to May 31, 2013 | | $ | 26.90 | | | | (0.09 | )5 | | | 8.38 | | | | (0.06 | ) | | | 0.00 | |
June 1, 2011 to May 31, 2012 | | $ | 30.22 | | | | (0.13 | )5 | | | (3.19 | ) | | | 0.00 | | | | 0.00 | |
October 1, 2010 to May 31, 20114 | | $ | 21.70 | | | | (0.14 | )5 | | | 8.66 | | | | 0.00 | | | | 0.00 | |
October 1, 2009 to September 30, 2010 | | $ | 18.90 | | | | (0.16 | )5 | | | 2.96 | | | | 0.00 | | | | 0.00 | |
October 1, 2008 to September 30, 2009 | | $ | 18.68 | | | | (0.12 | )5 | | | 0.34 | | | | 0.00 | | | | 0.00 | |
October 1, 2007 to September 30, 2008 | | $ | 30.54 | | | | (0.19 | )5 | | | (7.33 | ) | | | 0.00 | | | | (4.17 | ) |
Institutional Class | | | | | | | | | | | | | | | | | | | | |
June 1, 2013 to November 30, 2013 (unaudited) | | $ | 35.46 | | | | (0.09 | )5 | | | 7.34 | | | | 0.00 | | | | 0.00 | |
June 1, 2012 to May 31, 2013 | | $ | 27.15 | | | | (0.06 | )5 | | | 8.51 | | | | (0.14 | ) | | | 0.00 | |
June 1, 2011 to May 31, 2012 | | $ | 30.44 | | | | (0.07 | )5 | | | (3.22 | ) | | | 0.00 | | | | 0.00 | |
October 1, 2010 to May 31, 20114 | | $ | 21.81 | | | | (0.12 | )5 | | | 8.75 | | | | 0.00 | | | | 0.00 | |
October 1, 2009 to September 30, 2010 | | $ | 18.94 | | | | (0.05 | )5 | | | 2.92 | | | | 0.00 | | | | 0.00 | |
October 1, 2008 to September 30, 2009 | | $ | 18.70 | | | | (0.08 | )5 | | | 0.32 | | | | 0.00 | | | | 0.00 | |
March 31, 20088 to September 30, 2008 | | $ | 20.18 | | | | (0.05 | )5 | | | (1.43 | ) | | | 0.00 | | | | 0.00 | |
Please see footnotes on page 50.
The accompanying notes are an integral part of these financial statements.
| | | | | | |
| Financial highlights | | Wells Fargo Advantage Equity Gateway Funds | | | 49 | |
| | | | | | | | | | | | | | | | | | | | | | | | | | | | | | |
Distributions
from
tax basis
return
of capital | | | Ending
net asset
value
per
share | | | Ratio to average net assets (annualized) | | | Total
return2 | | | Portfolio
turnover
rate3 | | | Net assets at
end of period
(000s omitted) | |
| | | Net investment
income (loss)1 | | | Gross
expenses1 | | | Net
expenses1 | | | | |
| | | | | | | | |
| | | | | | | | | | | | | | | | | | | | | | | | | | | | | | | |
| | | | | | | | | | | | | | | | | | | | | | | | | | | | | | |
| | 0.00 | | | $ | 15.02 | | | | 1.48 | % | | | 1.08 | % | | | 1.05 | % | | | 12.68 | % | | | 6 | % | | $ | 2,320 | |
| | 0.00 | | | $ | 13.34 | | | | 2.81 | % | | | 1.08 | % | | | 1.05 | % | | | 29.20 | % | | | 16 | % | | $ | 1,941 | |
| | 0.00 | | | $ | 10.58 | | | | 3.20 | % | | | 1.03 | % | | | 1.03 | % | | | (21.26 | )% | | | 9 | % | | $ | 1,505 | |
| | 0.00 | | | $ | 13.98 | | | | 3.04 | % | | | 1.11 | % | | | 1.03 | % | | | 13.92 | % | | | 16 | % | | $ | 1,797 | |
| | 0.00 | | | $ | 12.58 | | | | 2.51 | % | | | 1.08 | % | | | 1.01 | % | | | 1.01 | % | | | 27 | % | | $ | 1,518 | |
| | 0.00 | | | $ | 12.71 | | | | 2.79 | % | | | 1.23 | % | | | 1.05 | % | | | 5.15 | % | | | 41 | % | | $ | 1,766 | |
| | 0.00 | | | $ | 12.72 | | | | 3.83 | % | | | 1.29 | % | | | 1.05 | % | | | (34.22 | )% | | | 23 | % | | $ | 786 | |
| | | | | | | |
| | | | | | | | | | | | | | | | | | | | | | | | | | | | | | | |
| | | | | | | | | | | | | | | | | | | | | | | | | | | | | | |
| | 0.00 | | | $ | 41.13 | | | | (0.98 | )% | | | 1.46 | % | | | 1.43 | % | | | 20.16 | % | | | 51 | % | | $ | 22,612 | |
| | 0.00 | | | $ | 34.23 | | | | (0.58 | )% | | | 1.53 | % | | | 1.45 | % | | | 30.55 | % | | | 109 | % | | $ | 9,357 | |
| | 0.00 | | | $ | 26.21 | | | | (0.70 | )% | | | 1.46 | % | | | 1.44 | % | | | (11.18 | )% | | | 107 | % | | $ | 6,450 | |
| | 0.00 | | | $ | 29.53 | | | | (1.04 | )% | | | 1.45 | % | | | 1.44 | % | | | 39.11 | % | | | 70 | % | | $ | 7,201 | |
| | 0.00 | | | $ | 21.23 | | | | (1.05 | )% | | | 1.50 | % | | | 1.45 | % | | | 14.39 | % | | | 129 | % | | $ | 4,042 | |
| | 0.00 | | | $ | 18.56 | | | | (1.13 | )% | | | 1.54 | % | | | 1.44 | % | | | 0.92 | % | | | 169 | % | | $ | 2,408 | |
| | (0.17 | ) | | $ | 18.38 | | | | (1.09 | )% | | | 1.53 | % | | | 1.45 | % | | | (27.91 | )% | | | 150 | % | | $ | 2,109 | |
| | | | | | | | | | | | | | | | | | | | | | | | | | | | | | |
| | 0.00 | | | $ | 37.78 | | | | (1.72 | )% | | | 2.21 | % | | | 2.18 | % | | | 19.75 | % | | | 51 | % | | $ | 204 | |
| | 0.00 | | | $ | 31.55 | | | | (1.33 | )% | | | 2.28 | % | | | 2.20 | % | | | 29.57 | % | | | 109 | % | | $ | 164 | |
| | 0.00 | | | $ | 24.35 | | | | (1.48 | )% | | | 2.21 | % | | | 2.19 | % | | | (11.87 | )% | | | 107 | % | | $ | 193 | |
| | 0.00 | | | $ | 27.63 | | | | (1.78 | )% | | | 2.19 | % | | | 2.19 | % | | | 38.43 | % | | | 70 | % | | $ | 380 | |
| | 0.00 | | | $ | 19.97 | | | | (1.83 | )% | | | 2.24 | % | | | 2.20 | % | | | 13.54 | % | | | 129 | % | | $ | 251 | |
| | 0.00 | | | $ | 17.58 | | | | (1.85 | )% | | | 2.29 | % | | | 2.19 | % | | | 0.17 | % | | | 169 | % | | $ | 312 | |
| | (0.17 | ) | | $ | 17.55 | | | | (1.85 | )% | | | 2.28 | % | | | 2.20 | % | | | (28.45 | )% | | | 150 | % | | $ | 344 | |
| | | | | | | | | | | | | | | | | | | | | | | | | | | | | | |
| | 0.00 | | | $ | 38.21 | | | | (1.73 | )% | | | 2.21 | % | | | 2.18 | % | | | 19.74 | % | | | 51 | % | | $ | 4,843 | |
| | 0.00 | | | $ | 31.91 | | | | (1.31 | )% | | | 2.28 | % | | | 2.20 | % | | | 29.56 | % | | | 109 | % | | $ | 2,406 | |
| | 0.00 | | | $ | 24.62 | | | | (1.45 | )% | | | 2.22 | % | | | 2.19 | % | | | (11.85 | )% | | | 107 | % | | $ | 1,628 | |
| | 0.00 | | | $ | 27.95 | | | | (1.80 | )% | | | 2.20 | % | | | 2.19 | % | | | 38.39 | % | | | 70 | % | | $ | 1,736 | |
| | 0.00 | | | $ | 20.19 | | | | (1.81 | )% | | | 2.24 | % | | | 2.20 | % | | | 13.62 | % | | | 129 | % | | $ | 820 | |
| | 0.00 | | | $ | 17.77 | | | | (1.87 | )% | | | 2.29 | % | | | 2.19 | % | | | 0.23 | % | | | 169 | % | | $ | 605 | |
| | (0.17 | ) | | $ | 17.73 | | | | (1.85 | )% | | | 2.23 | % | | | 2.20 | % | | | (28.44 | )% | | | 150 | % | | $ | 231 | |
| | | | | | | | | | | | | | | | | | | | | | | | | | | | | | |
| | 0.00 | | | $ | 42.26 | | | | (0.73 | )% | | | 1.30 | % | | | 1.20 | % | | | 20.30 | % | | | 51 | % | | $ | 100,871 | |
| | 0.00 | | | $ | 35.13 | | | | (0.30 | )% | | | 1.37 | % | | | 1.20 | % | | | 30.89 | % | | | 109 | % | | $ | 98,445 | |
| | 0.00 | | | $ | 26.90 | | | | (0.48 | )% | | | 1.30 | % | | | 1.20 | % | | | (10.99 | )% | | | 107 | % | | $ | 97,776 | |
| | 0.00 | | | $ | 30.22 | | | | (0.78 | )% | | | 1.28 | % | | | 1.20 | % | | | 39.33 | % | | | 70 | % | | $ | 177,938 | |
| | 0.00 | | | $ | 21.70 | | | | (0.82 | )% | | | 1.32 | % | | | 1.20 | % | | | 14.76 | % | | | 129 | % | | $ | 237,761 | |
| | 0.00 | | | $ | 18.90 | | | | (0.85 | )% | | | 1.35 | % | | | 1.19 | % | | | 1.18 | % | | | 169 | % | | $ | 229,380 | |
| | (0.17 | ) | | $ | 18.68 | | | | (0.84 | )% | | | 1.34 | % | | | 1.20 | % | | | (27.70 | )% | | | 150 | % | | $ | 242,802 | |
| | | | | | | | | | | | | | | | | | | | | | | | | | | | | | |
| | 0.00 | | | $ | 42.71 | | | | (0.49 | )% | | | 1.03 | % | | | 0.95 | % | | | 20.45 | % | | | 51 | % | | $ | 99,161 | |
| | 0.00 | | | $ | 35.46 | | | | (0.19 | )% | | | 1.10 | % | | | 0.95 | % | | | 31.25 | % | | | 109 | % | | $ | 71,336 | |
| | 0.00 | | | $ | 27.15 | | | | (0.27 | )% | | | 1.03 | % | | | 0.95 | % | | | (10.78 | )% | | | 107 | % | | $ | 9,692 | |
| | 0.00 | | | $ | 30.44 | | | | (0.61 | )% | | | 1.01 | % | | | 0.95 | % | | | 39.59 | % | | | 70 | % | | $ | 91,704 | |
| | 0.00 | | | $ | 21.81 | | | | (0.25 | )% | | | 1.05 | % | | | 0.95 | % | | | 14.98 | % | | | 129 | % | | $ | 1,175 | |
| | 0.00 | | | $ | 18.94 | | | | (0.57 | )% | | | 1.09 | % | | | 0.95 | % | | | 1.39 | % | | | 169 | % | | $ | 9 | |
| | 0.00 | | | $ | 18.70 | | | | (0.59 | )% | | | 1.08 | % | | | 0.95 | % | | | (7.33 | )% | | | 150 | % | | $ | 54,827 | |
Please see footnotes on page 50.
The accompanying notes are an integral part of these financial statements.
| | | | |
| 50 | | Wells Fargo Advantage Equity Gateway Funds | | Financial highlights |
| | | | | | | | | | | | | | | | | | | | |
| | | Beginning
net asset
value per
share | | | Net
investment
income (loss)1 | | | Net realized
and unrealized
gains (losses)
on investments | | | Distributions
from net
investment
income | | | Distributions
from net
realized gains | |
| | | | | |
Small Company Value Fund | | | | | | | | | | | | | | | | | | | | |
Class A | | | | | | | | | | | | | | | | | | | | |
June 1, 2013 to November 30, 2013 (unaudited) | | $ | 17.10 | | | | 0.06 | | | | 2.55 | | | | 0.00 | | | | 0.00 | |
June 1, 2012 to May 31, 2013 | | $ | 13.17 | | | | (0.00 | )6 | | | 3.93 | | | | 0.00 | | | | 0.00 | |
June 1, 2011 to May 31, 2012 | | $ | 14.36 | | | | 0.03 | | | | (1.11 | ) | | | (0.11 | ) | | | 0.00 | |
October 1, 2010 to May 31, 20114 | | $ | 11.38 | | | | 0.11 | | | | 2.87 | | | | 0.00 | | | | 0.00 | |
October 1, 2009 to September 30, 2010 | | $ | 9.84 | | | | (0.02 | ) | | | 1.56 | | | | 0.00 | | | | 0.00 | |
October 1, 2008 to September 30, 2009 | | $ | 10.55 | | | | 0.04 | 5 | | | (0.71 | ) | | | (0.04 | ) | | | 0.00 | |
October 1, 2007 to September 30, 2008 | | $ | 15.35 | | | | 0.05 | 5 | | | (3.36 | ) | | | 0.00 | | | | (1.49 | ) |
Class B | | | | | | | | | | | | | | | | | | | | |
June 1, 2013 to November 30, 2013 (unaudited) | | $ | 15.74 | | | | (0.03 | )5 | | | 2.36 | | | | 0.00 | | | | 0.00 | |
June 1, 2012 to May 31, 2013 | | $ | 12.21 | | | | (0.10 | )5 | | | 3.63 | | | | 0.00 | | | | 0.00 | |
June 1, 2011 to May 31, 2012 | | $ | 13.30 | | | | (0.08 | )5 | | | (1.01 | ) | | | 0.00 | | | | 0.00 | |
October 1, 2010 to May 31, 20114 | | $ | 10.59 | | | | 0.04 | 5 | | | 2.67 | | | | 0.00 | | | | 0.00 | |
October 1, 2009 to September 30, 2010 | | $ | 9.20 | | | | (0.10 | )5 | | | 1.49 | | | | 0.00 | | | | 0.00 | |
October 1, 2008 to September 30, 2009 | | $ | 9.89 | | | | (0.01 | )5 | | | (0.68 | ) | | | 0.00 | | | | 0.00 | |
October 1, 2007 to September 30, 2008 | | $ | 14.59 | | | | (0.04 | )5 | | | (3.17 | ) | | | 0.00 | | | | (1.49 | ) |
Class C | | | | | | | | | | | | | | | | | | | | |
June 1, 2013 to November 30, 2013 (unaudited) | | $ | 15.68 | | | | (0.01 | )5 | | | 2.33 | | | | 0.00 | | | | 0.00 | |
June 1, 2012 to May 31, 2013 | | $ | 12.16 | | | | (0.10 | )5 | | | 3.62 | | | | 0.00 | | | | 0.00 | |
June 1, 2011 to May 31, 2012 | | $ | 13.30 | | | | (0.08 | )5 | | | (1.02 | ) | | | (0.04 | ) | | | 0.00 | |
October 1, 2010 to May 31, 20114 | | $ | 10.59 | | | | 0.02 | 5 | | | 2.69 | | | | 0.00 | | | | 0.00 | |
October 1, 2009 to September 30, 2010 | | $ | 9.20 | | | | (0.09 | )5 | | | 1.48 | | | | 0.00 | | | | 0.00 | |
October 1, 2008 to September 30, 2009 | | $ | 9.89 | | | | (0.02 | )5 | | | (0.67 | ) | | | 0.00 | | | | 0.00 | |
October 1, 2007 to September 30, 2008 | | $ | 14.59 | | | | (0.04 | )5 | | | (3.17 | ) | | | 0.00 | | | | (1.49 | ) |
Administrator Class | | | | | | | | | | | | | | | | | | | | |
June 1, 2013 to November 30, 2013 (unaudited) | | $ | 17.42 | | | | 0.08 | | | | 2.59 | | | | 0.00 | | | | 0.00 | |
June 1, 2012 to May 31, 2013 | | $ | 13.39 | | | | 0.03 | 5 | | | 4.01 | | | | (0.01 | ) | | | 0.00 | |
June 1, 2011 to May 31, 2012 | | $ | 14.60 | | | | 0.06 | | | | (1.13 | ) | | | (0.14 | ) | | | 0.00 | |
October 1, 2010 to May 31, 20114 | | $ | 11.55 | | | | 0.12 | 5 | | | 2.93 | | | | 0.00 | | | | 0.00 | |
October 1, 2009 to September 30, 2010 | | $ | 9.94 | | | | (0.02 | ) | | | 1.63 | | | | 0.00 | | | | 0.00 | |
October 1, 2008 to September 30, 2009 | | $ | 10.69 | | | | 0.06 | 5 | | | (0.74 | ) | | | (0.07 | ) | | | 0.00 | |
October 1, 2007 to September 30, 2008 | | $ | 15.54 | | | | 0.08 | 5 | | | (3.39 | ) | | | (0.05 | ) | | | (1.49 | ) |
Institutional Class | | | | | | | | | | | | | | | | | | | | |
June 1, 2013 to November 30, 2013 (unaudited) | | $ | 17.45 | | | | 0.11 | | | | 2.59 | | | | 0.00 | | | | 0.00 | |
June 1, 2012 to May 31, 2013 | | $ | 13.41 | | | | 0.06 | 5 | | | 4.03 | | | | (0.05 | ) | | | 0.00 | |
June 1, 2011 to May 31, 2012 | | $ | 14.63 | | | | 0.11 | | | | (1.17 | ) | | | (0.16 | ) | | | 0.00 | |
October 1, 2010 to May 31, 20114 | | $ | 11.55 | | | | 0.13 | 5 | | | 2.95 | | | | 0.00 | | | | 0.00 | |
July 30, 20108 to September 30, 2010 | | $ | 11.26 | | | | 0.02 | | | | 0.27 | | | | 0.00 | | | | 0.00 | |
| 1. | Includes net expenses allocated from the affiliated Master Portfolio(s) in which the Fund invests. |
| 2. | Total return calculations do not include any sales charges. Returns for periods of less than one year are not annualized. |
| 3. | Portfolio turnover rate is calculated by aggregating the results of multiplying the Fund’s investment percentage in the respective Master Portfolio by the corresponding Master Portfolio’s portfolio turnover rate. |
| 4. | For the eight months ended May 31, 2011. The Fund changed its fiscal year end from September 30 to May 31, effective May 31, 2011. |
| 5. | Calculated based upon average shares outstanding |
| 6. | Amount is less than $0.005. |
| 7. | On June 20, 2008, Class D was renamed Investor Class. |
| 8. | Commencement of class operations |
| 9. | For the ten months ended May 31, 2011. The Fund changed its fiscal year end from July 31 to May 31, effective May 31, 2011. |
| 10. | At the close of business on July 16, 2010, the Fund acquired the net assets of Evergreen Equity Index Fund which became the accounting and performance survivor in the transaction. The information for the periods prior to July 19, 2010 is that of Evergreen Equity Index Fund. The per share information has been adjusted to give effect to this transaction. |
| 11. | Investor Class of Evergreen Equity Index Fund, the accounting and performance survivor, did not exist prior to the reorganization. As a result, accounting and performance information for Investor Class commenced operation on July 16, 2010. |
The accompanying notes are an integral part of these financial statements.
| | | | | | |
| Financial highlights | | Wells Fargo Advantage Equity Gateway Funds | | | 51 | |
| | | | | | | | | | | | | | | | | | | | | | | | | | |
Ending
net asset
value
per
share | | | Ratio to average net assets (annualized) | | | Total
return2 | | | Portfolio
turnover
rate3 | | | Net assets at
end of period
(000s omitted) | |
| | Net investment
income (loss)1 | | | Gross
expenses1 | | | Net
expenses1 | | | | |
| | | | | | | |
| | | | | | | | | | | | | | | | | | | | | | | | | | | |
| | | | | | | | | | | | | | | | | | | | | | | | | | |
| $ | 19.71 | | | | 0.69 | % | | | 1.57 | % | | | 1.43 | % | | | 15.26 | % | | | 25 | % | | $ | 26,999 | |
| $ | 17.10 | | | | (0.02 | )% | | | 1.57 | % | | | 1.45 | % | | | 29.84 | % | | | 57 | % | | $ | 21,652 | |
| $ | 13.17 | | | | 0.08 | % | | | 1.50 | % | | | 1.45 | % | | | (7.44 | )% | | | 60 | % | | $ | 18,605 | |
| $ | 14.36 | | | | 1.07 | % | | | 1.49 | % | | | 1.42 | % | | | 26.19 | % | | | 47 | % | | $ | 26,222 | |
| $ | 11.38 | | | | (0.21 | )% | | | 1.65 | % | | | 1.45 | % | | | 15.53 | % | | | 60 | % | | $ | 22,492 | |
| $ | 9.84 | | | | 0.55 | % | | | 1.55 | % | | | 1.45 | % | | | (6.14 | )% | | | 99 | % | | $ | 20,202 | |
| $ | 10.55 | | | | 0.42 | % | | | 1.52 | % | | | 1.45 | % | | | (22.58 | )% | | | 82 | % | | $ | 34,964 | |
| | | | | | | | | | | | | | | | | | | | | | | | | | |
| $ | 18.07 | | | | (0.31 | )% | | | 2.32 | % | | | 2.19 | % | | | 14.80 | % | | | 25 | % | | $ | 124 | |
| $ | 15.74 | | | | (0.75 | )% | | | 2.31 | % | | | 2.20 | % | | | 28.91 | % | | | 57 | % | | $ | 197 | |
| $ | 12.21 | | | | (0.67 | )% | | | 2.25 | % | | | 2.20 | % | | | (8.20 | )% | | | 60 | % | | $ | 500 | |
| $ | 13.30 | | | | 0.45 | % | | | 2.25 | % | | | 2.17 | % | | | 25.59 | % | | | 47 | % | | $ | 1,340 | |
| $ | 10.59 | | | | (0.99 | )% | | | 2.40 | % | | | 2.20 | % | | | 14.98 | % | | | 60 | % | | $ | 2,079 | |
| $ | 9.20 | | | | (0.20 | )% | | | 2.30 | % | | | 2.20 | % | | | (6.88 | )% | | | 99 | % | | $ | 2,792 | |
| $ | 9.89 | | | | (0.33 | )% | | | 2.31 | % | | | 2.20 | % | | | (23.16 | )% | | | 82 | % | | $ | 5,086 | |
| | | | | | | | | | | | | | | | | | | | | | | | | | |
| $ | 18.00 | | | | (0.07 | )% | | | 2.32 | % | | | 2.18 | % | | | 14.80 | % | | | 25 | % | | $ | 2,149 | |
| $ | 15.68 | | | | (0.76 | )% | | | 2.32 | % | | | 2.20 | % | | | 28.95 | % | | | 57 | % | | $ | 1,814 | |
| $ | 12.16 | | | | (0.68 | )% | | | 2.25 | % | | | 2.20 | % | | | (8.20 | )% | | | 60 | % | | $ | 1,557 | |
| $ | 13.30 | | | | 0.29 | % | | | 2.24 | % | | | 2.17 | % | | | 25.59 | % | | | 47 | % | | $ | 2,150 | |
| $ | 10.59 | | | | (0.94 | )% | | | 2.40 | % | | | 2.20 | % | | | 14.98 | % | | | 60 | % | | $ | 1,763 | |
| $ | 9.20 | | | | (0.26 | )% | | | 2.30 | % | | | 2.20 | % | | | (6.88 | )% | | | 99 | % | | $ | 1,437 | |
| $ | 9.89 | | | | (0.33 | )% | | | 2.30 | % | | | 2.20 | % | | | (23.15 | )% | | | 82 | % | | $ | 1,728 | |
| | | | | | | | | | | | | | | | | | | | | | | | | | |
| $ | 20.09 | | | | 0.91 | % | | | 1.41 | % | | | 1.20 | % | | | 15.33 | % | | | 25 | % | | $ | 70,157 | |
| $ | 17.42 | | | | 0.23 | % | | | 1.40 | % | | | 1.20 | % | | | 30.21 | % | | | 57 | % | | $ | 60,550 | |
| $ | 13.39 | | | | 0.32 | % | | | 1.33 | % | | | 1.20 | % | | | (7.24 | )% | | | 60 | % | | $ | 60,333 | |
| $ | 14.60 | | | | 1.34 | % | | | 1.33 | % | | | 1.20 | % | | | 26.41 | % | | | 47 | % | | $ | 70,022 | |
| $ | 11.55 | | | | (0.05 | )% | | | 1.47 | % | | | 1.20 | % | | | 16.20 | % | | | 60 | % | | $ | 60,081 | |
| $ | 9.94 | | | | 0.85 | % | | | 1.37 | % | | | 1.20 | % | | | (6.06 | )% | | | 99 | % | | $ | 124,072 | |
| $ | 10.69 | | | | 0.71 | % | | | 1.38 | % | | | 1.20 | % | | | (22.33 | )% | | | 82 | % | | $ | 252,275 | |
| | | | | | | | | | | | | | | | | | | | | | | | | | |
| $ | 20.15 | | | | 1.17 | % | | | 1.14 | % | | | 1.00 | % | | | 15.47 | % | | | 25 | % | | $ | 10,755 | |
| $ | 17.45 | | | | 0.40 | % | | | 1.14 | % | | | 1.00 | % | | | 30.54 | % | | | 57 | % | | $ | 8,185 | |
| $ | 13.41 | | | | 0.59 | % | | | 1.05 | % | | | 1.00 | % | | | (7.14 | )% | | | 60 | % | | $ | 62 | |
| $ | 14.63 | | | | 1.42 | % | | | 1.02 | % | | | 0.96 | % | | | 26.67 | % | | | 47 | % | | $ | 16 | |
| $ | 11.55 | | | | 1.02 | % | | | 1.15 | % | | | 1.00 | % | | | 2.58 | % | | | 60 | % | | $ | 10 | |
The accompanying notes are an integral part of these financial statements.
| | | | |
| 52 | | Wells Fargo Advantage Equity Gateway Funds | | Notes to financial statements (unaudited) |
1. ORGANIZATION
Wells Fargo Funds Trust (the “Trust”), a Delaware statutory trust organized on March 10, 1999, is an open-end management investment company registered under the Investment Company Act of 1940, as amended (the “1940 Act”). These financial statements report on the following funds: the Wells Fargo Advantage C&B Large Cap Value Fund (“C&B Large Cap Value Fund”), the Wells Fargo Advantage Diversified Equity Fund (“Diversified Equity Fund”), the Wells Fargo Advantage Emerging Growth Fund (“Emerging Growth Fund”), the Wells Fargo Advantage Index Fund (“Index Fund”), the Wells Fargo Advantage International Value Fund (“International Value Fund”), the Wells Fargo Advantage Small Company Growth Fund (“Small Company Growth Fund”), and the Wells Fargo Advantage Small Company Value Fund (“Small Company Value Fund”) (each, a “Fund”, collectively, the “Funds”). Each Fund is a diversified series of the Trust.
The Funds each seek to achieve its investment objective by investing all investable assets in one or more separate diversified portfolios (each, an “affiliated Master Portfolio”, collectively, the “affiliated Master Portfolios”) of Wells Fargo Master Trust, a registered open-end management investment company. Each affiliated Master Portfolio directly acquires portfolio securities, and a Fund investing in an affiliated Master Portfolio acquires an indirect interest in those securities. Each Fund accounts for its investment in the affiliated Master Portfolios as partnership investments and records on a daily basis its share of the affiliated Master Portfolio’s income, expense and realized and unrealized gains and losses. The financial statements of the affiliated Master Portfolios for the six months ended November 30, 2013, are included in this report and should be read in conjunction with each Fund’s financial statements. As of November 30, 2013, the Funds own the following percentages of the affiliated Master Portfolios:
| | | | | | | | | | | | | | |
| | | C&B
Large Cap
Value
Fund | | Diversified
Equity
Fund | | Emerging
Growth
Fund | | Index
Fund | | International
Value Fund | | Small
Company
Growth
Fund | | Small
Company
Value
Fund |
Wells Fargo Advantage C&B Large Cap Value Portfolio | | 86% | | 9% | | N/A | | N/A | | N/A | | N/A | | N/A |
Wells Fargo Advantage Diversified Large Cap Growth Portfolio | | N/A | | 61% | | N/A | | N/A | | N/A | | N/A | | N/A |
Wells Fargo Advantage Emerging Growth Portfolio | | N/A | | 1% | | 93% | | N/A | | N/A | | N/A | | N/A |
Wells Fargo Advantage Index Portfolio | | N/A | | 3% | | N/A | | 95% | | N/A | | N/A | | N/A |
Wells Fargo Advantage International Growth Portfolio | | N/A | | 18% | | N/A | | N/A | | N/A | | N/A | | N/A |
Wells Fargo Advantage International Value Portfolio | | N/A | | 6% | | N/A | | N/A | | 91% | | N/A | | N/A |
Wells Fargo Advantage Large Company Value Portfolio | | N/A | | 61% | | N/A | | N/A | | N/A | | N/A | | N/A |
Wells Fargo Advantage Small Company Growth Portfolio | | N/A | | 4% | | N/A | | N/A | | N/A | | 94% | | N/A |
Wells Fargo Advantage Small Company Value Portfolio | | N/A | | 9% | | N/A | | N/A | | N/A | | N/A | | 53% |
2. SIGNIFICANT ACCOUNTING POLICIES
The following significant accounting policies, which are consistently followed in the preparation of the financial statements of each Fund, are in conformity with U.S. generally accepted accounting principles which require management to make estimates and assumptions that affect the reported amounts of assets and liabilities, disclosure of contingent assets and liabilities at the date of the financial statements, and the reported amounts of revenues and expenses during the reporting period. Actual results could differ from those estimates.
Securities valuation
All investments are valued each business day as of the close of regular trading on the New York Stock Exchange (generally 4 p.m. Eastern Time).
Investments in the affiliated Master Portfolios are valued daily based on each Fund’s proportionate share of each affiliated Master Portfolio’s net assets, which are also valued daily. Securities held in the affiliated Master Portfolios are valued as discussed in the Notes to Financial Statements of the affiliated Master Portfolios, which are included elsewhere in this report.
| | | | | | |
| Notes to financial statements (unaudited) | | Wells Fargo Advantage Equity Gateway Funds | | | 53 | |
Security transactions and income recognition
Securities transactions are recorded on a trade date basis in each affiliated Master Portfolio. Realized gains or losses in each affiliated Master Portfolio are recorded on the basis of identified cost.
Interest income is accrued daily and bond discounts are accreted and premiums are amortized daily based on the effective interest method by each affiliated Master Portfolio. To the extent debt obligations are placed on non-accrual status, any related interest income may be reduced by writing off interest receivables when the collection of all or a portion of interest has become doubtful based on consistently applied procedures. If the issuer subsequently resumes interest payments or when the collectability of interest is reasonably assured, the debt obligation is removed from non-accrual status.
Dividend income in each affiliated Master Portfolio is recognized on the ex-dividend date, except for certain dividends from foreign securities, which are recorded as soon as the affiliated Master Portfolio is informed of the ex-dividend date. Dividend income from foreign securities in each affiliated Master Portfolio is recorded net of foreign taxes withheld where recovery of such taxes is not assured.
Each Fund records daily its proportionate share of each affiliated Master Portfolio’s interest and dividend income and realized and unrealized gains or losses.
Distributions to shareholders
Distributions to shareholders from net investment income and net realized gains, if any, are recorded on the ex-dividend date. Such distributions are determined in conformity with federal income tax regulations, which may differ in amount or character from net investment income and realized gains recognized for purposes of U.S. generally accepted accounting principles.
Federal and other taxes
Each Fund is treated as a separate entity for federal income tax purposes. Each Fund intends to continue to qualify as a regulated investment company by distributing substantially all of its investment company taxable income and any net realized capital gains (after reduction for capital loss carryforwards) sufficient to relieve it from all, or substantially all, federal income taxes. Accordingly, no provision for federal income taxes was required.
Each Fund’s income and federal excise tax returns and all financial records supporting those returns for the prior three fiscal years are subject to examination by the federal and Delaware revenue authorities. Management has analyzed each Fund’s tax positions taken on federal, state, and foreign tax returns for all open tax years and does not believe that there are any uncertain tax positions that require recognition of a tax liability.
At May 31, 2013, net capital loss carryforwards available to offset future net realized capital gains were as follows through the indicated expiration dates:
| | | | | | | | | | | | | | | | | | | | |
| | | | | | No expiration | |
| | | 2016 | | | 2017 | | | 2018 | | | 2019 | | | Long-term | |
C&B Large Cap Value Fund | | $ | 0 | | | $ | 4,858,463 | | | $ | 52,060,627 | | | $ | 16,296,879 | | | $ | 0 | |
International Value Fund | | | 0 | | | | 6,753,262 | | | | 39,532,291 | | | | 4,561,591 | | | | 3,424,543 | |
Small Company Growth Fund | | | 820,227 | | | | 273,409 | | | | 0 | | | | 0 | | | | 0 | |
Small Company Value Fund | | | 0 | | | | 19,365,293 | | | | 80,412,918 | | | | 0 | | | | 0 | |
At May 31, 2013, deferred post-October capital losses and late-year ordinary losses, which were recognized on the first day of the current fiscal year, were as follows:
| | | | | | | | |
| | | Deferred post-October capital loss | | | Late-year ordinary loss | |
Emerging Growth Fund | | $ | 0 | | | $ | 3,234,223 | |
International Value Fund | | | 1,203,684 | | | | 0 | |
Small Company Growth Fund | | | 0 | | | | 383,228 | |
Small Company Value Fund | | | 0 | | | | 34,585 | |
| | | | |
| 54 | | Wells Fargo Advantage Equity Gateway Funds | | Notes to financial statements (unaudited) |
Class allocations
The separate classes of shares offered by each Fund differ principally in applicable sales charges, distribution, shareholder servicing, and administration fees. Shareholders of each class bear certain expenses that pertain to that particular class. All shareholders bear the common expenses of a Fund, earn income from the portfolio, and are allocated unrealized gains and losses pro rata based on the average daily net assets of each class, without distinction between share classes. Dividends are determined separately for each class based on income and expenses allocable to each class. Realized gains and losses are allocated to each class pro rata based upon the net assets of each class on the date realized. Differences in per share dividend rates generally result from the relative weightings of pro rata income and realized gain allocations and from differences in separate class expenses, including distribution, shareholder servicing, and administration fees.
3. FAIR VALUATION MEASUREMENTS
Fair value measurements of investments are determined within a framework that has established a fair value hierarchy based upon the various data inputs utilized in determining the value of each Fund’s investments. The three-level hierarchy gives the highest priority to unadjusted quoted prices in active markets for identical assets or liabilities (Level 1) and the lowest priority to significant unobservable inputs (Level 3). Each Fund’s investments are classified within the fair value hierarchy based on the lowest level of input that is significant to the fair value measurement. The inputs are summarized into three broad levels as follows:
| n | | Level 1 – quoted prices in active markets for identical securities |
| n | | Level 2 – other significant observable inputs (including quoted prices for similar securities, interest rates, prepayment speeds, credit risk, use of amortized cost, etc.) |
| n | | Level 3 – significant unobservable inputs (including the Fund’s own assumptions in determining the fair value of investments) |
The inputs or methodologies used for valuing investments in securities are not necessarily an indication of the risk associated with investing in those securities.
At November 30, 2013, each Fund’s investments in an affiliated Master Portfolio carried at fair value were designated as Level 2 inputs. Further details on the investments of the affiliated Master Portfolios can be found in the Portfolio of Investments or Summary Portfolio of Investments of each affiliated Master Portfolio which is contained elsewhere in this report.
Transfers in and transfers out are recognized at the end of the reporting period. For the six months ended November 30, 2013, the Funds did not have any transfers into/out of Level 1, Level 2, or Level 3.
4. TRANSACTIONS WITH AFFILIATES AND OTHER EXPENSES
Advisory fees
The Trust has entered into an advisory contract with Wells Fargo Funds Management, LLC (“Funds Management”), an indirect wholly owned subsidiary of Wells Fargo & Company (“Wells Fargo”). The adviser is responsible for implementing investment policies and guidelines and for supervising the subadviser, who is responsible for day-to-day portfolio management of the Funds.
For each Fund that invests all of its assets in a single affiliated Master Portfolio, Funds Management does not currently receive an advisory fee. For Diversified Equity Fund which invests in multiple affiliated Master Portfolios, Funds Management is entitled to receive an annual advisory fee for providing such advisory services, including the determination of the asset allocations of its investments in the various affiliated Master Portfolios. Funds Management receives an annual advisory fee starting at 0.25% and declining to 0.19% as the average daily net assets of Diversified Equity Fund increase. For the six months ended November 30, 2013, the advisory fee for Diversified Equity Fund was equivalent to an annual rate of 0.25% of its average daily net assets.
Funds Management also serves as the adviser to each affiliated Master Portfolio and is entitled to receive a fee from each affiliated Master Portfolio for those services.
Administration and transfer agent fees
The Trust has entered into an administration agreement with Funds Management. Under this agreement, for providing administrative services, which includes paying fees and expenses for services provided by the transfer agent, sub-transfer agents, omnibus account servicers and record-keepers, Funds Management is entitled to receive from each Fund an annual
| | | | | | |
| Notes to financial statements (unaudited) | | Wells Fargo Advantage Equity Gateway Funds | | | 55 | |
fund level administration fee starting at 0.05% and declining to 0.03% as the average daily net assets of each Fund increase and a class level administration fee which is calculated based on the average daily net assets of each class as follows:
| | |
| | | Class level
administration fee |
Class A, Class B, Class C | | 0.26% |
Administrator Class | | 0.10 |
Institutional Class | | 0.08 |
Investor Class | | 0.32 |
Funds Management has contractually waived and/or reimbursed advisory and administration fees to the extent necessary to maintain certain net operating expense ratios for the Funds. Waiver of fees and/or reimbursement of expenses by Funds Management were made first from fund level expenses on a proportionate basis and then from class specific expenses. Funds Management has committed through September 30, 2014, to waive fees and/or reimburse expenses to the extent necessary to cap each Fund’s expenses as follows:
| | | | | | | | | | | | | | | | | | |
| | | Class A | | Class B | | Class C | | Administrator
Class | | | Institutional
Class | | | Investor
Class | |
C&B Large Cap Value Fund | | 1.15% | | 1.90% | | 1.90% | | | 0.95 | % | | | 0.70 | % | | | 1.20 | % |
Diversified Equity Fund | | 1.25 | | 2.00 | | 2.00 | | | 1..00 | | | | N/A | | | | N/A | |
Emerging Growth Fund | | 1.37 | | N/A | | 2.12 | | | 1.20 | | | | 0.90 | | | | 1.43 | |
Index Fund | | 0.56 | | 1.31 | | 1.31 | | | 0.25 | | | | N/A | | | | 0.45 | |
International Value Fund | | 1.50 | | 2.25 | | 2.25 | | | 1.25 | | | | 1.05 | | | | N/A | |
Small Company Growth Fund | | 1.40 | | 2.15 | | 2.15 | | | 1.20 | | | | 0.95 | | | | N/A | |
Small Company Value Fund | | 1.40 | | 2.15 | | 2.15 | | | 1.20 | | | | 1.00 | | | | N/A | |
Prior to the following dates, the expense caps for the following Funds and classes were as follows:
| | | | | | | | | | | | | | | | |
| | | Prior to | | | Class A | | | Class B | | | Class C | |
Small Company Growth Fund | | | October 1, 2013 | | | | 1.45 | % | | | 2.20 | % | | | 2.20 | % |
Small Company Value Fund | | | October 1, 2013 | | | | 1.45 | % | | | 2.20 | % | | | 2.20 | % |
Distribution fees
The Trust has adopted a Distribution Plan for Class B and Class C shares of the applicable Funds pursuant to Rule 12b-1 under the 1940 Act. Distribution fees are charged to the Class B and Class C shares and paid to Wells Fargo Funds Distributor, LLC, the principal underwriter of each Fund, at an annual rate of 0.75% of the average daily net assets of Class B and Class C shares.
For the six months ended November 30, 2013, Wells Fargo Funds Distributor, LLC received the following amounts in front-end sales charges and contingent deferred sales charges.
| | | | | | | | |
| | | Front-end sales charges | | | Contingent deferred sales charges | |
| | Class A | | | Class C | |
C&B Large Cap Value Fund | | $ | 1,636 | | | $ | 0 | |
Diversified Equity Fund | | | 2,310 | | | | 17 | |
Emerging Growth Fund | | | 449 | | | | 0 | |
Index Fund | | | 3,340 | | | | 121 | |
International Value Fund | | | 382 | | | | 0 | |
Small Company Growth Fund | | | 11,924 | | | | 10 | |
Small Company Value Fund | | | 2,318 | | | | 0 | |
| | | | |
| 56 | | Wells Fargo Advantage Equity Gateway Funds | | Notes to financial statements (unaudited) |
Shareholder servicing fees
The Trust has entered into contracts with one or more shareholder servicing agents, whereby Class A, Class B, Class C, Administrator Class, and Investor Class of each applicable Fund is charged a fee at an annual rate of 0.25% of the average daily net assets of each respective class. Administrator Class of the Index Fund is charged a fee at an annual rate of 0.10% of its average daily net assets.
A portion of these total shareholder servicing fees were paid to affiliates of Wells Fargo.
5. INVESTMENT PORTFOLIO TRANSACTIONS
Purchases and sales of investments, excluding U.S. Government obligations (if any) and short-term securities, for the six months ended November 30, 2013 were as follows:
| | | | | | | | |
| | | Purchases at cost* | | | Sales proceeds* | |
C&B Large Cap Value Fund | | $ | 31,349,037 | | | $ | 68,422,836 | |
Diversified Equity Fund | | | 71,449,424 | | | | 95,637,790 | |
Emerging Growth Fund | | | 342,847,504 | | | | 422,035,908 | |
Index Fund | | | 63,754,055 | | | | 70,394,784 | |
International Value Fund | | | 29,391,309 | | | | 22,871,344 | |
Small Company Growth Fund | | | 100,990,513 | | | | 98,061,646 | |
Small Company Value Fund | | | 26,735,838 | | | | 40,505,930 | |
| * | The Funds seek to achieve their investment objective by investing all of their investable assets in one or more affiliated Master Portfolios. Purchases and sales related to these investments have been calculated by aggregating the results of multiplying each Fund’s ownership percentage of the respective affiliated Master Portfolio by the corresponding affiliated Master Portfolio’s purchases and sales. |
6. ACQUISITIONS
After the close of business on March 1, 2013, Small Company Growth Fund acquired the net assets of Wells Fargo Advantage Diversified Small Cap Fund. The purpose of the transaction was to combine two funds with similar investment objectives and strategies. Shareholders holding Administrator Class shares of Wells Fargo Advantage Diversified Small Cap Fund received Institutional Class shares of Small Company Growth Fund in the reorganization. The acquisition was accomplished by a tax-free exchange of all of the shares of Wells Fargo Advantage Diversified Small Cap Fund for 301,128 Institutional Class shares of Small Company Growth Fund valued at $9,870,350 at an exchange ratio of 0.46. The investment portfolio of Wells Fargo Advantage Diversified Small Cap Fund with a fair value of $9,643,858, identified cost of $9,890,123 and unrealized losses of $246,265 at March 1, 2013 were the principal assets acquired by Small Company Growth Fund. The aggregate net assets of Wells Fargo Advantage Diversified Small Cap Fund and Small Company Growth Fund immediately prior to the acquisition were $9,870,350 and $152,550,197, respectively. The aggregate net assets of Small Company Growth Fund immediately after the acquisition were $162,420,547. For financial reporting purposes, assets received and shares issued by Small Company Growth Fund were recorded at fair value; however, the cost basis of the investments received from Wells Fargo Advantage Diversified Small Cap Fund was carried forward to align ongoing reporting of Small Company Growth Fund’s realized and unrealized gains and losses with amounts distributable to shareholders for tax purposes.
Assuming the acquisition had been completed June 1, 2012, the beginning of the annual reporting period for Small Company Growth Fund, the pro forma results of operations for the year ended May 31, 2013 would have been:
| | | | |
Net investment loss | | $ | (381,440 | ) |
Net realized and unrealized gains (losses) on investments | | $ | 41,583,507 | |
Net increase in net assets resulting from operations | | $ | 41,202,067 | |
7. BANK BORROWINGS
The Trust (excluding Diversified Equity Fund, the money market funds, and certain other funds in the Trust) and Wells Fargo Variable Trust are parties to a $150,000,000 revolving credit agreement with State Street Bank and Trust Company. Diversified Equity Fund and certain other funds in the Trust are parties to a $25,000,000 revolving credit agreement with Bank of New York Mellon. Under each agreement, the Funds are permitted to use bank borrowings for temporary or
| | | | | | |
| Notes to financial statements (unaudited) | | Wells Fargo Advantage Equity Gateway Funds | | | 57 | |
emergency purposes, such as to fund shareholder redemption requests. Interest under each credit agreement is charged to each Fund based on a borrowing rate equal to the higher of the Federal Funds rate in effect on that day plus 1.25% or the overnight LIBOR rate in effect on that day plus 1.25%. In addition, the applicable Funds pay an annual commitment fee equal to 0.10% under the credit agreement with State Street Bank and Trust Company and an annual commitment fee equal to 0.15% under the credit agreement with Bank of New York Mellon. The annual commitment fee applied on the unused balance is allocated to each participating fund. For the six months ended November 30, 2013, the Funds paid the following amounts in commitment fees:
| | | | |
| | | Commitment fee | |
C&B Large Cap Value Fund | | $ | 243 | |
Diversified Equity Fund | | | 507 | |
Emerging Growth Fund | | | 802 | |
Index Fund | | | 2,035 | |
International Value Fund | | | 399 | |
Small Company Growth Fund | | | 191 | |
Small Company Value Fund | | | 98 | |
For the six months ended November 30, 2013, there were no borrowings by the Funds under the agreement.
8. CONCENTRATION RISK
Concentration risks result from exposure to a limited number of sectors. Through their investments in affiliated Master Portfolio(s), Funds that invest a substantial portion of their assets in a sector may be more affected by changes in that sector than would be a fund whose investments are not heavily weighted in any sector.
9. INDEMNIFICATION
Under the Trust’s organizational documents, the officers and directors are indemnified against certain liabilities that may arise out of performance of their duties to the Trust. Additionally, in the normal course of business, the Trust may enter into contracts with service providers that contain a variety of indemnification clauses. The Trust’s maximum exposure under these arrangements is dependent on future claims that may be made against the Funds and, therefore, cannot be estimated.
10. SUBSEQUENT DISTRIBUTIONS
On December 11, 2013, the following Funds declared distributions from short-term capital gains and long-term capital gains to shareholders of record on December 10, 2013. The per share amounts payable on December 12, 2013 were as follows:
| | | | | | | | | | | | | | | | |
| | | Diversified
Equity Fund | | | Emerging
Growth Fund | | | Index
Fund | | | Small Company
Growth Fund | |
Short-term capital gains | | | | | | | | | | | | | | | | |
Class A | | $ | 1.07336 | | | $ | 0.00000 | | | $ | 0.08535 | | | $ | 1.36451 | |
Class B | | | 1.07336 | | | | N/A | | | | 0.08535 | | | | 1.36451 | |
Class C | | | 1.07336 | | | | 0.00000 | | | | 0.08535 | | | | 1.36451 | |
Administrator Class | | | 1.07336 | | | | 0.00000 | | | | 0.08535 | | | | 1.36451 | |
Institutional Class | | | N/A | | | | 0.00000 | | | | N/A | | | | 1.36451 | |
Investor Class | | | N/A | | | | 0.00000 | | | | 0.08535 | | | | N/A | |
Long-term capital gains | | | | | | | | | | | | | | | | |
Class A | | $ | 2.26819 | | | $ | 1.18024 | | | $ | 1.41324 | | | $ | 1.03829 | |
Class B | | | 2.26819 | | | | N/A | | | | 1.41324 | | | | 1.03829 | |
Class C | | | 2.26819 | | | | 1.18024 | | | | 1.41324 | | | | 1.03829 | |
Administrator Class | | | 2.26819 | | | | 1.18024 | | | | 1.41324 | | | | 1.03829 | |
Institutional Class | | | N/A | | | | 1.18024 | | | | N/A | | | | 1.03829 | |
Investor Class | | | N/A | | | | 1.18024 | | | | 1.41324 | | | | N/A | |
| | | | |
| 58 | | Wells Fargo Advantage Equity Gateway Funds | | Notes to financial statements (unaudited) |
On December 19, 2013, the following Funds declared distributions from net investment income to shareholders of record on December 18, 2013. The per share amounts payable on December 20, 2013, were as follows
| | | | | | | | | | | | | | | | |
| | | C&B Large
Cap Value Fund | | | Diversified
Equity Fund | | | Index
Fund | | | International
Value Fund | |
Net investment income | | | | | | | | | | | | | | | | |
Class A | | $ | 0.10479 | | | $ | 0.16932 | | | $ | 0.84501 | | | $ | 0.28300 | |
Class B | | | 0.00000 | | | | 0.00000 | | | | 0.23298 | | | | 0.13161 | |
Class C | | | 0.02493 | | | | 0.01350 | | | | 0.43802 | | | | 0.20683 | |
Administrator Class | | | 0.11839 | | | | 0.24161 | | | | 1.01535 | | | | 0.31937 | |
Institutional Class | | | 0.15033 | | | | N/A | | | | N/A | | | | 0.34654 | |
Investor Class | | | 0.09837 | | | | N/A | | | | 0.91433 | | | | N/A | |
These distributions are not reflected in the accompanying financial statements. The final determination of the source of all distributions is subject to change and made after the tax year-end of each Fund.
| | | | | | |
| Portfolio of investments—November 30, 2013 (unaudited) | | Wells Fargo Advantage Equity Gateway Funds | | | 59 | |
C&B LARGE CAP VALUE PORTFOLIO
| | | | | | | | | | | | |
| Security name | | | | | | Shares | | | Value | |
| | | | | | | | | | | | |
| | | | |
Common Stocks: 94.70% | | | | | | | | | | | | |
| | | | |
Consumer Discretionary: 14.00% | | | | | | | | | | | | |
| | | | |
| Hotels, Restaurants & Leisure: 4.40% | | | | | | | | | | | | |
Carnival Corporation | | | | | | | 211,600 | | | $ | 7,640,876 | |
McDonald’s Corporation | | | | | | | 80,300 | | | | 7,818,811 | |
| | | | |
| | | | | | | | | | | 15,459,687 | |
| | | | | | | | | | | | |
| | | | |
| Household Durables: 2.40% | | | | | | | | | | | | |
NVR Incorporated † | | | | | | | 8,670 | | | | 8,409,727 | |
| | | | | | | | | | | | |
| | | | |
| Media: 5.14% | | | | | | | | | | | | |
Omnicom Group Incorporated | | | | | | | 154,700 | | | | 11,053,315 | |
Twenty-First Century Fox Incorporated | | | | | | | 209,200 | | | | 7,006,108 | |
| | | | |
| | | | | | | | | | | 18,059,423 | |
| | | | | | | | | | | | |
| | | | |
| Multiline Retail: 2.06% | | | | | | | | | | | | |
Kohl’s Corporation | | | | | | | 130,600 | | | | 7,219,568 | |
| | | | | | | | | | | | |
| | | | |
Consumer Staples: 11.94% | | | | | | | | | | | | |
| | | | |
| Beverages: 2.45% | | | | | | | | | | | | |
Coca-Cola Enterprises Incorporated | | | | | | | 106,700 | | | | 4,474,998 | |
Diageo plc ADR | | | | | | | 32,300 | | | | 4,123,741 | |
| | | | |
| | | | | | | | | | | 8,598,739 | |
| | | | | | | | | | | | |
| | | | |
| Food Products: 1.97% | | | | | | | | | | | | |
Unilever NV ADR | | | | | | | 176,300 | | | | 6,921,538 | |
| | | | | | | | | | | | |
| | | | |
| Household Products: 4.61% | | | | | | | | | | | | |
Colgate-Palmolive Company | | | | | | | 80,600 | | | | 5,304,286 | |
Henkel AG & Company KGaA ADR | | | | | | | 61,200 | | | | 6,077,001 | |
Procter & Gamble Company | | | | | | | 57,000 | | | | 4,800,540 | |
| | | | |
| | | | | | | | | | | 16,181,827 | |
| | | | | | | | | | | | |
| | | | |
| Personal Products: 1.12% | | | | | | | | | | | | |
Avon Products Incorporated | | | | | | | 219,700 | | | | 3,917,251 | |
| | | | | | | | | | | | |
| | | | |
| Tobacco: 1.79% | | | | | | | | | | | | |
Philip Morris International | | | | | | | 73,600 | | | | 6,295,744 | |
| | | | | | | | | | | | |
| | | | |
Energy: 5.62% | | | | | | | | | | | | |
| | | | |
| Oil, Gas & Consumable Fuels: 5.62% | | | | | | | | | | | | |
Chevron Corporation | | | | | | | 45,700 | | | | 5,595,508 | |
Devon Energy Corporation | | | | | | | 128,900 | | | | 7,813,918 | |
Exxon Mobil Corporation | | | | | | | 67,600 | | | | 6,319,248 | |
| | | | |
| | | | | | | | | | | 19,728,674 | |
| | | | | | | | | | | | |
| | | | |
Financials: 23.71% | | | | | | | | | | | | |
| | | | |
| Capital Markets: 5.15% | | | | | | | | | | | | |
Charles Schwab Corporation | | | | | | | 208,800 | | | | 5,111,424 | |
State Street Corporation | | | | | | | 178,600 | | | | 12,968,146 | |
| | | | |
| | | | | | | | | | | 18,079,570 | |
| | | | | | | | | | | | |
| | | | |
| Commercial Banks: 1.99% | | | | | | | | | | | | |
PNC Financial Services Group Incorporated | | | | | | | 90,900 | | | | 6,994,755 | |
| | | | | | | | | | | | |
The accompanying notes are an integral part of these financial statements.
| | | | |
| 60 | | Wells Fargo Advantage Equity Gateway Funds | | Portfolio of investments—November 30, 2013 (unaudited) |
C&B LARGE CAP VALUE PORTFOLIO
| | | | | | | | | | | | |
| Security name | | | | | | Shares | | | Value | |
| | | | | | | | | | | | |
| | | | |
| Consumer Finance: 2.81% | | | | | | | | | | | | |
American Express Company | | | | | | | 114,800 | | | $ | 9,849,840 | |
| | | | | | | | | | | | |
| | | | |
| Diversified Financial Services: 6.79% | | | | | | | | | | | | |
Bank of America Corporation | | | | | | | 355,800 | | | | 5,628,756 | |
Berkshire Hathaway Incorporated Class B † | | | | | | | 59,100 | | | | 6,886,923 | |
JPMorgan Chase & Company | | | | | | | 197,800 | | | | 11,318,116 | |
| | | | |
| | | | | | | | | | | 23,833,795 | |
| | | | | | | | | | | | |
| | | | |
| Insurance: 6.97% | | | | | | | | | | | | |
Axis Capital Holdings Limited | | | | | | | 128,150 | | | | 6,296,010 | |
RenaissanceRe Holdings Limited | | | | | | | 80,500 | | | | 7,623,350 | |
The Progressive Corporation | | | | | | | 184,800 | | | | 5,161,464 | |
Willis Group Holdings plc | | | | | | | 120,300 | | | | 5,387,034 | |
| | | | |
| | | | | | | | | | | 24,467,858 | |
| | | | | | | | | | | | |
| | | | |
Health Care: 12.55% | | | | | | | | | | | | |
| | | | |
| Health Care Equipment & Supplies: 3.37% | | | | | | | | | | | | |
Baxter International Incorporated | | | | | | | 113,500 | | | | 7,769,075 | |
Becton Dickinson & Company | | | | | | | 37,400 | | | | 4,061,266 | |
| | | | |
| | | | | | | | | | | 11,830,341 | |
| | | | | | | | | | | | |
| | | | |
| Health Care Providers & Services: 6.70% | | | | | | | | | | | | |
Cardinal Health Incorporated | | | | | | | 140,600 | | | | 9,082,760 | |
Quest Diagnostics Incorporated | | | | | | | 131,600 | | | | 8,019,704 | |
UnitedHealth Group Incorporated | | | | | | | 86,000 | | | | 6,405,280 | |
| | | | |
| | | | | | | | | | | 23,507,744 | |
| | | | | | | | | | | | |
| | | | |
| Pharmaceuticals: 2.48% | | | | | | | | | | | | |
Johnson & Johnson | | | | | | | 92,000 | | | | 8,708,720 | |
| | | | | | | | | | | | |
| | | | |
Industrials: 10.77% | | | | | | | | | | | | |
| | | | |
| Aerospace & Defense: 1.03% | | | | | | | | | | | | |
Raytheon Company | | | | | | | 40,900 | | | | 3,627,012 | |
| | | | | | | | | | | | |
| | | | |
| Air Freight & Logistics: 1.53% | | | | | | | | | | | | |
United Parcel Service Incorporated Class B | | | | | | | 52,300 | | | | 5,354,474 | |
| | | | | | | | | | | | |
| | | | |
| Commercial Services & Supplies: 1.97% | | | | | | | | | | | | |
Cintas Corporation | | | | | | | 124,900 | | | | 6,931,950 | |
| | | | | | | | | | | | |
| | | | |
| Industrial Conglomerates: 2.85% | | | | | | | | | | | | |
3M Company | | | | | | | 74,900 | | | | 9,999,899 | |
| | | | | | | | | | | | |
| | | | |
| Machinery: 3.39% | | | | | | | | | | | | |
Illinois Tool Works Incorporated | | | | | | | 69,300 | | | | 5,514,894 | |
Parker Hannifin Corporation | | | | | | | 54,100 | | | | 6,375,144 | |
| | | | |
| | | | | | | | | | | 11,890,038 | |
| | | | | | | | | | | | |
| | | | |
Information Technology: 8.13% | | | | | | | | | | | | |
| | | | |
| Electronic Equipment, Instruments & Components: 1.00% | | | | | | | | | | | | |
TE Connectivity Limited | | | | | | | 67,000 | | | | 3,532,240 | |
| | | | | | | | | | | | |
The accompanying notes are an integral part of these financial statements.
| | | | | | |
| Portfolio of investments—November 30, 2013 (unaudited) | | Wells Fargo Advantage Equity Gateway Funds | | | 61 | |
C&B LARGE CAP VALUE PORTFOLIO
| | | | | | | | | | | | | | |
| Security name | | | | | | | Shares | | | Value | |
| | | | | | | | | | | | | | |
| | | | |
| IT Services: 4.16% | | | | | | | | | | | | | | |
Fiserv Incorporated † | | | | | | | | | 66,800 | | | $ | 7,340,652 | |
Western Union Company | | | | | | | | | 436,100 | | | | 7,269,787 | |
| | | | |
| | | | | | | | | | | | | 14,610,439 | |
| | | | | | | | | | | | | | |
| | | | |
| Semiconductors & Semiconductor Equipment: 1.42% | | | | | | | | | | | | | | |
Lam Research Corporation † | | | | | | | | | 95,600 | | | | 4,981,716 | |
| | | | | | | | | | | | | | |
| | | | |
| Software: 1.55% | | | | | | | | | | | | | | |
Microsoft Corporation | | | | | | | | | 142,500 | | | | 5,433,525 | |
| | | | | | | | | | | | | | |
| | | | |
Materials: 6.58% | | | | | | | | | | | | | | |
| | | | |
| Containers & Packaging: 6.58% | | | | | | | | | | | | | | |
Ball Corporation | | | | | | | | | 190,700 | | | | 9,531,186 | |
Crown Holdings Incorporated † | | | | | | | | | 160,100 | | | | 7,066,814 | |
Rock-Tenn Company Class A | | | | | | | | | 69,100 | | | | 6,524,422 | |
| | | | |
| | | | | | | | | | | | | 23,122,422 | |
| | | | | | | | | | | | | | |
| | | | |
Utilities: 1.40% | | | | | | | | | | | | | | |
| | | | |
| Electric Utilities: 1.40% | | | | | | | | | | | | | | |
Entergy Corporation | | | | | | | | | 79,300 | | | | 4,907,877 | |
| | | | | | | | | | | | | | |
| | | | |
Total Common Stocks (Cost $229,197,778) | | | | | | | | | | | | | 332,456,393 | |
| | | | | | | | | | | | | | |
| | | | |
| | | | | Dividend yield | | | | | | | |
| | | | |
Preferred Stocks: 0.44% | | | | | | | | | | | | | | |
| | | | |
Consumer Staples: 0.44% | | | | | | | | | | | | | | |
| | | | |
| Household Products: 0.44% | | | | | | | | | | | | | | |
Henkel AG & Company KGaA ADR ± | | | | | 1.09 | % | | | 13,600 | | | | 1,545,244 | |
| | | | | | | | | | | | | | |
| | | | |
Total Preferred Stocks (Cost $597,017) | | | | | | | | | | | | | 1,545,244 | |
| | | | | | | | | | | | | | |
| | | | |
| | | | | Yield | | | | | | | |
| | | | |
Short-Term Investments: 4.71% | | | | | | | | | | | | | | |
| | | | |
| Investment Companies: 4.71% | | | | | | | | | | | | | | |
Wells Fargo Advantage Cash Investment Money Market Fund, Select Class (l)(u) | | | | | 0.08 | | | | 16,519,640 | | | | 16,519,640 | |
| | | | | | | | | | | | | | |
| | | | |
Total Short-Term Investments (Cost $16,519,640) | | | | | | | | | | | | | 16,519,640 | |
| | | | | | | | | | | | | | |
| | | | | | | | |
| Total investments in securities | | | | | | | | |
| (Cost $246,314,435) * | | | 99.85 | % | | | 350,521,277 | |
Other assets and liabilities, net | | | 0.15 | | | | 528,363 | |
| | | | | | | | |
| Total net assets | | | 100.00 | % | | $ | 351,049,640 | |
| | | | | | | | |
| † | Non-income-earning security |
| ± | Variable rate investment. The rate shown is the rate in effect at period end. |
| (l) | Investment in an affiliate |
| (u) | Rate shown is the 7-day annualized yield at period end. |
| * | Cost for federal income tax purposes is $255,710,903 and unrealized appreciation (depreciation) consists of: |
| | | | |
Gross unrealized appreciation | | $ | 105,190,272 | |
Gross unrealized depreciation | | | (10,379,898 | ) |
| | | | |
Net unrealized appreciation | | $ | 94,810,374 | |
The accompanying notes are an integral part of these financial statements.
| | | | |
| 62 | | Wells Fargo Advantage Equity Gateway Funds | | Portfolio of investments—November 30, 2013 (unaudited) |
DIVERSIFIED LARGE CAP GROWTH PORTFOLIO
| | | | | | | | | | | | |
| Security name | | | | | | Shares | | | Value | |
| | | | | | | | | | | | |
| | | | |
Common Stocks: 99.30% | | | | | | | | | | | | |
| | | | |
Consumer Discretionary: 24.69% | | | | | | | | | | | | |
| | | | |
| Auto Components: 0.66% | | | | | | | | | | | | |
Delphi Automotive plc | | | | | | | 17,370 | | | $ | 1,017,014 | |
| | | | | | | | | | | | |
| | | | |
| Distributors: 0.22% | | | | | | | | | | | | |
LKQ Corporation † | | | | | | | 10,160 | | | | 336,804 | |
| | | | | | | | | | | | |
| | | | |
| Hotels, Restaurants & Leisure: 4.22% | | | | | | | | | | | | |
Chipotle Mexican Grill Incorporated † | | | | | | | 3,000 | | | | 1,571,580 | |
Marriott International Incorporated Class A | | | | | | | 11,890 | | | | 559,068 | |
Starbucks Corporation | | | | | | | 43,701 | | | | 3,559,883 | |
Wynn Resorts Limited | | | | | | | 4,700 | | | | 779,589 | |
| | | | |
| | | | | | | | | | | 6,470,120 | |
| | | | | | | | | | | | |
| | | | |
| Internet & Catalog Retail: 4.99% | | | | | | | | | | | | |
Amazon.com Incorporated † | | | | | | | 11,610 | | | | 4,569,928 | |
Netflix Incorporated † | | | | | | | 2,660 | | | | 973,028 | |
priceline.com Incorporated † | | | | | | | 1,770 | | | | 2,110,424 | |
| | | | |
| | | | | | | | | | | 7,653,380 | |
| | | | | | | | | | | | |
| | | | |
| Media: 3.17% | | | | | | | | | | | | |
CBS Corporation Class B | | | | | | | 13,250 | | | | 775,920 | |
Discovery Communications Incorporated Class A † | | | | | | | 13,730 | | | | 1,198,217 | |
Liberty Global plc Class C † | | | | | | | 16,210 | | | | 1,320,305 | |
Sirius XM Holdings Incorporated | | | | | | | 274,060 | | | | 1,033,206 | |
Twenty-First Century Fox Incorporated | | | | | | | 13,760 | | | | 460,822 | |
Walt Disney Company | | | | | | | 1,100 | | | | 77,594 | |
| | | | |
| | | | | | | | | | | 4,866,064 | |
| | | | | | | | | | | | |
| | | | |
| Multiline Retail: 2.85% | | | | | | | | | | | | |
Dollar General Corporation † | | | | | | | 6,030 | | | | 343,348 | |
Dollar Tree Incorporated † | | | | | | | 47,150 | | | | 2,623,898 | |
Nordstrom Incorporated | | | | | | | 22,610 | | | | 1,406,568 | |
| | | | |
| | | | | | | | | | | 4,373,814 | |
| | | | | | | | | | | | |
| | | | |
| Specialty Retail: 5.36% | | | | | | | | | | | | |
Bed Bath & Beyond Incorporated † | | | | | | | 3,150 | | | | 245,795 | |
Best Buy Company Incorporated | | | | | | | 23,540 | | | | 954,547 | |
Cabela’s Incorporated † | | | | | | | 6,900 | | | | 422,625 | |
CarMax Incorporated † | | | | | | | 33,150 | | | | 1,669,103 | |
GNC Holdings Incorporated Class A | | | | | | | 3,030 | | | | 182,345 | |
Home Depot Incorporated | | | | | | | 11,700 | | | | 943,839 | |
O’Reilly Automotive Incorporated † | | | | | | | 5,100 | | | | 637,296 | |
Ross Stores Incorporated | | | | | | | 7,970 | | | | 609,386 | |
TJX Companies Incorporated | | | | | | | 18,920 | | | | 1,189,690 | |
Tractor Supply Company | | | | | | | 10,880 | | | | 796,525 | |
Ulta Salon Cosmetics & Fragrance Incorporated † | | | | | | | 4,440 | | | | 563,614 | |
| | | | |
| | | | | | | | | | | 8,214,765 | |
| | | | | | | | | | | | |
The accompanying notes are an integral part of these financial statements.
| | | | | | |
| Portfolio of investments—November 30, 2013 (unaudited) | | Wells Fargo Advantage Equity Gateway Funds | | | 63 | |
DIVERSIFIED LARGE CAP GROWTH PORTFOLIO
| | | | | | | | | | | | |
| Security name | | | | | | Shares | | | Value | |
| | | | | | | | | | | | |
| | | | |
| Textiles, Apparel & Luxury Goods: 3.22% | | | | | | | | | | | | |
lululemon athletica incorporated † | | | | | | | 14,990 | | | $ | 1,045,103 | |
Michael Kors Holdings Limited † | | | | | | | 21,765 | | | | 1,774,936 | |
Nike Incorporated Class B | | | | | | | 11,430 | | | | 904,570 | |
Under Armour Incorporated Class A † | | | | | | | 6,140 | | | | 495,498 | |
VF Corporation | | | | | | | 3,050 | | | | 715,469 | |
| | | | |
| | | | | | | | | | | 4,935,576 | |
| | | | | | | | | | | | |
| | | | |
Consumer Staples: 5.47% | | | | | | | | | | | | |
| | | | |
| Beverages: 1.49% | | | | | | | | | | | | |
Constellation Brands Incorporated Class A † | | | | | | | 26,530 | | | | 1,867,977 | |
The Coca-Cola Company | | | | | | | 10,320 | | | | 414,761 | |
| | | | |
| | | | | | | | | | | 2,282,738 | |
| | | | | | | | | | | | |
| | | | |
| Food & Staples Retailing: 3.49% | | | | | | | | | | | | |
Costco Wholesale Corporation | | | | | | | 12,290 | | | | 1,541,535 | |
Sprouts Farmers Market Incorporated † | | | | | | | 3,819 | | | | 144,511 | |
Walgreen Company | | | | | | | 12,500 | | | | 740,000 | |
Whole Foods Market Incorporated | | | | | | | 51,710 | | | | 2,926,786 | |
| | | | |
| | | | | | | | | | | 5,352,832 | |
| | | | | | | | | | | | |
| | | | |
| Household Products: 0.12% | | | | | | | | | | | | |
Colgate-Palmolive Company | | | | | | | 2,900 | | | | 190,849 | |
| | | | | | | | | | | | |
| | | | |
| Personal Products: 0.37% | | | | | | | | | | | | |
Estee Lauder Companies Incorporated Class A | | | | | | | 7,510 | | | | 562,950 | |
| | | | | | | | | | | | |
| | | | |
Energy: 4.15% | | | | | | | | | | | | |
| | | | |
| Energy Equipment & Services: 0.73% | | | | | | | | | | | | |
National Oilwell Varco Incorporated | | | | | | | 5,765 | | | | 469,848 | |
Schlumberger Limited | | | | | | | 7,300 | | | | 645,466 | |
| | | | |
| | | | | | | | | | | 1,115,314 | |
| | | | | | | | | | | | |
| | | | |
| Oil, Gas & Consumable Fuels: 3.42% | | | | | | | | | | | | |
Antero Resources Corporation †« | | | | | | | 4,576 | | | | 251,222 | |
Concho Resources Incorporated † | | | | | | | 15,790 | | | | 1,641,055 | |
Continental Resources Incorporated †« | | | | | | | 3,810 | | | | 409,613 | |
EOG Resources Incorporated | | | | | | | 400 | | | | 66,000 | |
Pioneer Natural Resources Company | | | | | | | 16,220 | | | | 2,883,105 | |
| | | | |
| | | | | | | | | | | 5,250,995 | |
| | | | | | | | | | | | |
| | | | |
Financials: 6.06% | | | | | | | | | | | | |
| | | | |
| Capital Markets: 2.10% | | | | | | | | | | | | |
Affiliated Managers Group Incorporated † | | | | | | | 4,270 | | | | 855,068 | |
Ameriprise Financial Incorporated | | | | | | | 5,010 | | | | 542,333 | |
Northern Trust Corporation | | | | | | | 5,210 | | | | 307,338 | |
TD Ameritrade Holding Corporation | | | | | | | 52,750 | | | | 1,518,145 | |
| | | | |
| | | | | | | | | | | 3,222,884 | |
| | | | | | | | | | | | |
The accompanying notes are an integral part of these financial statements.
| | | | |
| 64 | | Wells Fargo Advantage Equity Gateway Funds | | Portfolio of investments—November 30, 2013 (unaudited) |
DIVERSIFIED LARGE CAP GROWTH PORTFOLIO
| | | | | | | | | | | | |
| Security name | | | | | | Shares | | | Value | |
| | | | | | | | | | | | |
| | | | |
| Consumer Finance: 1.86% | | | | | | | | | | | | |
American Express Company | | | | | | | 16,614 | | | $ | 1,425,481 | |
Discover Financial Services | | | | | | | 26,910 | | | | 1,434,303 | |
| | | | |
| | | | | | | | | | | 2,859,784 | |
| | | | | | | | | | | | |
| | | | |
| Diversified Financial Services: 1.30% | | | | | | | | | | | | |
CME Group Incorporated | | | | | | | 3,360 | | | | 275,352 | |
Intercontinental Exchange Incorporated † | | | | | | | 8,020 | | | | 1,710,586 | |
| | | | |
| | | | | | | | | | | 1,985,938 | |
| | | | | | | | | | | | |
| | | | |
| Insurance: 0.70% | | | | | | | | | | | | |
Aon plc | | | | | | | 13,210 | | | | 1,078,464 | |
| | | | | | | | | | | | |
| | | | |
| REITs: 0.10% | | | | | | | | | | | | |
American Tower Corporation | | | | | | | 2,000 | | | | 155,540 | |
| | | | | | | | | | | | |
| | | | |
Health Care: 16.03% | | | | | | | | | | | | |
| | | | |
| Biotechnology: 9.27% | | | | | | | | | | | | |
Alexion Pharmaceuticals Incorporated † | | | | | | | 20,940 | | | | 2,607,030 | |
Biogen Idec Incorporated † | | | | | | | 8,820 | | | | 2,566,355 | |
BioMarin Pharmaceutical Incorporated † | | | | | | | 3,990 | | | | 280,816 | |
Celgene Corporation † | | | | | | | 19,580 | | | | 3,167,457 | |
Gilead Sciences Incorporated † | | | | | | | 53,800 | | | | 4,024,778 | |
Medivation Incorporated † | | | | | | | 1,500 | | | | 94,515 | |
Quintiles Transnational Holdings Incorporated † | | | | | | | 5,383 | | | | 232,492 | |
Regeneron Pharmaceuticals Incorporated † | | | | | | | 3,280 | | | | 963,861 | |
Vertex Pharmaceuticals Incorporated † | | | | | | | 4,050 | | | | 281,151 | |
| | | | |
| | | | | | | | | | | 14,218,455 | |
| | | | | | | | | | | | |
| | | | |
| Health Care Equipment & Supplies: 1.35% | | | | | | | | | | | | |
Boston Scientific Corporation † | | | | | | | 80,530 | | | | 932,537 | |
Covidien plc | | | | | | | 16,780 | | | | 1,145,403 | |
| | | | |
| | | | | | | | | | | 2,077,940 | |
| | | | | | | | | | | | |
| | | | |
| Health Care Providers & Services: 1.92% | | | | | | | | | | | | |
AmerisourceBergen Corporation | | | | | | | 17,823 | | | | 1,257,056 | |
Catamaran Corporation † | | | | | | | 19,120 | | | | 872,446 | |
Envision Healthcare Holdings Incorporated † | | | | | | | 5,875 | | | | 174,018 | |
Express Scripts Holding Company † | | | | | | | 9,480 | | | | 638,478 | |
| | | | |
| | | | | | | | | | | 2,941,998 | |
| | | | | | | | | | | | |
| | | | |
| Health Care Technology: 0.93% | | | | | | | | | | | | |
Cerner Corporation † | | | | | | | 24,950 | | | | 1,433,877 | |
| | | | | | | | | | | | |
| | | | |
| Life Sciences Tools & Services: 0.37% | | | | | | | | | | | | |
Mettler-Toledo International Incorporated † | | | | | | | 2,280 | | | | 562,180 | |
| | | | | | | | | | | | |
| | | | |
| Pharmaceuticals: 2.19% | | | | | | | | | | | | |
Actavis plc † | | | | | | | 6,540 | | | | 1,066,478 | |
Allergan Incorporated | | | | | | | 2,550 | | | | 247,478 | |
The accompanying notes are an integral part of these financial statements.
| | | | | | |
| Portfolio of investments—November 30, 2013 (unaudited) | | Wells Fargo Advantage Equity Gateway Funds | | | 65 | |
DIVERSIFIED LARGE CAP GROWTH PORTFOLIO
| | | | | | | | | | | | |
| Security name | | | | | | Shares | | | Value | |
| | | | | | | | | | | | |
| | | | |
| Pharmaceuticals (continued) | | | | | | | | | | | | |
Bristol-Myers Squibb Company | | | | | | | 1,500 | | | $ | 77,070 | |
Mallinckrodt plc † | | | | | | | 1,332 | | | | 69,211 | |
Merck & Company Incorporated | | | | | | | 2,100 | | | | 104,643 | |
Mylan Laboratories Incorporated † | | | | | | | 1,400 | | | | 61,782 | |
Perrigo Company « | | | | | | | 6,940 | | | | 1,081,877 | |
Shire plc ADR | | | | | | | 2,440 | | | | 331,376 | |
Zoetis Incorporated | | | | | | | 10,130 | | | | 315,550 | |
| | | | |
| | | | | | | | | | | 3,355,465 | |
| | | | | | | | | | | | |
| | | | |
Industrials: 10.63% | | | | | | | | | | | | |
| | | | |
| Aerospace & Defense: 3.23% | | | | | | | | | | | | |
Precision Castparts Corporation | | | | | | | 9,683 | | | | 2,502,571 | |
The Boeing Company | | | | | | | 7,810 | | | | 1,048,493 | |
United Technologies Corporation | | | | | | | 12,720 | | | | 1,410,139 | |
| | | | |
| | | | | | | | | | | 4,961,203 | |
| | | | | | | | | | | | |
| | | | |
| Air Freight & Logistics: 0.65% | | | | | | | | | | | | |
United Parcel Service Incorporated Class B | | | | | | | 9,780 | | | | 1,001,276 | |
| | | | | | | | | | | | |
| | | | |
| Airlines: 0.76% | | | | | | | | | | | | |
Delta Air Lines Incorporated | | | | | | | 37,540 | | | | 1,087,909 | |
Southwest Airlines Company | | | | | | | 4,000 | | | | 74,360 | |
| | | | |
| | | | | | | | | | | 1,162,269 | |
| | | | | | | | | | | | |
| | | | |
| Building Products: 0.17% | | | | | | | | | | | | |
Fortune Brands Home & Security Incorporated | | | | | | | 5,920 | | | | 258,112 | |
| | | | | | | | | | | | |
| | | | |
| Electrical Equipment: 0.62% | | | | | | | | | | | | |
Eaton Corporation plc | | | | | | | 13,160 | | | | 956,206 | |
| | | | | | | | | | | | |
| | | | |
| Industrial Conglomerates: 0.73% | | | | | | | | | | | | |
Danaher Corporation | | | | | | | 15,020 | | | | 1,123,496 | |
| | | | | | | | | | | | |
| | | | |
| Machinery: 0.33% | | | | | | | | | | | | |
Flowserve Corporation | | | | | | | 6,330 | | | | 451,835 | |
Pentair Limited | | | | | | | 700 | | | | 49,504 | |
| | | | |
| | | | | | | | | | | 501,339 | |
| | | | | | | | | | | | |
| | | | |
| Professional Services: 0.24% | | | | | | | | | | | | |
Verisk Analytics Incorporated Class A † | | | | | | | 5,630 | | | | 366,569 | |
| | | | | | | | | | | | |
| | | | |
| Road & Rail: 3.35% | | | | | | | | | | | | |
CSX Corporation | | | | | | | 10,000 | | | | 272,700 | |
Genesee & Wyoming Incorporated † | | | | | | | 500 | | | | 48,100 | |
J.B. Hunt Transport Services Incorporated | | | | | | | 1,730 | | | | 130,079 | |
Kansas City Southern | | | | | | | 19,070 | | | | 2,307,851 | |
Norfolk Southern Corporation | | | | | | | 9,350 | | | | 819,902 | |
Union Pacific Corporation | | | | | | | 9,660 | | | | 1,565,306 | |
| | | | |
| | | | | | | | | | | 5,143,938 | |
| | | | | | | | | | | | |
The accompanying notes are an integral part of these financial statements.
| | | | |
| 66 | | Wells Fargo Advantage Equity Gateway Funds | | Portfolio of investments—November 30, 2013 (unaudited) |
DIVERSIFIED LARGE CAP GROWTH PORTFOLIO
| | | | | | | | | | | | |
| Security name | | | | | | Shares | | | Value | |
| | | | | | | | | | | | |
| | | | |
| Trading Companies & Distributors: 0.55% | | | | | | | | | | | | |
W.W. Grainger Incorporated | | | | | | | 3,250 | | | $ | 838,240 | |
| | | | | | | | | | | | |
| | | | |
Information Technology: 28.75% | | | | | | | | | | | | |
| | | | |
| Communications Equipment: 1.38% | | | | | | | | | | | | |
F5 Networks Incorporated † | | | | | | | 2,500 | | | | 205,650 | |
QUALCOMM Incorporated | | | | | | | 25,961 | | | | 1,910,210 | |
| | | | |
| | | | | | | | | | | 2,115,860 | |
| | | | | | | | | | | | |
| | | | |
| Computers & Peripherals: 3.13% | | | | | | | | | | | | |
Apple Incorporated | | | | | | | 8,641 | | | | 4,805,001 | |
| | | | | | | | | | | | |
| | | | |
| Electronic Equipment, Instruments & Components: 0.02% | | | | | | | | | | | | |
Trimble Navigation Limited † | | | | | | | 800 | | | | 25,520 | |
| | | | | | | | | | | | |
| | | | |
| Internet Software & Services: 10.20% | | | | | | | | | | | | |
Akamai Technologies Incorporated † | | | | | | | 7,050 | | | | 315,276 | |
Baidu Incorporated ADR † | | | | | | | 3,270 | | | | 544,684 | |
eBay Incorporated † | | | | | | | 50,040 | | | | 2,528,021 | |
Facebook Incorporated Class A † | | | | | | | 52,900 | | | | 2,486,829 | |
Google Incorporated Class A † | | | | | | | 6,774 | | | | 7,177,663 | |
LinkedIn Corporation Class A † | | | | | | | 5,410 | | | | 1,212,002 | |
MercadoLibre Incorporated « | | | | | | | 4,880 | | | | 540,265 | |
Pandora Media Incorporated † | | | | | | | 4,800 | | | | 136,320 | |
Rackspace Hosting Incorporated †« | | | | | | | 18,510 | | | | 707,267 | |
| | | | |
| | | | | | | | | | | 15,648,327 | |
| | | | | | | | | | | | |
| | | | |
| IT Services: 8.29% | | | | | | | | | | | | |
Accenture plc | | | | | | | 9,680 | | | | 749,910 | |
Alliance Data Systems Corporation † | | | | | | | 11,470 | | | | 2,778,722 | |
Cognizant Technology Solutions Corporation Class A † | | | | | | | 19,730 | | | | 1,852,450 | |
MasterCard Incorporated Class A | | | | | | | 4,596 | | | | 3,496,683 | |
Vantiv Incorporated Class A † | | | | | | | 30,470 | | | | 923,241 | |
Visa Incorporated Class A | | | | | | | 14,280 | | | | 2,905,409 | |
| | | | |
| | | | | | | | | | | 12,706,415 | |
| | | | | | | | | | | | |
| | | | |
| Semiconductors & Semiconductor Equipment: 2.75% | | | | | | | | | | | | |
ARM Holdings plc | | | | | | | 22,210 | | | | 1,108,279 | |
ASML Holding NV | | | | | | | 10,480 | | | | 978,622 | |
Avago Technologies Limited | | | | | | | 6,670 | | | | 298,349 | |
Linear Technology Corporation | | | | | | | 5,170 | | | | 219,984 | |
Microchip Technology Incorporated « | | | | | | | 33,010 | | | | 1,429,003 | |
Xilinx Incorporated | | | | | | | 4,150 | | | | 184,385 | |
| | | | |
| | | | | | | | | | | 4,218,622 | |
| | | | | | | | | | | | |
| | | | |
| Software: 2.98% | | | | | | | | | | | | |
Adobe Systems Incorporated † | | | | | | | 16,730 | | | | 949,929 | |
Fortinet Incorporated † | | | | | | | 13,140 | | | | 224,694 | |
NetSuite Incorporated † | | | | | | | 2,620 | | | | 251,730 | |
Salesforce.com Incorporated † | | | | | | | 42,404 | | | | 2,208,824 | |
The accompanying notes are an integral part of these financial statements.
| | | | | | |
| Portfolio of investments—November 30, 2013 (unaudited) | | Wells Fargo Advantage Equity Gateway Funds | | | 67 | |
DIVERSIFIED LARGE CAP GROWTH PORTFOLIO
| | | | | | | | | | | | | | |
| Security name | | | | | | | Shares | | | Value | |
| | | | | | | | | | | | | | |
| | | | |
| Software (continued) | | | | | | | | | | | | | | |
ServiceNow Incorporated † | | | | | | | | | 17,690 | | | $ | 939,516 | |
| | | | |
| | | | | | | | | | | | | 4,574,693 | |
| | | | | | | | | | | | | | |
| | | | |
Materials: 3.52% | | | | | | | | | | | | | | |
| | | | |
| Chemicals: 3.52% | | | | | | | | | | | | | | |
Airgas Incorporated | | | | | | | | | 2,970 | | | | 322,631 | |
Ecolab Incorporated | | | | | | | | | 6,200 | | | | 664,452 | |
Monsanto Company | | | | | | | | | 22,750 | | | | 2,578,253 | |
Praxair Incorporated | | | | | | | | | 14,470 | | | | 1,826,982 | |
| | | | |
| | | | | | | | | | | | | 5,392,318 | |
| | | | | | | | | | | | | | |
| | | | |
Total Common Stocks (Cost $104,838,269) | | | | | | | | | | | | | 152,315,144 | |
| | | | | | | | | | | | | | |
| | | | |
| | | Yield | | | | | | | | | |
| | | | |
Short-Term Investments: 3.41% | | | | | | | | | | | | | | |
| | | | |
| Investment Companies: 3.41% | | | | | | | | | | | | | | |
Wells Fargo Advantage Cash Investment Money Market Fund, Select Class (l)(u) | | | 0.08 | % | | | | | 1,076,336 | | | | 1,076,336 | |
Wells Fargo Securities Lending Cash Investments, LLC (l)(u)(r)(v) | | | 0.08 | | | | | | 4,148,421 | | | | 4,148,421 | |
| | | | |
Total Short-Term Investments (Cost $5,224,757) | | | | | | | | | | | | | 5,224,757 | |
| | | | | | | | | | | | | | |
| | | | | | | | |
| Total investments in securities | | | | | | | | |
| (Cost $110,063,026)* | | | 102.71 | % | | | 157,539,901 | |
Other assets and liabilities, net | | | (2.71 | ) | | | (4,154,017 | ) |
| | | | | | | | |
| Total net assets | | | 100.00 | % | | $ | 153,385,884 | |
| | | | | | | | |
| † | Non-income-earning security |
| « | All or a portion of this security is on loan. |
| (l) | Investment in an affiliate |
| (u) | Rate shown is the 7-day annualized yield at period end. |
| (r) | The investment company is exempt from registration under Section 3(c)(7) of the Investment Company Act of 1940, as amended. |
| (v) | Security represents investment of cash collateral received from securities on loan. |
| * | Cost for federal income tax purposes is $110,318,822 and unrealized appreciation (depreciation) consists of: |
| | | | |
Gross unrealized appreciation | | $ | 47,759,364 | |
Gross unrealized depreciation | | | (538,285 | ) |
| | | | |
Net unrealized appreciation | | $ | 47,221,079 | |
The accompanying notes are an integral part of these financial statements.
| | | | |
| 68 | | Wells Fargo Advantage Equity Gateway Funds | | Portfolio of investments—November 30, 2013 (unaudited) |
EMERGING GROWTH PORTFOLIO
| | | | | | | | | | | | |
| Security name | | | | | | Shares | | | Value | |
| | | | | | | | | | | | |
| | | | |
Common Stocks: 98.95% | | | | | | | | | | | | |
| | | | |
Consumer Discretionary: 15.23% | | | | | | | | | | | | |
| | | | |
| Auto Components: 0.42% | | | | | | | | | | | | |
Fox Factory Holding Corporation † | | | | | | | 282,500 | | | $ | 5,192,350 | |
| | | | | | | | | | | | |
| | | | |
| Diversified Consumer Services: 1.85% | | | | | | | | | | | | |
Grand Canyon Education Incorporated † | | | | | | | 255,100 | | | | 11,617,254 | |
LifeLock Incorporated † | | | | | | | 642,800 | | | | 11,069,016 | |
| | | | |
| | | | | | | | | | | 22,686,270 | |
| | | | | | | | | | | | |
| | | | |
| Hotels, Restaurants & Leisure: 2.87% | | | | | | | | | | | | |
Fiesta Restaurant Group Incorporated † | | | | | | | 392,965 | | | | 19,243,496 | |
Multimedia Games Holding Company † | | | | | | | 555,500 | | | | 16,109,500 | |
| | | | |
| | | | | | | | | | | 35,352,996 | |
| | | | | | | | | | | | |
| | | | |
| Internet & Catalog Retail: 3.83% | | | | | | | | | | | | |
HomeAway Incorporated † | | | | | | | 505,945 | | | | 18,466,993 | |
RetailMeNot Incorporated † | | | | | | | 162,450 | | | | 4,657,442 | |
Shutterfly Incorporated † | | | | | | | 506,485 | | | | 23,921,287 | |
| | | | |
| | | | | | | | | | | 47,045,722 | |
| | | | | | | | | | | | |
| | | | |
| Media: 2.16% | | | | | | | | | | | | |
IMAX Corporation †« | | | | | | | 863,010 | | | | 26,606,598 | |
| | | | | | | | | | | | |
| | | | |
| Specialty Retail: 4.10% | | | | | | | | | | | | |
Asbury Automotive Group Incorporated † | | | | | | | 131,100 | | | | 6,806,712 | |
Conn’s Incorporated † | | | | | | | 79,800 | | | | 4,814,334 | |
DSW Incorporated Class A | | | | | | | 547,500 | | | | 24,544,425 | |
Five Below Incorporated † | | | | | | | 268,797 | | | | 14,289,249 | |
| | | | |
| | | | | | | | | | | 50,454,720 | |
| | | | | | | | | | | | |
| | | | |
Consumer Staples: 3.00% | | | | | | | | | | | | |
| | | | |
| Food & Staples Retailing: 1.59% | | | | | | | | | | | | |
The Fresh Market Incorporated † | | | | | | | 264,270 | | | | 10,758,432 | |
United Natural Foods Incorporated † | | | | | | | 127,500 | | | | 8,778,375 | |
| | | | |
| | | | | | | | | | | 19,536,807 | |
| | | | | | | | | | | | |
| | | | |
| Food Products: 1.41% | | | | | | | | | | | | |
Annie’s Incorporated † | | | | | | | 377,000 | | | | 17,323,150 | |
| | | | | | | | | | | | |
| | | | |
Energy: 5.68% | | | | | | | | | | | | |
| | | | |
| Oil, Gas & Consumable Fuels: 5.68% | | | | | | | | | | | | |
Athlon Energy Incorporated † | | | | | | | 166,105 | | | | 5,418,345 | |
Bonanza Creek Energy Incorporated † | | | | | | | 401,900 | | | | 18,435,153 | |
Diamondback Energy Incorporated † | | | | | | | 315,157 | | | | 15,675,909 | |
Kodiak Oil & Gas Corporation † | | | | | | | 518,100 | | | | 5,875,254 | |
Laredo Petroleum Holdings Incorporated † | | | | | | | 318,831 | | | | 8,605,249 | |
Oasis Petroleum Incorporated † | | | | | | | 343,300 | | | | 15,836,429 | |
| | | | |
| | | | | | | | | | | 69,846,339 | |
| | | | | | | | | | | | |
The accompanying notes are an integral part of these financial statements.
| | | | | | |
| Portfolio of investments—November 30, 2013 (unaudited) | | Wells Fargo Advantage Equity Gateway Funds | | | 69 | |
EMERGING GROWTH PORTFOLIO
| | | | | | | | | | | | |
| Security name | | | | | | Shares | | | Value | |
| | | | | | | | | | | | |
| | | | |
Financials: 8.20% | | | | | | | | | | | | |
| | | | |
| Capital Markets: 2.59% | | | | | | | | | | | | |
Financial Engines Incorporated | | | | | | | 471,030 | | | $ | 31,912,283 | |
| | | | | | | | | | | | |
| | | | |
| Consumer Finance: 2.72% | | | | | | | | | | | | |
Encore Capital Group Incorporated † | | | | | | | 103,300 | | | | 4,926,377 | |
Portfolio Recovery Associates Incorporated † | | | | | | | 489,800 | | | | 28,604,319 | |
| | | | |
| | | | | | | | | | | 33,530,696 | |
| | | | | | | | | | | | |
| | | | |
| Diversified Financial Services: 2.89% | | | | | | | | | | | | |
MarketAxess Holdings Incorporated | | | | | | | 504,651 | | | | 35,512,291 | |
| | | | | | | | | | | | |
| | | | |
Health Care: 23.24% | | | | | | | | | | | | |
| | | | |
| Biotechnology: 2.25% | | | | | | | | | | | | |
Aegerion Pharmaceuticals Incorporated † | | | | | | | 14,347 | | | | 1,017,633 | |
Exact Sciences Corporation † | | | | | | | 344,753 | | | | 4,233,567 | |
Hyperion Therapeutics Incorporated † | | | | | | | 102,923 | | | | 2,628,653 | |
Ligand Pharmaceuticals Incorporated †« | | | | | | | 81,900 | | | | 4,560,192 | |
NPS Pharmaceuticals Incorporated † | | | | | | | 485,900 | | | | 12,832,619 | |
Onconova Therapeutics Incorporated †« | | | | | | | 162,698 | | | | 2,386,780 | |
| | | | |
| | | | | | | | | | | 27,659,444 | |
| | | | | | | | | | | | |
| | | | |
| Health Care Equipment & Supplies: 9.88% | | | | | | | | | | | | |
Align Technology Incorporated † | | | | | | | 146,900 | | | | 8,026,616 | |
Cardiovascular Systems Incorporated † | | | | | | | 283,758 | | | | 9,420,766 | |
Cynosure Incorporated Class A † | | | | | | | 710,778 | | | | 18,402,042 | |
DexCom Incorporated † | | | | | | | 756,070 | | | | 25,018,356 | |
Endologix Incorporated † | | | | | | | 1,169,794 | | | | 20,904,219 | |
Novadaq Technologies Incorporated † | | | | | | | 213,524 | | | | 3,555,175 | |
NxStage Medical Incorporated † | | | | | | | 685,960 | | | | 7,003,652 | |
Spectranetics Corporation † | | | | | | | 641,214 | | | | 14,914,638 | |
Tandem Diabetes Care Incorporated † | | | | | | | 245,137 | | | | 5,395,465 | |
TearLab Corporation †« | | | | | | | 488,037 | | | | 4,572,907 | |
Veracyte Incorporated † | | | | | | | 337,325 | | | | 4,378,479 | |
| | | | |
| | | | | | | | | | | 121,592,315 | |
| | | | | | | | | | | | |
| | | | |
| Health Care Providers & Services: 4.36% | | | | | | | | | | | | |
Acadia Healthcare Company Incorporated † | | | | | | | 594,200 | | | | 27,452,040 | |
ExamWorks Group Incorporated † | | | | | | | 60,200 | | | | 1,776,502 | |
MWI Veterinary Supply Incorporated † | | | | | | | 58,500 | | | | 10,656,945 | |
Team Health Holdings Incorporated † | | | | | | | 295,000 | | | | 13,785,350 | |
| | | | |
| | | | | | | | | | | 53,670,837 | |
| | | | | | | | | | | | |
| | | | |
| Health Care Technology: 2.32% | | | | | | | | | | | | |
Medidata Solutions Incorporated † | | | | | | | 240,600 | | | | 28,609,746 | |
| | | | | | | | | | | | |
| | | | |
| Life Sciences Tools & Services: 1.10% | | | | | | | | | | | | |
Cambrex Corporation † | | | | | | | 190,100 | | | | 3,706,950 | |
ICON plc ADR † | | | | | | | 257,400 | | | | 9,817,236 | |
| | | | |
| | | | | | | | | | | 13,524,186 | |
| | | | | | | | | | | | |
The accompanying notes are an integral part of these financial statements.
| | | | |
| 70 | | Wells Fargo Advantage Equity Gateway Funds | | Portfolio of investments—November 30, 2013 (unaudited) |
EMERGING GROWTH PORTFOLIO
| | | | | | | | | | | | |
| Security name | | | | | | Shares | | | Value | |
| | | | | | | | | | | | |
| | | | |
| Pharmaceuticals: 3.33% | | | | | | | | | | | | |
AcelRx Pharmaceuticals Incorporated †« | | | | | | | 545,130 | | | $ | 5,331,371 | |
Akorn Incorporated † | | | | | | | 830,235 | | | | 21,378,551 | |
Jazz Pharmaceuticals plc † | | | | | | | 96,180 | | | | 11,245,366 | |
Lannett Company Incorporated † | | | | | | | 101,800 | | | | 3,007,172 | |
| | | | |
| | | | | | | | | | | 40,962,460 | |
| | | | | | | | | | | | |
| | | | |
Industrials: 13.79% | | | | | | | | | | | | |
| | | | |
| Building Products: 1.24% | | | | | | | | | | | | |
A.O. Smith Corporation | | | | | | | 282,500 | | | | 15,297,375 | |
| | | | | | | | | | | | |
| | | | |
| Electrical Equipment: 0.90% | | | | | | | | | | | | |
Power Solutions International Incorporated † | | | | | | | 80,799 | | | | 6,043,765 | |
Powersecure International Incorporated † | | | | | | | 282,500 | | | | 4,963,525 | |
| | | | |
| | | | | | | | | | | 11,007,290 | |
| | | | | | | | | | | | |
| | | | |
| Machinery: 4.28% | | | | | | | | | | | | |
Chart Industries Incorporated † | | | | | | | 196,785 | | | | 19,147,181 | |
Proto Labs Incorporated † | | | | | | | 125,755 | | | | 9,343,597 | |
The ExOne Company † | | | | | | | 26,100 | | | | 1,393,740 | |
The Middleby Corporation † | | | | | | | 103,150 | | | | 22,779,646 | |
| | | | |
| | | | | | | | | | | 52,664,164 | |
| | | | | | | | | | | | |
| | | | |
| Professional Services: 4.75% | | | | | | | | | | | | |
Corporate Executive Board Company | | | | | | | 251,800 | | | | 18,540,034 | |
On Assignment Incorporated † | | | | | | | 865,013 | | | | 29,436,391 | |
Wageworks Incorporated † | | | | | | | 181,850 | | | | 10,420,005 | |
| | | | |
| | | | | | | | | | | 58,396,430 | |
| | | | | | | | | | | | |
| | | | |
| Road & Rail: 0.98% | | | | | | | | | | | | |
Roadrunner Transportation Systems Incorporated † | | | | | | | 442,400 | | | | 12,112,912 | |
| | | | | | | | | | | | |
| | | | |
| Trading Companies & Distributors: 1.64% | | | | | | | | | | | | |
DXP Enterprises Incorporated † | | | | | | | 206,116 | | | | 20,195,246 | |
| | | | | | | | | | | | |
| | | | |
Information Technology: 29.81% | | | | | | | | | | | | |
| | | | |
| Computers & Peripherals: 0.42% | | | | | | | | | | | | |
Stratasys Limited † | | | | | | | 43,600 | | | | 5,134,772 | |
| | | | | | | | | | | | |
| | | | |
| Electronic Equipment, Instruments & Components: 0.66% | | | | | | | | | | | | |
Methode Electronics Incorporated | | | | | | | 281,925 | | | | 8,156,090 | |
| | | | | | | | | | | | |
| | | | |
| Internet Software & Services: 10.21% | | | | | | | | | | | | |
CoStar Group Incorporated † | | | | | | | 120,900 | | | | 22,516,416 | |
Demandware Incorporated † | | | | | | | 241,200 | | | | 13,668,804 | |
Envestnet Incorporated † | | | | | | | 624,992 | | | | 24,843,432 | |
MercadoLibre Incorporated « | | | | | | | 26,430 | | | | 2,926,065 | |
OpenTable Incorporated † | | | | | | | 117,600 | | �� | | 9,827,832 | |
Pandora Media Incorporated † | | | | | | | 230,600 | | | | 6,549,040 | |
SciQuest Incorporated † | | | | | | | 513,218 | | | | 14,349,575 | |
SPS Commerce Incorporated † | | | | | | | 470,732 | | | | 30,960,043 | |
| | | | |
| | | | | | | | | | | 125,641,207 | |
| | | | | | | | | | | | |
The accompanying notes are an integral part of these financial statements.
| | | | | | |
| Portfolio of investments—November 30, 2013 (unaudited) | | Wells Fargo Advantage Equity Gateway Funds | | | 71 | |
EMERGING GROWTH PORTFOLIO
| | | | | | | | | | | | | | |
| Security name | | | | | | | Shares | | | Value | |
| | | | | | | | | | | | | | |
| | | | |
| IT Services: 2.92% | | | | | | | | | | | | | | |
InterXion Holding NV † | | | | | | | | | 580,900 | | | $ | 13,076,059 | |
Maximus Incorporated | | | | | | | | | 273,400 | | | | 12,439,700 | |
Wex Incorporated † | | | | | | | | | 105,421 | | | | 10,464,088 | |
| | | | |
| | | | | | | | | | | | | 35,979,847 | |
| | | | | | | | | | | | | | |
| | | | |
| Software: 15.60% | | | | | | | | | | | | | | |
Aspen Technology Incorporated † | | | | | | | | | 331,100 | | | | 13,088,383 | |
Ellie Mae Incorporated † | | | | | | | | | 526,500 | | | | 14,847,300 | |
Fleetmatics Group plc † | | | | | | | | | 641,820 | | | | 24,838,434 | |
Fortinet Incorporated † | | | | | | | | | 296,300 | | | | 5,066,730 | |
Guidewire Software Incorporated † | | | | | | | | | 278,601 | | | | 13,297,626 | |
Imperva Incorporated † | | | | | | | | | 479,191 | | | | 21,554,011 | |
Infoblox Incorporated † | | | | | | | | | 397,021 | | | | 12,617,327 | |
Proofpoint Incorporated † | | | | | | | | | 550,700 | | | | 16,796,350 | |
PROS Holdings Incorporated † | | | | | | | | | 409,722 | | | | 15,790,686 | |
Rally Software Development Corporation † | | | | | | | | | 225,315 | | | | 5,542,749 | |
SolarWinds Incorporated † | | | | | | | | | 59,626 | | | | 1,993,893 | |
Synchronoss Technologies Incorporated † | | | | | | | | | 438,101 | | | | 13,900,945 | |
Tyler Technologies Incorporated † | | | | | | | | | 167,325 | | | | 17,169,218 | |
Ultimate Software Group Incorporated † | | | | | | | | | 98,170 | | | | 15,382,257 | |
| | | | |
| | | | | | | | | | | | | 191,885,909 | |
| | | | | | | | | | | | | | |
| | | | |
Total Common Stocks (Cost $798,977,657) | | | | | | | | | | | | | 1,217,490,452 | |
| | | | | | | | | | | | | | |
| | | | |
| | | Yield | | | | | | | | | |
| Short-Term Investments: 3.66% | | | | | | | | | | | | | | |
| | | | |
| Investment Companies: 3.66% | | | | | | | | | | | | | | |
Wells Fargo Advantage Cash Investment Money Market Fund, Select Class (l)(u) | | | 0.08 | % | | | | | 13,303,139 | | | | 13,303,139 | |
Wells Fargo Securities Lending Cash Investments, LLC (v)(r)(l)(u) | | | 0.08 | | | | | | 31,741,350 | | | | 31,741,350 | |
| | | | |
Total Short-Term Investments (Cost $45,044,489) | | | | | | | | | | | | | 45,044,489 | |
| | | | | | | | | | | | | | |
| | | | | | | | |
Total investments in securities (Cost $844,022,146) * | | | 102.61 | % | | | 1,262,534,941 | |
Other assets and liabilities, net | | | (2.61 | ) | | | (32,080,878 | ) |
| | | | | | | | |
| Total net assets | | | 100.00 | % | | $ | 1,230,454,063 | |
| | | | | | | | |
| † | Non-income-earning security |
| « | All or a portion of this security is on loan. |
| (l) | Investment in an affiliate |
| (u) | Rate shown is the 7-day annualized yield at period end. |
| (v) | Security represents investment of cash collateral received from securities on loan. |
| (r) | The investment company is exempt from registration under Section 3(c)(7) of the Investment Company Act of 1940, as amended. |
| * | Cost for federal income tax purposes is $845,075,916 and unrealized appreciation (depreciation) consists of: |
| | | | |
Gross unrealized appreciation | | $ | 431,737,779 | |
Gross unrealized depreciation | | | (14,278,754 | ) |
| | | | |
Net unrealized appreciation | | $ | 417,459,025 | |
The accompanying notes are an integral part of these financial statements.
| | | | |
| 72 | | Wells Fargo Advantage Equity Gateway Funds | | Summary portfolio of investments—November 30, 2013 (unaudited) |
INDEX PORTFOLIO
The Summary Portfolio of Investments shows the 50 largest portfolio holdings in unaffiliated issuers and any holdings exceeding 1% of the total net assets as of the report date. The remaining securities held are grouped as “Other securities” in each category. You can request a complete schedule of portfolio holdings as of the report date, free of charge, by accessing the following website: http://a584.g.akamai.net/f/584/1326/1d/www.wellsfargoadvantagefunds.com/pdf/semi/holdings/index.pdf or by calling Wells Fargo Advantage Funds at 1-800-222-8222. This complete schedule, filed on Form N-CSRS, is also available on the SEC’s website at sec.gov.
| | | | | | | | | | | | | | | | |
| Security name | | | | | | Shares | | | Value | | | Percent of net assets | |
| | | | | | | | | | | | | | | | |
| | | | | |
Common Stocks: 98.53% | | | | | | | | | | | | | | | | |
| | | | | |
Consumer Discretionary: 12.42% | | | | | | | | | | | | | | | | |
| | | | | |
| Auto Components: 0.42% | | | | | | | | | | | | | | | | |
Other securities | | | | | | | | | | $ | 12,028,001 | | | | 0.42 | % |
| | | | | | | | | | | | | | | | |
| | | | | |
| Automobiles: 0.73% | | | | | | | | | | | | | | | | |
Other securities | | | | | | | | | | | 20,741,902 | | | | 0.73 | |
| | | | | | | | | | | | | | | | |
| | | | | |
| Distributors: 0.08% | | | | | | | | | | | | | | | | |
Other securities | | | | | | | | | | | 2,241,816 | | | | 0.08 | |
| | | | | | | | | | | | | | | | |
| | | | | |
| Diversified Consumer Services: 0.05% | | | | | | | | | | | | | | | | |
Other securities | | | | | | | | | | | 1,334,788 | | | | 0.05 | |
| | | | | | | | | | | | | | | | |
| | | | | |
| Hotels, Restaurants & Leisure: 1.75% | | | | | | | | | | | | | | | | |
McDonald’s Corporation | | | | | | | 174,692 | | | | 17,009,760 | | | | 0.60 | |
Other securities | | | | | | | | | | | 32,769,719 | | | | 1.15 | |
| | | | | |
| | | | | | | | | | | 49,779,479 | | | | 1.75 | |
| | | | | | | | | | | | | | | | |
| | | | | |
| Household Durables: 0.33% | | | | | | | | | | | | | | | | |
Other securities | | | | | | | | | | | 9,571,743 | | | | 0.33 | |
| | | | | | | | | | | | | | | | |
| | | | | |
| Internet & Catalog Retail: 1.50% | | | | | | | | | | | | | | | | |
Amazon.com Incorporated † | | | | | | | 64,672 | | | | 25,456,193 | | | | 0.89 | |
Other securities | | | | | | | | | | | 17,414,750 | | | | 0.61 | |
| | | | | |
| | | | | | | | | | | 42,870,943 | | | | 1.50 | |
| | | | | | | | | | | | | | | | |
| | | | | |
| Leisure Equipment & Products: 0.14% | | | | | | | | | | | | | | | | |
Other securities | | | | | | | | | | | 3,871,881 | | | | 0.14 | |
| | | | | | | | | | | | | | | | |
| | | | | |
| Media: 3.61% | | | | | | | | | | | | | | | | |
Comcast Corporation Class A | | | | | | | 457,062 | | | | 22,793,682 | | | | 0.80 | |
Walt Disney Company | | | | | | | 290,334 | | | | 20,480,160 | | | | 0.72 | |
Other securities | | | | | | | | | | | 59,662,600 | | | | 2.09 | |
| | | | | |
| | | | | | | | | | | 102,936,442 | | | | 3.61 | |
| | | | | | | | | | | | | | | | |
| | | | | |
| Multiline Retail: 0.71% | | | | | | | | | | | | | | | | |
Other securities | | | | | | | | | | | 20,256,710 | | | | 0.71 | |
| | | | | | | | | | | | | | | | |
| | | | | |
| Specialty Retail: 2.25% | | | | | | | | | | | | | | | | |
Home Depot Incorporated | | | | | | | 250,324 | | | | 20,193,637 | | | | 0.71 | |
Other securities | | | | | | | | | | | 43,896,649 | | | | 1.54 | |
| | | | | |
| | | | | | | | | | | 64,090,286 | | | | 2.25 | |
| | | | | | | | | | | | | | | | |
The accompanying notes are an integral part of these financial statements.
| | | | | | |
| Summary portfolio of investments—November 30, 2013 (unaudited) | | Wells Fargo Advantage Equity Gateway Funds | | | 73 | |
INDEX PORTFOLIO
| | | | | | | | | | | | | | | | |
| Security name | | | | | | Shares | | | Value | | | Percent of net assets | |
| | | | | | | | | | | | | | | | |
| | | | | |
| Textiles, Apparel & Luxury Goods: 0.85% | | | | | | | | | | | | | | | | |
Other securities | | | | | | | | | | $ | 24,229,309 | | | | 0.85 | % |
| | | | | | | | | | | | | | | | |
| | | | | |
Consumer Staples: 9.91% | | | | | | | | | | | | | | | | |
| | | | | |
| Beverages: 2.18% | | | | | | | | | | | | | | | | |
PepsiCo Incorporated | | | | | | | 269,507 | | | | 22,762,561 | | | | 0.80 | |
The Coca-Cola Company | | | | | | | 666,250 | | | | 26,776,588 | | | | 0.94 | |
Other securities | | | | | | | | | | | 12,475,103 | | | | 0.44 | |
| | | | | |
| | | | | | | | | | | 62,014,252 | | | | 2.18 | |
| | | | | | | | | | | | | | | | |
| | | | | |
| Food & Staples Retailing: 2.40% | | | | | | | | | | | | | | | | |
CVS Caremark Corporation | | | | | | | 214,662 | | | | 14,373,768 | | | | 0.50 | |
Wal-Mart Stores Incorporated | | | | | | | 284,451 | | | | 23,043,376 | | | | 0.81 | |
Other securities | | | | | | | | | | | 30,964,082 | | | | 1.09 | |
| | | | | |
| | | | | | | | | | | 68,381,226 | | | | 2.40 | |
| | | | | | | | | | | | | | | | |
| | | | | |
| Food Products: 1.55% | | | | | | | | | | | | | | | | |
Other securities | | | | | | | | | | | 44,250,487 | | | | 1.55 | |
| | | | | | | | | | | | | | | | |
| | | | | |
| Household Products: 2.10% | | | | | | | | | | | | | | | | |
Procter & Gamble Company | | | | | | | 478,608 | | | | 40,308,366 | | | | 1.41 | |
Other securities | | | | | | | | | | | 19,565,908 | | | | 0.69 | |
| | | | | |
| | | | | | | | | | | 59,874,274 | | | | 2.10 | |
| | | | | | | | | | | | | | | | |
| | | | | |
| Personal Products: 0.16% | | | | | | | | | | | | | | | | |
Other securities | | | | | | | | | | | 4,700,649 | | | | 0.16 | |
| | | | | | | | | | | | | | | | |
| | | | | |
| Tobacco: 1.52% | | | | | | | | | | | | | | | | |
Altria Group Incorporated | | | | | | | 350,278 | | | | 12,953,280 | | | | 0.45 | |
Philip Morris International | | | | | | | 282,847 | | | | 24,194,732 | | | | 0.85 | |
Other securities | | | | | | | | | | | 6,145,152 | | | | 0.22 | |
| | | | | |
| | | | | | | | | | | 43,293,164 | | | | 1.52 | |
| | | | | | | | | | | | | | | | |
| | | | | |
Energy: 10.14% | | | | | | | | | | | | | | | | |
| | | | | |
| Energy Equipment & Services: 1.89% | | | | | | | | | | | | | | | | |
Schlumberger Limited | | | | | | | 231,231 | | | | 20,445,445 | | | | 0.72 | |
Other securities | | | | | | | | | | | 33,403,915 | | | | 1.17 | |
| | | | | |
| | | | | | | | | | | 53,849,360 | | | | 1.89 | |
| | | | | | | | | | | | | | | | |
| | | | | |
| Oil, Gas & Consumable Fuels: 8.25% | | | | | | | | | | | | | | | | |
Chevron Corporation | | | | | | | 337,628 | | | | 41,339,172 | | | | 1.45 | |
ConocoPhillips Company | | | | | | | 213,725 | | | | 15,559,180 | | | | 0.55 | |
Exxon Mobil Corporation | | | | | | | 769,201 | | | | 71,904,909 | | | | 2.52 | |
Occidental Petroleum Corporation | | | | | | | 140,810 | | | | 13,371,318 | | | | 0.47 | |
Other securities | | | | | | | | | | | 92,841,347 | | | | 3.26 | |
| | | | | |
| | | | | | | | | | | 235,015,926 | | | | 8.25 | |
| | | | | | | | | | | | | | | | |
The accompanying notes are an integral part of these financial statements.
| | | | |
| 74 | | Wells Fargo Advantage Equity Gateway Funds | | Summary portfolio of investments—November 30, 2013 (unaudited) |
INDEX PORTFOLIO
| | | | | | | | | | | | | | | | |
| Security name | | | | | | Shares | | | Value | | | Percent of net assets | |
| | | | | | | | | | | | | | | | |
| | | | | |
Financials: 16.04% | | | | | | | | | | | | | | | | |
| | | | | |
| Capital Markets: 2.18% | | | | | | | | | | | | | | | | |
Other securities | | | | | | | | | | $ | 61,981,692 | | | | 2.18 | % |
| | | | | | | | | | | | | | | | |
| | | | | |
| Commercial Banks: 2.76% | | | | | | | | | | | | | | | | |
Wells Fargo & Company (l) | | | | | | | 844,392 | | | | 37,170,136 | | | | 1.31 | |
Other securities | | | | | | | | | | | 41,356,674 | | | | 1.45 | |
| | | | | |
| | | | | | | | | | | 78,526,810 | | | | 2.76 | |
| | | | | | | | | | | | | | | | |
| | | | | |
| Consumer Finance: 0.97% | | | | | | | | | | | | | | | | |
American Express Company | | | | | | | 162,140 | | | | 13,911,612 | | | | 0.49 | |
Other securities | | | | | | | | | | | 13,864,651 | | | | 0.48 | |
| | | | | |
| | | | | | | | | | | 27,776,263 | | | | 0.97 | |
| | | | | | | | | | | | | | | | |
| | | | | |
| Diversified Financial Services: 5.24% | | | | | | | | | | | | | | | | |
Bank of America Corporation | | | | | | | 1,877,399 | | | | 29,700,452 | | | | 1.04 | |
Berkshire Hathaway Incorporated Class B † | | | | | | | 314,543 | | | | 36,653,696 | | | | 1.29 | |
Citigroup Incorporated | | | | | | | 531,430 | | | | 28,123,276 | | | | 0.99 | |
JPMorgan Chase & Company | | | | | | | 657,807 | | | | 37,639,717 | | | | 1.32 | |
Other securities | | | | | | | | | | | 17,232,780 | | | | 0.60 | |
| | | | | |
| | | | | | | | | | | 149,349,921 | | | | 5.24 | |
| | | | | | | | | | | | | | | | |
| | | | | |
| Insurance: 3.02% | | | | | | | | | | | | | | | | |
American International Group Incorporated | | | | | | | 257,998 | | | | 12,835,401 | | | | 0.45 | |
Other securities | | | | | | | | | | | 73,222,629 | | | | 2.57 | |
| | | | | |
| | | | | | | | | | | 86,058,030 | | | | 3.02 | |
| | | | | | | | | | | | | | | | |
| | | | | |
| Real Estate Management & Development: 0.04% | | | | | | | | | | | | | | | | |
Other securities | | | | | | | | | | | 1,174,525 | | | | 0.04 | |
| | | | | | | | | | | | | | | | |
| | | | | |
| REITs: 1.77% | | | | | | | | | | | | | | | | |
Other securities | | | | | | | | | | | 50,498,845 | | | | 1.77 | |
| | | | | | | | | | | | | | | | |
| | | | | |
| Thrifts & Mortgage Finance: 0.06% | | | | | | | | | | | | | | | | |
Other securities | | | | | | | | | | | 1,625,483 | | | | 0.06 | |
| | | | | | | | | | | | | | | | |
| | | | | |
Health Care: 13.02% | | | | | | | | | | | | | | | | |
| | | | | |
| Biotechnology: 2.45% | | | | | | | | | | | | | | | | |
Amgen Incorporated | | | | | | | 131,652 | | | | 15,018,860 | | | | 0.53 | |
Gilead Sciences Incorporated † | | | | | | | 267,482 | | | | 20,010,328 | | | | 0.70 | |
Other securities | | | | | | | | | | | 34,797,090 | | | | 1.22 | |
| | | | | |
| | | | | | | | | | | 69,826,278 | | | | 2.45 | |
| | | | | | | | | | | | | | | | |
| | | | | |
| Health Care Equipment & Supplies: 2.04% | | | | | | | | | | | | | | | | |
Other securities | | | | | | | | | | | 58,188,290 | | | | 2.04 | |
| | | | | | | | | | | | | | | | |
| | | | | |
| Health Care Providers & Services: 2.07% | | | | | | | | | | | | | | | | |
UnitedHealth Group Incorporated | | | | | | | 177,672 | | | | 13,233,011 | | | | 0.46 | |
Other securities | | | | | | | | | | | 45,817,066 | | | | 1.61 | |
| | | | | |
| | | | | | | | | | | 59,050,077 | | | | 2.07 | |
| | | | | | | | | | | | | | | | |
The accompanying notes are an integral part of these financial statements.
| | | | | | |
| Summary portfolio of investments—November 30, 2013 (unaudited) | | Wells Fargo Advantage Equity Gateway Funds | | | 75 | |
INDEX PORTFOLIO
| | | | | | | | | | | | | | | | |
| Security name | | | | | | Shares | | | Value | | | Percent of net assets | |
| | | | | | | | | | | | | | | | |
| | | | | |
| Health Care Technology: 0.10% | | | | | | | | | | | | | | | | |
Other securities | | | | | | | | | | $ | 2,963,441 | | | | 0.10 | % |
| | | | | | | | | | | | | | | | |
| | | | | |
| Life Sciences Tools & Services: 0.49% | | | | | | | | | | | | | | | | |
Other securities | | | | | | | | | | | 13,961,340 | | | | 0.49 | |
| | | | | | | | | | | | | | | | |
| | | | | |
| Pharmaceuticals: 5.87% | | | | | | | | | | | | | | | | |
Abbvie Incorporated | | | | | | | 277,059 | | | | 13,423,509 | | | | 0.47 | |
Bristol-Myers Squibb Company | | | | | | | 287,701 | | | | 14,782,077 | | | | 0.52 | |
Johnson & Johnson | | | | | | | 492,468 | | | | 46,617,021 | | | | 1.64 | |
Merck & Company Incorporated | | | | | | | 511,394 | | | | 25,482,763 | | | | 0.89 | |
Pfizer Incorporated | | | | | | | 1,156,921 | | | | 36,709,103 | | | | 1.29 | |
Other securities | | | | | | | | | | | 30,160,740 | | | | 1.06 | |
| | | | | |
| | | | | | | | | | | 167,175,213 | | | | 5.87 | |
| | | | | | | | | | | | | | | | |
| | | | | |
Industrials: 10.69% | | | | | | | | | | | | | | | | |
| | | | | |
| Aerospace & Defense: 2.73% | | | | | | | | | | | | | | | | |
Boeing Company | | | | | | | 121,294 | | | | 16,283,720 | | | | 0.57 | |
United Technologies Corporation | | | | | | | 147,511 | | | | 16,353,069 | | | | 0.57 | |
Other securities | | | | | | | | | | | 45,205,205 | | | | 1.59 | |
| | | | | |
| | | | | | | | | | | 77,841,994 | | | | 2.73 | |
| | | | | | | | | | | | | | | | |
| | | | | |
| Air Freight & Logistics: 0.82% | | | | | | | | | | | | | | | | |
United Parcel Service Incorporated Class B | | | | | | | 126,255 | | | | 12,925,987 | | | | 0.45 | |
Other securities | | | | | | | | | | | 10,402,390 | | | | 0.37 | |
| | | | | |
| | | | | | | | | | | 23,328,377 | | | | 0.82 | |
| | | | | | | | | | | | | | | | |
| | | | | |
| Airlines: 0.23% | | | | | | | | | | | | | | | | |
Other securities | | | | | | | | | | | 6,639,219 | | | | 0.23 | |
| | | | | | | | | | | | | | | | |
| | | | | |
| Building Products: 0.05% | | | | | | | | | | | | | | | | |
Other securities | | | | | | | | | | | 1,398,492 | | | | 0.05 | |
| | | | | | | | | | | | | | | | |
| | | | | |
| Commercial Services & Supplies: 0.49% | | | | | | | | | | | | | | | | |
Other securities | | | | | | | | | | | 14,048,313 | | | | 0.49 | |
| | | | | | | | | | | | | | | | |
| | | | | |
| Construction & Engineering: 0.17% | | | | | | | | | | | | | | | | |
Other securities | | | | | | | | | | | 4,696,034 | | | | 0.17 | |
| | | | | | | | | | | | | | | | |
| | | | | |
| Electrical Equipment: 0.75% | | | | | | | | | | | | | | | | |
Other securities | | | | | | | | | | | 21,483,385 | | | | 0.75 | |
| | | | | | | | | | | | | | | | |
| | | | | |
| Industrial Conglomerates: 2.47% | | | | | | | | | | | | | | | | |
3M Company | | | | | | | 113,467 | | | | 15,148,979 | | | | 0.53 | |
General Electric Company | | | | | | | 1,779,651 | | | | 47,445,496 | | | | 1.67 | |
Other securities | | | | | | | | | | | 7,819,293 | | | | 0.27 | |
| | | | | |
| | | | | | | | | | | 70,413,768 | | | | 2.47 | |
| | | | | | | | | | | | | | | | |
| | | | | |
| Machinery: 1.72% | | | | | | | | | | | | | | | | |
Other securities | | | | | | | | | | | 48,877,693 | | | | 1.72 | |
| | | | | | | | | | | | | | | | |
The accompanying notes are an integral part of these financial statements.
| | | | |
| 76 | | Wells Fargo Advantage Equity Gateway Funds | | Summary portfolio of investments—November 30, 2013 (unaudited) |
INDEX PORTFOLIO
| | | | | | | | | | | | | | | | |
| Security name | | | | | | Shares | | | Value | | | Percent of net assets | |
| | | | | | | | | | | | | | | | |
| | | | | |
| Professional Services: 0.18% | | | | | | | | | | | | | | | | |
Other securities | | | | | | | | | | $ | 5,062,350 | | | | 0.18 | % |
| | | | | | | | | | | | | | | | |
| | | | | |
| Road & Rail: 0.90% | | | | | | | | | | | | | | | | |
Union Pacific Corporation | | | | | | | 81,058 | | | | 13,134,638 | | | | 0.46 | |
Other securities | | | | | | | | | | | 12,605,290 | | | | 0.44 | |
| | | | | |
| | | | | | | | | | | 25,739,928 | | | | 0.90 | |
| | | | | | | | | | | | | | | | |
| | | | | |
| Trading Companies & Distributors: 0.18% | | | | | | | | | | | | | | | | |
Other securities | | | | | | | | | | | 5,008,641 | | | | 0.18 | |
| | | | | | | | | | | | | | | | |
| | | | | |
| Information Technology: 17.64% | | | | | | | | | | | | | | | | |
| | | | | |
| Communications Equipment: 1.73% | | | | | | | | | | | | | | | | |
Cisco Systems Incorporated | | | | | | | 936,950 | | | | 19,910,188 | | | | 0.70 | |
QUALCOMM Incorporated | | | | | | | 299,777 | | | | 22,057,592 | | | | 0.77 | |
Other securities | | | | | | | | | | | 7,354,501 | | | | 0.26 | |
| | | | | |
| | | | | | | | | | | 49,322,281 | | | | 1.73 | |
| | | | | | | | | | | | | | | | |
| | | | | |
| Computers & Peripherals: 4.10% | | | | | | | | | | | | | | | | |
Apple Incorporated | | | | | | | 158,763 | | | | 88,283,341 | | | | 3.10 | |
Other securities | | | | | | | | | | | 28,543,584 | | | | 1.00 | |
| | | | | |
| | | | | | | | | | | 116,826,925 | | | | 4.10 | |
| | | | | | | | | | | | | | | | |
| | | | | |
| Electronic Equipment, Instruments & Components: 0.45% | | | | | | | | | | | | | | | | |
Other securities | | | | | | | | | | | 12,849,328 | | | | 0.45 | |
| | | | | | | | | | | | | | | | |
| | | | | |
| Internet Software & Services: 2.49% | | | | | | | | | | | | | | | | |
Google Incorporated Class A † | | | | | | | 48,885 | | | | 51,798,057 | | | | 1.82 | |
Other securities | | | | | | | | | | | 19,151,520 | | | | 0.67 | |
| | | | | |
| | | | | | | | | | | 70,949,577 | | | | 2.49 | |
| | | | | | | | | | | | | | | | |
| | | | | |
| IT Services: 3.43% | | | | | | | | | | | | | | | | |
International Business Machines Corporation | | | | | | | 179,944 | | | | 32,332,338 | | | | 1.13 | |
MasterCard Incorporated | | | | | | | 18,128 | | | | 13,791,964 | | | | 0.48 | |
Visa Incorporated Class A | | | | | | | 90,207 | | | | 18,353,516 | | | | 0.64 | |
Other securities | | | | | | | | | | | 33,169,122 | | | | 1.18 | |
| | | | | |
| | | | | | | | | | | 97,646,940 | | | | 3.43 | |
| | | | | | | | | | | | | | | | |
| | | | | |
| Office Electronics: 0.08% | | | | | | | | | | | | | | | | |
Other securities | | | | | | | | | | | 2,304,063 | | | | 0.08 | |
| | | | | | | | | | | | | | | | |
| | | | | |
| Semiconductors & Semiconductor Equipment: 1.96% | | | | | | | | | | | | | | | | |
Intel Corporation | | | | | | | 870,622 | | | | 20,755,628 | | | | 0.73 | |
Other securities | | | | | | | | | | | 34,997,584 | | | | 1.23 | |
| | | | | |
| | | | | | | | | | | 55,753,212 | | | | 1.96 | |
| | | | | | | | | | | | | | | | |
The accompanying notes are an integral part of these financial statements.
| | | | | | |
| Summary portfolio of investments—November 30, 2013 (unaudited) | | Wells Fargo Advantage Equity Gateway Funds | | | 77 | |
INDEX PORTFOLIO
| | | | | | | | | | | | | | | | |
| Security name | | | | | | Shares | | | Value | | | Percent of net assets | |
| | | | | | | | | | | | | | | | |
| | | | | |
| Software: 3.40% | | | | | | | | | | | | | | | | |
Microsoft Corporation | | | | | | | 1,324,677 | | | $ | 50,509,934 | | | | 1.77 | % |
Oracle Corporation | | | | | | | 623,122 | | | | 21,989,975 | | | | 0.77 | |
Other securities | | | | | | | | | | | 24,559,684 | | | | 0.86 | |
| | | | | |
| | | | | | | | | | | 97,059,593 | | | | 3.40 | |
| | | | | | | | | | | | | | | | |
| | | | | |
Materials: 3.40% | | | | | | | | | | | | | | | | |
| | | | | |
| Chemicals: 2.49% | | | | | | | | | | | | | | | | |
Other securities | | | | | | | | | | | 70,897,607 | | | | 2.49 | |
| | | | | | | | | | | | | | | | |
| | | | | |
| Construction Materials: 0.04% | | | | | | | | | | | | | | | | |
Other securities | | | | | | | | | | | 1,280,219 | | | | 0.04 | |
| | | | | | | | | | | | | | | | |
| | | | | |
| Containers & Packaging: 0.21% | | | | | | | | | | | | | | | | |
Other securities | | | | | | | | | | | 5,943,804 | | | | 0.21 | |
| | | | | | | | | | | | | | | | |
| | | | | |
| Metals & Mining: 0.53% | | | | | | | | | | | | | | | | |
Other securities | | | | | | | | | | | 15,060,297 | | | | 0.53 | |
| | | | | | | | | | | | | | | | |
| | | | | |
| Paper & Forest Products: 0.13% | | | | | | | | | | | | | | | | |
Other securities | | | | | | | | | | | 3,635,574 | | | | 0.13 | |
| | | | | | | | | | | | | | | | |
| | | | | |
Telecommunication Services: 2.34% | | | | | | | | | | | | | | | | |
| | | | | |
| Diversified Telecommunication Services: 2.19% | | | | | | | | | | | | | | | | |
AT&T Incorporated | | | | | | | 928,116 | | | | 32,678,964 | | | | 1.15 | |
Verizon Communications Incorporated | | | | | | | 500,083 | | | | 24,814,118 | | | | 0.87 | |
Other securities | | | | | | | | | | | 4,876,218 | | | | 0.17 | |
| | | | | |
| | | | | | | | | | | 62,369,300 | | | | 2.19 | |
| | | | | | | | | | | | | | | | |
| | | | | |
| Wireless Telecommunication Services: 0.15% | | | | | | | | | | | | | | | | |
Other securities | | | | | | | | | | | 4,269,932 | | | | 0.15 | |
| | | | | | | | | | | | | | | | |
| | | | | |
Utilities: 2.93% | | | | | | | | | | | | | | | | |
| | | | | |
| Electric Utilities: 1.61% | | | | | | | | | | | | | | | | |
Other securities | | | | | | | | | | | 46,030,341 | | | | 1.61 | |
| | | | | | | | | | | | | | | | |
| | | | | |
| Gas Utilities: 0.11% | | | | | | | | | | | | | | | | |
Other securities | | | | | | | | | | | 3,056,989 | | | | 0.11 | |
| | | | | | | | | | | | | | | | |
| | | | | |
| Independent Power Producers & Energy Traders: 0.11% | | | | | | | | | | | | | | | | |
Other securities | | | | | | | | | | | 3,060,395 | | | | 0.11 | |
| | | | | | | | | | | | | | | | |
| | | | | |
| Multi-Utilities: 1.10% | | | | | | | | | | | | | | | | |
Other securities | | | | | | | | | | | 31,383,171 | | | | 1.10 | |
| | | | | | | | | | | | | | | | |
| | | | | |
Total Common Stocks (Cost $1,688,319,423) | | | | | | | | | | | 2,807,726,588 | | | | 98.53 | |
| | | | | | | | | | | | | | | | |
The accompanying notes are an integral part of these financial statements.
| | | | |
| 78 | | Wells Fargo Advantage Equity Gateway Funds | | Summary portfolio of investments—November 30, 2013 (unaudited) |
INDEX PORTFOLIO
| | | | | | | | | | | | | | | | | | | | |
| Security name | | Yield | | | | | | Shares | | | Value | | | Percent of net assets | |
| | | | | | | | | | | | | | | | | | | | |
| | | | | |
Short-Term Investments: 1.56% | | | | | | | | | | | | | | | | | | | | |
| | | | | |
| Investment Companies: 1.47% | | | | | | | | | | | | | | | | | | | | |
Wells Fargo Advantage Cash Investment Money Market Fund, Select Class (l)(u) | | | 0.08 | % | | | | | | | 32,725,140 | | | $ | 32,725,140 | | | | 1.15 | % |
Wells Fargo Securities Lending Cash Investments, LLC (l)(u)(v)(r) | | | 0.08 | | | | | | | | 9,164,555 | | | | 9,164,555 | | | | 0.32 | |
| | | | | |
| | | | | | | | | | | | | | | 41,889,695 | | | | 1.47 | |
| | | | | | | | | | | | | | | | | | | | |
| | | | | |
| | | | | | Maturity date | | | Principal | | | | | | | |
| | | | | |
| U.S. Treasury Securities: 0.09% | | | | | | | | | | | | | | | | | | | | |
U.S. Treasury Bill (z)# | | | 0.01 | | | | 1-2-2014 | | | $ | 700,000 | | | | 699,994 | | | | 0.03 | |
U.S. Treasury Bill (z)# | | | 0.07 | | | | 4-10-2014 | | | | 1,750,000 | | | | 1,749,561 | | | | 0.06 | |
| | | | | |
| | | | | | | | | | | | | | | 2,449,555 | | | | 0.09 | |
| | | | | | | | | | | | | | | | | | | | |
| | | | | |
Total Short-Term Investments (Cost $44,339,250) | | | | | | | | | | | | | | | 44,339,250 | | | | 1.56 | |
| | | | | | | | | | | | | | | | | | | | |
| Total investments in securities | | | | | | | | | | | | | | | | | | | | |
| (Cost $1,732,658,673) * | | | | | | | | | | | | | | | 2,852,065,838 | | | | 100.09 | % |
Other assets and liabilities, net | | | | | | | | | | | | | | | (2,592,238 | ) | | | (0.09 | ) |
| | | | | | | | | | | | | | | | | | | | |
| Total net assets | | | | | | | | | | | | | | $ | 2,849,473,600 | | | | 100.00 | % |
| | | | | | | | | | | | | | | | | | | | |
| † | Non-income-earning security |
| (l) | Investment in an affiliate |
| (u) | Rate shown is the 7-day annualized yield at period end. |
| (v) | Security represents investment of cash collateral received from securities on loan. |
| (r) | The investment company is exempt from registration under Section 3(c)(7) of the Investment Company Act of 1940, as amended. |
| (z) | Zero coupon security. Rate represents yield to maturity at time of purchase. |
| # | All or a portion of this security is segregated as collateral for investments in derivative instruments. |
| * | Cost for federal income tax purposes is $1,836,348,596 and unrealized appreciation (depreciation) consists of: |
| | | | |
Gross unrealized appreciation | | $ | 1,158,532,327 | |
Gross unrealized depreciation | | | (142,815,085 | ) |
| | | | |
Net unrealized appreciation | | $ | 1,015,717,242 | |
The accompanying notes are an integral part of these financial statements.
| | | | | | |
| Portfolio of investments—November 30, 2013 (unaudited) | | Wells Fargo Advantage Equity Gateway Funds | | | 79 | |
INTERNATIONAL GROWTH PORTFOLIO
| | | | | | | | | | | | |
| Security name | | | | | | Shares | | | Value | |
| | | | | | | | | | | | |
| | | | |
Common Stocks: 94.72% | | | | | | | | | | | | |
| | | | |
| Belgium: 4.12% | | | | | | | | | | | | |
Anheuser-Busch InBev NV (Consumer Staples, Beverages) | | | | | | | 37,003 | | | $ | 3,777,683 | |
Telenet Group Holding NV (Consumer Discretionary, Media) | | | | | | | 22,559 | | | | 1,241,179 | |
UCB SA (Health Care, Pharmaceuticals) | | | | | | | 19,886 | | | | 1,334,412 | |
| | | | |
| | | | | | | | | | | 6,353,274 | |
| | | | | | | | | | | | |
| | | | |
| Brazil: 0.25% | | | | | | | | | | | | |
BM&F Bovespa SA (Financials, Diversified Financial Services) | | | | | | | 76,800 | | | | 380,696 | |
| | | | | | | | | | | | |
| | | | |
| Canada: 0.80% | | | | | | | | | | | | |
Canadian Pacific Railway Limited (Industrials, Road & Rail) | | | | | | | 7,998 | | | | 1,230,732 | |
| | | | | | | | | | | | |
| | | | |
| China: 6.46% | | | | | | | | | | | | |
Baidu Incorporated ADR (Information Technology, Internet Software & Services) † | | | | | | | 39,488 | | | | 6,577,516 | |
China Resources Land Limited (Financials, Real Estate Management & Development) | | | | | | | 524,500 | | | | 1,444,419 | |
Tencent Holdings Limited (Information Technology, Internet Software & Services) | | | | | | | 33,800 | | | | 1,954,934 | |
| | | | |
| | | | | | | | | | | 9,976,869 | |
| | | | | | | | | | | | |
| | | | |
| Denmark: 0.37% | | | | | | | | | | | | |
Rockwool International AS B Shares (Industrials, Building Products) | | | | | | | 3,303 | | | | 577,163 | |
| | | | | | | | | | | | |
| | | | |
| France: 6.93% | | | | | | | | | | | | |
LVMH Moet Hennessy Louis Vuitton SA (Consumer Discretionary, Textiles, Apparel & Luxury Goods) « | | | | | | | 4,023 | | | | 758,303 | |
Pernod-Ricard SA (Consumer Staples, Beverages) | | | | | | | 15,019 | | | | 1,702,248 | |
Schneider Electric SA (Industrials, Electrical Equipment) | | | | | | | 37,947 | | | | 3,212,143 | |
Unibail-Rodamco SE (Financials, REITs) | | | | | | | 7,996 | | | | 2,090,501 | |
Zodiac Aerospace SA (Industrials, Aerospace & Defense) | | | | | | | 17,330 | | | | 2,939,319 | |
| | | | |
| | | | | | | | | | | 10,702,514 | |
| | | | | | | | | | | | |
| | | | |
| Germany: 17.38% | | | | | | | | | | | | |
Allianz AG (Financials, Insurance) | | | | | | | 7,242 | | | | 1,257,821 | |
Axel Springer AG (Consumer Discretionary, Media) | | | | | | | 2,569 | | | | 154,432 | |
Bayer AG (Health Care, Pharmaceuticals) | | | | | | | 42,389 | | | | 5,654,892 | |
Beiersdorf AG (Consumer Staples, Personal Products) | | | | | | | 23,968 | | | | 2,433,248 | |
Deutsche Post AG (Industrials, Air Freight & Logistics) | | | | | | | 120,799 | | | | 4,271,665 | |
Heidelbergcement AG (Materials, Construction Materials) | | | | | | | 25,189 | | | | 1,970,003 | |
Linde AG (Materials, Chemicals) | | | | | | | 29,438 | | | | 6,010,726 | |
MTU Aero Engines AG (Industrials, Aerospace & Defense) | | | | | | | 20,344 | | | | 1,911,950 | |
Muenchener Rueckversicherungs-Gesellschaft AG (Financials, Insurance) | | | | | | | 14,459 | | | | 3,162,451 | |
| | | | |
| | | | | | | | | | | 26,827,188 | |
| | | | | | | | | | | | |
| | | | |
| Hong Kong: 5.89% | | | | | | | | | | | | |
AIA Group Limited (Financials, Insurance) | | | | | | | 989,600 | | | | 5,016,514 | |
Beijing Enterprises Holdings Limited (Industrials, Industrial Conglomerates) | | | | | | | 269,000 | | | | 2,408,028 | |
Hong Kong Land Holdings Limited (Financials, Real Estate Management & Development) | | | | | | | 115,966 | | | | 685,359 | |
Sands China Limited (Consumer Discretionary, Hotels, Restaurants & Leisure) | | | | | | | 130,400 | | | | 986,496 | |
| | | | |
| | | | | | | | | | | 9,096,397 | |
| | | | | | | | | | | | |
The accompanying notes are an integral part of these financial statements.
| | | | |
| 80 | | Wells Fargo Advantage Equity Gateway Funds | | Portfolio of investments—November 30, 2013 (unaudited) |
INTERNATIONAL GROWTH PORTFOLIO
| | | | | | | | | | | | |
| Security name | | | | | | Shares | | | Value | |
| | | | | | | | | | | | |
| | | | |
| India: 0.21% | | | | | | | | | | | | |
Coal India Limited (Energy, Oil, Gas & Consumable Fuels) | | | | | | | 75,394 | | | $ | 328,107 | |
| | | | | | | | | | | | |
| | | | |
| Indonesia: 0.57% | | | | | | | | | | | | |
PT Bank Rakyat Indonesia Tbk (Financials, Commercial Banks) | | | | | | | 1,405,000 | | | | 875,005 | |
| | | | | | | | | | | | |
| | | | |
| Ireland: 2.43% | | | | | | | | | | | | |
Covidien plc (Health Care, Health Care Equipment & Supplies) | | | | | | | 54,988 | | | | 3,753,481 | |
| | | | | | | | | | | | |
| | | | |
| Japan: 11.19% | | | | | | | | | | | | |
Denso Corporation (Consumer Discretionary, Auto Components) | | | | | | | 6,300 | | | | 315,538 | |
Honda Motor Company Limited (Consumer Discretionary, Automobiles) | | | | | | | 93,600 | | | | 3,956,925 | |
Ishikawajima-Harima Heavy Industries Company Limited (Industrials, Machinery) | | | | | | | 376,000 | | | | 1,571,179 | |
Japan Tobacco Incorporated (Consumer Staples, Tobacco) | | | | | | | 72,300 | | | | 2,442,353 | |
NGK Insulators Limited (Industrials, Machinery) | | | | | | | 167,000 | | | | 3,057,115 | |
Ono Pharmaceutical Company Limited (Health Care, Pharmaceuticals) | | | | | | | 14,900 | | | | 1,128,865 | |
ORIX Corporation (Financials, Diversified Financial Services) | | | | | | | 40,800 | | | | 742,905 | |
Takeda Pharmaceutical Company Limited (Health Care, Pharmaceuticals) | | | | | | | 16,700 | | | | 811,155 | |
Toyota Motor Corporation (Consumer Discretionary, Automobiles) | | | | | | | 52,100 | | | | 3,245,282 | |
| | | | |
| | | | | | | | | | | 17,271,317 | |
| | | | | | | | | | | | |
| | | | |
| Mexico: 1.29% | | | | | | | | | | | | |
Grupo Televisa SAB ADR (Consumer Discretionary, Media) | | | | | | | 65,247 | | | | 1,990,686 | |
| | | | | | | | | | | | |
| | | | |
| Netherlands: 3.81% | | | | | | | | | | | | |
Nielsen Holdings NV (Industrials, Professional Services) | | | | | | | 2,334 | | | | 100,718 | |
Unilever NV (Consumer Staples, Food Products) « | | | | | | | 107,080 | | | | 4,218,577 | |
Ziggo NV (Telecommunication Services, Diversified Telecommunication Services) | | | | | | | 36,504 | | | | 1,564,090 | |
| | | | |
| | | | | | | | | | | 5,883,385 | |
| | | | | | | | | | | | |
| | | | |
| Nigeria: 0.49% | | | | | | | | | | | | |
Nigerian Breweries plc (Consumer Staples, Beverages) | | | | | | | 712,597 | | | | 762,308 | |
| | | | | | | | | | | | |
| | | | |
| Singapore: 0.50% | | | | | | | | | | | | |
Global Logistic Properties Limited (Financials, Real Estate Management & Development) | | | | | | | 330,000 | | | | 775,666 | |
| | | | | | | | | | | | |
| | | | |
| South Korea: 0.59% | | | | | | | | | | | | |
Samsung Electronics Company Limited (Information Technology, Semiconductors & Semiconductor Equipment) | | | | | | | 640 | | | | 903,487 | |
| | | | | | | | | | | | |
| | | | |
| Spain: 0.62% | | | | | | | | | | | | |
Grifols SA (Health Care, Biotechnology) | | | | | | | 20,038 | | | | 916,144 | |
Grifols SA Class B (Health Care, Biotechnology) | | | | | | | 1,237 | | | | 42,205 | |
| | | | |
| | | | | | | | | | | 958,349 | |
| | | | | | | | | | | | |
| | | | |
| Switzerland: 9.28% | | | | | | | | | | | | |
Actelion Limited (Health Care, Biotechnology) | | | | | | | 8,180 | | | | 681,328 | |
Nestle SA (Consumer Staples, Food Products) | | | | | | | 65,507 | | | | 4,784,118 | |
Roche Holdings AG (Health Care, Pharmaceuticals) | | | | | | | 15,708 | | | | 4,379,074 | |
Swatch Group AG Class B (Consumer Discretionary, Textiles, Apparel & Luxury Goods) | | | | | | | 1,956 | | | | 1,281,774 | |
Swiss Reinsurance AG (Financials, Insurance) | | | | | | | 15,694 | | | | 1,396,350 | |
UBS AG (Financials, Capital Markets) | | | | | | | 94,916 | | | | 1,809,420 | |
| | | | |
| | | | | | | | | | | 14,332,064 | |
| | | | | | | | | | | | |
The accompanying notes are an integral part of these financial statements.
| | | | | | |
| Portfolio of investments—November 30, 2013 (unaudited) | | Wells Fargo Advantage Equity Gateway Funds | | | 81 | |
INTERNATIONAL GROWTH PORTFOLIO
| | | | | | | | | | | | | | |
| Security name | | | | | | | Shares | | | Value | |
| | | | | | | | | | | | | | |
| | | | |
| United Kingdom: 20.56% | | | | | | | | | | | | | | |
Diageo plc (Consumer Staples, Beverages) | | | | | | | | | 24,665 | | | $ | 785,633 | |
HSBC Holdings plc (Financials, Commercial Banks) | | | | | | | | | 200,197 | | | | 2,234,467 | |
Imperial Tobacco Group plc (Consumer Staples, Tobacco) | | | | | | | | | 88,097 | | | | 3,351,143 | |
Intercontinental Hotels Group plc (Consumer Discretionary, Hotels, Restaurants & Leisure) | | | | | | | | | 28,258 | | | | 880,189 | |
Johnson Matthey plc (Materials, Chemicals) | | | | | | | | | 38,520 | | | | 1,998,671 | |
Land Securities Group plc (Financials, REITs) | | | | | | | | | 133,950 | | | | 2,089,447 | |
Liberty Global plc Class A (Consumer Discretionary, Media) † | | | | | | | | | 31,095 | | | | 2,668,262 | |
Liberty Global plc Class C (Consumer Discretionary, Media) † | | | | | | | | | 2,512 | | | | 204,602 | |
Meggitt plc (Industrials, Aerospace & Defense) | | | | | | | | | 167,653 | | | | 1,369,603 | |
Prudential plc (Financials, Insurance) | | | | | | | | | 58,079 | | | | 1,242,483 | |
Rolls-Royce Holdings plc (Industrials, Aerospace & Defense) | | | | | | | | | 216,156 | | | | 4,369,483 | |
Rolls-Royce Holdings plc Class C Preference Shares (Industrials, Aerospace & Defense)†(a) | | | | | | | | | 15,559,894 | | | | 25,468 | |
Royal Mail plc (Industrials, Air Freight & Logistics) † | | | | | | | | | 116,473 | | | | 1,058,069 | |
SABMiller plc (Consumer Staples, Beverages) | | | | | | | | | 73,992 | | | | 3,818,603 | |
Tesco plc (Consumer Staples, Food & Staples Retailing) | | | | | | | | | 251,762 | | | | 1,433,846 | |
Vodafone Group plc (Telecommunication Services, Wireless Telecommunication Services) | | | | | | | | | 535,205 | | | | 1,986,822 | |
WPP plc (Consumer Discretionary, Media) | | | | | | | | | 100,479 | | | | 2,221,910 | |
| | | | |
| | | | | | | | | | | | | 31,738,701 | |
| | | �� | | | | | | | | | | | |
| | | | |
| United States: 0.98% | | | | | | | | | | | | | | |
Schlumberger Limited (Energy, Energy Equipment & Services) | | | | | | | | | 17,120 | | | | 1,513,750 | |
| | | | | | | | | | | | | | |
| | | | |
Total Common Stocks (Cost $111,347,427) | | | | | | | | | | | | | 146,231,139 | |
| | | | | | | | | | | | | | |
| | | | |
Participatory Notes: 0.37% | | | | | | | | | | | | | | |
HSBC Bank plc | | | | | | | | | 68,500 | | | | 573,788 | |
| | | | | | | | | | | | | | |
| | | | |
Total Participatory Notes (Cost $537,051) | | | | | | | | | | | | | 573,788 | |
| | | | | | | | | | | | | | |
| | | | |
| | | | | Dividend yield | | | | | | | |
| | | | |
Preferred Stocks: 1.46% | | | | | | | | | | | | | | |
| | | | |
| Germany: 1.46% | | | | | | | | | | | | | | |
Henkel AG & Company KGaA (Consumer Staples, Household Products) ± | | | | | 1.10 | % | | | 19,848 | | | | 2,250,105 | |
| | | | | | | | | | | | | | |
| | | | |
Total Preferred Stocks (Cost $1,503,116) | | | | | | | | | | | | | 2,250,105 | |
| | | | | | | | | | | | | | |
| | | | |
| | | | | Yield | | | Shares | | | | |
| | | | |
Short-Term Investments: 4.44% | | | | | | | | | | | | | | |
| | | | |
| Investment Companies: 4.44% | | | | | | | | | | | | | | |
Wells Fargo Advantage Cash Investment Money Market Fund, Select Class (l)(u) | | | | | 0.08 | | | | 6,093,828 | | | | 6,093,828 | |
Wells Fargo Securities Lending Cash Investments, LLC (r)(v)(l)(u) | | | | | 0.08 | | | | 765,419 | | | | 765,419 | |
| | | | | | | | | | | | | | |
| | | | |
Total Short-Term Investments (Cost $6,859,247) | | | | | | | | | | | | | 6,859,247 | |
| | | | | | | | | | | | | | |
| | | | | | | | |
| Total investments in securities | | | | | | | | |
| (Cost $120,246,841) * | | | 100.99 | % | | | 155,914,279 | |
Other assets and liabilities, net | | | (0.99 | ) | | | (1,527,178 | ) |
| | | | | | | | |
| Total net assets | | | 100.00 | % | | $ | 154,387,101 | |
| | | | | | | | |
The accompanying notes are an integral part of these financial statements.
| | | | |
| 82 | | Wells Fargo Advantage Equity Gateway Funds | | Portfolio of investments—November 30, 2013 (unaudited) |
INTERNATIONAL GROWTH PORTFOLIO
| « | All or a portion of this security is on loan. |
| † | Non-income-earning security |
| (a) | Security is fair valued by the Management Valuation Team, and in certain instances by the Board of Trustees, in accordance with procedures approved by the Board of Trustees. |
| ± | Variable rate investment. The rate shown is the rate in effect at period end. |
| (l) | Investment in an affiliate |
| (u) | Rate shown is the 7-day annualized yield at period end. |
| (r) | The investment company is exempt from registration under Section 3(c)(7) of the Investment Company Act of 1940, as amended. |
| (v) | Security represents investment of cash collateral received from securities on loan. |
| * | Cost for federal income tax purposes is $120,170,471 and unrealized appreciation (depreciation) consists of: |
| | | | |
Gross unrealized appreciation | | $ | 36,464,160 | |
Gross unrealized depreciation | | | (720,352 | ) |
| | | | |
Net unrealized appreciation | | $ | 35,743,808 | |
The following table shows the percent of total long-term investments by sector as of November 30, 2013:
| | | | |
Consumer Staples | | | 21.31 | % |
Industrials | | | 18.85 | |
Financials | | | 17.29 | |
Consumer Discretionary | | | 13.35 | |
Health Care | | | 12.55 | |
Materials | | | 6.70 | |
Information Technology | | | 6.33 | |
Telecommunication Services | | | 2.38 | |
Energy | | | 1.24 | |
| | | | |
| | | 100.00 | % |
| | | | |
The accompanying notes are an integral part of these financial statements.
| | | | | | |
| Portfolio of investments—November 30, 2013 (unaudited) | | Wells Fargo Advantage Equity Gateway Funds | | | 83 | |
INTERNATIONAL VALUE PORTFOLIO
| | | | | | | | | | | | |
| Security name | | | | | | Shares | | | Value | |
| | | | | | | | | | | | |
| | | | |
Common Stocks: 96.98% | | | | | | | | | | | | |
| | | | |
| Australia: 5.94% | | | | | | | | | | | | |
Arrium Limited (Materials, Metals & Mining) | | | | | | | 1,531,700 | | | $ | 2,197,841 | |
Bendigo Bank Limited (Financials, Commercial Banks) | | | | | | | 272,500 | | | | 2,795,419 | |
Boart Longyear Group Limited (Energy, Energy Equipment & Services) « | | | | | | | 199,991 | | | | 54,661 | |
Cabcharge Australia Limited (Industrials, Commercial Services & Supplies) « | | | | | | | 207,386 | | | | 748,198 | |
Challenger Financial Services Group Limited (Financials, Diversified Financial Services) | | | | | | | 475,400 | | | | 2,607,340 | |
Downer EDI Limited (Industrials, Commercial Services & Supplies) | | | | | | | 518,900 | | | | 2,250,260 | |
Leighton Holdings Limited (Industrials, Construction & Engineering) « | | | | | | | 77,400 | | | | 1,146,578 | |
Lend Lease Corporation Limited (Financials, Real Estate Management & Development) | | | | | | | 350,500 | | | | 3,528,518 | |
Metcash Limited (Consumer Staples, Food & Staples Retailing) | | | | | | | 785,500 | | | | 2,182,670 | |
Mincor Resources NL (Materials, Metals & Mining) (i) | | | | | | | 570,994 | | | | 260,102 | |
Myer Holdings Limited (Consumer Discretionary, Multiline Retail) « | | | | | | | 577,400 | | | | 1,499,214 | |
Primary Health Care Limited (Health Care, Health Care Providers & Services) | | | | | | | 339,000 | | | | 1,544,229 | |
Rio Tinto Limited (Materials, Metals & Mining) | | | | | | | 66,800 | | | | 4,020,287 | |
Sally Malay Mining Limited (Materials, Metals & Mining) | | | | | | | 368,800 | | | | 80,639 | |
Seven Network Limited (Industrials, Trading Companies & Distributors) | | | | | | | 165,800 | | | | 1,093,617 | |
Toll Holdings Limited (Industrials, Air Freight & Logistics) | | | | | | | 283,600 | | | | 1,477,897 | |
United Construction Group Limited (Industrials, Construction & Engineering) | | | | | | | 152,800 | | | | 897,894 | |
| | | | |
| | | | | | | | | | | 28,385,364 | |
| | | | | | | | | | | | |
| | | | |
| Austria: 1.40% | | | | | | | | | | | | |
OMV AG (Energy, Oil, Gas & Consumable Fuels) | | | | | | | 41,100 | | | | 2,012,828 | |
RHI AG (Materials, Construction Materials) (i) | | | | | | | 64,721 | | | | 2,314,146 | |
Voestalpine AG (Materials, Metals & Mining) | | | | | | | 47,700 | | | | 2,372,020 | |
| | | | |
| | | | | | | | | | | 6,698,994 | |
| | | | | | | | | | | | |
| | | | |
| Belgium: 1.12% | | | | | | | | | | | | |
Delhaize Group SA (Consumer Staples, Food & Staples Retailing) | | | | | | | 39,400 | | | | 2,295,951 | |
KBC Groep NV (Financials, Commercial Banks) | | | | | | | 53,400 | | | | 3,046,844 | |
| | | | |
| | | | | | | | | | | 5,342,795 | |
| | | | | | | | | | | | |
| | | | |
| Brazil: 1.25% | | | | | | | | | | | | |
Banco do Brasil SA (Financials, Commercial Banks) | | | | | | | 196,000 | | | | 2,141,980 | |
Companhia de Saneamento Basico do Estado de Sao Paulo SA (Utilities, Water Utilities) | | | | | | | 253,200 | | | | 2,657,619 | |
Companhia de Saneamento de Minas Gerais SA (Utilities, Water Utilities) | | | | | | | 72,400 | | | | 1,192,255 | |
| | | | |
| | | | | | | | | | | 5,991,854 | |
| | | | | | | | | | | | |
| | | | |
| Canada: 2.38% | | | | | | | | | | | | |
Magna International Incorporated Class A (Consumer Discretionary, Auto Components) « | | | | | | | 65,800 | | | | 5,365,726 | |
Metro Incorporated (Consumer Staples, Food & Staples Retailing) | | | | | | | 48,400 | | | | 2,851,321 | |
WestJet Airlines Limited (Industrials, Airlines) | | | | | | | 120,000 | | | | 3,155,635 | |
| | | | |
| | | | | | | | | | | 11,372,682 | |
| | | | | | | | | | | | |
| | | | |
| China: 2.18% | | | | | | | | | | | | |
China BlueChemical Limited (Materials, Chemicals) | | | | | | | 1,984,000 | | | | 1,346,100 | |
China Communications Services Corporation Limited (Telecommunication Services, Diversified
Telecommunication Services) | | | | | | | 2,836,000 | | | | 1,858,317 | |
China Petroleum & Chemical Corporation (Energy, Oil, Gas & Consumable Fuels) | | | | | | | 6,116,500 | | | | 5,254,447 | |
The accompanying notes are an integral part of these financial statements.
| | | | |
| 84 | | Wells Fargo Advantage Equity Gateway Funds | | Portfolio of investments—November 30, 2013 (unaudited) |
INTERNATIONAL VALUE PORTFOLIO
| | | | | | | | | | | | |
| Security name | | | | | | Shares | | | Value | |
| | | | | | | | | | | | |
| | | | |
| China (continued) | | | | | | | | | | | | |
China Railway Construction Corporation Limited (Industrials, Construction & Engineering) | | | | | | | 1,747,500 | | | $ | 1,958,785 | |
| | | | |
| | | | | | | | | | | 10,417,649 | |
| | | | | | | | | | | | |
| | | | |
| Czech Republic: 0.33% | | | | | | | | | | | | |
CEZ AS (Utilities, Electric Utilities) | | | | | | | 57,500 | | | | 1,595,965 | |
| | | | | | | | | | | | |
| | | | |
| Finland: 0.87% | | | | | | | | | | | | |
Kesko Oyj (Consumer Staples, Food & Staples Retailing) | | | | | | | 63,800 | | | | 2,380,888 | |
TietoEnator Oyj (Information Technology, IT Services) | | | | | | | 82,700 | | | | 1,780,715 | |
| | | | |
| | | | | | | | | | | 4,161,603 | |
| | | | | | | | | | | | |
| | | | |
| France: 9.10% | | | | | | | | | | | | |
Alstom SA (Industrials, Machinery) | | | | | | | 56,900 | | | | 2,088,996 | |
AXA SA (Financials, Insurance) | | | | | | | 132,200 | | | | 3,463,465 | |
BNP Paribas SA (Financials, Commercial Banks) | | | | | | | 49,100 | | | | 3,685,305 | |
Compagnie Generale des Etablissements Michelin SCA Class B (Consumer Discretionary, Auto Components) | | | | | | | 24,000 | | | | 2,606,690 | |
Credit Agricole SA (Financials, Commercial Banks) † | | | | | | | 219,328 | | | | 2,750,144 | |
Renault SA (Consumer Discretionary, Automobiles) | | | | | | | 40,500 | | | | 3,592,207 | |
Sanofi-Aventis SA (Health Care, Pharmaceuticals) | | | | | | | 61,400 | | | | 6,492,782 | |
SCOR SE (Financials, Insurance) | | | | | | | 109,700 | | | | 3,838,202 | |
Societe Generale SA (Financials, Commercial Banks) | | | | | | | 39,000 | | | | 2,242,972 | |
Thales SA (Industrials, Aerospace & Defense) | | | | | | | 59,100 | | | | 3,606,909 | |
Total SA (Energy, Oil, Gas & Consumable Fuels) | | | | | | | 93,700 | | | | 5,676,562 | |
Vivendi SA (Telecommunication Services, Diversified Telecommunication Services) | | | | | | | 134,746 | | | | 3,422,165 | |
| | | | |
| | | | | | | | | | | 43,466,399 | |
| | | | | | | | | | | | |
| | | | |
| Germany: 8.63% | | | | | | | | | | | | |
Allianz AG (Financials, Insurance) | | | | | | | 35,700 | | | | 6,200,527 | |
BASF SE (Materials, Chemicals) | | | | | | | 46,500 | | | | 4,965,182 | |
Daimler AG (Consumer Discretionary, Automobiles) | | | | | | | 69,300 | | | | 5,742,787 | |
Deutsche Bank AG (Financials, Capital Markets) | | | | | | | 41,200 | | | | 1,986,382 | |
E.ON SE (Utilities, Multi-Utilities) | | | | | | | 87,200 | | | | 1,677,411 | |
Gildemeister AG (Industrials, Machinery) | | | | | | | 74,500 | | | | 2,298,945 | |
Hannover Rueckversicherung AG (Financials, Insurance) | | | | | | | 31,000 | | | | 2,581,136 | |
Metro AG (Consumer Staples, Food & Staples Retailing) | | | | | | | 49,800 | | | | 2,495,730 | |
Muenchener Rueckversicherungs-Gesellschaft AG (Financials, Insurance) | | | | | | | 19,700 | | | | 4,308,754 | |
Norddeutsche Affinerie AG (Materials, Metals & Mining) | | | | | | | 25,900 | | | | 1,527,563 | |
RWE AG (Utilities, Multi-Utilities) | | | | | | | 40,900 | | | | 1,570,200 | |
Volkswagen AG (Consumer Discretionary, Automobiles) | | | | | | | 22,600 | | | | 5,884,057 | |
| | | | |
| | | | | | | | | | | 41,238,674 | |
| | | | | | | | | | | | |
| | | | |
| Hong Kong: 1.08% | | | | | | | | | | | | |
Johnson Electric Holdings Limited (Industrials, Electrical Equipment) | | | | | | | 1,133,500 | | | | 1,023,457 | |
Kingboard Laminates Holdings Limited (Information Technology, Electronic Equipment, Instruments & Components) (i) | | | | | | | 2,204,000 | | | | 955,214 | |
Wheelock & Company Limited (Financials, Real Estate Management & Development) | | | | | | | 379,000 | | | | 1,845,466 | |
Yue Yuen Industrial Holdings Limited (Consumer Discretionary, Textiles, Apparel & Luxury Goods) | | | | | | | 429,500 | | | | 1,343,460 | |
| | | | |
| | | | | | | | | | | 5,167,597 | |
| | | | | | | | | | | | |
The accompanying notes are an integral part of these financial statements.
| | | | | | |
| Portfolio of investments—November 30, 2013 (unaudited) | | Wells Fargo Advantage Equity Gateway Funds | | | 85 | |
INTERNATIONAL VALUE PORTFOLIO
| | | | | | | | | | | | |
| Security name | | | | | | Shares | | | Value | |
| | | | | | | | | | | | |
| | | | |
| India: 1.06% | | | | | | | | | | | | |
Gail Limited (Utilities, Gas Utilities) (i) | | | | | | | 26,700 | | | $ | 821,292 | |
Tata Motors Limited ADR (Consumer Discretionary, Automobiles) | | | | | | | 83,800 | | | | 2,720,986 | |
Tata Steel Limited GDR (Industrials, Machinery) | | | | | | | 245,900 | | | | 1,540,564 | |
| | | | |
| | | | | | | | | | | 5,082,842 | |
| | | | | | | | | | | | |
| | | | |
| Indonesia: 0.15% | | | | | | | | | | | | |
PT Japfa Comfeed Indonesia Tbk (Consumer Staples, Food Products) | | | | | | | 6,962,500 | | | | 721,714 | |
| | | | | | | | | | | | |
| | | | |
| Ireland: 0.65% | | | | | | | | | | | | |
Irish Life & Permanent Group Holdings plc (Financials, Insurance) † | | | | | | | 111,500 | | | | 6,847 | |
Smurfit Kappa Group plc (Materials, Containers & Packaging) | | | | | | | 130,200 | | | | 3,095,342 | |
| | | | |
| | | | | | | | | | | 3,102,189 | |
| | | | | | | | | | | | |
| | | | |
| Israel: 1.07% | | | | | | | | | | | | |
Bank Hapoalim Limited (Financials, Commercial Banks) | | | | | | | 542,900 | | | | 3,026,126 | |
Teva Pharmaceutical Industries Limited (Health Care, Pharmaceuticals) | | | | | | | 51,404 | | | | 2,080,378 | |
| | | | |
| | | | | | | | | | | 5,106,504 | |
| | | | | | | | | | | | |
| | | | |
| Italy: 1.43% | | | | | | | | | | | | |
Enel SpA (Utilities, Electric Utilities) | | | | | | | 688,400 | | | | 3,131,021 | |
ENI SpA (Energy, Oil, Gas & Consumable Fuels) | | | | | | | 153,300 | | | | 3,688,250 | |
| | | | |
| | | | | | | | | | | 6,819,271 | |
| | | | | | | | | | | | |
| | | | |
| Japan: 18.89% | | | | | | | | | | | | |
Adeka Corporation (Materials, Chemicals) | | | | | | | 203,200 | | | | 2,259,651 | |
Aisin Seiki Company Limited (Consumer Discretionary, Auto Components) | | | | | | | 46,400 | | | | 1,866,419 | |
Aoyama Trading Company Limited (Consumer Discretionary, Specialty Retail) | | | | | | | 73,100 | | | | 1,963,369 | |
Aozora Bank Limited (Financials, Commercial Banks) | | | | | | | 588,000 | | | | 1,693,532 | |
Chiba Bank Limited (Financials, Commercial Banks) | | | | | | | 329,000 | | | | 2,287,020 | |
DCM Japan Holdings Company Limited (Consumer Discretionary, Specialty Retail) | | | | | | | 143,100 | | | | 972,395 | |
Eizo Nanao Corporation (Information Technology, Computers & Peripherals) | | | | | | | 63,300 | | | | 1,661,837 | |
Fukuoka Financial Group Incorporated (Financials, Commercial Banks) | | | | | | | 378,000 | | | | 1,693,942 | |
Hitachi Capital Corporation (Financials, Consumer Finance) | | | | | | | 57,700 | | | | 1,662,977 | |
Itochu Corporation (Industrials, Trading Companies & Distributors) | | | | | | | 200,700 | | | | 2,531,651 | |
JX Holdings Incorporated (Energy, Oil, Gas & Consumable Fuels) | | | | | | | 408,000 | | | | 2,123,154 | |
Kaken Pharmaceutical Company Limited (Health Care, Pharmaceuticals) | | | | | | | 101,000 | | | | 1,529,422 | |
KDDI Corporation (Telecommunication Services, Wireless Telecommunication Services) | | | | | | | 120,000 | | | | 7,533,317 | |
Kyorin Company Limited (Health Care, Pharmaceuticals) | | | | | | | 99,000 | | | | 2,045,243 | |
Maeda Road Construction Company Limited (Industrials, Construction & Engineering) | | | | | | | 148,000 | | | | 2,274,367 | |
Marubeni Corporation (Industrials, Trading Companies & Distributors) | | | | | | | 516,000 | | | | 3,743,110 | |
Miraca Holdings Incorporated (Health Care, Health Care Providers & Services) | | | | | | | 25,100 | | | | 1,166,473 | |
Mitsubishi Corporation (Industrials, Trading Companies & Distributors) | | | | | | | 35,500 | | | | 698,389 | |
Mitsui & Company Limited (Industrials, Trading Companies & Distributors) | | | | | | | 260,300 | | | | 3,606,206 | |
Mizuho Financial Group Incorporated (Financials, Commercial Banks) | | | | | | | 1,831,300 | | | | 3,844,076 | |
Nichirei Corporation (Consumer Staples, Food Products) | | | | | | | 265,000 | | | | 1,402,294 | |
Nippon Electric Glass Company Limited (Information Technology, Electronic Equipment, Instruments & Components) | | | | | | | 107,000 | | | | 575,611 | |
Nippon Telegraph & Telephone Corporation (Telecommunication Services, Diversified Telecommunication Services) | | | | | | | 92,700 | | | | 4,651,970 | |
Nissan Motor Company Limited (Consumer Discretionary, Automobiles) | | | | | | | 151,400 | | | | 1,383,553 | |
The accompanying notes are an integral part of these financial statements.
| | | | |
| 86 | | Wells Fargo Advantage Equity Gateway Funds | | Portfolio of investments—November 30, 2013 (unaudited) |
INTERNATIONAL VALUE PORTFOLIO
| | | | | | | | | | | | |
| Security name | | | | | | Shares | | | Value | |
| | | | | | | | | | | | |
| | | | |
| Japan (continued) | | | | | | | | | | | | |
NTT DoCoMo Incorporated (Telecommunication Services, Wireless Telecommunication Services) | | | | | | | 180,000 | | | $ | 2,899,683 | |
Otsuka Holdings Company Limited (Health Care, Pharmaceuticals) | | | | | | | 133,900 | | | | 3,911,436 | |
Rengo Company Limited (Materials, Containers & Packaging) | | | | | | | 208,000 | | | | 1,118,946 | |
Resona Holdings Incorporated (Financials, Commercial Banks) | | | | | | | 598,500 | | | | 2,968,396 | |
Ryosan Company Limited (Information Technology, Electronic Equipment, Instruments & Components) | | | | | | | 16,200 | | | | 335,151 | |
Saizeriya Company Limited (Consumer Discretionary, Hotels, Restaurants & Leisure) | | | | | | | 99,800 | | | | 1,167,297 | |
Sankyu Incorporated (Industrials, Road & Rail) | | | | | | | 313,000 | | | | 1,182,631 | |
Shionogi & Company Limited (Health Care, Pharmaceuticals) | | | | | | | 79,300 | | | | 1,743,555 | |
Sojitz Corporation (Industrials, Trading Companies & Distributors) | | | | | | | 678,000 | | | | 1,251,081 | |
Sumitomo Corporation (Industrials, Trading Companies & Distributors) | | | | | | | 285,000 | | | | 3,525,458 | |
Sumitomo Mitsui Financial Group Incorporated (Financials, Commercial Banks) | | | | | | | 100,400 | | | | 4,969,763 | |
The Keiyo Bank Limited (Financials, Commercial Banks) | | | | | | | 62,000 | | | | 308,108 | |
Toshiba TEC Corporation (Information Technology, Office Electronics) | | | | | | | 234,000 | | | | 1,484,989 | |
Toyo Tire & Rubber Company Limited (Consumer Discretionary, Auto Components) | | | | | | | 325,000 | | | | 1,919,697 | |
Tsuruha Holdings Incorporated (Consumer Staples, Food & Staples Retailing) | | | | | | | 13,500 | | | | 1,242,909 | |
West Japan Railway Company (Industrials, Road & Rail) | | | | | | | 45,400 | | | | 1,985,765 | |
Yokohama Rubber Company Limited (Consumer Discretionary, Auto Components) | | | | | | | 297,000 | | | | 3,073,664 | |
| | | | |
| | | | | | | | | | | 90,258,507 | |
| | | | | | | | | | | | |
| | | | |
| Liechtenstein: 0.17% | | | | | | | | | | | | |
Verwaltungs-und Privat-Bank AG (Financials, Capital Markets) (i) | | | | | | | 7,800 | | | | 795,962 | |
| | | | | | | | | | | | |
| | | | |
| Malaysia: 0.50% | | | | | | | | | | | | |
Tenaga Nasional Berhad (Utilities, Electric Utilities) | | | | | | | 772,000 | | | | 2,361,750 | |
| | | | | | | | | | | | |
| | | | |
| Netherlands : 2.35% | | | | | | | | | | | | |
Aegon NV (Financials, Insurance) | | | | | | | 334,000 | | | | 2,966,999 | |
ING Groep NV (Financials, Diversified Financial Services) † | | | | | | | 237,100 | | | | 3,078,635 | |
Koninklijke Ahold NV (Consumer Staples, Food & Staples Retailing) | | | | | | | 285,600 | | | | 5,199,034 | |
| | | | |
| | | | | | | | | | | 11,244,668 | |
| | | | | | | | | | | | |
| | | | |
| Norway: 1.50% | | | | | | | | | | | | |
Atea ASA (Information Technology, IT Services) | | | | | | | 84,900 | | | | 823,902 | |
DnB Nor ASA (Financials, Commercial Banks) | | | | | | | 148,800 | | | | 2,630,772 | |
Statoil ASA (Energy, Oil, Gas & Consumable Fuels) | | | | | | | 61,700 | | | | 1,392,747 | |
Yara International ASA (Materials, Chemicals) | | | | | | | 53,600 | | | | 2,336,763 | |
| | | | |
| | | | | | | | | | | 7,184,184 | |
| | | | | | | | | | | | |
| | | | |
| Poland: 0.64% | | | | | | | | | | | | |
Asseco Poland SA (Information Technology, Software) | | | | | | | 101,800 | | | | 1,681,152 | |
KGHM Polska Miedz SA (Materials, Metals & Mining) | | | | | | | 36,500 | | | | 1,396,951 | |
| | | | |
| | | | | | | | | | | 3,078,103 | |
| | | | | | | | | | | | |
| | | | |
| Russia: 1.49% | | | | | | | | | | | | |
Gazprom Neft Sponsored ADR (Energy, Oil, Gas & Consumable Fuels) (i) | | | | | | | 150,900 | | | | 3,405,671 | |
Lukoil ADR (Energy, Oil, Gas & Consumable Fuels) | | | | | | | 60,400 | | | | 3,729,881 | |
| | | | |
| | | | | | | | | | | 7,135,552 | |
| | | | | | | | | | | | |
The accompanying notes are an integral part of these financial statements.
| | | | | | |
| Portfolio of investments—November 30, 2013 (unaudited) | | Wells Fargo Advantage Equity Gateway Funds | | | 87 | |
INTERNATIONAL VALUE PORTFOLIO
| | | | | | | | | | | | |
| Security name | | | | | | Shares | | | Value | |
| | | | | | | | | | | | |
| | | | |
| Singapore: 0.39% | | | | | | | | | | | | |
United Overseas Bank Limited (Financials, Commercial Banks) | | | | | | | 113,000 | | | $ | 1,883,558 | |
| | | | | | | | | | | | |
| | | | |
| South Africa: 0.26% | | | | | | | | | | | | |
Barclays Africa Group Limited (Financials, Commercial Banks) « | | | | | | | 92,100 | | | | 1,227,880 | |
| | | | | | | | | | | | |
| | | | |
| South Korea: 2.42% | | | | | | | | | | | | |
E-MART Company Limited (Consumer Staples, Food & Staples Retailing) | | | | | | | 8,500 | | | | 2,164,556 | |
Industrial Bank of Korea (Financials, Commercial Banks) | | | | | | | 192,500 | | | | 2,082,703 | |
SK Telecom Company Limited (Telecommunication Services, Wireless Telecommunication Services) | | | | | | | 22,300 | | | | 4,762,166 | |
Woori Finance Holdings Company Limited (Financials, Commercial Banks) | | | | | | | 212,200 | | | | 2,536,455 | |
| | | | |
| | | | | | | | | | | 11,545,880 | |
| | | | | | | | | | | | |
| | | | |
| Spain: 2.12% | | | | | | | | | | | | |
Banco Bilbao Vizcaya Argentaria SA (Financials, Commercial Banks) | | | | | | | 185,200 | | | | 2,212,519 | |
Banco Santander Central Hispano SA (Financials, Commercial Banks) | | | | | | | 429,681 | | | | 3,819,291 | |
Repsol YPF SA (Energy, Oil, Gas & Consumable Fuels) | | | | | | | 123,800 | | | | 3,250,964 | |
Telefonica SA (Telecommunication Services, Diversified Telecommunication Services) | | | | | | | 52,400 | | | | 862,055 | |
| | | | |
| | | | | | | | | | | 10,144,829 | |
| | | | | | | | | | | | |
| | | | |
| Sweden: 1.49% | | | | | | | | | | | | |
Boliden AB (Materials, Metals & Mining) | | | | | | | 169,300 | | | | 2,477,763 | |
Nordea Bank AB (Financials, Commercial Banks) | | | | | | | 177,300 | | | | 2,291,956 | |
Saab AB (Industrials, Aerospace & Defense) | | | | | | | 113,500 | | | | 2,338,885 | |
| | | | |
| | | | | | | | | | | 7,108,604 | |
| | | | | | | | | | | | |
| | | | |
| Switzerland: 5.71% | | | | | | | | | | | | |
Baloise Holding AG (Financials, Insurance) | | | | | | | 28,800 | | | | 3,399,636 | |
Credit Suisse Group AG (Financials, Capital Markets) | | | | | | | 184,595 | | | | 5,494,372 | |
Georg Fischer AG (Industrials, Machinery) | | | | | | | 3,000 | | | | 2,068,509 | |
Novartis AG (Health Care, Pharmaceuticals) | | | | | | | 48,000 | | | | 3,794,142 | |
Roche Holdings AG (Health Care, Pharmaceuticals) | | | | | | | 12,300 | | | | 3,428,992 | |
Swiss Reinsurance AG (Financials, Insurance) | | | | | | | 48,500 | | | | 4,315,213 | |
Zurich Financial Services AG (Financials, Insurance) | | | | | | | 17,100 | | | | 4,770,908 | |
| | | | |
| | | | | | | | | | | 27,271,772 | |
| | | | | | | | | | | | |
| | | | |
| Taiwan: 0.26% | | | | | | | | | | | | |
Powertech Technology Incorporated (Information Technology, Semiconductors &
Semiconductor Equipment) | | | | | | | 794,000 | | | | 1,227,462 | |
| | | | | | | | | | | | |
| | | | |
| Thailand: 0.74% | | | | | | | | | | | | |
Bangchak Petroleum PCL (Energy, Oil, Gas & Consumable Fuels) | | | | | | | 2,188,900 | | | | 2,266,612 | |
Thanachart Capital PCL (Financials, Commercial Banks) | | | | | | | 1,251,600 | | | | 1,276,546 | |
| | | | |
| | | | | | | | | | | 3,543,158 | |
| | | | | | | | | | | | |
| | | | |
| United Kingdom: 19.41% | | | | | | | | | | | | |
Alent plc (Materials, Chemicals) | | | | | | | 145,400 | | | | 804,409 | |
AMEC plc (Energy, Energy Equipment & Services) | | | | | | | 120,300 | | | | 2,228,988 | |
Amlin plc (Financials, Insurance) | | | | | | | 279,000 | | | | 2,055,003 | |
AstraZeneca plc (Health Care, Pharmaceuticals) | | | | | | | 150,200 | | | | 8,637,850 | |
Aviva plc (Financials, Insurance) | | | | | | | 314,900 | | | | 2,212,734 | |
BAE Systems plc (Industrials, Aerospace & Defense) | | | | | | | 684,100 | | | | 4,785,748 | |
Barclays plc (Financials, Commercial Banks) | | | | | | | 715,000 | | | | 3,179,721 | |
The accompanying notes are an integral part of these financial statements.
| | | | |
| 88 | | Wells Fargo Advantage Equity Gateway Funds | | Portfolio of investments—November 30, 2013 (unaudited) |
INTERNATIONAL VALUE PORTFOLIO
| | | | | | | | | | | | | | |
| Security name | | | | | | | Shares | | | Value | |
| | | | | | | | | | | | | | |
| | | | |
| United Kingdom (continued) | | | | | | | | | | | | | | |
BP plc (Energy, Oil, Gas & Consumable Fuels) | | | | | | | | | 844,300 | | | $ | 6,661,002 | |
BT Group plc (Telecommunication Services, Diversified Telecommunication Services) | | | | | | | | | 1,124,900 | | | | 6,862,290 | |
Carillion plc (Industrials, Construction & Engineering) | | | | | | | | | 261,500 | | | | 1,289,634 | |
Centrica plc (Utilities, Gas Utilities) | | | | | | | | | 524,600 | | | | 2,904,866 | |
Chemring Group plc (Industrials, Aerospace & Defense) | | | | | | | | | 247,200 | | | | 861,834 | |
Debenhams plc (Consumer Discretionary, Media) | | | | | | | | | 1,238,200 | | | | 1,960,819 | |
Firstgroup plc (Industrials, Road & Rail) | | | | | | | | | 254,700 | | | | 476,509 | |
GlaxoSmithKline plc (Health Care, Pharmaceuticals) | | | | | | | | | 57,700 | | | | 1,528,566 | |
Home Retail Group plc (Consumer Discretionary, Internet & Catalog Retail) | | | | | | | | | 290,000 | | | | 906,149 | |
Inchcape plc (Consumer Discretionary, Distributors) | | | | | | | | | 255,800 | | | | 2,491,227 | |
J Sainsbury plc (Consumer Staples, Food & Staples Retailing) | | | | | | | | | 706,400 | | | | 4,710,505 | |
Darty plc (Consumer Discretionary, Specialty Retail) (i) | | | | | | | | | 679,100 | | | | 972,607 | |
Marston’s plc (Consumer Discretionary, Hotels, Restaurants & Leisure) | | | | | | | | | 558,800 | | | | 1,369,222 | |
Old Mutual plc (Financials, Insurance) | | | | | | | | | 982,800 | | | | 3,202,817 | |
Pace plc (Consumer Discretionary, Household Durables) | | | | | | | | | 374,800 | | | | 1,937,347 | |
Premier Foods plc (Consumer Staples, Food Products) † | | | | | | | | | 31,510 | | | | 62,793 | |
Royal & Sun Alliance Insurance Group plc (Financials, Insurance) | | | | | | | | | 443,900 | | | | 773,077 | |
Royal Dutch Shell plc Class A (Energy, Oil, Gas & Consumable Fuels) | | | | | | | | | 14,300 | | | | 478,379 | |
Royal Dutch Shell plc Class B (Energy, Oil, Gas & Consumable Fuels) | | | | | | | | | 264,000 | | | | 9,266,713 | |
Tesco plc (Consumer Staples, Food & Staples Retailing) | | | | | | | | | 655,700 | | | | 3,734,374 | |
Tullett Prebon plc (Financials, Capital Markets) | | | | | | | | | 279,500 | | | | 1,532,577 | |
Vesuvius plc (Industrials, Machinery) | | | | | | | | | 145,400 | | | | 1,156,159 | |
Vodafone Group plc (Telecommunication Services, Wireless Telecommunication Services) | | | | | | | | | 1,962,500 | | | | 7,285,317 | |
WH Smith plc (Consumer Discretionary, Specialty Retail) | | | | | | | | | 223,600 | | | | 3,465,912 | |
William Morrison Supermarkets plc (Consumer Staples, Food & Staples Retailing) | | | | | | | | | 679,700 | | | | 2,953,802 | |
| | | | |
| | | | | | | | | | | | | 92,748,950 | |
| | | | | | | | | | | | | | |
| | | | |
Total Common Stocks (Cost $426,952,922) | | | | | | | | | | | | | 463,432,915 | |
| | | | | | | | | | | | | | |
| | | | |
| | | Dividend yield | | | | | | | | | |
| | | | |
Preferred Stocks: 0.65% | | | | | | | | | | | | | | |
| | | | |
| Brazil: 0.65% | | | | | | | | | | | | | | |
Banco do Estado do Rio Grande do Sul SA (Financials, Commercial Banks) ± | | | 5.57 | % | | | | | 173,300 | | | | 1,000,735 | |
Companhia Energetica de Minas Gerais SA (Energy, Oil, Gas & Consumable Fuels) ± | | | 18.81 | | | | | | 83,399 | | | | 692,939 | |
Companhia Vale Do Rio Doce Class A (Materials, Metals & Mining) ± | | | 5.41 | | | | | | 100,100 | | | | 1,402,454 | |
| | | | |
Total Preferred Stocks (Cost $4,315,406) | | | | | | | | | | | | | 3,096,128 | |
| | | | | | | | | | | | | | |
| | | | |
| | | Yield | | | | | | | | | |
| Short-Term Investments: 2.53% | | | | | | | | | | | | | | |
| | | | |
| Investment Companies: 2.53% | | | | | | | | | | | | | | |
Wells Fargo Advantage Cash Investment Money Market Fund, Select Class (l)(u) | | | 0.08 | | | | | | 2,748,860 | | | | 2,748,860 | |
Wells Fargo Securities Lending Cash Investments, LLC (l)(r)(u)(v) | | | 0.08 | | | | | | 9,341,704 | | | | 9,341,704 | |
| | | | | | | | | | | | | | |
| | | | |
Total Short-Term Investments (Cost $12,090,564) | | | | | | | | | | | | | 12,090,564 | |
| | | | | | | | | | | | | | |
| | | | | | | | |
Total investments in securities (Cost $443,358,892) * | | | 100.16 | % | | | 478,619,607 | |
Other assets and liabilities, net | | | (0.16 | ) | | | (786,528 | ) |
| | | | | | | | |
| Total net assets | | | 100.00 | % | | $ | 477,833,079 | |
| | | | | | | | |
The accompanying notes are an integral part of these financial statements.
| | | | | | |
| Portfolio of investments—November 30, 2013 (unaudited) | | Wells Fargo Advantage Equity Gateway Funds | | | 89 | |
INTERNATIONAL VALUE PORTFOLIO
| « | All or a portion of this security is on loan. |
| ± | Variable rate investment. The rate shown is the rate in effect at period end. |
| † | Non-income-earning security |
| (l) | Investment in an affiliate |
| (u) | Rate shown is the 7-day annualized yield at period end. |
| (r) | The investment company is exempt from registration under Section 3(c)(7) of the Investment Company Act of 1940, as amended. |
| (v) | Security represents investment of cash collateral received from securities on loan. |
| * | Cost for federal income tax purposes is $444,667,949 and unrealized appreciation (depreciation) consists of: |
| | | | |
Gross unrealized appreciation | | $ | 81,293,138 | |
Gross unrealized depreciation | | | (47,341,530 | ) |
| | | | |
Net unrealized appreciation | | $ | 33,951,608 | |
The following table shows the percent of total long-term investments by sector as of November 30, 2013:
| | | | |
Financials | | | 27.49 | % |
Industrials | | | 12.23 | |
Consumer Discretionary | | | 11.62 | |
Energy | | | 11.04 | |
Telecommunication Services | | | 8.60 | |
Health Care | | | 8.12 | |
Consumer Staples | | | 7.37 | |
Materials | | | 7.28 | |
Utilities | | | 3.99 | |
Information Technology | | | 2.26 | |
| | | | |
| | | 100.00 | % |
The accompanying notes are an integral part of these financial statements.
| | | | |
| 90 | | Wells Fargo Advantage Equity Gateway Funds | | Portfolio of investments—November 30, 2013 (unaudited) |
LARGE COMPANY VALUE PORTFOLIO
| | | | | | | | | | | | |
| Security name | | | | | | Shares | | | Value | |
| | | | | | | | | | | | |
| | | | |
Common Stocks: 97.64% | | | | | | | | | | | | |
| | | | |
Consumer Discretionary: 8.77% | | | | | | | | | | | | |
| | | | |
| Automobiles: 1.72% | | | | | | | | | | | | |
General Motors Company † | | | | | | | 45,392 | | | $ | 1,758,032 | |
| | | | | | | | | | | | |
| | | | |
| Hotels, Restaurants & Leisure: 1.03% | | | | | | | | | | | | |
Norwegian Cruise Line Holdings Limited † | | | | | | | 30,660 | | | | 1,045,506 | |
| | | | | | | | | | | | |
| | | | |
| Household Durables: 2.85% | | | | | | | | | | | | |
Harman International Industries Incorporated | | | | | | | 12,170 | | | | 986,257 | |
Newell Rubbermaid Incorporated | | | | | | | 63,295 | | | | 1,921,003 | |
| | | | |
| | | | | | | | | | | 2,907,260 | |
| | | | | | | | | | | | |
| | | | |
| Media: 2.21% | | | | | | | | | | | | |
Lamar Advertising Company Class A † | | | | | | | 27,401 | | | | 1,367,858 | |
Walt Disney Company | | | | | | | 12,553 | | | | 885,489 | |
| | | | |
| | | | | | | | | | | 2,253,347 | |
| | | | | | | | | | | | |
| | | | |
| Specialty Retail: 0.96% | | | | | | | | | | | | |
Bed Bath & Beyond Incorporated † | | | | | | | 12,479 | | | | 973,736 | |
| | | | | | | | | | | | |
| | | | |
Consumer Staples: 4.89% | | | | | | | | | | | | |
| | | | |
| Food & Staples Retailing: 2.32% | | | | | | | | | | | | |
CVS Caremark Corporation | | | | | | | 35,314 | | | | 2,364,625 | |
| | | | | | | | | | | | |
| | | | |
| Household Products: 1.40% | | | | | | | | | | | | |
Procter & Gamble Company | | | | | | | 16,902 | | | | 1,423,486 | |
| | | | | | | | | | | | |
| | | | |
| Personal Products: 1.17% | | | | | | | | | | | | |
Herbalife Limited « | | | | | | | 17,166 | | | | 1,196,127 | |
| | | | | | | | | | | | |
| | | | |
Energy: 13.34% | | | | | | | | | | | | |
| | | | |
| Energy Equipment & Services: 0.96% | | | | | | | | | | | | |
Baker Hughes Incorporated | | | | | | | 17,235 | | | | 981,706 | |
| | | | | | | | | | | | |
| | | | |
| Oil, Gas & Consumable Fuels: 12.38% | | | | | | | | | | | | |
Chevron Corporation | | | | | | | 13,274 | | | | 1,625,269 | |
ConocoPhillips Company | | | | | | | 18,151 | | | | 1,321,393 | |
Denbury Resources Incorporated † | | | | | | | 73,783 | | | | 1,230,700 | |
EnCana Corporation | | | | | | | 66,349 | | | | 1,273,237 | |
Exxon Mobil Corporation | | | | | | | 31,166 | | | | 2,913,398 | |
Marathon Oil Corporation | | | | | | | 55,250 | | | | 1,991,210 | |
Valero Energy Corporation | | | | | | | 18,823 | | | | 860,588 | |
Whiting Petroleum Corporation † | | | | | | | 23,110 | | | | 1,395,844 | |
| | | | |
| | | | | | | | | | | 12,611,639 | |
| | | | | | | | | | | | |
| | | | |
Financials: 31.20% | | | | | | | | | | | | |
| | | | |
| Capital Markets: 1.35% | | | | | | | | | | | | |
Goldman Sachs Group Incorporated | | | | | | | 8,139 | | | | 1,375,003 | |
| | | | | | | | | | | | |
The accompanying notes are an integral part of these financial statements.
| | | | | | |
| Portfolio of investments—November 30, 2013 (unaudited) | | Wells Fargo Advantage Equity Gateway Funds | | | 91 | |
LARGE COMPANY VALUE PORTFOLIO
| | | | | | | | | | | | |
| Security name | | | | | | Shares | | | Value | |
| | | | | | | | | | | | |
| | | | |
| Commercial Banks: 6.76% | | | | | | | | | | | | |
First Republic Bank Corporation | | | | | | | 36,349 | | | $ | 1,857,434 | |
KeyCorp | | | | | | | 129,016 | | | | 1,644,954 | |
SVB Financial Group † | | | | | | | 16,992 | | | | 1,720,270 | |
Synovus Financial Corporation | | | | | | | 476,436 | | | | 1,662,762 | |
| | | | |
| | | | | | | | | | | 6,885,420 | |
| | | | | | | | | | | | |
| | | | |
| Consumer Finance: 1.25% | | | | | | | | | | | | |
SLM Corporation | | | | | | | 47,671 | | | | 1,270,432 | |
| | | | | | | | | | | | |
| | | | |
| Diversified Financial Services: 7.06% | | | | | | | | | | | | |
Bank of America Corporation | | | | | | | 185,565 | | | | 2,935,638 | |
Citigroup Incorporated | | | | | | | 50,481 | | | | 2,671,455 | |
JPMorgan Chase & Company | | | | | | | 27,844 | | | | 1,593,234 | |
| | | | |
| | | | | | | | | | | 7,200,327 | |
| | | | | | | | | | | | |
| | | | |
| Insurance: 8.61% | | | | | | | | | | | | |
ACE Limited | | | | | | | 9,789 | | | | 1,006,113 | |
American International Group Incorporated | | | | | | | 44,026 | | | | 2,190,294 | |
MetLife Incorporated | | | | | | | 37,028 | | | | 1,932,491 | |
The Hartford Financial Services Group Incorporated | | | | | | | 65,234 | | | | 2,324,287 | |
The Travelers Companies Incorporated | | | | | | | 14,597 | | | | 1,324,532 | |
| | | | |
| | | | | | | | | | | 8,777,717 | |
| | | | | | | | | | | | |
| | | | |
| Real Estate Management & Development: 0.99% | | | | | | | | | | | | |
Realogy Holdings Corporation † | | | | | | | 21,244 | | | | 1,006,753 | |
| | | | | | | | | | | | |
| | | | |
| REITs: 5.18% | | | | | | | | | | | | |
American Tower Corporation | | | | | | | 22,300 | | | | 1,734,271 | |
Realty Income Corporation « | | | | | | | 36,255 | | | | 1,381,678 | |
Vornado Realty Trust | | | | | | | 11,650 | | | | 1,024,385 | |
Weyerhaeuser Company | | | | | | | 37,711 | | | | 1,136,232 | |
| | | | |
| | | | | | | | | | | 5,276,566 | |
| | | | | | | | | | | | |
| | | | |
Health Care: 10.94% | | | | | | | | | | | | |
| | | | |
| Health Care Equipment & Supplies: 2.51% | | | | | | | | | | | | |
Medtronic Incorporated | | | | | | | 18,368 | | | | 1,052,854 | |
Stryker Corporation | | | | | | | 20,232 | | | | 1,505,665 | |
| | | | |
| | | | | | | | | | | 2,558,519 | |
| | | | | | | | | | | | |
| | | | |
| Health Care Providers & Services: 1.73% | | | | | | | | | | | | |
Cigna Corporation | | | | | | | 20,170 | | | | 1,763,867 | |
| | | | | | | | | | | | |
| | | | |
| Pharmaceuticals: 6.70% | | | | | | | | | | | | |
Johnson & Johnson | | | | | | | 24,126 | | | | 2,283,767 | |
Merck & Company Incorporated | | | | | | | 21,599 | | | | 1,076,278 | |
Novartis AG ADR | | | | | | | 20,476 | | | | 1,620,061 | |
Pfizer Incorporated | | | | | | | 58,190 | | | | 1,846,369 | |
| | | | |
| | | | | | | | | | | 6,826,475 | |
| | | | | | | | | | | | |
The accompanying notes are an integral part of these financial statements.
| | | | |
| 92 | | Wells Fargo Advantage Equity Gateway Funds | | Portfolio of investments—November 30, 2013 (unaudited) |
LARGE COMPANY VALUE PORTFOLIO
| | | | | | | | | | | | |
| Security name | | | | | | Shares | | | Value | |
| | | | | | | | | | | | |
| | | | |
Industrials: 11.92% | | | | | | | | | | | | |
| | | | |
| Airlines: 1.54% | | | | | | | | | | | | |
United Continental Holdings Incorporated † | | | | | | | 39,988 | | | $ | 1,569,529 | |
| | | | | | | | | | | | |
| | | | |
| Construction & Engineering: 1.02% | | | | | | | | | | | | |
URS Corporation | | | | | | | 19,922 | | | | 1,035,346 | |
| | | | | | | | | | | | |
| | | | |
| Electrical Equipment: 1.90% | | | | | | | | | | | | |
Eaton Corporation plc | | | | | | | 26,600 | | | | 1,932,756 | |
| | | | | | | | | | | | |
| | | | |
| Industrial Conglomerates: 1.74% | | | | | | | | | | | | |
General Electric Company | | | | | | | 66,322 | | | | 1,768,145 | |
| | | | | | | | | | | | |
| | | | |
| Machinery: 2.09% | | | | | | | | | | | | |
Dover Corporation | | | | | | | 13,881 | | | | 1,259,562 | |
Stanley Black & Decker Incorporated | | | | | | | 10,740 | | | | 874,129 | |
| | | | |
| | | | | | | | | | | 2,133,691 | |
| | | | | | | | | | | | |
| | | | |
| Road & Rail: 1.66% | | | | | | | | | | | | |
Hertz Global Holdings Incorporated † | | | | | | | 69,933 | | | | 1,696,575 | |
| | | | | | | | | | | | |
| | | | |
| Trading Companies & Distributors: 1.97% | | | | | | | | | | | | |
WESCO International Incorporated † | | | | | | | 23,374 | | | | 2,009,697 | |
| | | | | | | | | | | | |
| | | | |
Information Technology: 6.94% | | | | | | | | | | | | |
| | | | |
| Communications Equipment: 0.75% | | | | | | | | | | | | |
JDS Uniphase Corporation † | | | | | | | 63,385 | | | | 769,494 | |
| | | | | | | | | | | | |
| | | | |
| Computers & Peripherals: 2.55% | | | | | | | | | | | | |
Apple Incorporated | | | | | | | 2,127 | | | | 1,182,761 | |
EMC Corporation | | | | | | | 59,180 | | | | 1,411,443 | |
| | | | |
| | | | | | | | | | | 2,594,204 | |
| | | | | | | | | | | | |
| | | | |
| Semiconductors & Semiconductor Equipment: 2.35% | | | | | | | | | | | | |
Maxim Integrated Products Incorporated | | | | | | | 28,115 | | | | 800,715 | |
Skyworks Solutions Incorporated † | | | | | | | 60,034 | | | | 1,596,304 | |
| | | | |
| | | | | | | | | | | 2,397,019 | |
| | | | | | | | | | | | |
| | | | |
| Software: 1.29% | | | | | | | | | | | | |
Symantec Corporation | | | | | | | 58,318 | | | | 1,311,572 | |
| | | | | | | | | | | | |
| | | | |
Materials: 3.04% | | | | | | | | | | | | |
| | | | |
| Chemicals: 3.04% | | | | | | | | | | | | |
Ashland Incorporated | | | | | | | 13,885 | | | | 1,264,646 | |
Huntsman Corporation | | | | | | | 43,658 | | | | 1,001,078 | |
Westlake Chemical Corporation | | | | | | | 7,360 | | | | 828,589 | |
| | | | |
| | | | | | | | | | | 3,094,313 | |
| | | | | | | | | | | | |
The accompanying notes are an integral part of these financial statements.
| | | | | | |
| Portfolio of investments—November 30, 2013 (unaudited) | | Wells Fargo Advantage Equity Gateway Funds | | | 93 | |
LARGE COMPANY VALUE PORTFOLIO
| | | | | | | | | | | | | | |
| Security name | | | | | | | Shares | | | Value | |
| | | | | | | | | | | | | | |
| | | | |
Telecommunication Services: 2.34% | | | | | | | | | | | | | | |
| | | | |
| Diversified Telecommunication Services: 2.34% | | | | | | | | | | | | | | |
AT&T Incorporated | | | | | | | | | 24,373 | | | $ | 858,170 | |
Verizon Communications Incorporated | | | | | | | | | 30,653 | | | | 1,521,002 | |
| | | | |
| | | | | | | | | | | | | 2,379,172 | |
| | | | | | | | | | | | | | |
| | | | |
Utilities: 4.26% | | | | | | | | | | | | | | |
| | | | |
| Electric Utilities: 1.22% | | | | | | | | | | | | | | |
Portland General Electric Company | | | | | | | | | 41,532 | | | | 1,238,069 | |
| | | | | | | | | | | | | | |
| | | | |
| Independent Power Producers & Energy Traders: 1.96% | | | | | | | | | | | | | | |
AES Corporation | | | | | | | | | 137,333 | | | | 2,000,942 | |
| | | | | | | | | | | | | | |
| | | | |
| Water Utilities: 1.08% | | | | | | | | | | | | | | |
Aqua America Incorporated | | | | | | | | | 45,800 | | | | 1,102,406 | |
| | | | | | | | | | | | | | |
| | | | |
| | | Yield | | | | | | | | | |
| Total Common Stocks (Cost $82,169,991) | | | | | | | | | | | | | 99,489,473 | |
| | | | | | | | | | | | | | |
| | | | |
Short-Term Investments: 4.81% | | | | | | | | | | | | | | |
| | | | |
| Investment Companies: 4.81% | | | | | | | | | | | | | | |
Wells Fargo Advantage Cash Investment Money Market Fund, Select Class (l)(u) | | | 0.08 | % | | | | | 2,329,957 | | | | 2,329,957 | |
Wells Fargo Securities Lending Cash Investments, LLC (l)(u)(r)(v) | | | 0.08 | | | | | | 2,575,400 | | | | 2,575,400 | |
| | | | | | | | | | | | | | |
| | | | |
Total Short-Term Investments (Cost $4,905,357) | | | | | | | | | | | | | 4,905,357 | |
| | | | | | | | | | | | | | |
| | | | | | | | |
Total investments in securities (Cost $87,075,348) * | | | 102.45 | % | | | 104,394,830 | |
Other assets and liabilities, net | | | (2.45 | ) | | | (2,497,243 | ) |
| | | | | | | | |
| Total net assets | | | 100.00 | % | | $ | 101,897,587 | |
| | | | | | | | |
| † | Non-income-earning security |
| (u) | Rate shown is the 7-day annualized yield at period end. |
| (l) | Investment in an affiliate |
| « | All or a portion of this security is on loan. |
| (v) | Security represents investment of cash collateral received from securities on loan. |
| (r) | The investment company is exempt from registration under Section 3(c)(7) of the Investment Company Act of 1940, as amended. |
| * | Cost for federal income tax purposes is $87,920,090 and unrealized appreciation (depreciation) consists of: |
| | | | |
Gross unrealized appreciation | | $ | 18,065,178 | |
Gross unrealized depreciation | | | (1,590,438 | ) |
| | | | |
Net unrealized appreciation | | $ | 16,474,740 | |
The accompanying notes are an integral part of these financial statements.
| | | | |
| 94 | | Wells Fargo Advantage Equity Gateway Funds | | Portfolio of investments — November 30, 2013 (unaudited) |
SMALL COMPANY GROWTH PORTFOLIO
| | | | | | | | | | | | |
| Security name | | | | | | Shares | | | Value | |
| | | | | | | | | | | | |
| | | | |
Common Stocks: 95.63% | | | | | | | | | | | | |
| | | | |
Consumer Discretionary: 14.66% | | | | | | | | | | | | |
| | | | |
| Auto Components: 0.93% | | | | | | | | | | | | |
Tower International Incorporated † | | | | | | | 104,840 | | | $ | 2,253,013 | |
| | | | | | | | | | | | |
| | | | |
| Diversified Consumer Services: 0.61% | | | | | | | | | | | | |
LifeLock Incorporated † | | | | | | | 85,540 | | | | 1,472,999 | |
| | | | | | | | | | | | |
| | | | |
| Hotels, Restaurants & Leisure: 1.48% | | | | | | | | | | | | |
Brinker International Incorporated | | | | | | | 43,340 | | | | 2,038,273 | |
Del Frisco’s Restaurant Group Incorporated † | | | | | | | 72,380 | | | | 1,532,285 | |
| | | | |
| | | | | | | | | | | 3,570,558 | |
| | | | | | | | | | | | |
| | | | |
| Household Durables: 0.62% | | | | | | | | | | | | |
Ethan Allen Interiors Incorporated | | | | | | | 48,440 | | | | 1,496,796 | |
| | | | | | | | | | | | |
| | | | |
| Media: 1.64% | | | | | | | | | | | | |
IMAX Corporation †« | | | | | | | 59,540 | | | | 1,835,618 | |
Lions Gate Entertainment Corporation † | | | | | | | 67,610 | | | | 2,139,180 | |
| | | | |
| | | | | | | | | | | 3,974,798 | |
| | | | | | | | | | | | |
| | | | |
| Specialty Retail: 4.76% | | | | | | | | | | | | |
Bebe Stores Incorporated | | | | | | | 207,120 | | | | 1,219,937 | |
Chico’s FAS Incorporated | | | | | | | 87,800 | | | | 1,640,982 | |
Dick’s Sporting Goods Incorporated | | | | | | | 41,760 | | | | 2,360,275 | |
GNC Holdings Incorporated Class A | | | | | | | 40,670 | | | | 2,447,521 | |
Pier 1 Imports Incorporated | | | | | | | 89,350 | | | | 1,991,612 | |
Sonic Automotive Incorporated | | | | | | | 78,950 | | | | 1,872,694 | |
| | | | |
| | | | | | | | | | | 11,533,021 | |
| | | | | | | | | | | | |
| | | | |
| Textiles, Apparel & Luxury Goods: 4.62% | | | | | | | | | | | | |
Deckers Outdoor Corporation † | | | | | | | 24,050 | | | | 1,987,492 | |
Hanesbrands Incorporated | | | | | | | 53,920 | | | | 3,779,792 | |
Movado Group Incorporated | | | | | | | 29,050 | | | | 1,322,356 | |
Skechers U.S.A. Incorporated Class A † | | | | | | | 69,420 | | | | 2,333,900 | |
Tumi Holdings Incorporated † | | | | | | | 73,380 | | | | 1,761,120 | |
| | | | |
| | | | | | | | | | | 11,184,660 | |
| | | | | | | | | | | | |
| | | | |
Consumer Staples: 0.89% | | | | | | | | | | | | |
| | | | |
| Food Products: 0.89% | | | | | | | | | | | | |
Whitewave Foods Company † | | | | | | | 101,040 | | | | 2,149,121 | |
| | | | | | | | | | | | |
| | | | |
Energy: 6.42% | | | | | | | | | | | | |
| | | | |
| Energy Equipment & Services: 1.56% | | | | | | | | | | | | |
Pacific Drilling SA † | | | | | | | 141,010 | | | | 1,593,413 | |
Tidewater Incorporated | | | | | | | 38,210 | | | | 2,179,498 | |
| | | | |
| | | | | | | | | | | 3,772,911 | |
| | | | | | | | | | | | |
The accompanying notes are an integral part of these financial statements.
| | | | | | |
| Portfolio of investments—November 30, 2013 (unaudited) | | Wells Fargo Advantage Equity Gateway Funds | | | 95 | |
SMALL COMPANY GROWTH PORTFOLIO
| | | | | | | | | | | | |
| Security name | | | | | | Shares | | | Value | |
| | | | | | | | | | | | |
| | | | |
| Oil, Gas & Consumable Fuels: 4.86% | | | | | | | | | | | | |
Delek US Holdings Incorporated | | | | | | | 82,770 | | | $ | 2,504,620 | |
Diamondback Energy Incorporated † | | | | | | | 29,480 | | | | 1,466,335 | |
GasLog Limited | | | | | | | 82,990 | | | | 1,322,031 | |
Gulfport Energy Corporation † | | | | | | | 32,280 | | | | 1,886,120 | |
Oasis Petroleum Incorporated † | | | | | | | 53,580 | | | | 2,471,645 | |
Rosetta Resources Incorporated † | | | | | | | 41,810 | | | | 2,114,332 | |
| | | | |
| | | | | | | | | | | 11,765,083 | |
| | | | | | | | | | | | |
| | | | |
Financials: 10.58% | | | | | | | | | | | | |
| | | | |
| Capital Markets: 4.25% | | | | | | | | | | | | |
Evercore Partners Incorporated Class A | | | | | | | 55,780 | | | | 3,059,533 | |
LPL Financial Holdings Incorporated | | | | | | | 58,330 | | | | 2,500,607 | |
Stifel Financial Corporation † | | | | | | | 50,970 | | | | 2,281,927 | |
Virtus Investment Partners Incorporated † | | | | | | | 11,760 | | | | 2,443,728 | |
| | | | |
| | | | | | | | | | | 10,285,795 | |
| | | | | | | | | | | | |
| | | | |
| Commercial Banks: 2.52% | | | | | | | | | | | | |
CapitalSource Incorporated | | | | | | | 151,150 | | | | 2,125,169 | |
Signature Bank † | | | | | | | 14,570 | | | | 1,548,063 | |
SVB Financial Group † | | | | | | | 23,990 | | | | 2,428,748 | |
| | | | |
| | | | | | | | | | | 6,101,980 | |
| | | | | | | | | | | | |
| | | | |
| Consumer Finance: 0.81% | | | | | | | | | | | | |
Encore Capital Group Incorporated † | | | | | | | 41,015 | | | | 1,956,005 | |
| | | | | | | | | | | | |
| | | | |
| Insurance: 1.16% | | | | | | | | | | | | |
Argo Group International Holdings Limited | | | | | | | 59,542 | | | | 2,815,741 | |
| | | | | | | | | | | | |
| | | | |
| REITs: 0.81% | | | | | | | | | | | | |
QTS Realty Trust Incorporated Class A † | | | | | | | 94,030 | | | | 1,957,705 | |
| | | | | | | | | | | | |
| | | | |
| Thrifts & Mortgage Finance: 1.03% | | | | | | | | | | | | |
Essent Group Limited † | | | | | | | 114,570 | | | | 2,490,752 | |
| | | | | | | | | | | | |
| | | | |
Health Care: 19.43% | | | | | | | | | | | | |
| | | | |
| Biotechnology: 4.11% | | | | | | | | | | | | |
Alnylam Pharmaceuticals Incorporated † | | | | | | | 32,280 | | | | 1,975,536 | |
Exelixis Incorporated †« | | | | | | | 222,430 | | | | 1,296,767 | |
Insys Therapeutics Incorporation † | | | | | | | 24,980 | | | | 1,101,618 | |
InterMune Incorporated † | | | | | | | 104,740 | | | | 1,448,554 | |
Intrexon Corporation †« | | | | | | | 34,170 | | | | 782,151 | |
Portola Pharmaceuticals Incorporation † | | | | | | | 49,770 | | | | 1,244,250 | |
Seattle Genetics Incorporated † | | | | | | | 26,160 | | | | 1,074,914 | |
Theravance Incorporated † | | | | | | | 27,250 | | | | 1,028,960 | |
| | | | |
| | | | | | | | | | | 9,952,750 | |
| | | | | | | | | | | | |
The accompanying notes are an integral part of these financial statements.
| | | | |
| 96 | | Wells Fargo Advantage Equity Gateway Funds | | Portfolio of investments—November 30, 2013 (unaudited) |
SMALL COMPANY GROWTH PORTFOLIO
| | | | | | | | | | | | |
| Security name | | | | | | Shares | | | Value | |
| | | | | | | | | | | | |
| | | | |
| Health Care Equipment & Supplies: 7.87% | | | | | | | | | | | | |
Accuray Incorporated †« | | | | | | | 213,560 | | | $ | 1,704,209 | |
ArthroCare Corporation † | | | | | | | 49,420 | | | | 1,864,122 | |
Atricure Incorporated † | | | | | | | 84,510 | | | | 1,323,427 | |
Cerus Corporation †« | | | | | | | 281,570 | | | | 1,883,703 | |
DexCom Incorporated † | | | | | | | 79,850 | | | | 2,642,237 | |
Endologix Incorporated † | | | | | | | 106,371 | | | | 1,900,850 | |
Insulet Corporation † | | | | | | | 50,730 | | | | 1,878,025 | |
Oxford Immunotec Global plc † | | | | | | | 73,920 | | | | 1,170,893 | |
Spectranetics Corporation † | | | | | | | 115,060 | | | | 2,676,296 | |
Sunshine Heart Incorporated †« | | | | | | | 95,650 | | | | 866,589 | |
Veracyte Incorporated † | | | | | | | 87,110 | | | | 1,130,688 | |
| | | | |
| | | | | | | | | | | 19,041,039 | |
| | | | | | | | | | | | |
| | | | |
| Health Care Providers & Services: 2.38% | | | | | | | | | | | | |
Capital Senior Living Corporation † | | | | | | | 57,980 | | | | 1,294,693 | |
Ensign Group Incorporated | | | | | | | 57,050 | | | | 2,576,949 | |
LifePoint Hospitals Incorporated † | | | | | | | 36,830 | | | | 1,886,801 | |
| | | | |
| | | | | | | | | | | 5,758,443 | |
| | | | | | | | | | | | |
| | | | |
| Health Care Technology: 0.83% | | | | | | | | | | | | |
Medidata Solutions Incorporated † | | | | | | | 12,000 | | | | 1,426,920 | |
Omnicell Incorporated † | | | | | | | 23,890 | | | | 579,333 | |
| | | | |
| | | | | | | | | | | 2,006,253 | |
| | | | | | | | | | | | |
| | | | |
| Life Sciences Tools & Services: 2.47% | | | | | | | | | | | | |
Cambrex Corporation † | | | | | | | 106,280 | | | | 2,072,460 | |
Fluidigm Corporation † | | | | | | | 44,690 | | | | 1,420,248 | |
ICON plc ADR † | | | | | | | 65,330 | | | | 2,491,686 | |
| | | | |
| | | | | | | | | | | 5,984,394 | |
| | | | | | | | | | | | |
| | | | |
| Pharmaceuticals: 1.77% | | | | | | | | | | | | |
AcelRx Pharmaceuticals Incorporated †« | | | | | | | 131,060 | | | | 1,281,767 | |
Akorn Incorporated † | | | | | | | 68,930 | | | | 1,774,948 | |
Pacira Pharmaceuticals Incorporated † | | | | | | | 22,370 | | | | 1,234,600 | |
| | | | |
| | | | | | | | | | | 4,291,315 | |
| | | | | | | | | | | | |
| | | | |
Industrials: 16.45% | | | | | | | | | | | | |
| | | | |
| Aerospace & Defense: 0.73% | | | | | | | | | | | | |
Esterline Technologies Corporation † | | | | | | | 20,080 | | | | 1,767,442 | |
| | | | | | | | | | | | |
| | | | |
| Air Freight & Logistics: 1.12% | | | | | | | | | | | | |
Hub Group Incorporated Class A † | | | | | | | 72,080 | | | | 2,712,370 | |
| | | | | | | | | | | | |
| | | | |
| Airlines: 0.42% | | | | | | | | | | | | |
Spirit Airlines Incorporated † | | | | | | | 22,330 | | | | 1,024,277 | |
| | | | | | | | | | | | |
| | | | |
| Building Products: 1.14% | | | | | | | | | | | | |
A.O. Smith Corporation | | | | | | | 51,010 | | | | 2,762,192 | |
| | | | | | | | | | | | |
The accompanying notes are an integral part of these financial statements.
| | | | | | |
| Portfolio of investments—November 30, 2013 (unaudited) | | Wells Fargo Advantage Equity Gateway Funds | | | 97 | |
SMALL COMPANY GROWTH PORTFOLIO
| | | | | | | | | | | | |
| Security name | | | | | | Shares | | | Value | |
| | | | | | | | | | | | |
| | | | |
| Commercial Services & Supplies: 2.20% | | | | | | | | | | | | |
ACCO Brands Corporation † | | | | | | | 178,660 | | | $ | 1,075,533 | |
Copart Incorporated † | | | | | | | 61,392 | | | | 2,113,727 | |
Kar Auction Services Incorporated | | | | | | | 76,890 | | | | 2,121,395 | |
| | | | |
| | | | | | | | | | | 5,310,655 | |
| | | | | | | | | | | | |
| | | | |
| Construction & Engineering: 1.17% | | | | | | | | | | | | |
Tutor Perini Corporation † | | | | | | | 115,450 | | | | 2,827,371 | |
| | | | | | | | | | | | |
| | | | |
| Machinery: 2.02% | | | | | | | | | | | | |
Actuant Corporation Class A | | | | | | | 52,970 | | | | 2,070,068 | |
Wabash National Corporation † | | | | | | | 232,490 | | | | 2,822,429 | |
| | | | |
| | | | | | | | | | | 4,892,497 | |
| | | | | | | | | | | | |
| | | | |
| Professional Services: 2.01% | | | | | | | | | | | | |
On Assignment Incorporated † | | | | | | | 106,630 | | | | 3,628,619 | |
RPX Corporation † | | | | | | | 75,110 | | | | 1,240,817 | |
| | | | |
| | | | | | | | | | | 4,869,436 | |
| | | | | | | | | | | | |
| | | | |
| Road & Rail: 2.52% | | | | | | | | | | | | |
Genesee & Wyoming Incorporated † | | | | | | | 17,290 | | | | 1,663,298 | |
Roadrunner Transportation Systems Incorporated † | | | | | | | 77,470 | | | | 2,121,129 | |
Swift Transportation Company †« | | | | | | | 99,740 | | | | 2,308,981 | |
| | | | |
| | | | | | | | | | | 6,093,408 | |
| | | | | | | | | | | | |
| | | | |
| Trading Companies & Distributors: 3.12% | | | | | | | | | | | | |
Beacon Roofing Supply Incorporated † | | | | | | | 63,600 | | | | 2,364,648 | |
MRC Global Incorporated † | | | | | | | 61,020 | | | | 1,866,602 | |
MSC Industrial Direct Company | | | | | | | 16,420 | | | | 1,261,877 | |
United Rentals Incorporated † | | | | | | | 30,070 | | | | 2,066,711 | |
| | | | |
| | | | | | | | | | | 7,559,838 | |
| | | | | | | | | | | | |
| | | | |
Information Technology: 22.19% | | | | | | | | | | | | |
| | | | |
| Communications Equipment: 1.97% | | | | | | | | | | | | |
Infinera Corporation † | | | | | | | 143,430 | | | | 1,333,899 | |
Palo Alto Networks Incorporated † | | | | | | | 40,310 | | | | 2,013,485 | |
Riverbed Technology Incorporated † | | | | | | | 82,790 | | | | 1,432,267 | |
| | | | |
| | | | | | | | | | | 4,779,651 | |
| | | | | | | | | | | | |
| | | | |
| Electronic Equipment, Instruments & Components: 1.84% | | | | | | | | | | | | |
InvenSense Incorporated †« | | | | | | | 89,410 | | | | 1,545,899 | |
OSI Systems Incorporated † | | | | | | | 38,040 | | | | 2,917,668 | |
| | | | |
| | | | | | | | | | | 4,463,567 | |
| | | | | | | | | | | | |
| | | | |
| Internet Software & Services: 1.03% | | | | | | | | | | | | |
Endurance International Group Holdings †« | | | | | | | 105,590 | | | | 1,508,881 | |
Zillow Incorporated Class A †« | | | | | | | 12,490 | | | | 981,964 | |
| | | | |
| | | | | | | | | | | 2,490,845 | |
| | | | | | | | | | | | |
The accompanying notes are an integral part of these financial statements.
| | | | |
| 98 | | Wells Fargo Advantage Equity Gateway Funds | | Portfolio of investments—November 30, 2013 (unaudited) |
SMALL COMPANY GROWTH PORTFOLIO
| | | | | | | | | | | | |
| Security name | | | | | | Shares | | | Value | |
| | | | | | | | | | | | |
| | | | |
| IT Services: 2.43% | | | | | | | | | | | | |
EVERTEC Incorporated | | | | | | | 92,330 | | | $ | 2,037,723 | |
InterXion Holding NV † | | | | | | | 55,580 | | | | 1,251,106 | |
Vantiv Incorporated Class A † | | | | | | | 85,260 | | | | 2,583,378 | |
| | | | |
| | | | | | | | | | | 5,872,207 | |
| | | | | | | | | | | | |
| | | | |
| Semiconductors & Semiconductor Equipment: 4.46% | | | | | | | | | | | | |
Advanced Energy Industries Incorporated † | | | | | | | 89,070 | | | | 2,121,647 | |
Applied Micro Circuits Corporation † | | | | | | | 85,940 | | | | 1,078,547 | |
Microsemi Corporation † | | | | | | | 73,040 | | | | 1,784,367 | |
Semtech Corporation † | | | | | | | 68,500 | | | | 2,035,820 | |
Spansion Incorporated Class A † | | | | | | | 125,590 | | | | 1,556,060 | |
Teradyne Incorporated † | | | | | | | 130,780 | | | | 2,227,183 | |
| | | | |
| | | | | | | | | | | 10,803,624 | |
| | | | | | | | | | | | |
| | | | |
| Software: 10.46% | | | | | | | | | | | | |
Bottomline Technologies Incorporated † | | | | | | | 58,650 | | | | 2,027,531 | |
BroadSoft Incorporated † | | | | | | | 29,880 | | | | 793,912 | |
Cadence Design Systems Incorporated † | | | | | �� | | 158,240 | | | | 2,096,680 | |
Concur Technologies Incorporated † | | | | | | | 14,642 | | | | 1,421,592 | |
Infoblox Incorporated † | | | | | | | 28,910 | | | | 918,760 | |
Jive Software Incorporated †« | | | | | | | 159,940 | | | | 1,773,735 | |
PTC Incorporated † | | | | | | | 69,170 | | | | 2,250,792 | |
Rally Software Development Corporation † | | | | | | | 65,070 | | | | 1,600,722 | |
Realpage Incorporated † | | | | | | | 71,770 | | | | 1,608,366 | |
Silver Spring Networks Incorporated †« | | | | | | | 142,620 | | | | 2,950,808 | |
SS&C Technologies Holdings † | | | | | | | 83,320 | | | | 3,591,925 | |
Synchronoss Technologies Incorporated † | | | | | | | 43,510 | | | | 1,380,572 | |
Tangoe Incorporated † | | | | | | | 85,720 | | | | 1,349,233 | |
Ultimate Software Group Incorporated † | | | | | | | 9,830 | | | | 1,540,263 | |
| | | | |
| | | | | | | | | | | 25,304,891 | |
| | | | | | | | | | | | |
| | | | |
Materials: 5.01% | | | | | | | | | | | | |
| | | | |
| Chemicals: 1.58% | | | | | | | | | | | | |
Calgon Carbon Corporation † | | | | | | | 108,400 | | | | 2,244,964 | |
Methanex Corporation | | | | | | | 25,750 | | | | 1,581,050 | |
| | | | |
| | | | | | | | | | | 3,826,014 | |
| | | | | | | | | | | | |
| | | | |
| Containers & Packaging: 0.82% | | | | | | | | | | | | |
Graphic Packaging Holding Company † | | | | | | | 219,980 | | | | 1,975,420 | |
| | | | | | | | | | | | |
| | | | |
| Metals & Mining: 1.76% | | | | | | | | | | | | |
Constellium NV Class A † | | | | | | | 121,870 | | | | 2,634,829 | |
Steel Dynamics Incorporated | | | | | | | 89,540 | | | | 1,631,419 | |
| | | | |
| | | | | | | | | | | 4,266,248 | |
| | | | | | | | | | | | |
| | | | |
| Paper & Forest Products: 0.85% | | | | | | | | | | | | |
Boise Cascade Company † | | | | | | | 79,630 | | | | 2,043,306 | |
| | | | | | | | | | | | |
| | | | |
Total Common Stocks (Cost $166,366,873) | | | | | | | | | | | 231,460,391 | |
| | | | | | | | | | | | |
The accompanying notes are an integral part of these financial statements.
| | | | | | |
| Portfolio of investments—November 30, 2013 (unaudited) | | Wells Fargo Advantage Equity Gateway Funds | | | 99 | |
SMALL COMPANY GROWTH PORTFOLIO
| | | | | | | | | | | | | | |
| Security name | | Yield | | | | | Shares | | | Value | |
| | | | | | | | | | | | | | |
| | | | |
Short-Term Investments: 9.20% | | | | | | | | | | | | | | |
| | | | |
| Investment Companies: 9.20% | | | | | | | | | | | | | | |
Wells Fargo Advantage Cash Investment Money Market Fund, Select Class (u)(l) | | | 0.08 | % | | | | | 9,672,711 | | | $ | 9,672,711 | |
Wells Fargo Securities Lending Cash Investments, LLC (r)(v)(u)(l) | | | 0.08 | | | | | | 12,598,600 | | | | 12,598,600 | |
| | | | |
Total Short-Term Investments (Cost $22,271,311) | | | | | | | | | | | | | 22,271,311 | |
| | | | | | | | | | | | | | |
| | | | | | | | |
Total investments in securities (Cost $188,638,184) * | | | 104.83 | % | | | 253,731,702 | |
Other assets and liabilities, net | | | (4.83 | ) | | | (11,689,750 | ) |
| | | | | | | | |
| Total net assets | | | 100.00 | % | | $ | 242,041,952 | |
| | | | | | | | |
| † | Non-income-earning security |
| « | All or a portion of this security is on loan. |
| (u) | Rate shown is the 7-day annualized yield at period end. |
| (l) | Investment in an affiliate |
| (r) | The investment company is exempt from registration under Section 3(c)(7) of the Investment Company Act of 1940, as amended. |
| (v) | Security represents investment of cash collateral received from securities on loan. |
| * | Cost for federal income tax purposes is $189,718,823 and unrealized appreciation (depreciation) consists of: |
| | | | |
Gross unrealized appreciation | | $ | 66,559,918 | |
Gross unrealized depreciation | | | (2,547,039 | ) |
| | | | |
Net unrealized appreciation | | $ | 64,012,879 | |
The accompanying notes are an integral part of these financial statements.
| | | | |
| 100 | | Wells Fargo Advantage Equity Gateway Funds | | Portfolio of investments—November 30, 2013 (unaudited) |
SMALL COMPANY VALUE PORTFOLIO
| | | | | | | | | | | | |
| Security name | | | | | | Shares | | | Value | |
| | | | | | | | | | | | |
| | | | |
Common Stocks: 97.30% | | | | | | | | | | | | |
| | | | |
Consumer Discretionary: 14.82% | | | | | | | | | | | | |
| | | | |
| Auto Components: 2.29% | | | | | | | | | | | | |
American Axle & Manufacturing Holdings Incorporated † | | | | | | | 137,365 | | | $ | 2,747,300 | |
Dana Holding Corporation | | | | | | | 98,799 | | | | 2,003,644 | |
| | | | |
| | | | | | | | | | | 4,750,944 | |
| | | | | | | | | | | | |
| | | |
| Distributors: 0.99% | | | | | | | | | | |
Core Mark Holding Company Incorporated | | | | | | | 27,763 | | | | 2,049,465 | |
| | | | | | | | | | | | |
| | | |
| Diversified Consumer Services: 2.70% | | | | | | | | | | |
Apollo Group Incorporated Class A † | | | | | | | 102,438 | | | | 2,693,095 | |
Houghton Mifflin Harcourt Company † | | | | | | | 75,690 | | | | 1,313,978 | |
Steiner Leisure Limited † | | | | | | | 27,113 | | | | 1,604,005 | |
| | | | |
| | | | | | | | | | | 5,611,078 | |
| | | | | | | | | | | | |
| | | |
| Hotels, Restaurants & Leisure: 1.88% | | | | | | | | | | |
Bob Evans Farms Incorporated | | | | | | | 34,188 | | | | 1,900,511 | |
ClubCorp Holdings Incorporated † | | | | | | | 120,800 | | | | 2,007,696 | |
| | | | |
| | | | | | | | | | | 3,908,207 | |
| | | | | | | | | | | | |
| | | |
| Leisure Equipment & Products: 0.71% | | | | | | | | | | |
Arctic Cat Incorporated | | | | | | | 26,215 | | | | 1,475,118 | |
| | | | | | | | | | | | |
| | | |
| Media: 0.78% | | | | | | | | | | |
Scholastic Corporation | | | | | | | 53,010 | | | | 1,618,925 | |
| | | | | | | | | | | | |
| | | |
| Specialty Retail: 2.98% | | | | | | | | | | |
Asbury Automotive Group Incorporated † | | | | | | | 53,503 | | | | 2,777,876 | |
Rent-A-Center Incorporated | | | | | | | 41,318 | | | | 1,407,291 | |
Zumiez Incorporated † | | | | | | | 72,327 | | | | 2,008,521 | |
| | | | |
| | | | | | | | | | | 6,193,688 | |
| | | | | | | | | | | | |
| | | |
| Textiles, Apparel & Luxury Goods: 2.49% | | | | | | | | | | |
G-III Apparel Group Limited † | | | | | | | 41,890 | | | | 2,523,873 | |
Vera Bradley Incorporated †« | | | | | | | 105,200 | | | | 2,642,624 | |
| | | | |
| | | | | | | | | | | 5,166,497 | |
| | | | | | | | | | | | |
| | | |
Consumer Staples: 1.83% | | | | | | | | | | |
| | | |
| Food Products: 1.83% | | | | | | | | | | |
Dean Foods Company | | | | | | | 92,450 | | | | 1,662,251 | |
Post Holdings Incorporated † | | | | | | | 42,096 | | | | 2,132,162 | |
| | | | |
| | | | | | | | | | | 3,794,413 | |
| | | | | | | | | | | | |
| | | |
Energy: 3.83% | | | | | | | | | | |
| | | |
| Energy Equipment & Services: 1.89% | | | | | | | | | | |
Basic Energy Services Incorporated † | | | | | | | 115,737 | | | | 1,642,308 | |
Key Energy Services Incorporated † | | | | | | | 291,414 | | | | 2,284,686 | |
| | | | |
| | | | | | | | | | | 3,926,994 | |
| | | | | | | | | | | | |
The accompanying notes are an integral part of these financial statements.
| | | | | | |
| Portfolio of investments—November 30, 2013 (unaudited) | | Wells Fargo Advantage Equity Gateway Funds | | | 101 | |
SMALL COMPANY VALUE PORTFOLIO
| | | | | | | | | | | | |
| Security name | | | | | | Shares | | | Value | |
| | | | | | | | | | | | |
| | | |
| Oil, Gas & Consumable Fuels: 1.94% | | | | | | | | | | |
Rex Energy Corporation † | | | | | | | 106,300 | | | $ | 2,038,834 | |
Sanchez Energy Corporation † | | | | | | | 77,775 | | | | 1,996,484 | |
| | | | |
| | | | | | | | | | | 4,035,318 | |
| | | | | | | | | | | | |
| | | | |
Financials: 37.39% | | | | | | | | | | | | |
| | | | |
| Capital Markets: 2.01% | | | | | | | | | | | | |
Greenhill & Company Incorporated | | | | | | | 38,605 | | | | 2,112,080 | |
Stifel Financial Corporation † | | | | | | | 46,174 | | | | 2,067,210 | |
| | | | |
| | | | | | | | | | | 4,179,290 | |
| | | | | | | | | | | | |
| | | | |
| Commercial Banks: 16.42% | | | | | | | | | | | | |
Associated Banc-Corp | | | | | | | 134,553 | | | | 2,319,694 | |
BancorpSouth Incorporated | | | | | | | 130,211 | | | | 3,113,345 | |
Banner Corporation | | | | | | | 48,215 | | | | 2,095,424 | |
City National Corporation | | | | | | | 31,669 | | | | 2,418,245 | |
FirstMerit Corporation | | | | | | | 108,890 | | | | 2,500,114 | |
IBERIABANK Corporation | | | | | | | 41,041 | | | | 2,573,271 | |
MB Financial Incorporated | | | | | | | 51,300 | | | | 1,672,893 | |
Old National Bancorp | | | | | | | 104,300 | | | | 1,621,865 | |
Pacwest Bancorp « | | | | | | | 48,969 | | | | 2,014,585 | |
PrivateBancorp Incorporated | | | | | | | 99,000 | | | | 2,745,270 | |
Umpqua Holdings Corporation « | | | | | | | 87,407 | | | | 1,609,163 | |
ViewPoint Financial Group Incorporated | | | | | | | 80,400 | | | | 2,040,552 | |
Webster Financial Corporation | | | | | | | 71,292 | | | | 2,101,688 | |
Western Alliance Bancorp † | | | | | | | 136,439 | | | | 3,168,114 | |
Wintrust Financial Corporation | | | | | | | 46,351 | | | | 2,102,481 | |
| | | | |
| | | | | | | | | | | 34,096,704 | |
| | | | | | | | | | | | |
| | | | |
| Insurance: 7.09% | | | | | | | | | | | | |
Amtrust Financial Services Incorporated « | | | | | | | 68,366 | | | | 2,858,382 | |
CNO Financial Group Incorporated | | | | | | | 184,061 | | | | 3,114,312 | |
Employers Holdings Incorporated | | | | | | | 83,034 | | | | 2,710,230 | |
OneBeacon Insurance Group Limited | | | | | | | 104,501 | | | | 1,661,566 | |
Primerica Incorporated | | | | | | | 50,997 | | | | 2,194,401 | |
Selective Insurance Group Incorporated | | | | | | | 77,617 | | | | 2,188,023 | |
| | | | |
| | | | | | | | | | | 14,726,914 | |
| | | | | | | | | | | | |
| | | | |
| Real Estate Management & Development: 0.80% | | | | | | | | | | | | |
Alexander & Baldwin Incorporated | | | | | | | 43,980 | | | | 1,662,004 | |
| | | | | | | | | | | | |
| | | | |
| REITs: 9.29% | | | | | | | | | | | | |
Ashford Hospitality Prime Incorporated † | | | | | | | 36,423 | | | | 745,215 | |
Ashford Hospitality Trust | | | | | | | 182,117 | | | | 1,495,181 | |
Campus Crest Communities Incorporated | | | | | | | 194,096 | | | | 1,931,255 | |
Corporate Office Properties Trust | | | | | | | 70,300 | | | | 1,562,769 | |
Cousins Properties Incorporated | | | | | | | 182,797 | | | | 1,957,756 | |
Education Realty Trust Incorporated | | | | | | | 223,700 | | | | 1,946,190 | |
LaSalle Hotel Properties | | | | | | | 64,396 | | | | 2,016,883 | |
Pebblebrook Hotel Trust | | | | | | | 64,011 | | | | 1,941,454 | |
The accompanying notes are an integral part of these financial statements.
| | | | |
| 102 | | Wells Fargo Advantage Equity Gateway Funds | | Portfolio of investments—November 30, 2013 (unaudited) |
SMALL COMPANY VALUE PORTFOLIO
| | | | | | | | | | | | |
| Security name | | | | | | Shares | | | Value | |
| | | | | | | | | | | | |
| | | | |
| REITs (continued) | | | | | | | | | | | | |
Sabra Health Care REIT Incorporated | | | | | | | 64,528 | | | $ | 1,721,607 | |
STAG Industrial Incorporated | | | | | | | 94,800 | | | | 2,055,264 | |
Sunstone Hotel Investors Incorporated | | | | | | | 147,221 | | | | 1,924,178 | |
| | | | |
| | | | | | | | | | | 19,297,752 | |
| | | | | | | | | | | | |
| | | | |
| Thrifts & Mortgage Finance: 1.78% | | | | | | | | | | | | |
BankUnited Incorporated | | | | | | | 66,646 | | | | 2,151,333 | |
Washington Federal Incorporated | | | | | | | 66,426 | | | | 1,553,704 | |
| | | | |
| | | | | | | | | | | 3,705,037 | |
| | | | | | | | | | | | |
| | | | |
Health Care: 5.38% | | | | | | | | | | | | |
| | | | |
| Health Care Equipment & Supplies: 1.13% | | | | | | | | | | | | |
Alere Incorporated † | | | | | | | 71,943 | | | | 2,353,975 | |
| | | | | | | | | | | | |
| | | | |
| Health Care Providers & Services: 3.01% | | | | | | | | | | | | |
Ensign Group Incorporated | | | | | | | 35,864 | | | | 1,619,977 | |
LifePoint Hospitals Incorporated † | | | | | | | 38,191 | | | | 1,956,525 | |
WellCare Health Plans Incorporated † | | | | | | | 35,880 | | | | 2,665,884 | |
| | | | |
| | | | | | | | | | | 6,242,386 | |
| | | | | | | | | | | | |
| | | | |
| Health Care Technology: 1.24% | | | | | | | | | | | | |
Medassets Incorporated † | | | | | | | 119,297 | | | | 2,569,657 | |
| | | | | | | | | | | | |
| | | | |
Industrials: 11.50% | | | | | | | | | | | | |
| | | | |
| Air Freight & Logistics: 1.46% | | | | | | | | | | | | |
Air Transport Services Group † | | | | | | | 138,038 | | | | 1,073,936 | |
Atlas Air Worldwide Holdings Incorporated † | | | | | | | 50,989 | | | | 1,957,978 | |
| | | | |
| | | | | | | | | | | 3,031,914 | |
| | | | | | | | | | | | |
| | | | |
| Commercial Services & Supplies: 1.57% | | | | | | | | | | | | |
ACCO Brands Corporation † | | | | | | | 268,340 | | | | 1,615,407 | |
Quad Graphics Incorporated | | | | | | | 62,877 | | | | 1,637,946 | |
| | | | |
| | | | | | | | | | | 3,253,353 | |
| | | | | | | | | | | | |
| | | | |
| Construction & Engineering: 2.03% | | | | | | | | | | | | |
Great Lakes Dredge & Dock Company | | | | | | | 212,722 | | | | 1,895,353 | |
Tutor Perini Corporation † | | | | | | | 94,941 | | | | 2,325,105 | |
| | | | |
| | | | | | | | | | | 4,220,458 | |
| | | | | | | | | | | | |
| | | | |
| Machinery: 3.02% | | | | | | | | | | | | |
Briggs & Stratton Corporation | | | | | | | 70,394 | | | | 1,423,367 | |
Global Brass & Copper Holdings Incorporated | | | | | | | 72,663 | | | | 1,198,940 | |
Kadant Incorporated | | | | | | | 48,452 | | | | 2,006,882 | |
Wabash National Corporation † | | | | | | | 134,999 | | | | 1,638,888 | |
| | | | |
| | | | | | | | | | | 6,268,077 | |
| | | | | | | | | | | | |
| | | | |
| Professional Services: 1.02% | | | | | | | | | | | | |
FTI Consulting Incorporated † | | | | | | | 47,191 | | | | 2,119,348 | |
| | | | | | | | | | | | |
The accompanying notes are an integral part of these financial statements.
| | | | | | |
| Portfolio of investments—November 30, 2013 (unaudited) | | Wells Fargo Advantage Equity Gateway Funds | | | 103 | |
SMALL COMPANY VALUE PORTFOLIO
| | | | | | | | | | | | |
| Security name | | | | | | Shares | | | Value | |
| | | | | | | | | | | | |
| | | | |
| Road & Rail: 1.48% | | | | | | | | | | | | |
Quality Distribution Incorporated † | | | | | | | 139,900 | | | $ | 1,710,977 | |
Ryder System Incorporated | | | | | | | 19,506 | | | | 1,362,299 | |
| | | | |
| | | | | | | | | | | 3,073,276 | |
| | | | | | | | | | | | |
| | | | |
| Trading Companies & Distributors: 0.92% | | | | | | | | | | | | |
Titan Machinery Incorporated †« | | | | | | | 107,533 | | | | 1,915,163 | |
| | | | | | | | | | | | |
| | | | |
Information Technology: 13.12% | | | | | | | | | | | | |
| | | | |
| Communications Equipment: 1.89% | | | | | | | | | | | | |
ARRIS Group Incorporated † | | | | | | | 120,850 | | | | 2,479,842 | |
Black Box Corporation | | | | | | | 51,946 | | | | 1,455,007 | |
| | | | |
| | | | | | | | | | | 3,934,849 | |
| | | | | | | | | | | | |
| | | | |
| Computers & Peripherals: 0.82% | | | | | | | | | | | | |
QLogic Corporation † | | | | | | | 137,730 | | | | 1,709,229 | |
| | | | | | | | | | | | |
| | | | |
| Electronic Equipment, Instruments & Components: 3.34% | | | | | | | | | | | | |
Itron Incorporated † | | | | | | | 36,310 | | | | 1,537,729 | |
Multi-Fineline Electronix Incorporated † | | | | | | | 71,135 | | | | 1,004,426 | |
Plexus Corporation † | | | | | | | 55,319 | | | | 2,233,228 | |
Sanmina Corporation † | | | | | | | 139,545 | | | | 2,160,157 | |
| | | | |
| | | | | | | | | | | 6,935,540 | |
| | | | | | | | | | | | |
| | | | |
| Internet Software & Services: 0.89% | | | | | | | | | | | | |
EarthLink Incorporated | | | | | | | 338,242 | | | | 1,843,419 | |
| | | | | | | | | | | | |
| | | | |
| Semiconductors & Semiconductor Equipment: 5.59% | | | | | | | | | | | | |
Cirrus Logic Incorporated †« | | | | | | | 106,590 | | | | 2,150,986 | |
Integrated Silicon Solution Incorporated † | | | | | | | 148,163 | | | | 1,754,250 | |
Kulicke & Soffa Industries Incorporated † | | | | | | | 186,646 | | | | 2,355,473 | |
MagnaChip Semiconductor Corporation † | | | | | | | 98,976 | | | | 2,009,213 | |
OmniVision Technologies Incorporated † | | | | | | | 90,984 | | | | 1,458,474 | |
Photronics Incorporated † | | | | | | | 217,754 | | | | 1,881,395 | |
| | | | |
| | | | | | | | | | | 11,609,791 | |
| | | | | | | | | | | | |
| | | | |
| Software: 0.59% | | | | | | | | | | | | |
EPIQ Systems Incorporated | | | | | | | 72,582 | | | | 1,214,297 | |
| | | | | | | | | | | | |
| | | | |
Materials: 5.33% | | | | | | | | | | | | |
| | | | |
| Chemicals: 1.66% | | | | | | | | | | | | |
Kraton Performance Polymers Incorporated † | | | | | | | 85,391 | | | | 1,988,756 | |
Zep Incorporated | | | | | | | 75,616 | | | | 1,456,364 | |
| | | | |
| | | | | | | | | | | 3,445,120 | |
| | | | | | | | | | | | |
| | | | |
| Metals & Mining: 3.67% | | | | | | | | | | | | |
A.M. Castle & Company † | | | | | | | 56,966 | | | | 796,954 | |
Commercial Metals Company | | | | | | | 115,670 | | | | 2,246,311 | |
Horsehead Holding Corporation † | | | | | | | 149,262 | | | | 2,234,452 | |
Suncoke Energy Incorporated † | | | | | | | 103,939 | | | | 2,356,297 | |
| | | | |
| | | | | | | | | | | 7,634,014 | |
| | | | | | | | | | | | |
The accompanying notes are an integral part of these financial statements.
| | | | |
| 104 | | Wells Fargo Advantage Equity Gateway Funds | | Portfolio of investments—November 30, 2013 (unaudited) |
SMALL COMPANY VALUE PORTFOLIO
| | | | | | | | | | | | | | | | |
| Security name | | | | | | | | Shares | | | Value | |
| | | | | | | | | | | | | | | | |
| | | | |
Telecommunication Services: 0.80% | | | | | | | | | | | | | | | | |
| | | | |
| Diversified Telecommunication Services: 0.80% | | | | | | | | | | | | | | | | |
Iridium Communications Incorporated † | | | | | | | | | | | 270,575 | | | $ | 1,664,036 | |
| | | | | | | | | | | | | | | | |
| | | | |
Utilities: 3.30% | | | | | | | | | | | | | | | | |
| | | | |
| Electric Utilities: 3.30% | | | | | | | | | | | | | | | | |
El Paso Electric Company | | | | | | | | | | | 63,350 | | | | 2,282,501 | |
PNM Resources Incorporated | | | | | | | | | | | 86,704 | | | | 2,017,602 | |
Portland General Electric Company | | | | | | | | | | | 85,697 | | | | 2,554,624 | |
| | | | |
| | | | | | | | | | | | | | | 6,854,727 | |
| | | | | | | | | | | | | | | | |
| | | | |
Total Common Stocks (Cost $147,320,398) | | | | | | | | | | | | | | | 202,090,977 | |
| | | | | | | | | | | | | | | | |
| | | | |
| | | | | | Expiration date | | | | | | | |
| | | | |
Warrants: 0.01% | | | | | | | | | | | | | | | | |
| | | | |
Health Care: 0.01% | | | | | | | | | | | | | | | | |
| | | | |
| Health Care Equipment & Supplies: 0.01% | | | | | | | | | | | | | | | | |
EnteroMedics Incorporated †(a) | | | | | | | 5-14-2016 | | | | 9,104 | | | | 10,778 | |
| | | | | | | | | | | | | | | | |
| | | | |
Total Warrants (Cost $0) | | | | | | | | | | | | | | | 10,778 | |
| | | | | | | | | | | | | | | | |
| | | | |
| | | Yield | | | | | | | | | | |
| | | | |
Short-Term Investments: 7.42% | | | | | | | | | | | | | | | | |
| | | | |
| Investment Companies: 7.42% | | | | | | | | | | | | | | | | |
Wells Fargo Advantage Cash Investment Money Market Fund, Select Class (l)(u) | | | 0.08 | % | | | | | | | 6,438,413 | | | | 6,438,413 | |
Wells Fargo Securities Lending Cash Investments, LLC (l)(u)(r)(v) | | | 0.08 | | | | | | | | 8,987,147 | | | | 8,987,147 | |
| | | | |
Total Short-Term Investments (Cost $15,425,560) | | | | | | | | | | | | | | | 15,425,560 | |
| | | | | | | | | | | | | | | | |
| | | | | | | | |
| Total investments in securities | | | | | | | | |
| (Cost $162,745,958) * | | | 104.73 | % | | | 217,527,315 | |
Other assets and liabilities, net | | | (4.73 | ) | | | (9,829,453 | ) |
| | | | | | | | |
| Total net assets | | | 100.00 | % | | $ | 207,697,862 | |
| | | | | | | | |
| † | Non-income-earning security |
| « | All or a portion of this security is on loan. |
| (a) | Security is fair valued by the Management Valuation Team, and in certain instances by the Board of Trustees, in accordance with procedures approved by the Board of Trustees. |
| (l) | Investment in an affiliate |
| (u) | Rate shown is the 7-day annualized yield at period end. |
| (r) | The investment company is exempt from registration under Section 3(c)(7) of the Investment Company Act of 1940, as amended. |
| (v) | Security represents investment of cash collateral received from securities on loan. |
| * | Cost for federal income tax purposes is $164,900,485 and unrealized appreciation (depreciation) consists of: |
| | | | |
Gross unrealized appreciation | | $ | 58,250,533 | |
Gross unrealized depreciation | | | (5,623,703 | ) |
| | | | |
Net unrealized appreciation | | $ | 52,626,830 | |
The accompanying notes are an integral part of these financial statements.
This page is intentionally left blank.
| | | | |
| 106 | | Wells Fargo Advantage Equity Gateway Funds | | Statements of assets and liabilities—November 30, 2013 (unaudited) |
| | | | | | | | |
| | | C&B Large Cap
Value Portfolio | | | Diversified Large
Cap Growth
Portfolio | |
| | |
Assets | | | | | | | | |
Investments | | | | | | | | |
In unaffiliated securities (including securities on loan), at value (see cost below) | | $ | 334,001,637 | | | $ | 152,315,144 | |
In affiliated securities, at value (see cost below) | | | 16,519,640 | | | | 5,224,757 | |
| | | | | | | | |
Total investments, at value (see cost below) | | | 350,521,277 | | | | 157,539,901 | |
Cash | | | 0 | | | | 0 | |
Foreign currency, at value (see cost below) | | | 0 | | | | 0 | |
Receivable for investments sold | | | 0 | | | | 210,527 | |
Receivable for dividends | | | 735,986 | | | | 128,954 | |
Receivable for securities lending income | | | 3,790 | | | | 1,130 | |
Prepaid expenses and other assets | | | 1,817 | | | | 788 | |
| | | | | | | | |
Total assets | | | 351,262,870 | | | | 157,881,300 | |
| | | | | | | | |
| | |
Liabilities | | | | | | | | |
Payable for investments purchased | | | 0 | | | | 249,277 | |
Payable upon receipt of securities loaned | | | 0 | | | | 4,148,421 | |
Payable for daily variation margin on open futures contracts | | | 0 | | | | 0 | |
Advisory fee payable | | | 191,820 | | | | 72,151 | |
Professional fees payable | | | 16,632 | | | | 19,112 | |
Contingent tax liability | | | 0 | | | | 0 | |
Accrued expenses and other liabilities | | | 4,778 | | | | 6,455 | |
| | | | | | | | |
Total liabilities | | | 213,230 | | | | 4,495,416 | |
| | | | | | | | |
Total net assets | | $ | 351,049,640 | | | $ | 153,385,884 | |
| | | | | | | | |
| | |
Investments in unaffiliated securities (including securities on loan), at cost | | $ | 229,794,795 | | | $ | 104,838,269 | |
| | | | | | | | |
Investments in affiliated securities, at cost | | $ | 16,519,640 | | | $ | 5,224,757 | |
| | | | | | | | |
Total investments, at cost | | $ | 246,314,435 | | | $ | 110,063,026 | |
| | | | | | | | |
Securities on loan, at value | | $ | 0 | | | $ | 4,055,923 | |
| | | | | | | | |
Foreign currency, at cost | | $ | 0 | | | $ | 0 | |
| | | | | | | | |
The accompanying notes are an integral part of these financial statements.
| | | | | | |
| Statements of assets and liabilities—November 30, 2013 (unaudited) | | Wells Fargo Advantage Equity Gateway Funds | | | 107 | |
| | | | | | | | | | | | | | | | | | | | | | | | | | |
Emerging Growth
Portfolio | | | Index Portfolio | | | International
Growth Portfolio | | | International Value
Portfolio | | | Large Company
Value Portfolio | | | Small Company
Growth Portfolio | | | Small Company
Value Portfolio | |
| | | | | | |
| | | | | | | | | | | | | | | | | | | | | | | | | | |
| | | | | | | | | | | | | | | | | | | | | | | | | | |
| $ | 1,217,490,452 | | | $ | 2,773,006,007 | | | $ | 149,055,032 | | | $ | 466,529,043 | | | $ | 99,489,473 | | | $ | 231,460,391 | | | $ | 202,101,755 | |
| | 45,044,489 | | | | 79,059,831 | | | | 6,859,247 | | | | 12,090,564 | | | | 4,905,357 | | | | 22,271,311 | | | | 15,425,560 | |
| | | | | | | | | | | | | | | | | | | | | | | | | | |
| | 1,262,534,941 | | | | 2,852,065,838 | | | | 155,914,279 | | | | 478,619,607 | | | | 104,394,830 | | | | 253,731,702 | | | | 217,527,315 | |
| | 0 | | | | 24,610 | | | | 0 | | | | 0 | | | | 0 | | | | 68,396 | | | | 0 | |
| | 0 | | | | 0 | | | | 114,497 | | | | 7,563,642 | | | | 0 | | | | 0 | | | | 0 | |
| | 5,072,716 | | | | 687,657 | | | | 1,216,929 | | | | 0 | | | | 0 | | | | 3,250,935 | | | | 71,635 | |
| | 1,018 | | | | 6,084,107 | | | | 163,571 | | | | 1,321,318 | | | | 155,945 | | | | 64,718 | | | | 115,502 | |
| | 104,730 | | | | 4,536 | | | | 7,239 | | | | 16,945 | | | | 1,732 | | | | 11,503 | | | | 13,602 | |
| | 10,524 | | | | 14,289 | | | | 1,924 | | | | 13,359 | | | | 1,761 | | | | 2,034 | | | | 2,912 | |
| | | | | | | | | | | | | | | | | | | | | | | | | | |
| | 1,267,723,929 | | | | 2,858,881,037 | | | | 157,418,439 | | | | 487,534,871 | | | | 104,554,268 | | | | 257,129,288 | | | | 217,730,966 | |
| | | | | | | | | | | | | | | | | | | | | | | | | | |
| | | | | | |
| | | | | | | | | | | | | | | | | | | | | | | | | | |
| | 4,704,890 | | | | 0 | | | | 2,068,091 | | | | 0 | | | | 0 | | | | 2,301,740 | | | | 879,783 | |
| | 31,741,350 | | | | 9,164,555 | | | | 765,419 | | | | 9,341,704 | | | | 2,575,400 | | | | 12,598,600 | | | | 8,987,147 | |
| | 0 | | | | 4,430 | | | | 0 | | | | 0 | | | | 0 | | | | 0 | | | | 0 | |
| | 802,493 | | | | 200,707 | | | | 109,465 | | | | 341,611 | | | | 55,975 | | | | 157,968 | | | | 138,030 | |
| | 10,510 | | | | 13,867 | | | | 16,685 | | | | 18,477 | | | | 17,825 | | | | 18,817 | | | | 18,704 | |
| | 0 | | | | 0 | | | | 45,316 | | | | 0 | | | | 0 | | | | 0 | | | | 0 | |
| | 10,623 | | | | 23,878 | | | | 26,362 | | | | 0 | | | | 7,481 | | | | 10,211 | | | | 9,440 | |
| | | | | | | | | | | | | | | | | | | | | | | | | | |
| | 37,269,866 | | | | 9,407,437 | | | | 3,031,338 | | | | 9,701,792 | | | | 2,656,681 | | | | 15,087,336 | | | | 10,033,104 | |
| | | | | | | | | | | | | | | | | | | | | | | | | | |
| $ | 1,230,454,063 | | | $ | 2,849,473,600 | | | $ | 154,387,101 | | | $ | 477,833,079 | | | $ | 101,897,587 | | | $ | 242,041,952 | | | $ | 207,697,862 | |
| | | | | | | | | | | | | | | | | | | | | | | | | | |
| | | | | | |
| $ | 798,977,657 | | | $ | 1,662,832,574 | | | $ | 113,387,594 | | | $ | 431,268,328 | | | $ | 82,169,991 | | | $ | 166,366,873 | | | $ | 147,320,398 | |
| | | | | | | | | | | | | | | | | | | | | | | | | | |
| $ | 45,044,489 | | | $ | 69,826,099 | | | $ | 6,859,247 | | | $ | 12,090,564 | | | $ | 4,905,357 | | | $ | 22,271,311 | | | $ | 15,425,560 | |
| | | | | | | | | | | | | | | | | | | | | | | | | | |
| $ | 844,022,146 | | | $ | 1,732,658,673 | | | $ | 120,246,841 | | | $ | 443,358,892 | | | $ | 87,075,348 | | | $ | 188,638,184 | | | $ | 162,745,958 | |
| | | | | | | | | | | | | | | | | | | | | | | | | | |
| $ | 30,955,510 | | | $ | 8,899,585 | | | $ | 730,218 | | | $ | 8,854,230 | | | $ | 2,516,705 | | | $ | 12,245,453 | | | $ | 8,776,029 | |
| | | | | | | | | | | | | | | | | | | | | | | | | | |
| $ | 0 | | | $ | 0 | | | $ | 114,739 | | | $ | 7,562,268 | | | $ | 0 | | | $ | 0 | | | $ | 0 | |
| | | | | | | | | | | | | | | | | | | | | | | | | | |
The accompanying notes are an integral part of these financial statements.
| | | | |
| 108 | | Wells Fargo Advantage Equity Gateway Funds | | Statements of operations—six months ended November 30, 2013 (unaudited) |
| | | | | | | | | | | | | | | | |
| | | C&B Large Cap Value Portfolio | | | Diversified Large Cap Growth
Portfolio | | | Emerging Growth
Portfolio | | | Index Portfolio | |
| | | | |
Investment income | | | | | | | | | | | | | | | | |
Dividends* | | $ | 3,520,363 | | | $ | 607,305 | | | $ | 612,385 | | | $ | 28,228,572 | |
Income from affiliated securities | | | 7,017 | | | | 492 | | | | 6,574 | | | | 16,633 | |
Securities lending income, net | | | 6,223 | | | | 7,309 | | | | 387,518 | | | | 31,800 | |
Interest | | | 0 | | | | 0 | | | | 0 | | | | 612 | |
| | | | | | | | | | | | | | | | |
Total investment income | | | 3,533,603 | | | | 615,106 | | | | 1,006,477 | | | | 28,277,617 | |
| | | | | | | | | | | | | | | | |
| | | | |
Expenses | | | | | | | | | | | | | | | | |
Advisory fee | | | 1,104,441 | | | | 484,377 | | | | 4,453,275 | | | | 1,129,369 | |
Custody and accounting fees | | | 12,835 | | | | 12,716 | | | | 34,439 | | | | 71,777 | |
Professional fees | | | 23,928 | | | | 23,046 | | | | 30,372 | | | | 38,378 | |
Shareholder report expenses | | | 790 | | | | 2,877 | | | | 970 | | | | 5,411 | |
Trustees’ fees and expenses | | | 5,547 | | | | 5,243 | | | | 5,287 | | | | 5,030 | |
Other fees and expenses | | | 5,868 | | | | 3,796 | | | | 12,801 | | | | 29,732 | |
| | | | | | | | | | | | | | | | |
Total expenses | | | 1,153,409 | | | | 532,055 | | | | 4,537,144 | | | | 1,279,697 | |
Less: Fee waivers and/or expense reimbursements | | | 0 | | | | (68,470 | ) | | | 0 | | | | 0 | |
| | | | | | | | | | | | | | | | |
Net expenses | | | 1,153,409 | | | | 463,585 | | | | 4,537,144 | | | | 1,279,697 | |
| | | | | | | | | | | | | | | | |
Net investment income (loss) | | | 2,380,194 | | | | 151,521 | | | | (3,530,667 | ) | | | 26,997,920 | |
| | | | | | | | | | | | | | | | |
| | | | |
REALIZED AND UNREALIZED GAINS (LOSSES) ON INVESTMENTS | | | | | | | | | | | | | | | | |
| | | | |
Net realized gains (losses) on: | | | | | | | | | | | | | | | | |
Unaffiliated securities | | | 21,465,517 | | | | 6,521,085 | | | | 89,132,120 | | | | (13,212,779 | ) |
Affiliated securities | | | 0 | | | | 0 | | | | 0 | | | | (5,489,503 | ) |
Futures transactions | | | 0 | | | | 0 | | | | 0 | | | | 6,192,875 | |
| | | | | | | | | | | | | | | | |
Net realized gain (losses) on investments | | | 21,465,517 | | | | 6,521,085 | | | | 89,132,120 | | | | (12,509,407 | ) |
| | | | | | | | | | | | | | | | |
Net change in unrealized gains (losses) on: | | | | | | | | | | | | | | | | |
Unaffiliated securities | | | 13,685,125 | | | | 17,953,571 | | | | 184,460,846 | | | | 283,715,260 | |
Affiliated securities | | | 0 | | | | 0 | | | | 0 | | | | 8,471,069 | |
Futures transactions | | | 0 | | | | 0 | | | | 0 | | | | (1,487,605 | ) |
| | | | | | | | | | | | | | | | |
Net change in unrealized gains (losses) on investments | | | 13,685,125 | | | | 17,953,571 | | | | 184,460,846 | | | | 290,698,724 | |
| | | | | | | | | | | | | | | | |
Net realized and unrealized gains (losses) on investments | | | 35,150,642 | | | | 24,474,656 | | | | 273,592,966 | | | | 278,189,317 | |
| | | | | | | | | | | | | | | | |
Net increase in net assets resulting from operations | | $ | 37,530,836 | | | $ | 24,626,177 | | | $ | 270,062,299 | | | $ | 305,187,237 | |
| | | | | | | | | | | | | | | | |
| | | | |
* Net of foreign dividend withholding taxes in the amount of | | | $4,015 | | | | $0 | | | | $0 | | | | $8,705 | |
The accompanying notes are an integral part of these financial statements.
| | | | | | |
| Statements of operations—six months ended November 30, 2013 (unaudited) | | Wells Fargo Advantage Equity Gateway Funds | | | 109 | |
| | | | | | | | | | | | | | | | | | |
International
Growth Portfolio | | | International Value
Portfolio | | | Large Company
Value Portfolio | | | Small Company
Growth Portfolio | | | Small Company
Value Portfolio | |
| | | | |
| | | | | | | | | | | | | | | | | | |
| $ | 971,778 | | | $ | 5,514,111 | | | $ | 835,741 | | | $ | 319,211 | | | $ | 2,042,480 | |
| | 1,739 | | | | 1,456 | | | | 779 | | | | 3,472 | | | | 2,669 | |
| | 22,359 | | | | 150,739 | | | | 12,873 | | | | 178,893 | | | | 90,742 | |
| | 0 | | | | 418 | | | | 0 | | | | 0 | | | | 0 | |
| | | | | | | | | | | | | | | | | | |
| | 995,876 | | | | 5,666,724 | | | | 849,393 | | | | 501,576 | | | | 2,135,891 | |
| | | | | | | | | | | | | | | | | | |
| | | | |
| | | | | | | | | | | | | | | | | | |
| | 611,832 | | | | 1,895,654 | | | | 322,545 | | | | 858,468 | | | | 829,713 | |
| | 82,746 | | | | 69,717 | | | | 5,634 | | | | 12,831 | | | | 17,363 | |
| | 23,378 | | | | 26,252 | | | | 22,561 | | | | 21,886 | | | | 22,580 | |
| | 211 | | | | 2,783 | | | | 1,895 | | | | 824 | | | | 3,030 | |
| | 4,419 | | | | 4,244 | | | | 3,767 | | | | 5,071 | | | | 4,399 | |
| | 15,338 | | | | 22,677 | | | | 3,230 | | | | 4,176 | | | | 4,704 | |
| | | | | | | | | | | | | | | | | | |
| | 737,924 | | | | 2,021,327 | | | | 359,632 | | | | 903,256 | | | | 881,789 | |
| | 0 | | | | 0 | | | | 0 | | | | 0 | | | | 0 | |
| | | | | | | | | | | | | | | | | | |
| | 737,924 | | | | 2,021,327 | | | | 359,632 | | | | 903,256 | | | | 881,789 | |
| | | | | | | | | | | | | | | | | | |
| | 257,952 | | | | 3,645,397 | | | | 489,761 | | | | (401,680 | ) | | | 1,254,102 | |
| | | | | | | | | | | | | | | | | | |
| | | | |
| | | | | | | | | | | | | | | | | | |
| | | | |
| | | | | | | | | | | | | | | | | | |
| | 3,220,646 | | | | 4,561,826 | | | | 5,946,885 | | | | 14,912,362 | | | | 15,007,141 | |
| | 0 | | | | 0 | | | | 0 | | | | 0 | | | | 0 | |
| | 0 | | | | 0 | | | | 0 | | | | 0 | | | | 0 | |
| | | | | | | | | | | | | | | | | | |
| | 3,220,646 | | | | 4,561,826 | | | | 5,946,885 | | | | 14,912,362 | | | | 15,007,141 | |
| | | | | | | | | | | | | | | | | | |
| | | | | | | | | | | | | | | | | | |
| | 14,254,583 | 1 | | | 45,940,372 | | | | 6,127,552 | | | | 25,744,178 | | | | 13,426,498 | |
| | 0 | | | | 0 | | | | 0 | | | | 0 | | | | 0 | |
| | 0 | | | | 0 | | | | 0 | | | | 0 | | | | 0 | |
| | | | | | | | | | | | | | | | | | |
| | 14,254,583 | | | | 45,940,372 | | | | 6,127,552 | | | | 25,744,178 | | | | 13,426,498 | |
| | | | | | | | | | | | | | | | | | |
| | 17,475,229 | | | | 50,502,198 | | | | 12,074,437 | | | | 40,656,540 | | | | 28,433,639 | |
| | | | | | | | | | | | | | | | | | |
| $ | 17,733,181 | | | $ | 54,147,595 | | | $ | 12,564,198 | | | $ | 40,254,860 | | | $ | 29,687,741 | |
| | | | | | | | | | | | | | | | | | |
| | | | |
| | $59,849 | | | | $568,387 | | | | $5,309 | | | | $2,926 | | | | $0 | |
| 1. | Net of foreign capital gains tax in the amount of $39,316. |
The accompanying notes are an integral part of these financial statements.
| | | | |
| 110 | | Wells Fargo Advantage Equity Gateway Funds | | Statements of changes in net assets |
| | | | | | | | |
| | | C&B Large Cap Value Portfolio | |
| | | Six months ended
November 30, 2013
(unaudited) | | | Year ended
May 31, 2013 | |
| | |
Operations | | | | | | | | |
Net investment income | | $ | 2,380,194 | | | $ | 5,797,743 | |
Net realized gains on investments | | | 21,465,517 | | | | 25,557,380 | |
Net change in unrealized gains (losses) on investments | | | 13,685,125 | | | | 54,634,553 | |
| | | | | | | | |
Net increase in net assets resulting from operations | | | 37,530,836 | | | | 85,989,676 | |
| | | | | | | | |
| | |
Capital share transactions | | | | | | | | |
Transactions in investors’ beneficial interests | | | | | | | | |
Contributions | | | 20,925,715 | | | | 19,812,149 | |
Withdrawals | | | (54,561,450 | ) | | | (83,570,402 | ) |
| | | | | | | | |
Net decrease in net assets resulting from capital share transactions | | | (33,635,735 | ) | | | (63,758,253 | ) |
| | | | | | | | |
Total increase in net assets | | | 3,895,101 | | | | 22,231,423 | |
| | | | | | | | |
| | |
Net assets | | | | | | | | |
Beginning of period | | | 347,154,539 | | | | 324,923,116 | |
| | | | | | | | |
End of period | | $ | 351,049,640 | | | $ | 347,154,539 | |
| | | | | | | | |
The accompanying notes are an integral part of these financial statements.
| | | | | | |
| Statements of changes in net assets | | Wells Fargo Advantage Equity Gateway Funds | | | 111 | |
| | | | | | | | | | | | |
| | | Diversified Large Cap Growth Portfolio | |
| | | Six months ended
November 30, 2013
(unaudited) | | | Year ended May 31, 2013 | |
| | | | |
Operations | | | | | | | | | | | | |
Net investment income | | | | $ | 151,521 | | | | | $ | 768,223 | |
Net realized gains on investments | | | | | 6,521,085 | | | | | | 15,571,692 | |
Net change in unrealized gains (losses) on investments | | | | | 17,953,571 | | | | | | 11,859,205 | |
| | | | | | | | | | | | |
Net increase in net assets resulting from operations | | | | | 24,626,177 | | | | | | 28,199,120 | |
| | | | | | | | | | | | |
| | | | |
Capital share transactions | | | | | | | | | | | | |
Transactions in investors’ beneficial interests | | | | | | | | | | | | |
Contributions | | | | | 922,518 | | | | | | 4,046,616 | |
Withdrawals | | | | | (20,008,204 | ) | | | | | (42,558,624 | ) |
| | | | | | | | | | | | |
Net decrease in net assets resulting from capital share transactions | | | | | (19,085,686 | ) | | | | | (38,512,008 | ) |
| | | | | | | | | | | | |
Total increase (decrease) in net assets | | | | | 5,540,491 | | | | | | (10,312,888 | ) |
| | | | | | | | | | | | |
| | | | |
Net assets | | | | | | | | | | | | |
Beginning of period | | | | | 147,845,393 | | | | | | 158,158,281 | |
| | | | | | | | | | | | |
End of period | | | | $ | 153,385,884 | | | | | $ | 147,845,393 | |
| | | | | | | | | | | | |
The accompanying notes are an integral part of these financial statements.
| | | | |
| 112 | | Wells Fargo Advantage Equity Gateway Funds | | Statements of changes in net assets |
| | | | | | | | |
| | | Emerging Growth Portfolio | |
| | | Six months ended
November 30, 2013
(unaudited) | | | Year ended
May 31, 2013 | |
| | |
Operations | | | | | | | | |
Net investment loss | | $ | (3,530,667 | ) | | $ | (4,657,230 | ) |
Net realized gains on investments | | | 89,132,120 | | | | 8,468,821 | |
Net change in unrealized gains (losses) on investments | | | 184,460,846 | | | | 182,265,995 | |
| | | | | | | | |
Net increase in net assets resulting from operations | | | 270,062,299 | | | | 186,077,586 | |
| | | | | | | | |
| | |
Capital share transactions | | | | | | | | |
Transactions in investors’ beneficial interests | | | | | | | | |
Contributions | | | 30,984,030 | | | | 43,331,221 | |
Withdrawals | | | (116,464,343 | ) | | | (182,428,836 | ) |
| | | | | | | | |
Net decrease in net assets resulting from capital share transactions | | | (85,480,313 | ) | | | (139,097,615 | ) |
| | | | | | | | |
Total increase in net assets | | | 184,581,986 | | | | 46,979,971 | |
| | | | | | | | |
| | |
Net assets | | | | | | | | |
Beginning of period | | | 1,045,872,077 | | | | 998,892,106 | |
| | | | | | | | |
End of period | | $ | 1,230,454,063 | | | $ | 1,045,872,077 | |
| | | | | | | | |
The accompanying notes are an integral part of these financial statements.
| | | | | | |
| Statements of changes in net assets | | Wells Fargo Advantage Equity Gateway Funds | | | 113 | |
| | | | | | | | |
| | | Index Portfolio | |
| | | Six months ended
November 30, 2013
(unaudited) | | | Year ended
May 31, 2013 | |
| | |
Operations | | | | | | | | |
Net investment income | | $ | 26,997,920 | | | $ | 55,499,759 | |
Net realized gains (losses) on investments | | | (12,509,407 | ) | | | 84,257,080 | |
Net change in unrealized gains (losses) on investments | | | 290,698,724 | | | | 466,355,999 | |
| | | | | | | | |
Net increase in net assets resulting from operations | | | 305,187,237 | | | | 606,112,838 | |
| | | | | | | | |
| | |
Capital share transactions | | | | | | | | |
Transactions in investors’ beneficial interests | | | | | | | | |
Contributions | | | 58,471,795 | | | | 103,522,576 | |
Withdrawals | | | (127,074,546 | ) | | | (480,245,028 | ) |
| | | | | | | | |
Net decrease in net assets resulting from capital share transactions | | | (68,602,751 | ) | | | (376,722,452 | ) |
| | | | | | | | |
Total increase in net assets | | | 236,584,486 | | | | 229,390,386 | |
| | | | | | | | |
| | |
Net assets | | | | | | | | |
Beginning of period | | | 2,612,889,114 | | | | 2,383,498,728 | |
| | | | | | | | |
End of period | | $ | 2,849,473,600 | | | $ | 2,612,889,114 | |
| | | | | | | | |
The accompanying notes are an integral part of these financial statements.
| | | | |
| 114 | | Wells Fargo Advantage Equity Gateway Funds | | Statements of changes in net assets |
| | | | | | | | |
| | | International Growth Portfolio | |
| | | Six months ended
November 30, 2013
(unaudited) | | | Year ended May 31, 2013 | |
| | |
Operations | | | | | | | | |
Net investment income | | $ | 257,952 | | | $ | 1,895,888 | |
Net realized gains on investments | | | 3,220,646 | | | | 8,384,099 | |
Net change in unrealized gains (losses) on investments | | | 14,254,583 | | | | 20,174,725 | |
| | | | | | | | |
Net increase in net assets resulting from operations | | | 17,733,181 | | | | 30,454,712 | |
| | | | | | | | |
| | |
Capital share transactions | | | | | | | | |
Transactions in investors’ beneficial interests | | | | | | | | |
Contributions | | | 8,194,851 | | | | 29,169,783 | 1 |
Withdrawals | | | (9,935,671 | ) | | | (29,751,222 | ) |
| | | | | | | | |
Net decrease in net assets resulting from capital share transactions | | | (1,740,820 | ) | | | (581,439 | ) |
| | | | | | | | |
Total increase in net assets | | | 15,992,361 | | | | 29,873,273 | |
| | | | | | | | |
| | |
Net assets | | | | | | | | |
Beginning of period | | | 138,394,740 | | | | 108,521,467 | |
| | | | | | | | |
End of period | | $ | 154,387,101 | | | $ | 138,394,740 | |
| | | | | | | | |
| 1. | Amount includes $22,586,786 related to an acquisition during the period. See Notes to Financial Statements for a discussion of the acquisition. |
The accompanying notes are an integral part of these financial statements.
| | | | | | |
| Statements of changes in net assets | | Wells Fargo Advantage Equity Gateway Funds | | | 115 | |
| | | | | | | | |
| | | International Value Portfolio | |
| | | Six months ended
November 30, 2013
(unaudited) | | | Year ended May 31, 2013 | |
| | |
Operations | | | | | | | | |
Net investment income | | $ | 3,645,397 | | | $ | 11,001,522 | |
Net realized gains (losses) on investments | | | 4,561,826 | | | | (3,085,904 | ) |
Net change in unrealized gains (losses) on investments | | | 45,940,372 | | | | 80,132,934 | |
| | | | | | | | |
Net increase in net assets resulting from operations | | | 54,147,595 | | | | 88,048,552 | |
| | | | | | | | |
| | |
Capital share transactions | | | | | | | | |
Transactions in investors’ beneficial interests | | | | | | | | |
Contributions | | | 12,384,981 | | | | 74,737,541 | 1 |
Withdrawals | | | (11,430,349 | ) | | | (29,346,621 | ) |
| | | | | | | | |
Net increase in net assets resulting from capital share transactions | | | 954,632 | | | | 45,390,920 | |
| | | | | | | | |
Total increase in net assets | | | 55,102,227 | | | | 133,439,472 | |
| | | | | | | | |
| | |
Net assets | | | | | | | | |
Beginning of period | | | 422,730,852 | | | | 289,291,380 | |
| | | | | | | | |
End of period | | $ | 477,833,079 | | | $ | 422,730,852 | |
| | | | | | | | |
| 1. | Amount includes $22,429,789 related to an acquisition during the period. See Notes to Financial Statements for a discussion of the acquisition. |
The accompanying notes are an integral part of these financial statements.
| | | | |
| 116 | | Wells Fargo Advantage Equity Gateway Funds | | Statements of changes in net assets |
| | | | | | | | |
| | | Large Company Value Portfolio | |
| | | Six months ended
November 30, 2013
(unaudited) | | | Year ended
May 31, 2013 | |
| | |
Operations | | | | | | | | |
Net investment income | | $ | 489,761 | | | $ | 848,345 | |
Net realized gains on investments | | | 5,946,885 | | | | 8,490,528 | |
Net change in unrealized gains (losses) on investments | | | 6,127,552 | | | | 6,509,832 | |
| | | | | | | | |
Net increase in net assets resulting from operations | | | 12,564,198 | | | | 15,848,705 | |
| | | | | | | | |
| | |
Capital share transactions | | | | | | | | |
Transactions in investors’ beneficial interests | | | | | | | | |
Contributions | | | 552,049 | | | | 51,038,318 | 1 |
Withdrawals | | | (9,624,252 | ) | | | (21,361,580 | ) |
| | | | | | | | |
Net increase (decrease) in net assets resulting from capital share transactions | | | (9,072,203 | ) | | | 29,676,738 | |
| | | | | | | | |
Total increase in net assets | | | 3,491,995 | | | | 45,525,443 | |
| | | | | | | | |
| | |
Net assets | | | | | | | | |
Beginning of period | | | 98,405,592 | | | | 52,880,149 | |
| | | | | | | | |
End of period | | $ | 101,897,587 | | | $ | 98,405,592 | |
| | | | | | | | |
| 1. | Amount includes $50,059,057 related to an acquisition during the period. See Notes to Financial Statements for a discussion of the acquisition. |
The accompanying notes are an integral part of these financial statements.
| | | | | | |
| Statements of changes in net assets | | Wells Fargo Advantage Equity Gateway Funds | | | 117 | |
| | | | | | | | |
| | | Small Company Growth Portfolio | |
| | | Six months ended November 30, 2013
(unaudited) | | | Year ended
May 31, 2013 | |
| | |
Operations | | | | | | | | |
Net investment loss | | $ | (401,680 | ) | | $ | (28,119 | ) |
Net realized gains on investments | | | 14,912,362 | | | | 14,699,969 | |
Net change in unrealized gains (losses) on investments | | | 25,744,178 | | | | 28,484,637 | |
| | | | | | | | |
Net increase in net assets resulting from operations | | | 40,254,860 | | | | 43,156,487 | |
| | | | | | | | |
| | |
Capital share transactions | | | | | | | | |
Transactions in investors’ beneficial interests | | | | | | | | |
Contributions | | | 36,159,000 | | | | 64,117,058 | |
Withdrawals | | | (30,857,904 | ) | | | (73,747,010 | ) |
| | | | | | | | |
Net increase (decrease) in net assets resulting from capital share transactions | | | 5,301,096 | | | | (9,629,952 | ) |
| | | | | | | | |
Total increase in net assets | | | 45,555,956 | | | | 33,526,535 | |
| | | | | | | | |
| | |
Net assets | | | | | | | | |
Beginning of period | | | 196,485,996 | | | | 162,959,461 | |
| | | | | | | | |
End of period | | $ | 242,041,952 | | | $ | 196,485,996 | |
| | | | | | | | |
The accompanying notes are an integral part of these financial statements.
| | | | |
| 118 | | Wells Fargo Advantage Equity Gateway Funds | | Statements of changes in net assets |
| | | | | | | | |
| | | Small Company Value Portfolio | |
| | | Six months ended November 30, 2013
(unaudited) | | | Year ended
May 31, 2013 | |
| | |
Operations | | | | | | | | |
Net investment income | | $ | 1,254,102 | | | $ | 1,093,425 | |
Net realized gains on investments | | | 15,007,141 | | | | 13,278,991 | |
Net change in unrealized gains (losses) on investments | | | 13,426,498 | | | | 36,327,755 | |
| | | | | | | | |
Net increase in net assets resulting from operations | | | 29,687,741 | | | | 50,700,171 | |
| | | | | | | | |
| | |
Capital share transactions | | | | | | | | |
Transactions in investors’ beneficial interests | | | | | | | | |
Contributions | | | 10,845,252 | | | | 40,236,818 | 1 |
Withdrawals | | | (36,672,386 | ) | | | (86,362,160 | ) |
| | | | | | | | |
Net decrease in net assets resulting from capital share transactions | | | (25,827,134 | ) | | | (46,125,342 | ) |
| | | | | | | | |
Total increase in net assets | | | 3,860,607 | | | | 4,574,829 | |
| | | | | | | | |
| | |
Net assets | | | | | | | | |
Beginning of period | | | 203,837,255 | | | | 199,262,426 | |
| | | | | | | | |
End of period | | $ | 207,697,862 | | | $ | 203,837,255 | |
| | | | | | | | |
| 1. | Amount includes $14,416,889 related to an acquisition during the period. See Notes to Financial Statements for a discussion of the acquisition. |
The accompanying notes are an integral part of these financial statements.
| | | | | | |
| Financial highlights | | Wells Fargo Advantage Equity Gateway Funds | | | 119 | |
| | | | | | | | | | | | | | | | | | | | |
| | | Ratio to average net assets (annualized) | | | Total
return1 | | | Portfolio turnover
rate | |
| | | Net investment
income (loss) | | | Gross
expenses | | | Net
expenses | | | |
| | | | | |
C&B Large Cap Value Portfolio | | | | | | | | | | | | | | | | | | | | |
June 1, 2013 to November 30, 2013 (unaudited) | | | 1.40 | % | | | 0.68 | % | | | 0.68 | % | | | 11.52 | % | | | 11 | % |
June 1, 2012 to May 31, 2013 | | | 1.73 | % | | | 0.68 | % | | | 0.68 | % | | | 29.30 | % | | | 18 | % |
June 1, 2011 to May 31, 2012 | | | 1.81 | % | | | 0.68 | % | | | 0.68 | % | | | (4.61 | )% | | | 21 | % |
October 1, 2010 to May 31, 20112 | | | 1.27 | % | | | 0.67 | % | | | 0.67 | % | | | 18.08 | % | | | 17 | % |
October 1, 2009 to September 30, 2010 | | | 1.40 | % | | | 0.70 | % | | | 0.68 | % | | | 7.49 | % | | | 13 | % |
October 1, 2008 to September 30, 2009 | | | 2.19 | % | | | 0.73 | % | | | 0.64 | % | | | (5.53 | )% | | | 28 | % |
October 1, 2007 to September 30, 2008 | | | 1.71 | % | | | 0.73 | % | | | 0.68 | % | | | (20.18 | )% | | | 21 | % |
| | | | | |
Diversified Large Cap Growth Portfolio | | | | | | | | | | | | | | | | | | | | |
June 1, 2013 to November 30, 2013 (unaudited) | | | 0.20 | % | | | 0.71 | % | | | 0.62 | % | | | 17.80 | % | | | 28 | % |
June 1, 2012 to May 31, 2013 | | | 0.51 | % | | | 0.71 | % | | | 0.62 | % | | | 20.30 | % | | | 56 | % |
June 1, 2011 to May 31, 2012 | | | 0.24 | % | | | 0.71 | % | | | 0.62 | % | | | 1.26 | % | | | 79 | % |
October 1, 2010 to May 31, 20112,3 | | | 0.40 | % | | | 0.69 | % | | | 0.62 | % | | | 22.78 | % | | | 101 | % |
October 1, 2009 to September 30, 20103 | | | 0.66 | % | | | 0.70 | % | | | 0.62 | % | | | 7.51 | % | | | 11 | % |
October 1, 2008 to September 30, 20093 | | | 0.97 | % | | | 0.70 | % | | | 0.62 | % | | | 3.31 | % | | | 13 | % |
October 1, 2007 to September 30, 20083 | | | 0.48 | % | | | 0.68 | % | | | 0.67 | % | | | (22.59 | )% | | | 7 | % |
| | | | | |
Emerging Growth Portfolio | | | | | | | | | | | | | | | | | | | | |
June 1, 2013 to November 30, 2013 (unaudited) | | | (0.62 | )% | | | 0.80 | % | | | 0.80 | % | | | 27.20 | % | | | 33 | % |
June 1, 2012 to May 31, 2013 | | | (0.47 | )% | | | 0.80 | % | | | 0.80 | % | | | 20.53 | % | | | 65 | % |
June 1, 2011 to May 31, 2012 | | | (0.57 | )% | | | 0.80 | % | | | 0.80 | % | | | (4.83 | )% | | | 75 | % |
October 1, 2010 to May 31, 20112 | | | (0.77 | )% | | | 0.94 | % | | | 0.91 | % | | | 37.91 | % | | | 59 | % |
October 1, 2009 to September 30, 2010 | | | (0.66 | )% | | | 1.02 | % | | | 0.94 | % | | | 20.49 | % | | | 97 | % |
October 1, 2008 to September 30, 2009 | | | (0.53 | )% | | | 0.94 | % | | | 0.91 | % | | | (5.70 | )% | | | 147 | % |
October 1, 2007 to September 30, 2008 | | | (0.49 | )% | | | 0.93 | % | | | 0.92 | % | | | (30.95 | )% | | | 191 | % |
October 1, 2007 to September 30, 2008 | | | (0.49 | )% | | | 0.93 | % | | | 0.92 | % | | | (30.95 | )% | | | 191 | % |
| | | | | |
Index Portfolio | | | | | | | | | | | | | | | | | | | | |
June 1, 2013 to November 30, 2013 (unaudited) | | | 2.02 | % | | | 0.10 | % | | | 0.10 | % | | | 11.86 | % | | | 3 | % |
June 1, 2012 to May 31, 2013 | | | 2.20 | % | | | 0.09 | % | | | 0.09 | % | | | 27.22 | % | | | 4 | % |
June 1, 2011 to May 31, 2012 | | | 2.09 | % | | | 0.10 | % | | | 0.10 | % | | | 0.52 | % | | | 9 | % |
October 1, 2010 to May 31, 20112 | | | 1.93 | % | | | 0.10 | % | | | 0.10 | % | | | 19.39 | % | | | 3 | % |
October 1, 2009 to September 30, 2010 | | | 2.01 | % | | | 0.10 | % | | | 0.10 | % | | | 9.97 | % | | | 22 | % |
October 1, 2008 to September 30, 2009 | | | 2.61 | % | | | 0.12 | % | | | 0.10 | % | | | (7.00 | )% | | | 10 | % |
October 1, 2007 to September 30, 2008 | | | 2.07 | % | | | 0.11 | % | | | 0.11 | % | | | (22.28 | )% | | | 5 | % |
| | | | | |
International Growth Portfolio | | | | | | | | | | | | | | | | | | | | |
June 1, 2013 to November 30, 2013 (unaudited) | | | 0.36 | % | | | 1.03 | % | | | 1.03 | % | | | 12.75 | % | | | 22 | % |
June 1, 2012 to May 31, 2013 | | | 1.63 | % | | | 1.04 | % | | | 1.04 | % | | | 30.34 | % | | | 46 | % |
June 1, 2011 to May 31, 2012 | | | 2.04 | % | | | 0.97 | % | | | 0.90 | % | | | (9.44 | )% | | | 69 | % |
October 1, 2010 to May 31, 20112 | | | 1.62 | % | | | 1.10 | % | | | 1.10 | % | | | 14.50 | % | | | 53 | % |
October 1, 2009 to September 30, 2010 | | | 0.89 | % | | | 1.42 | % | | | 1.20 | % | | | 3.25 | % | | | 89 | % |
October 1, 2008 to September 30, 2009 | | | 1.71 | % | | | 1.14 | % | | | 1.11 | % | | | 6.23 | % | | | 95 | % |
October 1, 2007 to September 30, 2008 | | | 1.17 | % | | | 1.08 | % | | | 1.05 | % | | | (28.68 | )% | | | 57 | % |
| | | | | |
International Value Portfolio | | | | | | | | | | | | | | | | | | | | |
June 1, 2013 to November 30, 2013 (unaudited) | | | 1.63 | % | | | 0.91 | % | | | 0.91 | % | | | 12.69 | % | | | 6 | % |
June 1, 2012 to May 31, 2013 | | | 3.04 | % | | | 0.91 | % | | | 0.91 | % | | | 29.45 | % | | | 16 | % |
June 1, 2011 to May 31, 2012 | | | 3.44 | % | | | 0.91 | % | | | 0.85 | % | | | (21.07 | )% | | | 9 | % |
October 1, 2010 to May 31, 20112 | | | 3.14 | % | | | 0.94 | % | | | 0.94 | % | | | 14.00 | % | | | 16 | % |
October 1, 2009 to September 30, 2010 | | | 2.41 | % | | | 1.20 | % | | | 1.06 | % | | | 0.92 | % | | | 27 | % |
October 1, 2008 to September 30, 2009 | | | 2.72 | % | | | 1.08 | % | | | 1.03 | % | | | 5.26 | % | | | 41 | % |
October 1, 2007 to September 30, 2008 | | | 3.68 | % | | | 1.07 | % | | | 1.01 | % | | | (34.21 | )% | | | 23 | % |
Please see footnotes on page 120.
The accompanying notes are an integral part of these financial statements.
| | | | |
| 120 | | Wells Fargo Advantage Equity Gateway Funds | | Financial highlights |
| | | | | | | | | | | | | | | | | | | | |
| | | Ratio to average net assets (annualized) | | | Total
return1 | | | Portfolio turnover
rate | |
| | | Net investment
income (loss) | | | Gross
expenses | | | Net
expenses | | | |
| | | | | |
Large Company Value Portfolio | | | | | | | | | | | | | | | | | | | | |
June 1, 2013 to November 30, 2013 (unaudited) | | | 0.99 | % | | | 0.72 | % | | | 0.72 | % | | | 13.38 | % | | | 36 | % |
June 1, 2012 to May 31, 2013 | | | 1.49 | % | | | 0.78 | % | | | 0.74 | % | | | 28.91 | % | | | 95 | % |
June 1, 2011 to May 31, 2012 | | | 1.67 | % | | | 0.77 | % | | | 0.74 | % | | | (6.06 | )% | | | 104 | % |
October 1, 2010 to May 31, 20112 | | | 1.58 | % | | | 0.78 | % | | | 0.74 | % | | | 21.46 | % | | | 38 | % |
October 1, 2009 to September 30, 2010 | | | 1.73 | % | | | 0.73 | % | | | 0.72 | % | | | 7.02 | % | | | 46 | % |
October 1, 2008 to September 30, 2009 | | | 2.69 | % | | | 0.75 | % | | | 0.69 | % | | | (9.66 | )% | | | 11 | % |
October 1, 2007 to September 30, 2008 | | | 2.16 | % | | | 0.75 | % | | | 0.57 | % | | | (23.18 | )% | | | 8 | % |
| | | | | |
Small Company Growth Portfolio | | | | | | | | | | | | | | | | | | | | |
June 1, 2013 to November 30, 2013 (unaudited) | | | (0.37 | )% | | | 0.84 | % | | | 0.84 | % | | | 20.63 | % | | | 51 | % |
June 1, 2012 to May 31, 2013 | | | (0.02 | )% | | | 0.86 | % | | | 0.86 | % | | | 31.39 | % | | | 109 | % |
June 1, 2011 to May 31, 2012 | | | (0.12 | )% | | | 0.83 | % | | | 0.83 | % | | | (10.75 | )% | | | 107 | % |
October 1, 2010 to May 31, 20112 | | | (0.42 | )% | | | 0.83 | % | | | 0.83 | % | | | 39.64 | % | | | 70 | % |
October 1, 2009 to September 30, 2010 | | | (0.48 | )% | | | 0.87 | % | | | 0.86 | % | | | 15.25 | % | | | 129 | % |
October 1, 2008 to September 30, 2009 | | | (0.53 | )% | | | 0.89 | % | | | 0.87 | % | | | 1.75 | % | | | 169 | % |
October 1, 2007 to September 30, 2008 | | | (0.53 | )% | | | 0.89 | % | | | 0.89 | % | | | (27.50 | )% | | | 150 | % |
| | | | | |
Small Company Value Portfolio | | | | | | | | | | | | | | | | | | | | |
June 1, 2013 to November 30, 2013 (unaudited) | | | 1.21 | % | | | 0.85 | % | | | 0.85 | % | | | 15.59 | % | | | 25 | % |
June 1, 2012 to May 31, 2013 | | | 0.58 | % | | | 0.85 | % | | | 0.85 | % | | | 30.76 | % | | | 57 | % |
June 1, 2011 to May 31, 2012 | | | 0.69 | % | | | 0.84 | % | | | 0.84 | % | | | (7.17 | )% | | | 60 | % |
October 1, 2010 to May 31, 20112 | | | 1.60 | % | | | 0.84 | % | | | 0.84 | % | | | 26.72 | % | | | 47 | % |
October 1, 2009 to September 30, 2010 | | | 0.31 | % | | | 0.89 | % | | | 0.89 | % | | | 16.38 | % | | | 60 | % |
October 1, 2008 to September 30, 2009 | | | 1.16 | % | | | 0.90 | % | | | 0.88 | % | | | (6.28 | )% | | | 99 | % |
October 1, 2007 to September 30, 2008 | | | 1.02 | % | | | 0.90 | % | | | 0.89 | % | | | (22.01 | )% | | | 82 | % |
| 1. | Returns for periods of less than one year are not annualized. |
| 2. | For the eight months ended May 31, 2011. The Portfolio changed its fiscal year end from September 30 to May 31, effective May 31, 2011. |
| 3. | After the close of business on January 28, 2011, the Diversified Large Cap Growth Portfolio acquired the net assets of Wells Fargo Advantage Disciplined Growth Portfolio, Wells Fargo Advantage Large Cap Appreciation Portfolio and Wells Fargo Advantage Large Company Growth Portfolio. Wells Fargo Advantage Large Company Growth Portfolio became the accounting and performance survivor in the transaction. The information for the periods prior to January 31, 2011 is that of the Wells Fargo Advantage Large Company Growth Portfolio. |
The accompanying notes are an integral part of these financial statements.
| | | | | | |
| Notes to financial statements (unaudited) | | Wells Fargo Advantage Equity Gateway Funds | | | 121 | |
1. ORGANIZATION
Wells Fargo Master Trust (the “Trust”), a Delaware statutory trust organized on March 10, 1999, is an open-end management investment company registered under the Investment Company Act of 1940, as amended (the “1940 Act”). These financial statements report on the following portfolios: the Wells Fargo Advantage C&B Large Cap Value Portfolio (“C&B Large Cap Value Portfolio”), the Wells Fargo Advantage Diversified Large Cap Growth Portfolio (“Diversified Large Cap Growth Portfolio”), the Wells Fargo Advantage Emerging Growth Portfolio (“Emerging Growth Portfolio”), the Wells Fargo Advantage Index Portfolio (“Index Portfolio”), the Wells Fargo Advantage International Growth Portfolio (“International Growth Portfolio”), the Wells Fargo Advantage International Value Portfolio (“International Value Portfolio”), the Wells Fargo Advantage Large Company Value Portfolio (“Large Company Value Portfolio”), the Wells Fargo Advantage Small Company Growth Portfolio (“Small Company Growth Portfolio”), and the Wells Fargo Advantage Small Company Value Portfolio (“Small Company Value Portfolio”) (each, a “Portfolio”, collectively, the “Portfolios”). Each Portfolio is a diversified series of the Trust.
The Portfolios, which are master portfolios in a master/feeder structure, offer their shares to multiple feeder funds and other master portfolios rather than directly to the public.
2. SIGNIFICANT ACCOUNTING POLICIES
The following significant accounting policies, which are consistently followed in the preparation of the financial statements of each Portfolio, are in conformity with U.S. generally accepted accounting principles which require management to make estimates and assumptions that affect the reported amounts of assets and liabilities, disclosure of contingent assets and liabilities at the date of the financial statements, and the reported amounts of revenues and expenses during the reporting period. Actual results could differ from those estimates.
Securities valuation
All investments are valued each business day as of the close of regular trading on the New York Stock Exchange (generally 4 p.m. Eastern Time).
Equity securities and futures that are listed on a foreign or domestic exchange or market are valued at the official closing price or, if none, the last sales price. If no sale occurs on the primary exchange or market for the security that day, the prior day’s price will be deemed “stale” and fair values will be determined in accordance with the Portfolios’ Valuation Procedures.
The values of securities denominated in foreign currencies will be converted to U.S. dollars at rates provided by an independent foreign currency pricing source at a time each business day specified by the Management Valuation Team of Wells Fargo Funds Management, LLC (“Funds Management”).
Many securities markets and exchanges outside the U.S. close prior to the close of the New York Stock Exchange and therefore may not fully reflect trading or events that occur after the close of the principal exchange in which the foreign securities are traded, but before the close of the New York Stock Exchange. If such trading or events are expected to materially affect the value of such securities, then fair value pricing procedures approved by the Board of Trustees of the Portfolios are applied. These procedures take into account multiple factors including movements in U.S. securities markets after foreign exchanges close. Foreign securities that are fair valued under these procedures are categorized as Level 2 and the application of these procedures may result in transfers between Level 1 and Level 2. Depending on market activity, such fair valuations may be frequent. Such fair value pricing may result in NAVs that are higher or lower than NAVs based on the last reported sales price or latest quoted bid price. On November 30, 2013, such fair value pricing was not used in pricing foreign securities.
Short-term securities, with maturities of 60 days or less at time of purchase, generally are valued at amortized cost which approximates fair value. The amortized cost method involves valuing a security at its cost, plus accretion of discount or minus amortization of premium over the period until maturity.
Investments in registered open-end investment companies are valued at net asset value. Non-registered investment vehicles are fair valued at net asset value.
Investments which are not valued using any of the methods discussed above are valued at their fair value, as determined in good faith by the Board of Trustees. The Board of Trustees has established a Valuation Committee comprised of the Trustees and has delegated to it the authority to take any actions regarding the valuation of portfolio securities that the Valuation Committee deems necessary or appropriate, including determining the fair value of portfolio securities, unless the determination has been delegated to the Management Valuation Team. The Board of Trustees retains the authority to make or ratify any valuation decisions or approve any changes to the Valuation Procedures as it deems appropriate. On a quarterly basis, the Board of Trustees receives reports on any valuation actions taken by the Valuation Committee or the Management Valuation Team which may include items for ratification.
| | | | |
| 122 | | Wells Fargo Advantage Equity Gateway Funds | | Notes to financial statements (unaudited) |
Valuations of fair valued securities are compared to the next actual sales price when available, or other appropriate market values, to assess the continued appropriateness of the fair valuation methodologies used. These securities are fair valued on a day-to-day basis, taking into consideration changes to appropriate market information and any significant changes to the inputs considered in the valuation process until there is a readily available price provided on an exchange or by an independent pricing service. Valuations received from an independent pricing service or independent broker-dealer quotes are periodically validated by comparisons to most recent trades and valuations provided by other independent pricing services in addition to the review of prices by the adviser and/or subadviser. Unobservable inputs used in determining fair valuations are identified based on the type of security, taking into consideration factors utilized by market participants in valuing the investment, knowledge about the issuer and the current market environment.
Foreign currency translation
The accounting records of the Portfolios are maintained in U.S. dollars. The value of other assets and liabilities denominated in foreign currencies will be converted to U.S. dollars at rates provided by an independent foreign currency pricing source at a time each business day specified by the Management Valuation Team. Purchases and sales of securities, and income and expenses are converted at the rate of exchange on the respective dates of such transactions. Reported net realized foreign exchange gains or losses arise from sales of foreign currencies, currency gains or losses realized between the trade and settlement dates on securities transactions, and the difference between the amounts of dividends, interest and foreign withholding taxes recorded and the U.S. dollar equivalent of the amounts actually paid or received. Net unrealized foreign exchange gains and losses arise from changes in the fair value of assets and liabilities other than investments in securities resulting from changes in exchange rates.
The changes in net assets arising from changes in exchange rates and the changes in net assets resulting from changes in market prices of securities are not separately presented. Such changes are recorded with net realized and unrealized gains or losses from investments. Gains and losses from certain foreign currency transactions are treated as ordinary income for U.S. federal income tax purposes.
Security loans
The Portfolios may lend their securities from time to time in order to earn additional income in the form of fees or interest on securities received as collateral or the investment of any cash received as collateral. The Portfolios continue to receive interest or dividends on the securities loaned. The Portfolios receive collateral in the form of cash or securities with a value at least equal to the value of the securities on loan. The value of the loaned securities is determined at the close of each business day and any additional required collateral is delivered to the Portfolios on the next business day. In a securities lending transaction, the net asset value of the Portfolios will be affected by an increase or decrease in the value of the securities loaned and by an increase or decrease in the value of the instrument in which collateral is invested. The amount of securities lending activity undertaken by the Portfolios fluctuate from time to time, In the event of default or bankruptcy by the borrower, the Portfolios may be prevented from recovering the loaned securities or gaining access to the collateral or may experience delays or costs in doing so. In addition, the investment of any cash collateral received may lose all or part of its value. The Portfolios have the right under the lending agreement to recover the securities from the borrower on demand.
The Portfolios lend their securities through an unaffiliated securities lending agent. Cash collateral received in connection with its securities lending transactions is invested in Wells Fargo Securities Lending Cash Investments, LLC (the “Securities Lending Fund”). The Securities Lending Fund is exempt from registration under Section 3(c)(7) of the 1940 Act and is managed by Funds Management and is subadvised by Wells Capital Management Incorporated (“WellsCap”). Funds Management receives an advisory fee starting at 0.05% and declining to 0.01% as the average daily net assets of the Securities Lending Fund increase. All of the fees received by Funds Management are paid to WellsCap for its services as subadviser. The Securities Lending Fund seeks to provide a positive return compared to the daily Fed Funds Open rate by investing in high-quality, U.S. dollar-denominated short-term money market instruments. Securities Lending Fund investments are fair valued based upon the amortized cost valuation technique. Income earned from investment in the Securities Lending Fund is included in securities lending income on the Statements of Operations.
Futures contracts
Each Portfolio may be subject to interest rate risk and equity price risk in the normal course of pursuing its investment objectives. The Portfolio may buy and sell futures contracts in order to gain exposure to, or protect against, changes in security values and interest rates. The primary risks associated with the use of futures contracts are the imperfect correlation between changes in market values of securities held by the Portfolio and the prices of futures contracts, and the possibility of an illiquid market.
| | | | | | |
| Notes to financial statements (unaudited) | | Wells Fargo Advantage Equity Gateway Funds | | | 123 | |
Futures contracts are valued based upon their quoted daily settlement prices when available. The aggregate principal amounts of the contracts are not recorded in the financial statements. Fluctuations in the value of the contracts are recorded in the Statements of Assets and Liabilities as an asset or liability and in the Statements of Operations as unrealized gains or losses until the contracts are closed, at which point they are recorded as net realized gains or losses on futures contracts. With futures contracts, there is minimal counterparty risk to the Portfolio since futures are exchange traded and the exchange’s clearinghouse, as counterparty to all exchange traded futures, guarantees the futures against default.
Security transactions and income recognition
Securities transactions are recorded on a trade date basis. Realized gains or losses are recorded on the basis of identified cost.
Interest income is accrued daily and bond discounts are accreted and premiums are amortized daily based on the effective interest method. To the extent debt obligations are placed on non-accrual status, any related interest income may be reduced by writing off interest receivables when the collection of all or a portion of interest has become doubtful based on consistently applied procedures. If the issuer subsequently resumes interest payments or when the collectability of interest is reasonably assured, the debt obligation is removed from non-accrual status.
Dividend income is recognized on the ex-dividend date, except for certain dividends from foreign securities, which are recorded as soon as the Portfolio is informed of the ex-dividend date.
Income from foreign securities is recorded net of foreign taxes withheld where recovery of such taxes is not assured.
Federal and other taxes
Each Portfolio is treated as a separate entity for federal income tax purposes. The Portfolios are not required to pay federal income taxes on their net investment income and net capital gain as they are treated as partnerships for federal income tax purposes. All interest, dividends, gains and losses of a Portfolio are deemed to have been “passed through” to the interestholders in proportion to their holdings of the Portfolio regardless of whether such interest, dividends and gains have been distributed by the Portfolio.
Each Portfolio’s income tax returns and all financial records supporting those returns for the prior three fiscal years are subject to examination by the federal revenue authority. Management has analyzed each Portfolio’s tax positions taken on federal, state, and foreign tax returns for all open tax years and does not believe that there are any uncertain tax positions that require recognition of a tax liability.
3. FAIR VALUATION MEASUREMENTS
Fair value measurements of investments are determined within a framework that has established a fair value hierarchy based upon the various data inputs utilized in determining the value of each Portfolio’s investments. The three-level hierarchy gives the highest priority to unadjusted quoted prices in active markets for identical assets or liabilities (Level 1) and the lowest priority to significant unobservable inputs (Level 3). Each Portfolio’s investments are classified within the fair value hierarchy based on the lowest level of input that is significant to the fair value measurement. The inputs are summarized into three broad levels as follows:
| n | | Level 1 – quoted prices in active markets for identical securities |
| n | | Level 2 – other significant observable inputs (including quoted prices for similar securities, interest rates, prepayment speeds, credit risk, use of amortized cost, etc.) |
| n | | Level 3 – significant unobservable inputs (including the Portfolio’s own assumptions in determining the fair value of investments) |
The inputs or methodologies used for valuing investments in securities are not necessarily an indication of the risk associated with investing in those securities.
| | | | |
| 124 | | Wells Fargo Advantage Equity Gateway Funds | | Notes to financial statements (unaudited) |
As of November 30, 2013, the inputs used in valuing investments in securities were as follows:
| | | | | | | | | | | | | | | | |
| Investments in securities | | Quoted prices
(Level 1) | | | Other significant
observable inputs
(Level 2) | | | Significant
unobservable inputs
(Level 3) | | | Total | |
C&B Large Cap Value Portfolio | | | | | | | | | | | | | | | | |
| | | | |
Equity securities | | | | | | | | | | | | | | | | |
Common stocks | | $ | 326,379,392 | | | $ | 6,077,001 | | | $ | 0 | | | $ | 332,456,393 | |
Preferred stocks | | | 0 | | | | 1,545,244 | | | | 0 | | | | 1,545,244 | |
| | | | |
Short-term investments | | | | | | | | | | | | | | | | |
Investment companies | | | 16,519,640 | | | | 0 | | | | 0 | | | | 16,519,640 | |
Total | | $ | 342,899,032 | | | $ | 7,622,245 | | | $ | 0 | | | $ | 350,521,277 | |
Diversified Large Cap Growth Portfolio | | | | | | | | | | | | | | | | |
| | | | |
Equity securities | | | | | | | | | | | | | | | | |
Common stocks | | $ | 152,315,144 | | | $ | 0 | | | $ | 0 | | | $ | 152,315,144 | |
| | | | |
Short-term investments | | | | | | | | | | | | | | | | |
Investment companies | | | 1,076,336 | | | | 4,148,421 | | | | 0 | | | | 5,224,757 | |
Total | | $ | 153,391,480 | | | $ | 4,148,421 | | | $ | 0 | | | $ | 157,539,901 | |
Emerging Growth Portfolio | | | | | | | | | | | | | | | | |
| | | | |
Equity securities | | | | | | | | | | | | | | | | |
Common stocks | | $ | 1,217,490,452 | | | $ | 0 | | | $ | 0 | | | $ | 1,217,490,452 | |
| | | | |
Short-term investments | | | | | | | | | | | | | | | | |
Investment companies | | | 13,303,139 | | | | 31,741,350 | | | | 0 | | | | 45,044,489 | |
Total | | $ | 1,230,793,591 | | | $ | 31,741,350 | | | $ | 0 | | | $ | 1,262,534,941 | |
Index Portfolio | | | | | | | | | | | | | | | | |
| | | | |
Equity securities | | | | | | | | | | | | | | | | |
Common stocks | | $ | 2,807,726,588 | | | $ | 0 | | | $ | 0 | | | $ | 2,807,726,588 | |
| | | | |
Short-term investments | | | | | | | | | | | | | | | | |
Investment companies | | | 32,725,140 | | | | 9,164,555 | | | | 0 | | | | 41,889,695 | |
U.S. Treasury securities | | | 699,994 | | | | 1,749,561 | | | | 0 | | | | 2,449,555 | |
Total | | $ | 2,841,151,722 | | | $ | 10,914,116 | | | $ | 0 | | | $ | 2,852,065,838 | |
International Growth Portfolio | | | | | | | | | | | | | | | | |
| | | | |
Equity securities | | | | | | | | | | | | | | | | |
Common stocks | | $ | 146,205,671 | | | $ | 25,468 | | | $ | 0 | | | $ | 146,231,139 | |
Participatory notes | | | 0 | | | | 573,788 | | | | 0 | | | | 573,788 | |
Preferred stocks | | | 2,250,105 | | | | 0 | | | | 0 | | | | 2,250,105 | |
| | | | |
Short-term investments | | | | | | | | | | | | | | | | |
Investment companies | | | 6,093,828 | | | | 765,419 | | | | 0 | | | | 6,859,247 | |
Total | | $ | 154,549,604 | | | $ | 1,364,675 | | | $ | 0 | | | $ | 155,914,279 | |
International Value Portfolio | | | | | | | | | | | | | | | | |
| | | | |
Equity securities | | | | | | | | | | | | | | | | |
Common stocks | | $ | 458,406,633 | | | $ | 5,026,282 | | | $ | 0 | | | $ | 463,432,915 | |
Preferred stocks | | | 3,096,128 | | | | 0 | | | | 0 | | | | 3,096,128 | |
| | | | |
Short-term investments | | | | | | | | | | | | | | | | |
Investment companies | | | 2,748,860 | | | | 9,341,704 | | | | 0 | | | | 12,090,564 | |
Total | | $ | 464,251,621 | | | $ | 14,367,986 | | | $ | 0 | | | $ | 478,619,607 | |
| | | | | | |
| Notes to financial statements (unaudited) | | Wells Fargo Advantage Equity Gateway Funds | | | 125 | |
| | | | | | | | | | | | | | | | |
| Investments in securities | | Quoted prices
(Level 1) | | | Other significant
observable inputs
(Level 2) | | | Significant
unobservable inputs
(Level 3) | | | Total | |
Large Company Value Portfolio | | | | | | | | | | | | | | | | |
| | | | |
Equity securities | | | | | | | | | | | | | | | | |
Common stocks | | $ | 99,489,473 | | | $ | 0 | | | $ | 0 | | | $ | 99,489,473 | |
| | | | |
Short-term investments | | | | | | | | | | | | | | | | |
Investment companies | | | 2,329,957 | | | | 2,575,400 | | | | 0 | | | | 4,905,357 | |
Total | | $ | 101,819,430 | | | $ | 2,575,400 | | | $ | 0 | | | $ | 104,394,830 | |
Small Company Growth Portfolio | | | | | | | | | | | | | | | | |
| | | | |
Equity securities | | | | | | | | | | | | | | | | |
Common stocks | | $ | 231,460,391 | | | $ | 0 | | | $ | 0 | | | $ | 231,460,391 | |
| | | | |
Short-term investments | | | | | | | | | | | | | | | | |
Investment companies | | | 9,672,711 | | | | 12,598,600 | | | | 0 | | | | 22,271,311 | |
Total | | $ | 241,133,102 | | | $ | 12,598,600 | | | $ | 0 | | | $ | 253,731,702 | |
Small Company Value Portfolio | | | | | | | | | | | | | | | | |
| | | | |
Equity securities | | | | | | | | | | | | | | | | |
Common stocks | | $ | 202,090,977 | | | $ | 0 | | | $ | 0 | | | $ | 202,090,977 | |
Warrants | | | 0 | | | | 10,778 | | | | 0 | | | | 10,778 | |
| | | | |
Short-term investments | | | | | | | | | | | | | | | | |
Investment companies | | | 6,438,413 | | | | 8,987,147 | | | | 0 | | | | 15,425,560 | |
Total | | $ | 208,529,390 | | | $ | 8,997,925 | | | $ | 0 | | | $ | 217,527,315 | |
As of November 30, 2013, the inputs used in valuing each Portfolio’s other financial instruments, which are carried at fair value, were as follows:
| | | | | | | | | | | | | | | | |
| Future contracts | | Quoted prices
(Level 1) | | | Other significant
observable inputs
(Level 2) | | | Significant
unobservable inputs
(Level 3) | | | Total | |
Index Portfolio | | $ | 1,280,490+ | | | $ | 0 | | | $ | 0 | | | $ | 1,280,490 | |
| + | Amount represents the net unrealized gains. |
Transfers in and transfers out are recognized at the end of the reporting period. For the six months ended November 30, 2013, the Portfolios did not have any transfers into/out of Level 1, Level 2, or Level 3.
4. TRANSACTIONS WITH AFFILIATES AND OTHER EXPENSES
Advisory fee
The Trust has entered into an advisory contract with Funds Management, an indirect wholly owned subsidiary of Wells Fargo & Company (“Wells Fargo”). The adviser is responsible for implementing investment policies and guidelines and for supervising the subadvisers, who are responsible for day-to-day portfolio management of the Portfolios.
Funds Management has retained the services of certain subadvisers to provide daily portfolio management for the Portfolios. Funds Management has engaged WellsCap (an affiliate of Funds Management and an indirect wholly owned subsidiary of Wells Fargo), Peregrine Capital Management, Inc. (an affiliate of Funds Management and an indirect wholly owned subsidiary of Wells Fargo), Artisan Partners Limited Partnership, Cooke & Bieler, L.P., Golden Capital Management, LLC (an affiliate of Funds Management and an indirect wholly owned subsidiary of Wells Fargo), LSV Asset Management and Phocas Financial Corporation as subadvisers.
| | | | |
| 126 | | Wells Fargo Advantage Equity Gateway Funds | | Notes to financial statements (unaudited) |
The fees for sub-advisory services are borne by Funds Management. The subadvisers are each entitled to receive from Funds Management an annual subadvisory fee which is calculated based on the average daily net assets of each Portfolio.
The annual advisory and subadvisory fee rates for each Portfolio is as follows:
| | | | | | | | | | | | | | | | | | | | | | | | |
| | | Advisory fee | | | Effective rate for
the six months ended November 30, 2013 | | | | | Subadviser | | Subadvisory fee | |
| | | starting at | | | declining to | | | | | | starting at | | | declining to | |
C&B Large Cap Value Portfolio | | | 0.65 | % | | | 0.55 | % | | | 0.65 | % | | | | Cooke & Bieler, L.P. | | | 0.38 | % | | | 0.30 | % |
Diversified Large Cap Growth Portfolio | | | 0.65 | % | | | 0.55 | % | | | 0.65 | % | | | | WellsCap | | | 0.30 | % | | | 0.20 | % |
Emerging Growth Portfolio | | | 0.80 | %1 | | | 0.68 | %1 | | | 0.78 | % | | | | WellsCap | | | 0.55 | % | | | 0.40 | % |
Index Portfolio | | | 0.10 | % | | | 0.05 | % | | | 0.08 | % | | | | Golden Capital Management, LLC | | | 0.05 | % | | | 0.02 | % |
International Growth Portfolio | | | 0.85 | % | | | 0.70 | % | | | 0.85 | % | | | | Artisan Partners Limited Partnership | | | 0.80 | % | | | 0.50 | % |
International Value Portfolio | | | 0.85 | % | | | 0.70 | % | | | 0.85 | % | | | | LSV Asset Management | | | 0.35 | % | | | 0.30 | % |
Large Company Value Portfolio | | | 0.65 | % | | | 0.55 | % | | | 0.65 | % | | | | Phocas Financial Corporation | | | 0.29 | % | | | 0.20 | % |
Small Company Growth Portfolio | | | 0.80 | %1 | | | 0.68 | %1 | | | 0.80 | % | | | | Peregrine Capital Management, Inc. | | | 0.50 | % | | | 0.45 | % |
Small Company Value Portfolio | | | 0.80 | %1 | | | 0.68 | %1 | | | 0.80 | % | | | | Peregrine Capital Management, Inc. | | | 0.45 | % | | | 0.40 | % |
| 1. | Prior to July 1, 2013, Funds Management received an annual advisory fee which started at 0.80% and declined to 0.70% as the average daily net assets of the Portfolio increased. |
Funds Management has voluntarily waived its advisory fee and/or reimbursed expenses to the extent necessary to maintain certain net operating expense ratios for the Portfolios.
5. INVESTMENT PORTFOLIO TRANSACTIONS
Purchases and sales of investments, excluding U.S. Government obligations (if any) and short-term securities, for the six months ended November 30, 2013 were as follows:
| | | | | | | | |
| | | Purchases at cost | | | Sales proceeds | |
C&B Large Cap Value Portfolio | | $ | 36,671,105 | | | $ | 80,038,855 | |
Diversified Large Cap Growth Portfolio | | | 41,688,955 | | | | 60,426,571 | |
Emerging Growth Portfolio | | | 367,162,900 | | | | 451,967,497 | |
Index Portfolio | | | 67,375,415 | | | | 74,393,351 | |
International Growth Portfolio | | | 30,252,427 | | | | 32,416,207 | |
International Value Portfolio | | | 32,477,956 | | | | 25,273,270 | |
Large Company Value Portfolio | | | 34,846,395 | | | | 44,214,455 | |
Small Company Growth Portfolio | | | 107,828,070 | | | | 104,700,905 | |
Small Company Value Portfolio | | | 50,499,950 | | | | 76,509,569 | |
6. DERIVATIVE TRANSACTIONS
During the six months ended November 30, 2013, Index Portfolio used uninvested cash to enter into futures contracts to gain market exposure.
| | | | | | |
| Notes to financial statements (unaudited) | | Wells Fargo Advantage Equity Gateway Funds | | | 127 | |
At November 30, 2013, Index Portfolio had long futures contracts outstanding as follows:
| | | | | | | | | | | | | | |
| | | Expiration date | | Contracts | | Type | | Contract value at November 30,
2013 | | | Unrealized
gains | |
Index Portfolio | | 12-19-2013 | | 92 Long | | S&P 500 Index | | $ | 41,494,300 | | | $ | 1,280,490 | |
Index Portfolio had an average notional amount of $45,194,517 in long futures contracts outstanding during the six months ended November 30, 2013.
The payable for daily variation margin on open futures contracts reflected in the Statements of Assets and Liabilities only represents the current day’s variation margin. The realized gains or losses and change in unrealized gains or losses on derivative instruments are reflected in the Statements of Operations.
For certain types of derivative transactions, the Portfolios have entered into International Swaps and Derivatives Association, Inc. master agreements (“ISDA Master Agreements”) or similar agreements with approved counterparties. The ISDA Master Agreements or similar agreements may have requirements to deliver/deposit securities or cash to/with an exchange or broker-dealer as collateral and allows each Portfolio to offset, with each counterparty, certain derivative financial instrument’s assets and/or liabilities with collateral held or pledged. Collateral requirements differ by type of derivative. Collateral or margin requirements are set by the broker or exchange clearing house for exchange traded derivatives while collateral terms are contract specific for over-the-counter traded. Cash collateral that has been pledged to cover obligations of each Portfolio under derivative contracts, if any, will be reported separately in the Statements of Assets and Liabilities. Securities pledged as collateral, if any, for the same purpose are noted in each Portfolio of Investments. With respect to balance sheet offsetting, absent an event of default by the counterparty or a termination of the agreement, the reported amounts of financial assets and financial liabilities in the Statements of Assets and Liabilities are not offset across transactions between each Portfolio and the applicable counterparty. As of November 30, 2013, the Porfolios have transactions subject to enforceable master netting agreements. A reconciliation of the gross amounts on the Statements of Assets and Liabilities to the net amounts by derivative type, including any collateral exposure, is as follows:
| | | | | | | | | | | | | | | | |
| | | Gross amounts of
liabilities in the
Statements of Assets and
Liabilities | | | Amounts subject to netting arrangements | | | Collateral | | | Net
amount
(not less
than $0) | |
Index Portfolio | | | | | | | | | | | | | | | | |
Futures - variation margin | | $ | 4,430 | | | $ | 0 | | | $ | 2,449,555 | | | $ | 0 | |
7. ACQUISITIONS
After the close of business on April 19, 2013, International Growth Portfolio acquired the net assets of Wells Fargo Advantage International Index Portfolio. The purpose of the transaction was to combine two funds with similar investment objectives and strategies. The investment portfolio of Wells Fargo Advantage International Index Portfolio with a fair value of $22,535,457, identified cost of $21,854,655, and unrealized gains of $680,802 at April 19, 2013 were the principal assets acquired by International Growth Portfolio. For financial reporting purposes, assets received by International Growth Portfolio was recorded at fair value; however, the cost basis of the investments received from Wells Fargo Advantage International Index Portfolio was carried forward to align ongoing reporting of International Growth Portfolio’s realized and unrealized gains and losses with amounts distributable to shareholders for tax purposes.
Assuming the acquisition had been completed June 1, 2012, the beginning of the annual reporting period for International Growth Portfolio, the pro forma results of operations for the year ended May 31, 2013 would have been:
| | | | |
Net investment income | | $ | 2,276,123 | |
Net realized and unrealized gains (losses) on investments | | $ | 31,301,977 | |
Net increase in net assets resulting from operations | | $ | 33,578,100 | |
After the close of business on April 19, 2013, International Value Portfolio acquired the net assets of Wells Fargo Advantage International Equity Portfolio. The purpose of the transaction was to combine two funds with similar investment objectives and strategies. The investment portfolio of Wells Fargo Advantage International Equity Portfolio with a fair value of $22,369,294, identified cost of $22,824,592 and unrealized losses of $455,298 at April 19, 2013 were
| | | | |
| 128 | | Wells Fargo Advantage Equity Gateway Funds | | Notes to financial statements (unaudited) |
the principal assets acquired by International Value Portfolio. For financial reporting purposes, assets received by International Value Portfolio were recorded at fair value; however, the cost basis of the investments received from Wells Fargo Advantage International Equity Portfolio was carried forward to align ongoing reporting of International Value Portfolio’s realized and unrealized gains and losses with amounts distributable to shareholders for tax purposes.
Assuming the acquisition had been completed June 1, 2012, the beginning of the annual reporting period for International Value Portfolio, the pro forma results of operations for the year ended May 31, 2013 would have been:
| | | | |
Net investment income | | $ | 21,429,816 | |
Net realized and unrealized gains (losses) on investments | | $ | 71,515,531 | |
Net increase in net assets resulting from operations | | $ | 92,945,347 | |
After the close of business on April 19, 2013, Large Company Value Portfolio acquired the net assets of Wells Fargo Advantage Equity Value Portfolio. The purpose of the transaction was to combine two funds with similar investment objectives and strategies. The investment portfolio of Wells Fargo Advantage Equity Value Portfolio with a fair value of $49,782,607, identified cost of $48,925,675 and unrealized gains of $856,932 at April 19, 2013 were the principal assets acquired by Large Company Value Portfolio. For financial reporting purposes, assets received by Large Company Value Portfolio were recorded at fair value; however, the cost basis of the investments received from Wells Fargo Advantage Equity Value Portfolio was carried forward to align ongoing reporting of Large Company Value Portfolio’s realized and unrealized gains and losses with amounts distributable to shareholders for tax purposes.
Assuming the acquisition had been completed June 1, 2012, the beginning of the annual reporting period for Large Company Value Portfolio, the pro forma results of operations for the year ended May 31, 2013 would have been:
| | | | |
Net investment loss | | $ | (3,466,147 | ) |
Net realized and unrealized gains (losses)on investments | | $ | 21,864,877 | |
Net increase in net assets resulting from operations | | $ | 18,218,730 | |
After the close of business on April 19, 2013, Small Company Value Portfolio acquired the net assets of Wells Fargo Advantage Small Cap Value Portfolio. The purpose of the transaction was to combine two funds with similar investment objectives and strategies. The investment portfolio of Wells Fargo Advantage Small Cap Value Portfolio with a fair value of $14,404,707 , identified cost of $14,875,954, and unrealized losses of $471,247, at April 19, 2013, were the principal assets acquired by Small Company Value Portfolio. For financial reporting purposes, assets received by Small Company Value Portfolio were recorded at fair value; however, the cost basis of the investments received from Wells Fargo Advantage Small Cap Value Portfolio was carried forward to align ongoing reporting of Small Company Value Portfolio’s realized and unrealized gains and losses with amounts distributable to shareholders for tax purposes.
Assuming the acquisitions had been completed June 1, 2012, the beginning of the annual reporting period for Small Company Value Portfolio, the pro forma results of operations for the year ended May 31, 2013 would have been
| | | | |
Net investment income | | $ | 1,370,856 | |
Net realized and unrealized gains (losses) on investments | | $ | 53,680,718 | |
Net increase in net assets resulting from operations | | $ | 55,051,574 | |
8. CONCENTRATION RISK
Concentration risks result from exposure to a limited number of sectors. Portfolios that invest a substantial portion of their assets in a sector may be more affected by changes in that sector than would be a fund whose investments are not heavily weighted in any sector.
9. INDEMNIFICATION
Under the Trust’s organizational documents, the officers and directors are indemnified against certain liabilities that may arise out of performance of their duties to the Trust. Additionally, in the normal course of business, the Trust may enter into contracts with service providers that contain a variety of indemnification clauses. The Trust’s maximum exposure under these arrangements is dependent on future claims that may be made against the Portfolios and, therefore, cannot be estimated.
| | | | | | |
| Other information (unaudited) | | Wells Fargo Advantage Equity Gateway Funds | | | 129 | |
TAX INFORMATION
Pursuant to Section 853 of the Internal Revenue Code, the International Value Fund designated the following amounts as foreign taxes paid for the fiscal year ended May 31, 2013. These amounts may be less than the actual foreign taxes paid for financial statement purposes. Foreign taxes paid or withheld should be included in taxable income with an offsetting deduction from gross income or as a credit for taxes paid to foreign governments. None of the income was derived from ineligible foreign sources as defined under Section 901(j) of the Internal Revenue Code.
| | | | |
Creditable
foreign taxes paid | | Per share
amount | | Foreign income as % of
ordinary income
distributions |
| $804,891 | | $0.02815 | | 84.32% |
PROXY VOTING INFORMATION
A description of the policies and procedures used to determine how to vote proxies relating to portfolio securities is available without charge, upon request, by calling 1-800-222-8222, visiting our website at wellsfargoadvantagefunds.com, or visiting the SEC website at sec.gov. Information regarding how the proxies related to portfolio securities were voted during the most recent 12-month period ended June 30 is available without charge on the website at wellsfargoadvantagefunds.com or by visiting the SEC website at sec.gov.
PORTFOLIO HOLDINGS INFORMATION
The complete portfolio holdings are publicly available on the website (wellsfargoadvantagefunds.com) on a monthly, 30-day or more delayed basis. In addition, top ten holdings information is publicly available on the website on a monthly, seven-day or more delayed basis. Each Fund and Portfolio files its complete schedule of portfolio holdings with the SEC for the first and third quarters of each fiscal year on Form N-Q, which is available without charge by visiting the SEC website at sec.gov. In addition, each Form N-Q may be reviewed and copied at the SEC’s Public Reference Room in Washington, DC, and at regional offices in New York City, at 233 Broadway, and in Chicago, at 175 West Jackson Boulevard, Suite 900. Information about the Public Reference Room may be obtained by calling 1-800-SEC-0330.
| | | | |
| 130 | | Wells Fargo Advantage Equity Gateway Funds | | Other information (unaudited) |
BOARD OF TRUSTEES AND OFFICERS
Each of the Trustees and Officers listed in the table below acts in identical capacities for each fund in the Wells Fargo Advantage family of funds, which consists of 131 mutual funds1 comprising the Wells Fargo Funds Trust, Wells Fargo Variable Trust, Wells Fargo Master Trust and four closed-end funds (collectively the “Fund Complex”). This table should be read in conjunction with the Prospectus and the Statement of Additional Information2. All of the Trustees are also Members of the Audit and Governance Committees of each Trust in the Fund Complex. The mailing address of each Trustee and Officer is 525 Market Street, 12th Floor, San Francisco, CA 94105. Each Trustee and Officer serves an indefinite term, however, each Trustee serves such term until reaching the mandatory retirement age established by the Trustees.
Independent Trustees
| | | | | | |
Name and year of birth | | Position held and length of service* | | Principal occupations during past five years | | Other directorships during past five years |
| Peter G. Gordon (Born 1942) | | Trustee, since 1998; Chairman, since 2005 | | Co-Founder, Retired Chairman, President and CEO of Crystal Geyser Water Company. Trustee Emeritus, Colby College. | | Asset Allocation Trust |
| Isaiah Harris, Jr. (Born 1952) | | Trustee, since 2009 | | Retired. Prior thereto, President and CEO of BellSouth Advertising and Publishing Corp. from 2005 to 2007, President and CEO of BellSouth Enterprises from 2004 to 2005 and President of BellSouth Consumer Services from 2000 to 2003. Emeritus member of the Iowa State University Foundation Board of Governors. Emeritus Member of the Advisory Board of Iowa State University School of Business. Advisory Board Member, Palm Harbor Academy (charter school). Mr. Harris is a certified public accountant. | | CIGNA Corporation; Deluxe Corporation; Asset Allocation Trust |
| Judith M. Johnson (Born 1949) | | Trustee, since 2008; Audit Committee Chairman, since 2008 | | Retired. Prior thereto, Chief Executive Officer and Chief Investment Officer of Minneapolis Employees Retirement Fund from 1996 to 2008. Ms. Johnson is an attorney, certified public accountant and a certified managerial accountant. | | Asset Allocation Trust |
| Leroy Keith, Jr. (Born 1939) | | Trustee, since 2010 | | Chairman, Bloc Global Services (development and construction). Trustee of the Evergreen Funds from 1983 to 2010. Former Managing Director, Almanac Capital Management (commodities firm), former Partner, Stonington Partners, Inc. (private equity fund), former Director, Obagi Medical Products Co. and former Director, Lincoln Educational Services. | | Trustee, Virtus Fund Complex (consisting of 48 portfolios as of 1/31/2013); Asset Allocation Trust |
| David F. Larcker (Born 1950) | | Trustee, since 2009 | | James Irvin Miller Professor of Accounting at the Graduate School of Business, Stanford University, Morgan Stanley Director of the Center for Leadership Development and Research and Senior Faculty of The Rock Center for Corporate Governance since 2006. From 2005 to 2008, Professor of Accounting at the Graduate School of Business, Stanford University. Prior thereto, Ernst & Young Professor of Accounting at The Wharton School, University of Pennsylvania from 1985 to 2005. | | Asset Allocation Trust |
| Olivia S. Mitchell (Born 1953) | | Trustee, since 2006 | | International Foundation of Employee Benefit Plans Professor, Wharton School of the University of Pennsylvania since 1993. Director of Wharton’s Pension Research Council and Boettner Center on Pensions & Retirement Research, and Research Associate at the National Bureau of Economic Research. Previously, Cornell University Professor from 1978 to 1993. | | Asset Allocation Trust |
| Timothy J. Penny (Born 1951) | | Trustee, since 1996 | | President and CEO of Southern Minnesota Initiative Foundation, a non-profit organization, since 2007 and Senior Fellow at the Humphrey Institute Policy Forum at the University of Minnesota since 1995. Member of the Board of Trustees of NorthStar Education Finance, Inc., a non-profit organization, since 2007. | | Asset Allocation Trust |
| | | | | | |
| Other information (unaudited) | | Wells Fargo Advantage Equity Gateway Funds | | | 131 | |
| | | | | | |
Name and year of birth | | Position held and length of service* | | Principal occupations during past five years | | Other directorships during past five years |
| Michael S. Scofield (Born 1943) | | Trustee, since 2010 | | Served on the Investment Company Institute’s Board of Governors and Executive Committee from 2008-2011 as well the Governing Council of the Independent Directors Council from 2006-2011 and the Independent Directors Council Executive Committee from 2008-2011. Chairman of the IDC from 2008-2010. Institutional Investor (Fund Directions) Trustee of Year in 2007. Trustee of the Evergreen Funds (and its predecessors) from 1984 to 2010. Chairman of the Evergreen Funds from 2000-2010. Former Trustee of the Mentor Funds. Retired Attorney, Law Offices of Michael S. Scofield. | | Asset Allocation Trust |
| Donald C. Willeke (Born 1940) | | Trustee, since 1996 | | Principal of the law firm of Willeke & Daniels. General Counsel of the Minneapolis Employees Retirement Fund from 1984 until its consolidation into the Minnesota Public Employees Retirement Association on June 30, 2010. Director and Vice Chair of The Tree Trust (non-profit corporation). Director of the American Chestnut Foundation (non-profit corporation). | | Asset Allocation Trust |
| * | Length of service dates reflect the Trustee’s commencement of service with the Trust’s predecessor entities, where applicable. |
Officers
| | | | | | |
Name and year of birth | | Position held and length of service | | Principal occupations during past five years | | |
| Karla M. Rabusch (Born 1959) | | President, since 2003 | | Executive Vice President of Wells Fargo Bank, N.A. and President of Wells Fargo Funds Management, LLC since 2003. | | |
| Jeremy DePalma1 (Born 1974) | | Treasurer, since 2012 | | Senior Vice President of Wells Fargo Funds Management, LLC since 2009. Senior Vice President of Evergreen Investment Management Company, LLC from 2008 to 2010. Vice President, Evergreen Investment Services, Inc. from 2004 to 2007. Head of the Fund Reporting and Control Team within Fund Administration from 2005 to 2010. | | |
Nancy Wiser1 (Born 1967) | | Treasurer, since 2012 | | Executive Vice President of Wells Fargo Funds Management, LLC since 2011. Chief Operating Officer and Chief Compliance Officer at LightBox Capital Management LLC, from 2008 to 2011. Owned and operated a consulting business providing services to various hedge funds including acting as Chief Operating Officer and Chief Compliance Officer for a hedge fund from 2007 to 2008. Chief Operating Officer and Chief Compliance Officer of GMN Capital LLC from 2006 to 2007. | | |
| C. David Messman (Born 1960) | | Secretary, since 2000; Chief Legal Officer, since 2003 | | Senior Vice President and Secretary of Wells Fargo Funds Management, LLC since 2001. Vice President and Managing Counsel of Wells Fargo Bank, N.A. since 1996. | | |
Debra Ann Early (Born 1964) | | Chief Compliance Officer, since 2007 | | Chief Compliance Officer of Wells Fargo Funds Management, LLC since 2007. Chief Compliance Officer of Parnassus Investments from 2005 to 2007. Chief Financial Officer of Parnassus Investments from 2004 to 2007. | | |
David Berardi (Born 1975) | | Assistant Treasurer, since 2009 | | Vice President of Wells Fargo Funds Management, LLC since 2009. Vice President of Evergreen Investment Management Company, LLC from 2008 to 2010. Assistant Vice President of Evergreen Investment Services, Inc. from 2004 to 2008. Manager of Fund Reporting and Control for Evergreen Investment Management Company, LLC from 2004 to 2010. | | |
| 1. | Jeremy DePalma acts as Treasurer of International Value Fund, International Growth Portfolio, and International Value Portfolio and Assistant Treasurer of the remaining funds in this shareholder report. In addition, Jeremy DePalma acts as Treasurer of 55 other funds and Assistant Treasurer of 60 other funds in the Fund Complex. Nancy Wiser serves as Treasurer of the remaining funds in this shareholder report as well as 60 other funds in the Fund Complex. |
| 2. | The Statement of Additional Information includes additional information about the Trustees and is available, without charge, upon request, by calling 1-800-222-8222 or by visiting the website at wellsfargoadvantagefunds.com. |
| | | | |
| 132 | | Wells Fargo Advantage Equity Gateway Funds | | List of abbreviations |
The following is a list of common abbreviations for terms and entities that may have appeared in this report.
| ACA | — ACA Financial Guaranty Corporation |
| ADR | — American depositary receipt |
| ADS | — American depositary shares |
| AGC | — Assured Guaranty Corporation |
| AGM | — Assured Guaranty Municipal |
| Ambac | — Ambac Financial Group Incorporated |
| AMT | — Alternative minimum tax |
| BAN | — Bond anticipation notes |
| BHAC | — Berkshire Hathaway Assurance Corporation |
| CAB | — Capital appreciation bond |
| CCAB | — Convertible capital appreciation bond |
| CDA | — Community Development Authority |
| CDO | — Collateralized debt obligation |
| DRIVER | — Derivative inverse tax-exempt receipts |
| DW&P | — Department of Water & Power |
| DWR | — Department of Water Resources |
| ECFA | — Educational & Cultural Facilities Authority |
| EDA | — Economic Development Authority |
| EDFA | — Economic Development Finance Authority |
| ETF | — Exchange-traded fund |
| FDIC | — Federal Deposit Insurance Corporation |
| FFCB | — Federal Farm Credit Banks |
| FGIC | — Financial Guaranty Insurance Corporation |
| FHA | — Federal Housing Administration |
| FHLB | — Federal Home Loan Bank |
| FHLMC | — Federal Home Loan Mortgage Corporation |
| FICO | — The Financing Corporation |
| FNMA | — Federal National Mortgage Association |
| GDR | — Global depositary receipt |
| GNMA | — Government National Mortgage Association |
| HCFR | — Healthcare facilities revenue |
| HEFA | — Health & Educational Facilities Authority |
| HEFAR | — Higher education facilities authority revenue |
| HFA | — Housing Finance Authority |
| HFFA | — Health Facilities Financing Authority |
| HUD | — Department of Housing and Urban Development |
| IDA | — Industrial Development Authority |
| IDAG | — Industrial Development Agency |
| KRW | — Republic of Korea won |
| LIBOR | — London Interbank Offered Rate |
| LLC | — Limited liability company |
| LLP | — Limited liability partnership |
| MBIA | — Municipal Bond Insurance Association |
| MFHR | — Multifamily housing revenue |
| MSTR | — Municipal securities trust receipts |
| MUD | — Municipal Utility District |
| National | — National Public Finance Guarantee Corporation |
| PCFA | — Pollution Control Financing Authority |
| PCL | — Public Company Limited |
| PCR | — Pollution control revenue |
| PFA | — Public Finance Authority |
| PFFA | — Public Facilities Financing Authority |
| PFOTER | — Puttable floating option tax-exempt receipts |
| plc | — Public limited company |
| PUTTER | — Puttable tax-exempt receipts |
| R&D | — Research & development |
| Radian | — Radian Asset Assurance |
| RAN | — Revenue anticipation notes |
| RDA | — Redevelopment Authority |
| RDFA | — Redevelopment Finance Authority |
| REIT | — Real estate investment trust |
| ROC | — Reset option certificates |
| SAVRS | — Select auction variable rate securities |
| SBA | — Small Business Authority |
| SFHR | — Single-family housing revenue |
| SFMR | — Single-family mortgage revenue |
| SPA | — Standby purchase agreement |
| SPDR | — Standard & Poor’s Depositary Receipts |
| STRIPS | — Separate trading of registered interest and principal securities |
| TAN | — Tax anticipation notes |
| TIPS | — Treasury inflation-protected securities |
| TRAN | — Tax revenue anticipation notes |
| TTFA | — Transportation Trust Fund Authority |
| TVA | — Tennessee Valley Authority |


For more information
More information about Wells Fargo Advantage Funds is available free upon request. To obtain literature, please write, email, visit the Fund’s website, or call:
Wells Fargo Advantage Funds
P.O. Box 8266
Boston, MA 02266-8266
Email: wfaf@wellsfargo.com
Website: wellsfargoadvantagefunds.com
Individual investors: 1-800-222-8222
Retail investment professionals: 1-888-877-9275
Institutional investment professionals: 1-866-765-0778
This report and the financial statements contained herein are submitted for the general information of the shareholders of Wells Fargo Advantage Funds. If this report is used for promotional purposes, distribution of the report must be accompanied or preceded by a current prospectus. For a current prospectus and, if available, a summary prospectus containing more complete information, including charges and expenses, call 1-800-222-8222 or visit the Fund’s website at wellsfargoadvantagefunds.com. Please consider the investment objectives, risks, charges, and expenses of the investment carefully before investing. This and other information about Wells Fargo Advantage Funds can be found in the current prospectus. Read the prospectus carefully before you invest or send money.
Wells Fargo Funds Management, LLC, a wholly owned subsidiary of Wells Fargo & Company, provides investment advisory and administrative services for Wells Fargo Advantage Funds. Other affiliates of Wells Fargo & Company provide subadvisory and other services for the Funds. The Funds are distributed by Wells Fargo Funds Distributor, LLC, Member FINRA/SIPC, an affiliate of Wells Fargo & Company.
NOT FDIC INSURED ¡ NO BANK GUARANTEE ¡ MAY LOSE VALUE
© 2013 Wells Fargo Funds Management, LLC. All rights reserved.
| | |
 | | 221300 01-14 SEGF/SAR111 11-13 |

Wells Fargo Advantage Income Funds

Semi-Annual Report
November 30, 2013
| n | | Wells Fargo Advantage Core Bond Fund |
| n | | Wells Fargo Advantage Inflation-Protected Bond Fund |

Reduce clutter. Save trees.
Sign up for electronic delivery of prospectuses and shareholder reports at wellsfargo.com/advantagedelivery
Contents
The views expressed and any forward-looking statements are as of November 30, 2013, unless otherwise noted, and are those of the Fund managers and/or Wells Fargo Funds Management, LLC. Discussions of individual securities, or the markets generally, or any Wells Fargo Advantage Fund are not intended as individual recommendations. Future events or results may vary significantly from those expressed in any forward-looking statements; the views expressed are subject to change at any time in response to changing circumstances in the market. Wells Fargo Funds Management, LLC and the Funds disclaim any obligation to publicly update or revise any views expressed or forward-looking statements.
NOT FDIC INSURED ¡ NO BANK GUARANTEE ¡ MAY LOSE VALUE
| | | | |
| 2 | | Wells Fargo Advantage Income Funds | | Letter to shareholders (unaudited) |

Karla M. Rabusch
President
Wells Fargo Advantage Funds
Fixed-income markets shifted significantly during the period as economic optimism surged in May and June 2013 and the Federal Reserve (Fed) announced intentions to taper its quantitative easing programs later in the year. This spurred a rally in equities but also a rise in U.S. Treasury yields.
Dear Valued Shareholder:
We are pleased to offer you this semi-annual report for the Wells Fargo Advantage Income Funds for the six-month period that ended November 30, 2013. Fixed-income markets shifted significantly during the period as economic optimism surged in May and June 2013 and the Federal Reserve (Fed) announced intentions to taper its quantitative easing programs later in the year. This spurred a rally in equities but also a rise in U.S. Treasury yields. Most investment-grade bond sectors correspondingly experienced price declines and rising yields during much of 2013. Below investment-grade securities tended to perform better as their higher yield spreads (“spreads” are the amount of extra yield over an equivalent U.S. Treasury security’s yield) cushioned some of the yield increases from the Treasury markets and then rallied later in the period. Structured products (such as asset-backed and mortgage-backed securities) generally protected their pricing better, particularly U.S. commercial mortgage-backed securities. On the whole, structured product sectors generally provided modestly positive returns, but investment-grade corporate bonds and U.S. Treasuries declined in value during the period.
The return of economic optimism in 2013 led to declines in bond prices as yields rose higher.
Before the period began, U.S. Treasury yields initially began to rise higher in the early months of 2013, driven by optimistic expectations for a strengthening U.S. economy. Consequently, fixed-income security yields shifted higher and prices declined across much of the U.S. investment-grade bond sector. However, investment-grade fixed-income markets rebounded when equity market exuberance was reined in by some sobering mixed economic indicators in subsequent months. By May 2013, economic exuberance returned powerfully, driving equities higher and bond prices lower—this trend carried into June 2013, the opening month of the reporting period.
The month of May 2013 turned in the largest monthly losses across the investment-grade bond markets in nearly five years. Unfortunately, the month of June 2013 was nearly as bad—it became the second-largest monthly price correction in investment-grade fixed income in nearly five years. The depreciating trends for bonds deepened in mid-June 2013 on comments from Fed Chairman Bernanke that tapering of the Fed’s bond-buying programs may begin later in the year and that the programs may end completely around mid-2014. For the last two weeks of June 2013, that debate appeared to play out daily, as volatility buffeted both the equity and bond markets, finally capitulating to yet another sustained rally in equities and a modest retreat in bond prices. High-yield bonds posted their worst monthly return of the year in June 2013 and investment grade securities had their largest quarterly decline in nine years during the second quarter.
In July and August 2013, equity exuberance quieted a bit and fixed-income markets stabilized. Returns were more mixed, with slightly negative returns in the highest-quality securities with modestly positive returns in the lowest-rated credit tiers. In September and October 2013, investment-grade and high-yield bond markets began generating positive returns yet again, as the Fed backtracked on its intentions to taper quantitative easing, postponing it until 2014 at the earliest. Bond markets rallied on the news through October 2013 before finally correcting again in November 2013 on strengthening employment figures.
| | | | | | |
| Letter to shareholders (unaudited) | | Wells Fargo Advantage Income Funds | | | 3 | |
On the whole, the declines in bond prices during June and August 2013 culminated in slightly negative returns across the investment-grade markets during the full period, despite some positive returns during September and October 2013. Thus, the theme for the period was a persistent increase in U.S. Treasury yields that pressured fixed-income security prices before relaxing in September and October 2013. Investment-grade securities generally declined, while lower-rated securities benefited from yield cushioning and a stronger investor appetite for equity-correlated returns.
Don’t let short-term uncertainty derail long-term investment goals.
Periods of uncertainty can present challenges, but experience has taught us that maintaining long-term investment goals can be an effective way to plan for the future. To help you create a sound strategy based on your personal goals and risk tolerance, Wells Fargo Advantage Funds offers more than 100 mutual funds and other investments spanning a wide range of asset classes and investment styles. Although diversification cannot guarantee an investment profit or prevent losses, we believe it can be an effective way to manage investment risk and potentially smooth out overall portfolio performance. We encourage investors to know their investments and to understand that appropriate levels of risk-taking may unlock opportunities.
Thank you for choosing to invest with Wells Fargo Advantage Funds. We appreciate your confidence in us and remain committed to helping you meet your financial needs. For current information about your fund investments, contact your investment professional, visit our website at wellsfargoadvantagefunds.com, or call us directly at 1-800-222-8222. We are available 24 hours a day, 7 days a week.
Sincerely,

Karla M. Rabusch
President
Wells Fargo Advantage Funds
The theme for the period was a persistent increase in U.S. Treasury yields that pressured fixed-income security prices before relaxing in September and October 2013. Investment-grade securities generally declined, while lower-rated securities benefited from yield cushioning and a stronger investor appetite for equity-correlated returns.
| | | | |
| 4 | | Wells Fargo Advantage Income Funds | | Performance highlights (unaudited) |
Wells Fargo Advantage Core Bond Fund1
Investment objective
The Fund seeks total return, consisting of income and capital appreciation.
Adviser
Wells Fargo Funds Management, LLC
Subadviser for master portfolio
Wells Capital Management Incorporated
Portfolio managers
Troy Ludgood
Thomas O’Connor, CFA
Average annual total returns2 (%) as of November 30, 2013
| | | | | | | | | | | | | | | | | | | | | | | | | | | | | | | | | | |
| | | | | Including sales charge | | | Excluding sales charge | | | Expense ratios3 (%) | |
| | | Inception date | | 1 year | | | 5 year | | | 10 year | | | 1 year | | | 5 year | | | 10 year | | | Gross | | | Net4 | |
| Class A (MBFAX) | | 10-31-2001 | | | (6.11 | ) | | | 5.94 | | | | 4.54 | | | | (1.69 | ) | | | 6.92 | | | | 5.02 | | | | 0.85 | | | | 0.78 | |
| Class B (MBFBX)* | | 10-31-2001 | | | (7.43 | ) | | | 5.73 | | | | 4.42 | | | | (2.43 | ) | | | 6.05 | | | | 4.42 | | | | 1.60 | | | | 1.53 | |
| Class C (MBFCX) | | 10-31-2001 | | | (3.45 | ) | | | 6.04 | | | | 4.20 | | | | (2.45 | ) | | | 6.04 | | | | 4.20 | | | | 1.60 | | | | 1.53 | |
| Class R (WTRRX) | | 7-9-2010 | | | – | | | | – | | | | – | | | | (1.93 | ) | | | 6.58 | | | | 4.77 | | | | 1.10 | | | | 1.03 | |
| Class R4 (MBFRX) | | 11-30-2012 | | | – | | | | – | | | | – | | | | (1.43 | ) | | | 7.15 | | | | 5.33 | | | | 0.62 | | | | 0.52 | |
| Class R6 (WTRIX) | | 11-30-2012 | | | – | | | | – | | | | – | | | | (1.29 | ) | | | 7.27 | | | | 5.44 | | | | 0.47 | | | | 0.37 | |
| Administrator Class (MNTRX) | | 6-30-1997 | | | – | | | | – | | | | – | | | | (1.61 | ) | | | 6.97 | | | | 5.16 | | | | 0.79 | | | | 0.70 | |
| Institutional Class (MBFIX) | | 10-31-2001 | | | – | | | | – | | | | – | | | | (1.41 | ) | | | 7.24 | | | | 5.43 | | | | 0.52 | | | | 0.42 | |
| Investor Class (WTRZX) | | 4-8-2005 | | | – | | | | – | | | | – | | | | (1.71 | ) | | | 6.81 | | | | 4.95 | | | | 0.88 | | | | 0.81 | |
| Barclays U.S. Aggregate Bond Index5 | | – | | | – | | | | – | | | | – | | | | (1.61 | ) | | | 5.33 | | | | 4.71 | | | | – | | | | – | |
| * | | Class B shares are closed to investment, except in connection with the reinvestment of any distributions and permitted exchanges. |
Figures quoted represent past performance, which is no guarantee of future results, and do not reflect taxes that a shareholder may pay on fund distributions or the redemption of fund shares. Investment return and principal value of an investment will fluctuate so that an investor’s shares, when redeemed, may be worth more or less than their original cost. Performance shown without sales charges would be lower if sales charges were reflected. Current performance may be lower or higher than the performance data quoted, which assumes the reinvestment of dividends and capital gains. Current month-end performance is available on the Fund’s website, wellsfargoadvantagefunds.com.
Index returns do not include transaction costs associated with buying and selling securities, any mutual fund fees or expenses, or any taxes. It is not possible to invest directly in an index.
For Class A shares, the maximum front-end sales charge is 4.50%. For Class B shares, the maximum contingent deferred sales charge is 5.00%. For Class C shares, the maximum contingent deferred sales charge is 1.00%. Performance including sales charge assumes the sales charge for the corresponding time period. Class R, Class R4, Class R6, Administrator Class, Institutional Class, and Investor Class shares are sold without a front-end sales charge or contingent deferred sales charge.
Bond values fluctuate in response to the financial condition of individual issuers, general market and economic conditions, and changes in interest rates. In general, when interest rates rise, bond values fall and investors may lose principal value. The use of derivatives may reduce returns and/or increase volatility. Certain investment strategies tend to increase the total risk of an investment (relative to the broader market). The Fund is exposed to foreign investment risk and mortgage- and asset-backed securities risk. Consult the Fund’s prospectus for additional information on these and other risks.
Please see footnotes on page 5.
| | | | | | |
| Performance highlights (unaudited) | | Wells Fargo Advantage Income Funds | | | 5 | |
Wells Fargo Advantage Core Bond Fund (continued)
| | | | |
| Ten largest long-term holdings6 (%) as of November 30, 2013 | |
U.S. Treasury Note, 0.63%, 11-15-2016 | | | 4.52 | |
U.S. Treasury Note, 3.13%, 4-30-2017 | | | 2.86 | |
U.S. Treasury Note, 0.38%, 8-31-2015 | | | 2.45 | |
U.S. Treasury Note, 0.63%, 10-15-2016 | | | 2.06 | |
GNMA, 4.00%, 1-1-2044 | | | 1.50 | |
FHLMC, 4.00%, 6-1-2042 | | | 1.43 | |
FNMA Series 2012-130 Class DC, 3.00%, 12-25-2042 | | | 1.23 | |
GNMA, 4.50%, 12-1-2043 | | | 1.15 | |
U.S. Treasury Note, 0.63%, 8-15-2016 | | | 1.14 | |
FNMA, 3.50%, 9-1-2042 | | | 1.08 | |
| | |
| Portfolio allocation7 as of November 30, 2013 |
|
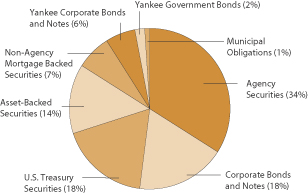
|
| 1. | The Fund is a gateway feeder fund that invests all of its assets in a single master portfolio of the Wells Fargo Master Trust with a substantially similar investment objective and substantially similar investment strategies. References to the investment activities of the Fund are intended to refer to the investment activities of the master portfolio in which it invests. |
| 2. | Historical performance shown for Class R4 shares prior to their inception reflects the performance of Institutional Class shares, adjusted to reflect the higher expenses applicable to Class R4 shares. Historical performance shown for Class R6 shares prior to their inception reflects the performance of Institutional Class shares and includes the higher expenses applicable to Institutional Class shares. If these expenses had not been included, returns would be higher. Historical performance shown for Class R and Investor Class shares prior to their inception reflects the performance of Administrator Class shares, adjusted to reflect the higher expenses applicable to Class R and Investor Class shares. Effective June 20, 2008, Class Z was renamed Investor Class and modified to assume the features and attributes of the Investor Class. |
| 3. | Reflects the expense ratios as stated in the most recent prospectuses. |
| 4. | The Adviser has committed through September 30, 2014, to waive fees and/or reimburse expenses to the extent necessary to cap the Fund’s Total Annual Fund Operating Expenses After Fee Waiver, excluding certain expenses, at the amounts shown. Brokerage commissions, stamp duty fees, interest, taxes, acquired fund fees and expenses, and extraordinary expenses are excluded from the cap. Fees from the underlying master portfolio are included in the cap. Without this cap, the Fund’s returns would have been lower. |
| 5. | The Barclays U.S. Aggregate Bond Index is composed of the Barclays U.S. Government/Credit Index and the Barclays U.S. Mortgage-Backed Securities Index and includes U.S. Treasury issues, agency issues, corporate bond issues, and mortgage-backed securities. You cannot invest directly in an index. |
| 6. | The ten largest long-term holdings are calculated based on the value of the securities of the master portfolio allocable to the Fund divided by the total net assets of the Fund. Holdings are subject to change and may have changed since the date specified. |
| 7. | Portfolio allocation is subject to change and represents the portfolio allocation of the master portfolio which is calculated based on the total long-term investments of the master portfolio. |
| | | | |
| 6 | | Wells Fargo Advantage Income Funds | | Performance highlights (unaudited) |
Wells Fargo Advantage Inflation-Protected Bond Fund1
Investment objective
The Fund seeks returns that exceed the rate of inflation over the long-term.
Adviser
Wells Fargo Funds Management, LLC
Subadviser for master portfolio
Wells Capital Management Incorporated
Portfolio managers
Michael J. Bray, CFA Jay N. Mueller, CFA
Average annual total returns (%) as of November 30, 2013
| | | | | | | | | | | | | | | | | | | | | | | | | | | | | | | | | | |
| | | | | Including sales charge | | | Excluding sales charge | | | Expense ratios2 (%) | |
| | | Inception date | | 1 year | | | 5 year | | | 10 year | | | 1 year | | | 5 year | | | 10 year | | | Gross | | �� | Net3 | |
| Class A (IPBAX) | | 2-28-2003 | | | (12.68 | ) | | | 5.00 | | | | 3.75 | | | | (8.56 | ) | | | 5.97 | | | | 4.23 | | | | 1.14 | | | | 0.85 | |
| Class B (IPBBX)* | | 2-28-2003 | | | (14.22 | ) | | | 4.94 | | | | 3.70 | | | | (9.22 | ) | | | 5.27 | | | | 3.70 | | | | 1.89 | | | | 1.60 | |
| Class C (IPBCX) | | 2-28-2003 | | | (10.28 | ) | | | 5.26 | | | | 3.48 | | | | (9.28 | ) | | | 5.26 | | | | 3.48 | | | | 1.89 | | | | 1.60 | |
| Administrator Class (IPBIX) | | 2-28-2003 | | | – | | | | – | | | | – | | | | (8.36 | ) | | | 6.30 | | | | 4.50 | | | | 1.08 | | | | 0.60 | |
| Barclays U.S. Treasury Inflation-Protected Securities Index4 | | – | | | – | | | | – | | | | – | | | | (7.85 | ) | | | 6.97 | | | | 5.11 | | | | – | | | | – | |
| * | | Class B shares are closed to investment, except in connection with the reinvestment of any distributions and permitted exchanges. |
Figures quoted represent past performance, which is no guarantee of future results, and do not reflect taxes that a shareholder may pay on fund distributions or the redemption of fund shares. Investment return and principal value of an investment will fluctuate so that an investor’s shares, when redeemed, may be worth more or less than their original cost. Performance shown without sales charges would be lower if sales charges were reflected. Current performance may be lower or higher than the performance data quoted, which assumes the reinvestment of dividends and capital gains. Current month-end performance is available on the Fund’s website, wellsfargoadvantagefunds.com.
Index returns do not include transaction costs associated with buying and selling securities, any mutual fund fees or expenses, or any taxes. It is not possible to invest directly in an index.
For Class A shares, the maximum front-end sales charge is 4.50%. For Class B shares, the maximum contingent deferred sales charge is 5.00%. For Class C shares, the maximum contingent deferred sales charge is 1.00%. Performance including sales charge assumes the sales charge for the corresponding time period. Administrator Class shares are sold without a front-end sales charge or contingent deferred sales charge.
Bond values fluctuate in response to the financial condition of individual issuers, general market and economic conditions, and changes in interest rates. In general, when interest rates rise, bond values fall and investors may lose principal value. The principal value of and interest payments on inflation-protected debt securities tend to fall with the rate of inflation. The use of derivatives may reduce returns and/or increase volatility. Certain investment strategies tend to increase the total risk of an investment (relative to the broader market). The Fund is exposed to mortgage- and asset-backed securities risk. Consult the Fund’s prospectus for additional information on these and other risks.
Please see footnotes on page 7.
| | | | | | |
| Performance highlights (unaudited) | | Wells Fargo Advantage Income Funds | | | 7 | |
Wells Fargo Advantage Inflation-Protected Bond Fund (continued)
| | | | |
| Ten largest long-term holdings5 (%) as of November 30, 2013 | |
TIPS, 0.13%, 4-15-2017 | | | 5.91 | |
TIPS, 0.13%, 1-15-2022 | | | 5.88 | |
TIPS, 0.13%, 4-15-2016 | | | 5.53 | |
TIPS, 1.13%, 1-15-2021 | | | 5.45 | |
TIPS, 0.63%, 7-15-2021 | | | 5.16 | |
TIPS, 0.13%, 7-15-2022 | | | 4.87 | |
TIPS, 1.25%, 7-15-2020 | | | 4.51 | |
TIPS, 0.13%, 1-15-2023 | | | 3.81 | |
TIPS, 2.38%, 1-15-2025 | | | 3.74 | |
TIPS, 1.38%, 7-15-2018 | | | 3.39 | |
|
| Effective maturity distribution6 as of November 30, 2013 |
|
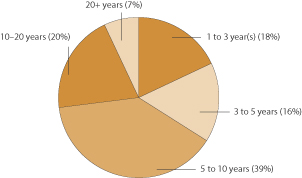
|
| 1. | The Fund is a gateway feeder fund that invests all of its assets in a single master portfolio of the Wells Fargo Master Trust with a substantially similar investment objective and substantially similar investment strategies. References to the investment activities of the Fund are intended to refer to the investment activities of the master portfolio in which it invests. |
| 2. | Reflects the expense ratios as stated in the most recent prospectuses. |
| 3. | The Adviser has committed through September 30, 2014, to waive fees and/or reimburse expenses to the extent necessary to cap the Fund’s Total Annual Fund Operating Expenses After Fee Waiver, excluding certain expenses, at the amounts shown. Brokerage commissions, stamp duty fees, interest, taxes, acquired fund fees and expenses, and extraordinary expenses are excluded from the cap. Fees from the underlying master portfolio are included in the cap. Without this cap, the Fund’s returns would have been lower. |
| 4. | The Barclays U.S. Treasury Inflation-Protected Securities Index is an index of inflation-indexed linked U.S. Treasury securities. You cannot invest directly in an index. |
| 5. | The ten largest long-term holdings are calculated based on the value of the securities of the master portfolio allocable to the Fund divided by the total net assets of the Fund. Holdings are subject to change and may have changed since the date specified. |
| 6. | Effective maturity represents the effective maturity of the master portfolio and is calculated based on the total long-term investments of the master portfolio. It is subject to change and may have changed since the date specified. |
| | | | |
| 8 | | Wells Fargo Advantage Income Funds | | Fund expenses (unaudited) |
As a shareholder of the Fund, you incur two types of costs: (1) transaction costs, including sales charges (loads) on purchase payments and contingent deferred sales charges (if any) on redemptions and (2) ongoing costs, including management fees, distribution (12b-1) and/or shareholder service fees, and other Fund expenses. This example is intended to help you understand your ongoing costs (in dollars) of investing in the Fund and to compare these costs with the ongoing costs of investing in other mutual funds.
The example is based on an investment of $1,000 invested at the beginning of the six-month period and held for the entire period from June 1, 2013 to November 30, 2013.
Actual expenses
The “Actual” line of the table below provides information about actual account values and actual expenses. You may use the information in this line, together with the amount you invested, to estimate the expenses that you paid over the period. Simply divide your account value by $1,000 (for example, an $8,600 account value divided by $1,000 = 8.6), then multiply the result by the number in the “Actual” line under the heading entitled “Expenses paid during period” for your applicable class of shares to estimate the expenses you paid on your account during this period.
Hypothetical example for comparison purposes
The “Hypothetical” line of the table below provides information about hypothetical account values and hypothetical expenses based on the Fund’s actual expense ratio and an assumed rate of return of 5% per year before expenses, which is not the Fund’s actual return. The hypothetical account values and expenses may not be used to estimate the actual ending account balance or expenses you paid for the period. You may use this information to compare the ongoing costs of investing in the Fund and other funds. To do so, compare this 5% hypothetical example with the 5% hypothetical examples that appear in the shareholder reports of the other funds.
Please note that the expenses shown in the table are meant to highlight your ongoing costs only and do not reflect any transactional costs, such as sales charges (loads) and contingent deferred sales charges. Therefore, the “Hypothetical” line of the table is useful in comparing ongoing costs only and will not help you determine the relative total costs of owning different funds. In addition, if these transactional costs were included, your costs would have been higher.
| | | | | | | | | | | | | | | | |
| Wells Fargo Advantage Core Bond Fund | | Beginning
account value
6-1-2013 | | | Ending
account value
11-30-2013 | | | Expenses
paid during
the period¹ | | | Net annual
expense ratio | |
Class A | | | | | | | | | | | | | | | | |
Actual | | $ | 1,000.00 | | | $ | 992.33 | | | $ | 3.90 | | | | 0.78 | % |
Hypothetical (5% return before expenses) | | $ | 1,000.00 | | | $ | 1,021.16 | | | $ | 3.95 | | | | 0.78 | % |
Class B | | | | | | | | | | | | | | | | |
Actual | | $ | 1,000.00 | | | $ | 988.56 | | | $ | 7.63 | | | | 1.53 | % |
Hypothetical (5% return before expenses) | | $ | 1,000.00 | | | $ | 1,017.40 | | | $ | 7.74 | | | | 1.53 | % |
Class C | | | | | | | | | | | | | | | | |
Actual | | $ | 1,000.00 | | | $ | 988.47 | | | $ | 7.63 | | | | 1.53 | % |
Hypothetical (5% return before expenses) | | $ | 1,000.00 | | | $ | 1,017.40 | | | $ | 7.74 | | | | 1.53 | % |
Class R | | | | | | | | | | | | | | | | |
Actual | | $ | 1,000.00 | | | $ | 991.50 | | | $ | 5.14 | | | | 1.03 | % |
Hypothetical (5% return before expenses) | | $ | 1,000.00 | | | $ | 1,019.90 | | | $ | 5.22 | | | | 1.03 | % |
Class R4 | | | | | | | | | | | | | | | | |
Actual | | $ | 1,000.00 | | | $ | 994.01 | | | $ | 2.60 | | | | 0.52 | % |
Hypothetical (5% return before expenses) | | $ | 1,000.00 | | | $ | 1,022.46 | | | $ | 2.64 | | | | 0.52 | % |
Class R6 | | | | | | | | | | | | | | | | |
Actual | | $ | 1,000.00 | | | $ | 994.78 | | | $ | 1.85 | | | | 0.37 | % |
Hypothetical (5% return before expenses) | | $ | 1,000.00 | | | $ | 1,023.21 | | | $ | 1.88 | | | | 0.37 | % |
Please see footnote on page 9.
| | | | | | |
| Fund expenses (unaudited) | | Wells Fargo Advantage Income Funds | | | 9 | |
| | | | | | | | | | | | | | | | |
| Wells Fargo Advantage Core Bond Fund | | Beginning
account value
6-1-2013 | | | Ending
account value
11-30-2013 | | | Expenses
paid during
the period¹ | | | Net annual
expense ratio | |
Administrator Class | | | | | | | | | | | | | | | | |
Actual | | $ | 1,000.00 | | | $ | 993.14 | | | $ | 3.50 | | | | 0.70 | % |
Hypothetical (5% return before expenses) | | $ | 1,000.00 | | | $ | 1,021.56 | | | $ | 3.55 | | | | 0.70 | % |
Institutional Class | | | | | | | | | | | | | | | | |
Actual | | $ | 1,000.00 | | | $ | 993.73 | | | $ | 2.10 | | | | 0.42 | % |
Hypothetical (5% return before expenses) | | $ | 1,000.00 | | | $ | 1,022.96 | | | $ | 2.13 | | | | 0.42 | % |
Investor Class | | | | | | | | | | | | | | | | |
Actual | | $ | 1,000.00 | | | $ | 992.60 | | | $ | 4.05 | | | | 0.81 | % |
Hypothetical (5% return before expenses) | | $ | 1,000.00 | | | $ | 1,021.01 | | | $ | 4.10 | | | | 0.81 | % |
| Wells Fargo Advantage Inflation-Protected Bond Fund | | | | | | | | | | | | |
Class A | | | | | | | | | | | | | | | | |
Actual | | $ | 1,000.00 | | | $ | 958.19 | | | $ | 4.17 | | | | 0.85 | % |
Hypothetical (5% return before expenses) | | $ | 1,000.00 | | | $ | 1,020.81 | | | $ | 4.31 | | | | 0.85 | % |
Class B | | | | | | | | | | | | | | | | |
Actual | | $ | 1,000.00 | | | $ | 955.10 | | | $ | 7.84 | | | | 1.60 | % |
Hypothetical (5% return before expenses) | | $ | 1,000.00 | | | $ | 1,017.05 | | | $ | 8.09 | | | | 1.60 | % |
Class C | | | | | | | | | | | | | | | | |
Actual | | $ | 1,000.00 | | | $ | 955.15 | | | $ | 7.84 | | | | 1.60 | % |
Hypothetical (5% return before expenses) | | $ | 1,000.00 | | | $ | 1,017.05 | | | $ | 8.09 | | | | 1.60 | % |
Administrator Class | | | | | | | | | | | | | | | | |
Actual | | $ | 1,000.00 | | | $ | 959.58 | | | $ | 2.95 | | | | 0.60 | % |
Hypothetical (5% return before expenses) | | $ | 1,000.00 | | | $ | 1,022.06 | | | $ | 3.04 | | | | 0.60 | % |
| 1. | Expenses paid is equal to the annualized expense ratio of each class multiplied by the average account value over the period, multiplied by the number of days in the most recent fiscal half-year divided by the number of days in the fiscal year (to reflect the one-half-year period). |
| | | | |
| 10 | | Wells Fargo Advantage Income Funds | | Portfolio of investments—November 30, 2013 (unaudited) |
CORE BOND FUND
| | | | | | | | | | |
| Security name | | | | | | | | Value | |
| | | | |
Investment Companies: 99.98% | | | | | | | | | | |
| | | | |
| Affiliated Master Portfolios: 99.98% | | | | | | | | | | |
Wells Fargo Advantage Core Bond Portfolio | | | | | | | | $ | 2,538,750,734 | |
| | | | | | | | | | |
| | | | |
Total Investment Companies (Cost $2,548,579,022) | | | | | | | | | 2,538,750,734 | |
| | | | | | | | | | |
| | | | | | | | |
| Total investments in securities | | | | | | | | |
| (Cost $2,548,579,022) * | | | 99.98 | % | | | 2,538,750,734 | |
Other assets and liabilities, net | | | 0.02 | | | | 610,253 | |
| | | | | | | | |
| Total net assets | | | 100.00 | % | | $ | 2,539,360,987 | |
| | | | | | | | |
| * | Cost for federal income tax purposes is $2,556,293,093 and unrealized appreciation (depreciation) consists of: |
| | | | |
Gross unrealized appreciation | | $ | 0 | |
Gross unrealized depreciation | | | (17,542,359 | ) |
| | | | |
Net unrealized depreciation | | $ | (17,542,359 | ) |
The accompanying notes are an integral part of these financial statements.
| | | | | | |
| Portfolio of investments—November 30, 2013 (unaudited) | | Wells Fargo Advantage Income Funds | | | 11 | |
INFLATION-PROTECTED BOND FUND
| | | | | | | | | | |
| Security name | | | | | | | | Value | |
| | | | |
Investment Companies: 100.07% | | | | | | | | | | |
| | | | |
| Affiliated Master Portfolios: 100.07% | | | | | | | | | | |
Wells Fargo Advantage Inflation-Protected Bond Portfolio | | | | | | | | $ | 37,650,474 | |
| | | | | | | | | | |
| | | | |
Total Investment Companies (Cost $37,216,143) | | | | | | | | | 37,650,474 | |
| | | | | | | | | | |
| | | | | | | | |
| Total investments in securities | | | | | | | | |
| (Cost $37,216,143) * | | | 100.07 | % | | | 37,650,474 | |
Other assets and liabilities, net | | | (0.07 | ) | | | (25,502 | ) |
| | | | | | | | |
| Total net assets | | | 100.00 | % | | $ | 37,624,972 | |
| | | | | | | | |
| * | Cost for federal income tax purposes is $37,087,193 and unrealized appreciation (depreciation) consists of: |
| | | | |
Gross unrealized appreciation | | $ | 563,281 | |
Gross unrealized depreciation | | | 0 | |
| | | | |
Net unrealized appreciation | | $ | 563,281 | |
The accompanying notes are an integral part of these financial statements.
| | | | |
| 12 | | Wells Fargo Advantage Income Funds | | Statements of assets and liabilities—November 30, 2013 (unaudited) |
| | | | | | | | |
| | | Core Bond Fund | | | Inflation-Protected
Bond Fund | |
| | |
Assets | | | | | | | | |
Investment in affiliated Master Portfolio, at value (see cost below) | | $ | 2,538,750,734 | | | $ | 37,650,474 | |
Receivable for Fund shares sold | | | 4,044,068 | | | | 32,009 | |
Receivable from administrator | | | 155,261 | | | | 12,624 | |
Prepaid expenses and other assets | | | 89,040 | | | | 18,552 | |
| | | | | | | | |
Total assets | | | 2,543,039,103 | | | | 37,713,659 | |
| | | | | | | | |
| | |
Liabilities | | | | | | | | |
Dividends payable | | | 485,868 | | | | 0 | |
Payable for Fund shares redeemed | | | 2,468,242 | | | | 41,728 | |
Distribution fees payable | | | 67,178 | | | | 7,016 | |
Due to other related parties | | | 314,660 | | | | 6,470 | |
Shareholder report expenses payable | | | 0 | | | | 16,891 | |
Shareholder servicing fees payable | | | 209,797 | | | | 7,920 | |
Professional fees payable | | | 11,822 | | | | 8,280 | |
Accrued expenses and other liabilities | | | 120,549 | | | | 382 | |
| | | | | | | | |
Total liabilities | | | 3,678,116 | | | | 88,687 | |
| | | | | | | | |
Total net assets | | $ | 2,539,360,987 | | | $ | 37,624,972 | |
| | | | | | | | |
| | |
NET ASSETS CONSIST OF | | | | | | | | |
Paid-in capital | | $ | 2,630,558,648 | | | $ | 34,944,096 | |
Undistributed net investment income | | | 2,159,331 | | | | 107,208 | |
Accumulated net realized gains (losses) on investments | | | (83,528,704 | ) | | | 2,139,337 | |
Net unrealized gains (losses) on investments | | | (9,828,288 | ) | | | 434,331 | |
| | | | | | | | |
Total net assets | | $ | 2,539,360,987 | | | $ | 37,624,972 | |
| | | | | | | | |
| | |
COMPUTATION OF NET ASSET VALUE AND OFFERING PRICE PER SHARE1 | | | | | | | | |
Net assets – Class A | | $ | 348,881,088 | | | $ | 19,886,181 | |
Shares outstanding – Class A | | | 27,209,866 | | | | 1,915,671 | |
Net asset value per share – Class A | | | $12.82 | | | | $10.38 | |
Maximum offering price per share – Class A2 | | | $13.42 | | | | $10.87 | |
Net assets – Class B | | $ | 5,930,808 | | | $ | 309,320 | |
Shares outstanding – Class B | | | 463,915 | | | | 30,162 | |
Net asset value per share – Class B | | | $12.78 | | | | $10.26 | |
Net assets – Class C | | $ | 92,346,062 | | | $ | 10,484,028 | |
Shares outstanding – Class C | | | 7,270,742 | | | | 1,021,100 | |
Net asset value per share – Class C | | | $12.70 | | | | $10.27 | |
Net assets – Class R | | $ | 16,685,951 | | | | N/A | |
Shares outstanding – Class R | | | 1,332,587 | | | | N/A | |
Net asset value per share – Class R | | | $12.52 | | | | N/A | |
Net assets – Class R4 | | $ | 9,856 | | | | N/A | |
Share outstanding – Class R4 | | | 788 | | | | N/A | |
Net asset value per share – Class R4 | | | $12.51 | | | | N/A | |
Net assets – Class R6 | | $ | 287,145,477 | | | | N/A | |
Share outstanding – Class R6 | | | 22,956,072 | | | | N/A | |
Net asset value per share – Class R6 | | | $12.51 | | | | N/A | |
Net assets – Administrator Class | | $ | 451,596,341 | | | $ | 6,945,443 | |
Shares outstanding – Administrator Class | | | 36,063,646 | | | | 665,108 | |
Net asset value per share – Administrator Class | | | $12.52 | | | | $10.44 | |
Net assets – Institutional Class | | $ | 1,260,945,408 | | | | N/A | |
Shares outstanding – Institutional Class | | | 100,839,596 | | | | N/A | |
Net asset value per share – Institutional Class | | | $12.50 | | | | N/A | |
Net assets – Investor Class | | $ | 75,819,996 | | | | N/A | |
Shares outstanding – Investor Class | | | 6,055,044 | | | | N/A | |
Net asset value per share – Investor Class | | | $12.52 | | | | N/A | |
| | |
Investments in affiliated Master Portfolio, at cost | | $ | 2,548,579,022 | | | $ | 37,216,143 | |
| | | | | | | | |
| 1. | Each Fund has an unlimited number of authorized shares. |
| 2. | Maximum offering price is computed as 100/95.50 of net asset value. On investments of $50,000 or more, the offering price is reduced. |
The accompanying notes are an integral part of these financial statements.
| | | | | | |
| Statements of operations—six months ended November 30, 2013 (unaudited) | | Wells Fargo Advantage Income Funds | | | 13 | |
| | | | | | | | |
| | | Core Bond Fund | | | Inflation-Protected
Bond Fund | |
| | |
Investment income | | | | | | | | |
Interest allocated from affiliated Master Portfolio** | | $ | 30,210,429 | | | $ | 352,626 | |
Securities lending income allocated from affiliated Master Portfolio | | | 8,998 | | | | 0 | |
Expenses allocated from affiliated Master Portfolio | | | (4,918,008 | ) | | | (111,422 | ) |
Waivers allocated from affiliated Master Portfolio | | | 327,119 | | | | 18,247 | |
| | | | | | | | |
Total investment income | | | 25,628,538 | | | | 259,451 | |
| | | | | | | | |
| | |
Expenses | | | | | | | | |
Administration fees | | | | | | | | |
Fund level | | | 656,758 | | | | 10,611 | |
Class A | | | 290,242 | | | | 18,279 | |
Class B | | | 5,469 | | | | 353 | |
Class C | | | 82,278 | | | | 9,284 | |
Class R | | | 13,865 | | | | N/A | |
Class R4 | | | 4 | | | | N/A | |
Class R6 | | | 32,458 | | | | N/A | |
Administrator Class | | | 235,092 | | | | 3,774 | |
Institutional Class | | | 547,315 | | | | N/A | |
Investor Class | | | 78,229 | | | | N/A | |
Shareholder servicing fees | | | | | | | | |
Class A | | | 453,503 | | | | 28,560 | |
Class B | | | 8,546 | | | | 551 | |
Class C | | | 128,559 | | | | 14,507 | |
Class R | | | 21,664 | | | | N/A | |
Class R4 | | | 5 | | | | N/A | |
Administrator Class | | | 582,911 | | | | 9,225 | |
Investor Class | | | 102,674 | | | | N/A | |
Distribution fees | | | | | | | | |
Class B | | | 25,637 | | | | 1,653 | |
Class C | | | 385,677 | | | | 43,521 | |
Class R | | | 21,664 | | | | N/A | |
Custody and accounting fees | | | 49,821 | | | | 1,609 | |
Professional fees | | | 14,940 | | | | 15,557 | |
Registration fees | | | 101,789 | | | | 19,485 | |
Shareholder report expenses | | | 62,761 | | | | 12,636 | |
Trustees’ fees and expenses | | | 2,410 | | | | 5,878 | |
Other fees and expenses | | | 34,932 | | | | 4,849 | |
| | | | | | | | |
Total expenses | | | 3,939,203 | | | | 200,332 | |
Less: Fee waivers and/or expense reimbursements | | | (933,934 | ) | | | (77,387 | ) |
| | | | | | | | |
Net expenses | | | 3,005,269 | | | | 122,945 | |
| | | | | | | | |
Net investment income | | | 22,623,269 | | | | 136,506 | |
| | | | | | | | |
| | |
REALIZED AND UNREALIZED GAINS (LOSSES) ON INVESTMENTS | | | | | | | | |
Net realized gains (losses) on securities transaction allocated from affiliated Master Portfolio | | | (35,775,354 | ) | | | 333,734 | |
Net change in unrealized gains (losses) on securities transactions allocated from affiliated
Master Portfolio | | | (8,277,635 | ) | | | (2,522,859 | ) |
| | | | | | | | |
Net realized and unrealized gains (losses) on investments | | | (44,052,989 | ) | | | (2,189,125 | ) |
| | | | | | | | |
Net decrease in net assets resulting from operations | | $ | (21,429,720 | ) | | $ | (2,052,619 | ) |
| | | | | | | | |
| | |
** Net of foreign interest withholding taxes allocated from affiliated Master Portfolio in the amount of | | | $9,431 | | | | $0 | |
The accompanying notes are an integral part of these financial statements.
| | | | |
| 14 | | Wells Fargo Advantage Income Funds | | Statements of changes in net assets |
| | | | | | | | | | | | | | | | |
| | | Core Bond Fund | |
| | | Six months ended
November 30, 2013
(unaudited) | | | Year ended
May 31, 2013 | |
| | | | |
Operations | | | | | | | | | | | | | | | | |
Net investment income | | | | | | $ | 22,623,269 | | | | | | | $ | 51,179,118 | |
Net realized gains (losses) on investments | | | | | | | (35,775,354 | ) | | | | | | | 117,955,586 | |
Net change in unrealized gains (losses) on investments | | | | | | | (8,277,635 | ) | | | | | | | (81,990,113 | ) |
| | | | | | | | | | | | | | | | |
Net increase (decrease) in net assets resulting from operations | | | | | | | (21,429,720 | ) | | | | | | | 87,144,591 | |
| | | | | | | | | | | | | | | | |
| | | | |
Distributions to shareholders from | | | | | | | | | | | | | | | | |
Net investment income | | | | | | | | | | | | | | | | |
Class A | | | | | | | (2,809,600 | ) | | | | | | | (5,916,535 | ) |
Class B | | | | | | | (27,373 | ) | | | | | | | (58,688 | ) |
Class C | | | | | | | (411,912 | ) | | | | | | | (709,826 | ) |
Class R | | | | | | | (112,518 | ) | | | | | | | (216,144 | ) |
Class R4 | | | | | | | (88 | ) | | | | | | | (72 | )1 |
Class R6 | | | | | | | (2,135,761 | ) | | | | | | | (1,667,009 | )1 |
Administrator Class | | | | | | | (3,830,561 | ) | | | | | | | (9,534,192 | ) |
Institutional Class | | | | | | | (13,044,900 | ) | | | | | | | (32,053,757 | ) |
Investor Class | | | | | | | (625,565 | ) | | | | | | | (1,184,456 | ) |
Net realized gains | | | | | | | | | | | | | | | | |
Class A | | | | | | | 0 | | | | | | | | (18,956,863 | ) |
Class B | | | | | | | 0 | | | | | | | | (425,601 | ) |
Class C | | | | | | | 0 | | | | | | | | (5,458,374 | ) |
Class R | | | | | | | 0 | | | | | | | | (858,020 | ) |
Class R4 | | | | | | | 0 | | | | | | | | (417 | )1 |
Class R6 | | | | | | | 0 | | | | | | | | (9,270,451 | )1 |
Administrator Class | | | | | | | 0 | | | | | | | | (26,829,353 | ) |
Institutional Class | | | | | | | 0 | | | | | | | | (71,947,246 | ) |
Investor Class | | | | | | | 0 | | | | | | | | (4,238,164 | ) |
| | | | | | | | | | | | | | | | |
Total distributions to shareholders | | | | | | | (22,998,278 | ) | | | | | | | (189,325,168 | ) |
| | | | | | | | | | | | | | | | |
| | | | |
| | | Shares | | | | | | Shares | | | | |
Capital share transactions | | | | | | | | | | | | | | | | |
Proceeds from shares sold | | | | | | | | | | | | | | | | |
Class A | | | 3,394,784 | | | | 43,458,022 | | | | 9,361,470 | | | | 125,808,138 | |
Class B | | | 5,458 | | | | 69,668 | | | | 93,346 | | | | 1,258,174 | |
Class C | | | 535,750 | | | | 6,777,261 | | | | 2,866,231 | | | | 38,164,758 | |
Class R | | | 243,939 | | | | 3,040,953 | | | | 891,651 | | | | 11,691,710 | |
Class R4 | | | 0 | | | | 0 | | | | 743 | 1 | | | 10,000 | 1 |
Class R6 | | | 7,091,072 | | | | 89,079,010 | | | | 17,117,948 | 1 | | | 230,395,982 | 1 |
Administrator Class | | | 3,024,206 | | | | 37,677,071 | | | | 14,798,228 | | | | 194,245,607 | |
Institutional Class | | | 12,038,089 | | | | 149,785,600 | | | | 72,162,712 | | | | 950,735,926 | |
Investor Class | | | 362,863 | | | | 4,521,197 | | | | 4,169,858 | | | | 54,916,836 | |
| | | | | | | | | | | | | | | | |
| | | | | | | 334,408,782 | | | | | | | | 1,607,227,131 | |
| | | | | | | | | | | | | | | | |
Reinvestment of distributions | | | | | | | | | | | | | | | | |
Class A | | | 190,248 | | | | 2,428,555 | | | | 1,657,453 | | | | 22,011,750 | |
Class B | | | 2,067 | | | | 26,304 | | | | 34,642 | | | | 457,980 | |
Class C | | | 15,407 | | | | 194,774 | | | | 239,546 | | | | 3,144,568 | |
Class R | | | 3,054 | | | | 38,077 | | | | 27,364 | | | | 354,744 | |
Class R4 | | | 7 | | | | 88 | | | | 38 | 1 | | | 489 | 1 |
Class R6 | | | 171,354 | | | | 2,135,702 | | | | 848,515 | 1 | | | 10,936,430 | 1 |
Administrator Class | | | 300,469 | | | | 3,746,287 | | | | 2,727,656 | | | | 35,410,074 | |
Institutional Class | | | 846,841 | | | | 10,540,094 | | | | 6,569,569 | | | | 85,243,105 | |
Investor Class | | | 48,687 | | | | 606,908 | | | | 410,442 | | | | 5,320,152 | |
| | | | | | | | | | | | | | | | |
| | | | | | | 19,716,789 | | | | | | | | 162,879,292 | |
| | | | | | | | | | | | | | | | |
Please see footnotes on page 15.
The accompanying notes are an integral part of these financial statements.
| | | | | | |
| Statements of changes in net assets | | Wells Fargo Advantage Income Funds | | | 15 | |
| | | | | | | | | | | | | | | | |
| | | Core Bond Fund | |
| | | Six months ended
November 30, 2013
(unaudited) | | | Year ended
May 31, 2013 | |
| | | | |
| | | Shares | | | | | | Shares | | | | |
| | | | |
Capital share transactions (continued) | | | | | | | | | | | | | | | | |
Payment for shares redeemed | | | | | | | | | | | | | | | | |
Class A | | | (7,783,767 | ) | | $ | (99,310,659 | ) | | | (13,032,444 | ) | | $ | (174,162,410 | ) |
Class B | | | (175,966 | ) | | | (2,236,348 | ) | | | (389,254 | ) | | | (5,214,504 | ) |
Class C | | | (2,341,045 | ) | | | (29,561,372 | ) | | | (3,614,009 | ) | | | (47,852,260 | ) |
Class R | | | (452,102 | ) | | | (5,623,947 | ) | | | (907,535 | ) | | | (11,920,035 | ) |
Class R6 | | | (465,001 | ) | | | (5,791,881 | ) | | | (1,807,816 | )1 | | | (23,202,983 | )1 |
Administrator Class | | | (8,637,302 | ) | | | (107,796,876 | ) | | | (37,145,520 | ) | | | (489,132,724 | ) |
Institutional Class | | | (30,610,455 | ) | | | (382,140,916 | ) | | | (109,689,751 | ) | | | (1,447,992,972 | ) |
Investor Class | | | (1,902,009 | ) | | | (23,709,690 | ) | | | (2,745,218 | ) | | | (35,674,872 | ) |
| | | | | | | | | | | | | | | | |
| | | | | | | (656,171,689 | ) | | | | | | | (2,235,152,760 | ) |
| | | | | | | | | | | | | | | | |
Net decrease in net assets resulting from capital share transactions | | | | | | | (302,046,118 | ) | | | | | | | (465,046,337 | ) |
| | | | | | | | | | | | | | | | |
Total decrease in net assets | | | | | | | (346,474,116 | ) | | | | | | | (567,226,914 | ) |
| | | | | | | | | | | | | | | | |
| | | | |
Net assets | | | | | | | | | | | | | | | | |
Beginning of period | | | | | | | 2,885,835,103 | | | | | | | | 3,453,062,017 | |
| | | | | | | | | | | | | | | | |
End of period | | | | | | $ | 2,539,360,987 | | | | | | | $ | 2,885,835,103 | |
| | | | | | | | | | | | | | | | |
Undistributed net investment income | | | | | | $ | 2,159,331 | | | | | | | $ | 2,534,340 | |
| | | | | | | | | | | | | | | | |
| 1. | For the period from November 30, 2012 (commencement of class operations) to May 31, 2013 |
The accompanying notes are an integral part of these financial statements.
| | | | |
| 16 | | Wells Fargo Advantage Income Funds | | Statements of changes in net assets |
| | | | | | | | | | | | | | | | |
| | | Inflation-Protected Bond Fund | |
| | | Six months ended
November 30, 2013
(unaudited) | | | Year ended
May 31, 2013 | |
| | | | |
Operations | | | | | | | | | | | | | | | | |
Net investment income | | | | | | $ | 136,506 | | | | | | | $ | 574,019 | |
Net realized gains on investments | | | | | | | 333,734 | | | | | | | | 2,809,999 | |
Net change in unrealized gains (losses) on investments | | | | | | | (2,522,859 | ) | | | | | | | (4,537,782 | ) |
| | | | | | | | | | | | | | | | |
Net decrease in net assets resulting from operations | | | | | | | (2,052,619 | ) | | | | | | | (1,153,764 | ) |
| | | | | | | | | | | | | | | | |
| | | | |
Distributions to shareholders from | | | | | | | | | | | | | | | | |
Net investment income | | | | | | | | | | | | | | | | |
Class A | | | | | | | (34,167 | ) | | | | | | | (671,794 | ) |
Class B | | | | | | | (316 | ) | | | | | | | (11,122 | ) |
Class C | | | | | | | (8,183 | ) | | | | | | | (200,710 | ) |
Administrator Class | | | | | | | (13,711 | ) | | | | | | | (195,781 | ) |
Net realized gains | | | | | | | | | | | | | | | | |
Class A | | | | | | | 0 | | | | | | | | (1,099,701 | ) |
Class B | | | | | | | 0 | | | | | | | | (24,694 | ) |
Class C | | | | | | | 0 | | | | | | | | (475,474 | ) |
Administrator Class | | | | | | | 0 | | | | | | | | (316,958 | ) |
| | | | | | | | | | | | | | | | |
Total distributions to shareholders | | | | | | | (56,377 | ) | | | | | | | (2,996,234 | ) |
| | | | | | | | | | | | | | | | |
| | | | |
| | | Shares | | | | | | | | Shares | | | | | |
Capital share transactions | | | | | | | | | | | | | | | | |
Proceeds from shares sold | | | | | | | | | | | | | | | | |
Class A | | | 135,986 | | | | 1,411,580 | | | | 665,668 | | | | 7,690,225 | |
Class B | | | 5 | | | | 45 | | | | 24,335 | | | | 279,888 | |
Class C | | | 24,944 | | | | 254,663 | | | | 190,711 | | | | 2,173,369 | |
Administrator Class | | | 113,633 | | | | 1,204,846 | | | | 289,346 | | | | 3,349,619 | |
| | | | | | | | | | | | | | | | |
| | | | | | | 2,871,134 | | | | | | | | 13,493,101 | |
| | | | | | | | | | | | | | | | |
Reinvestment of distributions | | | | | | | | | | | | | | | | |
Class A | | | 3,058 | | | | 31,835 | | | | 145,855 | | | | 1,677,947 | |
Class B | | | 26 | | | | 267 | | | | 2,677 | | | | 30,583 | |
Class C | | | 611 | | | | 6,279 | | | | 46,046 | | | | 526,069 | |
Administrator Class | | | 1,204 | | | | 12,605 | | | | 41,442 | | | | 478,559 | |
| | | | | | | | | | | | | | | | |
| | | | | | | 50,986 | | | | | | | | 2,713,158 | |
| | | | | | | | | | | | | | | | |
Payment for shares redeemed | | | | | | | | | | | | | | | | |
Class A | | | (832,069 | ) | | | (8,716,381 | ) | | | (1,370,768 | ) | | | (15,684,877 | ) |
Class B | | | (23,016 | ) | | | (238,641 | ) | | | (51,527 | ) | | | (590,723 | ) |
Class C | | | (284,547 | ) | | | (2,945,647 | ) | | | (305,031 | ) | | | (3,454,772 | ) |
Administrator Class | | | (208,473 | ) | | | (2,202,116 | ) | | | (411,861 | ) | | | (4,709,700 | ) |
| | | | | | | | | | | | | | | | |
| | | | | | | (14,102,785 | ) | | | | | | | (24,440,072 | ) |
| | | | | | | | | | | | | | | | |
Net decrease in net assets resulting from capital share transactions | | | | | | | (11,180,665 | ) | | | | | | | (8,233,813 | ) |
| | | | | | | | | | | | | | | | |
Total decrease in net assets | | | | | | | (13,289,661 | ) | | | | | | | (12,383,811 | ) |
| | | | | | | | | | | | | | | | |
| | | | |
Net assets | | | | | | | | | | | | | | | | |
Beginning of period | | | | | | | 50,914,633 | | | | | | | | 63,298,444 | |
| | | | | | | | | | | | | | | | |
End of period | | | | | | $ | 37,624,972 | | | | | | | $ | 50,914,633 | |
| | | | | | | | | | | | | | | | |
Undistributed net investment income | | | | | | $ | 107,208 | | | | | | | $ | 27,079 | |
| | | | | | | | | | | | | | | | |
The accompanying notes are an integral part of these financial statements.
This page is intentionally left blank.
| | | | |
| 18 | | Wells Fargo Advantage Income Funds | | Financial highlights |
| | | | | | | | | | | | | | | | |
| | | Beginning
net asset
value per
share | | | Net
investment
income1 | | |
Net realized
and unrealized
gains (losses)
on investments | | | Distributions
from net
investment
income | |
| | | | |
Core Bond Fund | | | | | | | | | | | | | | | | |
Class A | | | | | | | | | | | | | | | | |
June 1, 2013 to November 30, 2013 (unaudited) | | $ | 13.02 | | | | 0.10 | | | | (0.20 | ) | | | (0.10 | ) |
June 1, 2012 to May 31, 2013 | | $ | 13.46 | | | | 0.18 | | | | 0.12 | | | | (0.18 | ) |
June 1, 2011 to May 31, 2012 | | $ | 13.05 | | | | 0.26 | | | | 0.72 | | | | (0.26 | ) |
June 1, 2010 to May 31, 2011 | | $ | 13.25 | | | | 0.31 | | | | 0.52 | | | | (0.33 | ) |
June 1, 2009 to May 31, 2010 | | $ | 12.52 | | | | 0.36 | | | | 0.96 | | | | (0.47 | ) |
June 1, 2008 to May 31, 2009 | | $ | 12.37 | | | | 0.56 | | | | 0.17 | | | | (0.58 | ) |
Class B | | | | | | | | | | | | | | | | |
June 1, 2013 to November 30, 2013 (unaudited) | | $ | 12.98 | | | | 0.05 | 4 | | | (0.20 | ) | | | (0.05 | ) |
June 1, 2012 to May 31, 2013 | | $ | 13.43 | | | | 0.08 | 4 | | | 0.10 | | | | (0.07 | ) |
June 1, 2011 to May 31, 2012 | | $ | 13.01 | | | | 0.16 | | | | 0.73 | | | | (0.16 | ) |
June 1, 2010 to May 31, 2011 | | $ | 13.22 | | | | 0.20 | | | | 0.52 | | | | (0.23 | ) |
June 1, 2009 to May 31, 2010 | | $ | 12.53 | | | | 0.34 | | | | 0.84 | | | | (0.37 | ) |
June 1, 2008 to May 31, 2009 | | $ | 12.38 | | | | 0.45 | | | | 0.19 | | | | (0.49 | ) |
Class C | | | | | | | | | | | | | | | | |
June 1, 2013 to November 30, 2013 (unaudited) | | $ | 12.90 | | | | 0.05 | | | | (0.20 | ) | | | (0.05 | ) |
June 1, 2012 to May 31, 2013 | | $ | 13.34 | | | | 0.07 | | | | 0.12 | | | | (0.07 | ) |
June 1, 2011 to May 31, 2012 | | $ | 12.93 | | | | 0.16 | | | | 0.72 | | | | (0.16 | ) |
June 1, 2010 to May 31, 2011 | | $ | 13.14 | | | | 0.22 | | | | 0.50 | | | | (0.23 | ) |
June 1, 2009 to May 31, 2010 | | $ | 12.46 | | | | 0.34 | | | | 0.83 | | | | (0.37 | ) |
June 1, 2008 to May 31, 2009 | | $ | 12.31 | | | | 0.46 | | | | 0.18 | | | | (0.49 | ) |
Class R | | | | | | | | | | | | | | | | |
June 1, 2013 to November 30, 2013 (unaudited) | | $ | 12.71 | | | | 0.08 | 4 | | | (0.19 | ) | | | (0.08 | ) |
June 1, 2012 to May 31, 2013 | | $ | 13.16 | | | | 0.14 | 4 | | | 0.11 | | | | (0.14 | ) |
June 1, 2011 to May 31, 2012 | | $ | 12.76 | | | | 0.22 | | | | 0.71 | | | | (0.22 | ) |
July 9, 20105 to May 31, 2011 | | $ | 12.78 | | | | 0.25 | | | | 0.33 | | | | (0.25 | ) |
Class R4 | | | | | | | | | | | | | | | | |
June 1, 2013 to November 30, 2013 (unaudited) | | $ | 12.70 | | | | 0.11 | | | | (0.19 | ) | | | (0.11 | ) |
November 30, 20125 to May 31, 2013 | | $ | 13.46 | | | | 0.10 | 4 | | | (0.21 | ) | | | (0.09 | ) |
Class R6 | | | | | | | | | | | | | | | | |
June 1, 2013 to November 30, 2013 (unaudited) | | $ | 12.70 | | | | 0.12 | | | | (0.19 | ) | | | (0.12 | ) |
November 30, 20125 to May 31, 2013 | | $ | 13.46 | | | | 0.11 | 4 | | | (0.21 | ) | | | (0.10 | ) |
Administrator Class | | | | | | | | | | | | | | | | |
June 1, 2013 to November 30, 2013 (unaudited) | | $ | 12.71 | | | | 0.10 | | | | (0.19 | ) | | | (0.10 | ) |
June 1, 2012 to May 31, 2013 | | $ | 13.16 | | | | 0.19 | | | | 0.10 | | | | (0.18 | ) |
June 1, 2011 to May 31, 2012 | | $ | 12.76 | | | | 0.27 | | | | 0.71 | | | | (0.27 | ) |
June 1, 2010 to May 31, 2011 | | $ | 12.98 | | | | 0.33 | | | | 0.49 | | | | (0.34 | ) |
June 1, 2009 to May 31, 2010 | | $ | 12.31 | | | | 0.44 | | | | 0.83 | | | | (0.48 | ) |
June 1, 2008 to May 31, 2009 | | $ | 12.16 | | | | 0.56 | | | | 0.18 | | | | (0.59 | ) |
Institutional Class | | | | | | | | | | | | | | | | |
June 1, 2013 to November 30, 2013 (unaudited) | | $ | 12.70 | | | | 0.12 | | | | (0.20 | ) | | | (0.12 | ) |
June 1, 2012 to May 31, 2013 | | $ | 13.14 | | | | 0.22 | | | | 0.12 | | | | (0.22 | ) |
June 1, 2011 to May 31, 2012 | | $ | 12.75 | | | | 0.31 | | | | 0.69 | | | | (0.30 | ) |
June 1, 2010 to May 31, 2011 | | $ | 12.96 | | | | 0.36 | | | | 0.50 | | | | (0.37 | ) |
June 1, 2009 to May 31, 2010 | | $ | 12.30 | | | | 0.50 | | | | 0.79 | | | | (0.51 | ) |
June 1, 2008 to May 31, 2009 | | $ | 12.15 | | | | 0.59 | | | | 0.18 | | | | (0.62 | ) |
Investor Class | | | | | | | | | | | | | | | | |
June 1, 2013 to November 30, 2013 (unaudited) | | $ | 12.71 | | | | 0.10 | | | | (0.20 | ) | | | (0.09 | ) |
June 1, 2012 to May 31, 2013 | | $ | 13.16 | | | | 0.16 | | | | 0.12 | | | | (0.17 | ) |
June 1, 2011 to May 31, 2012 | | $ | 12.76 | | | | 0.24 | | | | 0.72 | | | | (0.25 | ) |
June 1, 2010 to May 31, 2011 | | $ | 12.98 | | | | 0.30 | | | | 0.50 | | | | (0.32 | ) |
June 1, 2009 to May 31, 2010 | | $ | 12.30 | | | | 0.45 | | | | 0.80 | | | | (0.45 | ) |
June 1, 2008 to May 31, 20096 | | $ | 12.15 | | | | 0.55 | | | | 0.17 | | | | (0.57 | ) |
Please see footnotes on page 20.
The accompanying notes are an integral part of these financial statements.
| | | | | | |
| Financial highlights | | Wells Fargo Advantage Income Funds | | | 19 | |
| | | | | | | | | | | | | | | | | | | | | | | | | | | | | | |
Distributions
from net
realized gains | | | Ending
net asset
value
per
share | | | Ratio to average net assets (annualized) | | | | | | Portfolio
turnover
rate3 | | | Net assets at
end of period
(000s omitted) | |
| | | Net investment
income | | | Gross
expenses1 | | | Net
expenses1 | | | Total
return2 | | | |
| | | | | | | |
| | | | | | | | | | | | | | | | | | | | | | | | | | | | | | | |
| | | | | | | | | | | | | | | | | | | | | | | | | | | | | | |
| | 0.00 | | | $ | 12.82 | | | | 1.52 | % | | | 0.83 | % | | | 0.78 | % | | | (0.77 | )% | | | 342 | % | | $ | 348,881 | |
| | (0.56 | ) | | $ | 13.02 | | | | 1.31 | % | | | 0.83 | % | | | 0.80 | % | | | 2.14 | % | | | 547 | % | | $ | 408,864 | |
| | (0.31 | ) | | $ | 13.46 | | | | 1.91 | % | | | 0.82 | % | | | 0.82 | % | | | 7.65 | % | | | 803 | % | | $ | 450,013 | |
| | (0.70 | ) | | $ | 13.05 | | | | 2.42 | % | | | 0.83 | % | | | 0.83 | % | | | 6.55 | % | | | 761 | % | | $ | 346,740 | |
| | (0.12 | ) | | $ | 13.25 | | | | 3.21 | % | | | 0.84 | % | | | 0.84 | % | | | 10.71 | % | | | 638 | % | | $ | 182,316 | |
| | 0.00 | | | $ | 12.52 | | | | 4.30 | % | | | 0.89 | % | | | 0.85 | % | | | 6.16 | % | | | 633 | % | | $ | 237,191 | |
| | | | | | | | | | | | | | | | | | | | | | | | | | | | | | |
| | 0.00 | | | $ | 12.78 | | | | 0.77 | % | | | 1.58 | % | | | 1.53 | % | | | (1.14 | )% | | | 342 | % | | $ | 5,931 | |
| | (0.56 | ) | | $ | 12.98 | | | | 0.56 | % | | | 1.57 | % | | | 1.55 | % | | | 1.31 | % | | | 547 | % | | $ | 8,208 | |
| | (0.31 | ) | | $ | 13.43 | | | | 1.23 | % | | | 1.57 | % | | | 1.57 | % | | | 6.95 | % | | | 803 | % | | $ | 11,998 | |
| | (0.70 | ) | | $ | 13.01 | | | | 1.66 | % | | | 1.58 | % | | | 1.58 | % | | | 5.69 | % | | | 761 | % | | $ | 18,762 | |
| | (0.12 | ) | | $ | 13.22 | | | | 2.65 | % | | | 1.59 | % | | | 1.59 | % | | | 9.56 | % | | | 638 | % | | $ | 7,514 | |
| | 0.00 | | | $ | 12.53 | | | | 3.77 | % | | | 1.65 | % | | | 1.60 | % | | | 5.38 | % | | | 633 | % | | $ | 10,082 | |
| | | | | | | | | | | | | | | | | | | | | | | | | | | | | | |
| | 0.00 | | | $ | 12.70 | | | | 0.77 | % | | | 1.58 | % | | | 1.53 | % | | | (1.15 | )% | | | 342 | % | | $ | 92,346 | |
| | (0.56 | ) | | $ | 12.90 | | | | 0.53 | % | | | 1.58 | % | | | 1.55 | % | | | 1.39 | % | | | 547 | % | | $ | 116,837 | |
| | (0.31 | ) | | $ | 13.34 | | | | 1.18 | % | | | 1.57 | % | | | 1.57 | % | | | 6.90 | % | | | 803 | % | | $ | 127,677 | |
| | (0.70 | ) | | $ | 12.93 | | | | 1.67 | % | | | 1.58 | % | | | 1.58 | % | | | 5.71 | % | | | 761 | % | | $ | 111,140 | |
| | (0.12 | ) | | $ | 13.14 | | | | 2.45 | % | | | 1.59 | % | | | 1.59 | % | | | 9.50 | % | | | 638 | % | | $ | 32,556 | |
| | 0.00 | | | $ | 12.46 | | | | 3.67 | % | | | 1.64 | % | | | 1.60 | % | | | 5.38 | % | | | 633 | % | | $ | 12,410 | |
| | | | | | | | | | | | | | | | | | | | | | | | | | | | | | |
| | 0.00 | | | $ | 12.52 | | | | 1.27 | % | | | 1.08 | % | | | 1.03 | % | | | (0.85 | )% | | | 342 | % | | $ | 16,686 | |
| | (0.56 | ) | | $ | 12.71 | | | | 1.04 | % | | | 1.07 | % | | | 1.05 | % | | | 1.83 | % | | | 547 | % | | $ | 19,548 | |
| | (0.31 | ) | | $ | 13.16 | | | | 1.67 | % | | | 1.07 | % | | | 1.07 | % | | | 7.43 | % | | | 803 | % | | $ | 20,088 | |
| | (0.35 | ) | | $ | 12.76 | | | | 2.18 | % | | | 1.08 | % | | | 1.08 | % | | | 4.73 | % | | | 761 | % | | $ | 14,596 | |
| | | | | | | | | | | | | | | | | | | | | | | | | | | | | | |
| | 0.00 | | | $ | 12.51 | | | | 1.78 | % | | | 0.57 | % | | | 0.52 | % | | | (0.60 | )% | | | 342 | % | | $ | 10 | |
| | (0.56 | ) | | $ | 12.70 | | | | 1.56 | % | | | 0.57 | % | | | 0.52 | % | | | (0.84 | )% | | | 547 | % | | $ | 10 | |
| | | | | | | | | | | | | | | | | | | | | | | | | | | | | | |
| | 0.00 | | | $ | 12.51 | | | | 1.96 | % | | | 0.45 | % | | | 0.37 | % | | | (0.52 | )% | | | 342 | % | | $ | 287,145 | |
| | (0.56 | ) | | $ | 12.70 | | | | 1.72 | % | | | 0.45 | % | | | 0.37 | % | | | (0.77 | )% | | | 547 | % | | $ | 205,225 | |
| | | | | | | | | | | | | | | | | | | | | | | | | | | | | | |
| | 0.00 | | | $ | 12.52 | | | | 1.60 | % | | | 0.77 | % | | | 0.70 | % | | | (0.69 | )% | | | 342 | % | | $ | 451,596 | |
| | (0.56 | ) | | $ | 12.71 | | | | 1.43 | % | | | 0.76 | % | | | 0.70 | % | | | 2.19 | % | | | 547 | % | | $ | 526,028 | |
| | (0.31 | ) | | $ | 13.16 | | | | 2.08 | % | | | 0.76 | % | | | 0.70 | % | | | 7.83 | % | | | 803 | % | | $ | 802,788 | |
| | (0.70 | ) | | $ | 12.76 | | | | 2.54 | % | | | 0.77 | % | | | 0.70 | % | | | 6.62 | % | | | 761 | % | | $ | 1,073,115 | |
| | (0.12 | ) | | $ | 12.98 | | | | 3.44 | % | | | 0.76 | % | | | 0.70 | % | | | 10.48 | % | | | 638 | % | | $ | 1,003,134 | |
| | 0.00 | | | $ | 12.31 | | | | 4.65 | % | | | 0.82 | % | | | 0.70 | % | | | 6.35 | % | | | 633 | % | | $ | 816,927 | |
| | | | | | | | | | | | | | | | | | | | | | | | | | | | | | |
| | 0.00 | | | $ | 12.50 | | | | 1.88 | % | | | 0.50 | % | | | 0.42 | % | | | (0.63 | )% | | | 342 | % | | $ | 1,260,945 | |
| | (0.56 | ) | | $ | 12.70 | | | | 1.67 | % | | | 0.50 | % | | | 0.42 | % | | | 2.56 | % | | | 547 | % | | $ | 1,505,192 | |
| | (0.31 | ) | | $ | 13.14 | | | | 2.32 | % | | | 0.49 | % | | | 0.42 | % | | | 8.05 | % | | | 803 | % | | $ | 1,965,338 | |
| | (0.70 | ) | | $ | 12.75 | | | | 2.84 | % | | | 0.50 | % | | | 0.42 | % | | | 7.00 | % | | | 761 | % | | $ | 1,325,962 | |
| | (0.12 | ) | | $ | 12.96 | | | | 3.68 | % | | | 0.49 | % | | | 0.42 | % | | | 10.70 | % | | | 638 | % | | $ | 1,000,253 | |
| | 0.00 | | | $ | 12.30 | | | | 4.91 | % | | | 0.55 | % | | | 0.42 | % | | | 6.65 | % | | | 633 | % | | $ | 604,992 | |
| | | | | | | | | | | | | | | | | | | | | | | | | | | | | | |
| | 0.00 | | | $ | 12.52 | | | | 1.49 | % | | | 0.86 | % | | | 0.81 | % | | | (0.74 | )% | | | 342 | % | | $ | 75,820 | |
| | (0.56 | ) | | $ | 12.71 | | | | 1.25 | % | | | 0.86 | % | | | 0.83 | % | | | 2.05 | % | | | 547 | % | | $ | 95,924 | |
| | (0.31 | ) | | $ | 13.16 | | | | 1.85 | % | | | 0.85 | % | | | 0.85 | % | | | 7.67 | % | | | 803 | % | | $ | 75,160 | |
| | (0.70 | ) | | $ | 12.76 | | | | 2.38 | % | | | 0.87 | % | | | 0.86 | % | | | 6.45 | % | | | 761 | % | | $ | 38,573 | |
| | (0.12 | ) | | $ | 12.98 | | | | 3.47 | % | | | 0.89 | % | | | 0.89 | % | | | 10.36 | % | | | 638 | % | | $ | 36,375 | |
| | 0.00 | | | $ | 12.30 | | | | 4.36 | % | | | 0.95 | % | | | 0.90 | % | | | 6.15 | % | | | 633 | % | | $ | 18,005 | |
Please see footnotes on page 20.
The accompanying notes are an integral part of these financial statements.
| | | | |
| 20 | | Wells Fargo Advantage Income Funds | | Financial highlights |
| | | | | | | | | | | | | | | | |
| | | Beginning
net asset
value per
share | | | Net
investment
income1 | | |
Net realized
and unrealized
gains (losses)
on investments | | | Distributions
from net
investment
income | |
| | | | |
Inflation-Protected Bond Fund | | | | | | | | | | | | | | | | |
Class A | | | | | | | | | | | | | | | | |
June 1, 2013 to November 30, 2013 (unaudited) | | $ | 10.85 | | | | 0.01 | | | | (0.46 | ) | | | (0.02 | ) |
June 1, 2012 to May 31, 2013 | | $ | 11.66 | | | | 0.11 | | | | (0.36 | ) | | | (0.21 | ) |
June 1, 2011 to May 31, 2012 | | $ | 10.84 | | | | 0.27 | | | | 1.01 | | | | (0.36 | ) |
June 1, 2010 to May 31, 2011 | | $ | 10.29 | | | | 0.31 | | | | 0.47 | | | | (0.23 | ) |
June 1, 2009 to May 31, 2010 | | $ | 9.76 | | | | 0.31 | 4 | | | 0.49 | | | | (0.27 | ) |
June 1, 2008 to May 31, 2009 | | $ | 10.22 | | | | 0.07 | | | | (0.25 | ) | | | (0.19 | ) |
Class B | | | | | | | | | | | | | | | | |
June 1, 2013 to November 30, 2013 (unaudited) | | $ | 10.75 | | | | 0.00 | 4,7 | | | (0.48 | ) | | | (0.01 | ) |
June 1, 2012 to May 31, 2013 | | $ | 11.58 | | | | 0.03 | 4 | | | (0.36 | ) | | | (0.15 | ) |
June 1, 2011 to May 31, 2012 | | $ | 10.76 | | | | 0.19 | 4 | | | 1.00 | | | | (0.27 | ) |
June 1, 2010 to May 31, 2011 | | $ | 10.20 | | | | 0.19 | 4 | | | 0.53 | | | | (0.16 | ) |
June 1, 2009 to May 31, 2010 | | $ | 9.71 | | | | 0.24 | 4 | | | 0.47 | | | | (0.22 | ) |
June 1, 2008 to May 31, 2009 | | $ | 10.20 | | | | 0.03 | | | | (0.29 | ) | | | (0.14 | ) |
Class C | | | | | | | | | | | | | | | | |
June 1, 2013 to November 30, 2013 (unaudited) | | $ | 10.76 | | | | 0.00 | 4,7 | | | (0.48 | ) | | | (0.01 | ) |
June 1, 2012 to May 31, 2013 | | $ | 11.59 | | | | 0.04 | | | | (0.37 | ) | | | (0.15 | ) |
June 1, 2011 to May 31, 2012 | | $ | 10.77 | | | | 0.19 | | | | 1.00 | | | | (0.27 | ) |
June 1, 2010 to May 31, 2011 | | $ | 10.21 | | | | 0.24 | 4 | | | 0.48 | | | | (0.16 | ) |
June 1, 2009 to May 31, 2010 | | $ | 9.72 | | | | 0.23 | 4 | | | 0.48 | | | | (0.22 | ) |
June 1, 2008 to May 31, 2009 | | $ | 10.20 | | | | 0.01 | | | | (0.26 | ) | | | (0.14 | ) |
Administrator Class | | | | | | | | | | | | | | | | |
June 1, 2013 to November 30, 2013 (unaudited) | | $ | 10.90 | | | | 0.06 | 4 | | | (0.50 | ) | | | (0.02 | ) |
June 1, 2012 to May 31, 2013 | | $ | 11.71 | | | | 0.15 | 4 | | | (0.37 | ) | | | (0.24 | ) |
June 1, 2011 to May 31, 2012 | | $ | 10.89 | �� | | | 0.39 | 4 | | | 0.92 | | | | (0.39 | ) |
June 1, 2010 to May 31, 2011 | | $ | 10.30 | | | | 0.33 | | | | 0.51 | | | | (0.25 | ) |
June 1, 2009 to May 31, 2010 | | $ | 9.75 | | | | 0.33 | 4 | | | 0.49 | | | | (0.27 | ) |
June 1, 2008 to May 31, 2009 | | $ | 10.21 | | | | 0.12 | | | | (0.28 | ) | | | (0.21 | ) |
| 1. | Includes net expenses allocated from the affiliated Master Portfolio in which the Fund invests. |
| 2. | Total return calculations do not include any sales charges. Returns for periods of less than one year are not annualized. |
| 3. | Portfolio turnover rate is calculated by aggregating the results of multiplying the Fund’s investment percentage in the respective Master Portfolio by the corresponding Master Portfolio’s portfolio turnover rate. |
| 4. | Calculated based upon average shares outstanding |
| 5. | Commencement of class operations |
| 6. | Effective June 20, 2008, Class Z was renamed Investor Class. |
| 7. | Amount is less than $0.005. |
The accompanying notes are an integral part of these financial statements.
| | | | | | |
| Financial highlights | | Wells Fargo Advantage Income Funds | | | 21 | |
| | | | | | | | | | | | | | | | | | | | | | | | | | | | | | | | | | |
Distributions
from net
realized gains | | | Distributions
from tax
return of
capital | | | Ending
net asset
value
per
share | | | Ratio to average net assets (annualized) | | | | | | Portfolio
turnover
rate3 | | | Net assets at
end of period
(000s omitted) | |
| | | | Net investment
income | | | Gross
expenses1 | | | Net
expenses1 | | | Total
return2 | | | |
| | | | | | | | |
| | | | | | | | | | | | | | | | | | | | | | | | | | | | | | | | | | | |
| | | | | | | | | | | | | | | | | | | | | | | | | | | | | | | | | | |
| | 0.00 | | | | 0.00 | | | $ | 10.38 | | | | 0.80 | % | | | 1.18 | % | | | 0.85 | % | | | (4.18 | )% | | | 4 | % | | $ | 19,886 | |
| | (0.35 | ) | | | 0.00 | | | $ | 10.85 | | | | 1.09 | % | | | 1.08 | % | | | 0.85 | % | | | (2.27 | )% | | | 15 | % | | $ | 28,298 | |
| | (0.10 | ) | | | 0.00 | | | $ | 11.66 | | | | 2.42 | % | | | 1.11 | % | | | 0.85 | % | | | 12.02 | % | | | 23 | % | | $ | 36,935 | |
| | 0.00 | | | | 0.00 | | | $ | 10.84 | | | | 2.90 | % | | | 1.04 | % | | | 0.85 | % | | | 7.59 | % | | | 19 | % | | $ | 30,581 | |
| | 0.00 | | | | 0.00 | | | $ | 10.29 | | | | 3.09 | % | | | 0.98 | % | | | 0.85 | % | | | 8.23 | % | | | 31 | % | | $ | 30,086 | |
| | 0.00 | | | | (0.09 | ) | | $ | 9.76 | | | | 0.66 | % | | | 0.95 | % | | | 0.83 | % | | | (1.68 | )% | | | 53 | % | | $ | 31,826 | |
| | | | | | | | | | | | | | | | | | | | | | | | | | | | | | | | | | |
| | 0.00 | | | | 0.00 | | | $ | 10.26 | | | | 0.05 | % | | | 1.93 | % | | | 1.60 | % | | | (4.49 | )% | | | 4 | % | | $ | 309 | |
| | (0.35 | ) | | | 0.00 | | | $ | 10.75 | | | | 0.29 | % | | | 1.83 | % | | | 1.60 | % | | | (3.02 | )% | | | 15 | % | | $ | 571 | |
| | (0.10 | ) | | | 0.00 | | | $ | 11.58 | | | | 1.69 | % | | | 1.84 | % | | | 1.60 | % | | | 11.25 | % | | | 23 | % | | $ | 899 | |
| | 0.00 | | | | 0.00 | | | $ | 10.76 | | | | 1.83 | % | | | 1.79 | % | | | 1.60 | % | | | 7.11 | % | | | 19 | % | | $ | 1,570 | |
| | 0.00 | | | | 0.00 | | | $ | 10.20 | | | | 2.41 | % | | | 1.75 | % | | | 1.60 | % | | | 7.38 | % | | | 31 | % | | $ | 2,942 | |
| | 0.00 | | | | (0.09 | ) | | $ | 9.71 | | | | 0.42 | % | | | 1.72 | % | | | 1.59 | % | | | (2.51 | )% | | | 53 | % | | $ | 5,255 | |
| | | | | | | | | | | | | | | | | | | | | | | | | | | | | | | | | | |
| | 0.00 | | | | 0.00 | | | $ | 10.27 | | | | 0.07 | % | | | 1.93 | % | | | 1.60 | % | | | (4.49 | )% | | | 4 | % | | $ | 10,484 | |
| | (0.35 | ) | | | 0.00 | | | $ | 10.76 | | | | 0.39 | % | | | 1.83 | % | | | 1.60 | % | | | (3.01 | )% | | | 15 | % | | $ | 13,774 | |
| | (0.10 | ) | | | 0.00 | | | $ | 11.59 | | | | 1.68 | % | | | 1.86 | % | | | 1.60 | % | | | 11.24 | % | | | 23 | % | | $ | 15,631 | |
| | 0.00 | | | | 0.00 | | | $ | 10.77 | | | | 2.27 | % | | | 1.79 | % | | | 1.60 | % | | | 7.11 | % | | | 19 | % | | $ | 14,074 | |
| | 0.00 | | | | 0.00 | | | $ | 10.21 | | | | 2.32 | % | | | 1.75 | % | | | 1.60 | % | | | 7.36 | % | | | 31 | % | | $ | 12,412 | |
| | 0.00 | | | | (0.09 | ) | | $ | 9.72 | | | | 0.18 | % | | | 1.69 | % | | | 1.59 | % | | | (2.41 | )% | | | 53 | % | | $ | 10,237 | |
| | | | | | | | | | | | | | | | | | | | | | | | | | | | | | | | | | |
| | 0.00 | | | | 0.00 | | | $ | 10.44 | | | | 1.08 | % | | | 1.12 | % | | | 0.60 | % | | | (4.04 | )% | | | 4 | % | | $ | 6,945 | |
| | (0.35 | ) | | | 0.00 | | | $ | 10.90 | | | | 1.34 | % | | | 1.02 | % | | | 0.60 | % | | | (2.08 | )% | | | 15 | % | | $ | 8,271 | |
| | (0.10 | ) | | | 0.00 | | | $ | 11.71 | | | | 3.42 | % | | | 1.01 | % | | | 0.60 | % | | | 12.26 | % | | | 23 | % | | $ | 9,833 | |
| | 0.00 | | | | 0.00 | | | $ | 10.89 | | | | 3.32 | % | | | 0.98 | % | | | 0.60 | % | | | 8.22 | % | | | 19 | % | | $ | 35,427 | |
| | 0.00 | | | | 0.00 | | | $ | 10.30 | | | | 3.26 | % | | | 0.92 | % | | | 0.60 | % | | | 8.49 | % | | | 31 | % | | $ | 28,476 | |
| | 0.00 | | | | (0.09 | ) | | $ | 9.75 | | | | 0.70 | % | | | 0.88 | % | | | 0.60 | % | | | (1.53 | )% | | | 53 | % | | $ | 27,428 | |
The accompanying notes are an integral part of these financial statements.
| | | | |
| 22 | | Wells Fargo Advantage Income Funds | | Notes to financial statements (unaudited) |
1. ORGANIZATION
Wells Fargo Funds Trust (the “Trust”), a Delaware statutory trust organized on March 10, 1999, is an open-end management investment company registered under the Investment Company Act of 1940, as amended (the “1940 Act”). These financial statements report on the following funds: the Wells Fargo Advantage Core Bond Fund (“Core Bond Fund”) and the Wells Fargo Advantage Inflation-Protected Bond Fund (“Inflation-Protected Bond Fund”) (each, a “Fund”, collectively, the “Funds”). Each Fund is a diversified series of the Trust.
Each Funds seeks to achieve its investment objective by investing 100% of all its investable assets in a separate diversified portfolio (each, an “affiliated Master Portfolio”, collectively, the “affiliated Master Portfolios”) of Wells Fargo Master Trust, a registered open-end management investment company. Each affiliated Master Portfolio directly acquires portfolio securities, and a Fund investing in an affiliated Master Portfolio acquires an indirect interest in those securities. Each Fund accounts for its investment in the affiliated Master Portfolios as partnership investments and records on a daily basis its share of the affiliated Master Portfolio’s income, expense and realized and unrealized gains and losses. The financial statements of the affiliated Master Portfolios for the six months ended November 30, 2013 are included in this report and should be read in conjunction with each Fund’s financial statements. As of November 30, 2013, Core Bond Fund owned 87% of Wells Fargo Advantage Core Bond Portfolio and Inflation-Protected Bond Fund owned 70% of Wells Fargo Advantage Inflation-Protected bond Portfolio.
2. SIGNIFICANT ACCOUNTING POLICIES
The following significant accounting policies, which are consistently followed in the preparation of the financial statements of each Fund, are in conformity with U.S. generally accepted accounting principles which require management to make estimates and assumptions that affect the reported amounts of assets and liabilities, disclosure of contingent assets and liabilities at the date of the financial statements, and the reported amounts of revenues and expenses during the reporting period. Actual results could differ from those estimates.
Securities valuation
All investments are valued each business day as of the close of regular trading on the New York Stock Exchange (generally 4 p.m. Eastern Time).
Investments in the affiliated Master Portfolios are valued daily based on each Fund’s proportionate share of each affiliated Master Portfolio’s net assets, which are also valued daily. Securities held in the affiliated Master Portfolios are valued as discussed in the Notes to Financial Statements of the affiliated Master Portfolios, which are included elsewhere in this report.
Security transactions and income recognition
Securities transactions are recorded on a trade date basis in each affiliated Master Portfolio. Realized gains or losses in each affiliated Master Portfolio are recorded on the basis of identified cost.
Interest income is accrued daily and bond discounts are accreted and premiums are amortized daily based on the effective interest method by each affiliated Master Portfolio. To the extent debt obligations are placed on non-accrual status, any related interest income may be reduced by writing off interest receivables when the collection of all or a portion of interest has become doubtful based on consistently applied procedures. If the issuer subsequently resumes interest payments or when the collectability of interest is reasonably assured, the debt obligation is removed from non-accrual status.
Each Fund records daily its proportionate share of each affiliated Master Portfolio’s interest income and realized and unrealized gains or losses.
Distributions to shareholders
For Core Bond Fund, distributions to shareholders from net investment income are accrued daily and paid monthly. For Inflation-Protected Bond Fund, distributions to shareholders from net investment income are recorded on the ex-dividend date. Distributions from net realized gains, if any, are recorded on the ex-dividend date. Such distributions are determined in conformity with federal income tax regulations, which may differ in amount or character from net investment income and realized gains recognized for purposes of U.S. generally accepted accounting principles.
Federal and other taxes
Each Fund is treated as a separate entity for federal income tax purposes. Each Fund intends to continue to qualify as a regulated investment company by distributing substantially all of its investment company taxable income and any net realized capital gains (after reduction for capital loss carryforwards) sufficient to relieve it from all, or substantially all, federal income taxes. Accordingly, no provision for federal income taxes was required.
| | | | | | |
| Notes to financial statements (unaudited) | | Wells Fargo Advantage Income Funds | | | 23 | |
Each Fund’s income and federal excise tax returns and all financial records supporting those returns for the prior three fiscal years are subject to examination by the federal and Delaware revenue authorities. Management has analyzed each Fund’s tax positions taken on federal, state, and foreign tax returns for all open tax years and does not believe that there are any uncertain tax positions that require recognition of a tax liability.
As of May 31, 2013, Core Bond Fund had capital loss carryforwards available to offset future net realized capital gains in the amount of $70,022,729 with $5,342,829 expiring in 2014; $47,174,218 expiring in 2016; and $17,505,682 expiring in 2017.
Class allocations
The separate classes of shares offered by each Fund differ principally in applicable sales charges, distribution, shareholder servicing, and administration fees. Shareholders of each class bear certain expenses that pertain to that particular class. All shareholders bear the common expenses of a Fund, earn income from the portfolio, and are allocated unrealized gains and losses pro rata based on the average daily net assets of each class, without distinction between share classes. Dividends are determined separately for each class based on income and expenses allocable to each class. Realized gains and losses are allocated to each class pro rata based upon the net assets of each class on the date realized. Differences in per share dividend rates generally result from the relative weightings of pro rata income and realized gain allocations and from differences in separate class expenses, including distribution, shareholder servicing, and administration fees.
3. FAIR VALUATION MEASUREMENTS
Fair value measurements of investments are determined within a framework that has established a fair value hierarchy based upon the various data inputs utilized in determining the value of each Fund’s investments. The three-level hierarchy gives the highest priority to unadjusted quoted prices in active markets for identical assets or liabilities (Level 1) and the lowest priority to significant unobservable inputs (Level 3). Each Fund’s investments are classified within the fair value hierarchy based on the lowest level of input that is significant to the fair value measurement. The inputs are summarized into three broad levels as follows:
| n | | Level 1 – quoted prices in active markets for identical securities |
| n | | Level 2 – other significant observable inputs (including quoted prices for similar securities, interest rates, prepayment speeds, credit risk, use of amortized cost, etc.) |
| n | | Level 3 – significant unobservable inputs (including the Fund’s own assumptions in determining the fair value of investments) |
The inputs or methodologies used for valuing investments in securities are not necessarily an indication of the risk associated with investing in those securities.
At November 30, 2013, each Fund’s investments in an affiliated Master Portfolio carried at fair value were designated as Level 2 inputs.
Further details on the investments of the affiliated Master Portfolios can be found in the Portfolio of Investments or Summary Portfolio of Investments of each affiliated Master Portfolio which is contained elsewhere in this report.
Transfers in and transfers out are recognized at the end of the reporting period. For the six months ended November 30, 2013, the Funds did not have any transfers into/out of Level 1, Level 2, or Level 3.
4. TRANSACTIONS WITH AFFILIATES AND OTHER EXPENSES
Advisory fee
The Trust has entered into an advisory contract with Wells Fargo Funds Management, LLC (“Funds Management”), an indirect wholly owned subsidiary of Wells Fargo & Company (“Wells Fargo”). The adviser is responsible for implementing investment policies and guidelines and for supervising the subadviser, who is responsible for day-to-day portfolio management of the Funds.
Since each Fund that invests all of its assets in a single affiliated Master Portfolio, Funds Management does not currently receive an advisory fee.
Funds Management also serves as the adviser to each affiliated Master Portfolio and is entitled to receive a fee from each affiliated Master Portfolio for those services.
Administration and transfer agent fees
The Trust has entered into an administration agreement with Funds Management. Under this agreement, for providing administrative services, which includes paying fees and expenses for services provided by the transfer agent, sub-transfer agents, omnibus account servicers and record-keepers, Funds Management is entitled to receive from each Fund an annual
| | | | |
| 24 | | Wells Fargo Advantage Income Funds | | Notes to financial statements (unaudited) |
fund level administration fee starting at 0.05% and declining to 0.03% as the average daily net assets of each Fund increase and a class level administration fee which is calculated based on the average daily net assets of each class as follows:
| | | | |
| | | Class level
administration fee | |
Class A, Class B, Class C, Class R | | | 0.16 | % |
Class R4, Institutional Class | | | 0.08 | |
Class R6 | | | 0.03 | |
Administrator Class | | | 0.10 | |
Investor Class | | | 0.19 | |
Funds Management has contractually waived and/or reimbursed advisory and administration fees to the extent necessary to maintain certain net operating expense ratios for the Funds. Waiver of fees and/or reimbursement of expenses by Funds Management were made first from fund level expenses on a proportionate basis and then from class specific expenses. Funds Management has committed through September 30, 2014 to waive fees and/or reimburse expenses to the extent necessary to cap each Fund’s expenses as follows:
| | | | | | | | | | | | | | | | | | | | | | | | | | | | | | | | | | | | |
| | | Class A | | | Class B | | | Class C | | | Class R | | | Class R4 | | | Class R6 | | | Administrator
Class | | | Institutional
Class | | | Investor
Class | |
Core Bond Fund | | | 0.78 | % | | | 1.53 | % | | | 1.53 | % | | | 1.03 | % | | | 0.52 | % | | | 0.37 | % | | | 0.70 | % | | | 0.42 | % | | | 0.81 | % |
Inflation-Protected Bond Fund | | | 0.85 | % | | | 1.60 | % | | | 1.60 | % | | | N/A | | | | N/A | | | | N/A | | | | 0.60 | % | | | N/A | | | | N/A | |
Distribution fees
The Trust has adopted a Distribution Plan for Class B, Class C and Class R shares of the applicable Funds pursuant to Rule 12b-1 under the 1940 Act. Distribution fees are charged to the Class B, Class C and Class R shares and paid to Wells Fargo Funds Distributor, LLC, the principal underwriter of each Fund, at an annual rate of 0.75% of the average daily net assets of Class B and Class C shares and 0.25% of the average daily net assets of Class R shares.
For the six months ended November 30, 2013, Wells Fargo Funds Distributor, LLC received the following amounts in front-end sales charges and contingent deferred sales charges.
| | | | | | | | | | | | |
| | | Front-end
sales charges Class A | | | Contingent deferred sales charges | |
| | | | Class B | | | Class C | |
Core Bond Fund | | $ | 2,411 | | | $ | 137 | | | $ | 744 | |
Inflation-Protected Bond Fund | | | 785 | | | | 0 | | | | 135 | |
Shareholder servicing fees
The Trust has entered into contracts with one or more shareholder servicing agents, whereby Class A, Class B, Class C, Class R, Administrator Class, and Investor Class of each applicable Fund is charged a fee at an annual rate of 0.25% of the average daily net assets of each respective class. Class R4 shares are charged a fee at an annual rate of 0.10% of its average daily net assets.
A portion of these total shareholder servicing fees were paid to affiliates of Wells Fargo.
5. INVESTMENT PORTFOLIO TRANSACTIONS
Purchases and sales of investments, excluding short-term securities, for the six months ended November 30, 2013 were as follows:
| | | | | | | | | | | | | | | | |
| | | Purchases at cost* | | | Sales proceeds* | |
| | | U.S. government | | | Non-U.S.
government | | | U.S.
government | | | Non-U.S.
government | |
Core Bond Fund | | $ | 8,254,662,701 | | | $ | 1,113,268,844 | | | $ | 8,251,451,445 | | | $ | 1,170,411,817 | |
Inflation-Protected Bond Fund | | | 1,704,804 | | | | 0 | | | | 8,279,222 | | | | 0 | |
| * | The Funds seek to achieve their investment objective by investing all of their investable assets in a single affiliated Master Portfolio. Purchases and sales have been calculated by aggregating the results of multiplying each Fund’s ownership percentage of the respective affiliated Master Portfolio by the corresponding affiliated Master Portfolio’s purchases and sales. |
| | | | | | |
| Notes to financial statements (unaudited) | | Wells Fargo Advantage Income Funds | | | 25 | |
6. CAPITAL SHARES
As a result of the transfer of assets from Funds Management, former program manager of the 529 college savings plans for the State of Wisconsin, to a new program manager, Core Bond Fund redeemed assets from its Institutional Class on October 26, 2012 with a value of $296,707,154, representing 8.15% of Core Bond Fund. This amount is reflected in the Statements of Changes in Net Assets for the year ended May 31, 2013.
7. BANK BORROWINGS
The Trust (excluding the money market funds and certain other funds in the Trust) and Wells Fargo Variable Trust are parties to a $150,000,000 revolving credit agreement with State Street Bank and Trust Company, whereby the Funds are permitted to use bank borrowings for temporary or emergency purposes, such as to fund shareholder redemption requests. Interest under the credit agreement is charged to each Fund based on a borrowing rate equal to the higher of the Federal Funds rate in effect on that day plus 1.25% or the overnight LIBOR rate in effect on that day plus 1.25%. In addition, an annual commitment fee equal to 0.10% of the unused balance is allocated to each participating fund. For the six months ended November 30, 2013, the Funds paid the following amounts in commitment fees:
| | | | |
| | | Commitment fee | |
Core Bond Fund | | $ | 1,783 | |
Inflation-Protected Bond Fund | | | 30 | |
For the six months ended November 30, 2013, there were no borrowings by the Funds under the agreement.
8. INDEMNIFICATION
Under the Trust’s organizational documents, the officers and directors are indemnified against certain liabilities that may arise out of performance of their duties to the Trust. Additionally, in the normal course of business, the Trust may enter into contracts with service providers that contain a variety of indemnification clauses. The Trust’s maximum exposure under these arrangements is dependent on future claims that may be made against the Funds and, therefore, cannot be estimated.
9. SUBSEQUENT DISTRIBUTIONS
On December 9, 2013, the Funds declared distributions from short-term capital gains and long-term capital gains to shareholders of record on December 6, 2013. The per share amounts payable on December 10, 2013 were as follows:
| | | | | | | | |
| | | Core Bond
Fund | | | Inflation-
Protected
Bond Fund | |
Short-term capital gains | | | | | | | | |
Class A | | $ | 0.07121 | | | $ | 0.00013 | |
Class B | | | 0.07121 | | | | 0.00013 | |
Class C | | | 0.07121 | | | | 0.00013 | |
Class R | | | 0.07121 | | | | N/A | |
Class R4 | | | 0.07121 | | | | N/A | |
Class R6 | | | 0.07121 | | | | N/A | |
Administrator Class | | | 0.07121 | | | | 0.00013 | |
Institutional Class | | | 0.07121 | | | | N/A | |
Investor Class | | | 0.07121 | | | | N/A | |
| | | | | | | | |
Long-term capital gains | | | | | | | | |
Class A | | $ | 0.07610 | | | $ | 0.54269 | |
Class B | | | 0.07610 | | | | 0.54269 | |
Class C | | | 0.07610 | | | | 0.54269 | |
Class R | | | 0.07610 | | | | N/A | |
Class R4 | | | 0.07610 | | | | N/A | |
Class R6 | | | 0.07610 | | | | N/A | |
Administrator Class | | | 0.07610 | | | | 0.54269 | |
Institutional Class | | | 0.07610 | | | | N/A | |
Investor Class | | | 0.07610 | | | | N/A | |
These distributions are not reflected in the accompanying financial statements. The final determination of the source of all distributions is subject to change and made after the tax year-end of each Fund.
| | | | |
| 26 | | Wells Fargo Advantage Income Funds | | Summary portfolio of investments—November 30, 2013 (unaudited) |
CORE BOND PORTFOLIO
The Summary Portfolio of Investments shows the 50 largest portfolio holdings in unaffiliated issuers and any holdings exceeding 1% of the total net assets as of the report date. The remaining securities held are grouped as “Other securities” in each category. You can request a complete schedule of portfolio holdings as of the report date, free of charge, by accessing the following website:
http://a584.g.akamai.net/f/584/1326/1d/www.wellsfargoadvantagefunds.com/pdf/semi/holdings/corebond.pdf or by calling
Wells Fargo Advantage Funds at 1-800-222-8222. This complete schedule, filed on Form N-CSRS, is also available on the SEC’s website at sec.gov.
| | | | | | | | | | | | | | | | | | | | |
| Security name | | Interest rate | | | Maturity date | | | Principal | | | Value | | | Percent of
net assets | |
| | | | | |
Agency Securities: 35.37% | | | | | | | | | | | | | | | | | | | | |
FHLMC | | | 0.87-7.50 | % | | | 8-1-2017 to 3-25-2044 | | | $ | 173,924,636 | | | $ | 181,042,032 | | | | 6.19 | % |
FHLMC ± | | | 2.24 | | | | 7-1-2043 | | | | 23,278,559 | | | | 23,569,893 | | | | 0.81 | |
FHLMC | | | 2.50 | | | | 5-1-2028 | | | | 12,513,622 | | | | 12,531,467 | | | | 0.43 | |
FHLMC | | | 4.00 | | | | 6-1-2042 | | | | 40,489,966 | | | | 41,785,852 | | | | 1.43 | |
FHLMC | | | 5.00 | | | | 8-1-2039 | | | | 18,018,076 | | | | 19,889,238 | | | | 0.68 | |
FHLMC | | | 5.00 | | | | 8-1-2041 | | | | 20,249,431 | | | | 22,158,409 | | | | 0.76 | |
FNMA ± | | | 1.98 | | | | 4-1-2043 | | | | 11,467,494 | | | | 11,522,648 | | | | 0.39 | |
FNMA | | | 1.99-7.50 | | | | 9-1-2016 to 1-1-2044 | | | | 255,764,291 | | | | 263,240,752 | | | | 9.00 | |
FNMA ± | | | 2.07 | | | | 7-1-2043 | | | | 13,681,802 | | | | 13,704,305 | | | | 0.47 | |
FNMA | | | 2.50 | | | | 10-1-2027 | | | | 11,804,385 | | | | 11,825,510 | | | | 0.41 | |
FNMA | | | 2.50 | | | | 11-1-2027 | | | | 15,003,607 | | | | 15,067,957 | | | | 0.52 | |
FNMA %% | | | 2.50 | | | | 12-1-2028 | | | | 22,400,000 | | | | 22,360,625 | | | | 0.77 | |
FNMA %% | | | 2.50 | | | | 1-1-2029 | | | | 15,100,000 | | | | 15,038,656 | | | | 0.52 | |
FNMA | | | 3.00 | | | | 1-1-2043 | | | | 16,293,677 | | | | 15,525,375 | | | | 0.53 | |
FNMA | | | 3.00 | | | | 3-1-2043 | | | | 17,551,721 | | | | 16,724,636 | | | | 0.57 | |
FNMA %% | | | 3.00 | | | | 12-1-2043 | | | | 31,500,000 | | | | 30,376,581 | | | | 1.04 | |
FNMA | | | 3.50 | | | | 9-1-2042 | | | | 31,802,633 | | | | 31,653,947 | | | | 1.08 | |
FNMA | | | 3.50 | | | | 2-1-2043 | | | | 14,478,427 | | | | 14,410,778 | | | | 0.49 | |
FNMA %% | | | 3.50 | | | | 1-1-2044 | | | | 29,300,000 | | | | 29,456,800 | | | | 1.01 | |
FNMA | | | 4.00 | | | | 6-1-2042 | | | | 13,523,103 | | | | 14,000,446 | | | | 0.48 | |
FNMA | | | 5.00 | | | | 7-1-2041 | | | | 13,374,316 | | | | 14,796,750 | | | | 0.51 | |
FNMA | | | 6.00 | | | | 3-1-2034 | | | | 24,451,502 | | | | 27,287,807 | | | | 0.93 | |
FNMA Series 416 Class A350 | | | 3.50 | | | | 11-25-2042 | | | | 13,576,515 | | | | 13,724,095 | | | | 0.47 | |
FNMA Series 2012-130 Class DC | | | 3.00 | | | | 12-25-2042 | | | | 37,626,024 | | | | 36,009,045 | | | | 1.23 | |
FNMA Series 2013-121 Class LB (a) | | | 3.00 | | | | 12-25-2043 | | | | 13,276,000 | | | | 13,707,588 | | | | 0.47 | |
GNMA | | | 2.50-8.05 | | | | 7-15-2019 to 1-1-2044 | | | | 21,098,033 | | | | 21,373,197 | | | | 0.71 | |
GNMA %% | | | 3.50 | | | | 12-1-2043 | | | | 12,200,000 | | | | 12,436,375 | | | | 0.43 | |
GNMA %% | | | 4.00 | | | | 12-1-2043 | | | | 10,800,000 | | | | 11,385,141 | | | | 0.39 | |
GNMA %% | | | 4.00 | | | | 1-1-2044 | | | | 41,600,000 | | | | 43,717,376 | | | | 1.50 | |
GNMA %% | | | 4.50 | | | | 12-1-2043 | | | | 31,200,000 | | | | 33,518,063 | | | | 1.15 | |
| | | | | | | | | | | | | | | | | | | | |
| | | | | |
Total Agency Securities (Cost $1,043,435,825) | | | | | | | | | | | | | | | 1,033,841,344 | | | | 35.37 | |
| | | | | | | | | | | | | | | | | | | | |
| | | | | |
Asset-Backed Securities: 14.85% | | | | | | | | | | | | | | | | | | | | |
Ally Auto Receivables Trust | | | 0.74-2.23 | | | | 5-15-2015 to 2-15-2018 | | | | 46,207,266 | | | | 46,379,568 | | | | 1.58 | |
American Express Credit Corporation | | | 0.45-0.60 | | | | 2-15-2019 to 5-17-2021 | | | | 21,262,000 | | | | 21,262,196 | | | | 0.73 | |
AmeriCredit Automobile Receivables Trust Series 2013-3 Class A2 | | | 0.68 | | | | 10-11-2016 | | | | 11,156,000 | | | | 11,163,084 | | | | 0.38 | |
Bank of America Credit Card Trust Series 2007-A10 Class A10 ± | | | 0.24 | | | | 12-15-2016 | | | | 8,216,000 | | | | 8,215,482 | | | | 0.28 | |
Capital Auto Receivables Asset Trust | | | 0.79-1.68 | | | | 9-20-2016 to 7-20-2018 | | | | 33,057,000 | | | | 33,151,544 | | | | 1.13 | |
Capital One Multi-Asset Execution Trust Series 2007-A1 Class A1 ± | | | 0.22 | | | | 11-15-2019 | | | | 11,267,000 | | | | 11,166,127 | | | | 0.38 | |
Citibank Credit Card Issuance Trust Series 2013-A10 Class A10 | | | 0.73 | | | | 2-7-2018 | | | | 17,764,000 | | | | 17,787,040 | | | | 0.61 | |
The accompanying notes are an integral part of these financial statements.
| | | | | | |
| Summary portfolio of investments—November 30, 2013 (unaudited) | | Wells Fargo Advantage Income Funds | | | 27 | |
CORE BOND PORTFOLIO
| | | | | | | | | | | | | | | | | | | | |
| Security name | | Interest rate | | | Maturity date | | | Principal | | | Value | | | Percent of
net assets | |
| | | | | |
Asset-Backed Securities (continued) | | | | | | | | | | | | | | | | | | | | |
Nelnet Student Loan Trust | | | 0.25-0.97 | % | | | 11-27-2018 to 4-25-2046 | | | $ | 34,927,980 | | | $ | 33,944,288 | | | | 1.16 | % |
Nelnet Student Loan Trust Series 2006-2 Class A4 ± | | | 0.32 | | | | 10-26-2026 | | | | 10,721,284 | | | | 10,689,795 | | | | 0.37 | |
Nelnet Student Loan Trust Series 2007-2A
Class A3L ±144A | | | 0.60 | | | | 3-25-2026 | | | | 17,148,000 | | | | 16,939,995 | | | | 0.58 | |
Santander Drive Auto Receivables Trust Series 2013-2 Class A3 | | | 0.70 | | | | 9-15-2017 | | | | 10,752,000 | | | | 10,761,107 | | | | 0.37 | |
SLM Student Loan Trust | | | 0.34-3.42 | | | | 9-25-2019 to 6-15-2045 | | | | 99,920,959 | | | | 99,775,371 | | | | 3.42 | |
SLM Student Loan Trust Series 2012-E
Class A1 ±144A | | | 0.92 | | | | 10-16-2023 | | | | 12,018,631 | | | | 12,027,813 | | | | 0.41 | |
SLM Student Loan Trust Series 2013-B
Class A2A 144A | | | 1.85 | | | | 6-17-2030 | | | | 11,683,000 | | | | 11,382,058 | | | | 0.39 | |
Other securities | | | | | | | | | | | | | | | 89,478,754 | | | | 3.06 | |
| | | | | | | | | | | | | | | | | | | | |
| | | | | |
Total Asset-Backed Securities
(Cost $433,125,939) | | | | | | | | | | | | | | | 434,124,222 | | | | 14.85 | |
| | | | | | | | | | | | | | | | | | | | |
| | | | | |
Corporate Bonds and Notes: 18.99% | | | | | | | | | | | | | | | | | | | | |
| | | | | |
Consumer Discretionary: 2.19% | | | | | | | | | | | | | | | | | | | | |
| | | | | |
| Auto Components: 0.13% | | | | | | | | | | | | | | | | | | | | |
Other securities | | | | | | | | | | | | | | | 3,865,788 | | | | 0.13 | |
| | | | | | | | | | | | | | | | | | | | |
| | | | | |
| Automobiles: 1.23% | | | | | | | | | | | | | | | | | | | | |
Other securities | | | | | | | | | | | | | | | 36,016,466 | | | | 1.23 | |
| | | | | | | | | | | | | | | | | | | | |
| | | | | |
| Media: 0.64% | | | | | | | | | | | | | | | | | | | | |
Other securities | | | | | | | | | | | | | | | 18,773,746 | | | | 0.64 | |
| | | | | | | | | | | | | | | | | | | | |
| | | | | |
| Specialty Retail: 0.19% | | | | | | | | | | | | | | | | | | | | |
Other securities | | | | | | | | | | | | | | | 5,453,067 | | | | 0.19 | |
| | | | | | | | | | | | | | | | | | | | |
| | | | | |
Consumer Staples: 1.10% | | | | | | | | | | | | | | | | | | | | |
| | | | | |
| Beverages: 0.29% | | | | | | | | | | | | | | | | | | | | |
Other securities | | | | | | | | | | | | | | | 8,516,732 | | | | 0.29 | |
| | | | | | | | | | | | | | | | | | | | |
| | | | | |
| Food Products: 0.72% | | | | | | | | | | | | | | | | | | | | |
Other securities | | | | | | | | | | | | | | | 20,984,102 | | | | 0.72 | |
| | | | | | | | | | | | | | | | | | | | |
| | | | | |
| Tobacco: 0.09% | | | | | | | | | | | | | | | | | | | | |
Other securities | | | | | | | | | | | | | | | 2,650,156 | | | | 0.09 | |
| | | | | | | | | | | | | | | | | | | | |
| | | | | |
Energy: 1.70% | | | | | | | | | | | | | | | | | | | | |
| | | | | |
| Energy Equipment & Services: 0.24% | | | | | | | | | | | | | | | | | | | | |
Other securities | | | | | | | | | | | | | | | 7,109,207 | | | | 0.24 | |
| | | | | | | | | | | | | | | | | | | | |
| | | | | |
| Oil, Gas & Consumable Fuels: 1.46% | | | | | | | | | | | | | | | | | | | | |
Other securities | | | | | | | | | | | | | | | 42,589,480 | | | | 1.46 | |
| | | | | | | | | | | | | | | | | | | | |
The accompanying notes are an integral part of these financial statements.
| | | | |
| 28 | | Wells Fargo Advantage Income Funds | | Summary portfolio of investments—November 30, 2013 (unaudited) |
CORE BOND PORTFOLIO
| | | | | | | | | | | | | | | | | | | | |
| Security name | | Interest rate | | | Maturity date | | | Principal | | | Value | | | Percent of
net assets | |
| | | | | |
Financials: 8.11% | | | | | | | | | | | | | | | | | | | | |
| | | | | |
| Capital Markets: 1.15% | | | | | | | | | | | | | | | | | | | | |
Morgan Stanley | | | 5.00-5.50 | % | | | 10-15-2015 to 11-24-2025 | | | $ | 9,048,000 | | | $ | 9,648,808 | | | | 0.33 | % |
Other securities | | | | | | | | | | | | | | | 24,025,225 | | | | 0.82 | |
| | | | | |
| | | | | | | | | | | | | | | 33,674,033 | | | | 1.15 | |
| | | | | | | | | | | | | | | | | | | | |
| | | | | |
| Commercial Banks: 0.34% | | | | | | | | | | | | | | | | | | | | |
Other securities | | | | | | | | | | | | | | | 9,878,938 | | | | 0.34 | |
| | | | | | | | | | | | | | | | | | | | |
| | | | | |
| Consumer Finance: 0.60% | | | | | | | | | | | | | | | | | | | | |
American Express Credit Corporation | | | 1.75 | | | | 6-12-2015 | | | | 7,664,000 | | | | 7,798,220 | | | | 0.27 | |
Other securities | | | | | | | | | | | | | | | 9,787,403 | | | | 0.33 | |
| | | | | |
| | | | | | | | | | | | | | | 17,585,623 | | | | 0.60 | |
| | | | | | | | | | | | | | | | | | | | |
| | | | | |
| Diversified Financial Services: 3.32% | | | | | | | | | | | | | | | | | | | | |
Bank of America Corporation | | | 1.13 | | | | 11-14-2016 | | | | 12,070,000 | | | | 12,097,025 | | | | 0.41 | |
Bank of America Corporation | | | 1.50 | | | | 10-9-2015 | | | | 12,066,000 | | | | 12,186,624 | | | | 0.42 | |
Bank of America Corporation | | | 2.60-6.00 | | | | 9-1-2017 to 7-24-2023 | | | | 20,880,000 | | | | 21,593,445 | | | | 0.74 | |
JPMorgan Chase & Company | | | 3.20-6.00 | | | | 10-1-2017 to 5-1-2023 | | | | 13,928,000 | | | | 14,748,855 | | | | 0.51 | |
Other securities | | | | | | | | | | | | | | | 36,529,117 | | | | 1.24 | |
| | | | | |
| | | | | | | | | | | | | | | 97,155,066 | | | | 3.32 | |
| | | | | | | | | | | | | | | | | | | | |
| | | | | |
| Insurance: 1.39% | | | | | | | | | | | | | | | | | | | | |
Other securities | | | | | | | | | | | | | | | 40,527,858 | | | | 1.39 | |
| | | | | | | | | | | | | | | | | | | | |
| | | | | |
| REITs: 1.31% | | | | | | | | | | | | | | | | | | | | |
Other securities | | | | | | | | | | | | | | | 38,198,247 | | | | 1.31 | |
| | | | | | | | | | | | | | | | | | | | |
| | | | | |
Health Care: 1.31% | | | | | | | | | | | | | | | | | | | | |
| | | | | |
| Biotechnology: 0.34% | | | | | | | | | | | | | | | | | | | | |
Other securities | | | | | | | | | | | | | | | 9,801,121 | | | | 0.34 | |
| | | | | | | | | | | | | | | | | | | | |
| | | | | |
| Health Care Equipment & Supplies: 0.13% | | | | | | | | | | | | | | | | | | | | |
Other securities | | | | | | | | | | | | | | | 3,920,985 | | | | 0.13 | |
| | | | | | | | | | | | | | | | | | | | |
| | | | | |
| Health Care Providers & Services: 0.36% | | | | | | | | | | | | | | | | | | | | |
Other securities | | | | | | | | | | | | | | | 10,457,193 | | | | 0.36 | |
| | | | | | | | | | | | | | | | | | | | |
| | | | | |
| Pharmaceuticals: 0.48% | | | | | | | | | | | | | | | | | | | | |
Other securities | | | | | | | | | | | | | | | 14,080,601 | | | | 0.48 | |
| | | | | | | | | | | | | | | | | | | | |
| | | | | |
Industrials: 0.46% | | | | | | | | | | | | | | | | | | | | |
| | | | | |
| Aerospace & Defense: 0.26% | | | | | | | | | | | | | | | | | | | | |
Other securities | | | | | | | | | | | | | | | 7,673,912 | | | | 0.26 | |
| | | | | | | | | | | | | | | | | | | | |
| | | | | |
| Machinery: 0.06% | | | | | | | | | | | | | | | | | | | | |
Other securities | | | | | | | | | | | | | | | 1,797,252 | | | | 0.06 | |
| | | | | | | | | | | | | | | | | | | | |
| | | | | |
| Road & Rail: 0.14% | | | | | | | | | | | | | | | | | | | | |
Other securities | | | | | | | | | | | | | | | 3,887,234 | | | | 0.14 | |
| | | | | | | | | | | | | | | | | | | | |
The accompanying notes are an integral part of these financial statements.
| | | | | | |
| Summary portfolio of investments—November 30, 2013 (unaudited) | | Wells Fargo Advantage Income Funds | | | 29 | |
CORE BOND PORTFOLIO
| | | | | | | | | | | | | | | | | | | | |
| Security name | | Interest rate | | | Maturity date | | | Principal | | | Value | | | Percent of
net assets | |
| | | | | |
Information Technology: 0.64% | | | | | | | | | | | | | | | | | | | | |
| | | | | |
| Computers & Peripherals: 0.17% | | | | | | | | | | | | | | | | | | | | |
Other securities | | | | | | | | | | | | | | $ | 4,905,887 | | | | 0.17 | % |
| | | | | | | | | | | | | | | | | | | | |
| | | | | |
| Semiconductors & Semiconductor Equipment: 0.08% | | | | | | | | | | | | | | | | | | | | |
Other securities | | | | | | | | | | | | | | | 2,275,988 | | | | 0.08 | |
| | | | | | | | | | | | | | | | | | | | |
| | | | | |
| Software: 0.39% | | | | | | | | | | | | | | | | | | | | |
Other securities | | | | | | | | | | | | | | | 11,586,202 | | | | 0.39 | |
| | | | | | | | | | | | | | | | | | | | |
| | | | | |
Materials: 0.08% | | | | | | | | | | | | | | | | | | | | |
| | | | | |
| Chemicals: 0.08% | | | | | | | | | | | | | | | | | | | | |
Other securities | | | | | | | | | | | | | | | 2,435,967 | | | | 0.08 | |
| | | | | | | | | | | | | | | | | | | | |
| | | | | |
| Telecommunication Services: 1.34% | | | | | | | | | | | | | | | | | | | | |
| | | | | |
| Diversified Telecommunication Services: 1.34% | | | | | | | | | | | | | | | | | | | | |
Verizon Communications Incorporated | | | 2.50-6.55 | % | | | 9-15-2016 to 9-15-2043 | | | $ | 31,063,000 | | | | 33,544,785 | | | | 1.15 | |
Other securities | | | | | | | | | | | | | | | 5,667,726 | | | | 0.19 | |
| | | | | |
| | | | | | | | | | | | | | | 39,212,511 | | | | 1.34 | |
| | | | | | | | | | | | | | | | | | | | |
| | | | | |
Utilities: 2.06% | | | | | | | | | | | | | | | | | | | | |
| | | | | |
| Electric Utilities: 0.96% | | | | | | | | | | | | | | | | | | | | |
Other securities | | | | | | | | | | | | | | | 28,034,317 | | | | 0.96 | |
| | | | | | | | | | | | | | | | | | | | |
| | | | | |
| Gas Utilities: 0.25% | | | | | | | | | | | | | | | | | | | | |
Other securities | | | | | | | | | | | | | | | 7,265,579 | | | | 0.25 | |
| | | | | | | | | | | | | | | | �� | | | | |
| | | | | |
| Multi-Utilities: 0.85% | | | | | | | | | | | | | | | | | | | | |
Other securities | | | | | | | | | | | | | | | 24,797,766 | | | | 0.85 | |
| | | | | | | | | | | | | | | | | | | | |
| | | | | |
Total Corporate Bonds and Notes
(Cost $552,322,555) | | | | | | | | | | | | | | | 555,111,024 | | | | 18.99 | |
| | | | | | | | | | | | | | | | | | | | |
| | | | | |
Municipal Obligations: 1.01% | | | | | | | | | | | | | | | | | | | | |
| | | | | |
| California: 0.26% | | | | | | | | | | | | | | | | | | | | |
Other securities | | | | | | | | | | | | | | | 7,679,498 | | | | 0.26 | |
| | | | | | | | | | | | | | | | | | | | |
| | | | | |
| Illinois: 0.13% | | | | | | | | | | | | | | | | | | | | |
Other securities | | | | | | | | | | | | | | | 3,887,469 | | | | 0.13 | |
| | | | | | | | | | | | | | | | | | | | |
| | | | | |
| Nevada: 0.14% | | | | | | | | | | | | | | | | | | | | |
Other securities | | | | | | | | | | | | | | | 3,927,132 | | | | 0.14 | |
| | | | | | | | | | | | | | | | | | | | |
| | | | | |
| New Jersey: 0.17% | | | | | | | | | | | | | | | | | | | | |
Other securities | | | | | | | | | | | | | | | 5,006,252 | | | | 0.17 | |
| | | | | | | | | | | | | | | | | | | | |
| | | | | |
| New York: 0.13% | | | | | | | | | | | | | | | | | | | | |
Other securities | | | | | | | | | | | | | | | 3,625,999 | | | | 0.13 | |
| | | | | | | | | | | | | | | | | | | | |
The accompanying notes are an integral part of these financial statements.
| | | | |
| 30 | | Wells Fargo Advantage Income Funds | | Summary portfolio of investments—November 30, 2013 (unaudited) |
CORE BOND PORTFOLIO
| | | | | | | | | | | | | | | | | | | | |
| Security name | | Interest rate | | | Maturity date | | | Principal | | | Value | | | Percent of
net assets | |
| | | | | |
| Ohio: 0.04% | | | | | | | | | | | | | | | | | | | | |
Other securities | | | | | | | | | | | | | | $ | 1,093,618 | | | | 0.04 | % |
| | | | | | | | | | | | | | | | | | | | |
| | | | | |
| Texas: 0.14% | | | | | | | | | | | | | | | | | | | | |
Other securities | | | | | | | | | | | | | | | 4,209,590 | | | | 0.14 | |
| | | | | | | | | | | | | | | | | | | | |
| | | | | |
Total Municipal Obligations (Cost $25,833,149) | | | | | | | | | | | | | | | 29,429,558 | | | | 1.01 | |
| | | | | | | | | | | | | | | | | | | | |
| | | | |
Non-Agency Mortgage Backed Securities: 7.34% | | | | | | | | | | | | | | | | | |
Commercial Mortgage Trust | | | 1.30-4.26 | % | | | 12-10-2044 to 10-10-2046 | | | $ | 29,294,531 | | | | 30,254,358 | | | | 1.04 | |
Impact Funding LLC Series 2010-1 Class A1 144A | | | 5.31 | | | | 8-25-2024 | | | | 10,957,525 | | | | 12,268,286 | | | | 0.42 | |
JPMorgan Chase & Company | | | 1.08-5.72 | | | | 11-15-2017 to 5-15-2047 | | | | 58,205,792 | | | | 60,994,764 | | | | 2.08 | |
Morgan Stanley | | | 0.28-4.97 | | | | 4-14-2040 to 2-25-2047 | | | | 34,507,225 | | | | 35,043,949 | | | | 1.20 | |
Other securities | | | | | | | | | | | | | | | 75,906,523 | | | | 2.60 | |
| | | | | | | | | | | | | | | | | | | | |
| | | | | |
Total Non-Agency Mortgage Backed Securities
(Cost $213,464,578) | | | | | | | | | | | | | | | 214,467,880 | | | | 7.34 | |
| | | | | | | | | | | | | | | | | | | | |
| | | | | |
U.S. Treasury Securities: 18.95% | | | | | | | | | | | | | | | | | | | | |
U.S. Treasury Bond | | | 2.75-3.75 | | | | 11-15-2041 to 11-15-2043 | | | | 16,780,000 | | | | 14,859,189 | | | | 0.50 | |
U.S. Treasury Bond | | | 3.13 | | | | 2-15-2043 | | | | 22,362,000 | | | | 19,601,679 | | | | 0.67 | |
U.S. Treasury Bond | | | 3.63 | | | | 8-15-2043 | | | | 18,809,000 | | | | 18,174,196 | | | | 0.62 | |
U.S. Treasury Note | | | 0.25 | | | | 9-30-2015 | | | | 24,408,000 | | | | 24,404,192 | | | | 0.84 | |
U.S. Treasury Note | | | 0.25 | | | | 10-31-2015 | | | | 28,464,000 | | | | 28,451,760 | | | | 0.97 | |
U.S. Treasury Note | | | 0.38 | | | | 8-31-2015 | | | | 71,293,000 | | | | 71,443,357 | | | | 2.45 | |
U.S. Treasury Note ## | | | 0.63 | | | | 8-15-2016 | | | | 33,136,000 | | | | 33,270,598 | | | | 1.14 | |
U.S. Treasury Note | | | 0.63 | | | | 10-15-2016 | | | | 59,869,000 | | | | 60,037,352 | | | | 2.06 | |
U.S. Treasury Note ## | | | 0.63 | | | | 11-15-2016 | | | | 131,711,000 | | | | 132,009,457 | | | | 4.52 | |
U.S. Treasury Note | | | 1.25-2.50 | | | | 11-30-2018 to 8-15-2023 | | | | 21,221,000 | | | | 20,946,724 | | | | 0.71 | |
U.S. Treasury Note | | | 2.38 | | | | 7-31-2017 | | | | 22,264,000 | | | | 23,479,815 | | | | 0.80 | |
U.S. Treasury Note | | | 2.75 | | | | 11-15-2023 | | | | 23,517,000 | | | | 23,524,337 | | | | 0.81 | |
U.S. Treasury Note ## | | | 3.13 | | | | 4-30-2017 | | | | 77,368,000 | | | | 83,551,405 | | | | 2.86 | |
| | | | | | | | | | | | | | | | | | | | |
| | | | | |
Total U.S. Treasury Securities
(Cost $553,760,297) | | | | | | | | | | | | | | | 553,754,061 | | | | 18.95 | |
| | | | | | | | | | | | | | | | | | | | |
| | | | |
Yankee Corporate Bonds and Notes: 6.54% | | | | | | | | | | | | | | | | | |
| | | | | |
Consumer Discretionary: 0.19% | | | | | | | | | | | | | | | | | | | | |
| | | | |
| Textiles, Apparel & Luxury Goods: 0.19% | | | | | | | | | | | | | | | | | |
Other securities | | | | | | | | | | | | | | | 5,525,338 | | | | 0.19 | |
| | | | | | | | | | | | | | | | | | | | |
| | | | | |
Consumer Staples: 0.37% | | | | | | | | | | | | | | | | | | | | |
| | | | | |
| Beverages: 0.37% | | | | | | | | | | | | | | | | | | | | |
Other securities | | | | | | | | | | | | | | | 10,836,652 | | | | 0.37 | |
| | | | | | | | | | | | | | | | | | | | |
| | | | | |
Energy: 1.45% | | | | | | | | | | | | | | | | | | | | |
| | | |
| Energy Equipment & Services: 0.10% | | | | | | | | | | | | | |
Other securities | | | | | | | | | | | | | | | 2,869,841 | | | | 0.10 | |
| | | | | | | | | | | | | | | | | | | | |
The accompanying notes are an integral part of these financial statements.
| | | | | | |
| Summary portfolio of investments—November 30, 2013 (unaudited) | | Wells Fargo Advantage Income Funds | | | 31 | |
CORE BOND PORTFOLIO
| | | | | | | | | | | | | | | | | | | | |
| Security name | | Interest rate | | | Maturity date | | | Principal | | | Value | | | Percent of
net assets | |
| | | | | |
| Oil, Gas & Consumable Fuels: 1.35% | | | | | | | | | | | | | | | | | | | | |
Other securities | | | | | | | | | | | | | | $ | 39,615,086 | | | | 1.35 | % |
| | | | | | | | | | | | | | | | | | | | |
| | | | | |
Financials: 2.21% | | | | | | | | | | | | | | | | | | | | |
| | | | | |
| Commercial Banks: 1.64% | | | | | | | | | | | | | | | | | | | | |
Norddeutsche Landesbank Pfandbriefe 144A | | | 2.00 | % | | | 2-5-2019 | | | $ | 13,100,000 | | | | 13,107,860 | | | | 0.45 | |
Other securities | | | | | | | | | | | | | | | 34,684,019 | | | | 1.19 | |
| | | | | |
| | | | | | | | | | | | | | | 47,791,879 | | | | 1.64 | |
| | | | | | | | | | | | | | | | | | | | |
| | | | | |
| Diversified Financial Services: 0.51% | | | | | | | | | | | | | | | | | | | | |
Other securities | | | | | | | | | | | | | | | 14,877,582 | | | | 0.51 | |
| | | | | | | | | | | | | | | | | | | | |
| | | | | |
| Insurance: 0.06% | | | | | | | | | | | | | | | | | | | | |
Other securities | | | | | | | | | | | | | | | 1,802,651 | | | | 0.06 | |
| | | | | | | | | | | | | | | | | | | | |
| | | | | |
Health Care: 0.49% | | | | | | | | | | | | | | | | | | | | |
| | | | | |
| Health Care Equipment & Supplies: 0.18% | | | | | | | | | | | | | | | | | | | | |
Other securities | | | | | | | | | | | | | | | 5,335,196 | | | | 0.18 | |
| | | | | | | | | | | | | | | | | | | | |
| | | | | |
| Pharmaceuticals: 0.31% | | | | | | | | | | | | | | | | | | | | |
Other securities | | | | | | | | | | | | | | | 8,935,823 | | | | 0.31 | |
| | | | | | | | | | | | | | | | | | | | |
| | | | | |
Information Technology: 0.12% | | | | | | | | | | | | | | | | | | | | |
| | | | | |
| Internet Software & Services: 0.12% | | | | | | | | | | | | | | | | | | | | |
Other securities | | | | | | | | | | | | | | | 3,405,058 | | | | 0.12 | |
| | | | | | | | | | | | | | | | | | | | |
| | | | | |
Materials: 0.66% | | | | | | | | | | | | | | | | | | | | |
| | | | | |
| Chemicals: 0.10% | | | | | | | | | | | | | | | | | | | | |
Other securities | | | | | | | | | | | | | | | 2,934,996 | | | | 0.10 | |
| | | | | | | | | | | | | | | | | | | | |
| | | | | |
| Metals & Mining: 0.56% | | | | | | | | | | | | | | | | | | | | |
Other securities | | | | | | | | | | | | | | | 16,450,232 | | | | 0.56 | |
| | | | | | | | | | | | | | | | | | | | |
| | | | | |
Telecommunication Services: 0.93% | | | | | | | | | | | | | | | | | | | | |
| | | | | |
Diversified Telecommunication
Services: 0.20% | | | | | | | | | | | | | | | | | | | | |
Other securities | | | | | | | | | | | | | | | 5,759,677 | | | | 0.20 | |
| | | | | | | | | | | | | | | | | | | | |
| | | | | |
| Wireless Telecommunication Services: 0.73% | | | | | | | | | | | | | | | | | | | | |
Other securities | | | | | | | | | | | | | | | 21,299,889 | | | | 0.73 | |
| | | | | | | | | | | | | | | | | | | | |
| | | | | |
Utilities: 0.12% | | | | | | | | | | | | | | | | | | | | |
| | | | | |
| Electric Utilities: 0.12% | | | | | | | | | | | | | | | | | | | | |
Other securities | | | | | | | | | | | | | | | 3,560,152 | | | | 0.12 | |
| | | | | | | | | | | | | | | | | | | | |
| | | | |
Total Yankee Corporate Bonds and Notes (Cost $193,375,955) | | | | | | | | | | | | 191,000,052 | | | | 6.54 | |
| | | | | | | | | | | | | | | | | | | | |
| | | | | |
Yankee Government Bonds: 2.00% | | | | | | | | | | | | | | | | | | | | |
Other securities | | | | | | | | | | | | | | | 58,409,823 | | | | 2.00 | |
| | | | | | | | | | | | | | | | | | | | |
| | | | |
Total Yankee Government Bonds (Cost $60,183,937) | | | | | | | | | | | | 58,409,823 | | | | 2.00 | |
| | | | | | | | | | | | | | | | | | | | |
The accompanying notes are an integral part of these financial statements.
| | | | |
| 32 | | Wells Fargo Advantage Income Funds | | Summary portfolio of investments—November 30, 2013 (unaudited) |
CORE BOND PORTFOLIO
| | | | | | | | | | | | | | | | | | |
| Security name | | Yield | | | Maturity date | | Shares | | | Value | | | Percent of
net assets | |
| | | | | |
Short-Term Investments: 2.31% | | | | | | | | | | | | | | | | | | |
| | | | | |
| Investment Companies: 2.31% | | | | | | | | | | | | | | | | | | |
Wells Fargo Advantage Cash Investment Money Market Fund, Select Class (l)(u) | | | 0.08 | % | | | | | 67,603,250 | | | $ | 67,603,250 | | | | 2.31 | % |
| | | | | | | | | | | | | | | | | | |
| | | | | |
Total Short-Term Investments (Cost $67,603,250) | | | | | | | | | | | | | 67,603,250 | | | | 2.31 | |
| | | | | | | | | | | | | | | | | | |
| Total investments in securities | | | | | | | | | | | | | | | | | | |
| (Cost $3,143,105,485) * | | | | | | | | | | | | | 3,137,741,214 | | | | 107.36 | % |
Other assets and liabilities, net | | | | | | | | | | | | | (215,149,848 | ) | | | (7.36 | ) |
| | | | | | | | | | | | | | | | | | |
| Total net assets | | | | | | | | | | | | $ | 2,922,591,366 | | | | 100.00 | % |
| | | | | | | | | | | | | | | | | | |
| ± | Variable rate investment. The rate shown is the rate in effect at period end. |
| %% | Security issued on a when-issued basis |
| (a) | Security is fair valued by the Management Valuation Team, and in certain instances by the Board of Trustees, in accordance with procedures approved by the Board of Trustees. |
| 144A | Security that may be resold to “qualified institutional buyers” under Rule 144A or security offered pursuant to Section 4(2) of the Securities Act of 1933, as amended. |
| ## | All or a portion of this security has been segregated for when-issued securities. |
| (l) | Investment in an affiliate |
| (u) | Rate shown is the 7-day annualized yield at period end. |
| * | Cost for federal income tax purposes is $3,149,708,027 and unrealized appreciation (depreciation) consists of: |
| | | | |
Gross unrealized appreciation | | $ | 30,693,980 | |
Gross unrealized depreciation | | | (42,660,793 | ) |
| | | | |
Net unrealized depreciation | | $ | (11,966,813 | ) |
The accompanying notes are an integral part of these financial statements.
| | | | | | |
| Portfolio of investments—November 30, 2013 (unaudited) | | Wells Fargo Advantage Income Funds | | | 33 | |
INFLATION-PROTECTED BOND PORTFOLIO
| | | | | | | | | | | | | | | | |
| Security name | | Interest rate | | | Maturity date | | | Principal | | | Value | |
| | | | |
U.S. Treasury Securities: 98.98% | | | | | | | | | | | | | | | | |
TIPS | | | 0.13 | % | | | 4-15-2016 | | | $ | 2,917,173 | | | $ | 2,991,925 | |
TIPS | | | 0.13 | | | | 4-15-2017 | | | | 3,097,855 | | | | 3,196,115 | |
TIPS | | | 0.13 | | | | 4-15-2018 | | | | 445,689 | | | | 459,617 | |
TIPS | | | 0.13 | | | | 1-15-2022 | | | | 3,253,597 | | | | 3,183,950 | |
TIPS | | | 0.13 | | | | 7-15-2022 | | | | 2,703,321 | | | | 2,634,681 | |
TIPS | | | 0.13 | | | | 1-15-2023 | | | | 2,145,477 | | | | 2,060,832 | |
TIPS | | | 0.38 | | | | 7-15-2023 | | | | 1,116,827 | | | | 1,095,799 | |
TIPS | | | 0.50 | | | | 4-15-2015 | | | | 1,010,230 | | | | 1,028,936 | |
TIPS | | | 0.63 | | | | 7-15-2021 | | | | 2,701,114 | | | | 2,791,645 | |
TIPS | | | 0.63 | | | | 2-15-2043 | | | | 1,135,549 | | | | 894,068 | |
TIPS | | | 0.75 | | | | 2-15-2042 | | | | 1,367,837 | | | | 1,124,939 | |
TIPS | | | 1.13 | | | | 1-15-2021 | | | | 2,756,229 | | | | 2,947,227 | |
TIPS | | | 1.25 | | | | 7-15-2020 | | | | 2,243,949 | | | | 2,442,223 | |
TIPS | | | 1.38 | | | | 7-15-2018 | | | | 1,672,178 | | | | 1,834,955 | |
TIPS | | | 1.38 | | | | 1-15-2020 | | | | 1,629,599 | | | | 1,778,554 | |
TIPS | | | 1.63 | | | | 1-15-2015 | | | | 1,097,503 | | | | 1,127,684 | |
TIPS | | | 1.63 | | | | 1-15-2018 | | | | 1,207,094 | | | | 1,325,541 | |
TIPS | | | 1.75 | | | | 1-15-2028 | | | | 1,067,384 | | | | 1,165,617 | |
TIPS | | | 1.88 | | | | 7-15-2015 | | | | 1,390,377 | | | | 1,461,417 | |
TIPS | | | 1.88 | | | | 7-15-2019 | | | | 1,118,552 | | | | 1,262,741 | |
TIPS | | | 2.00 | | | | 1-15-2016 | | | | 1,350,791 | | | | 1,439,014 | |
TIPS | | | 2.00 | | | | 1-15-2026 | | | | 1,232,818 | | | | 1,392,314 | |
TIPS | | | 2.13 | | | | 1-15-2019 | | | | 1,183,290 | | | | 1,339,799 | |
TIPS | | | 2.13 | | | | 2-15-2040 | | | | 498,327 | | | | 570,896 | |
TIPS | | | 2.13 | | | | 2-15-2041 | | | | 785,877 | | | | 900,566 | |
TIPS | | | 2.38 | | | | 1-15-2017 | | | | 1,079,804 | | | | 1,194,281 | |
TIPS | | | 2.38 | | | | 1-15-2025 | | | | 1,726,644 | | | | 2,025,029 | |
TIPS | | | 2.38 | | | | 1-15-2027 | | | | 1,027,556 | | | | 1,207,138 | |
TIPS | | | 2.50 | | | | 7-15-2016 | | | | 1,234,793 | | | | 1,357,789 | |
TIPS | | | 2.50 | | | | 1-15-2029 | | | | 992,437 | | | | 1,188,443 | |
TIPS | | | 2.63 | | | | 7-15-2017 | | | | 587,475 | | | | 665,086 | |
TIPS | | | 3.38 | | | | 4-15-2032 | | | | 481,490 | | | | 654,450 | |
TIPS | | | 3.63 | | | | 4-15-2028 | | | | 1,042,337 | | | | 1,404,954 | |
TIPS | | | 3.88 | | | | 4-15-2029 | | | | 1,046,875 | | | | 1,462,272 | |
| | | | |
Total U.S. Treasury Securities (Cost $52,182,123) | | | | | | | | | | | | | | | 53,610,497 | |
| | | | | | | | | | | | | | | | |
| | | | |
| | | Yield | | | | | | Shares | | | | |
| | | | |
Short-Term Investments: 0.70% | | | | | | | | | | | | | | | | |
| | | | |
| Investment Companies: 0.70% | | | | | | | | | | | | | | | | |
Wells Fargo Advantage Government Money Market Fund, Institutional Class (l)(u) | | | 0.01 | | | | | | | | 378,253 | | | | 378,253 | |
| | | | |
Total Short-Term Investments (Cost $378,253) | | | | | | | | | | | | | | | 378,253 | |
| | | | | | | | | | | | | | | | |
| | | | | | | | |
| Total investments in securities | | | | | | | | |
| (Cost $52,560,376) * | | | 99.68 | % | | | 53,988,750 | |
Other assets and liabilities, net | | | 0.32 | | | | 173,717 | |
| | | | | | | | |
| Total net assets | | | 100.00 | % | | $ | 54,162,467 | |
| | | | | | | | |
| (l) | Investment in an affiliate |
| (u) | Rate shown is the 7-day annualized yield at period end. |
| * | Cost for federal income tax purposes is $52,560,376 and unrealized appreciation (depreciation) consists of: |
| | | | |
Gross unrealized appreciation | | $ | 2,688,880 | |
Gross unrealized depreciation | | | (1,260,506 | ) |
| | | | |
Net unrealized appreciation | | $ | 1,428,374 | |
The accompanying notes are an integral part of these financial statements.
| | | | |
| 34 | | Wells Fargo Advantage Income Funds | | Statements of assets and liabilities—November 30, 2013 (unaudited) |
| | | | | | | | |
| | | Core Bond Portfolio | | | Inflation-Protected
Bond Portfolio | |
| | |
Assets | | | | | | | | |
Investments | | | | | | | | |
In unaffiliated securities (including securities on loan), at value (see cost below) | | $ | 3,070,137,964 | | | $ | 53,610,497 | |
In affiliated securities, at value (see cost below) | | | 67,603,250 | | | | 378,253 | |
| | | | | | | | |
Total investments, at value (see cost below) | | | 3,137,741,214 | | | | 53,988,750 | |
Cash | | | 165,867 | | | | 0 | |
Segregated cash | | | 0 | | | | 0 | |
Receivable for investments sold | | | 534,915,288 | | | | 0 | |
Principal paydown receivable | | | 139,908 | | | | 0 | |
Receivable for interest | | | 12,556,704 | | | | 209,205 | |
Receivable for daily variation margin on open futures contracts | | | 0 | | | | 0 | |
Receivable for securities lending income | | | 284 | | | | 0 | |
Prepaid expenses and other assets | | | 12,113 | | | | 1,842 | |
| | | | | | | | |
Total assets | | | 3,685,531,378 | | | | 54,199,797 | |
| | | | | | | | |
| | |
Liabilities | | | | | | | | |
Payable for investments purchased | | | 762,001,229 | | | | 0 | |
Payable upon receipt of securities loaned | | | 0 | | | | 0 | |
Advisory fee payable | | | 837,632 | | | | 14,246 | |
Shareholder report expenses payable | | | 6,925 | | | | 2,707 | |
Custodian and accounting fees payable | | | 58,006 | | | | 3,191 | |
Professional fees payable | | | 36,220 | | | | 16,035 | |
Accrued expenses and other liabilities | | | 0 | | | | 1,151 | |
| | | | | | | | |
Total liabilities | | | 762,940,012 | | | | 37,330 | |
| | | | | | | | |
Total net assets | | $ | 2,922,591,366 | | | $ | 54,162,467 | |
| | | | | | | | |
| | |
Investments in unaffiliated securities (including securities on loan), at cost | | $ | 3,075,502,235 | | | $ | 52,182,123 | |
| | | | | | | | |
Investments in affiliated securities, at cost | | $ | 67,603,250 | | | $ | 378,253 | |
| | | | | | | | |
Total investments, at cost | | $ | 3,143,105,485 | | | $ | 52,560,376 | |
| | | | | | | | |
Securities on loan, at value | | $ | 0 | | | $ | 0 | |
| | | | | | | | |
The accompanying notes are an integral part of these financial statements.
| | | | | | |
| Statements of operations—six months ended November 30, 2013 (unaudited) | | Wells Fargo Advantage Income Funds | | | 35 | |
| | | | | | | | |
| | | Core Bond
Portfolio | | | Inflation-Protected
Bond Portfolio | |
| | |
Investment income | | | | | | | | |
Interest** | | $ | 34,469,823 | | | $ | 488,200 | |
Income from affiliated securities | | | 36,697 | | | | 16 | |
Securities lending income, net | | | 10,228 | | | | 0 | |
| | | | | | | | |
Total investment income | | | 34,516,748 | | | | 488,216 | |
| | | | | | | | |
| | |
Expenses | | | | | | | | |
Advisory fee | | | 5,436,799 | | | | 116,720 | |
Custody and accounting fees | | | 98,169 | | | | 4,878 | |
Professional fees | | | 39,272 | | | | 20,475 | |
Shareholder report expenses | | | 5,786 | | | | 921 | |
Trustees’ fees and expenses | | | 5,029 | | | | 5,760 | |
Other fees and expenses | | | 31,103 | | | | 4,349 | |
| | | | | | | | |
Total expenses | | | 5,616,158 | | | | 153,103 | |
Less: Fee waivers and/or expense reimbursements | | | (373,637 | ) | | | (25,119 | ) |
| | | | | | | | |
Net expenses | | | 5,242,521 | | | | 127,984 | |
| | | | | | | | |
Net investment income | | | 29,274,227 | | | | 360,232 | |
| | | | | | | | |
| | |
REALIZED AND UNREALIZED GAINS (LOSSES) ON INVESTMENTS | | | | | | | | |
| | |
Net realized gains (losses) on: | | | | | | | | |
Unaffiliated securities | | | (41,557,005 | ) | | | 471,728 | |
Futures transactions | | | 0 | | | | (16,061 | ) |
TBA sale commitments | | | 75,320 | | | | 0 | |
| | | | | | | | |
Net realized gain (losses) on investments | | | (41,481,685 | ) | | | 455,667 | |
| | | | | | | | |
| | |
Net change in unrealized gains (losses) on: | | | | | | | | |
Unaffiliated securities | | | (8,824,874 | ) | | | (3,349,091 | ) |
Futures transactions | | | 0 | | | | 0 | |
TBA sale commitments | | | 46,020 | | | | 0 | |
| | | | | | | | |
Net change in unrealized gains (losses) on investments | | | (8,778,854 | ) | | | (3,349,091 | ) |
| | | | | | | | |
Net realized and unrealized gains (losses) on investments | | | (50,260,539 | ) | | | (2,893,424 | ) |
| | | | | | | | |
Net increase (decrease) in net assets resulting from operations | | $ | (20,986,312 | ) | | $ | (2,533,192 | ) |
| | | | | | | | |
| | |
** Net of foreign interest withholding taxes in the amount of | | | $10,617 | | | | $0 | |
The accompanying notes are an integral part of these financial statements.
| | | | |
| 36 | | Wells Fargo Advantage Income Funds | | Statements of changes in net assets |
| | | | | | | | |
| | | Core Bond Portfolio | |
| | | Six months ended November 30, 2013
(unaudited) | | | Year ended
May 31, 2013 | |
| | |
Operations | | | | | | | | |
Net investment income | | $ | 29,274,227 | | | $ | 65,763,655 | |
Net realized gains (losses) on investments | | | (41,481,685 | ) | | | 129,092,808 | |
Net change in unrealized gains (losses) on investments | | | (8,778,854 | ) | | | (90,545,176 | ) |
| | | | | | | | |
Net increase (decrease) in net assets resulting from operations | | | (20,986,312 | ) | | | 104,311,287 | |
| | | | | | | | |
| | |
Capital share transactions | | | | | | | | |
Transactions in investors’ beneficial interests | | | | | | | | |
Contributions | | | 92,659,414 | | | | 720,766,231 | |
Withdrawals | | | (497,518,530 | ) | | | (1,290,176,868 | ) |
| | | | | | | | |
Net decrease in net assets resulting from capital share transactions | | | (404,859,116 | ) | | | (569,410,637 | ) |
| | | | | | | | |
Total decrease in net assets | | | (425,845,428 | ) | | | (465,099,350 | ) |
| | | | | | | | |
| | |
Net assets | | | | | | | | |
Beginning of period | | | 3,348,436,794 | | | | 3,813,536,144 | |
| | | | | | | | |
End of period | | $ | 2,922,591,366 | | | $ | 3,348,436,794 | |
| | | | | | | | |
The accompanying notes are an integral part of these financial statements.
| | | | | | |
| Statements of changes in net assets | | Wells Fargo Advantage Income Funds | | | 37 | |
| | | | | | | | |
| | | Inflation-Protected Bond Portfolio | |
| | | Six months ended
November 30, 2013
(unaudited) | | | Year ended
May 31, 2013 | |
| | |
Operations | | | | | | | | |
Net investment income | | $ | 360,232 | | | $ | 1,198,434 | |
Net realized gains on investments | | | 455,667 | | | | 3,992,715 | |
Net change in unrealized gains (losses) on investments | | | (3,349,091 | ) | | | (6,233,421 | ) |
| | | | | | | | |
Net decrease in net assets resulting from operations | | | (2,533,192 | ) | | | (1,042,272 | ) |
| | | | | | | | |
| | |
Capital share transactions | | | | | | | | |
Transactions in investors’ beneficial interests | | | | | | | | |
Contributions | | | 3,860,948 | | | | 14,419,386 | |
Withdrawals | | | (13,797,507 | ) | | | (30,194,206 | ) |
| | | | | | | | |
Net decrease in net assets resulting from capital share transactions | | | (9,936,559 | ) | | | (15,774,820 | ) |
| | | | | | | | |
Total decrease in net assets | | | (12,469,751 | ) | | | (16,817,092 | ) |
| | | | | | | | |
| | |
Net assets | | | | | | | | |
Beginning of period | | | 66,632,218 | | | | 83,449,310 | |
| | | | | | | | |
End of period | | $ | 54,162,467 | | | $ | 66,632,218 | |
| | | | | | | | |
The accompanying notes are an integral part of these financial statements.
| | | | |
| 38 | | Wells Fargo Advantage Income Funds | | Financial highlights |
| | | | | | | | | | | | | | | | | | | | |
| | | Ratio to average net assets (annualized) | | | Total
Return1 | | | Portfolio turnover
rate | |
| | | Net investment
income | | | Gross
expenses | | | Net
expenses | | | |
| | | | | |
Core Bond Portfolio | | | | | | | | | | | | | | | | | | | | |
June 1, 2013 to November 30, 2013 (unaudited) | | | 1.95 | % | | | 0.37 | % | | | 0.35 | % | | | (0.56 | )% | | | 342 | % |
June 1, 2012 to May 31, 2013 | | | 1.75 | % | | | 0.37 | % | | | 0.35 | % | | | 2.61 | % | | | 547 | % |
June 1, 2011 to May 31, 2012 | | | 2.33 | % | | | 0.37 | % | | | 0.35 | % | | | 8.20 | % | | | 803 | % |
June 1, 2010 to May 31, 2011 | | | 2.99 | % | | | 0.37 | % | | | 0.35 | % | | | 7.02 | % | | | 789 | % |
June 1, 2009 to May 31, 2010 | | | 3.78 | % | | | 0.38 | % | | | 0.34 | % | | | 10.87 | % | | | 638 | % |
June 1, 2008 to May 31, 2009 | | | 4.92 | % | | | 0.40 | % | | | 0.39 | % | | | 6.58 | % | | | 633 | % |
| | | | | |
Inflation-Protected Bond Portfolio | | | | | | | | | | | | | | | | | | | | |
June 1, 2013 to November 30, 2013 (unaudited) | | | 1.23 | % | | | 0.52 | % | | | 0.44 | % | | | (3.91 | )% | | | 4 | % |
June 1, 2012 to May 31, 2013 | | | 1.52 | % | | | 0.50 | % | | | 0.44 | % | | | (1.86 | )% | | | 15 | % |
June 1, 2011 to May 31, 2012 | | | 3.00 | % | | | 0.48 | % | | | 0.44 | % | | | 12.62 | % | | | 23 | % |
June 1, 2010 to May 31, 2011 | | | 3.25 | % | | | 0.44 | % | | | 0.43 | % | | | 8.19 | % | | | 19 | % |
June 1, 2009 to May 31, 2010 | | | 3.53 | % | | | 0.45 | % | | | 0.44 | % | | | 8.28 | % | | | 31 | % |
June 1, 2008 to May 31, 2009 | | | 1.70 | % | | | 0.45 | % | | | 0.37 | % | | | (1.33 | )% | | | 53 | % |
| 1. | Returns for periods of less than one year are not annualized. |
The accompanying notes are an integral part of these financial statements.
| | | | | | |
| Notes to financial statements (unaudited) | | Wells Fargo Advantage Income Funds | | | 39 | |
1. ORGANIZATION
Wells Fargo Master Trust (the “Trust”), a Delaware statutory trust organized on March 10, 1999, is an open-end management investment company registered under the Investment Company Act of 1940, as amended (the “1940 Act”). These financial statements report on the following portfolios: the Wells Fargo Advantage Core Bond Portfolio (“Core Bond Portfolio”), and the Wells Fargo Advantage Inflation-Protected Bond Portfolio (“Inflation-Protected Bond Portfolio”) (each, a “Portfolio”, collectively, the “Portfolios”). Each portfolio is a diversified series of the Trust.
The Portfolios, which are master portfolios in a master/feeder structure, offer their shares to multiple feeder funds and other master portfolios rather than directly to the public.
2. SIGNIFICANT ACCOUNTING POLICIES
The following significant accounting policies, which are consistently followed in the preparation of the financial statements of each Portfolio, are in conformity with U.S. generally accepted accounting principles which require management to make estimates and assumptions that affect the reported amounts of assets and liabilities, disclosure of contingent assets and liabilities at the date of the financial statements, and the reported amounts of revenues and expenses during the reporting period. Actual results could differ from those estimates.
Securities valuation
All investments are valued each business day as of the close of regular trading on the New York Stock Exchange (generally 4 p.m. Eastern Time).
Fixed income securities acquired with maturities exceeding 60 days are valued based on evaluated bid prices provided by an independent pricing service which may utilize both transaction data and market information such as yield, quality, coupon rate, maturity, type of issue, trading characteristics and other market data. If prices are not available from the independent pricing service or prices received are deemed not representative of market value, prices will be obtained from an independent broker-dealer or otherwise determined based on the Portfolios’ Valuation Procedures.
Futures that are listed on a foreign or domestic exchange or market are valued at the official closing price.
Investments in registered open-end investment companies are valued at net asset value. Non-registered investment vehicles are fair valued at net asset value.
Investments which are not valued using any of the methods discussed above are valued at their fair value, as determined in good faith by the Board of Trustees of the Portfolios. The Board of Trustees has established a Valuation Committee comprised of the Trustees and has delegated to it the authority to take any actions regarding the valuation of portfolio securities that the Valuation Committee deems necessary or appropriate, including determining the fair value of portfolio securities, unless the determination has been delegated to the Management Valuation Team of Wells Fargo Funds Management, LLC (“Funds Management”). The Board of Trustees retains the authority to make or ratify any valuation decisions or approve any changes to the Valuation Procedures as it deems appropriate. On a quarterly basis, the Board of Trustees receives reports on any valuation actions taken by the Valuation Committee or the Management Valuation Team which may include items for ratification.
Valuations of fair valued securities are compared to the next actual sales price when available, or other appropriate market values, to assess the continued appropriateness of the fair valuation methodologies used. These securities are fair valued on a day-to-day basis, taking into consideration changes to appropriate market information and any significant changes to the inputs considered in the valuation process until there is a readily available price provided on an exchange or by an independent pricing service. Valuations received from an independent pricing service or independent broker-dealer quotes are periodically validated by comparisons to most recent trades and valuations provided by other independent pricing services in addition to the review of prices by the adviser and/or subadviser. Unobservable inputs used in determining fair valuations are identified based on the type of security, taking into consideration factors utilized by market participants in valuing the investment, knowledge about the issuer and the current market environment.
Security loans
The Portfolios may lend their securities from time to time in order to earn additional income in the form of fees or interest on securities received as collateral or the investment of any cash received as collateral. The Portfolios continue to receive interest or dividends on the securities loaned. The Portfolios receive collateral in the form of cash or securities with a value at least equal to the value of the securities on loan. The value of the loaned securities is determined at the close of
| | | | |
| 40 | | Wells Fargo Advantage Income Funds | | Notes to financial statements (unaudited) |
each business day and any additional required collateral is delivered to the Portfolios on the next business day. In a securities lending transaction, the net asset value of the Portfolios will be affected by an increase or decrease in the value of the securities loaned and by an increase or decrease in the value of the instrument in which collateral is invested. The amount of securities lending activity undertaken by the Portfolios fluctuate from time to time, In the event of default or bankruptcy by the borrower, the Portfolios may be prevented from recovering the loaned securities or gaining access to the collateral or may experience delays or costs in doing so. In addition, the investment of any cash collateral received may lose all or part of its value. The Portfolios have the right under the lending agreement to recover the securities from the borrower on demand.
The Portfolios lend their securities through an unaffiliated securities lending agent. Cash collateral received in connection with its securities lending transactions is invested in Wells Fargo Securities Lending Cash Investments, LLC (the “Securities Lending Fund”). The Securities Lending Fund is exempt from registration under Section 3(c)(7) of the 1940 Act and is managed by Funds Management and is subadvised by Wells Capital Management Incorporated (“WellsCap”). Funds Management receives an advisory fee starting at 0.05% and declining to 0.01% as the average daily net assets of the Securities Lending Fund increase. All of the fees received by Funds Management are paid to WellsCap for its services as subadviser. The Securities Lending Fund seeks to provide a positive return compared to the daily Fed Funds Open rate by investing in high-quality, U.S. dollar-denominated short-term money market instruments. Securities Lending Fund investments are fair valued based upon the amortized cost valuation technique. Income earned from investment in the Securities Lending Fund is included in securities lending income on the Statements of Operations.
When-issued transactions
Each Portfolio may purchase securities on a forward commitment or when-issued basis. A Portfolio records a when-issued transaction on the trade date and will segregate assets in an amount at least equal in value to the Portfolio’s commitment to purchase when-issued securities. Securities purchased on a when-issued basis are marked-to-market daily and the Portfolio begins earning interest on the settlement date. Losses may arise due to changes in the market value of the underlying securities or if the counterparty does not perform under the contract.
Futures contracts
Each Portfolio may be subject to interest rate risk in the normal course of pursuing its investment objectives. The Portfolio may buy and sell futures contracts in order to gain exposure to, or protect against, changes in security values and interest rates. The primary risks associated with the use of futures contracts are the imperfect correlation between changes in market values of securities held by the Portfolio and the prices of futures contracts, and the possibility of an illiquid market.
Futures contracts are valued based upon their quoted daily settlement prices when available. The aggregate principal amounts of the contracts are not recorded in the financial statements. Fluctuations in the value of the contracts are recorded in the Statements of Assets and Liabilities as an asset or liability and in the Statements of Operations as unrealized gains or losses until the contracts are closed, at which point they are recorded as net realized gains or losses on futures contracts. With futures contracts, there is minimal counterparty risk to the Portfolio since futures are exchange traded and the exchange’s clearinghouse, as counterparty to all exchange traded futures, guarantees the futures against default.
TBA sale commitments
Each Portfolio may enter into To Be Announced (“TBA”) sale commitments to hedge its portfolio positions or to sell mortgage-backed securities it owns under delayed delivery arrangements. Proceeds of TBA sale commitments are not received until the contractual settlement date. During the time a TBA sale commitment is outstanding, equivalent deliverable securities or offsetting TBA purchase commitments, which are deliverable on or before the sale commitment date, are held as “cover” for the transaction. Unsettled TBA sale commitments are valued at the current market value of the underlying securities, generally according to the procedures described under “Securities valuation”. The contract is marked-to-market daily and the change in market value is recorded by the Portfolio as an unrealized gain or loss. If the TBA sale commitment is closed through the acquisition of an offsetting purchase commitment, the Portfolio realizes a gain or loss. If the Portfolio delivers securities under the commitment, the Portfolio realizes a gain or a loss from the sale of the securities based upon the unit price established at the date the commitment was entered into.
Inflation-indexed bonds and TIPS
Each Portfolio may invest in inflation-indexed bonds, including Treasury inflation-protected securities (TIPS). Inflation-indexed bonds are fixed income securities whose principal value is periodically adjusted according to the rate of inflation. If the index measuring inflation falls, the principal value of inflation-indexed bonds (other than municipal inflation indexed bonds and certain corporate inflation-indexed bonds) will be adjusted downward, and consequently the interest payable on these securities (calculated with respect to a smaller principal amount) will be reduced. Repayment of the
| | | | | | |
| Notes to financial statements (unaudited) | | Wells Fargo Advantage Income Funds | | | 41 | |
original bond principal upon maturity (as adjusted for inflation) is guaranteed in the case of U.S. Treasury inflation-indexed bonds. For bonds that do not provide a similar guarantee, the adjusted principal value of the bond repaid at maturity may be less than the original principal. The value of inflation-indexed bonds is expected to change in response to changes in real interest rates. Real interest rates are tied to the relationship between nominal interest rates and the rate of inflation. If nominal interest rates increase at a faster rate than inflation, real interest rates may rise, leading to a decrease in value of inflation-indexed bonds. Inflation-indexed bonds, including TIPS, decline in value when real interest rates rise. In certain interest rate environments, such as when real interest rates are rising faster than nominal interest rates, inflation-indexed bonds may experience greater losses than other fixed income securities with similar durations.
Credit default swaps
Each Portfolio may be subject to credit risk in the normal course of pursuing its investment objectives. The Portfolio may enter into credit default swap contracts for hedging or speculative purposes to provide or receive a measure of protection against default on a referenced entity, obligation or index or for investment gains. Credit default swaps involve an exchange of a stream of payments for protection against the loss in value of an underlying security or index. Under the terms of the swap, one party acts as a guarantor (referred to as the seller of protection) and receives a periodic stream of payments, provided that there is no credit event, from another party (referred to as the buyer of protection) that is a fixed percentage applied to a notional principal amount over the term of the swap. An index credit default swap references all the names in the index, and if a credit event is triggered, the credit event is settled based on that name’s weight in the index. A credit event includes bankruptcy, failure to pay, obligation default, obligation acceleration, repudiation/moratorium, and restructuring. The Portfolio may enter into credit default swaps as either the seller of protection or the buyer of protection. As the seller of protection, the Portfolio is subject to investment exposure on the notional amount of the swap and has assumed the risk of default of the underlying security or index. As the buyer of protection, the Portfolio could be exposed to risks if the seller of the protection defaults on its obligation to perform, or if there are unfavorable changes in the fluctuation of interest rates. The maximum potential amount of future payments (undiscounted) that the Portfolio as the seller of protection could be required to make under the credit default swap contract would be an amount equal to the notional amount of the swap contract. The Portfolio’s maximum risk of loss from counterparty risk, either as the protection seller or as the protection buyer, is the fair value of the contract. This risk is mitigated by having a master netting arrangement between the Portfolio and the counterparty and by having the counterparty post collateral to cover the Portfolio’s exposure to the counterparty.
If the Portfolio is the seller of protection and a credit event occurs, as defined under the terms of that particular swap agreement, the Portfolio will pay to the buyer of protection the notional amount of the swap and take delivery of the referenced obligation or underlying securities comprising the referenced index. If the Portfolio is the buyer of protection and a credit event occurs, as defined under the terms of that particular swap agreement, the Portfolio will receive from the seller of protection the notional amount of the swap and deliver the referenced obligation or underlying securities comprising the referenced index.
Any premiums paid or received on the transactions are recorded as an asset or liability on the Statements of Assets and Liabilities and amortized. The value of the swap contract is marked-to-market daily based on quotations from an independent pricing service or market makers and any change in value is recorded as an unrealized gain or loss. Periodic payments made or received are recorded as realized gains or losses. In addition, payments received or made as a result of a credit event or termination of the contract are recognized as realized gains or losses.
Certain credit default swap contracts entered into by the Portfolio provide for conditions that result in events of default or termination that enable the counterparty to the agreement to cause an early termination of the transactions under those agreements. Any election by the counterparty to terminate early may impact the amounts reported on the financial statements.
Mortgage dollar roll transactions
Each Portfolio may engage in mortgage dollar roll transactions through TBA mortgage-backed securities issued by Government National Mortgage Association (GNMA), Federal National Mortgage Association (FNMA) and Federal Home Loan Mortgage Corporation (FHLMC). In a mortgage dollar roll transaction, a Portfolio sells a mortgage-backed security to a financial institution, such as a bank or broker-dealer and simultaneously agrees to repurchase a substantially similar security from the institution at a later date at an agreed upon price. The mortgage-backed securities that are repurchased will bear the same interest rate as those sold, but generally will be collateralized by different pools of mortgages with different pre-payment histories. During the roll period, a Portfolio foregoes principal and interest paid on the securities. A Portfolio is compensated by the difference between the current sales price and the forward price for the future purchase as well as by the earnings on the cash proceeds of the initial sale. Mortgage dollar rolls may be renewed without physical delivery of the securities subject to the contract. The Portfolios account for TBA dollar roll transactions as purchases and sales.
| | | | |
| 42 | | Wells Fargo Advantage Income Funds | | Notes to financial statements (unaudited) |
Security transactions and income recognition
Securities transactions are recorded on a trade date basis. Realized gains or losses are recorded on the basis of identified cost.
Interest income is accrued daily and bond discounts are accreted and premiums are amortized daily based on the effective interest method. To the extent debt obligations are placed on non-accrual status, any related interest income may be reduced by writing off interest receivables when the collection of all or a portion of interest has become doubtful based on consistently applied procedures. If the issuer subsequently resumes interest payments or when the collectability of interest is reasonably assured, the debt obligation is removed from non-accrual status.
Income from foreign securities is recorded net of foreign taxes withheld where recovery of such taxes is not assured.
Federal and other taxes
Each Portfolio is treated as a separate entity for federal income tax purposes. The Portfolios are not required to pay federal income taxes on their net investment income and net capital gain as they are treated as partnerships for federal income tax purposes. All interest, dividends, gains and losses of a Portfolio are deemed to have been “passed through” to the interestholders in proportion to their holdings of the Portfolio regardless of whether such interest, dividends and gains have been distributed by the Portfolio.
Each Portfolio’s income tax returns and all financial records supporting those returns for the prior three fiscal years are subject to examination by the federal revenue authority. Management has analyzed each Portfolio’s tax positions taken on federal, state, and foreign tax returns for all open tax years and does not believe that there are any uncertain tax positions that require recognition of a tax liability.
3. FAIR VALUATION MEASUREMENTS
Fair value measurements of investments are determined within a framework that has established a fair value hierarchy based upon the various data inputs utilized in determining the value of each Portfolio’s investments. The three-level hierarchy gives the highest priority to unadjusted quoted prices in active markets for identical assets or liabilities (Level 1) and the lowest priority to significant unobservable inputs (Level 3). Each Portfolio’s investments are classified within the fair value hierarchy based on the lowest level of input that is significant to the fair value measurement. The inputs are summarized into three broad levels as follows:
| n | | Level 1 – quoted prices in active markets for identical securities |
| n | | Level 2 – other significant observable inputs (including quoted prices for similar securities, interest rates, prepayment speeds, credit risk, use of amortized cost, etc.) |
| n | | Level 3 – significant unobservable inputs (including the Portfolio’s own assumptions in determining the fair value of investments) |
The inputs or methodologies used for valuing investments in securities are not necessarily an indication of the risk associated with investing in those securities.
As of November 30, 2013, the inputs used in valuing investments in securities were as follows:
| | | | | | | | | | | | | | | | |
| Investments in securities | | Quoted prices
(Level 1) | | | Other significant
observable inputs
(Level 2) | | | Significant
unobservable inputs
(Level 3) | | | Total | |
Core Bond Portfolio | | | | | | | | | | | | | | | | |
| | | | |
Agency securities | | $ | 0 | | | $ | 1,033,841,344 | | | $ | 0 | | | $ | 1,033,841,344 | |
| | | | |
Asset-backed securities | | | 0 | | | | 434,124,222 | | | | 0 | | | | 434,124,222 | |
| | | | |
Corporate bonds and notes | | | 0 | | | | 555,111,024 | | | | 0 | | | | 555,111,024 | |
| | | | |
Municipal obligations | | | 0 | | | | 29,429,558 | | | | 0 | | | | 29,429,558 | |
| | | | |
Non-agency mortgage backed securities | | | 0 | | | | 214,467,880 | | | | 0 | | | | 214,467,880 | |
| | | | |
U.S. Treasury securities | | | 553,754,061 | | | | 0 | | | | 0 | | | | 553,754,061 | |
| | | | |
Yankee corporate bonds and notes | | | 0 | | | | 191,000,052 | | | | 0 | | | | 191,000,052 | |
| | | | |
Yankee government bonds | | | 0 | | | | 58,409,823 | | | | 0 | | | | 58,409,823 | |
| | | | |
Short-term investments | | | | | | | | | | | | | | | | |
Investment companies | | | 67,603,250 | | | | 0 | | | | 0 | | | | 67,603,250 | |
Total | | $ | 621,357,311 | | | $ | 2,516,383,903 | | | $ | 0 | | | $ | 3,137,741,214 | |
| | | | | | |
| Notes to financial statements (unaudited) | | Wells Fargo Advantage Income Funds | | | 43 | |
| | | | | | | | | | | | | | | | |
| Investments in securities | | Quoted prices
(Level 1) | | | Other significant observable inputs
(Level 2) | | | Significant
unobservable inputs
(Level 3) | | | Total | |
Inflation-Protected Bond Portfolio | | | | | | | | | | | | | | | | |
| | | | |
U.S. Treasury securities | | $ | 53,610,497 | | | $ | 0 | | | $ | 0 | | | $ | 53,610,497 | |
| | | | |
Short-term investments | | | | | | | | | | | | | | | | |
Investment companies | | | 378,253 | | | | 0 | | | | 0 | | | | 378,253 | |
Total | | $ | 53,988,750 | | | $ | 0 | | | $ | 0 | | | $ | 53,988,750 | |
Transfers in and transfers out are recognized at the end of the reporting period. For the six months ended November 30, 2013, the Portfolios did not have any transfers into/out of Level 1, Level 2, or Level 3.
4. TRANSACTIONS WITH AFFILIATES AND OTHER EXPENSES
Advisory fee
The Trust has entered into an advisory contract with Funds Management, an indirect wholly owned subsidiary of Wells Fargo & Company (“Wells Fargo”). The adviser is responsible for implementing investment policies and guidelines and for supervising the subadvisers, who are responsible for day-to-day portfolio management of the Portfolios.
Funds Management is entitled to receive an annual advisory fee starting at 0.40% and declining to 0.30% as the average daily net assets of each Portfolio increase. For the six months ended November 30, 2013, the advisory fee for Core Bond Portfolio and Inflation-Protected Bond Portfolio was equivalent to an annual rate of 0.36% and 0.40%, respectively, of each Portfolio’s average daily net assets.
Funds Management has retained the services of certain subadvisers to provide daily portfolio management to the Portfolios. The fees for subadvisory services are borne by Funds Management. WellsCap, an affiliate of Funds Management and an indirect, wholly owned subsidiary of Wells Fargo, is the subadviser to each Portfolio and is entitled to receive a fee from Funds Management at an annual rate starting at 0.20% and declining to 0.10% as the average daily net assets of each Portfolio increase.
Funds Management has voluntarily waived its advisory fee and/or reimbursed expenses to the extent necessary to maintain certain net operating expense ratios for the Portfolios.
5. INVESTMENT PORTFOLIO TRANSACTIONS
Purchases and sales of investments, excluding short-term securities, for the six months ended November 30, 2013 were as follows:
| | | | | | | | | | | | |
| | | Purchases at cost | | | Sales proceeds | |
| | | U.S.
government | | Non-U.S.
government | | | U.S.
government | | Non-U.S.
government | |
Core Bond Portfolio | | $9,502,705,522 | | $ | 1,281,586,707 | | | $9,499,008,748 | | $ | 1,347,369,267 | |
Inflation-Protected Bond Portfolio | | 2,452,437 | | | 0 | | | 11,910,032 | | | 0 | |
6. DERIVATIVE TRANSACTIONS
During the six months ended November 30, 2013, Inflation-Protected Bond Portfolio entered into futures contracts to speculate on interest rates and to help manage the duration of the portfolio.
As of November 30, 2013, Inflation-Protected Bond Portfolio did not have any open futures contracts. Inflation-Protected Bond Portfolio had an average notional amount of $21,268 in long futures contracts during the six months ended November 30, 2013.
The realized losses and change in unrealized gains or losses on derivative instruments are reflected in the Statements of Operations.
7. INDEMNIFICATION
Under the Trust’s organizational documents, the officers and directors are indemnified against certain liabilities that may arise out of performance of their duties to the Trust. Additionally, in the normal course of business, the Trust may enter
into contracts with service providers that contain a variety of indemnification clauses. The Trust’s maximum exposure under these arrangements is dependent on future claims that may be made against the Portfolios and, therefore, cannot be estimated.
| | | | |
| 44 | | Wells Fargo Advantage Income Funds | | Other information (unaudited) |
PROXY VOTING INFORMATION
A description of the policies and procedures used to determine how to vote proxies relating to portfolio securities is available without charge, upon request, by calling 1-800-222-8222, visiting our website at wellsfargoadvantagefunds.com, or visiting the SEC website at sec.gov. Information regarding how the proxies related to portfolio securities were voted during the most recent 12-month period ended June 30 is available without charge on the website at wellsfargoadvantagefunds.com or by visiting the SEC website at sec.gov.
PORTFOLIO HOLDINGS INFORMATION
The complete portfolio holdings are publicly available on the website (wellsfargoadvantagefunds.com) on a monthly, 30-day or more delayed basis. In addition, top ten holdings information is publicly available on the website on a monthly, seven-day or more delayed basis. Each Fund and Portfolio files its complete schedule of portfolio holdings with the SEC for the first and third quarters of each fiscal year on Form N-Q, which is available without charge by visiting the SEC website at sec.gov. In addition, each Form N-Q may be reviewed and copied at the SEC’s Public Reference Room in Washington, DC, and at regional offices in New York City, at 233 Broadway, and in Chicago, at 175 West Jackson Boulevard, Suite 900. Information about the Public Reference Room may be obtained by calling 1-800-SEC-0330.
| | | | | | |
| Other information (unaudited) | | Wells Fargo Advantage Income Funds | | | 45 | |
BOARD OF TRUSTEES AND OFFICERS
Each of the Trustees and Officers listed in the table below acts in identical capacities for each fund in the Wells Fargo Advantage family of funds, which consists of 131 mutual funds1 comprising the Wells Fargo Funds Trust, Wells Fargo Variable Trust, Wells Fargo Master Trust and four closed-end funds (collectively the “Fund Complex”). This table should be read in conjunction with the Prospectus and the Statement of Additional Information2. All of the Trustees are also Members of the Audit and Governance Committees of each Trust in the Fund Complex. The mailing address of each Trustee and Officer is 525 Market Street, 12th Floor, San Francisco, CA 94105. Each Trustee and Officer serves an indefinite term, however, each Trustee serves such term until reaching the mandatory retirement age established by the Trustees.
Independent Trustees
| | | | | | |
Name and year of birth | | Position held and length of service* | | Principal occupations during past five years | | Other directorships during
past five years |
| Peter G. Gordon (Born 1942) | | Trustee, since 1998; Chairman, since 2005 | | Co-Founder, Retired Chairman, President and CEO of Crystal Geyser Water Company. Trustee Emeritus, Colby College. | | Asset Allocation Trust |
| Isaiah Harris, Jr. (Born 1952) | | Trustee, since 2009 | | Retired. Prior thereto, President and CEO of BellSouth Advertising and Publishing Corp. from 2005 to 2007, President and CEO of BellSouth Enterprises from 2004 to 2005 and President of BellSouth Consumer Services from 2000 to 2003. Emeritus member of the Iowa State University Foundation Board of Governors. Emeritus Member of the Advisory Board of Iowa State University School of Business. Advisory Board Member, Palm Harbor Academy (charter school). Mr. Harris is a certified public accountant. | | CIGNA Corporation; Deluxe Corporation; Asset Allocation Trust |
| Judith M. Johnson (Born 1949) | | Trustee, since 2008;
Audit Committee Chairman, since 2008 | | Retired. Prior thereto, Chief Executive Officer and Chief Investment Officer of Minneapolis Employees Retirement Fund from 1996 to 2008. Ms. Johnson is an attorney, certified public accountant and a certified managerial accountant. | | Asset Allocation Trust |
| Leroy Keith, Jr. (Born 1939) | | Trustee, since 2010 | | Chairman, Bloc Global Services (development and construction). Trustee of the Evergreen Funds from 1983 to 2010. Former Managing Director, Almanac Capital Management (commodities firm), former Partner, Stonington Partners, Inc. (private equity fund), former Director, Obagi Medical Products Co. and former Director, Lincoln Educational Services. | | Trustee, Virtus Fund Complex (consisting of 48 portfolios as of 1/31/2013); Asset Allocation Trust |
| David F. Larcker (Born 1950) | | Trustee, since 2009 | | James Irvin Miller Professor of Accounting at the Graduate School of Business, Stanford University, Morgan Stanley Director of the Center for Leadership Development and Research and Senior Faculty of The Rock Center for Corporate Governance since 2006. From 2005 to 2008, Professor of Accounting at the Graduate School of Business, Stanford University. Prior thereto, Ernst & Young Professor of Accounting at The Wharton School, University of Pennsylvania from 1985 to 2005. | | Asset Allocation Trust |
| Olivia S. Mitchell (Born 1953) | | Trustee, since 2006 | | International Foundation of Employee Benefit Plans Professor, Wharton School of the University of Pennsylvania since 1993. Director of Wharton’s Pension Research Council and Boettner Center on Pensions & Retirement Research, and Research Associate at the National Bureau of Economic Research. Previously, Cornell University Professor from 1978 to 1993. | | Asset Allocation Trust |
| Timothy J. Penny (Born 1951) | | Trustee, since 1996 | | President and CEO of Southern Minnesota Initiative Foundation, a non-profit organization, since 2007 and Senior Fellow at the Humphrey Institute Policy Forum at the University of Minnesota since 1995. Member of the Board of Trustees of NorthStar Education Finance, Inc., a non-profit organization, since 2007. | | Asset Allocation Trust |
| | | | |
| 46 | | Wells Fargo Advantage Income Funds | | Other information (unaudited) |
| | | | | | |
Name and year of birth | | Position held and length of service* | | Principal occupations during past five years | | Other directorships during
past five years |
| Michael S. Scofield (Born 1943) | | Trustee, since 2010 | | Served on the Investment Company Institute’s Board of Governors and Executive Committee from 2008-2011 as well the Governing Council of the Independent Directors Council from 2006-2011 and the Independent Directors Council Executive Committee from 2008-2011. Chairman of the IDC from 2008-2010. Institutional Investor (Fund Directions) Trustee of Year in 2007. Trustee of the Evergreen Funds (and its predecessors) from 1984 to 2010. Chairman of the Evergreen Funds from 2000-2010. Former Trustee of the Mentor Funds. Retired Attorney, Law Offices of Michael S. Scofield. | | Asset Allocation Trust |
| Donald C. Willeke (Born 1940) | | Trustee, since 1996 | | Principal of the law firm of Willeke & Daniels. General Counsel of the Minneapolis Employees Retirement Fund from 1984 until its consolidation into the Minnesota Public Employees Retirement Association on June 30, 2010. Director and Vice Chair of The Tree Trust (non-profit corporation). Director of the American Chestnut Foundation (non-profit corporation). | | Asset Allocation Trust |
| * | Length of service dates reflect the Trustee’s commencement of service with the Trust’s predecessor entities, where applicable. |
Officers
| | | | | | |
Name and
year of birth | | Position held and
length of service | | Principal occupations during past five years | | |
| Karla M. Rabusch (Born 1959) | | President, since 2003 | | Executive Vice President of Wells Fargo Bank, N.A. and President of Wells Fargo Funds Management, LLC since 2003. | | |
Nancy Wiser1
(Born 1967) | | Treasurer, since 2012 | | Executive Vice President of Wells Fargo Funds Management, LLC since 2011. Chief Operating Officer and Chief Compliance Officer at LightBox Capital Management LLC, from 2008 to 2011. Owned and operated a consulting business providing services to various hedge funds including acting as Chief Operating Officer and Chief Compliance Officer for a hedge fund from 2007 to 2008. Chief Operating Officer and Chief Compliance Officer of GMN Capital LLC from 2006 to 2007. | | |
| C. David Messman (Born 1960) | | Secretary, since 2000; Chief Legal Officer, since 2003 | | Senior Vice President and Secretary of Wells Fargo Funds Management, LLC since 2001. Vice President and Managing Counsel of Wells Fargo Bank, N.A. since 1996. | | |
Debra Ann Early
(Born 1964) | | Chief Compliance Officer, since 2007 | | Chief Compliance Officer of Wells Fargo Funds Management, LLC since 2007. Chief Compliance Officer of Parnassus Investments from 2005 to 2007. Chief Financial Officer of Parnassus Investments from 2004 to 2007. | | |
David Berardi
(Born 1975) | | Assistant Treasurer, since 2009 | | Vice President of Wells Fargo Funds Management, LLC since 2009. Vice President of Evergreen Investment Management Company, LLC from 2008 to 2010. Assistant Vice President of Evergreen Investment Services, Inc. from 2004 to 2008. Manager of Fund Reporting and Control for Evergreen Investment Management Company, LLC from 2004 to 2010. | | |
| Jeremy DePalma1 (Born 1974) | | Assistant Treasurer, since 2009 | | Senior Vice President of Wells Fargo Funds Management, LLC since 2009. Senior Vice President of Evergreen Investment Management Company, LLC from 2008 to 2010. Vice President, Evergreen Investment Services, Inc. from 2004 to 2007. Head of the Fund Reporting and Control Team within Fund Administration from 2005 to 2010. | | |
| 1. | Nancy Wiser acts as Treasurer of 73 funds in the Fund Complex. Jeremy DePalma acts as Treasurer of 58 funds and Assistant Treasurer of 73 funds in the Fund Complex. |
| 2. | The Statement of Additional Information includes additional information about the Trustees and is available, without charge, upon request, by calling 1-800-222-8222 or by visiting the website at wellsfargoadvantagefunds.com. |
| | | | | | |
| List of abbreviations | | Wells Fargo Advantage Income Funds | | | 47 | |
The following is a list of common abbreviations for terms and entities that may have appeared in this report.
| ACA | — ACA Financial Guaranty Corporation |
| ADR | — American depositary receipt |
| ADS | — American depositary shares |
| AGC | — Assured Guaranty Corporation |
| AGM | — Assured Guaranty Municipal |
| Ambac | — Ambac Financial Group Incorporated |
| AMT | — Alternative minimum tax |
| BAN | — Bond anticipation notes |
| BHAC | — Berkshire Hathaway Assurance Corporation |
| CAB | — Capital appreciation bond |
| CCAB | — Convertible capital appreciation bond |
| CDA | — Community Development Authority |
| CDO | — Collateralized debt obligation |
| COP | — Certificate of participation |
| DRIVER | — Derivative inverse tax-exempt receipts |
| DW&P | — Department of Water & Power |
| DWR | — Department of Water Resources |
| ECFA | — Educational & Cultural Facilities Authority |
| EDA | — Economic Development Authority |
| EDFA | — Economic Development Finance Authority |
| ETF | — Exchange-traded fund |
| FDIC | — Federal Deposit Insurance Corporation |
| FFCB | — Federal Farm Credit Banks |
| FGIC | — Financial Guaranty Insurance Corporation |
| FHA | — Federal Housing Administration |
| FHLB | — Federal Home Loan Bank |
| FHLMC | — Federal Home Loan Mortgage Corporation |
| FICO | — The Financing Corporation |
| FNMA | — Federal National Mortgage Association |
| GDR | — Global depositary receipt |
| GNMA | — Government National Mortgage Association |
| HCFR | — Healthcare facilities revenue |
| HEFA | — Health & Educational Facilities Authority |
| HEFAR | — Higher education facilities authority revenue |
| HFA | — Housing Finance Authority |
| HFFA | — Health Facilities Financing Authority |
| HUD | — Department of Housing and Urban Development |
| IDA | — Industrial Development Authority |
| IDAG | — Industrial Development Agency |
| IDR | — Industrial development revenue |
| KRW | — Republic of Korea won |
| LIBOR | — London Interbank Offered Rate |
| LLC | — Limited liability company |
| LLP | — Limited liability partnership |
| MBIA | — Municipal Bond Insurance Association |
| MFHR | — Multifamily housing revenue |
| MSTR | — Municipal securities trust receipts |
| MUD | — Municipal Utility District |
| National | — National Public Finance Guarantee Corporation |
| PCFA | — Pollution Control Financing Authority |
| PCL | — Public Company Limited |
| PCR | — Pollution control revenue |
| PFA | — Public Finance Authority |
| PFFA | — Public Facilities Financing Authority |
| PFOTER | — Puttable floating option tax-exempt receipts |
| plc | — Public limited company |
| PUTTER | — Puttable tax-exempt receipts |
| R&D | — Research & development |
| Radian | — Radian Asset Assurance |
| RAN | — Revenue anticipation notes |
| RDA | — Redevelopment Authority |
| RDFA | — Redevelopment Finance Authority |
| REIT | — Real estate investment trust |
| ROC | — Reset option certificates |
| SAVRS | — Select auction variable rate securities |
| SBA | — Small Business Authority |
| SFHR | — Single-family housing revenue |
| SFMR | — Single-family mortgage revenue |
| SPA | — Standby purchase agreement |
| SPDR | — Standard & Poor’s Depositary Receipts |
| STRIPS | — Separate trading of registered interest and principal securities |
| TAN | — Tax anticipation notes |
| TIPS | — Treasury inflation-protected securities |
| TRAN | — Tax revenue anticipation notes |
| TTFA | — Transportation Trust Fund Authority |
| TVA | — Tennessee Valley Authority |
This page is intentionally left blank.


For more information
More information about Wells Fargo Advantage Funds is available free upon request. To obtain literature, please write, email, visit the Fund’s website, or call:
Wells Fargo Advantage Funds
P.O. Box 8266
Boston, MA 02266-8266
Email: wfaf@wellsfargo.com
Website: wellsfargoadvantagefunds.com
Individual investors: 1-800-222-8222
Retail investment professionals: 1-888-877-9275
Institutional investment professionals: 1-866-765-0778
This report and the financial statements contained herein are submitted for the general information of the shareholders of Wells Fargo Advantage Funds. If this report is used for promotional purposes, distribution of the report must be accompanied or preceded by a current prospectus. For a current prospectus and, if available, a summary prospectus containing more complete information, including charges and expenses, call 1-800-222-8222 or visit the Fund’s website at wellsfargoadvantagefunds.com. Please consider the investment objectives, risks, charges, and expenses of the investment carefully before investing. This and other information about Wells Fargo Advantage Funds can be found in the current prospectus. Read the prospectus carefully before you invest or send money.
Wells Fargo Funds Management, LLC, a wholly owned subsidiary of Wells Fargo & Company, provides investment advisory and administrative services for Wells Fargo Advantage Funds. Other affiliates of Wells Fargo & Company provide subadvisory and other services for the Funds. The Funds are distributed by Wells Fargo Funds Distributor, LLC, Member FINRA/SIPC, an affiliate of Wells Fargo & Company.
NOT FDIC INSURED ¡ NO BANK GUARANTEE ¡ MAY LOSE VALUE
© 2013 Wells Fargo Funds Management, LLC. All rights reserved.
| | |
 | | 221301 01-14 SILD/SAR103 11-13 |

Wells Fargo Advantage WealthBuilder
PortfoliosSM

Semi-Annual Report
November 30, 2013
| n | | Wells Fargo Advantage WealthBuilder Conservative Allocation PortfolioSM |
| n | | Wells Fargo Advantage WealthBuilder Moderate Balanced PortfolioSM |
| n | | Wells Fargo Advantage WealthBuilder Growth Balanced PortfolioSM |
| n | | Wells Fargo Advantage WealthBuilder Growth Allocation PortfolioSM |
| n | | Wells Fargo Advantage WealthBuilder Equity PortfolioSM |
| n | | Wells Fargo Advantage WealthBuilder Tactical Equity PortfolioSM |

Reduce clutter. Save trees.
Sign up for electronic delivery of prospectuses and shareholder reports at wellsfargo.com/advantagedelivery
Contents
The views expressed and any forward-looking statements are as of November 30, 2013, unless otherwise noted, and are those of the Fund managers and/or Wells Fargo Funds Management, LLC. Discussions of individual securities, or the markets generally, or any Wells Fargo Advantage Fund are not intended as individual recommendations. Future events or results may vary significantly from those expressed in any forward-looking statements; the views expressed are subject to change at any time in response to changing circumstances in the market. Wells Fargo Funds Management, LLC and the Funds disclaim any obligation to publicly update or revise any views expressed or forward-looking statements.
NOT FDIC INSURED ¡ NO BANK GUARANTEE ¡ MAY LOSE VALUE
| | | | |
| 2 | | Wells Fargo Advantage WealthBuilder Portfolios | | Letter to shareholders (unaudited) |

Karla M. Rabusch
President
Wells Fargo Advantage Funds
Equity returns were bolstered by positive economic growth and accommodative monetary policies in many countries. Many fixed-income returns were modestly positive because interest rates stabilized and credit conditions were favorable, enabling lower-quality bonds to do well.
Dear Valued Shareholder:
We are pleased to offer you this semi-annual report for the Wells Fargo Advantage WealthBuilder Portfolios for the six-month period that ended November 30, 2013. Equity returns were bolstered by positive economic growth and accommodative monetary policies in many countries. Many fixed-income returns were modestly positive because interest rates stabilized and credit conditions were favorable, enabling lower-quality bonds to do well.
Economic growth was no longer a negative for investors.
Fears of a stalling U.S. economy, a eurozone recession, and a hard landing in China were largely erased. The U.S. economy grew modestly during the past six months. Broadly speaking, the U.S. saw gains in business investment and housing alongside some drag from government spending. Employment trended in the right direction, with the unemployment rate declining, though still higher than satisfactory levels. Meanwhile, monetary policy remained accommodative throughout the period. At the end of November 2013, the federal funds rate remained near zero and the quantitative easing program continued at the rate of $85 billion per month.
In other parts of the world, the eurozone ended its recession and began registering positive growth. While Germany was the healthiest of the eurozone economies, many of the troubled southern countries—such as Spain and Portugal—began growing again or showed significantly improved growth trends. Another sign of healing was that yields on government debt in Europe’s peripheral countries declined. Japan, meanwhile, continued its recovery. Emerging markets growth was mixed, but China’s growth appeared to stabilize. Meanwhile, the European Central Bank kept its monetary policy accommodative, lowering its short-term interest rates from 0.50% to 0.25% in November 2013.
Investor optimism resulted in positive equity returns.
Investor confidence grew during the period as economic concerns lessened. Stock markets also benefited from easy monetary policies and resolutions of political problems, such as the end of the U.S. government shutdown. As a result, the S&P 500 Index1 returned 11.91% for the six-month period that ended November 30, 2013. The index also managed to end higher than 1,800, a level typically considered a threshold for investor optimism. Meanwhile, the MSCI ACWI ex USA (Net)2, a measure of non-U.S. developed country equities, returned 9.37% during the six-month period that ended November 30, 2013.
Bond markets struggled to return to positive territory.
During the six months ended November 30, 2013, most categories of non-U.S. Treasury bonds managed to earn positive returns. However, it was a volatile path to positive results, and U.S. Treasury bonds did not manage to claw back into positive territory. June 2013 was a difficult month for bonds because yields increased in response to Federal Reserve Chairman Bernanke’s comments about the scaling back of its bond-buying program. Interest rates then stabilized, and
| 1. | The S&P 500 Index consists of 500 stocks chosen for market size, liquidity, and industry group representation. It is a market-value-weighted index with each stock’s weight in the index proportionate to its market value. You cannot invest directly in an index. |
| 2. | The Morgan Stanley Capital International All Country World Index ex USA (Net) (MSCI ACWI ex USA (Net)) is a free float-adjusted market capitalization weighted index that is designed to measure the equity market performance of developed and emerging markets. You cannot invest directly in an index. Source: MSCI. MSCI makes no express or implied warranties or representations and shall have no liability whatsoever with respect to any MSCI data contained herein. The MSCI data may not be further redistributed or used as a basis for other indexes or any securities or financial products. This report is not approved, reviewed or produced by MSCI. |
| | | | | | |
| Letter to shareholders (unaudited) | | Wells Fargo Advantage WealthBuilder Portfolios | | | 3 | |
investment-grade and high-yield bond markets began generating positive returns. U.S. Treasury bonds bore the brunt of the interest-rate increase, while bonds in lower-tier credit categories benefited from a yield cushion and investor appetite for equity-correlated returns.
Don’t let short-term uncertainty derail long-term investment goals.
Periods of uncertainty can present challenges, but experience has taught us that maintaining long-term investment goals can be an effective way to plan for the future. To help you create a sound strategy based on your personal goals and risk tolerance, Wells Fargo Advantage Funds offers more than 100 mutual funds and other investments spanning a wide range of asset classes and investment styles. Although diversification cannot guarantee an investment profit or prevent losses, we believe it can be an effective way to manage investment risk and potentially smooth out overall portfolio performance. Weencourage investors to know their investments and to understand that appropriate levels of risk-taking may unlock opportunities.
Thank you for choosing to invest with Wells Fargo Advantage Funds. We appreciate your confidence in us and remain committed to helping you meet your financial needs. For current information about your fund investments, contact your investment professional, visit our website at wellsfargoadvantagefunds.com, or call us directly at 1-800-222-8222. We are available 24 hours a day, 7 days a week.
Sincerely,

Karla M. Rabusch
President
Wells Fargo Advantage Funds
Periods of uncertainty can present challenges, but experience has taught us that maintaining long-term investment goals can be an effective way to plan for the future.
| | | | |
| 4 | | Wells Fargo Advantage WealthBuilder Portfolios | | Performance highlights (unaudited) |
Wells Fargo Advantage WealthBuilder Conservative Allocation Portfolio
Investment objective
The Portfolio seeks current income with a secondary emphasis on capital appreciation.
Adviser
Wells Fargo Funds Management, LLC
Subadviser
Wells Capital Management Incorporated
Portfolio managers
Kandarp Acharya, CFA, FRM
Christian L. Chan, CFA
Average annual total returns (%) as of November 30, 2013
| | | | | | | | | | | | | | | | | | | | | | | | | | | | | | | | | | |
| | | | | Including sales charge | | | Excluding sales charge | | | Expense ratios1 (%) | |
| | | Inception date | | 1 year | | | 5 year | | | Since
inception | | | 1 year | | | 5 year | | | Since
inception | | | Gross | | | Net2 | |
| Wells Fargo Advantage WealthBuilder Conservative Allocation Portfolio (WBCAX) | | 9-30-2004 | | | 2.69 | | | | 7.36 | | | | 3.83 | | | | 4.26 | | | | 7.69 | | | | 4.00 | | | | 2.07 | | | | 2.03 | |
| WealthBuilder Conservative Allocation Composite Index3 | | – | | | – | | | | – | | | | – | | | | 3.74 | | | | 7.87 | | | | 5.57 | | | | – | | | | – | |
| S&P 500 Index4,8 | | – | | | – | | | | – | | | | – | | | | 30.30 | | | | 17.60 | | | | 7.63 | | | | – | | | | – | |
| Barclays U.S. Aggregate Bond Index5,8 | | – | | | – | | | | – | | | | – | | | | (1.61 | ) | | | 5.33 | | | | 4.66 | | | | – | | | | – | |
| Russell 3000® Index6,8 | | – | | | – | | | | – | | | | – | | | | 31.71 | | | | 18.54 | | | | 8.13 | | | | – | | | | – | |
| MSCI ACWI ex USA (Net)7,8 | | – | | | – | | | | – | | | | – | | | | 18.24 | | | | 13.87 | | | | 7.63 | | | | – | | | | – | |
Figures quoted represent past performance, which is no guarantee of future results, and do not reflect taxes that a shareholder may pay on fund distributions or the redemption of fund shares. Investment return and principal value of an investment will fluctuate so that an investor’s shares, when redeemed, may be worth more or less than their original cost. Performance shown without sales charges would be lower if sales charges were reflected. Current performance may be lower or higher than the performance data quoted, which assumes the reinvestment of dividends and capital gains. Current month-end performance is available on the Portfolio’s website, wellsfargoadvantagefunds.com.
Index returns do not include transaction costs associated with buying and selling securities, any mutual fund fees or expenses, or any taxes. It is not possible to invest directly in an index.
For WealthBuilder Portfolio shares, the maximum front-end sales charge is 1.50%. Performance including sales charge assumes the sales charge for the corresponding time period.
Balanced funds may invest in stocks and bonds. Stock values fluctuate in response to the activities of individual companies and general market and economic conditions. Bond values fluctuate in response to the financial condition of individual issuers, general market and economic conditions, and changes in interest rates. In general, when interest rates rise, bond values fall and investors may lose principal value. The Portfolio will indirectly be exposed to all of the risks of an investment in the underlying funds and will indirectly bear expenses of the underlying funds. The use of derivatives may reduce returns and/or increase volatility. Certain investment strategies tend to increase the total risk of an investment (relative to the broader market). The Portfolio is exposed to alternative investment risk, foreign investment risk, high-yield securities risk, mortgage- and asset-backed securities risk, and smaller-company investment risk. Consult the Portfolio’s prospectus for additional information on these and other risks.
Please see footnotes on page 5.
| | | | | | |
| Performance highlights (unaudited) | | Wells Fargo Advantage WealthBuilder Portfolios | | | 5 | |
Wells Fargo Advantage WealthBuilder Conservative Allocation Portfolio (continued)
| | | | |
| Ten largest holdings9 (%) as of November 30, 2013 | |
Wells Fargo Advantage Short Duration Government Bond Fund | | | 28.10 | |
Wells Fargo Advantage Government Securities Fund | | | 18.71 | |
Wells Fargo Advantage Core Bond Portfolio | | | 18.70 | |
PIMCO High Yield Fund | | | 4.71 | |
Oppenheimer International Bond Fund | | | 4.69 | |
MFS Value Fund | | | 3.15 | |
PIMCO CommodityRealReturn Strategy Fund | | | 2.70 | |
Thornburg International Value Fund | | | 1.76 | |
ING Global Real Estate Fund | | | 1.76 | |
Eaton Vance Large Cap Value Fund | | | 1.58 | |
| | |
| Current target allocation10 as of November 30, 2013 |
|
|
| 1. | Reflects the expense ratios as stated in the most recent prospectuses. |
| 2. | The Adviser has committed through September 30, 2014, to waive fees and/or reimburse expenses to the extent necessary to cap the Portfolio’s Total Annual Fund Operating Expenses After FeeWaiver, excluding certain expenses, at 1.50%. Brokerage commissions, stamp duty fees, interest, taxes, acquired fund fees and expenses, and extraordinary expenses are excluded from the cap. Without this cap, the Portfolio’s returns would have been lower. |
| 3. | Source: Wells Fargo Funds Management, LLC. The WealthBuilder Conservative Allocation Composite Index is weighted 14% in the Russell 3000 Index, 6% in the MSCI ACWI ex USA (Net), and 80% in the Barclays U.S. Aggregate Bond Index. Prior to October 1, 2013, the composition of the index was 20% in the S&P 500 Index and 80% in the Barclays U.S. Aggregate Bond Index. You cannot invest directly in an index. |
| 4. | The S&P 500 Index consists of 500 stocks chosen for market size, liquidity, and industry group representation. It is a market-value-weighted index with each stock’s weight in the index proportionate to its market value. You cannot invest directly in an index. |
| 5. | The Barclays U.S. Aggregate Bond Index is composed of the Barclays U.S. Government/Credit Index and the Barclays U.S. Mortgage-Backed Securities Index and includes U.S. Treasury issues, agency issues, corporate bond issues, and mortgage-backed securities. You cannot invest directly in an index. |
| 6. | The Russell 3000® Index measures the performance of the 3,000 largest U.S. companies based on total market capitalization, which represents approximately 98% of the investable U.S. equity market. You cannot invest directly in an index. |
| 7. | The Morgan Stanley Capital International All Country World Index ex USA (Net) (MSCI ACWI ex USA (Net)) is a free float-adjusted market capitalization weighted index that is designed to measure the equity market performance of developed and emerging markets. You cannot invest directly in an index. Source: MSCI. MSCI makes no express or implied warranties or representations and shall have no liability whatsoever with respect to any MSCI data contained herein. The MSCI data may not be further redistributed or used as a basis for other indexes or any securities or financial products. This report is not approved, reviewed or produced by MSCI. |
| 8. | At the close of business on September 30, 2013, the Portfolio changed its benchmarks from the S&P 500 Index and the Barclays U.S. Aggregate Bond Index to the Russell 3000 Index, the MSCI ACWI ex USA (Net) and the Barclays U.S. Aggregate Bond Index. We believe these benchmarks are more similar to the characteristics of the Portfolio in light of the recent changes to the Portfolio’s investment strategies. |
| 9. | The ten largest holdings are calculated based on the value of the holdings divided by total net assets of the Portfolio. Holdings are subject to change and may have changed since the date specified. |
| 10. | Current target allocation is subject to change and is calculated based on the total long-term investments of the Portfolio. The Portfolio’s use of futures contracts to implement a Tactical Asset Allocation (TAA) shift toward stocks or bonds is reflected in the allocation shown. |
| | | | |
| 6 | | Wells Fargo Advantage WealthBuilder Portfolios | | Performance highlights (unaudited) |
Wells Fargo Advantage WealthBuilder Moderate Balanced Portfolio
Investment objective
The Portfolio seeks a combination of current income and capital appreciation.
Adviser
Wells Fargo Funds Management, LLC
Subadviser
Wells Capital Management Incorporated
Portfolio managers
Kandarp Acharya, CFA, FRM
Christian L. Chan, CFA
Average annual total returns (%) as of November 30, 2013
| | | | | | | | | | | | | | | | | | | | | | | | | | | | | | | | | | |
| | | | | Including sales charge | | | Excluding sales charge | | | Expense ratios1 (%) | |
| | | Inception date | | 1 year | | | 5 year | | | Since
inception | | | 1 year | | | 5 year | | | Since
inception | | | Gross | | | Net2 | |
| Wells Fargo Advantage WealthBuilder Moderate Balanced Portfolio (WBBBX) | | 9-30-2004 | | | 9.29 | | | | 10.44 | | | | 4.61 | | | | 10.95 | | | | 10.78 | | | | 4.79 | | | | 2.14 | | | | 2.10 | |
| WealthBuilder Moderate Balanced Composite Index3 | | – | | | – | | | | – | | | | – | | | | 9.33 | | | | 10.33 | | | | 6.37 | | | | – | | | | – | |
| S&P 500 Index4,8 | | – | | | – | | | | – | | | | – | | | | 30.30 | | | | 17.60 | | | | 7.63 | | | | – | | | | – | |
| Barclays U.S. Aggregate Bond Index5,8 | | – | | | – | | | | – | | | | – | | | | (1.61 | ) | | | 5.33 | | | | 4.66 | | | | – | | | | – | |
| Russell 3000® Index6,8 | | – | | | – | | | | – | | | | – | | | | 31.71 | | | | 18.54 | | | | 8.13 | | | | – | | | | – | |
| MSCI ACWI ex USA (Net)7,8 | | – | | | – | | | | – | | | | – | | | | 18.24 | | | | 13.87 | | | | 7.63 | | | | – | | | | – | |
Figures quoted represent past performance, which is no guarantee of future results, and do not reflect taxes that a shareholder may pay on fund distributions or the redemption of fund shares. Investment return and principal value of an investment will fluctuate so that an investor’s shares, when redeemed, may be worth more or less than their original cost. Performance shown without sales charges would be lower if sales charges were reflected. Current performance may be lower or higher than the performance data quoted, which assumes the reinvestment of dividends and capital gains. Current month-end performance is available on the Portfolio’s website, wellsfargoadvantagefunds.com.
Index returns do not include transaction costs associated with buying and selling securities, any mutual fund fees or expenses, or any taxes. It is not possible to invest directly in an index.
For WealthBuilder Portfolio shares, the maximum front-end sales charge is 1.50%. Performance including sales charge assumes the sales charge for the corresponding time period.
Balanced funds may invest in stocks and bonds. Stock values fluctuate in response to the activities of individual companies and general market and economic conditions. Bond values fluctuate in response to the financial condition of individual issuers, general market and economic conditions, and changes in interest rates. In general, when interest rates rise, bond values fall and investors may lose principal value. The Portfolio will indirectly be exposed to all of the risks of an investment in the underlying funds and will indirectly bear expenses of the underlying funds. The use of derivatives may reduce returns and/or increase volatility. Certain investment strategies tend to increase the total risk of an investment (relative to the broader market). The Portfolio is exposed to alternative investment risk, foreign investment risk, high-yield securities risk, mortgage- and asset-backed securities risk, and smaller-company investment risk. Consult the Portfolio’s prospectus for additional information on these and other risks.
Please see footnotes on page 7.
| | | | | | |
| Performance highlights (unaudited) | | Wells Fargo Advantage WealthBuilder Portfolios | | | 7 | |
Wells Fargo Advantage WealthBuilder Moderate Balanced Portfolio (continued)
| | | | |
| Ten largest holdings9 (%) as of November 30, 2013 | |
Wells Fargo Advantage Short Duration Government Bond Fund | | | 18.33 | |
Wells Fargo Advantage Core Bond Portfolio | | | 13.72 | |
Wells Fargo Advantage Government Securities Fund | | | 13.71 | |
MFS Value Fund | | | 6.41 | |
PIMCO High Yield Fund | | | 4.61 | |
Oppenheimer International Bond Fund | | | 4.59 | |
Thornburg International Value Fund | | | 3.49 | |
Eaton Vance Large Cap Value Fund | | | 3.20 | |
Invesco Growth and Income Fund | | | 3.19 | |
T. Rowe Price Blue Chip Growth Fund | | | 3.14 | |
|
| Current target allocation10 as of November 30, 2013 |
|
|
| 1. | Reflects the expense ratios as stated in the most recent prospectuses. |
| 2. | The Adviser has committed through September 30, 2014, to waive fees and/or reimburse expenses to the extent necessary to cap the Portfolio’s Total Annual Fund Operating Expenses After Fee Waiver, excluding certain expenses, at 1.50%. Brokerage commissions, stamp duty fees, interest, taxes, acquired fund fees and expenses, and extraordinary expenses are excluded from the cap. Without this cap, the Portfolio’s returns would have been lower. |
| 3. | Source: Wells Fargo Funds Management, LLC. The WealthBuilder Moderate Balanced Composite Index is weighted 28% in the Russell 3000 Index, 12% in the MSCI ACWI ex USA (Net), and 60% in the Barclays U.S. Aggregate Bond Index. Prior to October 1, 2013, the composition of the index was 40% in the S&P 500 Index and 60% in the Barclays U.S. Aggregate Bond Index. You cannot invest directly in an index. |
| 4. | The S&P 500 Index consists of 500 stocks chosen for market size, liquidity, and industry group representation. It is a market-value-weighted index with each stock’s weight in the index proportionate to its market value. You cannot invest directly in an index. |
| 5. | The Barclays U.S. Aggregate Bond Index is composed of the Barclays U.S. Government/Credit Index and the Barclays U.S. Mortgage-Backed Securities Index and includes U.S. Treasury issues, agency issues, corporate bond issues, and mortgage-backed securities. You cannot invest directly in an index. |
| 6. | The Russell 3000® Index measures the performance of the 3,000 largest U.S. companies based on total market capitalization, which represents approximately 98% of the investable U.S. equity market. You cannot invest directly in an index. |
| 7. | The Morgan Stanley Capital International All Country World Index ex USA (Net) (MSCI ACWI ex USA (Net)) is a free float-adjusted market capitalization weighted index that is designed to measure the equity market performance of developed and emerging markets. You cannot invest directly in an index. Source: MSCI. MSCI makes no express or implied warranties or representations and shall have no liability whatsoever with respect to any MSCI data contained herein. The MSCI data may not be further redistributed or used as a basis for other indexes or any securities or financial products. This report is not approved, reviewed or produced by MSCI. |
| 8. | At the close of business on September 30, 2013, the Portfolio changed its benchmarks from the S&P 500 Index and the Barclays U.S. Aggregate Bond Index to the Russell 3000 Index, the MSCI ACWI ex USA (Net) and the Barclays U.S. Aggregate Bond Index. We believe these benchmarks are more similar to the characteristics of the Portfolio in light of the recent changes to the Portfolio’s investment strategies. |
| 9. | The ten largest holdings are calculated based on the value of the holdings divided by total net assets of the Portfolio. Holdings are subject to change and may have changed since the date specified. |
| 10. | Current target allocation is subject to change and is calculated based on the total long-term investments of the Portfolio. The Portfolio’s use of futures contracts to implement a Tactical Asset Allocation (TAA) shift toward stocks or bonds is reflected in the allocation shown. |
| | | | |
| 8 | | Wells Fargo Advantage WealthBuilder Portfolios | | Performance highlights (unaudited) |
Wells Fargo Advantage WealthBuilder Growth Balanced Portfolio
Investment objective
The Portfolio seeks a combination of capital appreciation and current income.
Adviser
Wells Fargo Funds Management, LLC
Subadviser
Wells Capital Management Incorporated
Portfolio managers
Kandarp Acharya, CFA, FRM
Christian L. Chan, CFA
Average annual total returns (%) as of November 30, 2013
| | | | | | | | | | | | | | | | | | | | | | | | | | | | | | | | | | |
| | | | | Including sales charge | | | Excluding sales charge | | | Expense ratios1 (%) | |
| | | Inception date | | 1 year | | | 5 year | | | 10 year | | | 1 year | | | 5 year | | | 10 year | | | Gross | | | Net2 | |
| Wells Fargo Advantage WealthBuilder Growth Balanced Portfolio (WBGBX) | | 10-1-1997 | | | 17.02 | | | | 14.11 | | | | 5.30 | | | | 18.80 | | | | 14.45 | | | | 5.46 | | | | 2.22 | | | | 2.18 | |
| WealthBuilder Growth Balanced Composite Index3 | | – | | | – | | | | – | | | | – | | | | 15.16 | | | | 12.71 | | | | 7.15 | | | | – | | | | – | |
| S&P 500 Index4,8 | | – | | | – | | | | – | | | | – | | | | 30.30 | | | | 17.60 | | | | 7.69 | | | | – | | | | – | |
| Barclays U.S. Aggregate Bond Index5,8 | | – | | | – | | | | – | | | | – | | | | (1.61 | ) | | | 5.33 | | | | 4.71 | | | | – | | | | – | |
| Russell 3000® Index6,8 | | – | | | – | | | | – | | | | – | | | | 31.71 | | | | 18.54 | | | | 8.09 | | | | – | | | | – | |
| MSCI ACWI ex USA (Net)7,8 | | – | | | – | | | | – | | | | – | | | | 18.24 | | | | 13.87 | | | | 8.26 | | | | – | | | | – | |
Figures quoted represent past performance, which is no guarantee of future results, and do not reflect taxes that a shareholder may pay on fund distributions or the redemption of fund shares. Investment return and principal value of an investment will fluctuate so that an investor’s shares, when redeemed, may be worth more or less than their original cost. Performance shown without sales charges would be lower if sales charges were reflected. Current performance may be lower or higher than the performance data quoted, which assumes the reinvestment of dividends and capital gains. Current month-end performance is available on the Portfolio’s website, wellsfargoadvantagefunds.com.
Index returns do not include transaction costs associated with buying and selling securities, any mutual fund fees or expenses, or any taxes. It is not possible to invest directly in an index.
For WealthBuilder Portfolio shares, the maximum front-end sales charge is 1.50%. Performance including sales charge assumes the sales charge for the corresponding time period.
Balanced funds may invest in stocks and bonds. Stock values fluctuate in response to the activities of individual companies and general market and economic conditions. Bond values fluctuate in response to the financial condition of individual issuers, general market and economic conditions, and changes in interest rates. In general, when interest rates rise, bond values fall and investors may lose principal value. The Portfolio will indirectly be exposed to all of the risks of an investment in the underlying funds and will indirectly bear expenses of the underlying funds. The use of derivatives may reduce returns and/or increase volatility. Certain investment strategies tend to increase the total risk of an investment (relative to the broader market). The Portfolio is exposed to alternative investment risk, foreign investment risk, high-yield securities risk, mortgage- and asset-backed securities risk, and smaller-company investment risk. Consult the Portfolio’s prospectus for additional information on these and other risks.
Please see footnotes on page 9.
| | | | | | |
| Performance highlights (unaudited) | | Wells Fargo Advantage WealthBuilder Portfolios | | | 9 | |
Wells Fargo Advantage WealthBuilder Growth Balanced Portfolio (continued)
| | | | |
| Ten largest holdings9 (%) as of November 30, 2013 | |
Wells Fargo Advantage Government Securities Fund | | | 12.36 | |
Wells Fargo Advantage Core Bond Portfolio | | | 11.42 | |
MFS Value Fund | | | 9.94 | |
Thornburg International Value Fund | | | 5.42 | |
Eaton Vance Large Cap Value Fund | | | 4.95 | |
Invesco Growth and Income Fund | | | 4.93 | |
T. Rowe Price Blue Chip Growth Fund | | | 4.86 | |
PIMCO High Yield Fund | | | 4.80 | |
Oppenheimer International Bond Fund | | | 4.77 | |
Wells Fargo Advantage International Growth Portfolio | | | 3.62 | |
| | |
| Current target allocation10 as of November 30, 2013 |
|
|
| 1. | Reflects the expense ratios as stated in the most recent prospectuses. |
| 2. | The Adviser has committed through September 30, 2014, to waive fees and/or reimburse expenses to the extent necessary to cap the Portfolio’s Total Annual Fund Operating Expenses After FeeWaiver, excluding certain expenses, at 1.50%. Brokerage commissions, stamp duty fees, interest, taxes, acquired fund fees and expenses, and extraordinary expenses are excluded from the cap. Without this cap, the Portfolio’s returns would have been lower. |
| 3. | Source: Wells Fargo Funds Management, LLC. The WealthBuilder Growth Balanced Composite Index is weighted 42% in the Russell 3000 Index, 18% in the MSCI ACWI ex USA (Net), and 40% in the Barclays U.S. Aggregate Bond Index. Prior to October 1, 2013, the composition of the index was 65% in the S&P 500 Index and 35% in the Barclays U.S. Aggregate Bond Index. You cannot invest directly in an index. |
| 4. | The S&P 500 Index consists of 500 stocks chosen for market size, liquidity, and industry group representation. It is a market-value-weighted index with each stock’s weight in the index proportionate to its market value. You cannot invest directly in an index. |
| 5. | The Barclays U.S. Aggregate Bond Index is composed of the Barclays U.S. Government/Credit Index and the Barclays U.S. Mortgage-Backed Securities Index and includes U.S. Treasury issues, agency issues, corporate bond issues, and mortgage-backed securities. You cannot invest directly in an index. |
| 6. | The Russell 3000® Index measures the performance of the 3,000 largest U.S. companies based on total market capitalization, which represents approximately 98% of the investable U.S. equity market. You cannot invest directly in an index. |
| 7. | The Morgan Stanley Capital International All Country World Index ex USA (Net) (MSCI ACWI ex USA (Net)) is a free float-adjusted market capitalization weighted index that is designed to measure the equity market performance of developed and emerging markets. You cannot invest directly in an index. Source: MSCI. MSCI makes no express or implied warranties or representations and shall have no liability whatsoever with respect to any MSCI data contained herein. The MSCI data may not be further redistributed or used as a basis for other indexes or any securities or financial products. This report is not approved, reviewed or produced by MSCI. |
| 8. | At the close of business on September 30, 2013, the Portfolio changed its benchmarks from the S&P 500 Index and the Barclays U.S. Aggregate Bond Index to the Russell 3000 Index, the MSCI ACWI ex USA (Net) and the Barclays U.S. Aggregate Bond Index. We believe these benchmarks are more similar to the characteristics of the Portfolio in light of the recent changes to the Portfolio’s investment strategies. |
| 9. | The ten largest holdings are calculated based on the value of the holdings divided by total net assets of the Portfolio. Holdings are subject to change and may have changed since the date specified. |
| 10. | Current target allocation is subject to change and is calculated based on the total long-term investments of the Portfolio. The Portfolio’s use of futures contracts to implement a Tactical Asset Allocation (TAA) shift toward stocks or bonds is reflected in the allocation shown. |
| | | | |
| 10 | | Wells Fargo Advantage WealthBuilder Portfolios | | Performance highlights (unaudited) |
Wells Fargo Advantage WealthBuilder Growth Allocation Portfolio
Investment objective
The Portfolio seeks capital appreciation with a secondary emphasis on current income.
Adviser
Wells Fargo Funds Management, LLC
Subadviser
Wells Capital Management Incorporated
Portfolio managers
Kandarp Acharya, CFA, FRM
Christian L. Chan, CFA
Average annual total returns (%) as of November 30, 2013
| | | | | | | | | | | | | | | | | | | | | | | | | | | | | | | | | | |
| | | | | Including sales charge | | | Excluding sales charge | | | Expense ratios1 (%) | |
| | | Inception date | | 1 year | | | 5 year | | | Since
inception | | | 1 year | | | 5 year | | | Since
inception | | | Gross | | | Net2 | |
| Wells Fargo Advantage WealthBuilder Growth Allocation Portfolio (WBGGX) | | 9-30-2004 | | | 21.07 | | | | 15.51 | | | | 5.40 | | | | 22.92 | | | | 15.86 | | | | 5.58 | | | | 2.28 | | | | 2.21 | |
| WealthBuilder Growth Allocation Composite Index3 | | – | | | – | | | | – | | | | – | | | | 21.26 | | | | 15.01 | | | | 7.63 | | | | – | | | | – | |
| S&P 500 Index4,8 | | – | | | – | | | | – | | | | – | | | | 30.30 | | | | 17.60 | | | | 7.63 | | | | – | | | | – | |
| Barclays U.S. Aggregate Bond Index5,8 | | – | | | – | | | | – | | | | – | | | | (1.61 | ) | | | 5.33 | | | | 4.66 | | | | – | | | | – | |
| Russell 3000® Index6,8 | | – | | | – | | | | – | | | | – | | | | 31.71 | | | | 18.54 | | | | 8.13 | | | | – | | | | – | |
| MSCI ACWI ex USA (Net)7,8 | | – | | | – | | | | – | | | | – | | | | 18.24 | | | | 13.87 | | | | 7.63 | | | | – | | | | – | |
Figures quoted represent past performance, which is no guarantee of future results, and do not reflect taxes that a shareholder may pay on fund distributions or the redemption of fund shares. Investment return and principal value of an investment will fluctuate so that an investor’s shares, when redeemed, may be worth more or less than their original cost. Performance shown without sales charges would be lower if sales charges were reflected. Current performance may be lower or higher than the performance data quoted, which assumes the reinvestment of dividends and capital gains. Current month-end performance is available on the Portfolio’s website, wellsfargoadvantagefunds.com.
Index returns do not include transaction costs associated with buying and selling securities, any mutual fund fees or expenses, or any taxes. It is not possible to invest directly in an index.
For WealthBuilder Portfolio shares, the maximum front-end sales charge is 1.50%. Performance including sales charge assumes the sales charge for the corresponding time period.
Balanced funds may invest in stocks and bonds. Stock values fluctuate in response to the activities of individual companies and general market and economic conditions. Bond values fluctuate in response to the financial condition of individual issuers, general market and economic conditions, and changes in interest rates. In general, when interest rates rise, bond values fall and investors may lose principal value. The Portfolio will indirectly be exposed to all of the risks of an investment in the underlying funds and will indirectly bear expenses of the underlying funds. The use of derivatives may reduce returns and/or increase volatility. Certain investment strategies tend to increase the total risk of an investment (relative to the broader market). The Portfolio is exposed to alternative investment risk, foreign investment risk, high-yield securities risk, mortgage- and asset-backed securities risk, and smaller-company investment risk. Consult the Portfolio’s prospectus for additional information on these and other risks.
Please see footnotes on page 11.
| | | | | | |
| Performance highlights (unaudited) | | Wells Fargo Advantage WealthBuilder Portfolios | | | 11 | |
Wells Fargo Advantage WealthBuilder Growth Allocation Portfolio (continued)
| | | | |
| Ten largest holdings9 (%) as of November 30, 2013 | |
MFS Value Fund | | | 12.58 | |
Thornburg International Value Fund | | | 6.94 | |
Eaton Vance Large Cap Value Fund | | | 6.28 | |
Invesco Growth and Income Fund | | | 6.25 | |
T. Rowe Price Blue Chip Growth Fund | | | 6.18 | |
Wells Fargo Advantage Core Bond Portfolio | | | 5.78 | |
Wells Fargo Advantage Government Securities Fund | | | 5.78 | |
Wells Fargo Advantage Small Company Value Portfolio | | | 4.63 | |
American Century Growth Fund | | | 4.34 | |
Wells Fargo Advantage Endeavor Select Fund | | | 3.52 | |
| | |
| Current target allocation10 as of November 30, 2013 |
|
|
| 1. | Reflects the expense ratios as stated in the most recent prospectuses. |
| 2. | The Adviser has committed through September 30, 2014, to waive fees and/or reimburse expenses to the extent necessary to cap the Portfolio’s Total Annual Fund Operating Expenses After FeeWaiver, excluding certain expenses, at 1.50%. Brokerage commissions, stamp duty fees, interest, taxes, acquired fund fees and expenses, and extraordinary expenses are excluded from the cap. Without this cap, the Portfolio’s returns would have been lower. |
| 3. | Source: Wells Fargo Funds Management, LLC. The WealthBuilder Growth Allocation Composite Index is weighted 56% in the Russell 3000 Index, 24% in the MSCI ACWI ex USA (Net), and 20% in the Barclays U.S. Aggregate Bond Index. Prior to October 1, 2013, the composition of the index was 80% in the S&P 500 Index and 20% in the Barclays U.S. Aggregate Bond Index. You cannot invest directly in an index. |
| 4. | The S&P 500 Index consists of 500 stocks chosen for market size, liquidity, and industry group representation. It is a market-value-weighted index with each stock’s weight in the index proportionate to its market value. You cannot invest directly in an index. |
| 5. | The Barclays U.S. Aggregate Bond Index is composed of the Barclays U.S. Government/Credit Index and the Barclays U.S. Mortgage-Backed Securities Index and includes U.S. Treasury issues, agency issues, corporate bond issues, and mortgage-backed securities. You cannot invest directly in an index. |
| 6. | The Russell 3000® Index measures the performance of the 3,000 largest U.S. companies based on total market capitalization, which represents approximately 98% of the investable U.S. equity market. You cannot invest directly in an index. |
| 7. | The Morgan Stanley Capital International All Country World Index ex USA (Net) (MSCI ACWI ex USA (Net)) is a free float-adjusted market capitalization weighted index that is designed to measure the equity market performance of developed and emerging markets. You cannot invest directly in an index. Source: MSCI. MSCI makes no express or implied warranties or representations and shall have no liability whatsoever with respect to any MSCI data contained herein. The MSCI data may not be further redistributed or used as a basis for other indexes or any securities or financial products. This report is not approved, reviewed or produced by MSCI. |
| 8. | At the close of business on September 30, 2013, the Portfolio changed its benchmarks from the S&P 500 Index and the Barclays U.S. Aggregate Bond Index to the Russell 3000 Index, the MSCI ACWI ex USA (Net) and the Barclays U.S. Aggregate Bond Index. We believe these benchmarks are more similar to the characteristics of the Portfolio in light of the recent changes to the Portfolio’s investment strategies. |
| 9. | The ten largest holdings are calculated based on the value of the holdings divided by total net assets of the Portfolio. Holdings are subject to change and may have changed since the date specified. |
| 10. | Current target allocation is subject to change and is calculated based on the total long-term investments of the Portfolio. The Portfolio’s use of futures contracts to implement a Tactical Asset Allocation (TAA) shift toward stocks or bonds is reflected in the allocation shown. |
| | | | |
| 12 | | Wells Fargo Advantage WealthBuilder Portfolios | | Performance highlights (unaudited) |
Wells Fargo Advantage WealthBuilder Equity Portfolio
Investment objective
The Portfolio seeks long-term capital appreciation with no emphasis on income.
Adviser
Wells Fargo Funds Management, LLC
Subadviser
Wells Capital Management Incorporated
Portfolio managers
Kandarp Acharya, CFA, FRM
Christian L. Chan, CFA
Average annual total returns (%) as of November 30, 2013
| | | | | | | | | | | | | | | | | | | | | | | | | | | | | | | | | | |
| | | | | Including sales charge | | | Excluding sales charge | | | Expense ratios1 (%) | |
| | | Inception date | | 1 year | | | 5 year | | | 10 year | | | 1 year | | | 5 year | | | 10 year | | | Gross | | | Net2 | |
| Wells Fargo Advantage WealthBuilder Equity Portfolio (WBGIX) | | 10-1-1997 | | | 25.96 | | | | 15.81 | | | | 5.57 | | | | 27.88 | | | | 16.16 | | | | 5.73 | | | | 2.44 | | | | 2.31 | |
| WealthBuilder Equity Portfolio Composite Index3,7 | | – | | | – | | | | – | | | | – | | | | 27.63 | | | | 17.21 | | | | 8.23 | | | | – | | | | – | |
| S&P 500 Index4,7 | | – | | | – | | | | – | | | | – | | | | 30.30 | | | | 17.60 | | | | 7.69 | | | | – | | | | – | |
| Russell 3000® Index5,7 | | – | | | – | | | | – | | | | – | | | | 31.71 | | | | 18.54 | | | | 8.09 | | | | – | | | | – | |
| MSCI ACWI ex USA (Net)6,7 | | – | | | – | | | | – | | | | – | | | | 18.24 | | | | 13.87 | | | | 8.26 | | | | – | | | | – | |
Figures quoted represent past performance, which is no guarantee of future results, and do not reflect taxes that a shareholder may pay on fund distributions or the redemption of fund shares. Investment return and principal value of an investment will fluctuate so that an investor’s shares, when redeemed, may be worth more or less than their original cost. Performance shown without sales charges would be lower if sales charges were reflected. Current performance may be lower or higher than the performance data quoted, which assumes the reinvestment of dividends and capital gains. Current month-end performance is available on the Portfolio’s website, wellsfargoadvantagefunds.com.
Index returns do not include transaction costs associated with buying and selling securities, any mutual fund fees or expenses, or any taxes. It is not possible to invest directly in an index.
For WealthBuilder Portfolio shares, the maximum front-end sales charge is 1.50%. Performance including sales charge assumes the sales charge for the corresponding time period.
Please keep in mind that high double-digit returns were primarily achieved during favorable market conditions. You should not expect that such favorable returns can be consistently achieved. A Fund’s performance, especially for short time periods, should not be the sole factor in making your investment decision.
Stock values fluctuate in response to the activities of individual companies and general market and economic conditions. The Portfolio will indirectly be exposed to all of the risks of an investment in the underlying funds and will indirectly bear expenses of the underlying funds. Certain investment strategies tend to increase the total risk of an investment (relative to the broader market). The Portfolio is exposed to foreign investment risk and smaller-company investment risk. Consult the Portfolio’s prospectus for additional information on these and other risks.
Please see footnotes on page 13.
| | | | | | |
| Performance highlights (unaudited) | | Wells Fargo Advantage WealthBuilder Portfolios | | | 13 | |
Wells Fargo Advantage WealthBuilder Equity Portfolio (continued)
| | | | |
| Ten largest holdings8 (%) as of November 30, 2013 | |
MFS Value Fund | | | 14.93 | |
T. Rowe Price Blue Chip Growth Fund | | | 10.50 | |
Thornburg International Value Fund | | | 9.02 | |
Eaton Vance Large Cap Value Fund | | | 7.48 | |
Invesco Growth and Income Fund | | | 7.48 | |
American Century Growth Fund | | | 7.44 | |
Wells Fargo Advantage International Growth Portfolio | | | 6.03 | |
Wells Fargo Advantage Endeavor Select Fund | | | 6.00 | |
Wells Fargo Advantage Large Cap Growth Fund | | | 5.96 | |
Dodge & Cox International Stock Fund | | | 3.02 | |
| | |
| Portfolio allocation9 as of November 30, 2013 |
|
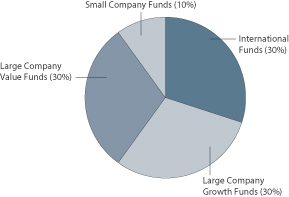
|
| 1. | Reflects the expense ratios as stated in the most recent prospectuses. |
| 2. | The Adviser has committed through September 30, 2014, to waive fees and/or reimburse expenses to the extent necessary to cap the Portfolio’s Total Annual Fund Operating Expenses After FeeWaiver, excluding certain expenses, at 1.50%. Brokerage commissions, stamp duty fees, interest, taxes, acquired fund fees and expenses, and extraordinary expenses are excluded from the cap. Without this cap, the Portfolio’s returns would have been lower. |
| 3. | Source: Wells Fargo Funds Management, LLC. The WealthBuilder Equity Portfolio Composite Index is weighted 70% in the Russell 3000 Index, and 30% in the MSCI ACWI ex USA (Net). You cannot invest directly in an index. |
| 4. | The S&P 500 Index consists of 500 stocks chosen for market size, liquidity, and industry group representation. It is a market-value-weighted index with each stock’s weight in the index proportionate to its market value. You cannot invest directly in an index. |
| 5. | The Russell 3000® Index measures the performance of the 3,000 largest U.S. companies based on total market capitalization, which represents approximately 98% of the investable U.S. equity market. You cannot invest directly in an index. |
| 6. | The Morgan Stanley Capital International All Country World Index ex USA (Net) (MSCI ACWI ex USA (Net)) is a free float-adjusted market capitalization weighted index that is designed to measure the equity market performance of developed and emerging markets. You cannot invest directly in an index. Source: MSCI. MSCI makes no express or implied warranties or representations and shall have no liability whatsoever with respect to any MSCI data contained herein. The MSCI data may not be further redistributed or used as a basis for other indexes or any securities or financial products. This report is not approved, reviewed or produced by MSCI. |
| 7. | At the close of business on September 30, 2013, the Portfolio changed its benchmark from the S&P 500 Index to the Russell 3000 Index and the MSCI ACWI ex USA (Net). We believe the new benchmarks are more similar to the characteristics of the Portfolio in light of the recent changes to the Portfolio’s investment strategies. |
| 8. | The ten largest holdings are calculated based on the value of the holdings divided by total net assets of the Portfolio. Holdings are subject to change and may have changed since the date specified. |
| 9. | Portfolio allocation is subject to change and is calculated based on the total long-term investments of the Portfolio. |
| | | | |
| 14 | | Wells Fargo Advantage WealthBuilder Portfolios | | Performance highlights (unaudited) |
Wells Fargo Advantage WealthBuilder Tactical Equity Portfolio
Investment objective
The Portfolio seeks long-term capital appreciation with no emphasis on income.
Adviser
Wells Fargo Funds Management, LLC
Subadviser
Wells Capital Management Incorporated
Portfolio managers
Kandarp Acharya, CFA, FRM
Christian L. Chan, CFA
Average annual total returns (%) as of November 30, 2013
| | | | | | | | | | | | | | | | | | | | | | | | | | | | | | | | | | |
| | | | | Including sales charge | | | Excluding sales charge | | | Expense ratios1 (%) | |
| | | Inception date | | 1 year | | | 5 year | | | 10 year | | | 1 year | | | 5 year | | | 10 year | | | Gross | | | Net2 | |
| Wells Fargo Advantage WealthBuilder Tactical Equity Portfolio (WBGAX) | | 10-1-1997 | | | 22.72 | | | | 16.49 | | | | 6.77 | | | | 24.59 | | | | 16.84 | | | | 6.93 | | | | 2.32 | | | | 2.26 | |
| WealthBuilder Tactical Equity Composite Index3,7 | | – | | | – | | | | – | | | | – | | | | 27.63 | | | | 17.21 | | | | 8.23 | | | | – | | | | – | |
| S&P 500 Index4,7 | | – | | | – | | | | – | | | | – | | | | 30.30 | | | | 17.60 | | | | 7.69 | | | | – | | | | – | |
| Russell 3000® Index5,7 | | – | | | – | | | | – | | | | – | | | | 31.71 | | | | 18.54 | | | | 8.09 | | | | – | | | | – | |
| MSCI ACWI ex USA (Net)6,7 | | – | | | – | | | | – | | | | – | | | | 18.24 | | | | 13.87 | | | | 8.26 | | | | – | | | | – | |
Figures quoted represent past performance, which is no guarantee of future results, and do not reflect taxes that a shareholder may pay on fund distributions or the redemption of fund shares. Investment return and principal value of an investment will fluctuate so that an investor’s shares, when redeemed, may be worth more or less than their original cost. Performance shown without sales charges would be lower if sales charges were reflected. Current performance may be lower or higher than the performance data quoted, which assumes the reinvestment of dividends and capital gains. Current month-end performance is available on the Portfolio’s website, wellsfargoadvantagefunds.com.
Index returns do not include transaction costs associated with buying and selling securities, any mutual fund fees or expenses, or any taxes. It is not possible to invest directly in an index.
For WealthBuilder Portfolio shares, the maximum front-end sales charge is 1.50%. Performance including sales charge assumes the sales charge for the corresponding time period.
Stock values fluctuate in response to the activities of individual companies and general market and economic conditions. The Portfolio will indirectly be exposed to all of the risks of an investment in the underlying funds and will indirectly bear expenses of the underlying funds. The use of derivatives may reduce returns and/or increase volatility. Certain investment strategies tend to increase the total risk of an investment (relative to the broader market). The Portfolio is exposed to alternative investment risk, foreign investment risk, and smaller-company investment risk. Consult the Portfolio’s prospectus for additional information on these and other risks.
Please see footnotes on page 15.
| | | | | | |
| Performance highlights (unaudited) | | Wells Fargo Advantage WealthBuilder Portfolios | | | 15 | |
Wells Fargo Advantage WealthBuilder Tactical Equity Portfolio (continued)
| | | | |
| Ten largest holdings8 (%) as of November 30, 2013 | |
MFS Value Fund | | | 16.19 | |
Thornburg International Value Fund | | | 8.97 | |
Eaton Vance Large Cap Value Fund | | | 8.10 | |
Invesco Growth and Income Fund | | | 8.09 | |
T. Rowe Price Blue Chip Growth Fund | | | 7.93 | |
Wells Fargo Advantage International Growth Portfolio | | | 5.98 | |
Wells Fargo Advantage Endeavor Select Fund | | | 4.53 | |
Wells Fargo Advantage Large Cap Growth Fund | | | 4.47 | |
Wells Fargo Advantage Small Company Value Portfolio | | | 3.79 | |
Wells Fargo Advantage Small Cap Value Fund | | | 3.78 | |
| | |
| Portfolio allocation9 as of November 30, 2013 |
|
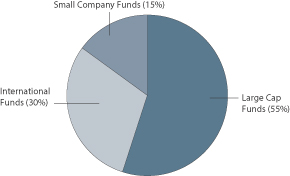
|
| 1. | Reflects the expense ratios as stated in the most recent prospectuses. |
| 2. | The Adviser has committed through September 30, 2014, to waive fees and/or reimburse expenses to the extent necessary to cap the Portfolio’s Total Annual Fund Operating Expenses After Fee Waiver, excluding certain expenses, at 1.50%. Brokerage commissions, stamp duty fees, interest, taxes, acquired fund fees and expenses, and extraordinary expenses are excluded from the cap. Without this cap, the Portfolio’s returns would have been lower. |
| 3. | Source: Wells Fargo Funds Management, LLC. The WealthBuilder Tactical Equity Composite Index is weighted 70% in the Russell 3000 Index, and 30% in the MSCI ACWI ex USA (Net). You cannot invest directly in an index. |
| 4. | The S&P 500 Index consists of 500 stocks chosen for market size, liquidity, and industry group representation. It is a market-value-weighted index with each stock’s weight in the index proportionate to its market value. You cannot invest directly in an index. |
| 5. | The Russell 3000® Index measures the performance of the 3,000 largest U.S. companies based on total market capitalization, which represents approximately 98% of the investable U.S. equity market. You cannot invest directly in an index. |
| 6. | The Morgan Stanley Capital International All Country World Index ex USA (Net) (MSCI ACWI ex USA (Net)) is a free float-adjusted market capitalization weighted index that is designed to measure the equity market performance of developed and emerging markets. You cannot invest directly in an index. Source: MSCI. MSCI makes no express or implied warranties or representations and shall have no liability whatsoever with respect to any MSCI data contained herein. The MSCI data may not be further redistributed or used as a basis for other indexes or any securities or financial products. This report is not approved, reviewed or produced by MSCI. |
| 7. | At the close of business on September 30, 2013, the Portfolio changed its benchmark from the S&P 500 Index to the Russell 3000 Index and the MSCI ACWI ex USA (Net). We believe the new benchmarks are more similar to the characteristics of the Portfolio in light of the recent changes to the Portfolio’s investment strategies. |
| 8. | The ten largest holdings are calculated based on the value of the holdings divided by total net assets of the Portfolio. Holdings are subject to change and may have changed since the date specified. |
| 9. | Portfolio allocation is subject to change and is calculated based on the total long-term investments of the Portfolio. |
| | | | |
| 16 | | Wells Fargo Advantage WealthBuilder Portfolios | | Fund expenses (unaudited) |
As a shareholder of the Fund, you incur two types of costs: (1) transaction costs, including sales charges (loads) on purchase payments and contingent deferred sales charges (if any) on redemptions and (2) ongoing costs, including management fees, distribution (12b-1) and/or shareholder service fees, and other Fund expenses. This example is intended to help you understand your ongoing costs (in dollars) of investing in the Fund and to compare these costs with the ongoing costs of investing in other mutual funds.
The example is based on an investment of $1,000 invested at the beginning of the six-month period and held for the entire period from June 1, 2013 to November 30, 2013.
Actual expenses
The “Actual” line of the table below provides information about actual account values and actual expenses. You may use the information in this line, together with the amount you invested, to estimate the expenses that you paid over the period. Simply divide your account value by $1,000 (for example, an $8,600 account value divided by $1,000 = 8.6), then multiply the result by the number in the “Actual” line under the heading entitled “Expenses paid during period” for your applicable class of shares to estimate the expenses you paid on your account during this period.
Hypothetical example for comparison purposes
The “Hypothetical” line of the table below provides information about hypothetical account values and hypothetical expenses based on the Fund’s actual expense ratio and an assumed rate of return of 5% per year before expenses, which is not the Fund’s actual return. The hypothetical account values and expenses may not be used to estimate the actual ending account balance or expenses you paid for the period. You may use this information to compare the ongoing costs of investing in the Fund and other funds. To do so, compare this 5% hypothetical example with the 5% hypothetical examples that appear in the shareholder reports of the other funds.
Please note that the expenses shown in the table are meant to highlight your ongoing costs only and do not reflect any transactional costs, such as sales charges (loads) and contingent deferred sales charges. Therefore, the “Hypothetical” line of the table is useful in comparing ongoing costs only and will not help you determine the relative total costs of owning different funds. In addition, if these transactional costs were included, your costs would have been higher.
| | | | | | | | | | | | | | | | |
| | | Beginning
account value
6-1-2013 | | | Ending
account value
11-30-2013 | | | Expenses
paid during
the period1 | | | Net annual
expense ratio | |
Wells Fargo Advantage WealthBuilder Conservative Allocation Portfolio | | | | | | | | | | | | | | | | |
Actual | | $ | 1,000.00 | | | $ | 1,019.13 | | | $ | 7.59 | | | | 1.50 | % |
Hypothetical (5% return before expenses) | | $ | 1,000.00 | | | $ | 1,017.55 | | | $ | 7.59 | | | | 1.50 | % |
Wells Fargo Advantage WealthBuilder Moderate Balanced Portfolio | | | | | | | | | | | | | | | | |
Actual | | $ | 1,000.00 | | | $ | 1,050.89 | | | $ | 7.71 | | | | 1.50 | % |
Hypothetical (5% return before expenses) | | $ | 1,000.00 | | | $ | 1,017.55 | | | $ | 7.59 | | | | 1.50 | % |
Wells Fargo Advantage WealthBuilder Growth Balanced Portfolio | | | | | | | | | | | | | | | | |
Actual | | $ | 1,000.00 | | | $ | 1,085.27 | | | $ | 7.84 | | | | 1.50 | % |
Hypothetical (5% return before expenses) | | $ | 1,000.00 | | | $ | 1,017.55 | | | $ | 7.59 | | | | 1.50 | % |
Wells Fargo Advantage WealthBuilder Growth Allocation Portfolio | | | | | | | | | | | | | | | | |
Actual | | $ | 1,000.00 | | | $ | 1,105.50 | | | $ | 7.92 | | | | 1.50 | % |
Hypothetical (5% return before expenses) | | $ | 1,000.00 | | | $ | 1,017.55 | | | $ | 7.59 | | | | 1.50 | % |
Wells Fargo Advantage WealthBuilder Equity Portfolio | | | | | | | | | | | | | | | | |
Actual | | $ | 1,000.00 | | | $ | 1,127.14 | | | $ | 8.00 | | | | 1.50 | % |
Hypothetical (5% return before expenses) | | $ | 1,000.00 | | | $ | 1,017.55 | | | $ | 7.59 | | | | 1.50 | % |
Wells Fargo Advantage ealthBuilder Tactical Equity Portfolio | | | | | | | | | | | | | | | | |
Actual | | $ | 1,000.00 | | | $ | 1,123.64 | | | $ | 7.99 | | | | 1.50 | % |
Hypothetical (5% return before expenses) | | $ | 1,000.00 | | | $ | 1,017.55 | | | $ | 7.59 | | | | 1.50 | % |
| 1. | Expenses paid is equal to the annualized expense ratio of each class multiplied by the average account value over the period, multiplied by the number of days in the most recent fiscal half-year divided by the number of days in the fiscal year (to reflect the one-half-year period). |
| | | | | | |
| Portfolio of investments—November 30, 2013 (unaudited) | | Wells Fargo Advantage WealthBuilder Portfolios | | | 17 | |
WEALTHBUILDER CONSERVATIVE ALLOCATION PORTFOLIO
| | | | | | | | | | | | |
| Security name | | | | | | Shares | | | Value | |
| | | | | | | | | | | | |
| | | | |
Investment Companies: 99.86% | | | | | | | | | | | | |
| | | | |
| Affiliated Master Portfolios: 21.35% | | | | | | | | | | | | |
Wells Fargo Advantage Core Bond Portfolio | | | | | | | | | | $ | 114,758,211 | |
Wells Fargo Advantage Emerging Growth Portfolio | | | | | | | | | | | 4,492,813 | |
Wells Fargo Advantage International Growth Portfolio | | | | | | | | | | | 7,223,948 | |
Wells Fargo Advantage Small Company Value Portfolio | | | | | | | | | | | 4,525,633 | |
| | | | |
| | | | | | | | | | | 131,000,605 | |
| | | | | | | | | | | | |
| | | | |
| Alternative Investment Funds: 5.46% | | | | | | | | | | | | |
AQR Managed Futures Strategy Fund | | | | | | | 298,075 | | | | 3,105,941 | |
ING Global Real Estate Fund | | | | | | | 591,508 | | | | 10,800,936 | |
PIMCO CommodityRealReturn Strategy Fund | | | | | | | 2,968,047 | | | | 16,561,703 | |
The Arbitrage Fund | | | | | | | 237,342 | | | | 3,054,590 | |
| | | | |
| | | | | | | | | | | 33,523,170 | |
| | | | | | | | | | | | |
| | | | |
| International Equity Funds: 4.69% | | | | | | | | | | | | |
DFA International Small Cap Value Portfolio | | | | | | | 118,508 | | | | 2,393,865 | |
Dodge & Cox International Stock Fund | | | | | | | 83,787 | | | | 3,604,502 | |
Oppenheimer Developing Markets Fund | | | | | | | 79,196 | | | | 2,976,199 | |
T. Rowe Price International Discovery Fund | | | | | | | 42,947 | | | | 2,408,049 | |
Templeton Institutional Foreign Equity Fund | | | | | | | 155,574 | | | | 3,603,095 | |
Thornburg International Value Fund | | | | | | | 340,902 | | | | 10,813,398 | |
Wells Fargo Advantage Emerging Markets Equity Fund (l) | | | | | | | 132,316 | | | | 2,962,545 | |
| | | | |
| | | | | | | | | | | 28,761,653 | |
| | | | | | | | | | | | |
| | | | |
| International Fixed Income Funds: 4.69% | | | | | | | | | | | | |
Oppenheimer International Bond Fund | | | | | | | 4,729,974 | | | | 28,758,240 | |
| | | | | | | | | | | | |
| | | | |
| U.S. Equity Funds: 12.17% | | | | | | | | | | | | |
American Century Growth Fund | | | | | | | 197,335 | | | | 6,725,178 | |
Eaton Vance Large Cap Value Fund | | | | | | | 394,159 | | | | 9,676,610 | |
Invesco Growth and Income Fund | | | | | | | 355,319 | | | | 9,661,132 | |
MFS Value Fund | | | | | | | 582,088 | | | | 19,348,615 | |
Royce Pennsylvania Mutual Fund | | | | | | | 296,571 | | | | 4,507,886 | |
T. Rowe Price Blue Chip Growth Fund | | | | | | | 151,282 | | | | 9,456,652 | |
Wells Fargo Advantage Endeavor Select Fund (l)† | | | | | | | 367,810 | | | | 5,414,161 | |
Wells Fargo Advantage Large Cap Growth Fund (l) | | | | | | | 119,891 | | | | 5,389,102 | |
Wells Fargo Advantage Small Cap Value Fund (l) | | | | | | | 115,485 | | | | 4,500,467 | |
| | | | |
| | | | | | | | | | | 74,679,803 | |
| | | | | | | | | | | | |
| | | | |
| U.S. Fixed Income Funds: 51.50% | | | | | | | | | | | | |
PIMCO High Yield Fund | | | | | | | 3,001,500 | | | | 28,874,434 | |
Wells Fargo Advantage Government Securities Fund (l) | | | | | | | 10,558,851 | | | | 114,774,708 | |
Wells Fargo Advantage Short Duration Government Bond Fund (l) | | | | | | | 17,017,911 | | | | 172,391,442 | |
| | | | |
| | | | | | | | | | | 316,040,584 | |
| | | | | | | | | | | | |
| | | | |
Total Investment Companies (Cost $576,279,571) | | | | | | | | | | | 612,764,055 | |
| | | | | | | | | | | | |
The accompanying notes are an integral part of these financial statements.
| | | | |
| 18 | | Wells Fargo Advantage WealthBuilder Portfolios | | Portfolio of investments—November 30, 2013 (unaudited) |
WEALTHBUILDER CONSERVATIVE ALLOCATION PORTFOLIO
| | | | | | | | | | | | | | | | |
| Security name | | Yield | | | | | | Shares | | | Value | |
| | | | | | | | | | | | | | | | |
| Short-Term Investments: 0.37% | | | | | | | | | | | | | | | | |
| | | | |
| Investment Companies: 0.18% | | | | | | | | | | | | | | | | |
Wells Fargo Advantage Cash Investment Money Market Fund, Select Class (l)(u) | | | 0.08 | % | | | | | | | 1,100,000 | | | $ | 1,100,000 | |
| | | | | | | | | | | | | | | | |
| | | | |
| | | | | | Maturity date | | | Principal | | | | |
| U.S. Treasury Securities: 0.19% | | | | | | | | | | | | | | | | |
Treasury Bill #(z) | | | 0.01 | | | | 12-26-2013 | | | $ | 1,164,000 | | | | 1,163,956 | |
| | | | | | | | | | | | | | | | |
| | | | |
Total Short-Term Investments (Cost $2,263,956) | | | | | | | | | | | | | | | 2,263,956 | |
| | | | | | | | | | | | | | | | |
| | | | | | | | |
| Total investments in securities | | | | | | | | |
| (Cost $578,543,527) * | | | 100.23 | % | | | 615,028,011 | |
Other assets and liabilities, net | | | (0.23 | ) | | | (1,436,148 | ) |
| | | | | | | | |
| Total net assets | | | 100.00 | % | | $ | 613,591,863 | |
| | | | | | | | |
| (l) | Investment in an affiliate |
| † | Non-income-earning security |
| (u) | Rate shown is the 7-day annualized yield at period end. |
| # | All or a portion of this security is segregated as collateral for investments in derivative instruments. |
| (z) | Zero coupon security. Rate represents yield to maturity at time of purchase. |
| * | Cost for federal income tax purposes is $585,060,217 and unrealized appreciation (depreciation) consists of: |
| | | | |
Gross unrealized appreciation | | $ | 42,403,325 | |
Gross unrealized depreciation | | | (12,435,531 | ) |
| | | | |
Net unrealized appreciation | | $ | 29,967,794 | |
The accompanying notes are an integral part of these financial statements.
| | | | | | |
| Portfolio of investments—November 30, 2013 (unaudited) | | Wells Fargo Advantage WealthBuilder Portfolios | | | 19 | |
WEALTHBUILDER MODERATE BALANCED PORTFOLIO
| | | | | | | | | | | | |
| Security name | | | | | | Shares | | | Value | |
| | | | | | | | | | | | |
| | | | |
Investment Companies: 99.46% | | | | | | | | | | | | |
| | | | |
| Affiliated Master Portfolios: 19.02% | | | | | | | | | | | | |
Wells Fargo Advantage Core Bond Portfolio | | | | | | | | | | $ | 115,089,312 | |
Wells Fargo Advantage Emerging Growth Portfolio | | | | | | | | | | | 12,329,268 | |
Wells Fargo Advantage International Growth Portfolio | | | | | | | | | | | 12,498,430 | |
Wells Fargo Advantage Small Company Value Portfolio | | | | | | | | | | | 19,718,916 | |
| | | | |
| | | | | | | | | | | 159,635,926 | |
| | | | | | | | | | | | |
| | | | |
| Alternative Investment Funds: 5.28% | | | | | | | | | | | | |
AQR Managed Futures Strategy Fund | | | | | | | 406,601 | | | | 4,236,782 | |
ING Global Real Estate Fund | | | | | | | 788,284 | | | | 14,394,062 | |
PIMCO CommodityRealReturn Strategy Fund | | | | | | | 3,870,693 | | | | 21,598,464 | |
The Arbitrage Fund | | | | | | | 318,054 | | | | 4,093,358 | |
| | | | |
| | | | | | | | | | | 44,322,666 | |
| | | | | | | | | | | | |
| | | | |
| International Equity Funds: 9.26% | | | | | | | | | | | | |
DFA International Small Cap Value Portfolio | | | | | | | 319,698 | | | | 6,457,895 | |
Dodge & Cox International Stock Fund | | | | | | | 228,172 | | | | 9,815,978 | |
Oppenheimer Developing Markets Fund | | | | | | | 212,131 | | | | 7,971,900 | |
T. Rowe Price International Discovery Fund | | | | | | | 116,247 | | | | 6,517,943 | |
Templeton Institutional Foreign Equity Fund | | | | | | | 421,547 | | | | 9,763,020 | |
Thornburg International Value Fund | | | | | | | 924,068 | | | | 29,311,425 | |
Wells Fargo Advantage Emerging Markets Equity Fund (l) | | | | | | | 351,333 | | | | 7,866,346 | |
| | | | |
| | | | | | | | | | | 77,704,507 | |
| | | | | | | | | | | | |
| | | | |
| International Fixed Income Funds: 4.59% | | | | | | | | | | | | |
Oppenheimer International Bond Fund | | | | | | | 6,328,474 | | | | 38,477,123 | |
| | | | | | | | | | | | |
| | | | |
| U.S. Equity Funds: 24.66% | | | | | | | | | | | | |
American Century Growth Fund | | | | | | | 541,258 | | | | 18,446,071 | |
Eaton Vance Large Cap Value Fund | | | | | | | 1,092,823 | | | | 26,828,816 | |
Invesco Growth and Income Fund | | | | | | | 983,678 | | | | 26,746,204 | |
MFS Value Fund | | | | | | | 1,617,250 | | | | 53,757,385 | |
Royce Pennsylvania Mutual Fund | | | | | | | 821,668 | | | | 12,489,351 | |
T. Rowe Price Blue Chip Growth Fund | | | | | | | 421,580 | | | | 26,352,961 | |
Wells Fargo Advantage Endeavor Select Fund †(l) | | | | | | | 1,020,563 | | | | 15,022,680 | |
Wells Fargo Advantage Large Cap Growth Fund (l) | | | | | | | 328,964 | | | | 14,786,938 | |
Wells Fargo Advantage Small Cap Value Fund (l) | | | | | | | 320,769 | | | | 12,500,368 | |
| | | | |
| | | | | | | | | | | 206,930,774 | |
| | | | | | | | | | | | |
| | | | |
| U.S. Fixed Income Funds: 36.65% | | | | | | | | | | | | |
PIMCO High Yield Fund | | | | | | | 4,018,224 | | | | 38,655,312 | |
Wells Fargo Advantage Government Securities Fund (l) | | | | | | | 10,586,464 | | | | 115,074,859 | |
Wells Fargo Advantage Short Duration Government Bond Fund (l) | | | | | | | 15,179,336 | | | | 153,766,678 | |
| | | | |
| | | | | | | | | | | 307,496,849 | |
| | | | | | | | | | | | |
| | | | |
Total Investment Companies (Cost $751,482,016) | | | | | | | | | | | 834,567,845 | |
| | | | | | | | | | | | |
The accompanying notes are an integral part of these financial statements.
| | | | |
| 20 | | Wells Fargo Advantage WealthBuilder Portfolios | | Portfolio of investments—November 30, 2013 (unaudited) |
WEALTHBUILDER MODERATE BALANCED PORTFOLIO
| | | | | | | | | | | | | | | | |
| Security name | | Yield | | | | | | Shares | | | Value | |
| | | | | | | | | | | | | | | | |
| | | | |
Short-Term Investments: 0.51% | | | | | | | | | | | | | | | | |
| | | | |
| Investment Companies: 0.14% | | | | | | | | | | | | | | | | |
Wells Fargo Advantage Cash Investment Money Market Fund, Select Class (u)(l) | | | 0.08 | % | | | | | | | 1,159,929 | | | $ | 1,159,929 | |
| | | | | | | | | | | | | | | | |
| | | | |
| | | | | | Maturity date | | | Principal | | | | |
| U.S. Treasury Securities: 0.37% | | | | | | | | | | | | | | | | |
U.S.Treasury Bill #(z) | | | 0.01 | | | | 12-26-2013 | | | $ | 3,111,000 | | | | 3,110,883 | |
| | | | | | | | | | | | | | | | |
| | | | |
Total Short-Term Investments (Cost $4,270,812) | | | | | | | | | | | | | | | 4,270,812 | |
| | | | | | | | | | | | | | | | |
| | | | | | | | |
Total investments in securities (Cost $755,752,828) * | | | 99.97 | % | | | 838,838,657 | |
Other assets and liabilities, net | | | 0.03 | | | | 268,042 | |
| | | | | | | | |
| Total net assets | | | 100.00 | % | | $ | 839,106,699 | |
| | | | | | | | |
| (l) | Investment in an affiliate |
| † | Non-income-earning security |
| (u) | Rate shown is the 7-day annualized yield at period end. |
| # | All or a portion of this security is segregated as collateral for investments in derivative instruments. |
| (z) | Zero coupon security. Rate represents yield to maturity at time of purchase. |
| * | Cost for federal income tax purposes is $765,943,391 and unrealized appreciation (depreciation) consists of: |
| | | | |
Gross unrealized appreciation | | $ | 91,993,039 | |
Gross unrealized depreciation | | | (19,097,773 | ) |
| | | | |
Net unrealized appreciation | | $ | 72,895,266 | |
The accompanying notes are an integral part of these financial statements.
| | | | | | |
| Portfolio of investments—November 30, 2013 (unaudited) | | Wells Fargo Advantage WealthBuilder Portfolios | | | 21 | |
WEALTHBUILDER GROWTH BALANCED PORTFOLIO
| | | | | | | | | | | | |
| Security name | | | | | | Shares | | | Value | |
| | | | | | | | | | | | |
| | | | |
Investment Companies: 99.32% | | | | | | | | | | | | |
| | | | |
| Affiliated Master Portfolios: 19.64% | | | | | | | | | | | | |
Wells Fargo Advantage Core Bond Portfolio | | | | | | | | | | $ | 99,680,822 | |
Wells Fargo Advantage Emerging Growth Portfolio | | | | | | | | | | | 19,927,501 | |
Wells Fargo Advantage International Growth Portfolio | | | | | | | | | | | 31,585,293 | |
Wells Fargo Advantage Small Company Value Portfolio | | | | | | | | | | | 20,195,279 | |
| | | | |
| | | | | | | | | | | 171,388,895 | |
| | | | | | | | | | | | |
| | | | |
| Alternative Investment Funds: 5.27% | | | | | | | | | | | | |
AQR Managed Futures Strategy Fund | | | | | | | 421,501 | | | | 4,392,042 | |
ING Global Real Estate Fund | | | | | | | 811,259 | | | | 14,813,584 | |
PIMCO CommodityRealReturn Strategy Fund | | | | | | | 4,042,035 | | | | 22,554,553 | |
The Arbitrage Fund | | | | | | | 331,243 | | | | 4,263,093 | |
| | | | |
| | | | | | | | | | | 46,023,272 | |
| | | | | | | | | | | | |
| | | | |
| International Equity Funds: 14.31% | | | | | | | | | | | | |
DFA International Small Cap Value Portfolio | | | | | | | 513,911 | | | | 10,381,000 | |
Dodge & Cox International Stock Fund | | | | | | | 365,866 | | | | 15,739,574 | |
Oppenheimer Developing Markets Fund | | | | | | | 340,205 | | | | 12,784,917 | |
T. Rowe Price International Discovery Fund | | | | | | | 186,648 | | | | 10,465,356 | |
Templeton Institutional Foreign Equity Fund | | | | | | | 675,334 | | | | 15,640,743 | |
Thornburg International Value Fund | | | | | | | 1,491,672 | | | | 47,315,821 | |
Wells Fargo Advantage Emerging Markets Equity Fund (l) | | | | | | | 563,777 | | | | 12,622,973 | |
| | | | |
| | | | | | | | | | | 124,950,384 | |
| | | | | | | | | | | | |
| | | | |
| International Fixed Income Funds: 4.78% | | | | | | | | | | | | |
Oppenheimer International Bond Fund | | | | | | | 6,854,737 | | | | 41,676,801 | |
| | | | | | | | | | | | |
| | | | |
| U.S. Equity Funds: 38.17% | | | | | | | | | | | | |
American Century Growth Fund | | | | | | | 866,987 | | | | 29,546,902 | |
Eaton Vance Large Cap Value Fund | | | | | | | 1,761,560 | | | | 43,246,301 | |
Invesco Growth and Income Fund | | | | | | | 1,582,717 | | | | 43,034,074 | |
MFS Value Fund | | | | | | | 2,610,571 | | | | 86,775,385 | |
Royce Pennsylvania Mutual Fund | | | | | | | 1,327,750 | | | | 20,181,804 | |
T. Rowe Price Blue Chip Growth Fund | | | | | | | 678,185 | | | | 42,393,355 | |
Wells Fargo Advantage Endeavor Select Fund (l)† | | | | | | | 1,634,859 | | | | 24,065,122 | |
Wells Fargo Advantage Large Cap Growth Fund (l) | | | | | | | 527,808 | | | | 23,724,988 | |
Wells Fargo Advantage Small Cap Value Fund (l) | | | | | | | 518,427 | | | | 20,203,094 | |
| | | | |
| | | | | | | | | | | 333,171,025 | |
| | | | | | | | | | | | |
| | | | |
| U.S. Fixed Income Funds: 17.15% | | | | | | | | | | | | |
PIMCO High Yield Fund | | | | | | | 4,351,226 | | | | 41,858,798 | |
Wells Fargo Advantage Government Securities Fund (l) | | | | | | | 9,921,557 | | | | 107,847,327 | |
| | | | |
| | | | | | | | | | | 149,706,125 | |
| | | | | | | | | | | | |
| | | | |
Total Investment Companies (Cost $725,912,782) | | | | | | | | | | | 866,916,502 | |
| | | | | | | | | | | | |
The accompanying notes are an integral part of these financial statements.
| | | | |
| 22 | | Wells Fargo Advantage WealthBuilder Portfolios | | Portfolio of investments—November 30, 2013 (unaudited) |
WEALTHBUILDER GROWTH BALANCED PORTFOLIO
| | | | | | | | | | | | | | | | |
| Security name | | Yield | | | | | | Shares | | | Value | |
| | | | | | | | | | | | | | | | |
| | | | |
Short-Term Investments: 0.67% | | | | | | | | | | | | | | | | |
| | | | |
| Investment Companies: 0.30% | | | | | | | | | | | | | | | | |
Wells Fargo Advantage Cash Investment Money Market Fund, Select Class (l)(u) | | | 0.08 | % | | | | | | | 2,652,130 | | | $ | 2,652,130 | |
| | | | | | | | | | | | | | | | |
| | | | |
| | | | | | Maturity date | | | Principal | | | | |
| U.S. Treasury Securities: 0.37% | | | | | | | | | | | | | | | | |
Treasury Bill #(z) | | | 0.01 | | | | 12-26-2013 | | | $ | 3,214,000 | | | | 3,213,879 | |
| | | | | | | | | | | | | | | | |
| | | | |
Total Short-Term Investments (Cost $5,866,009) | | | | | | | | | | | | | | | 5,866,009 | |
| | | | | | | | | | | | | | | | |
| | | | | | | | |
Total investments in securities (Cost $731,778,791) * | | | 99.99 | % | | | 872,782,511 | |
Other assets and liabilities, net | | | 0.01 | | | | 115,550 | |
| | | | | | | | |
| Total net assets | | | 100.00 | % | | $ | 872,898,061 | |
| | | | | | | | |
| (l) | Investment in an affiliate |
| † | Non-income-earning security |
| (u) | Rate shown is the 7-day annualized yield at period end. |
| # | All or a portion of this security is segregated as collateral for investments in derivative instruments. |
| (z) | Zero coupon security. Rate represents yield to maturity at time of purchase. |
| * | Cost for federal income tax purposes is $754,141,733 and unrealized appreciation (depreciation) consists of: |
| | | | |
Gross unrealized appreciation | | $ | 146,509,230 | |
Gross unrealized depreciation | | | (27,868,452 | ) |
| | | | |
Net unrealized appreciation | | $ | 118,640,778 | |
The accompanying notes are an integral part of these financial statements.
| | | | | | |
| Portfolio of investments—November 30, 2013 (unaudited) | | Wells Fargo Advantage WealthBuilder Portfolios | | | 23 | |
WEALTHBUILDER GROWTH ALLOCATION PORTFOLIO
| | | | | | | | | | | | |
| Security name | | | | | | Shares | | | Value | |
| | | | | | | | | | | | |
| | | | |
Investment Companies: 99.33% | | | | | | | | | | | | |
| | | | |
| Affiliated Master Portfolios: 16.27% | | | | | | | | | | | | |
Wells Fargo Advantage Core Bond Portfolio | | | | | | | | | | $ | 21,259,841 | |
Wells Fargo Advantage Emerging Growth Portfolio | | | | | | | | | | | 10,726,622 | |
Wells Fargo Advantage International Growth Portfolio | | | | | | | | | | | 10,784,677 | |
Wells Fargo Advantage Small Company Value Portfolio | | | | | | | | | | | 17,013,778 | |
| | | | |
| | | | | | | | | | | 59,784,918 | |
| | | | | | | | | | | | |
| | | | |
| Alternative Investment Funds: 5.37% | | | | | | | | | | | | |
AQR Managed Futures Strategy Fund | | | | | | | 175,981 | | | | 1,833,718 | |
ING Global Real Estate Fund | | | | | | | 348,928 | | | | 6,371,421 | |
PIMCO CommodityRealReturn Strategy Fund | | | | | | | 1,746,824 | | | | 9,747,280 | |
The Arbitrage Fund | | | | | | | 139,156 | | | | 1,790,939 | |
| | | | |
| | | | | | | | | | | 19,743,358 | |
| | | | | | | | | | | | |
| | | | |
| International Equity Funds: 18.44% | | | | | | | | | | | | |
DFA International Small Cap Value Portfolio | | | | | | | 279,114 | | | | 5,638,105 | |
Dodge & Cox International Stock Fund | | | | | | | 197,636 | | | | 8,502,279 | |
Oppenheimer Developing Markets Fund | | | | | | | 186,772 | | | | 7,018,904 | |
T. Rowe Price International Discovery Fund | | | | | | | 101,119 | | | | 5,669,732 | |
Templeton Institutional Foreign Equity Fund | | | | | | | 366,260 | | | | 8,482,571 | |
Thornburg International Value Fund | | | | | | | 803,684 | | | | 25,492,842 | |
Wells Fargo Advantage Emerging Markets Equity Fund (l) | | | | | | | 310,668 | | | | 6,955,849 | |
| | | | |
| | | | | | | | | | | 67,760,282 | |
| | | | | | | | | | | | |
| | | | |
| International Fixed Income Funds: 2.49% | | | | | | | | | | | | |
Oppenheimer International Bond Fund | | | | | | | 1,502,968 | | | | 9,138,043 | |
| | | | |
| | | | | | | | | | | 9,138,043 | |
| | | | | | | | | | | | |
| | | | |
| U.S. Equity Funds: 48.48% | | | | | | | | | | | | |
American Century Growth Fund | | | | | | | 467,675 | | | | 15,938,365 | |
Eaton Vance Large Cap Value Fund | | | | | | | 939,563 | | | | 23,066,271 | |
Invesco Growth and Income Fund | | | | | | | 845,196 | | | | 22,980,879 | |
MFS Value Fund | | | | | | | 1,391,181 | | | | 46,242,868 | |
Royce Pennsylvania Mutual Fund | | | | | | | 707,091 | | | | 10,747,782 | |
T. Rowe Price Blue Chip Growth Fund | | | | | | | 363,426 | | | | 22,717,785 | |
Wells Fargo Advantage Endeavor Select Fund †(l) | | | | | | | 878,480 | | | | 12,931,228 | |
Wells Fargo Advantage Large Cap Growth Fund (l) | | | | | | | 284,296 | | | | 12,779,087 | |
Wells Fargo Advantage Small Cap Value Fund (l) | | | | | | | 276,658 | | | | 10,781,357 | |
| | | | |
| | | | | | | | | | | 178,185,622 | |
| | | | | | | | | | | | |
| | | | |
| U.S. Fixed Income Funds: 8.28% | | | | | | | | | | | | |
PIMCO High Yield Fund | | | | | | | 953,630 | | | | 9,173,917 | |
Wells Fargo Advantage Government Securities Fund (l) | | | | | | | 1,955,753 | | | | 21,259,036 | |
| | | | |
| | | | | | | | | | | 30,432,953 | |
| | | | | | | | | | | | |
| | | | |
Total Investment Companies (Cost $295,442,052) | | | | | | | | | | | 365,045,176 | |
| | | | | | | | | | | | |
The accompanying notes are an integral part of these financial statements.
| | | | |
| 24 | | Wells Fargo Advantage WealthBuilder Portfolios | | Portfolio of investments—November 30, 2013 (unaudited) |
WEALTHBUILDER GROWTH ALLOCATION PORTFOLIO
| | | | | | | | | | | | | | | | |
| Security name | | Yield | | | | | | Shares | | | Value | |
| | | | | | | | | | | | | | | | |
| | | | |
Short-Term Investments: 0.58% | | | | | | | | | | | | | | | | |
| | | | |
| Investment Companies: 0.22% | | | | | | | | | | | | | | | | |
Wells Fargo Advantage Cash Investment Money Market Fund, Select Class (u)(l) | | | 0.08 | % | | | | | | | 796,059 | | | $ | 796,059 | |
| | | | | | | | | | | | | | | | |
| | | | |
| | | | | | Maturity date | | | Principal | | | | |
| U.S. Treasury Securities: 0.36% | | | | | | | | | | | | | | | | |
U.S.Treasury Bill #(z) | | | 0.01 | | | | 12-26-2013 | | | $ | 1,340,000 | | | | 1,339,950 | |
| | | | | | | | | | | | | | | | |
| | | | |
Total Short-Term Investments (Cost $2,136,009) | | | | | | | | | | | | | | | 2,136,009 | |
| | | | | | | | | | | | | | | | |
| | | | | | | | |
Total investments in securities (Cost $297,578,061) * | | | 99.91 | % | | | 367,181,185 | |
Other assets and liabilities, net | | | 0.09 | | | | 321,832 | |
| | | | | | | | |
| Total net assets | | | 100.00 | % | | $ | 367,503,017 | |
| | | | | | | | |
| (l) | Investment in an affiliate |
| (u) | Rate shown is the 7-day annualized yield at period end. |
| † | Non-income-earning security |
| # | All or a portion of this security is segregated as collateral for investments in derivative instruments. |
| (z) | Zero coupon security. Rate represents yield to maturity at time of purchase. |
| * | Cost for federal income tax purposes is $306,688,199 and unrealized appreciation (depreciation) consists of: |
| | | | |
Gross unrealized appreciation | | $ | 72,242,263 | |
Gross unrealized depreciation | | | (11,749,277 | ) |
| | | | |
Net unrealized appreciation | | $ | 60,492,986 | |
The accompanying notes are an integral part of these financial statements.
| | | | | | |
| Portfolio of investments—November 30, 2013 (unaudited) | | Wells Fargo Advantage WealthBuilder Portfolios | | | 25 | |
WEALTHBUILDER EQUITY PORTFOLIO
| | | | | | | | | | | | | | |
| Security name | | | | | | | | Shares | | | Value | |
| | | | | |
Investment Companies: 99.85% | | | | | | | | | | | | | | |
| | | | | |
| Affiliated Master Portfolios: 11.00% | | | | | | | | | | | | | | |
Wells Fargo Advantage Emerging Growth Portfolio | | | | | | | | | | | | $ | 3,321,965 | |
Wells Fargo Advantage International Growth Portfolio | | | | | | | | | | | | | 8,140,037 | |
Wells Fargo Advantage Small Company Value Portfolio | | | | | | | | | | | | | 3,376,023 | |
| | | | | |
| | | | | | | | | | | | | 14,838,025 | |
| | | | | | | | | | | | | | |
| | | | | |
| International Equity Funds: 24.05% | | | | | | | | | | | | | | |
DFA International Small Cap Value Portfolio | | | | | | | | | 133,333 | | | | 2,693,334 | |
Dodge & Cox International Stock Fund | | | | | | | | | 94,642 | | | | 4,071,492 | |
Oppenheimer Developing Markets Fund | | | | | | | | | 89,922 | | | | 3,379,255 | |
T. Rowe Price International Discovery Fund | | | | | | | | | 48,339 | | | | 2,710,340 | |
Templeton Institutional Foreign Equity Fund | | | | | | | | | 175,143 | | | | 4,056,315 | |
Thornburg International Value Fund | | | | | | | | | 383,567 | | | | 12,166,746 | |
Wells Fargo Advantage Emerging Markets Equity Fund (l) | | | | | | | | | 149,952 | | | | 3,357,435 | |
| | | | | |
| | | | | | | | | | | | | 32,434,917 | |
| | | | | | | | | | | | | | |
| | | | | |
| U.S. Equity Funds: 64.80% | | | | | | | | | | | | | | |
American Century Growth Fund | | | | | | | | | 294,623 | | | | 10,040,743 | |
Eaton Vance Large Cap Value Fund | | | | | | | | | 410,975 | | | | 10,089,434 | |
Invesco Growth and Income Fund | | | | | | | | | 370,877 | | | | 10,084,139 | |
MFS Value Fund | | | | | | | | | 605,794 | | | | 20,136,587 | |
Royce Pennsylvania Mutual Fund | | | | | | | | | 221,858 | | | | 3,372,249 | |
T. Rowe Price Blue Chip Growth Fund | | | | | | | | | 226,611 | | | | 14,165,438 | |
Wells Fargo Advantage Endeavor Select Fund †(l) | | | | | | | | | 550,212 | | | | 8,099,124 | |
Wells Fargo Advantage Large Cap Growth Fund (l) | | | | | | | | | 178,897 | | | | 8,041,421 | |
Wells Fargo Advantage Small Cap Value Fund (l) | | | | | | | | | 86,583 | | | | 3,374,135 | |
| | | | | |
| | | | | | | | | | | | | 87,403,270 | |
| | | | | | | | | | | | | | |
| | | | | |
Total Investment Companies (Cost $96,295,846) | | | | | | | | | | | | | 134,676,212 | |
| | | | | | | | | | | | | | |
| | | | | | | | |
Total investments in securities (Cost $96,295,846) * | | | 99.85 | % | | | 134,676,212 | |
Other assets and liabilities, net | | | 0.15 | | | | 206,878 | |
| | | | | | | | |
| Total net assets | | | 100.00 | % | | $ | 134,883,090 | |
| | | | | | | | |
| (l) | Investment in an affiliate |
| † | Non-income-earning security |
| * | Cost for federal income tax purposes is $96,526,481 and unrealized appreciation (depreciation) consists of: |
| | | | |
Gross unrealized appreciation | | $ | 38,877,854 | |
Gross unrealized depreciation | | | (728,123 | ) |
| | | | |
Net unrealized appreciation | | $ | 38,149,731 | |
The accompanying notes are an integral part of these financial statements.
| | | | |
| 26 | | Wells Fargo Advantage WealthBuilder Portfolios | | Portfolio of investments—November 30, 2013 (unaudited) |
WEALTHBUILDER TACTICAL EQUITY PORTFOLIO
| | | | | | | | | | | | | | |
| Security name | | | | | | | Shares | | | Value | |
| | | | |
Investment Companies: 99.72% | | | | | | | | | | | | | | |
| | | | |
| Affiliated Master Portfolios: 13.50% | | | | | | | | | | | | | | |
Wells Fargo Advantage Emerging Growth Portfolio | | | | | | | | | | | | $ | 15,377,997 | |
Wells Fargo Advantage International Growth Portfolio | | | | | | | | | | | | | 24,656,478 | |
Wells Fargo Advantage Small Company Value Portfolio | | | | | | | | | | | | | 15,613,689 | |
| | | | |
| | | | | | | | | | | | | 55,648,164 | |
| | | | | | | | | | | | | | |
| | | | |
| International Equity Funds: 23.76% | | | | | | | | | | | | | | |
DFA International Small Cap Value Portfolio | | | | | | | | | 401,708 | | | | 8,114,498 | |
Dodge & Cox International Stock Fund | | | | | | | | | 285,938 | | | | 12,301,066 | |
Oppenheimer Developing Markets Fund | | | | | | | | | 268,730 | | | | 10,098,867 | |
T. Rowe Price International Discovery Fund | | | | | | | | | 145,884 | | | | 8,179,708 | |
Templeton Institutional Foreign Equity Fund | | | | | | | | | 528,935 | | | | 12,250,131 | |
Thornburg International Value Fund | | | | | | | | | 1,165,486 | | | | 36,969,216 | |
Wells Fargo Advantage Emerging Markets Equity Fund (l) | | | | | | | | | 447,363 | | | | 10,016,450 | |
| | | | |
| | | | | | | | | | | | | 97,929,936 | |
| | | | | | | | | | | | | | |
| | | | |
| U.S. Equity Funds: 62.46% | | | | | | | | | | | | | | |
American Century Growth Fund | | | | | | | | | 675,061 | | | | 23,006,073 | |
Eaton Vance Large Cap Value Fund | | | | | | | | | 1,360,738 | | | | 33,406,119 | |
Invesco Growth and Income Fund | | | | | | | | | 1,226,250 | | | | 33,341,725 | |
MFS Value Fund | | | | | | | | | 2,008,250 | | | | 66,754,234 | |
Royce Pennsylvania Mutual Fund | | | | | | | | | 1,024,176 | | | | 15,567,482 | |
T. Rowe Price Blue Chip Growth Fund | | | | | | | | | 523,219 | | | | 32,706,449 | |
Wells Fargo Advantage Endeavor Select Fund †(l) | | | | | | | | | 1,268,313 | | | | 18,669,562 | |
Wells Fargo Advantage Large Cap Growth Fund (l) | | | | | | | | | 409,850 | | | | 18,422,736 | |
Wells Fargo Advantage Small Cap Value Fund (l) | | | | | | | | | 400,221 | | | | 15,596,600 | |
| | | | |
| | | | | | | | | | | | | 257,470,980 | |
| | | | | | | | | | | | | | |
| | | | |
Total Investment Companies (Cost $310,557,102) | | | | | | | | | | | | | 411,049,080 | |
| | | | | | | | | | | | | | |
| | | | |
| | | | | Yield | | | | | | | |
| Short-Term Investments: 0.49% | | | | | | | | | | | | | | |
| | | | |
| Investment Companies: 0.49% | | | | | | | | | | | | | | |
Wells Fargo Advantage Cash Investment Money Market Fund, Select Class (u)(l) | | | | | 0.08 | % | | | 2,000,000 | | | | 2,000,000 | |
| | | | | | | | | | | | | | |
| | | | |
Total Short-Term Investments (Cost $2,000,000) | | | | | | | | | | | | | 2,000,000 | |
| | | | | | | | | | | | | | |
| | | | | | | | |
Total investments in securities (Cost $312,557,102) * | | | 100.21 | % | | | 413,049,080 | |
Other assets and liabilities, net | | | (0.21 | ) | | | (857,432 | ) |
| | | | | | | | |
| Total net assets | | | 100.00 | % | | $ | 412,191,648 | |
| | | | | | | | |
| (l) | Investment in an affiliate |
| † | Non-income-earning security |
| (u) | Rate shown is the 7-day annualized yield at period end. |
| * | Cost for federal income tax purposes is $320,342,450 and unrealized appreciation (depreciation) consists of: |
| | | | |
Gross unrealized appreciation | | $ | 100,491,978 | |
Gross unrealized depreciation | | | (7,785,348 | ) |
| | | | |
Net unrealized appreciation | | $ | 92,706,630 | |
The accompanying notes are an integral part of these financial statements.
This page is intentionally left blank.
| | | | |
| 28 | | Wells Fargo Advantage WealthBuilder Portfolios | | Statements of assets and liabilities—November 30, 2013 (unaudited) |
| | | | | | | | |
| | | WealthBuilder
Conservative
Allocation
Portfolio | | | WealthBuilder
Moderate
Balanced Portfolio | |
| | |
Assets | | | | | | | | |
Investments | | | | | | | | |
In unaffiliated Underlying Funds and securities, at value (see cost below) | | $ | 177,494,981 | | | $ | 359,024,933 | |
In affiliated Underlying Funds, at value (see cost below) | | | 306,532,425 | | | | 320,177,798 | |
In affiliated Master Portfolios, at value (see cost below) | | | 131,000,605 | | | | 159,635,926 | |
| | | | | | | | |
Total investments, at value (see cost below) | | | 615,028,011 | | | | 838,838,657 | |
Cash | | | 65,837 | | | | 222,883 | |
Receivable for investments sold | | | 1,123,000 | | | | 3,008,771 | |
Receivable for Portfolio shares sold | | | 524,108 | | | | 1,989,625 | |
Receivable for dividends | | | 605,112 | | | | 652,787 | |
Prepaid expenses and other assets | | | 27,585 | | | | 29,182 | |
| | | | | | | | |
Total assets | | | 617,373,653 | | | | 844,741,905 | |
| | | | | | | | |
| | |
Liabilities | | | | | | | | |
Payable for investments purchased | | | 1,795,225 | | | | 3,764,351 | |
Payable for Portfolio shares redeemed | | | 1,221,191 | | | | 827,184 | |
Payable for daily variation margin on open futures contracts | | | 1,750 | | | | 4,650 | |
Advisory fee payable | | | 78,592 | | | | 113,978 | |
Distribution fee payable | | | 392,242 | | | | 529,835 | |
Due to other related parties | | | 162,127 | | | | 218,998 | |
Shareholder servicing fee payable | | | 129,925 | | | | 176,133 | |
Accrued expenses and other liabilities | | | 738 | | | | 77 | |
| | | | | | | | |
Total liabilities | | | 3,781,790 | | | | 5,635,206 | |
| | | | | | | | |
Total net assets | | $ | 613,591,863 | | | $ | 839,106,699 | |
| | | | | | | | |
| | |
NET ASSETS CONSIST OF | | | | | | | | |
Paid-in capital | | $ | 559,786,973 | | | $ | 716,846,429 | |
Overdistributed/accumulated net investment income (loss) | | | (9,391 | ) | | | (13,583 | ) |
Accumulated net realized gains (losses) on investments | | | 16,290,631 | | | | 36,428,338 | |
Net unrealized gains on investments | | | 37,523,650 | | | | 85,845,515 | |
| | | | | | | | |
Total net assets | | $ | 613,591,863 | | | $ | 839,106,699 | |
| | | | | | | | |
| | |
COMPUTATION OF NET ASSET VALUE AND OFFERING PRICE PER SHARE1 | | | | | | | | |
Net assets | | $ | 613,591,863 | | | $ | 839,106,699 | |
Shares outstanding | | | 55,067,723 | | | | 66,421,089 | |
Net asset value per share | | | $11.14 | | | | $12.63 | |
Maximum offering price per share2 | | | $11.31 | | | | $12.82 | |
| | |
Investments in unaffiliated Underlying Funds and securities, at cost | | $ | 148,085,051 | | | $ | 293,296,898 | |
| | | | | | | | |
Investments in affiliated Underlying Funds, at cost | | $ | 300,746,852 | | | $ | 305,226,313 | |
| | | | | | | | |
Investments in affiliated Master Portfolios, at cost | | $ | 129,711,624 | | | $ | 157,229,617 | |
| | | | | | | | |
Total investments, at cost | | $ | 578,543,527 | | | $ | 755,752,828 | |
| | | | | | | | |
| 1. | Each Portfolio has an unlimited number of authorized shares. |
| 2. | Maximum offering price is computed as 100/98.50 of net asset value. On investments of $50,000 or more, the offering price is reduced. |
The accompanying notes are an integral part of these financial statements.
| | | | | | |
| Statements of assets and liabilities—November 30, 2013 (unaudited) | | Wells Fargo Advantage WealthBuilder Portfolios | | | 29 | |
| | | | | | | | | | | | | | |
WealthBuilder
Growth Balanced
Portfolio | | | WealthBuilder
Growth Allocation
Portfolio | | | WealthBuilder
Equity Portfolio | | | WealthBuilder
Tactical Equity
Portfolio | |
| | | |
| | | | | | | | | | | | | | |
| | | | | | | | | | | | | | |
| $ | 510,277,982 | | | $ | 241,893,651 | | | $ | 96,966,072 | | | $ | 292,695,568 | |
| | 191,115,634 | | | | 65,502,616 | | | | 22,872,115 | | | | 64,705,348 | |
| | 171,388,895 | | | | 59,784,918 | | | | 14,838,025 | | | | 55,648,164 | |
| | | | | | | | | | | | | | |
| | 872,782,511 | | | | 367,181,185 | | | | 134,676,212 | | | | 413,049,080 | |
| | 432,440 | | | | 104,950 | | | | 400,000 | | | | 330,897 | |
| | 3,043,000 | | | | 1,405,891 | | | | 0 | | | | 0 | |
| | 2,288,918 | | | | 877,764 | | | | 125,525 | | | | 354,003 | |
| | 444,349 | | | | 94,392 | | | | 0 | | | | 134 | |
| | 38,981 | | | | 26,107 | | | | 17,487 | | | | 23,284 | |
| | | | | | | | | | | | | | |
| | 879,030,199 | | | | 369,690,289 | | | | 135,219,224 | | | | 413,757,398 | |
| | | | | | | | | | | | | | |
| | | |
| | | | | | | | | | | | | | |
| | 3,918,601 | | | | 1,434,089 | | | | 0 | | | | 330,897 | |
| | 1,125,859 | | | | 288,527 | | | | 163,425 | | | | 714,740 | |
| | 4,800 | | | | 2,000 | | | | 0 | | | | 0 | |
| | 118,208 | | | | 40,123 | | | | 10,412 | | | | 49,576 | |
| | 549,171 | | | | 230,044 | | | | 84,943 | | | | 258,854 | |
| | 226,990 | | | | 95,085 | | | | 35,110 | | | | 106,993 | |
| | 183,057 | | | | 76,681 | | | | 28,314 | | | | 86,285 | |
| | 5,452 | | | | 20,723 | | | | 13,930 | | | | 18,405 | |
| | | | | | | | | | | | | | |
| | 6,132,138 | | | | 2,187,272 | | | | 336,134 | | | | 1,565,750 | |
| | | | | | | | | | | | | | |
| $ | 872,898,061 | | | $ | 367,503,017 | | | $ | 134,883,090 | | | $ | 412,191,648 | |
| | | | | | | | | | | | | | |
| | | |
| | | | | | | | | | | | | | |
| $ | 761,692,901 | | | $ | 302,675,693 | | | $ | 121,276,023 | | | $ | 420,743,339 | |
| | (69,563 | ) | | | (605,978 | ) | | | (536,208 | ) | | | (2,685,994 | ) |
| | (32,577,483 | ) | | | (5,356,592 | ) | | | (24,237,091 | ) | | | (106,357,675 | ) |
| | 143,852,206 | | | | 70,789,894 | | | | 38,380,366 | | | | 100,491,978 | |
| | | | | | | | | | | | | | |
| $ | 872,898,061 | | | $ | 367,503,017 | | | $ | 134,883,090 | | | $ | 412,191,648 | |
| | | | | | | | | | | | | | |
| | | |
| | | | | | | | | | | | | | |
| $ | 872,898,061 | | | $ | 367,503,017 | | | $ | 134,883,090 | | | $ | 412,191,648 | |
| | 62,368,538 | | | | 25,411,221 | | | | 9,332,636 | | | | 23,495,808 | |
| | $14.00 | | | | $14.46 | | | | $14.45 | | | | $17.54 | |
| | $14.21 | | | | $14.68 | | | | $14.67 | | | | $17.81 | |
| | | |
| $ | 399,459,138 | | | $ | 187,212,459 | | | $ | 67,651,341 | | | $ | 214,807,220 | |
| | | | | | | | | | | | | | |
| $ | 164,450,978 | | | $ | 52,196,665 | | | $ | 15,916,951 | | | $ | 45,285,723 | |
| | | | | | | | | | | | | | |
| $ | 167,868,675 | | | $ | 58,168,937 | | | $ | 12,727,554 | | | $ | 52,464,159 | |
| | | | | | | | | | | | | | |
| $ | 731,778,791 | | | $ | 297,578,061 | | | $ | 96,295,846 | | | $ | 312,557,102 | |
| | | | | | | | | | | | | | |
The accompanying notes are an integral part of these financial statements.
| | | | |
| 30 | | Wells Fargo Advantage WealthBuilder Portfolios | | Statements of operations—six months ended November 30, 2013 (unaudited) |
| | | | | | | | |
| | | WealthBuilder
Conservative
Allocation
Portfolio | | | WealthBuilder
Moderate
Balanced
Portfolio | |
| | |
Investment income | | | | | | | | |
Dividends from unaffiliated Underlying Funds | | $ | 2,188,906 | | | $ | 3,345,933 | |
Dividends from affiliated Underlying Funds | | | 2,434,343 | | | | 2,121,000 | |
Dividends allocated from affiliated Master Portfolios* | | | 102,883 | | | | 266,445 | |
Interest | | | 869 | | | | 2,063 | |
Interest allocated from affiliated Master Portfolios** | | | 1,351,455 | | | | 1,278,897 | |
Securities lending income allocated from affiliated Master Portfolios | | | 5,761 | | | | 14,320 | |
Expenses allocated from affiliated Master Portfolios | | | (302,154 | ) | | | (421,736 | ) |
Waivers allocated from affiliated Master Portfolios | | | 14,631 | | | | 13,925 | |
| | | | | | | | |
Total investment income | | | 5,796,694 | | | | 6,620,847 | |
| | | | | | | | |
| | |
Expenses | | | | | | | | |
Advisory fee | | | 629,189 | | | | 809,549 | |
Administration fee | | | 975,244 | | | | 1,254,801 | |
Shareholder servicing fee | | | 783,861 | | | | 1,010,409 | |
Distribution fee | | | 2,359,461 | | | | 3,035,808 | |
Custody and accounting fees | | | 39,705 | | | | 33,499 | |
Professional fees | | | 14,948 | | | | 14,487 | |
Registration fees | | | 34,715 | | | | 31,781 | |
Shareholder report expenses | | | 20,435 | | | | 26,823 | |
Trustees’ fees and expenses | | | 5,038 | | | | 5,030 | |
Other fees and expenses | | | 12,248 | | | | 9,680 | |
| | | | | | | | |
Total expenses | | | 4,874,844 | | | | 6,231,867 | |
Less: Fee waivers and/or expense reimbursements | | | (155,923 | ) | | | (160,251 | ) |
| | | | | | | | |
Net expenses | | | 4,718,921 | | | | 6,071,616 | |
| | | | | | | | |
Net investment income (loss) | | | 1,077,773 | | | | 549,231 | |
| | | | | | | | |
| | |
REALIZED AND UNREALIZED GAINS (LOSSES) ON INVESTMENTS | | | | | | | | |
| | |
Net realized gains (losses) on: | | | | | | | | |
Unaffiliated Underlying Funds | | | 2,445,144 | | | | 3,141,460 | |
Affiliated Underlying Funds | | | 250,677 | | | | 727,988 | |
Futures transactions | | | 6,248,533 | | | | 15,141,164 | |
Capital gain distributions from unaffiliated Underlying Funds | | | 430 | | | | 1,091 | |
Securities transactions allocated from affiliated Master Portfolios | | | (592,756 | ) | | | 1,165,082 | |
| | | | | | | | |
Net realized gains on investments | | | 8,352,028 | | | | 20,176,785 | |
| | | | | | | | |
| | |
Net change in unrealized gains (losses) on: | | | | | | | | |
Unaffiliated Underlying Funds | | | 4,055,644 | | | | 17,900,142 | |
Affiliated Underlying Funds | | | (1,417,861 | ) | | | 1,750,958 | |
Futures transactions | | | (1,970,553 | ) | | | (4,618,636 | ) |
Securities transactions allocated from affiliated Master Portfolios | | | 1,711,957 | | | | 4,920,148 | |
| | | | | | | | |
Net change in unrealized gains (losses) on investments | | | 2,379,187 | | | | 19,952,612 | |
| | | | | | | | |
Net realized and unrealized gains (losses) on investments | | | 10,731,215 | | | | 40,129,397 | |
| | | | | | | | |
Net increase in net assets resulting from operations | | $ | 11,808,988 | | | $ | 40,678,628 | |
| | | | | | | | |
| | |
* Net of foreign dividend withholding taxes allocated from affiliated Master Portfolios in the amount of | | | $2,938 | | | | $7,571 | |
** Net of foreign interest withholding taxes allocated from affiliated Master Portfolios in the amount of | | | $408 | | | | $355 | |
The accompanying notes are an integral part of these financial statements.
| | | | | | |
| Statements of operations—six months ended November 30, 2013 (unaudited) | | Wells Fargo Advantage WealthBuilder Portfolios | | | 31 | |
| | | | | | | | | | | | | | |
WealthBuilder Growth Balanced Portfolio | | | WealthBuilder
Growth
Allocation
Portfolio | | | WealthBuilder
Equity
Portfolio | | | WealthBuilder
Tactical
Equity
Portfolio | |
| | | |
| | | | | | | | | | | | | | |
| $ | 4,099,060 | | | $ | 1,557,273 | | | $ | 395,546 | | | $ | 1,452,861 | |
| | 563,509 | | | | 121,068 | | | | 156 | | | | 935 | |
| | 427,256 | | | | 221,243 | | | | 103,062 | | | | 324,429 | |
| | 2,952 | | | | 1,424 | | | | 0 | | | | 1,571 | |
| | 1,051,331 | | | | 243,882 | | | | 0 | | | | 0 | |
| | 22,490 | | | | 11,482 | | | | 5,617 | | | | 16,752 | |
| | (509,836 | ) | | | (214,068 | ) | | | (86,409 | ) | | | (256,320 | ) |
| | 11,373 | | | | 2,636 | | | | 0 | | | | 0 | |
| | | | | | | | | | | | | | |
| | 5,668,135 | | | | 1,944,940 | | | | 417,972 | | | | 1,540,228 | |
| | | | | | | | | | | | | | |
| | | |
| | | | | | | | | | | | | | |
| | 819,717 | | | | 341,570 | | | | 126,719 | | | | 383,115 | |
| | 1,270,562 | | | | 529,434 | | | | 196,414 | | | | 593,828 | |
| | 1,024,183 | | | | 426,963 | | | | 158,399 | | | | 478,601 | |
| | 3,073,939 | | | | 1,280,889 | | | | 475,196 | | | | 1,436,681 | |
| | 38,431 | | | | 34,845 | | | | 17,882 | | | | 28,661 | |
| | 16,873 | | | | 14,473 | | | | 14,795 | | | | 14,507 | |
| | 20,018 | | | | 17,880 | | | | 13,293 | | | | 16,335 | |
| | 30,458 | | | | 22,348 | | | | 10,480 | | | | 23,655 | |
| | 5,879 | | | | 6,217 | | | | 5,036 | | | | 5,080 | |
| | 10,380 | | | | 5,199 | | | | 3,602 | | | | 5,285 | |
| | | | | | | | | | | | | | |
| | 6,310,440 | | | | 2,679,818 | | | | 1,021,816 | | | | 2,985,748 | |
| | (162,562 | ) | | | (118,042 | ) | | | (71,425 | ) | | | (112,385 | ) |
| | | | | | | | | | | | | | |
| | 6,147,878 | | | | 2,561,776 | | | | 950,391 | | | | 2,873,363 | |
| | | | | | | | | | | | | | |
| | (479,743 | ) | | | (616,836 | ) | | | (532,419 | ) | | | (1,333,135 | ) |
| | | | | | | | | | | | | | |
| | | |
| | | | | | | | | | | | | | |
| | | |
| | | | | | | | | | | | | | |
| | 2,913,509 | | | | 631,323 | | | | 1,626,422 | | | | 2,611,831 | |
| | 1,998,988 | | | | 359,644 | | | | 1,710,455 | | | | 1,862,753 | |
| | 22,429,773 | | | | 9,831,597 | | | | 0 | | | | 4,873,600 | |
| | 1,770 | | | | 906 | | | | 461 | | | | 1,321 | |
| | 3,043,011 | | | | 1,862,953 | | | | 1,075,207 | | | | 3,167,298 | |
| | | | | | | | | | | | | | |
| | 30,387,051 | | | | 12,686,423 | | | | 4,412,545 | | | | 12,516,803 | |
| | | | | | | | | | | | | | |
| | | |
| | | | | | | | | | | | | | |
| | 32,798,028 | | | | 18,710,439 | | | | 8,512,453 | | | | 27,173,705 | |
| | 5,225,605 | | | | 3,720,936 | | | | 1,042,257 | | | | 4,361,350 | |
| | (8,390,470 | ) | | | (3,882,756 | ) | | | 0 | | | | (3,441,320 | ) |
| | 7,994,732 | | | | 4,118,967 | | | | 1,987,104 | | | | 6,013,407 | |
| | | | | | | | | | | | | | |
| | 37,627,895 | | | | 22,667,586 | | | | 11,541,814 | | | | 34,107,142 | |
| | | | | | | | | | | | | | |
| | 68,014,946 | | | | 35,354,009 | | | | 15,954,359 | | | | 46,623,945 | |
| | | | | | | | | | | | | | |
| $ | 67,535,203 | | | $ | 34,737,173 | | | $ | 15,421,940 | | | $ | 45,290,810 | |
| | | | | | | | | | | | | | |
| | | |
| | $12,170 | | | | $6,321 | | | | $3,154 | | | | $9,310 | |
| | $258 | | | | $69 | | | | $0 | | | | $0 | |
The accompanying notes are an integral part of these financial statements.
| | | | |
| 32 | | Wells Fargo Advantage WealthBuilder Portfolios | | Statements of changes in net assets |
| | | | | | | | | | | | | | | | |
| | | WealthBuilder Conservative Allocation Portfolio | |
| | | Six months ended
November 30, 2013
(unaudited) | | | Year ended
May 31, 2013 | |
| | | | |
Operations | | | | | | | | | | | | | | | | |
Net investment income | | | | | | $ | 1,077,773 | | | | | | | $ | 3,599,448 | |
Net realized gains on investments | | | | | | | 8,352,028 | | | | | | | | 23,483,697 | |
Net change in unrealized gains (losses) on investments | | | | | | | 2,379,187 | | | | | | | | 13,833,222 | |
| | | | | | | | | | | | | | | | |
Net increase in net assets resulting from operations | | | | | | | 11,808,988 | | | | | | | | 40,916,367 | |
| | | | | | | | | | | | | | | | |
| | | | |
Distributions to shareholders from | | | | | | | | | | | | | | | | |
Net investment income | | | | | | | (1,109,252 | ) | | | | | | | (5,273,400 | ) |
Net realized gains | | | | | | | 0 | | | | | | | | (11,760,322 | ) |
| | | | | | | | | | | | | | | | |
Total distributions to shareholders | | | | | | | (1,109,252 | ) | | | | | | | (17,033,722 | ) |
| | | | | | | | | | | | | | | | |
| | | | |
| | | Shares | | | | | | | | Shares | | | | | |
Capital share transactions | | | | | | | | | | | | | | | | |
Proceeds from shares sold | | | 4,195,264 | | | | 45,951,127 | | | | 14,509,459 | | | | 157,653,896 | |
Reinvestment of distributions | | | 100,584 | | | | 1,100,306 | | | | 1,571,955 | | | | 16,942,167 | |
Payment for shares redeemed | | | (9,507,118 | ) | | | (104,136,605 | ) | | | (18,427,000 | ) | | | (200,593,341 | ) |
| | | | | | | | | | | | | | | | |
Net decrease in net assets resulting from capital share transactions | | | | | | | (57,085,172 | ) | | | | | | | (25,997,278 | ) |
| | | | | | | | | | | | | | | | |
Total decrease in net assets | | | | | | | (46,385,436 | ) | | | | | | | (2,114,633 | ) |
| | | | | | | | | | | | | | | | |
| | | | |
Net assets | | | | | | | | | | | | | | | | |
Beginning of period | | | | | | | 659,977,299 | | | | | | | | 662,091,932 | |
| | | | | | | | | | | | | | | | |
End of period | | | | | | $ | 613,591,863 | | | | | | | $ | 659,977,299 | |
| | | | | | | | | | | | | | | | |
Undistributed (overdistributed) net investment income | | | | | | $ | (9,391 | ) | | | | | | $ | 22,088 | |
| | | | | | | | | | | | | | | | |
The accompanying notes are an integral part of these financial statements.
| | | | | | |
| Statements of changes in net assets | | Wells Fargo Advantage WealthBuilder Portfolios | | | 33 | |
| | | | | | | | | | | | | | | | |
| | | WealthBuilder Moderate Balanced Portfolio | |
| | | Six months ended
November 30, 2013
(unaudited) | | | Year ended
May 31, 2013 | |
| | | | |
Operations | | | | | | | | | | | | | | | | |
Net investment income | | | | | | $ | 549,231 | | | | | | | $ | 2,613,522 | |
Net realized gains on investments | | | | | | | 20,176,785 | | | | | | | | 34,702,999 | |
Net change in unrealized gains on investments | | | | | | | 19,952,612 | | | | | | | | 44,251,871 | |
| | | | | | | | | | | | | | | | |
Net increase in net assets resulting from operations | | | | | | | 40,678,628 | | | | | | | | 81,568,392 | |
| | | | | | | | | | | | | | | | |
| | | | |
Distributions to shareholders from | | | | | | | | | | | | | | | | |
Net investment income | | | | | | | (765,806 | ) | | | | | | | (3,853,193 | ) |
Net realized gains | | | | | | | 0 | | | | | | | | (7,491,035 | ) |
| | | | | | | | | | | | | | | | |
Total distributions to shareholders | | | | | | | (765,806 | ) | | | | | | | (11,344,228 | ) |
| | | | | | | | | | | | | | | | |
| | | | |
| | | Shares | | | | | | | | Shares | | | | | |
Capital share transactions | | | | | | | | | | | | | | | | |
Proceeds from shares sold | | | 6,970,666 | | | | 85,471,060 | | | | 14,833,493 | | | | 172,153,400 | |
Reinvestment of distributions | | | 63,739 | | | | 762,929 | | | | 977,941 | | | | 11,284,104 | |
Payment for shares redeemed | | | (7,044,544 | ) | | | (86,290,845 | ) | | | (14,140,801 | ) | | | (164,212,360 | ) |
| | | | | | | | | | | | | | | | |
Net increase (decrease) in net assets resulting from capital share transactions | | | | | | | (56,856 | ) | | | | | | | 19,225,144 | |
| | | | | | | | | | | | | | | | |
Total increase in net assets | | | | | | | 39,855,966 | | | | | | | | 89,449,308 | |
| | | | | | | | | | | | | | | | |
| | | | |
Net assets | | | | | | | | | | | | | | | | |
Beginning of period | | | | | | | 799,250,733 | | | | | | | | 709,801,425 | |
| | | | | | | | | | | | | | | | |
End of period | | | | | | $ | 839,106,699 | | | | | | | $ | 799,250,733 | |
| | | | | | | | | | | | | | | | |
Undistributed (overdistributed) net investment income | | | | | | $ | (13,583 | ) | | | | | | $ | 202,992 | |
| | | | | | | | | | | | | | | | |
The accompanying notes are an integral part of these financial statements.
| | | | |
| 34 | | Wells Fargo Advantage WealthBuilder Portfolios | | Statements of changes in net assets |
| | | | | | | | | | | | | | | | |
| | | WealthBuilder Growth Balanced Portfolio | |
| | | Six months ended
November 30, 2013 (unaudited) | | | Year ended May 31, 2013 | |
| | | | |
Operations | | | | | | | | | | | | | | | | |
Net investment income (loss) | | | | | | $ | (479,743 | ) | | | | | | $ | 432,359 | |
Net realized gains on investments | | | | | | | 30,387,051 | | | | | | | | 51,806,143 | |
Net change in unrealized gains (losses) on investments | | | | | | | 37,627,895 | | | | | | | | 67,464,241 | |
| | | | | | | | | | | | | | | | |
Net increase in net assets resulting from operations | | | | | | | 67,535,203 | | | | | | | | 119,702,743 | |
| | | | | | | | | | | | | | | | |
| | | | |
Distributions to shareholders from | | | | | | | | | | | | | | | | |
Net investment income | | | | | | | 0 | | | | | | | | (1,540,541 | ) |
| | | | | | | | | | | | | | | | |
| | | | |
| | | Shares | | | | | | | | Shares | | | | | |
Capital share transactions | | | | | | | | | | | | | | | | |
Proceeds from shares sold | | | 6,173,043 | | | | 82,626,327 | | | | 10,081,790 | | | | 122,237,806 | |
Reinvestment of distributions | | | 0 | | | | 0 | | | | 131,179 | | | | 1,533,484 | |
Payment for shares redeemed | | | (4,909,121 | ) | | | (65,548,595 | ) | | | (11,984,547 | ) | | | (143,463,975 | ) |
| | | | | | | | | | | | | | | | |
Net increase (decrease) in net assets resulting from capital share transactions | | | | | | | 17,077,732 | | | | | | | | (19,692,685 | ) |
| | | | | | | | | | | | | | | | |
Total increase in net assets | | | | | | | 84,612,935 | | | | | | | | 98,469,517 | |
| | | | | | | | | | | | | | | | |
| | | | |
Net assets | | | | | | | | | | | | | | | | |
Beginning of period | | | | | | | 788,285,126 | | | | | | | | 689,815,609 | |
| | | | | | | | | | | | | | | | |
End of period | | | | | | $ | 872,898,061 | | | | | | | $ | 788,285,126 | |
| | | | | | | | | | | | | | | | |
Undistributed (accumulated) net investment income (loss) | | | | | | $ | (69,563 | ) | | | | | | $ | 410,180 | |
| | | | | | | | | | | | | | | | |
The accompanying notes are an integral part of these financial statements.
| | | | | | |
| Statements of changes in net assets | | Wells Fargo Advantage WealthBuilder Portfolios | | | 35 | |
| | | | | | | | | | | | | | | | |
| | | WealthBuilder Growth Allocation Portfolio | |
| | | Six months ended
November 30, 2013 (unaudited) | | | Year ended May 31, 2013 | |
| | | | |
Operations | | | | | | | | | | | | | | | | |
Net investment loss | | | | | | $ | (616,836 | ) | | | | | | $ | (394,894 | ) |
Net realized gains on investments | | | | | | | 12,686,423 | | | | | | | | 21,985,330 | |
Net change in unrealized gains (losses) on investments | | | | | | | 22,667,586 | | | | | | | | 33,335,171 | |
| | | | | | | | | | | | | | | | |
Net increase in net assets resulting from operations | | | | | | | 34,737,173 | | | | | | | | 54,925,607 | |
| | | | | | | | | | | | | | | | |
| | | | |
Distributions to shareholders from | | | | | | | | | | | | | | | | |
Net investment income | | | | | | | 0 | | | | | | | | (140,024 | ) |
| | | | | | | | | | | | | | | | |
| | | | |
| | | Shares | | | | | | | | Shares | | | | | |
Capital share transactions | | | | | | | | | | | | | | | | |
Proceeds from shares sold | | | 2,418,726 | | | | 33,136,877 | | | | 4,096,670 | | | | 49,761,855 | |
Reinvestment of distributions | | | 0 | | | | 0 | | | | 11,967 | | | | 139,421 | |
Payment for shares redeemed | | | (1,837,598 | ) | | | (25,093,762 | ) | | | (4,726,195 | ) | | | (56,620,766 | ) |
| | | | | | | | | | | | | | | | |
Net increase (decrease) in net assets resulting from capital share transactions | | | | | | | 8,043,115 | | | | | | | | (6,719,490 | ) |
| | | | | | | | | | | | | | | | |
Total increase in net assets | | | | | | | 42,780,288 | | | | | | | | 48,066,093 | |
| | | | | | | | | | | | | | | | |
| | | | |
Net assets | | | | | | | | | | | | | | | | |
Beginning of period | | | | | | | 324,722,729 | | | | | | | | 276,656,636 | |
| | | | | | | | | | | | | | | | |
End of period | | | | | | $ | 367,503,017 | | | | | | | $ | 324,722,729 | |
| | | | | | | | | | | | | | | | |
Undistributed (accumulated) net investment income (loss) | | | | | | $ | (605,978 | ) | | | | | | $ | 10,858 | |
| | | | | | | | | | | | | | | | |
The accompanying notes are an integral part of these financial statements.
| | | | |
| 36 | | Wells Fargo Advantage WealthBuilder Portfolios | | Statements of changes in net assets |
| | | | | | | | | | | | | | | | |
| | | WealthBuilder Equity Portfolio | |
| | | Six months ended
November 30, 2013
(unaudited) | | | Year ended May 31, 2013 | |
| | | | |
Operations | | | | | | | | | | | | | | | | |
Net investment loss | | | | | | $ | (532,419 | ) | | | | | | $ | (434,750 | ) |
Net realized gains on investments | | | | | | | 4,412,545 | | | | | | | | 6,665,168 | |
Net change in unrealized gains (losses) on investments | | | | | | | 11,541,814 | | | | | | | | 18,092,225 | |
| | | | | | | | | | | | | | | | |
Net increase in net assets resulting from operations | | | | | | | 15,421,940 | | | | | | | | 24,322,643 | |
| | | | | | | | | | | | | | | | |
| | | | |
| | | Shares | | | | | | | | Shares | | | | | |
Capital share transactions | | | | | | | | | | | | | | | | |
Proceeds from shares sold | | | 562,222 | | | | 7,536,485 | | | | 909,431 | | | | 10,940,547 | |
Payment for shares redeemed | | | (737,970 | ) | | | (9,963,549 | ) | | | (2,010,573 | ) | | | (23,101,672 | ) |
| | | | | | | | | | | | | | | | |
Net decrease in net assets resulting from capital share transactions | | | | | | | (2,427,064 | ) | | | | | | | (12,161,125 | ) |
| | | | | | | | | | | | | | | | |
Total increase in net assets | | | | | | | 12,994,876 | | | | | | | | 12,161,518 | |
| | | | | | | | | | | | | | | | |
| | | | |
Net assets | | | | | | | | | | | | | | | | |
Beginning of period | | | | | | | 121,888,214 | | | | | | | | 109,726,696 | |
| | | | | | | | | | | | | | | | |
End of period | | | | | | $ | 134,883,090 | | | | | | | $ | 121,888,214 | |
| | | | | | | | | | | | | | | | |
Accumulated net investment loss | | | | | | $ | (536,208 | ) | | | | | | $ | (3,789 | ) |
| | | | | | | | | | | | | | | | |
The accompanying notes are an integral part of these financial statements.
| | | | | | |
| Statements of changes in net assets | | Wells Fargo Advantage WealthBuilder Portfolios | | | 37 | |
| | | | | | | | | | | | | | | | |
| | | WealthBuilder Tactical Equity Portfolio | |
| | | Six months ended
November 30, 2013 (unaudited) | | | Year ended May 31, 2013 | |
| | | | |
Operations | | | | | | | | | | | | | | | | |
Net investment loss | | | | | | $ | (1,333,135 | ) | | | | | | $ | (1,758,873 | ) |
Net realized gains on investments | | | | | | | 12,516,803 | | | | | | | | 27,583,315 | |
Net change in unrealized gains (losses) on investments | | | | | | | 34,107,142 | | | | | | | | 36,561,320 | |
| | | | | | | | | | | | | | | | |
Net increase in net assets resulting from operations | | | | | | | 45,290,810 | | | | | | | | 62,385,762 | |
| | | | | | | | | | | | | | | | |
| | | | |
Distributions to shareholders from | | | | | | | | | | | | | | | | |
Net investment income | | | | | | | 0 | | | | | | | | (526,732 | ) |
| | | | | | | | | | | | | | | | |
| | | | |
| | | Shares | | | | | | | | Shares | | | | | |
Capital share transactions | | | | | | | | | | | | | | | | |
Proceeds from shares sold | | | 1,925,844 | | | | 31,818,830 | | | | 3,156,455 | | | | 45,431,489 | |
Reinvestment of distributions | | | 0 | | | | 0 | | | | 37,714 | | | | 524,598 | |
Payment for shares redeemed | | | (2,223,461 | ) | | | (36,251,714 | ) | | | (5,828,180 | ) | | | (83,313,807 | ) |
| | | | | | | | | | | | | | | | |
Net decrease in net assets resulting from capital share transactions | | | | | | | (4,432,884 | ) | | | | | | | (37,357,720 | ) |
| | | | | | | | | | | | | | | | |
Total increase in net assets | | | | | | | 40,857,926 | | | | | | | | 24,501,310 | |
| | | | | | | | | | | | | | | | |
| | | | |
Net assets | | | | | | | | | | | | | | | | |
Beginning of period | | | | | | | 371,333,722 | | | | | | | | 346,832,412 | |
| | | | | | | | | | | | | | | | |
End of period | | | | | | $ | 412,191,648 | | | | | | | $ | 371,333,722 | |
| | | | | | | | | | | | | | | | |
Accumulated net investment loss | | | | | | $ | (2,685,994 | ) | | | | | | $ | (1,352,859 | ) |
| | | | | | | | | | | | | | | | |
The accompanying notes are an integral part of these financial statements.
| | | | |
| 38 | | Wells Fargo Advantage WealthBuilder Portfolios | | Financial highlights |
| | | | | | | | | | | | | | | | |
| | |
Beginning
net asset
value per
share | | | Net
investment
income (loss)1 | | | Net realized
and unrealized
gains (losses)
on investments | | | Distributions
from net
investment
income | |
| | | | |
WealthBuilder Conservative Allocation Portfolio | | | | | | | | | | | | | | | | |
June 1, 2013 to November 30, 2013 (unaudited) | | $ | 10.95 | | | | 0.02 | | | | 0.19 | | | | (0.02 | ) |
June 1, 2012 to May 31, 2013 | | $ | 10.57 | | | | 0.06 | | | | 0.59 | | | | (0.08 | ) |
June 1, 2011 to May 31, 2012 | | $ | 11.02 | | | | 0.16 | | | | (0.20 | ) | | | (0.21 | ) |
June 1, 2010 to May 31, 2011 | | $ | 10.08 | | | | 0.18 | | | | 0.96 | | | | (0.20 | ) |
June 1, 2009 to May 31, 2010 | | $ | 9.38 | | | | 0.21 | | | | 0.71 | | | | (0.22 | ) |
June 1, 2008 to May 31, 2009 | | $ | 10.64 | | | | 0.31 | | | | (1.23 | ) | | | (0.32 | ) |
| | | | |
WealthBuilder Moderate Balanced Portfolio | | | | | | | | | | | | | | | | |
June 1, 2013 to November 30, 2013 (unaudited) | | $ | 12.03 | | | | 0.01 | | | | 0.60 | | | | (0.01 | ) |
June 1, 2012 to May 31, 2013 | | $ | 10.96 | | | | 0.04 | 3 | | | 1.21 | | | | (0.06 | ) |
June 1, 2011 to May 31, 2012 | | $ | 11.50 | | | | 0.13 | 3 | | | (0.48 | ) | | | (0.19 | ) |
June 1, 2010 to May 31, 2011 | | $ | 10.01 | | | | 0.14 | | | | 1.54 | | | | (0.19 | ) |
June 1, 2009 to May 31, 2010 | | $ | 9.01 | | | | 0.15 | | | | 1.00 | | | | (0.15 | ) |
June 1, 2008 to May 31, 2009 | | $ | 11.35 | | | | 0.24 | | | | (2.32 | ) | | | (0.26 | ) |
| | | | |
WealthBuilder Growth Balanced Portfolio | | | | | | | | | | | | | | | | |
June 1, 2013 to November 30, 2013 (unaudited) | | $ | 12.90 | | | | (0.01 | ) | | | 1.11 | | | | 0.00 | |
June 1, 2012 to May 31, 2013 | | $ | 10.97 | | | | 0.01 | | | | 1.95 | | | | (0.03 | ) |
June 1, 2011 to May 31, 2012 | | $ | 11.82 | | | | 0.09 | | | | (0.82 | ) | | | (0.12 | ) |
June 1, 2010 to May 31, 2011 | | $ | 9.60 | | | | 0.06 | | | | 2.26 | | | | (0.10 | ) |
June 1, 2009 to May 31, 2010 | | $ | 8.30 | | | | 0.10 | | | | 1.29 | | | | (0.09 | ) |
June 1, 2008 to May 31, 2009 | | $ | 12.27 | | | | 0.17 | | | | (3.86 | ) | | | (0.20 | ) |
| | | | |
WealthBuilder Growth Allocation Portfolio | | | | | | | | | | | | | | | | |
June 1, 2013 to November 30, 2013 (unaudited) | | $ | 13.08 | | | | (0.02 | ) | | | 1.40 | | | | 0.00 | |
June 1, 2012 to May 31, 2013 | | $ | 10.87 | | | | (0.01 | ) | | | 2.23 | | | | (0.01 | ) |
June 1, 2011 to May 31, 2012 | | $ | 11.83 | | | | 0.05 | 3 | | | (0.94 | ) | | | (0.07 | ) |
June 1, 2010 to May 31, 2011 | | $ | 9.34 | | | | 0.02 | | | | 2.53 | | | | (0.06 | ) |
June 1, 2009 to May 31, 2010 | | $ | 7.98 | | | | 0.04 | | | | 1.36 | | | | (0.04 | ) |
June 1, 2008 to May 31, 2009 | | $ | 12.47 | | | | 0.12 | | | | (4.41 | ) | | | (0.12 | ) |
| | | | |
WealthBuilder Equity Portfolio | | | | | | | | | | | | | | | | |
June 1, 2013 to November 30, 2013 (unaudited) | | $ | 12.82 | | | | (0.06 | ) | | | 1.69 | | | | 0.00 | |
June 1, 2012 to May 31, 2013 | | $ | 10.34 | | | | (0.05 | ) | | | 2.53 | | | | 0.00 | |
June 1, 2011 to May 31, 2012 | | $ | 11.45 | | | | (0.04 | ) | | | (1.07 | ) | | | 0.00 | |
June 1, 2010 to May 31, 2011 | | $ | 9.10 | | | | (0.07 | ) | | | 2.42 | | | | 0.00 | |
June 1, 2009 to May 31, 2010 | | $ | 7.72 | | | | (0.06 | ) | | | 1.44 | | | | 0.00 | |
June 1, 2008 to May 31, 2009 | | $ | 12.55 | | | | (0.01 | ) | | | (4.39 | ) | | | (0.01 | ) |
| | | | |
WealthBuilder Tactical Equity Portfolio | | | | | | | | | | | | | | | | |
June 1, 2013 to November 30, 2013 (unaudited) | | $ | 15.61 | | | | (0.06 | ) | | | 1.99 | | | | 0.00 | |
June 1, 2012 to May 31, 2013 | | $ | 13.12 | | | | (0.07 | ) | | | 2.58 | | | | (0.02 | ) |
June 1, 2011 to May 31, 2012 | | $ | 13.89 | | | | (0.08 | )3 | | | (0.69 | ) | | | 0.00 | |
June 1, 2010 to May 31, 2011 | | $ | 11.05 | | | | (0.10 | ) | | | 2.94 | | | | 0.00 | |
June 1, 2009 to May 31, 2010 | | $ | 9.13 | | | | (0.06 | ) | | | 1.98 | | | | 0.00 | |
June 1, 2008 to May 31, 2009 | | $ | 15.79 | | | | (0.01 | ) | | | (5.98 | ) | | | (0.01 | ) |
| 1. | Includes net expenses allocated from affiliated Master Portfolios in which the Portfolio invests. |
| 2. | Total return calculations do not include any sales charges. Returns for periods of less than one year are not annualized. |
| 3. | Calculated based upon average shares outstanding |
| 4. | Amount is less than $0.005. |
The accompanying notes are an integral part of these financial statements.
| | | | | | |
| Financial highlights | | Wells Fargo Advantage WealthBuilder Portfolios | | | 39 | |
| | | | | | | | | | | | | | | | | | | | | | | | | | | | | | |
Distributions
from net
realized gains | | | Ending
net asset
value
per
share | | | Ratio to average net assets | | | Total
return2 | | | Portfolio
turnover
rate | | | Net assets at
end of period
(000s omitted) | |
| | | Net investment
income (loss)1 | | | Gross
expenses1 | | | Net
expenses1 | | | | |
| | | | | | | |
| | | | | | | | | | | | | | | | | | | | | | | | | | | | | | | |
| | 0.00 | | | $ | 11.14 | | | | 0.34 | % | | | 1.55 | % | | | 1.50 | % | | | 1.91 | % | | | 73 | % | | $ | 613,592 | |
| | (0.19 | ) | | $ | 10.95 | | | | 0.53 | % | | | 1.54 | % | | | 1.50 | % | | | 6.19 | % | | | 128 | % | | $ | 659,977 | |
| | (0.20 | ) | | $ | 10.57 | | | | 1.51 | % | | | 1.54 | % | | | 1.50 | % | | | (0.32 | )% | | | 176 | % | | $ | 662,092 | |
| | 0.00 | | | $ | 11.02 | | | | 1.75 | % | | | 1.58 | % | | | 1.50 | % | | | 11.42 | % | | | 168 | % | | $ | 630,085 | |
| | 0.00 | | | $ | 10.08 | | | | 2.18 | % | | | 1.56 | % | | | 1.50 | % | | | 9.87 | % | | | 157 | % | | $ | 442,245 | |
| | (0.02 | ) | | $ | 9.38 | | | | 3.43 | % | | | 1.56 | % | | | 1.50 | % | | | (8.47 | )% | | | 153 | % | | $ | 206,683 | |
| | | | | | | |
| | | | | | | | | | | | | | | | | | | | | | | | | | | | | | | |
| | 0.00 | | | $ | 12.63 | | | | 0.13 | % | | | 1.54 | % | | | 1.50 | % | | | 5.09 | % | | | 59 | % | | $ | 839,107 | |
| | (0.12 | ) | | $ | 12.03 | | | | 0.34 | % | | | 1.54 | % | | | 1.50 | % | | | 11.42 | % | | | 115 | % | | $ | 799,251 | |
| | (0.00 | )4 | | $ | 10.96 | | | | 1.20 | % | | | 1.54 | % | | | 1.50 | % | | | (2.96 | )% | | | 145 | % | | $ | 709,801 | |
| | 0.00 | | | $ | 11.50 | | | | 1.24 | % | | | 1.55 | % | | | 1.50 | % | | | 16.96 | % | | | 142 | % | | $ | 691,145 | |
| | 0.00 | | | $ | 10.01 | | | | 1.62 | % | | | 1.57 | % | | | 1.50 | % | | | 12.81 | % | | | 130 | % | | $ | 472,947 | |
| | (0.00 | )4 | | $ | 9.01 | | | | 2.76 | % | | | 1.57 | % | | | 1.50 | % | | | (18.25 | )% | | | 134 | % | | $ | 249,607 | |
| | | | | | | |
| | | | | | | | | | | | | | | | | | | | | | | | | | | | | | | |
| | 0.00 | | | $ | 14.00 | | | | (0.12 | )% | | | 1.54 | % | | | 1.50 | % | | | 8.53 | % | | | 52 | % | | $ | 872,898 | |
| | 0.00 | | | $ | 12.90 | | | | 0.06 | % | | | 1.54 | % | | | 1.50 | % | | | 17.85 | % | | | 117 | % | | $ | 788,285 | |
| | 0.00 | | | $ | 10.97 | | | | 0.84 | % | | | 1.54 | % | | | 1.50 | % | | | (6.17 | )% | | | 131 | % | | $ | 689,816 | |
| | 0.00 | | | $ | 11.82 | | | | 0.59 | % | | | 1.54 | % | | | 1.50 | % | | | 24.27 | % | | | 140 | % | | $ | 785,283 | |
| | 0.00 | | | $ | 9.60 | | | | 1.12 | % | | | 1.56 | % | | | 1.50 | % | | | 16.75 | % | | | 120 | % | | $ | 590,907 | |
| | (0.08 | ) | | $ | 8.30 | | | | 1.95 | % | | | 1.56 | % | | | 1.50 | % | | | (29.76 | )% | | | 142 | % | | $ | 447,000 | |
| | | | | | | |
| | | | | | | | | | | | | | | | | | | | | | | | | | | | | | | |
| | 0.00 | | | $ | 14.46 | | | | (0.20 | )% | | | 1.57 | % | | | 1.50 | % | | | 10.55 | % | | | 36 | % | | $ | 367,503 | |
| | 0.00 | | | $ | 13.08 | | | | (0.13 | )% | | | 1.57 | % | | | 1.50 | % | | | 20.39 | % | | | 98 | % | | $ | 324,723 | |
| | 0.00 | | | $ | 10.87 | | | | 0.49 | % | | | 1.57 | % | | | 1.50 | % | | | (7.47 | )% | | | 96 | % | | $ | 276,657 | |
| | 0.00 | | | $ | 11.83 | | | | 0.16 | % | | | 1.57 | % | | | 1.50 | % | | | 27.33 | % | | | 110 | % | | $ | 313,206 | |
| | 0.00 | | | $ | 9.34 | | | | 0.47 | % | | | 1.60 | % | | | 1.50 | % | | | 17.51 | % | | | 97 | % | | $ | 219,357 | |
| | (0.08 | ) | | $ | 7.98 | | | | 1.42 | % | | | 1.59 | % | | | 1.50 | % | | | (34.13 | )% | | | 119 | % | | $ | 147,691 | |
| | | | | | | |
| | | | | | | | | | | | | | | | | | | | | | | | | | | | | | | |
| | 0.00 | | | $ | 14.45 | | | | (0.84 | )% | | | 1.61 | % | | | 1.50 | % | | | 12.71 | % | | | 14 | % | | $ | 134,883 | |
| | 0.00 | | | $ | 12.82 | | | | (0.38 | )% | | | 1.63 | % | | | 1.50 | % | | | 23.98 | % | | | 44 | % | | $ | 121,888 | |
| | 0.00 | | | $ | 10.34 | | | | (0.39 | )% | | | 1.60 | % | | | 1.50 | % | | | (9.69 | )% | | | 24 | % | | $ | 109,727 | |
| | 0.00 | | | $ | 11.45 | | | | (0.68 | )% | | | 1.60 | % | | | 1.50 | % | | | 25.82 | % | | | 52 | % | | $ | 141,425 | |
| | 0.00 | | | $ | 9.10 | | | | (0.68 | )% | | | 1.61 | % | | | 1.50 | % | | | 17.88 | % | | | 46 | % | | $ | 119,993 | |
| | (0.42 | ) | | $ | 7.72 | | | | (0.08 | )% | | | 1.61 | % | | | 1.50 | % | | | (34.63 | )% | | | 62 | % | | $ | 104,334 | |
| | | | | | | |
| | | | | | | | | | | | | | | | | | | | | | | | | | | | | | | |
| | 0.00 | | | $ | 17.54 | | | | (0.70 | )% | | | 1.56 | % | | | 1.50 | % | | | 12.36 | % | | | 15 | % | | $ | 412,192 | |
| | 0.00 | | | $ | 15.61 | | | | (0.49 | )% | | | 1.56 | % | | | 1.50 | % | | | 19.16 | % | | | 67 | % | | $ | 371,334 | |
| | 0.00 | | | $ | 13.12 | | | | (0.58 | )% | | | 1.56 | % | | | 1.50 | % | | | (5.54 | )% | | | 31 | % | | $ | 346,832 | |
| | 0.00 | | | $ | 13.89 | | | | (0.81 | )% | | | 1.55 | % | | | 1.50 | % | | | 25.70 | % | | | 73 | % | | $ | 416,863 | |
| | 0.00 | | | $ | 11.05 | | | | (0.54 | )% | | | 1.57 | % | | | 1.50 | % | | | 21.03 | % | | | 89 | % | | $ | 356,382 | |
| | (0.66 | ) | | $ | 9.13 | | | | (0.01 | )% | | | 1.57 | % | | | 1.50 | % | | | (37.36 | )% | | | 123 | % | | $ | 304,770 | |
The accompanying notes are an integral part of these financial statements.
| | | | |
| 40 | | Wells Fargo Advantage WealthBuilder Portfolios | | Notes to financial statements (unaudited) |
1. ORGANIZATION
Wells Fargo Funds Trust (the “Trust”), a Delaware statutory trust organized on March 10, 1999, is an open-end management investment company registered under the Investment Company Act of 1940, as amended (the “1940 Act”). These financial statements report on the following portfolios: the Wells Fargo Advantage WealthBuilder Conservative Allocation Portfolio (“WealthBuilder Conservative Allocation Portfolio”), the Wells Fargo Advantage WealthBuilder Moderate Balanced Portfolio (“WealthBuilder Moderate Balanced Portfolio”), the Wells Fargo Advantage WealthBuilder Growth Balanced Portfolio (“WealthBuilder Growth Balanced Portfolio”), the Wells Fargo Advantage WealthBuilder Growth Allocation Portfolio (“WealthBuilder Growth Allocation Portfolio” ), the Wells Fargo Advantage WealthBuilder Equity Portfolio (“WealthBuilder Equity Portfolio” ), and the Wells Fargo Advantage WealthBuilder Tactical Equity Portfolio (“WealthBuilder Tactical Equity Portfolio) (each, a “Portfolio”, collectively, the “Portfolios”). Each Portfolio is a diversified series of the Trust.
The Portfolios each seek to achieve their investment objectives by allocating their assets across asset classes of stocks, bonds and money market instruments by investing in a number of affiliated and unaffiliated funds (collectively, the “Underlying Funds”). The Underlying Funds incur separate expenses in seeking to achieve their investment objectives. The investment in affiliated funds may also include investments in one or more separate diversified portfolios (each, an “affiliated Master Portfolio”, collectively, the “affiliated Master Portfolios”) of Wells Fargo Master Trust, a registered open-end management investment company. Each affiliated Master Portfolio directly acquires portfolio securities, and a Portfolio investing in an affiliated Master Portfolio acquires an indirect interest in those securities. Each Portfolio accounts for its investment in the affiliated Master Portfolios as partnership investments and records on a daily basis its share of the affiliated Master Portfolio’s income, expense and realized and unrealized gains and losses. The financial statements and financial highlights for the Underlying Funds are presented in separate financial statements and may be obtained from Wells Fargo Investor Services or from the servicing agent of the unaffiliated funds.
As of November 30, 2013, the Portfolios own the following percentages of the affiliated Master Portfolios:
| | | | | | | | | | | | | | | | |
| | | Wells Fargo Advantage Core Bond Portfolio | | | Wells Fargo
Advantage Emerging Growth Portfolio | | | Wells Fargo Advantage International Growth
Portfolio | | | Wells Fargo Advantage Small Company Value Portfolio | |
WealthBuilder Conservative Allocation Portfolio | | | 4% | | | | 0 | %* | | | 5 | % | | | 2 | % |
WealthBuilder Moderate Balanced Portfolio | | | 4% | | | | 1 | % | | | 8 | % | | | 9 | % |
WealthBuilder Growth Balanced Portfolio | | | 3% | | | | 2 | % | | | 20 | % | | | 10 | % |
WealthBuilder Growth Allocation Portfolio | | | 1% | | | | 1 | % | | | 7 | % | | | 8 | % |
WealthBuilder Equity Portfolio | | | N/A | | | | 0 | %* | | | 5 | % | | | 2 | % |
WealthBuilder Tactical Equity Portfolio | | | N/A | | | | 1 | % | | | 16 | % | | | 8 | % |
| * | The amount invested is less than 1%. |
2. SIGNIFICANT ACCOUNTING POLICIES
The following significant accounting policies, which are consistently followed in the preparation of the financial statements of each Portfolio, are in conformity with U.S. generally accepted accounting principles which require management to make estimates and assumptions that affect the reported amounts of assets and liabilities, disclosure of contingent assets and liabilities at the date of the financial statements, and the reported amounts of revenues and expenses during the reporting period. Actual results could differ from those estimates.
Securities valuation
All investments are valued each business day as of the close of regular trading on the New York Stock Exchange (generally 4 p.m. Eastern Time).
Investments in underlying open-end investment companies are valued at net asset per share as reported by the Underlying Funds as of the close of the regular trading on the New York Stock Exchange on each day the exchange is open for trading. Investments in affiliated Master Portfolios are valued daily based on each Portfolio’s proportionate share of each affiliated Master Portfolio’s net assets, which are also valued daily.
Futures that are listed on a foreign or domestic exchange or market are valued at the official closing price.
Short-term securities, with maturities of 60 days or less at time of purchase, generally are valued at amortized cost which approximates fair value. The amortized cost method involves valuing a security at its cost, plus accretion of discount or minus amortization of premium over the period until maturity.
| | | | | | |
| Notes to financial statements (unaudited) | | Wells Fargo Advantage WealthBuilder Portfolios | | | 41 | |
Futures contracts
Each Portfolio may be subject to interest rate risk, equity price risk or foreign currency exchange rate risk in the normal course of pursuing its investment objectives. The Portfolio may buy and sell futures contracts in order to gain exposure to, or protect against, changes in security values and interest rates. The primary risks associated with the use of futures contracts are the imperfect correlation between changes in market values of securities held by the Portfolio and the prices of futures contracts, and the possibility of an illiquid market.
Futures contracts are valued based upon their quoted daily settlement prices when available. The aggregate principal amounts of the contracts are not recorded in the financial statements. Fluctuations in the value of the contracts are recorded in the Statements of Assets and Liabilities as an asset or liability and in the Statements of Operations as unrealized gains or losses until the contracts are closed, at which point they are recorded as net realized gains or losses on futures contracts. With futures contracts, there is minimal counterparty risk to the Portfolio since futures are exchange traded and the exchange’s clearinghouse, as counterparty to all exchange traded futures, guarantees the futures against default.
Security transactions and income recognition
Securities transactions are recorded on a trade date basis. Realized gains or losses are recorded on the basis of identified cost.
Income dividends and capital gain distributions from Underlying Funds are recorded on the ex-dividend date. Capital gain distributions from Underlying Funds are treated as realized gains.
Interest income is accrued daily and bond discounts are accreted and premiums are amortized daily based on the effective interest method. To the extent debt obligations are placed on non-accrual status, any related interest income may be reduced by writing off interest receivables when the collection of all or a portion of interest has become doubtful based on consistently applied procedures. If the issuer subsequently resumes interest payments or when the collectability of interest is reasonably assured, the debt obligation is removed from non-accrual status.
Each Portfolio records on a daily basis its proportionate share of each affiliated Master Portfolio’s interest and dividend income, in addition to expenses and realized and unrealized gains and losses.
Distributions to shareholders
Distributions to shareholders from net investment income and net realized gains, if any, are recorded on the ex-dividend date. Such distributions are determined in conformity with federal income tax regulations, which may differ in amount or character from net investment income and realized gains recognized for purposes of U.S. generally accepted accounting principles.
Federal and other taxes
Each Portfolio is treated as a separate entity for federal income tax purposes. Each Portfolio intends to continue to qualify as a regulated investment company by distributing substantially all of its investment company taxable income and any net realized capital gains (after reduction for capital loss carryforwards) sufficient to relieve it from all, or substantially all, federal income taxes. Accordingly, no provision for federal income taxes was required.
Each Portfolio’s income and federal excise tax returns and all financial records supporting those returns for the prior three fiscal years are subject to examination by the federal and Delaware revenue authorities. Management has analyzed each Portfolio’s tax positions taken on federal, state, and foreign tax returns for all open tax years and does not believe that there are any uncertain tax positions that require recognition of a tax liability.
At May 31, 2013, capital loss carryforwards available to offset future net realized capital gains expiring in 2018 were as follows:
| | | | |
WealthBuilder Growth Balanced Portfolio | | $ | 28,455,196 | |
WealthBuilder Growth Allocation Portfolio | | | 4,295,469 | |
WealthBuilder Equity Portfolio | | | 28,029,164 | |
WealthBuilder Tactical Equity Portfolio | | | 109,659,447 | |
As of May 31, 2013, WealthBuilder Tactical Equity Portfolio had a qualified late-year ordinary loss of $1,436,239 which was recognized on the first day of the current fiscal year.
| | | | |
| 42 | | Wells Fargo Advantage WealthBuilder Portfolios | | Notes to financial statements (unaudited) |
3. FAIR VALUATION MEASUREMENTS
Fair value measurements of investments are determined within a framework that has established a fair value hierarchy based upon the various data inputs utilized in determining the value of each Portfolio’s investments. The three-level hierarchy gives the highest priority to unadjusted quoted prices in active markets for identical assets or liabilities (Level 1) and the lowest priority to significant unobservable inputs (Level 3). Each Portfolio’s investments are classified within the fair value hierarchy based on the lowest level of input that is significant to the fair value measurement. The inputs are summarized into three broad levels as follows:
| n | | Level 1 – quoted prices in active markets for identical securities |
| n | | Level 2 – other significant observable inputs (including quoted prices for similar securities, interest rates, prepayment speeds, credit risk, use of amortized cost, etc.) |
| n | | Level 3 – significant unobservable inputs (including the Portfolio’s own assumptions in determining the fair value of investments) |
The inputs or methodologies used for valuing investments in securities are not necessarily an indication of the risk associated with investing in those securities.
As of November 30, 2013, the inputs used in valuing investments in securities were as follows:
| | | | | | | | | | | | | | | | |
| Investments in securities | | Quoted prices (Level 1) | | | Other significant
observable inputs (Level 2) | | | Significant unobservable inputs (Level 3) | | | Total | |
WealthBuilder Conservative Allocation Portfolio | | | | | | | | | | | | | | | | |
| | | | |
Equity securities | | | | | | | | | | | | | | | | |
Investment companies | | $ | 481,763,450 | | | $ | 131,000,605 | | | $ | 0 | | | $ | 612,764,055 | |
| | | | |
Short-term investments | | | | | | | | | | | | | | | | |
Investment companies | | | 1,100,000 | | | | 0 | | | | 0 | | | | 1,100,000 | |
U.S. Treasury securities | | | 0 | | | | 1,163,956 | | | | 0 | | | | 1,163,956 | |
| | | $ | 482,863,450 | | | $ | 132,164,561 | | | $ | 0 | | | $ | 615,028,011 | |
WealthBuilder Moderate Balanced Portfolio | | | | | | | | | | | | | | | | |
| | | | |
Equity securities | | | | | | | | | | | | | | | | |
Investment companies | | $ | 674,931,919 | | | $ | 159,635,926 | | | $ | 0 | | | $ | 834,567,845 | |
| | | | |
Short-term investments | | | | | | | | | | | | | | | | |
Investment companies | | | 1,159,929 | | | | 0 | | | | 0 | | | | 1,159,929 | |
U.S. Treasury securities | | | 0 | | | | 3,110,883 | | | | 0 | | | | 3,110,883 | |
| | | $ | 676,091,848 | | | $ | 162,746,809 | | | $ | 0 | | | $ | 838,838,657 | |
WealthBuilder Growth Balanced Portfolio | | | | | | | | | | | | | | | | |
| | | | |
Equity securities | | | | | | | | | | | | | | | | |
Investment companies | | $ | 695,527,607 | | | $ | 171,388,895 | | | $ | 0 | | | $ | 866,916,502 | |
| | | | |
Short-term investments | | | | | | | | | | | | | | | | |
Investment companies | | | 2,652,130 | | | | 0 | | | | 0 | | | | 2,652,130 | |
U.S. Treasury securities | | | 0 | | | | 3,213,879 | | | | 0 | | | | 3,213,879 | |
| | | $ | 698,179,737 | | | $ | 174,602,774 | | | $ | 0 | | | $ | 872,782,511 | |
WealthBuilder Growth Allocation Portfolio | | | | | | | | | | | | | | | | |
| | | | |
Equity securities | | | | | | | | | | | | | | | | |
Investment companies | | $ | 305,260,258 | | | $ | 59,784,918 | | | $ | 0 | | | $ | 365,045,176 | |
| | | | |
Short-term investments | | | | | | | | | | | | | | | | |
Investment companies | | | 796,059 | | | | 0 | | | | 0 | | | | 796,059 | |
U.S. Treasury securities | | | 0 | | | | 1,339,950 | | | | 0 | | | | 1,339,950 | |
| | | $ | 306,056,317 | | | $ | 61,124,868 | | | $ | 0 | | | $ | 367,181,185 | |
| | | | | | |
| Notes to financial statements (unaudited) | | Wells Fargo Advantage WealthBuilder Portfolios | | | 43 | |
| | | | | | | | | | | | | | | | |
| Investments in securities | | Quoted prices (Level 1) | | | Other significant
observable inputs (Level 2) | | | Significant unobservable inputs (Level 3) | | | Total | |
WealthBuilder Equity Portfolio | | | | | | | | | | | | | | | | |
| | | | |
Equity securities | | | | | | | | | | | | | | | | |
Investment companies | | $ | 119,838,187 | | | $ | 14,838,025 | | | $ | 0 | | | $ | 134,676,212 | |
| | | | |
WealthBuilder Tactical Equity Portfolio | | | | | | | | | | | | | | | | |
| | | | |
Equity securities | | | | | | | | | | | | | | | | |
Investment companies | | $ | 355,400,916 | | | $ | 55,648,164 | | | $ | 0 | | | $ | 411,049,080 | |
| | | | |
Short-term investments | | | | | | | | | | | | | | | | |
Investment companies | | | 2,000,000 | | | | 0 | | | | 0 | | | | 2,000,000 | |
| | | $ | 357,400,916 | | | $ | 55,648,164 | | | $ | 0 | | | $ | 413,049,080 | |
As of November 30, 2013, the inputs used in valuing each Portfolio’s other financial instruments were as follows:
| | | | | | | | | | | | | | | | |
| Futures contracts | | Quoted prices (Level 1) | | | Other significant
observable inputs (Level 2) | | | Significant unobservable inputs (Level 3) | | | Total | |
WealthBuilder Conservative Allocation Portfolio | | $ | 1,039,166+ | | | $ | 0 | | | $ | 0 | | | $ | 1,039,166 | |
WealthBuilder Moderate Balanced Portfolio | | | 2,759,686+ | | | | 0 | | | | 0 | | | | 2,759,686 | |
WealthBuilder Growth Balanced Portfolio | | | 2,848,486+ | | | | 0 | | | | 0 | | | | 2,848,486 | |
WealthBuilder Growth Allocation Portfolio | | | 1,186,770+ | | | | 0 | | | | 0 | | | | 1,186,770 | |
| + | Amount represents the net unrealized gains. |
Transfers in and transfers out are recognized at the end of the reporting period. For the six months ended November 30, 2013, the Portfolios did not have any transfers into/out of Level 1, Level 2, or Level 3.
4. TRANSACTIONS WITH AFFILIATES AND OTHER EXPENSES
Advisory fee
The Trust has entered into an advisory contract with Wells Fargo Funds Management, LLC (“Funds Management”), an indirect wholly owned subsidiary of Wells Fargo & Company (“Wells Fargo”). The adviser is responsible for implementing investment policies and guidelines and for supervising the subadviser, who is responsible for day-to-day portfolio management of the Portfolios.
Pursuant to the contract, Funds Management is entitled to receive an annual advisory fee starting at 0.20% and declining to 0.15% as the average daily net assets of each Portfolio increase. For the six months ended November 30, 2013, the advisory fee was equivalent to an annual rate of 0.20% of each Portfolio’s average daily net assets.
Funds Management also serves as the adviser to and is entitled to receive a fee from each affiliated Master Portfolio and affiliated Underlying Fund for those services.
Funds Management has retained the services of a subadviser to provide daily portfolio management to the Portfolios. The fee for subadvisory services is borne by Funds Management. Wells Capital Management Incorporated, an affiliate of Funds Management and an indirect wholly owned subsidiary of Wells Fargo, is the subadviser to each Portfolio and is paid an annual subadvisory fee of 0.15% of the average daily net assets of each Portfolio.
Administration and transfer agent fee
The Trust has entered into an administration agreement with Funds Management. Under this agreement, for providing administrative services, which includes paying fees and expenses for services provided by the transfer agent, sub-transfer agents, omnibus account servicers and record-keepers, Funds Management is entitled to receive from each Portfolio an annual fee starting at 0.31% and declining to 0.29% as the average daily net assets of each Portfolio increase. For the six months ended November 30, 2013, the administration fee for each Portfolio was equivalent to an annual rate of 0.31% of each Portfolio’s average daily net assets.
Funds Management has contractually waived and/or reimbursed advisory and administration fees to the extent necessary to maintain certain net operating expense ratios for the Portfolios. Funds Management has committed through September 30, 2014 to waive fees and/or reimburse expenses to the extent necessary to cap each Portfolio’s expenses at 1.50%.
| | | | |
| 44 | | Wells Fargo Advantage WealthBuilder Portfolios | | Notes to financial statements (unaudited) |
Distribution fee
The Trust has adopted a Distribution Plan for each Portfolio pursuant to Rule 12b-1 under the 1940 Act. A distribution fee is charged and paid to Wells Fargo Funds Distributor, LLC, the principal underwriter of each Portfolio, at an annual rate of 0.75% of each Portfolio’s average daily net assets.
For the six months ended November 30, 2013, Wells Fargo Funds Distributor, LLC received the following amounts in front-end sales charges:
| | | | |
| | | Front-end
sales charges | |
WealthBuilder Conservative Allocation Portfolio | | $ | 5,758 | |
WealthBuilder Moderate Balanced Portfolio | | | 10,292 | |
WealthBuilder Growth Balanced Portfolio | | | 9,322 | |
WealthBuilder Growth Allocation Portfolio | | | 3,897 | |
WealthBuilder Equity Portfolio | | | 951 | |
WealthBuilder Tactical Equity Portfolio | | | 2,787 | |
Shareholder servicing fee
The Trust has entered into contracts with one or more shareholder servicing agents, whereby each Portfolio is charged a fee at an annual rate of 0.25% of its average daily net assets.
5. INVESTMENT PORTFOLIO TRANSACTIONS
Purchases and sales of investments, excluding short-term securities, for the six months ended November 30, 2013 were as follows:
| | | | | | | | | | | | | | | | |
| | | Purchases at cost* | | | Sales proceeds* | |
| | | U.S.
government | | | Non-U.S.
government | | | U.S.
government | | | Non-U.S.
government | |
WealthBuilder Conservative Allocation Portfolio | | $ | 373,132,467 | | | $ | 85,832,209 | | | $ | 372,987,310 | | | $ | 122,026,081 | |
WealthBuilder Moderate Balanced Portfolio | | | 374,209,030 | | | | 121,634,944 | | | | 374,063,454 | | | | 99,866,556 | |
WealthBuilder Growth Balanced Portfolio | | | 324,108,843 | | | | 135,430,870 | | | | 323,982,757 | | | | 90,635,516 | |
WealthBuilder Growth Allocation Portfolio | | | 69,125,660 | | | | 75,136,048 | | | | 69,098,768 | | | | 50,618,237 | |
WealthBuilder Equity Portfolio | | | 0 | | | | 21,447,465 | | | | 0 | | | | 17,350,153 | |
WealthBuilder Tactical Equity Portfolio | | | 0 | | | | 71,206,557 | | | | 0 | | | | 55,171,507 | |
| * | The Portfolios seek to achieve their investment objective by investing some of their investable assets in one or more affiliated Master Portfolios. Purchases and sales related to these investments have been calculated by aggregating the results of multiplying such Portfolio’s ownership percentage of the respective affiliated Master Portfolio by the corresponding affiliated Master Portfolio’s purchases and sales. Purchases and sales of the affiliated and unaffiliated Underlying Funds in which the Portfolios invest are actual aggregate purchases and sales of those funds. |
6. INVESTMENTS IN AFFILIATES
A summary of each Portfolio’s transactions in shares of affiliated Underlying Funds (excluding short-term investments and affiliated Master Portfolios) during the six months ended November 30, 2013 were as follows:
| | | | | | | | | | | | | | | | | | | | | | | | |
| | | Shares,
beginning
of period | | | Shares
purchased | | | Shares
sold | | | Shares,
end
of period | | | Value, end
of period | | | Dividends from
affiliated
Underlying Funds | |
WealthBuilder Conservative Allocation Portfolio | | | | | | | | | | | | | | | | | | | | | | | | |
Wells Fargo Advantage Emerging Markets Equity Fund | | | 136,827 | | | | 15,236 | | | | 19,747 | | | | 132,316 | | | $ | 2,962,545 | | | $ | 0 | |
Wells Fargo Advantage Endeavor Select Fund | | | 292,123 | | | | 148,341 | | | | 72,654 | | | | 367,810 | | | | 5,414,161 | | | | 0 | |
Wells Fargo Advantage Government Securities Fund | | | 11,264,243 | | | | 304,924 | | | | 1,010,316 | | | | 10,558,851 | | | | 114,774,708 | | | | 671,854 | |
Wells Fargo Advantage Large Cap Growth Fund | | | 97,134 | | | | 47,966 | | | | 25,209 | | | | 119,891 | | | | 5,389,102 | | | | 0 | |
Wells Fargo Advantage Short Duration Government Bond Fund | | | 18,196,348 | | | | 555,586 | | | | 1,734,023 | | | | 17,017,911 | | | | 172,391,442 | | | | 1,762,310 | |
Wells Fargo Advantage Small Cap Value Fund | | | 175,119 | | | | 6,133 | | | | 65,767 | | | | 115,485 | | | | 4,500,467 | | | | 0 | |
| | | | | | | | | | | | | | | | | | | $ | 305,432,425 | | | $ | 2,434,164 | |
| | | | | | |
| Notes to financial statements (unaudited) | | Wells Fargo Advantage WealthBuilder Portfolios | | | 45 | |
| | | | | | | | | | | | | | | | | | | | | | | | |
| | | Shares, beginning of period | | | Shares
purchased | | | Shares
sold | | | Shares, end of period | | | Value, end of period | | | Dividends from
affiliated
Underlying Funds | |
WealthBuilder Moderate Balanced Portfolio | | | | | | | | | | | | | | | | | | | | | | | | |
Wells Fargo Advanatge Emerging Markets Equity Fund | | | 325,432 | | | | 42,161 | | | | 16,260 | | | | 351,333 | | | $ | 7,866,346 | | | $ | 0 | |
Wells Fargo Advantage Endeavor Select Fund | | | 710,464 | | | | 375,404 | | | | 65,305 | | | | 1,020,563 | | | | 15,022,680 | | | | 0 | |
Wells Fargo Advantage Government Securities Fund | | | 10,103,361 | | | | 1,077,978 | | | | 594,875 | | | | 10,586,464 | | | | 115,074,859 | | | | 638,202 | |
Wells Fargo Advantage Large Cap Growth Fund | | | 235,988 | | | | 121,379 | | | | 28,403 | | | | 328,964 | | | | 14,786,938 | | | | 0 | |
Wells Fargo Advantage Short Duration Government Bond Fund | | | 14,534,560 | | | | 1,696,926 | | | | 1,052,150 | | | | 15,179,336 | | | | 153,766,678 | | | | 1,482,330 | |
Wells Fargo Advantage Small Cap Value Fund | | | 424,834 | | | | 8,509 | | | | 112,574 | | | | 320,769 | | | | 12,500,368 | | | | 0 | |
| | | | | | | | | | | | | | | | | | | $ | 319,017,869 | | | $ | 2,120,532 | |
WealthBuilder Growth Balanced Portfolio | | | | | | | | | | | | | | | | | | | | | | | | |
Wells Fargo Advantage Emerging Markets Equity Fund | | | 521,516 | | | | 77,776 | | | | 35,515 | | | | 563,777 | | | $ | 12,622,973 | | | $ | 0 | |
Wells Fargo Advantage Endeavor Select Fund | | | 1,105,911 | | | | 556,970 | | | | 28,022 | | | | 1,634,859 | | | | 24,065,122 | | | | 0 | |
Wells Fargo Advantage Government Securities Fund | | | 8,613,562 | | | | 2,170,556 | | | | 862,561 | | | | 9,921,557 | | | | 107,847,327 | | | | 562,409 | |
Wells Fargo Advantage Large Cap Growth Fund | | | 367,912 | | | | 177,305 | | | | 17,409 | | | | 527,808 | | | | 23,724,988 | | | | 0 | |
Wells Fargo Advantage Small Cap Value Fund | | | 666,693 | | | | 36,813 | | | | 185,079 | | | | 518,427 | | | | 20,203,094 | | | | 0 | |
| | | | | | | | | | | | | | | | | | | $ | 188,463,504 | | | $ | 562,409 | |
WealthBuilder Growth Allocation Portfolio | | | | | | | | | | | | | | | | | | | | | | | | |
Wells Fargo Advanatge Emerging Markets Equity Fund | | | 266,167 | | | | 65,454 | | | | 20,953 | | | | 310,668 | | | $ | 6,955,849 | | | $ | 0 | |
Wells Fargo Advantage Endeavor Select Fund | | | 560,264 | | | | 342,942 | | | | 24,726 | | | | 878,480 | | | | 12,931,228 | | | | 0 | |
Wells Fargo Advantage Government Securities Fund | | | 1,906,485 | | | | 594,728 | | | | 545,460 | | | | 1,955,753 | | | | 21,259,036 | | | | 120,675 | |
Wells Fargo Advantage Large Cap Growth Fund | | | 185,859 | | | | 109,026 | | | | 10,589 | | | | 284,296 | | | | 12,779,087 | | | | 0 | |
Wells Fargo Advantage Small Cap Value Fund | | | 339,505 | | | | 31,580 | | | | 94,427 | | | | 276,658 | | | | 10,781,357 | | | | 0 | |
| | | | | | | | | | | | | | | | | | | $ | 64,706,557 | | | $ | 120,675 | |
WealthBuilder Equity Portfolio | | | | | | | | | | | | | | | | | | | | | | | | |
Wells Fargo Advanatge Emerging Markets Equity Fund | | | 134,054 | | | | 22,027 | | | | 6,129 | | | | 149,952 | | | $ | 3,357,435 | | | $ | 0 | |
Wells Fargo Advantage Endeavor Select Fund | | | 479,079 | | | | 99,455 | | | | 28,322 | | | | 550,212 | | | | 8,099,124 | | | | 0 | |
Wells Fargo Advantage Large Cap Growth Fund | | | 159,368 | | | | 30,370 | | | | 10,841 | | | | 178,897 | | | | 8,041,421 | | | | 0 | |
Wells Fargo Advantage Small Cap Value Fund | | | 172,775 | | | | 7,077 | | | | 93,269 | | | | 86,583 | | | | 3,374,135 | | | | 0 | |
| | | | | | | | | | | | | | | | | | | $ | 22,872,115 | | | $ | 0 | |
WealthBuilder Tactical Equity Portfolio | | | | | | | | | | | | | | | | | | | | | | | | |
Wells Fargo Advantage Emerging Markets Equity Fund | | | 400,441 | | | | 82,644 | | | | 35,722 | | | | 447,363 | | | $ | 10,016,450 | | | $ | 0 | |
Wells Fargo Advantage Endeavor Select Fund | | | 846,684 | | | | 476,193 | | | | 54,564 | | | | 1,268,313 | | | | 18,669,562 | | | | 0 | |
Wells Fargo Advantage Large Cap Growth Fund | | | 281,090 | | | | 150,935 | | | | 22,175 | | | | 409,850 | | | | 18,422,736 | | | | 0 | |
Wells Fargo Advantage Small Cap Value Fund | | | 510,204 | | | | 49,634 | | | | 159,617 | | | | 400,221 | | | | 15,596,600 | | | | 0 | |
| | | | | | | | | | | | | | | | | | | $ | 62,705,348 | | | $ | 0 | |
7. DERIVATIVE TRANSACTIONS
During the six months ended November 30, 2013, the Portfolios entered into futures contracts to gain market exposure to certain asset classes consistent with an active asset allocation strategy.
At November 30, 2013, the Portfolios had long and short futures contracts outstanding as follows:
| | | | | | | | | | | | | | |
| | | Expiration date | | Contracts | | Type | | Contract value at November 30, 2013 | | | Unrealized
gains (losses) | |
WealthBuilder Conservative Allcation Portfolio | | 12-19-2013 | | 35 Long | | S&P 500 Index | | $ | 15,785,875 | | | $ | 1,066,467 | |
| | | 3-20-2014 | | 115 Short | | U.S. Treasury Bonds | | | 15,036,250 | | | | (27,301 | ) |
WealthBuilder Moderate Balanced Portfolio | | 12-19-2013 | | 93 Long | | S&P 500 Index | | | 41,945,325 | | | | 2,833,755 | |
| | | 3-20-2014 | | 312 Short | | U.S. Treasury Bonds | | | 40,794,000 | | | | (74,069 | ) |
| | | | |
| 46 | | Wells Fargo Advantage WealthBuilder Portfolios | | Notes to financial statements (unaudited) |
| | | | | | | | | | | | | | |
| | | Expiration date | | Contracts | | Type | | Contract value at November 30, 2013 | | | Unrealized
gains (losses) | |
WealthBuilder Growth Balanced Portfolio | | 12-19-2013 | | 96 Long | | S&P 500 Index | | $ | 43,298,400 | | | $ | 2,925,166 | |
| | | 3-20-2014 | | 323 Short | | U.S. Treasury Bonds | | | 42,232,250 | | | | (76,680 | ) |
WealthBuilder Growth Allocation Portfolio | | 12-19-2013 | | 40 Long | | S&P 500 Index | | | 18,041,000 | | | | 1,218,819 | |
| | 3-20-2014 | | 135 Short | | U.S. Treasury Bonds | | | 17,651,250 | | | | (32,049 | ) |
As of November 30, 2013, WealthBuilder Tactical Equity Portfolio did not have any open futures contracts.
The Portfolios had average notional amounts in futures contracts outstanding during the six months ended November 30, 2013 as follows:
| | | | | | | | |
| | | Long contracts | | | Short contracts | |
WealthBuilder Conservative Allocation Portfolio | | $ | 45,880,358 | | | $ | 42,388,781 | |
WealthBuilder Growth Allocation Portfolio | | | 75,684,001 | | | | 71,381,700 | |
WealthBuilder Growth Balanced Portfolio | | | 166,693,028 | | | | 157,741,024 | |
WealthBuilder Moderate Balanced Portfolio | | | 113,998,170 | | | | 107,138,564 | |
WealthBuilder Tactical Equity Portfolio | | | 55,291,545 | | | | 47,767,521 | |
A summary of derivative instruments by primary risk exposure is outlined in the following tables unless the only primary risk exposure category is already reflected in the appropriate financial statements.
The fair value of derivative instruments as of November 30, 2013 was as follows for WealthBuilder Conservative Allocation Portfolio:
| | | | | | | | | | | | |
| | | Asset derivatives | | | Liability derivatives | |
| | | Statements of Assets and
Liabilities location | | Fair value | | | Statements of Assets and
Liabilities location | | Fair value | |
Interest rate contracts | | Net assets – Net unrealized gains on investments | | $ | 0 | | | Net assets – Net unrealized gains on investments | | $ | 27,301 | * |
Equity contracts | | Net assets – Net unrealized gains on investments | | | 1,066,467 | * | | Net assets – Net unrealized gains on investments | | | 0 | |
| | | | | $ | 1,066,467 | | | | | $ | 27,301 | |
| * | Amount represents cumulative unrealized gains/losses on futures contracts. Only the payable for variation margin as of November 30, 2013, which represents the current day’s variation margin, is reported separately on the Statements of Assets and Liabilities. |
The effect of derivative instruments on the Statements of Operations for the six months ended November 30, 2013 was as follows for WealthBuilder Conservative Allocation Portfolio:
| | | | | | | | |
| | | Amount of realized
gains on derivatives | | | Change in unrealized
gains (losses) on
derivatives | |
Interest rate contracts | | $ | 1,424,290 | | | $ | (81,259 | ) |
Equity contracts | | | 4,824,243 | | | | (1,889,294 | ) |
| | | $ | 6,248,533 | | | $ | (1,970,553 | ) |
| | | | | | |
| Notes to financial statements (unaudited) | | Wells Fargo Advantage WealthBuilder Portfolios | | | 47 | |
The fair value of derivative instruments as of November 30, 2013 was as follows for WealthBuilder Moderate Balanced Portfolio:
| | | | | | | | | | | | |
| | | Asset derivatives | | | Liability derivatives | |
| | | Statements of Assets and Liabilities location | | Fair value | | | Statements of Assets and Liabilities location | | Fair value | |
Interest rate contracts | | Net assets – Net unrealized gains on investments | | $ | 0 | | | Net assets – Net unrealized gains on investments | | $ | 74,069 | * |
Equity contracts | | Net assets – Net unrealized gains on investments | | | 2,833,755 | * | | Net assets – Net unrealized gains on investments | | | 0 | |
| | | | | $ | 2,833,755 | | | | | $ | 74,069 | |
| * | Amount represents cumulative unrealized gains/losses on futures contracts. Only the payable for variation margin as of November 30, 2013, which represents the current day’s variation margin, is reported separately on the Statements of Assets and Liabilities. |
The effect of derivative instruments on the Statements of Operations for the six months ended November 30, 2013 was as follows for WealthBuilder Moderate Balanced Portfolio:
| | | | | | | | |
| | | Amount of realized
gains on derivatives | | | Change in unrealized
gains (losses) on
derivatives | |
Interest rate contracts | | $ | 11,650,950 | | | $ | (210,713 | ) |
Equity contracts | | | 3,490,214 | | | | (4,407,923 | ) |
| | | $ | 15,141,164 | | | $ | (4,618,636 | ) |
The fair value of derivative instruments as of November 30, 2013 was as follows for WealthBuilder Growth Balanced Portfolio:
| | | | | | | | | | | | |
| | | Asset derivatives | | | Liability derivatives | |
| | | Statements of Assets and
Liabilities location | | Fair value | | | Statements of Assets and
Liabilities location | | Fair value | |
Interest rate contracts | | Net assets – Net unrealized gains on investments | | $ | 0 | | | Net assets – Net unrealized gains on investments | | $ | 76,680 | * |
Equity contracts | | Net assets – Net unrealized gains on investments | | | 2,925,166 | * | | Net assets – Net unrealized gains on investments | | | 0 | |
| | | | | $ | 2,925,166 | | | | | $ | 76,680 | |
| * | Amount represents cumulative unrealized gains/losses on futures contracts. Only the payable for variation margin as of November 30, 2013, which represents the current day’s variation margin, is reported separately on the Statements of Assets and Liabilities. |
The effect of derivative instruments on the Statements of Operations for the six months ended November 30, 2013 was as follows for WealthBuilder Growth Balanced Portfolio:
| | | | | | | | |
| | | Amount of realized
gains on derivatives | | | Change in unrealized
gains (losses) on derivatives | |
Interest rate contracts | | $ | 4,929,917 | | | $ | (284,669 | ) |
Equity contracts | | | 17,499,856 | | | | (8,105,801 | ) |
| | | $ | 22,429,773 | | | $ | (8,390,470 | ) |
The fair value of derivative instruments as of November 30, 2013 was as follows for WealthBuilder Growth Allocation Portfolio:
| | | | | | | | | | | | |
| | | Asset derivatives | | | Liability derivatives | |
| | | Statements of Assets and
Liabilities location | | Fair value | | | Statements of Assets and
Liabilities location | | Fair value | |
Interest rate contracts | | Net assets – Net unrealized gains on investments | | $ | 0 | | | Net assets – Net unrealized gains on investments | | $ | 32,049 | * |
Equity contracts | | Net assets – Net unrealized gains on investments | | | 1,218,819 | * | | Net assets – Net unrealized gains on investments | | | 0 | |
| | | | | $ | 1,218,819 | | | | | $ | 32,049 | |
| * | Amount represents cumulative unrealized gains/losses on futures contracts. Only the payable for variation margin as of November 30, 2013, which represents the current day’s variation margin, is reported separately on the Statements of Assets and Liabilities. |
| | | | |
| 48 | | Wells Fargo Advantage WealthBuilder Portfolios | | Notes to financial statements (unaudited) |
The effect of derivative instruments on the Statements of Operations for the six months ended November 30, 2013 was as follows for WealthBuilder Growth Allocation Portfolio:
| | | | | | | | |
| | | Amount of realized
gains on derivatives | | | Change in unrealized
gains (losses) on
derivatives | |
Interest rate contracts | | $ | 2,039,831 | | | $ | (119,075 | ) |
Equity contracts | | | 7,791,766 | | | | (3,763,681 | ) |
| | | $ | 9,831,597 | | | $ | (3,882,756 | ) |
For WealthBuilder Tactical Equity Portfolio, the realized gains and change in unrealized gains (losses) on futures contracts for the six months ended November 30, 2013 are reflected in the Statements of Operations.
For certain types of derivative transactions, the Portfolios have entered into International Swaps and Derivatives Association, Inc. master agreements (“ISDA Master Agreements”) with approved counterparties. The ISDA Master Agreements may have requirements to deliver/deposit securities or cash to/with an exchange or broker-dealer as collateral and allows the Portfolio to offset, with each counterparty, certain derivative financial instrument’s assets and/or liabilities with collateral held or pledged. Collateral requirements differ by type of derivative. Collateral or margin requirements are set by the broker or exchange clearing house for exchange traded derivatives while collateral terms are contract specific for over-the-counter traded. Cash collateral that has been pledged to cover obligations of the Portfolio under derivative contracts, if any, will be reported separately in the Statements of Assets and Liabilities. Securities pledged as collateral, if any, for the same purpose are noted in the Portfolio of Investments. With respect to balance sheet offsetting, absent an event of default by the counterparty or a termination of the agreement, the reported amounts of financial assets and financial liabilities in the Statements of Assets and Liabilities are not offset across transactions between the Portfolio and the applicable counterparty. As of November 30, 2013, the Portfolios have transactions subject to an enforceable master netting agreements. A reconciliation of the gross amounts on the Statements of Assets and Liabilities to the net amounts by derivative type, including any collateral exposure, is as follows:
| | | | | | | | | | | | | | | | | | | | |
| | | | | | Gross amounts
of liabilities in
the Statement
of Assets and
Liabilities | | | Amounts
subject to
netting
arrangements | | | Collateral | | | Net amount
(not less
than $0) | |
WealthBuilder Conservative Allocation Portfolio | | | Futures – variation margin | | | $ | 1,750 | | | $ | 0 | | | $ | 1,163,956 | | | $ | 0 | |
WealthBuilder Moderate Balanced Portfolio | | | Futures – variation margin | | | | 4,650 | | | | 0 | | | | 3,110,883 | | | | 0 | |
WealthBuilder Growth Balanced Portfolio | | | Futures – variation margin | | | | 4,800 | | | | 0 | | | | 3,213,879 | | | | 0 | |
WealthBuilder Growth Allocation Portfolio | | | Futures – variation margin | | | | 2,000 | | | | 0 | | | | 1,339,950 | | | | 0 | |
8. BANK BORROWINGS
The Trust (excluding the money market funds and certain other funds in the Trust) and Wells Fargo Variable Trust are parties to a $150,000,000 revolving credit agreement with State Street Bank and Trust Company, whereby the Portfolios are permitted to use bank borrowings for temporary or emergency purposes, such as to fund shareholder redemption requests. Interest under the credit agreement is charged to each Fund based on a borrowing rate equal to the higher of the Federal Funds rate in effect on that day plus 1.25% or the overnight LIBOR rate in effect on that day plus 1.25%. In addition, an annual commitment fee equal to 0.10% of the unused balance is allocated to each participating fund. For the six months ended November 30, 2013, the Portfolios paid the following amounts in commitment fees:
| | | | |
| | | Commitment fee | |
WealthBuilder Conservative Allocation Portfolio | | $ | 408 | |
WealthBuilder Moderate Balanced Portfolio | | | 498 | |
WealthBuilder Growth Balanced Portfolio | | | 655 | |
WealthBuilder Growth Allocation Portfolio | | | 270 | |
WealthBuilder Equity Portfolio | | | 101 | |
WealthBuilder Tactical Equity Portfolio | | | 307 | |
For the six months ended November 30, 2013, there were no borrowings by the Portfolios under the agreement.
| | | | | | |
| Notes to financial statements (unaudited) | | Wells Fargo Advantage WealthBuilder Portfolios | | | 49 | |
9. INDEMNIFICATION
Under the Trust’s organizational documents, the officers and directors are indemnified against certain liabilities that may arise out of performance of their duties to the Trust. Additionally, in the normal course of business, the Trust may enter into contracts with service providers that contain a variety of indemnification clauses. The Trust’s maximum exposure under these arrangements is dependent on future claims that may be made against the Portfolios and, therefore, cannot be estimated.
10. SUBSEQUENT DISTRIBUTIONS
On December 11, 2013, the Portfolios declared distributions from short-term capital gains and long-term capital gains to shareholders of record on December 10, 2013. The per share amounts payable on December 12, 2013 were as follows:
| | | | | | | | |
| | | Short-term capital gains | | | Long-term capital gains | |
WealthBuilder Conservative Allocation Portfolio | | $ | 0.08238 | | | $ | 0.34729 | |
WealthBuilder Moderate Balanced Portfolio | | | 0.18984 | | | | 0.51797 | |
WealthBuilder Growth Allocation Portfolio | | | 0.00000 | | | | 0.15763 | |
On December 30, 2013, the Portfolios declared distributions from net investment income to shareholders of record on December 27, 2013. The per share amounts payable on December 31, 2013 were as follows:
| | | | |
| | | Net investment income | |
WealthBuilder Conservative Allocation Portfolio | | $ | 0.02064 | |
WealthBuilder Moderate Balanced Portfolio | | | 0.00253 | |
WealthBuilder Growth Balanced Portfolio | | | 0.03601 | |
WealthBuilder Growth Allocation Portfolio | | | 0.00167 | |
These distributions are not reflected in the accompanying financial statements. The final determination of the source of all distributions is subject to change and made after the tax year-end of each Portfolio.
| | | | |
| 50 | | Wells Fargo Advantage WealthBuilder Portfolios | | Other information (unaudited) |
TAX INFORMATION
For the fiscal year ended May 31, 2013, WealthBuilder Conservative Allocation Portfolio distributed $300,000 of long-term capital gains in connection with share redemptions.
PROXY VOTING INFORMATION
A description of the policies and procedures used to determine how to vote proxies relating to portfolio securities is available without charge, upon request, by calling 1-800-222-8222, visiting our website at wellsfargoadvantagefunds.com, or visiting the SEC website at sec.gov. Information regarding how the proxies related to portfolio securities were voted during the most recent 12-month period ended June 30 is available without charge on the website at wellsfargoadvantagefunds.com or by visiting the SEC website at sec.gov.
PORTFOLIO HOLDINGS INFORMATION
The complete portfolio holdings are publicly available on the website (wellsfargoadvantagefunds.com) on a monthly, 30-day or more delayed basis. In addition, top ten holdings information is publicly available on the website on a monthly, seven-day or more delayed basis. Each Portfolio files its complete schedule of portfolio holdings with the SEC for the first and third quarters of each fiscal year on Form N-Q, which is available without charge by visiting the SEC website at sec.gov. In addition, each Form N-Q may be reviewed and copied at the SEC’s Public Reference Room in Washington, DC, and at regional offices in New York City, at 233 Broadway, and in Chicago, at 175 West Jackson Boulevard, Suite 900. Information about the Public Reference Room may be obtained by calling 1-800-SEC-0330.
| | | | | | |
| Other information (unaudited) | | Wells Fargo Advantage WealthBuilder Portfolios | | | 51 | |
BOARD OF TRUSTEES AND OFFICERS
Each of the Trustees and Officers listed in the table below acts in identical capacities for each fund in the Wells Fargo Advantage family of funds, which consists of 131 mutual funds1 comprising the Wells Fargo Funds Trust, Wells Fargo Variable Trust, Wells Fargo Master Trust and four closed-end funds (collectively the “Fund Complex”). This table should be read in conjunction with the Prospectus and the Statement of Additional Information2. All of the Trustees are also Members of the Audit and Governance Committees of each Trust in the Fund Complex. The mailing address of each Trustee and Officer is 525 Market Street, 12th Floor, San Francisco, CA 94105. Each Trustee and Officer serves an indefinite term, however, each Trustee serves such term until reaching the mandatory retirement age established by the Trustees.
Independent Trustees
| | | | | | |
Name and
year of birth | | Position held and
length of service* | | Principal occupations during past five years | | Other
directorships during
past five years |
| Peter G. Gordon (Born 1942) | | Trustee, since 1998; Chairman, since 2005 | | Co-Founder, Retired Chairman, President and CEO of Crystal Geyser Water Company. Trustee Emeritus, Colby College. | | Asset Allocation Trust |
| Isaiah Harris, Jr. (Born 1952) | | Trustee, since 2009 | | Retired. Prior thereto, President and CEO of BellSouth Advertising and Publishing Corp. from 2005 to 2007, President and CEO of BellSouth Enterprises from 2004 to 2005 and President of BellSouth Consumer Services from 2000 to 2003. Emeritus member of the Iowa State University Foundation Board of Governors. Emeritus Member of the Advisory Board of Iowa State University School of Business. Advisory Board Member, Palm Harbor Academy (charter school). Mr. Harris is a certified public accountant. | | CIGNA Corporation; Deluxe Corporation; Asset Allocation Trust |
| Judith M. Johnson (Born 1949) | | Trustee, since 2008; Audit Committee Chairman, since 2008 | | Retired. Prior thereto, Chief Executive Officer and Chief Investment Officer of Minneapolis Employees Retirement Fund from 1996 to 2008. Ms. Johnson is an attorney, certified public accountant and a certified managerial accountant. | | Asset Allocation Trust |
| Leroy Keith, Jr. (Born 1939) | | Trustee, since 2010 | | Chairman, Bloc Global Services (development and construction). Trustee of the Evergreen Funds from 1983 to 2010. Former Managing Director, Almanac Capital Management (commodities firm), former Partner, Stonington Partners, Inc. (private equity fund), former Director, Obagi Medical Products Co. and former Director, Lincoln Educational Services. | | Trustee, Virtus Fund Complex (consisting of 48 portfolios as of 1/31/2013); Asset Allocation Trust |
| David F. Larcker (Born 1950) | | Trustee, since 2009 | | James Irvin Miller Professor of Accounting at the Graduate School of Business, Stanford University, Morgan Stanley Director of the Center for Leadership Development and Research and Senior Faculty of The Rock Center for Corporate Governance since 2006. From 2005 to 2008, Professor of Accounting at the Graduate School of Business, Stanford University. Prior thereto, Ernst & Young Professor of Accounting at The Wharton School, University of Pennsylvania from 1985 to 2005. | | Asset Allocation Trust |
| Olivia S. Mitchell (Born 1953) | | Trustee, since 2006 | | International Foundation of Employee Benefit Plans Professor, Wharton School of the University of Pennsylvania since 1993. Director of Wharton’s Pension Research Council and Boettner Center on Pensions & Retirement Research, and Research Associate at the National Bureau of Economic Research. Previously, Cornell University Professor from 1978 to 1993. | | Asset Allocation Trust |
| Timothy J. Penny (Born 1951) | | Trustee, since 1996 | | President and CEO of Southern Minnesota Initiative Foundation, a non-profit organization, since 2007 and Senior Fellow at the Humphrey Institute Policy Forum at the University of Minnesota since 1995. Member of the Board of Trustees of NorthStar Education Finance, Inc., a non-profit organization, since 2007. | | Asset Allocation Trust |
| | | | |
| 52 | | Wells Fargo Advantage WealthBuilder Portfolios | | Other information (unaudited) |
| | | | | | |
Name and
year of birth | | Position held and
length of service* | | Principal occupations during past five years | | Other
directorships during
past five years |
| Michael S. Scofield (Born 1943) | | Trustee, since 2010 | | Served on the Investment Company Institute’s Board of Governors and Executive Committee from 2008-2011 as well the Governing Council of the Independent Directors Council from 2006-2011 and the Independent Directors Council Executive Committee from 2008-2011. Chairman of the IDC from 2008-2010. Institutional Investor (Fund Directions) Trustee of Year in 2007. Trustee of the Evergreen Funds (and its predecessors) from 1984 to 2010. Chairman of the Evergreen Funds from 2000-2010. Former Trustee of the Mentor Funds. Retired Attorney, Law Offices of Michael S. Scofield. | | Asset Allocation Trust |
| Donald C. Willeke (Born 1940) | | Trustee, since 1996 | | Principal of the law firm of Willeke & Daniels. General Counsel of the Minneapolis Employees Retirement Fund from 1984 until its consolidation into the Minnesota Public Employees Retirement Association on June 30, 2010. Director and Vice Chair of The Tree Trust (non-profit corporation). Director of the American Chestnut Foundation (non-profit corporation). | | Asset Allocation Trust |
| * | Length of service dates reflect the Trustee’s commencement of service with the Trust’s predecessor entities, where applicable. |
Officers
| | | | | | |
Name and
year of birth | | Position held and
length of service | | Principal occupations during past five years | | |
| Karla M. Rabusch (Born 1959) | | President, since 2003 | | Executive Vice President of Wells Fargo Bank, N.A. and President of Wells Fargo Funds Management, LLC since 2003. | | |
| Jeremy DePalma1 (Born 1974) | | Treasurer, since 2012 | | Senior Vice President of Wells Fargo Funds Management, LLC since 2009. Senior Vice President of Evergreen Investment Management Company, LLC from 2008 to 2010. Vice President, Evergreen Investment Services, Inc. from 2004 to 2007. Head of the Fund Reporting and Control Team within Fund Administration from 2005 to 2010. | | |
| C. David Messman (Born 1960) | | Secretary, since 2000; Chief Legal Officer, since 2003 | | Senior Vice President and Secretary of Wells Fargo Funds Management, LLC since 2001. Vice President and Managing Counsel of Wells Fargo Bank, N.A. since 1996. | | |
Debra Ann Early (Born 1964) | | Chief Compliance Officer, since 2007 | | Chief Compliance Officer of Wells Fargo Funds Management, LLC since 2007. Chief Compliance Officer of Parnassus Investments from 2005 to 2007. Chief Financial Officer of Parnassus Investments from 2004 to 2007. | | |
David Berardi (Born 1975) | | Assistant Treasurer, since 2009 | | Vice President of Wells Fargo Funds Management, LLC since 2009. Vice President of Evergreen Investment Management Company, LLC from 2008 to 2010. Assistant Vice President of Evergreen Investment Services, Inc. from 2004 to 2008. Manager of Fund Reporting and Control for Evergreen Investment Management Company, LLC from 2004 to 2010. | | |
| 1. | Jeremy DePalma acts as Treasurer of 58 funds and Assistant Treasurer of 73 funds in the Fund Complex. |
| 2. | The Statement of Additional Information includes additional information about the Trustees and is available, without charge, upon request, by calling 1-800-222-8222 or by visiting the website at wellsfargoadvantagefunds.com. |
| | | | | | |
| List of abbreviations | | Wells Fargo Advantage WealthBuilder Portfolios | | | 53 | |
The following is a list of common abbreviations for terms and entities that may have appeared in this report.
| ACA | — ACA Financial Guaranty Corporation |
| ADR | — American depositary receipt |
| ADS | — American depositary shares |
| AGC | — Assured Guaranty Corporation |
| AGM | — Assured Guaranty Municipal |
| Ambac | — Ambac Financial Group Incorporated |
| AMT | — Alternative minimum tax |
| BAN | — Bond anticipation notes |
| BHAC | — Berkshire Hathaway Assurance Corporation |
| CAB | — Capital appreciation bond |
| CCAB | — Convertible capital appreciation bond |
| CDA | — Community Development Authority |
| CDO | — Collateralized debt obligation |
| DRIVER | — Derivative inverse tax-exempt receipts |
| DW&P | — Department of Water & Power |
| DWR | — Department of Water Resources |
| ECFA | — Educational & Cultural Facilities Authority |
| EDA | — Economic Development Authority |
| EDFA | — Economic Development Finance Authority |
| ETF | — Exchange-traded fund |
| FDIC | — Federal Deposit Insurance Corporation |
| FFCB | — Federal Farm Credit Banks |
| FGIC | — Financial Guaranty Insurance Corporation |
| FHA | — Federal Housing Administration |
| FHLB | — Federal Home Loan Bank |
| FHLMC | — Federal Home Loan Mortgage Corporation |
| FICO | — The Financing Corporation |
| FNMA | — Federal National Mortgage Association |
| GDR | — Global depositary receipt |
| GNMA | — Government National Mortgage Association |
| HCFR | — Healthcare facilities revenue |
| HEFA | — Health & Educational Facilities Authority |
| HEFAR | — Higher education facilities authority revenue |
| HFA | — Housing Finance Authority |
| HFFA | — Health Facilities Financing Authority |
| HUD | — Department of Housing and Urban Development |
| IDA | — Industrial Development Authority |
| IDAG | — Industrial Development Agency |
| KRW | — Republic of Korea won |
| LIBOR | — London Interbank Offered Rate |
| LLC | — Limited liability company |
| LLP | — Limited liability partnership |
| MBIA | — Municipal Bond Insurance Association |
| MFHR | — Multifamily housing revenue |
| MSTR | — Municipal securities trust receipts |
| MUD | — Municipal Utility District |
| National | — National Public Finance Guarantee Corporation |
| PCFA | — Pollution Control Financing Authority |
| PCL | — Public Company Limited |
| PCR | — Pollution control revenue |
| PFA | — Public Finance Authority |
| PFFA | — Public Facilities Financing Authority |
| PFOTER | — Puttable floating option tax-exempt receipts |
| plc | — Public limited company |
| PUTTER | — Puttable tax-exempt receipts |
| R&D | — Research & development |
| Radian | — Radian Asset Assurance |
| RAN | — Revenue anticipation notes |
| RDA | — Redevelopment Authority |
| RDFA | — Redevelopment Finance Authority |
| REIT | — Real estate investment trust |
| ROC | — Reset option certificates |
| SAVRS | — Select auction variable rate securities |
| SBA | — Small Business Authority |
| SFHR | — Single-family housing revenue |
| SFMR | — Single-family mortgage revenue |
| SPA | — Standby purchase agreement |
| SPDR | — Standard & Poor’s Depositary Receipts |
| STRIPS | — Separate trading of registered interest and principal securities |
| TAN | — Tax anticipation notes |
| TIPS | — Treasury inflation-protected securities |
| TRAN | — Tax revenue anticipation notes |
| TTFA | — Transportation Trust Fund Authority |
| TVA | — Tennessee Valley Authority |
This page is intentionally left blank.
This page is intentionally left blank.
This page is intentionally left blank.


For more information
More information about Wells Fargo Advantage Funds is available free upon request. To obtain literature, please write, email, visit the Fund’s website, or call:
Wells Fargo Advantage Funds
P.O. Box 8266
Boston, MA 02266-8266
Email: wfaf@wellsfargo.com
Website: wellsfargoadvantagefunds.com
Individual investors: 1-800-222-8222
Retail investment professionals: 1-888-877-9275
Institutional investment professionals: 1-866-765-0778
This report and the financial statements contained herein are submitted for the general information of the shareholders of Wells Fargo Advantage Funds. If this report is used for promotional purposes, distribution of the report must be accompanied or preceded by a current prospectus. For a current prospectus and, if available, a summary prospectus containing more complete information, including charges and expenses, call 1-800-222-8222 or visit the Fund’s website at wellsfargoadvantagefunds.com. Please consider the investment objectives, risks, charges, and expenses of the investment carefully before investing. This and other information about Wells Fargo Advantage Funds can be found in the current prospectus. Read the prospectus carefully before you invest or send money.
Wells Fargo Funds Management, LLC, a wholly owned subsidiary of Wells Fargo & Company, provides investment advisory and administrative services for Wells Fargo Advantage Funds. Other affiliates of Wells Fargo & Company provide subadvisory and other services for the Funds. The Funds are distributed by Wells Fargo Funds Distributor, LLC, Member FINRA/SIPC, an affiliate of Wells Fargo & Company.
NOT FDIC INSURED ¡ NO BANK GUARANTEE ¡ MAY LOSE VALUE
© 2013 Wells Fargo Funds Management, LLC. All rights reserved.
| | |
 | | 221302 01-14 SWBP/SAR102 11-13 |
Not applicable.
| ITEM 3. | AUDIT COMMITTEE FINANCIAL EXPERT |
Not applicable.
| ITEM 4. | PRINCIPAL ACCOUNTANT FEES AND SERVICES |
Not applicable.
| ITEM 5. | AUDIT COMMITTEE OF LISTED REGISTRANTS |
Not applicable.
The Portfolio of investments is included as part of the report to shareholders filed under Item 1 of this Form.
| ITEM 7. | DISCLOSURE OF PROXY VOTING POLICIES AND PROCEDURES FOR CLOSED-END MANAGEMENT INVESTMENT COMPANIES |
Not applicable.
| ITEM 8. | PORTFOLIO MANAGERS OF CLOSED-END MANAGEMENT INVESTMENT COMPANIES |
Not applicable.
| ITEM 9. | PURCHASES OF EQUITY SECURITIES BY CLOSED-END MANAGEMENT INVESTMENT COMPANY AND AFFILIATED PURCHASERS |
Not applicable.
| ITEM 10. | SUBMISSION OF MATTERS TO A VOTE OF SECURITY HOLDERS |
There have been no material changes to the procedures by which shareholders may recommend nominees to the Registrant’s board of trustees that have been implemented since the Registrant’s last provided disclosure in response to the requirements of this Item.
| ITEM 11. | CONTROLS AND PROCEDURES |
(a) The President and Treasurer have concluded that the Wells Fargo Funds Trust (the “Trust”) disclosure controls and procedures (as defined in Rule 30a-3(c) under the Investment Company Act of 1940) provide reasonable assurances that material information relating to the Trust is made known to them by the appropriate persons, based on their evaluation of these controls and procedures as of a date within 90 days of the filing of this report.
(b) There were no significant changes in the Trust’s internal controls over financial reporting (as defined in Rule 30a-3(d) under the Investment Company Act of 1940) that occurred during the second fiscal quarter of the period covered by this report that materially affected, or is reasonably likely to materially affect, the registrant’s internal control over financial reporting.
(a)(1) Not applicable.
(a)(2) Certification pursuant to Rule 30a-2(a) under the Investment Company Act of 1940 (17 CFR 270.30a-2(a)) is filed and attached hereto as Exhibit 99.CERT.
(a)(3) Not applicable.
(b) Certification pursuant to Rule 30a-2(b) under the Investment Company Act of 1940 (17 CFR 270.30a-2(b)) is filed and attached hereto as Exhibit 99.906CERT.
SIGNATURES
Pursuant to the requirements of the Securities Exchange Act of 1934 and the Investment Company Act of 1940, the registrant has duly caused this report to be signed on its behalf by the undersigned, thereunto duly authorized.
| | |
Wells Fargo Funds Trust |
| |
By: | | /s/ Karla M. Rabusch |
| | Karla M. Rabusch |
| | President |
|
| Date: January 28, 2014 |
Pursuant to the requirements of the Securities Exchange Act of 1934 and the Investment Company Act of 1940, this report has been signed below by the following persons on behalf of the registrant and in the capacities and on the date indicated.
| | |
Wells Fargo Funds Trust |
| |
By: | | /s/ Karla M. Rabusch |
| | Karla M. Rabusch |
| | President |
|
| Date: January 28, 2014 |
| |
By: | | /s/ Nancy Wiser |
| | Nancy Wiser |
| | Treasurer |
|
Date: January 28, 2014 |
| |
By: | | /s/ Jeremy DePalma |
| | Jeremy DePalma |
| | Treasurer |
|
Date: January 28, 2014 |