
UNITED STATES
SECURITIES AND EXCHANGE COMMISSION
Washington, D.C. 20549
FORM N-CSRS
CERTIFIED SHAREHOLDER REPORT OF REGISTERED
MANAGEMENT INVESTMENT COMPANIES
Investment Company Act file number: 811-09253
Wells Fargo Funds Trust
(Exact name of registrant as specified in charter)
525 Market St., San Francisco, CA 94105
(Address of principal executive offices) (Zip code)
C. David Messman
Wells Fargo Funds Management, LLC
525 Market St., San Francisco, CA 94105
(Name and address of agent for service)
Registrant’s telephone number, including area code: 800-222-8222
Date of fiscal year end: Registrant is making a filing for 10 of its series, Wells Fargo Advantage Capital Growth Fund, Wells Fargo Advantage Disciplined U.S. Core Fund, Wells Fargo Advantage Endeavor Select Fund, Wells Fargo Advantage Growth Fund, Wells Fargo Advantage Intrinsic Value Fund, Wells Fargo Advantage Large Cap Core Fund, Wells Fargo Advantage Large Cap Growth Fund, Wells Fargo Advantage Large Company Value Fund, Wells Fargo Advantage Omega Growth Fund, and Wells Fargo Advantage Premier Large Company Growth Fund. Each series had a July 31 fiscal year end.
Date of reporting period: January 31, 2014
| ITEM 1. | REPORT TO STOCKHOLDERS |

Wells Fargo Advantage Capital Growth Fund

Semi-Annual Report
January 31, 2014

Reduce clutter. Save trees.
Sign up for electronic delivery of prospectuses and shareholder reports at wellsfargo.com/advantagedelivery
Contents
The views expressed and any forward-looking statements are as of January 31, 2014, unless otherwise noted, and are those of the Fund managers and/or Wells Fargo Funds Management, LLC. Discussions of individual securities, or the markets generally, or any Wells Fargo Advantage Fund are not intended as individual recommendations. Future events or results may vary significantly from those expressed in any forward-looking statements; the views expressed are subject to change at any time in response to changing circumstances in the market. Wells Fargo Funds Management, LLC and the Fund disclaim any obligation to publicly update or revise any views expressed or forward-looking statements.
NOT FDIC INSURED ¡ NO BANK GUARANTEE ¡ MAY LOSE VALUE
| | | | |
| 2 | | Wells Fargo Advantage Capital Growth Fund | | Letter to shareholders (unaudited) |

Karla M. Rabusch
President
Wells Fargo Advantage Funds
Major central banks continued to inject liquidity into the banks and the markets through various quantitative easing policies.
Dear Valued Shareholder:
We are pleased to offer you this semi-annual report for the Wells Fargo Advantage Capital Growth Fund for the six-month period that ended January 31, 2014. Much of the period was marked by monetary easing by global central banks. Entering the period, investors were concerned that the U.S. Federal Reserve (Fed) would end its bond-buying program, which initially led to higher interest rates and resulted in losses for bond indexes and volatility for global stock indexes. These fears dissipated in late September 2013 and ended altogether in mid-December 2013 when the Fed announced a tapering timeline that was far more moderate than some had feared. Growing confidence that the U.S. economy was staging a fragile recovery resulted in double-digit returns for domestic stock market indexes for the six-month reporting period.
Central banks continued to provide stimulus.
Major central banks continued to inject liquidity into the banks and the markets through various quantitative easing policies. Throughout the reporting period, the Federal Open Market Committee (FOMC)—the Fed’s monetary policymaking body—kept its key interest rate effectively near zero in order to support the economy and the financial system. Well before the reporting period began, the FOMC announced its intention to keep interest rates low for an extended period and to make open-ended purchases of $40 billion per month in mortgage-backed securities. The FOMC later added purchases of $45 billion per month in long-term U.S. Treasuries. Because the markets benefited from the FOMC’s liquidity, both stocks and bonds initially sold off after the FOMC indicated in May 2013 that it might reduce (or taper) its bond-buying program. However, in mid-December 2013, the FOMC announced that it would reduce its bond-buying program by $10 billion per month beginning in January 2014. The tapering was less aggressive than some investors had feared, and the markets ended 2013 strongly.
European markets continued to benefit from the European Central Bank’s (ECB’s) earlier announcement that it would purchase an unlimited amount of one- to three-year sovereign debt from countries that had formally applied for a bailout. In November 2013, the ECB cut its key rate to a historic low of 0.25%. The ECB’s aggressive actions helped ease investor worries about a eurozone sovereign debt default. Given the substantial ties between the U.S. and Europe, the improved sentiment about the eurozone helped provide a tailwind for U.S. markets.
U.S. stock markets gained on relatively good news.
For most of the period, U.S. economic data remained moderately positive. Reported gross domestic product (GDP) growth came in at a strong 4.1% annualized rate in the third quarter of 2013, and the advance annualized estimate for fourth-quarter GDP growth was 3.2%.
The most significant negative effect was the ongoing fight in Washington, D.C., over the federal budget and debt limit. The Budget Control Act of 2011, which was passed to resolve a previous fight over the federal debt ceiling, mandated budget sequestration that took effect on March 1, 2013, and was an overhang on economic growth throughout the reporting period. Most recently, Congress was unable to pass a resolution to continue to fund the federal government, and thus, the federal government underwent a partial shutdown from September 30, 2013, through October 16, 2013. The government reopened after the president and Congress reached a deal that funded the government through January 15, 2014, and raised the debt limit through February 7, 2014. In December 2013, Congress passed the Ryan-Murray budget agreement that funded the government through September 2015, lessening the near-term prospect of another shutdown.
| | | | | | |
| Letter to shareholders (unaudited) | | Wells Fargo Advantage Capital Growth Fund | | | 3 | |
Despite political headwinds, the relatively positive outlook for the U.S. economy contributed to a strong domestic stock market for most of the reporting period. Economically sensitive sectors, such as industrials and materials, outperformed. Dividend-paying sectors such as utilities and telecommunication services lagged as higher interest rates dampened their relative performance. Judging by various Russell indexes, small-cap stocks moderately outperformed large-cap stocks, and growth stocks strongly outperformed value stocks.
Don’t let short-term uncertainty derail long-term investment goals.
Periods of uncertainty can present challenges, but experience has taught us that maintaining long-term investment goals can be an effective way to plan for the future. Although diversification cannot guarantee an investment profit or prevent losses, we believe it can be an effective way to manage investment risk and potentially smooth out overall portfolio performance. We encourage investors to know their investments and to understand that appropriate levels of risk-taking may unlock opportunities.
Thank you for choosing to invest with Wells Fargo Advantage Funds. We appreciate your confidence in us and remain committed to helping you meet your financial needs. For current information about your fund investments, contact your investment professional, visit our website at wellsfargoadvantagefunds.com, or call us directly at 1-800-222-8222. We are available 24 hours a day, 7 days a week.
Sincerely,

Karla M. Rabusch
President
Wells Fargo Advantage Funds
Despite political headwinds, the relatively positive outlook for the U.S. economy contributed to a strong domestic stock market for most of the reporting period.
Notice to shareholders
The Fund and Wells Fargo Funds Management, LLC (“Funds Management”) have received an exemptive order from the SEC that permits Funds Management, subject to the approval of the Board of Trustees of the Fund, to select or replace certain subadvisers to manage all or a portion of the Fund’s assets and enter into, amend or terminate a sub-advisory agreement with certain subadvisers without obtaining shareholder approval (“Multi-manager Structure”). The Multi-manager Structure applies to subadvisers that are not affiliated with Funds Management or the Fund, except to the extent that affiliation arises solely because such subadvisers provide sub-advisory services to the Fund (“Non-affiliated Subadvisers”), as well as subadvisers that are indirect or direct wholly-owned subsidiaries of Funds Management or of another company that, indirectly or directly, wholly owns Funds Management (“Wholly-owned Subadvisers”).
Pursuant to the SEC order, Funds Management, with the approval of the Board of Trustees, has the discretion to terminate any subadvisers and allocate and reallocate the Fund’s assets among any other Non-affiliated Subadvisers or Wholly-owned Subadvisers. Funds Management, subject to oversight and supervision by the Board of Trustees, has responsibility to continue to oversee any subadvisers to the Fund and to recommend, for approval by the Board of Trustees, the hiring, termination and replacement of subadvisers for the Fund. In the event that a new subadviser is hired pursuant to the Multi-manager Structure, the Fund is required to provide notice to shareholders within 90 days.
Please contact your investment professional or call us directly at 1-800-222-8222 if you have any questions on this Notice to Shareholders.
| | | | |
| 4 | | Wells Fargo Advantage Capital Growth Fund | | Performance highlights (unaudited) |
Investment objective
The Fund seeks long-term capital appreciation.
Adviser
Wells Fargo Funds Management, LLC
Subadviser
Wells Capital Management Incorporated
Portfolio managers
Thomas J. Pence, CFA
Michael T. Smith, CFA
Average annual total returns1 (%) as of January 31, 2014
| | | | | | | | | | | | | | | | | | | | | | | | | | | | | | | | | | |
| | | | | Including sales charge | | | Excluding sales charge | | | Expense ratios2 (%) | |
| | | Inception date | | 1 year | | | 5 year | | | 10 year | | | 1 year | | | 5 year | | | 10 year | | | Gross | | | Net3 | |
| Class A (WFCGX) | | 7-31-2007 | | | 21.24 | | | | 17.63 | | | | 6.21 | | | | 28.67 | | | | 19.03 | | | | 6.84 | | | | 1.25 | | | | 1.11 | |
| Class C (WFCCX) | | 7-31-2007 | | | 26.66 | | | | 18.15 | | | | 6.12 | | | | 27.66 | | | | 18.15 | | | | 6.12 | | | | 2.00 | | | | 1.86 | |
| Class R4 (WCGRX) | | 11-30-2012 | | | – | | | | – | | | | – | | | | 29.16 | | | | 19.56 | | | | 7.38 | | | | 0.92 | | | | 0.75 | |
| Class R6 (WFCRX) | | 11-30-2012 | | | – | | | | – | | | | – | | | | 29.33 | | | | 19.63 | | | | 7.41 | | | | 0.77 | | | | 0.60 | |
| Administrator Class (WFCDX) | | 6-30-2003 | | | – | | | | – | | | | – | | | | 28.93 | | | | 19.35 | | | | 7.21 | | | | 1.09 | | | | 0.90 | |
| Institutional Class (WWCIX) | | 4-8-2005 | | | – | | | | – | | | | – | | | | 29.25 | | | | 19.61 | | | | 7.41 | | | | 0.82 | | | | 0.65 | |
| Investor Class (SLGIX) | | 11-3-1997 | | | – | | | | – | | | | – | | | | 28.63 | | | | 18.97 | | | | 6.78 | | | | 1.31 | | | | 1.17 | |
| Russell 1000® Growth Index4 | | – | | | – | | | | – | | | | – | | | | 24.35 | | | | 20.88 | | | | 7.30 | | | | – | | | | – | |
Figures quoted represent past performance, which is no guarantee of future results, and do not reflect taxes that a shareholder may pay on fund distributions or the redemption of fund shares. Investment return and principal value of an investment will fluctuate so that an investor’s shares, when redeemed, may be worth more or less than their original cost. Performance shown without sales charges would be lower if sales charges were reflected. Current performance may be lower or higher than the performance data quoted, which assumes the reinvestment of dividends and capital gains. Current month-end performance is available on the Fund’s website, wellsfargoadvantagefunds.com.
Index returns do not include transaction costs associated with buying and selling securities, any mutual fund fees or expenses, or any taxes. It is not possible to invest directly in an index.
For Class A shares, the maximum front-end sales charge is 5.75%. For Class C shares, the maximum contingent deferred sales charge is 1.00%. Performance including sales charge assumes the sales charge for the corresponding time period. Class R4, Class R6, Administrator Class, Institutional Class, and Investor Class shares are sold without a front-end sales charge or contingent deferred sales charge.
Please keep in mind that high double-digit returns were primarily achieved during favorable market conditions. You should not expect that such favorable returns can be consistently achieved. A fund’s performance, especially for short time periods, should not be the sole factor in making your investment decision.
Stock values fluctuate in response to the activities of individual companies and general market and economic conditions. Certain investment strategies tend to increase the total risk of an investment (relative to the broader market). The Fund is exposed to foreign investment risk. Consult the Fund’s prospectus for additional information on these and other risks.
Please see footnotes on page 5.
| | | | | | |
| Performance highlights (unaudited) | | Wells Fargo Advantage Capital Growth Fund | | | 5 | |
| | | | |
| Ten largest equity holdings5 (%) as of January 31, 2014 | |
Google Incorporated Class A | | | 4.70 | |
Amazon.com Incorporated | | | 2.98 | |
Facebook Incorporated Class A | | | 2.86 | |
Visa Incorporated Class A | | | 2.73 | |
Apple Incorporated | | | 2.72 | |
Constellation Brands Incorporated Class A | | | 2.58 | |
IntercontinentalExchange Group Incorporated | | | 2.51 | |
Gilead Sciences Incorporated | | | 2.40 | |
Alexion Pharmaceuticals Incorporated | | | 2.20 | |
Alliance Data Systems Corporation | | | 2.13 | |
| | |
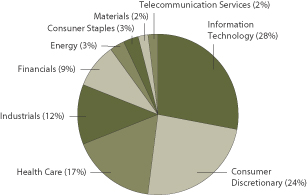
| Sector distribution6 as of January 31, 2014 |
|
|
| 1. | Historical performance shown for Class R4 shares prior to their inception reflects the performance of Institutional Class shares, adjusted to reflect the higher expenses applicable to Class R4 shares. Historical performance shown for Class R6 shares prior to their inception reflects the performance of Institutional Class shares, and includes the higher expenses applicable to Institutional Class shares. If these expenses had not been included, returns would be higher. Historical performance shown for Class A shares prior to their inception reflects the performance of Investor Class shares, and includes the higher expenses applicable to Investor Class shares. If these expenses had not been included, returns would be higher. Historical performance shown for Class C shares prior to their inception reflects the performance of Investor Class shares, adjusted to reflect the higher expenses applicable to Class C shares. Historical performance shown for Institutional Class shares prior to their inception reflects the performance of Administrator Class shares, and includes the higher expenses applicable to Administrator Class shares. If these expenses had not been included, returns would be higher. |
| 2. | Reflects the expense ratios as stated in the most recent prospectuses. The expense ratios shown are subject to change and may differ from the annualized expense ratios shown in the financial highlights of this report. |
| 3. | The Adviser has committed through November 30, 2014, to waive fees and/or reimburse expenses to the extent necessary to cap the Fund’s Total Annual Fund Operating Expenses After Fee Waiver, excluding certain expenses, at the amounts shown. Brokerage commissions, stamp duty fees, interest, taxes, acquired fund fees and expenses, and extraordinary expenses are excluded from the cap. Without this cap, the Fund’s returns would have been lower. |
| 4. | The Russell 1000® Growth Index measures the performance of those Russell 1000 Index companies with higher price-to-book ratios and higher forecasted growth values. You cannot invest directly in an index. |
| 5. | The ten largest equity holdings are calculated based on the value of the securities divided by total net assets of the Fund. Holdings are subject to change and may have changed since the date specified. |
| 6. | Sector distribution is subject to change and is calculated based on the total long-term investments of the Fund. |
| | | | |
| 6 | | Wells Fargo Advantage Capital Growth Fund | | Fund expenses (unaudited) |
As a shareholder of the Fund, you incur two types of costs: (1) transaction costs, including sales charges (loads) on purchase payments and contingent deferred sales charges (if any) on redemptions and (2) ongoing costs, including management fees, distribution (12b-1) and/or shareholder service fees, and other Fund expenses. This example is intended to help you understand your ongoing costs (in dollars) of investing in the Fund and to compare these costs with the ongoing costs of investing in other mutual funds.
The example is based on an investment of $1,000 invested at the beginning of the six-month period and held for the entire period from August 1, 2013 to January 31, 2014.
Actual expenses
The “Actual” line of the table below provides information about actual account values and actual expenses. You may use the information in this line, together with the amount you invested, to estimate the expenses that you paid over the period. Simply divide your account value by $1,000 (for example, an $8,600 account value divided by $1,000 = 8.6), then multiply the result by the number in the “Actual” line under the heading entitled “Expenses paid during period” for your applicable class of shares to estimate the expenses you paid on your account during this period.
Hypothetical example for comparison purposes
The “Hypothetical” line of the table below provides information about hypothetical account values and hypothetical expenses based on the Fund’s actual expense ratio and an assumed rate of return of 5% per year before expenses, which is not the Fund’s actual return. The hypothetical account values and expenses may not be used to estimate the actual ending account balance or expenses you paid for the period. You may use this information to compare the ongoing costs of investing in the Fund and other funds. To do so, compare this 5% hypothetical example with the 5% hypothetical examples that appear in the shareholder reports of the other funds.
Please note that the expenses shown in the table are meant to highlight your ongoing costs only and do not reflect any transactional costs, such as sales charges (loads) and contingent deferred sales charges. Therefore, the “Hypothetical” line of the table is useful in comparing ongoing costs only and will not help you determine the relative total costs of owning different funds. In addition, if these transactional costs were included, your costs would have been higher.
| | | | | | | | | | | | | | | | |
| | | Beginning
account value
8-1-2013 | | | Ending
account value
1-31-2014 | | | Expenses
paid during
the period1 | | | Net annualized
expense ratio | |
Class A | | | | | | | | | | | | | | | | |
Actual | | $ | 1,000.00 | | | $ | 1,142.26 | | | $ | 5.99 | | | | 1.11 | % |
Hypothetical (5% return before expenses) | | $ | 1,000.00 | | | $ | 1,019.61 | | | $ | 5.65 | | | | 1.11 | % |
Class C | | | | | | | | | | | | | | | | |
Actual | | $ | 1,000.00 | | | $ | 1,138.05 | | | $ | 10.02 | | | | 1.86 | % |
Hypothetical (5% return before expenses) | | $ | 1,000.00 | | | $ | 1,015.83 | | | $ | 9.45 | | | | 1.86 | % |
Class R4 | | | | | | | | | | | | | | | | |
Actual | | $ | 1,000.00 | | | $ | 1,144.66 | | | $ | 4.05 | | | | 0.75 | % |
Hypothetical (5% return before expenses) | | $ | 1,000.00 | | | $ | 1,021.42 | | | $ | 3.82 | | | | 0.75 | % |
Class R6 | | | | | | | | | | | | | | | | |
Actual | | $ | 1,000.00 | | | $ | 1,145.66 | | | $ | 3.24 | | | | 0.60 | % |
Hypothetical (5% return before expenses) | | $ | 1,000.00 | | | $ | 1,022.18 | | | $ | 3.06 | | | | 0.60 | % |
Administrator Class | | | | | | | | | | | | | | | | |
Actual | | $ | 1,000.00 | | | $ | 1,143.55 | | | $ | 4.86 | | | | 0.90 | % |
Hypothetical (5% return before expenses) | | $ | 1,000.00 | | | $ | 1,020.67 | | | $ | 4.58 | | | | 0.90 | % |
Institutional Class | | | | | | | | | | | | | | | | |
Actual | | $ | 1,000.00 | | | $ | 1,145.51 | | | $ | 3.52 | | | | 0.65 | % |
Hypothetical (5% return before expenses) | | $ | 1,000.00 | | | $ | 1,021.93 | | | $ | 3.31 | | | | 0.65 | % |
Investor Class | | | | | | | | | | | | | | | | |
Actual | | $ | 1,000.00 | | | $ | 1,142.38 | | | $ | 6.32 | | | | 1.17 | % |
Hypothetical (5% return before expenses) | | $ | 1,000.00 | | | $ | 1,019.31 | | | $ | 5.96 | | | | 1.17 | % |
| 1. | Expenses paid is equal to the annualized expense ratio of each class multiplied by the average account value over the period, multiplied by the number of days in the most recent fiscal half-year divided by the number of days in the fiscal year (to reflect the one-half-year period). |
| | | | | | |
| Portfolio of investments—January 31, 2014 (unaudited) | | Wells Fargo Advantage Capital Growth Fund | | | 7 | |
| | | | | | | | | | | | |
| Security name | | | | | | Shares | | | Value | |
| | | | | | | | | | | | |
| | | | |
Common Stocks: 97.99% | | | | | | | | | | | | |
| | | | |
Consumer Discretionary: 23.24% | | | | | | | | | | | | |
| | | | |
| Auto Components: 1.39% | | | | | | | | | | | | |
Delphi Automotive plc | | | | | | | 120,020 | | | $ | 7,308,018 | |
| | | | | | | | | | | | |
| | | | |
| Distributors: 0.90% | | | | | | | | | | | | |
LKQ Corporation † | | | | | | | 174,856 | | | | 4,733,352 | |
| | | | | | | | | | | | |
| | | | |
| Hotels, Restaurants & Leisure: 2.70% | | | | | | | | | | | | |
Las Vegas Sands Corporation | | | | | | | 72,550 | | | | 5,551,526 | |
Starbucks Corporation | | | | | | | 121,424 | | | | 8,635,675 | |
| | | | |
| | | | | | | | | | | 14,187,201 | |
| | | | | | | | | | | | |
| | | | |
| Household Durables: 1.25% | | | | | | | | | | | | |
Mohawk Industries Incorporated † | | | | | | | 46,150 | | | | 6,561,607 | |
| | | | | | | | | | | | |
| | | | |
| Internet & Catalog Retail: 6.65% | | | | | | | | | | | | |
Amazon.com Incorporated † | | | | | | | 43,580 | | | | 15,631,710 | |
Netflix Incorporated † | | | | | | | 20,430 | | | | 8,362,612 | |
priceline.com Incorporated † | | | | | | | 9,520 | | | | 10,899,353 | |
| | | | |
| | | | | | | | | | | 34,893,675 | |
| | | | | | | | | | | | |
| | | | |
| Media: 4.76% | | | | | | | | | | | | |
CBS Corporation Class B | | | | | | | 145,620 | | | | 8,550,806 | |
Liberty Global plc Class A † | | | | | | | 32,587 | | | | 2,604,679 | |
Liberty Global plc Class C † | | | | | | | 106,743 | | | | 8,467,922 | |
Twenty-First Century Fox Incorporated | | | | | | | 167,600 | | | | 5,333,032 | |
| | | | |
| | | | | | | | | | | 24,956,439 | |
| | | | | | | | | | | | |
| | | | |
| Specialty Retail: 3.45% | | | | | | | | | | | | |
Home Depot Incorporated | | | | | | | 127,690 | | | | 9,812,977 | |
TJX Companies Incorporated | | | | | | | 144,490 | | | | 8,287,946 | |
| | | | |
| | | | | | | | | | | 18,100,923 | |
| | | | | | | | | | | | |
| | | | |
| Textiles, Apparel & Luxury Goods: 2.14% | | | | | | | | | | | | |
Michael Kors Holdings Limited † | | | | | | | 44,975 | | | | 3,594,852 | |
Nike Incorporated Class B | | | | | | | 105,100 | | | | 7,656,535 | |
| | | | |
| | | | | | | | | | | 11,251,387 | |
| | | | | | | | | | | | |
| | | | |
Consumer Staples: 2.58% | | | | | | | | | | | | |
| | | | |
| Beverages: 2.58% | | | | | | | | | | | | |
Constellation Brands Incorporated Class A † | | | | | | | 176,730 | | | | 13,549,889 | |
| | | | | | | | | | | | |
| | | | |
Energy: 3.45% | | | | | | | | | | | | |
| | | | |
| Oil, Gas & Consumable Fuels: 3.45% | | | | | | | | | | | | |
Antero Resources Corporation † | | | | | | | 95,429 | | | | 5,605,499 | |
Marathon Petroleum Corporation | | | | | | | 45,050 | | | | 3,921,603 | |
Pioneer Natural Resources Company | | | | | | | 50,560 | | | | 8,560,819 | |
| | | | |
| | | | | | | | | | | 18,087,921 | |
| | | | | | | | | | | | |
The accompanying notes are an integral part of these financial statements.
| | | | |
| 8 | | Wells Fargo Advantage Capital Growth Fund | | Portfolio of investments—January 31, 2014 (unaudited) |
| | | | | | | | | | | | |
| Security name | | | | | | Shares | | | Value | |
| | | | | | | | | | | | |
| | | | |
Financials: 8.70% | | | | | | | | | | | | |
| | | | |
| Capital Markets: 1.31% | | | | | | | | | | | | |
Affiliated Managers Group Incorporated † | | | | | | | 34,452 | | | $ | 6,864,216 | |
| | | | | | | | | | | | |
| | | | |
| Consumer Finance: 2.00% | | | | | | | | | | | | |
American Express Company | | | | | | | 123,500 | | | | 10,499,970 | |
| | | | | | | | | | | | |
| | | | |
| Diversified Financial Services: 3.70% | | | | | | | | | | | | |
IntercontinentalExchange Group Incorporated | | | | | | | 62,980 | | | | 13,149,594 | |
JPMorgan Chase & Company | | | | | | | 113,950 | | | | 6,308,272 | |
| | | | |
| | | | | | | | | | | 19,457,866 | |
| | | | | | | | | | | | |
| | | | |
| Insurance: 1.69% | | | | | | | | | | | | |
Aon plc | | | | | | | 110,100 | | | | 8,858,646 | |
| | | | | | | | | | | | |
| | | | |
Health Care: 16.79% | | | | | | | | | | | | |
| | | | |
| Biotechnology: 8.59% | | | | | | | | | | | | |
Alexion Pharmaceuticals Incorporated † | | | | | | | 72,800 | | | | 11,555,544 | |
Biogen Idec Incorporated † | | | | | | | 32,750 | | | | 10,238,960 | |
Celgene Corporation † | | | | | | | 70,270 | | | | 10,676,121 | |
Gilead Sciences Incorporated † | | | | | | | 156,220 | | | | 12,599,143 | |
| | | | |
| | | | | | | | | | | 45,069,768 | |
| | | | | | | | | | | | |
| | | | |
| Health Care Equipment & Supplies: 1.41% | | | | | | | | | | | | |
Boston Scientific Corporation † | | | | | | | 545,950 | | | | 7,386,704 | |
| | | | | | | | | | | | |
| | | | |
| Health Care Providers & Services: 1.36% | | | | | | | | | | | | |
McKesson Corporation | | | | | | | 40,950 | | | | 7,142,090 | |
| | | | | | | | | | | | |
| | | | |
| Health Care Technology: 0.35% | | | | | | | | | | | | |
Cerner Corporation † | | | | | | | 32,830 | | | | 1,854,366 | |
| | | | | | | | | | | | |
| | | | |
| Pharmaceuticals: 5.08% | | | | | | | | | | | | |
AbbVie Incorporated | | | | | | | 118,500 | | | | 5,833,755 | |
Actavis plc † | | | | | | | 34,110 | | | | 6,446,108 | |
Bristol-Myers Squibb Company | | | | | | | 154,650 | | | | 7,727,861 | |
Shire plc ADR | | | | | | | 44,350 | | | | 6,635,647 | |
| | | | |
| | | | | | | | | | | 26,643,371 | |
| | | | | | | | | | | | |
| | | | |
Industrials: 11.88% | | | | | | | | | | | | |
| | | | |
| Aerospace & Defense: 3.21% | | | | | | | | | | | | |
B/E Aerospace Incorporated † | | | | | | | 94,900 | | | | 7,541,703 | |
Precision Castparts Corporation | | | | | | | 36,481 | | | | 9,293,535 | |
| | | | |
| | | | | | | | | | | 16,835,238 | |
| | | | | | | | | | | | |
| | | | |
| Airlines: 2.31% | | | | | | | | | | | | |
American Airlines Group Incorporated † | | | | | | | 81,600 | | | | 2,737,680 | |
Delta Air Lines Incorporated | | | | | | | 306,830 | | | | 9,392,066 | |
| | | | |
| | | | | | | | | | | 12,129,746 | |
| | | | | | | | | | | | |
The accompanying notes are an integral part of these financial statements.
| | | | | | |
| Portfolio of investments—January 31, 2014 (unaudited) | | Wells Fargo Advantage Capital Growth Fund | | | 9 | |
| | | | | | | | | | | | |
| Security name | | | | | | Shares | | | Value | |
| | | | | | | | | | | | |
| | | | |
| Building Products: 1.15% | | | | | | | | | | | | |
Fortune Brands Home & Security Incorporated | | | | | | | 134,010 | | | $ | 6,038,491 | |
| | | | | | | | | | | | |
| | | | |
| Electrical Equipment: 1.35% | | | | | | | | | | | | |
Eaton Corporation plc | | | | | | | 96,870 | | | | 7,080,228 | |
| | | | | | | | | | | | |
| | | | |
| Machinery: 0.97% | | | | | | | | | | | | |
Cummins Incorporated | | | | | | | 40,071 | | | | 5,088,216 | |
| | | | | | | | | | | | |
| | | | |
| Road & Rail: 1.40% | | | | | | | | | | | | |
Kansas City Southern | | | | | | | 69,580 | | | | 7,346,952 | |
| | | | | | | | | | | | |
| | | | |
| Trading Companies & Distributors: 1.49% | | | | | | | | | | | | |
United Rentals Incorporated † | | | | | | | 96,880 | | | | 7,841,467 | |
| | | | | | | | | | | | |
| | | | |
Information Technology: 27.80% | | | | | | | | | | | | |
| | | | |
| Computers & Peripherals: 2.72% | | | | | | | | | | | | |
Apple Incorporated | | | | | | | 28,525 | | | | 14,279,615 | |
| | | | | | | | | | | | |
| | | | |
| Internet Software & Services: 10.11% | | | | | | | | | | | | |
Baidu Incorporated † | | | | | | | 34,300 | | | | 5,367,950 | |
Facebook Incorporated Class A † | | | | | | | 240,060 | | | | 15,020,554 | |
Google Incorporated Class A † | | | | | | | 20,880 | | | | 24,658,654 | |
LinkedIn Corporation Class A † | | | | | | | 36,370 | | | | 7,827,188 | |
Twitter Incorporated Ǡ | | | | | | | 3,187 | | | | 205,562 | |
| | | | |
| | | | | | | | | | | 53,079,908 | |
| | | | | | | | | | | | |
| | | | |
| IT Services: 8.14% | | | | | | | | | | | | |
Alliance Data Systems Corporation † | | | | | | | 46,650 | | | | 11,180,139 | |
MasterCard Incorporated Class A | | | | | | | 138,490 | | | | 10,480,923 | |
Vantiv Incorporated Class A † | | | | | | | 220,890 | | | | 6,701,803 | |
Visa Incorporated Class A | | | | | | | 66,620 | | | | 14,351,947 | |
| | | | |
| | | | | | | | | | | 42,714,812 | |
| | | | | | | | | | | | |
| | | | |
| Semiconductors & Semiconductor Equipment: 2.37% | | | | | | | | | | | | |
ARM Holdings plc | | | | | | | 157,170 | | | | 7,240,822 | |
ASML Holding NV | | | | | | | 61,450 | | | | 5,200,514 | |
| | | | |
| | | | | | | | | | | 12,441,336 | |
| | | | | | | | | | | | |
| | | | |
| Software: 4.46% | | | | | | | | | | | | |
Adobe Systems Incorporated † | | | | | | | 134,690 | | | | 7,972,301 | |
Salesforce.com Incorporated † | | | | | | | 139,480 | | | | 8,442,724 | |
ServiceNow Incorporated † | | | | | | | 109,730 | | | | 6,960,174 | |
| | | | |
| | | | | | | | | | | 23,375,199 | |
| | | | | | | | | | | | |
| | | | |
Materials: 2.06% | | | | | | | | | | | | |
| | | | |
| Chemicals: 2.06% | | | | | | | | | | | | |
Monsanto Company | | | | | | | 101,420 | | | | 10,806,301 | |
| | | | | | | | | | | | |
The accompanying notes are an integral part of these financial statements.
| | | | |
| 10 | | Wells Fargo Advantage Capital Growth Fund | | Portfolio of investments—January 31, 2014 (unaudited) |
| | | | | | | | | | | | | | |
| Security name | | | | | | | Shares | | | Value | |
| | | | | | | | | | | | | | |
| | | | |
Telecommunication Services: 1.49% | | | | | | | | | | | | | | |
| | | | |
| Wireless Telecommunication Services: 1.49% | | | | | | | | | | | | | | |
SBA Communications Corporation Class A † | | | | | | | | | 84,599 | | | $ | 7,846,648 | |
| | | | | | | | | | | | | | |
| | | | |
Total Common Stocks (Cost $387,707,834) | | | | | | | | | | | | | 514,311,566 | |
| | | | | | | | | | | | | | |
| | | Yield | | | | | | | | | |
| | | | |
Short-Term Investments: 1.69% | | | | | | | | | | | | | | |
| | | | |
| Investment Companies: 1.69% | | | | | | | | | | | | | | |
Wells Fargo Advantage Cash Investment Money Market Fund, Select Class (l)(u) | | | 0.07 | % | | | | | 8,673,512 | | | | 8,673,512 | |
Wells Fargo Securities Lending Cash Investments, LLC (l)(r)(u)(v) | | | 0.08 | | | | | | 194,250 | | | | 194,250 | |
| | | | |
Total Short-Term Investments (Cost $8,867,762) | | | | | | | | | | | | | 8,867,762 | |
| | | | | | | | | | | | | | |
| | | | | | | | |
| Total investments in securities | | | | | | | | |
| (Cost $396,575,596) * | | | 99.68 | % | | | 523,179,328 | |
Other assets and liabilities, net | | | 0.32 | | | | 1,657,549 | |
| | | | | | | | |
| Total net assets | | | 100.00 | % | | $ | 524,836,877 | |
| | | | | | | | |
| † | Non-income-earning security |
| « | All or a portion of this security is on loan. |
| (l) | Investment in an affiliate |
| (u) | Rate shown is the 7-day annualized yield at period end. |
| (r) | The investment company is exempt from registration under Section 3(c)(7) of the Investment Company Act of 1940, as amended. |
| (v) | Security represents investment of cash collateral received from securities on loan. |
| * | Cost for federal income tax purposes is $396,962,923 and unrealized appreciation (depreciation) consists of: |
| | | | |
Gross unrealized appreciation | | $ | 129,879,277 | |
Gross unrealized depreciation | | | (3,662,872 | ) |
| | | | |
Net unrealized appreciation | | $ | 126,216,405 | |
The accompanying notes are an integral part of these financial statements.
| | | | | | |
| Statement of assets and liabilities—January 31, 2014 (unaudited) | | Wells Fargo Advantage Capital Growth Fund | | | 11 | |
| | | | |
| | | | |
| |
Assets | | | | |
Investments | | | | |
In unaffiliated securities (including securities on loan), at value (see cost below) | | $ | 514,311,566 | |
In affiliated securities, at value (see cost below) | | | 8,867,762 | |
| | | | |
Total investments, at value (see cost below) | | | 523,179,328 | |
Receivable for investments sold | | | 9,084,195 | |
Receivable for Fund shares sold | | | 522,825 | |
Receivable for dividends | | | 170,551 | |
Receivable for securities lending income | | | 349 | |
Prepaid expenses and other assets | | | 56,334 | |
| | | | |
Total assets | | | 533,013,582 | |
| | | | |
| |
Liabilities | | | | |
Payable for investments purchased | | | 7,372,241 | |
Payable for Fund shares redeemed | | | 144,761 | |
Payable upon receipt of securities loaned | | | 194,250 | |
Advisory fee payable | | | 234,588 | |
Distribution fees payable | | | 3,438 | |
Due to other related parties | | | 85,761 | |
Accrued expenses and other liabilities | | | 141,666 | |
| | | | |
Total liabilities | | | 8,176,705 | |
| | | | |
Total net assets | | $ | 524,836,877 | |
| | | | |
| |
NET ASSETS CONSIST OF | | | | |
Paid-in capital | | $ | 378,745,678 | |
Accumulated net investment loss | | | (408,616 | ) |
Accumulated net realized gains on investments | | | 19,896,083 | |
Net unrealized gains on investments | | | 126,603,732 | |
| | | | |
Total net assets | | $ | 524,836,877 | |
| | | | |
| |
COMPUTATION OF NET ASSET VALUE AND OFFERING PRICE PER SHARE1 | | | | |
Net assets – Class A | | $ | 19,247,067 | |
Shares outstanding – Class A | | | 941,458 | |
Net asset value per share – Class A | | | $20.44 | |
Maximum offering price per share – Class A2 | | | $21.69 | |
Net assets – Class C | | $ | 5,040,235 | |
Shares outstanding – Class C | | | 260,183 | |
Net asset value per share – Class C | | | $19.37 | |
Net assets – Class R4 | | $ | 13,370 | |
Share outstanding – Class R4 | | | 620 | |
Net asset value per share – Class R4 | | | $21.56 | |
Net assets – Class R6 | | $ | 66,799,196 | |
Share outstanding – Class R6 | | | 3,094,195 | |
Net asset value per share – Class R6 | | | $21.59 | |
Net assets – Administrator Class | | $ | 70,359,260 | |
Shares outstanding – Administrator Class | | | 3,304,361 | |
Net asset value per share – Administrator Class | | | $21.29 | |
Net assets – Institutional Class | | $ | 271,384,045 | |
Shares outstanding – Institutional Class | | | 12,588,991 | |
Net asset value per share – Institutional Class | | | $21.56 | |
Net assets – Investor Class | | $ | 91,993,704 | |
Shares outstanding – Investor Class | | | 4,530,251 | |
Net asset value per share – Investor Class | | | $20.31 | |
Investments in unaffiliated securities (including securities on loan), at cost | | $ | 387,707,834 | |
| | | | |
Investments in affiliated securities, at cost | | $ | 8,867,762 | |
| | | | |
Total investments, at cost | | $ | 396,575,596 | |
| | | | |
Securities on loan, at value | | $ | 190,410 | |
| | | | |
| 1. | The Fund has an unlimited number of authorized shares. |
| 2. | Maximum offering price is computed as 100/94.25 of net asset value. On investments of $50,000 or more, the offering price is reduced. |
The accompanying notes are an integral part of these financial statements.
| | | | |
| 12 | | Wells Fargo Advantage Capital Growth Fund | | Statement of operations—six months ended January 31, 2014 (unaudited) |
| | | | |
| | | | |
| |
Investment income | | | | |
Dividends | | $ | 1,709,981 | |
Securities lending income, net | | | 6,310 | |
Income from affiliated securities | | | 2,512 | |
| | | | |
Total investment income | | | 1,718,803 | |
| | | | |
| |
Expenses | | | | |
Advisory fee | | | 1,737,603 | |
Administration fees | | | | |
Fund level | | | 133,916 | |
Class A | | | 24,138 | |
Class C | | | 6,170 | |
Class R4 | | | 6 | |
Class R6 | | | 7,801 | |
Administrator Class | | | 35,048 | |
Institutional Class | | | 119,134 | |
Investor Class | | | 147,831 | |
Shareholder servicing fees | | | | |
Class A | | | 23,209 | |
Class C | | | 5,933 | |
Class R4 | | | 7 | |
Administrator Class | | | 86,599 | |
Investor Class | | | 115,493 | |
Distribution fees | | | | |
Class C | | | 17,798 | |
Custody and accounting fees | | | 19,851 | |
Professional fees | | | 24,878 | |
Registration fees | | | 38,234 | |
Shareholder report expenses | | | 18,905 | |
Trustees’ fees and expenses | | | 4,974 | |
Other fees and expenses | | | 13,617 | |
| | | | |
Total expenses | | | 2,581,145 | |
Less: Fee waivers and/or expense reimbursements | | | (453,971 | ) |
| | | | |
Net expenses | | | 2,127,174 | |
| | | | |
Net investment loss | | | (408,371 | ) |
| | | | |
| |
REALIZED AND UNREALIZED GAINS (LOSSES) ON INVESTMENTS | | | | |
Net realized gains on investments | | | 34,759,575 | |
Net change in unrealized gains (losses) on investments | | | 36,260,320 | |
| | | | |
Net realized and unrealized gains (losses) on investments | | | 71,019,895 | |
| | | | |
Net increase in net assets resulting from operations | | $ | 70,611,524 | |
| | | | |
The accompanying notes are an integral part of these financial statements.
| | | | | | |
| Statement of changes in net assets | | Wells Fargo Advantage Capital Growth Fund | | | 13 | |
| | | | | | | | | | | | | | | | |
| | | Six months ended
January 31, 2014
(unaudited) | | | Year ended July 31, 2013 | |
| | | | |
Operations | | | | | | | | | | | | | | | | |
Net investment income (loss) | | | | | | $ | (408,371 | ) | | | | | | $ | 1,940,707 | |
Net realized gains on investments | | | | | | | 34,759,575 | | | | | | | | 81,731,695 | |
Net change in unrealized gains (losses) on investments | | | | | | | 36,260,320 | | | | | | | | 19,679,033 | |
| | | | |
Net increase in net assets resulting from operations | | | | | | | 70,611,524 | | | | | | | | 103,351,435 | |
| | | | |
| | | | |
Distributions to shareholders from | | | | | | | | | | | | | | | | |
Net investment income | | | | | | | | | | | | | | | | |
Class A | | | | | | | (22,340 | ) | | | | | | | 0 | |
Class R4 | | | | | | | (30 | ) | | | | | | | (48 | )1 |
Class R6 | | | | | | | (188,590 | ) | | | | | | | (246 | )1 |
Administrator Class | | | | | | | (150,185 | ) | | | | | | | 0 | |
Institutional Class | | | | | | | (1,022,514 | ) | | | | | | | (1,895,530 | ) |
Investor Class | | | | | | | (86,333 | ) | | | | | | | 0 | |
Net realized gains | | | | | | | | | | | | | | | | |
Class A | | | | | | | (1,873,636 | ) | | | | | | | (314,970 | ) |
Class C | | | | | | | (492,729 | ) | | | | | | | (99,514 | ) |
Class R4 | | | | | | | (1,251 | ) | | | | | | | (167 | )1 |
Class R6 | | | | | | | (6,224,341 | ) | | | | | | | (837 | )1 |
Administrator Class | | | | | | | (6,836,708 | ) | | | | | | | (1,194,743 | ) |
Institutional Class | | | | | | | (27,083,256 | ) | | | | | | | (6,263,868 | ) |
Investor Class | | | | | | | (9,335,586 | ) | | | | | | | (1,405,932 | ) |
| | | | |
Total distributions to shareholders | | | | | | | (53,317,499 | ) | | | | | | | (11,175,855 | ) |
| | | | |
| | | | |
Capital share transactions | | | Shares | | | | | | | | Shares | | | | | |
Proceeds from shares sold | | | | | | | | | | | | | | | | |
Class A | | | 81,252 | | | | 1,697,648 | | | | 143,319 | | | | 2,580,951 | |
Class C | | | 43,277 | | | | 856,543 | | | | 25,668 | | | | 440,857 | |
Class R4 | | | 0 | | | | 0 | | | | 549 | 1 | | | 10,000 | 1 |
Class R6 | | | 2,915,393 | | | | 63,090,467 | | | | 2,744 | 1 | | | 50,000 | 1 |
Administrator Class | | | 226,657 | | | | 4,963,945 | | | | 451,886 | | | | 8,385,890 | |
Institutional Class | | | 688,530 | | | | 15,192,089 | | | | 2,394,980 | | | | 44,709,816 | |
Investor Class | | | 249,313 | | | | 5,202,610 | | | | 314,463 | | | | 5,648,504 | |
| | | | |
| | | | | | | 91,003,302 | | | | | | | | 61,826,018 | |
| | | | |
Reinvestment of distributions | | | | | | | | | | | | | | | | |
Class A | | | 90,669 | | | | 1,852,251 | | | | 18,353 | | | | 308,704 | |
Class C | | | 21,836 | | | | 422,743 | | | | 4,726 | | | | 76,288 | |
Class R4 | | | 59 | | | | 1,281 | | | | 12 | 1 | | | 215 | 1 |
Class R6 | | | 297,090 | | | | 6,412,931 | | | | 61 | 1 | | | 1,083 | 1 |
Administrator Class | | | 313,298 | | | | 6,669,296 | | | | 64,170 | | | | 1,117,846 | |
Institutional Class | | | 1,194,493 | | | | 25,770,101 | | | | 433,529 | | | | 7,652,649 | |
Investor Class | | | 451,521 | | | | 9,160,992 | | | | 81,385 | | | | 1,360,759 | |
| | | | |
| | | | | | | 50,289,595 | | | | | | | | 10,517,544 | |
| | | | |
Payment for shares redeemed | | | | | | | | | | | | | | | | |
Class A | | | (55,390 | ) | | | (1,168,090 | ) | | | (399,052 | ) | | | (7,220,538 | ) |
Class C | | | (42,186 | ) | | | (830,488 | ) | | | (167,822 | ) | | | (2,892,076 | ) |
Class R6 | | | (121,093 | ) | | | (2,708,890 | ) | | | 0 | 1 | | | 0 | 1 |
Administrator Class | | | (330,870 | ) | | | (7,166,114 | ) | | | (1,724,968 | ) | | | (32,214,397 | ) |
Institutional Class | | | (5,190,727 | ) | | | (113,078,580 | ) | | | (17,915,534 | ) | | | (327,311,363 | ) |
Investor Class | | | (490,220 | ) | | | (10,162,306 | ) | | | (951,999 | ) | | | (17,003,561 | ) |
| | | | |
| | | | | | | (135,114,468 | ) | | | | | | | (386,641,935 | ) |
| | | | |
Net increase (decrease) in net assets resulting from capital share transactions | | | | | | | 6,178,429 | | | | | | | | (314,298,373 | ) |
| | | | |
Total increase (decrease) in net assets | | | | | | | 23,472,454 | | | | | | | | (222,122,793 | ) |
| | | | |
| | | | |
Net assets | | | | | | | | | | | | | | | | |
Beginning of period | | | | | | | 501,364,423 | | | | | | | | 723,487,216 | |
| | | | |
End of period | | | | | | $ | 524,836,877 | | | | | | | $ | 501,364,423 | |
| | | | |
Undistributed (accumulated) net investment income (loss) | | | | | | $ | (408,616 | ) | | | | | | $ | 1,469,747 | |
| | | | |
| 1. | For the period from November 30, 2012 (commencement of class operations) to July 31, 2013 |
The accompanying notes are an integral part of these financial statements.
| | | | |
| 14 | | Wells Fargo Advantage Capital Growth Fund | | Financial highlights |
(For a share outstanding throughout each period)
| | | | | | | | | | | | | | | | | | | | | | | | |
| | | Six months ended
January 31, 2014
(unaudited) | | | Year ended July 31 | |
| CLASS A | | | 2013 | | | 2012 | | | 2011 | | | 2010 | | | 2009 | |
Net asset value, beginning of period | | $ | 19.87 | | | $ | 16.74 | | | $ | 16.25 | | | $ | 13.07 | | | $ | 11.83 | | | $ | 17.60 | |
Net investment income (loss) | | | (0.05 | )1 | | | 0.00 | 1,2 | | | (0.05 | )1 | | | (0.07 | )1 | | | (0.06 | )1 | | | (0.00 | )1,2 |
Net realized and unrealized gains (losses) on investments | | | 2.87 | | | | 3.43 | | | | 0.54 | | | | 3.25 | | | | 1.30 | | | | (5.26 | ) |
| | | | | | | | | | | | | | | | | | | | | | | | |
Total from investment operations | | | 2.82 | | | | 3.43 | | | | 0.49 | | | | 3.18 | | | | 1.24 | | | | (5.26 | ) |
Distributions to shareholders from | | | | | | | | | | | | | | | | | | | | | | | | |
Net investment income | | | (0.02 | ) | | | 0.00 | | | | 0.00 | | | | 0.00 | | | | 0.00 | | | | 0.00 | |
Net realized gains | | | (2.23 | ) | | | (0.30 | ) | | | 0.00 | | | | 0.00 | | | | 0.00 | | | | (0.51 | ) |
| | | | | | | | | | | | | | | | | | | | | | | | |
Total distributions to shareholders | | | (2.25 | ) | | | (0.30 | ) | | | 0.00 | | | | 0.00 | | | | 0.00 | | | | (0.51 | ) |
Net asset value, end of period | | $ | 20.44 | | | $ | 19.87 | | | $ | 16.74 | | | $ | 16.25 | | | $ | 13.07 | | | $ | 11.83 | |
Total return3 | | | 14.23 | % | | | 20.85 | % | | | 3.02 | % | | | 24.43 | % | | | 10.40 | % | | | (29.23 | )% |
Ratios to average net assets (annualized) | | | | | | | | | | | | | | | | | | | | | | | | |
Gross expenses | | | 1.25 | % | | | 1.26 | % | | | 1.21 | % | | | 1.21 | % | | | 1.27 | % | | | 1.31 | % |
Net expenses | | | 1.11 | % | | | 1.14 | % | | | 1.20 | % | | | 1.20 | % | | | 1.25 | % | | | 1.25 | % |
Net investment income (loss) | | | (0.48 | )% | | | 0.01 | % | | | (0.30 | )% | | | (0.48 | )% | | | (0.55 | )% | | | (0.01 | )% |
Supplemental data | | | | | | | | | | | | | | | | | | | | | | | | |
Portfolio turnover rate | | | 50 | % | | | 107 | % | | | 116 | % | | | 116 | % | | | 128 | % | | | 172 | % |
Net assets, end of period (000s omitted) | | | $19,247 | | | | $16,390 | | | | $17,784 | | | | $20,693 | | | | $24,222 | | | | $21,064 | |
| 1. | Calculated based upon average shares outstanding |
| 2. | Amount is less than $0.005. |
| 3. | Total return calculations do not include any sales charges. Returns for periods of less than one year are not annualized. |
The accompanying notes are an integral part of these financial statements.
| | | | | | |
| Financial highlights | | Wells Fargo Advantage Capital Growth Fund | | | 15 | |
(For a share outstanding throughout each period)
| | | | | | | | | | | | | | | | | | | | | | | | |
| | | Six months ended
January 31, 2014
(unaudited) | | | Year ended July 31 | |
| CLASS C | | | 2013 | | | 2012 | | | 2011 | | | 2010 | | | 2009 | |
Net asset value, beginning of period | | $ | 18.98 | | | $ | 16.12 | | | $ | 15.77 | | | $ | 12.77 | | | $ | 11.65 | | | $ | 17.47 | |
Net investment loss | | | (0.12 | )1 | | | (0.13 | )1 | | | (0.16 | )1 | | | (0.19 | )1 | | | (0.17 | ) | | | (0.08 | )1 |
Net realized and unrealized gains (losses) on investments | | | 2.74 | | | | 3.29 | | | | 0.51 | | | | 3.19 | | | | 1.29 | | | | (5.23 | ) |
| | | | | | | | | | | | | | | | | | | | | | | | |
Total from investment operations | | | 2.62 | | | | 3.16 | | | | 0.35 | | | | 3.00 | | | | 1.12 | | | | (5.31 | ) |
Distributions to shareholders from | | | | | | | | | | | | | | | | | | | | | | | | |
Net realized gains | | | (2.23 | ) | | | (0.30 | ) | | | 0.00 | | | | 0.00 | | | | 0.00 | | | | (0.51 | ) |
Net asset value, end of period | | $ | 19.37 | | | $ | 18.98 | | | $ | 16.12 | | | $ | 15.77 | | | $ | 12.77 | | | $ | 11.65 | |
Total return2 | | | 13.80 | % | | | 19.97 | % | | | 2.22 | % | | | 23.49 | % | | | 9.61 | % | | | (29.75 | )% |
Ratios to average net assets (annualized) | | | | | | | | | | | | | | | | | | | | | | | | |
Gross expenses | | | 2.00 | % | | | 2.01 | % | | | 1.96 | % | | | 1.96 | % | | | 2.02 | % | | | 2.02 | % |
Net expenses | | | 1.86 | % | | | 1.89 | % | | | 1.95 | % | | | 1.95 | % | | | 2.00 | % | | | 1.96 | % |
Net investment loss | | | (1.22 | )% | | | (0.73 | )% | | | (1.05 | )% | | | (1.23 | )% | | | (1.31 | )% | | | (0.70 | )% |
Supplemental data | | | | | | | | | | | | | | | | | | | | | | | | |
Portfolio turnover rate | | | 50 | % | | | 107 | % | | | 116 | % | | | 116 | % | | | 128 | % | | | 172 | % |
Net assets, end of period (000s omitted) | | | $5,040 | | | | $4,503 | | | | $6,042 | | | | $8,272 | | | | $7,127 | | | | $6,772 | |
| 1. | Calculated based upon average shares outstanding |
| 2. | Total return calculations do not include any sales charges. Returns for periods of less than one year are not annualized. |
The accompanying notes are an integral part of these financial statements.
| | | | |
| 16 | | Wells Fargo Advantage Capital Growth Fund | | Financial highlights |
(For a share outstanding throughout each period)
| | | | | | | | |
| CLASS R4 | | Six months ended January 31, 2014 (unaudited) | | | Year ended July 31, 20131 | |
Net asset value, beginning of period | | $ | 20.83 | | | $ | 18.22 | |
Net investment income (loss) | | | (0.01 | ) | | | 0.05 | |
Net realized and unrealized gains (losses) on investments | | | 3.02 | | | | 2.95 | |
| | | | | | | | |
Total from investment operations | | | 3.01 | | | | 3.00 | |
Distributions to shareholders from | | | | | | | | |
Net investment income | | | (0.05 | ) | | | (0.09 | ) |
Net realized gains | | | (2.23 | ) | | | (0.30 | ) |
| | | | | | | | |
Total distributions to shareholders | | | (2.28 | ) | | | (0.39 | ) |
Net asset value, end of period | | $ | 21.56 | | | $ | 20.83 | |
Total return2 | | | 14.47 | % | | | 16.86 | % |
Ratios to average net assets (annualized) | | | | | | | | |
Gross expenses | | | 0.91 | % | | | 0.90 | % |
Net expenses | | | 0.75 | % | | | 0.75 | % |
Net investment income (loss) | | | (0.12 | )% | | | 0.37 | % |
Supplemental data | | | | | | | | |
Portfolio turnover rate | | | 50 | % | | | 107 | % |
Net assets, end of period (000s omitted) | | | $13 | | | | $12 | |
| 1. | For the period from November 30, 2012 (commencement of class operations) to July 31, 2013 |
| 2. | Returns for periods of less than one year are not annualized. |
The accompanying notes are an integral part of these financial statements.
| | | | | | |
| Financial highlights | | Wells Fargo Advantage Capital Growth Fund | | | 17 | |
(For a share outstanding throughout each period)
| | | | | | | | |
| CLASS R6 | | Six months ended January 31, 2014 (unaudited) | | | Year ended July 31, 20131 | |
Net asset value, beginning of period | | $ | 20.85 | | | $ | 18.22 | |
Net investment income (loss) | | | (0.01 | )2 | | | 0.07 | |
Net realized and unrealized gains (losses) on investments | | | 3.04 | | | | 2.95 | |
| | | | | | | | |
Total from investment operations | | | 3.03 | | | | 3.02 | |
Distributions to shareholders from | | | | | | | | |
Net investment income | | | (0.06 | ) | | | (0.09 | ) |
Net realized gains | | | (2.23 | ) | | | (0.30 | ) |
| | | | | | | | |
Total distributions to shareholders | | | (2.29 | ) | | | (0.39 | ) |
Net asset value, end of period | | $ | 21.59 | | | $ | 20.85 | |
Total return3 | | | 14.57 | % | | | 16.99 | % |
Ratios to average net assets (annualized) | | | | | | | | |
Gross expenses | | | 0.77 | % | | | 0.79 | % |
Net expenses | | | 0.60 | % | | | 0.60 | % |
Net investment income (loss) | | | (0.13 | )% | | | 0.52 | % |
Supplemental data | | | | | | | | |
Portfolio turnover rate | | | 50 | % | | | 107 | % |
Net assets, end of period (000s omitted) | | | $66,799 | | | | $58 | |
| 1. | For the period from November 30, 2012 (commencement of class operations) to July 31, 2013 |
| 2. | Calculated based upon average shares outstanding |
| 3. | Returns for periods of less than one year are not annualized. |
The accompanying notes are an integral part of these financial statements.
| | | | |
| 18 | | Wells Fargo Advantage Capital Growth Fund | | Financial highlights |
(For a share outstanding throughout each period)
| | | | | | | | | | | | | | | | | | | | | | | | |
| | | Six months ended
January 31, 2014
(unaudited) | | | Year ended July 31 | |
| ADMINIATOR CLASS | | | 2013 | | | 2012 | | | 2011 | | | 2010 | | | 2009 | |
Net asset value, beginning of period | | $ | 20.61 | | | $ | 17.32 | | | $ | 16.77 | | | $ | 13.45 | | | $ | 12.17 | | | $ | 18.03 | |
Net investment income (loss) | | | (0.03 | )1 | | | 0.04 | 1 | | | (0.00 | )1,2 | | | (0.03 | )1 | | | (0.03 | )1 | | | 0.04 | 1 |
Net realized and unrealized gains (losses) on investments | | | 2.98 | | | | 3.55 | | | | 0.55 | | | | 3.35 | | | | 1.35 | | | | (5.39 | ) |
| | | | | | | | | | | | | | | | | | | | | | | | |
Total from investment operations | | | 2.95 | | | | 3.59 | | | | 0.55 | | | | 3.32 | | | | 1.32 | | | | (5.35 | ) |
Distributions to shareholders from | | | | | | | | | | | | | | | | | | | | | | | | |
Net investment income | | | (0.04 | ) | | | 0.00 | | | | 0.00 | | | | 0.00 | | | | (0.04 | ) | | | 0.00 | |
Net realized gains | | | (2.23 | ) | | | (0.30 | ) | | | 0.00 | | | | 0.00 | | | | 0.00 | | | | (0.51 | ) |
| | | | | | | | | | | | | | | | | | | | | | | | |
Total distributions to shareholders | | | (2.27 | ) | | | (0.30 | ) | | | 0.00 | | | | 0.00 | | | | (0.04 | ) | | | (0.51 | ) |
Net asset value, end of period | | $ | 21.29 | | | $ | 20.61 | | | $ | 17.32 | | | $ | 16.77 | | | $ | 13.45 | | | $ | 12.17 | |
Total return3 | | | 14.36 | % | | | 21.15 | % | | | 3.22 | % | | | 24.68 | % | | | 10.81 | % | | | (29.02 | )% |
Ratios to average net assets (annualized) | | | | | | | | | | | | | | | | | | | | | | | | |
Gross expenses | | | 1.09 | % | | | 1.09 | % | | | 1.05 | % | | | 1.05 | % | | | 1.09 | % | | | 1.13 | % |
Net expenses | | | 0.90 | % | | | 0.91 | % | | | 0.94 | % | | | 0.94 | % | | | 0.94 | % | | | 0.94 | % |
Net investment income (loss) | | | (0.26 | )% | | | 0.24 | % | | | (0.01 | )% | | | (0.21 | )% | | | (0.25 | )% | | | 0.33 | % |
Supplemental data | | | | | | | | | | | | | | | | | | | | | | | | |
Portfolio turnover rate | | | 50 | % | | | 107 | % | | | 116 | % | | | 116 | % | | | 128 | % | | | 172 | % |
Net assets, end of period (000s omitted) | | | $70,359 | | | | $63,786 | | | | $74,529 | | | | $372,178 | | | | $684,207 | | | | $680,869 | |
| 1. | Calculated based upon average shares outstanding |
| 2. | Amount is less than $0.005. |
| 3. | Returns for periods of less than one year are not annualized. |
The accompanying notes are an integral part of these financial statements.
| | | | | | |
| Financial highlights | | Wells Fargo Advantage Capital Growth Fund | | | 19 | |
(For a share outstanding throughout each period)
| | | | | | | | | | | | | | | | | | | | | | | | |
| | | Six months ended
January 31, 2014
(unaudited) | | | Year ended July 31 | |
| INSTITUTIONAL CLASS | | | 2013 | | | 2012 | | | 2011 | | | 2010 | | | 2009 | |
Net asset value, beginning of period | | $ | 20.84 | | | $ | 17.56 | | | $ | 16.96 | | | $ | 13.57 | | | $ | 12.27 | | | $ | 18.14 | |
Net Investment income (loss) | | | 0.00 | 1,2 | | | 0.09 | 1 | | | 0.03 | 1 | | | 0.00 | 1,2 | | | (0.00 | )1,2 | | | 0.06 | 1 |
Net realized and unrealized gains (losses) on investments | | | 3.03 | | | | 3.58 | | | | 0.57 | | | | 3.39 | | | | 1.36 | | | | (5.42 | ) |
| | | | | | | | | | | | | | | | | | | | | | | | |
Total from investment operations | | | 3.03 | | | | 3.67 | | | | 0.60 | | | | 3.39 | | | | 1.36 | | | | (5.36 | ) |
Distributions to shareholders from | | | | | | | | | | | | | | | | | | | | | | | | |
Net investment income | | | (0.08 | ) | | | (0.09 | ) | | | 0.00 | | | | 0.00 | | | | (0.06 | ) | | | 0.00 | |
Net realized gains | | | (2.23 | ) | | | (0.30 | ) | | | 0.00 | | | | 0.00 | | | | 0.00 | | | | (0.51 | ) |
| | | | | | | | | | | | | | | | | | | | | | | | |
Total distributions to shareholders | | | (2.31 | ) | | | (0.39 | ) | | | 0.00 | | | | 0.00 | | | | (0.06 | ) | | | (0.51 | ) |
Net asset value, end of period | | $ | 21.56 | | | $ | 20.84 | | | $ | 17.56 | | | $ | 16.96 | | | $ | 13.57 | | | $ | 12.27 | |
Total return3 | | | 14.55 | % | | | 21.42 | % | | | 3.48 | % | | | 25.07 | % | | | 10.97 | % | | | (28.90 | )% |
Ratios to average net assets (annualized) | | | | | | | | | | | | | | | | | | | | | | | | |
Gross expenses | | | 0.82 | % | | | 0.82 | % | | | 0.78 | % | | | 0.78 | % | | | 0.82 | % | | | 0.86 | % |
Net expenses | | | 0.65 | % | | | 0.67 | % | | | 0.70 | % | | | 0.70 | % | | | 0.75 | % | | | 0.75 | % |
Net investment income (loss) | | | 0.02 | % | | | 0.46 | % | | | 0.21 | % | | | 0.00 | % | | | (0.06 | )% | | | 0.51 | % |
Supplemental data | | | | | | | | | | | | | | | | | | | | | | | | |
Portfolio turnover rate | | | 50 | % | | | 107 | % | | | 116 | % | | | 116 | % | | | 128 | % | | | 172 | % |
Net assets, end of period (000s omitted) | | | $271,384 | | | | $331,310 | | | | $543,933 | | | | $988,633 | | | | $473,777 | | | | $443,931 | |
| 1. | Calculated based upon average shares outstanding |
| 2. | Amount is less than $0.005. |
| 3. | Returns for periods of less than one year are not annualized. |
The accompanying notes are an integral part of these financial statements.
| | | | |
| 20 | | Wells Fargo Advantage Capital Growth Fund | | Financial highlights |
(For a share outstanding throughout each period)
| | | | | | | | | | | | | | | | | | | | | | | | |
| | | Six months ended
January 31, 2014
(unaudited) | | | Year ended July 31 | |
| INVESTOR CLASS | | | 2013 | | | 2012 | | | 2011 | | | 2010 | | | 2009 | |
Net asset value, beginning of period | | $ | 19.75 | | | $ | 16.65 | | | $ | 16.18 | | | $ | 13.02 | | | $ | 11.79 | | | $ | 17.56 | |
Net investment loss | | | (0.06 | )1 | | | (0.01 | )1 | | | (0.06 | )1 | | | (0.08 | )1 | | | (0.08 | )1 | | | (0.01 | )1 |
Net realized and unrealized gains (losses) on investments | | | 2.87 | | | | 3.41 | | | | 0.53 | | | | 3.24 | | | | 1.31 | | | | (5.25 | ) |
| | | | | | | | | | | | | | | | | | | | | | | | |
Total from investment operations | | | 2.81 | | | | 3.40 | | | | 0.47 | | | | 3.16 | | | | 1.23 | | | | (5.26 | ) |
Distributions to shareholders from | | | | | | | | | | | | | | | | | | | | | | | | |
Net investment income | | | (0.02 | ) | | | 0.00 | | | | 0.00 | | | | 0.00 | | | | 0.00 | | | | 0.00 | |
Net realized gains | | | (2.23 | ) | | | (0.30 | ) | | | 0.00 | | | | 0.00 | | | | 0.00 | | | | (0.51 | ) |
| | | | | | | | | | | | | | | | | | | | | | | | |
Total distributions to shareholders | | | (2.25 | ) | | | (0.30 | ) | | | 0.00 | | | | 0.00 | | | | 0.00 | | | | (0.51 | ) |
Net asset value, end of period | | $ | 20.31 | | | $ | 19.75 | | | $ | 16.65 | | | $ | 16.18 | | | $ | 13.02 | | | $ | 11.79 | |
Total return2 | | | 14.24 | % | | | 20.78 | % | | | 2.90 | % | | | 24.37 | % | | | 10.35 | % | | | (29.30 | )% |
Ratios to average net assets (annualized) | | | | | | | | | | | | | | | | | | | | | | | | |
Gross expenses | | | 1.31 | % | | | 1.32 | % | | | 1.28 | % | | | 1.28 | % | | | 1.36 | % | | | 1.41 | % |
Net expenses | | | 1.17 | % | | | 1.20 | % | | | 1.27 | % | | | 1.27 | % | | | 1.35 | % | | | 1.36 | % |
Net investment loss | | | (0.53 | )% | | | (0.06 | )% | | | (0.37 | )% | | | (0.55 | )% | | | (0.64 | )% | | | (0.12 | )% |
Supplemental data | | | | | | | | | | | | | | | | | | | | | | | | |
Portfolio turnover rate | | | 50 | % | | | 107 | % | | | 116 | % | | | 116 | % | | | 128 | % | | | 172 | % |
Net assets, end of period (000s omitted) | | | $91,994 | | | | $85,306 | | | | $81,199 | | | | $96,941 | | | | $104,200 | | | | $220,008 | |
| 1. | Calculated based upon average shares outstanding |
| 2. | Returns for periods of less than one year are not annualized. |
The accompanying notes are an integral part of these financial statements.
| | | | | | |
| Notes to financial statements (unaudited) | | Wells Fargo Advantage Capital Growth Fund | | | 21 | |
1. ORGANIZATION
Wells Fargo Funds Trust (the “Trust”), a Delaware statutory trust organized on March 10, 1999, is an open-end management investment company registered under the Investment Company Act of 1940, as amended (the “1940 Act”). These financial statements report on the Wells Fargo Advantage Capital Growth Fund (the “Fund”) which is a diversified series of the Trust.
2. SIGNIFICANT ACCOUNTING POLICIES
The following significant accounting policies, which are consistently followed in the preparation of the financial statements of the Fund, are in conformity with U.S. generally accepted accounting principles which require management to make estimates and assumptions that affect the reported amounts of assets and liabilities, disclosure of contingent assets and liabilities at the date of the financial statements, and the reported amounts of revenues and expenses during the reporting period. Actual results could differ from those estimates.
Securities valuation
All investments are valued each business day as of the close of regular trading on the New York Stock Exchange (generally 4 p.m. Eastern Time).
Equity securities that are listed on a foreign or domestic exchange or market are valued at the official closing price or, if none, the last sales price. If no sale occurs on the primary exchange or market for the security that day, the prior day’s price will be deemed “stale” and fair values will be determined in accordance with the Fund’s Valuation Procedures.
Investments in registered open-end investment companies are valued at net asset value. Non-registered investment vehicles are fair valued at net asset value.
Investments which are not valued using any of the methods discussed above are valued at their fair value, as determined in good faith by the Board of Trustees of the Fund. The Board of Trustees has established a Valuation Committee comprised of the Trustees and has delegated to it the authority to take any actions regarding the valuation of portfolio securities that the Valuation Committee deems necessary or appropriate, including determining the fair value of portfolio securities, unless the determination has been delegated to the Management Valuation Team of Wells Fargo Funds Management, LLC (“Funds Management”). The Board of Trustees retains the authority to make or ratify any valuation decisions or approve any changes to the Valuation Procedures as it deems appropriate. On a quarterly basis, the Board of Trustees receives reports on any valuation actions taken by the Valuation Committee or the Management Valuation Team which may include items for ratification.
Valuations of fair valued securities are compared to the next actual sales price when available, or other appropriate market values, to assess the continued appropriateness of the fair valuation methodologies used. These securities are fair valued on a day-to-day basis, taking into consideration changes to appropriate market information and any significant changes to the inputs considered in the valuation process until there is a readily available price provided on an exchange or by an independent pricing service. Valuations received from an independent pricing service or independent broker-dealer quotes are periodically validated by comparisons to most recent trades and valuations provided by other independent pricing services in addition to the review of prices by the adviser and/or subadviser. Unobservable inputs used in determining fair valuations are identified based on the type of security, taking into consideration factors utilized by market participants in valuing the investment, knowledge about the issuer and the current market environment.
Security loans
The Fund may lend its securities from time to time in order to earn additional income in the form of fees or interest on securities received as collateral or the investment of any cash received as collateral. The Fund continues to receive interest or dividends on the securities loaned. The Fund receives collateral in the form of cash or securities with a value at least equal to the value of the securities on loan. The value of the loaned securities is determined at the close of each business day and any additional required collateral is delivered to the Fund on the next business day. In a securities lending transaction, the net asset value of the Fund will be affected by an increase or decrease in the value of the securities loaned and by an increase or decrease in the value of the instrument in which collateral is invested. The amount of securities lending activity undertaken by the Fund fluctuates from time to time. In the event of default or bankruptcy by the borrower, the Fund may be prevented from recovering the loaned securities or gaining access to the collateral or may experience delays or costs in doing so. In addition, the investment of any cash collateral received may lose all or part of its value. The Fund has the right under the lending agreement to recover the securities from the borrower on demand.
| | | | |
| 22 | | Wells Fargo Advantage Capital Growth Fund | | Notes to financial statements (unaudited) |
The Fund lends its securities through an unaffiliated securities lending agent. Cash collateral received in connection with its securities lending transactions is invested in Wells Fargo Securities Lending Cash Investments, LLC (the “Securities Lending Fund”). The Securities Lending Fund is exempt from registration under Section 3(c)(7) of the 1940 Act and is managed by Funds Management and is subadvised by Wells Capital Management Incorporated (“WellsCap”). Funds Management receives an advisory fee starting at 0.05% and declining to 0.01% as the average daily net assets of the Securities Lending Fund increase. All of the fees received by Funds Management are paid to WellsCap for its services as subadviser. The Securities Lending Fund seeks to provide a positive return compared to the daily Fed Funds Open rate by investing in high-quality, U.S. dollar-denominated short-term money market instruments. Securities Lending Fund investments are fair valued based upon the amortized cost valuation technique. Income earned from investment in the Securities Lending Fund is included in securities lending income on the Statement of Operations.
Security transactions and income recognition
Securities transactions are recorded on a trade date basis. Realized gains or losses are recorded on the basis of identified cost.
Dividend income is recognized on the ex-dividend date.
Distributions to shareholders
Distributions to shareholders from net investment income and net realized gains, if any, are recorded on the ex-dividend date. Such distributions are determined in conformity with federal income tax regulations, which may differ in amount or character from net investment income and realized gains recognized for purposes of U.S. generally accepted accounting principles.
Federal and other taxes
The Fund intends to continue to qualify as a regulated investment company by distributing substantially all of its investment company taxable income and any net realized capital gains (after reduction for capital loss carryforwards) sufficient to relieve it from all, or substantially all, federal income taxes. Accordingly, no provision for federal income taxes was required.
The Fund’s income and federal excise tax returns and all financial records supporting those returns for the prior three fiscal years are subject to examination by the federal and Delaware revenue authorities. Management has analyzed the Fund’s tax positions taken on federal, state, and foreign tax returns for all open tax years and does not believe that there are any uncertain tax positions that require recognition of a tax liability.
As of July 31, 2013, the Fund had capital loss carryforwards available to offset future net realized capital gains in the amount of $3,375,420 expiring in 2016.
Class allocations
The separate classes of shares offered by the Fund differ principally in applicable sales charges, distribution, shareholder servicing, and administration fees. Shareholders of each class bear certain expenses that pertain to that particular class. All shareholders bear the common expenses of the Fund, earn income from the portfolio, and are allocated any unrealized gains and losses pro rata based on the average daily net assets of each class, without distinction between share classes. Dividends are determined separately for each class based on income and expenses allocable to each class. Realized gains and losses are allocated to each class pro rata based upon the net assets of each class on the date realized. Differences in per share dividend rates generally result from the relative weightings of pro rata income and realized gain allocations and from differences in separate class expenses, including distribution, shareholder servicing, and administration fees.
3. FAIR VALUATION MEASUREMENTS
Fair value measurements of investments are determined within a framework that has established a fair value hierarchy based upon the various data inputs utilized in determining the value of the Fund’s investments. The three-level hierarchy gives the highest priority to unadjusted quoted prices in active markets for identical assets or liabilities (Level 1) and the lowest priority to significant unobservable inputs (Level 3). The Fund’s investments are classified within the fair value hierarchy based on the lowest level of input that is significant to the fair value measurement. The inputs are summarized into three broad levels as follows:
| n | | Level 1 – quoted prices in active markets for identical securities |
| n | | Level 2 – other significant observable inputs (including quoted prices for similar securities, interest rates, prepayment speeds, credit risk, use of amortized cost, etc.) |
| n | | Level 3 – significant unobservable inputs (including the Fund’s own assumptions in determining the fair value of investments) |
| | | | | | |
| Notes to financial statements (unaudited) | | Wells Fargo Advantage Capital Growth Fund | | | 23 | |
The inputs or methodologies used for valuing investments in securities are not necessarily an indication of the risk associated with investing in those securities.
As of January 31, 2014, the inputs used in valuing investments in securities were as follows:
| | | | | | | | | | | | | | | | |
| Investments in securities | | Quoted prices (Level 1) | | | Other significant
observable inputs (Level 2) | | | Significant unobservable inputs (Level 3) | | | Total | |
Equity securities | | | | | | | | | | | | | | | | |
Common stocks | | $ | 514,311,566 | | | $ | 0 | | | $ | 0 | | | $ | 514,311,566 | |
Short-term investments | | | | | | | | | | | | | | | | |
Investment companies | | | 8,673,512 | | | | 194,250 | | | | 0 | | | | 8,867,762 | |
| | | $ | 522,985,078 | | | $ | 194,250 | | | $ | 0 | | | $ | 523,179,328 | |
Transfers in and transfers out are recognized at the end of the reporting period. For the six months ended January 31, 2014, the Fund did not have any transfers into/out of Level 1, Level 2, or Level 3.
4. TRANSACTIONS WITH AFFILIATES AND OTHER EXPENSES
Advisory fee
The Trust has entered into an advisory contract with Funds Management, an indirect wholly owned subsidiary of Wells Fargo & Company (“Wells Fargo”). The adviser is responsible for implementing investment policies and guidelines and for supervising the subadviser, who is responsible for day-to-day portfolio management of the Fund.
Pursuant to the contract, Funds Management is entitled to receive an annual advisory fee starting at 0.65% and declining to 0.55% as the average daily net assets of the Fund increase. For the six months ended January 31, 2014, the advisory fee was equivalent to an annual rate of 0.65% of the Fund’s average daily net assets.
Funds Management has retained the services of a subadviser to provide daily portfolio management to the Fund. The fee for subadvisory services is borne by Funds Management. WellsCap, an affiliate of Funds Management and an indirect, wholly owned subsidiary of Wells Fargo, is the subadviser to the Fund and is entitled to receive a fee from Funds Management at an annual rate starting at 0.30% and declining to 0.20% as the average daily net assets of the Fund increase.
Administration and transfer agent fees
The Trust has entered into an administration agreement with Funds Management. Under this agreement, for providing administrative services, which includes paying fees and expenses for services provided by the transfer agent, sub-transfer agents, omnibus account servicers and record-keepers, Funds Management is entitled to receive from the Fund an annual fund level administration fee starting at 0.05% and declining to 0.03% as the average daily net assets of the Fund increase and a class level administration fee which is calculated based on the average daily net assets of each class as follows:
| | | | |
| | | Class level
administration fee | |
Class A, Class C | | | 0.26 | % |
Class R4, Institutional Class | | | 0.08 | |
Class R6 | | | 0.03 | |
Administrator Class | | | 0.10 | |
Investor Class | | | 0.32 | |
Funds Management has contractually waived and/or reimbursed advisory and administration fees to the extent necessary to maintain certain net operating expense ratios for the Fund. Waiver of fees and/or reimbursement of expenses by Funds Management were made first from fund level expenses on a proportionate basis and then from class specific expenses. Funds Management has committed through November 30, 2014 to waive fees and/or reimburse expenses to the extent necessary to cap the Fund’s expenses at 1.11% for Class A shares, 1.86% for Class C shares, 0.75% for Class R4 shares, 0.60% for Class R6 shares, 0.90% for Administrator Class shares, 0.65% for Institutional Class shares, and 1.17% for Investor Class shares.
| | | | |
| 24 | | Wells Fargo Advantage Capital Growth Fund | | Notes to financial statements (unaudited) |
Distribution fees
The Trust has adopted a Distribution Plan for Class C shares of the Fund pursuant to Rule 12b-1 under the 1940 Act. Distribution fees are charged to Class C shares and paid to Wells Fargo Funds Distributor, LLC, the principal underwriter, at an annual rate of 0.75% of the average daily net assets of Class C shares.
For the six months ended January 31, 2014, Wells Fargo Funds Distributor, LLC received $2,999 from the sale of Class A shares.
Shareholder servicing fees
The Trust has entered into contracts with one or more shareholder servicing agents, whereby Class A, Class C, Administrator Class, and Investor Class of the Fund is charged a fee at an annual rate of 0.25% of the average daily net assets of each respective class. Class R4 shares are charged a fee at an annual rate of 0.10% of its average daily net assets.
A portion of these total shareholder servicing fees were paid to affiliates of Wells Fargo.
5. INVESTMENT PORTFOLIO TRANSACTIONS
Purchases and sales of investments, excluding U.S. government obligations (if any) and short-term securities, for the six months ended January 31, 2014 were $260,872,083 and $309,925,643, respectively.
6. CAPITAL SHARES
As a result of the transfer of assets from Funds Management, former program manager of the 529 college savings plans for the State of Wisconsin, to a new program manager, the Fund redeemed assets from its Institutional Class on October 26, 2012 with a value of $167,017,167, representing 23.6% of the Fund. This amount is reflected in the Statement of Changes in Net Assets for the year ended July 31, 2013.
7. BANK BORROWINGS
The Trust (excluding the money market funds and certain other funds in the Trust) and Wells Fargo Variable Trust are parties to a $150,000,000 revolving credit agreement with State Street Bank and Trust Company, whereby the Fund is permitted to use bank borrowings for temporary or emergency purposes, such as to fund shareholder redemption requests. Interest under the credit agreement is charged to the Fund based on a borrowing rate equal to the higher of the Federal Funds rate in effect on that day plus 1.25% or the overnight LIBOR rate in effect on that day plus 1.25%. In addition, an annual commitment fee equal to 0.10% of the unused balance is allocated to each participating fund. For the six months ended January 31, 2014, the Fund paid $211 in commitment fees.
For the six months ended January 31, 2014, there were no borrowings by the Fund under the agreement.
8. CONCENTRATION RISK
Concentration risks result from exposure to a limited number of sectors. Funds that invest a substantial portion of their assets in any sector may be more affected by changes in that sector than would be a fund whose investments are not heavily weighted in any sector.
9. INDEMNIFICATION
Under the Trust’s organizational documents, the officers and directors are indemnified against certain liabilities that may arise out of performance of their duties to the Trust. Additionally, in the normal course of business, the Trust may enter into contracts with service providers that contain a variety of indemnification clauses. The Trust’s maximum exposure under these arrangements is dependent on future claims that may be made against the Fund and, therefore, cannot be estimated.
| | | | | | |
| Other information (unaudited) | | Wells Fargo Advantage Capital Growth Fund | | | 25 | |
PROXY VOTING INFORMATION
A description of the policies and procedures that the Fund uses to determine how to vote proxies relating to portfolio securities is available without charge, upon request, by calling 1-800-222-8222, visiting our website at wellsfargoadvantagefunds.com, or visiting the SEC website at sec.gov. Information regarding how the Fund voted proxies relating to portfolio securities during the most recent 12-month period ended June 30 is available without charge on the Fund’s website at wellsfargoadvantagefunds.com or by visiting the SEC website at sec.gov.
PORTFOLIO HOLDINGS INFORMATION
The complete portfolio holdings for the Fund are publicly available on the Fund’s website (wellsfargoadvantagefunds.com) on a monthly, 30-day or more delayed basis. In addition, top ten holdings information for the Fund is publicly available on the Fund’s website on a monthly, seven-day or more delayed basis. The Fund files its complete schedule of portfolio holdings with the SEC for the first and third quarters of each fiscal year on Form N-Q, which is available without charge by visiting the SEC website at sec.gov. In addition, the Fund’s Form N-Q may be reviewed and copied at the SEC’s Public Reference Room in Washington, DC, and at regional offices in New York City, at 233 Broadway, and in Chicago, at 175 West Jackson Boulevard, Suite 900. Information about the Public Reference Room may be obtained by calling 1-800-SEC-0330.
| | | | |
| 26 | | Wells Fargo Advantage Capital Growth Fund | | Other information (unaudited) |
BOARD OF TRUSTEES AND OFFICERS
Each of the Trustees and Officers listed in the table below acts in identical capacities for each fund in the Wells Fargo Advantage family of funds, which consists of 132 mutual funds1 comprising the Wells Fargo Funds Trust, Wells Fargo Variable Trust, Wells Fargo Master Trust and four closed-end funds (collectively the “Fund Complex”). This table should be read in conjunction with the Prospectus and the Statement of Additional Information2. All of the Trustees are also Members of the Audit and Governance Committees of each Trust in the Fund Complex. The mailing address of each Trustee and Officer is 525 Market Street, 12th Floor, San Francisco, CA 94105. Each Trustee and Officer serves an indefinite term, however, each Trustee serves such term until reaching the mandatory retirement age established by the Trustees.
Independent Trustees
| | | | | | |
Name and
year of birth | | Position held and
length of service* | | Principal occupations during past five years | | Other
directorships during
past five years |
| Peter G. Gordon (Born 1942) | | Trustee, since 1998; Chairman, since 2005 | | Co-Founder, Retired Chairman, President and CEO of Crystal Geyser Water Company. Trustee Emeritus, Colby College. | | Asset Allocation Trust |
| Isaiah Harris, Jr. (Born 1952) | | Trustee, since 2009 | | Retired. Prior thereto, President and CEO of BellSouth Advertising and Publishing Corp. from 2005 to 2007, President and CEO of BellSouth Enterprises from 2004 to 2005 and President of BellSouth Consumer Services from 2000 to 2003. Emeritus member of the Iowa State University Foundation Board of Governors. Emeritus Member of the Advisory Board of Iowa State University School of Business. Advisory Board Member, Palm Harbor Academy (charter school). Mr. Harris is a certified public accountant. | | CIGNA Corporation; Deluxe Corporation; Asset Allocation Trust |
| Judith M. Johnson (Born 1949) | | Trustee, since 2008; Audit Committee Chairman, since 2008 | | Retired. Prior thereto, Chief Executive Officer and Chief Investment Officer of Minneapolis Employees Retirement Fund from 1996 to 2008. Ms. Johnson is an attorney, certified public accountant and a certified managerial accountant. | | Asset Allocation Trust |
| Leroy Keith, Jr. (Born 1939) | | Trustee, since 2010 | | Chairman, Bloc Global Services (development and construction). Trustee of the Evergreen Funds from 1983 to 2010. Former Managing Director, Almanac Capital Management (commodities firm), former Partner, Stonington Partners, Inc. (private equity fund), former Director, Obagi Medical Products Co. and former Director, Lincoln Educational Services. | | Trustee, Virtus Fund Complex (consisting of 50 portfolios as of 12/16/2013); Asset Allocation Trust |
| David F. Larcker (Born 1950) | | Trustee, since 2009 | | James Irvin Miller Professor of Accounting at the Graduate School of Business, Stanford University, Morgan Stanley Director of the Center for Leadership Development and Research and Senior Faculty of The Rock Center for Corporate Governance since 2006. From 2005 to 2008, Professor of Accounting at the Graduate School of Business, Stanford University. Prior thereto, Ernst & Young Professor of Accounting at The Wharton School, University of Pennsylvania from 1985 to 2005. | | Asset Allocation Trust |
| Olivia S. Mitchell (Born 1953) | | Trustee, since 2006 | | International Foundation of Employee Benefit Plans Professor, Wharton School of the University of Pennsylvania since 1993. Director of Wharton’s Pension Research Council and Boettner Center on Pensions & Retirement Research, and Research Associate at the National Bureau of Economic Research. Previously, Cornell University Professor from 1978 to 1993. | | Asset Allocation Trust |
| Timothy J. Penny (Born 1951) | | Trustee, since 1996 | | President and CEO of Southern Minnesota Initiative Foundation, a non-profit organization, since 2007 and Senior Fellow at the Humphrey Institute Policy Forum at the University of Minnesota since 1995. Member of the Board of Trustees of NorthStar Education Finance, Inc., a non-profit organization, since 2007. | | Asset Allocation Trust |
| | | | | | |
| Other information (unaudited) | | Wells Fargo Advantage Capital Growth Fund | | | 27 | |
| | | | | | |
Name and
year of birth | | Position held and
length of service* | | Principal occupations during past five years | | Other
directorships during
past five years |
| Michael S. Scofield (Born 1943) | | Trustee, since 2010 | | Served on the Investment Company Institute’s Board of Governors and Executive Committee from 2008-2011 as well the Governing Council of the Independent Directors Council from 2006-2011 and the Independent Directors Council Executive Committee from 2008-2011. Chairman of the IDC from 2008-2010. Institutional Investor (Fund Directions) Trustee of Year in 2007. Trustee of the Evergreen Funds (and its predecessors) from 1984 to 2010. Chairman of the Evergreen Funds from 2000-2010. Former Trustee of the Mentor Funds. Retired Attorney, Law Offices of Michael S. Scofield. | | Asset Allocation Trust |
| Donald C. Willeke (Born 1940) | | Trustee, since 1996 | | Principal of the law firm of Willeke & Daniels. General Counsel of the Minneapolis Employees Retirement Fund from 1984 until its consolidation into the Minnesota Public Employees Retirement Association on June 30, 2010. Director and Vice Chair of The Tree Trust (non-profit corporation). Director of the American Chestnut Foundation (non-profit corporation). | | Asset Allocation Trust |
| * | Length of service dates reflect the Trustee’s commencement of service with the Trust’s predecessor entities, where applicable. |
Officers
| | | | | | |
Name and
year of birth | | Position held and
length of service | | Principal occupations during past five years | | |
Karla M. Rabusch (Born 1959) | | President, since 2003 | | Executive Vice President of Wells Fargo Bank, N.A. and President of Wells Fargo Funds Management, LLC since 2003. | | |
Jeremy DePalma1 (Born 1974) | | Treasurer, since 2012 | | Senior Vice President of Wells Fargo Funds Management, LLC since 2009. Senior Vice President of Evergreen Investment Management Company, LLC from 2008 to 2010. Vice President, Evergreen Investment Services, Inc. from 2004 to 2007. Head of the Fund Reporting and Control Team within Fund Administration from 2005 to 2010. | | |
| C. David Messman (Born 1960) | | Secretary, since 2000; Chief Legal Officer, since 2003 | | Senior Vice President and Secretary of Wells Fargo Funds Management, LLC since 2001. Vice President and Managing Counsel of Wells Fargo Bank, N.A. since 1996. | | |
Debra Ann Early (Born 1964) | | Chief Compliance Officer, since 2007 | | Chief Compliance Officer of Wells Fargo Funds Management, LLC since 2007. Chief Compliance Officer of Parnassus Investments from 2005 to 2007. Chief Financial Officer of Parnassus Investments from 2004 to 2007. | | |
David Berardi (Born 1975) | | Assistant Treasurer, since 2009 | | Vice President of Wells Fargo Funds Management, LLC since 2009. Vice President of Evergreen Investment Management Company, LLC from 2008 to 2010. Assistant Vice President of Evergreen Investment Services, Inc. from 2004 to 2008. Manager of Fund Reporting and Control for Evergreen Investment Management Company, LLC from 2004 to 2010. | | |
| 1. | Jeremy DePalma acts as Treasurer of 59 funds and Assistant Treasurer of 73 funds in the Fund Complex. |
| 2. | The Statement of Additional Information includes additional information about the Trustees and is available, without charge, upon request, by calling 1-800-222-8222 or by visiting the website at wellsfargoadvantagefunds.com. |
| | | | |
| 28 | | Wells Fargo Advantage Capital Growth Fund | | List of abbreviations |
The following is a list of common abbreviations for terms and entities that may have appeared in this report.
| ACA | — ACA Financial Guaranty Corporation |
| ADR | — American depositary receipt |
| ADS | — American depositary shares |
| AGC | — Assured Guaranty Corporation |
| AGM | — Assured Guaranty Municipal |
| Ambac | — Ambac Financial Group Incorporated |
| AMT | — Alternative minimum tax |
| BAN | — Bond anticipation notes |
| BHAC | — Berkshire Hathaway Assurance Corporation |
| CAB | — Capital appreciation bond |
| CCAB | — Convertible capital appreciation bond |
| CDA | — Community Development Authority |
| CDO | — Collateralized debt obligation |
| COP | — Certificate of participation |
| DRIVER | — Derivative inverse tax-exempt receipts |
| DW&P | — Department of Water & Power |
| DWR | — Department of Water Resources |
| ECFA | — Educational & Cultural Facilities Authority |
| EDA | — Economic Development Authority |
| EDFA | — Economic Development Finance Authority |
| ETF | — Exchange-traded fund |
| FDIC | — Federal Deposit Insurance Corporation |
| FFCB | — Federal Farm Credit Banks |
| FGIC | — Financial Guaranty Insurance Corporation |
| FHA | — Federal Housing Administration |
| FHLB | — Federal Home Loan Bank |
| FHLMC | — Federal Home Loan Mortgage Corporation |
| FICO | — The Financing Corporation |
| FNMA | — Federal National Mortgage Association |
| GDR | — Global depositary receipt |
| GNMA | — Government National Mortgage Association |
| HCFR | — Healthcare facilities revenue |
| HEFA | — Health & Educational Facilities Authority |
| HEFAR | — Higher education facilities authority revenue |
| HFA | — Housing Finance Authority |
| HFFA | — Health Facilities Financing Authority |
| HUD | — Department of Housing and Urban Development |
| IDA | — Industrial Development Authority |
| IDAG | — Industrial Development Agency |
| IDR | — Industrial development revenue |
| KRW | — Republic of Korea won |
| LIBOR | — London Interbank Offered Rate |
| LLC | — Limited liability company |
| LLLP | — Limited liability limited partnership |
| LLP | — Limited liability partnership |
| MBIA | — Municipal Bond Insurance Association |
| MFHR | — Multifamily housing revenue |
| MSTR | — Municipal securities trust receipts |
| MUD | — Municipal Utility District |
| National | — National Public Finance Guarantee Corporation |
| PCFA | — Pollution Control Financing Authority |
| PCL | — Public Company Limited |
| PCR | — Pollution control revenue |
| PFA | — Public Finance Authority |
| PFFA | — Public Facilities Financing Authority |
| PFOTER | — Puttable floating option tax-exempt receipts |
| plc | — Public limited company |
| PUTTER | — Puttable tax-exempt receipts |
| R&D | — Research & development |
| Radian | — Radian Asset Assurance |
| RAN | — Revenue anticipation notes |
| RDA | — Redevelopment Authority |
| RDFA | — Redevelopment Finance Authority |
| REIT | — Real estate investment trust |
| ROC | — Reset option certificates |
| SAVRS | — Select auction variable rate securities |
| SBA | — Small Business Authority |
| SFHR | — Single-family housing revenue |
| SFMR | — Single-family mortgage revenue |
| SPA | — Standby purchase agreement |
| SPDR | — Standard & Poor’s Depositary Receipts |
| STRIPS | — Separate trading of registered interest and principal securities |
| TAN | — Tax anticipation notes |
| TIPS | — Treasury inflation-protected securities |
| TRAN | — Tax revenue anticipation notes |
| TTFA | — Transportation Trust Fund Authority |
| TVA | — Tennessee Valley Authority |


For more information
More information about Wells Fargo Advantage Funds is available free upon request. To obtain literature, please write, email, visit the Fund’s website, or call:
Wells Fargo Advantage Funds
P.O. Box 8266
Boston, MA 02266-8266
Email: wfaf@wellsfargo.com
Website: wellsfargoadvantagefunds.com
Individual investors: 1-800-222-8222
Retail investment professionals: 1-888-877-9275
Institutional investment professionals: 1-866-765-0778
This report and the financial statements contained herein are submitted for the general information of the shareholders of Wells Fargo Advantage Funds. If this report is used for promotional purposes, distribution of the report must be accompanied or preceded by a current prospectus. For a current prospectus and, if available, a summary prospectus containing more complete information, including charges and expenses, call 1-800-222-8222 or visit the Fund’s website at wellsfargoadvantagefunds.com. Please consider the investment objectives, risks, charges, and expenses of the investment carefully before investing. This and other information about Wells Fargo Advantage Funds can be found in the current prospectus. Read the prospectus carefully before you invest or send money.
Wells Fargo Funds Management, LLC, a wholly owned subsidiary of Wells Fargo & Company, provides investment advisory and administrative services for Wells Fargo Advantage Funds. Other affiliates of Wells Fargo & Company provide subadvisory and other services for the Funds. The Funds are distributed by Wells Fargo Funds Distributor, LLC, Member FINRA/SIPC, an affiliate of Wells Fargo & Company.
NOT FDIC INSURED ¡ NO BANK GUARANTEE ¡ MAY LOSE VALUE
© 2014 Wells Fargo Funds Management, LLC. All rights reserved.
| | |
 | | 222985 03-14 SA200/SAR200 1-14 |

Wells Fargo Advantage
Disciplined U.S. Core Fund

Semi-Annual Report
January 31, 2014

Reduce clutter. Save trees.
Sign up for electronic delivery of prospectuses and shareholder reports at wellsfargo.com/advantagedelivery
Contents
The views expressed and any forward-looking statements are as of January 31, 2014, unless otherwise noted, and are those of the Fund managers and/or Wells Fargo Funds Management, LLC. Discussions of individual securities, or the markets generally, or any Wells Fargo Advantage Fund are not intended as individual recommendations. Future events or results may vary significantly from those expressed in any forward-looking statements; the views expressed are subject to change at any time in response to changing circumstances in the market. Wells Fargo Funds Management, LLC and the Fund disclaim any obligation to publicly update or revise any views expressed or forward-looking statements.
NOT FDIC INSURED ¡ NO BANK GUARANTEE ¡ MAY LOSE VALUE
| | | | |
| 2 | | Wells Fargo Advantage Disciplined U.S. Core Fund | | Letter to shareholders (unaudited) |

Karla M. Rabusch
President
Wells Fargo Advantage Funds
Major central banks continued to inject liquidity into the banks and the markets through various quantitative easing policies.
Dear Valued Shareholder:
We are pleased to offer you this semi-annual report for the Wells Fargo Advantage Disciplined U.S. Core Fund for the six-month period that ended January 31, 2014. Much of the period was marked by monetary easing by global central banks. Entering the period, investors were concerned that the U.S. Federal Reserve (Fed) would end its bond-buying program, which initially led to higher interest rates and resulted in losses for bond indexes and volatility for global stock indexes. These fears dissipated in late September 2013 and ended altogether in mid-December 2013 when the Fed announced a tapering timeline that was far more moderate than some had feared. Growing confidence that the U.S. economy was staging a fragile recovery resulted in double-digit returns for domestic stock market indexes for the six-month reporting period.
Central banks continued to provide stimulus.
Major central banks continued to inject liquidity into the banks and the markets through various quantitative easing policies. Throughout the reporting period, the Federal Open Market Committee (FOMC)—the Fed’s monetary policymaking body—kept its key interest rate effectively near zero in order to support the economy and the financial system. Well before the reporting period began, the FOMC announced its intention to keep interest rates low for an extended period and to make open-ended purchases of $40 billion per month in mortgage-backed securities. The FOMC later added purchases of $45 billion per month in long-term U.S. Treasuries. Because the markets benefited from the FOMC’s liquidity, both stocks and bonds initially sold off after the FOMC indicated in May 2013 that it might reduce (or taper) its bond-buying program. However, in mid-December 2013, the FOMC announced that it would reduce its bond-buying program by $10 billion per month beginning in January 2014. The tapering was less aggressive than some investors had feared, and the markets ended 2013 strongly.
European markets continued to benefit from the European Central Bank’s (ECB’s) earlier announcement that it would purchase an unlimited amount of one- to three-year sovereign debt from countries that had formally applied for a bailout. In November 2013, the ECB cut its key rate to a historic low of 0.25%. The ECB’s aggressive actions helped ease investor worries about a eurozone sovereign debt default. Given the substantial ties between the U.S. and Europe, the improved sentiment about the eurozone helped provide a tailwind for U.S. markets.
U.S. stock markets gained on relatively good news.
For most of the period, U.S. economic data remained moderately positive. Reported gross domestic product (GDP) growth came in at a strong 4.1% annualized rate in the third quarter of 2013, and the advance annualized estimate for fourth-quarter GDP growth was 3.2%.
The most significant negative effect was the ongoing fight in Washington, D.C., over the federal budget and debt limit. The Budget Control Act of 2011, which was passed to resolve a previous fight over the federal debt ceiling, mandated budget sequestration that took effect on March 1, 2013, and was an overhang on economic growth throughout the reporting period. Most recently, Congress was unable to pass a resolution to continue to fund the federal government, and thus, the federal government underwent a partial shutdown from September 30, 2013, through October 16, 2013. The government reopened after the president and Congress reached a deal that funded the government through January 15, 2014,
| | | | | | |
| Letter to shareholders (unaudited) | | Wells Fargo Advantage Disciplined U.S. Core Fund | | | 3 | |
and raised the debt limit through February 7, 2014. In December 2013, Congress passed the Ryan–Murray budget agreement that funded the government through September 2015, lessening the near-term prospect of another shutdown.
Despite political headwinds, the relatively positive outlook for the U.S. economy contributed to a strong domestic stock market for most of the reporting period. Economically sensitive sectors, such as industrials and materials, outperformed. Dividend-paying sectors such as utilities and telecommunication services lagged as higher interest rates dampened their relative performance. Judging by various Russell indexes, small-cap stocks moderately outperformed large-cap stocks, and growth stocks strongly outperformed value stocks.
Don’t let short-term uncertainty derail long-term investment goals.
Periods of uncertainty can present challenges, but experience has taught us that maintaining long-term investment goals can be an effective way to plan for the future. Although diversification cannot guarantee an investment profit or prevent losses, we believe it can be an effective way to manage investment risk and potentially smooth out overall portfolio performance. We encourage investors to know their investments and to understand that appropriate levels of risk-taking may unlock opportunities.
Thank you for choosing to invest with Wells Fargo Advantage Funds. We appreciate your confidence in us and remain committed to helping you meet your financial needs. For current information about your fund investments, contact your investment professional, visit our website at wellsfargoadvantagefunds.com, or call us directly at 1-800-222-8222. We are available 24 hours a day, 7 days a week.
Sincerely,

Karla M. Rabusch
President
Wells Fargo Advantage Funds
Despite political headwinds, the relatively positive outlook for the U.S. economy contributed to a strong domestic stock market for most of the reporting period.
Notice to shareholders
The Fund and Wells Fargo Funds Management, LLC (“Funds Management”) have received an exemptive order from the SEC that permits Funds Management, subject to the approval of the Board of Trustees of the Fund, to select or replace certain subadvisers to manage all or a portion of the Fund’s assets and enter into, amend or terminate a sub-advisory agreement with certain subadvisers without obtaining shareholder approval (“Multi-manager Structure”). The Multi-manager Structure applies to subadvisers that are not affiliated with Funds Management or the Fund, except to the extent that affiliation arises solely because such subadvisers provide sub-advisory services to the Fund (“Non-affiliated Subadvisers”), as well as subadvisers that are indirect or direct wholly-owned subsidiaries of Funds Management or of another company that, indirectly or directly, wholly owns Funds Management (“Wholly-owned Subadvisers”).
Pursuant to the SEC order, Funds Management, with the approval of the Board of Trustees, has the discretion to terminate any subadvisers and allocate and reallocate the Fund’s assets among any other Non-affiliated Subadvisers or Wholly-owned Subadvisers. Funds Management, subject to oversight and supervision by the Board of Trustees, has responsibility to continue to oversee any subadvisers to the Fund and to recommend, for approval by the Board of Trustees, the hiring, termination and replacement of subadvisers for the Fund. In the event that a new subadviser is hired pursuant to the Multi-manager Structure, the Fund is required to provide notice to shareholders within 90 days.
Please contact your investment professional or call us directly at 1-800-222-8222 if you have any questions on this Notice to Shareholders.
| | | | |
| 4 | | Wells Fargo Advantage Disciplined U.S. Core Fund | | Performance highlights (unaudited) |
Investment objective
The Fund seeks long-term capital appreciation.
Adviser
Wells Fargo Funds Management, LLC
Subadviser
Golden Capital Management, LLC
Portfolio manager
Greg Golden, CFA
Average annual total returns1 (%) as of January 31, 2014
| | | | | | | | | | | | | | | | | | | | | | | | | | | | | | | | | | |
| | | | | Including sales charge | | | Excluding sales charge | | | Expense ratios2 (%) | |
| | | Inception date | | 1 year | | | 5 year | | | 10 year | | | 1 year | | | 5 year | | | 10 year | | | Gross | | | Net3 | |
| Class A (EVSAX) | | 2-28-1990 | | | 15.22 | | | | 16.78 | | | | 6.53 | | | | 22.26 | | | | 18.17 | | | | 7.16 | | | | 0.94 | | | | 0.92 | |
| Class C (EVSTX) | | 6-30-1999 | | | 20.42 | | | | 17.30 | | | | 6.37 | | | | 21.42 | | | | 17.30 | | | | 6.37 | | | | 1.69 | | | | 1.67 | |
| Administrator Class (EVSYX) | | 2-21-1995 | | | – | | | | – | | | | – | | | | 22.49 | | | | 18.42 | | | | 7.41 | | | | 0.78 | | | | 0.74 | |
| Institutional Class (EVSIX) | | 7-30-2010 | | | – | | | | – | | | | – | | | | 22.81 | | | | 18.63 | | | | 7.51 | | | | 0.51 | | | | 0.48 | |
| S&P 500 Index4 | | – | | | – | | | | – | | | | – | | | | 21.52 | | | | 19.19 | | | | 6.83 | | | | – | | | | – | |
Figures quoted represent past performance, which is no guarantee of future results, and do not reflect taxes that a shareholder may pay on fund distributions or the redemption of fund shares. Investment return and principal value of an investment will fluctuate so that an investor’s shares, when redeemed, may be worth more or less than their original cost. Performance shown without sales charges would be lower if sales charges were reflected. Current performance may be lower or higher than the performance data quoted, which assumes the reinvestment of dividends and capital gains. Current month-end performance is available on the Fund’s website, wellsfargoadvantagefunds.com.
Index returns do not include transaction costs associated with buying and selling securities, any mutual fund fees or expenses, or any taxes. It is not possible to invest directly in an index.
For Class A shares, the maximum front-end sales charge is 5.75%. For Class C shares, the maximum contingent deferred sales charge is 1.00%. Performance including sales charge assumes the sales charge for the corresponding time period. Administrator Class and Institutional Class shares are sold without a front-end sales charge or contingent deferred sales charge.
Stock values fluctuate in response to the activities of individual companies and general market and economic conditions. The use of derivatives may reduce returns and/or increase volatility. Consult the Fund’s prospectus for additional information on these and other risks.
Please see footnotes on page 5.
| | | | | | |
| Performance highlights (unaudited) | | Wells Fargo Advantage Disciplined U.S. Core Fund | | | 5 | |
| | | | |
| Ten largest equity holdings5 (%) as of January 31, 2014 | |
Exxon Mobil Corporation | | | 3.00 | |
Apple Incorporated | | | 2.87 | |
Johnson & Johnson Services Incorporated | | | 2.23 | |
Chevron Corporation | | | 2.10 | |
Berkshire Hathaway Incorporated Class B | | | 2.04 | |
Microsoft Corporation | | | 1.99 | |
General Electric Company | | | 1.97 | |
Google Incorporated Class A | | | 1.91 | |
Pfizer Incorporated | | | 1.86 | |
Comcast Corporation Class A | | | 1.83 | |
|
| Sector distribution6 as of January 31, 2014 |
|
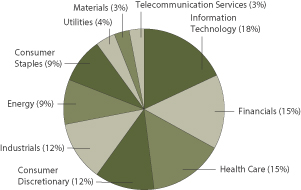 |
| 1. | Historical performance shown for Institutional Class shares prior to their inception reflects the performance of Administrator Class shares, and includes the higher expenses applicable to Administrator Class shares. If these expenses had not been included, returns would be higher. Historical performance shown for all classes of the Fund prior to July 19, 2010, is based on the performance of the Fund’s predecessor, Evergreen Enhanced S&P 500 Fund. |
| 2. | Reflects the expense ratios as stated in the most recent prospectuses. The expense ratios shown are subject to change and may differ from the annualized expense ratios shown in the financial highlights of this report. |
| 3. | The Adviser has committed through November 30, 2014, to waive fees and/or reimburse expenses to the extent necessary to cap the Fund’s Total Annual Fund Operating Expenses After Fee Waiver, excluding certain expenses, at the amounts shown. Brokerage commissions, stamp duty fees, interest, taxes, acquired fund fees and expenses, and extraordinary expenses are excluded from the cap. Without this cap, the Fund’s returns would have been lower. |
| 4. | The S&P 500 Index consists of 500 stocks chosen for market size, liquidity, and industry group representation. It is a market-value weighted index with each stock’s weight in the index proportionate to its market value. You cannot invest directly in an index |
| 5. | The ten largest equity holdings are calculated based on the value of the securities divided by total net assets of the Fund. Holdings are subject to change and may have changed since the date specified. |
| 6. | Sector distribution is subject to change and is calculated based on the total long-term investments of the Fund. |
| | | | |
| 6 | | Wells Fargo Advantage Disciplined U.S. Core Fund | | Fund expenses (unaudited) |
As a shareholder of the Fund, you incur two types of costs: (1) transaction costs, including sales charges (loads) on purchase payments and contingent deferred sales charges (if any) on redemptions and (2) ongoing costs, including management fees, distribution (12b-1) and/or shareholder service fees, and other Fund expenses. This example is intended to help you understand your ongoing costs (in dollars) of investing in the Fund and to compare these costs with the ongoing costs of investing in other mutual funds.
The example is based on an investment of $1,000 invested at the beginning of the six-month period and held for the entire period from August 1, 2013 to January 31, 2014.
Actual expenses
The “Actual” line of the table below provides information about actual account values and actual expenses. You may use the information in this line, together with the amount you invested, to estimate the expenses that you paid over the period. Simply divide your account value by $1,000 (for example, an $8,600 account value divided by $1,000 = 8.6), then multiply the result by the number in the “Actual” line under the heading entitled “Expenses paid during period” for your applicable class of shares to estimate the expenses you paid on your account during this period.
Hypothetical example for comparison purposes
The “Hypothetical” line of the table below provides information about hypothetical account values and hypothetical expenses based on the Fund’s actual expense ratio and an assumed rate of return of 5% per year before expenses, which is not the Fund’s actual return. The hypothetical account values and expenses may not be used to estimate the actual ending account balance or expenses you paid for the period. You may use this information to compare the ongoing costs of investing in the Fund and other funds. To do so, compare this 5% hypothetical example with the 5% hypothetical examples that appear in the shareholder reports of the other funds.
Please note that the expenses shown in the table are meant to highlight your ongoing costs only and do not reflect any transactional costs, such as sales charges (loads) and contingent deferred sales charges. Therefore, the “Hypothetical” line of the table is useful in comparing ongoing costs only and will not help you determine the relative total costs of owning different funds. In addition, if these transactional costs were included, your costs would have been higher.
| | | | | | | | | | | | | | | | |
| | | Beginning
account value
8-1-2013 | | | Ending
account value
1-31-2014 | | | Expenses
paid during
the period1 | | | Net annualized
expense ratio | |
Class A | | | | | | | | | | | | | | | | |
Actual | | $ | 1,000.00 | | | $ | 1,057.99 | | | $ | 4.77 | | | | 0.92 | % |
Hypothetical (5% return before expenses) | | $ | 1,000.00 | | | $ | 1,020.57 | | | $ | 4.69 | | | | 0.92 | % |
Class C | | | | | | | | | | | | | | | | |
Actual | | $ | 1,000.00 | | | $ | 1,054.45 | | | $ | 8.65 | | | | 1.67 | % |
Hypothetical (5% return before expenses) | | $ | 1,000.00 | | | $ | 1,016.79 | | | $ | 8.49 | | | | 1.67 | % |
Administrator Class | | | | | | | | | | | | | | | | |
Actual | | $ | 1,000.00 | | | $ | 1,059.05 | | | $ | 3.84 | | | | 0.74 | % |
Hypothetical (5% return before expenses) | | $ | 1,000.00 | | | $ | 1,021.48 | | | $ | 3.77 | | | | 0.74 | % |
Institutional Class | | | | | | | | | | | | | | | | |
Actual | | $ | 1,000.00 | | | $ | 1,060.63 | | | $ | 2.49 | | | | 0.48 | % |
Hypothetical (5% return before expenses) | | $ | 1,000.00 | | | $ | 1,022.79 | | | $ | 2.45 | | | | 0.48 | % |
| 1. | Expenses paid is equal to the annualized expense ratio of each class multiplied by the average account value over the period, multiplied by the number of days in the most recent fiscal half-year divided by the number of days in the fiscal year (to reflect the one-half-year period). |
| | | | | | |
| Portfolio of investments—January 31, 2014 (unaudited) | | Wells Fargo Advantage Disciplined U.S. Core Fund | | | 7 | |
| | | | | | | | | | | | |
| Security name | | | | | | Shares | | | Value | |
| | | |
Common Stocks: 99.48% | | | | | | | | | | |
| | | | |
Consumer Discretionary: 12.32% | | | | | | | | | | | | |
| | | |
| Auto Components: 0.43% | | | | | | | | | | |
The Goodyear Tire & Rubber Company | | | | | | | 73,828 | | | $ | 1,746,765 | |
| | | | | | | | | | | | |
| | | |
| Automobiles: 2.01% | | | | | | | | | | |
Ford Motor Company | | | | | | | 253,121 | | | | 3,786,690 | |
General Motors Company † | | | | | | | 123,752 | | | | 4,464,972 | |
| | | | |
| | | | | | | | | | | 8,251,662 | |
| | | | | | | | | | | | |
| | | |
| Hotels, Restaurants & Leisure: 0.25% | | | | | | | | | | |
Chipotle Mexican Grill Incorporated † | | | | | | | 1,845 | | | | 1,018,366 | |
| | | | | | | | | | | | |
| | | |
| Household Durables: 0.62% | | | | | | | | | | |
Pulte Homes Incorporated | | | | | | | 126,317 | | | | 2,566,761 | |
| | | | | | | | | | | | |
| | | | |
| Media: 4.17% | | | | | | | | | | | | |
Comcast Corporation Class A | | | | | | | 138,270 | | | | 7,528,802 | |
DIRECTV Group Incorporated † | | | | | | | 47,729 | | | | 3,313,824 | |
News Corporation Class A † | | | | | | | 47,226 | | | | 753,727 | |
Walt Disney Company | | | | | | | 76,535 | | | | 5,557,206 | |
| | | | |
| | | | | | | | | | | 17,153,559 | |
| | | | | | | | | | | | |
| | | | |
| Multiline Retail: 1.56% | | | | | | | | | | | | |
Dollar General Corporation † | | | | | | | 22,440 | | | | 1,263,821 | |
Macy’s Incorporated | | | | | | | 45,913 | | | | 2,442,572 | |
Target Corporation | | | | | | | 47,400 | | | | 2,684,736 | |
| | | | |
| | | | | | | | | | | 6,391,129 | |
| | | | | | | | | | | | |
| | | | |
| Specialty Retail: 3.28% | | | | | | | | | | | | |
Bed Bath & Beyond Incorporated † | | | | | | | 12,680 | | | | 809,618 | |
Best Buy Company Incorporated | | | | | | | 60,226 | | | | 1,417,720 | |
Gap Incorporated | | | | | | | 23,473 | | | | 893,852 | |
Home Depot Incorporated | | | | | | | 79,156 | | | | 6,083,139 | |
Lowe’s Companies Incorporated | | | | | | | 45,759 | | | | 2,118,184 | |
PetSmart Incorporated | | | | | | | 19,194 | | | | 1,209,222 | |
Staples Incorporated | | | | | | | 72,996 | | | | 960,627 | |
| | | | |
| | | | | | | | | | | 13,492,362 | |
| | | | | | | | | | | | |
| | | | |
Consumer Staples: 9.13% | | | | | | | | | | | | |
| | | | |
| Beverages: 1.05% | | | | | | | | | | | | |
Coca-Cola Enterprises Incorporated | | | | | | | 19,606 | | | | 848,744 | |
Dr Pepper Snapple Group Incorporated | | | | | | | 17,073 | | | | 817,455 | |
PepsiCo Incorporated | | | | | | | 23,578 | | | | 1,894,728 | |
The Coca-Cola Company | | | | | | | 20,601 | | | | 779,130 | |
| | | | |
| | | | | | | | | | | 4,340,057 | |
| | | | | | | | | | | | |
The accompanying notes are an integral part of these financial statements.
| | | | |
| 8 | | Wells Fargo Advantage Disciplined U.S. Core Fund | | Portfolio of investments—January 31, 2014 (unaudited) |
| | | | | | | | | | | | |
| Security name | | | | | | Shares | | | Value | |
| | | | |
| Food & Staples Retailing: 3.69% | | | | | | | | | | | | |
CVS Caremark Corporation | | | | | | | 81,127 | | | $ | 5,493,920 | |
Kroger Company | | | | | | | 80,578 | | | | 2,908,866 | |
The Andersons Incorporated | | | | | | | 17,853 | | | | 1,477,157 | |
Wal-Mart Stores Incorporated | | | | | | | 70,935 | | | | 5,297,426 | |
| | | | |
| | | | | | | | | | | 15,177,369 | |
| | | | | | | | | | | | |
| | | | |
| Food Products: 2.00% | | | | | | | | | | | | |
Archer Daniels Midland Company | | | | | | | 107,014 | | | | 4,224,913 | |
Sanderson Farms Incorporated | | | | | | | 53,559 | | | | 3,982,112 | |
| | | | |
| | | | | | | | | | | 8,207,025 | |
| | | | | | | | | | | | |
| | | | |
| Household Products: 0.57% | | | | | | | | | | | | |
Procter & Gamble Company | | | | | | | 30,685 | | | | 2,351,085 | |
| | | | | | | | | | | | |
| | | | |
| Personal Products: 0.58% | | | | | | | | | | | | |
Herbalife Limited « | | | | | | | 36,812 | | | | 2,369,588 | |
| | | | | | | | | | | | |
| | | | |
| Tobacco: 1.24% | | | | | | | | | | | | |
Altria Group Incorporated | | | | | | | 51,883 | | | | 1,827,319 | |
Lorillard Incorporated | | | | | | | 66,218 | | | | 3,259,250 | |
| | | | |
| | | | | | | | | | | 5,086,569 | |
| | | | | | | | | | | | |
| | | | |
Energy: 9.37% | | | | | | | | | | | | |
| | | | |
| Energy Equipment & Services: 0.62% | | | | | | | | | | | | |
Schlumberger Limited | | | | | | | 28,947 | | | | 2,534,889 | |
| | | | | | | | | | | | |
| | | | |
| Oil, Gas & Consumable Fuels: 8.75% | | | | | | | | | | | | |
Anadarko Petroleum Corporation | | | | | | | 20,483 | | | | 1,652,773 | |
Chesapeake Energy Corporation | | | | | | | 61,977 | | | | 1,667,801 | |
Chevron Corporation | | | | | | | 77,141 | | | | 8,611,250 | |
ConocoPhillips Company | | | | | | | 44,037 | | | | 2,860,203 | |
EOG Resources Incorporated | | | | | | | 21,130 | | | | 3,491,521 | |
Exxon Mobil Corporation | | | | | | | 133,849 | | | | 12,335,524 | |
Marathon Petroleum Corporation | | | | | | | 34,557 | | | | 3,008,187 | |
Phillips 66 | | | | | | | 31,897 | | | | 2,331,352 | |
| | | | |
| | | | | | | | | | | 35,958,611 | |
| | | | | | | | | | | | |
| | | | |
Financials: 15.33% | | | | | | | | | | | | |
| | | | |
| Capital Markets: 1.85% | | | | | | | | | | | | |
Bank of New York Mellon Corporation | | | | | | | 91,865 | | | | 2,936,005 | |
E*TRADE Financial Corporation † | | | | | | | 56,538 | | | | 1,131,891 | |
Legg Mason Incorporated | | | | | | | 64,748 | | | | 2,742,078 | |
Morgan Stanley | | | | | | | 27,469 | | | | 810,610 | |
| | | | |
| | | | | | | | | | | 7,620,584 | |
| | | | | | | | | | | | |
| | | | |
| Commercial Banks: 1.71% | | | | | | | | | | | | |
Fifth Third Bancorp | | | | | | | 65,431 | | | | 1,375,360 | |
Huntington Bancshares Incorporated | | | | | | | 83,338 | | | | 755,876 | |
The accompanying notes are an integral part of these financial statements.
| | | | | | |
| Portfolio of investments—January 31, 2014 (unaudited) | | Wells Fargo Advantage Disciplined U.S. Core Fund | | | 9 | |
| | | | | | | | | | | | |
| Security name | | | | | | Shares | | | Value | |
| | | | |
| Commercial Banks (continued) | | | | | | | | | | | | |
PNC Financial Services Group Incorporated | | | | | | | 24,421 | | | $ | 1,950,749 | |
Regions Financial Corporation | | | | | | | 207,433 | | | | 2,109,594 | |
SunTrust Banks Incorporated | | | | | | | 22,189 | | | | 821,437 | |
| | | | |
| | | | | | | | | | | 7,013,016 | |
| | | | | | | | | | | | |
| | | | |
| Consumer Finance: 0.37% | | | | | | | | | | | | |
Capital One Financial Corporation | | | | | | | 21,690 | | | | 1,531,531 | |
| | | | | | | | | | | | |
| | | | |
| Diversified Financial Services: 6.48% | | | | | | | | | | | | |
Bank of America Corporation | | | | | | | 410,369 | | | | 6,873,681 | |
Berkshire Hathaway Incorporated Class B † | | | | | | | 74,944 | | | | 8,363,750 | |
Citigroup Incorporated | | | | | | | 143,449 | | | | 6,803,786 | |
JPMorgan Chase & Company | | | | | | | 82,907 | | | | 4,589,732 | |
| | | | |
| | | | | | | | | | | 26,630,949 | |
| | | | | | | | | | | | |
| | | | |
| Insurance: 4.40% | | | | | | | | | | | | |
ACE Limited | | | | | | | 12,938 | | | | 1,213,714 | |
Allstate Corporation | | | | | | | 46,531 | | | | 2,382,387 | |
American Financial Group Incorporated | | | | | | | 22,040 | | | | 1,210,437 | |
American International Group Incorporated | | | | | | | 53,542 | | | | 2,567,874 | |
Assurant Incorporated | | | | | | | 12,754 | | | | 833,474 | |
Genworth Financial Incorporated † | | | | | | | 43,559 | | | | 642,495 | |
Lincoln National Corporation | | | | | | | 12,418 | | | | 596,437 | |
MetLife Incorporated | | | | | | | 51,835 | | | | 2,542,507 | |
Prudential Financial Incorporated | | | | | | | 9,810 | | | | 827,866 | |
Symetra Financial Corporation | | | | | | | 168,611 | | | | 3,228,901 | |
The Travelers Companies Incorporated | | | | | | | 9,067 | | | | 736,966 | |
XL Group plc | | | | | | | 44,487 | | | | 1,278,556 | |
| | | | |
| | | | | | | | | | | 18,061,614 | |
| | | | | | | | | | | | |
| | | | |
| REITs: 0.52% | | | | | | | | | | | | |
Simon Property Group Incorporated | | | | | | | 9,234 | | | | 1,429,793 | |
Ventas Incorporated | | | | | | | 11,136 | | | | 694,775 | |
| | | | |
| | | | | | | | | | | 2,124,568 | |
| | | | | | | | | | | | |
| | | | |
Health Care: 14.41% | | | | | | | | | | | | |
| | | | |
| Biotechnology: 1.42% | | | | | | | | | | | | |
Amgen Incorporated | | | | | | | 26,326 | | | | 3,131,478 | |
Biogen Idec Incorporated † | | | | | | | 3,302 | | | | 1,032,337 | |
Celgene Corporation † | | | | | | | 11,114 | | | | 1,688,550 | |
| | | | |
| | | | | | | | | | | 5,852,365 | |
| | | | | | | | | | | | |
| | | | |
| Health Care Equipment & Supplies: 3.23% | | | | | | | | | | | | |
Abbott Laboratories | | | | | | | 42,589 | | | | 1,561,313 | |
Boston Scientific Corporation † | | | | | | | 221,419 | | | | 2,995,799 | |
Covidien plc | | | | | | | 16,000 | | | | 1,091,840 | |
DexCom Incorporated † | | | | | | | 93,232 | | | | 3,772,167 | |
Medtronic Incorporated | | | | | | | 68,093 | | | | 3,851,340 | |
| | | | |
| | | | | | | | | | | 13,272,459 | |
| | | | | | | | | | | | |
The accompanying notes are an integral part of these financial statements.
| | | | |
| 10 | | Wells Fargo Advantage Disciplined U.S. Core Fund | | Portfolio of investments—January 31, 2014 (unaudited) |
| | | | | | | | | | | | |
| Security name | | | | | | Shares | | | Value | |
| | | | |
| Health Care Providers & Services: 3.51% | | | | | | | | | | | | |
Aetna Incorporated | | | | | | | 36,392 | | | $ | 2,486,665 | |
AmerisourceBergen Corporation | | | | | | | 41,281 | | | | 2,774,909 | |
Cardinal Health Incorporated | | | | | | | 9,810 | | | | 667,276 | |
Cigna Corporation | | | | | | | 10,119 | | | | 873,371 | |
Humana Incorporated | | | | | | | 13,847 | | | | 1,347,313 | |
McKesson Corporation | | | | | | | 20,379 | | | | 3,554,301 | |
UnitedHealth Group Incorporated | | | | | | | 26,588 | | | | 1,921,781 | |
WellPoint Incorporated | | | | | | | 9,125 | | | | 784,750 | |
| | | | |
| | | | | | | | | | | 14,410,366 | |
| | | | | | | | | | | | |
| | | | |
| Life Sciences Tools & Services: 0.24% | | | | | | | | | | | | |
Thermo Fisher Scientific Incorporated | | | | | | | 8,570 | | | | 986,750 | |
| | | | | | | | | | | | |
| | | | |
| Pharmaceuticals: 6.01% | | | | | | | | | | | | |
AbbVie Incorporated | | | | | | | 42,874 | | | | 2,110,687 | |
Eli Lilly & Company | | | | | | | 41,836 | | | | 2,259,562 | |
Johnson & Johnson Services Incorporated | | | | | | | 103,336 | | | | 9,142,136 | |
Merck & Company Incorporated | | | | | | | 66,143 | | | | 3,503,595 | |
Pfizer Incorporated | | | | | | | 252,030 | | | | 7,661,712 | |
| | | | |
| | | | | | | | | | | 24,677,692 | |
| | | | | | | | | | | | |
| | | | |
Industrials: 11.79% | | | | | | | | | | | | |
| | | | |
| Aerospace & Defense: 4.00% | | | | | | | | | | | | |
L-3 Communications Holdings Incorporated | | | | | | | 29,566 | | | | 3,283,896 | |
Lockheed Martin Corporation | | | | | | | 16,000 | | | | 2,414,560 | |
Northrop Grumman Corporation | | | | | | | 35,706 | | | | 4,125,828 | |
Raytheon Company | | | | | | | 30,220 | | | | 2,873,015 | |
The Boeing Company | | | | | | | 29,881 | | | | 3,742,894 | |
| | | | |
| | | | | | | | | | | 16,440,193 | |
| | | | | | | | | | | | |
| | | | |
| Air Freight & Logistics: 0.77% | | | | | | | | | | | | |
FedEx Corporation | | | | | | | 23,694 | | | | 3,158,884 | |
| | | | | | | | | | | | |
| | | | |
| Airlines: 1.60% | | | | | | | | | | | | |
Delta Air Lines Incorporated | | | | | | | 72,090 | | | | 2,206,675 | |
Southwest Airlines Company | | | | | | | 207,786 | | | | 4,353,117 | |
| | | | |
| | | | | | | | | | | 6,559,792 | |
| | | | | | | | | | | | |
| | | | |
| Building Products: 0.20% | | | | | | | | | | | | |
Masco Corporation | | | | | | | 38,260 | | | | 809,582 | |
| | | | | | | | | | | | |
| | | | |
| Commercial Services & Supplies: 0.56% | | | | | | | | | | | | |
RR Donnelley & Sons Company « | | | | | | | 91,659 | | | | 1,692,942 | |
The ADT Corporation « | | | | | | | 20,828 | | | | 625,673 | |
| | | | |
| | | | | | | | | | | 2,318,615 | |
| | | | | | | | | | | | |
| | | | |
| Construction & Engineering: 0.93% | | | | | | | | | | | | |
Fluor Corporation | | | | | | | 38,649 | | | | 2,935,778 | |
Quanta Services Incorporated † | | | | | | | 28,424 | | | | 885,976 | |
| | | | |
| | | | | | | | | | | 3,821,754 | |
| | | | | | | | | | | | |
The accompanying notes are an integral part of these financial statements.
| | | | | | |
| Portfolio of investments—January 31, 2014 (unaudited) | | Wells Fargo Advantage Disciplined U.S. Core Fund | | | 11 | |
| | | | | | | | | | | | |
| Security name | | | | | | Shares | | | Value | |
| | | | |
| Industrial Conglomerates: 2.18% | | | | | | | | | | | | |
3M Company | | | | | | | 6,867 | | | $ | 880,281 | |
General Electric Company | | | | | | | 322,215 | | | | 8,097,263 | |
| | | | |
| | | | | | | | | | | 8,977,544 | |
| | | | | | | | | | | | |
| | | | |
| Machinery: 0.80% | | | | | | | | | | | | |
Caterpillar Incorporated | | | | | | | 34,850 | | | | 3,272,764 | |
| | | | | | | | | | | | |
| | | | |
| Road & Rail: 0.75% | | | | | | | | | | | | |
CSX Corporation | | | | | | | 114,183 | | | | 3,072,665 | |
| | | | | | | | | | | | |
| | | | |
Information Technology: 18.04% | | | | | | | | | | | | |
| | | | |
| Communications Equipment: 2.69% | | | | | | | | | | | | |
Cisco Systems Incorporated | | | | | | | 183,556 | | | | 4,021,712 | |
Harris Corporation | | | | | | | 12,400 | | | | 859,816 | |
QUALCOMM Incorporated | | | | | | | 83,295 | | | | 6,182,155 | |
| | | | |
| | | | | | | | | | | 11,063,683 | |
| | | | | | | | | | | | |
| | | | |
| Computers & Peripherals: 4.87% | | | | | | | | | | | | |
Apple Incorporated | | | | | | | 23,549 | | | | 11,788,629 | |
EMC Corporation | | | | | | | 34,580 | | | | 838,219 | |
Hewlett-Packard Company | | | | | | | 68,688 | | | | 1,991,952 | |
NetApp Incorporated | | | | | | | 20,049 | | | | 848,875 | |
SanDisk Corporation | | | | | | | 18,785 | | | | 1,306,497 | |
Western Digital Corporation | | | | | | | 37,388 | | | | 3,221,724 | |
| | | | |
| | | | | | | | | | | 19,995,896 | |
| | | | | | | | | | | | |
| | | | |
| Electronic Equipment, Instruments & Components: 0.26% | | | | | | | | | | | | |
Corning Incorporated | | | | | | | 61,797 | | | | 1,063,526 | |
| | | | | | | | | | | | |
| | | | |
| Internet Software & Services: 1.91% | | | | | | | | | | | | |
Google Incorporated Class A † | | | | | | | 6,650 | | | | 7,853,451 | |
| | | | | | | | | | | | |
| | | | |
| IT Services: 2.17% | | | | | | | | | | | | |
Computer Sciences Corporation | | | | | | | 41,678 | | | | 2,517,768 | |
International Business Machines Corporation | | | | | | | 10,114 | | | | 1,786,942 | |
Leidos Holdings Incorporated « | | | | | | | 40,496 | | | | 1,836,089 | |
MasterCard Incorporated Class A | | | | | | | 9,810 | | | | 742,421 | |
Western Union Company | | | | | | | 130,279 | | | | 2,006,297 | |
| | | | |
| | | | | | | | | | | 8,889,517 | |
| | | | | | | | | | | | |
| | | | |
| Office Electronics: 0.92% | | | | | | | | | | | | |
Xerox Corporation | | | | | | | 348,040 | | | | 3,776,234 | |
| | | | | | | | | | | | |
| | | | |
| Semiconductors & Semiconductor Equipment: 1.04% | | | | | | | | | | | | |
Intel Corporation | | | | | | | 174,648 | | | | 4,285,862 | |
| | | | | | | | | | | | |
| | | | |
| Software: 4.18% | | | | | | | | | | | | |
CA Incorporated | | | | | | | 25,507 | | | | 818,265 | |
Intuit Incorporated | | | | | | | 10,791 | | | | 790,441 | |
The accompanying notes are an integral part of these financial statements.
| | | | |
| 12 | | Wells Fargo Advantage Disciplined U.S. Core Fund | | Portfolio of investments—January 31, 2014 (unaudited) |
| | | | | | | | | | | | |
| Security name | | | | | | Shares | | | Value | |
| | | | |
| Software (continued) | | | | | | | | | | | | |
Microsoft Corporation | | | | | | | 216,334 | | | $ | 8,188,242 | |
Oracle Corporation | | | | | | | 170,872 | | | | 6,305,177 | |
Symantec Corporation | | | | | | | 49,864 | | | | 1,067,588 | |
| | | | |
| | | | | | | | | | | 17,169,713 | |
| | | | | | | | | | | | |
| | | | |
Materials: 2.69% | | | | | | | | | | | | |
| | | | |
| Chemicals: 1.70% | | | | | | | | | | | | |
CF Industries Holdings Incorporated | | | | | | | 3,562 | | | | 822,323 | |
Dow Chemical Company | | | | | | | 82,837 | | | | 3,769,912 | |
LyondellBasell Industries NV Class A | | | | | | | 30,191 | | | | 2,377,843 | |
| | | | |
| | | | | | | | | | | 6,970,078 | |
| | | | | | | | | | | | |
| | | | |
| Containers & Packaging: 0.31% | | | | | | | | | | | | |
Avery Dennison Corporation | | | | | | | 26,353 | | | | 1,298,412 | |
| | | | | | | | | | | | |
| | | | |
| Metals & Mining: 0.68% | | | | | | | | | | | | |
Cliffs Natural Resources Incorporated « | | | | | | | 16,678 | | | | 322,219 | |
Freeport-McMoRan Copper & Gold Incorporated Class B | | | | | | | 48,070 | | | | 1,557,949 | |
United States Steel Corporation « | | | | | | | 35,377 | | | | 923,693 | |
| | | | |
| | | | | | | | | | | 2,803,861 | |
| | | | | | | | | | | | |
| | | | |
Telecommunication Services: 2.46% | | | | | | | | | | | | |
| | | | |
| Diversified Telecommunication Services: 2.46% | | | | | | | | | | | | |
AT&T Incorporated | | | | | | | 123,753 | | | | 4,123,450 | |
Verizon Communications Incorporated | | | | | | | 124,672 | | | | 5,986,749 | |
| | | | |
| | | | | | | | | | | 10,110,199 | |
| | | | | | | | | | | | |
| | | | |
Utilities: 3.94% | | | | | | | | | | | | |
| | | | |
| Electric Utilities: 1.83% | | | | | | | | | | | | |
Entergy Corporation | | | | | | | 14,685 | | | | 925,596 | |
Exelon Corporation | | | | | | | 114,838 | | | | 3,330,302 | |
Pinnacle West Capital Corporation | | | | | | | 15,696 | | | | 826,080 | |
PPL Corporation | | | | | | | 79,675 | | | | 2,435,665 | |
| | | | |
| | | | | | | | | | | 7,517,643 | |
| | | | | | | | | | | | |
| | | | |
| Gas Utilities: 1.15% | | | | | | | | | | | | |
AGL Resources Incorporated | | | | | | | 84,607 | | | | 4,042,522 | |
New Jersey Resources Corporation | | | | | | | 14,593 | | | | 665,441 | |
| | | | |
| | | | | | | | | | | 4,707,963 | |
| | | | | | | | | | | | |
| | | | |
| Independent Power Producers & Energy Traders: 0.31% | | | | | | | | | | | | |
AES Corporation | | | | | | | 91,075 | | | | 1,280,515 | |
| | | | | | | | | | | | |
| | | | |
| Multi-Utilities: 0.65% | | | | | | | | | | | | |
Public Service Enterprise Group Incorporated | | | | | | | 79,917 | | | | 2,664,433 | |
| | | | | | | | | | | | |
| | | | |
Total Common Stocks (Cost $272,246,039) | | | | | | | | | | | 408,710,470 | |
| | | | | | | | | | | | |
The accompanying notes are an integral part of these financial statements.
| | | | | | |
| Portfolio of investments—January 31, 2014 (unaudited) | | Wells Fargo Advantage Disciplined U.S. Core Fund | | | 13 | |
| | | | | | | | | | | | | | |
| Security name | | Yield | | | | | Shares | | | Value | |
| | | | |
Short-Term Investments: 2.37% | | | | | | | | | | | | | | |
| | | | |
| Investment Companies: 2.37% | | | | | | | | | | | | | | |
Wells Fargo Advantage Cash Investment Money Market Fund, Select Class (l)(u) | | | 0.07 | % | | | | | 2,575,087 | | | $ | 2,575,087 | |
Wells Fargo Securities Lending Cash Investments, LLC (r)(v)(l)(u) | | | 0.08 | | | | | | 7,164,909 | | | | 7,164,909 | |
| | | | |
Total Short-Term Investments (Cost $9,739,996) | | | | | | | | | | | | | 9,739,996 | |
| | | | | | | | | | | | | | |
| | | | | | | | |
| Total investments in securities | | | | | | | | |
| (Cost $281,986,035) * | | | 101.85 | % | | | 418,450,466 | |
Other assets and liabilities, net | | | (1.85 | ) | | | (7,605,044 | ) |
| | | | | | | | |
| Total net assets | | | 100.00 | % | | $ | 410,845,422 | |
| | | | | | | | |
| † | Non-income-earning security |
| « | All or a portion of this security is on loan. |
| (l) | Investment in an affiliate |
| (u) | Rate shown is the 7-day annualized yield at period end. |
| (r) | The investment company is exempt from registration under Section 3(c)(7) of the Investment Company Act of 1940, as amended. |
| (v) | Security represents investment of cash collateral received from securities on loan. |
| * | Cost for federal income tax purposes is $282,806,064 and unrealized appreciation (depreciation) consists of: |
| | | | |
Gross unrealized appreciation | | $ | 140,323,026 | |
Gross unrealized depreciation | | | (4,678,624 | ) |
| | | | |
Net unrealized appreciation | | $ | 135,644,402 | |
The accompanying notes are an integral part of these financial statements.
| | | | |
| 14 | | Wells Fargo Advantage Disciplined U.S. Core Fund | | Statement of assets and liabilities—January 31, 2014 (unaudited) |
| | | | |
| | | | |
| |
Assets | | | | |
Investments | | | | |
In unaffiliated securities (including securities on loan), at value (see cost below) | | $ | 408,710,470 | |
In affiliated securities, at value (see cost below) | | | 9,739,996 | |
| | | | |
Total investments, at value (see cost below) | | | 418,450,466 | |
Receivable for Fund shares sold | | | 72,503 | |
Receivable for dividends | | | 394,386 | |
Receivable for securities lending income | | | 3,457 | |
Prepaid expenses and other assets | | | 350 | |
| | | | |
Total assets | | | 418,921,162 | |
| | | | |
| |
Liabilities | | | | |
Payable for Fund shares redeemed | | | 358,214 | |
Payable upon receipt of securities loaned | | | 7,164,909 | |
Advisory fee payable | | | 110,705 | |
Distribution fees payable | | | 5,123 | |
Due to other related parties | | | 100,695 | |
Accrued expenses and other liabilities | | | 336,094 | |
| | | | |
Total liabilities | | | 8,075,740 | |
| | | | |
Total net assets | | $ | 410,845,422 | |
| | | | |
| |
NET ASSETS CONSIST OF | | | | |
Paid-in capital | | $ | 226,980,056 | |
Undistributed net investment income | | | 2,860,102 | |
Accumulated net realized gains on investments | | | 44,540,833 | |
Net unrealized gains on investments | | | 136,464,431 | |
| | | | |
Total net assets | | $ | 410,845,422 | |
| | | | |
| |
COMPUTATION OF NET ASSET VALUE AND OFFERING PRICE PER SHARE1 | | | | |
Net assets – Class A | | $ | 288,757,777 | |
Shares outstanding – Class A | | | 19,598,482 | |
Net asset value per share – Class A | | | $14.73 | |
Maximum offering price per share – Class A2 | | | $15.63 | |
Net assets – Class C | | $ | 10,040,217 | |
Shares outstanding – Class C | | | 714,809 | |
Net asset value per share – Class C | | | $14.05 | |
Net assets–Administrator Class | | $ | 49,209,893 | |
Shares outstanding – Administrator Class | | | 3,279,534 | |
Net asset value per share – Administrator Class | | | $15.01 | |
Net assets–Institutional Class | | $ | 62,837,535 | |
Shares outstanding – Institutional Class | | | 4,226,376 | |
Net asset value per share – Institutional Class | | | $14.87 | |
| |
Investments in unaffiliated securities (including securities on loan), at cost | | $ | 272,246,039 | |
| | | | |
Investments in affiliated securities, at cost | | $ | 9,739,996 | |
| | | | |
Total investments, at cost | | $ | 281,986,035 | |
| | | | |
Securities on loan, at value | | $ | 6,991,305 | |
| | | | |
| 1. | The Fund has an unlimited number of authorized shares. |
| 2. | Maximum offering price is computed as 100/94.25 of net asset value. On investments of $50,000 or more, the offering price is reduced. |
The accompanying notes are an integral part of these financial statements.
| | | | | | |
| Statement of operations—six months ended January 31, 2014 (unaudited) | | Wells Fargo Advantage Disciplined U.S. Core Fund | | | 15 | |
| | | | |
| | | | |
| |
Investment income | | | | |
Dividends | | $ | 4,711,638 | |
Securities lending income, net | | | 43,041 | |
Income from affiliated securities | | | 1,100 | |
| | | | |
Total investment income | | | 4,755,779 | |
| | | | |
| |
Expenses | | | | |
Advisory fee | | | 650,354 | |
Administration fees | | | | |
Fund level | | | 108,392 | |
Class A | | | 385,637 | |
Class C | | | 13,064 | |
Administrator Class | | | 29,692 | |
Institutional Class | | | 26,997 | |
Shareholder servicing fees | | | | |
Class A | | | 370,804 | |
Class C | | | 12,562 | |
Administrator Class | | | 72,242 | |
Distribution fees | | | | |
Class C | | | 37,685 | |
Custody and accounting fees | | | 24,142 | |
Professional fees | | | 26,868 | |
Registration fees | | | 22,731 | |
Shareholder report expenses | | | 27,806 | |
Trustees’ fees and expenses | | | 5,037 | |
Other fees and expenses | | | 42,778 | |
| | | | |
Total expenses | | | 1,856,791 | |
Less: Fee waivers and/or expense reimbursements | | | (27,456 | ) |
| | | | |
Net expenses | | | 1,829,335 | |
| | | | |
Net investment income | | | 2,926,444 | |
| | | | |
| |
REALIZED AND UNREALIZED GAINS (LOSSES) ON INVESTMENTS | | | | |
Net realized gains on investments | | | 45,526,228 | |
Net change in unrealized gains (losses) on investments | | | (23,671,821 | ) |
| | | | |
Net realized and unrealized gains (losses) on investments | | | 21,854,407 | |
| | | | |
Net increase in net assets resulting from operations | | $ | 24,780,851 | |
| | | | |
The accompanying notes are an integral part of these financial statements.
| | | | |
| 16 | | Wells Fargo Advantage Disciplined U.S. Core Fund | | Statement of changes in net assets |
| | | | | | | | | | | | | | | | |
| | | Six months ended
January 31, 2014
(unaudited) | | | Year ended
July 31, 2013 | |
| | | | |
Operations | | | | | | | | | | | | | | | | |
Net investment income | | | | | | $ | 2,926,444 | | | | | | | $ | 6,940,044 | |
Net realized gains on investments | | | | | | | 45,526,228 | | | | | | | | 57,444,012 | |
Net change in unrealized gains (losses) on investments | | | | | | | (23,671,821 | ) | | | | | | | 30,911,850 | |
| | | | |
Net increase in net assets resulting from operations | | | | | | | 24,780,851 | | | | | | | | 95,295,906 | |
| | | | |
| | | | |
Distributions to shareholders from | | | | | | | | | | | | | | | | |
Net investment income | | | | | | | | | | | | | | | | |
Class A | | | | | | | (4,752,589 | ) | | | | | | | (4,355,756 | ) |
Class C | | | | | | | (97,722 | ) | | | | | | | (82,326 | ) |
Administrator Class | | | | | | | (634,127 | ) | | | | | | | (2,153,996 | ) |
Institutional Class | | | | | | | (1,401,931 | ) | | | | | | | (24,206 | ) |
Net realized gains | | | | | | | | | | | | | | | | |
Class A | | | | | | | (38,995,790 | ) | | | | | | | (27,133,857 | ) |
Class C | | | | | | | (1,394,806 | ) | | | | | | | (948,466 | ) |
Administrator Class | | | | | | | (6,776,357 | ) | | | | | | | (14,145,664 | ) |
Institutional Class | | | | | | | (9,948,253 | ) | | | | | | | (117,107 | ) |
| | | | |
Total distributions to shareholders | | | | | | | (64,001,575 | ) | | | | | | | (48,961,378 | ) |
| | | | |
| | | | |
Capital share transactions | | | Shares | | | | | | | | Shares | | | | | |
Proceeds from shares sold | | | | | | | | | | | | | | | | |
Class A | | | 360,549 | | | | 5,727,417 | | | | 472,785 | | | | 7,027,919 | |
Class C | | | 64,475 | | | | 958,190 | | | | 98,506 | | | | 1,401,647 | |
Administrator Class | | | 124,869 | | | | 2,033,524 | | | | 469,700 | | | | 7,023,931 | |
Institutional Class | | | 4,669,889 | | | | 75,549,967 | | | | 41,930 | | | | 651,116 | |
| | | | |
| | | | | | | 84,269,098 | | | | | | | | 16,104,613 | |
| | | | |
Reinvestment of distributions | | | | | | | | | | | | | | | | |
Class A | | | 2,774,616 | | | | 42,041,138 | | | | 2,203,682 | | | | 29,725,637 | |
Class C | | | 73,060 | | | | 1,051,887 | | | | 53,713 | | | | 692,961 | |
Administrator Class | | | 399,637 | | | | 6,149,295 | | | | 433,941 | | | | 5,920,813 | |
Institutional Class | | | 96,268 | | | | 1,480,716 | | | | 10,367 | | | | 141,313 | |
| | | | |
| | | | | | | 50,723,036 | | | | | | | | 36,480,724 | |
| | | | |
Payment for shares redeemed | | | | | | | | | | | | | | | | |
Class A | | | (1,100,553 | ) | | | (17,612,667 | ) | | | (2,465,454 | ) | | | (36,487,861 | ) |
Class C | | | (35,287 | ) | | | (542,027 | ) | | | (148,904 | ) | | | (2,081,805 | ) |
Administrator Class | | | (4,980,235 | ) | | | (80,751,844 | ) | | | (3,339,540 | ) | | | (49,949,863 | ) |
Institutional Class | | | (653,902 | ) | | | (10,602,967 | ) | | | (20,333 | ) | | | (300,944 | ) |
| | | | |
| | | | | | | (109,509,505 | ) | | | | | | | (88,820,473 | ) |
| | | | |
Net increase (decrease) in net assets resulting from capital share transactions | | | | | | | 25,482,629 | | | | | | | | (36,235,136 | ) |
| | | | |
Total increase (decrease) in net assets | | | | | | | (13,738,095 | ) | | | | | | | 10,099,392 | |
| | | | |
| | | | |
Net assets | | | | | | | | | | | | | | | | |
Beginning of period | | | | | | | 424,583,517 | | | | | | | | 414,484,125 | |
| | | | |
End of period | | | | | | $ | 410,845,422 | | | | | | | $ | 424,583,517 | |
| | | | |
Undistributed net investment income | | | | | | $ | 2,860,102 | | | | | | | $ | 6,820,027 | |
| | | | |
The accompanying notes are an integral part of these financial statements.
| | | | | | |
| Financial highlights | | Wells Fargo Advantage Disciplined U.S. Core Fund | | | 17 | |
(For a share outstanding throughout each period)
| | | | | | | | | | | | | | | | | | | | | | | | |
| | | Six months ended
January 31, 2014
(unaudited) | | | Year ended July 31 | |
| CLASS A | | | 2013 | | | 2012 | | | 2011 | | | 20101 | | | 20091 | |
Net asset value, beginning of period | | $ | 16.27 | | | $ | 14.65 | | | $ | 14.25 | | | $ | 11.93 | | | $ | 10.85 | | | $ | 14.40 | |
Net investment income | | | 0.09 | | | | 0.24 | | | | 0.20 | | | | 0.16 | | | | 0.15 | | | | 0.18 | |
Net realized and unrealized gains (losses) on investments | | | 0.88 | | | | 3.25 | | | | 0.93 | | | | 2.17 | | | | 1.09 | | | | (3.15 | ) |
| | | | | | | | | | | | | | | | | | | | | | | | |
Total from investment operations | | | 0.97 | | | | 3.49 | | | | 1.13 | | | | 2.33 | | | | 1.24 | | | | (2.97 | ) |
Distributions to shareholders from | | | | | | | | | | | | | | | | | | | | | | | | |
Net investment income | | | (0.24 | ) | | | (0.24 | ) | | | (0.23 | ) | | | (0.01 | ) | | | (0.16 | ) | | | (0.17 | ) |
Net realized gains | | | (2.27 | ) | | | (1.63 | ) | | | (0.50 | ) | | | 0.00 | | | | 0.00 | | | | (0.41 | ) |
| | | | | | | | | | | | | | | | | | | | | | | | |
Total distributions to shareholders | | | (2.51 | ) | | | (1.87 | ) | | | (0.73 | ) | | | (0.01 | ) | | | (0.16 | ) | | | (0.58 | ) |
Net asset value, end of period | | $ | 14.73 | | | $ | 16.27 | | | $ | 14.65 | | | $ | 14.25 | | | $ | 11.93 | | | $ | 10.85 | |
Total return2 | | | 5.80 | % | | | 26.62 | % | | | 8.54 | % | | | 19.50 | % | | | 11.39 | % | | | (20.07 | )% |
Ratios to average net assets (annualized) | | | | | | | | | | | | | | | | | | | | | | | | |
Gross expenses | | | 0.93 | % | | | 0.94 | % | | | 0.92 | % | | | 0.93 | % | | | 0.76 | % | | | 1.00 | % |
Net expenses | | | 0.92 | % | | | 0.92 | % | | | 0.92 | % | | | 0.92 | % | | | 0.76 | % | | | 1.00 | % |
Net investment income | | | 1.27 | % | | | 1.66 | % | | | 1.43 | % | | | 1.18 | % | | | 1.27 | % | | | 1.71 | % |
Supplemental data | | | | | | | | | | | | | | | | | | | | | | | | |
Portfolio turnover rate | | | 38 | % | | | 64 | % | | | 82 | % | | | 64 | % | | | 63 | % | | | 30 | % |
Net assets, end of period (000s omitted) | | $ | 288,758 | | | $ | 285,780 | | | $ | 254,272 | | | $ | 268,460 | | | $ | 265,835 | | | $ | 243,049 | |
| 1. | After the close of business on July 16, 2010, the Fund acquired the net assets of Evergreen Enhanced S&P 500 Fund which became the accounting and performance survivor in the transaction. The information for the periods prior to July 19, 2010 is that of Class A of Evergreen Enhanced S&P 500 Fund. |
| 2. | Total return calculations do not include any sales charges. Returns for periods of less than one year are not annualized. |
The accompanying notes are an integral part of these financial statements.
| | | | |
| 18 | | Wells Fargo Advantage Disciplined U.S. Core Fund | | Financial highlights |
(For a share outstanding throughout each period)
| | | | | | | | | | | | | | | | | | | | | | | | |
| | | Six months ended
January 31, 2014 (unaudited) | | | Year ended July 31 | |
| CLASS C | | | 2013 | | | 2012 | | | 2011 | | | 20101 | | | 20091 | |
Net asset value, beginning of period | | $ | 15.58 | | | $ | 14.10 | | | $ | 13.69 | | | $ | 11.54 | | | $ | 10.50 | | | $ | 13.95 | |
Net investment income | | | 0.04 | | | | 0.12 | | | | 0.09 | | | | 0.05 | | | | 0.06 | | | | 0.11 | |
Net realized and unrealized gains (losses) on investments | | | 0.84 | | | | 3.12 | | | | 0.90 | | | | 2.10 | | | | 1.04 | | | | (3.06 | ) |
| | | | | | | | | | | | | | | | | | | | | | | | |
Total from investment operations | | | 0.88 | | | | 3.24 | | | | 0.99 | | | | 2.15 | | | | 1.10 | | | | (2.95 | ) |
Distributions to shareholders from | | | | | | | | | | | | | | | | | | | | | | | | |
Net investment income | | | (0.14 | ) | | | (0.13 | ) | | | (0.08 | ) | | | 0.00 | | | | (0.06 | ) | | | (0.09 | ) |
Net realized gains | | | (2.27 | ) | | | (1.63 | ) | | | (0.50 | ) | | | 0.00 | | | | 0.00 | | | | (0.41 | ) |
| | | | | | | | | | | | | | | | | | | | | | | | |
Total distributions to shareholders | | | (2.41 | ) | | | (1.76 | ) | | | (0.58 | ) | | | 0.00 | | | | (0.06 | ) | | | (0.50 | ) |
Net asset value, end of period | | $ | 14.05 | | | $ | 15.58 | | | $ | 14.10 | | | $ | 13.69 | | | $ | 11.54 | | | $ | 10.50 | |
Total return2 | | | 5.44 | % | | | 25.65 | % | | | 7.75 | % | | | 18.63 | % | | | 10.51 | % | | | (20.65 | )% |
Ratios to average net assets (annualized) | | | | | | | | | | | | | | | | | | | | | | | | |
Gross expenses | | | 1.68 | % | | | 1.69 | % | | | 1.67 | % | | | 1.68 | % | | | 1.51 | % | | | 1.76 | % |
Net expenses | | | 1.67 | % | | | 1.67 | % | | | 1.67 | % | | | 1.67 | % | | | 1.51 | % | | | 1.76 | % |
Net investment income | | | 0.51 | % | | | 0.92 | % | | | 0.68 | % | | | 0.44 | % | | | 0.52 | % | | | 0.95 | % |
Supplemental data | | | | | | | | | | | | | | | | | | | | | | | | |
Portfolio turnover rate | | | 38 | % | | | 64 | % | | | 82 | % | | | 64 | % | | | 63 | % | | | 30 | % |
Net assets, end of period (000s omitted) | | $ | 10,040 | | | $ | 9,544 | | | $ | 8,590 | | | $ | 8,768 | | | $ | 11,613 | | | $ | 11,462 | |
| 1. | After the close of business on July 16, 2010, the Fund acquired the net assets of Evergreen Enhanced S&P 500 Fund which became the accounting and performance survivor in the transaction. The information for the periods prior to July 19, 2010 is that of Class C of Evergreen Enhanced S&P 500 Fund. |
| 2. | Total return calculations do not include any sales charges. Returns for periods of less than one year are not annualized. |
The accompanying notes are an integral part of these financial statements.
| | | | | | |
| Financial highlights | | Wells Fargo Advantage Disciplined U.S. Core Fund | | | 19 | |
(For a share outstanding throughout each period)
| | | | | | | | | | | | | | | | | | | | | | | | |
| | | Six months ended
January 31, 2014 (unaudited) | | | Year ended July 31 | |
| ADMINISTRATOR CLASS | | | 2013 | | | 2012 | | | 2011 | | | 20101 | | | 20091 | |
Net asset value, beginning of period | | $ | 16.47 | | | $ | 14.79 | | | $ | 14.36 | | | $ | 11.99 | | | $ | 10.92 | | | $ | 14.48 | |
Net investment income | | | 0.14 | 2 | | | 0.28 | 2 | | | 0.23 | 2 | | | 0.19 | 2 | | | 0.20 | | | | 0.22 | |
Net realized and unrealized gains (losses) on investments | | | 0.86 | | | | 3.27 | | | | 0.93 | | | | 2.19 | | | | 1.06 | | | | (3.17 | ) |
| | | | | | | | | | | | | | | | | | | | | | | | |
Total from investment operations | | | 1.00 | | | | 3.55 | | | | 1.16 | | | | 2.38 | | | | 1.26 | | | | (2.95 | ) |
Distributions to shareholders from | | | | | | | | | | | | | | | | | | | | | | | | |
Net investment income | | | (0.19 | ) | | | (0.24 | ) | | | (0.23 | ) | | | (0.01 | ) | | | (0.19 | ) | | | (0.20 | ) |
Net realized gains | | | (2.27 | ) | | | (1.63 | ) | | | (0.50 | ) | | | 0.00 | | | | 0.00 | | | | (0.41 | ) |
| | | | | | | | | | | | | | | | | | | | | | | | |
Total distributions to shareholders | | | (2.46 | ) | | | (1.87 | ) | | | (0.73 | ) | | | (0.01 | ) | | | (0.19 | ) | | | (0.61 | ) |
Net asset value, end of period | | $ | 15.01 | | | $ | 16.47 | | | $ | 14.79 | | | $ | 14.36 | | | $ | 11.99 | | | $ | 10.92 | |
Total return3 | | | 5.91 | % | | | 26.82 | % | | | 8.72 | % | | | 19.84 | % | | | 11.51 | % | | | (19.81 | )% |
Ratios to average net assets (annualized) | | | | | | | | | | | | | | | | | | | | | | | | |
Gross expenses | | | 0.76 | % | | | 0.78 | % | | | 0.75 | % | | | 0.77 | % | | | 0.52 | % | | | 0.75 | % |
Net expenses | | | 0.74 | % | | | 0.74 | % | | | 0.74 | % | | | 0.74 | % | | | 0.52 | % | | | 0.75 | % |
Net investment income | | | 1.65 | % | | | 1.87 | % | | | 1.63 | % | | | 1.37 | % | | | 1.53 | % | | | 1.99 | % |
Supplemental data | | | | | | | | | | | | | | | | | | | | | | | | |
Portfolio turnover rate | | | 38 | % | | | 64 | % | | | 82 | % | | | 64 | % | | | 63 | % | | | 30 | % |
Net assets, end of period (000s omitted) | | $ | 49,210 | | | $ | 127,384 | | | $ | 150,408 | | | $ | 244,716 | | | $ | 371,389 | | | $ | 484,594 | |
| 1. | After the close of business on July 16, 2010, the Fund acquired the net assets of Evergreen Enhanced S&P 500 Fund which became the accounting and performance survivor in the transaction. The information for the periods prior to July 19, 2010 is that of Class I of Evergreen Enhanced S&P 500 Fund. |
| 2. | Calculated based upon average shares outstanding |
| 3. | Returns for periods of less than one year are not annualized. |
The accompanying notes are an integral part of these financial statements.
| | | | |
| 20 | | Wells Fargo Advantage Disciplined U.S. Core Fund | | Financial highlights |
(For a share outstanding throughout each period)
| | | | | | | | | | | | | | | | | | | | |
| | | Six months ended
January 31, 2014 (unaudited) | | | Year ended July 31 | |
| INSTITUTIONAL CLASS | | | 2013 | | | 2012 | | | 2011 | | | 20101 | |
Net asset value, beginning of period | | $ | 16.43 | | | $ | 14.78 | | | $ | 14.39 | | | $ | 11.99 | | | $ | 11.99 | |
Net investment income | | | 0.13 | 2 | | | 0.35 | | | | 0.26 | 2 | | | 0.22 | | | | 0.00 | |
Net realized and unrealized gains (losses) on investments | | | 0.89 | | | | 3.23 | | | | 0.93 | | | | 2.19 | | | | 0.00 | |
| | | | | | | | | | | | | | | | | | | | |
Total from investment operations | | | 1.02 | | | | 3.58 | | | | 1.19 | | | | 2.41 | | | | 0.00 | |
Distributions to shareholders from | | | | | | | | | | | | | | | | | | | | |
Net investment income | | | (0.31 | ) | | | (0.30 | ) | | | (0.30 | ) | | | (0.01 | ) | | | 0.00 | |
Net realized gains | | | (2.27 | ) | | | (1.63 | ) | | | (0.50 | ) | | | 0.00 | | | | 0.00 | |
| | | | | | | | | | | | | | | | | | | | |
Total distributions to shareholders | | | (2.58 | ) | | | (1.93 | ) | | | (0.80 | ) | | | (0.01 | ) | | | 0.00 | |
Net asset value, end of period | | $ | 14.87 | | | $ | 16.43 | | | $ | 14.78 | | | $ | 14.39 | | | $ | 11.99 | |
Total return3 | | | 6.06 | % | | | 27.16 | % | | | 9.02 | % | | | 20.10 | % | | | 0.00 | % |
Ratios to average net assets (annualized) | | | | | | | | | | | | | | | | | | | | |
Gross expenses | | | 0.50 | % | | | 0.51 | % | | | 0.49 | % | | | 0.51 | % | | | 0.00 | % |
Net expenses | | | 0.48 | % | | | 0.48 | % | | | 0.48 | % | | | 0.47 | % | | | 0.00 | % |
Net investment income | | | 1.58 | % | | | 2.08 | % | | | 1.80 | % | | | 1.62 | % | | | 0.00 | % |
Supplemental data | | | | | | | | | | | | | | | | | | | | |
Portfolio turnover rate | | | 38 | % | | | 64 | % | | | 82 | % | | | 64 | % | | | 63 | % |
Net assets, end of period (000s omitted) | | $ | 62,838 | | | $ | 1,875 | | | $ | 1,215 | | | | $12 | | | | $10 | |
| 1. | For the period from July 30, 2010 (commencement of class operations) to July 31, 2010 |
| 2. | Calculated based upon average shares outstanding |
| 3. | Returns for periods of less than one year are not annualized. |
The accompanying notes are an integral part of these financial statements.
| | | | | | |
| Notes to financial statements (unaudited) | | Wells Fargo Advantage Disciplined U.S. Core Fund | | | 21 | |
1. ORGANIZATION
Wells Fargo Funds Trust (the “Trust”), a Delaware statutory trust organized on March 10, 1999, is an open-end management investment company registered under the Investment Company Act of 1940, as amended (the “1940 Act”). These financial statements report on the Wells Fargo Advantage Disciplined U.S. Core Fund (the “Fund”) which is a diversified series of the Trust.
2. SIGNIFICANT ACCOUNTING POLICIES
The following significant accounting policies, which are consistently followed in the preparation of the financial statements of the Fund, are in conformity with U.S. generally accepted accounting principles which require management to make estimates and assumptions that affect the reported amounts of assets and liabilities, disclosure of contingent assets and liabilities at the date of the financial statements, and the reported amounts of revenues and expenses during the reporting period. Actual results could differ from those estimates.
Securities valuation
All investments are valued each business day as of the close of regular trading on the New York Stock Exchange (generally 4 p.m. Eastern Time).
Equity securities that are listed on a foreign or domestic exchange or market are valued at the official closing price or, if none, the last sales price. If no sale occurs on the primary exchange or market for the security that day, the prior day’s price will be deemed “stale” and fair values will be determined in accordance with the Fund’s Valuation Procedures.
Investments in registered open-end investment companies are valued at net asset value. Non-registered investment vehicles are fair valued at net asset value.
Investments which are not valued using any of the methods discussed above are valued at their fair value, as determined in good faith by the Board of Trustees of the Fund. The Board of Trustees has established a Valuation Committee comprised of the Trustees and has delegated to it the authority to take any actions regarding the valuation of portfolio securities that the Valuation Committee deems necessary or appropriate, including determining the fair value of portfolio securities, unless the determination has been delegated to the Management Valuation Team of Wells Fargo Funds Management, LLC (“Funds Management”). The Board of Trustees retains the authority to make or ratify any valuation decisions or approve any changes to the Valuation Procedures as it deems appropriate. On a quarterly basis, the Board of Trustees receives reports on any valuation actions taken by the Valuation Committee or the Management Valuation Team which may include items for ratification.
Valuations of fair valued securities are compared to the next actual sales price when available, or other appropriate market values, to assess the continued appropriateness of the fair valuation methodologies used. These securities are fair valued on a day-to-day basis, taking into consideration changes to appropriate market information and any significant changes to the inputs considered in the valuation process until there is a readily available price provided on an exchange or by an independent pricing service. Valuations received from an independent pricing service or independent broker-dealer quotes are periodically validated by comparisons to most recent trades and valuations provided by other independent pricing services in addition to the review of prices by the adviser and/or subadviser. Unobservable inputs used in determining fair valuations are identified based on the type of security, taking into consideration factors utilized by market participants in valuing the investment, knowledge about the issuer and the current market environment.
Security loans
The Fund may lend its securities from time to time in order to earn additional income in the form of fees or interest on securities received as collateral or the investment of any cash received as collateral. The Fund continues to receive interest or dividends on the securities loaned. The Fund receives collateral in the form of cash or securities with a value at least equal to the value of the securities on loan. The value of the loaned securities is determined at the close of each business day and any additional required collateral is delivered to the Fund on the next business day. In a securities lending transaction, the net asset value of the Fund will be affected by an increase or decrease in the value of the securities loaned and by an increase or decrease in the value of the instrument in which collateral is invested. The amount of securities lending activity undertaken by the Fund fluctuates from time to time. In the event of default or bankruptcy by the borrower, the Fund may be prevented from recovering the loaned securities or gaining access to the collateral or may experience delays or costs in doing so. In addition, the investment of any cash collateral received may lose all or part of its value. The Fund has the right under the lending agreement to recover the securities from the borrower on demand.
The Fund lends its securities through an unaffiliated securities lending agent. Cash collateral received in connection with its securities lending transactions is invested in Wells Fargo Securities Lending Cash Investments, LLC (the “Securities
| | | | |
| 22 | | Wells Fargo Advantage Disciplined U.S. Core Fund | | Notes to financial statements (unaudited) |
Lending Fund”). The Securities Lending Fund is exempt from registration under Section 3(c)(7) of the 1940 Act and is managed by Funds Management and is subadvised by Wells Capital Management Incorporated (“WellsCap”). Funds Management receives an advisory fee starting at 0.05% and declining to 0.01% as the average daily net assets of the Securities Lending Fund increase. All of the fees received by Funds Management are paid to WellsCap for its services as subadviser. The Securities Lending Fund seeks to provide a positive return compared to the daily Fed Funds Open rate by investing in high-quality, U.S. dollar-denominated short-term money market instruments. Securities Lending Fund investments are fair valued based upon the amortized cost valuation technique. Income earned from investment in the Securities Lending Fund is included in securities lending income on the Statement of Operations.
Security transactions and income recognition
Securities transactions are recorded on a trade date basis. Realized gains or losses are recorded on the basis of identified cost.
Dividend income is recognized on the ex-dividend date. Dividend income is recorded net of foreign taxes withheld where recovery of such taxes is not assured.
Distributions to shareholders
Distributions to shareholders from net investment income and net realized gains, if any, are recorded on the ex-dividend date. Such distributions are determined in conformity with federal income tax regulations, which may differ in amount or character from net investment income and realized gains recognized for purposes of U.S. generally accepted accounting principles.
Federal and other taxes
The Fund intends to continue to qualify as a regulated investment company by distributing substantially all of its investment company taxable income and any net realized capital gains (after reduction for capital loss carryforwards) sufficient to relieve it from all, or substantially all, federal income taxes. Accordingly, no provision for federal income taxes was required.
The Fund’s income and federal excise tax returns and all financial records supporting those returns for the prior three fiscal years are subject to examination by the federal and Delaware revenue authorities. Management has analyzed the Fund’s tax positions taken on federal, state, and foreign tax returns for all open tax years and does not believe that there are any uncertain tax positions that require recognition of a tax liability.
Class allocations
The separate classes of shares offered by the Fund differ principally in applicable sales charges, distribution, shareholder servicing, and administration fees. Shareholders of each class bear certain expenses that pertain to that particular class. All shareholders bear the common expenses of the Fund, earn income from the portfolio, and are allocated any unrealized gains and losses pro rata based on the average daily net assets of each class, without distinction between share classes. Dividends are determined separately for each class based on income and expenses allocable to each class. Realized gains and losses are allocated to each class pro rata based upon the net assets of each class on the date realized. Differences in per share dividend rates generally result from the relative weightings of pro rata income and realized gain allocations and from differences in separate class expenses, including distribution, shareholder servicing, and administration fees.
3. FAIR VALUATION MEASUREMENTS
Fair value measurements of investments are determined within a framework that has established a fair value hierarchy based upon the various data inputs utilized in determining the value of the Fund’s investments. The three-level hierarchy gives the highest priority to unadjusted quoted prices in active markets for identical assets or liabilities (Level 1) and the lowest priority to significant unobservable inputs (Level 3). The Fund’s investments are classified within the fair value hierarchy based on the lowest level of input that is significant to the fair value measurement. The inputs are summarized into three broad levels as follows:
| n | | Level 1 – quoted prices in active markets for identical securities |
| n | | Level 2 – other significant observable inputs (including quoted prices for similar securities, interest rates, prepayment speeds, credit risk, use of amortized cost, etc.) |
| n | | Level 3 – significant unobservable inputs (including the Fund’s own assumptions in determining the fair value of investments) |
The inputs or methodologies used for valuing investments in securities are not necessarily an indication of the risk associated with investing in those securities.
| | | | | | |
| Notes to financial statements (unaudited) | | Wells Fargo Advantage Disciplined U.S. Core Fund | | | 23 | |
As of January 31, 2014, the inputs used in valuing investments in securities were as follows:
| | | | | | | | | | | | | | | | |
| Investments in securities | | Quoted prices (Level 1) | | | Other significant
observable inputs (Level 2) | | | Significant unobservable inputs (Level 3) | | | Total | |
Equity securities | | | | | | | | | | | | | | | | |
Common stocks | | $ | 408,710,470 | | | $ | 0 | | | $ | 0 | | | $ | 408,710,470 | |
Short-term investments | | | | | | | | | | | | | | | | |
Investment companies | | | 2,575,087 | | | | 7,164,909 | | | | 0 | | | | 9,739,996 | |
| | | $ | 411,285,557 | | | $ | 7,164,909 | | | $ | 0 | | | $ | 418,450,466 | |
Transfers in and transfers out are recognized at the end of the reporting period. For the six months ended January 31, 2014, the Fund did not have any transfers into/out of Level 1, Level 2, or Level 3.
4. TRANSACTIONS WITH AFFILIATES AND OTHER EXPENSES
Advisory fee
The Trust has entered into an advisory contract with Funds Management, an indirect wholly owned subsidiary of Wells Fargo & Company (“Wells Fargo”). The adviser is responsible for implementing investment policies and guidelines and for supervising the subadviser, who is responsible for day-to-day portfolio management of the Fund.
Pursuant to the contract, Funds Management is entitled to receive an annual advisory fee starting at 0.30% and declining to 0.25% as the average daily net assets of the Fund increase. For the six months ended January 31, 2014, the advisory fee was equivalent to an annual rate of 0.30% of the Fund’s average daily net assets.
Funds Management has retained the services of a subadviser to provide daily portfolio management to the Fund. The fee for subadvisory services is borne by Funds Management. Golden Capital Management, LLC, an affiliate of Funds Management and an indirect, wholly owned subsidiary of Wells Fargo, is the subadviser to the Fund and is entitled to receive a fee from Funds Management at an annual rate starting at 0.25% and declining to 0.15% as the average daily net assets of the Fund increase.
Administration and transfer agent fees
The Trust has entered into an administration agreement with Funds Management. Under this agreement, for providing administrative services, which includes paying fees and expenses for services provided by the transfer agent, sub-transfer agents, omnibus account servicers and record-keepers, Funds Management is entitled to receive from the Fund an annual fund level administration fee starting at 0.05% and declining to 0.03% as the average daily net assets of the Fund increase and a class level administration fee which is calculated based on the average daily net assets of each class as follows:
| | | | |
| | | Class level
administration fee | |
Class A, Class C | | | 0.26 | % |
Administrator Class | | | 0.10 | |
Institutional Class | | | 0.08 | |
Funds Management has contractually waived and/or reimbursed advisory and administration fees to the extent necessary to maintain certain net operating expense ratios for the Fund. Waiver of fees and/or reimbursement of expenses by Funds Management were made first from fund level expenses on a proportionate basis and then from class specific expenses. Funds Management has committed through November 30, 2014 to waive fees and/or reimburse expenses to the extent necessary to cap the Fund’s expenses at 0.92% for Class A shares, 1.67% for Class C shares, 0.74% for Administrator Class shares, and 0.48% for Institutional Class shares.
Distribution fees
The Trust has adopted a Distribution Plan for Class C shares of the Fund pursuant to Rule 12b-1 under the 1940 Act. Distribution fees are charged to Class C shares and paid to Wells Fargo Funds Distributor, LLC, the principal underwriter, at an annual rate of 0.75% of the average daily net assets of Class C shares.
For the six months ended January 31, 2014, Wells Fargo Funds Distributor, LLC received $5,045 from the sale of Class A shares.
| | | | |
| 24 | | Wells Fargo Advantage Disciplined U.S. Core Fund | | Notes to financial sttements (unaudited) |
Shareholder servicing fees
The Trust has entered into contracts with one or more shareholder servicing agents, whereby Class A, Class C, and Administrator Class of the Fund is charged a fee at an annual rate of 0.25% of the average daily net assets of each respective class.
A portion of these total shareholder servicing fees were paid to affiliates of Wells Fargo.
5. INVESTMENT PORTFOLIO TRANSACTIONS
Purchases and sales of investments, excluding U.S. government obligations (if any) and short-term securities, for the six months ended January 31, 2014 were $158,409,037 and $190,735,646, respectively.
6. BANK BORROWINGS
The Trust (excluding the money market funds and certain other funds in the Trust) and Wells Fargo Variable Trust are parties to a $150,000,000 revolving credit agreement with State Street Bank and Trust Company, whereby the Fund is permitted to use bank borrowings for temporary or emergency purposes, such as to fund shareholder redemption requests. Interest under the credit agreement is charged to the Fund based on a borrowing rate equal to the higher of the Federal Funds rate in effect on that day plus 1.25% or the overnight LIBOR rate in effect on that day plus 1.25%. In addition, an annual commitment fee equal to 0.10% of the unused balance is allocated to each participating fund. For the six months ended January 31, 2014, the Fund paid $176 in commitment fees.
For the six months ended January 31, 2014, there were no borrowings by the Fund under the agreement.
7. INDEMNIFICATION
Under the Trust’s organizational documents, the officers and directors are indemnified against certain liabilities that may arise out of performance of their duties to the Trust. Additionally, in the normal course of business, the Trust may enter into contracts with service providers that contain a variety of indemnification clauses. The Trust’s maximum exposure under these arrangements is dependent on future claims that may be made against the Fund and, therefore, cannot be estimated.
| | | | | | |
| Other information (unaudited) | | Wells Fargo Advantage Disciplined U.S. Core Fund | | | 25 | |
PROXY VOTING INFORMATION
A description of the policies and procedures that the Fund uses to determine how to vote proxies relating to portfolio securities is available without charge, upon request, by calling 1-800-222-8222, visiting our website at wellsfargoadvantagefunds.com, or visiting the SEC website at sec.gov. Information regarding how the Fund voted proxies relating to portfolio securities during the most recent 12-month period ended June 30 is available without charge on the Fund’s website at wellsfargoadvantagefunds.com or by visiting the SEC website at sec.gov.
PORTFOLIO HOLDINGS INFORMATION
The complete portfolio holdings for the Fund are publicly available on the Fund’s website (wellsfargoadvantagefunds.com) on a monthly, 30-day or more delayed basis. In addition, top ten holdings information for the Fund is publicly available on the Fund’s website on a monthly, seven-day or more delayed basis. The Fund files its complete schedule of portfolio holdings with the SEC for the first and third quarters of each fiscal year on Form N-Q, which is available without charge by visiting the SEC website at sec.gov. In addition, the Fund’s Form N-Q may be reviewed and copied at the SEC’s Public Reference Room in Washington, DC, and at regional offices in New York City, at 233 Broadway, and in Chicago, at 175 West Jackson Boulevard, Suite 900. Information about the Public Reference Room may be obtained by calling 1-800-SEC-0330.
| | | | |
| 26 | | Wells Fargo Advantage Disciplined U.S. Core Fund | | Other information (unaudited) |
BOARD OF TRUSTEES AND OFFICERS
Each of the Trustees and Officers listed in the table below acts in identical capacities for each fund in the Wells Fargo Advantage family of funds, which consists of 132 mutual funds1 comprising the Wells Fargo Funds Trust, Wells Fargo Variable Trust, Wells Fargo Master Trust and four closed-end funds (collectively the “Fund Complex”). This table should be read in conjunction with the Prospectus and the Statement of Additional Information2. All of the Trustees are also Members of the Audit and Governance Committees of each Trust in the Fund Complex. The mailing address of each Trustee and Officer is 525 Market Street, 12th Floor, San Francisco, CA 94105. Each Trustee and Officer serves an indefinite term, however, each Trustee serves such term until reaching the mandatory retirement age established by the Trustees.
Independent Trustees
| | | | | | |
Name and
year of birth | | Position held and
length of service* | | Principal occupations during past five years | | Other
directorships during
past five years |
| Peter G. Gordon (Born 1942) | | Trustee, since 1998; Chairman, since 2005 | | Co-Founder, Retired Chairman, President and CEO of Crystal Geyser Water Company. Trustee Emeritus, Colby College. | | Asset Allocation Trust |
| Isaiah Harris, Jr. (Born 1952) | | Trustee, since 2009 | | Retired. Prior thereto, President and CEO of BellSouth Advertising and Publishing Corp. from 2005 to 2007, President and CEO of BellSouth Enterprises from 2004 to 2005 and President of BellSouth Consumer Services from 2000 to 2003. Emeritus member of the Iowa State University Foundation Board of Governors. Emeritus Member of the Advisory Board of Iowa State University School of Business. Advisory Board Member, Palm Harbor Academy (charter school). Mr. Harris is a certified public accountant. | | CIGNA Corporation; Deluxe Corporation; Asset Allocation Trust |
| Judith M. Johnson (Born 1949) | | Trustee, since 2008; Audit Committee Chairman, since 2008 | | Retired. Prior thereto, Chief Executive Officer and Chief Investment Officer of Minneapolis Employees Retirement Fund from 1996 to 2008. Ms. Johnson is an attorney, certified public accountant and a certified managerial accountant. | | Asset Allocation Trust |
| Leroy Keith, Jr. (Born 1939) | | Trustee, since 2010 | | Chairman, Bloc Global Services (development and construction). Trustee of the Evergreen Funds from 1983 to 2010. Former Managing Director, Almanac Capital Management (commodities firm), former Partner, Stonington Partners, Inc. (private equity fund), former Director, Obagi Medical Products Co. and former Director, Lincoln Educational Services. | | Trustee, Virtus Fund Complex (consisting of 50 portfolios as of 12/16/2013); Asset Allocation Trust |
| David F. Larcker (Born 1950) | | Trustee, since 2009 | | James Irvin Miller Professor of Accounting at the Graduate School of Business, Stanford University, Morgan Stanley Director of the Center for Leadership Development and Research and Senior Faculty of The Rock Center for Corporate Governance since 2006. From 2005 to 2008, Professor of Accounting at the Graduate School of Business, Stanford University. Prior thereto, Ernst & Young Professor of Accounting at The Wharton School, University of Pennsylvania from 1985 to 2005. | | Asset Allocation Trust |
| Olivia S. Mitchell (Born 1953) | | Trustee, since 2006 | | International Foundation of Employee Benefit Plans Professor, Wharton School of the University of Pennsylvania since 1993. Director of Wharton’s Pension Research Council and Boettner Center on Pensions & Retirement Research, and Research Associate at the National Bureau of Economic Research. Previously, Cornell University Professor from 1978 to 1993. | | Asset Allocation Trust |
| Timothy J. Penny (Born 1951) | | Trustee, since 1996 | | President and CEO of Southern Minnesota Initiative Foundation, a non-profit organization, since 2007 and Senior Fellow at the Humphrey Institute Policy Forum at the University of Minnesota since 1995. Member of the Board of Trustees of NorthStar Education Finance, Inc., a non-profit organization, since 2007. | | Asset Allocation Trust |
| | | | | | |
| Other information (unaudited) | | Wells Fargo Advantage Disciplined U.S. Core Fund | | | 27 | |
| | | | | | |
Name and
year of birth | | Position held and
length of service* | | Principal occupations during past five years | | Other
directorships during
past five years |
| Michael S. Scofield (Born 1943) | | Trustee, since 2010 | | Served on the Investment Company Institute’s Board of Governors and Executive Committee from 2008-2011 as well the Governing Council of the Independent Directors Council from 2006-2011 and the Independent Directors Council Executive Committee from 2008-2011. Chairman of the IDC from 2008-2010. Institutional Investor (Fund Directions) Trustee of Year in 2007. Trustee of the Evergreen Funds (and its predecessors) from 1984 to 2010. Chairman of the Evergreen Funds from 2000-2010. Former Trustee of the Mentor Funds. Retired Attorney, Law Offices of Michael S. Scofield. | | Asset Allocation Trust |
| Donald C. Willeke (Born 1940) | | Trustee, since 1996 | | Principal of the law firm of Willeke & Daniels. General Counsel of the Minneapolis Employees Retirement Fund from 1984 until its consolidation into the Minnesota Public Employees Retirement Association on June 30, 2010. Director and Vice Chair of The Tree Trust (non-profit corporation). Director of the American Chestnut Foundation (non-profit corporation). | | Asset Allocation Trust |
| * | Length of service dates reflect the Trustee’s commencement of service with the Trust’s predecessor entities, where applicable. |
Officers
| | | | | | |
Name and
year of birth | | Position held and
length of service | | Principal occupations during past five years | | |
| Karla M. Rabusch (Born 1959) | | President, since 2003 | | Executive Vice President of Wells Fargo Bank, N.A. and President of Wells Fargo Funds Management, LLC since 2003. | | |
| Jeremy DePalma1 (Born 1974) | | Treasurer, since 2012 | | Senior Vice President of Wells Fargo Funds Management, LLC since 2009. Senior Vice President of Evergreen Investment Management Company, LLC from 2008 to 2010. Vice President, Evergreen Investment Services, Inc. from 2004 to 2007. Head of the Fund Reporting and Control Team within Fund Administration from 2005 to 2010. | | |
| C. David Messman (Born 1960) | | Secretary, since 2000; Chief Legal Officer, since 2003 | | Senior Vice President and Secretary of Wells Fargo Funds Management, LLC since 2001. Vice President and Managing Counsel of Wells Fargo Bank, N.A. since 1996. | | |
Debra Ann Early (Born 1964) | | Chief Compliance Officer, since 2007 | | Chief Compliance Officer of Wells Fargo Funds Management, LLC since 2007. Chief Compliance Officer of Parnassus Investments from 2005 to 2007. Chief Financial Officer of Parnassus Investments from 2004 to 2007. | | |
David Berardi (Born 1975) | | Assistant Treasurer, since 2009 | | Vice President of Wells Fargo Funds Management, LLC since 2009. Vice President of Evergreen Investment Management Company, LLC from 2008 to 2010. Assistant Vice President of Evergreen Investment Services, Inc. from 2004 to 2008. Manager of Fund Reporting and Control for Evergreen Investment Management Company, LLC from 2004 to 2010. | | |
| 1. | Jeremy DePalma acts as Treasurer of 59 funds and Assistant Treasurer of 73 funds in the Fund Complex. |
| 2. | The Statement of Additional Information includes additional information about the Trustees and is available, without charge, upon request, by calling 1-800-222-8222 or by visiting the website at wellsfargoadvantagefunds.com. |
| | | | |
| 28 | | Wells Fargo Advantage Disciplined U.S. Core Fund | | List of abbreviations |
The following is a list of common abbreviations for terms and entities that may have appeared in this report.
| ACA | — ACA Financial Guaranty Corporation |
| ADR | — American depositary receipt |
| ADS | — American depositary shares |
| AGC | — Assured Guaranty Corporation |
| AGM | — Assured Guaranty Municipal |
| Ambac | — Ambac Financial Group Incorporated |
| AMT | — Alternative minimum tax |
| BAN | — Bond anticipation notes |
| BHAC | — Berkshire Hathaway Assurance Corporation |
| CAB | — Capital appreciation bond |
| CCAB | — Convertible capital appreciation bond |
| CDA | — Community Development Authority |
| CDO | — Collateralized debt obligation |
| COP | — Certificate of participation |
| DRIVER | — Derivative inverse tax-exempt receipts |
| DW&P | — Department of Water & Power |
| DWR | — Department of Water Resources |
| ECFA | — Educational & Cultural Facilities Authority |
| EDA | — Economic Development Authority |
| EDFA | — Economic Development Finance Authority |
| ETF | — Exchange-traded fund |
| FDIC | — Federal Deposit Insurance Corporation |
| FFCB | — Federal Farm Credit Banks |
| FGIC | — Financial Guaranty Insurance Corporation |
| FHA | — Federal Housing Administration |
| FHLB | — Federal Home Loan Bank |
| FHLMC | — Federal Home Loan Mortgage Corporation |
| FICO | — The Financing Corporation |
| FNMA | — Federal National Mortgage Association |
| GDR | — Global depositary receipt |
| GNMA | — Government National Mortgage Association |
| HCFR | — Healthcare facilities revenue |
| HEFA | — Health & Educational Facilities Authority |
| HEFAR | — Higher education facilities authority revenue |
| HFA | — Housing Finance Authority |
| HFFA | — Health Facilities Financing Authority |
| HUD | — Department of Housing and Urban Development |
| IDA | — Industrial Development Authority |
| IDAG | — Industrial Development Agency |
| IDR | — Industrial development revenue |
| KRW | — Republic of Korea won |
| LIBOR | — London Interbank Offered Rate |
| LLC | — Limited liability company |
| LLLP | — Limited liability limited partnership |
| LLP | — Limited liability partnership |
| MBIA | — Municipal Bond Insurance Association |
| MFHR | — Multifamily housing revenue |
| MSTR | — Municipal securities trust receipts |
| MUD | — Municipal Utility District |
| National | — National Public Finance Guarantee Corporation |
| PCFA | — Pollution Control Financing Authority |
| PCL | — Public Company Limited |
| PCR | — Pollution control revenue |
| PFA | — Public Finance Authority |
| PFFA | — Public Facilities Financing Authority |
| PFOTER | — Puttable floating option tax-exempt receipts |
| plc | — Public limited company |
| PUTTER | — Puttable tax-exempt receipts |
| R&D | — Research & development |
| Radian | — Radian Asset Assurance |
| RAN | — Revenue anticipation notes |
| RDA | — Redevelopment Authority |
| RDFA | — Redevelopment Finance Authority |
| REIT | — Real estate investment trust |
| ROC | — Reset option certificates |
| SAVRS | — Select auction variable rate securities |
| SBA | — Small Business Authority |
| SFHR | — Single-family housing revenue |
| SFMR | — Single-family mortgage revenue |
| SPA | — Standby purchase agreement |
| SPDR | — Standard & Poor’s Depositary Receipts |
| STRIPS | — Separate trading of registered interest and principal securities |
| TAN | — Tax anticipation notes |
| TIPS | — Treasury inflation-protected securities |
| TRAN | — Tax revenue anticipation notes |
| TTFA | — Transportation Trust Fund Authority |
| TVA | — Tennessee Valley Authority |


For more information
More information about Wells Fargo Advantage Funds is available free upon request. To obtain literature, please write, email, visit the Fund’s website, or call:
Wells Fargo Advantage Funds
P.O. Box 8266
Boston, MA 02266-8266
Email: wfaf@wellsfargo.com
Website: wellsfargoadvantagefunds.com
Individual investors: 1-800-222-8222
Retail investment professionals: 1-888-877-9275
Institutional investment professionals: 1-866-765-0778
This report and the financial statements contained herein are submitted for the general information of the shareholders of Wells Fargo Advantage Funds. If this report is used for promotional purposes, distribution of the report must be accompanied or preceded by a current prospectus. For a current prospectus and, if available, a summary prospectus containing more complete information, including charges and expenses, call 1-800-222-8222 or visit the Fund’s website at wellsfargoadvantagefunds.com. Please consider the investment objectives, risks, charges, and expenses of the investment carefully before investing. This and other information about Wells Fargo Advantage Funds can be found in the current prospectus. Read the prospectus carefully before you invest or send money.
Wells Fargo Funds Management, LLC, a wholly owned subsidiary of Wells Fargo & Company, provides investment advisory and administrative services for Wells Fargo Advantage Funds. Other affiliates of Wells Fargo & Company provide subadvisory and other services for the Funds. The Funds are distributed by Wells Fargo Funds Distributor, LLC, Member FINRA/SIPC, an affiliate of Wells Fargo & Company.
NOT FDIC INSURED ¡ NO BANK GUARANTEE ¡ MAY LOSE VALUE
© 2014 Wells Fargo Funds Management, LLC. All rights reserved.
| | |
 | | 222986 03-14 SA203/SAR203 1-14 |

Wells Fargo Advantage Endeavor Select FundSM

Semi-Annual Report
January 31, 2014

Reduce clutter. Save trees.
Sign up for electronic delivery of prospectuses and shareholder reports at wellsfargo.com/advantagedelivery
Contents
The views expressed and any forward-looking statements are as of January 31, 2014, unless otherwise noted, and are those of the Fund managers and/or Wells Fargo Funds Management, LLC. Discussions of individual securities, or the markets generally, or any Wells Fargo Advantage Fund are not intended as individual recommendations. Future events or results may vary significantly from those expressed in any forward-looking statements; the views expressed are subject to change at any time in response to changing circumstances in the market. Wells Fargo Funds Management, LLC and the Fund disclaim any obligation to publicly update or revise any views expressed or forward-looking statements.
NOT FDIC INSURED ¡ NO BANK GUARANTEE ¡ MAY LOSE VALUE
| | | | |
| 2 | | Wells Fargo Advantage Endeavor Select Fund | | Letter to shareholders (unaudited) |

Karla M. Rabusch
President
Wells Fargo Advantage Funds
Major central banks continued to inject liquidity into the banks and the markets through various quantitative easing policies.
Dear Valued Shareholder:
We are pleased to offer you this semi-annual report for the Wells Fargo Advantage Endeavor Select Fund for the six-month period that ended January 31, 2014. Much of the period was marked by monetary easing by global central banks. Entering the period, investors were concerned that the U.S. Federal Reserve (Fed) would end its bond-buying program, which initially led to higher interest rates and resulted in losses for bond indexes and volatility for global stock indexes. These fears dissipated in late September 2013 and ended altogether in mid-December 2013 when the Fed announced a tapering timeline that was far more moderate than some had feared. Growing confidence that the U.S. economy was staging a fragile recovery resulted in double-digit returns for domestic stock market indexes for the six-month reporting period.
Central banks continued to provide stimulus.
Major central banks continued to inject liquidity into the banks and the markets through various quantitative easing policies. Throughout the reporting period, the Federal Open Market Committee (FOMC)—the Fed’s monetary policymaking body—kept its key interest rate effectively near zero in order to support the economy and the financial system. Well before the reporting period began, the FOMC announced its intention to keep interest rates low for an extended period and to make open-ended purchases of $40 billion per month in mortgage-backed securities. The FOMC later added purchases of $45 billion per month in long-term U.S. Treasuries. Because the markets benefited from the FOMC’s liquidity, both stocks and bonds initially sold off after the FOMC indicated in May 2013 that it might reduce (or taper) its bond-buying program. However, in mid-December 2013, the FOMC announced that it would reduce its bond-buying program by $10 billion per month beginning in January 2014. The tapering was less aggressive than some investors had feared, and the markets ended 2013 strongly.
European markets continued to benefit from the European Central Bank’s (ECB’s) earlier announcement that it would purchase an unlimited amount of one- to three-year sovereign debt from countries that had formally applied for a bailout. In November 2013, the ECB cut its key rate to a historic low of 0.25%. The ECB’s aggressive actions helped ease investor worries about a eurozone sovereign debt default. Given the substantial ties between the U.S. and Europe, the improved sentiment about the eurozone helped provide a tailwind for U.S. markets.
U.S. stock markets gained on relatively good news.
For most of the period, U.S. economic data remained moderately positive. Reported gross domestic product (GDP) growth came in at a strong 4.1% annualized rate in the third quarter of 2013, and the advance annualized estimate for fourth-quarter GDP growth was 3.2%.
The most significant negative effect was the ongoing fight in Washington, D.C., over the federal budget and debt limit. The Budget Control Act of 2011, which was passed to resolve a previous fight over the federal debt ceiling, mandated budget sequestration that took effect on March 1, 2013, and was an overhang on economic growth throughout the reporting period. Most recently, Congress was unable to pass a resolution to continue to fund the federal government, and thus, the federal government underwent a partial shutdown from September 30, 2013, through October 16, 2013. The government reopened after the president and Congress reached a deal that funded the government through January 15, 2014, and raised the debt limit through February 7, 2014. In December 2013, Congress passed the Ryan–Murray budget agreement that funded the government through September 2015, lessening the near-term prospect of another shutdown.
| | | | | | |
| Letter to shareholders (unaudited) | | Wells Fargo Advantage Endeavor Select Fund | | | 3 | |
Despite political headwinds, the relatively positive outlook for the U.S. economy contributed to a strong domestic stock market for most of the reporting period. Economically sensitive sectors, such as industrials and materials, outperformed. Dividend-paying sectors such as utilities and telecommunication services lagged as higher interest rates dampened their relative performance. Judging by various Russell indexes, small-cap stocks moderately outperformed large-cap stocks, and growth stocks strongly outperformed value stocks.
Don’t let short-term uncertainty derail long-term investment goals.
Periods of uncertainty can present challenges, but experience has taught us that maintaining long-term investment goals can be an effective way to plan for the future. Although diversification cannot guarantee an investment profit or prevent losses, we believe it can be an effective way to manage investment risk and potentially smooth out overall portfolio performance. We encourage investors to know their investments and to understand that appropriate levels of risk-taking may unlock opportunities.
Thank you for choosing to invest with Wells Fargo Advantage Funds. We appreciate your confidence in us and remain committed to helping you meet your financial needs. For current information about your fund investments, contact your investment professional, visit our website at wellsfargoadvantagefunds.com, or call us directly at 1-800-222-8222. We are available 24 hours a day, 7 days a week.
Sincerely,

Karla M. Rabusch
President
Wells Fargo Advantage Funds
Despite political headwinds, the relatively positive outlook for the U.S. economy contributed to a strong domestic stock market for most of the reporting period.
Notice to shareholders
The Fund and Wells Fargo Funds Management, LLC (“Funds Management”) have received an exemptive order from the SEC that permits Funds Management, subject to the approval of the Board of Trustees of the Fund, to select or replace certain subadvisers to manage all or a portion of the Fund’s assets and enter into, amend or terminate a sub-advisory agreement with certain subadvisers without obtaining shareholder approval (“Multi-manager Structure”). The Multi-manager Structure applies to subadvisers that are not affiliated with Funds Management or the Fund, except to the extent that affiliation arises solely because such subadvisers provide sub-advisory services to the Fund (“Non-affiliated Subadvisers”), as well as subadvisers that are indirect or direct wholly-owned subsidiaries of Funds Management or of another company that, indirectly or directly, wholly owns Funds Management (“Wholly-owned Subadvisers”).
Pursuant to the SEC order, Funds Management, with the approval of the Board of Trustees, has the discretion to terminate any subadvisers and allocate and reallocate the Fund’s assets among any other Non-affiliated Subadvisers or Wholly-owned Subadvisers. Funds Management, subject to oversight and supervision by the Board of Trustees, has responsibility to continue to oversee any subadvisers to the Fund and to recommend, for approval by the Board of Trustees, the hiring, termination and replacement of subadvisers for the Fund. In the event that a new subadviser is hired pursuant to the Multi-manager Structure, the Fund is required to provide notice to shareholders within 90 days.
Please contact your investment professional or call us directly at 1-800-222-8222 if you have any questions on this Notice to Shareholders.
| | | | |
| 4 | | Wells Fargo Advantage Endeavor Select Fund | | Performance highlights (unaudited) |
Investment objective
The Fund seeks long-term capital appreciation.
Adviser
Wells Fargo Funds Management, LLC
Subadviser
Wells Capital Management Incorporated
Portfolio managers
Thomas J. Pence, CFA
Michael T. Smith, CFA
Average annual total returns1 (%) as of January 31, 2014
| | | | | | | | | | | | | | | | | | | | | | | | | | | | | | | | | | |
| | | | | Including sales charge | | | Excluding sales charge | | | Expense ratios2 (%) | |
| | | Inception date | | 1 year | | | 5 year | | | 10 year | | | 1 year | | | 5 year | | | 10 year | | | Gross | | | Net3 | |
| Class A (STAEX) | | 12-29-2000 | | | 19.63 | | | | 17.48 | | | | 5.91 | | | | 26.95 | | | | 18.88 | | | | 6.54 | | | | 1.27 | | | | 1.26 | |
| Class B (WECBX)* | | 12-29-2000 | | | 21.12 | | | | 17.77 | | | | 5.97 | | | | 26.12 | | | | 17.97 | | | | 5.97 | | | | 2.02 | | | | 2.01 | |
| Class C (WECCX) | | 12-29-2000 | | | 25.12 | | | | 18.02 | | | | 5.74 | | | | 26.12 | | | | 18.02 | | | | 5.74 | | | | 2.02 | | | | 2.01 | |
| Administrator Class (WECDX) | | 4-8-2005 | | | – | | | | – | | | | – | | | | 27.34 | | | | 19.20 | | | | 6.78 | | | | 1.11 | | | | 1.01 | |
| Institutional Class (WFCIX) | | 4-8-2005 | | | – | | | | – | | | | – | | | | 27.59 | | | | 19.42 | | | | 6.96 | | | | 0.84 | | | | 0.81 | |
| Russell 1000® Growth Index4 | | – | | | – | | | | – | | | | – | | | | 24.35 | | | | 20.88 | | | | 7.30 | | | | – | | | | – | |
| * | | Class B shares are closed to investment, except in connection with the reinvestment of any distributions and permitted exchanges. |
Figures quoted represent past performance, which is no guarantee of future results, and do not reflect taxes that a shareholder may pay on fund distributions or the redemption of fund shares. Investment return and principal value of an investment will fluctuate so that an investor’s shares, when redeemed, may be worth more or less than their original cost. Performance shown without sales charges would be lower if sales charges were reflected. Current performance may be lower or higher than the performance data quoted, which assumes the reinvestment of dividends and capital gains. Current month-end performance is available on the Fund’s website, wellsfargoadvantagefunds.com.
Index returns do not include transaction costs associated with buying and selling securities, any mutual fund fees or expenses, or any taxes. It is not possible to invest directly in an index.
For Class A shares, the maximum front-end sales charge is 5.75%. For Class B shares, the maximum contingent deferred sales charge is 5.00%. For Class C shares, the maximum contingent deferred sales charge is 1.00%. Performance including sales charge assumes the sales charge for the corresponding time period. Administrator Class and Institutional Class shares are sold without a front-end sales charge or contingent deferred sales charge.
Please keep in mind that high double-digit returns were primarily achieved during favorable market conditions. You should not expect that such favorable returns can be consistently achieved. A fund’s performance, especially for short time periods, should not be the sole factor in making your investment decision.
Stock values fluctuate in response to the activities of individual companies and general market and economic conditions. Certain investment strategies tend to increase the total risk of an investment (relative to the broader market). The Fund is exposed to foreign investment risk and non-diversification risk. Consult the Fund’s prospectus for additional information on these and other risks.
Please see footnotes on page 5.
| | | | | | |
| Performance highlights (unaudited) | | Wells Fargo Advantage Endeavor Select Fund | | | 5 | |
| | | | |
| Ten largest equity holdings5 (%) as of January 31, 2014 | |
Google Incorporated Class A | | | 5.36 | |
Amazon.com Incorporated | | | 3.99 | |
Constellation Brands Incorporated Class A | | | 3.85 | |
Facebook Incorporated Class A | | | 3.58 | |
IntercontinentalExchange Group Incorporated | | | 3.41 | |
Visa Incorporated Class A | | | 3.30 | |
Apple Incorporated | | | 3.16 | |
Alliance Data Systems Corporation | | | 3.13 | |
Alexion Pharmaceuticals Incorporated | | | 3.09 | |
Gilead Sciences Incorporated | | | 2.95 | |
| | |
| Sector distribution6 as of January 31, 2014 |
|
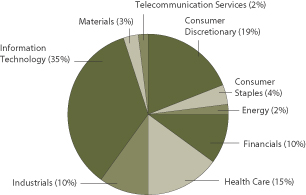
|
| 1. | Historical performance shown for Administrator Class shares and Institutional Class shares prior to their inception reflects the performance of Class A shares, and includes the higher expenses applicable to Class A shares. If these expenses had not been included, returns would be higher. |
| 2. | Reflects the expense ratios as stated in the most recent prospectuses, which include the impact of 0.01% in acquired fund fees and expenses. The expense ratios shown are subject to change and may differ from the annualized expense ratios shown in the financial highlights of this report, which do not include acquired fund fees and expenses. |
| 3. | The Adviser has committed through November 30, 2014, to waive fees and/or reimburse expenses to the extent necessary to cap the Fund’s Total Annual Fund Operating Expenses After Fee Waiver, excluding certain expenses, at 1.25% for Class A, 2.00% for Class B, 2.00% for Class C, 1.00% for Administrator Class, and 0.80% for Institutional Class. Brokerage commissions, stamp duty fees, interest, taxes, acquired fund fees and expenses, and extraordinary expenses are excluded from the cap. Without this cap, the Fund’s returns would have been lower. |
| 4. | The Russell 1000® Growth Index measures the performance of those Russell 1000 Index companies with higher price-to-book ratios and higher forecasted growth values. You cannot invest directly in an index. |
| 5. | The ten largest equity holdings are calculated based on the value of the securities divided by total net assets of the Fund. Holdings are subject to change and may have changed since the date specified. |
| 6. | Sector distribution is subject to change and is calculated based on the total long-term investments of the Fund. |
| | | | |
| 6 | | Wells Fargo Advantage Endeavor Select Fund | | Fund expenses (unaudited) |
As a shareholder of the Fund, you incur two types of costs: (1) transaction costs, including sales charges (loads) on purchase payments and contingent deferred sales charges (if any) on redemptions and (2) ongoing costs, including management fees, distribution (12b-1) and/or shareholder service fees, and other Fund expenses. This example is intended to help you understand your ongoing costs (in dollars) of investing in the Fund and to compare these costs with the ongoing costs of investing in other mutual funds.
The example is based on an investment of $1,000 invested at the beginning of the six-month period and held for the entire period from August 1, 2013 to January 31, 2014.
Actual expenses
The “Actual” line of the table below provides information about actual account values and actual expenses. You may use the information in this line, together with the amount you invested, to estimate the expenses that you paid over the period. Simply divide your account value by $1,000 (for example, an $8,600 account value divided by $1,000 = 8.6), then multiply the result by the number in the “Actual” line under the heading entitled “Expenses paid during period” for your applicable class of shares to estimate the expenses you paid on your account during this period.
Hypothetical example for comparison purposes
The “Hypothetical” line of the table below provides information about hypothetical account values and hypothetical expenses based on the Fund’s actual expense ratio and an assumed rate of return of 5% per year before expenses, which is not the Fund’s actual return. The hypothetical account values and expenses may not be used to estimate the actual ending account balance or expenses you paid for the period. You may use this information to compare the ongoing costs of investing in the Fund and other funds. To do so, compare this 5% hypothetical example with the 5% hypothetical examples that appear in the shareholder reports of the other funds.
Please note that the expenses shown in the table are meant to highlight your ongoing costs only and do not reflect any
transactional costs, such as sales charges (loads) and contingent deferred sales charges. Therefore, the “Hypothetical” line
of the table is useful in comparing ongoing costs only and will not help you determine the relative total costs of owning
different funds. In addition, if these transactional costs were included, your costs would have been higher.
| | | | | | | | | | | | | | | | |
| | | Beginning
account value
8-1-2013 | | | Ending
account value
1-31-2014 | | | Expenses
paid during
the period1 | | | Net annualized
expense ratio | |
Class A | | | | | | | | | | | | | | | | |
Actual | | $ | 1,000.00 | | | $ | 1,143.74 | | | $ | 6.75 | | | | 1.25 | % |
Hypothetical (5% return before expenses) | | $ | 1,000.00 | | | $ | 1,018.90 | | | $ | 6.36 | | | | 1.25 | % |
Class B | | | | | | | | | | | | | | | | |
Actual | | $ | 1,000.00 | | | $ | 1,139.61 | | | $ | 10.79 | | | | 2.00 | % |
Hypothetical (5% return before expenses) | | $ | 1,000.00 | | | $ | 1,015.12 | | | $ | 10.16 | | | | 2.00 | % |
Class C | | | | | | | | | | | | | | | | |
Actual | | $ | 1,000.00 | | | $ | 1,139.61 | | | $ | 10.79 | | | | 2.00 | % |
Hypothetical (5% return before expenses) | | $ | 1,000.00 | | | $ | 1,015.12 | | | $ | 10.16 | | | | 2.00 | % |
Administrator Class | | | | | | | | | | | | | | | | |
Actual | | $ | 1,000.00 | | | $ | 1,145.76 | | | $ | 5.41 | | | | 1.00 | % |
Hypothetical (5% return before expenses) | | $ | 1,000.00 | | | $ | 1,020.16 | | | $ | 5.09 | | | | 1.00 | % |
Institutional Class | | | | | | | | | | | | | | | | |
Actual | | $ | 1,000.00 | | | $ | 1,146.75 | | | $ | 4.33 | | | | 0.80 | % |
Hypothetical (5% return before expenses) | | $ | 1,000.00 | | | $ | 1,021.17 | | | $ | 4.08 | | | | 0.80 | % |
| 1. | Expenses paid is equal to the annualized expense ratio of each class multiplied by the average account value over the period, multiplied by the number of days in the most recent fiscal half-year divided by the number of days in the fiscal year (to reflect the one-half-year period). |
| | | | | | |
| Portfolio of investments—January 31, 2014 (unaudited) | | Wells Fargo Advantage Endeavor Select Fund | | | 7 | |
| | | | | | | | | | | | |
| Security name | | | | | | Shares | | | Value | |
| | | | |
Common Stocks: 97.64% | | | | | | | | | | | | |
| | | | |
Consumer Discretionary: 19.02% | | | | | | | | | | | | |
| | | | |
| Auto Components: 2.09% | | | | | | | | | | | | |
Delphi Automotive plc | | | | | | | 239,900 | | | $ | 14,607,511 | |
| | | | | | | | | | | | |
| | | | |
| Hotels, Restaurants & Leisure: 2.21% | | | | | | | | | | | | |
Starbucks Corporation | | | | | | | 217,147 | | | | 15,443,495 | |
| | | | | | | | | | | | |
| | | | |
| Household Durables: 1.13% | | | | | | | | | | | | |
Mohawk Industries Incorporated † | | | | | | | 55,379 | | | | 7,873,786 | |
| | | | | | | | | | | | |
| | | | |
| Internet & Catalog Retail: 6.23% | | | | | | | | | | | | |
Amazon.com Incorporated † | | | | | | | 77,900 | | | | 27,941,951 | |
Netflix Incorporated † | | | | | | | 38,300 | | | | 15,677,339 | |
| | | | |
| | | | | | | | | | | 43,619,290 | |
| | | | | | | | | | | | |
| | | | |
| Media: 4.14% | | | | | | | | | | | | |
Liberty Global plc Class C † | | | | | | | 253,300 | | | | 20,094,289 | |
Twenty-First Century Fox Incorporated | | | | | | | 279,700 | | | | 8,900,054 | |
| | | | |
| | | | | | | | | | | 28,994,343 | |
| | | | | | | | | | | | |
| | | | |
| Specialty Retail: 2.23% | | | | | | | | | | | | |
TJX Companies Incorporated | | | | | | | 271,400 | | | | 15,567,504 | |
| | | | | | | | | | | | |
| | | | |
| Textiles, Apparel & Luxury Goods: 0.99% | | | | | | | | | | | | |
Michael Kors Holdings Limited † | | | | | | | 87,054 | | | | 6,958,226 | |
| | | | | | | | | | | | |
| | | | |
Consumer Staples: 3.85% | | | | | | | | | | | | |
| | | | |
| Beverages: 3.85% | | | | | | | | | | | | |
Constellation Brands Incorporated Class A † | | | | | | | 350,900 | | | | 26,903,503 | |
| | | | | | | | | | | | |
| | | | |
Energy: 2.13% | | | | | | | | | | | | |
| | | | |
| Oil, Gas & Consumable Fuels: 2.13% | | | | | | | | | | | | |
Pioneer Natural Resources Company | | | | | | | 88,100 | | | | 14,917,092 | |
| | | | | | | | | | | | |
| | | | |
Financials: 10.02% | | | | | | | | | | | | |
| | | | |
| Capital Markets: 1.72% | | | | | | | | | | | | |
Affiliated Managers Group Incorporated † | | | | | | | 60,400 | | | | 12,034,096 | |
| | | | | | | | | | | | |
| | | | |
| Consumer Finance: 2.61% | | | | | | | | | | | | |
American Express Company | | | | | | | 214,500 | | | | 18,236,790 | |
| | | | | | | | | | | | |
| | | | |
| Diversified Financial Services: 3.41% | | | | | | | | | | | | |
IntercontinentalExchange Group Incorporated | | | | | | | 114,300 | | | | 23,864,697 | |
| | | | | | | | | | | | |
| | | | |
| Insurance: 2.28% | | | | | | | | | | | | |
Aon plc | | | | | | | 198,700 | | | | 15,987,402 | |
| | | | | | | | | | | | |
The accompanying notes are an integral part of these financial statements.
| | | | |
| 8 | | Wells Fargo Advantage Endeavor Select Fund | | Portfolio of investments—January 31, 2014 (unaudited) |
| | | | | | | | | | | | |
| Security name | | | | | | Shares | | | Value | |
| | | | |
Health Care: 15.00% | | | | | | | | | | | | |
| | | | |
| Biotechnology: 10.68% | | | | | | | | | | | | |
Alexion Pharmaceuticals Incorporated † | | | | | | | 136,300 | | | $ | 21,634,899 | |
Biogen Idec Incorporated † | | | | | | | 55,200 | | | | 17,257,728 | |
Celgene Corporation † | | | | | | | 100,000 | | | | 15,193,000 | |
Gilead Sciences Incorporated † | | | | | | | 255,900 | | | | 20,638,335 | |
| | | | |
| | | | | | | | | | | 74,723,962 | |
| | | | | | | | | | | | |
| | | | |
| Health Care Equipment & Supplies: 2.22% | | | | | | | | | | | | |
Boston Scientific Corporation † | | | | | | | 1,145,700 | | | | 15,501,321 | |
| | | | | | | | | | | | |
| | | | |
| Pharmaceuticals: 2.10% | | | | | | | | | | | | |
Actavis plc † | | | | | | | 77,900 | | | | 14,721,542 | |
| | | | | | | | | | | | |
| | | | |
Industrials: 9.63% | | | | | | | | | | | | |
| | | | |
| Aerospace & Defense: 2.64% | | | | | | | | | | | | |
Precision Castparts Corporation | | | | | | | 72,542 | | | | 18,480,075 | |
| | | | | | | | | | | | |
| | | | |
| Airlines: 2.68% | | | | | | | | | | | | |
Delta Air Lines Incorporated | | | | | | | 613,700 | | | | 18,785,357 | |
| | | | | | | | | | | | |
| | | | |
| Electrical Equipment: 2.20% | | | | | | | | | | | | |
Eaton Corporation plc | | | | | | | 210,400 | | | | 15,378,136 | |
| | | | | | | | | | | | |
| | | | |
| Road & Rail: 2.11% | | | | | | | | | | | | |
Kansas City Southern | | | | | | | 139,600 | | | | 14,740,364 | |
| | | | | | | | | | | | |
| | | | |
Information Technology: 33.73% | | | | | | | | | | | | |
| | | | |
| Computers & Peripherals: 3.16% | | | | | | | | | | | | |
Apple Incorporated | | | | | | | 44,149 | | | | 22,100,989 | |
| | | | | | | | | | | | |
| | | | |
| Internet Software & Services: 12.12% | | | | | | | | | | | | |
Baidu Incorporated ADR † | | | | | | | 60,400 | | | | 9,452,600 | |
Facebook Incorporated Class A † | | | | | | | 400,700 | | | | 25,071,799 | |
Google Incorporated Class A † | | | | | | | 31,775 | | | | 37,525,322 | |
LinkedIn Corporation Class A † | | | | | | | 59,100 | | | | 12,718,911 | |
| | | | |
| | | | | | | | | | | 84,768,632 | |
| | | | | | | | | | | | |
| | | | |
| IT Services: 8.17% | | | | | | | | | | | | |
Alliance Data Systems Corporation † | | | | | | | 91,500 | | | | 21,928,890 | |
Vantiv Incorporated Class A † | | | | | | | 401,400 | | | | 12,178,476 | |
Visa Incorporated Class A | | | | | | | 107,100 | | | | 23,072,553 | |
| | | | |
| | | | | | | | | | | 57,179,919 | |
| | | | | | | | | | | | |
| | | | |
| Semiconductors & Semiconductor Equipment: 3.72% | | | | | | | | | | | | |
ARM Holdings plc | | | | | | | 287,000 | | | | 13,222,090 | |
ASML Holding NV | | | | | | | 151,300 | | | | 12,804,519 | |
| | | | |
| | | | | | | | | | | 26,026,609 | |
| | | | | | | | | | | | |
The accompanying notes are an integral part of these financial statements.
| | | | | | |
| Portfolio of investments—January 31, 2014 (unaudited) | | Wells Fargo Advantage Endeavor Select Fund | | | 9 | |
| | | | | | | | | | | | | | |
| Security name | | | | | | | Shares | | | Value | |
| | | | |
| Software: 6.56% | | | | | | | | | | | | | | |
Adobe Systems Incorporated † | | | | | | | | | 271,400 | | | $ | 16,064,166 | |
Salesforce.com Incorporated † | | | | | | | | | 270,100 | | | | 16,349,153 | |
ServiceNow Incorporated † | | | | | | | | | 213,000 | | | | 13,510,590 | |
| | | | |
| | | | | | | | | | | | | 45,923,909 | |
| | | | | | | | | | | | | | |
| | | | |
Materials: 2.52% | | | | | | | | | | | | | | |
| | | | |
| Chemicals: 2.52% | | | | | | | | | | | | | | |
Monsanto Company | | | | | | | | | 165,400 | | | | 17,623,370 | |
| | | | | | | | | | | | | | |
| | | | |
Telecommunication Services: 1.74% | | | | | | | | | | | | | | |
| | | | |
| Wireless Telecommunication Services: 1.74% | | | | | | | | | | | | | | |
SBA Communications Corporation Class A † | | | | | | | | | 130,979 | | | | 12,148,302 | |
| | | | | | | | | | | | | | |
| | | | |
Total Common Stocks (Cost $508,481,622) | | | | | | | | | | | | | 683,110,222 | |
| | | | | | | | | | | | | | |
| | | | |
| | | Yield | | | | | | | | | |
| Short-Term Investments: 0.96% | | | | | | | | | | | | | | |
| | | | |
| Investment Companies: 0.96% | | | | | | | | | | | | | | |
Wells Fargo Advantage Cash Investment Money Market Fund, Select Class (u)(l) | | | 0.07 | % | | | | | 6,727,804 | | | | 6,727,804 | |
| | | | | | | | | | | | | | |
| | | | |
Total Short-Term Investments (Cost $6,727,804) | | | | | | | | | | | | | 6,727,804 | |
| | | | | | | | | | | | | | |
| | | | | | | | |
Total investments in securities
(Cost $515,209,426) * | | | 98.60 | % | | | 689,838,026 | |
Other assets and liabilities, net | | | 1.40 | | | | 9,815,679 | |
| | | | | | | | |
| Total net assets | | | 100.00 | % | | $ | 699,653,705 | |
| | | | | | | | |
| † | Non-income-earning security |
| (u) | Rate shown is the 7-day annualized yield at period end. |
| (l) | Investment in an affiliate |
| * | Cost for federal income tax purposes is $515,882,867, and unrealized appreciation (depreciation) consists of: |
| | | | |
Gross unrealized appreciation | | $ | 180,256,886 | |
Gross unrealized depreciation | | | (6,301,727 | ) |
| | | | |
Net unrealized appreciation | | $ | 173,955,159 | |
The accompanying notes are an integral part of these financial statements.
| | | | |
| 10 | | Wells Fargo Advantage Endeavor Select Fund | | Statement of assets and liabilities—January 31, 2014 (unaudited) |
| | | | |
| | | | |
| |
Assets | | | | |
Investments | | | | |
In unaffiliated securities, at value (see cost below) | | $ | 683,110,222 | |
In affiliated securities, at value (see cost below) | | | 6,727,804 | |
| | | | |
Total investments, at value (see cost below) | | | 689,838,026 | |
Receivable for investments sold | | | 19,523,082 | |
Receivable for Fund shares sold | | | 1,083,366 | |
Receivable for dividends | | | 191,201 | |
Receivable for securities lending income | | | 41 | |
Prepaid expenses and other assets | | | 39,148 | |
| | | | |
Total assets | | | 710,674,864 | |
| | | | |
| |
Liabilities | | | | |
Payable for investments purchased | | | 9,580,935 | |
Payable for Fund shares redeemed | | | 787,374 | |
Advisory fee payable | | | 398,340 | |
Distribution fees payable | | | 5,130 | |
Due to other related parties | | | 93,635 | |
Accrued expenses and other liabilities | | | 155,745 | |
| | | | |
Total liabilities | | | 11,021,159 | |
| | | | |
Total net assets | | $ | 699,653,705 | |
| | | | |
| |
NET ASSETS CONSIST OF | | | | |
Paid-in capital | | $ | 501,861,927 | |
Accumulated net investment loss | | | (1,226,171 | ) |
Accumulated net realized gains on investments | | | 24,389,349 | |
Net unrealized gains on investments | | | 174,628,600 | |
| | | | |
Total net assets | | $ | 699,653,705 | |
| | | | |
| |
COMPUTATION OF NET ASSET VALUE AND OFFERING PRICE PER SHARE1 | | | | |
Net assets – Class A | | $ | 45,592,856 | |
Shares outstanding – Class A | | | 3,339,763 | |
Net asset value per share – Class A | | | $13.65 | |
Maximum offering price per share – Class A2 | | | $14.48 | |
Net assets – Class B | | $ | 383,562 | |
Shares outstanding – Class B | | | 31,390 | |
Net asset value per share – Class B | | | $12.22 | |
Net assets – Class C | | $ | 6,803,528 | |
Shares outstanding – Class C | | | 556,724 | |
Net asset value per share – Class C | | | $12.22 | |
Net assets – Administrator Class | | $ | 63,933,531 | |
Shares outstanding – Administrator Class | | | 4,587,224 | |
Net asset value per share – Administrator Class | | | $13.94 | |
Net assets – Institutional Class | | $ | 582,940,228 | |
Shares outstanding – Institutional Class | | | 41,285,066 | |
Net asset value per share – Institutional Class | | | $14.12 | |
| |
Investments in unaffiliated securities, at cost | | $ | 508,481,622 | |
| | | | |
Investments in affiliated securities, at cost | | $ | 6,727,804 | |
| | | | |
Total investments, at cost | | $ | 515,209,426 | |
| | | | |
| 1. | The Fund has an unlimited number of authorized shares. |
| 2. | Maximum offering price is computed as 100/94.25 of net asset value. On investments of $50,000 or more, the offering price is reduced. |
The accompanying notes are an integral part of these financial statements.
| | | | | | |
| Statement of operations—six months ended January 31, 2014 (unaudited) | | Wells Fargo Advantage Endeavor Select Fund | | | 11 | |
| | | | |
| | | | |
| |
Investment income | | | | |
Dividends | | $ | 1,722,189 | |
Securities lending income, net | | | 8,838 | |
Income from affiliated securities | | | 3,711 | |
| | | | |
Total investment income | | | 1,734,738 | |
| | | | |
| |
Expenses | | | | |
Advisory fee | | | 2,206,919 | |
Administration fees | | | | |
Fund level | | | 171,458 | |
Class A | | | 60,599 | |
Class B | | | 566 | |
Class C | | | 8,941 | |
Administrator Class | | | 34,197 | |
Institutional Class | | | 225,403 | |
Shareholder servicing fees | | | | |
Class A | | | 58,268 | |
Class B | | | 545 | |
Class C | | | 8,597 | |
Administrator Class | | | 77,689 | |
Distribution fees | | | | |
Class B | | | 1,634 | |
Class C | | | 25,792 | |
Custody and accounting fees | | | 22,087 | |
Professional fees | | | 20,023 | |
Registration fees | | | 35,952 | |
Shareholder report expenses | | | 85,704 | |
Trustees’ fees and expenses | | | 6,086 | |
Other fees and expenses | | | 7,998 | |
| | | | |
Total expenses | | | 3,058,458 | |
Less: Fee waivers and/or expense reimbursements | | | (98,129 | ) |
| | | | |
Net expenses | | | 2,960,329 | |
| | | | |
Net investment loss | | | (1,225,591 | ) |
| | | | |
| |
REALIZED AND UNREALIZED GAINS (LOSSES) ON INVESTMENTS | | | | |
Net realized gains on investments | | | 56,161,256 | |
Net change in unrealized gains (losses) on investments | | | 35,808,745 | |
| | | | |
Net realized and unrealized gains (losses) on investments | | | 91,970,001 | |
| | | | |
Net increase in net assets resulting from operations | | $ | 90,744,410 | |
| | | | |
The accompanying notes are an integral part of these financial statements.
| | | | |
| 12 | | Wells Fargo Advantage Endeavor Select Fund | | Statement of changes in net assets |
| | | | | | | | | | | | | | | | |
| | | Six months ended January 31, 2014 (unaudited) | | | Year ended July 31, 2013 | |
| | | | |
Operations | | | | | | | | | | | | | | | | |
Net investment income (loss) | | | | | | $ | (1,225,591 | ) | | | | | | $ | 2,709,721 | |
Net realized gains on investments | | | | | | | 56,161,256 | | | | | | | | 140,899,605 | |
Net change in unrealized gains (losses) on investments | | | | | | | 35,808,745 | | | | | | | | (23,588,525 | ) |
| | | | |
Net increase in net assets resulting from operations | | | | | | | 90,744,410 | | | | | | | | 120,020,801 | |
| | | | |
| | | | |
Distributions to shareholders from | | | | | | | | | | | | | | | | |
Net investment income | | | | | | | | | | | | | | | | |
Administrator Class | | | | | | | (97,085 | ) | | | | | | | 0 | |
Institutional Class | | | | | | | (2,001,641 | ) | | | | | | | 0 | |
Net realized gains | | | | | | | | | | | | | | | | |
Class A | | | | | | | (2,203,446 | ) | | | | | | | 0 | |
Class B | | | | | | | (22,001 | ) | | | | | | | 0 | |
Class C | | | | | | | (364,783 | ) | | | | | | | 0 | |
Administrator Class | | | | | | | (2,987,418 | ) | | | | | | | 0 | |
Institutional Class | | | | | | | (26,344,957 | ) | | | | | | | 0 | |
| | | | |
Total distributions to shareholders | | | | | | | (34,021,331 | ) | | | | | | | 0 | |
| | | | |
| | | | |
Capital share transactions | | | Shares | | | | | | | | Shares | | | | | |
Proceeds from shares sold | | | | | | | | | | | | | | | | |
Class A | | | 139,501 | | | | 1,866,923 | | | | 419,904 | | | | 4,822,123 | |
Class B | | | 468 | | | | 5,779 | | | | 1,531 | | | | 16,659 | |
Class C | | | 32,874 | | | | 406,274 | | | | 51,254 | | | | 528,802 | |
Administrator Class | | | 260,469 | | | | 3,575,680 | | | | 2,170,274 | | | | 26,247,659 | |
Institutional Class | | | 5,626,307 | | | | 77,565,943 | | | | 8,615,117 | | | | 101,674,535 | |
| | | | |
| | | | | | | 83,420,599 | | | | | | | | 133,289,778 | |
| | | | |
Reinvestment of distributions | | | | | | | | | | | | | | | | |
Class A | | | 158,036 | | | | 2,144,550 | | | | 0 | | | | 0 | |
Class B | | | 1,707 | | | | 20,756 | | | | 0 | | | | 0 | |
Class C | | | 29,369 | | | | 357,128 | | | | 0 | | | | 0 | |
Administrator Class | | | 194,104 | | | | 2,691,721 | | | | 0 | | | | 0 | |
Institutional Class | | | 1,890,146 | | | | 26,598,582 | | | | 0 | | | | 0 | |
| | | | |
| | | | | | | 31,812,737 | | | | | | | | 0 | |
| | | | |
Payment for shares redeemed | | | | | | | | | | | | | | | | |
Class A | | | (474,178 | ) | | | (6,369,692 | ) | | | (1,424,499 | ) | | | (16,145,152 | ) |
Class B | | | (14,556 | ) | | | (173,933 | ) | | | (72,878 | ) | | | (742,509 | ) |
Class C | | | (64,086 | ) | | | (772,500 | ) | | | (144,602 | ) | | | (1,485,085 | ) |
Administrator Class | | | (1,237,131 | ) | | | (17,068,108 | ) | | | (2,211,989 | ) | | | (25,682,424 | ) |
Institutional Class | | | (5,520,902 | ) | | | (76,071,340 | ) | | | (37,737,981 | ) | | | (428,796,022 | ) |
| | | | |
| | | | | | | (100,455,573 | ) | | | | | | | (472,851,192 | ) |
| | | | |
Net increase (decrease) in net assets resulting from capital share transactions | | | | | | | 14,777,763 | | | | | | | | (339,561,414 | ) |
| | | | |
Total increase (decrease) in net assets | | | | | | | 71,500,842 | | | | | | | | (219,540,613 | ) |
| | | | |
| | | |
Net assets | | | | | | | | | | | | |
Beginning of period | | | | | | | 628,152,863 | | | | | | | | 847,693,476 | |
| | | | |
End of period | | | | | | $ | 699,653,705 | | | | | | | $ | 628,152,863 | |
| | | | |
Undistributed (accumulated) net investment income (loss) | | | | | | $ | (1,226,171 | ) | | | | | | $ | 2,098,146 | |
| | | | |
The accompanying notes are an integral part of these financial statements.
| | | | | | |
| Financial highlights | | Wells Fargo Advantage Endeavor Select Fund | | | 13 | |
(For a share outstanding throughout each period)
| | | | | | | | | | | | | | | | | | | | | | | | |
| | | Six months ended
January 31, 2014 (unaudited) | | | Year ended July 31 | |
| CLASS A | | | 2013 | | | 2012 | | | 2011 | | | 2010 | | | 2009 | |
Net asset value, beginning of period | | $ | 12.52 | | | $ | 10.45 | | | $ | 10.12 | | | $ | 8.12 | | | $ | 7.25 | | | $ | 10.81 | |
Net investment income (loss) | | | (0.05 | )1 | | | 0.00 | 1 ,2 | | | (0.05 | )1 | | | (0.05 | )1 | | | (0.04 | )1 | | | (0.01 | )1 |
Net realized and unrealized gains (losses) on investments | | | 1.85 | | | | 2.07 | | | | 0.38 | | | | 2.05 | | | | 0.91 | | | | (3.29 | ) |
| | | | | | | | | | | | | | | | | | | | | | | | |
Total from investment operations | | | 1.80 | | | | 2.07 | | | | 0.33 | | | | 2.00 | | | | 0.87 | | | | (3.30 | ) |
Distributions to shareholders from | | | | | | | | | | | | | | | | | | | | | | | | |
Net realized gains | | | (0.67 | ) | | | 0.00 | | | | 0.00 | | | | 0.00 | | | | 0.00 | | | | (0.26 | ) |
Net asset value, end of period | | $ | 13.65 | | | $ | 12.52 | | | $ | 10.45 | | | $ | 10.12 | | | $ | 8.12 | | | $ | 7.25 | |
Total return3 | | | 14.37 | % | | | 19.81 | % | | | 3.26 | % | | | 24.63 | % | | | 12.00 | % | | | (30.10 | )% |
Ratios to average net assets (annualized) | | | | | | | | | | | | | | | | | | | | | | | | |
Gross expenses | | | 1.26 | % | | | 1.26 | % | | | 1.23 | % | | | 1.23 | % | | | 1.28 | % | | | 1.32 | % |
Net expenses | | | 1.25 | % | | | 1.25 | % | | | 1.23 | % | | | 1.23 | % | | | 1.25 | % | | | 1.25 | % |
Net investment income (loss) | | | (0.74 | )% | | | 0.03 | % | | | (0.49 | )% | | | (0.52 | )% | | | (0.51 | )% | | | (0.08 | )% |
Supplemental data | | | | | | | | | | | | | | | | | | | | | | | | |
Portfolio turnover rate | | | 56 | % | | | 97 | % | | | 94 | % | | | 100 | % | | | 139 | % | | | 173 | % |
Net assets, end of period (000s omitted) | | | $45,593 | | | | $44,041 | | | | $47,233 | | | | $94,704 | | | | $125,266 | | | | $155,666 | |
| 1. | Calculated based upon average shares outstanding |
| 2. | Amount is less than $0.005. |
| 3. | Total return calculations do not include any sales charges. Returns for periods of less than one year are not annualized. |
The accompanying notes are an integral part of these financial statements.
| | | | |
| 14 | | Wells Fargo Advantage Endeavor Select Fund | | Financial highlights |
(For a share outstanding throughout each period)
| | | | | | | | | | | | | | | | | | | | | | | | |
| | | Six months ended
January 31, 2014 (unaudited) | | | Year ended July 31 | |
| CLASS B | | | 2013 | | | 2012 | | | 2011 | | | 2010 | | | 2009 | |
Net asset value, beginning of period | | $ | 11.31 | | | $ | 9.51 | | | $ | 9.28 | | | $ | 7.50 | | | $ | 6.75 | | | $ | 10.18 | |
Net investment loss | | | (0.09 | )1 | | | (0.07 | )1 | | | (0.11 | )1 | | | (0.11 | )1 | | | (0.09 | )1 | | | (0.06 | )1 |
Net realized and unrealized gains (losses) on investments | | | 1.67 | | | | 1.87 | | | | 0.34 | | | | 1.89 | | | | 0.84 | | | | (3.11 | ) |
| | | | | | | | | | | | | | | | | | | | | | | | |
Total from investment operations | | | 1.58 | | | | 1.80 | | | | 0.23 | | | | 1.78 | | | | 0.75 | | | | (3.17 | ) |
Distributions to shareholders from | | | | | | | | | | | | | | | | | | | | | | | | |
Net realized gains | | | (0.67 | ) | | | 0.00 | | | | 0.00 | | | | 0.00 | | | | 0.00 | | | | (0.26 | ) |
Net asset value, end of period | | $ | 12.22 | | | $ | 11.31 | | | $ | 9.51 | | | $ | 9.28 | | | $ | 7.50 | | | $ | 6.75 | |
Total return2 | | | 13.96 | % | | | 18.93 | % | | | 2.48 | % | | | 23.73 | % | | | 11.11 | % | | | (30.71 | )% |
Ratios to average net assets (annualized) | | | | | | | | | | | | | | | | | | | | | | | | |
Gross expenses | | | 2.00 | % | | | 2.00 | % | | | 1.98 | % | | | 1.98 | % | | | 2.02 | % | | | 2.07 | % |
Net expenses | | | 2.00 | % | | | 2.00 | % | | | 1.98 | % | | | 1.98 | % | | | 2.00 | % | | | 2.00 | % |
Net investment loss | | | (1.48 | )% | | | (0.67 | )% | | | (1.24 | )% | | | (1.26 | )% | | | (1.25 | )% | | | (0.85 | )% |
Supplemental data | | | | | | | | | | | | | | | | | | | | | | | | |
Portfolio turnover rate | | | 56 | % | | | 97 | % | | | 94 | % | | | 100 | % | | | 139 | % | | | 173 | % |
Net assets, end of period (000s omitted) | | | $384 | | | | $495 | | | | $1,095 | | | | $1,633 | | | | $2,622 | | | | $3,976 | |
| 1. | Calculated based upon average shares outstanding |
| 2. | Total return calculations do not include any sales charges. Returns for periods of less than one year are not annualized. |
The accompanying notes are an integral part of these financial statements.
| | | | | | |
| Financial highlights | | Wells Fargo Advantage Endeavor Select Fund | | | 15 | |
(For a share outstanding throughout each period)
| | | | | | | | | | | | | | | | | | | | | | | | |
| | | Six months ended
January 31, 2014 (unaudited) | | | Year ended July 31 | |
| CLASS C | | | 2013 | | | 2012 | | | 2011 | | | 2010 | | | 2009 | |
Net asset value, beginning of period | | $ | 11.32 | | | $ | 9.51 | | | $ | 9.28 | | | $ | 7.50 | | | $ | 6.75 | | | $ | 10.18 | |
Net investment loss | | | (0.09 | )1 | | | (0.07 | )1 | | | (0.11 | )1 | | | (0.11 | )1 | | | (0.09 | )1 | | | (0.05 | )1 |
Net realized and unrealized gains (losses) on investments | | | 1.66 | | | | 1.88 | | | | 0.34 | | | | 1.89 | | | | 0.84 | | | | (3.12 | ) |
| | | | | | | | | | | | | | | | | | | | | | | | |
Total from investment operations | | | 1.57 | | | | 1.81 | | | | 0.23 | | | | 1.78 | | | | 0.75 | | | | (3.17 | ) |
Distributions to shareholders from | | | | | | | | | | | | | | | | | | | | | | | | |
Net realized gains | | | (0.67 | ) | | | 0.00 | | | | 0.00 | | | | 0.00 | | | | 0.00 | | | | (0.26 | ) |
Net asset value, end of period | | $ | 12.22 | | | $ | 11.32 | | | $ | 9.51 | | | $ | 9.28 | | | $ | 7.50 | | | $ | 6.75 | |
Total return2 | | | 13.96 | % | | | 18.93 | % | | | 2.48 | % | | | 23.73 | % | | | 11.11 | % | | | (30.70 | )% |
Ratios to average net assets (annualized) | | | | | | | | | | | | | | | | | | | | | | | | |
Gross expenses | | | 2.01 | % | | | 2.01 | % | | | 1.98 | % | | | 1.98 | % | | | 2.03 | % | | | 2.07 | % |
Net expenses | | | 2.00 | % | | | 2.00 | % | | | 1.98 | % | | | 1.98 | % | | | 2.00 | % | | | 2.00 | % |
Net investment loss | | | (1.50 | )% | | | (0.72 | )% | | | (1.25 | )% | | | (1.27 | )% | | | (1.26 | )% | | | (0.82 | )% |
Supplemental data | | | | | | | | | | | | | | | | | | | | | | | | |
Portfolio turnover rate | | | 56 | % | | | 97 | % | | | 94 | % | | | 100 | % | | | 139 | % | | | 173 | % |
Net assets, end of period (000s omitted) | | | $6,804 | | | | $6,320 | | | | $6,199 | | | | $7,448 | | | | $7,825 | | | | $9,139 | |
| 1. | Calculated based upon average shares outstanding |
| 2. | Total return calculations do not include any sales charges. Returns for periods of less than one year are not annualized. |
The accompanying notes are an integral part of these financial statements.
| | | | |
| 16 | | Wells Fargo Advantage Endeavor Select Fund | | Financial highlights |
(For a share outstanding throughout each period)
| | | | | | | | | | | | | | | | | | | | | | | | |
| | | Six months ended
January 31, 2014 (unaudited) | | | Year ended July 31 | |
| ADMINISTRATOR CLASS | | | 2013 | | | 2012 | | | 2011 | | | 2010 | | | 2009 | |
Net asset value, beginning of period | | $ | 12.78 | | | $ | 10.63 | | | $ | 10.26 | | | $ | 8.22 | | | $ | 7.34 | | | $ | 10.91 | |
Net investment income (loss) | | | (0.03 | )1 | | | 0.03 | 1 | | | (0.03 | )1 | | | (0.03 | )1 | | | (0.02 | )1 | | | 0.01 | 1 |
Net realized and unrealized gains (losses) on investments | | | 1.88 | | | | 2.12 | | | | 0.40 | | | | 2.07 | | | | 0.91 | | | | (3.32 | ) |
| | | | | | | | | | | | | | | | | | | | | | | | |
Total from investment operations | | | 1.85 | | | | 2.15 | | | | 0.37 | | | | 2.04 | | | | 0.89 | | | | (3.31 | ) |
Distributions to shareholders from | | | | | | | | | | | | | | | | | | | | | | | | |
Net investment income | | | (0.02 | ) | | | 0.00 | | | | 0.00 | | | | 0.00 | | | | (0.01 | ) | | | 0.00 | |
Net realized gains | | | (0.67 | ) | | | 0.00 | | | | 0.00 | | | | 0.00 | | | | 0.00 | | | | (0.26 | ) |
| | | | | | | | | | | | | | | | | | | | | | | | |
Total distributions to shareholders | | | (0.69 | ) | | | 0.00 | | | | 0.00 | | | | 0.00 | | | | (0.01 | ) | | | (0.26 | ) |
Net asset value, end of period | | $ | 13.94 | | | $ | 12.78 | | | $ | 10.63 | | | $ | 10.26 | | | $ | 8.22 | | | $ | 7.34 | |
Total return2 | | | 14.58 | % | | | 20.13 | % | | | 3.51 | % | | | 24.94 | % | | | 12.16 | % | | | (29.91 | )% |
Ratios to average net assets (annualized) | | | | | | | | | | | | | | | | | | | | | | | | |
Gross expenses | | | 1.07 | % | | | 1.08 | % | | | 1.07 | % | | | 1.07 | % | | | 1.10 | % | | | 1.14 | % |
Net expenses | | | 1.00 | % | | | 1.00 | % | | | 1.00 | % | | | 1.00 | % | | | 1.00 | % | | | 1.00 | % |
Net investment income (loss) | | | (0.48 | )% | | | 0.23 | % | | | (0.27 | )% | | | (0.29 | )% | | | (0.26 | )% | | | 0.20 | % |
Supplemental data | | | | | | | | | | | | | | | | | | | | | | | | |
Portfolio turnover rate | | | 56 | % | | | 97 | % | | | 94 | % | | | 100 | % | | | 139 | % | | | 173 | % |
Net assets, end of period (000s omitted) | | | $63,934 | | | | $68,611 | | | | $57,533 | | | | $232,954 | | | | $223,320 | | | | $247,298 | |
| 1. | Calculated based upon average shares outstanding |
| 2. | Returns for periods of less than one year are not annualized. |
The accompanying notes are an integral part of these financial statements.
| | | | | | |
| Financial highlights | | Wells Fargo Advantage Endeavor Select Fund | | | 17 | |
(For a share outstanding throughout each period)
| | | | | | | | | | | | | | | | | | | | | | | | |
| | | Six months ended
January 31, 2014 (unaudited) | | | Year ended July 31 | |
| INSTITUTIONAL CLASS | | | 2013 | | | 2012 | | | 2011 | | | 2010 | | | 2009 | |
Net asset value, beginning of period | | $ | 12.95 | | | $ | 10.75 | | | $ | 10.37 | | | $ | 8.28 | | | $ | 7.39 | | | $ | 10.97 | |
Net Investment income (loss) | | | (0.02 | )1 | | | 0.06 | 1 | | | (0.01 | )1 | | | (0.01 | )1 | | | (0.01 | )1 | | | 0.03 | 1 |
Net realized and unrealized gains (losses) on investments | | | 1.91 | | | | 2.14 | | | | 0.39 | | | | 2.10 | | | | 0.93 | | | | (3.35 | ) |
| | | | | | | | | | | | | | | | | | | | | | | | |
Total from investment operations | | | 1.89 | | | | 2.20 | | | | 0.38 | | | | 2.09 | | | | 0.92 | | | | (3.32 | ) |
Distributions to shareholders from | | | | | | | | | | | | | | | | | | | | | | | | |
Net investment income | | | (0.05 | ) | | | 0.00 | | | | 0.00 | | | | 0.00 | | | | (0.03 | ) | | | 0.00 | |
Net realized gains | | | (0.67 | ) | | | 0.00 | | | | 0.00 | | | | 0.00 | | | | 0.00 | | | | (0.26 | ) |
| | | | | | | | | | | | | | | | | | | | | | | | |
Total distributions to shareholders | | | (0.72 | ) | | | 0.00 | | | | 0.00 | | | | 0.00 | | | | (0.03 | ) | | | (0.26 | ) |
Net asset value, end of period | | $ | 14.12 | | | $ | 12.95 | | | $ | 10.75 | | | $ | 10.37 | | | $ | 8.28 | | | $ | 7.39 | |
Total return2 | | | 14.68 | % | | | 20.37 | % | | | 3.66 | % | | | 25.24 | % | | | 12.41 | % | | | (29.84 | )% |
Ratios to average net assets (annualized) | | | | | | | | | | | | | | | | | | | | | | | | |
Gross expenses | | | 0.83 | % | | | 0.83 | % | | | 0.80 | % | | | 0.80 | % | | | 0.83 | % | | | 0.88 | % |
Net expenses | | | 0.80 | % | | | 0.80 | % | | | 0.79 | % | | | 0.80 | % | | | 0.80 | % | | | 0.80 | % |
Net investment income (loss) | | | (0.30 | )% | | | 0.50 | % | | | (0.06 | )% | | | (0.08 | )% | | | (0.07 | )% | | | 0.38 | % |
Supplemental data | | | | | | | | | | | | | | | | | | | | | | | | |
Portfolio turnover rate | | | 56 | % | | | 97 | % | | | 94 | % | | | 100 | % | | | 139 | % | | | 173 | % |
Net assets, end of period (000s omitted) | | | $582,940 | | | | $508,685 | | | | $735,633 | | | | $853,494 | | | | $933,587 | | | | $867,167 | |
| 1. | Calculated based upon average shares outstanding |
| 2. | Returns for periods of less than one year are not annualized. |
The accompanying notes are an integral part of these financial statements.
| | | | |
| 18 | | Wells Fargo Advantage Endeavor Select Fund | | Notes to financial statements (unaudited) |
1. ORGANIZATION
Wells Fargo Funds Trust (the “Trust”), a Delaware statutory trust organized on March 10, 1999, is an open-end management investment company registered under the Investment Company Act of 1940, as amended (the “1940 Act”). These financial statements report on the Wells Fargo Advantage Endeavor Select Fund (the “Fund”) which is a non-diversified series of the Trust.
2. SIGNIFICANT ACCOUNTING POLICIES
The following significant accounting policies, which are consistently followed in the preparation of the financial statements of the Fund, are in conformity with U.S. generally accepted accounting principles which require management to make estimates and assumptions that affect the reported amounts of assets and liabilities, disclosure of contingent assets and liabilities at the date of the financial statements, and the reported amounts of revenues and expenses during the reporting period. Actual results could differ from those estimates.
Securities valuation
All investments are valued each business day as of the close of regular trading on the New York Stock Exchange (generally 4 p.m. Eastern Time).
Equity securities that are listed on a foreign or domestic exchange or market are valued at the official closing price or, if none, the last sales price. If no sale occurs on the primary exchange or market for the security that day, the prior day’s price will be deemed “stale” and fair values will be determined in accordance with the Fund’s Valuation Procedures.
Investments in registered open-end investment companies are valued at net asset value. Non-registered investment vehicles are fair valued at net asset value.
Investments which are not valued using any of the methods discussed above are valued at their fair value, as determined in good faith by the Board of Trustees of the Fund . The Board of Trustees has established a Valuation Committee comprised of the Trustees and has delegated to it the authority to take any actions regarding the valuation of portfolio securities that the Valuation Committee deems necessary or appropriate, including determining the fair value of portfolio securities, unless the determination has been delegated to the Management Valuation Team of Wells Fargo Funds Management, LLC (“Funds Management”). The Board of Trustees retains the authority to make or ratify any valuation decisions or approve any changes to the Valuation Procedures as it deems appropriate. On a quarterly basis, the Board of Trustees receives reports on any valuation actions taken by the Valuation Committee or the Management Valuation Team which may include items for ratification.
Valuations of fair valued securities are compared to the next actual sales price when available, or other appropriate market values, to assess the continued appropriateness of the fair valuation methodologies used. These securities are fair valued on a day-to-day basis, taking into consideration changes to appropriate market information and any significant changes to the inputs considered in the valuation process until there is a readily available price provided on an exchange or by an independent pricing service. Valuations received from an independent pricing service or independent broker-dealer quotes are periodically validated by comparisons to most recent trades and valuations provided by other independent pricing services in addition to the review of prices by the adviser and/or subadviser. Unobservable inputs used in determining fair valuations are identified based on the type of security, taking into consideration factors utilized by market participants in valuing the investment, knowledge about the issuer and the current market environment.
Security loans
The Fund may lend its securities from time to time in order to earn additional income in the form of fees or interest on securities received as collateral or the investment of any cash received as collateral. The Fund continues to receive interest or dividends on the securities loaned. The Fund receives collateral in the form of cash or securities with a value at least equal to the value of the securities on loan. The value of the loaned securities is determined at the close of each business day and any additional required collateral is delivered to the Fund on the next business day. In a securities lending transaction, the net asset value of the Fund will be affected by an increase or decrease in the value of the securities loaned and by an increase or decrease in the value of the instrument in which collateral is invested. The amount of securities lending activity undertaken by the Fund fluctuates from time to time. In the event of default or bankruptcy by the borrower, the Fund may be prevented from recovering the loaned securities or gaining access to the collateral or may experience delays or costs in doing so. In addition, the investment of any cash collateral received may lose all or part of its value. The Fund has the right under the lending agreement to recover the securities from the borrower on demand.
The Fund lends its securities through an unaffiliated securities lending agent. Cash collateral received in connection with its securities lending transactions is invested in Wells Fargo Securities Lending Cash Investments, LLC (the “Securities Lending Fund”). The Securities Lending Fund is exempt from registration under Section 3(c)(7) of the 1940 Act and is
| | | | | | |
| Notes to financial statements (unaudited) | | Wells Fargo Advantage Endeavor Select Fund | | | 19 | |
managed by Funds Management and is subadvised by Wells Capital Management Incorporated (“WellsCap”). Funds Management receives an advisory fee starting at 0.05% and declining to 0.01% as the average daily net assets of the Securities Lending Fund increase. All of the fees received by Funds Management are paid to WellsCap for its services as subadviser. The Securities Lending Fund seeks to provide a positive return compared to the daily Fed Funds Open rate by investing in high-quality, U.S. dollar-denominated short-term money market instruments. Securities Lending Fund investments are fair valued based upon the amortized cost valuation technique. Income earned from investment in the Securities Lending Fund is included in securities lending income on the Statement of Operations.
Security transactions and income recognition
Securities transactions are recorded on a trade date basis. Realized gains or losses are recorded on the basis of identified cost.
Dividend income is recognized on the ex-dividend date.
Distributions to shareholders
Distributions to shareholders from net investment income and net realized gains, if any, are recorded on the ex-dividend date. Such distributions are determined in conformity with federal income tax regulations, which may differ in amount or character from net investment income and realized gains recognized for purposes of U.S. generally accepted accounting principles.
Federal and other taxes
The Fund intends to continue to qualify as a regulated investment company by distributing substantially all of its investment company taxable income and any net realized capital gains (after reduction for capital loss carryforwards) sufficient to relieve it from all, or substantially all, federal income taxes. Accordingly, no provision for federal income taxes was required.
The Fund’s income and federal excise tax returns and all financial records supporting those returns for the prior three fiscal years are subject to examination by the federal and Delaware revenue authorities. Management has analyzed the Fund’s tax positions taken on federal, state, and foreign tax returns for all open tax years and does not believe that there are any uncertain tax positions that require recognition of a tax liability.
Class allocations
The separate classes of shares offered by the Fund differ principally in applicable sales charges, distribution, shareholder servicing, and administration fees. Shareholders of each class bear certain expenses that pertain to that particular class. All shareholders bear the common expenses of the Fund, earn income from the portfolio, and are allocated any unrealized gains and losses pro rata based on the average daily net assets of each class, without distinction between share classes. Dividends are determined separately for each class based on income and expenses allocable to each class. Realized gains and losses are allocated to each class pro rata based upon the net assets of each class on the date realized. Differences in per share dividend rates generally result from the relative weightings of pro rata income and realized gain allocations and from differences in separate class expenses, including distribution, shareholder servicing, and administration fees.
3. FAIR VALUATION MEASUREMENTS
Fair value measurements of investments are determined within a framework that has established a fair value hierarchy based upon the various data inputs utilized in determining the value of the Fund’s investments. The three-level hierarchy gives the highest priority to unadjusted quoted prices in active markets for identical assets or liabilities (Level 1) and the lowest priority to significant unobservable inputs (Level 3). The Fund’s investments are classified within the fair value hierarchy based on the lowest level of input that is significant to the fair value measurement. The inputs are summarized into three broad levels as follows:
| n | | Level 1 – quoted prices in active markets for identical securities |
| n | | Level 2 – other significant observable inputs (including quoted prices for similar securities, interest rates, prepayment speeds, credit risk, use of amortized cost, etc.) |
| n | | Level 3 – significant unobservable inputs (including the Fund’s own assumptions in determining the fair value of investments) |
The inputs or methodologies used for valuing investments in securities are not necessarily an indication of the risk associated with investing in those securities.
| | | | |
| 20 | | Wells Fargo Advantage Endeavor Select Fund | | Notes to financial statements (unaudited) |
As of January 31, 2014, the inputs used in valuing investments in securities were as follows:
| | | | | | | | | | | | | | | | |
| Investments in securities | | Quoted prices (Level 1) | | | Other significant observable inputs (Level 2) | | | Significant unobservable inputs (Level 3) | | | Total | |
Equity securities | | | | | | | | | | | | | | | | |
Common stocks | | $ | 683,110,222 | | | $ | 0 | | | $ | 0 | | | $ | 683,110,222 | |
Short-term investments | | | | | | | | | | | | | | | | |
Investment companies | | | 6,727,804 | | | | 0 | | | | 0 | | | | 6,727,804 | |
| | | $ | 689,838,026 | | | $ | 0 | | | $ | 0 | | | $ | 689,838,026 | |
Transfers in and transfers out are recognized at the end of the reporting period. For the six months ended January 31, 2014, the Fund did not have any transfers into/out of Level 1, Level 2, or Level 3.
4. TRANSACTIONS WITH AFFILIATES AND OTHER EXPENSES
Advisory fee
The Trust has entered into an advisory contract with Funds Management, an indirect wholly owned subsidiary of Wells Fargo & Company (“Wells Fargo”). The adviser is responsible for implementing investment policies and guidelines and for supervising the subadviser, who is responsible for day-to-day portfolio management of the Fund.
Pursuant to the contract, Funds Management is entitled to receive an annual advisory fee starting at 0.65% and declining to 0.55% as the average daily net assets of the Fund increase. For the six months ended January 31, 2014, the advisory fee was equivalent to an annual rate of 0.64% of the Fund’s average daily net assets.
Funds Management has retained the services of a subadviser to provide daily portfolio management to the Fund. The fee for subadvisory services is borne by Funds Management. WellsCap, an affiliate of Funds Management and an indirect, wholly owned subsidiary of Wells Fargo, is the subadviser to the Fund and is entitled to receive a fee from Funds Management at an annual rate starting at 0.30% and declining to 0.20% as the average daily net assets of the Fund increase.
Administration and transfer agent fees
The Trust has entered into an administration agreement with Funds Management. Under this agreement, for providing administrative services, which includes paying fees and expenses for services provided by the transfer agent, sub-transfer agents, omnibus account servicers and record-keepers, Funds Management is entitled to receive from the Fund an annual fund level administration fee starting at 0.05% and declining to 0.03% as the average daily net assets of the Fund increase and a class level administration fee which is calculated based on the average daily net assets of each class as follows:
| | | | |
| | | Class level
administration fee | |
Class A, Class B, Class C | | | 0.26 | % |
Administrator Class | | | 0.10 | |
Institutional Class | | | 0.08 | |
Funds Management has contractually waived and/or reimbursed advisory and administration fees to the extent necessary to maintain certain net operating expense ratios for the Fund. Waiver of fees and/or reimbursement of expenses by Funds Management were made first from fund level expenses on a proportionate basis and then from class specific expenses. Funds Management has committed through November 30, 2014 to waive fees and/or reimburse expenses to the extent necessary to cap the Fund’s expenses at 1.25% for Class A shares, 2.00% for Class B shares, 2.00% for Class C shares, 1.00% for Administrator Class shares, and 0.80% for Institutional Class shares.
Distribution fees
The Trust has adopted a Distribution Plan for Class B and Class C shares of the Fund pursuant to Rule 12b-1 under the 1940 Act. Distribution fees are charged to Class B and Class C shares and paid to Wells Fargo Funds Distributor, LLC, the principal underwriter, at an annual rate of 0.75% of the average daily net assets of Class B and Class C shares.
For the six months ended January 31, 2014, Wells Fargo Funds Distributor, LLC received $2,665 from the sale of Class A shares.
| | | | | | |
| Notes to financial statements (unaudited) | | Wells Fargo Advantage Endeavor Select Fund | | | 21 | |
Shareholder servicing fees
The Trust has entered into contracts with one or more shareholder servicing agents, whereby Class A, Class B, Class C, and Administrator Class of the Fund is charged a fee at an annual rate of 0.25% of the average daily net assets of each respective class.
A portion of these total shareholder servicing fees were paid to affiliates of Wells Fargo.
5. INVESTMENT PORTFOLIO TRANSACTIONS
Purchases and sales of investments, excluding U.S. government obligations (if any) and short-term securities, for the six months ended January 31, 2014 were $372,689,994 and $404,156,406, respectively.
6. BANK BORROWINGS
The Trust (excluding the money market funds and certain other funds in the Trust) and Wells Fargo Variable Trust are parties to a $150,000,000 revolving credit agreement with State Street Bank and Trust Company, whereby the Fund is permitted to use bank borrowings for temporary or emergency purposes, such as to fund shareholder redemption requests. Interest under the credit agreement is charged to the Fund based on a borrowing rate equal to the higher of the Federal Funds rate in effect on that day plus 1.25% or the overnight LIBOR rate in effect on that day plus 1.25%. In addition, an annual commitment fee equal to 0.10% of the unused balance is allocated to each participating fund. For the six months ended January 31, 2014, the Fund paid $264 in commitment fees.
For the six months ended January 31, 2014, there were no borrowings by the Fund under the agreement.
7. CONCENTRATION RISK
Concentration risks result from exposure to a limited number of sectors. Funds that invest a substantial portion of their assets in any sector may be more affected by changes in that sector than would be a fund whose investments are not heavily weighted in any sector.
8. INDEMNIFICATION
Under the Trust’s organizational documents, the officers and directors are indemnified against certain liabilities that may arise out of performance of their duties to the Trust. Additionally, in the normal course of business, the Trust may enter into contracts with service providers that contain a variety of indemnification clauses. The Trust’s maximum exposure under these arrangements is dependent on future claims that may be made against the Fund and, therefore, cannot be estimated.
| | | | |
| 22 | | Wells Fargo Advantage Endeavor Select Fund | | Other information (unaudited) |
PROXY VOTING INFORMATION
A description of the policies and procedures that the Fund uses to determine how to vote proxies relating to portfolio securities is available without charge, upon request, by calling 1-800-222-8222, visiting our website at wellsfargoadvantagefunds.com, or visiting the SEC website at sec.gov. Information regarding how the Fund voted proxies relating to portfolio securities during the most recent 12-month period ended June 30 is available without charge on the Fund’s website at wellsfargoadvantagefunds.com or by visiting the SEC website at sec.gov.
PORTFOLIO HOLDINGS INFORMATION
The complete portfolio holdings for the Fund are publicly available on the Fund’s website (wellsfargoadvantagefunds.com) on a monthly, 30-day or more delayed basis. In addition, top ten holdings information for the Fund is publicly available on the Fund’s website on a monthly, seven-day or more delayed basis. The Fund files its complete schedule of portfolio holdings with the SEC for the first and third quarters of each fiscal year on Form N-Q, which is available without charge by visiting the SEC website at sec.gov. In addition, the Fund’s Form N-Q may be reviewed and copied at the SEC’s Public Reference Room in Washington, DC, and at regional offices in New York City, at 233 Broadway, and in Chicago, at 175 West Jackson Boulevard, Suite 900. Information about the Public Reference Room may be obtained by calling 1-800-SEC-0330.
| | | | | | |
| Other information (unaudited) | | Wells Fargo Advantage Endeavor Select Fund | | | 23 | |
BOARD OF TRUSTEES AND OFFICERS
Each of the Trustees and Officers listed in the table below acts in identical capacities for each fund in the Wells Fargo Advantage family of funds, which consists of 132 mutual funds1 comprising the Wells Fargo Funds Trust, Wells Fargo Variable Trust, Wells Fargo Master Trust and four closed-end funds (collectively the “Fund Complex”). This table should be read in conjunction with the Prospectus and the Statement of Additional Information2. All of the Trustees are also Members of the Audit and Governance Committees of each Trust in the Fund Complex. The mailing address of each Trustee and Officer is 525 Market Street, 12th Floor, San Francisco, CA 94105. Each Trustee and Officer serves an indefinite term, however, each Trustee serves such term until reaching the mandatory retirement age established by the Trustees.
Independent Trustees
| | | | | | |
Name and year of birth | | Position held and length of service* | | Principal occupations during past five years | | Other directorships during
past five years |
| Peter G. Gordon (Born 1942) | | Trustee, since 1998; Chairman, since 2005 | | Co-Founder, Retired Chairman, President and CEO of Crystal Geyser Water Company. Trustee Emeritus, Colby College. | | Asset Allocation Trust |
| Isaiah Harris, Jr. (Born 1952) | | Trustee, since 2009 | | Retired. Prior thereto, President and CEO of BellSouth Advertising and Publishing Corp. from 2005 to 2007, President and CEO of BellSouth Enterprises from 2004 to 2005 and President of BellSouth Consumer Services from 2000 to 2003. Emeritus member of the Iowa State University Foundation Board of Governors. Emeritus Member of the Advisory Board of Iowa State University School of Business. Advisory Board Member, Palm Harbor Academy (charter school). Mr. Harris is a certified public accountant. | | CIGNA Corporation; Deluxe Corporation; Asset Allocation Trust |
| Judith M. Johnson (Born 1949) | | Trustee, since 2008; Audit Committee Chairman, since 2008 | | Retired. Prior thereto, Chief Executive Officer and Chief Investment Officer of Minneapolis Employees Retirement Fund from 1996 to 2008. Ms. Johnson is an attorney, certified public accountant and a certified managerial accountant. | | Asset Allocation Trust |
| Leroy Keith, Jr. (Born 1939) | | Trustee, since 2010 | | Chairman, Bloc Global Services (development and construction). Trustee of the Evergreen Funds from 1983 to 2010. Former Managing Director, Almanac Capital Management (commodities firm), former Partner, Stonington Partners, Inc. (private equity fund), former Director, Obagi Medical Products Co. and former Director, Lincoln Educational Services. | | Trustee, Virtus Fund Complex (consisting of 50 portfolios as of 12/16/2013); Asset Allocation Trust |
| David F. Larcker (Born 1950) | | Trustee, since 2009 | | James Irvin Miller Professor of Accounting at the Graduate School of Business, Stanford University, Morgan Stanley Director of the Center for Leadership Development and Research and Senior Faculty of The Rock Center for Corporate Governance since 2006. From 2005 to 2008, Professor of Accounting at the Graduate School of Business, Stanford University. Prior thereto, Ernst & Young Professor of Accounting at The Wharton School, University of Pennsylvania from 1985 to 2005. | | Asset Allocation Trust |
| Olivia S. Mitchell (Born 1953) | | Trustee, since 2006 | | International Foundation of Employee Benefit Plans Professor, Wharton School of the University of Pennsylvania since 1993. Director of Wharton’s Pension Research Council and Boettner Center on Pensions & Retirement Research, and Research Associate at the National Bureau of Economic Research. Previously, Cornell University Professor from 1978 to 1993. | | Asset Allocation Trust |
| Timothy J. Penny (Born 1951) | | Trustee, since 1996 | | President and CEO of Southern Minnesota Initiative Foundation, a non-profit organization, since 2007 and Senior Fellow at the Humphrey Institute Policy Forum at the University of Minnesota since 1995. Member of the Board of Trustees of NorthStar Education Finance, Inc., a non-profit organization, since 2007. | | Asset Allocation Trust |
| | | | |
| 24 | | Wells Fargo Advantage Endeavor Select Fund | | Other information (unaudited) |
| | | | | | |
Name and year of birth | | Position held and length of service* | | Principal occupations during past five years | | Other directorships during
past five years |
| Michael S. Scofield (Born 1943) | | Trustee, since 2010 | | Served on the Investment Company Institute’s Board of Governors and Executive Committee from 2008-2011 as well the Governing Council of the Independent Directors Council from 2006-2011 and the Independent Directors Council Executive Committee from 2008-2011. Chairman of the IDC from 2008-2010. Institutional Investor (Fund Directions) Trustee of Year in 2007. Trustee of the Evergreen Funds (and its predecessors) from 1984 to 2010. Chairman of the Evergreen Funds from 2000-2010. Former Trustee of the Mentor Funds. Retired Attorney, Law Offices of Michael S. Scofield. | | Asset Allocation Trust |
| Donald C. Willeke (Born 1940) | | Trustee, since 1996 | | Principal of the law firm of Willeke & Daniels. General Counsel of the Minneapolis Employees Retirement Fund from 1984 until its consolidation into the Minnesota Public Employees Retirement Association on June 30, 2010. Director and Vice Chair of The Tree Trust (non-profit corporation). Director of the American Chestnut Foundation (non-profit corporation). | | Asset Allocation Trust |
| * | Length of service dates reflect the Trustee’s commencement of service with the Trust’s predecessor entities, where applicable. |
Officers
| | | | | | |
Name and year of birth | | Position held and
length of service | | Principal occupations during past five years | | |
| Karla M. Rabusch (Born 1959) | | President, since 2003 | | Executive Vice President of Wells Fargo Bank, N.A. and President of Wells Fargo Funds Management, LLC since 2003. | | |
| Jeremy DePalma1 (Born 1974) | | Treasurer, since 2012 | | Senior Vice President of Wells Fargo Funds Management, LLC since 2009. Senior Vice President of Evergreen Investment Management Company, LLC from 2008 to 2010. Vice President, Evergreen Investment Services, Inc. from 2004 to 2007. Head of the Fund Reporting and Control Team within Fund Administration from 2005 to 2010. | | |
| C. David Messman (Born 1960) | | Secretary, since 2000; Chief Legal Officer, since 2003 | | Senior Vice President and Secretary of Wells Fargo Funds Management, LLC since 2001. Vice President and Managing Counsel of Wells Fargo Bank, N.A. since 1996. | | |
Debra Ann Early (Born 1964) | | Chief Compliance Officer, since 2007 | | Chief Compliance Officer of Wells Fargo Funds Management, LLC since 2007. Chief Compliance Officer of Parnassus Investments from 2005 to 2007. Chief Financial Officer of Parnassus Investments from 2004 to 2007. | | |
David Berardi (Born 1975) | | Assistant Treasurer, since 2009 | | Vice President of Wells Fargo Funds Management, LLC since 2009. Vice President of Evergreen Investment Management Company, LLC from 2008 to 2010. Assistant Vice President of Evergreen Investment Services, Inc. from 2004 to 2008. Manager of Fund Reporting and Control for Evergreen Investment Management Company, LLC from 2004 to 2010. | | |
| 1. | Jeremy DePalma acts as Treasurer of 59 funds and Assistant Treasurer of 73 funds in the Fund Complex. |
| 2. | The Statement of Additional Information includes additional information about the Trustees and is available, without charge, upon request, by calling 1-800-222-8222 or by visiting the website at wellsfargoadvantagefunds.com. |
| | | | | | |
| List of abbreviations | | Wells Fargo Advantage Endeavor Select Fund | | | 25 | |
The following is a list of common abbreviations for terms and entities that may have appeared in this report.
| ACA | — ACA Financial Guaranty Corporation |
| ADR | — American depositary receipt |
| ADS | — American depositary shares |
| AGC | — Assured Guaranty Corporation |
| AGM | — Assured Guaranty Municipal |
| Ambac | — Ambac Financial Group Incorporated |
| AMT | — Alternative minimum tax |
| BAN | — Bond anticipation notes |
| BHAC | — Berkshire Hathaway Assurance Corporation |
| CAB | — Capital appreciation bond |
| CCAB | — Convertible capital appreciation bond |
| CDA | — Community Development Authority |
| CDO | — Collateralized debt obligation |
| COP | — Certificate of participation |
| DRIVER | — Derivative inverse tax-exempt receipts |
| DW&P | — Department of Water & Power |
| DWR | — Department of Water Resources |
| ECFA | — Educational & Cultural Facilities Authority |
| EDA | — Economic Development Authority |
| EDFA | — Economic Development Finance Authority |
| ETF | — Exchange-traded fund |
| FDIC | — Federal Deposit Insurance Corporation |
| FFCB | — Federal Farm Credit Banks |
| FGIC | — Financial Guaranty Insurance Corporation |
| FHA | — Federal Housing Administration |
| FHLB | — Federal Home Loan Bank |
| FHLMC | — Federal Home Loan Mortgage Corporation |
| FICO | — The Financing Corporation |
| FNMA | — Federal National Mortgage Association |
| GDR | — Global depositary receipt |
| GNMA | — Government National Mortgage Association |
| HCFR | — Healthcare facilities revenue |
| HEFA | — Health & Educational Facilities Authority |
| HEFAR | — Higher education facilities authority revenue |
| HFA | — Housing Finance Authority |
| HFFA | — Health Facilities Financing Authority |
| HUD | — Department of Housing and Urban Development |
| IDA | — Industrial Development Authority |
| IDAG | — Industrial Development Agency |
| IDR | — Industrial development revenue |
| KRW | — Republic of Korea won |
| LIBOR | — London Interbank Offered Rate |
| LLC | — Limited liability company |
| LLLP | — Limited liability limited partnership |
| LLP | — Limited liability partnership |
| MBIA | — Municipal Bond Insurance Association |
| MFHR | — Multifamily housing revenue |
| MSTR | — Municipal securities trust receipts |
| MUD | — Municipal Utility District |
| National | — National Public Finance Guarantee Corporation |
| PCFA | — Pollution Control Financing Authority |
| PCL | — Public Company Limited |
| PCR | — Pollution control revenue |
| PFA | — Public Finance Authority |
| PFFA | — Public Facilities Financing Authority |
| PFOTER | — Puttable floating option tax-exempt receipts |
| plc | — Public limited company |
| PUTTER | — Puttable tax-exempt receipts |
| R&D | — Research & development |
| Radian | — Radian Asset Assurance |
| RAN | — Revenue anticipation notes |
| RDA | — Redevelopment Authority |
| RDFA | — Redevelopment Finance Authority |
| REIT | — Real estate investment trust |
| ROC | — Reset option certificates |
| SAVRS | — Select auction variable rate securities |
| SBA | — Small Business Authority |
| SFHR | — Single-family housing revenue |
| SFMR | — Single-family mortgage revenue |
| SPA | — Standby purchase agreement |
| SPDR | — Standard & Poor’s Depositary Receipts |
| STRIPS | — Separate trading of registered interest and principal securities |
| TAN | — Tax anticipation notes |
| TIPS | — Treasury inflation-protected securities |
| TRAN | — Tax revenue anticipation notes |
| TTFA | — Transportation Trust Fund Authority |
| TVA | — Tennessee Valley Authority |
This page is intentionally left blank.
This page is intentionally left blank.
This page is intentionally left blank.


For more information
More information about Wells Fargo Advantage Funds is available free upon request. To obtain literature, please write, email, visit the Fund’s website, or call:
Wells Fargo Advantage Funds
P.O. Box 8266
Boston, MA 02266-8266
Email: wfaf@wellsfargo.com
Website: wellsfargoadvantagefunds.com
Individual investors: 1-800-222-8222
Retail investment professionals: 1-888-877-9275
Institutional investment professionals: 1-866-765-0778
This report and the financial statements contained herein are submitted for the general information of the shareholders of Wells Fargo Advantage Funds. If this report is used for promotional purposes, distribution of the report must be accompanied or preceded by a current prospectus. For a current prospectus and, if available, a summary prospectus containing more complete information, including charges and expenses, call 1-800-222-8222 or visit the Fund’s website at wellsfargoadvantagefunds.com. Please consider the investment objectives, risks, charges, and expenses of the investment carefully before investing. This and other information about Wells Fargo Advantage Funds can be found in the current prospectus. Read the prospectus carefully before you invest or send money.
Wells Fargo Funds Management, LLC, a wholly owned subsidiary of Wells Fargo & Company, provides investment advisory and administrative services for Wells Fargo Advantage Funds. Other affiliates of Wells Fargo & Company provide subadvisory and other services for the Funds. The Funds are distributed by Wells Fargo Funds Distributor, LLC, Member FINRA/SIPC, an affiliate of Wells Fargo & Company.
NOT FDIC INSURED ¡ NO BANK GUARANTEE ¡ MAY LOSE VALUE
© 2014 Wells Fargo Funds Management, LLC. All rights reserved.
| | |
 | | 222987 03-14 SA205/SAR205 1-14 |

Wells Fargo Advantage Growth Fund

Semi-Annual Report
January 31, 2014

Reduce clutter. Save trees.
Sign up for electronic delivery of prospectuses and shareholder reports at wellsfargo.com/advantagedelivery
Contents
The views expressed and any forward-looking statements are as of January 31, 2014, unless otherwise noted, and are those of the Fund managers and/or Wells Fargo Funds Management, LLC. Discussions of individual securities, or the markets generally, or any Wells Fargo Advantage Fund are not intended as individual recommendations. Future events or results may vary significantly from those expressed in any forward-looking statements; the views expressed are subject to change at any time in response to changing circumstances in the market. Wells Fargo Funds Management, LLC and the Fund disclaim any obligation to publicly update or revise any views expressed or forward-looking statements.
NOT FDIC INSURED ¡ NO BANK GUARANTEE ¡ MAY LOSE VALUE
| | | | |
| 2 | | Wells Fargo Advantage Growth Fund | | Letter to shareholders (unaudited) |

Karla M. Rabusch
President
Wells Fargo Advantage Funds
Major central banks continued to inject liquidity into the banks and the markets through various quantitative easing policies.
Dear Valued Shareholder:
We are pleased to offer you this semi-annual report for the Wells Fargo Advantage Growth Fund for the six-month period that ended January 31, 2014. Much of the period was marked by monetary easing by global central banks. Entering the period, investors were concerned that the U.S. Federal Reserve (Fed) would end its bond-buying program, which initially led to higher interest rates and resulted in losses for bond indexes and volatility for global stock indexes. These fears dissipated in late September 2013 and ended altogether in mid-December 2013 when the Fed announced a tapering timeline that was far more moderate than some had feared. Growing confidence that the U.S. economy was staging a fragile recovery resulted in double-digit returns for domestic stock market indexes for the six-month reporting period.
Central banks continued to provide stimulus.
Major central banks continued to inject liquidity into the banks and the markets through various quantitative easing policies. Throughout the reporting period, the Federal Open Market Committee (FOMC)—the Fed’s monetary policymaking body—kept its key interest rate effectively near zero in order to support the economy and the financial system. Well before the reporting period began, the FOMC announced its intention to keep interest rates low for an extended period and to make open-ended purchases of $40 billion per month in mortgage-backed securities. The FOMC later added purchases of $45 billion per month in long-term U.S. Treasuries. Because the markets benefited from the FOMC’s liquidity, both stocks and bonds initially sold off after the FOMC indicated in May 2013 that it might reduce (or taper) its bond-buying program. However, in mid-December 2013, the FOMC announced that it would reduce its bond-buying program by $10 billion per month beginning in January 2014. The tapering was less aggressive than some investors had feared, and the markets ended 2013 strongly.
European markets continued to benefit from the European Central Bank’s (ECB’s) earlier announcement that it would purchase an unlimited amount of one- to three-year sovereign debt from countries that had formally applied for a bailout. In November 2013, the ECB cut its key rate to a historic low of 0.25%. The ECB’s aggressive actions helped ease investor worries about a eurozone sovereign debt default. Given the substantial ties between the U.S. and Europe, the improved sentiment about the eurozone helped provide a tailwind for U.S. markets.
U.S. stock markets gained on relatively good news.
For most of the period, U.S. economic data remained moderately positive. Reported gross domestic product (GDP) growth came in at a strong 4.1% annualized rate in the third quarter of 2013, and the advance annualized estimate for fourth-quarter GDP growth was 3.2%.
The most significant negative effect was the ongoing fight in Washington, D.C., over the federal budget and debt limit. The Budget Control Act of 2011, which was passed to resolve a previous fight over the federal debt ceiling, mandated budget sequestration that took effect on March 1, 2013, and was an overhang on economic growth throughout the reporting period. Most recently, Congress was unable to pass a resolution to continue to fund the federal government, and thus, the federal government underwent a partial shutdown from September 30, 2013, through October 16, 2013. The government reopened after the president and Congress reached a deal that funded the government through January 15, 2014, and raised the debt limit through February 7, 2014. In December 2013, Congress passed the Ryan–Murray budget agreement that funded the government through September 2015, lessening the near-term prospect of another shutdown.
| | | | | | |
| Letter to shareholders (unaudited) | | Wells Fargo Advantage Growth Fund | | | 3 | |
Despite political headwinds, the relatively positive outlook for the U.S. economy contributed to a strong domestic stock market for most of the reporting period. Economically sensitive sectors, such as industrials and materials, outperformed. Dividend-paying sectors such as utilities and telecommunication services lagged as higher interest rates dampened their relative performance. Judging by various Russell indexes, small-cap stocks moderately outperformed large-cap stocks, and growth stocks strongly outperformed value stocks.
Don’t let short-term uncertainty derail long-term investment goals.
Periods of uncertainty can present challenges, but experience has taught us that maintaining long-term investment goals can be an effective way to plan for the future. Although diversification cannot guarantee an investment profit or prevent losses, we believe it can be an effective way to manage investment risk and potentially smooth out overall portfolio performance. We encourage investors to know their investments and to understand that appropriate levels of risk-taking may unlock opportunities.
Thank you for choosing to invest with Wells Fargo Advantage Funds. We appreciate your confidence in us and remain committed to helping you meet your financial needs. For current information about your fund investments, contact your investment professional, visit our website at wellsfargoadvantagefunds.com, or call us directly at 1-800-222-8222. We are available 24 hours a day, 7 days a week.
Sincerely,

Karla M. Rabusch
President
Wells Fargo Advantage Funds
Despite political headwinds, the relatively positive outlook for the U.S. economy contributed to a strong domestic stock market for most of the reporting period.
Notice to shareholders
The Fund and Wells Fargo Funds Management, LLC (“Funds Management”) have received an exemptive order from the SEC that permits Funds Management, subject to the approval of the Board of Trustees of the Fund, to select or replace certain subadvisers to manage all or a portion of the Fund’s assets and enter into, amend or terminate a sub-advisory agreement with certain subadvisers without obtaining shareholder approval (“Multi-manager Structure”). The Multi-manager Structure applies to subadvisers that are not affiliated with Funds Management or the Fund, except to the extent that affiliation arises solely because such subadvisers provide sub-advisory services to the Fund (“Non-affiliated Subadvisers”), as well as subadvisers that are indirect or direct wholly-owned subsidiaries of Funds Management or of another company that, indirectly or directly, wholly owns Funds Management (“Wholly-owned Subadvisers”).
Pursuant to the SEC order, Funds Management, with the approval of the Board of Trustees, has the discretion to terminate any subadvisers and allocate and reallocate the Fund’s assets among any other Non-affiliated Subadvisers or Wholly-owned Subadvisers. Funds Management, subject to oversight and supervision by the Board of Trustees, has responsibility to continue to oversee any subadvisers to the Fund and to recommend, for approval by the Board of Trustees, the hiring, termination and replacement of subadvisers for the Fund. In the event that a new subadviser is hired pursuant to the Multi-manager Structure, the Fund is required to provide notice to shareholders within 90 days.
Please contact your investment professional or call us directly at 1-800-222-8222 if you have any questions on this Notice to Shareholders.
| | | | |
| 4 | | Wells Fargo Advantage Growth Fund | | Performance highlights (unaudited) |
The Fund is currently closed to most new investors1.
Investment objective
The Fund seeks long-term capital appreciation.
Adviser
Wells Fargo Funds Management, LLC
Subadviser
Wells Capital Management Incorporated
Portfolio managers
Thomas C. Ognar, CFA
Bruce C. Olson, CFA
Joseph M. Eberhardy, CFA, CPA
Average annual total returns (%) as of January 31, 2014
| | | | | | | | | | | | | | | | | | | | | | | | | | | | | | | | | | |
| | | | | Including sales charge | | | Excluding sales charge | | | Expense ratios3 (%) | |
| | | Inception date | | 1 year | | | 5 year | | | 10 year | | | 1 year | | | 5 year | | | 10 year | | | Gross | | | Net4 | |
| Class A (SGRAX)2 | | 2-24-2000 | | | 16.70 | | | | 24.27 | | | | 10.95 | | | | 23.82 | | | | 25.76 | | | | 11.61 | | | | 1.18 | | | | 1.18 | |
| Class C (WGFCX) | | 12-26-2002 | | | 21.90 | | | | 24.82 | | | | 10.80 | | | | 22.90 | | | | 24.82 | | | | 10.80 | | | | 1.93 | | | | 1.93 | |
| Administrator Class (SGRKX) | | 8-30-2002 | | | – | | | | – | | | | – | | | | 24.13 | | | | 26.10 | | | | 11.98 | | | | 1.02 | | | | 0.96 | |
| Institutional Class (SGRNX) | | 2-24-2000 | | | – | | | | – | | | | – | | | | 24.38 | | | | 26.33 | | | | 12.15 | | | | 0.75 | | | | 0.75 | |
| Investor Class (SGROX) | | 12-31-1993 | | | – | | | | – | | | | – | | | | 23.75 | | | | 25.65 | | | | 11.51 | | | | 1.24 | | | | 1.24 | |
| Russell 3000® Growth Index5 | | – | | | – | | | | – | | | | – | | | | 24.95 | | | | 21.13 | | | | 7.41 | | | | – | | | | – | |
Figures quoted represent past performance, which is no guarantee of future results, and do not reflect taxes that a shareholder may pay on fund distributions or the redemption of fund shares. Investment return and principal value of an investment will fluctuate so that an investor’s shares, when redeemed, may be worth more or less than their original cost. Performance shown without sales charges would be lower if sales charges were reflected. Current performance may be lower or higher than the performance data quoted, which assumes the reinvestment of dividends and capital gains. Current month-end performance is available on the Fund’s website, wellsfargoadvantagefunds.com.
Index returns do not include transaction costs associated with buying and selling securities, any mutual fund fees or expenses, or any taxes. It is not possible to invest directly in an index.
For Class A shares, the maximum front-end sales charge is 5.75%. For Class C shares, the maximum contingent deferred sales charge is 1.00%. Performance including sales charge assumes the sales charge for the corresponding time period. Administrator Class, Institutional Class, and Investor Class shares are sold without a front-end sales charge or contingent deferred sales charge.
Please keep in mind that high double-digit returns were primarily achieved during favorable market conditions. You should not expect that such favorable returns can be consistently achieved. A fund’s performance, especially for short time periods, should not be the sole factor in making your investment decision.
Stock values fluctuate in response to the activities of individual companies and general market and economic conditions. Certain investment strategies tend to increase the total risk of an investment (relative to the broader market). The Fund is exposed to foreign investment risk. Consult the Fund’s prospectus for additional information on these and other risks.
Please see footnotes on page 5.
| | | | | | |
| Performance highlights (unaudited) | | Wells Fargo Advantage Growth Fund | | | 5 | |
| | | | |
| Ten largest equity holdings6 (%) as of January 31, 2014 | |
Google Incorporated Class A | | | 4.89 | |
Alexion Pharmaceuticals Incorporated | | | 3.09 | |
Dollar Tree Incorporated | | | 2.49 | |
Whole Foods Market Incorporated | | | 2.37 | |
Gilead Sciences Incorporated | | | 2.09 | |
Amazon.com Incorporated | | | 2.07 | |
CarMax Incorporated | | | 2.06 | |
Concho Resources Incorporated | | | 2.05 | |
eBay Incorporated | | | 1.89 | |
MasterCard Incorporated Class A | | | 1.88 | |
|
| Sector distribution7 as of January 31, 2014 |
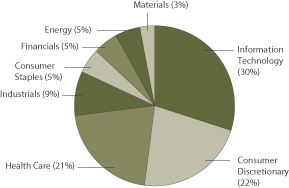
|
| 1. | Please see the Fund’s current Statement of Additional Information for further details. |
| 2. | Effective June 20, 2008, Advisor Class was renamed Class A and modified to assume the features and attributes of Class A. Historical performance shown for Class A shares through June 20, 2008, includes Advisor Class expenses. |
| 3. | Reflects the expense ratios as stated in the most recent prospectuses. The expense ratios shown are subject to change and may differ from the annualized expense ratios shown in the financial highlights of this report. |
| 4. | The Adviser has committed through November 30, 2014, to waive fees and/or reimburse expenses to the extent necessary to cap the Fund’s Total Annual Fund Operating Expenses After Fee Waiver, excluding certain expenses, at 1.21% for Class A, 1.96% for Class C, 0.96% for Administrator Class, 0.75% for Institutional Class, and 1.27% for Investor Class. Brokerage commissions, stamp duty fees, interest, taxes, acquired fund fees and expenses, and extraordinary expenses are excluded from the cap. Without this cap, the Fund’s returns would have been lower. |
| 5. | The Russell 3000® Growth Index measures the performance of those Russell 3000® Index companies with higher price-to-book ratios and higher forecasted growth values. You cannot invest directly in an index. |
| 6. | The ten largest equity holdings are calculated based on the value of the securities divided by total net assets of the Fund. Holdings are subject to change and may have changed since the date specified. |
| 7. | Sector distribution is subject to change and is calculated based on the total long-term investments of the Fund. |
| | | | |
| 6 | | Wells Fargo Advantage Growth Fund | | Fund expenses (unaudited) |
As a shareholder of the Fund, you incur two types of costs: (1) transaction costs, including sales charges (loads) on purchase payments and contingent deferred sales charges (if any) on redemptions and (2) ongoing costs, including management fees, distribution (12b-1) and/or shareholder service fees, and other Fund expenses. This example is intended to help you understand your ongoing costs (in dollars) of investing in the Fund and to compare these costs with the ongoing costs of investing in other mutual funds.
The example is based on an investment of $1,000 invested at the beginning of the six-month period and held for the entire period from August 1, 2013 to January 31, 2014.
Actual expenses
The “Actual” line of the table below provides information about actual account values and actual expenses. You may use the information in this line, together with the amount you invested, to estimate the expenses that you paid over the period. Simply divide your account value by $1,000 (for example, an $8,600 account value divided by $1,000 = 8.6), then multiply the result by the number in the “Actual” line under the heading entitled “Expenses paid during period” for your applicable class of shares to estimate the expenses you paid on your account during this period.
Hypothetical example for comparison purposes
The “Hypothetical” line of the table below provides information about hypothetical account values and hypothetical expenses based on the Fund’s actual expense ratio and an assumed rate of return of 5% per year before expenses, which is not the Fund’s actual return. The hypothetical account values and expenses may not be used to estimate the actual ending account balance or expenses you paid for the period. You may use this information to compare the ongoing costs of investing in the Fund and other funds. To do so, compare this 5% hypothetical example with the 5% hypothetical examples that appear in the shareholder reports of the other funds.
Please note that the expenses shown in the table are meant to highlight your ongoing costs only and do not reflect any transactional costs, such as sales charges (loads) and contingent deferred sales charges. Therefore, the “Hypothetical” line of the table is useful in comparing ongoing costs only and will not help you determine the relative total costs of owning different funds. In addition, if these transactional costs were included, your costs would have been higher.
| | | | | | | | | | | | | | | | |
| | | Beginning
account value
8-1-2013 | | | Ending
account value
1-31-2014 | | | Expenses
paid during
the period1 | | | Net annualized
expense ratio | |
Class A | | | | | | | | | | | | | | | | |
Actual | | $ | 1,000.00 | | | $ | 1,108.36 | | | $ | 6.27 | | | | 1.18 | % |
Hypothetical (5% return before expenses) | | $ | 1,000.00 | | | $ | 1,019.26 | | | $ | 6.01 | | | | 1.18 | % |
Class C | | | | | | | | | | | | | | | | |
Actual | | $ | 1,000.00 | | | $ | 1,104.42 | | | $ | 10.24 | | | | 1.93 | % |
Hypothetical (5% return before expenses) | | $ | 1,000.00 | | | $ | 1,015.48 | | | $ | 9.80 | | | | 1.93 | % |
Administrator Class | | | | | | | | | | | | | | | | |
Actual | | $ | 1,000.00 | | | $ | 1,109.96 | | | $ | 5.11 | | | | 0.96 | % |
Hypothetical (5% return before expenses) | | $ | 1,000.00 | | | $ | 1,020.37 | | | $ | 4.89 | | | | 0.96 | % |
Institutional Class | | | | | | | | | | | | | | | | |
Actual | | $ | 1,000.00 | | | $ | 1,111.12 | | | $ | 3.99 | | | | 0.75 | % |
Hypothetical (5% return before expenses) | | $ | 1,000.00 | | | $ | 1,021.42 | | | $ | 3.82 | | | | 0.75 | % |
Investor Class | | | | | | | | | | | | | | | | |
Actual | | $ | 1,000.00 | | | $ | 1,108.23 | | | $ | 6.59 | | | | 1.24 | % |
Hypothetical (5% return before expenses) | | $ | 1,000.00 | | | $ | 1,018.95 | | | $ | 6.31 | | | | 1.24 | % |
| 1. | Expenses paid is equal to the annualized expense ratio of each class multiplied by the average account value over the period, multiplied by the number of days in the most recent fiscal half-year divided by the number of days in the fiscal year (to reflect the one-half-year period). |
| | | | | | |
| Portfolio of investments—January 31, 2014 (unaudited) | | Wells Fargo Advantage Growth Fund | | | 7 | |
| | | | | | | | | | | | |
| Security name | | | | | | Shares | | | Value | |
| | | | | | | | | | | | |
| | | | |
Common Stocks: 99.87% | | | | | | | | | | | | |
| | | | |
Consumer Discretionary: 21.95% | | | | | | | | | | | | |
| | | | |
| Auto Components: 0.22% | | | | | | | | | | | | |
Delphi Automotive plc | | | | | | | 450,000 | | | $ | 27,400,500 | |
| | | | | | | | | | | | |
| | | | |
| Distributors: 1.17% | | | | | | | | | | | | |
LKQ Corporation † | | | | | | | 5,280,000 | | | | 142,929,600 | |
| | | | | | | | | | | | |
| | | | |
| Diversified Consumer Services: 0.25% | | | | | | | | | | | | |
Grand Canyon Education Incorporated † | | | | | | | 685,000 | | | | 30,016,700 | |
| | | | | | | | | | | | |
| | | | |
| Hotels, Restaurants & Leisure: 2.45% | | | | | | | | | | | | |
Chipotle Mexican Grill Incorporated † | | | | | | | 340,000 | | | | 187,666,400 | |
Starbucks Corporation | | | | | | | 1,575,000 | | | | 112,014,000 | |
| | | | |
| | | | | | | | | | | 299,680,400 | |
| | | | | | | | | | | | |
| | | | |
| Internet & Catalog Retail: 6.52% | | | | | | | | | | | | |
Amazon.com Incorporated † | | | | | | | 707,000 | | | | 253,593,830 | |
HomeAway Incorporated † | | | | | | | 3,750,000 | | | | 153,225,000 | |
priceline.com Incorporated † | | | | | | | 168,000 | | | | 192,341,520 | |
RetailMeNot Incorporated †« | | | | | | | 1,443,000 | | | | 51,096,630 | |
Shutterfly Incorporated †** | | | | | | | 2,760,000 | | | | 130,713,600 | |
TripAdvisor Incorporated † | | | | | | | 228,000 | | | | 17,599,320 | |
| | | | |
| | | | | | | | | | | 798,569,900 | |
| | | | | | | | | | | | |
| | | | |
| Multiline Retail: 2.49% | | | | | | | | | | | | |
Dollar Tree Incorporated † | | | | | | | 6,025,000 | | | | 304,383,000 | |
| | | | | | | | | | | | |
| | | | |
| Specialty Retail: 7.09% | | | | | | | | | | | | |
Cabela’s Incorporated † | | | | | | | 3,050,000 | | | | 203,923,000 | |
CarMax Incorporated † | | | | | | | 5,590,000 | | | | 252,164,900 | |
DSW Incorporated Class A | | | | | | | 2,331,700 | | | | 87,788,505 | |
Five Below Incorporated †« | | | | | | | 2,200,000 | | | | 80,630,000 | |
GNC Holdings Incorporated Class A | | | | | | | 215,000 | | | | 10,988,650 | |
Tractor Supply Company | | | | | | | 2,285,000 | | | | 151,975,350 | |
Ulta Salon, Cosmetics & Fragrance Incorporated † | | | | | | | 709,000 | | | | 60,768,390 | |
Urban Outfitters Incorporated † | | | | | | | 545,000 | | | | 19,521,900 | |
Vitamin Shoppe Incorporated † | | | | | | | 15,000 | | | | 672,300 | |
| | | | |
| | | | | | | | | | | 868,432,995 | |
| | | | | | | | | | | | |
| | | | |
| Textiles, Apparel & Luxury Goods: 1.76% | | | | | | | | | | | | |
lululemon athletica incorporated †« | | | | | | | 235,000 | | | | 10,737,150 | |
Michael Kors Holdings Limited † | | | | | | | 597,000 | | | | 47,718,210 | |
Under Armour Incorporated Class A † | | | | | | | 1,450,000 | | | | 156,759,500 | |
| | | | |
| | | | | | | | | | | 215,214,860 | |
| | | | | | | | | | | | |
| | | | |
Consumer Staples: 5.03% | | | | | | | | | | | | |
| | | | |
| Food & Staples Retailing: 4.24% | | | | | | | | | | | | |
Costco Wholesale Corporation | | | | | | | 595,000 | | | | 66,854,200 | |
Sprouts Farmers Market Incorporated † | | | | | | | 1,850,000 | | | | 66,119,000 | |
The accompanying notes are an integral part of these financial statements.
| | | | |
| 8 | | Wells Fargo Advantage Growth Fund | | Portfolio of investments—January 31, 2014 (unaudited) |
| | | | | | | | | | | | |
| Security name | | | | | | Shares | | | Value | |
| | | | | | | | | | | | |
| | | | |
| Food & Staples Retailing (continued) | | | | | | | | | | | | |
The Fresh Market Incorporated † | | | | | | | 2,725,000 | | | $ | 95,266,000 | |
Whole Foods Market Incorporated | | | | | | | 5,551,000 | | | | 290,095,260 | |
| | | | |
| | | | | | | | | | | 518,334,460 | |
| | | | | | | | | | | | |
| | | | |
| Food Products: 0.33% | | | | | | | | | | | | |
Annie’s Incorporated † | | | | | | | 1,016,470 | | | | 40,780,776 | |
| | | | | | | | | | | | |
| | | | |
| Personal Products: 0.46% | | | | | | | | | | | | |
Estee Lauder Companies Incorporated Class A | | | | | | | 819,000 | | | | 56,298,060 | |
| | | | | | | | | | | | |
| | | | |
Energy: 5.18% | | | | | | | | | | | | |
| | | | |
| Oil, Gas & Consumable Fuels: 5.18% | | | | | | | | | | | | |
Antero Resources Corporation † | | | | | | | 40,799 | | | | 2,396,533 | |
Concho Resources Incorporated † | | | | | | | 2,565,000 | | | | 250,831,350 | |
Energy XXI (Bermuda) Limited | | | | | | | 3,410,600 | | | | 78,273,270 | |
Oasis Petroleum Incorporated † | | | | | | | 1,475,000 | | | | 61,669,750 | |
Pioneer Natural Resources Company | | | | | | | 1,107,000 | | | | 187,437,240 | |
Whiting Petroleum Corporation † | | | | | | | 925,000 | | | | 54,001,500 | |
| | | | |
| | | | | | | | | | | 634,609,643 | |
| | | | | | | | | | | | |
| | | | |
Financials: 5.00% | | | | | | | | | | | | |
| | | | |
| Capital Markets: 2.34% | | | | | | | | | | | | |
Financial Engines Incorporated | | | | | | | 1,050,000 | | | | 63,966,000 | |
TD Ameritrade Holding Corporation | | | | | | | 7,100,000 | | | | 221,875,000 | |
| | | | |
| | | | | | | | | | | 285,841,000 | |
| | | | | | | | | | | | |
| | | | |
| Consumer Finance: 1.73% | | | | | | | | | | | | |
American Express Company | | | | | | | 2,270,000 | | | | 192,995,400 | |
Discover Financial Services | | | | | | | 360,000 | | | | 19,314,000 | |
| | | | |
| | | | | | | | | | | 212,309,400 | |
| | | | | | | | | | | | |
| | | | |
| Diversified Financial Services: 0.93% | | | | | | | | | | | | |
MarketAxess Holdings Incorporated | | | | | | | 1,820,000 | | | | 114,186,800 | |
| | | | | | | | | | | | |
| | | | |
Health Care: 20.42% | | | | | | | | | | | | |
| | | | |
| Biotechnology: 11.02% | | | | | | | | | | | | |
Alexion Pharmaceuticals Incorporated † | | | | | | | 2,380,000 | | | | 377,777,400 | |
Biogen Idec Incorporated † | | | | | | | 339,000 | | | | 105,984,960 | |
BioMarin Pharmaceutical Incorporated † | | | | | | | 1,242,000 | | | | 85,548,960 | |
Celgene Corporation † | | | | | | | 1,180,000 | | | | 179,277,400 | |
Gilead Sciences Incorporated † | | | | | | | 3,172,000 | | | | 255,821,800 | |
Medivation Incorporated † | | | | | | | 1,327,000 | | | | 105,629,200 | |
Pharmacyclics Incorporated † | | | | | | | 59,000 | | | | 7,851,130 | |
Quintiles Transnational Holdings Incorporated † | | | | | | | 509,000 | | | | 24,243,670 | |
Regeneron Pharmaceuticals Incorporated † | | | | | | | 501,000 | | | | 144,583,590 | |
Vertex Pharmaceuticals Incorporated † | | | | | | | 781,000 | | | | 61,730,240 | |
| | | | |
| | | | | | | | | | | 1,348,448,350 | |
| | | | | | | | | | | | |
The accompanying notes are an integral part of these financial statements.
| | | | | | |
| Portfolio of investments—January 31, 2014 (unaudited) | | Wells Fargo Advantage Growth Fund | | | 9 | |
| | | | | | | | | | | | |
| Security name | | | | | | Shares | | | Value | |
| | | | | | | | | | | | |
| | | | |
| Health Care Equipment & Supplies: 0.94% | | | | | | | | | | | | |
Covidien plc | | | | | | | 1,660,300 | | | $ | 113,298,872 | |
NxStage Medical Incorporated † | | | | | | | 170,000 | | | | 2,201,500 | |
| | | | |
| | | | | | | | | | | 115,500,372 | |
| | | | | | | | | | | | |
| | | | |
| Health Care Providers & Services: 3.32% | | | | | | | | | | | | |
AmerisourceBergen Corporation | | | | | | | 1,860,000 | | | | 125,029,200 | |
Catamaran Corporation † | | | | | | | 2,985,000 | | | | 145,130,700 | |
Envision Healthcare Holdings Incorporated † | | | | | | | 624,000 | | | | 20,629,440 | |
Express Scripts Holding Company † | | | | | | | 1,550,000 | | | | 115,769,500 | |
| | | | |
| | | | | | | | | | | 406,558,840 | |
| | | | | | | | | | | | |
| | | | |
| Health Care Technology: 1.66% | | | | | | | | | | | | |
Cerner Corporation † | | | | | | | 3,220,000 | | | | 183,185,800 | |
Veeva Systems Incorporated Class A †« | | | | | | | 625,000 | | | | 19,868,750 | |
| | | | |
| | | | | | | | | | | 203,054,550 | |
| | | | | | | | | | | | |
| | | | |
| Life Sciences Tools & Services: 1.48% | | | | | | | | | | | | |
Covance Incorporated † | | | | | | | 678,000 | | | | 64,111,680 | |
Mettler-Toledo International Incorporated † | | | | | | | 476,000 | | | | 117,238,800 | |
| | | | |
| | | | | | | | | | | 181,350,480 | |
| | | | | | | | | | | | |
| | | | |
| Pharmaceuticals: 2.00% | | | | | | | | | | | | |
Jazz Pharmaceuticals plc † | | | | | | | 225,000 | | | | 34,123,500 | |
Mallinckrodt plc † | | | | | | | 306,000 | | | | 17,695,980 | |
Mylan Laboratories Incorporated † | | | | | | | 825,000 | | | | 37,463,250 | |
Perrigo Company plc | | | | | | | 998,000 | | | | 155,348,680 | |
| | | | |
| | | | | | | | | | | 244,631,410 | |
| | | | | | | | | | | | |
| | | | |
Industrials: 9.42% | | | | | | | | | | | | |
| | | | |
| Aerospace & Defense: 2.41% | | | | | | | | | | | | |
Precision Castparts Corporation | | | | | | | 480,000 | | | | 122,280,000 | |
The Boeing Company | | | | | | | 502,000 | | | | 62,880,520 | |
United Technologies Corporation | | | | | | | 965,000 | | | | 110,029,300 | |
| | | | |
| | | | | | | | | | | 295,189,820 | |
| | | | | | | | | | | | |
| | | | |
| Air Freight & Logistics: 0.66% | | | | | | | | | | | | |
United Parcel Service Incorporated Class B | | | | | | | 854,000 | | | | 81,326,420 | |
| | | | | | | | | | | | |
| | | | |
| Building Products: 0.54% | | | | | | | | | | | | |
Fortune Brands Home & Security Incorporated | | | | | | | 1,465,000 | | | | 66,012,900 | |
| | | | | | | | | | | | |
| | | | |
| Commercial Services & Supplies: 0.09% | | | | | | | | | | | | |
Tyco International Limited | | | | | | | 273,000 | | | | 11,053,770 | |
| | | | | | | | | | | | |
| | | | |
| Industrial Conglomerates: 0.55% | | | | | | | | | | | | |
Danaher Corporation | | | | | | | 900,000 | | | | 66,951,000 | |
| | | | | | | | | | | | |
| | | | |
| Machinery: 0.69% | | | | | | | | | | | | |
Flowserve Corporation | | | | | | | 1,162,500 | | | | 84,083,625 | |
| | | | | | | | | | | | |
The accompanying notes are an integral part of these financial statements.
| | | | |
| 10 | | Wells Fargo Advantage Growth Fund | | Portfolio of investments—January 31, 2014 (unaudited) |
| | | | | | | | | | | | |
| Security name | | | | | | Shares | | | Value | |
| | | | | | | | | | | | |
| | | | |
| Professional Services: 0.38% | | | | | | | | | | | | |
Verisk Analytics Incorporated Class A † | | | | | | | 725,000 | | | $ | 46,298,500 | |
| | | | | | | | | | | | |
| | | | |
| Road & Rail: 4.10% | | | | | | | | | | | | |
Genesee & Wyoming Incorporated Class A † | | | | | | | 1,715,000 | | | | 154,933,100 | |
J.B. Hunt Transport Services Incorporated | | | | | | | 421,000 | | | | 31,596,050 | |
Kansas City Southern | | | | | | | 1,228,000 | | | | 129,664,520 | |
Norfolk Southern Corporation | | | | | | | 1,270,000 | | | | 117,589,300 | |
Union Pacific Corporation | | | | | | | 395,000 | | | | 68,824,800 | |
| | | | |
| | | | | | | | | | | 502,607,770 | |
| | | | | | | | | | | | |
| | | | |
Information Technology: 29.83% | | | | | | | | | | | | |
| | | | |
| Communications Equipment: 1.33% | | | | | | | | | | | | |
QUALCOMM Incorporated | | | | | | | 2,200,000 | | | | 163,284,000 | |
| | | | | | | | | | | | |
| | | | |
| Computers & Peripherals: 1.97% | | | | | | | | | | | | |
Apple Incorporated | | | | | | | 401,000 | | | | 200,740,600 | |
Stratasys Limited † | | | | | | | 336,000 | | | | 40,508,160 | |
| | | | |
| | | | | | | | | | | 241,248,760 | |
| | | | | | | | | | | | |
| | | | |
| Internet Software & Services: 12.93% | | | | | | | | | | | | |
Akamai Technologies Incorporated † | | | | | | | 1,656,000 | | | | 78,958,080 | |
CoStar Group Incorporated † | | | | | | | 222,000 | | | | 38,192,880 | |
Criteo SA ADR † | | | | | | | 5,707 | | | | 200,830 | |
Demandware Incorporated † | | | | | | | 375,000 | | | | 23,880,000 | |
eBay Incorporated † | | | | | | | 4,350,000 | | | | 231,420,000 | |
Envestnet Incorporated † | | | | | | | 473,625 | | | | 20,247,469 | |
Facebook Incorporated Class A † | | | | | | | 2,881,000 | | | | 180,264,170 | |
Google Incorporated Class A † | | | | | | | 507,000 | | | | 598,751,790 | |
MercadoLibre Incorporated « | | | | | | | 1,500,000 | | | | 144,735,000 | |
Pandora Media Incorporated † | | | | | | | 2,400,000 | | | | 86,568,000 | |
Rackspace Hosting Incorporated † | | | | | | | 3,820,000 | | | | 139,086,200 | |
Shutterstock Incorporated † | | | | | | | 122,720 | | | | 9,892,459 | |
Textura Corporation †« | | | | | | | 403,000 | | | | 12,670,320 | |
Yelp Incorporated † | | | | | | | 230,000 | | | | 17,468,500 | |
| | | | |
| | | | | | | | | | | 1,582,335,698 | |
| | | | | | | | | | | | |
| | | | |
| IT Services: 5.78% | | | | | | | | | | | | |
Alliance Data Systems Corporation † | | | | | | | 745,000 | | | | 178,546,700 | |
Cognizant Technology Solutions Corporation Class A † | | | | | | | 1,885,000 | | | | 182,694,200 | |
MasterCard Incorporated Class A | | | | | | | 3,036,000 | | | | 229,764,480 | |
Visa Incorporated Class A | | | | | | | 540,000 | | | | 116,332,200 | |
| | | | |
| | | | | | | | | | | 707,337,580 | |
| | | | | | | | | | | | |
| | | | |
| Semiconductors & Semiconductor Equipment: 2.44% | | | | | | | | | | | | |
Linear Technology Corporation | | | | | | | 229,500 | | | | 10,221,930 | |
Microchip Technology Incorporated « | | | | | | | 4,290,661 | | | | 192,479,052 | |
Silicon Laboratories Incorporated † | | | | | | | 1,565,000 | | | | 73,930,600 | |
Xilinx Incorporated | | | | | | | 485,000 | | | | 22,513,700 | |
| | | | |
| | | | | | | | | | | 299,145,282 | |
| | | | | | | | | | | | |
The accompanying notes are an integral part of these financial statements.
| | | | | | |
| Portfolio of investments—January 31, 2014 (unaudited) | | Wells Fargo Advantage Growth Fund | | | 11 | |
| | | | | | | | | | | | | | |
| Security name | | | | | | | Shares | | | Value | |
| | | | | | | | | | | | | | |
| | | | |
| Software: 5.38% | | | | | | | | | | | | | | |
Concur Technologies Incorporated † | | | | | | | | | 205,000 | | | $ | 24,874,700 | |
Fleetmatics Group plc † | | | | | | | | | 2,400,000 | | | | 96,024,000 | |
Fortinet Incorporated † | | | | | | | | | 1,356,600 | | | | 28,759,920 | |
Gigamon Incorporated † | | | | | | | | | 300,000 | | | | 9,138,000 | |
NetSuite Incorporated † | | | | | | | | | 325,900 | | | | 34,278,162 | |
Qlik Technologies Incorporated † | | | | | | | | | 200,000 | | | | 5,404,000 | |
Salesforce.com Incorporated † | | | | | | | | | 2,376,000 | | | | 143,819,280 | |
ServiceNow Incorporated † | | | | | | | | | 167,000 | | | | 10,592,810 | |
Splunk Incorporated † | | | | | | | | | 1,136,000 | | | | 87,506,080 | |
Synchronoss Technologies Incorporated † | | | | | | | | | 855,000 | | | | 22,794,300 | |
Tableau Software Incorporated Class A † | | | | | | | | | 383,000 | | | | 30,954,060 | |
Ultimate Software Group Incorporated † | | | | | | | | | 1,010,000 | | | | 164,862,300 | |
| | | | |
| | | | | | | | | | | | | 659,007,612 | |
| | | | | | | | | | | | | | |
| | | | |
Materials: 3.04% | | | | | | | | | | | | | | |
| | | | |
| Chemicals: 3.04% | | | | | | | | | | | | | | |
Airgas Incorporated | | | | | | | | | 560,000 | | | | 57,814,400 | |
Monsanto Company | | | | | | | | | 1,474,000 | | | | 157,054,700 | |
Praxair Incorporated | | | | | | | | | 1,263,000 | | | | 157,521,360 | |
| | | | |
| | | | | | | | | | | | | 372,390,460 | |
| | | | | | | | | | | | | | |
| | | | |
Total Common Stocks (Cost $7,826,853,577) | | | | | | | | | | | | | 12,226,805,293 | |
| | | | | | | | | | | | | | |
| | | | |
| | | Yield | | | | | | | | | |
| Short-Term Investments: 1.95% | | | | | | | | | | | | | | |
| | | | |
| Investment Companies: 1.95% | | | | | | | | | | | | | | |
Wells Fargo Advantage Cash Investment Money Market Fund, Select Class (l)(u) | | | 0.07 | % | | | | | 35,852,317 | | | | 35,852,317 | |
Wells Fargo Securities Lending Cash Investments, LLC (l)(u)(v)(r) | | | 0.08 | | | | | | 202,225,164 | | | | 202,225,164 | |
| | | | | | | | | | | | | | |
| | | | |
Total Short-Term Investments (Cost $238,077,481) | | | | | | | | | | | | | 238,077,481 | |
| | | | | | | | | | | | | | |
| | | | | | | | |
| Total investments in securities | | | | | | | | |
| (Cost $8,064,931,058) * | | | 101.82 | % | | | 12,464,882,774 | |
Other assets and liabilities, net | | | (1.82 | ) | | | (222,450,755 | ) |
| | | | | | | | |
Total net assets | | | 100.00 | % | | $ | 12,242,432,019 | |
| | | | | | | | |
| † | Non-income-earning security |
| ** | Represents an affiliate of the Fund under section 2(a)(2) and 2(a)(3) of the Investment Company Act of 1940, as amended, as the Fund holds 5% or more of the issuer’s outstanding voting shares. |
| (l) | Investment in an affiliate |
| (u) | Rate shown is the 7-day annualized yield at period end. |
| (v) | Security represents investment of cash collateral received from securities on loan. |
| (r) | The investment company is exempt from registration under Section 3(c)(7) of the Investment Company Act of 1940, as amended. |
| * | Cost for federal income tax purposes is $8,079,203,787 and unrealized appreciation (depreciation) consists of: |
| | | | |
Gross unrealized appreciation | | $ | 4,472,757,864 | |
Gross unrealized depreciation | | | (87,078,877 | ) |
| | | | |
Net unrealized appreciation | | $ | 4,385,678,987 | |
The accompanying notes are an integral part of these financial statements.
| | | | |
| 12 | | Wells Fargo Advantage Growth Fund | | Statement of assets and liabilities—January 31, 2014 (unaudited) |
| | | | |
| | | | |
| |
Assets | | | | |
Investments | | | | |
In unaffiliated securities (including securities on loan), at value (see cost below) | | $ | 12,096,091,693 | |
In affiliated securities, at value (see cost below) | | | 368,791,081 | |
| | | | |
Total investments, at value (see cost below) | | | 12,464,882,774 | |
Receivable for investments sold | | | 59,877,020 | |
Receivable for Fund shares sold | | | 17,468,791 | |
Receivable for dividends | | | 1,397,360 | |
Receivable for securities lending income | | | 82,519 | |
Prepaid expenses and other assets | | | 118,033 | |
| | | | |
Total assets | | | 12,543,826,497 | |
| | | | |
| |
Liabilities | | | | |
Payable for investments purchased | | | 70,631,349 | |
Payable for Fund shares redeemed | | | 16,698,460 | |
Payable upon receipt of securities loaned | | | 202,225,164 | |
Advisory fee payable | | | 6,642,869 | |
Distribution fees payable | | | 431,550 | |
Due to other related parties | | | 2,499,251 | |
Accrued expenses and other liabilities | | | 2,265,835 | |
| | | | |
Total liabilities | | | 301,394,478 | |
| | | | |
Total net assets | | $ | 12,242,432,019 | |
| | | | |
| |
NET ASSETS CONSIST OF | | | | |
Paid-in capital | | $ | 7,536,700,273 | |
Accumulated net investment loss | | | (63,239,721 | ) |
Accumulated net realized gains on investments | | | 369,019,751 | |
Net unrealized gains on investments | | | 4,399,951,716 | |
| | | | |
Total net assets | | $ | 12,242,432,019 | |
| | | | |
| |
COMPUTATION OF NET ASSET VALUE AND OFFERING PRICE PER SHARE1 | | | | |
Net assets – Class A | | $ | 2,559,886,269 | |
Shares outstanding – Class A | | | 51,171,589 | |
Net asset value per share – Class A | | | $50.03 | |
Maximum offering price per share – Class A2 | | | $53.08 | |
Net assets – Class C | | $ | 626,380,997 | |
Shares outstanding – Class C | | | 13,569,482 | |
Net asset value per share – Class C | | | $46.16 | |
Net assets – Administrator Class | | $ | 3,591,156,997 | |
Shares outstanding – Administrator Class | | | 68,039,429 | |
Net asset value per share – Administrator Class | | | $52.78 | |
Net assets – Institutional Class | | $ | 3,030,598,806 | |
Shares outstanding – Institutional Class | | | 55,636,486 | |
Net asset value per share – Institutional Class | | | $54.47 | |
Net assets – Investor Class | | $ | 2,434,408,950 | |
Shares outstanding – Investor Class | | | 48,812,573 | |
Net asset value per share – Investor Class | | | $49.87 | |
| |
Investments in unaffiliated securities (including securities on loan), at cost | | $ | 7,752,660,578 | |
| | | | |
Investments in affiliated securities, at cost | | $ | 312,270,480 | |
| | | | |
Total investments, at cost | | $ | 8,064,931,058 | |
| | | | |
Securities on loan, at value | | $ | 197,819,832 | |
| | | | |
| 1. | The Fund has an unlimited number of authorized shares. |
| 2. | Maximum offering price is computed as 100/94.25 of net asset value. On investments of $50,000 or more, the offering price is reduced. |
The accompanying notes are an integral part of these financial statements.
| | | | | | |
| Statement of operations—six months ended January 31, 2014 (unaudited) | | Wells Fargo Advantage Growth Fund | | | 13 | |
| | | | |
| | | | |
| |
Investment income | | | | |
Dividends | | $ | 31,477,292 | |
Securities lending income, net | | | 337,670 | |
Income from affiliated securities | | | 966,945 | |
| | | | |
Total investment income | | | 32,781,907 | |
| | | | |
| |
Expenses | | | | |
Advisory fee | | | 37,682,925 | |
Administration fees | | | | |
Fund level | | | 2,601,386 | |
Class A | | | 3,388,434 | |
Class C | | | 822,559 | |
Administrator Class | | | 1,796,323 | |
Institutional Class | | | 1,179,450 | |
Investor Class | | | 3,945,904 | |
Shareholder servicing fees | | | | |
Class A | | | 3,258,109 | |
Class C | | | 790,922 | |
Administrator Class | | | 4,405,873 | |
Investor Class | | | 3,080,904 | |
Distribution fees | | | | |
Class C | | | 2,372,765 | |
Custody and accounting fees | | | 304,098 | |
Professional fees | | | 34,093 | |
Registration fees | | | 111,211 | |
Shareholder report expenses | | | 439,235 | |
Trustees’ fees and expenses | | | 5,485 | |
Other fees and expenses | | | 126,208 | |
| | | | |
Total expenses | | | 66,345,884 | |
Less: Fee waivers and/or expense reimbursements | | | (1,158,737 | ) |
| | | | |
Net expenses | | | 65,187,147 | |
| | | | |
Net investment loss | | | (32,405,240 | ) |
| | | | |
| |
REALIZED AND UNREALIZED GAINS (LOSSES) ON INVESTMENTS | | | | |
| |
Net realized gains (losses) on: | | | | |
Unaffiliated securities | | | 593,670,182 | |
Affiliated securities | | | (14,524,932 | ) |
| | | | |
Net realized gains on investments | | | 579,145,250 | |
| | | | |
| |
Net change in unrealized gains (losses) on: | | | | |
Unaffiliated securities | | | 724,963,648 | |
Affiliated securities | | | (46,518,052 | ) |
| | | | |
Net change in unrealized gains (losses) on investments | | | 678,445,596 | |
| | | | |
Net realized and unrealized gains (losses) on investments | | | 1,257,590,846 | |
| | | | |
Net increase in net assets resulting from operations | | $ | 1,225,185,606 | |
| | | | |
The accompanying notes are an integral part of these financial statements.
| | | | |
| 14 | | Wells Fargo Advantage Growth Fund | | Statement of changes in net assets |
| | | | | | | | | | | | | | | | |
| | | Six months ended January 31, 2014 (unaudited) | | | Year ended July 31, 2013 | |
| | | | |
Operations | | | | | | | | | | | | | | | | |
Net investment loss | | | | | | $ | (32,405,240 | ) | | | | | | $ | (31,466,810 | ) |
Net realized gains on investments | | | | | | | 579,145,250 | | | | | | | | 462,255,497 | |
Net change in unrealized gains (losses) on investments | | | | | | | 678,445,596 | | | | | | | | 1,822,346,339 | |
| | | | |
Net increase in net assets resulting from operations | | | | | | | 1,225,185,606 | | | | | | | | 2,253,135,026 | |
| | | | |
| | | | |
Distributions to shareholders from | | | | | | | | | | | | | | | | |
Net realized gains | | | | | | | | | | | | | | | | |
Class A | | | | | | | (89,729,153 | ) | | | | | | | 0 | |
Class C | | | | | | | (23,545,922 | ) | | | | | | | 0 | |
Administrator Class | | | | | | | (118,713,858 | ) | | | | | | | 0 | |
Institutional Class | | | | | | | (93,848,760 | ) | | | | | | | 0 | |
Investor Class | | | | | | | (85,239,966 | ) | | | | | | | 0 | |
| | | | |
Total distributions to shareholders | | | | | | | (411,077,659 | ) | | | | | | | 0 | |
| | | | |
| | | | |
Capital share transactions | | | Shares | | | | | | | | Shares | | | | | |
Proceeds from shares sold | | | | | | | | | | | | | | | | |
Class A | | | 3,473,408 | | | | 172,869,657 | | | | 9,894,040 | | | | 408,238,204 | |
Class C | | | 573,281 | | | | 26,422,248 | | | | 1,147,995 | | | | 44,251,040 | |
Administrator Class | | | 8,206,588 | | | | 430,160,008 | | | | 20,894,228 | | | | 909,698,951 | |
Institutional Class | | | 6,972,128 | | | | 374,123,277 | | | | 18,150,039 | | | | 808,730,212 | |
Investor Class | | | 2,186,626 | | | | 107,562,279 | | | | 4,832,369 | | | | 198,790,403 | |
| | | | |
| | | | | | | 1,111,137,469 | | | | | | | | 2,369,708,810 | |
| | | | |
Reinvestment of distributions | | | | | | | | | | | | | | | | |
Class A | | | 1,674,692 | | | | 83,232,180 | | | | 0 | | | | 0 | |
Class C | | | 351,793 | | | | 16,150,797 | | | | 0 | | | | 0 | |
Administrator Class | | | 2,144,766 | | | | 112,428,654 | | | | 0 | | | | 0 | |
Institutional Class | | | 1,666,978 | | | | 90,150,182 | | | | 0 | | | | 0 | |
Investor Class | | | 1,690,906 | | | | 83,784,433 | | | | 0 | | | | 0 | |
| | | | |
| | | | | | | 385,746,246 | | | | | | | | 0 | |
| | | | |
Payment for shares redeemed | | | | | | | | | | | | | | | | |
Class A | | | (6,710,496 | ) | | | (332,258,324 | ) | | | (17,025,386 | ) | | | (706,155,026 | ) |
Class C | | | (932,237 | ) | | | (42,839,630 | ) | | | (2,400,300 | ) | | | (93,030,757 | ) |
Administrator Class | | | (9,630,576 | ) | | | (503,153,040 | ) | | | (28,712,741 | ) | | | (1,239,210,292 | ) |
Institutional Class | | | (5,321,063 | ) | | | (285,425,838 | ) | | | (22,463,835 | ) | | | (993,743,121 | ) |
Investor Class | | | (4,477,689 | ) | | | (220,786,451 | ) | | | (13,875,944 | ) | | | (570,744,025 | ) |
| | | | |
| | | | | | | (1,384,463,283 | ) | | | | | | | (3,602,883,221 | ) |
| | | | |
Net increase (decrease) in net assets resulting from capital share transactions | | | | | | | 112,420,432 | | | | | | | | (1,233,174,411 | ) |
| | | | |
Total increase in net assets | | | | | | | 926,528,379 | | | | | | | | 1,019,960,615 | |
| | | | |
| | | | |
Net assets | | | | | | | | | | | | | | | | |
Beginning of period | | | | | | | 11,315,903,640 | | | | | | | | 10,295,943,025 | |
| | | | |
End of period | | | | | | $ | 12,242,432,019 | | | | | | | $ | 11,315,903,640 | |
| | | | |
Accumulated net investment loss | | | | | | $ | (63,239,721 | ) | | | | | | $ | (30,834,481 | ) |
| | | | |
The accompanying notes are an integral part of these financial statements.
| | | | | | |
| Financial highlights | | Wells Fargo Advantage Growth Fund | | | 15 | |
(For a share outstanding throughout each period)
| | | | | | | | | | | | | | | | | | | | | | | | |
| | | Six months ended
January 31, 2014
(unaudited) | | | Year ended July 31 | |
| CLASS A | | | 2013 | | | 2012 | | | 2011 | | | 2010 | | | 2009 | |
Net asset value, beginning of period | | $ | 46.74 | | | $ | 37.85 | | | $ | 35.88 | | | $ | 26.10 | | | $ | 21.13 | | | $ | 25.20 | |
Net investment loss | | | (0.16 | )1 | | | (0.17 | )1 | | | (0.21 | )1 | | | (0.27 | )1 | | | (0.16 | )1 | | | (0.08 | )1 |
Net realized and unrealized gains (losses) on investments | | | 5.22 | | | | 9.06 | | | | 2.65 | | | | 10.05 | | | | 5.13 | | | | (3.99 | ) |
| | | | | | | | | | | | | | | | | | | | | | | | |
Total from investment operations | | | 5.06 | | | | 8.89 | | | | 2.44 | | | | 9.78 | | | | 4.97 | | | | (4.07 | ) |
Distributions to shareholders from | | | | | | | | | | | | | | | | | | | | | | | | |
Net realized gains | | | (1.77 | ) | | | 0.00 | | | | (0.47 | ) | | | 0.00 | | | | 0.00 | | | | 0.00 | |
Net asset value, end of period | | $ | 50.03 | | | $ | 46.74 | | | $ | 37.85 | | | $ | 35.88 | | | $ | 26.10 | | | $ | 21.13 | |
Total return2 | | | 10.84 | % | | | 23.49 | % | | | 6.93 | % | | | 37.43 | % | | | 23.52 | % | | | (16.15 | )% |
Ratios to average net assets (annualized) | | | | | | | | | | | | | | | | | | | | | | | | |
Gross expenses | | | 1.18 | % | | | 1.19 | % | | | 1.20 | % | | | 1.24 | % | | | 1.31 | % | | | 1.35 | % |
Net expenses | | | 1.18 | % | | | 1.19 | % | | | 1.20 | % | | | 1.24 | % | | | 1.30 | % | | | 1.29 | % |
Net investment loss | | | (0.65 | )% | | | (0.41 | )% | | | (0.56 | )% | | | (0.81 | )% | | | (0.64 | )% | | | (0.44 | )% |
Supplemental data | | | | | | | | | | | | | | | | | | | | | | | | |
Portfolio turnover rate | | | 18 | % | | | 38 | % | | | 47 | % | | | 54 | % | | | 72 | % | | | 88 | % |
Net assets, end of period (000s omitted) | | | $2,559,886 | | | | $2,464,533 | | | | $2,265,845 | | | | $1,204,675 | | | | $163,485 | | | | $46,250 | |
| 1. | Calculated based upon average shares outstanding |
| 2. | Total return calculations do not include any sales charges. Returns for periods of less than one year are not annualized. |
The accompanying notes are an integral part of these financial statements.
| | | | |
| 16 | | Wells Fargo Advantage Growth Fund | | Financial highlights |
(For a share outstanding throughout each period)
| | | | | | | | | | | | | | | | | | | | | | | | |
| | | Six months ended
January 31, 2014 (unaudited) | | | Year ended July 31 | |
| CLASS C | | | 2013 | | | 2012 | | | 2011 | | | 2010 | | | 2009 | |
Net asset value, beginning of period | | $ | 43.41 | | | $ | 35.42 | | | $ | 33.86 | | | $ | 24.81 | | | $ | 20.24 | | | $ | 24.30 | |
Net investment loss | | | (0.33 | )1 | | | (0.45 | )1 | | | (0.46 | )1 | | | (0.51 | )1 | | | (0.34 | )1 | | | (0.21 | )1 |
Net realized and unrealized gains (losses) on investments | | | 4.85 | | | | 8.44 | | | | 2.49 | | | | 9.56 | | | | 4.91 | | | | (3.85 | ) |
| | | | | | | | | | | | | | | | | | | | | | | | |
Total from investment operations | | | 4.52 | | | | 7.99 | | | | 2.03 | | | | 9.05 | | | | 4.57 | | | | (4.06 | ) |
Distributions to shareholders from | | | | | | | | | | | | | | | | | | | | | | | | |
Net realized gains | | | (1.77 | ) | | | 0.00 | | | | (0.47 | ) | | | 0.00 | | | | 0.00 | | | | 0.00 | |
Net asset value, end of period | | $ | 46.16 | | | $ | 43.41 | | | $ | 35.42 | | | $ | 33.86 | | | $ | 24.81 | | | $ | 20.24 | |
Total return2 | | | 10.44 | % | | | 22.56 | % | | | 6.12 | % | | | 36.44 | % | | | 22.58 | % | | | (16.71 | )% |
Ratios to average net assets (annualized) | | | | | | | | | | | | | | | | | | | | | | | | |
Gross expenses | | | 1.93 | % | | | 1.94 | % | | | 1.95 | % | | | 1.99 | % | | | 2.06 | % | | | 2.07 | % |
Net expenses | | | 1.93 | % | | | 1.94 | % | | | 1.95 | % | | | 1.99 | % | | | 2.05 | % | | | 2.02 | % |
Net investment loss | | | (1.40 | )% | | | (1.16 | )% | | | (1.32 | )% | | | (1.57 | )% | | | (1.40 | )% | | | (1.17 | )% |
Supplemental data | | | | | | | | | | | | | | | | | | | | | | | | |
Portfolio turnover rate | | | 18 | % | | | 38 | % | | | 47 | % | | | 54 | % | | | 72 | % | | | 88 | % |
Net assets, end of period (000s omitted) | | | $626,381 | | | | $589,402 | | | | $525,285 | | | | $233,114 | | | | $14,737 | | | | $2,387 | |
| 1. | Calculated based upon average shares outstanding |
| 2. | Total return calculations do not include any sales charges. Returns for periods of less than one year are not annualized. |
The accompanying notes are an integral part of these financial statements.
| | | | | | |
| Financial highlights | | Wells Fargo Advantage Growth Fund | | | 17 | |
(For a share outstanding throughout each period)
| | | | | | | | | | | | | | | | | | | | | | | | |
| | | Six months ended
January 31, 2014 (unaudited) | | | Year ended July 31 | |
| ADMINISTRATOR CLASS | | | 2013 | | | 2012 | | | 2011 | | | 2010 | | | 2009 | |
Net asset value, beginning of period | | $ | 49.16 | | | $ | 39.72 | | | $ | 37.54 | | | $ | 27.24 | | | $ | 21.98 | | | $ | 26.12 | |
Net investment loss | | | (0.11 | ) | | | (0.08 | )1 | | | (0.13 | )1 | | | (0.18 | )1 | | | (0.08 | )1 | | | (0.01 | )1 |
Net realized and unrealized gains (losses) on investments | | | 5.50 | | | | 9.52 | | | | 2.78 | | | | 10.48 | | | | 5.34 | | | | (4.13 | ) |
| | | | | | | | | | | | | | | | | | | | | | | | |
Total from investment operations | | | 5.39 | | | | 9.44 | | | | 2.65 | | | | 10.30 | | | | 5.26 | | | | (4.14 | ) |
Distributions to shareholders from | | | | | | | | | | | | | | | | | | | | | | | | |
Net realized gains | | | (1.77 | ) | | | 0.00 | | | | (0.47 | ) | | | 0.00 | | | | 0.00 | | | | 0.00 | |
Net asset value, end of period | | | $52.78 | | | | $49.16 | | | | $39.72 | | | | $37.54 | | | | $27.24 | | | | $21.98 | |
Total return2 | | | 11.00 | % | | | 23.77 | % | | | 7.15 | % | | | 37.81 | % | | | 23.93 | % | | | (15.85 | )% |
Ratios to average net assets (annualized) | | | | | | | | | | | | | | | | | | | | | | | | |
Gross expenses | | | 1.02 | % | | | 1.03 | % | | | 1.03 | % | | | 1.08 | % | | | 1.13 | % | | | 1.18 | % |
Net expenses | | | 0.96 | % | | | 0.96 | % | | | 0.96 | % | | | 0.96 | % | | | 0.96 | % | | | 0.96 | % |
Net investment loss | | | (0.42 | )% | | | (0.18 | )% | | | (0.33 | )% | | | (0.51 | )% | | | (0.29 | )% | | | (0.07 | )% |
Supplemental data | | | | | | | | | | | | | | | | | | | | | | | | |
Portfolio turnover rate | | | 18 | % | | | 38 | % | | | 47 | % | | | 54 | % | | | 72 | % | | | 88 | % |
Net assets, end of period (000s omitted) | | | $3,591,157 | | | | $3,309,683 | | | | $2,984,775 | | | | $1,339,245 | | | | $414,489 | | | | $196,301 | |
| 1. | Calculated based upon average shares outstanding |
| 2. | Returns for periods of less than one year are not annualized. |
The accompanying notes are an integral part of these financial statements.
| | | | |
| 18 | | Wells Fargo Advantage Growth Fund | | Financial highlights |
(For a share outstanding throughout each period)
| | | | | | | | | | | | | | | | | | | | | | | | |
| | | Six months ended
January 31, 2014 (unaudited) | | | Year ended July 31 | |
| INSTITUTIONAL CLASS | | | 2013 | | | 2012 | | | 2011 | | | 2010 | | | 2009 | |
Net asset value, beginning of period | | $ | 50.63 | | | $ | 40.83 | | | $ | 38.49 | | | $ | 27.88 | | | $ | 22.46 | | | $ | 26.65 | |
Net Investment income (loss) | | | (0.06 | )1 | | | 0.01 | 1 | | | (0.05 | )1 | | | (0.12 | )1 | | | (0.03 | )1 | | | 0.01 | 1 |
Net realized and unrealized gains (losses) on investments | | | 5.67 | | | | 9.79 | | | | 2.86 | | | | 10.73 | | | | 5.45 | | | | (4.20 | ) |
| | | | | | | | | | | | | | | | | | | | | | | | |
Total from investment operations | | | 5.61 | | | | 9.80 | | | | 2.81 | | | | 10.61 | | | | 5.42 | | | | (4.19 | ) |
Distributions to shareholders from | | | | | | | | | | | | | | | | | | | | | | | | |
Net realized gains | | | (1.77 | ) | | | 0.00 | | | | (0.47 | ) | | | 0.00 | | | | 0.00 | | | | 0.00 | |
Net asset value, end of period | | $ | 54.47 | | | $ | 50.63 | | | $ | 40.83 | | | $ | 38.49 | | | $ | 27.88 | | | $ | 22.46 | |
Total return2 | | | 11.11 | % | | | 24.03 | % | | | 7.37 | % | | | 38.06 | % | | | 24.13 | % | | | (15.72 | )% |
Ratios to average net assets (annualized) | | | | | | | | | | | | | | | | | | | | | | | | |
Gross expenses | | | 0.75 | % | | | 0.76 | % | | | 0.77 | % | | | 0.81 | % | | | 0.86 | % | | | 0.91 | % |
Net expenses | | | 0.75 | % | | | 0.75 | % | | | 0.76 | % | | | 0.80 | % | | | 0.80 | % | | | 0.80 | % |
Net investment income (loss) | | | (0.22 | )% | | | 0.02 | % | | | (0.13 | )% | | | (0.35 | )% | | | (0.12 | )% | | | 0.07 | % |
Supplemental data | | | | | | | | | | | | | | | | | | | | | | | | |
Portfolio turnover rate | | | 18 | % | | | 38 | % | | | 47 | % | | | 54 | % | | | 72 | % | | | 88 | % |
Net assets, end of period (000s omitted) | | | $3,030,599 | | | | $2,649,095 | | | | $2,312,074 | | | | $992,748 | | | | $367,360 | | | | $255,282 | |
| 1. | Calculated based upon average shares outstanding |
| 2. | Returns for periods of less than one year are not annualized. |
The accompanying notes are an integral part of these financial statements.
| | | | | | |
| Financial highlights | | Wells Fargo Advantage Growth Fund | | | 19 | |
(For a share outstanding throughout each period)
| | | | | | | | | | | | | | | | | | | | | | | | |
| | | Six months ended
January 31, 2014 (unaudited) | | | Year ended July 31 | |
| INVESTOR CLASS | | | 2013 | | | 2012 | | | 2011 | | | 2010 | | | 2009 | |
Net asset value, beginning of period | | $ | 46.61 | | | $ | 37.77 | | | $ | 35.83 | | | $ | 26.09 | | | $ | 21.14 | | | $ | 25.23 | |
Net investment loss | | | (0.18 | )1 | | | (0.19 | )1 | | | (0.23 | )1 | | | (0.28 | )1 | | | (0.17 | )1 | | | (0.10 | )1 |
Net realized and unrealized gains (losses) on investments | | | 5.21 | | | | 9.03 | | | | 2.64 | | | | 10.02 | | | | 5.12 | | | | (3.99 | ) |
| | | | | | | | | | | | | | | | | | | | | | | | |
Total from investment operations | | | 5.03 | | | | 8.84 | | | | 2.41 | | | | 9.74 | | | | 4.95 | | | | (4.09 | ) |
Distributions to shareholders from | | | | | | | | | | | | | | | | | | | | | | | | |
Net realized gains | | | (1.77 | ) | | | 0.00 | | | | (0.47 | ) | | | 0.00 | | | | 0.00 | | | | 0.00 | |
Net asset value, end of period | | $ | 49.87 | | | $ | 46.61 | | | $ | 37.77 | | | $ | 35.83 | | | $ | 26.09 | | | $ | 21.14 | |
Total return2 | | | 10.82 | % | | | 23.40 | % | | | 6.85 | % | | | 37.29 | % | | | 23.42 | % | | | (16.21 | )% |
Ratios to average net assets (annualized) | | | | | | | | | | | | | | | | | | | | | | | | |
Gross expenses | | | 1.24 | % | | | 1.25 | % | | | 1.26 | % | | | 1.31 | % | | | 1.41 | % | | | 1.46 | % |
Net expenses | | | 1.24 | % | | | 1.25 | % | | | 1.26 | % | | | 1.31 | % | | | 1.40 | % | | | 1.40 | % |
Net investment loss | | | (0.71 | )% | | | (0.47 | )% | | | (0.64 | )% | | | (0.85 | )% | | | (0.71 | )% | | | (0.54 | )% |
Supplemental data | | | | | | | | | | | | | | | | | | | | | | | | |
Portfolio turnover rate | | | 18 | % | | | 38 | % | | | 47 | % | | | 54 | % | | | 72 | % | | | 88 | % |
Net assets, end of period (000s omitted) | | | $2,434,409 | | | | $2,303,191 | | | | $2,207,964 | | | | $1,707,285 | | | | $941,660 | | | | $748,218 | |
| 1. | Calculated based upon average shares outstanding |
| 2. | Returns for periods of less than one year are not annualized. |
The accompanying notes are an integral part of these financial statements.
| | | | |
| 20 | | Wells Fargo Advantage Growth Fund | | Notes to financial statements (unaudited) |
1. ORGANIZATION
Wells Fargo Funds Trust (the “Trust”), a Delaware statutory trust organized on March 10, 1999, is an open-end management investment company registered under the Investment Company Act of 1940, as amended (the “1940 Act”). These financial statements report on the Wells Fargo Advantage Growth Fund (the “Fund”) which is a diversified series of the Trust.
2. SIGNIFICANT ACCOUNTING POLICIES
The following significant accounting policies, which are consistently followed in the preparation of the financial statements of the Fund, are in conformity with U.S. generally accepted accounting principles which require management to make estimates and assumptions that affect the reported amounts of assets and liabilities, disclosure of contingent assets and liabilities at the date of the financial statements, and the reported amounts of revenues and expenses during the reporting period. Actual results could differ from those estimates.
Securities valuation
All investments are valued each business day as of the close of regular trading on the New York Stock Exchange (generally 4 p.m. Eastern Time).
Equity securities that are listed on a foreign or domestic exchange or market are valued at the official closing price or, if none, the last sales price. If no sale occurs on the primary exchange or market for the security that day, the prior day’s price will be deemed “stale” and fair values will be determined in accordance with the Fund’s Valuation Procedures.
Investments in registered open-end investment companies are valued at net asset value. Non-registered investment vehicles are fair valued at net asset value.
Investments which are not valued using any of the methods discussed above are valued at their fair value, as determined in good faith by the Board of Trustees of the Fund. The Board of Trustees has established a Valuation Committee comprised of the Trustees and has delegated to it the authority to take any actions regarding the valuation of portfolio securities that the Valuation Committee deems necessary or appropriate, including determining the fair value of portfolio securities, unless the determination has been delegated to the Management Valuation Team of Wells Fargo Funds Management, LLC (“Funds Management”). The Board of Trustees retains the authority to make or ratify any valuation decisions or approve any changes to the Valuation Procedures as it deems appropriate. On a quarterly basis, the Board of Trustees receives reports on any valuation actions taken by the Valuation Committee or the Management Valuation Team which may include items for ratification.
Valuations of fair valued securities are compared to the next actual sales price when available, or other appropriate market values, to assess the continued appropriateness of the fair valuation methodologies used. These securities are fair valued on a day-to-day basis, taking into consideration changes to appropriate market information and any significant changes to the inputs considered in the valuation process until there is a readily available price provided on an exchange or by an independent pricing service. Valuations received from an independent pricing service or independent broker-dealer quotes are periodically validated by comparisons to most recent trades and valuations provided by other independent pricing services in addition to the review of prices by the adviser and/or subadviser. Unobservable inputs used in determining fair valuations are identified based on the type of security, taking into consideration factors utilized by market participants in valuing the investment, knowledge about the issuer and the current market environment.
Security loans
The Fund may lend its securities from time to time in order to earn additional income in the form of fees or interest on securities received as collateral or the investment of any cash received as collateral. The Fund continues to receive interest or dividends on the securities loaned. The Fund receives collateral in the form of cash or securities with a value at least equal to the value of the securities on loan. The value of the loaned securities is determined at the close of each business day and any additional required collateral is delivered to the Fund on the next business day. In a securities lending transaction, the net asset value of the Fund will be affected by an increase or decrease in the value of the securities loaned and by an increase or decrease in the value of the instrument in which collateral is invested. The amount of securities lending activity undertaken by the Fund fluctuates from time to time. In the event of default or bankruptcy by the borrower, the Fund may be prevented from recovering the loaned securities or gaining access to the collateral or may experience delays or costs in doing so. In addition, the investment of any cash collateral received may lose all or part of its value. The Fund has the right under the lending agreement to recover the securities from the borrower on demand.
The Fund lends its securities through an unaffiliated securities lending agent. Cash collateral received in connection with its securities lending transactions is invested in Wells Fargo Securities Lending Cash Investments, LLC (the “Securities
| | | | | | |
| Notes to financial statements (unaudited) | | Wells Fargo Advantage Growth Fund | | | 21 | |
Lending Fund”). The Securities Lending Fund is exempt from registration under Section 3(c)(7) of the 1940 Act and is managed by Funds Management and is subadvised by Wells Capital Management Incorporated (“WellsCap”). Funds Management receives an advisory fee starting at 0.05% and declining to 0.01% as the average daily net assets of the Securities Lending Fund increase. All of the fees received by Funds Management are paid to WellsCap for its services as subadviser. The Securities Lending Fund seeks to provide a positive return compared to the daily Fed Funds Open rate by investing in high-quality, U.S. dollar-denominated short-term money market instruments. Securities Lending Fund investments are fair valued based upon the amortized cost valuation technique. Income earned from investment in the Securities Lending Fund is included in securities lending income on the Statement of Operations.
Security transactions and income recognition
Securities transactions are recorded on a trade date basis. Realized gains or losses are recorded on the basis of identified cost.
Dividend income is recognized on the ex-dividend date.
Distributions to shareholders
Distributions to shareholders from net investment income and net realized gains, if any, are recorded on the ex-dividend date. Such distributions are determined in conformity with federal income tax regulations, which may differ in amount or character from net investment income and realized gains recognized for purposes of U.S. generally accepted accounting principles.
Federal and other taxes
The Fund intends to continue to qualify as a regulated investment company by distributing substantially all of its investment company taxable income and any net realized capital gains (after reduction for capital loss carryforwards) sufficient to relieve it from all, or substantially all, federal income taxes. Accordingly, no provision for federal income taxes was required.
The Fund’s income and federal excise tax returns and all financial records supporting those returns for the prior three fiscal years are subject to examination by the federal and Delaware revenue authorities. Management has analyzed the Fund’s tax positions taken on federal, state, and foreign tax returns for all open tax years and does not believe that there are any uncertain tax positions that require recognition of a tax liability.
As of July 31, 2013, the Fund had a qualified late-year ordinary loss of $30,834,481 which was recognized on the first day of the current fiscal year.
Class allocations
The separate classes of shares offered by the Fund differ principally in applicable sales charges, distribution, shareholder servicing, and administration fees. Shareholders of each class bear certain expenses that pertain to that particular class. All shareholders bear the common expenses of the Fund, earn income from the portfolio, and are allocated any unrealized gains and losses pro rata based on the average daily net assets of each class, without distinction between share classes. Dividends are determined separately for each class based on income and expenses allocable to each class. Realized gains and losses are allocated to each class pro rata based upon the net assets of each class on the date realized. Differences in per share dividend rates generally result from the relative weightings of pro rata income and realized gain allocations and from differences in separate class expenses, including distribution, shareholder servicing, and administration fees.
3. FAIR VALUATION MEASUREMENTS
Fair value measurements of investments are determined within a framework that has established a fair value hierarchy based upon the various data inputs utilized in determining the value of the Fund’s investments. The three-level hierarchy gives the highest priority to unadjusted quoted prices in active markets for identical assets or liabilities (Level 1) and the lowest priority to significant unobservable inputs (Level 3). The Fund’s investments are classified within the fair value hierarchy based on the lowest level of input that is significant to the fair value measurement. The inputs are summarized into three broad levels as follows:
| n | | Level 1 – quoted prices in active markets for identical securities |
| n | | Level 2 – other significant observable inputs (including quoted prices for similar securities, interest rates, prepayment speeds, credit risk, use of amortized cost, etc.) |
| n | | Level 3 – significant unobservable inputs (including the Fund’s own assumptions in determining the fair value of investments) |
| | | | |
| 22 | | Wells Fargo Advantage Growth Fund | | Notes to financial statements (unaudited) |
The inputs or methodologies used for valuing investments in securities are not necessarily an indication of the risk associated with investing in those securities.
As of January 31, 2014, the inputs used in valuing investments in securities were as follows:
| | | | | | | | | | | | | | | | |
| Investments in securities | | Quoted prices (Level 1) | | | Other significant observable inputs (Level 2) | | | Significant unobservable inputs (Level 3) | | | Total | |
Equity securities | | | | | | | | | | | | | | | | |
Common stocks | | $ | 12,226,805,293 | | | $ | 0 | | | $ | 0 | | | $ | 12,226,805,293 | |
Short-term investments | | | | | | | | | | | | | | | | |
Investment companies | | | 35,852,317 | | | | 202,225,164 | | | | 0 | | | | 238,077,481 | |
| | | $ | 12,262,657,610 | | | $ | 202,225,164 | | | $ | 0 | | | $ | 12,464,882,774 | |
Transfers in and transfers out are recognized at the end of the reporting period. For the six months ended January 31, 2014, the Fund did not have any transfers into/out of Level 1, Level 2, or Level 3.
4. TRANSACTIONS WITH AFFILIATES AND OTHER EXPENSES
Advisory fee
The Trust has entered into an advisory contract with Funds Management, an indirect wholly owned subsidiary of Wells Fargo & Company (“Wells Fargo”). The adviser is responsible for implementing investment policies and guidelines and for supervising the subadviser, who is responsible for day-to-day portfolio management of the Fund.
Pursuant to the contract, Funds Management is entitled to receive an annual advisory fee starting at 0.75% and declining to 0.55% as the average daily net assets of the Fund increase. Prior to December 1, 2013, Funds Management received an annual advisory feel which started at 0.75% and declined to 0.60% as the average daily net assets of the Fund increased. For the six months ended January 31, 2014, the advisory fee was equivalent to an annual rate of 0.62% of the Fund’s average daily net assets.
Funds Management has retained the services of a subadviser to provide daily portfolio management to the Fund. The fee for subadvisory services is borne by Funds Management. WellsCap, an affiliate of Funds Management and an indirect, wholly owned subsidiary of Wells Fargo, is the subadviser to the Fund and is entitled to receive a fee from Funds Management at an annual rate starting at 0.45% and declining to 0.30% as the average daily net assets of the Fund increase.
Administration and transfer agent fees
The Trust has entered into an administration agreement with Funds Management. Under this agreement, for providing administrative services, which includes paying fees and expenses for services provided by the transfer agent, sub-transfer agents, omnibus account servicers and record-keepers, Funds Management is entitled to receive from the Fund an annual fund level administration fee starting at 0.05% and declining to 0.03% as the average daily net assets of the Fund increase and a class level administration fee which is calculated based on the average daily net assets of each class as follows:
| | | | |
| | | Class level administration fee | |
Class A, Class C | | | 0.26 | % |
Administrator Class | | | 0.10 | |
Institutional Class | | | 0.08 | |
Investor Class | | | 0.32 | |
Funds Management has contractually waived and/or reimbursed advisory and administration fees to the extent necessary to maintain certain net operating expense ratios for the Fund. Waiver of fees and/or reimbursement of expenses by Funds Management were made first from fund level expenses on a proportionate basis and then from class specific expenses. Funds Management has committed through November 31, 2014 to waive fees and/or reimburse expenses to the extent necessary to cap the Fund’s expenses at 1.21% for Class A shares, 1.96% for Class C shares, 0.96% for Administrator Class shares, 0.75% for Institutional Class shares, and 1.27% for Investor Class shares.
| | | | | | |
| Notes to financial statements (unaudited) | | Wells Fargo Advantage Growth Fund | | | 23 | |
Distribution fees
The Trust has adopted a Distribution Plan for Class C shares of the Fund pursuant to Rule 12b-1 under the 1940 Act. Distribution fees are charged to Class C shares and paid to Wells Fargo Funds Distributor, LLC, the principal underwriter, at an annual rate of 0.75% of its average daily net assets.
For the six months ended January 31, 2014, Wells Fargo Funds Distributor, LLC received $44,526 from the sale of Class A shares and $824 in contingent deferred sales charges from redemptions of Class C shares.
Shareholder servicing fees
The Trust has entered into contracts with one or more shareholder servicing agents, whereby Class A, Class C, Administrator Class, and Investor Class of the Fund is charged a fee at an annual rate of 0.25% of the average daily net assets of each respective class.
A portion of these total shareholder servicing fees were paid to affiliates of Wells Fargo.
5. INVESTMENT PORTFOLIO TRANSACTIONS
Purchases and sales of investments, excluding U.S. government obligations (if any) and short-term securities, for the six months ended January 31, 2014 were $2,156,766,110 and $2,403,452,617, respectively.
6. INVESTMENTS IN AFFILIATES
An affiliated investment is a company in which the Fund has ownership of at least 5% of the outstanding voting shares. The following is a summary of transactions in issuers that were either affiliates of the Fund at the beginning of the period or the end of the period.
| | | | | | | | | | | | | | | | | | | | | | | | | | | | |
| | | Shares,
beginning
of period | | | Shares
purchased | | | Shares
sold | | | Shares, end of period | | | Value, end of period | | | Income from affiliated securities | | | Realized gains (losses) | |
Energy XXI (Bermuda) Limited | | | 3,950,000 | | | | 0 | | | | 539,400 | | | | 3,410,600 | | | $ | 78,273,270 | | | $ | 948,000 | | | $ | (5,974,067 | ) |
Shutterfly Incorporated | | | 2,760,000 | | | | 0 | | | | 0 | | | | 2,760,000 | | | | 130,713,600 | | | | 0 | | | | 0 | |
The Fresh Market Incorporated | | | 3,985,000 | | | | 0 | | | | 1,260,000 | | | | 2,725,000 | | | | 95,266,000 | | | | 0 | | | | (14,435,444 | ) |
Vitamin Shoppe Incorporated | | | 2,565,000 | | | | 0 | | | | 2,550,000 | | | | 15,000 | | | | 672,300 | | | | 0 | | | | 5,884,579 | |
| | | | | | | | | | | | | | | | | | | $ | 304,925,170 | | | $ | 948,000 | | | $ | (14,524,932 | ) |
7. BANK BORROWINGS
The Trust (excluding the money market funds and certain other funds in the Trust) and Wells Fargo Variable Trust are parties to a $150,000,000 revolving credit agreement with State Street Bank and Trust Company, whereby the Fund is permitted to use bank borrowings for temporary or emergency purposes, such as to fund shareholder redemption requests. Interest under the credit agreement is charged to the Fund based on a borrowing rate equal to the higher of the Federal Funds rate in effect on that day plus 1.25% or the overnight LIBOR rate in effect on that day plus 1.25%. In addition, an annual commitment fee equal to 0.10% of the unused balance is allocated to each participating fund. For the six months ended January 31, 2014, the Fund paid $4,702 in commitment fees.
For the six months ended January 31, 2014, there were no borrowings by the Fund under the agreement.
8. CONCENTRATION RISK
Concentration risks result from exposure to a limited number of sectors. Funds that invest a substantial portion of their assets in any sector may be more affected by changes in that sector than would be a fund whose investments are not heavily weighted in any sector.
9. INDEMNIFICATION
Under the Trust’s organizational documents, the officers and directors are indemnified against certain liabilities that may arise out of performance of their duties to the Trust. Additionally, in the normal course of business, the Trust may enter into contracts with service providers that contain a variety of indemnification clauses. The Trust’s maximum exposure under these arrangements is dependent on future claims that may be made against the Fund and, therefore, cannot be estimated.
| | | | |
| 24 | | Wells Fargo Advantage Growth Fund | | Other information (unaudited) |
PROXY VOTING INFORMATION
A description of the policies and procedures that the Fund uses to determine how to vote proxies relating to portfolio securities is available without charge, upon request, by calling 1-800-222-8222, visiting our website at wellsfargoadvantagefunds.com, or visiting the SEC website at sec.gov. Information regarding how the Fund voted proxies relating to portfolio securities during the most recent 12-month period ended June 30 is available without charge on the Fund’s website at wellsfargoadvantagefunds.com or by visiting the SEC website at sec.gov.
PORTFOLIO HOLDINGS INFORMATION
The complete portfolio holdings for the Fund are publicly available on the Fund’s website (wellsfargoadvantagefunds.com) on a monthly, 30-day or more delayed basis. In addition, top ten holdings information for the Fund is publicly available on the Fund’s website on a monthly, seven-day or more delayed basis. The Fund files its complete schedule of portfolio holdings with the SEC for the first and third quarters of each fiscal year on Form N-Q, which is available without charge by visiting the SEC website at sec.gov. In addition, the Fund’s Form N-Q may be reviewed and copied at the SEC’s Public Reference Room in Washington, DC, and at regional offices in New York City, at 233 Broadway, and in Chicago, at 175 West Jackson Boulevard, Suite 900. Information about the Public Reference Room may be obtained by calling 1-800-SEC-0330.
| | | | | | |
| Other information (unaudited) | | Wells Fargo Advantage Growth Fund | | | 25 | |
BOARD OF TRUSTEES AND OFFICERS
Each of the Trustees and Officers listed in the table below acts in identical capacities for each fund in the Wells Fargo Advantage family of funds, which consists of 132 mutual funds1 comprising the Wells Fargo Funds Trust, Wells Fargo Variable Trust, Wells Fargo Master Trust and four closed-end funds (collectively the “Fund Complex”). This table should be read in conjunction with the Prospectus and the Statement of Additional Information2. All of the Trustees are also Members of the Audit and Governance Committees of each Trust in the Fund Complex. The mailing address of each Trustee and Officer is 525 Market Street, 12th Floor, San Francisco, CA 94105. Each Trustee and Officer serves an indefinite term, however, each Trustee serves such term until reaching the mandatory retirement age established by the Trustees.
Independent Trustees
| | | | | | |
Name and year of birth | | Position held and length of service* | | Principal occupations during past five years | | Other directorships during
past five years |
Peter G. Gordon
(Born 1942) | | Trustee, since 1998; Chairman, since 2005 | | Co-Founder, Retired Chairman, President and CEO of Crystal Geyser Water Company. Trustee Emeritus, Colby College. | | Asset Allocation Trust |
Isaiah Harris, Jr.
(Born 1952) | | Trustee, since 2009 | | Retired. Prior thereto, President and CEO of BellSouth Advertising and Publishing Corp. from 2005 to 2007, President and CEO of BellSouth Enterprises from 2004 to 2005 and President of BellSouth Consumer Services from 2000 to 2003. Emeritus member of the Iowa State University Foundation Board of Governors. Emeritus Member of the Advisory Board of Iowa State University School of Business. Advisory Board Member, Palm Harbor Academy (charter school). Mr. Harris is a certified public accountant. | | CIGNA Corporation; Deluxe Corporation; Asset Allocation Trust |
Judith M. Johnson
(Born 1949) | | Trustee, since 2008;
Audit Committee Chairman, since 2008 | | Retired. Prior thereto, Chief Executive Officer and Chief Investment Officer of Minneapolis Employees Retirement Fund from 1996 to 2008. Ms. Johnson is an attorney, certified public accountant and a certified managerial accountant. | | Asset Allocation Trust |
Leroy Keith, Jr.
(Born 1939) | | Trustee, since 2010 | | Chairman, Bloc Global Services (development and construction). Trustee of the Evergreen Funds from 1983 to 2010. Former Managing Director, Almanac Capital Management (commodities firm), former Partner, Stonington Partners, Inc. (private equity fund), former Director, Obagi Medical Products Co. and former Director, Lincoln Educational Services. | | Trustee, Virtus Fund Complex (consisting of 50 portfolios as of 12/16/2013); Asset Allocation Trust |
David F. Larcker
(Born 1950) | | Trustee, since 2009 | | James Irvin Miller Professor of Accounting at the Graduate School of Business, Stanford University, Morgan Stanley Director of the Center for Leadership Development and Research and Senior Faculty of The Rock Center for Corporate Governance since 2006. From 2005 to 2008, Professor of Accounting at the Graduate School of Business, Stanford University. Prior thereto, Ernst & Young Professor of Accounting at The Wharton School, University of Pennsylvania from 1985 to 2005. | | Asset Allocation Trust |
Olivia S. Mitchell
(Born 1953) | | Trustee, since 2006 | | International Foundation of Employee Benefit Plans Professor, Wharton School of the University of Pennsylvania since 1993. Director of Wharton’s Pension Research Council and Boettner Center on Pensions & Retirement Research, and Research Associate at the National Bureau of Economic Research. Previously, Cornell University Professor from 1978 to 1993. | | Asset Allocation Trust |
Timothy J. Penny
(Born 1951) | | Trustee, since 1996 | | President and CEO of Southern Minnesota Initiative Foundation, a non-profit organization, since 2007 and Senior Fellow at the Humphrey Institute Policy Forum at the University of Minnesota since 1995. Member of the Board of Trustees of NorthStar Education Finance, Inc., a non-profit organization, since 2007. | | Asset Allocation Trust |
| | | | |
| 26 | | Wells Fargo Advantage Growth Fund | | Other information (unaudited) |
| | | | | | |
Name and year of birth | | Position held and length of service* | | Principal occupations during past five years | | Other directorships during
past five years |
Michael S. Scofield
(Born 1943) | | Trustee, since 2010 | | Served on the Investment Company Institute’s Board of Governors and Executive Committee from 2008-2011 as well the Governing Council of the Independent Directors Council from 2006-2011 and the Independent Directors Council Executive Committee from 2008-2011. Chairman of the IDC from 2008-2010. Institutional Investor (Fund Directions) Trustee of Year in 2007. Trustee of the Evergreen Funds (and its predecessors) from 1984 to 2010. Chairman of the Evergreen Funds from 2000-2010. Former Trustee of the Mentor Funds. Retired Attorney, Law Offices of Michael S. Scofield. | | Asset Allocation Trust |
Donald C. Willeke
(Born 1940) | | Trustee, since 1996 | | Principal of the law firm of Willeke & Daniels. General Counsel of the Minneapolis Employees Retirement Fund from 1984 until its consolidation into the Minnesota Public Employees Retirement Association on June 30, 2010. Director and Vice Chair of The Tree Trust (non-profit corporation). Director of the American Chestnut Foundation (non-profit corporation). | | Asset Allocation Trust |
| * | Length of service dates reflect the Trustee’s commencement of service with the Trust’s predecessor entities, where applicable. |
Officers
| | | | | | |
Name and
year of birth | | Position held and
length of service | | Principal occupations during past five years | | |
Karla M. Rabusch
(Born 1959) | | President, since 2003 | | Executive Vice President of Wells Fargo Bank, N.A. and President of Wells Fargo Funds Management, LLC since 2003. | | |
Jeremy DePalma1
(Born 1974) | | Treasurer, since 2012 | | Senior Vice President of Wells Fargo Funds Management, LLC since 2009. Senior Vice President of Evergreen Investment Management Company, LLC from 2008 to 2010. Vice President, Evergreen Investment Services, Inc. from 2004 to 2007. Head of the Fund Reporting and Control Team within Fund Administration from 2005 to 2010. | | |
C. David Messman
(Born 1960) | | Secretary, since 2000; Chief Legal Officer, since 2003 | | Senior Vice President and Secretary of Wells Fargo Funds Management, LLC since 2001. Vice President and Managing Counsel of Wells Fargo Bank, N.A. since 1996. | | |
Debra Ann Early
(Born 1964) | | Chief Compliance Officer, since 2007 | | Chief Compliance Officer of Wells Fargo Funds Management, LLC since 2007. Chief Compliance Officer of Parnassus Investments from 2005 to 2007. Chief Financial Officer of Parnassus Investments from 2004 to 2007. | | |
David Berardi
(Born 1975) | | Assistant Treasurer, since 2009 | | Vice President of Wells Fargo Funds Management, LLC since 2009. Vice President of Evergreen Investment Management Company, LLC from 2008 to 2010. Assistant Vice President of Evergreen Investment Services, Inc. from 2004 to 2008. Manager of Fund Reporting and Control for Evergreen Investment Management Company, LLC from 2004 to 2010. | | |
| 1. | Jeremy DePalma acts as Treasurer of 59 funds and Assistant Treasurer of 73 funds in the Fund Complex. |
| 2. | The Statement of Additional Information includes additional information about the Trustees and is available, without charge, upon request, by calling 1-800-222-8222 or by visiting the website at wellsfargoadvantagefunds.com. |
| | | | | | |
| List of abbreviations | | Wells Fargo Advantage Growth Fund | | | 27 | |
The following is a list of common abbreviations for terms and entities that may have appeared in this report.
| ACA | — ACA Financial Guaranty Corporation |
| ADR | — American depositary receipt |
| ADS | — American depositary shares |
| AGC | — Assured Guaranty Corporation |
| AGM | — Assured Guaranty Municipal |
| Ambac | — Ambac Financial Group Incorporated |
| AMT | — Alternative minimum tax |
| BAN | — Bond anticipation notes |
| BHAC | — Berkshire Hathaway Assurance Corporation |
| CAB | — Capital appreciation bond |
| CCAB | — Convertible capital appreciation bond |
| CDA | — Community Development Authority |
| CDO | — Collateralized debt obligation |
| COP | — Certificate of participation |
| DRIVER | — Derivative inverse tax-exempt receipts |
| DW&P | — Department of Water & Power |
| DWR | — Department of Water Resources |
| ECFA | — Educational & Cultural Facilities Authority |
| EDA | — Economic Development Authority |
| EDFA | — Economic Development Finance Authority |
| ETF | — Exchange-traded fund |
| FDIC | — Federal Deposit Insurance Corporation |
| FFCB | — Federal Farm Credit Banks |
| FGIC | — Financial Guaranty Insurance Corporation |
| FHA | — Federal Housing Administration |
| FHLB | — Federal Home Loan Bank |
| FHLMC | — Federal Home Loan Mortgage Corporation |
| FICO | — The Financing Corporation |
| FNMA | — Federal National Mortgage Association |
| GDR | — Global depositary receipt |
| GNMA | — Government National Mortgage Association |
| HCFR | — Healthcare facilities revenue |
| HEFA | — Health & Educational Facilities Authority |
| HEFAR | — Higher education facilities authority revenue |
| HFA | — Housing Finance Authority |
| HFFA | — Health Facilities Financing Authority |
| HUD | — Department of Housing and Urban Development |
| IDA | — Industrial Development Authority |
| IDAG | — Industrial Development Agency |
| IDR | — Industrial development revenue |
| KRW | — Republic of Korea won |
| LIBOR | — London Interbank Offered Rate |
| LLC | — Limited liability company |
| LLLP | — Limited liability limited partnership |
| LLP | — Limited liability partnership |
| MBIA | — Municipal Bond Insurance Association |
| MFHR | — Multifamily housing revenue |
| MSTR | — Municipal securities trust receipts |
| MUD | — Municipal Utility District |
| National | — National Public Finance Guarantee Corporation |
| PCFA | — Pollution Control Financing Authority |
| PCL | — Public Company Limited |
| PCR | — Pollution control revenue |
| PFA | — Public Finance Authority |
| PFFA | — Public Facilities Financing Authority |
| PFOTER | — Puttable floating option tax-exempt receipts |
| plc | — Public limited company |
| PUTTER | — Puttable tax-exempt receipts |
| R&D | — Research & development |
| Radian | — Radian Asset Assurance |
| RAN | — Revenue anticipation notes |
| RDA | — Redevelopment Authority |
| RDFA | — Redevelopment Finance Authority |
| REIT | — Real estate investment trust |
| ROC | — Reset option certificates |
| SAVRS | — Select auction variable rate securities |
| SBA | — Small Business Authority |
| SFHR | — Single-family housing revenue |
| SFMR | — Single-family mortgage revenue |
| SPA | — Standby purchase agreement |
| SPDR | — Standard & Poor’s Depositary Receipts |
| STRIPS | — Separate trading of registered interest and principal securities |
| TAN | — Tax anticipation notes |
| TIPS | — Treasury inflation-protected securities |
| TRAN | — Tax revenue anticipation notes |
| TTFA | — Transportation Trust Fund Authority |
| TVA | — Tennessee Valley Authority |
This page is intentionally left blank.


For more information
More information about Wells Fargo Advantage Funds is available free upon request. To obtain literature, please write, email, visit the Fund’s website, or call:
Wells Fargo Advantage Funds
P.O. Box 8266
Boston, MA 02266-8266
Email: wfaf@wellsfargo.com
Website: wellsfargoadvantagefunds.com
Individual investors: 1-800-222-8222
Retail investment professionals: 1-888-877-9275
Institutional investment professionals: 1-866-765-0778
This report and the financial statements contained herein are submitted for the general information of the shareholders of Wells Fargo Advantage Funds. If this report is used for promotional purposes, distribution of the report must be accompanied or preceded by a current prospectus. For a current prospectus and, if available, a summary prospectus containing more complete information, including charges and expenses, call 1-800-222-8222 or visit the Fund’s website at wellsfargoadvantagefunds.com. Please consider the investment objectives, risks, charges, and expenses of the investment carefully before investing. This and other information about Wells Fargo Advantage Funds can be found in the current prospectus. Read the prospectus carefully before you invest or send money.
Wells Fargo Funds Management, LLC, a wholly owned subsidiary of Wells Fargo & Company, provides investment advisory and administrative services for Wells Fargo Advantage Funds. Other affiliates of Wells Fargo & Company provide subadvisory and other services for the Funds. The Funds are distributed by Wells Fargo Funds Distributor, LLC, Member FINRA/SIPC, an affiliate of Wells Fargo & Company.
NOT FDIC INSURED ¡ NO BANK GUARANTEE ¡ MAY LOSE VALUE
© 2014 Wells Fargo Funds Management, LLC. All rights reserved.
| | |
 | | 222988 03-14 SA206/SAR206 1-14 |

Wells Fargo Advantage Intrinsic Value Fund

Semi-Annual Report
January 31, 2014

Reduce clutter. Save trees.
Sign up for electronic delivery of prospectuses and shareholder reports at wellsfargo.com/advantagedelivery
Contents
The views expressed and any forward-looking statements are as of January 31, 2014, unless otherwise noted, and are those of the Fund managers and/or Wells Fargo Funds Management, LLC. Discussions of individual securities, or the markets generally, or any Wells Fargo Advantage Fund are not intended as individual recommendations. Future events or results may vary significantly from those expressed in any forward-looking statements; the views expressed are subject to change at any time in response to changing circumstances in the market. Wells Fargo Funds Management, LLC and the Fund disclaim any obligation to publicly update or revise any views expressed or forward-looking statements.
NOT FDIC INSURED ¡ NO BANK GUARANTEE ¡ MAY LOSE VALUE
| | | | |
| 2 | | Wells Fargo Advantage Intrinsic Value Fund | | Letter to shareholders (unaudited) |

Karla M. Rabusch
President
Wells Fargo Advantage Funds
Major central banks continued to inject liquidity into the banks and the markets through various quantitative easing policies.
Dear Valued Shareholder:
We are pleased to offer you this semi-annual report for the Wells Fargo Advantage Intrinsic Value Fund for the six-month period that ended January 31, 2014. Much of the period was marked by monetary easing by global central banks. Entering the period, investors were concerned that the U.S. Federal Reserve (Fed) would end its bond-buying program, which initially led to higher interest rates and resulted in losses for bond indexes and volatility for global stock indexes. These fears dissipated in late September 2013 and ended altogether in mid-December 2013 when the Fed announced a tapering timeline that was far more moderate than some had feared. Growing confidence that the U.S. economy was staging a fragile recovery resulted in double-digit returns for domestic stock market indexes for the six-month reporting period.
Central banks continued to provide stimulus.
Major central banks continued to inject liquidity into the banks and the markets through various quantitative easing policies. Throughout the reporting period, the Federal Open Market Committee (FOMC)—the Fed’s monetary policymaking body—kept its key interest rate effectively near zero in order to support the economy and the financial system. Well before the reporting period began, the FOMC announced its intention to keep interest rates low for an extended period and to make open-ended purchases of $40 billion per month in mortgage-backed securities. The FOMC later added purchases of $45 billion per month in long-term U.S. Treasuries. Because the markets benefited from the FOMC’s liquidity, both stocks and bonds initially sold off after the FOMC indicated in May 2013 that it might reduce (or taper) its bond-buying program. However, in mid-December 2013, the FOMC announced that it would reduce its bond-buying program by $10 billion per month beginning in January 2014. The tapering was less aggressive than some investors had feared, and the markets ended 2013 strongly.
European markets continued to benefit from the European Central Bank’s (ECB’s) earlier announcement that it would purchase an unlimited amount of one- to three-year sovereign debt from countries that had formally applied for a bailout. In November 2013, the ECB cut its key rate to a historic low of 0.25%. The ECB’s aggressive actions helped ease investor worries about a eurozone sovereign debt default. Given the substantial ties between the U.S. and Europe, the improved sentiment about the eurozone helped provide a tailwind for U.S. markets.
U.S. stock markets gained on relatively good news.
For most of the period, U.S. economic data remained moderately positive. Reported gross domestic product (GDP) growth came in at a strong 4.1% annualized rate in the third quarter of 2013, and the advance annualized estimate for fourth-quarter GDP growth was 3.2%.
The most significant negative effect was the ongoing fight in Washington, D.C., over the federal budget and debt limit. The Budget Control Act of 2011, which was passed to resolve a previous fight over the federal debt ceiling, mandated budget sequestration that took effect on March 1, 2013, and was an overhang on economic growth throughout the reporting period. Most recently, Congress was unable to pass a resolution to continue to fund the federal government, and thus, the federal government underwent a partial shutdown from September 30, 2013, through October 16, 2013. The government reopened after the president and Congress reached a deal that funded the government through January 15, 2014,
| | | | | | |
| Letter to shareholders (unaudited) | | Wells Fargo Advantage Intrinsic Value Fund | | | 3 | |
and raised the debt limit through February 7, 2014. In December 2013, Congress passed the Ryan–Murray budget agreement that funded the government through September 2015, lessening the near-term prospect of another shutdown.
Despite political headwinds, the relatively positive outlook for the U.S. economy contributed to a strong domestic stock market for most of the reporting period. Economically sensitive sectors, such as industrials and materials, outperformed. Dividend-paying sectors such as utilities and telecommunication services lagged as higher interest rates dampened their relative performance. Judging by various Russell indexes, small-cap stocks moderately outperformed large-cap stocks, and growth stocks strongly outperformed value stocks.
Don’t let short-term uncertainty derail long-term investment goals.
Periods of uncertainty can present challenges, but experience has taught us that maintaining long-term investment goals can be an effective way to plan for the future. Although diversification cannot guarantee an investment profit or prevent losses, we believe it can be an effective way to manage investment risk and potentially smooth out overall portfolio performance. We encourage investors to know their investments and to understand that appropriate levels of risk-taking may unlock opportunities.
Thank you for choosing to invest with Wells Fargo Advantage Funds. We appreciate your confidence in us and remain committed to helping you meet your financial needs. For current information about your fund investments, contact your investment professional, visit our website at wellsfargoadvantagefunds.com, or call us directly at 1-800-222-8222. We are available 24 hours a day, 7 days a week.
Sincerely,

Karla M. Rabusch
President
Wells Fargo Advantage Funds
Despite political headwinds, the relatively positive outlook for the U.S. economy contributed to a strong domestic stock market for most of the reporting period.
Notice to shareholders
The Fund and Wells Fargo Funds Management, LLC (“Funds Management”) have received an exemptive order from the SEC that permits Funds Management, subject to the approval of the Board of Trustees of the Fund, to select or replace certain subadvisers to manage all or a portion of the Fund’s assets and enter into, amend or terminate a sub-advisory agreement with certain subadvisers without obtaining shareholder approval (“Multi-manager Structure”). The Multi-manager Structure applies to subadvisers that are not affiliated with Funds Management or the Fund, except to the extent that affiliation arises solely because such subadvisers provide sub-advisory services to the Fund (“Non-affiliated Subadvisers”), as well as subadvisers that are indirect or direct wholly-owned subsidiaries of Funds Management or of another company that, indirectly or directly, wholly owns Funds Management (“Wholly-owned Subadvisers”).
Pursuant to the SEC order, Funds Management, with the approval of the Board of Trustees, has the discretion to terminate any subadvisers and allocate and reallocate the Fund’s assets among any other Non-affiliated Subadvisers or Wholly-owned Subadvisers. Funds Management, subject to oversight and supervision by the Board of Trustees, has responsibility to continue to oversee any subadvisers to the Fund and to recommend, for approval by the Board of Trustees, the hiring, termination and replacement of subadvisers for the Fund. In the event that a new subadviser is hired pursuant to the Multi-manager Structure, the Fund is required to provide notice to shareholders within 90 days.
Please contact your investment professional or call us directly at 1-800-222-8222 if you have any questions on this Notice to Shareholders.
| | | | |
| 4 | | Wells Fargo Advantage Intrinsic Value Fund | | Performance highlights (unaudited) |
Investment objective
The Fund seeks long-term capital appreciation.
Adviser
Wells Fargo Funds Management, LLC
Subadviser
Metropolitan West Capital Management, LLC
Portfolio managers
Jeffrey Peck
Jean-Baptiste Nadal, CFA
Miguel E. Giaconi, CFA
Average annual total returns1 (%) as of January 31, 2014
| | | | | | | | | | | | | | | | | | | | | | | | | | | | | | | | | | |
| | | | | Including sales charge | | | Excluding sales charge | | | Expense ratios2 (%) | |
| | | Inception date | | 1 year | | | 5 year | | | Since Inception | | | 1 year | | | 5 year | | | Since Inception | | | Gross | | | Net3 | |
| Class A (EIVAX) | | 8-1-2006 | | | 11.56 | | | | 18.04 | | | | 6.72 | | | | 18.36 | | | | 19.45 | | | | 7.57 | | | | 1.23 | | | | 1.17 | |
| Class B (EIVBX)* | | 8-1-2006 | | | 12.42 | | | | 18.34 | | | | 6.83 | | | | 17.42 | | | | 18.54 | | | | 6.83 | | | | 1.98 | | | | 1.92 | |
| Class C (EIVCX) | | 8-1-2006 | | | 16.44 | | | | 18.54 | | | | 6.78 | | | | 17.44 | | | | 18.54 | | | | 6.78 | | | | 1.98 | | | | 1.92 | |
| Class R (EIVTX) | | 3-1-2013 | | | – | | | | – | | | | – | | | | 18.18 | | | | 19.16 | | | | 7.33 | | | | 1.48 | | | | 1.42 | |
| Class R4 (EIVRX) | | 11-30-2012 | | | – | | | | – | | | | – | | | | 18.77 | | | | 19.80 | | | | 7.87 | | | | 0.90 | | | | 0.81 | |
| Class R6 (EIVFX) | | 11-30-2012 | | | – | | | | – | | | | – | | | | 18.93 | | | | 19.83 | | | | 7.89 | | | | 0.75 | | | | 0.66 | |
| Administrator Class (EIVDX) | | 7-30-2010 | | | – | | | | – | | | | – | | | | 18.63 | | | | 19.67 | | | | 7.76 | | | | 1.07 | | | | 0.96 | |
| Institutional Class (EIVIX) | | 8-1-2006 | | | – | | | | – | | | | – | | | | 18.87 | | | | 19.82 | | | | 7.88 | | | | 0.80 | | | | 0.71 | |
| Russell 1000® Value Index4 | | – | | | – | | | | – | | | | – | | | | 20.02 | | | | 18.69 | | | | 5.32 | | | | – | | | | – | |
| * | | Class B shares are closed to investment, except in connection with the reinvestment of any distributions and permitted exchanges. |
Figures quoted represent past performance, which is no guarantee of future results, and do not reflect taxes that a shareholder may pay on fund distributions or the redemption of fund shares. Investment return and principal value of an investment will fluctuate so that an investor’s shares, when redeemed, may be worth more or less than their original cost. Performance shown without sales charges would be lower if sales charges were reflected. Current performance may be lower or higher than the performance data quoted, which assumes the reinvestment of dividends and capital gains. Current month-end performance is available on the Fund’s website, wellsfargoadvantagefunds.com.
Index returns do not include transaction costs associated with buying and selling securities, any mutual fund fees or expenses, or any taxes. It is not possible to invest directly in an index.
For Class A shares, the maximum front-end sales charge is 5.75%. For Class B shares, the maximum contingent deferred sales charge is 5.00%. For Class C shares, the maximum contingent deferred sales charge is 1.00%. Performance including sales charge assumes the sales charge for the corresponding time period. Class R, Class R4, Class R6, Administrator Class, and Institutional Class shares are sold without a front-end sales charge or contingent deferred sales charge.
Stock values fluctuate in response to the activities of individual companies and general market and economic conditions. Certain investment strategies tend to increase the total risk of an investment (relative to the broader market). The Fund is exposed to foreign investment risk. Consult the Fund’s prospectus for additional information on these and other risks.
Please see footnotes on page 5.
| | | | | | |
| Performance highlights (unaudited) | | Wells Fargo Advantage Intrinsic Value Fund | | | 5 | |
| | | | |
| Ten largest equity holdings5 (%) as of January 31, 2014 | |
Zions Bancorporation | | | 3.27 | |
NextEra Energy Incorporated | | | 3.24 | |
The Boeing Company | | | 2.95 | |
Walt Disney Company | | | 2.89 | |
TRW Automotive Holdings Corporation | | | 2.76 | |
Goldman Sachs Group Incorporated | | | 2.71 | |
PepsiCo Incorporated | | | 2.64 | |
Cigna Corporation | | | 2.62 | |
Intuit Incorporated | | | 2.55 | |
Honeywell International Incorporated | | | 2.55 | |
|
| Sector distribution6 as of January 31, 2014 |
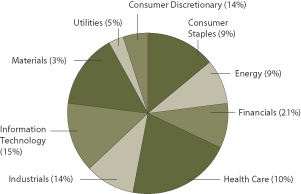
|
| 1. | Historical performance shown for Class R shares prior to their inception reflects the performance of Institutional Class shares, adjusted to reflect the higher expenses applicable to Class R shares. Historical performance shown for Class R4 shares prior to their inception reflects the performance of Institutional Class shares, adjusted to reflect the higher expenses applicable to Class R4 shares. Historical performance shown for Class R6 shares prior to their inception reflects the performance of Institutional Class shares, and includes the higher expenses applicable to Institutional Class shares. If these expenses had not been included, returns would be higher. Historical performance shown for Administrator Class shares prior to their inception reflects the performance of Institutional Class shares, adjusted to reflect the higher expenses applicable to Administrator Class shares. Historical performance shown for all classes of the Fund prior to July 19, 2010, is based on the performance of the Fund’s predecessor, Evergreen Intrinsic Value Fund. |
| 2. | Reflects the expense ratios as stated in the most recent prospectuses, which include the impact of 0.01% in acquired fund fees and expenses. The expense ratios shown are subject to change and may differ from the annualized expense ratios shown in the financial highlights of this report, which do not include acquired fund fees and expenses. |
| 3. | The Adviser has committed through November 30, 2014, to waive fees and/or reimburse expenses to the extent necessary to cap the Fund’s Total Annual Fund Operating Expenses After Fee Waiver, excluding certain expenses, at 1.16% for Class A, 1.91% for Class B, 1.91% for Class C, 1.41% for Class R, 0.80% for Class R4, 0.65% for Class R6, 0.95% for Administrator Class, and 0.70% for Institutional Class. Brokerage commissions, stamp duty fees, interest, taxes, acquired fund fees and expenses, and extraordinary expenses are excluded from the cap. Without this cap, the Fund’s returns would have been lower. |
| 4. | The Russell 1000® Value Index measures the performance of those Russell 1000 Index companies with lower price-to-book ratios and lower forecasted growth values. You cannot invest directly in an index. |
| 5. | The ten largest equity holdings are calculated based on the value of the securities divided by total net assets of the Fund. Holdings are subject to change and may have changed since the date specified. |
| 6. | Sector distribution is subject to change and is calculated based on the total long-term investments of the Fund. |
| | | | |
| 6 | | Wells Fargo Advantage Intrinsic Value Fund | | Fund expenses (unaudited) |
As a shareholder of the Fund, you incur two types of costs: (1) transaction costs, including sales charges (loads) on purchase payments and contingent deferred sales charges (if any) on redemptions and (2) ongoing costs, including management fees, distribution (12b-1) and/or shareholder service fees, and other Fund expenses. This example is intended to help you understand your ongoing costs (in dollars) of investing in the Fund and to compare these costs with the ongoing costs of investing in other mutual funds.
The example is based on an investment of $1,000 invested at the beginning of the six-month period and held for the entire period from August 1, 2013 to January 31, 2014.
Actual expenses
The “Actual” line of the table below provides information about actual account values and actual expenses. You may use the information in this line, together with the amount you invested, to estimate the expenses that you paid over the period. Simply divide your account value by $1,000 (for example, an $8,600 account value divided by $1,000 = 8.6), then multiply the result by the number in the “Actual” line under the heading entitled “Expenses paid during period” for your applicable class of shares to estimate the expenses you paid on your account during this period.
Hypothetical example for comparison purposes
The “Hypothetical” line of the table below provides information about hypothetical account values and hypothetical expenses based on the Fund’s actual expense ratio and an assumed rate of return of 5% per year before expenses, which is not the Fund’s actual return. The hypothetical account values and expenses may not be used to estimate the actual ending account balance or expenses you paid for the period. You may use this information to compare the ongoing costs of investing in the Fund and other funds. To do so, compare this 5% hypothetical example with the 5% hypothetical examples that appear in the shareholder reports of the other funds.
Please note that the expenses shown in the table are meant to highlight your ongoing costs only and do not reflect any transactional costs, such as sales charges (loads) and contingent deferred sales charges. Therefore, the “Hypothetical” line of the table is useful in comparing ongoing costs only and will not help you determine the relative total costs of owning different funds. In addition, if these transactional costs were included, your costs would have been higher.
| | | | | | | | | | | | | | | | |
| | | Beginning
account value
8-1-2013 | | | Ending
account value
1-31-2014 | | | Expenses
paid during
the period¹ | | | Net annualized
expense ratio | |
Class A | | | | | | | | | | | | | | | | |
Actual | | $ | 1,000.00 | | | $ | 1,042.77 | | | $ | 5.97 | | | | 1.16 | % |
Hypothetical (5% return before expenses) | | $ | 1,000.00 | | | $ | 1,019.36 | | | $ | 5.90 | | | | 1.16 | % |
Class B | | | | | | | | | | | | | | | | |
Actual | | $ | 1,000.00 | | | $ | 1,039.02 | | | $ | 9.82 | | | | 1.91 | % |
Hypothetical (5% return before expenses) | | $ | 1,000.00 | | | $ | 1,015.58 | | | $ | 9.70 | | | | 1.91 | % |
Class C | | | | | | | | | | | | | | | | |
Actual | | $ | 1,000.00 | | | $ | 1,039.27 | | | $ | 9.82 | | | | 1.91 | % |
Hypothetical (5% return before expenses) | | $ | 1,000.00 | | | $ | 1,015.58 | | | $ | 9.70 | | | | 1.91 | % |
Class R | | | | | | | | | | | | | | | | |
Actual | | $ | 1,000.00 | | | $ | 1,041.01 | | | $ | 7.25 | | | | 1.41 | % |
Hypothetical (5% return before expenses) | | $ | 1,000.00 | | | $ | 1,018.10 | | | $ | 7.17 | | | | 1.41 | % |
Class R4 | | | | | | | | | | | | | | | | |
Actual | | $ | 1,000.00 | | | $ | 1,044.79 | | | $ | 4.12 | | | | 0.80 | % |
Hypothetical (5% return before expenses) | | $ | 1,000.00 | | | $ | 1,021.17 | | | $ | 4.08 | | | | 0.80 | % |
Class R6 | | | | | | | | | | | | | | | | |
Actual | | $ | 1,000.00 | | | $ | 1,045.37 | | | $ | 3.35 | | | | 0.65 | % |
Hypothetical (5% return before expenses) | | $ | 1,000.00 | | | $ | 1,021.93 | | | $ | 3.31 | | | | 0.65 | % |
Administrator Class | | | | | | | | | | | | | | | | |
Actual | | $ | 1,000.00 | | | $ | 1,044.19 | | | $ | 4.89 | | | | 0.95 | % |
Hypothetical (5% return before expenses) | | $ | 1,000.00 | | | $ | 1,020.42 | | | $ | 4.84 | | | | 0.95 | % |
Institutional Class | | | | | | | | | | | | | | | | |
Actual | | $ | 1,000.00 | | | $ | 1,044.99 | | | $ | 3.61 | | | | 0.70 | % |
Hypothetical (5% return before expenses) | | $ | 1,000.00 | | | $ | 1,021.68 | | | $ | 3.57 | | | | 0.70 | % |
| 1. | Expenses paid is equal to the annualized expense ratio of each class multiplied by the average account value over the period, multiplied by the number of days in the most recent fiscal half-year divided by the number of days in the fiscal year(to reflect the one-half-year period). |
| | | | | | |
| Portfolio of investments—January 31, 2014 (unaudited) | | Wells Fargo Advantage Intrinsic Value Fund | | | 7 | |
| | | | | | | | | | | | |
| Security name | | | | | | Shares | | | Value | |
| | | | |
Common Stocks: 95.05% | | | | | | | | | | | | |
| | | | |
Consumer Discretionary: 13.06% | | | | | | | | | | | | |
| | | | |
| Auto Components: 2.76% | | | | | | | | | | | | |
TRW Automotive Holdings Corporation † | | | | | | | 436,500 | | | $ | 32,366,475 | |
| | | | | | | | | | | | |
| | | | |
| Media: 5.29% | | | | | | | | | | | | |
Time Warner Incorporated | | | | | | | 448,175 | | | | 28,158,835 | |
Walt Disney Company | | | | | | | 466,300 | | | | 33,858,043 | |
| | | | |
| | | | | | | | | | | 62,016,878 | |
| | | | | | | | | | | | |
| | | | |
| Specialty Retail: 3.21% | | | | | | | | | | | | |
Home Depot Incorporated | | | | | | | 318,600 | | | | 24,484,410 | |
Tiffany & Company | | | | | | | 156,800 | | | | 13,044,192 | |
| | | | |
| | | | | | | | | | | 37,528,602 | |
| | | | | | | | | | | | |
| | | | |
| Textiles, Apparel & Luxury Goods: 1.80% | | | | | | | | | | | | |
Kering Unsponsored ADR | | | | | | | 1,063,587 | | | | 21,112,202 | |
| | | | | | | | | | | | |
| | | | |
Consumer Staples: 8.99% | | | | | | | | | | | | |
| | | | |
| Beverages: 4.41% | | | | | | | | | | | | |
Diageo plc ADR | | | | | | | 172,903 | | | | 20,757,005 | |
PepsiCo Incorporated | | | | | | | 384,500 | | | | 30,898,420 | |
| | | | |
| | | | | | | | | | | 51,655,425 | |
| | | | | | | | | | | | |
| | | | |
| Food Products: 4.58% | | | | | | | | | | | | |
The Hershey Company | | | | | | | 292,309 | | | | 29,055,515 | |
Unilever NV ADR | | | | | | | 658,525 | | | | 24,589,324 | |
| | | | |
| | | | | | | | | | | 53,644,839 | |
| | | | | | | | | | | | |
| | | | |
Energy: 8.40% | | | | | | | | | | | | |
| | | | |
| Energy Equipment & Services: 4.08% | | | | | | | | | | | | |
FMC Technologies Incorporated † | | | | | | | 511,184 | | | | 25,272,937 | |
Schlumberger Limited | | | | | | | 257,565 | | | | 22,554,967 | |
| | | | |
| | | | | | | | | | | 47,827,904 | |
| | | | | | | | | | | | |
| | | | |
| Oil, Gas & Consumable Fuels: 4.32% | | | | | | | | | | | | |
EOG Resources Incorporated | | | | | | | 105,652 | | | | 17,457,936 | |
Hess Corporation | | | | | | | 70,902 | | | | 5,352,392 | |
Occidental Petroleum Corporation | | | | | | | 317,731 | | | | 27,823,704 | |
| | | | |
| | | | | | | | | | | 50,634,032 | |
| | | | | | | | | | | | |
| | | | |
Financials: 19.66% | | | | | | | | | | | | |
| | | | |
| Capital Markets: 11.47% | | | | | | | | | | | | |
Charles Schwab Corporation | | | | | | | 1,026,978 | | | | 25,489,594 | |
Franklin Resources Incorporated | | | | | | | 460,278 | | | | 23,939,059 | |
Goldman Sachs Group Incorporated | | | | | | | 193,584 | | | | 31,771,006 | |
Northern Trust Corporation | | | | | | | 455,811 | | | | 27,448,938 | |
UBS AG | | | | | | | 1,294,362 | | | | 25,718,973 | |
| | | | |
| | | | | | | | | | | 134,367,570 | |
| | | | | | | | | | | | |
The accompanying notes are an integral part of these financial statements.
| | | | |
| 8 | | Wells Fargo Advantage Intrinsic Value Fund | | Portfolio of investments—January 31, 2014 (unaudited) |
| | | | | | | | | | | | |
| Security name | | | | | | Shares | | | Value | |
| | | | |
| Commercial Banks: 5.69% | | | | | | | | | | | | |
SunTrust Banks Incorporated | | | | | | | 766,150 | | | $ | 28,362,873 | |
Zions Bancorporation | | | | | | | 1,332,116 | | | | 38,298,335 | |
| | | | |
| | | | | | | | | | | 66,661,208 | |
| | | | | | | | | | | | |
| | | | |
| Diversified Financial Services: 2.50% | | | | | | | | | | | | |
JPMorgan Chase & Company | | | | | | | 529,900 | | | | 29,335,264 | |
| | | | | | | | | | | | |
| | | | |
Health Care: 9.85% | | | | | | | | | | | | |
| | | | |
| Health Care Equipment & Supplies: 4.43% | | | | | | | | | | | | |
Abbott Laboratories | | | | | | | 765,761 | | | | 28,072,798 | |
Baxter International Incorporated | | | | | | | 349,100 | | | | 23,843,530 | |
| | | | |
| | | | | | | | | | | 51,916,328 | |
| | | | | | | | | | | | |
| | | | |
| Health Care Providers & Services: 4.98% | | | | | | | | | | | | |
Cigna Corporation | | | | | | | 355,347 | | | | 30,670,000 | |
Express Scripts Holding Company † | | | | | | | 371,534 | | | | 27,749,874 | |
| | | | |
| | | | | | | | | | | 58,419,874 | |
| | | | | | | | | | | | |
| | | | |
| Pharmaceuticals: 0.44% | | | | | | | | | | | | |
AbbVie Incorporated | | | | | | | 104,000 | | | | 5,119,920 | |
| | | | | | | | | | | | |
| | | | |
Industrials: 13.22% | | | | | | | | | | | | |
| | | | |
| Aerospace & Defense: 7.25% | | | | | | | | | | | | |
Honeywell International Incorporated | | | | | | | 327,300 | | | | 29,859,579 | |
Huntington Ingalls Industries Incorporated | | | | | | | 216,488 | | | | 20,570,690 | |
The Boeing Company | | | | | | | 276,145 | | | | 34,589,923 | |
| | | | |
| | | | | | | | | | | 85,020,192 | |
| | | | | | | | | | | | |
| | | | |
| Air Freight & Logistics: 2.42% | | | | | | | | | | | | |
United Parcel Service Incorporated Class B | | | | | | | 298,017 | | | | 28,380,159 | |
| | | | | | | | | | | | |
| | | | |
| Electrical Equipment: 1.77% | | | | | | | | | | | | |
Sensata Technologies Holdings NV † | | | | | | | 552,960 | | | | 20,702,822 | |
| | | | | | | | | | | | |
| | | | |
| Machinery: 1.78% | | | | | | | | | | | | |
Deere & Company | | | | | | | 242,578 | | | | 20,852,005 | |
| | | | | | | | | | | | |
| | | | |
Information Technology: 14.34% | | | | | | | | | | | | |
| | | | |
| Communications Equipment: 2.50% | | | | | | | | | | | | |
QUALCOMM Incorporated | | | | | | | 394,935 | | | | 29,312,076 | |
| | | | | | | | | | | | |
| | | | |
| Computers & Peripherals: 3.62% | | | | | | | | | | | | |
Apple Incorporated | | | | | | | 41,700 | | | | 20,875,020 | |
EMC Corporation | | | | | | | 889,917 | | | | 21,571,588 | |
| | | | |
| | | | | | | | | | | 42,446,608 | |
| | | | | | | | | | | | |
| | | | |
| IT Services: 1.39% | | | | | | | | | | | | |
International Business Machines Corporation | | | | | | | 91,947 | | | | 16,245,196 | |
| | | | | | | | | | | | |
The accompanying notes are an integral part of these financial statements.
| | | | | | |
| Portfolio of investments—January 31, 2014 (unaudited) | | Wells Fargo Advantage Intrinsic Value Fund | | | 9 | |
| | | | | | | | | | | | | | |
| Security name | | | | | | | Shares | | | Value | |
| | | | |
| Semiconductors & Semiconductor Equipment: 1.92% | | | | | | | | | | | | | | |
Texas Instruments Incorporated | | | | | | | | | 529,270 | | | $ | 22,441,048 | |
| | | | | | | | | | | | | | |
| | | | |
| Software: 4.91% | | | | | | | | | | | | | | |
Intuit Incorporated | | | | | | | | | 408,175 | | | | 29,898,819 | |
Oracle Corporation | | | | | | | | | 749,900 | | | | 27,671,310 | |
| | | | |
| | | | | | | | | | | | | 57,570,129 | |
| | | | | | | | | | | | | | |
| | | | |
Materials: 2.47% | | | | | | | | | | | | | | |
| | | | |
| Chemicals: 2.47% | | | | | | | | | | | | | | |
E.I. du Pont de Nemours & Company | | | | | | | | | 474,142 | | | | 28,927,403 | |
| | | | | | | | | | | | | | |
| | | | |
Utilities: 5.06% | | | | | | | | | | | | | | |
| | | | |
| Electric Utilities: 5.06% | | | | | | | | | | | | | | |
NextEra Energy Incorporated | | | | | | | | | 413,000 | | | | 37,967,090 | |
Northeast Utilities | | | | | | | | | 485,630 | | | | 21,270,594 | |
| | | | |
| | | | | | | | | | | | | 59,237,684 | |
| | | | | | | | | | | | | | |
| | | | |
Total Common Stocks (Cost $891,814,408) | | | | | | | | | | | | | 1,113,741,843 | |
| | | | | | | | | | | | | | |
| | | | |
| | | Yield | | | | | | | | | |
| Short-Term Investments: 5.24% | | | | | | | | | | | | | | |
| | | | |
| Investment Companies: 5.24% | | | | | | | | | | | | | | |
Wells Fargo Advantage Cash Investment Money Market Fund, Select Class (l)(u) | | | 0.07 | % | | | | | 61,450,275 | | | | 61,450,275 | |
| | | | | | | | | | | | | | |
| | | | |
Total Short-Term Investments (Cost $61,450,275) | | | | | | | | | | | | | 61,450,275 | |
| | | | | | | | | | | | | | |
| | | | | | | | |
Total investments in securities
(Cost $953,264,683) * | | | 100.29 | % | | | 1,175,192,118 | |
Other assets and liabilities, net | | | (0.29 | ) | | | (3,440,794 | ) |
| | | | | | | | |
| Total net assets | | | 100.00 | % | | $ | 1,171,751,324 | |
| | | | | | | | |
| † | Non-income-earning security |
| (l) | Investment in an affiliate |
| (u) | Rate shown is the 7-day annualized yield at period end. |
| * | Cost for federal income tax purposes is $953,532,807 and unrealized appreciation (depreciation) consists of: |
| | | | |
Gross unrealized appreciation | | $ | 224,953,050 | |
Gross unrealized depreciation | | | (3,293,739 | ) |
| | | | |
Net unrealized appreciation | | $ | 221,659,311 | |
The accompanying notes are an integral part of these financial statements.
| | | | |
| 10 | | Wells Fargo Advantage Intrinsic Value Fund | | Statement of assets and liabilities—January 31, 2014 (unaudited) |
| | | | |
| | | | |
| |
Assets | | | | |
Investments | | | | |
In unaffiliated securities, at value (see cost below) | | $ | 1,113,741,843 | |
In affiliated securities, at value (see cost below) | | | 61,450,275 | |
| | | | |
Total investments, at value (see cost below) | | | 1,175,192,118 | |
Receivable for investments sold | | | 1,140,047 | |
Receivable for Fund shares sold | | | 562,373 | |
Receivable for dividends | | | 758,600 | |
Receivable for securities lending income | | | 7,429 | |
Prepaid expenses and other assets | | | 65,613 | |
| | | | |
Total assets | | | 1,177,726,180 | |
| | | | |
| |
Liabilities | | | | |
Payable for investments purchased | | | 3,540,767 | |
Payable for Fund shares redeemed | | | 1,136,939 | |
Advisory fee payable | | | 595,606 | |
Distribution fees payable | | | 28,044 | |
Due to other related parties | | | 222,259 | |
Accrued expenses and other liabilities | | | 451,241 | |
| | | | |
Total liabilities | | | 5,974,856 | |
| | | | |
Total net assets | | $ | 1,171,751,324 | |
| | | | |
| |
NET ASSETS CONSIST OF | | | | |
Paid-in capital | | $ | 957,564,414 | |
Overdistributed net investment income | | | (389,619 | ) |
Accumulated net realized losses on investments | | | (7,350,906 | ) |
Net unrealized gains on investments | | | 221,927,435 | |
| | | | |
Total net assets | | $ | 1,171,751,324 | |
| | | | |
| |
COMPUTATION OF NET ASSET VALUE AND OFFERING PRICE PER SHARE1 | | | | |
Net assets – Class A | | $ | 381,748,468 | |
Shares outstanding – Class A | | | 30,452,610 | |
Net asset value per share – Class A | | | $12.54 | |
Maximum offering price per share – Class A2 | | | $13.31 | |
Net assets – Class B | | $ | 4,740,838 | |
Shares outstanding – Class B | | | 380,882 | |
Net asset value per share – Class B | | | $12.45 | |
Net assets – Class C | | $ | 35,322,643 | |
Shares outstanding – Class C | | | 2,856,346 | |
Net asset value per share – Class C | | | $12.37 | |
Net assets – Class R | | $ | 22,404 | |
Shares outstanding – Class R | | | 1,776 | |
Net asset value per share – Class R | | | $12.61 | |
Net assets – Class R4 | | $ | 14,113 | |
Share outstanding – Class R4 | | | 1,124 | |
Net asset value per share – Class R4 | | | $12.56 | |
Net assets – Class R6 | | $ | 3,796,992 | |
Share outstanding – Class R6 | | | 302,303 | |
Net asset value per share – Class R6 | | | $12.56 | |
Net assets – Administrator Class | | $ | 515,790,862 | |
Shares outstanding – Administrator Class | | | 39,771,489 | |
Net asset value per share – Administrator Class | | | $12.97 | |
Net assets – Institutional Class | | $ | 230,315,004 | |
Shares outstanding – Institutional Class | | | 18,315,854 | |
Net asset value per share – Institutional Class | | | $12.57 | |
| |
Investments in unaffiliated securities, at cost | | $ | 891,814,408 | |
| | | | |
Investments in affiliated securities, at cost | | $ | 61,450,275 | |
| | | | |
Total investments, at cost | | $ | 953,264,683 | |
| | | | |
| 1. | The Fund has an unlimited number of authorized shares. |
| 2. | Maximum offering price is computed as 100/94.25 of net asset value. On investments of $50,000 or more, the offering price is reduced. |
The accompanying notes are an integral part of these financial statements.
| | | | | | |
| Statement of operations—six months ended January 31, 2014 (unaudited) | | Wells Fargo Advantage Intrinsic Value Fund | | | 11 | |
| | | | |
| | | | |
| |
Investment income | | | | |
Dividends* | | $ | 9,948,131 | |
Securities lending income, net | | | 30,693 | |
Income from affiliated securities | | | 13,982 | |
| | | | |
Total investment income | | | 9,992,806 | |
| | | | |
| |
Expenses | | | | |
Advisory fee | | | 3,795,096 | |
Administration fees | | | | |
Fund level | | | 300,333 | |
Class A | | | 512,985 | |
Class B | | | 6,853 | |
Class C | | | 47,309 | |
Class R | | | 27 | |
Class R4 | | | 6 | |
Class R6 | | | 547 | |
Administrator Class | | | 264,470 | |
Institutional Class | | | 92,978 | |
Shareholder servicing fees | | | | |
Class A | | | 474,325 | |
Class B | | | 6,589 | |
Class C | | | 45,489 | |
Class R | | | 26 | |
Class R4 | | | 7 | |
Administrator Class | | | 658,338 | |
Distribution fees | | | | |
Class B | | | 19,768 | |
Class C | | | 136,468 | |
Class R | | | 26 | |
Custody and accounting fees | | | 39,927 | |
Professional fees | | | 22,047 | |
Registration fees | | | 49,039 | |
Shareholder report expenses | | | 56,142 | |
Trustees’ fees and expenses | | | 5,941 | |
Other fees and expenses | | | 9,811 | |
| | | | |
Total expenses | | | 6,544,547 | |
Less: Fee waivers and/or expense reimbursements | | | (519,888 | ) |
| | | | |
Net expenses | | | 6,024,659 | |
| | | | |
Net investment income | | | 3,968,147 | |
| | | | |
| |
REALIZED AND UNREALIZED GAINS (LOSSES) ON INVESTMENTS | | | | |
Net realized gains on investments | | | 36,337,460 | |
Net change in unrealized gains (losses) on investments | | | 9,816,696 | |
| | | | |
Net realized and unrealized gains (losses) on investments | | | 46,154,156 | |
| | | | |
Net increase in net assets resulting from operations | | $ | 50,122,303 | |
| | | | |
| |
* Net of foreign dividend withholding taxes in the amount of | | | $105,303 | |
The accompanying notes are an integral part of these financial statements.
| | | | |
| 12 | | Wells Fargo Advantage Intrinsic Value Fund | | Statement of changes in net assets |
| | | | | | | | | | | | | | | | |
| | | Six months ended
January 31, 2014
(unaudited) | | | Year ended
July 31, 2013 | |
| | | | |
Operations | | | | | | | | | | | | | | | | |
Net investment income | | | | | | $ | 3,968,147 | | | | | | | $ | 5,318,452 | |
Net realized gains on investments | | | | | | | 36,337,460 | | | | | | | | 41,283,039 | |
Net change in unrealized gains (losses) on investments | | | | | | | 9,816,696 | | | | | | | | 132,950,802 | |
| | | | |
Net increase in net assets resulting from operations | | | | | | | 50,122,303 | | | | | | | | 179,552,293 | |
| | | | |
| | | | |
Distributions to shareholders from | | | | | | | | | | | | | | | | |
Net investment income | | | | | | | | | | | | | | | | |
Class A | | | | | | | (1,863,705 | ) | | | | | | | (826,684 | ) |
Class C | | | | | | | 0 | | | | | | | | (35,977 | ) |
Class R4 | | | | | | | (108 | ) | | | | | | | (146 | )1 |
Class R6 | | | | | | | (33,391 | ) | | | | | | | (739 | )1 |
Administrator Class | | | | | | | (3,445,927 | ) | | | | | | | (376,820 | ) |
Institutional Class | | | | | | | (1,982,826 | ) | | | | | | | (2,942,395 | ) |
Net realized gains | | | | | | | | | | | | | | | | |
Class A | | | | | | | (13,761,999 | ) | | | | | | | (4,870,427 | ) |
Class B | | | | | | | (178,855 | ) | | | | | | | (216,860 | ) |
Class C | | | | | | | (1,277,956 | ) | | | | | | | (1,166,530 | ) |
Class R | | | | | | | (749 | ) | | | | | | | 0 | |
Class R4 | | | | | | | (494 | ) | | | | | | | (575 | )1 |
Class R6 | | | | | | | (129,126 | ) | | | | | | | (2,875 | )1 |
Administrator Class | | | | | | | (17,781,237 | ) | | | | | | | (1,660,496 | ) |
Institutional Class | | | | | | | (8,059,479 | ) | | | | | | | (12,200,925 | ) |
| | | | |
Total distributions to shareholders | | | | | | | (48,515,852 | ) | | | | | | | (24,301,449 | ) |
| | | | |
| | | | |
Capital share transactions | | | Shares | | | | | | | | Shares | | | | | |
Proceeds from shares sold | | | | | | | | | | | | | | | | |
Class A | | | 927,853 | | | | 11,676,337 | | | | 2,587,655 | | | | 29,210,360 | |
Class B | | | 4,844 | | | | 59,525 | | | | 21,974 | | | | 252,188 | |
Class C | | | 128,293 | | | | 1,601,847 | | | | 435,208 | | | | 4,836,134 | |
Class R | | | 268 | | | | 3,421 | | | | 498 | 2 | | | 5,814 | 2 |
Class R4 | | | 0 | | | | 0 | | | | 1,008 | 1 | | | 11,250 | 1 |
Class R6 | | | 22,148 | | | | 283,245 | | | | 272,791 | 1 | | | 3,141,744 | 1 |
Administrator Class | | | 943,594 | | | | 12,537,254 | | | | 2,240,595 | | | | 26,209,292 | |
Institutional Class | | | 2,013,785 | | | | 25,464,380 | | | | 4,894,846 | | | | 55,815,367 | |
| | | | |
| | | | | | | 51,626,009 | | | | | | | | 119,482,149 | |
| | | | |
Reinvestment of distributions | | | | | | | | | | | | | | | | |
Class A | | | 1,176,654 | | | | 14,917,979 | | | | 494,065 | | | | 5,145,848 | |
Class B | | | 13,464 | | | | 169,111 | | | | 20,170 | | | | 207,553 | |
Class C | | | 88,113 | | | | 1,099,654 | | | | 105,346 | | | | 1,079,736 | |
Class R | | | 59 | | | | 749 | | | | 0 | 2 | | | 0 | 2 |
Class R4 | | | 47 | | | | 602 | | | | 69 | 1 | | | 721 | 1 |
Class R6 | | | 12,775 | | | | 162,517 | | | | 346 | 1 | | | 3,614 | 1 |
Administrator Class | | | 1,521,595 | | | | 19,959,360 | | | | 162,841 | | | | 1,754,702 | |
Institutional Class | | | 652,707 | | | | 8,311,423 | | | | 1,242,972 | | | | 13,004,364 | |
| | | | |
| | | | | | | 44,621,395 | | | | | | | | 21,196,538 | |
| | | | |
Payment for shares redeemed | | | | | | | | | | | | | | | | |
Class A | | | (2,536,808 | ) | | | (32,230,499 | ) | | | (4,054,040 | ) | | | (46,084,349 | ) |
Class B | | | (87,333 | ) | | | (1,095,504 | ) | | | (238,288 | ) | | | (2,654,133 | ) |
Class C | | | (245,068 | ) | | | (3,065,658 | ) | | | (603,858 | ) | | | (6,727,108 | ) |
Class R | | | (2 | ) | | | (19 | ) | | | (20,128 | )2 | | | (229,294 | )2 |
Class R6 | | | 0 | | | | 0 | | | | (5,757 | )1 | | | (70,000 | )1 |
Administrator Class | | | (2,474,800 | ) | | | (32,381,677 | ) | | | (3,436,486 | ) | | | (41,653,388 | ) |
Institutional Class | | | (1,935,255 | ) | | | (24,720,112 | ) | | | (9,893,065 | ) | | | (111,918,543 | ) |
| | | | |
| | | | | | | (93,493,469 | ) | | | | | | | (209,336,815 | ) |
| | | | |
Please see footnotes on page 13.
The accompanying notes are an integral part of these financial statements.
| | | | | | |
| Statement of changes in net assets | | Wells Fargo Advantage Intrinsic Value Fund | | | 13 | |
| | | | | | | | | | | | | | | | |
| | | Six months ended
January 31, 2014
(unaudited) | | | Year ended
July 31, 2013 | |
| | | | |
Capital share transactions (continued) | | | Shares | | | | | | | | Shares | | | | | |
Net asset value of shares issued in acquisition | | | | | | | | | | | | | | | | |
Class A | | | 0 | | | $ | 0 | | | | 23,447,416 | | | $ | 261,933,505 | |
Class B | | | 0 | | | | 0 | | | | 228,046 | | | | 2,535,706 | |
Class C | | | 0 | | | | 0 | | | | 987,872 | | | | 10,916,010 | |
Class R | | | 0 | | | | 0 | | | | 21,081 | 2 | | | 236,100 | 2 |
Administrator Class | | | 0 | | | | 0 | | | | 38,338,821 | | | | 442,513,613 | |
Institutional Class | | | 0 | | | | 0 | | | | 65,474 | | | | 733,280 | |
| | | | |
| | | | | | | 0 | | | | | | | | 718,868,214 | |
| | | | |
Net increase in net assets resulting from capital share transactions | | | | | | | 2,753,935 | | | | | | | | 650,210,086 | |
| | | | |
Total increase in net assets | | | | | | | 4,360,386 | | | | | | | | 805,460,930 | |
| | | | |
| | | | |
Net assets | | | | | | | | | | | | | | | | |
Beginning of period | | | | | | | 1,167,390,938 | | | | | | | | 361,930,008 | |
| | | | |
End of period | | | | | | $ | 1,171,751,324 | | | | | | | $ | 1,167,390,938 | |
| | | | |
Undistributed (overdistributed) net investment income | | | | | | $ | (389,619 | ) | | | | | | $ | 2,968,191 | |
| | | | |
| 1. | For the period from November 30, 2012 (commencement of class operations) to July 31, 2013 |
| 2. | For the period from March 1, 2013 (commencement of class operations) to July 31, 2013 |
The accompanying notes are an integral part of these financial statements.
| | | | |
| 14 | | Wells Fargo Advantage Intrinsic Value Fund | | Financial highlights |
(For a share outstanding throughout each period)
| | | | | | | | | | | | | | | | | | | | | | | | |
| | | Six months ended
January 31, 2014
(unaudited) | | | Year ended July 31 | |
| CLASS A | | | 2013 | | | 2012 | | | 2011 | | | 20101 | | | 20091 | |
Net asset value, beginning of period | | $ | 12.52 | | | $ | 10.44 | | | $ | 11.50 | | | $ | 9.84 | | | $ | 8.48 | | | $ | 10.19 | |
Net investment income | | | 0.03 | | | | 0.07 | 2 | | | 0.11 | 2 | | | 0.10 | | | | 0.10 | 2 | | | 0.10 | |
Net realized and unrealized gains (losses) on investments | | | 0.51 | | | | 2.75 | | | | 0.24 | | | | 1.65 | | | | 1.31 | | | | (1.71 | ) |
| | | | | | | | | | | | | | | | | | | | | | | | |
Total from investment operations | | | 0.54 | | | | 2.82 | | | | 0.35 | | | | 1.75 | | | | 1.41 | | | | (1.61 | ) |
Distributions to shareholders from | | | | | | | | | | | | | | | | | | | | | | | | |
Net investment income | | | (0.06 | ) | | | (0.10 | ) | | | (0.28 | ) | | | (0.09 | ) | | | (0.05 | ) | | | (0.04 | ) |
Net realized gains | | | (0.46 | ) | | | (0.64 | ) | | | (1.13 | ) | | | 0.00 | | | | 0.00 | | | | (0.06 | ) |
| | | | | | | | | | | | | | | | | | | | | | | | |
Total distributions to shareholders | | | (0.52 | ) | | | (0.74 | ) | | | (1.41 | ) | | | (0.09 | ) | | | (0.05 | ) | | | (0.10 | ) |
Net asset value, end of period | | $ | 12.54 | | | $ | 12.52 | | | $ | 10.44 | | | $ | 11.50 | | | $ | 9.84 | | | $ | 8.48 | |
Total return3 | | | 4.28 | % | | | 28.53 | % | | | 4.38 | % | | | 17.88 | % | | | 16.67 | % | | | (15.62 | )% |
Ratios to average net assets (annualized) | | | | | | | | | | | | | | | | | | | | | | | | |
Gross expenses | | | 1.21 | % | | | 1.20 | % | | | 1.24 | % | | | 1.24 | % | | | 1.17 | % | | | 1.15 | % |
Net expenses | | | 1.16 | % | | | 1.16 | % | | | 1.17 | % | | | 1.17 | % | | | 1.11 | % | | | 1.14 | % |
Net investment income | | | 0.50 | % | | | 0.57 | % | | | 1.05 | % | | | 0.81 | % | | | 1.05 | % | | | 1.62 | % |
Supplemental data | | | | | | | | | | | | | | | | | | | | | | | | |
Portfolio turnover rate | | | 10 | % | | | 28 | % | | | 34 | % | | | 25 | % | | | 23 | % | | | 23 | % |
Net assets, end of period (000s omitted) | | | $381,748 | | | | $386,655 | | | | $87,784 | | | | $159,178 | | | | $147,957 | | | | $90,382 | |
| 1. | After the close of business on July 16, 2010, the Fund acquired the net assets of Evergreen Intrinsic Value Fund which became the accounting and performance survivor in the transaction. The information for the periods prior to July 19, 2010 is that of Class A of Evergreen Intrinsic Value Fund. |
| 2. | Calculated based upon average shares outstanding |
| 3. | Total return calculations do not include any sales charges. Returns for periods of less than one year are not annualized. |
The accompanying notes are an integral part of these financial statements.
| | | | | | |
| Financial highlights | | Wells Fargo Advantage Intrinsic Value Fund | | | 15 | |
(For a share outstanding throughout each period)
| | | | | | | | | | | | | | | | | | | | | | | | |
| | | Six months ended
January 31, 2014
(unaudited) | | | Year ended July 31 | |
| CLASS B | | | 2013 | | | 2012 | | | 2011 | | | 20101 | | | 20091 | |
Net asset value, beginning of period | | $ | 12.42 | | | $ | 10.34 | | | $ | 11.37 | | | $ | 9.72 | | | $ | 8.40 | | | $ | 10.11 | |
Net investment income (loss) | | | (0.01 | )2 | | | (0.02 | ) | | | 0.03 | 2 | | | 0.01 | 2 | | | 0.03 | 2 | | | 0.07 | 2 |
Net realized and unrealized gains (losses) on investments | | | 0.50 | | | | 2.74 | | | | 0.24 | | | | 1.64 | | | | 1.29 | | | | (1.72 | ) |
| | | | | | | | | | | | | | | | | | | | | | | | |
Total from investment operations | | | 0.49 | | | | 2.72 | | | | 0.27 | | | | 1.65 | | | | 1.32 | | | | (1.65 | ) |
Distributions to shareholders from | | | | | | | | | | | | | | | | | | | | | | | | |
Net investment income | | | 0.00 | | | | 0.00 | | | | (0.17 | ) | | | (0.00 | )3 | | | 0.00 | | | | 0.00 | |
Net realized gains | | | (0.46 | ) | | | (0.64 | ) | | | (1.13 | ) | | | 0.00 | | | | 0.00 | | | | (0.06 | ) |
| | | | | | | | | | | | | | | | | | | | | | | | |
Total distributions to shareholders | | | (0.46 | ) | | | (0.64 | ) | | | (1.30 | ) | | | (0.00 | )3 | | | 0.00 | | | | (0.06 | ) |
Net asset value, end of period | | $ | 12.45 | | | $ | 12.42 | | | $ | 10.34 | | | $ | 11.37 | | | $ | 9.72 | | | $ | 8.40 | |
Total return4 | | | 3.90 | % | | | 27.57 | % | | | 3.56 | % | | | 17.03 | % | | | 15.71 | % | | | (16.22 | )% |
Ratios to average net assets (annualized) | | | | | | | | | | | | | | | | | | | | | | | | |
Gross expenses | | | 1.97 | % | | | 1.97 | % | | | 2.01 | % | | | 1.99 | % | | | 1.93 | % | | | 1.91 | % |
Net expenses | | | 1.91 | % | | | 1.91 | % | | | 1.92 | % | | | 1.91 | % | | | 1.88 | % | | | 1.90 | % |
Net investment income (loss) | | | (0.23 | )% | | | (0.03 | )% | | | 0.27 | % | | | 0.07 | % | | | 0.30 | % | | | 0.84 | % |
Supplemental data | | | | | | | | | | | | | | | | | | | | | | | | |
Portfolio turnover rate | | | 10 | % | | | 28 | % | | | 34 | % | | | 25 | % | | | 23 | % | | | 23 | % |
Net assets, end of period (000s omitted) | | | $4,741 | | | | $5,589 | | | | $4,323 | | | | $7,666 | | | | $9,206 | | | | $10,014 | |
| 1. | After the close of business on July 16, 2010, the Fund acquired the net assets of Evergreen Intrinsic Value Fund which became the accounting and performance survivor in the transaction. The information for the periods prior to July 19, 2010 is that of Class B of Evergreen Intrinsic Value Fund. |
| 2. | Calculated based upon average shares outstanding |
| 3. | Amount is less than $0.005. |
| 4. | Total return calculations do not include any sales charges. Returns for periods of less than one year are not annualized. |
The accompanying notes are an integral part of these financial statements.
| | | | |
| 16 | | Wells Fargo Advantage Intrinsic Value Fund | | Financial highlights |
(For a share outstanding throughout each period)
| | | | | | | | | | | | | | | | | | | | | | | | |
| | | Six months ended
January 31, 2014
(unaudited) | | | Year ended July 31 | |
| CLASS C | | | 2013 | | | 2012 | | | 2011 | | | 20101 | | | 20091 | |
Net asset value, beginning of period | | $ | 12.35 | | | $ | 10.30 | | | $ | 11.35 | | | $ | 9.72 | | | $ | 8.40 | | | $ | 10.11 | |
Net investment income (loss) | | | (0.02 | ) | | | (0.01 | )2 | | | 0.03 | 2 | | | 0.02 | | | | 0.03 | 2 | | | 0.06 | 2 |
Net realized and unrealized gains (losses) on investments | | | 0.50 | | | | 2.72 | | | | 0.24 | | | | 1.63 | | | | 1.29 | | | | (1.71 | ) |
| | | | | | | | | | | | | | | | | | | | | | | | |
Total from investment operations | | | 0.48 | | | | 2.71 | | | | 0.27 | | | | 1.65 | | | | 1.32 | | | | (1.65 | ) |
Distributions to shareholders from | | | | | | | | | | | | | | | | | | | | | | | | |
Net investment income | | | 0.00 | | | | (0.02 | ) | | | (0.19 | ) | | | (0.02 | ) | | | 0.00 | | | | 0.00 | |
Net realized gains | | | (0.46 | ) | | | (0.64 | ) | | | (1.13 | ) | | | 0.00 | | | | 0.00 | | | | (0.06 | ) |
| | | | | | | | | | | | | | | | | | | | | | | | |
Total distributions to shareholders | | | (0.46 | ) | | | (0.66 | ) | | | (1.32 | ) | | | (0.02 | ) | | | 0.00 | | | | (0.06 | ) |
Net asset value, end of period | | $ | 12.37 | | | $ | 12.35 | | | $ | 10.30 | | | $ | 11.35 | | | $ | 9.72 | | | $ | 8.40 | |
Total return3 | | | 3.93 | % | | | 27.50 | % | | | 3.62 | % | | | 16.98 | % | | | 15.71 | % | | | (16.22 | )% |
Ratios to average net assets (annualized) | | | | | | | | | | | | | | | | | | | | | | | | |
Gross expenses | | | 1.97 | % | | | 1.97 | % | | | 2.01 | % | | | 1.97 | % | | | 1.94 | % | | | 1.92 | % |
Net expenses | | | 1.91 | % | | | 1.91 | % | | | 1.92 | % | | | 1.92 | % | | | 1.88 | % | | | 1.91 | % |
Net investment income (loss) | | | (0.24 | )% | | | (0.05 | )% | | | 0.26 | % | | | 0.07 | % | | | 0.29 | % | | | 0.84 | % |
Supplemental data | | | | | | | | | | | | | | | | | | | | | | | | |
Portfolio turnover rate | | | 10 | % | | | 28 | % | | | 34 | % | | | 25 | % | | | 23 | % | | | 23 | % |
Net assets, end of period (000s omitted) | | | $35,323 | | | | $35,616 | | | | $20,187 | | | | $28,230 | | | | $26,934 | | | | $20,396 | |
| 1. | After the close of business on July 16, 2010, the Fund acquired the net assets of Evergreen Intrinsic Value Fund which became the accounting and performance survivor in the transaction. The information for the periods prior to July 19, 2010 is that of Class C of Evergreen Intrinsic Value Fund. |
| 2. | Calculated based upon average shares outstanding |
| 3. | Total return calculations do not include any sales charges. Returns for periods of less than one year are not annualized. |
The accompanying notes are an integral part of these financial statements.
| | | | | | |
| Financial highlights | | Wells Fargo Advantage Intrinsic Value Fund | | | 17 | |
(For a share outstanding throughout each period)
| | | | | | | | |
| CLASS R | | Six months ended
January 31, 2014 (unaudited) | | | Year ended July 31, 20131 | |
Net asset value, beginning of period | | $ | 12.55 | | | $ | 11.20 | |
Net investment income | | | 0.02 | | | | 0.00 | 2 |
Net realized and unrealized gains (losses) on investments | | | 0.50 | | | | 1.35 | |
| | | | | | | | |
Total from investment operations | | | 0.52 | | | | 1.35 | |
Distributions to shareholders from | | | | | | | | |
Net realized gains | | | (0.46 | ) | | | 0.00 | |
Net asset value, end of period | | $ | 12.61 | | | $ | 12.55 | |
Total return3 | | | 4.10 | % | | | 12.05 | % |
Ratios to average net assets (annualized) | | | | | | | | |
Gross expenses | | | 1.49 | % | | | 1.46 | % |
Net expenses | | | 1.41 | % | | | 1.41 | % |
Net investment income | | | 0.24 | % | | | 0.01 | % |
Supplemental data | | | | | | | | |
Portfolio turnover rate | | | 10 | % | | | 28 | % |
Net assets, end of period (000s omitted) | | | $22 | | | | $18 | |
| 1. | For the period from March 1, 2013 (commencement of class operations) to July 31, 2013 |
| 2. | Amount is less than $0.005. |
| 3. | Returns for periods of less than one year are not annualized. |
The accompanying notes are an integral part of these financial statements.
| | | | |
| 18 | | Wells Fargo Advantage Intrinsic Value Fund | | Financial highlights |
(For a share outstanding throughout each period)
| | | | | | | | |
| CLASS R4 | | Six months ended
January 31, 2014
(unaudited) | | | Year ended
July 31, 20131 | |
Net asset value, beginning of period | | $ | 12.55 | | | $ | 11.10 | |
Net investment income | | | 0.06 | | | | 0.09 | |
Net realized and unrealized gains (losses) on investments | | | 0.51 | | | | 2.15 | |
| | | | | | | | |
Total from investment operations | | | 0.57 | | | | 2.24 | |
Distributions to shareholders from | | | | | | | | |
Net investment income | | | (0.10 | ) | | | (0.15 | ) |
Net realized gains | | | (0.46 | ) | | | (0.64 | ) |
| | | | | | | | |
Total distributions to shareholders | | | (0.56 | ) | | | (0.79 | ) |
Net asset value, end of period | | $ | 12.56 | | | $ | 12.55 | |
Total return2 | | | 4.48 | % | | | 21.73 | % |
Ratios to average net assets (annualized) | | | | | | | | |
Gross expenses | | | 0.88 | % | | | 0.88 | % |
Net expenses | | | 0.80 | % | | | 0.80 | % |
Net investment income | | | 0.86 | % | | | 0.99 | % |
Supplemental data | | | | | | | | |
Portfolio turnover rate | | | 10 | % | | | 28 | % |
Net assets, end of period (000s omitted) | | | $14 | | | | $14 | |
| 1. | For the period from November 30, 2012 (commencement of class operations) to July 31, 2013 |
| 2. | Returns for periods of less than one year are not annualized. |
The accompanying notes are an integral part of these financial statements.
| | | | | | |
| Financial highlights | | Wells Fargo Advantage Intrinsic Value Fund | | | 19 | |
(For a share outstanding throughout each period)
| | | | | | | | |
| CLASS R6 | | Six months ended
January 31, 2014
(unaudited) | | | Year ended
July 31, 20131 | |
Net asset value, beginning of period | | $ | 12.56 | | | $ | 11.10 | |
Net investment income | | | 0.07 | 2 | | | 0.19 | |
Net realized and unrealized gains (losses) on investments | | | 0.50 | | | | 2.06 | |
| | | | | | | | |
Total from investment operations | | | 0.57 | | | | 2.25 | |
Distributions to shareholders from | | | | | | | | |
Net investment income | | | (0.11 | ) | | | (0.15 | ) |
Net realized gains | | | (0.46 | ) | | | (0.64 | ) |
| | | | | | | | |
Total distributions to shareholders | | | (0.57 | ) | | | (0.79 | ) |
Net asset value, end of period | | $ | 12.56 | | | $ | 12.56 | |
Total return3 | | | 4.54 | % | | | 21.84 | % |
Ratios to average net assets (annualized) | | | | | | | | |
Gross expenses | | | 0.74 | % | | | 0.73 | % |
Net expenses | | | 0.65 | % | | | 0.65 | % |
Net investment income | | | 1.00 | % | | | 0.85 | % |
Supplemental data | | | | | | | | |
Portfolio turnover rate | | | 10 | % | | | 28 | % |
Net assets, end of period (000s omitted) | | | $3,797 | | | | $3,359 | |
| 1. | For the period from November 30, 2012 (commencement of class operations) to July 31, 2013 |
| 2. | Calculated based upon average shares outstanding |
| 3. | Returns for periods of less than one year are not annualized. |
The accompanying notes are an integral part of these financial statements.
| | | | |
| 20 | | Wells Fargo Advantage Intrinsic Value Fund | | Financial highlights |
| (For | a share outstanding throughout each period) |
| | | | | | | | | | | | | | | | | | | | |
| | | Six months ended
January 31, 2014
(unaudited) | | | Year ended July 31 | |
| ADMINISTRATOR CLASS | | | 2013 | | | 2012 | | | 2011 | | | 20101 | |
Net asset value, beginning of period | | $ | 12.95 | | | $ | 10.78 | | | $ | 11.55 | | | $ | 9.87 | | | $ | 9.87 | |
Net investment income | | | 0.05 | | | | 0.08 | 2 | | | 0.12 | 2 | | | 0.11 | 2 | | | 0.00 | |
Net realized and unrealized gains (losses) on investments | | | 0.52 | | | | 2.87 | | | | 0.28 | | | | 1.68 | | | | 0.00 | |
| | | | | | | | | | | | | | | | | | | | |
Total from investment operations | | | 0.57 | | | | 2.95 | | | | 0.40 | | | | 1.79 | | | | 0.00 | |
Distributions to shareholders from | | | | | | | | | | | | | | | | | | | | |
Net investment income | | | (0.09 | ) | | | (0.14 | ) | | | (0.04 | ) | | | (0.11 | ) | | | 0.00 | |
Net realized gains | | | (0.46 | ) | | | (0.64 | ) | | | (1.13 | ) | | | 0.00 | | | | 0.00 | |
| | | | | | | | | | | | | | | | | | | | |
Total distributions to shareholders | | | (0.55 | ) | | | (0.78 | ) | | | (1.17 | ) | | | (0.11 | ) | | | 0.00 | |
Net asset value, end of period | | $ | 12.97 | | | $ | 12.95 | | | $ | 10.78 | | | $ | 11.55 | | | $ | 9.87 | |
Total return3 | | | 4.42 | % | | | 28.77 | % | | | 4.57 | % | | | 18.23 | % | | | 0.00 | % |
Ratios to average net assets (annualized) | | | | | | | | | | | | | | | | | | | | |
Gross expenses | | | 1.06 | % | | | 1.05 | % | | | 1.09 | % | | | 1.06 | % | | | 0.00 | % |
Net expenses | | | 0.95 | % | | | 0.95 | % | | | 0.95 | % | | | 0.95 | % | | | 0.00 | % |
Net investment income | | | 0.72 | % | | | 0.68 | % | | | 1.13 | % | | | 1.04 | % | | | 0.00 | % |
Supplemental data | | | | | | | | | | | | | | | | | | | | |
Portfolio turnover rate | | | 10 | % | | | 28 | % | | | 34 | % | | | 25 | % | | | 23 | % |
Net assets, end of period (000s omitted) | | | $515,791 | | | | $515,012 | | | | $26,687 | | | | $9,693 | | | | $10 | |
| 1. | For the period from July 30, 2010 (commencement of class operations) to July 31, 2010 |
| 2. | Calculated based upon average shares outstanding |
| 3. | Returns for periods of less than one year are not annualized. |
The accompanying notes are an integral part of these financial statements.
| | | | | | |
| Financial highlights | | Wells Fargo Advantage Intrinsic Value Fund | | | 21 | |
(For a share outstanding throughout each period)
| | | | | | | | | | | | | | | | | | | | | | | | |
| | | Six months ended
January 31, 2014
(unaudited) | | | Year ended July 31 | |
| INSTITUTIONAL CLASS | | | 2013 | | | 2012 | | | 2011 | | | 20101 | | | 20091 | |
Net asset value, beginning of period | | $ | 12.58 | | | $ | 10.48 | | | $ | 11.56 | | | $ | 9.87 | | | $ | 8.51 | | | $ | 10.22 | |
Net investment income | | | 0.06 | | | | 0.16 | | | | 0.14 | 2 | | | 0.13 | 2 | | | 0.12 | 2 | | | 0.12 | |
Net realized and unrealized gains (losses) on investments | | | 0.50 | | | | 2.73 | | | | 0.24 | | | | 1.67 | | | | 1.32 | | | | (1.72 | ) |
| | | | | | | | | | | | | | | | | | | | | | | | |
Total from investment operations | | | 0.56 | | | | 2.89 | | | | 0.38 | | | | 1.80 | | | | 1.44 | | | | (1.60 | ) |
Distributions to shareholders from | | | | | | | | | | | | | | | | | | | | | | | | |
Net investment income | | | (0.11 | ) | | | (0.15 | ) | | | (0.33 | ) | | | (0.11 | ) | | | (0.08 | ) | | | (0.05 | ) |
Net realized gains | | | (0.46 | ) | | | (0.64 | ) | | | (1.13 | ) | | | 0.00 | | | | 0.00 | | | | (0.06 | ) |
| | | | | | | | | | | | | | | | | | | | | | | | |
Total distributions to shareholders | | | (0.57 | ) | | | (0.79 | ) | | | (1.46 | ) | | | (0.11 | ) | | | (0.08 | ) | | | (0.11 | ) |
Net asset value, end of period | | $ | 12.57 | | | $ | 12.58 | | | $ | 10.48 | | | $ | 11.56 | | | $ | 9.87 | | | $ | 8.51 | |
Total return3 | | | 4.50 | % | | | 29.04 | % | | | 4.71 | % | | | 18.32 | % | | | 16.93 | % | | | (15.44 | )% |
Ratios to average net assets (annualized) | | | | | | | | | | | | | | | | | | | | | | | | |
Gross expenses | | | 0.79 | % | | | 0.79 | % | | | 0.83 | % | | | 0.79 | % | | | 0.94 | % | | | 0.92 | % |
Net expenses | | | 0.70 | % | | | 0.73 | % | | | 0.82 | % | | | 0.79 | % | | | 0.88 | % | | | 0.91 | % |
Net investment income | | | 0.96 | % | | | 1.21 | % | | | 1.35 | % | | | 1.16 | % | | | 1.27 | % | | | 1.86 | % |
Supplemental data | | | | | | | | | | | | | | | | | | | | | | | | |
Portfolio turnover rate | | | 10 | % | | | 28 | % | | | 34 | % | | | 25 | % | | | 23 | % | | | 23 | % |
Net assets, end of period (000s omitted) | | | $230,315 | | | | $221,128 | | | | $222,949 | | | | $277,329 | | | | $1,109,507 | | | | $348,093 | |
| 1. | After the close of business on July 16, 2010, the Fund acquired the net assets of Evergreen Intrinsic Value Fund which became the accounting and performance survivor in the transaction. The information for the periods prior to July 19, 2010 is that of Class I of Evergreen Intrinsic Value Fund. |
| 2. | Calculated based upon average shares outstanding |
| 3. | Returns for periods of less than one year are not annualized. |
The accompanying notes are an integral part of these financial statements.
| | | | |
| 22 | | Wells Fargo Advantage Intrinsic Value Fund | | Notes to financial statements (unaudited) |
1. ORGANIZATION
Wells Fargo Funds Trust (the “Trust”), a Delaware statutory trust organized on March 10, 1999, is an open-end management investment company registered under the Investment Company Act of 1940, as amended (the “1940 Act”). These financial statements report on the Wells Fargo Advantage Intrinsic Value Fund (the “Fund”) which is a diversified series of the Trust.
2. SIGNIFICANT ACCOUNTING POLICIES
The following significant accounting policies, which are consistently followed in the preparation of the financial statements of the Fund, are in conformity with U.S. generally accepted accounting principles which require management to make estimates and assumptions that affect the reported amounts of assets and liabilities, disclosure of contingent assets and liabilities at the date of the financial statements, and the reported amounts of revenues and expenses during the reporting period. Actual results could differ from those estimates.
Securities valuation
All investments are valued each business day as of the close of regular trading on the New York Stock Exchange (generally 4 p.m. Eastern Time).
Equity securities that are listed on a foreign or domestic exchange or market are valued at the official closing price or, if none, the last sales price. If no sale occurs on the primary exchange or market for the security that day, the prior day’s price will be deemed “stale” and fair values will be determined in accordance with the Fund’s Valuation Procedures.
Investments in registered open-end investment companies are valued at net asset value. Non-registered investment vehicles are fair valued at net asset value.
Investments which are not valued using any of the methods discussed above are valued at their fair value, as determined in good faith by the Board of Trustees of the Fund. The Board of Trustees has established a Valuation Committee comprised of the Trustees and has delegated to it the authority to take any actions regarding the valuation of portfolio securities that the Valuation Committee deems necessary or appropriate, including determining the fair value of portfolio securities, unless the determination has been delegated to the Management Valuation Team of Wells Fargo Funds Management, LLC (“Funds Management”). The Board of Trustees retains the authority to make or ratify any valuation decisions or approve any changes to the Valuation Procedures as it deems appropriate. On a quarterly basis, the Board of Trustees receives reports on any valuation actions taken by the Valuation Committee or the Management Valuation Team which may include items for ratification.
Valuations of fair valued securities are compared to the next actual sales price when available, or other appropriate market values, to assess the continued appropriateness of the fair valuation methodologies used. These securities are fair valued on a day-to-day basis, taking into consideration changes to appropriate market information and any significant changes to the inputs considered in the valuation process until there is a readily available price provided on an exchange or by an independent pricing service. Valuations received from an independent pricing service or independent broker-dealer quotes are periodically validated by comparisons to most recent trades and valuations provided by other independent pricing services in addition to the review of prices by the adviser and/or subadviser. Unobservable inputs used in determining fair valuations are identified based on the type of security, taking into consideration factors utilized by market participants in valuing the investment, knowledge about the issuer and the current market environment.
Security loans
The Fund may lend its securities from time to time in order to earn additional income in the form of fees or interest on securities received as collateral or the investment of any cash received as collateral. The Fund continues to receive interest or dividends on the securities loaned. The Fund receives collateral in the form of cash or securities with a value at least equal to the value of the securities on loan. The value of the loaned securities is determined at the close of each business day and any additional required collateral is delivered to the Fund on the next business day. In a securities lending transaction, the net asset value of the Fund will be affected by an increase or decrease in the value of the securities loaned and by an increase or decrease in the value of the instrument in which collateral is invested. The amount of securities lending activity undertaken by the Fund fluctuates from time to time. In the event of default or bankruptcy by the borrower, the Fund may be prevented from recovering the loaned securities or gaining access to the collateral or may experience delays or costs in doing so. In addition, the investment of any cash collateral received may lose all or part of its value. The Fund has the right under the lending agreement to recover the securities from the borrower on demand.
The Fund lends its securities through an unaffiliated securities lending agent. Cash collateral received in connection with its securities lending transactions is invested in Wells Fargo Securities Lending Cash Investments, LLC (the “Securities Lending
| | | | | | |
| Notes to financial statements (unaudited) | | Wells Fargo Advantage Intrinsic Value Fund | | | 23 | |
Fund”). The Securities Lending Fund is exempt from registration under Section 3(c)(7) of the 1940 Act and is managed by Funds Management and is subadvised by Wells Capital Management Incorporated (“WellsCap”). Funds Management receives an advisory fee starting at 0.05% and declining to 0.01% as the average daily net assets of the Securities Lending Fund increase. All of the fees received by Funds Management are paid to WellsCap for its services as subadviser. The Securities Lending Fund seeks to provide a positive return compared to the daily Fed Funds Open rate by investing in high-quality, U.S. dollar-denominated short-term money market instruments. Securities Lending Fund investments are fair valued based upon the amortized cost valuation technique. Income earned from investment in the Securities Lending Fund is included in securities lending income on the Statement of Operations.
Security transactions and income recognition
Securities transactions are recorded on a trade date basis. Realized gains or losses are recorded on the basis of identified cost.
Dividend income is recognized on the ex-dividend date. Dividend income from foreign securities is recorded net of foreign taxes withheld where recovery of such taxes is not assured.
Distributions to shareholders
Distributions to shareholders from net investment income and net realized gains, if any, are recorded on the ex-dividend date. Such distributions are determined in conformity with federal income tax regulations, which may differ in amount or character from net investment income and realized gains recognized for purposes of U.S. generally accepted accounting principles.
Federal and other taxes
The Fund intends to continue to qualify as a regulated investment company by distributing substantially all of its investment company taxable income and any net realized capital gains (after reduction for capital loss carryforwards) sufficient to relieve it from all, or substantially all, federal income taxes. Accordingly, no provision for federal income taxes was required.
The Fund’s income and federal excise tax returns and all financial records supporting those returns for the prior three fiscal years are subject to examination by the federal and Delaware revenue authorities. Management has analyzed the Fund’s tax positions taken on federal, state, and foreign tax returns for all open tax years and does not believe that there are any uncertain tax positions that require recognition of a tax liability.
As of July 31, 2013, capital loss carryforwards available to offset future net realized capital gains were as follows through the indicated expiration dates:
| | | | |
| 2014 | | 2015 | | 2017 |
| $3,137,764 | | $3,137,764 | | $28,092,343 |
Class allocations
The separate classes of shares offered by the Fund differ principally in applicable sales charges, distribution, shareholder servicing, and administration fees. Shareholders of each class bear certain expenses that pertain to that particular class. All shareholders bear the common expenses of the Fund, earn income from the portfolio, and are allocated any unrealized gains and losses pro rata based on the average daily net assets of each class, without distinction between share classes. Dividends are determined separately for each class based on income and expenses allocable to each class. Realized gains and losses are allocated to each class pro rata based upon the net assets of each class on the date realized. Differences in per share dividend rates generally result from the relative weightings of pro rata income and realized gain allocations and from differences in separate class expenses, including distribution, shareholder servicing, and administration fees.
3. FAIR VALUATION MEASUREMENTS
Fair value measurements of investments are determined within a framework that has established a fair value hierarchy based upon the various data inputs utilized in determining the value of the Fund’s investments. The three-level hierarchy gives the highest priority to unadjusted quoted prices in active markets for identical assets or liabilities (Level 1) and the lowest priority to significant unobservable inputs (Level 3). The Fund’s investments are classified within the fair value hierarchy based on the lowest level of input that is significant to the fair value measurement. The inputs are summarized into three broad levels as follows:
| n | | Level 1 – quoted prices in active markets for identical securities |
| n | | Level 2 – other significant observable inputs (including quoted prices for similar securities, interest rates, prepayment speeds, credit risk, use of amortized cost, etc.) |
| | | | |
| 24 | | Wells Fargo Advantage Intrinsic Value Fund | | Notes to financial statements (unaudited) |
| n | | Level 3 – significant unobservable inputs (including the Fund’s own assumptions in determining the fair value of investments) |
The inputs or methodologies used for valuing investments in securities are not necessarily an indication of the risk associated with investing in those securities.
As of January 31, 2014, the inputs used in valuing investments in securities were as follows:
| | | | | | | | | | | | | | | | |
| Investments in Securities | | Quoted prices (level 1) | | | Other significant
observable inputs (level 2) | | | Significant unobservable inputs (level 3) | | | Total | |
| | | | |
Equity securities | | | | | | | | | | | | | | | | |
Common stocks | | $ | 1,113,741,843 | | | $ | 0 | | | $ | 0 | | | $ | 1,113,741,843 | |
| | | | |
Short-term investments | | | | | | | | | | | | | | | | |
Investment companies | | | 61,450,275 | | | | 0 | | | | 0 | | | | 61,450,275 | |
| | | $ | 1,175,192,118 | | | $ | 0 | | | $ | 0 | | | $ | 1,175,192,118 | |
Transfers in and transfers out are recognized at the end of the reporting period. For the six months ended January 31, 2014, the Fund did not have any transfers into/out of Level 1, Level 2, or Level 3.
4. TRANSACTIONS WITH AFFILIATES AND OTHER EXPENSES
Advisory fee
The Trust has entered into an advisory contract with Funds Management, an indirect wholly owned subsidiary of Wells Fargo & Company (“Wells Fargo”). The adviser is responsible for implementing investment policies and guidelines and for supervising the subadviser, who is responsible for day-to-day portfolio management of the Fund.
Pursuant to the contract, Funds Management is entitled to receive an annual advisory fee starting at 0.65% and declining to 0.55% as the average daily net assets of the Fund increase. For the six months ended January 31, 2014, the advisory fee was equivalent to an annual rate of 0.63% of the Fund’s average daily net assets.
Funds Management has retained the services of a subadviser to provide daily portfolio management to the Fund. The fee for subadvisory services is borne by Funds Management. Metropolitan West Capital Management, LLC, an affiliate of Funds Management and an indirect, wholly owned subsidiary of Wells Fargo, is the subadviser to the Fund and is entitled to receive a fee from Funds Management at an annual rate starting at 0.35% and declining to 0.25% as the average daily net assets of the Fund increase.
Administration and transfer agent fees
The Trust has entered into an administration agreement with Funds Management. Under this agreement, for providing administrative services, which includes paying fees and expenses for services provided by the transfer agent, sub-transfer agents, omnibus account servicers and record-keepers, Funds Management is entitled to receive from the Fund an annual fund level administration fee starting at 0.05% and declining to 0.03% as the average daily net assets of the Fund increase and a class level administration fee which is calculated based on the average daily net assets of each class as follows:
| | | | |
| | | Class level
administration fee | |
Class A, Class B, Class C, Class R | | | 0.26 | % |
Class R4, Institutional Class | | | 0.08 | |
Class R6 | | | 0.03 | |
Administrator Class | | | 0.10 | |
Funds Management has contractually waived and/or reimbursed advisory and administration fees to the extent necessary to maintain certain net operating expense ratios for the Fund. Waiver of fees and/or reimbursement of expenses by Funds Management were made first from fund level expenses on a proportionate basis and then from class specific expenses. Funds Management has committed through November 30, 2014 to waive fees and/or reimburse expenses to the extent necessary to cap the Fund’s expenses at 1.16% for Class A shares, 1.91% for Class B shares, 1.91% for Class C shares, 1.41% for Class R shares, 0.80% for Class R4 shares, 0.65% for Class R6 shares, 0.95% for Administrator Class shares, and 0.70% for Institutional Class shares.
| | | | | | |
| Notes to financial statements (unaudited) | | Wells Fargo Advantage Intrinsic Value Fund | | | 25 | |
Distribution fees
The Trust has adopted a Distribution Plan for Class B, Class C, and Class R shares of the Fund pursuant to Rule 12b-1 under the 1940 Act. Distribution fees are charged to Class B, Class C, and Class R shares and paid to Wells Fargo Funds Distributor, LLC, the principal underwriter, at an annual rate of 0.75% of the average daily net assets of Class B and Class C shares and 0.25% of the average daily net assets for Class R shares.
For the six months ended January 31, 2014, Wells Fargo Funds Distributor, LLC received $6,701 from the sale of Class A shares and $133 and $25 in contingent deferred sales charges from redemptions of Class B and Class C shares, respectively.
Shareholder servicing fees
The Trust has entered into contracts with one or more shareholder servicing agents, whereby Class A, Class B, Class C, Class R, and Administrator Class of the Fund is charged a fee at an annual rate of 0.25% of the average daily net assets of each respective class. Class R4 shares are charged a fee at an annual rate of 0.10% of its average daily net assets.
A portion of these total shareholder servicing fees were paid to affiliates of Wells Fargo.
5. INVESTMENT PORTFOLIO TRANSACTIONS
Purchases and sales of investments, excluding U.S. government obligations (if any) and short-term securities, for the six months ended January 31, 2014 were $114,155,904 and $186,666,825, respectively.
6. ACQUISITION
After the close of business on March 1, 2013, the Fund acquired the net assets of Wells Fargo Advantage Equity Value Fund. The purpose of the transaction was to combine two funds with similar investment objectives and strategies. Shareholders holding Class A, Class B, Class C, Class R, Administrator Class, and Institutional Class shares of Wells Fargo Advantage Equity Value Fund received Class A, Class B, Class C, Class R, Administrator Class, and Institutional Class shares, respectively, of the Fund in the reorganization. The acquisition was accomplished by a tax-free exchange of all of the shares of Wells Fargo Advantage Equity Value Fund for 63,088,710 shares of the Fund valued at $718,868,214 at an exchange ratio of 1.13, 1.13, 1.12, 1.15, 1.12, and 1.15 for Class A, Class B, Class C, Class R, Administrator Class, and Institutional Class shares, respectively. The investment portfolio of Wells Fargo Advantage Equity Value Fund with a fair value of $718,463,173, identified cost of $710,507,118 and unrealized gains of $7,956,055 at March 1, 2013 were the principal assets acquired by the Fund. The aggregate net assets of Wells Fargo Advantage Equity Value Fund and the Fund immediately prior to the acquisition were $718,868,214 and $355,325,407, respectively. The aggregate net assets of the Fund immediately after the acquisition were $1,074,193,621. For financial reporting purposes, assets received and shares issued by the Fund were recorded at fair value; however, the cost basis of the investments received from Wells Fargo Advantage Equity Value Fund was carried forward to align ongoing reporting of the Fund’s realized and unrealized gains and losses with amounts distributable to shareholders for tax purposes.
Assuming the acquisition had been completed August 1, 2012, the beginning of the annual reporting period for the Fund, the pro forma results of operations for the year ended July 31, 2013 would have been:
| | | | |
Net investment income | | $ | 12,347,528 | |
Net realized and unrealized gains (losses) on investments | | $ | 268,034,789 | |
Net increase in net assets resulting from operations | | $ | 280,382,317 | |
7. BANK BORROWINGS
The Trust (excluding the money market funds and certain other funds in the Trust) and Wells Fargo Variable Trust are parties to a $150,000,000 revolving credit agreement with State Street Bank and Trust Company, whereby the Fund is permitted to use bank borrowings for temporary or emergency purposes, such as to fund shareholder redemption requests. Interest under the credit agreement is charged to the Fund based on a borrowing rate equal to the higher of the Federal Funds rate in effect on that day plus 1.25% or the overnight LIBOR rate in effect on that day plus 1.25%. In addition, an annual commitment fee equal to 0.10% of the unused balance is allocated to each participating fund. For the six months ended January 31, 2014, the Fund paid $485 in commitment fees.
| | | | |
| 26 | | Wells Fargo Advantage Intrinsic Value Fund | | Notes to financial statements (unaudited) |
For the six months ended January 31, 2014, there were no borrowings by the Fund under the agreement.
8. INDEMNIFICATION
Under the Trust’s organizational documents, the officers and directors are indemnified against certain liabilities that may arise out of performance of their duties to the Trust. Additionally, in the normal course of business, the Trust may enter into contracts with service providers that contain a variety of indemnification clauses. The Trust’s maximum exposure under these arrangements is dependent on future claims that may be made against the Fund and, therefore, cannot be estimated.
| | | | | | |
| Other information (unaudited) | | Wells Fargo Advantage Intrinsic Value Fund | | | 27 | |
PROXY VOTING INFORMATION
A description of the policies and procedures that the Fund uses to determine how to vote proxies relating to portfolio securities is available without charge, upon request, by calling 1-800-222-8222, visiting our website at wellsfargoadvantagefunds.com, or visiting the SEC website at sec.gov. Information regarding how the Fund voted proxies relating to portfolio securities during the most recent 12-month period ended June 30 is available without charge on the Fund’s website at wellsfargoadvantagefunds.com or by visiting the SEC website at sec.gov.
PORTFOLIO HOLDINGS INFORMATION
The complete portfolio holdings for the Fund are publicly available on the Fund’s website (wellsfargoadvantagefunds.com) on a monthly, 30-day or more delayed basis. In addition, top ten holdings information for the Fund is publicly available on the Fund’s website on a monthly, seven-day or more delayed basis. The Fund files its complete schedule of portfolio holdings with the SEC for the first and third quarters of each fiscal year on Form N-Q, which is available without charge by visiting the SEC website at sec.gov. In addition, the Fund’s Form N-Q may be reviewed and copied at the SEC’s Public Reference Room in Washington, DC, and at regional offices in New York City, at 233 Broadway, and in Chicago, at 175 West Jackson Boulevard, Suite 900. Information about the Public Reference Room may be obtained by calling 1-800-SEC-0330.
| | | | |
| 28 | | Wells Fargo Advantage Intrinsic Value Fund | | Other information (unaudited) |
BOARD OF TRUSTEES AND OFFICERS
Each of the Trustees and Officers listed in the table below acts in identical capacities for each fund in the Wells Fargo Advantage family of funds, which consists of 132 mutual funds1 comprising the Wells Fargo Funds Trust, Wells Fargo Variable Trust, Wells Fargo Master Trust and four closed-end funds (collectively the “Fund Complex”). This table should be read in conjunction with the Prospectus and the Statement of Additional Information2. All of the Trustees are also Members of the Audit and Governance Committees of each Trust in the Fund Complex. The mailing address of each Trustee and Officer is 525 Market Street, 12th Floor, San Francisco, CA 94105. Each Trustee and Officer serves an indefinite term, however, each Trustee serves such term until reaching the mandatory retirement age established by the Trustees.
Independent Trustees
| | | | | | |
Name and year of birth | | Position held and length of service* | | Principal occupations during past five years | | Other directorships during
past five years |
Peter G. Gordon
(Born 1942) | | Trustee, since 1998; Chairman, since 2005 | | Co-Founder, Retired Chairman, President and CEO of Crystal Geyser Water Company. Trustee Emeritus, Colby College. | | Asset Allocation Trust |
Isaiah Harris, Jr.
(Born 1952) | | Trustee, since 2009 | | Retired. Prior thereto, President and CEO of BellSouth Advertising and Publishing Corp. from 2005 to 2007, President and CEO of BellSouth Enterprises from 2004 to 2005 and President of BellSouth Consumer Services from 2000 to 2003. Emeritus member of the Iowa State University Foundation Board of Governors. Emeritus Member of the Advisory Board of Iowa State University School of Business. Advisory Board Member, Palm Harbor Academy (charter school). Mr. Harris is a certified public accountant. | | CIGNA Corporation; Deluxe Corporation; Asset Allocation Trust |
Judith M. Johnson
(Born 1949) | | Trustee, since 2008; Audit Committee Chairman, since 2008 | | Retired. Prior thereto, Chief Executive Officer and Chief Investment Officer of Minneapolis Employees Retirement Fund from 1996 to 2008. Ms. Johnson is an attorney, certified public accountant and a certified managerial accountant. | | Asset Allocation Trust |
Leroy Keith, Jr.
(Born 1939) | | Trustee, since 2010 | | Chairman, Bloc Global Services (development and construction). Trustee of the Evergreen Funds from 1983 to 2010. Former Managing Director, Almanac Capital Management (commodities firm), former Partner, Stonington Partners, Inc. (private equity fund), former Director, Obagi Medical Products Co. and former Director, Lincoln Educational Services. | | Trustee, Virtus Fund Complex (consisting of 50 portfolios as of 12/16/2013); Asset Allocation Trust |
David F. Larcker
(Born 1950) | | Trustee, since 2009 | | James Irvin Miller Professor of Accounting at the Graduate School of Business, Stanford University, Morgan Stanley Director of the Center for Leadership Development and Research and Senior Faculty of The Rock Center for Corporate Governance since 2006. From 2005 to 2008, Professor of Accounting at the Graduate School of Business, Stanford University. Prior thereto, Ernst & Young Professor of Accounting at The Wharton School, University of Pennsylvania from 1985 to 2005. | | Asset Allocation Trust |
Olivia S. Mitchell
(Born 1953) | | Trustee, since 2006 | | International Foundation of Employee Benefit Plans Professor, Wharton School of the University of Pennsylvania since 1993. Director of Wharton’s Pension Research Council and Boettner Center on Pensions & Retirement Research, and Research Associate at the National Bureau of Economic Research. Previously, Cornell University Professor from 1978 to 1993. | | Asset Allocation Trust |
Timothy J. Penny
(Born 1951) | | Trustee, since 1996 | | President and CEO of Southern Minnesota Initiative Foundation, a non-profit organization, since 2007 and Senior Fellow at the Humphrey Institute Policy Forum at the University of Minnesota since 1995. Member of the Board of Trustees of NorthStar Education Finance, Inc., a non-profit organization, since 2007. | | Asset Allocation Trust |
| | | | | | |
| Other information (unaudited) | | Wells Fargo Advantage Intrinsic Value Fund | | | 29 | |
| | | | | | |
Name and year of birth | | Position held and length of service* | | Principal occupations during past five years | | Other directorships during
past five years |
Michael S. Scofield
(Born 1943) | | Trustee, since 2010 | | Served on the Investment Company Institute’s Board of Governors and Executive Committee from 2008-2011 as well the Governing Council of the Independent Directors Council from 2006-2011 and the Independent Directors Council Executive Committee from 2008-2011. Chairman of the IDC from 2008-2010. Institutional Investor (Fund Directions) Trustee of Year in 2007. Trustee of the Evergreen Funds (and its predecessors) from 1984 to 2010. Chairman of the Evergreen Funds from 2000-2010. Former Trustee of the Mentor Funds. Retired Attorney, Law Offices of Michael S. Scofield. | | Asset Allocation Trust |
Donald C. Willeke
(Born 1940) | | Trustee, since 1996 | | Principal of the law firm of Willeke & Daniels. General Counsel of the Minneapolis Employees Retirement Fund from 1984 until its consolidation into the Minnesota Public Employees Retirement Association on June 30, 2010. Director and Vice Chair of The Tree Trust (non-profit corporation). Director of the American Chestnut Foundation (non-profit corporation). | | Asset Allocation Trust |
| * | Length of service dates reflect the Trustee’s commencement of service with the Trust’s predecessor entities, where applicable. |
Officers
| | | | | | |
Name and year of birth | | Position held and length of service | | Principal occupations during past five years | | |
Karla M. Rabusch
(Born 1959) | | President, since 2003 | | Executive Vice President of Wells Fargo Bank, N.A. and President of Wells Fargo Funds Management, LLC since 2003. | | |
Jeremy DePalma1
(Born 1974) | | Treasurer, since 2012 | | Senior Vice President of Wells Fargo Funds Management, LLC since 2009. Senior Vice President of Evergreen Investment Management Company, LLC from 2008 to 2010. Vice President, Evergreen Investment Services, Inc. from 2004 to 2007. Head of the Fund Reporting and Control Team within Fund Administration from 2005 to 2010. | | |
C. David Messman
(Born 1960) | | Secretary, since 2000; Chief Legal Officer, since 2003 | | Senior Vice President and Secretary of Wells Fargo Funds Management, LLC since 2001. Vice President and Managing Counsel of Wells Fargo Bank, N.A. since 1996. | | |
Debra Ann Early
(Born 1964) | | Chief Compliance Officer, since 2007 | | Chief Compliance Officer of Wells Fargo Funds Management, LLC since 2007. Chief Compliance Officer of Parnassus Investments from 2005 to 2007. Chief Financial Officer of Parnassus Investments from 2004 to 2007. | | |
David Berardi
(Born 1975) | | Assistant Treasurer, since 2009 | | Vice President of Wells Fargo Funds Management, LLC since 2009. Vice President of Evergreen Investment Management Company, LLC from 2008 to 2010. Assistant Vice President of Evergreen Investment Services, Inc. from 2004 to 2008. Manager of Fund Reporting and Control for Evergreen Investment Management Company, LLC from 2004 to 2010. | | |
| 1. | Jeremy DePalma acts as Treasurer of 59 funds and Assistant Treasurer of 73 funds in the Fund Complex. |
| 2. | The Statement of Additional Information includes additional information about the Trustees and is available, without charge, upon request, by calling 1-800-222-8222 or by visiting the website at wellsfargoadvantagefunds.com. |
| | | | |
| 30 | | Wells Fargo Advantage Intrinsic Value Fund | | List of abbreviations |
The following is a list of common abbreviations for terms and entities that may have appeared in this report.
| ACA | — ACA Financial Guaranty Corporation |
| ADR | — American depositary receipt |
| ADS | — American depositary shares |
| AGC | — Assured Guaranty Corporation |
| AGM | — Assured Guaranty Municipal |
| Ambac | — Ambac Financial Group Incorporated |
| AMT | — Alternative minimum tax |
| BAN | — Bond anticipation notes |
| BHAC | — Berkshire Hathaway Assurance Corporation |
| CAB | — Capital appreciation bond |
| CCAB | — Convertible capital appreciation bond |
| CDA | — Community Development Authority |
| CDO | — Collateralized debt obligation |
| COP | — Certificate of participation |
| DRIVER | — Derivative inverse tax-exempt receipts |
| DW&P | — Department of Water & Power |
| DWR | — Department of Water Resources |
| ECFA | — Educational & Cultural Facilities Authority |
| EDA | — Economic Development Authority |
| EDFA | — Economic Development Finance Authority |
| ETF | — Exchange-traded fund |
| FDIC | — Federal Deposit Insurance Corporation |
| FFCB | — Federal Farm Credit Banks |
| FGIC | — Financial Guaranty Insurance Corporation |
| FHA | — Federal Housing Administration |
| FHLB | — Federal Home Loan Bank |
| FHLMC | — Federal Home Loan Mortgage Corporation |
| FICO | — The Financing Corporation |
| FNMA | — Federal National Mortgage Association |
| GDR | — Global depositary receipt |
| GNMA | — Government National Mortgage Association |
| HCFR | — Healthcare facilities revenue |
| HEFA | — Health & Educational Facilities Authority |
| HEFAR | — Higher education facilities authority revenue |
| HFA | — Housing Finance Authority |
| HFFA | — Health Facilities Financing Authority |
| HUD | — Department of Housing and Urban Development |
| IDA | — Industrial Development Authority |
| IDAG | — Industrial Development Agency |
| IDR | — Industrial development revenue |
| KRW | — Republic of Korea won |
| LIBOR | — London Interbank Offered Rate |
| LLC | — Limited liability company |
| LLLP | — Limited liability limited partnership |
| LLP | — Limited liability partnership |
| MBIA | — Municipal Bond Insurance Association |
| MFHR | — Multifamily housing revenue |
| MSTR | — Municipal securities trust receipts |
| MUD | — Municipal Utility District |
| National | — National Public Finance Guarantee Corporation |
| PCFA | — Pollution Control Financing Authority |
| PCL | — Public Company Limited |
| PCR | — Pollution control revenue |
| PFA | — Public Finance Authority |
| PFFA | — Public Facilities Financing Authority |
| PFOTER | — Puttable floating option tax-exempt receipts |
| plc | — Public limited company |
| PUTTER | — Puttable tax-exempt receipts |
| R&D | — Research & development |
| Radian | — Radian Asset Assurance |
| RAN | — Revenue anticipation notes |
| RDA | — Redevelopment Authority |
| RDFA | — Redevelopment Finance Authority |
| REIT | — Real estate investment trust |
| ROC | — Reset option certificates |
| SAVRS | — Select auction variable rate securities |
| SBA | — Small Business Authority |
| SFHR | — Single-family housing revenue |
| SFMR | — Single-family mortgage revenue |
| SPA | — Standby purchase agreement |
| SPDR | — Standard & Poor’s Depositary Receipts |
| STRIPS | — Separate trading of registered interest and principal securities |
| TAN | — Tax anticipation notes |
| TIPS | — Treasury inflation-protected securities |
| TRAN | — Tax revenue anticipation notes |
| TTFA | — Transportation Trust Fund Authority |
| TVA | — Tennessee Valley Authority |
This page is intentionally left blank.
This page is intentionally left blank.


For more information
More information about Wells Fargo Advantage Funds is available free upon request. To obtain literature, please write, email, visit the Fund’s website, or call:
Wells Fargo Advantage Funds
P.O. Box 8266
Boston, MA 02266-8266
Email: wfaf@wellsfargo.com
Website: wellsfargoadvantagefunds.com
Individual investors: 1-800-222-8222
Retail investment professionals: 1-888-877-9275
Institutional investment professionals: 1-866-765-0778
This report and the financial statements contained herein are submitted for the general information of the shareholders of Wells Fargo Advantage Funds. If this report is used for promotional purposes, distribution of the report must be accompanied or preceded by a current prospectus. For a current prospectus and, if available, a summary prospectus containing more complete information, including charges and expenses, call 1-800-222-8222 or visit the Fund’s website at wellsfargoadvantagefunds.com. Please consider the investment objectives, risks, charges, and expenses of the investment carefully before investing. This and other information about Wells Fargo Advantage Funds can be found in the current prospectus. Read the prospectus carefully before you invest or send money.
Wells Fargo Funds Management, LLC, a wholly owned subsidiary of Wells Fargo & Company, provides investment advisory and administrative services for Wells Fargo Advantage Funds. Other affiliates of Wells Fargo & Company provide subadvisory and other services for the Funds. The Funds are distributed by Wells Fargo Funds Distributor, LLC, Member FINRA/SIPC, an affiliate of Wells Fargo & Company.
NOT FDIC INSURED ¡ NO BANK GUARANTEE ¡ MAY LOSE VALUE
© 2014 Wells Fargo Funds Management, LLC. All rights reserved.
| | |

| | 222989 03-14 SA207/SAR207 1-14 |

Wells Fargo Advantage Large Cap Core Fund

Semi-Annual Report
January 31, 2014

Reduce clutter. Save trees.
Sign up for electronic delivery of prospectuses and shareholder reports at wellsfargo.com/advantagedelivery
Contents
The views expressed and any forward-looking statements are as of January 31, 2014, unless otherwise noted, and are those of the Fund managers and/or Wells Fargo Funds Management, LLC. Discussions of individual securities, or the markets generally, or any Wells Fargo Advantage Fund are not intended as individual recommendations. Future events or results may vary significantly from those expressed in any forward-looking statements; the views expressed are subject to change at any time in response to changing circumstances in the market. Wells Fargo Funds Management, LLC and the Fund disclaim any obligation to publicly update or revise any views expressed or forward-looking statements.
NOT FDIC INSURED ¡ NO BANK GUARANTEE ¡ MAY LOSE VALUE
| | | | |
| 2 | | Wells Fargo Advantage Large Cap Core Fund | | Letter to shareholders (unaudited) |

Karla M. Rabusch
President
Wells Fargo Advantage Funds
Major central banks continued to inject liquidity into the banks and the markets through various quantitative easing policies.
Dear Valued Shareholder:
We are pleased to offer you this semi-annual report for the Wells Fargo Advantage Large Cap Core Fund for the six-month period that ended January 31, 2014. Much of the period was marked by monetary easing by global central banks. Entering the period, investors were concerned that the U.S. Federal Reserve (Fed) would end its bond-buying program, which initially led to higher interest rates and resulted in losses for bond indexes and volatility for global stock indexes. These fears dissipated in late September 2013 and ended altogether in mid-December 2013 when the Fed announced a tapering timeline that was far more moderate than some had feared. Growing confidence that the U.S. economy was staging a fragile recovery resulted in double-digit returns for domestic stock market indexes for the six-month reporting period.
Central banks continued to provide stimulus.
Major central banks continued to inject liquidity into the banks and the markets through various quantitative easing policies. Throughout the reporting period, the Federal Open Market Committee (FOMC)—the Fed’s monetary policymaking body—kept its key interest rate effectively near zero in order to support the economy and the financial system. Well before the reporting period began, the FOMC announced its intention to keep interest rates low for an extended period and to make open-ended purchases of $40 billion per month in mortgage-backed securities. The FOMC later added purchases of $45 billion per month in long-term U.S. Treasuries. Because the markets benefited from the FOMC’s liquidity, both stocks and bonds initially sold off after the FOMC indicated in May 2013 that it might reduce (or taper) its bond-buying program. However, in mid-December 2013, the FOMC announced that it would reduce its bond-buying program by $10 billion per month beginning in January 2014. The tapering was less aggressive than some investors had feared, and the markets ended 2013 strongly.
European markets continued to benefit from the European Central Bank’s (ECB’s) earlier announcement that it would purchase an unlimited amount of one- to three-year sovereign debt from countries that had formally applied for a bailout. In November 2013, the ECB cut its key rate to a historic low of 0.25%. The ECB’s aggressive actions helped ease investor worries about a eurozone sovereign debt default. Given the substantial ties between the U.S. and Europe, the improved sentiment about the eurozone helped provide a tailwind for U.S. markets.
U.S. stock markets gained on relatively good news.
For most of the period, U.S. economic data remained moderately positive. Reported gross domestic product (GDP) growth came in at a strong 4.1% annualized rate in the third quarter of 2013, and the advance annualized estimate for fourth-quarter GDP growth was 3.2%.
The most significant negative effect was the ongoing fight in Washington, D.C., over the federal budget and debt limit. The Budget Control Act of 2011, which was passed to resolve a previous fight over the federal debt ceiling, mandated budget sequestration that took effect on March 1, 2013, and was an overhang on economic growth throughout the reporting period. Most recently, Congress was unable to pass a resolution to continue to fund the federal government, and thus, the federal government underwent a partial shutdown from September 30, 2013, through October 16, 2013. The government reopened after the president and Congress reached a deal that funded the government through January 15, 2014, and raised the debt limit through February 7, 2014. In December 2013, Congress
| | | | | | |
| Letter to shareholders (unaudited) | | Wells Fargo Advantage Large Cap Core Fund | | | 3 | |
passed the Ryan–Murray budget agreement that funded the government through September 2015, lessening the near-term prospect of another shutdown.
Despite political headwinds, the relatively positive outlook for the U.S. economy contributed to a strong domestic stock market for most of the reporting period. Economically sensitive sectors, such as industrials and materials, outperformed. Dividend-paying sectors such as utilities and telecommunication services lagged as higher interest rates dampened their relative performance. Judging by various Russell indexes, small-cap stocks moderately outperformed large-cap stocks, and growth stocks strongly outperformed value stocks.
Don’t let short-term uncertainty derail long-term investment goals.
Periods of uncertainty can present challenges, but experience has taught us that maintaining long-term investment goals can be an effective way to plan for the future. Although diversification cannot guarantee an investment profit or prevent losses, we believe it can be an effective way to manage investment risk and potentially smooth out overall portfolio performance. We encourage investors to know their investments and to understand that appropriate levels of risk-taking may unlock opportunities.
Thank you for choosing to invest with Wells Fargo Advantage Funds. We appreciate your confidence in us and remain committed to helping you meet your financial needs. For current information about your fund investments, contact your investment professional, visit our website at wellsfargoadvantagefunds.com, or call us directly at 1-800-222-8222. We are available 24 hours a day, 7 days a week.
Sincerely,

Karla M. Rabusch
President
Wells Fargo Advantage Funds
Despite political headwinds, the relatively positive outlook for the U.S. economy contributed to a strong domestic stock market for most of the reporting period.
Notice to shareholders
The Fund and Wells Fargo Funds Management, LLC (“Funds Management”) have received an exemptive order from the SEC that permits Funds Management, subject to the approval of the Board of Trustees of the Fund, to select or replace certain subadvisers to manage all or a portion of the Fund’s assets and enter into, amend or terminate a sub-advisory agreement with certain subadvisers without obtaining shareholder approval (“Multi-manager Structure”). The Multi-manager Structure applies to subadvisers that are not affiliated with Funds Management or the Fund, except to the extent that affiliation arises solely because such subadvisers provide sub-advisory services to the Fund (“Non-affiliated Subadvisers”), as well as subadvisers that are indirect or direct wholly-owned subsidiaries of Funds Management or of another company that, indirectly or directly, wholly owns Funds Management (“Wholly-owned Subadvisers”).
Pursuant to the SEC order, Funds Management, with the approval of the Board of Trustees, has the discretion to terminate any subadvisers and allocate and reallocate the Fund’s assets among any other Non-affiliated Subadvisers or Wholly-owned Subadvisers. Funds Management, subject to oversight and supervision by the Board of Trustees, has responsibility to continue to oversee any subadvisers to the Fund and to recommend, for approval by the Board of Trustees, the hiring, termination and replacement of subadvisers for the Fund. In the event that a new subadviser is hired pursuant to the Multi-manager Structure, the Fund is required to provide notice to shareholders within 90 days.
Please contact your investment professional or call us directly at 1-800-222-8222 if you have any questions on this Notice to Shareholders.
| | | | |
| 4 | | Wells Fargo Advantage Large Cap Core Fund | | Performance highlights (unaudited) |
Investment objective
The Fund seeks long-term capital appreciation.
Adviser
Wells Fargo Funds Management, LLC
Subadviser
Golden Capital Management, LLC
Portfolio manager
Jeff C. Moser, CFA
Average annual total returns1 (%) as of January 31, 2014
| | | | | | | | | | | | | | | | | | | | | | | | | | | | | | | | | | |
| | | | | Including sales charge | | | Excluding sales charge | | | Expense ratios2 (%) | |
| | | Inception date | | 1 year | | | 5 year | | | Since inception | | | 1 year | | | 5 year | | | Since inception | | | Gross | | | Net3 | |
| Class A (EGOAX) | | 12-17-2007 | | | 20.31 | | | | 16.21 | | | | 4.35 | | | | 27.65 | | | | 17.59 | | | | 5.37 | | | | 1.33 | | | | 1.14 | |
| Class C (EGOCX) | | 12-17-2007 | | | 25.65 | | | | 16.70 | | | | 4.61 | | | | 26.65 | | | | 16.70 | | | | 4.61 | | | | 2.08 | | | | 1.89 | |
| Administrator Class (WFLLX) | | 7-16-2010 | | | – | | | | – | | | | – | | | | 27.95 | | | | 17.84 | | | | 5.55 | | | | 1.17 | | | | 0.90 | |
| Institutional Class (EGOIX) | | 12-17-2007 | | | – | | | | – | | | | – | | | | 28.21 | | | | 18.09 | | | | 5.78 | | | | 0.90 | | | | 0.66 | |
| Investor Class (WFLNX) | | 7-16-2010 | | | – | | | | – | | | | – | | | | 27.44 | | | | 17.43 | | | | 5.19 | | | | 1.39 | | | | 1.20 | |
| S&P 500 Index4 | | – | | | – | | | | – | | | | – | | | | 21.52 | | | | 19.19 | | | | 5.78 | | | | – | | | | – | |
Figures quoted represent past performance, which is no guarantee of future results, and do not reflect taxes that a shareholder may pay on fund distributions or the redemption of fund shares. Investment return and principal value of an investment will fluctuate so that an investor’s shares, when redeemed, may be worth more or less than their original cost. Performance shown without sales charges would be lower if sales charges were reflected. Current performance may be lower or higher than the performance data quoted, which assumes the reinvestment of dividends and capital gains. Current month-end performance is available on the Fund’s website, wellsfargoadvantagefunds.com.
Index returns do not include transaction costs associated with buying and selling securities, any mutual fund fees or expenses, or any taxes. It is not possible to invest directly in an index.
For Class A shares, the maximum front-end sales charge is 5.75%. For Class C shares, the maximum contingent deferred sales charge is 1.00%. Performance including sales charge assumes the sales charge for the corresponding time period. Administrator Class, Institutional Class, and Investor Class shares are sold without a front-end sales charge or contingent deferred sales charge.
Please keep in mind that high double-digit returns were primarily achieved during favorable market conditions. You should not expect that such favorable returns can be consistently achieved. A fund’s performance, especially for very short time periods, should not be the sole factor in making your investment decision.
Stock values fluctuate in response to the activities of individual companies and general market and economic conditions. Certain investment strategies tend to increase the total risk of an investment (relative to the broader market). The Fund is exposed to foreign investment risk. Consult the Fund’s prospectus for additional information on these and other risks.
Please see footnotes on page 5.
| | | | | | |
| Performance highlights (unaudited) | | Wells Fargo Advantage Large Cap Core Fund | | | 5 | |
| | | | |
| Ten largest equity holdings5 (%) as of January 31, 2014 | |
McKesson Corporation | | | 2.47 | |
Hanesbrands Incorporated | | | 2.46 | |
Delta Air Lines Incorporated | | | 2.45 | |
Lincoln National Corporation | | | 2.44 | |
Marvell Technology Group Limited | | | 2.38 | |
Micron Technology Incorporated | | | 2.31 | |
CVS Caremark Corporation | | | 2.30 | |
United Therapeutics Corporation | | | 2.23 | |
MetLife Incorporated | | | 2.20 | |
Bank of America Corporation | | | 2.19 | |
| | |
| Sector distribution6 as of January 31, 2014 |
|
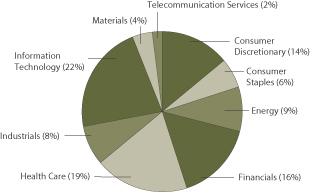
|
| 1. | Historical performance shown for Administrator Class and Investor Class shares prior to their inception reflects the performance of Institutional Class shares, adjusted to reflect higher expenses applicable to Administrator Class and Investor Class shares. Historical performance shown for all classes of the Fund prior to July 19, 2010, is based on the performance of the Fund’s predecessor, Evergreen Golden Large Cap Core Fund. |
| 2. | Reflects the expense ratios as stated in the most recent prospectuses. The expense ratios shown are subject to change and may differ from the annualized expense ratios shown in the financial highlights of this report. |
| 3. | The Adviser has committed through November 30, 2014, to waive fees and/or reimburse expenses to the extent necessary to cap the Fund’s Total Annual Fund Operating Expenses After Fee Waiver, excluding certain expenses, at the amounts shown. Brokerage commissions, stamp duty fees, interest, taxes, acquired fund fees and expenses, and extraordinary expenses are excluded from the cap. Without this cap, the Fund’s returns would have been lower. |
| 4. | The S&P 500 Index consists of 500 stocks chosen for market size, liquidity, and industry group representation. It is a market-value weighted index with each stock’s weight in the index proportionate to its market value. You cannot invest directly in an index. |
| 5. | The ten largest equity holdings are calculated based on the value of the securities divided by total net assets of the Fund. Holdings are subject to change and may have changed since the date specified. |
| 6. | Sector distribution is subject to change and is calculated based on the total long-term investments of the Fund. |
| | | | |
| 6 | | Wells Fargo Advantage Large Cap Core Fund | | Fund expenses (unaudited) |
As a shareholder of the Fund, you incur two types of costs: (1) transaction costs, including sales charges (loads) on purchase payments and contingent deferred sales charges (if any) on redemptions and (2) ongoing costs, including management fees, distribution (12b-1) and/or shareholder service fees, and other Fund expenses. This example is intended to help you understand your ongoing costs (in dollars) of investing in the Fund and to compare these costs with the ongoing costs of investing in other mutual funds.
The example is based on an investment of $1,000 invested at the beginning of the six-month period and held for the entire period from August 1, 2013 to January 31, 2014.
Actual expenses
The “Actual” line of the table below provides information about actual account values and actual expenses. You may use the information in this line, together with the amount you invested, to estimate the expenses that you paid over the period. Simply divide your account value by $1,000 (for example, an $8,600 account value divided by $1,000 = 8.6), then multiply the result by the number in the “Actual” line under the heading entitled “Expenses paid during period” for your applicable class of shares to estimate the expenses you paid on your account during this period.
Hypothetical example for comparison purposes
The “Hypothetical” line of the table below provides information about hypothetical account values and hypothetical expenses based on the Fund’s actual expense ratio and an assumed rate of return of 5% per year before expenses, which is not the Fund’s actual return. The hypothetical account values and expenses may not be used to estimate the actual ending account balance or expenses you paid for the period. You may use this information to compare the ongoing costs of investing in the Fund and other funds. To do so, compare this 5% hypothetical example with the 5% hypothetical examples that appear in the shareholder reports of the other funds.
Please note that the expenses shown in the table are meant to highlight your ongoing costs only and do not reflect any transactional costs, such as sales charges (loads) and contingent deferred sales charges. Therefore, the “Hypothetical” line of the table is useful in comparing ongoing costs only and will not help you determine the relative total costs of owning different funds. In addition, if these transactional costs were included, your costs would have been higher.
| | | | | | | | | | | | | | | | |
| | | Beginning
account value 8-1-2013 | | | Ending account value 1-31-2014 | | | Expenses
paid during the period1 | | | Net annualized expense ratio | |
Class A | | | | | | | | | | | | | | | | |
Actual | | $ | 1,000.00 | | | $ | 1,087.07 | | | $ | 6.00 | | | | 1.14 | % |
Hypothetical (5% return before expenses) | | $ | 1,000.00 | | | $ | 1,019.46 | | | $ | 5.80 | | | | 1.14 | % |
Class C | | | | | | | | | | | | | | | | |
Actual | | $ | 1,000.00 | | | $ | 1,082.60 | | | $ | 9.92 | | | | 1.89 | % |
Hypothetical (5% return before expenses) | | $ | 1,000.00 | | | $ | 1,015.68 | | | $ | 9.60 | | | | 1.89 | % |
Administrator Class | | | | | | | | | | | | | | | | |
Actual | | $ | 1,000.00 | | | $ | 1,087.97 | | | $ | 4.74 | | | | 0.90 | % |
Hypothetical (5% return before expenses) | | $ | 1,000.00 | | | $ | 1,020.67 | | | $ | 4.58 | | | | 0.90 | % |
Institutional Class | | | | | | | | | | | | | | | | |
Actual | | $ | 1,000.00 | | | $ | 1,089.11 | | | $ | 3.48 | | | | 0.66 | % |
Hypothetical (5% return before expenses) | | $ | 1,000.00 | | | $ | 1,021.88 | | | $ | 3.36 | | | | 0.66 | % |
Investor Class | | | | | | | | | | | | | | | | |
Actual | | $ | 1,000.00 | | | $ | 1,086.38 | | | $ | 6.31 | | | | 1.20 | % |
Hypothetical (5% return before expenses) | | $ | 1,000.00 | | | $ | 1,019.16 | | | $ | 6.11 | | | | 1.20 | % |
| 1. | Expenses paid is equal to the annualized expense ratio of each class multiplied by the average account value over the period, multiplied by the number of days in the most recent fiscal half-year divided by the number of days in the fiscal year (to reflect the one-half-year period). |
| | | | | | |
| Portfolio of investments—January 31, 2014 (unaudited) | | Wells Fargo Advantage Large Cap Core Fund | | | 7 | |
| | | | | | | | | | | | |
| Security name | | | | | | Shares | | | Value | |
| | | | | | | | | | | | |
| | | | |
Common Stocks: 98.52% | | | | | | | | | | | | |
| | | | |
Consumer Discretionary: 13.86% | | | | | | | | | | | | |
| | | | |
| Auto Components: 3.98% | | | | | | | | | | | | |
Lear Corporation | | | | | | | 60,149 | | | $ | 4,350,577 | |
Magna International Incorporated Class A | | | | | | | 62,593 | | | | 5,311,016 | |
| | | | |
| | | | | | | | | | | 9,661,593 | |
| | | | | | | | | | | | |
| | | | |
| Automobiles: 1.58% | | | | | | | | | | | | |
Ford Motor Company | | | | | | | 256,940 | | | | 3,843,822 | |
| | | | | | | | | | | | |
| | | | |
| Media: 2.17% | | | | | | | | | | | | |
Comcast Corporation Class A | | | | | | | 96,604 | | | | 5,260,088 | |
| | | | | | | | | | | | |
| | | | |
| Specialty Retail: 3.66% | | | | | | | | | | | | |
Home Depot Incorporated | | | | | | | 62,280 | | | | 4,786,218 | |
Lowe’s Companies Incorporated | | | | | | | 88,574 | | | | 4,100,090 | |
| | | | |
| | | | | | | | | | | 8,886,308 | |
| | | | | | | | | | | | |
| | | | |
| Textiles, Apparel & Luxury Goods: 2.47% | | | | | | | | | | | | |
Hanesbrands Incorporated | | | | | | | 84,063 | | | | 5,980,242 | |
| | | | | | | | | | | | |
| | | | |
Consumer Staples: 5.77% | | | | | | | | | | | | |
| | | | |
| Food & Staples Retailing: 3.88% | | | | | | | | | | | | |
CVS Caremark Corporation | | | | | | | 82,627 | | | | 5,595,500 | |
Wal-Mart Stores Incorporated | | | | | | | 51,321 | | | | 3,832,652 | |
| | | | |
| | | | | | | | | | | 9,428,152 | |
| | | | | | | | | | | | |
| | | | |
| Personal Products: 1.89% | | | | | | | | | | | | |
Herbalife Limited « | | | | | | | 71,229 | | | | 4,585,011 | |
| | | | | | | | | | | | |
| | | | |
Energy: 8.92% | | | | | | | | | | | | |
| | | | |
| Oil, Gas & Consumable Fuels: 8.92% | | | | | | | | | | | | |
Chevron Corporation | | | | | | | 35,785 | | | | 3,994,680 | |
ConocoPhillips Company | | | | | | | 62,163 | | | | 4,037,487 | |
Exxon Mobil Corporation | | | | | | | 47,010 | | | | 4,332,442 | |
Phillips 66 | | | | | | | 65,782 | | | | 4,808,006 | |
SandRidge Energy Incorporated Ǡ | | | | | | | 729,587 | | | | 4,486,960 | |
| | | | |
| | | | | | | | | | | 21,659,575 | |
| | | | | | | | | | | | |
| | | | |
Financials: 15.98% | | | | | | | | | | | | |
| | | | |
| Capital Markets: 1.86% | | | | | | | | | | | | |
Morgan Stanley | | | | | | | 153,183 | | | | 4,520,430 | |
| | | | | | | | | | | | |
| | | | |
| Diversified Financial Services: 7.64% | | | | | | | | | | | | |
Bank of America Corporation | | | | | | | 317,355 | | | | 5,315,696 | |
Berkshire Hathaway Incorporated Class B † | | | | | | | 40,011 | | | | 4,465,228 | |
Citigroup Incorporated | | | | | | | 89,525 | | | | 4,246,171 | |
ING US Incorporated | | | | | | | 133,494 | | | | 4,508,092 | |
| | | | |
| | | | | | | | | | | 18,535,187 | |
| | | | | | | | | | | | |
The accompanying notes are an integral part of these financial statements.
| | | | |
| 8 | | Wells Fargo Advantage Large Cap Core Fund | | Portfolio of investments—January 31, 2014 (unaudited) |
| | | | | | | | | | | | |
| Security name | | | | | | Shares | | | Value | |
| | | | | | | | | | | | |
| | | | |
| Insurance: 6.48% | | | | | | | | | | | | |
Allstate Corporation | | | | | | | 87,161 | | | $ | 4,462,643 | |
Lincoln National Corporation | | | | | | | 123,484 | | | | 5,930,937 | |
MetLife Incorporated | | | | | | | 109,055 | | | | 5,349,148 | |
| | | | |
| | | | | | | | | | | 15,742,728 | |
| | | | | | | | | | | | |
| | | | |
Health Care: 18.50% | | | | | | | | | | | | |
| | | | |
| Biotechnology: 4.11% | | | | | | | | | | | | |
Amgen Incorporated | | | | | | | 38,324 | | | | 4,558,640 | |
United Therapeutics Corporation † | | | | | | | 52,782 | | | | 5,416,489 | |
| | | | |
| | | | | | | | | | | 9,975,129 | |
| | | | | | | | | | | | |
| | | | |
| Health Care Equipment & Supplies: 2.12% | | | | | | | | | | | | |
Boston Scientific Corporation † | | | | | | | 380,764 | | | | 5,151,737 | |
| | | | | | | | | | | | |
| | | | |
| Health Care Providers & Services: 6.71% | | | | | | | | | | | | |
Cardinal Health Incorporated | | | | | | | 73,723 | | | | 5,014,638 | |
McKesson Corporation | | | | | | | 34,367 | | | | 5,993,948 | |
Omnicare Incorporated | | | | | | | 84,504 | | | | 5,278,120 | |
| | | | |
| | | | | | | | | | | 16,286,706 | |
| | | | | | | | | | | | |
| | | | |
| Pharmaceuticals: 5.56% | | | | | | | | | | | | |
AbbVie Incorporated | | | | | | | 91,968 | | | | 4,527,585 | |
Actavis plc † | | | | | | | 28,058 | | | | 5,302,401 | |
Johnson & Johnson Services Incorporated | | | | | | | 41,552 | | | | 3,676,105 | |
| | | | |
| | | | | | | | | | | 13,506,091 | |
| | | | | | | | | | | | |
| | | | |
Industrials: 8.31% | | | | | | | | | | | | |
| | | | |
| Aerospace & Defense: 3.76% | | | | | | | | | | | | |
Northrop Grumman Corporation | | | | | | | 41,634 | | | | 4,810,809 | |
The Boeing Company | | | | | | | 34,388 | | | | 4,307,441 | |
| | | | |
| | | | | | | | | | | 9,118,250 | |
| | | | | | | | | | | | |
| | | | |
| Airlines: 2.45% | | | | | | | | | | | | |
Delta Air Lines Incorporated | | | | | | | 194,444 | | | | 5,951,931 | |
| | | | | | | | | | | | |
| | | | |
| Machinery: 2.10% | | | | | | | | | | | | |
Oshkosh Corporation | | | | | | | 94,293 | | | | 5,105,023 | |
| | | | | | | | | | | | |
| | | | |
Information Technology: 21.50% | | | | | | | | | | | | |
| | | | |
| Communications Equipment: 3.54% | | | | | | | | | | | | |
Cisco Systems Incorporated | | | | | | | 187,070 | | | | 4,098,704 | |
QUALCOMM Incorporated | | | | | | | 60,585 | | | | 4,496,619 | |
| | | | |
| | | | | | | | | | | 8,595,323 | |
| | | | | | | | | | | | |
| | | | |
| Computers & Peripherals: 5.60% | | | | | | | | | | | | |
Apple Incorporated | | | | | | | 8,495 | | | | 4,252,597 | |
SanDisk Corporation | | | | | | | 70,759 | | | | 4,921,288 | |
Seagate Technology plc | | | | | | | 83,861 | | | | 4,432,892 | |
| | | | |
| | | | | | | | | | | 13,606,777 | |
| | | | | | | | | | | | |
The accompanying notes are an integral part of these financial statements.
| | | | | | |
| Portfolio of investments—January 31, 2014 (unaudited) | | Wells Fargo Advantage Large Cap Core Fund | | | 9 | |
| | | | | | | | | | | | | | |
| Security name | | | | | | | Shares | | | Value | |
| | | | | | | | | | | | | | |
| | | | |
| IT Services: 4.00% | | | | | | | | | | | | | | |
DST Systems Incorporated | | | | | | | | | 56,666 | | | $ | 5,156,606 | |
MasterCard Incorporated Class A | | | | | | | | | 60,139 | | | | 4,551,320 | |
| | | | |
| | | | | | | | | | | | | 9,707,926 | |
| | | | | | | | | | | | | | |
| | | | |
| Semiconductors & Semiconductor Equipment: 4.69% | | | | | | | | | | | | | | |
Marvell Technology Group Limited | | | | | | | | | 386,533 | | | | 5,770,938 | |
Micron Technology Incorporated † | | | | | | | | | 243,179 | | | | 5,602,844 | |
| | | | |
| | | | | | | | | | | | | 11,373,782 | |
| | | | | | | | | | | | | | |
| | | | |
| Software: 3.67% | | | | | | | | | | | | | | |
Microsoft Corporation | | | | | | | | | 126,806 | | | | 4,799,607 | |
Oracle Corporation | | | | | | | | | 111,592 | | | | 4,117,744 | |
| | | | |
| | | | | | | | | | | | | 8,917,351 | |
| | | | | | | | | | | | | | |
| | | | |
Materials: 3.97% | | | | | | | | | | | | | | |
| | | | |
| Chemicals: 2.10% | | | | | | | | | | | | | | |
Dow Chemical Company | | | | | | | | | 111,847 | | | | 5,090,157 | |
| | | | | | | | | | | | | | |
| | | | |
| Containers & Packaging: 1.87% | | | | | | | | | | | | | | |
Packaging Corporation of America | | | | | | | | | 70,172 | | | | 4,533,111 | |
| | | | | | | | | | | | | | |
| | | | |
Telecommunication Services: 1.71% | | | | | | | | | | | | | | |
| | | | |
| Diversified Telecommunication Services: 1.71% | | | | | | | | | | | | | | |
Verizon Communications Incorporated | | | | | | | | | 86,482 | | | | 4,152,866 | |
| | | | | | | | | | | | | | |
| | | | |
Total Common Stocks (Cost $186,627,638) | | | | | | | | | | | | | 239,175,296 | |
| | | | | | | | | | | | | | |
| | | | |
| | | Yield | | | | | | | | | |
| Short-Term Investments: 5.15% | | | | | | | | | | | | | | |
| | | | |
| Investment Companies: 5.15% | | | | | | | | | | | | | | |
Wells Fargo Advantage Cash Investment Money Market Fund, Select Class (l)(u) | | | 0.07 | % | | | | | 3,516,184 | | | | 3,516,184 | |
Wells Fargo Securities Lending Cash Investments, LLC (l)(u)(r)(v) | | | 0.08 | | | | | | 8,985,253 | | | | 8,985,253 | |
| | | | | | | | | | | | | | |
| | | | |
Total Short-Term Investments (Cost $12,501,437) | | | | | | | | | | | | | 12,501,437 | |
| | | | | | | | | | | | | | |
| | | | | | | | |
Total investments in securities (Cost $199,129,075) * | | | 103.67 | % | | | 251,676,733 | |
Other assets and liabilities, net | | | (3.67 | ) | | | (8,918,118 | ) |
| | | | | | | | |
| Total net assets | | | 100.00 | % | | $ | 242,758,615 | |
| | | | | | | | |
| « | All or a portion of this security is on loan. |
| † | Non-income-earning security |
| (l) | Investment in an affiliate |
| (u) | Rate shown is the 7-day annualized yield at period end. |
| (r) | The investment company is exempt from registration under Section 3(c)(7) of the Investment Company Act of 1940, as amended. |
| (v) | Security represents investment of cash collateral received from securities on loan. |
| * | Cost for federal income tax purposes is $199,164,157 and unrealized appreciation (depreciation) consists of: |
| | | | |
Gross unrealized appreciation | | $ | 54,731,013 | |
Gross unrealized depreciation | | | (2,218,437 | ) |
| | | | |
Net unrealized appreciation | | $ | 52,512,576 | |
The accompanying notes are an integral part of these financial statements.
| | | | |
| 10 | | Wells Fargo Advantage Large Cap Core Fund | | Statement of assets and liabilities—January 31, 2014 (unaudited) |
| | | | |
| | | | |
| |
Assets | | | | |
Investments | | | | |
In unaffiliated securities (including securities on loan), at value (see cost below) | | $ | 239,175,296 | |
In affiliated securities, at value (see cost below) | | | 12,501,437 | |
| | | | |
Total investments, at value (see cost below) | | | 251,676,733 | |
Receivable for Fund shares sold | | | 217,460 | |
Receivable for dividends | | | 250,619 | |
Receivable for securities lending income | | | 17,896 | |
Prepaid expenses and other assets | | | 32,543 | |
| | | | |
Total assets | | | 252,195,251 | |
| | | | |
| |
Liabilities | | | | |
Payable for Fund shares redeemed | | | 135,655 | |
Payable upon receipt of securities loaned | | | 8,985,253 | |
Advisory fee payable | | | 110,186 | |
Distribution fees payable | | | 3,794 | |
Due to other related parties | | | 79,772 | |
Accrued expenses and other liabilities | | | 121,976 | |
| | | | |
Total liabilities | | | 9,436,636 | |
| | | | |
Total net assets | | $ | 242,758,615 | |
| | | | |
| |
NET ASSETS CONSIST OF | | | | |
Paid-in capital | | $ | 218,449,742 | |
Undistributed net investment income | | | 44,573 | |
Accumulated net realized losses on investments | | | (28,283,358 | ) |
Net unrealized gains on investments | | | 52,547,658 | |
| | | | |
Total net assets | | $ | 242,758,615 | |
| | | | |
| |
COMPUTATION OF NET ASSET VALUE AND OFFERING PRICE PER SHARE1 | | | | |
Net assets – Class A | | $ | 23,293,397 | |
Shares outstanding – Class A | | | 1,778,647 | |
Net asset value per share – Class A | | | $13.10 | |
Maximum offering price per share – Class A2 | | | $13.90 | |
Net assets – Class C | | $ | 5,537,681 | |
Shares outstanding – Class C | | | 425,011 | |
Net asset value per share – Class C | | | $13.03 | |
Net assets – Administrator Class | | $ | 3,805,133 | |
Shares outstanding – Administrator Class | | | 290,061 | |
Net asset value per share – Administrator Class | | | $13.12 | |
Net assets – Institutional Class | | $ | 2,951,271 | |
Shares outstanding – Institutional Class | | | 225,049 | |
Net asset value per share – Institutional Class | | | $13.11 | |
Net assets – Investor Class | | $ | 207,171,133 | |
Shares outstanding – Investor Class | | | 15,799,200 | |
Net asset value per share – Investor Class | | | $13.11 | |
| |
Investments in unaffiliated securities (including securities on loan), at cost | | $ | 186,627,638 | |
| | | | |
Investments in affiliated securities, at cost | | $ | 12,501,437 | |
| | | | |
Total investments, at cost | | $ | 199,129,075 | |
| | | | |
Securities on loan, at value | | $ | 8,711,904 | |
| | | | |
| 1. | The Fund has an unlimited number of authorized shares. |
| 2. | Maximum offering price is computed as 100/94.25 of net asset value. On investments of $50,000 or more, the offering price is reduced. |
The accompanying notes are an integral part of these financial statements.
| | | | | | |
| Statement of operations—six months ended January 31, 2014 (unaudited) | | Wells Fargo Advantage Large Cap Core Fund | | | 11 | |
| | | | |
| | | | |
| |
Investment income | | | | |
Dividends* | | $ | 1,958,030 | |
Securities lending income, net | | | 63,847 | |
Income from affiliated securities | | | 1,457 | |
| | | | |
Total investment income | | | 2,023,334 | |
| | | | |
| |
Expenses | | | | |
Advisory fee | | | 747,367 | |
Administration fees | | | | |
Fund level | | | 57,490 | |
Class A | | | 25,716 | |
Class C | | | 6,359 | |
Administrator Class | | | 1,285 | |
Institutional Class | | | 326 | |
Investor Class | | | 323,041 | |
Shareholder servicing fees | | | | |
Class A | | | 24,727 | |
Class C | | | 6,114 | |
Administrator Class | | | 2,763 | |
Investor Class | | | 247,918 | |
Distribution fees | | | | |
Class C | | | 18,343 | |
Custody and accounting fees | | | 8,839 | |
Professional fees | | | 22,804 | |
Registration fees | | | 31,341 | |
Shareholder report expenses | | | 30,932 | |
Trustees’ fees and expenses | | | 6,013 | |
Other fees and expenses | | | 6,842 | |
| | | | |
Total expenses | | | 1,568,220 | |
Less: Fee waivers and/or expense reimbursements | | | (183,581 | ) |
| | | | |
Net expenses | | | 1,384,639 | |
| | | | |
Net investment income | | | 638,695 | |
| | | | |
| |
REALIZED AND UNREALIZED GAINS (LOSSES) ON INVESTMENTS | | | | |
Net realized gains on investments | | | 18,688,197 | |
Net change in unrealized gains (losses) on investments | | | (979,998 | ) |
| | | | |
Net realized and unrealized gains (losses) on investments | | | 17,708,199 | |
| | | | |
Net increase in net assets resulting from operations | | $ | 18,346,894 | |
| | | | |
| |
* Net of foreign dividend withholding taxes in the amount of | | | $5,744 | |
The accompanying notes are an integral part of these financial statements.
| | | | |
| 12 | | Wells Fargo Advantage Large Cap Core Fund | | Statement of changes in net assets |
| | | | | | | | | | | | | | | | |
| | | Six months ended
January 31, 2014
(unaudited) | | | Year ended
July 31, 2013 | |
| | | | |
Operations | | | | | | | | | | | | | | | | |
Net investment income | | | | | | $ | 638,695 | | | | | | | $ | 1,254,904 | |
Net realized gains on investments | | | | | | | 18,688,197 | | | | | | | | 24,469,816 | |
Net change in unrealized gains (losses) on investments | | | | | | | (979,998 | ) | | | | | | | 21,507,466 | |
| | | | |
Net increase in net assets resulting from operations | | | | | | | 18,346,894 | | | | | | | | 47,232,186 | |
| | | | |
| | | | |
Distributions to shareholders from | | | | | | | | | | | | | | | | |
Net investment income | | | | | | | | | | | | | | | | |
Class A | | | | | | | (146,205 | ) | | | | | | | (77,247 | ) |
Class C | | | | | | | (6,279 | ) | | | | | | | (6,053 | ) |
Administrator Class | | | | | | | (28,910 | ) | | | | | | | (7,825 | ) |
Institutional Class | | | | | | | (5,938 | ) | | | | | | | (6,104 | ) |
Investor Class | | | | | | | (1,041,373 | ) | | | | | | | (1,162,943 | ) |
| | | | |
Total distributions to shareholders | | | | | | | (1,228,705 | ) | | | | | | | (1,260,172 | ) |
| | | | |
| | | | |
Capital share transactions | | | Shares | | | | | | | | Shares | | | | | |
Proceeds from shares sold | | | | | | | | | | | | | | | | |
Class A | | | 654,205 | | | | 8,286,084 | | | | 697,150 | | | | 7,513,792 | |
Class C | | | 131,521 | | | | 1,634,162 | | | | 154,383 | | | | 1,658,379 | |
Administrator Class | | | 195,468 | | | | 2,496,683 | | | | 52,398 | | | | 554,364 | |
Institutional Class | | | 188,086 | | | | 2,562,529 | | | | 9,423 | | | | 102,947 | |
Investor Class | | | 748,595 | | | | 9,639,426 | | | | 743,611 | | | | 7,836,866 | |
| | | | |
| | | | | | | 24,618,884 | | | | | | | | 17,666,348 | |
| | | | |
Reinvestment of distributions | | | | | | | | | | | | | | | | |
Class A | | | 10,833 | | | | 140,173 | | | | 7,711 | | | | 74,568 | |
Class C | | | 372 | | | | 4,789 | | | | 522 | | | | 5,039 | |
Administrator Class | | | 2,030 | | | | 26,308 | | | | 531 | | | | 5,134 | |
Institutional Class | | | 445 | | | | 5,766 | | | | 615 | | | | 5,941 | |
Investor Class | | | 78,721 | | | | 1,020,228 | | | | 116,833 | | | | 1,129,779 | |
| | | | |
| | | | | | | 1,197,264 | | | | | | | | 1,220,461 | |
| | | | |
Payment for shares redeemed | | | | | | | | | | | | | | | | |
Class A | | | (144,758 | ) | | | (1,834,724 | ) | | | (317,587 | ) | | | (3,341,160 | ) |
Class C | | | (21,062 | ) | | | (267,052 | ) | | | (56,580 | ) | | | (615,032 | ) |
Administrator Class | | | (5,482 | ) | | | (67,862 | ) | | | (9,693 | ) | | | (104,966 | ) |
Institutional Class | | | (7,630 | ) | | | (101,439 | ) | | | (16,316 | ) | | | (183,055 | ) |
Investor Class | | | (740,568 | ) | | | (9,348,291 | ) | | | (1,928,682 | ) | | | (19,912,637 | ) |
| | | | |
| | | | | | | (11,619,368 | ) | | | | | | | (24,156,850 | ) |
| | | | |
Net increase (decrease) in net assets resulting from capital share transactions | | | | | | | 14,196,780 | | | | | | | | (5,270,041 | ) |
| | | | |
Total increase in net assets | | | | | | | 31,314,969 | | | | | | | | 40,701,973 | |
| | | | |
| | | | |
Net assets | | | | | | | | | | | | | | | | |
Beginning of period | | | | | | | 211,443,646 | | | | | | | | 170,741,673 | |
| | | | |
End of period | | | | | | $ | 242,758,615 | | | | | | | $ | 211,443,646 | |
| | | | |
Undistributed net investment income | | | | | | $ | 44,573 | | | | | | | $ | 634,583 | |
| | | | |
The accompanying notes are an integral part of these financial statements.
| | | | | | |
| Financial highlights | | Wells Fargo Advantage Large Cap Core Fund | | | 13 | |
(For a share outstanding throughout each period)
| | | | | | | | | | | | | | | | | | | | | | | | |
| | | Six months ended
January 31, 2014
(unaudited) | | | Year ended July 31 | |
| CLASS A | | | 2013 | | | 2012 | | | 2011 | | | 20101 | | | 20091 | |
Net asset value, beginning of period | | $ | 12.13 | | | $ | 9.50 | | | $ | 8.75 | | | $ | 7.37 | | | $ | 6.96 | | | $ | 8.77 | |
Net investment income | | | 0.03 | | | | 0.07 | | | | 0.06 | | | | 0.05 | | | | 0.06 | | | | 0.08 | |
Net realized and unrealized gains (losses) on investments | | | 1.03 | | | | 2.64 | | | | 0.74 | | | | 1.36 | | | | 0.46 | | | | (1.82 | ) |
| | | | | | | | | | | | | | | | | | | | | | | | |
Total from investment operations | | | 1.06 | | | | 2.71 | | | | 0.80 | | | | 1.41 | | | | 0.52 | | | | (1.74 | ) |
Distributions to shareholders from | | | | | | | | | | | | | | | | | | | | | | | | |
Net investment income | | | (0.09 | ) | | | (0.08 | ) | | | (0.05 | ) | | | (0.03 | ) | | | (0.11 | ) | | | (0.07 | ) |
Net asset value, end of period | | $ | 13.10 | | | $ | 12.13 | | | $ | 9.50 | | | $ | 8.75 | | | $ | 7.37 | | | $ | 6.96 | |
Total return2 | | | 8.71 | % | | | 28.76 | % | | | 9.27 | % | | | 19.16 | % | | | 7.43 | % | | | (19.78 | )% |
Ratios to average net assets (annualized) | | | | | | | | | | | | | | | | | | | | | | | | |
Gross expenses | | | 1.30 | % | | | 1.33 | % | | | 1.37 | % | | | 1.30 | % | | | 2.55 | % | | | 4.10 | % |
Net expenses | | | 1.14 | % | | | 1.14 | % | | | 1.14 | % | | | 1.14 | % | | | 1.15 | % | | | 1.15 | % |
Net investment income | | | 0.59 | % | | | 0.75 | % | | | 0.71 | % | | | 0.61 | % | | | 0.91 | % | | | 1.22 | % |
Supplemental data | | | | | | | | | | | | | | | | | | | | | | | | |
Portfolio turnover rate | | | 40 | % | | | 67 | % | | | 41 | % | | | 43 | % | | | 18 | % | | | 45 | % |
Net assets, end of period (000s omitted) | | | $23,293 | | | | $15,267 | | | | $8,277 | | | | $7,495 | | | | $8,501 | | | | $533 | |
| 1. | After the close of business on July 16, 2010, the Fund acquired the net assets of Evergreen Golden Large Cap Core Fund and Wells Fargo Advantage Large Company Core Fund. Evergreen Golden Large Cap Core Fund was the accounting and performance survivor in the transaction. The information for the periods prior to July 19, 2010 is that of Class A of Evergreen Golden Large Cap Core Fund. |
| 2. | Total return calculations do not include any sales charges. Returns for periods of less than one year are not annualized. |
The accompanying notes are an integral part of these financial statements.
| | | | |
| 14 | | Wells Fargo Advantage Large Cap Core Fund | | Financial highlights |
(For a share outstanding throughout each period)
| | | | | | | | | | | | | | | | | | | | | | | | |
| | | Six months ended
January 31, 2014
(unaudited) | | | Year ended July 31 | |
| CLASS C | | | 2013 | | | 2012 | | | 2011 | | | 20101 | | | 20091 | |
Net asset value, beginning of period | | $ | 12.05 | | | $ | 9.45 | | | $ | 8.71 | | | $ | 7.37 | | | $ | 6.94 | | | $ | 8.75 | |
Net investment income (loss) | | | (0.01 | )2 | | | (0.00 | )3 | | | (0.00 | )3 | | | (0.01 | ) | | | 0.01 | | | | 0.03 | |
Net realized and unrealized gains (losses) on investments | | | 1.01 | | | | 2.62 | | | | 0.74 | | | | 1.35 | | | | 0.44 | | | | (1.81 | ) |
| | | | | | | | | | | | | | | | | | | | | | | | |
Total from investment operations | | | 1.00 | | | | 2.62 | | | | 0.74 | | | | 1.34 | | | | 0.45 | | | | (1.78 | ) |
Distributions to shareholders from | | | | | | | | | | | | | | | | | | | | | | | | |
Net investment income | | | (0.02 | ) | | | (0.02 | ) | | | 0.00 | | | | 0.00 | | | | (0.02 | ) | | | (0.03 | ) |
Net asset value, end of period | | $ | 13.03 | | | $ | 12.05 | | | $ | 9.45 | | | $ | 8.71 | | | $ | 7.37 | | | $ | 6.94 | |
Total return4 | | | 8.26 | % | | | 27.82 | % | | | 8.50 | % | | | 18.18 | % | | | 6.54 | % | | | (20.33 | )% |
Ratios to average net assets (annualized) | | | | | | | | | | | | | | | | | | | | | | | | |
Gross expenses | | | 2.05 | % | | | 2.08 | % | | | 2.12 | % | | | 2.05 | % | | | 3.75 | % | | | 4.85 | % |
Net expenses | | | 1.89 | % | | | 1.89 | % | | | 1.89 | % | | | 1.89 | % | | | 1.90 | % | | | 1.90 | % |
Net investment income (loss) | | | (0.15 | )% | | | (0.01 | )% | | | (0.04 | )% | | | (0.13 | )% | | | 0.09 | % | | | 0.48 | % |
Supplemental data | | | | | | | | | | | | | | | | | | | | | | | | |
Portfolio turnover rate | | | 40 | % | | | 67 | % | | | 41 | % | | | 43 | % | | | 18 | % | | | 45 | % |
Net assets, end of period (000s omitted) | | | $5,538 | | | | $3,786 | | | | $2,041 | | | | $1,750 | | | | $1,947 | | | | $1,043 | |
| 1. | After the close of business on July 16, 2010, the Fund acquired the net assets of Evergreen Golden Large Cap Core Fund and Wells Fargo Advantage Large Company Core Fund. Evergreen Golden Large Cap Core Fund was the accounting and performance survivor in the transaction. The information for the periods prior to July 19, 2010 is that of Class C of Evergreen Golden Large Cap Core Fund. |
| 2. | Calculated based upon average shares outstanding. |
| 3. | Amount is less than $0.005. |
| 4. | Total return calculations do not include any sales charges. Returns for periods of less than one year are not annualized. |
The accompanying notes are an integral part of these financial statements.
| | | | | | |
| Financial highlights | | Wells Fargo Advantage Large Cap Core Fund | | | 15 | |
(For a share outstanding throughout each period)
| | | | | | | | | | | | | | | | | | | | |
| | | Six months ended
January 31, 2014
(unaudited) | | | Year ended July 31 | |
| ADMINISTRATOR CLASS | | | 2013 | | | 2012 | | | 2011 | | | 20101 | |
Net asset value, beginning of period | | $ | 12.16 | | | $ | 9.52 | | | $ | 8.77 | | | $ | 7.38 | | | $ | 7.22 | |
Net investment income | | | 0.04 | | | | 0.10 | | | | 0.09 | | | | 0.07 | 2 | | | 0.00 | 3 |
Net realized and unrealized gains (losses) on investments | | | 1.03 | | | | 2.64 | | | | 0.74 | | | | 1.36 | | | | 0.16 | |
| | | | | | | | | | | | | | | | | | | | |
Total from investment operations | | | 1.07 | | | | 2.74 | | | | 0.83 | | | | 1.43 | | | | 0.16 | |
Distributions to shareholders from | | | | | | | | | | | | | | | | | | | | |
Net investment income | | | (0.11 | ) | | | (0.10 | ) | | | (0.08 | ) | | | (0.04 | ) | | | 0.00 | |
Net asset value, end of period | | $ | 13.12 | | | $ | 12.16 | | | $ | 9.52 | | | $ | 8.77 | | | $ | 7.38 | |
Total return4 | | | 8.80 | % | | | 29.12 | % | | | 9.61 | % | | | 19.44 | % | | | 2.22 | % |
Ratios to average net assets (annualized) | | | | | | | | | | | | | | | | | | | | |
Gross expenses | | | 1.11 | % | | | 1.14 | % | | | 1.16 | % | | | 1.08 | % | | | 1.12 | % |
Net expenses | | | 0.90 | % | | | 0.89 | % | | | 0.87 | % | | | 0.86 | % | | | 0.89 | % |
Net investment income | | | 0.75 | % | | | 1.00 | % | | | 0.97 | % | | | 0.76 | % | | | 1.12 | % |
Supplemental data | | | | | | | | | | | | | | | | | | | | |
Portfolio turnover rate | | | 40 | % | | | 67 | % | | | 41 | % | | | 43 | % | | | 18 | % |
Net assets, end of period (000s omitted) | | | $3,805 | | | | $1,192 | | | | $522 | | | | $477 | | | | $42 | |
| 1. | For the period from July 16, 2010 (commencement of class operations) to July 31, 2010 |
| 2. | Calculated based upon average shares outstanding |
| 3. | Amount is less than $0.005. |
| 4. | Returns for periods of less than one year are not annualized. |
The accompanying notes are an integral part of these financial statements.
| | | | |
| 16 | | Wells Fargo Advantage Large Cap Core Fund | | Financial highlights |
(For a share outstanding throughout each period)
| | | | | | | | | | | | | | | | | | | | | | | | |
| | | Six months ended
January 31, 2014
(unaudited) | | | Year ended July 31 | |
| INSTITUTIONAL CLASS | | | 2013 | | | 2012 | | | 2011 | | | 20101 | | | 20091 | |
Net asset value, beginning of period | | $ | 12.16 | | | $ | 9.52 | | | $ | 8.77 | | | $ | 7.38 | | | $ | 6.97 | | | $ | 8.79 | |
Net investment income | | | 0.06 | 2 | | | 0.13 | 2 | | | 0.12 | | | | 0.10 | 2 | | | 0.08 | | | | 0.09 | |
Net realized and unrealized gains (losses) on investments | | | 1.02 | | | | 2.63 | | | | 0.73 | | | | 1.35 | | | | 0.46 | | | | (1.82 | ) |
| | | | | | | | | | | | | | | | | | | | | | | | |
Total from investment operations | | | 1.08 | | | | 2.76 | | | | 0.85 | | | | 1.45 | | | | 0.54 | | | | (1.73 | ) |
Distributions to shareholders from | | | | | | | | | | | | | | | | | | | | | | | | |
Net investment income | | | (0.13 | ) | | | (0.12 | ) | | | (0.10 | ) | | | (0.06 | ) | | | (0.13 | ) | | | (0.09 | ) |
Net asset value, end of period | | $ | 13.11 | | | $ | 12.16 | | | $ | 9.52 | | | $ | 8.77 | | | $ | 7.38 | | | $ | 6.97 | |
Total return3 | | | 8.91 | % | | | 29.38 | % | | | 9.88 | % | | | 19.65 | % | | | 7.79 | % | | | (19.61 | )% |
Ratios to average net assets (annualized) | | | | | | | | | | | | | | | | | | | | | | | | |
Gross expenses | | | 0.87 | % | | | 0.90 | % | | | 0.94 | % | | | 0.86 | % | | | 2.80 | % | | | 3.85 | % |
Net expenses | | | 0.66 | % | | | 0.66 | % | | | 0.66 | % | | | 0.66 | % | | | 0.89 | % | | | 0.90 | % |
Net investment income | | | 0.85 | % | | | 1.24 | % | | | 1.19 | % | | | 1.32 | % | | | 1.09 | % | | | 1.47 | % |
Supplemental data | | | | | | | | | | | | | | | | | | | | | | | | |
Portfolio turnover rate | | | 40 | % | | | 67 | % | | | 41 | % | | | 43 | % | | | 18 | % | | | 45 | % |
Net assets, end of period (000s omitted) | | | $2,951 | | | | $537 | | | | $480 | | | | $478 | | | | $3,132 | | | | $2,809 | |
| 1. | After the close of business on July 16, 2010, the Fund acquired the net assets of Evergreen Golden Large Cap Core Fund and Wells Fargo Advantage Large Company Core Fund. Evergreen Golden Large Cap Core Fund was the accounting and performance survivor in the transaction. The information for the periods prior to July 19, 2010 is that of Class I of Evergreen Golden Large Cap Core Fund. |
| 2. | Calculated based upon average shares outstanding |
| 3. | Returns for periods of less than one year are not annualized. |
The accompanying notes are an integral part of these financial statements.
| | | | | | |
| Financial highlights | | Wells Fargo Advantage Large Cap Core Fund | | | 17 | |
(For a share outstanding throughout each period)
| | | | | | | | | | | | | | | | | | | | |
| | | Six months ended
January 31, 2014
(unaudited) | | | Year ended July 31 | |
| INVESTOR CLASS | | | 2013 | | | 2012 | | | 2011 | | | 20101 | |
Net asset value, beginning of period | | $ | 12.13 | | | $ | 9.50 | | | $ | 8.75 | | | $ | 7.38 | | | $ | 7.22 | |
Net investment income | | | 0.04 | | | | 0.07 | | | | 0.06 | | | | 0.05 | | | | 0.00 | 2 |
Net realized and unrealized gains (losses) on investments | | | 1.01 | | | | 2.63 | | | | 0.74 | | | | 1.35 | | | | 0.16 | |
| | | | | | | | | | | | | | | | | | | | |
Total from investment operations | | | 1.05 | | | | 2.70 | | | | 0.80 | | | | 1.40 | | | | 0.16 | |
Distributions to shareholders from | | | | | | | | | | | | | | | | | | | | |
Net investment income | | | (0.07 | ) | | | (0.07 | ) | | | (0.05 | ) | | | (0.03 | ) | | | 0.00 | |
Net asset value, end of period | | $ | 13.11 | | | $ | 12.13 | | | $ | 9.50 | | | $ | 8.75 | | | $ | 7.38 | |
Total return3 | | | 8.64 | % | | | 28.63 | % | | | 9.21 | % | | | 18.97 | % | | | 2.22 | % |
Ratios to average net assets (annualized) | | | | | | | | | | | | | | | | | | | | |
Gross expenses | | | 1.36 | % | | | 1.38 | % | | | 1.43 | % | | | 1.37 | % | | | 1.37 | % |
Net expenses | | | 1.20 | % | | | 1.20 | % | | | 1.21 | % | | | 1.21 | % | | | 1.21 | % |
Net investment income | | | 0.57 | % | | | 0.69 | % | | | 0.64 | % | | | 0.53 | % | | | 1.03 | % |
Supplemental data | | | | | | | | | | | | | | | | | | | | |
Portfolio turnover rate | | | 40 | % | | | 67 | % | | | 41 | % | | | 43 | % | | | 18 | % |
Net assets, end of period (000s omitted) | | | $207,171 | | | | $190,661 | | | | $159,422 | | | | $158,966 | | | | $150,157 | |
| 1. | For the period from July 16, 2010 (commencement of class operations) to July 31, 2010 |
| 2. | Amount is less than $0.005. |
| 3. | Returns for periods of less than one year are not annualized. |
The accompanying notes are an integral part of these financial statements.
| | | | |
| 18 | | Wells Fargo Advantage Large Cap Core Fund | | Notes to financial statements (unaudited) |
1. ORGANIZATION
Wells Fargo Funds Trust (the “Trust”), a Delaware statutory trust organized on March 10, 1999, is an open-end management investment company registered under the Investment Company Act of 1940, as amended (the “1940 Act”). These financial statements report on the Wells Fargo Advantage Large Cap Core Fund (the “Fund”) which is a diversified series of the Trust.
2. SIGNIFICANT ACCOUNTING POLICIES
The following significant accounting policies, which are consistently followed in the preparation of the financial statements of the Fund, are in conformity with U.S. generally accepted accounting principles which require management to make estimates and assumptions that affect the reported amounts of assets and liabilities, disclosure of contingent assets and liabilities at the date of the financial statements, and the reported amounts of revenues and expenses during the reporting period. Actual results could differ from those estimates.
Securities valuation
All investments are valued each business day as of the close of regular trading on the New York Stock Exchange (generally 4 p.m. Eastern Time).
Equity securities that are listed on a foreign or domestic exchange or market are valued at the official closing price or, if none, the last sales price. If no sale occurs on the primary exchange or market for the security that day, the prior day’s price will be deemed “stale” and fair values will be determined in accordance with the Fund’s Valuation Procedures.
Investments in registered open-end investment companies are valued at net asset value. Non-registered investment vehicles are fair valued at net asset value.
Investments which are not valued using any of the methods discussed above are valued at their fair value, as determined in good faith by the Board of Trustees of the Fund. The Board of Trustees has established a Valuation Committee comprised of the Trustees and has delegated to it the authority to take any actions regarding the valuation of portfolio securities that the Valuation Committee deems necessary or appropriate, including determining the fair value of portfolio securities, unless the determination has been delegated to the Management Valuation Team of Wells Fargo Funds Management, LLC (“Funds Management”). The Board of Trustees retains the authority to make or ratify any valuation decisions or approve any changes to the Valuation Procedures as it deems appropriate. On a quarterly basis, the Board of Trustees receives reports on any valuation actions taken by the Valuation Committee or the Management Valuation Team which may include items for ratification.
Valuations of fair valued securities are compared to the next actual sales price when available, or other appropriate market values, to assess the continued appropriateness of the fair valuation methodologies used. These securities are fair valued on a day-to-day basis, taking into consideration changes to appropriate market information and any significant changes to the inputs considered in the valuation process until there is a readily available price provided on an exchange or by an independent pricing service. Valuations received from an independent pricing service or independent broker-dealer quotes are periodically validated by comparisons to most recent trades and valuations provided by other independent pricing services in addition to the review of prices by the adviser and/or subadviser. Unobservable inputs used in determining fair valuations are identified based on the type of security, taking into consideration factors utilized by market participants in valuing the investment, knowledge about the issuer and the current market environment.
Security loans
The Fund may lend its securities from time to time in order to earn additional income in the form of fees or interest on securities received as collateral or the investment of any cash received as collateral. The Fund continues to receive interest or dividends on the securities loaned. The Fund receives collateral in the form of cash or securities with a value at least equal to the value of the securities on loan. The value of the loaned securities is determined at the close of each business day and any additional required collateral is delivered to the Fund on the next business day. In a securities lending transaction, the net asset value of the Fund will be affected by an increase or decrease in the value of the securities loaned and by an increase or decrease in the value of the instrument in which collateral is invested. The amount of securities lending activity undertaken by the Fund fluctuates from time to time. In the event of default or bankruptcy by the borrower, the Fund may be prevented from recovering the loaned securities or gaining access to the collateral or may experience delays or costs in doing so. In addition, the investment of any cash collateral received may lose all or part of its value. The Fund has the right under the lending agreement to recover the securities from the borrower on demand.
The Fund lends its securities through an unaffiliated securities lending agent. Cash collateral received in connection with its securities lending transactions is invested in Wells Fargo Securities Lending Cash Investments, LLC (the “Securities
| | | | | | |
| Notes to financial statements (unaudited) | | Wells Fargo Advantage Large Cap Core Fund | | | 19 | |
Lending Fund”). The Securities Lending Fund is exempt from registration under Section 3(c)(7) of the 1940 Act and is managed by Funds Management and is subadvised by Wells Capital Management Incorporated (“WellsCap”). Funds Management receives an advisory fee starting at 0.05% and declining to 0.01% as the average daily net assets of the Securities Lending Fund increase. All of the fees received by Funds Management are paid to WellsCap for its services as subadviser. The Securities Lending Fund seeks to provide a positive return compared to the daily Fed Funds Open rate by investing in high-quality, U.S. dollar-denominated short-term money market instruments. Securities Lending Fund investments are fair valued based upon the amortized cost valuation technique. Income earned from investment in the Securities Lending Fund is included in securities lending income on the Statement of Operations.
Security transactions and income recognition
Securities transactions are recorded on a trade date basis. Realized gains or losses are recorded on the basis of identified cost.
Dividend income is recognized on the ex-dividend date. Dividend income is recorded net of foreign taxes withheld where recovery of such taxes is not assured.
Distributions to shareholders
Distributions to shareholders from net investment income and net realized gains, if any, are recorded on the ex-dividend date. Such distributions are determined in conformity with federal income tax regulations, which may differ in amount or character from net investment income and realized gains recognized for purposes of U.S. generally accepted accounting principles.
Federal and other taxes
The Fund intends to continue to qualify as a regulated investment company by distributing substantially all of its investment company taxable income and any net realized capital gains (after reduction for capital loss carryforwards) sufficient to relieve it from all, or substantially all, federal income taxes. Accordingly, no provision for federal income taxes was required.
The Fund’s income and federal excise tax returns and all financial records supporting those returns for the prior three fiscal years are subject to examination by the federal and Delaware revenue authorities. Management has analyzed the Fund’s tax positions taken on federal, state, and foreign tax returns for all open tax years and does not believe that there are any uncertain tax positions that require recognition of a tax liability.
As of July 31, 2013, the Fund had capital loss carryforwards available to offset future net realized capital gains in the amount of $46,936,485 with $706,825 expiring in 2017 and $46,229,660 expiring in 2018.
Class allocations
The separate classes of shares offered by the Fund differ principally in applicable sales charges, distribution, shareholder servicing, and administration fees. Shareholders of each class bear certain expenses that pertain to that particular class. All shareholders bear the common expenses of the Fund, earn income from the portfolio, and are allocated any unrealized gains and losses pro rata based on the average daily net assets of each class, without distinction between share classes. Dividends are determined separately for each class based on income and expenses allocable to each class. Realized gains and losses are allocated to each class pro rata based upon the net assets of each class on the date realized. Differences in per share dividend rates generally result from the relative weightings of pro rata income and realized gain allocations and from differences in separate class expenses, including distribution, shareholder servicing, and administration fees.
3. FAIR VALUATION MEASUREMENTS
Fair value measurements of investments are determined within a framework that has established a fair value hierarchy based upon the various data inputs utilized in determining the value of the Fund’s investments. The three-level hierarchy gives the highest priority to unadjusted quoted prices in active markets for identical assets or liabilities (Level 1) and the lowest priority to significant unobservable inputs (Level 3). The Fund’s investments are classified within the fair value hierarchy based on the lowest level of input that is significant to the fair value measurement. The inputs are summarized into three broad levels as follows:
| n | | Level 1 – quoted prices in active markets for identical securities |
| n | | Level 2 – other significant observable inputs (including quoted prices for similar securities, interest rates, prepayment speeds, credit risk, use of amortized cost, etc.) |
| n | | Level 3 – significant unobservable inputs (including the Fund’s own assumptions in determining the fair value of investments) |
| | | | |
| 20 | | Wells Fargo Advantage Large Cap Core Fund | | Notes to financial statements (unaudited) |
The inputs or methodologies used for valuing investments in securities are not necessarily an indication of the risk associated with investing in those securities.
As of January 31, 2014, the inputs used in valuing investments in securities were as follows:
| | | | | | | | | | | | | | | | |
| Investments in securities | | Quoted prices (Level 1) | | | Other significant
observable inputs (Level 2) | | | Significant unobservable inputs (Level 3) | | | Total | |
| | | | |
Equity securities | | | | | | | | | | | | | | | | |
Common stocks | | $ | 239,175,296 | | | $ | 0 | | | $ | 0 | | | $ | 239,175,296 | |
| | | | |
Short-term investments | | | | | | | | | | | | | | | | |
Investment companies | | | 3,516,184 | | | | 8,985,253 | | | | 0 | | | | 12,501,437 | |
| | | $ | 242,691,480 | | | $ | 8,985,253 | | | $ | 0 | | | $ | 251,676,733 | |
Transfers in and transfers out are recognized at the end of the reporting period. For the six months ended January 31, 2014, the Fund did not have any transfers into/out of Level 1, Level 2, or Level 3.
4. TRANSACTIONS WITH AFFILIATES AND OTHER EXPENSES
Advisory fee
The Trust has entered into an advisory contract with Funds Management, an indirect wholly owned subsidiary of Wells Fargo & Company (“Wells Fargo”). The adviser is responsible for implementing investment policies and guidelines and for supervising the subadviser, who is responsible for day-to-day portfolio management of the Fund.
Pursuant to the contract, Funds Management is entitled to receive an annual advisory fee starting at 0.65% and declining to 0.55% as the average daily net assets of the Fund increase. For the six months ended January 31, 2014, the advisory fee was equivalent to an annual rate of 0.65% of the Fund’s average daily net assets.
Funds Management has retained the services of a subadviser to provide daily portfolio management to the Fund. The fee for subadvisory services is borne by Funds Management. Golden Capital Management, LLC, an affiliate of Funds Management, is the subadviser to the Fund and is entitled to receive a fee from Funds Management at an annual rate starting at 0.35% and declining to 0.30% as the average daily net assets of the Fund increase.
Administration and transfer agent fees
The Trust has entered into an administration agreement with Funds Management. Under this agreement, for providing administrative services, which includes paying fees and expenses for services provided by the transfer agent, sub-transfer agents, omnibus account servicers and record-keepers, Funds Management is entitled to receive from the Fund an annual fund level administration fee starting at 0.05% and declining to 0.03% as the average daily net assets of the Fund increase and a class level administration fee which is calculated based on the average daily net assets of each class as follows:
| | | | |
| | | Class level
administration fee | |
Class A, Class C | | | 0.26 | % |
Administrator Class | | | 0.10 | |
Institutional Class | | | 0.08 | |
Investor Class | | | 0.32 | |
Funds Management has contractually waived and/or reimbursed advisory and administration fees to the extent necessary to maintain certain net operating expense ratios for the Fund. Waiver of fees and/or reimbursement of expenses by Funds Management were made first from fund level expenses on a proportionate basis and then from class specific expenses. Funds Management has committed through November 30, 2014 to waive fees and/or reimburse expenses to the extent necessary to cap the Fund’s expenses at 1.14% for Class A shares, 1.89% for Class C shares, 0.90% for Administrator Class shares, 0.66% for Institutional Class shares, and 1.20% for Investor Class shares.
Distribution fees
The Trust has adopted a Distribution Plan for Class C shares of the Fund pursuant to Rule 12b-1 under the 1940 Act. Distribution fees are charged to Class C shares and paid to Wells Fargo Funds Distributor, LLC, the principal underwriter, at an annual rate of 0.75% of the average daily net assets of Class C shares.
| | | | | | |
| Notes to financial statements (unaudited) | | Wells Fargo Advantage Large Cap Core Fund | | | 21 | |
For the six months ended January 31, 2014, Wells Fargo Funds Distributor, LLC received $5,001 from the sale of Class A shares.
Shareholder servicing fees
The Trust has entered into contracts with one or more shareholder servicing agents, whereby Class A, Class C, Administrator Class, and Investor Class of the Fund is charged a fee at an annual rate of 0.25% of the average daily net assets of each respective class.
A portion of these total shareholder servicing fees were paid to affiliates of Wells Fargo.
5. INVESTMENT PORTFOLIO TRANSACTIONS
Purchases and sales of investments, excluding U.S. government obligations (if any) and short-term securities, for the six months ended January 31, 2014 were $102,816,233 and $89,093,454, respectively.
6. BANK BORROWINGS
The Trust (excluding the money market funds and certain other funds in the Trust) and Wells Fargo Variable Trust are parties to a $150,000,000 revolving credit agreement with State Street Bank and Trust Company, whereby the Fund is permitted to use bank borrowings for temporary or emergency purposes, such as to fund shareholder redemption requests. Interest under the credit agreement is charged to the Fund based on a borrowing rate equal to the higher of the Federal Funds rate in effect on that day plus 1.25% or the overnight LIBOR rate in effect on that day plus 1.25%. In addition, an annual commitment fee equal to 0.10% of the unused balance is allocated to each participating fund. For the six months ended January 31, 2014, the Fund paid $87 in commitment fees.
For the six months ended January 31, 2014, there were no borrowings by the Fund under the agreement.
7. INDEMNIFICATION
Under the Trust’s organizational documents, the officers and directors are indemnified against certain liabilities that may arise out of performance of their duties to the Trust. Additionally, in the normal course of business, the Trust may enter into contracts with service providers that contain a variety of indemnification clauses. The Trust’s maximum exposure under these arrangements is dependent on future claims that may be made against the Fund and, therefore, cannot be estimated.
| | | | |
| 22 | | Wells Fargo Advantage Large Cap Core Fund | | Other information (unaudited) |
PROXY VOTING INFORMATION
A description of the policies and procedures that the Fund uses to determine how to vote proxies relating to portfolio securities is available without charge, upon request, by calling 1-800-222-8222, visiting our website at wellsfargoadvantagefunds.com, or visiting the SEC website at sec.gov. Information regarding how the Fund voted proxies relating to portfolio securities during the most recent 12-month period ended June 30 is available without charge on the Fund’s website at wellsfargoadvantagefunds.com or by visiting the SEC website at sec.gov.
PORTFOLIO HOLDINGS INFORMATION
The complete portfolio holdings for the Fund are publicly available on the Fund’s website (wellsfargoadvantagefunds.com) on a monthly, 30-day or more delayed basis. In addition, top ten holdings information for the Fund is publicly available on the Fund’s website on a monthly, seven-day or more delayed basis. The Fund files its complete schedule of portfolio holdings with the SEC for the first and third quarters of each fiscal year on Form N-Q, which is available without charge by visiting the SEC website at sec.gov. In addition, the Fund’s Form N-Q may be reviewed and copied at the SEC’s Public Reference Room in Washington, DC, and at regional offices in New York City, at 233 Broadway, and in Chicago, at 175 West Jackson Boulevard, Suite 900. Information about the Public Reference Room may be obtained by calling 1-800-SEC-0330.
| | | | | | |
| Other information (unaudited) | | Wells Fargo Advantage Large Cap Core Fund | | | 23 | |
BOARD OF TRUSTEES AND OFFICERS
Each of the Trustees and Officers listed in the table below acts in identical capacities for each fund in the Wells Fargo Advantage family of funds, which consists of 132 mutual funds1 comprising the Wells Fargo Funds Trust, Wells Fargo Variable Trust, Wells Fargo Master Trust and four closed-end funds (collectively the “Fund Complex”). This table should be read in conjunction with the Prospectus and the Statement of Additional Information2. All of the Trustees are also Members of the Audit and Governance Committees of each Trust in the Fund Complex. The mailing address of each Trustee and Officer is 525 Market Street, 12th Floor, San Francisco, CA 94105. Each Trustee and Officer serves an indefinite term, however, each Trustee serves such term until reaching the mandatory retirement age established by the Trustees.
Independent Trustees
| | | | | | |
Name and
year of birth | | Position held and
length of service* | | Principal occupations during past five years | | Other
directorships during
past five years |
| Peter G. Gordon (Born 1942) | | Trustee, since 1998; Chairman, since 2005 | | Co-Founder, Retired Chairman, President and CEO of Crystal Geyser Water Company. Trustee Emeritus, Colby College. | | Asset Allocation Trust |
| Isaiah Harris, Jr. (Born 1952) | | Trustee, since 2009 | | Retired. Prior thereto, President and CEO of BellSouth Advertising and Publishing Corp. from 2005 to 2007, President and CEO of BellSouth Enterprises from 2004 to 2005 and President of BellSouth Consumer Services from 2000 to 2003. Emeritus member of the Iowa State University Foundation Board of Governors. Emeritus Member of the Advisory Board of Iowa State University School of Business. Advisory Board Member, Palm Harbor Academy (charter school). Mr. Harris is a certified public accountant. | | CIGNA Corporation; Deluxe Corporation; Asset Allocation Trust |
| Judith M. Johnson (Born 1949) | | Trustee, since 2008; Audit Committee Chairman, since 2008 | | Retired. Prior thereto, Chief Executive Officer and Chief Investment Officer of Minneapolis Employees Retirement Fund from 1996 to 2008. Ms. Johnson is an attorney, certified public accountant and a certified managerial accountant. | | Asset Allocation Trust |
| Leroy Keith, Jr. (Born 1939) | | Trustee, since 2010 | | Chairman, Bloc Global Services (development and construction). Trustee of the Evergreen Funds from 1983 to 2010. Former Managing Director, Almanac Capital Management (commodities firm), former Partner, Stonington Partners, Inc. (private equity fund), former Director, Obagi Medical Products Co. and former Director, Lincoln Educational Services. | | Trustee, Virtus Fund Complex (consisting of 50 portfolios as of 12/16/2013); Asset Allocation Trust |
| David F. Larcker (Born 1950) | | Trustee, since 2009 | | James Irvin Miller Professor of Accounting at the Graduate School of Business, Stanford University, Morgan Stanley Director of the Center for Leadership Development and Research and Senior Faculty of The Rock Center for Corporate Governance since 2006. From 2005 to 2008, Professor of Accounting at the Graduate School of Business, Stanford University. Prior thereto, Ernst & Young Professor of Accounting at The Wharton School, University of Pennsylvania from 1985 to 2005. | | Asset Allocation Trust |
| Olivia S. Mitchell (Born 1953) | | Trustee, since 2006 | | International Foundation of Employee Benefit Plans Professor, Wharton School of the University of Pennsylvania since 1993. Director of Wharton’s Pension Research Council and Boettner Center on Pensions & Retirement Research, and Research Associate at the National Bureau of Economic Research. Previously, Cornell University Professor from 1978 to 1993. | | Asset Allocation Trust |
| Timothy J. Penny (Born 1951) | | Trustee, since 1996 | | President and CEO of Southern Minnesota Initiative Foundation, a non-profit organization, since 2007 and Senior Fellow at the Humphrey Institute Policy Forum at the University of Minnesota since 1995. Member of the Board of Trustees of NorthStar Education Finance, Inc., a non-profit organization, since 2007. | | Asset Allocation Trust |
| | | | |
| 24 | | Wells Fargo Advantage Large Cap Core Fund | | Other information (unaudited) |
| | | | | | |
Name and
year of birth | | Position held and
length of service* | | Principal occupations during past five years | | Other
directorships during
past five years |
| Michael S. Scofield (Born 1943) | | Trustee, since 2010 | | Served on the Investment Company Institute’s Board of Governors and Executive Committee from 2008-2011 as well the Governing Council of the Independent Directors Council from 2006-2011 and the Independent Directors Council Executive Committee from 2008-2011. Chairman of the IDC from 2008-2010. Institutional Investor (Fund Directions) Trustee of Year in 2007. Trustee of the Evergreen Funds (and its predecessors) from 1984 to 2010. Chairman of the Evergreen Funds from 2000-2010. Former Trustee of the Mentor Funds. Retired Attorney, Law Offices of Michael S. Scofield. | | Asset Allocation Trust |
| Donald C. Willeke (Born 1940) | | Trustee, since 1996 | | Principal of the law firm of Willeke & Daniels. General Counsel of the Minneapolis Employees Retirement Fund from 1984 until its consolidation into the Minnesota Public Employees Retirement Association on June 30, 2010. Director and Vice Chair of The Tree Trust (non-profit corporation). Director of the American Chestnut Foundation (non-profit corporation). | | Asset Allocation Trust |
| * | Length of service dates reflect the Trustee’s commencement of service with the Trust’s predecessor entities, where applicable. |
Officers
| | | | | | |
Name and
year of birth | | Position held and
length of service | | Principal occupations during past five years | | |
| Karla M. Rabusch (Born 1959) | | President, since 2003 | | Executive Vice President of Wells Fargo Bank, N.A. and President of Wells Fargo Funds Management, LLC since 2003. | | |
| Jeremy DePalma1 (Born 1974) | | Treasurer, since 2012 | | Senior Vice President of Wells Fargo Funds Management, LLC since 2009. Senior Vice President of Evergreen Investment Management Company, LLC from 2008 to 2010. Vice President, Evergreen Investment Services, Inc. from 2004 to 2007. Head of the Fund Reporting and Control Team within Fund Administration from 2005 to 2010. | | |
| C. David Messman (Born 1960) | | Secretary, since 2000; Chief Legal Officer, since 2003 | | Senior Vice President and Secretary of Wells Fargo Funds Management, LLC since 2001. Vice President and Managing Counsel of Wells Fargo Bank, N.A. since 1996. | | |
Debra Ann Early
(Born 1964) | | Chief Compliance Officer, since 2007 | | Chief Compliance Officer of Wells Fargo Funds Management, LLC since 2007. Chief Compliance Officer of Parnassus Investments from 2005 to 2007. Chief Financial Officer of Parnassus Investments from 2004 to 2007. | | |
David Berardi
(Born 1975) | | Assistant Treasurer, since 2009 | | Vice President of Wells Fargo Funds Management, LLC since 2009. Vice President of Evergreen Investment Management Company, LLC from 2008 to 2010. Assistant Vice President of Evergreen Investment Services, Inc. from 2004 to 2008. Manager of Fund Reporting and Control for Evergreen Investment Management Company, LLC from 2004 to 2010. | | |
| 1. | Jeremy DePalma acts as Treasurer of 59 funds and Assistant Treasurer of 73 funds in the Fund Complex. |
| 2. | The Statement of Additional Information includes additional information about the Trustees and is available, without charge, upon request, by calling 1-800-222-8222 or by visiting the website at wellsfargoadvantagefunds.com. |
| | | | | | |
| List of abbreviations | | Wells Fargo Advantage Large Cap Core Fund | | | 25 | |
The following is a list of common abbreviations for terms and entities that may have appeared in this report.
| ACA | — ACA Financial Guaranty Corporation |
| ADR | — American depositary receipt |
| ADS | — American depositary shares |
| AGC | — Assured Guaranty Corporation |
| AGM | — Assured Guaranty Municipal |
| Ambac | — Ambac Financial Group Incorporated |
| AMT | — Alternative minimum tax |
| BAN | — Bond anticipation notes |
| BHAC | — Berkshire Hathaway Assurance Corporation |
| CAB | — Capital appreciation bond |
| CCAB | — Convertible capital appreciation bond |
| CDA | — Community Development Authority |
| CDO | — Collateralized debt obligation |
| COP | — Certificate of participation |
| DRIVER | — Derivative inverse tax-exempt receipts |
| DW&P | — Department of Water & Power |
| DWR | — Department of Water Resources |
| ECFA | — Educational & Cultural Facilities Authority |
| EDA | — Economic Development Authority |
| EDFA | — Economic Development Finance Authority |
| ETF | — Exchange-traded fund |
| FDIC | — Federal Deposit Insurance Corporation |
| FFCB | — Federal Farm Credit Banks |
| FGIC | — Financial Guaranty Insurance Corporation |
| FHA | — Federal Housing Administration |
| FHLB | — Federal Home Loan Bank |
| FHLMC | — Federal Home Loan Mortgage Corporation |
| FICO | — The Financing Corporation |
| FNMA | — Federal National Mortgage Association |
| GDR | — Global depositary receipt |
| GNMA | — Government National Mortgage Association |
| HCFR | — Healthcare facilities revenue |
| HEFA | — Health & Educational Facilities Authority |
| HEFAR | — Higher education facilities authority revenue |
| HFA | — Housing Finance Authority |
| HFFA | — Health Facilities Financing Authority |
| HUD | — Department of Housing and Urban Development |
| IDA | — Industrial Development Authority |
| IDAG | — Industrial Development Agency |
| IDR | — Industrial development revenue |
| KRW | — Republic of Korea won |
| LIBOR | — London Interbank Offered Rate |
| LLC | — Limited liability company |
| LLLP | — Limited liability limited partnership |
| LLP | — Limited liability partnership |
| MBIA | — Municipal Bond Insurance Association |
| MFHR | — Multifamily housing revenue |
| MSTR | — Municipal securities trust receipts |
| MUD | — Municipal Utility District |
| National | — National Public Finance Guarantee Corporation |
| PCFA | — Pollution Control Financing Authority |
| PCL | — Public Company Limited |
| PCR | — Pollution control revenue |
| PFA | — Public Finance Authority |
| PFFA | — Public Facilities Financing Authority |
| PFOTER | — Puttable floating option tax-exempt receipts |
| plc | — Public limited company |
| PUTTER | — Puttable tax-exempt receipts |
| R&D | — Research & development |
| Radian | — Radian Asset Assurance |
| RAN | — Revenue anticipation notes |
| RDA | — Redevelopment Authority |
| RDFA | — Redevelopment Finance Authority |
| REIT | — Real estate investment trust |
| ROC | — Reset option certificates |
| SAVRS | — Select auction variable rate securities |
| SBA | — Small Business Authority |
| SFHR | — Single-family housing revenue |
| SFMR | — Single-family mortgage revenue |
| SPA | — Standby purchase agreement |
| SPDR | — Standard & Poor’s Depositary Receipts |
| STRIPS | — Separate trading of registered interest and principal securities |
| TAN | — Tax anticipation notes |
| TIPS | — Treasury inflation-protected securities |
| TRAN | — Tax revenue anticipation notes |
| TTFA | — Transportation Trust Fund Authority |
| TVA | — Tennessee Valley Authority |
This page is intentionally left blank.
This page is intentionally left blank.
This page is intentionally left blank.


For more information
More information about Wells Fargo Advantage Funds is available free upon request. To obtain literature, please write, email, visit the Fund’s website, or call:
Wells Fargo Advantage Funds
P.O. Box 8266
Boston, MA 02266-8266
Email: wfaf@wellsfargo.com
Website: wellsfargoadvantagefunds.com
Individual investors: 1-800-222-8222
Retail investment professionals: 1-888-877-9275
Institutional investment professionals: 1-866-765-0778
This report and the financial statements contained herein are submitted for the general information of the shareholders of Wells Fargo Advantage Funds. If this report is used for promotional purposes, distribution of the report must be accompanied or preceded by a current prospectus. For a current prospectus and, if available, a summary prospectus containing more complete information, including charges and expenses, call 1-800-222-8222 or visit the Fund’s website at wellsfargoadvantagefunds.com. Please consider the investment objectives, risks, charges, and expenses of the investment carefully before investing. This and other information about Wells Fargo Advantage Funds can be found in the current prospectus. Read the prospectus carefully before you invest or send money.
Wells Fargo Funds Management, LLC, a wholly owned subsidiary of Wells Fargo & Company, provides investment advisory and administrative services for Wells Fargo Advantage Funds. Other affiliates of Wells Fargo & Company provide subadvisory and other services for the Funds. The Funds are distributed by Wells Fargo Funds Distributor, LLC, Member FINRA/SIPC, an affiliate of Wells Fargo & Company.
NOT FDIC INSURED ¡ NO BANK GUARANTEE ¡ MAY LOSE VALUE
© 2014 Wells Fargo Funds Management, LLC. All rights reserved.
| | |
 | | 222990 03-14 SA208/SAR208 1-14 |

Wells Fargo Advantage Large Cap Growth Fund

Semi-Annual Report
January 31, 2014

Reduce clutter. Save trees.
Sign up for electronic delivery of prospectuses and shareholder reports at wellsfargo.com/advantagedelivery
Contents
The views expressed and any forward-looking statements are as of January 31, 2014, unless otherwise noted, and are those of the Fund managers and/or Wells Fargo Funds Management, LLC. Discussions of individual securities, or the markets generally, or any Wells Fargo Advantage Fund are not intended as individual recommendations. Future events or results may vary significantly from those expressed in any forward-looking statements; the views expressed are subject to change at any time in response to changing circumstances in the market. Wells Fargo Funds Management, LLC and the Fund disclaim any obligation to publicly update or revise any views expressed or forward-looking statements.
NOT FDIC INSURED ¡ NO BANK GUARANTEE ¡ MAY LOSE VALUE
| | | | |
| 2 | | Wells Fargo Advantage Large Cap Growth Fund | | Letter to shareholders (unaudited) |

Karla M. Rabusch
President
Wells Fargo Advantage Funds
Major central banks continued to inject liquidity into the banks and the markets through various quantitative easing policies.
Dear Valued Shareholder:
We are pleased to offer you this semi-annual report for the Wells Fargo Advantage Large Cap Growth Fund for the six-month period that ended January 31, 2014. Much of the period was marked by monetary easing by global central banks. Entering the period, investors were concerned that the U.S. Federal Reserve (Fed) would end its bond-buying program, which initially led to higher interest rates and resulted in losses for bond indexes and volatility for global stock indexes. These fears dissipated in late September 2013 and ended altogether in mid-December 2013 when the Fed announced a tapering timeline that was far more moderate than some had feared. Growing confidence that the U.S. economy was staging a fragile recovery resulted in double-digit returns for domestic stock market indexes for the six-month reporting period.
Central banks continued to provide stimulus.
Major central banks continued to inject liquidity into the banks and the markets through various quantitative easing policies. Throughout the reporting period, the Federal Open Market Committee (FOMC)—the Fed’s monetary policymaking body—kept its key interest rate effectively near zero in order to support the economy and the financial system. Well before the reporting period began, the FOMC announced its intention to keep interest rates low for an extended period and to make open-ended purchases of $40 billion per month in mortgage-backed securities. The FOMC later added purchases of $45 billion per month in long-term U.S. Treasuries. Because the markets benefited from the FOMC’s liquidity, both stocks and bonds initially sold off after the FOMC indicated in May 2013 that it might reduce (or taper) its bond-buying program. However, in mid-December 2013, the FOMC announced that it would reduce its bond-buying program by $10 billion per month beginning in January 2014. The tapering was less aggressive than some investors had feared, and the markets ended 2013 strongly.
European markets continued to benefit from the European Central Bank’s (ECB’s) earlier announcement that it would purchase an unlimited amount of one- to three-year sovereign debt from countries that had formally applied for a bailout. In November 2013, the ECB cut its key rate to a historic low of 0.25%. The ECB’s aggressive actions helped ease investor worries about a eurozone sovereign debt default. Given the substantial ties between the U.S. and Europe, the improved sentiment about the eurozone helped provide a tailwind for U.S. markets.
U.S. stock markets gained on relatively good news.
For most of the period, U.S. economic data remained moderately positive. Reported gross domestic product (GDP) growth came in at a strong 4.1% annualized rate in the third quarter of 2013, and the advance annualized estimate for fourth-quarter GDP growth was 3.2%.
The most significant negative effect was the ongoing fight in Washington, D.C., over the federal budget and debt limit. The Budget Control Act of 2011, which was passed to resolve a previous fight over the federal debt ceiling, mandated budget sequestration that took effect on March 1, 2013, and was an overhang on economic growth throughout the reporting period. Most recently, Congress was unable to pass a resolution to continue to fund the federal government, and thus, the federal government underwent a partial shutdown from September 30, 2013, through October 16, 2013. The government reopened after the president and Congress reached a deal that funded the government through January 15, 2014, and raised the debt limit through February 7, 2014. In December 2013, Congress
| | | | | | |
| Letter to shareholders (unaudited) | | Wells Fargo Advantage Large Cap Growth Fund | | | 3 | |
passed the Ryan-Murray budget agreement that funded the government through September 2015, lessening the near-term prospect of another shutdown.
Despite political headwinds, the relatively positive outlook for the U.S. economy contributed to a strong domestic stock market for most of the reporting period. Economically sensitive sectors, such as industrials and materials, outperformed. Dividend-paying sectors such as utilities and telecommunication services lagged as higher interest rates dampened their relative performance. Judging by various Russell indexes, small-cap stocks moderately outperformed large-cap stocks, and growth stocks strongly outperformed value stocks.
Don’t let short-term uncertainty derail long-term investment goals.
Periods of uncertainty can present challenges, but experience has taught us that maintaining long-term investment goals can be an effective way to plan for the future. Although diversification cannot guarantee an investment profit or prevent losses, we believe it can be an effective way to manage investment risk and potentially smooth out overall portfolio performance. We encourage investors to know their investments and to understand that appropriate levels of risk-taking may unlock opportunities.
Thank you for choosing to invest with Wells Fargo Advantage Funds. We appreciate your confidence in us and remain committed to helping you meet your financial needs. For current information about your fund investments, contact your investment professional, visit our website at wellsfargoadvantagefunds.com, or call us directly at 1-800-222-8222. We are available 24 hours a day, 7 days a week.
Sincerely,

Karla M. Rabusch
President
Wells Fargo Advantage Funds
Despite political headwinds, the relatively positive outlook for the U.S. economy contributed to a strong domestic stock market for most of the reporting period.
Notice to shareholders
The Fund and Wells Fargo Funds Management, LLC (“Funds Management”) have received an exemptive order from the SEC that permits Funds Management, subject to the approval of the Board of Trustees of the Fund, to select or replace certain subadvisers to manage all or a portion of the Fund’s assets and enter into, amend or terminate a sub-advisory agreement with certain subadvisers without obtaining shareholder approval (“Multi-manager Structure”). The Multi-manager Structure applies to subadvisers that are not affiliated with Funds Management or the Fund, except to the extent that affiliation arises solely because such subadvisers provide sub-advisory services to the Fund (“Non-affiliated Subadvisers”), as well as subadvisers that are indirect or direct wholly-owned subsidiaries of Funds Management or of another company that, indirectly or directly, wholly owns Funds Management (“Wholly-owned Subadvisers”).
Pursuant to the SEC order, Funds Management, with the approval of the Board of Trustees, has the discretion to terminate any subadvisers and allocate and reallocate the Fund’s assets among any other Non-affiliated Subadvisers or Wholly-owned Subadvisers. Funds Management, subject to oversight and supervision by the Board of Trustees, has responsibility to continue to oversee any subadvisers to the Fund and to recommend, for approval by the Board of Trustees, the hiring, termination and replacement of subadvisers for the Fund. In the event that a new subadviser is hired pursuant to the Multi-manager Structure, the Fund is required to provide notice to shareholders within 90 days.
Please contact your investment professional or call us directly at 1-800-222-8222 if you have any questions on this Notice to Shareholders.
| | | | |
| 4 | | Wells Fargo Advantage Large Cap Growth Fund | | Performance highlights (unaudited) |
Investment objective
The Fund seeks long-term capital appreciation.
Adviser
Wells Fargo Funds Management, LLC
Subadviser
Wells Capital Management Incorporated
Portfolio managers
Thomas C. Ognar, CFA
Bruce C. Olson, CFA
Joseph M. Eberhardy, CFA, CPA
Average annual total returns1 (%) as of January 31, 2014
| | | | | | | | | | | | | | | | | | | | | | | | | | | | | | | | | | |
| | | | | Including sales charge | | | Excluding sales charge | | | Expense ratios2 (%) | |
| | | Inception date | | 1 year | | | 5 year | | | 10 year | | | 1 year | | | 5 year | | | 10 year | | | Gross | | | Net3 | |
| Class A (STAFX) | | 7-30-2010 | | | 19.09 | | | | 18.72 | | | | 7.10 | | | | 26.35 | | | | 20.14 | | | | 7.73 | | | | 1.22 | | | | 1.07 | |
| Class C (STOFX) | | 7-30-2010 | | | 24.43 | | | | 19.27 | | | | 6.98 | | | | 25.43 | | | | 19.27 | | | | 6.98 | | | | 1.97 | | | | 1.82 | |
| Class R (STMFX) | | 6-15-2012 | | | – | | | | – | | | | – | | | | 26.04 | | | | 19.90 | | | | 7.55 | | | | 1.47 | | | | 1.32 | |
| Class R4 (SLGRX) | | 11-30-2012 | | | – | | | | – | | | | – | | | | 26.78 | | | | 20.44 | | | | 7.86 | | | | 0.89 | | | | 0.75 | |
| Class R6 (STFFX) | | 11-30-2012 | | | – | | | | – | | | | – | | | | 26.96 | | | | 20.48 | | | | 7.88 | | | | 0.74 | | | | 0.60 | |
| Administrator Class (STDFX) | | 7-30-2010 | | | – | | | | – | | | | – | | | | 26.54 | | | | 20.26 | | | | 7.78 | | | | 1.06 | | | | 0.95 | |
| Institutional Class (STNFX) | | 7-30-2010 | | | – | | | | – | | | | – | | | | 26.92 | | | | 20.46 | | | | 7.87 | | | | 0.79 | | | | 0.65 | |
| Investor Class (STRFX) | | 12-30-1981 | | | – | | | | – | | | | – | | | | 26.29 | | | | 20.08 | | | | 7.70 | | | | 1.28 | | | | 1.13 | |
| Russell 1000® Growth Index4 | | – | | | – | | | | – | | | | – | | | | 24.35 | | | | 20.88 | | | | 7.30 | | | | – | | | | – | |
Figures quoted represent past performance, which is no guarantee of future results, and do not reflect taxes that a shareholder may pay on fund distributions or the redemption of fund shares. Investment return and principal value of an investment will fluctuate so that an investor’s shares, when redeemed, may be worth more or less than their original cost. Performance shown without sales charges would be lower if sales charges were reflected. Current performance may be lower or higher than the performance data quoted, which assumes the reinvestment of dividends and capital gains. Current month-end performance is available on the Fund’s website, wellsfargoadvantagefunds.com.
Index returns do not include transaction costs associated with buying and selling securities, any mutual fund fees or expenses, or any taxes. It is not possible to invest directly in an index.
For Class A shares, the maximum front-end sales charge is 5.75%. For Class C shares, the maximum contingent deferred sales charge is 1.00%. Performance including sales charge assumes the sales charge for the corresponding time period. Class R, Class R4, Class R6, Administrator Class, Institutional Class, and Investor Class shares are sold without a front-end sales charge or contingent deferred sales charge.
Please keep in mind that high double-digit returns were primarily achieved during favorable market conditions. You should not expect that such favorable returns can be consistently achieved. A fund’s performance, especially for short time periods, should not be the sole factor in making your investment decision.
Stock values fluctuate in response to the activities of individual companies and general market and economic conditions. Certain investment strategies tend to increase the total risk of an investment (relative to the broader market). The Fund is exposed to foreign investment risk. Consult the Fund’s prospectus for additional information on these and other risks.
Please see footnotes on page 5.
| | | | | | |
| Performance highlights (unaudited) | | Wells Fargo Advantage Large Cap Growth Fund | | | 5 | |
| | | | |
| Ten largest equity holdings5 (%) as of January 31, 2014 | |
Google Incorporated Class A | | | 5.16% | |
Gilead Sciences Incorporated | | | 2.87% | |
Alexion Pharmaceuticals Incorporated | | | 2.60% | |
Whole Foods Market Incorporated | | | 2.53% | |
Union Pacific Corporation | | | 2.32% | |
Apple Incorporated | | | 2.23% | |
Dollar Tree Incorporated | | | 2.20% | |
MasterCard Incorporated Class A | | | 2.19% | |
QUALCOMM Incorporated | | | 2.02% | |
Costco Wholesale Corporation | | | 2.02% | |
| | |
| Sector distribution6 as of January 31, 2014 |
|
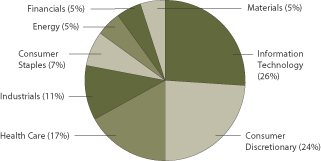
|
| 1. | Historical performance shown for Class R4 shares prior to their inception reflects the performance of Institutional Class shares, adjusted to reflect the higher expenses applicable to Class R4 shares. Historical performance shown for Class R6 shares prior to their inception reflects the performance of Institutional Class shares, and includes the higher expenses applicable to Institutional Class shares. If these expenses had not been included, returns would be higher. Historical performance for Institutional Class shares prior to their inception reflects the performance of Investor Class shares, and includes the higher expenses applicable to Investor Class shares. If these expenses had not been included, returns would be higher. Historical performance shown for Class R shares prior to their inception reflects the performance of Investor Class shares, adjusted to reflect the higher expenses applicable to Class R shares. Historical performance shown for Class C shares prior to their inception reflects the performance of Investor Class shares, adjusted to reflect the higher expenses applicable to Class C shares. Historical performance shown for Class A and Administrator shares prior to their inception reflects the performance of Investor Class shares, and includes the higher expenses applicable to Investor Class shares. If these expenses had not been included, returns would be higher. |
| 2. | Reflects the expense ratios as stated in the most recent prospectuses. The expense ratios shown are subject to change and may differ from the annualized expense ratios shown in the financial highlights of this report. |
| 3. | The Adviser has committed through November 30, 2014, to waive fees and/or reimburse expenses to the extent necessary to cap the Fund’s Total Annual Fund Operating Expenses After Fee Waiver, excluding certain expenses, at the amounts shown. Brokerage commissions, stamp duty fees, interest, taxes, acquired fund fees and expenses, and extraordinary expenses are excluded from the cap. Without this cap, the Fund’s returns would have been lower. |
| 4. | The Russell 1000® Growth Index measures the performance of those Russell 1000 Index companies with higher price-to-book ratios and higher forecasted growth values. You cannot invest directly in an index. |
| 5. | The ten largest equity holdings are calculated based on the value of the securities divided by total net assets of the Fund. Holdings are subject to change and may have changed since the date specified. |
| 6. | Sector distribution is subject to change and is calculated based on the total long-term investments of the Fund. |
| | | | |
| 6 | | Wells Fargo Advantage Large Cap Growth Fund | | Fund expenses (unaudited) |
As a shareholder of the Fund, you incur two types of costs: (1) transaction costs, including sales charges (loads) on purchase payments and contingent deferred sales charges (if any) on redemptions and (2) ongoing costs, including management fees, distribution (12b-1) and/or shareholder service fees, and other Fund expenses. This example is intended to help you understand your ongoing costs (in dollars) of investing in the Fund and to compare these costs with the ongoing costs of investing in other mutual funds.
The example is based on an investment of $1,000 invested at the beginning of the six-month period and held for the entire period from August 1, 2013 to January 31, 2014.
Actual expenses
The “Actual” line of the table below provides information about actual account values and actual expenses. You may use the information in this line, together with the amount you invested, to estimate the expenses that you paid over the period. Simply divide your account value by $1,000 (for example, an $8,600 account value divided by $1,000 = 8.6), then multiply the result by the number in the “Actual” line under the heading entitled “Expenses paid during period” for your applicable class of shares to estimate the expenses you paid on your account during this period.
Hypothetical example for comparison purposes
The “Hypothetical” line of the table below provides information about hypothetical account values and hypothetical expenses based on the Fund’s actual expense ratio and an assumed rate of return of 5% per year before expenses, which is not the Fund’s actual return. The hypothetical account values and expenses may not be used to estimate the actual ending account balance or expenses you paid for the period. You may use this information to compare the ongoing costs of investing in the Fund and other funds. To do so, compare this 5% hypothetical example with the 5% hypothetical examples that appear in the shareholder reports of the other funds.
Please note that the expenses shown in the table are meant to highlight your ongoing costs only and do not reflect any transactional costs, such as sales charges (loads) and contingent deferred sales charges. Therefore, the “Hypothetical” line of the table is useful in comparing ongoing costs only and will not help you determine the relative total costs of owning different funds. In addition, if these transactional costs were included, your costs would have been higher.
| | | | | | | | | | | | | | | | |
| | | Beginning
account value
8-1-2013 | | | Ending
account value
1-31-2014 | | | Expenses
paid during
the period1 | | | Net annualized
expense ratio | |
Class A | | | | | | | | | | | | | | | | |
Actual | | $ | 1,000.00 | | | $ | 1,122.30 | | | $ | 5.72 | | | | 1.07 | % |
Hypothetical (5% return before expenses) | | $ | 1,000.00 | | | $ | 1,019.81 | | | $ | 5.45 | | | | 1.07 | % |
Class C | | | | | | | | | | | | | | | | |
Actual | | $ | 1,000.00 | | | $ | 1,118.20 | | | $ | 9.72 | | | | 1.82 | % |
Hypothetical (5% return before expenses) | | $ | 1,000.00 | | | $ | 1,016.03 | | | $ | 9.25 | | | | 1.82 | % |
Class R | | | | | | | | | | | | | | | | |
Actual | | $ | 1,000.00 | | | $ | 1,120.96 | | | $ | 7.06 | | | | 1.32 | % |
Hypothetical (5% return before expenses) | | $ | 1,000.00 | | | $ | 1,018.55 | | | $ | 6.72 | | | | 1.32 | % |
Class R4 | | | | | | | | | | | | | | | | |
Actual | | $ | 1,000.00 | | | $ | 1,124.23 | | | $ | 4.02 | | | | 0.75 | % |
Hypothetical (5% return before expenses) | | $ | 1,000.00 | | | $ | 1,021.42 | | | $ | 3.82 | | | | 0.75 | % |
Class R6 | | | | | | | | | | | | | | | | |
Actual | | $ | 1,000.00 | | | $ | 1,124.95 | | | $ | 3.21 | | | | 0.60 | % |
Hypothetical (5% return before expenses) | | $ | 1,000.00 | | | $ | 1,022.18 | | | $ | 3.06 | | | | 0.60 | % |
Administrator Class | | | | | | | | | | | | | | | | |
Actual | | $ | 1,000.00 | | | $ | 1,123.21 | | | $ | 5.08 | | | | 0.95 | % |
Hypothetical (5% return before expenses) | | $ | 1,000.00 | | | $ | 1,020.42 | | | $ | 4.84 | | | | 0.95 | % |
Institutional Class | | | | | | | | | | | | | | | | |
Actual | | $ | 1,000.00 | | | $ | 1,124.60 | | | $ | 3.48 | | | | 0.65 | % |
Hypothetical (5% return before expenses) | | $ | 1,000.00 | | | $ | 1,021.93 | | | $ | 3.31 | | | | 0.65 | % |
Investor Class | | | | | | | | | | | | | | | | |
Actual | | $ | 1,000.00 | | | $ | 1,121.92 | | | $ | 6.04 | | | | 1.13 | % |
Hypothetical (5% return before expenses) | | $ | 1,000.00 | | | $ | 1,019.51 | | | $ | 5.75 | | | | 1.13 | % |
| 1. | Expenses paid is equal to the annualized expense ratio of each class multiplied by the average account value over the period, multiplied by the number of days in the most recent fiscal half-year divided by the number of days in the fiscal year (to reflect the one-half-year period). |
| | | | | | |
| Portfolio of investments—January 31, 2014 (unaudited) | | Wells Fargo Advantage Large Cap Growth Fund | | | 7 | |
| | | | | | | | | | | | |
| Security name | | | | | | Shares | | | Value | |
| | | | |
Common Stocks: 98.64% | | | | | | | | | | | | |
| | | | |
Consumer Discretionary: 23.88% | | | | | | | | | | | | |
| | | | |
| Hotels, Restaurants & Leisure: 6.31% | | | | | | | | | | | | |
Chipotle Mexican Grill Incorporated † | | | | | | | 41,180 | | | $ | 22,729,713 | |
Hilton Worldwide Holdings Incorporated † | | | | | | | 172,367 | | | | 3,731,746 | |
Marriott International Incorporated Class A | | | | | | | 330,000 | | | | 16,269,000 | |
Starbucks Corporation | | | | | | | 345,340 | | | | 24,560,581 | |
Wynn Resorts Limited | | | | | | | 127,000 | | | | 27,612,340 | |
| | | | |
| | | | | | | | | | | 94,903,380 | |
| | | | | | | | | | | | |
| | | | |
| Internet & Catalog Retail: 3.92% | | | | | | | | | | | | |
Amazon.com Incorporated † | | | | | | | 82,530 | | | | 29,602,686 | |
priceline.com Incorporated † | | | | | | | 25,670 | | | | 29,389,326 | |
| | | | |
| | | | | | | | | | | 58,992,012 | |
| | | | | | | | | | | | |
| | | | |
| Media: 2.93% | | | | | | | | | | | | |
CBS Corporation Class B | | | | | | | 385,000 | | | | 22,607,200 | |
The Walt Disney Company | | | | | | | 102,000 | | | | 7,406,220 | |
Twenty-First Century Fox Incorporated | | | | | | | 441,000 | | | | 14,032,620 | |
| | | | |
| | | | | | | | | | | 44,046,040 | |
| | | | | | | | | | | | |
| | | | |
| Multiline Retail: 3.89% | | | | | | | | | | | | |
Dollar General Corporation † | | | | | | | 124,060 | | | | 6,987,059 | |
Dollar Tree Incorporated † | | | | | | | 654,000 | | | | 33,040,080 | |
Nordstrom Incorporated | | | | | | | 322,500 | | | | 18,527,625 | |
| | | | |
| | | | | | | | | | | 58,554,764 | |
| | | | | | | | | | | | |
| | | | |
| Specialty Retail: 2.93% | | | | | | | | | | | | |
CarMax Incorporated † | | | | | | | 442,580 | | | | 19,964,784 | |
O’Reilly Automotive Incorporated † | | | | | | | 150,000 | | | | 19,647,000 | |
Ross Stores Incorporated | | | | | | | 66,000 | | | | 4,482,060 | |
| | | | |
| | | | | | | | | | | 44,093,844 | |
| | | | | | | | | | | | |
| | | | |
| Textiles, Apparel & Luxury Goods: 3.90% | | | | | | | | | | | | |
lululemon athletica incorporated Ǡ | | | | | | | 64,470 | | | | 2,945,634 | |
Michael Kors Holdings Limited † | | | | | | | 186,730 | | | | 14,925,329 | |
Nike Incorporated Class B | | | | | | | 290,980 | | | | 21,197,893 | |
VF Corporation | | | | | | | 335,120 | | | | 19,587,764 | |
| | | | |
| | | | | | | | | | | 58,656,620 | |
| | | | | | | | | | | | |
| | | | |
Consumer Staples: 6.48% | | | | | | | | | | | | |
| | | | |
| Food & Staples Retailing: 5.88% | | | | | | | | | | | | |
Costco Wholesale Corporation | | | | | | | 270,000 | | | | 30,337,200 | |
Walgreen Company | | | | | | | 350,420 | | | | 20,096,587 | |
Whole Foods Market Incorporated | | | | | | | 727,000 | | | | 37,993,020 | |
| | | | |
| | | | | | | | | | | 88,426,807 | |
| | | | | | | | | | | | |
| | | | |
| Personal Products: 0.60% | | | | | | | | | | | | |
Estee Lauder Companies Incorporated Class A | | | | | | | 130,660 | | | | 8,981,568 | |
| | | | | | | | | | | | |
The accompanying notes are an integral part of these financial statements.
| | | | |
| 8 | | Wells Fargo Advantage Large Cap Growth Fund | | Portfolio of investments—January 31, 2014 (unaudited) |
| | | | | | | | | | | | |
| Security name | | | | | | Shares | | | Value | |
| | | | |
Energy: 5.42% | | | | | | | | | | | | |
| | | | |
| Energy Equipment & Services: 1.73% | | | | | | | | | | | | |
National Oilwell Varco Incorporated | | | | | | | 90,000 | | | $ | 6,750,900 | |
Schlumberger Limited | | | | | | | 220,000 | | | | 19,265,400 | |
| | | | |
| | | | | | | | | | | 26,016,300 | |
| | | | | | | | | | | | |
| | | | |
| Oil, Gas & Consumable Fuels: 3.69% | | | | | | | | | | | | |
Antero Resources Corporation † | | | | | | | 109,696 | | | | 6,443,543 | |
Concho Resources Incorporated † | | | | | | | 158,600 | | | | 15,509,494 | |
Continental Resources Incorporated † | | | | | | | 62,980 | | | | 6,940,396 | |
Pioneer Natural Resources Company | | | | | | | 157,000 | | | | 26,583,240 | |
| | | | |
| | | | | | | | | | | 55,476,673 | |
| | | | | | | | | | | | |
| | | | |
Financials: 5.01% | | | | | | | | | | | | |
| | | | |
| Capital Markets: 1.86% | | | | | | | | | | | | |
Northern Trust Corporation | | | | | | | 151,000 | | | | 9,093,220 | |
TD Ameritrade Holding Corporation | | | | | | | 605,000 | | | | 18,906,250 | |
| | | | |
| | | | | | | | | | | 27,999,470 | |
| | | | | | | | | | | | |
| | | | |
| Consumer Finance: 2.45% | | | | | | | | | | | | |
American Express Company | | | | | | | 228,340 | | | | 19,413,467 | |
Discover Financial Services | | | | | | | 325,200 | | | | 17,446,980 | |
| | | | |
| | | | | | | | | | | 36,860,447 | |
| | | | | | | | | | | | |
| | | | |
| Diversified Financial Services: 0.70% | | | | | | | | | | | | |
CME Group Incorporated | | | | | | | 140,000 | | | | 10,466,400 | |
| | | | | | | | | | | | |
| | | | |
Health Care: 16.51% | | | | | | | | | | | | |
| | | | |
| Biotechnology: 9.25% | | | | | | | | | | | | |
Alexion Pharmaceuticals Incorporated † | | | | | | | 246,000 | | | | 39,047,580 | |
Biogen Idec Incorporated † | | | | | | | 61,960 | | | | 19,371,174 | |
Celgene Corporation † | | | | | | | 148,380 | | | | 22,543,373 | |
Gilead Sciences Incorporated † | | | | | | | 535,120 | | | | 43,157,428 | |
Regeneron Pharmaceuticals Incorporated † | | | | | | | 52,180 | | | | 15,058,626 | |
| | | | |
| | | | | | | | | | | 139,178,181 | |
| | | | | | | | | | | | |
| | | | |
| Health Care Equipment & Supplies: 0.83% | | | | | | | | | | | | |
Covidien plc | | | | | | | 182,130 | | | | 12,428,551 | |
| | | | | | | | | | | | |
| | | | |
| Health Care Providers & Services: 1.79% | | | | | | | | | | | | |
AmerisourceBergen Corporation | | | | | | | 207,170 | | | | 13,925,967 | |
Catamaran Corporation † | | | | | | | 266,600 | | | | 12,962,092 | |
| | | | |
| | | | | | | | | | | 26,888,059 | |
| | | | | | | | | | | | |
| | | | |
| Health Care Technology: 1.35% | | | | | | | | | | | | |
Cerner Corporation † | | | | | | | 356,940 | | | | 20,306,317 | |
| | | | | | | | | | | | |
| | | | |
| Pharmaceuticals: 3.29% | | | | | | | | | | | | |
Allergan Incorporated | | | | | | | 42,450 | | | | 4,864,770 | |
Bristol-Myers Squibb Company | | | | | | | 164,000 | | | | 8,195,080 | |
The accompanying notes are an integral part of these financial statements.
| | | | | | |
| Portfolio of investments—January 31, 2014 (unaudited) | | Wells Fargo Advantage Large Cap Growth Fund | | | 9 | |
| | | | | | | | | | | | |
| Security name | | | | | | Shares | | | Value | |
| | | | |
| Pharmaceuticals (continued) | | | | | | | | | | | | |
Merck & Company Incorporated | | | | | | | 113,000 | | | $ | 5,985,610 | |
Perrigo Company plc | | | | | | | 115,160 | | | | 17,925,806 | |
Shire plc ADR | | | | | | | 59,740 | | | | 8,938,299 | |
Zoetis Incorporated | | | | | | | 120,000 | | | | 3,643,200 | |
| | | | |
| | | | | | | | | | | 49,552,765 | |
| | | | | | | | | | | | |
| | | | |
Industrials: 11.20% | | | | | | | | | | | | |
| | | | |
| Aerospace & Defense: 3.72% | | | | | | | | | | | | |
Precision Castparts Corporation | | | | | | | 73,000 | | | | 18,596,750 | |
The Boeing Company | | | | | | | 142,000 | | | | 17,786,920 | |
United Technologies Corporation | | | | | | | 170,870 | | | | 19,482,597 | |
| | | | |
| | | | | | | | | | | 55,866,267 | |
| | | | | | | | | | | | |
| | | | |
| Air Freight & Logistics: 0.80% | | | | | | | | | | | | |
United Parcel Service Incorporated Class B | | | | | | | 126,050 | | | | 12,003,742 | |
| | | | | | | | | | | | |
| | | | |
| Airlines: 0.16% | | | | | | | | | | | | |
Southwest Airlines Company | | | | | | | 117,000 | | | | 2,451,150 | |
| | | | | | | | | | | | |
| | | | |
| Industrial Conglomerates: 1.00% | | | | | | | | | | | | |
Danaher Corporation | | | | | | | 202,240 | | | | 15,044,634 | |
| | | | | | | | | | | | |
| | | | |
| Professional Services: 0.39% | | | | | | | | | | | | |
Verisk Analytics Incorporated Class A † | | | | | | | 91,900 | | | | 5,868,734 | |
| | | | | | | | | | | | |
| | | | |
| Road & Rail: 3.62% | | | | | | | | | | | | |
Kansas City Southern | | | | | | | 66,680 | | | | 7,040,741 | |
Norfolk Southern Corporation | | | | | | | 136,000 | | | | 12,592,240 | |
Union Pacific Corporation | | | | | | | 200,000 | | | | 34,848,000 | |
| | | | |
| | | | | | | | | | | 54,480,981 | |
| | | | | | | | | | | | |
| | | | |
| Trading Companies & Distributors: 1.51% | | | | | | | | | | | | |
W.W. Grainger Incorporated | | | | | | | 97,100 | | | | 22,768,008 | |
| | | | | | | | | | | | |
| | | | |
Information Technology: 25.56% | | | | | | | | | | | | |
| | | | |
| Communications Equipment: 2.02% | | | | | | | | | | | | |
QUALCOMM Incorporated | | | | | | | 410,080 | | | | 30,436,138 | |
| | | | | | | | | | | | |
| | | | |
| Computers & Peripherals: 2.23% | | | | | | | | | | | | |
Apple Incorporated | | | | | | | 66,870 | | | | 33,475,122 | |
| | | | | | | | | | | | |
| | | | |
| Internet Software & Services: 10.44% | | | | | | | | | | | | |
eBay Incorporated † | | | | | | | 562,850 | | | | 29,943,620 | |
Facebook Incorporated Class A † | | | | | | | 408,000 | | | | 25,528,560 | |
Google Incorporated Class A † | | | | | | | 65,670 | | | | 77,554,300 | |
LinkedIn Corporation Class A † | | | | | | | 39,790 | | | | 8,563,206 | |
Pandora Media Incorporated † | | | | | | | 232,100 | | | | 8,371,847 | |
Rackspace Hosting Incorporated † | | | | | | | 195,800 | | | | 7,129,078 | |
| | | | |
| | | | | | | | | | | 157,090,611 | |
| | | | | | | | | | | | |
The accompanying notes are an integral part of these financial statements.
| | | | |
| 10 | | Wells Fargo Advantage Large Cap Growth Fund | | Portfolio of investments—January 31, 2014 (unaudited) |
| | | | | | | | | | | | | | |
| Security name | | | | | | | Shares | | | Value | |
| | | | |
| IT Services: 6.37% | | | | | | | | | | | | | | |
Accenture plc | | | | | | | | | 113,480 | | | $ | 9,064,782 | |
Alliance Data Systems Corporation † | | | | | | | | | 45,000 | | | | 10,784,700 | |
Cognizant Technology Solutions Corporation Class A † | | | | | | | | | 240,200 | | | | 23,280,184 | |
MasterCard Incorporated Class A | | | | | | | | | 435,700 | | | | 32,973,776 | |
Visa Incorporated Class A | | | | | | | | | 91,530 | | | | 19,718,308 | |
| | | | |
| | | | | | | | | | | | | 95,821,750 | |
| | | | | | | | | | | | | | |
| | | |
| Semiconductors & Semiconductor Equipment: 1.29% | | | | | | | | | | | |
Microchip Technology Incorporated « | | | | | | | | | 432,880 | | | | 19,418,997 | |
| | | | | | | | | | | | | | |
| | | |
| Software: 3.21% | | | | | | | | | | | |
NetSuite Incorporated † | | | | | | | | | 89,000 | | | | 9,361,020 | |
Salesforce.com Incorporated † | | | | | | | | | 489,000 | | | | 29,599,170 | |
ServiceNow Incorporated † | | | | | | | | | 146,300 | | | | 9,279,809 | |
| | | | |
| | | | | | | | | | | | | 48,239,999 | |
| | | | | | | | | | | | | | |
| | | |
Materials: 4.58% | | | | | | | | | | | |
| | | | |
| Chemicals: 4.58% | | | | | | | | | | | | | | |
Ecolab Incorporated | | | | | | | | | 164,760 | | | | 16,564,970 | |
Monsanto Company | | | | | | | | | 210,000 | | | | 22,375,500 | |
Praxair Incorporated | | | | | | | | | 240,000 | | | | 29,932,799 | |
| | | | |
| | | | | | | | | | | | | 68,873,269 | |
| | | | | | | | | | | | | | |
| | | |
Total Common Stocks (Cost $1,044,786,348) | | | | | | | | | | 1,483,667,600 | |
| | | | | | | | | | | | | | |
| | | | |
| | | Yield | | | | | | | | | |
| Short-Term Investments: 2.08% | | | | | | | | | | | | | | |
| | | | |
| Investment Companies: 2.08% | | | | | | | | | | | | | | |
Wells Fargo Advantage Cash Investment Money Market Fund, Select Class (l)(u) | | | 0.07 | % | | | | | 19,208,789 | | | | 19,208,789 | |
Wells Fargo Securities Lending Cash Investments, LLC (l)(u)(v)(r) | | | 0.08 | | | | | | 12,146,844 | | | | 12,146,844 | |
| | | | |
Total Short-Term Investments (Cost $31,355,633) | | | | | | | | | | | | | 31,355,633 | |
| | | | | | | | | | | | | | |
| | | | | | | | |
| Total investments in securities | | | | | | | | |
| (Cost $1,076,141,981) * | | | 100.72 | % | | | 1,515,023,233 | |
Other assets and liabilities, net | | | (0.72 | ) | | | (10,815,880 | ) |
| | | | | | | | |
| Total net assets | | | 100.00 | % | | $ | 1,504,207,353 | |
| | | | | | | | |
| † | Non-income-earning security |
| « | All or a portion of this security is on loan. |
| (l) | Investment in an affiliate |
| (u) | Rate shown is the 7-day annualized yield at period end. |
| (v) | Security represents investment of cash collateral received from securities on loan. |
| (r) | The investment company is exempt from registration under Section 3(c)(7) of the Investment Company Act of 1940, as amended. |
| * | Cost for federal income tax purposes is $1,076,862,001 and unrealized appreciation (depreciation) consists of: |
| | | | |
Gross unrealized appreciation | | $ | 444,342,321 | |
Gross unrealized depreciation | | | (6,181,089 | ) |
| | | | |
Net unrealized appreciation | | $ | 438,161,232 | |
The accompanying notes are an integral part of these financial statements.
| | | | | | |
| Statement of assets and liabilities—January 31, 2014 (unaudited) | | Wells Fargo Advantage Large Cap Growth Fund | | | 11 | |
| | | | |
| | | | |
| |
Assets | | | | |
Investments | | | | |
In unaffiliated securities (including securities on loan), at value (see cost below) | | $ | 1,483,667,600 | |
In affiliated securities, at value (see cost below) | | | 31,355,633 | |
| | | | |
Total investments, at value (see cost below) | | | 1,515,023,233 | |
Receivable for investments sold | | | 8,931,195 | |
Receivable for Fund shares sold | | | 2,096,607 | |
Receivable for dividends | | | 177,136 | |
Receivable for securities lending income | | | 6,264 | |
Prepaid expenses and other assets | | | 55,692 | |
| | | | |
Total assets | | | 1,526,290,127 | |
| | | | |
| |
Liabilities | | | | |
Payable for investments purchased | | | 6,259,253 | |
Payable for Fund shares redeemed | | | 2,396,255 | |
Payable upon receipt of securities loaned | | | 12,146,844 | |
Advisory fee payable | | | 676,150 | |
Distribution fees payable | | | 16,328 | |
Due to other related parties | | | 314,026 | |
Accrued expenses and other liabilities | | | 273,918 | |
| | | | |
Total liabilities | | | 22,082,774 | |
| | | | |
Total net assets | | $ | 1,504,207,353 | |
| | | | |
| |
NET ASSETS CONSIST OF | | | | |
Paid-in capital | | $ | 1,060,114,898 | |
Overdistributed net investment income | | | (640,037 | ) |
Accumulated net realized gains on investments | | | 5,851,240 | |
Net unrealized gains on investments | | | 438,881,252 | |
| | | | |
Total net assets | | $ | 1,504,207,353 | |
| | | | |
| |
COMPUTATION OF NET ASSET VALUE AND OFFERING PRICE PER SHARE1 | | | | |
Net assets – Class A | | $ | 146,819,076 | |
Shares outstanding – Class A | | | 3,398,257 | |
Net asset value per share – Class A | | | $43.20 | |
Maximum offering price per share – Class A2 | | | $45.84 | |
Net assets – Class C | | $ | 20,811,130 | |
Shares outstanding – Class C | | | 494,244 | |
Net asset value per share – Class C | | | $42.11 | |
Net assets – Class R | | $ | 10,405,970 | |
Shares outstanding – Class R | | | 242,041 | |
Net asset value per share – Class R | | | $42.99 | |
Net assets – Class R4 | | $ | 1,965,000 | |
Share outstanding – Class R4 | | | 45,103 | |
Net asset value per share – Class R4 | | | $43.57 | |
Net assets – Class R6 | | $ | 2,695,503 | |
Share outstanding – Class R6 | | | 61,836 | |
Net asset value per share – Class R6 | | | $43.59 | |
Net assets – Administrator Class | | $ | 235,056,129 | |
Shares outstanding – Administrator Class | | | 5,420,029 | |
Net asset value per share – Administrator Class | | | $43.37 | |
Net assets – Institutional Class | | $ | 632,778,786 | |
Shares outstanding – Institutional Class | | | 14,516,330 | |
Net asset value per share – Institutional Class | | | $43.59 | |
Net assets – Investor Class | | $ | 453,675,759 | |
Shares outstanding – Investor Class | | | 10,515,532 | |
Net asset value per share – Investor Class | | | $43.14 | |
Investments in unaffiliated securities (including securities on loan), at cost | | $ | 1,044,786,348 | |
| | | | |
Investments in affiliated securities, at cost | | $ | 31,355,633 | |
| | | | |
Total investments, at cost | | $ | 1,076,141,981 | |
| | | | |
Securities on loan, at value | | $ | 11,848,863 | |
| | | | |
| 1. | The Fund has an unlimited number of authorized shares. |
| 2. | Maximum offering price is computed as 100/94.25 of net asset value. On investments of $50,000 or more, the offering price is reduced. |
The accompanying notes are an integral part of these financial statements.
| | | | |
| 12 | | Wells Fargo Advantage Large Cap Growth Fund | | Statement of operations—six months ended January 31, 2014 (unaudited) |
| | | | |
| | | | |
| |
Investment income | | | | |
Dividends | | $ | 6,675,120 | |
Securities lending income, net | | | 45,862 | |
Income from affiliated securities | | | 10,173 | |
| | | | |
Total investment income | | | 6,731,155 | |
| | | | |
| |
Expenses | | | | |
Advisory fee | | | 4,526,790 | |
Administration fees | | | | |
Fund level | | | 361,308 | |
Class A | | | 190,537 | |
Class C | | | 25,836 | |
Class R | | | 12,297 | |
Class R4 | | | 452 | |
Class R6 | | | 363 | |
Administrator Class | | | 113,811 | |
Institutional Class | | | 236,388 | |
Investor Class | | | 715,502 | |
Shareholder servicing fees | | | | |
Class A | | | 183,209 | |
Class C | | | 24,842 | |
Class R | | | 11,824 | |
Class R4 | | | 564 | |
Administrator Class | | | 283,365 | |
Investor Class | | | 558,986 | |
Distribution fees | | | | |
Class C | | | 74,525 | |
Class R | | | 11,823 | |
Custody and accounting fees | | | 40,371 | |
Professional fees | | | 22,073 | |
Registration fees | | | 99,244 | |
Shareholder report expenses | | | 53,321 | |
Trustees’ fees and expenses | | | 5,906 | |
Other fees and expenses | | | 27,698 | |
| | | | |
Total expenses | | | 7,581,035 | |
Less: Fee waivers and/or expense reimbursements | | | (1,013,649 | ) |
| | | | |
Net expenses | | | 6,567,386 | |
| | | | |
Net investment income | | | 163,769 | |
| | | | |
| |
REALIZED AND UNREALIZED GAINS (LOSSES) ON INVESTMENTS | | | | |
Net realized gains on investments | | | 14,844,359 | |
Net change in unrealized gains (losses) on investments | | | 145,194,310 | |
| | | | |
Net realized and unrealized gains (losses) on investments | | | 160,038,669 | |
| | | | |
Net increase in net assets resulting from operations | | $ | 160,202,438 | |
| | | | |
The accompanying notes are an integral part of these financial statements.
| | | | | | |
| Statement of changes in net assets | | Wells Fargo Advantage Large Cap Growth Fund | | | 13 | |
| | | | | | | | | | | | | | | | |
| | | Six months ended
January 31, 2014
(unaudited) | | | Year ended
July 31, 2013 | |
| | | | |
Operations | | | | | | | | | | | | | | | | |
Net investment income | | | | | | $ | 163,769 | | | | | | | $ | 3,624,257 | |
Net realized gains on investments | | | | | | | 14,844,359 | | | | | | | | 101,802,906 | |
Net change in unrealized gains (losses) on investments | | | | | | | 145,194,310 | | | | | | | | 131,147,844 | |
| | | | |
Net increase in net assets resulting from operations | | | | | | | 160,202,438 | | | | | | | | 236,575,007 | |
| | | | |
| | | | |
Distributions to shareholders from | | | | | | | | | | | | | | | | |
Net investment income | | | | | | | | | | | | | | | | |
Class A | | | | | | | 0 | | | | | | | | (121,892 | ) |
Class R | | | | | | | 0 | | | | | | | | (2,374 | ) |
Class R4 | | | | | | | (4,388 | ) | | | | | | | (32 | )1 |
Class R6 | | | | | | | (7,794 | ) | | | | | | | (169 | )1 |
Administrator Class | | | | | | | (59,550 | ) | | | | | | | (406,148 | ) |
Institutional Class | | | | | | | (1,868,611 | ) | | | | | | | (1,878,484 | ) |
Net realized gains | | | | | | | | | | | | | | | | |
Class A | | | | | | | (4,658,059 | ) | | | | | | | 0 | |
Class C | | | | | | | (653,384 | ) | | | | | | | 0 | |
Class R | | | | | | | (306,050 | ) | | | | | | | 0 | |
Class R4 | | | | | | | (60,168 | ) | | | | | | | 0 | 1 |
Class R6 | | | | | | | (74,852 | ) | | | | | | | 0 | 1 |
Administrator Class | | | | | | | (7,171,992 | ) | | | | | | | 0 | |
Institutional Class | | | | | | | (19,978,900 | ) | | | | | | | 0 | |
Investor Class | | | | | | | (14,255,159 | ) | | | | | | | 0 | |
| | | | |
Total distributions to shareholders | | | | | | | (49,098,907 | ) | | | | | | | (2,409,099 | ) |
| | | | |
| | | | |
Capital share transactions | | | Shares | | | | | | | | Shares | | | | | |
Proceeds from shares sold | | | | | | | | | | | | | | | | |
Class A | | | 466,256 | | | | 19,866,583 | | | | 1,674,624 | | | | 58,604,595 | |
Class C | | | 87,249 | | | | 3,636,720 | | | | 217,087 | | | | 7,527,427 | |
Class R | | | 72,672 | | | | 3,081,441 | | | | 106,112 | | | | 3,695,703 | |
Class R4 | | | 44,750 | | | | 1,967,418 | | | | 292 | 1 | | | 10,000 | 1 |
Class R6 | | | 8,420 | | | | 369,422 | | | | 60,170 | 1 | | | 2,168,017 | 1 |
Administrator Class | | | 559,002 | | | | 23,942,690 | | | | 4,448,450 | | | | 153,858,585 | |
Institutional Class | | | 2,786,059 | | | | 121,124,088 | | | | 3,915,231 | | | | 138,162,580 | |
Investor Class | | | 544,147 | | | | 23,198,936 | | | | 1,103,953 | | | | 38,838,329 | |
| | | | |
| | | | | | | 197,187,298 | | | | | | | | 402,865,236 | |
| | | | |
Reinvestment of distributions | | | | | | | | | | | | | | | | |
Class A | | | 82,404 | | | | 3,548,336 | | | | 2,942 | | | | 98,914 | |
Class C | | | 11,441 | | | | 480,638 | | | | 0 | | | | 0 | |
Class R | | | 2,882 | | | | 123,530 | | | | 33 | | | | 1,092 | |
Class R4 | | | 1,485 | | | | 64,556 | | | | 1 | 1 | | | 32 | 1 |
Class R6 | | | 1,899 | | | | 82,646 | | | | 5 | 1 | | | 169 | 1 |
Administrator Class | | | 162,979 | | | | 7,043,571 | | | | 10,982 | | | | 370,195 | |
Institutional Class | | | 431,004 | | | | 18,751,185 | | | | 45,346 | | | | 1,534,948 | |
Investor Class | | | 322,257 | | | | 13,857,073 | | | | 0 | | | | 0 | |
| | | | |
| | | | | | | 43,951,535 | | | | | | | | 2,005,350 | |
| | | | |
Payment for shares redeemed | | | | | | | | | | | | | | | | |
Class A | | | (462,908 | ) | | | (19,834,920 | ) | | | (647,781 | ) | | | (23,109,975 | ) |
Class C | | | (60,669 | ) | | | (2,510,583 | ) | | | (125,588 | ) | | | (4,392,790 | ) |
Class R | | | (39,321 | ) | | | (1,688,300 | ) | | | (54,480 | ) | | | (1,975,873 | ) |
Class R4 | | | (1,425 | ) | | | (63,649 | ) | | | 0 | 1 | | | 0 | 1 |
Class R6 | | | (5,272 | ) | | | (216,149 | ) | | | (3,386 | )1 | | | (127,149 | )1 |
Administrator Class | | | (521,011 | ) | | | (22,197,883 | ) | | | (1,514,385 | ) | | | (54,136,656 | ) |
Institutional Class | | | (1,388,646 | ) | | | (59,642,105 | ) | | | (9,415,760 | ) | | | (337,271,362 | ) |
Investor Class | | | (590,341 | ) | | | (24,993,744 | ) | | | (1,758,314 | ) | | | (61,752,915 | ) |
| | | | |
| | | | | | | (131,147,333 | ) | | | | | | | (482,766,720 | ) |
| | | | |
Net increase (decrease) in net assets resulting from capital share transactions | | | | | | | 109,991,500 | | | | | | | | (77,896,134 | ) |
| | | | |
Total increase in net assets | | | | | | | 221,095,031 | | | | | | | | 156,269,774 | |
| | | | |
| | | | |
Net assets | | | | | | | | | | | | | | | | |
Beginning of period | | | | | | | 1,283,112,322 | | | | | | | | 1,126,842,548 | |
| | | | |
End of period | | | | | | $ | 1,504,207,353 | | | | | | | $ | 1,283,112,322 | |
| | | | |
Undistributed (overdistributed) net investment income | | | | | | $ | (640,037 | ) | | | | | | $ | 1,136,537 | |
| | | | |
| 1. | For the period from November 30, 2012 (commencement of class operations) to July 31, 2013 |
The accompanying notes are an integral part of these financial statements.
| | | | |
| 14 | | Wells Fargo Advantage Large Cap Growth Fund | | Financial highlights |
(For a share outstanding throughout each period)
| | | | | | | | | | | | | | | | | | | | |
| | | Six months ended
January 31, 2014
(unaudited) | | | Year ended July 31 | |
| CLASS A | | | 2013 | | | 2012 | | | 2011 | | | 20101 | |
Net asset value, beginning of period | | $ | 39.73 | | | $ | 32.92 | | | $ | 31.62 | | | $ | 24.54 | | | $ | 24.54 | |
Net investment income (loss) | | | (0.03 | ) | | | 0.04 | | | | (0.12 | )2 | | | (0.10 | )2 | | | 0.00 | 3 |
Net realized and unrealized gains (losses) on investments | | | 4.88 | | | | 6.81 | | | | 1.42 | | | | 7.18 | | | | 0.00 | 3 |
| | | | | | | | | | | | | | | | | | | | |
Total from investment operations | | | 4.85 | | | | 6.85 | | | | 1.30 | | | | 7.08 | | | | 0.00 | 3 |
Distributions to shareholders from | | | | | | | | | | | | | | | | | | | | |
Net investment income | | | 0.00 | | | | (0.04 | ) | | | 0.00 | | | | 0.00 | | | | 0.00 | |
Net realized gains | | | (1.38 | ) | | | 0.00 | | | | 0.00 | | | | 0.00 | | | | 0.00 | |
| | | | | | | | | | | | | | | | | | | | |
Total distributions to shareholders | | | (1.38 | ) | | | (0.04 | ) | | | 0.00 | | | | 0.00 | | | | 0.00 | |
Net asset value, end of period | | $ | 43.20 | | | $ | 39.73 | | | $ | 32.92 | | | $ | 31.62 | | | $ | 24.54 | |
Total return4 | | | 12.23 | % | | | 20.84 | % | | | 4.08 | % | | | 28.89 | % | | | 0.00 | % |
Ratios to average net assets (annualized) | | | | | | | | | | | | | | | | | | | | |
Gross expenses | | | 1.22 | % | | | 1.23 | % | | | 1.24 | % | | | 1.25 | % | | | 0.00 | % |
Net expenses | | | 1.07 | % | | | 1.07 | % | | | 1.10 | % | | | 1.12 | % | | | 0.00 | % |
Net investment income (loss) | | | (0.13 | )% | | | 0.09 | % | | | (0.37 | )% | | | (0.33 | )% | | | 0.00 | % |
Supplemental data | | | | | | | | | | | | | | | | | | | | |
Portfolio turnover rate | | | 15 | % | | | 57 | % | | | 46 | % | | | 47 | % | | | 60 | % |
Net assets, end of period (000s omitted) | | | $146,819 | | | | $131,616 | | | | $75,149 | | | | $2,368 | | | | $10 | |
| 1. | For the period from July 30, 2010 (commencement of class operations) to July 31, 2010 |
| 2. | Calculated based upon average shares outstanding |
| 3. | Amount is less than $0.005. |
| 4. | Total return calculations do not include any sales charges. Returns for periods of less than one year are not annualized. |
The accompanying notes are an integral part of these financial statements.
| | | | | | |
| Financial highlights | | Wells Fargo Advantage Large Cap Growth Fund | | | 15 | |
(For a share outstanding throughout each period)
| | | | | | | | | | | | | | | | | | | | |
| | | Six months ended
January 31, 2014 (unaudited) | | | Year ended July 31 | |
| CLASS C | | | 2013 | | | 2012 | | | 2011 | | | 20101 | |
Net asset value, beginning of period | | $ | 38.90 | | | $ | 32.43 | | | $ | 31.38 | | | $ | 24.54 | | | $ | 24.54 | |
Net investment income (loss) | | | (0.16 | ) | | | (0.20 | ) | | | (0.37 | )2 | | | (0.32 | )2 | | | 0.00 | 3 |
Net realized and unrealized gains (losses) on investments | | | 4.75 | | | | 6.67 | | | | 1.42 | | | | 7.16 | | | | 0.00 | 3 |
| | | | | | | | | | | | | | | | | | | | |
Total from investment operations | | | 4.59 | | | | 6.47 | | | | 1.05 | | | | 6.84 | | | | 0.00 | 3 |
Distributions to shareholders from | | | | | | | | | | | | | | | | | | | | |
Net realized gains | | | (1.38 | ) | | | 0.00 | | | | 0.00 | | | | 0.00 | | | | 0.00 | |
Net asset value, end of period | | $ | 42.11 | | | $ | 38.90 | | | $ | 32.43 | | | $ | 31.38 | | | $ | 24.54 | |
Total return4 | | | 11.82 | % | | | 19.95 | % | | | 3.31 | % | | | 27.91 | % | | | 0.00 | % |
Ratios to average net assets (annualized) | | | | | | | | | | | | | | | | | | | | |
Gross expenses | | | 1.97 | % | | | 1.98 | % | | | 1.99 | % | | | 2.00 | % | | | 0.00 | % |
Net expenses | | | 1.82 | % | | | 1.82 | % | | | 1.84 | % | | | 1.87 | % | | | 0.00 | % |
Net investment income (loss) | | | (0.88 | )% | | | (0.65 | )% | | | (1.16 | )% | | | (1.04 | )% | | | 0.00 | % |
Supplemental data | | | | | | | | | | | | | | | | | | | | |
Portfolio turnover rate | | | 15 | % | | | 57 | % | | | 46 | % | | | 47 | % | | | 60 | % |
Net assets, end of period (000s omitted) | | | $20,811 | | | | $17,748 | | | | $11,829 | | | | $272 | | | | $10 | |
| 1. | For the period from July 30, 2010 (commencement of class operations) to July 31, 2010 |
| 2. | Calculated based upon average shares outstanding |
| 3. | Amount is less than $0.005. |
| 4. | Total return calculations do not include any sales charges. Returns for periods of less than one year are not annualized. |
The accompanying notes are an integral part of these financial statements.
| | | | |
| 16 | | Wells Fargo Advantage Large Cap Growth Fund | | Financial highlights |
(For a share outstanding throughout each period)
| | | | | | | | | | | | |
| | | Six months ended
January 31, 2014 (unaudited) | | | Year ended July 31 | |
| CLASS R | | | 2013 | | | 20121 | |
Net asset value, beginning of period | | $ | 39.59 | | | $ | 32.86 | | | $ | 32.91 | |
Net investment loss | | | (0.09 | )2 | | | (0.06 | )2 | | | (0.05 | )2 |
Net realized and unrealized gains (losses) on investments | | | 4.87 | | | | 6.80 | | | | 0.00 | 3 |
| | | | | | | | | | | | |
Total from investment operations | | | 4.78 | | | | 6.74 | | | | (0.05 | ) |
Distributions to shareholders from | | | | | | | | | | | | |
Net investment income | | | 0.00 | | | | (0.01 | ) | | | 0.00 | |
Net realized gains | | | (1.38 | ) | | | 0.00 | | | | 0.00 | |
| | | | | | | | | | | | |
Total distributions to shareholders | | | (1.38 | ) | | | (0.01 | ) | | | 0.00 | |
Net asset value, end of period | | $ | 42.99 | | | $ | 39.59 | | | $ | 32.86 | |
Total return4 | | | 12.10 | % | | | 20.53 | % | | | (0.15 | )% |
Ratios to average net assets (annualized) | | | | | | | | | | | | |
Gross expenses | | | 1.47 | % | | | 1.47 | % | | | 1.47 | % |
Net expenses | | | 1.32 | % | | | 1.32 | % | | | 1.32 | % |
Net investment loss | | | (0.40 | )% | | | (0.16 | )% | | | (0.95 | )% |
Supplemental data | | | | | | | | | | | | |
Portfolio turnover rate | | | 15 | % | | | 57 | % | | | 46 | % |
Net assets, end of period (000s omitted) | | | $10,406 | | | | $8,149 | | | | $5,065 | |
| 1. | For the period from June 15, 2012 (commencement of class operations) to July 31, 2012 |
| 2. | Calculated based upon average shares outstanding |
| 3. | Amount is less than $0.005. |
| 4. | Returns for periods of less than one year are not annualized. |
The accompanying notes are an integral part of these financial statements.
| | | | | | |
| Financial highlights | | Wells Fargo Advantage Large Cap Growth Fund | | | 17 | |
(For a share outstanding throughout each period)
| | | | | | | | |
| | | Six months ended
January 31, 2014
(unaudited) | | | Year ended
July 31, 20131 | |
| CLASS R4 | | |
Net asset value, beginning of period | | $ | 40.05 | | | $ | 34.26 | |
Net investment income | | | 0.04 | | | | 0.09 | |
Net realized and unrealized gains (losses) on investments | | | 4.96 | | | | 5.81 | |
| | | | | | | | |
Total from investment operations | | | 5.00 | | | | 5.90 | |
Distributions to shareholders from | | | | | | | | |
Net investment income | | | (0.10 | ) | | | (0.11 | ) |
Net realized gains | | | (1.38 | ) | | | 0.00 | |
| | | | | | | | |
Total distributions to shareholders | | | (1.48 | ) | | | (0.11 | ) |
Net asset value, end of period | | $ | 43.57 | | | $ | 40.05 | |
Total return2 | | | 12.42 | % | | | 17.37 | % |
Ratios to average net assets (annualized) | | | | | | | | |
Gross expenses | | | 0.89 | % | | | 0.87 | % |
Net expenses | | | 0.75 | % | | | 0.75 | % |
Net investment income | | | 0.17 | % | | | 0.39 | % |
Supplemental data | | | | | | | | |
Portfolio turnover rate | | | 15 | % | | | 57 | % |
Net assets, end of period (000s omitted) | | | $1,965 | | | | $12 | |
| 1. | For the period from November 30, 2012 (commencement of class operations) to July 31, 2013 |
| 2. | Returns for periods of less than one year are not annualized. |
The accompanying notes are an integral part of these financial statements.
| | | | |
| 18 | | Wells Fargo Advantage Large Cap Growth Fund | | Financial highlights |
(For a share outstanding throughout each period)
| | | | | | | | |
| | | Six months ended
January 31, 2014
(unaudited) | | | Year ended
July 31, 20131 | |
| CLASS R6 | | |
Net asset value, beginning of period | | $ | 40.11 | | | $ | 34.26 | |
Net investment income | | | 0.08 | | | | 0.15 | |
Net realized and unrealized gains (losses) on investments | | | 4.92 | | | | 5.82 | |
| | | | | | | | |
Total from investment operations | | | 5.00 | | | | 5.97 | |
Distributions to shareholders from | | | | | | | | |
Net investment income | | | (0.14 | ) | | | (0.12 | ) |
Net realized gains | | | (1.38 | ) | | | 0.00 | |
| | | | | | | | |
Total distributions to shareholders | | | (1.52 | ) | | | (0.12 | ) |
Net asset value, end of period | | $ | 43.59 | | | $ | 40.11 | |
Total return2 | | | 12.50 | % | | | 17.48 | % |
Ratios to average net assets (annualized) | | | | | | | | |
Gross expenses | | | 0.74 | % | | | 0.75 | % |
Net expenses | | | 0.60 | % | | | 0.60 | % |
Net investment income | | | 0.33 | % | | | 0.26 | % |
Supplemental data | | | | | | | | |
Portfolio turnover rate | | | 15 | % | | | 57 | % |
Net assets, end of period (000s omitted) | | | $2,696 | | | $ | 2,278 | |
| 1. | For the period from November 30, 2012 (commencement of class operations) to July 31, 2013 |
| 2. | Returns for periods of less than one year are not annualized. |
The accompanying notes are an integral part of these financial statements.
| | | | | | |
| Financial highlights | | Wells Fargo Advantage Large Cap Growth Fund | | | 19 | |
(For a share outstanding throughout each period)
| | | | | | | | | | | | | | | | | | | | |
| | | Six months ended
January 31, 2014
(unaudited) | | | Year ended July 31 | |
| ADMINISTRATOR CLASS | | | 2013 | | | 2012 | | | 2011 | | | 20101 | |
Net asset value, beginning of period | | $ | 39.86 | | | $ | 33.02 | | | $ | 31.67 | | | $ | 24.54 | | | $ | 24.54 | |
Net investment income (loss) | | | (0.00 | )3 | | | 0.09 | 2 | | | (0.06 | )2 | | | (0.06 | )2 | | | 0.00 | 3 |
Net realized and unrealized gains (losses) on investments | | | 4.90 | | | | 6.83 | | | | 1.41 | | | | 7.19 | | | | 0.00 | 3 |
| | | | | | | | | | | | | | | | | | | | |
Total from investment operations | | | 4.90 | | | | 6.92 | | | | 1.35 | | | | 7.13 | | | | 0.00 | 3 |
Distributions to shareholders from | | | | | | | | | | | | | | | | | | | | |
Net investment income | | | (0.01 | ) | | | (0.08 | ) | | | 0.00 | | | | 0.00 | | | | 0.00 | |
Net realized gains | | | (1.38 | ) | | | 0.00 | | | | 0.00 | | | | 0.00 | | | | 0.00 | |
| | | | | | | | | | | | | | | | | | | | |
Total distributions to shareholders | | | (1.39 | ) | | | (0.08 | ) | | | 0.00 | | | | 0.00 | | | | 0.00 | |
Net asset value, end of period | | $ | 43.37 | | | $ | 39.86 | | | $ | 33.02 | | | $ | 31.67 | | | $ | 24.54 | |
Total return4 | | | 12.32 | % | | | 21.00 | % | | | 4.26 | % | | | 29.05 | % | | | 0.00 | % |
Ratios to average net assets (annualized) | | | | | | | | | | | | | | | | | | | | |
Gross expenses | | | 1.06 | % | | | 1.07 | % | | | 1.08 | % | | | 1.07 | % | | | 0.00 | % |
Net expenses | | | 0.95 | % | | | 0.95 | % | | | 0.95 | % | | | 0.94 | % | | | 0.00 | % |
Net investment income (loss) | | | (0.01 | )% | | | 0.24 | % | | | (0.17 | )% | | | (0.19 | )% | | | 0.00 | % |
Supplemental data | | | | | | | | | | | | | | | | | | | | |
Portfolio turnover rate | | | 15 | % | | | 57 | % | | | 46 | % | | | 47 | % | | | 60 | % |
Net assets, end of period (000s omitted) | | | $235,056 | | | | $208,053 | | | | $75,099 | | | | $1,379 | | | | $10 | |
| 1. | For the period from July 30, 2010 (commencement of class operations) to July 31, 2010 |
| 2. | Calculated based upon average shares outstanding |
| 3. | Amount is less than $0.005. |
| 4. | Returns for periods of less than one year are not annualized. |
The accompanying notes are an integral part of these financial statements.
| | | | |
| 20 | | Wells Fargo Advantage Large Cap Growth Fund | | Financial highlights |
(For a share outstanding throughout each period)
| | | | | | | | | | | | | | | | | | | | |
| | | Six months ended
January 31, 2014 (unaudited) | | | Year ended July 31 | |
| INSTITUTIONAL CLASS | | | 2013 | | | 2012 | | | 2011 | | | 20101 | |
Net asset value, beginning of period | | $ | 40.11 | | | $ | 33.16 | | | $ | 31.73 | | | $ | 24.54 | | | $ | 24.54 | |
Net Investment income (loss) | | | 0.06 | 2 | | | 0.20 | | | | (0.08 | )2 | | | (0.00 | )3 | | | 0.00 | 3 |
Net realized and unrealized gains (losses) on investments | | | 4.93 | | | | 6.86 | | | | 1.51 | | | | 7.19 | | | | 0.00 | 3 |
| | | | | | | | | | | | | | | | | | | | |
Total from investment operations | | | 4.99 | | | | 7.06 | | | | 1.43 | | | | 7.19 | | | | 0.00 | 3 |
Distributions to shareholders from | | | | | | | | | | | | | | | | | | | | |
Net investment income | | | (0.13 | ) | | | (0.11 | ) | | | 0.00 | | | | 0.00 | | | | 0.00 | |
Net realized gains | | | (1.38 | ) | | | 0.00 | | | | 0.00 | | | | 0.00 | | | | 0.00 | |
| | | | | | | | | | | | | | | | | | | | |
Total distributions to shareholders | | | (1.51 | ) | | | (0.11 | ) | | | 0.00 | | | | 0.00 | | | | 0.00 | |
Net asset value, end of period | | $ | 43.59 | | | $ | 40.11 | | | $ | 33.16 | | | $ | 31.73 | | | $ | 24.54 | |
Total return4 | | | 12.46 | % | | | 21.34 | % | | | 4.47 | % | | | 29.34 | % | | | 0.00 | % |
Ratios to average net assets (annualized) | | | | | | | | | | | | | | | | | | | | |
Gross expenses | | | 0.79 | % | | | 0.79 | % | | | 0.80 | % | | | 0.81 | % | | | 0.00 | % |
Net expenses | | | 0.65 | % | | | 0.69 | % | | | 0.75 | % | | | 0.75 | % | | | 0.00 | % |
Net investment income (loss) | | | 0.27 | % | | | 0.53 | % | | | (0.25 | )% | | | (0.01 | )% | | | 0.00 | % |
Supplemental data | | | | | | | | | | | | | | | | | | | | |
Portfolio turnover rate | | | 15 | % | | | 57 | % | | | 46 | % | | | 47 | % | | | 60 | % |
Net assets, end of period (000s omitted) | | | $632,779 | | | | $508,853 | | | | $601,684 | | | | $846 | | | | $10 | |
| 1. | For the period from July 30, 2010 (commencement of class operations) to July 31, 2010 |
| 2. | Calculated based upon average shares outstanding |
| 3. | Amount is less than $0.005. |
| 4. | Returns for periods of less than one year are not annualized. |
The accompanying notes are an integral part of these financial statements.
| | | | | | |
| Financial highlights | | Wells Fargo Advantage Large Cap Growth Fund | | | 21 | |
(For a share outstanding throughout each period)
| | | | | | | | | | | | | | | | | | | | | | | | |
| | | Six months ended
January 31, 2014
(unaudited) | | | Year ended July 31 | |
| INVESTOR CLASS | | | 2013 | | | 2012 | | | 2011 | | | 2010 | | | 2009 | |
Net asset value, beginning of period | | $ | 39.69 | | | $ | 32.86 | | | $ | 31.59 | | | $ | 24.54 | | | $ | 21.77 | | | $ | 26.62 | |
Net investment income (loss) | | | (0.04 | ) | | | 0.02 | | | | (0.07 | ) | | | (0.06 | ) | | | (0.02 | )1 | | | 0.02 | 1 |
Net realized and unrealized gains (losses) on investments | | | 4.87 | | | | 6.81 | | | | 1.34 | | | | 7.11 | | | | 2.81 | | | | (4.87 | ) |
| | | | | | | | | | | | | | | | | | | | | | | | |
Total from investment operations | | | 4.83 | | | | 6.83 | | | | 1.27 | | | | 7.05 | | | | 2.79 | | | | (4.85 | ) |
Distributions to shareholders from | | | | | | | | | | | | | | | | | | | | | | | | |
Net investment income | | | 0.00 | | | | 0.00 | | | | 0.00 | | | | 0.00 | | | | (0.02 | ) | | | 0.00 | |
Net realized gains | | | (1.38 | ) | | | 0.00 | | | | 0.00 | | | | 0.00 | | | | 0.00 | | | | 0.00 | |
| | | | | | | | | | | | | | | | | | | | | | | | |
Total distributions to shareholders | | | (1.38 | ) | | | 0.00 | | | | 0.00 | | | | 0.00 | | | | (0.02 | ) | | | 0.00 | |
Net asset value, end of period | | $ | 43.14 | | | $ | 39.69 | | | $ | 32.86 | | | $ | 31.59 | | | $ | 24.54 | | | $ | 21.77 | |
Total return2 | | | 12.19 | % | | | 20.79 | % | | | 4.02 | % | | | 28.73 | % | | | 12.80 | % | | | (18.22 | )% |
Ratios to average net assets (annualized) | | | | | | | | | | | | | | | | | | | | | | | | |
Gross expenses | | | 1.28 | % | | | 1.28 | % | | | 1.32 | % | | | 1.32 | % | | | 1.43 | % | | | 1.46 | % |
Net expenses | | | 1.13 | % | | | 1.13 | % | | | 1.18 | % | | | 1.19 | % | | | 1.19 | % | | | 1.19 | % |
Net investment income (loss) | | | (0.19 | )% | | | 0.06 | % | | | (0.23 | )% | | | (0.19 | )% | | | (0.07 | )% | | | 0.07 | % |
Supplemental data | | | | | | | | | | | | | | | | | | | | | | | | |
Portfolio turnover rate | | | 15 | % | | | 57 | % | | | 46 | % | | | 47 | % | | | 60 | % | | | 81 | % |
Net assets, end of period (000s omitted) | | | $453,676 | | | | $406,405 | | | | $358,017 | | | | $336,128 | | | | $278,585 | | | | $264,776 | |
| 1. | Calculated based upon average shares outstanding |
| 2. | Returns for periods of less than one year are not annualized. |
The accompanying notes are an integral part of these financial statements.
| | | | |
| 22 | | Wells Fargo Advantage Large Cap Growth Fund | | Notes to financial statements (unaudited) |
1. ORGANIZATION
Wells Fargo Funds Trust (the “Trust”), a Delaware statutory trust organized on March 10, 1999, is an open-end management investment company registered under the Investment Company Act of 1940, as amended (the “1940 Act”). These financial statements report on the Wells Fargo Advantage Large Cap Growth Fund (the “Fund”) which is a diversified series of the Trust.
2. SIGNIFICANT ACCOUNTING POLICIES
The following significant accounting policies, which are consistently followed in the preparation of the financial statements of the Fund, are in conformity with U.S. generally accepted accounting principles which require management to make estimates and assumptions that affect the reported amounts of assets and liabilities, disclosure of contingent assets and liabilities at the date of the financial statements, and the reported amounts of revenues and expenses during the reporting period. Actual results could differ from those estimates.
Securities valuation
All investments are valued each business day as of the close of regular trading on the New York Stock Exchange (generally 4 p.m. Eastern Time).
Equity securities that are listed on a foreign or domestic exchange or market are valued at the official closing price or, if none, the last sales price. If no sale occurs on the primary exchange or market for the security that day, the prior day’s price will be deemed “stale” and fair values will be determined in accordance with the Fund’s Valuation Procedures.
Investments in registered open-end investment companies are valued at net asset value. Non-registered investment vehicles are fair valued at net asset value.
Investments which are not valued using any of the methods discussed above are valued at their fair value, as determined in good faith by the Board of Trustees of the Fund. The Board of Trustees has established a Valuation Committee comprised of the Trustees and has delegated to it the authority to take any actions regarding the valuation of portfolio securities that the Valuation Committee deems necessary or appropriate, including determining the fair value of portfolio securities, unless the determination has been delegated to the Management Valuation Team of Wells Fargo Funds Management, LLC (“Funds Management”). The Board of Trustees retains the authority to make or ratify any valuation decisions or approve any changes to the Valuation Procedures as it deems appropriate. On a quarterly basis, the Board of Trustees receives reports on any valuation actions taken by the Valuation Committee or the Management Valuation Team which may include items for ratification.
Valuations of fair valued securities are compared to the next actual sales price when available, or other appropriate market values, to assess the continued appropriateness of the fair valuation methodologies used. These securities are fair valued on a day-to-day basis, taking into consideration changes to appropriate market information and any significant changes to the inputs considered in the valuation process until there is a readily available price provided on an exchange or by an independent pricing service. Valuations received from an independent pricing service or independent broker-dealer quotes are periodically validated by comparisons to most recent trades and valuations provided by other independent pricing services in addition to the review of prices by the adviser and/or subadviser. Unobservable inputs used in determining fair valuations are identified based on the type of security, taking into consideration factors utilized by market participants in valuing the investment, knowledge about the issuer and the current market environment.
Security loans
The Fund may lend its securities from time to time in order to earn additional income in the form of fees or interest on securities received as collateral or the investment of any cash received as collateral. The Fund continues to receive interest or dividends on the securities loaned. The Fund receives collateral in the form of cash or securities with a value at least equal to the value of the securities on loan. The value of the loaned securities is determined at the close of each business day and any additional required collateral is delivered to the Fund on the next business day. In a securities lending transaction, the net asset value of the Fund will be affected by an increase or decrease in the value of the securities loaned and by an increase or decrease in the value of the instrument in which collateral is invested. The amount of securities lending activity undertaken by the Fund fluctuates from time to time. In the event of default or bankruptcy by the borrower, the Fund may be prevented from recovering the loaned securities or gaining access to the collateral or may experience delays or costs in doing so. In addition, the investment of any cash collateral received may lose all or part of its value. The Fund has the right under the lending agreement to recover the securities from the borrower on demand.
The Fund lends its securities through an unaffiliated securities lending agent. Cash collateral received in connection with its securities lending transactions is invested in Wells Fargo Securities Lending Cash Investments, LLC (the “Securities
| | | | | | |
| Notes to financial statements (unaudited) | | Wells Fargo Advantage Large Cap Growth Fund | | | 23 | |
Lending Fund”). The Securities Lending Fund is exempt from registration under Section 3(c)(7) of the 1940 Act and is managed by Funds Management and is subadvised by Wells Capital Management Incorporated (“WellsCap”). Funds Management receives an advisory fee starting at 0.05% and declining to 0.01% as the average daily net assets of the Securities Lending Fund increase. All of the fees received by Funds Management are paid to WellsCap for its services as subadviser. The Securities Lending Fund seeks to provide a positive return compared to the daily Fed Funds Open rate by investing in high-quality, U.S. dollar-denominated short-term money market instruments. Securities Lending Fund investments are fair valued based upon the amortized cost valuation technique. Income earned from investment in the Securities Lending Fund is included in securities lending income on the Statement of Operations.
Security transactions and income recognition
Securities transactions are recorded on a trade date basis. Realized gains or losses are recorded on the basis of identified cost.
Dividend income is recognized on the ex-dividend date.
Distributions to shareholders
Distributions to shareholders from net investment income and net realized gains, if any, are recorded on the ex-dividend date. Such distributions are determined in conformity with federal income tax regulations, which may differ in amount or character from net investment income and realized gains recognized for purposes of U.S. generally accepted accounting principles.
Federal and other taxes
The Fund intends to continue to qualify as a regulated investment company by distributing substantially all of its investment company taxable income and any net realized capital gains (after reduction for capital loss carryforwards) sufficient to relieve it from all, or substantially all, federal income taxes. Accordingly, no provision for federal income taxes was required.
The Fund’s income and federal excise tax returns and all financial records supporting those returns for the prior three fiscal years are subject to examination by the federal and Delaware revenue authorities. Management has analyzed the Fund’s tax positions taken on federal, state, and foreign tax returns for all open tax years and does not believe that there are any uncertain tax positions that require recognition of a tax liability.
Class allocations
The separate classes of shares offered by the Fund differ principally in applicable sales charges, distribution, shareholder servicing, and administration fees. Shareholders of each class bear certain expenses that pertain to that particular class. All shareholders bear the common expenses of the Fund, earn income from the portfolio, and are allocated any unrealized gains and losses pro rata based on the average daily net assets of each class, without distinction between share classes. Dividends are determined separately for each class based on income and expenses allocable to each class. Realized gains and losses are allocated to each class pro rata based upon the net assets of each class on the date realized. Differences in per share dividend rates generally result from the relative weightings of pro rata income and realized gain allocations and from differences in separate class expenses, including distribution, shareholder servicing, and administration fees.
3. FAIR VALUATION MEASUREMENTS
Fair value measurements of investments are determined within a framework that has established a fair value hierarchy based upon the various data inputs utilized in determining the value of the Fund’s investments. The three-level hierarchy gives the highest priority to unadjusted quoted prices in active markets for identical assets or liabilities (Level 1) and the lowest priority to significant unobservable inputs (Level 3). The Fund’s investments are classified within the fair value hierarchy based on the lowest level of input that is significant to the fair value measurement. The inputs are summarized into three broad levels as follows:
| n | | Level 1 – quoted prices in active markets for identical securities |
| n | | Level 2 – other significant observable inputs (including quoted prices for similar securities, interest rates, prepayment speeds, credit risk, use of amortized cost, etc.) |
| n | | Level 3 – significant unobservable inputs (including the Fund’s own assumptions in determining the fair value of investments) |
The inputs or methodologies used for valuing investments in securities are not necessarily an indication of the risk associated with investing in those securities.
| | | | |
| 24 | | Wells Fargo Advantage Large Cap Growth Fund | | Notes to financial statements (unaudited) |
As of January 31, 2014, the inputs used in valuing investments in securities were as follows:
| | | | | | | | | | | | | | | | |
| Investments in securities | | Quoted prices (Level 1) | | | Other significant
observable inputs (Level 2) | | | Significant
unobservable inputs (Level 3) | | | Total | |
Equity securities | | | | | | | | | | | | | | | | |
Common stocks | | $ | 1,483,667,600 | | | $ | 0 | | | $ | 0 | | | $ | 1,483,667,600 | |
Short-term investments | | | | | | | | | | | | | | | | |
Investment companies | | | 19,208,789 | | | | 12,146,844 | | | | 0 | | | | 31,355,633 | |
| | | $ | 1,502,876,389 | | | $ | 12,146,844 | | | $ | 0 | | | $ | 1,515,023,233 | |
Transfers in and transfers out are recognized at the end of the reporting period. For the six months ended January 31, 2014, the Fund did not have any transfers into/out of Level 1, Level 2, or Level 3.
4. TRANSACTIONS WITH AFFILIATES AND OTHER EXPENSES
Advisory fee
The Trust has entered into an advisory contract with Funds Management, an indirect wholly owned subsidiary of Wells Fargo & Company (“Wells Fargo”). The adviser is responsible for implementing investment policies and guidelines and for supervising the subadviser, who is responsible for day-to-day portfolio management of the Fund.
Pursuant to the contract, Funds Management is entitled to receive an annual advisory fee starting at 0.65% and declining to 0.55% as the average daily net assets of the Fund increase. For the six months ended January 31, 2014, the advisory fee was equivalent to an annual rate of 0.63% of the Fund’s average daily net assets.
Funds Management has retained the services of a subadviser to provide daily portfolio management to the Fund. The fee for subadvisory services is borne by Funds Management. WellsCap, an affiliate of Funds Management and an indirect, wholly owned subsidiary of Wells Fargo, is the subadviser to the Fund and is entitled to receive a fee from Funds Management at an annual rate starting at 0.30% and declining to 0.20% as the average daily net assets of the Fund increase.
Administration and transfer agent fees
The Trust has entered into an administration agreement with Funds Management. Under this agreement, for providing administrative services, which includes paying fees and expenses for services provided by the transfer agent, sub-transfer agents, omnibus account servicers and record-keepers, Funds Management is entitled to receive from the Fund an annual fund level administration fee starting at 0.05% and declining to 0.03% as the average daily net assets of the Fund increase and a class level administration fee which is calculated based on the average daily net assets of each class as follows:
| | | | |
| | | Class level
administration fee | |
Class A, Class C, Class R | | | 0.26 | % |
Class R4, Institutional Class | | | 0.08 | |
Class R6 | | | 0.03 | |
Administrator Class | | | 0.10 | |
Investor Class | | | 0.32 | |
Funds Management has contractually waived and/or reimbursed advisory and administration fees to the extent necessary to maintain certain net operating expense ratios for the Fund. Waiver of fees and/or reimbursement of expenses by Funds Management were made first from fund level expenses on a proportionate basis and then from class specific expenses. Funds Management has committed through November 30, 2014 to waive fees and/or reimburse expenses to the extent necessary to cap the Fund’s expenses at 1.07% for Class A shares, 1.82% for Class C shares, 1.32% for Class R shares, 0.75% for Class R4 shares, 0.60% for Class R6 shares, 0.95% for Administrator Class shares, 0.65% for Institutional Class shares and 1.13% for Investor Class shares.
Distribution fees
The Trust has adopted a Distribution Plan for Class C and Class R shares of the Fund pursuant to Rule 12b-1 under the 1940 Act. Distribution fees are charged to Class C and Class R shares and paid to Wells Fargo Funds Distributor, LLC, the principal underwriter, at an annual rate of 0.75% of the average daily net assets of Class C shares and 0.25% of the average daily net assets for Class R shares.
| | | | | | |
| Notes to financial statements (unaudited) | | Wells Fargo Advantage Large Cap Growth Fund | | | 25 | |
For the six months ended January 31, 2014, Wells Fargo Funds Distributor, LLC received $7,008 from the sale of Class A shares.
Shareholder servicing fees
The Trust has entered into contracts with one or more shareholder servicing agents, whereby Class A, Class C, Class R, Administrator Class, and Investor Class of the Fund is charged a fee at an annual rate of 0.25% of the average daily net assets of each respective class. Class R4 shares are charged a fee at an annual rate of 0.10% of its average daily net assets.
A portion of these total shareholder servicing fees were paid to affiliates of Wells Fargo.
5. INVESTMENT PORTFOLIO TRANSACTIONS
Purchases and sales of investments, excluding U.S. government obligations (if any) and short-term securities, for the six months ended January 31, 2014 were $251,375,382 and $202,536,414, respectively.
6. BANK BORROWINGS
The Trust (excluding the money market funds and certain other funds in the Trust) and Wells Fargo Variable Trust are parties to a $150,000,000 revolving credit agreement with State Street Bank and Trust Company, whereby the Fund is permitted to use bank borrowings for temporary or emergency purposes, such as to fund shareholder redemption requests. Interest under the credit agreement is charged to the Fund based on a borrowing rate equal to the higher of the Federal Funds rate in effect on that day plus 1.25% or the overnight LIBOR rate in effect on that day plus 1.25%. In addition, an annual commitment fee equal to 0.10% of the unused balance is allocated to each participating fund. For the six months ended January 31, 2014, the Fund paid $534 in commitment fees.
For the six months ended January 31, 2014, there were no borrowings by the Fund under the agreement.
7. CONCENTRATION RISK
Concentration risks result from exposure to a limited number of sectors. Funds that invest a substantial portion of their assets in any sector may be more affected by changes in that sector than would be a fund whose investments are not heavily weighted in any sector.
8. INDEMNIFICATION
Under the Trust’s organizational documents, the officers and directors are indemnified against certain liabilities that may arise out of performance of their duties to the Trust. Additionally, in the normal course of business, the Trust may enter into contracts with service providers that contain a variety of indemnification clauses. The Trust’s maximum exposure under these arrangements is dependent on future claims that may be made against the Fund and, therefore, cannot be estimated.
| | | | |
| 26 | | Wells Fargo Advantage Large Cap Growth Fund | | Other information (unaudited) |
PROXY VOTING INFORMATION
A description of the policies and procedures that the Fund uses to determine how to vote proxies relating to portfolio securities is available without charge, upon request, by calling 1-800-222-8222, visiting our website at wellsfargoadvantagefunds.com, or visiting the SEC website at sec.gov. Information regarding how the Fund voted proxies relating to portfolio securities during the most recent 12-month period ended June 30 is available without charge on the Fund’s website at wellsfargoadvantagefunds.com or by visiting the SEC website at sec.gov.
PORTFOLIO HOLDINGS INFORMATION
The complete portfolio holdings for the Fund are publicly available on the Fund’s website (wellsfargoadvantagefunds.com) on a monthly, 30-day or more delayed basis. In addition, top ten holdings information for the Fund is publicly available on the Fund’s website on a monthly, seven-day or more delayed basis. The Fund files its complete schedule of portfolio holdings with the SEC for the first and third quarters of each fiscal year on Form N-Q, which is available without charge by visiting the SEC website at sec.gov. In addition, the Fund’s Form N-Q may be reviewed and copied at the SEC’s Public Reference Room in Washington, DC, and at regional offices in New York City, at 233 Broadway, and in Chicago, at 175 West Jackson Boulevard, Suite 900. Information about the Public Reference Room may be obtained by calling 1-800-SEC-0330.
| | | | | | |
| Other information (unaudited) | | Wells Fargo Advantage Large Cap Growth Fund | | | 27 | |
BOARD OF TRUSTEES AND OFFICERS
Each of the Trustees and Officers listed in the table below acts in identical capacities for each fund in the Wells Fargo Advantage family of funds, which consists of 132 mutual funds1 comprising the Wells Fargo Funds Trust, Wells Fargo Variable Trust, Wells Fargo Master Trust and four closed-end funds (collectively the “Fund Complex”). This table should be read in conjunction with the Prospectus and the Statement of Additional Information2. All of the Trustees are also Members of the Audit and Governance Committees of each Trust in the Fund Complex. The mailing address of each Trustee and Officer is 525 Market Street, 12th Floor, San Francisco, CA 94105. Each Trustee and Officer serves an indefinite term, however, each Trustee serves such term until reaching the mandatory retirement age established by the Trustees.
Independent Trustees
| | | | | | |
Name and
year of birth | | Position held and
length of service* | | Principal occupations during past five years | | Other
directorships during
past five years |
Peter G. Gordon
(Born 1942) | | Trustee, since 1998; Chairman, since 2005 | | Co-Founder, Retired Chairman, President and CEO of Crystal Geyser Water Company. Trustee Emeritus, Colby College. | | Asset Allocation Trust |
Isaiah Harris, Jr.
(Born 1952) | | Trustee, since 2009 | | Retired. Prior thereto, President and CEO of BellSouth Advertising and Publishing Corp. from 2005 to 2007, President and CEO of BellSouth Enterprises from 2004 to 2005 and President of BellSouth Consumer Services from 2000 to 2003. Emeritus member of the Iowa State University Foundation Board of Governors. Emeritus Member of the Advisory Board of Iowa State University School of Business. Advisory Board Member, Palm Harbor Academy (charter school). Mr. Harris is a certified public accountant. | | CIGNA Corporation; Deluxe Corporation; Asset Allocation Trust |
Judith M. Johnson
(Born 1949) | | Trustee, since 2008; Audit Committee Chairman, since 2008 | | Retired. Prior thereto, Chief Executive Officer and Chief Investment Officer of Minneapolis Employees Retirement Fund from 1996 to 2008. Ms. Johnson is an attorney, certified public accountant and a certified managerial accountant. | | Asset Allocation Trust |
Leroy Keith, Jr.
(Born 1939) | | Trustee, since 2010 | | Chairman, Bloc Global Services (development and construction). Trustee of the Evergreen Funds from 1983 to 2010. Former Managing Director, Almanac Capital Management (commodities firm), former Partner, Stonington Partners, Inc. (private equity fund), former Director, Obagi Medical Products Co. and former Director, Lincoln Educational Services. | | Trustee, Virtus Fund Complex (consisting of 50 portfolios as of 12/16/2013); Asset Allocation Trust |
David F. Larcker
(Born 1950) | | Trustee, since 2009 | | James Irvin Miller Professor of Accounting at the Graduate School of Business, Stanford University, Morgan Stanley Director of the Center for Leadership Development and Research and Senior Faculty of The Rock Center for Corporate Governance since 2006. From 2005 to 2008, Professor of Accounting at the Graduate School of Business, Stanford University. Prior thereto, Ernst & Young Professor of Accounting at The Wharton School, University of Pennsylvania from 1985 to 2005. | | Asset Allocation Trust |
Olivia S. Mitchell
(Born 1953) | | Trustee, since 2006 | | International Foundation of Employee Benefit Plans Professor, Wharton School of the University of Pennsylvania since 1993. Director of Wharton’s Pension Research Council and Boettner Center on Pensions & Retirement Research, and Research Associate at the National Bureau of Economic Research. Previously, Cornell University Professor from 1978 to 1993. | | Asset Allocation Trust |
Timothy J. Penny
(Born 1951) | | Trustee, since 1996 | | President and CEO of Southern Minnesota Initiative Foundation, a non-profit organization, since 2007 and Senior Fellow at the Humphrey Institute Policy Forum at the University of Minnesota since 1995. Member of the Board of Trustees of NorthStar Education Finance, Inc., a non-profit organization, since 2007. | | Asset Allocation Trust |
| | | | |
| 28 | | Wells Fargo Advantage Large Cap Growth Fund | | Other information (unaudited) |
| | | | | | |
Name and
year of birth | | Position held and
length of service* | | Principal occupations during past five years | | Other
directorships during
past five years |
Michael S. Scofield
(Born 1943) | | Trustee, since 2010 | | Served on the Investment Company Institute’s Board of Governors and Executive Committee from 2008-2011 as well the Governing Council of the Independent Directors Council from 2006-2011 and the Independent Directors Council Executive Committee from 2008-2011. Chairman of the IDC from 2008-2010. Institutional Investor (Fund Directions) Trustee of Year in 2007. Trustee of the Evergreen Funds (and its predecessors) from 1984 to 2010. Chairman of the Evergreen Funds from 2000-2010. Former Trustee of the Mentor Funds. Retired Attorney, Law Offices of Michael S. Scofield. | | Asset Allocation Trust |
Donald C. Willeke
(Born 1940) | | Trustee, since 1996 | | Principal of the law firm of Willeke & Daniels. General Counsel of the Minneapolis Employees Retirement Fund from 1984 until its consolidation into the Minnesota Public Employees Retirement Association on June 30, 2010. Director and Vice Chair of The Tree Trust (non-profit corporation). Director of the American Chestnut Foundation (non-profit corporation). | | Asset Allocation Trust |
| * | Length of service dates reflect the Trustee’s commencement of service with the Trust’s predecessor entities, where applicable. |
Officers
| | | | | | |
Name and
year of birth | | Position held and
length of service | | Principal occupations during past five years | | |
Karla M. Rabusch
(Born 1959) | | President, since 2003 | | Executive Vice President of Wells Fargo Bank, N.A. and President of Wells Fargo Funds Management, LLC since 2003. | | |
Jeremy DePalma1
(Born 1974) | | Treasurer, since 2012 | | Senior Vice President of Wells Fargo Funds Management, LLC since 2009. Senior Vice President of Evergreen Investment Management Company, LLC from 2008 to 2010. Vice President, Evergreen Investment Services, Inc. from 2004 to 2007. Head of the Fund Reporting and Control Team within Fund Administration from 2005 to 2010. | | |
C. David Messman
(Born 1960) | | Secretary, since 2000; Chief Legal Officer, since 2003 | | Senior Vice President and Secretary of Wells Fargo Funds Management, LLC since 2001. Vice President and Managing Counsel of Wells Fargo Bank, N.A. since 1996. | | |
Debra Ann Early
(Born 1964) | | Chief Compliance Officer, since 2007 | | Chief Compliance Officer of Wells Fargo Funds Management, LLC since 2007. Chief Compliance Officer of Parnassus Investments from 2005 to 2007. Chief Financial Officer of Parnassus Investments from 2004 to 2007. | | |
David Berardi
(Born 1975) | | Assistant Treasurer, since 2009 | | Vice President of Wells Fargo Funds Management, LLC since 2009. Vice President of Evergreen Investment Management Company, LLC from 2008 to 2010. Assistant Vice President of Evergreen Investment Services, Inc. from 2004 to 2008. Manager of Fund Reporting and Control for Evergreen Investment Management Company, LLC from 2004 to 2010. | | |
| 1. | Jeremy DePalma acts as Treasurer of 59 funds and Assistant Treasurer of 73 funds in the Fund Complex. |
| 2. | The Statement of Additional Information includes additional information about the Trustees and is available, without charge, upon request, by calling 1-800-222-8222 or by visiting the website at wellsfargoadvantagefunds.com. |
| | | | | | |
| List of abbreviations | | Wells Fargo Advantage Large Cap Growth Fund | | | 29 | |
The following is a list of common abbreviations for terms and entities that may have appeared in this report.
| ACA | — ACA Financial Guaranty Corporation |
| ADR | — American depositary receipt |
| ADS | — American depositary shares |
| AGC | — Assured Guaranty Corporation |
| AGM | — Assured Guaranty Municipal |
| Ambac | — Ambac Financial Group Incorporated |
| AMT | — Alternative minimum tax |
| BAN | — Bond anticipation notes |
| BHAC | — Berkshire Hathaway Assurance Corporation |
| CAB | — Capital appreciation bond |
| CCAB | — Convertible capital appreciation bond |
| CDA | — Community Development Authority |
| CDO | — Collateralized debt obligation |
| COP | — Certificate of participation |
| DRIVER | — Derivative inverse tax-exempt receipts |
| DW&P | — Department of Water & Power |
| DWR | — Department of Water Resources |
| ECFA | — Educational & Cultural Facilities Authority |
| EDA | — Economic Development Authority |
| EDFA | — Economic Development Finance Authority |
| ETF | — Exchange-traded fund |
| FDIC | — Federal Deposit Insurance Corporation |
| FFCB | — Federal Farm Credit Banks |
| FGIC | — Financial Guaranty Insurance Corporation |
| FHA | — Federal Housing Administration |
| FHLB | — Federal Home Loan Bank |
| FHLMC | — Federal Home Loan Mortgage Corporation |
| FICO | — The Financing Corporation |
| FNMA | — Federal National Mortgage Association |
| GDR | — Global depositary receipt |
| GNMA | — Government National Mortgage Association |
| HCFR | — Healthcare facilities revenue |
| HEFA | — Health & Educational Facilities Authority |
| HEFAR | — Higher education facilities authority revenue |
| HFA | — Housing Finance Authority |
| HFFA | — Health Facilities Financing Authority |
| HUD | — Department of Housing and Urban Development |
| IDA | — Industrial Development Authority |
| IDAG | — Industrial Development Agency |
| IDR | — Industrial development revenue |
| KRW | — Republic of Korea won |
| LIBOR | — London Interbank Offered Rate |
| LLC | — Limited liability company |
| LLLP | — Limited liability limited partnership |
| LLP | — Limited liability partnership |
| MBIA | — Municipal Bond Insurance Association |
| MFHR | — Multifamily housing revenue |
| MSTR | — Municipal securities trust receipts |
| MUD | — Municipal Utility District |
| National | — National Public Finance Guarantee Corporation |
| PCFA | — Pollution Control Financing Authority |
| PCL | — Public Company Limited |
| PCR | — Pollution control revenue |
| PFA | — Public Finance Authority |
| PFFA | — Public Facilities Financing Authority |
| PFOTER | — Puttable floating option tax-exempt receipts |
| plc | — Public limited company |
| PUTTER | — Puttable tax-exempt receipts |
| R&D | — Research & development |
| Radian | — Radian Asset Assurance |
| RAN | — Revenue anticipation notes |
| RDA | — Redevelopment Authority |
| RDFA | — Redevelopment Finance Authority |
| REIT | — Real estate investment trust |
| ROC | — Reset option certificates |
| SAVRS | — Select auction variable rate securities |
| SBA | — Small Business Authority |
| SFHR | — Single-family housing revenue |
| SFMR | — Single-family mortgage revenue |
| SPA | — Standby purchase agreement |
| SPDR | — Standard & Poor’s Depositary Receipts |
| STRIPS | — Separate trading of registered interest and principal securities |
| TAN | — Tax anticipation notes |
| TIPS | — Treasury inflation-protected securities |
| TRAN | — Tax revenue anticipation notes |
| TTFA | — Transportation Trust Fund Authority |
| TVA | — Tennessee Valley Authority |
This page is intentionally left blank.
This page is intentionally left blank.
This page is intentionally left blank.


For more information
More information about Wells Fargo Advantage Funds is available free upon request. To obtain literature, please write, email, visit the Fund’s website, or call:
Wells Fargo Advantage Funds
P.O. Box 8266
Boston, MA 02266-8266
Email: wfaf@wellsfargo.com
Website: wellsfargoadvantagefunds.com
Individual investors: 1-800-222-8222
Retail investment professionals: 1-888-877-9275
Institutional investment professionals: 1-866-765-0778
This report and the financial statements contained herein are submitted for the general information of the shareholders of Wells Fargo Advantage Funds. If this report is used for promotional purposes, distribution of the report must be accompanied or preceded by a current prospectus. For a current prospectus and, if available, a summary prospectus containing more complete information, including charges and expenses, call 1-800-222-8222 or visit the Fund’s website at wellsfargoadvantagefunds.com. Please consider the investment objectives, risks, charges, and expenses of the investment carefully before investing. This and other information about Wells Fargo Advantage Funds can be found in the current prospectus. Read the prospectus carefully before you invest or send money.
Wells Fargo Funds Management, LLC, a wholly owned subsidiary of Wells Fargo & Company, provides investment advisory and administrative services for Wells Fargo Advantage Funds. Other affiliates of Wells Fargo & Company provide subadvisory and other services for the Funds. The Funds are distributed by Wells Fargo Funds Distributor, LLC, Member FINRA/SIPC, an affiliate of Wells Fargo & Company.
NOT FDIC INSURED ¡ NO BANK GUARANTEE ¡ MAY LOSE VALUE
© 2014 Wells Fargo Funds Management, LLC. All rights reserved.
| | |
 | | 222991 03-14 SA209/SAR209 1-14 |

Wells Fargo Advantage
Large Company Value Fund

Semi-Annual Report
January 31, 2014

Reduce clutter. Save trees.
Sign up for electronic delivery of prospectuses and shareholder reports at wellsfargo.com/advantagedelivery
Contents
The views expressed and any forward-looking statements are as of January 31, 2014, unless otherwise noted, and are those of the Fund managers and/or Wells Fargo Funds Management, LLC. Discussions of individual securities, or the markets generally, or any Wells Fargo Advantage Fund are not intended as individual recommendations. Future events or results may vary significantly from those expressed in any forward-looking statements; the views expressed are subject to change at any time in response to changing circumstances in the market. Wells Fargo Funds Management, LLC and the Fund disclaim any obligation to publicly update or revise any views expressed or forward-looking statements.
NOT FDIC INSURED ¡ NO BANK GUARANTEE ¡ MAY LOSE VALUE
| | | | |
| 2 | | Wells Fargo Advantage Large Company Value Fund | | Letter to shareholders (unaudited) |

Karla M. Rabusch
President
Wells Fargo Advantage Funds
Major central banks continued to inject liquidity into the banks and the markets through various quantitative easing policies.
Dear Valued Shareholder:
We are pleased to offer you this semi-annual report for the Wells Fargo Advantage Large Company Value Fund for the six-month period that ended January 31, 2014. Much of the period was marked by monetary easing by global central banks. Entering the period, investors were concerned that the U.S. Federal Reserve (Fed) would end its bond-buying program, which initially led to higher interest rates and resulted in losses for bond indexes and volatility for global stock indexes. These fears dissipated in late September 2013 and ended altogether in mid-December 2013 when the Fed announced a tapering timeline that was far more moderate than some had feared. Growing confidence that the U.S. economy was staging a fragile recovery resulted in double-digit returns for domestic stock market indexes for the six-month reporting period.
Central banks continued to provide stimulus.
Major central banks continued to inject liquidity into the banks and the markets through various quantitative easing policies. Throughout the reporting period, the Federal Open Market Committee (FOMC)—the Fed’s monetary policymaking body—kept its key interest rate effectively near zero in order to support the economy and the financial system. Well before the reporting period began, the FOMC announced its intention to keep interest rates low for an extended period and to make open-ended purchases of $40 billion per month in mortgage-backed securities. The FOMC later added purchases of $45 billion per month in long-term U.S. Treasuries. Because the markets benefited from the FOMC’s liquidity, both stocks and bonds initially sold off after the FOMC indicated in May 2013 that it might reduce (or taper) its bond-buying program. However, in mid-December 2013, the FOMC announced that it would reduce its bond-buying program by $10 billion per month beginning in January 2014. The tapering was less aggressive than some investors had feared, and the markets ended 2013 strongly.
European markets continued to benefit from the European Central Bank’s (ECB’s) earlier announcement that it would purchase an unlimited amount of one- to three-year sovereign debt from countries that had formally applied for a bailout. In November 2013, the ECB cut its key rate to a historic low of 0.25%. The ECB’s aggressive actions helped ease investor worries about a eurozone sovereign debt default. Given the substantial ties between the U.S. and Europe, the improved sentiment about the eurozone helped provide a tailwind for U.S. markets.
U.S. stock markets gained on relatively good news.
For most of the period, U.S. economic data remained moderately positive. Reported gross domestic product (GDP) growth came in at a strong 4.1% annualized rate in the third quarter of 2013, and the advance annualized estimate for fourth-quarter GDP growth was 3.2%.
The most significant negative effect was the ongoing fight in Washington, D.C., over the federal budget and debt limit. The Budget Control Act of 2011, which was passed to resolve a previous fight over the federal debt ceiling, mandated budget sequestration that took effect on March 1, 2013, and was an overhang on economic growth throughout the reporting period. Most recently, Congress was unable to pass a resolution to continue to fund the federal government, and thus, the federal government underwent a partial shutdown from September 30, 2013, through October 16, 2013. The government reopened after the president and Congress reached a deal that funded the government through January 15, 2014,
| | | | | | |
| Letter to shareholders (unaudited) | | Wells Fargo Advantage Large Company Value Fund | | | 3 | |
and raised the debt limit through February 7, 2014. In December 2013, Congress passed the Ryan–Murray budget agreement that funded the government through September 2015, lessening the near-term prospect of another shutdown.
Despite political headwinds, the relatively positive outlook for the U.S. economy contributed to a strong domestic stock market for most of the reporting period. Economically sensitive sectors, such as industrials and materials, outperformed. Dividend-paying sectors such as utilities and telecommunication services lagged as higher interest rates dampened their relative performance. Judging by various Russell indexes, small-cap stocks moderately outperformed large-cap stocks, and growth stocks strongly outperformed value stocks.
Don’t let short-term uncertainty derail long-term investment goals.
Periods of uncertainty can present challenges, but experience has taught us that maintaining long-term investment goals can be an effective way to plan for the future. Although diversification cannot guarantee an investment profit or prevent losses, we believe it can be an effective way to manage investment risk and potentially smooth out overall portfolio performance. We encourage investors to know their investments and to understand that appropriate levels of risk-taking may unlock opportunities.
Thank you for choosing to invest with Wells Fargo Advantage Funds. We appreciate your confidence in us and remain committed to helping you meet your financial needs. For current information about your fund investments, contact your investment professional, visit our website at wellsfargoadvantagefunds.com, or call us directly at 1-800-222-8222. We are available 24 hours a day, 7 days a week.
Sincerely,

Karla M. Rabusch
President
Wells Fargo Advantage Funds
Despite political headwinds, the relatively positive outlook for the U.S. economy contributed to a strong domestic stock market for most of the reporting period.
Notice to shareholders
The Fund and Wells Fargo Funds Management, LLC (“Funds Management”) have received an exemptive order from the SEC that permits Funds Management, subject to the approval of the Board of Trustees of the Fund, to select or replace certain subadvisers to manage all or a portion of the Fund’s assets and enter into, amend or terminate a sub-advisory agreement with certain subadvisers without obtaining shareholder approval (“Multi-manager Structure”). The Multi-manager Structure applies to subadvisers that are not affiliated with Funds Management or the Fund, except to the extent that affiliation arises solely because such subadvisers provide sub-advisory services to the Fund (“Non-affiliated Subadvisers”), as well as subadvisers that are indirect or direct wholly-owned subsidiaries of Funds Management or of another company that, indirectly or directly, wholly owns Funds Management (“Wholly-owned Subadvisers”).
Pursuant to the SEC order, Funds Management, with the approval of the Board of Trustees, has the discretion to terminate any subadvisers and allocate and reallocate the Fund’s assets among any other Non-affiliated Subadvisers or Wholly-owned Subadvisers. Funds Management, subject to oversight and supervision by the Board of Trustees, has responsibility to continue to oversee any subadvisers to the Fund and to recommend, for approval by the Board of Trustees, the hiring, termination and replacement of subadvisers for the Fund. In the event that a new subadviser is hired pursuant to the Multi-manager Structure, the Fund is required to provide notice to shareholders within 90 days.
Please contact your investment professional or call us directly at 1-800-222-8222 if you have any questions on this Notice to Shareholders.
| | | | |
| 4 | | Wells Fargo Advantage Large Company Value Fund | | Performance highlights (unaudited) |
Investment objective
The Fund seeks long-term capital appreciation.
Adviser
Wells Fargo Funds Management, LLC
Subadviser
Phocas Financial Corporation
Portfolio managers
Stephen L. Block, CFA
William F.K. Schaff, CFA
Average annual total returns1 (%) as of January 31, 2014
| | | | | | | | | | | | | | | | | | | | | | | | | | | | | | | | | | |
| | | | | Including sales charge | | | Excluding sales charge | | | Expense ratios2 (%) | |
| | | Inception date | | 1 year | | | 5 year | | | 10 year | | | 1 year | | | 5 year | | | 10 year | | | Gross | | | Net3 | |
| Class A (WLCAX) | | 3-31-2008 | | | 15.04 | | | | 15.62 | | | | 6.17 | | | | 22.04 | | | | 17.00 | | | | 6.81 | | | | 1.27 | | | | 1.10 | |
| Class C (WFLVX) | | 3-31-2008 | | | 20.07 | | | | 16.13 | | | | 6.07 | | | | 21.07 | | | | 16.13 | | | | 6.07 | | | | 2.02 | | | | 1.85 | |
| Administrator Class (WWIDX) | | 12-31-2001 | | | – | | | | – | | | | – | | | | 22.29 | | | | 17.31 | | | | 7.16 | | | | 1.11 | | | | 0.85 | |
| Institutional Class (WLCIX) | | 3-31-2008 | | | – | | | | – | | | | – | | | | 22.54 | | | | 17.55 | | | | 7.29 | | | | 0.84 | | | | 0.65 | |
| Investor Class (SDVIX) | | 7-1-1993 | | | – | | | | – | | | | – | | | | 21.92 | | | | 16.91 | | | | 6.76 | | | | 1.33 | | | | 1.16 | |
| Russell 1000® Value Index4 | | – | | | – | | | | – | | | | – | | | | 20.02 | | | | 18.69 | | | | 7.01 | | | | – | | | | – | |
Figures quoted represent past performance, which is no guarantee of future results, and do not reflect taxes that a shareholder may pay on fund distributions or the redemption of fund shares. Investment return and principal value of an investment will fluctuate so that an investor’s shares, when redeemed, may be worth more or less than their original cost. Performance shown without sales charges would be lower if sales charges were reflected. Current performance may be lower or higher than the performance data quoted, which assumes the reinvestment of dividends and capital gains. Current month-end performance is available on the Fund’s website, wellsfargoadvantagefunds.com.
Index returns do not include transaction costs associated with buying and selling securities, any mutual fund fees or expenses, or any taxes. It is not possible to invest directly in an index.
For Class A shares, the maximum front-end sales charge is 5.75%. For Class C shares, the maximum contingent deferred sales charge is 1.00%. Performance including sales charge assumes the sales charge for the corresponding time period. Administrator Class, Institutional Class, and Investor Class shares are sold without a front-end sales charge or contingent deferred sales charge.
Stock values fluctuate in response to the activities of individual companies and general market and economic conditions. Certain investment strategies tend to increase the total risk of an investment (relative to the broader market). The Fund is exposed to foreign investment risk. Consult the Fund’s prospectus for additional information on these and other risks.
Please see footnotes on page 5.
| | | | | | |
| Performance highlights (unaudited) | | Wells Fargo Advantage Large Company Value Fund | | | 5 | |
| | | | |
| Ten largest equity holdings5 (%) as of January 31, 2014 | |
Bank of America Corporation | | | 3.10 | |
Exxon Mobil Corporation | | | 2.87 | |
JPMorgan Chase & Company | | | 2.58 | |
Citigroup Incorporated | | | 2.39 | |
CVS Caremark Corporation | | | 2.39 | |
The Hartford Financial Services Group Incorporated | | | 2.17 | |
Merck & Company Incorporated | | | 2.12 | |
American International Group Incorporated | | | 2.11 | |
Newell Rubbermaid Incorporated | | | 1.95 | |
Eaton Corporation plc | | | 1.94 | |
| | |
| Sector distribution6 as of January 31, 2014 |
|
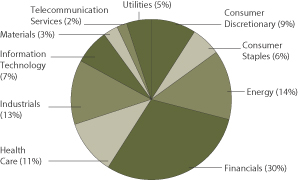
|
| 1. | Historical performance shown for Class A shares prior to their inception reflects the performance of Investor Class shares, and includes the higher expenses applicable to Investor Class shares (except during those periods in which the expenses of Class A shares would have been higher than those of Investor Class shares). If these expenses had not been included, returns would be higher. Historical performance shown for Class C shares prior to their inception reflects the performance of Investor Class shares, adjusted to reflect the higher expenses applicable to Class C shares. Historical performance shown for Institutional Class shares prior to their inception reflects the performance of Investor Class shares and includes the higher expenses applicable to Investor Class shares. If these expenses had not been included, returns would be higher. |
| 2. | Reflects the expense ratios as stated in the most recent prospectuses. The expense ratios shown are subject to change and may differ from the annualized expense ratios shown in the financial highlights of this report. |
| 3. | The Adviser has committed through November 30, 2014, to waive fees and/or reimburse expenses to the extent necessary to cap the Fund’s Total Annual Fund Operating Expenses After Fee Waiver, excluding certain expenses, at the amounts shown. Brokerage commissions, stamp duty fees, interest, taxes, acquired fund fees and expenses, and extraordinary expenses are excluded from the cap. Without this cap, the Fund’s returns would have been lower. |
| 4. | The Russell 1000® Value Index measures the performance of those Russell 1000 Index companies with lower price-to-book ratios and lower forecasted growth values. You cannot invest directly in an index. |
| 5. | The ten largest equity holdings are calculated based on the value of the securities divided by total net assets of the Fund. Holdings are subject to change and may have changed since the date specified. |
| 6. | Sector distribution is subject to change and is calculated based on the total long-term investments of the Fund. |
| | | | |
| 6 | | Wells Fargo Advantage Large Company Value Fund | | Fund expenses (unaudited) |
As a shareholder of the Fund, you incur two types of costs: (1) transaction costs, including sales charges (loads) on purchase payments and contingent deferred sales charges (if any) on redemptions and (2) ongoing costs, including management fees, distribution (12b-1) and/or shareholder service fees, and other Fund expenses. This example is intended to help you understand your ongoing costs (in dollars) of investing in the Fund and to compare these costs with the ongoing costs of investing in other mutual funds.
The example is based on an investment of $1,000 invested at the beginning of the six-month period and held for the entire period from August 1, 2013 to January 31, 2014.
Actual expenses
The “Actual” line of the table below provides information about actual account values and actual expenses. You may use the information in this line, together with the amount you invested, to estimate the expenses that you paid over the period. Simply divide your account value by $1,000 (for example, an $8,600 account value divided by $1,000 = 8.6), then multiply the result by the number in the “Actual” line under the heading entitled “Expenses paid during period” for your applicable class of shares to estimate the expenses you paid on your account during this period.
Hypothetical example for comparison purposes
The “Hypothetical” line of the table below provides information about hypothetical account values and hypothetical expenses based on the Fund’s actual expense ratio and an assumed rate of return of 5% per year before expenses, which is not the Fund’s actual return. The hypothetical account values and expenses may not be used to estimate the actual ending account balance or expenses you paid for the period. You may use this information to compare the ongoing costs of investing in the Fund and other funds. To do so, compare this 5% hypothetical example with the 5% hypothetical examples that appear in the shareholder reports of the other funds.
Please note that the expenses shown in the table are meant to highlight your ongoing costs only and do not reflect any transactional costs, such as sales charges (loads) and contingent deferred sales charges. Therefore, the “Hypothetical” line of the table is useful in comparing ongoing costs only and will not help you determine the relative total costs of owning different funds. In addition, if these transactional costs were included, your costs would have been higher.
| | | | | | | | | | | | | | | | |
| | | Beginning
account value
8-1-2013 | | | Ending
account value
1-31-2014 | | | Expenses
paid during
the period1 | | | Net annualized
expense ratio | |
Class A | | | | | | | | | | | | | | | | |
Actual | | $ | 1,000.00 | | | $ | 1,061.42 | | | $ | 5.72 | | | | 1.10 | % |
Hypothetical (5% return before expenses) | | $ | 1,000.00 | | | $ | 1,019.66 | | | $ | 5.60 | | | | 1.10 | % |
Class C | | | | | | | | | | | | | | | | |
Actual | | $ | 1,000.00 | | | $ | 1,057.06 | | | $ | 9.59 | | | | 1.85 | % |
Hypothetical (5% return before expenses) | | $ | 1,000.00 | | | $ | 1,015.88 | | | $ | 9.40 | | | | 1.85 | % |
Administrator Class | | | | | | | | | | | | | | | | |
Actual | | $ | 1,000.00 | | | $ | 1,061.77 | | | $ | 4.42 | | | | 0.85 | % |
Hypothetical (5% return before expenses) | | $ | 1,000.00 | | | $ | 1,020.92 | | | $ | 4.33 | | | | 0.85 | % |
Institutional Class | | | | | | | | | | | | | | | | |
Actual | | $ | 1,000.00 | | | $ | 1,063.36 | | | $ | 3.38 | | | | 0.65 | % |
Hypothetical (5% return before expenses) | | $ | 1,000.00 | | | $ | 1,021.93 | | | $ | 3.31 | | | | 0.65 | % |
Investor Class | | | | | | | | | | | | | | | | |
Actual | | $ | 1,000.00 | | | $ | 1,060.79 | | | $ | 6.03 | | | | 1.16 | % |
Hypothetical (5% return before expenses) | | $ | 1,000.00 | | | $ | 1,019.36 | | | $ | 5.90 | | | | 1.16 | % |
| 1. | Expenses paid is equal to the annualized expense ratio of each class multiplied by the average account value over the period, multiplied by the number of days in the most recent fiscal half-year divided by the number of days in the fiscal year (to reflect the one-half-year period). |
| | | | | | |
| Portfolio of investments—January 31, 2014 (unaudited) | | Wells Fargo Advantage Large Company Value Fund | | | 7 | |
| | | | | | | | | | | | |
| Security name | | | | | | Shares | | | Value | |
| | | |
Common Stocks: 96.93% | | | | | | | | | | |
| | | | |
Consumer Discretionary: 8.70% | | | | | | | | | | | | |
| | | |
| Automobiles: 1.63% | | | | | | | | | | |
General Motors Company † | | | | | | | 134,428 | | | $ | 4,850,162 | |
| | | | | | | | | | | | |
| | | |
| Hotels, Restaurants & Leisure: 1.07% | | | | | | | | | | |
Norwegian Cruise Line Company † | | | | | | | 90,800 | | | | 3,179,816 | |
| | | | | | | | | | | | |
| | | |
| Household Durables: 1.95% | | | | | | | | | | |
Newell Rubbermaid Incorporated | | | | | | | 187,448 | | | | 5,792,143 | |
| | | | | | | | | | | | |
| | | |
| Media: 2.24% | | | | | | | | | | |
Lamar Advertising Company Class A † | | | | | | | 81,149 | | | | 3,948,710 | |
The Walt Disney Company | | | | | | | 37,174 | | | | 2,699,204 | |
| | | | |
| | | | | | | | | | | 6,647,914 | |
| | | | | | | | | | | | |
| | | |
| Multiline Retail: 1.01% | | | | | | | | | | |
Dillard’s Incorporated Class A | | | | | | | 34,187 | | | | 2,984,525 | |
| | | | | | | | | | | | |
| | | |
| Specialty Retail: 0.80% | | | | | | | | | | |
Bed Bath & Beyond Incorporated † | | | | | | | 36,958 | | | | 2,359,768 | |
| | | | | | | | | | | | |
| | | | |
Consumer Staples: 5.78% | | | | | | | | | | | | |
| | | | |
| Food & Staples Retailing: 2.39% | | | | | | | | | | | | |
CVS Caremark Corporation | | | | | | | 104,582 | | | | 7,082,293 | |
| | | | | | | | | | | | |
| | | |
| Food Products: 1.00% | | | | | | | | | | |
Darling International Incorporated † | | | | | | | 151,178 | | | | 2,957,042 | |
| | | | | | | | | | | | |
| | | |
| Household Products: 1.29% | | | | | | | | | | |
Procter & Gamble Company | | | | | | | 50,054 | | | | 3,835,137 | |
| | | | | | | | | | | | |
| | | |
| Personal Products: 1.10% | | | | | | | | | | |
Herbalife Limited « | | | | | | | 50,837 | | | | 3,272,378 | |
| | | | | | | | | | | | |
| | | | |
Energy: 13.34% | | | | | | | | | | | | |
| | | |
| Energy Equipment & Services: 0.98% | | | | | | | | | | |
Baker Hughes Incorporated | | | | | | | 51,041 | | | | 2,890,962 | |
| | | | | | | | | | | | |
| | | |
| Oil, Gas & Consumable Fuels: 12.36% | | | | | | | | | | |
Chevron Corporation | | | | | | | 39,312 | | | | 4,388,399 | |
ConocoPhillips Company | | | | | | | 53,754 | | | | 3,491,322 | |
Denbury Resources Incorporated † | | | | | | | 218,507 | | | | 3,511,407 | |
EnCana Corporation | | | | | | | 196,490 | | | | 3,530,925 | |
Exxon Mobil Corporation | | | | | | | 92,299 | | | | 8,506,276 | |
Marathon Oil Corporation | | | | | | | 163,623 | | | | 5,365,198 | |
Valero Energy Corporation | | | | | | | 76,042 | | | | 3,885,746 | |
Whiting Petroleum Corporation † | | | | | | | 68,440 | | | | 3,995,527 | |
| | | | |
| | | | | | | | | | | 36,674,800 | |
| | | | | | | | | | | | |
The accompanying notes are an integral part of these financial statements.
| | | | |
| 8 | | Wells Fargo Advantage Large Company Value Fund | | Portfolio of investments—January 31, 2014 (unaudited) |
| | | | | | | | | | | | |
| Security name | | | | | | Shares | | | Value | |
| | | | |
Financials: 29.32% | | | | | | | | | | | | |
| | | | |
| Capital Markets: 1.33% | | | | | | | | | | | | |
Goldman Sachs Group Incorporated | | | | | | | 24,103 | | | $ | 3,955,784 | |
| | | | | | | | | | | | |
| | | |
| Commercial Banks: 5.96% | | | | | | | | | | |
First Republic Bank Corporation | | | | | | | 107,648 | | | | 5,224,157 | |
KeyCorp | | | | | | | 382,078 | | | | 4,875,315 | |
SVB Financial Group † | | | | | | | 25,556 | | | | 2,868,150 | |
Synovus Financial Corporation | | | | | | | 1,410,957 | | | | 4,726,706 | |
| | | | |
| | | | | | | | | | | 17,694,328 | |
| | | | | | | | | | | | |
| | | |
| Diversified Financial Services: 8.07% | | | | | | | | | | |
Bank of America Corporation | | | | | | | 549,547 | | | | 9,204,912 | |
Citigroup Incorporated | | | | | | | 149,497 | | | | 7,090,643 | |
JPMorgan Chase & Company | | | | | | | 138,218 | | | | 7,651,748 | |
| | | | |
| | | | | | | | | | | 23,947,303 | |
| | | | | | | | | | | | |
| | | |
| Insurance: 7.00% | | | | | | | | | | |
ACE Limited | | | | | | | 28,991 | | | | 2,719,646 | |
American International Group Incorporated | | | | | | | 130,384 | | | | 6,253,217 | |
MetLife Incorporated | | | | | | | 109,658 | | | | 5,378,725 | |
The Hartford Financial Services Group Incorporated | | | | | | | 193,189 | | | | 6,423,534 | |
| | | | |
| | | | | | | | | | | 20,775,122 | |
| | | | | | | | | | | | |
| | | | |
| Real Estate Management & Development: 0.97% | | | | | | | | | | | | |
Realogy Holdings Corporation † | | | | | | | 62,915 | | | | 2,867,037 | |
| | | | | | | | | | | | |
| | | | |
| REITs: 5.99% | | | | | | | | | | | | |
American Campus Communities Incorporated | | | | | | | 110,286 | | | | 3,833,541 | |
American Tower Corporation | | | | | | | 37,645 | | | | 3,044,728 | |
Realty Income Corporation « | | | | | | | 107,368 | | | | 4,378,467 | |
Vornado Realty Trust | | | | | | | 34,500 | | | | 3,168,135 | |
Weyerhaeuser Company | | | | | | | 111,681 | | | | 3,337,028 | |
| | | | |
| | | | | | | | | | | 17,761,899 | |
| | | | | | | | | | | | |
| | | | |
Health Care: 10.95% | | | | | | | | | | | | |
| | | | |
| Health Care Equipment & Supplies: 2.60% | | | | | | | | | | | | |
Medtronic Incorporated | | | | | | | 54,397 | | | | 3,076,694 | |
Stryker Corporation | | | | | | | 59,915 | | | | 4,649,404 | |
| | | | |
| | | | | | | | | | | 7,726,098 | |
| | | | | | | | | | | | |
| | | | |
| Health Care Providers & Services: 1.74% | | | | | | | | | | | | |
Cigna Corporation | | | | | | | 59,733 | | | | 5,155,555 | |
| | | | | | | | | | | | |
| | | | |
| Pharmaceuticals: 6.61% | | | | | | | | | | | | |
Johnson & Johnson Services Incorporated | | | | | | | 36,898 | | | | 3,264,366 | |
Merck & Company Incorporated | | | | | | | 118,912 | | | | 6,298,769 | |
Novartis AG ADR | | | | | | | 60,640 | | | | 4,794,805 | |
Pfizer Incorporated | | | | | | | 172,330 | | | | 5,238,832 | |
| | | | |
| | | | | | | | | | | 19,596,772 | |
| | | | | | | | | | | | |
The accompanying notes are an integral part of these financial statements.
| | | | | | |
| Portfolio of investments—January 31, 2014 (unaudited) | | Wells Fargo Advantage Large Company Value Fund | | | 9 | |
| | | | | | | | | | | | |
| Security name | | | | | | Shares | | | Value | |
| | | | |
Industrials: 12.02% | | | | | | | | | | | | |
| | | | |
| Airlines: 1.83% | | | | | | | | | | | | |
United Continental Holdings Incorporated † | | | | | | | 118,424 | | | $ | 5,428,556 | |
| | | | | | | | | | | | |
| | | | |
| Electrical Equipment: 2.74% | | | | | | | | | | | | |
Eaton Corporation plc | | | | | | | 78,776 | | | | 5,757,738 | |
Regal-Beloit Corporation | | | | | | | 32,033 | | | | 2,373,325 | |
| | | | |
| | | | | | | | | | | 8,131,063 | |
| | | | | | | | | | | | |
| | | |
| Industrial Conglomerates: 1.66% | | | | | | | | | | |
General Electric Company | | | | | | | 196,411 | | | | 4,935,808 | |
| | | | | | | | | | | | |
| | | | |
| Machinery: 2.03% | | | | | | | | | | | | |
Dover Corporation | | | | | | | 41,109 | | | | 3,558,395 | |
Stanley Black & Decker Incorporated | | | | | | | 31,808 | | | | 2,461,939 | |
| | | | |
| | | | | | | | | | | 6,020,334 | |
| | | | | | | | | | | | |
| | | | |
| Road & Rail: 1.82% | | | | | | | | | | | | |
Hertz Global Holdings Incorporated † | | | | | | | 207,104 | | | | 5,388,846 | |
| | | | | | | | | | | | |
| | | | |
| Trading Companies & Distributors: 1.94% | | | | | | | | | | | | |
WESCO International Incorporated † | | | | | | | 69,223 | | | | 5,742,740 | |
| | | | | | | | | | | | |
| | | | |
Information Technology: 7.14% | | | | | | | | | | | | |
| | | | |
| Computers & Peripherals: 2.42% | | | | | | | | | | | | |
Apple Incorporated | | | | | | | 5,850 | | | | 2,928,510 | |
EMC Corporation | | | | | | | 175,260 | | | | 4,248,302 | |
| | | | |
| | | | | | | | | | | 7,176,812 | |
| | | | | | | | | | | | |
| | | | |
| Internet Software & Services: 0.81% | | | | | | | | | | | | |
eBay Incorporated † | | | | | | | 45,374 | | | | 2,413,897 | |
| | | | | | | | | | | | |
| | | | |
| Semiconductors & Semiconductor Equipment: 2.66% | | | | | | | | | | | | |
Maxim Integrated Products Incorporated | | | | | | | 83,263 | | | | 2,519,538 | |
Skyworks Solutions Incorporated † | | | | | | | 177,791 | | | | 5,378,178 | |
| | | | |
| | | | | | | | | | | 7,897,716 | |
| | | | | | | | | | | | |
| | | | |
| Software: 1.25% | | | | | | | | | | | | |
Symantec Corporation | | | | | | | 172,708 | | | | 3,697,678 | |
| | | | | | | | | | | | |
| | | | |
Materials: 3.13% | | | | | | | | | | | | |
| | | | |
| Chemicals: 3.13% | | | | | | | | | | | | |
Ashland Incorporated | | | | | | | 41,121 | | | | 3,816,440 | |
Huntsman Corporation | | | | | | | 129,293 | | | | 2,834,103 | |
Westlake Chemical Corporation | | | | | | | 21,797 | | | | 2,649,207 | |
| | | | |
| | | | | | | | | | | 9,299,750 | |
| | | | | | | | | | | | |
The accompanying notes are an integral part of these financial statements.
| | | | |
| 10 | | Wells Fargo Advantage Large Company Value Fund | | Portfolio of investments—January 31, 2014 (unaudited) |
| | | | | | | | | | | | | | |
| Security name | | | | | | | Shares | | | Value | |
| | | | |
Telecommunication Services: 2.28% | | | | | | | | | | | | | | |
| | | | |
| Diversified Telecommunication Services: 2.28% | | | | | | | | | | | | | | |
AT&T Incorporated | | | | | | | | | 72,180 | | | $ | 2,405,038 | |
Verizon Communications Incorporated | | | | | | | | | 90,779 | | | | 4,359,208 | |
| | | | |
| | | | | | | | | | | | | 6,764,246 | |
| | | | | | | | | | | | | | |
| | | | |
Utilities: 4.27% | | | | | | | | | | | | | | |
| | | | |
| Electric Utilities: 1.25% | | | | | | | | | | | | | | |
Portland General Electric Company | | | | | | | | | 122,995 | | | | 3,711,989 | |
| | | | | | | | | | | | | | |
| | | | |
| Independent Power Producers & Energy Traders: 1.93% | | | | | | | | | | | | | | |
AES Corporation | | | | | | | | | 406,710 | | | | 5,718,343 | |
| | | | | | | | | | | | | | |
| | | | |
| Water Utilities: 1.09% | | | | | | | | | | | | | | |
Aqua America Incorporated | | | | | | | | | 135,637 | | | | 3,248,510 | |
| | | | | | | | | | | | | | |
| | | | |
Total Common Stocks (Cost $223,694,330) | | | | | | | | | | | | | 287,583,126 | |
| | | | | | | | | | | | | | |
| | | Yield | | | | | | | | | |
| | | | |
Short-Term Investments: 5.68% | | | | | | | | | | | | | | |
| | | | |
| Investment Companies: 5.68% | | | | | | | | | | | | | | |
Wells Fargo Advantage Cash Investment Money Market Fund, Select Class (l)(u) | | | 0.07 | % | | | | | 9,235,294 | | | | 9,235,294 | |
Wells Fargo Securities Lending Cash Investments, LLC (l)(u)(v)(r) | | | 0.08 | | | | | | 7,619,825 | | | | 7,619,825 | |
| | | | |
Total Short-Term Investments (Cost $16,855,119) | | | | | | | | | | | | | 16,855,119 | |
| | | | | | | | | | | | | | |
| | | | | | | | |
Total investments in securities
(Cost $240,549,449) * | | | 102.61 | % | | | 304,438,245 | |
Other assets and liabilities, net | | | (2.61 | ) | | | (7,739,380 | ) |
| | | | | | | | |
| Total net assets | | | 100.00 | % | | $ | 296,698,865 | |
| | | | | | | | |
| † | Non-income-earning security |
| « | All or a portion of this security is on loan. |
| (l) | Investment in an affiliate |
| (u) | Rate shown is the 7-day annualized yield at period end. |
| (v) | Security represents investment of cash collateral received from securities on loan. |
| (r) | The investment company is exempt from registration under Section 3(c)(7) of the 1940 Act. |
| * | Cost for federal income tax purposes is $245,088,468 and unrealized appreciation (depreciation) consists of: |
| | | | |
Gross unrealized appreciation | | $ | 66,471,991 | |
Gross unrealized depreciation | | | (7,122,214 | ) |
| | | | |
Net unrealized appreciation | | $ | 59,349,777 | |
The accompanying notes are an integral part of these financial statements.
| | | | | | |
| Statement of assets and liabilities —January 31, 2014 (unaudited) | | Wells Fargo Advantage Large Company Value Fund | | | 11 | |
| | | | |
| | | | |
| |
Assets | | | | |
Investments | | | | |
In unaffiliated securities (including securities on loan), at value (see cost below) | | $ | 287,583,126 | |
In affiliated securities, at value (see cost below) | | | 16,855,119 | |
| | | | |
Total investments, at value (see cost below) | | | 304,438,245 | |
Receivable for Fund shares sold | | | 71,013 | |
Receivable for dividends | | | 227,764 | |
Receivable for securities lending income | | | 3,068 | |
Prepaid expenses and other assets | | | 31,924 | |
| | | | |
Total assets | | | 304,772,014 | |
| | | | |
| |
Liabilities | | | | |
Payable for Fund shares redeemed | | | 107,748 | |
Payable upon receipt of securities loaned | | | 7,619,825 | |
Advisory fee payable | | | 127,494 | |
Distribution fees payable | | | 3,247 | |
Due to other related parties | | | 88,514 | |
Accrued expenses and other liabilities | | | 126,321 | |
| | | | |
Total liabilities | | | 8,073,149 | |
| | | | |
Total net assets | | $ | 296,698,865 | |
| | | | |
| |
NET ASSETS CONSIST OF | | | | |
Paid-in capital | | $ | 240,005,338 | |
Overdistributed net investment income | | | (18,876 | ) |
Accumulated net realized losses on investments | | | (7,176,393 | ) |
Net unrealized gains on investments | | | 63,888,796 | |
| | | | |
Total net assets | | $ | 296,698,865 | |
| | | | |
| |
COMPUTATION OF NET ASSET VALUE AND OFFERING PRICE PER SHARE1 | | | | |
Net assets – Class A | | $ | 115,568,576 | |
Shares outstanding – Class A | | | 7,344,225 | |
Net asset value per share – Class A | | | $15.74 | |
Maximum offering price per share – Class A2 | | | $16.70 | |
Net assets – Class C | | $ | 4,455,274 | |
Shares outstanding – Class C | | | 277,540 | |
Net asset value per share – Class C | | | $16.05 | |
Net assets – Administrator Class | | $ | 35,810,763 | |
Shares outstanding – Administrator Class | | | 2,262,940 | |
Net asset value per share – Administrator Class | | | $15.82 | |
Net assets – Institutional Class | | $ | 727,190 | |
Shares outstanding – Institutional Class | | | 46,029 | |
Net asset value per share – Institutional Class | | | $15.80 | |
Net assets – Investor Class | | $ | 140,137,062 | |
Shares outstanding – Investor Class | | | 8,677,446 | |
Net asset value per share – Investor Class | | | $16.15 | |
| |
Investments in unaffiliated securities (including securities on loan), at cost | | $ | 223,694,330 | |
| | | | |
Investments in affiliated securities, at cost | | $ | 16,855,119 | |
| | | | |
Total investments, at cost | | $ | 240,549,449 | |
| | | | |
Securities on loan, at value | | $ | 7,444,779 | |
| | | | |
| 1. | The Fund has an unlimited number of authorized shares. |
| 2. | Maximum offering price is computed as 100/94.25 of net asset value. On investments of $50,000 or more, the offering price is reduced. |
The accompanying notes are an integral part of these financial statements.
| | | | |
| 12 | | Wells Fargo Advantage Large Company Value Fund | | Statement of operations—six months ended January 31, 2014 (unaudited) |
| | | | |
| | | | |
| |
Investment income | | | | |
Dividends* | | $ | 2,420,470 | |
Securities lending income, net | | | 41,853 | |
Income from affiliated securities | | | 1,999 | |
| | | | |
Total investment income | | | 2,464,322 | |
| | | | |
| |
Expenses | | | | |
Advisory fee | | | 1,006,359 | |
Administration fees | | | | |
Fund level | | | 77,412 | |
Class A | | | 155,788 | |
Class C | | | 6,195 | |
Administrator Class | | | 19,510 | |
Institutional Class | | | 674 | |
Investor Class | | | 230,946 | |
Shareholder servicing fees | | | | |
Class A | | | 149,796 | |
Class C | | | 5,957 | |
Administrator Class | | | 48,232 | |
Investor Class | | | 180,151 | |
Distribution fees | | | | |
Class C | | | 17,870 | |
Custody and accounting fees | | | 12,308 | |
Professional fees | | | 21,012 | |
Registration fees | | | 39,155 | |
Shareholder report expenses | | | 31,191 | |
Trustees’ fees and expenses | | | 5,122 | |
Other fees and expenses | | | 7,680 | |
| | | | |
Total expenses | | | 2,015,358 | |
Less: Fee waivers and/or expense reimbursements | | | (303,685 | ) |
| | | | |
Net expenses | | | 1,711,673 | |
| | | | |
Net investment income | | | 752,649 | |
| | | | |
| |
REALIZED AND UNREALIZED GAINS (LOSSES) ON INVESTMENTS | | | | |
Net realized gains on investments | | | 26,720,777 | |
Net change in unrealized gains (losses) on investments | | | (9,424,155 | ) |
| | | | |
Net realized and unrealized gains (losses) on investments | | | 17,296,622 | |
| | | | |
Net increase in net assets resulting from operations | | $ | 18,049,271 | |
| | | | |
| |
* Net of foreign dividend withholding taxes in the amount of | | | $2,120 | |
The accompanying notes are an integral part of these financial statements.
| | | | | | |
| Statement of changes in net assets | | Wells Fargo Advantage Large Company Value Fund | | | 13 | |
| | | | | | | | | | | | | | | | |
| | | Six months ended
January 31, 2014
(unaudited) | | | Year ended
July 31, 2013 | |
| | | | |
Operations | | | | | | | | | | | | | | | | |
Net investment income | | | | | | $ | 752,649 | | | | | | | $ | 3,273,209 | |
Net realized gains on investments | | | | | | | 26,720,777 | | | | | | | | 54,703,809 | |
Net change in unrealized gains (losses) on investments | | | | | | | (9,424,155 | ) | | | | | | | 17,262,829 | |
| | | | |
Net increase in net assets resulting from operations | | | | | | | 18,049,271 | | | | | | | | 75,239,847 | |
| | | | |
| | | | |
Distributions to shareholders from | | | | | | | | | | | | | | | | |
Net investment income | | | | | | | | | | | | | | | | |
Class A | | | | | | | (359,512 | ) | | | | | | | (1,472,740 | ) |
Class C | | | | | | | 0 | | | | | | | | (26,206 | ) |
Administrator Class | | | | | | | (167,411 | ) | | | | | | | (1,433,133 | ) |
Institutional Class | | | | | | | (9,988 | ) | | | | | | | (49,792 | ) |
Investor Class | | | | | | | (371,419 | ) | | | | | | | (1,616,046 | ) |
Net realized gains | | | | | | | | | | | | | | | | |
Class A | | | | | | | (11,065,974 | ) | | | | | | | 0 | |
Class C | | | | | | | (448,468 | ) | | | | | | | 0 | |
Administrator Class | | | | | | | (3,552,432 | ) | | | | | | | 0 | |
Institutional Class | | | | | | | (122,590 | ) | | | | | | | 0 | |
Investor Class | | | | | | | (13,095,944 | ) | | | | | | | 0 | |
| | | | |
Total distributions to shareholders | | | | | | | (29,193,738 | ) | | | | | | | (4,597,917 | ) |
| | | | |
| | | | |
Capital share transactions | | | Shares | | | | | | | | Shares | | | | | |
Proceeds from shares sold | | | | | | | | | | | | | | | | |
Class A | | | 75,943 | | | | 1,261,752 | | | | 159,878 | | | | 2,339,175 | |
Class C | | | 23,311 | | | | 393,271 | | | | 33,034 | | | | 495,282 | |
Administrator Class | | | 161,647 | | | | 2,651,622 | | | | 403,341 | | | | 5,621,478 | |
Institutional Class | | | 2,993 | | | | 48,617 | | | | 108,212 | | | | 1,742,756 | |
Investor Class | | | 189,576 | | | | 3,211,701 | | | | 470,273 | | | | 6,954,261 | |
| | | | |
| | | | | | | 7,566,963 | | | | | | | | 17,152,952 | |
| | | | |
Reinvestment of distributions | | | | | | | | | | | | | | | | |
Class A | | | 696,721 | | | | 11,172,926 | | | | 103,270 | | | | 1,434,082 | |
Class C | | | 23,973 | | | | 391,960 | | | | 1,631 | | | | 22,707 | |
Administrator Class | | | 204,125 | | | | 3,294,110 | | | | 97,837 | | | | 1,351,842 | |
Institutional Class | | | 7,562 | | | | 121,981 | | | | 2,882 | | | | 40,021 | |
Investor Class | | | 780,310 | | | | 12,840,272 | | | | 107,208 | | | | 1,522,722 | |
| | | | |
| | | | | | | 27,821,249 | | | | | | | | 4,371,374 | |
| | | | |
Payment for shares redeemed | | | | | | | | | | | | | | | | |
Class A | | | (501,589 | ) | | | (8,295,366 | ) | | | (1,153,703 | ) | | | (16,474,460 | ) |
Class C | | | (41,810 | ) | | | (683,577 | ) | | | (67,146 | ) | | | (991,593 | ) |
Administrator Class | | | (458,586 | ) | | | (7,615,193 | ) | | | (11,711,657 | ) | | | (158,129,190 | ) |
Institutional Class | | | (165,133 | ) | | | (2,709,865 | ) | | | (1,135,403 | ) | | | (15,208,554 | ) |
Investor Class | | | (552,979 | ) | | | (9,340,699 | ) | | | (1,650,877 | ) | | | (23,800,694 | ) |
| | | | |
| | | | | | | (28,644,700 | ) | | | | | | | (214,604,491 | ) |
| | | | |
Net increase (decrease) in net assets resulting from capital share transactions | | | | | | | 6,743,512 | | | | | | | | (193,080,165 | ) |
| | | | |
Total decrease in net assets | | | | | | | (4,400,955 | ) | | | | | | | (122,438,235 | ) |
| | | | |
| | | | |
Net assets | | | | | | | | | | | | | | | | |
Beginning of period | | | | | | | 301,099,820 | | | | | | | | 423,538,055 | |
| | | | |
End of period | | | | | | $ | 296,698,865 | | | | | | | $ | 301,099,820 | |
| | | | |
Undistributed (overdistributed) net investment income | | | | | | $ | (18,876 | ) | | | | | | $ | 136,805 | |
| | | | |
The accompanying notes are an integral part of these financial statements.
| | | | |
| 14 | | Wells Fargo Advantage Large Company Value Fund | | Financial highlights |
(For a share outstanding throughout each period)
| | | | | | | | | | | | | | | | | | | | | | | | |
| | | Six months ended
January 31, 2014
(unaudited) | | | Year ended July 31 | |
| CLASS A | | | 2013 | | | 2012 | | | 2011 | | | 2010 | | | 2009 | |
Net asset value, beginning of period | | $ | 16.39 | | | $ | 12.96 | | | $ | 12.61 | | | $ | 11.04 | | | $ | 9.84 | | | $ | 14.43 | |
Net investment income | | | 0.04 | | | | 0.14 | | | | 0.17 | | | | 0.12 | | | | 0.09 | | | | 0.17 | 1 |
Net realized and unrealized gains (losses) on investments | | | 0.98 | | | | 3.48 | | | | 0.35 | | | | 1.51 | | | | 1.21 | | | | (3.39 | ) |
| | | | | | | | | | | | | | | | | | | | | | | | |
Total from investment operations | | | 1.02 | | | | 3.62 | | | | 0.52 | | | | 1.63 | | | | 1.30 | | | | (3.22 | ) |
Distributions to shareholders from | | | | | | | | | | | | | | | | | | | | | | | | |
Net investment income | | | (0.05 | ) | | | (0.19 | ) | | | (0.17 | ) | | | (0.06 | ) | | | (0.10 | ) | | | (0.24 | ) |
Net realized gains | | | (1.62 | ) | | | 0.00 | | | | 0.00 | | | | 0.00 | | | | 0.00 | | | | (1.13 | ) |
| | | | | | | | | | | | | | | | | | | | | | | | |
Total distributions to shareholders | | | (1.67 | ) | | | (0.19 | ) | | | (0.17 | ) | | | (0.06 | ) | | | (0.10 | ) | | | (1.37 | ) |
Net asset value, end of period | | | $15.74 | | | | $16.39 | | | | $12.96 | | | | $12.61 | | | | $11.04 | | | | $9.84 | |
Total return2 | | | 6.14 | % | | | 28.16 | % | | | 4.21 | % | | | 14.77 | % | | | 13.22 | % | | | (21.52 | )% |
Ratios to average net assets (annualized) | | | | | | | | | | | | | | | | | | | | | | | | |
Gross expenses | | | 1.29 | % | | | 1.28 | % | | | 1.27 | % | | | 1.32 | % | | | 1.42 | % | | | 1.52 | % |
Net expenses | | | 1.10 | % | | | 1.10 | % | | | 1.10 | % | | | 1.25 | % | | | 1.25 | % | | | 1.23 | % |
Net investment income | | | 0.49 | % | | | 1.00 | % | | | 1.29 | % | | | 0.74 | % | | | 0.74 | % | | | 1.85 | % |
Supplemental data | | | | | | | | | | | | | | | | | | | | | | | | |
Portfolio turnover rate | | | 31 | % | | | 78 | % | | | 37 | % | | | 35 | % | | | 42 | % | | | 61 | % |
Net assets, end of period (000s omitted) | | | $115,569 | | | | $115,895 | | | | $103,195 | | | | $642 | | | | $362 | | | | $165 | |
| 1. | Calculated based upon average shares outstanding |
| 2. | Total return calculations do not include any sales charges. Returns for periods of less than one year are not annualized. |
The accompanying notes are an integral part of these financial statements.
| | | | | | |
| Financial highlights | | Wells Fargo Advantage Large Company Value Fund | | | 15 | |
(For a share outstanding throughout each period)
| | | | | | | | | | | | | | | | | | | | | | | | |
| | | Six months ended
January 31, 2014
(unaudited) | | | Year ended July 31 | |
| CLASS C | | | 2013 | | | 2012 | | | 2011 | | | 2010 | | | 2009 | |
Net asset value, beginning of period | | $ | 16.70 | | | $ | 13.21 | | | $ | 12.81 | | | $ | 11.26 | | | $ | 10.03 | | | $ | 14.66 | |
Net investment income (loss) | | | (0.02 | ) | | | 0.04 | | | | 0.09 | | | | 0.01 | | | | 0.03 | | | | 0.06 | 1 |
Net realized and unrealized gains (losses) on investments | | | 0.99 | | | | 3.54 | | | | 0.36 | | | | 1.55 | | | | 1.22 | | | | (3.40 | ) |
| | | | | | | | | | | | | | | | | | | | | | | | |
Total from investment operations | | | 0.97 | | | | 3.58 | | | | 0.45 | | | | 1.56 | | | | 1.25 | | | | (3.34 | ) |
Distributions to shareholders from | | | | | | | | | | | | | | | | | | | | | | | | |
Net investment income | | | 0.00 | | | | (0.09 | ) | | | (0.05 | ) | | | (0.01 | ) | | | (0.02 | ) | | | (0.16 | ) |
Net realized gains | | | (1.62 | ) | | | 0.00 | | | | 0.00 | | | | 0.00 | | | | 0.00 | | | | (1.13 | ) |
| | | | | | | | | | | | | | | | | | | | | | | | |
Total distributions to shareholders | | | (1.62 | ) | | | (0.09 | ) | | | (0.05 | ) | | | (0.01 | ) | | | (0.02 | ) | | | (1.29 | ) |
Net asset value, end of period | | $ | 16.05 | | | $ | 16.70 | | | $ | 13.21 | | | $ | 12.81 | | | $ | 11.26 | | | $ | 10.03 | |
Total return2 | | | 5.71 | % | | | 27.17 | % | | | 3.49 | % | | | 13.85 | % | | | 12.47 | % | | | (22.07 | )% |
Ratios to average net assets (annualized) | | | | | | | | | | | | | | | | | | | | | | | | |
Gross expenses | | | 2.03 | % | | | 2.03 | % | | | 2.02 | % | | | 2.08 | % | | | 2.17 | % | | | 2.23 | % |
Net expenses | | | 1.85 | % | | | 1.85 | % | | | 1.85 | % | | | 2.00 | % | | | 2.00 | % | | | 1.97 | % |
Net investment income (loss) | | | (0.26 | )% | | | 0.25 | % | | | 0.54 | % | | | 0.04 | % | | | 0.02 | % | | | 0.69 | % |
Supplemental data | | | | | | | | | | | | | | | | | | | | | | | | |
Portfolio turnover rate | | | 31 | % | | | 78 | % | | | 37 | % | | | 35 | % | | | 42 | % | | | 61 | % |
Net assets, end of period (000s omitted) | | | $4,455 | | | | $4,543 | | | | $4,022 | | | | $513 | | | | $438 | | | | $274 | |
| 1. | Calculated based upon average shares outstanding |
| 2. | Total return calculations do not include any sales charges. Returns for periods of less than one year are not annualized. |
The accompanying notes are an integral part of these financial statements.
| | | | |
| 16 | | Wells Fargo Advantage Large Company Value Fund | | Financial highlights |
(For a share outstanding throughout each period)
| | | | | | | | | | | | | | | | | | | | | | | | |
| | | Six months ended
January 31, 2014
(unaudited) | | | Year ended July 31 | |
| ADMINISTRATOR CLASS | | | 2013 | | | 2012 | | | 2011 | | | 2010 | | | 2009 | |
Net asset value, beginning of period | | $ | 16.47 | | | $ | 13.02 | | | $ | 12.68 | | | $ | 11.08 | | | $ | 9.87 | | | $ | 14.43 | |
Net investment income | | | 0.06 | | | | 0.21 | | | | 0.19 | 1 | | | 0.11 | | | | 0.12 | 1 | | | 0.31 | 1 |
Net realized and unrealized gains (losses) on investments | | | 0.98 | | | | 3.46 | | | | 0.36 | | | | 1.56 | | | | 1.22 | | | | (3.49 | ) |
| | | | | | | | | | | | | �� | | | | | | | | | | | |
Total from investment operations | | | 1.04 | | | | 3.67 | | | | 0.55 | | | | 1.67 | | | | 1.34 | | | | (3.18 | ) |
Distributions to shareholders from | | | | | | | | | | | | | | | | | | | | | | | | |
Net investment income | | | (0.07 | ) | | | (0.22 | ) | | | (0.21 | ) | | | (0.07 | ) | | | (0.13 | ) | | | (0.25 | ) |
Net realized gains | | | (1.62 | ) | | | 0.00 | | | | 0.00 | | | | 0.00 | | | | 0.00 | | | | (1.13 | ) |
| | | | | | | | | | | | | | | | | | | | | | | | |
Total distributions to shareholders | | | (1.69 | ) | | | (0.22 | ) | | | (0.21 | ) | | | (0.07 | ) | | | (0.13 | ) | | | (1.38 | ) |
Net asset value, end of period | | $ | 15.82 | | | $ | 16.47 | | | $ | 13.02 | | | $ | 12.68 | | | $ | 11.08 | | | $ | 9.87 | |
Total return2 | | | 6.18 | % | | | 28.52 | % | | | 4.47 | % | | | 15.12 | % | | | 13.53 | % | | | (21.20 | )% |
Ratios to average net assets (annualized) | | | | | | | | | | | | | | | | | | | | | | | | |
Gross expenses | | | 1.12 | % | | | 1.10 | % | | | 1.11 | % | | | 1.17 | % | | | 1.24 | % | | | 1.30 | % |
Net expenses | | | 0.85 | % | | | 0.85 | % | | | 0.85 | % | | | 0.96 | % | | | 0.96 | % | | | 0.95 | % |
Net investment income | | | 0.75 | % | | | 1.28 | % | | | 1.54 | % | | | 1.93 | % | | | 1.12 | % | | | 2.56 | % |
Supplemental data | | | | | | | | | | | | | | | | | | | | | | | | |
Portfolio turnover rate | | | 31 | % | | | 78 | % | | | 37 | % | | | 35 | % | | | 42 | % | | | 61 | % |
Net assets, end of period (000s omitted) | | | $35,811 | | | | $38,798 | | | | $176,623 | | | | $667 | | | | $289 | | | | $185 | |
| 1. | Calculated based upon average shares outstanding |
| 2. | Returns for periods of less than one year are not annualized. |
The accompanying notes are an integral part of these financial statements.
| | | | | | |
| Financial highlights | | Wells Fargo Advantage Large Company Value Fund | | | 17 | |
(For a share outstanding throughout each period)
| | | | | | | | | | | | | | | | | | | | | | | | |
| | | Six months ended
January 31, 2014
(unaudited) | | | Year ended July 31 | |
| INSTITUTIONAL CLASS | | | 2013 | | | 2012 | | | 2011 | | | 2010 | | | 2009 | |
Net asset value, beginning of period | | $ | 16.44 | | | $ | 13.00 | | | $ | 12.68 | | | $ | 11.08 | | | $ | 9.86 | | | $ | 14.43 | |
Net investment income | | | 0.09 | 1 | | | 0.26 | 1 | | | 0.22 | | | | 0.14 | | | | 0.14 | | | | 0.26 | 1 |
Net realized and unrealized gains (losses) on investments | | | 0.98 | | | | 3.45 | | | | 0.35 | | | | 1.54 | | | | 1.23 | | | | (3.42 | ) |
| | | | | | | | | | | | | | | | | | | | | | | | |
Total from investment operations | | | 1.07 | | | | 3.71 | | | | 0.57 | | | | 1.68 | | | | 1.37 | | | | (3.16 | ) |
Distributions to shareholders from | | | | | | | | | | | | | | | | | | | | | | | | |
Net investment income | | | (0.09 | ) | | | (0.27 | ) | | | (0.25 | ) | | | (0.08 | ) | | | (0.15 | ) | | | (0.28 | ) |
Net realized gains | | | (1.62 | ) | | | 0.00 | | | | 0.00 | | | | 0.00 | | | | 0.00 | | | | (1.13 | ) |
| | | | | | | | | | | | | | | | | | | | | | | | |
Total distributions to shareholders | | | (1.71 | ) | | | (0.27 | ) | | | (0.25 | ) | | | (0.08 | ) | | | (0.15 | ) | | | (1.41 | ) |
Net asset value, end of period | | $ | 15.80 | | | $ | 16.44 | | | $ | 13.00 | | | $ | 12.68 | | | $ | 11.08 | | | $ | 9.86 | |
Total return2 | | | 6.34 | % | | | 28.93 | % | | | 4.67 | % | | | 15.36 | % | | | 13.76 | % | | | (21.07 | )% |
Ratios to average net assets (annualized) | | | | | | | | | | | | | | | | | | | | | | | | |
Gross expenses | | | 0.86 | % | | | 0.84 | % | | | 0.85 | % | | | 0.89 | % | | | 0.96 | % | | | 1.06 | % |
Net expenses | | | 0.65 | % | | | 0.65 | % | | | 0.66 | % | | | 0.75 | % | | | 0.75 | % | | | 0.75 | % |
Net investment income | | | 1.07 | % | | | 1.83 | % | | | 1.80 | % | | | 1.12 | % | | | 1.28 | % | | | 2.64 | % |
Supplemental data | | | | | | | | | | | | | | | | | | | | | | | | |
Portfolio turnover rate | | | 31 | % | | | 78 | % | | | 37 | % | | | 35 | % | | | 42 | % | | | 61 | % |
Net assets, end of period (000s omitted) | | | $727 | | | | $3,299 | | | | $15,924 | | | | $14,401 | | | | $9 | | | | $8 | |
| 1. | Calculated based upon average shares outstanding |
| 2. | Returns for periods of less than one year are not annualized. |
The accompanying notes are an integral part of these financial statements.
| | | | |
| 18 | | Wells Fargo Advantage Large Company Value Fund | | Financial highlights |
(For a share outstanding throughout each period)
| | | | | | | | | | | | | | | | | | | | | | | | |
| | | Six months ended
January 31, 2014
(unaudited) | | | Year ended July 31 | |
| INVESTOR CLASS | | | 2013 | | | 2012 | | | 2011 | | | 2010 | | | 2009 | |
Net asset value, beginning of period | | $ | 16.77 | | | $ | 13.26 | | | $ | 12.89 | | | $ | 11.28 | | | $ | 10.05 | | | $ | 14.67 | |
Net investment income | | | 0.04 | | | | 0.14 | | | | 0.16 | | | | 0.09 | | | | 0.08 | | | | 0.21 | 1 |
Net realized and unrealized gains (losses) on investments | | | 1.00 | | | | 3.55 | | | | 0.36 | | | | 1.57 | | | | 1.23 | | | | (3.48 | ) |
| | | | | | | | | | | | | | | | | | | | | | | | |
Total from investment operations | | | 1.04 | | | | 3.69 | | | | 0.52 | | | | 1.66 | | | | 1.31 | | | | (3.27 | ) |
Distributions to shareholders from | | | | | | | | | | | | | | | | | | | | | | | | |
Net investment income | | | (0.04 | ) | | | (0.18 | ) | | | (0.15 | ) | | | (0.05 | ) | | | (0.08 | ) | | | (0.22 | ) |
Net realized gains | | | (1.62 | ) | | | 0.00 | | | | 0.00 | | | | 0.00 | | | | 0.00 | | | | (1.13 | ) |
| | | | | | | | | | | | | | | | | | | | | | | | |
Total distributions to shareholders | | | (1.66 | ) | | | (0.18 | ) | | | (0.15 | ) | | | (0.05 | ) | | | (0.08 | ) | | | (1.35 | ) |
Net asset value, end of period | | $ | 16.15 | | | $ | 16.77 | | | $ | 13.26 | | | $ | 12.89 | | | $ | 11.28 | | | $ | 10.05 | |
Total return2 | | | 6.08 | % | | | 28.12 | % | | | 4.09 | % | | | 14.75 | % | | | 13.06 | % | | | (21.53 | )% |
Ratios to average net assets (annualized) | | | | | | | | | | | | | | | | | | | | | | | | |
Gross expenses | | | 1.34 | % | | | 1.34 | % | | | 1.34 | % | | | 1.40 | % | | | 1.52 | % | | | 1.63 | % |
Net expenses | | | 1.16 | % | | | 1.16 | % | | | 1.18 | % | | | 1.32 | % | | | 1.35 | % | | | 1.35 | % |
Net investment income | | | 0.43 | % | | | 0.94 | % | | | 1.27 | % | | | 0.74 | % | | | 0.70 | % | | | 2.05 | % |
Supplemental data | | | | | | | | | | | | | | | | | | | | | | | | |
Portfolio turnover rate | | | 31 | % | | | 78 | % | | | 37 | % | | | 35 | % | | | 42 | % | | | 61 | % |
Net assets, end of period (000s omitted) | | | $140,137 | | | | $138,565 | | | | $123,774 | | | | $110,554 | | | | $108,703 | | | | $106,931 | |
| 1. | Calculated based upon average shares outstanding |
| 2. | Returns for periods of less than one year are not annualized. |
The accompanying notes are an integral part of these financial statements.
| | | | | | |
| Notes to financial statements (unaudited) | | Wells Fargo Advantage Large Company Value Fund | | | 19 | |
1. ORGANIZATION
Wells Fargo Funds Trust (the “Trust”), a Delaware statutory trust organized on March 10, 1999, is an open-end management investment company registered under the Investment Company Act of 1940, as amended (the “1940 Act”). These financial statements report on the Wells Fargo Advantage Large Company Value Fund (the “Fund”) which is a diversified series of the Trust.
2. SIGNIFICANT ACCOUNTING POLICIES
The following significant accounting policies, which are consistently followed in the preparation of the financial statements of the Fund, are in conformity with U.S. generally accepted accounting principles which require management to make estimates and assumptions that affect the reported amounts of assets and liabilities, disclosure of contingent assets and liabilities at the date of the financial statements, and the reported amounts of revenues and expenses during the reporting period. Actual results could differ from those estimates.
Securities valuation
All investments are valued each business day as of the close of regular trading on the New York Stock Exchange (generally 4 p.m. Eastern Time).
Equity securities that are listed on a foreign or domestic exchange or market are valued at the official closing price or, if none, the last sales price. If no sale occurs on the primary exchange or market for the security that day, the prior day’s price will be deemed “stale” and fair values will be determined in accordance with the Fund’s Valuation Procedures.
Investments in registered open-end investment companies are valued at net asset value. Non-registered investment vehicles are fair valued at net asset value.
Investments which are not valued using any of the methods discussed above are valued at their fair value, as determined in good faith by the Board of Trustees of the Fund. The Board of Trustees has established a Valuation Committee comprised of the Trustees and has delegated to it the authority to take any actions regarding the valuation of portfolio securities that the Valuation Committee deems necessary or appropriate, including determining the fair value of portfolio securities, unless the determination has been delegated to the Management Valuation Team of Wells Fargo Funds Management, LLC (“Funds Management”). The Board of Trustees retains the authority to make or ratify any valuation decisions or approve any changes to the Valuation Procedures as it deems appropriate. On a quarterly basis, the Board of Trustees receives reports on any valuation actions taken by the Valuation Committee or the Management Valuation Team which may include items for ratification.
Valuations of fair valued securities are compared to the next actual sales price when available, or other appropriate market values, to assess the continued appropriateness of the fair valuation methodologies used. These securities are fair valued on a day-to-day basis, taking into consideration changes to appropriate market information and any significant changes to the inputs considered in the valuation process until there is a readily available price provided on an exchange or by an independent pricing service. Valuations received from an independent pricing service or independent broker-dealer quotes are periodically validated by comparisons to most recent trades and valuations provided by other independent pricing services in addition to the review of prices by the adviser and/or subadviser. Unobservable inputs used in determining fair valuations are identified based on the type of security, taking into consideration factors utilized by market participants in valuing the investment, knowledge about the issuer and the current market environment.
Security loans
The Fund may lend its securities from time to time in order to earn additional income in the form of fees or interest on securities received as collateral or the investment of any cash received as collateral. The Fund continues to receive interest or dividends on the securities loaned. The Fund receives collateral in the form of cash or securities with a value at least equal to the value of the securities on loan. The value of the loaned securities is determined at the close of each business day and any additional required collateral is delivered to the Fund on the next business day. In a securities lending transaction, the net asset value of the Fund will be affected by an increase or decrease in the value of the securities loaned and by an increase or decrease in the value of the instrument in which collateral is invested. The amount of securities lending activity undertaken by the Fund fluctuates from time to time. In the event of default or bankruptcy by the borrower, the Fund may be prevented from recovering the loaned securities or gaining access to the collateral or may experience delays or costs in doing so. In addition, the investment of any cash collateral received may lose all or part of its value. The Fund has the right under the lending agreement to recover the securities from the borrower on demand.
The Fund lends its securities through an unaffiliated securities lending agent. Cash collateral received in connection with its securities lending transactions is invested in Wells Fargo Securities Lending Cash Investments, LLC (the “Securities
| | | | |
| 20 | | Wells Fargo Advantage Large Company Value Fund | | Notes to financial statements (unaudited) |
Lending Fund”). The Securities Lending Fund is exempt from registration under Section 3(c)(7) of the 1940 Act and is managed by Funds Management and is subadvised by Wells Capital Management Incorporated (“WellsCap”). Funds Management receives an advisory fee starting at 0.05% and declining to 0.01% as the average daily net assets of the Securities Lending Fund increase. All of the fees received by Funds Management are paid to WellsCap for its services as subadviser. The Securities Lending Fund seeks to provide a positive return compared to the daily Fed Funds Open rate by investing in high-quality, U.S. dollar-denominated short-term money market instruments. Securities Lending Fund investments are fair valued based upon the amortized cost valuation technique. Income earned from investment in the Securities Lending Fund is included in securities lending income on the Statement of Operations.
Security transactions and income recognition
Securities transactions are recorded on a trade date basis. Realized gains or losses are recorded on the basis of identified cost.
Dividend income is recognized on the ex-dividend date. Dividend income is recorded net of foreign taxes withheld where recovery of such taxes is not assured.
Distributions to shareholders
Distributions to shareholders from net investment income and net realized gains, if any, are recorded on the ex-dividend date. Such distributions are determined in conformity with federal income tax regulations, which may differ in amount or character from net investment income and realized gains recognized for purposes of U.S. generally accepted accounting principles.
Federal and other taxes
The Fund intends to continue to qualify as a regulated investment company by distributing substantially all of its investment company taxable income and any net realized capital gains (after reduction for capital loss carryforwards) sufficient to relieve it from all, or substantially all, federal income taxes. Accordingly, no provision for federal income taxes was required.
The Fund’s income and federal excise tax returns and all financial records supporting those returns for the prior three fiscal years are subject to examination by the federal and Delaware revenue authorities. Management has analyzed the Fund’s tax positions taken on federal, state, and foreign tax returns for all open tax years and does not believe that there are any uncertain tax positions that require recognition of a tax liability.
As of July 31, 2013, the Fund had capital loss carryforwards available to offset future net realized capital gains in the amount of $29,120,637 with $22,057,566 expiring in 2016 and $7,063,071 expiring in 2018.
Class allocations
The separate classes of shares offered by the Fund differ principally in applicable sales charges, distribution, shareholder servicing, and administration fees. Shareholders of each class bear certain expenses that pertain to that particular class. All shareholders bear the common expenses of the Fund, earn income from the portfolio, and are allocated any unrealized gains and losses pro rata based on the average daily net assets of each class, without distinction between share classes. Dividends are determined separately for each class based on income and expenses allocable to each class. Realized gains and losses are allocated to each class pro rata based upon the net assets of each class on the date realized. Differences in per share dividend rates generally result from the relative weightings of pro rata income and realized gain allocations and from differences in separate class expenses, including distribution, shareholder servicing, and administration fees.
3. FAIR VALUATION MEASUREMENTS
Fair value measurements of investments are determined within a framework that has established a fair value hierarchy based upon the various data inputs utilized in determining the value of the Fund’s investments. The three-level hierarchy gives the highest priority to unadjusted quoted prices in active markets for identical assets or liabilities (Level 1) and the lowest priority to significant unobservable inputs (Level 3). The Fund’s investments are classified within the fair value hierarchy based on the lowest level of input that is significant to the fair value measurement. The inputs are summarized into three broad levels as follows:
| n | | Level 1 – quoted prices in active markets for identical securities |
| n | | Level 2 – other significant observable inputs (including quoted prices for similar securities, interest rates, prepayment speeds, credit risk, use of amortized cost, etc.) |
| n | | Level 3 – significant unobservable inputs (including the Fund’s own assumptions in determining the fair value of investments) |
| | | | | | |
| Notes to financial statements (unaudited) | | Wells Fargo Advantage Large Company Value Fund | | | 21 | |
The inputs or methodologies used for valuing investments in securities are not necessarily an indication of the risk associated with investing in those securities.
As of January 31, 2014, the inputs used in valuing investments in securities were as follows:
| | | | | | | | | | | | | | | | |
| Investments in securities | | Quoted prices (Level 1) | | | Other significant
observable inputs (Level 2) | | | Significant unobservable inputs (Level 3) | | | Total | |
Equity securities | | | | | | | | | | | | | | | | |
Common stocks | | $ | 287,583,126 | | | $ | 0 | | | $ | 0 | | | $ | 287,583,126 | |
Short-term investments | | | | | | | | | | | | | | | | |
Investment companies | | | 9,235,294 | | | | 7,619,825 | | | | 0 | | | | 16,855,119 | |
| | | $ | 296,818,420 | | | $ | 7,619,825 | | | $ | 0 | | | $ | 304,438,245 | |
Transfers in and transfers out are recognized at the end of the reporting period. For the six months ended January 31, 2014, the Fund did not have any transfers into/out of Level 1, Level 2, or Level 3.
4. TRANSACTIONS WITH AFFILIATES AND OTHER EXPENSES
Advisory fee
The Trust has entered into an advisory contract with Funds Management, an indirect wholly owned subsidiary of Wells Fargo & Company (“Wells Fargo”). The adviser is responsible for implementing investment policies and guidelines and for supervising the subadviser, who is responsible for day-to-day portfolio management of the Fund.
Pursuant to the contract, Funds Management is entitled to receive an annual advisory fee starting at 0.65% and declining to 0.55% as the average daily net assets of the Fund increase. For the six months ended January 31, 2014, the advisory fee was equivalent to an annual rate of 0.65% of the Fund’s average daily net assets.
Funds Management has retained the services of a subadviser to provide daily portfolio management to the Fund. The fee for subadvisory services is borne by Funds Management. Phocas Financial Corporation is the subadviser to the Fund and is entitled to receive a fee from Funds Management at an annual rate starting at 0.29% and declining to 0.20% as the average daily net assets of the Fund increase.
Administration and transfer agent fees
The Trust has entered into an administration agreement with Funds Management. Under this agreement, for providing administrative services, which includes paying fees and expenses for services provided by the transfer agent, sub-transfer agents, omnibus account servicers and record-keepers, Funds Management is entitled to receive from the Fund an annual fund level administration fee starting at 0.05% and declining to 0.03% as the average daily net assets of the Fund increase and a class level administration fee which is calculated based on the average daily net assets of each class as follows:
| | | | |
| | | Class level administration fee | |
Class A , Class C | | | 0.26 | % |
Administrator Class | | | 0.10 | |
Institutional Class | | | 0.08 | |
Investor Class | | | 0.32 | |
Funds Management has contractually waived and/or reimbursed advisory and administration fees to the extent necessary to maintain certain net operating expense ratios for the Fund. Waiver of fees and/or reimbursement of expenses by Funds Management were made first from fund level expenses on a proportionate basis and then from class specific expenses. Funds Management has committed through November 30, 2014 to waive fees and/or reimburse expenses to the extent necessary to cap the Fund’s expenses at 1.10% for Class A shares, 1.85% for Class C shares, 0.85% for Administrator Class shares, 0.65% for Institutional Class shares, and 1.16% for Investor Class shares.
Distribution fees
The Trust has adopted a Distribution Plan for Class C shares of the Fund pursuant to Rule 12b-1 under the 1940 Act. Distribution fees are charged to Class C shares and paid to Wells Fargo Funds Distributor, LLC, the principal underwriter, at an annual rate of 0.75% of the average daily net assets of Class C shares.
| | | | |
| 22 | | Wells Fargo Advantage Large Company Value Fund | | Notes to financial statements (unaudited) |
For the six months ended January 31, 2014, Wells Fargo Funds Distributor, LLC received $2,714 from the sale of Class A shares.
Shareholder servicing fees
The Trust has entered into contracts with one or more shareholder servicing agents, whereby Class A, Class C, Administrator Class, and Investor Class of the Fund is charged a fee at an annual rate of 0.25% of the average daily net assets of each respective class.
A portion of these total shareholder servicing fees were paid to affiliates of Wells Fargo.
5. INVESTMENT PORTFOLIO TRANSACTIONS
Purchases and sales of investments, excluding U.S. government obligations (if any) and short-term securities, for the six months ended January 31, 2014 were $91,096,499 and $114,724,070, respectively.
6. BANK BORROWINGS
The Trust (excluding the money market funds and certain other funds in the Trust) and Wells Fargo Variable Trust are parties to a $150,000,000 revolving credit agreement with State Street Bank and Trust Company, whereby the Fund is permitted to use bank borrowings for temporary or emergency purposes, such as to fund shareholder redemption requests. Interest under the credit agreement is charged to the Fund based on a borrowing rate equal to the higher of the Federal Funds rate in effect on that day plus 1.25% or the overnight LIBOR rate in effect on that day plus 1.25%. In addition, an annual commitment fee equal to 0.10% of the unused balance is allocated to each participating fund. For the six months ended January 31, 2014, the Fund paid $125 in commitment fees.
For the six months ended January 31, 2014, there were no borrowings by the Fund under the agreement.
7. CONCENTRATION RISK
Concentration risks result from exposure to a limited number of sectors. Funds that invest a substantial portion of their assets in any sector may be more affected by changes in that sector than would be a fund whose investments are not heavily weighted in any sector.
8. INDEMNIFICATION
Under the Trust’s organizational documents, the officers and directors are indemnified against certain liabilities that may arise out of performance of their duties to the Trust. Additionally, in the normal course of business, the Trust may enter into contracts with service providers that contain a variety of indemnification clauses. The Trust’s maximum exposure under these arrangements is dependent on future claims that may be made against the Fund and, therefore, cannot be estimated.
9. SUBSEQUENT DISTRIBUTION
On March 25, 2014, the Fund declared distributions from net investment income to shareholders of record on March 24, 2014. The per share amounts payable on March 26, 2014 were as follows:
| | | | |
| | | Net investment
income | |
Class A | | $ | 0.03680 | |
Class C | | | 0.01083 | |
Administrator Class | | | 0.04532 | |
Institutional Class | | | 0.05154 | |
Investor Class | | | 0.03450 | |
These distributions are not reflected in the accompanying financial statements. The final determination of the source of all distributions is subject to change and made after the Fund’s tax year-end.
| | | | | | |
| Other information (unaudited) | | Wells Fargo Advantage Large Company Value Fund | | | 23 | |
PROXY VOTING INFORMATION
A description of the policies and procedures that the Fund uses to determine how to vote proxies relating to portfolio securities is available without charge, upon request, by calling 1-800-222-8222, visiting our website at wellsfargoadvantagefunds.com, or visiting the SEC website at sec.gov. Information regarding how the Fund voted proxies relating to portfolio securities during the most recent 12-month period ended June 30 is available without charge on the Fund’s website at wellsfargoadvantagefunds.com or by visiting the SEC website at sec.gov.
PORTFOLIO HOLDINGS INFORMATION
The complete portfolio holdings for the Fund are publicly available on the Fund’s website (wellsfargoadvantagefunds.com) on a monthly, 30-day or more delayed basis. In addition, top ten holdings information for the Fund is publicly available on the Fund’s website on a monthly, seven-day or more delayed basis. The Fund files its complete schedule of portfolio holdings with the SEC for the first and third quarters of each fiscal year on Form N-Q, which is available without charge by visiting the SEC website at sec.gov. In addition, the Fund’s Form N-Q may be reviewed and copied at the SEC’s Public Reference Room in Washington, DC, and at regional offices in New York City, at 233 Broadway, and in Chicago, at 175 West Jackson Boulevard, Suite 900. Information about the Public Reference Room may be obtained by calling 1-800-SEC-0330.
| | | | |
| 24 | | Wells Fargo Advantage Large Company Value Fund | | Other information (unaudited) |
BOARD OF TRUSTEES AND OFFICERS
Each of the Trustees and Officers listed in the table below acts in identical capacities for each fund in the Wells Fargo Advantage family of funds, which consists of 132 mutual funds1 comprising the Wells Fargo Funds Trust, Wells Fargo Variable Trust, Wells Fargo Master Trust and four closed-end funds (collectively the “Fund Complex”). This table should be read in conjunction with the Prospectus and the Statement of Additional Information2. All of the Trustees are also Members of the Audit and Governance Committees of each Trust in the Fund Complex. The mailing address of each Trustee and Officer is 525 Market Street, 12th Floor, San Francisco, CA 94105. Each Trustee and Officer serves an indefinite term, however, each Trustee serves such term until reaching the mandatory retirement age established by the Trustees.
Independent Trustees
| | | | | | |
Name and year of birth | | Position held and length of service* | | Principal occupations during past five years | | Other directorships during past five years |
Peter G. Gordon
(Born 1942) | | Trustee, since 1998; Chairman, since 2005 | | Co-Founder, Retired Chairman, President and CEO of Crystal Geyser Water Company. Trustee Emeritus, Colby College. | | Asset Allocation Trust |
Isaiah Harris, Jr.
(Born 1952) | | Trustee, since 2009 | | Retired. Prior thereto, President and CEO of BellSouth Advertising and Publishing Corp. from 2005 to 2007, President and CEO of BellSouth Enterprises from 2004 to 2005 and President of BellSouth Consumer Services from 2000 to 2003. Emeritus member of the Iowa State University Foundation Board of Governors. Emeritus Member of the Advisory Board of Iowa State University School of Business. Advisory Board Member, Palm Harbor Academy (charter school). Mr. Harris is a certified public accountant. | | CIGNA Corporation; Deluxe Corporation; Asset Allocation Trust |
Judith M. Johnson
(Born 1949) | | Trustee, since 2008; Audit Committee Chairman, since 2008 | | Retired. Prior thereto, Chief Executive Officer and Chief Investment Officer of Minneapolis Employees Retirement Fund from 1996 to 2008. Ms. Johnson is an attorney, certified public accountant and a certified managerial accountant. | | Asset Allocation Trust |
Leroy Keith, Jr.
(Born 1939) | | Trustee, since 2010 | | Chairman, Bloc Global Services (development and construction). Trustee of the Evergreen Funds from 1983 to 2010. Former Managing Director, Almanac Capital Management (commodities firm), former Partner, Stonington Partners, Inc. (private equity fund), former Director, Obagi Medical Products Co. and former Director, Lincoln Educational Services. | | Trustee, Virtus Fund Complex (consisting of 50 portfolios as of 12/16/2013); Asset Allocation Trust |
David F. Larcker
(Born 1950) | | Trustee, since 2009 | | James Irvin Miller Professor of Accounting at the Graduate School of Business, Stanford University, Morgan Stanley Director of the Center for Leadership Development and Research and Senior Faculty of The Rock Center for Corporate Governance since 2006. From 2005 to 2008, Professor of Accounting at the Graduate School of Business, Stanford University. Prior thereto, Ernst & Young Professor of Accounting at The Wharton School, University of Pennsylvania from 1985 to 2005. | | Asset Allocation Trust |
Olivia S. Mitchell
(Born 1953) | | Trustee, since 2006 | | International Foundation of Employee Benefit Plans Professor, Wharton School of the University of Pennsylvania since 1993. Director of Wharton’s Pension Research Council and Boettner Center on Pensions & Retirement Research, and Research Associate at the National Bureau of Economic Research. Previously, Cornell University Professor from 1978 to 1993. | | Asset Allocation Trust |
Timothy J. Penny
(Born 1951) | | Trustee, since 1996 | | President and CEO of Southern Minnesota Initiative Foundation, a non-profit organization, since 2007 and Senior Fellow at the Humphrey Institute Policy Forum at the University of Minnesota since 1995. Member of the Board of Trustees of NorthStar Education Finance, Inc., a non-profit organization, since 2007. | | Asset Allocation Trust |
| | | | | | |
| Other information (unaudited) | | Wells Fargo Advantage Large Company Value Fund | | | 25 | |
| | | | | | |
Name and year of birth | | Position held and length of service* | | Principal occupations during past five years | | Other directorships during past five years |
Michael S. Scofield
(Born 1943) | | Trustee, since 2010 | | Served on the Investment Company Institute’s Board of Governors and Executive Committee from 2008-2011 as well the Governing Council of the Independent Directors Council from 2006-2011 and the Independent Directors Council Executive Committee from 2008-2011. Chairman of the IDC from 2008-2010. Institutional Investor (Fund Directions) Trustee of Year in 2007. Trustee of the Evergreen Funds (and its predecessors) from 1984 to 2010. Chairman of the Evergreen Funds from 2000-2010. Former Trustee of the Mentor Funds. Retired Attorney, Law Offices of Michael S. Scofield. | | Asset Allocation Trust |
Donald C. Willeke
(Born 1940) | | Trustee, since 1996 | | Principal of the law firm of Willeke & Daniels. General Counsel of the Minneapolis Employees Retirement Fund from 1984 until its consolidation into the Minnesota Public Employees Retirement Association on June 30, 2010. Director and Vice Chair of The Tree Trust (non-profit corporation). Director of the American Chestnut Foundation (non-profit corporation). | | Asset Allocation Trust |
| * | Length of service dates reflect the Trustee’s commencement of service with the Trust’s predecessor entities, where applicable. |
Officers
| | | | | | |
Name and year of birth | | Position held and length of service | | Principal occupations during past five years | | |
Karla M. Rabusch
(Born 1959) | | President, since 2003 | | Executive Vice President of Wells Fargo Bank, N.A. and President of Wells Fargo Funds Management, LLC since 2003. | | |
Jeremy DePalma1
(Born 1974) | | Treasurer, since 2012 | | Senior Vice President of Wells Fargo Funds Management, LLC since 2009. Senior Vice President of Evergreen Investment Management Company, LLC from 2008 to 2010. Vice President, Evergreen Investment Services, Inc. from 2004 to 2007. Head of the Fund Reporting and Control Team within Fund Administration from 2005 to 2010. | | |
C. David Messman
(Born 1960) | | Secretary, since 2000; Chief Legal Officer, since 2003 | | Senior Vice President and Secretary of Wells Fargo Funds Management, LLC since 2001. Vice President and Managing Counsel of Wells Fargo Bank, N.A. since 1996. | | |
Debra Ann Early
(Born 1964) | | Chief Compliance Officer, since 2007 | | Chief Compliance Officer of Wells Fargo Funds Management, LLC since 2007. Chief Compliance Officer of Parnassus Investments from 2005 to 2007. Chief Financial Officer of Parnassus Investments from 2004 to 2007. | | |
David Berardi
(Born 1975) | | Assistant Treasurer, since 2009 | | Vice President of Wells Fargo Funds Management, LLC since 2009. Vice President of Evergreen Investment Management Company, LLC from 2008 to 2010. Assistant Vice President of Evergreen Investment Services, Inc. from 2004 to 2008. Manager of Fund Reporting and Control for Evergreen Investment Management Company, LLC from 2004 to 2010. | | |
| 1. | Jeremy DePalma acts as Treasurer of 59 funds and Assistant Treasurer of 73 funds in the Fund Complex. |
| 2. | The Statement of Additional Information includes additional information about the Trustees and is available, without charge, upon request, by calling 1-800-222-8222 or by visiting the website at wellsfargoadvantagefunds.com. |
The following is a list of common abbreviations for terms and entities that may have appeared in this report.
| ACA | — ACA Financial Guaranty Corporation |
| ADR | — American depositary receipt |
| ADS | — American depositary shares |
| AGC | — Assured Guaranty Corporation |
| AGM | — Assured Guaranty Municipal |
| Ambac | — Ambac Financial Group Incorporated |
| AMT | — Alternative minimum tax |
| BAN | — Bond anticipation notes |
| BHAC | — Berkshire Hathaway Assurance Corporation |
| CAB | — Capital appreciation bond |
| CCAB | — Convertible capital appreciation bond |
| CDA | — Community Development Authority |
| CDO | — Collateralized debt obligation |
| COP | — Certificate of participation |
| DRIVER | — Derivative inverse tax-exempt receipts |
| DW&P | — Department of Water & Power |
| DWR | — Department of Water Resources |
| ECFA | — Educational & Cultural Facilities Authority |
| EDA | — Economic Development Authority |
| EDFA | — Economic Development Finance Authority |
| ETF | — Exchange-traded fund |
| FDIC | — Federal Deposit Insurance Corporation |
| FFCB | — Federal Farm Credit Banks |
| FGIC | — Financial Guaranty Insurance Corporation |
| FHA | — Federal Housing Administration |
| FHLB | — Federal Home Loan Bank |
| FHLMC | — Federal Home Loan Mortgage Corporation |
| FICO | — The Financing Corporation |
| FNMA | — Federal National Mortgage Association |
| GDR | — Global depositary receipt |
| GNMA | — Government National Mortgage Association |
| HCFR | — Healthcare facilities revenue |
| HEFA | — Health & Educational Facilities Authority |
| HEFAR | — Higher education facilities authority revenue |
| HFA | — Housing Finance Authority |
| HFFA | — Health Facilities Financing Authority |
| HUD | — Department of Housing and Urban Development |
| IDA | — Industrial Development Authority |
| IDAG | — Industrial Development Agency |
| IDR | — Industrial development revenue |
| KRW | — Republic of Korea won |
| LIBOR | — London Interbank Offered Rate |
| LLC | — Limited liability company |
| LLLP | — Limited liability limited partnership |
| LLP | — Limited liability partnership |
| MBIA | — Municipal Bond Insurance Association |
| MFHR | — Multifamily housing revenue |
| MSTR | — Municipal securities trust receipts |
| MUD | — Municipal Utility District |
| National | — National Public Finance Guarantee Corporation |
| PCFA | — Pollution Control Financing Authority |
| PCL | — Public Company Limited |
| PCR | — Pollution control revenue |
| PFA | — Public Finance Authority |
| PFFA | — Public Facilities Financing Authority |
| PFOTER | — Puttable floating option tax-exempt receipts |
| plc | — Public limited company |
| PUTTER | — Puttable tax-exempt receipts |
| R&D | — Research & development |
| Radian | — Radian Asset Assurance |
| RAN | — Revenue anticipation notes |
| RDA | — Redevelopment Authority |
| RDFA | — Redevelopment Finance Authority |
| REIT | — Real estate investment trust |
| ROC | — Reset option certificates |
| SAVRS | — Select auction variable rate securities |
| SBA | — Small Business Authority |
| SFHR | — Single-family housing revenue |
| SFMR | — Single-family mortgage revenue |
| SPA | — Standby purchase agreement |
| SPDR | — Standard & Poor’s Depositary Receipts |
| STRIPS | — Separate trading of registered interest and principal securities |
| TAN | — Tax anticipation notes |
| TIPS | — Treasury inflation-protected securities |
| TRAN | — Tax revenue anticipation notes |
| TTFA | — Transportation Trust Fund Authority |
| TVA | — Tennessee Valley Authority |
This page is intentionally left blank.
This page is intentionally left blank.


For more information
More information about Wells Fargo Advantage Funds is available free upon request. To obtain literature, please write, email, visit the Fund’s website, or call:
Wells Fargo Advantage Funds
P.O. Box 8266
Boston, MA 02266-8266
Email: wfaf@wellsfargo.com
Website: wellsfargoadvantagefunds.com
Individual investors: 1-800-222-8222
Retail investment professionals: 1-888-877-9275
Institutional investment professionals: 1-866-765-0778
This report and the financial statements contained herein are submitted for the general information of the shareholders of Wells Fargo Advantage Funds. If this report is used for promotional purposes, distribution of the report must be accompanied or preceded by a current prospectus. For a current prospectus and, if available, a summary prospectus containing more complete information, including charges and expenses, call 1-800-222-8222 or visit the Fund’s website at wellsfargoadvantagefunds.com. Please consider the investment objectives, risks, charges, and expenses of the investment carefully before investing. This and other information about Wells Fargo Advantage Funds can be found in the current prospectus. Read the prospectus carefully before you invest or send money.
Wells Fargo Funds Management, LLC, a wholly owned subsidiary of Wells Fargo & Company, provides investment advisory and administrative services for Wells Fargo Advantage Funds. Other affiliates of Wells Fargo & Company provide subadvisory and other services for the Funds. The Funds are distributed by Wells Fargo Funds Distributor, LLC, Member FINRA/SIPC, an affiliate of Wells Fargo & Company.
NOT FDIC INSURED ¡ NO BANK GUARANTEE ¡ MAY LOSE VALUE
© 2014 Wells Fargo Funds Management, LLC. All rights reserved.
| | |
 | | 222992 03-14 SA210/SAR210 1-14 |

Wells Fargo Advantage Omega Growth Fund

Semi-Annual Report
January 31, 2014

Reduce clutter. Save trees.
Sign up for electronic delivery of prospectuses and shareholder reports at wellsfargo.com/advantagedelivery
Contents
The views expressed and any forward-looking statements are as of January 31, 2014, unless otherwise noted, and are those of the Fund managers and/or Wells Fargo Funds Management, LLC. Discussions of individual securities, or the markets generally, or any Wells Fargo Advantage Fund are not intended as individual recommendations. Future events or results may vary significantly from those expressed in any forward-looking statements; the views expressed are subject to change at any time in response to changing circumstances in the market. Wells Fargo Funds Management, LLC and the Fund disclaim any obligation to publicly update or revise any views expressed or forward-looking statements.
NOT FDIC INSURED ¡ NO BANK GUARANTEE ¡ MAY LOSE VALUE
| | | | |
| 2 | | Wells Fargo Advantage Omega Growth Fund | | Letter to shareholders (unaudited) |

Karla M. Rabusch
President
Wells Fargo Advantage Funds
Major central banks continued to inject liquidity into the banks and the markets through various quantitative easing policies.
Dear Valued Shareholder:
We are pleased to offer you this semi-annual report for the Wells Fargo Advantage Omega Growth Fund for the six-month period that ended January 31, 2014. Much of the period was marked by monetary easing by global central banks. Entering the period, investors were concerned that the U.S. Federal Reserve (Fed) would end its bond-buying program, which initially led to higher interest rates and resulted in losses for bond indexes and volatility for global stock indexes. These fears dissipated in late September 2013 and ended altogether in mid-December 2013 when the Fed announced a tapering timeline that was far more moderate than some had feared. Growing confidence that the U.S. economy was staging a fragile recovery resulted in double-digit returns for domestic stock market indexes for the six-month reporting period.
Central banks continued to provide stimulus.
Major central banks continued to inject liquidity into the banks and the markets through various quantitative easing policies. Throughout the reporting period, the Federal Open Market Committee (FOMC)—the Fed’s monetary policymaking body—kept its key interest rate effectively near zero in order to support the economy and the financial system. Well before the reporting period began, the FOMC announced its intention to keep interest rates low for an extended period and to make open-ended purchases of $40 billion per month in mortgage-backed securities. The FOMC later added purchases of $45 billion per month in long-term U.S. Treasuries. Because the markets benefited from the FOMC’s liquidity, both stocks and bonds initially sold off after the FOMC indicated in May 2013 that it might reduce (or taper) its bond-buying program. However, in mid-December 2013, the FOMC announced that it would reduce its bond-buying program by $10 billion per month beginning in January 2014. The tapering was less aggressive than some investors had feared, and the markets ended 2013 strongly.
European markets continued to benefit from the European Central Bank’s (ECB’s) earlier announcement that it would purchase an unlimited amount of one- to three-year sovereign debt from countries that had formally applied for a bailout. In November 2013, the ECB cut its key rate to a historic low of 0.25%. The ECB’s aggressive actions helped ease investor worries about a eurozone sovereign debt default. Given the substantial ties between the U.S. and Europe, the improved sentiment about the eurozone helped provide a tailwind for U.S. markets.
U.S. stock markets gained on relatively good news.
For most of the period, U.S. economic data remained moderately positive. Reported gross domestic product (GDP) growth came in at a strong 4.1% annualized rate in the third quarter of 2013, and the advance annualized estimate for fourth-quarter GDP growth was 3.2%.
The most significant negative effect was the ongoing fight in Washington, D.C., over the federal budget and debt limit. The Budget Control Act of 2011, which was passed to resolve a previous fight over the federal debt ceiling, mandated budget sequestration that took effect on March 1, 2013, and was an overhang on economic growth throughout the reporting period. Most recently, Congress was unable to pass a resolution to continue to fund the federal government, and thus, the federal government underwent a partial shutdown from September 30, 2013, through October 16, 2013. The government reopened after the president and Congress reached a deal that funded the government through January 15, 2014,
| | | | | | |
| Letter to shareholders (unaudited) | | Wells Fargo Advantage Omega Growth Fund | | | 3 | |
and raised the debt limit through February 7, 2014. In December 2013, Congress passed the Ryan–Murray budget agreement that funded the government through September 2015, lessening the near-term prospect of another shutdown.
Despite political headwinds, the relatively positive outlook for the U.S. economy contributed to a strong domestic stock market for most of the reporting period. Economically sensitive sectors, such as industrials and materials, outperformed. Dividend-paying sectors such as utilities and telecommunication services lagged as higher interest rates dampened their relative performance. Judging by various Russell indexes, small-cap stocks moderately outperformed large-cap stocks, and growth stocks strongly outperformed value stocks.
Don’t let short-term uncertainty derail long-term investment goals.
Periods of uncertainty can present challenges, but experience has taught us that maintaining long-term investment goals can be an effective way to plan for the future. Although diversification cannot guarantee an investment profit or prevent losses, we believe it can be an effective way to manage investment risk and potentially smooth out overall portfolio performance. We encourage investors to know their investments and to understand that appropriate levels of risk-taking may unlock opportunities.
Thank you for choosing to invest with Wells Fargo Advantage Funds. We appreciate your confidence in us and remain committed to helping you meet your financial needs. For current information about your fund investments, contact your investment professional, visit our website at wellsfargoadvantagefunds.com, or call us directly at 1-800-222-8222. We are available 24 hours a day, 7 days a week.
Sincerely,

Karla M. Rabusch
President
Wells Fargo Advantage Funds
Despite political headwinds, the relatively positive outlook for the U.S. economy contributed to a strong domestic stock market for most of the reporting period.
Notice to shareholders
The Fund and Wells Fargo Funds Management, LLC (“Funds Management”) have received an exemptive order from the SEC that permits Funds Management, subject to the approval of the Board of Trustees of the Fund, to select or replace certain subadvisers to manage all or a portion of the Fund’s assets and enter into, amend or terminate a sub-advisory agreement with certain subadvisers without obtaining shareholder approval (“Multi-manager Structure”). The Multi-manager Structure applies to subadvisers that are not affiliated with Funds Management or the Fund, except to the extent that affiliation arises solely because such subadvisers provide sub-advisory services to the Fund (“Non-affiliated Subadvisers”), as well as subadvisers that are indirect or direct wholly-owned subsidiaries of Funds Management or of another company that, indirectly or directly, wholly owns Funds Management (“Wholly-owned Subadvisers”).
Pursuant to the SEC order, Funds Management, with the approval of the Board of Trustees, has the discretion to terminate any subadvisers and allocate and reallocate the Fund’s assets among any other Non-affiliated Subadvisers or Wholly-owned Subadvisers. Funds Management, subject to oversight and supervision by the Board of Trustees, has responsibility to continue to oversee any subadvisers to the Fund and to recommend, for approval by the Board of Trustees, the hiring, termination and replacement of subadvisers for the Fund. In the event that a new subadviser is hired pursuant to the Multi-manager Structure, the Fund is required to provide notice to shareholders within 90 days.
Please contact your investment professional or call us directly at 1-800-222-8222 if you have any questions on this Notice to Shareholders.
| | | | |
| 4 | | Wells Fargo Advantage Omega Growth Fund | | Performance highlights (unaudited) |
Investment objective
The Fund seeks long-term capital appreciation.
Adviser
Wells Fargo Funds Management, LLC
Subadviser
Wells Capital Management Incorporated
Portfolio managers
Thomas J. Pence, CFA
Michael T. Smith, CFA
Average annual total returns1 (%) as of January 31, 2014
| | | | | | | | | | | | | | | | | | | | | | | | | | | | | | | | | | |
| | | | | Including sales charge | | | Excluding sales charge | | | Expense ratios2 (%) | |
| | | Inception date | | 1 year | | | 5 year | | | 10 year | | | 1 year | | | 5 year | | | 10 year | | | Gross | | | Net3 | |
| Class A (EKOAX) | | 4-29-1968 | | | 22.32 | | | | 21.08 | | | | 8.31 | | | | 29.78 | | | | 22.52 | | | | 8.96 | | | | 1.34 | | | | 1.30 | |
| Class B (EKOBX)* | | 8-2-1993 | | | 23.80 | | | | 21.42 | | | | 8.40 | | | | 28.80 | | | | 21.60 | | | | 8.40 | | | | 2.09 | | | | 2.05 | |
| Class C (EKOCX) | | 8-2-1993 | | | 27.79 | | | | 21.60 | | | | 8.16 | | | | 28.79 | | | | 21.60 | | | | 8.16 | | | | 2.09 | | | | 2.05 | |
| Class R (EKORX) | | 10-10-2003 | | | – | | | | – | | | | – | | | | 29.44 | | | | 22.21 | | | | 8.70 | | | | 1.59 | | | | 1.55 | |
| Administrator Class (EOMYX) | | 1-13-1997 | | | – | | | | – | | | | – | | | | 30.11 | | | | 22.82 | | | | 9.25 | | | | 1.18 | | | | 1.05 | |
| Institutional Class (EKONX) | | 7-30-2010 | | | – | | | | – | | | | – | | | | 30.41 | | | | 23.04 | | | | 9.34 | | | | 0.91 | | | | 0.80 | |
| Russell 3000® Growth Index4 | | – | | | – | | | | – | | | | – | | | | 24.95 | | | | 21.13 | | | | 7.41 | | | | – | | | | – | |
| * | | Class B shares are closed to investment, except in connection with the reinvestment of any distributions and permitted exchanges. |
Figures quoted represent past performance, which is no guarantee of future results, and do not reflect taxes that a shareholder may pay on fund distributions or the redemption of fund shares. Investment return and principal value of an investment will fluctuate so that an investor’s shares, when redeemed, may be worth more or less than their original cost. Performance shown without sales charges would be lower if sales charges were reflected. Current performance may be lower or higher than the performance data quoted, which assumes the reinvestment of dividends and capital gains. Current month-end performance is available on the Fund’s website, wellsfargoadvantagefunds.com.
Index returns do not include transaction costs associated with buying and selling securities, any mutual fund fees or expenses, or any taxes. It is not possible to invest directly in an index.
For Class A shares, the maximum front-end sales charge is 5.75%. For Class B shares, the maximum contingent deferred sales charge is 5.00%. For Class C shares, the maximum contingent deferred sales charge is 1.00%. Performance including sales charge assumes the sales charge for the corresponding time period. Class R, Administrator Class, and Institutional Class shares are sold without a front-end sales charge or contingent deferred sales charge.
Please keep in mind that high double-digit returns were primarily achieved during favorable market conditions. You should not expect that such favorable returns can be consistently achieved. A fund’s performance, especially for short time periods, should not be the sole factor in making your investment decision.
Stock values fluctuate in response to the activities of individual companies and general market and economic conditions. Certain investment strategies tend to increase the total risk of an investment (relative to the broader market). The Fund is exposed to foreign investment risk and smaller-company securities risk. Consult the Fund’s prospectus for additional information on these and other risks.
Please see footnotes on page 5.
| | | | | | |
| Performance highlights (unaudited) | | Wells Fargo Advantage Omega Growth Fund | | | 5 | |
| | | | |
| Ten largest equity holdings5 (%) as of January 31, 2014 | |
Google Incorporated Class A | | | 4.21 | |
Amazon.com Incorporated | | | 2.91 | |
Facebook Incorporated Class A | | | 2.43 | |
Visa Incorporated Class A | | | 2.38 | |
Gilead Sciences Incorporated | | | 2.29 | |
Constellation Brands Incorporated Class A | | | 2.24 | |
SBA Communications Corporation Class A | | | 2.23 | |
IntercontinentalExchange Group Incorporated | | | 2.15 | |
Alliance Data Systems Corporation | | | 2.14 | |
Alexion Pharmaceuticals Incorporated | | | 2.14 | |
|
| Sector distribution6 as of January 31, 2014 |
|
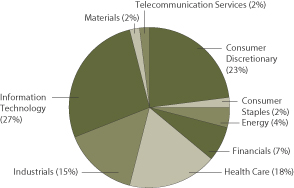 |
| 1. | Historical performance shown for Institutional Class shares prior to their inception reflects the performance of Administrator Class shares, and includes the higher expenses applicable to Administrator Class shares. If these expenses had not been included, returns would be higher. Historical performance shown for all classes of the Fund prior to July 19, 2010, is based on the performance of the Fund’s predecessor, Evergreen Omega Fund. |
| 2. | Reflects the expense ratios as stated in the most recent prospectuses. The expense ratios shown are subject to change and may differ from the annualized expense ratios shown in the financial highlights of this report. |
| 3. | The Adviser has committed through November 30, 2014, to waive fees and/or reimburse expenses to the extent necessary to cap the Fund’s Total Annual Fund Operating Expenses After Fee Waiver, excluding certain expenses, at the amounts shown. Brokerage commissions, stamp duty fees, interest, taxes, acquired fund fees and expenses, and extraordinary expenses are excluded from the cap. Without this cap, the Fund’s returns would have been lower. |
| 4. | The Russell 3000® Growth Index measures the performance of those Russell 3000 Index companies with higher price-to-book ratios and higher forecasted growth values. You cannot invest directly in an index. |
| 5. | The ten largest equity holdings are calculated based on the value of the securities divided by total net assets of the Fund. Holdings are subject to change and may have changed since the date specified. |
| 6. | Sector distribution is subject to change and is calculated based on the total long-term investments of the Fund. |
| | | | |
| 6 | | Wells Fargo Advantage Omega Growth Fund | | Fund expenses (unaudited) |
As a shareholder of the Fund, you incur two types of costs: (1) transaction costs, including sales charges (loads) on purchase payments and contingent deferred sales charges (if any) on redemptions and (2) ongoing costs, including management fees, distribution (12b-1) and/or shareholder service fees, and other Fund expenses. This example is intended to help you understand your ongoing costs (in dollars) of investing in the Fund and to compare these costs with the ongoing costs of investing in other mutual funds.
The example is based on an investment of $1,000 invested at the beginning of the six-month period and held for the entire period from August 1, 2013 to January 31, 2014.
Actual expenses
The “Actual” line of the table below provides information about actual account values and actual expenses. You may use
the information in this line, together with the amount you invested, to estimate the expenses that you paid over the period. Simply divide your account value by $1,000 (for example, an $8,600 account value divided by $1,000 = 8.6), then multiply the result by the number in the “Actual” line under the heading entitled “Expenses paid during period” for your applicable class of shares to estimate the expenses you paid on your account during this period.
Hypothetical example for comparison purposes
The “Hypothetical” line of the table below provides information about hypothetical account values and hypothetical expenses based on the Fund’s actual expense ratio and an assumed rate of return of 5% per year before expenses, which is not the Fund’s actual return. The hypothetical account values and expenses may not be used to estimate the actual ending account balance or expenses you paid for the period. You may use this information to compare the ongoing costs of investing in the Fund and other funds. To do so, compare this 5% hypothetical example with the 5% hypothetical examples that appear in the shareholder reports of the other funds.
Please note that the expenses shown in the table are meant to highlight your ongoing costs only and do not reflect any transactional costs, such as sales charges (loads) and contingent deferred sales charges. Therefore, the “Hypothetical” line of the table is useful in comparing ongoing costs only and will not help you determine the relative total costs of owning different funds. In addition, if these transactional costs were included, your costs would have been higher.
| | | | | | | | | | | | | | | | |
| | | Beginning
account value
8-1-2013 | | | Ending
account value
1-31-2014 | | | Expenses
paid during
the period1 | | | Net annualized
expense ratio | |
Class A | | | | | | | | | | | | | | | | |
Actual | | $ | 1,000.00 | | | $ | 1,140.87 | | | $ | 7.02 | | | | 1.30 | % |
Hypothetical (5% return before expenses) | | $ | 1,000.00 | | | $ | 1,018.65 | | | $ | 6.61 | | | | 1.30 | % |
Class B | | | | | | | | | | | | | | | | |
Actual | | $ | 1,000.00 | | | $ | 1,136.53 | | | $ | 11.04 | | | | 2.05 | % |
Hypothetical (5% return before expenses) | | $ | 1,000.00 | | | $ | 1,014.87 | | | $ | 10.41 | | | | 2.05 | % |
Class C | | | | | | | | | | | | | | | | |
Actual | | $ | 1,000.00 | | | $ | 1,136.47 | | | $ | 11.04 | | | | 2.05 | % |
Hypothetical (5% return before expenses) | | $ | 1,000.00 | | | $ | 1,014.87 | | | $ | 10.41 | | | | 2.05 | % |
Class R | | | | | | | | | | | | | | | | |
Actual | | $ | 1,000.00 | | | $ | 1,139.30 | | | $ | 8.36 | | | | 1.55 | % |
Hypothetical (5% return before expenses) | | $ | 1,000.00 | | | $ | 1,017.39 | | | $ | 7.88 | | | | 1.55 | % |
Administrator Class | | | | | | | | | | | | | | | | |
Actual | | $ | 1,000.00 | | | $ | 1,142.38 | | | $ | 5.67 | | | | 1.05 | % |
Hypothetical (5% return before expenses) | | $ | 1,000.00 | | | $ | 1,019.91 | | | $ | 5.35 | | | | 1.05 | % |
Institutional Class | | | | | | | | | | | | | | | | |
Actual | | $ | 1,000.00 | | | $ | 1,143.67 | | | $ | 4.32 | | | | 0.80 | % |
Hypothetical (5% return before expenses) | | $ | 1,000.00 | | | $ | 1,021.17 | | | $ | 4.08 | | | | 0.80 | % |
| 1. | Expenses paid is equal to the annualized expense ratio of each class multiplied by the average account value over the period, multiplied by the number of days in the most recent fiscal half-year divided by the number of days in the fiscal year (to reflect the one-half-year period). |
| | | | | | |
| Portfolio of investments—January 31, 2014 (unaudited) | | Wells Fargo Advantage Omega Growth Fund | | | 7 | |
| | | | | | | | | | | | |
| Security name | | | | | | Shares | | | Value | |
| | | | | | | | | | | | |
| | | | |
Common Stocks: 97.68% | | | | | | | | | | | | |
| | | | |
Consumer Discretionary: 22.16% | | | | | | | | | | | | |
| | | | |
| Auto Components: 1.45% | | | | | | | | | | | | |
Delphi Automotive plc | | | | | | | 245,800 | | | $ | 14,966,762 | |
| | | | | | | | | | | | |
| | | | |
| Distributors: 1.10% | | | | | | | | | | | | |
LKQ Corporation † | | | | | | | 418,600 | | | | 11,331,502 | |
| | | | | | | | | | | | |
| | | | |
| Hotels, Restaurants & Leisure: 1.61% | | | | | | | | | | | | |
Starbucks Corporation | | | | | | | 234,530 | | | | 16,679,774 | |
| | | | | | | | | | | | |
| | | | |
| Household Durables: 1.32% | | | | | | | | | | | | |
Mohawk Industries Incorporated † | | | | | | | 95,762 | | | | 13,615,441 | |
| | | | | | | | | | | | |
| | | | |
| Internet & Catalog Retail: 6.37% | | | | | | | | | | | | |
Amazon.com Incorporated † | | | | | | | 83,700 | | | | 30,022,353 | |
Netflix Incorporated † | | | | | | | 41,500 | | | | 16,987,195 | |
priceline.com Incorporated † | | | | | | | 16,410 | | | | 18,787,645 | |
| | | | |
| | | | | | | | | | | 65,797,193 | |
| | | | | | | | | | | | |
| | | | |
| Media: 4.21% | | | | | | | | | | | | |
AMC Networks Incorporated Class A † | | | | | | | 201,800 | | | | 13,003,992 | |
Liberty Global plc Class A † | | | | | | | 74,559 | | | | 5,959,501 | |
Liberty Global plc Class C † | | | | | | | 178,233 | | | | 14,139,224 | |
Twenty-First Century Fox Incorporated | | | | | | | 328,100 | | | | 10,440,142 | |
| | | | |
| | | | | | | | | | | 43,542,859 | |
| | | | | | | | | | | | |
| | | | |
| Specialty Retail: 4.38% | | | | | | | | | | | | |
Advance Auto Parts Incorporated | | | | | | | 55,400 | | | | 6,360,474 | |
AutoNation Incorporated † | | | | | | | 222,700 | | | | 10,999,153 | |
DSW Incorporated Class A | | | | | | | 142,400 | | | | 5,361,360 | |
Restoration Hardware Holdings Incorporated † | | | | | | | 155,076 | | | | 8,799,012 | |
TJX Companies Incorporated | | | | | | | 239,100 | | | | 13,714,776 | |
| | | | |
| | | | | | | | | | | 45,234,775 | |
| | | | | | | | | | | | |
| | | | |
| Textiles, Apparel & Luxury Goods: 1.72% | | | | | | | | | | | | |
Michael Kors Holdings Limited † | | | | | | | 88,236 | | | | 7,052,703 | |
Under Armour Incorporated Class A † | | | | | | | 99,100 | | | | 10,713,701 | |
| | | | |
| | | | | | | | | | | 17,766,404 | |
| | | | | | | | | | | | |
| | | | |
Consumer Staples: 2.24% | | | | | | | | | | | | |
| | | | |
| Beverages: 2.24% | | | | | | | | | | | | |
Constellation Brands Incorporated Class A † | | | | | | | 302,000 | | | | 23,154,340 | |
| | | | | | | | | | | | |
| | | | |
Energy: 3.93% | | | | | | | | | | | | |
| | | | |
| Oil, Gas & Consumable Fuels: 3.93% | | | | | | | | | | | | |
Antero Resources Corporation † | | | | | | | 140,885 | | | | 8,275,585 | |
Gulfport Energy Corporation † | | | | | | | 130,600 | | | | 7,960,070 | |
Marathon Petroleum Corporation | | | | | | | 88,400 | | | | 7,695,220 | |
Pioneer Natural Resources Company | | | | | | | 98,186 | | | | 16,624,854 | |
| | | | |
| | | | | | | | | | | 40,555,729 | |
| | | | | | | | | | | | |
The accompanying notes are an integral part of these financial statements.
| | | | |
| 8 | | Wells Fargo Advantage Omega Growth Fund | | Portfolio of investments—January 31, 2014 (unaudited) |
| | | | | | | | | | | | |
| Security name | | | | | | Shares | | | Value | |
| | | | | | | | | | | | |
| | | | |
Financials: 7.24% | | | | | | | | | | | | |
| | | | |
| Capital Markets: 1.28% | | | | | | | | | | | | |
Affiliated Managers Group Incorporated † | | | | | | | 66,072 | | | $ | 13,164,185 | |
| | | | | | | | | | | | |
| | | | |
| Commercial Banks: 1.01% | | | | | | | | | | | | |
Texas Capital Bancshares Incorporated † | | | | | | | 175,229 | | | | 10,420,869 | |
| | | | | | | | | | | | |
| | | | |
| Consumer Finance: 1.95% | | | | | | | | | | | | |
American Express Company | | | | | | | 236,800 | | | | 20,132,736 | |
| | | | | | | | | | | | |
| | | | |
| Diversified Financial Services: 2.15% | | | | | | | | | | | | |
IntercontinentalExchange Group Incorporated | | | | | | | 106,400 | | | | 22,215,256 | |
| | | | | | | | | | | | |
| | | | |
| Insurance: 0.85% | | | | | | | | | | | | |
eHealth Incorporated † | | | | | | | 165,100 | | | | 8,821,293 | |
| | | | | | | | | | | | |
| | | | |
Health Care: 17.59% | | | | | | | | | | | | |
| | | | |
| Biotechnology: 7.48% | | | | | | | | | | | | |
Alexion Pharmaceuticals Incorporated † | | | | | | | 139,350 | | | | 22,119,026 | |
Biogen Idec Incorporated † | | | | | | | 50,200 | | | | 15,694,528 | |
Celgene Corporation † | | | | | | | 103,800 | | | | 15,770,334 | |
Gilead Sciences Incorporated † | | | | | | | 293,280 | | | | 23,653,032 | |
| | | | |
| | | | | | | | | | | 77,236,920 | |
| | | | | | | | | | | | |
| | | | |
| Health Care Equipment & Supplies: 1.45% | | | | | | | | | | | | |
Boston Scientific Corporation † | | | | | | | 1,110,500 | | | | 15,025,065 | |
| | | | | | | | | | | | |
| | | | |
| Health Care Providers & Services: 4.06% | | | | | | | | | | | | |
Cardinal Health Incorporated | | | | | | | 107,100 | | | | 7,284,942 | |
DaVita HealthCare Partners Incorporated † | | | | | | | 177,300 | | | | 11,512,089 | |
Envision Healthcare Holdings Incorporated † | | | | | | | 285,253 | | | | 9,430,464 | |
McKesson Corporation | | | | | | | 70,300 | | | | 12,261,023 | |
Team Health Holdings Incorporated † | | | | | | | 34,400 | | | | 1,484,704 | |
| | | | |
| | | | | | | | | | | 41,973,222 | |
| | | | | | | | | | | | |
| | | | |
| Pharmaceuticals: 4.60% | | | | | | | | | | | | |
AbbVie Incorporated | | | | | | | 213,300 | | | | 10,500,759 | |
Actavis plc † | | | | | | | 81,000 | | | | 15,307,380 | |
Bristol-Myers Squibb Company | | | | | | | 269,400 | | | | 13,461,918 | |
Shire plc ADR | | | | | | | 55,300 | | | | 8,273,986 | |
| | | | |
| | | | | | | | | | | 47,544,043 | |
| | | | | | | | | | | | |
| | | | |
Industrials: 14.49% | | | | | | | | | | | | |
| | | | |
| Aerospace & Defense: 2.94% | | | | | | | | | | | | |
B/E Aerospace Incorporated † | | | | | | | 201,500 | | | | 16,013,205 | |
Precision Castparts Corporation | | | | | | | 56,300 | | | | 14,342,425 | |
| | | | |
| | | | | | | | | | | 30,355,630 | |
| | | | | | | | | | | | |
The accompanying notes are an integral part of these financial statements.
| | | | | | |
| Portfolio of investments—January 31, 2014 (unaudited) | | Wells Fargo Advantage Omega Growth Fund | | | 9 | |
| | | | | | | | | | | | |
| Security name | | | | | | Shares | | | Value | |
| | | | | | | | | | | | |
| | | | |
| Airlines: 3.59% | | | | | | | | | | | | |
American Airlines Group Incorporated † | | | | | | | 160,000 | | | $ | 5,368,000 | |
Copa Holdings SA Class A | | | | | | | 98,400 | | | | 12,860,880 | |
Delta Air Lines Incorporated | | | | | | | 616,700 | | | | 18,877,187 | |
| | | | |
| | | | | | | | | | | 37,106,067 | |
| | | | | | | | | | | | |
| | | | |
| Building Products: 1.06% | | | | | | | | | | | | |
Fortune Brands Home & Security Incorporated | | | | | | | 242,159 | | | | 10,911,685 | |
| | | | | | | | | | | | |
| | | | |
| Construction & Engineering: 0.76% | | | | | | | | | | | | |
Quanta Services Incorporated † | | | | | | | 253,800 | | | | 7,910,946 | |
| | | | | | | | | | | | |
| | | | |
| Electrical Equipment: 1.47% | | | | | | | | | | | | |
Eaton Corporation plc | | | | | | | 208,300 | | | | 15,224,647 | |
| | | | | | | | | | | | |
| | | | |
| Machinery: 0.01% | | | | | | | | | | | | |
Proto Labs Incorporated † | | | | | | | 1,242 | | | | 98,565 | |
| | | | | | | | | | | | |
| | | | |
| Professional Services: 1.97% | | | | | | | | | | | | |
IHS Incorporated Class A † | | | | | | | 97,365 | | | | 11,042,165 | |
The Advisory Board Company † | | | | | | | 147,300 | | | | 9,325,563 | |
| | | | |
| | | | | | | | | | | 20,367,728 | |
| | | | | | | | | | | | |
| | | | |
| Road & Rail: 1.36% | | | | | | | | | | | | |
Kansas City Southern | | | | | | | 133,095 | | | | 14,053,501 | |
| | | | | | | | | | | | |
| | | | |
| Trading Companies & Distributors: 1.33% | | | | | | | | | | | | |
United Rentals Incorporated † | | | | | | | 169,400 | | | | 13,711,236 | |
| | | | | | | | | | | | |
| | | | |
Information Technology: 26.05% | | | | | | | | | | | | |
| | | | |
| Computers & Peripherals: 2.94% | | | | | | | | | | | | |
Apple Incorporated | | | | | | | 40,100 | | | | 20,074,060 | |
Stratasys Limited † | | | | | | | 85,148 | | | | 10,265,443 | |
| | | | |
| | | | | | | | | | | 30,339,503 | |
| | | | | | | | | | | | |
| | | | |
| Electronic Equipment, Instruments & Components: 0.93% | | | | | | | | | | | | |
Cognex Corporation † | | | | | | | 244,000 | | | | 9,625,800 | |
| | | | | | | | | | | | |
| | | | |
| Internet Software & Services: 7.94% | | | | | | | | | | | | |
Facebook Incorporated Class A † | | | | | | | 401,200 | | | | 25,103,084 | |
Google Incorporated Class A † | | | | | | | 36,800 | | | | 43,459,696 | |
LinkedIn Corporation Class A † | | | | | | | 60,900 | | | | 13,106,289 | |
Twitter Incorporated †« | | | | | | | 6,480 | | | | 417,960 | |
| | | | |
| | | | | | | | | | | 82,087,029 | |
| | | | | | | | | | | | |
| | | | |
| IT Services: 5.77% | | | | | | | | | | | | |
Alliance Data Systems Corporation † | | | | | | | 92,400 | | | | 22,144,584 | |
Vantiv Incorporated Class A † | | | | | | | 423,674 | | | | 12,854,269 | |
Visa Incorporated Class A | | | | | | | 114,201 | | | | 24,602,321 | |
| | | | |
| | | | | | | | | | | 59,601,174 | |
| | | | | | | | | | | | |
The accompanying notes are an integral part of these financial statements.
| | | | |
| 10 | | Wells Fargo Advantage Omega Growth Fund | | Portfolio of investments—January 31, 2014 (unaudited) |
| | | | | | | | | | | | | | |
| Security name | | | | | | | Shares | | | Value | |
| | | | | | | | | | | | | | |
| | | | |
| Semiconductors & Semiconductor Equipment: 2.44% | | | | | | | | | | | | | | |
ARM Holdings plc | | | | | | | | | 273,941 | | | $ | 12,620,462 | |
ASML Holding NV | | | | | | | | | 148,200 | | | | 12,542,166 | |
| | | | |
| | | | | | | | | | | | | 25,162,628 | |
| | | | | | | | | | | | | | |
| | | | |
| Software: 6.03% | | | | | | | | | | | | | | |
CommVault Systems Incorporated † | | | | | | | | | 150,600 | | | | 10,401,942 | |
Fleetmatics Group plc † | | | | | | | | | 137,300 | | | | 5,493,373 | |
Guidewire Software Incorporated † | | | | | | | | | 134,129 | | | | 6,332,230 | |
Salesforce.com Incorporated † | | | | | | | | | 308,900 | | | | 18,697,717 | |
ServiceNow Incorporated † | | | | | | | | | 210,900 | | | | 13,377,387 | |
Tableau Software Incorporated Class A † | | | | | | | | | 99,000 | | | | 8,001,180 | |
| | | | |
| | | | | | | | | | | | | 62,303,829 | |
| | | | | | | | | | | | | | |
| | | | |
Materials: 1.75% | | | | | | | | | | | | | | |
| | | | |
| Chemicals: 1.75% | | | | | | | | | | | | | | |
Monsanto Company | | | | | | | | | 170,200 | | | | 18,134,808 | |
| | | | | | | | | | | | | | |
| | | | |
Telecommunication Services: 2.23% | | | | | | | | | | | | | | |
| | | | |
| Wireless Telecommunication Services: 2.23% | | | | | | | | | | | | | | |
SBA Communications Corporation Class A † | | | | | | | | | 248,302 | | | | 23,030,011 | |
| | | | | | | | | | | | | | |
| | | | |
Total Common Stocks (Cost $760,941,320) | | | | | | | | | | | | | 1,009,203,155 | |
| | | | | | | | | | | | | | |
| | | | |
| | | Yield | | | | | | | | | |
| | | | |
Short-Term Investments: 0.79% | | | | | | | | | | | | | | |
| | | | |
| Investment Companies: 0.79% | | | | | | | | | | | | | | |
Wells Fargo Advantage Cash Investment Money Market Fund, Select Class (l)(u) | | | 0.07 | % | | | | | 7,727,570 | | | | 7,727,570 | |
Wells Fargo Securities Lending Cash Investments, LLC (l)(u)(r)(v) | | | 0.08 | | | | | | 394,975 | | | | 394,975 | |
| | | | |
Total Short-Term Investments (Cost $8,122,545) | | | | | | | | | | | | | 8,122,545 | |
| | | | | | | | | | | | | | |
| | | | | | | | |
| Total investments in securities | | | | | | | | |
| (Cost $769,063,865) * | | | 98.47 | % | | | 1,017,325,700 | |
Other assets and liabilities, net | | | 1.53 | | | | 15,806,422 | |
| | | | | | | | |
| Total net assets | | | 100.00 | % | | $ | 1,033,132,122 | |
| | | | | | | | |
| † | Non-income-earning security |
| « | All or a portion of this security is on loan. |
| (l) | Investment in an affiliate |
| (u) | Rate shown is the 7-day annualized yield at period end. |
| (r) | The investment company is exempt from registration under Section 3(c)(7) of the Investment Company Act of 1940, as amended. |
| (v) | Security represents investment of cash collateral received from securities on loan. |
| * | Cost for federal income tax purposes is $769,613,823 and unrealized appreciation (depreciation) consists of: |
| | | | |
Gross unrealized appreciation | | $ | 255,865,336 | |
Gross unrealized depreciation | | | (8,153,459 | ) |
| | | | |
Net unrealized appreciation | | $ | 247,711,877 | |
The accompanying notes are an integral part of these financial statements.
| | | | | | |
| Statement of assets and liabilities—January 31, 2014 (unaudited) | | Wells Fargo Advantage Omega Growth Fund | | | 11 | |
| | | | |
| | | | |
| |
Assets | | | | |
Investments | | | | |
In unaffiliated securities (including securities on loan), at value (see cost below) | | $ | 1,009,203,155 | |
In affiliated securities, at value (see cost below) | | | 8,122,545 | |
| | | | |
Total investments, at value (see cost below) | | | 1,017,325,700 | |
Receivable for investments sold | | | 29,172,102 | |
Receivable for Fund shares sold | | | 2,414,874 | |
Receivable for dividends | | | 223,512 | |
Receivable for securities lending income | | | 698 | |
Prepaid expenses and other assets | | | 54,091 | |
| | | | |
Total assets | | | 1,049,190,977 | |
| | | | |
| |
Liabilities | | | | |
Payable for investments purchased | | | 12,973,762 | |
Payable for Fund shares redeemed | | | 1,288,344 | |
Payable upon receipt of securities loaned | | | 394,975 | |
Advisory fee payable | | | 657,435 | |
Distribution fees payable | | | 89,803 | |
Due to other related parties | | | 277,187 | |
Accrued expenses and other liabilities | | | 377,349 | |
| | | | |
Total liabilities | | | 16,058,855 | |
| | | | |
Total net assets | | $ | 1,033,132,122 | |
| | | | |
| |
NET ASSETS CONSIST OF | | | | |
Paid-in capital | | $ | 745,557,563 | |
Accumulated net investment loss | | | (4,668,660 | ) |
Accumulated net realized gains on investments | | | 43,981,384 | |
Net unrealized gains on investments | | | 248,261,835 | |
| | | | |
Total net assets | | $ | 1,033,132,122 | |
| | | | |
| |
COMPUTATION OF NET ASSET VALUE AND OFFERING PRICE PER SHARE1 | | | | |
Net assets – Class A | | $ | 769,117,782 | |
Shares outstanding – Class A | | | 15,723,119 | |
Net asset value per share – Class A | | | $48.92 | |
Maximum offering price per share – Class A2 | | | $51.90 | |
Net assets – Class B | | $ | 16,133,978 | |
Shares outstanding – Class B | | | 406,087 | |
Net asset value per share – Class B | | | $39.73 | |
Net assets – Class C | | $ | 106,335,281 | |
Shares outstanding – Class C | | | 2,669,608 | |
Net asset value per share – Class C | | | $39.83 | |
Net assets – Class R | | $ | 28,272,562 | |
Shares outstanding – Class R | | | 593,522 | |
Net asset value per share – Class R | | | $47.64 | |
Net assets – Administrator Class | | $ | 100,253,619 | |
Shares outstanding – Administrator Class | | | 1,953,985 | |
Net asset value per share – Administrator Class | | | $51.31 | |
Net assets – Institutional Class | | $ | 13,018,900 | |
Shares outstanding – Institutional Class | | | 251,237 | |
Net asset value per share – Institutional Class | | | $51.82 | |
| |
Investments in unaffiliated securities (including securities on loan), at cost | | $ | 760,941,320 | |
| | | | |
Investments in affiliated securities, at cost | | $ | 8,122,545 | |
| | | | |
Total investments, at cost | | $ | 769,063,865 | |
| | | | |
Securities on loan, at value | | $ | 387,167 | |
| | | | |
| 1. | The Fund has an unlimited number of authorized shares. |
| 2. | Maximum offering price is computed as 100/94.25 of net asset value. On investments of $50,000 or more, the offering price is reduced. |
The accompanying notes are an integral part of these financial statements.
| | | | |
| 12 | | Wells Fargo Advantage Omega Growth Fund | | Statement of operations—six months ended January 31, 2014 (unaudited) |
| | | | |
| | | | |
| |
Investment income | | | | |
Dividends | | $ | 2,074,511 | |
Securities lending income, net | | | 15,931 | |
Income from affiliated securities | | | 8,274 | |
| | | | |
Total investment income | | | 2,098,716 | |
| | | | |
| |
Expenses | | | | |
Advisory fee | | | 3,571,091 | |
Administration fees | | | | |
Fund level | | | 246,179 | |
Class A | | | 968,849 | |
Class B | | | 22,618 | |
Class C | | | 127,437 | |
Class R | | | 35,613 | |
Administrator Class | | | 43,264 | |
Institutional Class | | | 4,038 | |
Shareholder servicing fees | | | | |
Class A | | | 931,586 | |
Class B | | | 21,748 | |
Class C | | | 122,536 | |
Class R | | | 34,243 | |
Administrator Class | | | 103,088 | |
Distribution fees | | | | |
Class B | | | 65,243 | |
Class C | | | 367,607 | |
Class R | | | 34,243 | |
Custody and accounting fees | | | 28,266 | |
Professional fees | | | 24,621 | |
Registration fees | | | 40,025 | |
Shareholder report expenses | | | 88,335 | |
Trustees’ fees and expenses | | | 4,812 | |
Other fees and expenses | | | 11,298 | |
| | | | |
Total expenses | | | 6,896,740 | |
Less: Fee waivers and/or expense reimbursements | | | (162,413 | ) |
| | | | |
Net expenses | | | 6,734,327 | |
| | | | |
Net investment loss | | | (4,635,611 | ) |
| | | | |
| |
REALIZED AND UNREALIZED GAINS (LOSSES) ON INVESTMENTS | | | | |
Net realized gains on investments | | | 79,276,071 | |
Net change in unrealized gains (losses) on investments | | | 48,380,386 | |
| | | | |
Net realized and unrealized gains (losses) on investments | | | 127,656,457 | |
| | | | |
Net increase in net assets resulting from operations | | $ | 123,020,846 | |
| | | | |
The accompanying notes are an integral part of these financial statements.
| | | | | | |
| Statement of changes in net assets | | Wells Fargo Advantage Omega Growth Fund | | | 13 | |
| | | | | | | | | | | | | | | | |
| | | Six months ended
January 31, 2014
(unaudited) | | | Year ended
July 31, 2013 | |
| | | | |
Operations | | | | | | | | | | | | | | | | |
Net investment loss | | | | | | $ | (4,635,611 | ) | | | | | | $ | (1,230,294 | ) |
Net realized gains on investments | | | | | | | 79,276,071 | | | | | | | | 99,889,570 | |
Net change in unrealized gains (losses) on investments | | | | | | | 48,380,386 | | | | | | | | 84,234,481 | |
| | | | |
Net increase in net assets resulting from operations | | | | | | | 123,020,846 | | | | | | | | 182,893,757 | |
| | | | |
| | | | |
Distributions to shareholders from | | | | | | | | | | | | | | | | |
Net realized gains | | | | | | | | | | | | | | | | |
Class A | | | | | | | (79,931,223 | ) | | | | | | | (19,509,990 | ) |
Class B | | | | | | | (2,146,719 | ) | | | | | | | (778,633 | ) |
Class C | | | | | | | (13,032,342 | ) | | | | | | | (2,595,551 | ) |
Class R | | | | | | | (3,057,781 | ) | | | | | | | (558,930 | ) |
Administrator Class | | | | | | | (9,323,528 | ) | | | | | | | (1,813,617 | ) |
Institutional Class | | | | | | | (1,312,052 | ) | | | | | | | (37,612 | ) |
| | | | |
Total distributions to shareholders | | | | | | | (108,803,645 | ) | | | | | | | (25,294,333 | ) |
| | | | |
| | | | |
Capital share transactions | | | Shares | | | | | | | | Shares | | | | | |
Proceeds from shares sold | | | | | | | | | | | | | | | | |
Class A | | | 1,877,624 | | | | 94,189,568 | | | | 2,441,057 | | | | 104,920,005 | |
Class B | | | 13,558 | | | | 568,938 | | | | 16,792 | | | | 614,054 | |
Class C | | | 475,232 | | | | 19,792,327 | | | | 566,393 | | | | 20,612,900 | |
Class R | | | 176,448 | | | | 8,575,768 | | | | 271,923 | | | | 11,504,921 | |
Administrator Class | | | 659,585 | | | | 34,742,991 | | | | 672,754 | | | | 30,573,612 | |
Institutional Class | | | 174,390 | | | | 9,356,131 | | | | 55,050 | | | | 2,614,807 | |
| | | | |
| | | | | | | 167,225,723 | | | | | | | | 170,840,299 | |
| | | | |
Reinvestment of distributions | | | | | | | | | | | | | | | | |
Class A | | | 1,527,223 | | | | 74,253,607 | | | | 456,141 | | | | 18,163,520 | |
Class B | | | 53,475 | | | | 2,114,420 | | | | 22,894 | | | | 765,115 | |
Class C | | | 265,973 | | | | 10,543,167 | | | | 63,333 | | | | 2,121,010 | |
Class R | | | 19,145 | | | | 906,888 | | | | 3,387 | | | | 132,045 | |
Administrator Class | | | 147,977 | | | | 7,543,849 | | | | 33,510 | | | | 1,388,644 | |
Institutional Class | | | 25,487 | | | | 1,312,052 | | | | 902 | | | | 37,612 | |
| | | | |
| | | | | | | 96,673,983 | | | | | | | | 22,607,946 | |
| | | | |
Payment for shares redeemed | | | | | | | | | | | | | | | | |
Class A | | | (1,627,575 | ) | | | (82,160,728 | ) | | | (3,039,206 | ) | | | (129,087,456 | ) |
Class B | | | (97,122 | ) | | | (4,086,435 | ) | | | (276,032 | ) | | | (9,857,351 | ) |
Class C | | | (143,799 | ) | | | (6,003,665 | ) | | | (350,073 | ) | | | (12,599,633 | ) |
Class R | | | (108,313 | ) | | | (5,318,504 | ) | | | (170,843 | ) | | | (7,177,147 | ) |
Administrator Class | | | (238,746 | ) | | | (12,639,792 | ) | | | (591,027 | ) | | | (26,140,182 | ) |
Institutional Class | | | (18,229 | ) | | | (965,823 | ) | | | (5,455 | ) | | | (253,725 | ) |
| | | | |
| | | | | | | (111,174,947 | ) | | | | | | | (185,115,494 | ) |
| | | | |
Net increase in net assets resulting from capital share transactions | | | | | | | 152,724,759 | | | | | | | | 8,332,751 | |
| | | | |
Total increase in net assets | | | | | | | 166,941,960 | | | | | | | | 165,932,175 | |
| | | | |
| | | | |
Net assets | | | | | | | | | | | | | | | | |
Beginning of period | | | | | | | 866,190,162 | | | | | | | | 700,257,987 | |
| | | | |
End of period | | | | | | $ | 1,033,132,122 | | | | | | | $ | 866,190,162 | |
| | | | |
Accumulated net investment loss | | | | | | $ | (4,668,660 | ) | | | | | | $ | (33,049 | ) |
| | | | |
The accompanying notes are an integral part of these financial statements.
| | | | |
| 14 | | Wells Fargo Advantage Omega Growth Fund | | Financial highlights |
(For a share outstanding throughout each period)
| | | | | | | | | | | | | | | | | | | | | | | | | | | | |
| | | Six months ended
January 31, 2014
(unaudited) | | | Year ended July 31 | | | Year ended September 30 | |
| CLASS A | | | 2013 | | | 2012 | | | 2011 | | | 20101,2 | | | 20091 | | | 20081 | |
Net asset value, beginning of period | | $ | 47.97 | | | $ | 39.09 | | | $ | 38.29 | | | $ | 30.11 | | | $ | 28.44 | | | $ | 27.26 | | | $ | 31.44 | |
Net investment income (loss) | | | (0.22 | )3 | | | (0.02 | ) | | | (0.28 | )3 | | | (0.29 | ) | | | (0.10 | )3 | | | 0.18 | 3 | | | 0.05 | 3 |
Net realized and unrealized gains (losses) on investments | | | 6.94 | | | | 10.31 | | | | 1.08 | | | | 8.47 | | | | 1.96 | | | | 1.00 | | | | (4.23 | ) |
| | | | | | | | | | | | | | | | | | | | | | | | | | | | |
Total from investment operations | | | 6.72 | | | | 10.29 | | | | 0.80 | | | | 8.18 | | | | 1.86 | | | | 1.18 | | | | (4.18 | ) |
Distributions to shareholders from | | | | | | | | | | | | | | | | | | | | | | | | | | | | |
Net investment income | | | 0.00 | | | | 0.00 | | | | 0.00 | | | | 0.00 | | | | (0.19 | ) | | | 0.00 | | | | 0.00 | |
Net realized gains | | | (5.77 | ) | | | (1.41 | ) | | | 0.00 | | | | 0.00 | | | | 0.00 | | | | 0.00 | | | | 0.00 | |
| | | | | | | | | | | | | | | | | | | | | | | | | | | | |
Total distributions to shareholders | | | (5.77 | ) | | | (1.41 | ) | | | 0.00 | | | | 0.00 | | | | (0.19 | ) | | | 0.00 | | | | 0.00 | |
Net asset value, end of period | | | $48.92 | | | | $47.97 | | | | $39.09 | | | | $38.29 | | | | $30.11 | | | | $28.44 | | | | $27.26 | |
Total return4 | | | 14.09 | % | | | 27.07 | % | | | 2.09 | % | | | 27.17 | % | | | 6.53 | % | | | 4.33 | % | | | (13.30 | )% |
Ratios to average net assets (annualized) | | | | | | | | | | | | | | | | | | | | | | | | | | | | |
Gross expenses | | | 1.33 | % | | | 1.34 | % | | | 1.35 | % | | | 1.36 | % | | | 1.35 | % | | | 1.48 | % | | | 1.44 | % |
Net expenses | | | 1.30 | % | | | 1.30 | % | | | 1.30 | % | | | 1.30 | % | | | 1.34 | % | | | 1.39 | % | | | 1.37 | % |
Net investment income (loss) | | | (0.87 | )% | | | (0.08 | )% | | | (0.75 | )% | | | (0.80 | )% | | | (0.40 | )% | | | 0.79 | % | | | 0.16 | % |
Supplemental data | | | | | | | | | | | | | | | | | | | | | | | | | | | | |
Portfolio turnover rate | | | 51 | % | | | 88 | % | | | 101 | % | | | 123 | % | | | 116 | % | | | 26 | % | | | 44 | % |
Net assets, end of period (000s omitted) | | | $769,118 | | | | $668,992 | | | | $550,758 | | | | $584,871 | | | | $460,187 | | | | $460,082 | | | | $465,952 | |
| 1. | After the close of business on July 16, 2010, the Fund acquired the net assets of Evergreen Omega Fund which became the accounting and performance survivor in the transaction. The information for the periods prior to July 19, 2010 is that of Class A of Evergreen Omega Fund. |
| 2. | For the ten months ended July 31, 2010. The Fund changed its fiscal year end from September 30 to July 31, effective July 31, 2010. |
| 3. | Calculated based upon average shares outstanding |
| 4. | Total return calculations do not include any sales charges. Returns for periods of less than one year are not annualized. |
The accompanying notes are an integral part of these financial statements.
| | | | | | |
| Financial highlights | | Wells Fargo Advantage Omega Growth Fund | | | 15 | |
(For a share outstanding throughout each period)
| | | | | | | | | | | | | | | | | | | | | | | | | | | | |
| | | Six months ended
January 31, 2014
(unaudited) | | | Year ended July 31 | | | Year ended September 30 | |
| CLASS B | | | 2013 | | | 2012 | | | 2011 | | | 20101,2 | | | 20091 | | | 20081 | |
Net asset value, beginning of period | | $ | 40.07 | | | $ | 33.12 | | | $ | 32.68 | | | $ | 25.89 | | | $ | 24.46 | | | $ | 23.62 | | | $ | 27.45 | |
Net investment income (loss) | | | (0.34 | )3 | | | (0.28 | )3 | | | (0.47 | )3 | | | (0.48 | )3 | | | (0.25 | )3 | | | 0.02 | 3 | | | (0.15 | )3 |
Net realized and unrealized gains (losses) on investments | | | 5.77 | | | | 8.64 | | | | 0.91 | | | | 7.27 | | | | 1.68 | | | | 0.82 | | | | (3.68 | ) |
| | | | | | | | | | | | | | | | | | | | | | | | | | | | |
Total from investment operations | | | 5.43 | | | | 8.36 | | | | 0.44 | | | | 6.79 | | | | 1.43 | | | | 0.84 | | | | (3.83 | ) |
Distributions to shareholders from | | | | | | | | | | | | | | | | | | | | | | | | | | | | |
Net realized gains | | | (5.77 | ) | | | (1.41 | ) | | | 0.00 | | | | 0.00 | | | | 0.00 | | | | 0.00 | | | | 0.00 | |
Net asset value, end of period | | $ | 39.73 | | | $ | 40.07 | | | $ | 33.12 | | | $ | 32.68 | | | $ | 25.89 | | | $ | 24.46 | | | $ | 23.62 | |
Total return4 | | | 13.65 | % | | | 26.11 | % | | | 1.32 | % | | | 26.23 | % | | | 5.85 | % | | | 3.56 | % | | | (13.95 | )% |
Ratios to average net assets (annualized) | | | | | | | | | | | | | | | | | | | | | | | | | | | | |
Gross expenses | | | 2.07 | % | | | 2.09 | % | | | 2.10 | % | | | 2.12 | % | | | 2.10 | % | | | 2.22 | % | | | 2.16 | % |
Net expenses | | | 2.05 | % | | | 2.05 | % | | | 2.05 | % | | | 2.05 | % | | | 2.09 | % | | | 2.13 | % | | | 2.11 | % |
Net investment income (loss) | | | (1.61 | )% | | | (0.78 | )% | | | (1.51 | )% | | | (1.55 | )% | | | (1.14 | )% | | | 0.10 | % | | | (0.61 | )% |
Supplemental data | | | | | | | | | | | | | | | | | | | | | | | | | | | | |
Portfolio turnover rate | | | 51 | % | | | 88 | % | | | 101 | % | | | 123 | % | | | 116 | % | | | 26 | % | | | 44 | % |
Net assets, end of period (000s omitted) | | | $16,134 | | | | $17,476 | | | | $22,271 | | | | $40,023 | | | | $46,434 | | | | $51,984 | | | | $85,008 | |
| 1. | After the close of business on July 16, 2010, the Fund acquired the net assets of Evergreen Omega Fund which became the accounting and performance survivor in the transaction. The information for the periods prior to July 19, 2010 is that of Class B of Evergreen Omega Fund. |
| 2. | For the ten months ended July 31, 2010. The Fund changed its fiscal year end from September 30 to July 31, effective July 31, 2010. |
| 3. | Calculated based upon average shares outstanding |
| 4. | Total return calculations do not include any sales charges. Returns for periods of less than one year are not annualized. |
The accompanying notes are an integral part of these financial statements.
| | | | |
| 16 | | Wells Fargo Advantage Omega Growth Fund | | Financial highlights |
(For a share outstanding throughout each period)
| | | | | | | | | | | | | | | | | | | | | | | | | | | | |
| | | Six months ended
January 31, 2014
(unaudited) | | | Year ended July 31 | | | Year ended September 30 | |
| CLASS C | | | 2013 | | | 2012 | | | 2011 | | | 20101,2 | | | 20091 | | | 20081 | |
Net asset value, beginning of period | | $ | 40.15 | | | $ | 33.18 | | | $ | 32.75 | | | $ | 25.94 | | | $ | 24.53 | | | $ | 23.69 | | | $ | 27.52 | |
Net investment income (loss) | | | (0.35 | )3 | | | (0.31 | )3 | | | (0.47 | )3 | | | (0.49 | )3 | | | (0.25 | )3 | | | 0.00 | 3,4 | | | (0.15 | )3 |
Net realized and unrealized gains (losses) on investments | | | 5.80 | | | | 8.69 | | | | 0.90 | | | | 7.30 | | | | 1.68 | | | | 0.84 | | | | (3.68 | ) |
| | | | | | | | | | | | | | | | | | | | | | | | | | | | |
Total from investment operations | | | 5.45 | | | | 8.38 | | | | 0.43 | | | | 6.81 | | | | 1.43 | | | | 0.84 | | | | (3.83 | ) |
Distributions to shareholders from | | | | | | | | | | | | | | | | | | | | | | | | | | | | |
Net investment income | | | 0.00 | | | | 0.00 | | | | 0.00 | | | | 0.00 | | | | (0.02 | ) | | | 0.00 | | | | 0.00 | |
Net realized gains | | | (5.77 | ) | | | (1.41 | ) | | | 0.00 | | | | 0.00 | | | | 0.00 | | | | 0.00 | | | | 0.00 | |
| | | | | | | | | | | | | | | | | | | | | | | | | | | | |
Total distributions to shareholders | | | (5.77 | ) | | | (1.41 | ) | | | 0.00 | | | | 0.00 | | | | (0.02 | ) | | | 0.00 | | | | 0.00 | |
Net asset value, end of period | | $ | 39.83 | | | $ | 40.15 | | | $ | 33.18 | | | $ | 32.75 | | | $ | 25.94 | | | $ | 24.53 | | | $ | 23.69 | |
Total return5 | | | 13.65 | % | | | 26.11 | % | | | 1.31 | % | | | 26.25 | % | | | 5.83 | % | | | 3.55 | % | | | (13.92 | )% |
Ratios to average net assets (annualized) | | | | | | | | | | | | | | | | | | | | | | | | | | | | |
Gross expenses | | | 2.08 | % | | | 2.09 | % | | | 2.10 | % | | | 2.11 | % | | | 2.10 | % | | | 2.23 | % | | | 2.16 | % |
Net expenses | | | 2.05 | % | | | 2.05 | % | | | 2.05 | % | | | 2.05 | % | | | 2.09 | % | | | 2.14 | % | | | 2.11 | % |
Net investment income (loss) | | | (1.63 | )% | | | (0.85 | )% | | | (1.49 | )% | | | (1.55 | )% | | | (1.15 | )% | | | 0.02 | % | | | (0.58 | )% |
Supplemental data | | | | | | | | | | | | | | | | | | | | | | | | | | | | |
Portfolio turnover rate | | | 51 | % | | | 88 | % | | | 101 | % | | | 123 | % | | | 116 | % | | | 26 | % | | | 44 | % |
Net assets, end of period (000s omitted) | | | $106,335 | | | | $83,206 | | | | $59,481 | | | | $58,329 | | | | $44,892 | | | | $43,806 | | | | $40,829 | |
| 1. | After the close of business on July 16, 2010, the Fund acquired the net assets of Evergreen Omega Fund which became the accounting and performance survivor in the transaction. The information for the periods prior to July 19, 2010 is that of Class C of Evergreen Omega Fund. |
| 2. | For the ten months ended July 31, 2010. The Fund changed its fiscal year end from September 30 to July 31, effective July 31, 2010. |
| 3. | Calculated based upon average shares outstanding |
| 4. | Amount is less than $0.005. |
| 5. | Total return calculations do not include any sales charges. Returns for periods of less than one year are not annualized. |
The accompanying notes are an integral part of these financial statements.
| | | | | | |
| Financial highlights | | Wells Fargo Advantage Omega Growth Fund | | | 17 | |
(For a share outstanding throughout each period)
| | | | | | | | | | | | | | | | | | | | | | | | | | | | |
| | | Six months ended
January 31, 2014
(unaudited) | | | Year ended July 31 | | | Year ended September 30 | |
| CLASS R | | | 2013 | | | 2012 | | | 2011 | | | 20101,2 | | | 20091 | | | 20081 | |
Net asset value, beginning of period | | $ | 46.90 | | | $ | 38.35 | | | $ | 37.66 | | | $ | 29.69 | | | $ | 28.09 | | | $ | 26.99 | | | $ | 31.20 | |
Net investment income (loss) | | | (0.24 | ) | | | (0.09 | ) | | | (0.36 | )3 | | | (0.13 | ) | | | (0.16 | )3 | | | 0.08 | 3 | | | (0.02 | )3 |
Net realized and unrealized gains (losses) on investments | | | 6.75 | | | | 10.05 | | | | 1.05 | | | | 8.10 | | | | 1.94 | | | | 1.02 | | | | (4.19 | ) |
| | | | | | | | | | | | | | | | | | | | | | | | | | | | |
Total from investment operations | | | 6.51 | | | | 9.96 | | | | 0.69 | | | | 7.97 | | | | 1.78 | | | | 1.10 | | | | (4.21 | ) |
Distributions to shareholders from | | | | | | | | | | | | | | | | | | | | | | | | | | | | |
Net investment income | | | 0.00 | | | | 0.00 | | | | 0.00 | | | | 0.00 | | | | (0.18 | ) | | | 0.00 | | | | 0.00 | |
Net realized gains | | | (5.77 | ) | | | (1.41 | ) | | | 0.00 | | | | 0.00 | | | | 0.00 | | | | 0.00 | | | | 0.00 | |
| | | | | | | | | | | | | | | | | | | | | | | | | | | | |
Total distributions to shareholders | | | (5.77 | ) | | | (1.41 | ) | | | 0.00 | | | | 0.00 | | | | (0.18 | ) | | | 0.00 | | | | 0.00 | |
Net asset value, end of period | | $ | 47.64 | | | $ | 46.90 | | | $ | 38.35 | | | $ | 37.66 | | | $ | 29.69 | | | $ | 28.09 | | | $ | 26.99 | |
Total return4 | | | 13.93 | % | | | 26.73 | % | | | 1.83 | % | | | 26.89 | % | | | 6.29 | % | | | 4.08 | % | | | (13.49 | )% |
Ratios to average net assets (annualized) | | | | | | | | | | | | | | | | | | | | | | | | | | | | |
Gross expenses | | | 1.58 | % | | | 1.59 | % | | | 1.60 | % | | | 1.59 | % | | | 1.60 | % | | | 1.76 | % | | | 1.66 | % |
Net expenses | | | 1.55 | % | | | 1.55 | % | | | 1.55 | % | | | 1.55 | % | | | 1.59 | % | | | 1.67 | % | | | 1.61 | % |
Net investment income (loss) | | | (1.12 | )% | | | (0.38 | )% | | | (0.99 | )% | | | (1.08 | )% | | | (0.65 | )% | | | 0.35 | % | | | (0.08 | )% |
Supplemental data | | | | | | | | | | | | | | | | | | | | | | | | | | | | |
Portfolio turnover rate | | | 51 | % | | | 88 | % | | | 101 | % | | | 123 | % | | | 116 | % | | | 26 | % | | | 44 | % |
Net assets, end of period (000s omitted) | | | $28,273 | | | | $23,745 | | | | $15,408 | | | | $6,515 | | | | $1,523 | | | | $838 | | | | $84 | |
| 1. | After the close of business on July 16, 2010, the Fund acquired the net assets of Evergreen Omega Fund which became the accounting and performance survivor in the transaction. The information for the periods prior to July 19, 2010 is that of Class R of Evergreen Omega Fund. |
| 2. | For the ten months ended July 31, 2010. The Fund changed its fiscal year end from September 30 to July 31, effective July 31, 2010. |
| 3. | Calculated based upon average shares outstanding |
| 4. | Returns for periods of less than one year are not annualized. |
The accompanying notes are an integral part of these financial statements.
| | | | |
| 18 | | Wells Fargo Advantage Omega Growth Fund | | Financial highlights |
(For a share outstanding throughout each period)
| | | | | | | | | | | | | | | | | | | | | | | | | | | | |
| | | Six months ended
January 31, 2014
(unaudited) | | | Year ended July 31 | | | Year ended September 30 | |
| ADMINISTRATOR CLASS | | | 2013 | | | 2012 | | | 2011 | | | 20101,2 | | | 20091 | | | 20081 | |
Net asset value, beginning of period | | $ | 50.00 | | | $ | 40.60 | | | $ | 39.67 | | | $ | 31.12 | | | $ | 29.39 | | | $ | 28.10 | | | $ | 32.32 | |
Net investment income (loss) | | | (0.17 | )3 | | | 0.07 | 3 | | | (0.19 | )3 | | | (0.21 | )3 | | | (0.04 | )3 | | | 0.24 | 3 | | | 0.13 | 3 |
Net realized and unrealized gains (losses) on investments | | | 7.25 | | | | 10.74 | | | | 1.12 | | | | 8.76 | | | | 2.02 | | | | 1.05 | | | | (4.35 | ) |
| | | | | | | | | | | | | | | | | | | | | | | | | | | | |
Total from investment operations | | | 7.08 | | | | 10.81 | | | | 0.93 | | | | 8.55 | | | | 1.98 | | | | 1.29 | | | | (4.22 | ) |
Distributions to shareholders from | | | | | | | | | | | | | | | | | | | | | | | | | | | | |
Net investment income | | | 0.00 | | | | 0.00 | | | | 0.00 | | | | 0.00 | | | | (0.25 | ) | | | 0.00 | | | | 0.00 | |
Net realized gains | | | (5.77 | ) | | | (1.41 | ) | | | 0.00 | | | | 0.00 | | | | 0.00 | | | | 0.00 | | | | 0.00 | |
| | | | | | | | | | | | | | | | | | | | | | | | | | | | |
Total distributions to shareholders | | | (5.77 | ) | | | (1.41 | ) | | | 0.00 | | | | 0.00 | | | | (0.25 | ) | | | 0.00 | | | | 0.00 | |
Net asset value, end of period | | $ | 51.31 | | | $ | 50.00 | | | $ | 40.60 | | | $ | 39.67 | | | $ | 31.12 | | | $ | 29.39 | | | $ | 28.10 | |
Total return4 | | | 14.24 | % | | | 27.35 | % | | | 2.34 | % | | | 27.47 | % | | | 6.75 | % | | | 4.59 | % | | | (13.06 | )% |
Ratios to average net assets (annualized) | | | | | | | | | | | | | | | | | | | | | | | | | | | | |
Gross expenses | | | 1.16 | % | | | 1.17 | % | | | 1.17 | % | | | 1.18 | % | | | 1.11 | % | | | 1.23 | % | | | 1.17 | % |
Net expenses | | | 1.05 | % | | | 1.05 | % | | | 1.05 | % | | | 1.05 | % | | | 1.09 | % | | | 1.14 | % | | | 1.12 | % |
Net investment income (loss) | | | (0.63 | )% | | | 0.16 | % | | | (0.49 | )% | | | (0.56 | )% | | | (0.16 | )% | | | 1.00 | % | | | 0.42 | % |
Supplemental data | | | | | | | | | | | | | | | | | | | | | | | | | | | | |
Portfolio turnover rate | | | 51 | % | | | 88 | % | | | 101 | % | | | 123 | % | | | 116 | % | | | 26 | % | | | 44 | % |
Net assets, end of period (000s omitted) | | | $100,254 | | | | $69,264 | | | | $51,560 | | | | $41,242 | | | | $29,724 | | | | $32,437 | | | | $23,910 | |
| 1. | After the close of business on July 16, 2010, the Fund acquired the net assets of Evergreen Omega Fund which became the accounting and performance survivor in the transaction. The information for the periods prior to July 19, 2010 is that of Class I of Evergreen Omega Fund. |
| 2. | For the ten months ended July 31, 2010. The Fund changed its fiscal year end from September 30 to July 31, effective July 31, 2010. |
| 3. | Calculated based upon average shares outstanding |
| 4. | Returns for periods of less than one year are not annualized. |
The accompanying notes are an integral part of these financial statements.
| | | | | | |
| Financial highlights | | Wells Fargo Advantage Omega Growth Fund | | | 19 | |
(For a share outstanding throughout each period)
| | | | | | | | | | | | | | | | | | | | |
| | | Six months ended
January 31, 2014
(unaudited) | | | Year ended July 31 | |
| INSTITUTIONAL CLASS | | | 2013 | | | 2012 | | | 2011 | | | 20101 | |
Net asset value, beginning of period | | $ | 50.40 | | | $ | 40.81 | | | $ | 39.77 | | | $ | 31.12 | | | $ | 31.12 | |
Net investment income (loss) | | | (0.12 | )2 | | | 0.11 | 2 | | | (0.10 | ) | | | (0.03 | ) | | | 0.00 | |
Net realized and unrealized gains (losses) on investments | | | 7.31 | | | | 10.89 | | | | 1.14 | | | | 8.68 | | | | 0.00 | |
| | �� | | | | | | | | | | | | | | | | | | |
Total from investment operations | | | 7.19 | | | | 11.00 | | | | 1.04 | | | | 8.65 | | | | 0.00 | |
Distributions to shareholders from | | | | | | | | | | | | | | | | | | | | |
Net realized gains | | | (5.77 | ) | | | (1.41 | ) | | | 0.00 | | | | 0.00 | | | | 0.00 | |
Net asset value, end of period | | $ | 51.82 | | | $ | 50.40 | | | $ | 40.81 | | | $ | 39.77 | | | $ | 31.12 | |
Total return3 | | | 14.37 | % | | | 27.68 | % | | | 2.62 | % | | | 27.80 | % | | | 0.00 | % |
Ratios to average net assets (annualized) | | | | | | | | | | | | | | | | | | | | |
Gross expenses | | | 0.89 | % | | | 0.91 | % | | | 0.92 | % | | | 0.88 | % | | | 0.00 | % |
Net expenses | | | 0.80 | % | | | 0.80 | % | | | 0.80 | % | | | 0.80 | % | | | 0.00 | % |
Net investment income (loss) | | | (0.44 | )% | | | 0.24 | % | | | (0.24 | )% | | | (0.34 | )% | | | 0.00 | % |
Supplemental data | | | | | | | | | | | | | | | | | | | | |
Portfolio turnover rate | | | 51 | % | | | 88 | % | | | 101 | % | | | 123 | % | | | 116 | % |
Net assets, end of period (000s omitted) | | | $13,019 | | | | $3,507 | | | | $779 | | | | $656 | | | | $10 | |
| 1. | For the period from July 30, 2010 (commencement of class operations) to July 31, 2010 |
| 2. | Calculated based upon average shares outstanding |
| 3. | Returns for periods of less than one year are not annualized. |
The accompanying notes are an integral part of these financial statements.
| | | | |
| 20 | | Wells Fargo Advantage Omega Growth Fund | | Notes to financial statements (unaudited) |
1. ORGANIZATION
Wells Fargo Funds Trust (the “Trust”), a Delaware statutory trust organized on March 10, 1999, is an open-end management investment company registered under the Investment Company Act of 1940, as amended (the “1940 Act”). These financial statements report on the Wells Fargo Advantage Omega Growth Fund (the “Fund”) which is a diversified series of the Trust.
2. SIGNIFICANT ACCOUNTING POLICIES
The following significant accounting policies, which are consistently followed in the preparation of the financial statements of the Fund, are in conformity with U.S. generally accepted accounting principles which require management to make estimates and assumptions that affect the reported amounts of assets and liabilities, disclosure of contingent assets and liabilities at the date of the financial statements, and the reported amounts of revenues and expenses during the reporting period. Actual results could differ from those estimates.
Securities valuation
All investments are valued each business day as of the close of regular trading on the New York Stock Exchange (generally 4 p.m. Eastern Time).
Equity securities that are listed on a foreign or domestic exchange or market are valued at the official closing price or, if none, the last sales price. If no sale occurs on the primary exchange or market for the security that day, the prior day’s price will be deemed “stale” and fair values will be determined in accordance with the Fund’s Valuation Procedures.
Investments in registered open-end investment companies are valued at net asset value. Non-registered investment vehicles are fair valued at net asset value.
Investments which are not valued using any of the methods discussed above are valued at their fair value, as determined in good faith by the Board of Trustees of the Fund. The Board of Trustees has established a Valuation Committee comprised of the Trustees and has delegated to it the authority to take any actions regarding the valuation of portfolio securities that the Valuation Committee deems necessary or appropriate, including determining the fair value of portfolio securities, unless the determination has been delegated to the Management Valuation Team of Wells Fargo Funds Management, LLC (“Funds Management”). The Board of Trustees retains the authority to make or ratify any valuation decisions or approve any changes to the Valuation Procedures as it deems appropriate. On a quarterly basis, the Board of Trustees receives reports on any valuation actions taken by the Valuation Committee or the Management Valuation Team which may include items for ratification.
Valuations of fair valued securities are compared to the next actual sales price when available, or other appropriate market values, to assess the continued appropriateness of the fair valuation methodologies used. These securities are fair valued on a day-to-day basis, taking into consideration changes to appropriate market information and any significant changes to the inputs considered in the valuation process until there is a readily available price provided on an exchange or by an independent pricing service. Valuations received from an independent pricing service or independent broker-dealer quotes are periodically validated by comparisons to most recent trades and valuations provided by other independent pricing services in addition to the review of prices by the adviser and/or subadviser. Unobservable inputs used in determining fair valuations are identified based on the type of security, taking into consideration factors utilized by market participants in valuing the investment, knowledge about the issuer and the current market environment.
Security loans
The Fund may lend its securities from time to time in order to earn additional income in the form of fees or interest on securities received as collateral or the investment of any cash received as collateral. The Fund continues to receive interest or dividends on the securities loaned. The Fund receives collateral in the form of cash or securities with a value at least equal to the value of the securities on loan. The value of the loaned securities is determined at the close of each business day and any additional required collateral is delivered to the Fund on the next business day. In a securities lending transaction, the net asset value of the Fund will be affected by an increase or decrease in the value of the securities loaned and by an increase or decrease in the value of the instrument in which collateral is invested. The amount of securities lending activity undertaken by the Fund fluctuates from time to time. In the event of default or bankruptcy by the borrower, the Fund may be prevented from recovering the loaned securities or gaining access to the collateral or may experience delays or costs in doing so. In addition, the investment of any cash collateral received may lose all or part of its value. The Fund has the right under the lending agreement to recover the securities from the borrower on demand.
The Fund lends its securities through an unaffiliated securities lending agent. Cash collateral received in connection with its securities lending transactions is invested in Wells Fargo Securities Lending Cash Investments, LLC (the “Securities
| | | | | | |
| Notes to financial statements (unaudited) | | Wells Fargo Advantage Omega Growth Fund | | | 21 | |
Lending Fund”). The Securities Lending Fund is exempt from registration under Section 3(c)(7) of the 1940 Act and is managed by Funds Management and is subadvised by Wells Capital Management Incorporated (“WellsCap”). Funds Management receives an advisory fee starting at 0.05% and declining to 0.01% as the average daily net assets of the Securities Lending Fund increase. All of the fees received by Funds Management are paid to WellsCap for its services as subadviser. The Securities Lending Fund seeks to provide a positive return compared to the daily Fed Funds Open rate by investing in high-quality, U.S. dollar-denominated short-term money market instruments. Securities Lending Fund investments are fair valued based upon the amortized cost valuation technique. Income earned from investment in the Securities Lending Fund is included in securities lending income on the Statement of Operations.
Security transactions and income recognition
Securities transactions are recorded on a trade date basis. Realized gains or losses are recorded on the basis of identified cost.
Dividend income is recognized on the ex-dividend date.
Distributions to shareholders
Distributions to shareholders from net investment income and net realized gains, if any, are recorded on the ex-dividend date. Such distributions are determined in conformity with federal income tax regulations, which may differ in amount or character from net investment income and realized gains recognized for purposes of U.S. generally accepted accounting principles.
Federal and other taxes
The Fund intends to continue to qualify as a regulated investment company by distributing substantially all of its investment company taxable income and any net realized capital gains (after reduction for capital loss carryforwards) sufficient to relieve it from all, or substantially all, federal income taxes. Accordingly, no provision for federal income taxes was required.
The Fund’s income and federal excise tax returns and all financial records supporting those returns for the prior three fiscal years are subject to examination by the federal and Delaware revenue authorities. Management has analyzed the Fund’s tax positions taken on federal, state, and foreign tax returns for all open tax years and does not believe that there are any uncertain tax positions that require recognition of a tax liability.
Class allocations
The separate classes of shares offered by the Fund differ principally in applicable sales charges, distribution, shareholder servicing, and administration fees. Shareholders of each class bear certain expenses that pertain to that particular class. All shareholders bear the common expenses of the Fund, earn income from the portfolio, and are allocated any unrealized gains and losses pro rata based on the average daily net assets of each class, without distinction between share classes. Dividends are determined separately for each class based on income and expenses allocable to each class. Realized gains and losses are allocated to each class pro rata based upon the net assets of each class on the date realized. Differences in per share dividend rates generally result from the relative weightings of pro rata income and realized gain allocations and from differences in separate class expenses, including distribution, shareholder servicing, and administration fees.
3. FAIR VALUATION MEASUREMENTS
Fair value measurements of investments are determined within a framework that has established a fair value hierarchy based upon the various data inputs utilized in determining the value of the Fund’s investments. The three-level hierarchy gives the highest priority to unadjusted quoted prices in active markets for identical assets or liabilities (Level 1) and the lowest priority to significant unobservable inputs (Level 3). The Fund’s investments are classified within the fair value hierarchy based on the lowest level of input that is significant to the fair value measurement. The inputs are summarized into three broad levels as follows:
| n | | Level 1 – quoted prices in active markets for identical securities |
| n | | Level 2 – other significant observable inputs (including quoted prices for similar securities, interest rates, prepayment speeds, credit risk, use of amortized cost, etc.) |
| n | | Level 3 – significant unobservable inputs (including the Fund’s own assumptions in determining the fair value of investments) |
The inputs or methodologies used for valuing investments in securities are not necessarily an indication of the risk associated with investing in those securities.
| | | | |
| 22 | | Wells Fargo Advantage Omega Growth Fund | | Notes to financial statements (unaudited) |
As of January 31, 2014, the inputs used in valuing investments in securities were as follows:
| | | | | | | | | | | | | | | | |
| Investments in securities | | Quoted prices (Level 1) | | | Other significant
observable inputs (Level 2) | | | Significant unobservable inputs (Level 3) | | | Total | |
Equity securities | | | | | | | | | | | | | | | | |
Common stocks | | $ | 1,009,203,155 | | | $ | 0 | | | $ | 0 | | | $ | 1,009,203,155 | |
Short-term investments | | | | | | | | | | | | | | | | |
Investment companies | | | 7,727,570 | | | | 394,975 | | | | 0 | | | | 8,122,545 | |
| | | $ | 1,016,930,725 | | | $ | 394,975 | | | $ | 0 | | | $ | 1,017,325,700 | |
Transfers in and transfers out are recognized at the end of the reporting period. For the six months ended January 31, 2014, the Fund did not have any transfers into/out of Level 1, Level 2, or Level 3.
4. TRANSACTIONS WITH AFFILIATES AND OTHER EXPENSES
Advisory fee
The Trust has entered into an advisory contract with Funds Management, an indirect wholly owned subsidiary of Wells Fargo & Company (“Wells Fargo”). The adviser is responsible for implementing investment policies and guidelines and for supervising the subadviser, who is responsible for day-to-day portfolio management of the Fund.
Pursuant to the contract, Funds Management is entitled to receive an annual advisory fee starting at 0.75% and declining to 0.55% as the average daily net assets of the Fund increase. Prior to December 1, 2013, Funds Management was entitled to receive an annual advisory fee which started at 0.75% and declined to 0.60% as the average daily net assets of the Fund increased. For the six months ended January 31, 2014, the advisory fee was equivalent to an annual rate of 0.73% of the Fund’s average daily net assets.
Funds Management has retained the services of a subadviser to provide daily portfolio management to the Fund. The fee for subadvisory services is borne by Funds Management. WellsCap, an affiliate of Funds Management and an indirect, wholly owned subsidiary of Wells Fargo, is the subadviser to the Fund and is entitled to receive a fee from Funds Management at an annual rate starting at 0.45% and declining to 0.30% as the average daily net assets of the Fund increase.
Administration and transfer agent fees
The Trust has entered into an administration agreement with Funds Management. Under this agreement, for providing administrative services, which includes paying fees and expenses for services provided by the transfer agent, sub-transfer agents, omnibus account servicers and record-keepers, Funds Management is entitled to receive from the Fund an annual fund level administration fee starting at 0.05% and declining to 0.03% as the average daily net assets of the Fund increase and a class level administration fee which is calculated based on the average daily net assets of each class as follows:
| | | | |
| | | Class level
administration fee | |
Class A, Class B, Class C, Class R | | | 0.26 | % |
Administrator Class | | | 0.10 | |
Institutional Class | | | 0.08 | |
Funds Management has contractually waived and/or reimbursed advisory and administration fees to the extent necessary to maintain certain net operating expense ratios for the Fund. Waiver of fees and/or reimbursement of expenses by Funds Management were made first from fund level expenses on a proportionate basis and then from class specific expenses. Funds Management has committed through November 30, 2014 to waive fees and/or reimburse expenses to the extent necessary to cap the Fund’s expenses at 1.30% for Class A shares, 2.05% for Class B shares, 2.05% for Class C shares, 1.55% for Class R shares, 1.05% for Administrator Class shares, and 0.80% for Institutional Class shares.
Distribution fees
The Trust has adopted a Distribution Plan for Class B, Class C, and Class R shares of the Fund pursuant to Rule 12b-1 under the 1940 Act. Distribution fees are charged to Class B, Class C, and Class R shares and paid to Wells Fargo Funds Distributor, LLC, the principal underwriter, at an annual rate of 0.75% of the average daily net assets of Class B and Class C shares and 0.25% of the average daily net assets for Class R shares.
| | | | | | |
| Notes to financial statements (unaudited) | | Wells Fargo Advantage Omega Growth Fund | | | 23 | |
For the six months ended January 31, 2014, Wells Fargo Funds Distributor, LLC received $50,757 from the sale of Class A shares and $259 and $180 in contingent deferred sales charges from redemptions of Class B and Class C shares, respectively.
Shareholder servicing fees
The Trust has entered into contracts with one or more shareholder servicing agents, whereby Class A, Class B, Class C, Class R, and Administrator Class of the Fund is charged a fee at an annual rate of 0.25% of the average daily net assets of each respective class.
A portion of these total shareholder servicing fees were paid to affiliates of Wells Fargo.
5. INVESTMENT PORTFOLIO TRANSACTIONS
Purchases and sales of investments, excluding U.S. government obligations (if any) and short-term securities, for the six months ended January 31, 2014 were $505,568,315 and $480,221,840, respectively.
6. BANK BORROWINGS
The Trust (excluding the money market funds and certain other funds in the Trust) and Wells Fargo Variable Trust are parties to a $150,000,000 revolving credit agreement with State Street Bank and Trust Company, whereby the Fund is permitted to use bank borrowings for temporary or emergency purposes, such as to fund shareholder redemption requests. Interest under the credit agreement is charged to the Fund based on a borrowing rate equal to the higher of the Federal Funds rate in effect on that day plus 1.25% or the overnight LIBOR rate in effect on that day plus 1.25%. In addition, an annual commitment fee equal to 0.10% of the unused balance is allocated to each participating fund. For the six months ended January 31, 2014, the Fund paid $363 in commitment fees.
For the six months ended January 31, 2014, there were no borrowings by the Fund under the agreement.
7. CONCENTRATION RISK
Concentration risks result from exposure to a limited number of sectors. Funds that invest a substantial portion of their assets in any sector may be more affected by changes in that sector than would be a fund whose investments are not heavily weighted in any sector.
8. INDEMNIFICATION
Under the Trust’s organizational documents, the officers and directors are indemnified against certain liabilities that may arise out of performance of their duties to the Trust. Additionally, in the normal course of business, the Trust may enter into contracts with service providers that contain a variety of indemnification clauses. The Trust’s maximum exposure under these arrangements is dependent on future claims that may be made against the Fund and, therefore, cannot be estimated.
| | | | |
| 24 | | Wells Fargo Advantage Omega Growth Fund | | Other information (unaudited) |
PROXY VOTING INFORMATION
A description of the policies and procedures that the Fund uses to determine how to vote proxies relating to portfolio securities is available without charge, upon request, by calling 1-800-222-8222, visiting our website at wellsfargoadvantagefunds.com, or visiting the SEC website at sec.gov. Information regarding how the Fund voted proxies relating to portfolio securities during the most recent 12-month period ended June 30 is available without charge on the Fund’s website at wellsfargoadvantagefunds.com or by visiting the SEC website at sec.gov.
PORTFOLIO HOLDINGS INFORMATION
The complete portfolio holdings for the Fund are publicly available on the Fund’s website (wellsfargoadvantagefunds.com) on a monthly, 30-day or more delayed basis. In addition, top ten holdings information for the Fund is publicly available on the Fund’s website on a monthly, seven-day or more delayed basis. The Fund files its complete schedule of portfolio holdings with the SEC for the first and third quarters of each fiscal year on Form N-Q, which is available without charge by visiting the SEC website at sec.gov. In addition, the Fund’s Form N-Q may be reviewed and copied at the SEC’s Public Reference Room in Washington, DC, and at regional offices in New York City, at 233 Broadway, and in Chicago, at 175 West Jackson Boulevard, Suite 900. Information about the Public Reference Room may be obtained by calling 1-800-SEC-0330.
| | | | | | |
| Other information (unaudited) | | Wells Fargo Advantage Omega Growth Fund | | | 25 | |
BOARD OF TRUSTEES AND OFFICERS
Each of the Trustees and Officers listed in the table below acts in identical capacities for each fund in the Wells Fargo Advantage family of funds, which consists of 132 mutual funds1 comprising the Wells Fargo Funds Trust, Wells Fargo Variable Trust, Wells Fargo Master Trust and four closed-end funds (collectively the “Fund Complex”). This table should be read in conjunction with the Prospectus and the Statement of Additional Information2. All of the Trustees are also Members of the Audit and Governance Committees of each Trust in the Fund Complex. The mailing address of each Trustee and Officer is 525 Market Street, 12th Floor, San Francisco, CA 94105. Each Trustee and Officer serves an indefinite term, however, each Trustee serves such term until reaching the mandatory retirement age established by the Trustees.
Independent Trustees
| | | | | | |
Name and year of birth | | Position held and length of service* | | Principal occupations during past five years | | Other directorships during
past five years |
Peter G. Gordon
(Born 1942) | | Trustee, since 1998; Chairman, since 2005 | | Co-Founder, Retired Chairman, President and CEO of Crystal Geyser Water Company. Trustee Emeritus, Colby College. | | Asset Allocation Trust |
Isaiah Harris, Jr.
(Born 1952) | | Trustee, since 2009 | | Retired. Prior thereto, President and CEO of BellSouth Advertising and Publishing Corp. from 2005 to 2007, President and CEO of BellSouth Enterprises from 2004 to 2005 and President of BellSouth Consumer Services from 2000 to 2003. Emeritus member of the Iowa State University Foundation Board of Governors. Emeritus Member of the Advisory Board of Iowa State University School of Business. Advisory Board Member, Palm Harbor Academy (charter school). Mr. Harris is a certified public accountant. | | CIGNA Corporation; Deluxe Corporation; Asset Allocation Trust |
Judith M. Johnson
(Born 1949) | | Trustee, since 2008;
Audit Committee Chairman, since 2008 | | Retired. Prior thereto, Chief Executive Officer and Chief Investment Officer of Minneapolis Employees Retirement Fund from 1996 to 2008. Ms. Johnson is an attorney, certified public accountant and a certified managerial accountant. | | Asset Allocation Trust |
Leroy Keith, Jr.
(Born 1939) | | Trustee, since 2010 | | Chairman, Bloc Global Services (development and construction). Trustee of the Evergreen Funds from 1983 to 2010. Former Managing Director, Almanac Capital Management (commodities firm), former Partner, Stonington Partners, Inc. (private equity fund), former Director, Obagi Medical Products Co. and former Director, Lincoln Educational Services. | | Trustee, Virtus Fund Complex (consisting of 50 portfolios as of 12/16/2013); Asset Allocation Trust |
David F. Larcker
(Born 1950) | | Trustee, since 2009 | | James Irvin Miller Professor of Accounting at the Graduate School of Business, Stanford University, Morgan Stanley Director of the Center for Leadership Development and Research and Senior Faculty of The Rock Center for Corporate Governance since 2006. From 2005 to 2008, Professor of Accounting at the Graduate School of Business, Stanford University. Prior thereto, Ernst & Young Professor of Accounting at The Wharton School, University of Pennsylvania from 1985 to 2005. | | Asset Allocation Trust |
Olivia S. Mitchell
(Born 1953) | | Trustee, since 2006 | | International Foundation of Employee Benefit Plans Professor, Wharton School of the University of Pennsylvania since 1993. Director of Wharton’s Pension Research Council and Boettner Center on Pensions & Retirement Research, and Research Associate at the National Bureau of Economic Research. Previously, Cornell University Professor from 1978 to 1993. | | Asset Allocation Trust |
Timothy J. Penny
(Born 1951) | | Trustee, since 1996 | | President and CEO of Southern Minnesota Initiative Foundation, a non-profit organization, since 2007 and Senior Fellow at the Humphrey Institute Policy Forum at the University of Minnesota since 1995. Member of the Board of Trustees of NorthStar Education Finance, Inc., a non-profit organization, since 2007. | | Asset Allocation Trust |
| | | | |
| 26 | | Wells Fargo Advantage Omega Growth Fund | | Other information (unaudited) |
| | | | | | |
Name and year of birth | | Position held and length of service* | | Principal occupations during past five years | | Other directorships during
past five years |
Michael S. Scofield
(Born 1943) | | Trustee, since 2010 | | Served on the Investment Company Institute’s Board of Governors and Executive Committee from 2008-2011 as well the Governing Council of the Independent Directors Council from 2006-2011 and the Independent Directors Council Executive Committee from 2008-2011. Chairman of the IDC from 2008-2010. Institutional Investor (Fund Directions) Trustee of Year in 2007. Trustee of the Evergreen Funds (and its predecessors) from 1984 to 2010. Chairman of the Evergreen Funds from 2000-2010. Former Trustee of the Mentor Funds. Retired Attorney, Law Offices of Michael S. Scofield. | | Asset Allocation Trust |
Donald C. Willeke
(Born 1940) | | Trustee, since 1996 | | Principal of the law firm of Willeke & Daniels. General Counsel of the Minneapolis Employees Retirement Fund from 1984 until its consolidation into the Minnesota Public Employees Retirement Association on June 30, 2010. Director and Vice Chair of The Tree Trust (non-profit corporation). Director of the American Chestnut Foundation (non-profit corporation). | | Asset Allocation Trust |
| * | Length of service dates reflect the Trustee’s commencement of service with the Trust’s predecessor entities, where applicable. |
Officers
| | | | | | |
Name and year of birth | | Position held and
length of service | | Principal occupations during past five years | | |
Karla M. Rabusch
(Born 1959) | | President, since 2003 | | Executive Vice President of Wells Fargo Bank, N.A. and President of Wells Fargo Funds Management, LLC since 2003. | | |
Jeremy DePalma1
(Born 1974) | | Treasurer, since 2012 | | Senior Vice President of Wells Fargo Funds Management, LLC since 2009. Senior Vice President of Evergreen Investment Management Company, LLC from 2008 to 2010. Vice President, Evergreen Investment Services, Inc. from 2004 to 2007. Head of the Fund Reporting and Control Team within Fund Administration from 2005 to 2010. | | |
C. David Messman
(Born 1960) | | Secretary, since 2000; Chief Legal Officer, since 2003 | | Senior Vice President and Secretary of Wells Fargo Funds Management, LLC since 2001. Vice President and Managing Counsel of Wells Fargo Bank, N.A. since 1996. | | |
Debra Ann Early
(Born 1964) | | Chief Compliance Officer, since 2007 | | Chief Compliance Officer of Wells Fargo Funds Management, LLC since 2007. Chief Compliance Officer of Parnassus Investments from 2005 to 2007. Chief Financial Officer of Parnassus Investments from 2004 to 2007. | | |
David Berardi
(Born 1975) | | Assistant Treasurer, since 2009 | | Vice President of Wells Fargo Funds Management, LLC since 2009. Vice President of Evergreen Investment Management Company, LLC from 2008 to 2010. Assistant Vice President of Evergreen Investment Services, Inc. from 2004 to 2008. Manager of Fund Reporting and Control for Evergreen Investment Management Company, LLC from 2004 to 2010. | | |
| 1. | Jeremy DePalma acts as Treasurer of 59 funds and Assistant Treasurer of 73 funds in the Fund Complex. |
| 2. | The Statement of Additional Information includes additional information about the Trustees and is available, without charge, upon request, by calling 1-800-222-8222 or by visiting the website at wellsfargoadvantagefunds.com. |
| | | | | | |
| List of abbreviations | | Wells Fargo Advantage Omega Growth Fund | | | 27 | |
The following is a list of common abbreviations for terms and entities that may have appeared in this report.
| ACA | — ACA Financial Guaranty Corporation |
| ADR | — American depositary receipt |
| ADS | — American depositary shares |
| AGC | — Assured Guaranty Corporation |
| AGM | — Assured Guaranty Municipal |
| Ambac | — Ambac Financial Group Incorporated |
| AMT | — Alternative minimum tax |
| BAN | — Bond anticipation notes |
| BHAC | — Berkshire Hathaway Assurance Corporation |
| CAB | — Capital appreciation bond |
| CCAB | — Convertible capital appreciation bond |
| CDA | — Community Development Authority |
| CDO | — Collateralized debt obligation |
| COP | — Certificate of participation |
| DRIVER | — Derivative inverse tax-exempt receipts |
| DW&P | — Department of Water & Power |
| DWR | — Department of Water Resources |
| ECFA | — Educational & Cultural Facilities Authority |
| EDA | — Economic Development Authority |
| EDFA | — Economic Development Finance Authority |
| ETF | — Exchange-traded fund |
| FDIC | — Federal Deposit Insurance Corporation |
| FFCB | — Federal Farm Credit Banks |
| FGIC | — Financial Guaranty Insurance Corporation |
| FHA | — Federal Housing Administration |
| FHLB | — Federal Home Loan Bank |
| FHLMC | — Federal Home Loan Mortgage Corporation |
| FICO | — The Financing Corporation |
| FNMA | — Federal National Mortgage Association |
| GDR | — Global depositary receipt |
| GNMA | — Government National Mortgage Association |
| HCFR | — Healthcare facilities revenue |
| HEFA | — Health & Educational Facilities Authority |
| HEFAR | — Higher education facilities authority revenue |
| HFA | — Housing Finance Authority |
| HFFA | — Health Facilities Financing Authority |
| HUD | — Department of Housing and Urban Development |
| IDA | — Industrial Development Authority |
| IDAG | — Industrial Development Agency |
| IDR | — Industrial development revenue |
| KRW | — Republic of Korea won |
| LIBOR | — London Interbank Offered Rate |
| LLC | — Limited liability company |
| LLLP | — Limited liability limited partnership |
| LLP | — Limited liability partnership |
| MBIA | — Municipal Bond Insurance Association |
| MFHR | — Multifamily housing revenue |
| MSTR | — Municipal securities trust receipts |
| MUD | — Municipal Utility District |
| National | — National Public Finance Guarantee Corporation |
| PCFA | — Pollution Control Financing Authority |
| PCL | — Public Company Limited |
| PCR | — Pollution control revenue |
| PFA | — Public Finance Authority |
| PFFA | — Public Facilities Financing Authority |
| PFOTER | — Puttable floating option tax-exempt receipts |
| plc | — Public limited company |
| PUTTER | — Puttable tax-exempt receipts |
| R&D | — Research & development |
| Radian | — Radian Asset Assurance |
| RAN | — Revenue anticipation notes |
| RDA | — Redevelopment Authority |
| RDFA | — Redevelopment Finance Authority |
| REIT | — Real estate investment trust |
| ROC | — Reset option certificates |
| SAVRS | — Select auction variable rate securities |
| SBA | — Small Business Authority |
| SFHR | — Single-family housing revenue |
| SFMR | — Single-family mortgage revenue |
| SPA | — Standby purchase agreement |
| SPDR | — Standard & Poor’s Depositary Receipts |
| STRIPS | — Separate trading of registered interest and principal securities |
| TAN | — Tax anticipation notes |
| TIPS | — Treasury inflation-protected securities |
| TRAN | — Tax revenue anticipation notes |
| TTFA | — Transportation Trust Fund Authority |
| TVA | — Tennessee Valley Authority |
This page is intentionally left blank.


For more information
More information about Wells Fargo Advantage Funds is available free upon request. To obtain literature, please write, email, visit the Fund’s website, or call:
Wells Fargo Advantage Funds
P.O. Box 8266
Boston, MA 02266-8266
Email: wfaf@wellsfargo.com
Website: wellsfargoadvantagefunds.com
Individual investors: 1-800-222-8222
Retail investment professionals: 1-888-877-9275
Institutional investment professionals: 1-866-765-0778
This report and the financial statements contained herein are submitted for the general information of the shareholders of Wells Fargo Advantage Funds. If this report is used for promotional purposes, distribution of the report must be accompanied or preceded by a current prospectus. For a current prospectus and, if available, a summary prospectus containing more complete information, including charges and expenses, call 1-800-222-8222 or visit the Fund’s website at wellsfargoadvantagefunds.com. Please consider the investment objectives, risks, charges, and expenses of the investment carefully before investing. This and other information about Wells Fargo Advantage Funds can be found in the current prospectus. Read the prospectus carefully before you invest or send money.
Wells Fargo Funds Management, LLC, a wholly owned subsidiary of Wells Fargo & Company, provides investment advisory and administrative services for Wells Fargo Advantage Funds. Other affiliates of Wells Fargo & Company provide subadvisory and other services for the Funds. The Funds are distributed by Wells Fargo Funds Distributor, LLC, Member FINRA/SIPC, an affiliate of Wells Fargo & Company.
NOT FDIC INSURED ¡ NO BANK GUARANTEE ¡ MAY LOSE VALUE
© 2014 Wells Fargo Funds Management, LLC. All rights reserved.
| | |
 | | 222993 03-14 SA211/SAR211 1-14 |

Wells Fargo Advantage
Premier Large Company Growth Fund

Semi-Annual Report
January 31, 2014

Reduce clutter. Save trees.
Sign up for electronic delivery of prospectuses and shareholder reports at wellsfargo.com/advantagedelivery
Contents
The views expressed and any forward-looking statements are as of January 31, 2014, unless otherwise noted, and are those of the Fund managers and/or Wells Fargo Funds Management, LLC. Discussions of individual securities, or the markets generally, or any Wells Fargo Advantage Fund are not intended as individual recommendations. Future events or results may vary significantly from those expressed in any forward-looking statements; the views expressed are subject to change at any time in response to changing circumstances in the market. Wells Fargo Funds Management, LLC and the Fund disclaim any obligation to publicly update or revise any views expressed or forward-looking statements.
NOT FDIC INSURED ¡ NO BANK GUARANTEE ¡ MAY LOSE VALUE
| | | | |
| 2 | | Wells Fargo Advantage Premier Large Company Growth Fund | | Letter to shareholders (unaudited) |

Karla M. Rabusch
President
Wells Fargo Advantage Funds
Major central banks continued to inject liquidity into the banks and the markets through various quantitative easing policies.
Dear Valued Shareholder:
We are pleased to offer you this semi-annual report for the Wells Fargo Advantage Premier Large Company Growth Fund for the six-month period that ended January 31, 2014. Much of the period was marked by monetary easing by global central banks. Entering the period, investors were concerned that the U.S. Federal Reserve (Fed) would end its bond-buying program, which initially led to higher interest rates and resulted in losses for bond indexes and volatility for global stock indexes. These fears dissipated in late September 2013 and ended altogether in mid-December 2013 when the Fed announced a tapering timeline that was far more moderate than some had feared. Growing confidence that the U.S. economy was staging a fragile recovery resulted in double-digit returns for domestic stock market indexes for the six-month reporting period.
Central banks continued to provide stimulus.
Major central banks continued to inject liquidity into the banks and the markets through various quantitative easing policies. Throughout the reporting period, the Federal Open Market Committee (FOMC)—the Fed’s monetary policymaking body—kept its key interest rate effectively near zero in order to support the economy and the financial system. Well before the reporting period began, the FOMC announced its intention to keep interest rates low for an extended period and to make open-ended purchases of $40 billion per month in mortgage-backed securities. The FOMC later added purchases of $45 billion per month in long-term U.S. Treasuries. Because the markets benefited from the FOMC’s liquidity, both stocks and bonds initially sold off after the FOMC indicated in May 2013 that it might reduce (or taper) its bond-buying program. However, in mid-December 2013, the FOMC announced that it would reduce its bond-buying program by $10 billion per month beginning in January 2014. The tapering was less aggressive than some investors had feared, and the markets ended 2013 strongly.
European markets continued to benefit from the European Central Bank’s (ECB’s) earlier announcement that it would purchase an unlimited amount of one- to three-year sovereign debt from countries that had formally applied for a bailout. In November 2013, the ECB cut its key rate to a historic low of 0.25%. The ECB’s aggressive actions helped ease investor worries about a eurozone sovereign debt default. Given the substantial ties between the U.S. and Europe, the improved sentiment about the eurozone helped provide a tailwind for U.S. markets.
U.S. stock markets gained on relatively good news.
For most of the period, U.S. economic data remained moderately positive. Reported gross domestic product (GDP) growth came in at a strong 4.1% annualized rate in the third quarter of 2013, and the advance annualized estimate for fourth-quarter GDP growth was 3.2%.
The most significant negative effect was the ongoing fight in Washington, D.C., over the federal budget and debt limit. The Budget Control Act of 2011, which was passed to resolve a previous fight over the federal debt ceiling, mandated budget sequestration that took effect on March 1, 2013, and was an overhang on economic growth throughout the reporting period. Most recently, Congress was unable to pass a resolution to continue to fund the federal government, and thus, the federal government underwent a partial shutdown from September 30, 2013, through October 16, 2013. The government reopened after the president and Congress reached a deal that funded the government through January 15, 2014, and raised the debt limit through February 7, 2014. In December 2013, Congress
| | | | | | |
| Letter to shareholders (unaudited) | | Wells Fargo Advantage Premier Large Company Growth Fund | | | 3 | |
passed the Ryan–Murray budget agreement that funded the government through September 2015, lessening the near-term prospect of another shutdown.
Despite political headwinds, the relatively positive outlook for the U.S. economy contributed to a strong domestic stock market for most of the reporting period. Economically sensitive sectors, such as industrials and materials, outperformed. Dividend-paying sectors such as utilities and telecommunication services lagged as higher interest rates dampened their relative performance. Judging by various Russell indexes, small-cap stocks moderately outperformed large-cap stocks, and growth stocks strongly outperformed value stocks.
Don’t let short-term uncertainty derail long-term investment goals.
Periods of uncertainty can present challenges, but experience has taught us that maintaining long-term investment goals can be an effective way to plan for the future. Although diversification cannot guarantee an investment profit or prevent losses, we believe it can be an effective way to manage investment risk and potentially smooth out overall portfolio performance. We encourage investors to know their investments and to understand that appropriate levels of risk-taking may unlock opportunities.
Thank you for choosing to invest with Wells Fargo Advantage Funds. We appreciate your confidence in us and remain committed to helping you meet your financial needs. For current information about your fund investments, contact your investment professional, visit our website at wellsfargoadvantagefunds.com, or call us directly at 1-800-222-8222. We are available 24 hours a day, 7 days a week.
Sincerely,

Karla M. Rabusch
President
Wells Fargo Advantage Funds
Despite political headwinds, the relatively positive outlook for the U.S. economy contributed to a strong domestic stock market for most of the reporting period.
Notice to shareholders
The Fund and Wells Fargo Funds Management, LLC (“Funds Management”) have received an exemptive order from the SEC that permits Funds Management, subject to the approval of the Board of Trustees of the Fund, to select or replace certain subadvisers to manage all or a portion of the Fund’s assets and enter into, amend or terminate a sub-advisory agreement with certain subadvisers without obtaining shareholder approval (“Multi-manager Structure”). The Multi-manager Structure applies to subadvisers that are not affiliated with Funds Management or the Fund, except to the extent that affiliation arises solely because such subadvisers provide sub-advisory services to the Fund (“Non-affiliated Subadvisers”), as well as subadvisers that are indirect or direct wholly-owned subsidiaries of Funds Management or of another company that, indirectly or directly, wholly owns Funds Management (“Wholly-owned Subadvisers”).
Pursuant to the SEC order, Funds Management, with the approval of the Board of Trustees, has the discretion to terminate any subadvisers and allocate and reallocate the Fund’s assets among any other Non-affiliated Subadvisers or Wholly-owned Subadvisers. Funds Management, subject to oversight and supervision by the Board of Trustees, has responsibility to continue to oversee any subadvisers to the Fund and to recommend, for approval by the Board of Trustees, the hiring, termination and replacement of subadvisers for the Fund. In the event that a new subadviser is hired pursuant to the Multi-manager Structure, the Fund is required to provide notice to shareholders within 90 days.
Please contact your investment professional or call us directly at 1-800-222-8222 if you have any questions on this Notice to Shareholders.
| | | | |
| 4 | | Wells Fargo Advantage Premier Large Company Growth Fund | | Performance highlights (unaudited) |
Investment objective
The Fund seeks long-term capital appreciation.
Adviser
Wells Fargo Funds Management, LLC
Subadviser
Wells Capital Management Incorporated
Portfolio managers
Thomas C. Ognar, CFA
Bruce C. Olson, CFA
Joseph M. Eberhardy, CFA, CPA
Average annual total returns1 (%) as of January 31, 2014
| | | | | | | | | | | | | | | | | | | | | | | | | | | | | | | | | | |
| | | | | Including sales charge | | | Excluding sales charge | | | Expense ratios2 (%) | |
| | | Inception date | | 1 year | | | 5 year | | | 10 year | | | 1 year | | | 5 year | | | 10 year | | | Gross | | | Net3 | |
| Class A (EKJAX) | | 1-20-1998 | | | 17.14 | | | | 20.09 | | | | 8.06 | | | | 24.31 | | | | 21.51 | | | | 8.70 | | | | 1.20 | | | | 1.13 | |
| Class B (EKJBX)* | | 9-11-1935 | | | 18.34 | | | | 20.42 | | | | 8.16 | | | | 23.34 | | | | 20.61 | | | | 8.16 | | | | 1.95 | | | | 1.88 | |
| Class C (EKJCX) | | 1-22-1998 | | | 22.29 | | | | 20.60 | | | | 7.90 | | | | 23.29 | | | | 20.60 | | | | 7.90 | | | | 1.95 | | | | 1.88 | |
| Class R4 (EKJRX) | | 11-30-2012 | | | – | | | | – | | | | – | | | | 24.60 | | | | 21.90 | | | | 9.03 | | | | 0.87 | | | | 0.81 | |
| Class R6 (EKJFX) | | 11-30-2012 | | | – | | | | – | | | | – | | | | 24.69 | | | | 21.93 | | | | 9.05 | | | | 0.72 | | | | 0.66 | |
| Administrator Class (WFPDX) | | 7-16-2010 | | | – | | | | – | | | | – | | | | 24.49 | | | | 21.67 | | | | 8.82 | | | | 1.04 | | | | 0.96 | |
| Institutional Class (EKJYX) | | 6-30-1999 | | | – | | | | – | | | | – | | | | 24.80 | | | | 21.93 | | | | 9.05 | | | | 0.77 | | | | 0.71 | |
| Investor Class (WFPNX) | | 7-16-2010 | | | – | | | | – | | | | – | | | | 24.09 | | | | 21.41 | | | | 8.62 | | | | 1.26 | | | | 1.19 | |
| Russell 1000® Growth Index4 | | – | | | – | | | | – | | | | – | | | | 24.35 | | | | 20.88 | | | | 7.30 | | | | – | | | | – | |
| * | | Class B shares are closed to investment, except in connection with the reinvestment of any distributions and permitted exchanges. |
Figures quoted represent past performance, which is no guarantee of future results, and do not reflect taxes that a shareholder may pay on fund distributions or the redemption of fund shares. Investment return and principal value of an investment will fluctuate so that an investor’s shares, when redeemed, may be worth more or less than their original cost. Performance shown without sales charges would be lower if sales charges were reflected. Current performance may be lower or higher than the performance data quoted, which assumes the reinvestment of dividends and capital gains. Current month-end performance is available on the Fund’s website, wellsfargoadvantagefunds.com.
Index returns do not include transaction costs associated with buying and selling securities, any mutual fund fees or expenses, or any taxes. It is not possible to invest directly in an index.
For Class A shares, the maximum front-end sales charge is 5.75%. For Class B shares, the maximum contingent deferred sales charge is 5.00%. For Class C shares, the maximum contingent deferred sales charge is 1.00%. Performance including sales charge assumes the sales charge for the corresponding time period. Class R4, Class R6, Administrator Class, Institutional Class, and Investor Class shares are sold without a front-end sales charge or contingent deferred sales charge.
Stock values fluctuate in response to the activities of individual companies and general market and economic conditions. Certain investment strategies tend to increase the total risk of an investment (relative to the broader market). The Fund is exposed to foreign investment risk. Consult the Fund’s prospectus for additional information on these and other risks.
Please see footnotes on page 5.
| | | | | | |
| Performance highlights (unaudited) | | Wells Fargo Advantage Premier Large Company Growth Fund | | | 5 | |
| | | | |
| Ten largest equity holdings5 (%) as of January 31, 2014 | |
Google Incorporated Class A | | | 4.81 | |
Alexion Pharmaceuticals Incorporated | | | 3.18 | |
Dollar Tree Incorporated | | | 2.32 | |
Whole Foods Market Incorporated | | | 2.31 | |
Gilead Sciences Incorporated | | | 2.22 | |
Concho Resources Incorporated | | | 2.08 | |
Amazon.com Incorporated | | | 2.06 | |
CarMax Incorporated | | | 2.05 | |
eBay Incorporated | | | 2.02 | |
TD Ameritrade Holding Corporation | | | 1.78 | |
| | |
| Sector distribution6 as of January 31, 2014 |
|
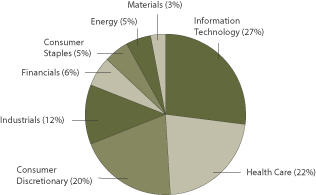
|
| 1. | Historical performance shown for Class R4 shares prior to their inception reflects the performance of Institutional Class shares, adjusted to reflect the higher expenses applicable to Class R4 shares. Historical performance shown for Class R6 shares prior to their inception reflects the performance of Institutional Class shares, and includes the higher expenses applicable to Institutional Class shares. If these expenses had not been included, returns would be higher. Historical performance shown for Administrator Class shares prior to their inception reflects the performance of Institutional Class shares, adjusted to reflect the higher expenses applicable to Administrator Class shares. Historical performance shown for Investor Class shares prior to their inception reflects the performance of Class A shares, adjusted to reflect the higher expenses applicable to Investor Class shares. Historical performance shown for all classes of the Fund prior to July 19, 2010, is based on the performance of the Fund’s predecessor, Evergreen Large Company Growth Fund. |
| 2. | Reflects the expense ratios as stated in the most recent prospectuses, which include the impact of 0.01% in acquired fund fees and expenses. The expense ratios shown are subject to change and may differ from the annualized expense ratios shown in the financial highlights of this report, which do not include acquired fund fees and expenses. |
| 3. | The Adviser has committed through November 30, 2014, to waive fees and/or reimburse expenses to the extent necessary to cap the Fund’s Total Annual Fund Operating Expenses After Fee Waiver, excluding certain expenses, at 1.12% for Class A, 1.87% for Class B, 1.87% for Class C, 0.80% for Class R4, 0.65% for Class R6, 0.95% for Administrator Class, 0.70% for Institutional Class, and 1.18% for Investor Class. Brokerage commissions, stamp duty fees, interest, taxes, acquired fund fees and expenses, and extraordinary expenses are excluded from the cap. Without this cap, the Fund’s returns would have been lower. |
| 4. | The Russell 1000® Growth Index measures the performance of those Russell 1000 Index companies with higher price-to-book ratios and higher forecasted growth values. You cannot invest directly in an index. |
| 5. | The ten largest equity holdings are calculated based on the value of the securities divided by total net assets of the Fund. Holdings are subject to change and may have changed since the date specified. |
| 6. | Sector distribution is subject to change and is calculated based on the total long-term investments of the Fund. |
| | | | |
| 6 | | Wells Fargo Advantage Premier Large Company Growth Fund | | Fund expenses (unaudited) |
As a shareholder of the Fund, you incur two types of costs: (1) transaction costs, including sales charges (loads) on purchase payments and contingent deferred sales charges (if any) on redemptions and (2) ongoing costs, including management fees, distribution (12b-1) and/or shareholder service fees, and other Fund expenses. This example is intended to help you understand your ongoing costs (in dollars) of investing in the Fund and to compare these costs with the ongoing costs of investing in other mutual funds.
The example is based on an investment of $1,000 invested at the beginning of the six-month period and held for the entire period from August 1, 2013 to January 31, 2014.
Actual expenses
The “Actual” line of the table below provides information about actual account values and actual expenses. You may use the information in this line, together with the amount you invested, to estimate the expenses that you paid over the period. Simply divide your account value by $1,000 (for example, an $8,600 account value divided by $1,000 = 8.6), then multiply the result by the number in the “Actual” line under the heading entitled “Expenses paid during period” for your applicable class of shares to estimate the expenses you paid on your account during this period.
Hypothetical example for comparison purposes
The “Hypothetical” line of the table below provides information about hypothetical account values and hypothetical expenses based on the Fund’s actual expense ratio and an assumed rate of return of 5% per year before expenses, which is not the Fund’s actual return. The hypothetical account values and expenses may not be used to estimate the actual ending account balance or expenses you paid for the period. You may use this information to compare the ongoing costs of investing in the Fund and other funds. To do so, compare this 5% hypothetical example with the 5% hypothetical examples that appear in the shareholder reports of the other funds.
Please note that the expenses shown in the table are meant to highlight your ongoing costs only and do not reflect any transactional costs, such as sales charges (loads) and contingent deferred sales charges. Therefore, the “Hypothetical” line of the table is useful in comparing ongoing costs only and will not help you determine the relative total costs of owning different funds. In addition, if these transactional costs were included, your costs would have been higher.
| | | | | | | | | | | | | | | | |
| | | Beginning
account value
8-1-2013 | | | Ending
account value
1-31-2014 | | | Expenses
paid during
the period1 | | | Net annualized
expense ratio | |
Class A | | | | | | | | | | | | | | | | |
Actual | | $ | 1,000.00 | | | $ | 1,114.56 | | | $ | 5.97 | | | | 1.12 | % |
Hypothetical (5% return before expenses) | | $ | 1,000.00 | | | $ | 1,019.56 | | | $ | 5.70 | | | | 1.12 | % |
Class B | | | | | | | | | | | | | | | | |
Actual | | $ | 1,000.00 | | | $ | 1,110.42 | | | $ | 9.95 | | | | 1.87 | % |
Hypothetical (5% return before expenses) | | $ | 1,000.00 | | | $ | 1,015.78 | | | $ | 9.50 | | | | 1.87 | % |
Class C | | | | | | | | | | | | | | | | |
Actual | | $ | 1,000.00 | | | $ | 1,110.71 | | | $ | 9.95 | | | | 1.87 | % |
Hypothetical (5% return before expenses) | | $ | 1,000.00 | | | $ | 1,015.78 | | | $ | 9.50 | | | | 1.87 | % |
Class R4 | | | | | | | | | | | | | | | | |
Actual | | $ | 1,000.00 | | | $ | 1,116.54 | | | $ | 4.27 | | | | 0.80 | % |
Hypothetical (5% return before expenses) | | $ | 1,000.00 | | | $ | 1,021.17 | | | $ | 4.08 | | | | 0.80 | % |
Class R6 | | | | | | | | | | | | | | | | |
Actual | | $ | 1,000.00 | | | $ | 1,116.44 | | | $ | 3.47 | | | | 0.65 | % |
Hypothetical (5% return before expenses) | | $ | 1,000.00 | | | $ | 1,021.93 | | | $ | 3.31 | | | | 0.65 | % |
Administrator Class | | | | | | | | | | | | | | | | |
Actual | | $ | 1,000.00 | | | $ | 1,115.69 | | | $ | 5.07 | | | | 0.95 | % |
Hypothetical (5% return before expenses) | | $ | 1,000.00 | | | $ | 1,020.42 | | | $ | 4.84 | | | | 0.95 | % |
Institutional Class | | | | | | | | | | | | | | | | |
Actual | | $ | 1,000.00 | | | $ | 1,116.44 | | | $ | 3.73 | | | | 0.70 | % |
Hypothetical (5% return before expenses) | | $ | 1,000.00 | | | $ | 1,021.68 | | | $ | 3.57 | | | | 0.70 | % |
Investor Class | | | | | | | | | | | | | | | | |
Actual | | $ | 1,000.00 | | | $ | 1,114.13 | | | $ | 6.29 | | | | 1.18 | % |
Hypothetical (5% return before expenses) | | $ | 1,000.00 | | | $ | 1,019.26 | | | $ | 6.01 | | | | 1.18 | % |
| 1. | Expenses paid is equal to the annualized expense ratio of each class multiplied by the average account value over the period, multiplied by the number of days in the most recent fiscal half-year divided by the number of days in the fiscal year (to reflect the one-half-year period). |
| | | | | | |
| Portfolio of investments—January 31, 2014 (unaudited) | | Wells Fargo Advantage Premier Large Company Growth Fund | | | 7 | |
| | | | | | | | | | | | |
| Security name | | | | | | Shares | | | Value | |
| | | | | | | | | | | | |
| | | | |
Common Stocks: 98.56% | | | | | | | | | | | | |
| | | | |
Consumer Discretionary: 19.58% | | | | | | | | | | | | |
| | | | |
| Auto Components: 0.43% | | | | | | | | | | | | |
BorgWarner Incorporated | | | | | | | 223,760 | | | $ | 12,015,912 | |
Delphi Automotive plc | | | | | | | 159,990 | | | | 9,741,791 | |
| | | | |
| | | | | | | | | | | 21,757,703 | |
| | | | | | | | | | | | |
| | | | |
| Distributors: 0.96% | | | | | | | | | | | | |
LKQ Corporation † | | | | | | | 1,786,020 | | | | 48,347,561 | |
| | | | | | | | | | | | |
| | | | |
| Hotels, Restaurants & Leisure: 3.04% | | | | | | | | | | | | |
Chipotle Mexican Grill Incorporated † | | | | | | | 127,410 | | | | 70,325,224 | |
Starbucks Corporation | | | | | | | 1,158,940 | | | | 82,423,813 | |
| | | | |
| | | | | | | | | | | 152,749,037 | |
| | | | | | | | | | | | |
| | | | |
| Internet & Catalog Retail: 3.51% | | | | | | | | | | | | |
Amazon.com Incorporated † | | | | | | | 289,550 | | | | 103,858,690 | |
priceline.com Incorporated † | | | | | | | 63,438 | | | | 72,629,532 | |
| | | | |
| | | | | | | | | | | 176,488,222 | |
| | | | | | | | | | | | |
| | | | |
| Media: 0.72% | | | | | | | | | | | | |
Walt Disney Company | | | | | | | 498,500 | | | | 36,196,085 | |
| | | | | | | | | | | | |
| | | | |
| Multiline Retail: 3.22% | | | | | | | | | | | | |
Dollar General Corporation † | | | | | | | 230,680 | | | | 12,991,898 | |
Dollar Tree Incorporated † | | | | | | | 2,314,610 | | | | 116,934,097 | |
Nordstrom Incorporated | | | | | | | 554,480 | | | | 31,854,876 | |
| | | | |
| | | | | | | | | | | 161,780,871 | |
| | | | | | | | | | | | |
| | | | |
| Specialty Retail: 5.44% | | | | | | | | | | | | |
Cabela’s Incorporated † | | | | | | | 835,700 | | | | 55,874,902 | |
CarMax Incorporated † | | | | | | | 2,288,190 | | | | 103,220,251 | |
GNC Holdings Incorporated Class A | | | | | | | 345,200 | | | | 17,643,172 | |
TJX Companies Incorporated | | | | | | | 115,000 | | | | 6,607,417 | |
Tractor Supply Company | | | | | | | 931,380 | | | | 61,946,084 | |
Ulta Salon, Cosmetics & Fragrance Incorporated † | | | | | | | 333,340 | | | | 28,570,571 | |
| | | | |
| | | | | | | | | | | 273,862,397 | |
| | | | | | | | | | | | |
| | | | |
| Textiles, Apparel & Luxury Goods: 2.26% | | | | | | | | | | | | |
lululemon athletica incorporated Ǡ | | | | | | | 209,810 | | | | 9,586,219 | |
Michael Kors Holdings Limited † | | | | | | | 268,894 | | | | 21,492,697 | |
Nike Incorporated Class B | | | | | | | 317,890 | | | | 23,158,287 | |
Under Armour Incorporated Class A † | | | | | | | 551,360 | | | | 59,607,530 | |
| | | | |
| | | | | | | | | | | 113,844,733 | |
| | | | | | | | | | | | |
| | | | |
Consumer Staples: 4.96% | | | | | | | | | | | | |
| | | | |
| Beverages: 0.23% | | | | | | | | | | | | |
The Coca-Cola Company | | | | | | | 304,910 | | | | 11,531,696 | |
| | | | | | | | | | | | |
The accompanying notes are an integral part of these financial statements.
| | | | |
| 8 | | Wells Fargo Advantage Premier Large Company Growth Fund | | Portfolio of investments—January 31, 2014 (unaudited) |
| | | | | | | | | | | | |
| Security name | | | | | | Shares | | | Value | |
| | | | | | | | | | | | |
| | | | |
| Food & Staples Retailing: 3.73% | | | | | | | | | | | | |
Costco Wholesale Corporation | | | | | | | 477,790 | | | $ | 53,684,484 | |
Sprouts Farmers Market Incorporated † | | | | | | | 491,400 | | | | 17,562,636 | |
Whole Foods Market Incorporated | | | | | | | 2,219,500 | | | | 115,991,070 | |
| | | | |
| | | | | | | | | | | 187,238,190 | |
| | | | | | | | | | | | |
| | | | |
| Household Products: 0.37% | | | | | | | | | | | | |
Colgate-Palmolive Company | | | | | | | 305,500 | | | | 18,705,765 | |
| | | | | | | | | | | | |
| | | | |
| Personal Products: 0.63% | | | | | | | | | | | | |
Estee Lauder Companies Incorporated Class A | | | | | | | 462,190 | | | | 31,770,941 | |
| | | | | | | | | | | | |
| | | | |
Energy: 4.72% | | | | | | | | | | | | |
| | | | |
| Energy Equipment & Services: 0.85% | | | | | | | | | | | | |
National Oilwell Varco Incorporated | | | | | | | 182,030 | | | | 13,654,070 | |
Schlumberger Limited | | | | | | | 330,470 | | | | 28,939,258 | |
| | | | |
| | | | | | | | | | | 42,593,328 | |
| | | | | | | | | | | | |
| | | | |
| Oil, Gas & Consumable Fuels: 3.87% | | | | | | | | | | | | |
Concho Resources Incorporated † | | | | | | | 1,070,710 | | | | 104,704,731 | |
EOG Resources Incorporated | | | | | | | 56,500 | | | | 9,336,060 | |
Pioneer Natural Resources Company | | | | | | | 476,570 | | | | 80,692,832 | |
| | | | |
| | | | | | | | | | | 194,733,623 | |
| | | | | | | | | | | | |
| | | | |
Financials: 6.20% | | | | | | | | | | | | |
| | | | |
| Capital Markets: 2.68% | | | | | | | | | | | | |
Ameriprise Financial Incorporated | | | | | | | 424,720 | | | | 44,867,421 | |
TD Ameritrade Holding Corporation | | | | | | | 2,869,710 | | | | 89,678,438 | |
| | | | |
| | | | | | | | | | | 134,545,859 | |
| | | | | | | | | | | | |
| | | | |
| Consumer Finance: 3.08% | | | | | | | | | | | | |
American Express Company | | | | | | | 971,200 | | | | 82,571,424 | |
Discover Financial Services | | | | | | | 1,351,890 | | | | 72,528,899 | |
| | | | |
| | | | | | | | | | | 155,100,323 | |
| | | | | | | | | | | | |
| | | | |
| REITs: 0.44% | | | | | | | | | | | | |
American Tower Corporation | | | | | | | 275,500 | | | | 22,282,440 | |
| | | | | | | | | | | | |
| | | | |
Health Care: 21.70% | | | | | | | | | | | | |
| | | | |
| Biotechnology: 12.06% | | | | | | | | | | | | |
Alexion Pharmaceuticals Incorporated † | | | | | | | 1,007,490 | | | | 159,918,888 | |
Biogen Idec Incorporated † | | | | | | | 216,040 | | | | 67,542,746 | |
BioMarin Pharmaceutical Incorporated † | | | | | | | 519,550 | | | | 35,786,604 | |
Celgene Corporation † | | | | | | | 542,359 | | | | 82,400,603 | |
Gilead Sciences Incorporated † | | | | | | | 1,385,630 | | | | 111,751,060 | |
Medivation Incorporated † | | | | | | | 274,500 | | | | 21,850,200 | |
The accompanying notes are an integral part of these financial statements.
| | | | | | |
| Portfolio of investments—January 31, 2014 (unaudited) | | Wells Fargo Advantage Premier Large Company Growth Fund | | | 9 | |
| | | | | | | | | | | | |
| Security name | | | | | | Shares | | | Value | |
| | | | | | | | | | | | |
| | | | |
| Biotechnology (continued) | | | | | | | | | | | | |
Quintiles Transnational Holdings Incorporated † | | | | | | | 731,000 | | | $ | 34,817,530 | |
Regeneron Pharmaceuticals Incorporated † | | | | | | | 217,630 | | | | 62,805,842 | |
Vertex Pharmaceuticals Incorporated † | | | | | | | 377,540 | | | | 29,840,762 | |
| | | | |
| | | | | | | | | | | 606,714,235 | |
| | | | | | | | | | | | |
| | | | |
| Health Care Equipment & Supplies: 1.09% | | | | | | | | | | | | |
Covidien plc | | | | | | | 803,490 | | | | 54,830,158 | |
| | | | | | | | | | | | |
| | | | |
| Health Care Providers & Services: 3.54% | | | | | | | | | | | | |
AmerisourceBergen Corporation | | | | | | | 679,900 | | | | 45,702,878 | |
Catamaran Corporation † | | | | | | | 1,132,380 | | | | 55,056,316 | |
Envision Healthcare Holdings Incorporated † | | | | | | | 299,833 | | | | 9,912,479 | |
Express Scripts Holding Company † | | | | | | | 898,940 | | | | 67,141,829 | |
| | | | |
| | | | | | | | | | | 177,813,502 | |
| | | | | | | | | | | | |
| | | | |
| Health Care Technology: 1.29% | | | | | | | | | | | | |
Cerner Corporation † | | | | | | | 1,142,640 | | | | 65,004,790 | |
| | | | | | | | | | | | |
| | | | |
| Life Sciences Tools & Services: 0.79% | | | | | | | | | | | | |
Mettler-Toledo International Incorporated † | | | | | | | 162,220 | | | | 39,954,786 | |
| | | | | | | | | | | | |
| | | | |
| Pharmaceuticals: 2.93% | | | | | | | | | | | | |
Allergan Incorporated | | | | | | | 3,340 | | | | 382,764 | |
Bristol-Myers Squibb Company | | | | | | | 429,000 | | | | 21,437,130 | |
Mallinckrodt plc † | | | | | | | 152,123 | | | | 8,797,273 | |
Merck & Company Incorporated | | | | | | | 619,500 | | | | 32,814,915 | |
Mylan Laboratories Incorporated † | | | | | | | 293,000 | | | | 13,305,130 | |
Perrigo Company plc | | | | | | | 453,880 | | | | 70,650,961 | |
| | | | |
| | | | | | | | | | | 147,388,173 | |
| | | | | | | | | | | | |
| | | | |
Industrials: 12.19% | | | | | | | | | | | | |
| | | | |
| Aerospace & Defense: 3.17% | | | | | | | | | | | | |
Precision Castparts Corporation | | | | | | | 180,150 | | | | 45,893,213 | |
The Boeing Company | | | | | | | 287,160 | | | | 35,969,662 | |
United Technologies Corporation | | | | | | | 681,600 | | | | 77,716,032 | |
| | | | |
| | | | | | | | | | | 159,578,907 | |
| | | | | | | | | | | | |
| | | | |
| Air Freight & Logistics: 0.88% | | | | | | | | | | | | |
United Parcel Service Incorporated Class B | | | | | | | 464,640 | | | | 44,247,667 | |
| | | | | | | | | | | | |
| | | | |
| Airlines: 0.25% | | | | | | | | | | | | |
Southwest Airlines Company | | | | | | | 587,660 | | | | 12,311,477 | |
| | | | | | | | | | | | |
| | | | |
| Building Products: 0.62% | | | | | | | | | | | | |
Fortune Brands Home & Security Incorporated | | | | | | | 686,140 | | | | 30,917,468 | |
| | | | | | | | | | | | |
| | | | |
| Commercial Services & Supplies: 0.31% | | | | | | | | | | | | |
Tyco International Limited | | | | | | | 380,500 | | | | 15,406,445 | |
| | | | | | | | | | | | |
The accompanying notes are an integral part of these financial statements.
| | | | |
| 10 | | Wells Fargo Advantage Premier Large Company Growth Fund | | Portfolio of investments—January 31, 2014 (unaudited) |
| | | | | | | | | | | | |
| Security name | | | | | | Shares | | | Value | |
| | | | | | | | | | | | |
| | | | |
| Industrial Conglomerates: 0.76% | | | | | | | | | | | | |
Danaher Corporation | | | | | | | 516,230 | | | $ | 38,402,350 | |
| | | | | | | | | | | | |
| | | | |
| Machinery: 0.79% | | | | | | | | | | | | |
Flowserve Corporation | | | | | | | 423,550 | | | | 30,635,372 | |
Pentair Limited | | | | | | | 125,500 | | | | 9,328,415 | |
| | | | |
| | | | | | | | | | | 39,963,787 | |
| | | | | | | | | | | | |
| | | | |
| Professional Services: 0.39% | | | | | | | | | | | | |
Verisk Analytics Incorporated Class A † | | | | | | | 307,160 | | | | 19,615,238 | |
| | | | | | | | | | | | |
| | | | |
| Road & Rail: 5.02% | | | | | | | | | | | | |
CSX Corporation | | | | | | | 1,904,000 | | | | 51,236,640 | |
Genesee & Wyoming Incorporated Class A † | | | | | | | 324,000 | | | | 29,270,160 | |
J.B. Hunt Transport Services Incorporated | | | | | | | 138,060 | | | | 10,361,403 | |
Kansas City Southern | | | | | | | 584,900 | | | | 61,759,591 | |
Norfolk Southern Corporation | | | | | | | 608,340 | | | | 56,326,201 | |
Union Pacific Corporation | | | | | | | 250,070 | | | | 43,572,197 | |
| | | | |
| | | | | | | | | | | 252,526,192 | |
| | | | | | | | | | | | |
| | | | |
Information Technology: 26.28% | | | | | | | | | | | | |
| | | | |
| Communications Equipment: 2.07% | | | | | | | | | | | | |
F5 Networks Incorporated † | | | | | | | 307,000 | | | | 32,849,000 | |
QUALCOMM Incorporated | | | | | | | 958,480 | | | | 71,138,386 | |
| | | | |
| | | | | | | | | | | 103,987,386 | |
| | | | | | | | | | | | |
| | | | |
| Computers & Peripherals: 1.59% | | | | | | | | | | | | |
Apple Incorporated | | | | | | | 159,380 | | | | 79,785,628 | |
| | | | | | | | | | | | |
| | | | |
| Electronic Equipment, Instruments & Components: 0.10% | | | | | | | | | | | | |
Trimble Navigation Limited † | | | | | | | 153,000 | | | | 4,946,490 | |
| | | | | | | | | | | | |
| | | | |
| Internet Software & Services: 11.98% | | | | | | | | | | | | |
Akamai Technologies Incorporated † | | | | | | | 919,810 | | | | 43,856,541 | |
eBay Incorporated † | | | | | | | 1,907,500 | | | | 101,479,000 | |
Facebook Incorporated Class A † | | | | | | | 1,410,490 | | | | 88,254,359 | |
Google Incorporated Class A † | | | | | | | 204,720 | | | | 241,768,178 | |
MercadoLibre Incorporated « | | | | | | | 469,320 | | | | 45,284,687 | |
Pandora Media Incorporated † | | | | | | | 885,500 | | | | 31,939,985 | |
Rackspace Hosting Incorporated † | | | | | | | 1,377,870 | | | | 50,168,247 | |
| | | | |
| | | | | | | | | | | 602,750,997 | |
| | | | | | | | | | | | |
| | | | |
| IT Services: 6.45% | | | | | | | | | | | | |
Accenture plc | | | | | | | 494,500 | | | | 39,500,660 | |
Alliance Data Systems Corporation † | | | | | | | 275,780 | | | | 66,093,435 | |
Cognizant Technology Solutions Corporation Class A † | | | | | | | 777,820 | | | | 75,386,314 | |
MasterCard Incorporated Class A | | | | | | | 1,079,800 | | | | 81,719,264 | |
Visa Incorporated Class A | | | | | | | 287,740 | | | | 61,987,828 | |
| | | | |
| | | | | | | | | | | 324,687,501 | |
| | | | | | | | | | | | |
The accompanying notes are an integral part of these financial statements.
| | | | | | |
| Portfolio of investments—January 31, 2014 (unaudited) | | Wells Fargo Advantage Premier Large Company Growth Fund | | | 11 | |
| | | | | | | | | | | | | | |
| Security name | | | | | | | Shares | | | Value | |
| | | | | | | | | | | | | | |
| | | | |
| Semiconductors & Semiconductor Equipment: 2.17% | | | | | | | | | | | | | | |
Avago Technologies Limited | | | | | | | | | 67,000 | | | $ | 3,660,880 | |
Linear Technology Corporation | | | | | | | | | 200,160 | | | | 8,915,126 | |
Microchip Technology Incorporated « | | | | | | | | | 1,715,670 | | | | 76,964,956 | |
Xilinx Incorporated | | | | | | | | | 425,830 | | | | 19,767,029 | |
| | | | |
| | | | | | | | | | | | | 109,307,991 | |
| | | | | | | | | | | | | | |
| | | | |
| Software: 1.92% | | | | | | | | | | | | | | |
Fortinet Incorporated † | | | | | | | | | 426,470 | | | | 9,041,164 | |
Salesforce.com Incorporated † | | | | | | | | | 1,257,450 | | | | 76,113,449 | |
Splunk Incorporated † | | | | | | | | | 148,000 | | | | 11,400,440 | |
| | | | |
| | | | | | | | | | | | | 96,555,053 | |
| | | | | | | | | | | | | | |
| | | | |
Materials: 2.93% | | | | | | | | | | | | | | |
| | | | |
| Chemicals: 2.93% | | | | | | | | | | | | | | |
Airgas Incorporated | | | | | | | | | 245,300 | | | | 25,324,772 | |
Monsanto Company | | | | | | | | | 647,840 | | | | 69,027,352 | |
Praxair Incorporated | | | | | | | | | 423,600 | | | | 52,831,384 | |
| | | | |
| | | | | | | | | | | | | 147,183,508 | |
| | | | | | | | | | | | | | |
| | | | |
Total Common Stocks (Cost $3,687,238,261) | | | | | | | | | | | | | 4,957,408,503 | |
| | | | | | | | | | | | | | |
| | | | |
| | | Yield | | | | | | | | | |
| Short-Term Investments: 3.41% | | | | | | | | | | | | | | |
| | | | |
| Investment Companies: 3.41% | | | | | | | | | | | | | | |
Wells Fargo Advantage Cash Investment Money Market Fund, Select Class (l)(u) | | | 0.07 | % | | | | | 92,571,974 | | | | 92,571,974 | |
Wells Fargo Securities Lending Cash Investments, LLC (l)(u)(v)(r) | | | 0.08 | | | | | | 78,984,300 | | | | 78,984,300 | |
| | | | |
Total Short-Term Investments (Cost $171,556,274) | | | | | | | | | | | | | 171,556,274 | |
| | | | | | | | | | | | | | |
| | | | | | | | |
| Total investments in securities | | | | | | | | |
| (Cost $3,858,794,535) * | | | 101.97 | % | | | 5,128,964,777 | |
Other assets and liabilities, net | | | (1.97 | ) | | | (99,147,485 | ) |
| | | | | | | | |
| Total net assets | | | 100.00 | % | | $ | 5,029,817,292 | |
| | | | | | | | |
| † | Non-income-earning security |
| « | All or a portion of this security is on loan. |
| (l) | Investment in an affiliate |
| (u) | Rate shown is the 7-day annualized yield at period end. |
| (v) | Security represents investment of cash collateral received from securities on loan. |
| (r) | The investment company is exempt from registration under Section 3(c)(7) of the Investment Company Act of 1940, as amended. |
| * | Cost for federal income tax purposes is $3,869,123,995 and unrealized appreciation (depreciation) consists of: |
| | | | |
Gross unrealized appreciation | | $ | 1,281,407,839 | |
Gross unrealized depreciation | | | (21,567,057 | ) |
| | | | |
Net unrealized appreciation | | $ | 1,259,840,782 | |
The accompanying notes are an integral part of these financial statements.
| | | | |
| 12 | | Wells Fargo Advantage Premier Large Company Growth Fund | | Statement of assets and liabilities—January 31, 2014 (unaudited) |
| | | | |
| | | | |
| |
Assets | | | | |
Investments | | | | |
In unaffiliated securities (including securities on loan), at value (see cost below) | | $ | 4,957,408,503 | |
In affiliated securities, at value (see cost below) | | | 171,556,274 | |
| | | | |
Total investments, at value (see cost below) | | | 5,128,964,777 | |
Receivable for investments sold | | | 16,603,875 | |
Receivable for Fund shares sold | | | 28,126,735 | |
Receivable for dividends | | | 865,160 | |
Receivable for securities lending income | | | 26,236 | |
Prepaid expenses and other assets | | | 241,062 | |
| | | | |
Total assets | | | 5,174,827,845 | |
| | | | |
| |
Liabilities | | | | |
Payable for investments purchased | | | 55,274,639 | |
Payable for Fund shares redeemed | | | 6,209,243 | |
Payable upon receipt of securities loaned | | | 78,984,300 | |
Advisory fee payable | | | 2,499,232 | |
Distribution fees payable | | | 242,211 | |
Due to other related parties | | | 1,000,061 | |
Accrued expenses and other liabilities | | | 800,867 | |
| | | | |
Total liabilities | | | 145,010,553 | |
| | | | |
Total net assets | | $ | 5,029,817,292 | |
| | | | |
| |
NET ASSETS CONSIST OF | | | | |
Paid-in capital | | $ | 3,841,723,868 | |
Accumulated net investment loss | | | (10,859,581 | ) |
Accumulated net realized losses on investments | | | (71,217,237 | ) |
Net unrealized gains on investments | | | 1,270,170,242 | |
| | | | |
Total net assets | | $ | 5,029,817,292 | |
| | | | |
| |
COMPUTATION OF NET ASSET VALUE AND OFFERING PRICE PER SHARE1 | | | | |
Net assets – Class A | | $ | 1,856,709,418 | |
Shares outstanding – Class A | | | 132,563,430 | |
Net asset value per share – Class A | | | $14.01 | |
Maximum offering price per share – Class A2 | | | $14.86 | |
Net assets – Class B | | $ | 5,222,726 | |
Shares outstanding – Class B | | | 418,847 | |
Net asset value per share – Class B | | | $12.47 | |
Net assets – Class C | | $ | 351,442,989 | |
Shares outstanding – Class C | | | 28,253,972 | |
Net asset value per share – Class C | | | $12.44 | |
Net assets – Class R4 | | $ | 251,453 | |
Share outstanding – Class R4 | | | 17,737 | |
Net asset value per share – Class R4 | | | $14.18 | |
Net assets – Class R6 | | $ | 160,976,945 | |
Share outstanding – Class R6 | | | 11,342,363 | |
Net asset value per share – Class R6 | | | $14.19 | |
Net assets – Administrator Class | | $ | 845,488,898 | |
Shares outstanding – Administrator Class | | | 60,048,615 | |
Net asset value per share – Administrator Class | | | $14.08 | |
Net assets – Institutional Class | | $ | 1,622,453,466 | |
Shares outstanding – Institutional Class | | | 114,329,849 | |
Net asset value per share – Institutional Class | | | $14.19 | |
Net assets – Investor Class | | $ | 187,271,397 | |
Shares outstanding – Investor Class | | | 13,411,907 | |
Net asset value per share – Investor Class | | | $13.96 | |
Investments in unaffiliated securities (including securities on loan), at cost | | $ | 3,687,238,261 | |
| | | | |
Investments in affiliated securities, at cost | | $ | 171,556,274 | |
| | | | |
Total investments, at cost | | $ | 3,858,794,535 | |
| | | | |
Securities on loan, at value | | $ | 77,193,172 | |
| | | | |
| 1. | The Fund has an unlimited number of authorized shares. |
| 2. | Maximum offering price is computed as 100/94.25 of net asset value. On investments of $50,000 or more, the offering price is reduced. |
The accompanying notes are an integral part of these financial statements.
| | | | | | |
| Statement of operations—six months ended January 31, 2014 (unaudited) | | Wells Fargo Advantage Premier Large Company Growth Fund | | | 13 | |
| | | | |
| | | | |
| |
Investment income | | | | |
Dividends* | | $ | 17,552,153 | |
Securities lending income, net | | | 138,646 | |
Income from affiliated securities | | | 34,984 | |
| | | | |
Total investment income | | | 17,725,783 | |
| | | | |
| |
Expenses | | | | |
Advisory fee | | | 13,825,500 | |
Administration fees | | | | |
Fund level | | | 1,169,587 | |
Class A | | | 2,258,153 | |
Class B | | | 7,419 | |
Class C | | | 423,491 | |
Class R4 | | | 78 | |
Class R6 | | | 16,907 | |
Administrator Class | | | 380,483 | |
Institutional Class | | | 625,188 | |
Investor Class | | | 279,800 | |
Shareholder servicing fees | | | | |
Class A | | | 2,171,301 | |
Class B | | | 7,133 | |
Class C | | | 407,203 | |
Class R4 | | | 97 | |
Administrator Class | | | 899,439 | |
Investor Class | | | 218,211 | |
Distribution fees | | | | |
Class B | | | 21,399 | |
Class C | | | 1,221,610 | |
Custody and accounting fees | | | 104,637 | |
Professional fees | | | 30,270 | |
Registration fees | | | 96,156 | |
Shareholder report expenses | | | 121,583 | |
Trustees’ fees and expenses | | | 6,378 | |
Other fees and expenses | | | 44,546 | |
| | | | |
Total expenses | | | 24,336,569 | |
Less: Fee waivers and/or expense reimbursements | | | (1,026,079 | ) |
| | | | |
Net expenses | | | 23,310,490 | |
| | | | |
Net investment loss | | | (5,584,707 | ) |
| | | | |
| |
REALIZED AND UNREALIZED GAINS (LOSSES) ON INVESTMENTS | | | | |
Net realized gains on investments | | | 41,696,464 | |
Net change in unrealized gains (losses) on investments | | | 444,404,590 | |
| | | | |
Net realized and unrealized gains (losses) on investments | | | 486,101,054 | |
| | | | |
Net increase in net assets resulting from operations | | $ | 480,516,347 | |
| | | | |
| |
* Net of foreign dividend withholding taxes in the amount of | | | $4,706 | |
The accompanying notes are an integral part of these financial statements.
| | | | |
| 14 | | Wells Fargo Advantage Premier Large Company Growth Fund | | Statement of changes in net assets |
| | | | | | | | | | | | | | | | |
| | | Six months ended
January 31, 2014
(unaudited) | | | Year ended
July 31, 2013 | |
| | | | |
Operations | | | | | | | | | | | | | | | | |
Net investment loss | | | | | | $ | (5,584,707 | ) | | | | | | $ | (3,217,694 | ) |
Net realized gains (losses) on investments | | | | | | | 41,696,464 | | | | | | | | (23,360,925 | ) |
Net change in unrealized gains (losses) on investments | | | | | | | 444,404,590 | | | | | | | | 576,741,851 | |
| | | | |
Net increase in net assets resulting from operations | | | | | | | 480,516,347 | | | | | | | | 550,163,232 | |
| | | | |
| | | | |
| | | Shares | | | | | | | | Shares | | | | | |
Capital share transactions | | | | | | | | | | | | | | | | |
Proceeds from shares sold | | | | | | | | | | | | | | | | |
Class A | | | 23,323,103 | | | | 316,672,001 | | | | 49,335,147 | | | | 553,272,236 | |
Class B | | | 22,025 | | | | 265,001 | | | | 62,609 | | | | 628,941 | |
Class C | | | 5,197,836 | | | | 62,579,433 | | | | 13,893,047 | | | | 138,936,604 | |
Class R4 | | | 7,420 | | | | 100,929 | | | | 10,323 | 1 | | | 118,563 | 1 |
Class R6 | | | 11,854,454 | | | | 159,251,801 | | | | 389,039 | 1 | | | 4,458,029 | 1 |
Administrator Class | | | 16,575,780 | | | | 225,840,081 | | | | 38,801,671 | | | | 437,518,368 | |
Institutional Class | | | 18,752,389 | | | | 253,684,156 | | | | 93,560,023 | | | | 1,099,346,660 | |
Investor Class | | | 2,339,228 | | | | 31,718,774 | | | | 4,558,094 | | | | 51,317,595 | |
| | | | |
| | | | | | | 1,050,112,176 | | | | | | | | 2,285,596,996 | |
| | | | |
Payment for shares redeemed | | | | | | | | | | | | | | | | |
Class A | | | (11,366,441 | ) | | | (153,949,470 | ) | | | (20,029,188 | ) | | | (225,190,548 | ) |
Class B | | | (105,067 | ) | | | (1,273,779 | ) | | | (317,995 | ) | | | (3,178,971 | ) |
Class C | | | (1,862,408 | ) | | | (22,405,390 | ) | | | (3,149,685 | ) | | | (31,843,465 | ) |
Class R4 | | | (6 | ) | | | (81 | ) | | | 0 | 1 | | | 0 | 1 |
Class R6 | | | (876,296 | ) | | | (12,201,526 | ) | | | (24,834 | )1 | | | (290,259 | )1 |
Administrator Class | | | (7,263,507 | ) | | | (98,269,292 | ) | | | (12,658,949 | ) | | | (144,005,179 | ) |
Institutional Class | | | (9,008,520 | ) | | | (125,323,620 | ) | | | (10,729,480 | ) | | | (123,281,356 | ) |
Investor Class | | | (1,233,043 | ) | | | (16,575,950 | ) | | | (2,036,199 | ) | | | (22,879,772 | ) |
| | | | |
| | | | | | | (429,999,108 | ) | | | | | | | (550,669,550 | ) |
| | | | |
Net increase in net assets resulting from capital share transactions | | | | | | | 620,113,068 | | | | | | | | 1,734,927,446 | |
| | | | |
Total increase in net assets | | | | | | | 1,100,629,415 | | | | | | | | 2,285,090,678 | |
| | | | |
| | | | |
Net assets | | | | | | | | | | | | | | | | |
Beginning of period | | | | | | | 3,929,187,877 | | | | | | | | 1,644,097,199 | |
| | | | |
End of period | | | | | | $ | 5,029,817,292 | | | | | | | $ | 3,929,187,877 | |
| | | | |
Accumulated net investment loss | | | | | | $ | (10,859,581 | ) | | | | | | $ | (5,274,874 | ) |
| | | | |
| 1. | For the period from November 30, 2012 (commencement of class operations) to July 31, 2013 |
The accompanying notes are an integral part of these financial statements.
| | | | | | |
| Financial highlights | | Wells Fargo Advantage Premier Large Company Growth Fund | | | 15 | |
(For a share outstanding throughout each period)
| | | | | | | | | | | | | | | | | | | | | | | | | | | | |
| | | Six months ended
January 31, 2014
(unaudited) | | | Year ended July 31 | | | Year ended
September 30 | |
| CLASS A | | | 2013 | | | 2012 | | | 2011 | | | 20101,2 | | | 20091 | | | 20081 | |
Net asset value, beginning of period | | $ | 12.57 | | | $ | 10.21 | | | $ | 9.89 | | | $ | 7.75 | | | $ | 7.23 | | | $ | 7.20 | | | $ | 8.50 | |
Net investment income (loss) | | | (0.02 | ) | | | (0.02 | ) | | | (0.03 | )3 | | | (0.01 | ) | | | 0.00 | 3,4 | | | 0.05 | 3 | | | 0.03 | 3 |
Net realized and unrealized gains (losses) on investments | | | 1.46 | | | | 2.38 | | | | 0.60 | | | | 2.15 | | | | 0.57 | | | | 0.02 | | | | (1.33 | ) |
| | | | | | | | | | | | | | | | | | | | | | | | | | | | |
Total from investment operations | | | 1.44 | | | | 2.36 | | | | 0.57 | | | | 2.14 | | | | 0.57 | | | | 0.07 | | | | (1.30 | ) |
Distributions to shareholders from | | | | | | | | | | | | | | | | | | | | | | | | | | | | |
Net investment income | | | 0.00 | | | | 0.00 | | | | 0.00 | | | | (0.00 | )4 | | | (0.05 | ) | | | (0.04 | ) | | | (0.00 | )4 |
Net realized gains | | | 0.00 | | | | 0.00 | | | | (0.25 | ) | | | 0.00 | | | | 0.00 | | | | 0.00 | | | | 0.00 | |
| | | | | | | | | | | | | | | | | | | | | | | | | | | | |
Total distributions to shareholders | | | 0.00 | | | | 0.00 | | | | (0.25 | ) | | | (0.00 | )4 | | | (0.05 | ) | | | (0.04 | ) | | | (0.00 | )4 |
Net asset value, end of period | | $ | 14.01 | | | $ | 12.57 | | | $ | 10.21 | | | $ | 9.89 | | | $ | 7.75 | | | $ | 7.23 | | | $ | 7.20 | |
Total return5 | | | 11.46 | % | | | 23.11 | % | | | 6.08 | % | | | 27.55 | % | | | 7.93 | % | | | 1.04 | % | | | (15.25 | )% |
Ratios to average net assets (annualized) | | | | | | | | | | | | | | | | | | | | | | | | | | | | |
Gross expenses | | | 1.17 | % | | | 1.19 | % | | | 1.23 | % | | | 1.24 | % | | | 1.09 | % | | | 1.12 | % | | | 1.09 | % |
Net expenses | | | 1.12 | % | | | 1.12 | % | | | 1.12 | % | | | 1.12 | % | | | 1.08 | % | | | 1.12 | % | | | 1.07 | % |
Net investment income (loss) | | | (0.36 | )% | | | (0.15 | )% | | | (0.30 | )% | | | (0.13 | )% | | | 0.06 | % | | | 0.86 | % | | | 0.44 | % |
Supplemental data | | | | | | | | | | | | | | | | | | | | | | | | | | | | |
Portfolio turnover rate | | | 13 | % | | | 32 | % | | | 51 | % | | | 65 | % | | | 89 | % | | | 24 | % | | | 39 | % |
Net assets, end of period (000s omitted) | | | $1,856,709 | | | | $1,515,862 | | | | $932,106 | | | | $620,262 | | | | $491,290 | | | | $268,422 | | | | $276,771 | |
| 1. | After the close of business on July 16, 2010, the Fund acquired the net assets of Evergreen Large Company Growth Fund and Wells Fargo Advantage Large Company Growth Fund. Evergreen Large Company Growth Fund became the accounting and performance survivor in the transaction. The information for the periods prior to July 19, 2010 is that of Class A of Evergreen Large Company Growth Fund. |
| 2. | For the ten months ended July 31, 2010. The Fund changed its fiscal year end from September 30 to July 31, effective July 31, 2010. |
| 3. | Calculated based upon average shares outstanding |
| 4. | Amount is less than $0.005. |
| 5. | Total return calculations do not include any sales charges. Returns for periods of less than one year are not annualized. |
The accompanying notes are an integral part of these financial statements.
| | | | |
| 16 | | Wells Fargo Advantage Premier Large Company Growth Fund | | Financial highlights |
(For a share outstanding throughout each period)
| | | | | | | | | | | | | | | | | | | | | | | | | | | | |
| | | Six months ended
January 31, 2014
(unaudited) | | | Year ended July 31 | | | Year ended
September 30 | |
| CLASS B | | | 2013 | | | 2012 | | | 2011 | | | 20101,2 | | | 20091 | | | 20081 | |
Net asset value, beginning of period | | $ | 11.23 | | | $ | 9.19 | | | $ | 8.99 | | | $ | 7.10 | | | $ | 6.62 | | | $ | 6.60 | | | $ | 7.85 | |
Net investment income (loss) | | | (0.07 | )3 | | | (0.09 | )3 | | | (0.09 | )3 | | | (0.07 | )3 | | | (0.04 | )3 | | | 0.01 | 3 | | | (0.02 | )3 |
Net realized and unrealized gains (losses) on investments | | | 1.31 | | | | 2.13 | | | | 0.54 | | | | 1.96 | | | | 0.52 | | | | 0.01 | | | | (1.23 | ) |
| | | | | | | | | | | | | | | | | | | | | | | | | | | | |
Total from investment operations | | | 1.24 | | | | 2.04 | | | | 0.45 | | | | 1.89 | | | | 0.48 | | | | 0.02 | | | | (1.25 | ) |
Distributions to shareholders from | | | | | | | | | | | | | | | | | | | | | | | | | | | | |
Net realized gains | | | 0.00 | | | | 0.00 | | | | (0.25 | ) | | | 0.00 | | | | 0.00 | | | | 0.00 | | | | 0.00 | |
Net asset value, end of period | | $ | 12.47 | | | $ | 11.23 | | | $ | 9.19 | | | $ | 8.99 | | | $ | 7.10 | | | $ | 6.62 | | | $ | 6.60 | |
Total return4 | | | 11.04 | % | | | 22.20 | % | | | 5.22 | % | | | 26.62 | % | | | 7.25 | % | | | 0.30 | % | | | (15.92 | )% |
Ratios to average net assets (annualized) | | | | | | | | | | | | | | | | | | | | | | | | | | | | |
Gross expenses | | | 1.92 | % | | | 1.94 | % | | | 1.97 | % | | | 2.00 | % | | | 1.84 | % | | | 1.87 | % | | | 1.81 | % |
Net expenses | | | 1.87 | % | | | 1.87 | % | | | 1.87 | % | | | 1.87 | % | | | 1.83 | % | | | 1.87 | % | | | 1.81 | % |
Net investment income (loss) | | | (1.09 | )% | | | (0.87 | )% | | | (1.04 | )% | | | (0.85 | )% | | | (0.69 | )% | | | 0.11 | % | | | (0.31 | )% |
Supplemental data | | | | | | | | | | | | | | | | | | | | | | | | | | | | |
Portfolio turnover rate | | | 13 | % | | | 32 | % | | | 51 | % | | | 65 | % | | | 89 | % | | | 24 | % | | | 39 | % |
Net assets, end of period (000s omitted) | | $ | 5,223 | | | $ | 5,637 | | | $ | 6,962 | | | $ | 10,244 | | | $ | 13,957 | | | $ | 7,951 | | | $ | 10,489 | |
| 1. | After the close of business on July 16, 2010, the Fund acquired the net assets of Evergreen Large Company Growth Fund and Wells Fargo Advantage Large Company Growth Fund. Evergreen Large Company Growth Fund became the accounting and performance survivor in the transaction. The information for the periods prior to July 19, 2010 is that of Class B of Evergreen Large Company Growth Fund. |
| 2. | For the ten months ended July 31, 2010. The Fund changed its fiscal year end from September 30 to July 31, effective July 31, 2010. |
| 3. | Calculated based upon average shares outstanding |
| 4. | Total return calculations do not include any sales charges. Returns for periods of less than one year are not annualized. |
The accompanying notes are an integral part of these financial statements.
| | | | | | |
| Financial highlights | | Wells Fargo Advantage Premier Large Company Growth Fund | | | 17 | |
(For a share outstanding throughout each period)
| | | | | | | | | | | | | | | | | | | | | | | | | | | | |
| | | Six months ended
January 31, 2014 (unaudited) | | | Year ended July 31 | | | Year ended
September 30 | |
| CLASS C | | | 2013 | | | 2012 | | | 2011 | | | 20101,2 | | | 20091 | | | 20081 | |
Net asset value, beginning of period | | $ | 11.20 | | | $ | 9.17 | | | $ | 8.97 | | | $ | 7.08 | | | $ | 6.62 | | | $ | 6.59 | | | $ | 7.84 | |
Net investment income (loss) | | | (0.07 | )3 | | | (0.09 | )3 | | | (0.10 | )3 | | | (0.08 | )3 | | | (0.04 | )3 | | | 0.00 | 3,4 | | | (0.02 | )3 |
Net realized and unrealized gains (losses) on investments | | | 1.31 | | | | 2.12 | | | | 0.55 | | | | 1.97 | | | | 0.52 | | | | 0.03 | | | | (1.23 | ) |
| | | | | | | | | | | | | | | | | | | | | | | | | | | | |
Total from investment operations | | | 1.24 | | | | 2.03 | | | | 0.45 | | | | 1.89 | | | | 0.48 | | | | 0.03 | | | | (1.25 | ) |
Distributions to shareholders from | | | | | | | | | | | | | | | | | | | | | | | | | | | | |
Net investment income | | | 0.00 | | | | 0.00 | | | | 0.00 | | | | 0.00 | | | | (0.02 | ) | | | 0.00 | | | | 0.00 | |
Net realized gains | | | 0.00 | | | | 0.00 | | | | (0.25 | ) | | | 0.00 | | | | 0.00 | | | | 0.00 | | | | 0.00 | |
| | | | | | | | | | | | | | | | | | | | | | | | | | | | |
Total distributions to shareholders | | | 0.00 | | | | 0.00 | | | | (0.25 | ) | | | 0.00 | | | | (0.02 | ) | | | 0.00 | | | | 0.00 | |
Net asset value, end of period | | $ | 12.44 | | | $ | 11.20 | | | $ | 9.17 | | | $ | 8.97 | | | $ | 7.08 | | | $ | 6.62 | | | $ | 6.59 | |
Total return5 | | | 11.07 | % | | | 22.14 | % | | | 5.24 | % | | | 26.69 | % | | | 7.18 | % | | | 0.46 | % | | | (15.94 | )% |
Ratios to average net assets (annualized) | | | | | | | | | | | | | | | | | | | | | | | | | | | | |
Gross expenses | | | 1.92 | % | | | 1.94 | % | | | 1.98 | % | | | 1.99 | % | | | 1.84 | % | | | 1.87 | % | | | 1.82 | % |
Net expenses | | | 1.87 | % | | | 1.87 | % | | | 1.87 | % | | | 1.87 | % | | | 1.83 | % | | | 1.87 | % | | | 1.82 | % |
Net investment income (loss) | | | (1.11 | )% | | | (0.91 | )% | | | (1.07 | )% | | | (0.90 | )% | | | (0.68 | )% | | | 0.08 | % | | | (0.30 | )% |
Supplemental data | | | | | | | | | | | | | | | | | | | | | | | | | | | | |
Portfolio turnover rate | | | 13 | % | | | 32 | % | | | 51 | % | | | 65 | % | | | 89 | % | | | 24 | % | | | 39 | % |
Net assets, end of period (000s omitted) | | | $351,443 | | | | $279,203 | | | | $129,980 | | | | $35,783 | | | | $22,246 | | | | $13,717 | | | | $10,046 | |
| 1. | After the close of business on July 16, 2010, the Fund acquired the net assets of Evergreen Large Company Growth Fund and Wells Fargo Advantage Large Company Growth Fund. Evergreen Large Company Growth Fund became the accounting and performance survivor in the transaction. The information for the periods prior to July 19, 2010 is that of Class C of Evergreen Large Company Growth Fund. |
| 2. | For the ten months ended July 31, 2010. The Fund changed its fiscal year end from September 30 to July 31, effective July 31, 2010. |
| 3. | Calculated based upon average shares outstanding |
| 4. | Amount is less than $0.005. |
| 5. | Total return calculations do not include any sales charges. Returns for periods of less than one year are not annualized. |
The accompanying notes are an integral part of these financial statements.
| | | | |
| 18 | | Wells Fargo Advantage Premier Large Company Growth Fund | | Financial highlights |
(For a share outstanding throughout each period)
| | | | | | | | |
| | | Six months ended
January 31, 2014
(unaudited) | | | Year ended
July 31, 20131 | |
| CLASS R4 | | |
Net asset value, beginning of period | | $ | 12.70 | | | $ | 10.81 | |
Net investment income (loss) | | | (0.01 | ) | | | 0.00 | 2 |
Net realized and unrealized gains (losses) on investments | | | 1.49 | | | | 1.89 | |
| | | | | | | | |
Total from investment operations | | | 1.48 | | | | 1.89 | |
Net asset value, end of period | | $ | 14.18 | | | $ | 12.70 | |
Total return3 | | | 11.65 | % | | | 17.48 | % |
Ratios to average net assets (annualized) | | | | | | | | |
Gross expenses | | | 0.84 | % | | | 0.85 | % |
Net expenses | | | 0.80 | % | | | 0.80 | % |
Net investment income (loss) | | | (0.10 | )% | | | 0.06 | % |
Supplemental data | | | | | | | | |
Portfolio turnover rate | | | 13 | % | | | 32 | % |
Net assets, end of period (000s omitted) | | | $251 | | | | $131 | |
| 1. | For the period from November 30, 2012 (commencement of class operations) to July 31, 2013 |
| 2. | Amount is less than $0.005. |
| 3. | Returns for periods of less than one year are not annualized. |
The accompanying notes are an integral part of these financial statements.
| | | | | | |
| Financial highlights | | Wells Fargo Advantage Premier Large Company Growth Fund | | | 19 | |
(For a share outstanding throughout each period)
| | | | | | | | |
| | | Six months ended
January 31, 2014 (unaudited) | | | Year ended July 31, 20131 | |
| CLASS R6 | | |
Net asset value, beginning of period | | $ | 12.71 | | | $ | 10.81 | |
Net investment income | | | 0.00 | 2,3 | | | 0.00 | 2 |
Net realized and unrealized gains (losses) on investments | | | 1.48 | | | | 1.90 | |
| | | | | | | | |
Total from investment operations | | | 1.48 | | | | 1.90 | |
Net asset value, end of period | | $ | 14.19 | | | $ | 12.71 | |
Total return4 | | | 11.64 | % | | | 17.58 | % |
Ratios to average net assets (annualized) | | | | | | | | |
Gross expenses | | | 0.69 | % | | | 0.71 | % |
Net expenses | | | 0.65 | % | | | 0.65 | % |
Net investment income | | | 0.06 | % | | | 0.05 | % |
Supplemental data | | | | | | | | |
Portfolio turnover rate | | | 13 | % | | | 32 | % |
Net assets, end of period (000s omitted) | | | $160,977 | | | | $4,629 | |
| 1. | For the period from November 30, 2012 (commencement of class operations) to July 31, 2013 |
| 2. | Amount is less than $0.005. |
| 3. | Calculated based upon average shares outstanding |
| 4. | Returns for periods of less than one year are not annualized. |
The accompanying notes are an integral part of these financial statements.
| | | | |
| 20 | | Wells Fargo Advantage Premier Large Company Growth Fund | | Financial highlights |
(For a share outstanding throughout each period)
| | | | | | | | | | | | | | | | | | | | |
| | | Six months ended
January 31, 2014
(unaudited) | | | Year ended July 31 | |
| ADMINISTRATOR CLASS | | | 2013 | | | 2012 | | | 2011 | | | 20101 | |
Net asset value, beginning of period | | $ | 12.62 | | | $ | 10.24 | | | $ | 9.90 | | | $ | 7.75 | | | $ | 7.53 | |
Net investment income (loss) | | | (0.01 | ) | | | (0.00 | )2 | | | (0.02 | ) | | | 0.00 | 2 | | | (0.00 | )2 |
Net realized and unrealized gains (losses) on investments | | | 1.47 | | | | 2.38 | | | | 0.61 | | | | 2.16 | | | | 0.22 | |
| | | | | | | | | | | | | | | | | | | | |
Total from investment operations | | | 1.46 | | | | 2.38 | | | | 0.59 | | | | 2.16 | | | | 0.22 | |
Distributions to shareholders from | | | | | | | | | | | | | | | | | | | | |
Net investment income | | | 0.00 | | | | 0.00 | | | | 0.00 | | | | (0.01 | ) | | | 0.00 | |
Net realized gains | | | 0.00 | | | | 0.00 | | | | (0.25 | ) | | | 0.00 | | | | 0.00 | |
| | | | | | | | | | | | | | | | | | | | |
Total distributions to shareholders | | | 0.00 | | | | 0.00 | | | | (0.25 | ) | | | (0.01 | ) | | | 0.00 | |
Net asset value, end of period | | $ | 14.08 | | | $ | 12.62 | | | $ | 10.24 | | | $ | 9.90 | | | $ | 7.75 | |
Total return3 | | | 11.57 | % | | | 23.24 | % | | | 6.28 | % | | | 27.75 | % | | | 2.92 | % |
Ratios to average net assets (annualized) | | | | | | | | | | | | | | | | | | | | |
Gross expenses | | | 0.99 | % | | | 1.04 | % | | | 1.07 | % | | | 1.08 | % | | | 1.13 | % |
Net expenses | | | 0.95 | % | | | 0.95 | % | | | 0.95 | % | | | 0.95 | % | | | 0.95 | % |
Net investment income (loss) | | | (0.19 | )% | | | (0.01 | )% | | | (0.16 | )% | | | 0.01 | % | | | (0.34 | )% |
Supplemental data | | | | | | | | | | | | | | | | | | | | |
Portfolio turnover rate | | | 13 | % | | | 32 | % | | | 51 | % | | | 65 | % | | | 89 | % |
Net assets, end of period (000s omitted) | | $ | 845,489 | | | $ | 640,494 | | | $ | 251,759 | | | $ | 54,335 | | | $ | 36,508 | |
| 1. | For the period from July 16, 2010 (commencement of class operations) to July 31, 2010 |
| 2. | Amount is less than $0.005. |
| 3. | Returns for periods of less than one year are not annualized. |
The accompanying notes are an integral part of these financial statements.
| | | | | | |
| Financial highlights | | Wells Fargo Advantage Premier Large Company Growth Fund | | | 21 | |
(For a share outstanding throughout each period)
| | | | | | | | | | | | | | | | | | | | | | | | | | | | |
| | | Six months ended
January 31, 2014
(unaudited) | | | Year ended July 31 | | | Year ended
September 30 | |
| INSTITUTIONAL CLASS | | | 2013 | | | 2012 | | | 2011 | | | 20101,2 | | | 20091 | | | 20081 | |
Net asset value, beginning of period | | $ | 12.71 | | | $ | 10.28 | | | $ | 9.91 | | | $ | 7.75 | | | $ | 7.24 | | | $ | 7.22 | | | $ | 8.53 | |
Net investment income | | | 0.00 | 3 | | | 0.00 | 3 | | | 0.00 | 3,4 | | | 0.02 | 4 | | | 0.02 | | | | 0.06 | 4 | | | 0.05 | 4 |
Net realized and unrealized gains (losses) on investments | | | 1.48 | | | | 2.43 | | | | 0.62 | | | | 2.15 | | | | 0.57 | | | | 0.02 | | | | (1.33 | ) |
| | | | | | | | | | | | | | | | | | | | | | | | | | | | |
Total from investment operations | | | 1.48 | | | | 2.43 | | | | 0.62 | | | | 2.17 | | | | 0.59 | | | | 0.08 | | | | (1.28 | ) |
Distributions to shareholders from | | | | | | | | | | | | | | | | | | | | | | | | | | | | |
Net investment income | | | 0.00 | | | | 0.00 | | | | 0.00 | | | | (0.01 | ) | | | (0.08 | ) | | | (0.06 | ) | | | (0.03 | ) |
Net realized gains | | | 0.00 | | | | 0.00 | | | | (0.25 | ) | | | 0.00 | | | | 0.00 | | | | 0.00 | | | | 0.00 | |
| | | | | | | | | | | | | | | | | | | | | | | | | | | | |
Total distributions to shareholders | | | 0.00 | | | | 0.00 | | | | (0.25 | ) | | | (0.01 | ) | | | (0.08 | ) | | | (0.06 | ) | | | (0.03 | ) |
Net asset value, end of period | | $ | 14.19 | | | $ | 12.71 | | | $ | 10.28 | | | $ | 9.91 | | | $ | 7.75 | | | $ | 7.24 | | | $ | 7.22 | |
Total return5 | | | 11.64 | % | | | 23.64 | % | | | 6.48 | % | | | 28.03 | % | | | 8.20 | % | | | 1.28 | % | | | (15.07 | )% |
Ratios to average net assets (annualized) | | | | | | | | | | | | | | | | | | | | | | | | | | | | |
Gross expenses | | | 0.74 | % | | | 0.76 | % | | | 0.79 | % | | | 0.81 | % | | | 0.83 | % | | | 0.87 | % | | | 0.81 | % |
Net expenses | | | 0.70 | % | | | 0.71 | % | | | 0.75 | % | | | 0.75 | % | | | 0.82 | % | | | 0.87 | % | | | 0.81 | % |
Net investment income | | | 0.06 | % | | | 0.16 | % | | | 0.04 | % | | | 0.22 | % | | | 0.34 | % | | | 1.04 | % | | | 0.68 | % |
Supplemental data | | | | | | | | | | | | | | | | | | | | | | | | | | | | |
Portfolio turnover rate | | | 13 | % | | | 32 | % | | | 51 | % | | | 65 | % | | | 89 | % | | | 24 | % | | | 39 | % |
Net assets, end of period (000s omitted) | | | $1,622,453 | | | | $1,328,994 | | | | $223,616 | | | | $30,493 | | | | $18,841 | | | | $11,335 | | | | $6,321 | |
| 1. | After the close of business on July 16, 2010, the Fund acquired the net assets of Evergreen Large Company Growth Fund and Wells Fargo Advantage Large Company Growth Fund. Evergreen Large Company Growth Fund became the accounting and performance survivor in the transaction. The information for the periods prior to July 19, 2010 is that of Class I of Evergreen Large Company Growth Fund. |
| 2. | For the ten months ended July 31, 2010. The Fund changed its fiscal year end from September 30 to July 31, effective July 31, 2010. |
| 3. | Amount is less than $0.005. |
| 4. | Calculated based upon average shares outstanding |
| 5. | Returns for periods of less than one year are not annualized. |
The accompanying notes are an integral part of these financial statements.
| | | | |
| 22 | | Wells Fargo Advantage Premier Large Company Growth Fund | | Financial highlights |
(For a share outstanding throughout each period)
| | | | | | | | | | | | | | | | | | | | |
| | | Six months ended
January 31, 2014
(unaudited) | | | Year ended July 31 | |
| INVESTOR CLASS | | | 2013 | | | 2012 | | | 2011 | | | 20101 | |
Net asset value, beginning of period | | $ | 12.53 | | | $ | 10.19 | | | $ | 9.87 | | | $ | 7.75 | | | $ | 7.54 | |
Net investment loss | | | (0.02 | ) | | | (0.02 | ) | | | (0.03 | ) | | | (0.02 | ) | | | (0.00 | )2 |
Net realized and unrealized gains (losses) on investments | | | 1.45 | | | | 2.36 | | | | 0.60 | | | | 2.15 | | | | 0.21 | |
| | | | | | | | | | | | | | | | | | | | |
Total from investment operations | | | 1.43 | | | | 2.34 | | | | 0.57 | | | | 2.13 | | | | 0.21 | |
Distributions to shareholders from | | | | | | | | | | | | | | | | | | | | |
Net investment income | | | 0.00 | | | | 0.00 | | | | 0.00 | | | | (0.01 | ) | | | 0.00 | |
Net realized gains | | | 0.00 | | | | 0.00 | | | | (0.25 | ) | | | 0.00 | | | | 0.00 | |
| | | | | | | | | | | | | | | | | | | | |
Total distributions to shareholders | | | 0.00 | | | | 0.00 | | | | (0.25 | ) | | | (0.01 | ) | | | 0.00 | |
Net asset value, end of period | | $ | 13.96 | | | $ | 12.53 | | | $ | 10.19 | | | $ | 9.87 | | | $ | 7.75 | |
Total return3 | | | 11.41 | % | | | 22.96 | % | | | 5.99 | % | | | 27.48 | % | | | 2.79 | % |
Ratios to average net assets (annualized) | | | | | | | | | | | | | | | | | | | | |
Gross expenses | | | 1.23 | % | | | 1.25 | % | | | 1.29 | % | | | 1.31 | % | | | 1.36 | % |
Net expenses | | | 1.18 | % | | | 1.18 | % | | | 1.19 | % | | | 1.19 | % | | | 1.19 | % |
Net investment loss | | | (0.42 | )% | | | (0.21 | )% | | | (0.37 | )% | | | (0.20 | )% | | | (0.59 | )% |
Supplemental data | | | | | | | | | | | | | | | | | | | | |
Portfolio turnover rate | | | 13 | % | | | 32 | % | | | 51 | % | | | 65 | % | | | 89 | % |
Net assets, end of period (000s omitted) | | | $187,271 | | | | $154,238 | | | | $99,675 | | | | $79,464 | | | | $64,781 | |
| 1. | For the period from July 16, 2010 (commencement of class operations) to July 31, 2010 |
| 2. | Amount is less than $0.005. |
| 3. | Returns for periods of less than one year are not annualized. |
The accompanying notes are an integral part of these financial statements.
| | | | | | |
| Notes to financial statements (unaudited) | | Wells Fargo Advantage Premier Large Company Growth Fund | | | 23 | |
1. ORGANIZATION
Wells Fargo Funds Trust (the “Trust”), a Delaware statutory trust organized on March 10, 1999, is an open-end management investment company registered under the Investment Company Act of 1940, as amended (the “1940 Act”). These financial statements report on the Wells Fargo Advantage Premier Large Company Growth Fund (the “Fund”) which is a diversified series of the Trust.
2. SIGNIFICANT ACCOUNTING POLICIES
The following significant accounting policies, which are consistently followed in the preparation of the financial statements of the Fund, are in conformity with U.S. generally accepted accounting principles which require management to make estimates and assumptions that affect the reported amounts of assets and liabilities, disclosure of contingent assets and liabilities at the date of the financial statements, and the reported amounts of revenues and expenses during the reporting period. Actual results could differ from those estimates.
Securities valuation
All investments are valued each business day as of the close of regular trading on the New York Stock Exchange (generally 4 p.m. Eastern Time).
Equity securities that are listed on a foreign or domestic exchange or market are valued at the official closing price or, if none, the last sales price. If no sale occurs on the primary exchange or market for the security that day, the prior day’s price will be deemed “stale” and fair values will be determined in accordance with the Fund’s Valuation Procedures.
Investments in registered open-end investment companies are valued at net asset value. Non-registered investment vehicles are fair valued at net asset value.
Investments which are not valued using any of the methods discussed above are valued at their fair value, as determined in good faith by the Board of Trustees of the Fund. The Board of Trustees has established a Valuation Committee comprised of the Trustees and has delegated to it the authority to take any actions regarding the valuation of portfolio securities that the Valuation Committee deems necessary or appropriate, including determining the fair value of portfolio securities, unless the determination has been delegated to the Management Valuation Team of Wells Fargo Funds Management, LLC (“Funds Management”). The Board of Trustees retains the authority to make or ratify any valuation decisions or approve any changes to the Valuation Procedures as it deems appropriate. On a quarterly basis, the Board of Trustees receives reports on any valuation actions taken by the Valuation Committee or the Management Valuation Team which may include items for ratification.
Valuations of fair valued securities are compared to the next actual sales price when available, or other appropriate market values, to assess the continued appropriateness of the fair valuation methodologies used. These securities are fair valued on a day-to-day basis, taking into consideration changes to appropriate market information and any significant changes to the inputs considered in the valuation process until there is a readily available price provided on an exchange or by an independent pricing service. Valuations received from an independent pricing service or independent broker-dealer quotes are periodically validated by comparisons to most recent trades and valuations provided by other independent pricing services in addition to the review of prices by the adviser and/or subadviser. Unobservable inputs used in determining fair valuations are identified based on the type of security, taking into consideration factors utilized by market participants in valuing the investment, knowledge about the issuer and the current market environment.
Security loans
The Fund may lend its securities from time to time in order to earn additional income in the form of fees or interest on securities received as collateral or the investment of any cash received as collateral. The Fund continues to receive interest or dividends on the securities loaned. The Fund receives collateral in the form of cash or securities with a value at least equal to the value of the securities on loan. The value of the loaned securities is determined at the close of each business day and any additional required collateral is delivered to the Fund on the next business day. In a securities lending transaction, the net asset value of the Fund will be affected by an increase or decrease in the value of the securities loaned and by an increase or decrease in the value of the instrument in which collateral is invested. The amount of securities lending activity undertaken by the Fund fluctuates from time to time. In the event of default or bankruptcy by the borrower, the Fund may be prevented from recovering the loaned securities or gaining access to the collateral or may experience delays or costs in doing so. In addition, the investment of any cash collateral received may lose all or part of its value. The Fund has the right under the lending agreement to recover the securities from the borrower on demand.
The Fund lends its securities through an unaffiliated securities lending agent. Cash collateral received in connection with its securities lending transactions is invested in Wells Fargo Securities Lending Cash Investments, LLC (the “Securities
| | | | |
| 24 | | Wells Fargo Advantage Premier Large Company Growth Fund | | Notes to financial statements (unaudited) |
Lending Fund”). The Securities Lending Fund is exempt from registration under Section 3(c)(7) of the 1940 Act and is managed by Funds Management and is subadvised by Wells Capital Management Incorporated (“WellsCap”). Funds Management receives an advisory fee starting at 0.05% and declining to 0.01% as the average daily net assets of the Securities Lending Fund increase. All of the fees received by Funds Management are paid to WellsCap for its services as subadviser. The Securities Lending Fund seeks to provide a positive return compared to the daily Fed Funds Open rate by investing in high-quality, U.S. dollar-denominated short-term money market instruments. Securities Lending Fund investments are fair valued based upon the amortized cost valuation technique. Income earned from investment in the Securities Lending Fund is included in securities lending income on the Statement of Operations.
Security transactions and income recognition
Securities transactions are recorded on a trade date basis. Realized gains or losses are recorded on the basis of identified cost.
Dividend income is recognized on the ex-dividend date. Dividend income is recorded net of foreign taxes withheld where recovery of such taxes is not assured.
Distributions to shareholders
Distributions to shareholders from net investment income and net realized gains, if any, are recorded on the ex-dividend date. Such distributions are determined in conformity with federal income tax regulations, which may differ in amount or character from net investment income and realized gains recognized for purposes of U.S. generally accepted accounting principles.
Federal and other taxes
The Fund intends to continue to qualify as a regulated investment company by distributing substantially all of its investment company taxable income and any net realized capital gains (after reduction for capital loss carryforwards) sufficient to relieve it from all, or substantially all, federal income taxes. Accordingly, no provision for federal income taxes was required.
The Fund’s income and federal excise tax returns and all financial records supporting those returns for the prior three fiscal years are subject to examination by the federal and Delaware revenue authorities. Management has analyzed the Fund’s tax positions taken on federal, state, and foreign tax returns for all open tax years and does not believe that there are any uncertain tax positions that require recognition of a tax liability.
As of July 31, 2013, the Fund had capital loss carryforwards available to offset future net realized capital gains in the amount of $66,018,086 with $47,798,610 expiring in 2016 and $18,219,476 expiring in 2017.
As of July 31, 2013, the Fund had $34,368,610 of current year deferred post-October capital losses and a qualified late-year ordinary loss of $5,249,397 which were both recognized on the first day of the current fiscal year.
Class allocations
The separate classes of shares offered by the Fund differ principally in applicable sales charges, distribution, shareholder servicing, and administration fees. Shareholders of each class bear certain expenses that pertain to that particular class. All shareholders bear the common expenses of the Fund, earn income from the portfolio, and are allocated any unrealized gains and losses pro rata based on the average daily net assets of each class, without distinction between share classes. Dividends are determined separately for each class based on income and expenses allocable to each class. Realized gains and losses are allocated to each class pro rata based upon the net assets of each class on the date realized. Differences in per share dividend rates generally result from the relative weightings of pro rata income and realized gain allocations and from differences in separate class expenses, including distribution, shareholder servicing, and administration fees.
3. FAIR VALUATION MEASUREMENTS
Fair value measurements of investments are determined within a framework that has established a fair value hierarchy based upon the various data inputs utilized in determining the value of the Fund’s investments. The three-level hierarchy gives the highest priority to unadjusted quoted prices in active markets for identical assets or liabilities (Level 1) and the lowest priority to significant unobservable inputs (Level 3). The Fund’s investments are classified within the fair value hierarchy based on the lowest level of input that is significant to the fair value measurement. The inputs are summarized into three broad levels as follows:
| n | | Level 1 – quoted prices in active markets for identical securities |
| n | | Level 2 – other significant observable inputs (including quoted prices for similar securities, interest rates, prepayment speeds, credit risk, use of amortized cost, etc.) |
| | | | | | |
| Notes to financial statements (unaudited) | | Wells Fargo Advantage Premier Large Company Growth Fund | | | 25 | |
| n | | Level 3 – significant unobservable inputs (including the Fund’s own assumptions in determining the fair value of investments) |
The inputs or methodologies used for valuing investments in securities are not necessarily an indication of the risk associated with investing in those securities.
As of January 31, 2014, the inputs used in valuing investments in securities were as follows:
| | | | | | | | | | | | | | | | |
| Investments in securities | | Quoted prices (Level 1) | | | Other significant observable inputs (Level 2) | | | Significant unobservable inputs (Level 3) | | | Total | |
| | | | |
Equity securities | | | | | | | | | | | | | | | | |
Common stocks | | $ | 4,957,408,503 | | | $ | 0 | | | $ | 0 | | | $ | 4,957,408,503 | |
| | | | |
Short-term investments | | | | | | | | | | | | | | | | |
Investment companies | | | 92,571,974 | | | | 78,984,300 | | | | 0 | | | | 171,556,274 | |
| | | $ | 5,049,980,477 | | | $ | 78,984,300 | | | $ | 0 | | | $ | 5,128,964,777 | |
Transfers in and transfers out are recognized at the end of the reporting period. For the six months ended January 31, 2014, the Fund did not have any transfers into/out of Level 1, Level 2, or Level 3.
4. TRANSACTIONS WITH AFFILIATES AND OTHER EXPENSES
Advisory fee
The Trust has entered into an advisory contract with Funds Management, an indirect wholly owned subsidiary of Wells Fargo & Company (“Wells Fargo”). The adviser is responsible for implementing investment policies and guidelines and for supervising the subadviser, who is responsible for day-to-day portfolio management of the Fund.
Pursuant to the contract, Funds Management is entitled to receive an annual advisory fee starting at 0.65% and declining to 0.55% as the average daily net assets of the Fund increase. For the six months ended January 31, 2014, the advisory fee was equivalent to an annual rate of 0.59% of the Fund’s average daily net assets.
Funds Management has retained the services of a subadviser to provide daily portfolio management to the Fund. The fee for subadvisory services is borne by Funds Management. WellsCap, an affiliate of Funds Management and an indirect, wholly owned subsidiary of Wells Fargo, is the subadviser to the Fund and is entitled to receive a fee from Funds Management at an annual rate starting at 0.35% and declining to 0.275% as the average daily net assets of the Fund increase.
Administration and transfer agent fees
The Trust has entered into an administration agreement with Funds Management. Under this agreement, for providing administrative services, which includes paying fees and expenses for services provided by the transfer agent, sub-transfer agents, omnibus account servicers and record-keepers, Funds Management is entitled to receive from the Fund an annual fund level administration fee starting at 0.05% and declining to 0.03% as the average daily net assets of the Fund increase and a class level administration fee which is calculated based on the average daily net assets of each class as follows:
| | | | |
| | | Class level administration fee | |
Class A, Class B, Class C | | | 0.26 | % |
Class R4, Institutional Class | | | 0.08 | |
Class R6 | | | 0.03 | |
Administrator Class | | | 0.10 | |
Investor Class | | | 0.32 | |
Funds Management has contractually waived and/or reimbursed advisory and administration fees to the extent necessary to maintain certain net operating expense ratios for the Fund. Waiver of fees and/or reimbursement of expenses by Funds Management were made first from fund level expenses on a proportionate basis and then from class specific expenses. Funds Management has committed through November 30, 2014 to waive fees and/or reimburse expenses to the extent necessary to cap the Fund’s expenses at 1.12% for Class A shares, 1.87% for Class B shares, 1.87% for Class C shares, 0.80% for Class R4 shares, 0.65% for Class R6 shares, 0.95% for Administrator Class shares, 0.70% for Institutional Class shares, and 1.18% for Investor Class shares.
| | | | |
| 26 | | Wells Fargo Advantage Premier Large Company Growth Fund | | Notes to financial statements (unaudited) |
Distribution fees
The Trust has adopted a Distribution Plan for Class B and Class C shares of the Fund pursuant to Rule 12b-1 under the 1940 Act. Distribution fees are charged to Class B and Class C shares and paid to Wells Fargo Funds Distributor, LLC, the principal underwriter, at an annual rate of 0.75% of the average daily net assets of Class B and Class C shares.
For the six months ended January 31, 2014, Wells Fargo Funds Distributor, LLC received $135,738 from the sale of Class A shares and $1,227, $77 and $2,436 in contingent deferred sales charges from redemptions of Class A, Class B, and Class C shares, respectively.
Shareholder servicing fees
The Trust has entered into contracts with one or more shareholder servicing agents, whereby Class A, Class B, Class C, Administrator Class, and Investor Class of the Fund is charged a fee at an annual rate of 0.25% of the average daily net assets of each respective class. Class R4 shares are charged a fee at an annual rate of 0.10% of its average daily net assets.
A portion of these total shareholder servicing fees were paid to affiliates of Wells Fargo.
5. INVESTMENT PORTFOLIO TRANSACTIONS
Purchases and sales of investments, excluding U.S. government obligations (if any) and short-term securities, for the six months ended January 31, 2014 were $1,200,465,259 and $602,568,974, respectively.
6. BANK BORROWINGS
The Trust (excluding the money market funds and certain other funds in the Trust) and Wells Fargo Variable Trust are parties to a $150,000,000 revolving credit agreement with State Street Bank and Trust Company, whereby the Fund is permitted to use bank borrowings for temporary or emergency purposes, such as to fund shareholder redemption requests. Interest under the credit agreement is charged to the Fund based on a borrowing rate equal to the higher of the Federal Funds rate in effect on that day plus 1.25% or the overnight LIBOR rate in effect on that day plus 1.25%. In addition, an annual commitment fee equal to 0.10% of the unused balance is allocated to each participating fund. For the six months ended January 31, 2014, the Fund paid $1,618 in commitment fees.
For the six months ended January 31, 2014, there were no borrowings by the Fund under the agreement.
7. CONCENTRATION RISK
Concentration risks result from exposure to a limited number of sectors. Funds that invest a substantial portion of their assets in any sector may be more affected by changes in that sector than would be a fund whose investments are not heavily weighted in any sector.
8. INDEMNIFICATION
Under the Trust’s organizational documents, the officers and directors are indemnified against certain liabilities that may arise out of performance of their duties to the Trust. Additionally, in the normal course of business, the Trust may enter into contracts with service providers that contain a variety of indemnification clauses. The Trust’s maximum exposure under these arrangements is dependent on future claims that may be made against the Fund and, therefore, cannot be estimated.
| | | | | | |
| Other information (unaudited) | | Wells Fargo Advantage Premier Large Company Growth Fund | | | 27 | |
PROXY VOTING INFORMATION
A description of the policies and procedures that the Fund uses to determine how to vote proxies relating to portfolio securities is available without charge, upon request, by calling 1-800-222-8222, visiting our website at wellsfargoadvantagefunds.com, or visiting the SEC website at sec.gov. Information regarding how the Fund voted proxies relating to portfolio securities during the most recent 12-month period ended June 30 is available without charge on the Fund’s website at wellsfargoadvantagefunds.com or by visiting the SEC website at sec.gov.
PORTFOLIO HOLDINGS INFORMATION
The complete portfolio holdings for the Fund are publicly available on the Fund’s website (wellsfargoadvantagefunds.com) on a monthly, 30-day or more delayed basis. In addition, top ten holdings information for the Fund is publicly available on the Fund’s website on a monthly, seven-day or more delayed basis. The Fund files its complete schedule of portfolio holdings with the SEC for the first and third quarters of each fiscal year on Form N-Q, which is available without charge by visiting the SEC website at sec.gov. In addition, the Fund’s Form N-Q may be reviewed and copied at the SEC’s Public Reference Room in Washington, DC, and at regional offices in New York City, at 233 Broadway, and in Chicago, at 175 West Jackson Boulevard, Suite 900. Information about the Public Reference Room may be obtained by calling 1-800-SEC-0330.
| | | | |
| 28 | | Wells Fargo Advantage Premier Large Company Growth Fund | | Other information (unaudited) |
BOARD OF TRUSTEES AND OFFICERS
Each of the Trustees and Officers listed in the table below acts in identical capacities for each fund in the Wells Fargo Advantage family of funds, which consists of 132 mutual funds1 comprising the Wells Fargo Funds Trust, Wells Fargo Variable Trust, Wells Fargo Master Trust and four closed-end funds (collectively the “Fund Complex”). This table should be read in conjunction with the Prospectus and the Statement of Additional Information2. All of the Trustees are also Members of the Audit and Governance Committees of each Trust in the Fund Complex. The mailing address of each Trustee and Officer is 525 Market Street, 12th Floor, San Francisco, CA 94105. Each Trustee and Officer serves an indefinite term, however, each Trustee serves such term until reaching the mandatory retirement age established by the Trustees.
Independent Trustees
| | | | | | |
Name and year of birth | | Position held and length of service* | | Principal occupations during past five years | | Other directorships during
past five years |
Peter G. Gordon
(Born 1942) | | Trustee, since 1998; Chairman, since 2005 | | Co-Founder, Retired Chairman, President and CEO of Crystal Geyser Water Company. Trustee Emeritus, Colby College. | | Asset Allocation Trust |
Isaiah Harris, Jr.
(Born 1952) | | Trustee, since 2009 | | Retired. Prior thereto, President and CEO of BellSouth Advertising and Publishing Corp. from 2005 to 2007, President and CEO of BellSouth Enterprises from 2004 to 2005 and President of BellSouth Consumer Services from 2000 to 2003. Emeritus member of the Iowa State University Foundation Board of Governors. Emeritus Member of the Advisory Board of Iowa State University School of Business. Advisory Board Member, Palm Harbor Academy (charter school). Mr. Harris is a certified public accountant. | | CIGNA Corporation; Deluxe Corporation; Asset Allocation Trust |
Judith M. Johnson
(Born 1949) | | Trustee, since 2008; Audit Committee Chairman, since 2008 | | Retired. Prior thereto, Chief Executive Officer and Chief Investment Officer of Minneapolis Employees Retirement Fund from 1996 to 2008. Ms. Johnson is an attorney, certified public accountant and a certified managerial accountant. | | Asset Allocation Trust |
Leroy Keith, Jr.
(Born 1939) | | Trustee, since 2010 | | Chairman, Bloc Global Services (development and construction). Trustee of the Evergreen Funds from 1983 to 2010. Former Managing Director, Almanac Capital Management (commodities firm), former Partner, Stonington Partners, Inc. (private equity fund), former Director, Obagi Medical Products Co. and former Director, Lincoln Educational Services. | | Trustee, Virtus Fund Complex (consisting of 50 portfolios as of 12/16/2013); Asset Allocation Trust |
David F. Larcker
(Born 1950) | | Trustee, since 2009 | | James Irvin Miller Professor of Accounting at the Graduate School of Business, Stanford University, Morgan Stanley Director of the Center for Leadership Development and Research and Senior Faculty of The Rock Center for Corporate Governance since 2006. From 2005 to 2008, Professor of Accounting at the Graduate School of Business, Stanford University. Prior thereto, Ernst & Young Professor of Accounting at The Wharton School, University of Pennsylvania from 1985 to 2005. | | Asset Allocation Trust |
Olivia S. Mitchell
(Born 1953) | | Trustee, since 2006 | | International Foundation of Employee Benefit Plans Professor, Wharton School of the University of Pennsylvania since 1993. Director of Wharton’s Pension Research Council and Boettner Center on Pensions & Retirement Research, and Research Associate at the National Bureau of Economic Research. Previously, Cornell University Professor from 1978 to 1993. | | Asset Allocation Trust |
Timothy J. Penny
(Born 1951) | | Trustee, since 1996 | | President and CEO of Southern Minnesota Initiative Foundation, a non-profit organization, since 2007 and Senior Fellow at the Humphrey Institute Policy Forum at the University of Minnesota since 1995. Member of the Board of Trustees of NorthStar Education Finance, Inc., a non-profit organization, since 2007. | | Asset Allocation Trust |
| | | | | | |
| Other information (unaudited) | | Wells Fargo Advantage Premier Large Company Growth Fund | | | 29 | |
| | | | | | |
Name and year of birth | | Position held and length of service* | | Principal occupations during past five years | | Other directorships during
past five years |
Michael S. Scofield
(Born 1943) | | Trustee, since 2010 | | Served on the Investment Company Institute’s Board of Governors and Executive Committee from 2008-2011 as well the Governing Council of the Independent Directors Council from 2006-2011 and the Independent Directors Council Executive Committee from 2008-2011. Chairman of the IDC from 2008-2010. Institutional Investor (Fund Directions) Trustee of Year in 2007. Trustee of the Evergreen Funds (and its predecessors) from 1984 to 2010. Chairman of the Evergreen Funds from 2000-2010. Former Trustee of the Mentor Funds. Retired Attorney, Law Offices of Michael S. Scofield. | | Asset Allocation Trust |
Donald C. Willeke
(Born 1940) | | Trustee, since 1996 | | Principal of the law firm of Willeke & Daniels. General Counsel of the Minneapolis Employees Retirement Fund from 1984 until its consolidation into the Minnesota Public Employees Retirement Association on June 30, 2010. Director and Vice Chair of The Tree Trust (non-profit corporation). Director of the American Chestnut Foundation (non-profit corporation). | | Asset Allocation Trust |
| * | Length of service dates reflect the Trustee’s commencement of service with the Trust’s predecessor entities, where applicable. |
Officers
| | | | | | |
Name and year of birth | | Position held and
length of service | | Principal occupations during past five years | | |
Karla M. Rabusch (Born 1959) | | President, since 2003 | | Executive Vice President of Wells Fargo Bank, N.A. and President of Wells Fargo Funds Management, LLC since 2003. | | |
Jeremy DePalma1 (Born 1974) | | Treasurer, since 2012 | | Senior Vice President of Wells Fargo Funds Management, LLC since 2009. Senior Vice President of Evergreen Investment Management Company, LLC from 2008 to 2010. Vice President, Evergreen Investment Services, Inc. from 2004 to 2007. Head of the Fund Reporting and Control Team within Fund Administration from 2005 to 2010. | | |
C. David Messman (Born 1960) | | Secretary, since 2000; Chief Legal Officer, since 2003 | | Senior Vice President and Secretary of Wells Fargo Funds Management, LLC since 2001. Vice President and Managing Counsel of Wells Fargo Bank, N.A. since 1996. | | |
Debra Ann Early (Born 1964) | | Chief Compliance Officer, since 2007 | | Chief Compliance Officer of Wells Fargo Funds Management, LLC since 2007. Chief Compliance Officer of Parnassus Investments from 2005 to 2007. Chief Financial Officer of Parnassus Investments from 2004 to 2007. | | |
David Berardi (Born 1975) | | Assistant Treasurer, since 2009 | | Vice President of Wells Fargo Funds Management, LLC since 2009. Vice President of Evergreen Investment Management Company, LLC from 2008 to 2010. Assistant Vice President of Evergreen Investment Services, Inc. from 2004 to 2008. Manager of Fund Reporting and Control for Evergreen Investment Management Company, LLC from 2004 to 2010. | | |
| 1. | Jeremy DePalma acts as Treasurer of 59 funds and Assistant Treasurer of 73 funds in the Fund Complex. |
| 2. | The Statement of Additional Information includes additional information about the Trustees and is available, without charge, upon request, by calling 1-800-222-8222 or by visiting the website at wellsfargoadvantagefunds.com. |
| | | | |
| 30 | | Wells Fargo Advantage Premier Large Company Growth Fund | | Other information (unaudited) |
The following is a list of common abbreviations for terms and entities that may have appeared in this report.
| ACA | — ACA Financial Guaranty Corporation |
| ADR | — American depositary receipt |
| ADS | — American depositary shares |
| AGC | — Assured Guaranty Corporation |
| AGM | — Assured Guaranty Municipal |
| Ambac | — Ambac Financial Group Incorporated |
| AMT | — Alternative minimum tax |
| BAN | — Bond anticipation notes |
| BHAC | — Berkshire Hathaway Assurance Corporation |
| CAB | — Capital appreciation bond |
| CCAB | — Convertible capital appreciation bond |
| CDA | — Community Development Authority |
| CDO | — Collateralized debt obligation |
| COP | — Certificate of participation |
| DRIVER | — Derivative inverse tax-exempt receipts |
| DW&P | — Department of Water & Power |
| DWR | — Department of Water Resources |
| ECFA | — Educational & Cultural Facilities Authority |
| EDA | — Economic Development Authority |
| EDFA | — Economic Development Finance Authority |
| ETF | — Exchange-traded fund |
| FDIC | — Federal Deposit Insurance Corporation |
| FFCB | — Federal Farm Credit Banks |
| FGIC | — Financial Guaranty Insurance Corporation |
| FHA | — Federal Housing Administration |
| FHLB | — Federal Home Loan Bank |
| FHLMC | — Federal Home Loan Mortgage Corporation |
| FICO | — The Financing Corporation |
| FNMA | — Federal National Mortgage Association |
| GDR | — Global depositary receipt |
| GNMA | — Government National Mortgage Association |
| HCFR | — Healthcare facilities revenue |
| HEFA | — Health & Educational Facilities Authority |
| HEFAR | — Higher education facilities authority revenue |
| HFA | — Housing Finance Authority |
| HFFA | — Health Facilities Financing Authority |
| HUD | — Department of Housing and Urban Development |
| IDA | — Industrial Development Authority |
| IDAG | — Industrial Development Agency |
| IDR | — Industrial development revenue |
| KRW | — Republic of Korea won |
| LIBOR | — London Interbank Offered Rate |
| LLC | — Limited liability company |
| LLLP | — Limited liability limited partnership |
| LLP | — Limited liability partnership |
| MBIA | — Municipal Bond Insurance Association |
| MFHR | — Multifamily housing revenue |
| MSTR | — Municipal securities trust receipts |
| MUD | — Municipal Utility District |
| National | — National Public Finance Guarantee Corporation |
| PCFA | — Pollution Control Financing Authority |
| PCL | — Public Company Limited |
| PCR | — Pollution control revenue |
| PFA | — Public Finance Authority |
| PFFA | — Public Facilities Financing Authority |
| PFOTER | — Puttable floating option tax-exempt receipts |
| plc | — Public limited company |
| PUTTER | — Puttable tax-exempt receipts |
| R&D | — Research & development |
| Radian | — Radian Asset Assurance |
| RAN | — Revenue anticipation notes |
| RDA | — Redevelopment Authority |
| RDFA | — Redevelopment Finance Authority |
| REIT | — Real estate investment trust |
| ROC | — Reset option certificates |
| SAVRS | — Select auction variable rate securities |
| SBA | — Small Business Authority |
| SFHR | — Single-family housing revenue |
| SFMR | — Single-family mortgage revenue |
| SPA | — Standby purchase agreement |
| SPDR | — Standard & Poor’s Depositary Receipts |
| STRIPS | — Separate trading of registered interest and principal securities |
| TAN | — Tax anticipation notes |
| TIPS | — Treasury inflation-protected securities |
| TRAN | — Tax revenue anticipation notes |
| TTFA | — Transportation Trust Fund Authority |
| TVA | — Tennessee Valley Authority |
This page is intentionally left blank.
This page is intentionally left blank.


For more information
More information about Wells Fargo Advantage Funds is available free upon request. To obtain literature, please write, email, visit the Fund’s website, or call:
Wells Fargo Advantage Funds
P.O. Box 8266
Boston, MA 02266-8266
Email: wfaf@wellsfargo.com
Website: wellsfargoadvantagefunds.com
Individual investors: 1-800-222-8222
Retail investment professionals: 1-888-877-9275
Institutional investment professionals: 1-866-765-0778
This report and the financial statements contained herein are submitted for the general information of the shareholders of Wells Fargo Advantage Funds. If this report is used for promotional purposes, distribution of the report must be accompanied or preceded by a current prospectus. For a current prospectus and, if available, a summary prospectus containing more complete information, including charges and expenses, call 1-800-222-8222 or visit the Fund’s website at wellsfargoadvantagefunds.com. Please consider the investment objectives, risks, charges, and expenses of the investment carefully before investing. This and other information about Wells Fargo Advantage Funds can be found in the current prospectus. Read the prospectus carefully before you invest or send money.
Wells Fargo Funds Management, LLC, a wholly owned subsidiary of Wells Fargo & Company, provides investment advisory and administrative services for Wells Fargo Advantage Funds. Other affiliates of Wells Fargo & Company provide subadvisory and other services for the Funds. The Funds are distributed by Wells Fargo Funds Distributor, LLC, Member FINRA/SIPC, an affiliate of Wells Fargo & Company.
NOT FDIC INSURED ¡ NO BANK GUARANTEE ¡ MAY LOSE VALUE
© 2014 Wells Fargo Funds Management, LLC. All rights reserved.
| | |
 | | 222994 03-14 SA212/SAR212 1-14 |
Not applicable.
| ITEM 3. | AUDIT COMMITTEE FINANCIAL EXPERT |
Not applicable.
| ITEM 4. | PRINCIPAL ACCOUNTANT FEES AND SERVICES |
Not applicable.
| ITEM 5. | AUDIT COMMITTEE OF LISTED REGISTRANTS |
Not applicable.
The Portfolio of investments is included as part of the report to shareholders filed under Item 1 of this Form.
| ITEM 7. | DISCLOSURE OF PROXY VOTING POLICIES AND PROCEDURES FOR CLOSED-END MANAGEMENT INVESTMENT COMPANIES |
Not applicable.
| ITEM 8. | PORTFOLIO MANAGERS OF CLOSED-END MANAGEMENT INVESTMENT COMPANIES |
Not applicable.
| ITEM 9. | PURCHASES OF EQUITY SECURITIES BY CLOSED-END MANAGEMEENT INVESTMENT COMPANY AND AFFILIATED PURCHASERS |
Not applicable.
| ITEM 10. | SUBMISSION OF MATTERS TO A VOTE OF SECURITY HOLDERS |
There have been no material changes to the procedures by which shareholders may recommend nominees to the Registrant’s board of trustees that have been implemented since the Registrant’s last provided disclosure in response to the requirements of this Item.
| ITEM 11. | CONTROLS AND PROCEDURES |
(a) The President and Treasurer have concluded that the Wells Fargo Funds Trust (the “Trust”) disclosure controls and procedures (as defined in Rule 30a-3(c) under the Investment Company Act of 1940) provide reasonable assurances that material information relating to the Trust is made known to them by the appropriate persons, based on their evaluation of these controls and procedures as of a date within 90 days of the filing of this report.
(b) There were no significant changes in the Trust’s internal controls over financial reporting (as defined in Rule 30a-3(d) under the Investment Company Act of 1940) that occurred during the second fiscal quarter of the period covered by this report that materially affected, or is reasonably likely to materially affect, the registrant’s internal control over financial reporting.
(a)(1) Not applicable.
(a)(2) Certification pursuant to Rule 30a-2(a) under the Investment Company Act of 1940 (17 CFR 270.30a-2(a)) is filed and attached hereto as Exhibit 99.CERT.
(a)(3) Not applicable.
(b) Certification pursuant to Rule 30a-2(b) under the Investment Company Act of 1940 (17 CFR 270.30a-2(b)) is filed and attached hereto as Exhibit 99.906CERT.
SIGNATURES
Pursuant to the requirements of the Securities Exchange Act of 1934 and the Investment Company Act of 1940, the registrant has duly caused this report to be signed on its behalf by the undersigned, thereunto duly authorized.
| | |
Wells Fargo Funds Trust |
| |
| By: | | /s/ Karla M. Rabusch |
| |
| | Karla M. Rabusch |
| | President |
| |
| Date: | | March 26, 2014 |
Pursuant to the requirements of the Securities Exchange Act of 1934 and the Investment Company Act of 1940, this report has been signed below by the following persons on behalf of the registrant and in the capacities and on the date indicated.
| | |
Wells Fargo Funds Trust |
| |
| By: | | /s/ Karla M. Rabusch |
| |
| | Karla M. Rabusch |
| | President |
| |
| Date: | | March 26, 2014 |
| |
| By: | | /s/ Jeremy DePalma |
| |
| | Jeremy DePalma |
| | Treasurer |
| |
| Date: | | March 26, 2014 |