
UNITED STATES
SECURITIES AND EXCHANGE COMMISSION
Washington, D.C. 20549
FORM N-CSRS
CERTIFIED SHAREHOLDER REPORT OF REGISTERED
MANAGEMENT INVESTMENT COMPANIES
Investment Company Act file number: 811-09253
Wells Fargo Funds Trust
(Exact name of registrant as specified in charter)
525 Market St., San Francisco, CA 94105
(Address of principal executive offices) (Zip code)
C. David Messman
Wells Fargo Funds Management, LLC
525 Market St., San Francisco, CA 94105
(Name and address of agent for service)
Registrant’s telephone number, including area code: 800-222-8222
Date of fiscal year end: Registrant is making a filing for 10 of its series, Wells Fargo Advantage Adjustable Rate Government Fund, Wells Fargo Advantage Conservative Income Fund, Wells Fargo Advantage Government Securities Fund, Wells Fargo Advantage High Income Fund, Wells Fargo Advantage High Yield Bond Fund, Wells Fargo Advantage Income Plus Fund, Wells Fargo Advantage Short Duration Government Bond Fund, Wells Fargo Advantage Short-Term Bond Fund, Wells Fargo Advantage Short-Term High Yield Bond Fund, and Wells Fargo Advantage Ultra Short-Term Income Fund. Each series had an August 31 fiscal year end.
Date of reporting period: February 28, 2014
| ITEM 1. | REPORT TO STOCKHOLDERS |

Wells Fargo Advantage
Adjustable Rate Government Fund

Semi-Annual Report
February 28, 2014

Reduce clutter. Save trees.
Sign up for electronic delivery of prospectuses and shareholder reports at wellsfargo.com/advantagedelivery
Contents
The views expressed and any forward-looking statements are as of February 28, 2014, unless otherwise noted, and are those of the Fund managers and/or Wells Fargo Funds Management, LLC. Discussions of individual securities, or the markets generally, or any Wells Fargo Advantage Fund are not intended as individual recommendations. Future events or results may vary significantly from those expressed in any forward-looking statements; the views expressed are subject to change at any time in response to changing circumstances in the market. Wells Fargo Funds Management, LLC and the Fund disclaim any obligation to publicly update or revise any views expressed or forward-looking statements.
NOT FDIC INSURED ¡ NO BANK GUARANTEE ¡ MAY LOSE VALUE
| | | | |
| 2 | | Wells Fargo Advantage Adjustable Rate Government Fund | | Letter to shareholders (unaudited) |

Karla M. Rabusch
President
Wells Fargo Advantage Funds
Fixed-income markets shifted during the period, driven by vacillations between U.S. Treasury yield increases and subsequent declines.
Reassurances from the Fed that a highly accommodative monetary policy would continue throughout 2014 inspired price rallies across both the investment-grade and high-yield bond markets.
Dear Valued Shareholder:
We are pleased to offer you this semi-annual report for the Wells Fargo Advantage Adjustable Rate Government Fund for the six-month period that ended February 28, 2014. Fixed-income markets shifted during the period, driven by vacillations between U.S. Treasury yield increases and subsequent declines. However, on the whole, investment-grade (measured by the Barclays U.S. Aggregate Bond Index1) and high-yield markets (measured by the Barclays U.S. High Yield Bond Index2) generated positive returns during the period, notably benefiting from the strong price improvement and declining U.S. Treasury yields that occurred in September and October of 2013 as well as the opening months of 2014. Although the returns of the U.S. high-yield market have often been positively correlated with U.S. equity returns (measured by the S&P 500 Index3) over the long-run, over the period, high-yield (measured by the Barclays U.S. High Yield Bond Index) generally performed well even when equities did not. The lower-rated corporate bond credit tiers outperformed the respectively higher-rated investment-grade credit tiers during the period.
A decline in bond prices was halted by the Fed’s postponement of tapering its bond-buying program.
Before the six-month period began, equity markets rallied, most notably in May and June of 2013. This led to a sharp increase in U.S. Treasury yields and declining valuations for much of the fixed-income markets (measured by the Barclays U.S. Aggregate Bond Index). However, in July and August 2013, that equity exuberance quieted a bit, and fixed-income markets stabilized. Returns across the fixed-income markets were largely negative in investment-grade and high-yield markets but modest in comparison with the declines in May and June of 2013.
But, by September and October of 2013, investment-grade and high-yield bond markets began generating positive returns yet again, as the Federal Reserve (Fed) backtracked on its intentions to taper its quantitative easing program, postponing it until 2014, at the earliest. This created a temporary rally in bonds that lasted until around November 20, 2013, when notes were released from the Fed’s October 2013 meeting that tapering of the bond-buying programs would not be postponed beyond January 2014. In response, long-term U.S. Treasury yields and mortgage rates ratcheted higher on expectations for an unwinding of monetary accommodation in the upcoming months. This led to declines in pricing across much of the core fixed-income markets (measured by the Barclays U.S. Aggregate Bond Index). U.S. high-yield markets were better able to absorb the shift in U.S. Treasury yields and continued to provide positive returns along with rallies in the equity markets.
Favorable conditions for fixed-income markets were restored in January and February 2014.
Seemingly much to the surprise of many everyday investors and seasoned investment professionals alike, fixed-income markets (measured by the Barclays U.S. Aggregate Bond Index) largely outperformed U.S. equity markets (measured by the S&P 500 Index) during the opening months of 2014. A pullback in equity exuberance in January and reassurances from the Fed that a highly accommodative monetary policy would continue throughout 2014 inspired price rallies across both the investment-grade and high-yield bond markets. U.S. Treasury yields declined in January 2014 and corporate bonds and mortgage-backed securities performed notably well. U.S. high-yield securities generated positive returns in January 2014 but lagged the rally across the investment-grade bond markets. This theme reversed in February 2014, as high-yield sectors rallied and investment-grade sectors performed well but not to the extent of the lowest-rated credit tiers.
| | | | | | |
| Letter to shareholders (unaudited) | | Wells Fargo Advantage Adjustable Rate Government Fund | | | 3 | |
One positive takeaway for bond investors that helped fuel the fixed-income (measured by the Barclays U.S. Aggregate Bond Index) rallies was former Fed Chairman Bernanke’s guidance at the end of 2013. He indicated that the tapering of the Fed’s bond-buying program would proceed at a slow pace and that a reduction in quantitative easing should not be equivocated with a tightening of monetary policy. The distinction was important—although the bond-buying program was declining in volume, it was, nonetheless, still continuing. Additionally, the federal funds target rate would remain unchanged for the foreseeable future, with the implications that it would not increase until the bond-buying program was fully disbanded. These were important statements for fixed-income investors that helped bolster U.S. fixed-income valuations in the opening months of 2014.
Don’t let short-term uncertainty derail long-term investment goals.
Periods of investment uncertainty can present challenges, but experience has taught us that maintaining long-term investment goals can be an effective way to plan for the future. To help you create a sound strategy based on your personal goals and risk tolerance, Wells Fargo Advantage Funds offers more than 100 mutual funds and other investments spanning a wide range of asset classes and investment styles. Although diversification cannot guarantee an investment profit or prevent losses, we believe it can be an effective way to manage investment risk and potentially smooth out overall portfolio performance. We encourage investors to know their investments and to understand that appropriate levels of risk-taking may unlock opportunities.
Thank you for choosing to invest with Wells Fargo Advantage Funds. We appreciate your confidence in us and remain committed to helping you meet your financial needs. For current information about your fund investments, contact your investment professional, visit our website at wellsfargoadvantagefunds.com, or call us directly at 1-800-222-8222. We are available 24 hours a day, 7 days a week.
Sincerely,

Karla M. Rabusch
President
Wells Fargo Advantage Funds
| 1. | The Barclays U.S. Aggregate Bond Index is a broad-based benchmark that measures the investment-grade, U.S. dollar-denominated, fixed-rate taxable bond market, including Treasuries, government-related and corporate securities, MBS (agency fixed-rate and hybrid ARM passthroughs), ABS, and CMBS. You cannot invest directly in an index. |
| 2. | The Barclays U.S. High Yield Bond Index is an index consisting of all domestic and Yankee bonds, rated below investment grade, with a minimum outstanding amount of $100 million and maturing over one year. You cannot invest directly in an index. |
| 3. | The S&P 500 Index consists of 500 stocks chosen for market size, liquidity, and industry group representation. It is a market-value-weighted index with each stock’s weight in the index proportionate to its market value. You cannot invest directly in an index. |
| | | | |
| 4 | | Wells Fargo Advantage Adjustable Rate Government Fund | | Letter to shareholders (unaudited) |
Notice to shareholders
The Fund and Wells Fargo Funds Management, LLC (“Funds Management”) have received an exemptive order from the SEC that permits Funds Management, subject to the approval of the Board of Trustees of the Fund, to select or replace certain subadvisers to manage all or a portion of the Fund’s assets and enter into, amend or terminate a sub-advisory agreement with certain subadvisers without obtaining shareholder approval (“Multi-manager Structure”). The Multi-manager Structure applies to subadvisers that are not affiliated with Funds Management or the Fund, except to the extent that affiliation arises solely because such subadvisers provide sub-advisory services to the Fund (“Non-affiliated Subadvisers”), as well as subadvisers that are indirect or direct wholly-owned subsidiaries of Funds Management or of another company that, indirectly or directly, wholly owns Funds Management (“Wholly-owned Subadvisers”).
Pursuant to the SEC order, Funds Management, with the approval of the Board of Trustees, has the discretion to terminate any subadvisers and allocate and reallocate the Fund’s assets among any other Non-affiliated Subadvisers or Wholly-owned Subadvisers. Funds Management, subject to oversight and supervision by the Board of Trustees, has responsibility to continue to oversee any subadvisers to the Fund and to recommend, for approval by the Board of Trustees, the hiring, termination and replacement of subadvisers for the Fund. In the event that a new subadviser is hired pursuant to the Multi-manager Structure, the Fund is required to provide notice to shareholders within 90 days.
Please contact your investment professional or call us directly at 1-800-222-8222 if you have any questions on this Notice to Shareholders.
This page is intentionally left blank.
| | | | |
| 6 | | Wells Fargo Advantage Adjustable Rate Government Fund | | Performance highlights (unaudited) |
Investment objective
The Fund seeks current income consistent with capital preservation.
Adviser
Wells Fargo Funds Management, LLC
Subadviser
Wells Capital Management Incorporated
Portfolio managers
Michael J. Bray, CFA
Christopher Y. Kauffman, CFA
Average annual total returns1 (%) as of February 28, 2014
| | | | | | | | | | | | | | | | | | | | | | | | | | | | | | | | | | |
| | | | | Including sales charge | | | Excluding sales charge | | | Expense ratios2 (%) | |
| | | Inception date | | 1 year | | | 5 year | | | 10 year | | | 1 year | | | 5 year | | | 10 year | | | Gross | | | Net3 | |
| Class A (ESAAX) | | 6-30-2000 | | | (1.60 | ) | | | 1.90 | | | | 2.20 | | | | 0.44 | | | | 2.32 | | | | 2.41 | | | | 0.79 | | | | 0.74 | |
| Class B (ESABX)* | | 6-30-2000 | | | (1.81 | ) | | | 1.73 | | | | 2.11 | | | | (0.31 | ) | | | 1.73 | | | | 2.11 | | | | 1.54 | | | | 1.49 | |
| Class C (ESACX) | | 6-30-2000 | | | (1.31 | ) | | | 1.55 | | | | 1.66 | | | | (0.31 | ) | | | 1.55 | | | | 1.66 | | | | 1.54 | | | | 1.49 | |
| Administrator Class (ESADX) | | 7-30-2010 | | | – | | | | – | | | | – | | | | 0.58 | | | | 2.46 | | | | 2.56 | | | | 0.73 | | | | 0.60 | |
| Institutional Class (EKIZX) | | 10-1-1991 | | | – | | | | – | | | | – | | | | 0.62 | | | | 2.58 | | | | 2.68 | | | | 0.46 | | | | 0.46 | |
| Barclays 6-Month Treasury Bill Index4 | | – | | | – | | | | – | | | | – | | | | 0.19 | | | | 0.31 | | | | 1.97 | | | | – | | | | – | |
| * | | Class B shares are closed to investment, except in connection with the reinvestment of any distributions and permitted exchanges. |
Figures quoted represent past performance, which is no guarantee of future results, and do not reflect taxes that a shareholder may pay on fund distributions or the redemption of fund shares. Investment return and principal value of an investment will fluctuate so that an investor’s shares, when redeemed, may be worth more or less than their original cost. Performance shown without sales charges would be lower if sales charges were reflected. Current performance may be lower or higher than the performance data quoted, which assumes the reinvestment of dividends and capital gains. Current month-end performance is available on the Fund’s website, wellsfargoadvantagefunds.com.
Index returns do not include transaction costs associated with buying and selling securities, any mutual fund fees or expenses, or any taxes. It is not possible to invest directly in an index.
For Class A shares, the maximum front-end sales charge is 2.00%. For Class B shares, the maximum contingent deferred sales charge is 1.50%. For Class C shares, the maximum contingent deferred sales charge is 1.00%. Performance including sales charge assumes the sales charge for the corresponding time period. Administrator Class and Institutional Class shares are sold without a front-end sales charge or contingent deferred sales charge.
Bond values fluctuate in response to the financial condition of individual issuers, general market and economic conditions, and changes in interest rates. In general, when interest rates rise, bond values fall and investors may lose principal value. The use of derivatives may reduce returns and/or increase volatility. Securities issued by U.S. government agencies or government-sponsored entities may not be guaranteed by the U.S. Treasury. Certain investment strategies tend to increase the total risk of an investment (relative to the broader market). The Fund is exposed to mortgage- and asset-backed securities risk. Consult the Fund’s prospectus for additional information on these and other risks. The U.S. government guarantee applies to certain underlying securities and not to shares of the Fund.
Please see footnotes on page 7.
| | | | | | |
| Performance highlights (unaudited) | | Wells Fargo Advantage Adjustable Rate Government Fund | | | 7 | |
| | | | |
Ten largest long-term holdings5 (%) as of
February 28, 2014 | |
FNMA, 2.55%, 10-1-2033 | | | 1.21 | |
FNMA Series 2003-W18 Class 2A, 3.35%,
6-25-2043 | | | 1.16 | |
FNMA, 2.80%, 11-1-2035 | | | 1.14 | |
FHLMC, 2.12%, 7-1-2034 | | | 1.06 | |
FHLMC Series T-67 Class 1A1C, 2.98%,
3-25-2036 | | | 1.03 | |
FHLMC, 2.38%, 9-1-2035 | | | 1.01 | |
FHLMC, 2.47%, 9-1-2030 | | | 0.97 | |
SBA, 4.01%, 9-25-2037 | | | 0.95 | |
FNMA, 2.40%, 2-1-2036 | | | 0.94 | |
FNMA, 2.32%, 12-1-2040 | | | 0.87 | |
|
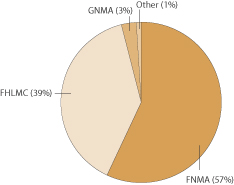
| Portfolio allocation6 as of February 28, 2014 |
|
|
| 1. | Historical performance shown for Administrator Class shares prior to their inception reflects the performance of Institutional Class shares, adjusted to reflect the higher expenses applicable to Administrator Class shares. Historical performance shown for all classes of the Fund prior to July 12, 2010, is based on the performance of the Fund’s predecessor, Evergreen Adjustable Rate Fund. |
| 2. | Reflects the expense ratios as stated in the most recent prospectuses. The expense ratios shown are subject to change and may differ from the annualized expense ratios shown in the financial highlights of this report. |
| 3. | The Adviser has committed through December 31, 2014, to waive fees and/or reimburse expenses to the extent necessary to cap the Fund’s Total Annual Fund Operating Expenses After Fee Waiver, excluding certain expenses, at the amounts shown. Brokerage commissions, stamp duty fees, interest, taxes, acquired fund fees and expenses, and extraordinary expenses are excluded from the cap. Without this cap, the Fund’s returns would have been lower. |
| 4. | The Barclays 6-Month Treasury Bill Index tracks the performance and attributes of recently issued 6-month U.S. Treasury Bills. The index follows Barclays’ monthly rebalancing conventions. You cannot invest directly in an index. |
| 5. | The ten largest long-term holdings are calculated based on the value of the securities divided by total net assets of the Fund. Holdings are subject to change and may have changed since the date specified. |
| 6. | Portfolio allocation is subject to change and is calculated based on the total long-term investments of the Fund. |
| | | | |
| 8 | | Wells Fargo Advantage Adjustable Rate Government Fund | | Fund expenses (unaudited) |
As a shareholder of the Fund, you incur two types of costs: (1) transaction costs, including sales charges (loads) on purchase payments and contingent deferred sales charges (if any) on redemptions and (2) ongoing costs, including management fees, distribution (12b-1) and/or shareholder service fees, and other Fund expenses. This example is intended to help you understand your ongoing costs (in dollars) of investing in the Fund and to compare these costs with the ongoing costs of investing in other mutual funds.
The example is based on an investment of $1,000 invested at the beginning of the six-month period and held for the entire period from September 1, 2013 to February 28, 2014.
Actual expenses
The “Actual” line of the table below provides information about actual account values and actual expenses. You may use the information in this line, together with the amount you invested, to estimate the expenses that you paid over the period. Simply divide your account value by $1,000 (for example, an $8,600 account value divided by $1,000 = 8.6), then multiply the result by the number in the “Actual” line under the heading entitled “Expenses paid during period” for your applicable class of shares to estimate the expenses you paid on your account during this period.
Hypothetical example for comparison purposes
The “Hypothetical” line of the table below provides information about hypothetical account values and hypothetical expenses based on the Fund’s actual expense ratio and an assumed rate of return of 5% per year before expenses, which is not the Fund’s actual return. The hypothetical account values and expenses may not be used to estimate the actual ending account balance or expenses you paid for the period. You may use this information to compare the ongoing costs of investing in the Fund and other funds. To do so, compare this 5% hypothetical example with the 5% hypothetical examples that appear in the shareholder reports of the other funds.
Please note that the expenses shown in the table are meant to highlight your ongoing costs only and do not reflect any transactional costs, such as sales charges (loads) and contingent deferred sales charges. Therefore, the “Hypothetical” line of the table is useful in comparing ongoing costs only and will not help you determine the relative total costs of owning different funds. In addition, if these transactional costs were included, your costs would have been higher.
| | | | | | | | | | | | | | | | |
| | | Beginning
account value
9-1-2013 | | | Ending
account value
2-28-2014 | | | Expenses
paid during
the period1 | | | Net annualized
expense ratio | |
Class A | | | | | | | | | | | | | | | | |
Actual | | $ | 1,000.00 | | | $ | 1,004.95 | | | $ | 3.68 | | | | 0.74 | % |
Hypothetical (5% return before expenses) | | $ | 1,000.00 | | | $ | 1,021.12 | | | $ | 3.71 | | | | 0.74 | % |
Class B | | | | | | | | | | | | | | | | |
Actual | | $ | 1,000.00 | | | $ | 1,002.30 | | | $ | 7.40 | | | | 1.49 | % |
Hypothetical (5% return before expenses) | | $ | 1,000.00 | | | $ | 1,017.41 | | | $ | 7.45 | | | | 1.49 | % |
Class C | | | | | | | | | | | | | | | | |
Actual | | $ | 1,000.00 | | | $ | 1,001.22 | | | $ | 7.39 | | | | 1.49 | % |
Hypothetical (5% return before expenses) | | $ | 1,000.00 | | | $ | 1,017.41 | | | $ | 7.45 | | | | 1.49 | % |
Administrator Class | | | | | | | | | | | | | | | | |
Actual | | $ | 1,000.00 | | | $ | 1,005.65 | | | $ | 2.98 | | | | 0.60 | % |
Hypothetical (5% return before expenses) | | $ | 1,000.00 | | | $ | 1,021.82 | | | $ | 3.01 | | | | 0.60 | % |
Institutional Class | | | | | | | | | | | | | | | | |
Actual | | $ | 1,000.00 | | | $ | 1,006.36 | | | $ | 2.29 | | | | 0.46 | % |
Hypothetical (5% return before expenses) | | $ | 1,000.00 | | | $ | 1,022.51 | | | $ | 2.31 | | | | 0.46 | % |
| 1. | Expenses paid is equal to the annualized expense ratio of each class multiplied by the average account value over the period, multiplied by the number of days in the most recent fiscal half-year divided by the number of days in the fiscal year (to reflect the one-half-year period). |
| | | | | | |
| Summary portfolio of investments—February 28, 2014 (unaudited) | | Wells Fargo Advantage Adjustable Rate Government Fund | | | 9 | |
The Summary Portfolio of Investments shows the 50 largest portfolio holdings in unaffiliated issuers and any holdings exceeding 1% of the total net assets as of the report date. The remaining securities held are grouped as “Other securities” in each category. You can request a complete schedule of portfolio holdings as of the report date, free of charge, by accessing the following website:
http://a584.g.akamai.net/f/584/1326/1d/www.wellsfargoadvantagefunds.com/pdf/semi/holdings/adjustablerategovt.pdf or by calling Wells Fargo Advantage Funds at 1-800-222-8222. This complete schedule, filed on the Form N -CSRS, is also available on the SEC’s website at sec.gov.
| | | | | | | | | | | | | | | | | | | | |
| Security name | | Interest rate | | | Maturity date | | | Principal | | | Value | | | Percent of
net assets | |
| | | | | |
Agency Securities: 96.73% | | | | | | | | | | | | | | | | | | | | |
FHLMC | | | 0.20-8.50 | % | | | 1-1-2016 to 2-25-2045 | | | $ | 378,290,306 | | | $ | 402,048,099 | | | | 26.10 | % |
FHLMC ± | | | 2.12 | | | | 7-1-2034 | | | | 15,455,947 | | | | 16,396,359 | | | | 1.06 | |
FHLMC ± | | | 2.33 | | | | 6-1-2037 | | | | 9,380,789 | | | | 10,028,693 | | | | 0.65 | |
FHLMC ± | | | 2.35 | | | | 3-1-2035 | | | | 8,489,037 | | | | 9,081,562 | | | | 0.59 | |
FHLMC ± | | | 2.36 | | | | 6-1-2037 | | | | 9,953,786 | | | | 10,546,164 | | | | 0.68 | |
FHLMC ± | | | 2.36 | | | | 9-1-2035 | | | | 9,215,208 | | | | 9,808,292 | | | | 0.64 | |
FHLMC ± | | | 2.38 | | | | 8-1-2035 | | | | 9,588,365 | | | | 10,245,818 | | | | 0.66 | |
FHLMC ± | | | 2.38 | | | | 9-1-2035 | | | | 14,560,655 | | | | 15,508,105 | | | | 1.01 | |
FHLMC ± | | | 2.38 | | | | 4-1-2038 | | | | 9,159,474 | | | | 9,762,840 | | | | 0.63 | |
FHLMC ± | | | 2.38 | | | | 3-1-2037 | | | | 7,894,394 | | | | 8,479,073 | | | | 0.55 | |
FHLMC ± | | | 2.39 | | | | 2-1-2035 | | | | 7,223,905 | | | | 7,738,165 | | | | 0.50 | |
FHLMC ± | | | 2.41 | | | | 4-1-2034 | | | | 7,038,823 | | | | 7,471,861 | | | | 0.48 | |
FHLMC ± | | | 2.47 | | | | 9-1-2030 | | | | 14,032,446 | | | | 15,022,972 | | | | 0.97 | |
FHLMC ± | | | 2.49 | | | | 9-1-2035 | | | | 7,055,661 | | | | 7,624,475 | | | | 0.49 | |
FHLMC ± | | | 2.63 | | | | 2-1-2036 | | | | 8,636,126 | | | | 9,235,441 | | | | 0.60 | |
FHLMC ± | | | 2.69 | | | | 8-1-2030 | | | | 7,553,487 | | | | 8,077,246 | | | | 0.52 | |
FHLMC Series T-67 Class 1A1C ± | | | 2.98 | | | | 3-25-2036 | | | | 15,364,881 | | | | 15,950,190 | | | | 1.03 | |
FHLMC Series T-67 Class 2A1C ± | | | 3.03 | | | | 3-25-2036 | | | | 9,716,861 | | | | 10,159,931 | | | | 0.66 | |
FNMA | | | 0.29-12.50 | | | | 3-1-2014 to 12-1-2050 | | | | 489,916,143 | | | | 522,102,079 | | | | 33.86 | |
FNMA ± | | | 2.03 | | | | 10-1-2035 | | | | 10,338,874 | | | | 10,899,881 | | | | 0.71 | |
FNMA ± | | | 2.08 | | | | 12-1-2035 | | | | 8,816,487 | | | | 9,325,436 | | | | 0.60 | |
FNMA ± | | | 2.22 | | | | 9-1-2032 | | | | 8,488,649 | | | | 9,040,558 | | | | 0.59 | |
FNMA ± | | | 2.30 | | | | 1-1-2037 | | | | 11,334,904 | | | | 12,058,245 | | | | 0.78 | |
FNMA ± | | | 2.31 | | | | 7-1-2038 | | | | 7,808,720 | | | | 8,411,013 | | | | 0.55 | |
FNMA ± | | | 2.32 | | | | 9-1-2039 | | | | 10,541,690 | | | | 11,210,591 | | | | 0.73 | |
FNMA ± | | | 2.32 | | | | 12-1-2040 | | | | 12,508,026 | | | | 13,355,604 | | | | 0.87 | |
FNMA ± | | | 2.34 | | | | 1-1-2038 | | | | 8,289,468 | | | | 8,836,504 | | | | 0.57 | |
FNMA ± | | | 2.35 | | | | 9-1-2034 | | | | 10,712,322 | | | | 11,436,154 | | | | 0.74 | |
FNMA ± | | | 2.36 | | | | 7-1-2035 | | | | 7,548,722 | | | | 8,045,848 | | | | 0.52 | |
FNMA ± | | | 2.36 | | | | 2-1-2036 | | | | 7,205,099 | | | | 7,704,133 | | | | 0.50 | |
FNMA ± | | | 2.36 | | | | 5-1-2042 | | | | 7,896,217 | | | | 8,429,926 | | | | 0.55 | |
FNMA ± | | | 2.38 | | | | 9-1-2039 | | | | 8,881,833 | | | | 9,519,191 | | | | 0.62 | |
FNMA ± | | | 2.40 | | | | 2-1-2036 | | | | 13,420,992 | | | | 14,445,542 | | | | 0.94 | |
FNMA ± | | | 2.40 | | | | 7-1-2048 | | | | 8,625,890 | | | | 9,241,391 | | | | 0.60 | |
FNMA ± | | | 2.40 | | | | 12-1-2040 | | | | 6,831,659 | | | | 7,331,199 | | | | 0.48 | |
FNMA ± | | | 2.44 | | | | 4-1-2036 | | | | 6,837,161 | | | | 7,315,146 | | | | 0.47 | |
FNMA ± | | | 2.46 | | | | 8-1-2039 | | | | 7,316,310 | | | | 7,813,370 | | | | 0.51 | |
FNMA ± | | | 2.49 | | | | 11-1-2034 | | | | 8,091,135 | | | | 8,630,131 | | | | 0.56 | |
FNMA ± | | | 2.50 | | | | 9-1-2037 | | | | 7,232,321 | | | | 7,748,985 | | | | 0.50 | |
FNMA ± | | | 2.55 | | | | 10-1-2033 | | | | 17,471,054 | | | | 18,673,513 | | | | 1.21 | |
FNMA ± | | | 2.56 | | | | 1-1-2036 | | | | 11,783,228 | | | | 12,589,302 | | | | 0.82 | |
FNMA ± | | | 2.56 | | | | 10-1-2036 | | | | 8,060,310 | | | | 8,489,956 | | | | 0.55 | |
FNMA ± | | | 2.61 | | | | 2-1-2035 | | | | 7,955,862 | | | | 8,523,493 | | | | 0.55 | |
FNMA ± | | | 2.80 | | | | 11-1-2035 | | | | 16,260,585 | | | | 17,539,404 | | | | 1.14 | |
The accompanying notes are an integral part of these financial statements.
| | | | |
| 10 | | Wells Fargo Advantage Adjustable Rate Government Fund | | Summary portfolio of investments—February 28, 2014 (unaudited) |
| | | | | | | | | | | | | | | | | | | | |
| Security name | | Interest rate | | | Maturity date | | | Principal | | | Value | | | Percent of
net assets | |
| | | | | |
Agency Securities (continued) | | | | | | | | | | | | | | | | | | | | |
FNMA Series 2001-T12 Class A4 ± | | | 3.38 | % | | | 8-25-2041 | | | $ | 9,069,591 | | | $ | 9,245,042 | | | | 0.60 | % |
FNMA Series 2002-66 Class A3 ± | | | 3.09 | | | | 4-25-2042 | | | | 12,487,158 | | | | 12,825,023 | | | | 0.83 | |
FNMA Series 2003-W18 Class 2A ± | | | 3.35 | | | | 6-25-2043 | | | | 17,120,777 | | | | 17,908,641 | | | | 1.16 | |
FNMA Series 2004-W12 Class 2A ± | | | 3.36 | | | | 6-25-2044 | | | | 8,661,849 | | | | 9,226,341 | | | | 0.60 | |
FNMA Series 2004-W15 Class 3A ± | | | 2.67 | | | | 6-25-2044 | | | | 11,345,918 | | | | 11,989,788 | | | | 0.78 | |
FNMA Series 2006-W1 Class 3A ± | | | 2.15 | | | | 10-25-2045 | | | | 12,364,158 | | | | 13,040,811 | | | | 0.85 | |
GNMA | | | 0.66-9.00 | | | | 8-20-2015 to 9-20-2062 | | | | 30,706,312 | | | | 31,990,009 | | | | 2.01 | |
GNMA ± | | | 2.06 | | | | 8-20-2062 | | | | 8,685,894 | | | | 9,156,521 | | | | 0.59 | |
SBA ± | | | 4.01 | | | | 9-25-2037 | | | | 12,752,064 | | | | 14,658,541 | | | | 0.95 | |
Other securities | | | | | | | | | | | | | | | 241,657 | | | | 0.02 | |
| | | | | |
Total Agency Securities
(Cost $1,465,657,494) | | | | | | | | | | | | | | | 1,492,184,255 | | | | 96.73 | |
| | | | | | | | | | | | | | | | | | | | |
| | | | | |
| | | Yield | | | | | | Shares | | | | | | | |
| | | | | |
Short-Term Investments: 2.60% | | | | | | | | | | | | | | | | | | | | |
| | | | | |
| Investment Companies: 2.54% | | | | | | | | | | | | | | | | | | | | |
Wells Fargo Advantage Government Money Market Fund, Institutional Class (l)(u) | | | 0.01 | | | | | | | | 39,291,402 | | | | 39,291,402 | | | | 2.54 | |
| | | | | | | | | | | | | | | | | | | | |
| | | | | |
| | | | | | | | | Principal | | | | | | | |
| U.S. Treasury Securities: 0.06% | | | | | | | | | | | | | | | | | | | | |
U.S. Treasury Bill #(z) | | | 0.03 | | | | 3-20-2014 | | | $ | 900,000 | | | | 899,987 | | | | 0.06 | |
| | | | | | | | | | | | | | | | | | | | |
| | | | | |
Total Short-Term Investments
(Cost $40,191,376) | | | | | | | | | | | | | | | 40,191,389 | | | | 2.60 | |
| | | | | | | | | | | | | | | | | | | | |
Total investments in securities
(Cost $1,505,848,870) * | | | | | | | | | | | | | | | 1,532,375,644 | | | | 99.33 | |
Other assets and liabilities, net | | | | | | | | | | | | | | | 10,264,945 | | | | 0.67 | |
| | | | | | | | | | | | | | | | | | | | |
| Total net assets | | | | | | | | | | | | | | $ | 1,542,640,589 | | | | 100.00 | % |
| | | | | | | | | | | | | | | | | | | | |
| ± | Variable rate investment. The rate shown is the rate in effect at period end. |
| (l) | Investment in an affiliate |
| (u) | Rate shown is the 7-day annualized yield at period end. |
| # | All or a portion of this security is segregated as collateral for investments in derivative instruments. |
| (z) | Zero coupon security. Rate represents the current yield to maturity. |
| * | Cost for federal income tax purposes is $1,506,813,578 and unrealized appreciation (depreciation) consists of: |
| | | | |
Gross unrealized appreciation | | $ | 27,480,767 | |
Gross unrealized depreciation | | | (1,918,701 | ) |
| | | | |
Net unrealized appreciation | | $ | 25,562,066 | |
The accompanying notes are an integral part of these financial statements.
| | | | | | |
| Statement of assets and liabilities—February 28, 2014 (unaudited) | | Wells Fargo Advantage Adjustable Rate Government Fund | | | 11 | |
| | | | |
| | | | |
| |
Assets | | | | |
Investments | | | | |
In unaffiliated securities, at value (see cost below) | | $ | 1,493,084,242 | |
In affiliated securities, at value (see cost below) | | | 39,291,402 | |
| | | | |
Total investments, at value (see cost below) | | | 1,532,375,644 | |
Cash | | | 3,565,574 | |
Principal paydown receivable | | | 8,786,091 | |
Receivable for Fund shares sold | | | 1,017,021 | |
Receivable for interest | | | 1,275,724 | |
Receivable for daily variation margin on open futures contracts | | | 111,375 | |
Prepaid expenses and other assets | | | 37,296 | |
| | | | |
Total assets | | | 1,547,168,725 | |
| | | | |
| |
Liabilities | | | | |
Dividends payable | | | 328,202 | |
Payable for investments purchased | | | 2,028,583 | |
Payable for Fund shares redeemed | | | 1,206,895 | |
Advisory fee payable | | | 342,882 | |
Distribution fees payable | | | 104,758 | |
Due to other related parties | | | 195,498 | |
Accrued expenses and other liabilities | | | 321,318 | |
| | | | |
Total liabilities | | | 4,528,136 | |
| | | | |
Total net assets | | $ | 1,542,640,589 | |
| | | | |
| |
NET ASSETS CONSIST OF | | | | |
Paid-in capital | | $ | 1,586,565,878 | |
Overdistributed net investment income | | | (1,209,478 | ) |
Accumulated net realized losses on investments | | | (69,073,508 | ) |
Net unrealized gains on investments | | | 26,357,697 | |
| | | | |
Total net assets | | $ | 1,542,640,589 | |
| | | | |
| |
COMPUTATION OF NET ASSET VALUE AND OFFERING PRICE PER SHARE1 | | | | |
Net assets – Class A | | $ | 264,091,076 | |
Shares outstanding – Class A | | | 28,855,067 | |
Net asset value per share – Class A | | | $9.15 | |
Maximum offering price per share – Class A2 | | | $9.34 | |
Net assets – Class B | | $ | 1,942,990 | |
Shares outstanding – Class B | | | 212,219 | |
Net asset value per share – Class B | | | $9.16 | |
Net assets – Class C | | $ | 165,841,685 | |
Shares outstanding – Class C | | | 18,119,957 | |
Net asset value per share – Class C | | | $9.15 | |
Net assets – Administrator Class | | $ | 117,008,488 | |
Shares outstanding – Administrator Class | | | 12,783,258 | |
Net asset value per share – Administrator Class | | | $9.15 | |
Net assets – Institutional Class | | $ | 993,756,350 | |
Shares outstanding – Institutional Class | | | 108,558,788 | |
Net asset value per share – Institutional Class | | | $9.15 | |
| |
Investments in unaffiliated securities, at cost | | $ | 1,466,557,468 | |
| | | | |
Investments in affiliated securities, at cost | | $ | 39,291,402 | |
| | | | |
Total investments, at cost | | $ | 1,505,848,870 | |
| | | | |
| 1. | The Fund has an unlimited number of authorized shares. |
| 2. | Maximum offering price is computed as 100/98 of net asset value. On investments of $50,000 or more, the offering price is reduced. |
The accompanying notes are an integral part of these financial statements.
| | | | |
| 12 | | Wells Fargo Advantage Adjustable Rate Government Fund | | Statement of operations—six months ended February 28, 2014 (unaudited) |
| | | | |
| | | | |
| |
Investment income | | | | |
Interest | | $ | 10,478,611 | |
Income from affiliated securities | | | 2,428 | |
| | | | |
Total investment income | | | 10,481,039 | |
| | | | |
| |
Expenses | | | | |
Advisory fee | | | 2,320,773 | |
Administration fees | | | | |
Fund level | | | 369,709 | |
Class A | | | 217,495 | |
Class B | | | 1,959 | |
Class C | | | 141,368 | |
Administrator Class | | | 55,824 | |
Institutional Class | | | 366,464 | |
Shareholder servicing fees | | | | |
Class A | | | 339,836 | |
Class B | | | 3,061 | |
Class C | | | 220,887 | |
Administrator Class | | | 136,711 | |
Distribution fees | | | | |
Class B | | | 9,183 | |
Class C | | | 662,660 | |
Custody and accounting fees | | | 51,770 | |
Professional fees | | | 32,147 | |
Registration fees | | | 66,860 | |
Shareholder report expenses | | | 47,002 | |
Trustees’ fees and expenses | | | 5,390 | |
Other fees and expenses | | | 33,876 | |
| | | | |
Total expenses | | | 5,082,975 | |
Less: Fee waivers and/or expense reimbursements | | | (311,253 | ) |
| | | | |
Net expenses | | | 4,771,722 | |
| | | | |
Net investment income | | | 5,709,317 | |
| | | | |
| |
REALIZED AND UNREALIZED GAINS (LOSSES) ON INVESTMENTS | | | | |
| |
Net realized gains (losses) on: | | | | |
Unaffiliated securities | | | 232,644 | |
Futures transactions | | | (1,473,311 | ) |
| | | | |
Net realized losses on investments | | | (1,240,667 | ) |
| | | | |
| |
Net change in unrealized gains (losses) on: | | | | |
Unaffiliated securities | | | 4,223,312 | |
Futures transactions | | | (61,211 | ) |
| | | | |
Net change in unrealized gains (losses) on investments | | | 4,162,101 | |
| | | | |
Net realized and unrealized gains (losses) on investments | | | 2,921,434 | |
| | | | |
Net increase in net assets resulting from operations | | $ | 8,630,751 | |
| | | | |
The accompanying notes are an integral part of these financial statements.
| | | | | | |
| Statement of changes in net assets | | Wells Fargo Advantage Adjustable Rate Government Fund | | | 13 | |
| | | | | | | | | | | | | | | | |
| | | Six months ended February 28, 2014 (unaudited) | | | Year ended August 31, 2013 | |
| | | | |
Operations | | | | | | | | | | | | | | | | |
Net investment income | | | | | | $ | 5,709,317 | | | | | | | $ | 10,804,546 | |
Net realized gains (losses) on investments | | | | | | | (1,240,667 | ) | | | | | | | 2,659,262 | |
Net change in unrealized gains (losses) on investments | | | | | | | 4,162,101 | | | | | | | | (10,514,094 | ) |
| | | | |
Net increase in net assets resulting from operations | | | | | | | 8,630,751 | | | | | | | | 2,949,714 | |
| | | | |
| | | | |
Distributions to shareholders from | | | | | | | | | | | | | | | | |
Net investment income | | | | | | | | | | | | | | | | |
Class A | | | | | | | (1,056,274 | ) | | | | | | | (2,245,241 | ) |
Class B | | | | | | | (276 | ) | | | | | | | (1,184 | ) |
Class C | | | | | | | (23,815 | ) | | | | | | | (56,838 | ) |
Administrator Class | | | | | | | (512,593 | ) | | | | | | | (954,995 | ) |
Institutional Class | | | | | | | (4,866,391 | ) | | | | | | | (8,298,462 | ) |
Tax basis return of capital | | | | | | | | | | | | | | | | |
Class A | | | | | | | 0 | | | | | | | | (41,486 | ) |
Class B | | | | | | | 0 | | | | | | | | (22 | ) |
Class C | | | | | | | 0 | | | | | | | | (1,050 | ) |
Administrator Class | | | | | | | 0 | | | | | | | | (17,646 | ) |
Institutional Class | | | | | | | 0 | | | | | | | | (153,334 | ) |
| | | | |
Total distributions to shareholders | | | | | | | (6,459,349 | ) | | | | | | | (11,770,258 | ) |
| | | | |
| | | | |
Capital share transactions | | | Shares | | | | | | | | Shares | | | | | |
Proceeds from shares sold | | | | | | | | | | | | | | | | |
Class A | | | 4,004,010 | | | | 36,622,756 | | | | 9,109,427 | | | | 83,682,254 | |
Class B | | | 3,857 | | | | 35,274 | | | | 31,268 | | | | 287,126 | |
Class C | | | 303,536 | | | | 2,776,460 | | | | 839,351 | | | | 7,710,932 | |
Administrator Class | | | 3,963,165 | | | | 36,242,463 | | | | 8,957,655 | | | | 82,281,335 | |
Institutional Class | | | 32,425,619 | | | | 296,816,837 | | | | 111,798,068 | | | | 1,027,507,716 | |
| | | | |
| | | | | | | 372,493,790 | | | | | | | | 1,201,469,363 | |
| | | | |
Reinvestment of distributions | | | | | | | | | | | | | | | | |
Class A | | | 97,444 | | | | 891,123 | | | | 204,160 | | | | 1,875,097 | |
Class B | | | 28 | | | | 259 | | | | 123 | | | | 1,136 | |
Class C | | | 1,936 | | | | 17,707 | | | | 4,710 | | | | 43,331 | |
Administrator Class | | | 37,125 | | | | 339,594 | | | | 61,507 | | | | 564,819 | |
Institutional Class | | | 351,660 | | | | 3,216,587 | | | | 643,170 | | | | 5,906,428 | |
| | | | |
| | | | | | | 4,465,270 | | | | | | | | 8,390,811 | |
| | | | |
Payment for shares redeemed | | | | | | | | | | | | | | | | |
Class A | | | (6,000,961 | ) | | | (54,882,675 | ) | | | (12,269,012 | ) | | | (112,668,495 | ) |
Class B | | | (107,372 | ) | | | (982,625 | ) | | | (440,076 | ) | | | (4,045,250 | ) |
Class C | | | (2,989,866 | ) | | | (27,345,474 | ) | | | (7,063,937 | ) | | | (64,901,729 | ) |
Administrator Class | | | (2,409,385 | ) | | | (22,030,368 | ) | | | (10,045,881 | ) | | | (92,236,416 | ) |
Institutional Class | | | (23,422,474 | ) | | | (214,255,745 | ) | | | (87,926,435 | ) | | | (807,965,965 | ) |
| | | | |
| | | | | | | (319,496,887 | ) | | | | | | | (1,081,817,855 | ) |
| | | | |
Net increase in net assets resulting from capital share transactions | | | | | | | 57,462,173 | | | | | | | | 128,042,319 | |
| | | | |
Total increase in net assets | | | | | | | 59,633,575 | | | | | | | | 119,221,775 | |
| | | | |
| | | | |
Net assets | | | | | | | | | | | | | | | | |
Beginning of period | | | | | | | 1,483,007,014 | | | | | | | | 1,363,785,239 | |
| | | | |
End of period | | | | | | $ | 1,542,640,589 | | | | | | | $ | 1,483,007,014 | |
| | | | |
Overdistributed net investment income | | | | | | $ | (1,209,478 | ) | | | | | | $ | (459,446 | ) |
| | | | |
The accompanying notes are an integral part of these financial statements.
| | | | |
| 14 | | Wells Fargo Advantage Adjustable Rate Government Fund | | Financial highlights |
(For a share outstanding throughout each period)
| | | | | | | | | | | | | | | | | | | | | | | | | | | | |
| | | Six months ended
February 28, 2014 (unaudited) | | | Year ended August 31 | | | Year ended June 30 | |
| CLASS A | | | 2013 | | | 2012 | | | 2011 | | | 20101,2 | | | 20101 | | | 20091 | |
Net asset value, beginning of period | | $ | 9.14 | | | $ | 9.19 | | | $ | 9.12 | | | $ | 9.12 | | | $ | 9.11 | | | $ | 9.00 | | | $ | 9.15 | |
Net investment income | | | 0.03 | | | | 0.06 | | | | 0.09 | | | | 0.14 | | | | 0.02 | | | | 0.20 | | | | 0.32 | |
Net realized and unrealized gains (losses)
on investments | | | 0.02 | | | | (0.04 | ) | | | 0.08 | | | | 0.04 | | | | 0.02 | | | | 0.11 | | | | (0.14 | ) |
| | | | | | | | | | | | | | | | | | | | | | | | | | | | |
Total from investment operations | | | 0.05 | | | | 0.02 | | | | 0.17 | | | | 0.18 | | | | 0.04 | | | | 0.31 | | | | 0.18 | |
Distributions to shareholders from | | | | | | | | | | | | | | | | | | | | | | | | | | | | |
Net investment income | | | (0.04 | ) | | | (0.07 | ) | | | (0.09 | ) | | | (0.13 | )3 | | | (0.01 | )3 | | | (0.20 | ) | | | (0.33 | ) |
Tax basis return of capital | | | 0.00 | | | | (0.00 | )4 | | | (0.01 | ) | | | (0.05 | )3 | | | (0.02 | )3 | | | 0.00 | | | | 0.00 | |
| | | | | | | | | | | | | | | | | | | | | | | | | | | | |
Total distributions to shareholders | | | (0.04 | ) | | | (0.07 | ) | | | (0.10 | ) | | | (0.18 | ) | | | (0.03 | ) | | | (0.20 | ) | | | (0.33 | ) |
Net asset value, end of period | | $ | 9.15 | | | $ | 9.14 | | | $ | 9.19 | | | $ | 9.12 | | | $ | 9.12 | | | $ | 9.11 | | | $ | 9.00 | |
Total return5 | | | 0.49 | % | | | 0.23 | % | | | 1.84 | % | | | 2.04 | % | | | 0.49 | % | | | 3.51 | % | | | 2.09 | % |
Ratios to average net assets (annualized) | | | | | | | | | | | | | | | | | | | | | | | | | | | | |
Gross expenses | | | 0.81 | % | | | 0.84 | % | | | 0.86 | % | | | 0.88 | % | | | 0.88 | % | | | 0.73 | % | | | 0.73 | % |
Net expenses | | | 0.74 | % | | | 0.74 | % | | | 0.74 | % | | | 0.74 | % | | | 0.74 | % | | | 0.73 | % | | | 0.73 | % |
Net investment income | | | 0.68 | % | | | 0.71 | % | | | 1.01 | % | | | 1.50 | % | | | 1.18 | % | | | 2.27 | % | | | 3.61 | % |
Supplemental data | | | | | | | | | | | | | | | | | | | | | | | | | | | | |
Portfolio turnover rate | | | 1 | % | | | 10 | % | | | 9 | % | | | 18 | % | | | 0 | % | | | 14 | % | | | 41 | % |
Net assets, end of period (000s omitted) | | | $264,091 | | | | $281,028 | | | | $309,827 | | | | $328,427 | | | | $353,453 | | | | $271,853 | | | | $277,862 | |
| 1. | After the close of business on July 9, 2010, the Fund acquired the net assets of Evergreen Adjustable Rate Fund which became the accounting and performance survivor in the transaction. The information for the periods prior to July 12, 2010 is that of Class A of Evergreen Adjustable Rate Fund. |
| 2. | For the two months ended August 31, 2010. The Fund changed its fiscal year end from June 30 to August 31, effective August 31, 2010. |
| 3. | Calculated based upon average shares outstanding |
| 4. | Amount is less than $0.005. |
| 5. | Total return calculations do not include any sales charges. Returns for periods of less than one year are not annualized. |
The accompanying notes are an integral part of these financial statements.
| | | | | | |
| Financial highlights | | Wells Fargo Advantage Adjustable Rate Government Fund | | | 15 | |
(For a share outstanding throughout each period)
| | | | | | | | | | | | | | | | | | | | | | | | | | | | |
| | | Six months ended
February 28, 2014 (unaudited) | | �� | Year ended August 31 | | | Year ended June 30 | |
| CLASS B | | | 2013 | | | 2012 | | | 2011 | | | 20101,2 | | | 20101 | | | 20091 | |
Net asset value, beginning of period | | $ | 9.14 | | | $ | 9.19 | | | $ | 9.12 | | | $ | 9.12 | | | $ | 9.11 | | | $ | 9.00 | | | $ | 9.15 | |
Net investment income (loss) | | | (0.00 | )3,4 | | | (0.00 | )3,4 | | | 0.03 | 3 | | | 0.07 | 3 | | | 0.00 | 4 | | | 0.13 | 3 | | | 0.26 | 3 |
Net realized and unrealized gains (losses)
on investments | | | 0.02 | | | | (0.05 | ) | | | 0.07 | | | | 0.05 | | | | 0.03 | | | | 0.11 | | | | (0.14 | ) |
| | | | | | | | | | | | | | | | | | | | | | | | | | | | |
Total from investment operations | | | 0.02 | | | | (0.05 | ) | | | 0.10 | | | | 0.12 | | | | 0.03 | | | | 0.24 | | | | 0.12 | |
Distributions to shareholders from | | | | | | | | | | | | | | | | | | | | | | | | | | | | |
Net investment income | | | (0.00 | )4 | | | (0.00 | )4 | | | (0.03 | ) | | | (0.07 | )3 | | | (0.00 | )3,4 | | | (0.13 | ) | | | (0.27 | ) |
Tax basis return of capital | | | 0.00 | | | | (0.00 | )4 | | | (0.00 | )4 | | | (0.05 | )3 | | | (0.02 | )3 | | | 0.00 | | | | 0.00 | |
| | | | | | | | | | | | | | | | | | | | | | | | | | | | |
Total distributions to shareholders | | | (0.00 | )4 | | | (0.00 | )4 | | | (0.03 | ) | | | (0.12 | ) | | | (0.02 | ) | | | (0.13 | ) | | | (0.27 | ) |
Net asset value, end of period | | $ | 9.16 | | | $ | 9.14 | | | $ | 9.19 | | | $ | 9.12 | | | $ | 9.12 | | | $ | 9.11 | | | $ | 9.00 | |
Total return5 | | | 0.23 | % | | | (0.52 | )% | | | 1.08 | % | | | 1.28 | % | | | 0.36 | % | | | 2.73 | % | | | 1.33 | % |
Ratios to average net assets (annualized) | | | | | | | | | | | | | | | | | | | | | | | | | | | | |
Gross expenses | | | 1.56 | % | | | 1.60 | % | | | 1.61 | % | | | 1.63 | % | | | 1.62 | % | | | 1.48 | % | | | 1.48 | % |
Net expenses | | | 1.49 | % | | | 1.49 | % | | | 1.49 | % | | | 1.49 | % | | | 1.49 | % | | | 1.48 | % | | | 1.48 | % |
Net investment income (loss) | | | (0.08 | )% | | | (0.03 | )% | | | 0.27 | % | | | 0.81 | % | | | 0.24 | % | | | 1.55 | % | | | 2.95 | % |
Supplemental data | | | | | | | | | | | | | | | | | | | | | | | | | | | | |
Portfolio turnover rate | | | 1 | % | | | 10 | % | | | 9 | % | | | 18 | % | | | 0 | % | | | 14 | % | | | 41 | % |
Net assets, end of period (000s omitted) | | | $1,943 | | | | $2,886 | | | | $6,660 | | | | $14,911 | | | | $50,229 | | | | $52,414 | | | | $90,520 | |
| 1. | After the close of business on July 9, 2010, the Fund acquired the net assets of Evergreen Adjustable Rate Fund which became the accounting and performance survivor in the transaction. The information for the periods prior to July 12, 2010 is that of Class B of Evergreen Adjustable Rate Fund. |
| 2. | For the two months ended August 31, 2010. The Fund changed its fiscal year end from June 30 to August 31, effective August 31, 2010. |
| 3. | Calculated based upon average shares outstanding |
| 4. | Amount is less than $0.005. |
| 5. | Total return calculations do not include any sales charges. Returns for periods of less than one year are not annualized. |
The accompanying notes are an integral part of these financial statements.
| | | | |
| 16 | | Wells Fargo Advantage Adjustable Rate Government Fund | | Financial highlights |
(For a share outstanding throughout each period)
| | | | | | | | | | | | | | | | | | | | | | | | | | | | |
| | | Six months ended
February 28, 2014 (unaudited) | | | Year ended August 31 | | | Year ended June 30 | |
| CLASS C | | | 2013 | | | 2012 | | | 2011 | | | 20101,2 | | | 20101 | | | 20091 | |
Net asset value, beginning of period | | $ | 9.14 | | | $ | 9.19 | | | $ | 9.12 | | | $ | 9.12 | | | $ | 9.11 | | | $ | 9.00 | | | $ | 9.15 | |
Net investment income (loss) | | | (0.01 | ) | | | (0.00 | )3,4 | | | 0.02 | 4 | | | 0.06 | | | | 0.00 | 3 | | | 0.14 | | | | 0.25 | |
Net realized and unrealized gains (losses)
on investments | | | 0.02 | | | | (0.05 | ) | | | 0.08 | | | | 0.06 | | | | 0.03 | | | | 0.10 | | | | (0.13 | ) |
| | | | | | | | | | | | | | | | | | | | | | | | | | | | |
Total from investment operations | | | 0.01 | | | | (0.05 | ) | | | 0.10 | | | | 0.12 | | | | 0.03 | | | | 0.24 | | | | 0.12 | |
Distributions to shareholders from | | | | | | | | | | | | | | | | | | | | | | | | | | | | |
Net investment income | | | (0.00 | )3 | | | (0.00 | )3 | | | (0.03 | ) | | | (0.07 | )4 | | | (0.00 | )3,4 | | | (0.13 | ) | | | (0.27 | ) |
Tax basis return of capital | | | 0.00 | | | | (0.00 | )3 | | | (0.00 | )3 | | | (0.05 | )4 | | | (0.02 | )4 | | | 0.00 | | | | 0.00 | |
| | | | | | | | | | | | | | | | | | | | | | | | | | | | |
Total distributions to shareholders | | | (0.00 | )3 | | | (0.00 | )3 | | | (0.03 | ) | | | (0.12 | ) | | | (0.02 | ) | | | (0.13 | ) | | | (0.27 | ) |
Net asset value, end of period | | $ | 9.15 | | | $ | 9.14 | | | $ | 9.19 | | | $ | 9.12 | | | $ | 9.12 | | | $ | 9.11 | | | $ | 9.00 | |
Total return5 | | | 0.12 | % | | | (0.52 | )% | | | 1.08 | % | | | 1.28 | % | | | 0.36 | % | | | 2.73 | % | | | 1.33 | % |
Ratios to average net assets (annualized) | | | | | | | | | | | | | | | | | | | | | | | | | | | | |
Gross expenses | | | 1.56 | % | | | 1.59 | % | | | 1.61 | % | | | 1.63 | % | | | 1.62 | % | | | 1.48 | % | | | 1.48 | % |
Net expenses | | | 1.49 | % | | | 1.49 | % | | | 1.49 | % | | | 1.49 | % | | | 1.51 | % | | | 1.48 | % | | | 1.48 | % |
Net investment income (loss) | | | (0.08 | )% | | | (0.04 | )% | | | 0.26 | % | | | 0.74 | % | | | 0.23 | % | | | 1.52 | % | | | 2.88 | % |
Supplemental data | | | | | | | | | | | | | | | | | | | | | | | | | | | | |
Portfolio turnover rate | | | 1 | % | | | 10 | % | | | 9 | % | | | 18 | % | | | 0 | % | | | 14 | % | | | 41 | % |
Net assets, end of period (000s omitted) | | | $165,842 | | | | $190,110 | | | | $248,392 | | | | $296,645 | | | | $340,278 | | | | $349,562 | | | | $360,607 | |
| 1. | After the close of business on July 9, 2010, the Fund acquired the net assets of Evergreen Adjustable Rate Fund which became the accounting and performance survivor in the transaction. The information for the periods prior to July 12, 2010 is that of Class C of Evergreen Adjustable Rate Fund. |
| 2. | For the two months ended August 31, 2010. The Fund changed its fiscal year end from June 30 to August 31, effective August 31, 2010. |
| 3. | Amount is less than $0.005. |
| 4. | Calculated based upon average shares outstanding |
| 5. | Total return calculations do not include any sales charges. Returns for periods of less than one year are not annualized. |
The accompanying notes are an integral part of these financial statements.
| | | | | | |
| Financial highlights | | Wells Fargo Advantage Adjustable Rate Government Fund | | | 17 | |
(For a share outstanding throughout each period)
| | | | | | | | | | | | | | | | | | | | |
| | | Six months ended
February 28, 2014 (unaudited) | | | Year ended August 31 | |
| ADMINISTRATOR CLASS | | | 2013 | | | 2012 | | | 2011 | | | 20101 | |
Net asset value, beginning of period | | $ | 9.14 | | | $ | 9.19 | | | $ | 9.12 | | | $ | 9.12 | | | $ | 9.11 | |
Net investment income | | | 0.04 | | | | 0.08 | | | | 0.11 | | | | 0.14 | 2 | | | 0.02 | |
Net realized and unrealized gains (losses) on investments | | | 0.01 | | | | (0.05 | ) | | | 0.07 | | | | 0.06 | | | | 0.01 | |
| | | | | | | | | | | | | | | | | | | | |
Total from investment operations | | | 0.05 | | | | 0.03 | | | | 0.18 | | | | 0.20 | | | | 0.03 | |
Distributions to shareholders from | | | | | | | | | | | | | | | | | | | | |
Net investment income | | | (0.04 | ) | | | (0.08 | ) | | | (0.10 | ) | | | (0.15 | )2 | | | (0.00 | )2,3 |
Tax basis return of capital | | | 0.00 | | | | (0.00 | )3 | | | (0.01 | ) | | | (0.05 | )2 | | | (0.02 | )2 |
| | | | | | | | | | | | | | | | | | | | |
Total distributions to shareholders | | | (0.04 | ) | | | (0.08 | ) | | | (0.11 | ) | | | (0.20 | ) | | | (0.02 | ) |
Net asset value, end of period | | $ | 9.15 | | | $ | 9.14 | | | $ | 9.19 | | | $ | 9.12 | | | $ | 9.12 | |
Total return4 | | | 0.56 | % | | | 0.37 | % | | | 1.98 | % | | | 2.18 | % | | | 0.31 | % |
Ratios to average net assets (annualized) | | | | | | | | | | | | | | | | | | | | |
Gross expenses | | | 0.74 | % | | | 0.77 | % | | | 0.79 | % | | | 0.78 | % | | | 0.90 | % |
Net expenses | | | 0.60 | % | | | 0.60 | % | | | 0.60 | % | | | 0.60 | % | | | 0.62 | % |
Net investment income | | | 0.82 | % | | | 0.85 | % | | | 1.14 | % | | | 1.49 | % | | | 2.01 | % |
Supplemental data | | | | | | | | | | | | | | | | | | | | |
Portfolio turnover rate | | | 1 | % | | | 10 | % | | | 9 | % | | | 18 | % | | | 0 | % |
Net assets, end of period (000s omitted) | | | $117,008 | | | | $102,284 | | | | $112,319 | | | | $34,946 | | | | $10 | |
| 1. | For the period from July 30, 2010 (commencement of class operations) to August 31, 2010 |
| 2. | Calculated based upon average shares outstanding |
| 3. | Amount is less than $0.005. |
| 4. | Returns for periods of less than one year are not annualized. |
The accompanying notes are an integral part of these financial statements.
| | | | |
| 18 | | Wells Fargo Advantage Adjustable Rate Government Fund | | Financial highlights |
(For a share outstanding throughout each period)
| | | | | | | | | | | | | | | | | | | | | | | | | | | | |
| | | Six months ended
February 28, 2014 (unaudited) | | | Year ended August 31 | | | Year ended June 30 | |
| INSTITUTIONAL CLASS | | | 2013 | | | 2012 | | | 2011 | | | 20101,2 | | | 20101 | | | 20091 | |
Net asset value, beginning of period | | $ | 9.14 | | | $ | 9.19 | | | $ | 9.12 | | | $ | 9.12 | | | $ | 9.11 | | | $ | 9.00 | | | $ | 9.15 | |
Net investment income | | | 0.04 | | | | 0.09 | 3 | | | 0.12 | 3 | | | 0.15 | | | | 0.02 | | | | 0.23 | | | | 0.35 | |
Net realized and unrealized gains (losses) on investments | | | 0.02 | | | | (0.04 | ) | | | 0.07 | | | | 0.06 | | | | 0.03 | | | | 0.10 | | | | (0.14 | ) |
| | | | | | | | | | | | | | | | | | | | | | | | | | | | |
Total from investment operations | | | 0.06 | | | | 0.05 | | | | 0.19 | | | | 0.21 | | | | 0.05 | | | | 0.33 | | | | 0.21 | |
Distributions to shareholders from | | | | | | | | | | | | | | | | | | | | | | | | | | | | |
Net investment income | | | (0.05 | ) | | | (0.10 | ) | | | (0.11 | ) | | | (0.16 | )3 | | | (0.02 | )3 | | | (0.22 | ) | | | (0.36 | ) |
Tax basis return of capital | | | 0.00 | | | | (0.00 | )4 | | | (0.01 | ) | | | (0.05 | )3 | | | (0.02 | )3 | | | 0.00 | | | | 0.00 | |
| | | | | | | | | | | | | | | | | | | | | | | | | | | | |
Total distributions to shareholders | | | (0.05 | ) | | | (0.10 | ) | | | (0.12 | ) | | | (0.21 | ) | | | (0.04 | ) | | | (0.22 | ) | | | (0.36 | ) |
Net asset value, end of period | | $ | 9.15 | | | $ | 9.14 | | | $ | 9.19 | | | $ | 9.12 | | | $ | 9.12 | | | $ | 9.11 | | | $ | 9.00 | |
Total return5 | | | 0.64 | % | | | 0.50 | % | | | 2.09 | % | | | 2.30 | % | | | 0.53 | % | | | 3.76 | % | | | 2.35 | % |
Ratios to average net assets (annualized) | | | | | | | | | | | | | | | | | | | | | | | | | | | | |
Gross expenses | | | 0.48 | % | | | 0.51 | % | | | 0.53 | % | | | 0.55 | % | | | 0.55 | % | | | 0.48 | % | | | 0.48 | % |
Net expenses | | | 0.46 | % | | | 0.47 | % | | | 0.49 | % | | | 0.49 | % | | | 0.49 | % | | | 0.48 | % | | | 0.48 | % |
Net investment income | | | 0.96 | % | | | 0.98 | % | | | 1.25 | % | | | 1.72 | % | | | 1.21 | % | | | 2.52 | % | | | 3.91 | % |
Supplemental data | | | | | | | | | | | | | | | | | | | | | | | | | | | | |
Portfolio turnover rate | | | 1 | % | | | 10 | % | | | 9 | % | | | 18 | % | | | 0 | % | | | 14 | % | | | 41 | % |
Net assets, end of period (000s omitted) | | | $993,756 | | | | $906,698 | | | | $686,587 | | | | $597,521 | | | | $368,066 | | | | $389,075 | | | | $483,565 | |
| 1. | After the close of business on July 9, 2010, the Fund acquired the net assets of Evergreen Adjustable Rate Fund which became the accounting and performance survivor in the transaction. The information for the periods prior to July 12, 2010 is that of Class I of Evergreen Adjustable Rate Fund. |
| 2. | For the two months ended August 31, 2010. The Fund changed its fiscal year end from June 30 to August 31, effective August 31, 2010. |
| 3. | Calculated based upon average shares outstanding |
| 4. | Amount is less than $0.005. |
| 5. | Returns for periods of less than one year are not annualized. |
The accompanying notes are an integral part of these financial statements.
| | | | | | |
| Notes to financial statements (unaudited) | | Wells Fargo Advantage Adjustable Rate Government Fund | | | 19 | |
1. ORGANIZATION
Wells Fargo Funds Trust (the “Trust”), a Delaware statutory trust organized on March 10, 1999, is an open-end management investment company registered under the Investment Company Act of 1940, as amended (the “1940 Act”). These financial statements report on the Wells Fargo Advantage Adjustable Rate Government Fund (the “Fund”) which is a diversified series of the Trust.
2. SIGNIFICANT ACCOUNTING POLICIES
The following significant accounting policies, which are consistently followed in the preparation of the financial statements of the Fund, are in conformity with U.S. generally accepted accounting principles which require management to make estimates and assumptions that affect the reported amounts of assets and liabilities, disclosure of contingent assets and liabilities at the date of the financial statements, and the reported amounts of revenues and expenses during the reporting period. Actual results could differ from those estimates.
Securities valuation
All investments are valued each business day as of the close of regular trading on the New York Stock Exchange (generally 4 p.m. Eastern Time).
Fixed income securities acquired with maturities exceeding 60 days are valued based on evaluated bid prices provided by an independent pricing service which may utilize both transaction data and market information such as yield, quality, coupon rate, maturity, type of issue, trading characteristics and other market data. If prices are not available from the independent pricing service or prices received are deemed not representative of market value, prices will be obtained from an independent broker-dealer or otherwise determined based on the Fund’s Valuation Procedures.
Futures that are listed on a foreign or domestic exchange or market are valued at the official closing price or, if none, the last sales price.
Short-term securities, with maturities of 60 days or less at time of purchase, generally are valued at amortized cost which approximates fair value. The amortized cost method involves valuing a security at its cost, plus accretion of discount or minus amortization of premium over the period until maturity.
Investments in registered open-end investment companies are valued at net asset value.
Investments which are not valued using any of the methods discussed above are valued at their fair value, as determined in good faith by the Board of Trustees of the Fund. The Board of Trustees has established a Valuation Committee comprised of the Trustees and has delegated to it the authority to take any actions regarding the valuation of portfolio securities that the Valuation Committee deems necessary or appropriate, including determining the fair value of portfolio securities, unless the determination has been delegated to the Management Valuation Team of Wells Fargo Funds Management, LLC (“Funds Management”). The Board of Trustees retains the authority to make or ratify any valuation decisions or approve any changes to the Valuation Procedures as it deems appropriate. On a quarterly basis, the Board of Trustees receives reports on any valuation actions taken by the Valuation Committee or the Management Valuation Team which may include items for ratification.
Valuations of fair valued securities are compared to the next actual sales price when available, or other appropriate market values, to assess the continued appropriateness of the fair valuation methodologies used. These securities are fair valued on a day-to-day basis, taking into consideration changes to appropriate market information and any significant changes to the inputs considered in the valuation process until there is a readily available price provided on an exchange or by an independent pricing service. Valuations received from an independent pricing service or independent broker-dealer quotes are periodically validated by comparisons to most recent trades and valuations provided by other independent pricing services in addition to the review of prices by the adviser and/or subadviser. Unobservable inputs used in determining fair valuations are identified based on the type of security, taking into consideration factors utilized by market participants in valuing the investment, knowledge about the issuer and the current market environment.
Futures contracts
The Fund may be subject to interest rate risk in the normal course of pursuing its investment objectives. The Fund may buy and sell futures contracts in order to gain exposure to, or protect against, changes in security values and interest rates. The primary risks associated with the use of futures contracts are the imperfect correlation between changes in market values of securities held by the Fund and the prices of futures contracts, and the possibility of an illiquid market.
The aggregate principal amounts of the contracts are not recorded in the financial statements. Fluctuations in the value of the contracts are recorded in the Statement of Assets and Liabilities as an asset or liability and in the Statement of Operations as unrealized gains or losses until the contracts are closed, at which point they are recorded as net realized gains or losses on
| | | | |
| 20 | | Wells Fargo Advantage Adjustable Rate Government Fund | | Notes to financial statements (unaudited) |
futures contracts. With futures contracts, there is minimal counterparty risk to the Fund since futures are exchange traded and the exchange’s clearinghouse, as counterparty to all exchange traded futures, guarantees the futures against default.
Security transactions and income recognition
Securities transactions are recorded on a trade date basis. Realized gains or losses are recorded on the basis of identified cost.
Interest income is accrued daily and bond discounts are accreted and premiums are amortized daily based on the effective interest method. To the extent debt obligations are placed on non-accrual status, any related interest income may be reduced by writing off interest receivables when the collection of all or a portion of interest has become doubtful based on consistently applied procedures. If the issuer subsequently resumes interest payments or when the collectability of interest is reasonably assured, the debt obligation is removed from non-accrual status.
Distributions to shareholders
Distributions to shareholders from net investment income are accrued daily and paid monthly. Distributions from net realized gains, if any, are recorded on the ex-dividend date. Such distributions are determined in conformity with federal income tax regulations, which may differ in amount or character from net investment income and realized gains recognized for purposes of U.S. generally accepted accounting principles.
Federal and other taxes
The Fund intends to continue to qualify as a regulated investment company by distributing substantially all of its investment company taxable income and any net realized capital gains (after reduction for capital loss carryforwards) sufficient to relieve it from all, or substantially all, federal income taxes. Accordingly, no provision for federal income taxes was required.
The Fund’s income and federal excise tax returns and all financial records supporting those returns for the prior three fiscal years are subject to examination by the federal and Delaware revenue authorities. Management has analyzed the Fund’s tax positions taken on federal, state, and foreign tax returns for all open tax years and does not believe that there are any uncertain tax positions that require recognition of a tax liability.
As of August 31, 2013, capital loss carryforwards available to offset future net realized capital gains were as follows through the indicated expiration dates:
| | | | | | | | | | |
| 2014 | | 2015 | | 2016 | | 2017 | | 2018 | | 2019 |
| $11,283,743 | | $18,541,278 | | $10,766,785 | | $24,262,054 | | $1,705,150 | | $66,443 |
As of August 31, 2013, the Fund had $270,821 of current year deferred post-October capital losses, which were recognized on the first day of the current fiscal year.
Class allocations
The separate classes of shares offered by the Fund differ principally in applicable sales charges, distribution, shareholder servicing, and administration fees. Shareholders of each class bear certain expenses that pertain to that particular class. All shareholders bear the common expenses of the Fund, earn income from the portfolio, and are allocated any unrealized gains and losses pro rata based on the average daily net assets of each class, without distinction between share classes. Dividends are determined separately for each class based on income and expenses allocable to each class. Realized gains and losses are allocated to each class pro rata based upon the net assets of each class on the date realized. Differences in per share dividend rates generally result from the relative weightings of pro rata income and realized gain allocations and from differences in separate class expenses, including distribution, shareholder servicing, and administration fees.
3. FAIR VALUATION MEASUREMENTS
Fair value measurements of investments are determined within a framework that has established a fair value hierarchy based upon the various data inputs utilized in determining the value of the Fund’s investments. The three-level hierarchy gives the highest priority to unadjusted quoted prices in active markets for identical assets or liabilities (Level 1) and the lowest priority to significant unobservable inputs (Level 3). The Fund’s investments are classified within the fair value hierarchy based on the lowest level of input that is significant to the fair value measurement. The inputs are summarized into three broad levels as follows:
| n | | Level 1 – quoted prices in active markets for identical securities |
| n | | Level 2 – other significant observable inputs (including quoted prices for similar securities, interest rates, prepayment speeds, credit risk, use of amortized cost, etc.) |
| n | | Level 3 – significant unobservable inputs (including the Fund’s own assumptions in determining the fair value of investments) |
| | | | | | |
| Notes to financial statements (unaudited) | | Wells Fargo Advantage Adjustable Rate Government Fund | | | 21 | |
The inputs or methodologies used for valuing investments in securities are not necessarily an indication of the risk associated with investing in those securities.
As of February 28, 2014, the inputs used in valuing investments in securities were as follows:
| | | | | | | | | | | | | | | | |
| Investments in securities | | Quoted prices (Level 1) | | | Other significant
observable inputs (Level 2) | | | Significant unobservable inputs (Level 3) | | | Total | |
Agency securities | | $ | 0 | | | $ | 1,492,184,255 | | | $ | 0 | | | $ | 1,492,184,255 | |
Short-term investments | | | | | | | | | | | | | | | | |
Investment companies | | | 39,291,402 | | | | 0 | | | | 0 | | | | 39,291,402 | |
U.S. Treasury securities | | | 899,987 | | | | 0 | | | | 0 | | | | 899,987 | |
| | | $ | 40,191,389 | | | $ | 1,492,184,255 | | | $ | 0 | | | $ | 1,532,375,644 | |
As of February 28, 2014, the inputs used in valuing the Fund’s other financial instruments were as follows:
| | | | | | | | | | | | | | |
| | | Quoted prices (Level 1) | | | Other significant
observable inputs (Level 2) | | | Significant unobservable inputs (Level 3) | | | Total |
Futures contracts | | $ | (169,077 | )* | | $ | 0 | | | $ | 0 | | | $(169,077) |
| * | Amount represents the net unrealized losses. |
Transfers in and transfers out are recognized at the end of the reporting period. For the six months ended February 28, 2014, the Fund did not have any transfers into/out of Level 1, Level 2, or Level 3.
4. TRANSACTIONS WITH AFFILIATES AND OTHER EXPENSES
Advisory fee
The Trust has entered into an advisory contract with Funds Management, an indirect wholly owned subsidiary of Wells Fargo & Company (“Wells Fargo”). The adviser is responsible for implementing investment policies and guidelines and for supervising the subadviser, who is responsible for day-to-day portfolio management of the Fund.
Pursuant to the contract, Funds Management is entitled to receive an annual advisory fee starting at 0.30% and declining to 0.225% as the average daily net assets of the Fund increase. Prior to January 1, 2014, Funds Management was entitled to receive an annual advisory fee which started at 0.35% and declined to 0.25% as the average daily net assets of the Fund increased. For the six months ended February 28, 2014, the advisory fee was equivalent to an annual rate of 0.31% of the Fund’s average daily net assets.
Funds Management has retained the services of a subadviser to provide daily portfolio management to the Fund. The fee for subadvisory services is borne by Funds Management. Wells Capital Management Incorporated, an affiliate of Funds Management and an indirect, wholly owned subsidiary of Wells Fargo, is the subadviser to the Fund and is entitled to receive a fee from Funds Management at an annual rate starting at 0.20% and declining to 0.10% as the average daily net assets of the Fund increase.
Administration and transfer agent fees
The Trust has entered into an administration agreement with Funds Management. Under this agreement, for providing administrative services, which includes paying fees and expenses for services provided by the transfer agent, sub-transfer agents, omnibus account servicers and record-keepers, Funds Management is entitled to receive from the Fund an annual fund level administration fee starting at 0.05% and declining to 0.03% as the average daily net assets of the Fund increase and a class level administration fee which is calculated based on the average daily net assets of each class as follows:
| | | | |
| | | Class level
administration fee | |
Class A, Class B, Class C | | | 0.16 | % |
Administrator Class | | | 0.10 | |
Institutional Class | | | 0.08 | |
Funds Management has contractually waived and/or reimbursed advisory and administration fees to the extent necessary to maintain certain net operating expense ratios for the Fund. Waiver of fees and/or reimbursement of expenses by Funds Management were made first from fund level expenses on a proportionate basis and then from class
| | | | |
| 22 | | Wells Fargo Advantage Adjustable Rate Government Fund | | Notes to financial statements (unaudited) |
specific expenses. Funds Management has committed through December 31, 2014 to waive fees and/or reimburse expenses to the extent necessary to cap the Fund’s expenses at 0.74% for Class A shares, 1.49% for Class B shares, 1.49% for Class C shares, 0.60% for Administrator Class shares, and 0.46% for Institutional Class shares.
Distribution fees
The Trust has adopted a Distribution Plan for Class B and Class C shares of the Fund pursuant to Rule 12b-1 under the 1940 Act. Distribution fees are charged to Class B and Class C shares and paid to Wells Fargo Funds Distributor, LLC, the principal underwriter, at an annual rate of 0.75% of the average daily net assets of Class B and Class C shares.
For the six months ended February 28, 2014, Wells Fargo Funds Distributor, LLC received $1,128 from the sale of Class A shares and $219 in contingent deferred sales charges from redemptions of Class C shares.
Shareholder servicing fees
The Trust has entered into contracts with one or more shareholder servicing agents, whereby Class A, Class B, Class C, and Administrator Class of the Fund is charged a fee at an annual rate of 0.25% of the average daily net assets of each respective class.
A portion of these total shareholder servicing fees were paid to affiliates of Wells Fargo.
5. INVESTMENT PORTFOLIO TRANSACTIONS
Purchases and sales of U.S. government obligations, excluding short-term securities, for the six months ended February 28, 2014 were $181,996,940 and $18,188,118, respectively.
6. DERIVATIVE TRANSACTIONS
During the six months ended February 28, 2014, the Fund entered into futures contracts to speculate on interest rates and to help manage the duration of the portfolio.
At February 28, 2014, the Fund had short futures contracts outstanding as follows:
| | | | | | | | | | | | | | |
| Expiration date | | Counterparty | | Contracts | | Type | | Contract value at February 28, 2014 | | | Unrealized
losses | |
6-19-2014 | | JPMorgan | | 267 Short | | 10-Year US Treasury Note | | $ | 33,249,844 | | | $ | (67,257 | ) |
6-30-2014 | | JPMorgan | | 452 Short | | 5-Year US Treasury Note | | | 54,176,438 | | | | (101,820 | ) |
The Fund had an average notional amount of $84,536,705 in short futures contracts during the six months ended February 28, 2014.
On February 28, 2014, the cumulative unrealized losses on futures contracts in the amount of $169,077 are reflected in net unrealized gains on investments on the Statement of Assets and Liabilities. The receivable for daily variation margin on open futures contracts reflected in the Statement of Assets and Liabilities only represents the current day’s variation margin. The realized gains and change in unrealized gains (losses) on futures contracts are reflected in the Statement of Operations.
For certain types of derivative transactions, the Fund has entered into International Swaps and Derivatives Association, Inc. master agreements (“ISDA Master Agreements”) or similar agreements with approved counterparties. The ISDA Master Agreements or similar agreements may have requirements to deliver/deposit securities or cash to/with an exchange or broker-dealer as collateral and allows the Fund to offset, with each counterparty, certain derivative financial instrument’s assets and/or liabilities with collateral held or pledged. Collateral requirements differ by type of derivative. Collateral or margin requirements are set by the broker or exchange clearing house for exchange traded derivatives while collateral terms are contract specific for over-the-counter traded. Cash collateral that has been pledged to cover obligations of the Fund under derivative contracts, if any, will be reported separately in the Statement of Assets and Liabilities. Securities pledged as collateral, if any, for the same purpose are noted in the Portfolio of Investments. With respect to balance sheet offsetting, absent an event of default by the counterparty or a termination of the agreement, the reported amounts of financial assets and financial liabilities in the Statement of Assets and Liabilities are not offset across transactions between the Fund and the applicable counterparty. A reconciliation of the gross amounts on the Statement of Assets and Liabilities to the net amounts by derivative type, including any collateral exposure, is as follows:
| | | | | | | | | | | | | | | | |
| Derivative type | | Counterparty | | Gross amounts of assets in the Statement of Assets and Liabilities | | Amounts subject
to netting
agreements | | | Collateral
received | | | Net
amount | |
| Futures – variation margin | | JPMorgan | | $111,375 | | $ | 0 | | | $ | 0 | | | $ | 111,375 | |
| | | | | | |
| Notes to financial statements (unaudited) | | Wells Fargo Advantage Adjustable Rate Government Fund | | | 23 | |
7. BANK BORROWINGS
The Trust (excluding the money market funds and certain other funds in the Trust) and Wells Fargo Variable Trust are parties to a $150,000,000 revolving credit agreement with State Street Bank and Trust Company, whereby the Fund is permitted to use bank borrowings for temporary or emergency purposes, such as to fund shareholder redemption requests. Interest under the credit agreement is charged to the Fund based on a borrowing rate equal to the higher of the Federal Funds rate in effect on that day plus 1.25% or the overnight LIBOR rate in effect on that day plus 1.25%. In addition, an annual commitment fee equal to 0.10% of the unused balance is allocated to each participating fund. For the six months ended February 28, 2014, the Fund paid $307 in commitment fees.
For the six months ended February 28, 2014, there were no borrowings by the Fund under the agreement.
8. INDEMNIFICATION
Under the Trust’s organizational documents, the officers and directors are indemnified against certain liabilities that may arise out of performance of their duties to the Trust. Additionally, in the normal course of business, the Trust may enter into contracts with service providers that contain a variety of indemnification clauses. The Trust’s maximum exposure under these arrangements is dependent on future claims that may be made against the Fund and, therefore, cannot be estimated.
| | | | |
| 24 | | Wells Fargo Advantage Adjustable Rate Government Fund | | Other information (unaudited) |
PROXY VOTING INFORMATION
A description of the policies and procedures that the Fund uses to determine how to vote proxies relating to portfolio securities is available without charge, upon request, by calling 1-800-222-8222, visiting our website at wellsfargoadvantagefunds.com, or visiting the SEC website at sec.gov. Information regarding how the Fund voted proxies relating to portfolio securities during the most recent 12-month period ended June 30 is available without charge on the Fund’s website at wellsfargoadvantagefunds.com or by visiting the SEC website at sec.gov.
PORTFOLIO HOLDINGS INFORMATION
The complete portfolio holdings for the Fund are publicly available on the Fund’s website (wellsfargoadvantagefunds.com) on a monthly, 30-day or more delayed basis. In addition, top ten holdings information for the Fund is publicly available on the Fund’s website on a monthly, seven-day or more delayed basis. The Fund files its complete schedule of portfolio holdings with the SEC for the first and third quarters of each fiscal year on Form N-Q, which is available without charge by visiting the SEC website at sec.gov. In addition, the Fund’s Form N-Q may be reviewed and copied at the SEC’s Public Reference Room in Washington, DC, and at regional offices in New York City, at 233 Broadway, and in Chicago, at 175 West Jackson Boulevard, Suite 900. Information about the Public Reference Room may be obtained by calling 1-800-SEC-0330.
| | | | | | |
| Other information (unaudited) | | Wells Fargo Advantage Adjustable Rate Government Fund | | | 25 | |
BOARD OF TRUSTEES AND OFFICERS
Each of the Trustees and Officers listed in the table below acts in identical capacities for each fund in the Wells Fargo Advantage family of funds, which consists of 132 mutual funds1 comprising the Wells Fargo Funds Trust, Wells Fargo Variable Trust, Wells Fargo Master Trust and four closed-end funds (collectively the “Fund Complex”). This table should be read in conjunction with the Prospectus and the Statement of Additional Information2. All of the Trustees are also Members of the Audit and Governance Committees of each Trust in the Fund Complex. The mailing address of each Trustee and Officer is 525 Market Street, 12th Floor, San Francisco, CA 94105. Each Trustee and Officer serves an indefinite term, however, each Trustee serves such term until reaching the mandatory retirement age established by the Trustees.
Independent Trustees
| | | | | | |
Name and year of birth | | Position held and length of service* | | Principal occupations during past five years | | Other directorships during past five years |
Peter G. Gordon (Born 1942) | | Trustee, since 1998; Chairman, since 2005 | | Co-Founder, Retired Chairman, President and CEO of Crystal Geyser Water Company. Trustee Emeritus, Colby College. | | Asset Allocation Trust |
Isaiah Harris, Jr. (Born 1952) | | Trustee, since 2009 | | Retired. Prior thereto, President and CEO of BellSouth Advertising and Publishing Corp. from 2005 to 2007, President and CEO of BellSouth Enterprises from 2004 to 2005 and President of BellSouth Consumer Services from 2000 to 2003. Emeritus member of the Iowa State University Foundation Board of Governors. Emeritus Member of the Advisory Board of Iowa State University School of Business. Advisory Board Member, Palm Harbor Academy (charter school). Mr. Harris is a certified public accountant. | | CIGNA Corporation; Deluxe Corporation; Asset Allocation Trust |
Judith M. Johnson (Born 1949) | | Trustee, since 2008; Audit Committee Chairman, since 2008 | | Retired. Prior thereto, Chief Executive Officer and Chief Investment Officer of Minneapolis Employees Retirement Fund from 1996 to 2008. Ms. Johnson is an attorney, certified public accountant and a certified managerial accountant. | | Asset Allocation Trust |
Leroy Keith, Jr. (Born 1939) | | Trustee, since 2010 | | Chairman, Bloc Global Services (development and construction). Trustee of the Evergreen Funds from 1983 to 2010. Former Managing Director, Almanac Capital Management (commodities firm), former Partner, Stonington Partners, Inc. (private equity fund), former Director, Obagi Medical Products Co. and former Director, Lincoln Educational Services. | | Trustee, Virtus Fund Complex (consisting of 50 portfolios as of 12/16/2013); Asset Allocation Trust |
David F. Larcker (Born 1950) | | Trustee, since 2009 | | James Irvin Miller Professor of Accounting at the Graduate School of Business, Stanford University, Morgan Stanley Director of the Center for Leadership Development and Research and Senior Faculty of The Rock Center for Corporate Governance since 2006. From 2005 to 2008, Professor of Accounting at the Graduate School of Business, Stanford University. Prior thereto, Ernst & Young Professor of Accounting at The Wharton School, University of Pennsylvania from 1985 to 2005. | | Asset Allocation Trust |
Olivia S. Mitchell (Born 1953) | | Trustee, since 2006 | | International Foundation of Employee Benefit Plans Professor, Wharton School of the University of Pennsylvania since 1993. Director of Wharton’s Pension Research Council and Boettner Center on Pensions & Retirement Research, and Research Associate at the National Bureau of Economic Research. Previously, Cornell University Professor from 1978 to 1993. | | Asset Allocation Trust |
Timothy J. Penny (Born 1951) | | Trustee, since 1996 | | President and CEO of Southern Minnesota Initiative Foundation, a non-profit organization, since 2007 and Senior Fellow at the Humphrey Institute Policy Forum at the University of Minnesota since 1995. Member of the Board of Trustees of NorthStar Education Finance, Inc., a non-profit organization, since 2007. | | Asset Allocation Trust |
| | | | |
| 26 | | Wells Fargo Advantage Adjustable Rate Government Fund | | Other information (unaudited) |
| | | | | | |
Name and year of birth | | Position held and length of service* | | Principal occupations during past five years | | Other directorships during past five years |
Michael S. Scofield (Born 1943) | | Trustee, since 2010 | | Served on the Investment Company Institute’s Board of Governors and Executive Committee from 2008-2011 as well the Governing Council of the Independent Directors Council from 2006-2011 and the Independent Directors Council Executive Committee from 2008-2011. Chairman of the IDC from 2008-2010. Institutional Investor (Fund Directions) Trustee of Year in 2007. Trustee of the Evergreen Funds (and its predecessors) from 1984 to 2010. Chairman of the Evergreen Funds from 2000-2010. Former Trustee of the Mentor Funds. Retired Attorney, Law Offices of Michael S. Scofield. | | Asset Allocation Trust |
Donald C. Willeke (Born 1940) | | Trustee, since 1996 | | Principal of the law firm of Willeke & Daniels. General Counsel of the Minneapolis Employees Retirement Fund from 1984 until its consolidation into the Minnesota Public Employees Retirement Association on June 30, 2010. Director and Vice Chair of The Tree Trust (non-profit corporation). Director of the American Chestnut Foundation (non-profit corporation). | | Asset Allocation Trust |
| * | Length of service dates reflect the Trustee’s commencement of service with the Trust’s predecessor entities, where applicable. |
Officers
| | | | | | |
Name and year of birth | | Position held and length of service | | Principal occupations during past five years | | |
Karla M. Rabusch (Born 1959) | | President, since 2003 | | Executive Vice President of Wells Fargo Bank, N.A. and President of Wells Fargo Funds Management, LLC since 2003. | | |
Nancy Wiser1 (Born 1967) | | Treasurer, since 2012 | | Executive Vice President of Wells Fargo Funds Management, LLC since 2011. Chief Operating Officer and Chief Compliance Officer at LightBox Capital Management LLC, from 2008 to 2011. Owned and operated a consulting business providing services to various hedge funds including acting as Chief Operating Officer and Chief Compliance Officer for a hedge fund from 2007 to 2008. Chief Operating Officer and Chief Compliance Officer of GMN Capital LLC from 2006 to 2007. | | |
C. David Messman (Born 1960) | | Secretary, since 2000; Chief Legal Officer, since 2003 | | Senior Vice President and Secretary of Wells Fargo Funds Management, LLC since 2001. Vice President and Managing Counsel of Wells Fargo Bank, N.A. since 1996. | | |
Debra Ann Early (Born 1964) | | Chief Compliance Officer, since 2007 | | Chief Compliance Officer of Wells Fargo Funds Management, LLC since 2007. Chief Compliance Officer of Parnassus Investments from 2005 to 2007. Chief Financial Officer of Parnassus Investments from 2004 to 2007. | | |
David Berardi (Born 1975) | | Assistant Treasurer, since 2009 | | Vice President of Wells Fargo Funds Management, LLC since 2009. Vice President of Evergreen Investment Management Company, LLC from 2008 to 2010. Assistant Vice President of Evergreen Investment Services, Inc. from 2004 to 2008. Manager of Fund Reporting and Control for Evergreen Investment Management Company, LLC from 2004 to 2010. | | |
Jeremy DePalma1 (Born 1974) | | Assistant Treasurer, since 2009 | | Senior Vice President of Wells Fargo Funds Management, LLC since 2009. Senior Vice President of Evergreen Investment Management Company, LLC from 2008 to 2010. Vice President, Evergreen Investment Services, Inc. from 2004 to 2007. Head of the Fund Reporting and Control Team within Fund Administration from 2005 to 2010. | | |
| 1. | Nancy Wiser acts as Treasurer of 73 funds in the Fund Complex. Jeremy DePalma acts as Treasurer of 59 funds and Assistant Treasurer of 73 funds in the Fund Complex. |
| 2. | The Statement of Additional Information includes additional information about the Trustees and is available, without charge, upon request, by calling 1-800-222-8222 or by visiting the website at wellsfargoadvantagefunds.com. |
| | | | | | |
| List of abbreviations | | Wells Fargo Advantage Adjustable Rate Government Fund | | | 27 | |
The following is a list of common abbreviations for terms and entities that may have appeared in this report.
| ACA | — ACA Financial Guaranty Corporation |
| ADR | — American depositary receipt |
| ADS | — American depositary shares |
| AGC | — Assured Guaranty Corporation |
| AGM | — Assured Guaranty Municipal |
| Ambac | — Ambac Financial Group Incorporated |
| AMT | — Alternative minimum tax |
| BAN | — Bond anticipation notes |
| BHAC | — Berkshire Hathaway Assurance Corporation |
| CAB | — Capital appreciation bond |
| CCAB | — Convertible capital appreciation bond |
| CDA | — Community Development Authority |
| CDO | — Collateralized debt obligation |
| DRIVER | — Derivative inverse tax-exempt receipts |
| DW&P | — Department of Water & Power |
| DWR | — Department of Water Resources |
| ECFA | — Educational & Cultural Facilities Authority |
| EDA | — Economic Development Authority |
| EDFA | — Economic Development Finance Authority |
| ETF | — Exchange-traded fund |
| FDIC | — Federal Deposit Insurance Corporation |
| FFCB | — Federal Farm Credit Banks |
| FGIC | — Financial Guaranty Insurance Corporation |
| FHA | — Federal Housing Administration |
| FHLB | — Federal Home Loan Bank |
| FHLMC | — Federal Home Loan Mortgage Corporation |
| FICO | — The Financing Corporation |
| FNMA | — Federal National Mortgage Association |
| GDR | — Global depositary receipt |
| GNMA | — Government National Mortgage Association |
| HCFR | — Healthcare facilities revenue |
| HEFA | — Health & Educational Facilities Authority |
| HEFAR | — Higher education facilities authority revenue |
| HFA | — Housing Finance Authority |
| HFFA | — Health Facilities Financing Authority |
| HUD | — Department of Housing and Urban Development |
| IDA | — Industrial Development Authority |
| IDAG | — Industrial Development Agency |
| KRW | — Republic of Korea won |
| LIBOR | — London Interbank Offered Rate |
| LLC | — Limited liability company |
| LLLP | — Limited liability limited partnership |
| LLP | — Limited liability partnership |
| MBIA | — Municipal Bond Insurance Association |
| MFHR | — Multifamily housing revenue |
| MSTR | — Municipal securities trust receipts |
| MUD | — Municipal Utility District |
| National | — National Public Finance Guarantee Corporation |
| PCFA | — Pollution Control Financing Authority |
| PCL | — Public Company Limited |
| PCR | — Pollution control revenue |
| PFA | — Public Finance Authority |
| PFFA | — Public Facilities Financing Authority |
| PFOTER | — Puttable floating option tax-exempt receipts |
| plc | — Public limited company |
| PUTTER | — Puttable tax-exempt receipts |
| R&D | — Research & development |
| Radian | — Radian Asset Assurance |
| RAN | — Revenue anticipation notes |
| RDA | — Redevelopment Authority |
| RDFA | — Redevelopment Finance Authority |
| REIT | — Real estate investment trust |
| ROC | — Reset option certificates |
| SAVRS | — Select auction variable rate securities |
| SBA | — Small Business Authority |
| SFHR | — Single-family housing revenue |
| SFMR | — Single-family mortgage revenue |
| SPA | — Standby purchase agreement |
| SPDR | — Standard & Poor’s Depositary Receipts |
| STRIPS | — Separate trading of registered interest and principal securities |
| TAN | — Tax anticipation notes |
| TIPS | — Treasury inflation-protected securities |
| TRAN | — Tax revenue anticipation notes |
| TTFA | — Transportation Trust Fund Authority |
| TVA | — Tennessee Valley Authority |
This page is intentionally left blank.


For more information
More information about Wells Fargo Advantage Funds is available free upon request. To obtain literature, please write, email, visit the Fund’s website, or call:
Wells Fargo Advantage Funds
P.O. Box 8266
Boston, MA 02266-8266
Email: wfaf@wellsfargo.com
Website: wellsfargoadvantagefunds.com
Individual investors: 1-800-222-8222
Retail investment professionals: 1-888-877-9275
Institutional investment professionals: 1-866-765-0778
This report and the financial statements contained herein are submitted for the general information of the shareholders of Wells Fargo Advantage Funds. If this report is used for promotional purposes, distribution of the report must be accompanied or preceded by a current prospectus. For a current prospectus and, if available, a summary prospectus containing more complete information, including charges and expenses, call 1-800-222-8222 or visit the Fund’s website at wellsfargoadvantagefunds.com. Please consider the investment objectives, risks, charges, and expenses of the investment carefully before investing. This and other information about Wells Fargo Advantage Funds can be found in the current prospectus. Read the prospectus carefully before you invest or send money.
Wells Fargo Funds Management, LLC, a wholly owned subsidiary of Wells Fargo & Company, provides investment advisory and administrative services for Wells Fargo Advantage Funds. Other affiliates of Wells Fargo & Company provide subadvisory and other services for the Funds. The Funds are distributed by Wells Fargo Funds Distributor, LLC, Member FINRA/SIPC, an affiliate of Wells Fargo & Company.
NOT FDIC INSURED ¡ NO BANK GUARANTEE ¡ MAY LOSE VALUE
© 2014 Wells Fargo Funds Management, LLC. All rights reserved.
| | |
 | | 223528 04-14 SA215/SAR215 02-14 |

Wells Fargo Advantage
Conservative Income Fund

Semi-Annual Report
February 28, 2014

Reduce clutter. Save trees.
Sign up for electronic delivery of prospectuses and shareholder reports at wellsfargo.com/advantagedelivery
Contents
The views expressed and any forward-looking statements are as of February 28, 2014, unless otherwise noted, and are those of the Fund managers and/or Wells Fargo Funds Management, LLC. Discussions of individual securities, or the markets generally, or any Wells Fargo Advantage Fund are not intended as individual recommendations. Future events or results may vary significantly from those expressed in any forward-looking statements; the views expressed are subject to change at any time in response to changing circumstances in the market. Wells Fargo Funds Management, LLC and the Fund disclaim any obligation to publicly update or revise any views expressed or forward-looking statements.
NOT FDIC INSURED ¡ NO BANK GUARANTEE ¡ MAY LOSE VALUE
| | | | |
| 2 | | Wells Fargo Advantage Conservative Income Fund | | Letter to shareholders (unaudited) |

Karla M. Rabusch
President
Wells Fargo Advantage Funds
Fixed-income markets shifted during the period, driven by vacillations between U.S. Treasury yield increases and subsequent declines.
Reassurances from the Fed that a highly accommodative monetary policy would continue throughout 2014 inspired price rallies across both the investment-grade and high-yield bond markets.
Dear Valued Shareholder:
We are pleased to offer you this semi-annual report for the Wells Fargo Advantage Conservative Income Fund for the six-month period that ended February 28, 2014. Fixed-income markets shifted during the period, driven by vacillations between U.S. Treasury yield increases and subsequent declines. However, on the whole, investment-grade (measured by the Barclays U.S. Aggregate Bond Index1) and high-yield markets (measured by the Barclays U.S. High Yield Bond Index2) generated positive returns during the period, notably benefiting from the strong price improvement and declining U.S. Treasury yields that occurred in September and October of 2013 as well as the opening months of 2014. Although the returns of the U.S. high-yield market have often been positively correlated with U.S. equity returns (measured by the S&P 500 Index3) over the long-run, over the period, high-yield (measured by the Barclays U.S. High Yield Bond Index) generally performed well even when equities did not. The lower-rated corporate bond credit tiers outperformed the respectively higher-rated investment-grade credit tiers during the period.
A decline in bond prices was halted by the Fed’s postponement of tapering its bond-buying program.
Before the six-month period began, equity markets rallied, most notably in May and June of 2013. This led to a sharp increase in U.S. Treasury yields and declining valuations for much of the fixed-income markets (measured by the Barclays U.S. Aggregate Bond Index). However, in July and August 2013, that equity exuberance quieted a bit, and fixed-income markets stabilized. Returns across the fixed-income markets were largely negative in investment-grade and high-yield markets but modest in comparison with the declines in May and June of 2013.
But, by September and October of 2013, investment-grade and high-yield bond markets began generating positive returns yet again, as the Federal Reserve (Fed) backtracked on its intentions to taper its quantitative easing program, postponing it until 2014, at the earliest. This created a temporary rally in bonds that lasted until around November 20, 2013, when notes were released from the Fed’s October 2013 meeting that tapering of the bond-buying programs would not be postponed beyond January 2014. In response, long-term U.S. Treasury yields and mortgage rates ratcheted higher on expectations for an unwinding of monetary accommodation in the upcoming months. This led to declines in pricing across much of the core fixed-income markets (measured by the Barclays U.S. Aggregate Bond Index). U.S. high-yield markets were better able to absorb the shift in U.S. Treasury yields and continued to provide positive returns along with rallies in the equity markets.
Favorable conditions for fixed-income markets were restored in January and February 2014.
Seemingly much to the surprise of many everyday investors and seasoned investment professionals alike, fixed-income markets (measured by the Barclays U.S. Aggregate Bond Index) largely outperformed U.S. equity markets (measured by the S&P 500 Index) during the opening months of 2014. A pullback in equity exuberance in January and reassurances from the Fed that a highly accommodative monetary policy would continue throughout 2014 inspired price rallies across both the investment-grade and high-yield bond markets. U.S. Treasury yields declined in January 2014 and corporate bonds and mortgage-backed securities performed notably well. U.S. high-yield securities generated positive returns in January 2014 but lagged the rally across the investment-grade bond markets. This theme reversed in February 2014, as high-yield sectors rallied and investment-grade sectors performed well but not to the extent of the lowest-rated credit tiers.
| | | | | | |
| Letter to shareholders (unaudited) | | Wells Fargo Advantage Conservative Income Fund | | | 3 | |
One positive takeaway for bond investors that helped fuel the fixed-income (measured by the Barclays U.S. Aggregate Bond Index) rallies was former Fed Chairman Bernanke’s guidance at the end of 2013. He indicated that the tapering of the Fed’s bond-buying program would proceed at a slow pace and that a reduction in quantitative easing should not be equivocated with a tightening of monetary policy. The distinction was important—although the bond-buying program was declining in volume, it was, nonetheless, still continuing. Additionally, the federal funds target rate would remain unchanged for the foreseeable future, with the implications that it would not increase until the bond-buying program was fully disbanded. These were important statements for fixed-income investors that helped bolster U.S. fixed-income valuations in the opening months of 2014.
Don’t let short-term uncertainty derail long-term investment goals.
Periods of investment uncertainty can present challenges, but experience has taught us that maintaining long-term investment goals can be an effective way to plan for the future. To help you create a sound strategy based on your personal goals and risk tolerance, Wells Fargo Advantage Funds offers more than 100 mutual funds and other investments spanning a wide range of asset classes and investment styles. Although diversification cannot guarantee an investment profit or prevent losses, we believe it can be an effective way to manage investment risk and potentially smooth out overall portfolio performance. We encourage investors to know their investments and to understand that appropriate levels of risk-taking may unlock opportunities.
Thank you for choosing to invest with Wells Fargo Advantage Funds. We appreciate your confidence in us and remain committed to helping you meet your financial needs. For current information about your fund investments, contact your investment professional, visit our website at wellsfargoadvantagefunds.com, or call us directly at 1-800-222-8222. We are available 24 hours a day, 7 days a week.
Sincerely,

Karla M. Rabusch
President
Wells Fargo Advantage Funds
| 1. | The Barclays U.S. Aggregate Bond Index is a broad-based benchmark that measures the investment-grade, U.S. dollar-denominated, fixed-rate taxable bond market, including Treasuries, government-related and corporate securities, MBS (agency fixed-rate and hybrid ARM passthroughs), ABS, and CMBS. You cannot invest directly in an index. |
| 2. | The Barclays U.S. High Yield Bond Index is an index consisting of all domestic and Yankee bonds, rated below investment grade, with a minimum outstanding amount of $100 million and maturing over one year. You cannot invest directly in an index. |
| 3. | The S&P 500 Index consists of 500 stocks chosen for market size, liquidity, and industry group representation. It is a market-value-weighted index with each stock’s weight in the index proportionate to its market value. You cannot invest directly in an index. |
| | | | |
| 4 | | Wells Fargo Advantage Conservative Income Fund | | Letter to shareholders (unaudited) |
Notice to shareholders
The Fund and Wells Fargo Funds Management, LLC (“Funds Management”) have received an exemptive order from the SEC that permits Funds Management, subject to the approval of the Board of Trustees of the Fund, to select or replace certain subadvisers to manage all or a portion of the Fund’s assets and enter into, amend or terminate a sub-advisory agreement with certain subadvisers without obtaining shareholder approval (“Multi-manager Structure”). The Multi-manager Structure applies to subadvisers that are not affiliated with Funds Management or the Fund, except to the extent that affiliation arises solely because such subadvisers provide sub-advisory services to the Fund (“Non-affiliated Subadvisers”), as well as subadvisers that are indirect or direct wholly-owned subsidiaries of Funds Management or of another company that, indirectly or directly, wholly owns Funds Management (“Wholly-owned Subadvisers”).
Pursuant to the SEC order, Funds Management, with the approval of the Board of Trustees, has the discretion to terminate any subadvisers and allocate and reallocate the Fund’s assets among any other Non-affiliated Subadvisers or Wholly-owned Subadvisers. Funds Management, subject to oversight and supervision by the Board of Trustees, has responsibility to continue to oversee any subadvisers to the Fund and to recommend, for approval by the Board of Trustees, the hiring, termination and replacement of subadvisers for the Fund. In the event that a new subadviser is hired pursuant to the Multi-manager Structure, the Fund is required to provide notice to shareholders within 90 days.
Please contact your investment professional or call us directly at 1-800-222-8222 if you have any questions on this Notice to Shareholders.
This page is intentionally left blank.
| | | | |
| 6 | | Wells Fargo Advantage Conservative Income Fund | | Performance highlights (unaudited) |
Investment objective
The Fund seeks current income consistent with capital preservation.
Adviser
Wells Fargo Funds Management, LLC
Subadviser
Wells Capital Management Incorporated
Portfolio managers
Andrew M. Greenberg, CFA
Anthony J. Melville, CFA
Jeffrey L. Weaver, CFA
Average annual total returns (%) as of February 28, 2014
| | | | | | | | | | | | | | | | |
| | | | | | | | | | Expense ratios1 (%) | |
| | | Inception date | | Since inception | | | | | Gross | | | Net2 | |
| Institutional Class (WCIIX) | | 5-31-2013 | | | 0.52 | | | | | | 0.74 | | | | 0.27 | |
| Barclays 6-9 Month Treasury Bill Index3 | | – | | | 0.08 | | | | | | – | | | | – | |
Figures quoted represent past performance, which is no guarantee of future results, and do not reflect taxes that a shareholder may pay on fund distributions or the redemption of fund shares. Investment return and principal value of an investment will fluctuate so that an investor’s shares, when redeemed, may be worth more or less than their original cost. Performance shown without sales charges would be lower if sales charges were reflected. Current performance may be lower or higher than the performance data quoted, which assumes the reinvestment of dividends and capital gains. Current month-end performance is available on the Fund’s website, wellsfargoadvantagefunds.com.
Index returns do not include transaction costs associated with buying and selling securities, any mutual fund fees or expenses, or any taxes. It is not possible to invest directly in an index.
Institutional Class shares are sold without a front-end sales charge or contingent deferred sales charge.
Bond values fluctuate in response to the financial condition of individual issuers, general market and economic conditions, and changes in interest rates. In general, when interest rates rise, bond values fall and investors may lose principal value. The use of derivatives may reduce returns and/or increase volatility. Certain investment strategies tend to increase the total risk of an investment (relative to the broader market). The Fund is exposed to foreign investment risk, mortgage- and asset-backed securities risk and municipal securities risk. Consult the Fund’s prospectus for additional information on these and other risks.
Please see footnotes on page 7.
| | | | | | |
| Performance highlights (unaudited) | | Wells Fargo Advantage Conservative Income Fund | | | 7 | |
| | | | |
| Ten largest long-term holdings4 (%) as of February 28, 2014 | |
Fifth Third Auto Trust 2014-1 Class A2, 0.46%, 8-15-2016 | | | 1.90 | |
ABN Amro Bank NV, 1.04%, 10-28-2016 | | | 1.53 | |
Ford Credit Auto Owner Trust Series 2013-B Class A3, 0.76%, 9-15-2016 | | | 1.53 | |
JPMorgan Chase & Company, 0.76%, 2-15-2017 | | | 1.53 | |
Suffolk County NY TAN Series I, 1.50%, 8-14-2014 | | | 1.53 | |
CarMax Auto Owner Trust Series 2013-3 Class A2,
0.59%, 8-15-2016 | | | 1.52 | |
Credit Suisse NY, 0.56%, 8-24-2015 | | | 1.52 | |
Volvo Financial Equipment LLC Series 2014-1A Class A2, 0.54%, 11-15-2016 | | | 1.52 | |
Citibank Credit Card Issuance Trust Series 2004-A8, 4.90%, 12-12-2016 | | | 1.40 | |
HSBC Finance Corporation, 5.00%, 6-30-2015 | | | 1.25 | |
| | | | |
| Portfolio allocation5 as of February 28, 2014 |
| |
| | 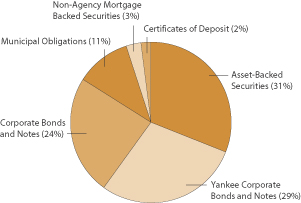
|
| 1. | Reflects the expense ratio as stated in the most recent prospectus. The expense ratio shown is subject to change and may differ from the annualized expense ratio shown in the financial highlights of this report. |
| 2. | The Adviser has committed through December 31, 2014, to waive fees and/or reimburse expenses to the extent necessary to cap the Fund’s Total Annual Fund Operating Expenses After Fee Waiver, excluding certain expenses, at the amount shown. Brokerage commissions, stamp duty fees, interest, taxes, acquired fund fees and expenses, and extraordinary expenses are excluded from the cap. Without this cap, the Fund’s returns would have been lower. |
| 3. | The Barclays 6–9 Month Treasury Bill Index includes all publicly issued zero-coupon U.S. Treasury bills that have a remaining maturity of less than nine months and more than six, are rated investment-grade, and have $250 million or more of outstanding face value. You cannot invest directly in an index. |
| 4. | The ten largest long-term holdings are calculated based on the value of the securities divided by total net assets of the Fund. Holdings are subject to change and may have changed since the date specified. |
| 5. | Portfolio allocation is subject to change and is calculated based on the total long-term investments of the Fund. |
| | | | |
| 8 | | Wells Fargo Advantage Conservative Income Fund | | Fund expenses (unaudited) |
As a shareholder of the Fund, you incur ongoing costs and other Fund expenses. This example is intended to help you understand your ongoing costs (in dollars) of investing in the Fund and to compare these costs with the ongoing costs of investing in other mutual funds.
The example is based on an investment of $1,000 invested at the beginning of the six-month period and held for the entire period from September 1, 2013 to February 28, 2014.
Actual expenses
The “Actual” line of the table below provides information about actual account values and actual expenses. You may use the information in this line, together with the amount you invested, to estimate the expenses that you paid over the period. Simply divide your account value by $1,000 (for example, an $8,600 account value divided by $1,000 = 8.6), then multiply the result by the number in the “Actual” line under the heading entitled “Expenses paid during period” for your applicable class of shares to estimate the expenses you paid on your account during this period.
Hypothetical example for comparison purposes
The “Hypothetical” line of the table below provides information about hypothetical account values and hypothetical expenses based on the Fund’s actual expense ratio and an assumed rate of return of 5% per year before expenses, which is not the Fund’s actual return. The hypothetical account values and expenses may not be used to estimate the actual ending account balance or expenses you paid for the period. You may use this information to compare the ongoing costs of investing in the Fund and other funds. To do so, compare this 5% hypothetical example with the 5% hypothetical examples that appear in the shareholder reports of the other funds.
Please note that the expenses shown in the table are meant to highlight your ongoing costs only and do not reflect any transactional costs, such as sales charges (loads) and contingent deferred sales charges. Therefore, the “Hypothetical” line of the table is useful in comparing ongoing costs only and will not help you determine the relative total costs of owning different funds. In addition, if these transactional costs were included, your costs would have been higher.
| | | | | | | | | | | | | | | | |
| | | Beginning
account value
9-1-2013 | | | Ending
account value
2-28-2014 | | | Expenses
paid during
the period1 | | | Net annualized
expense ratio | |
Institutional Class | | | | | | | | | | | | | | | | |
Actual | | $ | 1,000.00 | | | $ | 1,005.15 | | | $ | 1.34 | | | | 0.27 | % |
Hypothetical (5% return before expenses) | | $ | 1,000.00 | | | $ | 1,023.46 | | | $ | 1.35 | | | | 0.27 | % |
| 1. | Expenses paid is equal to the annualized expense ratio multiplied by the average account value over the period, multiplied by the number of days in the most recent fiscal half-year divided by the number of days in the fiscal year (to reflect the one-half-year period). |
| | | | | | |
| Portfolio of investments—February 28, 2014 (unaudited) | | Wells Fargo Advantage Conservative Income Fund | | | 9 | |
| | | | | | | | | | | | | | | | |
| Security name | | Interest rate | | | Maturity date | | | Principal | | | Value | |
| | | | |
Asset-Backed Securities: 22.11% | | | | | | | | | | | | | | | | |
Ally Auto Receivables Trust Series 2012-3 Class A2 | | | 0.52 | % | | | 5-20-2015 | | | $ | 414,033 | | | $ | 414,040 | |
Cards II Trust Series 2012-4A Class A ±144A | | | 0.60 | | | | 9-15-2017 | | | | 1,000,000 | | | | 1,000,860 | |
CarMax Auto Owner Trust Series 2013-3 Class A2 | | | 0.59 | | | | 8-15-2016 | | | | 2,000,000 | | | | 2,002,382 | |
Citibank Credit Card Issuance Trust Series 2004-A8 | | | 4.90 | | | | 12-12-2016 | | | | 1,775,000 | | | | 1,838,579 | |
Fifth Third Auto Trust 2014-1 Class A2 | | | 0.46 | | | | 8-15-2016 | | | | 2,500,000 | | | | 2,500,100 | |
Ford Credit Auto Owner Trust Series 2013-B Class A3 | | | 0.76 | | | | 9-15-2016 | | | | 2,000,000 | | | | 2,006,784 | |
Golden Credit Card Trust Series 2012-5A Class A 144A | | | 0.79 | | | | 9-15-2017 | | | | 1,000,000 | | | | 1,001,949 | |
Hyundai Auto Lease Securitization Trust Series 2013-A Class A3 144A | | | 0.66 | | | | 6-15-2016 | | | | 1,250,000 | | | | 1,251,799 | |
Hyundai Auto Lease Securitization Trust Series 2013-B Class A3 144A | | | 0.98 | | | | 10-17-2016 | | | | 600,000 | | | | 603,236 | |
M&T Bank Auto Receivables Trust Series 2013-1A Class A2 144A | | | 0.66 | | | | 2-16-2016 | | | | 1,000,000 | | | | 1,001,330 | |
M&T Bank Auto Receivables Trust Series 2013-1A Class A3 144A | | | 1.06 | | | | 11-15-2017 | | | | 1,200,000 | | | | 1,209,797 | |
Mercedes-Benz Auto Lease Trust Series 2013-B Class A2 | | | 0.53 | | | | 9-15-2015 | | | | 250,000 | | | | 250,207 | |
Mercedes-Benz Auto Lease Trust Series 2013-B Class A3 | | | 0.62 | | | | 7-15-2016 | | | | 1,000,000 | | | | 1,000,690 | |
Nissan Auto Lease Trust Series 2012-B Class A2A | | | 0.45 | | | | 6-15-2015 | | | | 195,629 | | | | 195,633 | |
Nissan Auto Lease Trust Series 2013-B Class A3 | | | 0.75 | | | | 6-15-2016 | | | | 1,000,000 | | | | 1,002,895 | |
Penarth Master Issuer Series 2012-1A Class A ±144A | | | 0.72 | | | | 3-18-2014 | | | | 1,000,000 | | | | 1,000,106 | |
Penarth Master Issuer Series 2013-1A Class A1 ±144A | | | 0.54 | | | | 11-18-2017 | | | | 1,000,000 | | | | 1,001,378 | |
Porsche Innovative Lease Owner Pilot Trust Series 2013-1 Class A2 144A | | | 0.54 | | | | 1-22-2016 | | | | 1,510,000 | | | | 1,511,416 | |
Smart Trust Series 2011-4USA Class A3A 144A | | | 1.81 | | | | 11-14-2015 | | | | 542,499 | | | | 544,882 | |
USAA Auto Owner Trust 2014-1 Clas A2 | | | 0.38 | | | | 10-17-2016 | | | | 1,500,000 | | | | 1,499,959 | |
Volkswagen Auto Lease Trust Series 2013-A Class A2A | | | 0.63 | | | | 12-21-2015 | | | | 535,624 | | | | 536,418 | |
Volkswagen Auto Lease Trust Series 2014-A Class A2A | | | 0.52 | | | | 10-20-2016 | | | | 1,500,000 | | | | 1,503,935 | |
Volvo Financial Equipment LLC Series 2014-1A Class A2 144A%% | | | 0.54 | | | | 11-15-2016 | | | | 2,000,000 | | | | 1,999,994 | |
World Omni Automobile Lease Securitization Trust Series 2012-A Class A3 | | | 0.93 | | | | 11-16-2015 | | | | 996,894 | | | | 999,093 | |
World Omni Automobile Receivables Trust Series 2013-B Class A2 | | | 0.48 | | | | 11-15-2016 | | | | 1,175,000 | | | | 1,175,605 | |
| | | | |
Total Asset-Backed Securities (Cost $29,034,510) | | | | | | | | | | | | | | | 29,053,067 | |
| | | | | | | | | | | | | | | | |
| | | | |
Certificates of Deposit: 1.52% | | | | | | | | | | | | | | | | |
Credit Suisse NY ± | | | 0.56 | | | | 8-24-2015 | | | | 2,000,000 | | | | 2,000,000 | |
| | | | | | | | | | | | | | | | |
| | | | |
Total Certificates of Deposit (Cost $2,000,000) | | | | | | | | | | | | | | | 2,000,000 | |
| | | | | | | | | | | | | | | | |
| | | | |
Corporate Bonds and Notes: 17.50% | | | | | | | | | | | | | | | | |
| | | | |
Consumer Discretionary: 1.66% | | | | | | | | | | | | | | | | |
| | | | |
| Automobiles: 0.47% | | | | | | | | | | | | | | | | |
American Honda Finance ± | | | 0.74 | | | | 10-7-2016 | | | | 615,000 | | | | 619,749 | |
| | | | | | | | | | | | | | | | |
| | | | |
| Media: 1.19% | | | | | | | | | | | | | | | | |
NBCUniversal Media LLC | | | 3.65 | | | | 4-30-2015 | | | | 1,500,000 | | | | 1,554,746 | |
| | | | | | | | | | | | | | | | |
| | | | |
Financials: 12.30% | | | | | | | | | | | | | | | | |
| | | | |
| Banks: 0.38% | | | | | | | | | | | | | | | | |
Union Bank NA ± | | | 1.00 | | | | 9-26-2016 | | | | 500,000 | | | | 504,824 | |
| | | | | | | | | | | | | | | | |
| | | | |
| Capital Markets: 4.64% | | | | | | | | | | | | | | | | |
Daimler Finance NA LLC 144A | | | 2.30 | | | | 1-9-2015 | | | | 1,030,000 | | | | 1,045,589 | |
Goldman Sachs Group Incorporated | | | 3.30 | | | | 5-3-2015 | | | | 1,250,000 | | | | 1,287,049 | |
Goldman Sachs Group Incorporated | | | 3.70 | | | | 8-1-2015 | | | | 600,000 | | | | 623,827 | |
Macquarie Group Limited 144A | | | 7.30 | | | | 8-1-2014 | | | | 1,000,000 | | | | 1,027,307 | |
Merrill Lynch & Company | | | 5.30 | | | | 9-30-2015 | | | | 595,000 | | | | 634,243 | |
The accompanying notes are an integral part of these financial statements.
| | | | |
| 10 | | Wells Fargo Advantage Conservative Income Fund | | Portfolio of investments—February 28, 2014 (unaudited) |
| | | | | | | | | | | | | | | | |
| Security name | | Interest rate | | | Maturity date | | | Principal | | | Value | |
| | | | |
| Capital Markets (continued) | | | | | | | | | | | | | | | | |
Morgan Stanley | | | 6.00 | % | | | 4-28-2015 | | | $ | 1,400,000 | | | $ | 1,484,433 | |
| | | | |
| | | | | | | | | | | | | | | 6,102,448 | |
| | | | | | | | | | | | | | | | |
| | | | |
| Consumer Finance: 1.95% | | | | | | | | | | | | | | | | |
American Express Credit Corporation | | | 2.75 | | | | 9-15-2015 | | | | 521,000 | | | | 538,323 | |
Daimler Finance NA LLC 144A | | | 1.65 | | | | 4-10-2015 | | | | 375,000 | | | | 378,881 | |
HSBC Finance Corporation | | | 5.00 | | | | 6-30-2015 | | | | 1,560,000 | | | | 1,644,082 | |
| | | | |
| | | | | | | | | | | | | | | 2,561,286 | |
| | | | | | | | | | | | | | | | |
| | | | |
| Diversified Financial Services: 4.75% | | | | | | | | | | | | | | | | |
Bank of America Corporation ± | | | 0.71 | | | | 2-14-2017 | | | | 250,000 | | | | 249,929 | |
Bank of America Corporation | | | 4.50 | | | | 4-1-2015 | | | | 500,000 | | | | 520,197 | |
Bank of America Corporation | | | 5.00 | | | | 1-15-2015 | | | | 450,000 | | | | 466,747 | |
BHP Billiton Finance USA Limited | | | 1.13 | | | | 11-21-2014 | | | | 515,000 | | | | 518,299 | |
Citigroup Incorporated ± | | | 0.92 | | | | 11-15-2016 | | | | 500,000 | | | | 502,469 | |
Citigroup Incorporated ± | | | 1.20 | | | | 7-25-2016 | | | | 500,000 | | | | 505,577 | |
Citigroup Incorporated | | | 2.25 | | | | 8-7-2015 | | | | 500,000 | | | | 510,079 | |
General Electric Capital Corporation | | | 3.50 | | | | 6-29-2015 | | | | 925,000 | | | | 961,975 | |
JPMorgan Chase & Company ± | | | 0.76 | | | | 2-15-2017 | | | | 2,000,000 | | | | 2,004,094 | |
| | | | |
| | | | | | | | | | | | | | | 6,239,366 | |
| | | | | | | | | | | | | | | | |
| | | | |
| Insurance: 0.58% | | | | | | | | | | | | | | | | |
New York Life Global Funding 144A | | | 1.30 | | | | 1-12-2015 | | | | 750,000 | | | | 756,310 | |
| | | | | | | | | | | | | | | | |
| | | | |
Health Care: 0.76% | | | | | | | | | | | | | | | | |
| | | | |
| Health Care Providers & Services: 0.76% | | | | | | | | | | | | | | | | |
Providence Health & Services Obligated Group ± | | | 0.90 | | | | 10-1-2015 | | | | 1,000,000 | | | | 998,291 | |
| | | | | | | | | | | | | | | | |
| | | | |
Information Technology: 1.14% | | | | | | | | | | | | | | | | |
| | | | |
| Communications Equipment: 1.14% | | | | | | | | | | | | | | | | |
Cisco Systems Incorporated ±%% | | | 0.52 | | | | 3-3-2017 | | | | 1,500,000 | | | | 1,503,569 | |
| | | | | | | | | | | | | | | | |
| | | | |
Utilities: 1.64% | | | | | | | | | | | | | | | | |
| | | | |
| Electric Utilities: 1.64% | | | | | | | | | | | | | | | | |
Commonwealth Edison Company | | | 4.70 | | | | 4-15-2015 | | | | 524,000 | | | | 547,147 | |
Public Service Colorado | | | 5.50 | | | | 4-1-2014 | | | | 1,600,000 | | | | 1,606,008 | |
| | | | |
| | | | | | | | | | | | | | | 2,153,155 | |
| | | | | | | | | | | | | | | | |
| | | | |
Total Corporate Bonds and Notes (Cost $22,938,976) | | | | | | | | | | | | | | | 22,993,744 | |
| | | | | | | | | | | | | | | | |
| | | | |
Municipal Obligations: 8.26% | | | | | | | | | | | | | | | | |
| | | | |
| California: 3.03% | | | | | | | | | | | | | | | | |
California (GO) | | | 0.85 | | | | 2-1-2015 | | | | 1,000,000 | | | | 1,004,640 | |
California (GO) | | | 5.10 | | | | 8-1-2014 | | | | 350,000 | | | | 357,084 | |
Irvine Ranch CA Water District (Water & Sewer Revenue) | | | 2.39 | | | | 3-15-2014 | | | | 565,000 | | | | 565,458 | |
Northern California Transmission Refunding Oregon Project Series B (Utilities Revenue) | | | 5.37 | | | | 5-1-2015 | | | | 1,000,000 | | | | 1,057,510 | |
University of California Series Y-1 (Education Revenue) ± | | | 0.74 | | | | 7-1-2041 | | | | 1,000,000 | | | | 1,000,060 | |
| | | | |
| | | | | | | | | | | | | | | 3,984,752 | |
| | | | | | | | | | | | | | | | |
The accompanying notes are an integral part of these financial statements.
| | | | | | |
| Portfolio of investments—February 28, 2014 (unaudited) | | Wells Fargo Advantage Conservative Income Fund | | | 11 | |
| | | | | | | | | | | | | | | | |
| Security name | | Interest rate | | | Maturity date | | | Principal | | | Value | |
| | | | |
| Illinois: 1.43% | | | | | | | | | | | | | | | | |
Chicago IL Midway Airport Series C (Airport Revenue) | | | 1.32 | % | | | 1-1-2016 | | | $ | 600,000 | | | $ | 608,562 | |
Illinois (GO) | | | 4.96 | | | | 3-1-2016 | | | | 1,175,000 | | | | 1,265,369 | |
| | | | |
| | | | | | | | | | | | | | | 1,873,931 | |
| | | | | | | | | | | | | | | | |
| | | | |
| Indiana: 0.38% | | | | | | | | | | | | | | | | |
Indiana Bond Bank Taxable School Severance Funding (Miscellaneous Revenue) | | | 0.66 | | | | 1-15-2015 | | | | 500,000 | | | | 502,415 | |
| | | | | | | | | | | | | | | | |
| | | |
| New Jersey: 0.77% | | | | | | | | | | | | | |
New Jersey Building Authority Series B (Miscellaneous Revenue) | | | 0.75 | | | | 6-15-2015 | | | | 1,000,000 | | | | 1,006,190 | |
| | | | | | | | | | | | | | | | |
| | | |
| New York: 1.53% | | | | | | | | | | | | | |
Suffolk County NY TAN Series I (GO) | | | 1.50 | | | | 8-14-2014 | | | | 2,000,000 | | | | 2,010,780 | |
| | | | | | | | | | | | | | | | |
| | | |
| Ohio: 0.27% | | | | | | | | | | | | | |
JobsOhio Beverage Systems Statewide Liquor Profits Senior Lien Series 2013-B (Miscellaneous Revenue) | | | 0.87 | | | | 1-1-2015 | | | | 350,000 | | | | 351,652 | |
| | | | | | | | | | | | | | | | |
| | | |
| South Carolina: 0.85% | | | | | | | | | | | | | |
Lancaster SC Educational Assistance Program Incorporated Installment Purchase Refunding Bonds School District Series 2013-A (Miscellaneous Revenue) | | | 0.73 | | | | 12-1-2014 | | | | 355,000 | | | | 356,367 | |
South Carolina State Public Service Authority Series D (GO) ± | | | 1.03 | | | | 6-1-2015 | | | | 760,000 | | | | 763,374 | |
| | | | |
| | | | | | | | | | | | | | | 1,119,741 | |
| | | | | | | | | | | | | | | | |
| | | | |
Total Municipal Obligations (Cost $10,788,691) | | | | | | | | | | | | | | | 10,849,461 | |
| | | | | | | | | | | | | | | | |
| | | |
Non-Agency Mortgage Backed Securities: 2.43% | | | | | | | | | | | | | |
Bear Stearns Commercial Mortgage Securities Incorporated Series 2005-T20 Class A4A ± | | | 5.14 | | | | 10-12-2042 | | | | 920,000 | | | | 972,612 | |
Citigroup/Deutsche Bank Commercial Mortgage Trust Pass-Through Certificate Series 2005-CD1 Class A4 ± | | | 5.22 | | | | 7-15-2044 | | | | 500,000 | | | | 527,829 | |
Commercial Mortgage Trust Pass-Through Ceriificate Series 2005-C6 Class A5A ± | | | 5.12 | | | | 6-10-2044 | | | | 599,273 | | | | 628,661 | |
JPMorgan Chase Commercial Mortgage Securities Trust Series 2005-LDP3 Class A4A ± | | | 4.94 | | | | 8-15-2042 | | | | 497,766 | | | | 520,389 | |
JPMorgan Chase Commercial Mortgage Securities Trust Series 2005-LDP5 Class A4 ± | | | 5.24 | | | | 12-15-2044 | | | | 515,000 | | | | 546,136 | |
| | | | |
Total Non-Agency Mortgage Backed Securities (Cost $3,190,082) | | | | | | | | | | | | | | | 3,195,627 | |
| | | | | | | | | | | | | | | | |
| | | | |
Yankee Corporate Bonds and Notes: 20.95% | | | | | | | | | | | | | | | | |
| | | | |
Consumer Discretionary: 1.15% | | | | | | | | | | | | | | | | |
| | | |
| Automobiles: 1.15% | | | | | | | | | | | | | |
Volkswagen International Finance NV 144A | | | 1.63 | | | | 3-22-2015 | | | | 1,500,000 | | | | 1,515,162 | |
| | | | | | | | | | | | | | | | |
| | | |
Consumer Staples: 1.23% | | | | | | | | | | | | | |
| | | |
| Tobacco: 1.23% | | | | | | | | | | | | | |
BAT International Finance plc 144A | | | 1.40 | | | | 6-5-2015 | | | | 1,600,000 | | | | 1,615,837 | |
| | | | | | | | | | | | | | | | |
| | | | |
Energy: 0.71% | | | | | | | | | | | | | | | | |
| | | | |
| Oil, Gas & Consumable Fuels: 0.71% | | | | | | | | | | | | | | | | |
BP Capital Markets plc | | | 3.88 | | | | 3-10-2015 | | | | 900,000 | | | | 932,032 | |
| | | | | | | | | | | | | | | | |
The accompanying notes are an integral part of these financial statements.
| | | | |
| 12 | | Wells Fargo Advantage Conservative Income Fund | | Portfolio of investments—February 28, 2014 (unaudited) |
| | | | | | | | | | | | | | | | |
| Security name | | Interest rate | | | Maturity date | | | Principal | | | Value | |
| | | |
Financials: 16.03% | | | | | | | | | | | | | |
| | | |
| Banks: 13.53% | | | | | | | | | | | | | |
ABN Amro Bank NV ±144A | | | 1.04 | % | | | 10-28-2016 | | | $ | 2,000,000 | | | $ | 2,010,004 | |
ANZ New Zealand International Limited of London 144A | | | 1.85 | | | | 10-15-2015 | | | | 1,050,000 | | | | 1,070,012 | |
Banque Federative du Credit Mutuel SA ±144A | | | 1.09 | | | | 1-20-2017 | | | | 1,000,000 | | | | 1,000,287 | |
Barclays Bank plc | | | 5.20 | | | | 7-10-2014 | | | | 750,000 | | | | 762,524 | |
Export-Import Bank of Korea ± | | | 0.99 | | | | 1-14-2017 | | | | 500,000 | | | | 503,535 | |
Export-Import Bank of Korea | | | 5.88 | | | | 1-14-2015 | | | | 750,000 | | | | 783,539 | |
ING Bank NV 144A | | | 2.00 | | | | 9-25-2015 | | | | 1,000,000 | | | | 1,017,364 | |
Kookmin Bank ±144A | | | 1.11 | | | | 1-27-2017 | | | | 1,000,000 | | | | 1,003,860 | |
Kookmin Bank ±144A | | | 1.49 | | | | 10-11-2016 | | | | 500,000 | | | | 506,540 | |
Lloyds TSB Bank plc 144A | | | 4.38 | | | | 1-12-2015 | | | | 1,500,000 | | | | 1,547,403 | |
Macquarie Bank Limited 144A | | | 3.45 | | | | 7-27-2015 | | | | 1,000,000 | | | | 1,034,364 | |
National Australia Bank of New York ± | | | 0.79 | | | | 7-25-2016 | | | | 700,000 | | | | 703,841 | |
Nationwide Building Society 144A | | | 4.65 | | | | 2-25-2015 | | | | 1,500,000 | | | | 1,555,140 | |
Rabobank Nederland 144A | | | 3.20 | | | | 3-11-2015 | | | | 900,000 | | | | 925,371 | |
Royal Bank of Scotland plc | | | 4.88 | | | | 3-16-2015 | | | | 850,000 | | | | 885,360 | |
Royal Bank of Scotland plc 144A | | | 4.88 | | | | 8-25-2014 | | | | 500,000 | | | | 509,698 | |
Sumitomo Mitsui Trust Bank Limited ±144A | | | 1.02 | | | | 9-16-2016 | | | | 750,000 | | | | 755,075 | |
Svenska Handelsbanken AB ± | | | 0.72 | | | | 9-23-2016 | | | | 700,000 | | | | 703,193 | |
Westpac Banking Corporation ± | | | 0.66 | | | | 11-25-2016 | | | | 500,000 | | | | 501,749 | |
| | | | | | | | | | | | | | | 17,778,859 | |
| | | | | | | | | | | | | | | | |
| | | |
| Diversified Financial Services: 2.50% | | | | | | | | | | | | | |
Abbey National Treasury Services plc | | | 2.88 | | | | 4-25-2014 | | | | 500,000 | | | | 501,748 | |
Abbey National Treasury Services plc 144A | | | 3.88 | | | | 11-10-2014 | | | | 1,250,000 | | | | 1,278,810 | |
Deutsche Bank AG London | | | 3.88 | | | | 8-18-2014 | | | | 500,000 | | | | 507,957 | |
UBS AG (Stamford) | | | 3.88 | | | | 1-15-2015 | | | | 961,000 | | | | 989,730 | |
| | | | |
| | | | | | | | | | | | | | | 3,278,245 | |
| | | | | | | | | | | | | | | | |
| | | |
Materials: 0.39% | | | | | | | | | | | | | |
| | | | |
| Metals & Mining: 0.39% | | | | | | | | | | | | | | | | |
Rio Tinto Finance USA Limited | | | 8.95 | | | | 5-1-2014 | | | | 500,000 | | | | 506,602 | |
| | | | | | | | | | | | | | | | |
| | | |
Telecommunication Services: 1.05% | | | | | | | | | | | | | |
| | | |
| Wireless Telecommunication Services: 1.05% | | | | | | | | | | | | | |
America Movil SAB de CV ± | | | 1.24 | | | | 9-12-2016 | | | | 850,000 | | | | 861,455 | |
America Movil SAB de CV | | | 5.75 | | | | 1-15-2015 | | | | 500,000 | | | | 520,625 | |
| | | | |
| | | | | | | | | | | | | | | 1,382,080 | |
| | | | | | | | | | | | | | | | |
| | | |
Utilities: 0.39% | | | | | | | | | | | | | |
| | | |
| Electric Utilities: 0.39% | | | | | | | | | | | | | |
Korea Electric Power Corporation 144A | | | 5.50 | | | | 7-21-2014 | | | | 500,000 | | | | 508,897 | |
| | | | | | | | | | | | | | | | |
| | | | |
Total Yankee Corporate Bonds and Notes (Cost $27,438,355) | | | | | | | | | | | | | | | 27,517,714 | |
| | | | | | | | | | | | | | | | |
| | | |
Short-Term Investments: 29.58% | | | | | | | | | | | | | |
| | | |
| Commercial Paper: 26.88% | | | | | | | | | | | | | |
Anglesea Funding LLC 144A(p) | | | 0.35 | | | | 5-28-2014 | | | | 2,000,000 | | | | 1,998,328 | |
The accompanying notes are an integral part of these financial statements.
| | | | | | |
| Portfolio of investments—February 28, 2014 (unaudited) | | Wells Fargo Advantage Conservative Income Fund | | | 13 | |
| | | | | | | | | | | | | | | | |
| Security name | | Interest rate | | | Maturity date | | | Principal | | | Value | |
| | | |
| Commercial Paper (continued) | | | | | | | | | | | | | |
Antalis US Funding Corporation 144A(p) | | | 0.01 | % | | | 5-5-2014 | | | $ | 900,000 | | | $ | 899,654 | |
Atlantic Asset Securitization LLC 144A | | | 0.21 | | | | 4-15-2014 | | | | 1,500,000 | | | | 1,499,624 | |
Bedford Row Funding Corporation 144A(p) | | | 0.28 | | | | 5-19-2014 | | | | 1,250,000 | | | | 1,249,251 | |
Bennington Stark Capital Company LLC 144A(p) | | | 0.44 | | | | 6-2-2014 | | | | 2,200,000 | | | | 2,197,495 | |
CNPC Finance (HK) Limited 144A(p) | | | 0.38 | | | | 4-15-2014 | | | | 2,500,000 | | | | 2,498,806 | |
Collateralized Commercial Paper Company II LLC (p) | | | 0.41 | | | | 10-16-2014 | | | | 2,000,000 | | | | 1,994,956 | |
GDF Suez 144A | | | 0.24 | | | | 3-25-2014 | | | | 1,000,000 | | | | 999,853 | |
ING (U.S.) Funding LLC | | | 0.32 | | | | 7-10-2014 | | | | 1,000,000 | | | | 998,889 | |
Institutional Secured Funding LLC 144A(p) | | | 0.25 | | | | 3-11-2014 | | | | 3,000,000 | | | | 2,999,779 | |
LMA Americas LLC 144A(p) | | | 0.20 | | | | 3-19-2014 | | | | 2,200,000 | | | | 2,199,774 | |
Mountcliff Funding LLC 144A(p) | | | 0.39 | | | | 8-7-2014 | | | | 2,000,000 | | | | 1,996,686 | |
Natixis US Finance Company LLC | | | 0.35 | | | | 5-27-2014 | | | | 950,000 | | | | 949,193 | |
Natixis US Finance Company LLC | | | 0.42 | | | | 5-23-2014 | | | | 1,250,000 | | | | 1,248,819 | |
Ridgefield Funding Company LLC 144A(p) | | | 0.22 | | | | 5-6-2014 | | | | 3,000,000 | | | | 2,998,773 | |
Sinopec Century Bright Capital Investment Limited 144A | | | 0.23 | | | | 3-7-2014 | | | | 1,000,000 | | | | 999,966 | |
Sinopec Century Bright Capital Investment Limited 144A | | | 0.01 | | | | 3-12-2014 | | | | 1,000,000 | | | | 999,923 | |
Sinopec Century Bright Capital Investment Limited 144A | | | 0.38 | | | | 4-11-2014 | | | | 1,000,000 | | | | 999,599 | |
Starbird Funding Corporation 144A(p) | | | 0.19 | | | | 5-12-2014 | | | | 3,000,000 | | | | 2,998,833 | |
Suncorp Group Limited 144A | | | 0.55 | | | | 7-10-2014 | | | | 1,100,000 | | | | 1,097,832 | |
Suncorp Group Limited 144A | | | 0.01 | | | | 1-29-2015 | | | | 1,500,000 | | | | 1,492,807 | |
| | | | | | | | | | | | | | | 35,318,840 | |
| | | | | | | | | | | | | | | | |
| | | | |
| | | Yield | | | | | | Shares | | | | |
| | | | |
| Investment Companies: 2.70% | | | | | | | | | | | | | | | | |
Wells Fargo Advantage Cash Investment Money Market Fund, Select Class (u)(l)## | | | 0.07 | | | | | | | | 3,542,157 | | | | 3,542,157 | |
| | | | | | | | | | | | | | | | |
| | | | |
| | | | | | | | | Principal | | | | |
| | | | |
| U.S. Treasury Securities: 0.00% | | | | | | | | | | | | | | | | |
U.S. Treasury Bill #(z) | | | 0.00 | | | | 3-20-2014 | | | $ | 5,000 | | | | 5,000 | |
| | | | | | | | | | | | | | | | |
| | | | |
Total Short-Term Investments (Cost $38,865,997) | | | | | | | | | | | | | | | 38,865,997 | |
| | | | | | | | | | | | | | | | |
| | | | | | | | |
Total investments in securities (Cost $134,256,611) * | | | 102.35 | % | | | 134,475,610 | |
Other assets and liabilities, net | | | (2.35 | ) | | | (3,083,146 | ) |
| | | | | | | | |
| Total net assets | | | 100.00 | % | | $ | 131,392,464 | |
| | | | | | | | |
| ± | Variable rate investment. The rate shown is the rate in effect at period end. |
| 144A | Security that may be resold to “qualified institutional buyers” under Rule 144A or security offered pursuant to Section 4(2) of the Securities Act of 1933, as amended. |
| %% | Security issued on a when-issued basis. |
| (p) | Asset-backed commercial paper |
| (u) | Rate shown is the 7-day annualized yield at period end. |
| (l) | Investment in an affiliate |
| (z) | Zero coupon security. Rate represents the current yield to maturity. |
| # | All or a portion of this security is segregated as collateral for investments in derivative instruments. |
| ## | All or a portion of this security has been segregated for when-issued securities. |
| * | Cost for federal income tax purposes is $134,256,611 and unrealized appreciation (depreciation) consists of: |
| | | | |
Gross unrealized appreciation | | $ | 232,413 | |
Gross unrealized depreciation | | | (13,414 | ) |
| | | | |
Net unrealized appreciation | | $ | 218,999 | |
The accompanying notes are an integral part of these financial statements.
| | | | |
| 14 | | Wells Fargo Advantage Conservative Income Fund | | Statement of assets and liabilities—February 28, 2014 (unaudited) |
| | | | |
| | | | |
| |
Assets | | | | |
Investments | | | | |
In unaffiliated securities, at value (see cost below) | | $ | 130,933,453 | |
In affiliated securities, at value (see cost below) | | | 3,542,157 | |
| | | | |
Total investments, at value (see cost below) | | | 134,475,610 | |
Receivable for interest | | | 461,919 | |
Receivable for daily variation margin on open futures contracts | | | 469 | |
Prepaid expenses and other assets | | | 9,794 | |
| | | | |
Total assets | | | 134,947,792 | |
| | | | |
| |
Liabilities | | | | |
Dividends payable | | | 5,300 | |
Payable for investments purchased | | | 3,499,970 | |
Advisory fee payable | | | 4,622 | |
Due to other related parties | | | 13,424 | |
Accrued expenses and other liabilities | | | 32,012 | |
| | | | |
Total liabilities | | | 3,555,328 | |
| | | | |
Total net assets | | $ | 131,392,464 | |
| | | | |
| |
NET ASSETS CONSIST OF | | | | |
Paid-in capital | | $ | 131,165,102 | |
Accumulated net realized gains on investments | | | 9,329 | |
Net unrealized gains on investments | | | 218,033 | |
| | | | |
Total net assets | | $ | 131,392,464 | |
| | | | |
| |
COMPUTATION OF NET ASSET VALUE PER SHARE1 | | | | |
Net assets – Institutional Class | | $ | 131,392,464 | |
Shares outstanding – Institutional Class | | | 13,112,377 | |
Net asset value per share – Institutional Class | | | $10.02 | |
| |
Investments in unaffiliated securities, at cost | | $ | 130,714,454 | |
| | | | |
Investments in affiliated securities, at cost | | $ | 3,542,157 | |
| | | | |
Total investments, at cost | | $ | 134,256,611 | |
| | | | |
| 1. | The Fund has an unlimited number of authorized shares. |
The accompanying notes are an integral part of these financial statements.
| | | | | | |
| Statement of operations—six months ended February 28, 2014 (unaudited) | | Wells Fargo Advantage Conservative Income Fund | | | 15 | |
| | | | |
| | | | |
| |
Investment income | | | | |
Interest** | | $ | 338,985 | |
Income from affiliated securities | | | 481 | |
| | | | |
Total investment income | | | 339,466 | |
| | | | |
| |
Expenses | | | | |
Advisory fee | | | 97,555 | |
Administration fees | | | | |
Fund level | | | 24,389 | |
Institutional Class | | | 39,022 | |
Custody and accounting fees | | | 3,375 | |
Professional fees | | | 20,556 | |
Registration fees | | | 15,628 | |
Shareholder report expenses | | | 11,946 | |
Trustees’ fees and expenses | | | 6,033 | |
Other fees and expenses | | | 1,289 | |
| | | | |
Total expenses | | | 219,793 | |
Less: Fee waivers and/or expense reimbursements | | | (88,093 | ) |
| | | | |
Net expenses | | | 131,700 | |
| | | | |
Net investment income | | | 207,766 | |
| | | | |
| |
REALIZED AND UNREALIZED GAINS (LOSSES) ON INVESTMENTS | | | | |
| |
Net realized gains (losses) on: | | | | |
Unaffiliated securities | | | 39,889 | |
Futures transactions | | | (6,838 | ) |
| | | | |
Net realized gains on investments | | | 33,051 | |
| | | | |
| |
Net change in unrealized gains (losses) on: | | | | |
Unaffiliated securities | | | 277,453 | |
Futures transactions | | | (966 | ) |
| | | | |
Net change in unrealized gains (losses) on investments | | | 276,487 | |
| | | | |
Net realized and unrealized gains (losses) on investments | | | 309,538 | |
| | | | |
Net increase in net assets resulting from operations | | $ | 517,304 | |
| | | | |
| |
** Net of foreign interest withholding taxes in the amount of | | | $127 | |
The accompanying notes are an integral part of these financial statements.
| | | | |
| 16 | | Wells Fargo Advantage Conservative Income Fund | | Statement of changes in net assets |
| | | | | | | | | | | | | | | | |
| | | Six months ended February 28, 2014 (unaudited) | | | Year ended August 31, 20131 | |
| | | | |
Operations | | | | | | | | | | | | | | | | |
Net investment income | | | | | | $ | 207,766 | | | | | | | $ | 55,349 | |
Net realized gains (losses) on investments | | | | | | | 33,051 | | | | | | | | (13,432 | ) |
Net change in unrealized gains (losses) on investments | | | | | | | 276,487 | | | | | | | | (58,454 | ) |
| | | | | | | | |
Net increase (decrease) in net assets resulting from operations | | | | | | | 517,304 | | | | | | | | (16,537 | ) |
| | | | | | | | |
| | | | |
Distributions to shareholders from | | | | | | | | | | | | | | | | |
Net investment income | | | | | | | | | | | | | | | | |
Institutional Class | | | | | | | (207,766 | ) | | | | | | | (55,808 | ) |
Net realized gains | | | | | | | | | | | | | | | | |
Institutional Class | | | | | | | (10,290 | ) | | | | | | | 0 | |
| | | | | | | | |
Total distributions to shareholders | | | | | | | (218,056 | ) | | | | | | | (55,808 | ) |
| | | | | | | | |
| | | | |
Capital share transactions | | | Shares | | | | | | | | Shares | | | | | |
Proceeds from shares sold | | | | | | | | | | | | | | | | |
Institutional Class | | | 9,404,779 | | | | 94,102,963 | | | | 5,000,000 | | | | 50,000,000 | |
Reinvestment of distributions | | | | | | | | | | | | | | | | |
Institutional Class | | | 19,558 | | | | 195,829 | | | | 5,588 | | | | 55,808 | |
Payment for shares redeemed | | | | | | | | | | | | | | | | |
Institutional Class | | | (1,317,548 | ) | | | (13,189,039 | ) | | | 0 | | | | 0 | |
| | | | | | | | |
Net increase in net assets resulting from capital share transactions | | | | | | | 81,109,753 | | | | | | | | 50,055,808 | |
| | | | | | | | |
Total increase in net assets | | | | | | | 81,409,001 | | | | | | | | 49,983,463 | |
| | | | | | | | |
| | | | |
Net assets | | | | | | | | | | | | | | | | |
Beginning of period | | | | | | | 49,983,463 | | | | | | | | 0 | |
| | | | | | | | |
End of period | | | | | | $ | 131,392,464 | | | | | | | $ | 49,983,463 | |
| | | | | | | | |
Undistributed net investment income | | | | | | $ | 0 | | | | | | | $ | 0 | |
| | | | | | | | |
| 1. | For the period from May 31, 2013 (commencement of operations) to August 31, 2013 |
The accompanying notes are an integral part of these financial statements.
| | | | | | |
| Financial highlights | | Wells Fargo Advantage Conservative Income Fund | | | 17 | |
(For a share outstanding throughout each period)
| | | | | | | | |
| | | Six months ended
February 28, 2014 | | | Year ended | |
| INSTITUTIONAL CLASS | | (unaudited) | | | August 31, 20131 | |
Net asset value, beginning of period | | $ | 9.99 | | | $ | 10.00 | |
Net investment income | | | 0.02 | | | | 0.01 | |
Net realized and unrealized gains (losses) on investments | | | 0.03 | | | | (0.01 | ) |
| | | | | | | | |
Total from investment operations | | | 0.05 | | | | 0.00 | |
Distributions to shareholders from | | | | | | | | |
Net investment income | | | (0.02 | ) | | | (0.01 | ) |
Net realized gains | | | (0.00 | )2 | | | 0.00 | |
| | | | | | | | |
Total distributions to shareholders | | | (0.02 | ) | | | (0.01 | ) |
Net asset value, end of period | | $ | 10.02 | | | $ | 9.99 | |
Total return3 | | | 0.52 | % | | | 0.01 | % |
Ratios to average net assets (annualized) | | | | | | | | |
Gross expenses | | | 0.45 | % | | | 0.74 | % |
Net expenses | | | 0.27 | % | | | 0.27 | % |
Net investment income | | | 0.43 | % | | | 0.44 | % |
Supplemental data | | | | | | | | |
Portfolio turnover rate | | | 33 | % | | | 10 | % |
Net assets, end of period (000s omitted) | | | $131,392 | | | | $49,983 | |
| 1. | For the period from May 31, 2013 (commencement of class operations) to August 31, 2013 |
| 2. | Amount is less than $0.005. |
| 3. | Returns for periods of less than one year are not annualized. |
The accompanying notes are an integral part of these financial statements.
| | | | |
| 18 | | Wells Fargo Advantage Conservative Income Fund | | Notes to financial statements (unaudited) |
1. ORGANIZATION
Wells Fargo Funds Trust (the “Trust”), a Delaware statutory trust organized on March 10, 1999, is an open-end management investment company registered under the Investment Company Act of 1940, as amended (the “1940 Act”). These financial statements report on the Wells Fargo Advantage Conservative Income Fund (the “Fund”) which is a diversified series of the Trust.
2. SIGNIFICANT ACCOUNTING POLICIES
The following significant accounting policies, which are consistently followed in the preparation of the financial statements of the Fund, are in conformity with U.S. generally accepted accounting principles which require management to make estimates and assumptions that affect the reported amounts of assets and liabilities, disclosure of contingent assets and liabilities at the date of the financial statements, and the reported amounts of revenues and expenses during the reporting period. Actual results could differ from those estimates.
Securities valuation
All investments are valued each business day as of the close of regular trading on the New York Stock Exchange (generally 4 p.m. Eastern Time).
Fixed income securities acquired with maturities exceeding 60 days are valued based on evaluated bid prices provided by an independent pricing service which may utilize both transaction data and market information such as yield, quality, coupon rate, maturity, type of issue, trading characteristics and other market data. If prices are not available from the independent pricing service or prices received are deemed not representative of market value, prices will be obtained from an independent broker-dealer or otherwise determined based on the Fund’s Valuation Procedures.
Short-term securities, with maturities of 60 days or less at time of purchase, generally are valued at amortized cost which approximates fair value. The amortized cost method involves valuing a security at its cost, plus accretion of discount or minus amortization of premium over the period until maturity.
Futures that are listed on a foreign or domestic exchange or market are valued at the official closing price or, if none, the last sales price.
Investments in registered open-end investment companies are valued at net asset value.
Investments which are not valued using any of the methods discussed above are valued at their fair value, as determined in good faith by the Board of Trustees of the Fund. The Board of Trustees has established a Valuation Committee comprised of the Trustees and has delegated to it the authority to take any actions regarding the valuation of portfolio securities that the Valuation Committee deems necessary or appropriate, including determining the fair value of portfolio securities, unless the determination has been delegated to the Management Valuation Team of Wells Fargo Funds Management, LLC (“Funds Management”). The Board of Trustees retains the authority to make or ratify any valuation decisions or approve any changes to the Valuation Procedures as it deems appropriate. On a quarterly basis, the Board of Trustees receives reports on any valuation actions taken by the Valuation Committee or the Management Valuation Team which may include items for ratification.
Valuations of fair valued securities are compared to the next actual sales price when available, or other appropriate market values, to assess the continued appropriateness of the fair valuation methodologies used. These securities are fair valued on a day-to-day basis, taking into consideration changes to appropriate market information and any significant changes to the inputs considered in the valuation process until there is a readily available price provided on an exchange or by an independent pricing service. Valuations received from an independent pricing service or independent broker-dealer quotes are periodically validated by comparisons to most recent trades and valuations provided by other independent pricing services in addition to the review of prices by the adviser and/or subadviser. Unobservable inputs used in determining fair valuations are identified based on the type of security, taking into consideration factors utilized by market participants in valuing the investment, knowledge about the issuer and the current market environment.
When-issued transactions
The Fund may purchase securities on a forward commitment or when-issued basis. The Fund records a when-issued transaction on the trade date and will segregate assets in an amount at least equal in value to the Fund’s commitment to purchase when-issued securities. Securities purchased on a when-issued basis are marked-to-market daily and the Fund begins earning interest on the settlement date. Losses may arise due to changes in the market value of the underlying securities or if the counterparty does not perform under the contract.
| | | | | | |
| Notes to financial statements (unaudited) | | Wells Fargo Advantage Conservative Income Fund | | | 19 | |
Futures contracts
The Fund may be subject to interest rate risk in the normal course of pursuing its investment objectives. The Fund may buy and sell futures contracts in order to gain exposure to, or protect against, changes in security values and interest rates. The primary risks associated with the use of futures contracts are the imperfect correlation between changes in market values of securities held by the Fund and the prices of futures contracts, and the possibility of an illiquid market.
The aggregate principal amounts of the contracts are not recorded in the financial statements. Fluctuations in the value of the contracts are recorded in the Statement of Assets and Liabilities as an asset or liability and in the Statement of Operations as unrealized gains or losses until the contracts are closed, at which point they are recorded as net realized gains or losses on futures contracts. With futures contracts, there is minimal counterparty risk to the Fund since futures are exchange traded and the exchange’s clearinghouse, as counterparty to all exchange traded futures, guarantees the futures against default.
Security transactions and income recognition
Securities transactions are recorded on a trade date basis. Realized gains or losses are recorded on the basis of identified cost.
Interest income is accrued daily and bond discounts are accreted and premiums are amortized daily based on the effective interest method. To the extent debt obligations are placed on non-accrual status, any related interest income may be reduced by writing off interest receivables when the collection of all or a portion of interest has become doubtful based on consistently applied procedures. If the issuer subsequently resumes interest payments or when the collectability of interest is reasonably assured, the debt obligation is removed from non-accrual status.
Income from foreign securities is recorded net of foreign taxes withheld where recovery of such taxes is not assured.
Distributions to shareholders
Distributions to shareholders from net investment income are accrued daily and paid monthly. Distributions from net realized gains, if any, are recorded on the ex-dividend date. Such distributions are determined in conformity with federal income tax regulations, which may differ in amount or character from net investment income and realized gains recognized for purposes of U.S. generally accepted accounting principles.
Federal and other taxes
The Fund intends to continue to qualify as a regulated investment company by distributing substantially all of its investment company taxable income and any net realized capital gains (after reduction for capital loss carryforwards) sufficient to relieve it from all, or substantially all, federal income taxes. Accordingly, no provision for federal income taxes was required.
The Fund’s income and federal excise tax returns and all financial records supporting those returns for the prior three fiscal years are subject to examination by the federal and Delaware revenue authorities. Management has analyzed the Fund’s tax positions taken on federal, state, and foreign tax returns for all open tax years and does not believe that there are any uncertain tax positions that require recognition of a tax liability.
As of August 31, 2013, the Fund had capital loss carryforwards which consisted of $13,432 in short-term capital losses.
3. FAIR VALUATION MEASUREMENTS
Fair value measurements of investments are determined within a framework that has established a fair value hierarchy based upon the various data inputs utilized in determining the value of the Fund’s investments. The three-level hierarchy gives the highest priority to unadjusted quoted prices in active markets for identical assets or liabilities (Level 1) and the lowest priority to significant unobservable inputs (Level 3). The Fund’s investments are classified within the fair value hierarchy based on the lowest level of input that is significant to the fair value measurement. The inputs are summarized into three broad levels as follows:
| n | | Level 1 – quoted prices in active markets for identical securities |
| n | | Level 2 – other significant observable inputs (including quoted prices for similar securities, interest rates, prepayment speeds, credit risk, use of amortized cost, etc.) |
| n | | Level 3 – significant unobservable inputs (including the Fund’s own assumptions in determining the fair value of investments) |
The inputs or methodologies used for valuing investments in securities are not necessarily an indication of the risk associated with investing in those securities.
| | | | |
| 20 | | Wells Fargo Advantage Conservative Income Fund | | Notes to financial statements (unaudited) |
As of February 28, 2014, the inputs used in valuing investments in securities were as follows:
| | | | | | | | | | | | | | | | |
| Investments in securities | | Quoted prices (Level 1) | | | Other significant observable inputs (Level 2) | | | Significant unobservable inputs (Level 3) | | | Total | |
Asset-backed securities | | $ | 0 | | | $ | 29,053,067 | | | $ | 0 | | | $ | 29,053,067 | |
Certificates of deposit | | | 0 | | | | 2,000,000 | | | | 0 | | | | 2,000,000 | |
Corporate bonds and notes | | | 0 | | | | 22,993,744 | | | | 0 | | | | 22,993,744 | |
Municipal obligations | | | 0 | | | | 10,849,461 | | | | 0 | | | | 10,849,461 | |
Non-agency mortgage backed securities | | | 0 | | | | 3,195,627 | | | | 0 | | | | 3,195,627 | |
Yankee corporate bonds and notes | | | 0 | | | | 27,517,714 | | | | 0 | | | | 27,517,714 | |
Short-term investments | | | | | | | | | | | | | | | | |
Commercial paper | | | 0 | | | | 35,318,840 | | | | 0 | | | | 35,318,840 | |
Investment companies | | | 3,542,157 | | | | 0 | | | | 0 | | | | 3,542,157 | |
U.S. Treasury securities | | | 5,000 | | | | 0 | | | | 0 | | | | 5,000 | |
| | | $ | 3,547,157 | | | $ | 130,928,453 | | | $ | 0 | | | $ | 134,475,610 | |
As of February 28, 2014, the inputs used in valuing the Fund’s other financial instruments were as follows:
| | | | | | | | | | | | | | | | |
| Other financial instruments | | Quoted prices (Level 1) | | | Other significant
observable inputs (Level 2) | | | Significant unobservable inputs (Level 3) | | | Total | |
Futures contracts | | $ | (966 | )* | | $ | 0 | | | $ | 0 | | | $ | (966 | ) |
| * | Amount represents the net unrealized losses. |
Transfers in and transfers out are recognized at the end of the reporting period. For the six months ended February 28, 2014, the Fund did not have any transfers into/out of Level 1, Level 2, or Level 3.
4. TRANSACTIONS WITH AFFILIATES AND OTHER EXPENSES
Advisory fee
The Trust has entered into an advisory contract with Funds Management, an indirect wholly owned subsidiary of Wells Fargo & Company (“Wells Fargo”). The adviser is responsible for implementing investment policies and guidelines and for supervising the subadviser, who is responsible for day-to-day portfolio management of the Fund.
Pursuant to the contract, Funds Management is entitled to receive an annual advisory fee starting at 0.20% and declining to 0.15% as the average daily net assets of the Fund increase. For the six months ended February 28, 2014, the advisory fee was equivalent to an annual rate of 0.20% of the Fund’s average daily net assets.
Funds Management has retained the services of a subadviser to provide daily portfolio management to the Fund. The fee for subadvisory services is borne by Funds Management. Wells Capital Management Incorporated, an affiliate of Funds Management and an indirect, wholly owned subsidiary of Wells Fargo, is the subadviser to the Fund and is entitled to receive a fee from Funds Management at an annual rate starting at 0.10% and declining to 0.05% as the average daily net assets of the Fund increase.
Administration and transfer agent fees
The Trust has entered into an administration agreement with Funds Management. Under this agreement, for providing administrative services, which includes paying fees and expenses for services provided by the transfer agent, sub-transfer agents, omnibus account servicers and record-keepers, Funds Management is entitled to receive from the Fund an annual fund level administration fee starting at 0.05% and declining to 0.03% as the average daily net assets of the Fund increase and for Institutional Class shares a class level administration fee of 0.08% of the average daily net assets.
Funds Management has contractually waived and/or reimbursed advisory and administration fees to the extent necessary to maintain certain net operating expense ratios for the Fund. Waiver of fees and/or reimbursement of expenses by Funds Management were made first from fund level expenses on a proportionate basis and then from class specific expenses. Funds Management has committed through December 31, 2014 to waive fees and/or reimburse expenses to the extent necessary to cap the Fund’s expenses at 0.27% for Institutional Class shares.
| | | | | | |
| Notes to financial statements (unaudited) | | Wells Fargo Advantage Conservative Income Fund | | | 21 | |
5. INVESTMENT PORTFOLIO TRANSACTIONS
Purchases and sales of investments, excluding U.S. government obligations (if any) and short-term securities, for the six months ended February 28, 2014 were $79,992,850 and $21,829,386, respectively.
6. DERIVATIVE TRANSACTIONS
During the six months ended February 28, 2014, the Fund entered into futures contracts to speculate on interest rates and to help manage the duration of the portfolio.
At February 28, 2014, the Fund had short futures contracts outstanding as follows:
| | | | | | | | | | | | | | | | | | |
| Expiration date | | Counterparty | | Contracts | | | Type | | | Contract value at
February 28, 2014 | | | Unrealized
losses | |
| 6-30-2014 | | JPMorgan | | | 15 Short | | | | 2-Year U.S. Treasury Notes | | | $ | 3,298,125 | | | $ | (966 | ) |
The Fund had an average notional amount of $1,038,199 in short futures contracts during the six months ended February 28, 2014.
On February 28, 2014, the cumulative unrealized losses on futures contracts in the amount of $966 are reflected in net unrealized gains on investments on the Statement of Assets and Liabilities. The receivable for daily variation margin on open futures contracts reflected in the Statement of Assets and Liabilities only represents the current day’s variation margin. The realized losses and change in unrealized gains (losses) on futures contracts are reflected in the Statement of Operations.
For certain types of derivative transactions, the Fund has entered into International Swaps and Derivatives Association, Inc. master agreements (“ISDA Master Agreements”) or similar agreements with approved counterparties. The ISDA Master Agreements or similar agreements may have requirements to deliver/deposit securities or cash to/with an exchange or broker-dealer as collateral and allows the Fund to offset, with each counterparty, certain derivative financial instrument’s assets and/or liabilities with collateral held or pledged. Collateral requirements differ by type of derivative. Collateral or margin requirements are set by the broker or exchange clearing house for exchange traded derivatives while collateral terms are contract specific for over-the-counter traded. Cash collateral that has been pledged to cover obligations of the Fund under derivative contracts, if any, will be reported separately in the Statement of Assets and Liabilities. Securities pledged as collateral, if any, for the same purpose are noted in the Portfolio of Investments. With respect to balance sheet offsetting, absent an event of default by the counterparty or a termination of the agreement, the reported amounts of financial assets and financial liabilities in the Statement of Assets and Liabilities are not offset across transactions between the Fund and the applicable counterparty. A reconciliation of the gross amounts on the Statement of Assets and Liabilities to the net amounts by derivative type, including any collateral exposure, is as follows:
| | | | | | | | | | | | | | | | | | |
| Derivative type | | Counterparty | | Gross
amounts of
assets in the
Statement of
Assets and
Liabilities | | | Amounts
subject to
netting
agreements | | | Collateral
received | | | Net
amount | |
| Futures - variation margin | | JPMorgan | | $ | 469 | | | $ | 0 | | | $ | 0 | | | $ | 469 | |
7. BANK BORROWINGS
The Trust (excluding the money market funds and certain other funds in the Trust) and Wells Fargo Variable Trust are parties to a $150,000,000 revolving credit agreement with State Street Bank and Trust Company, whereby the Fund is permitted to use bank borrowings for temporary or emergency purposes, such as to fund shareholder redemption requests. Interest under the credit agreement is charged to the Fund based on a borrowing rate equal to the higher of the Federal Funds rate in effect on that day plus 1.25% or the overnight LIBOR rate in effect on that day plus 1.25%. In addition, an annual commitment fee equal to 0.10% of the unused balance is allocated to each participating fund. For the six months ended February 28, 2014, the Fund paid $42 in commitment fees.
For the six months ended February 28, 2014, there were no borrowings by the Fund under the agreement.
8. INDEMNIFICATION
Under the Trust’s organizational documents, the officers and directors are indemnified against certain liabilities that may arise out of performance of their duties to the Trust. Additionally, in the normal course of business, the Trust may enter into contracts with service providers that contain a variety of indemnification clauses. The Trust’s maximum exposure under these arrangements is dependent on future claims that may be made against the Fund and, therefore, cannot be estimated.
| | | | |
| 22 | | Wells Fargo Advantage Conservative Income Fund | | Other information (unaudited) |
PROXY VOTING INFORMATION
A description of the policies and procedures that the Fund uses to determine how to vote proxies relating to portfolio securities is available without charge, upon request, by calling 1-800-222-8222, visiting our website at wellsfargoadvantagefunds.com, or visiting the SEC website at sec.gov. Information regarding how the Fund voted proxies relating to portfolio securities during the most recent 12-month period ended June 30 is available without charge on the Fund’s website at wellsfargoadvantagefunds.com or by visiting the SEC website at sec.gov.
PORTFOLIO HOLDINGS INFORMATION
The complete portfolio holdings for the Fund are publicly available on the Fund’s website (wellsfargoadvantagefunds.com) on a monthly, 30-day or more delayed basis. In addition, top ten holdings information for the Fund is publicly available on the Fund’s website on a monthly, seven-day or more delayed basis. The Fund files its complete schedule of portfolio holdings with the SEC for the first and third quarters of each fiscal year on Form N-Q, which is available without charge by visiting the SEC website at sec.gov. In addition, the Fund’s Form N-Q may be reviewed and copied at the SEC’s Public Reference Room in Washington, DC, and at regional offices in New York City, at 233 Broadway, and in Chicago, at 175 West Jackson Boulevard, Suite 900. Information about the Public Reference Room may be obtained by calling 1-800-SEC-0330.
| | | | | | |
| Other information (unaudited) | | Wells Fargo Advantage Conservative Income Fund | | | 23 | |
BOARD OF TRUSTEES AND OFFICERS
Each of the Trustees and Officers listed in the table below acts in identical capacities for each fund in the WellsFargo Advantage family of funds, which consists of 132 mutual funds1 comprising the Wells Fargo Funds Trust, Wells Fargo Variable Trust, Wells Fargo Master Trust and four closed-end funds (collectively the “Fund Complex”). This table should be read in conjunction with the Prospectus and the Statement of Additional Information2. All of the Trustees are also Members of the Audit and Governance Committees of each Trust in the Fund Complex. The mailing address of each Trustee and Officer is 525 Market Street, 12th Floor, San Francisco, CA 94105. Each Trustee and Officer serves an indefinite term, however, each Trustee serves such term until reaching the mandatory retirement age established by the Trustees.
Independent Trustees
| | | | | | |
Name and
year of birth | | Position held and length of service* | | Principal occupations during past five years | | Other directorships during past five years |
| Peter G. Gordon (Born 1942) | | Trustee, since 1998; Chairman, since 2005 | | Co-Founder, Retired Chairman, President and CEO of Crystal Geyser Water Company. Trustee Emeritus, Colby College. | | Asset Allocation Trust |
| Isaiah Harris, Jr. (Born 1952) | | Trustee, since 2009 | | Retired. Prior thereto, President and CEO of BellSouth Advertising and Publishing Corp. from 2005 to 2007, President and CEO of BellSouth Enterprises from 2004 to 2005 and President of BellSouth Consumer Services from 2000 to 2003. Emeritus member of the Iowa State University Foundation Board of Governors. Emeritus Member of the Advisory Board of Iowa State University School of Business. Advisory Board Member, Palm Harbor Academy (charter school). Mr. Harris is a certified public accountant. | | CIGNA Corporation; Deluxe Corporation; Asset Allocation Trust |
| Judith M. Johnson (Born 1949) | | Trustee, since 2008; Audit Committee Chairman, since 2008 | | Retired. Prior thereto, Chief Executive Officer and Chief Investment Officer of Minneapolis Employees Retirement Fund from 1996 to 2008. Ms. Johnson is an attorney, certified public accountant and a certified managerial accountant. | | Asset Allocation Trust |
| Leroy Keith, Jr. (Born 1939) | | Trustee, since 2010 | | Chairman, Bloc Global Services (development and construction). Trustee of the Evergreen Funds from 1983 to 2010. Former Managing Director, Almanac Capital Management (commodities firm), former Partner, Stonington Partners, Inc. (private equity fund), former Director, Obagi Medical Products Co. and former Director, Lincoln Educational Services. | | Trustee, Virtus Fund Complex (consisting of 50 portfolios as of 12/16/2013); Asset Allocation Trust |
| David F. Larcker (Born 1950) | | Trustee, since 2009 | | James Irvin Miller Professor of Accounting at the Graduate School of Business, Stanford University, Morgan Stanley Director of the Center for Leadership Development and Research and Senior Faculty of The Rock Center for Corporate Governance since 2006. From 2005 to 2008, Professor of Accounting at the Graduate School of Business, Stanford University. Prior thereto, Ernst & Young Professor of Accounting at The Wharton School, University of Pennsylvania from 1985 to 2005. | | Asset Allocation Trust |
| Olivia S. Mitchell (Born 1953) | | Trustee, since 2006 | | International Foundation of Employee Benefit Plans Professor, Wharton School of the University of Pennsylvania since 1993. Director of Wharton’s Pension Research Council and Boettner Center on Pensions & Retirement Research, and Research Associate at the National Bureau of Economic Research. Previously, Cornell University Professor from 1978 to 1993. | | Asset Allocation Trust |
| Timothy J. Penny (Born 1951) | | Trustee, since 1996 | | President and CEO of Southern Minnesota Initiative Foundation, a non-profit organization, since 2007 and Senior Fellow at the Humphrey Institute Policy Forum at the University of Minnesota since 1995. Member of the Board of Trustees of NorthStar Education Finance, Inc., a non-profit organization, since 2007. | | Asset Allocation Trust |
| | | | |
| 24 | | Wells Fargo Advantage Conservative Income Fund | | Other information (unaudited) |
| | | | | | |
Name and
year of birth | | Position held and length of service* | | Principal occupations during past five years | | Other directorships during past five years |
| Michael S. Scofield (Born 1943) | | Trustee, since 2010 | | Served on the Investment Company Institute’s Board of Governors and Executive Committee from 2008-2011 as well the Governing Council of the Independent Directors Council from 2006-2011 and the Independent Directors Council Executive Committee from 2008-2011. Chairman of the IDC from 2008-2010. Institutional Investor (Fund Directions) Trustee of Year in 2007. Trustee of the Evergreen Funds (and its predecessors) from 1984 to 2010. Chairman of the Evergreen Funds from 2000-2010. Former Trustee of the Mentor Funds. Retired Attorney, Law Offices of Michael S. Scofield. | | Asset Allocation Trust |
| Donald C. Willeke (Born 1940) | | Trustee, since 1996 | | Principal of the law firm of Willeke & Daniels. General Counsel of the Minneapolis Employees Retirement Fund from 1984 until its consolidation into the Minnesota Public Employees Retirement Association on June 30, 2010. Director and Vice Chair of The Tree Trust (non-profit corporation). Director of the American Chestnut Foundation (non-profit corporation). | | Asset Allocation Trust |
| * | Length of service dates reflect the Trustee’s commencement of service with the Trust’s predecessor entities, where applicable. |
Officers
| | | | | | |
Name and
year of birth | | Position held and
length of service | | Principal occupations during past five years | | |
Karla M. Rabusch (Born 1959) | | President, since 2003 | | Executive Vice President of Wells Fargo Bank, N.A. and President of Wells Fargo Funds Management, LLC since 2003. | | |
Nancy Wiser1 (Born 1967) | | Treasurer, since 2012 | | Executive Vice President of Wells Fargo Funds Management, LLC since 2011. Chief Operating Officer and Chief Compliance Officer at LightBox Capital Management LLC, from 2008 to 2011. Owned and operated a consulting business providing services to various hedge funds including acting as Chief Operating Officer and Chief Compliance Officer for a hedge fund from 2007 to 2008. Chief Operating Officer and Chief Compliance Officer of GMN Capital LLC from 2006 to 2007. | | |
| C. David Messman (Born 1960) | | Secretary, since 2000; Chief Legal Officer, since 2003 | | Senior Vice President and Secretary of Wells Fargo Funds Management, LLC since 2001. Vice President and Managing Counsel of Wells Fargo Bank, N.A. since 1996. | | |
Debra Ann Early (Born 1964) | | Chief Compliance Officer, since 2007 | | Chief Compliance Officer of Wells Fargo Funds Management, LLC since 2007. Chief Compliance Officer of Parnassus Investments from 2005 to 2007. Chief Financial Officer of Parnassus Investments from 2004 to 2007. | | |
David Berardi (Born 1975) | | Assistant Treasurer, since 2009 | | Vice President of Wells Fargo Funds Management, LLC since 2009. Vice President of Evergreen Investment Management Company, LLC from 2008 to 2010. Assistant Vice President of Evergreen Investment Services, Inc. from 2004 to 2008. Manager of Fund Reporting and Control for Evergreen Investment Management Company, LLC from 2004 to 2010. | | |
Jeremy DePalma1 (Born 1974) | | Assistant Treasurer, since 2009 | | Senior Vice President of Wells Fargo Funds Management, LLC since 2009. Senior Vice President of Evergreen Investment Management Company, LLC from 2008 to 2010. Vice President, Evergreen Investment Services, Inc. from 2004 to 2007. Head of the Fund Reporting and Control Team within Fund Administration from 2005 to 2010. | | |
| 1. | Nancy Wiser acts as Treasurer of 73 funds in the Fund Complex. Jeremy DePalma acts as Treasurer of 59 funds and Assistant Treasurer of 73 funds in the Fund Complex. |
| 2. | The Statement of Additional Information includes additional information about the Trustees and is available, without charge, upon request, by calling 1-800-222-8222 or by visiting the website at wellsfargoadvantagefunds.com. |
| | | | | | |
| List of abbreviations | | Wells Fargo Advantage Conservative Income Fund | | | 25 | |
The following is a list of common abbreviations for terms and entities that may have appeared in this report.
| ACA | — ACA Financial Guaranty Corporation |
| ADR | — American depositary receipt |
| ADS | — American depositary shares |
| AGC | — Assured Guaranty Corporation |
| AGM | — Assured Guaranty Municipal |
| Ambac | — Ambac Financial Group Incorporated |
| AMT | — Alternative minimum tax |
| BAN | — Bond anticipation notes |
| BHAC | — Berkshire Hathaway Assurance Corporation |
| CAB | — Capital appreciation bond |
| CCAB | — Convertible capital appreciation bond |
| CDA | — Community Development Authority |
| CDO | — Collateralized debt obligation |
| DRIVER | — Derivative inverse tax-exempt receipts |
| DW&P | — Department of Water & Power |
| DWR | — Department of Water Resources |
| ECFA | — Educational & Cultural Facilities Authority |
| EDA | — Economic Development Authority |
| EDFA | — Economic Development Finance Authority |
| ETF | — Exchange-traded fund |
| FDIC | — Federal Deposit Insurance Corporation |
| FFCB | — Federal Farm Credit Banks |
| FGIC | — Financial Guaranty Insurance Corporation |
| FHA | — Federal Housing Administration |
| FHLB | — Federal Home Loan Bank |
| FHLMC | — Federal Home Loan Mortgage Corporation |
| FICO | — The Financing Corporation |
| FNMA | — Federal National Mortgage Association |
| GDR | — Global depositary receipt |
| GNMA | — Government National Mortgage Association |
| HCFR | — Healthcare facilities revenue |
| HEFA | — Health & Educational Facilities Authority |
| HEFAR | — Higher education facilities authority revenue |
| HFA | — Housing Finance Authority |
| HFFA | — Health Facilities Financing Authority |
| HUD | — Department of Housing and Urban Development |
| IDA | — Industrial Development Authority |
| IDAG | — Industrial Development Agency |
| KRW | — Republic of Korea won |
| LIBOR | — London Interbank Offered Rate |
| LLC | — Limited liability company |
| LLLP | — Limited liability limited partnership |
| LLP | — Limited liability partnership |
| MBIA | — Municipal Bond Insurance Association |
| MFHR | — Multifamily housing revenue |
| MSTR | — Municipal securities trust receipts |
| MUD | — Municipal Utility District |
| National | — National Public Finance Guarantee Corporation |
| PCFA | — Pollution Control Financing Authority |
| PCL | — Public Company Limited |
| PCR | — Pollution control revenue |
| PFA | — Public Finance Authority |
| PFFA | — Public Facilities Financing Authority |
| PFOTER | — Puttable floating option tax-exempt receipts |
| plc | — Public limited company |
| PUTTER | — Puttable tax-exempt receipts |
| R&D | — Research & development |
| Radian | — Radian Asset Assurance |
| RAN | — Revenue anticipation notes |
| RDA | — Redevelopment Authority |
| RDFA | — Redevelopment Finance Authority |
| REIT | — Real estate investment trust |
| ROC | — Reset option certificates |
| SAVRS | — Select auction variable rate securities |
| SBA | — Small Business Authority |
| SFHR | — Single-family housing revenue |
| SFMR | — Single-family mortgage revenue |
| SPA | — Standby purchase agreement |
| SPDR | — Standard & Poor’s Depositary Receipts |
| STRIPS | — Separate trading of registered interest and principal securities |
| TAN | — Tax anticipation notes |
| TIPS | — Treasury inflation-protected securities |
| TRAN | — Tax revenue anticipation notes |
| TTFA | — Transportation Trust Fund Authority |
| TVA | — Tennessee Valley Authority |
This page is intentionally left blank.
This page is intentionally left blank.
This page is intentionally left blank.


For more information
More information about Wells Fargo Advantage Funds is available free upon request. To obtain literature, please write, email, visit the Fund’s website, or call:
Wells Fargo Advantage Funds
P.O. Box 8266
Boston, MA 02266-8266
Email: wfaf@wellsfargo.com
Website: wellsfargoadvantagefunds.com
Individual investors: 1-800-222-8222
Retail investment professionals: 1-888-877-9275
Institutional investment professionals: 1-866-765-0778
This report and the financial statements contained herein are submitted for the general information of the shareholders of Wells Fargo Advantage Funds. If this report is used for promotional purposes, distribution of the report must be accompanied or preceded by a current prospectus. For a current prospectus and, if available, a summary prospectus containing more complete information, including charges and expenses, call 1-800-222-8222 or visit the Fund’s website at wellsfargoadvantagefunds.com. Please consider the investment objectives, risks, charges, and expenses of the investment carefully before investing. This and other information about Wells Fargo Advantage Funds can be found in the current prospectus. Read the prospectus carefully before you invest or send money.
Wells Fargo Funds Management, LLC, a wholly owned subsidiary of Wells Fargo & Company, provides investment advisory and administrative services for Wells Fargo Advantage Funds. Other affiliates of Wells Fargo & Company provide subadvisory and other services for the Funds. The Funds are distributed by Wells Fargo Funds Distributor, LLC, Member FINRA/SIPC, an affiliate of Wells Fargo & Company.
NOT FDIC INSURED ¡ NO BANK GUARANTEE ¡ MAY LOSE VALUE
© 2014 Wells Fargo Funds Management, LLC. All rights reserved.
| | |
 | | 223529 04-14 SA265/SAR265 02-14 |

Wells Fargo Advantage
Government Securities Fund

Semi-Annual Report
February 28, 2014

Reduce clutter. Save trees.
Sign up for electronic delivery of prospectuses and shareholder reports at wellsfargo.com/advantagedelivery
Contents
The views expressed and any forward-looking statements are as of February 28, 2014, unless otherwise noted, and are those of the Fund managers and/or Wells Fargo Funds Management, LLC. Discussions of individual securities, or the markets generally, or any Wells Fargo Advantage Fund are not intended as individual recommendations. Future events or results may vary significantly from those expressed in any forward-looking statements; the views expressed are subject to change at any time in response to changing circumstances in the market. Wells Fargo Funds Management, LLC and the Fund disclaim any obligation to publicly update or revise any views expressed or forward-looking statements.
NOT FDIC INSURED ¡ NO BANK GUARANTEE ¡ MAY LOSE VALUE
| | | | |
| 2 | | Wells Fargo Advantage Government Securities Fund | | Letter to shareholders (unaudited) |

Karla M. Rabusch
President
Wells Fargo Advantage Funds
Fixed-income markets shifted during the period, driven by vacillations between U.S. Treasury yield increases and subsequent declines.
Reassurances from the Fed that a highly accommodative monetary policy would continue throughout 2014 inspired price rallies across both the investment-grade and high-yield bond markets.
Dear Valued Shareholder:
We are pleased to offer you this semi-annual report for the Wells Fargo Advantage Government Securities Fund for the six-month period that ended February 28, 2014. Fixed-income markets shifted during the period, driven by vacillations between U.S. Treasury yield increases and subsequent declines. However, on the whole, investment-grade (measured by the Barclays U.S. Aggregate Bond Index1) and high-yield markets (measured by the Barclays U.S. High Yield Bond Index2) generated positive returns during the period, notably benefiting from the strong price improvement and declining U.S. Treasury yields that occurred in September and October of 2013 as well as the opening months of 2014. Although the returns of the U.S. high-yield market have often been positively correlated with U.S. equity returns (measured by the S&P 500 Index3) over the long-run, over the period, high-yield (measured by the Barclays U.S. High Yield Bond Index) generally performed well even when equities did not. The lower-rated corporate bond credit tiers outperformed the respectively higher-rated investment-grade credit tiers during the period.
A decline in bond prices was halted by the Fed’s postponement of tapering its bond-buying program.
Before the six-month period began, equity markets rallied, most notably in May and June of 2013. This led to a sharp increase in U.S. Treasury yields and declining valuations for much of the fixed-income markets (measured by the Barclays U.S. Aggregate Bond Index). However, in July and August 2013, that equity exuberance quieted a bit, and fixed-income markets stabilized. Returns across the fixed-income markets were largely negative in investment-grade and high-yield markets but modest in comparison with the declines in May and June of 2013.
But, by September and October of 2013, investment-grade and high-yield bond markets began generating positive returns yet again, as the Federal Reserve (Fed) backtracked on its intentions to taper its quantitative easing program, postponing it until 2014, at the earliest. This created a temporary rally in bonds that lasted until around November 20, 2013, when notes were released from the Fed’s October 2013 meeting that tapering of the bond-buying programs would not be postponed beyond January 2014. In response, long-term U.S. Treasury yields and mortgage rates ratcheted higher on expectations for an unwinding of monetary accommodation in the upcoming months. This led to declines in pricing across much of the core fixed-income markets (measured by the Barclays U.S. Aggregate Bond Index). U.S. high-yield markets were better able to absorb the shift in U.S. Treasury yields and continued to provide positive returns along with rallies in the equity markets.
Favorable conditions for fixed-income markets were restored in January and February 2014.
Seemingly much to the surprise of many everyday investors and seasoned investment professionals alike, fixed-income markets (measured by the Barclays U.S. Aggregate Bond Index) largely outperformed U.S. equity markets (measured by the S&P 500 Index) during the opening months of 2014. A pullback in equity exuberance in January and reassurances from the Fed that a highly accommodative monetary policy would continue throughout 2014 inspired price rallies across both the investment-grade and high-yield bond markets. U.S. Treasury yields declined in January 2014 and corporate bonds and mortgage-backed securities performed notably well. U.S. high-yield securities generated positive returns in January 2014 but lagged the rally across the investment-grade bond markets. This theme reversed in February 2014, as high-yield sectors rallied and investment-grade sectors performed well but not to the extent of the lowest-rated credit tiers.
| | | | | | |
| Letter to shareholders (unaudited) | | Wells Fargo Advantage Government Securities Fund | | | 3 | |
One positive takeaway for bond investors that helped fuel the fixed-income (measured by the Barclays U.S. Aggregate Bond Index) rallies was former Fed Chairman Bernanke’s guidance at the end of 2013. He indicated that the tapering of the Fed’s bond-buying program would proceed at a slow pace and that a reduction in quantitative easing should not be equivocated with a tightening of monetary policy. The distinction was important—although the bond-buying program was declining in volume, it was, nonetheless, still continuing. Additionally, the federal funds target rate would remain unchanged for the foreseeable future, with the implications that it would not increase until the bond-buying program was fully disbanded. These were important statements for fixed-income investors that helped bolster U.S. fixed-income valuations in the opening months of 2014.
Don’t let short-term uncertainty derail long-term investment goals.
Periods of investment uncertainty can present challenges, but experience has taught us that maintaining long-term investment goals can be an effective way to plan for the future. To help you create a sound strategy based on your personal goals and risk tolerance, Wells Fargo Advantage Funds offers more than 100 mutual funds and other investments spanning a wide range of asset classes and investment styles. Although diversification cannot guarantee an investment profit or prevent losses, we believe it can be an effective way to manage investment risk and potentially smooth out overall portfolio performance. We encourage investors to know their investments and to understand that appropriate levels of risk-taking may unlock opportunities.
Thank you for choosing to invest with Wells Fargo Advantage Funds. We appreciate your confidence in us and remain committed to helping you meet your financial needs. For current information about your fund investments, contact your investment professional, visit our website at wellsfargoadvantagefunds.com, or call us directly at 1-800-222-8222. We are available 24 hours a day, 7 days a week.
Sincerely,

Karla M. Rabusch
President
Wells Fargo Advantage Funds
| 1. | The Barclays U.S. Aggregate Bond Index is a broad-based benchmark that measures the investment-grade, U.S. dollar-denominated, fixed-rate taxable bond market, including Treasuries, government-related and corporate securities, MBS (agency fixed-rate and hybrid ARM passthroughs), ABS, and CMBS. You cannot invest directly in an index. |
| 2. | The Barclays U.S. High Yield Bond Index is an index consisting of all domestic and Yankee bonds, rated below investment grade, with a minimum outstanding amount of $100 million and maturing over one year. You cannot invest directly in an index. |
| 3. | The S&P 500 Index consists of 500 stocks chosen for market size, liquidity, and industry group representation. It is a market-value-weighted index with each stock’s weight in the index proportionate to its market value. You cannot invest directly in an index |
| | | | |
| 4 | | Wells Fargo Advantage Government Securities Fund | | Letter to shareholders (unaudited) |
Notice to shareholders
The Fund and Wells Fargo Funds Management, LLC (“Funds Management”) have received an exemptive order from the SEC that permits Funds Management, subject to the approval of the Board of Trustees of the Fund, to select or replace certain subadvisers to manage all or a portion of the Fund’s assets and enter into, amend or terminate a sub-advisory agreement with certain subadvisers without obtaining shareholder approval (“Multi-manager Structure”). The Multi-manager Structure applies to subadvisers that are not affiliated with Funds Management or the Fund, except to the extent that affiliation arises solely because such subadvisers provide sub-advisory services to the Fund (“Non-affiliated Subadvisers”), as well as subadvisers that are indirect or direct wholly-owned subsidiaries of Funds Management or of another company that, indirectly or directly, wholly owns Funds Management (“Wholly-owned Subadvisers”).
Pursuant to the SEC order, Funds Management, with the approval of the Board of Trustees, has the discretion to terminate any subadvisers and allocate and reallocate the Fund’s assets among any other Non-affiliated Subadvisers or Wholly-owned Subadvisers. Funds Management, subject to oversight and supervision by the Board of Trustees, has responsibility to continue to oversee any subadvisers to the Fund and to recommend, for approval by the Board of Trustees, the hiring, termination and replacement of subadvisers for the Fund. In the event that a new subadviser is hired pursuant to the Multi-manager Structure, the Fund is required to provide notice to shareholders within 90 days.
Please contact your investment professional or call us directly at 1-800-222-8222 if you have any questions on this Notice to Shareholders.
This page is intentionally left blank.
| | | | |
| 6 | | Wells Fargo Advantage Government Securities Fund | | Performance highlights (unaudited) |
Investment objective
The Fund seeks current income.
Adviser
Wells Fargo Funds Management, LLC
Subadviser
Wells Capital Management Incorporated
Portfolio managers
Michael J. Bray, CFA
Christopher Y. Kauffman, CFA
Average annual total returns1 (%) as of February 28, 2014
| | | | | | | | | | | | | | | | | | | | | | | | | | | | | | | | | | |
| | | | | Including sales charge | | | Excluding sales charge | | | Expense ratios2 (%) | |
| | | Inception date | | 1 year | | | 5 year | | | 10 year | | | 1 year | | | 5 year | | | 10 year | | | Gross | | | Net3 | |
| Class A (SGVDX) | | 8-31-1999 | | | (4.94 | ) | | | 2.72 | | | | 3.43 | | | | (0.46 | ) | | | 3.67 | | | | 3.90 | | | | 0.88 | | | | 0.88 | |
| Class B (WGSBX)* | | 7-18-2008 | | | (6.20 | ) | | | 2.52 | | | | 3.38 | | | | (1.20 | ) | | | 2.88 | | | | 3.38 | | | | 1.63 | | | | 1.63 | |
| Class C (WGSCX) | | 12-26-2002 | | | (2.21 | ) | | | 2.88 | | | | 3.07 | | | | (1.21 | ) | | | 2.88 | | | | 3.07 | | | | 1.63 | | | | 1.63 | |
| Administrator Class (WGSDX) | | 4-8-2005 | | | – | | | | – | | | | – | | | | (0.25 | ) | | | 3.87 | | | | 4.13 | | | | 0.82 | | | | 0.67 | |
| Institutional Class (SGVIX) | | 8-31-1999 | | | – | | | | – | | | | – | | | | (0.09 | ) | | | 4.07 | | | | 4.34 | | | | 0.55 | | | | 0.51 | |
| Investor Class (STVSX) | | 10-29-1986 | | | – | | | | – | | | | – | | | | (0.49 | ) | | | 3.61 | | | | 3.87 | | | | 0.91 | | | | 0.91 | |
| Barclays U.S. Aggregate excluding Credit Bond Index4 | | – | | | – | | | | – | | | | – | | | | (0.15 | ) | | | 3.98 | | | | 4.31 | | | | – | | | | – | |
| Barclays Intermediate U.S. Government Bond Index5 | | – | | | – | | | | – | | | | – | | | | (0.26 | ) | | | 2.71 | | | | 3.69 | | | | – | | | | – | |
| * | | Class B shares are closed to investment, except in connection with the reinvestment of any distributions and permitted exchanges. |
Figures quoted represent past performance, which is no guarantee of future results, and do not reflect taxes that a shareholder may pay on fund distributions or the redemption of fund shares. Investment return and principal value of an investment will fluctuate so that an investor’s shares, when redeemed, may be worth more or less than their original cost. Performance shown without sales charges would be lower if sales charges were reflected. Current performance may be lower or higher than the performance data quoted, which assumes the reinvestment of dividends and capital gains. Current month-end performance is available on the Fund’s website, wellsfargoadvantagefunds.com.
Index returns do not include transaction costs associated with buying and selling securities, any mutual fund fees or expenses, or any taxes. It is not possible to invest directly in an index.
For Class A shares, the maximum front-end sales charge is 4.50%. For Class B shares, the maximum contingent deferred sales charge is 5.00%. For Class C shares, the maximum contingent deferred sales charge is 1.00%. Performance including sales charge assumes the sales charge for the corresponding time period. Administrator Class, Institutional Class, and Investor Class shares are sold without a front-end sales charge or contingent deferred sales charge.
Bond values fluctuate in response to the financial condition of individual issuers, general market and economic conditions, and changes in interest rates. In general, when interest rates rise, bond values fall and investors may lose principal value. The use of derivatives may reduce returns and/or increase volatility. Securities issued by U.S. government agencies or government-sponsored entities may not be guaranteed by the U.S. Treasury. Certain investment strategies tend to increase the total risk of an investment (relative to the broader market). The Fund is exposed to mortgage- and asset-backed securities risk. Consult the Fund’s prospectus for additional information on these and other risks. The U.S. government guarantee applies to certain underlying securities and not to shares of the Fund.
Please see footnotes on page 7.
| | | | | | |
| Performance highlights (unaudited) | | Wells Fargo Advantage Government Securities Fund | | | 7 | |
| | | | |
| Ten largest long-term holdings6 (%) as of February 28, 2014 | |
U.S. Treasury Note, 0.25%, 5-31-2014 | | | 9.69 | |
U.S. Treasury Note, 0.13%, 7-31-2014 | | | 9.69 | |
U.S. Treasury Note, 0.50%, 10-15-2014 | | | 9.05 | |
U.S. Treasury Note, 0.38%, 3-15-2015 | | | 6.16 | |
FHLMC, 3.50%, 3-1-2044 | | | 6.14 | |
FNMA, 3.00%, 3-1-2044 | | | 5.93 | |
FNMA, 4.00%, 3-1-2044 | | | 4.28 | |
GNMA, 4.50%, 3-1-2044 | | | 3.40 | |
U.S. Treasury Note, 1.38%, 2-28-2019 | | | 2.72 | |
FNMA, 5.00%, 8-1-2040 | | | 2.31 | |
| | |
| Portfolio allocation7 as of February 28, 2014 |
| |
| | 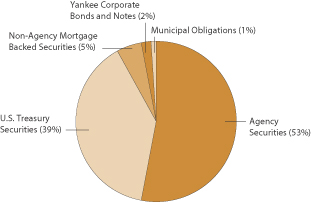
|
| 1. | Historical performance shown for Class B shares prior to their inception reflects the performance of Investor Class shares, adjusted to reflect the higher expenses applicable to Class B. Historical performance shown for Administrator Class shares prior to their inception reflects the performance of Institutional Class shares, adjusted to reflect the higher expenses applicable to Administrator Class shares. Effective June 20, 2008, the Advisor Class was renamed Class A and modified to assume the features and attributes of Class A. Historical performance shown for Class A shares through June 19, 2008, includes Advisor Class expenses. |
| 2. | Reflects the expense ratios as stated in the most recent prospectuses, which include the impact of 0.03% in acquired fund fees and expenses. The expense ratios shown are subject to change and may differ from the annualized expense ratios shown in the financial highlights of this report, which do not include acquired fund fees and expenses. |
| 3. | The Adviser has committed through December 31, 2014, to waive fees and/or reimburse expenses to the extent necessary to cap the Fund’s Total Annual Fund Operating Expenses After Fee Waiver, excluding certain expenses, at 0.85% for Class A, 1.60% for Class B, 1.60% for Class C, 0.64% for Administrator Class, 0.48% for Institutional Class, and 0.88% for Investor Class. Brokerage commissions, stamp duty fees, interest, taxes, acquired fund fees and expenses, and extraordinary expenses are excluded from the cap. Without this cap, the Fund’s returns would have been lower. |
| 4. | The Barclays U.S. Aggregate excluding Credit Bond Index is composed of the Barclays U.S. Government Bond Index and the Barclays U.S. Mortgage-Backed Securities Index and it includes Treasury issues, agency issues, and mortgage-backed securities. You cannot invest directly in an index. |
| 5. | The Barclays Intermediate U.S. Government Bond Index is an unmanaged index composed of U.S. Government securities with maturities in the one to 10-year range, including securities issued by the U.S. Treasury and U.S. government agencies. You cannot invest directly in an index. |
| 6. | The ten largest long-term holdings are calculated based on the value of the securities divided by total net assets of the Fund. Holdings are subject to change and may have changed since the date specified. |
| 7. | Portfolio allocation is subject to change and is calculated based on the total long-term investments of the Fund. |
| | | | |
| 8 | | Wells Fargo Advantage Government Securities Fund | | Fund expenses (unaudited) |
As a shareholder of the Fund, you incur two types of costs: (1) transaction costs, including sales charges (loads) on purchase payments and contingent deferred sales charges (if any) on redemptions and (2) ongoing costs, including management fees, distribution (12b-1) and/or shareholder service fees, and other Fund expenses. This example is intended to help you understand your ongoing costs (in dollars) of investing in the Fund and to compare these costs with the ongoing costs of investing in other mutual funds.
The example is based on an investment of $1,000 invested at the beginning of the six-month period and held for the entire period from September 1, 2013 to February 28, 2014.
Actual expenses
The “Actual” line of the table below provides information about actual account values and actual expenses. You may use the information in this line, together with the amount you invested, to estimate the expenses that you paid over the period. Simply divide your account value by $1,000 (for example, an $8,600 account value divided by $1,000 = 8.6), then multiply the result by the number in the “Actual” line under the heading entitled “Expenses paid during period” for your applicable class of shares to estimate the expenses you paid on your account during this period.
Hypothetical example for comparison purposes
The “Hypothetical” line of the table below provides information about hypothetical account values and hypothetical expenses based on the Fund’s actual expense ratio and an assumed rate of return of 5% per year before expenses, which is not the Fund’s actual return. The hypothetical account values and expenses may not be used to estimate the actual ending account balance or expenses you paid for the period. You may use this information to compare the ongoing costs of investing in the Fund and other funds. To do so, compare this 5% hypothetical example with the 5% hypothetical examples that appear in the shareholder reports of the other funds.
Please note that the expenses shown in the table are meant to highlight your ongoing costs only and do not reflect any transactional costs, such as sales charges (loads) and contingent deferred sales charges. Therefore, the “Hypothetical” line of the table is useful in comparing ongoing costs only and will not help you determine the relative total costs of owning different funds. In addition, if these transactional costs were included, your costs would have been higher.
| | | | | | | | | | | | | | | | |
| | | Beginning
account value
9-1-2013 | | | Ending
account value
2-28-2014 | | | Expenses
paid during
the period1 | | | Net annualized
expense ratio | |
Class A | | | | | | | | | | | | | | | | |
Actual | | $ | 1,000.00 | | | $ | 1,022.87 | | | $ | 4.31 | | | | 0.86 | % |
Hypothetical (5% return before expenses) | | $ | 1,000.00 | | | $ | 1,020.53 | | | $ | 4.31 | | | | 0.86 | % |
Class B | | | | | | | | | | | | | | | | |
Actual | | $ | 1,000.00 | | | $ | 1,018.25 | | | $ | 7.96 | | | | 1.59 | % |
Hypothetical (5% return before expenses) | | $ | 1,000.00 | | | $ | 1,016.91 | | | $ | 7.95 | | | | 1.59 | % |
Class C | | | | | | | | | | | | | | | | |
Actual | | $ | 1,000.00 | | | $ | 1,018.16 | | | $ | 8.06 | | | | 1.61 | % |
Hypothetical (5% return before expenses) | | $ | 1,000.00 | | | $ | 1,016.81 | | | $ | 8.05 | | | | 1.61 | % |
Administrator Class | | | | | | | | | | | | | | | | |
Actual | | $ | 1,000.00 | | | $ | 1,024.01 | | | $ | 3.21 | | | | 0.64 | % |
Hypothetical (5% return before expenses) | | $ | 1,000.00 | | | $ | 1,021.62 | | | $ | 3.21 | | | | 0.64 | % |
Institutional Class | | | | | | | | | | | | | | | | |
Actual | | $ | 1,000.00 | | | $ | 1,024.82 | | | $ | 2.41 | | | | 0.48 | % |
Hypothetical (5% return before expenses) | | $ | 1,000.00 | | | $ | 1,022.41 | | | $ | 2.41 | | | | 0.48 | % |
Investor Class | | | | | | | | | | | | | | | | |
Actual | | $ | 1,000.00 | | | $ | 1,022.72 | | | $ | 4.46 | | | | 0.89 | % |
Hypothetical (5% return before expenses) | | $ | 1,000.00 | | | $ | 1,020.38 | | | $ | 4.46 | | | | 0.89 | % |
| 1. | Expenses paid is equal to the annualized expense ratio of each class multiplied by the average account value over the period, multiplied by the number of days in the most recent fiscal half-year divided by the number of days in the fiscal year (to reflect the one-half-year period). |
| | | | | | |
| Summary portfolio of investments—February 28, 2014 (unaudited) | | Wells Fargo Advantage Government Securities Fund | | | 9 | |
The Summary Portfolio of Investments shows the 50 largest portfolio holdings in unaffiliated issuers and any holdings exceeding 1% of the total net assets as of the report date. The remaining securities held are grouped as “Other securities” in each category. You can request a complete schedule of portfolio holdings as of the report date, free of charge, by accessing the following website:
http://a584.g.akamai.net/f/584/1326/1d/www.wellsfargoadvantagefunds.com/pdf/semi/holdings/govtsecurities.pdf or by calling Wells Fargo Advantage Funds at 1-800-222-8222. This complete schedule, filed on the Form N-CSRS, is also available on the SEC’s website at sec.gov.
| | | | | | | | | | | | | | | | | | | | |
| Security name | | Interest rate | | | Maturity date | | | Principal | | | Value | | | Percent of
net assets | |
| | | | | | | | | | | | | | | | | | | | |
| | | | | |
Agency Securities: 66.43% | | | | | | | | | | | | | | | | | | | | |
FDIC Series 2010-S1 Class 1A ± 144A | | | 0.71 | % | | | 2-25-2048 | | | $ | 9,668,791 | | | $ | 9,708,172 | | | | 0.73 | % |
FDIC Series 2013-R1 Class A 144A | | | 1.15 | | | | 3-25-2033 | | | | 6,581,242 | | | | 6,394,135 | | | | 0.48 | |
FHLB | | | 5.63 | | | | 3-14-2036 | | | | 6,150,000 | | | | 7,551,616 | | | | 0.57 | |
FHLMC | | | 2.38 | | | | 1-13-2022 | | | | 10,415,000 | | | | 10,263,639 | | | | 0.77 | |
FHLMC %% | | | 3.50 | | | | 3-1-2044 | | | | 80,990,000 | | | | 81,888,487 | | | | 6.14 | |
FHLMC %% | | | 4.00 | | | | 3-1-2044 | | | | 11,875,000 | | | | 12,413,086 | | | | 0.93 | |
FHLMC | | | 5.50 | | | | 7-1-2035 | | | | 10,764,843 | | | | 11,975,290 | | | | 0.90 | |
FHLMC | | | 5.50 | | | | 12-1-2038 | | | | 7,071,545 | | | | 7,751,900 | | | | 0.58 | |
FHLMC | | | 6.00 | | | | 5-25-2043 | | | | 7,321,620 | | | | 8,358,002 | | | | 0.63 | |
FHLMC | | | 0.20-10.50 | | | | 10-1-2014 to 7-25-2043 | | | | 112,618,466 | | | | 71,906,187 | | | | 5.40 | |
FNMA | | | 1.75 | | | | 5-30-2019 | | | | 19,000,000 | | | | 18,934,241 | | | | 1.42 | |
FNMA %% | | | 3.00 | | | | 3-1-2029 | | | | 18,235,000 | | | | 18,867,527 | | | | 1.42 | |
FNMA %% | | | 3.00 | | | | 3-1-2044 | | | | 81,485,000 | | | | 79,142,306 | | | | 5.93 | |
FNMA %% | | | 3.50 | | | | 3-1-2029 | | | | 15,180,000 | | | | 16,045,734 | | | | 1.20 | |
FNMA %% | | | 3.50 | | | | 3-1-2044 | | | | 28,175,000 | | | | 28,558,005 | | | | 2.14 | |
FNMA %% | | | 4.00 | | | | 3-1-2029 | | | | 12,615,000 | | | | 13,458,628 | | | | 1.01 | |
FNMA %% | | | 4.00 | | | | 3-1-2044 | | | | 54,450,000 | | | | 57,049,138 | | | | 4.28 | |
FNMA | | | 4.15 | | | | 7-1-2014 | | | | 10,294,702 | | | | 10,302,902 | | | | 0.77 | |
FNMA %% | | | 4.50 | | | | 3-1-2029 | | | | 11,445,000 | | | | 12,217,538 | | | | 0.92 | |
FNMA %% | | | 4.50 | | | | 3-1-2044 | | | | 17,387,000 | | | | 18,671,329 | | | | 1.40 | |
FNMA %% | | | 5.00 | | | | 8-1-2040 | | | | 28,108,758 | | | | 30,864,115 | | | | 2.31 | |
FNMA | | | 5.50 | | | | 6-1-2034 | | | | 10,629,334 | | | | 11,795,141 | | | | 0.88 | |
FNMA %% | | | 6.00 | | | | 3-1-2044 | | | | 21,385,000 | | | | 23,804,178 | | | | 1.79 | |
FNMA | | | 0.36-11.25 | | | | 4-1-2014 to 8-25-2047 | | | | 165,139,668 | | | | 180,157,228 | | | | 13.50 | |
FNMA Series 2002-T19 Class A1 | | | 6.50 | | | | 7-25-2042 | | | | 6,867,133 | | | | 7,889,986 | | | | 0.59 | |
GNMA | | | 4.00 | | | | 6-20-2042 | | | | 19,790,116 | | | | 21,019,415 | | | | 1.58 | |
GNMA %% | | | 4.50 | | | | 3-1-2044 | | | | 41,770,000 | | | | 45,379,187 | | | | 3.40 | |
GNMA | | | 5.00 | | | | 7-20-2040 | | | | 9,724,002 | | | | 10,781,649 | | | | 0.81 | |
GNMA | | | 0.00-13.00 | | | | 11-15-2014 to 2-16-2050 | | | | 143,819,352 | | | | 13,037,441 | | | | 0.97 | |
GNMA Series 2006-32 Class C ± | | | 5.51 | | | | 11-16-2038 | | | | 12,510,000 | | | | 13,531,379 | | | | 1.01 | |
GNMA Series 2006-68 Class D ± | | | 5.31 | | | | 12-16-2037 | | | | 12,520,000 | | | | 13,776,908 | | | | 1.03 | |
GNMA Series 2007-35 Class NF ± | | | 0.25 | | | | 10-16-2035 | | | | 8,556,535 | | | | 8,550,691 | | | | 0.64 | |
Other securities | | | | | | | | | | | | | | | 4,054,131 | | | | 0.30 | |
| | | | | |
Total Agency Securities (Cost $869,713,654) | | | | | | | | | | | | | | | 886,099,311 | | | | 66.43 | |
| | | | | | | | | | | | | | | | | | | | |
| | | | | |
Municipal Obligations: 0.60% | | | | | | | | | | | | | | | | | | | | |
| | | | | |
| Arkansas: 0.00% | | | | | | | | | | | | | | | | | | | | |
Other securities | | | | | | | | | | | | | | | 35,550 | | | | 0.00 | |
| | | | | | | | | | | | | | | | | | | | |
| | | | | |
| Texas: 0.60% | | | | | | | | | | | | | | | | | | | | |
Retama TX Development Corporation
(Miscellaneous Revenue) | | | 10.00 | | | | 12-15-2020 | | | | 5,405,000 | | | | 8,023,398 | | | | 0.60 | |
| | | | | | | | | | | | | | | | | | | | |
| | | | | |
Total Municipal Obligations (Cost $6,882,723) | | | | | | | | | | | | | | | 8,058,948 | | | | 0.60 | |
| | | | | | | | | | | | | | | | | | | | |
The accompanying notes are an integral part of these financial statements.
| | | | |
| 10 | | Wells Fargo Advantage Government Securities Fund | | Summary portfolio of investments—February 28, 2014 (unaudited) |
| | | | | | | | | | | | | | | | | | | | |
| Security name | | Interest rate | | | Maturity date | | | Principal | | | Value | | | Percent of
net assets | |
| | | | | | | | | | | | | | | | | | | | |
| | | | | |
Non-Agency Mortgage Backed Securities: 6.04% | | | | | | | | | | | | | | | | | | | | |
Citigroup Commercial Mortgage Trust Series 2006-C4
Class A3 ± | | | 5.78 | % | | | 3-15-2049 | | | $ | 9,917,003 | | | $ | 10,757,122 | | | | 0.81 | % |
Citigroup Commercial Mortgage Trust Series 2006-C5
Class A4 | | | 5.43 | | | | 10-15-2049 | | | | 11,280,000 | | | | 12,345,983 | | | | 0.92 | |
GE Capital Commercial Mortgage Corporation Series 2005-C3 Class A7A ± | | | 4.97 | | | | 7-10-2045 | | | | 9,360,000 | | | | 9,778,813 | | | | 0.73 | |
Lehman Brothers UBS Commercial Mortgage Trust Series 2006-C1 Class A4 | | | 5.16 | | | | 2-15-2031 | | | | 13,165,000 | | | | 13,965,129 | | | | 1.05 | |
National Credit Union Administration Guaranteed Notes Series 2010-C1 Class APT | | | 2.65 | | | | 10-29-2020 | | | | 8,600,617 | | | | 8,871,536 | | | | 0.66 | |
National Credit Union Administration Guaranteed Notes | | | 0.54-2.90 | | | | 3-6-2020 to 10-29-2020 | | | | 9,391,838 | | | | 9,526,425 | | | | 0.72 | |
Other securities | | | | | | | | | | | | | | | 15,368,254 | | | | 1.15 | |
| | | | | |
Total Non-Agency Mortgage Backed Securities
(Cost $81,236,038) | | | | | | | | | | | | | | | 80,613,262 | | | | 6.04 | |
| | | | | | | | | | | | | | | | | | | | |
| | | | | |
U.S. Treasury Securities: 49.23% | | | | | | | | | | | | | | | | | | | | |
U.S. Treasury Bond | | | 2.75 | | | | 8-15-2042 | | | | 10,585,000 | | | | 8,980,716 | | | | 0.67 | |
U.S. Treasury Bond | | | 3.75 | | | | 8-15-2041 | | | | 20,565,000 | | | | 21,323,334 | | | | 1.60 | |
U.S. Treasury Bond | | | 4.50 | | | | 2-15-2036 | | | | 7,475,000 | | | | 8,759,766 | | | | 0.66 | |
U.S. Treasury Bond | | | 4.63 | | | | 2-15-2040 | | | | 20,150,000 | | | | 24,088,700 | | | | 1.81 | |
U.S. Treasury Bond | | | 6.25 | | | | 8-15-2023 | | | | 18,460,000 | | | | 24,287,877 | | | | 1.82 | |
U.S. Treasury Bond | | | 7.25 | | | | 8-15-2022 | | | | 4,685,000 | | | | 6,456,881 | | | | 0.48 | |
U.S. Treasury Note | | | 0.13 | | | | 7-31-2014 | | | | 129,195,000 | | | | 129,215,154 | | | | 9.69 | |
U.S. Treasury Note ## | | | 0.25 | | | | 5-31-2014 | | | | 129,170,000 | | | | 129,225,543 | | | | 9.69 | |
U.S. Treasury Note ## | | | 0.38 | | | | 3-15-2015 | | | | 82,035,000 | | | | 82,220,891 | | | | 6.16 | |
U.S. Treasury Note ## | | | 0.38 | | | | 11-15-2015 | | | | 30,605,000 | | | | 30,667,159 | | | | 2.30 | |
U.S. Treasury Note ## | | | 0.50 | | | | 10-15-2014 | | | | 120,390,000 | | | | 120,681,585 | | | | 9.05 | |
U.S. Treasury Note | | | 1.00 | | | | 8-31-2016 | | | | 12,240,000 | | | | 12,390,136 | | | | 0.93 | |
U.S. Treasury Note | | | 1.38 | | | | 2-28-2019 | | | | 36,475,000 | | | | 36,218,544 | | | | 2.72 | |
U.S. Treasury Note | | | 2.75 | | | | 11-15-2023 | | | | 21,845,000 | | | | 22,077,103 | | | | 1.65 | |
| | | | | |
Total U.S. Treasury Securities (Cost $654,764,813) | | | | | | | | | | | | | | | 656,593,389 | | | | 49.23 | |
| | | | | | | | | | | | | | | | | | | | |
| | | | | |
Yankee Corporate Bonds and Notes: 2.91% | | | | | | | | | | | | | | | | | | | | |
| | | | | |
Financials: 2.91% | | | | | | | | | | | | | | | | | | | | |
| | | | | |
| Banks: 2.91% | | | | | | | | | | | | | | | | | | | | |
Bank of Nova Scotia 144A | | | 1.65 | | | | 10-29-2015 | | | | 13,235,000 | | | | 13,496,629 | | | | 1.01 | |
Canadian Imperial Bank 144A | | | 0.90 | | | | 9-19-2014 | | | | 8,355,000 | | | | 8,385,788 | | | | 0.63 | |
Nordea Eiendomskreditt 144A | | | 1.88 | | | | 4-7-2014 | | | | 10,430,000 | | | | 10,445,228 | | | | 0.79 | |
Other securities | | | | | | | | | | | | | | | 6,437,216 | | | | 0.48 | |
| | | | | |
Total Yankee Corporate Bonds and Notes
(Cost $38,374,786) | | | | | | | | | | | | | | | 38,764,861 | | | | 2.91 | |
| | | | | | | | | | | | | | | | | | | | |
| | | | | |
| | | Yield | | | | | | Shares | | | | | | | |
| | | | | |
Short-Term Investments: 4.48% | | | | | | | | | | | | | | | | | | | | |
| | | | | |
| Investment Companies: 1.27% | | | | | | | | | | | | | | | | | | | | |
Wells Fargo Advantage Government Money Market Fund, Institutional Class (u)(l)## | | | 0.01 | | | | | | | | 16,851,793 | | | | 16,851,793 | | | | 1.27 | |
| | | | | | | | | | | | | | | | | | | | |
The accompanying notes are an integral part of these financial statements.
| | | | | | |
| Summary portfolio of investments—February 28, 2014 (unaudited) | | Wells Fargo Advantage Government Securities Fund | | | 11 | |
| | | | | | | | | | | | | | | | | | | | |
| Security name | | Interest rate | | | Maturity date | | | Principal | | | Value | | | Percent of
net assets | |
| | | | | | | | | | | | | | | | | | | | |
| | | | | |
| U.S. Treasury Securities: 3.21% | | | | | | | | | | | | | | | | | | | | |
U.S. Treasury Bill (z)# | | | 0.03 | % | | | 3-20-2014 | | | $ | 1,400,000 | | | $ | 1,399,980 | | | | 0.10 | % |
U.S. Treasury Bill (z)# | | | 0.04 | | | | 3-20-2014 | | | | 41,450,000 | | | | 41,449,119 | | | | 3.11 | |
| | | | | |
| | | | | | | | | | | | | | | 42,849,099 | | | | 3.21 | |
| | | | | | | | | | | | | | | | | | | | |
| | | | | |
Total Short-Term Investments (Cost $59,700,871) | | | | | | | | | | | | | | | 59,700,892 | | | | 4.48 | |
| | | | | | | | | | | | | | | | | | | | |
| Total investments in securities | | | | | | | | | | | | | | | | | | | | |
| (Cost $1,710,672,885)* | | | | | | | | | | | | | | | 1,729,830,663 | | | | 129.69 | |
Other assets and liabilities, net | | | | | | | | | | | | | | | (396,059,275 | ) | | | (29.69 | ) |
| | | | | | | | | | | | | | | | | | | | |
| Total net assets | | | | | | | | | | | | | | $ | 1,333,771,388 | | | | 100.00 | % |
| | | | | | | | | | | | | | | | | | | | |
| ± | Variable rate investment. The rate shown is the rate in effect at period end. |
| 144A | Security that may be resold to “qualified institutional buyers” under Rule 144A or security offered pursuant to Section 4(2) of the Securities Act of 1933, as amended. |
| %% | Security issued on a when-issued basis. |
| ## | All or a portion of this security has been segregated for when-issued securities. |
| (u) | Rate shown is the 7-day annualized yield at period end. |
| (l) | Investment in an affiliate |
| (z) | Zero coupon security. Rate represents the current yield to maturity. |
| # | All or a portion of this security is segregated as collateral for investments in derivative instruments. |
| * | Cost for federal income tax purposes is $1,712,116,317 and unrealized appreciation (depreciation) consists of: |
| | | | |
Gross unrealized appreciation | | $ | 31,158,764 | |
Gross unrealized depreciation | | | (13,444,418 | ) |
| | | | |
Net unrealized appreciation | | $ | 17,714,346 | |
The accompanying notes are an integral part of these financial statements.
| | | | |
| 12 | | Wells Fargo Advantage Government Securities Fund | | Statement of assets and liabilities—February 28, 2014 (unaudited) |
| | | | |
| | | | |
| |
Assets | | | | |
Investments | | | | |
In unaffiliated securities, at value (see cost below) | | $ | 1,712,978,870 | |
In affiliated securities, at value (see cost below) | | | 16,851,793 | |
| | | | |
Total investments, at value (see cost below) | | | 1,729,830,663 | |
Cash | | | 301,934 | |
Receivable for investments sold | | | 15,306,028 | |
Principal paydown receivable | | | 136,930 | |
Receivable for daily variation margin on open futures contracts | | | 21,736 | |
Receivable for Fund shares sold | | | 1,981,118 | |
Receivable for interest | | | 4,412,638 | |
Prepaid expenses and other assets | | | 63,661 | |
| | | | |
Total assets | | | 1,752,054,708 | |
| | | | |
| |
Liabilities | | | | |
Dividends payable | | | 46,528 | |
Payable for investments purchased | | | 414,290,344 | |
Payable for Fund shares redeemed | | | 2,799,059 | |
Payable for daily variation margin on open futures contracts | | | 269,031 | |
Advisory fee payable | | | 344,371 | |
Distribution fees payable | | | 23,761 | |
Due to other related parties | | | 195,328 | |
Accrued expenses and other liabilities | | | 314,898 | |
| | | | |
Total liabilities | | | 418,283,320 | |
| | | | |
Total net assets | | $ | 1,333,771,388 | |
| | | | |
| |
NET ASSETS CONSIST OF | | | | |
Paid-in capital | | $ | 1,354,728,182 | |
Overdistributed net investment income | | | (9,398,601 | ) |
Accumulated net realized losses on investments | | | (30,840,566 | ) |
Net unrealized gains on investments | | | 19,282,373 | |
| | | | |
Total net assets | | $ | 1,333,771,388 | |
| | | | |
| |
COMPUTATION OF NET ASSET VALUE AND OFFERING PRICE PER SHARE1 | | | | |
Net assets – Class A | | $ | 184,204,035 | |
Shares outstanding – Class A | | | 16,829,588 | |
Net asset value per share – Class A | | | $10.95 | |
Maximum offering price per share – Class A2 | | | $11.47 | |
Net assets – Class B | | $ | 1,664,771 | |
Shares outstanding – Class B | | | 152,125 | |
Net asset value per share – Class B | | | $10.94 | |
Net assets – Class C | | $ | 36,148,738 | |
Shares outstanding – Class C | | | 3,303,163 | |
Net asset value per share – Class C | | | $10.94 | |
Net assets – Administrator Class | | $ | 200,138,665 | |
Shares outstanding – Administrator Class | | | 18,292,574 | |
Net asset value per share – Administrator Class | | | $10.94 | |
Net assets – Institutional Class | | $ | 535,349,226 | |
Shares outstanding – Institutional Class | | | 48,955,556 | |
Net asset value per share – Institutional Class | | | $10.94 | |
Net assets – Investor Class | | $ | 376,265,953 | |
Shares outstanding – Investor Class | | | 34,355,740 | |
Net asset value per share – Investor Class | | | $10.95 | |
| |
Investments in unaffiliated securities, at cost | | $ | 1,693,821,092 | |
| | | | |
Investments in affiliated securities, at cost | | $ | 16,851,793 | |
| | | | |
Total investments, at cost | | $ | 1,710,672,885 | |
| | | | |
| 1. | The Fund has an unlimited number of authorized shares. |
| 2. | Maximum offering price is computed as 100/95.50 of net asset value. On investments of $50,000 or more, the offering price is reduced. |
The accompanying notes are an integral part of these financial statements.
| | | | | | |
| Statement of operations—six months ended February 28, 2014 (unaudited) | | Wells Fargo Advantage Government Securities Fund | | | 13 | |
| | | | |
| | | | |
| |
Investment income | | | | |
Interest | | $ | 9,762,863 | |
Income from affiliated securities | | | 12,357 | |
| | | | |
Total investment income | | | 9,775,220 | |
| | | | |
| |
Expenses | | | | |
Advisory fee | | | 2,612,803 | |
Administration fees | | | | |
Fund level | | | 346,692 | |
Class A | | | 154,357 | |
Class B | | | 1,537 | |
Class C | | | 31,946 | |
Administrator Class | | | 110,340 | |
Institutional Class | | | 211,416 | |
Investor Class | | | 382,610 | |
Shareholder servicing fees | | | | |
Class A | | | 241,184 | |
Class B | | | 2,195 | |
Class C | | | 49,916 | |
Administrator Class | | | 270,911 | |
Investor Class | | | 498,085 | |
Distribution fees | | | | |
Class B | | | 7,204 | |
Class C | | | 149,748 | |
Custody and accounting fees | | | 47,626 | |
Professional fees | | | 40,553 | |
Registration fees | | | 58,009 | |
Shareholder report expenses | | | 79,928 | |
Trustees’ fees and expenses | | | 5,575 | |
Other fees and expenses | | | 26,742 | |
| | | | |
Total expenses | | | 5,329,377 | |
Less: Fee waivers and/or expense reimbursements | | | (388,853 | ) |
| | | | |
Net expenses | | | 4,940,524 | |
| | | | |
Net investment income | | | 4,834,696 | |
| | | | |
| |
REALIZED AND UNREALIZED GAINS (LOSSES) ON INVESTMENTS | | | | |
| |
Net realized gains on: | | | | |
Unaffiliated securities | | | 11,848,568 | |
Futures transactions | | | 3,158,377 | |
| | | | |
Net realized gains on investments | | | 15,006,945 | |
| | | | |
| |
Net change in unrealized gains (losses) on: | | | | |
Unaffiliated securities | | | 13,535,191 | |
Futures transactions | | | (349,500 | ) |
| | | | |
Net change in unrealized gains (losses) on investments | | | 13,185,691 | |
| | | | |
Net realized and unrealized gains (losses) on investments | | | 28,192,636 | |
| | | | |
Net increase in net assets resulting from operations | | $ | 33,027,332 | |
| | | | |
The accompanying notes are an integral part of these financial statements.
| | | | |
| 14 | | Wells Fargo Advantage Government Securities Fund | | Statement of changes in net assets |
| | | | | | | | | | | | | | | | |
| | | Six months ended
February 28, 2014
(unaudited) | | | Year ended
August 31, 2013 | |
| | | | |
Operations | | | | | | | | | | | | | | | | |
Net investment income | | | | | | $ | 4,834,696 | | | | | | | $ | 15,501,192 | |
Net realized gains (losses) on investments | | | | | | | 15,006,945 | | | | | | | | (1,664,045 | ) |
Net change in unrealized gains (losses) on investments | | | | | | | 13,185,691 | | | | | | | | (70,187,287 | ) |
| | | | |
Net increase (decrease) in net assets resulting from operations | | | | | | | 33,027,332 | | | | | | | | (56,350,140 | ) |
| | | | |
| | | | |
Distributions to shareholders from | | | | | | | | | | | | | | | | |
Net investment income | | | | | | | | | | | | | | | | |
Class A | | | | | | | (1,167,961 | ) | | | | | | | (1,828,007 | ) |
Class B | | | | | | | (4,313 | ) | | | | | | | (801 | ) |
Class C | | | | | | | (91,203 | ) | | | | | | | (14,343 | ) |
Administrator Class | | | | | | | (1,552,594 | ) | | | | | | | (4,122,563 | ) |
Institutional Class | | | | | | | (4,201,618 | ) | | | | | | | (7,352,891 | ) |
Investor Class | | | | | | | (2,370,720 | ) | | | | | | | (4,066,924 | ) |
Net realized gains | | | | | | | | | | | | | | | | |
Class A | | | | | | | 0 | | | | | | | | (5,787,244 | ) |
Class B | | | | | | | 0 | | | | | | | | (91,631 | ) |
Class C | | | | | | | 0 | | | | | | | | (1,652,441 | ) |
Administrator Class | | | | | | | 0 | | | | | | | | (11,374,048 | ) |
Institutional Class | | | | | | | 0 | | | | | | | | (15,064,172 | ) |
Investor Class | | | | | | | 0 | | | | | | | | (14,139,250 | ) |
| | | | |
Total distributions to shareholders | | | | | | | (9,388,409 | ) | | | | | | | (65,494,315 | ) |
| | | | |
| | | | |
Capital share transactions | | | Shares | | | | | | | | Shares | | | | | |
Proceeds from shares sold | | | | | | | | | | | | | | | | |
Class A | | | 666,570 | | | | 7,240,006 | | | | 2,608,358 | | | | 29,241,926 | |
Class B | | | 3,264 | | | | 35,580 | | | | 4,179 | | | | 46,967 | |
Class C | | | 51,752 | | | | 562,749 | | | | 581,904 | | | | 6,542,961 | |
Administrator Class | | | 2,319,445 | | | | 25,161,890 | | | | 17,563,407 | | | | 197,163,327 | |
Institutional Class | | | 7,273,349 | | | | 78,952,125 | | | | 15,309,231 | | | | 170,689,174 | |
Investor Class | | | 1,784,642 | | | | 19,401,537 | | | | 5,551,759 | | | | 62,174,744 | |
| | | | |
| | | | | | | 131,353,887 | | | | | | | | 465,859,099 | |
| | | | |
Reinvestment of distributions | | | | | | | | | | | | | | | | |
Class A | | | 94,088 | | | | 1,020,333 | | | | 589,275 | | | | 6,585,929 | |
Class B | | | 334 | | | | 3,597 | | | | 6,795 | | | | 76,052 | |
Class C | | | 3,227 | | | | 34,774 | | | | 60,071 | | | | 672,281 | |
Administrator Class | | | 119,269 | | | | 1,294,028 | | | | 596,405 | | | | 6,657,442 | |
Institutional Class | | | 378,185 | | | | 4,101,541 | | | | 1,774,405 | | | | 19,798,248 | |
Investor Class | | | 212,980 | | | | 2,311,369 | | | | 1,574,233 | | | | 17,613,825 | |
| | | | |
| | | | | | | 8,765,642 | | | | | | | | 51,403,777 | |
| | | | |
Payment for shares redeemed | | | | | | | | | | | | | | | | |
Class A | | | (2,778,959 | ) | | | (30,204,512 | ) | | | (6,850,146 | ) | | | (76,132,673 | ) |
Class B | | | (61,964 | ) | | | (673,840 | ) | | | (212,273 | ) | | | (2,365,200 | ) |
Class C | | | (898,568 | ) | | | (9,751,579 | ) | | | (3,049,844 | ) | | | (33,827,414 | ) |
Administrator Class | | | (15,682,389 | ) | | | (170,331,441 | ) | | | (24,665,991 | ) | | | (273,105,092 | ) |
Institutional Class | | | (11,267,870 | ) | | | (121,808,424 | ) | | | (32,414,586 | ) | | | (363,854,199 | ) |
Investor Class | | | (8,219,364 | ) | | | (89,321,194 | ) | | | (22,307,918 | ) | | | (248,387,251 | ) |
| | | | |
| | | | | | | (422,090,990 | ) | | | | | | | (997,671,829 | ) |
| | | | |
Net decrease in net assets resulting from capital share transactions | | | | | | | (281,971,461 | ) | | | | | | | (480,408,953 | ) |
| | | | |
Total decrease in net assets | | | | | | | (258,332,538 | ) | | | | | | | (602,253,408 | ) |
| | | | |
| | | | |
Net assets | | | | | | | | | | | | | | | | |
Beginning of period | | | | | | | 1,592,103,926 | | | | | | | | 2,194,357,334 | |
| | | | |
End of period | | | | | | $ | 1,333,771,388 | | | | | | | $ | 1,592,103,926 | |
| | | | |
Overdistributed net investment income | | | | | | $ | (9,398,601 | ) | | | | | | $ | (4,844,888 | ) |
| | | | |
The accompanying notes are an integral part of these financial statements.
| | | | | | |
| Financial highlights | | Wells Fargo Advantage Government Securities Fund | | | 15 | |
(For a share outstanding throughout each period)
| | | | | | | | | | | | | | | | | | | | | | | | | | | | |
| | | Six months ended
February 28, 2014
(unaudited) | | | Year ended August 31 | | | Year ended May 31 | |
| CLASS A | | | 2013 | | | 2012 | | | 2011 | | | 20101 | | | 2010 | | | 20092 | |
Net asset value, beginning of period | | $ | 10.77 | | | $ | 11.48 | | | $ | 11.23 | | | $ | 11.16 | | | $ | 10.89 | | | $ | 10.71 | | | $ | 10.45 | |
Net investment income | | | 0.03 | 3 | | | 0.07 | | | | 0.15 | | | | 0.25 | | | | 0.06 | 3 | | | 0.29 | | | | 0.39 | 3 |
Net realized and unrealized gains (losses)
on investments | | | 0.22 | | | | (0.42 | ) | | | 0.33 | | | | 0.16 | | | | 0.30 | | | | 0.39 | | | | 0.34 | |
| | | | | | | | | | | | | | | | | | | | | | | | | | | | |
Total from investment operations | | | 0.25 | | | | (0.35 | ) | | | 0.48 | | | | 0.41 | | | | 0.36 | | | | 0.68 | | | | 0.73 | |
Distributions to shareholders from | | | | | | | | | | | | | | | | | | | | | | | | | | | | |
Net investment income | | | (0.07 | ) | | | (0.09 | ) | | | (0.17 | ) | | | (0.34 | ) | | | (0.09 | ) | | | (0.41 | ) | | | (0.44 | ) |
Net realized gains | | | 0.00 | | | | (0.27 | ) | | | (0.06 | ) | | | 0.00 | | | | 0.00 | | | | (0.09 | ) | | | (0.03 | ) |
| | | | | | | | | | | | | | | | | | | | | | | | | | | | |
Total distributions to shareholders | | | (0.07 | ) | | | (0.36 | ) | | | (0.23 | ) | | | (0.34 | ) | | | (0.09 | ) | | | (0.50 | ) | | | (0.47 | ) |
Net asset value, end of period | | $ | 10.95 | | | $ | 10.77 | | | $ | 11.48 | | | $ | 11.23 | | | $ | 11.16 | | | $ | 10.89 | | | $ | 10.71 | |
Total return4 | | | 2.29 | % | | | (3.22 | )% | | | 4.35 | % | | | 3.75 | % | | | 3.29 | % | | | 6.48 | % | | | 7.17 | % |
Ratios to average net assets (annualized) | | | | | | | | | | | | | | | | | | | | | | | | | | | | |
Gross expenses | | | 0.87 | % | | | 0.85 | % | | | 0.86 | % | | | 0.85 | % | | | 0.86 | % | | | 0.89 | % | | | 0.90 | % |
Net expenses | | | 0.86 | % | | | 0.85 | % | | | 0.86 | % | | | 0.85 | % | | | 0.86 | % | | | 0.89 | % | | | 0.90 | % |
Net investment income | | | 0.54 | % | | | 0.67 | % | | | 1.35 | % | | | 2.31 | % | | | 2.10 | % | | | 2.71 | % | | | 3.65 | % |
Supplemental data | | | | | | | | | | | | | | | | | | | | | | | | | | | | |
Portfolio turnover rate | | | 179 | % | | | 341 | % | | | 327 | % | | | 268 | % | | | 89 | % | | | 194 | % | | | 368 | % |
Net assets, end of period (000s omitted) | | | $184,204 | | | | $202,955 | | | | $258,329 | | | | $270,253 | | | | $326,800 | | | | $174,781 | | | | $181,342 | |
| 1. | For the three months ended August 31, 2010. The Fund changed its fiscal year end from May 31 to August 31, effective August 31, 2010. |
| 2. | On June 20, 2008, Advisor Class was renamed Class A. |
| 3. | Calculated based upon average shares outstanding |
| 4. | Total return calculations do not include any sales charges. Returns for periods of less than one year are not annualized. |
The accompanying notes are an integral part of these financial statements.
| | | | |
| 16 | | Wells Fargo Advantage Government Securities Fund | | Financial highlights |
(For a share outstanding throughout each period)
| | | | | | | | | | | | | | | | | | | | | | | | | | | | |
| | | Six months ended
February 28, 2014
(unaudited) | | | Year ended August 31 | | | Year ended May 31 | |
| CLASS B | | | 2013 | | | 2012 | | | 2011 | | | 20101 | | | 2010 | | | 20092 | |
Net asset value, beginning of period | | $ | 10.77 | | | $ | 11.48 | | | $ | 11.23 | | | $ | 11.16 | | | $ | 10.89 | | | $ | 10.70 | | | $ | 10.32 | |
Net investment income (loss) | | | (0.01 | )3 | | | (0.03 | ) | | | 0.08 | 3 | | | 0.15 | | | | 0.04 | 3 | | | 0.24 | 3 | | | 0.27 | 3 |
Net realized and unrealized gains (losses)
on investments | | | 0.21 | | | | (0.41 | ) | | | 0.31 | | | | 0.17 | | | | 0.30 | | | | 0.37 | | | | 0.45 | |
| | | | | | | | | | | | | | | | | | | | | | | | | | | | |
Total from investment operations | | | 0.20 | | | | (0.44 | ) | | | 0.39 | | | | 0.32 | | | | 0.34 | | | | 0.61 | | | | 0.72 | |
Distributions to shareholders from | | | | | | | | | | | | | | | | | | | | | | | | | | | | |
Net investment income | | | (0.03 | ) | | | (0.00 | )4 | | | (0.08 | ) | | | (0.25 | ) | | | (0.07 | ) | | | (0.33 | ) | | | (0.31 | ) |
Net realized gains | | | 0.00 | | | | (0.27 | ) | | | (0.06 | ) | | | 0.00 | | | | 0.00 | | | | (0.09 | ) | | | (0.03 | ) |
| | | | | | | | | | | | | | | | | | | | | | | | | | | | |
Total distributions to shareholders | | | (0.03 | ) | | | (0.27 | ) | | | (0.14 | ) | | | (0.25 | ) | | | (0.07 | ) | | | (0.42 | ) | | | (0.34 | ) |
Net asset value, end of period | | $ | 10.94 | | | $ | 10.77 | | | $ | 11.48 | | | $ | 11.23 | | | $ | 11.16 | | | $ | 10.89 | | | $ | 10.70 | |
Total return5 | | | 1.83 | % | | | (3.94 | )% | | | 3.57 | % | | | 2.98 | % | | | 3.10 | % | | | 5.80 | % | | | 7.00 | % |
Ratios to average net assets (annualized) | | | | | | | | | | | | | | | | | | | | | | | | | | | | |
Gross expenses | | | 1.60 | % | | | 1.60 | % | | | 1.61 | % | | | 1.60 | % | | | 1.60 | % | | | 1.63 | % | | | 1.65 | % |
Net expenses | | | 1.59 | % | | | 1.60 | % | | | 1.61 | % | | | 1.60 | % | | | 1.60 | % | | | 1.63 | % | | | 1.65 | % |
Net investment income (loss) | | | (0.17 | )% | | | (0.08 | )% | | | 0.68 | % | | | 1.55 | % | | | 1.29 | % | | | 2.09 | % | | | 2.94 | % |
Supplemental data | | | | | | | | | | | | | | | | | | | | | | | | | | | | |
Portfolio turnover rate | | | 179 | % | | | 341 | % | | | 327 | % | | | 268 | % | | | 89 | % | | | 194 | % | | | 368 | % |
Net assets, end of period (000s omitted) | | | $1,665 | | | | $2,266 | | | | $4,727 | | | | $7,083 | | | | $11,495 | | | | $2,159 | | | | $5,297 | |
| 1. | For the three months ended August 31, 2010. The Fund changed its fiscal year end from May 31 to August 31, effective August 31, 2010. |
| 2. | For the period from July 18, 2008 (commencement of class operations) to May 31, 2009. |
| 3. | Calculated based upon average shares outstanding |
| 4. | Amount is less than $0.005. |
| 5. | Total return calculations do not include any sales charges. Returns for periods of less than one year are not annualized. |
The accompanying notes are an integral part of these financial statements.
| | | | | | |
| Financial highlights | | Wells Fargo Advantage Government Securities Fund | | | 17 | |
(For a share outstanding throughout each period)
| | | | | | | | | | | | | | | | | | | | | | | | | | | | |
| | | Six months ended
February 28, 2014
(unaudited) | | | Year ended August 31 | | | Year ended May 31 | |
| CLASS C | | | 2013 | | | 2012 | | | 2011 | | | 20101 | | | 2010 | | | 2009 | |
Net asset value, beginning of period | | $ | 10.77 | | | $ | 11.48 | | | $ | 11.23 | | | $ | 11.16 | | | $ | 10.89 | | | $ | 10.70 | | | $ | 10.45 | |
Net investment income (loss) | | | (0.01 | )2 | | | (0.02 | ) | | | 0.07 | | | | 0.17 | | | | 0.04 | 2 | | | 0.23 | | | | 0.30 | 2 |
Net realized and unrealized gains (losses)
on investments | | | 0.21 | | | | (0.42 | ) | | | 0.32 | | | | 0.15 | | | | 0.30 | | | | 0.38 | | | | 0.35 | |
| | | | | | | | | | | | | | | | | | | | | | | | | | | | |
Total from investment operations | | | 0.20 | | | | (0.44 | ) | | | 0.39 | | | | 0.32 | | | | 0.34 | | | | 0.61 | | | | 0.65 | |
Distributions to shareholders from | | | | | | | | | | | | | | | | | | | | | | | | | | | | |
Net investment income | | | (0.03 | ) | | | (0.00 | )3 | | | (0.08 | ) | | | (0.25 | ) | | | (0.07 | ) | | | (0.33 | ) | | | (0.37 | ) |
Net realized gains | | | 0.00 | | | | (0.27 | ) | | | (0.06 | ) | | | 0.00 | | | | 0.00 | | | | (0.09 | ) | | | (0.03 | ) |
| | | | | | | | | | | | | | | | | | | | | | | | | | | | |
Total distributions to shareholders | | | (0.03 | ) | | | (0.27 | ) | | | (0.14 | ) | | | (0.25 | ) | | | (0.07 | ) | | | (0.42 | ) | | | (0.40 | ) |
Net asset value, end of period | | $ | 10.94 | | | $ | 10.77 | | | $ | 11.48 | | | $ | 11.23 | | | $ | 11.16 | | | $ | 10.89 | | | $ | 10.70 | |
Total return4 | | | 1.82 | % | | | (3.94 | )% | | | 3.57 | % | | | 2.98 | % | | | 3.09 | % | | | 5.78 | % | | | 6.28 | % |
Ratios to average net assets (annualized) | | | | | | | | | | | | | | | | | | | | | | | | | | | | |
Gross expenses | | | 1.62 | % | | | 1.60 | % | | | 1.61 | % | | | 1.60 | % | | | 1.61 | % | | | 1.64 | % | | | 1.63 | % |
Net expenses | | | 1.61 | % | | | 1.60 | % | | | 1.61 | % | | | 1.60 | % | | | 1.61 | % | | | 1.64 | % | | | 1.63 | % |
Net investment income (loss) | | | (0.21 | )% | | | (0.08 | )% | | | 0.55 | % | | | 1.56 | % | | | 1.35 | % | | | 1.89 | % | | | 2.78 | % |
Supplemental data | | | | | | | | | | | | | | | | | | | | | | | | | | | | |
Portfolio turnover rate | | | 179 | % | | | 341 | % | | | 327 | % | | | 268 | % | | | 89 | % | | | 194 | % | | | 368 | % |
Net assets, end of period (000s omitted) | | | $36,149 | | | | $44,647 | | | | $75,244 | | | | $58,576 | | | | $59,580 | | | | $34,927 | | | | $21,783 | |
| 1. | For the three months ended August 31, 2010. The Fund changed its fiscal year end from May 31 to August 31, effective August 31, 2010. |
| 2. | Calculated based upon average shares outstanding |
| 3. | Amount is less than $0.005. |
| 4. | Total return calculations do not include any sales charges. Returns for periods of less than one year are not annualized. |
The accompanying notes are an integral part of these financial statements.
| | | | |
| 18 | | Wells Fargo Advantage Government Securities Fund | | Financial highlights |
(For a share outstanding throughout each period)
| | | | | | | | | | | | | | | | | | | | | | | | | | | | |
| | | Six months ended
February 28, 2014
(unaudited) | | | Year ended August 31 | | | Year ended May 31 | |
| ADMINISTRATOR CLASS | | | 2013 | | | 2012 | | | 2011 | | | 20101 | | | 2010 | | | 2009 | |
Net asset value, beginning of period | | $ | 10.76 | | | $ | 11.48 | | | $ | 11.23 | | | $ | 11.16 | | | $ | 10.89 | | | $ | 10.70 | | | $ | 10.45 | |
Net investment income | | | 0.04 | 2 | | | 0.09 | | | | 0.17 | 2 | | | 0.27 | 2 | | | 0.06 | 2 | | | 0.32 | | | | 0.41 | 2 |
Net realized and unrealized gains (losses)
on investments | | | 0.22 | | | | (0.43 | ) | | | 0.33 | | | | 0.16 | | | | 0.30 | | | | 0.39 | | | | 0.34 | |
| | | | | | | | | | | | | | | | | | | | | | | | | | | | |
Total from investment operations | | | 0.26 | | | | (0.34 | ) | | | 0.50 | | | | 0.43 | | | | 0.36 | | | | 0.71 | | | | 0.75 | |
Distributions to shareholders from | | | | | | | | | | | | | | | | | | | | | | | | | | | | |
Net investment income | | | (0.08 | ) | | | (0.11 | ) | | | (0.19 | ) | | | (0.36 | ) | | | (0.09 | ) | | | (0.43 | ) | | | (0.47 | ) |
Net realized gains | | | 0.00 | | | | (0.27 | ) | | | (0.06 | ) | | | 0.00 | | | | 0.00 | | | | (0.09 | ) | | | (0.03 | ) |
| | | | | | | | | | | | | | | | | | | | | | | | | | | | |
Total distributions to shareholders | | | (0.08 | ) | | | (0.38 | ) | | | (0.25 | ) | | | (0.36 | ) | | | (0.09 | ) | | | (0.52 | ) | | | (0.50 | ) |
Net asset value, end of period | | $ | 10.94 | | | $ | 10.76 | | | $ | 11.48 | | | $ | 11.23 | | | $ | 11.16 | | | $ | 10.89 | | | $ | 10.70 | |
Total return3 | | | 2.40 | % | | | (3.10 | )% | | | 4.57 | % | | | 3.97 | % | | | 3.34 | % | | | 6.78 | % | | | 7.28 | % |
Ratios to average net assets (annualized) | | | | | | | | | | | | | | | | | | | | | | | | | | | | |
Gross expenses | | | 0.81 | % | | | 0.79 | % | | | 0.79 | % | | | 0.74 | % | | | 0.79 | % | | | 0.81 | % | | | 0.81 | % |
Net expenses | | | 0.64 | % | | | 0.64 | % | | | 0.64 | % | | | 0.64 | % | | | 0.67 | % | | | 0.70 | % | | | 0.70 | % |
Net investment income | | | 0.79 | % | | | 0.88 | % | | | 1.49 | % | | | 2.50 | % | | | 2.30 | % | | | 2.90 | % | | | 3.86 | % |
Supplemental data | | | | | | | | | | | | | | | | | | | | | | | | | | | | |
Portfolio turnover rate | | | 179 | % | | | 341 | % | | | 327 | % | | | 268 | % | | | 89 | % | | | 194 | % | | | 368 | % |
Net assets, end of period (000s omitted) | | | $200,139 | | | | $339,446 | | | | $436,578 | | | | $276,334 | | | | $366,430 | | | | $243,760 | | | | $266,579 | |
| 1. | For the three months ended August 31, 2010. The Fund changed its fiscal year end from May 31 to August 31, effective August 31, 2010. |
| 2. | Calculated based upon average shares outstanding |
| 3. | Returns for periods of less than one year are not annualized. |
The accompanying notes are an integral part of these financial statements.
| | | | | | |
| Financial highlights | | Wells Fargo Advantage Government Securities Fund | | | 19 | |
(For a share outstanding throughout each period)
| | | | | | | | | | | | | | | | | | | | | | | | | | | | |
| | | Six months ended
February 28, 2014 (unaudited) | | | Year ended August 31 | | | Year ended May 31 | |
| INSTITUTIONAL CLASS | | | 2013 | | | 2012 | | | 2011 | | | 20101 | | | 2010 | | | 2009 | |
Net asset value, beginning of period | | $ | 10.76 | | | $ | 11.47 | | | $ | 11.22 | | | $ | 11.15 | | | $ | 10.88 | | | $ | 10.70 | | | $ | 10.44 | |
Net investment income | | | 0.05 | | | | 0.11 | | | | 0.19 | 2 | | | 0.30 | | | | 0.07 | 2 | | | 0.32 | 2 | | | 0.44 | 2 |
Net realized and unrealized gains (losses)
on investments | | | 0.22 | | | | (0.42 | ) | | | 0.33 | | | | 0.15 | | | | 0.30 | | | | 0.41 | | | | 0.34 | |
| | | | | | | | | | | | | | | | | | | | | | | | | | | | |
Total from investment operations | | | 0.27 | | | | (0.31 | ) | | | 0.52 | | | | 0.45 | | | | 0.37 | | | | 0.73 | | | | 0.78 | |
Distributions to shareholders from | | | | | | | | | | | | | | | | | | | | | | | | | | | | |
Net investment income | | | (0.09 | ) | | | (0.13 | ) | | | (0.21 | ) | | | (0.38 | ) | | | (0.10 | ) | | | (0.46 | ) | | | (0.49 | ) |
Net realized gains | | | 0.00 | | | | (0.27 | ) | | | (0.06 | ) | | | 0.00 | | | | 0.00 | | | | (0.09 | ) | | | (0.03 | ) |
| | | | | | | | | | | | | | | | | | | | | | | | | | | | |
Total distributions to shareholders | | | (0.09 | ) | | | (0.40 | ) | | | (0.27 | ) | | | (0.38 | ) | | | (0.10 | ) | | | (0.55 | ) | | | (0.52 | ) |
Net asset value, end of period | | $ | 10.94 | | | $ | 10.76 | | | $ | 11.47 | | | $ | 11.22 | | | $ | 11.15 | | | $ | 10.88 | | | $ | 10.70 | |
Total return3 | | | 2.48 | % | | | (2.86 | )% | | | 4.74 | % | | | 4.14 | % | | | 3.39 | % | | | 6.92 | % | | | 7.62 | % |
Ratios to average net assets (annualized) | | | | | | | | | | | | | | | | | | | | | | | | | | | | |
Gross expenses | | | 0.54 | % | | | 0.52 | % | | | 0.53 | % | | | 0.52 | % | | | 0.52 | % | | | 0.54 | % | | | 0.56 | % |
Net expenses | | | 0.48 | % | | | 0.48 | % | | | 0.48 | % | | | 0.48 | % | | | 0.48 | % | | | 0.48 | % | | | 0.48 | % |
Net investment income | | | 0.93 | % | | | 1.05 | % | | | 1.71 | % | | | 2.71 | % | | | 2.52 | % | | | 3.06 | % | | | 4.14 | % |
Supplemental data | | | | | | | | | | | | | | | | | | | | | | | | | | | | |
Portfolio turnover rate | | | 179 | % | | | 341 | % | | | 327 | % | | | 268 | % | | | 89 | % | | | 194 | % | | | 368 | % |
Net assets, end of period (000s omitted) | | | $535,349 | | | | $565,573 | | | | $778,919 | | | | $718,411 | | | | $531,890 | | | | $463,726 | | | | $313,486 | |
| 1. | For the three months ended August 31, 2010. The Fund changed its fiscal year end from May 31 to August 31, effective August 31, 2010. |
| 2. | Calculated based upon average shares outstanding |
| 3. | Returns for periods of less than one year are not annualized. |
The accompanying notes are an integral part of these financial statements.
| | | | |
| 20 | | Wells Fargo Advantage Government Securities Fund | | Financial highlights |
(For a share outstanding throughout each period)
| | | | | | | | | | | | | | | | | | | | | | | | | | | | |
| | | Six months ended
February 28, 2014
(unaudited) | | | Year ended August 31 | | | Year ended May 31 | |
| INVESTOR CLASS | | | 2013 | | | 2012 | | | 2011 | | | 20101 | | | 2010 | | | 2009 | |
Net asset value, beginning of period | | $ | 10.77 | | | $ | 11.49 | | | $ | 11.24 | | | $ | 11.17 | | | $ | 10.90 | | | $ | 10.71 | | | $ | 10.46 | |
Net investment income | | | 0.02 | | | | 0.07 | | | | 0.15 | 2 | | | 0.25 | 2 | | | 0.06 | 2 | | | 0.29 | | | | 0.39 | 2 |
Net realized and unrealized gains (losses)
on investments | | | 0.22 | | | | (0.44 | ) | | | 0.33 | | | | 0.15 | | | | 0.30 | | | | 0.40 | | | | 0.33 | |
| | | | | | | | | | | | | | | | | | | | | | | | | | | | |
Total from investment operations | | | 0.24 | | | | (0.37 | ) | | | 0.48 | | | | 0.40 | | | | 0.36 | | | | 0.69 | | | | 0.72 | |
Distributions to shareholders from | | | | | | | | | | | | | | | | | | | | | | | | | | | | |
Net investment income | | | (0.06 | ) | | | (0.08 | ) | | | (0.17 | ) | | | (0.33 | ) | | | (0.09 | ) | | | (0.41 | ) | | | (0.44 | ) |
Net realized gains | | | 0.00 | | | | (0.27 | ) | | | (0.06 | ) | | | 0.00 | | | | 0.00 | | | | (0.09 | ) | | | (0.03 | ) |
| | | | | | | | | | | | | | | | | | | | | | | | | | | | |
Total distributions to shareholders | | | (0.06 | ) | | | (0.35 | ) | | | (0.23 | ) | | | (0.33 | ) | | | (0.09 | ) | | | (0.50 | ) | | | (0.47 | ) |
Net asset value, end of period | | $ | 10.95 | | | $ | 10.77 | | | $ | 11.49 | | | $ | 11.24 | | | $ | 11.17 | | | $ | 10.90 | | | $ | 10.71 | |
Total return3 | | | 2.27 | % | | | (3.33 | )% | | | 4.31 | % | | | 3.72 | % | | | 3.28 | % | | | 6.53 | % | | | 7.02 | % |
Ratios to average net assets (annualized) | | | | | | | | | | | | | | | | | | | | | | | | | | | | |
Gross expenses | | | 0.90 | % | | | 0.87 | % | | | 0.89 | % | | | 0.88 | % | | | 0.90 | % | | | 0.94 | % | | | 0.94 | % |
Net expenses | | | 0.89 | % | | | 0.87 | % | | | 0.89 | % | | | 0.88 | % | | | 0.90 | % | | | 0.94 | % | | | 0.94 | % |
Net investment income | | | 0.51 | % | | | 0.65 | % | | | 1.33 | % | | | 2.25 | % | | | 2.10 | % | | | 2.66 | % | | | 3.65 | % |
Supplemental data | | | | | | | | | | | | | | | | | | | | | | | | | | | | |
Portfolio turnover rate | | | 179 | % | | | 341 | % | | | 327 | % | | | 268 | % | | | 89 | % | | | 194 | % | | | 368 | % |
Net assets, end of period (000s omitted) | | | $376,266 | | | | $437,217 | | | | $640,561 | | | | $678,022 | | | | $1,146,356 | | | | $1,024,088 | | | | $1,134,770 | |
| 1. | For the three months ended August 31, 2010. The Fund changed its fiscal year end from May 31 to August 31, effective August 31, 2010. |
| 2. | Calculated based upon average shares outstanding |
| 3. | Returns for periods of less than one year are not annualized. |
The accompanying notes are an integral part of these financial statements.
| | | | | | |
| Notes to financial statements (unaudited) | | Wells Fargo Advantage Government Securities Fund | | | 21 | |
1. ORGANIZATION
Wells Fargo Funds Trust (the “Trust”), a Delaware statutory trust organized on March 10, 1999, is an open-end management investment company registered under the Investment Company Act of 1940, as amended (the “1940 Act”). These financial statements report on the Wells Fargo Advantage Government Securities Fund (the “Fund”) which is a diversified series of the Trust.
2. SIGNIFICANT ACCOUNTING POLICIES
The following significant accounting policies, which are consistently followed in the preparation of the financial statements of the Fund, are in conformity with U.S. generally accepted accounting principles which require management to make estimates and assumptions that affect the reported amounts of assets and liabilities, disclosure of contingent assets and liabilities at the date of the financial statements, and the reported amounts of revenues and expenses during the reporting period. Actual results could differ from those estimates.
Securities valuation
All investments are valued each business day as of the close of regular trading on the New York Stock Exchange (generally 4 p.m. Eastern Time).
Fixed income securities acquired with maturities exceeding 60 days are valued based on evaluated bid prices provided by an independent pricing service which may utilize both transaction data and market information such as yield, quality, coupon rate, maturity, type of issue, trading characteristics and other market data. If prices are not available from the independent pricing service or prices received are deemed not representative of market value, prices will be obtained from an independent broker-dealer or otherwise determined based on the Fund’s Valuation Procedures.
Futures that are listed on a foreign or domestic exchange or market are valued at the official closing price or, if none, the last sales price.
Short-term securities, with maturities of 60 days or less at time of purchase, generally are valued at amortized cost which approximates fair value. The amortized cost method involves valuing a security at its cost, plus accretion of discount or minus amortization of premium over the period until maturity.
Investments in registered open-end investment companies are valued at net asset value. Non-registered investment vehicles are fair valued at net asset value.
Investments which are not valued using any of the methods discussed above are valued at their fair value, as determined in good faith by the Board of Trustees of the Fund. The Board of Trustees has established a Valuation Committee comprised of the Trustees and has delegated to it the authority to take any actions regarding the valuation of portfolio securities that the Valuation Committee deems necessary or appropriate, including determining the fair value of portfolio securities, unless the determination has been delegated to the Management Valuation Team of Wells Fargo Funds Management, LLC (“Funds Management”). The Board of Trustees retains the authority to make or ratify any valuation decisions or approve any changes to the Valuation Procedures as it deems appropriate. On a quarterly basis, the Board of Trustees receives reports on any valuation actions taken by the Valuation Committee or the Management Valuation Team which may include items for ratification.
Valuations of fair valued securities are compared to the next actual sales price when available, or other appropriate market values, to assess the continued appropriateness of the fair valuation methodologies used. These securities are fair valued on a day-to-day basis, taking into consideration changes to appropriate market information and any significant changes to the inputs considered in the valuation process until there is a readily available price provided on an exchange or by an independent pricing service. Valuations received from an independent pricing service or independent broker-dealer quotes are periodically validated by comparisons to most recent trades and valuations provided by other independent pricing services in addition to the review of prices by the adviser and/or subadviser. Unobservable inputs used in determining fair valuations are identified based on the type of security, taking into consideration factors utilized by market participants in valuing the investment, knowledge about the issuer and the current market environment.
Security loans
The Fund may lend its securities from time to time in order to earn additional income in the form of fees or interest on securities received as collateral or the investment of any cash received as collateral. The Fund continues to receive interest or dividends on the securities loaned. The Fund receives collateral in the form of cash or securities with a value at least equal to the value of the securities on loan. The value of the loaned securities is determined at the close of each business day and any additional required collateral is delivered to the Fund on the next business day. In a securities lending transaction, the net asset value of the Fund will be affected by an increase or decrease in the value of the securities loaned and by an increase or decrease in the value of the instrument in which collateral is invested. The amount
| | | | |
| 22 | | Wells Fargo Advantage Government Securities Fund | | Notes to financial statements (unaudited) |
of securities lending activity undertaken by the Fund fluctuates from time to time. In the event of default or bankruptcy by the borrower, the Fund may be prevented from recovering the loaned securities or gaining access to the collateral or may experience delays or costs in doing so. In addition, the investment of any cash collateral received may lose all or part of its value. The Fund has the right under the lending agreement to recover the securities from the borrower on demand.
The Fund lends its securities through an unaffiliated securities lending agent. Cash collateral received in connection with its securities lending transactions is invested in Wells Fargo Securities Lending Cash Investments, LLC (the “Securities Lending Fund”). The Securities Lending Fund is exempt from registration under Section 3(c)(7) of the 1940 Act and is managed by Funds Management and is subadvised by Wells Capital Management Incorporated (“WellsCap”). Funds Management receives an advisory fee starting at 0.05% and declining to 0.01% as the average daily net assets of the Securities Lending Fund increase. All of the fees received by Funds Management are paid to WellsCap for its services as subadviser. The Securities Lending Fund seeks to provide a positive return compared to the daily Fed Funds Open rate by investing in high-quality, U.S. dollar-denominated short-term money market instruments. Securities Lending Fund investments are fair valued based upon the amortized cost valuation technique. Income earned from investment in the Securities Lending Fund is included in securities lending income on the Statement of Operations.
When-issued transactions
The Fund may purchase securities on a forward commitment or when-issued basis. The Fund records a when-issued transaction on the trade date and will segregate assets in an amount at least equal in value to the Fund’s commitment to purchase when-issued securities. Securities purchased on a when-issued basis are marked-to-market daily and the Fund begins earning interest on the settlement date. Losses may arise due to changes in the market value of the underlying securities or if the counterparty does not perform under the contract.
Futures contracts
The Fund may be subject to interest rate risk in the normal course of pursuing its investment objectives. The Fund may buy and sell futures contracts in order to gain exposure to, or protect against, changes in security values and interest rates. The primary risks associated with the use of futures contracts are the imperfect correlation between changes in market values of securities held by the Fund and the prices of futures contracts, and the possibility of an illiquid market.
The aggregate principal amounts of the contracts are not recorded in the financial statements. Fluctuations in the value of the contracts are recorded in the Statement of Assets and Liabilities as an asset or liability and in the Statement of Operations as unrealized gains or losses until the contracts are closed, at which point they are recorded as net realized gains or losses on futures contracts. With futures contracts, there is minimal counterparty risk to the Fund since futures are exchange traded and the exchange’s clearinghouse, as counterparty to all exchange traded futures, guarantees the futures against default.
Security transactions and income recognition
Securities transactions are recorded on a trade date basis. Realized gains or losses are recorded on the basis of identified cost.
Interest income is accrued daily and bond discounts are accreted and premiums are amortized daily based on the effective interest method. To the extent debt obligations are placed on non-accrual status, any related interest income may be reduced by writing off interest receivables when the collection of all or a portion of interest has become doubtful based on consistently applied procedures. If the issuer subsequently resumes interest payments or when the collectability of interest is reasonably assured, the debt obligation is removed from non-accrual status.
Distributions to shareholders
Distributions to shareholders from net investment income are accrued daily and paid monthly. Distributions from net realized gains, if any, are recorded on the ex-dividend date. Such distributions are determined in conformity with federal income tax regulations, which may differ in amount or character from net investment income and realized gains recognized for purposes of U.S. generally accepted accounting principles.
Federal and other taxes
The Fund intends to continue to qualify as a regulated investment company by distributing substantially all of its investment company taxable income and any net realized capital gains (after reduction for capital loss carryforwards) sufficient to relieve it from all, or substantially all, federal income taxes. Accordingly, no provision for federal income taxes was required.
The Fund’s income and federal excise tax returns and all financial records supporting those returns for the prior three fiscal years are subject to examination by the federal and Delaware revenue authorities. Management has analyzed the Fund’s tax positions taken on federal, state, and foreign tax returns for all open tax years and does not believe that there are any uncertain tax positions that require recognition of a tax liability.
| | | | | | |
| Notes to financial statements (unaudited) | | Wells Fargo Advantage Government Securities Fund | | | 23 | |
As of August 31, 2013, the Fund had capital loss carryforwards available to offset future net realized capital gains in the amount of $26,015,724 with $2,028,091 expiring in 2016 and $23,987,633 expiring in 2017.
As of August 31, 2013, the Fund had $18,343,495 of current year deferred post-October capital losses, which were recognized on the first day of the current fiscal year.
Class allocations
The separate classes of shares offered by the Fund differ principally in applicable sales charges, distribution, shareholder servicing, and administration fees. Shareholders of each class bear certain expenses that pertain to that particular class. All shareholders bear the common expenses of the Fund, earn income from the portfolio, and are allocated any unrealized gains and losses pro rata based on the average daily net assets of each class, without distinction between share classes. Dividends are determined separately for each class based on income and expenses allocable to each class. Realized gains and losses are allocated to each class pro rata based upon the net assets of each class on the date realized. Differences in per share dividend rates generally result from the relative weightings of pro rata income and realized gain allocations and from differences in separate class expenses, including distribution, shareholder servicing, and administration fees.
3. FAIR VALUATION MEASUREMENTS
Fair value measurements of investments are determined within a framework that has established a fair value hierarchy based upon the various data inputs utilized in determining the value of the Fund’s investments. The three-level hierarchy gives the highest priority to unadjusted quoted prices in active markets for identical assets or liabilities (Level 1) and the lowest priority to significant unobservable inputs (Level 3). The Fund’s investments are classified within the fair value hierarchy based on the lowest level of input that is significant to the fair value measurement. The inputs are summarized into three broad levels as follows:
| n | | Level 1 – quoted prices in active markets for identical securities |
| n | | Level 2 – other significant observable inputs (including quoted prices for similar securities, interest rates, prepayment speeds, credit risk, use of amortized cost, etc.) |
| n | | Level 3 – significant unobservable inputs (including the Fund’s own assumptions in determining the fair value of investments) |
The inputs or methodologies used for valuing investments in securities are not necessarily an indication of the risk associated with investing in those securities.
As of February 28, 2014, the inputs used in valuing investments in securities were as follows:
| | | | | | | | | | | | | | | | |
| Investments in securities | | Quoted prices (Level 1) | | | Other significant
observable inputs (Level 2) | | | Significant unobservable inputs (Level 3) | | | Total | |
Agency securities | | $ | 0 | | | $ | 886,094,408 | | | $ | 4,903 | | | $ | 886,099,311 | |
Municipal obligations | | | 0 | | | | 8,058,948 | | | | 0 | | | | 8,058,948 | |
Non-agency mortgage backed securities | | | 0 | | | | 80,613,262 | | | | 0 | | | | 80,613,262 | |
U.S. Treasury securities | | | 656,593,389 | | | | 0 | | | | 0 | | | | 656,593,389 | |
Yankee corporate bonds and notes | | | 0 | | | | 38,764,861 | | | | 0 | | | | 38,764,861 | |
Short-term investments | | | | | | | | | | | | | | | | |
Investment companies | | | 16,851,793 | | | | 0 | | | | 0 | | | | 16,851,793 | |
U.S. Treasury securities | | | 1,399,980 | | | | 41,449,119 | | | | 0 | | | | 42,849,099 | |
| | | $ | 674,845,162 | | | $ | 1,054,980,598 | | | $ | 4,903 | | | $ | 1,729,830,663 | |
As of February 28, 2014, the inputs used in valuing the Fund’s other financial instruments were as follows:
| | | | | | | | | | | | | | |
| | | Quoted prices (Level 1) | | | Other significant
observable inputs (Level 2) | | | Significant unobservable inputs (Level 3) | | | Total |
Futures contracts | | $ | 124,595 | * | | $ | 0 | | | $ | 0 | | | $124,595 |
| * | Amount represents the net unrealized gains. |
Transfers in and transfers out are recognized at the end of the reporting period. For the six months ended February 28, 2014, the Fund did not have any transfers into/out of Level 1, Level 2, or Level 3.
| | | | |
| 24 | | Wells Fargo Advantage Government Securities Fund | | Notes to financial statements (unaudited) |
4. TRANSACTIONS WITH AFFILIATES AND OTHER EXPENSES
Advisory fee
The Trust has entered into an advisory contract with Funds Management, an indirect wholly owned subsidiary of Wells Fargo & Company (“Wells Fargo”). The adviser is responsible for implementing investment policies and guidelines and for supervising the subadviser, who is responsible for day-to-day portfolio management of the Fund.
Pursuant to the contract, Funds Management is entitled to receive an annual advisory fee starting at 0.40% and declining to 0.30% as the average daily net assets of the Fund increase. For the six months ended February 28, 2014, the advisory fee was equivalent to an annual rate of 0.38% of the Fund’s average daily net assets.
Funds Management has retained the services of a subadviser to provide daily portfolio management to the Fund. The fee for subadvisory services is borne by Funds Management. WellsCap, an affiliate of Funds Management and an indirect, wholly owned subsidiary of Wells Fargo, is the subadviser to the Fund and is entitled to receive a fee from Funds Management at an annual rate starting at 0.20% and declining to 0.10% as the average daily net assets of the Fund increase.
Administration and transfer agent fees
The Trust has entered into an administration agreement with Funds Management. Under this agreement, for providing administrative services, which includes paying fees and expenses for services provided by the transfer agent, sub-transfer agents, omnibus account servicers and record-keepers, Funds Management is entitled to receive from the Fund an annual fund level administration fee starting at 0.05% and declining to 0.03% as the average daily net assets of the Fund increase and a class level administration fee which is calculated based on the average daily net assets of each class as follows:
| | | | |
| | | Class level
administration fee | |
Class A, Class B, Class C | | | 0.16 | % |
Administrator Class | | | 0.10 | |
Institutional Class | | | 0.08 | |
Investor Class | | | 0.19 | |
Funds Management has contractually waived and/or reimbursed advisory and administration fees to the extent necessary to maintain certain net operating expense ratios for the Fund. Waiver of fees and/or reimbursement of expenses by Funds Management were made first from fund level expenses on a proportionate basis and then from class specific expenses. Funds Management has committed through December 31, 2014 to waive fees and/or reimburse expenses to the extent necessary to cap the Fund’s expenses at 0.85% for Class A shares, 1.60% for Class B shares, 1.60% for Class C shares, 0.64% for Administrator Class shares, 0.48% for Institutional Class shares, and 0.88% for Investor Class shares. Prior to January 1, 2014, the Fund’s expenses were capped at 0.87% for Class A shares, 1.62% for Class B shares, 1.62% for Class C shares, and 0.90% for Investor Class shares.
Distribution fees
The Trust has adopted a Distribution Plan for Class B and Class C shares of the Fund pursuant to Rule 12b-1 under the 1940 Act. Distribution fees are charged to Class B and Class C shares and paid to Wells Fargo Funds Distributor, LLC, the principal underwriter, at an annual rate of 0.75% of the average daily net assets of Class B and Class C shares.
For the six months ended February 28, 2014, Wells Fargo Funds Distributor, LLC received $291 from the sale of Class A shares.
Shareholder servicing fees
The Trust has entered into contracts with one or more shareholder servicing agents, whereby Class A, Class B, Class C, Administrator Class, and Investor Class of the Fund is charged a fee at an annual rate of 0.25% of the average daily net assets of each respective class.
A portion of these total shareholder servicing fees were paid to affiliates of Wells Fargo.
5. INVESTMENT PORTFOLIO TRANSACTIONS
Purchases and sales of investments, excluding short-term securities, for the six months ended February 28, 2014 were as follows:
| | | | | | |
Purchases at cost | | Sales proceeds |
U.S. government | | Non-U.S. government | | U.S. government | | Non-U.S. government |
| $2,877,821,208 | | $25,054,652 | | $2,745,980,971 | | $47,141,728 |
| | | | | | |
| Notes to financial statements (unaudited) | | Wells Fargo Advantage Government Securities Fund | | | 25 | |
6. DERIVATIVE TRANSACTIONS
During the six months ended February 28, 2014, the Fund entered into futures contracts to speculate on interest rates and to help manage the duration of the portfolio.
At February 28, 2014, the Fund had long and short futures contracts outstanding as follows:
| | | | | | | | | | | | | | |
| Expiration date | | Counterparty | | Contracts | | Type | | Contract value at February 28, 2014 | | | Unrealized
gains
(losses) | |
6-19-2014 | | JPMorgan | | 923 Long | | 10-Year U.S. Treasury Notes | | $ | 114,942,344 | | | $ | 236,207 | |
6-19-2014 | | JPMorgan | | 159 Short | | U.S. Treasury Bonds | | | 22,831,406 | | | | (185,441 | ) |
6-30-2014 | | JPMorgan | | 203 Short | | 2-Year U.S. Treasury Notes | | | 44,634,625 | | | | (13,073 | ) |
6-30-2014 | | JPMorgan | | 742 Long | | 5-Year U.S. Treasury Notes | | | 88,935,656 | | | | 86,902 | |
The Fund had an average notional amount of $153,296,589 and $66,254,734 in long futures contracts and short futures contracts, respectively, during the six months ended February 28, 2014.
On February 28, 2014, the cumulative unrealized gains on futures contracts in the amount of $124,595 are reflected in net unrealized gains on investments on the Statement of Assets and Liabilities. The receivable and payable for daily variation margin on open futures contracts reflected in the Statement of Assets and Liabilities only represents the current day’s variation margin. The realized gains and change in unrealized gains (losses) on futures contracts are reflected in the Statement of Operations.
For certain types of derivative transactions, the Fund has entered into International Swaps and Derivatives Association, Inc. master agreements (“ISDA Master Agreements”) or similar agreements with approved counterparties. The ISDA Master Agreements or similar agreements may have requirements to deliver/deposit securities or cash to/with an exchange or broker-dealer as collateral and allows the Fund to offset, with each counterparty, certain derivative financial instrument’s assets and/or liabilities with collateral held or pledged. Collateral requirements differ by type of derivative. Collateral or margin requirements are set by the broker or exchange clearing house for exchange traded derivatives while collateral terms are contract specific for over-the-counter traded. Cash collateral that has been pledged to cover obligations of the Fund under derivative contracts, if any, will be reported separately in the Statement of Assets and Liabilities. Securities pledged as collateral, if any, for the same purpose are noted in the Portfolio of Investments. With respect to balance sheet offsetting, absent an event of default by the counterparty or a termination of the agreement, the reported amounts of financial assets and financial liabilities in the Statement of Assets and Liabilities are not offset across transactions between the Fund and the applicable counterparty. A reconciliation of the gross amounts on the Statement of Assets and Liabilities to the net amounts by derivative type, including any collateral exposure, is as follows:
| | | | | | | | | | |
| Derivative type | | Counterparty | | Gross amounts of
assets in the
Statement of
Assets and
Liabilities | | Amounts
subject to
netting
agreements | | Collateral
received | | Net
amount |
| Futures - variation margin | | JPMorgan | | $21,736 | | ($21,736) | | $0 | | $0 |
| | | | | | | | | | |
| Derivative type | | Counterparty | | Gross amounts of
liabilities in the Statement of Assets and Liabilities | | Amounts subject to netting agreements | | Collateral pledged | | Net amount |
| Futures - variation margin | | JPMorgan | | $269,031 | | $(21,736) | | $(247,295) | | $0 |
7. BANK BORROWINGS
The Trust (excluding the money market funds and certain other funds in the Trust) and Wells Fargo Variable Trust are parties to a $150,000,000 revolving credit agreement with State Street Bank and Trust Company, whereby the Fund is permitted to use bank borrowings for temporary or emergency purposes, such as to fund shareholder redemption requests. Interest under the credit agreement is charged to the Fund based on a borrowing rate equal to the higher of the Federal Funds rate in effect on that day plus 1.25% or the overnight LIBOR rate in effect on that day plus 1.25%. In addition, an annual commitment fee equal to 0.10% of the unused balance is allocated to each participating fund. For the six months ended February 28, 2014, the Fund paid $314 in commitment fees.
| | | | |
| 26 | | Wells Fargo Advantage Government Securities Fund | | Notes to financial statements (unaudited) |
For the six months ended February 28, 2014, there were no borrowings by the Fund under the agreement.
8. INDEMNIFICATION
Under the Trust’s organizational documents, the officers and directors are indemnified against certain liabilities that may arise out of performance of their duties to the Trust. Additionally, in the normal course of business, the Trust may enter into contracts with service providers that contain a variety of indemnification clauses. The Trust’s maximum exposure under these arrangements is dependent on future claims that may be made against the Fund and, therefore, cannot be estimated.
| | | | | | |
| Other information (unaudited) | | Wells Fargo Advantage Government Securities Fund | | | 27 | |
PROXY VOTING INFORMATION
A description of the policies and procedures that the Fund uses to determine how to vote proxies relating to portfolio securities is available without charge, upon request, by calling 1-800-222-8222, visiting our website at wellsfargoadvantagefunds.com, or visiting the SEC website at sec.gov. Information regarding how the Fund voted proxies relating to portfolio securities during the most recent 12-month period ended June 30 is available without charge on the Fund’s website at wellsfargoadvantagefunds.com or by visiting the SEC website at sec.gov.
PORTFOLIO HOLDINGS INFORMATION
The complete portfolio holdings for the Fund are publicly available on the Fund’s website (wellsfargoadvantagefunds.com) on a monthly, 30-day or more delayed basis. In addition, top ten holdings information for the Fund is publicly available on the Fund’s website on a monthly, seven-day or more delayed basis. The Fund files its complete schedule of portfolio holdings with the SEC for the first and third quarters of each fiscal year on Form N-Q, which is available without charge by visiting the SEC website at sec.gov. In addition, the Fund’s Form N-Q may be reviewed and copied at the SEC’s Public Reference Room in Washington, DC, and at regional offices in New York City, at 233 Broadway, and in Chicago, at 175 West Jackson Boulevard, Suite 900. Information about the Public Reference Room may be obtained by calling 1-800-SEC-0330.
| | | | |
| 28 | | Wells Fargo Advantage Government Securities Fund | | Other information (unaudited) |
BOARD OF TRUSTEES AND OFFICERS
Each of the Trustees and Officers listed in the table below acts in identical capacities for each fund in the Wells Fargo Advantage family of funds, which consists of 132 mutual funds1 comprising the Wells Fargo Funds Trust, Wells Fargo Variable Trust, Wells Fargo Master Trust and four closed-end funds (collectively the “Fund Complex”). This table should be read in conjunction with the Prospectus and the Statement of Additional Information2. All of the Trustees are also Members of the Audit and Governance Committees of each Trust in the Fund Complex. The mailing address of each Trustee and Officer is 525 Market Street, 12th Floor, San Francisco, CA 94105. Each Trustee and Officer serves an indefinite term, however, each Trustee serves such term until reaching the mandatory retirement age established by the Trustees.
Independent Trustees
| | | | | | |
Name and year of birth | | Position held and length of service* | | Principal occupations during past five years | | Other directorships during
past five years |
Peter G. Gordon
(Born 1942) | | Trustee, since 1998; Chairman, since 2005 | | Co-Founder, Retired Chairman, President and CEO of Crystal Geyser Water Company. Trustee Emeritus, Colby College. | | Asset Allocation Trust |
Isaiah Harris, Jr.
(Born 1952) | | Trustee, since 2009 | | Retired. Prior thereto, President and CEO of BellSouth Advertising and Publishing Corp. from 2005 to 2007, President and CEO of BellSouth Enterprises from 2004 to 2005 and President of BellSouth Consumer Services from 2000 to 2003. Emeritus member of the Iowa State University Foundation Board of Governors. Emeritus Member of the Advisory Board of Iowa State University School of Business. Advisory Board Member, Palm Harbor Academy (charter school). Mr. Harris is a certified public accountant. | | CIGNA Corporation; Deluxe Corporation; Asset Allocation Trust |
Judith M. Johnson
(Born 1949) | | Trustee, since 2008; Audit Committee Chairman, since 2008 | | Retired. Prior thereto, Chief Executive Officer and Chief Investment Officer of Minneapolis Employees Retirement Fund from 1996 to 2008. Ms. Johnson is an attorney, certified public accountant and a certified managerial accountant. | | Asset Allocation Trust |
Leroy Keith, Jr.
(Born 1939) | | Trustee, since 2010 | | Chairman, Bloc Global Services (development and construction). Trustee of the Evergreen Funds from 1983 to 2010. Former Managing Director, Almanac Capital Management (commodities firm), former Partner, Stonington Partners, Inc. (private equity fund), former Director, Obagi Medical Products Co. and former Director, Lincoln Educational Services. | | Trustee, Virtus Fund Complex (consisting of 50 portfolios as of 12/16/2013); Asset Allocation Trust |
David F. Larcker
(Born 1950) | | Trustee, since 2009 | | James Irvin Miller Professor of Accounting at the Graduate School of Business, Stanford University, Morgan Stanley Director of the Center for Leadership Development and Research and Senior Faculty of The Rock Center for Corporate Governance since 2006. From 2005 to 2008, Professor of Accounting at the Graduate School of Business, Stanford University. Prior thereto, Ernst & Young Professor of Accounting at The Wharton School, University of Pennsylvania from 1985 to 2005. | | Asset Allocation Trust |
Olivia S. Mitchell
(Born 1953) | | Trustee, since 2006 | | International Foundation of Employee Benefit Plans Professor, Wharton School of the University of Pennsylvania since 1993. Director of Wharton’s Pension Research Council and Boettner Center on Pensions & Retirement Research, and Research Associate at the National Bureau of Economic Research. Previously, Cornell University Professor from 1978 to 1993. | | Asset Allocation Trust |
Timothy J. Penny
(Born 1951) | | Trustee, since 1996 | | President and CEO of Southern Minnesota Initiative Foundation, a non-profit organization, since 2007 and Senior Fellow at the Humphrey Institute Policy Forum at the University of Minnesota since 1995. Member of the Board of Trustees of NorthStar Education Finance, Inc., a non-profit organization, since 2007. | | Asset Allocation Trust |
| | | | | | |
| Other information (unaudited) | | Wells Fargo Advantage Government Securities Fund | | | 29 | |
| | | | | | |
Name and year of birth | | Position held and length of service* | | Principal occupations during past five years | | Other directorships during
past five years |
Michael S. Scofield
(Born 1943) | | Trustee, since 2010 | | Served on the Investment Company Institute’s Board of Governors and Executive Committee from 2008-2011 as well the Governing Council of the Independent Directors Council from 2006-2011 and the Independent Directors Council Executive Committee from 2008-2011. Chairman of the IDC from 2008-2010. Institutional Investor (Fund Directions) Trustee of Year in 2007. Trustee of the Evergreen Funds (and its predecessors) from 1984 to 2010. Chairman of the Evergreen Funds from 2000-2010. Former Trustee of the Mentor Funds. Retired Attorney, Law Offices of Michael S. Scofield. | | Asset Allocation Trust |
Donald C. Willeke
(Born 1940) | | Trustee, since 1996 | | Principal of the law firm of Willeke & Daniels. General Counsel of the Minneapolis Employees Retirement Fund from 1984 until its consolidation into the Minnesota Public Employees Retirement Association on June 30, 2010. Director and Vice Chair of The Tree Trust (non-profit corporation). Director of the American Chestnut Foundation (non-profit corporation). | | Asset Allocation Trust |
| * | Length of service dates reflect the Trustee’s commencement of service with the Trust’s predecessor entities, where applicable. |
Officers
| | | | | | |
Name and year of birth | | Position held and
length of service | | Principal occupations during past five years | | |
Karla M. Rabusch
(Born 1959) | | President, since 2003 | | Executive Vice President of Wells Fargo Bank, N.A. and President of Wells Fargo Funds Management, LLC since 2003. | | |
Nancy Wiser1
(Born 1967) | | Treasurer, since 2012 | | Executive Vice President of Wells Fargo Funds Management, LLC since 2011. Chief Operating Officer and Chief Compliance Officer at LightBox Capital Management LLC, from 2008 to 2011. Owned and operated a consulting business providing services to various hedge funds including acting as Chief Operating Officer and Chief Compliance Officer for a hedge fund from 2007 to 2008. Chief Operating Officer and Chief Compliance Officer of GMN Capital LLC from 2006 to 2007. | | |
C. David Messman
(Born 1960) | | Secretary, since 2000; Chief Legal Officer, since 2003 | | Senior Vice President and Secretary of Wells Fargo Funds Management, LLC since 2001. Vice President and Managing Counsel of Wells Fargo Bank, N.A. since 1996. | | |
Debra Ann Early
(Born 1964) | | Chief Compliance Officer, since 2007 | | Chief Compliance Officer of Wells Fargo Funds Management, LLC since 2007. Chief Compliance Officer of Parnassus Investments from 2005 to 2007. Chief Financial Officer of Parnassus Investments from 2004 to 2007. | | |
David Berardi
(Born 1975) | | Assistant Treasurer, since 2009 | | Vice President of Wells Fargo Funds Management, LLC since 2009. Vice President of Evergreen Investment Management Company, LLC from 2008 to 2010. Assistant Vice President of Evergreen Investment Services, Inc. from 2004 to 2008. Manager of Fund Reporting and Control for Evergreen Investment Management Company, LLC from 2004 to 2010. | | |
| Jeremy DePalma1 (Born 1974) | | Assistant Treasurer, since 2009 | | Senior Vice President of Wells Fargo Funds Management, LLC since 2009. Senior Vice President of Evergreen Investment Management Company, LLC from 2008 to 2010. Vice President, Evergreen Investment Services, Inc. from 2004 to 2007. Head of the Fund Reporting and Control Team within Fund Administration from 2005 to 2010. | | |
| 1. | Nancy Wiser acts as Treasurer of 73 funds in the Fund Complex. Jeremy DePalma acts as Treasurer of 59 funds and Assistant Treasurer of 73 funds in the Fund Complex. |
| 2. | The Statement of Additional Information includes additional information about the Trustees and is available, without charge, upon request, by calling 1-800-222-8222 or by visiting the website at wellsfargoadvantagefunds.com. |
| | | | |
| 30 | | Wells Fargo Advantage Government Securities Fund | | List of abbreviations |
The following is a list of common abbreviations for terms and entities that may have appeared in this report.
| ACA | — ACA Financial Guaranty Corporation |
| ADR | — American depositary receipt |
| ADS | — American depositary shares |
| AGC | — Assured Guaranty Corporation |
| AGM | — Assured Guaranty Municipal |
| Ambac | — Ambac Financial Group Incorporated |
| AMT | — Alternative minimum tax |
| BAN | — Bond anticipation notes |
| BHAC | — Berkshire Hathaway Assurance Corporation |
| CAB | — Capital appreciation bond |
| CCAB | — Convertible capital appreciation bond |
| CDA | — Community Development Authority |
| CDO | — Collateralized debt obligation |
| DRIVER | — Derivative inverse tax-exempt receipts |
| DW&P | — Department of Water & Power |
| DWR | — Department of Water Resources |
| ECFA | — Educational & Cultural Facilities Authority |
| EDA | — Economic Development Authority |
| EDFA | — Economic Development Finance Authority |
| ETF | — Exchange-traded fund |
| FDIC | — Federal Deposit Insurance Corporation |
| FFCB | — Federal Farm Credit Banks |
| FGIC | — Financial Guaranty Insurance Corporation |
| FHA | — Federal Housing Administration |
| FHLB | — Federal Home Loan Bank |
| FHLMC | — Federal Home Loan Mortgage Corporation |
| FICO | — The Financing Corporation |
| FNMA | — Federal National Mortgage Association |
| GDR | — Global depositary receipt |
| GNMA | — Government National Mortgage Association |
| HCFR | — Healthcare facilities revenue |
| HEFA | — Health & Educational Facilities Authority |
| HEFAR | — Higher education facilities authority revenue |
| HFA | — Housing Finance Authority |
| HFFA | — Health Facilities Financing Authority |
| HUD | — Department of Housing and Urban Development |
| IDA | — Industrial Development Authority |
| IDAG | — Industrial Development Agency |
| KRW | — Republic of Korea won |
| LIBOR | — London Interbank Offered Rate |
| LLC | — Limited liability company |
| LLLP | — Limited liability limited partnership |
| LLP | — Limited liability partnership |
| MBIA | — Municipal Bond Insurance Association |
| MFHR | — Multifamily housing revenue |
| MSTR | — Municipal securities trust receipts |
| MUD | — Municipal Utility District |
| National | — National Public Finance Guarantee Corporation |
| PCFA | — Pollution Control Financing Authority |
| PCL | — Public Company Limited |
| PCR | — Pollution control revenue |
| PFA | — Public Finance Authority |
| PFFA | — Public Facilities Financing Authority |
| PFOTER | — Puttable floating option tax-exempt receipts |
| plc | — Public limited company |
| PUTTER | — Puttable tax-exempt receipts |
| R&D | — Research & development |
| Radian | — Radian Asset Assurance |
| RAN | — Revenue anticipation notes |
| RDA | — Redevelopment Authority |
| RDFA | — Redevelopment Finance Authority |
| REIT | — Real estate investment trust |
| ROC | — Reset option certificates |
| SAVRS | — Select auction variable rate securities |
| SBA | — Small Business Authority |
| SFHR | — Single-family housing revenue |
| SFMR | — Single-family mortgage revenue |
| SPA | — Standby purchase agreement |
| SPDR | — Standard & Poor’s Depositary Receipts |
| STRIPS | — Separate trading of registered interest and principal securities |
| TAN | — Tax anticipation notes |
| TIPS | — Treasury inflation-protected securities |
| TRAN | — Tax revenue anticipation notes |
| TTFA | — Transportation Trust Fund Authority |
| TVA | — Tennessee Valley Authority |
This page is intentionally left blank.
This page is intentionally left blank.


For more information
More information about Wells Fargo Advantage Funds is available free upon request. To obtain literature, please write, email, visit the Fund’s website, or call:
Wells Fargo Advantage Funds
P.O. Box 8266
Boston, MA 02266-8266
Email: wfaf@wellsfargo.com
Website: wellsfargoadvantagefunds.com
Individual investors: 1-800-222-8222
Retail investment professionals: 1-888-877-9275
Institutional investment professionals: 1-866-765-0778
This report and the financial statements contained herein are submitted for the general information of the shareholders of Wells Fargo Advantage Funds. If this report is used for promotional purposes, distribution of the report must be accompanied or preceded by a current prospectus. For a current prospectus and, if available, a summary prospectus containing more complete information, including charges and expenses, call 1-800-222-8222 or visit the Fund’s website at wellsfargoadvantagefunds.com. Please consider the investment objectives, risks, charges, and expenses of the investment carefully before investing. This and other information about Wells Fargo Advantage Funds can be found in the current prospectus. Read the prospectus carefully before you invest or send money.
Wells Fargo Funds Management, LLC, a wholly owned subsidiary of Wells Fargo & Company, provides investment advisory and administrative services for Wells Fargo Advantage Funds. Other affiliates of Wells Fargo & Company provide subadvisory and other services for the Funds. The Funds are distributed by Wells Fargo Funds Distributor, LLC, Member FINRA/SIPC, an affiliate of Wells Fargo & Company.
NOT FDIC INSURED ¡ NO BANK GUARANTEE ¡ MAY LOSE VALUE
© 2014 Wells Fargo Funds Management, LLC. All rights reserved.
| | |
 | | 223530 04-14 SA216/SAR216 02-14 |

Wells Fargo Advantage High Income Fund

Semi-Annual Report
February 28, 2014

Reduce clutter. Save trees.
Sign up for electronic delivery of prospectuses and shareholder reports at wellsfargo.com/advantagedelivery
Contents
The views expressed and any forward-looking statements are as of February 28, 2014, unless otherwise noted, and are those of the Fund managers and/or Wells Fargo Funds Management, LLC. Discussions of individual securities, or the markets generally, or any Wells Fargo Advantage Fund are not intended as individual recommendations. Future events or results may vary significantly from those expressed in any forward-looking statements; the views expressed are subject to change at any time in response to changing circumstances in the market. Wells Fargo Funds Management, LLC and the Fund disclaim any obligation to publicly update or revise any views expressed or forward-looking statements.
NOT FDIC INSURED ¡ NO BANK GUARANTEE ¡ MAY LOSE VALUE
| | | | |
| 2 | | Wells Fargo Advantage High Income Fund | | Letter to shareholders (unaudited) |

Karla M. Rabusch
President
Wells Fargo Advantage Funds
Fixed-income markets shifted during the period, driven by vacillations between U.S. Treasury yield increases and subsequent declines.
Reassurances from the Fed that a highly accommodative monetary policy would continue throughout 2014 inspired price rallies across both the investment-grade and high-yield bond markets.
Dear Valued Shareholder:
We are pleased to offer you this semi-annual report for the Wells Fargo Advantage High Income Fund for the six-month period that ended February 28, 2014. Fixed-income markets shifted during the period, driven by vacillations between U.S. Treasury yield increases and subsequent declines. However, on the whole, investment-grade (measured by the Barclays U.S. Aggregate Bond Index1) and high-yield markets (measured by the Barclays U.S. High Yield Bond Index2) generated positive returns during the period, notably benefiting from the strong price improvement and declining U.S. Treasury yields that occurred in September and October of 2013 as well as the opening months of 2014. Although the returns of the U.S. high-yield market have often been positively correlated with U.S. equity returns (measured by the S&P 500 Index3) over the long-run, over the period, high-yield (measured by the Barclays U.S. High Yield Bond Index) generally performed well even when equities did not. The lower-rated corporate bond credit tiers outperformed the respectively higher-rated investment-grade credit tiers during the period.
A decline in bond prices was halted by the Fed’s postponement of tapering its bond-buying program.
Before the six-month period began, equity markets rallied, most notably in May and June of 2013. This led to a sharp increase in U.S. Treasury yields and declining valuations for much of the fixed-income markets (measured by the Barclays U.S. Aggregate Bond Index). However, in July and August 2013, that equity exuberance quieted a bit, and fixed-income markets stabilized. Returns across the fixed-income markets were largely negative in investment- grade and high-yield markets but modest in comparison with the declines in May and June of 2013.
But, by September and October of 2013, investment-grade and high-yield bond markets began generating positive returns yet again, as the Federal Reserve (Fed) backtracked on its intentions to taper its quantitative easing program, postponing it until 2014, at the earliest. This created a temporary rally in bonds that lasted until around November 20, 2013, when notes were released from the Fed’s October 2013 meeting that tapering of the bond-buying programs would not be postponed beyond January 2014. In response, long-term U.S. Treasury yields and mortgage rates ratcheted higher on expectations for an unwinding of monetary accommodation in the upcoming months. This led to declines in pricing across much of the core fixed-income markets (measured by the Barclays U.S. Aggregate Bond Index). U.S. high-yield markets were better able to absorb the shift in U.S. Treasury yields and continued to provide positive returns along with rallies in the equity markets.
Favorable conditions for fixed-income markets were restored in January and February 2014.
Seemingly much to the surprise of many everyday investors and seasoned investment professionals alike, fixed-income markets (measured by the Barclays U.S. Aggregate Bond Index) largely outperformed U.S. equity markets (measured by the S&P 500 Index) during the opening months of 2014. A pullback in equity exuberance in January and reassurances from the Fed that a highly accommodative monetary policy would continue throughout 2014 inspired price rallies across both the investment-grade and high-yield bond markets. U.S. Treasury yields declined in January 2014 and corporate bonds and mortgage-backed securities performed notably well. U.S. high-yield securities generated positive returns in January 2014 but lagged the rally across the investment-grade
| | | | | | |
| Letter to shareholders (unaudited) | | Wells Fargo Advantage High Income Fund | | | 3 | |
bond markets. This theme reversed in February 2014, as high-yield sectors rallied and investment-grade sectors performed well but not to the extent of the lowest-rated credit tiers.
One positive takeaway for bond investors that helped fuel the fixed-income (measured by the Barclays U.S. Aggregate Bond Index) rallies was former Fed Chairman Bernanke’s guidance at the end of 2013. He indicated that the tapering of the Fed’s bond-buying program would proceed at a slow pace and that a reduction in quantitative easing should not be equivocated with a tightening of monetary policy. The distinction was important—although the bond-buying program was declining in volume, it was, nonetheless, still continuing. Additionally, the federal funds target rate would remain unchanged for the foreseeable future, with the implications that it would not increase until the bond-buying program was fully disbanded. These were important statements for fixed-income investors that helped bolster U.S. fixed-income valuations in the opening months of 2014.
Don’t let short-term uncertainty derail long-term investment goals.
Periods of investment uncertainty can present challenges, but experience has taught us that maintaining long-term investment goals can be an effective way to plan for the future. To help you create a sound strategy based on your personal goals and risk tolerance, Wells Fargo Advantage Funds offers more than 100 mutual funds and other investments spanning a wide range of asset classes and investment styles. Although diversification cannot guarantee an investment profit or prevent losses, we believe it can be an effective way to manage investment risk and potentially smooth out overall portfolio performance. We encourage investors to know their investments and to understand that appropriate levels of risk-taking may unlock opportunities.
Thank you for choosing to invest with Wells Fargo Advantage Funds. We appreciate your confidence in us and remain committed to helping you meet your financial needs. For current information about your fund investments, contact your investment professional, visit our website at wellsfargoadvantagefunds.com, or call us directly at 1-800-222-8222. We are available 24 hours a day, 7 days a week.
Sincerely,

Karla M. Rabusch
President
Wells Fargo Advantage Funds
| 1. | The Barclays U.S. Aggregate Bond Index is a broad-based benchmark that measures the investment-grade, U.S. dollar-denominated, fixed-rate taxable bond market, including Treasuries, government-related and corporate securities, MBS (agency fixed-rate and hybrid ARM passthroughs), ABS, and CMBS. You cannot invest directly in an index. |
| 2. | The Barclays U.S. High Yield Bond Index is an index consisting of all domestic and Yankee bonds, rated below investment grade, with a minimum outstanding amount of $100 million and maturing over one year. You cannot invest directly in an index. |
| 3. | The S&P 500 Index consists of 500 stocks chosen for market size, liquidity, and industry group representation. It is a market-value-weighted index with each stock’s weight in the index proportionate to its market value. You cannot invest directly in an index. |
| | | | |
| 4 | | Wells Fargo Advantage High Income Fund | | Letter to shareholders (unaudited) |
Notice to shareholders
The Fund and Wells Fargo Funds Management, LLC (“Funds Management”) have received an exemptive order from the SEC that permits Funds Management, subject to the approval of the Board of Trustees of the Fund, to select or replace certain subadvisers to manage all or a portion of the Fund’s assets and enter into, amend or terminate a sub-advisory agreement with certain subadvisers without obtaining shareholder approval (“Multi-manager Structure”). The Multi-manager Structure applies to subadvisers that are not affiliated with Funds Management or the Fund, except to the extent that affiliation arises solely because such subadvisers provide sub-advisory services to the Fund (“Non-affiliated Subadvisers”), as well as subadvisers that are indirect or direct wholly-owned subsidiaries of Funds Management or of another company that, indirectly or directly, wholly owns Funds Management (“Wholly-owned Subadvisers”).
Pursuant to the SEC order, Funds Management, with the approval of the Board of Trustees, has the discretion to terminate any subadvisers and allocate and reallocate the Fund’s assets among any other Non-affiliated Subadvisers or Wholly-owned Subadvisers. Funds Management, subject to oversight and supervision by the Board of Trustees, has responsibility to continue to oversee any subadvisers to the Fund and to recommend, for approval by the Board of Trustees, the hiring, termination and replacement of subadvisers for the Fund. In the event that a new subadviser is hired pursuant to the Multi-manager Structure, the Fund is required to provide notice to shareholders within 90 days.
Please contact your investment professional or call us directly at 1-800-222-8222 if you have any questions on this Notice to Shareholders.
This page is intentionally left blank.
| | | | |
| 6 | | Wells Fargo Advantage High Income Fund | | Performance highlights (unaudited) |
Investment objective
The Fund seeks total return, consisting of a high level of current income and capital appreciation.
Adviser
Wells Fargo Funds Management, LLC
Subadviser
Wells Capital Management Incorporated
Portfolio managers
Thomas M. Price, CFA
Kevin J. Maas, CFA
Michael J. Schueller, CFA
Average annual total returns1 (%) as of February 28, 2014
| | | | | | | | | | | | | | | | | | | | | | | | | | | | | | | | | | |
| | | | | Including sales charge | | | Excluding sales charge | | | Expense ratios2 (%) | |
| | | Inception date | | 1 year | | | 5 year | | | 10 year | | | 1 year | | | 5 year | | | 10 year | | | Gross | | | Net3 | |
| Class A (SHBAX) | | 2-29-2000 | | | 1.24 | | | | 12.19 | | | | 6.79 | | | | 6.01 | | | | 13.23 | | | | 7.28 | | | | 1.00 | | | | 0.91 | |
| Class B (WFNBX)* | | 7-18-2008 | | | 0.22 | | | | 12.13 | | | | 6.72 | | | | 5.22 | | | | 12.39 | | | | 6.72 | | | | 1.75 | | | | 1.66 | |
| Class C (WFNCX) | | 7-18-2008 | | | 4.23 | | | | 12.39 | | | | 6.48 | | | | 5.23 | | | | 12.39 | | | | 6.48 | | | | 1.75 | | | | 1.66 | |
| Administrator Class (WFNDX) | | 7-30-2010 | | | – | | | | – | | | | – | | | | 6.11 | | | | 13.37 | | | | 7.46 | | | | 0.94 | | | | 0.81 | |
| Institutional Class (SHYYX) | | 7-31-2001 | | | – | | | | – | | | | – | | | | 6.43 | | | | 13.69 | | | | 7.77 | | | | 0.67 | | | | 0.51 | |
| Investor Class (STHYX) | | 12-28-1995 | | | – | | | | – | | | | – | | | | 5.85 | | | | 13.16 | | | | 7.27 | | | | 1.03 | | | | 0.94 | |
| Barclays U.S. Corporate High Yield Bond Index4 | | – | | | – | | | | – | | | | – | | | | 8.38 | | | | 18.94 | | | | 8.73 | | | | – | | | | – | |
| * | | Class B shares are closed to investment, except in connection with the reinvestment of any distributions and permitted exchanges. |
Figures quoted represent past performance, which is no guarantee of future results, and do not reflect taxes that a shareholder may pay on fund distributions or the redemption of fund shares. Investment return and principal value of an investment will fluctuate so that an investor’s shares, when redeemed, may be worth more or less than their original cost. Performance shown without sales charges would be lower if sales charges were reflected. Current performance may be lower or higher than the performance data quoted, which assumes the reinvestment of dividends and capital gains. Current month-end performance is available on the Fund’s website, wellsfargoadvantagefunds.com.
Index returns do not include transaction costs associated with buying and selling securities, any mutual fund fees or expenses, or any taxes. It is not possible to invest directly in an index.
For Class A shares, the maximum front-end sales charge is 4.50%. For Class B shares, the maximum contingent deferred sales charge is 5.00%. For Class C shares, the maximum contingent deferred sales charge is 1.00%. Performance including sales charge assumes the sales charge for the corresponding time period. Administrator Class, Institutional Class, and Investor Class shares are sold without a front-end sales charge or contingent deferred sales charge.
Bond values fluctuate in response to the financial condition of individual issuers, general market and economic conditions, and changes in interest rates. In general, when interest rates rise, bond values fall and investors may lose principal value. High-yield securities have a greater risk of default and tend to be more volatile than higher-rated debt securities. Loans are subject to risks similar to those associated with other below-investment-grade bond investments, such as credit risk (for example, risk of issuer default), below-investment grade bond risk (for example, risk of greater volatility in value) and risk that the loan may become illiquid or difficult to price. The use of derivatives may reduce returns and/or increase volatility. Certain investment strategies tend to increase the total risk of an investment (relative to the broader market). The Fund is exposed to foreign investment risk. Consult the Fund’s prospectus for additional information on these and other risks.
Please see footnotes on page 7.
| | | | | | |
| Performance highlights (unaudited) | | Wells Fargo Advantage High Income Fund | | | 7 | |
| | | | |
| Ten largest long-term holdings5 (%) as of February 28, 2014 | |
Sprint Corporation, 7.88%, 9-15-2023 | | | 1.63 | |
Intelsat Bermuda Limited, 7.75%, 6-1-2021 | | | 1.35 | |
ArcelorMittal, 6.75%, 2-25-2022 | | | 1.24 | |
SLM Corporation, 8.00%, 3-25-2020 | | | 1.21 | |
RSC Equipment Rental Incorporated, 8.25%, 2-1-2021 | | | 1.11 | |
DaVita Incorporated, 6.63%, 11-1-2020 | | | 1.05 | |
Valeant Pharmaceuticals International Incorporated, 7.50%, 7-15-2021 | | | 0.96 | |
Ally Financial Incorporated, 8.00%, 3-15-2020 | | | 0.95 | |
HealthSouth Corporation, 8.13%, 2-15-2020 | | | 0.95 | |
Deluxe Corporation, 7.00%, 3-15-2019 | | | 0.94 | |
| | |
| Credit quality6 as of February 28, 2014 |
|
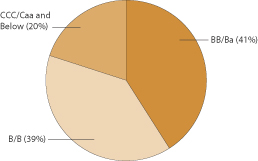
|
| 1. | Historical performance shown for Class B and Class C shares prior to their inception reflects the performance of Investor Class shares, adjusted to reflect the higher expenses applicable to Class B and Class C shares. Historical performance shown for Administrator Class shares prior to their inception reflects the performance of Institutional Class shares, adjusted to reflect the higher expenses applicable to Administrator Class shares. Effective June 20, 2008, Advisor Class was renamed Class A and modified to assume the features and attributes of Class A. Historical performance shown for Class A shares through June 19, 2008, includes Advisor Class expenses. |
| 2. | Reflects the expense ratios as stated in the most recent prospectuses, which include the impact of 0.01% in acquired fund fees and expenses. The expense ratios shown are subject to change and may differ from the annualized expense ratios shown in the financial highlights of this report, which do not include acquired fund fees and expenses. |
| 3. | The Adviser has committed through December 31, 2014, to waive fees and/or reimburse expenses to the extent necessary to cap the Fund’s Total Annual Fund Operating Expenses After Fee Waiver, excluding certain expenses, at 0.90% for Class A, 1.65% for Class B, 1.65% for Class C, 0.80% for Administrator Class, 0.50% for Institutional Class, and 0.93% for Investor Class. Brokerage commissions, stamp duty fees, interest, taxes, acquired fund fees and expenses, and extraordinary expenses are excluded from the cap. Without this cap, the Fund’s returns would have been lower. |
| 4. | The Barclays U.S. Corporate High Yield Bond Index is an unmanaged, U.S. dollar-denominated, nonconvertible, non-investment-grade debt index. The index consists of domestic and corporate bonds rated Ba and below with a minimum outstanding amount of $150 million. You cannot invest directly in an index. |
| 5. | The ten largest long-term holdings are calculated based on the value of the securities divided by total net assets of the Fund. Holdings are subject to change and may have changed since the date specified. |
| 6. | The credit quality of portfolio holdings reflected in the chart is based on ratings from Standard & Poor’s, Moody’s Investors Service, and/or Fitch Ratings Ltd. Credit quality ratings apply to the underlying holdings of the Fund and not to the Fund itself. The percentages of the Fund’s portfolio with the ratings depicted in the chart are calculated based on the total market value of fixed income securities held by the Fund. If a security was rated by all three rating agencies, the middle rating was utilized. If rated by two of three rating agencies, the lower rating was utilized, and if rated by one of the rating agencies, that rating was utilized. Standard & Poor’s rates the creditworthiness of bonds, ranging from AAA (highest) to D (lowest). Ratings from A to CCC may be modified by the addition of a plus (+) or minus (-) sign to show relative standing within the rating categories. Standard & Poor’s rates the creditworthiness of short-term notes from SP-1 (highest) to SP-3 (lowest). Moody’s rates the creditworthiness of bonds, ranging from Aaa (highest) to C (lowest). Ratings Aa to B may be modified by the addition of a number 1 (highest) to 3 (lowest) to show relative standing within the ratings categories. Moody’s rates the creditworthiness of short-term U.S. tax-exempt municipal securities from MIG 1/VMIG 1 (highest) to SG (lowest). Fitch rates the creditworthiness of bonds, ranging from AAA (highest) to D (lowest). Credit quality, and credit quality ratings are subject to change. |
| | | | |
| 8 | | Wells Fargo Advantage High Income Fund | | Fund expenses (unaudited) |
As a shareholder of the Fund, you incur two types of costs: (1) transaction costs, including sales charges (loads) on
purchase payments and contingent deferred sales charges (if any) on redemptions and (2) ongoing costs, including
management fees, distribution (12b-1) and/or shareholder service fees, and other Fund expenses. This example is intended to help you understand your ongoing costs (in dollars) of investing in the Fund and to compare these costs with the ongoing costs of investing in other mutual funds.
The example is based on an investment of $1,000 invested at the beginning of the six-month period and held for the entire period from September 1, 2013 to February 28, 2014.
Actual expenses
The “Actual” line of the table below provides information about actual account values and actual expenses. You may use
the information in this line, together with the amount you invested, to estimate the expenses that you paid over the period. Simply divide your account value by $1,000 (for example, an $8,600 account value divided by $1,000 = 8.6), then multiply the result by the number in the “Actual” line under the heading entitled “Expenses paid during period” for your applicable class of shares to estimate the expenses you paid on your account during this period.
Hypothetical example for comparison purposes
The “Hypothetical” line of the table below provides information about hypothetical account values and hypothetical
expenses based on the Fund’s actual expense ratio and an assumed rate of return of 5% per year before expenses, which
is not the Fund’s actual return. The hypothetical account values and expenses may not be used to estimate the actual
ending account balance or expenses you paid for the period. You may use this information to compare the ongoing costs
of investing in the Fund and other funds. To do so, compare this 5% hypothetical example with the 5% hypothetical examples that appear in the shareholder reports of the other funds.
Please note that the expenses shown in the table are meant to highlight your ongoing costs only and do not reflect any transactional costs, such as sales charges (loads) and contingent deferred sales charges. Therefore, the “Hypothetical” line of the table is useful in comparing ongoing costs only and will not help you determine the relative total costs of owning different funds. In addition, if these transactional costs were included, your costs would have been higher.
| | | | | | | | | | | | | | | | |
| | | Beginning
account value
9-1-2013 | | | Ending
account value
2-28-2014 | | | Expenses
paid during
the period1 | | | Net annualized
expense ratio | |
Class A | | | | | | | | | | | | | | | | |
Actual | | $ | 1,000.00 | | | $ | 1,067.62 | | | $ | 4.61 | | | | 0.90 | % |
Hypothetical (5% return before expenses) | | $ | 1,000.00 | | | $ | 1,020.33 | | | $ | 4.51 | | | | 0.90 | % |
Class B | | | | | | | | | | | | | | | | |
Actual | | $ | 1,000.00 | | | $ | 1,063.68 | | | $ | 8.44 | | | | 1.65 | % |
Hypothetical (5% return before expenses) | | $ | 1,000.00 | | | $ | 1,016.61 | | | $ | 8.25 | | | | 1.65 | % |
Class C | | | | | | | | | | | | | | | | |
Actual | | $ | 1,000.00 | | | $ | 1,063.69 | | | $ | 8.44 | | | | 1.65 | % |
Hypothetical (5% return before expenses) | | $ | 1,000.00 | | | $ | 1,016.61 | | | $ | 8.25 | | | | 1.65 | % |
Administrator Class | | | | | | | | | | | | | | | | |
Actual | | $ | 1,000.00 | | | $ | 1,067.70 | | | $ | 4.10 | | | | 0.80 | % |
Hypothetical (5% return before expenses) | | $ | 1,000.00 | | | $ | 1,020.83 | | | $ | 4.01 | | | | 0.80 | % |
Institutional Class | | | | | | | | | | | | | | | | |
Actual | | $ | 1,000.00 | | | $ | 1,069.34 | | | $ | 2.57 | | | | 0.50 | % |
Hypothetical (5% return before expenses) | | $ | 1,000.00 | | | $ | 1,022.32 | | | $ | 2.51 | | | | 0.50 | % |
Investor Class | | | | | | | | | | | | | | | | |
Actual | | $ | 1,000.00 | | | $ | 1,067.31 | | | $ | 4.77 | | | | 0.93 | % |
Hypothetical (5% return before expenses) | | $ | 1,000.00 | | | $ | 1,020.18 | | | $ | 4.66 | | | | 0.93 | % |
| 1. | Expenses paid is equal to the annualized expense ratio of each class multiplied by the average account value over the period, multiplied by the number of days in the most recent fiscal half-year divided by the number of days in the fiscal year (to reflect the one-half-year period). |
| | | | | | |
| Portfolio of investments—February 28, 2014 (unaudited) | | Wells Fargo Advantage High Income Fund | | | 9 | |
| | | | | | | | | | | | | | | | |
| Security name | | Interest rate | | | Maturity date | | | Principal | | | Value | |
| | | | |
Corporate Bonds and Notes: 82.65% | | | | | | | | | | | | | | | | |
| | | | |
Consumer Discretionary: 18.99% | | | | | | | | | | | | | | | | |
| | | | |
| Auto Components: 2.12% | | | | | | | | | | | | | | | | |
American Axle Manufacturing Incorporated | | | 6.63 | % | | | 10-15-2022 | | | $ | 6,000,000 | | | $ | 6,525,000 | |
Goodyear Tire & Rubber Company | | | 6.50 | | | | 3-1-2021 | | | | 5,000,000 | | | | 5,462,500 | |
Tenneco Automotive Incorporated | | | 7.75 | | | | 8-15-2018 | | | | 3,000,000 | | | | 3,183,750 | |
| | | | |
| | | | | | | | | | | | | | | 15,171,250 | |
| | | | | | | | | | | | | | | | |
| | | | |
| Diversified Consumer Services: 0.77% | | | | | | | | | | | | | | | | |
Service Corporation International | | | 7.50 | | | | 4-1-2027 | | | | 200,000 | | | | 212,500 | |
Stewart Enterprises Incorporated | | | 6.50 | | | | 4-15-2019 | | | | 5,000,000 | | | | 5,265,000 | |
| | | | |
| | | | | | | | | | | | | | | 5,477,500 | |
| | | | | | | | | | | | | | | | |
| | | | |
| Hotels, Restaurants & Leisure: 2.36% | | | | | | | | | | | | | | | | |
Caesars Entertainment Corporation | | | 8.50 | | | | 2-15-2020 | | | | 1,000,000 | | | | 960,000 | |
Caesars Entertainment Corporation | | | 9.00 | | | | 2-15-2020 | | | | 5,000,000 | | | | 4,862,500 | |
MGM Resorts International Company | | | 6.63 | | | | 12-15-2021 | | | | 4,000,000 | | | | 4,390,000 | |
MGM Resorts International Company | | | 8.63 | | | | 2-1-2019 | | | | 1,000,000 | | | | 1,197,500 | |
Tunica-Biloxi Gaming Authority 144A | | | 9.00 | | | | 11-15-2015 | | | | 6,260,000 | | | | 5,477,500 | |
| | | | |
| | | | | | | | | | | | | | | 16,887,500 | |
| | | | | | | | | | | | | | | | |
| | | | |
| Household Durables: 2.51% | | | | | | | | | | | | | | | | |
Beazer Homes USA Company | | | 6.63 | | | | 4-15-2018 | | | | 1,000,000 | | | | 1,080,000 | |
Beazer Homes USA Company | | | 7.25 | | | | 2-1-2023 | | | | 5,000,000 | | | | 5,150,000 | |
Lennar Corporation | | | 4.13 | | | | 12-1-2018 | | | | 5,000,000 | | | | 5,087,500 | |
Meritage Homes Corporation | | | 7.00 | | | | 4-1-2022 | | | | 1,500,000 | | | | 1,642,500 | |
Meritage Homes Corporation | | | 7.15 | | | | 4-15-2020 | | | | 4,500,000 | | | | 4,995,000 | |
| | | | |
| | | | | | | | | | | | | | | 17,955,000 | |
| | | | | | | | | | | | | | | | |
| | | | |
| Media: 7.80% | | | | | | | | | | | | | | | | |
CCO Holdings LLC | | | 6.50 | | | | 4-30-2021 | | | | 4,000,000 | | | | 4,275,000 | |
CCO Holdings LLC | | | 6.63 | | | | 1-31-2022 | | | | 2,000,000 | | | | 2,155,000 | |
Cequel Communications Holdings 144A | | | 6.38 | | | | 9-15-2020 | | | | 5,000,000 | | | | 5,287,500 | |
Clear Channel Communications Incorporated | | | 9.00 | | | | 3-1-2021 | | | | 4,000,000 | | | | 4,190,000 | |
Clear Channel Communications Incorporated | | | 14.00 | | | | 2-1-2021 | | | | 2,020,000 | | | | 2,004,850 | |
Clear Channel Worldwide Holdings Incorporated | | | 6.50 | | | | 11-15-2022 | | | | 6,000,000 | | | | 6,345,000 | |
Cumulus Media Holdings Incorporated | | | 7.75 | | | | 5-1-2019 | | | | 2,400,000 | | | | 2,592,000 | |
DISH DBS Corporation | | | 5.88 | | | | 7-15-2022 | | | | 1,500,000 | | | | 1,578,750 | |
DISH DBS Corporation | | | 7.88 | | | | 9-1-2019 | | | | 4,500,000 | | | | 5,287,500 | |
Lynx I Corporation 144A | | | 5.38 | | | | 4-15-2021 | | | | 6,160,000 | | | | 6,344,800 | |
Lynx II Corporation 144A | | | 6.38 | | | | 4-15-2023 | | | | 2,000,000 | | | | 2,115,000 | |
National CineMedia LLC | | | 6.00 | | | | 4-15-2022 | | | | 3,000,000 | | | | 3,142,500 | |
Regal Entertainment Group %% | | | 5.75 | | | | 3-15-2022 | | | | 2,000,000 | | | | 2,045,000 | |
Sinclair Television Group Incorporated | | | 5.38 | | | | 4-1-2021 | | | | 5,000,000 | | | | 5,025,000 | |
Visant Corporation | | | 10.00 | | | | 10-1-2017 | | | | 3,500,000 | | | | 3,386,250 | |
| | | | |
| | | | | | | | | | | | | | | 55,774,150 | |
| | | | | | | | | | | | | | | | |
The accompanying notes are an integral part of these financial statements.
| | | | |
| 10 | | Wells Fargo Advantage High Income Fund | | Portfolio of investments—February 28, 2014 (unaudited) |
| | | | | | | | | | | | | | | | |
| Security name | | Interest rate | | | Maturity date | | | Principal | | | Value | |
| | | | |
| Multiline Retail: 0.40% | | | | | | | | | | | | | | | | |
Bon Ton Stores Incorporated « | | | 8.00 | % | | | 6-15-2021 | | | $ | 3,000,000 | | | $ | 2,857,500 | |
| | | | | | | | | | | | | | | | |
| | | | |
| Specialty Retail: 2.26% | | | | | | | | | | | | | | | | |
L Brands Incorporated | | | 6.63 | | | | 4-1-2021 | | | | 5,000,000 | | | | 5,606,250 | |
Neiman Marcus Group Limited 144A | | | 8.00 | | | | 10-15-2021 | | | | 5,500,000 | | | | 5,898,750 | |
Sally Beauty Holdings Incorporated | | | 5.75 | | | | 6-1-2022 | | | | 4,400,000 | | | | 4,653,000 | |
| | | | |
| | | | | | | | | | | | | | | 16,158,000 | |
| | | | | | | | | | | | | | | | |
| | | | |
| Textiles, Apparel & Luxury Goods: 0.77% | | | | | | | | | | | | | | | | |
Hanesbrands Incorporated | | | 6.38 | | | | 12-15-2020 | | | | 5,000,000 | | | | 5,487,500 | |
| | | | | | | | | | | | | | | | |
| | | | |
Consumer Staples: 1.98% | | | | | | | | | | | | | | | | |
| | | | |
| Food Products: 1.98% | | | | | | | | | | | | | | | | |
JBS USA Finance Incorporated 144A | | | 7.25 | | | | 6-1-2021 | | | | 4,250,000 | | | | 4,505,000 | |
Michael Foods Holdings Incorporated (PIK at 9.25%) 144A¥ | | | 8.50 | | | | 7-15-2018 | | | | 2,000,000 | | | | 2,097,500 | |
Post Holdings Incorporated 144A | | | 6.75 | | | | 12-1-2021 | | | | 4,000,000 | | | | 4,285,000 | |
Smithfield Foods Incorporated 144A | | | 5.25 | | | | 8-1-2018 | | | | 500,000 | | | | 524,375 | |
TreeHouse Foods Incorporated %% | | | 4.88 | | | | 3-15-2022 | | | | 2,730,000 | | | | 2,777,775 | |
| | | | |
| | | | | | | | | | | | | | | 14,189,650 | |
| | | | | | | | | | | | | | | | |
| | | | |
Energy: 17.83% | | | | | | | | | | | | | | | | |
| | | | |
| Energy Equipment & Services: 3.48% | | | | | | | | | | | | | | | | |
Basic Energy Services Company | | | 7.75 | | | | 2-15-2019 | | | | 2,185,000 | | | | 2,332,488 | |
Basic Energy Services Company | | | 7.75 | | | | 10-15-2022 | | | | 4,000,000 | | | | 4,270,000 | |
Energy Future Intermediate Holding Company LLC 144A | | | 10.25 | | | | 12-1-2020 | | | | 4,000,000 | | | | 4,160,000 | |
Gulfmark Offshore Incorporated | | | 6.38 | | | | 3-15-2022 | | | | 4,000,000 | | | | 4,120,000 | |
Hercules Offshore Incorporated 144A | | | 7.13 | | | | 4-1-2017 | | | | 3,500,000 | | | | 3,696,875 | |
Key Energy Services Incorporated | | | 6.75 | | | | 3-1-2021 | | | | 5,000,000 | | | | 5,237,500 | |
Parker Drilling Company 144A | | | 6.75 | | | | 7-15-2022 | | | | 1,000,000 | | | | 1,040,000 | |
| | | | |
| | | | | | | | | | | | | | | 24,856,863 | |
| | | | | | | | | | | | | | | | |
| | | | |
| Oil, Gas & Consumable Fuels: 14.35% | | | | | | | | | | | | | | | | |
Arch Coal Incorporated « | | | 7.25 | | | | 6-15-2021 | | | | 5,000,000 | | | | 4,025,000 | |
Athlon Holdings LP 144A | | | 7.38 | | | | 4-15-2021 | | | | 4,000,000 | | | | 4,240,000 | |
Atlas Pipeline Partners LP | | | 5.88 | | | | 8-1-2023 | | | | 5,000,000 | | | | 4,912,500 | |
Bill Barrett Corporation | | | 7.63 | | | | 10-1-2019 | | | | 3,100,000 | | | | 3,340,250 | |
BreitBurn Energy Partners LP | | | 8.63 | | | | 10-15-2020 | | | | 4,000,000 | | | | 4,330,000 | |
Chesapeake Energy Corporation | | | 6.63 | | | | 11-15-2019 | | | | 3,100,000 | | | | 3,286,000 | |
Chesapeake Energy Corporation | | | 6.63 | | | | 8-15-2020 | | | | 2,000,000 | | | | 2,285,000 | |
CITGO Petroleum Corporation 144A | | | 11.50 | | | | 7-1-2017 | | | | 6,000,000 | | | | 6,480,000 | |
Comstock Resources Incorporated | | | 9.50 | | | | 6-15-2020 | | | | 5,500,000 | | | | 6,249,375 | |
El Paso LLC | | | 6.50 | | | | 9-15-2020 | | | | 3,500,000 | | | | 3,836,508 | |
Energy XXI Gulf Coast Incorporated 144A | | | 7.50 | | | | 12-15-2021 | | | | 5,000,000 | | | | 5,225,000 | |
Energy XXI Gulf Coast Incorporated | | | 7.75 | | | | 6-15-2019 | | | | 1,450,000 | | | | 1,558,750 | |
Goodrich Petroleum Corporation | | | 8.88 | | | | 3-15-2019 | | | | 4,090,000 | | | | 4,212,700 | |
Halcon Resources Corporation | | | 8.88 | | | | 5-15-2021 | | | | 5,000,000 | | | | 5,087,500 | |
James River Coal Company (s) | | | 7.88 | | | | 4-1-2019 | | | | 5,000,000 | | | | 837,500 | |
Newfield Exploration Company | | | 6.88 | | | | 2-1-2020 | | | | 4,950,000 | | | | 5,315,063 | |
The accompanying notes are an integral part of these financial statements.
| | | | | | |
| Portfolio of investments—February 28, 2014 (unaudited) | | Wells Fargo Advantage High Income Fund | | | 11 | |
| | | | | | | | | | | | | | | | |
| Security name | | Interest rate | | | Maturity date | | | Principal | | | Value | |
| | | | |
| Oil, Gas & Consumable Fuels (continued) | | | | | | | | | | | | | | | | |
Oasis Petroleum Incorporated | | | 6.88 | % | | | 1-15-2023 | | | $ | 4,000,000 | | | $ | 4,350,000 | |
Peabody Energy Corporation | | | 6.00 | | | | 11-15-2018 | | | | 1,000,000 | | | | 1,082,500 | |
Peabody Energy Corporation « | | | 6.25 | | | | 11-15-2021 | | | | 5,000,000 | | | | 5,162,500 | |
Penn Virginia Corporation | | | 8.50 | | | | 5-1-2020 | | | | 4,000,000 | | | | 4,400,000 | |
Sabine Pass Liquefaction LLC 144A | | | 5.88 | | | | 2-1-2021 | | | | 4,500,000 | | | | 4,612,500 | |
Sandridge Energy Incorporated | | | 7.50 | | | | 2-15-2023 | | | | 6,000,000 | | | | 6,330,000 | |
Targa Resources Partners Incorporated | | | 6.38 | | | | 8-1-2022 | | | | 750,000 | | | | 804,375 | |
Targa Resources Partners Incorporated | | | 6.88 | | | | 2-1-2021 | | | | 4,000,000 | | | | 4,340,000 | |
Tesoro Logistics LP Corporation | | | 6.13 | | | | 10-15-2021 | | | | 1,000,000 | | | | 1,045,000 | |
Ultra Petroleum Corporation 144A | | | 5.75 | | | | 12-15-2018 | | | | 5,000,000 | | | | 5,237,500 | |
| | | | |
| | | | | | | | | | | | | | | 102,585,521 | |
| | | | | | | | | | | | | | | | |
| | | | |
Financials: 7.45% | | | | | | | | | | | | | | | | |
| | | | |
| Banks: 1.77% | | | | | | | | | | | | | | | | |
CIT Group Incorporated | | | 5.25 | | | | 3-15-2018 | | | | 5,000,000 | | | | 5,425,000 | |
CIT Group Incorporated | | | 5.38 | | | | 5-15-2020 | | | | 3,000,000 | | | | 3,240,000 | |
Regions Bank | | | 7.50 | | | | 5-15-2018 | | | | 3,350,000 | | | | 3,988,711 | |
| | | | |
| | | | | | | | | | | | | | | 12,653,711 | |
| | | | | | | | | | | | | | | | |
| | | | |
| Consumer Finance: 4.14% | | | | | | | | | | | | | | | | |
Ally Financial Incorporated | | | 5.50 | | | | 2-15-2017 | | | | 1,500,000 | | | | 1,638,750 | |
Ally Financial Incorporated | | | 6.25 | | | | 12-1-2017 | | | | 2,000,000 | | | | 2,250,000 | |
Ally Financial Incorporated | | | 8.00 | | | | 3-15-2020 | | | | 5,500,000 | | | | 6,806,250 | |
Chrysler Group LLC 144A | | | 8.25 | | | | 6-15-2021 | | | | 5,000,000 | | | | 5,662,500 | |
General Motors Financial Company Incorporated | | | 4.25 | | | | 5-15-2023 | | | | 4,550,000 | | | | 4,595,500 | |
SLM Corporation | | | 8.00 | | | | 3-25-2020 | | | | 7,500,000 | | | | 8,662,500 | |
| | | | |
| | | | | | | | | | | | | | | 29,615,500 | |
| | | | | | | | | | | | | | | | |
| | | | |
| Real Estate Management & Development: 0.82% | | | | | | | | | | | | | | | | |
CBRE Services Incorporated | | | 5.00 | | | | 3-15-2023 | | | | 3,000,000 | | | | 3,000,000 | |
Icahn Enterprises Company 144A | | | 6.00 | | | | 8-1-2020 | | | | 2,735,000 | | | | 2,885,425 | |
| | | | |
| | | | | | | | | | | | | | | 5,885,425 | |
| | | | | | | | | | | | | | | | |
| | | | |
| REITs: 0.72% | | | | | | | | | | | | | | | | |
Crown Castle International Corporation | | | 5.25 | | | | 1-15-2023 | | | | 5,000,000 | | | | 5,125,000 | |
| | | | | | | | | | | | | | | | |
| | | | |
Health Care: 8.27% | | | | | | | | | | | | | | | | |
| | | | |
| Health Care Equipment & Supplies: 1.40% | | | | | | | | | | | | | | | | |
Biomet Incorporated | | | 6.50 | | | | 8-1-2020 | | | | 5,000,000 | | | | 5,393,750 | |
Kinetics Concepts Incorporated | | | 10.50 | | | | 11-1-2018 | | | | 4,000,000 | | | | 4,625,000 | |
| | | | |
| | | | | | | | | | | | | | | 10,018,750 | |
| | | | | | | | | | | | | | | | |
| | | | |
| Health Care Providers & Services: 6.87% | | | | | | | | | | | | | | | | |
Community Health Systems Incorporated | | | 6.88 | | | | 2-1-2022 | | | | 1,000,000 | | | | 1,063,750 | |
Community Health Systems Incorporated | | | 8.00 | | | | 11-15-2019 | | | | 4,000,000 | | | | 4,444,000 | |
DaVita Incorporated | | | 6.63 | | | | 11-1-2020 | | | | 7,000,000 | | | | 7,516,250 | |
Fresenius Medical Care Holdings Incorporated 144A | | | 5.63 | | | | 7-31-2019 | | | | 1,500,000 | | | | 1,616,250 | |
Fresenius Medical Care Holdings Incorporated 144A | | | 5.88 | | | | 1-31-2022 | | | | 2,500,000 | | | | 2,675,000 | |
The accompanying notes are an integral part of these financial statements.
| | | | |
| 12 | | Wells Fargo Advantage High Income Fund | | Portfolio of investments—February 28, 2014 (unaudited) |
| | | | | | | | | | | | | | | | |
| Security name | | Interest rate | | | Maturity date | | | Principal | | | Value | |
| | | | |
| Health Care Providers & Services (continued) | | | | | | | | | | | | | | | | |
Hanger Orthopedic Group | | | 7.13 | % | | | 11-15-2018 | | | $ | 4,000,000 | | | $ | 4,260,000 | |
HCA Holdings Incorporated | | | 6.25 | | | | 2-15-2021 | | | | 4,000,000 | | | | 4,360,000 | |
HCA Incorporated | | | 4.75 | | | | 5-1-2023 | | | | 3,500,000 | | | | 3,500,000 | |
HealthSouth Corporation | | | 8.13 | | | | 2-15-2020 | | | | 6,200,000 | | | | 6,758,000 | |
Iasis Healthcare Corporation | | | 8.38 | | | | 5-15-2019 | | | | 5,000,000 | | | | 5,350,000 | |
Select Medical Corporation | | | 6.38 | | | | 6-1-2021 | | | | 2,000,000 | | | | 2,040,000 | |
Tenet Healthcare Corporation | | | 8.00 | | | | 8-1-2020 | | | | 5,000,000 | | | | 5,487,500 | |
| | | | |
| | | | | | | | | | | | | | | 49,070,750 | |
| | | | | | | | | | | | | | | | |
| | | | |
Industrials: 12.15% | | | | | | | | | | | | | | | | |
| | | | |
| Aerospace & Defense: 2.29% | | | | | | | | | | | | | | | | |
BE Aerospace Incorporated | | | 5.25 | | | | 4-1-2022 | | | | 3,500,000 | | | | 3,609,375 | |
DigitalGlobe Incorporated | | | 5.25 | | | | 2-1-2021 | | | | 5,000,000 | | | | 4,950,000 | |
Esterline Technologies Corporation | | | 7.00 | | | | 8-1-2020 | | | | 3,750,000 | | | | 4,078,125 | |
TransDigm Group Incorporated | | | 7.75 | | | | 12-15-2018 | | | | 3,500,000 | | | | 3,749,375 | |
| | | | |
| | | | | | | | | | | | | | | 16,386,875 | |
| | | | | | | | | | | | | | | | |
| | | | |
| Building Products: 1.86% | | | | | | | | | | | | | | | | |
Masco Corporation | | | 5.95 | | | | 3-15-2022 | | | | 6,130,000 | | | | 6,620,400 | |
Nortek Incorporated | | | 8.50 | | | | 4-15-2021 | | | | 5,000,000 | | | | 5,600,000 | |
Ply Gem Industries Incorporated 144A | | | 6.50 | | | | 2-1-2022 | | | | 500,000 | | | | 507,500 | |
USG Corporation 144A | | | 5.88 | | | | 11-1-2021 | | | | 500,000 | | | | 532,500 | |
| | | | |
| | | | | | | | | | | | | | | 13,260,400 | |
| | | | | | | | | | | | | | | | |
| | | | |
| Commercial Services & Supplies: 2.41% | | | | | | | | | | | | | | | | |
Casella Waste Systems Incorporated | | | 7.75 | | | | 2-15-2019 | | | | 4,250,000 | | | | 4,377,500 | |
Clean Harbors Incorporated | | | 5.13 | | | | 6-1-2021 | | | | 5,000,000 | | | | 5,100,000 | |
Deluxe Corporation | | | 6.00 | | | | 11-15-2020 | | | | 1,000,000 | | | | 1,040,000 | |
Deluxe Corporation | | | 7.00 | | | | 3-15-2019 | | | | 6,300,000 | | | | 6,741,000 | |
| | | | |
| | | | | | | | | | | | | | | 17,258,500 | |
| | | | | | | | | | | | | | | | |
| | | | |
| Machinery: 2.42% | | | | | | | | | | | | | | | | |
Briggs & Stratton Corporation | | | 6.88 | | | | 12-15-2020 | | | | 2,970,000 | | | | 3,296,700 | |
Gardner Denver Incorporated 144A | | | 6.88 | | | | 8-15-2021 | | | | 1,500,000 | | | | 1,533,750 | |
Manitowoc Company Incorporated | | | 8.50 | | | | 11-1-2020 | | | | 4,000,000 | | | | 4,535,000 | |
RSC Equipment Rental Incorporated | | | 8.25 | | | | 2-1-2021 | | | | 7,000,000 | | | | 7,901,250 | |
| | | | |
| | | | | | | | | | | | | | | 17,266,700 | |
| | | | | | | | | | | | | | | | |
| | | | |
| Professional Services: 1.25% | | | | | | | | | | | | | | | | |
Checkout Holdings Corporation 144A¤ | | | 0.00 | | | | 11-15-2015 | | | | 3,000,000 | | | | 2,535,000 | |
FTI Consulting Incorporated | | | 6.75 | | | | 10-1-2020 | | | | 5,900,000 | | | | 6,416,250 | |
| | | | |
| | | | | | | | | | | | | | | 8,951,250 | |
| | | | | | | | | | | | | | | | |
| | | | |
| Road & Rail: 0.41% | | | | | | | | | | | | | | | | |
Hertz Corporation | | | 5.88 | | | | 10-15-2020 | | | | 2,750,000 | | | | 2,915,000 | |
| | | | | | | | | | | | | | | | |
The accompanying notes are an integral part of these financial statements.
| | | | | | |
| Portfolio of investments—February 28, 2014 (unaudited) | | Wells Fargo Advantage High Income Fund | | | 13 | |
| | | | | | | | | | | | | | | | |
| Security name | | Interest rate | | | Maturity date | | | Principal | | | Value | |
| | | | |
| Trading Companies & Distributors: 1.51% | | | | | | | | | | | | | | | | |
Ashtead Capital Incorporated 144A | | | 6.50 | % | | | 7-15-2022 | | | $ | 3,740,000 | | | $ | 4,057,900 | |
International Lease Finance Corporation | | | 8.25 | | | | 12-15-2020 | | | | 5,500,000 | | | | 6,730,625 | |
| | | | |
| | | | | | | | | | | | | | | 10,788,525 | |
| | | | | | | | | | | | | | | | |
| | | | |
Information Technology: 3.74% | | | | | | | | | | | | | | | | |
| | | | |
| Internet Software & Services: 0.28% | | | | | | | | | | | | | | | | |
Zayo Group LLC | | | 10.13 | | | | 7-1-2020 | | | | 1,700,000 | | | | 1,972,000 | |
| | | | | | | | | | | | | | | | |
| | | | |
| IT Services: 1.59% | | | | | | | | | | | | | | | | |
First Data Corporation 144A | | | 10.63 | | | | 6-15-2021 | | | | 3,000,000 | | | | 3,375,000 | |
First Data Corporation (PIK at 10.00%) 144A¥ | | | 8.75 | | | | 1-15-2022 | | | | 3,000,000 | | | | 3,281,250 | |
Neustar Incorporated | | | 4.50 | | | | 1-15-2023 | | | | 5,500,000 | | | | 4,743,750 | |
| | | | |
| | | | | | | | | | | | | | | 11,400,000 | |
| | | | | | | | | | | | | | | | |
| | | | |
| Semiconductors & Semiconductor Equipment: 1.87% | | | | | | | | | | | | | | | | |
Amkor Technology Incorporated | | | 6.38 | | | | 10-1-2022 | | | | 5,000,000 | | | | 5,175,000 | |
Magnachip Semiconductor Corporation | | | 6.63 | | | | 7-15-2021 | | | | 4,000,000 | | | | 4,120,000 | |
Micron Technology Incorporated 144A | | | 5.88 | | | | 2-15-2022 | | | | 3,910,000 | | | | 4,085,950 | |
| | | | |
| | | | | | | | | | | | | | | 13,380,950 | |
| | | | | | | | | | | | | | | | |
| | | | |
Materials: 4.77% | | | | | | | | | | | | | | | | |
| | | | |
| Chemicals: 1.32% | | | | | | | | | | | | | | | | |
Huntsman International LLC | | | 4.88 | | | | 11-15-2020 | | | | 4,000,000 | | | | 4,075,000 | |
Momentive Performance Materials Incorporated | | | 8.88 | | | | 10-15-2020 | | | | 5,000,000 | | | | 5,350,000 | |
| | | | |
| | | | | | | | | | | | | | | 9,425,000 | |
| | | | | | | | | | | | | | | | |
| | | | |
| Containers & Packaging: 2.25% | | | | | | | | | | | | | | | | |
BOE Intermediate Holding Corporation (PIK at 9.75%) 144A¥ | | | 9.00 | | | | 11-1-2017 | | | | 2,091,000 | | | | 2,247,825 | |
BWAY Corporation | | | 10.00 | | | | 6-15-2018 | | | | 4,000,000 | | | | 4,280,000 | |
Reynolds Group Holdings | | | 5.75 | | | | 10-15-2020 | | | | 5,000,000 | | | | 5,225,000 | |
Reynolds Group Holdings | | | 8.25 | | | | 2-15-2021 | | | | 4,000,000 | | | | 4,370,000 | |
| | | | |
| | | | | | | | | | | | | | | 16,122,825 | |
| | | | | | | | | | | | | | | | |
| | | | |
| Metals & Mining: 1.20% | | | | | | | | | | | | | | | | |
AK Steel Corporation | | | 7.63 | | | | 5-15-2020 | | | | 1,000,000 | | | | 990,000 | |
AK Steel Corporation | | | 8.38 | | | | 4-1-2022 | | | | 2,840,000 | | | | 2,811,600 | |
US Steel Corporation | | | 6.88 | | | | 4-1-2021 | | | | 4,500,000 | | | | 4,770,000 | |
| | | | |
| | | | | | | | | | | | | | | 8,571,600 | |
| | | | | | | | | | | | | | | | |
| | | | |
Telecommunication Services: 6.20% | | | | | | | | | | | | | | | | |
| | | | |
| Diversified Telecommunication Services: 3.67% | | | | | | | | | | | | | | | | |
CenturyLink Incorporated | | | 5.63 | | | | 4-1-2020 | | | | 5,000,000 | | | | 5,225,000 | |
Cincinnati Bell Incorporated | | | 8.38 | | | | 10-15-2020 | | | | 3,000,000 | | | | 3,270,000 | |
Frontier Communications Corporation | | | 8.75 | | | | 4-15-2022 | | | | 2,000,000 | | | | 2,290,000 | |
Level 3 Communications Incorporated | | | 8.88 | | | | 6-1-2019 | | | | 3,500,000 | | | | 3,858,750 | |
Level 3 Financing Incorporated | | | 7.00 | | | | 6-1-2020 | | | | 5,000,000 | | | | 5,450,000 | |
TW Telecommunications Holdings Incorporated | | | 5.38 | | | | 10-1-2022 | | | | 6,000,000 | | | | 6,120,000 | |
| | | | |
| | | | | | | | | | | | | | | 26,213,750 | |
| | | | | | | | | | | | | | | | |
The accompanying notes are an integral part of these financial statements.
| | | | |
| 14 | | Wells Fargo Advantage High Income Fund | | Portfolio of investments—February 28, 2014 (unaudited) |
| | | | | | | | | | | | | | | | |
| Security name | | Interest rate | | | Maturity date | | | Principal | | | Value | |
| | | | |
| Wireless Telecommunication Services: 2.53% | | | | | | | | | | | | | | | | |
Sprint Capital Corporation | | | 6.90 | % | | | 5-1-2019 | | | $ | 3,000,000 | | | $ | 3,300,000 | |
Sprint Corporation 144A | | | 7.88 | | | | 9-15-2023 | | | | 10,500,000 | | | | 11,628,750 | |
T-Mobile USA Incorporated | | | 6.25 | | | | 4-1-2021 | | | | 3,000,000 | | | | 3,198,750 | |
| | | | |
| | | | | | | | | | | | | | | 18,127,500 | |
| | | | | | | | | | | | | | | | |
| | | | |
Utilities: 1.27% | | | | | | | | | | | | | | | | |
| | | | |
| Independent Power & Renewable Electricity Producers: 1.27% | | | | | | | | | | | | | | | | |
Calpine Corporation 144A | | | 7.88 | | | | 1-15-2023 | | | | 4,795,000 | | | | 5,394,375 | |
NRG Energy Incorporated | | | 6.63 | | | | 3-15-2023 | | | | 3,500,000 | | | | 3,692,500 | |
| | | | |
| | | | | | | | | | | | | | | 9,086,875 | |
| | | | | | | | | | | | | | | | |
| | | | |
Total Corporate Bonds and Notes (Cost $572,178,555) | | | | | | | | | | | | | | | 590,897,320 | |
| | | | | | | | | | | | | | | | |
| | | | |
Municipal Obligations: 0.59% | | | | | | | | | | | | | | | | |
| | | | |
| Florida: 0.59% | | | | | | | | | | | | | | | | |
Florida Development Financial Corporation Renaissance Charter School Project Series 2011B (Education Revenue) | | | 8.00 | | | | 12-15-2018 | | | | 2,710,000 | | | | 2,772,005 | |
Florida Development Financial Corporation Renaissance Charter School Project Series 2012B (Education Revenue) | | | 7.50 | | | | 6-15-2018 | | | | 1,450,000 | | | | 1,443,475 | |
| | | | |
Total Municipal Obligations (Cost $4,160,000) | | | | | | | | | | | | | | | 4,215,480 | |
| | | | | | | | | | | | | | | | |
| | | | |
Term Loans ±: 0.56% | | | | | | | | | | | | | | | | |
Dell Incorporated | | | 4.50 | | | | 4-29-2020 | | | | 3,990,000 | | | | 3,977,870 | |
| | | | | | | | | | | | | | | | |
| | | | |
Total Term Loans (Cost $3,955,713) | | | | | | | | | | | | | | | 3,977,870 | |
| | | | | | | | | | | | | | | | |
| | | | |
Yankee Corporate Bonds and Notes: 10.24% | | | | | | | | | | | | | | | | |
| | | | |
Consumer Discretionary: 1.77% | | | | | | | | | | | | | | | | |
| | | | |
| Automobiles: 1.06% | | | | | | | | | | | | | | | | |
Jaguar Land Rover plc 144A | | | 5.63 | | | | 2-1-2023 | | | | 3,500,000 | | | | 3,657,500 | |
Jaguar Land Rover plc 144A | | | 8.13 | | | | 5-15-2021 | | | | 3,500,000 | | | | 3,963,750 | |
| | | | |
| | | | | | | | | | | | | | | 7,621,250 | |
| | | | | | | | | | | | | | | | |
| | | | |
| Media: 0.71% | | | | | | | | | | | | | | | | |
Quebecor Media Incorporated | | | 5.75 | | | | 1-15-2023 | | | | 5,000,000 | | | | 5,062,500 | |
| | | | | | | | | | | | | | | | |
| | | | |
Energy: 0.72% | | | | | | | | | | | | | | | | |
| | | | |
| Oil, Gas & Consumable Fuels: 0.72% | | | | | | | | | | | | | | | | |
Petrobakken Energy Limited 144A | | | 8.63 | | | | 2-1-2020 | | | | 5,000,000 | | | | 5,112,500 | |
| | | | | | | | | | | | | | | | |
| | | | |
Health Care: 0.96% | | | | | | | | | | | | | | | | |
| | | | |
| Pharmaceuticals: 0.96% | | | | | | | | | | | | | | | | |
Valeant Pharmaceuticals International Incorporated 144A | | | 7.50 | | | | 7-15-2021 | | | | 6,000,000 | | | | 6,840,000 | |
| | | | | | | | | | | | | | | | |
| | | | |
Industrials: 0.57% | | | | | | | | | | | | | | | | |
| | | | |
| Aerospace & Defense: 0.57% | | | | | | | | | | | | | | | | |
Bombardier Incorporated 144A | | | 6.13 | | | | 1-15-2023 | | | | 4,000,000 | | | | 4,050,000 | |
| | | | | | | | | | | | | | | | |
The accompanying notes are an integral part of these financial statements.
| | | | | | |
| Portfolio of investments—February 28, 2014 (unaudited) | | Wells Fargo Advantage High Income Fund | | | 15 | |
| | | | | | | | | | | | | | | | |
| Security name | | Interest rate | | | Maturity date | | | Principal | | | Value | |
| | | | |
Information Technology: 1.12% | | | | | | | | | | | | | | | | |
| | | | |
| Electronic Equipment, Instruments & Components: 0.60% | | | | | | | | | | | | | | | | |
Sensata Technologies BV 144A | | | 6.50 | % | | | 5-15-2019 | | | $ | 4,000,000 | | | $ | 4,300,000 | |
| | | | | | | | | | | | | | | | |
| | | | |
| Semiconductors & Semiconductor Equipment: 0.52% | | | | | | | | | | | | | | | | |
NXP Funding LLC 144A | | | 5.75 | | | | 2-15-2021 | | | | 3,500,000 | | | | 3,727,500 | |
| | | | | | | | | | | | | | | | |
| | | | |
Materials: 3.75% | | | | | | | | | | | | | | | | |
| | | | |
| Chemicals: 1.18% | | | | | | | | | | | | | | | | |
Ineos Finance plc 144A | | | 7.50 | | | | 5-1-2020 | | | | 1,000,000 | | | | 1,100,000 | |
Ineos Group Holdings plc 144A | | | 5.88 | | | | 2-15-2019 | | | | 1,000,000 | | | | 1,030,000 | |
Ineos Group Holdings plc 144A | | | 6.13 | | | | 8-15-2018 | | | | 5,000,000 | | | | 5,175,000 | |
Ineos Group Holdings plc 144A | | | 8.38 | | | | 2-15-2019 | | | | 1,000,000 | | | | 1,107,500 | |
| | | | |
| | | | | | | | | | | | | | | 8,412,500 | |
| | | | | | | | | | | | | | | | |
| | | | |
| Containers & Packaging: 0.14% | | | | | | | | | | | | | | | | |
Ardagh Holdings USA Incorporated 144A | | | 6.75 | | | | 1-31-2021 | | | | 1,000,000 | | | | 1,040,000 | |
| | | | | | | | | | | | | | | | |
| | | | |
| Metals & Mining: 1.86% | | | | | | | | | | | | | | | | |
ArcelorMittal « | | | 6.75 | | | | 2-25-2022 | | | | 8,000,000 | | | | 8,880,000 | |
FMG Resources Property Limited 144A | | | 8.25 | | | | 11-1-2019 | | | | 4,000,000 | | | | 4,410,000 | |
| | | | |
| | | | | | | | | | | | | | | 13,290,000 | |
| | | | | | | | | | | | | | | | |
| | | | |
| Paper & Forest Products: 0.57% | | | | | | | | | | | | | | | | |
Sappi Papier Holding GmbH 144A | | | 6.63 | | | | 4-15-2021 | | | | 4,000,000 | | | | 4,080,000 | |
| | | | | | | | | | | | | | | | |
| | | | |
Telecommunication Services: 1.35% | | | | | | | | | | | | | | | | |
| | | | |
| Diversified Telecommunication Services: 1.35% | | | | | | | | | | | | | | | | |
Intelsat Bermuda Limited 144A | | | 7.75 | | | | 6-1-2021 | | | | 9,000,000 | | | | 9,686,248 | |
| | | | | | | | | | | | | | | | |
| | | | |
Total Yankee Corporate Bonds and Notes (Cost $70,237,545) | | | | | | | | | | | | | | | 73,222,498 | |
| | | | | | | | | | | | | | | | |
| | | | |
| | | Yield | | | | | | Shares | | | | |
| | | | |
Short-Term Investments: 6.80% | | | | | | | | | | | | | | | | |
| | | | |
| Investment Companies: 6.69% | | | | | | | | | | | | | | | | |
Wells Fargo Advantage Cash Investment Money Market Fund, Select Class (l)(u)## | | | 0.07 | | | | | | | | 33,388,112 | | | | 33,388,112 | |
Wells Fargo Securities Lending Cash Investments, LLC (l)(r)(u)(v) | | | 0.09 | | | | | | | | 14,423,525 | | | | 14,423,525 | |
| | | | |
| | | | | | | | | | | | | | | 47,811,637 | |
| | | | | | | | | | | | | | | | |
| | | | | | | | | Principal | | | | |
| U.S. Treasury Securities: 0.11% | | | | | | | | | | | | | | | | |
U.S. Treasury Bill (z)# | | | 0.02 | | | | 3-20-2014 | | | $ | 800,000 | | | | 799,989 | |
| | | | | | | | | | | | | | | | |
| | | | |
Total Short-Term Investments (Cost $48,611,614) | | | | | | | | | | | | | | | 48,611,626 | |
| | | | | | | | | | | | | | | | |
| | | | | | | | |
Total investments in securities (Cost $699,143,427)* | | | 100.84 | % | | | 720,924,794 | |
Other assets and liabilities, net | | | (0.84 | ) | | | (5,983,659 | ) |
| | | | | | | | |
| Total net assets | | | 100.00 | % | | $ | 714,941,135 | |
| | | | | | | | |
The accompanying notes are an integral part of these financial statements.
| | | | |
| 16 | | Wells Fargo Advantage High Income Fund | | Portfolio of investments—February 28, 2014 (unaudited) |
| 144A | Security that may be resold to “qualified institutional buyers” under Rule 144A or security offered pursuant to Section 4(2) of the Securities Act of 1933, as amended. |
| %% | Security issued on a when-issued basis. |
| « | All or a portion of this security is on loan. |
| ¥ | A payment-in-kind (PIK) security is a security in which the issuer may make interest or dividend payments in cash or additional securities. These additional securities generally have the same terms as the original holdings. |
| (s) | Security is currently in default with regards to scheduled interest and/or principal payments. The Fund has stopped accruing interest on this security. |
| ¤ | Security issued in zero coupon form with no periodic interest payments. |
| ± | Variable rate investment. The rate shown is the rate in effect at period end |
| (l) | Investment in an affiliate |
| (u) | Rate shown is the 7-day annualized yield at period end. |
| ## | All or a portion of this security has been segregated for when-issued securities. |
| (r) | The investment company is exempt from registration under Section 3(c)(7) of the Investment Company Act of 1940, as amended. |
| (v) | Security represents investment of cash collateral received from securities on loan. |
| (z) | Zero coupon security. Rate represents the current yield to maturity. |
| # | All or a portion of this security is segregated as collateral for investments in derivative instruments. |
| * | Cost for federal income tax purposes is $699,059,582 and unrealized appreciation (depreciation) consists of: |
| | | | |
Gross unrealized appreciation | | $ | 29,414,472 | |
Gross unrealized depreciation | | | (7,549,260 | ) |
| | | | |
Net unrealized appreciation | | $ | 21,865,212 | |
The accompanying notes are an integral part of these financial statements.
| | | | | | |
| Statement of assets and liabilities—February 28, 2014 (unaudited) | | Wells Fargo Advantage High Income Fund | | | 17 | |
| | | | |
| | | | |
| |
Assets | | | | |
Investments | | | | |
In unaffiliated securities (including securities on loan), at value (see cost below) | | $ | 673,113,157 | |
In affiliated securities, at value (see cost below) | | | 47,811,637 | |
| | | | |
Total investments, at value (see cost below) | | | 720,924,794 | |
Receivable for investments sold | | | 3,440,000 | |
Receivable for Fund shares sold | | | 617,880 | |
Receivable for interest | | | 11,941,783 | |
Receivable for daily variation margin on open futures contracts | | | 57,031 | |
Receivable for securities lending income | | | 8,103 | |
Prepaid expenses and other assets | | | 68,248 | |
| | | | |
Total assets | | | 737,057,839 | |
| | | | |
| |
Liabilities | | | | |
Dividends payable | | | 728,779 | |
Payable for investments purchased | | | 4,730,000 | |
Payable for Fund shares redeemed | | | 1,726,553 | |
Payable upon receipt of securities loaned | | | 14,423,525 | |
Advisory fee payable | | | 211,861 | |
Distribution fees payable | | | 19,229 | |
Due to other related parties | | | 114,169 | |
Accrued expenses and other liabilities | | | 162,588 | |
| | | | |
Total liabilities | | | 22,116,704 | |
| | | | |
Total net assets | | $ | 714,941,135 | |
| | | | |
| |
NET ASSETS CONSIST OF | | | | |
Paid-in capital | | $ | 691,057,741 | |
Overdistributed net investment income | | | (65,214 | ) |
Accumulated net realized gains on investments | | | 2,259,696 | |
Net unrealized gains on investments | | | 21,688,912 | |
| | | | |
Total net assets | | $ | 714,941,135 | |
| | | | |
| |
COMPUTATION OF NET ASSET VALUE AND OFFERING PRICE PER SHARE1 | | | | |
Net assets – Class A | | $ | 104,738,318 | |
Shares outstanding – Class A | | | 14,000,687 | |
Net asset value per share – Class A | | | $7.48 | |
Maximum offering price per share – Class A2 | | | $7.83 | |
Net assets – Class B | | $ | 809,094 | |
Shares outstanding – Class B | | | 108,162 | |
Net asset value per share – Class B | | | $7.48 | |
Net assets – Class C | | $ | 30,539,948 | |
Shares outstanding – Class C | | | 4,082,573 | |
Net asset value per share – Class C | | | $7.48 | |
Net assets – Administrator Class | | $ | 71,641,899 | |
Shares outstanding – Administrator Class | | | 9,480,901 | |
Net asset value per share – Administrator Class | | | $7.56 | |
Net assets – Institutional Class | | $ | 175,316,983 | |
Shares outstanding – Institutional Class | | | 23,215,074 | |
Net asset value per share – Institutional Class | | | $7.55 | |
Net assets – Investor Class | | $ | 331,894,893 | |
Shares outstanding – Investor Class | | | 44,179,332 | |
Net asset value per share – Investor Class | | | $7.51 | |
| |
Investments in unaffiliated securities (including securities on loan), at cost | | $ | 651,331,790 | |
| | | | |
Investments in affiliated securities, at cost | | $ | 47,811,637 | |
| | | | |
Total investments, at cost | | $ | 699,143,427 | |
| | | | |
Securities on loan, at value | | $ | 14,120,970 | |
| | | | |
| 1. | The Fund has an unlimited number of authorized shares. |
| 2. | Maximum offering price is computed as 100/95.50 of net asset value. On investments of $50,000 or more, the offering price is reduced. |
The accompanying notes are an integral part of these financial statements.
| | | | |
| 18 | | Wells Fargo Advantage High Income Fund | | Statement of operations—six months ended February 28, 2014 (unaudited) |
| | | | |
| | | | |
| |
Investment income | | | | |
Interest | | $ | 22,509,740 | |
Securities lending income, net | | | 68,220 | |
Income from affiliated securities | | | 10,667 | |
| | | | |
Total investment income | | | 22,588,627 | |
| | | | |
| |
Expenses | | | | |
Advisory fee | | | 1,759,923 | |
Administration fees | | | | |
Fund level | | | 178,730 | |
Class A | | | 75,708 | |
Class B | | | 752 | |
Class C | | | 24,728 | |
Administrator Class | | | 33,845 | |
Institutional Class | | | 81,032 | |
Investor Class | | | 302,259 | |
Shareholder servicing fees | | | | |
Class A | | | 118,293 | |
Class B | | | 1,174 | |
Class C | | | 38,638 | |
Administrator Class | | | 81,043 | |
Investor Class | | | 389,681 | |
Distribution fees | | | | |
Class B | | | 3,523 | |
Class C | | | 115,914 | |
Custody and accounting fees | | | 21,220 | |
Professional fees | | | 34,258 | |
Registration fees | | | 56,117 | |
Shareholder report expenses | | | 51,771 | |
Trustees’ fees and expenses | | | 6,304 | |
Other fees and expenses | | | 17,628 | |
| | | | |
Total expenses | | | 3,392,541 | |
Less: Fee waivers and/or expense reimbursements | | | (447,236 | ) |
| | | | |
Net expenses | | | 2,945,305 | |
| | | | |
Net investment income | | | 19,643,322 | |
| | | | |
| |
REALIZED AND UNREALIZED GAINS (LOSSES) ON INVESTMENTS | | | | |
| |
Net realized gains (losses) on: | | | | |
Unaffiliated securities | | | 4,476,017 | |
Futures transactions | | | (1,389,705 | ) |
| | | | |
Net realized gains on investments | | | 3,086,312 | |
| | | | |
| |
Net change in unrealized gains (losses) on: | | | | |
Unaffiliated securities | | | 24,595,204 | |
Futures transactions | | | 67,680 | |
| | | | |
Net change in unrealized gains (losses) on investments | | | 24,662,884 | |
| | | | |
Net realized and unrealized gains (losses) on investments | | | 27,749,196 | |
| | | | |
Net increase in net assets resulting from operations | | $ | 47,392,518 | |
| | | | |
The accompanying notes are an integral part of these financial statements.
| | | | | | |
| Statement of changes in net assets | | Wells Fargo Advantage High Income Fund | | | 19 | |
| | | | | | | | | | | | | | | | |
| | | Six months ended
February 28, 2014
(unaudited) | | | Year ended
August 31, 2013 | |
| | | | |
Operations | | | | | | | | | | | | | | | | |
Net investment income | | | | | | $ | 19,643,322 | | | | | | | $ | 46,786,557 | |
Net realized gains on investments | | | | | | | 3,086,312 | | | | | | | | 31,870,957 | |
Net change in unrealized gains (losses) on investments | | | | | | | 24,662,884 | | | | | | | | (37,958,563 | ) |
| | | | | | | | | | | | | | | | |
Net increase in net assets resulting from operations | | | | | | | 47,392,518 | | | | | | | | 40,698,951 | |
| | | | | | | | | | | | | | | | |
| | | | |
Distributions to shareholders from | | | | | | | | | | | | | | | | |
Net investment income | | | | | | | | | | | | | | | | |
Class A | | | | | | | (2,568,610 | ) | | | | | | | (6,334,223 | ) |
Class B | | | | | | | (21,967 | ) | | | | | | | (60,295 | ) |
Class C | | | | | | | (723,129 | ) | | | | | | | (1,561,617 | ) |
Administrator Class | | | | | | | (1,868,766 | ) | | | | | | | (3,027,716 | ) |
Institutional Class | | | | | | | (5,893,662 | ) | | | | | | | (16,317,531 | ) |
Investor Class | | | | | | | (8,585,694 | ) | | | | | | | (19,486,135 | ) |
Net realized gains | | | | | | | | | | | | | | | | |
Class A | | | | | | | (3,842,804 | ) | | | | | | | (630,804 | ) |
Class B | | | | | | | (38,215 | ) | | | | | | | (7,202 | ) |
Class C | | | | | | | (1,274,798 | ) | | | | | | | (173,756 | ) |
Administrator Class | | | | | | | (2,836,913 | ) | | | | | | | (184,150 | ) |
Institutional Class | | | | | | | (8,563,107 | ) | | | | | | | (1,630,359 | ) |
Investor Class | | | | | | | (13,040,948 | ) | | | | | | | (1,906,689 | ) |
| | | | | | | | | | | | | | | | |
Total distributions to shareholders | | | | | | | (49,258,613 | ) | | | | | | | (51,320,477 | ) |
| | | | | | | | | | | | | | | | |
| | | | |
Capital share transactions | | | Shares | | | | | | | | Shares | | | | | |
Proceeds from shares sold | | | | | | | | | | | | | | | | |
Class A | | | 2,767,780 | | | | 20,596,797 | | | | 3,729,282 | | | | 28,906,262 | |
Class B | | | 12,058 | | | | 91,004 | | | | 34,483 | | | | 267,438 | |
Class C | | | 309,497 | | | | 2,332,959 | | | | 988,380 | | | | 7,647,434 | |
Administrator Class | | | 2,355,821 | | | | 17,926,770 | | | | 10,774,515 | | | | 84,601,571 | |
Institutional Class | | | 1,448,521 | | | | 10,963,153 | | | | 9,948,069 | | | | 77,497,291 | |
Investor Class | | | 7,546,997 | | | | 56,788,891 | | | | 27,967,225 | | | | 217,146,116 | |
| | | | | | | | | | | | | | | | |
| | | | | | | 108,699,574 | | | | | | | | 416,066,112 | |
| | | | | | | | | | | | | | | | |
Reinvestment of distributions | | | | | | | | | | | | | | | | |
Class A | | | 827,081 | | | | 6,143,398 | | | | 863,554 | | | | 6,659,606 | |
Class B | | | 7,542 | | | | 55,985 | | | | 8,173 | | | | 63,017 | |
Class C | | | 258,015 | | | | 1,915,079 | | | | 215,962 | | | | 1,664,678 | |
Administrator Class | | | 591,839 | | | | 4,441,554 | | | | 390,072 | | | | 3,034,685 | |
Institutional Class | | | 501,603 | | | | 3,760,383 | | | | 771,438 | | | | 6,014,965 | |
Investor Class | | | 2,629,319 | | | | 19,603,463 | | | | 2,396,488 | | | | 18,560,873 | |
| | | | | | | | | | | | | | | | |
| | | | | | | 35,919,862 | | | | | | | | 35,997,824 | |
| | | | | | | | | | | | | | | | |
Payment for shares redeemed | | | | | | | | | | | | | | | | |
Class A | | | (2,842,579 | ) | | | (21,350,360 | ) | | | (7,565,808 | ) | | | (58,516,955 | ) |
Class B | | | (51,052 | ) | | | (383,490 | ) | | | (95,801 | ) | | | (739,857 | ) |
Class C | | | (687,737 | ) | | | (5,156,985 | ) | | | (1,208,988 | ) | | | (9,304,082 | ) |
Administrator Class | | | (1,997,014 | ) | | | (15,120,582 | ) | | | (6,972,702 | ) | | | (54,516,411 | ) |
Institutional Class | | | (7,480,428 | ) | | | (56,329,830 | ) | | | (21,331,616 | ) | | | (167,130,276 | ) |
Investor Class | | | (7,731,605 | ) | | | (58,155,653 | ) | | | (33,521,435 | ) | | | (259,877,886 | ) |
| | | | | | | | | | | | | | | | |
| | | | | | | (156,496,900 | ) | | | | | | | (550,085,467 | ) |
| | | | | | | | | | | | | | | | |
Net decrease in net assets resulting from capital share transactions | | | | | | | (11,877,464 | ) | | | | | | | (98,021,531 | ) |
| | | | | | | | | | | | | | | | |
Total decrease in net assets | | | | | | | (13,743,559 | ) | | | | | | | (108,643,057 | ) |
| | | | | | | | | | | | | | | | |
| | | | |
Net assets | | | | | | | | | | | | | | | | |
Beginning of period | | | | | | | 728,684,694 | | | | | | | | 837,327,751 | |
| | | | | | | | | | | | | | | | |
End of period | | | | | | $ | 714,941,135 | | | | | | | $ | 728,684,694 | |
| | | | | | | | | | | | | | | | |
Overdistributed net investment income | | | | | | $ | (65,214 | ) | | | | | | $ | (46,708 | ) |
| | | | | | | | | | | | | | | | |
The accompanying notes are an integral part of these financial statements.
| | | | |
| 20 | | Wells Fargo Advantage High Income Fund | | Financial highlights |
(For a share outstanding throughout each period)
| | | | | | | | | | | | | | | | | | | | | | | | | | | | |
| | | Six months ended
February 28, 2014
(unaudited) | | | Year ended August 31 | | | Year ended May 31 | |
| | | |
| CLASS A | | | 2013 | | | 2012 | | | 2011 | | | 20101 | | | 2010 | | | 20092 | |
Net asset value, beginning of period | | $ | 7.50 | | | $ | 7.63 | | | $ | 7.17 | | | $ | 7.14 | | | $ | 6.90 | | | $ | 6.35 | | | $ | 7.25 | |
Net investment income | | | 0.20 | | | | 0.43 | | | | 0.46 | | | | 0.50 | | | | 0.13 | | | | 0.53 | | | | 0.50 | |
Net realized and unrealized gains (losses) on investments | | | 0.29 | | | | (0.10 | ) | | | 0.47 | | | | 0.03 | | | | 0.24 | | | | 0.54 | | | | (0.90 | ) |
| | | | | | | | | | | | | | | | | | | | | | | | | | | | |
Total from investment operations | | | 0.49 | | | | 0.33 | | | | 0.93 | | | | 0.53 | | | | 0.37 | | | | 1.07 | | | | (0.40 | ) |
Distributions to shareholders from | | | | | | | | | | | | | | | | | | | | | | | | | | | | |
Net investment income | | | (0.20 | ) | | | (0.42 | ) | | | (0.47 | ) | | | (0.50 | ) | | | (0.13 | ) | | | (0.52 | ) | | | (0.50 | ) |
Net realized gains | | | (0.31 | ) | | | (0.04 | ) | | | 0.00 | | | | 0.00 | | | | 0.00 | | | | 0.00 | | | | 0.00 | |
| | | | | | | | | | | | | | | | | | | | | | | | | | | | |
Total distributions to shareholders | | | (0.51 | ) | | | (0.46 | ) | | | (0.47 | ) | | | (0.50 | ) | | | (0.13 | ) | | | (0.52 | ) | | | (0.50 | ) |
Net asset value, end of period | | $ | 7.48 | | | $ | 7.50 | | | $ | 7.63 | | | $ | 7.17 | | | $ | 7.14 | | | $ | 6.90 | | | $ | 6.35 | |
Total return3 | | | 6.76 | % | | | 4.42 | % | | | 13.30 | % | | | 7.41 | % | | | 5.44 | % | | | 17.20 | % | | | (5.07 | )% |
Ratios to average net assets (annualized) | | | | | | | | | | | | | | | | | | | | | | | | | | | | |
Gross expenses | | | 1.00 | % | | | 0.99 | % | | | 1.00 | % | | | 1.01 | % | | | 1.00 | % | | | 1.03 | % | | | 1.05 | % |
Net expenses | | | 0.90 | % | | | 0.90 | % | | | 0.90 | % | | | 0.90 | % | | | 0.90 | % | | | 0.90 | % | | | 0.89 | % |
Net investment income | | | 5.43 | % | | | 5.52 | % | | | 6.30 | % | | | 6.77 | % | | | 7.52 | % | | | 7.86 | % | | | 8.13 | % |
Supplemental data | | | | | | | | | | | | | | | | | | | | | | | | | | | | |
Portfolio turnover rate | | | 26 | % | | | 60 | % | | | 22 | % | | | 78 | % | | | 11 | % | | | 77 | % | | | 52 | % |
Net assets, end of period (000s omitted) | | | $104,738 | | | | $99,410 | | | | $123,727 | | | | $102,361 | | | | $124,730 | | | | $99,515 | | | | $105,678 | |
| 1. | For the three months ended August 31, 2010. The Fund changed its fiscal year end from May 31 to August 31, effective August 31, 2010. |
| 2. | On June 20, 2008, Advisor Class was renamed Class A. |
| 3. | Total return calculations do not include any sales charges. Returns for periods of less than one year are not annualized. |
The accompanying notes are an integral part of these financial statements.
| | | | | | |
| Financial highlights | | Wells Fargo Advantage High Income Fund | | | 21 | |
(For a share outstanding throughout each period)
| | | | | | | | | | | | | | | | | | | | | | | | | | | | |
| | | Six months ended
February 28, 2014
(unaudited) | | | Year ended August 31 | | | Year ended May 31 | |
| CLASS B | | | 2013 | | | 2012 | | | 2011 | | | 20101 | | | 2010 | | | 20092 | |
Net asset value, beginning of period | | $ | 7.50 | | | $ | 7.63 | | | $ | 7.17 | | | $ | 7.13 | | | $ | 6.90 | | | $ | 6.35 | | | $ | 6.99 | |
Net investment income | | | 0.17 | 3 | | | 0.37 | 3 | | | 0.41 | 3 | | | 0.45 | | | | 0.12 | | | | 0.48 | | | | 0.39 | |
Net realized and unrealized gains (losses) on investments | | | 0.29 | | | | (0.09 | ) | | | 0.46 | | | | 0.04 | | | | 0.23 | | | | 0.54 | | | | (0.64 | ) |
| | | | | | | | | | | | | | | | | | | | | | | | | | | | |
Total from investment operations | | | 0.46 | | | | 0.28 | | | | 0.87 | | | | 0.49 | | | | 0.35 | | | | 1.02 | | | | (0.25 | ) |
Distributions to shareholders from | | | | | | | | | | | | | | | | | | | | | | | | | | | | |
Net investment income | | | (0.17 | ) | | | (0.37 | ) | | | (0.41 | ) | | | (0.45 | ) | | | (0.12 | ) | | | (0.47 | ) | | | (0.39 | ) |
Net realized gains | | | (0.31 | ) | | | (0.04 | ) | | | 0.00 | | | | 0.00 | | | | 0.00 | | | | 0.00 | | | | 0.00 | |
| | | | | | | | | | | | | | | | | | | | | | | | | | | | |
Total distributions to shareholders | | | (0.48 | ) | | | (0.41 | ) | | | (0.41 | ) | | | (0.45 | ) | | | (0.12 | ) | | | (0.47 | ) | | | (0.39 | ) |
Net asset value, end of period | | $ | 7.48 | | | $ | 7.50 | | | $ | 7.63 | | | $ | 7.17 | | | $ | 7.13 | | | $ | 6.90 | | | $ | 6.35 | |
Total return4 | | | 6.37 | % | | | 3.64 | % | | | 12.46 | % | | | 6.76 | % | | | 5.10 | % | | | 16.33 | % | | | (3.11 | )% |
Ratios to average net assets (annualized) | | | | | | | | | | | | | | | | | | | | | | | | | | | | |
Gross expenses | | | 1.75 | % | | | 1.74 | % | | | 1.75 | % | | | 1.76 | % | | | 1.75 | % | | | 1.78 | % | | | 1.79 | % |
Net expenses | | | 1.65 | % | | | 1.65 | % | | | 1.65 | % | | | 1.65 | % | | | 1.65 | % | | | 1.65 | % | | | 1.65 | % |
Net investment income | | | 4.67 | % | | | 4.77 | % | | | 5.59 | % | | | 6.04 | % | | | 6.66 | % | | | 7.17 | % | | | 7.35 | % |
Supplemental data | | | | | | | | | | | | | | | | | | | | | | | | | | | | |
Portfolio turnover rate | | | 26 | % | | | 60 | % | | | 22 | % | | | 78 | % | | | 11 | % | | | 77 | % | | | 52 | % |
Net assets, end of period (000s omitted) | | | $809 | | | | $1,047 | | | | $1,470 | | | | $2,452 | | | | $5,451 | | | | $4,564 | | | | $7,908 | |
| 1. | For the three months ended August 31, 2010. The Fund changed its fiscal year end from May 31 to August 31, effective August 31, 2010. |
| 2. | For the period from July 18, 2008 (commencement of class operations) to May 31, 2009 |
| 3. | Calculated based upon average shares outstanding |
| 4. | Total return calculations do not include any sales charges. Returns for periods of less than one year are not annualized. |
The accompanying notes are an integral part of these financial statements.
| | | | |
| 22 | | Wells Fargo Advantage High Income Fund | | Financial highlights |
(For a share outstanding throughout each period)
| | | | | | | | | | | | | | | | | | | | | | | | | | | | |
| | | Six months ended
February 28, 2014
(unaudited) | | | Year ended August 31 | | | Year ended May 31 | |
| CLASS C | | | 2013 | | | 2012 | | | 2011 | | | 20101 | | | 2010 | | | 20092 | |
Net asset value, beginning of period | | $ | 7.50 | | | $ | 7.63 | | | $ | 7.17 | | | $ | 7.14 | | | $ | 6.90 | | | $ | 6.35 | | | $ | 6.99 | |
Net investment income | | | 0.17 | | | | 0.37 | | | | 0.41 | | | | 0.45 | | | | 0.12 | | | | 0.48 | | | | 0.39 | |
Net realized and unrealized gains (losses) on investments | | | 0.29 | | | | (0.09 | ) | | | 0.46 | | | | 0.03 | | | | 0.24 | | | | 0.54 | | | | (0.64 | ) |
| | | | | | | | | | | | | | | | | | | | | | | | | | | | |
Total from investment operations | | | 0.46 | | | | 0.28 | | | | 0.87 | | | | 0.48 | | | | 0.36 | | | | 1.02 | | | | (0.25 | ) |
Distributions to shareholders from | | | | | | | | | | | | | | | | | | | | | | | | | | | | |
Net investment income | | | (0.17 | ) | | | (0.37 | ) | | | (0.41 | ) | | | (0.45 | ) | | | (0.12 | ) | | | (0.47 | ) | | | (0.39 | ) |
Net realized gains | | | (0.31 | ) | | | (0.04 | ) | | | 0.00 | | | | 0.00 | | | | 0.00 | | | | 0.00 | | | | 0.00 | |
| | | | | | | | | | | | | | | | | | | | | | | | | | | | |
Total distributions to shareholders | | | (0.48 | ) | | | (0.41 | ) | | | (0.41 | ) | | | (0.45 | ) | | | (0.12 | ) | | | (0.47 | ) | | | (0.39 | ) |
Net asset value, end of period | | $ | 7.48 | | | $ | 7.50 | | | $ | 7.63 | | | $ | 7.17 | | | $ | 7.14 | | | $ | 6.90 | | | $ | 6.35 | |
Total return3 | | | 6.37 | % | | | 3.65 | % | | | 12.47 | % | | | 6.62 | % | | | 5.25 | % | | | 16.33 | % | | | (3.12 | )% |
Ratios to average net assets (annualized) | | | | | | | | | | | | | | | | | | | | | | | | | | | | |
Gross expenses | | | 1.76 | % | | | 1.74 | % | | | 1.75 | % | | | 1.76 | % | | | 1.75 | % | | | 1.78 | % | | | 1.79 | % |
Net expenses | | | 1.65 | % | | | 1.65 | % | | | 1.65 | % | | | 1.65 | % | | | 1.65 | % | | | 1.65 | % | | | 1.65 | % |
Net investment income | | | 4.67 | % | | | 4.76 | % | | | 5.56 | % | | | 6.01 | % | | | 6.75 | % | | | 7.04 | % | | | 7.29 | % |
Supplemental data | | | | | | | | | | | | | | | | | | | | | | | | | | | | |
Portfolio turnover rate | | | 26 | % | | | 60 | % | | | 22 | % | | | 78 | % | | | 11 | % | | | 77 | % | | | 52 | % |
Net assets, end of period (000s omitted) | | | $30,540 | | | | $31,534 | | | | $32,089 | | | | $30,645 | | | | $30,332 | | | | $18,573 | | | | $13,460 | |
| 1. | For the three months ended August 31, 2010. The Fund changed its fiscal year end from May 31 to August 31, effective August 31, 2010. |
| 2. | For the period from July 18, 2008 (commencement of class operations) to May 31, 2009 |
| 3. | Total return calculations do not include any sales charges. Returns for periods of less than one year are not annualized. |
The accompanying notes are an integral part of these financial statements.
| | | | | | |
| Financial highlights | | Wells Fargo Advantage High Income Fund | | | 23 | |
(For a share outstanding throughout each period)
| | | | | | | | | | | | | | | | | | | | |
| | | Six months ended
February 28, 2014
(unaudited) | | | Year ended August 31 | |
| ADMINISTRATOR CLASS | | | 2013 | | | 2012 | | | 2011 | | | 20101 | |
Net asset value, beginning of period | | $ | 7.58 | | | $ | 7.70 | | | $ | 7.24 | | | $ | 7.20 | | | $ | 7.23 | |
Net investment income | | | 0.21 | | | | 0.44 | | | | 0.48 | | | | 0.51 | | | | 0.04 | |
Net realized and unrealized gains (losses) on investments | | | 0.29 | | | | (0.08 | ) | | | 0.46 | | | | 0.04 | | | | (0.02 | ) |
| | | | | | | | | | | | | | | | | | | | |
Total from investment operations | | | 0.50 | | | | 0.36 | | | | 0.94 | | | | 0.55 | | | | 0.02 | |
Distributions to shareholders from | | | | | | | | | | | | | | | | | | | | |
Net investment income | | | (0.21 | ) | | | (0.44 | ) | | | (0.48 | ) | | | (0.51 | ) | | | (0.05 | ) |
Net realized gains | | | (0.31 | ) | | | (0.04 | ) | | | 0.00 | | | | 0.00 | | | | 0.00 | |
| | | | | | | | | | | | | | | | | | | | |
Total distributions to shareholders | | | (0.52 | ) | | | (0.48 | ) | | | (0.48 | ) | | | (0.51 | ) | | | (0.05 | ) |
Net asset value, end of period | | $ | 7.56 | | | $ | 7.58 | | | $ | 7.70 | | | $ | 7.24 | | | $ | 7.20 | |
Total return2 | | | 6.77 | % | | | 4.68 | % | | | 13.36 | % | | | 7.66 | % | | | 0.22 | % |
Ratios to average net assets (annualized) | | | | | | | | | | | | | | | | | | | | |
Gross expenses | | | 0.93 | % | | | 0.91 | % | | | 0.90 | % | | | 0.92 | % | | | 0.99 | % |
Net expenses | | | 0.80 | % | | | 0.80 | % | | | 0.80 | % | | | 0.79 | % | | | 0.84 | % |
Net investment income | | | 5.52 | % | | | 5.57 | % | | | 6.37 | % | | | 6.73 | % | | | 7.78 | % |
Supplemental data | | | | | | | | | | | | | | | | | | | | |
Portfolio turnover rate | | | 26 | % | | | 60 | % | | | 22 | % | | | 78 | % | | | 11 | % |
Net assets, end of period (000s omitted) | | | $71,642 | | | | $64,626 | | | | $33,395 | | | | $14,654 | | | | $10 | |
| 1. | For the period from July 30, 2010 (commencement of class operations) to August 31, 2010 |
| 2. | Returns for periods of less than one year are not annualized. |
The accompanying notes are an integral part of these financial statements.
| | | | |
| 24 | | Wells Fargo Advantage High Income Fund | | Financial highlights |
(For a share outstanding throughout each period)
| | | | | | | | | | | | | | | | | | | | | | | | | | | | |
| | | Six months ended
February 28, 2014
(unaudited) | | | Year ended August 31 | | | Year ended May 31 | |
| INSTITUTIONAL CLASS | | | 2013 | | | 2012 | | | 2011 | | | 20101 | | | 2010 | | | 2009 | |
Net asset value, beginning of period | | $ | 7.57 | | | $ | 7.70 | | | $ | 7.24 | | | $ | 7.20 | | | $ | 6.96 | | | $ | 6.40 | | | $ | 7.31 | |
Net investment income | | | 0.22 | | | | 0.46 | | | | 0.50 | | | | 0.54 | | | | 0.14 | | | | 0.57 | | | | 0.53 | |
Net realized and unrealized gains (losses) on investments | | | 0.29 | | | | (0.09 | ) | | | 0.46 | | | | 0.04 | | | | 0.24 | | | | 0.54 | | | | (0.91 | ) |
| | | | | | | | | | | | | | | | | | | | | | | | | | | | |
Total from investment operations | | | 0.51 | | | | 0.37 | | | | 0.96 | | | | 0.58 | | | | 0.38 | | | | 1.11 | | | | (0.38 | ) |
Distributions to shareholders from | | | | | | | | | | | | | | | | | | | | | | | | | | | | |
Net investment income | | | (0.22 | ) | | | (0.46 | ) | | | (0.50 | ) | | | (0.54 | ) | | | (0.14 | ) | | | (0.55 | ) | | | (0.53 | ) |
Net realized gains | | | (0.31 | ) | | | (0.04 | ) | | | 0.00 | | | | 0.00 | | | | 0.00 | | | | 0.00 | | | | 0.00 | |
| | | | | | | | | | | | | | | | | | | | | | | | | | | | |
Total distributions to shareholders | | | (0.53 | ) | | | (0.50 | ) | | | (0.50 | ) | | | (0.54 | ) | | | (0.14 | ) | | | (0.55 | ) | | | (0.53 | ) |
Net asset value, end of period | | $ | 7.55 | | | $ | 7.57 | | | $ | 7.70 | | | $ | 7.24 | | | $ | 7.20 | | | $ | 6.96 | | | $ | 6.40 | |
Total return2 | | | 6.93 | % | | | 4.85 | % | | | 13.69 | % | | | 7.98 | % | | | 5.52 | % | | | 17.76 | % | | | (4.75 | )% |
Ratios to average net assets (annualized) | | | | | | | | | | | | | | | | | | | | | | | | | | | | |
Gross expenses | | | 0.67 | % | | | 0.66 | % | | | 0.67 | % | | | 0.68 | % | | | 0.67 | % | | | 0.68 | % | | | 0.70 | % |
Net expenses | | | 0.50 | % | | | 0.50 | % | | | 0.50 | % | | | 0.50 | % | | | 0.50 | % | | | 0.50 | % | | | 0.50 | % |
Net investment income | | | 5.81 | % | | | 5.92 | % | | | 6.69 | % | | | 7.15 | % | | | 7.94 | % | | | 8.18 | % | | | 8.42 | % |
Supplemental data | | | | | | | | | | | | | | | | | | | | | | | | | | | | |
Portfolio turnover rate | | | 26 | % | | | 60 | % | | | 22 | % | | | 78 | % | | | 11 | % | | | 77 | % | | | 52 | % |
Net assets, end of period (000s omitted) | | | $175,317 | | | | $217,648 | | | | $302,894 | | | | $238,490 | | | | $197,158 | | | $ | 189,936 | | | | $119,004 | |
| 1. | For the three months ended August 31, 2010. The Fund changed its fiscal year end from May 31 to August 31, effective August 31, 2010. |
| 2. | Returns for periods of less than one year are not annualized. |
The accompanying notes are an integral part of these financial statements.
| | | | | | |
| Financial highlights | | Wells Fargo Advantage High Income Fund | | | 25 | |
(For a share outstanding throughout each period)
| | | | | | | | | | | | | | | | | | | | | | | | | | | | |
| | | Six months ended
February 28, 2014
(unaudited) | | | Year ended August 31 | | | Year ended May 31 | |
| INVESTOR CLASS | | | 2013 | | | 2012 | | | 2011 | | | 20101 | | | 2010 | | | 2009 | |
Net asset value, beginning of period | | $ | 7.53 | | | $ | 7.66 | | | $ | 7.20 | | | $ | 7.16 | | | $ | 6.93 | | | $ | 6.37 | | | $ | 7.28 | |
Net investment income | | | 0.20 | | | | 0.42 | | | | 0.47 | | | | 0.50 | | | | 0.13 | | | | 0.53 | | | | 0.50 | |
Net realized and unrealized gains (losses) on investments | | | 0.29 | | | | (0.09 | ) | | | 0.46 | | | | 0.04 | | | | 0.23 | | | | 0.55 | | | | (0.91 | ) |
| | | | | | | | | | | | | | | | | | | | | | | | | | | | |
Total from investment operations | | | 0.49 | | | | 0.33 | | | | 0.93 | | | | 0.54 | | | | 0.36 | | | | 1.08 | | | | (0.41 | ) |
Distributions to shareholders from | | | | | | | | | | | | | | | | | | | | | | | | | | | | |
Net investment income | | | (0.20 | ) | | | (0.42 | ) | | | (0.47 | ) | | | (0.50 | ) | | | (0.13 | ) | | | (0.52 | ) | | | (0.50 | ) |
Net realized gains | | | (0.31 | ) | | | (0.04 | ) | | | 0.00 | | | | 0.00 | | | | 0.00 | | | | 0.00 | | | | 0.00 | |
| | | | | | | | | | | | | | | | | | | | | | | | | | | | |
Total distributions to shareholders | | | (0.51 | ) | | | (0.46 | ) | | | (0.47 | ) | | | (0.50 | ) | | | (0.13 | ) | | | (0.52 | ) | | | (0.50 | ) |
Net asset value, end of period | | $ | 7.51 | | | $ | 7.53 | | | $ | 7.66 | | | $ | 7.20 | | | $ | 7.16 | | | $ | 6.93 | | | $ | 6.37 | |
Total return2 | | | 6.73 | % | | | 4.40 | % | | | 13.24 | % | | | 7.53 | % | | | 5.27 | % | | | 17.28 | % | | | (5.20 | )% |
Ratios to average net assets (annualized) | | | | | | | | | | | | | | | | | | | | | | | | | | | | |
Gross expenses | | | 1.03 | % | | | 1.01 | % | | | 1.03 | % | | | 1.04 | % | | | 1.04 | % | | | 1.07 | % | | | 1.10 | % |
Net expenses | | | 0.93 | % | | | 0.93 | % | | | 0.93 | % | | | 0.93 | % | | | 0.94 | % | | | 0.95 | % | | | 0.92 | % |
Net investment income | | | 5.39 | % | | | 5.48 | % | | | 6.27 | % | | | 6.73 | % | | | 7.49 | % | | | 7.76 | % | | | 7.95 | % |
Supplemental data | | | | | | | | | | | | | | | | | | | | | | | | | | | | |
Portfolio turnover rate | | | 26 | % | | | 60 | % | | | 22 | % | | | 78 | % | | | 11 | % | | | 77 | % | | | 52 | % |
Net assets, end of period (000s omitted) | | | $331,895 | | | | $314,420 | | | | $343,752 | | | | $278,024 | | | | $322,015 | | | | $286,836 | | | | $231,308 | |
| 1. | For the three months ended August 31, 2010. The Fund changed its fiscal year end from May 31 to August 31, effective August 31, 2010. |
| 2. | Returns for periods of less than one year are not annualized. |
The accompanying notes are an integral part of these financial statements.
| | | | |
| 26 | | Wells Fargo Advantage High Income Fund | | Notes to financial statements (unaudited) |
1. ORGANIZATION
Wells Fargo Funds Trust (the “Trust”), a Delaware statutory trust organized on March 10, 1999, is an open-end management investment company registered under the Investment Company Act of 1940, as amended (the “1940 Act”). These financial statements report on the Wells Fargo Advantage High Income Fund (the “Fund”) which is a diversified series of the Trust.
2. SIGNIFICANT ACCOUNTING POLICIES
The following significant accounting policies, which are consistently followed in the preparation of the financial statements of the Fund, are in conformity with U.S. generally accepted accounting principles which require management to make estimates and assumptions that affect the reported amounts of assets and liabilities, disclosure of contingent assets and liabilities at the date of the financial statements, and the reported amounts of revenues and expenses during the reporting period. Actual results could differ from those estimates.
Securities valuation
All investments are valued each business day as of the close of regular trading on the New York Stock Exchange (generally 4 p.m. Eastern Time).
Fixed income securities acquired with maturities exceeding 60 days are valued based on evaluated bid prices provided by an independent pricing service which may utilize both transaction data and market information such as yield, quality, coupon rate, maturity, type of issue, trading characteristics and other market data. If prices are not available from the independent pricing service or prices received are deemed not representative of market value, prices will be obtained from an independent broker-dealer or otherwise determined based on the Fund’s Valuation Procedures.
Short-term securities, with maturities of 60 days or less at time of purchase, generally are valued at amortized cost which approximates fair value. The amortized cost method involves valuing a security at its cost, plus accretion of discount or minus amortization of premium over the period until maturity.
Futures that are listed on a foreign or domestic exchange or market are valued at the official closing price or, if none, the last sales price.
Investments in registered open-end investment companies are valued at net asset value. Non-registered investment vehicles are fair valued at net asset value.
Investments which are not valued using any of the methods discussed above are valued at their fair value, as determined in good faith by the Board of Trustees of the Fund. The Board of Trustees has established a Valuation Committee comprised of the Trustees and has delegated to it the authority to take any actions regarding the valuation of portfolio securities that the Valuation Committee deems necessary or appropriate, including determining the fair value of portfolio securities, unless the determination has been delegated to the Management Valuation Team of Wells Fargo Funds Management, LLC (“Funds Management”). The Board of Trustees retains the authority to make or ratify any valuation decisions or approve any changes to the Valuation Procedures as it deems appropriate. On a quarterly basis, the Board of Trustees receives reports on any valuation actions taken by the Valuation Committee or the Management Valuation Team which may include items for ratification.
Valuations of fair valued securities are compared to the next actual sales price when available, or other appropriate market values, to assess the continued appropriateness of the fair valuation methodologies used. These securities are fair valued on a day-to-day basis, taking into consideration changes to appropriate market information and any significant changes to the inputs considered in the valuation process until there is a readily available price provided on an exchange or by an independent pricing service. Valuations received from an independent pricing service or independent broker-dealer quotes are periodically validated by comparisons to most recent trades and valuations provided by other independent pricing services in addition to the review of prices by the adviser and/or subadviser. Unobservable inputs used in determining fair valuations are identified based on the type of security, taking into consideration factors utilized by market participants in valuing the investment, knowledge about the issuer and the current market environment.
Security loans
The Fund may lend its securities from time to time in order to earn additional income in the form of fees or interest on securities received as collateral or the investment of any cash received as collateral. The Fund continues to receive interest or dividends on the securities loaned. The Fund receives collateral in the form of cash or securities with a value at least equal to the value of the securities on loan. The value of the loaned securities is determined at the close of each business day and any additional required collateral is delivered to the Fund on the next business day. In a securities lending transaction, the net asset value of the Fund will be affected by an increase or decrease in the value of the
| | | | | | |
| Notes to financial statements (unaudited) | | Wells Fargo Advantage High Income Fund | | | 27 | |
securities loaned and by an increase or decrease in the value of the instrument in which collateral is invested. The amount of securities lending activity undertaken by the Fund fluctuates from time to time. In the event of default or bankruptcy by the borrower, the Fund may be prevented from recovering the loaned securities or gaining access to the collateral or may experience delays or costs in doing so. In addition, the investment of any cash collateral received may lose all or part of its value. The Fund has the right under the lending agreement to recover the securities from the borrower on demand.
The Fund lends its securities through an unaffiliated securities lending agent. Cash collateral received in connection with its securities lending transactions is invested in Wells Fargo Securities Lending Cash Investments, LLC (the “Securities Lending Fund”). The Securities Lending Fund is exempt from registration under Section 3(c)(7) of the 1940 Act and is managed by Funds Management and is subadvised by Wells Capital Management Incorporated (“WellsCap”). Funds Management receives an advisory fee starting at 0.05% and declining to 0.01% as the average daily net assets of the Securities Lending Fund increase. All of the fees received by Funds Management are paid to WellsCap for its services as subadviser. The Securities Lending Fund seeks to provide a positive return compared to the daily Fed Funds Open rate by investing in high-quality, U.S. dollar-denominated short-term money market instruments. Securities Lending Fund investments are fair valued based upon the amortized cost valuation technique. Income earned from investment in the Securities Lending Fund is included in securities lending income on the Statement of Operations.
When-issued transactions
The Fund may purchase securities on a forward commitment or when-issued basis. The Fund records a when-issued transaction on the trade date and will segregate assets in an amount at least equal in value to the Fund’s commitment to purchase when-issued securities. Securities purchased on a when-issued basis are marked-to-market daily and the Fund begins earning interest on the settlement date. Losses may arise due to changes in the market value of the underlying securities or if the counterparty does not perform under the contract.
Term loans
The Fund may invest in term loans. The Fund begins earning interest when the loans are funded. The loans pay interest at rates which are periodically reset by reference to a base lending rate plus a spread. The Fund assumes the credit risk of the borrower and there could be potential loss to the Fund in the event of default by the borrower.
Futures contracts
The Fund may be subject to interest rate risk in the normal course of pursuing its investment objectives. The Fund may buy and sell futures contracts in order to gain exposure to, or protect against, changes in security values and interest rates. The primary risks associated with the use of futures contracts are the imperfect correlation between changes in market values of securities held by the Fund and the prices of futures contracts, and the possibility of an illiquid market.
The aggregate principal amounts of the contracts are not recorded in the financial statements. Fluctuations in the value of the contracts are recorded in the Statement of Assets and Liabilities as an asset or liability and in the Statement of Operations as unrealized gains or losses until the contracts are closed, at which point they are recorded as net realized gains or losses on futures contracts. With futures contracts, there is minimal counterparty risk to the Fund since futures are exchange traded and the exchange’s clearinghouse, as counterparty to all exchange traded futures, guarantees the futures against default.
Security transactions and income recognition
Securities transactions are recorded on a trade date basis. Realized gains or losses are recorded on the basis of identified cost.
Interest income is accrued daily and bond discounts are accreted and premiums are amortized daily based on the effective interest method. To the extent debt obligations are placed on non-accrual status, any related interest income may be reduced by writing off interest receivables when the collection of all or a portion of interest has become doubtful based on consistently applied procedures. If the issuer subsequently resumes interest payments or when the collectability of interest is reasonably assured, the debt obligation is removed from non-accrual status.
Distributions to shareholders
Distributions to shareholders from net investment income are accrued daily and paid monthly. Distributions from net realized gains, if any, are recorded on the ex-dividend date. Such distributions are determined in conformity with federal income tax regulations, which may differ in amount or character from net investment income and realized gains recognized for purposes of U.S. generally accepted accounting principles.
Federal and other taxes
The Fund intends to continue to qualify as a regulated investment company by distributing substantially all of its investment company taxable income and any net realized capital gains (after reduction for capital loss carryforwards) sufficient to relieve it from all, or substantially all, federal income taxes. Accordingly, no provision for federal income taxes was required.
| | | | |
| 28 | | Wells Fargo Advantage High Income Fund | | Notes to financial statements (unaudited) |
The Fund’s income and federal excise tax returns and all financial records supporting those returns for the prior three fiscal years are subject to examination by the federal and Delaware revenue authorities. Management has analyzed the Fund’s tax positions taken on federal, state, and foreign tax returns for all open tax years and does not believe that there are any uncertain tax positions that require recognition of a tax liability.
As of August 31, 2013, the Fund had capital loss carryforwards available to offset future net realized capital gains in the amount of $1,069,723 with $1,019,921 expiring in 2016 and $49,802 expiring in 2017.
Class allocations
The separate classes of shares offered by the Fund differ principally in applicable sales charges, distribution, shareholder servicing, and administration fees. Shareholders of each class bear certain expenses that pertain to that particular class. All shareholders bear the common expenses of the Fund, earn income from the portfolio, and are allocated any unrealized gains and losses pro rata based on the average daily net assets of each class, without distinction between share classes. Dividends are determined separately for each class based on income and expenses allocable to each class. Realized gains and losses are allocated to each class pro rata based upon the net assets of each class on the date realized. Differences in per share dividend rates generally result from the relative weightings of pro rata income and realized gain allocations and from differences in separate class expenses, including distribution, shareholder servicing, and administration fees.
3. FAIR VALUATION MEASUREMENTS
Fair value measurements of investments are determined within a framework that has established a fair value hierarchy based upon the various data inputs utilized in determining the value of the Fund’s investments. The three-level hierarchy gives the highest priority to unadjusted quoted prices in active markets for identical assets or liabilities (Level 1) and the lowest priority to significant unobservable inputs (Level 3). The Fund’s investments are classified within the fair value hierarchy based on the lowest level of input that is significant to the fair value measurement. The inputs are summarized into three broad levels as follows:
| n | | Level 1 – quoted prices in active markets for identical securities |
| n | | Level 2 – other significant observable inputs (including quoted prices for similar securities, interest rates, prepayment speeds, credit risk, use of amortized cost, etc.) |
| n | | Level 3 – significant unobservable inputs (including the Fund’s own assumptions in determining the fair value of investments) |
The inputs or methodologies used for valuing investments in securities are not necessarily an indication of the risk associated with investing in those securities.
As of February 28, 2014, the inputs used in valuing investments in securities were as follows:
| | | | | | | | | | | | | | | | |
| Investments in securities | | Quoted prices (Level 1) | | | Other significant
observable inputs (Level 2) | | | Significant unobservable inputs (Level 3) | | | Total | |
| | | | |
Corporate bonds and notes | | $ | 0 | | | $ | 590,897,320 | | | $ | 0 | | | $ | 590,897,320 | |
| | | | |
Municipal obligations | | | 0 | | | | 4,215,480 | | | | 0 | | | | 4,215,480 | |
| | | | |
Term loans | | | 0 | | | | 3,977,870 | | | | 0 | | | | 3,977,870 | |
| | | | |
Yankee corporate bonds and notes | | | 0 | | | | 73,222,498 | | | | 0 | | | | 73,222,498 | |
| | | | |
Short-term investments | | | | | | | | | | | | | | | | |
Investment companies | | | 33,388,112 | | | | 14,423,525 | | | | 0 | | | | 47,811,637 | |
U.S. Treasury securities | | | 799,989 | | | | 0 | | | | 0 | | | | 799,989 | |
| | | $ | 34,188,101 | | | $ | 686,736,693 | | | $ | 0 | | | $ | 720,924,794 | |
As of February 28, 2014, the inputs used in valuing the Fund’s other financial instruments were as follows:
| | | | | | | | | | | | | | | | |
| | | Quoted prices (Level 1) | | | Other significant
observable inputs (Level 2) | | | Significant unobservable inputs (Level 3) | | | Total | |
Futures contracts | | $ | (92,455 | )* | | $ | 0 | | | $ | 0 | | | $ | (92,455 | ) |
| * | Amount represents the net unrealized losses. |
| | | | | | |
| Notes to financial statements (unaudited) | | Wells Fargo Advantage High Income Fund | | | 29 | |
Transfers in and transfers out are recognized at the end of the reporting period. For the six months ended February 28, 2014, the Fund did not have any transfers into/out of Level 1, Level 2, or Level 3.
4. TRANSACTIONS WITH AFFILIATES AND OTHER EXPENSES
Advisory fee
The Trust has entered into an advisory contract with Funds Management, an indirect wholly owned subsidiary of Wells Fargo & Company (“Wells Fargo”). The adviser is responsible for implementing investment policies and guidelines and for supervising the subadviser, who is responsible for day-to-day portfolio management of the Fund.
Pursuant to the contract, Funds Management is entitled to receive an annual advisory fee starting at 0.50% and declining to 0.40% as the average daily net assets of the Fund increase. For the six months ended February 28, 2014, the advisory fee was equivalent to an annual rate of 0.49% of the Fund’s average daily net assets.
Funds Management has retained the services of a subadviser to provide daily portfolio management to the Fund. The fee for subadvisory services is borne by Funds Management. WellsCap, an affiliate of Funds Management and an indirect, wholly owned subsidiary of Wells Fargo, is the subadviser to the Fund and is entitled to receive a fee from Funds Management at an annual rate starting at 0.35% and declining to 0.20% as the average daily net assets of the Fund increase.
Administration and transfer agent fees
The Trust has entered into an administration agreement with Funds Management. Under this agreement, for providing administrative services, which includes paying fees and expenses for services provided by the transfer agent, sub-transfer agents, omnibus account servicers and record-keepers, Funds Management is entitled to receive from the Fund an annual fund level administration fee starting at 0.05% and declining to 0.03% as the average daily net assets of the Fund increase and a class level administration fee which is calculated based on the average daily net assets of each class as follows:
| | | | |
| | | Class level
administration fee | |
Class A, Class B, Class C | | | 0.16 | % |
Administrator Class | | | 0.10 | |
Institutional Class | | | 0.08 | |
Investor Class | | | 0.19 | |
Funds Management has contractually waived and/or reimbursed advisory and administration fees to the extent necessary to maintain certain net operating expense ratios for the Fund. Waiver of fees and/or reimbursement of expenses by Funds Management were made first from fund level expenses on a proportionate basis and then from class specific expenses. Funds Management has committed through December 31, 2014 to waive fees and/or reimburse expenses to the extent necessary to cap the Fund’s expenses at 0.90% for Class A shares, 1.65% for Class B shares, 1.65% for Class C shares, 0.80% for Administrator Class shares, 0.50% for Institutional Class shares, and 0.93% for Investor Class shares.
Distribution fees
The Trust has adopted a Distribution Plan for Class B and Class C shares of the Fund pursuant to Rule 12b-1 under the 1940 Act. Distribution fees are charged to Class B and Class C shares and paid to Wells Fargo Funds Distributor, LLC, the principal underwriter, at an annual rate of 0.75% of the average daily net assets of Class B and Class C shares.
For the six months ended February 28, 2014, Wells Fargo Funds Distributor, LLC received $2,570 from the sale of Class A shares and $64 and $24 in contingent deferred sales charges from redemptions of Class B and Class C shares, respectively.
Shareholder servicing fees
The Trust has entered into contracts with one or more shareholder servicing agents, whereby Class A, Class B, Class C, Administrator Class, and Investor Class of the Fund is charged a fee at an annual rate of 0.25% of the average daily net assets of each respective class.
A portion of these total shareholder servicing fees were paid to affiliates of Wells Fargo.
5. INVESTMENT PORTFOLIO TRANSACTIONS
Purchases and sales of investments, excluding U.S. government obligations (if any) and short-term securities, for the six months ended February 28, 2014 were $175,430,590 and $214,246,707, respectively.
| | | | |
| 30 | | Wells Fargo Advantage High Income Fund | | Notes to financial statements (unaudited) |
6. DERIVATIVE TRANSACTIONS
During the six months ended February 28, 2014, the Fund entered into futures contracts to speculate on interest rates and to help manage the duration of the portfolio.
At February 28, 2014, the Fund had short futures contracts outstanding as follows:
| | | | | | | | | | | | | | |
| Expiration date | | Counterparty | | Contracts | | Type | | Contract value at
February 28, 2014 | | | Unrealized
losses | |
6-19-2014 | | JPMorgan | | 100 Short | | 10-Year U.S. Treasury Notes | | $ | 12,453,125 | | | $ | (25,190 | ) |
6-30-2014 | | JPMorgan | | 300 Short | | 5-Year U.S. Treasury Notes | | | 35,957,813 | | | | (67,265 | ) |
The Fund had an average notional amount of $64,483,359 in short futures contracts during the six months ended February 28, 2014.
On February 28, 2014, the cumulative unrealized losses on futures contracts in the amount of $92,455 are reflected in net unrealized gains on investments on the Statement of Assets and Liabilities. The receivable for daily variation margin on open futures contracts reflected in the Statement of Assets and Liabilities only represents the current day’s variation margin. The realized losses and change in unrealized gains (losses) on futures contracts are reflected in the Statement of Operations.
For certain types of derivative transactions, the Fund has entered into International Swaps and Derivatives Association, Inc. master agreements (“ISDA Master Agreements”) or similar agreements with approved counterparties. The ISDA Master Agreements or similar agreements may have requirements to deliver/deposit securities or cash to/with an exchange or broker-dealer as collateral and allows the Fund to offset, with each counterparty, certain derivative financial instrument’s assets and/or liabilities with collateral held or pledged. Collateral requirements differ by type of derivative. Collateral or margin requirements are set by the broker or exchange clearing house for exchange traded derivatives while collateral terms are contract specific for over-the-counter traded. Cash collateral that has been pledged to cover obligations of the Fund under derivative contracts, if any, will be reported separately in the Statement of Assets and Liabilities. Securities pledged as collateral, if any, for the same purpose are noted in the Portfolio of Investments. With respect to balance sheet offsetting, absent an event of default by the counterparty or a termination of the agreement, the reported amounts of financial assets and financial liabilities in the Statement of Assets and Liabilities are not offset across transactions between the Fund and the applicable counterparty. A reconciliation of the gross amounts on the Statement of Assets and Liabilities to the net amounts by derivative type, including any collateral exposure, is as follows:
| | | | | | | | | | | | | | | | | | | | |
Derivative type | | Counterparty | | | Gross amounts of
assets in the
Statement of
Assets and
Liabilities | | | Amounts
subject to
netting
agreements | | | Collateral
received | | | Net amount | |
Futures - variation margin | | | JPMorgan | | | $ | 57,031 | | | $ | 0 | | | $ | 0 | | | $ | 57,031 | |
7. BANK BORROWINGS
The Trust (excluding the money market funds and certain other funds in the Trust) and Wells Fargo Variable Trust are parties to a $150,000,000 revolving credit agreement with State Street Bank and Trust Company, whereby the Fund is permitted to use bank borrowings for temporary or emergency purposes, such as to fund shareholder redemption requests. Interest under the credit agreement is charged to the Fund based on a borrowing rate equal to the higher of the Federal Funds rate in effect on that day plus 1.25% or the overnight LIBOR rate in effect on that day plus 1.25%. In addition, an annual commitment fee equal to 0.10% of the unused balance is allocated to each participating fund. For the six months ended February 28, 2014, the Fund paid $754 in commitment fees.
For the six months ended February 28, 2014, there were no borrowings by the Fund under the agreement.
8. INDEMNIFICATION
Under the Trust’s organizational documents, the officers and directors are indemnified against certain liabilities that may arise out of performance of their duties to the Trust. Additionally, in the normal course of business, the Trust may enter into contracts with service providers that contain a variety of indemnification clauses. The Trust’s maximum exposure under these arrangements is dependent on future claims that may be made against the Fund and, therefore, cannot be estimated.
| | | | | | |
| Other information (unaudited) | | Wells Fargo Advantage High Income Fund | | | 31 | |
PROXY VOTING INFORMATION
A description of the policies and procedures that the Fund uses to determine how to vote proxies relating to portfolio securities is available without charge, upon request, by calling 1-800-222-8222, visiting our website at wellsfargoadvantagefunds.com, or visiting the SEC website at sec.gov. Information regarding how the Fund voted proxies relating to portfolio securities during the most recent 12-month period ended June 30 is available without charge on the Fund’s website at wellsfargoadvantagefunds.com or by visiting the SEC website at sec.gov.
PORTFOLIO HOLDINGS INFORMATION
The complete portfolio holdings for the Fund are publicly available on the Fund’s website (wellsfargoadvantagefunds.com) on a monthly, 30-day or more delayed basis. In addition, top ten holdings information for the Fund is publicly available on the Fund’s website on a monthly, seven-day or more delayed basis. The Fund files its complete schedule of portfolio holdings with the SEC for the first and third quarters of each fiscal year on Form N-Q, which is available without charge by visiting the SEC website at sec.gov. In addition, the Fund’s Form N-Q may be reviewed and copied at the SEC’s Public Reference Room in Washington, DC, and at regional offices in New York City, at 233 Broadway, and in Chicago, at 175 West Jackson Boulevard, Suite 900. Information about the Public Reference Room may be obtained by calling 1-800-SEC-0330.
| | | | |
| 32 | | Wells Fargo Advantage High Income Fund | | Other information (unaudited) |
BOARD OF TRUSTEES AND OFFICERS
Each of the Trustees and Officers listed in the table below acts in identical capacities for each fund in the Wells Fargo Advantage family of funds, which consists of 132 mutual funds1 comprising the Wells Fargo Funds Trust, Wells Fargo Variable Trust, Wells Fargo Master Trust and four closed-end funds (collectively the “Fund Complex”). This table should be read in conjunction with the Prospectus and the Statement of Additional Information2. All of the Trustees are also Members of the Audit and Governance Committees of each Trust in the Fund Complex. The mailing address of each Trustee and Officer is 525 Market Street, 12th Floor, San Francisco, CA 94105. Each Trustee and Officer serves an indefinite term, however, each Trustee serves such term until reaching the mandatory retirement age established by the Trustees.
Independent Trustees
| | | | | | |
Name and
year of birth | | Position held and
length of service* | | Principal occupations during past five years | | Other
directorships during
past five years |
| Peter G. Gordon (Born 1942) | | Trustee, since 1998; Chairman, since 2005 | | Co-Founder, Retired Chairman, President and CEO of Crystal Geyser Water Company. Trustee Emeritus, Colby College. | | Asset Allocation Trust |
| Isaiah Harris, Jr. (Born 1952) | | Trustee, since 2009 | | Retired. Prior thereto, President and CEO of BellSouth Advertising and Publishing Corp. from 2005 to 2007, President and CEO of BellSouth Enterprises from 2004 to 2005 and President of BellSouth Consumer Services from 2000 to 2003. Emeritus member of the Iowa State University Foundation Board of Governors. Emeritus Member of the Advisory Board of Iowa State University School of Business. Advisory Board Member, Palm Harbor Academy (charter school). Mr. Harris is a certified public accountant. | | CIGNA Corporation; Deluxe Corporation; Asset Allocation Trust |
| Judith M. Johnson (Born 1949) | | Trustee, since 2008; Audit Committee Chairman, since 2008 | | Retired. Prior thereto, Chief Executive Officer and Chief Investment Officer of Minneapolis Employees Retirement Fund from 1996 to 2008. Ms. Johnson is an attorney, certified public accountant and a certified managerial accountant. | | Asset Allocation Trust |
| Leroy Keith, Jr. (Born 1939) | | Trustee, since 2010 | | Chairman, Bloc Global Services (development and construction). Trustee of the Evergreen Funds from 1983 to 2010. Former Managing Director, Almanac Capital Management (commodities firm), former Partner, Stonington Partners, Inc. (private equity fund), former Director, Obagi Medical Products Co. and former Director, Lincoln Educational Services. | | Trustee, Virtus Fund Complex (consisting of 50 portfolios as of 12/16/2013); Asset Allocation Trust |
| David F. Larcker (Born 1950) | | Trustee, since 2009 | | James Irvin Miller Professor of Accounting at the Graduate School of Business, Stanford University, Morgan Stanley Director of the Center for Leadership Development and Research and Senior Faculty of The Rock Center for Corporate Governance since 2006. From 2005 to 2008, Professor of Accounting at the Graduate School of Business, Stanford University. Prior thereto, Ernst & Young Professor of Accounting at The Wharton School, University of Pennsylvania from 1985 to 2005. | | Asset Allocation Trust |
| Olivia S. Mitchell (Born 1953) | | Trustee, since 2006 | | International Foundation of Employee Benefit Plans Professor, Wharton School of the University of Pennsylvania since 1993. Director of Wharton’s Pension Research Council and Boettner Center on Pensions & Retirement Research, and Research Associate at the National Bureau of Economic Research. Previously, Cornell University Professor from 1978 to 1993. | | Asset Allocation Trust |
| Timothy J. Penny (Born 1951) | | Trustee, since 1996 | | President and CEO of Southern Minnesota Initiative Foundation, a non-profit organization, since 2007 and Senior Fellow at the Humphrey Institute Policy Forum at the University of Minnesota since 1995. Member of the Board of Trustees of NorthStar Education Finance, Inc., a non-profit organization, since 2007. | | Asset Allocation Trust |
| | | | | | |
| Other information (unaudited) | | Wells Fargo Advantage High Income Fund | | | 33 | |
| | | | | | |
Name and
year of birth | | Position held and
length of service* | | Principal occupations during past five years | | Other
directorships during
past five years |
| Michael S. Scofield (Born 1943) | | Trustee, since 2010 | | Served on the Investment Company Institute’s Board of Governors and Executive Committee from 2008-2011 as well the Governing Council of the Independent Directors Council from 2006-2011 and the Independent Directors Council Executive Committee from 2008-2011. Chairman of the IDC from 2008-2010. Institutional Investor (Fund Directions) Trustee of Year in 2007. Trustee of the Evergreen Funds (and its predecessors) from 1984 to 2010. Chairman of the Evergreen Funds from 2000-2010. Former Trustee of the Mentor Funds. Retired Attorney, Law Offices of Michael S. Scofield. | | Asset Allocation Trust |
| Donald C. Willeke (Born 1940) | | Trustee, since 1996 | | Principal of the law firm of Willeke & Daniels. General Counsel of the Minneapolis Employees Retirement Fund from 1984 until its consolidation into the Minnesota Public Employees Retirement Association on June 30, 2010. Director and Vice Chair of The Tree Trust (non-profit corporation). Director of the American Chestnut Foundation (non-profit corporation). | | Asset Allocation Trust |
| * | Length of service dates reflect the Trustee’s commencement of service with the Trust’s predecessor entities, where applicable. |
Officers
| | | | | | |
Name and year of birth | | Position held and
length of service | | Principal occupations during past five years | | |
| Karla M. Rabusch (Born 1959) | | President, since 2003 | | Executive Vice President of Wells Fargo Bank, N.A. and President of Wells Fargo Funds Management, LLC since 2003. | | |
Nancy Wiser1 (Born 1967) | | Treasurer, since 2012 | | Executive Vice President of Wells Fargo Funds Management, LLC since 2011. Chief Operating Officer and Chief Compliance Officer at LightBox Capital Management LLC, from 2008 to 2011. Owned and operated a consulting business providing services to various hedge funds including acting as Chief Operating Officer and Chief Compliance Officer for a hedge fund from 2007 to 2008. Chief Operating Officer and Chief Compliance Officer of GMN Capital LLC from 2006 to 2007. | | |
| C. David Messman (Born 1960) | | Secretary, since 2000; Chief Legal Officer, since 2003 | | Senior Vice President and Secretary of Wells Fargo Funds Management, LLC since 2001. Vice President and Managing Counsel of Wells Fargo Bank, N.A. since 1996. | | |
Debra Ann Early (Born 1964) | | Chief Compliance Officer, since 2007 | | Chief Compliance Officer of Wells Fargo Funds Management, LLC since 2007. Chief Compliance Officer of Parnassus Investments from 2005 to 2007. Chief Financial Officer of Parnassus Investments from 2004 to 2007. | | |
David Berardi (Born 1975) | | Assistant Treasurer, since 2009 | | Vice President of Wells Fargo Funds Management, LLC since 2009. Vice President of Evergreen Investment Management Company, LLC from 2008 to 2010. Assistant Vice President of Evergreen Investment Services, Inc. from 2004 to 2008. Manager of Fund Reporting and Control for Evergreen Investment Management Company, LLC from 2004 to 2010. | | |
| Jeremy DePalma1 (Born 1974) | | Assistant Treasurer, since 2009 | | Senior Vice President of Wells Fargo Funds Management, LLC since 2009. Senior Vice President of Evergreen Investment Management Company, LLC from 2008 to 2010. Vice President, Evergreen Investment Services, Inc. from 2004 to 2007. Head of the Fund Reporting and Control Team within Fund Administration from 2005 to 2010. | | |
| 1. | Nancy Wiser acts as Treasurer of 73 funds in the Fund Complex. Jeremy DePalma acts as Treasurer of 59 funds and Assistant Treasurer of 73 funds in the Fund Complex. |
| 2. | The Statement of Additional Information includes additional information about the Trustees and is available, without charge, upon request, by calling 1-800-222-8222 or by visiting the website at wellsfargoadvantagefunds.com. |
| | | | |
| 34 | | Wells Fargo Advantage High Income Fund | | List of abbreviations |
The following is a list of common abbreviations for terms and entities that may have appeared in this report.
| ACA | — ACA Financial Guaranty Corporation |
| ADR | — American depositary receipt |
| ADS | — American depositary shares |
| AGC | — Assured Guaranty Corporation |
| AGM | — Assured Guaranty Municipal |
| Ambac | — Ambac Financial Group Incorporated |
| AMT | — Alternative minimum tax |
| BAN | — Bond anticipation notes |
| BHAC | — Berkshire Hathaway Assurance Corporation |
| CAB | — Capital appreciation bond |
| CCAB | — Convertible capital appreciation bond |
| CDA | — Community Development Authority |
| CDO | — Collateralized debt obligation |
| DRIVER | — Derivative inverse tax-exempt receipts |
| DW&P | — Department of Water & Power |
| DWR | — Department of Water Resources |
| ECFA | — Educational & Cultural Facilities Authority |
| EDA | — Economic Development Authority |
| EDFA | — Economic Development Finance Authority |
| ETF | — Exchange-traded fund |
| FDIC | — Federal Deposit Insurance Corporation |
| FFCB | — Federal Farm Credit Banks |
| FGIC | — Financial Guaranty Insurance Corporation |
| FHA | — Federal Housing Administration |
| FHLB | — Federal Home Loan Bank |
| FHLMC | — Federal Home Loan Mortgage Corporation |
| FICO | — The Financing Corporation |
| FNMA | — Federal National Mortgage Association |
| GDR | — Global depositary receipt |
| GNMA | — Government National Mortgage Association |
| HCFR | — Healthcare facilities revenue |
| HEFA | — Health & Educational Facilities Authority |
| HEFAR | — Higher education facilities authority revenue |
| HFA | — Housing Finance Authority |
| HFFA | — Health Facilities Financing Authority |
| HUD | — Department of Housing and Urban Development |
| IDA | — Industrial Development Authority |
| IDAG | — Industrial Development Agency |
| KRW | — Republic of Korea won |
| LIBOR | — London Interbank Offered Rate |
| LLC | — Limited liability company |
| LLLP | — Limited liability limited partnership |
| LLP | — Limited liability partnership |
| MBIA | — Municipal Bond Insurance Association |
| MFHR | — Multifamily housing revenue |
| MSTR | — Municipal securities trust receipts |
| MUD | — Municipal Utility District |
| National | — National Public Finance Guarantee Corporation |
| PCFA | — Pollution Control Financing Authority |
| PCL | — Public Company Limited |
| PCR | — Pollution control revenue |
| PFA | — Public Finance Authority |
| PFFA | — Public Facilities Financing Authority |
| PFOTER | — Puttable floating option tax-exempt receipts |
| plc | — Public limited company |
| PUTTER | — Puttable tax-exempt receipts |
| R&D | — Research & development |
| Radian | — Radian Asset Assurance |
| RAN | — Revenue anticipation notes |
| RDA | — Redevelopment Authority |
| RDFA | — Redevelopment Finance Authority |
| REIT | — Real estate investment trust |
| ROC | — Reset option certificates |
| SAVRS | — Select auction variable rate securities |
| SBA | — Small Business Authority |
| SFHR | — Single-family housing revenue |
| SFMR | — Single-family mortgage revenue |
| SPA | — Standby purchase agreement |
| SPDR | — Standard & Poor’s Depositary Receipts |
| STRIPS | — Separate trading of registered interest and principal securities |
| TAN | — Tax anticipation notes |
| TIPS | — Treasury inflation-protected securities |
| TRAN | — Tax revenue anticipation notes |
| TTFA | — Transportation Trust Fund Authority |
| TVA | — Tennessee Valley Authority |
This page is intentionally left blank.
This page is intentionally left blank.


For more information
More information about Wells Fargo Advantage Funds is available free upon request. To obtain literature, please write, email, visit the Fund’s website, or call:
Wells Fargo Advantage Funds
P.O. Box 8266
Boston, MA 02266-8266
Email: wfaf@wellsfargo.com
Website: wellsfargoadvantagefunds.com
Individual investors: 1-800-222-8222
Retail investment professionals: 1-888-877-9275
Institutional investment professionals: 1-866-765-0778
This report and the financial statements contained herein are submitted for the general information of the shareholders of Wells Fargo Advantage Funds. If this report is used for promotional purposes, distribution of the report must be accompanied or preceded by a current prospectus. For a current prospectus and, if available, a summary prospectus containing more complete information, including charges and expenses, call 1-800-222-8222 or visit the Fund’s website at wellsfargoadvantagefunds.com. Please consider the investment objectives, risks, charges, and expenses of the investment carefully before investing. This and other information about Wells Fargo Advantage Funds can be found in the current prospectus. Read the prospectus carefully before you invest or send money.
Wells Fargo Funds Management, LLC, a wholly owned subsidiary of Wells Fargo & Company, provides investment advisory and administrative services for Wells Fargo Advantage Funds. Other affiliates of Wells Fargo & Company provide subadvisory and other services for the Funds. The Funds are distributed by Wells Fargo Funds Distributor, LLC, Member FINRA/SIPC, an affiliate of Wells Fargo & Company.
NOT FDIC INSURED ¡ NO BANK GUARANTEE ¡ MAY LOSE VALUE
© 2014 Wells Fargo Funds Management, LLC. All rights reserved.
| | |
 | | 223531 04-14 SA217/SAR217 02-14 |

Wells Fargo Advantage High Yield Bond Fund

Semi-Annual Report
February 28, 2014

Reduce clutter. Save trees.
Sign up for electronic delivery of prospectuses and shareholder reports at wellsfargo.com/advantagedelivery
Contents
The views expressed and any forward-looking statements are as of February 28, 2014, unless otherwise noted, and are those of the Fund managers and/or Wells Fargo Funds Management, LLC. Discussions of individual securities, or the markets generally, or any Wells Fargo Advantage Fund are not intended as individual recommendations. Future events or results may vary significantly from those expressed in any forward-looking statements; the views expressed are subject to change at any time in response to changing circumstances in the market. Wells Fargo Funds Management, LLC and the Fund disclaim any obligation to publicly update or revise any views expressed or forward-looking statements.
NOT FDIC INSURED ¡ NO BANK GUARANTEE ¡ MAY LOSE VALUE
| | | | |
| 2 | | Wells Fargo Advantage High Yield Bond Fund | | Letter to shareholders (unaudited) |

Karla M. Rabusch
President
Wells Fargo Advantage Funds
Fixed-income markets shifted during the period, driven by vacillations between U.S. Treasury yield increases and subsequent declines.
Reassurances from the Fed that a highly accommodative monetary policy would continue throughout 2014 inspired price rallies across both the investment-grade and high-yield bond markets.
Dear Valued Shareholder:
We are pleased to offer you this semi-annual report for the Wells Fargo Advantage High Yield Bond Fund for the six-month period that ended February 28, 2014. Fixed-income markets shifted during the period, driven by vacillations between U.S. Treasury yield increases and subsequent declines. However, on the whole, investment-grade (measured by the Barclays U.S. Aggregate Bond Index1) and high-yield markets (measured by the Barclays U.S. High Yield Bond Index2) generated positive returns during the period, notably benefiting from the strong price improvement and declining U.S. Treasury yields that occurred in September and October of 2013 as well as the opening months of 2014. Although the returns of the U.S. high-yield market have often been positively correlated with U.S. equity returns (measured by the S&P 500 Index3) over the long-run, over the period, high-yield (measured by the Barclays U.S. High Yield Bond Index) generally performed well even when equities did not. The lower-rated corporate bond credit tiers outperformed the respectively higher-rated investment-grade credit tiers during the period.
A decline in bond prices was halted by the Fed’s postponement of tapering its bond-buying program.
Before the six-month period began, equity markets rallied, most notably in May and June of 2013. This led to a sharp increase in U.S. Treasury yields and declining valuations for much of the fixed-income markets (measured by the Barclays U.S. Aggregate Bond Index). However, in July and August 2013, that equity exuberance quieted a bit, and fixed-income markets stabilized. Returns across the fixed-income markets were largely negative in investment-grade and high-yield markets but modest in comparison with the declines in May and June of 2013.
But, by September and October of 2013, investment-grade and high-yield bond markets began generating positive returns yet again, as the Federal Reserve (Fed) backtracked on its intentions to taper its quantitative easing program, postponing it until 2014, at the earliest. This created a temporary rally in bonds that lasted until around November 20, 2013, when notes were released from the Fed’s October 2013 meeting that tapering of the bond-buying programs would not be postponed beyond January 2014. In response, long-term U.S. Treasury yields and mortgage rates ratcheted higher on expectations for an unwinding of monetary accommodation in the upcoming months. This led to declines in pricing across much of the core fixed-income markets (measured by the Barclays U.S. Aggregate Bond Index). U.S. high-yield markets were better able to absorb the shift in U.S. Treasury yields and continued to provide positive returns along with rallies in the equity markets.
Favorable conditions for fixed-income markets were restored in January and February 2014.
Seemingly much to the surprise of many everyday investors and seasoned investment professionals alike, fixed-income markets (measured by the Barclays U.S. Aggregate Bond Index) largely outperformed U.S. equity markets (measured by the S&P 500 Index) during the opening months of 2014. A pullback in equity exuberance in January and reassurances from the Fed that a highly accommodative monetary policy would continue throughout 2014 inspired price rallies across both the investment-grade and high-yield bond markets. U.S. Treasury yields declined in January 2014 and corporate bonds and mortgage-backed securities performed notably well. U.S. high-yield securities generated positive returns in January 2014 but lagged the rally across the investment-grade bond markets. This theme reversed in February 2014, as high-yield sectors rallied and investment-grade sectors performed well but not to the extent of the lowest-rated credit tiers.
| | | | | | |
| Letter to shareholders (unaudited) | | Wells Fargo Advantage High Yield Bond Fund | | | 3 | |
One positive takeaway for bond investors that helped fuel the fixed-income (measured by the Barclays U.S. Aggregate Bond Index) rallies was former Fed Chairman Bernanke’s guidance at the end of 2013. He indicated that the tapering of the Fed’s bond-buying program would proceed at a slow pace and that a reduction in quantitative easing should not be equivocated with a tightening of monetary policy. The distinction was important—although the bond-buying program was declining in volume, it was, nonetheless, still continuing. Additionally, the federal funds target rate would remain unchanged for the foreseeable future, with the implications that it would not increase until the bond-buying program was fully disbanded. These were important statements for fixed-income investors that helped bolster U.S. fixed-income valuations in the opening months of 2014.
Don’t let short-term uncertainty derail long-term investment goals.
Periods of investment uncertainty can present challenges, but experience has taught us that maintaining long-term investment goals can be an effective way to plan for the future. To help you create a sound strategy based on your personal goals and risk tolerance, Wells Fargo Advantage Funds offers more than 100 mutual funds and other investments spanning a wide range of asset classes and investment styles. Although diversification cannot guarantee an investment profit or prevent losses, we believe it can be an effective way to manage investment risk and potentially smooth out overall portfolio performance. We encourage investors to know their investments and to understand that appropriate levels of risk-taking may unlock opportunities.
Thank you for choosing to invest with Wells Fargo Advantage Funds. We appreciate your confidence in us and remain committed to helping you meet your financial needs. For current information about your fund investments, contact your investment professional, visit our website at wellsfargoadvantagefunds.com, or call us directly at 1-800-222-8222. We are available 24 hours a day, 7 days a week.
Sincerely,

Karla M. Rabusch
President
Wells Fargo Advantage Funds
| 1. | The Barclays U.S. Aggregate Bond Index is a broad-based benchmark that measures the investment-grade, U.S. dollar-denominated, fixed-rate taxable bond market, including Treasuries, government-related and corporate securities, MBS (agency fixed-rate and hybrid ARM passthroughs), ABS, and CMBS. You cannot invest directly in an index. |
| 2. | The Barclays U.S. High Yield Bond Index is an index consisting of all domestic and Yankee bonds, rated below investment grade, with a minimum outstanding amount of $100 million and maturing over one year. You cannot invest directly in an index. |
| 3. | The S&P 500 Index consists of 500 stocks chosen for market size, liquidity, and industry group representation. It is a market-value-weighted index with each stock’s weight in the index proportionate to its market value. You cannot invest directly in an index. |
| | | | |
| 4 | | Wells Fargo Advantage High Yield Bond Fund | | Letter to shareholders (unaudited) |
Notice to shareholders
The Fund and Wells Fargo Funds Management, LLC (“Funds Management”) have received an exemptive order from the SEC that permits Funds Management, subject to the approval of the Board of Trustees of the Fund, to select or replace certain subadvisers to manage all or a portion of the Fund’s assets and enter into, amend or terminate a sub-advisory agreement with certain subadvisers without obtaining shareholder approval (“Multi-manager Structure”). The Multi-manager Structure applies to subadvisers that are not affiliated with Funds Management or the Fund, except to the extent that affiliation arises solely because such subadvisers provide sub-advisory services to the Fund (“Non-affiliated Subadvisers”), as well as subadvisers that are indirect or direct wholly-owned subsidiaries of Funds Management or of another company that, indirectly or directly, wholly owns Funds Management (“Wholly-owned Subadvisers”).
Pursuant to the SEC order, Funds Management, with the approval of the Board of Trustees, has the discretion to terminate any subadvisers and allocate and reallocate the Fund’s assets among any other Non-affiliated Subadvisers or Wholly-owned Subadvisers. Funds Management, subject to oversight and supervision by the Board of Trustees, has responsibility to continue to oversee any subadvisers to the Fund and to recommend, for approval by the Board of Trustees, the hiring, termination and replacement of subadvisers for the Fund. In the event that a new subadviser is hired pursuant to the Multi-manager Structure, the Fund is required to provide notice to shareholders within 90 days.
Please contact your investment professional or call us directly at 1-800-222-8222 if you have any questions on this Notice to Shareholders.
This page is intentionally left blank.
| | | | |
| 6 | | Wells Fargo Advantage High Yield Bond Fund | | Performance highlights (unaudited) |
Investment objective
The Fund seeks total return, consisting of a high level of current income and capital appreciation.
Adviser
Wells Fargo Funds Management, LLC
Subadviser
Wells Capital Management Incorporated
Portfolio manager
Margaret D. Patel
Average annual total returns1 (%) as of February 28, 2014
| | | | | | | | | | | | | | | | | | | | | | | | | | | | | | | | | | |
| | | | | Including sales charge | | | Excluding sales charge | | | Expense ratios2 (%) | |
| | | Inception date | | 1 year | | | 5 year | | | 10 year | | | 1 year | | | 5 year | | | 10 year | | | Gross | | | Net3 | |
| Class A (EKHAX) | | 1-20-1998 | | | 0.94 | | | | 15.25 | | | | 6.52 | | | | 5.56 | | | | 16.29 | | | | 7.00 | | | | 1.04 | | | | 1.03 | |
| Class B (EKHBX)* | | 9-11-1935 | | | (0.22 | ) | | | 15.20 | | | | 6.46 | | | | 4.78 | | | | 15.43 | | | | 6.46 | | | | 1.79 | | | | 1.78 | |
| Class C (EKHCX) | | 1-21-1998 | | | 3.78 | | | | 15.43 | | | | 6.22 | | | | 4.78 | | | | 15.43 | | | | 6.22 | | | | 1.79 | | | | 1.78 | |
| Administrator Class (EKHYX) | | 4-14-1998 | | | – | | | | – | | | | – | | | | 5.81 | | | | 16.56 | | | | 7.27 | | | | 0.98 | | | | 0.80 | |
| BofA Merrill Lynch U.S. High Yield Master II Constrained Index4 | | – | | | – | | | | – | | | | – | | | | 8.37 | | | | 18.77 | | | | 8.59 | | | | – | | | | – | |
| * | | Class B shares are closed to investment, except in connection with the reinvestment of any distributions and permitted exchanges. |
Figures quoted represent past performance, which is no guarantee of future results, and do not reflect taxes that a shareholder may pay on fund distributions or the redemption of fund shares. Investment return and principal value of an investment will fluctuate so that an investor’s shares, when redeemed, may be worth more or less than their original cost. Performance shown without sales charges would be lower if sales charges were reflected. Current performance may be lower or higher than the performance data quoted, which assumes the reinvestment of dividends and capital gains. Current month-end performance is available on the Fund’s website, wellsfargoadvantagefunds.com.
Index returns do not include transaction costs associated with buying and selling securities, any mutual fund fees or expenses, or any taxes. It is not possible to invest directly in an index.
For Class A shares, the maximum front-end sales charge is 4.50%. For Class B shares, the maximum contingent deferred sales charge is 5.00%. For Class C shares, the maximum contingent deferred sales charge is 1.00%. Performance including sales charge assumes the sales charge for the corresponding time period. Administrator Class shares are sold without a front-end sales charge or contingent deferred sales charge.
Bond values fluctuate in response to the financial condition of individual issuers, general market and economic conditions, and changes in interest rates. In general, when interest rates rise, bond values fall and investors may lose principal value. High-yield securities have a greater risk of default and tend to be more volatile than higher-rated debt securities. Loans are subject to risks similar to those associated with other below-investment-grade bond investments, such as credit risk (for example, risk of issuer default), below-investment-grade bond risk (for example, risk of greater volatility in value), and risk that the loan may become illiquid or difficult to price. Consult the Fund’s prospectus for additional information on these and other risks.
Please see footnotes on page 7.
| | | | | | |
| Performance highlights (unaudited) | | Wells Fargo Advantage High Yield Bond Fund | | | 7 | |
| | | | |
| Ten largest long-term holdings5 (%) as of February 28, 2014 | |
Tronox Finance LLC, 6.38%, 8-15-2020 | | | 5.00 | |
Hertz Corporation, 6.25%, 10-15-2022 | | | 4.51 | |
Seagate Technology HDD Holdings, 7.00%, 11-1-2021 | | | 4.37 | |
Olin Corporation, 5.50%, 8-15-2022 | | | 4.35 | |
DaVita HealthCare Partners Incorporated, 5.75%, 8-15-2022 | | | 4.31 | |
Bristow Group Incorporated, 6.25%, 10-15-2022 | | | 4.19 | |
NRG Energy Incorporated, 6.63%, 3-15-2023 | | | 4.17 | |
Fresenius Medical Care Holdings Incorporated,
5.88%, 1-31-2022 | | | 4.07 | |
Valeant Pharmaceuticals International Incorporated, 7.25%, 7-15-2022 | | | 4.06 | |
Penske Auto Group Incorporated, 5.75%, 10-1-2022 | | | 3.40 | |
| | |
| Credit quality6 as of February 28, 2014 |
|
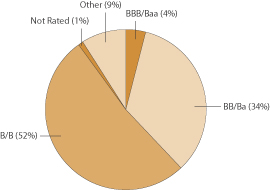
|
| 1. | Historical performance shown for all classes of the Fund prior to July 12, 2010 is based on the performance of the Fund’s predecessor, Evergreen High Income Fund. |
| 2. | Reflects the expense ratios as stated in the most recent prospectuses. The expense ratios shown are subject to change and may differ from the annualized expense ratios shown in the financial highlights of this report. |
| 3. | The Adviser has committed through December 31, 2014, to waive fees and/or reimburse expenses to the extent necessary to cap the Fund’s Total Annual Fund Operating Expenses After Fee Waiver, excluding certain expenses, at the amounts shown. Brokerage commissions, stamp duty fees, interest, taxes, acquired fund fees and expenses, and extraordinary expenses are excluded from the cap. Without this cap, the Fund’s returns would have been lower. |
| 4. | The BofA Merrill Lynch U.S. High Yield Master II Constrained Index is a market value-weighted index of all domestic and yankee high-yield bonds, including deferred interest bonds and payment-in kind securities. Issues included in the index have maturities of one year or more and have a credit rating lower than BBB–/Baa3, but are not in default. The BofA Merrill Lynch U.S. High Yield Master II Constrained Index limits any individual issuer to a maximum of 2% benchmark exposure. You cannot invest directly in an index. |
| 5. | The ten largest long-term holdings are calculated based on the value of the securities divided by total net assets of the Fund. Holdings are subject to change and may have changed since the date specified. |
| 6. | The credit quality of portfolio holdings reflected in the chart is based on ratings from Standard & Poor’s, Moody’s Investors Service, and/or Fitch Ratings Ltd. Credit quality ratings apply to the underlying holdings of the Fund and not to the Fund itself. The percentages of the Fund’s portfolio with the ratings depicted in the chart are calculated based on the total market value of fixed income securities held by the Fund. If a security was rated by all three rating agencies, the middle rating was utilized. If rated by two of three rating agencies, the lower rating was utilized, and if rated by one of the rating agencies, that rating was utilized. Standard & Poor’s rates the creditworthiness of bonds, ranging from AAA (highest) to D (lowest). Ratings from A to CCC may be modified by the addition of a plus (+) or minus (-) sign to show relative standing within the rating categories. Standard & Poor’s rates the creditworthiness of short-term notes from SP-1 (highest) to SP-3 (lowest). Moody’s rates the creditworthiness of bonds, ranging from Aaa (highest) to C (lowest). Ratings Aa to B may be modified by the addition of a number 1 (highest) to 3 (lowest) to show relative standing within the ratings categories. Moody’s rates the creditworthiness of short-term U.S. tax-exempt municipal securities from MIG 1/VMIG 1 (highest) to SG (lowest). Fitch rates the creditworthiness of bonds, ranging from AAA (highest) to D (lowest). Credit quality, and credit quality ratings are subject to change. |
| | | | |
| 8 | | Wells Fargo Advantage High Yield Bond Fund | | Fund expenses (unaudited) |
As a shareholder of the Fund, you incur two types of costs: (1) transaction costs, including sales charges (loads) on purchase payments and contingent deferred sales charges (if any) on redemptions and (2) ongoing costs, including management fees, distribution (12b-1) and/or shareholder service fees, and other Fund expenses. This example is intended to help you understand your ongoing costs (in dollars) of investing in the Fund and to compare these costs with the ongoing costs of investing in other mutual funds.
The example is based on an investment of $1,000 invested at the beginning of the six-month period and held for the entire period from September 1, 2013 to February 28, 2014.
Actual expenses
The “Actual” line of the table below provides information about actual account values and actual expenses. You may use the information in this line, together with the amount you invested, to estimate the expenses that you paid over the period. Simply divide your account value by $1,000 (for example, an $8,600 account value divided by $1,000 = 8.6), then multiply the result by the number in the “Actual” line under the heading entitled “Expenses paid during period” for your applicable class of shares to estimate the expenses you paid on your account during this period.
Hypothetical example for comparison purposes
The “Hypothetical” line of the table below provides information about hypothetical account values and hypothetical expenses based on the Fund’s actual expense ratio and an assumed rate of return of 5% per year before expenses, which is not the Fund’s actual return. The hypothetical account values and expenses may not be used to estimate the actual ending account balance or expenses you paid for the period. You may use this information to compare the ongoing costs of investing in the Fund and other funds. To do so, compare this 5% hypothetical example with the 5% hypothetical examples that appear in the shareholder reports of the other funds.
Please note that the expenses shown in the table are meant to highlight your ongoing costs only and do not reflect any transactional costs, such as sales charges (loads) and contingent deferred sales charges. Therefore, the “Hypothetical” line of the table is useful in comparing ongoing costs only and will not help you determine the relative total costs of owning different funds. In addition, if these transactional costs were included, your costs would have been higher.
| | | | | | | | | | | | | | | | |
| | | Beginning
account value
9-1-2013 | | | Ending
account value
2-28-2014 | | | Expenses
paid during
the period1 | | | Net annualized
expense ratio | |
Class A | | | | | | | | | | | | | | | | |
Actual | | $ | 1,000.00 | | | $ | 1,074.67 | | | $ | 5.30 | | | | 1.03 | % |
Hypothetical (5% return before expenses) | | $ | 1,000.00 | | | $ | 1,019.69 | | | $ | 5.16 | | | | 1.03 | % |
Class B | | | | | | | | | | | | | | | | |
Actual | | $ | 1,000.00 | | | $ | 1,070.76 | | | $ | 9.09 | | | | 1.77 | % |
Hypothetical (5% return before expenses) | | $ | 1,000.00 | | | $ | 1,016.02 | | | $ | 8.85 | | | | 1.77 | % |
Class C | | | | | | | | | | | | | | | | |
Actual | | $ | 1,000.00 | | | $ | 1,070.73 | | | $ | 9.14 | | | | 1.78 | % |
Hypothetical (5% return before expenses) | | $ | 1,000.00 | | | $ | 1,015.97 | | | $ | 8.90 | | | | 1.78 | % |
Administrator Class | | | | | | | | | | | | | | | | |
Actual | | $ | 1,000.00 | | | $ | 1,075.90 | | | $ | 4.12 | | | | 0.80 | % |
Hypothetical (5% return before expenses) | | $ | 1,000.00 | | | $ | 1,020.83 | | | $ | 4.01 | | | | 0.80 | % |
| 1. | Expenses paid is equal to the annualized expense ratio of each class multiplied by the average account value over the period, multiplied by the number of days in the most recent fiscal half-year divided by the number of days in the fiscal year (to reflect the one-half-year period). |
| | | | | | |
| Portfolio of investments—February 28, 2014 (unaudited) | | Wells Fargo Advantage High Yield Bond Fund | | | 9 | |
| | | | | | | | | | | | |
| Security name | | | | | | Shares | | | Value | |
| | | | | | | | | | | | |
| | | | |
Common Stocks: 9.31% | | | | | | | | | | | | |
| | | | |
Consumer Discretionary: 1.16% | | | | | | | | | | | | |
| | | | |
| Distributors: 0.53% | | | | | | | | | | | | |
Genuine Parts Company | | | | | | | 20,000 | | | $ | 1,761,800 | |
| | | | | | | | | | | | |
| | | | |
| Hotels, Restaurants & Leisure: 0.00% | | | | | | | | | | | | |
Trump Entertainment Resorts Incorporated †(a)(i) | | | | | | | 1,840 | | | | 0 | |
| | | | | | | | | | | | |
| | | | |
| Media: 0.63% | | | | | | | | | | | | |
Comcast Corporation Class A | | | | | | | 40,000 | | | | 2,067,600 | |
| | | | | | | | | | | | |
| | | | |
Consumer Staples: 0.33% | | | | | | | | | | | | |
| | | | |
| Food & Staples Retailing: 0.33% | | | | | | | | | | | | |
CVS Caremark Corporation | | | | | | | 15,000 | | | | 1,097,100 | |
| | | | | | | | | | | | |
| | | | |
Energy: 2.03% | | | | | | | | | | | | |
| | | | |
| Energy Equipment & Services: 0.12% | | | | | | | | | | | | |
Bristow Group Incorporated | | | | | | | 5,000 | | | | 388,000 | |
| | | | | | | | | | | | |
| | | | |
| Oil, Gas & Consumable Fuels: 1.91% | | | | | | | | | | | | |
ConocoPhillips Company | | | | | | | 5,000 | | | | 332,500 | |
Energy Transfer LP | | | | | | | 25,000 | | | | 1,091,250 | |
EOG Resources Incorporated | | | | | | | 3,000 | | | | 568,260 | |
Marathon Petroleum Corporation | | | | | | | 12,000 | | | | 1,008,000 | |
Phillips 66 | | | | | | | 15,000 | | | | 1,122,900 | |
Plains All American Pipeline LP | | | | | | | 40,000 | | | | 2,166,800 | |
| | | | |
| | | | | | | | | | | 6,289,710 | |
| | | | | | | | | | | | |
| | | | |
Financials: 0.53% | | | | | | | | | | | | |
| | | | |
| REITs: 0.53% | | | | | | | | | | | | |
Plum Creek Timber Company | | | | | | | 40,000 | | | | 1,731,600 | |
| | | | | | | | | | | | |
| | | | |
Health Care: 1.85% | | | | | | | | | | | | |
| | | | |
| Biotechnology: 0.19% | | | | | | | | | | | | |
Amgen Incorporated | | | | | | | 5,000 | | | | 620,100 | |
| | | | | | | | | | | | |
| | | | |
| Health Care Equipment & Supplies: 0.68% | | | | | | | | | | | | |
Becton Dickinson & Company | | | | | | | 7,000 | | | | 806,540 | |
Covidien plc | | | | | | | 20,000 | | | | 1,439,000 | |
| | | | |
| | | | | | | | | | | 2,245,540 | |
| | | | | | | | | �� | | | |
| | | | |
| Life Sciences Tools & Services: 0.23% | | | | | | | | | | | | |
Thermo Fisher Scientific Incorporated | | | | | | | 6,000 | | | | 747,240 | |
| | | | | | | | | | | | |
| | | | |
| Pharmaceuticals: 0.75% | | | | | | | | | | | | |
AbbVie Incorporated | | | | | | | 20,000 | | | | 1,018,200 | |
Eli Lilly & Company | | | | | | | 15,000 | | | | 894,150 | |
Mylan Laboratories Incorporated † | | | | | | | 10,000 | | | | 555,700 | |
| | | | |
| | | | | | | | | | | 2,468,050 | |
| | | | | | | | | | | | |
The accompanying notes are an integral part of these financial statements.
| | | | |
| 10 | | Wells Fargo Advantage High Yield Bond Fund | | Portfolio of investments—February 28, 2014 (unaudited) |
| | | | | | | | | | | | | | | | |
| Security name | | | | | | | | Shares | | | Value | |
| | | | | | | | | | | | | | | | |
| | | | |
Industrials: 1.37% | | | | | | | | | | | | | | | | |
| | | | |
| Aerospace & Defense: 0.76% | | | | | | | | | | | | | | | | |
General Dynamics Corporation | | | | | | | | | | | 8,000 | | | $ | 876,320 | |
Lockheed Martin Corporation | | | | | | | | | | | 10,000 | | | | 1,623,000 | |
| | | | |
| | | | | | | | | | | | | | | 2,499,320 | |
| | | | | | | | | | | | | | | | |
| | | | |
| Electrical Equipment: 0.35% | | | | | | | | | | | | | | | | |
AMETEK Incorporated | | | | | | | | | | | 10,000 | | | | 532,400 | |
Regal-Beloit Corporation | | | | | | | | | | | 2,000 | | | | 147,380 | |
Rockwell Automation Incorporated | | | | | | | | | | | 4,000 | | | | 491,360 | |
| | | | |
| | | | | | | | | | | | | | | 1,171,140 | |
| | | | | | | | | | | | | | | | |
| | | | |
| Industrial Conglomerates: 0.03% | | | | | | | | | | | | | | | | |
General Electric Company | | | | | | | | | | | 4,000 | | | | 101,880 | |
| | | | | | | | | | | | | | | | |
| | | | |
| Machinery: 0.23% | | | | | | | | | | | | | | | | |
IDEX Corporation | | | | | | | | | | | 10,000 | | | | 750,700 | |
| | | | | | | | | | | | | | | | |
| | | | |
Information Technology : 0.55% | | | | | | | | | | | | | | | | |
| | | | |
| IT Services: 0.23% | | | | | | | | | | | | | | | | |
Automatic Data Processing Incorporated | | | | | | | | | | | 10,000 | | | | 777,800 | |
| | | | | | | | | | | | | | | | |
| | | | |
| Technology Hardware, Storage & Peripherals: 0.32% | | | | | | | | | | | | | | | | |
Seagate Technology plc | | | | | | | | | | | 20,000 | | | | 1,043,800 | |
| | | | | | | | | | | | | | | | |
| | | | |
Materials: 1.27% | | | | | | | | | | | | | | | | |
| | | | |
| Chemicals: 1.27% | | | | | | | | | | | | | | | | |
FMC Corporation | | | | | | | | | | | 5,000 | | | | 385,900 | |
LyondellBasell Industries Class A | | | | | | | | | | | 43,000 | | | | 3,787,440 | |
| | | | |
| | | | | | | | | | | | | | | 4,173,340 | |
| | | | | | | | | | | | | | | | |
| | | | |
Utilities: 0.22% | | | | | | | | | | | | | | | | |
| | | | |
| Electric Utilities: 0.22% | | | | | | | | | | | | | | | | |
American Electric Power Company Incorporated | | | | | | | | | | | 7,000 | | | | 351,400 | |
Edison International | | | | | | | | | | | 7,000 | | | | 366,590 | |
| | | | |
| | | | | | | | | | | | | | | 717,990 | |
| | | | | | | | | | | | | | | | |
| | | | |
Total Common Stocks (Cost $27,091,097) | | | | | | | | | | | | | | | 30,652,710 | |
| | | | | | | | | | | | | | | | |
| | | | |
| | | Interest rate | | | Maturity date | | | Principal | | | | |
| Corporate Bonds and Notes: 83.49% | | | | | | | | | | | | | | | | |
| | | | |
Consumer Discretionary: 6.35% | | | | | | | | | | | | | | | | |
| | | | |
| Auto Components: 2.08% | | | | | | | | | | | | | | | | |
American Axle Manufacturing Incorporated | | | 6.63 | % | | | 10-15-2022 | | | $ | 2,250,000 | | | | 2,446,875 | |
Cooper Tire & Rubber Company | | | 7.63 | | | | 3-15-2027 | | | | 1,500,000 | | | | 1,477,500 | |
Lear Corporation 144A | | | 4.75 | | | | 1-15-2023 | | | | 3,000,000 | | | | 2,910,000 | |
| | | | |
| | | | | | | | | | | | | | | 6,834,375 | |
| | | | | | | | | | | | | | | | |
The accompanying notes are an integral part of these financial statements.
| | | | | | |
| Portfolio of investments—February 28, 2014 (unaudited) | | Wells Fargo Advantage High Yield Bond Fund | | | 11 | |
| | | | | | | | | | | | | | | | |
| Security name | | Interest rate | | | Maturity date | | | Principal | | | Value | |
| | | | | | | | | | | | | | | | |
| | | | |
| Hotels, Restaurants & Leisure: 0.57% | | | | | | | | | | | | | | | | |
Speedway Motorsports Incorporated | | | 6.75 | % | | | 2-1-2019 | | | $ | 1,775,000 | | | $ | 1,881,500 | |
| | | | | | | | | | | | | | | | |
| | | | |
| Media: 0.30% | | | | | | | | | | | | | | | | |
DISH DBS Corporation | | | 5.00 | | | | 3-15-2023 | | | | 1,000,000 | | | | 992,500 | |
| | | | | | | | | | | | | | | | |
| | | | |
| Specialty Retail: 3.40% | | | | | | | | | | | | | | | | |
Penske Auto Group Incorporated | | | 5.75 | | | | 10-1-2022 | | | | 10,702,000 | | | | 11,183,590 | |
| | | | | | | | | | | | | | | | |
| | | | |
Energy: 15.84% | | | | | | | | | | | | | | | | |
| | | | |
| Energy Equipment & Services: 7.36% | | | | | | | | | | | | | | | | |
Atwood Oceanics Incorporated | | | 6.50 | | | | 2-1-2020 | | | | 1,000,000 | | | | 1,077,500 | |
Bristow Group Incorporated | | | 6.25 | | | | 10-15-2022 | | | | 12,990,000 | | | | 13,801,875 | |
Dresser-Rand Group Incorporated | | | 6.50 | | | | 5-1-2021 | | | | 1,225,000 | | | | 1,310,750 | |
Gulfmark Offshore Incorporated | | | 6.38 | | | | 3-15-2022 | | | | 1,635,000 | | | | 1,684,050 | |
Hornbeck Offshore Services Incorporated | | | 5.88 | | | | 4-1-2020 | | | | 1,350,000 | | | | 1,404,000 | |
PHI Incorporated | | | 8.63 | | | | 10-15-2018 | | | | 2,050,000 | | | | 2,203,750 | |
Regency Energy Partners LP | | | 5.88 | | | | 3-1-2022 | | | | 2,625,000 | | | | 2,730,000 | |
| | | | |
| | | | | | | | | | | | | | | 24,211,925 | |
| | | | | | | | | | | | | | | | |
| | | | |
| Oil, Gas & Consumable Fuels: 8.48% | | | | | | | | | | | | | | | | |
Atlas Pipeline Partners LP | | | 5.88 | | | | 8-1-2023 | | | | 8,000,000 | | | | 7,860,000 | |
Energy Transfer Equity LP | | | 7.50 | | | | 10-15-2020 | | | | 3,475,000 | | | | 3,970,188 | |
QEP Resources Incorporated | | | 5.25 | | | | 5-1-2023 | | | | 2,000,000 | | | | 1,995,000 | |
Sabine Pass Liquefaction LLC 144A | | | 5.88 | | | | 2-1-2021 | | | | 7,000,000 | | | | 7,175,000 | |
Suburban Propane Partners LP | | | 7.38 | | | | 3-15-2020 | | | | 2,550,000 | | | | 2,741,250 | |
Tesoro Logistics LP | | | 5.88 | | | | 10-1-2020 | | | | 4,000,000 | | | | 4,180,000 | |
| | | | |
| | | | | | | | | | | | | | | 27,921,438 | |
| | | | | | | | | | | | | | | | |
| | | | |
Financials: 1.84% | | | | | | | | | | | | | | | | |
| | | | |
| REITs: 1.84% | | | | | | | | | | | | | | | | |
Crown Castle International Corporation | | | 5.25 | | | | 1-15-2023 | | | | 2,000,000 | | | | 2,050,000 | |
Sabra Health Care Incorporated | | | 5.38 | | | | 6-1-2023 | | | | 4,000,000 | | | | 3,990,000 | |
| | | | |
| | | | | | | | | | | | | | | 6,040,000 | |
| | | | | | | | | | | | | | | | |
| | | | |
Health Care: 18.50% | | | | | | | | | | | | | | | | |
| | | | |
| Health Care Equipment & Supplies: 2.60% | | | | | | | | | | | | | | | | |
Hologic Incorporated | | | 6.25 | | | | 8-1-2020 | | | | 8,062,000 | | | | 8,565,875 | |
| | | | | | | | | | | | | | | | |
| | | | |
| Health Care Providers & Services: 9.30% | | | | | | | | | | | | | | | | |
Aviv Healthcare Properties LP | | | 7.75 | | | | 2-15-2019 | | | | 1,150,000 | | | | 1,242,000 | |
DaVita HealthCare Partners Incorporated | | | 5.75 | | | | 8-15-2022 | | | | 13,425,000 | | | | 14,196,938 | |
Fresenius Medical Care Holdings Incorporated 144A | | | 5.88 | | | | 1-31-2022 | | | | 12,529,000 | | | | 13,406,030 | |
MPT Operating Partnership LP | | | 6.88 | | | | 5-1-2021 | | | | 1,625,000 | | | | 1,759,063 | |
| | | | |
| | | | | | | | | | | | | | | 30,604,031 | |
| | | | | | | | | | | | | | | | |
| | | | |
| Pharmaceuticals: 6.60% | | | | | | | | | | | | | | | | |
Forest Laboratories Incorporated 144A | | | 5.00 | | | | 12-15-2021 | | | | 2,000,000 | | | | 2,140,000 | |
Salix Pharmaceuticals Incorporated 144A | | | 6.00 | | | | 1-15-2021 | | | | 5,800,000 | | | | 6,206,000 | |
The accompanying notes are an integral part of these financial statements.
| | | | |
| 12 | | Wells Fargo Advantage High Yield Bond Fund | | Portfolio of investments—February 28, 2014 (unaudited) |
| | | | | | | | | | | | | | | | |
| Security name | | Interest rate | | | Maturity date | | | Principal | | | Value | |
| | | | | | | | | | | | | | | | |
| | | | |
| Pharmaceuticals (continued) | | | | | | | | | | | | | | | | |
Valeant Pharmaceuticals International Incorporated 144A | | | 7.25 | % | | | 7-15-2022 | | | $ | 12,000,000 | | | $ | 13,350,000 | |
| | | | |
| | | | | | | | | | | | | | | 21,696,000 | |
| | | | | | | | | | | | | | | | |
| | | | |
Industrials: 12.47% | | | | | | | | | | | | | | | | |
| | | | |
| Aerospace & Defense: 0.62% | | | | | | | | | | | | | | | | |
Alliant Techsystems Incorporated 144A | | | 5.25 | | | | 10-1-2021 | | | | 2,000,000 | | | | 2,050,000 | |
| | | | | | | | | | | | | | | | |
| | | | |
| Building Products: 0.66% | | | | | | | | | | | | | | | | |
Dycom Investments Incorporated | | | 7.13 | | | | 1-15-2021 | | | | 2,000,000 | | | | 2,160,000 | |
| | | | | | | | | | | | | | | | |
| | | | |
| Commercial Services & Supplies: 2.28% | | | | | | | | | | | | | | | | |
Clean Harbors Incorporated | | | 5.13 | | | | 6-1-2021 | | | | 1,000,000 | | | | 1,020,000 | |
Iron Mountain Incorporated | | | 5.75 | | | | 8-15-2024 | | | | 6,650,000 | | | | 6,483,750 | |
| | | | |
| | | | | | | | | | | | | | | 7,503,750 | |
| | | | | | | | | | | | | | | | |
| | | | |
| Electrical Equipment: 4.23% | | | | | | | | | | | | | | | | |
Belden Incorporated 144A | | | 5.50 | | | | 9-1-2022 | | | | 2,850,000 | | | | 2,814,375 | |
General Cable Corporation 144A | | | 6.50 | | | | 10-1-2022 | | | | 11,000,000 | | | | 11,110,000 | |
| | | | |
| | | | | | | | | | | | | | | 13,924,375 | |
| | | | | | | | | | | | | | | | |
| | | | |
| Machinery: 0.17% | | | | | | | | | | | | | | | | |
Columbus McKinnon Corporation | | | 7.88 | | | | 2-1-2019 | | | | 525,000 | | | | 567,000 | |
| | | | | | | | | | | | | | | | |
| | | | |
| Road & Rail: 4.51% | | | | | | | | | | | | | | | | |
Hertz Corporation « | | | 6.25 | | | | 10-15-2022 | | | | 14,021,000 | | | | 14,827,208 | |
| | | | | | | | | | | | | | | | |
| | | | |
Information Technology: 1.57% | | | | | | | | | | | | | | | | |
| | | | |
| IT Services: 1.57% | | | | | | | | | | | | | | | | |
Neustar Incorporated | | | 4.50 | | | | 1-15-2023 | | | | 6,000,000 | | | | 5,175,000 | |
| | | | | | | | | | | | | | | | |
| | | | |
Materials: 15.99% | | | | | | | | | | | | | | | | |
| | | | |
| Chemicals: 10.94% | | | | | | | | | | | | | | | | |
Celanese U.S. Holdings LLC | | | 4.63 | | | | 11-15-2022 | | | | 2,000,000 | | | | 1,990,000 | |
Huntsman International LLC | | | 4.88 | | | | 11-15-2020 | | | | 1,000,000 | | | | 1,018,750 | |
Kraton Polymers LLC | | | 6.75 | | | | 3-1-2019 | | | | 2,105,000 | | | | 2,239,194 | |
Olin Corporation | | | 5.50 | | | | 8-15-2022 | | | | 14,000,000 | | | | 14,315,000 | |
Tronox Finance LLC « | | | 6.38 | | | | 8-15-2020 | | | | 16,000,000 | | | | 16,440,000 | |
| | | | |
| | | | | | | | | | | | | | | 36,002,944 | |
| | | | | | | | | | | | | | | | |
| | | | |
| Containers & Packaging: 3.60% | | | | | | | | | | | | | | | | |
Sealed Air Corporation 144A | | | 5.25 | | | | 4-1-2023 | | | | 500,000 | | | | 507,500 | |
Sealed Air Corporation 144A | | | 6.50 | | | | 12-1-2020 | | | | 8,635,000 | | | | 9,552,469 | |
Silgan Holdings Incorporated | | | 5.00 | | | | 4-1-2020 | | | | 1,750,000 | | | | 1,785,000 | |
| | | | |
| | | | | | | | | | | | | | | 11,844,969 | |
| | | | | | | | | | | | | | | | |
| | | | |
| Paper & Forest Products: 1.45% | | | | | | | | | | | | | | | | |
P.H. Glatfelter Company | | | 5.38 | | | | 10-15-2020 | | | | 4,630,000 | | | | 4,768,900 | |
| | | | | | | | | | | | | | | | |
The accompanying notes are an integral part of these financial statements.
| | | | | | |
| Portfolio of investments—February 28, 2014 (unaudited) | | Wells Fargo Advantage High Yield Bond Fund | | | 13 | |
| | | | | | | | | | | | | | | | |
| Security name | | Interest rate | | | Maturity date | | | Principal | | | Value | |
| | | | | | | | | | | | | | | | |
| | | | |
Telecommunication Services: 4.22% | | | | | | | | | | | | | | | | |
| | | | |
| Diversified Telecommunication Services: 1.06% | | | | | | | | | | | | | �� | | | |
GCI Incorporated | | | 8.63 | % | | | 11-15-2019 | | | $ | 3,235,000 | | | $ | 3,477,625 | |
| | | | | | | | | | | | | | | | |
| | | | |
| Wireless Telecommunication Services: 3.16% | | | | | | | | | | | | | | | | |
MetroPCS Wireless Incorporated | | | 6.63 | | | | 11-15-2020 | | | | 1,575,000 | | | | 1,689,188 | |
SBA Telecommunications Corporation | | | 5.63 | | | | 10-1-2019 | | | | 6,700,000 | | | | 7,018,250 | |
SBA Telecommunications Corporation | | | 5.75 | | | | 7-15-2020 | | | | 1,625,000 | | | | 1,710,313 | |
| | | | |
| | | | | | | | | | | | | | | 10,417,751 | |
| | | | | | | | | | | | | | | | |
| | | | |
Utilities: 6.71% | | | | | | | | | | | | | | | | |
| | | | |
| Electric Utilities: 1.33% | | | | | | | | | | | | | | | | |
DPL Incorporated | | | 7.25 | | | | 10-15-2021 | | | | 4,375,000 | | | | 4,369,531 | |
| | | | | | | | | | | | | | | | |
| | | | |
| Gas Utilities: 0.53% | | | | | | | | | | | | | | | | |
AmeriGas Finance LLC | | | 6.75 | | | | 5-20-2020 | | | | 1,600,000 | | | | 1,744,000 | |
| | | | | | | | | | | | | | | | |
| | | | |
| Independent Power & Renewable Electricity Producers: 4.85% | | | | | | | | | | | | | | | | |
Calpine Corporation 144A | | | 5.88 | | | | 1-15-2024 | | | | 500,000 | | | | 512,500 | |
Calpine Corporation 144A | | | 6.00 | | | | 1-15-2022 | | | | 1,625,000 | | | | 1,722,500 | |
NRG Energy Incorporated | | | 6.63 | | | | 3-15-2023 | | | | 13,000,000 | | | | 13,715,000 | |
| | | | |
| | | | | | | | | | | | | | | 15,950,000 | |
| | | | | | | | | | | | | | | | |
| | | | |
Total Corporate Bonds and Notes (Cost $268,443,195) | | | | | | | | | | | | | | | 274,714,287 | |
| | | | | | | | | | | | | | | | |
| | | | |
Yankee Corporate Bonds and Notes: 5.69% | | | | | | | | | | | | | | | | |
| | | | |
Financials: 0.00% | | | | | | | | | | | | | | | | |
| | | | |
| Diversified Financial Services: 0.00% | | | | | | | | | | | | | | | | |
Preferred Term Securities XII Limited (s)(i) | | | 0.00 | | | | 12-24-2033 | | | | 720,000 | | | | 7 | |
| | | | | | | | | | | | | | | | |
| | | | |
Industrials: 0.45% | | | | | | | | | | | | | | | | |
| | | | |
| Electrical Equipment: 0.45% | | | | | | | | | | | | | | | | |
Sensata Technologies Holdings B.V. 144A | | | 4.88 | | | | 10-15-2023 | | | | 1,500,000 | | | | 1,473,747 | |
| | | | | | | | | | | | | | | | |
| | | | |
Information Technology: 4.37% | | | | | | | | | | | | | | | | |
| | | | |
| Technology Hardware, Storage & Peripherals: 4.37% | | | | | | | | | | | | | | | | |
Seagate Technology HDD Holdings | | | 7.00 | | | | 11-1-2021 | | | | 12,850,000 | | | | 14,392,000 | |
| | | | | | | | | | | | | | | | |
| | | | |
Telecommunication Services: 0.87% | | | | | | | | | | | | | | | | |
| | | | |
| Diversified Telecommunication Services: 0.87% | | | | | | | | | | | | | | | | |
Intelsat Jackson Holdings SA | | | 7.25 | | | | 10-15-2020 | | | | 2,625,000 | | | | 2,854,688 | |
| | | | | | | | | | | | | | | | |
| | | | |
Total Yankee Corporate Bonds and Notes (Cost $18,152,338) | | | | | | | | | | | | | | | 18,720,442 | |
| | | | | | | | | | | | | | | | |
| | | | |
| | | Yield | | | | | | Shares | | | | |
| Short-Term Investments: 2.02% | | | | | | | | | | | | | | | | |
| | | | |
| Investment Companies: 1.94% | | | | | | | | | | | | | | | | |
Wells Fargo Advantage Cash Investment Money Market Fund, Select Class (l)(u) | | | 0.07 | | | | | | | | 767,385 | | | | 767,385 | |
Wells Fargo Securities Lending Cash Investments, LLC (r)(v)(l)(u) | | | 0.09 | | | | | | | | 5,618,660 | | | | 5,618,660 | |
| | | | |
| | | | | | | | | | | | | | | 6,386,045 | |
| | | | | | | | | | | | | | | | |
The accompanying notes are an integral part of these financial statements.
| | | | |
| 14 | | Wells Fargo Advantage High Yield Bond Fund | | Portfolio of investments—February 28, 2014 (unaudited) |
| | | | | | | | | | | | | | | | |
| Security name | | Yield | | | Maturity date | | | Principal | | | Value | |
| | | | | | | | | | | | | | | | |
| U.S. Treasury Securities: 0.08% | | | | | | | | | | | | | | | | |
U.S. Treasury Bill (z)# | | | 0.01 | % | | | 3-13-2014 | | | $ | 252,000 | | | $ | 251,999 | |
| | | | | | | | | | | | | | | | |
| | | | |
Total Short-Term Investments (Cost $6,638,034) | | | | | | | | | | | | | | | 6,638,044 | |
| | | | | | | | | | | | | | | | |
| | | | | | | | |
| Total investments in securities | | | | | | | | |
| (Cost $320,324,664) * | | | 100.51 | % | | | 330,725,483 | |
Other assets and liabilities, net | | | (0.51 | ) | | | (1,669,766 | ) |
| | | | | | | | |
| Total net assets | | | 100.00 | % | | $ | 329,055,717 | |
| | | | | | | | |
| † | Non-income-earning security |
| (a) | Security is fair valued by the Management Valuation Team, and in certain instances by the Board of Trustees, in accordance with procedures approved by the Board of Trustees. |
| 144A | Security that may be resold to “qualified institutional buyers” under Rule 144A or security offered pursuant to Section 4(2) of the Securities Act of 1933, as amended. |
| « | All or a portion of this security is on loan. |
| (s) | Security is currently in default with regards to scheduled interest and/or principal payments. The Fund has stopped accruing interest on this security. |
| (l) | Investment in an affiliate |
| (u) | Rate shown is the 7-day annualized yield at period end. |
| (r) | The investment company is exempt from registration under Section 3(c)(7) of the Investment Company Act of 1940, as amended. |
| (v) | Security represents investment of cash collateral received from securities on loan. |
| (z) | Zero coupon security. Rate represents the current yield to maturity. |
| # | All or a portion of this security is segregated as collateral for investments in derivative instruments. |
| * | Cost for federal income tax purposes is $320,320,743 and unrealized appreciation (depreciation) consists of: |
| | | | |
Gross unrealized appreciation | | $ | 12,654,734 | |
Gross unrealized depreciation | | | (2,249,994 | ) |
| | | | |
Net unrealized appreciation | | $ | 10,404,740 | |
The accompanying notes are an integral part of these financial statements.
| | | | | | |
| Statement of assets and liabilities—February 28, 2014 (unaudited) | | Wells Fargo Advantage High Yield Bond Fund | | | 15 | |
| | | | |
| | | | |
| |
Assets | | | | |
Investments | | | | |
In unaffiliated securities (including securities on loan), at value (see cost below) | | $ | 324,339,438 | |
In affiliated securities, at value (see cost below) | | | 6,386,045 | |
| | | | |
Total investments, at value (see cost below) | | | 330,725,483 | |
Foreign currency, at value (see cost below) | | | 48 | |
Receivable for investments sold | | | 2,481,352 | |
Receivable for Fund shares sold | | | 100,560 | |
Receivable for dividends and interest | | | 4,330,316 | |
Receivable for daily variation margin on open futures contracts | | | 35,000 | |
Receivable for securities lending income | | | 882 | |
Prepaid expenses and other assets | | | 127,773 | |
| | | | |
Total assets | | | 337,801,414 | |
| | | | |
| |
Liabilities | | | | |
Dividends payable | | | 138,000 | |
Payable for investments purchased | | | 1,830,480 | |
Payable for Fund shares redeemed | | | 735,500 | |
Payable upon receipt of securities loaned | | | 5,618,660 | |
Advisory fee payable | | | 129,786 | |
Distribution fees payable | | | 50,580 | |
Due to other related parties | | | 54,877 | |
Accrued expenses and other liabilities | | | 187,814 | |
| | | | |
Total liabilities | | | 8,745,697 | |
| | | | |
Total net assets | | $ | 329,055,717 | |
| | | | |
| |
NET ASSETS CONSIST OF | | | | |
Paid-in capital | | $ | 380,403,334 | |
Overdistributed net investment income | | | (108,773 | ) |
Accumulated net realized losses on investments | | | (61,541,783 | ) |
Net unrealized gains on investments | | | 10,302,939 | |
| | | | |
Total net assets | | $ | 329,055,717 | |
| | | | |
| |
COMPUTATION OF NET ASSET VALUE AND OFFERING PRICE PER SHARE1 | | | | |
Net assets – Class A | | $ | 221,601,257 | |
Shares outstanding – Class A | | | 67,042,664 | |
Net asset value per share – Class A | | | $3.31 | |
Maximum offering price per share – Class A2 | | | $3.47 | |
Net assets – Class B | | $ | 5,338,032 | |
Shares outstanding – Class B | | | 1,614,718 | |
Net asset value per share – Class B | | | $3.31 | |
Net assets – Class C | | $ | 76,993,411 | |
Shares outstanding – Class C | | | 23,289,209 | |
Net asset value per share – Class C | | | $3.31 | |
Net assets – Administrator Class | | $ | 25,123,017 | |
Shares outstanding – Administrator Class | | | 7,589,088 | |
Net asset value per share – Administrator Class | | | $3.31 | |
| |
Investments in unaffiliated securities (including securities on loan), at cost | | $ | 313,938,619 | |
| | | | |
Investments in affiliated securities, at cost | | $ | 6,386,045 | |
| | | | |
Total investments, at cost | | $ | 320,324,664 | |
| | | | |
Securities on loan, at value | | $ | 5,507,087 | |
| | | | |
Foreign currency, at cost | | $ | 45 | |
| | | | |
| 1. | The Fund has an unlimited number of authorized shares. |
| 2. | Maximum offering price is computed as 100/95.50 of net asset value. On investments of $50,000 or more, the offering price is reduced. |
The accompanying notes are an integral part of these financial statements.
| | | | |
| 16 | | Wells Fargo Advantage High Yield Bond Fund | | Statement of operations—six months ended February 28, 2014 (unaudited) |
| | | | |
| | | | |
| |
Investment income | | | | |
Interest | | $ | 8,880,596 | |
Dividends | | | 287,048 | |
Securities lending income, net | | | 11,311 | |
Income from affiliated securities | | | 869 | |
| | | | |
Total investment income | | | 9,179,824 | |
| | | | |
| |
Expenses | | | | |
Advisory fee | | | 817,794 | |
Administration fees | | | | |
Fund level | | | 81,779 | |
Class A | | | 177,118 | |
Class B | | | 4,698 | |
Class C | | | 63,256 | |
Administrator Class | | | 10,389 | |
Shareholder servicing fees | | | | |
Class A | | | 276,747 | |
Class B | | | 7,137 | |
Class C | | | 98,837 | |
Administrator Class | | | 24,761 | |
Distribution fees | | | | |
Class B | | | 22,020 | |
Class C | | | 296,512 | |
Custody and accounting fees | | | 11,610 | |
Professional fees | | | 34,542 | |
Registration fees | | | 30,216 | |
Shareholder report expenses | | | 32,215 | |
Trustees’ fees and expenses | | | 5,017 | |
Other fees and expenses | | | 6,618 | |
| | | | |
Total expenses | | | 2,001,266 | |
Less: Fee waivers and/or expense reimbursements | | | (22,184 | ) |
| | | | |
Net expenses | | | 1,979,082 | |
| | | | |
Net investment income | | | 7,200,742 | |
| | | | |
| |
REALIZED AND UNREALIZED GAINS (LOSSES) ON INVESTMENTS | | | | |
| |
Net realized gains (losses) on: | | | | |
Unaffiliated securities | | | 1,309,355 | |
Futures transactions | | | (600,678 | ) |
| | | | |
Net realized gains on investments | | | 708,677 | |
| | | | |
| |
Net change in unrealized gains (losses) on: | | | | |
Unaffiliated securities | | | 15,418,689 | |
Futures transactions | | | 102,594 | |
| | | | |
Net change in unrealized gains (losses) on investments | | | 15,521,283 | |
| | | | |
Net realized and unrealized gains (losses) on investments | | | 16,229,960 | |
| | | | |
Net increase in net assets resulting from operations | | $ | 23,430,702 | |
| | | | |
The accompanying notes are an integral part of these financial statements.
| | | | | | |
| Statement of changes in net assets | | Wells Fargo Advantage High Yield Bond Fund | | | 17 | |
| | | | | | | | | | | | | | | | |
| | | Six months ended
February 28, 2014
(unaudited) | | | Year ended
August 31, 2013 | |
| | | | |
Operations | | | | | | | | | | | | | | | | |
Net investment income | | | | | | $ | 7,200,742 | | | | | | | $ | 17,384,672 | |
Net realized gains on investments | | | | | | | 708,677 | | | | | | | | 18,224,276 | |
Net change in unrealized gains (losses) on investments | | | | | | | 15,521,283 | | | | | | | | (20,063,715 | ) |
| | | | |
Net increase in net assets resulting from operations | | | | | | | 23,430,702 | | | | | | | | 15,545,233 | |
| | | | |
| | | | |
Distributions to shareholders from | | | | | | | | | | | | | | | | |
Net investment income | | | | | | | | | | | | | | | | |
Class A | | | | | | | (5,055,774 | ) | | | | | | | (11,802,757 | ) |
Class B | | | | | | | (112,165 | ) | | | | | | | (390,499 | ) |
Class C | | | | | | | (1,509,742 | ) | | | | | | | (3,771,645 | ) |
Administrator Class | | | | | | | (497,874 | ) | | | | | | | (1,421,343 | ) |
| | | | |
Total distributions to shareholders | | | | | | | (7,175,555 | ) | | | | | | | (17,386,244 | ) |
| | | | |
| | | | |
Capital share transactions | | | Shares | | | | | | | | Shares | | | | | |
Proceeds from shares sold | | | | | | | | | | | | | | | | |
Class A | | | 2,990,995 | | | | 9,586,655 | | | | 8,686,785 | | | | 28,273,612 | |
Class B | | | 3,953 | | | | 12,745 | | | | 67,461 | | | | 219,086 | |
Class C | | | 496,256 | | | | 1,593,936 | | | | 1,743,975 | | | | 5,681,242 | |
Administrator Class | | | 2,273,680 | | | | 7,377,623 | | | | 3,242,704 | | | | 10,578,643 | |
| | | | |
| | | | | | | 18,570,959 | | | | | | | | 44,752,583 | |
| | | | |
Reinvestment of distributions | | | | | | | | | | | | | | | | |
Class A | | | 1,354,088 | | | | 4,382,107 | | | | 3,080,175 | | | | 9,994,164 | |
Class B | | | 30,873 | | | | 99,842 | | | | 103,737 | | | | 336,538 | |
Class C | | | 424,201 | | | | 1,372,616 | | | | 1,024,306 | | | | 3,323,484 | |
Administrator Class | | | 136,113 | | | | 440,937 | | | | 383,719 | | | | 1,245,710 | |
| | | | |
| | | | | | | 6,295,502 | | | | | | | | 14,899,896 | |
| | | | |
Payment for shares redeemed | | | | | | | | | | | | | | | | |
Class A | | | (9,043,827 | ) | | | (29,054,270 | ) | | | (22,446,941 | ) | | | (72,965,905 | ) |
Class B | | | (538,457 | ) | | | (1,731,899 | ) | | | (2,220,348 | ) | | | (7,234,458 | ) |
Class C | | | (4,178,048 | ) | | | (13,437,784 | ) | | | (7,565,262 | ) | | | (24,547,467 | ) |
Administrator Class | | | (1,605,729 | ) | | | (5,176,241 | ) | | | (8,617,078 | ) | | | (28,015,457 | ) |
| | | | |
| | | | | | | (49,400,194 | ) | | | | | | | (132,763,287 | ) |
| | | | |
Net decrease in net assets resulting from capital share transactions | | | | | | | (24,533,733 | ) | | | | | | | (73,110,808 | ) |
| | | | |
Total decrease in net assets | | | | | | | (8,278,586 | ) | | | | | | | (74,951,819 | ) |
| | | | |
| | | | |
Net assets | | | | | | | | | | | | | | | | |
Beginning of period | | | | | | | 337,334,303 | | | | | | | | 412,286,122 | |
| | | | |
End of period | | | | | | $ | 329,055,717 | | | | | | | $ | 337,334,303 | |
| | | | |
Overdistributed net investment income | | | | | | $ | (108,773 | ) | | | | | | $ | (133,960 | ) |
| | | | |
The accompanying notes are an integral part of these financial statements.
| | | | |
| 18 | | Wells Fargo Advantage High Yield Bond Fund | | Financial highlights |
(For a share outstanding throughout each period)
| | | | | | | | | | | | | | | | | | | | | | | | | | | | |
| | | Six months ended
February 28, 2014
(unaudited) | | | Year ended August 31 | | | Year ended April 30 | |
| CLASS A | | | 2013 | | | 2012 | | | 2011 | | | 20101,2 | | | 20101 | | | 20091 | |
Net asset value, beginning of period | | $ | 3.15 | | | $ | 3.18 | | | $ | 3.03 | | | $ | 3.05 | | | $ | 3.10 | | | $ | 2.39 | | | $ | 3.13 | |
Net investment income | | | 0.07 | | | | 0.15 | | | | 0.20 | | | | 0.21 | | | | 0.08 | | | | 0.25 | | | | 0.27 | |
Net realized and unrealized gains (losses) on investments | | | 0.16 | | | | (0.03 | ) | | | 0.15 | | | | (0.02 | ) | | | (0.05 | ) | | | 0.72 | | | | (0.76 | ) |
| | | | | | | | | | | | | | | | | | | | | | | | | | | | |
Total from investment operations | | | 0.23 | | | | 0.12 | | | | 0.35 | | | | 0.19 | | | | 0.03 | | | | 0.97 | | | | (0.49 | ) |
Distributions to shareholders from | | | | | | | | | | | | | | | | | | | | | | | | | | | | |
Net investment income | | | (0.07 | ) | | | (0.15 | ) | | | (0.20 | ) | | | (0.21 | ) | | | (0.08 | ) | | | (0.26 | ) | | | (0.25 | ) |
Net asset value, end of period | | $ | 3.31 | | | $ | 3.15 | | | $ | 3.18 | | | $ | 3.03 | | | $ | 3.05 | | | $ | 3.10 | | | $ | 2.39 | |
Total return3 | | | 7.47 | % | | | 3.78 | % | | | 12.00 | % | | | 6.07 | % | | | 0.99 | % | | | 42.27 | % | | | (15.50 | )% |
Ratios to average net assets (annualized) | | | | | | | | | | | | | | | | | | | | | | | | | | | | |
Gross expenses | | | 1.03 | % | | | 1.04 | % | | | 1.02 | % | | | 1.02 | % | | | 1.06 | % | | | 1.14 | % | | | 1.22 | % |
Net expenses | | | 1.03 | % | | | 1.03 | % | | | 1.02 | % | | | 1.02 | % | | | 1.05 | % | | | 1.13 | % | | | 1.08 | % |
Net investment income | | | 4.58 | % | | | 4.65 | % | | | 6.52 | % | | | 6.60 | % | | | 7.70 | % | | | 8.96 | % | | | 10.60 | % |
Supplemental data | | | | | | | | | | | | | | | | | | | | | | | | | | | | |
Portfolio turnover rate | | | 13 | % | | | 95 | % | | | 37 | % | | | 70 | % | | | 46 | % | | | 129 | % | | | 119 | % |
Net assets, end of period (000s omitted) | | | $221,601 | | | | $225,743 | | | | $261,938 | | | | $240,653 | | | | $281,044 | | | | $292,039 | | | | $217,199 | |
| 1. | After the close of business on July 9, 2010, the Fund acquired the net assets of Evergreen High Income Fund which became the accounting and performance survivor in the transaction. The information for the periods prior to July 12, 2010 is that of Class A of Evergreen High Income Fund. |
| 2. | For the four months ended August 31, 2010. The Fund changed its fiscal year end from April 30 to August 31, effective August 31, 2010. |
| 3. | Total return calculations do not include any sales charges. Returns for periods of less than one year are not annualized. |
The accompanying notes are an integral part of these financial statements.
| | | | | | |
| Financial highlights | | Wells Fargo Advantage High Yield Bond Fund | | | 19 | |
(For a share outstanding throughout each period)
| | | | | | | | | | | | | | | | | | | | | | | | | | | | |
| | | Six months ended
February 28, 2014
(unaudited) | | | Year ended August 31 | | | Year ended April 30 | |
| CLASS B | | | 2013 | | | 2012 | | | 2011 | | | 20101,2 | | | 20101 | | | 20091 | |
Net asset value, beginning of period | | $ | 3.15 | | | $ | 3.18 | | | $ | 3.03 | | | $ | 3.05 | | | $ | 3.10 | | | $ | 2.39 | | | $ | 3.13 | |
Net investment income | | | 0.06 | 3 | | | 0.13 | 3 | | | 0.18 | 3 | | | 0.18 | 3 | | | 0.07 | | | | 0.22 | | | | 0.25 | 3 |
Net realized and unrealized gains (losses) on investments | | | 0.16 | | | | (0.03 | ) | | | 0.15 | | | | (0.02 | ) | | | (0.05 | ) | | | 0.73 | | | | (0.76 | ) |
| | | | | | | | | | | | | | | | | | | | | | | | | | | | |
Total from investment operations | | | 0.22 | | | | 0.10 | | | | 0.33 | | | | 0.16 | | | | 0.02 | | | | 0.95 | | | | (0.51 | ) |
Distributions to shareholders from | | | | | | | | | | | | | | | | | | | | | | | | | | | | |
Net investment income | | | (0.06 | ) | | | (0.13 | ) | | | (0.18 | ) | | | (0.18 | ) | | | (0.07 | ) | | | (0.24 | ) | | | (0.23 | ) |
Net asset value, end of period | | $ | 3.31 | | | $ | 3.15 | | | $ | 3.18 | | | $ | 3.03 | | | $ | 3.05 | | | $ | 3.10 | | | $ | 2.39 | |
Total return4 | | | 7.08 | % | | | 3.01 | % | | | 11.17 | % | | | 5.28 | % | | | 0.74 | % | | | 41.23 | % | | | (16.13 | )% |
Ratios to average net assets (annualized) | | | | | | | | | | | | | | | | | | | | | | | | | | | | |
Gross expenses | | | 1.78 | % | | | 1.78 | % | | | 1.77 | % | | | 1.78 | % | | | 1.81 | % | | | 1.89 | % | | | 1.97 | % |
Net expenses | | | 1.77 | % | | | 1.78 | % | | | 1.77 | % | | | 1.77 | % | | | 1.81 | % | | | 1.88 | % | | | 1.83 | % |
Net investment income | | | 3.83 | % | | | 3.93 | % | | | 5.80 | % | | | 5.85 | % | | | 6.98 | % | | | 8.29 | % | | | 9.70 | % |
Supplemental data | | | | | | | | | | | | | | | | | | | | | | | | | | | | |
Portfolio turnover rate | | | 13 | % | | | 95 | % | | | 37 | % | | | 70 | % | | | 46 | % | | | 129 | % | | | 119 | % |
Net assets, end of period (000s omitted) | | | $5,338 | | | | $6,667 | | | | $13,247 | | | | $21,656 | | | | $50,671 | | | | $54,017 | | | | $58,429 | |
| 1. | After the close of business on July 9, 2010, the Fund acquired the net assets of Evergreen High Income Fund which became the accounting and performance survivor in the transaction. The information for the periods prior to July 12, 2010 is that of Class B of Evergreen High Income Fund. |
| 2. | For the four months ended August 31, 2010. The Fund changed its fiscal year end from April 30 to August 31, effective August 31, 2010. |
| 3. | Calculated based upon average shares outstanding |
| 4. | Total return calculations do not include any sales charges. Returns for periods of less than one year are not annualized. |
The accompanying notes are an integral part of these financial statements.
| | | | |
| 20 | | Wells Fargo Advantage High Yield Bond Fund | | Financial highlights |
(For a share outstanding throughout each period)
| | | | | | | | | | | | | | | | | | | | | | | | | | | | |
| | | Six months ended
February 28, 2014
(unaudited) | | | Year ended August 31 | | | Year ended April 30 | |
| CLASS C | | | 2013 | | | 2012 | | | 2011 | | | 20101,2 | | | 20101 | | | 20091 | |
Net asset value, beginning of period | | $ | 3.15 | | | $ | 3.18 | | | $ | 3.03 | | | $ | 3.05 | | | $ | 3.10 | | | $ | 2.39 | | | $ | 3.13 | |
Net investment income | | | 0.06 | | | | 0.13 | | | | 0.18 | | | | 0.18 | | | | 0.07 | | | | 0.23 | | | | 0.25 | |
Net realized and unrealized gains (losses) on investments | | | 0.16 | | | | (0.03 | ) | | | 0.15 | | | | (0.02 | ) | | | (0.05 | ) | | | 0.72 | | | | (0.76 | ) |
| | | | | | | | | | | | | | | | | | | | | | | | | | | | |
Total from investment operations | | | 0.22 | | | | 0.10 | | | | 0.33 | | | | 0.16 | | | | 0.02 | | | | 0.95 | | | | (0.51 | ) |
Distributions to shareholders from | | | | | | | | | | | | | | | | | | | | | | | | | | | | |
Net investment income | | | (0.06 | ) | | | (0.13 | ) | | | (0.18 | ) | | | (0.18 | ) | | | (0.07 | ) | | | (0.24 | ) | | | (0.23 | ) |
Net asset value, end of period | | $ | 3.31 | | | $ | 3.15 | | | $ | 3.18 | | | $ | 3.03 | | | $ | 3.05 | | | $ | 3.10 | | | $ | 2.39 | |
Total return3 | | | 7.07 | % | | | 3.01 | % | | | 11.17 | % | | | 5.28 | % | | | 0.74 | % | | | 41.23 | % | | | (16.13 | )% |
Ratios to average net assets (annualized) | | | | | | | | | | | | | | | | | | | | | | | | | | | | |
Gross expenses | | | 1.78 | % | | | 1.79 | % | | | 1.77 | % | | | 1.77 | % | | | 1.81 | % | | | 1.89 | % | | | 1.97 | % |
Net expenses | | | 1.78 | % | | | 1.78 | % | | | 1.77 | % | | | 1.77 | % | | | 1.81 | % | | | 1.88 | % | | | 1.83 | % |
Net investment income | | | 3.83 | % | | | 3.90 | % | | | 5.78 | % | | | 5.85 | % | | | 6.97 | % | | | 8.21 | % | | | 9.79 | % |
Supplemental data | | | | | | | | | | | | | | | | | | | | | | | | | | | | |
Portfolio turnover rate | | | 13 | % | | | 95 | % | | | 37 | % | | | 70 | % | | | 46 | % | | | 129 | % | | | 119 | % |
Net assets, end of period (000s omitted) | | | $76,993 | | | | $83,548 | | | | $99,633 | | | | $95,999 | | | | $104,954 | | | | $106,886 | | | | $78,995 | |
| 1. | After the close of business on July 9, 2010, the Fund acquired the net assets of Evergreen High Income Fund which became the accounting and performance survivor in the transaction. The information for the periods prior to July 12, 2010 is that of Class C of Evergreen High Income Fund. |
| 2. | For the four months ended August 31, 2010. The Fund changed its fiscal year end from April 30 to August 31, effective August 31, 2010. |
| 3. | Total return calculations do not include any sales charges. Returns for periods of less than one year are not annualized. |
The accompanying notes are an integral part of these financial statements.
| | | | | | |
| Financial highlights | | Wells Fargo Advantage High Yield Bond Fund | | | 21 | |
(For a share outstanding throughout each period)
| | | | | | | | | | | | | | | | | | | | | | | | | | | | |
| | | Six months ended
February 28, 2014
(unaudited) | | | Year ended August 31 | | | Year ended April 30 | |
| ADMINISTRATOR CLASS | | | 2013 | | | 2012 | | | 2011 | | | 20101,2 | | | 20101 | | | 20091 | |
Net asset value, beginning of period | | $ | 3.15 | | | $ | 3.18 | | | $ | 3.03 | | | $ | 3.05 | | | $ | 3.10 | | | $ | 2.39 | | | $ | 3.13 | |
Net investment income | | | 0.08 | | | | 0.16 | | | | 0.21 | | | | 0.22 | | | | 0.08 | | | | 0.26 | | | | 0.28 | 3 |
Net realized and unrealized gains (losses) on investments | | | 0.16 | | | | (0.03 | ) | | | 0.15 | | | | (0.03 | ) | | | (0.05 | ) | | | 0.72 | | | | (0.76 | ) |
| | | | | | | | | | | | | | | | | | | | | | | | | | | | |
Total from investment operations | | | 0.24 | | | | 0.13 | | | | 0.36 | | | | 0.19 | | | | 0.03 | | | | 0.98 | | | | (0.48 | ) |
Distributions to shareholders from | | | | | | | | | | | | | | | | | | | | | | | | | | | | |
Net investment income | | | (0.08 | ) | | | (0.16 | ) | | | (0.21 | ) | | | (0.21 | ) | | | (0.08 | ) | | | (0.27 | ) | | | (0.26 | ) |
Net asset value, end of period | | | $3.31 | | | | $3.15 | | | | $3.18 | | | | $3.03 | | | | $3.05 | | | | $3.10 | | | | $2.39 | |
Total return4 | | | 7.59 | % | | | 4.02 | % | | | 12.25 | % | | | 6.30 | % | | | 1.07 | % | | | 42.62 | % | | | (15.28 | )% |
Ratios to average net assets (annualized) | | | | | | | | | | | | | | | | | | | | | | | | | | | | |
Gross expenses | | | 0.96 | % | | | 0.96 | % | | | 0.95 | % | | | 0.95 | % | | | 0.87 | % | | | 0.89 | % | | | 0.94 | % |
Net expenses | | | 0.80 | % | | | 0.80 | % | | | 0.80 | % | | | 0.80 | % | | | 0.81 | % | | | 0.88 | % | | | 0.80 | % |
Net investment income | | | 4.81 | % | | | 4.91 | % | | | 6.73 | % | | | 6.79 | % | | | 7.95 | % | | | 9.17 | % | | | 11.89 | % |
Supplemental data | | | | | | | | | | | | | | | | | | | | | | | | | | | | |
Portfolio turnover rate | | | 13 | % | | | 95 | % | | | 37 | % | | | 70 | % | | | 46 | % | | | 129 | % | | | 119 | % |
Net assets, end of period (000s omitted) | | | $25,123 | | | | $21,376 | | | | $37,469 | | | | $26,234 | | | | $48,709 | | | | $93,639 | | | | $68,991 | |
| 1. | After the close of business on July 9, 2010, the Fund acquired the net assets of Evergreen High Income Fund which became the accounting and performance survivor in the transaction. The information for the periods prior to July 12, 2010 is that of Class I of Evergreen High Income Fund. |
| 2. | For the four months ended August 31, 2010. The Fund changed its fiscal year end from April 30 to August 31, effective August 31, 2010. |
| 3. | Calculated based upon average shares outstanding |
| 4. | Returns for periods of less than one year are not annualized. |
The accompanying notes are an integral part of these financial statements.
| | | | |
| 22 | | Wells Fargo Advantage High Yield Bond Fund | | Notes to financial statements (unaudited) |
1. ORGANIZATION
Wells Fargo Funds Trust (the “Trust”), a Delaware statutory trust organized on March 10, 1999, is an open-end management investment company registered under the Investment Company Act of 1940, as amended (the “1940 Act”). These financial statements report on the Wells Fargo Advantage High Yield Bond Fund (the “Fund”) which is a diversified series of the Trust.
2. SIGNIFICANT ACCOUNTING POLICIES
The following significant accounting policies, which are consistently followed in the preparation of the financial statements of the Fund, are in conformity with U.S. generally accepted accounting principles which require management to make estimates and assumptions that affect the reported amounts of assets and liabilities, disclosure of contingent assets and liabilities at the date of the financial statements, and the reported amounts of revenues and expenses during the reporting period. Actual results could differ from those estimates.
Securities valuation
All investments are valued each business day as of the close of regular trading on the New York Stock Exchange (generally 4 p.m. Eastern Time).
Fixed income securities acquired with maturities exceeding 60 days are valued based on evaluated bid prices provided by an independent pricing service which may utilize both transaction data and market information such as yield, quality, coupon rate, maturity, type of issue, trading characteristics and other market data. If prices are not available from the independent pricing service or prices received are deemed not representative of market value, prices will be obtained from an independent broker-dealer or otherwise determined based on the Fund’s Valuation Procedures.
Equity securities and futures that are listed on a foreign or domestic exchange or market are valued at the official closing price or, if none, the last sales price. If no sale occurs on the primary exchange or market for the security that day, the prior day’s price will be deemed “stale” and fair values will be determined in accordance with the Fund’s Valuation Procedures.
Short-term securities, with maturities of 60 days or less at time of purchase, generally are valued at amortized cost which approximates fair value. The amortized cost method involves valuing a security at its cost, plus accretion of discount or minus amortization of premium over the period until maturity.
Investments in registered open-end investment companies are valued at net asset value. Non-registered investment vehicles are fair valued at net asset value.
Investments which are not valued using any of the methods discussed above are valued at their fair value, as determined in good faith by the Board of Trustees of the Fund. The Board of Trustees has established a Valuation Committee comprised of the Trustees and has delegated to it the authority to take any actions regarding the valuation of portfolio securities that the Valuation Committee deems necessary or appropriate, including determining the fair value of portfolio securities, unless the determination has been delegated to the Management Valuation Team of Wells Fargo Funds Management, LLC (“Funds Management”). The Board of Trustees retains the authority to make or ratify any valuation decisions or approve any changes to the Valuation Procedures as it deems appropriate. On a quarterly basis, the Board of Trustees receives reports on any valuation actions taken by the Valuation Committee or the Management Valuation Team which may include items for ratification.
Valuations of fair valued securities are compared to the next actual sales price when available, or other appropriate market values, to assess the continued appropriateness of the fair valuation methodologies used. These securities are fair valued on a day-to-day basis, taking into consideration changes to appropriate market information and any significant changes to the inputs considered in the valuation process until there is a readily available price provided on an exchange or by an independent pricing service. Valuations received from an independent pricing service or independent broker-dealer quotes are periodically validated by comparisons to most recent trades and valuations provided by other independent pricing services in addition to the review of prices by the adviser and/or subadviser. Unobservable inputs used in determining fair valuations are identified based on the type of security, taking into consideration factors utilized by market participants in valuing the investment, knowledge about the issuer and the current market environment.
Foreign currency translation
The accounting records of the Fund are maintained in U.S. dollars. The values of other assets and liabilities denominated in foreign currencies will be converted to U.S. dollars at rates provided by an independent foreign currency pricing source at a time each business day specified by the Management Valuation Team. Purchases and sales of securities, and income and expenses are converted at the rate of exchange on the respective dates of such transactions. Reported net realized
| | | | | | |
| Notes to financial statements (unaudited) | | Wells Fargo Advantage High Yield Bond Fund | | | 23 | |
foreign exchange gains or losses arise from sales of foreign currencies, currency gains or losses realized between the trade and settlement dates on securities transactions, and the difference between the amounts of dividends, interest and foreign withholding taxes recorded and the U.S. dollar equivalent of the amounts actually paid or received. Net unrealized foreign exchange gains and losses arise from changes in the fair value of assets and liabilities other than investments in securities resulting from changes in exchange rates.
The changes in net assets arising from changes in exchange rates and the changes in net assets resulting from changes in market prices of securities are not separately presented. Such changes are recorded with net realized and unrealized gains or losses from investments. Gains and losses from certain foreign currency transactions are treated as ordinary income for U.S. federal income tax purposes.
Security loans
The Fund may lend its securities from time to time in order to earn additional income in the form of fees or interest on securities received as collateral or the investment of any cash received as collateral. The Fund continues to receive interest or dividends on the securities loaned. The Fund receives collateral in the form of cash or securities with a value at least equal to the value of the securities on loan. The value of the loaned securities is determined at the close of each business day and any additional required collateral is delivered to the Fund on the next business day. In a securities lending transaction, the net asset value of the Fund will be affected by an increase or decrease in the value of the securities loaned and by an increase or decrease in the value of the instrument in which collateral is invested. The amount of securities lending activity undertaken by the Fund fluctuates from time to time. In the event of default or bankruptcy by the borrower, the Fund may be prevented from recovering the loaned securities or gaining access to the collateral or may experience delays or costs in doing so. In addition, the investment of any cash collateral received may lose all or part of its value. The Fund has the right under the lending agreement to recover the securities from the borrower on demand.
The Fund lends its securities through an unaffiliated securities lending agent. Cash collateral received in connection with its securities lending transactions is invested in Wells Fargo Securities Lending Cash Investments, LLC (the “Securities Lending Fund”). The Securities Lending Fund is exempt from registration under Section 3(c)(7) of the 1940 Act and is managed by Funds Management and is subadvised by Wells Capital Management Incorporated (“WellsCap”). Funds Management receives an advisory fee starting at 0.05% and declining to 0.01% as the average daily net assets of the Securities Lending Fund increase. All of the fees received by Funds Management are paid to WellsCap for its services as subadviser. The Securities Lending Fund seeks to provide a positive return compared to the daily Fed Funds Open rate by investing in high-quality, U.S. dollar-denominated short-term money market instruments. Securities Lending Fund investments are fair valued based upon the amortized cost valuation technique. Income earned from investment in the Securities Lending Fund is included in securities lending income on the Statement of Operations.
When-issued transactions
The Fund may purchase securities on a forward commitment or when-issued basis. The Fund records a when-issued transaction on the trade date and will segregate assets in an amount at least equal in value to the Fund’s commitment to purchase when-issued securities. Securities purchased on a when-issued basis are marked-to-market daily and the Fund begins earning interest on the settlement date. Losses may arise due to changes in the market value of the underlying securities or if the counterparty does not perform under the contract.
Term loans
The Fund may invest in term loans. The Fund begins earning interest when the loans are funded. The loans pay interest at rates which are periodically reset by reference to a base lending rate plus a spread. The Fund assumes the credit risk of the borrower and there could be potential loss to the Fund in the event of default by the borrower.
Futures contracts
The Fund may be subject to interest rate risk in the normal course of pursuing its investment objectives. The Fund may buy and sell futures contracts in order to gain exposure to, or protect against, changes in security values and interest rates. The primary risks associated with the use of futures contracts are the imperfect correlation between changes in market values of securities held by the Fund and the prices of futures contracts, and the possibility of an illiquid market.
The aggregate principal amounts of the contracts are not recorded in the financial statements. Fluctuations in the value of the contracts are recorded in the Statement of Assets and Liabilities as an asset or liability and in the Statement of Operations as unrealized gains or losses until the contracts are closed, at which point they are recorded as net realized gains or losses on futures contracts. With futures contracts, there is minimal counterparty risk to the Fund since futures are exchange traded and the exchange’s clearinghouse, as counterparty to all exchange traded futures, guarantees the futures against default.
| | | | |
| 24 | | Wells Fargo Advantage High Yield Bond Fund | | Notes to financial statements (unaudited) |
Security transactions and income recognition
Securities transactions are recorded on a trade date basis. Realized gains or losses are recorded on the basis of identified cost.
Interest income is accrued daily and bond discounts are accreted and premiums are amortized daily based on the effective interest method. To the extent debt obligations are placed on non-accrual status, any related interest income may be reduced by writing off interest receivables when the collection of all or a portion of interest has become doubtful based on consistently applied procedures. If the issuer subsequently resumes interest payments or when the collectability of interest is reasonably assured, the debt obligation is removed from non-accrual status.
Dividend income is recognized on the ex-dividend date.
Distributions to shareholders
Distributions to shareholders from net investment income are accrued daily and paid monthly. Distributions from net realized gains, if any, are recorded on the ex-dividend date. Such distributions are determined in conformity with federal income tax regulations, which may differ in amount or character from net investment income and realized gains recognized for purposes of U.S. generally accepted accounting principles.
Federal and other taxes
The Fund intends to continue to qualify as a regulated investment company by distributing substantially all of its investment company taxable income and any net realized capital gains (after reduction for capital loss carryforwards) sufficient to relieve it from all, or substantially all, federal income taxes. Accordingly, no provision for federal income taxes was required.
The Fund’s income and federal excise tax returns and all financial records supporting those returns for the prior three fiscal years are subject to examination by the federal and Delaware revenue authorities. Management has analyzed the Fund’s tax positions taken on federal, state, and foreign tax returns for all open tax years and does not believe that there are any uncertain tax positions that require recognition of a tax liability.
As of August 31, 2013, the Fund had capital loss carryforwards available to offset future net realized capital gains in the amount of $62,421,082 with $25,170,390 expiring in 2016 and $37,250,692 expiring in 2017.
Class allocations
The separate classes of shares offered by the Fund differ principally in applicable sales charges, distribution, shareholder servicing, and administration fees. Shareholders of each class bear certain expenses that pertain to that particular class. All shareholders bear the common expenses of the Fund, earn income from the portfolio, and are allocated any unrealized gains and losses pro rata based on the average daily net assets of each class, without distinction between share classes. Dividends are determined separately for each class based on income and expenses allocable to each class. Realized gains and losses are allocated to each class pro rata based upon the net assets of each class on the date realized. Differences in per share dividend rates generally result from the relative weightings of pro rata income and realized gain allocations and from differences in separate class expenses, including distribution, shareholder servicing, and administration fees.
3. FAIR VALUATION MEASUREMENTS
Fair value measurements of investments are determined within a framework that has established a fair value hierarchy based upon the various data inputs utilized in determining the value of the Fund’s investments. The three-level hierarchy gives the highest priority to unadjusted quoted prices in active markets for identical assets or liabilities (Level 1) and the lowest priority to significant unobservable inputs (Level 3). The Fund’s investments are classified within the fair value hierarchy based on the lowest level of input that is significant to the fair value measurement. The inputs are summarized into three broad levels as follows:
| n | | Level 1 – quoted prices in active markets for identical securities |
| n | | Level 2 – other significant observable inputs (including quoted prices for similar securities, interest rates, prepayment speeds, credit risk, use of amortized cost, etc.) |
| n | | Level 3 – significant unobservable inputs (including the Fund’s own assumptions in determining the fair value of investments) |
The inputs or methodologies used for valuing investments in securities are not necessarily an indication of the risk associated with investing in those securities.
| | | | | | |
| Notes to financial statements (unaudited) | | Wells Fargo Advantage High Yield Bond Fund | | | 25 | |
As of February 28, 2014, the inputs used in valuing investments in securities were as follows:
| | | | | | | | | | | | | | | | |
| Investments in securities | | Quoted prices (Level 1) | | | Other significant
observable inputs (Level 2) | | | Significant unobservable inputs (Level 3) | | | Total | |
| | | | |
Equity securities | | | | | | | | | | | | | | | | |
Common stocks | | $ | 30,652,710 | | | $ | 0 | | | $ | 0 | | | $ | 30,652,710 | |
| | | | |
Corporate bonds and notes | | | 0 | | | | 274,714,287 | | | | 0 | | | | 274,714,287 | |
| | | | |
Yankee corporate bonds and notes | | | 0 | | | | 18,720,442 | | | | 0 | | | | 18,720,442 | |
| | | | |
Short-term investments | | | | | | | | | | | | | | | | |
Investment companies | | | 767,385 | | | | 5,618,660 | | | | 0 | | | | 6,386,045 | |
U.S. Treasury securities | | | 251,999 | | | | 0 | | | | 0 | | | | 251,999 | |
| | | $ | 31,672,094 | | | $ | 299,053,389 | | | $ | 0 | | | $ | 330,725,483 | |
As of February 28, 2014, the inputs used in valuing the Fund’s other financial instruments were as follows:
| | | | | | | | | | | | | | | | |
| Other financial instruments | | Quoted prices (Level 1) | | | Other significant
observable inputs (Level 2) | | | Significant unobservable inputs (Level 3) | | | Total | |
Futures contracts | | $ | (97,883 | )* | | $ | 0 | | | $ | 0 | | | $ | (97,883 | ) |
| * | Amount represents the net unrealized losses. |
Transfers in and transfers out are recognized at the end of the reporting period. For the six months ended February 28, 2014, the Fund did not have any transfers into/out of Level 1, Level 2, or Level 3.
4. TRANSACTIONS WITH AFFILIATES AND OTHER EXPENSES
Advisory fee
The Trust has entered into an advisory contract with Funds Management, an indirect wholly owned subsidiary of Wells Fargo & Company (“Wells Fargo”). The adviser is responsible for implementing investment policies and guidelines and for supervising the subadviser, who is responsible for day-to-day portfolio management of the Fund.
Pursuant to the contract, Funds Management is entitled to receive an annual advisory fee starting at 0.50% and declining to 0.40% as the average daily net assets of the Fund increase. For the six months ended February 28, 2014, the advisory fee was equivalent to an annual rate of 0.50% of the Fund’s average daily net assets.
Funds Management has retained the services of a subadviser to provide daily portfolio management to the Fund. The fee for subadvisory services is borne by Funds Management. WellsCap, an affiliate of Funds Management and an indirect, wholly owned subsidiary of Wells Fargo, is the subadviser to the Fund and is entitled to receive a fee from Funds Management at an annual rate starting at 0.35% and declining to 0.20% as the average daily net assets of the Fund increase.
Administration and transfer agent fees
The Trust has entered into an administration agreement with Funds Management. Under this agreement, for providing administrative services, which includes paying fees and expenses for services provided by the transfer agent, sub-transfer agents, omnibus account servicers and record-keepers, Funds Management is entitled to receive from the Fund an annual fund level administration fee starting at 0.05% and declining to 0.03% as the average daily net assets of the Fund increase and a class level administration fee which is calculated based on the average daily net assets of each class as follows:
| | | | |
| | | Class level
administration fee | |
Class A, Class B, Class C | | | 0.16 | % |
Administrator Class | | | 0.10 | |
Funds Management has contractually waived and/or reimbursed advisory and administration fees to the extent necessary to maintain certain net operating expense ratios for the Fund. Waiver of fees and/or reimbursement of expenses by Funds Management were made first from fund level expenses on a proportionate basis and then from class specific expenses.
| | | | |
| 26 | | Wells Fargo Advantage High Yield Bond Fund | | Notes to financial statements (unaudited) |
Funds Management has committed through December 31, 2014 to waive fees and/or reimburse expenses to the extent necessary to cap the Fund’s expenses at 1.03% for Class A shares, 1.78% for Class B shares, 1.78% for Class C shares, and 0.80% for Administrator Class shares.
Distribution fees
The Trust has adopted a Distribution Plan for Class B and Class C shares of the Fund pursuant to Rule 12b-1 under the 1940 Act. Distribution fees are charged to Class B and Class C shares and paid to Wells Fargo Funds Distributor, LLC, the principal underwriter, at an annual rate of 0.75% of the average daily net assets of Class B and Class C shares.
For the six months ended February 28, 2014, Wells Fargo Funds Distributor, LLC received $2,210 from the sale of Class A shares and $19 and $690 in contingent deferred sales charges from redemptions of Class B and Class C shares, respectively.
Shareholder servicing fees
The Trust has entered into contracts with one or more shareholder servicing agents, whereby all classes of the Fund are charged a fee at an annual rate of 0.25% of the average daily net assets of each respective class.
A portion of these total shareholder servicing fees were paid to affiliates of Wells Fargo.
5. INVESTMENT PORTFOLIO TRANSACTIONS
Purchases and sales of investments, excluding U.S. government obligations (if any) and short-term securities, for the six months ended February 28, 2014 were $42,772,541 and $66,149,069, respectively.
6. DERIVATIVE TRANSACTIONS
During the six months ended February 28, 2014, the Fund entered into futures contracts to speculate on interest rates and to help manage the duration of the portfolio.
At February 28, 2014, the Fund had short futures contracts outstanding as follows:
| | | | | | | | | | | | | | | | |
| Expiration date | | Counterparty | | Contracts | | Type | | | Contract
value at
February 28, 2014 | | | Unrealized
losses | |
| 6-19-2014 | | Goldman Sachs | | 160 Short | | | 10-Year U.S. Treasury Notes | | | $ | 19,925,000 | | | $ | (97,883 | ) |
The Fund had an average notional amount of $19,966,353 in short futures contracts during the six months ended February 28, 2014.
On February 28, 2014, the cumulative unrealized losses on futures contracts in the amount of $97,883 are reflected in net unrealized gains on investments on the Statement of Assets and Liabilities. The receivable for daily variation margin on open futures contracts reflected in the Statement of Assets and Liabilities only represents the current day’s variation margin. The realized losses and change in unrealized gains (losses) on futures contracts are reflected in the Statement of Operations.
For certain types of derivative transactions, the Fund has entered into International Swaps and Derivatives Association, Inc. master agreements (“ISDA Master Agreements”) or similar agreements with approved counterparties. The ISDA Master Agreements or similar agreements may have requirements to deliver/deposit securities or cash to/with an exchange or broker-dealer as collateral and allows the Fund to offset, with each counterparty, certain derivative financial instrument’s assets and/or liabilities with collateral held or pledged. Collateral requirements differ by type of derivative. Collateral or margin requirements are set by the broker or exchange clearing house for exchange traded derivatives while collateral terms are contract specific for over-the-counter traded. Cash collateral that has been pledged to cover obligations of the Fund under derivative contracts, if any, will be reported separately in the Statement of Assets and Liabilities. Securities pledged as collateral, if any, for the same purpose are noted in the Portfolio of Investments. With respect to balance sheet offsetting, absent an event of default by the counterparty or a termination of the agreement, the reported amounts of financial assets and financial liabilities in the Statement of Assets and Liabilities are not offset across transactions between the Fund and the applicable counterparty. A reconciliation of the gross amounts on the Statement of Assets and Liabilities to the net amounts by derivative type, including any collateral exposure, is as follows:
| | | | | | | | | | | | | | | | |
| Derivative type | | Counterparty | | Gross amounts of
assets in the
Statement of Assets
and Liabilities | | Amounts subject
to netting
agreements | | | Collateral
received | | | Net
amount | |
| Futures - variation margin | | Goldman Sachs | | $35,000 | | $ | 0 | | | $ | 0 | | | $ | 35,000 | |
| | | | | | |
| Notes to financial statements (unaudited) | | Wells Fargo Advantage High Yield Bond Fund | | | 27 | |
7. BANK BORROWINGS
The Trust (excluding the money market funds and certain other funds in the Trust) and Wells Fargo Variable Trust are parties to a $150,000,000 revolving credit agreement with State Street Bank and Trust Company, whereby the Fund is permitted to use bank borrowings for temporary or emergency purposes, such as to fund shareholder redemption requests. Interest under the credit agreement is charged to the Fund based on a borrowing rate equal to the higher of the Federal Funds rate in effect on that day plus 1.25% or the overnight LIBOR rate in effect on that day plus 1.25%. In addition, an annual commitment fee equal to 0.10% of the unused balance is allocated to each participating fund. For the six months ended February 28, 2014, the Fund paid $349 in commitment fees.
For the six months ended February 28, 2014, there were no borrowings by the Fund under the agreement.
8. INDEMNIFICATION
Under the Trust’s organizational documents, the officers and directors are indemnified against certain liabilities that may arise out of performance of their duties to the Trust. Additionally, in the normal course of business, the Trust may enter into contracts with service providers that contain a variety of indemnification clauses. The Trust’s maximum exposure under these arrangements is dependent on future claims that may be made against the Fund and, therefore, cannot be estimated.
| | | | |
| 28 | | Wells Fargo Advantage High Yield Bond Fund | | Other information (unaudited) |
PROXY VOTING INFORMATION
A description of the policies and procedures that the Fund uses to determine how to vote proxies relating to portfolio securities is available without charge, upon request, by calling 1-800-222-8222, visiting our website at wellsfargoadvantagefunds.com, or visiting the SEC website at sec.gov. Information regarding how the Fund voted proxies relating to portfolio securities during the most recent 12-month period ended June 30 is available without charge on the Fund’s website at wellsfargoadvantagefunds.com or by visiting the SEC website at sec.gov.
PORTFOLIO HOLDINGS INFORMATION
The complete portfolio holdings for the Fund are publicly available on the Fund’s website (wellsfargoadvantagefunds.com) on a monthly, 30-day or more delayed basis. In addition, top ten holdings information for the Fund is publicly available on the Fund’s website on a monthly, seven-day or more delayed basis. The Fund files its complete schedule of portfolio holdings with the SEC for the first and third quarters of each fiscal year on Form N-Q, which is available without charge by visiting the SEC website at sec.gov. In addition, the Fund’s Form N-Q may be reviewed and copied at the SEC’s Public Reference Room in Washington, DC, and at regional offices in New York City, at 233 Broadway, and in Chicago, at 175 West Jackson Boulevard, Suite 900. Information about the Public Reference Room may be obtained by calling 1-800-SEC-0330.
| | | | | | |
| Other information (unaudited) | | Wells Fargo Advantage High Yield Bond Fund | | | 29 | |
BOARD OF TRUSTEES AND OFFICERS
Each of the Trustees and Officers listed in the table below acts in identical capacities for each fund in the Wells Fargo Advantage family of funds, which consists of 132 mutual funds1 comprising the Wells Fargo Funds Trust, Wells Fargo Variable Trust, Wells Fargo Master Trust and four closed-end funds (collectively the “Fund Complex”). This table should be read in conjunction with the Prospectus and the Statement of Additional Information2. All of the Trustees are also Members of the Audit and Governance Committees of each Trust in the Fund Complex. The mailing address of each Trustee and Officer is 525 Market Street, 12th Floor, San Francisco, CA 94105. Each Trustee and Officer serves an indefinite term, however, each Trustee serves such term until reaching the mandatory retirement age established by the Trustees.
Independent Trustees
| | | | | | |
Name and
year of birth | | Position held and
length of service* | | Principal occupations during past five years | | Other
directorships during
past five years |
| Peter G. Gordon (Born 1942) | | Trustee, since 1998; Chairman, since 2005 | | Co-Founder, Retired Chairman, President and CEO of Crystal Geyser Water Company. Trustee Emeritus, Colby College. | | Asset Allocation Trust |
| Isaiah Harris, Jr. (Born 1952) | | Trustee, since 2009 | | Retired. Prior thereto, President and CEO of BellSouth Advertising and Publishing Corp. from 2005 to 2007, President and CEO of BellSouth Enterprises from 2004 to 2005 and President of BellSouth Consumer Services from 2000 to 2003. Emeritus member of the Iowa State University Foundation Board of Governors. Emeritus Member of the Advisory Board of Iowa State University School of Business. Advisory Board Member, Palm Harbor Academy (charter school). Mr. Harris is a certified public accountant. | | CIGNA Corporation; Deluxe Corporation; Asset Allocation Trust |
| Judith M. Johnson (Born 1949) | | Trustee, since 2008; Audit Committee Chairman, since 2008 | | Retired. Prior thereto, Chief Executive Officer and Chief Investment Officer of Minneapolis Employees Retirement Fund from 1996 to 2008. Ms. Johnson is an attorney, certified public accountant and a certified managerial accountant. | | Asset Allocation Trust |
| Leroy Keith, Jr. (Born 1939) | | Trustee, since 2010 | | Chairman, Bloc Global Services (development and construction). Trustee of the Evergreen Funds from 1983 to 2010. Former Managing Director, Almanac Capital Management (commodities firm), former Partner, Stonington Partners, Inc. (private equity fund), former Director, Obagi Medical Products Co. and former Director, Lincoln Educational Services. | | Trustee, Virtus Fund Complex (consisting of 50 portfolios as of 12/16/2013); Asset Allocation Trust |
| David F. Larcker (Born 1950) | | Trustee, since 2009 | | James Irvin Miller Professor of Accounting at the Graduate School of Business, Stanford University, Morgan Stanley Director of the Center for Leadership Development and Research and Senior Faculty of The Rock Center for Corporate Governance since 2006. From 2005 to 2008, Professor of Accounting at the Graduate School of Business, Stanford University. Prior thereto, Ernst & Young Professor of Accounting at The Wharton School, University of Pennsylvania from 1985 to 2005. | | Asset Allocation Trust |
| Olivia S. Mitchell (Born 1953) | | Trustee, since 2006 | | International Foundation of Employee Benefit Plans Professor, Wharton School of the University of Pennsylvania since 1993. Director of Wharton’s Pension Research Council and Boettner Center on Pensions & Retirement Research, and Research Associate at the National Bureau of Economic Research. Previously, Cornell University Professor from 1978 to 1993. | | Asset Allocation Trust |
| Timothy J. Penny (Born 1951) | | Trustee, since 1996 | | President and CEO of Southern Minnesota Initiative Foundation, a non-profit organization, since 2007 and Senior Fellow at the Humphrey Institute Policy Forum at the University of Minnesota since 1995. Member of the Board of Trustees of NorthStar Education Finance, Inc., a non-profit organization, since 2007. | | Asset Allocation Trust |
| | | | |
| 30 | | Wells Fargo Advantage High Yield Bond Fund | | Other information (unaudited) |
| | | | | | |
Name and
year of birth | | Position held and
length of service* | | Principal occupations during past five years | | Other
directorships during
past five years |
| Michael S. Scofield (Born 1943) | | Trustee, since 2010 | | Served on the Investment Company Institute’s Board of Governors and Executive Committee from 2008-2011 as well the Governing Council of the Independent Directors Council from 2006-2011 and the Independent Directors Council Executive Committee from 2008-2011. Chairman of the IDC from 2008-2010. Institutional Investor (Fund Directions) Trustee of Year in 2007. Trustee of the Evergreen Funds (and its predecessors) from 1984 to 2010. Chairman of the Evergreen Funds from 2000-2010. Former Trustee of the Mentor Funds. Retired Attorney, Law Offices of Michael S. Scofield. | | Asset Allocation Trust |
| Donald C. Willeke (Born 1940) | | Trustee, since 1996 | | Principal of the law firm of Willeke & Daniels. General Counsel of the Minneapolis Employees Retirement Fund from 1984 until its consolidation into the Minnesota Public Employees Retirement Association on June 30, 2010. Director and Vice Chair of The Tree Trust (non-profit corporation). Director of the American Chestnut Foundation (non-profit corporation). | | Asset Allocation Trust |
| * | Length of service dates reflect the Trustee’s commencement of service with the Trust’s predecessor entities, where applicable. |
Officers
| | | | | | |
Name and
year of birth | | Position held and
length of service | | Principal occupations during past five years | | |
| Karla M. Rabusch (Born 1959) | | President, since 2003 | | Executive Vice President of Wells Fargo Bank, N.A. and President of Wells Fargo Funds Management, LLC since 2003. | | |
Nancy Wiser1 (Born 1967) | | Treasurer, since 2012 | | Executive Vice President of Wells Fargo Funds Management, LLC since 2011. Chief Operating Officer and Chief Compliance Officer at LightBox Capital Management LLC, from 2008 to 2011. Owned and operated a consulting business providing services to various hedge funds including acting as Chief Operating Officer and Chief Compliance Officer for a hedge fund from 2007 to 2008. Chief Operating Officer and Chief Compliance Officer of GMN Capital LLC from 2006 to 2007. | | |
| C. David Messman (Born 1960) | | Secretary, since 2000; Chief Legal Officer, since 2003 | | Senior Vice President and Secretary of Wells Fargo Funds Management, LLC since 2001. Vice President and Managing Counsel of Wells Fargo Bank, N.A. since 1996. | | |
Debra Ann Early (Born 1964) | | Chief Compliance Officer, since 2007 | | Chief Compliance Officer of Wells Fargo Funds Management, LLC since 2007. Chief Compliance Officer of Parnassus Investments from 2005 to 2007. Chief Financial Officer of Parnassus Investments from 2004 to 2007. | | |
David Berardi (Born 1975) | | Assistant Treasurer, since 2009 | | Vice President of Wells Fargo Funds Management, LLC since 2009. Vice President of Evergreen Investment Management Company, LLC from 2008 to 2010. Assistant Vice President of Evergreen Investment Services, Inc. from 2004 to 2008. Manager of Fund Reporting and Control for Evergreen Investment Management Company, LLC from 2004 to 2010. | | |
| Jeremy DePalma1 (Born 1974) | | Assistant Treasurer, since 2009 | | Senior Vice President of Wells Fargo Funds Management, LLC since 2009. Senior Vice President of Evergreen Investment Management Company, LLC from 2008 to 2010. Vice President, Evergreen Investment Services, Inc. from 2004 to 2007. Head of the Fund Reporting and Control Team within Fund Administration from 2005 to 2010. | | |
| 1. | Nancy Wiser acts as Treasurer of 73 funds in the Fund Complex. Jeremy DePalma acts as Treasurer of 59 funds and Assistant Treasurer of 73 funds in the Fund Complex. |
| 2. | The Statement of Additional Information includes additional information about the Trustees and is available, without charge, upon request, by calling 1-800-222-8222 or by visiting the website at wellsfargoadvantagefunds.com. |
| | | | | | |
| List of abbreviations | | Wells Fargo Advantage High Yield Bond Fund | | | 31 | |
The following is a list of common abbreviations for terms and entities that may have appeared in this report.
| ACA | — ACA Financial Guaranty Corporation |
| ADR | — American depositary receipt |
| ADS | — American depositary shares |
| AGC | — Assured Guaranty Corporation |
| AGM | — Assured Guaranty Municipal |
| Ambac | — Ambac Financial Group Incorporated |
| AMT | — Alternative minimum tax |
| BAN | — Bond anticipation notes |
| BHAC | — Berkshire Hathaway Assurance Corporation |
| CAB | — Capital appreciation bond |
| CCAB | — Convertible capital appreciation bond |
| CDA | — Community Development Authority |
| CDO | — Collateralized debt obligation |
| DRIVER | — Derivative inverse tax-exempt receipts |
| DW&P | — Department of Water & Power |
| DWR | — Department of Water Resources |
| ECFA | — Educational & Cultural Facilities Authority |
| EDA | — Economic Development Authority |
| EDFA | — Economic Development Finance Authority |
| ETF | — Exchange-traded fund |
| FDIC | — Federal Deposit Insurance Corporation |
| FFCB | — Federal Farm Credit Banks |
| FGIC | — Financial Guaranty Insurance Corporation |
| FHA | — Federal Housing Administration |
| FHLB | — Federal Home Loan Bank |
| FHLMC | — Federal Home Loan Mortgage Corporation |
| FICO | — The Financing Corporation |
| FNMA | — Federal National Mortgage Association |
| GDR | — Global depositary receipt |
| GNMA | — Government National Mortgage Association |
| HCFR | — Healthcare facilities revenue |
| HEFA | — Health & Educational Facilities Authority |
| HEFAR | — Higher education facilities authority revenue |
| HFA | — Housing Finance Authority |
| HFFA | — Health Facilities Financing Authority |
| HUD | — Department of Housing and Urban Development |
| IDA | — Industrial Development Authority |
| IDAG | — Industrial Development Agency |
| KRW | — Republic of Korea won |
| LIBOR | — London Interbank Offered Rate |
| LLC | — Limited liability company |
| LLLP | — Limited liability limited partnership |
| LLP | — Limited liability partnership |
| MBIA | — Municipal Bond Insurance Association |
| MFHR | — Multifamily housing revenue |
| MSTR | — Municipal securities trust receipts |
| MUD | — Municipal Utility District |
| National | — National Public Finance Guarantee Corporation |
| PCFA | — Pollution Control Financing Authority |
| PCL | — Public Company Limited |
| PCR | — Pollution control revenue |
| PFA | — Public Finance Authority |
| PFFA | — Public Facilities Financing Authority |
| PFOTER | — Puttable floating option tax-exempt receipts |
| plc | — Public limited company |
| PUTTER | — Puttable tax-exempt receipts |
| R&D | — Research & development |
| Radian | — Radian Asset Assurance |
| RAN | — Revenue anticipation notes |
| RDA | — Redevelopment Authority |
| RDFA | — Redevelopment Finance Authority |
| REIT | — Real estate investment trust |
| ROC | — Reset option certificates |
| SAVRS | — Select auction variable rate securities |
| SBA | — Small Business Authority |
| SFHR | — Single-family housing revenue |
| SFMR | — Single-family mortgage revenue |
| SPA | — Standby purchase agreement |
| SPDR | — Standard & Poor’s Depositary Receipts |
| STRIPS | — Separate trading of registered interest and principal securities |
| TAN | — Tax anticipation notes |
| TIPS | — Treasury inflation-protected securities |
| TRAN | — Tax revenue anticipation notes |
| TTFA | — Transportation Trust Fund Authority |
| TVA | — Tennessee Valley Authority |
This page is intentionally left blank.


For more information
More information about Wells Fargo Advantage Funds is available free upon request. To obtain literature, please write, email, visit the Fund’s website, or call:
Wells Fargo Advantage Funds
P.O. Box 8266
Boston, MA 02266-8266
Email: wfaf@wellsfargo.com
Website: wellsfargoadvantagefunds.com
Individual investors: 1-800-222-8222
Retail investment professionals: 1-888-877-9275
Institutional investment professionals: 1-866-765-0778
This report and the financial statements contained herein are submitted for the general information of the shareholders of Wells Fargo Advantage Funds. If this report is used for promotional purposes, distribution of the report must be accompanied or preceded by a current prospectus. For a current prospectus and, if available, a summary prospectus containing more complete information, including charges and expenses, call 1-800-222-8222 or visit the Fund’s website at wellsfargoadvantagefunds.com. Please consider the investment objectives, risks, charges, and expenses of the investment carefully before investing. This and other information about Wells Fargo Advantage Funds can be found in the current prospectus. Read the prospectus carefully before you invest or send money.
Wells Fargo Funds Management, LLC, a wholly owned subsidiary of Wells Fargo & Company, provides investment advisory and administrative services for Wells Fargo Advantage Funds. Other affiliates of Wells Fargo & Company provide subadvisory and other services for the Funds. The Funds are distributed by Wells Fargo Funds Distributor, LLC, Member FINRA/SIPC, an affiliate of Wells Fargo & Company.
NOT FDIC INSURED ¡ NO BANK GUARANTEE ¡ MAY LOSE VALUE
© 2014 Wells Fargo Funds Management, LLC. All rights reserved.
| | |
 | | 223532 04-14 SA218/SAR218 02-14 |

Wells Fargo Advantage Income Plus Fund

Semi-Annual Report
February 28, 2014

Reduce clutter. Save trees.
Sign up for electronic delivery of prospectuses and shareholder reports at wellsfargo.com/advantagedelivery
Contents
The views expressed and any forward-looking statements are as of February 28, 2014, unless otherwise noted, and are those of the Fund managers and/or Wells Fargo Funds Management, LLC. Discussions of individual securities, or the markets generally, or any Wells Fargo Advantage Fund are not intended as individual recommendations. Future events or results may vary significantly from those expressed in any forward-looking statements; the views expressed are subject to change at any time in response to changing circumstances in the market. Wells Fargo Funds Management, LLC and the Fund disclaim any obligation to publicly update or revise any views expressed or forward-looking statements.
NOT FDIC INSURED ¡ NO BANK GUARANTEE ¡ MAY LOSE VALUE
| | | | |
| 2 | | Wells Fargo Advantage Income Plus Fund | | Letter to shareholders (unaudited) |

Karla M. Rabusch
President
Wells Fargo Advantage Funds
Fixed-income markets shifted during the period, driven by vacillations between U.S. Treasury yield increases and subsequent declines.
Reassurances from the Fed that a highly accommodative monetary policy would continue throughout 2014 inspired price rallies across both the investment-grade and high-yield bond markets.
Dear Valued Shareholder:
We are pleased to offer you this semi-annual report for the Wells Fargo Advantage Income Plus Fund for the six-month period that ended February 28, 2014. Fixed-income markets shifted during the period, driven by vacillations between U.S. Treasury yield increases and subsequent declines. However, on the whole, investment-grade (measured by the Barclays U.S. Aggregate Bond Index1) and high-yield markets (measured by the Barclays U.S. High Yield Bond Index2) generated positive returns during the period, notably benefiting from the strong price improvement and declining U.S. Treasury yields that occurred in September and October of 2013 as well as the opening months of 2014. Although the returns of the U.S. high-yield market have often been positively correlated with U.S. equity returns (measured by the S&P 500 Index3) over the long-run, over the period, high-yield (measured by the Barclays U.S. High Yield Bond Index) generally performed well even when equities did not. The lower-rated corporate bond credit tiers outperformed the respectively higher-rated investment-grade credit tiers during the period.
A decline in bond prices was halted by the Fed’s postponement of tapering its bond-buying program.
Before the six-month period began, equity markets rallied, most notably in May and June of 2013. This led to a sharp increase in U.S. Treasury yields and declining valuations for much of the fixed-income markets (measured by the Barclays U.S. Aggregate Bond Index). However, in July and August 2013, that equity exuberance quieted a bit, and fixed-income markets stabilized. Returns across the fixed-income markets were largely negative in investment-grade and high-yield markets but modest in comparison with the declines in May and June of 2013.
But, by September and October of 2013, investment-grade and high-yield bond markets began generating positive returns yet again, as the Federal Reserve (Fed) backtracked on its intentions to taper its quantitative easing program, postponing it until 2014, at the earliest. This created a temporary rally in bonds that lasted until around November 20, 2013, when notes were released from the Fed’s October 2013 meeting that tapering of the bond-buying programs would not be postponed beyond January 2014. In response, long-term U.S. Treasury yields and mortgage rates ratcheted higher on expectations for an unwinding of monetary accommodation in the upcoming months. This led to declines in pricing across much of the core fixed-income markets (measured by the Barclays U.S. Aggregate Bond Index). U.S. high-yield markets were better able to absorb the shift in U.S. Treasury yields and continued to provide positive returns along with rallies in the equity markets.
Favorable conditions for fixed-income markets were restored in January and February 2014.
Seemingly much to the surprise of many everyday investors and seasoned investment professionals alike, fixed-income markets (measured by the Barclays U.S. Aggregate Bond Index) largely outperformed U.S. equity markets (measured by the S&P 500 Index) during the opening months of 2014. A pullback in equity exuberance in January and reassurances from the Fed that a highly accommodative monetary policy would continue throughout 2014 inspired price rallies across both the investment-grade and high-yield bond markets. U.S. Treasury yields declined in January 2014 and corporate bonds and mortgage-backed securities performed notably well. U.S. high-yield securities generated positive returns in January 2014 but lagged the rally across the investment-grade bond markets. This theme reversed in February 2014, as high-yield sectors rallied and investment-grade sectors performed well but not to the extent of the lowest-rated credit tiers.
| | | | | | |
| Letter to shareholders (unaudited) | | Wells Fargo Advantage Income Plus Fund | | | 3 | |
One positive takeaway for bond investors that helped fuel the fixed-income (measured by the Barclays U.S. Aggregate Bond Index) rallies was former Fed Chairman Bernanke’s guidance at the end of 2013. He indicated that the tapering of the Fed’s bond-buying program would proceed at a slow pace and that a reduction in quantitative easing should not be equivocated with a tightening of monetary policy. The distinction was important—although the bond-buying program was declining in volume, it was, nonetheless, still continuing. Additionally, the federal funds target rate would remain unchanged for the foreseeable future, with the implications that it would not increase until the bond-buying program was fully disbanded. These were important statements for fixed-income investors that helped bolster U.S. fixed-income valuations in the opening months of 2014.
Don’t let short-term uncertainty derail long-term investment goals.
Periods of investment uncertainty can present challenges, but experience has taught us that maintaining long-term investment goals can be an effective way to plan for the future. To help you create a sound strategy based on your personal goals and risk tolerance, Wells Fargo Advantage Funds offers more than 100 mutual funds and other investments spanning a wide range of asset classes and investment styles. Although diversification cannot guarantee an investment profit or prevent losses, we believe it can be an effective way to manage investment risk and potentially smooth out overall portfolio performance. We encourage investors to know their investments and to understand that appropriate levels of risk-taking may unlock opportunities.
Thank you for choosing to invest with Wells Fargo Advantage Funds. We appreciate your confidence in us and remain committed to helping you meet your financial needs. For current information about your fund investments, contact your investment professional, visit our website at wellsfargoadvantagefunds.com, or call us directly at 1-800-222-8222. We are available 24 hours a day, 7 days a week.
Sincerely,

Karla M. Rabusch
President
Wells Fargo Advantage Funds
| 1. | The Barclays U.S. Aggregate Bond Index is a broad-based benchmark that measures the investment-grade, U.S. dollar-denominated, fixed-rate taxable bond market, including Treasuries, government-related and corporate securities, MBS (agency fixed-rate and hybrid ARM passthroughs), ABS, and CMBS. You cannot invest directly in an index. |
| 2. | The Barclays U.S. High Yield Bond Index is an index consisting of all domestic and Yankee bonds, rated below investment grade, with a minimum outstanding amount of $100 million and maturing over one year. You cannot invest directly in an index. |
| 3. | The S&P 500 Index consists of 500 stocks chosen for market size, liquidity, and industry group representation. It is a market-value-weighted index with each stock’s weight in the index proportionate to its market value. You cannot invest directly in an index. |
| | | | |
| 4 | | Wells Fargo Advantage Income Plus Fund | | Letter to shareholders (unaudited) |
Notice to shareholders
The Fund and Wells Fargo Funds Management, LLC (“Funds Management”) have received an exemptive order from the SEC that permits Funds Management, subject to the approval of the Board of Trustees of the Fund, to select or replace certain subadvisers to manage all or a portion of the Fund’s assets and enter into, amend or terminate a sub-advisory agreement with certain subadvisers without obtaining shareholder approval (“Multi-manager Structure”). The Multi-manager Structure applies to subadvisers that are not affiliated with Funds Management or the Fund, except to the extent that affiliation arises solely because such subadvisers provide sub-advisory services to the Fund (“Non-affiliated Subadvisers”), as well as subadvisers that are indirect or direct wholly-owned subsidiaries of Funds Management or of another company that, indirectly or directly, wholly owns Funds Management (“Wholly-owned Subadvisers”).
Pursuant to the SEC order, Funds Management, with the approval of the Board of Trustees, has the discretion to terminate any subadvisers and allocate and reallocate the Fund’s assets among any other Non-affiliated Subadvisers or Wholly-owned Subadvisers. Funds Management, subject to oversight and supervision by the Board of Trustees, has responsibility to continue to oversee any subadvisers to the Fund and to recommend, for approval by the Board of Trustees, the hiring, termination and replacement of subadvisers for the Fund. In the event that a new subadviser is hired pursuant to the Multi-manager Structure, the Fund is required to provide notice to shareholders within 90 days.
Please contact your investment professional or call us directly at 1-800-222-8222 if you have any questions on this Notice to Shareholders.
This page is intentionally left blank.
| | | | |
| 6 | | Wells Fargo Advantage Income Plus Fund | | Performance highlights (unaudited) |
Investment objective
The Fund seeks total return, consisting of current income and capital appreciation.
Adviser
Wells Fargo Funds Management, LLC
Subadviser
Wells Capital Management Incorporated
Portfolio managers
Thomas M. Price, CFA
Janet S. Rilling, CFA, CPA
Michael J. Bray, CFA
Average annual total returns1 (%) as of February 28, 2014
| | | | | | | | | | | | | | | | | | | | | | | | | | | | | | | | | | |
| | | | | Including sales charge | | | Excluding sales charge | | | Expense ratios2 (%) | |
| | | Inception date | | 1 year | | | 5 year | | | 10 year | | | 1 year | | | 5 year | | | 10 year | | | Gross | | | Net3 | |
| Class A (STYAX) | | 7-13-1998 | | | (3.63 | ) | | | 5.83 | | | | 4.88 | | | | 0.89 | | | | 6.81 | | | | 5.37 | | | | 0.93 | | | | 0.86 | |
| Class B (STYBX)* | | 7-13-1998 | | | (4.82 | ) | | | 5.71 | | | | 4.82 | | | | 0.18 | | | | 6.03 | | | | 4.82 | | | | 1.68 | | | | 1.61 | |
| Class C (WFIPX) | | 7-13-1998 | | | (0.79 | ) | | | 6.04 | | | | 4.59 | | | | 0.21 | | | | 6.04 | | | | 4.59 | | | | 1.68 | | | | 1.61 | |
| Administrator Class (WIPDX) | | 7-30-2010 | | | – | | | | – | | | | – | | | | 1.04 | | | | 6.97 | | | | 5.38 | | | | 0.87 | | | | 0.74 | |
| Institutional Class (WIPIX) | | 7-18-2008 | | | – | | | | – | | | | – | | | | 1.18 | | | | 7.17 | | | | 5.56 | | | | 0.60 | | | | 0.60 | |
| Investor Class (WIPNX) | | 7-18-2008 | | | – | | | | – | | | | – | | | | 0.89 | | | | 6.80 | | | | 5.35 | | | | 0.96 | | | | 0.87 | |
| Barclays U.S. Universal Bond Index4 | | – | | | – | | | | – | | | | – | | | | 0.72 | | | | 6.07 | | | | 4.87 | | | | – | | | | – | |
| * | | Class B shares are closed to investment, except in connection with the reinvestment of any distributions and permitted exchanges. |
Figures quoted represent past performance, which is no guarantee of future results, and do not reflect taxes that a shareholder may pay on fund distributions or the redemption of fund shares. Investment return and principal value of an investment will fluctuate so that an investor’s shares, when redeemed, may be worth more or less than their original cost. Performance shown without sales charges would be lower if sales charges were reflected. Current performance may be lower or higher than the performance data quoted, which assumes the reinvestment of dividends and capital gains. Current month-end performance is available on the Fund’s website, wellsfargoadvantagefunds.com.
Index returns do not include transaction costs associated with buying and selling securities, any mutual fund fees or expenses, or any taxes. It is not possible to invest directly in an index.
For Class A shares, the maximum front-end sales charge is 4.50%. For Class B shares, the maximum contingent deferred sales charge is 5.00%. For Class C shares, the maximum contingent deferred sales charge is 1.00%. Performance including sales charge assumes the sales charge for the corresponding time period. Administrator Class, Institutional Class, and Investor Class shares are sold without a front-end sales charge or contingent deferred sales charge.
Bond values fluctuate in response to the financial condition of individual issuers, general market and economic conditions, and changes in interest rates. In general, when interest rates rise, bond values fall and investors may lose principal value. The use of derivatives may reduce returns and/or increase volatility. Certain investment strategies tend to increase the total risk of an investment (relative to the broader market). The Fund is exposed to foreign investment risk, high-yield securities risk, and mortgage- and asset-backed securities risk. Consult the Fund’s prospectus for additional information on these and other risks.
Please see footnotes on page 7.
| | | | | | |
| Performance highlights (unaudited) | | Wells Fargo Advantage Income Plus Fund | | | 7 | |
| | | | |
| Ten largest long-term holdings5 (%) as of February 28, 2014 | |
U.S. Treasury Note, 0.50%, 8-15-2014 | | | 8.09 | |
U.S. Treasury Note, 0.38%, 3-15-2015 | | | 5.23 | |
FHLMC, 3.50%, 3-1-2044 | | | 4.43 | |
FNMA, 3.00%, 3-1-2044 | | | 3.95 | |
U.S. Treasury Note, 2.25%, 7-31-2018 | | | 3.93 | |
U.S. Treasury Note, 1.00%, 8-31-2016 | | | 2.83 | |
U.S. Treasury Note, 0.88%, 1-31-2018 | | | 2.79 | |
U.S. Treasury Note, 0.25%, 12-15-2015 | | | 2.43 | |
FNMA, 4.00%, 3-1-2044 | | | 2.30 | |
U.S. Treasury Note, 1.00%, 5-31-2018 | | | 2.19 | |
|
| Portfolio allocation6 as of February 28, 2014 |
|
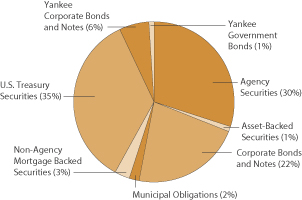
|
| 1. | Historical performance shown for Administrator Class shares prior to their inception reflects the performance of Institutional Class shares and has been adjusted to include the higher expenses applicable to Administrator Class shares. Historical performance shown for Investor Class shares prior to their inception reflects the performance of Class A shares and has been adjusted to include the higher expenses applicable to Investor Class shares. Historical performance shown for Institutional Class shares prior to their inception reflects the performance of Class A shares and includes the higher expenses applicable to Class A shares. If these expenses had not been included, returns would be higher. |
| 2. | Reflects the expense ratios as stated in the most recent prospectuses, which include the impact of 0.02% in acquired fund fees and expenses. The expense ratios shown are subject to change and may differ from the annualized expense ratios shown in the financial highlights of this report, which do not include acquired fund fees and expenses. |
| 3. | The Adviser has committed through December 31, 2014, to waive fees and/or reimburse expenses to the extent necessary to cap the Fund’s Total Annual Fund Operating Expenses After Fee Waiver, excluding certain expenses, at 0.84% for Class A, 1.59% for Class B, 1.59% for Class C, 0.72% for Administrator Class, 0.58% for Institutional Class, and 0.85% for Investor Class. Brokerage commissions, stamp duty fees, interest, taxes, acquired fund fees and expenses, and extraordinary expenses are excluded from the cap. Without this cap, the Fund’s returns would have been lower. |
| 4. | The Barclays U.S. Universal Bond Index is an unmanaged market value-weighted performance benchmark for the U.S. dollar-denominated bond market, which includes investment-grade, high yield, and emerging market debt securities with maturities of one year or more. You cannot invest directly in an index. |
| 5. | The ten largest long-term holdings are calculated based on the value of the securities divided by total net assets of the Fund. Holdings are subject to change and may have changed since the date specified. |
| 6. | Portfolio allocation is subject to change and is calculated based on the total long-term investments of the Fund. |
| | | | |
| 8 | | Wells Fargo Advantage Income Plus Fund | | Fund expenses (unaudited) |
As a shareholder of the Fund, you incur two types of costs: (1) transaction costs, including sales charges (loads) on purchase payments and contingent deferred sales charges (if any) on redemptions and (2) ongoing costs, including management fees, distribution (12b-1) and/or shareholder service fees, and other Fund expenses. This example is intended to help you understand your ongoing costs (in dollars) of investing in the Fund and to compare these costs with the ongoing costs of investing in other mutual funds.
The example is based on an investment of $1,000 invested at the beginning of the six-month period and held for the entire period from September 1, 2013 to February 28, 2014.
Actual expenses
The “Actual” line of the table below provides information about actual account values and actual expenses. You may use the information in this line, together with the amount you invested, to estimate the expenses that you paid over the period. Simply divide your account value by $1,000 (for example, an $8,600 account value divided by $1,000 = 8.6), then multiply the result by the number in the “Actual” line under the heading entitled “Expenses paid during period” for your applicable class of shares to estimate the expenses you paid on your account during this period.
Hypothetical example for comparison purposes
The “Hypothetical” line of the table below provides information about hypothetical account values and hypothetical expenses based on the Fund’s actual expense ratio and an assumed rate of return of 5% per year before expenses, which is not the Fund’s actual return. The hypothetical account values and expenses may not be used to estimate the actual ending account balance or expenses you paid for the period. You may use this information to compare the ongoing costs of investing in the Fund and other funds. To do so, compare this 5% hypothetical example with the 5% hypothetical examples that appear in the shareholder reports of the other funds.
Please note that the expenses shown in the table are meant to highlight your ongoing costs only and do not reflect any transactional costs, such as sales charges (loads) and contingent deferred sales charges. Therefore, the “Hypothetical” line of the table is useful in comparing ongoing costs only and will not help you determine the relative total costs of owning different funds. In addition, if these transactional costs were included, your costs would have been higher.
| | | | | | | | | | | | | | | | |
| | | Beginning
account value
9-1-2013 | | | Ending
account value
2-28-2014 | | | Expenses
paid during
the period1 | | | Net annualized
expense ratio | |
Class A | | | | | | | | | | | | | | | | |
Actual | | $ | 1,000.00 | | | $ | 1,038.61 | | | $ | 4.35 | | | | 0.86 | % |
Hypothetical (5% return before expenses) | | $ | 1,000.00 | | | $ | 1,020.53 | | | $ | 4.31 | | | | 0.86 | % |
Class B | | | | | | | | | | | | | | | | |
Actual | | $ | 1,000.00 | | | $ | 1,035.34 | | | $ | 8.12 | | | | 1.61 | % |
Hypothetical (5% return before expenses) | | $ | 1,000.00 | | | $ | 1,016.81 | | | $ | 8.05 | | | | 1.61 | % |
Class C | | | | | | | | | | | | | | | | |
Actual | | $ | 1,000.00 | | | $ | 1,035.61 | | | $ | 8.13 | | | | 1.61 | % |
Hypothetical (5% return before expenses) | | $ | 1,000.00 | | | $ | 1,016.81 | | | $ | 8.05 | | | | 1.61 | % |
Administrator Class | | | | | | | | | | | | | | | | |
Actual | | $ | 1,000.00 | | | $ | 1,039.43 | | | $ | 3.64 | | | | 0.72 | % |
Hypothetical (5% return before expenses) | | $ | 1,000.00 | | | $ | 1,021.22 | | | $ | 3.61 | | | | 0.72 | % |
Institutional Class | | | | | | | | | | | | | | | | |
Actual | | $ | 1,000.00 | | | $ | 1,040.05 | | | $ | 2.93 | | | | 0.58 | % |
Hypothetical (5% return before expenses) | | $ | 1,000.00 | | | $ | 1,021.92 | | | $ | 2.91 | | | | 0.58 | % |
Investor Class | | | | | | | | | | | | | | | | |
Actual | | $ | 1,000.00 | | | $ | 1,038.58 | | | $ | 4.40 | | | | 0.87 | % |
Hypothetical (5% return before expenses) | | $ | 1,000.00 | | | $ | 1,020.48 | | | $ | 4.36 | | | | 0.87 | % |
| 1. | Expenses paid is equal to the annualized expense ratio of each class multiplied by the average account value over the period, multiplied by the number of days in the most recent fiscal half-year divided by the number of days in the fiscal year (to reflect the one-half-year period). |
| | | | | | |
| Portfolio of investments—February 28, 2014 (unaudited) | | Wells Fargo Advantage Income Plus Fund | | | 9 | |
| | | | | | | | | | | | | | | | |
| Security name | | Interest rate | | | Maturity date | | | Principal | | | Value | |
| | | | | | | | | | | | | | | | |
| | | | |
Agency Securities: 33.12% | | | | | | | | | | | | | | | | |
FHLB Series VN-2015 Class A | | | 5.46 | % | | | 11-27-2015 | | | $ | 920,266 | | | $ | 974,438 | |
FHLMC ± | | | 1.95 | | | | 1-1-2036 | | | | 83,465 | | | | 88,166 | |
FHLMC %% | | | 3.50 | | | | 3-1-2044 | | | | 20,440,000 | | | | 20,666,757 | |
FHLMC %% | | | 4.00 | | | | 3-1-2044 | | | | 6,310,000 | | | | 6,595,922 | |
FHLMC | | | 5.00 | | | | 6-1-2036 | | | | 887,045 | | | | 968,897 | |
FHLMC | | | 5.00 | | | | 8-1-2040 | | | | 841,385 | | | | 920,757 | |
FHLMC | | | 5.50 | | | | 10-1-2017 | | | | 414,041 | | | | 440,092 | |
FHLMC | | | 5.50 | | | | 11-1-2023 | | | | 191,621 | | | | 209,112 | |
FHLMC | | | 5.50 | | | | 8-1-2038 | | | | 209,109 | | | | 229,227 | |
FHLMC | | | 5.50 | | | | 12-1-2038 | | | | 1,766,685 | | | | 1,936,658 | |
FHLMC | | | 5.50 | | | | 6-1-2040 | | | | 1,919,984 | | | | 2,112,662 | |
FHLMC | | | 7.50 | | | | 5-1-2038 | | | | 7,889 | | | | 8,658 | |
FHLMC | | | 8.00 | | | | 2-1-2030 | | | | 613 | | | | 739 | |
FHLMC Series 2013-K28 Class B ±144A | | | 3.49 | | | | 6-25-2046 | | | | 1,970,000 | | | | 1,831,696 | |
FHLMC Series 2013-K30 Class B ±144A | | | 3.56 | | | | 6-25-2045 | | | | 2,515,000 | | | | 2,347,393 | |
FHLMC Series 2013-K32 Class B ±144A | | | 3.54 | | | | 10-25-2046 | | | | 1,875,000 | | | | 1,746,866 | |
FHLMC Series 3774 Class AB | | | 3.50 | | | | 12-15-2020 | | | | 634,074 | | | | 674,882 | |
FHLMC Series K020 Class X1 ±(c) | | | 1.47 | | | | 5-25-2022 | | | | 14,578,923 | | | | 1,364,339 | |
FHLMC Series K021 Class X1 ±(c) | | | 1.51 | | | | 6-25-2022 | | | | 12,985,745 | | | | 1,268,837 | |
FHLMC Series M009 Class A ±(i) | | | 5.40 | | | | 10-15-2021 | | | | 106,099 | | | | 106,099 | |
FHLMC Series T-42 Class A5 | | | 7.50 | | | | 2-25-2042 | | | | 2,599,568 | | | | 3,056,923 | |
FHLMC Series T-57 Class 2A1 ± | | | 3.24 | | | | 7-25-2043 | | | | 83,383 | | | | 87,112 | |
FHLMC Series T-59 Class 2A1 ± | | | 2.91 | | | | 10-25-2043 | | | | 76,918 | | | | 79,348 | |
FNMA ± | | | 2.40 | | | | 1-1-2036 | | | | 268,820 | | | | 285,675 | |
FNMA ± | | | 2.41 | | | | 8-1-2036 | | | | 114,153 | | | | 122,640 | |
FNMA ± | | | 2.48 | | | | 9-1-2036 | | | | 67,429 | | | | 71,501 | |
FNMA | | | 2.75 | | | | 10-1-2022 | | | | 2,250,000 | | | | 2,167,079 | |
FNMA %% | | | 3.00 | | | | 3-1-2029 | | | | 3,355,000 | | | | 3,471,377 | |
FNMA %% | | | 3.00 | | | | 3-1-2044 | | | | 18,940,000 | | | | 18,395,475 | |
FNMA | | | 3.27 | | | | 7-1-2022 | | | | 1,313,993 | | | | 1,348,994 | |
FNMA %% | | | 3.50 | | | | 3-1-2029 | | | | 3,655,000 | | | | 3,863,449 | |
FNMA %% | | | 3.50 | | | | 3-1-2044 | | | | 4,400,000 | | | | 4,459,813 | |
FNMA | | | 3.95 | | | | 9-1-2021 | | | | 440,833 | | | | 472,548 | |
FNMA | | | 4.00 | | | | 9-1-2024 | | | | 291,071 | | | | 310,808 | |
FNMA %% | | | 4.00 | | | | 3-1-2029 | | | | 2,570,000 | | | | 2,741,869 | |
FNMA %% | | | 4.00 | | | | 3-1-2044 | | | | 10,230,000 | | | | 10,718,323 | |
FNMA | | | 4.26 | | | | 4-1-2021 | | | | 2,889,528 | | | | 3,157,503 | |
FNMA | | | 4.39 | | | | 1-1-2020 | | | | 1,586,866 | | | | 1,747,371 | |
FNMA %% | | | 4.50 | | | | 3-1-2029 | | | | 3,760,000 | | | | 4,013,800 | |
FNMA %% | | | 4.50 | | | | 3-1-2044 | | | | 8,250,000 | | | | 8,859,404 | |
FNMA | | | 5.00 | | | | 1-1-2024 | | | | 382,844 | | | | 415,839 | |
FNMA | | | 5.00 | | | | 2-1-2036 | | | | 85,128 | | | | 93,273 | |
FNMA | | | 5.00 | | | | 6-1-2040 | | | | 279,667 | | | | 307,008 | |
FNMA | | | 5.00 | | | | 8-1-2040 | | | | 5,031,910 | | | | 5,525,162 | |
FNMA | | | 5.50 | | | | 8-1-2034 | | | | 292,640 | | | | 324,394 | |
FNMA | | | 5.50 | | | | 2-1-2035 | | | | 88,917 | | | | 98,560 | |
FNMA | | | 5.50 | | | | 8-1-2038 | | | | 476,990 | | | | 525,373 | |
FNMA | | | 5.50 | | | | 8-1-2038 | | | | 1,166,317 | | | | 1,293,408 | |
FNMA | | | 6.00 | | | | 10-1-2037 | | | | 1,713,192 | | | | 1,907,244 | |
FNMA | | | 6.00 | | | | 11-1-2037 | | | | 144,873 | | | | 161,440 | |
The accompanying notes are an integral part of these financial statements.
| | | | |
| 10 | | Wells Fargo Advantage Income Plus Fund | | Portfolio of investments—February 28, 2014 (unaudited) |
| | | | | | | | | | | | | | | | |
| Security name | | Interest rate | | | Maturity date | | | Principal | | | Value | |
| | | | | | | | | | | | | | | | |
| | | | |
Agency Securities (continued) | | | | | | | | | | | | | | | | |
FNMA %% | | | 6.00 | % | | | 3-1-2044 | | | $ | 795,000 | | | $ | 884,934 | |
FNMA | | | 6.50 | | | | 7-1-2036 | | | | 73,158 | | | | 81,894 | |
FNMA | | | 6.50 | | | | 7-1-2036 | | | | 28,809 | | | | 32,229 | |
FNMA | | | 6.50 | | | | 11-1-2036 | | | | 25,757 | | | | 28,981 | |
FNMA | | | 6.50 | | | | 7-1-2037 | | | | 2,028,819 | | | | 2,274,926 | |
FNMA | | | 7.00 | | | | 3-1-2024 | | | | 837,125 | | | | 908,250 | |
FNMA | | | 7.00 | | | | 7-1-2036 | | | | 35,532 | | | | 40,665 | |
FNMA | | | 7.00 | | | | 11-1-2037 | | | | 39,990 | | | | 42,842 | |
FNMA | | | 7.50 | | | | 5-1-2038 | | | | 2,084 | | | | 2,126 | |
FNMA Series 2002-T12 Class A3 | | | 7.50 | | | | 5-25-2042 | | | | 10,437 | | | | 12,308 | |
FNMA Series 2003-W08 Class 4A ± | | | 3.13 | | | | 11-25-2042 | | | | 217,926 | | | | 227,070 | |
FNMA Series 2003-W14 Class 2A ± | | | 2.21 | | | | 6-25-2035 | | | | 194,295 | | | | 199,164 | |
FNMA Series 2003-W14 Class 2A ± | | | 3.40 | | | | 1-25-2043 | | | | 109,733 | | | | 113,769 | |
FNMA Series 2004-W11 Class 1A3 | | | 7.00 | | | | 5-25-2044 | | | | 2,143,308 | | | | 2,566,086 | |
FNMA Series 2004-W15 Class 1A3 | | | 7.00 | | | | 8-25-2044 | | | | 1,592,063 | | | | 1,863,829 | |
GNMA | | | 4.00 | | | | 6-20-2042 | | | | 4,814,936 | | | | 5,114,025 | |
GNMA %% | | | 4.50 | | | | 3-1-2044 | | | | 7,540,000 | | | | 8,191,503 | |
GNMA | | | 5.00 | | | | 7-20-2040 | | | | 2,158,857 | | | | 2,393,668 | |
GNMA | | | 7.50 | | | | 12-15-2029 | | | | 832 | | | | 949 | |
GNMA Series 2008-22 Class XM ±(c) | | | 3.70 | | | | 2-16-2050 | | | | 5,149,952 | | | | 183,410 | |
GNMA Series 2008-86 Class D | | | 5.46 | | | | 6-16-2040 | | | | 4,365,000 | | | | 4,680,136 | |
| | | | |
Total Agency Securities (Cost $151,344,438) | | | | | | | | | | | | | | | 154,417,674 | |
| | | | | | | | | | | | | | | | |
| | | | |
Asset-Backed Securities: 1.11% | | | | | | | | | | | | | | | | |
CVS Pass-Through Trust First Lien | | | 6.04 | | | | 12-10-2028 | | | | 1,517,668 | | | | 1,719,386 | |
Nissan Auto Lease Trust Series 2013-A Class A2A | | | 0.45 | | | | 9-15-2015 | | | | 3,441,248 | | | | 3,442,338 | |
| | | | |
Total Asset-Backed Securities (Cost $4,948,601) | | | | | | | | | | | | | | | 5,161,724 | |
| | | | | | | | | | | | | | | | |
| | | | |
Corporate Bonds and Notes: 25.14% | | | | | | | | | | | | | | | | |
| | | | |
Consumer Discretionary: 4.22% | | | | | | | | | | | | | | | | |
| | | | |
| Auto Components: 0.62% | | | | | | | | | | | | | | | | |
Delphi Corporation | | | 5.00 | | | | 2-15-2023 | | | | 1,025,000 | | | | 1,092,906 | |
TRW Automotive Incorporated 144A | | | 4.50 | | | | 3-1-2021 | | | | 1,750,000 | | | | 1,811,250 | |
| | | | |
| | | | | | | | | | | | | | | 2,904,156 | |
| | | | | | | | | | | | | | | | |
| | | | |
| Automobiles: 0.45% | | | | | | | | | | | | | | | | |
Ford Motor Company | | | 7.45 | | | | 7-16-2031 | | | | 1,645,000 | | | | 2,114,626 | |
| | | | | | | | | | | | | | | | |
| | | | |
| Diversified Consumer Services: 0.37% | | | | | | | | | | | | | | | | |
Service Corporation International | | | 8.00 | | | | 11-15-2021 | | | | 1,500,000 | | | | 1,730,625 | |
| | | | | | | | | | | | | | | | |
| | | | |
| Hotels, Restaurants & Leisure: 0.33% | | | | | | | | | | | | | | | | |
Agua Caliente Band of Cahuilla Indians 144A | | | 6.44 | | | | 10-1-2016 | | | | 434,000 | | | | 407,682 | |
Darden Restaurants Incorporated | | | 6.80 | | | | 10-15-2037 | | | | 1,060,000 | | | | 1,147,245 | |
| | | | |
| | | | | | | | | | | | | | | 1,554,927 | |
| | | | | | | | | | | | | | | | |
| | | | |
| Household Durables: 0.35% | | | | | | | | | | | | | | | | |
D.R. Horton Incorporated | | | 4.75 | | | | 2-15-2023 | | | | 1,650,000 | | | | 1,617,000 | |
| | | | | | | | | | | | | | | | |
The accompanying notes are an integral part of these financial statements.
| | | | | | |
| Portfolio of investments—February 28, 2014 (unaudited) | | Wells Fargo Advantage Income Plus Fund | | | 11 | |
| | | | | | | | | | | | | | | | |
| Security name | | Interest rate | | | Maturity date | | | Principal | | | Value | |
| | | | | | | | | | | | | | | | |
| | | | |
| Media: 1.20% | | | | | | | | | | | | | | | | |
CBS Corporation | | | 7.88 | % | | | 7-30-2030 | | | $ | 775,000 | | | $ | 1,009,489 | |
CCO Holdings LLC | | | 8.13 | | | | 4-30-2020 | | | | 1,300,000 | | | | 1,423,500 | |
National CineMedia LLC | | | 6.00 | | | | 4-15-2022 | | | | 1,500,000 | | | | 1,571,250 | |
News America Incorporated | | | 7.85 | | | | 3-1-2039 | | | | 1,180,000 | | | | 1,573,018 | |
| | | | |
| | | | | | | | | | | | | | | 5,577,257 | |
| | | | | | | | | | | | | | | | |
| | | | |
| Multiline Retail: 0.34% | | | | | | | | | | | | | | | | |
Macy’s Retail Holdings Incorporated | | | 6.65 | | | | 7-15-2024 | | | | 1,330,000 | | | | 1,599,560 | |
| | | | | | | | | | | | | | | | |
| | | | |
| Specialty Retail: 0.56% | | | | | | | | | | | | | | | | |
L Brands Incorporated | | | 6.63 | | | | 4-1-2021 | | | | 1,020,000 | | | | 1,143,675 | |
Sally Beauty Holdings Incorporated | | | 5.75 | | | | 6-1-2022 | | | | 1,360,000 | | | | 1,438,200 | |
| | | | |
| | | | | | | | | | | | | | | 2,581,875 | |
| | | | | | | | | | | | | | | | |
| | | | |
Consumer Staples: 0.30% | | | | | | | | | | | | | | | | |
| | | | |
| Food Products: 0.04% | | | | | | | | | | | | | | | | |
TreeHouse Foods Incorporated %% | | | 4.88 | | | | 3-15-2022 | | | | 180,000 | | | | 183,150 | |
| | | | | | | | | | | | | | | | |
| | | | |
| Tobacco: 0.26% | | | | | | | | | | | | | | | | |
Lorillard Incorporated | | | 8.13 | | | | 6-23-2019 | | | | 975,000 | | | | 1,215,936 | |
| | | | | | | | | | | | | | | | |
| | | | |
Energy: 1.98% | | | | | | | | | | | | | | | | |
| | | | |
| Energy Equipment & Services: 0.33% | | | | | | | | | | | | | | | | |
SESI LLC | | | 7.13 | | | | 12-15-2021 | | | | 1,410,000 | | | | 1,565,100 | |
| | | | | | | | | | | | | | | | |
| | | | |
| Oil, Gas & Consumable Fuels: 1.65% | | | | | | | | | | | | | | | | |
Chesapeake Energy Corporation | | | 6.63 | | | | 8-15-2020 | | | | 1,390,000 | | | | 1,588,075 | |
Energy Transfer Equity LP | | | 7.50 | | | | 10-15-2020 | | | | 1,450,000 | | | | 1,656,625 | |
Kinder Morgan Energy Partners LP | | | 5.50 | | | | 3-1-2044 | | | | 1,335,000 | | | | 1,347,672 | |
Newfield Exploration Company | | | 6.88 | | | | 2-1-2020 | | | | 1,500,000 | | | | 1,610,625 | |
Sabine Pass Liquefaction LLC 144A | | | 5.63 | | | | 4-15-2023 | | | | 1,500,000 | | | | 1,473,750 | |
| | | | |
| | | | | | | | | | | | | | | 7,676,747 | |
| | | | | | | | | | | | | | | | |
| | | | |
Financials: 10.71% | | | | | | | | | | | | | | | | |
| | | | |
| Banks: 3.56% | | | | | | | | | | | | | | | | |
Australia and New Zealand Banking Group Limited 144A | | | 2.40 | | | | 11-23-2016 | | | | 3,320,000 | | | | 3,445,403 | |
Bank of America Corporation | | | 6.50 | | | | 8-1-2016 | | | | 2,300,000 | | | | 2,590,430 | |
Bank of America Corporation | | | 7.63 | | | | 6-1-2019 | | | | 2,480,000 | | | | 3,089,289 | |
CBA Capital Trust II ±144A | | | 6.02 | | | | 12-31-2049 | | | | 1,300,000 | | | | 1,374,750 | |
CIT Group Incorporated | | | 5.38 | | | | 5-15-2020 | | | | 1,650,000 | | | | 1,782,000 | |
Citigroup Incorporated | | | 5.88 | | | | 1-30-2042 | | | | 1,390,000 | | | | 1,610,120 | |
JPMorgan Chase & Company Series Q ± | | | 5.15 | | | | 12-31-2049 | | | | 1,620,000 | | | | 1,530,900 | |
PNC Financial Services Group Incorporated ±« | | | 4.45 | | | | 5-29-2049 | | | | 1,165,000 | | | | 1,166,165 | |
| | | | |
| | | | | | | | | | | | | | | 16,589,057 | |
| | | | | | | | | | | | | | | | |
| | | | |
| Capital Markets: 0.53% | | | | | | | | | | | | | | | | |
Alterra Finance LLC | | | 6.25 | | | | 9-30-2020 | | | | 2,150,000 | | | | 2,499,736 | |
| | | | | | | | | | | | | | | | |
The accompanying notes are an integral part of these financial statements.
| | | | |
| 12 | | Wells Fargo Advantage Income Plus Fund | | Portfolio of investments—February 28, 2014 (unaudited) |
| | | | | | | | | | | | | | | | |
| Security name | | Interest rate | | | Maturity date | | | Principal | | | Value | |
| | | | | | | | | | | | | | | | |
| | | | |
| Consumer Finance: 1.91% | | | | | | | | | | | | | | | | |
Ally Financial Incorporated | | | 8.00 | % | | | 3-15-2020 | | | $ | 1,000,000 | | | $ | 1,237,500 | |
Discover Financial Services | | | 5.20 | | | | 4-27-2022 | | | | 1,795,000 | | | | 1,933,712 | |
General Motors Financial Company Incorporated | | | 4.25 | | | | 5-15-2023 | | | | 1,710,000 | | | | 1,727,100 | |
HSBC Finance Corporation | | | 6.68 | | | | 1-15-2021 | | | | 2,185,000 | | | | 2,569,250 | |
SLM Corporation | | | 8.00 | | | | 3-25-2020 | | | | 1,240,000 | | | | 1,432,200 | |
| | | | |
| | | | | | | | | | | | | | | 8,899,762 | |
| | | | | | | | | | | | | | | | |
| | | | |
| Diversified Financial Services: 1.32% | | | | | | | | | | | | | | | | |
Blackstone Holdings Finance Company LLC 144A | | | 5.88 | | | | 3-15-2021 | | | | 1,110,000 | | | | 1,274,858 | |
General Electric Capital Corporation ± | | | 6.38 | | | | 11-15-2067 | | | | 2,200,000 | | | | 2,433,750 | |
Moody’s Corporation | | | 5.50 | | | | 9-1-2020 | | | | 2,165,000 | | | | 2,427,740 | |
| | | | |
| | | | | | | | | | | | | | | 6,136,348 | |
| | | | | | | | | | | | | | | | |
| | | | |
| Insurance: 3.03% | | | | | | | | | | | | | | | | |
Allstate Corporation ± | | | 5.75 | | | | 8-15-2053 | | | | 1,635,000 | | | | 1,700,564 | |
National Life Insurance Company of Vermont 144A | | | 10.50 | | | | 9-15-2039 | | | | 1,315,000 | | | | 1,821,596 | |
Platinum Underwriters Finance Incorporated Series B | | | 7.50 | | | | 6-1-2017 | | | | 1,730,000 | | | | 1,958,978 | |
Protective Life Corporation | | | 8.45 | | | | 10-15-2039 | | | | 1,855,000 | | | | 2,495,628 | |
Prudential Financial Incorporated ± | | | 8.88 | | | | 6-15-2038 | | | | 1,645,000 | | | | 2,006,900 | |
Torchmark Corporation | | | 9.25 | | | | 6-15-2019 | | | | 1,600,000 | | | | 2,071,930 | |
ZFS Finance (USA) Trust II ±144A | | | 6.45 | | | | 12-15-2065 | | | | 1,920,000 | | | | 2,054,400 | |
| | | | |
| | | | | | | | | | | | | | | 14,109,996 | |
| | | | | | | | | | | | | | | | |
| | | | |
| REITs: 0.36% | | | | | | | | | | | | | | | | |
American Tower Corporation | | | 7.00 | | | | 10-15-2017 | | | | 1,455,000 | | | | 1,706,311 | |
| | | | | | | | | | | | | | | | |
| | | | |
Health Care: 1.09% | | | | | | | | | | | | | | | | |
| | | | |
| Health Care Providers & Services: 0.76% | | | | | | | | | | | | | | | | |
Community Health Systems Incorporated | | | 5.13 | | | | 8-1-2021 | | | | 335,000 | | | | 346,725 | |
Fresenius Medical Care Holdings Incorporated 144A | | | 5.88 | | | | 1-31-2022 | | | | 1,435,000 | | | | 1,535,450 | |
HCA Incorporated | | | 6.50 | | | | 2-15-2020 | | | | 1,450,000 | | | | 1,636,688 | |
| | | | |
| | | | | | | | | | | | | | | 3,518,863 | |
| | | | | | | | | | | | | | | | |
| | | | |
| Pharmaceuticals: 0.33% | | | | | | | | | | | | | | | | |
Teva Pharmaceutical Finance Company LLC | | | 6.15 | | | | 2-1-2036 | | | | 1,370,000 | | | | 1,559,407 | |
| | | | | | | | | | | | | | | | |
| | | | |
Industrials: 2.61% | | | | | | | | | | | | | | | | |
| | | | |
| Aerospace & Defense: 0.13% | | | | | | | | | | | | | | | | |
DigitalGlobe Incorporated | | | 5.25 | | | | 2-1-2021 | | | | 635,000 | | | | 628,650 | |
| | | | | | | | | | | | | | | | |
| | | | |
| Building Products: 0.34% | | | | | | | | | | | | | | | | |
Masco Corporation | | | 5.95 | | | | 3-15-2022 | | | | 1,450,000 | | | | 1,566,000 | |
| | | | | | | | | | | | | | | | |
| | | | |
| Commercial Services & Supplies: 0.62% | | | | | | | | | | | | | | | | |
Clean Harbors Incorporated | | | 5.25 | | | | 8-1-2020 | | | | 1,375,000 | | | | 1,416,250 | |
Penske Truck Leasing Company LP 144A | | | 3.13 | | | | 5-11-2015 | | | | 1,445,000 | | | | 1,485,324 | |
| | | | |
| | | | | | | | | | | | | | | 2,901,574 | |
| | | | | | | | | | | | | | | | |
The accompanying notes are an integral part of these financial statements.
| | | | | | |
| Portfolio of investments—February 28, 2014 (unaudited) | | Wells Fargo Advantage Income Plus Fund | | | 13 | |
| | | | | | | | | | | | | | | | |
| Security name | | Interest rate | | | Maturity date | | | Principal | | | Value | |
| | | | | | | | | | | | | | | | |
| | | | |
| Professional Services: 1.02% | | | | | | | | | | | | | | | | |
FTI Consulting Incorporated | | | 6.75 | % | | | 10-1-2020 | | | $ | 1,650,000 | | | $ | 1,794,375 | |
Verisk Analytics Incorporated | | | 5.80 | | | | 5-1-2021 | | | | 2,650,000 | | | | 2,945,043 | |
| | | | |
| | | | | | | | | | | | | | | 4,739,418 | |
| | | | | | | | | | | | | | | | |
| | | | |
| Trading Companies & Distributors: 0.50% | | | | | | | | | | | | | | | | |
Ashtead Capital Incorporated 144A | | | 6.50 | | | | 7-15-2022 | | | | 790,000 | | | | 857,150 | |
International Lease Finance Corporation | | | 8.25 | | | | 12-15-2020 | | | | 1,190,000 | | | | 1,456,263 | |
| | | | |
| | | | | | | | | | | | | | | 2,313,413 | |
| | | | | | | | | | | | | | | | |
| | | | |
Information Technology: 0.82% | | | | | | | | | | | | | | | | |
| | | | |
| Electronic Equipment, Instruments & Components: 0.49% | | | | | | | | | | | | | | | | |
Corning Incorporated | | | 7.25 | | | | 8-15-2036 | | | | 1,912,000 | | | | 2,306,015 | |
| | | | | | | | | | | | | | | | |
| | | | |
| Semiconductors & Semiconductor Equipment: 0.01% | | | | | | | | | | | | | | | | |
Micron Technology Incorporated 144A | | | 5.88 | | | | 2-15-2022 | | | | 60,000 | | | | 62,700 | |
| | | | | | | | | | | | | | | | |
| | | | |
| Software: 0.32% | | | | | | | | | | | | | | | | |
Activision Blizzard Incorporated 144A | | | 5.63 | | | | 9-15-2021 | | | | 1,370,000 | | | | 1,472,750 | |
| | | | | | | | | | | | | | | | |
| | | | |
Materials: 1.23% | | | | | | | | | | | | | | | | |
| | | | |
| Chemicals: 0.33% | | | | | | | | | | | | | | | | |
Rockwood Specialties Group Incorporated | | | 4.63 | | | | 10-15-2020 | | | | 1,475,000 | | | | 1,530,313 | |
| | | | | | | | | | | | | | | | |
| | | | |
| Metals & Mining: 0.35% | | | | | | | | | | | | | | | | |
Steel Dynamics Incorporated | | | 6.38 | | | | 8-15-2022 | | | | 1,465,000 | | | | 1,607,838 | |
| | | | | | | | | | | | | | | | |
| | | | |
| Paper & Forest Products: 0.55% | | | | | | | | | | | | | | | | |
International Paper Company | | | 7.30 | | | | 11-15-2039 | | | | 1,970,000 | | | | 2,574,695 | |
| | | | | | | | | | | | | | | | |
| | | | |
Telecommunication Services: 1.37% | | | | | | | | | | | | | | | | |
| | | | |
| Diversified Telecommunication Services: 0.90% | | | | | | | | | | | | | | | | |
CenturyLink Incorporated | | | 5.63 | | | | 4-1-2020 | | | | 1,375,000 | | | | 1,436,875 | |
Verizon Communications Incorporated | | | 6.55 | | | | 9-15-2043 | | | | 1,080,000 | | | | 1,322,441 | |
Virgin Media Secured Finance plc 144A | | | 5.38 | | | | 4-15-2021 | | | | 1,390,000 | | | | 1,431,700 | |
| | | | |
| | | | | | | | | | | | | | | 4,191,016 | |
| | | | | | | | | | | | | | | | |
| | | | |
| Wireless Telecommunication Services: 0.47% | | | | | | | | | | | | | | | | |
SBA Tower Trust 144A | | | 3.72 | | | | 4-15-2048 | | | | 1,820,000 | | | | 1,744,823 | |
Sprint Corporation 144A | | | 7.88 | | | | 9-15-2023 | | | | 430,000 | | | | 476,225 | |
| | | | |
| | | | | | | | | | | | | | | 2,221,048 | |
| | | | | | | | | | | | | | | | |
| | | | |
Utilities: 0.81% | | | | | | | | | | | | | | | | |
| | | | |
| Independent Power & Renewable Electricity Producers: 0.81% | | | | | | | | | | | | | | | | |
Calpine Corporation 144A | | | 7.88 | | | | 1-15-2023 | | | | 1,294,000 | | | | 1,455,750 | |
Harper Lake Solar Funding Corporation 144A | | | 7.65 | | | | 12-31-2018 | | | | 1,340,064 | | | | 1,408,687 | |
NRG Energy Incorporated | | | 7.63 | | | | 1-15-2018 | | | | 800,000 | | | | 904,000 | |
| | | | |
| | | | | | | | | | | | | | | 3,768,437 | |
| | | | | | | | | | | | | | | | |
| | | | |
Total Corporate Bonds and Notes (Cost $109,892,543) | | | | | | | | | | | | | | | 117,224,306 | |
| | | | | | | | | | | | | | | | |
The accompanying notes are an integral part of these financial statements.
| | | | |
| 14 | | Wells Fargo Advantage Income Plus Fund | | Portfolio of investments—February 28, 2014 (unaudited) |
| | | | | | | | | | | | | | | | |
| Security name | | Interest rate | | | Maturity date | | | Principal | | | Value | |
| | | | | | | | | | | | | | | | |
| | | | |
Municipal Obligations: 2.09% | | | | | | | | | | | | | | | | |
| | | | |
| California: 0.99% | | | | | | | | | | | | | | | | |
California Build America Bonds Stem Cell Research and Cures Series A (GO) | | | 4.99 | % | | | 4-1-2039 | | | $ | 1,505,000 | | | $ | 1,511,110 | |
San Jose CA Series B (Airport Revenue, AGM Insured) | | | 6.60 | | | | 3-1-2041 | | | | 3,000,000 | | | | 3,113,880 | |
| | | | |
| | | | | | | | | | | | | | | 4,624,990 | |
| | | | | | | | | | | | | | | | |
| | | | |
| Illinois: 0.67% | | | | | | | | | | | | | | | | |
Illinois (GO) | | | 4.51 | | | | 3-1-2015 | | | | 3,000,000 | | | | 3,114,480 | |
| | | | | | | | | | | | | | | | |
| | | | |
| Puerto Rico: 0.43% | | | | | | | | | | | | | | | | |
Puerto Rico Government Development Bank (Miscellaneous Revenue, National Insured) ± | | | 4.75 | | | | 12-1-2015 | | | | 2,005,000 | | | | 1,986,795 | |
| | | | | | | | | | | | | | | | |
| | | | |
Total Municipal Obligations (Cost $9,430,213) | | | | | | | | | | | | | | | 9,726,265 | |
| | | | | | | | | | | | | | | | |
| | | | |
Non-Agency Mortgage Backed Securities: 3.69% | | | | | | | | | | | | | | | | |
Bear Stearns Commercial Mortgage Securities Incorporated Series 2005-PWR-7
Class A3 ± | | | 5.12 | | | | 2-11-2041 | | | | 1,940,000 | | | | 2,001,735 | |
Bear Stearns Commercial Mortgage Securities Incorporated Series 2005-T20
Class A4A ± | | | 5.14 | | | | 10-12-2042 | | | | 2,480,000 | | | | 2,621,824 | |
Commercial Mortgage Trust Pass-Through Certificates Series 2005-C6 Class A5A ± | | | 5.12 | | | | 6-10-2044 | | | | 1,712,921 | | | | 1,796,921 | |
Credit Suisse First Boston Commercial Mortgage Trust Series 1998-C2 Class AX ±(c) | | | 0.34 | | | | 11-15-2030 | | | | 354,130 | | | | 1,398 | |
Financial Asset Securitization Incorporated Series 1997-NAM2 Class B2 (s) | | | 7.88 | | | | 7-25-2027 | | | | 92,234 | | | | 90,928 | |
GE Capital Commercial Mortgage Corporation Series 2005-C3 Class A7A ± | | | 4.97 | | | | 7-10-2045 | | | | 2,695,000 | | | | 2,815,588 | |
Lehman Brothers UBS Commercial Mortgage Trust Series 2006-C1 Class A4 | | | 5.16 | | | | 2-15-2031 | | | | 3,545,000 | | | | 3,760,454 | |
Mach One Trust Commercial Mortgage Backed Series 2004-1 Class X ±144A(c)(i) | | | 0.53 | | | | 5-28-2040 | | | | 630,519 | | | | 10,870 | |
Morgan Stanley Capital I Series 2004-HQ4 Class A7 | | | 4.97 | | | | 4-14-2040 | | | | 1,423,767 | | | | 1,432,167 | |
Morgan Stanley Capital I Series 2004-RR2 Class X ±144A(c) | | | 0.54 | | | | 10-28-2033 | | | | 409,743 | | | | 3,073 | |
Morgan Stanley Capital I Series 2005-T19 Class A4A | | | 4.89 | | | | 6-12-2047 | | | | 2,564,008 | | | | 2,676,316 | |
| | | | |
Total Non-Agency Mortgage Backed Securities (Cost $17,431,202) | | | | | | | | | | | | | | | 17,211,274 | |
| | | | | | | | | | | | | | | | |
| | | | |
U.S. Treasury Securities: 39.43% | | | | | | | | | | | | | | | | |
U.S. Treasury Bond ## | | | 2.75 | | | | 11-15-2042 | | | | 3,280,000 | | | | 2,776,723 | |
U.S. Treasury Bond | | | 2.88 | | | | 5-15-2043 | | | | 5,370,000 | | | | 4,656,800 | |
U.S. Treasury Bond | | | 3.75 | | | | 11-15-2043 | | | | 4,680,000 | | | | 4,820,400 | |
U.S. Treasury Bond | | | 4.50 | | | | 2-15-2036 | | | | 4,415,000 | | | | 5,173,828 | |
U.S. Treasury Note | | | 0.25 | | | | 12-15-2015 | | | | 11,350,000 | | | | 11,345,562 | |
U.S. Treasury Note | | | 0.25 | | | | 5-15-2016 | | | | 2,975,000 | | | | 2,965,471 | |
U.S. Treasury Note | | | 0.38 | | | | 3-15-2015 | | | | 24,345,000 | | | | 24,400,166 | |
U.S. Treasury Note | | | 0.38 | | | | 11-15-2015 | | | | 5,820,000 | | | | 5,831,820 | |
U.S. Treasury Note ## | | | 0.38 | | | | 3-15-2016 | | | | 2,250,000 | | | | 2,251,582 | |
U.S. Treasury Note ## | | | 0.50 | | | | 8-15-2014 | | | | 37,625,000 | | | | 37,695,547 | |
U.S. Treasury Note ## | | | 0.88 | | | | 1-31-2018 | | | | 13,145,000 | | | | 13,025,880 | |
U.S. Treasury Note | | | 1.00 | | | | 8-31-2016 | | | | 13,015,000 | | | | 13,174,642 | |
U.S. Treasury Note | | | 1.00 | | | | 5-31-2018 | | | | 10,335,000 | | | | 10,228,425 | |
U.S. Treasury Note | | | 1.25 | | | | 10-31-2018 | | | | 9,915,000 | | | | 9,844,514 | |
U.S. Treasury Note ## | | | 1.38 | | | | 7-31-2018 | | | | 4,290,000 | | | | 4,301,394 | |
U.S. Treasury Note | | | 1.38 | | | | 2-28-2019 | | | | 7,915,000 | | | | 7,859,350 | |
U.S. Treasury Note | | | 2.25 | | | | 7-31-2018 | | | | 17,585,000 | | | | 18,300,762 | |
U.S. Treasury Note | | | 2.75 | | | | 2-15-2024 | | | | 5,105,000 | | | | 5,147,275 | |
| | | | |
Total U.S. Treasury Securities (Cost $184,050,901) | | | | | | | | | | | | | | | 183,800,141 | |
| | | | | | | | | | | | | | | | |
The accompanying notes are an integral part of these financial statements.
| | | | | | |
| Portfolio of investments—February 28, 2014 (unaudited) | | Wells Fargo Advantage Income Plus Fund | | | 15 | |
| | | | | | | | | | | | | | | | |
| Security name | | Interest rate | | | Maturity date | | | Principal | | | Value | |
| | | | | | | | | | | | | | | | |
| | | | |
Yankee Corporate Bonds and Notes: 6.85% | | | | | | | | | | | | | | | | |
| | | | |
Consumer Discretionary: 1.18% | | | | | | | | | | | | | | | | |
| | | | |
| Media: 1.18% | | | | | | | | | | | | | | | | |
British Sky Broadcasting Group plc 144A | | | 9.50 | % | | | 11-15-2018 | | | $ | 1,785,000 | | | $ | 2,340,660 | |
Myriad International Holdings BV 144A | | | 6.38 | | | | 7-28-2017 | | | | 1,445,000 | | | | 1,603,950 | |
WPP Finance 2010 | | | 5.63 | | | | 11-15-2043 | | | | 1,470,000 | | | | 1,548,942 | |
| | | | |
| | | | | | | | | | | | | | | 5,493,552 | |
| | | | | | | | | | | | | | | | |
| | | | |
Consumer Staples: 0.28% | | | | | | | | | | | | | | | | |
| | | | |
| Food Products: 0.28% | | | | | | | | | | | | | | | | |
BRF SA 144A | | | 3.95 | | | | 5-22-2023 | | | | 1,525,000 | | | | 1,322,938 | |
| | | | | | | | | | | | | | | | |
| | | | |
Energy: 1.37% | | | | | | | | | | | | | | | | |
| | | | |
| Oil, Gas & Consumable Fuels: 1.37% | | | | | | | | | | | | | | | | |
CNOOC Finance 2013 Limited | | | 3.00 | | | | 5-9-2023 | | | | 1,565,000 | | | | 1,418,142 | |
Petroleos Mexicanos 144A | | | 6.38 | | | | 1-23-2045 | | | | 2,005,000 | | | | 2,129,116 | |
Talisman Energy Incorporated | | | 5.50 | | | | 5-15-2042 | | | | 1,070,000 | | | | 1,075,289 | |
Weatherford International Limited | | | 9.63 | | | | 3-1-2019 | | | | 1,370,000 | | | | 1,788,383 | |
| | | | |
| | | | | | | | | | | | | | | 6,410,930 | |
| | | | | | | | | | | | | | | | |
| | | | |
Financials: 1.02% | | | | | | | | | | | | | | | | |
| | | | |
| Banks: 0.82% | | | | | | | | | | | | | | | | |
BBVA Bancomer SA 144A | | | 4.50 | | | | 3-10-2016 | | | | 1,720,000 | | | | 1,821,050 | |
BPCE SA 144A | | | 5.15 | | | | 7-21-2024 | | | | 2,005,000 | | | | 2,012,820 | |
| | | | |
| | | | | | | | | | | | | | | 3,833,870 | |
| | | | | | | | | | | | | | | | |
| | | | |
| Capital Markets: 0.20% | | | | | | | | | | | | | | | | |
Macquarie Group Limited 144A | | | 6.00 | | | | 1-14-2020 | | | | 825,000 | | | | 921,773 | |
| | | | | | | | | | | | | | | | |
| | | | |
Health Care: 0.37% | | | | | | | | | | | | | | | | |
| | | | |
| Pharmaceuticals: 0.37% | | | | | | | | | | | | | | | | |
Perrigo Company Limited 144A | | | 5.30 | | | | 11-15-2043 | | | | 1,635,000 | | | | 1,734,581 | |
| | | | | | | | | | | | | | | | |
| | | | |
Information Technology: 0.37% | | | | | | | | | | | | | | | | |
| | | | |
| Internet Software & Services: 0.37% | | | | | | | | | | | | | | | | |
Tencent Holdings Limited 144A | | | 4.63 | | | | 12-12-2016 | | | | 1,595,000 | | | | 1,708,492 | |
| | | | | | | | | | | | | | | | |
| | | | |
Materials: 0.37% | | | | | | | | | | | | | | | | |
| | | | |
| Metals & Mining: 0.37% | | | | | | | | | | | | | | | | |
ArcelorMittal | | | 6.13 | | | | 6-1-2018 | | | | 1,565,000 | | | | 1,721,500 | |
| | | | | | | | | | | | | | | | |
| | | | |
Telecommunication Services: 0.96% | | | | | | | | | | | | | | | | |
| | | | |
| Diversified Telecommunication Services: 0.49% | | | | | | | | | | | | | | | | |
Telefonos de Mexico SAB de CV | | | 5.50 | | | | 11-15-2019 | | | | 2,045,000 | | | | 2,287,844 | |
| | | | | | | | | | | | | | | | |
| | | | |
| Wireless Telecommunication Services: 0.47% | | | | | | | | | | | | | | | | |
Globo Communicacoes Participacoes SA 144A | | | 4.88 | | | | 4-11-2022 | | | | 2,145,000 | | | | 2,166,450 | |
| | | | | | | | | | | | | | | | |
The accompanying notes are an integral part of these financial statements.
| | | | |
| 16 | | Wells Fargo Advantage Income Plus Fund | | Portfolio of investments—February 28, 2014 (unaudited) |
| | | | | | | | | | | | | | | | |
| Security name | | Interest rate | | | Maturity date | | | Principal | | | Value | |
| | | | | | | | | | | | | | | | |
| | | | |
Utilities: 0.93% | | | | | | | | | | | | | | | | |
| | | | |
| Electric Utilities: 0.93% | | | | | | | | | | | | | | | | |
Comision Federal de Electricidad 144A | | | 4.88 | % | | | 1-15-2024 | | | $ | 1,635,000 | | | $ | 1,655,438 | |
Western Power Distributions Holdings Limited 144A | | | 7.38 | | | | 12-15-2028 | | | | 2,265,000 | | | | 2,701,291 | |
| | | | |
| | | | | | | | | | | | | | | 4,356,729 | |
| | | | | | | | | | | | | | | | |
| | | | |
Total Yankee Corporate Bonds and Notes (Cost $29,618,764) | | | | | | | | | | | | | | | 31,958,659 | |
| | | | | | | | | | | | | | | | |
| | | | |
Yankee Government Bonds: 0.42% | | | | | | | | | | | | | | | | |
Banco Nacional de Desenvolvimento Economico e Social 144A | | | 5.50 | | | | 7-12-2020 | | | | 1,855,000 | | | | 1,954,706 | |
| | | | | | | | | | | | | | | | |
| | | | |
Total Yankee Government Bonds (Cost $1,841,869) | | | | | | | | | | | | | | | 1,954,706 | |
| | | | | | | | | | | | | | | | |
| | | | |
| | | Yield | | | | | | Shares | | | | |
| Short-Term Investments: 7.92% | | | | | | | | | | | | | | | | |
| | | | |
| Investment Companies : 7.83% | | | | | | | | | | | | | | | | |
Wells Fargo Advantage Cash Investment Money Market Fund, Select Class (l)(u)## | | | 0.07 | | | | | | | | 35,359,841 | | | | 35,359,841 | |
Wells Fargo Securities Lending Cash Investments, LLC (l)(u)(r)(v) | | | 0.09 | | | | | | | | 1,149,500 | | | | 1,149,500 | |
| | | | |
| | | | | | | | | | | | | | | 36,509,341 | |
| | | | | | | | | | | | | | | | |
| | | | |
| | | | | | | | | Principal | | | | |
| U.S. Treasury Securities: 0.09% | | | | | | | | | | | | | | | | |
U.S. Treasury Bill (z)# | | | 0.03 | | | | 3-20-2014 | | | $ | 400,000 | | | | 399,994 | |
| | | | | | | | | | | | | | | | |
| | | | |
Total Short-Term Investments (Cost $36,909,329) | | | | | | | | | | | | | | | 36,909,335 | |
| | | | | | | | | | | | | | | | |
| | | | | | | | |
Total investments in securities
(Cost $545,467,860) * | | | 119.77 | % | | | 558,364,084 | |
Other assets and liabilities, net | | | (19.77 | ) | | | (92,183,476 | ) |
| | | | | | | | |
| Total net assets | | | 100.00 | % | | $ | 466,180,608 | |
| | | | | | | | |
| ± | Variable rate investment. The rate shown is the rate in effect at period end. |
| %% | Security issued on a when-issued basis. |
| 144A | Security that may be resold to “qualified institutional buyers” under Rule 144A or security offered pursuant to Section 4(2) of the Securities Act of 1933, as amended. |
| (c) | Interest-only securities entitle holders to receive only the interest payments on the underlying mortgages. The principal amount shown is the notional amount of the underlying mortgages. Interest rate disclosed represents the coupon rate. |
| « | All or a portion of this security is on loan. |
| (s) | Security is currently in default with regards to scheduled interest and/or principal payments. The Fund has stopped accruing interest on this security. |
| ## | All or a portion of this security has been segregated for when-issued securities. |
| (l) | Investment in an affiliate |
| (u) | Rate shown is the 7-day annualized yield at period end. |
| (r) | The investment company is exempt from registration under Section 3(c)(7) of the Investment Company Act of 1940, as amended. |
| (v) | Security represents investment of cash collateral received from securities on loan. |
| (z) | Zero coupon security. Rate represents the current yield to maturity. |
| # | All or a portion of this security is segregated as collateral for investments in derivative instruments. |
| * | Cost for federal income tax purposes is $545,662,572 and unrealized appreciation (depreciation) consists of: |
| | | | |
Gross unrealized appreciation | | $ | 15,288,843 | |
Gross unrealized depreciation | | | (2,587,331 | ) |
| | | | |
Net unrealized appreciation | | $ | 12,701,512 | |
The accompanying notes are an integral part of these financial statements.
| | | | | | |
| Statement of assets and liabilities—February 28, 2014 (unaudited) | | Wells Fargo Advantage Income Plus Fund | | | 17 | |
| | | | |
| | | | |
| |
Assets | | | | |
Investments | | | | |
In unaffiliated securities (including securities on loan), at value (see cost below) | | $ | 521,854,743 | |
In affiliated securities, at value (see cost below) | | | 36,509,341 | |
| | | | |
Total investments, at value (see cost below) | | | 558,364,084 | |
Receivable for investments sold | | | 3,001,249 | |
Principal paydown receivable | | | 828 | |
Receivable for Fund shares sold | | | 371,049 | |
Receivable for interest | | | 3,268,842 | |
Receivable for daily variation margin on open futures contracts | | | 2,592 | |
Receivable for securities lending income | | | 219 | |
Prepaid expenses and other assets | | | 198,844 | |
| | | | |
Total assets | | | 565,207,707 | |
| | | | |
| |
Liabilities | | | | |
Payable for investments purchased | | | 94,691,574 | |
Payable for Fund shares redeemed | | | 1,482,961 | |
Payable upon receipt of securities loaned | | | 1,149,500 | |
Payable for daily variation margin on open futures contracts | | | 3,875 | |
Due to custodian bank | | | 1,317,545 | |
Advisory fee payable | | | 113,644 | |
Distribution fees payable | | | 16,756 | |
Due to other related parties | | | 77,471 | |
Accrued expenses and other liabilities | | | 173,773 | |
| | | | |
Total liabilities | | | 99,027,099 | |
| | | | |
Total net assets | | $ | 466,180,608 | |
| | | | |
| |
NET ASSETS CONSIST OF | | | | |
Paid-in capital | | $ | 485,752,461 | |
Undistributed net investment income | | | 283,691 | |
Accumulated net realized losses on investments | | | (32,758,223 | ) |
Net unrealized gains on investments | | | 12,902,679 | |
| | | | |
Total net assets | | $ | 466,180,608 | |
| | | | |
| |
COMPUTATION OF NET ASSET VALUE AND OFFERING PRICE PER SHARE1 | | | | |
Net assets – Class A | | $ | 136,614,827 | |
Shares outstanding – Class A | | | 11,390,558 | |
Net asset value per share – Class A | | | $11.99 | |
Maximum offering price per share – Class A2 | | | $12.55 | |
Net assets – Class B | | $ | 1,084,996 | |
Shares outstanding – Class B | | | 90,270 | |
Net asset value per share – Class B | | | $12.02 | |
Net assets – Class C | | $ | 25,901,963 | |
Shares outstanding – Class C | | | 2,160,633 | |
Net asset value per share – Class C | | | $11.99 | |
Net assets – Administrator Class | | $ | 103,558,914 | |
Shares outstanding – Administrator Class | | | 8,648,330 | |
Net asset value per share – Administrator Class | | | $11.97 | |
Net assets – Institutional Class | | $ | 30,793,610 | |
Shares outstanding – Institutional Class | | | 2,565,595 | |
Net asset value per share – Institutional Class | | | $12.00 | |
Net assets – Investor Class | | $ | 168,226,298 | |
Shares outstanding – Investor Class | | | 14,027,758 | |
Net asset value per share – Investor Class | | | $11.99 | |
| |
Investments in unaffiliated securities (including securities on loan), at cost | | $ | 508,958,519 | |
| | | | |
Investments in affiliated securities, at cost | | $ | 36,509,341 | |
| | | | |
Total investments, at cost | | $ | 545,467,860 | |
| | | | |
Securities on loan, at value | | $ | 1,125,552 | |
| | | | |
| 1. | The Fund has an unlimited number of authorized shares. |
| 2. | Maximum offering price is computed as 100/95.50 of net asset value. On investments of $50,000 or more, the offering price is reduced. |
The accompanying notes are an integral part of these financial statements.
| | | | |
| 18 | | Wells Fargo Advantage Income Plus Fund | | Statement of operations—six months ended February 28, 2014 (unaudited) |
| | | | |
| | | | |
| |
Investment income | | | | |
Interest | | $ | 7,048,771 | |
Income from affiliated securities | | | 7,470 | |
Securities lending income, net | | | 406 | |
| | | | |
Total investment income | | | 7,056,647 | |
| | | | |
| |
Expenses | | | | |
Advisory fee | | | 939,948 | |
Administration fees | | | | |
Fund level | | | 117,494 | |
Class A | | | 110,037 | |
Class B | | | 1,018 | |
Class C | | | 21,962 | |
Administrator Class | | | 51,767 | |
Institutional Class | | | 12,616 | |
Investor Class | | | 160,198 | |
Shareholder servicing fees | | | | |
Class A | | | 171,932 | |
Class B | | | 1,590 | |
Class C | | | 34,316 | |
Administrator Class | | | 128,434 | |
Investor Class | | | 206,733 | |
Distribution fees | | | | |
Class B | | | 4,771 | |
Class C | | | 102,949 | |
Custody and accounting fees | | | 18,141 | |
Professional fees | | | 33,833 | |
Registration fees | | | 49,932 | |
Shareholder report expenses | | | 35,968 | |
Trustees’ fees and expenses | | | 5,671 | |
Other fees and expenses | | | 12,433 | |
| | | | |
Total expenses | | | 2,221,743 | |
Less: Fee waivers and/or expense reimbursements | | | (200,935 | ) |
| | | | |
Net expenses | | | 2,020,808 | |
| | | | |
Net investment income | | | 5,035,839 | |
| | | | |
| |
REALIZED AND UNREALIZED GAINS (LOSSES) ON INVESTMENTS | | | | |
| |
Net realized gains (losses) on: | | | | |
Unaffiliated securities | | | 4,666,301 | |
Futures transactions | | | (348,107 | ) |
| | | | |
Net realized gains on investments | | | 4,318,194 | |
| | | | |
| |
Net change in unrealized gains (losses) on: | | | | |
Unaffiliated securities | | | 8,613,554 | |
Futures transactions | | | 116,066 | |
| | | | |
Net change in unrealized gains (losses) on investments | | | 8,729,620 | |
| | | | |
Net realized and unrealized gains (losses) on investments | | | 13,047,814 | |
| | | | |
Net increase in net assets resulting from operations | | $ | 18,083,653 | |
| | | | |
The accompanying notes are an integral part of these financial statements.
| | | | | | |
| Statement of changes in net assets | | Wells Fargo Advantage Income Plus Fund | | | 19 | |
| | | | | | | | | | | | | | | | |
| | | Six months ended
February 28, 2014
(unaudited) | | | Year ended August 31, 2013 | |
| | | | |
Operations | | | | | | | | | | | | | | | | |
Net investment income | | | | | | $ | 5,035,839 | | | | | | | $ | 11,794,250 | |
Net realized gains on investments | | | | | | | 4,318,194 | | | | | | | | 8,469,691 | |
Net change in unrealized gains (losses) on investments | | | | | | | 8,729,620 | | | | | | | | (31,180,884 | ) |
| | | | |
Net increase (decrease) in net assets resulting from operations | | | | | | | 18,083,653 | | | | | | | | (10,916,943 | ) |
| | | | |
| | | | |
Distributions to shareholders from | | | | | | | | | | | | | | | | |
Net investment income | | | | | | | | | | | | | | | | |
Class A | | | | | | | (1,377,623 | ) | | | | | | | (3,255,786 | ) |
Class B | | | | | | | (7,505 | ) | | | | | | | (28,488 | ) |
Class C | | | | | | | (170,782 | ) | | | | | | | (477,921 | ) |
Administrator Class | | | | | | | (1,117,187 | ) | | | | | | | (3,262,469 | ) |
Institutional Class | | | | | | | (362,607 | ) | | | | | | | (1,185,125 | ) |
Investor Class | | | | | | | (1,688,423 | ) | | | | | | | (3,772,466 | ) |
Net realized gains | | | | | | | | | | | | | | | | |
Class A | | | | | | | 0 | | | | | | | | (5,344,156 | ) |
Class B | | | | | | | 0 | | | | | | | | (84,631 | ) |
Class C | | | | | | | 0 | | | | | | | | (1,334,285 | ) |
Administrator Class | | | | | | | 0 | | | | | | | | (5,253,361 | ) |
Institutional Class | | | | | | | 0 | | | | | | | | (3,379,857 | ) |
Investor Class | | | | | | | 0 | | | | | | | | (6,207,603 | ) |
| | | | |
Total distributions to shareholders | | | | | | | (4,724,127 | ) | | | | | | | (33,586,148 | ) |
| | | | |
| | | | |
Capital share transactions | | | Shares | | | | | | | | Shares | | | | | |
Proceeds from shares sold | | | | | | | | | | | | | | | | |
Class A | | | 656,444 | | | | 7,771,502 | | | | 2,194,258 | | | | 26,576,272 | |
Class B | | | 1,292 | | | | 15,321 | | | | 19,713 | | | | 244,010 | |
Class C | | | 49,236 | | | | 582,848 | | | | 557,473 | | | | 6,833,980 | |
Administrator Class | | | 702,092 | | | | 8,294,793 | | | | 3,465,099 | | | | 42,415,638 | |
Institutional Class | | | 200,845 | | | | 2,344,569 | | | | 564,097 | | | | 6,695,195 | |
Investor Class | | | 414,400 | | | | 4,902,862 | | | | 1,665,351 | | | | 20,364,228 | |
| | | | |
| | | | | | | 23,911,895 | | | | | | | | 103,129,323 | |
| | | | |
Reinvestment of distributions | | | | | | | | | | | | | | | | |
Class A | | | 100,000 | | | | 1,183,488 | | | | 626,860 | | | | 7,655,699 | |
Class B | | | 580 | | | | 6,874 | | | | 8,527 | | | | 104,611 | |
Class C | | | 10,720 | | | | 126,781 | | | | 115,670 | | | | 1,414,974 | |
Administrator Class | | | 93,273 | | | | 1,102,074 | | | | 689,176 | | | | 8,404,691 | |
Institutional Class | | | 27,404 | | | | 324,617 | | | | 129,399 | | | | 1,584,715 | |
Investor Class | | | 130,130 | | | | 1,540,094 | | | | 746,653 | | | | 9,115,740 | |
| | | | |
| | | | | | | 4,283,928 | | | | | | | | 28,280,430 | |
| | | | |
Payment for shares redeemed | | | | | | | | | | | | | | | | |
Class A | | | (1,958,461 | ) | | | (23,094,420 | ) | | | (3,958,532 | ) | | | (48,016,018 | ) |
Class B | | | (48,268 | ) | | | (569,653 | ) | | | (115,777 | ) | | | (1,405,362 | ) |
Class C | | | (447,003 | ) | | | (5,281,863 | ) | | | (1,409,995 | ) | | | (16,983,515 | ) |
Administrator Class | | | (1,174,023 | ) | | | (13,866,577 | ) | | | (8,041,038 | ) | | | (96,613,493 | ) |
Institutional Class | | | (338,158 | ) | | | (4,001,026 | ) | | | (10,844,409 | ) | | | (133,899,676 | ) |
Investor Class | | | (1,313,156 | ) | | | (15,517,392 | ) | | | (3,158,782 | ) | | | (38,294,452 | ) |
| | | | |
| | | | | | | (62,330,931 | ) | | | | | | | (335,212,516 | ) |
| | | | |
Net decrease in net assets resulting from capital share transactions | | | | | | | (34,135,108 | ) | | | | | | | (203,802,763 | ) |
| | | | |
Total decrease in net assets | | | | | | | (20,775,582 | ) | | | | | | | (248,305,854 | ) |
| | | | |
| | | | |
Net assets | | | | | | | | | | | | | | | | |
Beginning of period | | | | | | | 486,956,190 | | | | | | | | 735,262,044 | |
| | | | |
End of period | | | | | | $ | 466,180,608 | | | | | | | $ | 486,956,190 | |
| | | | |
Undistributed (overdistributed) net investment income | | | | | | $ | 283,691 | | | | | | | $ | (28,021 | ) |
| | | | |
The accompanying notes are an integral part of these financial statements.
| | | | |
| 20 | | Wells Fargo Advantage Income Plus Fund | | Financial highlights |
(For a share outstanding throughout each period)
| | | | | | | | | | | | | | | | | | | | | | | | | | | | |
| | | Six months ended
February 28, 2014
(unaudited) | | | Year ended August 31 | | | Year ended May 31 | |
| CLASS A | | | 2013 | | | 2012 | | | 2011 | | | 20101 | | | 2010 | | | 2009 | |
Net asset value, beginning of period | | $ | 11.66 | | | $ | 12.57 | | | $ | 12.04 | | | $ | 12.00 | | | $ | 11.59 | | | $ | 10.82 | | | $ | 10.70 | |
Net investment income | | | 0.13 | | | | 0.25 | | | | 0.30 | | | | 0.37 | 2 | | | 0.09 | 2 | | | 0.37 | 2 | | | 0.42 | 2 |
Net realized and unrealized gains (losses) on investments | | | 0.32 | | | | (0.51 | ) | | | 0.55 | | | | 0.18 | | | | 0.44 | | | | 0.88 | | | | 0.15 | |
| | | | | | | | | | | | | | | | | | | | | | | | | | | | |
Total from investment operations | | | 0.45 | | | | (0.26 | ) | | | 0.85 | | | | 0.55 | | | | 0.53 | | | | 1.25 | | | | 0.57 | |
Distributions to shareholders from | | | | | | | | | | | | | | | | | | | | | | | | | | | | |
Net investment income | | | (0.12 | ) | | | (0.25 | ) | | | (0.29 | ) | | | (0.42 | ) | | | (0.12 | ) | | | (0.48 | ) | | | (0.45 | ) |
Net realized gains | | | 0.00 | | | | (0.40 | ) | | | (0.03 | ) | | | (0.09 | ) | | | 0.00 | | | | 0.00 | | | | 0.00 | |
| | | | | | | | | | | | | | | | | | | | | | | | | | | | |
Total distributions to shareholders | | | (0.12 | ) | | | (0.65 | ) | | | (0.32 | ) | | | (0.51 | ) | | | (0.12 | ) | | | (0.48 | ) | | | (0.45 | ) |
Net asset value, end of period | | $ | 11.99 | | | $ | 11.66 | | | $ | 12.57 | | | $ | 12.04 | | | $ | 12.00 | | | $ | 11.59 | | | $ | 10.82 | |
Total return3 | | | 3.86 | % | | | (2.25 | )% | | | 7.19 | % | | | 4.76 | % | | | 4.62 | % | | | 11.74 | % | | | 5.52 | % |
Ratios to average net assets (annualized) | | | | | | | | | | | | | | | | | | | | | | | | | | | | |
Gross expenses | | | 0.93 | % | | | 0.91 | % | | | 0.89 | % | | | 0.88 | % | | | 0.91 | % | | | 1.03 | % | | | 1.05 | % |
Net expenses | | | 0.86 | % | | | 0.87 | % | | | 0.88 | % | | | 0.88 | % | | | 0.88 | % | | | 0.90 | % | | | 0.90 | % |
Net investment income | | | 2.14 | % | | | 2.00 | % | | | 2.42 | % | | | 3.17 | % | | | 3.07 | % | | | 3.29 | % | | | 4.01 | % |
Supplemental data | | | | | | | | | | | | | | | | | | | | | | | | | | | | |
Portfolio turnover rate | | | 131 | % | | | 256 | % | | | 256 | % | | | 215 | % | | | 84 | % | | | 187 | % | | | 455 | % |
Net assets, end of period (000s omitted) | | | $136,615 | | | | $146,836 | | | | $172,577 | | | | $163,499 | | | | $261,227 | | | | $130,382 | | | | $94,938 | |
| 1. | For the three months ended August 31, 2010. The Fund changed its fiscal year end from May 31 to August 31, effective August 31, 2010. |
| 2. | Calculated based upon average shares outstanding |
| 3. | Total return calculations do not include any sales charges. Returns for periods of less than one year are not annualized. |
The accompanying notes are an integral part of these financial statements.
| | | | | | |
| Financial highlights | | Wells Fargo Advantage Income Plus Fund | | | 21 | |
(For a share outstanding throughout each period)
| | | | | | | | | | | | | | | | | | | | | | | | | | | | |
| | | Six months ended
February 28, 2014
(unaudited) | | | Year ended August 31 | | | Year ended May 31 | |
| CLASS B | | | 2013 | | | 2012 | | | 2011 | | | 20101 | | | 2010 | | | 2009 | |
Net asset value, beginning of period | | $ | 11.68 | | | $ | 12.59 | | | $ | 12.05 | | | $ | 12.01 | | | $ | 11.61 | | | $ | 10.82 | | | $ | 10.70 | |
Net investment income | | | 0.08 | 2 | | | 0.15 | 2 | | | 0.21 | 2 | | | 0.29 | 2 | | | 0.07 | 2 | | | 0.29 | 2 | | | 0.35 | 2 |
Net realized and unrealized gains (losses) on investments | | | 0.33 | | | | (0.51 | ) | | | 0.56 | | | | 0.17 | | | | 0.43 | | | | 0.89 | | | | 0.14 | |
| | | | | | | | | | | | | | | | | | | | | | | | | | | | |
Total from investment operations | | | 0.41 | | | | (0.36 | ) | | | 0.77 | | | | 0.46 | | | | 0.50 | | | | 1.18 | | | | 0.49 | |
Distributions to shareholders from | | | | | | | | | | | | | | | | | | | | | | | | | | | | |
Net investment income | | | (0.07 | ) | | | (0.15 | ) | | | (0.20 | ) | | | (0.33 | ) | | | (0.10 | ) | | | (0.39 | ) | | | (0.37 | ) |
Net realized gains | | | 0.00 | | | | (0.40 | ) | | | (0.03 | ) | | | (0.09 | ) | | | 0.00 | | | | 0.00 | | | | 0.00 | |
| | | | | | | | | | | | | | | | | | | | | | | | | | | | |
Total distributions to shareholders | | | (0.07 | ) | | | (0.55 | ) | | | (0.23 | ) | | | (0.42 | ) | | | (0.10 | ) | | | (0.39 | ) | | | (0.37 | ) |
Net asset value, end of period | | $ | 12.02 | | | $ | 11.68 | | | $ | 12.59 | | | $ | 12.05 | | | $ | 12.01 | | | $ | 11.61 | | | $ | 10.82 | |
Total return3 | | | 3.53 | % | | | (3.00 | )% | | | 6.45 | % | | | 3.97 | % | | | 4.31 | % | | | 11.04 | % | | | 4.69 | % |
Ratios to average net assets (annualized) | | | | | | | | | | | | | | | | | | | | | | | | | | | | |
Gross expenses | | | 1.67 | % | | | 1.66 | % | | | 1.63 | % | | | 1.63 | % | | | 1.65 | % | | | 1.78 | % | | | 1.80 | % |
Net expenses | | | 1.61 | % | | | 1.62 | % | | | 1.62 | % | | | 1.63 | % | | | 1.62 | % | | | 1.65 | % | | | 1.65 | % |
Net investment income | | | 1.38 | % | | | 1.24 | % | | | 1.71 | % | | | 2.40 | % | | | 2.33 | % | | | 2.54 | % | | | 3.30 | % |
Supplemental data | | | | | | | | | | | | | | | | | | | | | | | | | | | | |
Portfolio turnover rate | | | 131 | % | | | 256 | % | | | 256 | % | | | 215 | % | | | 84 | % | | | 187 | % | | | 455 | % |
Net assets, end of period (000s omitted) | | | $1,085 | | | | $1,597 | | | | $2,823 | | | | $4,054 | | | | $6,140 | | | | $1,839 | | | | $3,937 | |
| 1. | For the three months ended August 31, 2010. The Fund changed its fiscal year end from May 31 to August 31, effective August 31, 2010. |
| 2. | Calculated based upon average shares outstanding |
| 3. | Total return calculations do not include any sales charges. Returns for periods of less than one year are not annualized. |
The accompanying notes are an integral part of these financial statements.
| | | | |
| 22 | | Wells Fargo Advantage Income Plus Fund | | Financial highlights |
(For a share outstanding throughout each period)
| | | | | | | | | | | | | | | | | | | | | | | | | | | | |
| | | Six months ended
February 28, 2014
(unaudited) | | | Year ended August 31 | | | Year ended May 31 | |
| CLASS C | | | 2013 | | | 2012 | | | 2011 | | | 20101 | | | 2010 | | | 2009 | |
Net asset value, beginning of period | | $ | 11.65 | | | $ | 12.56 | | | $ | 12.03 | | | $ | 12.00 | | | $ | 11.59 | | | $ | 10.82 | | | $ | 10.69 | |
Net investment income | | | 0.08 | | | | 0.15 | | | | 0.21 | | | | 0.29 | 2 | | | 0.07 | 2 | | | 0.29 | 2 | | | 0.35 | 2 |
Net realized and unrealized gains (losses) on investments | | | 0.33 | | | | (0.51 | ) | | | 0.55 | | | | 0.16 | | | | 0.44 | | | | 0.88 | | | | 0.15 | |
| | | | | | | | | | | | | | | | | | | | | | | | | | | | |
Total from investment operations | | | 0.41 | | | | (0.36 | ) | | | 0.76 | | | | 0.45 | | | | 0.51 | | | | 1.17 | | | | 0.50 | |
Distributions to shareholders from | | | | | | | | | | | | | | | | | | | | | | | | | | | | |
Net investment income | | | (0.07 | ) | | | (0.15 | ) | | | (0.20 | ) | | | (0.33 | ) | | | (0.10 | ) | | | (0.40 | ) | | | (0.37 | ) |
Net realized gains | | | 0.00 | | | | (0.40 | ) | | | (0.03 | ) | | | (0.09 | ) | | | 0.00 | | | | 0.00 | | | | 0.00 | |
| | | | | | | | | | | | | | | | | | | | | | | | | | | | |
Total distributions to shareholders | | | (0.07 | ) | | | (0.55 | ) | | | (0.23 | ) | | | (0.42 | ) | | | (0.10 | ) | | | (0.40 | ) | | | (0.37 | ) |
Net asset value, end of period | | $ | 11.99 | | | $ | 11.65 | | | $ | 12.56 | | | $ | 12.03 | | | $ | 12.00 | | | $ | 11.59 | | | $ | 10.82 | |
Total return3 | | | 3.56 | % | | | (3.00 | )% | | | 6.40 | % | | | 3.92 | % | | | 4.42 | % | | | 10.93 | % | | | 4.85 | % |
Ratios to average net assets (annualized) | | | | | | | | | | | | | | | | | | | | | | | | | | | | |
Gross expenses | | | 1.68 | % | | | 1.66 | % | | | 1.64 | % | | | 1.63 | % | | | 1.66 | % | | | 1.78 | % | | | 1.80 | % |
Net expenses | | | 1.61 | % | | | 1.62 | % | | | 1.63 | % | | | 1.63 | % | | | 1.63 | % | | | 1.65 | % | | | 1.65 | % |
Net investment income | | | 1.39 | % | | | 1.24 | % | | | 1.65 | % | | | 2.41 | % | | | 2.32 | % | | | 2.53 | % | | | 3.32 | % |
Supplemental data | | | | | | | | | | | | | | | | | | | | | | | | | | | | |
Portfolio turnover rate | | | 131 | % | | | 256 | % | | | 256 | % | | | 215 | % | | | 84 | % | | | 187 | % | | | 455 | % |
Net assets, end of period (000s omitted) | | | $25,902 | | | | $29,692 | | | | $41,259 | | | | $30,364 | | | | $30,253 | | | | $14,533 | | | | $7,242 | |
| 1. | For the three months ended August 31, 2010. The Fund changed its fiscal year end from May 31 to August 31, effective August 31, 2010. |
| 2. | Calculated based upon average shares outstanding |
| 3. | Total return calculations do not include any sales charges. Returns for periods of less than one year are not annualized. |
The accompanying notes are an integral part of these financial statements.
| | | | | | |
| Financial highlights | | Wells Fargo Advantage Income Plus Fund | | | 23 | |
(For a share outstanding throughout each period)
| | | | | | | | | | | | | | | | | | | | |
| | | Six months ended
February 28, 2014
(unaudited) | | | Year ended August 31 | |
| ADMINISTRATOR CLASS | | | 2013 | | | 2012 | | | 2011 | | | 20101 | |
Net asset value, beginning of period | | $ | 11.64 | | | $ | 12.55 | | | $ | 12.02 | | | $ | 12.00 | | | $ | 11.87 | |
Net investment income | | | 0.13 | | | | 0.26 | 2 | | | 0.33 | | | | 0.39 | 2 | | | 0.03 | 2 |
Net realized and unrealized gains (losses) on investments | | | 0.33 | | | | (0.51 | ) | | | 0.54 | | | | 0.16 | | | | 0.14 | |
| | | | | | | | | | | | | | | | | | | | |
Total from investment operations | | | 0.46 | | | | (0.25 | ) | | | 0.87 | | | | 0.55 | | | | 0.17 | |
Distributions to shareholders from | | | | | | | | | | | | | | | | | | | | |
Net investment income | | | (0.13 | ) | | | (0.26 | ) | | | (0.31 | ) | | | (0.44 | ) | | | (0.04 | ) |
Net realized gains | | | 0.00 | | | | (0.40 | ) | | | (0.03 | ) | | | (0.09 | ) | | | 0.00 | |
| | | | | | | | | | | | | | | | | | | | |
Total distributions to shareholders | | | (0.13 | ) | | | (0.66 | ) | | | (0.34 | ) | | | (0.53 | ) | | | (0.04 | ) |
Net asset value, end of period | | $ | 11.97 | | | $ | 11.64 | | | $ | 12.55 | | | $ | 12.02 | | | $ | 12.00 | |
Total return3 | | | 3.94 | % | | | (2.11 | )% | | | 7.37 | % | | | 4.82 | % | | | 1.43 | % |
Ratios to average net assets (annualized) | | | | | | | | | | | | | | | | | | | | |
Gross expenses | | | 0.86 | % | | | 0.85 | % | | | 0.83 | % | | | 0.82 | % | | | 0.86 | % |
Net expenses | | | 0.72 | % | | | 0.72 | % | | | 0.73 | % | | | 0.75 | % | | | 0.86 | % |
Net investment income | | | 2.28 | % | | | 2.14 | % | | | 2.53 | % | | | 3.29 | % | | | 3.31 | % |
Supplemental data | | | | | | | | | | | | | | | | | | | | |
Portfolio turnover rate | | | 131 | % | | | 256 | % | | | 256 | % | | | 215 | % | | | 84 | % |
Net assets, end of period (000s omitted) | | | $103,559 | | | | $105,094 | | | | $162,067 | | | | $90,063 | | | | $10 | |
| 1. | For the period from July 30, 2010 (commencement of class operations) to August 31, 2010 |
| 2. | Calculated based upon average shares outstanding |
| 3. | Returns for periods of less than one year are not annualized. |
The accompanying notes are an integral part of these financial statements.
| | | | |
| 24 | | Wells Fargo Advantage Income Plus Fund | | Financial highlights |
(For a share outstanding throughout each period)
| | | | | | | | | | | | | | | | | | | | | | | | | | | | |
| | | Six months ended
February 28, 2014
(unaudited) | | | Year ended August 31 | | | Year ended May 31 | |
| INSTITUTIONAL CLASS | | | 2013 | | | 2012 | | | 2011 | | | 20101 | | | 2010 | | | 20092 | |
Net asset value, beginning of period | | | $11.67 | | | | $12.57 | | | | $12.03 | | | | $12.00 | | | | $11.60 | | | | $10.82 | | | | $10.51 | |
Net investment income | | | 0.14 | | | | 0.27 | 3 | | | 0.34 | | | | 0.41 | 3 | | | 0.10 | 3 | | | 0.41 | 3 | | | 0.39 | 3 |
Net realized and unrealized gains (losses) on investments | | | 0.32 | | | | (0.49 | ) | | | 0.56 | | | | 0.17 | | | | 0.43 | | | | 0.88 | | | | 0.36 | |
| | | | | | | | | | | | | | | | | | | | | | | | | | | | |
Total from investment operations | | | 0.46 | | | | (0.22 | ) | | | 0.90 | | | | 0.58 | | | | 0.53 | | | | 1.29 | | | | 0.75 | |
Distributions to shareholders from | | | | | | | | | | | | | | | | | | | | | | | | | | | | |
Net investment income | | | (0.13 | ) | | | (0.28 | ) | | | (0.33 | ) | | | (0.46 | ) | | | (0.13 | ) | | | (0.51 | ) | | | (0.44 | ) |
Net realized gains | | | 0.00 | | | | (0.40 | ) | | | (0.03 | ) | | | (0.09 | ) | | | 0.00 | | | | 0.00 | | | | 0.00 | |
| | | | | | | | | | | | | | | | | | | | | | | | | | | | |
Total distributions to shareholders | | | (0.13 | ) | | | (0.68 | ) | | | (0.36 | ) | | | (0.55 | ) | | | (0.13 | ) | | | (0.51 | ) | | | (0.44 | ) |
Net asset value, end of period | | | $12.00 | | | | $11.67 | | | | $12.57 | | | | $12.03 | | | | $12.00 | | | | $11.60 | | | | $10.82 | |
Total return4 | | | 4.00 | % | | | (1.89 | )% | | | 7.62 | % | | | 5.04 | % | | | 4.71 | % | | | 12.06 | % | | | 7.29 | % |
Ratios to average net assets (annualized) | | | | | | | | | | | | | | | | | | | | | | | | | | | | |
Gross expenses | | | 0.60 | % | | | 0.56 | % | | | 0.56 | % | | | 0.55 | % | | | 0.59 | % | | | 0.68 | % | | | 0.69 | % |
Net expenses | | | 0.58 | % | | | 0.56 | % | | | 0.56 | % | | | 0.55 | % | | | 0.56 | % | | | 0.61 | % | | | 0.61 | % |
Net investment income | | | 2.42 | % | | | 2.26 | % | | | 2.74 | % | | | 3.53 | % | | | 3.36 | % | | | 3.58 | % | | | 4.29 | % |
Supplemental data | | | | | | | | | | | | | | | | | | | | | | | | | | | | |
Portfolio turnover rate | | | 131 | % | | | 256 | % | | | 256 | % | | | 215 | % | | | 84 | % | | | 187 | % | | | 455 | % |
Net assets, end of period (000s omitted) | | $ | 30,794 | | | $ | 31,221 | | | $ | 161,191 | | | $ | 161,276 | | | $ | 147,102 | | | $ | 112,163 | | | $ | 97,574 | |
| 1. | For the three months ended August 31, 2010. The Fund changed its fiscal year end from May 31 to August 31, effective August 31, 2010. |
| 2. | For the period from July 18, 2008 (commencement of class operations) to May 31, 2009 |
| 3. | Calculated based upon average shares outstanding |
| 4. | Returns for periods of less than one year are not annualized. |
The accompanying notes are an integral part of these financial statements.
| | | | | | |
| Financial highlights | | Wells Fargo Advantage Income Plus Fund | | | 25 | |
(For a share outstanding throughout each period)
| | | | | | | | | | | | | | | | | | | | | | | | | | | | |
| | | Six months ended
February 28, 2014
(unaudited) | | | Year ended August 31 | | | Year ended May 31 | |
| INVESTOR CLASS | | | 2013 | | | 2012 | | | 2011 | | | 20101 | | | 2010 | | | 20092 | |
Net asset value, beginning of period | | $ | 11.66 | | | $ | 12.57 | | | $ | 12.03 | | | $ | 12.00 | | | $ | 11.60 | | | $ | 10.82 | | | $ | 10.51 | |
Net investment income | | | 0.13 | | | | 0.24 | | | | 0.30 | | | | 0.37 | 3 | | | 0.09 | 3 | | | 0.37 | 3 | | | 0.36 | 3 |
Net realized and unrealized gains (losses) on investments | | | 0.32 | | | | (0.51 | ) | | | 0.56 | | | | 0.17 | | | | 0.43 | | | | 0.88 | | | | 0.36 | |
| | | | | | | | | | | | | | | | | | | | | | | | | | | | |
Total from investment operations | | | 0.45 | | | | (0.27 | ) | | | 0.86 | | | | 0.54 | | | | 0.52 | | | | 1.25 | | | | 0.72 | |
Distributions to shareholders from | | | | | | | | | | | | | | | | | | | | | | | | | | | | |
Net investment income | | | (0.12 | ) | | | (0.24 | ) | | | (0.29 | ) | | | (0.42 | ) | | | (0.12 | ) | | | (0.47 | ) | | | (0.41 | ) |
Net realized gains | | | 0.00 | | | | (0.40 | ) | | | (0.03 | ) | | | (0.09 | ) | | | 0.00 | | | | 0.00 | | | | 0.00 | |
| | | | | | | | | | | | | | | | | | | | | | | | | | | | |
Total distributions to shareholders | | | (0.12 | ) | | | (0.64 | ) | | | (0.32 | ) | | | (0.51 | ) | | | (0.12 | ) | | | (0.47 | ) | | | (0.41 | ) |
Net asset value, end of period | | $ | 11.99 | | | $ | 11.66 | | | $ | 12.57 | | | $ | 12.03 | | | $ | 12.00 | | | $ | 11.60 | | | $ | 10.82 | |
Total return4 | | | 3.86 | % | | | (2.26 | )% | | | 7.25 | % | | | 4.67 | % | | | 4.52 | % | | | 11.79 | % | | | 6.99 | % |
Ratios to average net assets (annualized) | | | | | | | | | | | | | | | | | | | | | | | | | | | | |
Gross expenses | | | 0.95 | % | | | 0.93 | % | | | 0.91 | % | | | 0.90 | % | | | 0.97 | % | | | 1.07 | % | | | 1.08 | % |
Net expenses | | | 0.87 | % | | | 0.89 | % | | | 0.90 | % | | | 0.90 | % | | | 0.92 | % | | | 0.94 | % | | | 0.94 | % |
Net investment income | | | 2.13 | % | | | 1.98 | % | | | 2.40 | % | | | 3.14 | % | | | 3.00 | % | | | 3.25 | % | | | 3.94 | % |
Supplemental data | | | | | | | | | | | | | | | | | | | | | | | | | | | | |
Portfolio turnover rate | | | 131 | % | | | 256 | % | | | 256 | % | | | 215 | % | | | 84 | % | | | 187 | % | | | 455 | % |
Net assets, end of period (000s omitted) | | | $168,226 | | | | $172,516 | | | | $195,346 | | | | $189,051 | | | | $198,176 | | | | $188,551 | | | | $177,010 | |
| 1. | For the three months ended August 31, 2010. The Fund changed its fiscal year end from May 31 to August 31, effective August 31, 2010. |
| 2. | For the period from July 18, 2008 (commencement of class operations) to May 31, 2009 |
| 3. | Calculated based upon average shares outstanding |
| 4. | Returns for periods of less than one year are not annualized. |
The accompanying notes are an integral part of these financial statements.
| | | | |
| 26 | | Wells Fargo Advantage Income Plus Fund | | Notes to financial statements (unaudited) |
1. ORGANIZATION
Wells Fargo Funds Trust (the “Trust”), a Delaware statutory trust organized on March 10, 1999, is an open-end management investment company registered under the Investment Company Act of 1940, as amended (the “1940 Act”). These financial statements report on the Wells Fargo Advantage Income Plus Fund (the “Fund”) which is a diversified series of the Trust.
2. SIGNIFICANT ACCOUNTING POLICIES
The following significant accounting policies, which are consistently followed in the preparation of the financial statements of the Fund, are in conformity with U.S. generally accepted accounting principles which require management to make estimates and assumptions that affect the reported amounts of assets and liabilities, disclosure of contingent assets and liabilities at the date of the financial statements, and the reported amounts of revenues and expenses during the reporting period. Actual results could differ from those estimates.
Securities valuation
All investments are valued each business day as of the close of regular trading on the New York Stock Exchange (generally 4 p.m. Eastern Time).
Fixed income securities acquired with maturities exceeding 60 days are valued based on evaluated bid prices provided by an independent pricing service which may utilize both transaction data and market information such as yield, quality, coupon rate, maturity, type of issue, trading characteristics and other market data. If prices are not available from the independent pricing service or prices received are deemed not representative of market value, prices will be obtained from an independent broker-dealer or otherwise determined based on the Fund’s Valuation Procedures.
Futures that are listed on a foreign or domestic exchange or market are valued at the official closing price or, if none, the last sales price.
Short-term securities, with maturities of 60 days or less at time of purchase, generally are valued at amortized cost which approximates fair value. The amortized cost method involves valuing a security at its cost, plus accretion of discount or minus amortization of premium over the period until maturity.
Investments in registered open-end investment companies are valued at net asset value. Non-registered investment vehicles are fair valued at net asset value.
Investments which are not valued using any of the methods discussed above are valued at their fair value, as determined in good faith by the Board of Trustees of the Fund. The Board of Trustees has established a Valuation Committee comprised of the Trustees and has delegated to it the authority to take any actions regarding the valuation of portfolio securities that the Valuation Committee deems necessary or appropriate, including determining the fair value of portfolio securities, unless the determination has been delegated to the Management Valuation Team of Wells Fargo Funds Management, LLC (“Funds Management”). The Board of Trustees retains the authority to make or ratify any valuation decisions or approve any changes to the Valuation Procedures as it deems appropriate. On a quarterly basis, the Board of Trustees receives reports on any valuation actions taken by the Valuation Committee or the Management Valuation Team which may include items for ratification.
Valuations of fair valued securities are compared to the next actual sales price when available, or other appropriate market values, to assess the continued appropriateness of the fair valuation methodologies used. These securities are fair valued on a day-to-day basis, taking into consideration changes to appropriate market information and any significant changes to the inputs considered in the valuation process until there is a readily available price provided on an exchange or by an independent pricing service. Valuations received from an independent pricing service or independent broker-dealer quotes are periodically validated by comparisons to most recent trades and valuations provided by other independent pricing services in addition to the review of prices by the adviser and/or subadviser. Unobservable inputs used in determining fair valuations are identified based on the type of security, taking into consideration factors utilized by market participants in valuing the investment, knowledge about the issuer and the current market environment.
Security loans
The Fund may lend its securities from time to time in order to earn additional income in the form of fees or interest on securities received as collateral or the investment of any cash received as collateral. The Fund continues to receive interest or dividends on the securities loaned. The Fund receives collateral in the form of cash or securities with a value at least equal to the value of the securities on loan. The value of the loaned securities is determined at the close of each business day and any additional required collateral is delivered to the Fund on the next business day. In a securities lending transaction, the net asset value of the Fund will be affected by an increase or decrease in the value of the securities loaned and by an increase or decrease in the value of the instrument in which collateral is invested. The amount of securities lending activity undertaken by the Fund fluctuates from time to time. In the event of default or bankruptcy
| | | | | | |
| Notes to financial statements (unaudited) | | Wells Fargo Advantage Income Plus Fund | | | 27 | |
by the borrower, the Fund may be prevented from recovering the loaned securities or gaining access to the collateral or may experience delays or costs in doing so. In addition, the investment of any cash collateral received may lose all or part of its value. The Fund has the right under the lending agreement to recover the securities from the borrower on demand.
The Fund lends its securities through an unaffiliated securities lending agent. Cash collateral received in connection with its securities lending transactions is invested in Wells Fargo Securities Lending Cash Investments, LLC (the “Securities Lending Fund”). The Securities Lending Fund is exempt from registration under Section 3(c)(7) of the 1940 Act and is managed by Funds Management and is subadvised by Wells Capital Management Incorporated (“WellsCap”). Funds Management receives an advisory fee starting at 0.05% and declining to 0.01% as the average daily net assets of the Securities Lending Fund increase. All of the fees received by Funds Management are paid to WellsCap for its services as subadviser. The Securities Lending Fund seeks to provide a positive return compared to the daily Fed Funds Open rate by investing in high-quality, U.S. dollar-denominated short-term money market instruments. Securities Lending Fund investments are fair valued based upon the amortized cost valuation technique. Income earned from investment in the Securities Lending Fund is included in securities lending income on the Statement of Operations.
When-issued transactions
The Fund may purchase securities on a forward commitment or when-issued basis. The Fund records a when-issued transaction on the trade date and will segregate assets in an amount at least equal in value to the Fund’s commitment to purchase when-issued securities. Securities purchased on a when-issued basis are marked-to-market daily and the Fund begins earning interest on the settlement date. Losses may arise due to changes in the market value of the underlying securities or if the counterparty does not perform under the contract.
Futures contracts
The Fund may be subject to interest rate risk in the normal course of pursuing its investment objectives. The Fund may buy and sell futures contracts in order to gain exposure to, or protect against, changes in security values and interest rates. The primary risks associated with the use of futures contracts are the imperfect correlation between changes in market values of securities held by the Fund and the prices of futures contracts, and the possibility of an illiquid market.
The aggregate principal amounts of the contracts are not recorded in the financial statements. Fluctuations in the value of the contracts are recorded in the Statement of Assets and Liabilities as an asset or liability and in the Statement of Operations as unrealized gains or losses until the contracts are closed, at which point they are recorded as net realized gains or losses on futures contracts. With futures contracts, there is minimal counterparty risk to the Fund since futures are exchange traded and the exchange’s clearinghouse, as counterparty to all exchange traded futures, guarantees the futures against default.
Security transactions and income recognition
Securities transactions are recorded on a trade date basis. Realized gains or losses are recorded on the basis of identified cost.
Interest income is accrued daily and bond discounts are accreted and premiums are amortized daily based on the effective interest method. To the extent debt obligations are placed on non-accrual status, any related interest income may be reduced by writing off interest receivables when the collection of all or a portion of interest has become doubtful based on consistently applied procedures. If the issuer subsequently resumes interest payments or when the collectability of interest is reasonably assured, the debt obligation is removed from non-accrual status.
Distributions to shareholders
Distributions to shareholders from net investment income are paid monthly. Distributions from net realized gains, if any, are recorded on the ex-dividend date. Such distributions are determined in conformity with federal income tax regulations, which may differ in amount or character from net investment income and realized gains recognized for purposes of U.S. generally accepted accounting principles.
Federal and other taxes
The Fund intends to continue to qualify as a regulated investment company by distributing substantially all of its investment company taxable income and any net realized capital gains (after reduction for capital loss carryforwards) sufficient to relieve it from all, or substantially all, federal income taxes. Accordingly, no provision for federal income taxes was required.
The Fund’s income and federal excise tax returns and all financial records supporting those returns for the prior three fiscal years are subject to examination by the federal and Delaware revenue authorities. Management has analyzed the Fund’s tax positions taken on federal, state, and foreign tax returns for all open tax years and does not believe that there are any uncertain tax positions that require recognition of a tax liability.
| | | | |
| 28 | | Wells Fargo Advantage Income Plus Fund | | Notes to financial statements (unaudited) |
As of August 31, 2013, the Fund had capital loss carryforwards available to offset future net realized capital gains in the amount of $33,383,427 with $1,522,495 expiring in 2015; $21,588,119 expiring in 2016; and $10,272,813 expiring in 2017.
As of August 31, 2013, the Fund had $3,018,429 of current year deferred post-October capital losses, which were recognized on the first day of the current fiscal year.
Class allocations
The separate classes of shares offered by the Fund differ principally in applicable sales charges, distribution, shareholder servicing, and administration fees. Shareholders of each class bear certain expenses that pertain to that particular class. All shareholders bear the common expenses of the Fund, earn income from the portfolio, and are allocated any unrealized gains and losses pro rata based on the average daily net assets of each class, without distinction between share classes. Dividends are determined separately for each class based on income and expenses allocable to each class. Realized gains and losses are allocated to each class pro rata based upon the net assets of each class on the date realized. Differences in per share dividend rates generally result from the relative weightings of pro rata income and realized gain allocations and from differences in separate class expenses, including distribution, shareholder servicing, and administration fees.
3. FAIR VALUATION MEASUREMENTS
Fair value measurements of investments are determined within a framework that has established a fair value hierarchy based upon the various data inputs utilized in determining the value of the Fund’s investments. The three-level hierarchy gives the highest priority to unadjusted quoted prices in active markets for identical assets or liabilities (Level 1) and the lowest priority to significant unobservable inputs (Level 3). The Fund’s investments are classified within the fair value hierarchy based on the lowest level of input that is significant to the fair value measurement. The inputs are summarized into three broad levels as follows:
| n | | Level 1 – quoted prices in active markets for identical securities |
| n | | Level 2 – other significant observable inputs (including quoted prices for similar securities, interest rates, prepayment speeds, credit risk, use of amortized cost, etc.) |
| n | | Level 3 – significant unobservable inputs (including the Fund’s own assumptions in determining the fair value of investments) |
The inputs or methodologies used for valuing investments in securities are not necessarily an indication of the risk associated with investing in those securities.
As of February 28, 2014, the inputs used in valuing investments in securities were as follows:
| | | | | | | | | | | | | | | | |
| Investments in securities | | Quoted prices (Level 1) | | | Other significant
observable inputs (Level 2) | | | Significant unobservable inputs (Level 3) | | | Total | |
Agency securities | | $ | 0 | | | $ | 154,417,674 | | | $ | 0 | | | $ | 154,417,674 | |
Asset-backed securities | | | 0 | | | | 5,161,724 | | | | 0 | | | | 5,161,724 | |
Corporate bonds and notes | | | 0 | | | | 117,224,306 | | | | 0 | | | | 117,224,306 | |
Municipal obligations | | | 0 | | | | 9,726,265 | | | | 0 | | | | 9,726,265 | |
Non-agency mortgage backed securities | | | 0 | | | | 17,211,274 | | | | 0 | | | | 17,211,274 | |
U.S. Treasury securities | | | 183,800,141 | | | | 0 | | | | 0 | | | | 183,800,141 | |
Yankee corporate bonds and notes | | | 0 | | | | 31,958,659 | | | | 0 | | | | 31,958,659 | |
Yankee government bonds | | | 0 | | | | 1,954,706 | | | | 0 | | | | 1,954,706 | |
Short-term investments | | | | | | | | | | | | | | | | |
Investment companies | | | 35,359,841 | | | | 1,149,500 | | | | 0 | | | | 36,509,341 | |
U.S. Treasury securities | | | 399,994 | | | | 0 | | | | 0 | | | | 399,994 | |
| | | $ | 219,559,976 | | | $ | 338,804,108 | | | $ | 0 | | | $ | 558,364,084 | |
| | | | | | |
| Notes to financial statements (unaudited) | | Wells Fargo Advantage Income Plus Fund | | | 29 | |
As of February 28, 2014, the inputs used in valuing the Fund’s other financial instruments were as follows:
| | | | | | | | | | | | | | | | |
| | | Quoted prices (Level 1) | | | Other significant
observable inputs (Level 2) | | | Significant unobservable inputs (Level 3) | | | Total | |
Futures contracts | | $ | 6,455 | * | | $ | 0 | | | $ | 0 | | | $ | 6,455 | |
| * | Amount represents the net unrealized gains. |
Transfers in and transfers out are recognized at the end of the reporting period. For the six months ended February 28, 2014, the Fund did not have any transfers into/out of Level 1, Level 2, or Level 3.
4. TRANSACTIONS WITH AFFILIATES AND OTHER EXPENSES
Advisory fee
The Trust has entered into an advisory contract with Funds Management, an indirect wholly owned subsidiary of Wells Fargo & Company (“Wells Fargo”). The adviser is responsible for implementing investment policies and guidelines and for supervising the subadviser, who is responsible for day-to-day portfolio management of the Fund.
Pursuant to the contract, Funds Management is entitled to receive an annual advisory fee starting at 0.40% and declining to 0.30% as the average daily net assets of the Fund increase. For the six months ended February 28, 2014, the advisory fee was equivalent to an annual rate of 0.40% of the Fund’s average daily net assets.
Funds Management has retained the services of a subadviser to provide daily portfolio management to the Fund. The fee for subadvisory services is borne by Funds Management. WellsCap, an affiliate of Funds Management and an indirect, wholly owned subsidiary of Wells Fargo, is the subadviser to the Fund and is entitled to receive a fee from Funds Management at an annual rate starting at 0.20% and declining to 0.10% as the average daily net assets of the Fund increase.
Administration and transfer agent fees
The Trust has entered into an administration agreement with Funds Management. Under this agreement, for providing administrative services, which includes paying fees and expenses for services provided by the transfer agent, sub-transfer agents, omnibus account servicers and record-keepers, Funds Management is entitled to receive from the Fund an annual fund level administration fee starting at 0.05% and declining to 0.03% as the average daily net assets of the Fund increase and a class level administration fee which is calculated based on the average daily net assets of each class as follows:
| | | | |
| | | Class level
administration fee | |
Class A, Class B, Class C | | | 0.16 | % |
Administrator Class | | | 0.10 | |
Institutional Class | | | 0.08 | |
Investor Class | | | 0.19 | |
Funds Management has contractually waived and/or reimbursed advisory and administration fees to the extent necessary to maintain certain net operating expense ratios for the Fund. Waiver of fees and/or reimbursement of expenses by Funds Management were made first from fund level expenses on a proportionate basis and then from class specific expenses. Funds Management has committed through December 31, 2014 to waive fees and/or reimburse expenses to the extent necessary to cap the Fund’s expenses at 0.84% for Class A shares, 1.59% for Class B shares, 1.59% for Class C shares, 0.72% for Administrator Class shares, 0.58% for Institutional Class shares, and 0.85% for Investor Class shares. Prior to January 1, 2014, the Fund’s expenses were capped at 0.87% for Class A shares, 1.62% for Class B shares, 1.62% for Class C shares, and 0.88% for Investor Class shares.
Distribution fees
The Trust has adopted a Distribution Plan for Class B and Class C shares of the Fund pursuant to Rule 12b-1 under the 1940 Act. Distribution fees are charged to Class B and Class C shares and paid to Wells Fargo Funds Distributor, LLC, the principal underwriter, at an annual rate of 0.75% of the average daily net assets of Class B and Class C shares.
For the six months ended February 28, 2014, Wells Fargo Funds Distributor, LLC received $3,296 from the sale of Class A shares.
| | | | |
| 30 | | Wells Fargo Advantage Income Plus Fund | | Notes to financial statements (unaudited) |
Shareholder servicing fees
The Trust has entered into contracts with one or more shareholder servicing agents, whereby Class A, Class B, Class C, Administrator Class, and Investor Class of the Fund is charged a fee at an annual rate of 0.25% of the average daily net assets of each respective class.
A portion of these total shareholder servicing fees were paid to affiliates of Wells Fargo.
5. INVESTMENT PORTFOLIO TRANSACTIONS
Purchases and sales of investments, excluding short-term securities, for the six months ended February 28, 2014 were as follows:
| | | | | | |
Purchases at cost | | Sales proceeds |
U.S.
government | | Non-U.S.
government | | U.S.
government | | Non-U.S.
government |
| $639,319,022 | | $69,781,372 | | $642,731,034 | | $92,901,285 |
6. DERIVATIVE TRANSACTIONS
During the six months ended February 28, 2014, the Fund entered into futures contracts to speculate on interest rates and to help manage the duration of the portfolio.
At February 28, 2014, the Fund had long futures contracts outstanding as follows:
| | | | | | | | | | | | | | |
| Expiration date | | Counterparty | | Contracts | | Type | | Contract value at February 28, 2014 | | | Unrealized
gains | |
| 6-19-2014 | | JPMorgan | | 37 Long | | 10-Year U.S. Treasury Notes | | $ | 4,607,656 | | | $ | 3,359 | |
| 6-30-2014 | | JPMorgan | | 103 Long | | 2-Year U.S. Treasury Notes | | | 22,647,125 | | | | 3,096 | |
The Fund had an average notional amount of $16,746,477 and $22,298,583 in long and short futures contracts, respectively, during the six months ended February 28, 2014.
On February 28, 2014, the cumulative unrealized gains on futures contracts in the amount of $6,455 is reflected in net unrealized gains on investments on the Statement of Assets and Liabilities. The receivable and payable for daily variation margin on open futures contracts reflected in the Statement of Assets and Liabilities only represents the current day’s variation margin. The realized losses and change in unrealized gains (losses) on futures contracts are reflected in the Statement of Operations.
For certain types of derivative transactions, the Fund has entered into International Swaps and Derivatives Association, Inc. master agreements (“ISDA Master Agreements”) or similar agreements with approved counterparties. The ISDA Master Agreements or similar agreements may have requirements to deliver/deposit securities or cash to/with an exchange or broker-dealer as collateral and allows the Fund to offset, with each counterparty, certain derivative financial instrument’s assets and/or liabilities with collateral held or pledged. Collateral requirements differ by type of derivative. Collateral or margin requirements are set by the broker or exchange clearing house for exchange traded derivatives while collateral terms are contract specific for over-the-counter traded. Cash collateral that has been pledged to cover obligations of the Fund under derivative contracts, if any, will be reported separately in the Statement of Assets and Liabilities. Securities pledged as collateral, if any, for the same purpose are noted in the Portfolio of Investments. With respect to balance sheet offsetting, absent an event of default by the counterparty or a termination of the agreement, the reported amounts of financial assets and financial liabilities in the Statement of Assets and Liabilities are not offset across transactions between the Fund and the applicable counterparty. A reconciliation of the gross amounts on the Statement of Assets and Liabilities to the net amounts by derivative type, including any collateral exposure, is as follows:
| | | | | | | | | | | | | | | | | | |
| Derivative type | | Counterparty | | Gross amounts of
assets in the
Statement of
Assets and
Liabilities | | | Amounts subject
to netting
agreements | | | Collateral
received | | | Net
amount | |
| Futures – variation margin | | JPMorgan | | $ | 2,592 | | | $ | (2,592 | ) | | $ | 0 | | | $ | 0 | |
| | | | | | |
| Notes to financial statements (unaudited) | | Wells Fargo Advantage Income Plus Fund | | | 31 | |
| | | | | | | | | | | | | | | | | | |
| Derivative type | | Counterparty | | Gross amounts of
liabilities in the
Statement of
Assets and
Liabilities | | | Amounts subject
to netting
agreements | | | Collateral
pledged | | | Net
amount | |
| Futures – variation margin | | JPMorgan | | $ | 3,875 | | | $ | (2,592 | ) | | $ | (1,283 | ) | | $ | 0 | |
7. BANK BORROWINGS
The Trust (excluding the money market funds and certain other funds in the Trust) and Wells Fargo Variable Trust are parties to a $150,000,000 revolving credit agreement with State Street Bank and Trust Company, whereby the Fund is permitted to use bank borrowings for temporary or emergency purposes, such as to fund shareholder redemption requests. Interest under the credit agreement is charged to the Fund based on a borrowing rate equal to the higher of the Federal Funds rate in effect on that day plus 1.25% or the overnight LIBOR rate in effect on that day plus 1.25%. In addition, an annual commitment fee equal to 0.10% of the unused balance is allocated to each participating fund. For the six months ended February 28, 2014, the Fund paid $305 in commitment fees.
For the six months ended February 28, 2014, there were no borrowings by the Fund under the agreement.
8. INDEMNIFICATION
Under the Trust’s organizational documents, the officers and directors are indemnified against certain liabilities that may arise out of performance of their duties to the Trust. Additionally, in the normal course of business, the Trust may enter into contracts with service providers that contain a variety of indemnification clauses. The Trust’s maximum exposure under these arrangements is dependent on future claims that may be made against the Fund and, therefore, cannot be estimated.
9. SUBSEQUENT DISTRIBUTIONS
On March 25, 2014, the Fund declared distributions from net investment income to shareholders of record on March 24, 2014. The per share amounts payable on March 26, 2014 were as follows:
| | | | |
| | | Net investment income | |
Class A | | $ | 0.01974 | |
Class B | | | 0.01218 | |
Class C | | | 0.01247 | |
Administrator Class | | | 0.02088 | |
Institutional Class | | | 0.02220 | |
Investor Class | | | 0.01963 | |
On April 24, 2014, the Fund declared distributions from net investment income to shareholders of record on April 23, 2014. The per share amounts payable on April 25, 2014 were as follows:
| | | | |
| | | Net investment income | |
Class A | | $ | 0.02302 | |
Class B | | | 0.01415 | |
Class C | | | 0.01479 | |
Administrator Class | | | 0.02432 | |
Institutional Class | | | 0.02588 | |
Investor Class | | | 0.02292 | |
These distributions are not reflected in the accompanying financial statements. The final determination of the source of all distributions is subject to change and made after the Fund’s tax year-end.
| | | | |
| 32 | | Wells Fargo Advantage Income Plus Fund | | Other information (unaudited) |
PROXY VOTING INFORMATION
A description of the policies and procedures that the Fund uses to determine how to vote proxies relating to portfolio securities is available without charge, upon request, by calling 1-800-222-8222, visiting our website at wellsfargoadvantagefunds.com, or visiting the SEC website at sec.gov. Information regarding how the Fund voted proxies relating to portfolio securities during the most recent 12-month period ended June 30 is available without charge on the Fund’s website at wellsfargoadvantagefunds.com or by visiting the SEC website at sec.gov.
PORTFOLIO HOLDINGS INFORMATION
The complete portfolio holdings for the Fund are publicly available on the Fund’s website (wellsfargoadvantagefunds.com) on a monthly, 30-day or more delayed basis. In addition, top ten holdings information for the Fund is publicly available on the Fund’s website on a monthly, seven-day or more delayed basis. The Fund files its complete schedule of portfolio holdings with the SEC for the first and third quarters of each fiscal year on Form N-Q, which is available without charge by visiting the SEC website at sec.gov. In addition, the Fund’s Form N-Q may be reviewed and copied at the SEC’s Public Reference Room in Washington, DC, and at regional offices in New York City, at 233 Broadway, and in Chicago, at 175 West Jackson Boulevard, Suite 900. Information about the Public Reference Room may be obtained by calling 1-800-SEC-0330.
| | | | | | |
| Other information (unaudited) | | Wells Fargo Advantage Income Plus Fund | | | 33 | |
BOARD OF TRUSTEES AND OFFICERS
Each of the Trustees and Officers listed in the table below acts in identical capacities for each fund in the Wells Fargo Advantage family of funds, which consists of 132 mutual funds1 comprising the Wells Fargo Funds Trust, Wells Fargo Variable Trust, Wells Fargo Master Trust and four closed-end funds (collectively the “Fund Complex”). This table should be read in conjunction with the Prospectus and the Statement of Additional Information2. All of the Trustees are also Members of the Audit and Governance Committees of each Trust in the Fund Complex. The mailing address of each Trustee and Officer is 525 Market Street, 12th Floor, San Francisco, CA 94105. Each Trustee and Officer serves an indefinite term, however, each Trustee serves such term until reaching the mandatory retirement age established by the Trustees.
Independent Trustees
| | | | | | |
Name and year of birth | | Position held and length of service* | | Principal occupations during past five years | | Other directorships during past five years |
Peter G. Gordon (Born 1942) | | Trustee, since 1998; Chairman, since 2005 | | Co-Founder, Retired Chairman, President and CEO of Crystal Geyser Water Company. Trustee Emeritus, Colby College. | | Asset Allocation Trust |
Isaiah Harris, Jr. (Born 1952) | | Trustee, since 2009 | | Retired. Prior thereto, President and CEO of BellSouth Advertising and Publishing Corp. from 2005 to 2007, President and CEO of BellSouth Enterprises from 2004 to 2005 and President of BellSouth Consumer Services from 2000 to 2003. Emeritus member of the Iowa State University Foundation Board of Governors. Emeritus Member of the Advisory Board of Iowa State University School of Business. Advisory Board Member, Palm Harbor Academy (charter school). Mr. Harris is a certified public accountant. | | CIGNA Corporation; Deluxe Corporation; Asset Allocation Trust |
Judith M. Johnson (Born 1949) | | Trustee, since 2008; Audit Committee Chairman, since 2008 | | Retired. Prior thereto, Chief Executive Officer and Chief Investment Officer of Minneapolis Employees Retirement Fund from 1996 to 2008. Ms. Johnson is an attorney, certified public accountant and a certified managerial accountant. | | Asset Allocation Trust |
Leroy Keith, Jr. (Born 1939) | | Trustee, since 2010 | | Chairman, Bloc Global Services (development and construction). Trustee of the Evergreen Funds from 1983 to 2010. Former Managing Director, Almanac Capital Management (commodities firm), former Partner, Stonington Partners, Inc. (private equity fund), former Director, Obagi Medical Products Co. and former Director, Lincoln Educational Services. | | Trustee, Virtus Fund Complex (consisting of 50 portfolios as of 12/16/2013); Asset Allocation Trust |
David F. Larcker (Born 1950) | | Trustee, since 2009 | | James Irvin Miller Professor of Accounting at the Graduate School of Business, Stanford University, Morgan Stanley Director of the Center for Leadership Development and Research and Senior Faculty of The Rock Center for Corporate Governance since 2006. From 2005 to 2008, Professor of Accounting at the Graduate School of Business, Stanford University. Prior thereto, Ernst & Young Professor of Accounting at The Wharton School, University of Pennsylvania from 1985 to 2005. | | Asset Allocation Trust |
Olivia S. Mitchell (Born 1953) | | Trustee, since 2006 | | International Foundation of Employee Benefit Plans Professor, Wharton School of the University of Pennsylvania since 1993. Director of Wharton’s Pension Research Council and Boettner Center on Pensions & Retirement Research, and Research Associate at the National Bureau of Economic Research. Previously, Cornell University Professor from 1978 to 1993. | | Asset Allocation Trust |
Timothy J. Penny (Born 1951) | | Trustee, since 1996 | | President and CEO of Southern Minnesota Initiative Foundation, a non-profit organization, since 2007 and Senior Fellow at the Humphrey Institute Policy Forum at the University of Minnesota since 1995. Member of the Board of Trustees of NorthStar Education Finance, Inc., a non-profit organization, since 2007. | | Asset Allocation Trust |
| | | | |
| 34 | | Wells Fargo Advantage Income Plus Fund | | Other information (unaudited) |
| | | | | | |
Name and year of birth | | Position held and length of service* | | Principal occupations during past five years | | Other directorships during past five years |
Michael S. Scofield (Born 1943) | | Trustee, since 2010 | | Served on the Investment Company Institute’s Board of Governors and Executive Committee from 2008-2011 as well the Governing Council of the Independent Directors Council from 2006-2011 and the Independent Directors Council Executive Committee from 2008-2011. Chairman of the IDC from 2008-2010. Institutional Investor (Fund Directions) Trustee of Year in 2007. Trustee of the Evergreen Funds (and its predecessors) from 1984 to 2010. Chairman of the Evergreen Funds from 2000-2010. Former Trustee of the Mentor Funds. Retired Attorney, Law Offices of Michael S. Scofield. | | Asset Allocation Trust |
Donald C. Willeke (Born 1940) | | Trustee, since 1996 | | Principal of the law firm of Willeke & Daniels. General Counsel of the Minneapolis Employees Retirement Fund from 1984 until its consolidation into the Minnesota Public Employees Retirement Association on June 30, 2010. Director and Vice Chair of The Tree Trust (non-profit corporation). Director of the American Chestnut Foundation (non-profit corporation). | | Asset Allocation Trust |
| * | Length of service dates reflect the Trustee’s commencement of service with the Trust’s predecessor entities, where applicable. |
Officers
| | | | | | |
Name and year of birth | | Position held and length of service | | Principal occupations during past five years | | |
Karla M. Rabusch (Born 1959) | | President, since 2003 | | Executive Vice President of Wells Fargo Bank, N.A. and President of Wells Fargo Funds Management, LLC since 2003. | | |
Nancy Wiser1 (Born 1967) | | Treasurer, since 2012 | | Executive Vice President of Wells Fargo Funds Management, LLC since 2011. Chief Operating Officer and Chief Compliance Officer at LightBox Capital Management LLC, from 2008 to 2011. Owned and operated a consulting business providing services to various hedge funds including acting as Chief Operating Officer and Chief Compliance Officer for a hedge fund from 2007 to 2008. Chief Operating Officer and Chief Compliance Officer of GMN Capital LLC from 2006 to 2007. | | |
C. David Messman (Born 1960) | | Secretary, since 2000; Chief Legal Officer, since 2003 | | Senior Vice President and Secretary of Wells Fargo Funds Management, LLC since 2001. Vice President and Managing Counsel of Wells Fargo Bank, N.A. since 1996. | | |
Debra Ann Early (Born 1964) | | Chief Compliance Officer, since 2007 | | Chief Compliance Officer of Wells Fargo Funds Management, LLC since 2007. Chief Compliance Officer of Parnassus Investments from 2005 to 2007. Chief Financial Officer of Parnassus Investments from 2004 to 2007. | | |
David Berardi (Born 1975) | | Assistant Treasurer, since 2009 | | Vice President of Wells Fargo Funds Management, LLC since 2009. Vice President of Evergreen Investment Management Company, LLC from 2008 to 2010. Assistant Vice President of Evergreen Investment Services, Inc. from 2004 to 2008. Manager of Fund Reporting and Control for Evergreen Investment Management Company, LLC from 2004 to 2010. | | |
Jeremy DePalma1 (Born 1974) | | Assistant Treasurer, since 2009 | | Senior Vice President of Wells Fargo Funds Management, LLC since 2009. Senior Vice President of Evergreen Investment Management Company, LLC from 2008 to 2010. Vice President, Evergreen Investment Services, Inc. from 2004 to 2007. Head of the Fund Reporting and Control Team within Fund Administration from 2005 to 2010. | | |
| 1. | Nancy Wiser acts as Treasurer of 73 funds in the Fund Complex. Jeremy DePalma acts as Treasurer of 59 funds and Assistant Treasurer of 73 funds in the Fund Complex. |
| 2. | The Statement of Additional Information includes additional information about the Trustees and is available, without charge, upon request, by calling 1-800-222-8222 or by visiting the website at wellsfargoadvantagefunds.com. |
| | | | | | |
| List of abbreviations | | Wells Fargo Advantage Income Plus Fund | | | 35 | |
The following is a list of common abbreviations for terms and entities that may have appeared in this report.
| ACA | — ACA Financial Guaranty Corporation |
| ADR | — American depositary receipt |
| ADS | — American depositary shares |
| AGC | — Assured Guaranty Corporation |
| AGM | — Assured Guaranty Municipal |
| Ambac | — Ambac Financial Group Incorporated |
| AMT | — Alternative minimum tax |
| BAN | — Bond anticipation notes |
| BHAC | — Berkshire Hathaway Assurance Corporation |
| CAB | — Capital appreciation bond |
| CCAB | — Convertible capital appreciation bond |
| CDA | — Community Development Authority |
| CDO | — Collateralized debt obligation |
| DRIVER | — Derivative inverse tax-exempt receipts |
| DW&P | — Department of Water & Power |
| DWR | — Department of Water Resources |
| ECFA | — Educational & Cultural Facilities Authority |
| EDA | — Economic Development Authority |
| EDFA | — Economic Development Finance Authority |
| ETF | — Exchange-traded fund |
| FDIC | — Federal Deposit Insurance Corporation |
| FFCB | — Federal Farm Credit Banks |
| FGIC | — Financial Guaranty Insurance Corporation |
| FHA | — Federal Housing Administration |
| FHLB | — Federal Home Loan Bank |
| FHLMC | — Federal Home Loan Mortgage Corporation |
| FICO | — The Financing Corporation |
| FNMA | — Federal National Mortgage Association |
| GDR | — Global depositary receipt |
| GNMA | — Government National Mortgage Association |
| HCFR | — Healthcare facilities revenue |
| HEFA | — Health & Educational Facilities Authority |
| HEFAR | — Higher education facilities authority revenue |
| HFA | — Housing Finance Authority |
| HFFA | — Health Facilities Financing Authority |
| HUD | — Department of Housing and Urban Development |
| IDA | — Industrial Development Authority |
| IDAG | — Industrial Development Agency |
| KRW | — Republic of Korea won |
| LIBOR | — London Interbank Offered Rate |
| LLC | — Limited liability company |
| LLLP | — Limited liability limited partnership |
| LLP | — Limited liability partnership |
| MBIA | — Municipal Bond Insurance Association |
| MFHR | — Multifamily housing revenue |
| MSTR | — Municipal securities trust receipts |
| MUD | — Municipal Utility District |
| National | — National Public Finance Guarantee Corporation |
| PCFA | — Pollution Control Financing Authority |
| PCL | — Public Company Limited |
| PCR | — Pollution control revenue |
| PFA | — Public Finance Authority |
| PFFA | — Public Facilities Financing Authority |
| PFOTER | — Puttable floating option tax-exempt receipts |
| plc | — Public limited company |
| PUTTER | — Puttable tax-exempt receipts |
| R&D | — Research & development |
| Radian | — Radian Asset Assurance |
| RAN | — Revenue anticipation notes |
| RDA | — Redevelopment Authority |
| RDFA | — Redevelopment Finance Authority |
| REIT | — Real estate investment trust |
| ROC | — Reset option certificates |
| SAVRS | — Select auction variable rate securities |
| SBA | — Small Business Authority |
| SFHR | — Single-family housing revenue |
| SFMR | — Single-family mortgage revenue |
| SPA | — Standby purchase agreement |
| SPDR | — Standard & Poor’s Depositary Receipts |
| STRIPS | — Separate trading of registered interest and principal securities |
| TAN | — Tax anticipation notes |
| TIPS | — Treasury inflation-protected securities |
| TRAN | — Tax revenue anticipation notes |
| TTFA | — Transportation Trust Fund Authority |
| TVA | — Tennessee Valley Authority |
This page is intentionally left blank.


For more information
More information about Wells Fargo Advantage Funds is available free upon request. To obtain literature, please write, email, visit the Fund’s website, or call:
Wells Fargo Advantage Funds
P.O. Box 8266
Boston, MA 02266-8266
Email: wfaf@wellsfargo.com
Website: wellsfargoadvantagefunds.com
Individual investors: 1-800-222-8222
Retail investment professionals: 1-888-877-9275
Institutional investment professionals: 1-866-765-0778
This report and the financial statements contained herein are submitted for the general information of the shareholders of Wells Fargo Advantage Funds. If this report is used for promotional purposes, distribution of the report must be accompanied or preceded by a current prospectus. For a current prospectus and, if available, a summary prospectus containing more complete information, including charges and expenses, call 1-800-222-8222 or visit the Fund’s website at wellsfargoadvantagefunds.com. Please consider the investment objectives, risks, charges, and expenses of the investment carefully before investing. This and other information about Wells Fargo Advantage Funds can be found in the current prospectus. Read the prospectus carefully before you invest or send money.
Wells Fargo Funds Management, LLC, a wholly owned subsidiary of Wells Fargo & Company, provides investment advisory and administrative services for Wells Fargo Advantage Funds. Other affiliates of Wells Fargo & Company provide subadvisory and other services for the Funds. The Funds are distributed by Wells Fargo Funds Distributor, LLC, Member FINRA/SIPC, an affiliate of Wells Fargo & Company.
NOT FDIC INSURED ¡ NO BANK GUARANTEE ¡ MAY LOSE VALUE
© 2014 Wells Fargo Funds Management, LLC. All rights reserved.
| | |
 | | 223533 04-14 SA219/SAR219 02-14 |

Wells Fargo Advantage
Short Duration Government Bond Fund

Semi-Annual Report
February 28, 2014

Reduce clutter. Save trees.
Sign up for electronic delivery of prospectuses and shareholder reports at wellsfargo.com/advantagedelivery
Contents
The views expressed and any forward-looking statements are as of February 28, 2014, unless otherwise noted, and are those of the Fund managers and/or Wells Fargo Funds Management, LLC. Discussions of individual securities, or the markets generally, or any Wells Fargo Advantage Fund are not intended as individual recommendations. Future events or results may vary significantly from those expressed in any forward-looking statements; the views expressed are subject to change at any time in response to changing circumstances in the market. Wells Fargo Funds Management, LLC and the Fund disclaim any obligation to publicly update or revise any views expressed or forward-looking statements.
NOT FDIC INSURED ¡ NO BANK GUARANTEE ¡ MAY LOSE VALUE
| | | | |
| 2 | | Wells Fargo Advantage Short Duration Government Bond Fund | | Letter to shareholders (unaudited) |

Karla M. Rabusch
President
Wells Fargo Advantage Funds
Fixed-income markets shifted during the period, driven by vacillations between U.S. Treasury yield increases and subsequent declines.
Reassurances from the Fed that a highly accommodative monetary policy would continue throughout 2014 inspired price rallies across both the investment-grade and high-yield bond markets.
Dear Valued Shareholder:
We are pleased to offer you this semi-annual report for the Wells Fargo Advantage Short Duration Government Bond Fund for the six-month period that ended February 28, 2014. Fixed-income markets shifted during the period, driven by vacillations between U.S. Treasury yield increases and subsequent declines. However, on the whole, investment-grade (measured by the Barclays U.S. Aggregate Bond Index1) and high-yield markets (measured by the Barclays U.S. High Yield Bond Index2) generated positive returns in September and October of 2013 as well as the period, notably benefiting from the strong price improvement and declining U.S. Treasury yields that occurred during the opening months of 2014. Although the returns of the U.S. high-yield market have often been positively correlated with U.S. equity returns (measured by the S&P 500 Index3) over the long-run, over the period, high-yield (measured by the Barclays U.S. High Yield Bond Index) generally performed well even when equities did not. The lower-rated corporate bond credit tiers outperformed the respectively higher-rated investment-grade credit tiers during the period.
A decline in bond prices was halted by the Fed’s postponement of tapering its bond-buying program.
Before the six-month period began, equity markets rallied, most notably in May and June of 2013. This led to a sharp increase in U.S. Treasury yields and declining valuations for much of the fixed-income markets (measured by the Barclays U.S. Aggregate Bond Index). However, in July and August 2013, that equity exuberance quieted a bit, and fixed-income markets stabilized. Returns across the fixed-income markets were largely negative in investment-grade and high-yield markets but modest in comparison with the declines in May and June of 2013.
But, by September and October of 2013, investment-grade and high-yield bond markets began generating positive returns yet again, as the Federal Reserve (Fed) backtracked on its intentions to taper its quantitative easing program, postponing it until 2014, at the earliest. This created a temporary rally in bonds that lasted until around November 20, 2013, when notes were released from the Fed’s October 2013 meeting that tapering of the bond-buying programs would not be postponed beyond January 2014. In response, long-term U.S. Treasury yields and mortgage rates ratcheted higher on expectations for an unwinding of monetary accommodation in the upcoming months. This led to declines in pricing across much of the core fixed-income markets (measured by the Barclays U.S. Aggregate Bond Index). U.S. high-yield markets were better able to absorb the shift in U.S. Treasury yields and continued to provide positive returns along with rallies in the equity markets.
Favorable conditions for fixed-income markets were restored in January and February 2014.
Seemingly much to the surprise of many everyday investors and seasoned investment professionals alike, fixed-income markets (measured by the Barclays U.S. Aggregate Bond Index) largely outperformed U.S. equity markets (measured by the S&P 500 Index) during the opening months of 2014. A pullback in equity exuberance in January and reassurances from the Fed that a highly accommodative monetary policy would continue throughout 2014 inspired price rallies across both the investment-grade and high-yield bond markets. U.S. Treasury yields declined in January 2014 and corporate bonds and mortgage-backed securities performed notably well. U.S. high-yield securities generated positive returns in January 2014 but lagged the rally across the investment-grade
| | | | | | |
| Letter to shareholders (unaudited) | | Wells Fargo Advantage Short Duration Government Bond Fund | | | 3 | |
bond markets. This theme reversed in February 2014, as high-yield sectors rallied and investment-grade sectors performed well but not to the extent of the lowest-rated credit tiers.
One positive takeaway for bond investors that helped fuel the fixed-income (measured by the Barclays U.S. Aggregate Bond Index) rallies was former Fed Chairman Bernanke’s guidance at the end of 2013. He indicated that the tapering of the Fed’s bond-buying program would proceed at a slow pace and that a reduction in quantitative easing should not be equivocated with a tightening of monetary policy. The distinction was important—although the bond-buying program was declining in volume, it was, nonetheless, still continuing. Additionally, the federal funds target rate would remain unchanged for the foreseeable future, with the implications that it would not increase until the bond-buying program was fully disbanded. These were important statements for fixed-income investors that helped bolster U.S. fixed-income valuations in the opening months of 2014.
Don’t let short-term uncertainty derail long-term investment goals.
Periods of investment uncertainty can present challenges, but experience has taught us that maintaining long-term investment goals can be an effective way to plan for the future. To help you create a sound strategy based on your personal goals and risk tolerance, Wells Fargo Advantage Funds offers more than 100 mutual funds and other investments spanning a wide range of asset classes and investment styles. Although diversification cannot guarantee an investment profit or prevent losses, we believe it can be an effective way to manage investment risk and potentially smooth out overall portfolio performance. We encourage investors to know their investments and to understand that appropriate levels of risk-taking may unlock opportunities.
Thank you for choosing to invest with Wells Fargo Advantage Funds. We appreciate your confidence in us and remain committed to helping you meet your financial needs. For current information about your fund investments, contact your investment professional, visit our website at wellsfargoadvantagefunds.com, or call us directly at 1-800-222-8222. We are available 24 hours a day, 7 days a week.
Sincerely,

Karla M. Rabusch
President
Wells Fargo Advantage Funds
| 1. | The Barclays U.S. Aggregate Bond Index is a broad-based benchmark that measures the investment-grade, U.S. dollar-denominated, fixed-rate taxable bond market, including Treasuries, government-related and corporate securities, MBS (agency fixed-rate and hybrid ARM passthroughs), ABS, and CMBS. You cannot invest directly in an index. |
| 2. | The Barclays U.S. High Yield Bond Index is an index consisting of all domestic and Yankee bonds, rated below investment grade, with a minimum outstanding amount of $100 million and maturing over one year. You cannot invest directly in an index. |
| 3. | The S&P 500 Index consists of 500 stocks chosen for market size, liquidity, and industry group representation. It is a market-value-weighted index with each stock’s weight in the index proportionate to its market value. You cannot invest directly in an index. |
| | | | |
| 4 | | Wells Fargo Advantage Short Duration Government Bond Fund | | Letter to shareholders (unaudited) |
Notice to shareholders
The Fund and Wells Fargo Funds Management, LLC (“Funds Management”) have received an exemptive order from the SEC that permits Funds Management, subject to the approval of the Board of Trustees of the Fund, to select or replace certain subadvisers to manage all or a portion of the Fund’s assets and enter into, amend or terminate a sub-advisory agreement with certain subadvisers without obtaining shareholder approval (“Multi-manager Structure”). The Multi-manager Structure applies to subadvisers that are not affiliated with Funds Management or the Fund, except to the extent that affiliation arises solely because such subadvisers provide sub-advisory services to the Fund (“Non-affiliated Subadvisers”), as well as subadvisers that are indirect or direct wholly-owned subsidiaries of Funds Management or of another company that, indirectly or directly, wholly owns Funds Management (“Wholly-owned Subadvisers”).
Pursuant to the SEC order, Funds Management, with the approval of the Board of Trustees, has the discretion to terminate any subadvisers and allocate and reallocate the Fund’s assets among any other Non-affiliated Subadvisers or Wholly-owned Subadvisers. Funds Management, subject to oversight and supervision by the Board of Trustees, has responsibility to continue to oversee any subadvisers to the Fund and to recommend, for approval by the Board of Trustees, the hiring, termination and replacement of subadvisers for the Fund. In the event that a new subadviser is hired pursuant to the Multi-manager Structure, the Fund is required to provide notice to shareholders within 90 days.
Please contact your investment professional or call us directly at 1-800-222-8222 if you have any questions on this Notice to Shareholders.
This page is intentionally left blank.
| | | | |
| 6 | | Wells Fargo Advantage Short Duration Government Bond Fund | | Performance highlights (unaudited) |
Investment objective
The Fund seeks to provide current income consistent with capital preservation.
Adviser
Wells Fargo Funds Management, LLC
Subadviser
Wells Capital Management Incorporated
Portfolio managers
Thomas O’Connor, CFA
Troy Ludgood
Average annual total returns1 (%) as of February 28, 2014
| | | | | | | | | | | | | | | | | | | | | | | | |
| | | | | Including sales charge | | Excluding sales charge | | | Expense ratios2 (%) |
| | | Inception date | | 1 year | | 5 year | | 10 year | | 1 year | | | 5 year | | | 10 year | | | Gross | | Net3 |
| Class A (MSDAX) | | 3-11-1996 | | (2.04) | | 2.01 | | 2.72 | | | (0.04 | ) | | | 2.43 | | | | 2.93 | | | 0.77 | | 0.77 |
| Class B (MSDBX)* | | 5-31-2002 | | (3.88) | | 1.82 | | 2.62 | | | (0.88 | ) | | | 1.82 | | | | 2.62 | | | 1.52 | | 1.52 |
| Class C (MSDCX) | | 5-31-2002 | | (1.88) | | 1.66 | | 2.15 | | | (0.88 | ) | | | 1.66 | | | | 2.15 | | | 1.52 | | 1.52 |
| Class R6 (MSDRX) | | 11-30-2012 | | – | | – | | – | | | 0.28 | | | | 2.89 | | | | 3.35 | | | 0.39 | | 0.37 |
| Administrator Class (MNSGX) | | 12-18-1992 | | – | | – | | – | | | 0.05 | | | | 2.65 | | | | 3.16 | | | 0.71 | | 0.60 |
| Institutional Class (WSGIX) | | 4-8-2005 | | – | | – | | – | | | 0.23 | | | | 2.84 | | | | 3.33 | | | 0.44 | | 0.42 |
| Barclays 1-3 Year U.S. Government Bond Index4 | | – | | – | | – | | – | | | 0.53 | | | | 1.34 | | | | 2.62 | | | – | | – |
| * | | Class B shares are closed to investment, except in connection with the reinvestment of any distributions and permitted exchanges. |
Figures quoted represent past performance, which is no guarantee of future results, and do not reflect taxes that a shareholder may pay on fund distributions or the redemption of fund shares. Investment return and principal value of an investment will fluctuate so that an investor’s shares, when redeemed, may be worth more or less than their original cost. Performance shown without sales charges would be lower if sales charges were reflected. Current performance may be lower or higher than the performance data quoted, which assumes the reinvestment of dividends and capital gains. Current month-end performance is available on the Fund’s website, wellsfargoadvantagefunds.com.
Index returns do not include transaction costs associated with buying and selling securities, any mutual fund fees or expenses, or any taxes. It is not possible to invest directly in an index.
For Class A shares, the maximum front-end sales charge is 2.00%. For Class B shares, the maximum contingent deferred sales charge is 3.00%. For Class C shares, the maximum contingent deferred sales charge is 1.00%. Performance including sales charge assumes the sales charge for the corresponding time period. Class R6, Administrator Class, and Institutional Class shares are sold without a front-end sales charge or contingent deferred sales charge.
Bond values fluctuate in response to the financial condition of individual issuers, general market and economic conditions, and changes in interest rates. In general, when interest rates rise, bond values fall and investors may lose principal value. Securities issued by U.S. government agencies or government-sponsored entities may not be guaranteed by the U.S. Treasury. Certain investment strategies tend to increase the total risk of an investment (relative to the broader market). The Fund is exposed to mortgage- and asset-backed securities risk. Consult the Fund’s prospectus for additional information on these and other risks. The U.S. government guarantee applies to certain underlying securities and not to shares of the Fund.
Please see footnotes on page 7.
| | | | | | |
| Performance highlights (unaudited) | | Wells Fargo Advantage Short Duration Government Bond Fund | | | 7 | |
| | | | |
| Ten largest long-term holdings5 (%) as of February 28, 2014 | |
U.S. Treasury Note, 0.25%, 2-29-2016 | | | 17.38 | |
U.S. Treasury Note, 0.25%, 5-31-2014 | | | 14.55 | |
U.S. Treasury Note, 0.38%, 1-31-2016 | | | 6.96 | |
FNMA Series 2013-121 Class LB, 3.00%,
12-25-2043 | | | 4.21 | |
U.S. Treasury Note, 0.25%, 7-31-2015 | | | 3.42 | |
U.S. Treasury Note, 0.25%, 9-30-2015 | | | 2.82 | |
U.S. Treasury Note, 0.25%, 10-31-2015 | | | 2.69 | |
FNMA, 5.50%, 12-1-2041 | | | 2.20 | |
FNMA Series 2011-53 Class TN, 4.00%,
6-25-2041 | | | 1.85 | |
FNMA, 2.76%, 1-1-2044 | | | 1.63 | |
|
| Portfolio allocation6 as of February 28, 2014 |
|
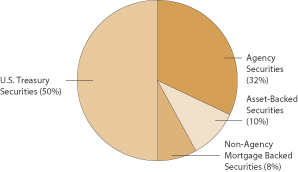
|
| 1. | Historical performance shown for Class R6 shares prior to its inception reflects the performance of Institutional Class shares and includes the higher expenses applicable to Institutional Class shares. If these expenses had not been included, returns would be higher. Historical performance shown for Institutional Class shares prior to their inception reflects the performance of Administrator Class shares and includes the higher expenses applicable to Administrator Class shares. If these expenses had not been included, returns would be higher. |
| 2. | Reflects the expense ratios as stated in the most recent prospectuses. The expense ratios shown are subject to change and may differ from the annualized expense ratios shown in the financial highlights of this report. |
| 3. | The Adviser has committed through December 31, 2014, to waive fees and/or reimburse expenses to the extent necessary to cap the Fund’s Total Annual Fund Operating Expenses After Fee Waiver, excluding certain expenses, at 0.78% for Class A, 1.53% for Class B, 1.53% for Class C, 0.37% for Class R6, 0.60% for Administrator Class, and 0.42% for Institutional Class. Brokerage commissions, stamp duty fees, interest, taxes, acquired fund fees and expenses, and extraordinary expenses are excluded from the cap. Without this cap, the Fund’s returns would have been lower. |
| 4. | The Barclays 1-3 Year U.S. Government Bond Index is composed of all publicly issued, nonconvertible domestic debt of the U.S. government and its agencies. The index also includes corporate debt guaranteed by the U.S. government. Only notes and bonds with a minimum maturity of one year up to a maximum maturity of 2.9 years are included. You cannot invest directly in an index. |
| 5. | The ten largest long-term holdings are calculated based on the value of the securities divided by total net assets of the Fund. Holdings are subject to change and may have changed since the date specified. |
| 6. | Portfolio allocation is subject to change and is calculated based on the total long-term investments of the Fund. |
| | | | |
| 8 | | Wells Fargo Advantage Short Duration Government Bond Fund | | Fund expenses (unaudited) |
As a shareholder of the Fund, you incur two types of costs: (1) transaction costs, including sales charges (loads) on purchase payments and contingent deferred sales charges (if any) on redemptions and (2) ongoing costs, including management fees, distribution (12b-1) and/or shareholder service fees, and other Fund expenses. This example is intended to help you understand your ongoing costs (in dollars) of investing in the Fund and to compare these costs with the ongoing costs of investing in other mutual funds.
The example is based on an investment of $1,000 invested at the beginning of the six-month period and held for the entire period from September 1, 2013 to February 28, 2014.
Actual expenses
The “Actual” line of the table below provides information about actual account values and actual expenses. You may use the information in this line, together with the amount you invested, to estimate the expenses that you paid over the period. Simply divide your account value by $1,000 (for example, an $8,600 account value divided by $1,000 = 8.6), then multiply the result by the number in the “Actual” line under the heading entitled “Expenses paid during period” for your applicable class of shares to estimate the expenses you paid on your account during this period.
Hypothetical example for comparison purposes
The “Hypothetical” line of the table below provides information about hypothetical account values and hypothetical expenses based on the Fund’s actual expense ratio and an assumed rate of return of 5% per year before expenses, which is not the Fund’s actual return. The hypothetical account values and expenses may not be used to estimate the actual ending account balance or expenses you paid for the period. You may use this information to compare the ongoing costs of investing in the Fund and other funds. To do so, compare this 5% hypothetical example with the 5% hypothetical examples that appear in the shareholder reports of the other funds.
Please note that the expenses shown in the table are meant to highlight your ongoing costs only and do not reflect any transactional costs, such as sales charges (loads) and contingent deferred sales charges. Therefore, the “Hypothetical” line of the table is useful in comparing ongoing costs only and will not help you determine the relative total costs of owning different funds. In addition, if these transactional costs were included, your costs would have been higher.
| | | | | | | | | | | | | | | | |
| | | Beginning
account value
9-1-2013 | | | Ending
account value
2-28-2014 | | | Expenses
paid during
the period1 | | | Net annualized
expense ratio | |
Class A | | | | | | | | | | | | | | | | |
Actual | | $ | 1,000.00 | | | $ | 1,008.60 | | | $ | 3.88 | | | | 0.78 | % |
Hypothetical (5% return before expenses) | | $ | 1,000.00 | | | $ | 1,020.93 | | | $ | 3.91 | | | | 0.78 | % |
Class B | | | | | | | | | | | | | | | | |
Actual | | $ | 1,000.00 | | | $ | 1,003.87 | | | $ | 7.60 | | | | 1.53 | % |
Hypothetical (5% return before expenses) | | $ | 1,000.00 | | | $ | 1,017.21 | | | $ | 7.65 | | | | 1.53 | % |
Class C | | | | | | | | | | | | | | | | |
Actual | | $ | 1,000.00 | | | $ | 1,003.87 | | | $ | 7.60 | | | | 1.53 | % |
Hypothetical (5% return before expenses) | | $ | 1,000.00 | | | $ | 1,017.21 | | | $ | 7.65 | | | | 1.53 | % |
Class R6 | | | | | | | | | | | | | | | | |
Actual | | $ | 1,000.00 | | | $ | 1,009.64 | | | $ | 1.84 | | | | 0.37 | % |
Hypothetical (5% return before expenses) | | $ | 1,000.00 | | | $ | 1,022.96 | | | $ | 1.86 | | | | 0.37 | % |
Administrator Class | | | | | | | | | | | | | | | | |
Actual | | $ | 1,000.00 | | | $ | 1,008.50 | | | $ | 2.99 | | | | 0.60 | % |
Hypothetical (5% return before expenses) | | $ | 1,000.00 | | | $ | 1,021.82 | | | $ | 3.01 | | | | 0.60 | % |
Institutional Class | | | | | | | | | | | | | | | | |
Actual | | $ | 1,000.00 | | | $ | 1,010.39 | | | $ | 2.09 | | | | 0.42 | % |
Hypothetical (5% return before expenses) | | $ | 1,000.00 | | | $ | 1,022.71 | | | $ | 2.11 | | | | 0.42 | % |
| 1. | Expenses paid is equal to the annualized expense ratio of each class multiplied by the average account value over the period, multiplied by the number of days in the most recent fiscal half-year divided by the number of days in the fiscal year (to reflect the one-half-year period). |
| | | | | | |
| Portfolio of investments—February 28, 2014 (unaudited) | | Wells Fargo Advantage Short Duration Government Bond Fund | | | 9 | |
| | | | | | | | | | | | | | | | |
| Security name | | Interest rate | | | Maturity date | | | Principal | | | Value | |
| | | | | | | | | | | | | | | | |
| | | | |
Agency Securities: 32.36% | | | | | | | | | | | | | | | | |
FHLMC (a)%% | | | 2.93 | % | | | 3-15-2044 | | | $ | 8,548,000 | | | $ | 8,875,466 | |
FHLMC ± | | | 3.11 | | | | 10-1-2043 | | | | 1,224,513 | | | | 1,276,923 | |
FHLMC ± | | | 3.15 | | | | 8-1-2041 | | | | 6,614,629 | | | | 6,927,658 | |
FHLMC ±%% | | | 3.26 | | | | 10-1-2041 | | | | 4,802,019 | | | | 5,027,559 | |
FHLMC ± | | | 3.56 | | | | 8-1-2041 | | | | 1,567,400 | | | | 1,670,125 | |
FHLMC ± | | | 3.63 | | | | 6-1-2041 | | | | 7,677,482 | | | | 8,142,900 | |
FHLMC ± | | | 3.65 | | | | 10-1-2041 | | | | 6,505,478 | | | | 6,877,368 | |
FHLMC | | | 4.50 | | | | 9-1-2024 | | | | 3,982,319 | | | | 4,298,055 | |
FHLMC | | | 4.50 | | | | 12-1-2024 | | | | 1,327,483 | | | | 1,432,996 | |
FHLMC | | | 4.50 | | | | 7-1-2025 | | | | 2,923,735 | | | | 3,155,159 | |
FHLMC | | | 4.50 | | | | 6-1-2026 | | | | 1,428,654 | | | | 1,542,228 | |
FHLMC | | | 4.50 | | | | 7-1-2026 | | | | 1,756,342 | | | | 1,896,517 | |
FHLMC | | | 4.50 | | | | 8-1-2026 | | | | 775,843 | | | | 837,548 | |
FHLMC | | | 5.50 | | | | 12-15-2039 | | | | 14,786,376 | | | | 16,512,271 | |
FHLMC | | | 5.50 | | | | 7-1-2041 | | | | 1,816,476 | | | | 2,061,637 | |
FHLMC ± | | | 5.86 | | | | 7-1-2038 | | | | 7,396,439 | | | | 7,980,467 | |
FHLMC ± | | | 5.95 | | | | 10-1-2038 | | | | 593,608 | | | | 635,322 | |
FHLMC | | | 6.00 | | | | 5-15-2039 | | | | 4,938,888 | | | | 5,477,010 | |
FHLMC ± | | | 6.06 | | | | 6-1-2037 | | | | 1,591,409 | | | | 1,706,861 | |
FHLMC | | | 6.50 | | | | 11-1-2037 | | | | 952,122 | | | | 1,079,187 | |
FHLMC | | | 6.50 | | | | 12-1-2038 | | | | 1,912,480 | | | | 2,107,094 | |
FHLMC | | | 7.00 | | | | 3-25-2044 | | | | 2,259,579 | | | | 2,738,728 | |
FHLMC Series 2638 Class MJ | | | 5.00 | | | | 7-15-2033 | | | | 4,711,000 | | | | 5,193,562 | |
FHLMC Series 2744 Class JH | | | 5.00 | | | | 2-15-2034 | | | | 1,809,000 | | | | 1,981,105 | |
FHLMC Series 2762 Class LY | | | 5.00 | | | | 3-15-2034 | | | | 1,888,000 | | | | 2,082,821 | |
FHLMC Series 3704 Class CT | | | 7.00 | | | | 12-15-2036 | | | | 2,905,715 | | | | 3,496,423 | |
FHLMC Series T-57 Class 1A3 | | | 7.50 | | | | 7-25-2043 | | | | 437,470 | | | | 525,424 | |
FHLMC Series T-59 Class 1A3 | | | 7.50 | | | | 10-25-2043 | | | | 183,642 | | | | 218,564 | |
FHLMC Series T-60 Class 1A3 | | | 7.50 | | | | 3-25-2044 | | | | 68,377 | | | | 82,002 | |
FHLMC Structured Pass-Through Securities Series T-51
Class 2A ± | | | 7.50 | | | | 8-25-2042 | | | | 2,030,543 | | | | 2,442,426 | |
FHLMC Structured Pass-Through Securities Series T-55
Class 1A2 | | | 7.00 | | | | 3-25-2043 | | | | 632,835 | | | | 712,112 | |
FNMA ± | | | 2.76 | | | | 1-1-2044 | | | | 21,373,680 | | | | 22,149,188 | |
FNMA ± | | | 2.80 | | | | 3-1-2044 | | | | 12,059,000 | | | | 12,479,945 | |
FNMA ± | | | 2.81 | | | | 11-1-2043 | | | | 5,748,685 | | | | 5,968,912 | |
FNMA ± | | | 2.89 | | | | 4-1-2042 | | | | 4,412,052 | | | | 4,582,071 | |
FNMA ± | | | 3.04 | | | | 10-1-2041 | | | | 1,307,780 | | | | 1,384,851 | |
FNMA ± | | | 3.26 | | | | 6-1-2041 | | | | 2,275,451 | | | | 2,387,755 | |
FNMA ± | | | 3.29 | | | | 7-1-2041 | | | | 3,194,552 | | | | 3,385,862 | |
FNMA ± | | | 3.30 | | | | 11-1-2041 | | | | 6,165,510 | | | | 6,466,869 | |
FNMA ± | | | 3.55 | | | | 7-1-2041 | | | | 4,133,774 | | | | 4,398,434 | |
FNMA ± | | | 3.67 | | | | 7-1-2041 | | | | 2,356,388 | | | | 2,516,030 | |
FNMA | | | 4.50 | | | | 8-1-2024 | | | | 794,824 | | | | 861,370 | |
FNMA | | | 4.50 | | | | 10-1-2024 | | | | 3,362,995 | | | | 3,644,132 | |
FNMA | | | 4.50 | | | | 12-1-2024 | | | | 1,294,841 | | | | 1,403,097 | |
FNMA | | | 4.50 | | | | 6-1-2025 | | | | 828,871 | | | | 898,334 | |
FNMA | | | 4.50 | | | | 2-1-2026 | | | | 1,044,389 | | | | 1,131,963 | |
FNMA | | | 5.00 | | | | 2-1-2023 | | | | 7,422,522 | | | | 8,041,360 | |
FNMA | | | 5.00 | | | | 5-1-2023 | | | | 1,308,355 | | | | 1,419,321 | |
FNMA %% | | | 5.00 | | | | 8-1-2030 | | | | 1,474,262 | | | | 1,621,356 | |
FNMA | | | 5.50 | | | | 11-1-2033 | | | | 13,055,415 | | | | 14,518,413 | |
The accompanying notes are an integral part of these financial statements.
| | | | |
| 10 | | Wells Fargo Advantage Short Duration Government Bond Fund | | Portfolio of investments—February 28, 2014 (unaudited) |
| | | | | | | | | | | | | | | | |
| Security name | | Interest rate | | | Maturity date | | | Principal | | | Value | |
| | | | | | | | | | | | | | | | |
| | | | |
Agency Securities (continued) | | | | | | | | | | | | | | | | |
FNMA | | | 5.50 | % | | | 9-1-2039 | | | $ | 1,328,147 | | | $ | 1,501,878 | |
FNMA | | | 5.50 | | | | 8-1-2040 | | | | 1,596,485 | | | | 1,787,790 | |
FNMA | | | 5.50 | | | | 12-1-2041 | | | | 26,882,182 | | | | 29,902,001 | |
FNMA | | | 6.00 | | | | 3-25-2035 | | | | 1,733,385 | | | | 1,844,704 | |
FNMA | | | 6.00 | | | | 7-1-2036 | | | | 8,703,082 | | | | 10,053,566 | |
FNMA | | | 6.50 | | | | 8-1-2037 | | | | 9,176,465 | | | | 10,476,026 | |
FNMA | | | 6.50 | | | | 6-1-2038 | | | | 6,398,658 | | | | 7,463,015 | |
FNMA | | | 6.50 | | | | 8-1-2039 | | | | 7,213,916 | | | | 8,158,079 | |
FNMA | | | 6.50 | | | | 2-1-2041 | | | | 2,560,879 | | | | 2,893,648 | |
FNMA | | | 7.50 | | | | 7-1-2032 | | | | 311,703 | | | | 356,241 | |
FNMA Grantor Trust Series 2000-T6 Class A1 | | | 7.50 | | | | 6-25-2030 | | | | 695,647 | | | | 811,618 | |
FNMA Grantor Trust Series 2001-T16 Class A2 | | | 7.00 | | | | 7-25-2042 | | | | 284,289 | | | | 328,903 | |
FNMA Grantor Trust Series 2001-T3 Class A1 | | | 7.50 | | | | 11-25-2040 | | | | 767,457 | | | | 902,586 | |
FNMA Series 1999-T2 Class A1 ± | | | 7.50 | | | | 1-19-2039 | | | | 453,960 | | | | 507,683 | |
FNMA Series 2001-T4 Class A1 | | | 7.50 | | | | 7-25-2041 | | | | 103,130 | | | | 123,689 | |
FNMA Series 2001-W03 Class A ± | | | 7.00 | | | | 9-25-2041 | | | | 780,075 | | | | 899,962 | |
FNMA Series 2002-14 Class A2 | | | 7.00 | | | | 1-25-2042 | | | | 743,473 | | | | 852,133 | |
FNMA Series 2002-14 Class A2 | | | 7.50 | | | | 1-25-2042 | | | | 1,597,600 | | | | 1,892,925 | |
FNMA Series 2002-26 Class A1 | | | 7.00 | | | | 1-25-2048 | | | | 980,897 | | | | 1,145,432 | |
FNMA Series 2002-33 Class A2 | | | 7.50 | | | | 6-25-2032 | | | | 232,032 | | | | 275,028 | |
FNMA Series 2002-90 Class A1 | | | 6.50 | | | | 6-25-2042 | | | | 28,417 | | | | 32,859 | |
FNMA Series 2002-T12 Class A3 | | | 7.50 | | | | 5-25-2042 | | | | 3,886,949 | | | | 4,584,069 | |
FNMA Series 2002-W1 Class 2A ± | | | 6.64 | | | | 2-25-2042 | | | | 605,002 | | | | 711,786 | |
FNMA Series 2002-W6 Class 2A1 ± | | | 6.50 | | | | 6-25-2042 | | | | 12,863 | | | | 14,796 | |
FNMA Series 2003-W1 Class 2A ± | | | 6.68 | | | | 12-25-2042 | | | | 314,711 | | | | 370,979 | |
FNMA Series 2003-W2 Class 1A1 | | | 6.50 | | | | 7-25-2042 | | | | 179,902 | | | | 206,376 | |
FNMA Series 2003-W4 Class 4A ± | | | 7.07 | | | | 10-25-2042 | | | | 824,899 | | | | 954,023 | |
FNMA Series 2004-W02 Class 5A | | | 7.50 | | | | 3-25-2044 | | | | 153,839 | | | | 181,093 | |
FNMA Series 2004-W8 Class 3A | | | 7.50 | | | | 6-25-2044 | | | | 1,378,237 | | | | 1,616,706 | |
FNMA Series 2004-W9 Class 1A3 | | | 6.05 | | | | 2-25-2044 | | | | 4,735,804 | | | | 5,379,220 | |
FNMA Series 2004-W9 Class 2A3 | | | 7.50 | | | | 2-25-2044 | | | | 850,040 | | | | 1,042,680 | |
FNMA Series 2005-W3 Class 1A | | | 7.50 | | | | 3-25-2045 | | | | 254,693 | | | | 304,526 | |
FNMA Series 2009-14 Class A | | | 7.00 | | | | 6-25-2035 | | | | 1,870,739 | | | | 2,194,671 | |
FNMA Series 2010-111 Class WA ± | | | 6.05 | | | | 10-25-2040 | | | | 1,120,894 | | | | 1,293,069 | |
FNMA Series 2011-53 Class TN | | | 4.00 | | | | 6-25-2041 | | | | 23,639,217 | | | | 25,144,633 | |
FNMA Series 2011-58 Class AT | | | 4.00 | | | | 7-25-2041 | | | | 257,854 | | | | 271,970 | |
FNMA Series 2011-M2 Class A1 | | | 2.02 | | | | 4-25-2021 | | | | 3,760,039 | | | | 3,850,836 | |
FNMA Series 2012-28 Class PT | | | 4.00 | | | | 3-25-2042 | | | | 1,368,755 | | | | 1,440,619 | |
FNMA Series 2012-65 Class HJ | | | 5.00 | | | | 7-25-2040 | | | | 12,183,032 | | | | 13,511,384 | |
FNMA Series 2013-121 Class LB | | | 3.00 | | | | 12-25-2043 | | | | 55,575,688 | | | | 57,298,868 | |
FNMA Whole Loan Series 2002-W8 Class A3 | | | 7.50 | | | | 6-25-2042 | | | | 129,180 | | | | 152,564 | |
FNMA Whole Loan Series 2004-W11 Class 1A2 | | | 6.50 | | | | 5-25-2044 | | | | 5,442,427 | | | | 6,334,310 | |
FNMA Whole Loan Series 2004-W14 Class 2A | | | 7.50 | | | | 7-25-2044 | | | | 164,385 | | | | 183,952 | |
FNMA Whole Loan Series 2005-W1 Class 1A4 | | | 7.50 | | | | 10-25-2044 | | | | 421,356 | | | | 505,439 | |
GNMA ± | | | 3.00 | | | | 8-20-2041 | | | | 5,110,991 | | | | 5,322,244 | |
GNMA | | | 5.50 | | | | 3-15-2033 | | | | 1,721,574 | | | | 1,939,254 | |
GNMA | | | 6.00 | | | | 9-15-2035 | | | | 11,584,732 | | | | 13,321,157 | |
GNMA Series 2009-42 Class CT | | | 6.00 | | | | 8-16-2035 | | | | 1,623,521 | | | | 1,900,461 | |
| | | | |
Total Agency Securities (Cost $439,258,787) | | | | | | | | | | | | | | | 440,494,232 | |
| | | | | | | | | | | | | | | | |
The accompanying notes are an integral part of these financial statements.
| | | | | | |
| Portfolio of investments—February 28, 2014 (unaudited) | | Wells Fargo Advantage Short Duration Government Bond Fund | | | 11 | |
| | | | | | | | | | | | | | | | |
| Security name | | Interest rate | | | Maturity date | | | Principal | | | Value | |
| | | | | | | | | | | | | | | | |
| | | | |
Asset-Backed Securities: 11.69% | | | | | | | | | | | | | | | | |
Ally Auto Receivables Trust Series 2013-2 Class A4 | | | 1.24 | % | | | 11-15-2018 | | | $ | 3,396,000 | | | $ | 3,393,422 | |
Ally Master Owner Trust Series 2014-1 Class A1 ± | | | 0.62 | | | | 1-15-2019 | | | | 4,646,000 | | | | 4,651,394 | |
American Express Issuance Trust II Series 2013-1 Class A ± | | | 0.43 | | | | 2-15-2019 | | | | 8,456,000 | | | | 8,462,875 | |
American Express Issuance Trust II Series 2013-2 Class A ± | | | 0.57 | | | | 5-17-2021 | | | | 7,166,000 | | | | 7,189,533 | |
American Express Issuance Trust II Series 2013-2 Class A ± | | | 0.58 | | | | 8-15-2019 | | | | 4,304,000 | | | | 4,321,677 | |
California Republic Auto Receivables Trust Series 2013-2 Class A2 | | | 1.23 | | | | 3-15-2019 | | | | 6,225,000 | | | | 6,226,282 | |
Capital Auto Receivables Asset Trust Series 2013-1 Class A3 | | | 0.79 | | | | 6-20-2017 | | | | 5,028,000 | | | | 5,031,867 | |
Capital Auto Receivables Asset Trust Series 2013-3 Class A2 | | | 1.04 | | | | 11-21-2016 | | | | 8,512,000 | | | | 8,551,096 | |
Capital Auto Receivables Asset Trust Series 2014-1 Class A3 | | | 1.32 | | | | 6-20-2018 | | | | 7,667,000 | | | | 7,690,530 | |
Citibank Credit Card Issuance Trust Series 2013-A7 Class A7 ± | | | 0.59 | | | | 9-10-2020 | | | | 5,664,000 | | | | 5,684,742 | |
Developers Diversified Realty Corporation Trust Series 2009-DDR1 Class A 144A | | | 3.81 | | | | 10-14-2022 | | | | 8,357,131 | | | | 8,500,924 | |
Discover Card Master Trust I Series 2013-A1 Class A1 ± | | | 0.45 | | | | 8-17-2020 | | | | 3,443,000 | | | | 3,436,696 | |
Ford Credit Floorplan Master Owner Trust Series 2014-1 Class A1 | | | 1.20 | | | | 2-15-2019 | | | | 8,063,000 | | | | 8,064,459 | |
Nelnet Student Loan Trust Series 2006-2 Class A4 ± | | | 0.32 | | | | 10-26-2026 | | | | 6,484,687 | | | | 6,467,892 | |
Nelnet Student Loan Trust Series 2007-1 Class A1 ± | | | 0.24 | | | | 11-27-2018 | | | | 876,318 | | | | 874,668 | |
Santander Drive Auto Receivables Trust Series 2012-5 Class A2 | | | 0.57 | | | | 12-15-2015 | | | | 469,498 | | | | 469,531 | |
Santander Drive Auto Receivables Trust Series 2012-5 Class A3 | | | 0.83 | | | | 12-15-2016 | | | | 2,745,000 | | | | 2,749,562 | |
SLC Student Loan Trust Series 2010-1 Class A ± | | | 1.11 | | | | 11-25-2042 | | | | 2,234,705 | | | | 2,267,075 | |
SLM Student Loan Trust Series 2002-6 Class A4 ± | | | 0.40 | | | | 3-15-2019 | | | | 1,252,181 | | | | 1,251,499 | |
SLM Student Loan Trust Series 2003-6 Class A4 ± | | | 0.44 | | | | 12-17-2018 | | | | 759,300 | | | | 758,765 | |
SLM Student Loan Trust Series 2005-6 Class A5 ± | | | 1.44 | | | | 7-27-2026 | | | | 1,855,871 | | | | 1,883,413 | |
SLM Student Loan Trust Series 2006-7 Class A5 ± | | | 0.34 | | | | 1-27-2025 | | | | 11,255,000 | | | | 11,109,934 | |
SLM Student Loan Trust Series 2007-2 Class A2 ± | | | 0.64 | | | | 5-15-2028 | | | | 1,166,773 | | | | 1,164,775 | |
SLM Student Loan Trust Series 2010-1 Class A ± | | | 0.56 | | | | 3-25-2025 | | | | 5,448,998 | | | | 5,466,893 | |
SLM Student Loan Trust Series 2010-A Class 2A ±144A | | | 3.40 | | | | 5-16-2044 | | | | 12,943,329 | | | | 13,745,790 | |
SLM Student Loan Trust Series 2010-A Class1A ±144A | | | 3.20 | | | | 5-16-2044 | | | | 4,269,701 | | | | 4,431,881 | |
SLM Student Loan Trust Series 2011-B Class A4 ±144A | | | 1.00 | | | | 12-16-2024 | | | | 2,997,560 | | | | 3,006,807 | |
SLM Student Loan Trust Series 2011-C Class A2A ±144A | | | 3.40 | | | | 10-17-2044 | | | | 1,882,000 | | | | 2,031,128 | |
SLM Student Loan Trust Series 2012-E Class A2 ±144A | | | 1.90 | | | | 6-15-2045 | | | | 3,636,000 | | | | 3,722,911 | |
SLM Student Loan Trust Series 2013-1 Class A2 ± | | | 0.41 | | | | 9-25-2019 | | | | 2,919,000 | | | | 2,895,309 | |
SLM Student Loan Trust Series 2013-3 Class A2 ± | | | 0.46 | | | | 5-26-2020 | | | | 1,762,000 | | | | 1,761,209 | |
SLM Student Loan Trust Series 2013-6 Class A2 ± | | | 0.66 | | | | 2-25-2021 | | | | 1,490,000 | | | | 1,495,379 | |
SLM Student Loan Trust Series 2013-B Class A2A 144A | | | 1.85 | | | | 6-17-2030 | | | | 6,259,000 | | | | 6,098,012 | |
SLM Student Loan Trust Series 2014-A Class A2B ±144A%% | | | 1.71 | | | | 1-15-2026 | | | | 4,304,000 | | | | 4,304,052 | |
| | | | |
Total Asset-Backed Securities (Cost $159,165,633) | | | | | | | | | | | | | | | 159,161,982 | |
| | | | | | | | | | | | | | | | |
| | | | |
Non-Agency Mortgage Backed Securities: 5.71% | | | | | | | | | | | | | | | | |
CFCRE Commercial Mortgage Trust Series 2011-C1
Class A1 144A | | | 1.87 | | | | 4-15-2044 | | | | 2,970,666 | | | | 3,002,924 | |
CFCRE Commercial Mortgage Trust Series 2011-C2 Class A1 | | | 1.56 | | | | 12-15-2047 | | | | 2,172,176 | | | | 2,183,801 | |
Commercial Mortgage Trust Series 2013-CR10 Class A1 | | | 1.28 | | | | 8-10-2046 | | | | 5,630,614 | | | | 5,649,944 | |
Commercial Mortgage Trust Series 2013-CR11 Class A1 | | | 1.47 | | | | 10-10-2046 | | | | 3,286,733 | | | | 3,301,428 | |
Commercial Mortgage Trust Series 2013-CR12 Class A1 | | | 1.30 | | | | 10-10-2046 | | | | 2,312,713 | | | | 2,316,936 | |
Commercial Mortgage Trust Series 2013-CR6 Class A1 | | | 0.72 | | | | 3-10-2046 | | | | 3,510,608 | | | | 3,489,351 | |
Commercial Mortgage Trust Series 2013-CR8 Class A1 | | | 1.02 | | | | 6-10-2046 | | | | 7,741,087 | | | | 7,727,695 | |
Credit Suisse First Boston Mortgage Securities Corporation Series 2005-C1 Class A4 ± | | | 5.01 | | | | 2-15-2038 | | | | 3,203,629 | | | | 3,282,214 | |
DBUBS Mortgage Trust Series 2011 Class C2 144A | | | 3.53 | | | | 7-10-2044 | | | | 1,156,628 | | | | 1,222,473 | |
DBUBS Mortgage Trust Series 2011-LC3A Class A1 | | | 2.24 | | | | 8-10-2044 | | | | 2,074,746 | | | | 2,101,552 | |
GS Mortgage Securities Trust Series 2010-C2 Class A1 144A | | | 3.85 | | | | 12-10-2043 | | | | 7,562,473 | | | | 7,973,372 | |
GS Mortgage Securities Trust Series 2013-GC16 Class A1 | | | 1.26 | | | | 11-10-2046 | | | | 4,431,880 | | | | 4,445,198 | |
The accompanying notes are an integral part of these financial statements.
| | | | |
| 12 | | Wells Fargo Advantage Short Duration Government Bond Fund | | Portfolio of investments—February 28, 2014 (unaudited) |
| | | | | | | | | | | | | | | | |
| Security name | | Interest rate | | | Maturity date | | | Principal | | | Value | |
| | | | | | | | | | | | | | | | |
| | | | |
Non-Agency Mortgage Backed Securities (continued) | | | | | | | | | | | | | | | | |
JPMorgan Chase Commercial Mortgage Securities Corporation Series 2010-C1
Class A2 144A | | | 4.61 | % | | | 6-15-2043 | | | $ | 2,478,000 | | | $ | 2,706,323 | |
JPMorgan Chase Commercial Mortgage Securities Corporation Series 2010-CNTR
Class A1 144A | | | 3.30 | | | | 8-5-2032 | | | | 1,866,737 | | | | 1,954,498 | |
JPMorgan Chase Commercial Mortgage Securities Corporation Series 2011-C3
Class A1 144A | | | 1.87 | | | | 2-15-2046 | | | | 684,792 | | | | 687,105 | |
Lehman Brothers UBS Commercial Mortgage Trust Series 2004-C6 Class A6 ± | | | 5.02 | | | | 8-15-2029 | | | | 2,279,412 | | | | 2,299,052 | |
Lehman Brothers UBS Commercial Mortgage Trust Series 2005-C7 Class A3 ± | | | 5.46 | | | | 11-15-2030 | | | | 2,404,619 | | | | 2,481,454 | |
Morgan Stanley Capital I Trust Series 2011-C2 Class A1 144A | | | 1.48 | | | | 6-15-2044 | | | | 1,561,244 | | | | 1,565,625 | |
Motel 6 Trust Series 2012-MTL6 Class A2 144A | | | 1.95 | | | | 10-5-2025 | | | | 19,517,000 | | | | 19,380,264 | |
| | | | |
Total Non-Agency Mortgage Backed Securities (Cost $78,655,315) | | | | | | | | | | | | | | | 77,771,209 | |
| | | | | | | | | | | | | | | | |
| | | | |
U.S. Treasury Securities: 49.75% | | | | | | | | | | | | | | | | |
U.S. Treasury Note | | | 0.13 | | | | 12-31-2014 | | | | 19,046,000 | | | | 19,046,000 | |
U.S. Treasury Note | | | 0.25 | | | | 5-31-2014 | | | | 197,940,000 | | | | 198,025,114 | |
U.S. Treasury Note | | | 0.25 | | | | 7-31-2015 | | | | 46,514,000 | | | | 46,559,444 | |
U.S. Treasury Note | | | 0.25 | | | | 9-30-2015 | | | | 38,312,000 | | | | 38,332,957 | |
U.S. Treasury Note | | | 0.25 | | | | 10-31-2015 | | | | 36,571,000 | | | | 36,576,705 | |
U.S. Treasury Note | | | 0.25 | | | | 12-31-2015 | | | | 2,004,000 | | | | 2,003,138 | |
U.S. Treasury Note | | | 0.25 | | | | 2-29-2016 | | | | 236,983,000 | | | | 236,631,317 | |
U.S. Treasury Note | | | 0.38 | | | | 8-31-2015 | | | | 1,200,000 | | | | 1,203,094 | |
U.S. Treasury Note | | | 0.38 | | | | 1-31-2016 | | | | 94,595,000 | | | | 94,728,001 | |
U.S. Treasury Note | | | 0.75 | | | | 1-15-2017 | | | | 3,995,000 | | | | 4,007,030 | |
| | | | |
Total U.S. Treasury Securities (Cost $676,638,367) | | | | | | | | | | | | | | | 677,112,800 | |
| | | | | | | | | | | | | | | | |
| | | | |
| | | Yield | | | | | | Shares | | | | |
| | | | |
Short-Term Investments: 5.49% | | | | | | | | | | | | | | | | |
| | | | |
| Investment Companies: 5.49% | | | | | | | | | | | | | | | | |
Wells Fargo Advantage Government Money Market Fund, Institutional Class (l)(u)## | | | 0.01 | | | | | | | | 74,690,151 | | | | 74,690,151 | |
| | | | | | | | | | | | | | | | |
| | | | |
Total Short-Term Investments (Cost $74,690,151) | | | | | | | | | | | | | | | 74,690,151 | |
| | | | | | | | | | | | | | | | |
| | | | | | | | |
| Total investments in securities | | | | | | | | |
| (Cost $1,428,408,253) * | | | 105.00 | % | | | 1,429,230,374 | |
Other assets and liabilities, net | | | (5.00 | ) | | | (68,063,485 | ) |
| | | | | | | | |
| Total net assets | | | 100.00 | % | | $ | 1,361,166,889 | |
| | | | | | | | |
| (a) | Security is fair valued by the Management Valuation Team, and in certain instances by the Board of Trustees, in accordance with procedures approved by the Board of Trustees. |
| %% | Security issued on a when-issued basis. |
| ± | Variable rate investment. The rate shown is the rate in effect at period end. |
| 144A | Security that may be resold to “qualified institutional buyers” under Rule 144A or security offered pursuant to Section 4(2) of the Securities Act of 1933, as amended. |
| (l) | Investment in an affiliate |
| (u) | Rate shown is the 7-day annualized yield at period end. |
| ## | All or a portion of this security has been segregated for when-issued securities. |
| * | Cost for federal income tax purposes is $1,429,476,231 and unrealized appreciation (depreciation) consists of: |
| | | | |
Gross unrealized appreciation | | $ | 4,756,591 | |
Gross unrealized depreciation | | | (5,002,448 | ) |
| | | | |
Net unrealized depreciation | | $ | (245,857) | |
The accompanying notes are an integral part of these financial statements.
| | | | | | |
| Statement of assets and liabilities—February 28, 2014 (unaudited) | | Wells Fargo Advantage Short Duration Government Bond Fund | | | 13 | |
| | | | |
| | | | |
| |
Assets | | | | |
Investments | | | | |
In unaffiliated securities, at value (see cost below) | | $ | 1,354,540,223 | |
In affiliated securities, at value (see cost below) | | | 74,690,151 | |
| | | | |
Total investments, at value (see cost below) | | | 1,429,230,374 | |
Receivable for investments sold | | | 17,668,134 | |
Principal paydown receivable | | | 677,080 | |
Receivable for Fund shares sold | | | 426,576 | |
Receivable for interest | | | 2,263,986 | |
Prepaid expenses and other assets | | | 60,315 | |
| | | | |
Total assets | | | 1,450,326,465 | |
| | | | |
| |
Liabilities | | | | |
Dividends payable | | | 119,009 | |
Payable for investments purchased | | | 84,321,130 | |
Payable for Fund shares redeemed | | | 4,115,661 | |
Advisory fee payable | | | 267,191 | |
Distribution fees payable | | | 33,060 | |
Due to other related parties | | | 155,522 | |
Accrued expenses and other liabilities | | | 148,003 | |
| | | | |
Total liabilities | | | 89,159,576 | |
| | | | |
Total net assets | | $ | 1,361,166,889 | |
| | | | |
| |
NET ASSETS CONSIST OF | | | | |
Paid-in capital | | $ | 1,394,814,398 | |
Overdistributed net investment income | | | (6,864,789 | ) |
Accumulated net realized losses on investments | | | (27,604,841 | ) |
Net unrealized gains on investments | | | 822,121 | |
| | | | |
Total net assets | | $ | 1,361,166,889 | |
| | | | |
| |
COMPUTATION OF NET ASSET VALUE AND OFFERING PRICE PER SHARE1 | | | | |
Net assets – Class A | | $ | 113,374,037 | |
Shares outstanding – Class A | | | 11,218,128 | |
Net asset value per share – Class A | | | $10.11 | |
Maximum offering price per share – Class A2 | | | $10.32 | |
Net assets – Class B | | $ | 400,123 | |
Shares outstanding – Class B | | | 39,567 | |
Net asset value per share – Class B | | | $10.11 | |
Net assets – Class C | | $ | 52,522,043 | |
Shares outstanding – Class C | | | 5,188,431 | |
Net asset value per share – Class C | | | $10.12 | |
Net assets – Class R6 | | $ | 58,796,713 | |
Share outstanding – Class R6 | | | 5,799,756 | |
Net asset value per share – Class R6 | | | $10.14 | |
Net assets – Administrator Class | | $ | 205,352,236 | |
Shares outstanding – Administrator Class | | | 20,286,268 | |
Net asset value per share – Administrator Class | | | $10.12 | |
Net assets – Institutional Class | | $ | 930,721,737 | |
Shares outstanding – Institutional Class | | | 91,958,130 | |
Net asset value per share – Institutional Class | | | $10.12 | |
| |
Investments in unaffiliated securities, at cost | | $ | 1,353,718,102 | |
| | | | |
Investments in affiliated securities, at cost | | $ | 74,690,151 | |
| | | | |
Total investments, at cost | | $ | 1,428,408,253 | |
| | | | |
| 1. | The Fund has an unlimited number of authorized shares. |
| 2. | Maximum offering price is computed as 100/98 of net asset value. On investments of $50,000 or more, the offering price is reduced. |
The accompanying notes are an integral part of these financial statements.
| | | | |
| 14 | | Wells Fargo Advantage Short Duration Government Bond Fund | | Statement of operations—six months ended February 28, 2014 (unaudited) |
| | | | |
| | | | |
| |
Investment income | | | | |
Interest | | $ | 7,698,642 | |
Income from affiliated securities | | | 3,193 | |
| | | | |
Total investment income | | | 7,701,835 | |
| | | | |
| |
Expenses | | | | |
Advisory fee | | | 2,126,880 | |
Administration fees | | | | |
Fund level | | | 335,918 | |
Class A | | | 94,125 | |
Class B | | | 526 | |
Class C | | | 45,636 | |
Class R6 | | | 591 | |
Administrator Class | | | 104,432 | |
Institutional Class | | | 382,204 | |
Shareholder servicing fees | | | | |
Class A | | | 147,070 | |
Class B | | | 821 | |
Class C | | | 71,307 | |
Administrator Class | | | 261,081 | |
Distribution fees | | | | |
Class B | | | 2,464 | |
Class C | | | 213,922 | |
Custody and accounting fees | | | 38,832 | |
Professional fees | | | 26,232 | |
Registration fees | | | 83,354 | |
Shareholder report expenses | | | 52,738 | |
Trustees’ fees and expenses | | | 5,808 | |
Other fees and expenses | | | 19,928 | |
| | | | |
Total expenses | | | 4,013,869 | |
Less: Fee waivers and/or expense reimbursements | | | (473,131 | ) |
| | | | |
Net expenses | | | 3,540,738 | |
| | | | |
Net investment income | | | 4,161,097 | |
| | | | |
| |
REALIZED AND UNREALIZED GAINS (LOSSES) ON INVESTMENTS | | | | |
| |
Net realized gains (losses) on: | | | | |
Unaffiliated securities | | | (4,196,892 | ) |
TBA sale commitments | | | 161,445 | |
| | | | |
Net realized losses on investments | | | (4,035,447 | ) |
| | | | |
| |
Net change in unrealized gains (losses) on: | | | | |
Unaffiliated securities | | | 12,763,174 | |
TBA sale commitments | | | 47,031 | |
| | | | |
Net change in unrealized gains (losses) on investments | | | 12,810,205 | |
| | | | |
Net realized and unrealized gains (losses) on investments | | | 8,774,758 | |
| | | | |
Net increase in net assets resulting from operations | | $ | 12,935,855 | |
| | | | |
The accompanying notes are an integral part of these financial statements.
| | | | | | |
| Statement of changes in net assets | | Wells Fargo Advantage Short Duration Government Bond Fund | | | 15 | |
| | | | | | | | | | | | | | | | |
| | | Six months ended February 28, 2014 (unaudited) | | | Year ended
August 31, 2013 | |
| | | | |
Operations | | | | | | | | | | | | | | | | |
Net investment income | | | | | | $ | 4,161,097 | | | | | | | $ | 11,723,427 | |
Net realized gains (losses) on investments | | | | | | | (4,035,447 | ) | | | | | | | 3,557,750 | |
Net change in unrealized gains (losses) on investments | | | | | | | 12,810,205 | | | | | | | | (20,513,653 | ) |
| | | | | | | | |
Net increase (decrease) in net assets resulting from operations | | | | | | | 12,935,855 | | | | | | | | (5,232,476 | ) |
| | | | | | | | |
| | | | |
Distributions to shareholders from | | | | | | | | | | | | | | | | |
Net investment income | | | | | | | | | | | | | | | | |
Class A | | | | | | | (780,732 | ) | | | | | | | (2,893,432 | ) |
Class B | | | | | | | (2,001 | ) | | | | | | | (12,194 | ) |
Class C | | | | | | | (166,380 | ) | | | | | | | (849,500 | ) |
Class R6 | | | | | | | (32,381 | ) | | | | | | | (2,174 | )1 |
Administrator Class | | | | | | | (1,572,723 | ) | | | | | | | (5,836,366 | ) |
Institutional Class | | | | | | | (8,048,451 | ) | | | | | | | (24,450,585 | ) |
| | | | | | | | |
Total distributions to shareholders | | | | | | | (10,602,668 | ) | | | | | | | (34,044,251 | ) |
| | | | | | | | |
| | | | |
Capital share transactions | | | Shares | | | | | | | | Shares | | | | | |
Proceeds from shares sold | | | | | | | | | | | | | | | | |
Class A | | | 1,108,699 | | | | 11,200,615 | | | | 5,827,532 | | | | 59,920,732 | |
Class B | | | 5,110 | | | | 51,685 | | | | 39,572 | | | | 406,801 | |
Class C | | | 207,605 | | | | 2,101,610 | | | | 1,407,819 | | | | 14,495,026 | |
Class R6 | | | 5,868,873 | | | | 59,513,180 | | | | 297,805 | 1 | | | 3,017,844 | 1 |
Administrator Class | | | 2,525,266 | | | | 25,564,265 | | | | 12,119,160 | | | | 124,915,405 | |
Institutional Class | | | 15,611,631 | | | | 158,034,854 | | | | 57,274,381 | | | | 589,598,252 | |
| | | | | | | | |
| | | | | | | 256,466,209 | | | | | | | | 792,354,060 | |
| | | | | | | | |
Reinvestment of distributions | | | | | | | | | | | | | | | | |
Class A | | | 71,247 | | | | 720,195 | | | | 262,636 | | | | 2,692,834 | |
Class B | | | 174 | | | | 1,764 | | | | 1,070 | | | | 10,987 | |
Class C | | | 15,210 | | | | 153,985 | | | | 76,201 | | | | 782,704 | |
Class R6 | | | 3,193 | | | | 32,381 | | | | 213 | 1 | | | 2,174 | 1 |
Administrator Class | | | 142,010 | | | | 1,437,625 | | | | 447,427 | | | | 4,598,087 | |
Institutional Class | | | 725,116 | | | | 7,340,752 | | | | 2,105,516 | | | | 21,621,155 | |
| | | | | | | | |
| | | | | | | 9,686,702 | | | | | | | | 29,707,941 | |
| | | | | | | | |
Payment for shares redeemed | | | | | | | | | | | | | | | | |
Class A | | | (2,481,865 | ) | | | (25,074,869 | ) | | | (9,733,675 | ) | | | (99,903,018 | ) |
Class B | | | (50,496 | ) | | | (510,667 | ) | | | (63,520 | ) | | | (651,395 | ) |
Class C | | | (1,280,941 | ) | | | (12,965,116 | ) | | | (2,799,797 | ) | | | (28,742,133 | ) |
Class R6 | | | (366,865 | ) | | | (3,720,380 | ) | | | (3,463 | )1 | | | (35,115 | )1 |
Administrator Class | | | (5,617,260 | ) | | | (56,823,536 | ) | | | (16,889,747 | ) | | | (173,638,405 | ) |
Institutional Class | | | (28,467,033 | ) | | | (288,006,461 | ) | | | (66,951,756 | ) | | | (689,561,038 | ) |
| | | | | | | | |
| | | | | | | (387,101,029 | ) | | | | | | | (992,531,104 | ) |
| | | | | | | | |
Net decrease in net assets resulting from capital share transactions | | | | | | | (120,948,118 | ) | | | | | | | (170,469,103 | ) |
| | | | | | | | |
Total decrease in net assets | | | | | | | (118,614,931 | ) | | | | | | | (209,745,830 | ) |
| | | | | | | | |
| | | | |
Net assets | | | | | | | | | | | | | | | | |
Beginning of period | | | | | | | 1,479,781,820 | | | | | | | | 1,689,527,650 | |
| | | | | | | | |
End of period | | | | | | $ | 1,361,166,889 | | | | | | | $ | 1,479,781,820 | |
| | | | | | | | |
Undistributed (overdistributed) net investment income | | | | | | $ | (6,864,789 | ) | | | | | | $ | 606,566 | |
| | | | | | | | |
| 1. | For the period from November 30, 2012 (commencement of class operations) to August 31, 2013 |
The accompanying notes are an integral part of these financial statements.
| | | | |
| 16 | | Wells Fargo Advantage Short Duration Government Bond Fund | | Financial highlights |
(For a share outstanding throughout each period)
| | | | | | | | | | | | | | | | | | | | | | | | | | | | |
| | | Six months ended
February 28, 2014 (unaudited) | | | Year ended August 31 | | | Year ended May 31 | |
| CLASS A | | | 2013 | | | 2012 | | | 2011 | | | 20101 | | | 2010 | | | 2009 | |
Net asset value, beginning of period | | $ | 10.09 | | | $ | 10.35 | | | $ | 10.36 | | | $ | 10.47 | | | $ | 10.41 | | | $ | 10.30 | | | $ | 10.01 | |
Net investment income | | | 0.02 | | | | 0.08 | 2 | | | 0.10 | | | | 0.16 | | | | 0.05 | | | | 0.19 | 2 | | | 0.37 | |
Net realized and unrealized gains (losses) on investments | | | 0.07 | | | | (0.14 | ) | | | 0.09 | | | | 0.07 | | | | 0.08 | | | | 0.20 | | | | 0.32 | |
| | | | | | | | | | | | | | | | | | | | | | | | | | | | |
Total from investment operations | | | 0.09 | | | | (0.06 | ) | | | 0.19 | | | | 0.23 | | | | 0.13 | | | | 0.39 | | | | 0.69 | |
Distributions to shareholders from | | | | | | | | | | | | | | | | | | | | | | | | | | | | |
Net investment income | | | (0.07 | ) | | | (0.20 | ) | | | (0.20 | ) | | | (0.25 | ) | | | (0.07 | ) | | | (0.28 | ) | | | (0.40 | ) |
Net realized gains | | | 0.00 | | | | 0.00 | | | | 0.00 | | | | (0.09 | ) | | | 0.00 | | | | 0.00 | | | | 0.00 | |
| | | | | | | | | | | | | | | | | | | | | | | | | | | | |
Total distributions to shareholders | | | (0.07 | ) | | | (0.20 | ) | | | (0.20 | ) | | | (0.34 | ) | | | (0.07 | ) | | | (0.28 | ) | | | (0.40 | ) |
Net asset value, end of period | | $ | 10.11 | | | $ | 10.09 | | | $ | 10.35 | | | $ | 10.36 | | | $ | 10.47 | | | $ | 10.41 | | | $ | 10.30 | |
Total return3 | | | 0.86 | % | | | (0.63 | )% | | | 1.86 | % | | | 2.17 | % | | | 1.23 | % | | | 3.85 | % | | | 7.05 | % |
Ratios to average net assets (annualized) | | | | | | | | | | | | | | | | | | | | | | | | | | | | |
Gross expenses | | | 0.81 | % | | | 0.82 | % | | | 0.86 | % | | | 0.87 | % | | | 0.86 | % | | | 0.88 | % | | | 0.94 | % |
Net expenses | | | 0.78 | % | | | 0.79 | % | | | 0.83 | % | | | 0.83 | % | | | 0.84 | % | | | 0.85 | % | | | 0.85 | % |
Net investment income | | | 0.09 | % | | | 0.80 | % | | | 0.98 | % | | | 1.60 | % | | | 1.85 | % | | | 1.86 | % | | | 3.61 | % |
Supplemental data | | | | | | | | | | | | | | | | | | | | | | | | | | | | |
Portfolio turnover rate | | | 198 | % | | | 324 | % | | | 399 | % | | | 485 | % | | | 135 | % | | | 501 | % | | | 277 | % |
Net assets, end of period (000s omitted) | | | $113,374 | | | | $126,316 | | | | $167,266 | | | | $162,719 | | | | $181,951 | | | | $162,737 | | | | $105,430 | |
| 1. | For the three months ended August 31, 2010. The Fund changed its fiscal year end from May 31 to August 31, effective August 31, 2010. |
| 2. | Calculated based upon average shares outstanding |
| 3. | Total return calculations do not include any sales charges. Returns for periods of less than one year are not annualized. |
The accompanying notes are an integral part of these financial statements.
| | | | | | |
| Financial highlights | | Wells Fargo Advantage Short Duration Government Bond Fund | | | 17 | |
(For a share outstanding throughout each period)
| | | | | | | | | | | | | | | | | | | | | | | | | | | | |
| | | Six months ended
February 28, 2014
(unaudited) | | | Year ended August 31 | | | Year ended May 31 | |
| CLASS B | | | 2013 | | | 2012 | | | 2011 | | | 20101 | | | 2010 | | | 2009 | |
Net asset value, beginning of period | | $ | 10.10 | | | $ | 10.36 | | | $ | 10.36 | | | $ | 10.48 | | | $ | 10.42 | | | $ | 10.31 | | | $ | 10.01 | |
Net investment income (loss) | | | (0.02 | )2 | | | 0.01 | 2 | | | 0.03 | 2 | | | 0.09 | | | | 0.03 | | | | 0.14 | 2 | | | 0.30 | |
Net realized and unrealized gains (losses) on investments | | | 0.06 | | | | (0.15 | ) | | | 0.10 | | | | 0.05 | | | | 0.08 | | | | 0.18 | | | | 0.32 | |
| | | | | | | | | | | | | | | | | | | | | | | | | | | | |
Total from investment operations | | | 0.04 | | | | (0.14 | ) | | | 0.13 | | | | 0.14 | | | | 0.11 | | | | 0.32 | | | | 0.62 | |
Distributions to shareholders from | | | | | | | | | | | | | | | | | | | | | | | | | | | | |
Net investment income | | | (0.03 | ) | | | (0.12 | ) | | | (0.13 | ) | | | (0.17 | ) | | | (0.05 | ) | | | (0.21 | ) | | | (0.32 | ) |
Net realized gains | | | 0.00 | | | | 0.00 | | | | 0.00 | | | | (0.09 | ) | | | 0.00 | | | | 0.00 | | | | 0.00 | |
| | | | | | | | | | | | | | | | | | | | | | | | | | | | |
Total distributions to shareholders | | | (0.03 | ) | | | (0.12 | ) | | | (0.13 | ) | | | (0.26 | ) | | | (0.05 | ) | | | (0.21 | ) | | | (0.32 | ) |
Net asset value, end of period | | $ | 10.11 | | | $ | 10.10 | | | $ | 10.36 | | | $ | 10.36 | | | $ | 10.48 | | | $ | 10.42 | | | $ | 10.31 | |
Total return3 | | | 0.39 | % | | | (1.37 | )% | | | 1.22 | % | | | 1.32 | % | | | 1.04 | % | | | 3.08 | % | | | 6.36 | % |
Ratios to average net assets (annualized) | | | | | | | | | | | | | | | | | | | | | | | | | | | | |
Gross expenses | | | 1.56 | % | | | 1.58 | % | | | 1.60 | % | | | 1.62 | % | | | 1.62 | % | | | 1.66 | % | | | 1.69 | % |
Net expenses | | | 1.53 | % | | | 1.54 | % | | | 1.57 | % | | | 1.58 | % | | | 1.59 | % | | | 1.60 | % | | | 1.60 | % |
Net investment income (loss) | | | (0.10 | )% | | | 0.06 | % | | | 0.25 | % | | | 0.85 | % | | | 1.07 | % | | | 1.30 | % | | | 2.90 | % |
Supplemental data | | | | | | | | | | | | | | | | | | | | | | | | | | | | |
Portfolio turnover rate | | | 198 | % | | | 324 | % | | | 399 | % | | | 485 | % | | | 135 | % | | | 501 | % | | | 277 | % |
Net assets, end of period (000s omitted) | | | $400 | | | | $856 | | | | $1,115 | | | | $1,543 | | | | $1,548 | | | | $1,760 | | | | $4,779 | |
| 1. | For the three months ended August 31, 2010. The Fund changed its fiscal year end from May 31 to August 31, effective August 31, 2010. |
| 2. | Calculated based upon average shares outstanding |
| 3. | Total return calculations do not include any sales charges. Returns for periods of less than one year are not annualized. |
The accompanying notes are an integral part of these financial statements.
| | | | |
| 18 | | Wells Fargo Advantage Short Duration Government Bond Fund | | Financial highlights |
(For a share outstanding throughout each period)
| | | | | | | | | | | | | | | | | | | | | | | | | | | | |
| | | Six months ended
February 28, 2014 (unaudited) | | | Year ended August 31 | | | Year ended May 31 | |
| CLASS C | | | 2013 | | | 2012 | | | 2011 | | | 20101 | | | 2010 | | | 2009 | |
Net asset value, beginning of period | | $ | 10.11 | | | $ | 10.37 | | | $ | 10.37 | | | $ | 10.48 | | | $ | 10.43 | | | $ | 10.32 | | | $ | 10.02 | |
Net investment income (loss) | | | (0.02 | ) | | | 0.01 | 2 | | | 0.03 | | | | 0.08 | | | | 0.03 | | | | 0.11 | 2 | | | 0.34 | |
Net realized and unrealized gains (losses) on investments | | | 0.06 | | | | (0.15 | ) | | | 0.09 | | | | 0.07 | | | | 0.07 | | | | 0.20 | | | | 0.28 | |
| | | | | | | | | | | | | | | | | | | | | | | | | | | | |
Total from investment operations | | | 0.04 | | | | (0.14 | ) | | | 0.12 | | | | 0.15 | | | | 0.10 | | | | 0.31 | | | | 0.62 | |
Distributions to shareholders from | | | | | | | | | | | | | | | | | | | | | | | | | | | | |
Net investment income | | | (0.03 | ) | | | (0.12 | ) | | | (0.12 | ) | | | (0.17 | ) | | | (0.05 | ) | | | (0.20 | ) | | | (0.32 | ) |
Net realized gains | | | 0.00 | | | | 0.00 | | | | 0.00 | | | | (0.09 | ) | | | 0.00 | | | | 0.00 | | | | 0.00 | |
| | | | | | | | | | | | | | | | | | | | | | | | | | | | |
Total distributions to shareholders | | | (0.03 | ) | | | (0.12 | ) | | | (0.12 | ) | | | (0.26 | ) | | | (0.05 | ) | | | (0.20 | ) | | | (0.32 | ) |
Net asset value, end of period | | $ | 10.12 | | | $ | 10.11 | | | $ | 10.37 | | | $ | 10.37 | | | $ | 10.48 | | | $ | 10.43 | | | $ | 10.32 | |
Total return3 | | | 0.39 | % | | | (1.37 | )% | | | 1.20 | % | | | 1.41 | % | | | 0.94 | % | | | 3.06 | % | | | 6.34 | % |
Ratios to average net assets (annualized) | | | | | | | | | | | | | | | | | | | | | | | | | | | | |
Gross expenses | | | 1.56 | % | | | 1.57 | % | | | 1.61 | % | | | 1.62 | % | | | 1.62 | % | | | 1.65 | % | | | 1.69 | % |
Net expenses | | | 1.53 | % | | | 1.54 | % | | | 1.58 | % | | | 1.58 | % | | | 1.59 | % | | | 1.60 | % | | | 1.60 | % |
Net investment income (loss) | | | (0.09 | )% | | | 0.05 | % | | | 0.23 | % | | | 0.85 | % | | | 1.10 | % | | | 1.01 | % | | | 2.82 | % |
Supplemental data | | | | | | | | | | | | | | | | | | | | | | | | | | | | |
Portfolio turnover rate | | | 198 | % | | | 324 | % | | | 399 | % | | | 485 | % | | | 135 | % | | | 501 | % | | | 277 | % |
Net assets, end of period (000s omitted) | | | $52,522 | | | | $63,126 | | | | $78,385 | | | | $69,077 | | | | $72,124 | | | | $65,664 | | | | $18,009 | |
| 1. | For the three months ended August 31, 2010. The Fund changed its fiscal year end from May 31 to August 31, effective August 31, 2010. |
| 2. | Calculated based upon average shares outstanding |
| 3. | Total return calculations do not include any sales charges. Returns for periods of less than one year are not annualized. |
The accompanying notes are an integral part of these financial statements.
| | | | | | |
| Financial highlights | | Wells Fargo Advantage Short Duration Government Bond Fund | | | 19 | |
(For a share outstanding throughout each period)
| | | | | | | | |
| CLASS R6 | | Six months ended
February 28, 2014 (unaudited) | | | Year ended
August 31, 20131 | |
Net asset value, beginning of period | | $ | 10.13 | | | $ | 10.33 | |
Net investment income | | | 0.05 | 2 | | | 0.13 | 2 |
Net realized and unrealized gains (losses) on investments | | | 0.05 | | | | (0.15 | ) |
| | | | | | | | |
Total from investment operations | | | 0.10 | | | | (0.02 | ) |
Distributions to shareholders from | | | | | | | | |
Net investment income | | | (0.09 | ) | | | (0.18 | ) |
Net asset value, end of period | | $ | 10.14 | | | $ | 10.13 | |
Total return3 | | | 0.96 | % | | | (0.17 | )% |
Ratios to average net assets (annualized) | | | | | | | | |
Gross expenses | | | 0.42 | % | | | 0.43 | % |
Net expenses | | | 0.37 | % | | | 0.37 | % |
Net investment income | | | 0.22 | % | | | 0.81 | % |
Supplemental data | | | | | | | | |
Portfolio turnover rate | | | 198 | % | | | 324 | % |
Net assets, end of period (000s omitted) | | | $58,797 | | | | $2,983 | |
| 1. | For the period from November 30, 2012 (commencement of class operations) to August 31, 2013 |
| 2. | Calculated based upon average shares outstanding |
| 3. | Returns for periods of less than one year are not annualized. |
The accompanying notes are an integral part of these financial statements.
| | | | |
| 20 | | Wells Fargo Advantage Short Duration Government Bond Fund | | Financial highlights |
(For a share outstanding throughout each period)
| | | | | | | | | | | | | | | | | | | | | | | | | | | | |
| | | Six months ended
February 28, 2014
(unaudited) | | | Year ended August 31 | | | Year ended May 31 | |
| ADMINISTRATOR CLASS | | | 2013 | | | 2012 | | | 2011 | | | 20101 | | | 2010 | | | 2009 | |
Net asset value, beginning of period | | $ | 10.11 | | | $ | 10.36 | | | $ | 10.37 | | | $ | 10.48 | | | $ | 10.42 | | | $ | 10.32 | | | $ | 10.02 | |
Net investment income | | | 0.03 | | | | 0.10 | 2 | | | 0.13 | | | | 0.17 | | | | 0.05 | | | | 0.22 | 2 | | | 0.39 | |
Net realized and unrealized gains (losses) on investments | | | 0.06 | | | | (0.13 | ) | | | 0.09 | | | | 0.08 | | | | 0.08 | | | | 0.19 | | | | 0.33 | |
| | | | | | | | | | | | | | | | | | | | | | | | | | | | |
Total from investment operations | | | 0.09 | | | | (0.03 | ) | | | 0.22 | | | | 0.25 | | | | 0.13 | | | | 0.41 | | | | 0.72 | |
Distributions to shareholders from | | | | | | | | | | | | | | | | | | | | | | | | | | | | |
Net investment income | | | (0.08 | ) | | | (0.22 | ) | | | (0.23 | ) | | | (0.27 | ) | | | (0.07 | ) | | | (0.31 | ) | | | (0.42 | ) |
Net realized gains | | | 0.00 | | | | 0.00 | | | | 0.00 | | | | (0.09 | ) | | | 0.00 | | | | 0.00 | | | | 0.00 | |
| | | | | | | | | | | | | | | | | | | | | | | | | | | | |
Total distributions to shareholders | | | (0.08 | ) | | | (0.22 | ) | | | (0.23 | ) | | | (0.36 | ) | | | (0.07 | ) | | | (0.31 | ) | | | (0.42 | ) |
Net asset value, end of period | | $ | 10.12 | | | $ | 10.11 | | | $ | 10.36 | | | $ | 10.37 | | | $ | 10.48 | | | $ | 10.42 | | | $ | 10.32 | |
Total return3 | | | 0.85 | % | | | (0.34 | )% | | | 2.10 | % | | | 2.41 | % | | | 1.29 | % | | | 4.01 | % | | | 7.42 | % |
Ratios to average net assets (annualized) | | | | | | | | | | | | | | | | | | | | | | | | | | | | |
Gross expenses | | | 0.75 | % | | | 0.76 | % | | | 0.80 | % | | | 0.80 | % | | | 0.79 | % | | | 0.80 | % | | | 0.84 | % |
Net expenses | | | 0.60 | % | | | 0.60 | % | | | 0.60 | % | | | 0.60 | % | | | 0.60 | % | | | 0.60 | % | | | 0.60 | % |
Net investment income | | | 0.13 | % | | | 0.99 | % | | | 1.20 | % | | | 1.84 | % | | | 2.06 | % | | | 2.13 | % | | | 3.89 | % |
Supplemental data | | | | | | | | | | | | | | | | | | | | | | | | | | | | |
Portfolio turnover rate | | | 198 | % | | | 324 | % | | | 399 | % | | | 485 | % | | | 135 | % | | | 501 | % | | | 277 | % |
Net assets, end of period (000s omitted) | | | $205,352 | | | | $234,808 | | | | $285,637 | | | | $247,357 | | | | $435,363 | | | | $505,432 | | | | $356,409 | |
| 1. | For the three months ended August 31, 2010. The Fund changed its fiscal year end from May 31 to August 31, effective August 31, 2010. |
| 2. | Calculated based upon average shares outstanding |
| 3. | Returns for periods of less than one year are not annualized. |
The accompanying notes are an integral part of these financial statements.
| | | | | | |
| Financial highlights | | Wells Fargo Advantage Short Duration Government Bond Fund | | | 21 | |
(For a share outstanding throughout each period)
| | | | | | | | | | | | | | | | | | | | | | | | | | | | |
| | | Six months ended
February 28, 2014
(unaudited) | | | Year ended August 31 | | | Year ended May 31 | |
| INSTITUTIONAL CLASS | | | 2013 | | | 2012 | | | 2011 | | | 20101 | | | 2010 | | | 2009 | |
Net asset value, beginning of period | | $ | 10.10 | | | $ | 10.36 | | | $ | 10.37 | | | $ | 10.48 | | | $ | 10.43 | | | $ | 10.32 | | | $ | 10.02 | |
Net investment income | | | 0.04 | | | | 0.12 | | | | 0.15 | | | | 0.21 | | | | 0.06 | | | | 0.31 | 2 | | | 0.41 | |
Net realized and unrealized gains (losses) on investments | | | 0.06 | | | | (0.15 | ) | | | 0.09 | | | | 0.06 | | | | 0.07 | | | | 0.13 | | | | 0.33 | |
| | | | | | | | | | | | | | | | | | | | | | | | | | | | |
Total from investment operations | | | 0.10 | | | | (0.03 | ) | | | 0.24 | | | | 0.27 | | | | 0.13 | | | | 0.44 | | | | 0.74 | |
Distributions to shareholders from | | | | | | | | | | | | | | | | | | | | | | | | | | | | |
Net investment income | | | (0.08 | ) | | | (0.23 | ) | | | (0.25 | ) | | | (0.29 | ) | | | (0.08 | ) | | | (0.33 | ) | | | (0.44 | ) |
Net realized gains | | | 0.00 | | | | 0.00 | | | | 0.00 | | | | (0.09 | ) | | | 0.00 | | | | 0.00 | | | | 0.00 | |
| | | | | | | | | | | | | | | | | | | | | | | | | | | | |
Total distributions to shareholders | | | (0.08 | ) | | | (0.23 | ) | | | (0.25 | ) | | | (0.38 | ) | | | (0.08 | ) | | | (0.33 | ) | | | (0.44 | ) |
Net asset value, end of period | | $ | 10.12 | | | $ | 10.10 | | | $ | 10.36 | | | $ | 10.37 | | | $ | 10.48 | | | $ | 10.43 | | | $ | 10.32 | |
Total return3 | | | 1.04 | % | | | (0.26 | )% | | | 2.28 | % | | | 2.59 | % | | | 1.24 | % | | | 4.30 | % | | | 7.61 | % |
Ratios to average net assets (annualized) | | | | | | | | | | | | | | | | | | | | | | | | | | | | |
Gross expenses | | | 0.48 | % | | | 0.49 | % | | | 0.53 | % | | | 0.54 | % | | | 0.53 | % | | | 0.55 | % | | | 0.59 | % |
Net expenses | | | 0.42 | % | | | 0.42 | % | | | 0.42 | % | | | 0.42 | % | | | 0.42 | % | | | 0.42 | % | | | 0.42 | % |
Net investment income | | | 0.18 | % | | | 1.16 | % | | | 1.39 | % | | | 1.97 | % | | | 2.27 | % | | | 2.98 | % | | | 4.02 | % |
Supplemental data | | | | | | | | | | | | | | | | | | | | | | | | | | | | |
Portfolio turnover rate | | | 198 | % | | | 324 | % | | | 399 | % | | | 485 | % | | | 135 | % | | | 501 | % | | | 277 | % |
Net assets, end of period (000s omitted) | | | $930,722 | | | | $1,051,693 | | | | $1,157,125 | | | | $862,174 | | | | $572,274 | | | | $489,762 | | | | $248,124 | |
| 1. | For the three months ended August 31, 2010. The Fund changed its fiscal year end from May 31 to August 31, effective August 31, 2010. |
| 2. | Calculated based upon average shares outstanding |
| 3. | Returns for periods of less than one year are not annualized. |
The accompanying notes are an integral part of these financial statements.
| | | | |
| 22 | | Wells Fargo Advantage Short Duration Government Bond Fund | | Notes to financial statements (unaudited) |
1. ORGANIZATION
Wells Fargo Funds Trust (the “Trust”), a Delaware statutory trust organized on March 10, 1999, is an open-end management investment company registered under the Investment Company Act of 1940, as amended (the “1940 Act”). These financial statements report on the Wells Fargo Advantage Short Duration Government Bond Fund (the “Fund”) which is a diversified series of the Trust.
2. SIGNIFICANT ACCOUNTING POLICIES
The following significant accounting policies, which are consistently followed in the preparation of the financial statements of the Fund, are in conformity with U.S. generally accepted accounting principles which require management to make estimates and assumptions that affect the reported amounts of assets and liabilities, disclosure of contingent assets and liabilities at the date of the financial statements, and the reported amounts of revenues and expenses during the reporting period. Actual results could differ from those estimates.
Securities valuation
All investments are valued each business day as of the close of regular trading on the New York Stock Exchange (generally 4 p.m. Eastern Time).
Fixed income securities acquired with maturities exceeding 60 days are valued based on evaluated bid prices provided by an independent pricing service which may utilize both transaction data and market information such as yield, quality, coupon rate, maturity, type of issue, trading characteristics and other market data. If prices are not available from the independent pricing service or prices received are deemed not representative of market value, prices will be obtained from an independent broker-dealer or otherwise determined based on the Fund’s Valuation Procedures.
Short-term securities, with maturities of 60 days or less at time of purchase, generally are valued at amortized cost which approximates fair value. The amortized cost method involves valuing a security at its cost, plus accretion of discount or minus amortization of premium over the period until maturity.
Investments in registered open-end investment companies are valued at net asset value. Non-registered investment vehicles are fair valued at net asset value.
Investments which are not valued using any of the methods discussed above are valued at their fair value, as determined in good faith by the Board of Trustees of the Fund. The Board of Trustees has established a Valuation Committee comprised of the Trustees and has delegated to it the authority to take any actions regarding the valuation of portfolio securities that the Valuation Committee deems necessary or appropriate, including determining the fair value of portfolio securities, unless the determination has been delegated to the Management Valuation Team of Wells Fargo Funds Management, LLC (“Funds Management”). The Board of Trustees retains the authority to make or ratify any valuation decisions or approve any changes to the Valuation Procedures as it deems appropriate. On a quarterly basis, the Board of Trustees receives reports on any valuation actions taken by the Valuation Committee or the Management Valuation Team which may include items for ratification.
Valuations of fair valued securities are compared to the next actual sales price when available, or other appropriate market values, to assess the continued appropriateness of the fair valuation methodologies used. These securities are fair valued on a day-to-day basis, taking into consideration changes to appropriate market information and any significant changes to the inputs considered in the valuation process until there is a readily available price provided on an exchange or by an independent pricing service. Valuations received from an independent pricing service or independent broker-dealer quotes are periodically validated by comparisons to most recent trades and valuations provided by other independent pricing services in addition to the review of prices by the adviser and/or subadviser. Unobservable inputs used in determining fair valuations are identified based on the type of security, taking into consideration factors utilized by market participants in valuing the investment, knowledge about the issuer and the current market environment.
Security loans
The Fund may lend its securities from time to time in order to earn additional income in the form of fees or interest on securities received as collateral or the investment of any cash received as collateral. The Fund continues to receive interest or dividends on the securities loaned. The Fund receives collateral in the form of cash or securities with a value at least equal to the value of the securities on loan. The value of the loaned securities is determined at the close of each business day and any additional required collateral is delivered to the Fund on the next business day. In a securities lending transaction, the net asset value of the Fund will be affected by an increase or decrease in the value of the securities loaned and by an increase or decrease in the value of the instrument in which collateral is invested. The amount of securities lending activity undertaken by the Fund fluctuates from time to time. In the event of default or bankruptcy
| | | | | | |
| Notes to financial statements (unaudited) | | Wells Fargo Advantage Short Duration Government Bond Fund | | | 23 | |
by the borrower, the Fund may be prevented from recovering the loaned securities or gaining access to the collateral or may experience delays or costs in doing so. In addition, the investment of any cash collateral received may lose all or part of its value. The Fund has the right under the lending agreement to recover the securities from the borrower on demand.
The Fund lends its securities through an unaffiliated securities lending agent. Cash collateral received in connection with its securities lending transactions is invested in Wells Fargo Securities Lending Cash Investments, LLC (the “Securities Lending Fund”). The Securities Lending Fund is exempt from registration under Section 3(c)(7) of the 1940 Act and is managed by Funds Management and is subadvised by Wells Capital Management Incorporated (“WellsCap”). Funds Management receives an advisory fee starting at 0.05% and declining to 0.01% as the average daily net assets of the Securities Lending Fund increase. All of the fees received by Funds Management are paid to WellsCap for its services as subadviser. The Securities Lending Fund seeks to provide a positive return compared to the daily Fed Funds Open rate by investing in high-quality, U.S. dollar-denominated short-term money market instruments. Securities Lending Fund investments are fair valued based upon the amortized cost valuation technique.
When-issued transactions
The Fund may purchase securities on a forward commitment or when-issued basis. The Fund records a when-issued transaction on the trade date and will segregate assets in an amount at least equal in value to the Fund’s commitment to purchase when-issued securities. Securities purchased on a when-issued basis are marked-to-market daily and the Fund begins earning interest on the settlement date. Losses may arise due to changes in the market value of the underlying securities or if the counterparty does not perform under the contract.
TBA sale commitments
The Fund may enter into To Be Announced (“TBA”) sale commitments to hedge its portfolio positions or to sell mortgage-backed securities it owns under delayed delivery arrangements. Proceeds of TBA sale commitments are not received until the contractual settlement date. During the time a TBA sale commitment is outstanding, equivalent deliverable securities or offsetting TBA purchase commitments, which are deliverable on or before the sale commitment date, are held as “cover” for the transaction. Unsettled TBA sale commitments are valued at the current market value of the underlying securities, according to the procedures described under “Securities valuation”. The contract is marked-to-market daily and the change in market value is recorded by the Fund as an unrealized gain or loss. If the TBA sale commitment is closed through the acquisition of an offsetting purchase commitment, the Fund realizes a gain or loss. If the Fund delivers securities under the commitment, the Fund realizes a gain or a loss from the sale of the securities based upon the unit price established at the date the commitment was entered into.
Security transactions and income recognition
Securities transactions are recorded on a trade date basis. Realized gains or losses are recorded on the basis of identified cost.
Interest income is accrued daily and bond discounts are accreted and premiums are amortized daily based on the effective interest method. To the extent debt obligations are placed on non-accrual status, any related interest income may be reduced by writing off interest receivables when the collection of all or a portion of interest has become doubtful based on consistently applied procedures. If the issuer subsequently resumes interest payments or when the collectability of interest is reasonably assured, the debt obligation is removed from non-accrual status.
Distributions to shareholders
Distributions to shareholders from net investment income are accrued daily and paid monthly. Distributions from net realized gains, if any, are recorded on the ex-dividend date. Such distributions are determined in conformity with federal income tax regulations, which may differ in amount or character from net investment income and realized gains recognized for purposes of U.S. generally accepted accounting principles.
Federal and other taxes
The Fund intends to continue to qualify as a regulated investment company by distributing substantially all of its investment company taxable income and any net realized capital gains (after reduction for capital loss carryforwards) sufficient to relieve it from all, or substantially all, federal income taxes. Accordingly, no provision for federal income taxes was required.
The Fund’s income and federal excise tax returns and all financial records supporting those returns for the prior three fiscal years are subject to examination by the federal and Delaware revenue authorities. Management has analyzed the Fund’s tax positions taken on federal, state, and foreign tax returns for all open tax years and does not believe that there are any uncertain tax positions that require recognition of a tax liability.
| | | | |
| 24 | | Wells Fargo Advantage Short Duration Government Bond Fund | | Notes to financial statements (unaudited) |
As of August 31, 2013, the Fund had capital loss carryforwards which consisted of $5,241,457 in short-term capital losses and $409,157 in long-term capital losses.
As of August 31, 2013, the Fund had $16,977,404 of current year deferred post-October capital losses, which were recognized on the first day of the current fiscal year.
Class allocations
The separate classes of shares offered by the Fund differ principally in applicable sales charges, distribution, shareholder servicing, and administration fees. Shareholders of each class bear certain expenses that pertain to that particular class. All shareholders bear the common expenses of the Fund, earn income from the portfolio, and are allocated any unrealized gains and losses pro rata based on the average daily net assets of each class, without distinction between share classes. Dividends are determined separately for each class based on income and expenses allocable to each class. Realized gains and losses are allocated to each class pro rata based upon the net assets of each class on the date realized. Differences in per share dividend rates generally result from the relative weightings of pro rata income and realized gain allocations and from differences in separate class expenses, including distribution, shareholder servicing, and administration fees.
3. FAIR VALUATION MEASUREMENTS
Fair value measurements of investments are determined within a framework that has established a fair value hierarchy based upon the various data inputs utilized in determining the value of the Fund’s investments. The three-level hierarchy gives the highest priority to unadjusted quoted prices in active markets for identical assets or liabilities (Level 1) and the lowest priority to significant unobservable inputs (Level 3). The Fund’s investments are classified within the fair value hierarchy based on the lowest level of input that is significant to the fair value measurement. The inputs are summarized into three broad levels as follows:
| n | | Level 1 – quoted prices in active markets for identical securities |
| n | | Level 2 – other significant observable inputs (including quoted prices for similar securities, interest rates, prepayment speeds, credit risk, use of amortized cost, etc.) |
| n | | Level 3 – significant unobservable inputs (including the Fund’s own assumptions in determining the fair value of investments) |
The inputs or methodologies used for valuing investments in securities are not necessarily an indication of the risk associated with investing in those securities.
As of February 28, 2014, the inputs used in valuing investments in securities were as follows:
| | | | | | | | | | | | | | | | |
| Investments in securities | | Quoted prices (Level 1) | | | Other significant
observable inputs (Level 2) | | | Significant unobservable inputs (Level 3) | | | Total | |
Agency securities | | $ | 0 | | | $ | 440,494,232 | | | $ | 0 | | | $ | 440,494,232 | |
Asset-backed securities | | | 0 | | | | 159,161,982 | | | | 0 | | | | 159,161,982 | |
Non-agency mortgage backed securities | | | 0 | | | | 77,771,209 | | | | 0 | | | | 77,771,209 | |
U.S. Treasury securities | | | 677,112,800 | | | | 0 | | | | 0 | | | | 677,112,800 | |
Short-term investments | | | | | | | | | | | | | | | | |
Investment companies | | | 74,690,151 | | | | 0 | | | | 0 | | | | 74,690,151 | |
| | | $ | 751,802,951 | | | $ | 677,427,423 | | | $ | 0 | | | $ | 1,429,230,374 | |
Transfers in and transfers out are recognized at the end of the reporting period. For the six months ended February 28, 2014, the Fund did not have any transfers into/out of Level 1, Level 2, or Level 3.
4. TRANSACTIONS WITH AFFILIATES AND OTHER EXPENSES
Advisory fee
The Trust has entered into an advisory contract with Funds Management, an indirect wholly owned subsidiary of Wells Fargo & Company (“Wells Fargo”). The adviser is responsible for implementing investment policies and guidelines and for supervising the subadviser, who is responsible for day-to-day portfolio management of the Fund.
| | | | | | |
| Notes to financial statements (unaudited) | | Wells Fargo Advantage Short Duration Government Bond Fund | | | 25 | |
Pursuant to the contract, Funds Management is entitled to receive an annual advisory fee starting at 0.30% and declining to 0.225% as the average daily net assets of the Fund increase. Prior to January 1, 2014, Funds Management was entitled to receive an annual advisory fee which started at 0.35% and declined to 0.25% as the average daily net assets of the Fund increased. For the six months ended February 28, 2014, the advisory fee was equivalent to an annual rate of 0.32% of the Fund’s average daily net assets.
Funds Management has retained the services of a subadviser to provide daily portfolio management to the Fund. The fee for subadvisory services is borne by Funds Management. WellsCap, an affiliate of Funds Management and an indirect, wholly owned subsidiary of Wells Fargo, is a subadviser to the Fund and is entitled to receive a fee from Funds Management at an annual rate starting at 0.15% and declining to 0.05% as the average daily net assets of the Fund increase.
Administration and transfer agent fees
The Trust has entered into an administration agreement with Funds Management. Under this agreement, for providing administrative services, which includes paying fees and expenses for services provided by the transfer agent, sub-transfer agents, omnibus account servicers and record-keepers, Funds Management is entitled to receive from the Fund an annual fund level administration fee starting at 0.05% and declining to 0.03% as the average daily net assets of the Fund increase and a class level administration fee which is calculated based on the average daily net assets of each class as follows:
| | | | |
| | | Class level
administration fee | |
Class A, Class B, Class C | | | 0.16 | % |
Class R6 | | | 0.03 | |
Administrator Class | | | 0.10 | |
Institutional Class | | | 0.08 | |
Funds Management has contractually waived and/or reimbursed advisory and administration fees to the extent necessary to maintain certain net operating expense ratios for the Fund. Waiver of fees and/or reimbursement of expenses by Funds Management were made first from fund level expenses on a proportionate basis and then from class specific expenses. Funds Management has committed through December 31, 2014 to waive fees and/or reimburse expenses to the extent necessary to cap the Fund’s expenses at 0.78% for Class A shares, 1.53% for Class B shares, 1.53%
for Class C shares, 0.37% for Class R6 shares, 0.60% for Administrator Class shares, and 0.42% for Institutional Class shares.
Distribution fees
The Trust has adopted a Distribution Plan for Class B and Class C shares of the Fund pursuant to Rule 12b-1 under the 1940 Act. Distribution fees are charged to Class B and Class C shares and paid to Wells Fargo Funds Distributor, LLC, the principal underwriter, at an annual rate of 0.75% of the average daily net assets of Class B and Class C shares.
For the six months ended February 28, 2014, Wells Fargo Funds Distributor, LLC received $701 from the sale of Class A shares and $21 in contingent deferred sales charges from redemptions of Class C shares.
Shareholder servicing fees
The Trust has entered into contracts with one or more shareholder servicing agents, whereby Class A, Class B, Class C, and Administrator Class of the Fund is charged a fee at an annual rate of 0.25% of the average daily net assets of each respective class.
A portion of these total shareholder servicing fees were paid to affiliates of Wells Fargo.
5. INVESTMENT PORTFOLIO TRANSACTIONS
Purchases and sales of investments, excluding short-term securities, for the six months ended February 28, 2014 were as follows:
| | | | | | |
Purchases at cost | | Sales proceeds |
U.S.
government | | Non-U.S.
government | | U.S.
government | | Non-U.S.
government |
| $2,564,541,662 | | $155,985,812 | | $2,563,002,629 | | $147,622,878 |
| | | | |
| 26 | | Wells Fargo Advantage Short Duration Government Bond Fund | | Notes to financial statements (unaudited) |
6. BANK BORROWINGS
The Trust (excluding the money market funds and certain other funds in the Trust) and Wells Fargo Variable Trust are parties to a $150,000,000 revolving credit agreement with State Street Bank and Trust Company, whereby the Fund is permitted to use bank borrowings for temporary or emergency purposes, such as to fund shareholder redemption requests. Interest under the credit agreement is charged to the Fund based on a borrowing rate equal to the higher of the Federal Funds rate in effect on that day plus 1.25% or the overnight LIBOR rate in effect on that day plus 1.25%. In addition, an annual commitment fee equal to 0.10% of the unused balance is allocated to each participating fund. For the six months ended February 28, 2014, the Fund paid $874 in commitment fees.
For the six months ended February 28, 2014, there were no borrowings by the Fund under the agreement.
7. INDEMNIFICATION
Under the Trust’s organizational documents, the officers and directors are indemnified against certain liabilities that may arise out of performance of their duties to the Trust. Additionally, in the normal course of business, the Trust may enter into contracts with service providers that contain a variety of indemnification clauses. The Trust’s maximum exposure under these arrangements is dependent on future claims that may be made against the Fund and, therefore, cannot be estimated.
| | | | | | |
| Other information (unaudited) | | Wells Fargo Advantage Short Duration Government Bond Fund | | | 27 | |
PROXY VOTING INFORMATION
A description of the policies and procedures that the Fund uses to determine how to vote proxies relating to portfolio securities is available without charge, upon request, by calling 1-800-222-8222, visiting our website at wellsfargoadvantagefunds.com, or visiting the SEC website at sec.gov. Information regarding how the Fund voted proxies relating to portfolio securities during the most recent 12-month period ended June 30 is available without charge on the Fund’s website at wellsfargoadvantagefunds.com or by visiting the SEC website at sec.gov.
PORTFOLIO HOLDINGS INFORMATION
The complete portfolio holdings for the Fund are publicly available on the Fund’s website (wellsfargoadvantagefunds.com) on a monthly, 30-day or more delayed basis. In addition, top ten holdings information for the Fund is publicly available on the Fund’s website on a monthly, seven-day or more delayed basis. The Fund files its complete schedule of portfolio holdings with the SEC for the first and third quarters of each fiscal year on Form N-Q, which is available without charge by visiting the SEC website at sec.gov. In addition, the Fund’s Form N-Q may be reviewed and copied at the SEC’s Public Reference Room in Washington, DC, and at regional offices in New York City, at 233 Broadway, and in Chicago, at 175 West Jackson Boulevard, Suite 900. Information about the Public Reference Room may be obtained by calling 1-800-SEC-0330.
| | | | |
| 28 | | Wells Fargo Advantage Short Duration Government Bond Fund | | Other information (unaudited) |
BOARD OF TRUSTEES AND OFFICERS
Each of the Trustees and Officers listed in the table below acts in identical capacities for each fund in the Wells Fargo Advantage family of funds, which consists of 132 mutual funds1 comprising the Wells Fargo Funds Trust, Wells Fargo Variable Trust, Wells Fargo Master Trust and four closed-end funds (collectively the “Fund Complex”). This table should be read in conjunction with the Prospectus and the Statement of Additional Information2. All of the Trustees are also Members of the Audit and Governance Committees of each Trust in the Fund Complex. The mailing address of each Trustee and Officer is 525 Market Street, 12th Floor, San Francisco, CA 94105. Each Trustee and Officer serves an indefinite term, however, each Trustee serves such term until reaching the mandatory retirement age established by the Trustees.
Independent Trustees
| | | | | | |
Name and year of birth | | Position held and length of service* | | Principal occupations during past five years | | Other directorships during
past five years |
Peter G. Gordon
(Born 1942) | | Trustee, since 1998; Chairman, since 2005 | | Co-Founder, Retired Chairman, President and CEO of Crystal Geyser Water Company. Trustee Emeritus, Colby College. | | Asset Allocation Trust |
Isaiah Harris, Jr.
(Born 1952) | | Trustee, since 2009 | | Retired. Prior thereto, President and CEO of BellSouth Advertising and Publishing Corp. from 2005 to 2007, President and CEO of BellSouth Enterprises from 2004 to 2005 and President of BellSouth Consumer Services from 2000 to 2003. Emeritus member of the Iowa State University Foundation Board of Governors. Emeritus Member of the Advisory Board of Iowa State University School of Business. Advisory Board Member, Palm Harbor Academy (charter school). Mr. Harris is a certified public accountant. | | CIGNA Corporation; Deluxe Corporation; Asset Allocation Trust |
Judith M. Johnson
(Born 1949) | | Trustee, since 2008; Audit Committee Chairman, since 2008 | | Retired. Prior thereto, Chief Executive Officer and Chief Investment Officer of Minneapolis Employees Retirement Fund from 1996 to 2008. Ms. Johnson is an attorney, certified public accountant and a certified managerial accountant. | | Asset Allocation Trust |
Leroy Keith, Jr.
(Born 1939) | | Trustee, since 2010 | | Chairman, Bloc Global Services (development and construction). Trustee of the Evergreen Funds from 1983 to 2010. Former Managing Director, Almanac Capital Management (commodities firm), former Partner, Stonington Partners, Inc. (private equity fund), former Director, Obagi Medical Products Co. and former Director, Lincoln Educational Services. | | Trustee, Virtus Fund Complex (consisting of 50 portfolios as of 12/16/2013); Asset Allocation Trust |
David F. Larcker
(Born 1950) | | Trustee, since 2009 | | James Irvin Miller Professor of Accounting at the Graduate School of Business, Stanford University, Morgan Stanley Director of the Center for Leadership Development and Research and Senior Faculty of The Rock Center for Corporate Governance since 2006. From 2005 to 2008, Professor of Accounting at the Graduate School of Business, Stanford University. Prior thereto, Ernst & Young Professor of Accounting at The Wharton School, University of Pennsylvania from 1985 to 2005. | | Asset Allocation Trust |
Olivia S. Mitchell
(Born 1953) | | Trustee, since 2006 | | International Foundation of Employee Benefit Plans Professor, Wharton School of the University of Pennsylvania since 1993. Director of Wharton’s Pension Research Council and Boettner Center on Pensions & Retirement Research, and Research Associate at the National Bureau of Economic Research. Previously, Cornell University Professor from 1978 to 1993. | | Asset Allocation Trust |
Timothy J. Penny
(Born 1951) | | Trustee, since 1996 | | President and CEO of Southern Minnesota Initiative Foundation, a non-profit organization, since 2007 and Senior Fellow at the Humphrey Institute Policy Forum at the University of Minnesota since 1995. Member of the Board of Trustees of NorthStar Education Finance, Inc., a non-profit organization, since 2007. | | Asset Allocation Trust |
| | | | | | |
| Other information (unaudited) | | Wells Fargo Advantage Short Duration Government Bond Fund | | | 29 | |
| | | | | | |
Name and year of birth | | Position held and length of service* | | Principal occupations during past five years | | Other directorships during
past five years |
Michael S. Scofield
(Born 1943) | | Trustee, since 2010 | | Served on the Investment Company Institute’s Board of Governors and Executive Committee from 2008-2011 as well the Governing Council of the Independent Directors Council from 2006-2011 and the Independent Directors Council Executive Committee from 2008-2011. Chairman of the IDC from 2008-2010. Institutional Investor (Fund Directions) Trustee of Year in 2007. Trustee of the Evergreen Funds (and its predecessors) from 1984 to 2010. Chairman of the Evergreen Funds from 2000-2010. Former Trustee of the Mentor Funds. Retired Attorney, Law Offices of Michael S. Scofield. | | Asset Allocation Trust |
Donald C. Willeke
(Born 1940) | | Trustee, since 1996 | | Principal of the law firm of Willeke & Daniels. General Counsel of the Minneapolis Employees Retirement Fund from 1984 until its consolidation into the Minnesota Public Employees Retirement Association on June 30, 2010. Director and Vice Chair of The Tree Trust (non-profit corporation). Director of the American Chestnut Foundation (non-profit corporation). | | Asset Allocation Trust |
| * | Length of service dates reflect the Trustee’s commencement of service with the Trust’s predecessor entities, where applicable. |
Officers
| | | | | | |
Name and year of birth | | Position held and
length of service | | Principal occupations during past five years | | |
Karla M. Rabusch
(Born 1959) | | President, since 2003 | | Executive Vice President of Wells Fargo Bank, N.A. and President of Wells Fargo Funds Management, LLC since 2003. | | |
Nancy Wiser1
(Born 1967) | | Treasurer, since 2012 | | Executive Vice President of Wells Fargo Funds Management, LLC since 2011. Chief Operating Officer and Chief Compliance Officer at LightBox Capital Management LLC, from 2008 to 2011. Owned and operated a consulting business providing services to various hedge funds including acting as Chief Operating Officer and Chief Compliance Officer for a hedge fund from 2007 to 2008. Chief Operating Officer and Chief Compliance Officer of GMN Capital LLC from 2006 to 2007. | | |
C. David Messman
(Born 1960) | | Secretary, since 2000; Chief Legal Officer, since 2003 | | Senior Vice President and Secretary of Wells Fargo Funds Management, LLC since 2001. Vice President and Managing Counsel of Wells Fargo Bank, N.A. since 1996. | | |
Debra Ann Early
(Born 1964) | | Chief Compliance Officer, since 2007 | | Chief Compliance Officer of Wells Fargo Funds Management, LLC since 2007. Chief Compliance Officer of Parnassus Investments from 2005 to 2007. Chief Financial Officer of Parnassus Investments from 2004 to 2007. | | |
David Berardi
(Born 1975) | | Assistant Treasurer, since 2009 | | Vice President of Wells Fargo Funds Management, LLC since 2009. Vice President of Evergreen Investment Management Company, LLC from 2008 to 2010. Assistant Vice President of Evergreen Investment Services, Inc. from 2004 to 2008. Manager of Fund Reporting and Control for Evergreen Investment Management Company, LLC from 2004 to 2010. | | |
Jeremy DePalma1
(Born 1974) | | Assistant Treasurer, since 2009 | | Senior Vice President of Wells Fargo Funds Management, LLC since 2009. Senior Vice President of Evergreen Investment Management Company, LLC from 2008 to 2010. Vice President, Evergreen Investment Services, Inc. from 2004 to 2007. Head of the Fund Reporting and Control Team within Fund Administration from 2005 to 2010. | | |
| 1. | Nancy Wiser acts as Treasurer of 73 funds in the Fund Complex. Jeremy DePalma acts as Treasurer of 59 funds and Assistant Treasurer of 73 funds in the Fund Complex. |
| 2. | The Statement of Additional Information includes additional information about the Trustees and is available, without charge, upon request, by calling 1-800-222-8222 or by visiting the website at wellsfargoadvantagefunds.com. |
| | | | |
| 30 | | Wells Fargo Advantage Short Duration Government Bond Fund | | List of abbreviations |
The following is a list of common abbreviations for terms and entities that may have appeared in this report.
| ACA | — ACA Financial Guaranty Corporation |
| ADR | — American depositary receipt |
| ADS | — American depositary shares |
| AGC | — Assured Guaranty Corporation |
| AGM | — Assured Guaranty Municipal |
| Ambac | — Ambac Financial Group Incorporated |
| AMT | — Alternative minimum tax |
| BAN | — Bond anticipation notes |
| BHAC | — Berkshire Hathaway Assurance Corporation |
| CAB | — Capital appreciation bond |
| CCAB | — Convertible capital appreciation bond |
| CDA | — Community Development Authority |
| CDO | — Collateralized debt obligation |
| DRIVER | — Derivative inverse tax-exempt receipts |
| DW&P | — Department of Water & Power |
| DWR | — Department of Water Resources |
| ECFA | — Educational & Cultural Facilities Authority |
| EDA | — Economic Development Authority |
| EDFA | — Economic Development Finance Authority |
| ETF | — Exchange-traded fund |
| FDIC | — Federal Deposit Insurance Corporation |
| FFCB | — Federal Farm Credit Banks |
| FGIC | — Financial Guaranty Insurance Corporation |
| FHA | — Federal Housing Administration |
| FHLB | — Federal Home Loan Bank |
| FHLMC | — Federal Home Loan Mortgage Corporation |
| FICO | — The Financing Corporation |
| FNMA | — Federal National Mortgage Association |
| GDR | — Global depositary receipt |
| GNMA | — Government National Mortgage Association |
| HCFR | — Healthcare facilities revenue |
| HEFA | — Health & Educational Facilities Authority |
| HEFAR | — Higher education facilities authority revenue |
| HFA | — Housing Finance Authority |
| HFFA | — Health Facilities Financing Authority |
| HUD | — Department of Housing and Urban Development |
| IDA | — Industrial Development Authority |
| IDAG | — Industrial Development Agency |
| KRW | — Republic of Korea won |
| LIBOR | — London Interbank Offered Rate |
| LLC | — Limited liability company |
| LLLP | — Limited liability limited partnership |
| LLP | — Limited liability partnership |
| MBIA | — Municipal Bond Insurance Association |
| MFHR | — Multifamily housing revenue |
| MSTR | — Municipal securities trust receipts |
| MUD | — Municipal Utility District |
| National | — National Public Finance Guarantee Corporation |
| PCFA | — Pollution Control Financing Authority |
| PCL | — Public Company Limited |
| PCR | — Pollution control revenue |
| PFA | — Public Finance Authority |
| PFFA | — Public Facilities Financing Authority |
| PFOTER | — Puttable floating option tax-exempt receipts |
| plc | — Public limited company |
| PUTTER | — Puttable tax-exempt receipts |
| R&D | — Research & development |
| Radian | — Radian Asset Assurance |
| RAN | — Revenue anticipation notes |
| RDA | — Redevelopment Authority |
| RDFA | — Redevelopment Finance Authority |
| REIT | — Real estate investment trust |
| ROC | — Reset option certificates |
| SAVRS | — Select auction variable rate securities |
| SBA | — Small Business Authority |
| SFHR | — Single-family housing revenue |
| SFMR | — Single-family mortgage revenue |
| SPA | — Standby purchase agreement |
| SPDR | — Standard & Poor’s Depositary Receipts |
| STRIPS | — Separate trading of registered interest and principal securities |
| TAN | — Tax anticipation notes |
| TIPS | — Treasury inflation-protected securities |
| TRAN | — Tax revenue anticipation notes |
| TTFA | — Transportation Trust Fund Authority |
| TVA | — Tennessee Valley Authority |
This page is intentionally left blank.
This page is intentionally left blank.


For more information
More information about Wells Fargo Advantage Funds is available free upon request. To obtain literature, please write, email, visit the Fund’s website, or call:
Wells Fargo Advantage Funds
P.O. Box 8266
Boston, MA 02266-8266
Email: wfaf@wellsfargo.com
Website: wellsfargoadvantagefunds.com
Individual investors: 1-800-222-8222
Retail investment professionals: 1-888-877-9275
Institutional investment professionals: 1-866-765-0778
This report and the financial statements contained herein are submitted for the general information of the shareholders of Wells Fargo Advantage Funds. If this report is used for promotional purposes, distribution of the report must be accompanied or preceded by a current prospectus. For a current prospectus and, if available, a summary prospectus containing more complete information, including charges and expenses, call 1-800-222-8222 or visit the Fund’s website at wellsfargoadvantagefunds.com. Please consider the investment objectives, risks, charges, and expenses of the investment carefully before investing. This and other information about Wells Fargo Advantage Funds can be found in the current prospectus. Read the prospectus carefully before you invest or send money.
Wells Fargo Funds Management, LLC, a wholly owned subsidiary of Wells Fargo & Company, provides investment advisory and administrative services for Wells Fargo Advantage Funds. Other affiliates of Wells Fargo & Company provide subadvisory and other services for the Funds. The Funds are distributed by Wells Fargo Funds Distributor, LLC, Member FINRA/SIPC, an affiliate of Wells Fargo & Company.
NOT FDIC INSURED ¡ NO BANK GUARANTEE ¡ MAY LOSE VALUE
© 2014 Wells Fargo Funds Management, LLC. All rights reserved.
| | |
 | | 223534 04-14 SA220/SAR220 02-14 |

Wells Fargo Advantage Short-Term Bond Fund

Semi-Annual Report
February 28, 2014

Reduce clutter. Save trees.
Sign up for electronic delivery of prospectuses and shareholder reports at wellsfargo.com/advantagedelivery
Contents
The views expressed and any forward-looking statements are as of February 28, 2014, unless otherwise noted, and are those of the Fund managers and/or Wells Fargo Funds Management, LLC. Discussions of individual securities, or the markets generally, or any Wells Fargo Advantage Fund are not intended as individual recommendations. Future events or results may vary significantly from those expressed in any forward-looking statements; the views expressed are subject to change at any time in response to changing circumstances in the market. Wells Fargo Funds Management, LLC and the Fund disclaim any obligation to publicly update or revise any views expressed or forward-looking statements.
NOT FDIC INSURED ¡ NO BANK GUARANTEE ¡ MAY LOSE VALUE
| | | | |
| 2 | | Wells Fargo Advantage Short-Term Bond Fund | | Letter to shareholders (unaudited) |

Karla M. Rabusch
President
Wells Fargo Advantage Funds
Fixed-income markets shifted during the period, driven by vacillations between U.S. Treasury yield increases and subsequent declines.
Reassurances from the Fed that a highly accommodative monetary policy would continue throughout 2014 inspired price rallies across both the investment-grade and high-yield bond markets.
Dear Valued Shareholder:
We are pleased to offer you this semi-annual report for the Wells Fargo Advantage Short-Term Bond Fund for the six-month period that ended February 28, 2014. Fixed-income markets shifted during the period, driven by vacillations between U.S. Treasury yield increases and subsequent declines. However, on the whole, investment-grade (measured by the Barclays U.S. Aggregate Bond Index1) and high-yield markets (measured by the Barclays U.S. High Yield Bond Index2) generated positive returns during the period, notably benefiting from the strong price improvement and declining U.S. Treasury yields that occurred in September and October of 2013 as well as the opening months of 2014. Although the returns of the U.S. high-yield market have often been positively correlated with U.S. equity returns (measured by the S&P 500 Index3) over the long-run, over the period, high-yield (measured by the Barclays U.S. High Yield Bond Index) generally performed well even when equities did not. The lower-rated corporate bond credit tiers outperformed the respectively higher-rated investment-grade credit tiers during the period.
A decline in bond prices was halted by the Fed’s postponement of tapering its bond-buying program.
Before the six-month period began, equity markets rallied, most notably in May and June of 2013. This led to a sharp increase in U.S. Treasury yields and declining valuations for much of the fixed-income markets (measured by the Barclays U.S. Aggregate Bond Index). However, in July and August 2013, that equity exuberance quieted a bit, and fixed-income markets stabilized. Returns across the fixed-income markets were largely negative in investment-grade and high-yield markets but modest in comparison with the declines in May and June of 2013.
But, by September and October of 2013, investment-grade and high-yield bond markets began generating positive returns yet again, as the Federal Reserve (Fed) backtracked on its intentions to taper its quantitative easing program, postponing it until 2014, at the earliest. This created a temporary rally in bonds that lasted until around November 20, 2013, when notes were released from the Fed’s October 2013 meeting that tapering of the bond-buying programs would not be postponed beyond January 2014. In response, long-term U.S. Treasury yields and mortgage rates ratcheted higher on expectations for an unwinding of monetary accommodation in the upcoming months. This led to declines in pricing across much of the core fixed-income markets (measured by the Barclays U.S. Aggregate Bond Index). U.S. High-yield markets were better able to absorb the shift in U.S. Treasury yields and continued to provide positive returns along with rallies in the equity markets.
Favorable conditions for fixed-income markets were restored in January and February 2014.
Seemingly much to the surprise of many everyday investors and seasoned investment professionals alike, fixed-income markets (measured by the Barclays U.S. Aggregate Bond Index) largely outperformed U.S. equity markets (measured by the S&P 500 Index) during the opening months of 2014. A pullback in equity exuberance in January and reassurances from the Fed that a highly accommodative monetary policy would continue throughout 2014 inspired price rallies across both the investment-grade and high-yield bond markets. U.S. Treasury yields declined in January 2014 and corporate bonds and mortgage-backed securities performed notably well. U.S. high-yield securities generated positive returns in January 2014 but lagged the rally across the investment-grade
| | | | | | |
| Letter to shareholders (unaudited) | | Wells Fargo Advantage Short-Term Bond Fund | | | 3 | |
bond markets. This theme reversed in February 2014, as high-yield sectors rallied and investment-grade sectors performed well but not to the extent of the lowest-rated credit tiers.
One positive takeaway for bond investors that helped fuel the fixed-income (measured by the Barclays U.S. Aggregate Bond Index) rallies was former Fed Chairman Bernanke’s guidance at the end of 2013. He indicated that the tapering of the Fed’s bond-buying program would proceed at a slow pace and that a reduction in quantitative easing should not be equivocated with a tightening of monetary policy. The distinction was important—although the bond-buying program was declining in volume, it was, nonetheless, still continuing. Additionally, the federal funds target rate would remain unchanged for the foreseeable future, with the implications that it would not increase until the bond-buying program was fully disbanded. These were important statements for fixed-income investors that helped bolster U.S. fixed-income valuations in the opening months of 2014.
Don’t let short-term uncertainty derail long-term investment goals.
Periods of investment uncertainty can present challenges, but experience has taught us that maintaining long-term investment goals can be an effective way to plan for the future. To help you create a sound strategy based on your personal goals and risk tolerance, Wells Fargo Advantage Funds offers more than 100 mutual funds and other investments spanning a wide range of asset classes and investment styles. Although diversification cannot guarantee an investment profit or prevent losses, we believe it can be an effective way to manage investment risk and potentially smooth out overall portfolio performance. We encourage investors to know their investments and to understand that appropriate levels of risk-taking may unlock opportunities.
Thank you for choosing to invest with Wells Fargo Advantage Funds. We appreciate your confidence in us and remain committed to helping you meet your financial needs. For current information about your fund investments, contact your investment professional, visit our website at wellsfargoadvantagefunds.com, or call us directly at 1-800-222-8222. We are available 24 hours a day, 7 days a week.
Sincerely,

Karla M. Rabusch
President
Wells Fargo Advantage Funds
| 1. | The Barclays U.S. Aggregate Bond Index is a broad-based benchmark that measures the investment-grade, U.S. dollar-denominated, fixed-rate taxable bond market, including Treasuries, government-related and corporate securities, MBS (agency fixed-rate and hybrid ARM passthroughs), ABS, and CMBS. You cannot invest directly in an index. |
| 2. | The Barclays U.S. High Yield Bond Index is an index consisting of all domestic and Yankee bonds, rated below investment grade, with a minimum outstanding amount of $100 million and maturing over one year. You cannot invest directly in an index. |
| 3. | The S&P 500 Index consists of 500 stocks chosen for market size, liquidity, and industry group representation. It is a market-value-weighted index with each stock’s weight in the index proportionate to its market value. You cannot invest directly in an index. |
| | | | |
| 4 | | Wells Fargo Advantage Short-Term Bond Fund | | Letter to shareholders (unaudited) |
Notice to shareholders
The Fund and Wells Fargo Funds Management, LLC (“Funds Management”) have received an exemptive order from the SEC that permits Funds Management, subject to the approval of the Board of Trustees of the Fund, to select or replace certain subadvisers to manage all or a portion of the Fund’s assets and enter into, amend or terminate a sub-advisory agreement with certain subadvisers without obtaining shareholder approval (“Multi-manager Structure”). The Multi-manager Structure applies to subadvisers that are not affiliated with Funds Management or the Fund, except to the extent that affiliation arises solely because such subadvisers provide sub-advisory services to the Fund (“Non-affiliated Subadvisers”), as well as subadvisers that are indirect or direct wholly-owned subsidiaries of Funds Management or of another company that, indirectly or directly, wholly owns Funds Management (“Wholly-owned Subadvisers”).
Pursuant to the SEC order, Funds Management, with the approval of the Board of Trustees, has the discretion to terminate any subadvisers and allocate and reallocate the Fund’s assets among any other Non-affiliated Subadvisers or Wholly-owned Subadvisers. Funds Management, subject to oversight and supervision by the Board of Trustees, has responsibility to continue to oversee any subadvisers to the Fund and to recommend, for approval by the Board of Trustees, the hiring, termination and replacement of subadvisers for the Fund. In the event that a new subadviser is hired pursuant to the Multi-manager Structure, the Fund is required to provide notice to shareholders within 90 days.
Please contact your investment professional or call us directly at 1-800-222-8222 if you have any questions on this Notice to Shareholders.
This page is intentionally left blank.
| | | | |
| 6 | | Wells Fargo Advantage Short-Term Bond Fund | | Performance highlights (unaudited) |
Investment objective
The Fund seeks current income consistent with capital preservation.
Adviser
Wells Fargo Funds Management, LLC
Subadviser
Wells Capital Management Incorporated
Portfolio managers
Jay N. Mueller, CFA
Christopher Y. Kauffman, CFA
Noah Wise, CFA
Average annual total returns1 (%) as of February 28, 2014
| | | | | | | | | | | | | | | | | | | | | | | | | | | | | | | | | | |
| | | | | Including sales charge | | | Excluding sales charge | | | Expense ratios2 (%) | |
| | | Inception date | | 1 year | | | 5 year | | | 10 year | | | 1 year | | | 5 year | | | 10 year | | | Gross | | | Net3 | |
| Class A (SSTVX) | | 8-31-1999 | | | (0.94 | ) | | | 3.24 | | | | 2.87 | | | | 1.09 | | | | 3.65 | | | | 3.07 | | | | 0.81 | | | | 0.78 | |
| Class C (WFSHX) | | 3-31-2008 | | | (0.67 | ) | | | 2.88 | | | | 2.32 | | | | 0.33 | | | | 2.88 | | | | 2.32 | | | | 1.56 | | | | 1.53 | |
| Institutional Class (SSHIX) | | 8-31-1999 | | | – | | | | – | | | | – | | | | 1.41 | | | | 3.96 | | | | 3.43 | | | | 0.48 | | | | 0.48 | |
| Investor Class (SSTBX) | | 8-31-1987 | | | – | | | | – | | | | – | | | | 1.07 | | | | 3.62 | | | | 3.06 | | | | 0.84 | | | | 0.79 | |
| Barclays 1-3 Year U.S. Government/Credit Bond Index4 | | – | | | – | | | | – | | | | – | | | | 0.81 | | | | 2.07 | | | | 2.86 | | | | – | | | | – | |
Figures quoted represent past performance, which is no guarantee of future results, and do not reflect taxes that a shareholder may pay on fund distributions or the redemption of fund shares. Investment return and principal value of an investment will fluctuate so that an investor’s shares, when redeemed, may be worth more or less than their original cost. Performance shown without sales charges would be lower if sales charges were reflected. Current performance may be lower or higher than the performance data quoted, which assumes the reinvestment of dividends and capital gains. Current month-end performance is available on the Fund’s website, wellsfargoadvantagefunds.com.
Index returns do not include transaction costs associated with buying and selling securities, any mutual fund fees or expenses, or any taxes. It is not possible to invest directly in an index.
For Class A shares, the maximum front-end sales charge is 2.00%. For Class C shares, the maximum contingent deferred sales charge is 1.00%. Performance including sales charge assumes the sales charge for the corresponding time period. Institutional Class and Investor Class shares are sold without a front-end sales charge or contingent deferred sales charge.
Bond values fluctuate in response to the financial condition of individual issuers, general market and economic conditions, and changes in interest rates. In general, when interest rates rise, bond values fall and investors may lose principal value. Loans are subject to risks similar to those associated with other below-investment-grade bond investments, such as credit risk (for example, risk of issuer default), below-investment-grade bond risk (for example, risk of greater volatility in value), and risk that the loan may become illiquid or difficult to price. The use of derivatives may reduce returns and/or increase volatility. Certain investment strategies tend to increase the total risk of an investment (relative to the broader market). The Fund is exposed to foreign investment risk, high-yield securities risk, and mortgage- and asset-backed securities risk. Consult the Fund’s prospectus for additional information on these and other risks.
Please see footnotes on page 7.
| | | | | | |
| Performance highlights (unaudited) | | Wells Fargo Advantage Short-Term Bond Fund | | | 7 | |
| | | | |
| Ten largest long-term holdings5 (%) as of February 28, 2014 | |
Nordea Eiendomskreditt, 1.88%, 4-7-2014 | | | 0.93% | |
Volvo Financial Equipment LLC Series 2014-1A Class A2, 0.54%, 11-15-2016 | | | 0.79% | |
CNH Equipment Trust Series 2013-C Class A2, 0.63%, 1-17-2017 | | | 0.77% | |
GNMA Series 2012-19 Class A, 1.83%, 3-16-2039 | | | 0.74% | |
Ford Credit Auto Owner Trust Series 2014-A Class A2, 0.48%, 11-15-2016 | | | 0.72% | |
FNMA, 3.25%, 4-1-2015 | | | 0.65% | |
Mercedes-Benz Auto Lease Trust Series 2013-B Class A2, 0.53%, 9-15-2015 | | | 0.64% | |
Port Arthur TX Navigation District Jefferson County Environmental Facilities Motiva Enterprises LLC Project Series D,
0.28%, 11-1-2040 | | | 0.64% | |
Murray Street Investment Trust I, 4.65%, 3-9-2017 | | | 0.62% | |
Portland OR Taxable Pension, 0.08%, 6-1-2019 | | | 0.61% | |
| | |
| Portfolio allocation6 as of February 28, 2014 |
|
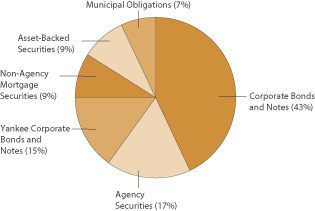
|
| 1. | Historical performance shown for Class C shares prior to their inception reflects the performance of Investor Class shares, adjusted to include the higher expenses applicable to Class C shares. Effective June 20, 2008, Advisor Class was renamed Class A and modified to assume the features and attributes of Class A. Historical performance shown for Class A shares through June 19, 2008, includes Advisor Class expenses. |
| 2. | Reflects the expense ratios as stated in the most recent prospectuses, which include the impact of 0.01% in acquired fund fees and expenses. The expense ratios shown are subject to change and may differ from the annualized expense ratios shown in the financial highlights of this report, which do not include acquired fund fees and expenses. |
| 3. | The Adviser has committed through December 31, 2014, to waive fees and/or reimburse expenses to the extent necessary to cap the Fund’s Total Annual Fund Operating Expenses After Fee Waiver, excluding certain expenses, at 0.77% for Class A, 1.52% for Class C, 0.48% for Institutional Class, and 0.78% for Investor Class. Brokerage commissions, stamp duty fees, interest, taxes, acquired fund fees and expenses, and extraordinary expenses are excluded from the cap. Without this cap, the Fund’s returns would have been lower. |
| 4. | The Barclays 1-3 Year U.S. Government/Credit Bond Index is the one- to three-year component of the Barclays Government/Credit Bond Index which includes securities in the Government and Credit Indices. The Government Index includes Treasuries (that is, public obligations of the U.S. Treasury that have remaining maturities of more than one year) and agencies (that is, publicly issued debt of U.S. Government agencies, quasi-federal corporations, and corporate or foreign debt guaranteed by the U.S. Government). The Credit Index includes publicly issued U.S. corporate and foreign debentures and secured notes that meet specified maturity, liquidity, and quality requirements. You cannot invest directly in an index. |
| 5. | The ten largest long-term holdings are calculated based on the value of the securities divided by total net assets of the Fund. Holdings are subject to change and may have changed since the date specified. |
| 6. | Portfolio allocation is subject to change and is calculated based on the total long-term investments of the Fund. |
| | | | |
| 8 | | Wells Fargo Advantage Short-Term Bond Fund | | Fund expenses (unaudited) |
As a shareholder of the Fund, you incur two types of costs: (1) transaction costs, including sales charges (loads) on purchase payments and contingent deferred sales charges (if any) on redemptions and (2) ongoing costs, including management fees, distribution (12b-1) and/or shareholder service fees, and other Fund expenses. This example is intended to help you understand your ongoing costs (in dollars) of investing in the Fund and to compare these costs with the ongoing costs of investing in other mutual funds.
The example is based on an investment of $1,000 invested at the beginning of the six-month period and held for the entire period from September 1, 2013 to February 28, 2014.
Actual expenses
The “Actual” line of the table below provides information about actual account values and actual expenses. You may use the information in this line, together with the amount you invested, to estimate the expenses that you paid over the period. Simply divide your account value by $1,000 (for example, an $8,600 account value divided by $1,000 = 8.6), then multiply the result by the number in the “Actual” line under the heading entitled “Expenses paid during period” for your applicable class of shares to estimate the expenses you paid on your account during this period.
Hypothetical example for comparison purposes
The “Hypothetical” line of the table below provides information about hypothetical account values and hypothetical expenses based on the Fund’s actual expense ratio and an assumed rate of return of 5% per year before expenses, which is not the Fund’s actual return. The hypothetical account values and expenses may not be used to estimate the actual ending account balance or expenses you paid for the period. You may use this information to compare the ongoing costs of investing in the Fund and other funds. To do so, compare this 5% hypothetical example with the 5% hypothetical examples that appear in the shareholder reports of the other funds.
Please note that the expenses shown in the table are meant to highlight your ongoing costs only and do not reflect any transactional costs, such as sales charges (loads) and contingent deferred sales charges. Therefore, the “Hypothetical” line of the table is useful in comparing ongoing costs only and will not help you determine the relative total costs of owning different funds. In addition, if these transactional costs were included, your costs would have been higher.
| | | | | | | | | | | | | | | | |
| | | Beginning
account value
9-1-2013 | | | Ending
account value
2-28-2014 | | | Expenses
paid during
the period1 | | | Net annualized
expense ratio | |
Class A | | | | | | | | | | | | | | | | |
Actual | | $ | 1,000.00 | | | $ | 1,011.54 | | | $ | 3.94 | | | | 0.79 | % |
Hypothetical (5% return before expenses) | | $ | 1,000.00 | | | $ | 1,020.88 | | | $ | 3.96 | | | | 0.79 | % |
Class C | | | | | | | | | | | | | | | | |
Actual | | $ | 1,000.00 | | | $ | 1,007.79 | | | $ | 7.67 | | | | 1.54 | % |
Hypothetical (5% return before expenses) | | $ | 1,000.00 | | | $ | 1,017.16 | | | $ | 7.70 | | | | 1.54 | % |
Institutional Class | | | | | | | | | | | | | | | | |
Actual | | $ | 1,000.00 | | | $ | 1,013.10 | | | $ | 2.40 | | | | 0.48 | % |
Hypothetical (5% return before expenses) | | $ | 1,000.00 | | | $ | 1,022.41 | | | $ | 2.41 | | | | 0.48 | % |
Investor Class | | | | | | | | | | | | | | | | |
Actual | | $ | 1,000.00 | | | $ | 1,012.63 | | | $ | 3.99 | | | | 0.80 | % |
Hypothetical (5% return before expenses) | | $ | 1,000.00 | | | $ | 1,020.83 | | | $ | 4.01 | | | | 0.80 | % |
| 1. | Expenses paid is equal to the annualized expense ratio of each class multiplied by the average account value over the period, multiplied by the number of days in the most recent fiscal half-year divided by the number of days in the fiscal year (to reflect the one-half-year period). |
| | | | | | |
| Portfolio of investments—February 28, 2014 (unaudited) | | Wells Fargo Advantage Short-Term Bond Fund | | | 9 | |
| | | | | | | | | | | | | | | | |
| Security name | | Interest rate | | | Maturity date | | | Principal | | | Value | |
| | | | |
Agency Securities: 16.04% | | | | | | | | | | | | | | | | |
FDIC Series 2010-R1 Class A 144A | | | 2.18 | % | | | 5-25-2050 | | | $ | 2,405,586 | | | $ | 2,422,103 | |
FDIC Series 2013-R1 Class A 144A | | | 1.15 | | | | 3-25-2033 | | | | 2,056,638 | | | | 1,998,167 | |
FHLMC ± | | | 2.38 | | | | 4-1-2032 | | | | 68,742 | | | | 72,753 | |
FHLMC ± | | | 2.53 | | | | 7-1-2029 | | | | 5,828 | | | | 6,146 | |
FHLMC ± | | | 2.53 | | | | 9-1-2031 | | | | 7,404 | | | | 7,556 | |
FHLMC ± | | | 2.95 | | | | 5-1-2026 | | | | 136,200 | | | | 142,503 | |
FHLMC | | | 3.00 | | | | 2-15-2024 | | | | 1,753,033 | | | | 1,813,939 | |
FHLMC | | | 3.50 | | | | 6-15-2038 | | | | 1,730,935 | | | | 1,816,534 | |
FHLMC | | | 4.50 | | | | 5-15-2018 | | | | 320,085 | | | | 337,785 | |
FHLMC | | | 4.50 | | | | 7-15-2022 | | | | 404,263 | | | | 411,535 | |
FHLMC | | | 5.00 | | | | 10-15-2032 | | | | 757,102 | | | | 789,138 | |
FHLMC | | | 6.00 | | | | 10-1-2021 | | | | 748,735 | | | | 820,156 | |
FHLMC | | | 8.50 | | | | 9-1-2017 | | | | 117,018 | | | | 123,857 | |
FHLMC | | | 9.00 | | | | 8-1-2018 | | | | 95,938 | | | | 103,366 | |
FHLMC | | | 9.00 | | | | 6-1-2019 | | | | 113,517 | | | | 122,624 | |
FHLMC | | | 9.00 | | | | 10-1-2019 | | | | 211,007 | | | | 234,155 | |
FHLMC | | | 9.50 | | | | 12-1-2022 | | | | 181,875 | | | | 200,105 | |
FHLMC | | | 10.50 | | | | 1-1-2016 | | | | 1,663 | | | | 1,756 | |
FHLMC | | | 10.50 | | | | 11-1-2017 | | | | 939 | | | | 1,033 | |
FHLMC | | | 10.50 | | | | 8-1-2018 | | | | 81,640 | | | | 90,643 | |
FHLMC | | | 10.50 | | | | 2-1-2019 | | | | 1,175 | | | | 1,330 | |
FHLMC | | | 10.50 | | | | 4-1-2019 | | | | 494 | | | | 544 | |
FHLMC | | | 10.50 | | | | 5-1-2019 | | | | 561 | | | | 634 | |
FHLMC | | | 10.50 | | | | 6-1-2019 | | | | 4,381 | | | | 4,885 | |
FHLMC | | | 10.50 | | | | 7-1-2019 | | | | 1,159 | | | | 1,316 | |
FHLMC Series 2597 Series AE | | | 5.50 | | | | 4-15-2033 | | | | 454,310 | | | | 506,044 | |
FHLMC Series 2631 Class LC | | | 4.50 | | | | 6-15-2018 | | | | 717,032 | | | | 755,784 | |
FHLMC Series 2656 Class BG | | | 5.00 | | | | 10-15-2032 | | | | 1,755,218 | | | | 1,849,708 | |
FHLMC Series 2958 Class QD | | | 4.50 | | | | 4-15-2020 | | | | 2,343,604 | | | | 2,477,783 | |
FHLMC Series 3117 Class PL | | | 5.00 | | | | 8-15-2034 | | | | 1,563,103 | | | | 1,604,095 | |
FHLMC Series 3656 Class BH | | | 3.00 | | | | 12-15-2019 | | | | 3,079,695 | | | | 3,129,047 | |
FHLMC Series 3778 Class BM | | | 3.50 | | | | 8-15-2028 | | | | 839,332 | | | | 875,278 | |
FHLMC Series 3794 Class LK | | | 3.00 | | | | 2-15-2024 | | | | 3,167,097 | | | | 3,285,733 | |
FHLMC Series 3855 Class HL | | | 3.50 | | | | 2-15-2026 | | | | 654,422 | | | | 693,099 | |
FHLMC Series 3920 Class AB | | | 3.00 | | | | 9-15-2025 | | | | 1,519,328 | | | | 1,591,661 | |
FHLMC Series T-57 Class 2A1 ± | | | 3.24 | | | | 7-25-2043 | | | | 28,489 | | | | 29,763 | |
FHLMC Series T-59 Class 2A1 ± | | | 2.91 | | | | 10-25-2043 | | | | 1,196,438 | | | | 1,234,242 | |
FHLMC Structured Pass-Through Securities Series T-42 Class A6 | | | 9.50 | | | | 2-25-2042 | | | | 556,488 | | | | 695,777 | |
FNMA ± | | | 2.31 | | | | 11-1-2031 | | | | 71,608 | | | | 76,214 | |
FNMA | | | 2.73 | | | | 10-1-2017 | | | | 3,083,386 | | | | 3,229,526 | |
FNMA | | | 2.93 | | | | 12-1-2017 | | | | 2,407,994 | | | | 2,537,306 | |
FNMA | | | 3.25 | | | | 4-1-2015 | | | | 4,415,480 | | | | 4,526,874 | |
FNMA | | | 3.33 | | | | 10-1-2017 | | | | 1,659,210 | | | | 1,719,356 | |
FNMA | | | 3.34 | | | | 4-1-2016 | | | | 975,359 | | | | 1,017,811 | |
FNMA | | | 3.34 | | | | 9-1-2017 | | | | 1,431,210 | | | | 1,523,236 | |
FNMA | | | 3.50 | | | | 10-1-2023 | | | | 1,977,322 | | | | 2,100,010 | |
FNMA | | | 3.50 | | | | 11-1-2023 | | | | 1,184,099 | | | | 1,257,635 | |
FNMA | | | 3.69 | | | | 6-1-2017 | | | | 3,387,307 | | | | 3,649,246 | |
FNMA | | | 3.74 | | | | 5-1-2018 | | | | 1,327,545 | | | | 1,433,328 | |
FNMA | | | 3.85 | | | | 10-1-2016 | | | | 3,167,929 | | | | 3,236,903 | |
The accompanying notes are an integral part of these financial statements.
| | | | |
| 10 | | Wells Fargo Advantage Short-Term Bond Fund | | Portfolio of investments—February 28, 2014 (unaudited) |
| | | | | | | | | | | | | | | | |
| Security name | | Interest rate | | | Maturity date | | | Principal | | | Value | |
| | | | |
Agency Securities (continued) | | | | | | | | | | | | | | | | |
FNMA | | | 4.00 | % | | | 5-25-2019 | | | $ | 578,996 | | | $ | 610,230 | |
FNMA | | | 4.00 | | | | 12-15-2024 | | | | 908,898 | | | | 959,763 | |
FNMA | | | 4.00 | | | | 6-25-2026 | | | | 1,728,034 | | | | 1,856,775 | |
FNMA | | | 4.00 | | | | 8-25-2037 | | | | 1,812,115 | | | | 1,882,468 | |
FNMA | | | 4.34 | | | | 2-1-2017 | | | | 475,888 | | | | 490,213 | |
FNMA | | | 4.44 | | | | 9-1-2015 | | | | 1,718,645 | | | | 1,822,674 | |
FNMA | | | 4.69 | | | | 11-1-2015 | | | | 1,781,801 | | | | 1,863,472 | |
FNMA | | | 5.00 | | | | 1-15-2022 | | | | 2,545,761 | | | | 2,719,398 | |
FNMA | | | 5.00 | | | | 3-25-2034 | | | | 812,503 | | | | 831,380 | |
FNMA | | | 5.09 | | | | 2-1-2016 | | | | 875,711 | | | | 926,077 | |
FNMA | | | 5.19 | | | | 1-1-2018 | | | | 2,365,155 | | | | 2,540,770 | |
FNMA | | | 5.29 | | | | 8-1-2015 | | | | 2,700,053 | | | | 2,837,782 | |
FNMA | | | 5.50 | | | | 1-1-2016 | | | | 344,486 | | | | 365,333 | |
FNMA | | | 5.50 | | | | 8-25-2034 | | | | 1,242,736 | | | | 1,341,424 | |
FNMA | | | 6.00 | | | | 4-1-2021 | | | | 1,292,197 | | | | 1,377,969 | |
FNMA | | | 6.00 | | | | 3-1-2033 | | | | 1,057,214 | | | | 1,196,228 | |
FNMA | | | 6.28 | | | | 11-1-2018 | | | | 754,708 | | | | 787,771 | |
FNMA | | | 6.50 | | | | 8-1-2031 | | | | 514,666 | | | | 582,518 | |
FNMA | | | 7.60 | | | | 8-1-2018 | | | | 205,675 | | | | 225,320 | |
FNMA | | | 8.00 | | | | 4-1-2017 | | | | 156,369 | | | | 166,231 | |
FNMA | | | 8.00 | | | | 9-1-2019 | | | | 110,272 | | | | 117,428 | |
FNMA | | | 8.00 | | | | 9-1-2023 | | | | 12,164 | | | | 13,132 | |
FNMA | | | 8.33 | | | | 7-15-2020 | | | | 39,743 | | | | 44,488 | |
FNMA | | | 8.50 | | | | 7-1-2018 | | | | 73,522 | | | | 78,382 | |
FNMA | | | 8.50 | | | | 2-1-2023 | | | | 78,604 | | | | 84,276 | |
FNMA | | | 9.00 | | | | 2-15-2020 | | | | 1,495 | | | | 1,730 | |
FNMA | | | 9.00 | | | | 11-1-2024 | | | | 132,380 | | | | 150,449 | |
FNMA | | | 11.00 | | | | 10-15-2020 | | | | 62,049 | | | | 64,627 | |
FNMA | | | 12.00 | | | | 3-1-2017 | | | | 6,570 | | | | 6,638 | |
FNMA Grantor Trust Series 2002-T12 Class A4 | | | 9.50 | | | | 5-25-2042 | | | | 882,428 | | | | 1,103,301 | |
FNMA Series 1989-29 Class Z | | | 10.00 | | | | 6-25-2019 | | | | 127,813 | | | | 146,256 | |
FNMA Series 1989-63 Class Z | | | 9.40 | | | | 10-25-2019 | | | | 66,694 | | | | 73,063 | |
FNMA Series 2002-T1 Class A4 | | | 9.50 | | | | 11-25-2031 | | | | 77,276 | | | | 94,836 | |
FNMA Series 2003-15 Class CB | | | 5.00 | | | | 3-25-2018 | | | | 1,478,793 | | | | 1,565,224 | |
FNMA Series 2003-41 Class PE | | | 5.50 | | | | 5-25-2023 | | | | 1,908,411 | | | | 2,087,202 | |
FNMA Series 2004-90 Class XY | | | 4.00 | | | | 9-25-2034 | | | | 1,233,596 | | | | 1,301,389 | |
FNMA Series 2006-48 Class TD | | | 5.50 | | | | 12-25-2034 | | | | 992,309 | | | | 1,017,581 | |
FNMA Series 2006-9 Class BM | | | 6.00 | | | | 10-25-2033 | | | | 490,509 | | | | 492,908 | |
FNMA Series 2008-53 Class CA | | | 5.00 | | | | 7-25-2023 | | | | 1,549,791 | | | | 1,660,573 | |
FNMA Series 2011-133 Class A | | | 3.50 | | | | 6-25-2029 | | | | 2,388,455 | | | | 2,507,156 | |
FNMA Series 2011-17 Class ED | | | 3.50 | | | | 7-25-2025 | | | | 710,688 | | | | 740,799 | |
FNMA Series 2011-39 Class CA | | | 3.00 | | | | 5-25-2024 | | | | 623,678 | | | | 648,960 | |
FNMA Series 2011-66 Class BE | | | 3.00 | | | | 3-25-2025 | | | | 1,531,117 | | | | 1,589,468 | |
FNMA Series 2011-71 Class DJ | | | 3.00 | | | | 3-25-2025 | | | | 3,037,839 | | | | 3,134,937 | |
FNMA Series G95-2 Class IO | | | 10.00 | | | | 5-25-2020 | | | | 166,957 | | | | 15,401 | |
FNMA Whole Loan Series 2003-W06 Class PT4 ± | | | 8.86 | | | | 10-25-2042 | | | | 121,557 | | | | 141,421 | |
FNMA Whole Loan Series 2003-W11 Class A1 ± | | | 3.29 | | | | 6-25-2033 | | | | 25,294 | | | | 25,001 | |
FNMA Whole Loan Series 2003-W6 Class 6A ± | | | 3.05 | | | | 8-25-2042 | | | | 1,419,973 | | | | 1,481,920 | |
FNMA Whole Loan Series 2004-W6 Class 1A4 | | | 5.50 | | | | 7-25-2034 | | | | 1,109,313 | | | | 1,127,650 | |
GNMA | | | 4.00 | | | | 8-16-2023 | | | | 1,090,657 | | | | 1,165,675 | |
The accompanying notes are an integral part of these financial statements.
| | | | | | |
| Portfolio of investments—February 28, 2014 (unaudited) | | Wells Fargo Advantage Short-Term Bond Fund | | | 11 | |
| | | | | | | | | | | | | | | | |
| Security name | | Interest rate | | | Maturity date | | | Principal | | | Value | |
| | | | |
Agency Securities (continued) | | | | | | | | | | | | | | | | |
GNMA | | | 4.50 | % | | | 4-20-2035 | | | $ | 871,615 | | | $ | 934,261 | |
GNMA | | | 8.00 | | | | 12-15-2023 | | | | 44,967 | | | | 53,253 | |
GNMA | | | 9.00 | | | | 11-15-2017 | | | | 52,306 | | | | 56,786 | |
GNMA | | | 9.00 | | | | 11-15-2024 | | | | 31,690 | | | | 37,164 | |
GNMA | | | 10.00 | | | | 2-20-2018 | | | | 8,955 | | | | 9,857 | |
GNMA | | | 12.50 | | | | 4-15-2019 | | | | 44,618 | | | | 45,842 | |
GNMA Series 2010-6 Class EA | | | 4.00 | | | | 9-16-2023 | | | | 1,108,247 | | | | 1,164,395 | |
GNMA Series 2012-19 Class A | | | 1.83 | | | | 3-16-2039 | | | | 5,201,063 | | | | 5,201,885 | |
| | | | |
Total Agency Securities (Cost $111,079,240) | | | | | | | | | | | | | | | 112,129,132 | |
| | | | | | | | | | | | | | | | |
| | | | |
Asset-Backed Securities: 8.28% | | | | | | | | | | | | | | | | |
ASG Resecuritization Trust Series 2009-4 Class A60 144A | | | 6.00 | | | | 6-28-2037 | | | | 676,915 | | | | 707,272 | |
CNH Equipment Trust Series 2013-C Class A2 | | | 0.63 | | | | 1-17-2017 | | | | 5,402,964 | | | | 5,409,907 | |
DBRR Trust Series 2012-EZ1 Class A 144A | | | 0.95 | | | | 9-25-2045 | | | | 548,818 | | | | 548,847 | |
Ford Credit Auto Owner Trust Series 2012-D Class A2 | | | 0.40 | | | | 9-15-2015 | | | | 456,698 | | | | 456,707 | |
Ford Credit Auto Owner Trust Series 2013-A Class A2 | | | 0.38 | | | | 11-15-2015 | | | | 809,501 | | | | 809,716 | |
Ford Credit Auto Owner Trust Series 2014-A Class A2 | | | 0.48 | | | | 11-15-2016 | | | | 5,000,000 | | | | 5,003,435 | |
GE Equipment LLC Series 2013-2 Class A2 | | | 0.61 | | | | 6-24-2016 | | | | 3,250,000 | | | | 3,252,418 | |
GE Equipment Small Ticket LLC Series 2013-1A Class A2 144A | | | 0.73 | | | | 1-25-2016 | | | | 1,700,000 | | | | 1,702,491 | |
GE Equipment Transportation LLC Series 2013-1 Class A2 | | | 0.50 | | | | 11-24-2015 | | | | 2,147,204 | | | | 2,147,024 | |
Home Equity Asset Trust Series 2003-6 Class M1 ± | | | 1.66 | | | | 2-25-2034 | | | | 1,696,076 | | | | 1,594,293 | |
Honda Auto Receivables Owner Trust Series 2014-1 Class A2 | | | 0.41 | | | | 9-21-2016 | | | | 2,700,000 | | | | 2,699,668 | |
Hyundai Auto Lease Securitization Trust Series 2013-A Class A2 144A | | | 0.51 | | | | 9-15-2015 | | | | 2,102,622 | | | | 2,103,318 | |
Hyundai Auto Lease Securitization Trust Series 2013-B Class A2 144A | | | 0.75 | | | | 3-15-2016 | | | | 3,900,000 | | | | 3,908,424 | |
Hyundai Auto Receivables Trust Hart Series 2013-A Class A2 | | | 0.40 | | | | 12-15-2015 | | | | 1,208,274 | | | | 1,208,779 | |
Mercedes-Benz Auto Lease Trust Series 2013-B Class A2 | | | 0.53 | | | | 9-15-2015 | | | | 4,500,000 | | | | 4,503,722 | |
Mercedes-Benz Auto Receivables Trust Series 2012-1 Class A2 | | | 0.37 | | | | 3-16-2015 | | | | 299,346 | | | | 299,362 | |
Newcastle Investment Trust Series 2011-MH1 Class A 144A | | | 2.45 | | | | 12-10-2033 | | | | 554,690 | | | | 559,569 | |
Nissan Auto Lease Trust Series 2013-A Class A2A | | | 0.45 | | | | 9-15-2015 | | | | 3,236,140 | | | | 3,237,166 | |
Nissan Auto Receivables Owner Trust Series 2012-B Class A2 | | | 0.39 | | | | 4-15-2015 | | | | 338,981 | | | | 338,993 | |
Porsche Innovative Lease Owner Pilot Trust Series 2013-1 Class A2 144A | | | 0.54 | | | | 1-22-2016 | | | | 3,000,000 | | | | 3,002,814 | |
Volkswagen Auto Lease Trust Series 2013-A Class A2A | | | 0.63 | | | | 12-21-2015 | | | | 2,357,701 | | | | 2,361,195 | |
Volkswagen Auto Lease Trust Series 2014-A Class A2A | | | 0.52 | | | | 10-20-2016 | | | | 4,100,000 | | | | 4,110,754 | |
Volvo Financial Equipment LLC Series 2013-1A Class A2 144A | | | 0.53 | | | | 11-16-2015 | | | | 2,407,499 | | | | 2,408,023 | |
Volvo Financial Equipment LLC Series 2014-1A Class A2
144A%% | | | 0.54 | | | | 11-15-2016 | | | | 5,500,000 | | | | 5,499,985 | |
| | | | |
Total Asset-Backed Securities (Cost $57,895,006) | | | | | | | | | | | | | | | 57,873,882 | |
| | | | | | | | | | | | | | | | |
| | | | |
Corporate Bonds and Notes: 41.01% | | | | | | | | | | | | | | | | |
| | | | |
Consumer Discretionary: 5.57% | | | | | | | | | | | | | | | | |
| | | | |
| Automobiles: 0.89% | | | | | | | | | | | | | | | | |
Ford Motor Company | | | 6.50 | | | | 8-1-2018 | | | | 2,667,000 | | | | 3,108,124 | |
Hyundai Motor Company 144A | | | 4.50 | | | | 4-15-2015 | | | | 3,006,000 | | | | 3,121,893 | |
| | | | |
| | | | | | | | | | | | | | | 6,230,017 | |
| | | | | | | | | | | | | | | | |
| | | | |
| Leisure Products: 0.39% | | | | | | | | | | | | | | | | |
Hasbro Incorporated | | | 6.13 | | | | 5-15-2014 | | | | 2,725,000 | | | | 2,754,174 | |
| | | | | | | | | | | | | | | | |
The accompanying notes are an integral part of these financial statements.
| | | | |
| 12 | | Wells Fargo Advantage Short-Term Bond Fund | | Portfolio of investments—February 28, 2014 (unaudited) |
| | | | | | | | | | | | | | | | |
| Security name | | Interest rate | | | Maturity date | | | Principal | | | Value | |
| | | | |
| Media: 3.36% | | | | | | | | | | | | | | | | |
Cox Communications Incorporated | | | 5.45 | % | | | 12-15-2014 | | | $ | 1,543,000 | | | $ | 1,601,569 | |
Cox Communications Incorporated | | | 5.50 | | | | 10-1-2015 | | | | 2,000,000 | | | | 2,143,576 | |
Interpublic Group of Companies Incorporated | | | 6.25 | | | | 11-15-2014 | | | | 2,860,000 | | | | 2,956,525 | |
McGraw-Hill Company Incorporated | | | 5.90 | | | | 11-15-2017 | | | | 3,500,000 | | | | 3,855,541 | |
TCI Communications Incorporated | | | 8.75 | | | | 8-1-2015 | | | | 2,290,000 | | | | 2,550,078 | |
Tcm Sub LLC 144A | | | 3.55 | | | | 1-15-2015 | | | | 4,000,000 | | | | 4,101,132 | |
Thompson Reuters Corporation | | | 6.50 | | | | 7-15-2018 | | | | 2,500,000 | | | | 2,911,778 | |
Viacom Incorporated | | | 6.25 | | | | 4-30-2016 | | | | 3,000,000 | | | | 3,335,841 | |
| | | | |
| | | | | | | | | | | | | | | 23,456,040 | |
| | | | | | | | | | | | | | | | |
| | | | |
| Multiline Retail: 0.93% | | | | | | | | | | | | | | | | |
Dollar General Corporation | | | 4.13 | | | | 7-15-2017 | | | | 3,000,000 | | | | 3,229,926 | |
Macy’s Retail Holding Incorporated | | | 7.88 | | | | 7-15-2015 | | | | 3,000,000 | | | | 3,278,454 | |
| | | | |
| | | | | | | | | | | | | | | 6,508,380 | |
| | | | | | | | | | | | | | | | |
| | | | |
Consumer Staples: 1.63% | | | | | | | | | | | | | | | | |
| | | | |
| Beverages: 0.16% | | | | | | | | | | | | | | | | |
Constellation Brands Incorporated | | | 7.25 | | | | 9-1-2016 | | | | 1,000,000 | | | | 1,132,500 | |
| | | | | | | | | | | | | | | | |
| | | | |
| Food & Staples Retailing: 0.99% | | | | | | | | | | | | | | | | |
Safeway Incorporated | | | 5.63 | | | | 8-15-2014 | | | | 3,000,000 | | | | 3,055,911 | |
Tyson Foods Incorporated | | | 6.60 | | | | 4-1-2016 | | | | 3,495,000 | | | | 3,883,805 | |
| | | | |
| | | | | | | | | | | | | | | 6,939,716 | |
| | | | | | | | | | | | | | | | |
| | | | |
| Household Products: 0.48% | | | | | | | | | | | | | | | | |
Newell Rubbermaid Incorporated | | | 2.00 | | | | 6-15-2015 | | | | 3,290,000 | | | | 3,336,646 | |
| | | | | | | | | | | | | | | | |
| | | | |
Energy: 3.65% | | | | | | | | | | | | | | | | |
| | | | |
| Oil, Gas & Consumable Fuels: 3.65% | | | | | | | | | | | | | | | | |
Boardwalk Pipelines LP | | | 5.88 | | | | 11-15-2016 | | | | 1,000,000 | | | | 1,093,635 | |
Buckeye Partners LP | | | 2.65 | | | | 11-15-2018 | | | | 3,000,000 | | | | 3,007,746 | |
Continental Resources Company | | | 8.25 | | | | 10-1-2019 | | | | 3,075,000 | | | | 3,328,688 | |
Energy Transfer Partners LP | | | 5.95 | | | | 2-1-2015 | | | | 3,205,000 | | | | 3,351,174 | |
Marathon Petroleum Corporation | | | 3.50 | | | | 3-1-2016 | | | | 3,000,000 | | | | 3,150,288 | |
Nabors Industries Incorporated 144A | | | 2.35 | | | | 9-15-2016 | | | | 3,000,000 | | | | 3,071,946 | |
Pioneer Natural Resources Company | | | 5.88 | | | | 7-15-2016 | | | | 2,940,000 | | | | 3,251,614 | |
Weatherford Bermuda Company | | | 5.50 | | | | 2-15-2016 | | | | 2,000,000 | | | | 2,154,678 | |
Williams Partners LP | | | 3.80 | | | | 2-15-2015 | | | | 3,000,000 | | | | 3,086,979 | |
| | | | |
| | | | | | | | | | | | | | | 25,496,748 | |
| | | | | | | | | | | | | | | | |
| | | | |
Financials: 14.43% | | | | | | | | | | | | | | | | |
| | | | |
| Banks: 1.65% | | | | | | | | | | | | | | | | |
Australia and New Zealand Banking Group Limited 144A | | | 2.40 | | | | 11-23-2016 | | | | 3,000,000 | | | | 3,113,316 | |
Bank of America Corporation | | | 6.50 | | | | 8-1-2016 | | | | 3,000,000 | | | | 3,378,822 | |
Bank One Corporation | | | 4.90 | | | | 4-30-2015 | | | | 1,500,000 | | | | 1,571,459 | |
ING Bank NV ± | | | 0.91 | | | | 5-23-2016 | | | | 2,500,000 | | | | 2,468,750 | |
US Bank NA ± | | | 3.78 | | | | 4-29-2020 | | | | 1,006,000 | | | | 1,040,315 | |
| | | | |
| | | | | | | | | | | | | | | 11,572,662 | |
| | | | | | | | | | | | | | | | |
The accompanying notes are an integral part of these financial statements.
| | | | | | |
| Portfolio of investments—February 28, 2014 (unaudited) | | Wells Fargo Advantage Short-Term Bond Fund | | | 13 | |
| | | | | | | | | | | | | | | | |
| Security name | | Interest rate | | | Maturity date | | | Principal | | | Value | |
| | | | |
| Capital Markets: 1.11% | | | | | | | | | | | | | | | | |
Janus Capital Group Incorporated | | | 6.70 | % | | | 6-15-2017 | | | $ | 2,500,000 | | | $ | 2,849,883 | |
Lazard Group LLC | | | 6.85 | | | | 6-15-2017 | | | | 3,000,000 | | | | 3,428,883 | |
Merrill Lynch & Company | | | 5.30 | | | | 9-30-2015 | | | | 1,400,000 | | | | 1,492,336 | |
| | | | |
| | | | | | | | | | | | | | | 7,771,102 | |
| | | | | | | | | | | | | | | | |
| | | | |
| Consumer Finance: 3.96% | | | | | | | | | | | | | | | | |
Capital One Bank Company | | | 1.20 | | | | 2-13-2017 | | | | 3,000,000 | | | | 3,002,085 | |
Discover Financial Services Company | | | 6.45 | | | | 6-12-2017 | | | | 3,000,000 | | | | 3,400,392 | |
Ford Motor Credit Company | | | 5.63 | | | | 9-15-2015 | | | | 1,000,000 | | | | 1,070,401 | |
Gatx Financial Corporation | | | 5.70 | | | | 4-15-2015 | | | | 2,635,000 | | | | 2,776,571 | |
General Motors Financial Company Incorporated | | | 2.75 | | | | 5-15-2016 | | | | 3,665,000 | | | | 3,736,468 | |
Harley-Davidson Funding Corporation 144A | | | 5.75 | | | | 12-15-2014 | | | | 3,000,000 | | | | 3,117,240 | |
Murray Street Investment Trust I | | | 4.65 | | | | 3-9-2017 | | | | 4,000,000 | | | | 4,335,284 | |
Nissan Motor Acceptance Corporation ±144A%% | | | 1.00 | | | | 3-3-2017 | | | | 3,000,000 | | | | 2,995,500 | |
SLM Corporation | | | 3.88 | | | | 9-10-2015 | | | | 1,500,000 | | | | 1,551,266 | |
SLM Corporation | | | 6.25 | | | | 1-25-2016 | | | | 1,535,000 | | | | 1,657,800 | |
| | | | |
| | | | | | | | | | | | | | | 27,643,007 | |
| | | | | | | | | | | | | | | | |
| | | | |
| Diversified Financial Services: 3.36% | | | | | | | | | | | | | | | | |
Citigroup Incorporated | | | 1.30 | | | | 4-1-2016 | | | | 2,300,000 | | | | 2,313,108 | |
HSBC Finance Corporation | | | 5.25 | | | | 4-15-2015 | | | | 3,000,000 | | | | 3,150,750 | |
JPMorgan Chase & Company | | | 1.35 | | | | 2-15-2017 | | | | 2,000,000 | | | | 2,008,316 | |
Morgan Stanley | | | 4.75 | | | | 4-1-2014 | | | | 3,000,000 | | | | 3,009,294 | |
Raymond James Financial Incorporated | | | 4.25 | | | | 4-15-2016 | | | | 2,000,000 | | | | 2,129,304 | |
Santander Holdings USA | | | 4.63 | | | | 4-19-2016 | | | | 2,000,000 | | | | 2,143,980 | |
Toll Road Investors Partnership II 144A¤ | | | 0.00 | | | | 2-15-2016 | | | | 2,500,000 | | | | 2,312,205 | |
UBS AG Stamford Connecticut | | | 5.88 | | | | 7-15-2016 | | | | 3,000,000 | | | | 3,332,829 | |
Woodside Finance Limited 144A | | | 4.50 | | | | 11-10-2014 | | | | 3,000,000 | | | | 3,077,154 | |
| | | | |
| | | | | | | | | | | | | | | 23,476,940 | |
| | | | | | | | | | | | | | | | |
| | | | |
| Insurance: 2.21% | | | | | | | | | | | | | | | | |
Genworth Financial Incorporated | | | 8.63 | | | | 12-15-2016 | | | | 2,000,000 | | | | 2,365,064 | |
MetLife Insurance Company 144A | | | 7.70 | | | | 11-1-2015 | | | | 3,000,000 | | | | 3,302,862 | |
Prudential Insurance Company 144A | | | 8.10 | | | | 7-15-2015 | | | | 3,910,000 | | | | 4,205,099 | |
Symetra Financial Corporation 144A | | | 6.13 | | | | 4-1-2016 | | | | 2,150,000 | | | | 2,297,327 | |
Unum Group 144A | | | 6.85 | | | | 11-15-2015 | | | | 2,997,000 | | | | 3,264,117 | |
| | | | |
| | | | | | | | | | | | | | | 15,434,469 | |
| | | | | | | | | | | | | | | | |
| | | | |
| REITs: 2.14% | | | | | | | | | | | | | | | | |
American Tower Corporation | | | 4.50 | | | | 1-15-2018 | | | | 2,700,000 | | | | 2,936,966 | |
ARC Properties Operating Partnership LP 144A | | | 2.00 | | | | 2-6-2017 | | | | 3,245,000 | | | | 3,247,197 | |
Digital Realty Trust LP | | | 4.50 | | | | 7-15-2015 | | | | 3,000,000 | | | | 3,115,698 | |
Health Care REIT Incorporated | | | 3.63 | | | | 3-15-2016 | | | | 2,380,000 | | | | 2,505,033 | |
Regency Centers LP | | | 5.25 | | | | 8-1-2015 | | | | 3,000,000 | | | | 3,172,218 | |
| | | | |
| | | | | | | | | | | | | | | 14,977,112 | |
| | | | | | | | | | | | | | | | |
| | | | |
Health Care: 1.30% | | | | | | | | | | | | | | | | |
| | | | |
| Biotechnology: 0.52% | | | | | | | | | | | | | | | | |
Biogen Idec Incorporated | | | 6.88 | | | | 3-1-2018 | | | | 3,045,000 | | | | 3,611,397 | |
| | | | | | | | | | | | | | | | |
The accompanying notes are an integral part of these financial statements.
| | | | |
| 14 | | Wells Fargo Advantage Short-Term Bond Fund | | Portfolio of investments—February 28, 2014 (unaudited) |
| | | | | | | | | | | | | | | | |
| Security name | | Interest rate | | | Maturity date | | | Principal | | | Value | |
| | | | |
| Health Care Equipment & Supplies: 0.31% | | | | | | | | | | | | | | | | |
Boston Scientific Corporation | | | 6.25 | % | | | 11-15-2015 | | | $ | 2,000,000 | | | $ | 2,177,320 | |
| | | | | | | | | | | | | | | | |
| | | | |
| Life Sciences Tools & Services: 0.47% | | | | | | | | | | | | | | | | |
Life Technologies Corporation | | | 4.40 | | | | 3-1-2015 | | | | 3,170,000 | | | | 3,284,380 | |
| | | | | | | | | | | | | | | | |
| | | | |
Industrials: 4.52% | | | | | | | | | | | | | | | | |
| | | | |
| Aerospace & Defense: 0.92% | | | | | | | | | | | | | | | | |
BAE Systems Holdings Incorporated 144A | | | 4.95 | | | | 6-1-2014 | | | | 3,000,000 | | | | 3,031,065 | |
L-3 Communications Corporation | | | 3.95 | | | | 11-15-2016 | | | | 3,175,000 | | | | 3,379,499 | |
| | | | |
| | | | | | | | | | | | | | | 6,410,564 | |
| | | | | | | | | | | | | | | | |
| | | | |
| Airlines: 0.43% | | | | | | | | | | | | | | | | |
Delta Air Lines Incorporated | | | 4.75 | | | | 11-7-2021 | | | | 2,789,789 | | | | 2,999,023 | |
| | | | | | | | | | | | | | | | |
| | | | |
| Building Products: 0.41% | | | | | | | | | | | | | | | | |
Owens Corning Incorporated | | | 6.50 | | | | 12-1-2016 | | | | 2,575,000 | | | | 2,863,907 | |
| | | | | | | | | | | | | | | | |
| | | | |
| Commercial Services & Supplies: 1.39% | | | | | | | | | | | | | | | | |
Boardwalk Pipelines LLC | | | 5.20 | | | | 6-1-2018 | | | | 2,179,000 | | | | 2,311,287 | |
Brambles USA Incorporated 144A | | | 3.95 | | | | 4-1-2015 | | | | 2,000,000 | | | | 2,062,728 | |
Equifax Incorporated | | | 4.45 | | | | 12-1-2014 | | | | 2,000,000 | | | | 2,055,138 | |
Penske Truck Leasing Company LP 144A | | | 2.50 | | | | 7-11-2014 | | | | 1,500,000 | | | | 1,509,936 | |
Penske Truck Leasing Company LP 144A | | | 3.13 | | | | 5-11-2015 | | | | 1,740,000 | | | | 1,788,556 | |
| | | | |
| | | | | | | | | | | | | | | 9,727,645 | |
| | | | | | | | | | | | | | | | |
| | | | |
| Machinery: 0.42% | | | | | | | | | | | | | | | | |
CNH Capital LLC | | | 3.25 | | | | 2-1-2017 | | | | 1,760,000 | | | | 1,786,400 | |
CNH Capital LLC | | | 3.88 | | | | 11-1-2015 | | | | 1,145,000 | | | | 1,177,919 | |
| | | | |
| | | | | | | | | | | | | | | 2,964,319 | |
| | | | | | | | | | | | | | | | |
| | | | |
| Road & Rail: 0.95% | | | | | | | | | | | | | | | | |
JB Hunt Transportation Services Company | | | 3.38 | | | | 9-15-2015 | | | | 3,700,000 | | | | 3,827,099 | |
Ryder System Incoporated | | | 3.60 | | | | 3-1-2016 | | | | 2,675,000 | | | | 2,807,217 | |
| | | | |
| | | | | | | | | | | | | | | 6,634,316 | |
| | | | | | | | | | | | | | | | |
| | | | |
Information Technology: 3.43% | | | | | | | | | | | | | | | | |
| | | | |
| Electronic Equipment, Instruments & Components: 0.64% | | | | | | | | | | | | | | | | |
Agilent Technologies Incorporated | | | 5.50 | | | | 9-14-2015 | | | | 1,300,000 | | | | 1,393,428 | |
Arrow Electronics Incorporated | | | 3.38 | | | | 11-1-2015 | | | | 3,000,000 | | | | 3,104,037 | |
| | | | |
| | | | | | | | | | | | | | | 4,497,465 | |
| | | | | | | | | | | | | | | | |
| | | | |
| IT Services: 0.40% | | | | | | | | | | | | | | | | |
Western Union Company | | | 2.38 | | | | 12-10-2015 | | | | 2,700,000 | | | | 2,770,419 | |
| | | | | | | | | | | | | | | | |
The accompanying notes are an integral part of these financial statements.
| | | | | | |
| Portfolio of investments—February 28, 2014 (unaudited) | | Wells Fargo Advantage Short-Term Bond Fund | | | 15 | |
| | | | | | | | | | | | | | | | |
| Security name | | Interest rate | | | Maturity date | | | Principal | | | Value | |
| | | | |
| Software: 1.53% | | | | | | | | | | | | | | | | |
Autodesk Incorporated | | | 1.95 | % | | | 12-15-2017 | | | $ | 3,000,000 | | | $ | 3,024,468 | |
CA Incorporated | | | 6.13 | | | | 12-1-2014 | | | | 3,000,000 | | | | 3,121,953 | |
Fidelity National Information Services Incorporated | | | 2.00 | | | | 4-15-2018 | | | | 2,000,000 | | | | 1,969,610 | |
Symantec Corporation | | | 2.75 | | | | 9-15-2015 | | | | 1,000,000 | | | | 1,029,685 | |
Symantec Corporation | | | 2.75 | | | | 6-15-2017 | | | | 1,500,000 | | | | 1,555,128 | |
| | | | |
| | | | | | | | | | | | | | | 10,700,844 | |
| | | | | | | | | | | | | | | | |
| | | | |
| Technology Hardware, Storage & Peripherals: 0.86% | | | | | | | | | | | | | | | | |
Hewlett-Packard Company | | | 2.75 | | | | 1-14-2019 | | | | 3,000,000 | | | | 3,043,692 | |
Xerox Corporation | | | 8.25 | | | | 5-15-2014 | | | | 2,940,000 | | | | 2,981,866 | |
| | | | |
| | | | | | | | | | | | | | | 6,025,558 | |
| | | | | | | | | | | | | | | | |
| | | | |
Materials: 0.77% | | | | | | | | | | | | | | | | |
| | | | |
| Chemicals: 0.19% | | | | | | | | | | | | | | | | |
CF Industries Incorporated | | | 6.88 | | | | 5-1-2018 | | | | 1,165,000 | | | | 1,357,922 | |
| | | | | | | | | | | | | | | | |
| | | | |
| Metals & Mining: 0.58% | | | | | | | | | | | | | | | | |
Arcelormittal Company | | | 3.75 | | | | 2-25-2015 | | | | 1,000,000 | | | | 1,023,750 | |
Glencore Funding LLC 144A | | | 1.70 | | | | 5-27-2016 | | | | 3,000,000 | | | | 3,019,569 | |
| | | | |
| | | | | | | | | | | | | | | 4,043,319 | |
| | | | | | | | | | | | | | | | |
| | | | |
Telecommunication Services: 1.65% | | | | | | | | | | | | | | | | |
| | | | |
| Diversified Telecommunication Services: 1.65% | | | | | | | | | | | | | | | | |
Crown Castle Towers LLC 144A | | | 3.21 | | | | 8-15-2035 | | | | 2,650,000 | | | | 2,701,431 | |
Qwest Corporation | | | 7.50 | | | | 10-1-2014 | | | | 3,520,000 | | | | 3,648,110 | |
SBA Tower Trust 144A | | | 4.25 | | | | 4-15-2040 | | | | 3,000,000 | | | | 3,033,741 | |
Verizon Communications Incorporated | | | 3.65 | | | | 9-14-2018 | | | | 2,000,000 | | | | 2,131,360 | |
| | | | |
| | | | | | | | | | | | | | | 11,514,642 | |
| | | | | | | | | | | | | | | | |
| | | | |
Utilities: 4.06% | | | | | | | | | | | | | | | | |
| | | | |
| Electric Utilities: 4.06% | | | | | | | | | | | | | | | | |
Ameren Corporation | | | 8.88 | | | | 5-15-2014 | | | | 3,738,000 | | | | 3,797,662 | |
Dayton Power & Light Company 144A | | | 1.88 | | | | 9-15-2016 | | | | 4,000,000 | | | | 4,071,916 | |
FPL Group Capital Incorporated | | | 2.60 | | | | 9-1-2015 | | | | 3,000,000 | | | | 3,082,413 | |
Interstate Power & Light Company | | | 3.30 | | | | 6-15-2015 | | | | 3,750,000 | | | | 3,859,136 | |
ITC Holdings Corporation 144A | | | 5.88 | | | | 9-30-2016 | | | | 3,000,000 | | | | 3,311,052 | |
Monongahela Power Company 144A | | | 5.70 | | | | 3-15-2017 | | | | 3,000,000 | | | | 3,263,937 | |
Niagara Mohawk Power Corporation 144A | | | 3.55 | | | | 10-1-2014 | | | | 3,667,000 | | | | 3,731,987 | |
Progress Energy Incorporated | | | 5.63 | | | | 1-15-2016 | | | | 3,000,000 | | | | 3,260,922 | |
| | | | |
| | | | | | | | | | | | | | | 28,379,025 | |
| | | | | | | | | �� | | | | | | | |
| | | | |
Total Corporate Bonds and Notes (Cost $283,993,172) | | | | | | | | | | | | | | | 286,691,578 | |
| | | | | | | | | | | | | | | | |
| | | | |
Municipal Obligations: 6.27% | | | | | | | | | | | | | | | | |
| | | | |
| California: 1.90% | | | | | | | | | | | | | | | | |
California PCFA Solid Waste Disposal Series A (Resource Recovery Revenue) ø144A | | | 0.55 | | | | 8-1-2023 | | | | 3,000,000 | | | | 3,000,000 | |
California PCFA Waste Management Services Incorporated
Series A1 (Resource Recovery Revenue) ± | | | 1.88 | | | | 4-1-2025 | | | | 2,000,000 | | | | 2,021,340 | |
The accompanying notes are an integral part of these financial statements.
| | | | |
| 16 | | Wells Fargo Advantage Short-Term Bond Fund | | Portfolio of investments—February 28, 2014 (unaudited) |
| | | | | | | | | | | | | | | | |
| Security name | | Interest rate | | | Maturity date | | | Principal | | | Value | |
| | | | |
| California (continued) | | | | | | | | | | | | | | | | |
California Public Works Board Lease Series E (Miscellaneous Revenue) | | | 3.68 | % | | | 12-1-2015 | | | $ | 2,960,000 | | | $ | 3,068,810 | |
Irvine Ranch CA Water District (Water & Sewer Revenue) | | | 2.39 | | | | 3-15-2014 | | | | 2,305,000 | | | | 2,306,867 | |
San Bernardino County CA Financing Authority (Miscellaneous Revenue, National Insured) ¤ | | | 0.00 | | | | 8-1-2017 | | | | 3,500,000 | | | | 2,911,300 | |
| | | | |
| | | | | | | | | | | | | | | 13,308,317 | |
| | | | | | | | | | | | | | | | |
| | | | |
| Florida: 0.17% | | | | | | | | | | | | | | | | |
Miami-Dade County FL IDA Waste Management Incorporated Florida Project (Resource Recovery Revenue) ± | | | 2.63 | | | | 8-1-2023 | | | | 1,200,000 | | | | 1,208,172 | |
| | | | | | | | | | | | | | | | |
| | | | |
| Georgia: 0.45% | | | | | | | | | | | | | | | | |
Georgia Municipal Gas Authority Taxable Gas Portfolio III Series F (Utilities Revenue) | | | 4.77 | | | | 8-1-2015 | | | | 3,000,000 | | | | 3,172,080 | |
| | | | | | | | | | | | | | | | |
| | | | |
| Illinois: 0.79% | | | | | | | | | | | | | | | | |
Chicago IL (Tax Revenue) | | | 6.30 | | | | 12-1-2021 | | | | 2,000,000 | | | | 2,242,320 | |
Illinois (GO) | | | 5.16 | | | | 2-1-2018 | | | | 2,545,000 | | | | 2,754,479 | |
Illinois (GO) | | | 5.20 | | | | 3-1-2018 | | | | 500,000 | | | | 542,380 | |
| | | | |
| | | | | | | | | | | | | | | 5,539,179 | |
| | | | | | | | | | | | | | | | |
| | | | |
| Michigan: 0.27% | | | | | | | | | | | | | | | | |
Michigan Strategic Fund Limited Obligation Revenue (Resource Recovery Revenue) ± | | | 4.25 | | | | 8-1-2031 | | | | 1,885,000 | | | | 1,888,450 | |
| | | | | | | | | | | | | | | | |
| | | | |
| Ohio: 0.43% | | | | | | | | | | | | | | | | |
Columbus Franklin County OH Finance Authority Research & Development (Industrial Development Revenue) | | | 3.45 | | | | 2-15-2015 | | | | 2,885,000 | | | | 2,965,463 | |
| | | | | | | | | | | | | | | | |
| | | | |
| Oregon: 0.61% | | | | | | | | | | | | | | | | |
Portland OR Taxable Pension (GO) ±(m)(n) | | | 0.08 | | | | 6-1-2019 | | | | 4,525,000 | | | | 4,253,500 | |
| | | | | | | | | | | | | | | | |
| | | | |
| Pennsylvania: 0.29% | | | | | | | | | | | | | | | | |
Bucks County PA IDA (Resource Recovery Revenue) ± | | | 1.38 | | | | 12-1-2022 | | | | 2,000,000 | | | | 2,005,980 | |
| | | | | | | | | | | | | | | | |
| | | | |
| South Carolina: 0.43% | | | | | | | | | | | | | | | | |
South Carolina Public Service Authority Series D (GO) ± | | | 1.03 | | | | 6-1-2015 | | | | 3,000,000 | | | | 3,013,320 | |
| | | | | | | | | | | | | | | | |
| | | | |
| Texas: 0.64% | | | | | | | | | | | | | | | | |
Port Arthur TX Navigation District Jefferson County Environmental Facilities Motiva Enterprises LLC Project Series D (Industrial Development Revenue) ø | | | 0.28 | | | | 11-1-2040 | | | | 4,500,000 | | | | 4,500,000 | |
| | | | | | | | | | | | | | | | |
| | | | |
| Wisconsin: 0.29% | | | | | | | | | | | | | | | | |
Menomonee Falls WI (GO) | | | 4.25 | | | | 11-1-2014 | | | | 2,000,000 | | | | 2,007,340 | |
| | | | | | | | | | | | | | | | |
| | | | |
Total Municipal Obligations (Cost $43,718,595) | | | | | | | | | | | | | | | 43,861,801 | |
| | | | | | | | | | | | | | | | |
| | | | |
Non-Agency Mortgage Backed Securities: 8.65% | | | | | | | | | | | | | | | | |
Bank of America Mortgage Securities Series 2002-K Class 3A1 ± | | | 2.63 | | | | 10-20-2032 | | | | 23,040 | | | | 23,428 | |
Bear Stearns Commercial Mortgage Securities Incorporated
Series 2005-PWR 9 Class A4A | | | 4.87 | | | | 9-11-2042 | | | | 3,302,000 | | | | 3,453,615 | |
Bear Stearns Commercial Mortgage Securities Incorporated
Series 2005-PWR-7 Class A3 ± | | | 5.12 | | | | 2-11-2041 | | | | 2,055,000 | | | | 2,120,394 | |
The accompanying notes are an integral part of these financial statements.
| | | | | | |
| Portfolio of investments—February 28, 2014 (unaudited) | | Wells Fargo Advantage Short-Term Bond Fund | | | 17 | |
| | | | | | | | | | | | | | | | |
| Security name | | Interest rate | | | Maturity date | | | Principal | | | Value | |
| | | | |
Non-Agency Mortgage Backed Securities (continued) | | | | | | | | | | | | | | | | |
Bear Stearns Commercial Mortgage Securities Incorporated
Series 2005-PWR8 Class A4 | | | 4.67 | % | | | 6-11-2041 | | | $ | 2,719,934 | | | $ | 2,822,258 | |
Bear Stearns Commercial Mortgage Securities Incorporated
Series 2005-T18 Class A4 ± | | | 4.93 | | | | 2-13-2042 | | | | 2,431,979 | | | | 2,508,802 | |
Bear Stearns Commercial Mortgage Securities Incorporated
Series 2005-T20 Class A4A ± | | | 5.14 | | | | 10-12-2042 | | | | 1,100,000 | | | | 1,162,906 | |
Citigroup Commercial Mortgage Trust Series 2004-C1 Class A4 ± | | | 5.35 | | | | 4-15-2040 | | | | 1,483,328 | | | | 1,489,269 | |
Citigroup/Deutsche Bank Commercial Mortgage Trust Pass-Through Certificate Series 2005-CD1 Class A4 ± | | | 5.22 | | | | 7-15-2044 | | | | 2,500,000 | | | | 2,639,145 | |
Commercial Mortgage Trust Pass-Through
Certificate Series 2005-C6 Class A5A ± | | | 5.12 | | | | 6-10-2044 | | | | 2,790,614 | | | | 2,927,463 | |
Commercial Mortgage Trust Series 2010-C1 Class A1 144A | | | 3.16 | | | | 7-10-2046 | | | | 2,720,628 | | | | 2,794,871 | |
Commercial Mortgage Trust Series 2012-CR2 Class A1 | | | 0.82 | | | | 8-15-2045 | | | | 1,802,193 | | | | 1,799,409 | |
Commercial Mortgage Trust Series 2013-FL3 Class B ±144A | | | 2.15 | | | | 10-13-2028 | | | | 3,000,000 | | | | 3,004,791 | |
ContiMortgage Home Equity Trust Series 1996-2 ±(c)(i) | | | 0.00 | | | | 7-15-2027 | | | | 1,049,571 | | | | 5,573 | |
Countrywide Home Loans Mortgage Pass-Through Trust
Series 2001-HYB1 Class 2A1 ± | | | 1.93 | | | | 6-19-2031 | | | | 334,308 | | | | 335,925 | |
Countrywide Home Loans Mortgage Pass-Through Trust
Series 2004-20 Class 3A1 ± | | | 2.27 | | | | 9-25-2034 | | | | 87,475 | | | | 75,427 | |
Credit Suisse First Boston Mortgage Securities Corporation
Series 2006-C1 Class AAB ± | | | 5.49 | | | | 2-15-2039 | | | | 1,144,664 | | | | 1,166,266 | |
Credit Suisse Mortgage Capital Certificates Series 2006-C5
Class A3 | | | 5.31 | | | | 12-15-2039 | | | | 1,000,000 | | | | 1,089,015 | |
Drexel Burnham Lambert CMO Trust Series T Class 4 | | | 8.45 | | | | 9-20-2019 | | | | 118,455 | | | | 128,609 | |
EquiFirst Mortgage Loan Trust Series 2003-2 Class 3A3 ± | | | 1.28 | | | | 9-25-2033 | | | | 633,477 | | | | 607,431 | |
Fedex Express Corporation 1998 Pass Through Certificates Series 981C Class C | | | 7.02 | | | | 1-15-2016 | | | | 1,173,444 | | | | 1,232,116 | |
Golden National Mortgage Asset-Backed Certificates
Series 1998-GN1 Class M2 (s)(i) | | | 8.02 | | | | 2-25-2027 | | | | 46,429 | | | | 46,439 | |
Greenwich Capital Commercial Funding Corporation
Series 2007-GG9 Class A4 | | | 5.44 | | | | 3-10-2039 | | | | 3,000,000 | | | | 3,307,095 | |
GSMPS Mortgage Loan Trust Series 1998-1 Class A ±144A | | | 8.00 | | | | 9-19-2027 | | | | 382,760 | | | | 390,730 | |
GSMPS Mortgage Loan Trust Series 2006-RP2 Class 1AF1 ±144A | | | 0.56 | | | | 4-25-2036 | | | | 1,302,504 | | | | 1,089,480 | |
JPMorgan Chase Commercial Mortgage Securities Corporation Series 2006-CB16 Class A4 | | | 5.55 | | | | 5-12-2045 | | | | 973,042 | | | | 1,055,734 | |
JPMorgan Chase Commercial Mortgage Securities Corporation Series 2007-CB18 Class A4 | | | 5.44 | | | | 6-12-2047 | | | | 2,810,000 | | | | 3,095,145 | |
Lehman Brothers UBS Commercial Mortgage Trust
Series 2004-C6 Class A6 ± | | | 5.02 | | | | 8-15-2029 | | | | 199,162 | | | | 200,878 | |
Lehman Brothers UBS Commercial Mortgage Trust
Series 2005-C1 Class A4 | | | 4.74 | | | | 2-15-2030 | | | | 2,506,386 | | | | 2,572,016 | |
Lehman Brothers UBS Commercial Mortgage Trust
Series 2005-C5 Class 4 | | | 4.95 | | | | 9-15-2030 | | | | 2,457,320 | | | | 2,564,464 | |
Master Mortgages Trust Series 2002-3 Class 4A1 ± | | | 2.50 | | | | 10-25-2032 | | | | 9,818 | | | | 9,877 | |
Merrill Lynch Mortgage Trust Series 2004-KEY 2 Class A4 ± | | | 4.86 | | | | 8-12-2039 | | | | 1,142,195 | | | | 1,153,754 | |
Morgan Stanley Capital I Series 2005-IQ10 Class A4A ± | | | 5.23 | | | | 9-15-2042 | | | | 3,021,993 | | | | 3,167,562 | |
Morgan Stanley Capital I Series 2005-T19 Class A4A | | | 4.89 | | | | 6-12-2047 | | | | 2,549,043 | | | | 2,660,696 | |
Morgan Stanley Capital I Series 2007-IQ Class A4 | | | 5.81 | | | | 12-12-2049 | | | | 2,705,000 | | | | 3,035,253 | |
Morgan Stanley Dean Witter Capital I Series 2005-IQ9 Class A5 | | | 4.70 | | | | 7-15-2056 | | | | 919,389 | | | | 936,906 | |
NCUA Guaranteed Notes Series 2010-C1 Class APT | | | 2.65 | | | | 10-29-2020 | | | | 2,428,717 | | | | 2,505,221 | |
Nomura Asset Acceptance Corporation Series 2005-AR1
Class 1A1 ± | | | 2.62 | | | | 2-25-2035 | | | | 1,134,894 | | | | 1,144,166 | |
Salomon Brothers Mortgage Securities VI Series 1987-3
Class A ¤ | | | 0.00 | | | | 10-23-2017 | | | | 55 | | | | 55 | |
Structured Mortgage Asset Residential Trust Series 1992-5B
Class BO ¤(i) | | | 0.00 | | | | 6-25-2023 | | | | 8,054 | | | | 7,592 | |
Terwin Mortgage Trust Series 2004-21HE Class 1A1 ± | | | 1.12 | | | | 12-25-2034 | | | | 16,249 | | | | 15,522 | |
Wilshire Funding Corporation Series 1996-3 Class M2 ± | | | 5.76 | | | | 8-25-2032 | | | | 96,936 | | | | 95,088 | |
Wilshire Funding Corporation Series 1996-3 Class M3 ± | | | 5.76 | | | | 8-25-2032 | | | | 98,532 | | | | 94,684 | |
Wilshire Funding Corporation Series 1998-2 Class M1 ± | | | 2.00 | | | | 12-28-2037 | | | | 36,408 | | | | 33,405 | |
| | | | |
Total Non-Agency Mortgage Backed Securities
(Cost $61,024,574) | | | | | | | | | | | | | | | 60,568,475 | |
| | | | | | | | | | | | | | | | |
The accompanying notes are an integral part of these financial statements.
| | | | |
| 18 | | Wells Fargo Advantage Short-Term Bond Fund | | Portfolio of investments—February 28, 2014 (unaudited) |
| | | | | | | | | | | | | | | | |
| Security name | | Dividend yield | | | | | | Shares | | | Value | |
| | | | |
Preferred Stocks: 0.23% | | | | | | | | | | | | | | | | |
| | | | |
Financials: 0.23% | | | | | | | | | | | | | | | | |
| | | | |
| Banks: 0.23% | | | | | | | | | | | | | | | | |
Huntington Bancshares ±(a)(i) | | | 3.69 | % | | | | | | | 80,000 | | | $ | 1,610,000 | |
| | | | | | | | | | | | | | | | |
| | | | |
Total Preferred Stocks (Cost $1,958,484) | | | | | | | | | | | | | | | 1,610,000 | |
| | | | | | | | | | | | | | | | |
| | | | |
| | | Interest rate | | | Maturity date | | | Principal | | | | |
| | | | |
Yankee Corporate Bonds and Notes: 13.69% | | | | | | | | | | | | | | | | |
| | | | |
Consumer Discretionary: 0.72% | | | | | | | | | | | | | | | | |
| | | | |
| Auto Components: 0.29% | | | | | | | | | | | | | | | | |
Autoliv Incorporated | | | 3.85 | | | | 4-30-2014 | | | $ | 2,000,000 | | | | 2,004,072 | |
| | | | | | | | | | | | | | | | |
| | | | |
| Diversified Consumer Services: 0.43% | | | | | | | | | | | | | | | | |
Anglo American Capital Company 144A | | | 9.38 | | | | 4-8-2014 | | | | 3,000,000 | | | | 3,023,271 | |
| | | | | | | | | | | | | | | | |
| | | | |
Consumer Staples: 0.89% | | | | | | | | | | | | | | | | |
| | | | |
| Food & Staples Retailing: 0.45% | | | | | | | | | | | | | | | | |
Tesco plc 144A | | | 2.70 | | | | 1-5-2017 | | | | 3,000,000 | | | | 3,105,747 | |
| | | | | | | | | | | | | | | | |
| | | | |
| Food Products: 0.44% | | | | | | | | | | | | | | | | |
Tate & Lyle International Finance plc 144A | | | 5.00 | | | | 11-15-2014 | | | | 3,000,000 | | | | 3,083,070 | |
| | | | | | | | | | | | | | | | |
| | | | |
Energy: 1.47% | | | | | | | | | | | | | | | | |
| | | | |
| Oil, Gas & Consumable Fuels: 1.47% | | | | | | | | | | | | | | | | |
Korea National Oil Corporation 144A | | | 2.75 | | | | 1-23-2019 | | | | 3,000,000 | | | | 3,038,376 | |
Petrobras International Finance Company | | | 2.88 | | | | 2-6-2015 | | | | 3,000,000 | | | | 3,037,500 | |
Petroleos Mexicanos Company 144A | | | 3.13 | | | | 1-23-2019 | | | | 1,000,000 | | | | 1,022,000 | |
Petroleos Mexicanos Company | | | 4.88 | | | | 3-15-2015 | | | | 3,070,000 | | | | 3,188,963 | |
| | | | |
| | | | | | | | | | | | | | | 10,286,839 | |
| | | | | | | | | | | | | | | | |
| | | | |
Financials: 7.21% | | | | | | | | | | | | | | | | |
| | | | |
| Banks: 4.82% | | | | | | | | | | | | | | | | |
Bank of Montreal 144A | | | 1.30 | | | | 10-31-2014 | | | | 2,500,000 | | | | 2,517,508 | |
Bank of Nova Scotia 144A | | | 1.65 | | | | 10-29-2015 | | | | 3,430,000 | | | | 3,497,804 | |
Banque Federative du Credit Mutuel SA 144A | | | 1.70 | | | | 1-20-2017 | | | | 2,850,000 | | | | 2,858,550 | |
Canadian Imperial Bank 144A | | | 0.90 | | | | 9-19-2014 | | | | 4,100,000 | | | | 4,115,109 | |
Canadian Imperial Bank 144A | | | 2.75 | | | | 1-27-2016 | | | | 3,000,000 | | | | 3,125,007 | |
Corporacion Andina De Fomento | | | 3.75 | | | | 1-15-2016 | | | | 3,385,000 | | | | 3,536,885 | |
Lloyds TSB Bank plc | | | 4.88 | | | | 1-21-2016 | | | | 2,000,000 | | | | 2,154,652 | |
Nordea Eiendomskreditt 144A | | | 1.88 | | | | 4-7-2014 | | | | 6,500,000 | | | | 6,509,490 | |
Swedbank Hypotek 144A | | | 2.13 | | | | 8-31-2016 | | | | 3,000,000 | | | | 3,094,929 | |
Westpac Banking Corporation 144A | | | 5.30 | | | | 10-15-2015 | | | | 2,150,000 | | | | 2,286,598 | |
| | | | |
| | | | | | | | | | | | | | | 33,696,532 | |
| | | | | | | | | | | | | | | | |
| | | | |
| Capital Markets: 0.43% | | | | | | | | | | | | | | | | |
Nomura Holdings Incorporated | | | 2.00 | | | | 9-13-2016 | | | | 3,000,000 | | | | 3,040,620 | |
| | | | | | | | | | | | | | | | |
The accompanying notes are an integral part of these financial statements.
| | | | | | |
| Portfolio of investments—February 28, 2014 (unaudited) | | Wells Fargo Advantage Short-Term Bond Fund | | | 19 | |
| | | | | | | | | | | | | | | | |
| Security name | | Interest rate | | | Maturity date | | | Principal | | | Value | |
| | | | |
| Diversified Financial Services: 0.52% | | | | | | | | | | | | | | | | |
WPP Finance | | | 8.00 | % | | | 9-15-2014 | | | $ | 3,485,000 | | | $ | 3,619,465 | |
| | | | | | | | | | | | | | | | |
| | | | |
| Insurance: 0.85% | | | | | | | | | | | | | | | | |
Endurance Specialty Holdings Limited | | | 6.15 | | | | 10-15-2015 | | | | 2,850,000 | | | | 3,059,880 | |
QBE Insurance Group Limited 144A | | | 2.40 | | | | 5-1-2018 | | | | 2,985,000 | | | | 2,916,205 | |
| | | | |
| | | | | | | | | | | | | | | 5,976,085 | |
| | | | | | | | | | | | | | | | |
| | | | |
| Real Estate Management & Development: 0.59% | | | | | | | | | | | | | | | | |
Deutsche Annington Finance BV 144A | | | 3.20 | | | | 10-2-2017 | | | | 4,000,000 | | | | 4,102,760 | |
| | | | | | | | | | | | | | | | |
| | | | |
Health Care: 0.46% | | | | | | | | | | | | | | | | |
| | | | |
| Pharmaceuticals: 0.46% | | | | | | | | | | | | | | | | |
Warner Chilcott Company | | | 7.75 | | | | 9-15-2018 | | | | 3,000,000 | | | | 3,210,000 | |
| | | | | | | | | | | | | | | | |
| | | | |
Information Technology: 0.64% | | | | | | | | | | | | | | | | |
| | | | |
| Electronic Equipment, Instruments & Components: 0.22% | | | | | | | | | | | | | | | | |
Seagate HDD Cayman Company 144A | | | 3.75 | | | | 11-15-2018 | | | | 1,500,000 | | | | 1,548,750 | |
| | | | | | | | | | | | | | | | |
| | | | |
| Semiconductors & Semiconductor Equipment: 0.42% | | | | | | | | | | | | | | | | |
TSMC Global Limited 144A | | | 1.63 | | | | 4-3-2018 | | | | 3,035,000 | | | | 2,928,050 | |
| | | | | | | | | | | | | | | | |
| | | | |
Materials: 0.19% | | | | | | | | | | | | | | | | |
| | | | |
| Construction Materials: 0.19% | | | | | | | | | | | | | | | | |
Lafarge SA 144A | | | 6.20 | | | | 7-9-2015 | | | | 1,255,000 | | | | 1,327,163 | |
| | | | | | | | | | | | | | | | |
| | | | |
Telecommunication Services: 1.10% | | | | | | | | | | | | | | | | |
| | | | |
| Diversified Telecommunication Services: 0.81% | | | | | | | | | | | | | | | | |
Orange SA | | | 2.75 | | | | 2-6-2019 | | | | 3,000,000 | | | | 3,040,047 | |
Telefonos de Mexico SA | | | 5.50 | | | | 1-27-2015 | | | | 2,510,000 | | | | 2,597,850 | |
| | | | |
| | | | | | | | | | | | | | | 5,637,897 | |
| | | | | | | | | | | | | | | | |
| | | | |
| Wireless Telecommunication Services: 0.29% | | | | | | | | | | | | | | | | |
Telefonica Moviles Chile SA 144A | | | 2.88 | | | | 11-9-2015 | | | | 2,000,000 | | | | 2,037,972 | |
| | | | | | | | | | | | | | | | |
| | | | |
Utilities: 1.01% | | | | | | | | | | | | | | | | |
| | | | |
| Independent Power & Renewable Electricity Producers: 0.56% | | | | | | | | | | | | | | | | |
TransAlta Corporation | | | 4.75 | | | | 1-15-2015 | | | | 3,820,000 | | | | 3,946,068 | |
| | | | | | | | | | | | | | | | |
| | | | |
| Multi-Utilities: 0.45% | | | | | | | | | | | | | | | | |
Korea Western Power Company 144A | | | 3.13 | | | | 5-10-2017 | | | | 3,000,000 | | | | 3,123,111 | |
| | | | | | | | | | | | | | | | |
| | | | |
Total Yankee Corporate Bonds and Notes (Cost $94,805,217) | | | | | | | | | | | | | | | 95,697,472 | |
| | | | | | | | | | | | | | | | |
| | | | |
| | | Yield | | | | | | Shares | | | | |
| Short-Term Investments: 6.24% | | | | | | | | | | | | | | | | |
| | | | |
| Investment Companies: 6.20% | | | | | | | | | | | | | | | | |
Wells Fargo Advantage Cash Investment Money Market Fund, Select Class (l)(u)## | | | 0.07 | | | | | | | | 43,314,863 | | | | 43,314,863 | |
| | | | | | | | | | | | | | | | |
The accompanying notes are an integral part of these financial statements.
| | | | |
| 20 | | Wells Fargo Advantage Short-Term Bond Fund | | Portfolio of investments—February 28, 2014 (unaudited) |
| | | | | | | | | | | | | | | | |
| Security name | | Yield | | | Maturity date | | | Principal | | | Value | |
| | | | |
| U.S. Treasury Securities: 0.04% | | | | | | | | | | | | | | | | |
U.S. Treasury Bill #(z) | | | 0.06 | % | | | 3-20-2014 | | | $ | 300,000 | | | $ | 299,996 | |
| | | | | | | | | | | | | | | | |
| | | | |
Total Short-Term Investments (Cost $43,614,854) | | | | | | | | | | | | | | | 43,614,859 | |
| | | | | | | | | | | | | | | | |
| | | | | | | | |
| Total investments in securities | | | | | | | | |
| (Cost $698,089,142) * | | | 100.41 | % | | | 702,047,199 | |
Other assets and liabilities, net | | | (0.41 | ) | | | (2,880,874 | ) |
| | | | | | | | |
| Total net assets | | | 100.00 | % | | $ | 699,166,325 | |
| | | | | | | | |
| 144A | Security that may be resold to “qualified institutional buyers” under Rule 144A or security offered pursuant to Section 4(2) of the Securities Act of 1933, as amended. |
| ± | Variable rate investment. The rate shown is the rate in effect at period end. |
| ø | Variable rate demand notes are subject to a demand feature which reduces the effective maturity. The maturity date shown represents the final maturity date of the security. The interest rate is determined and reset by the issuer daily, weekly, or monthly depending upon the terms of the security. The interest rate shown is the rate in effect at period end. |
| (c) | Interest-only securities entitle holders to receive only the interest payments on the underlying mortgages. The principal amount shown is the notional amount of the underlying mortgages. Interest rate disclosed represents the coupon rate. |
| %% | Security issued on a when-issued basis. |
| ¤ | Security issued in zero coupon form with no periodic interest payments. |
| (m) | An auction-rate security whose interest rate resets at predetermined short-term intervals through a Dutch auction; rate shown represents the rate in effect at period-end. |
| (n) | Auction to set interest rate on security failed at period end due to insufficient investor interest; failed auction does not itself cause a default. |
| (s) | Security is currently in default with regards to scheduled interest and/or principal payments. The Fund has stopped accruing interest on this security. |
| (l) | Investment in an affiliate |
| (a) | Security is fair valued by the Management Valuation Team, and in certain instances by the Board of Trustees, in accordance with procedures approved by the Board of Trustees. |
| # | All or a portion of this security is segregated as collateral for investments in derivative instruments. |
| (z) | Zero coupon security. Rate represents the current yield to maturity. |
| (u) | Rate shown is the 7-day annualized yield at period end. |
| ## | All or a portion of this security has been segregated for when-issued. |
| * | Cost for federal income tax purposes is $698,094,953 and unrealized appreciation (depreciation) consists of: |
| | | | |
Gross unrealized appreciation | | $ | 6,313,525 | |
Gross unrealized depreciation | | | (2,361,279 | ) |
| | | | |
Net unrealized appreciation | | $ | 3,952,246 | |
The accompanying notes are an integral part of these financial statements.
| | | | | | |
| Statement of assets and liabilities—February 28, 2014 (unaudited) | | Wells Fargo Advantage Short-Term Bond Fund | | | 21 | |
| | | | |
| | | | |
| |
Assets | | | | |
Investments | | | | |
In unaffiliated securities, at value (see cost below) | | $ | 658,732,336 | |
In affiliated securities, at value (see cost below) | | | 43,314,863 | |
| | | | |
Total investments, at value (see cost below) | | | 702,047,199 | |
Principal paydown receivable | | | 28,596 | |
Receivable for Fund shares sold | | | 1,274,508 | |
Receivable for dividend and interest | | | 5,407,192 | |
Receivable for daily variation margin on open futures contracts | | | 38,438 | |
Prepaid expenses and other assets | | | 41,167 | |
| | | | |
Total assets | | | 708,837,100 | |
| | | | |
| |
Liabilities | | | | |
Dividends payable | | | 152,103 | |
Payable for investments purchased | | | 8,499,919 | |
Payable for Fund shares redeemed | | | 595,615 | |
Payable for daily variation margin on open futures contracts | | | 23,671 | |
Advisory fee payable | | | 156,308 | |
Distribution fees payable | | | 9,520 | |
Due to other related parties | | | 101,691 | |
Accrued expenses and other liabilities | | | 131,948 | |
| | | | |
Total liabilities | | | 9,670,775 | |
| | | | |
Total net assets | | $ | 699,166,325 | |
| | | | |
| |
NET ASSETS CONSIST OF | | | | |
Paid-in capital | | $ | 694,721,655 | |
Undistributed net investment income | | | 145,691 | |
Accumulated net realized gains on investments | | | 392,074 | |
Net unrealized gains on investments | | | 3,906,905 | |
| | | | |
Total net assets | | $ | 699,166,325 | |
| | | | |
| |
COMPUTATION OF NET ASSET VALUE AND OFFERING PRICE PER SHARE1 | | | | |
Net assets – Class A | | $ | 78,398,482 | |
Shares outstanding – Class A | | | 8,888,825 | |
Net asset value per share – Class A | | | $8.82 | |
Maximum offering price per share – Class A2 | | | $9.00 | |
Net assets – Class C | | $ | 15,934,142 | |
Shares outstanding – Class C | | | 1,808,640 | |
Net asset value per share – Class C | | | $8.81 | |
Net assets – Institutional Class | | $ | 356,362,569 | |
Shares outstanding – Institutional Class | | | 40,384,583 | |
Net asset value per share – Institutional Class | | | $8.82 | |
Net assets – Investor Class | | $ | 248,471,132 | |
Shares outstanding – Investor Class | | | 28,184,332 | |
Net asset value per share – Investor Class | | | $8.82 | |
| |
Investments in unaffiliated securities, at cost | | $ | 654,774,279 | |
| | | | |
Investments in affiliated securities, at cost | | $ | 43,314,863 | |
| | | | |
Total investments, at cost | | $ | 698,089,142 | |
| | | | |
| 1. | The Fund has an unlimited number of authorized shares. |
| 2. | Maximum offering price is computed as 100/98 of net asset value. On investments of $50,000 or more, the offering price is reduced. |
The accompanying notes are an integral part of these financial statements.
| | | | |
| 22 | | Wells Fargo Advantage Short-Term Bond Fund | | Statement of operations—six months ended February 28, 2014 (unaudited) |
| | | | |
| | | | |
| |
Investment income | | | | |
Interest** | | $ | 5,896,663 | |
Dividends | | | 29,558 | |
Income from affiliated securities | | | 11,666 | |
Securities lending income, net | | | 1,479 | |
| | | | |
Total investment income | | | 5,939,366 | |
| | | | |
| |
Expenses | | | | |
Advisory fee | | | 1,022,835 | |
Administration fees | | | | |
Fund level | | | 155,203 | |
Class A | | | 57,440 | |
Class C | | | 12,802 | |
Institutional Class | | | 115,449 | |
Investor Class | | | 232,167 | |
Shareholder servicing fees | | | | |
Class A | | | 89,750 | |
Class C | | | 20,004 | |
Investor Class | | | 305,231 | |
Distribution fees | | | | |
Class C | | | 60,012 | |
Custody and accounting fees | | | 21,373 | |
Professional fees | | | 26,898 | |
Registration fees | | | 41,219 | |
Shareholder report expenses | | | 30,603 | |
Trustees’ fees and expenses | | | 6,058 | |
Other fees and expenses | | | 10,931 | |
| | | | |
Total expenses | | | 2,207,975 | |
Less: Fee waivers and/or expense reimbursements | | | (135,272 | ) |
| | | | |
Net expenses | | | 2,072,703 | |
| | | | |
Net investment income | | | 3,866,663 | |
| | | | |
| |
REALIZED AND UNREALIZED GAINS (LOSSES) ON INVESTMENTS | | | | |
| |
Net realized gains (losses) on: | | | | |
Unaffiliated securities | | | 1,123,917 | |
Futures transactions | | | (427,900 | ) |
| | | | |
Net realized gains on investments | | | 696,017 | |
| | | | |
| |
Net change in unrealized gains (losses) on: | | | | |
Unaffiliated securities | | | 3,200,826 | |
Futures transactions | | | 36,650 | |
| | | | |
Net change in unrealized gains (losses) on investments | | | 3,237,476 | |
| | | | |
Net realized and unrealized gains (losses) on investments | | | 3,933,493 | |
| | | | |
Net increase in net assets resulting from operations | | $ | 7,800,156 | |
| | | | |
| |
** Net of foreign interest withholding taxes in the amount of | | | $168 | |
The accompanying notes are an integral part of these financial statements.
| | | | | | |
| Statement of changes in net assets | | Wells Fargo Advantage Short-Term Bond Fund | | | 23 | |
| | | | | | | | | | | | | | | | |
| | | Six months ended
February 28, 2014
(unaudited) | | | Year ended
August 31, 2013 | |
| | | | |
Operations | | | | | | | | | | | | | | | | |
Net investment income | | | | | | $ | 3,866,663 | | | | | | | $ | 7,271,403 | |
Net realized gains on investments | | | | | | | 696,017 | | | | | | | | 3,042,972 | |
Net change in unrealized gains (losses) on investments | | | | | | | 3,237,476 | | | | | | | | (5,844,682 | ) |
| | | | |
Net increase in net assets resulting from operations | | | | | | | 7,800,156 | | | | | | | | 4,469,693 | |
| | | | |
| | | | |
Distributions to shareholders from | | | | | | | | | | | | | | | | |
Net investment income | | | | | | | | | | | | | | | | |
Class A | | | | | | | (417,700 | ) | | | | | | | (765,025 | ) |
Class C | | | | | | | (33,546 | ) | | | | | | | (77,500 | ) |
Institutional Class | | | | | | | (2,119,999 | ) | | | | | | | (3,571,064 | ) |
Investor Class | | | | | | | (1,408,490 | ) | | | | | | | (2,857,617 | ) |
| | | | |
Total distributions to shareholders | | | | | | | (3,979,735 | ) | | | | | | | (7,271,206 | ) |
| | | | |
| | | | |
Capital share transactions | | | Shares | | | | | | | | Shares | | | | | |
Proceeds from shares sold | | | | | | | | | | | | | | | | |
Class A | | | 2,871,354 | | | | 25,246,036 | | | | 4,511,065 | | | | 39,715,808 | |
Class C | | | 366,171 | | | | 3,217,089 | | | | 802,264 | | | | 7,057,514 | |
Institutional Class | | | 15,550,877 | | | | 136,861,317 | | | | 21,596,913 | | | | 190,360,131 | |
Investor Class | | | 3,484,644 | | | | 30,634,865 | | | | 6,399,086 | | | | 56,331,030 | |
| | | | |
| | | | | | | 195,959,307 | | | | | | | | 293,464,483 | |
| | | | |
Reinvestment of distributions | | | | | | | | | | | | | | | | |
Class A | | | 40,702 | | | | 358,188 | | | | 75,025 | | | | 660,884 | |
Class C | | | 3,134 | | | | 27,537 | | | | 7,821 | | | | 68,854 | |
Institutional Class | | | 138,680 | | | | 1,220,734 | | | | 216,233 | | | | 1,904,254 | |
Investor Class | | | 149,164 | | | | 1,311,994 | | | | 296,167 | | | | 2,607,124 | |
| | | | |
| | | | | | | 2,918,453 | | | | | | | | 5,241,116 | |
| | | | |
Payment for shares redeemed | | | | | | | | | | | | | | | | |
Class A | | | (1,530,887 | ) | | | (13,468,784 | ) | | | (4,941,438 | ) | | | (43,537,034 | ) |
Class C | | | (466,251 | ) | | | (4,095,183 | ) | | | (1,007,483 | ) | | | (8,862,824 | ) |
Institutional Class | | | (5,990,350 | ) | | | (52,603,330 | ) | | | (23,189,763 | ) | | | (204,359,095 | ) |
Investor Class | | | (3,767,626 | ) | | | (33,105,884 | ) | | | (6,579,452 | ) | | | (57,918,194 | ) |
| | | | |
| | | | | | | (103,273,181 | ) | | | | | | | (314,677,147 | ) |
| | | | |
Net increase (decrease) in net assets resulting from capital share transactions | | | | | | | 95,604,579 | | | | | | | | (15,971,548 | ) |
| | | | |
Total increase (decrease) in net assets | | | | | | | 99,425,000 | | | | | | | | (18,773,061 | ) |
| | | | |
| | | | |
Net assets | | | | | | | | | | | | | | | | |
Beginning of period | | | | | | | 599,741,325 | | | | | | | | 618,514,386 | |
| | | | |
End of period | | | | | | $ | 699,166,325 | | | | | | | $ | 599,741,325 | |
| | | | |
Undistributed net investment income | | | | | | $ | 145,691 | | | | | | | $ | 258,763 | |
| | | | |
The accompanying notes are an integral part of these financial statements.
| | | | |
| 24 | | Wells Fargo Advantage Short-Term Bond Fund | | Financial highlights |
(For a share outstanding throughout each period)
| | | | | | | | | | | | | | | | | | | | | | | | | | | | |
| | | Six months ended
February 28, 2014
(unaudited) | | | Year ended August 28 | | | Year ended May 31 | |
| CLASS A | | | 2013 | | | 2012 | | | 2011 | | | 20101 | | | 2010 | | | 20092 | |
Net asset value, beginning of period | | $ | 8.77 | | | $ | 8.81 | | | $ | 8.76 | | | $ | 8.73 | | | $ | 8.66 | | | $ | 8.23 | | | $ | 8.38 | |
Net investment income | | | 0.05 | | | | 0.10 | | | | 0.14 | | | | 0.16 | | | | 0.05 | | | | 0.23 | | | | 0.32 | |
Net realized and unrealized gains (losses) on investments | | | 0.05 | | | | (0.04 | ) | | | 0.05 | | | | 0.04 | | | | 0.07 | | | | 0.46 | | | | (0.15 | ) |
| | | | | | | | | | | | | | | | | | | | | | | | | | | | |
Total from investment operations | | | 0.10 | | | | 0.06 | | | | 0.19 | | | | 0.20 | | | | 0.12 | | | | 0.69 | | | | 0.17 | |
Distributions to shareholders from | | | | | | | | | | | | | | | | | | | | | | | | | | | | |
Net investment income | | | (0.05 | ) | | | (0.10 | ) | | | (0.14 | ) | | | (0.17 | ) | | | (0.05 | ) | | | (0.26 | ) | | | (0.32 | ) |
Net asset value, end of period | | $ | 8.82 | | | $ | 8.77 | | | $ | 8.81 | | | $ | 8.76 | | | $ | 8.73 | | | $ | 8.66 | | | $ | 8.23 | |
Total return3 | | | 1.15 | % | | | 0.72 | % | | | 2.22 | % | | | 2.33 | % | | | 1.37 | % | | | 8.43 | % | | | 2.14 | % |
Ratios to average net assets (annualized) | | | | | | | | | | | | | | | | | | | | | | | | | | | | |
Gross expenses | | | 0.83 | % | | | 0.87 | % | | | 0.90 | % | | | 0.89 | % | | | 0.89 | % | | | 0.93 | % | | | 0.95 | % |
Net expenses | | | 0.79 | % | | | 0.80 | % | | | 0.80 | % | | | 0.80 | % | | | 0.80 | % | | | 0.80 | % | | | 0.80 | % |
Net investment income | | | 1.13 | % | | | 1.17 | % | | | 1.63 | % | | | 1.84 | % | | | 2.05 | % | | | 2.64 | % | | | 3.86 | % |
Supplemental data | | | | | | | | | | | | | | | | | | | | | | | | | | | | |
Portfolio turnover rate | | | 36 | % | | | 75 | % | | | 44 | % | | | 51 | % | | | 11 | % | | | 45 | % | | | 50 | % |
Net assets, end of period (000s omitted) | | | $78,398 | | | | $65,812 | | | | $69,247 | | | | $56,555 | | | | $47,121 | | | | $41,369 | | | | $16,456 | |
| 1. | For the three months ended August 31, 2010. The Fund changed its fiscal year end from May 31 to August 31, effective August 31, 2010. |
| 2. | On June 20, 2008, Advisor Class was renamed Class A. |
| 3. | Total return calculations do not include any sales charges. Returns for periods of less than one year are not annualized. |
The accompanying notes are an integral part of these financial statements.
| | | | | | |
| Financial highlights | | Wells Fargo Advantage Short-Term Bond Fund | | | 25 | |
(For a share outstanding throughout each period)
| | | | | | | | | | | | | | | | | | | | | | | | | | | | |
| | | Six months ended
February 28, 2014
(unaudited) | | | Year ended August 28 | | | Year ended May 31 | |
| CLASS C | | | 2013 | | | 2012 | | | 2011 | | | 20101 | | | 2010 | | | 2009 | |
Net asset value, beginning of period | | $ | 8.76 | | | $ | 8.80 | | | $ | 8.75 | | | $ | 8.73 | | | $ | 8.65 | | | $ | 8.22 | | | $ | 8.37 | |
Net investment income | | | 0.02 | | | | 0.04 | | | | 0.08 | | | | 0.10 | | | | 0.03 | | | | 0.16 | | | | 0.26 | |
Net realized and unrealized gains (losses) on investments | | | 0.05 | | | | (0.04 | ) | | | 0.05 | | | | 0.03 | | | | 0.08 | | | | 0.46 | | | | (0.15 | ) |
| | | | | | | | | | | | | | | | | | | | | | | | | | | | |
Total from investment operations | | | 0.07 | | | | 0.00 | | | | 0.13 | | | | 0.13 | | | | 0.11 | | | | 0.62 | | | | 0.11 | |
Distributions to shareholders from | | | | | | | | | | | | | | | | | | | | | | | | | | | | |
Net investment income | | | (0.02 | ) | | | (0.04 | ) | | | (0.08 | ) | | | (0.11 | ) | | | (0.03 | ) | | | (0.19 | ) | | | (0.26 | ) |
Net asset value, end of period | | $ | 8.81 | | | $ | 8.76 | | | $ | 8.80 | | | $ | 8.75 | | | $ | 8.73 | | | $ | 8.65 | | | $ | 8.22 | |
Total return2 | | | 0.78 | % | | | (0.03 | )% | | | 1.46 | % | | | 1.45 | % | | | 1.29 | % | | | 7.61 | % | | | 1.35 | % |
Ratios to average net assets (annualized) | | | | | | | | | | | | | | | | | | | | | | | | | | | | |
Gross expenses | | | 1.59 | % | | | 1.62 | % | | | 1.65 | % | | | 1.65 | % | | | 1.65 | % | | | 1.68 | % | | | 1.67 | % |
Net expenses | | | 1.54 | % | | | 1.55 | % | | | 1.55 | % | | | 1.55 | % | | | 1.55 | % | | | 1.55 | % | | | 1.53 | % |
Net investment income | | | 0.37 | % | | | 0.42 | % | | | 0.89 | % | | | 1.10 | % | | | 1.28 | % | | | 1.70 | % | | | 2.72 | % |
Supplemental data | | | | | | | | | | | | | | | | | | | | | | | | | | | | |
Portfolio turnover rate | | | 36 | % | | | 75 | % | | | 44 | % | | | 51 | % | | | 11 | % | | | 45 | % | | | 50 | % |
Net assets, end of period (000s omitted) | | | $15,934 | | | | $16,686 | | | | $18,501 | | | | $19,510 | | | | $14,299 | | | | $11,050 | | | | $1,199 | |
| 1. | For the three months ended August 31, 2010. The Fund changed its fiscal year end from May 31 to August 31, effective August 31, 2010. |
| 2. | Total return calculations do not include any sales charges. Returns for periods of less than one year are not annualized. |
The accompanying notes are an integral part of these financial statements.
| | | | |
| 26 | | Wells Fargo Advantage Short-Term Bond Fund | | Financial highlights |
(For a share outstanding throughout each period)
| | | | | | | | | | | | | | | | | | | | | | | | | | | | |
| | | Six months ended
February 28, 2014
(unaudited) | | | Year ended February 28 | | | Year ended May 31 | |
| INSTITUTIONAL CLASS | | | 2013 | | | 2012 | | | 2011 | | | 20101 | | | 2010 | | | 2009 | |
Net asset value, beginning of period | | $ | 8.77 | | | $ | 8.81 | | | $ | 8.77 | | | $ | 8.74 | | | $ | 8.66 | | | $ | 8.24 | | | $ | 8.39 | |
Net investment income | | | 0.06 | | | | 0.13 | | | | 0.17 | | | | 0.19 | | | | 0.06 | | | | 0.25 | | | | 0.35 | |
Net realized and unrealized gains (losses) on investments | | | 0.05 | | | | (0.04 | ) | | | 0.04 | | | | 0.04 | | | | 0.08 | | | | 0.45 | | | | (0.15 | ) |
| | | | | | | | | | | | | | | | | | | | | | | | | | | | |
Total from investment operations | | | 0.11 | | | | 0.09 | | | | 0.21 | | | | 0.23 | | | | 0.14 | | | | 0.70 | | | | 0.20 | |
Distributions to shareholders from | | | | | | | | | | | | | | | | | | | | | | | | | | | | |
Net investment income | | | (0.06 | ) | | | (0.13 | ) | | | (0.17 | ) | | | (0.20 | ) | | | (0.06 | ) | | | (0.28 | ) | | | (0.35 | ) |
Net asset value, end of period | | $ | 8.82 | | | $ | 8.77 | | | $ | 8.81 | | | $ | 8.77 | | | $ | 8.74 | | | $ | 8.66 | | | $ | 8.24 | |
Total return2 | | | 1.31 | % | | | 1.04 | % | | | 2.43 | % | | | 2.66 | % | | | 1.57 | % | | | 8.65 | % | | | 2.47 | % |
Ratios to average net assets (annualized) | | | | | | | | | | | | | | | | | | | | | | | | | | | | |
Gross expenses | | | 0.50 | % | | | 0.53 | % | | | 0.57 | % | | | 0.56 | % | | | 0.56 | % | | | 0.58 | % | | | 0.59 | % |
Net expenses | | | 0.48 | % | | | 0.48 | % | | | 0.48 | % | | | 0.48 | % | | | 0.48 | % | | | 0.48 | % | | | 0.48 | % |
Net investment income | | | 1.44 | % | | | 1.47 | % | | | 1.95 | % | | | 2.17 | % | | | 2.38 | % | | | 2.84 | % | | | 4.22 | % |
Supplemental data | | | | | | | | | | | | | | | | | | | | | | | | | | | | |
Portfolio turnover rate | | | 36 | % | | | 75 | % | | | 44 | % | | | 51 | % | | | 11 | % | | | 45 | % | | | 50 | % |
Net assets, end of period (000s omitted) | | | $356,363 | | | | $269,123 | | | | $282,512 | | | | $327,124 | | | | $292,080 | | | | $285,559 | | | | $77,900 | |
| 1. | For the three months ended August 31, 2010. The Fund changed its fiscal year end from May 31 to August 31, effective August 31, 2010. |
| 2. | Returns for periods of less than one year are not annualized. |
The accompanying notes are an integral part of these financial statements.
| | | | | | |
| Financial highlights | | Wells Fargo Advantage Short-Term Bond Fund | | | 27 | |
(For a share outstanding throughout each period)
| | | | | | | | | | | | | | | | | | | | | | | | | | | | |
| | | Six months ended
February 28, 2014
(unaudited) | | | Year ended August 31 | | | Year ended May 31 | |
| INVESTOR CLASS | | | 2013 | | | 2012 | | | 2011 | | | 20101 | | | 2010 | | | 2009 | |
Net asset value, beginning of period | | $ | 8.76 | | | $ | 8.80 | | | $ | 8.76 | | | $ | 8.73 | | | $ | 8.66 | | | $ | 8.23 | | | $ | 8.38 | |
Net investment income | | | 0.05 | | | | 0.10 | | | | 0.14 | | | | 0.16 | | | | 0.05 | | | | 0.23 | | | | 0.32 | |
Net realized and unrealized gains (losses) on investments | | | 0.06 | | | | (0.04 | ) | | | 0.04 | | | | 0.04 | | | | 0.07 | | | | 0.45 | | | | (0.15 | ) |
| | | | | | | | | | | | | | | | | | | | | | | | | | | | |
Total from investment operations | | | 0.11 | | | | 0.06 | | | | 0.18 | | | | 0.20 | | | | 0.12 | | | | 0.68 | | | | 0.17 | |
Distributions to shareholders from | | | | | | | | | | | | | | | | | | | | | | | | | | | | |
Net investment income | | | (0.05 | ) | | | (0.10 | ) | | | (0.14 | ) | | | (0.17 | ) | | | (0.05 | ) | | | (0.25 | ) | | | (0.32 | ) |
Net asset value, end of period | | $ | 8.82 | | | $ | 8.76 | | | $ | 8.80 | | | $ | 8.76 | | | $ | 8.73 | | | $ | 8.66 | | | $ | 8.23 | |
Total return2 | | | 1.26 | % | | | 0.70 | % | | | 2.08 | % | | | 2.30 | % | | | 1.36 | % | | | 8.38 | % | | | 2.09 | % |
Ratios to average net assets (annualized) | | | | | | | | | | | | | | | | | | | | | | | | | | | | |
Gross expenses | | | 0.86 | % | | | 0.90 | % | | | 0.93 | % | | | 0.92 | % | | | 0.94 | % | | | 0.99 | % | | | 0.99 | % |
Net expenses | | | 0.80 | % | | | 0.82 | % | | | 0.83 | % | | | 0.83 | % | | | 0.84 | % | | | 0.85 | % | | | 0.85 | % |
Net investment income | | | 1.11 | % | | | 1.15 | % | | | 1.61 | % | | | 1.82 | % | | | 2.02 | % | | | 2.73 | % | | | 3.87 | % |
Supplemental data | | | | | | | | | | | | | | | | | | | | | | | | | | | | |
Portfolio turnover rate | | | 36 | % | | | 75 | % | | | 44 | % | | | 51 | % | | | 11 | % | | | 45 | % | | | 50 | % |
Net assets, end of period (000s omitted) | | | $248,471 | | | | $248,120 | | | | $248,254 | | | | $248,514 | | | | $266,746 | | | | $267,625 | | | | $250,572 | |
| 1. | For the three months ended August 31, 2010. The Fund changed its fiscal year end from May 31 to August 31, effective August 31, 2010. |
| 2. | Returns for periods of less than one year are not annualized. |
The accompanying notes are an integral part of these financial statements.
| | | | |
| 28 | | Wells Fargo Advantage Short-Term Bond Fund | | Notes to financial statements (unaudited) |
1. ORGANIZATION
Wells Fargo Funds Trust (the “Trust”), a Delaware statutory trust organized on March 10, 1999, is an open-end management investment company registered under the Investment Company Act of 1940, as amended (the “1940 Act”). These financial statements report on the Wells Fargo Advantage Short-Term Bond Fund (the “Fund”) which is a diversified series of the Trust.
2. SIGNIFICANT ACCOUNTING POLICIES
The following significant accounting policies, which are consistently followed in the preparation of the financial statements of the Fund, are in conformity with U.S. generally accepted accounting principles which require management to make estimates and assumptions that affect the reported amounts of assets and liabilities, disclosure of contingent assets and liabilities at the date of the financial statements, and the reported amounts of revenues and expenses during the reporting period. Actual results could differ from those estimates.
Securities valuation
All investments are valued each business day as of the close of regular trading on the New York Stock Exchange (generally 4 p.m. Eastern Time).
Fixed income securities acquired with maturities exceeding 60 days are valued based on evaluated bid prices provided by an independent pricing service which may utilize both transaction data and market information such as yield, quality, coupon rate, maturity, type of issue, trading characteristics and other market data. If prices are not available from the independent pricing service or prices received are deemed not representative of market value, prices will be obtained from an independent broker-dealer or otherwise determined based on the Fund’s Valuation Procedures.
Short-term securities, with maturities of 60 days or less at time of purchase, generally are valued at amortized cost which approximates fair value. The amortized cost method involves valuing a security at its cost, plus accretion of discount or minus amortization of premium over the period until maturity.
Equity securities and futures that are listed on a foreign or domestic exchange or market are valued at the official closing price or, if none, the last sales price. If no sale occurs on the primary exchange or market for the security that day, the prior day’s price will be deemed “stale” and fair values will be determined in accordance with the Fund’s Valuation Procedures.
Investments in registered open-end investment companies are valued at net asset value. Non-registered investment vehicles are fair valued at net asset value.
Investments which are not valued using any of the methods discussed above are valued at their fair value, as determined in good faith by the Board of Trustees of the Fund. The Board of Trustees has established a Valuation Committee comprised of the Trustees and has delegated to it the authority to take any actions regarding the valuation of portfolio securities that the Valuation Committee deems necessary or appropriate, including determining the fair value of portfolio securities, unless the determination has been delegated to the Management Valuation Team of Wells Fargo Funds Management, LLC (“Funds Management”). The Board of Trustees retains the authority to make or ratify any valuation decisions or approve any changes to the Valuation Procedures as it deems appropriate. On a quarterly basis, the Board of Trustees receives reports on any valuation actions taken by the Valuation Committee or the Management Valuation Team which may include items for ratification.
Valuations of fair valued securities are compared to the next actual sales price when available, or other appropriate market values, to assess the continued appropriateness of the fair valuation methodologies used. These securities are fair valued on a day-to-day basis, taking into consideration changes to appropriate market information and any significant changes to the inputs considered in the valuation process until there is a readily available price provided on an exchange or by an independent pricing service. Valuations received from an independent pricing service or independent broker-dealer quotes are periodically validated by comparisons to most recent trades and valuations provided by other independent pricing services in addition to the review of prices by the adviser and/or subadviser. Unobservable inputs used in determining fair valuations are identified based on the type of security, taking into consideration factors utilized by market participants in valuing the investment, knowledge about the issuer and the current market environment.
Security loans
The Fund may lend its securities from time to time in order to earn additional income in the form of fees or interest on securities received as collateral or the investment of any cash received as collateral. The Fund continues to receive interest or dividends on the securities loaned. The Fund receives collateral in the form of cash or securities with a value at least equal to the value of the securities on loan. The value of the loaned securities is determined at the close of each
| | | | | | |
| Notes to financial statements (unaudited) | | Wells Fargo Advantage Short-Term Bond Fund | | | 29 | |
business day and any additional required collateral is delivered to the Fund on the next business day. In a securities lending transaction, the net asset value of the Fund will be affected by an increase or decrease in the value of the securities loaned and by an increase or decrease in the value of the instrument in which collateral is invested. The amount of securities lending activity undertaken by the Fund fluctuates from time to time. In the event of default or bankruptcy by the borrower, the Fund may be prevented from recovering the loaned securities or gaining access to the collateral or may experience delays or costs in doing so. In addition, the investment of any cash collateral received may lose all or part of its value. The Fund has the right under the lending agreement to recover the securities from the borrower on demand.
The Fund lends its securities through an unaffiliated securities lending agent. Cash collateral received in connection with its securities lending transactions is invested in Wells Fargo Securities Lending Cash Investments, LLC (the “Securities Lending Fund”). The Securities Lending Fund is exempt from registration under Section 3(c)(7) of the 1940 Act and is managed by Funds Management and is subadvised by Wells Capital Management Incorporated (“WellsCap”). Funds Management receives an advisory fee starting at 0.05% and declining to 0.01% as the average daily net assets of the Securities Lending Fund increase. All of the fees received by Funds Management are paid to WellsCap for its services as subadviser. The Securities Lending Fund seeks to provide a positive return compared to the daily Fed Funds Open rate by investing in high-quality, U.S. dollar-denominated short-term money market instruments. Securities Lending Fund investments are fair valued based upon the amortized cost valuation technique. Income earned from investment in the Securities Lending Fund is included in securities lending income on the Statement of Operations.
When-issued transactions
The Fund may purchase securities on a forward commitment or when-issued basis. The Fund records a when-issued transaction on the trade date and will segregate assets in an amount at least equal in value to the Fund’s commitment to purchase when-issued securities. Securities purchased on a when-issued basis are marked-to-market daily and the Fund begins earning interest on the settlement date. Losses may arise due to changes in the market value of the underlying securities or if the counterparty does not perform under the contract.
Futures contracts
The Fund may be subject to interest rate risk in the normal course of pursuing its investment objectives. The Fund may buy and sell futures contracts in order to gain exposure to, or protect against, changes in security values and interest rates. The primary risks associated with the use of futures contracts are the imperfect correlation between changes in market values of securities held by the Fund and the prices of futures contracts, and the possibility of an illiquid market.
The aggregate principal amounts of the contracts are not recorded in the financial statements. Fluctuations in the value of the contracts are recorded in the Statement of Assets and Liabilities as an asset or liability and in the Statement of Operations as unrealized gains or losses until the contracts are closed, at which point they are recorded as net realized gains or losses on futures contracts. With futures contracts, there is minimal counterparty risk to the Fund since futures are exchange traded and the exchange’s clearinghouse, as counterparty to all exchange traded futures, guarantees the futures against default.
Security transactions and income recognition
Securities transactions are recorded on a trade date basis. Realized gains or losses are recorded on the basis of identified cost.
Interest income is accrued daily and bond discounts are accreted and premiums are amortized daily based on the effective interest method. To the extent debt obligations are placed on non-accrual status, any related interest income may be reduced by writing off interest receivables when the collection of all or a portion of interest has become doubtful based on consistently applied procedures. If the issuer subsequently resumes interest payments or when the collectability of interest is reasonably assured, the debt obligation is removed from non-accrual status.
Dividend income is recognized on the ex-dividend date.
Income from foreign securities is recorded net of foreign taxes withheld where recovery of such taxes is not assured.
Distributions to shareholders
Distributions to shareholders from net investment income are accrued daily and paid monthly. Distributions from net realized gains, if any, are recorded on the ex-dividend date. Such distributions are determined in conformity with federal income tax regulations, which may differ in amount or character from net investment income and realized gains recognized for purposes of U.S. generally accepted accounting principles.
Federal and other taxes
The Fund intends to continue to qualify as a regulated investment company by distributing substantially all of its investment company taxable income and any net realized capital gains (after reduction for capital loss carryforwards) sufficient to relieve it from all, or substantially all, federal income taxes. Accordingly, no provision for federal income taxes was required.
| | | | |
| 30 | | Wells Fargo Advantage Short-Term Bond Fund | | Notes to financial statements (unaudited) |
The Fund’s income and federal excise tax returns and all financial records supporting those returns for the prior three fiscal years are subject to examination by the federal and Delaware revenue authorities. Management has analyzed the Fund’s tax positions taken on federal, state, and foreign tax returns for all open tax years and does not believe that there are any uncertain tax positions that require recognition of a tax liability.
As of August 31, 2013, the Fund had capital loss carryforwards which consisted of $385,934 in long-term capital losses.
Class allocations
The separate classes of shares offered by the Fund differ principally in applicable sales charges, distribution, shareholder servicing, and administration fees. Shareholders of each class bear certain expenses that pertain to that particular class. All shareholders bear the common expenses of the Fund, earn income from the portfolio, and are allocated any unrealized gains and losses pro rata based on the average daily net assets of each class, without distinction between share classes. Dividends are determined separately for each class based on income and expenses allocable to each class. Realized gains and losses are allocated to each class pro rata based upon the net assets of each class on the date realized. Differences in per share dividend rates generally result from the relative weightings of pro rata income and realized gain allocations and from differences in separate class expenses, including distribution, shareholder servicing, and administration fees.
3. FAIR VALUATION MEASUREMENTS
Fair value measurements of investments are determined within a framework that has established a fair value hierarchy based upon the various data inputs utilized in determining the value of the Fund’s investments. The three-level hierarchy gives the highest priority to unadjusted quoted prices in active markets for identical assets or liabilities (Level 1) and the lowest priority to significant unobservable inputs (Level 3). The Fund’s investments are classified within the fair value hierarchy based on the lowest level of input that is significant to the fair value measurement. The inputs are summarized into three broad levels as follows:
| n | | Level 1 – quoted prices in active markets for identical securities |
| n | | Level 2 – other significant observable inputs (including quoted prices for similar securities, interest rates, prepayment speeds, credit risk, use of amortized cost, etc.) |
| n | | Level 3 – significant unobservable inputs (including the Fund’s own assumptions in determining the fair value of investments) |
The inputs or methodologies used for valuing investments in securities are not necessarily an indication of the risk associated with investing in those securities.
As of February 28, 2014, the inputs used in valuing investments in securities were as follows:
| | | | | | | | | | | | | | | | |
| Investments in securities | | Quoted prices (Level 1) | | | Other significant
observable inputs (Level 2) | | | Significant unobservable inputs (Level 3) | | | Total | |
Agency securities | | $ | 0 | | | $ | 112,129,132 | | | $ | 0 | | | $ | 112,129,132 | |
Asset-backed securities | | | 0 | | | | 57,873,882 | | | | 0 | | | | 57,873,882 | |
Corporate bonds and notes | | | 0 | | | | 286,691,578 | | | | 0 | | | | 286,691,578 | |
Municipal obligations | | | 0 | | | | 39,608,301 | | | | 4,253,500 | | | | 43,861,801 | |
Non-agency mortgage backed securities | | | 0 | | | | 60,568,475 | | | | 0 | | | | 60,568,475 | |
Equity securities | | | | | | | | | | | | | | | | |
Preferred stocks | | | 0 | | | | 0 | | | | 1,610,000 | | | | 1,610,000 | |
Yankee corporate bonds and notes | | | 0 | | | | 95,697,472 | | | | 0 | | | | 95,697,472 | |
Short-term investments | | | | | | | | | | | | | | | | |
Investment companies | | | 43,314,863 | | | | 0 | | | | 0 | | | | 43,314,863 | |
U.S. Treasury securities | | | 299,996 | | | | 0 | | | | 0 | | | | 299,996 | |
| | | $ | 43,614,859 | | | $ | 652,568,840 | | | $ | 5,863,500 | | | $ | 702,047,199 | |
| | | | | | |
| Notes to financial statements (unaudited) | | Wells Fargo Advantage Short-Term Bond Fund | | | 31 | |
As of February 28, 2014, the inputs used in valuing the Fund’s other financial instruments were as follows:
| | | | | | | | | | | | | | | | |
| Other financial instruments | | Quoted prices (Level 1) | | | Other significant
observable inputs (Level 2) | | | Significant unobservable inputs (Level 3) | | | Total | |
Futures contracts | | $ | (51,152 | )* | | $ | 0 | | | $ | 0 | | | $ | (51,152 | ) |
| * | Amount represents the net unrealized losses. |
Transfers in and transfers out are recognized at the end of the reporting period. For the six months ended February 28, 2014, the Fund did not have any transfers into/out of Level 1, Level 2, or Level 3.
4. TRANSACTIONS WITH AFFILIATES AND OTHER EXPENSES
Advisory fee
The Trust has entered into an advisory contract with Funds Management, an indirect wholly owned subsidiary of Wells Fargo & Company (“Wells Fargo”). The adviser is responsible for implementing investment policies and guidelines and for supervising the subadviser, who is responsible for day-to-day portfolio management of the Fund.
Pursuant to the contract, Funds Management is entitled to receive an annual advisory fee starting at 0.30% and declining to 0.225% as the average daily net assets of the Fund increase. Prior to January 1, 2014, Funds Management was entitled to receive an annual advisory fee starting at 0.35% and declining to 0.25% as the average daily net assets of the Fund increased. For the six months ended February 28, 2014, the advisory fee was equivalent to an annual rate of 0.33% of the Fund’s average daily net assets.
Funds Management has retained the services of a subadviser to provide daily portfolio management to the Fund. The fee for subadvisory services is borne by Funds Management. WellsCap, an affiliate of Funds Management and an indirect, wholly owned subsidiary of Wells Fargo, is the subadviser to the Fund and is entitled to receive a fee from Funds Management at an annual rate starting at 0.15% and declining to 0.05% as the average daily net assets of the Fund increase.
Administration and transfer agent fees
The Trust has entered into an administration agreement with Funds Management. Under this agreement, for providing administrative services, which includes paying fees and expenses for services provided by the transfer agent, sub-transfer agents, omnibus account servicers and record-keepers, Funds Management is entitled to receive from the Fund an annual fund level administration fee starting at 0.05% and declining to 0.03% as the average daily net assets of the Fund increase and a class level administration fee which is calculated based on the average daily net assets of each class as follows:
| | | | |
| | | Class level
administration fee | |
Class A, Class C | | | 0.16 | % |
Institutional Class | | | 0.08 | |
Investor Class | | | 0.19 | |
Funds Management has contractually waived and/or reimbursed advisory and administration fees to the extent necessary to maintain certain net operating expense ratios for the Fund. Waiver of fees and/or reimbursement of expenses by Funds Management were made first from fund level expenses on a proportionate basis and then from class specific expenses. Funds Management has committed through December 31, 2014 to waive fees and/or reimburse expenses to the extent necessary to cap the Fund’s expenses at 0.77% for Class A shares, 1.52% for Class C shares, 0.48% for Institutional Class shares, and 0.78% for Investor Class shares. Prior to January 1, 2014, the Fund’s expenses were capped at 0.80% for Class A shares, 1.55% for Class B shares, 1.55% for Class C shares, and 0.81% for Investor Class shares.
Distribution fees
The Trust has adopted a Distribution Plan for Class C shares of the Fund pursuant to Rule 12b-1 under the 1940 Act. Distribution fees are charged to Class C shares and paid to Wells Fargo Funds Distributor, LLC, the principal underwriter, at an annual rate of 0.75% of the average daily net assets of Class C shares.
For the six months ended February 28, 2014, Wells Fargo Funds Distributor, LLC received $497 from the sale of Class A shares and $107 and $100 in contingent deferred sales charges from redemptions of Class A and Class C shares, respectively.
| | | | |
| 32 | | Wells Fargo Advantage Short-Term Bond Fund | | Notes to financial statements (unaudited) |
Shareholder servicing fees
The Trust has entered into contracts with one or more shareholder servicing agents, whereby Class A, Class C, and Investor Class of the Fund is charged a fee at an annual rate of 0.25% of the average daily net assets of each respective class.
A portion of these total shareholder servicing fees were paid to affiliates of Wells Fargo.
5. INVESTMENT PORTFOLIO TRANSACTIONS
Purchases and sales of investments, excluding short-term securities, for the six months ended February 28, 2014 were as follows:
| | | | | | |
Purchases at cost | | Sales proceeds |
U.S.
government | | Non-U.S.
government | | U.S.
government | | Non-U.S.
government |
| $50,572,710 | | $283,307,917 | | $10,577,284 | | $208,244,402 |
6. DERIVATIVE TRANSACTIONS
During the six months ended February 28, 2014, the Fund entered into futures contracts for to speculate on interest rates and to help manage the duration of the portfolio.
At February 28, 2014, the Fund had long and short futures contracts outstanding as follows:
| | | | | | | | | | | | | | |
| Expiration date | | Counterparty | | Contracts | | Type | | Contract value at February 28, 2014 | | | Unrealized
gains (losses) | |
| 6-30-2014 | | JPMorgan | | 842 Long | | 2-Year U.S. Treasury Notes | | $ | 185,134,750 | | | $ | 22,479 | |
| 6-30-2014 | | JPMorgan | | 328 Short | | 5-Year U.S. Treasury Notes | | | 39,313,875 | | | | (73,631 | ) |
The Fund had an average notional amount of $152,059,955 and $44,534,800 in long and short futures contracts, respectively, during the six months ended February 28, 2014.
On February 28, 2014, the cumulative unrealized loss on futures contracts in the amount of $51,152 are reflected in net unrealized gains on investments on the Statement of Assets and Liabilities. The receivable and payable for daily variation margin on open futures contracts reflected in the Statement of Assets and Liabilities only represents the current day’s variation margin. The realized losses and change in unrealized gains (losses) on futures contracts are reflected in the Statement of Operations.
For certain types of derivative transactions, the Fund has entered into International Swaps and Derivatives Association, Inc. master agreements (“ISDA Master Agreements”) or similar agreements with approved counterparties. The ISDA Master Agreements or similar agreements may have requirements to deliver/deposit securities or cash to/with an exchange or broker-dealer as collateral and allows the Fund to offset, with each counterparty, certain derivative financial instrument’s assets and/or liabilities with collateral held or pledged. Collateral requirements differ by type of derivative. Collateral or margin requirements are set by the broker or exchange clearing house for exchange traded derivatives while collateral terms are contract specific for over-the-counter traded. Cash collateral that has been pledged to cover obligations of the Fund under derivative contracts, if any, will be reported separately in the Statement of Assets and Liabilities. Securities pledged as collateral, if any, for the same purpose are noted in the Portfolio of Investments. With respect to balance sheet offsetting, absent an event of default by the counterparty or a termination of the agreement, the reported amounts of financial assets and financial liabilities in the Statement of Assets and Liabilities are not offset across transactions between the Fund and the applicable counterparty. A reconciliation of the gross amounts on the Statement of Assets and Liabilities to the net amounts by derivative type, including any collateral exposure, is as follows:
| | | | | | | | | | | | | | | | | | |
| Derivative type | | Counterparty | | Gross amounts of
assets in the Statement
of Assets and Liabilities | | | Amounts subject
to netting
agreements | | | Collateral
received | | | Net
amount | |
Futures – variation margin | | JPMorgan | | $ | 38,438 | | | $ | (23,671 | ) | | $ | 0 | | | $ | 14,767 | |
| | | | | | | | | | | | | | | | | | |
| Derivative type | | Counterparty | | Gross amounts of
liabilities in the Statement
of Assets and Liabilities | | | Amounts subject
to netting
agreements | | | Collateral
pledged | | | Net
amount | |
Futures – variation margin | | JPMorgan | | $ | 23,671 | | | $ | (23,671 | ) | | $ | 0 | | | $ | 0 | |
| | | | | | |
| Notes to financial statements (unaudited) | | Wells Fargo Advantage Short-Term Bond Fund | | | 33 | |
7. CAPITAL SHARES
As a result of the transfer of assets from Funds Management, former program manager of the 529 college savings plans for the State of Wisconsin, to a new program manager, the Fund redeemed assets from its Institutional Class on October 26, 2012 with a value of $96,706,612, representing 16.1% of the Fund. This amount is reflected in the Statement of Changes in Net Assets for the year ended August 31, 2013.
8. BANK BORROWINGS
The Trust (excluding the money market funds and certain other funds in the Trust) and Wells Fargo Variable Trust are parties to a $150,000,000 revolving credit agreement with State Street Bank and Trust Company, whereby the Fund is permitted to use bank borrowings for temporary or emergency purposes, such as to fund shareholder redemption requests. Interest under the credit agreement is charged to the Fund based on a borrowing rate equal to the higher of the Federal Funds rate in effect on that day plus 1.25% or the overnight LIBOR rate in effect on that day plus 1.25%. In addition, an annual commitment fee equal to 0.10% of the unused balance is allocated to each participating fund. For the six months ended February 28, 2014, the Fund paid $373 in commitment fees.
For the six months ended February 28, 2014, there were no borrowings by the Fund under the agreement.
9. INDEMNIFICATION
Under the Trust’s organizational documents, the officers and directors are indemnified against certain liabilities that may arise out of performance of their duties to the Trust. Additionally, in the normal course of business, the Trust may enter into contracts with service providers that contain a variety of indemnification clauses. The Trust’s maximum exposure under these arrangements is dependent on future claims that may be made against the Fund and, therefore, cannot be estimated.
| | | | |
| 34 | | Wells Fargo Advantage Short-Term Bond Fund | | Other information (unaudited) |
PROXY VOTING INFORMATION
A description of the policies and procedures that the Fund uses to determine how to vote proxies relating to portfolio securities is available without charge, upon request, by calling 1-800-222-8222, visiting our website at wellsfargoadvantagefunds.com, or visiting the SEC website at sec.gov. Information regarding how the Fund voted proxies relating to portfolio securities during the most recent 12-month period ended June 30 is available without charge on the Fund’s website at wellsfargoadvantagefunds.com or by visiting the SEC website at sec.gov.
PORTFOLIO HOLDINGS INFORMATION
The complete portfolio holdings for the Fund are publicly available on the Fund’s website (wellsfargoadvantagefunds.com) on a monthly, 30-day or more delayed basis. In addition, top ten holdings information for the Fund is publicly available on the Fund’s website on a monthly, seven-day or more delayed basis. The Fund files its complete schedule of portfolio holdings with the SEC for the first and third quarters of each fiscal year on Form N-Q, which is available without charge by visiting the SEC website at sec.gov. In addition, the Fund’s Form N-Q may be reviewed and copied at the SEC’s Public Reference Room in Washington, DC, and at regional offices in New York City, at 233 Broadway, and in Chicago, at 175 West Jackson Boulevard, Suite 900. Information about the Public Reference Room may be obtained by calling 1-800-SEC-0330.
| | | | | | |
| Other information (unaudited) | | Wells Fargo Advantage Short-Term Bond Fund | | | 35 | |
BOARD OF TRUSTEES AND OFFICERS
Each of the Trustees and Officers listed in the table below acts in identical capacities for each fund in the Wells Fargo Advantage family of funds, which consists of 132 mutual funds1 comprising the Wells Fargo Funds Trust, Wells Fargo Variable Trust, Wells Fargo Master Trust and four closed-end funds (collectively the “Fund Complex”). This table should be read in conjunction with the Prospectus and the Statement of Additional Information2. All of the Trustees are also Members of the Audit and Governance Committees of each Trust in the Fund Complex. The mailing address of each Trustee and Officer is 525 Market Street, 12th Floor, San Francisco, CA 94105. Each Trustee and Officer serves an indefinite term, however, each Trustee serves such term until reaching the mandatory retirement age established by the Trustees.
Independent Trustees
| | | | | | |
Name and year of birth | | Position held and length of service* | | Principal occupations during past five years | | Other directorships during
past five years |
| Peter G. Gordon (Born 1942) | | Trustee, since 1998; Chairman, since 2005 | | Co-Founder, Retired Chairman, President and CEO of Crystal Geyser Water Company. Trustee Emeritus, Colby College. | | Asset Allocation Trust |
| Isaiah Harris, Jr. (Born 1952) | | Trustee, since 2009 | | Retired. Prior thereto, President and CEO of BellSouth Advertising and Publishing Corp. from 2005 to 2007, President and CEO of BellSouth Enterprises from 2004 to 2005 and President of BellSouth Consumer Services from 2000 to 2003. Emeritus member of the Iowa State University Foundation Board of Governors. Emeritus Member of the Advisory Board of Iowa State University School of Business. Advisory Board Member, Palm Harbor Academy (charter school). Mr. Harris is a certified public accountant. | | CIGNA Corporation; Deluxe Corporation; Asset Allocation Trust |
| Judith M. Johnson (Born 1949) | | Trustee, since 2008; Audit Committee Chairman, since 2008 | | Retired. Prior thereto, Chief Executive Officer and Chief Investment Officer of Minneapolis Employees Retirement Fund from 1996 to 2008. Ms. Johnson is an attorney, certified public accountant and a certified managerial accountant. | | Asset Allocation Trust |
| Leroy Keith, Jr. (Born 1939) | | Trustee, since 2010 | | Chairman, Bloc Global Services (development and construction). Trustee of the Evergreen Funds from 1983 to 2010. Former Managing Director, Almanac Capital Management (commodities firm), former Partner, Stonington Partners, Inc. (private equity fund), former Director, Obagi Medical Products Co. and former Director, Lincoln Educational Services. | | Trustee, Virtus Fund Complex (consisting of 50 portfolios as of 12/16/2013); Asset Allocation Trust |
| David F. Larcker (Born 1950) | | Trustee, since 2009 | | James Irvin Miller Professor of Accounting at the Graduate School of Business, Stanford University, Morgan Stanley Director of the Center for Leadership Development and Research and Senior Faculty of The Rock Center for Corporate Governance since 2006. From 2005 to 2008, Professor of Accounting at the Graduate School of Business, Stanford University. Prior thereto, Ernst & Young Professor of Accounting at The Wharton School, University of Pennsylvania from 1985 to 2005. | | Asset Allocation Trust |
| Olivia S. Mitchell (Born 1953) | | Trustee, since 2006 | | International Foundation of Employee Benefit Plans Professor, Wharton School of the University of Pennsylvania since 1993. Director of Wharton’s Pension Research Council and Boettner Center on Pensions & Retirement Research, and Research Associate at the National Bureau of Economic Research. Previously, Cornell University Professor from 1978 to 1993. | | Asset Allocation Trust |
| Timothy J. Penny (Born 1951) | | Trustee, since 1996 | | President and CEO of Southern Minnesota Initiative Foundation, a non-profit organization, since 2007 and Senior Fellow at the Humphrey Institute Policy Forum at the University of Minnesota since 1995. Member of the Board of Trustees of NorthStar Education Finance, Inc., a non-profit organization, since 2007. | | Asset Allocation Trust |
| | | | |
| 36 | | Wells Fargo Advantage Short-Term Bond Fund | | Other information (unaudited) |
| | | | | | |
Name and year of birth | | Position held and length of service* | | Principal occupations during past five years | | Other directorships during
past five years |
| Michael S. Scofield (Born 1943) | | Trustee, since 2010 | | Served on the Investment Company Institute’s Board of Governors and Executive Committee from 2008-2011 as well the Governing Council of the Independent Directors Council from 2006-2011 and the Independent Directors Council Executive Committee from 2008-2011. Chairman of the IDC from 2008-2010. Institutional Investor (Fund Directions) Trustee of Year in 2007. Trustee of the Evergreen Funds (and its predecessors) from 1984 to 2010. Chairman of the Evergreen Funds from 2000-2010. Former Trustee of the Mentor Funds. Retired Attorney, Law Offices of Michael S. Scofield. | | Asset Allocation Trust |
| Donald C. Willeke (Born 1940) | | Trustee, since 1996 | | Principal of the law firm of Willeke & Daniels. General Counsel of the Minneapolis Employees Retirement Fund from 1984 until its consolidation into the Minnesota Public Employees Retirement Association on June 30, 2010. Director and Vice Chair of The Tree Trust (non-profit corporation). Director of the American Chestnut Foundation (non-profit corporation). | | Asset Allocation Trust |
| * | Length of service dates reflect the Trustee’s commencement of service with the Trust’s predecessor entities, where applicable. |
Officers
| | | | | | |
Name and year of birth | | Position held and
length of service | | Principal occupations during past five years | | |
Karla M. Rabusch (Born 1959) | | President, since 2003 | | Executive Vice President of Wells Fargo Bank, N.A. and President of Wells Fargo Funds Management, LLC since 2003. | | |
Nancy Wiser1 (Born 1967) | | Treasurer, since 2012 | | Executive Vice President of Wells Fargo Funds Management, LLC since 2011. Chief Operating Officer and Chief Compliance Officer at LightBox Capital Management LLC, from 2008 to 2011. Owned and operated a consulting business providing services to various hedge funds including acting as Chief Operating Officer and Chief Compliance Officer for a hedge fund from 2007 to 2008. Chief Operating Officer and Chief Compliance Officer of GMN Capital LLC from 2006 to 2007. | | |
C. David Messman (Born 1960) | | Secretary, since 2000; Chief Legal Officer, since 2003 | | Senior Vice President and Secretary of Wells Fargo Funds Management, LLC since 2001. Vice President and Managing Counsel of Wells Fargo Bank, N.A. since 1996. | | |
Debra Ann Early (Born 1964) | | Chief Compliance Officer, since 2007 | | Chief Compliance Officer of Wells Fargo Funds Management, LLC since 2007. Chief Compliance Officer of Parnassus Investments from 2005 to 2007. Chief Financial Officer of Parnassus Investments from 2004 to 2007. | | |
David Berardi (Born 1975) | | Assistant Treasurer, since 2009 | | Vice President of Wells Fargo Funds Management, LLC since 2009. Vice President of Evergreen Investment Management Company, LLC from 2008 to 2010. Assistant Vice President of Evergreen Investment Services, Inc. from 2004 to 2008. Manager of Fund Reporting and Control for Evergreen Investment Management Company, LLC from 2004 to 2010. | | |
Jeremy DePalma1 (Born 1974) | | Assistant Treasurer, since 2009 | | Senior Vice President of Wells Fargo Funds Management, LLC since 2009. Senior Vice President of Evergreen Investment Management Company, LLC from 2008 to 2010. Vice President, Evergreen Investment Services, Inc. from 2004 to 2007. Head of the Fund Reporting and Control Team within Fund Administration from 2005 to 2010. | | |
| 1. | Nancy Wiser acts as Treasurer of 73 funds in the Fund Complex. Jeremy DePalma acts as Treasurer of 59 funds and Assistant Treasurer of 73 funds in the Fund Complex. |
| 2. | The Statement of Additional Information includes additional information about the Trustees and is available, without charge, upon request, by calling 1-800-222-8222 or by visiting the website at wellsfargoadvantagefunds.com. |
| | | | | | |
| List of abbreviations | | Wells Fargo Advantage Short-Term Bond Fund | | | 37 | |
The following is a list of common abbreviations for terms and entities that may have appeared in this report.
| ACA | — ACA Financial Guaranty Corporation |
| ADR | — American depositary receipt |
| ADS | — American depositary shares |
| AGC | — Assured Guaranty Corporation |
| AGM | — Assured Guaranty Municipal |
| Ambac | — Ambac Financial Group Incorporated |
| AMT | — Alternative minimum tax |
| BAN | — Bond anticipation notes |
| BHAC | — Berkshire Hathaway Assurance Corporation |
| CAB | — Capital appreciation bond |
| CCAB | — Convertible capital appreciation bond |
| CDA | — Community Development Authority |
| CDO | — Collateralized debt obligation |
| DRIVER | — Derivative inverse tax-exempt receipts |
| DW&P | — Department of Water & Power |
| DWR | — Department of Water Resources |
| ECFA | — Educational & Cultural Facilities Authority |
| EDA | — Economic Development Authority |
| EDFA | — Economic Development Finance Authority |
| ETF | — Exchange-traded fund |
| FDIC | — Federal Deposit Insurance Corporation |
| FFCB | — Federal Farm Credit Banks |
| FGIC | — Financial Guaranty Insurance Corporation |
| FHA | — Federal Housing Administration |
| FHLB | — Federal Home Loan Bank |
| FHLMC | — Federal Home Loan Mortgage Corporation |
| FICO | — The Financing Corporation |
| FNMA | — Federal National Mortgage Association |
| GDR | — Global depositary receipt |
| GNMA | — Government National Mortgage Association |
| HCFR | — Healthcare facilities revenue |
| HEFA | — Health & Educational Facilities Authority |
| HEFAR | — Higher education facilities authority revenue |
| HFA | — Housing Finance Authority |
| HFFA | — Health Facilities Financing Authority |
| HUD | — Department of Housing and Urban Development |
| IDA | — Industrial Development Authority |
| IDAG | — Industrial Development Agency |
| KRW | — Republic of Korea won |
| LIBOR | — London Interbank Offered Rate |
| LLC | — Limited liability company |
| LLLP | — Limited liability limited partnership |
| LLP | — Limited liability partnership |
| MBIA | — Municipal Bond Insurance Association |
| MFHR | — Multifamily housing revenue |
| MSTR | — Municipal securities trust receipts |
| MUD | — Municipal Utility District |
| National | — National Public Finance Guarantee Corporation |
| PCFA | — Pollution Control Financing Authority |
| PCL | — Public Company Limited |
| PCR | — Pollution control revenue |
| PFA | — Public Finance Authority |
| PFFA | — Public Facilities Financing Authority |
| PFOTER | — Puttable floating option tax-exempt receipts |
| plc | — Public limited company |
| PUTTER | — Puttable tax-exempt receipts |
| R&D | — Research & development |
| Radian | — Radian Asset Assurance |
| RAN | — Revenue anticipation notes |
| RDA | — Redevelopment Authority |
| RDFA | — Redevelopment Finance Authority |
| REIT | — Real estate investment trust |
| ROC | — Reset option certificates |
| SAVRS | — Select auction variable rate securities |
| SBA | — Small Business Authority |
| SFHR | — Single-family housing revenue |
| SFMR | — Single-family mortgage revenue |
| SPA | — Standby purchase agreement |
| SPDR | — Standard & Poor’s Depositary Receipts |
| STRIPS | — Separate trading of registered interest and principal securities |
| TAN | — Tax anticipation notes |
| TIPS | — Treasury inflation-protected securities |
| TRAN | — Tax revenue anticipation notes |
| TTFA | — Transportation Trust Fund Authority |
| TVA | — Tennessee Valley Authority |
This page is intentionally left blank.
This page is intentionally left blank.
This page is intentionally left blank.


For more information
More information about Wells Fargo Advantage Funds is available free upon request. To obtain literature, please write, email, visit the Fund’s website, or call:
Wells Fargo Advantage Funds
P.O. Box 8266
Boston, MA 02266-8266
Email: wfaf@wellsfargo.com
Website: wellsfargoadvantagefunds.com
Individual investors: 1-800-222-8222
Retail investment professionals: 1-888-877-9275
Institutional investment professionals: 1-866-765-0778
This report and the financial statements contained herein are submitted for the general information of the shareholders of Wells Fargo Advantage Funds. If this report is used for promotional purposes, distribution of the report must be accompanied or preceded by a current prospectus. For a current prospectus and, if available, a summary prospectus containing more complete information, including charges and expenses, call 1-800-222-8222 or visit the Fund’s website at wellsfargoadvantagefunds.com. Please consider the investment objectives, risks, charges, and expenses of the investment carefully before investing. This and other information about Wells Fargo Advantage Funds can be found in the current prospectus. Read the prospectus carefully before you invest or send money.
Wells Fargo Funds Management, LLC, a wholly owned subsidiary of Wells Fargo & Company, provides investment advisory and administrative services for Wells Fargo Advantage Funds. Other affiliates of Wells Fargo & Company provide subadvisory and other services for the Funds. The Funds are distributed by Wells Fargo Funds Distributor, LLC, Member FINRA/SIPC, an affiliate of Wells Fargo & Company.
NOT FDIC INSURED ¡ NO BANK GUARANTEE ¡ MAY LOSE VALUE
© 2014 Wells Fargo Funds Management, LLC. All rights reserved.
| | |
 | | 223535 04-14 SA221/SAR221 02-14 |

Wells Fargo Advantage
Short-Term High Yield Bond Fund

Semi-Annual Report
February 28, 2014

Reduce clutter. Save trees.
Sign up for electronic delivery of prospectuses and shareholder reports at wellsfargo.com/advantagedelivery
Contents
The views expressed and any forward-looking statements are as of February 28, 2014, unless otherwise noted, and are those of the Fund managers and/or Wells Fargo Funds Management, LLC. Discussions of individual securities, or the markets generally, or any Wells Fargo Advantage Fund are not intended as individual recommendations. Future events or results may vary significantly from those expressed in any forward-looking statements; the views expressed are subject to change at any time in response to changing circumstances in the market. Wells Fargo Funds Management, LLC and the Fund disclaim any obligation to publicly update or revise any views expressed or forward-looking statements.
NOT FDIC INSURED ¡ NO BANK GUARANTEE ¡ MAY LOSE VALUE
| | | | |
| 2 | | Wells Fargo Advantage Short-Term High Yield Bond Fund | | Letter to shareholders (unaudited) |

Karla M. Rabusch
President
Wells Fargo Advantage Funds
Fixed-income markets shifted during the period, driven by vacillations between U.S. Treasury yield increases and subsequent declines.
Reassurances from the Fed that a highly accommodative monetary policy would continue throughout 2014 inspired price rallies across both the investment-grade and high-yield bond markets.
Dear Valued Shareholder:
We are pleased to offer you this semi-annual report for the Wells Fargo Advantage Short-Term High Yield Bond Fund for the six-month period that ended February 28, 2014. Fixed-income markets shifted during the period, driven by vacillations between U.S. Treasury yield increases and subsequent declines. However, on the whole, investment-grade (measured by the Barclays U.S. Aggregate Bond Index1) and high-yield markets (measured by the Barclays U.S. High Yield Bond Index2) generated positive returns during the period, notably benefiting from the strong price improvement and declining U.S. Treasury yields that occurred in September and October of 2013 as well as the opening months of 2014. Although the returns of the U.S. high-yield market have often been positively correlated with U.S. equity returns (measured by the S&P 500 Index3) over the long-run, over the period, high-yield (measured by the Barclays U.S. High Yield Bond Index) generally performed well even when equities did not. The lower-rated corporate bond credit tiers outperformed the respectively higher-rated investment-grade credit tiers during the period.
A decline in bond prices was halted by the Fed’s postponement of tapering its bond-buying program.
Before the six-month period began, equity markets rallied, most notably in May and June of 2013. This led to a sharp increase in U.S. Treasury yields and declining valuations for much of the fixed-income markets (measured by the Barclays U.S. Aggregate Bond Index). However, in July and August 2013, that equity exuberance quieted a bit, and fixed-income markets stabilized. Returns across the fixed-income markets were largely negative in investment-grade and high-yield markets but modest in comparison with the declines in May and June of 2013.
But, by September and October of 2013, investment-grade and high-yield bond markets began generating positive returns yet again, as the Federal Reserve (Fed) backtracked on its intentions to taper its quantitative easing program, postponing it until 2014, at the earliest. This created a temporary rally in bonds that lasted until around November 20, 2013, when notes were released from the Fed’s October 2013 meeting that tapering of the bond-buying programs would not be postponed beyond January 2014. In response, long-term U.S. Treasury yields and mortgage rates ratcheted higher on expectations for an unwinding of monetary accommodation in the upcoming months. This led to declines in pricing across much of the core fixed-income markets (measured by the Barclays U.S. Aggregate Bond Index). U.S. high-yield markets were better able to absorb the shift in U.S. Treasury yields and continued to provide positive returns along with rallies in the equity markets.
Favorable conditions for fixed-income markets were restored in January and February 2014.
Seemingly much to the surprise of many everyday investors and seasoned investment professionals alike, fixed-income markets (measured by the Barclays U.S. Aggregate Bond Index) largely outperformed U.S. equity markets (measured by the S&P 500 Index) during the opening months of 2014. A pullback in equity exuberance in January and reassurances from the Fed that a highly accommodative monetary policy would continue throughout 2014 inspired price rallies across both the investment-grade and high-yield bond markets. U.S. Treasury yields declined in January 2014 and corporate bonds and mortgage-backed securities performed notably well. U.S. high-yield securities generated positive returns in January 2014 but lagged the rally across the investment-grade bond markets. This theme reversed in February 2014, as high-yield sectors rallied and investment-grade sectors performed well but not to the extent of the lowest-rated credit tiers.
| | | | | | |
| Letter to shareholders (unaudited) | | Wells Fargo Advantage Short-Term High Yield Bond Fund | | | 3 | |
One positive takeaway for bond investors that helped fuel the fixed-income (measured by the Barclays U.S. Aggregate Bond Index) rallies was former Fed Chairman Bernanke’s guidance at the end of 2013. He indicated that the tapering of the Fed’s bond-buying program would proceed at a slow pace and that a reduction in quantitative easing should not be equivocated with a tightening of monetary policy. The distinction was important—although the bond-buying program was declining in volume, it was, nonetheless, still continuing. Additionally, the federal funds target rate would remain unchanged for the foreseeable future, with the implications that it would not increase until the bond-buying program was fully disbanded. These were important statements for fixed-income investors that helped bolster U.S. fixed-income valuations in the opening months of 2014.
Don’t let short-term uncertainty derail long-term investment goals.
Periods of investment uncertainty can present challenges, but experience has taught us that maintaining long-term investment goals can be an effective way to plan for the future. To help you create a sound strategy based on your personal goals and risk tolerance, Wells Fargo Advantage Funds offers more than 100 mutual funds and other investments spanning a wide range of asset classes and investment styles. Although diversification cannot guarantee an investment profit or prevent losses, we believe it can be an effective way to manage investment risk and potentially smooth out overall portfolio performance. We encourage investors to know their investments and to understand that appropriate levels of risk-taking may unlock opportunities.
Thank you for choosing to invest with Wells Fargo Advantage Funds. We appreciate your confidence in us and remain committed to helping you meet your financial needs. For current information about your fund investments, contact your investment professional, visit our website at wellsfargoadvantagefunds.com, or call us directly at 1-800-222-8222. We are available 24 hours a day, 7 days a week.
Sincerely,

Karla M. Rabusch
President
Wells Fargo Advantage Funds
| 1. | The Barclays U.S. Aggregate Bond Index is a broad-based benchmark that measures the investment-grade, U.S. dollar-denominated, fixed-rate taxable bond market, including Treasuries, government-related and corporate securities, MBS (agency fixed-rate and hybrid ARM passthroughs), ABS, and CMBS. You cannot invest directly in an index. |
| 2. | The Barclays U.S. High Yield Bond Index is an index consisting of all domestic and Yankee bonds, rated below investment grade, with a minimum outstanding amount of $100 million and maturing over one year. You cannot invest directly in an index. |
| 3. | The S&P 500 Index consists of 500 stocks chosen for market size, liquidity, and industry group representation. It is a market-value-weighted index with each stock’s weight in the index proportionate to its market value. You cannot invest directly in an index. |
| | | | |
| 4 | | Wells Fargo Advantage Short-Term High Yield Bond Fund | | Letter to shareholders (unaudited) |
Notice to shareholders
The Fund and Wells Fargo Funds Management, LLC (“Funds Management”) have received an exemptive order from the SEC that permits Funds Management, subject to the approval of the Board of Trustees of the Fund, to select or replace certain subadvisers to manage all or a portion of the Fund’s assets and enter into, amend or terminate a sub-advisory agreement with certain subadvisers without obtaining shareholder approval (“Multi-manager Structure”). The Multi-manager Structure applies to subadvisers that are not affiliated with Funds Management or the Fund, except to the extent that affiliation arises solely because such subadvisers provide sub-advisory services to the Fund (“Non-affiliated Subadvisers”), as well as subadvisers that are indirect or direct wholly-owned subsidiaries of Funds Management or of another company that, indirectly or directly, wholly owns Funds Management (“Wholly-owned Subadvisers”).
Pursuant to the SEC order, Funds Management, with the approval of the Board of Trustees, has the discretion to terminate any subadvisers and allocate and reallocate the Fund’s assets among any other Non-affiliated Subadvisers or Wholly-owned Subadvisers. Funds Management, subject to oversight and supervision by the Board of Trustees, has responsibility to continue to oversee any subadvisers to the Fund and to recommend, for approval by the Board of Trustees, the hiring, termination and replacement of subadvisers for the Fund. In the event that a new subadviser is hired pursuant to the Multi-manager Structure, the Fund is required to provide notice to shareholders within 90 days.
Please contact your investment professional or call us directly at 1-800-222-8222 if you have any questions on this Notice to Shareholders.
This page is intentionally left blank.
| | | | |
| 6 | | Wells Fargo Advantage Short-Term High Yield Bond Fund | | Performance highlights (unaudited) |
Investment objective
The Fund seeks total return, consisting of a high level of current income and capital appreciation.
Adviser
Wells Fargo Funds Management, LLC
Subadviser
Wells Capital Management Incorporated
Portfolio managers
Thomas M. Price, CFA
Kevin J. Maas, CFA
Michael J. Schueller, CFA
Average annual total returns1 (%) as of February 28, 2014
| | | | | | | | | | | | | | | | | | | | | | | | | | | | | | | | | | |
| | | | | Including sales charge | | | Excluding sales charge | | | Expense ratios2 (%) | |
| | | Inception date | | 1 year | | | 5 year | | | 10 year | | | 1 year | | | 5 year | | | 10 year | | | Gross | | | Net3 | |
| Class A (SSTHX) | | 2-29-2000 | | | 0.40 | | | | 5.64 | | | | 4.18 | | | | 3.51 | | | | 6.29 | | | | 4.50 | | | | 0.94 | | | | 0.83 | |
| Class C (WFHYX) | | 3-31-2008 | | | 1.74 | | | | 5.49 | | | | 3.74 | | | | 2.74 | | | | 5.49 | | | | 3.74 | | | | 1.69 | | | | 1.58 | |
| Administrator Class (WDHYX) | | 7-30-2010 | | | – | | | | – | | | | – | | | | 3.68 | | | | 6.40 | | | | 4.55 | | | | 0.88 | | | | 0.67 | |
| Institutional Class (STYIX) | | 11-30-2012 | | | – | | | | – | | | | – | | | | 3.83 | | | | 6.40 | | | | 4.55 | | | | 0.61 | | | | 0.52 | |
| Investor Class (STHBX) | | 6-30-1997 | | | – | | | | – | | | | – | | | | 3.48 | | | | 6.25 | | | | 4.49 | | | | 0.97 | | | | 0.86 | |
BofA Merrill Lynch High Yield U.S. Corporates, Cash Pay, BB Rated,
1-5 Year Index4 | | – | | | – | | | | – | | | | – | | | | 6.83 | | | | 13.35 | | | | 7.23 | | | | – | | | | – | |
| Short-Term High Yield Bond Index III5 | | – | | | – | | | | – | | | | – | | | | 7.18 | | | | 14.16 | | | | 7.54 | | | | – | | | | – | |
Figures quoted represent past performance, which is no guarantee of future results, and do not reflect taxes that a shareholder may pay on fund distributions or the redemption of fund shares. Investment return and principal value of an investment will fluctuate so that an investor’s shares, when redeemed, may be worth more or less than their original cost. Performance shown without sales charges would be lower if sales charges were reflected. Current performance may be lower or higher than the performance data quoted, which assumes the reinvestment of dividends and capital gains. Current month-end performance is available on the Fund’s website, wellsfargoadvantagefunds.com.
Index returns do not include transaction costs associated with buying and selling securities, any mutual fund fees or expenses, or any taxes. It is not possible to invest directly in an index.
For Class A shares, the maximum front-end sales charge is 3.00%. For Class C shares, the maximum contingent deferred sales charge is 1.00%. Performance including sales charge assumes the sales charge for the corresponding time period. Administrator Class, Institutional Class, and Investor Class shares are sold without a front-end sales charge or contingent deferred sales charge.
Bond values fluctuate in response to the financial condition of individual issuers, general market and economic conditions, and changes in interest rates. In general, when interest rates rise, bond values fall and investors may lose principal value. High-yield securities have a greater risk of default and tend to be more volatile than higher-rated debt securities. Loans are subject to risks similar to those associated with other below investment-grade bond investments, such as credit risk (for example, risk of issuer default), below-investment-grade bond risk (for example, risk of greater volatility in value), and risk that the loan may become illiquid or difficult to price. The use of derivatives may reduce returns and/or increase volatility. Certain investment strategies tend to increase the total risk of an investment (relative to the broader market). The Fund is exposed to foreign investment risk. Consult the Fund’s prospectus for additional information on these and other risks.
Please see footnotes on page 7.
| | | | | | |
| Performance highlights (unaudited) | | Wells Fargo Advantage Short-Term High Yield Bond Fund | | | 7 | |
| | | | |
| Ten largest long-term holdings6 (%) as of February 28, 2014 | |
CIT Group Incorporated, 4.25%, 8-15-2017 | | | 1.13 | |
Sally Beauty Holdings Incorporated, 6.88%,
11-15-2019 | | | 1.13 | |
FMG Resources Limited, 6.00%, 4-1-2017 | | | 1.05 | |
United Rentals Incorporated, 5.75%, 7-15-2018 | | | 1.04 | |
Kodiak Oil & Gas Corporation, 8.13%, 12-1-2019 | | | 1.01 | |
Regency Energy Partners Company, 6.88%,
12-1-2018 | | | 1.01 | |
Energy XXI Gulf Coast Incorporated, 9.25%,
12-15-2017 | | | 0.98 | |
SESI LLC, 6.38%, 5-1-2019 | | | 0.96 | |
General Motors Financial Company Incorporated, 4.75%, 8-15-2017 | | | 0.93 | |
Sprint Nextel Corporation, 6.00%, 12-1-2016 | | | 0.90 | |
|
| Credit quality7 as of February 28, 2014 |
|
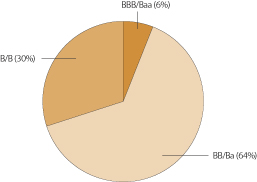
|
| 1. | Historical performance shown for Class C shares prior to their inception reflects the performance of Investor Class shares, adjusted to include the higher expenses applicable to Class C shares. Historical performance shown for Administrator Class shares prior to their inception reflects the performance of Class A shares and includes the higher expenses applicable to Class A shares. If these expenses had not been included, returns would be higher. Historical performance shown for Institutional Class shares prior to their inception reflects the performance of Administrator Class shares and includes the higher expenses applicable to Administrator Class shares. If these expenses had not been included, returns would be higher. Effective June 20, 2008, Advisor Class was renamed Class A and modified to assume the features and attributes of Class A. Historical performance shown for Class A shares through June 19, 2008, includes Advisor Class expenses. |
| 2. | Reflects the expense ratios as stated in the most recent prospectuses, which include the impact of 0.02% in acquired fund fees and expenses. The expense ratios shown are subject to change and may differ from the annualized expense ratios shown in the financial highlights of this report, which do not include acquired fund fees and expenses. |
| 3. | The Adviser has committed through December 31, 2014, to waive fees and/or reimburse expenses to the extent necessary to cap the Fund’s Total Annual Fund Operating Expenses After Fee Waiver, excluding certain expenses, at 0.81% for Class A, 1.56% for Class C, 0.65% for Administrator Class, 0.50% for Institutional Class, and 0.84% for Investor Class. Brokerage commissions, stamp duty fees, interest, taxes, acquired fund fees and expenses, and extraordinary expenses are excluded from the cap. Without this cap, the Fund’s returns would have been lower. |
| 4. | The BofA Merrill Lynch High Yield U.S. Corporates, Cash Pay, BB Rated, 1-5 Year Index is an unmanaged index that generally tracks the performance of BB rated U.S. dollar-denominated corporate bonds publicly issued in the U.S. domestic market with maturities of one to five years. You cannot invest directly in an index. |
| 5. | The Short-Term High Yield Bond Index III is comprised of 70% of BofA Merrill Lynch High Yield U.S. Corporates, Cash Pay, BB Rated, 1-5 Year Index and 30% of BofA Merrill Lynch High Yield U.S. Corporates, Cash Pay, B Rated, 1-5 Year Index. The BofA Merrill Lynch High Yield U.S. Corporates, Cash Pay, BB Rated, 1-5 Year Index is an unmanaged index that generally tracks the performance of BB rated U.S. dollar-denominated corporate bonds publicly issued in the U.S. domestic market with maturities of one to five years. The BofA Merrill Lynch High Yield U.S. Corporates, Cash Pay, B Rated, 1-5 Year Index is an unmanaged index that generally tracks the performance of B rated U.S. dollar-denominated corporate bonds publicly issued in the U.S. domestic market with maturities of one to five years. You cannot invest directly in an index. |
| 6. | The ten largest long-term holdings are calculated based on the value of the securities divided by total net assets of the Fund. Holdings are subject to change and may have changed since the date specified. |
| 7. | The credit quality of portfolio holdings reflected in the chart is based on ratings from Standard & Poor’s, Moody’s Investors Service, and/or Fitch Ratings Ltd. Credit quality ratings apply to the underlying holdings of the Fund and not to the Fund itself. The percentages of the Fund’s portfolio with the ratings depicted in the chart are calculated based on the total market value of fixed income securities held by the Fund. If a security was rated by all three rating agencies, the middle rating was utilized. If rated by two of three rating agencies, the lower rating was utilized, and if rated by one of the rating agencies, that rating was utilized. Standard & Poor’s rates the creditworthiness of bonds, ranging from AAA (highest) to D (lowest). Ratings from A to CCC may be modified by the addition of a plus (+) or minus (-) sign to show relative standing within the rating categories. Standard & Poor’s rates the creditworthiness of short-term notes from SP-1 (highest) to SP-3 (lowest). Moody’s rates the creditworthiness of bonds, ranging from Aaa (highest) to C (lowest). Ratings Aa to B may be modified by the addition of a number 1 (highest) to 3 (lowest) to show relative standing within the ratings categories. Moody’s rates the creditworthiness of short-term U.S. tax-exempt municipal securities from MIG 1/VMIG 1 (highest) to SG (lowest). Fitch rates the creditworthiness of bonds, ranging from AAA (highest) to D (lowest). Credit quality, and credit quality ratings are subject to change. |
| | | | |
| 8 | | Wells Fargo Advantage Short-Term High Yield Bond Fund | | Fund expenses (unaudited) |
As a shareholder of the Fund, you incur two types of costs: (1) transaction costs, including sales charges (loads) on purchase payments and contingent deferred sales charges (if any) on redemptions and (2) ongoing costs, including management fees, distribution (12b-1) and/or shareholder service fees, and other Fund expenses. This example is intended to help you understand your ongoing costs (in dollars) of investing in the Fund and to compare these costs with the ongoing costs of investing in other mutual funds.
The example is based on an investment of $1,000 invested at the beginning of the six-month period and held for the entire period from September 1, 2013 to February 28, 2014.
Actual expenses
The “Actual” line of the table below provides information about actual account values and actual expenses. You may use the information in this line, together with the amount you invested, to estimate the expenses that you paid over the period. Simply divide your account value by $1,000 (for example, an $8,600 account value divided by $1,000 = 8.6), then multiply the result by the number in the “Actual” line under the heading entitled “Expenses paid during period” for your applicable class of shares to estimate the expenses you paid on your account during this period.
Hypothetical example for comparison purposes
The “Hypothetical” line of the table below provides information about hypothetical account values and hypothetical expenses based on the Fund’s actual expense ratio and an assumed rate of return of 5% per year before expenses, which is not the Fund’s actual return. The hypothetical account values and expenses may not be used to estimate the actual ending account balance or expenses you paid for the period. You may use this information to compare the ongoing costs of investing in the Fund and other funds. To do so, compare this 5% hypothetical example with the 5% hypothetical examples that appear in the shareholder reports of the other funds.
Please note that the expenses shown in the table are meant to highlight your ongoing costs only and do not reflect any transactional costs, such as sales charges (loads) and contingent deferred sales charges. Therefore, the “Hypothetical” line of the table is useful in comparing ongoing costs only and will not help you determine the relative total costs of owning different funds. In addition, if these transactional costs were included, your costs would have been higher.
| | | | | | | | | | | | | | | | |
| | | Beginning
account value
9-1-2013 | | | Ending
account value
2-28-2014 | | | Expenses
paid during
the period1 | | | Net annualized
expense ratio | |
Class A | | | | | | | | | | | | | | | | |
Actual | | $ | 1,000.00 | | | $ | 1,026.17 | | | $ | 4.07 | | | | 0.81 | % |
Hypothetical (5% return before expenses) | | $ | 1,000.00 | | | $ | 1,020.78 | | | $ | 4.06 | | | | 0.81 | % |
Class C | | | | | | | | | | | | | | | | |
Actual | | $ | 1,000.00 | | | $ | 1,022.37 | | | $ | 7.82 | | | | 1.56 | % |
Hypothetical (5% return before expenses) | | $ | 1,000.00 | | | $ | 1,017.06 | | | $ | 7.80 | | | | 1.56 | % |
Administrator Class | | | | | | | | | | | | | | | | |
Actual | | $ | 1,000.00 | | | $ | 1,028.24 | | | $ | 3.27 | | | | 0.65 | % |
Hypothetical (5% return before expenses) | | $ | 1,000.00 | | | $ | 1,021.57 | | | $ | 3.26 | | | | 0.65 | % |
Institutional Class | | | | | | | | | | | | | | | | |
Actual | | $ | 1,000.00 | | | $ | 1,029.02 | | | $ | 2.52 | | | | 0.50 | % |
Hypothetical (5% return before expenses) | | $ | 1,000.00 | | | $ | 1,022.32 | | | $ | 2.51 | | | | 0.50 | % |
Investor Class | | | | | | | | | | | | | | | | |
Actual | | $ | 1,000.00 | | | $ | 1,026.02 | | | $ | 4.22 | | | | 0.84 | % |
Hypothetical (5% return before expenses) | | $ | 1,000.00 | | | $ | 1,020.63 | | | $ | 4.21 | | | | 0.84 | % |
| 1. | Expenses paid is equal to the annualized expense ratio of each class multiplied by the average account value over the period, multiplied by the number of days in the most recent fiscal half-year divided by the number of days in the fiscal year (to reflect the one-half-year period). |
| | | | | | |
| Portfolio of investments—February 28, 2014 (unaudited) | | Wells Fargo Advantage Short-Term High Yield Bond Fund | | | 9 | |
| | | | | | | | | | | | | | | | |
| Security name | | Interest rate | | | Maturity date | | | Principal | | | Value | |
| | | |
Corporate Bonds and Notes: 63.43% | | | | | | | | | | | | | |
| | | |
Consumer Discretionary: 17.01 | | | | | | | | | | | | | |
| | | |
| Auto Components: 1.89% | | | | | | | | | | | | | |
Cooper-Standard Holdings Incorporated | | | 8.50 | % | | | 5-1-2018 | | | $ | 6,280,000 | | | $ | 6,609,700 | |
Lear Corporation | | | 7.88 | | | | 3-15-2018 | | | | 9,273,000 | | | | 9,655,511 | |
Tenneco Automotive Incorporated | | | 7.75 | | | | 8-15-2018 | | | | 7,570,000 | | | | 8,033,663 | |
TRW Automotive Incorporated 144A | | | 7.25 | | | | 3-15-2017 | | | | 7,400,000 | | | | 8,454,500 | |
| | | | |
| | | | | | | | | | | | | | | 32,753,374 | |
| | | | | | | | | | | | | | | | |
| | | |
| Automobiles: 0.75 | | | | | | | | | | | | | |
Chrysler Group LLC/CG Co-Issuer Incorporated 144A | | | 8.00 | | | | 6-15-2019 | | | | 3,200,000 | | | | 3,520,000 | |
Chrysler Group LLC/CG Co-Issuer Incorporated | | | 8.00 | | | | 6-15-2019 | | | | 8,630,000 | | | | 9,493,000 | |
| | | | |
| | | | | | | | | | | | | | | 13,013,000 | |
| | | | | | | | | | | | | | | | |
| | | |
| Diversified Consumer Services: 2.87% | | | | | | | | | | | | | |
ADT Corporation | | | 2.25 | | | | 7-15-2017 | | | | 13,255,000 | | | | 13,163,090 | |
Avis Budget Car Rental LLC ±144A | | | 2.99 | | | | 12-1-2017 | | | | 7,000,000 | | | | 7,070,000 | |
Avis Budget Car Rental LLC « | | | 4.88 | | | | 11-15-2017 | | | | 8,120,000 | | | | 8,566,600 | |
Hertz Corporation | | | 7.50 | | | | 10-15-2018 | | | | 5,870,000 | | | | 6,273,563 | |
Service Corporation International | | | 7.00 | | | | 6-15-2017 | | | | 13,006,000 | | | | 14,615,493 | |
| | | | |
| | | | | | | | | | | | | | | 49,688,746 | |
| | | | | | | | | | | | | | | | |
| | | |
| Hotels, Restaurants & Leisure: 0.92% | | | | | | | | | | | | | |
Burger King Corporation | | | 9.88 | | | | 10-15-2018 | | | | 3,310,000 | | | | 3,616,175 | |
MGM Resorts International | | | 6.63 | | | | 7-15-2015 | | | | 6,000,000 | | | | 6,397,200 | |
MGM Resorts International | | | 7.50 | | | | 6-1-2016 | | | | 5,265,000 | | | | 5,870,475 | |
| | | | |
| | | | | | | | | | | | | | | 15,883,850 | |
| | | | | | | | | | | | | | | | |
| | | |
| Household Durables: 3.30% | | | | | | | | | | | | | |
Beazer Homes USA Company | | | 6.63 | | | | 4-15-2018 | | | | 12,395,000 | | | | 13,386,600 | |
DR Horton Incorporated | | | 3.63 | | | | 2-15-2018 | | | | 2,000,000 | | | | 2,052,500 | |
DR Horton Incorporated | | | 4.75 | | | | 5-15-2017 | | | | 6,050,000 | | | | 6,473,500 | |
Jarden Corporation | | | 7.50 | | | | 5-1-2017 | | | | 12,300,000 | | | | 14,145,000 | |
Lennar Corporation | | | 4.13 | | | | 12-1-2018 | | | | 7,000,000 | | | | 7,122,500 | |
Lennar Corporation | | | 4.75 | | | | 12-15-2017 | | | | 300,000 | | | | 318,750 | |
Mohawk Industries Incorporated | | | 6.13 | | | | 1-15-2016 | | | | 7,035,000 | | | | 7,632,975 | |
Pulte Group Incorporated | | | 7.63 | | | | 10-15-2017 | | | | 5,155,000 | | | | 5,966,913 | |
| | | | |
| | | | | | | | | | | | | | | 57,098,738 | |
| | | | | | | | | | | | | | | | |
| | | |
| Media: 4.03% | | | | | | | | | | | | | |
Allbritton Communications Company | | | 8.00 | | | | 5-15-2018 | | | | 12,955,000 | | | | 13,619,592 | |
CSC Holdings LLC | | | 7.63 | | | | 7-15-2018 | | | | 8,050,000 | | | | 9,358,125 | |
DISH DBS Corporation | | | 4.63 | | | | 7-15-2017 | | | | 12,800,000 | | | | 13,584,000 | |
Gannett Companies Incorporated | | | 7.13 | | | | 9-1-2018 | | | | 11,500,000 | | | | 12,190,000 | |
Gannett Companies Incorporated | | | 8.75 | | | | 11-15-2014 | | | | 5,000,000 | | | | 5,250,000 | |
Lamar Media Corporation | | | 7.88 | | | | 4-15-2018 | | | | 300,000 | | | | 314,250 | |
Mediacom LLC/Mediacom Capital Corporation | | | 9.13 | | | | 8-15-2019 | | | | 9,430,000 | | | | 10,137,250 | |
Regal Cinemas Corporation | | | 8.63 | | | | 7-15-2019 | | | | 5,000,000 | | | | 5,355,000 | |
| | | | |
| | | | | | | | | | | | | | | 69,808,217 | |
| | | | | | | | | | | | | | | | |
The accompanying notes are an integral part of these financial statements.
| | | | |
| 10 | | Wells Fargo Advantage Short-Term High Yield Bond Fund | | Portfolio of investments—February 28, 2014 (unaudited) |
| | | | | | | | | | | | | | | | |
| Security name | | Interest rate | | | Maturity date | | | Principal | | | Value | |
| | | |
| Multiline Retail: 0.15% | | | | | | | | | | | | | |
Macy’s Retail Holdings Incorporated | | | 5.75 | % | | | 7-15-2014 | | | $ | 2,500,000 | | | $ | 2,545,968 | |
| | | | | | | | | | | | | | | | |
| | | | |
| Specialty Retail: 2.61% | | | | | | | | | | | | | | | | |
AutoNation Incorporated | | | 6.75 | | | | 4-15-2018 | | | | 10,382,000 | | | | 11,965,255 | |
Limited Brands Incorporated | | | 6.90 | | | | 7-15-2017 | | | | 12,025,000 | | | | 13,768,625 | |
Sally Beauty Holdings Incorporated | | | 6.88 | | | | 11-15-2019 | | | | 17,825,000 | | | | 19,562,938 | |
| | | | |
| | | | | | | | | | | | | | | 45,296,818 | |
| | | | | | | | | | | | | | | | |
| | | | |
| Textiles, Apparel & Luxury Goods: 0.49% | | | | | | | | | | | | | | | | |
Jones Group Incorporated | | | 5.13 | | | | 11-15-2014 | | | | 8,385,000 | | | | 8,573,663 | |
| | | | | | | | | | | | | | | | |
| | | | |
Consumer Staples: 1.69% | | | | | | | | | | | | | | | | |
| | | | |
| Beverages: 0.86% | | | | | | | | | | | | | | | | |
Constellation Brands Incorporated | | | 7.25 | | | | 9-1-2016 | | | | 13,190,000 | | | | 14,937,675 | |
| | | | | | | | | | | | | | | | |
| | | | |
| Food Products: 0.83% | | | | | | | | | | | | | | | | |
Dean Foods Company | | | 7.00 | | | | 6-1-2016 | | | | 5,300,000 | | | | 5,843,250 | |
TreeHouse Foods Incorporated | | | 7.75 | | | | 3-1-2018 | | | | 8,205,000 | | | | 8,557,815 | |
| | | | |
| | | | | | | | | | | | | | | 14,401,065 | |
| | | | | | | | | | | | | | | | |
| | | | |
Energy: 12.31% | | | | | | | | | | | | | | | | |
| | | | |
| Energy Equipment & Services: 2.65% | | | | | | | | | | | | | | | | |
Exterran Holdings Incorporated | | | 7.25 | | | | 12-1-2018 | | | | 5,910,000 | | | | 6,249,825 | |
Hercules Offshore Incorporated 144A | | | 7.13 | | | | 4-1-2017 | | | | 11,455,000 | | | | 12,099,344 | |
SESI LLC | | | 6.38 | | | | 5-1-2019 | | | | 15,550,000 | | | | 16,599,625 | |
Targa Resources Partners LP | | | 7.88 | | | | 10-15-2018 | | | | 10,255,000 | | | | 10,998,488 | |
| | | | |
| | | | | | | | | | | | | | | 45,947,282 | |
| | | | | | | | | | | | | | | | |
| | | | |
| Oil, Gas & Consumable Fuels: 9.66% | | | | | | | | | | | | | | | | |
Berry Petroleum Companies Class A | | | 10.25 | | | | 6-1-2014 | | | | 5,329,000 | | | | 5,435,580 | |
Carrizo Oil & Gas Incorporated | | | 8.63 | | | | 10-15-2018 | | | | 12,185,000 | | | | 13,129,338 | |
Chesapeake Energy Corporation | | | 3.25 | | | | 3-15-2016 | | | | 965,000 | | | | 972,238 | |
Chesapeake Energy Corporation | | | 9.50 | | | | 2-15-2015 | | | | 7,700,000 | | | | 8,287,125 | |
CITGO Petroleum Corporation 144A | | | 11.50 | | | | 7-1-2017 | | | | 9,500,000 | | | | 10,260,000 | |
Consol Energy Incorporated | | | 8.00 | | | | 4-1-2017 | | | | 9,300,000 | | | | 9,706,875 | |
El Paso LLC | | | 7.00 | | | | 6-15-2017 | | | | 5,300,000 | | | | 5,992,662 | |
Energy XXI Gulf Coast Incorporated | | | 9.25 | | | | 12-15-2017 | | | | 15,595,000 | | | | 17,037,538 | |
Kinder Morgan Finance Company LLC 144A | | | 6.00 | | | | 1-15-2018 | | | | 9,000,000 | | | | 9,922,500 | |
Kodiak Oil & Gas Corporation | | | 8.13 | | | | 12-1-2019 | | | | 15,785,000 | | | | 17,560,813 | |
Oasis Petroleum Incorporated | | | 7.25 | | | | 2-1-2019 | | | | 1,860,000 | | | | 1,999,491 | |
Peabody Energy Corporation | | | 7.38 | | | | 11-1-2016 | | | | 7,100,000 | | | | 8,005,250 | |
Plains Exploration & Production Company | | | 6.13 | | | | 6-15-2019 | | | | 13,755,000 | | | | 15,147,694 | |
PVR Partners LP | | | 8.25 | | | | 4-15-2018 | | | | 7,140,000 | | | | 7,479,150 | |
Regency Energy Partners Company | | | 6.88 | | | | 12-1-2018 | | | | 16,311,000 | | | | 17,411,993 | |
Tesoro Corporation | | | 4.25 | | | | 10-1-2017 | | | | 4,000,000 | | | | 4,210,000 | |
Tesoro Corporation | | | 9.75 | | | | 6-1-2019 | | | | 1,300,000 | | | | 1,387,750 | |
WPX Energy Incorporated | | | 5.25 | | | | 1-15-2017 | | | | 12,450,000 | | | | 13,368,188 | |
| | | | |
| | | | | | | | | | | | | | | 167,314,185 | |
| | | | | | | | | | | | | | | | |
The accompanying notes are an integral part of these financial statements.
| | | | | | |
| Portfolio of investments—February 28, 2014 (unaudited) | | Wells Fargo Advantage Short-Term High Yield Bond Fund | | | 11 | |
| | | | | | | | | | | | | | | | |
| Security name | | Interest rate | | | Maturity date | | | Principal | | | Value | |
| | | | |
Financials: 8.09% | | | | | | | | | | | | | | | | |
| | | | |
| Banks: 1.88% | | | | | | | | | | | | | | | | |
AmSouth Bank | | | 5.20 | % | | | 4-1-2015 | | | $ | 5,370,000 | | | $ | 5,593,671 | |
CIT Group Incorporated | | | 4.25 | | | | 8-15-2017 | | | | 18,700,000 | | | | 19,611,625 | |
CIT Group Incorporated | | | 5.00 | | | | 5-15-2017 | | | | 135,000 | | | | 144,788 | |
Zions Bancorporation | | | 7.75 | | | | 9-23-2014 | | | | 7,000,000 | | | | 7,256,347 | |
| | | | |
| | | | | | | | | | | | | | | 32,606,431 | |
| | | | | | | | | | | | | | | | |
| | | | |
| Consumer Finance: 6.21% | | | | | | | | | | | | | | | | |
Ally Financial Incorporated ± | | | 2.92 | | | | 7-18-2016 | | | | 4,560,000 | | | | 4,654,757 | |
Ally Financial Incorporated | | | 5.50 | | | | 2-15-2017 | | | | 9,500,000 | | | | 10,378,750 | |
Discover Financial Services Company | | | 6.45 | | | | 6-12-2017 | | | | 8,035,000 | | | | 9,107,383 | |
Ford Motor Credit Company LLC | | | 3.88 | | | | 1-15-2015 | | | | 2,000,000 | | | | 2,055,308 | |
Ford Motor Credit Company LLC | | | 8.00 | | | | 12-15-2016 | | | | 8,385,000 | | | | 9,859,293 | |
Ford Motor Credit Company LLC | | | 8.70 | | | | 10-1-2014 | | | | 3,500,000 | | | | 3,661,312 | |
General Motors Financial Company Incorporated | | | 3.25 | | | | 5-15-2018 | | | | 880,000 | | | | 900,900 | |
General Motors Financial Company Incorporated | | | 4.75 | | | | 8-15-2017 | | | | 14,970,000 | | | | 16,190,055 | |
Icahn Enterprises LP/Icahn Enterprises Finance Corporation 144A | | | 3.50 | | | | 3-15-2017 | | | | 8,595,000 | | | | 8,702,438 | |
Nielsen Finance LLC | | | 7.75 | | | | 10-15-2018 | | | | 13,880,000 | | | | 14,868,950 | |
SLM Corporation | | | 3.88 | | | | 9-10-2015 | | | | 8,000,000 | | | | 8,273,416 | |
SLM Corporation Series A | | | 5.00 | | | | 4-15-2015 | | | | 7,300,000 | | | | 7,592,000 | |
Toll Brothers Finance Corporation | | | 4.00 | | | | 12-31-2018 | | | | 1,905,000 | | | | 1,952,625 | |
Toll Brothers Finance Corporation | | | 8.91 | | | | 10-15-2017 | | | | 7,750,000 | | | | 9,377,500 | |
| | | | |
| | | | | | | | | | | | | | | 107,574,687 | |
| | | | | | | | | | | | | | | | |
| | | | |
Health Care: 3.39% | | | | | | | | | | | | | | | | |
| | | | |
| Health Care Equipment & Supplies: 0.44% | | | | | | | | | | | | | | | | |
Fresenius US Finance II Incorporated 144A | | | 9.00 | | | | 7-15-2015 | | | | 7,000,000 | | | | 7,682,500 | |
| | | | | | | | | | | | | | | | |
| | | | |
| Health Care Providers & Services: 2.95% | | | | | | | | | | | | | | | | |
DaVita HealthCare Partners Incorporated | | | 6.38 | | | | 11-1-2018 | | | | 7,400,000 | | | | 7,779,250 | |
Fresenius Medical Care Holdings Incorporated | | | 6.88 | | | | 7-15-2017 | | | | 9,120,000 | | | | 10,351,200 | |
Hanger Incorporated | | | 7.13 | | | | 11-15-2018 | | | | 13,547,000 | | | | 14,427,555 | |
HealthSouth Corporation | | | 7.25 | | | | 10-1-2018 | | | | 7,470,000 | | | | 7,936,875 | |
Universal Health Services Incorporated | | | 7.00 | | | | 10-1-2018 | | | | 9,650,000 | | | | 10,229,000 | |
Universal Health Services Incorporated | | | 7.13 | | | | 6-30-2016 | | | | 300,000 | | | | 337,500 | |
| | | | |
| | | | | | | | | | | | | | | 51,061,380 | |
| | | | | | | | | | | | | | | | |
| | | | |
Industrials: 6.79% | | | | | | | | | | | | | | | | |
| | | | |
| Building Products: 0.63% | | | | | | | | | | | | | | | | |
Masco Corporation | | | 5.85 | | | | 3-15-2017 | | | | 508,000 | | | | 560,070 | |
Masco Corporation | | | 6.13 | | | | 10-3-2016 | | | | 9,409,000 | | | | 10,443,990 | |
| | | | |
| | | | | | | | | | | | | | | 11,004,060 | |
| | | | | | | | | | | | | | | | |
| | | | |
| Commercial Services & Supplies: 3.50% | | | | | | | | | | | | | | | | |
Case Corporation | | | 7.25 | | | | 1-15-2016 | | | | 5,800,000 | | | | 6,380,000 | |
Deluxe Corporation | | | 5.13 | | | | 10-1-2014 | | | | 5,000,000 | | | | 5,090,625 | |
Deluxe Corporation | | | 7.00 | | | | 3-15-2019 | | | | 6,770,000 | | | | 7,243,900 | |
International Lease Finance Corporation | | | 4.88 | | | | 4-1-2015 | | | | 5,300,000 | | | | 5,498,750 | |
International Lease Finance Corporation | | | 5.65 | | | | 6-1-2014 | | | | 5,000,000 | | | | 5,058,100 | |
RR Donnelley & Sons Company | | | 5.50 | | | | 5-15-2015 | | | | 6,550,000 | | | | 6,861,125 | |
Swift Services Holdings Incorporated | | | 10.00 | | | | 11-15-2018 | | | | 11,775,000 | | | | 12,967,219 | |
West Corporation | | | 7.88 | | | | 1-15-2019 | | | | 2,420,000 | | | | 2,601,500 | |
West Corporation | | | 8.63 | | | | 10-1-2018 | | | | 8,230,000 | | | | 8,867,825 | |
| | | | |
| | | | | | | | | | | | | | | 60,569,044 | |
| | | | | | | | | | | | | | | | |
The accompanying notes are an integral part of these financial statements.
| | | | |
| 12 | | Wells Fargo Advantage Short-Term High Yield Bond Fund | | Portfolio of investments—February 28, 2014 (unaudited) |
| | | | | | | | | | | | | | | | |
| Security name | | Interest rate | | | Maturity date | | | Principal | | | Value | |
| | | | |
| Electrical Equipment: 0.29% | | | | | | | | | | | | | | | | |
General Cable Corporation ± | | | 2.62 | % | | | 4-1-2015 | | | $ | 5,000,000 | | | $ | 4,987,500 | |
| | | | | | | | | | | | | | | | |
| | | | |
| Machinery: 1.33% | | | | | | | | | | | | | | | | |
Case New Holland Incorporated | | | 7.88 | | | | 12-1-2017 | | | | 8,000,000 | | | | 9,370,000 | |
CNH Capital America LLC Company | | | 3.88 | | | | 11-1-2015 | | | | 2,000,000 | | | | 2,057,500 | |
Oshkosh Corporation | | | 8.25 | | | | 3-1-2017 | | | | 2,985,000 | | | | 3,111,863 | |
SPX Corporation | | | 6.88 | | | | 9-1-2017 | | | | 7,545,000 | | | | 8,582,438 | |
| | | | |
| | | | | | | | | | | | | | | 23,121,801 | |
| | | | | | | | | | | | | | | | |
| | | | |
| Trading Companies & Distributors: 1.04% | | | | | | | | | | | | | | | | |
United Rentals Incorporated | | | 5.75 | | | | 7-15-2018 | | | | 16,730,000 | | | | 17,942,925 | |
| | | | | | | | | | | | | | | | |
| | | | |
Information Technology: 2.95% | | | | | | | | | | | | | | | | |
| | | | |
| Communications Equipment: 0.50% | | | | | | | | | | | | | | | | |
Crown Castle International Corporation | | | 7.13 | | | | 11-1-2019 | | | | 8,070,000 | | | | 8,614,725 | |
| | | | | | | | | | | | | | | | |
| | | | |
| Electronic Equipment, Instruments & Components: 0.56% | | | | | | | | | | | | | | | | |
CDW LLC | | | 8.00 | | | | 12-15-2018 | | | | 275,000 | | | | 297,688 | |
Jabil Circuit Incorporated | | | 7.75 | | | | 7-15-2016 | | | | 8,300,000 | | | | 9,451,625 | |
| | | | |
| | | | | | | | | | | | | | | 9,749,313 | |
| | | | | | | | | | | | | | | | |
| | | | |
| Internet Software & Services: 0.46% | | | | | | | | | | | | | | | | |
IAC/InterActiveCorp 144A | | | 4.88 | | | | 11-30-2018 | | | | 7,640,000 | | | | 7,964,700 | |
| | | | | | | | | | | | | | | | |
| | | | |
| IT Services: 1.43% | | | | | | | | | | | | | | | | |
Cardtronics Incorporated | | | 8.25 | | | | 9-1-2018 | | | | 8,535,000 | | | | 9,132,450 | |
iGATE Corporation | | | 9.00 | | | | 5-1-2016 | | | | 14,755,000 | | | | 15,584,969 | |
| | | | |
| | | | | | | | | | | | | | | 24,717,419 | |
| | | | | | | | | | | | | | | | |
| | | | |
Materials: 4.65% | | | | | | | | | | | | | | | | |
| | | | |
| Chemicals: 0.39% | | | | | | | | | | | | | | | | |
Celanese US Holdings LLC | | | 6.63 | | | | 10-15-2018 | | | | 6,299,000 | | | | 6,676,940 | |
| | | | | | | | | | | | | | | | |
| | | | |
| Construction Materials: 0.52% | | | | | | | | | | | | | | | | |
Vulcan Materials Company | | | 6.40 | | | | 11-30-2017 | | | | 3,250,000 | | | | 3,680,625 | |
Vulcan Materials Company | | | 6.50 | | | | 12-1-2016 | | | | 4,735,000 | | | | 5,350,550 | |
| | | | |
| | | | | | | | | | | | | | | 9,031,175 | |
| | | | | | | | | | | | | | | | |
| | | | |
| Containers & Packaging: 2.69% | | | | | | | | | | | | | | | | |
Graphic Packaging International Company | | | 7.88 | | | | 10-1-2018 | | | | 3,482,000 | | | | 3,730,093 | |
Greif Incorporated | | | 6.75 | | | | 2-1-2017 | | | | 10,590,000 | | | | 11,754,900 | |
Owens Brockway Glass Container Incorporated | | | 7.38 | | | | 5-15-2016 | | | | 6,560,000 | | | | 7,306,200 | |
Owens-Illinois Incorporated | | | 7.80 | | | | 5-15-2018 | | | | 7,975,000 | | | | 9,370,625 | |
Reynolds Group Holdings Limited | | | 7.13 | | | | 4-15-2019 | | | | 195,000 | | | | 207,431 | |
Reynolds Group Holdings Limited | | | 7.88 | | | | 8-15-2019 | | | | 2,500,000 | | | | 2,762,500 | |
Sealed Air Corporation 144A | | | 8.13 | | | | 9-15-2019 | | | | 10,285,000 | | | | 11,532,056 | |
| | | | |
| | | | | | | | | | | | | | | 46,663,805 | |
| | | | | | | | | | | | | | | | |
The accompanying notes are an integral part of these financial statements.
| | | | | | |
| Portfolio of investments—February 28, 2014 (unaudited) | | Wells Fargo Advantage Short-Term High Yield Bond Fund | | | 13 | |
| | | | | | | | | | | | | | | | |
| Security name | | Interest rate | | | Maturity date | | | Principal | | | Value | |
| | | | |
| Metals & Mining: 1.05% | | | | | | | | | | | | | | | | |
Sunchoke Energy Incorporated | | | 7.63 | % | | | 8-1-2019 | | | $ | 9,850,000 | | | $ | 10,588,750 | |
US Steel Corporation | | | 7.00 | | | | 2-1-2018 | | | | 6,903,000 | | | | 7,627,815 | |
| | | | |
| | | | | | | | | | | | | | | 18,216,565 | |
| | | | | | | | | | | | | | | | |
| | | | |
Telecommunication Services: 4.52% | | | | | | | | | | | | | | | | |
| | | | |
| Diversified Telecommunication Services: 2.60% | | | | | | | | | | | | | | | | |
Centurylink Incorporated | | | 6.00 | | | | 4-1-2017 | | | | 10,390,000 | | | | 11,480,950 | |
Frontier Communications Corporation | | | 8.25 | | | | 4-15-2017 | | | | 7,630,000 | | | | 8,869,875 | |
Windstream Corporation | | | 7.88 | | | | 11-1-2017 | | | | 8,050,000 | | | | 9,217,250 | |
Windstream Corporation | | | 9.88 | | | | 12-1-2018 | | | | 3,630,000 | | | | 4,020,225 | |
Zayo Group LLC/Zayo Capital Incorporated | | | 8.13 | | | | 1-1-2020 | | | | 10,290,000 | | | | 11,344,725 | |
| | | | |
| | | | | | | | | | | | | | | 44,933,025 | |
| | | | | | | | | | | | | | | | |
| | | | |
| Wireless Telecommunication Services: 1.92% | | | | | | | | | | | | | | | | |
CCO Holdings LLC | | | 7.00 | | | | 1-15-2019 | | | | 4,625,000 | | | | 4,896,719 | |
CCO Holdings LLC | | | 7.25 | | | | 10-30-2017 | | | | 8,500,000 | | | | 9,031,250 | |
MetroPCS Wireless Incorporated | | | 7.88 | | | | 9-1-2018 | | | | 3,545,000 | | | | 3,775,425 | |
Sprint Nextel Corporation | | | 6.00 | | | | 12-1-2016 | | | | 14,260,000 | | | | 15,596,875 | |
| | | | |
| | | | | | | | | | | | | | | 33,300,269 | |
| | | | | | | | | | | | | | | | |
| | | | |
Utilities: 2.03% | | | | | | | | | | | | | | | | |
| | | | |
| Gas Utilities: 0.56% | | | | | | | | | | | | | | | | |
AmeriGas Partners LP | | | 6.25 | | | | 8-20-2019 | | | | 9,085,000 | | | | 9,766,375 | |
| | | | | | | | | | | | | | | | |
| | | | |
Independent Power & Renewable Electricity
Producers: 1.47% | | | | | | | | | | | | | | | | |
AES Corporation | | | 8.00 | | | | 10-15-2017 | | | | 13,110,000 | | | | 15,535,350 | |
NRG Energy Incorporated | | | 7.63 | | | | 5-15-2019 | | | | 9,470,000 | | | | 9,919,825 | |
| | | | |
| | | | | | | | | | | | | | | 25,455,175 | |
| | | | | | | | | | | | | | | | |
| | | | |
Total Corporate Bonds and Notes (Cost $1,085,922,060) | | | | | | | | | | | | | | | 1,098,902,395 | |
| | | | | | | | | | | | | | | | |
| | | | |
Municipal Obligations: 0.49% | | | | | | | | | | | | | | | | |
| | | | |
| California: 0.49% | | | | | | | | | | | | | | | | |
California Judgment Trust (Miscellaneous Revenue) ± | | | 1.59 | | | | 6-1-2015 | | | | 3,175,000 | | | | 3,174,905 | |
Oakland CA Redevelopment Agency Refunding Bond Subordinated Housing
Series 2006A (Tax Revenue, Ambac Insured) | | | 5.38 | | | | 9-1-2016 | | | | 5,000,000 | | | | 5,201,450 | |
| | | | |
Total Municipal Obligations (Cost $8,159,536) | | | | | | | | | | | | | | | 8,376,355 | |
| | | | | | | | | | | | | | | | |
| | | | |
Non-Agency Mortgage Backed Securities: 0.00% | | | | | | | | | | | | | | | | |
Salomon Brothers Mortgage Securities VII Series 1994-5
Class B2 ±(i) | | | 2.80 | | | | 4-25-2024 | | | | 46,822 | | | | 39,249 | |
| | | | | | | | | | | | | | | | |
| | | | |
Total Non-Agency Mortgage Backed Securities (Cost $47,954) | | | | | | | | | | | | | | | 39,249 | |
| | | | | | | | | | | | | | | | |
| | | | |
Term Loans ±: 27.15% | | | | | | | | | | | | | | | | |
Activision Blizzard Incorporated | | | 3.25 | | | | 10-12-2020 | | | | 11,441,250 | | | | 11,458,641 | |
Allison Transmission Incorporated | | | 3.16 | | | | 8-7-2017 | | | | 2,085,748 | | | | 2,092,693 | |
Allison Transmission Incorporated | | | 3.50 | | | | 8-23-2019 | | | | 6,260,765 | | | | 6,258,824 | |
ARAMARK Corporation < | | | 0.00 | | | | 9-21-2019 | | | | 7,775,000 | | | | 7,742,578 | |
The accompanying notes are an integral part of these financial statements.
| | | | |
| 14 | | Wells Fargo Advantage Short-Term High Yield Bond Fund | | Portfolio of investments—February 28, 2014 (unaudited) |
| | | | | | | | | | | | | | | | |
| Security name | | Interest rate | | | Maturity date | | | Principal | | | Value | |
| | | |
Term Loans ± (continued) | | | | | | | | | | | | | |
ARAMARK Corporation | | | 3.60 | % | | | 7-26-2016 | | | $ | 253,281 | | | $ | 253,342 | |
Berry Plastics Group Incorporated | | | 3.50 | | | | 2-8-2020 | | | | 14,213,448 | | | | 14,129,446 | |
Biomet Incorporated | | | 3.66 | | | | 7-25-2017 | | | | 10,833,804 | | | | 10,848,430 | |
Biomet Incorporated | | | 3.15 | | | | 3-25-2015 | | | | 1,042,070 | | | | 1,045,978 | |
Burger King Corporation | | | 3.75 | | | | 9-28-2019 | | | | 7,607,957 | | | | 7,640,291 | |
BWAY Holding Company | | | 4.50 | | | | 8-6-2017 | | | | 10,288,270 | | | | 10,329,423 | |
CDW LLC | | | 3.25 | | | | 4-29-2020 | | | | 11,910,019 | | | | 11,845,466 | |
Cequel Communications LLC < | | | 3.50 | | | | 2-14-2019 | | | | 11,977,273 | | | | 11,965,655 | |
Chrysler Group LLC | | | 3.50 | | | | 5-24-2017 | | | | 7,829,471 | | | | 7,844,112 | |
CHS/Community Health System Incorporated | | | 4.25 | | | | 1-22-2021 | | | | 6,900,000 | | | | 6,957,477 | |
CHS/Community Health System Incorporated | | | 3.45 | | | | 1-25-2017 | | | | 9,300,000 | | | | 9,342,594 | |
Cinemark USA Incorporated | | | 3.16 | | | | 12-18-2019 | | | | 990,000 | | | | 990,139 | |
Crown Castle Operating Company | | | 3.25 | | | | 1-31-2021 | | | | 2,000,000 | | | | 1,999,620 | |
DaVita Incorporated | | | 4.50 | | | | 10-20-2016 | | | | 4,850,000 | | | | 4,872,747 | |
Dell Incorporated | | | 4.50 | | | | 4-29-2020 | | | | 8,349,075 | | | | 8,323,694 | |
DigitalGlobe Incorporated | | | 3.75 | | | | 1-31-2020 | | | | 11,441,112 | | | | 11,426,811 | |
EFS Cogen Holdings I LLC | | | 3.75 | | | | 12-17-2020 | | | | 8,230,000 | | | | 8,267,693 | |
Generac Power Systems Incorporated < | | | 3.50 | | | | 5-31-2020 | | | | 14,527,075 | | | | 14,524,460 | |
HCA Incorporated | | | 2.65 | | | | 2-2-2016 | | | | 6,809,764 | | | | 6,804,112 | |
HCA Incorporated | | | 2.90 | | | | 3-31-2017 | | | | 8,977,500 | | | | 8,966,278 | |
Huntsman International LLC < | | | 0.00 | | | | 10-15-2020 | | | | 11,120,000 | | | | 11,130,453 | |
Iasis Healthcare LLC | | | 4.50 | | | | 5-3-2018 | | | | 7,811,025 | | | | 7,832,974 | |
Ineos US Finance LLC < | | | 3.75 | | | | 5-4-2018 | | | | 15,566,003 | | | | 15,522,729 | |
Intelsat Jackson Holdings < | | | 3.75 | | | | 6-30-2019 | | | | 14,548,512 | | | | 14,644,677 | |
KAR Auction Services Incorporated < | | | 3.75 | | | | 5-19-2017 | | | | 12,283,411 | | | | 12,288,570 | |
Lifepoint Hospitals Incorporated | | | 2.66 | | | | 7-24-2017 | | | | 4,793,654 | | | | 4,803,577 | |
Manitowoc Company Incorporated | | | 3.25 | | | | 1-3-2021 | | | | 2,000,000 | | | | 2,007,460 | |
Michaels Stores Incorporated | | | 3.75 | | | | 1-28-2020 | | | | 11,215,996 | | | | 11,239,774 | |
NBTY Incorporated | | | 3.50 | | | | 10-1-2017 | | | | 8,172,889 | | | | 8,178,038 | |
Novelis Incorporated < | | | 3.75 | | | | 3-10-2017 | | | | 13,333,904 | | | | 13,377,639 | |
Omnova Solutions Incorporated | | | 4.25 | | | | 5-31-2018 | | | | 2,297,813 | | | | 2,306,429 | |
Peabody Energy Corporation | | | 4.25 | | | | 9-24-2020 | | | | 7,595,963 | | | | 7,612,598 | |
Phillips Van Heusen Corporation | | | 3.25 | | | | 2-13-2020 | | | | 7,437,705 | | | | 7,443,878 | |
Pinnacle Foods Finance LLC | | | 3.25 | | | | 4-29-2020 | | | | 6,962,450 | | | | 6,934,182 | |
Progressive Waste Solutions Limited | | | 3.00 | | | | 10-24-2019 | | | | 11,294,444 | | | | 11,333,974 | |
Rexnord LLC | | | 4.00 | | | | 8-21-2020 | | | | 11,556,536 | | | | 11,581,267 | |
Reynolds Group Holdings Incorporated | | | 4.00 | | | | 12-1-2018 | | | | 7,377,237 | | | | 7,427,033 | |
Salix Pharmaceuticals Limited < | | | 4.25 | | | | 1-2-2020 | | | | 10,510,000 | | | | 10,601,963 | |
Select Medical Corporation | | | 3.50 | | | | 2-19-2016 | | | | 990,000 | | | | 991,238 | |
Select Medical Corporation | | | 4.00 | | | | 6-1-2018 | | | | 9,710,323 | | | | 9,742,658 | |
Sensata Technologies Finance Company | | | 3.25 | | | | 5-12-2018 | | | | 1,701,418 | | | | 1,706,301 | |
Serta Simmons Holdings LLC | | | 4.25 | | | | 10-1-2019 | | | | 1,939,198 | | | | 1,950,271 | |
Spectrum Brands Incorporated | | | 3.50 | | | | 9-4-2019 | | | | 997,500 | | | | 996,253 | |
Sungard Data Systems Incorporated | | | 4.00 | | | | 3-8-2020 | | | | 6,054,682 | | | | 6,079,203 | |
Swift Transportation Company LLC | | | 2.90 | | | | 12-21-2016 | | | | 1,326,019 | | | | 1,331,323 | |
Swift Transportation Company LLC | | | 4.00 | | | | 12-21-2017 | | | | 4,422,287 | | | | 4,463,768 | |
Tempur-Pedic International Incorporated | | | 3.50 | | | | 3-18-2020 | | | | 11,745,415 | | | | 11,736,606 | |
Terex Corporation < | | | 3.50 | | | | 4-28-2017 | | | | 11,223,795 | | | | 11,265,884 | |
The Hertz Corporation | | | 3.00 | | | | 3-11-2018 | | | | 9,328,635 | | | | 9,297,571 | |
The accompanying notes are an integral part of these financial statements.
| | | | | | |
| Portfolio of investments—February 28, 2014 (unaudited) | | Wells Fargo Advantage Short-Term High Yield Bond Fund | | | 15 | |
| | | | | | | | | | | | | | | | |
| Security name | | Interest rate | | | Maturity date | | | Principal | | | Value | |
| | | |
Term Loans ± (continued) | | | | | | | | | | | | | |
The Hertz Corporation | | | 3.75 | % | | | 3-11-2018 | | | $ | 2,227,500 | | | $ | 2,230,262 | |
Transdigm Group Incorporated | | | 3.50 | | | | 2-14-2017 | | | | 784,270 | | | | 788,583 | |
Transdigm Group Incorporated | | | 3.75 | | | | 2-28-2020 | | | | 12,748,968 | | | | 12,796,777 | |
UCI International Incorporarted | | | 5.50 | | | | 7-26-2017 | | | | 3,543,657 | | | | 3,537,030 | |
Universal Health Services Incorporated | | | 2.40 | | | | 11-15-2016 | | | | 3,423,473 | | | | 3,440,591 | |
Valeant Pharmaceuticals International Incorporated | | | 3.75 | | | | 2-13-2019 | | | | 10,917,085 | | | | 10,946,125 | |
Virgin Media Investment Holdings Limited | | | 3.50 | | | | 6-7-2020 | | | | 14,270,000 | | | | 14,254,731 | |
Wendy’s International Incorporated | | | 3.25 | | | | 5-15-2019 | | | | 2,041,408 | | | | 2,037,591 | |
West Corporation < | | | 0.00 | | | | 6-30-2018 | | | | 8,600,000 | | | | 8,551,668 | |
| | | | |
Total Term Loans (Cost $471,163,396) | | | | | | | | | | | | | | | 470,342,153 | |
| | | | | | | | | | | | | | | | |
| | | | |
Yankee Corporate Bonds and Notes: 5.25% | | | | | | | | | | | | | | | | |
| | | | |
Consumer Discretionary: 0.17% | | | | | | | | | | | | | | | | |
| | | | |
| Automobiles: 0.17% | | | | | | | | | | | | | | | | |
Jaguar Land Rover Automotive plc 144A | | | 4.13 | | | | 12-15-2018 | | | | 2,905,000 | | | | 2,963,100 | |
| | | | | | | | | | | | | | | | |
| | | | |
Financials: 0.12% | | | | | | | | | | | | | | | | |
| | | | |
| Consumer Finance: 0.12% | | | | | | | | | | | | | | | | |
Inmarsat Finance plc 144A | | | 7.38 | | | | 12-1-2017 | | | | 2,000,000 | | | | 2,080,000 | |
| | | | | | | | | | | | | | | | |
| | | | |
Health Care: 0.38% | | | | | | | | | | | | | | | | |
| | | | |
| Pharmaceuticals : 0.38% | | | | | | | | | | | | | | | | |
Valeant Pharmaceuticals International Incorporated 144A | | | 6.75 | | | | 8-15-2018 | | | | 5,900,000 | | | | 6,504,750 | |
| | | | | | | | | | | | | | | | |
| | | | |
Information Technology: 1.71% | | | | | | | | | | | | | | | | |
| | | | |
| Electronic Equipment, Instruments & Components: 1.24% | | | | | | | | | | | | | | | | |
NXP BV/NXP Funding LLC 144A | | | 3.50 | | | | 9-15-2016 | | | | 8,705,000 | | | | 8,922,622 | |
Sensata Technologies BV 144A | | | 6.50 | | | | 5-15-2019 | | | | 11,709,000 | | | | 12,587,175 | |
| | | | |
| | | | | | | | | | | | | | | 21,509,797 | |
| | | | | | | | | | | | | | | | |
| | | | |
| Technology Hardware, Storage & Peripherals: 0.47% | | | | | | | | | | | | | | | | |
Seagate Technology HDD Holdings | | | 6.80 | | | | 10-1-2016 | | | | 7,300,000 | | | | 8,194,250 | |
| | | | | | | | | | | | | | | | |
| | | | |
Materials: 2.74% | | | | | | | | | | | | | | | | |
| | | | |
| Metals & Mining: 2.10% | | | | | | | | | | | | | | | | |
ArcelorMittal SA | | | 4.25 | | | | 8-5-2015 | | | | 7,300,000 | | | | 7,528,125 | |
ArcelorMittal SA | | | 5.00 | | | | 2-25-2017 | | | | 10,000,000 | | | | 10,687,500 | |
FMG Resources Limited 144A« | | | 6.00 | | | | 4-1-2017 | | | | 17,260,000 | | | | 18,209,300 | |
| | | | |
| | | | | | | | | | | | | | | 36,424,925 | |
| | | | | | | | | | | | | | | | |
| | | | |
| Paper & Forest Products: 0.64% | | | | | | | | | | | | | | | | |
Smurfit Kappa Acquisitions 144A | | | 4.88 | | | | 9-15-2018 | | | | 8,000,000 | | | | 8,420,000 | |
UPM Kymmene Corporation 144A | | | 5.63 | | | | 12-1-2014 | | | | 2,500,000 | | | | 2,581,250 | |
| | | | |
| | | | | | | | | | | | | | | 11,001,250 | |
| | | | | | | | | | | | | | | | |
The accompanying notes are an integral part of these financial statements.
| | | | |
| 16 | | Wells Fargo Advantage Short-Term High Yield Bond Fund | | Portfolio of investments—February 28, 2014 (unaudited) |
| | | | | | | | | | | | | | | | |
| Security name | | Interest rate | | | Maturity date | | | Principal | | | Value | |
| | | | |
Telecommunication Services: 0.13% | | | | | | | | | | | | | | | | |
| | | | |
| Diversified Telecommunication Services: 0.13% | | | | | | | | | | | | | | | | |
Intelsat Jackson Holdings SA | | | 7.25 | % | | | 4-1-2019 | | | $ | 2,140,000 | | | $ | 2,305,850 | |
| | | | | | | | | | | | | | | | |
| | | | |
Total Yankee Corporate Bonds and Notes (Cost $89,762,602) | | | | | | | | | | | | | | | 90,983,922 | |
| | | | | | | | | | | | | | | | |
| | | | |
| | | Yield | | | | | | Shares | | | | |
| Short-Term Investments: 6.15% | | | | | | | | | | | | | | | | |
| | | | |
| Investment Companies: 6.15% | | | | | | | | | | | | | | | | |
Wells Fargo Advantage Cash Investment Money Market Fund, Select Class (l)(u)## | | | 0.07 | | | | | | | | 100,726,393 | | | | 100,726,393 | |
Wells Fargo Securities Lending Cash Investments,
LLC (l)(r)(u)(v) | | | 0.09 | | | | | | | | 5,794,353 | | | | 5,794,353 | |
| | | | | | | | | | | | | | | | |
| | | | |
Total Short-Term Investments (Cost $106,520,746) | | | | | | | | | | | | | | | 106,520,746 | |
| | | | | | | | | | | | | | | | |
| | | | | | | | |
Total investments in securities (Cost $1,761,576,294)* | | | 102.47 | % | | | 1,775,164,820 | |
Other assets and liabilities, net | | | (2.47 | ) | | | (42,761,414 | ) |
| | | | | | | | |
| Total net assets | | | 100.00 | % | | $ | 1,732,403,406 | |
| | | | | | | | |
| 144A | Security that may be resold to “qualified institutional buyers” under Rule 144A or security offered pursuant to Section 4(2) of the Securities Act of 1933, as amended. |
| ± | Variable rate investment. The rate shown is the rate in effect at period end. |
| « | All or a portion of this security is on loan. |
| < | All or a portion of the position represents an unfunded term loan commitment. |
| (l) | Investment in an affiliate |
| (u) | Rate shown is the 7-day annualized yield at period end. |
| ## | All or a portion of this security has been segregated for unfunded term loans. |
| (r) | The investment company is exempt from registration under Section 3(c)(7) of the Investment Company Act of 1940, as amended. |
| (v) | Security represents investment of cash collateral received from securities on loan. |
| * | Cost for federal income tax purposes is $1,761,579,460 and unrealized appreciation (depreciation) consists of: |
| | | | |
Gross unrealized appreciation | | $ | 19,232,664 | |
Gross unrealized depreciation | | | (5,647,304 | ) |
| | | | |
Net unrealized appreciation | | $ | 13,585,360 | |
The accompanying notes are an integral part of these financial statements.
| | | | | | |
| Statement of assets and liabilities—February 28, 2014 (unaudited) | | Wells Fargo Advantage Short-Term High Yield Bond Fund | | | 17 | |
| | | | |
| | | | |
| |
Assets | | | | |
Investments | | | | |
In unaffiliated securities (including securities on loan), at value (see cost below) | | $ | 1,668,644,074 | |
In affiliated securities, at value (see cost below) | | | 106,520,746 | |
| | | | |
Total investments, at value (see cost below) | | | 1,775,164,820 | |
Receivable for investments sold | | | 7,367,317 | |
Receivable for Fund shares sold | | | 4,750,236 | |
Receivable for interest | | | 23,085,097 | |
Receivable for securities lending income | | | 1,704 | |
Prepaid expenses and other assets | | | 83,257 | |
| | | | |
Total assets | | | 1,810,452,431 | |
| | | | |
| |
Liabilities | | | | |
Dividends payable | | | 944,497 | |
Payable for investments purchased | | | 66,650,713 | |
Payable for Fund shares redeemed | | | 3,576,928 | |
Payable upon receipt of securities loaned | | | 5,794,353 | |
Advisory fee payable | | | 423,816 | |
Distribution fees payable | | | 87,973 | |
Due to other related parties | | | 246,174 | |
Accrued expenses and other liabilities | | | 324,571 | |
| | | | |
Total liabilities | | | 78,049,025 | |
| | | | |
Total net assets | | $ | 1,732,403,406 | |
| | | | |
| |
NET ASSETS CONSIST OF | | | | |
Paid-in capital | | $ | 1,720,661,035 | |
Overdistributed net investment income | | | (422,872 | ) |
Accumulated net realized losses on investments | | | (1,423,283 | ) |
Net unrealized gains on investments | | | 13,588,526 | |
| | | | |
Total net assets | | $ | 1,732,403,406 | |
| | | | |
| |
COMPUTATION OF NET ASSET VALUE AND OFFERING PRICE PER SHARE1 | | | | |
Net assets – Class A | | $ | 324,640,254 | |
Shares outstanding – Class A | | | 39,247,644 | |
Net asset value per share – Class A | | | $8.27 | |
Maximum offering price per share – Class A2 | | | $8.53 | |
Net assets – Class C | | $ | 143,983,131 | |
Shares outstanding – Class C | | | 17,406,687 | |
Net asset value per share – Class C | | | $8.27 | |
Net assets – Administrator Class | | $ | 591,018,937 | |
Shares outstanding – Administrator Class | | | 71,473,658 | |
Net asset value per share – Administrator Class | | | $8.27 | |
Net assets – Institutional Class | | $ | 413,501,415 | |
Shares outstanding – Institutional Class | | | 50,078,559 | |
Net asset value per share – Institutional Class | | | $8.26 | |
Net assets – Investor Class | | $ | 259,259,669 | |
Shares outstanding – Investor Class | | | 31,340,997 | |
Net asset value per share – Investor Class | | | $8.27 | |
| |
Investments in unaffiliated securities (including securities on loan), at cost | | $ | 1,655,055,548 | |
| | | | |
Investments in affiliated securities, at cost | | $ | 106,520,746 | |
| | | | |
Total investments, at cost | | $ | 1,761,576,294 | |
| | | | |
Securities on loan, at value | | $ | 5,669,258 | |
| | | | |
| 1. | The Fund has an unlimited number of authorized shares. |
| 2. | Maximum offering price is computed as 100/97 of net asset value. On investments of $50,000 or more, the offering price is reduced. |
The accompanying notes are an integral part of these financial statements.
| | | | |
| 18 | | Wells Fargo Advantage Short-Term High Yield Bond Fund | | Statement of operations—six months ended February 28, 2014 (unaudited) |
| | | | |
| | | | |
| |
Investment income | | | | |
Interest | | $ | 32,179,777 | |
Income from affiliated securities | | | 41,230 | |
Securities lending income, net | | | 21,691 | |
| | | | |
Total investment income | | | 32,242,698 | |
| | | | |
| |
Expenses | | | | |
Advisory fee | | | 3,284,019 | |
Administration fees | | | | |
Fund level | | | 387,258 | |
Class A | | | 241,317 | |
Class C | | | 110,409 | |
Administrator Class | | | 277,436 | |
Institutional Class | | | 117,124 | |
Investor Class | | | 248,604 | |
Shareholder servicing fees | | | | |
Class A | | | 377,058 | |
Class C | | | 172,513 | |
Administrator Class | | | 672,657 | |
Investor Class | | | 327,110 | |
Distribution fees | | | | |
Class C | | | 517,540 | |
Custody and accounting fees | | | 40,670 | |
Professional fees | | | 27,802 | |
Registration fees | | | 63,766 | |
Shareholder report expenses | | | 48,973 | |
Trustees’ fees and expenses | | | 5,245 | |
Other fees and expenses | | | 13,607 | |
| | | | |
Total expenses | | | 6,933,108 | |
Less: Fee waivers and/or expense reimbursements | | | (1,000,498 | ) |
| | | | |
Net expenses | | | 5,932,610 | |
| | | | |
Net investment income | | | 26,310,088 | |
| | | | |
| |
REALIZED AND UNREALIZED GAINS (LOSSES) ON INVESTMENTS | | | | |
Net realized losses on investments | | | (1,276,047 | ) |
Net change in unrealized gains (losses) on investments | | | 15,942,942 | |
| | | | |
Net realized and unrealized gains (losses) on investments | | | 14,666,895 | |
| | | | |
Net increase in net assets resulting from operations | | $ | 40,976,983 | |
| | | | |
The accompanying notes are an integral part of these financial statements.
| | | | | | |
| Statement of changes in net assets | | Wells Fargo Advantage Short-Term High Yield Bond Fund | | | 19 | |
| | | | | | | | | | | | | | | | |
| | | Six months ended
February 28, 2014
(unaudited) | | | Year ended
August 31, 2013 | |
| | | | |
Operations | | | | | | | | | | | | | | | | |
Net investment income | | | | | | $ | 26,310,088 | | | | | | | $ | 47,173,697 | |
Net realized gains (losses) on investments | | | | | | | (1,276,047 | ) | | | | | | | 3,396,952 | |
Net change in unrealized gains (losses) on investments | | | | | | | 15,942,942 | | | | | | | | (13,871,308 | ) |
| | | | |
Net increase in net assets resulting from operations | | | | | | | 40,976,983 | | | | | | | | 36,699,341 | |
| | | | |
| | | | |
Distributions to shareholders from | | | | | | | | | | | | | | | | |
Net investment income | | | | | | | | | | | | | | | | |
Class A | | | | | | | (4,975,102 | ) | | | | | | | (10,513,974 | ) |
Class C | | | | | | | (1,758,568 | ) | | | | | | | (3,582,237 | ) |
Administrator Class | | | | | | | (9,615,919 | ) | | | | | | | (20,506,069 | ) |
Institutional Class | | | | | | | (5,325,387 | ) | | | | | | | (3,103,533 | )1 |
Investor Class | | | | | | | (4,268,857 | ) | | | | | | | (9,162,511 | ) |
Net realized gains | | | | | | | | | | | | | | | | |
Class A | | | | | | | (679,349 | ) | | | | | | | (39,696 | ) |
Class C | | | | | | | (311,057 | ) | | | | | | | (16,294 | ) |
Administrator Class | | | | | | | (1,207,759 | ) | | | | | | | (72,797 | ) |
Institutional Class | | | | | | | (665,596 | ) | | | | | | | (720 | )1 |
Investor Class | | | | | | | (604,264 | ) | | | | | | | (34,580 | ) |
| | | | |
Total distributions to shareholders | | | | | | | (29,411,858 | ) | | | | | | | (47,032,411 | ) |
| | | | |
| | | | |
Capital share transactions | | | Shares | | | | | | | | Shares | | | | | |
Proceeds from shares sold | | | | | | | | | | | | | | | | |
Class A | | | 9,781,990 | | | | 80,845,404 | | | | 20,148,710 | | | | 166,913,214 | |
Class C | | | 3,573,647 | | | | 29,515,203 | | | | 7,114,933 | | | | 58,920,937 | |
Administrator Class | | | 30,718,372 | | | | 253,873,882 | | | | 52,099,199 | | | | 430,972,636 | |
Institutional Class | | | 37,955,425 | | | | 313,265,925 | | | | 29,495,940 | 1 | | | 243,096,222 | 1 |
Investor Class | | | 11,845,658 | | | | 97,907,563 | | | | 20,125,073 | | | | 166,584,407 | |
| | | | |
| | | | | | | 775,407,977 | | | | | | | | 1,066,487,416 | |
| | | | |
Reinvestment of distributions | | | | | | | | | | | | | | | | |
Class A | | | 659,588 | | | | 5,453,152 | | | | 1,222,470 | | | | 10,111,232 | |
Class C | | | 238,894 | | | | 1,975,054 | | | | 407,267 | | | | 3,367,963 | |
Administrator Class | | | 1,096,702 | | | | 9,063,556 | | | | 1,777,306 | | | | 14,688,659 | |
Institutional Class | | | 408,573 | | | | 3,373,025 | | | | 324,060 | 1 | | | 2,672,119 | 1 |
Investor Class | | | 537,638 | | | | 4,445,138 | | | | 932,578 | | | | 7,712,933 | |
| | | | |
| | | | | | | 24,309,925 | | | | | | | | 38,552,906 | |
| | | | |
Payment for shares redeemed | | | | | | | | | | | | | | | | |
Class A | | | (6,007,476 | ) | | | (49,644,290 | ) | | | (18,180,394 | ) | | | (150,369,835 | ) |
Class C | | | (2,657,076 | ) | | | (21,953,406 | ) | | | (3,715,552 | ) | | | (30,732,520 | ) |
Administrator Class | | | (27,495,426 | ) | | | (227,270,967 | ) | | | (42,406,628 | ) | | | (350,281,858 | ) |
Institutional Class | | | (14,118,097 | ) | | | (116,600,427 | ) | | | (3,987,342 | )1 | | | (32,846,380 | )1 |
Investor Class | | | (12,513,166 | ) | | | (103,441,106 | ) | | | (17,698,204 | ) | | | (146,319,663 | ) |
| | | | |
| | | | | | | (518,910,196 | ) | | | | | | | (710,550,256 | ) |
| | | | |
Net increase in net assets resulting from capital share transactions | | | | | | | 280,807,706 | | | | | | | | 394,490,066 | |
| | | | |
Total increase in net assets | | | | | | | 292,372,831 | | | | | | | | 384,156,996 | |
| | | | |
| | | | |
Net assets | | | | | | | | | | | | | | | | |
Beginning of period | | | | | | | 1,440,030,575 | | | | | | | | 1,055,873,579 | |
| | | | |
End of period | | | | | | $ | 1,732,403,406 | | | | | | | $ | 1,440,030,575 | |
| | | | |
Overdistributed net investment income | | | | | | $ | (422,872 | ) | | | | | | $ | (789,127 | ) |
| | | | |
| 1. | For the period from November 30, 2012 (commencement of class operations) to August 31, 2013 |
The accompanying notes are an integral part of these financial statements.
| | | | |
| 20 | | Wells Fargo Advantage Short-Term High Yield Bond Fund | | Financial highlights |
(For a share outstanding throughout each period)
| | | | | | | | | | | | | | | | | | | | | | | | | | | | |
| | | Six months ended
February 28, 2014
(unaudited) | | | Year ended August 31 | | | Year ended May 31 | |
| CLASS A | | | 2013 | | | 2012 | | | 2011 | | | 20101 | | | 2010 | | | 20092 | |
Net asset value, beginning of period | | $ | 8.21 | | | $ | 8.26 | | | $ | 8.04 | | | $ | 8.18 | | | $ | 8.09 | | | $ | 7.82 | | | $ | 8.31 | |
Net investment income | | | 0.14 | | | | 0.31 | | | | 0.36 | | | | 0.40 | | | | 0.11 | | | | 0.45 | | | | 0.40 | |
Net realized and unrealized gains (losses) on investments | | | 0.08 | | | | (0.05 | ) | | | 0.26 | | | | (0.14 | ) | | | 0.09 | | | | 0.26 | | | | (0.49 | ) |
| | | | | | | | | | | | | | | | | | | | | | | | | | | | |
Total from investment operations | | | 0.22 | | | | 0.26 | | | | 0.62 | | | | 0.26 | | | | 0.20 | | | | 0.71 | | | | (0.09 | ) |
Distributions to shareholders from | | | | | | | | | | | | | | | | | | | | | | | | | | | | |
Net investment income | | | (0.14 | ) | | | (0.31 | ) | | | (0.36 | ) | | | (0.40 | ) | | | (0.11 | ) | | | (0.44 | ) | | | (0.40 | ) |
Net realized gains | | | (0.02 | ) | | | (0.00 | )3 | | | (0.04 | ) | | | 0.00 | | | | 0.00 | | | | 0.00 | | | | 0.00 | |
| | | | | | | | | | | | | | | | | | | | | | | | | | | | |
Total distributions to shareholders | | | (0.16 | ) | | | (0.31 | ) | | | (0.40 | ) | | | (0.40 | ) | | | (0.11 | ) | | | (0.44 | ) | | | (0.40 | ) |
Net asset value, end of period | | $ | 8.27 | | | $ | 8.21 | | | $ | 8.26 | | | $ | 8.04 | | | $ | 8.18 | | | $ | 8.09 | | | $ | 7.82 | |
Total return4 | | | 2.62 | % | | | 3.17 | % | | | 7.81 | % | | | 3.10 | % | | | 2.43 | % | | | 9.17 | % | | | (0.89 | )% |
Ratios to average net assets (annualized) | | | | | | | | | | | | | | | | | | | | | | | | | | | | |
Gross expenses | | | 0.91 | % | | | 0.94 | % | | | 0.99 | % | | | 1.00 | % | | | 1.01 | % | | | 1.03 | % | | | 1.08 | % |
Net expenses | | | 0.81 | % | | | 0.81 | % | | | 0.81 | % | | | 0.81 | % | | | 0.81 | % | | | 0.81 | % | | | 0.81 | % |
Net investment income | | | 3.35 | % | | | 3.73 | % | | | 4.33 | % | | | 4.77 | % | | | 5.14 | % | | | 5.50 | % | | | 5.27 | % |
Supplemental data | | | | | | | | | | | | | | | | | | | | | | | | | | | | |
Portfolio turnover rate | | | 14 | % | | | 33 | % | | | 28 | % | | | 36 | % | | | 15 | % | | | 40 | % | | | 46 | % |
Net assets, end of period (000s omitted) | | | $324,640 | | | | $285,726 | | | | $261,173 | | | | $201,523 | | | | $235,754 | | | | $212,688 | | | | $110,451 | |
| 1. | For the three months ended August 31, 2010. The Fund changed its fiscal year end from May 31 to August 31, effective August 31, 2010. |
| 2. | On June 20, 2008, Advisor Class was renamed Class A. |
| 3. | Amount is less than $0.005. |
| 4. | Total return calculations do not include any sales charges. Returns for periods of less than one year are not annualized. |
The accompanying notes are an integral part of these financial statements.
| | | | | | |
| Financial highlights | | Wells Fargo Advantage Short-Term High Yield Bond Fund | | | 21 | |
(For a share outstanding throughout each period)
| | | | | | | | | | | | | | | | | | | | | | | | | | | | |
| | | Six months ended
February 28, 2014
(unaudited) | | | Year ended August 31 | | | Year ended May 31 | |
| CLASS C | | | 2013 | | | 2012 | | | 2011 | | | 20101 | | | 2010 | | | 2009 | |
Net asset value, beginning of period | | $ | 8.21 | | | $ | 8.26 | | | $ | 8.04 | | | $ | 8.18 | | | $ | 8.09 | | | $ | 7.82 | | | $ | 8.31 | |
Net investment income | | | 0.11 | | | | 0.25 | | | | 0.29 | 2 | | | 0.33 | | | | 0.09 | | | | 0.38 | | | | 0.34 | |
Net realized and unrealized gains (losses) on investments | | | 0.07 | | | | (0.06 | ) | | | 0.26 | | | | (0.14 | ) | | | 0.09 | | | | 0.26 | | | | (0.49 | ) |
| | | | | | | | | | | | | | | | | | | | | | | | | | | | |
Total from investment operations | | | 0.18 | | | | 0.19 | | | | 0.55 | | | | 0.19 | | | | 0.18 | | | | 0.64 | | | | (0.15 | ) |
Distributions to shareholders from | | | | | | | | | | | | | | | | | | | | | | | | | | | | |
Net investment income | | | (0.10 | ) | | | (0.24 | ) | | | (0.29 | ) | | | (0.33 | ) | | | (0.09 | ) | | | (0.37 | ) | | | (0.34 | ) |
Net realized gains | | | (0.02 | ) | | | (0.00 | )3 | | | (0.04 | ) | | | 0.00 | | | | 0.00 | | | | 0.00 | | | | 0.00 | |
| | | | | | | | | | | | | | | | | | | | | | | | | | | | |
Total distributions to shareholders | | | (0.12 | ) | | | (0.24 | ) | | | (0.33 | ) | | | (0.33 | ) | | | (0.09 | ) | | | (0.37 | ) | | | (0.34 | ) |
Net asset value, end of period | | $ | 8.27 | | | $ | 8.21 | | | $ | 8.26 | | | $ | 8.04 | | | $ | 8.18 | | | $ | 8.09 | | | $ | 7.82 | |
Total return4 | | | 2.24 | % | | | 2.40 | % | | | 7.00 | % | | | 2.33 | % | | | 2.24 | % | | | 8.35 | % | | | (1.70 | )% |
Ratios to average net assets (annualized) | | | | | | | | | | | | | | | | | | | | | | | | | | | | |
Gross expenses | | | 1.66 | % | | | 1.69 | % | | | 1.73 | % | | | 1.75 | % | | | 1.76 | % | | | 1.78 | % | | | 1.76 | % |
Net expenses | | | 1.56 | % | | | 1.56 | % | | | 1.56 | % | | | 1.56 | % | | | 1.56 | % | | | 1.56 | % | | | 1.56 | % |
Net investment income | | | 2.60 | % | | | 2.98 | % | | | 3.58 | % | | | 3.97 | % | | | 4.39 | % | | | 4.69 | % | | | 4.50 | % |
Supplemental data | | | | | | | | | | | | | | | | | | | | | | | | | | | | |
Portfolio turnover rate | | | 14 | % | | | 33 | % | | | 28 | % | | | 36 | % | | | 15 | % | | | 40 | % | | | 46 | % |
Net assets, end of period (000s omitted) | | | $143,983 | | | | $133,379 | | | | $102,780 | | | | $71,831 | | | | $36,050 | | | | $32,985 | | | | $11,096 | |
| 1. | For the three months ended August 31, 2010. The Fund changed its fiscal year end from May 31 to August 31, effective August 31, 2010. |
| 2. | Calculated based upon average shares outstanding |
| 3. | Amount is less than $0.005. |
| 4. | Total return calculations do not include any sales charges. Returns for periods of less than one year are not annualized. |
The accompanying notes are an integral part of these financial statements.
| | | | |
| 22 | | Wells Fargo Advantage Short-Term High Yield Bond Fund | | Financial highlights |
(For a share outstanding throughout each period)
| | | | | | | | | | | | | | | | | | | | |
| | | Six months ended
February 28, 2014
(unaudited) | | | Year ended August 31 | |
| ADMINISTRATOR CLASS | | | 2013 | | | 2012 | | | 2011 | | | 20101 | |
Net asset value, beginning of period | | $ | 8.20 | | | $ | 8.26 | | | $ | 8.03 | | | $ | 8.18 | | | $ | 8.18 | |
Net investment income | | | 0.14 | | | | 0.32 | | | | 0.37 | | | | 0.41 | | | | 0.03 | 2 |
Net realized and unrealized gains (losses) on investments | | | 0.09 | | | | (0.06 | ) | | | 0.27 | | | | (0.15 | ) | | | 0.00 | 3 |
| | | | | | | | | | | | | | | | | | | | |
Total from investment operations | | | 0.23 | | | | 0.26 | | | | 0.64 | | | | 0.26 | | | | 0.03 | |
Distributions to shareholders from | | | | | | | | | | | | | | | | | | | | |
Net investment income | | | (0.14 | ) | | | (0.32 | ) | | | (0.37 | ) | | | (0.41 | ) | | | (0.03 | ) |
Net realized gains | | | (0.02 | ) | | | (0.00 | )3 | | | (0.04 | ) | | | 0.00 | | | | 0.00 | |
| | | | | | | | | | | | | | | | | | | | |
Total distributions to shareholders | | | (0.16 | ) | | | (0.32 | ) | | | (0.41 | ) | | | (0.41 | ) | | | (0.03 | ) |
Net asset value, end of period | | $ | 8.27 | | | $ | 8.20 | | | $ | 8.26 | | | $ | 8.03 | | | $ | 8.18 | |
Total return4 | | | 2.82 | % | | | 3.21 | % | | | 8.12 | % | | | 3.15 | % | | | 0.39 | % |
Ratios to average net assets (annualized) | | | | | | | | | | | | | | | | | | | | |
Gross expenses | | | 0.84 | % | | | 0.87 | % | | | 0.92 | % | | | 0.94 | % | | | 0.89 | % |
Net expenses | | | 0.65 | % | | | 0.65 | % | | | 0.65 | % | | | 0.65 | % | | | 0.64 | % |
Net investment income | | | 3.52 | % | | | 3.89 | % | | | 4.48 | % | | | 4.87 | % | | | 4.39 | % |
Supplemental data | | | | | | | | | | | | | | | | | | | | |
Portfolio turnover rate | | | 14 | % | | | 33 | % | | | 28 | % | | | 36 | % | | | 15 | % |
Net assets, end of period (000s omitted) | | | $591,019 | | | | $550,981 | | | | $459,746 | | | | $249,301 | | | | $60 | |
| 1. | For the period from July 30, 2010 (commencement of class operations) to August 31, 2010 |
| 2. | Calculated based upon average shares outstanding |
| 3. | Amount is less than $0.005. |
| 4. | Returns for periods of less than one year are not annualized. |
The accompanying notes are an integral part of these financial statements.
| | | | | | |
| Financial highlights | | Wells Fargo Advantage Short-Term High Yield Bond Fund | | | 23 | |
(For a share outstanding throughout each period)
| | | | | | | | |
| INSTITUTIONAL CLASS | | Six months ended February 28, 2014 (unaudited) | | | Year ended August 31, 20131 | |
Net asset value, beginning of period | | $ | 8.19 | | | $ | 8.28 | |
Net investment income | | | 0.15 | | | | 0.25 | |
Net realized and unrealized gains (losses) on investments | | | 0.09 | | | | (0.09 | ) |
| | | | | | | | |
Total from investment operations | | | 0.24 | | | | 0.16 | |
Distributions to shareholders from | | | | | | | | |
Net investment income | | | (0.15 | ) | | | (0.25 | ) |
Net realized gains | | | (0.02 | ) | | | (0.00 | )2 |
| | | | | | | | |
Total distributions to shareholders | | | (0.17 | ) | | | (0.25 | ) |
Net asset value, end of period | | $ | 8.26 | | | $ | 8.19 | |
Total return3 | | | 2.90 | % | | | 1.92 | % |
Ratios to average net assets (annualized) | | | | | | | | |
Gross expenses | | | 0.58 | % | | | 0.60 | % |
Net expenses | | | 0.50 | % | | | 0.50 | % |
Net investment income | | | 3.67 | % | | | 4.05 | % |
Supplemental data | | | | | | | | |
Portfolio turnover rate | | | 14 | % | | | 33 | % |
Net assets, end of period (000s omitted) | | | $413,501 | | | | $211,642 | |
| 1. | For the period from November 30, 2012 (commencement of class operations) to August 31, 2013 |
| 2. | Amount is less than $0.005. |
| 3. | Returns for periods of less than one year are not annualized. |
The accompanying notes are an integral part of these financial statements.
| | | | |
| 24 | | Wells Fargo Advantage Short-Term High Yield Bond Fund | | Financial highlights |
(For a share outstanding throughout each period)
| | | | | | | | | | | | | | | | | | | | | | | | | | | | |
| | | Six months ended
February 28, 2014 (unaudited) | | | Year ended August 31 | | | Year ended May 31 | |
| INVESTOR CLASS | | | 2013 | | | 2012 | | | 2011 | | | 20101 | | | 2010 | | | 2009 | |
Net asset value, beginning of period | | $ | 8.21 | | | $ | 8.26 | | | $ | 8.03 | | | $ | 8.18 | | | $ | 8.09 | | | $ | 7.82 | | | $ | 8.31 | |
Net investment income | | | 0.14 | | | | 0.31 | | | | 0.35 | 2 | | | 0.39 | | | | 0.11 | | | | 0.44 | | | | 0.40 | |
Net realized and unrealized gains (losses) on investments | | | 0.07 | | | | (0.06 | ) | | | 0.27 | | | | (0.15 | ) | | | 0.08 | | | | 0.26 | | | | (0.49 | ) |
| | | | | | | | | | | | | | | | | | | | | | | | | | | | |
Total from investment operations | | | 0.21 | | | | 0.25 | | | | 0.62 | | | | 0.24 | | | | 0.19 | | | | 0.70 | | | | (0.09 | ) |
Distributions to shareholders from | | | | | | | | | | | | | | | | | | | | | | | | | | | | |
Net investment income | | | (0.13 | ) | | | (0.30 | ) | | | (0.35 | ) | | | (0.39 | ) | | | (0.10 | ) | | | (0.43 | ) | | | (0.40 | ) |
Net realized gains | | | (0.02 | ) | | | (0.00 | )3 | | | (0.04 | ) | | | 0.00 | | | | 0.00 | | | | 0.00 | | | | 0.00 | |
| | | | | | | | | | | | | | | | | | | | | | | | | | | | |
Total distributions to shareholders | | | (0.15 | ) | | | (0.30 | ) | | | (0.39 | ) | | | (0.39 | ) | | | (0.10 | ) | | | (0.43 | ) | | | (0.40 | ) |
Net asset value, end of period | | $ | 8.27 | | | $ | 8.21 | | | $ | 8.26 | | | $ | 8.03 | | | $ | 8.18 | | | $ | 8.09 | | | $ | 7.82 | |
Total return4 | | | 2.60 | % | | | 3.13 | % | | | 7.91 | % | | | 2.95 | % | | | 2.42 | % | | | 9.12 | % | | | (0.91 | )% |
Ratios to average net assets (annualized) | | | | | | | | | | | | | | | | | | | | | | | | | | | | |
Gross expenses | | | 0.94 | % | | | 0.97 | % | | | 1.01 | % | | | 1.03 | % | | | 1.05 | % | | | 1.07 | % | | | 1.13 | % |
Net expenses | | | 0.84 | % | | | 0.84 | % | | | 0.84 | % | | | 0.84 | % | | | 0.85 | % | | | 0.86 | % | | | 0.84 | % |
Net investment income | | | 3.31 | % | | | 3.70 | % | | | 4.30 | % | | | 4.76 | % | | | 5.10 | % | | | 5.49 | % | | | 5.20 | % |
Supplemental data | | | | | | | | | | | | | | | | | | | | | | | | | | | | |
Portfolio turnover rate | | | 14 | % | | | 33 | % | | | 28 | % | | | 36 | % | | | 15 | % | | | 40 | % | | | 46 | % |
Net assets, end of period (000s omitted) | | | $259,260 | | | | $258,302 | | | | $232,175 | | | | $170,952 | | | | $177,946 | | | | $165,759 | | | | $128,789 | |
| 1. | For the three months ended August 31, 2010. The Fund changed its fiscal year end from May 31 to August 31, effective August 31, 2010. |
| 2. | Calculated based upon average shares outstanding |
| 3. | Amount is less than $0.005. |
| 4. | Returns for periods of less than one year are not annualized. |
The accompanying notes are an integral part of these financial statements.
| | | | | | |
| Notes to financial statements (unaudited) | | Wells Fargo Advantage Short-Term High Yield Bond Fund | | | 25 | |
1. ORGANIZATION
Wells Fargo Funds Trust (the “Trust”), a Delaware statutory trust organized on March 10, 1999, is an open-end management investment company registered under the Investment Company Act of 1940, as amended (the “1940 Act”). These financial statements report on the Wells Fargo Advantage Short-Term High Yield Bond Fund (the “Fund”) which is a diversified series of the Trust.
2. SIGNIFICANT ACCOUNTING POLICIES
The following significant accounting policies, which are consistently followed in the preparation of the financial statements of the Fund, are in conformity with U.S. generally accepted accounting principles which require management to make estimates and assumptions that affect the reported amounts of assets and liabilities, disclosure of contingent assets and liabilities at the date of the financial statements, and the reported amounts of revenues and expenses during the reporting period. Actual results could differ from those estimates.
Securities valuation
All investments are valued each business day as of the close of regular trading on the New York Stock Exchange (generally 4 p.m. Eastern Time).
Fixed income securities acquired with maturities exceeding 60 days are valued based on evaluated bid prices provided by an independent pricing service which may utilize both transaction data and market information such as yield, quality, coupon rate, maturity, type of issue, trading characteristics and other market data. If prices are not available from the independent pricing service or prices received are deemed not representative of market value, prices will be obtained from an independent broker-dealer or otherwise determined based on the Fund’s Valuation Procedures.
Short-term securities, with maturities of 60 days or less at time of purchase, generally are valued at amortized cost which approximates fair value. The amortized cost method involves valuing a security at its cost, plus accretion of discount or minus amortization of premium over the period until maturity.
Investments in registered open-end investment companies are valued at net asset value. Non-registered investment vehicles are fair valued at net asset value.
Investments which are not valued using any of the methods discussed above are valued at their fair value, as determined in good faith by the Board of Trustees of the Fund. The Board of Trustees has established a Valuation Committee comprised of the Trustees and has delegated to it the authority to take any actions regarding the valuation of portfolio securities that the Valuation Committee deems necessary or appropriate, including determining the fair value of portfolio securities, unless the determination has been delegated to the Management Valuation Team of Wells Fargo Funds Management, LLC (“Funds Management”). The Board of Trustees retains the authority to make or ratify any valuation decisions or approve any changes to the Valuation Procedures as it deems appropriate. On a quarterly basis, the Board of Trustees receives reports on any valuation actions taken by the Valuation Committee or the Management Valuation Team which may include items for ratification.
Valuations of fair valued securities are compared to the next actual sales price when available, or other appropriate market values, to assess the continued appropriateness of the fair valuation methodologies used. These securities are fair valued on a day-to-day basis, taking into consideration changes to appropriate market information and any significant changes to the inputs considered in the valuation process until there is a readily available price provided on an exchange or by an independent pricing service. Valuations received from an independent pricing service or independent broker-dealer quotes are periodically validated by comparisons to most recent trades and valuations provided by other independent pricing services in addition to the review of prices by the adviser and/or subadviser. Unobservable inputs used in determining fair valuations are identified based on the type of security, taking into consideration factors utilized by market participants in valuing the investment, knowledge about the issuer and the current market environment.
Security loans
The Fund may lend its securities from time to time in order to earn additional income in the form of fees or interest on securities received as collateral or the investment of any cash received as collateral. The Fund continues to receive interest or dividends on the securities loaned. The Fund receives collateral in the form of cash or securities with a value at least equal to the value of the securities on loan. The value of the loaned securities is determined at the close of each business day and any additional required collateral is delivered to the Fund on the next business day. In a securities lending transaction, the net asset value of the Fund will be affected by an increase or decrease in the value of the securities loaned and by an increase or decrease in the value of the instrument in which collateral is invested. The amount of securities lending activity undertaken by the Fund fluctuates from time to time. In the event of default or bankruptcy
| | | | |
| 26 | | Wells Fargo Advantage Short-Term High Yield Bond Fund | | Notes to financial statements (unaudited) |
by the borrower, the Fund may be prevented from recovering the loaned securities or gaining access to the collateral or may experience delays or costs in doing so. In addition, the investment of any cash collateral received may lose all or part of its value. The Fund has the right under the lending agreement to recover the securities from the borrower on demand.
The Fund lends its securities through an unaffiliated securities lending agent. Cash collateral received in connection with its securities lending transactions is invested in Wells Fargo Securities Lending Cash Investments, LLC (the “Securities Lending Fund”). The Securities Lending Fund is exempt from registration under Section 3(c)(7) of the 1940 Act and is managed by Funds Management and is subadvised by Wells Capital Management Incorporated (“WellsCap”). Funds Management receives an advisory fee starting at 0.05% and declining to 0.01% as the average daily net assets of the Securities Lending Fund increase. All of the fees received by Funds Management are paid to WellsCap for its services as subadviser. The Securities Lending Fund seeks to provide a positive return compared to the daily Fed Funds Open rate by investing in high-quality, U.S. dollar-denominated short-term money market instruments. Securities Lending Fund investments are fair valued based upon the amortized cost valuation technique. Income earned from investment in the Securities Lending Fund is included in securities lending income on the Statement of Operations.
When-issued transactions
The Fund may purchase securities on a forward commitment or when-issued basis. The Fund records a when-issued transaction on the trade date and will segregate assets in an amount at least equal in value to the Fund’s commitment to purchase when-issued securities. Securities purchased on a when-issued basis are marked-to-market daily and the Fund begins earning interest on the settlement date. Losses may arise due to changes in the market value of the underlying securities or if the counterparty does not perform under the contract.
Term loans
The Fund may invest in term loans. The Fund begins earning interest when the loans are funded. The loans pay interest at rates which are periodically reset by reference to a base lending rate plus a spread. The Fund assumes the credit risk of the borrower and there could be potential loss to the Fund in the event of default by the borrower.
Security transactions and income recognition
Securities transactions are recorded on a trade date basis. Realized gains or losses are recorded on the basis of identified cost.
Interest income is accrued daily and bond discounts are accreted and premiums are amortized daily based on the effective interest method. To the extent debt obligations are placed on non-accrual status, any related interest income may be reduced by writing off interest receivables when the collection of all or a portion of interest has become doubtful based on consistently applied procedures. If the issuer subsequently resumes interest payments or when the collectability of interest is reasonably assured, the debt obligation is removed from non-accrual status.
Distributions to shareholders
Distributions to shareholders from net investment income are accrued daily and paid monthly. Distributions from net realized gains, if any, are recorded on the ex-dividend date. Such distributions are determined in conformity with federal income tax regulations, which may differ in amount or character from net investment income and realized gains recognized for purposes of U.S. generally accepted accounting principles.
Federal and other taxes
The Fund intends to continue to qualify as a regulated investment company by distributing substantially all of its investment company taxable income and any net realized capital gains (after reduction for capital loss carryforwards) sufficient to relieve it from all, or substantially all, federal income taxes. Accordingly, no provision for federal income taxes was required.
The Fund’s income and federal excise tax returns and all financial records supporting those returns for the prior three fiscal years are subject to examination by the federal and Delaware revenue authorities. Management has analyzed the Fund’s tax positions taken on federal, state, and foreign tax returns for all open tax years and does not believe that there are any uncertain tax positions that require recognition of a tax liability.
Class allocations
The separate classes of shares offered by the Fund differ principally in applicable sales charges, distribution, shareholder servicing, and administration fees. Shareholders of each class bear certain expenses that pertain to that particular class. All shareholders bear the common expenses of the Fund, earn income from the portfolio, and are allocated any unrealized gains and losses pro rata based on the average daily net assets of each class, without distinction between share classes. Dividends are determined separately for each class based on income and expenses allocable to each class. Realized gains and losses are allocated to each class pro rata based upon the net assets of each class on the date realized.
| | | | | | |
| Notes to financial statements (unaudited) | | Wells Fargo Advantage Short-Term High Yield Bond Fund | | | 27 | |
Differences in per share dividend rates generally result from the relative weightings of pro rata income and realized gain allocations and from differences in separate class expenses, including distribution, shareholder servicing, and administration fees.
3. FAIR VALUATION MEASUREMENTS
Fair value measurements of investments are determined within a framework that has established a fair value hierarchy based upon the various data inputs utilized in determining the value of the Fund’s investments. The three-level hierarchy gives the highest priority to unadjusted quoted prices in active markets for identical assets or liabilities (Level 1) and the lowest priority to significant unobservable inputs (Level 3). The Fund’s investments are classified within the fair value hierarchy based on the lowest level of input that is significant to the fair value measurement. The inputs are summarized into three broad levels as follows:
| n | | Level 1 – quoted prices in active markets for identical securities |
| n | | Level 2 – other significant observable inputs (including quoted prices for similar securities, interest rates, prepayment speeds, credit risk, use of amortized cost, etc.) |
| n | | Level 3 – significant unobservable inputs (including the Fund’s own assumptions in determining the fair value of investments) |
The inputs or methodologies used for valuing investments in securities are not necessarily an indication of the risk associated with investing in those securities.
As of February 28, 2014, the inputs used in valuing investments in securities were as follows:
| | | | | | | | | | | | | | | | |
| Investments in securities | | Quoted prices
(Level 1) | | | Other significant
observable inputs
(Level 2) | | �� | Significant
unobservable inputs
(Level 3) | | | Total | |
| | | | |
Corporate bonds and notes | | $ | 0 | | | $ | 1,098,902,395 | | | $ | 0 | | | $ | 1,098,902,395 | |
| | | | |
Municipal obligations | | | 0 | | | | 8,376,355 | | | | 0 | | | | 8,376,355 | |
| | | | |
Non-agency mortgage backed securities | | | 0 | | | | 39,249 | | | | 0 | | | | 39,249 | |
| | | | |
Term loans | | | 0 | | | | 468,035,724 | | | | 2,306,429 | | | | 470,342,153 | |
| | | | |
Yankee corporate bonds and notes | | | 0 | | | | 90,983,922 | | | | 0 | | | | 90,983,922 | |
| | | | |
Short-term investments | | | | | | | | | | | | | | | | |
Investment companies | | | 100,726,393 | | | | 5,794,353 | | | | 0 | | | | 106,520,746 | |
| | | $ | 100,726,393 | | | $ | 1,672,131,998 | | | $ | 2,306,429 | | | $ | 1,775,164,820 | |
Transfers in and transfers out are recognized at the end of the reporting period. For the six months ended February 28, 2014, the Fund did not have any transfers into/out of Level 1, Level 2, or Level 3.
4. TRANSACTIONS WITH AFFILIATES AND OTHER EXPENSES
Advisory fee
The Trust has entered into an advisory contract with Funds Management, an indirect wholly owned subsidiary of Wells Fargo & Company (“Wells Fargo”). The adviser is responsible for implementing investment policies and guidelines and for supervising the subadviser, who is responsible for day-to-day portfolio management of the Fund.
Pursuant to the contract, Funds Management is entitled to receive an annual advisory fee starting at 0.45% and declining to 0.35% as the average daily net assets of the Fund increase. For the six months ended February 28, 2014, the advisory fee was equivalent to an annual rate of 0.42% of the Fund’s average daily net assets.
Funds Management has retained the services of a subadviser to provide daily portfolio management to the Fund. The fee for subadvisory services is borne by Funds Management. WellsCap, an affiliate of Funds Management and an
indirect, wholly owned subsidiary of Wells Fargo, is the subadviser to the Fund and is entitled to receive a fee from Funds Management at an annual rate starting at 0.35% and declining to 0.20% as the average daily net assets of the Fund increase.
Administration and transfer agent fees
The Trust has entered into an administration agreement with Funds Management. Under this agreement, for providing administrative services, which includes paying fees and expenses for services provided by the transfer agent, sub-transfer
| | | | |
| 28 | | Wells Fargo Advantage Short-Term High Yield Bond Fund | | Notes to financial statements (unaudited) |
agents, omnibus account servicers and record-keepers, Funds Management is entitled to receive from the Fund an annual fund level administration fee starting at 0.05% and declining to 0.03% as the average daily net assets of the Fund increase and a class level administration fee which is calculated based on the average daily net assets of each class as follows:
| | | | |
| | | Class level
administration fee | |
Class A, Class C | | | 0.16 | % |
Administrator Class | | | 0.10 | |
Institutional Class | | | 0.08 | |
Investor Class | | | 0.19 | |
Funds Management has contractually waived and/or reimbursed advisory and administration fees to the extent necessary to maintain certain net operating expense ratios for the Fund. Waiver of fees and/or reimbursement of expenses by Funds Management were made first from fund level expenses on a proportionate basis and then from class specific expenses. Funds Management has committed through December 31, 2014 to waive fees and/or reimburse expenses to the extent necessary to cap the Fund’s expenses at 0.81 % for Class A shares, 1.56% for Class C shares, 0.65% for Administrator Class shares, 0.50% for Institutional Class shares, and 0.84% for Investor Class shares.
Distribution fees
The Trust has adopted a Distribution Plan for Class C shares of the Fund pursuant to Rule 12b-1 under the 1940 Act. Distribution fees are charged to Class C shares and paid to Wells Fargo Funds Distributor, LLC, the principal underwriter, at an annual rate of 0.75% of the average daily net assets of Class C shares.
For the six months ended February 28, 2014, Wells Fargo Funds Distributor, LLC received $12,720 from the sale of Class A shares and $120 and $787 in contingent deferred sales charges from redemptions of Class A and Class C shares, respectively.
Shareholder servicing fees
The Trust has entered into contracts with one or more shareholder servicing agents, whereby Class A, Class C, Administrator Class, and Investor Class of the Fund is charged a fee at an annual rate of 0.25% of the average daily net assets of each respective class.
A portion of these total shareholder servicing fees were paid to affiliates of Wells Fargo.
5. INVESTMENT PORTFOLIO TRANSACTIONS
Purchases and sales of investments, excluding U.S. government obligations (if any) and short-term securities, for the six months ended February 28, 2014 were $678,591,567 and $205,105,225, respectively.
As of February 28, 2014, the Fund had unfunded term loan commitments of $63,210,713.
6. BANK BORROWINGS
The Trust (excluding the money market funds and certain other funds in the Trust) and Wells Fargo Variable Trust are parties to a $150,000,000 revolving credit agreement with State Street Bank and Trust Company, whereby the Fund is permitted to use bank borrowings for temporary or emergency purposes, such as to fund shareholder redemption requests. Interest under the credit agreement is charged to the Fund based on a borrowing rate equal to the higher of the Federal Funds rate in effect on that day plus 1.25% or the overnight LIBOR rate in effect on that day plus 1.25%. In addition, an annual commitment fee equal to 0.10% of the unused balance is allocated to each participating fund. For the six months ended February 28, 2014, the Fund paid $1,476 in commitment fees.
For the six months ended February 28, 2014, there were no borrowings by the Fund under the agreement.
7. INDEMNIFICATION
Under the Trust’s organizational documents, the officers and directors are indemnified against certain liabilities that may arise out of performance of their duties to the Trust. Additionally, in the normal course of business, the Trust may enter into contracts with service providers that contain a variety of indemnification clauses. The Trust’s maximum exposure under these arrangements is dependent on future claims that may be made against the Fund and, therefore, cannot be estimated.
| | | | | | |
| Other information (unaudited) | | Wells Fargo Advantage Short-Term High Yield Bond Fund | | | 29 | |
PROXY VOTING INFORMATION
A description of the policies and procedures that the Fund uses to determine how to vote proxies relating to portfolio securities is available without charge, upon request, by calling 1-800-222-8222, visiting our website at wellsfargoadvantagefunds.com, or visiting the SEC website at sec.gov. Information regarding how the Fund voted proxies relating to portfolio securities during the most recent 12-month period ended June 30 is available without charge on the Fund’s website at wellsfargoadvantagefunds.com or by visiting the SEC website at sec.gov.
PORTFOLIO HOLDINGS INFORMATION
The complete portfolio holdings for the Fund are publicly available on the Fund’s website (wellsfargoadvantagefunds.com) on a monthly, 30-day or more delayed basis. In addition, top ten holdings information for the Fund is publicly available on the Fund’s website on a monthly, seven-day or more delayed basis. The Fund files its complete schedule of portfolio holdings with the SEC for the first and third quarters of each fiscal year on Form N-Q, which is available without charge by visiting the SEC website at sec.gov. In addition, the Fund’s Form N-Q may be reviewed and copied at the SEC’s Public Reference Room in Washington, DC, and at regional offices in New York City, at 233 Broadway, and in Chicago, at 175 West Jackson Boulevard, Suite 900. Information about the Public Reference Room may be obtained by calling 1-800-SEC-0330.
| | | | |
| 30 | | Wells Fargo Advantage Short-Term High Yield Bond Fund | | Other information (unaudited) |
BOARD OF TRUSTEES AND OFFICERS
Each of the Trustees and Officers listed in the table below acts in identical capacities for each fund in the Wells Fargo Advantage family of funds, which consists of 132 mutual funds1 comprising the Wells Fargo Funds Trust, Wells Fargo Variable Trust, Wells Fargo Master Trust and four closed-end funds (collectively the “Fund Complex”). This table should be read in conjunction with the Prospectus and the Statement of Additional Information2. All of the Trustees are also Members of the Audit and Governance Committees of each Trust in the Fund Complex. The mailing address of each Trustee and Officer is 525 Market Street, 12th Floor, San Francisco, CA 94105. Each Trustee and Officer serves an indefinite term, however, each Trustee serves such term until reaching the mandatory retirement age established by the Trustees.
Independent Trustees
| | | | | | |
Name and year of birth | | Position held and length of service* | | Principal occupations during past five years | | Other directorships during
past five years |
| Peter G. Gordon (Born 1942) | | Trustee, since 1998; Chairman, since 2005 | | Co-Founder, Retired Chairman, President and CEO of Crystal Geyser Water Company. Trustee Emeritus, Colby College. | | Asset Allocation Trust |
| Isaiah Harris, Jr. (Born 1952) | | Trustee, since 2009 | | Retired. Prior thereto, President and CEO of BellSouth Advertising and Publishing Corp. from 2005 to 2007, President and CEO of BellSouth Enterprises from 2004 to 2005 and President of BellSouth Consumer Services from 2000 to 2003. Emeritus member of the Iowa State University Foundation Board of Governors. Emeritus Member of the Advisory Board of Iowa State University School of Business. Advisory Board Member, Palm Harbor Academy (charter school). Mr. Harris is a certified public accountant. | | CIGNA Corporation; Deluxe Corporation; Asset Allocation Trust |
| Judith M. Johnson (Born 1949) | | Trustee, since 2008; Audit Committee Chairman, since 2008 | | Retired. Prior thereto, Chief Executive Officer and Chief Investment Officer of Minneapolis Employees Retirement Fund from 1996 to 2008. Ms. Johnson is an attorney, certified public accountant and a certified managerial accountant. | | Asset Allocation Trust |
| Leroy Keith, Jr. (Born 1939) | | Trustee, since 2010 | | Chairman, Bloc Global Services (development and construction). Trustee of the Evergreen Funds from 1983 to 2010. Former Managing Director, Almanac Capital Management (commodities firm), former Partner, Stonington Partners, Inc. (private equity fund), former Director, Obagi Medical Products Co. and former Director, Lincoln Educational Services. | | Trustee, Virtus Fund Complex (consisting of 50 portfolios as of 12/16/2013); Asset Allocation Trust |
| David F. Larcker (Born 1950) | | Trustee, since 2009 | | James Irvin Miller Professor of Accounting at the Graduate School of Business, Stanford University, Morgan Stanley Director of the Center for Leadership Development and Research and Senior Faculty of The Rock Center for Corporate Governance since 2006. From 2005 to 2008, Professor of Accounting at the Graduate School of Business, Stanford University. Prior thereto, Ernst & Young Professor of Accounting at The Wharton School, University of Pennsylvania from 1985 to 2005. | | Asset Allocation Trust |
| Olivia S. Mitchell (Born 1953) | | Trustee, since 2006 | | International Foundation of Employee Benefit Plans Professor, Wharton School of the University of Pennsylvania since 1993. Director of Wharton’s Pension Research Council and Boettner Center on Pensions & Retirement Research, and Research Associate at the National Bureau of Economic Research. Previously, Cornell University Professor from 1978 to 1993. | | Asset Allocation Trust |
| Timothy J. Penny (Born 1951) | | Trustee, since 1996 | | President and CEO of Southern Minnesota Initiative Foundation, a non-profit organization, since 2007 and Senior Fellow at the Humphrey Institute Policy Forum at the University of Minnesota since 1995. Member of the Board of Trustees of NorthStar Education Finance, Inc., a non-profit organization, since 2007. | | Asset Allocation Trust |
| | | | | | |
| Other information (unaudited) | | Wells Fargo Advantage Short-Term High Yield Bond Fund | | | 31 | |
| | | | | | |
Name and year of birth | | Position held and length of service* | | Principal occupations during past five years | | Other directorships during
past five years |
| Michael S. Scofield (Born 1943) | | Trustee, since 2010 | | Served on the Investment Company Institute’s Board of Governors and Executive Committee from 2008-2011 as well the Governing Council of the Independent Directors Council from 2006-2011 and the Independent Directors Council Executive Committee from 2008-2011. Chairman of the IDC from 2008-2010. Institutional Investor (Fund Directions) Trustee of Year in 2007. Trustee of the Evergreen Funds (and its predecessors) from 1984 to 2010. Chairman of the Evergreen Funds from 2000-2010. Former Trustee of the Mentor Funds. Retired Attorney, Law Offices of Michael S. Scofield. | | Asset Allocation Trust |
| Donald C. Willeke (Born 1940) | | Trustee, since 1996 | | Principal of the law firm of Willeke & Daniels. General Counsel of the Minneapolis Employees Retirement Fund from 1984 until its consolidation into the Minnesota Public Employees Retirement Association on June 30, 2010. Director and Vice Chair of The Tree Trust (non-profit corporation). Director of the American Chestnut Foundation (non-profit corporation). | | Asset Allocation Trust |
| * | Length of service dates reflect the Trustee’s commencement of service with the Trust’s predecessor entities, where applicable. |
Officers
| | | | | | |
Name and year of birth | | Position held and
length of service | | Principal occupations during past five years | | |
| Karla M. Rabusch (Born 1959) | | President, since 2003 | | Executive Vice President of Wells Fargo Bank, N.A. and President of Wells Fargo Funds Management, LLC since 2003. | | |
Nancy Wiser1 (Born 1967) | | Treasurer, since 2012 | | Executive Vice President of Wells Fargo Funds Management, LLC since 2011. Chief Operating Officer and Chief Compliance Officer at LightBox Capital Management LLC, from 2008 to 2011. Owned and operated a consulting business providing services to various hedge funds including acting as Chief Operating Officer and Chief Compliance Officer for a hedge fund from 2007 to 2008. Chief Operating Officer and Chief Compliance Officer of GMN Capital LLC from 2006 to 2007. | | |
| C. David Messman (Born 1960) | | Secretary, since 2000; Chief Legal Officer, since 2003 | | Senior Vice President and Secretary of Wells Fargo Funds Management, LLC since 2001. Vice President and Managing Counsel of Wells Fargo Bank, N.A. since 1996. | | |
Debra Ann Early (Born 1964) | | Chief Compliance Officer, since 2007 | | Chief Compliance Officer of Wells Fargo Funds Management, LLC since 2007. Chief Compliance Officer of Parnassus Investments from 2005 to 2007. Chief Financial Officer of Parnassus Investments from 2004 to 2007. | | |
David Berardi (Born 1975) | | Assistant Treasurer, since 2009 | | Vice President of Wells Fargo Funds Management, LLC since 2009. Vice President of Evergreen Investment Management Company, LLC from 2008 to 2010. Assistant Vice President of Evergreen Investment Services, Inc. from 2004 to 2008. Manager of Fund Reporting and Control for Evergreen Investment Management Company, LLC from 2004 to 2010. | | |
| Jeremy DePalma1 (Born 1974) | | Assistant Treasurer, since 2009 | | Senior Vice President of Wells Fargo Funds Management, LLC since 2009. Senior Vice President of Evergreen Investment Management Company, LLC from 2008 to 2010. Vice President, Evergreen Investment Services, Inc. from 2004 to 2007. Head of the Fund Reporting and Control Team within Fund Administration from 2005 to 2010. | | |
| 1. | Nancy Wiser acts as Treasurer of 73 funds in the Fund Complex. Jeremy DePalma acts as Treasurer of 59 funds and Assistant Treasurer of 73 funds in the Fund Complex. |
| 2. | The Statement of Additional Information includes additional information about the Trustees and is available, without charge, upon request, by calling 1-800-222-8222 or by visiting the website at wellsfargoadvantagefunds.com. |
| | | | |
| 32 | | Wells Fargo Advantage Short-Term High Yield Bond Fund | | List of abbreviations |
The following is a list of common abbreviations for terms and entities that may have appeared in this report.
| ACA | — ACA Financial Guaranty Corporation |
| ADR | — American depositary receipt |
| ADS | — American depositary shares |
| AGC | — Assured Guaranty Corporation |
| AGM | — Assured Guaranty Municipal |
| Ambac | — Ambac Financial Group Incorporated |
| AMT | — Alternative minimum tax |
| BAN | — Bond anticipation notes |
| BHAC | — Berkshire Hathaway Assurance Corporation |
| CAB | — Capital appreciation bond |
| CCAB | — Convertible capital appreciation bond |
| CDA | — Community Development Authority |
| CDO | — Collateralized debt obligation |
| DRIVER | — Derivative inverse tax-exempt receipts |
| DW&P | — Department of Water & Power |
| DWR | — Department of Water Resources |
| ECFA | — Educational & Cultural Facilities Authority |
| EDA | — Economic Development Authority |
| EDFA | — Economic Development Finance Authority |
| ETF | — Exchange-traded fund |
| FDIC | — Federal Deposit Insurance Corporation |
| FFCB | — Federal Farm Credit Banks |
| FGIC | — Financial Guaranty Insurance Corporation |
| FHA | — Federal Housing Administration |
| FHLB | — Federal Home Loan Bank |
| FHLMC | — Federal Home Loan Mortgage Corporation |
| FICO | — The Financing Corporation |
| FNMA | — Federal National Mortgage Association |
| GDR | — Global depositary receipt |
| GNMA | — Government National Mortgage Association |
| HCFR | — Healthcare facilities revenue |
| HEFA | — Health & Educational Facilities Authority |
| HEFAR | — Higher education facilities authority revenue |
| HFA | — Housing Finance Authority |
| HFFA | — Health Facilities Financing Authority |
| HUD | — Department of Housing and Urban Development |
| IDA | — Industrial Development Authority |
| IDAG | — Industrial Development Agency |
| KRW | — Republic of Korea won |
| LIBOR | — London Interbank Offered Rate |
| LLC | — Limited liability company |
| LLLP | — Limited liability limited partnership |
| LLP | — Limited liability partnership |
| MBIA | — Municipal Bond Insurance Association |
| MFHR | — Multifamily housing revenue |
| MSTR | — Municipal securities trust receipts |
| MUD | — Municipal Utility District |
| National | — National Public Finance Guarantee Corporation |
| PCFA | — Pollution Control Financing Authority |
| PCL | — Public Company Limited |
| PCR | — Pollution control revenue |
| PFA | — Public Finance Authority |
| PFFA | — Public Facilities Financing Authority |
| PFOTER | — Puttable floating option tax-exempt receipts |
| plc | — Public limited company |
| PUTTER | — Puttable tax-exempt receipts |
| R&D | — Research & development |
| Radian | — Radian Asset Assurance |
| RAN | — Revenue anticipation notes |
| RDA | — Redevelopment Authority |
| RDFA | — Redevelopment Finance Authority |
| REIT | — Real estate investment trust |
| ROC | — Reset option certificates |
| SAVRS | — Select auction variable rate securities |
| SBA | — Small Business Authority |
| SFHR | — Single-family housing revenue |
| SFMR | — Single-family mortgage revenue |
| SPA | — Standby purchase agreement |
| SPDR | — Standard & Poor’s Depositary Receipts |
| STRIPS | — Separate trading of registered interest and |
| TAN | — Tax anticipation notes |
| TIPS | — Treasury inflation-protected securities |
| TRAN | — Tax revenue anticipation notes |
| TTFA | — Transportation Trust Fund Authority |
| TVA | — Tennessee Valley Authority |


For more information
More information about Wells Fargo Advantage Funds is available free upon request. To obtain literature, please write, email, visit the Fund’s website, or call:
Wells Fargo Advantage Funds
P.O. Box 8266
Boston, MA 02266-8266
Email: wfaf@wellsfargo.com
Website: wellsfargoadvantagefunds.com
Individual investors: 1-800-222-8222
Retail investment professionals: 1-888-877-9275
Institutional investment professionals: 1-866-765-0778
This report and the financial statements contained herein are submitted for the general information of the shareholders of Wells Fargo Advantage Funds. If this report is used for promotional purposes, distribution of the report must be accompanied or preceded by a current prospectus. For a current prospectus and, if available, a summary prospectus containing more complete information, including charges and expenses, call 1-800-222-8222 or visit the Fund’s website at wellsfargoadvantagefunds.com. Please consider the investment objectives, risks, charges, and expenses of the investment carefully before investing. This and other information about Wells Fargo Advantage Funds can be found in the current prospectus. Read the prospectus carefully before you invest or send money.
Wells Fargo Funds Management, LLC, a wholly owned subsidiary of Wells Fargo & Company, provides investment advisory and administrative services for Wells Fargo Advantage Funds. Other affiliates of Wells Fargo & Company provide subadvisory and other services for the Funds. The Funds are distributed by Wells Fargo Funds Distributor, LLC, Member FINRA/SIPC, an affiliate of Wells Fargo & Company.
NOT FDIC INSURED ¡ NO BANK GUARANTEE ¡ MAY LOSE VALUE
© 2014 Wells Fargo Funds Management, LLC. All rights reserved.
| | |
 | | 223536 04-14 SA222/SAR222 02-14 |

Wells Fargo Advantage
Ultra Short-Term Income Fund

Semi-Annual Report
February 28, 2014

Reduce clutter. Save trees.
Sign up for electronic delivery of prospectuses and shareholder reports at wellsfargo.com/advantagedelivery
Contents
The views expressed and any forward-looking statements are as of February 28, 2014, unless otherwise noted, and are those of the Fund managers and/or Wells Fargo Funds Management, LLC. Discussions of individual securities, or the markets generally, or any Wells Fargo Advantage Fund are not intended as individual recommendations. Future events or results may vary significantly from those expressed in any forward-looking statements; the views expressed are subject to change at any time in response to changing circumstances in the market. Wells Fargo Funds Management, LLC and the Fund disclaim any obligation to publicly update or revise any views expressed or forward-looking statements.
NOT FDIC INSURED ¡ NO BANK GUARANTEE ¡ MAY LOSE VALUE
| | | | |
| 2 | | Wells Fargo Advantage Ultra Short-Term Income Fund | | Letter to shareholders (unaudited) |

Karla M. Rabusch
President
Wells Fargo Advantage Funds
Fixed-income markets shifted during the period, driven by vacillations between U.S. Treasury yield increases and subsequent declines.
Reassurances from the Fed that a highly accommodative monetary policy would continue throughout 2014 inspired price rallies across both the investment-grade and high-yield bond markets.
Dear Valued Shareholder:
We are pleased to offer you this semi-annual report for the Wells Fargo Advantage Ultra Short-Term Income Fund for the six-month period that ended February 28, 2014. Fixed-income markets shifted during the period, driven by vacillations between U.S. Treasury yield increases and subsequent declines. However, on the whole, investment-grade (measured by the Barclays U.S. Aggregate Bond Index1) and high-yield markets (measured by the Barclays U.S. High Yield Bond Index2) generated positive returns during the period, notably benefiting from the strong price improvement and declining U.S. Treasury yields that occurred in September and October of 2013 as well as the opening months of 2014. Although the returns of the U.S. high-yield market have often been positively correlated with U.S. equity returns (measured by the S&P 500 Index3) over the long-run, over the period, high-yield (measured by the Barclays U.S. High Yield Bond Index) generally performed well even when equities did not. The lower-rated corporate bond credit tiers outperformed the respectively higher-rated investment-grade credit tiers during the period.
A decline in bond prices was halted by the Fed’s postponement of tapering its bond-buying program.
Before the six-month period began, equity markets rallied, most notably in May and June of 2013. This led to a sharp increase in U.S. Treasury yields and declining valuations for much of the fixed-income markets (measured by the Barclays U.S. Aggregate Bond Index). However, in July and August 2013, that equity exuberance quieted a bit, and fixed-income markets stabilized. Returns across the fixed-income markets were largely negative in investment-grade and high-yield markets but modest in comparison with the declines in May and June of 2013.
But, by September and October of 2013, investment-grade and high-yield bond markets began generating positive returns yet again, as the Federal Reserve (Fed) backtracked on its intentions to taper its quantitative easing program, postponing it until 2014, at the earliest. This created a temporary rally in bonds that lasted until around November 20, 2013, when notes were released from the Fed’s October 2013 meeting that tapering of the bond-buying programs would not be postponed beyond January 2014. In response, long-term U.S. Treasury yields and mortgage rates ratcheted higher on expectations for an unwinding of monetary accommodation in the upcoming months. This led to declines in pricing across much of the core fixed-income markets (measured by the Barclays U.S. Aggregate Bond Index). U.S. high-yield markets were better able to absorb the shift in U.S. Treasury yields and continued to provide positive returns along with rallies in the equity markets.
Favorable conditions for fixed-income markets were restored in January and February 2014.
Seemingly much to the surprise of many everyday investors and seasoned investment professionals alike, fixed-income markets (measured by the Barclays U.S. Aggregate Bond Index) largely outperformed U.S. equity markets (measured by the S&P 500 Index) during the opening months of 2014. A pullback in equity exuberance in January and reassurances from the Fed that a highly accommodative monetary policy would continue throughout 2014 inspired price rallies across both the investment-grade and high-yield bond markets. U.S. Treasury yields declined in January 2014 and corporate bonds and mortgage-backed securities performed notably well. U.S. high-yield securities generated positive returns in January 2014 but lagged the rally across the investment-grade bond markets. This theme reversed in February 2014, as high-yield sectors rallied and investment-grade sectors performed well but not to the extent of the lowest-rated credit tiers.
| | | | | | |
| Letter to shareholders (unaudited) | | Wells Fargo Advantage Ultra Short-Term Income Fund | | | 3 | |
One positive takeaway for bond investors that helped fuel the fixed-income (measured by the Barclays U.S. Aggregate Bond Index) rallies was former Fed Chairman Bernanke’s guidance at the end of 2013. He indicated that the tapering of the Fed’s bond-buying program would proceed at a slow pace and that a reduction in quantitative easing should not be equivocated with a tightening of monetary policy. The distinction was important—although the bond-buying program was declining in volume, it was, nonetheless, still continuing. Additionally, the federal funds target rate would remain unchanged for the foreseeable future, with the implications that it would not increase until the bond-buying program was fully disbanded. These were important statements for fixed-income investors that helped bolster U.S. fixed-income valuations in the opening months of 2014.
Don’t let short-term uncertainty derail long-term investment goals.
Periods of investment uncertainty can present challenges, but experience has taught us that maintaining long-term investment goals can be an effective way to plan for the future. To help you create a sound strategy based on your personal goals and risk tolerance, Wells Fargo Advantage Funds offers more than 100 mutual funds and other investments spanning a wide range of asset classes and investment styles. Although diversification cannot guarantee an investment profit or prevent losses, we believe it can be an effective way to manage investment risk and potentially smooth out overall portfolio performance. We encourage investors to know their investments and to understand that appropriate levels of risk-taking may unlock opportunities.
Thank you for choosing to invest with Wells Fargo Advantage Funds. We appreciate your confidence in us and remain committed to helping you meet your financial needs. For current information about your fund investments, contact your investment professional, visit our website at wellsfargoadvantagefunds.com, or call us directly at 1-800-222-8222. We are available 24 hours a day, 7 days a week.
Sincerely,

Karla M. Rabusch
President
Wells Fargo Advantage Funds
| 1. | The Barclays U.S. Aggregate Bond Index is a broad-based benchmark that measures the investment-grade, U.S. dollar-denominated, fixed-rate taxable bond market, including Treasuries, government-related and corporate securities, MBS (agency fixed-rate and hybrid ARM passthroughs), ABS, and CMBS. You cannot invest directly in an index. |
| 2. | The Barclays U.S. High Yield Bond Index is an index consisting of all domestic and Yankee bonds, rated below investment grade, with a minimum outstanding amount of $100 million and maturing over one year. You cannot invest directly in an index. |
| 3. | The S&P 500 Index consists of 500 stocks chosen for market size, liquidity, and industry group representation. It is a market-value-weighted index with each stock’s weight in the index proportionate to its market value. You cannot invest directly in an index. |
| | | | |
| 4 | | Wells Fargo Advantage Ultra Short-Term Income Fund | | Letter to shareholders (unaudited) |
Notice to shareholders
The Fund and Wells Fargo Funds Management, LLC (“Funds Management”) have received an exemptive order from the SEC that permits Funds Management, subject to the approval of the Board of Trustees of the Fund, to select or replace certain subadvisers to manage all or a portion of the Fund’s assets and enter into, amend or terminate a sub-advisory agreement with certain subadvisers without obtaining shareholder approval (“Multi-manager Structure”). The Multi-manager Structure applies to subadvisers that are not affiliated with Funds Management or the Fund, except to the extent that affiliation arises solely because such subadvisers provide sub-advisory services to the Fund (“Non-affiliated Subadvisers”), as well as subadvisers that are indirect or direct wholly-owned subsidiaries of Funds Management or of another company that, indirectly or directly, wholly owns Funds Management (“Wholly-owned Subadvisers”).
Pursuant to the SEC order, Funds Management, with the approval of the Board of Trustees, has the discretion to terminate any subadvisers and allocate and reallocate the Fund’s assets among any other Non-affiliated Subadvisers or Wholly-owned Subadvisers. Funds Management, subject to oversight and supervision by the Board of Trustees, has responsibility to continue to oversee any subadvisers to the Fund and to recommend, for approval by the Board of Trustees, the hiring, termination and replacement of subadvisers for the Fund. In the event that a new subadviser is hired pursuant to the Multi-manager Structure, the Fund is required to provide notice to shareholders within 90 days.
Please contact your investment professional or call us directly at 1-800-222-8222 if you have any questions on this Notice to Shareholders.
This page is intentionally left blank.
| | | | |
| 6 | | Wells Fargo Advantage Ultra Short-Term Income Fund | | Performance highlights (unaudited) |
Investment objective
The Fund seeks current income consistent with capital preservation.
Adviser
Wells Fargo Funds Management, LLC
Subadviser
Wells Capital Management Incorporated
Portfolio managers
Thomas M. Price, CFA
Jay N. Mueller, CFA
Christopher Y. Kauffman, CFA
Noah Wise, CFA
Average annual total returns1 (%) as of February 28, 2014
| | | | | | | | | | | | | | | | | | | | | | | | | | | | | | | | | | |
| | | | | Including sales charge | | | Excluding sales charge | | | Expense ratios2 (%) | |
| | | Inception date | | 1 year | | | 5 year | | | 10 year | | | 1 year | | | 5 year | | | 10 year | | | Gross | | | Net3 | |
| Class A (SADAX) | | 8-31-1999 | | | (1.53 | ) | | | 2.41 | | | | 1.83 | | | | 0.48 | | | | 2.82 | | | | 2.03 | | | | 0.79 | | | | 0.71 | |
| Class C (WUSTX) | | 7-18-2008 | | | (1.09 | ) | | | 2.07 | | | | 1.31 | | | | (0.09 | ) | | | 2.07 | | | | 1.31 | | | | 1.54 | | | | 1.46 | |
| Administrator Class (WUSDX) | | 4-8-2005 | | | – | | | | – | | | | – | | | | 0.75 | | | | 2.96 | | | | 2.20 | | | | 0.73 | | | | 0.56 | |
| Institutional Class (SADIX) | | 8-31-1999 | | | – | | | | – | | | | – | | | | 0.95 | | | | 3.19 | | | | 2.47 | | | | 0.46 | | | | 0.36 | |
| Investor Class (STADX) | | 11-25-1998 | | | – | | | | – | | | | – | | | | 0.57 | | | | 2.79 | | | | 2.04 | | | | 0.82 | | | | 0.74 | |
| Barclays Short-Term U.S. Government/Corporate Index4 | | – | | | – | | | | – | | | | – | | | | 0.25 | | | | 0.60 | | | | – | | | | – | | | | – | |
| Barclays 9-12 Month U.S. Short-Term Treasury Index5 | | – | | | – | | | | – | | | | – | | | | 0.25 | | | | 0.52 | | | | 2.04 | | | | – | | | | – | |
| Barclays 1-3 Year U.S. Government/Credit Bond Index6 | | – | | | – | | | | – | | | | – | | | | 0.81 | | | | 2.07 | | | | 2.86 | | | | – | | | | – | |
Figures quoted represent past performance, which is no guarantee of future results, and do not reflect taxes that a shareholder may pay on fund distributions or the redemption of fund shares. Investment return and principal value of an investment will fluctuate so that an investor’s shares, when redeemed, may be worth more or less than their original cost. Performance shown without sales charges would be lower if sales charges were reflected. Current performance may be lower or higher than the performance data quoted, which assumes the reinvestment of dividends and capital gains. Current month-end performance is available on the Fund’s website, wellsfargoadvantagefunds.com.
Index returns do not include transaction costs associated with buying and selling securities, any mutual fund fees or expenses, or any taxes. It is not possible to invest directly in an index.
For Class A shares, the maximum front-end sales charge is 2.00%. For Class C shares, the maximum contingent deferred sales charge is 1.00%. Performance including sales charge assumes the sales charge for the corresponding time period. Administrator Class, Institutional Class, and Investor Class shares are sold without a front-end sales charge or contingent deferred sales charge.
Bond values fluctuate in response to the financial condition of individual issuers, general market and economic conditions, and changes in interest rates. In general, when interest rates rise, bond values fall and investors may lose principal value. The use of derivatives may reduce returns and/or increase volatility. Certain investment strategies tend to increase the total risk of an investment (relative to the broader market). The Fund is exposed to foreign investment risk, high-yield securities risk, and mortgage- and asset-backed securities risk. Consult the Fund’s prospectus for additional information on these and other risks.
Please see footnotes on page 7.
| | | | | | |
| Performance highlights (unaudited) | | Wells Fargo Advantage Ultra Short-Term Income Fund | | | 7 | |
| | | | |
| Ten largest long-term holdings7 (%) as of February 28, 2014 | |
Bank Nederlandse Gemeenten, 5.00%, 5-16-2014 | | | 0.80 | |
Ford Credit Auto Owner Trust Series 2014-A
Class A2, 0.48%, 11-15-2016 | | | 0.79 | |
California PCFA Solid Waste Disposal Series A, 0.55%, 8-1-2023 | | | 0.79 | |
Nordea Eiendomskreditt, 1.88%, 4-7-2014 | | | 0.71 | |
Mercedes-Benz Auto Lease Trust Series 2013-B
Class A2, 0.53%, 9-15-2015 | | | 0.68 | |
Port Arthur TX Navigation District Motiva Enterprises Project Series B, 0.28%, 12-1-2039 | | | 0.68 | |
Providence Health & Services Company,
1.05%, 10-1-2016 | | | 0.68 | |
Prudential Insurance Company, 8.10%, 7-15-2015 | | | 0.68 | |
FHLMC Series 3166 Class AC, 5.00%, 6-15-2021 | | | 0.67 | |
Mercedes-Benz Auto Lease Trust Series 2013-A
Class A2, 0.49%, 6-15-2015 | | | 0.66 | |
| | | | |
| Portfolio allocation8 as of February 28, 2014 |
| |
| | 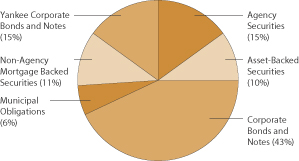
|
| 1. | Historical performance shown for Class C shares prior to their inception reflects the performance of Investor Class shares, adjusted to include the higher expenses applicable to Class C shares. Historical performance shown for Administrator Class shares prior to their inception reflects the performance of Institutional Class shares, adjusted to include the higher expenses applicable to Administrator Class shares. Effective June 20, 2008, Advisor Class was renamed Class A and modified to assume the features and attributes of Class A. Historical performance shown for Class A shares through June 19, 2008, includes Advisor Class expenses. |
| 2. | Reflects the expense ratios as stated in the most recent prospectuses, which include the impact of 0.01% in acquired fund fees and expenses. The expense ratios shown are subject to change and may differ from the annualized expense ratios shown in the financial highlights of this report, which do not include acquired fund fees and expenses. |
| 3. | The Adviser has committed through December 31, 2014, to waive fees and/or reimburse expenses to the extent necessary to cap the Fund’s Total Annual Fund Operating Expenses After Fee Waiver, excluding certain expenses, at 0.70% for Class A, 1.45% for Class C, 0.55% for Administrator Class, 0.35% for Institutional Class, and 0.73% for Investor Class. Brokerage commissions, stamp duty fees, interest, taxes, acquired fund fees and expenses, and extraordinary expenses are excluded from the cap. Without this cap, the Fund’s returns would have been lower. |
| 4. | The Barclays Short-Term U.S. Government/Corporate Index contains securities that have fallen out of the Barclays U.S. Government/Credit Index because of the standard minimum one-year to maturity constraint. Securities in the Barclays Short-Term U.S. Government/Corporate Index must have a maturity from one up to (but not including) 12 months. However, the limited performance history of the index does not allow for comparison to all periods of the Fund’s performance. This index has an inception date of August 9, 2004. You cannot invest directly in an index. |
| 5. | The Barclays 9-12 Month U.S. Short-Term Treasury Index includes aged U.S. Treasury bills, notes and bonds with a remaining maturity from nine up to (but not including) 12 months. It excludes zero coupon STRIPS. You cannot invest directly in an index. |
| 6. | The Barclays 1-3 Year U.S. Government/Credit Bond Index is the one- to three-year component of the Barclays U.S. Government/Credit Bond Index which includes securities in the Government and Credit Indices. The Government Index includes treasuries (i.e., public obligations of the U.S. Treasury that have remaining maturities of more than one year) and agencies (i.e., publicly issued debt of U.S. Government agencies, quasi-federal corporations, and corporate or foreign debt guaranteed by the U.S. Government). The Credit Index includes publicly issued U.S. corporate and foreign debentures and secured notes that meet specified maturity, liquidity, and quality requirements. You cannot invest directly in an index. |
| 7. | The ten largest long-term holdings are calculated based on the value of the securities divided by total net assets of the Fund. Holdings are subject to change and may have changed since the date specified. |
| 8. | Portfolio allocation is subject to change and is calculated based on the total long-term investments of the Fund. |
| | | | |
| 8 | | Wells Fargo Advantage Ultra Short-Term Income Fund | | Fund expenses (unaudited) |
As a shareholder of the Fund, you incur two types of costs: (1) transaction costs, including sales charges (loads) on purchase payments and contingent deferred sales charges (if any) on redemptions and (2) ongoing costs, including management fees, distribution (12b-1) and/or shareholder service fees, and other Fund expenses. This example is intended to help you understand your ongoing costs (in dollars) of investing in the Fund and to compare these costs with the ongoing costs of investing in other mutual funds.
The example is based on an investment of $1,000 invested at the beginning of the six-month period and held for the entire period from September 1, 2013 to February 28, 2014.
Actual expenses
The “Actual” line of the table below provides information about actual account values and actual expenses. You may use the information in this line, together with the amount you invested, to estimate the expenses that you paid over the period. Simply divide your account value by $1,000 (for example, an $8,600 account value divided by $1,000 = 8.6), then multiply the result by the number in the “Actual” line under the heading entitled “Expenses paid during period” for your applicable class of shares to estimate the expenses you paid on your account during this period.
Hypothetical example for comparison purposes
The “Hypothetical” line of the table below provides information about hypothetical account values and hypothetical expenses based on the Fund’s actual expense ratio and an assumed rate of return of 5% per year before expenses, which is not the Fund’s actual return. The hypothetical account values and expenses may not be used to estimate the actual ending account balance or expenses you paid for the period. You may use this information to compare the ongoing costs of investing in the Fund and other funds. To do so, compare this 5% hypothetical example with the 5% hypothetical examples that appear in the shareholder reports of the other funds.
Please note that the expenses shown in the table are meant to highlight your ongoing costs only and do not reflect any transactional costs, such as sales charges (loads) and contingent deferred sales charges. Therefore, the “Hypothetical” line of the table is useful in comparing ongoing costs only and will not help you determine the relative total costs of owning different funds. In addition, if these transactional costs were included, your costs would have been higher.
| | | | | | | | | | | | | | | | |
| | | Beginning
account value
9-1-2013 | | | Ending
account value
2-28-2014 | | | Expenses
paid during
the period1 | | | Net annualized
expense ratio | |
Class A | | | | | | | | | | | | | | | | |
Actual | | $ | 1,000.00 | | | $ | 1,004.87 | | | $ | 3.48 | | | | 0.70 | % |
Hypothetical (5% return before expenses) | | $ | 1,000.00 | | | $ | 1,021.32 | | | $ | 3.51 | | | | 0.70 | % |
Class C | | | | | | | | | | | | | | | | |
Actual | | $ | 1,000.00 | | | $ | 1,002.62 | | | $ | 7.20 | | | | 1.45 | % |
Hypothetical (5% return before expenses) | | $ | 1,000.00 | | | $ | 1,017.60 | | | $ | 7.25 | | | | 1.45 | % |
Administrator Class | | | | | | | | | | | | | | | | |
Actual | | $ | 1,000.00 | | | $ | 1,005.63 | | | $ | 2.74 | | | | 0.55 | % |
Hypothetical (5% return before expenses) | | $ | 1,000.00 | | | $ | 1,022.07 | | | $ | 2.76 | | | | 0.55 | % |
Institutional Class | | | | | | | | | | | | | | | | |
Actual | | $ | 1,000.00 | | | $ | 1,007.80 | | | $ | 1.74 | | | | 0.35 | % |
Hypothetical (5% return before expenses) | | $ | 1,000.00 | | | $ | 1,023.06 | | | $ | 1.76 | | | | 0.35 | % |
Investor Class | | | | | | | | | | | | | | | | |
Actual | | $ | 1,000.00 | | | $ | 1,005.90 | | | $ | 3.63 | | | | 0.73 | % |
Hypothetical (5% return before expenses) | | $ | 1,000.00 | | | $ | 1,021.17 | | | $ | 3.66 | | | | 0.73 | % |
| 1. | Expenses paid is equal to the annualized expense ratio of each class multiplied by the average account value over the period, multiplied by the number of days in the most recent fiscal half-year divided by the number of days in the fiscal year (to reflect the one-half-year period). |
| | | | | | |
| Portfolio of investments—February 28, 2014 (unaudited) | | Wells Fargo Advantage Ultra Short-Term Income Fund | | | 9 | |
| | | | | | | | | | | | | | | | |
| Security name | | Interest rate | | | Maturity date | | | Principal | | | Value | |
| | | | |
Agency Securities: 14.72% | | | | | | | | | | | | | | | | |
FDIC Series 2013-R1 Class A 144A | | | 1.15 | % | | | 3-25-2033 | | | $ | 4,524,604 | | | $ | 4,395,968 | |
FHLMC ± | | | 2.35 | | | | 3-1-2035 | | | | 1,837,497 | | | | 1,965,752 | |
FHLMC ± | | | 2.37 | | | | 11-1-2035 | | | | 7,940,574 | | | | 8,461,896 | |
FHLMC ± | | | 2.38 | | | | 4-1-2032 | | | | 163,263 | | | | 172,789 | |
FHLMC ± | | | 2.38 | | | | 6-1-2032 | | | | 7,634 | | | | 8,037 | |
FHLMC ± | | | 2.46 | | | | 1-1-2029 | | | | 83,027 | | | | 83,731 | |
FHLMC ± | | | 2.53 | | | | 7-1-2029 | | | | 5,828 | | | | 6,146 | |
FHLMC ± | | | 2.69 | | | | 10-1-2031 | | | | 81,129 | | | | 81,609 | |
FHLMC | | | 5.00 | | | | 12-1-2019 | | | | 3,342,241 | | | | 3,631,635 | |
FHLMC | | | 5.50 | | | | 8-1-2018 | | | | 940,227 | | | | 1,008,838 | |
FHLMC | | | 6.00 | | | | 4-1-2016 | | | | 183,917 | | | | 190,757 | |
FHLMC | | | 6.00 | | | | 5-1-2017 | | | | 356,404 | | | | 374,001 | |
FHLMC | | | 6.00 | | | | 1-1-2024 | | | | 2,952,217 | | | | 3,232,799 | |
FHLMC | | | 7.00 | | | | 6-1-2031 | | | | 439,143 | | | | 498,551 | |
FHLMC | | | 9.00 | | | | 11-1-2016 | | | | 80,438 | | | | 85,943 | |
FHLMC | | | 9.00 | | | | 12-1-2016 | | | | 394,543 | | | | 419,137 | |
FHLMC | | | 9.00 | | | | 8-1-2018 | | | | 106,546 | | | | 114,796 | |
FHLMC | | | 9.00 | | | | 10-1-2019 | | | | 61,827 | | | | 68,610 | |
FHLMC | | | 9.50 | | | | 12-1-2016 | | | | 41,090 | | | | 43,569 | |
FHLMC | | | 9.50 | | | | 5-1-2020 | | | | 19,859 | | | | 21,448 | |
FHLMC | | | 9.50 | | | | 9-1-2020 | | | | 160,522 | | | | 179,694 | |
FHLMC | | | 9.50 | | | | 12-1-2022 | | | | 310,999 | | | | 342,172 | |
FHLMC | | | 10.00 | | | | 11-17-2021 | | | | 49,792 | | | | 51,683 | |
FHLMC | | | 10.50 | | | | 5-1-2020 | | | | 134,472 | | | | 153,363 | |
FHLMC Series 2530 Class BH | | | 5.00 | | | | 11-15-2017 | | | | 2,535,637 | | | | 2,679,149 | |
FHLMC Series 2617 Class GR | | | 4.50 | | | | 5-15-2018 | | | | 735,588 | | | | 775,639 | |
FHLMC Series 2684 Class PE | | | 5.00 | | | | 1-15-2033 | | | | 113,019 | | | | 117,438 | |
FHLMC Series 2690 Class TG | | | 4.50 | | | | 4-15-2032 | | | | 653,246 | | | | 678,262 | |
FHLMC Series 2707 Class QE | | | 4.50 | | | | 11-15-2018 | | | | 709,548 | | | | 753,100 | |
FHLMC Series 2727 Class PE | | | 4.50 | | | | 7-15-2032 | | | | 1,385,983 | | | | 1,426,096 | |
FHLMC Series 2843 Class BC | | | 5.00 | | | | 8-15-2019 | | | | 1,671,732 | | | | 1,789,232 | |
FHLMC Series 2849 Class B | | | 5.00 | | | | 8-15-2019 | | | | 3,172,443 | | | | 3,398,546 | |
FHLMC Series 2855 Class WN | | | 4.00 | | | | 9-15-2019 | | | | 692,372 | | | | 729,587 | |
FHLMC Series 2864 Class NB | | | 5.50 | | | | 7-15-2033 | | | | 2,827,761 | | | | 3,067,001 | |
FHLMC Series 2896 Class CB | | | 4.50 | | | | 11-15-2019 | | | | 2,585,623 | | | | 2,751,193 | |
FHLMC Series 2911 Class UE | | | 5.00 | | | | 6-15-2033 | | | | 1,392,970 | | | | 1,420,093 | |
FHLMC Series 2937 Class HJ | | | 5.00 | | | | 10-15-2019 | | | | 513,028 | | | | 524,932 | |
FHLMC Series 2948 Class KB | | | 4.50 | | | | 7-15-2019 | | | | 484,964 | | | | 487,776 | |
FHLMC Series 2953 Class LD | | | 5.00 | | | | 12-15-2034 | | | | 803,698 | | | | 867,722 | |
FHLMC Series 2963 Class BP | | | 5.00 | | | | 9-15-2034 | | | | 550,509 | | | | 576,130 | |
FHLMC Series 3053 Class AC | | | 5.00 | | | | 2-15-2035 | | | | 1,622,254 | | | | 1,653,807 | |
FHLMC Series 3166 Class AC | | | 5.00 | | | | 6-15-2021 | | | | 10,585,600 | | | | 11,848,589 | |
FHLMC Series 3420 Class A | | | 4.50 | | | | 1-15-2027 | | | | 603,840 | | | | 615,555 | |
FHLMC Series 3574 Class EA | | | 3.00 | | | | 9-15-2021 | | | | 697,163 | | | | 715,293 | |
FHLMC Series 3589 Class CA | | | 4.00 | | | | 10-15-2021 | | | | 1,231,082 | | | | 1,278,013 | |
FHLMC Series 3643 Class AJ | | | 1.50 | | | | 7-15-2015 | | | | 137,024 | | | | 137,026 | |
FHLMC Series 3647 Class BG | | | 4.00 | | | | 12-15-2027 | | | | 924,353 | | | | 933,178 | |
FHLMC Series 3689 Class AJ | | | 4.00 | | | | 12-15-2027 | | | | 1,881,631 | | | | 1,898,148 | |
FHLMC Series 3689 Class BD | | | 2.00 | | | | 7-15-2020 | | | | 1,025,353 | | | | 1,033,171 | |
FHLMC Series 3772 Class HC | | | 3.00 | | | | 10-15-2018 | | | | 1,917,664 | | | | 1,985,873 | |
The accompanying notes are an integral part of these financial statements.
| | | | |
| 10 | | Wells Fargo Advantage Ultra Short-Term Income Fund | | Portfolio of investments—February 28, 2014 (unaudited) |
| | | | | | | | | | | | | | | | |
| Security name | | Interest rate | | | Maturity date | | | Principal | | | Value | |
| | | | |
Agency Securities (continued) | | | | | | | | | | | | | | | | |
FHLMC Series 3780 Class DG | | | 3.00 | % | | | 10-15-2027 | | | $ | 1,530,142 | | | $ | 1,566,248 | |
FHLMC Series 3821 Class LA | | | 3.50 | | | | 4-15-2025 | | | | 1,073,560 | | | | 1,127,689 | |
FHLMC Series 3834 Class EA | | | 3.50 | | | | 6-15-2029 | | | | 1,159,434 | | | | 1,228,902 | |
FHLMC Series 3842 Class CJ | | | 2.00 | | | | 9-15-2018 | | | | 618,100 | | | | 628,758 | |
FHLMC Series 3878 Class JA | | | 3.50 | | | | 1-15-2025 | | | | 1,020,348 | | | | 1,064,658 | |
FHLMC Series 3898 Class NE | | | 4.00 | | | | 7-15-2040 | | | | 1,648,978 | | | | 1,728,686 | |
FHLMC Series 3952 Class MK | | | 3.00 | | | | 11-15-2021 | | | | 2,207,856 | | | | 2,249,461 | |
FHLMC Series K003 Class A3 | | | 4.32 | | | | 12-25-2015 | | | | 2,025,000 | | | | 2,141,974 | |
FHLMC Series K003 Class AAB | | | 4.77 | | | | 5-25-2018 | | | | 1,291,000 | | | | 1,388,625 | |
FHLMC Structured Pass-Through Securities Series T-42 Class A6 | | | 9.50 | | | | 2-25-2042 | | | | 1,070,170 | | | | 1,338,033 | |
FNMA ± | | | 1.77 | | | | 10-1-2031 | | | | 156,223 | | | | 161,206 | |
FNMA | | | 1.89 | | | | 2-1-2017 | | | | 2,000,000 | | | | 2,046,073 | |
FNMA ± | | | 1.98 | | | | 1-1-2023 | | | | 22,615 | | | | 22,931 | |
FNMA ± | | | 2.14 | | | | 12-1-2034 | | | | 1,777,275 | | | | 1,881,310 | |
FNMA ± | | | 2.25 | | | | 5-1-2032 | | | | 49,701 | | | | 52,766 | |
FNMA ± | | | 2.31 | | | | 11-1-2031 | | | | 102,922 | | | | 109,542 | |
FNMA ± | | | 2.34 | | | | 6-1-2032 | | | | 151,196 | | | | 154,809 | |
FNMA ± | | | 2.39 | | | | 12-1-2040 | | | | 482,352 | | | | 516,493 | |
FNMA ± | | | 2.39 | | | | 2-1-2033 | | | | 1,205,474 | | | | 1,279,481 | |
FNMA ± | | | 2.41 | | | | 8-1-2045 | | | | 1,648,837 | | | | 1,754,288 | |
FNMA ± | | | 2.42 | | | | 5-1-2036 | | | | 1,885,540 | | | | 2,014,927 | |
FNMA ± | | | 2.49 | | | | 11-1-2034 | | | | 1,288,397 | | | | 1,374,225 | |
FNMA ± | | | 2.51 | | | | 5-1-2036 | | | | 1,843,353 | | | | 1,953,964 | |
FNMA | | | 2.71 | | | | 9-1-2017 | | | | 3,414,922 | | | | 3,571,191 | |
FNMA | | | 3.00 | | | | 1-1-2021 | | | | 1,229,408 | | | | 1,287,419 | |
FNMA | | | 3.03 | | | | 1-1-2015 | | | | 2,600,000 | | | | 2,623,766 | |
FNMA ± | | | 3.05 | | | | 4-1-2033 | | | | 9,088 | | | | 9,681 | |
FNMA | | | 3.09 | | | | 5-1-2016 | | | | 1,167,112 | | | | 1,211,265 | |
FNMA ± | | | 3.45 | | | | 7-1-2033 | | | | 66,652 | | | | 66,829 | |
FNMA | | | 3.50 | | | | 9-1-2018 | | | | 1,199,040 | | | | 1,269,774 | |
FNMA | | | 3.77 | | | | 1-1-2018 | | | | 958,414 | | | | 979,712 | |
FNMA | | | 3.85 | | | | 10-1-2016 | | | | 7,178,249 | | | | 7,334,538 | |
FNMA | | | 4.00 | | | | 5-25-2019 | | | | 246,073 | | | | 259,348 | |
FNMA | | | 4.00 | | | | 12-15-2024 | | | | 1,413,142 | | | | 1,492,227 | |
FNMA | | | 4.22 | | | | 5-1-2016 | | | | 2,285,049 | | | | 2,418,830 | |
FNMA | | | 4.29 | | | | 5-1-2016 | | | | 784,550 | | | | 830,148 | |
FNMA | | | 4.33 | | | | 8-1-2014 | | | | 700,115 | | | | 704,121 | |
FNMA | | | 4.34 | | | | 2-1-2017 | | | | 727,643 | | | | 749,546 | |
FNMA | | | 4.44 | | | | 9-1-2015 | | | | 4,008,544 | | | | 4,251,181 | |
FNMA | | | 4.50 | | | | 6-1-2019 | | | | 376,640 | | | | 402,524 | |
FNMA | | | 4.50 | | | | 5-1-2020 | | | | 651,642 | | | | 696,246 | |
FNMA | | | 5.00 | | | | 1-15-2022 | | | | 5,673,411 | | | | 6,060,372 | |
FNMA | | | 5.09 | | | | 12-1-2016 | | | | 985,111 | | | | 1,080,780 | |
FNMA | | | 5.13 | | | | 2-1-2016 | | | | 6,484,391 | | | | 6,892,965 | |
FNMA | | | 5.17 | | | | 1-1-2016 | | | | 1,132,695 | | | | 1,194,427 | |
FNMA | | | 5.19 | | | | 1-1-2018 | | | | 2,421,468 | | | | 2,601,265 | |
FNMA | | | 5.23 | | | | 7-1-2018 | | | | 1,747,098 | | | | 1,846,495 | |
FNMA | | | 5.27 | | | | 12-1-2016 | | | | 958,594 | | | | 1,055,568 | |
FNMA | | | 5.29 | | | | 8-1-2015 | | | | 5,767,933 | | | | 6,062,154 | |
FNMA | | | 5.40 | | | | 12-1-2016 | | | | 991,284 | | | | 1,091,435 | |
The accompanying notes are an integral part of these financial statements.
| | | | | | |
| Portfolio of investments—February 28, 2014 (unaudited) | | Wells Fargo Advantage Ultra Short-Term Income Fund | | | 11 | |
| | | | | | | | | | | | | | | | |
| Security name | | Interest rate | | | Maturity date | | | Principal | | | Value | |
| | | | |
Agency Securities (continued) | | | | | | | | | | | | | | | | |
FNMA | | | 5.50 | % | | | 1-1-2016 | | | $ | 2,814,949 | | | $ | 2,985,300 | |
FNMA | | | 5.85 | | | | 5-1-2016 | | | | 4,000,000 | | | | 4,369,488 | |
FNMA | | | 6.00 | | | | 4-1-2021 | | | | 2,399,794 | | | | 2,559,085 | |
FNMA | | | 6.50 | | | | 8-1-2031 | | | | 828,037 | | | | 937,202 | |
FNMA | | | 7.00 | | | | 11-1-2014 | | | | 23,233 | | | | 23,505 | |
FNMA | | | 7.84 | | | | 4-1-2018 | | | | 4,798,235 | | | | 5,184,792 | |
FNMA | | | 8.33 | | | | 7-15-2020 | | | | 55,334 | | | | 61,941 | |
FNMA | | | 8.50 | | | | 7-1-2017 | | | | 284,590 | | | | 303,979 | |
FNMA | | | 9.00 | | | | 12-1-2016 | | | | 262,111 | | | | 280,092 | |
FNMA | | | 9.00 | | | | 2-15-2020 | | | | 169,472 | | | | 196,069 | |
FNMA | | | 9.00 | | | | 10-1-2021 | | | | 104,806 | | | | 117,914 | |
FNMA | | | 9.00 | | | | 6-1-2024 | | | | 127,584 | | | | 142,024 | |
FNMA | | | 9.50 | | | | 12-1-2020 | | | | 119,575 | | | | 133,898 | |
FNMA | | | 9.50 | | | | 3-1-2021 | | | | 31,414 | | | | 33,619 | |
FNMA | | | 10.00 | | | | 3-1-2018 | | | | 47,946 | | | | 49,510 | |
FNMA | | | 10.25 | | | | 9-1-2021 | | | | 134,088 | | | | 150,610 | |
FNMA | | | 10.50 | | | | 10-1-2014 | | | | 10,170 | | | | 10,222 | |
FNMA | | | 10.50 | | | | 8-1-2020 | | | | 5,701 | | | | 6,452 | |
FNMA | | | 10.50 | | | | 4-1-2022 | | | | 167,042 | | | | 182,671 | |
FNMA Grantor Trust Series 2000-T6 Class A2 | | | 9.50 | | | | 6-25-2030 | | | | 656,125 | | | | 754,270 | |
FNMA Grantor Trust Series 2001-T10 Class A3 | | | 9.50 | | | | 12-25-2041 | | | | 1,361,190 | | | | 1,567,795 | |
FNMA Grantor Trust Series 2001-T12 Class A3 | | | 9.50 | | | | 8-25-2041 | | | | 1,138,686 | | | | 1,344,128 | |
FNMA Grantor Trust Series 2001-T8 Class A3 ± | | | 3.61 | | | | 7-25-2041 | | | | 2,724,653 | | | | 2,746,101 | |
FNMA Series 1988-4 Class Z | | | 9.25 | | | | 3-25-2018 | | | | 60,988 | | | | 66,796 | |
FNMA Series 1988-9 Class Z | | | 9.45 | | | | 4-25-2018 | | | | 34,552 | | | | 37,703 | |
FNMA Series 1989-30 Class Z | | | 9.50 | | | | 6-25-2019 | | | | 178,241 | | | | 199,402 | |
FNMA Series 1989-49 Class E | | | 9.30 | | | | 8-25-2019 | | | | 24,252 | | | | 26,584 | |
FNMA Series 1990-111 Class Z | | | 8.75 | | | | 9-25-2020 | | | | 36,887 | | | | 40,133 | |
FNMA Series 1990-119 Class J | | | 9.00 | | | | 10-25-2020 | | | | 107,332 | | | | 122,463 | |
FNMA Series 1990-124 Class Z | | | 9.00 | | | | 10-25-2020 | | | | 44,501 | | | | 50,802 | |
FNMA Series 1990-21 Class Z | | | 9.00 | | | | 3-25-2020 | | | | 163,033 | | | | 186,057 | |
FNMA Series 1990-27 Class Z | | | 9.00 | | | | 3-25-2020 | | | | 121,703 | | | | 139,059 | |
FNMA Series 1990-30 Class D | | | 9.75 | | | | 3-25-2020 | | | | 50,692 | | | | 57,932 | |
FNMA Series 1990-77 Class D | | | 9.00 | | | | 6-25-2020 | | | | 49,454 | | | | 55,528 | |
FNMA Series 1991-132 Class Z | | | 8.00 | | | | 10-25-2021 | | | | 222,087 | | | | 255,658 | |
FNMA Series 1992-71 Class X | | | 8.25 | | | | 5-25-2022 | | | | 80,910 | | | | 95,064 | |
FNMA Series 2002-94 Class BK | | | 5.50 | | | | 1-25-2018 | | | | 2,182,782 | | | | 2,302,381 | |
FNMA Series 2002-T1 Class A4 | | | 9.50 | | | | 11-25-2031 | | | | 1,441,622 | | | | 1,769,208 | |
FNMA Series 2002-W4 Class A6 ± | | | 3.33 | | | | 5-25-2042 | | | | 1,335,129 | | | | 1,407,098 | |
FNMA Series 2003-125 Class AY | | | 4.00 | | | | 12-25-2018 | | | | 3,418,195 | | | | 3,591,945 | |
FNMA Series 2003-129 Class AP | | | 4.00 | | | | 1-25-2019 | | | | 1,015,738 | | | | 1,050,436 | |
FNMA Series 2003-15 Class CN | | | 5.00 | | | | 3-25-2018 | | | | 646,419 | | | | 685,965 | |
FNMA Series 2003-35 Class BC | | | 5.00 | | | | 5-25-2018 | | | | 1,210,423 | | | | 1,286,432 | |
FNMA Series 2003-35 Class ME | | | 5.00 | | | | 5-25-2018 | | | | 640,613 | | | | 681,131 | |
FNMA Series 2006-74 Class DP %% | | | 5.50 | | | | 3-25-2035 | | | | 847,429 | | | | 867,299 | |
FNMA Series 2006-9 Class BM | | | 6.00 | | | | 10-25-2033 | | | | 1,118,090 | | | | 1,123,557 | |
FNMA Series 2006-M3 Class B | | | 5.10 | | | | 8-25-2016 | | | | 634,506 | | | | 688,356 | |
FNMA Series 2007-2 Class FA ± | | | 0.36 | | | | 2-25-2037 | | | | 261,519 | | | | 261,554 | |
FNMA Series 2007-79 Class A | | | 6.00 | | | | 10-25-2036 | | | | 635,268 | | | | 641,517 | |
FNMA Series 2007-W2 Class 1A1 ± | | | 0.48 | | | | 3-25-2037 | | | | 1,667,456 | | | | 1,662,552 | |
The accompanying notes are an integral part of these financial statements.
| | | | |
| 12 | | Wells Fargo Advantage Ultra Short-Term Income Fund | | Portfolio of investments—February 28, 2014 (unaudited) |
| | | | | | | | | | | | | | | | |
| Security name | | Interest rate | | | Maturity date | | | Principal | | | Value | |
| | | | |
Agency Securities (continued) | | | | | | | | | | | | | | | | |
FNMA Series 2008-36 Class AB | | | 4.50 | % | | | 10-25-2022 | | | $ | 1,234,727 | | | $ | 1,273,275 | |
FNMA Series 2009-76 Class HA | | | 4.00 | | | | 1-25-2019 | | | | 898,475 | | | | 932,992 | |
FNMA Series 2010-153 Class AB | | | 2.00 | | | | 11-25-2018 | | | | 1,814,533 | | | | 1,847,414 | |
FNMA Series 2010-153 Class BG | | | 2.50 | | | | 11-25-2018 | | | | 1,117,183 | | | | 1,148,246 | |
FNMA Series 2010-39 Class PD | | | 3.00 | | | | 6-25-2038 | | | | 964,494 | | | | 988,604 | |
FNMA Series 2010-39 Class VY | | | 4.50 | | | | 3-25-2025 | | | | 2,570,000 | | | | 2,748,050 | |
FNMA Series 2010-57 Class DQ | | | 3.00 | | | | 6-25-2025 | | | | 1,206,528 | | | | 1,264,248 | |
FNMA Series 2010-9 Class PD | | | 4.50 | | | | 10-25-2039 | | | | 1,290,330 | | | | 1,321,915 | |
FNMA Series 2011-111 Class MA | | | 4.00 | | | | 7-25-2038 | | | | 2,068,378 | | | | 2,134,996 | |
FNMA Series 2011-115 Class DP | | | 3.50 | | | | 4-25-2034 | | | | 957,191 | | | | 988,589 | |
FNMA Series 2011-122 Class A | | | 3.00 | | | | 12-25-2025 | | | | 796,510 | | | | 821,215 | |
FNMA Series 2011-129 Class LG | | | 3.00 | | | | 3-25-2037 | | | | 1,336,620 | | | | 1,388,219 | |
FNMA Series 2011-33 Class GA | | | 3.50 | | | | 10-25-2028 | | | | 2,136,384 | | | | 2,220,295 | |
FNMA Series 2011-35 Class PA | | | 4.00 | | | | 2-25-2039 | | | | 1,571,200 | | | | 1,640,522 | |
FNMA Series 2011-39 Class DA | | | 3.50 | | | | 7-25-2024 | | | | 1,125,432 | | | | 1,165,976 | |
FNMA Series 2011-40 Class CA | | | 3.50 | | | | 12-25-2028 | | | | 1,686,145 | | | | 1,757,933 | |
FNMA Series 2011-42 Class A | | | 3.00 | | | | 2-25-2024 | | | | 8,670,036 | | | | 9,007,448 | |
FNMA Series 2011-56 Class AC | | | 2.00 | | | | 7-25-2018 | | | | 635,671 | | | | 645,457 | |
FNMA Series 2011-99 Class AB | | | 4.00 | | | | 12-25-2038 | | | | 514,942 | | | | 534,531 | |
FNMA Series 2012-94 Class E | | | 3.00 | | | | 6-25-2022 | | | | 270,757 | | | | 283,021 | |
FNMA Series 2013-M5 Class ASQ2 | | | 0.59 | | | | 8-25-2015 | | | | 4,455,236 | | | | 4,464,102 | |
FNMA Series G-22 Class ZT | | | 8.00 | | | | 12-25-2016 | | | | 307,728 | | | | 328,630 | |
FNMA Whole Loan Series 2003-W11 Class A1 ± | | | 3.29 | | | | 6-25-2033 | | | | 65,213 | | | | 64,458 | |
FNMA Whole Loan Series 2003-W3 Class 1A4 ± | | | 3.36 | | | | 8-25-2042 | | | | 59,008 | | | | 61,720 | |
FNMA Whole Loan Series 2003-W6 Class 6A ± | | | 3.05 | | | | 8-25-2042 | | | | 3,904,926 | | | | 4,075,279 | |
FNMA Whole Loan Series 2004-W6 Class 1A4 | | | 5.50 | | | | 7-25-2034 | | | | 3,314,003 | | | | 3,368,784 | |
GNMA | | | 7.00 | | | | 6-15-2033 | | | | 811,556 | | | | 971,762 | |
GNMA | | | 9.00 | | | | 11-15-2017 | | | | 91,646 | | | | 99,495 | |
GNMA | | | 9.50 | | | | 11-15-2017 | | | | 25,635 | | | | 26,752 | |
GNMA | | | 10.00 | | | | 10-20-2017 | | | | 65,650 | | | | 68,197 | |
GNMA Series 2004-11 Class QE | | | 5.00 | | | | 12-16-2032 | | | | 2,094,096 | | | | 2,170,035 | |
GNMA Series 2009-35 Class PA | | | 5.00 | | | | 11-16-2032 | | | | 1,052,578 | | | | 1,090,725 | |
GNMA Series 2009-74 Class BP | | | 3.50 | | | | 1-20-2037 | | | | 873,218 | | | | 907,696 | |
GNMA Series 2010-10 Class KC | | | 3.00 | | | | 8-20-2035 | | | | 1,224,593 | | | | 1,246,204 | |
GNMA Series 2010-133 Class QK | | | 3.50 | | | | 9-16-2034 | | | | 1,412,163 | | | | 1,474,719 | |
GNMA Series 2010-145 Class UA | | | 1.25 | | | | 1-20-2036 | | | | 452,161 | | | | 453,788 | |
GNMA Series 2010-29 Class PL | | | 3.00 | | | | 8-20-2036 | | | | 1,191,817 | | | | 1,216,936 | |
GNMA Series 2010-32 Class PL %% | | | 3.25 | | | | 3-20-2036 | | | | 1,203,246 | | | | 1,229,435 | |
GNMA Series 2010-43 Class JA | | | 3.00 | | | | 9-20-2037 | | | | 1,210,015 | | | | 1,246,727 | |
GNMA Series 2010-7 Class CK | | | 3.50 | | | | 1-16-2034 | | | | 1,002,894 | | | | 1,029,353 | |
GNMA Series 2010-84 Class PA | | | 2.00 | | | | 2-20-2033 | | | | 167,994 | | | | 168,993 | |
GNMA Series 2011-29 Class AG | | | 3.00 | | | | 8-16-2037 | | | | 545,357 | | | | 561,508 | |
| | | | |
Total Agency Securities (Cost $257,076,398) | | | | | | | | | | | | | | | 259,493,852 | |
| | | | | | | | | | | | | | | | |
| | | | |
Asset-Backed Securities: 9.85% | | | | | | | | | | | | | | | | |
CNH Equipment Trust Series 2012-C Class A2 | | | 0.44 | | | | 2-16-2016 | | | | 1,290,282 | | | | 1,290,430 | |
CNH Equipment Trust Series 2013-A Class A2 | | | 0.44 | | | | 7-15-2016 | | | | 3,571,222 | | | | 3,571,536 | |
CNH Equipment Trust Series 2013-C Class A2 | | | 0.63 | | | | 1-17-2017 | | | | 6,409,801 | | | | 6,418,038 | |
Countrywide Asset-Backed Certificates Series 2004-AB2 Class A3 ± | | | 0.98 | | | | 5-25-2036 | | | | 1,141,919 | | | | 1,134,061 | |
DBRR Trust Series 2012-EZ1 Class A 144A | | | 0.95 | | | | 9-25-2045 | | | | 1,324,002 | | | | 1,324,072 | |
The accompanying notes are an integral part of these financial statements.
| | | | | | |
| Portfolio of investments—February 28, 2014 (unaudited) | | Wells Fargo Advantage Ultra Short-Term Income Fund | | | 13 | |
| | | | | | | | | | | | | | | | |
| Security name | | Interest rate | | | Maturity date | | | Principal | | | Value | |
| | | | |
Asset-Backed Securities (continued) | | | | | | | | | | | | | | | | |
Ford Credit Auto Lease Trust Series 2012-A Class A3 | | | 0.85 | % | | | 1-15-2015 | | | $ | 4,511,018 | | | $ | 4,513,634 | |
Ford Credit Auto Lease Trust Series 2012-B Class A2 | | | 0.54 | | | | 11-15-2014 | | | | 512,980 | | | | 513,044 | |
Ford Credit Auto Owner Trust Series 2012-D Class A2 | | | 0.40 | | | | 9-15-2015 | | | | 20,902 | | | | 20,902 | |
Ford Credit Auto Owner Trust Series 2013-A Class A2 | | | 0.38 | | | | 11-15-2015 | | | | 1,688,620 | | | | 1,689,067 | |
Ford Credit Auto Owner Trust Series 2014-A Class A2 | | | 0.48 | | | | 11-15-2016 | | | | 14,000,000 | | | | 14,009,618 | |
GE Equipment LLC Series 2013-1 Class A2 | | | 0.64 | | | | 3-22-2016 | | | | 5,000,000 | | | | 5,003,540 | |
GE Equipment LLC Series 2013-2 Class A2 | | | 0.61 | | | | 6-24-2016 | | | | 8,750,000 | | | | 8,756,510 | |
GE Equipment Small Ticket LLC Series 2013-1A Class A2 144A | | | 0.73 | | | | 1-25-2016 | | | | 10,800,000 | | | | 10,815,822 | |
GE Equipment Transportation LLC Series 2013-1 Class A2 | | | 0.50 | | | | 11-24-2015 | | | | 4,402,563 | | | | 4,402,193 | |
Honda Auto Receivables Owner Trust 2014-1 Class A2 | | | 0.41 | | | | 9-21-2016 | | | | 7,300,000 | | | | 7,299,102 | |
Honda Auto Receivables Owner Trust Series 2012-4 Class A2 | | | 0.40 | | | | 4-20-2015 | | | | 1,174,003 | | | | 1,174,245 | |
Hyundai Auto Lease Securitization Trust Series 2013-A Class A2 144A | | | 0.51 | | | | 9-15-2015 | | | | 4,552,311 | | | | 4,553,818 | |
Hyundai Auto Lease Securitization Trust Series 2013-A Class A3 144A | | | 0.66 | | | | 6-15-2016 | | | | 6,407,000 | | | | 6,416,220 | |
Hyundai Auto Lease Securitization Trust Series 2013-B Class A2 144A | | | 0.75 | | | | 3-15-2016 | | | | 10,600,000 | | | | 10,622,896 | |
Hyundai Auto Receivables Trust Hart Series 2013-A Class A2 | | | 0.40 | | | | 12-15-2015 | | | | 2,909,722 | | | | 2,910,938 | |
Mercedes-Benz Auto Lease Trust Series 2013-A Class A2 | | | 0.49 | | | | 6-15-2015 | | | | 11,641,696 | | | | 11,644,793 | |
Mercedes-Benz Auto Lease Trust Series 2013-B Class A2 | | | 0.53 | | | | 9-15-2015 | | | | 12,000,000 | | | | 12,009,924 | |
Mercedes-Benz Auto Receivables Trust Series 2012-1 Class A2 | | | 0.37 | | | | 3-16-2015 | | | | 628,888 | | | | 628,922 | |
Nissan Auto Lease Trust Series 2013-A Class A2A | | | 0.45 | | | | 9-15-2015 | | | | 7,634,556 | | | | 7,636,976 | |
Nissan Auto Receivables Owner Trust Series 2012-B Class A2 | | | 0.39 | | | | 4-15-2015 | | | | 1,001,829 | | | | 1,001,865 | |
Porsche Innovative Lease Owner Pilot Trust Series 2013-1 Class A2 144A | | | 0.54 | | | | 1-22-2016 | | | | 8,000,000 | | | | 8,007,504 | |
Toyota Auto Receivables Owner Trust Series 2013-B Class A2 | | | 0.48 | | | | 2-15-2016 | | | | 7,000,000 | | | | 7,006,013 | |
Volkswagen Auto Lease Trust Series 2013-A Class A2A | | | 0.63 | | | | 12-21-2015 | | | | 5,035,819 | | | | 5,043,282 | |
Volkswagen Auto Lease Trust Series 2014-A Class A2A | | | 0.52 | | | | 10-20-2016 | | | | 11,055,000 | | | | 11,083,997 | |
Volvo Financial Equipment LLC Series 2013-1A Class A2 144A | | | 0.53 | | | | 11-16-2015 | | | | 5,165,179 | | | | 5,166,305 | |
World Omni Automobile Lease Trust Series 2013-A Class A2A | | | 0.73 | | | | 5-16-2016 | | | | 7,970,000 | | | | 7,989,359 | |
| | | | |
Total Asset-Backed Securities (Cost $173,509,641) | | | | | | | | | | | | | | | 173,658,626 | |
| | | | | | | | | | | | | | | | |
| | | | |
Corporate Bonds and Notes: 40.91% | | | | | | | | | | | | | | | | |
| | | | |
Consumer Discretionary: 4.85% | | | | | | | | | | | | | | | | |
| | | | |
| Automobiles: 0.46% | | | | | | | | | | | | | | | | |
Harley-Davidson Financial Services Incorporated 144A | | | 1.15 | | | | 9-15-2015 | | | | 2,500,000 | | | | 2,510,553 | |
Harley-Davidson Financial Services Incorporated 144A | | | 3.88 | | | | 3-15-2016 | | | | 1,500,000 | | | | 1,585,377 | |
Nissan Motor Acceptance Corporation ±144A%% | | | 0.79 | | | | 3-3-2017 | | | | 4,000,000 | | | | 3,994,000 | |
| | | | |
| | | | | | | | | | | | | | | 8,089,930 | |
| | | | | | | | | | | | | | | | |
| | | | |
| Leisure Products: 0.29% | | | | | | | | | | | | | | | | |
Hasbro Incorporated | | | 6.13 | | | | 5-15-2014 | | | | 5,000,000 | | | | 5,053,530 | |
| | | | | | | | | | | | | | | | |
| | | | |
| Media: 3.56% | | | | | | | | | | | | | | | | |
Cox Communications Incorporated | | | 5.50 | | | | 10-1-2015 | | | | 9,000,000 | | | | 9,646,092 | |
DIRECTV Holdings LLC | | | 3.55 | | | | 3-15-2015 | | | | 3,000,000 | | | | 3,085,170 | |
DIRECTV Holdings LLC | | | 4.75 | | | | 10-1-2014 | | | | 7,000,000 | | | | 7,169,701 | |
Interpublic Group of Companies Incorporated | | | 6.25 | | | | 11-15-2014 | | | | 8,243,000 | | | | 8,521,201 | |
News America Incorporated | | | 7.60 | | | | 10-11-2015 | | | | 5,618,000 | | | | 6,183,047 | |
News America Incorporated | | | 8.00 | | | | 10-17-2016 | | | | 827,000 | | | | 973,507 | |
Omnicom Group Incorporated | | | 5.90 | | | | 4-15-2016 | | | | 7,000,000 | | | | 7,702,065 | |
Tcm Sub LLC 144A | | | 3.55 | | | | 1-15-2015 | | | | 9,071,000 | | | | 9,300,342 | |
Thompson Reuters Corporation | | | 1.30 | | | | 2-23-2017 | | | | 3,000,000 | | | | 2,997,753 | |
Viacom Incorporated | | | 6.25 | | | | 4-30-2016 | | | | 6,500,000 | | | | 7,227,656 | |
| | | | |
| | | | | | | | | | | | | | | 62,806,534 | |
| | | | | | | | | | | | | | | | |
The accompanying notes are an integral part of these financial statements.
| | | | |
| 14 | | Wells Fargo Advantage Ultra Short-Term Income Fund | | Portfolio of investments—February 28, 2014 (unaudited) |
| | | | | | | | | | | | | | | | |
| Security name | | Interest rate | | | Maturity date | | | Principal | | | Value | |
| | | | |
| Multiline Retail: 0.54% | | | | | | | | | | | | | | | | |
Macy’s Retail Holdings Incorporated | | | 5.75 | % | | | 7-15-2014 | | | $ | 6,000,000 | | | $ | 6,110,322 | |
Macy’s Retail Holdings Incorporated | | | 5.90 | | | | 12-1-2016 | | | | 3,000,000 | | | | 3,357,882 | |
| | | | |
| | | | | | | | | | | | | | | 9,468,204 | |
| | | | | | | | | | | | | | | | |
| | | | |
Consumer Staples: 2.20% | | | | | | | | | | | | | | | | |
| | | | |
| Beverages: 0.42% | | | | | | | | | | | | | | | | |
Constellation Brands Incorporated | | | 7.25 | | | | 9-1-2016 | | | | 6,600,000 | | | | 7,474,500 | |
| | | | | | | | | | | | | | | | |
| | | | |
| Food & Staples Retailing: 0.81% | | | | | | | | | | | | | | | | |
Safeway Incorporated | | | 5.63 | | | | 8-15-2014 | | | | 6,600,000 | | | | 6,723,004 | |
Tyson Foods Incorporated | | | 6.60 | | | | 4-1-2016 | | | | 6,760,000 | | | | 7,512,023 | |
| | | | |
| | | | | | | | | | | | | | | 14,235,027 | |
| | | | | | | | | | | | | | | | |
| | | | |
| Food Products: 0.43% | | | | | | | | | | | | | | | | |
Conagra Foods Incorporated | | | 5.88 | | | | 4-15-2014 | | | | 5,500,000 | | | | 5,534,007 | |
Kraft Foods Group Incorporated | | | 4.13 | | | | 2-9-2016 | | | | 2,000,000 | | | | 2,124,916 | |
| | | | |
| | | | | | | | | | | | | | | 7,658,923 | |
| | | | | | | | | | | | | | | | |
| | | | |
| Household Products: 0.54% | | | | | | | | | | | | | | | | |
Newell Rubbermaid Incorporated | | | 2.00 | | | | 6-15-2015 | | | | 9,360,000 | | | | 9,492,706 | |
| | | | | | | | | | | | | | | | |
| | | | |
Energy: 5.36% | | | | | | | | | | | | | | | | |
| | | | |
| Energy Equipment & Services: 0.35% | | | | | | | | | | | | | | | | |
Enterprise Products Operating LLC | | | 3.70 | | | | 6-1-2015 | | | | 6,000,000 | | | | 6,225,300 | |
| | | | | | | | | | | | | | | | |
| | | | |
| Oil, Gas & Consumable Fuels: 5.01% | | | | | | | | | | | | | | | | |
Boardwalk Pipelines LP | | | 5.88 | | | | 11-15-2016 | | | | 9,000,000 | | | | 9,842,715 | |
Colorado Interstate Gas Company | | | 5.95 | | | | 3-15-2015 | | | | 8,450,000 | | | | 8,863,087 | |
Energy Transfer Partners LP | | | 5.95 | | | | 2-1-2015 | | | | 3,970,000 | | | | 4,151,064 | |
Enterprise Products Operating LLC | | | 1.25 | | | | 8-13-2015 | | | | 3,000,000 | | | | 3,023,523 | |
Magellan Midstream Partners LP | | | 6.45 | | | | 6-1-2014 | | | | 6,929,000 | | | | 7,028,577 | |
Marathon Petroleum Corporation | | | 3.50 | | | | 3-1-2016 | | | | 9,029,000 | | | | 9,481,317 | |
Maritimes & NE Pipeline Company 144A | | | 7.50 | | | | 5-31-2014 | | | | 2,468,400 | | | | 2,499,517 | |
Nabors Industries Incorporated 144A | | | 2.35 | | | | 9-15-2016 | | | | 10,000,000 | | | | 10,239,820 | |
ONEOK Partners LP | | | 3.25 | | | | 2-1-2016 | | | | 10,000,000 | | | | 10,427,210 | |
Spectra Energy Capital LLC | | | 5.67 | | | | 8-15-2014 | | | | 6,996,000 | | | | 7,155,236 | |
Valero Energy Corporation | | | 4.75 | | | | 4-1-2014 | | | | 5,125,000 | | | | 5,140,759 | |
Williams Partners LP | | | 3.80 | | | | 2-15-2015 | | | | 6,000,000 | | | | 6,173,958 | |
Williams Partners LP | | | 7.25 | | | | 2-1-2017 | | | | 3,700,000 | | | | 4,275,587 | |
| | | | |
| | | | | | | | | | | | | | | 88,302,370 | |
| | | | | | | | | | | | | | | | |
| | | | |
Financials: 13.86% | | | | | | | | | | | | | | | | |
| | | | |
| Banks: 0.84% | | | | | | | | | | | | | | | | |
Bank One Corporation | | | 4.90 | | | | 4-30-2015 | | | | 4,260,000 | | | | 4,462,942 | |
US Bank NA ± | | | 3.78 | | | | 4-29-2020 | | | | 10,000,000 | | | | 10,341,100 | |
| | | | |
| | | | | | | | | | | | | | | 14,804,042 | |
| | | | | | | | | | | | | | | | |
The accompanying notes are an integral part of these financial statements.
| | | | | | |
| Portfolio of investments—February 28, 2014 (unaudited) | | Wells Fargo Advantage Ultra Short-Term Income Fund | | | 15 | |
| | | | | | | | | | | | | | | | |
| Security name | | Interest rate | | | Maturity date | | | Principal | | | Value | |
| | | | |
| Capital Markets: 1.21% | | | | | | | | | | | | | | | | |
Goldman Sachs Group Incorporated | | | 5.13 | % | | | 1-15-2015 | | | $ | 3,000,000 | | | $ | 3,116,844 | |
Goldman Sachs Group Incorporated | | | 5.63 | | | | 1-15-2017 | | | | 6,261,000 | | | | 6,939,511 | |
Merrill Lynch & Company | | | 5.30 | | | | 9-30-2015 | | | | 1,600,000 | | | | 1,705,526 | |
Morgan Stanley | | | 1.75 | | | | 2-25-2016 | | | | 5,500,000 | | | | 5,594,298 | |
Morgan Stanley | | | 6.00 | | | | 4-28-2015 | | | | 3,660,000 | | | | 3,880,731 | |
| | | | |
| | | | | | | | | | | | | | | 21,236,910 | |
| | | | | | | | | | | | | | | | |
| | | | |
| Consumer Finance: 4.19% | | | | | | | | | | | | | | | | |
American Express Company | | | 7.25 | | | | 5-20-2014 | | | | 6,000,000 | | | | 6,085,716 | |
Capital One Financial Corporation | | | 1.00 | | | | 11-6-2015 | | | | 2,315,000 | | | | 2,321,457 | |
Capital One Financial Corporation | | | 7.38 | | | | 5-23-2014 | | | | 7,000,000 | | | | 7,105,819 | |
Ford Motor Credit Company LLC | | | 3.88 | | | | 1-15-2015 | | | | 5,000,000 | | | | 5,138,270 | |
Ford Motor Credit Company LLC | | | 4.21 | | | | 4-15-2016 | | | | 5,000,000 | | | | 5,322,060 | |
Ford Motor Credit Company LLC | | | 12.00 | | | | 5-15-2015 | | | | 1,000,000 | | | | 1,131,531 | |
General Motors Financial Company Incorporated | | | 2.75 | | | | 5-15-2016 | | | | 9,890,000 | | | | 10,082,855 | |
Harley-Davidson Funding Corporation 144A | | | 5.75 | | | | 12-15-2014 | | | | 4,866,000 | | | | 5,056,163 | |
HSBC Finance Corporation | | | 5.50 | | | | 1-19-2016 | | | | 2,665,000 | | | | 2,886,789 | |
Hyundai Capital America Company 144A | | | 3.75 | | | | 4-6-2016 | | | | 7,331,000 | | | | 7,700,761 | |
Nisource Finance Corporation | | | 5.40 | | | | 7-15-2014 | | | | 4,797,000 | | | | 4,879,902 | |
SLM Corporation | | | 3.88 | | | | 9-10-2015 | | | | 3,500,000 | | | | 3,619,620 | |
SLM Corporation | | | 6.25 | | | | 1-25-2016 | | | | 3,465,000 | | | | 3,742,200 | |
Western Union Company ± | | | 1.23 | | | | 8-21-2015 | | | | 8,830,000 | | | | 8,895,836 | |
| | | | |
| | | | | | | | | | | | | | | 73,968,979 | |
| | | | | | | | | | | | | | | | |
| | | | |
| Diversified Financial Services: 2.70% | | | | | | | | | | | | | | | | |
Bank of America Corporation | | | 6.05 | | | | 5-16-2016 | | | | 8,000,000 | | | | 8,803,560 | |
Citigroup Incorporated | | | 4.88 | | | | 5-7-2015 | | | | 5,589,000 | | | | 5,844,635 | |
Citigroup Incorporated | | | 6.38 | | | | 8-12-2014 | | | | 3,556,000 | | | | 3,647,738 | |
JPMorgan Chase & Company | | | 1.35 | | | | 2-15-2017 | | | | 5,000,000 | | | | 5,020,790 | |
PNC Funding Corporation | | | 5.25 | | | | 11-15-2015 | | | | 9,221,000 | | | | 9,890,426 | |
Toll Road Investors Partnership II 144A¤ | | | 0.00 | | | | 2-15-2016 | | | | 6,000,000 | | | | 5,549,292 | |
UBS AG Stamford Connecticut | | | 5.88 | | | | 7-15-2016 | | | | 8,000,000 | | | | 8,887,544 | |
| | | | |
| | | | | | | | | | | | | | | 47,643,985 | |
| | | | | | | | | | | | | | | | |
| | | | |
| Insurance: 1.92% | | | | | | | | | | | | | | | | |
American International Group Incorporated | | | 5.05 | | | | 10-1-2015 | | | | 1,675,000 | | | | 1,785,957 | |
MetLife Insurance Company 144A | | | 7.70 | | | | 11-1-2015 | | | | 8,500,000 | | | | 9,358,109 | |
Prudential Insurance Company 144A | | | 8.10 | | | | 7-15-2015 | | | | 11,090,000 | | | | 11,926,996 | |
Unum Group 144A | | | 6.85 | | | | 11-15-2015 | | | | 7,425,000 | | | | 8,086,775 | |
W.R. Berkley Corporation | | | 5.60 | | | | 5-15-2015 | | | | 2,620,000 | | | | 2,755,572 | |
| | | | |
| | | | | | | | | | | | | | | 33,913,409 | |
| | | | | | | | | | | | | | | | |
| | | | |
| REITs: 3.00% | | | | | | | | | | | | | | | | |
American Tower Corporation | | | 4.63 | | | | 4-1-2015 | | | | 7,300,000 | | | | 7,593,372 | |
ARC Properties Operating Partnership LP 144A | | | 2.00 | | | | 2-6-2017 | | | | 8,755,000 | | | | 8,760,927 | |
Camden Property Trust | | | 5.00 | | | | 6-15-2015 | | | | 6,490,000 | | | | 6,831,374 | |
Digital Realty Trust LP | | | 4.50 | | | | 7-15-2015 | | | | 8,210,000 | | | | 8,526,627 | |
Health Care REIT Incorporated | | | 3.63 | | | | 3-15-2016 | | | | 5,470,000 | | | | 5,757,366 | |
Health Care REIT Incorporated | | | 6.20 | | | | 6-1-2016 | | | | 3,000,000 | | | | 3,337,299 | |
Liberty Property LP | | | 5.65 | | | | 8-15-2014 | | | | 2,750,000 | | | | 2,807,899 | |
Realty Income Corporation | | | 5.50 | | | | 11-15-2015 | | | | 3,833,000 | | | | 4,125,316 | |
Regency Centers LP | | | 5.25 | | | | 8-1-2015 | | | | 4,788,000 | | | | 5,062,860 | |
| | | | |
| | | | | | | | | | | | | | | 52,803,040 | |
| | | | | | | | | | | | | | | | |
The accompanying notes are an integral part of these financial statements.
| | | | |
| 16 | | Wells Fargo Advantage Ultra Short-Term Income Fund | | Portfolio of investments—February 28, 2014 (unaudited) |
| | | | | | | | | | | | | | | | |
| Security name | | Interest rate | | | Maturity date | | | Principal | | | Value | |
| | | | |
Health Care: 2.39% | | | | | | | | | | | | | | | | |
| | | | |
| Health Care Equipment & Supplies: 0.23% | | | | | | | | | | | | | | | | |
CareFusion Corporation | | | 5.13 | % | | | 8-1-2014 | | | $ | 4,000,000 | | | $ | 4,073,988 | |
| | | | | | | | | | | | | | | | |
| | | | |
| Health Care Providers & Services: 1.53% | | | | | | | | | | | | | | | | |
Cardinal Health Incorporated | | | 5.80 | | | | 10-15-2016 | | | | 4,500,000 | | | | 5,045,184 | |
Express Scripts Holding Company | | | 2.10 | | | | 2-12-2015 | | | | 8,160,000 | | | | 8,273,767 | |
Express Scripts Holding Company | | | 2.75 | | | | 11-21-2014 | | | | 1,745,000 | | | | 1,773,105 | |
Providence Health & Services Company ± | | | 1.05 | | | | 10-1-2016 | | | | 12,000,000 | | | | 11,936,352 | |
| | | | |
| | | | | | | | | | | | | | | 27,028,408 | |
| | | | | | | | | | | | | | | | |
| | | | |
| Life Sciences Tools & Services: 0.63% | | | | | | | | | | | | | | | | |
Life Technologies Corporation | | | 4.40 | | | | 3-1-2015 | | | | 5,830,000 | | | | 6,040,358 | |
Thermo Fisher Scientific Incorporated | | | 1.30 | | | | 2-1-2017 | | | | 5,000,000 | | | | 5,000,535 | |
| | | | |
| | | | | | | | | | | | | | | 11,040,893 | |
| | | | | | | | | | | | | | | | |
| | | | |
Industrials: 2.63% | | | | | | | | | | | | | | | | |
| | | | |
| Aerospace & Defense: 0.52% | | | | | | | | | | | | | | | | |
L-3 Communications Corporation | | | 3.95 | | | | 11-15-2016 | | | | 8,590,000 | | | | 9,143,273 | |
| | | | | | | | | | | | | | | | |
| | | | |
| Air Freight & Logistics: 0.19% | | | | | | | | | | | | | | | | |
Fedex Express Corporation 1998 Pass Through Certificates | | | 7.02 | | | | 1-15-2016 | | | | 3,295,054 | | | | 3,459,807 | |
| | | | | | | | | | | | | | | | |
| | | | |
| Commercial Services & Supplies: 0.64% | | | | | | | | | | | | | | | | |
Penske Truck Leasing Company LP 144A | | | 2.50 | | | | 7-11-2014 | | | | 2,000,000 | | | | 2,013,248 | |
Penske Truck Leasing Company LP 144A | | | 2.50 | | | | 3-15-2016 | | | | 2,720,000 | | | | 2,797,743 | |
Penske Truck Leasing Company LP 144A | | | 3.13 | | | | 5-11-2015 | | | | 6,310,000 | | | | 6,486,087 | |
| | | | |
| | | | | | | | | | | | | | | 11,297,078 | |
| | | | | | | | | | | | | | | | |
| | | | |
| Machinery: 0.50% | | | | | | | | | | | | | | | | |
CNH Capital LLC | | | 3.25 | | | | 2-1-2017 | | | | 5,240,000 | | | | 5,318,600 | |
CNH Capital LLC | | | 3.88 | | | | 11-1-2015 | | | | 3,355,000 | | | | 3,451,456 | |
| | | | |
| | | | | | | | | | | | | | | 8,770,056 | |
| | | | | | | | | | | | | | | | |
| | | | |
| Road & Rail: 0.78% | | | | | | | | | | | | | | | | |
Erac USA Finance LLC 144A | | | 1.40 | | | | 4-15-2016 | | | | 1,024,000 | | | | 1,032,076 | |
Erac USA Finance LLC 144A | | | 2.75 | | | | 3-15-2017 | | | | 750,000 | | | | 773,012 | |
Erac USA Finance LLC 144A | | | 5.90 | | | | 11-15-2015 | | | | 1,020,000 | | | | 1,105,531 | |
GATX Corporation | | | 4.75 | | | | 5-15-2015 | | | | 5,442,000 | | | | 5,699,554 | |
Ryder System Incorporated | | | 3.15 | | | | 3-2-2015 | | | | 5,000,000 | | | | 5,123,295 | |
| | | | |
| | | | | | | | | | | | | | | 13,733,468 | |
| | | | | | | | | | | | | | | | |
| | | | |
Information Technology: 2.38% | | | | | | | | | | | | | | | | |
| | | | |
| Electronic Equipment, Instruments & Components: 0.97% | | | | | | | | | | | | | | | | |
Agilent Technologies Incorporated | | | 5.50 | | | | 9-14-2015 | | | | 7,456,000 | | | | 7,991,848 | |
Arrow Electronics Incorporated | | | 3.38 | | | | 11-1-2015 | | | | 8,800,000 | | | | 9,105,175 | |
| | | | |
| | | | | | | | | | | | | | | 17,097,023 | |
| | | | | | | | | | | | | | | | |
| | | | |
| Software: 0.35% | | | | | | | | | | | | | | | | |
CA Incorporated | | | 6.13 | | | | 12-1-2014 | | | | 6,000,000 | | | | 6,243,906 | |
| | | | | | | | | | | | | | | | |
The accompanying notes are an integral part of these financial statements.
| | | | | | |
| Portfolio of investments—February 28, 2014 (unaudited) | | Wells Fargo Advantage Ultra Short-Term Income Fund | | | 17 | |
| | | | | | | | | | | | | | | | |
| Security name | | Interest rate | | | Maturity date | | | Principal | | | Value | |
| | | | |
| Technology Hardware, Storage & Peripherals: 1.06% | | | | | | | | | | | | | | | | |
Hewlett-Packard Company | | | 6.13 | % | | | 3-1-2014 | | | $ | 9,257,000 | | | $ | 9,257,000 | |
Xerox Corporation | | | 6.40 | | | | 3-15-2016 | | | | 2,950,000 | | | | 3,262,591 | |
Xerox Corporation | | | 8.25 | | | | 5-15-2014 | | | | 6,000,000 | | | | 6,085,440 | |
| | | | |
| | | | | | | | | | | | | | | 18,605,031 | |
| | | | | | | | | | | | | | | | |
| | | | |
Materials: 1.04% | | | | | | | | | | | | | | | | |
| | | | |
| Chemicals: 0.57% | | | | | | | | | | | | | | | | |
Eastman Chemical Company | | | 3.00 | | | | 12-15-2015 | | | | 9,760,000 | | | | 10,120,368 | |
| | | | | | | | | | | | | | | | |
| | | | |
| Paper & Forest Products: 0.47% | | | | | | | | | | | | | | | | |
Georgia-Pacific LLC | | | 7.70 | | | | 6-15-2015 | | | | 7,570,000 | | | | 8,240,604 | |
| | | | | | | | | | | | | | | | |
| | | | |
Telecommunication Services: 2.62% | | | | | | | | | | | | | | | | |
| | | | |
| Diversified Telecommunication Services: 2.62% | | | | | | | | | | | | | | | | |
Alltel Corporation | | | 7.00 | | | | 3-15-2016 | | | | 1,000,000 | | | | 1,119,037 | |
AT&T Incorporated | | | 0.88 | | | | 2-13-2015 | | | | 6,976,000 | | | | 7,005,446 | |
Crown Castle Towers LLC 144A | | | 3.21 | | | | 8-15-2035 | | | | 8,061,000 | | | | 8,217,448 | |
Qwest Corporation | | | 7.50 | | | | 10-1-2014 | | | | 8,609,000 | | | | 8,922,325 | |
SBA Tower Trust 144A | | | 4.25 | | | | 4-15-2040 | | | | 10,090,000 | | | | 10,203,482 | |
Verizon Communications Incorporated | | | 0.70 | | | | 11-2-2015 | | | | 2,325,000 | | | | 2,326,862 | |
Verizon Communications Incorporated | | | 2.50 | | | | 9-15-2016 | | | | 8,000,000 | | | | 8,302,600 | |
| | | | |
| | | | | | | | | | | | | | | 46,097,200 | |
| | | | | | | | | | | | | | | | |
| | | | |
Utilities: 3.58% | | | | | | | | | | | | | | | | |
| | | | |
| Electric Utilities: 2.44% | | | | | | | | | | | | | | | | |
Ameren Corporation | | | 8.88 | | | | 5-15-2014 | | | | 8,000,000 | | | | 8,127,688 | |
Dayton Power & Light Company 144A | | | 1.88 | | | | 9-15-2016 | | | | 9,000,000 | | | | 9,161,811 | |
Exelon Corporation | | | 4.90 | | | | 6-15-2015 | | | | 2,000,000 | | | | 2,100,824 | |
ITC Holdings Corporation 144A | | | 5.88 | | | | 9-30-2016 | | | | 7,000,000 | | | | 7,725,788 | |
LG&E & KU Energy LLC | | | 2.13 | | | | 11-15-2015 | | | | 7,635,000 | | | | 7,782,638 | |
Nextera Energy Capital Holdings Incorporated | | | 1.34 | | | | 9-1-2015 | | | | 7,000,000 | | | | 7,060,802 | |
PECO Energy Company | | | 5.00 | | | | 10-1-2014 | | | | 1,000,000 | | | | 1,025,630 | |
| | | | |
| | | | | | | | | | | | | | | 42,985,181 | |
| | | | | | | | | | | | | | | | |
| | | | |
| Gas Utilities: 0.33% | | | | | | | | | | | | | | | | |
Atmos Energy Corporation | | | 4.95 | | | | 10-15-2014 | | | | 5,640,000 | | | | 5,789,466 | |
| | | | | | | | | | | | | | | | |
| | | | |
| Multi-Utilities: 0.81% | | | | | | | | | | | | | | | | |
CMS Energy Corporation | | | 4.25 | | | | 9-30-2015 | | | | 6,901,000 | | | | 7,271,411 | |
DTE Energy Company | | | 6.35 | | | | 6-1-2016 | | | | 6,250,000 | | | | 6,980,768 | |
| | | | |
| | | | | | | | | | | | | | | 14,252,179 | |
| | | | | | | | | | | | | | | | |
| | | | |
Total Corporate Bonds and Notes (Cost $718,725,713) | | | | | | | | | | | | | | | 721,155,318 | |
| | | | | | | | | | | | | | | | |
| | | | |
Municipal Obligations: 5.55% | | | | | | | | | | | | | | | | |
| | | | |
| California: 1.63% | | | | | | | | | | | | | | | | |
California PCFA Solid Waste Disposal Series A (Resource Recovery Revenue) ±144A | | | 0.55 | | | | 8-1-2023 | | | | 14,000,000 | | | | 14,000,000 | |
California PCFA Waste Management Services Incorporated Series A1 (Resource Recovery Revenue) ± | | | 1.88 | | | | 4-1-2025 | | | | 4,000,000 | | | | 4,042,680 | |
California Public Works Board Lease Series E (Miscellaneous Revenue) | | | 3.68 | | | | 12-1-2015 | | | | 5,000,000 | | | | 5,183,800 | |
Irvine Ranch CA Water District (Water & Sewer Revenue) | | | 2.39 | | | | 3-15-2014 | | | | 5,535,000 | | | | 5,539,483 | |
| | | | |
| | | | | | | | | | | | | | | 28,765,963 | |
| | | | | | | | | | | | | | | | |
The accompanying notes are an integral part of these financial statements.
| | | | |
| 18 | | Wells Fargo Advantage Ultra Short-Term Income Fund | | Portfolio of investments—February 28, 2014 (unaudited) |
| | | | | | | | | | | | | | | | |
| Security name | | Interest rate | | | Maturity date | | | Principal | | | Value | |
| | | | |
| Connecticut: 0.44% | | | | | | | | | | | | | | | | |
Connecticut Series A (GO) | | | 5.46 | % | | | 3-1-2019 | | | $ | 7,090,000 | | | $ | 7,699,315 | |
| | | | | | | | | | | | | | | | |
| | | | |
| Florida: 0.16% | | | | | | | | | | | | | | | | |
Miami-Dade County FL IDA Waste Management Incorporated Florida Project (Resource Recovery Revenue) ± | | | 2.63 | | | | 8-1-2023 | | | | 2,800,000 | | | | 2,819,068 | |
| | | | | | | | | | | | | | | | |
| | | | |
| Illinois: 0.58% | | | | | | | | | | | | | | | | |
Illinois (GO) | | | 4.42 | | | | 1-1-2015 | | | | 9,865,000 | | | | 10,174,169 | |
| | | | | | | | | | | | | | | | |
| | | | |
| Michigan: 0.13% | | | | | | | | | | | | | | | | |
Michigan Housing Development Authority Series A (Housing Revenue) ± | | | 0.81 | | | | 12-1-2014 | | | | 2,300,000 | | | | 2,300,230 | |
| | | | | | | | | | | | | | | | |
| | | | |
| Minnesota: 0.08% | | | | | | | | | | | | | | | | |
Minnesota Tobacco Securitization Authority Series A (Tobacco Revenue) | | | 2.64 | | | | 3-1-2014 | | | | 1,500,000 | | | | 1,500,285 | |
| | | | | | | | | | | | | | | | |
| | | | |
| New York: 0.67% | | | | | | | | | | | | | | | | |
Dutchess County NY Local Development Corporation (Health Revenue) | | | 1.35 | | | | 7-1-2014 | | | | 1,775,000 | | | | 1,779,296 | |
Suffolk County NY TAN Series I (GO) | | | 1.50 | | | | 8-14-2014 | | | | 10,000,000 | | | | 10,053,900 | |
| | | | |
| | | | | | | | | | | | | | | 11,833,196 | |
| | | | | | | | | | | | | | | | |
| | | | |
| Pennsylvania: 0.46% | | | | | | | | | | | | | | | | |
Bucks County PA IDA (Resource Recovery Revenue) ± | | | 1.38 | | | | 12-1-2022 | | | | 1,000,000 | | | | 1,002,990 | |
Pennsylvania EDFA Waste Management Incorporated (Resource Recovery Revenue) ± | | | 0.50 | | | | 8-1-2045 | | | | 4,000,000 | | | | 4,000,000 | |
Philadelphia PA School District Series C (GO, AGM Insured) | | | 4.66 | | | | 7-1-2014 | | | | 3,145,000 | | | | 3,183,023 | |
| | | | |
| | | | | | | | | | | | | | | 8,186,013 | |
| | | | | | | | | | | | | | | | |
| | | | |
| South Carolina: 0.63% | | | | | | | | | | | | | | | | |
South Carolina Jobs EDA Waste Management South Carolina Incorporated Project (Resource Recovery Revenue) ± | | | 1.88 | | | | 11-1-2016 | | | | 2,500,000 | | | | 2,516,925 | |
South Carolina Public Service Authority Series D (GO) ± | | | 1.03 | | | | 6-1-2015 | | | | 8,500,000 | | | | 8,537,740 | |
| | | | |
| | | | | | | | | | | | | | | 11,054,665 | |
| | | | | | | | | | | | | | | | |
| | | | |
| Texas: 0.77% | | | | | | | | | | | | | | | | |
Port Arthur TX Navigation District Jefferson County Environmental Facilities Motiva Enterprises LLC Project Series D (Industrial Development Revenue) § | | | 0.28 | | | | 11-1-2040 | | | | 1,500,000 | | | | 1,500,000 | |
Port Arthur TX Navigation District Motiva Enterprises Project Series B (Resource Recovery Revenue) § | | | 0.28 | | | | 12-1-2039 | | | | 12,000,000 | | | | 12,000,000 | |
| | | | |
| | | | | | | | | | | | | | | 13,500,000 | |
| | | | | | | | | | | | | | | | |
| | | | |
Total Municipal Obligations (Cost $97,508,229) | | | | | | | | | | | | | | | 97,832,904 | |
| | | | | | | | | | | | | | | | |
| | | | |
Non-Agency Mortgage Backed Securities: 10.14% | | | | | | | | | | | | | | | | |
Bank of America Commercial Mortgage Incorporated Series 2004-3 Class A5 ± | | | 5.35 | | | | 6-10-2039 | | | | 3,020,500 | | | | 3,026,284 | |
Bank of America Commercial Mortgage Incorporated Series 2004-5 Class A4 ± | | | 4.94 | | | | 11-10-2041 | | | | 4,832,880 | | | | 4,879,073 | |
Bank of America Commercial Mortgage Incorporated Series 2007-3 Class A1A ± | | | 5.62 | | | | 6-10-2049 | | | | 1,208,596 | | | | 1,317,016 | |
Bank of America Mortgage Securities Series 2002-K Class 3A1 ± | | | 2.63 | | | | 10-20-2032 | | | | 2,560 | | | | 2,603 | |
Bear Stearns Commercial Mortgage Securities Incorporated Series 2005-PW10 Class A4 ± | | | 5.41 | | | | 12-11-2040 | | | | 7,430,805 | | | | 7,827,721 | |
Bear Stearns Commercial Mortgage Securities Incorporated Series 2005-PWR 9 Class A4A | | | 4.87 | | | | 9-11-2042 | | | | 5,850,000 | | | | 6,118,609 | |
The accompanying notes are an integral part of these financial statements.
| | | | | | |
| Portfolio of investments—February 28, 2014 (unaudited) | | Wells Fargo Advantage Ultra Short-Term Income Fund | | | 19 | |
| | | | | | | | | | | | | | | | |
| Security name | | Interest rate | | | Maturity date | | | Principal | | | Value | |
| | | | |
Non-Agency Mortgage Backed Securities (continued) | | | | | | | | | | | | | | | | |
Bear Stearns Commercial Mortgage Securities Incorporated Series 2005-PWR-7 Class A3 ± | | | 5.12 | % | | | 2-11-2041 | | | $ | 5,270,000 | | | $ | 5,437,702 | |
Bear Stearns Commercial Mortgage Securities Incorporated Series 2005-PWR8 Class A4 | | | 4.67 | | | | 6-11-2041 | | | | 6,178,136 | | | | 6,410,557 | |
Bear Stearns Commercial Mortgage Securities Incorporated Series 2005-T18 Class A4 ± | | | 4.93 | | | | 2-13-2042 | | | | 5,589,675 | | | | 5,766,247 | |
Bear Stearns Commercial Mortgage Securities Incorporated Series 2007-PWR15 Class A4 | | | 5.33 | | | | 2-11-2044 | | | | 2,606,376 | | | | 2,842,444 | |
Citigroup Commercial Mortgage Trust Series 2004-C1 Class A4 ± | | | 5.35 | | | | 4-15-2040 | | | | 2,786,859 | | | | 2,798,021 | |
Citigroup/Deutsche Bank Commercial Mortgage Trust Pass-Through Certificate Series 2005-CD1 Class A4 ± | | | 5.22 | | | | 7-15-2044 | | | | 3,675,000 | | | | 3,879,543 | |
Collateralized Mortgage Obligation Trust Series 66 Class Z | | | 8.00 | | | | 9-20-2021 | | | | 93,803 | | | | 103,801 | |
Commercial Mortgage Trust Pass-Through Ceriificate Series 2005-C6 Class A5A ± | | | 5.12 | | | | 6-10-2044 | | | | 5,578,231 | | | | 5,851,782 | |
Commercial Mortgage Trust Series 2010-C1 Class A1 144A | | | 3.16 | | | | 7-10-2046 | | | | 8,321,921 | | | | 8,549,018 | |
Commercial Mortgage Trust Series 2013-FL3 Class B ±144A | | | 2.15 | | | | 10-13-2028 | | | | 9,000,000 | | | | 9,014,373 | |
Countrywide Home Loans Mortgage Pass-Through Trust Series 2001-HYB1 Class 1A1 ± | | | 2.08 | | | | 6-19-2031 | | | | 625,680 | | | | 626,957 | |
Countrywide Home Loans Mortgage Pass-Through Trust Series 2001-HYB1 Class 2A1 ± | | | 1.93 | | | | 6-19-2031 | | | | 285,418 | | | | 286,799 | |
Countrywide Home Loans Mortgage Pass-Through Trust Series 2004-20 Class 3A1 ± | | | 2.27 | | | | 9-25-2034 | | | | 210,425 | | | | 181,445 | |
Credit Suisse First Boston Mortgage Securities Corporation Series 2004-C3 Class A5 ± | | | 5.11 | | | | 7-15-2036 | | | | 2,671,217 | | | | 2,693,263 | |
Credit Suisse First Boston Mortgage Securities Corporation Series 2005-C3 Class A4 | | | 4.69 | | | | 7-15-2037 | | | | 5,747,000 | | | | 5,928,691 | |
Credit Suisse First Boston Mortgage Securities Corporation Series 2005-C5 Class A4 ± | | | 5.10 | | | | 8-15-2038 | | | | 2,850,000 | | | | 2,979,732 | |
Credit Suisse First Boston Mortgage Securities Corporation Series 2006-C4 Class A3 | | | 5.47 | | | | 9-15-2039 | | | | 5,155,542 | | | | 5,614,035 | |
Credit Suisse Mortgage Capital Certificates Series 2006-C5 Class A3 | | | 5.31 | | | | 12-15-2039 | | | | 8,958,064 | | | | 9,755,466 | |
DLJ Mortgage Acceptance Corporation Series 1990-2 Class A ± | | | 3.34 | | | | 1-25-2022 | | | | 107,035 | | | | 109,399 | |
DLJ Mortgage Acceptance Corporation Series 1991-3 Class A1 ± | | | 1.93 | | | | 1-25-2021 | | | | 34,742 | | | | 35,396 | |
EquiFirst Mortgage Loan Trust Series 2003-2 Class 3A3 ± | | | 1.28 | | | | 9-25-2033 | | | | 731,378 | | | | 701,307 | |
GE Capital Commercial Mortgage Corporation Series 2004-C3 Class A4 ± | | | 5.19 | | | | 7-10-2039 | | | | 2,860,820 | | | | 2,883,703 | |
GE Capital Commercial Mortgage Corporation Series 2005-C3 Class A7A ± | | | 4.97 | | | | 7-10-2045 | | | | 5,430,000 | | | | 5,672,965 | |
GSMPS Mortgage Loan Trust Series 1998-1 Class A ±144A | | | 8.00 | | | | 9-19-2027 | | | | 88,035 | | | | 89,868 | |
Housing Securities Incorporated Series 1992-8 Class E ± | | | 3.56 | | | | 6-25-2024 | | | | 142,544 | | | | 143,975 | |
JPMorgan Chase Commercial Mortgage Securities Corporation Series 2006-LDP6 Class A4 ± | | | 5.48 | | | | 4-15-2043 | | | | 1,752,503 | | | | 1,887,549 | |
JPMorgan Chase Commercial Mortgage Securities Corporation Series 2006-LDP7 Class A4 ± | | | 5.87 | | | | 4-15-2045 | | | | 2,200,000 | | | | 2,403,773 | |
Lehman Brothers UBS Commercial Mortgage Trust Series 2005-C1 Class A4 | | | 4.74 | | | | 2-15-2030 | | | | 5,083,167 | | | | 5,216,270 | |
Lehman Brothers UBS Commercial Mortgage Trust Series 2005-C5 Class 4 | | | 4.95 | | | | 9-15-2030 | | | | 4,838,066 | | | | 5,049,015 | |
Lehman Brothers UBS Commercial Mortgage Trust Series 2007-C2 Class A3 | | | 5.43 | | | | 2-15-2040 | | | | 2,941,736 | | | | 3,252,078 | |
Master Mortgages Trust Series 2002-3 Class 4A1 ± | | | 2.50 | | | | 10-25-2032 | | | | 19,635 | | | | 19,753 | |
Morgan Stanley Capital I Series 2005-IQ10 Class A4A ± | | | 5.23 | | | | 9-15-2042 | | | | 5,905,784 | | | | 6,190,266 | |
Morgan Stanley Capital I Series 2005-T19 Class A4A | | | 4.89 | | | | 6-12-2047 | | | | 4,828,715 | | | | 5,040,222 | |
Morgan Stanley Capital I Series 2007-IQ Class A4 | | | 5.81 | | | | 12-12-2049 | | | | 7,800,000 | | | | 8,752,302 | |
Morgan Stanley Dean Witter Capital I Series 2005-IQ9 Class A5 | | | 4.70 | | | | 7-15-2056 | | | | 919,389 | | | | 936,906 | |
Morgan Stanley Mortgage Trust Series 35 Class 2 ±(w)(i) | | | 15,333.50 | | | | 4-20-2021 | | | | 16 | | | | 2,680 | |
NCUA Guaranteed Notes Series 2010-C1 Class A1 | | | 1.60 | | | | 10-29-2020 | | | | 5,831,414 | | | | 5,876,526 | |
NCUA Guaranteed Notes Series 2010-C1 Class APT | | | 2.65 | | | | 10-29-2020 | | | | 4,840,023 | | | | 4,992,484 | |
NCUA Guaranteed Notes Series 2010-R1 Class 2A | | | 1.84 | | | | 10-7-2020 | | | | 688,442 | | | | 694,434 | |
Prudential Home Mortgage Securities Series 1988-1 Class A ± | | | 2.43 | | | | 4-25-2018 | | | | 21,350 | | | | 21,746 | |
Resecuritization Mortgage Trust Series 1998-B Class A ±144A | | | 0.40 | | | | 4-26-2021 | | | | 9,822 | | | | 9,233 | |
Salomon Brothers Mortgage Securities VII Series 1990-2 Class A ± | | | 2.24 | | | | 11-25-2020 | | | | 409,869 | | | | 419,787 | |
SCG Trust Series 2013-SRP1 Class A ±144A | | | 1.55 | | | | 11-15-2026 | | | | 7,500,000 | | | | 7,507,763 | |
Springleaf Mortgage Loan Trust Series 2012-2A Class A ±144A | | | 2.22 | | | | 10-25-2057 | | | | 2,541,616 | | | | 2,587,538 | |
Structured Asset Mortgage Investments Incorporated Series 2001-4 Class A2 ± | | | 9.54 | | | | 10-25-2024 | | | | 148,873 | | | | 156,040 | |
The accompanying notes are an integral part of these financial statements.
| | | | |
| 20 | | Wells Fargo Advantage Ultra Short-Term Income Fund | | Portfolio of investments—February 28, 2014 (unaudited) |
| | | | | | | | | | | | | | | | |
| Security name | | Interest rate | | | Maturity date | | | Principal | | | Value | |
| | | | |
Non-Agency Mortgage Backed Securities (continued) | | | | | | | | | | | | | | | | |
Structured Asset Securities Corporation Series 1998-2 Class A ± | | | 0.68 | % | | | 2-25-2028 | | | $ | 268,125 | | | $ | 263,931 | |
Terwin Mortgage Trust Series 2004-21HE Class 1A1 ± | | | 1.12 | | | | 12-25-2034 | | | | 34,215 | | | | 32,684 | |
UBS Barclays Commercial Mortgage Trust Series 2012-C2 Class A1 | | | 1.01 | | | | 5-10-2063 | | | | 4,887,830 | | | | 4,908,950 | |
Wilshire Funding Corporation Series 1996-3 Class M2 ± | | | 5.76 | | | | 8-25-2032 | | | | 160,222 | | | | 157,168 | |
Wilshire Funding Corporation Series 1996-3 Class M3 ± | | | 5.76 | | | | 8-25-2032 | | | | 143,574 | | | | 137,968 | |
Wilshire Funding Corporation Series 1998-2 Class M1 ± | | | 2.00 | | | | 12-28-2037 | | | | 695,373 | | | | 638,021 | |
| | | | |
Total Non-Agency Mortgage Backed Securities (Cost $178,558,191) | | | | | | | | | | | | | | | 178,682,882 | |
| | | | | | | | | | | | | | | | |
| | | | |
Yankee Corporate Bonds and Notes: 14.41% | | | | | | | | | | | | | | | | |
| | | | |
Consumer Discretionary: 0.58% | | | | | | | | | | | | | | | | |
| | | | |
| Auto Components: 0.23% | | | | | | | | | | | | | | | | |
Autoliv Incorporated | | | 3.85 | | | | 4-30-2014 | | | | 4,000,000 | | | | 4,008,144 | |
| | | | | | | | | | | | | | | | |
| | | | |
| Diversified Consumer Services: 0.35% | | | | | | | | | | | | | | | | |
Anglo American Capital Company 144A | | | 9.38 | | | | 4-8-2014 | | | | 6,130,000 | | | | 6,177,550 | |
| | | | | | | | | | | | | | | | |
| | | | |
Consumer Staples: 1.23% | | | | | | | | | | | | | | | | |
| | | | |
| Food & Staples Retailing: 0.82% | | | | | | | | | | | | | | | | |
FBG Finance Limited 144A | | | 5.13 | | | | 6-15-2015 | | | | 5,900,000 | | | | 6,222,022 | |
Tesco plc 144A | | | 2.70 | | | | 1-5-2017 | | | | 8,000,000 | | | | 8,281,992 | |
| | | | |
| | | | | | | | | | | | | | | 14,504,014 | |
| | | | | | | | | | | | | | | | |
| | | | |
| Food Products: 0.41% | | | | | | | | | | | | | | | | |
Tate & Lyle International Finance plc 144A | | | 5.00 | | | | 11-15-2014 | | | | 7,000,000 | | | | 7,193,830 | |
| | | | | | | | | | | | | | | | |
| | | | |
Energy: 2.15% | | | | | | | | | | | | | | | | |
| | | | |
| Energy Equipment & Services: 0.50% | | | | | | | | | | | | | | | | |
Ensco plc | | | 3.25 | | | | 3-15-2016 | | | | 8,380,000 | | | | 8,774,597 | |
| | | | | | | | | | | | | | | | |
| | | | |
| Oil, Gas & Consumable Fuels: 1.65% | | | | | | | | | | | | | | | | |
Husky Energy Incorporated | | | 5.90 | | | | 6-15-2014 | | | | 8,640,000 | | | | 8,770,395 | |
Petrobras International Finance Company | | | 2.88 | | | | 2-6-2015 | | | | 7,000,000 | | | | 7,087,500 | |
Petroleos Mexicanos Company | | | 4.88 | | | | 3-15-2015 | | | | 6,930,000 | | | | 7,198,538 | |
Woodside Finance Limited 144A | | | 8.13 | | | | 3-1-2014 | | | | 6,000,000 | | | | 6,000,000 | |
| | | | |
| | | | | | | | | | | | | | | 29,056,433 | |
| | | | | | | | | | | | | | | | |
| | | | |
Financials: 6.74% | | | | | | | | | | | | | | | | |
| | | | |
| Banks: 4.59% | | | | | | | | | | | | | | | | |
ABN AMRO Bank NV 144A | | | 1.38 | | | | 1-22-2016 | | | | 9,815,000 | | | | 9,912,914 | |
ANZ New Zealand International Limited 144A | | | 1.13 | | | | 3-24-2016 | | | | 4,000,000 | | | | 4,015,532 | |
Bank Nederlandse Gemeenten | | | 5.00 | | | | 5-16-2014 | | | | 14,000,000 | | | | 14,132,636 | |
Bank of Montreal 144A | | | 1.30 | | | | 10-31-2014 | | | | 5,500,000 | | | | 5,538,517 | |
Banque Federative du Credit Mutuel SA 144A | | | 1.70 | | | | 1-20-2017 | | | | 8,150,000 | | | | 8,174,450 | |
ING Bank NV 144A | | | 1.38 | | | | 3-7-2016 | | | | 8,000,000 | | | | 8,036,648 | |
Macquarie Bank Limited 144A | | | 3.45 | | | | 7-27-2015 | | | | 5,000,000 | | | | 5,171,820 | |
Nordea Eiendomskreditt 144A | | | 1.88 | | | | 4-7-2014 | | | | 12,500,000 | | | | 12,518,250 | |
Royal Bank of Scotland plc | | | 3.95 | | | | 9-21-2015 | | | | 3,000,000 | | | | 3,140,145 | |
Westpac Banking Corporation 144A | | | 5.30 | | | | 10-15-2015 | | | | 4,040,000 | | | | 4,296,677 | |
Xstrata Finance Canada Limited 144A | | | 2.85 | | | | 11-10-2014 | | | | 6,000,000 | | | | 6,074,928 | |
| | | | |
| | | | | | | | | | | | | | | 81,012,517 | |
| | | | | | | | | | | | | | | | |
The accompanying notes are an integral part of these financial statements.
| | | | | | |
| Portfolio of investments—February 28, 2014 (unaudited) | | Wells Fargo Advantage Ultra Short-Term Income Fund | | | 21 | |
| | | | | | | | | | | | | | | | |
| Security name | | Interest rate | | | Maturity date | | | Principal | | | Value | |
| | | | |
| Diversified Financial Services: 0.82% | | | | | | | | | | | | | | | | |
Abbey National Treasury Services plc 144A | | | 3.88 | % | | | 11-10-2014 | | | $ | 4,400,000 | | | $ | 4,501,411 | |
WPP Finance | | | 8.00 | | | | 9-15-2014 | | | | 9,533,000 | | | | 9,900,821 | |
| | | | |
| | | | | | | | | | | | | | | 14,402,232 | |
| | | | | | | | | | | | | | | | |
| | | | |
| Insurance: 1.03% | | | | | | | | | | | | | | | | |
Allied World Assurance Company Holdings AG | | | 7.50 | | | | 8-1-2016 | | | | 9,252,000 | | | | 10,570,105 | |
Endurance Specialty Holdings Limited | | | 6.15 | | | | 10-15-2015 | | | | 7,130,000 | | | | 7,655,067 | |
| | | | |
| | | | | | | | | | | | | | | 18,225,172 | |
| | | | | | | | | | | | | | | | |
| | | | |
| Thrifts & Mortgage Finance: 0.30% | | | | | | | | | | | | | | | | |
Korea Finance Corporation | | | 3.25 | | | | 9-20-2016 | | | | 5,000,000 | | | | 5,254,365 | |
| | | | | | | | | | | | | | | | |
| | | | |
Information Technology: 0.19% | | | | | | | | | | | | | | | | |
| | | | |
| Semiconductors & Semiconductor Equipment: 0.19% | | | | | | | | | | | | | | | | |
TSMC Global Limited 144A | | | 0.95 | | | | 4-3-2016 | | | | 3,385,000 | | | | 3,352,446 | |
| | | | | | | | | | | | | | | | |
| | | | |
Materials: 1.08% | | | | | | | | | | | | | | | | |
| | | | |
| Construction Materials: 0.46% | | | | | | | | | | | | | | | | |
Lafarge SA 144A | | | 6.20 | | | | 7-9-2015 | | | | 7,720,000 | | | | 8,163,900 | |
| | | | | | | | | | | | | | | | |
| | | | |
| Metals & Mining: 0.62% | | | | | | | | | | | | | | | | |
ArcelorMittal | | | 9.50 | | | | 2-15-2015 | | | | 5,450,000 | | | | 5,845,125 | |
Rio Tinto Finance USA Limited | | | 8.95 | | | | 5-1-2014 | | | | 5,000,000 | | | | 5,066,015 | |
| | | | |
| | | | | | | | | | | | | | | 10,911,140 | |
| | | | | | | | | | | | | | | | |
| | | | |
Telecommunication Services: 1.78% | | | | | | | | | | | | | | | | |
| | | | |
| Diversified Telecommunication Services: 1.55% | | | | | | | | | | | | | | | | |
Deutsche Telekom International Finance Company 144A | | | 3.13 | | | | 4-11-2016 | | | | 10,290,000 | | | | 10,753,914 | |
Rogers Cable Incorporated | | | 5.50 | | | | 3-15-2014 | | | | 2,000,000 | | | | 2,002,828 | |
Telefonica Emisiones SAU | | | 6.42 | | | | 6-20-2016 | | | | 7,500,000 | | | | 8,345,948 | |
Telefonos de Mexico SA | | | 5.50 | | | | 1-27-2015 | | | | 6,000,000 | | | | 6,210,000 | |
| | | | |
| | | | | | | | | | | | | | | 27,312,690 | |
| | | | | | | | | | | | | | | | |
| | | | |
| Wireless Telecommunication Services: 0.23% | | | | | | | | | | | | | | | | |
America Movil SAB de CV ± | | | 1.24 | | | | 9-12-2016 | | | | 4,000,000 | | | | 4,053,908 | |
| | | | | | | | | | | | | | | | |
| | | | |
Utilities: 0.66% | | | | | | | | | | | | | | | | |
| | | | |
| Independent Power & Renewable Electricity Producers: 0.66% | | | | | | | | | | | | | | | | |
TransAlta Corporation | | | 4.75 | | | | 1-15-2015 | | | | 11,217,000 | | | | 11,587,183 | |
| | | | | | | | | | | | | | | | |
| | | | |
Total Yankee Corporate Bonds and Notes (Cost $252,572,355) | | | | | | | | | | | | | | | 253,990,121 | |
| | | | | | | | | | | | | | | | |
| | | Yield | | | | | | Shares | | | | |
| Short-Term Investments: 3.49% | | | | | | | | | | | | | | | | |
| | | | |
| Investment Companies: 3.39% | | | | | | | | | | | | | | | | |
Wells Fargo Advantage Cash Investment Money Market Fund, Select Class (l)(u)## | | | 0.07 | | | | | | | | 59,839,038 | | | | 59,839,038 | |
| | | | | | | | | | | | | | | | |
The accompanying notes are an integral part of these financial statements.
| | | | |
| 22 | | Wells Fargo Advantage Ultra Short-Term Income Fund | | Portfolio of investments—February 28, 2014 (unaudited) |
| | | | | | | | | | | | | | | | |
| Security name | | Yield | | | Maturity date | | | Principal | | | Value | |
| | | | |
| U.S. Treasury Securities: 0.10% | | | | | | | | | | | | | | | | |
U.S. Treasury Bill (z)# | | | 0.02 | % | | | 3-20-2014 | | | $ | 1,750,000 | | | $ | 1,749,976 | |
| | | | | | | | | | | | | | | | |
| | | | |
Total Short-Term Investments (Cost $61,588,989) | | | | | | | | | | | | | | | 61,589,014 | |
| | | | | | | | | | | | | | | | |
| | | | | | | | |
| Total investments in securities | | | | | | | | |
| (Cost $1,739,539,516)* | | | 99.07 | % | | | 1,746,402,717 | |
Other assets and liabilities, net | | | 0.93 | | | | 16,430,246 | |
| | | | | | | | |
| Total net assets | | | 100.00 | % | | $ | 1,762,832,963 | |
| | | | | | | | |
| 144A | Security that may be resold to “qualified institutional buyers” under Rule 144A or security offered pursuant to Section 4(2) of the Securities Act of 1933, as amended. |
| ± | Variable rate investment. The rate shown is the rate in effect at period end. |
| %% | Security issued on a when-issued basis. |
| ¤ | Security issued in zero coupon form with no periodic interest payments. |
| § | Security is subject to a demand feature which reduces the effective maturity. |
| (w) | This security is a structured note which generates income based on a coupon formula (-1,500 * 1 month LIBOR + 15,573.5%) and the prepayment behavior of the underlying collateral. The coupon is subject to amandatory cap of 15,573.5% and a mandatory floor of 11%. |
| (l) | Investment in an affiliate |
| (u) | Rate shown is the 7-day annualized yield at period end. |
| ## | All or a portion of this security has been segregated for when-issued securities. |
| (z) | Zero coupon security. Rate represents the current yield to maturity. |
| # | All or a portion of this security is segregated as collateral for investments in derivative instruments. |
| * | Cost for federal income tax purposes is $1,739,078,990 and unrealized appreciation (depreciation) consists of: |
| | | | |
Gross unrealized appreciation | | $ | 9,722,053 | |
Gross unrealized depreciation | | | (2,398,326 | ) |
| | | | |
Net unrealized appreciation | | $ | 7,323,727 | |
The accompanying notes are an integral part of these financial statements.
| | | | | | |
| Statement of assets and liabilities—February 28, 2014 (unaudited) | | Wells Fargo Advantage Ultra Short-Term Income Fund | | | 23 | |
| | | | |
| | | | |
| |
Assets | | | | |
Investments | | | | |
In unaffiliated securities, at value (see cost below) | | $ | 1,686,563,679 | |
In affiliated securities, at value (see cost below) | | | 59,839,038 | |
| | | | |
Total investments, at value (see cost below) | | | 1,746,402,717 | |
Cash | | | 3,354,221 | |
Receivable for investments sold | | | 1,420,000 | |
Principal paydown receivable | | | 3,706,435 | |
Receivable for Fund shares sold | | | 8,723,182 | |
Receivable for interest | | | 11,250,293 | |
Receivable for daily variation margin on open futures contracts | | | 202,518 | |
Prepaid expenses and other assets | | | 89,197 | |
| | | | |
Total assets | | | 1,775,148,563 | |
| | | | |
| |
Liabilities | | | | |
Dividends payable | | | 835,652 | |
Payable for investments purchased | | | 6,345,826 | |
Payable for Fund shares redeemed | | | 4,361,728 | |
Advisory fee payable | | | 295,568 | |
Distribution fees payable | | | 6,421 | |
Due to other related parties | | | 238,043 | |
Accrued expenses and other liabilities | | | 232,362 | |
| | | | |
Total liabilities | | | 12,315,600 | |
| | | | |
Total net assets | | $ | 1,762,832,963 | |
| | | | |
| |
NET ASSETS CONSIST OF | | | | |
Paid-in capital | | $ | 1,866,290,411 | |
Overdistributed net investment income | | | (1,016,381 | ) |
Accumulated net realized losses on investments | | | (108,916,467 | ) |
Net unrealized gains on investments | | | 6,475,400 | |
| | | | |
Total net assets | | $ | 1,762,832,963 | |
| | | | |
| |
COMPUTATION OF NET ASSET VALUE AND OFFERING PRICE PER SHARE1 | | | | |
Net assets – Class A | | $ | 181,030,577 | |
Shares outstanding – Class A | | | 21,189,773 | |
Net asset value per share – Class A | | | $8.54 | |
Maximum offering price per share – Class A2 | | | $8.71 | |
Net assets – Class C | | $ | 10,428,880 | |
Shares outstanding – Class C | | | 1,221,834 | |
Net asset value per share – Class C | | | $8.54 | |
Net assets – Administrator Class | | $ | 116,036,206 | |
Shares outstanding – Administrator Class | | | 13,632,159 | |
Net asset value per share – Administrator Class | | | $8.51 | |
Net assets – Institutional Class | | $ | 1,130,915,287 | |
Shares outstanding – Institutional Class | | | 132,446,202 | |
Net asset value per share – Institutional Class | | | $8.54 | |
Net assets – Investor Class | | $ | 324,422,013 | |
Shares outstanding – Investor Class | | | 37,962,698 | |
Net asset value per share – Investor Class | | | $8.55 | |
| |
Investments in unaffiliated securities, at cost | | $ | 1,679,700,478 | |
| | | | |
Investments in affiliated securities, at cost | | $ | 59,839,038 | |
| | | | |
Total investments, at cost | | $ | 1,739,539,516 | |
| | | | |
| 1. | The Fund has an unlimited number of authorized shares. |
| 2. | Maximum offering price is computed as 100/98 of net asset value. On investments of $50,000 or more, the offering price is reduced. |
The accompanying notes are an integral part of these financial statements.
| | | | |
| 24 | | Wells Fargo Advantage Ultra Short-Term Income Fund | | Statement of operations—six months ended February 28, 2014 (unaudited) |
| | | | |
| | | | |
| |
Investment income | | | | |
Interest** | | $ | 11,842,698 | |
Income from affiliated securities | | | 42,620 | |
Securities lending income, net | | | 1,546 | |
| | | | |
Total investment income | | | 11,886,864 | |
| | | | |
| |
Expenses | | | | |
Advisory fee | | | 2,679,692 | |
Administration fees | | | | |
Fund level | | | 431,560 | |
Class A | | | 134,438 | |
Class C | | | 8,765 | |
Administrator Class | | | 62,815 | |
Institutional Class | | | 438,123 | |
Investor Class | | | 309,983 | |
Shareholder servicing fees | | | | |
Class A | | | 210,060 | |
Class C | | | 13,696 | |
Administrator Class | | | 156,650 | |
Investor Class | | | 407,633 | |
Distribution fees | | | | |
Class C | | | 41,088 | |
Custody and accounting fees | | | 46,078 | |
Professional fees | | | 36,397 | |
Registration fees | | | 50,018 | |
Shareholder report expenses | | | 52,269 | |
Trustees’ fees and expenses | | | 6,056 | |
Other fees and expenses | | | 17,065 | |
| | | | |
Total expenses | | | 5,102,386 | |
Less: Fee waivers and/or expense reimbursements | | | (981,524 | ) |
| | | | |
Net expenses | | | 4,120,862 | |
| | | | |
Net investment income | | | 7,766,002 | |
| | | | |
| |
REALIZED AND UNREALIZED GAINS (LOSSES) ON INVESTMENTS | | | | |
| |
Net realized gains (losses) on: | | | | |
Unaffiliated securities | | | 1,724,421 | |
Futures transactions | | | (4,722,183 | ) |
| | | | |
Net realized losses on investments | | | (2,997,762 | ) |
| | | | |
| |
Net change in unrealized gains (losses) on: | | | | |
Unaffiliated securities | | | 6,550,570 | |
Futures transactions | | | 72,725 | |
| | | | |
Net change in unrealized gains (losses) on investments | | | 6,623,295 | |
| | | | |
Net realized and unrealized gains (losses) on investments | | | 3,625,533 | |
| | | | |
Net increase in net assets resulting from operations | | $ | 11,391,535 | |
| | | | |
| |
** Net of foreign interest withholding taxes in the amount of | | | $578 | |
The accompanying notes are an integral part of these financial statements.
| | | | | | |
| Statement of changes in net assets | | Wells Fargo Advantage Ultra Short-Term Income Fund | | | 25 | |
| | | | | | | | | | | | | | | | |
| | | Six months ended February 28, 2014 (unaudited) | | | Year ended August 31, 2013 | |
| | | | |
Operations | | | | | | | | | | | | | | | | |
Net investment income | | | | | | $ | 7,766,002 | | | | | | | $ | 11,503,650 | |
Net realized losses on investments | | | | | | | (2,997,762 | ) | | | | | | | (234,972 | ) |
Net change in unrealized gains (losses) on investments | | | | | | | 6,623,295 | | | | | | | | (3,619,071 | ) |
| | | | |
Net increase in net assets resulting from operations | | | | | | | 11,391,535 | | | | | | | | 7,649,607 | |
| | | | |
| | | | |
Distributions to shareholders from | | | | | | | | | | | | | | | | |
Net investment income | | | | | | | | | | | | | | | | |
Class A | | | | | | | (628,048 | ) | | | | | | | (1,173,593 | ) |
Class C | | | | | | | (2,957 | ) | | | | | | | (5,744 | ) |
Administrator Class | | | | | | | (562,652 | ) | | | | | | | (902,787 | ) |
Institutional Class | | | | | | | (6,025,382 | ) | | | | | | | (7,274,377 | ) |
Investor Class | | | | | | | (1,169,750 | ) | | | | | | | (2,478,423 | ) |
| | | | |
Total distributions to shareholders | | | | | | | (8,388,789 | ) | | | | | | | (11,834,924 | ) |
| | | | |
| | | | |
Capital share transactions | | | Shares | | | | | | | | Shares | | | | | |
Proceeds from shares sold | | | | | | | | | | | | | | | | |
Class A | | | 9,128,557 | | | | 77,934,305 | | | | 19,035,708 | | | | 162,795,928 | |
Class C | | | 98,403 | | | | 839,441 | | | | 361,139 | | | | 3,086,464 | |
Administrator Class | | | 7,906,377 | | | | 67,258,913 | | | | 19,412,067 | | | | 165,243,754 | |
Institutional Class | | | 102,372,291 | | | | 873,555,924 | | | | 151,122,150 | | | | 1,291,229,934 | |
Investor Class | | | 5,045,081 | | | | 43,088,037 | | | | 11,705,065 | | | | 100,154,971 | |
| | | | |
| | | | | | | 1,062,676,620 | | | | | | | | 1,722,511,051 | |
| | | | |
Reinvestment of distributions | | | | | | | | | | | | | | | | |
Class A | | | 72,159 | | | | 616,019 | | | | 134,732 | | | | 1,152,206 | |
Class C | | | 333 | | | | 2,841 | | | | 655 | | | | 5,604 | |
Administrator Class | | | 35,176 | | | | 299,156 | | | | 66,524 | | | | 566,898 | |
Institutional Class | | | 302,703 | | | | 2,582,951 | | | | 455,243 | | | | 3,890,255 | |
Investor Class | | | 131,046 | | | | 1,119,395 | | | | 272,097 | | | | 2,328,027 | |
| | | | |
| | | | | | | 4,620,362 | | | | | | | | 7,942,990 | |
| | | | |
Payment for shares redeemed | | | | | | | | | | | | | | | | |
Class A | | | (6,580,232 | ) | | | (56,178,770 | ) | | | (17,716,568 | ) | | | (151,488,125 | ) |
Class C | | | (268,370 | ) | | | (2,289,037 | ) | | | (718,484 | ) | | | (6,146,290 | ) |
Administrator Class | | | (11,434,114 | ) | | | (97,240,981 | ) | | | (14,537,285 | ) | | | (123,830,546 | ) |
Institutional Class | | | (87,132,153 | ) | | | (743,545,574 | ) | | | (103,476,714 | ) | | | (884,571,432 | ) |
Investor Class | | | (6,328,983 | ) | | | (54,052,069 | ) | | | (13,992,732 | ) | | | (119,750,034 | ) |
| | | | |
| | | | | | | (953,306,431 | ) | | | | | | | (1,285,786,427 | ) |
| | | | |
Net increase in net assets resulting from capital share transactions | | | | | | | 113,990,551 | | | | | | | | 444,667,614 | |
| | | | |
Total increase in net assets | | | | | | | 116,993,297 | | | | | | | | 440,482,297 | |
| | | | |
| | | | |
Net assets | | | | | | | | | | | | | | | | |
Beginning of period | | | | | | | 1,645,839,666 | | | | | | | | 1,205,357,369 | |
| | | | |
End of period | | | | | | $ | 1,762,832,963 | | | | | | | $ | 1,645,839,666 | |
| | | | |
Overdistributed net investment income | | | | | | $ | (1,016,381 | ) | | | | | | $ | (393,594 | ) |
| | | | |
The accompanying notes are an integral part of these financial statements.
| | | | |
| 26 | | Wells Fargo Advantage Ultra Short-Term Income Fund | | Financial highlights |
(For a share outstanding throughout each period)
| | | | | | | | | | | | | | | | | | | | | | | | | | | | |
| | | Six months ended February 28, 2014 (unaudited) | | | Year ended August 31 | | | Year ended May 31 | |
| CLASS A | | | 2013 | | | 2012 | | | 2011 | | | 20101 | | | 2010 | | | 20092 | |
Net asset value, beginning of period | | $ | 8.53 | | | $ | 8.55 | | | $ | 8.52 | | | $ | 8.52 | | | $ | 8.48 | | | $ | 8.03 | | | $ | 8.71 | |
Net investment income | | | 0.03 | | | | 0.06 | | | | 0.10 | | | | 0.10 | | | | 0.04 | | | | 0.17 | | | | 0.31 | |
Net realized and unrealized gains (losses) on investments | | | 0.01 | | | | (0.02 | ) | | | 0.03 | | | | 0.02 | | | | 0.04 | | | | 0.48 | | | | (0.68 | ) |
| | | | | | | | | | | | | | | | | | | | | | | | | | | | |
Total from investment operations | | | 0.04 | | | | 0.04 | | | | 0.13 | | | | 0.12 | | | | 0.08 | | | | 0.65 | | | | (0.37 | ) |
Distributions to shareholders from | | | | | | | | | | | | | | | | | | | | | | | | | | | | |
Net investment income | | | (0.03 | ) | | | (0.06 | ) | | | (0.10 | ) | | | (0.12 | ) | | | (0.04 | ) | | | (0.20 | ) | | | (0.31 | ) |
Net asset value, end of period | | $ | 8.54 | | | $ | 8.53 | | | $ | 8.55 | | | $ | 8.52 | | | $ | 8.52 | | | $ | 8.48 | | | $ | 8.03 | |
Total return3 | | | 0.49 | % | | | 0.52 | % | | | 1.47 | % | | | 1.37 | % | | | 0.94 | % | | | 8.22 | % | | | (4.27 | )% |
Ratios to average net assets (annualized) | | | | | | | | | | | | | | | | | | | | | | | | | | | | |
Gross expenses | | | 0.79 | % | | | 0.83 | % | | | 0.88 | % | | | 0.87 | % | | | 0.88 | % | | | 0.91 | % | | | 0.93 | % |
Net expenses | | | 0.70 | % | | | 0.70 | % | | | 0.70 | % | | | 0.70 | % | | | 0.70 | % | | | 0.70 | % | | | 0.70 | % |
Net investment income | | | 0.68 | % | | | 0.72 | % | | | 1.11 | % | | | 1.17 | % | | | 1.62 | % | | | 1.98 | % | | | 3.70 | % |
Supplemental data | | | | | | | | | | | | | | | | | | | | | | | | | | | | |
Portfolio turnover rate | | | 25 | % | | | 56 | % | | | 61 | % | | | 60 | % | | | 9 | % | | | 45 | % | | | 32 | % |
Net assets, end of period (000s omitted) | | | $181,031 | | | | $158,363 | | | | $146,400 | | | | $160,768 | | | | $208,845 | | | | $154,016 | | | | $44,163 | |
| 1. | For the three months ended August 31, 2010. The Fund changed its fiscal year end from May 31 to August 31, effective August 31, 2010. |
| 2. | On June 20, 2008, Advisor Class was renamed Class A. |
| 3. | Total return calculations do not include any sales charges. Returns for periods of less than one year are not annualized. |
The accompanying notes are an integral part of these financial statements.
| | | | | | |
| Financial highlights | | Wells Fargo Advantage Ultra Short-Term Income Fund | | | 27 | |
(For a share outstanding throughout each period)
| | | | | | | | | | | | | | | | | | | | | | | | | | | | |
| | | Six months ended
February 28, 2014
(unaudited) | | | Year ended August 31 | | | Year ended May 31 | |
| CLASS C | | | 2013 | | | 2012 | | | 2011 | | | 20101 | | | 2010 | | | 20092 | |
Net asset value, beginning of period | | $ | 8.52 | | | $ | 8.55 | | | $ | 8.52 | | | $ | 8.52 | | | $ | 8.48 | | | $ | 8.03 | | | $ | 8.57 | |
Net investment income (loss) | | | (0.00 | )3 | | | (0.00 | )3 | | | 0.03 | | | | 0.04 | | | | 0.02 | | | | 0.12 | | | | 0.21 | |
Net realized and unrealized gains (losses) on investments | | | 0.02 | | | | (0.03 | ) | | | 0.03 | | | | 0.01 | | | | 0.04 | | | | 0.47 | | | | (0.54 | ) |
| | | | | | | | | | | | | | | | | | | | | | | | | | | | |
Total from investment operations | | | 0.02 | | | | (0.03 | ) | | | 0.06 | | | | 0.05 | | | | 0.06 | | | | 0.59 | | | | (0.33 | ) |
Distributions to shareholders from | | | | | | | | | | | | | | | | | | | | | | | | | | | | |
Net investment income | | | (0.00 | )3 | | | (0.00 | )3 | | | (0.03 | ) | | | (0.05 | ) | | | (0.02 | ) | | | (0.14 | ) | | | (0.21 | ) |
Net asset value, end of period | | $ | 8.54 | | | $ | 8.52 | | | $ | 8.55 | | | $ | 8.52 | | | $ | 8.52 | | | $ | 8.48 | | | $ | 8.03 | |
Total return4 | | | 0.26 | % | | | (0.31 | )% | | | 0.71 | % | | | 0.61 | % | | | 0.75 | % | | | 7.41 | % | | | (3.85 | )% |
Ratios to average net assets (annualized) | | | | | | | | | | | | | | | | | | | | | | | | | | | | |
Gross expenses | | | 1.55 | % | | | 1.59 | % | | | 1.63 | % | | | 1.62 | % | | | 1.63 | % | | | 1.67 | % | | | 1.64 | % |
Net expenses | | | 1.45 | % | | | 1.45 | % | | | 1.45 | % | | | 1.45 | % | | | 1.45 | % | | | 1.45 | % | | | 1.45 | % |
Net investment income (loss) | | | (0.07 | )% | | | (0.02 | )% | | | 0.37 | % | | | 0.43 | % | | | 0.88 | % | | | 1.30 | % | | | 2.77 | % |
Supplemental data | | | | | | | | | | | | | | | | | | | | | | | | | | | | |
Portfolio turnover rate | | | 25 | % | | | 56 | % | | | 61 | % | | | 60 | % | | | 9 | % | | | 45 | % | | | 32 | % |
Net assets, end of period (000s omitted) | | | $10,429 | | | | $11,859 | | | | $14,951 | | | | $19,117 | | | | $21,226 | | | | $16,519 | | | | $4,775 | |
| 1. | For the three months ended August 31, 2010. The Fund changed its fiscal year end from May 31 to August 31, effective August 31, 2010. |
| 2. | For the period from July 18, 2008 (commencement of class operations) to May 31, 2009 |
| 3. | Amount is less than $0.005. |
| 4. | Total return calculations do not include any sales charges. Returns for periods of less than one year are not annualized. |
The accompanying notes are an integral part of these financial statements.
| | | | |
| 28 | | Wells Fargo Advantage Ultra Short-Term Income Fund | | Financial highlights |
(For a share outstanding throughout each period)
| | | | | | | | | | | | | | | | | | | | | | | | | | | | |
| | | Six months ended
February 28, 2014 (unaudited) | | | Year ended August 31 | | | Year ended May 31 | |
| ADMINISTRATOR CLASS | | | 2013 | | | 2012 | | | 2011 | | | 20101 | | | 2010 | | | 2009 | |
Net asset value, beginning of period | | $ | 8.50 | | | $ | 8.52 | | | $ | 8.48 | | | $ | 8.48 | | | $ | 8.45 | | | $ | 8.00 | | | $ | 8.68 | |
Net investment income | | | 0.04 | | | | 0.07 | | | | 0.11 | | | | 0.11 | | | | 0.04 | | | | 0.19 | | | | 0.32 | |
Net realized and unrealized gains (losses) on investments | | | 0.01 | | | | (0.01 | ) | | | 0.04 | | | | 0.02 | | | | 0.03 | | | | 0.46 | | | | (0.68 | ) |
| | | | | | | | | | | | | | | | | | | | | | | | | | | | |
Total from investment operations | | | 0.05 | | | | 0.06 | | | | 0.15 | | | | 0.13 | | | | 0.07 | | | | 0.65 | | | | (0.36 | ) |
Distributions to shareholders from | | | | | | | | | | | | | | | | | | | | | | | | | | | | |
Net investment income | | | (0.04 | ) | | | (0.08 | ) | | | (0.11 | ) | | | (0.13 | ) | | | (0.04 | ) | | | (0.20 | ) | | | (0.32 | ) |
Net asset value, end of period | | $ | 8.51 | | | $ | 8.50 | | | $ | 8.52 | | | $ | 8.48 | | | $ | 8.48 | | | $ | 8.45 | | | $ | 8.00 | |
Total return2 | | | 0.56 | % | | | 0.67 | % | | | 1.74 | % | | | 1.52 | % | | | 0.86 | % | | | 8.41 | % | | | (4.15 | )% |
Ratios to average net assets (annualized) | | | | | | | | | | | | | | | | | | | | | | | | | | | | |
Gross expenses | | | 0.74 | % | | | 0.77 | % | | | 0.82 | % | | | 0.79 | % | | | 0.79 | % | | | 0.81 | % | | | 0.81 | % |
Net expenses | | | 0.55 | % | | | 0.55 | % | | | 0.55 | % | | | 0.55 | % | | | 0.55 | % | | | 0.55 | % | | | 0.55 | % |
Net investment income | | | 0.83 | % | | | 0.87 | % | | | 1.26 | % | | | 1.33 | % | | | 1.65 | % | | | 2.32 | % | | | 3.77 | % |
Supplemental data | | | | | | | | | | | | | | | | | | | | | | | | | | | | |
Portfolio turnover rate | | | 25 | % | | | 56 | % | | | 61 | % | | | 60 | % | | | 9 | % | | | 45 | % | | | 32 | % |
Net assets, end of period (000s omitted) | | | $116,036 | | | | $145,498 | | | | $103,810 | | | | $107,449 | | | | $205,587 | | | | $82,835 | | | | $59,184 | |
| 1. | For the three months ended August 31, 2010. The Fund changed its fiscal year end from May 31 to August 31, effective August 31, 2010. |
| 2. | Returns for periods of less than one year are not annualized. |
The accompanying notes are an integral part of these financial statements.
| | | | | | |
| Financial highlights | | Wells Fargo Advantage Ultra Short-Term Income Fund | | | 29 | |
(For a share outstanding throughout each period)
| | | | | | | | | | | | | | | | | | | | | | | | | | | | |
| | | Six months ended
February 28, 2014 (unaudited) | | | Year ended August 31 | | | Year ended May 31 | |
| INSTITUTIONAL CLASS | | | 2013 | | | 2012 | | | 2011 | | | 20101 | | | 2010 | | | 2009 | |
Net asset value, beginning of period | | $ | 8.52 | | | $ | 8.55 | | | $ | 8.51 | | | $ | 8.51 | | | $ | 8.48 | | | $ | 8.03 | | | $ | 8.71 | |
Net investment income | | | 0.04 | | | | 0.09 | | | | 0.13 | | | | 0.13 | | | | 0.04 | | | | 0.19 | | | | 0.33 | |
Net realized and unrealized gains (losses) on investments | | | 0.03 | | | | (0.03 | ) | | | 0.04 | | | | 0.02 | | | | 0.04 | | | | 0.49 | | | | (0.67 | ) |
| | | | | | | | | | | | | | | | | | | | | | | | | | | | |
Total from investment operations | | | 0.07 | | | | 0.06 | | | | 0.17 | | | | 0.15 | | | | 0.08 | | | | 0.68 | | | | (0.34 | ) |
Distributions to shareholders from | | | | | | | | | | | | | | | | | | | | | | | | | | | | |
Net investment income | | | (0.05 | ) | | | (0.09 | ) | | | (0.13 | ) | | | (0.15 | ) | | | (0.05 | ) | | | (0.23 | ) | | | (0.34 | ) |
Net asset value, end of period | | $ | 8.54 | | | $ | 8.52 | | | $ | 8.55 | | | $ | 8.51 | | | $ | 8.51 | | | $ | 8.48 | | | $ | 8.03 | |
Total return2 | | | 0.78 | % | | | 0.75 | % | | | 1.94 | % | | | 1.72 | % | | | 1.03 | % | | | 8.48 | % | | | (3.93 | )% |
Ratios to average net assets (annualized) | | | | | | | | | | | | | | | | | | | | | | | | | | | | |
Gross expenses | | | 0.46 | % | | | 0.50 | % | | | 0.55 | % | | | 0.54 | % | | | 0.54 | % | | | 0.57 | % | | | 0.59 | % |
Net expenses | | | 0.35 | % | | | 0.35 | % | | | 0.35 | % | | | 0.35 | % | | | 0.35 | % | | | 0.35 | % | | | 0.35 | % |
Net investment income | | | 1.03 | % | | | 1.07 | % | | | 1.46 | % | | | 1.50 | % | | | 2.01 | % | | | 2.26 | % | | | 4.09 | % |
Supplemental data | | | | | | | | | | | | | | | | | | | | | | | | | | | | |
Portfolio turnover rate | | | 25 | % | | | 56 | % | | | 61 | % | | | 60 | % | | | 9 | % | | | 45 | % | | | 32 | % |
Net assets, end of period (000s omitted) | | | $1,130,915 | | | | $996,437 | | | | $588,228 | | | | $596,838 | | | | $260,747 | | | | $197,087 | | | | $27,680 | |
| 1. | For the three months ended August 31, 2010. The Fund changed its fiscal year end from May 31 to August 31, effective August 31, 2010. |
| 2. | Returns for periods of less than one year are not annualized. |
The accompanying notes are an integral part of these financial statements.
| | | | |
| 30 | | Wells Fargo Advantage Ultra Short-Term Income Fund | | Financial highlights |
(For a share outstanding throughout each period)
| | | | | | | | | | | | | | | | | | | | | | | | | | | | |
| | | Six months ended
February 28, 2014 (unaudited) | | | Year ended August 31 | | | Year ended May 31 | |
| INVESTOR CLASS | | | 2013 | | | 2012 | | | 2011 | | | 20101 | | | 2010 | | | 2009 | |
Net asset value, beginning of period | | $ | 8.53 | | | $ | 8.56 | | | $ | 8.52 | | | $ | 8.52 | | | $ | 8.48 | | | $ | 8.03 | | | $ | 8.71 | |
Net investment income | | | 0.03 | | | | 0.06 | | | | 0.09 | | | | 0.10 | | | | 0.04 | | | | 0.18 | | | | 0.31 | |
Net realized and unrealized gains (losses) on investments | | | 0.02 | | | | (0.03 | ) | | | 0.04 | | | | 0.01 | | | | 0.04 | | | | 0.47 | | | | (0.68 | ) |
| | | | | | | | | | | | | | | | | | | | | | | | | | | | |
Total from investment operations | | | 0.05 | | | | 0.03 | | | | 0.13 | | | | 0.11 | | | | 0.08 | | | | 0.65 | | | | (0.37 | ) |
Distributions to shareholders from | | | | | | | | | | | | | | | | | | | | | | | | | | | | |
Net investment income | | | (0.03 | ) | | | (0.06 | ) | | | (0.09 | ) | | | (0.11 | ) | | | (0.04 | ) | | | (0.20 | ) | | | (0.31 | ) |
Net asset value, end of period | | $ | 8.55 | | | $ | 8.53 | | | $ | 8.56 | | | $ | 8.52 | | | $ | 8.52 | | | $ | 8.48 | | | $ | 8.03 | |
Total return2 | | | 0.59 | % | | | 0.37 | % | | | 1.56 | % | | | 1.34 | % | | | 0.93 | % | | | 8.18 | % | | | (4.32 | )% |
Ratios to average net assets (annualized) | | | | | | | | | | | | | | | | | | | | | | | | | | | | |
Gross expenses | | | 0.82 | % | | | 0.87 | % | | | 0.91 | % | | | 0.90 | % | | | 0.92 | % | | | 0.98 | % | | | 0.99 | % |
Net expenses | | | 0.73 | % | | | 0.73 | % | | | 0.73 | % | | | 0.73 | % | | | 0.74 | % | | | 0.75 | % | | | 0.75 | % |
Net investment income | | | 0.65 | % | | | 0.69 | % | | | 1.08 | % | | | 1.15 | % | | | 1.66 | % | | | 2.16 | % | | | 3.69 | % |
Supplemental data | | | | | | | | | | | | | | | | | | | | | | | | | | | | |
Portfolio turnover rate | | | 25 | % | | | 56 | % | | | 61 | % | | | 60 | % | | | 9 | % | | | 45 | % | | | 32 | % |
Net assets, end of period (000s omitted) | | | $324,422 | | | | $333,684 | | | | $351,969 | | | | $384,998 | | | | $436,991 | | | | $453,772 | | | | $423,039 | |
| 1. | For the three months ended August 31, 2010. The Fund changed its fiscal year end from May 31 to August 31, effective August 31, 2010. |
| 2. | Returns for periods of less than one year are not annualized. |
The accompanying notes are an integral part of these financial statements.
| | | | | | |
| Notes to financial statements (unaudited) | | Wells Fargo Advantage Ultra Short-Term Income Fund | | | 31 | |
1. ORGANIZATION
Wells Fargo Funds Trust (the “Trust”), a Delaware statutory trust organized on March 10, 1999, is an open-end management investment company registered under the Investment Company Act of 1940, as amended (the “1940 Act”). These financial statements report on the Wells Fargo Advantage Ultra Short-Term Income Fund (the “Fund”) which is a diversified series of the Trust.
2. SIGNIFICANT ACCOUNTING POLICIES
The following significant accounting policies, which are consistently followed in the preparation of the financial statements of the Fund, are in conformity with U.S. generally accepted accounting principles which require management to make estimates and assumptions that affect the reported amounts of assets and liabilities, disclosure of contingent assets and liabilities at the date of the financial statements, and the reported amounts of revenues and expenses during the reporting period. Actual results could differ from those estimates.
Securities valuation
All investments are valued each business day as of the close of regular trading on the New York Stock Exchange (generally 4 p.m. Eastern Time).
Fixed income securities acquired with maturities exceeding 60 days are valued based on evaluated bid prices provided by an independent pricing service which may utilize both transaction data and market information such as yield, quality, coupon rate, maturity, type of issue, trading characteristics and other market data. If prices are not available from the independent pricing service or prices received are deemed not representative of market value, prices will be obtained from an independent broker-dealer or otherwise determined based on the Fund’s Valuation Procedures.
Futures that are listed on a foreign or domestic exchange or market are valued at the official closing price or, if none, the last sales price.
Short-term securities, with maturities of 60 days or less at time of purchase, generally are valued at amortized cost which approximates fair value. The amortized cost method involves valuing a security at its cost, plus accretion of discount or minus amortization of premium over the period until maturity.
Investments in registered open-end investment companies are valued at net asset value. Non-registered investment vehicles are fair valued at net asset value.
Investments which are not valued using any of the methods discussed above are valued at their fair value, as determined in good faith by the Board of Trustees of the Fund. The Board of Trustees has established a Valuation Committee comprised of the Trustees and has delegated to it the authority to take any actions regarding the valuation of portfolio securities that the Valuation Committee deems necessary or appropriate, including determining the fair value of portfolio securities, unless the determination has been delegated to the Management Valuation Team of Wells Fargo Funds Management, LLC (“Funds Management”). The Board of Trustees retains the authority to make or ratify any valuation decisions or approve any changes to the Valuation Procedures as it deems appropriate. On a quarterly basis, the Board of Trustees receives reports on any valuation actions taken by the Valuation Committee or the Management Valuation Team which may include items for ratification.
Valuations of fair valued securities are compared to the next actual sales price when available, or other appropriate market values, to assess the continued appropriateness of the fair valuation methodologies used. These securities are fair valued on a day-to-day basis, taking into consideration changes to appropriate market information and any significant changes to the inputs considered in the valuation process until there is a readily available price provided on an exchange or by an independent pricing service. Valuations received from an independent pricing service or independent broker-dealer quotes are periodically validated by comparisons to most recent trades and valuations provided by other independent pricing services in addition to the review of prices by the adviser and/or subadviser. Unobservable inputs used in determining fair valuations are identified based on the type of security, taking into consideration factors utilized by market participants in valuing the investment, knowledge about the issuer and the current market environment.
Security loans
The Fund may lend its securities from time to time in order to earn additional income in the form of fees or interest on securities received as collateral or the investment of any cash received as collateral. The Fund continues to receive interest or dividends on the securities loaned. The Fund receives collateral in the form of cash or securities with a value at least equal to the value of the securities on loan. The value of the loaned securities is determined at the close of each business day and any additional required collateral is delivered to the Fund on the next business day. In a securities lending transaction, the net asset value of the Fund will be affected by an increase or decrease in the value of the securities loaned and by an increase or decrease in the value of the instrument in which collateral is invested. The amount of securities lending activity undertaken by the Fund fluctuates from time to time. In the event of default or bankruptcy
| | | | |
| 32 | | Wells Fargo Advantage Ultra Short-Term Income Fund | | Notes to financial statements (unaudited) |
by the borrower, the Fund may be prevented from recovering the loaned securities or gaining access to the collateral or may experience delays or costs in doing so. In addition, the investment of any cash collateral received may lose all or part of its value. The Fund has the right under the lending agreement to recover the securities from the borrower on demand.
The Fund lends its securities through an unaffiliated securities lending agent. Cash collateral received in connection with its securities lending transactions is invested in Wells Fargo Securities Lending Cash Investments, LLC (the “Securities Lending Fund”). The Securities Lending Fund is exempt from registration under Section 3(c)(7) of the 1940 Act and is managed by Funds Management and is subadvised by Wells Capital Management Incorporated (“WellsCap”). Funds Management receives an advisory fee starting at 0.05% and declining to 0.01% as the average daily net assets of the Securities Lending Fund increase. All of the fees received by Funds Management are paid to WellsCap for its services as subadviser. The Securities Lending Fund seeks to provide a positive return compared to the daily Fed Funds Open rate by investing in high-quality, U.S. dollar-denominated short-term money market instruments. Securities Lending Fund investments are fair valued based upon the amortized cost valuation technique. Income earned from investment in the Securities Lending Fund is included in securities lending income on the Statement of Operations.
When-issued transactions
The Fund may purchase securities on a forward commitment or when-issued basis. The Fund records a when-issued transaction on the trade date and will segregate assets in an amount at least equal in value to the Fund’s commitment to purchase when-issued securities. Securities purchased on a when-issued basis are marked-to-market daily and the Fund begins earning interest on the settlement date. Losses may arise due to changes in the market value of the underlying securities or if the counterparty does not perform under the contract.
Futures contracts
The Fund may be subject to interest rate risk in the normal course of pursuing its investment objectives. The Fund may buy and sell futures contracts in order to gain exposure to, or protect against, changes in security values and interest rates. The primary risks associated with the use of futures contracts are the imperfect correlation between changes in market values of securities held by the Fund and the prices of futures contracts, and the possibility of an illiquid market.
The aggregate principal amounts of the contracts are not recorded in the financial statements. Fluctuations in the value of the contracts are recorded in the Statement of Assets and Liabilities as an asset or liability and in the Statement of Operations as unrealized gains or losses until the contracts are closed, at which point they are recorded as net realized gains or losses on futures contracts. With futures contracts, there is minimal counterparty risk to the Fund since futures are exchange traded and the exchange’s clearinghouse, as counterparty to all exchange traded futures, guarantees the futures against default.
Security transactions and income recognition
Securities transactions are recorded on a trade date basis. Realized gains or losses are recorded on the basis of identified cost.
Interest income is accrued daily and bond discounts are accreted and premiums are amortized daily based on the effective interest method. To the extent debt obligations are placed on non-accrual status, any related interest income may be reduced by writing off interest receivables when the collection of all or a portion of interest has become doubtful based on consistently applied procedures. If the issuer subsequently resumes interest payments or when the collectability of interest is reasonably assured, the debt obligation is removed from non-accrual status.
Income from foreign securities is recorded net of foreign taxes withheld where recovery of such taxes is not assured.
Distributions to shareholders
Distributions to shareholders from net investment income are accrued daily and paid monthly. Distributions from net realized gains, if any, are recorded on the ex-dividend date. Such distributions are determined in conformity with federal income tax regulations, which may differ in amount or character from net investment income and realized gains recognized for purposes of U.S. generally accepted accounting principles.
Federal and other taxes
The Fund intends to continue to qualify as a regulated investment company by distributing substantially all of its investment company taxable income and any net realized capital gains (after reduction for capital loss carryforwards) sufficient to relieve it from all, or substantially all, federal income taxes. Accordingly, no provision for federal income taxes was required.
The Fund’s income and federal excise tax returns and all financial records supporting those returns for the prior three fiscal years are subject to examination by the federal and Delaware revenue authorities. Management has analyzed the Fund’s tax positions taken on federal, state, and foreign tax returns for all open tax years and does not believe that there are any uncertain tax positions that require recognition of a tax liability.
| | | | | | |
| Notes to financial statements (unaudited) | | Wells Fargo Advantage Ultra Short-Term Income Fund | | | 33 | |
As of August 31, 2013, capital loss carryforwards available to offset future net realized capital gains were as follows through the indicated expiration dates:
| | | | | | | | | | | | | | | | | | | | | | | | | | | | |
| | | | | | | | | | | | | | | | | | No expiration | |
| 2014 | | 2015 | | | 2016 | | | 2017 | | | 2018 | | | 2019 | | | Short-term | | | Long-term | |
$25,866,042 | | $ | 2,154,408 | | | $ | 8,848,032 | | | $ | 35,029,445 | | | $ | 7,738,751 | | | $ | 7,448,920 | | | $ | 870,403 | | | $ | 18,423,230 | |
Class allocations
The separate classes of shares offered by the Fund differ principally in applicable sales charges, distribution, shareholder servicing, and administration fees. Shareholders of each class bear certain expenses that pertain to that particular class. All shareholders bear the common expenses of the Fund, earn income from the portfolio, and are allocated any unrealized gains and losses pro rata based on the average daily net assets of each class, without distinction between share classes. Dividends are determined separately for each class based on income and expenses allocable to each class. Realized gains and losses are allocated to each class pro rata based upon the net assets of each class on the date realized. Differences in per share dividend rates generally result from the relative weightings of pro rata income and realized gain allocations and from differences in separate class expenses, including distribution, shareholder servicing, and administration fees.
3. FAIR VALUATION MEASUREMENTS
Fair value measurements of investments are determined within a framework that has established a fair value hierarchy based upon the various data inputs utilized in determining the value of the Fund’s investments. The three-level hierarchy gives the highest priority to unadjusted quoted prices in active markets for identical assets or liabilities (Level 1) and the lowest priority to significant unobservable inputs (Level 3). The Fund’s investments are classified within the fair value hierarchy based on the lowest level of input that is significant to the fair value measurement. The inputs are summarized into three broad levels as follows:
| n | | Level 1 – quoted prices in active markets for identical securities |
| n | | Level 2 – other significant observable inputs (including quoted prices for similar securities, interest rates, prepayment speeds, credit risk, use of amortized cost, etc.) |
| n | | Level 3 – significant unobservable inputs (including the Fund’s own assumptions in determining the fair value of investments) |
The inputs or methodologies used for valuing investments in securities are not necessarily an indication of the risk associated with investing in those securities.
As of February 28, 2014, the inputs used in valuing investments in securities were as follows:
| | | | | | | | | | | | | | | | |
| Investments in securities | | Quoted prices (Level 1) | | | Other significant
observable inputs (Level 2) | | | Significant unobservable inputs (Level 3) | | | Total | |
Agency securities | | $ | 0 | | | $ | 259,493,852 | | | $ | 0 | | | $ | 259,493,852 | |
Asset-backed securities | | | 0 | | | | 173,658,626 | | | | 0 | | | | 173,658,626 | |
Corporate bonds and notes | | | 0 | | | | 721,155,318 | | | | 0 | | | | 721,155,318 | |
Municipal obligations | | | 0 | | | | 97,832,904 | | | | 0 | | | | 97,832,904 | |
Non-agency mortgage backed securities | | | 0 | | | | 178,682,882 | | | | 0 | | | | 178,682,882 | |
Yankee corporate bonds and notes | | | 0 | | | | 253,990,121 | | | | 0 | | | | 253,990,121 | |
Short-term investments | | | | | | | | | | | | | | | | |
Investment companies | | | 59,839,038 | | | | 0 | | | | 0 | | | | 59,839,038 | |
U.S. Treasury securities | | | 1,749,976 | | | | 0 | | | | 0 | | | | 1,749,976 | |
| | | $ | 61,589,014 | | | $ | 1,684,813,703 | | | $ | 0 | | | $ | 1,746,402,717 | |
| | | | |
| 34 | | Wells Fargo Advantage Ultra Short-Term Income Fund | | Notes to financial statements (unaudited) |
As of February 28, 2014, the inputs used in valuing the Fund’s other financial instruments were as follows:
| | | | | | | | | | | | | | | | |
| Other financial instruments | | Quoted prices (Level 1) | | | Other significant
observable inputs (Level 2) | | | Significant unobservable inputs (Level 3) | | | Total | |
Futures contracts | | $ | (387,801 | )* | | $ | 0 | | | $ | 0 | | | $ | (387,801 | ) |
| * | Amount represents the net unrealized losses. |
Transfers in and transfers out are recognized at the end of the reporting period. For the six months ended February 28, 2014, the Fund did not have any transfers into/out of Level 1, Level 2, or Level 3.
4. TRANSACTIONS WITH AFFILIATES AND OTHER EXPENSES
Advisory fee
The Trust has entered into an advisory contract with Funds Management, an indirect wholly owned subsidiary of Wells Fargo & Company (“Wells Fargo”). The adviser is responsible for implementing investment policies and guidelines and for supervising the subadviser, who is responsible for day-to-day portfolio management of the Fund.
Pursuant to the contract, Funds Management is entitled to receive an annual advisory fee starting at 0.30% and declining to 0.225% as the average daily net assets of the Fund increase. Prior to January 1, 2014, Funds Management was entitled to receive an annual advisory fee which started at 0.35% and declined to 0.25% as the average daily net assets of the Fund increased. For the six months ended February 28, 2014, the advisory fee was equivalent to an annual rate of 0.31% of the Fund’s average daily net assets.
Funds Management has retained the services of a subadviser to provide daily portfolio management to the Fund. The fee for subadvisory services is borne by Funds Management. WellsCap, an affiliate of Funds Management and an indirect, wholly owned subsidiary of Wells Fargo, is the subadviser to the Fund and is entitled to receive a fee from Funds Management at an annual rate starting at 0.15% and declining to 0.05% as the average daily net assets of the Fund increase.
Administration and transfer agent fees
The Trust has entered into an administration agreement with Funds Management. Under this agreement, for providing administrative services, which includes paying fees and expenses for services provided by the transfer agent, sub-transfer agents, omnibus account servicers and record-keepers, Funds Management is entitled to receive from the Fund an annual fund level administration fee starting at 0.05% and declining to 0.03% as the average daily net assets of the Fund increase and a class level administration fee which is calculated based on the average daily net assets of each class as follows:
| | | | |
| | | Class level
administration fee | |
Class A, Class C | | | 0.16 | % |
Administrator Class | | | 0.10 | |
Institutional Class | | | 0.08 | |
Investor Class | | | 0.19 | |
Funds Management has contractually waived and/or reimbursed advisory and administration fees to the extent necessary to maintain certain net operating expense ratios for the Fund. Waiver of fees and/or reimbursement of expenses by Funds Management were made first from fund level expenses on a proportionate basis and then from class specific expenses. Funds Management has committed through December 31, 2014 to waive fees and/or reimburse expenses to the extent necessary to cap the Fund’s expenses at 0.70% for Class A shares, 1.45% for Class C shares, 0.55% for Administrator Class shares, 0.35% for Institutional Class shares, and 0.73% for Investor Class shares.
Distribution fees
The Trust has adopted a Distribution Plan for Class C shares of the Fund pursuant to Rule 12b-1 under the 1940 Act. Distribution fees are charged to Class C shares and paid to Wells Fargo Funds Distributor, LLC, the principal underwriter, at an annual rate of 0.75% of the average daily net assets of Class C shares.
For the six months ended February 28, 2014, Wells Fargo Funds Distributor, LLC received $855 from the sale of Class A shares and $550 in contingent deferred sales charges from redemptions of Class C shares.
| | | | | | |
| Notes to financial statements (unaudited) | | Wells Fargo Advantage Ultra Short-Term Income Fund | | | 35 | |
Shareholder servicing fees
The Trust has entered into contracts with one or more shareholder servicing agents, whereby Class A, Class C, Administrator Class, and Investor Class of the Fund is charged a fee at an annual rate of 0.25% of the average daily net assets of each respective class.
A portion of these total shareholder servicing fees were paid to affiliates of Wells Fargo.
5. INVESTMENT PORTFOLIO TRANSACTIONS
Purchases and sales of investments, excluding short-term securities, for the six months ended February 28, 2014 were as follows:
| | | | | | |
Purchases at cost | | Sales proceeds |
U.S.
government | | Non-U.S.
government | | U.S.
government | | Non-U.S.
government |
| $144,880,519 | | $722,751,036 | | $17,852,902 | | $382,855,572 |
6. DERIVATIVE TRANSACTIONS
During the six months ended February 28, 2014, the Fund entered into futures contracts to speculate on interest rates and to help manage the duration of the portfolio.
At February 28, 2014, the Fund had short futures contracts outstanding as follows:
| | | | | | | | | | | | | | |
| Expiration date | | Counterparty | | Contracts | | Type | | Contract
value at
February 28, 2014 | | | Unrealized
losses | |
6-30-2014 | | JPMorgan | | 2,149 Short | | 2-Year U.S. Treasury Notes | | $ | 472,511,375 | | | $ | (138,396 | ) |
6-30-2014 | | JPMorgan | | 1,110 Short | | 5-Year U.S. Treasury Notes | | | 133,043,906 | | | | (249,405 | ) |
The Fund had an average notional amount of $687,303,411 in short futures contracts during the six months ended February 28, 2014.
On August 31, 2013, the cumulative unrealized losses on futures contracts in the amount of $387,801 is reflected in net unrealized gains on investments on the Statement of Assets and Liabilities. The receivable for daily variation margin on open futures contracts reflected in the Statement of Assets and Liabilities only represents the current day’s variation margin. The realized losses and change in unrealized gains (losses) on futures contracts are reflected in the Statement of Operations.
For certain types of derivative transactions, the Fund has entered into International Swaps and Derivatives Association, Inc. master agreements (“ISDA Master Agreements”) or similar agreements with approved counterparties. The ISDA Master Agreements or similar agreements may have requirements to deliver/deposit securities or cash to/with an exchange or broker-dealer as collateral and allows the Fund to offset, with each counterparty, certain derivative financial instrument’s assets and/or liabilities with collateral held or pledged. Collateral requirements differ by type of derivative. Collateral or margin requirements are set by the broker or exchange clearing house for exchange traded derivatives while collateral terms are contract specific for over-the-counter traded. Cash collateral that has been pledged to cover obligations of the Fund under derivative contracts, if any, will be reported separately in the Statement of Assets and Liabilities. Securities pledged as collateral, if any, for the same purpose are noted in the Portfolio of Investments. With respect to balance sheet offsetting, absent an event of default by the counterparty or a termination of the agreement, the reported amounts of financial assets and financial liabilities in the Statement of Assets and Liabilities are not offset across transactions between the Fund and the applicable counterparty. A reconciliation of the gross amounts on the Statement of Assets and Liabilities to the net amounts by derivative type, including any collateral exposure, is as follows:
| | | | | | | | | | | | | | | | | | | | |
| Derivative type | | Counterparty | | | Gross amounts of
assets in the Statement
of Assets and
Liabilities | | | Amounts subject
to netting
agreements | | | Collateral
received | | | Net
amount | |
Futures - variation margin | | | JPMorgan | | | $ | 202,518 | | | $ | 0 | | | $ | 0 | | | $ | 202,518 | |
| | | | |
| 36 | | Wells Fargo Advantage Ultra Short-Term Income Fund | | Notes to financial statements (unaudited) |
7. BANK BORROWINGS
The Trust (excluding the money market funds and certain other funds in the Trust) and Wells Fargo Variable Trust are parties to a $150,000,000 revolving credit agreement with State Street Bank and Trust Company, whereby the Fund is permitted to use bank borrowings for temporary or emergency purposes, such as to fund shareholder redemption requests. Interest under the credit agreement is charged to the Fund based on a borrowing rate equal to the higher of the Federal Funds rate in effect on that day plus 1.25% or the overnight LIBOR rate in effect on that day plus 1.25%. In addition, an annual commitment fee equal to 0.10% of the unused balance is allocated to each participating fund. For the six months ended February 28, 2014, the Fund paid $930 in commitment fees.
For the six months ended February 28, 2014, there were no borrowings by the Fund under the agreement.
8. INDEMNIFICATION
Under the Trust’s organizational documents, the officers and directors are indemnified against certain liabilities that may arise out of performance of their duties to the Trust. Additionally, in the normal course of business, the Trust may enter into contracts with service providers that contain a variety of indemnification clauses. The Trust’s maximum exposure under these arrangements is dependent on future claims that may be made against the Fund and, therefore, cannot be estimated.
| | | | | | |
| Other information (unaudited) | | Wells Fargo Advantage Ultra Short-Term Income Fund | | | 37 | |
PROXY VOTING INFORMATION
A description of the policies and procedures that the Fund uses to determine how to vote proxies relating to portfolio securities is available without charge, upon request, by calling 1-800-222-8222, visiting our website at wellsfargoadvantagefunds.com, or visiting the SEC website at sec.gov. Information regarding how the Fund voted proxies relating to portfolio securities during the most recent 12-month period ended June 30 is available without charge on the Fund’s website at wellsfargoadvantagefunds.com or by visiting the SEC website at sec.gov.
PORTFOLIO HOLDINGS INFORMATION
The complete portfolio holdings for the Fund are publicly available on the Fund’s website (wellsfargoadvantagefunds.com) on a monthly, 30-day or more delayed basis. In addition, top ten holdings information for the Fund is publicly available on the Fund’s website on a monthly, seven-day or more delayed basis. The Fund files its complete schedule of portfolio holdings with the SEC for the first and third quarters of each fiscal year on Form N-Q, which is available without charge by visiting the SEC website at sec.gov. In addition, the Fund’s Form N-Q may be reviewed and copied at the SEC’s Public Reference Room in Washington, DC, and at regional offices in New York City, at 233 Broadway, and in Chicago, at 175 West Jackson Boulevard, Suite 900. Information about the Public Reference Room may be obtained by calling 1-800-SEC-0330.
| | | | |
| 38 | | Wells Fargo Advantage Ultra Short-Term Income Fund | | Other information (unaudited) |
BOARD OF TRUSTEES AND OFFICERS
Each of the Trustees and Officers listed in the table below acts in identical capacities for each fund in the Wells Fargo Advantage family of funds, which consists of 132 mutual funds1 comprising the Wells Fargo Funds Trust, Wells Fargo Variable Trust, Wells Fargo Master Trust and four closed-end funds (collectively the “Fund Complex”). This table should be read in conjunction with the Prospectus and the Statement of Additional Information2. All of the Trustees are also Members of the Audit and Governance Committees of each Trust in the Fund Complex. The mailing address of each Trustee and Officer is 525 Market Street, 12th Floor, San Francisco, CA 94105. Each Trustee and Officer serves an indefinite term, however, each Trustee serves such term until reaching the mandatory retirement age established by the Trustees.
Independent Trustees
| | | | | | |
Name and year of birth | | Position held and length of service* | | Principal occupations during past five years | | Other directorships during
past five years |
| Peter G. Gordon (Born 1942) | | Trustee, since 1998; Chairman, since 2005 | | Co-Founder, Retired Chairman, President and CEO of Crystal Geyser Water Company. Trustee Emeritus, Colby College. | | Asset Allocation Trust |
| Isaiah Harris, Jr. (Born 1952) | | Trustee, since 2009 | | Retired. Prior thereto, President and CEO of BellSouth Advertising and Publishing Corp. from 2005 to 2007, President and CEO of BellSouth Enterprises from 2004 to 2005 and President of BellSouth Consumer Services from 2000 to 2003. Emeritus member of the Iowa State University Foundation Board of Governors. Emeritus Member of the Advisory Board of Iowa State University School of Business. Advisory Board Member, Palm Harbor Academy (charter school). Mr. Harris is a certified public accountant. | | CIGNA Corporation; Deluxe Corporation; Asset Allocation Trust |
| Judith M. Johnson (Born 1949) | | Trustee, since 2008; Audit Committee Chairman, since 2008 | | Retired. Prior thereto, Chief Executive Officer and Chief Investment Officer of Minneapolis Employees Retirement Fund from 1996 to 2008. Ms. Johnson is an attorney, certified public accountant and a certified managerial accountant. | | Asset Allocation Trust |
| Leroy Keith, Jr. (Born 1939) | | Trustee, since 2010 | | Chairman, Bloc Global Services (development and construction). Trustee of the Evergreen Funds from 1983 to 2010. Former Managing Director, Almanac Capital Management (commodities firm), former Partner, Stonington Partners, Inc. (private equity fund), former Director, Obagi Medical Products Co. and former Director, Lincoln Educational Services. | | Trustee, Virtus Fund Complex (consisting of 50 portfolios as of 12/16/2013); Asset Allocation Trust |
| David F. Larcker (Born 1950) | | Trustee, since 2009 | | James Irvin Miller Professor of Accounting at the Graduate School of Business, Stanford University, Morgan Stanley Director of the Center for Leadership Development and Research and Senior Faculty of The Rock Center for Corporate Governance since 2006. From 2005 to 2008, Professor of Accounting at the Graduate School of Business, Stanford University. Prior thereto, Ernst & Young Professor of Accounting at The Wharton School, University of Pennsylvania from 1985 to 2005. | | Asset Allocation Trust |
| Olivia S. Mitchell (Born 1953) | | Trustee, since 2006 | | International Foundation of Employee Benefit Plans Professor, Wharton School of the University of Pennsylvania since 1993. Director of Wharton’s Pension Research Council and Boettner Center on Pensions & Retirement Research, and Research Associate at the National Bureau of Economic Research. Previously, Cornell University Professor from 1978 to 1993. | | Asset Allocation Trust |
| Timothy J. Penny (Born 1951) | | Trustee, since 1996 | | President and CEO of Southern Minnesota Initiative Foundation, a non-profit organization, since 2007 and Senior Fellow at the Humphrey Institute Policy Forum at the University of Minnesota since 1995. Member of the Board of Trustees of NorthStar Education Finance, Inc., a non-profit organization, since 2007. | | Asset Allocation Trust |
| | | | | | |
| Other information (unaudited) | | Wells Fargo Advantage Ultra Short-Term Income Fund | | | 39 | |
| | | | | | |
Name and year of birth | | Position held and length of service* | | Principal occupations during past five years | | Other directorships during
past five years |
| Michael S. Scofield (Born 1943) | | Trustee, since 2010 | | Served on the Investment Company Institute’s Board of Governors and Executive Committee from 2008-2011 as well the Governing Council of the Independent Directors Council from 2006-2011 and the Independent Directors Council Executive Committee from 2008-2011. Chairman of the IDC from 2008-2010. Institutional Investor (Fund Directions) Trustee of Year in 2007. Trustee of the Evergreen Funds (and its predecessors) from 1984 to 2010. Chairman of the Evergreen Funds from 2000-2010. Former Trustee of the Mentor Funds. Retired Attorney, Law Offices of Michael S. Scofield. | | Asset Allocation Trust |
| Donald C. Willeke (Born 1940) | | Trustee, since 1996 | | Principal of the law firm of Willeke & Daniels. General Counsel of the Minneapolis Employees Retirement Fund from 1984 until its consolidation into the Minnesota Public Employees Retirement Association on June 30, 2010. Director and Vice Chair of The Tree Trust (non-profit corporation). Director of the American Chestnut Foundation (non-profit corporation). | | Asset Allocation Trust |
| * | Length of service dates reflect the Trustee’s commencement of service with the Trust’s predecessor entities, where applicable. |
Officers
| | | | | | |
Name and year of birth | | Position held and
length of service | | Principal occupations during past five years | | |
| Karla M. Rabusch (Born 1959) | | President, since 2003 | | Executive Vice President of Wells Fargo Bank, N.A. and President of Wells Fargo Funds Management, LLC since 2003. | | |
Nancy Wiser1 (Born 1967) | | Treasurer, since 2012 | | Executive Vice President of Wells Fargo Funds Management, LLC since 2011. Chief Operating Officer and Chief Compliance Officer at LightBox Capital Management LLC, from 2008 to 2011. Owned and operated a consulting business providing services to various hedge funds including acting as Chief Operating Officer and Chief Compliance Officer for a hedge fund from 2007 to 2008. Chief Operating Officer and Chief Compliance Officer of GMN Capital LLC from 2006 to 2007. | | |
| C. David Messman (Born 1960) | | Secretary, since 2000; Chief Legal Officer, since 2003 | | Senior Vice President and Secretary of Wells Fargo Funds Management, LLC since 2001. Vice President and Managing Counsel of Wells Fargo Bank, N.A. since 1996. | | |
Debra Ann Early (Born 1964) | | Chief Compliance Officer, since 2007 | | Chief Compliance Officer of Wells Fargo Funds Management, LLC since 2007. Chief Compliance Officer of Parnassus Investments from 2005 to 2007. Chief Financial Officer of Parnassus Investments from 2004 to 2007. | | |
David Berardi (Born 1975) | | Assistant Treasurer, since 2009 | | Vice President of Wells Fargo Funds Management, LLC since 2009. Vice President of Evergreen Investment Management Company, LLC from 2008 to 2010. Assistant Vice President of Evergreen Investment Services, Inc. from 2004 to 2008. Manager of Fund Reporting and Control for Evergreen Investment Management Company, LLC from 2004 to 2010. | | |
| Jeremy DePalma1 (Born 1974) | | Assistant Treasurer, since 2009 | | Senior Vice President of Wells Fargo Funds Management, LLC since 2009. Senior Vice President of Evergreen Investment Management Company, LLC from 2008 to 2010. Vice President, Evergreen Investment Services, Inc. from 2004 to 2007. Head of the Fund Reporting and Control Team within Fund Administration from 2005 to 2010. | | |
| 1. | Nancy Wiser acts as Treasurer of 73 funds in the Fund Complex. Jeremy DePalma acts as Treasurer of 59 funds and Assistant Treasurer of 73 funds in the Fund Complex. |
| 2. | The Statement of Additional Information includes additional information about the Trustees and is available, without charge, upon request, by calling 1-800-222-8222 or by visiting the website at wellsfargoadvantagefunds.com. |
| | | | |
| 40 | | Wells Fargo Advantage Ultra Short-Term Income Fund | | List of abbreviations |
The following is a list of common abbreviations for terms and entities that may have appeared in this report.
| ACA | — ACA Financial Guaranty Corporation |
| ADR | — American depositary receipt |
| ADS | — American depositary shares |
| AGC | — Assured Guaranty Corporation |
| AGM | — Assured Guaranty Municipal |
| Ambac | — Ambac Financial Group Incorporated |
| AMT | — Alternative minimum tax |
| BAN | — Bond anticipation notes |
| BHAC | — Berkshire Hathaway Assurance Corporation |
| CAB | — Capital appreciation bond |
| CCAB | — Convertible capital appreciation bond |
| CDA | — Community Development Authority |
| CDO | — Collateralized debt obligation |
| DRIVER | — Derivative inverse tax-exempt receipts |
| DW&P | — Department of Water & Power |
| DWR | — Department of Water Resources |
| ECFA | — Educational & Cultural Facilities Authority |
| EDA | — Economic Development Authority |
| EDFA | — Economic Development Finance Authority |
| ETF | — Exchange-traded fund |
| FDIC | — Federal Deposit Insurance Corporation |
| FFCB | — Federal Farm Credit Banks |
| FGIC | — Financial Guaranty Insurance Corporation |
| FHA | — Federal Housing Administration |
| FHLB | — Federal Home Loan Bank |
| FHLMC | — Federal Home Loan Mortgage Corporation |
| FICO | — The Financing Corporation |
| FNMA | — Federal National Mortgage Association |
| GDR | — Global depositary receipt |
| GNMA | — Government National Mortgage Association |
| HCFR | — Healthcare facilities revenue |
| HEFA | — Health & Educational Facilities Authority |
| HEFAR | — Higher education facilities authority revenue |
| HFA | — Housing Finance Authority |
| HFFA | — Health Facilities Financing Authority |
| HUD | — Department of Housing and Urban Development |
| IDA | — Industrial Development Authority |
| IDAG | — Industrial Development Agency |
| KRW | — Republic of Korea won |
| LIBOR | — London Interbank Offered Rate |
| LLC | — Limited liability company |
| LLLP | — Limited liability limited partnership |
| LLP | — Limited liability partnership |
| MBIA | — Municipal Bond Insurance Association |
| MFHR | — Multifamily housing revenue |
| MSTR | — Municipal securities trust receipts |
| MUD | — Municipal Utility District |
| National | — National Public Finance Guarantee Corporation |
| PCFA | — Pollution Control Financing Authority |
| PCL | — Public Company Limited |
| PCR | — Pollution control revenue |
| PFA | — Public Finance Authority |
| PFFA | — Public Facilities Financing Authority |
| PFOTER | — Puttable floating option tax-exempt receipts |
| plc | — Public limited company |
| PUTTER | — Puttable tax-exempt receipts |
| R&D | — Research & development |
| Radian | — Radian Asset Assurance |
| RAN | — Revenue anticipation notes |
| RDA | — Redevelopment Authority |
| RDFA | — Redevelopment Finance Authority |
| REIT | — Real estate investment trust |
| ROC | — Reset option certificates |
| SAVRS | — Select auction variable rate securities |
| SBA | — Small Business Authority |
| SFHR | — Single-family housing revenue |
| SFMR | — Single-family mortgage revenue |
| SPA | — Standby purchase agreement |
| SPDR | — Standard & Poor’s Depositary Receipts |
| STRIPS | — Separate trading of registered interest and principal securities |
| TAN | — Tax anticipation notes |
| TIPS | — Treasury inflation-protected securities |
| TRAN | — Tax revenue anticipation notes |
| TTFA | — Transportation Trust Fund Authority |
| TVA | — Tennessee Valley Authority |


For more information
More information about Wells Fargo Advantage Funds is available free upon request. To obtain literature, please write, email, visit the Fund’s website, or call:
Wells Fargo Advantage Funds
P.O. Box 8266
Boston, MA 02266-8266
Email: wfaf@wellsfargo.com
Website: wellsfargoadvantagefunds.com
Individual investors: 1-800-222-8222
Retail investment professionals: 1-888-877-9275
Institutional investment professionals: 1-866-765-0778
This report and the financial statements contained herein are submitted for the general information of the shareholders of Wells Fargo Advantage Funds. If this report is used for promotional purposes, distribution of the report must be accompanied or preceded by a current prospectus. For a current prospectus and, if available, a summary prospectus containing more complete information, including charges and expenses, call 1-800-222-8222 or visit the Fund’s website at wellsfargoadvantagefunds.com. Please consider the investment objectives, risks, charges, and expenses of the investment carefully before investing. This and other information about Wells Fargo Advantage Funds can be found in the current prospectus. Read the prospectus carefully before you invest or send money.
Wells Fargo Funds Management, LLC, a wholly owned subsidiary of Wells Fargo & Company, provides investment advisory and administrative services for Wells Fargo Advantage Funds. Other affiliates of Wells Fargo & Company provide subadvisory and other services for the Funds. The Funds are distributed by Wells Fargo Funds Distributor, LLC, Member FINRA/SIPC, an affiliate of Wells Fargo & Company.
NOT FDIC INSURED ¡ NO BANK GUARANTEE ¡ MAY LOSE VALUE
© 2014 Wells Fargo Funds Management, LLC. All rights reserved.
| | |
 | | 223537 04-14 SA223/SAR223 02-14 |
Not applicable.
| ITEM 3. | AUDIT COMMITTEE FINANCIAL EXPERT |
Not applicable.
| ITEM 4. | PRINCIPAL ACCOUNTANT FEES AND SERVICES |
Not applicable.
| ITEM 5. | AUDIT COMMITTEE OF LISTED REGISTRANTS |
Not applicable.
Except as noted below, the schedules of investments are included as part of the report to shareholders filed under Item 1 of this Form. The schedules of investments for Wells Fargo Advantage Adjustable Rate Government Fund and Wells Fargo Advantage Government Securities Fund, are filed under this Item.
| | | | | | |
| Portfolio of investments—February 28, 2014 (unaudited) | | Wells Fargo Advantage Adjustable Rate Government Fund | | | 1 | |
| | | | | | | | | | | | | | | | |
| Security name | | Interest rate | | | Maturity date | | | Principal | | | Value | |
| | | | | | | | | | | | | | | | |
| | | | |
Agency Securities: 96.73% | | | | | | | | | | | | | | | | |
Federal Agricultural Mortgage Corporation Series 2000-A Class A ± | | | 1.22 | % | | | 12-15-2039 | | | $ | 239,106 | | | $ | 241,657 | |
FHLMC ± | | | 1.79 | | | | 2-1-2037 | | | | 17,373 | | | | 18,550 | |
FHLMC ± | | | 1.97 | | | | 3-15-2024 | | | | 1,292,404 | | | | 1,337,115 | |
FHLMC ± | | | 2.00 | | | | 1-1-2023 | | | | 63,394 | | | | 65,719 | |
FHLMC ± | | | 2.03 | | | | 2-1-2037 | | | | 738,290 | | | | 781,231 | |
FHLMC ± | | | 2.04 | | | | 5-1-2035 | | | | 1,296,295 | | | | 1,365,287 | |
FHLMC ± | | | 2.05 | | | | 5-1-2028 | | | | 373,780 | | | | 399,379 | |
FHLMC ± | | | 2.05 | | | | 6-1-2037 | | | | 1,614,558 | | | | 1,697,251 | |
FHLMC ± | | | 2.07 | | | | 1-1-2037 | | | | 3,802,249 | | | | 4,055,890 | |
FHLMC ± | | | 2.10 | | | | 1-1-2024 | | | | 39,770 | | | | 39,347 | |
FHLMC ± | | | 2.11 | | | | 6-1-2024 | | | | 11,754 | | | | 12,646 | |
FHLMC ± | | | 2.11 | | | | 11-1-2034 | | | | 1,056,904 | | | | 1,118,394 | |
FHLMC ± | | | 2.12 | | | | 7-1-2034 | | | | 15,455,947 | | | | 16,396,359 | |
FHLMC ± | | | 2.13 | | | | 5-1-2019 | | | | 7,931 | | | | 8,048 | |
FHLMC ± | | | 2.14 | | | | 6-1-2020 | | | | 2,418 | | | | 2,428 | |
FHLMC ± | | | 2.14 | | | | 5-1-2020 | | | | 748 | | | | 762 | |
FHLMC ± | | | 2.14 | | | | 5-1-2020 | | | | 1,583 | | | | 1,591 | |
FHLMC ± | | | 2.16 | | | | 3-1-2025 | | | | 142,195 | | | | 146,566 | |
FHLMC ± | | | 2.19 | | | | 7-1-2024 | | | | 54,514 | | | | 56,586 | |
FHLMC ± | | | 2.20 | | | | 8-1-2033 | | | | 3,211,459 | | | | 3,432,547 | |
FHLMC ± | | | 2.21 | | | | 1-1-2030 | | | | 8,973 | | | | 9,383 | |
FHLMC ± | | | 2.21 | | | | 1-1-2030 | | | | 15,487 | | | | 16,324 | |
FHLMC ± | | | 2.21 | | | | 7-1-2030 | | | | 202,074 | | | | 214,470 | |
FHLMC ± | | | 2.21 | | | | 6-1-2035 | | | | 4,349,576 | | | | 4,598,981 | |
FHLMC ± | | | 2.21 | | | | 9-1-2016 | | | | 4,756 | | | | 4,826 | |
FHLMC ± | | | 2.21 | | | | 11-1-2016 | | | | 102,610 | | | | 106,891 | |
FHLMC ± | | | 2.21 | | | | 7-1-2018 | | | | 2,766 | | | | 2,822 | |
FHLMC ± | | | 2.21 | | | | 1-1-2019 | | | | 7,981 | | | | 8,359 | |
FHLMC ± | | | 2.21 | | | | 2-1-2019 | | | | 14,050 | | | | 14,724 | |
FHLMC ± | | | 2.21 | | | | 7-1-2030 | | | | 27,963 | | | | 29,436 | |
FHLMC ± | | | 2.21 | | | | 2-1-2035 | | | | 476,362 | | | | 500,640 | |
FHLMC ± | | | 2.23 | | | | 1-1-2030 | | | | 33,016 | | | | 35,322 | |
FHLMC ± | | | 2.23 | | | | 2-1-2035 | | | | 1,857,996 | | | | 1,954,795 | |
FHLMC ± | | | 2.24 | | | | 12-1-2017 | | | | 5,783 | | | | 5,768 | |
FHLMC ± | | | 2.25 | | | | 12-1-2017 | | | | 20,669 | | | | 21,688 | |
FHLMC ± | | | 2.25 | | | | 5-1-2018 | | | | 1,004 | | | | 1,052 | |
FHLMC ± | | | 2.25 | | | | 6-1-2018 | | | | 12,640 | | | | 13,237 | |
FHLMC ± | | | 2.25 | | | | 9-1-2018 | | | | 2,351 | | | | 2,481 | |
FHLMC ± | | | 2.26 | | | | 7-1-2019 | | | | 1,991 | | | | 2,004 | |
FHLMC ± | | | 2.29 | | | | 6-1-2033 | | | | 827,310 | | | | 878,637 | |
FHLMC ± | | | 2.29 | | | | 10-1-2037 | | | | 2,001,321 | | | | 2,142,816 | |
FHLMC ± | | | 2.29 | | | | 11-1-2030 | | | | 1,339,033 | | | | 1,382,660 | |
FHLMC ± | | | 2.30 | | | | 8-1-2034 | | | | 2,311,984 | | | | 2,461,318 | |
FHLMC ± | | | 2.30 | | | | 8-1-2036 | | | | 5,351,546 | | | | 5,706,625 | |
FHLMC ± | | | 2.30 | | | | 4-1-2023 | | | | 487,850 | | | | 503,656 | |
FHLMC ± | | | 2.33 | | | | 7-1-2036 | | | | 887,079 | | | | 945,996 | |
FHLMC ± | | | 2.33 | | | | 6-1-2037 | | | | 9,380,789 | | | | 10,028,693 | |
FHLMC ± | | | 2.34 | | | | 10-1-2033 | | | | 3,083,152 | | | | 3,279,438 | |
FHLMC ± | | | 2.34 | | | | 10-1-2033 | | | | 762,520 | | | | 811,065 | |
FHLMC ± | | | 2.34 | | | | 10-1-2033 | | | | 1,559,207 | | | | 1,658,473 | |
| | | | |
| 2 | | Wells Fargo Advantage Adjustable Rate Government Fund | | Portfolio of investments—February 28, 2014 (unaudited) |
| | | | | | | | | | | | | | | | |
| Security name | | Interest rate | | | Maturity date | | | Principal | | | Value | |
| | | | | | | | | | | | | | | | |
| | | | |
Agency Securities (continued) | | | | | | | | | | | | | | | | |
FHLMC ± | | | 2.34 | % | | | 8-1-2036 | | | $ | 4,831,244 | | | $ | 5,166,803 | |
FHLMC ± | | | 2.35 | | | | 8-1-2033 | | | | 694,966 | | | | 739,737 | |
FHLMC ± | | | 2.35 | | | | 12-1-2034 | | | | 1,051,105 | | | | 1,118,356 | |
FHLMC ± | | | 2.35 | | | | 1-1-2033 | | | | 1,473,746 | | | | 1,557,525 | |
FHLMC ± | | | 2.35 | | | | 7-1-2036 | | | | 6,443,555 | | | | 6,913,967 | |
FHLMC ± | | | 2.35 | | | | 10-1-2033 | | | | 67,871 | | | | 70,448 | |
FHLMC ± | | | 2.35 | | | | 2-1-2034 | | | | 2,041,105 | | | | 2,174,495 | |
FHLMC ± | | | 2.35 | | | | 4-1-2034 | | | | 1,517,567 | | | | 1,618,109 | |
FHLMC ± | | | 2.35 | | | | 1-1-2035 | | | | 609,990 | | | | 644,927 | |
FHLMC ± | | | 2.35 | | | | 9-1-2035 | | | | 3,317,877 | | | | 3,558,659 | |
FHLMC ± | | | 2.35 | | | | 5-1-2032 | | | | 79,490 | | | | 81,072 | |
FHLMC ± | | | 2.35 | | | | 5-1-2034 | | | | 4,319,163 | | | | 4,614,541 | |
FHLMC ± | | | 2.35 | | | | 3-1-2035 | | | | 8,489,037 | | | | 9,081,562 | |
FHLMC ± | | | 2.36 | | | | 4-1-2034 | | | | 1,269,673 | | | | 1,354,003 | |
FHLMC ± | | | 2.36 | | | | 6-1-2037 | | | | 9,953,786 | | | | 10,546,164 | |
FHLMC ± | | | 2.36 | | | | 9-1-2035 | | | | 9,215,208 | | | | 9,808,292 | |
FHLMC ± | | | 2.36 | | | | 10-1-2030 | | | | 19,095 | | | | 20,234 | |
FHLMC ± | | | 2.36 | | | | 7-1-2034 | | | | 312,924 | | | | 332,592 | |
FHLMC ± | | | 2.36 | | | | 5-1-2038 | | | | 3,543,369 | | | | 3,796,142 | |
FHLMC ± | | | 2.36 | | | | 1-1-2036 | | | | 3,736,556 | | | | 3,978,987 | |
FHLMC ± | | | 2.36 | | | | 2-1-2036 | | | | 1,618,364 | | | | 1,734,557 | |
FHLMC ± | | | 2.36 | | | | 5-1-2036 | | | | 3,391,197 | | | | 3,589,398 | |
FHLMC ± | | | 2.37 | | | | 12-1-2032 | | | | 4,898,171 | | | | 5,246,576 | |
FHLMC ± | | | 2.37 | | | | 6-1-2035 | | | | 4,264,100 | | | | 4,537,822 | |
FHLMC ± | | | 2.37 | | | | 12-1-2036 | | | | 736,466 | | | | 780,874 | |
FHLMC ± | | | 2.37 | | | | 11-1-2035 | | | | 2,726,041 | | | | 2,905,014 | |
FHLMC ± | | | 2.37 | | | | 11-1-2022 | | | | 438,674 | | | | 451,905 | |
FHLMC ± | | | 2.37 | | | | 3-1-2027 | | | | 322,973 | | | | 346,260 | |
FHLMC ± | | | 2.37 | | | | 4-1-2035 | | | | 4,350,442 | | | | 4,665,009 | |
FHLMC ± | | | 2.37 | | | | 2-1-2036 | | | | 1,719,860 | | | | 1,830,754 | |
FHLMC ± | | | 2.37 | | | | 5-1-2036 | | | | 2,639,195 | | | | 2,816,418 | |
FHLMC ± | | | 2.37 | | | | 11-1-2036 | | | | 2,187,449 | | | | 2,329,630 | |
FHLMC ± | | | 2.37 | | | | 8-1-2035 | | | | 1,167,775 | | | | 1,242,935 | |
FHLMC ± | | | 2.37 | | | | 8-1-2035 | | | | 5,512,763 | | | | 5,905,656 | |
FHLMC ± | | | 2.38 | | | | 12-1-2032 | | | | 2,810,180 | | | | 2,967,229 | |
FHLMC ± | | | 2.38 | | | | 9-1-2033 | | | | 547,025 | | | | 579,883 | |
FHLMC ± | | | 2.38 | | | | 4-1-2034 | | | | 5,646,486 | | | | 6,045,237 | |
FHLMC ± | | | 2.38 | | | | 5-1-2034 | | | | 1,240,309 | | | | 1,322,715 | |
FHLMC ± | | | 2.38 | | | | 5-1-2034 | | | | 183,881 | | | | 195,503 | |
FHLMC ± | | | 2.38 | | | | 9-1-2034 | | | | 1,319,035 | | | | 1,420,628 | |
FHLMC ± | | | 2.38 | | | | 2-1-2035 | | | | 3,232,702 | | | | 3,443,448 | |
FHLMC ± | | | 2.38 | | | | 7-1-2035 | | | | 5,309,911 | | | | 5,678,538 | |
FHLMC ± | | | 2.38 | | | | 8-1-2035 | | | | 9,588,365 | | | | 10,245,818 | |
FHLMC ± | | | 2.38 | | | | 9-1-2035 | | | | 14,560,655 | | | | 15,508,105 | |
FHLMC ± | | | 2.38 | | | | 12-1-2035 | | | | 4,229,455 | | | | 4,543,315 | |
FHLMC ± | | | 2.38 | | | | 2-1-2036 | | | | 2,510,268 | | | | 2,685,085 | |
FHLMC ± | | | 2.38 | | | | 2-1-2036 | | | | 2,791,197 | | | | 2,994,145 | |
FHLMC ± | | | 2.38 | | | | 3-1-2036 | | | | 1,762,455 | | | | 1,882,554 | |
FHLMC ± | | | 2.38 | | | | 1-1-2037 | | | | 484,090 | | | | 509,083 | |
FHLMC ± | | | 2.38 | | | | 4-1-2038 | | | | 9,159,474 | | | | 9,762,840 | |
| | | | | | |
| Portfolio of investments—February 28, 2014 (unaudited) | | Wells Fargo Advantage Adjustable Rate Government Fund | | | 3 | |
| | | | | | | | | | | | | | | | |
| Security name | | Interest rate | | | Maturity date | | | Principal | | | Value | |
| | | | | | | | | | | | | | | | |
| | | | |
Agency Securities (continued) | | | | | | | | | | | | | | | | |
FHLMC ± | | | 2.38 | % | | | 3-1-2037 | | | $ | 7,894,394 | | | $ | 8,479,073 | |
FHLMC ± | | | 2.38 | | | | 2-1-2036 | | | | 1,420,064 | | | | 1,511,483 | |
FHLMC ± | | | 2.38 | | | | 9-1-2030 | | | | 685,780 | | | | 733,215 | |
FHLMC ± | | | 2.38 | | | | 7-1-2031 | | | | 3,516,633 | | | | 3,687,099 | |
FHLMC ± | | | 2.38 | | | | 12-1-2034 | | | | 6,404,898 | | | | 6,868,671 | |
FHLMC ± | | | 2.38 | | | | 10-1-2034 | | | | 2,399,369 | | | | 2,575,467 | |
FHLMC ± | | | 2.38 | | | | 6-1-2036 | | | | 5,648,199 | | | | 6,016,450 | |
FHLMC ± | | | 2.39 | | | | 2-1-2035 | | | | 7,223,905 | | | | 7,738,165 | |
FHLMC ± | | | 2.39 | | | | 5-1-2035 | | | | 5,257,718 | | | | 5,582,228 | |
FHLMC ± | | | 2.39 | | | | 10-1-2035 | | | | 5,967,681 | | | | 6,424,654 | |
FHLMC ± | | | 2.39 | | | | 8-1-2035 | | | | 403,500 | | | | 413,530 | |
FHLMC ± | | | 2.39 | | | | 2-1-2036 | | | | 1,695,527 | | | | 1,809,705 | |
FHLMC ± | | | 2.39 | | | | 8-1-2027 | | | | 9,775 | | | | 9,985 | |
FHLMC ± | | | 2.40 | | | | 5-1-2025 | | | | 112,265 | | | | 120,055 | |
FHLMC ± | | | 2.40 | | | | 11-1-2029 | | | | 203,822 | | | | 218,303 | |
FHLMC ± | | | 2.40 | | | | 10-1-2036 | | | | 1,703,618 | | | | 1,807,286 | |
FHLMC ± | | | 2.40 | | | | 10-1-2036 | | | | 1,096,716 | | | | 1,182,009 | |
FHLMC ± | | | 2.40 | | | | 11-1-2035 | | | | 837,517 | | | | 889,999 | |
FHLMC ± | | | 2.40 | | | | 2-1-2034 | | | | 4,205,276 | | | | 4,498,185 | |
FHLMC ± | | | 2.41 | | | | 3-1-2018 | | | | 19,152 | | | | 19,320 | |
FHLMC ± | | | 2.41 | | | | 1-1-2035 | | | | 729,519 | | | | 775,282 | |
FHLMC ± | | | 2.41 | | | | 11-1-2036 | | | | 2,194,971 | | | | 2,350,868 | |
FHLMC ± | | | 2.41 | | | | 5-1-2034 | | | | 3,570,308 | | | | 3,820,147 | |
FHLMC ± | | | 2.41 | | | | 11-1-2035 | | | | 2,541,034 | | | | 2,724,388 | |
FHLMC ± | | | 2.41 | | | | 11-1-2027 | | | | 994,101 | | | | 1,064,972 | |
FHLMC ± | | | 2.41 | | | | 11-1-2029 | | | | 415,741 | | | | 444,555 | |
FHLMC ± | | | 2.41 | | | | 4-1-2034 | | | | 7,038,823 | | | | 7,471,861 | |
FHLMC ± | | | 2.42 | | | | 9-1-2033 | | | | 1,988,562 | | | | 2,127,852 | |
FHLMC ± | | | 2.42 | | | | 6-1-2020 | | | | 123,505 | | | | 131,660 | |
FHLMC ± | | | 2.42 | | | | 6-1-2026 | | | | 1,748,474 | | | | 1,884,672 | |
FHLMC ± | | | 2.42 | | | | 2-1-2031 | | | | 1,457,927 | | | | 1,531,295 | |
FHLMC ± | | | 2.43 | | | | 6-1-2035 | | | | 702,458 | | | | 745,241 | |
FHLMC ± | | | 2.43 | | | | 6-1-2035 | | | | 2,725,824 | | | | 2,893,825 | |
FHLMC ± | | | 2.43 | | | | 9-1-2032 | | | | 3,568,000 | | | | 3,826,485 | |
FHLMC ± | | | 2.44 | | | | 7-1-2031 | | | | 416,266 | | | | 446,671 | |
FHLMC ± | | | 2.44 | | | | 10-1-2035 | | | | 4,232,931 | | | | 4,488,232 | |
FHLMC ± | | | 2.45 | | | | 6-1-2035 | | | | 4,189,822 | | | | 4,491,060 | |
FHLMC ± | | | 2.45 | | | | 10-1-2033 | | | | 3,483,840 | | | | 3,730,190 | |
FHLMC ± | | | 2.46 | | | | 9-1-2033 | | | | 1,502,053 | | | | 1,624,104 | |
FHLMC ± | | | 2.46 | | | | 8-1-2018 | | | | 3,808 | | | | 4,028 | |
FHLMC ± | | | 2.47 | | | | 9-1-2030 | | | | 14,032,446 | | | | 15,022,972 | |
FHLMC ± | | | 2.48 | | | | 1-1-2033 | | | | 254,836 | | | | 254,858 | |
FHLMC ± | | | 2.48 | | | | 10-1-2035 | | | | 3,495,364 | | | | 3,732,508 | |
FHLMC ± | | | 2.48 | | | | 7-1-2038 | | | | 3,869,028 | | | | 4,167,017 | |
FHLMC ± | | | 2.48 | | | | 2-1-2036 | | | | 299,406 | | | | 318,790 | |
FHLMC ± | | | 2.48 | | | | 6-1-2035 | | | | 1,095,894 | | | | 1,170,284 | |
FHLMC ± | | | 2.48 | | | | 9-1-2036 | | | | 3,097,874 | | | | 3,293,762 | |
FHLMC ± | | | 2.48 | | | | 1-1-2038 | | | | 4,572,726 | | | | 4,906,341 | |
FHLMC ± | | | 2.48 | | | | 4-1-2038 | | | | 3,076,994 | | | | 3,282,005 | |
FHLMC ± | | | 2.48 | | | | 1-1-2028 | | | | 33,855 | | | | 36,254 | |
| | | | |
| 4 | | Wells Fargo Advantage Adjustable Rate Government Fund | | Portfolio of investments—February 28, 2014 (unaudited) |
| | | | | | | | | | | | | | | | |
| Security name | | Interest rate | | | Maturity date | | | Principal | | | Value | |
| | | | | | | | | | | | | | | | |
| | | | |
Agency Securities (continued) | | | | | | | | | | | | | | | | |
FHLMC ± | | | 2.48 | % | | | 1-1-2028 | | | $ | 7,757 | | | $ | 8,334 | |
FHLMC ± | | | 2.48 | | | | 12-1-2034 | | | | 6,052,748 | | | | 6,496,767 | |
FHLMC ± | | | 2.48 | | | | 2-1-2035 | | | | 2,601,597 | | | | 2,781,346 | |
FHLMC ± | | | 2.48 | | | | 9-1-2038 | | | | 1,401,648 | | | | 1,500,976 | |
FHLMC ± | | | 2.48 | | | | 1-1-2037 | | | | 2,155,118 | | | | 2,304,849 | |
FHLMC ± | | | 2.49 | | | | 1-1-2019 | | | | 934 | | | | 941 | |
FHLMC ± | | | 2.49 | | | | 5-1-2037 | | | | 4,617,565 | | | | 4,926,711 | |
FHLMC ± | | | 2.49 | | | | 9-1-2035 | | | | 7,055,661 | | | | 7,624,475 | |
FHLMC ± | | | 2.49 | | | | 7-1-2034 | | | | 1,377,766 | | | | 1,492,643 | |
FHLMC ± | | | 2.50 | | | | 5-1-2037 | | | | 535,648 | | | | 566,108 | |
FHLMC ± | | | 2.50 | | | | 6-1-2033 | | | | 2,959,284 | | | | 3,173,907 | |
FHLMC ± | | | 2.50 | | | | 7-1-2027 | | | | 901,290 | | | | 968,676 | |
FHLMC ± | | | 2.51 | | | | 10-1-2030 | | | | 3,416,446 | | | | 3,671,049 | |
FHLMC ± | | | 2.51 | | | | 5-1-2033 | | | | 461,880 | | | | 476,055 | |
FHLMC ± | | | 2.51 | | | | 4-1-2034 | | | | 1,372,995 | | | | 1,466,087 | |
FHLMC ± | | | 2.51 | | | | 12-1-2032 | | | | 1,253,372 | | | | 1,323,934 | |
FHLMC ± | | | 2.52 | | | | 3-1-2037 | | | | 3,490,969 | | | | 3,717,693 | |
FHLMC ± | | | 2.52 | | | | 5-1-2023 | | | | 91,958 | | | | 92,397 | |
FHLMC ± | | | 2.52 | | | | 6-1-2035 | | | | 3,151,872 | | | | 3,373,562 | |
FHLMC ± | | | 2.53 | | | | 9-1-2031 | | | | 157,474 | | | | 161,710 | |
FHLMC ± | | | 2.53 | | | | 7-1-2029 | | | | 110,949 | | | | 118,881 | |
FHLMC ± | | | 2.53 | | | | 4-1-2035 | | | | 695,435 | | | | 740,622 | |
FHLMC ± | | | 2.53 | | | | 4-1-2036 | | | | 4,192,025 | | | | 4,446,866 | |
FHLMC ± | | | 2.53 | | | | 7-1-2037 | | | | 1,294,571 | | | | 1,389,481 | |
FHLMC ± | | | 2.54 | | | | 10-1-2029 | | | | 144,409 | | | | 153,369 | |
FHLMC ± | | | 2.54 | | | | 1-1-2022 | | | | 28,731 | | | | 28,928 | |
FHLMC ± | | | 2.54 | | | | 10-1-2036 | | | | 1,491,398 | | | | 1,598,521 | |
FHLMC ± | | | 2.55 | | | | 6-1-2025 | | | | 111,002 | | | | 113,008 | |
FHLMC ± | | | 2.55 | | | | 8-1-2029 | | | | 169,762 | | | | 172,593 | |
FHLMC ± | | | 2.55 | | | | 6-1-2028 | | | | 507,850 | | | | 531,567 | |
FHLMC ± | | | 2.55 | | | | 2-1-2037 | | | | 880,002 | | | | 934,327 | |
FHLMC ± | | | 2.56 | | | | 11-1-2018 | | | | 16,405 | | | | 16,513 | |
FHLMC ± | | | 2.57 | | | | 2-1-2029 | | | | 278,252 | | | | 281,231 | |
FHLMC ± | | | 2.57 | | | | 4-1-2029 | | | | 174,049 | | | | 182,281 | |
FHLMC ± | | | 2.57 | | | | 10-1-2024 | | | | 241,383 | | | | 258,072 | |
FHLMC ± | | | 2.57 | | | | 11-1-2035 | | | | 5,340,818 | | | | 5,707,437 | |
FHLMC ± | | | 2.58 | | | | 4-1-2035 | | | | 1,724,034 | | | | 1,833,958 | |
FHLMC ± | | | 2.59 | | | | 6-1-2019 | | | | 95,351 | | | | 95,812 | |
FHLMC ± | | | 2.60 | | | | 7-1-2034 | | | | 2,851,181 | | | | 3,045,639 | |
FHLMC ± | | | 2.60 | | | | 7-1-2017 | | | | 29,998 | | | | 31,903 | |
FHLMC ± | | | 2.60 | | | | 10-1-2025 | | | | 139,963 | | | | 142,257 | |
FHLMC ± | | | 2.60 | | | | 10-1-2025 | | | | 46,094 | | | | 46,564 | |
FHLMC ± | | | 2.60 | | | | 2-1-2030 | | | | 66,353 | | | | 71,169 | |
FHLMC ± | | | 2.60 | | | | 6-1-2030 | | | | 146,772 | | | | 157,372 | |
FHLMC ± | | | 2.60 | | | | 6-1-2030 | | | | 544,813 | | | | 585,084 | |
FHLMC ± | | | 2.60 | | | | 6-1-2030 | | | | 142,363 | | | | 145,387 | |
FHLMC ± | | | 2.60 | | | | 11-1-2032 | | | | 242,853 | | | | 251,950 | |
FHLMC ± | | | 2.60 | | | | 4-1-2035 | | | | 4,224,896 | | | | 4,512,612 | |
FHLMC ± | | | 2.62 | | | | 5-1-2035 | | | | 675,310 | | | | 716,983 | |
FHLMC ± | | | 2.62 | | | | 5-1-2036 | | | | 5,905,890 | | | | 6,357,400 | |
| | | | | | |
| Portfolio of investments—February 28, 2014 (unaudited) | | Wells Fargo Advantage Adjustable Rate Government Fund | | | 5 | |
| | | | | | | | | | | | | | | | |
| Security name | | Interest rate | | | Maturity date | | | Principal | | | Value | |
| | | | | | | | | | | | | | | | |
| | | | |
Agency Securities (continued) | | | | | | | | | | | | | | | | |
FHLMC ± | | | 2.63 | % | | | 2-1-2036 | | | $ | 8,636,126 | | | $ | 9,235,441 | |
FHLMC ± | | | 2.63 | | | | 11-1-2029 | | | | 1,443,459 | | | | 1,533,938 | |
FHLMC ± | | | 2.65 | | | | 11-1-2029 | | | | 325,250 | | | | 333,633 | |
FHLMC ± | | | 2.66 | | | | 7-1-2036 | | | | 1,453,342 | | | | 1,554,345 | |
FHLMC ± | | | 2.67 | | | | 1-1-2017 | | | | 544 | | | | 550 | |
FHLMC ± | | | 2.67 | | | | 9-1-2029 | | | | 177,931 | | | | 190,640 | |
FHLMC ± | | | 2.69 | | | | 8-1-2030 | | | | 7,553,487 | | | | 8,077,246 | |
FHLMC ± | | | 2.69 | | | | 5-1-2028 | | | | 458,140 | | | | 472,834 | |
FHLMC ± | | | 2.69 | | | | 11-1-2026 | | | | 377,533 | | | | 388,299 | |
FHLMC ± | | | 2.70 | | | | 10-1-2018 | | | | 70,580 | | | | 74,039 | |
FHLMC ± | | | 2.70 | | | | 4-1-2035 | | | | 2,617,299 | | | | 2,811,778 | |
FHLMC ± | | | 2.71 | | | | 4-1-2037 | | | | 2,194,310 | | | | 2,349,841 | |
FHLMC ± | | | 2.71 | | | | 2-1-2036 | | | | 6,732,226 | | | | 7,278,230 | |
FHLMC ± | | | 2.73 | | | | 6-1-2032 | | | | 257,444 | | | | 259,190 | |
FHLMC ± | | | 2.74 | | | | 9-1-2030 | | | | 184,461 | | | | 188,431 | |
FHLMC ± | | | 2.74 | | | | 3-1-2032 | | | | 1,968,387 | | | | 2,124,173 | |
FHLMC ± | | | 2.75 | | | | 4-1-2037 | | | | 991,920 | | | | 1,061,761 | |
FHLMC ± | | | 2.75 | | | | 8-1-2029 | | | | 254,418 | | | | 257,454 | |
FHLMC ± | | | 2.75 | | | | 4-1-2020 | | | | 29,709 | | | | 31,763 | |
FHLMC ± | | | 2.79 | | | | 2-1-2024 | | | | 34,726 | | | | 34,999 | |
FHLMC ± | | | 2.84 | | | | 6-1-2022 | | | | 1,741 | | | | 1,721 | |
FHLMC ± | | | 2.88 | | | | 6-1-2019 | | | | 114,425 | | | | 122,131 | |
FHLMC ± | | | 2.88 | | | | 10-1-2019 | | | | 31,790 | | | | 31,656 | |
FHLMC ± | | | 2.88 | | | | 5-1-2039 | | | | 3,003,276 | | | | 3,206,780 | |
FHLMC ± | | | 2.91 | | | | 2-1-2018 | | | | 5,104 | | | | 5,136 | |
FHLMC ± | | | 2.91 | | | | 12-1-2018 | | | | 34,101 | | | | 34,288 | |
FHLMC ± | | | 2.91 | | | | 12-1-2018 | | | | 30,781 | | | | 30,883 | |
FHLMC ± | | | 2.91 | | | | 3-1-2025 | | | | 3,804,463 | | | | 4,013,934 | |
FHLMC ± | | | 2.92 | | | | 5-1-2032 | | | | 293,463 | | | | 314,735 | |
FHLMC ± | | | 2.95 | | | | 4-1-2032 | | | | 139,535 | | | | 141,895 | |
FHLMC ± | | | 2.97 | | | | 6-1-2029 | | | | 1,284,684 | | | | 1,374,001 | |
FHLMC ± | | | 3.00 | | | | 9-1-2016 | | | | 23,295 | | | | 23,142 | |
FHLMC ± | | | 3.08 | | | | 12-1-2025 | | | | 554,842 | | | | 576,588 | |
FHLMC ± | | | 3.12 | | | | 2-1-2027 | | | | 194,400 | | | | 203,354 | |
FHLMC ± | | | 3.15 | | | | 4-1-2019 | | | | 28,842 | | | | 28,903 | |
FHLMC ± | | | 3.25 | | | | 8-1-2019 | | | | 21,637 | | | | 21,750 | |
FHLMC ± | | | 3.29 | | | | 6-1-2035 | | | | 2,241,898 | | | | 2,433,435 | |
FHLMC ± | | | 3.32 | | | | 7-1-2028 | | | | 100,945 | | | | 102,902 | |
FHLMC ± | | | 3.37 | | | | 5-1-2031 | | | | 191,814 | | | | 196,688 | |
FHLMC ± | | | 3.39 | | | | 6-1-2021 | | | | 143,203 | | | | 152,316 | |
FHLMC ± | | | 3.48 | | | | 7-1-2018 | | | | 82,132 | | | | 82,691 | |
FHLMC ± | | | 3.56 | | | | 12-1-2025 | | | | 884,709 | | | | 955,183 | |
FHLMC ± | | | 3.61 | | | | 11-1-2026 | | | | 197,068 | | | | 205,931 | |
FHLMC ± | | | 3.90 | | | | 4-1-2023 | | | | 206,989 | | | | 211,085 | |
FHLMC | | | 4.00 | | | | 12-15-2023 | | | | 260,659 | | | | 273,923 | |
FHLMC | | | 4.00 | | | | 3-15-2039 | | | | 536,619 | | | | 550,485 | |
FHLMC ± | | | 4.21 | | | | 8-1-2029 | | | | 43,624 | | | | 45,031 | |
FHLMC ± | | | 4.47 | | | | 10-1-2029 | | | | 3,485 | | | | 3,412 | |
FHLMC ± | | | 4.52 | | | | 2-1-2021 | | | | 44,593 | | | | 45,558 | |
FHLMC ± | | | 4.72 | | | | 8-1-2027 | | | | 82,798 | | | | 83,124 | |
| | | | |
| 6 | | Wells Fargo Advantage Adjustable Rate Government Fund | | Portfolio of investments—February 28, 2014 (unaudited) |
| | | | | | | | | | | | | | | | |
| Security name | | Interest rate | | | Maturity date | | | Principal | | | Value | |
| | | | | | | | | | | | | | | | |
| | | | |
Agency Securities (continued) | | | | | | | | | | | | | | | | |
FHLMC | | | 5.00 | % | | | 10-1-2022 | | | $ | 51,314 | | | $ | 55,853 | |
FHLMC ± | | | 5.50 | | | | 8-1-2024 | | | | 645,377 | | | | 691,855 | |
FHLMC | | | 6.50 | | | | 4-1-2018 | | | | 99,105 | | | | 110,873 | |
FHLMC | | | 7.00 | | | | 9-1-2035 | | | | 70,415 | | | | 77,489 | |
FHLMC | | | 7.50 | | | | 1-1-2016 | | | | 13,555 | | | | 13,824 | |
FHLMC | | | 7.50 | | | | 6-1-2016 | | | | 4,859 | | | | 4,951 | |
FHLMC | | | 8.50 | | | | 5-1-2020 | | | | 125,656 | | | | 134,419 | |
FHLMC Series 0020 Class F ± | | | 1.15 | | | | 7-1-2029 | | | | 30,869 | | | | 31,512 | |
FHLMC Series 1671 Class QA ± | | | 1.73 | | | | 2-15-2024 | | | | 590,190 | | | | 607,955 | |
FHLMC Series 1686 Class FE ± | | | 1.88 | | | | 2-15-2024 | | | | 53,162 | | | | 54,568 | |
FHLMC Series 1730 Class FA ± | | | 2.22 | | | | 5-15-2024 | | | | 357,910 | | | | 373,417 | |
FHLMC Series 2315 Class FW ± | | | 0.70 | | | | 4-15-2027 | | | | 213,549 | | | | 216,029 | |
FHLMC Series 2391 Class EF ± | | | 0.65 | | | | 6-15-2031 | | | | 186,139 | | | | 188,004 | |
FHLMC Series 2454 Class SL ±(c) | | | 7.85 | | | | 3-15-2032 | | | | 423,125 | | | | 85,466 | |
FHLMC Series 2461 Class FI ± | | | 0.65 | | | | 4-15-2028 | | | | 275,123 | | | | 278,139 | |
FHLMC Series 2464 Class FE ± | | | 1.15 | | | | 3-15-2032 | | | | 275,782 | | | | 283,642 | |
FHLMC Series 2466 Class FV ± | | | 0.70 | | | | 3-15-2032 | | | | 458,409 | | | | 463,981 | |
FHLMC Series 2882 Class EC | | | 4.00 | | | | 9-15-2034 | | | | 4,927,257 | | | | 5,250,534 | |
FHLMC Series T-48 Class 2A ± | | | 3.35 | | | | 7-25-2033 | | | | 3,525,051 | | | | 3,686,611 | |
FHLMC Series T-54 Class 4A ± | | | 3.05 | | | | 2-25-2043 | | | | 2,521,522 | | | | 2,649,343 | |
FHLMC Series T-55 Class 1A1 | | | 6.50 | | | | 3-25-2043 | | | | 116,219 | | | | 130,785 | |
FHLMC Series T-62 Class 1A1 ± | | | 1.34 | | | | 10-25-2044 | | | | 5,938,282 | | | | 6,057,802 | |
FHLMC Series T-63 Class 1A1 ± | | | 1.34 | | | | 2-25-2045 | | | | 3,554,631 | | | | 3,637,717 | |
FHLMC Series T-66 Class 2A1 ± | | | 2.84 | | | | 1-25-2036 | | | | 4,269,980 | | | | 4,435,570 | |
FHLMC Series T-67 Class 1A1C ± | | | 2.98 | | | | 3-25-2036 | | | | 15,364,881 | | | | 15,950,190 | |
FHLMC Series T-67 Class 2A1C ± | | | 3.03 | | | | 3-25-2036 | | | | 9,716,861 | | | | 10,159,931 | |
FHLMC Series T-75 Class A1 ± | | | 0.20 | | | | 12-25-2036 | | | | 4,013,788 | | | | 3,983,504 | |
FHLMC Series T61 Class 1A1 ± | | | 1.54 | | | | 7-25-2044 | | | | 2,040,150 | | | | 2,075,183 | |
FNMA ± | | | 2.30 | | | | 12-1-2034 | | | | 2,485,760 | | | | 2,644,808 | |
FNMA ± | | | 1.25 | | | | 12-1-2020 | | | | 32,734 | | | | 32,794 | |
FNMA ± | | | 1.25 | | | | 6-1-2021 | | | | 78,310 | | | | 80,199 | |
FNMA ± | | | 1.38 | | | | 1-1-2021 | | | | 5,002 | | | | 5,170 | |
FNMA ± | | | 1.38 | | | | 1-1-2021 | | | | 4,887 | | | | 4,922 | |
FNMA ± | | | 1.45 | | | | 9-1-2032 | | | | 66,881 | | | | 67,712 | |
FNMA ± | | | 1.52 | | | | 8-1-2032 | | | | 276,753 | | | | 280,818 | |
FNMA ± | | | 1.53 | | | | 12-1-2030 | | | | 175,627 | | | | 183,343 | |
FNMA ± | | | 1.63 | | | | 12-1-2016 | | | | 1,223 | | | | 1,227 | |
FNMA ± | | | 1.63 | | | | 7-1-2017 | | | | 1,547 | | | | 1,555 | |
FNMA ± | | | 1.63 | | | | 3-1-2015 | | | | 4,582 | | | | 4,590 | |
FNMA ± | | | 1.71 | | | | 3-1-2034 | | | | 672,521 | | | | 693,613 | |
FNMA ± | | | 1.73 | | | | 1-1-2017 | | | | 1,601 | | | | 1,623 | |
FNMA ± | | | 1.74 | | | | 1-1-2032 | | | | 450,079 | | | | 460,846 | |
FNMA ± | | | 1.74 | | | | 8-1-2033 | | | | 428,904 | | | | 442,833 | |
FNMA ± | | | 1.75 | | | | 8-1-2033 | | | | 4,152 | | | | 4,259 | |
FNMA ± | | | 1.75 | | | | 8-1-2031 | | | | 163,266 | | | | 165,828 | |
FNMA ± | | | 1.75 | | | | 12-1-2031 | | | | 27,601 | | | | 28,235 | |
FNMA ± | | | 1.77 | | | | 5-1-2029 | | | | 460,562 | | | | 493,959 | |
FNMA ± | | | 1.79 | | | | 1-1-2035 | | | | 156,070 | | | | 161,970 | |
FNMA ± | | | 1.79 | | | | 8-1-2031 | | | | 146,523 | | | | 148,095 | |
FNMA ± | | | 1.79 | | | | 9-1-2031 | | | | 265,983 | | | | 280,229 | |
| | | | | | |
| Portfolio of investments—February 28, 2014 (unaudited) | | Wells Fargo Advantage Adjustable Rate Government Fund | | | 7 | |
| | | | | | | | | | | | | | | | |
| Security name | | Interest rate | | | Maturity date | | | Principal | | | Value | |
| | | | | | | | | | | | | | | | |
| | | | |
Agency Securities (continued) | | | | | | | | | | | | | | | | |
FNMA ± | | | 1.79 | % | | | 12-1-2031 | | | $ | 399,465 | | | $ | 425,056 | |
FNMA ± | | | 1.79 | | | | 4-1-2033 | | | | 691,002 | | | | 733,873 | |
FNMA ± | | | 1.80 | | | | 12-1-2022 | | | | 16,189 | | | | 16,495 | |
FNMA ± | | | 1.81 | | | | 12-1-2031 | | | | 168,385 | | | | 179,987 | |
FNMA ± | | | 1.82 | | | | 3-1-2030 | | | | 24,471 | | | | 25,099 | |
FNMA ± | | | 1.83 | | | | 7-1-2020 | | | | 15,923 | | | | 16,089 | |
FNMA ± | | | 1.87 | | | | 5-1-2018 | | | | 8,072 | | | | 8,058 | |
FNMA ± | | | 1.87 | | | | 1-1-2032 | | | | 36,954 | | | | 36,814 | |
FNMA ± | | | 1.88 | | | | 1-1-2022 | | | | 13,263 | | | | 13,423 | |
FNMA ± | | | 1.88 | | | | 8-1-2032 | | | | 169,738 | | | | 178,035 | |
FNMA ± | | | 1.92 | | | | 2-1-2035 | | | | 5,404,166 | | | | 5,746,976 | |
FNMA ± | | | 1.92 | | | | 1-1-2035 | | | | 4,237,505 | | | | 4,469,537 | |
FNMA ± | | | 1.94 | | | | 2-1-2033 | | | | 268,891 | | | | 282,522 | |
FNMA ± | | | 1.95 | | | | 6-1-2031 | | | | 334,535 | | | | 354,024 | |
FNMA ± | | | 1.95 | | | | 4-1-2038 | | | | 1,225,091 | | | | 1,293,799 | |
FNMA ± | | | 2.01 | | | | 8-1-2031 | | | | 76,780 | | | | 78,295 | |
FNMA ± | | | 2.01 | | | | 7-1-2032 | | | | 222,553 | | | | 223,340 | |
FNMA ± | | | 2.02 | | | | 6-1-2032 | | | | 155,419 | | | | 156,035 | |
FNMA ± | | | 2.03 | | | | 10-1-2035 | | | | 10,338,874 | | | | 10,899,881 | |
FNMA ± | | | 2.03 | | | | 4-1-2042 | | | | 4,399,068 | | | | 4,653,101 | |
FNMA ± | | | 2.03 | | | | 10-1-2044 | | | | 2,098,898 | | | | 2,220,751 | |
FNMA ± | | | 2.08 | | | | 12-1-2035 | | | | 8,816,487 | | | | 9,325,436 | |
FNMA ± | | | 2.08 | | | | 7-1-2035 | | | | 2,470,671 | | | | 2,591,610 | |
FNMA ± | | | 2.10 | | | | 7-1-2018 | | | | 2,470 | | | | 2,484 | |
FNMA ± | | | 2.10 | | | | 1-1-2036 | | | | 5,031,526 | | | | 5,328,728 | |
FNMA ± | | | 2.10 | | | | 10-1-2018 | | | | 120,503 | | | | 126,616 | |
FNMA ± | | | 2.12 | | | | 10-1-2024 | | | | 61,927 | | | | 65,722 | |
FNMA ± | | | 2.12 | | | | 12-1-2024 | | | | 96,464 | | | | 101,904 | |
FNMA ± | | | 2.13 | | | | 11-1-2017 | | | | 153,331 | | | | 162,286 | |
FNMA ± | | | 2.13 | | | | 2-1-2020 | | | | 16,081 | | | | 16,893 | |
FNMA ± | | | 2.15 | | | | 7-1-2035 | | | | 2,034,779 | | | | 2,144,978 | |
FNMA ± | | | 2.15 | | | | 10-1-2035 | | | | 1,066,484 | | | | 1,127,408 | |
FNMA ± | | | 2.15 | | | | 11-1-2027 | | | | 63,505 | | | | 67,386 | |
FNMA ± | | | 2.15 | | | | 12-1-2032 | | | | 1,284,045 | | | | 1,343,798 | |
FNMA ± | | | 2.16 | | | | 6-1-2018 | | | | 1,985 | | | | 2,054 | |
FNMA ± | | | 2.16 | | | | 6-1-2034 | | | | 1,084,893 | | | | 1,153,491 | |
FNMA ± | | | 2.17 | | | | 9-1-2035 | | | | 1,940,316 | | | | 2,053,449 | |
FNMA ± | | | 2.18 | | | | 4-1-2030 | | | | 173,795 | | | | 185,106 | |
FNMA ± | | | 2.18 | | | | 1-1-2034 | | | | 4,184,486 | | | | 4,464,140 | |
FNMA ± | | | 2.18 | | | | 12-1-2023 | | | | 12,749 | | | | 12,890 | |
FNMA ± | | | 2.20 | | | | 4-1-2021 | | | | 93,153 | | | | 97,567 | |
FNMA ± | | | 2.20 | | | | 4-1-2019 | | | | 7,024 | | | | 7,079 | |
FNMA ± | | | 2.21 | | | | 10-1-2017 | | | | 57,569 | | | | 59,231 | |
FNMA ± | | | 2.21 | | | | 3-1-2033 | | | | 297,889 | | | | 310,502 | |
FNMA ± | | | 2.21 | | | | 8-1-2033 | | | | 1,687,022 | | | | 1,796,281 | |
FNMA ± | | | 2.21 | | | | 11-1-2024 | | | | 13,266 | | | | 13,911 | |
FNMA ± | | | 2.21 | | | | 8-1-2025 | | | | 51,567 | | | | 54,743 | |
FNMA ± | | | 2.21 | | | | 1-1-2036 | | | | 537,960 | | | | 568,179 | |
FNMA ± | | | 2.21 | | | | 1-1-2018 | | | | 73,364 | | | | 75,634 | |
FNMA ± | | | 2.21 | | | | 11-1-2023 | | | | 45,104 | | | | 46,824 | |
| | | | |
| 8 | | Wells Fargo Advantage Adjustable Rate Government Fund | | Portfolio of investments—February 28, 2014 (unaudited) |
| | | | | | | | | | | | | | | | |
| Security name | | Interest rate | | | Maturity date | | | Principal | | | Value | |
| | | | | | | | | | | | | | | | |
| | | | |
Agency Securities (continued) | | | | | | | | | | | | | | | | |
FNMA ± | | | 2.22 | % | | | 11-1-2034 | | | $ | 1,752,886 | | | $ | 1,876,511 | |
FNMA ± | | | 2.22 | | | | 9-1-2032 | | | | 8,488,649 | | | | 9,040,558 | |
FNMA ± | | | 2.22 | | | | 12-1-2017 | | | | 80,181 | | | | 81,573 | |
FNMA ± | | | 2.22 | | | | 1-1-2038 | | | | 754,039 | | | | 791,080 | |
FNMA ± | | | 2.23 | | | | 4-1-2018 | | | | 395,142 | | | | 416,435 | |
FNMA ± | | | 2.23 | | | | 7-1-2038 | | | | 1,671,389 | | | | 1,773,848 | |
FNMA ± | | | 2.23 | | | | 7-1-2018 | | | | 450,739 | | | | 474,757 | |
FNMA ± | | | 2.23 | | | | 12-1-2033 | | | | 2,135,173 | | | | 2,276,464 | |
FNMA ± | | | 2.23 | | | | 7-1-2036 | | | | 4,847,853 | | | | 5,163,461 | |
FNMA ± | | | 2.23 | | | | 9-1-2036 | | | | 1,886,048 | | | | 2,020,093 | |
FNMA ± | | | 2.23 | | | | 3-1-2034 | | | | 971,526 | | | | 1,035,429 | |
FNMA ± | | | 2.24 | | | | 11-1-2035 | | | | 964,263 | | | | 1,011,612 | |
FNMA ± | | | 2.24 | | | | 8-1-2036 | | | | 5,035,385 | | | | 5,335,319 | |
FNMA ± | | | 2.24 | | | | 12-1-2025 | | | | 24,869 | | | | 25,030 | |
FNMA ± | | | 2.24 | | | | 8-1-2026 | | | | 112,481 | | | | 113,871 | |
FNMA ± | | | 2.24 | | | | 7-1-2035 | | | | 2,010,740 | | | | 2,146,061 | |
FNMA ± | | | 2.25 | | | | 3-1-2031 | | | | 44,281 | | | | 46,765 | |
FNMA ± | | | 2.25 | | | | 4-1-2035 | | | | 4,276,124 | | | | 4,549,182 | |
FNMA ± | | | 2.25 | | | | 1-1-2035 | | | | 1,607,837 | | | | 1,681,283 | |
FNMA ± | | | 2.25 | | | | 7-1-2017 | | | | 3,114 | | | | 3,171 | |
FNMA ± | | | 2.25 | | | | 8-1-2017 | | | | 1,250 | | | | 1,267 | |
FNMA ± | | | 2.25 | | | | 1-1-2018 | | | | 652,272 | | | | 686,295 | |
FNMA ± | | | 2.25 | | | | 3-1-2021 | | | | 1,223 | | | | 1,277 | |
FNMA ± | | | 2.25 | | | | 10-1-2025 | | | | 166,641 | | | | 175,405 | |
FNMA ± | | | 2.25 | | | | 1-1-2027 | | | | 46,048 | | | | 48,794 | |
FNMA ± | | | 2.25 | | | | 3-1-2030 | | | | 38,066 | | | | 40,063 | |
FNMA ± | | | 2.25 | | | | 5-1-2033 | | | | 1,277,820 | | | | 1,361,579 | |
FNMA ± | | | 2.26 | | | | 10-1-2035 | | | | 516,643 | | | | 552,073 | |
FNMA ± | | | 2.26 | | | | 8-1-2035 | | | | 826,399 | | | | 867,239 | |
FNMA ± | | | 2.26 | | | | 4-1-2040 | | | | 370,693 | | | | 395,475 | |
FNMA ± | | | 2.26 | | | | 7-1-2029 | | | | 917,488 | | | | 963,541 | |
FNMA ± | | | 2.26 | | | | 12-1-2033 | | | | 2,810,591 | | | | 2,992,496 | |
FNMA ± | | | 2.26 | | | | 9-1-2035 | | | | 3,570,144 | | | | 3,805,055 | |
FNMA ± | | | 2.27 | | | | 10-1-2033 | | | | 904,339 | | | | 963,141 | |
FNMA ± | | | 2.27 | | | | 1-1-2037 | | | | 4,121,875 | | | | 4,352,127 | |
FNMA ± | | | 2.28 | | | | 4-1-2018 | | | | 5,543 | | | | 5,708 | |
FNMA ± | | | 2.28 | | | | 12-1-2039 | | | | 438,386 | | | | 465,981 | |
FNMA ± | | | 2.29 | | | | 4-1-2034 | | | | 5,518,277 | | | | 5,876,579 | |
FNMA ± | | | 2.29 | | | | 4-1-2028 | | | | 46,977 | | | | 47,360 | |
FNMA ± | | | 2.29 | | | | 4-1-2033 | | | | 1,071,127 | | | | 1,150,134 | |
FNMA ± | | | 2.30 | | | | 10-1-2035 | | | | 4,077,720 | | | | 4,342,123 | |
FNMA ± | | | 2.30 | | | | 12-1-2024 | | | | 38,457 | | | | 40,686 | |
FNMA ± | | | 2.30 | | | | 6-1-2032 | | | | 47,278 | | | | 48,502 | |
FNMA ± | | | 2.30 | | | | 6-1-2032 | | | | 368,772 | | | | 377,510 | |
FNMA ± | | | 2.30 | | | | 1-1-2035 | | | | 503,309 | | | | 535,945 | |
FNMA ± | | | 2.30 | | | | 6-1-2035 | | | | 604,823 | | | | 648,869 | |
FNMA ± | | | 2.30 | | | | 1-1-2036 | | | | 1,756,701 | | | | 1,864,709 | |
FNMA ± | | | 2.30 | | | | 1-1-2037 | | | | 11,334,904 | | | | 12,058,245 | |
FNMA ± | | | 2.30 | | | | 3-1-2038 | | | | 5,898,991 | | | | 6,268,928 | |
FNMA ± | | | 2.31 | | | | 2-1-2036 | | | | 1,504,245 | | | | 1,601,897 | |
| | | | | | |
| Portfolio of investments—February 28, 2014 (unaudited) | | Wells Fargo Advantage Adjustable Rate Government Fund | | | 9 | |
| | | | | | | | | | | | | | | | |
| Security name | | Interest rate | | | Maturity date | | | Principal | | | Value | |
| | | | | | | | | | | | | | | | |
| | | | |
Agency Securities (continued) | | | | | | | | | | | | | | | | |
FNMA ± | | | 2.31 | % | | | 7-1-2038 | | | $ | 7,808,720 | | | $ | 8,411,013 | |
FNMA ± | | | 2.31 | | | | 3-1-2035 | | | | 1,826,366 | | | | 1,965,010 | |
FNMA ± | | | 2.31 | | | | 2-1-2033 | | | | 420,660 | | | | 449,058 | |
FNMA ± | | | 2.31 | | | | 1-1-2035 | | | | 3,451,035 | | | | 3,646,964 | |
FNMA ± | | | 2.31 | | | | 12-1-2035 | | | | 991,658 | | | | 1,055,227 | |
FNMA ± | | | 2.32 | | | | 6-1-2033 | | | | 1,230,279 | | | | 1,303,024 | |
FNMA ± | | | 2.32 | | | | 9-1-2039 | | | | 10,541,690 | | | | 11,210,591 | |
FNMA ± | | | 2.32 | | | | 7-1-2048 | | | | 6,307,329 | | | | 6,743,252 | |
FNMA ± | | | 2.32 | | | | 1-1-2040 | | | | 726,138 | | | | 771,270 | |
FNMA ± | | | 2.32 | | | | 12-1-2043 | | | | 3,492,510 | | | | 3,717,138 | |
FNMA ± | | | 2.32 | | | | 6-1-2023 | | | | 842 | | | | 850 | |
FNMA ± | | | 2.32 | | | | 2-1-2035 | | | | 571,246 | | | | 602,453 | |
FNMA ± | | | 2.32 | | | | 7-1-2043 | | | | 2,848,373 | | | | 3,043,329 | |
FNMA ± | | | 2.32 | | | | 10-1-2024 | | | | 407,372 | | | | 436,833 | |
FNMA ± | | | 2.32 | | | | 12-1-2040 | | | | 12,508,026 | | | | 13,355,604 | |
FNMA ± | | | 2.33 | | | | 5-1-2033 | | | | 782,459 | | | | 836,966 | |
FNMA ± | | | 2.33 | | | | 7-1-2025 | | | | 5,782 | | | | 6,003 | |
FNMA ± | | | 2.33 | | | | 2-1-2035 | | | | 5,615,162 | | | | 6,005,834 | |
FNMA ± | | | 2.33 | | | | 6-1-2035 | | | | 3,732,294 | | | | 3,973,512 | |
FNMA ± | | | 2.33 | | | | 5-1-2034 | | | | 3,930,447 | | | | 4,148,600 | |
FNMA ± | | | 2.33 | | | | 6-1-2033 | | | | 685,241 | | | | 722,334 | |
FNMA ± | | | 2.33 | | | | 5-1-2037 | | | | 2,778,713 | | | | 2,957,689 | |
FNMA ± | | | 2.33 | | | | 1-1-2027 | | | | 915,882 | | | | 976,987 | |
FNMA ± | | | 2.34 | | | | 7-1-2033 | | | | 216,439 | | | | 226,666 | |
FNMA ± | | | 2.34 | | | | 6-1-2035 | | | | 1,939,910 | | | | 2,058,142 | |
FNMA ± | | | 2.34 | | | | 7-1-2035 | | | | 2,467,741 | | | | 2,646,805 | |
FNMA ± | | | 2.34 | | | | 7-1-2038 | | | | 1,551,467 | | | | 1,663,380 | |
FNMA ± | | | 2.34 | | | | 1-11-2035 | | | | 2,986,904 | | | | 3,194,855 | |
FNMA ± | | | 2.34 | | | | 9-1-2034 | | | | 6,060,461 | | | | 6,446,236 | |
FNMA ± | | | 2.34 | | | | 1-1-2044 | | | | 2,974,187 | | | | 3,159,757 | |
FNMA ± | | | 2.34 | | | | 4-1-2030 | | | | 19,788 | | | | 21,026 | |
FNMA ± | | | 2.34 | | | | 9-1-2032 | | | | 141,951 | | | | 142,751 | |
FNMA ± | | | 2.34 | | | | 2-1-2033 | | | | 2,045 | | | | 2,049 | |
FNMA ± | | | 2.34 | | | | 4-1-2033 | | | | 2,766,153 | | | | 2,932,370 | |
FNMA ± | | | 2.34 | | | | 6-1-2037 | | | | 405,492 | | | | 430,444 | |
FNMA ± | | | 2.34 | | | | 1-1-2038 | | | | 8,289,468 | | | | 8,836,504 | |
FNMA ± | | | 2.34 | | | | 6-1-2027 | | | | 119,656 | | | | 127,385 | |
FNMA ± | | | 2.34 | | | | 7-1-2040 | | | | 4,901,349 | | | | 5,205,909 | |
FNMA ± | | | 2.34 | | | | 4-1-2043 | | | | 6,094,935 | | | | 6,508,789 | |
FNMA ± | | | 2.35 | | | | 8-1-2031 | | | | 138,306 | | | | 140,126 | |
FNMA ± | | | 2.35 | | | | 10-1-2034 | | | | 566,334 | | | | 605,239 | |
FNMA ± | | | 2.35 | | | | 7-1-2035 | | | | 2,697,880 | | | | 2,888,250 | |
FNMA ± | | | 2.35 | | | | 7-1-2035 | | | | 987,732 | | | | 1,053,073 | |
FNMA ± | | | 2.35 | | | | 6-1-2026 | | | | 98,841 | | | | 105,829 | |
FNMA ± | | | 2.35 | | | | 7-1-2033 | | | | 103,991 | | | | 110,700 | |
FNMA ± | | | 2.35 | | | | 7-1-2038 | | | | 4,181,365 | | | | 4,467,202 | |
FNMA ± | | | 2.35 | | | | 9-1-2033 | | | | 65,291 | | | | 68,987 | |
FNMA ± | | | 2.35 | | | | 9-1-2033 | | | | 70,418 | | | | 71,524 | |
FNMA ± | | | 2.35 | | | | 10-1-2035 | | | | 2,070,708 | | | | 2,212,177 | |
FNMA ± | | | 2.35 | | | | 1-1-2036 | | | | 613,334 | | | | 640,214 | |
| | | | |
| 10 | | Wells Fargo Advantage Adjustable Rate Government Fund | | Portfolio of investments—February 28, 2014 (unaudited) |
| | | | | | | | | | | | | | | | |
| Security name | | Interest rate | | | Maturity date | | | Principal | | | Value | |
| | | | | | | | | | | | | | | | |
| | | | |
Agency Securities (continued) | | | | | | | | | | | | | | | | |
FNMA ± | | | 2.35 | % | | | 12-1-2040 | | | $ | 4,060,787 | | | $ | 4,313,881 | |
FNMA ± | | | 2.35 | | | | 9-1-2034 | | | | 10,712,322 | | | | 11,436,154 | |
FNMA ± | | | 2.35 | | | | 5-1-2035 | | | | 3,168,427 | | | | 3,374,789 | |
FNMA ± | | | 2.36 | | | | 7-1-2035 | | | | 7,548,722 | | | | 8,045,848 | |
FNMA ± | | | 2.36 | | | | 7-1-2028 | | | | 312 | | | | 332 | |
FNMA ± | | | 2.36 | | | | 2-1-2036 | | | | 7,205,099 | | | | 7,704,133 | |
FNMA ± | | | 2.36 | | | | 5-1-2036 | | | | 6,274,307 | | | | 6,726,546 | |
FNMA ± | | | 2.36 | | | | 10-1-2036 | | | | 6,083,013 | | | | 6,520,916 | |
FNMA ± | | | 2.36 | | | | 5-1-2042 | | | | 7,896,217 | | | | 8,429,926 | |
FNMA ± | | | 2.36 | | | | 2-1-2034 | | | | 4,409,723 | | | | 4,729,987 | |
FNMA ± | | | 2.37 | | | | 4-1-2032 | | | | 45,599 | | | | 47,850 | |
FNMA ± | | | 2.37 | | | | 4-1-2033 | | | | 1,198,706 | | | | 1,280,473 | |
FNMA ± | | | 2.37 | | | | 8-1-2026 | | | | 980,732 | | | | 1,046,543 | |
FNMA ± | | | 2.37 | | | | 6-1-2034 | | | | 6,086,170 | | | | 6,489,750 | |
FNMA ± | | | 2.37 | | | | 6-1-2036 | | | | 6,107,649 | | | | 6,502,720 | |
FNMA ± | | | 2.37 | | | | 1-1-2031 | | | | 1,172,470 | | | | 1,244,705 | |
FNMA ± | | | 2.37 | | | | 6-1-2027 | | | | 2,893 | | | | 3,037 | |
FNMA ± | | | 2.38 | | | | 1-1-2019 | | | | 134,678 | | | | 139,499 | |
FNMA ± | | | 2.38 | | | | 9-1-2019 | | | | 7,654 | | | | 7,733 | |
FNMA ± | | | 2.38 | | | | 6-1-2025 | | | | 9,840 | | | | 9,926 | |
FNMA ± | | | 2.38 | | | | 5-1-2033 | | | | 6,700,825 | | | | 7,133,926 | |
FNMA ± | | | 2.38 | | | | 10-1-2029 | | | | 218,303 | | | | 224,708 | |
FNMA ± | | | 2.38 | | | | 3-1-2035 | | | | 6,008,789 | | | | 6,410,797 | |
FNMA ± | | | 2.38 | | | | 5-1-2035 | | | | 799,684 | | | | 838,319 | |
FNMA ± | | | 2.38 | | | | 5-1-2018 | | | | 145,061 | | | | 142,639 | |
FNMA ± | | | 2.38 | | | | 9-1-2036 | | | | 1,583,706 | | | | 1,683,328 | |
FNMA ± | | | 2.38 | | | | 9-1-2039 | | | | 8,881,833 | | | | 9,519,191 | |
FNMA ± | | | 2.39 | | | | 6-1-2034 | | | | 1,653,572 | | | | 1,754,040 | |
FNMA ± | | | 2.39 | | | | 7-1-2034 | | | | 1,188,409 | | | | 1,259,995 | |
FNMA ± | | | 2.40 | | | | 8-1-2017 | | | | 480,517 | | | | 493,217 | |
FNMA ± | | | 2.40 | | | | 2-1-2036 | | | | 13,420,992 | | | | 14,445,542 | |
FNMA ± | | | 2.40 | | | | 7-1-2048 | | | | 8,625,890 | | | | 9,241,391 | |
FNMA ± | | | 2.40 | | | | 4-1-2024 | | | | 80,055 | | | | 85,672 | |
FNMA ± | | | 2.40 | | | | 4-1-2024 | | | | 28,860 | | | | 30,189 | |
FNMA ± | | | 2.40 | | | | 7-1-2024 | | | | 16,789 | | | | 17,657 | |
FNMA ± | | | 2.40 | | | | 9-1-2026 | | | | 118,311 | | | | 121,501 | |
FNMA ± | | | 2.40 | | | | 2-1-2037 | | | | 4,258,341 | | | | 4,572,396 | |
FNMA ± | | | 2.40 | | | | 9-1-2030 | | | | 221,187 | | | | 237,386 | |
FNMA ± | | | 2.40 | | | | 12-1-2040 | | | | 6,831,659 | | | | 7,331,199 | |
FNMA ± | | | 2.41 | | | | 10-1-2036 | | | | 1,622,281 | | | | 1,733,734 | |
FNMA ± | | | 2.42 | | | | 12-1-2030 | | | | 87,244 | | | | 88,972 | |
FNMA ± | | | 2.42 | | | | 9-1-2034 | | | | 2,760,562 | | | | 2,974,691 | |
FNMA ± | | | 2.42 | | | | 8-1-2035 | | | | 1,749,658 | | | | 1,834,069 | |
FNMA ± | | | 2.42 | | | | 7-1-2035 | | | | 4,347,260 | | | | 4,665,441 | |
FNMA ± | | | 2.42 | | | | 5-1-2034 | | | | 1,703,580 | | | | 1,819,014 | |
FNMA ± | | | 2.42 | | | | 6-1-2035 | | | | 2,827,100 | | | | 3,010,050 | |
FNMA ± | | | 2.42 | | | | 1-1-2019 | | | | 3,903 | | | | 3,970 | |
FNMA ± | | | 2.42 | | | | 5-1-2036 | | | | 3,451,891 | | | | 3,672,985 | |
FNMA ± | | | 2.42 | | | | 9-1-2036 | | | | 1,090,972 | | | | 1,159,498 | |
FNMA ± | | | 2.43 | | | | 9-1-2037 | | | | 1,290,178 | | | | 1,376,393 | |
| | | | | | |
| Portfolio of investments—February 28, 2014 (unaudited) | | Wells Fargo Advantage Adjustable Rate Government Fund | | | 11 | |
| | | | | | | | | | | | | | | | |
| Security name | | Interest rate | | | Maturity date | | | Principal | | | Value | |
| | | | | | | | | | | | | | | | |
| | | | |
Agency Securities (continued) | | | | | | | | | | | | | | | | |
FNMA ± | | | 2.43 | % | | | 12-1-2042 | | | $ | 2,137,029 | | | $ | 2,270,044 | |
FNMA ± | | | 2.44 | | | | 12-1-2034 | | | | 1,498,523 | | | | 1,598,173 | |
FNMA ± | | | 2.44 | | | | 2-1-2035 | | | | 2,141,579 | | | | 2,287,741 | |
FNMA ± | | | 2.44 | | | | 5-1-2035 | | | | 2,837,648 | | | | 3,039,439 | |
FNMA ± | | | 2.44 | | | | 5-1-2025 | | | | 66,370 | | | | 70,881 | |
FNMA ± | | | 2.44 | | | | 4-1-2036 | | | | 6,837,161 | | | | 7,315,146 | |
FNMA ± | | | 2.44 | | | | 5-1-2039 | | | | 5,632,401 | | | | 5,981,276 | |
FNMA ± | | | 2.44 | | | | 2-1-2038 | | | | 1,660,503 | | | | 1,759,428 | |
FNMA ± | | | 2.45 | | | | 4-1-2028 | | | | 344,046 | | | | 368,818 | |
FNMA ± | | | 2.45 | | | | 6-1-2032 | | | | 53,497 | | | | 53,423 | |
FNMA ± | | | 2.45 | | | | 4-1-2033 | | | | 1,453,639 | | | | 1,555,993 | |
FNMA ± | | | 2.45 | | | | 4-1-2020 | | | | 7,431 | | | | 7,554 | |
FNMA ± | | | 2.45 | | | | 3-1-2033 | | | | 7,812 | | | | 7,880 | |
FNMA ± | | | 2.45 | | | | 6-1-2033 | | | | 581,982 | | | | 624,773 | |
FNMA ± | | | 2.45 | | | | 1-1-2028 | | | | 10,226 | | | | 10,887 | |
FNMA ± | | | 2.45 | | | | 9-1-2028 | | | | 118,711 | | | | 121,714 | |
FNMA ± | | | 2.46 | | | | 11-1-2024 | | | | 184,496 | | | | 190,280 | |
FNMA ± | | | 2.46 | | | | 4-1-2034 | | | | 1,916,989 | | | | 2,035,418 | |
FNMA ± | | | 2.46 | | | | 12-1-2028 | | | | 55,754 | | | | 59,200 | |
FNMA ± | | | 2.46 | | | | 8-1-2039 | | | | 7,316,310 | | | | 7,813,370 | |
FNMA ± | | | 2.46 | | | | 1-1-2026 | | | | 479,226 | | | | 503,916 | |
FNMA ± | | | 2.46 | | | | 2-1-2032 | | | | 1,996,240 | | | | 2,104,328 | |
FNMA ± | | | 2.47 | | | | 4-1-2024 | | | | 3,637,393 | | | | 3,887,431 | |
FNMA ± | | | 2.48 | | | | 6-1-2030 | | | | 215,104 | | | | 230,813 | |
FNMA ± | | | 2.48 | | | | 11-1-2017 | | | | 74,895 | | | | 77,363 | |
FNMA ± | | | 2.48 | | | | 6-1-2027 | | | | 100,116 | | | | 106,438 | |
FNMA ± | | | 2.48 | | | | 12-1-2030 | | | | 1,038,497 | | | | 1,116,157 | |
FNMA ± | | | 2.48 | | | | 9-1-2037 | | | | 1,214,249 | | | | 1,290,313 | |
FNMA ± | | | 2.49 | | | | 1-1-2029 | | | | 893,658 | | | | 942,652 | |
FNMA ± | | | 2.49 | | | | 11-1-2034 | | | | 8,091,135 | | | | 8,630,131 | |
FNMA ± | | | 2.49 | | | | 3-1-2033 | | | | 2,484,701 | | | | 2,670,505 | |
FNMA ± | | | 2.49 | | | | 5-1-2032 | | | | 228,154 | | | | 232,188 | |
FNMA ± | | | 2.50 | | | | 7-1-2027 | | | | 101,349 | | | | 109,078 | |
FNMA ± | | | 2.50 | | | | 9-1-2030 | | | | 1,163,766 | | | | 1,239,411 | |
FNMA ± | | | 2.50 | | | | 8-1-2035 | | | | 4,371,475 | | | | 4,658,612 | |
FNMA ± | | | 2.50 | | | | 1-1-2032 | | | | 152,315 | | | | 163,024 | |
FNMA ± | | | 2.50 | | | | 6-1-2017 | | | | 19,836 | | | | 19,806 | |
FNMA ± | | | 2.50 | | | | 5-1-2017 | | | | 51,305 | | | | 51,231 | |
FNMA ± | | | 2.50 | | | | 5-1-2017 | | | | 54,314 | | | | 55,928 | |
FNMA ± | | | 2.50 | | | | 7-1-2017 | | | | 5,567 | | | | 5,768 | |
FNMA ± | | | 2.50 | | | | 2-1-2018 | | | | 8,826 | | | | 9,046 | |
FNMA ± | | | 2.50 | | | | 2-1-2019 | | | | 2,211 | | | | 2,251 | |
FNMA ± | | | 2.50 | | | | 5-1-2019 | | | | 742 | | | | 752 | |
FNMA ± | | | 2.50 | | | | 6-1-2019 | | | | 998 | | | | 993 | |
FNMA ± | | | 2.50 | | | | 7-1-2027 | | | | 373,542 | | | | 402,270 | |
FNMA ± | | | 2.50 | | | | 9-1-2037 | | | | 7,232,321 | | | | 7,748,985 | |
FNMA ± | | | 2.50 | | | | 12-1-2021 | | | | 103,819 | | | | 106,569 | |
FNMA ± | | | 2.51 | | | | 6-1-2036 | | | | 967,102 | | | | 1,035,935 | |
FNMA ± | | | 2.51 | | | | 11-1-2020 | | | | 1,165,582 | | | | 1,227,419 | |
FNMA ± | | | 2.51 | | | | 12-1-2033 | | | | 2,743,535 | | | | 2,936,938 | |
| | | | |
| 12 | | Wells Fargo Advantage Adjustable Rate Government Fund | | Portfolio of investments—February 28, 2014 (unaudited) |
| | | | | | | | | | | | | | | | |
| Security name | | Interest rate | | | Maturity date | | | Principal | | | Value | |
| | | | | | | | | | | | | | | | |
| | | | |
Agency Securities (continued) | | | | | | | | | | | | | | | | |
FNMA ± | | | 2.52 | % | | | 9-1-2022 | | | $ | 588,974 | | | $ | 634,035 | |
FNMA ± | | | 2.52 | | | | 4-1-2035 | | | | 3,124,816 | | | | 3,322,176 | |
FNMA ± | | | 2.52 | | | | 4-1-2035 | | | | 2,782,102 | | | | 2,966,524 | |
FNMA ± | | | 2.53 | | �� | | 6-1-2024 | | | | 61,120 | | | | 64,321 | |
FNMA ± | | | 2.53 | | | | 7-1-2035 | | | | 1,517,974 | | | | 1,617,463 | |
FNMA ± | | | 2.53 | | | | 7-1-2017 | | | | 154,437 | | | | 159,097 | |
FNMA ± | | | 2.53 | | | | 5-1-2027 | | | | 104,226 | | | | 111,964 | |
FNMA ± | | | 2.53 | | | | 7-1-2037 | | | | 2,184,564 | | | | 2,338,777 | |
FNMA ± | | | 2.53 | | | | 7-1-2020 | | | | 154,447 | | | | 163,486 | |
FNMA ± | | | 2.54 | | | | 10-1-2034 | | | | 793,213 | | | | 850,935 | |
FNMA ± | | | 2.54 | | | | 8-1-2035 | | | | 1,890,499 | | | | 2,013,569 | |
FNMA ± | | | 2.54 | | | | 5-1-2036 | | | | 915,628 | | | | 976,053 | |
FNMA ± | | | 2.55 | | | | 7-1-2033 | | | | 1,600,967 | | | | 1,721,012 | |
FNMA ± | | | 2.55 | | | | 10-1-2033 | | | | 17,471,054 | | | | 18,673,513 | |
FNMA ± | | | 2.55 | | | | 5-1-2035 | | | | 2,170,004 | | | | 2,324,423 | |
FNMA ± | | | 2.56 | | | | 1-1-2036 | | | | 11,783,228 | | | | 12,589,302 | |
FNMA ± | | | 2.56 | | | | 4-1-2030 | | | | 33,996 | | | | 36,009 | |
FNMA ± | | | 2.56 | | | | 10-1-2036 | | | | 8,060,310 | | | | 8,489,956 | |
FNMA ± | | | 2.56 | | | | 4-1-2018 | | | | 716,214 | | | | 738,121 | |
FNMA ± | | | 2.57 | | | | 3-1-2035 | | | | 4,775,158 | | | | 5,115,861 | |
FNMA ± | | | 2.57 | | | | 8-1-2036 | | | | 696,698 | | | | 743,609 | |
FNMA ± | | | 2.57 | | | | 12-1-2046 | | | | 1,968,917 | | | | 2,099,182 | |
FNMA ± | | | 2.57 | | | | 8-1-2040 | | | | 1,445,276 | | | | 1,556,607 | |
FNMA ± | | | 2.58 | | | | 1-1-2033 | | | | 2,850,048 | | | | 3,062,015 | |
FNMA ± | | | 2.58 | | | | 1-1-2036 | | | | 145,708 | | | | 153,374 | |
FNMA ± | | | 2.58 | | | | 3-1-2027 | | | | 198,318 | | | | 199,095 | |
FNMA ± | | | 2.59 | | | | 9-1-2035 | | | | 190,616 | | | | 203,499 | |
FNMA ± | | | 2.59 | | | | 9-1-2033 | | | | 1,444,904 | | | | 1,540,479 | |
FNMA ± | | | 2.59 | | | | 5-1-2033 | | | | 1,475,799 | | | | 1,581,731 | |
FNMA ± | | | 2.59 | | | | 3-1-2036 | | | | 928,717 | | | | 997,151 | |
FNMA ± | | | 2.60 | | | | 2-1-2035 | | | | 1,738,276 | | | | 1,857,266 | |
FNMA ± | | | 2.60 | | | | 4-1-2036 | | | | 6,299,304 | | | | 6,646,188 | |
FNMA ± | | | 2.61 | | | | 2-1-2035 | | | | 7,955,862 | | | | 8,523,493 | |
FNMA ± | | | 2.62 | | | | 9-1-2030 | | | | 986,131 | | | | 1,060,521 | |
FNMA ± | | | 2.63 | | | | 10-1-2029 | | | | 605,317 | | | | 650,286 | |
FNMA ± | | | 2.64 | | | | 7-1-2036 | | | | 5,011,356 | | | | 5,400,934 | |
FNMA ± | | | 2.64 | | | | 6-1-2032 | | | | 235,300 | | | | 252,495 | |
FNMA ± | | | 2.64 | | | | 9-1-2035 | | | | 1,066,952 | | | | 1,136,536 | |
FNMA ± | | | 2.64 | | | | 11-1-2024 | | | | 94,817 | | | | 96,570 | |
FNMA ± | | | 2.64 | | | | 3-1-2033 | | | | 737,258 | | | | 784,089 | |
FNMA ± | | | 2.64 | | | | 5-1-2035 | | | | 2,807,852 | | | | 3,014,500 | |
FNMA ± | | | 2.65 | | | | 10-1-2024 | | | | 54,006 | | | | 54,884 | |
FNMA ± | | | 2.65 | | | | 9-1-2030 | | | | 901,877 | | | | 950,516 | |
FNMA ± | | | 2.65 | | | | 5-1-2037 | | | | 2,896,609 | | | | 3,108,641 | |
FNMA ± | | | 2.65 | | | | 6-1-2040 | | | | 1,296,712 | | | | 1,374,829 | |
FNMA ± | | | 2.65 | | | | 5-1-2035 | | | | 4,081,660 | | | | 4,393,820 | |
FNMA ± | | | 2.66 | | | | 8-1-2034 | | | | 4,037,492 | | | | 4,315,402 | |
FNMA ± | | | 2.68 | | | | 1-1-2025 | | | | 72,331 | | | | 73,493 | |
FNMA ± | | | 2.70 | | | | 5-1-2028 | | | | 88,212 | | | | 92,024 | |
FNMA ± | | | 2.70 | | | | 3-1-2032 | | | | 144,810 | | | | 155,689 | |
| | | | | | |
| Portfolio of investments—February 28, 2014 (unaudited) | | Wells Fargo Advantage Adjustable Rate Government Fund | | | 13 | |
| | | | | | | | | | | | | | | | |
| Security name | | Interest rate | | | Maturity date | | | Principal | | | Value | |
| | | | | | | | | | | | | | | | |
| | | | |
Agency Securities (continued) | | | | | | | | | | | | | | | | |
FNMA ± | | | 2.70 | % | | | 3-1-2035 | | | $ | 1,593,667 | | | $ | 1,702,822 | |
FNMA ± | | | 2.72 | | | | 10-1-2018 | | | | 651,028 | | | | 675,801 | |
FNMA ± | | | 2.72 | | | | 10-1-2025 | | | | 15,405 | | | | 16,545 | |
FNMA ± | | | 2.72 | | | | 2-1-2028 | | | | 49,764 | | | | 53,282 | |
FNMA ± | | | 2.72 | | | | 4-1-2026 | | | | 9,302 | | | | 9,297 | |
FNMA ± | | | 2.74 | | | | 8-1-2035 | | | | 4,291,355 | | | | 4,596,518 | |
FNMA ± | | | 2.74 | | | | 10-1-2018 | | | | 139,079 | | | | 144,079 | |
FNMA ± | | | 2.74 | | | | 9-1-2017 | | | | 456,853 | | | | 475,561 | |
FNMA ± | | | 2.75 | | | | 6-1-2016 | | | | 78,993 | | | | 82,874 | |
FNMA ± | | | 2.75 | | | | 7-1-2016 | | | | 16,289 | | | | 17,153 | |
FNMA ± | | | 2.75 | | | | 6-1-2018 | | | | 20,797 | | | | 20,949 | |
FNMA ± | | | 2.75 | | | | 8-1-2018 | | | | 79,189 | | | | 83,518 | |
FNMA ± | | | 2.75 | | | | 12-1-2028 | | | | 177,652 | | | | 187,249 | |
FNMA ± | | | 2.75 | | | | 1-1-2029 | | | | 23,198 | | | | 24,481 | |
FNMA ± | | | 2.76 | | | | 3-1-2034 | | | | 67,435 | | | | 67,888 | |
FNMA ± | | | 2.76 | | | | 5-1-2018 | | | | 405,377 | | | | 422,790 | |
FNMA ± | | | 2.76 | | | | 4-1-2033 | | | | 656,271 | | | | 704,930 | |
FNMA ± | | | 2.77 | | | | 10-1-2025 | | | | 9,640 | | | | 10,184 | |
FNMA ± | | | 2.78 | | | | 11-1-2022 | | | | 83,367 | | | | 88,810 | |
FNMA ± | | | 2.78 | | | | 9-1-2032 | | | | 179,112 | | | | 186,480 | |
FNMA ± | | | 2.78 | | | | 1-1-2033 | | | | 173,744 | | | | 177,760 | |
FNMA ± | | | 2.79 | | | | 11-1-2034 | | | | 1,145,782 | | | | 1,225,146 | |
FNMA ± | | | 2.79 | | | | 7-1-2020 | | | | 2,564,530 | | | | 2,662,630 | |
FNMA ± | | | 2.80 | | | | 11-1-2035 | | | | 16,260,585 | | | | 17,539,404 | |
FNMA ± | | | 2.80 | | | | 10-1-2028 | | | | 295,284 | | | | 317,048 | |
FNMA ± | | | 2.80 | | | | 7-1-2039 | | | | 3,116,018 | | | | 3,412,180 | |
FNMA ± | | | 2.80 | | | | 11-1-2034 | | | | 2,801,699 | | | | 3,017,439 | |
FNMA ± | | | 2.83 | | | | 10-1-2017 | | | | 4,850 | | | | 4,804 | |
FNMA ± | | | 2.85 | | | | 5-1-2028 | | | | 274,535 | | | | 285,876 | |
FNMA ± | | | 2.86 | | | | 9-1-2019 | | | | 70,465 | | | | 71,169 | |
FNMA ± | | | 2.86 | | | | 9-1-2033 | | | | 43,116 | | | | 43,678 | |
FNMA ± | | | 2.87 | | | | 10-1-2024 | | | | 15,279 | | | | 16,413 | |
FNMA ± | | | 2.88 | | | | 7-1-2028 | | | | 374,713 | | | | 402,548 | |
FNMA ± | | | 2.91 | | | | 7-1-2019 | | | | 3,284 | | | | 3,349 | |
FNMA ± | | | 2.93 | | | | 3-1-2019 | | | | 591,628 | | | | 624,291 | |
FNMA ± | | | 2.96 | | | | 4-1-2040 | | | | 2,882,067 | | | | 3,130,786 | |
FNMA ± | | | 2.97 | | | | 9-1-2021 | | | | 120,007 | | | | 120,364 | |
FNMA ± | | | 2.98 | | | | 9-1-2032 | | | | 1,871,876 | | | | 2,043,801 | |
FNMA ± | | | 3.00 | | | | 1-1-2029 | | | | 36,477 | | | | 38,069 | |
FNMA ± | | | 3.00 | | | | 8-1-2030 | | | | 255,090 | | | | 263,594 | |
FNMA ± | | | 3.00 | | | | 5-1-2017 | | | | 74,238 | | | | 79,113 | |
FNMA ± | | | 3.00 | | | | 11-1-2028 | | | | 208,011 | | | | 222,853 | |
FNMA ± | | | 3.00 | | | | 2-1-2029 | | | | 135,148 | | | | 144,981 | |
FNMA ± | | | 3.00 | | | | 8-1-2029 | | | | 903,790 | | | | 970,367 | |
FNMA ± | | | 3.02 | | | | 1-1-2031 | | | | 84,506 | | | | 84,300 | |
FNMA ± | | | 3.02 | | | | 11-1-2024 | | | | 167,442 | | | | 167,964 | |
FNMA ± | | | 3.04 | | | | 5-1-2018 | | | | 917 | | | | 924 | |
FNMA ± | | | 3.09 | | | | 8-1-2031 | | | | 72,216 | | | | 76,698 | |
FNMA ± | | | 3.09 | | | | 3-1-2030 | | | | 165,566 | | | | 177,742 | |
FNMA ± | | | 3.12 | | | | 4-1-2020 | | | | 2,096,436 | | | | 2,224,151 | |
| | | | |
| 14 | | Wells Fargo Advantage Adjustable Rate Government Fund | | Portfolio of investments—February 28, 2014 (unaudited) |
| | | | | | | | | | | | | | | | |
| Security name | | Interest rate | | | Maturity date | | | Principal | | | Value | |
| | | | | | | | | | | | | | | | |
| | | | |
Agency Securities (continued) | | | | | | | | | | | | | | | | |
FNMA ± | | | 3.15 | % | | | 4-1-2024 | | | $ | 438,599 | | | $ | 465,963 | |
FNMA ± | | | 3.16 | | | | 7-1-2033 | | | | 28,184 | | | | 28,464 | |
FNMA ± | | | 3.16 | | | | 9-1-2033 | | | | 191,100 | | | | 191,370 | |
FNMA ± | | | 3.17 | | | | 1-1-2033 | | | | 72,829 | | | | 73,074 | |
FNMA ± | | | 3.19 | | | | 1-1-2021 | | | | 643,651 | | | | 683,688 | |
FNMA ± | | | 3.23 | | | | 7-1-2017 | | | | 117,419 | | | | 119,253 | |
FNMA ± | | | 3.23 | | | | 4-1-2034 | | | | 3,531,003 | | | | 3,812,007 | |
FNMA ± | | | 3.25 | | | | 9-1-2017 | | | | 2,784 | | | | 2,814 | |
FNMA ± | | | 3.25 | | | | 7-1-2028 | | | | 104,346 | | | | 108,687 | |
FNMA ± | | | 3.36 | | | | 6-1-2024 | | | | 35,886 | | | | 36,474 | |
FNMA ± | | | 3.37 | | | | 2-1-2029 | | | | 2,338,565 | | | | 2,517,845 | |
FNMA ± | | | 3.45 | | | | 11-1-2031 | | | | 45,924 | | | | 45,768 | |
FNMA ± | | | 3.46 | | | | 11-1-2029 | | | | 10,735 | | | | 11,432 | |
FNMA ± | | | 3.48 | | | | 9-1-2033 | | | | 62,496 | | | | 62,563 | |
FNMA ± | | | 3.58 | | | | 10-1-2017 | | | | 487,872 | | | | 500,754 | |
FNMA ± | | | 3.61 | | | | 4-1-2034 | | | | 1,912,238 | | | | 2,065,493 | |
FNMA ± | | | 3.63 | | | | 7-1-2021 | | | | 234,412 | | | | 238,835 | |
FNMA ± | | | 3.75 | | | | 10-1-2034 | | | | 388,747 | | | | 400,450 | |
FNMA ± | | | 3.78 | | | | 12-1-2050 | | | | 222,291 | | | | 224,210 | |
FNMA ± | | | 3.83 | | | | 7-1-2017 | | | | 40,483 | | | | 43,409 | |
FNMA ± | | | 3.85 | | | | 12-1-2032 | | | | 177,296 | | | | 187,105 | |
FNMA ± | | | 3.92 | | | | 2-1-2033 | | | | 101,845 | | | | 102,889 | |
FNMA ± | | | 3.92 | | | | 4-1-2032 | | | | 260,440 | | | | 261,748 | |
FNMA ± | | | 3.95 | | | | 9-1-2023 | | | | 7,624 | | | | 7,716 | |
FNMA ± | | | 3.97 | | | | 9-1-2028 | | | | 8,017 | | | | 8,374 | |
FNMA ± | | | 4.05 | | | | 5-1-2034 | | | | 561,416 | | | | 605,752 | |
FNMA ± | | | 4.06 | | | | 10-1-2018 | | | | 60 | | | | 61 | |
FNMA ± | | | 4.09 | | | | 6-1-2019 | | | | 5,203 | | | | 5,298 | |
FNMA ± | | | 4.20 | | | | 9-1-2017 | | | | 3,287 | | | | 3,286 | |
FNMA ± | | | 4.20 | | | | 11-1-2031 | | | | 158,020 | | | | 157,470 | |
FNMA ± | | | 4.20 | | | | 11-1-2031 | | | | 23,993 | | | | 24,290 | |
FNMA ± | | | 4.26 | | | | 8-1-2017 | | | | 33,394 | | | | 34,847 | |
FNMA ± | | | 4.30 | | | | 1-1-2018 | | | | 998 | | | | 994 | |
FNMA ± | | | 4.31 | | | | 6-1-2034 | | | | 495,728 | | | | 526,937 | |
FNMA ± | | | 4.34 | | | | 5-1-2017 | | | | 1,582 | | | | 1,598 | |
FNMA ± | | | 4.39 | | | | 9-1-2031 | | | | 349,405 | | | | 355,979 | |
FNMA ± | | | 4.40 | | | | 12-1-2036 | | | | 174,637 | | | | 185,726 | |
FNMA ± | | | 4.47 | | | | 6-1-2028 | | | | 83,801 | | | | 89,913 | |
FNMA | | | 4.60 | | | | 9-1-2016 | | | | 471,727 | | | | 480,744 | |
FNMA ± | | | 4.61 | | | | 2-1-2019 | | | | 471,899 | | | | 504,836 | |
FNMA ± | | | 4.79 | | | | 1-1-2019 | | | | 636,726 | | | | 681,822 | |
FNMA ± | | | 4.94 | | | | 4-1-2018 | | | | 256,991 | | | | 275,058 | |
FNMA ± | | | 4.96 | | | | 5-1-2025 | | | | 1,260 | | | | 1,277 | |
FNMA ± | | | 5.06 | | | | 11-1-2019 | | | | 410 | | | | 416 | |
FNMA ± | | | 5.16 | | | | 6-1-2028 | | | | 53,290 | | | | 51,824 | |
FNMA ± | | | 5.25 | | | | 10-1-2021 | | | | 16,724 | | | | 16,757 | |
FNMA ± | | | 5.45 | | | | 11-1-2014 | | | | 481 | | | | 480 | |
FNMA ± | | | 5.49 | | | | 7-1-2037 | | | | 1,481,192 | | | | 1,554,512 | |
FNMA | | | 5.50 | | | | 9-1-2019 | | | | 231,005 | | | | 248,117 | |
FNMA ± | | | 5.57 | | | | 1-1-2019 | | | | 145,771 | | | | 158,543 | |
| | | | | | |
| Portfolio of investments—February 28, 2014 (unaudited) | | Wells Fargo Advantage Adjustable Rate Government Fund | | | 15 | |
| | | | | | | | | | | | | | | | |
| Security name | | Interest rate | | | Maturity date | | | Principal | | | Value | |
| | | | | | | | | | | | | | | | |
| | | | |
Agency Securities (continued) | | | | | | | | | | | | | | | | |
FNMA ± | | | 5.85 | % | | | 3-1-2014 | | | $ | 802 | | | $ | 853 | |
FNMA ± | | | 6.00 | | | | 1-1-2020 | | | | 16,884 | | | | 17,206 | |
FNMA ± | | | 6.14 | | | | 9-1-2017 | | | | 437 | | | | 453 | |
FNMA ± | | | 6.45 | | | | 2-1-2034 | | | | 79,939 | | | | 79,189 | |
FNMA | | | 6.50 | | | | 8-1-2028 | | | | 72,194 | | | | 74,404 | |
FNMA | | | 6.50 | | | | 5-1-2031 | | | | 213,009 | | �� | | 238,593 | |
FNMA ± | | | 6.72 | | | | 3-1-2023 | | | | 6,489 | | | | 6,349 | |
FNMA | | | 7.00 | | | | 11-1-2014 | | | | 1,277 | | | | 1,292 | |
FNMA | | | 7.00 | | | | 11-1-2017 | | | | 37,246 | | | | 39,636 | |
FNMA | | | 7.06 | | | | 11-1-2024 | | | | 51,884 | | | | 54,298 | |
FNMA | | | 7.06 | | | | 12-1-2024 | | | | 35,564 | | | | 36,006 | |
FNMA | | | 7.06 | | | | 1-1-2025 | | | | 32,150 | | | | 32,453 | |
FNMA | | | 7.06 | | | | 3-1-2025 | | | | 67,199 | | | | 70,415 | |
FNMA | | | 7.06 | | | | 3-1-2025 | | | | 12,111 | | | | 12,154 | |
FNMA | | | 7.06 | | | | 4-1-2025 | | | | 24,141 | | | | 24,228 | |
FNMA | | | 7.06 | | | | 1-1-2027 | | | | 62,186 | | | | 64,777 | |
FNMA | | | 7.50 | | | | 2-1-2016 | | | | 144,576 | | | | 149,868 | |
FNMA | | | 7.50 | | | | 1-1-2031 | | | | 240,498 | | | | 274,501 | |
FNMA | | | 7.50 | | | | 1-1-2033 | | | | 331,976 | | | | 377,696 | |
FNMA | | | 7.50 | | | | 5-1-2033 | | | | 235,899 | | | | 268,365 | |
FNMA | | | 7.50 | | | | 5-1-2033 | | | | 219,122 | | | | 248,463 | |
FNMA | | | 7.50 | | | | 6-1-2033 | | | | 140,282 | | | | 153,096 | |
FNMA | | | 7.50 | | | | 7-1-2033 | | | | 289,589 | | | | 330,509 | |
FNMA | | | 7.50 | | | | 8-1-2033 | | | | 260,432 | | | | 297,111 | |
FNMA | | | 8.00 | | | | 12-1-2026 | | | | 142,232 | | | | 163,170 | |
FNMA | | | 8.00 | | | | 2-1-2030 | | | | 372 | | | | 381 | |
FNMA | | | 8.00 | | | | 3-1-2030 | | | | 418 | | | | 474 | |
FNMA | | | 8.00 | | | | 7-1-2031 | | | | 47,126 | | | | 48,412 | |
FNMA | | | 8.00 | | | | 5-1-2033 | | | | 326,937 | | | | 376,667 | |
FNMA | | | 8.50 | | | | 10-1-2026 | | | | 18,615 | | | | 21,062 | |
FNMA | | | 8.50 | | | | 2-1-2027 | | | | 50,956 | | | | 54,084 | |
FNMA | | | 8.50 | | | | 6-1-2030 | | | | 66,508 | | | | 70,503 | |
FNMA | | | 8.51 | | | | 8-1-2024 | | | | 82,330 | | | | 87,199 | |
FNMA | | | 9.00 | | | | 7-1-2030 | | | | 15,319 | | | | 15,395 | |
FNMA ± | | | 9.10 | | | | 10-1-2024 | | | | 524 | | | | 496 | |
FNMA | | | 9.50 | | | | 8-1-2021 | | | | 39,573 | | | | 42,286 | |
FNMA | | | 9.50 | | | | 12-1-2024 | | | | 29,022 | | | | 29,634 | |
FNMA | | | 10.00 | | | | 1-1-2021 | | | | 25,720 | | | | 26,501 | |
FNMA | | | 11.00 | | | | 1-1-2018 | | | | 9,459 | | | | 10,496 | |
FNMA | | | 12.50 | | | | 7-1-2015 | | | | 127 | | | | 128 | |
FNMA Series 1989-74 Class J | | | 9.80 | | | | 10-25-2019 | | | | 23,945 | | | | 27,469 | |
FNMA Series 1989-96 Class H | | | 9.00 | | | | 12-25-2019 | | | | 13,526 | | | | 15,176 | |
FNMA Series 1992-39 Class FA ± | | | 2.18 | | | | 3-25-2022 | | | | 273,617 | | | | 288,501 | |
FNMA Series 1992-45 Class F ± | | | 2.18 | | | | 4-25-2022 | | | | 49,089 | | | | 51,548 | |
FNMA Series 1992-87 Class Z | | | 8.00 | | | | 5-25-2022 | | | | 30,835 | | | | 35,032 | |
FNMA Series 1993-113 Class FA ± | | | 2.10 | | | | 7-25-2023 | | | | 193,877 | | | | 202,396 | |
FNMA Series 1994-14 Class F ± | | | 2.38 | | | | 10-25-2023 | | | | 427,887 | | | | 444,221 | |
FNMA Series 1998-T2 Class A5 ± | | | 2.35 | | | | 1-25-2032 | | | | 952,531 | | | | 975,302 | |
FNMA Series 2001-50 Class BA | | | 7.00 | | | | 10-25-2041 | | | | 322,335 | | | | 371,209 | |
FNMA Series 2001-63 Class FD ± | | | 0.75 | | | | 12-18-2031 | | | | 229,539 | | | | 232,658 | |
| | | | |
| 16 | | Wells Fargo Advantage Adjustable Rate Government Fund | | Portfolio of investments—February 28, 2014 (unaudited) |
| | | | | | | | | | | | | | | | |
| Security name | | Interest rate | | | Maturity date | | | Principal | | | Value | |
| | | | | | | | | | | | | | | | |
| | | | |
Agency Securities (continued) | | | | | | | | | | | | | | | | |
FNMA Series 2001-81 Class F ± | | | 0.71 | % | | | 1-25-2032 | | | $ | 154,391 | | | $ | 156,284 | |
FNMA Series 2001-T08 Class A1 | | | 7.50 | | | | 7-25-2041 | | | | 220,856 | | | | 258,876 | |
FNMA Series 2001-T10 Class A2 | | | 7.50 | | | | 12-25-2041 | | | | 4,946,993 | | | | 5,748,589 | |
FNMA Series 2001-T12 Class A2 | | | 7.50 | | | | 8-25-2041 | | | | 359,550 | | | | 425,039 | |
FNMA Series 2001-T12 Class A4 ± | | | 3.38 | | | | 8-25-2041 | | | | 9,069,591 | | | | 9,245,042 | |
FNMA Series 2001-W03 Class A ± | | | 7.00 | | | | 9-25-2041 | | | | 1,152,839 | | | | 1,330,015 | |
FNMA Series 2002-05 Class FD ± | | | 1.06 | | | | 2-25-2032 | | | | 431,696 | | | | 441,885 | |
FNMA Series 2002-66 Class A3 ± | | | 3.09 | | | | 4-25-2042 | | | | 12,487,158 | | | | 12,825,023 | |
FNMA Series 2002-T12 Class A3 | | | 7.50 | | | | 5-25-2042 | | | | 1,591,813 | | | | 1,877,303 | |
FNMA Series 2002-T12 Class A5 ± | | | 3.44 | | | | 10-25-2041 | | | | 2,966,020 | | | | 3,083,133 | |
FNMA Series 2002-T18 Class A5 ± | | | 3.53 | | | | 5-25-2042 | | | | 868,861 | | | | 912,840 | |
FNMA Series 2002-T19 Class A4 ± | | | 3.32 | | | | 3-25-2042 | | | | 181,756 | | | | 189,125 | |
FNMA Series 2002-W1 Class 3A ± | | | 3.15 | | | | 4-25-2042 | | | | 2,132,180 | | | | 2,173,511 | |
FNMA Series 2002-W4 Class A6 ± | | | 3.33 | | | | 5-25-2042 | | | | 3,295,452 | | | | 3,473,090 | |
FNMA Series 2003-07 Class A2 ± | | | 2.41 | | | | 5-25-2042 | | | | 1,486,249 | | | | 1,560,492 | |
FNMA Series 2003-63 Class A8 ± | | | 2.64 | | | | 1-25-2043 | | | | 1,993,735 | | | | 2,034,016 | |
FNMA Series 2003-W02 Class 1A3 | | | 7.50 | | | | 7-25-2042 | | | | 519,197 | | | | 613,703 | |
FNMA Series 2003-W04 Class 5A ± | | | 3.13 | | | | 10-25-2042 | | | | 1,923,316 | | | | 1,987,385 | |
FNMA Series 2003-W08 Class 4A ± | | | 3.13 | | | | 11-25-2042 | | | | 2,416,824 | | | | 2,518,229 | |
FNMA Series 2003-W10 Class 2A ± | | | 3.07 | | | | 6-25-2043 | | | | 4,709,416 | | | | 4,949,280 | |
FNMA Series 2003-W18 Class 2A ± | | | 3.35 | | | | 6-25-2043 | | | | 17,120,777 | | | | 17,908,641 | |
FNMA Series 2004-T3 Class 1A3 | | | 7.00 | | | | 2-25-2044 | | | | 807,506 | | | | 919,656 | |
FNMA Series 2004-T3 Class 2A ± | | | 3.13 | | | | 8-25-2043 | | | | 2,797,745 | | | | 2,951,492 | |
FNMA Series 2004-T9 Class A1 ± | | | 0.29 | | | | 4-25-2035 | | | | 178,826 | | | | 177,555 | |
FNMA Series 2004-W02 Class 5A | | | 7.50 | | | | 3-25-2044 | | | | 323,641 | | | | 380,976 | |
FNMA Series 2004-W1 Class 2A2 | | | 7.00 | | | | 12-25-2033 | | | | 443,445 | | | | 513,468 | |
FNMA Series 2004-W1 Class 3A ± | | | 3.28 | | | | 1-25-2043 | | | | 144,346 | | | | 153,454 | |
FNMA Series 2004-W12 Class 2A ± | | | 3.36 | | | | 6-25-2044 | | | | 8,661,849 | | | | 9,226,341 | |
FNMA Series 2004-W15 Class 3A ± | | | 2.67 | | | | 6-25-2044 | | | | 11,345,918 | | | | 11,989,788 | |
FNMA Series 2005-W3 Class 3A ± | | | 2.69 | | | | 4-25-2045 | | | | 2,228,313 | | | | 2,372,645 | |
FNMA Series 2006-W1 Class 3A ± | | | 2.15 | | | | 10-25-2045 | | | | 12,364,158 | | | | 13,040,811 | |
FNMA Series 2009-95 Class AY | | | 4.00 | | | | 6-25-2023 | | | | 2,185 | | | | 2,185 | |
FNMA Series 2010-M3 Class A1 | | | 2.59 | | | | 3-25-2020 | | | | 59,170 | | | | 59,634 | |
FNMA Series G92-20 Class FB ± | | | 2.18 | | | | 4-25-2022 | | | | 167,161 | | | | 166,272 | |
FNMA Series G93-1 Class K | | | 6.68 | | | | 1-25-2023 | | | | 817,335 | | | | 914,820 | |
FNMA Series G93-19 Class FD ± | | | 2.10 | | | | 4-25-2023 | | | | 734,487 | | | | 768,307 | |
GNMA ± | | | 1.63 | | | | 2-20-2017 | | | | 11,302 | | | | 11,383 | |
GNMA ± | | | 1.63 | | | | 3-20-2017 | | | | 14,533 | | | | 15,116 | |
GNMA ± | | | 1.63 | | | | 5-20-2017 | | | | 34,127 | | | | 35,430 | |
GNMA ± | | | 1.63 | | | | 5-20-2017 | | | | 15,818 | | | | 16,423 | |
GNMA ± | | | 1.63 | | | | 6-20-2017 | | | | 3,389 | | | | 3,519 | |
GNMA ± | | | 1.63 | | | | 9-20-2017 | | | | 23,598 | | | | 24,297 | |
GNMA ± | | | 1.63 | | | | 9-20-2017 | | | | 2,035 | | | | 2,115 | |
GNMA ± | | | 1.63 | | | | 6-20-2021 | | | | 67,199 | | | | 69,805 | |
GNMA ± | | | 1.63 | | | | 8-20-2021 | | | | 24,397 | | | | 25,369 | |
GNMA ± | | | 1.63 | | | | 8-20-2021 | | | | 52,430 | | | | 54,519 | |
GNMA ± | | | 1.63 | | | | 12-20-2021 | | | | 10,778 | | | | 11,238 | |
GNMA ± | | | 1.63 | | | | 1-20-2022 | | | | 120,908 | | | | 125,847 | |
GNMA ± | | | 1.63 | | | | 2-20-2022 | | | | 46,342 | | | | 47,922 | |
GNMA ± | | | 1.63 | | | | 2-20-2022 | | | | 108,553 | | | | 112,989 | |
| | | | | | |
| Portfolio of investments—February 28, 2014 (unaudited) | | Wells Fargo Advantage Adjustable Rate Government Fund | | | 17 | |
| | | | | | | | | | | | | | | | |
| Security name | | Interest rate | | | Maturity date | | | Principal | | | Value | |
| | | | | | | | | | | | | | | | |
| | | | |
Agency Securities (continued) | | | | | | | | | | | | | | | | |
GNMA ± | | | 1.63 | % | | | 2-20-2022 | | | $ | 7,037 | | | $ | 7,325 | |
GNMA ± | | | 1.63 | | | | 3-20-2022 | | | | 130,983 | | | | 136,335 | |
GNMA ± | | | 1.63 | | | | 3-20-2022 | | | | 220,291 | | | | 229,292 | |
GNMA ± | | | 1.63 | | | | 4-20-2022 | | | | 351,224 | | | | 364,860 | |
GNMA ± | | | 1.63 | | | | 4-20-2022 | | | | 342,510 | | | | 355,807 | |
GNMA ± | | | 1.63 | | | | 5-20-2022 | | | | 33,131 | | | | 34,418 | |
GNMA ± | | | 1.63 | | | | 5-20-2022 | | | | 327,362 | | | | 340,073 | |
GNMA ± | | | 1.63 | | | | 5-20-2022 | | | | 90,149 | | | | 93,649 | |
GNMA ± | | | 1.63 | | | | 6-20-2022 | | | | 27,163 | | | | 28,218 | |
GNMA ± | | | 1.63 | | | | 7-20-2022 | | | | 13,261 | | | | 13,789 | |
GNMA ± | | | 1.63 | | | | 9-20-2022 | | | | 113,402 | | | | 113,619 | |
GNMA ± | | | 1.63 | | | | 9-20-2022 | | | | 51,370 | | | | 53,419 | |
GNMA ± | | | 1.63 | | | | 9-20-2022 | | | | 11,407 | | | | 11,862 | |
GNMA ± | | | 1.63 | | | | 10-20-2022 | | | | 38,286 | | | | 39,921 | |
GNMA ± | | | 1.63 | | | | 10-20-2022 | | | | 134,330 | | | | 140,066 | |
GNMA ± | | | 1.63 | | | | 11-20-2022 | | | | 84,027 | | | | 87,615 | |
GNMA ± | | | 1.63 | | | | 11-20-2022 | | | | 105,639 | | | | 110,150 | |
GNMA ± | | | 1.63 | | | | 12-20-2022 | | | | 31,202 | | | | 32,534 | |
GNMA ± | | | 1.63 | | | | 12-20-2022 | | | | 421,088 | | | | 439,071 | |
GNMA ± | | | 1.63 | | | | 12-20-2022 | | | | 8,439 | | | | 8,799 | |
GNMA ± | | | 1.63 | | | | 1-20-2023 | | | | 944,705 | | | | 983,345 | |
GNMA ± | | | 1.63 | | | | 1-20-2023 | | | | 67,019 | | | | 69,760 | |
GNMA ± | | | 1.63 | | | | 2-20-2023 | | | | 84,927 | | | | 88,401 | |
GNMA ± | | | 1.63 | | | | 2-20-2023 | | | | 47,408 | | | | 49,348 | |
GNMA ± | | | 1.63 | | | | 2-20-2023 | | | | 87,131 | | | | 90,695 | |
GNMA ± | | | 1.63 | | | | 3-20-2023 | | | | 90,052 | | | | 93,736 | |
GNMA ± | | | 1.63 | | | | 4-20-2023 | | | | 14,794 | | | | 15,369 | |
GNMA ± | | | 1.63 | | | | 4-20-2023 | | | | 35,986 | | | | 37,385 | |
GNMA ± | | | 1.63 | | | | 5-20-2023 | | | | 13,332 | | | | 13,850 | |
GNMA ± | | | 1.63 | | | | 5-20-2023 | | | | 31,300 | | | | 31,953 | |
GNMA ± | | | 1.63 | | | | 6-20-2023 | | | | 336,348 | | | | 349,424 | |
GNMA ± | | | 1.63 | | | | 6-20-2023 | | | | 147,389 | | | | 153,118 | |
GNMA ± | | | 1.63 | | | | 7-20-2023 | | | | 4,940 | | | | 5,138 | |
GNMA ± | | | 1.63 | | | | 9-20-2023 | | | | 449,894 | | | | 467,859 | |
GNMA ± | | | 1.63 | | | | 9-20-2023 | | | | 97,936 | | | | 101,846 | |
GNMA ± | | | 1.63 | | | | 9-20-2023 | | | | 388,528 | | | | 404,042 | |
GNMA ± | | | 1.63 | | | | 10-20-2023 | | | | 961,057 | | | | 1,002,135 | |
GNMA ± | | | 1.63 | | | | 11-20-2023 | | | | 703,724 | | | | 733,805 | |
GNMA ± | | | 1.63 | | | | 11-20-2023 | | | | 684,442 | | | | 713,698 | |
GNMA ± | | | 1.63 | | | | 12-20-2023 | | | | 31,440 | | | | 32,784 | |
GNMA ± | | | 1.63 | | | | 12-20-2023 | | | | 123,429 | | | | 128,705 | |
GNMA ± | | | 1.63 | | | | 12-20-2023 | | | | 913,545 | | | | 952,595 | |
GNMA ± | | | 1.63 | | | | 4-20-2024 | | | | 47,276 | | | | 49,115 | |
GNMA ± | | | 1.63 | | | | 4-20-2024 | | | | 263,499 | | | | 273,750 | |
GNMA ± | | | 1.63 | | | | 5-20-2024 | | | | 222,224 | | | | 230,870 | |
GNMA ± | | | 1.63 | | | | 5-20-2024 | | | | 20,071 | | | | 20,852 | |
GNMA ± | | | 1.63 | | | | 6-20-2024 | | | | 24,403 | | | | 25,352 | |
GNMA ± | | | 1.63 | | | | 6-20-2024 | | | | 35,884 | | | | 37,280 | |
GNMA ± | | | 1.63 | | | | 6-20-2024 | | | | 127,959 | | | | 132,937 | |
GNMA ± | | | 1.63 | | | | 7-20-2024 | | | | 87,961 | | | | 91,476 | |
| | | | |
| 18 | | Wells Fargo Advantage Adjustable Rate Government Fund | | Portfolio of investments—February 28, 2014 (unaudited) |
| | | | | | | | | | | | | | | | |
| Security name | | Interest rate | | | Maturity date | | | Principal | | | Value | |
| | | | | | | | | | | | | | | | |
| | | | |
Agency Securities (continued) | | | | | | | | | | | | | | | | |
GNMA ± | | | 1.63 | % | | | 7-20-2024 | | | $ | 660,507 | | | $ | 686,900 | |
GNMA ± | | | 1.63 | | | | 8-20-2024 | | | | 43,640 | | | | 45,384 | |
GNMA ± | | | 1.63 | | | | 11-20-2024 | | | | 114,130 | | | | 119,012 | |
GNMA ± | | | 1.63 | | | | 4-20-2025 | | | | 138,530 | | | | 143,924 | |
GNMA ± | | | 1.63 | | | | 9-20-2025 | | | | 184,138 | | | | 191,504 | |
GNMA ± | | | 1.63 | | | | 10-20-2025 | | | | 672,653 | | | | 701,453 | |
GNMA ± | | | 1.63 | | | | 1-20-2026 | | | | 732,050 | | | | 762,071 | |
GNMA ± | | | 1.63 | | | | 2-20-2026 | | | | 568,952 | | | | 592,286 | |
GNMA ± | | | 1.63 | | | | 10-20-2026 | | | | 125,727 | | | | 131,113 | |
GNMA ± | | | 1.63 | | | | 1-20-2027 | | | | 261,131 | | | | 271,847 | |
GNMA ± | | | 1.63 | | | | 1-20-2027 | | | | 10,151 | | | | 10,459 | |
GNMA ± | | | 1.63 | | | | 5-20-2027 | | | | 27,060 | | | | 28,115 | |
GNMA ± | | | 1.63 | | | | 8-20-2027 | | | | 21,677 | | | | 22,512 | |
GNMA ± | | | 1.63 | | | | 9-20-2027 | | | | 3,871 | | | | 4,026 | |
GNMA ± | | | 1.63 | | | | 10-20-2027 | | | | 7,882 | | | | 8,220 | |
GNMA ± | | | 1.63 | | | | 1-20-2028 | | | | 8,690 | | | | 9,047 | |
GNMA ± | | | 1.63 | | | | 12-20-2029 | | | | 238,112 | | | | 248,326 | |
GNMA ± | | | 1.63 | | | | 1-20-2030 | | | | 132,499 | | | | 137,942 | |
GNMA ± | | | 1.63 | | | | 10-20-2030 | | | | 167,328 | | | | 174,508 | |
GNMA ± | | | 1.63 | | | | 11-20-2031 | | | | 6,157 | | | | 6,345 | |
GNMA ± | | | 1.63 | | | | 4-20-2032 | | | | 80,878 | | | | 84,037 | |
GNMA ± | | | 1.63 | | | | 5-20-2032 | | | | 218,634 | | | | 227,172 | |
GNMA ± | | | 1.63 | | | | 6-20-2032 | | | | 472,709 | | | | 491,170 | |
GNMA ± | | | 1.63 | | | | 11-20-2032 | | | | 559,163 | | | | 583,168 | |
GNMA ± | | | 1.63 | | | | 2-20-2033 | | | | 4,263 | | | | 4,438 | |
GNMA ± | | | 1.63 | | | | 3-20-2033 | | | | 48,683 | | | | 50,685 | |
GNMA ± | | | 2.00 | | | | 1-20-2017 | | | | 8,511 | | | | 8,849 | |
GNMA ± | | | 2.00 | | | | 2-20-2017 | | | | 46,352 | | | | 48,197 | |
GNMA ± | | | 2.00 | | | | 3-20-2017 | | | | 8,021 | | | | 8,340 | |
GNMA ± | | | 2.00 | | | | 9-20-2017 | | | | 2,939 | | | | 3,066 | |
GNMA ± | | | 2.00 | | | | 7-20-2018 | | | | 481 | | | | 501 | |
GNMA ± | | | 2.00 | | | | 8-20-2018 | | | | 7,221 | | | | 7,536 | |
GNMA ± | | | 2.00 | | | | 1-20-2021 | | | | 22,730 | | | | 23,650 | |
GNMA ± | | | 2.00 | | | | 2-20-2021 | | | | 54,000 | | | | 56,187 | |
GNMA ± | | | 2.00 | | | | 8-20-2021 | | | | 11,536 | | | | 12,042 | |
GNMA ± | | | 2.00 | | | | 10-20-2021 | | | | 247,261 | | | | 258,113 | |
GNMA ± | | | 2.00 | | | | 11-20-2021 | | | | 31,510 | | | | 32,894 | |
GNMA ± | | | 2.00 | | | | 2-20-2022 | | | | 4,987 | | | | 5,189 | |
GNMA ± | | | 2.00 | | | | 3-20-2022 | | | | 42,246 | | | | 43,960 | |
GNMA ± | | | 2.00 | | | | 5-20-2022 | | | | 20,419 | | | | 21,367 | |
GNMA ± | | | 2.00 | | | | 7-20-2022 | | | | 7,098 | | | | 7,410 | |
GNMA ± | | | 2.00 | | | | 12-20-2022 | | | | 71,490 | | | | 74,632 | |
GNMA ± | | | 2.00 | | | | 2-20-2023 | | | | 5,834 | | | | 6,071 | |
GNMA ± | | | 2.00 | | | | 10-20-2024 | | | | 1,200,675 | | | | 1,253,537 | |
GNMA ± | | | 2.00 | | | | 11-20-2024 | | | | 578,886 | | | | 604,374 | |
GNMA ± | | | 2.00 | | | | 7-20-2025 | | | | 8,109 | | | | 8,467 | |
GNMA ± | | | 2.00 | | | | 9-20-2026 | | | | 121,152 | | | | 126,495 | |
GNMA ± | | | 2.00 | | | | 11-20-2026 | | | | 10,659 | | | | 11,128 | |
GNMA ± | | | 2.00 | | | | 2-20-2027 | | | | 7,536 | | | | 7,843 | |
GNMA ± | | | 2.00 | | | | 7-20-2027 | | | | 2,869 | | | | 2,995 | |
| | | | | | |
| Portfolio of investments—February 28, 2014 (unaudited) | | Wells Fargo Advantage Adjustable Rate Government Fund | | | 19 | |
| | | | | | | | | | | | | | | | |
| Security name | | Interest rate | | | Maturity date | | | Principal | | | Value | |
| | | | | | | | | | | | | | | | |
| | | | |
Agency Securities (continued) | | | | | | | | | | | | | | | | |
GNMA ± | | | 2.00 | % | | | 8-20-2027 | | | $ | 4,578 | | | $ | 4,780 | |
GNMA ± | | | 2.00 | | | | 11-20-2027 | | | | 6,713 | | | | 6,874 | |
GNMA ± | | | 2.06 | | | | 8-20-2062 | | | | 8,685,894 | | | | 9,156,521 | |
GNMA ± | | | 2.07 | | | | 9-20-2062 | | | | 2,693,790 | | | | 2,844,383 | |
GNMA ± | | | 2.13 | | | | 1-20-2022 | | | | 4,614 | | | | 4,806 | |
GNMA ± | | | 2.13 | | | | 7-20-2022 | | | | 5,236 | | | | 5,468 | |
GNMA ± | | | 2.13 | | | | 7-20-2022 | | | | 6,584 | | | | 6,876 | |
GNMA ± | | | 2.50 | | | | 7-20-2016 | | | | 9,961 | | | | 10,402 | |
GNMA ± | | | 2.50 | | | | 8-20-2017 | | | | 15,482 | | | | 16,176 | |
GNMA ± | | | 2.50 | | | | 10-20-2017 | | | | 6,872 | | | | 7,216 | |
GNMA ± | | | 2.50 | | | | 11-20-2017 | | | | 14,400 | | | | 15,120 | |
GNMA ± | | | 2.50 | | | | 12-20-2017 | | | | 15,447 | | | | 16,221 | |
GNMA ± | | | 2.50 | | | | 7-20-2018 | | | | 41,960 | | | | 43,851 | |
GNMA ± | | | 2.50 | | | | 8-20-2018 | | | | 16,887 | | | | 17,649 | |
GNMA ± | | | 2.50 | | | | 3-20-2019 | | | | 2,767 | | | | 2,889 | |
GNMA ± | | | 2.50 | | | | 11-20-2020 | | | | 17,930 | | | | 18,838 | |
GNMA ± | | | 2.50 | | | | 12-20-2020 | | | | 12,314 | | | | 12,938 | |
GNMA ± | | | 2.50 | | | | 5-20-2021 | | | | 11,790 | | | | 12,338 | |
GNMA ± | | | 2.50 | | | | 12-20-2021 | | | | 30,005 | | | | 31,050 | |
GNMA ± | | | 2.50 | | | | 7-20-2022 | | | | 7,335 | | | | 7,669 | |
GNMA ± | | | 2.50 | | | | 7-20-2024 | | | | 318,339 | | | | 332,850 | |
GNMA ± | | | 2.50 | | | | 8-20-2024 | | | | 58,575 | | | | 61,245 | |
GNMA ± | | | 2.50 | | | | 10-20-2024 | | | | 558,308 | | | | 586,696 | |
GNMA ± | | | 2.50 | | | | 12-20-2024 | | | | 399,450 | | | | 419,762 | |
GNMA ± | | | 2.50 | | | | 4-20-2025 | | | | 5,843 | | | | 6,116 | |
GNMA ± | | | 2.75 | | | | 10-20-2017 | | | | 38,350 | | | | 40,141 | |
GNMA ± | | | 3.00 | | | | 2-20-2016 | | | | 6,240 | | | | 6,338 | |
GNMA ± | | | 3.00 | | | | 3-20-2016 | | | | 12,542 | | | | 12,787 | |
GNMA ± | | | 3.00 | | | | 4-20-2016 | | | | 11,041 | | | | 11,399 | |
GNMA ± | | | 3.00 | | | | 5-20-2016 | | | | 965 | | | | 996 | |
GNMA ± | | | 3.00 | | | | 7-20-2017 | | | | 7,924 | | | | 8,189 | |
GNMA ± | | | 3.00 | | | | 8-20-2017 | | | | 82,974 | | | | 86,279 | |
GNMA ± | | | 3.00 | | | | 8-20-2017 | | | | 6,717 | | | | 6,939 | |
GNMA ± | | | 3.00 | | | | 9-20-2017 | | | | 87,289 | | | | 90,768 | |
GNMA ± | | | 3.00 | | | | 11-20-2017 | | | | 16,997 | | | | 17,692 | |
GNMA ± | | | 3.00 | | | | 12-20-2017 | | | | 107,510 | | | | 111,906 | |
GNMA ± | | | 3.00 | | | | 1-20-2018 | | | | 29,048 | | | | 30,486 | |
GNMA ± | | | 3.00 | | | | 6-20-2018 | | | | 6,611 | | | | 6,864 | |
GNMA ± | | | 3.00 | | | | 11-20-2018 | | | | 3,999 | | | | 4,179 | |
GNMA ± | | | 3.00 | | | | 12-20-2018 | | | | 978 | | | | 1,022 | |
GNMA ± | | | 3.00 | | | | 1-20-2019 | | | | 3,143 | | | | 3,299 | |
GNMA ± | | | 3.00 | | | | 2-20-2019 | | | | 7,250 | | | | 7,611 | |
GNMA ± | | | 3.00 | | | | 3-20-2019 | | | | 10,463 | | | | 10,984 | |
GNMA ± | | | 3.00 | | | | 5-20-2019 | | | | 17,484 | | | | 18,156 | |
GNMA ± | | | 3.00 | | | | 6-20-2019 | | | | 37,421 | | | | 38,859 | |
GNMA ± | | | 3.00 | | | | 8-20-2019 | | | | 13,238 | | | | 13,687 | |
GNMA ± | | | 3.00 | | | | 6-20-2020 | | | | 8,429 | | | | 8,754 | |
GNMA ± | | | 3.00 | | | | 1-20-2021 | | | | 260 | | | | 273 | |
GNMA ± | | | 3.00 | | | | 2-20-2021 | | | | 366 | | | | 384 | |
GNMA ± | | | 3.50 | | | | 9-20-2017 | | | | 14,987 | | | | 15,770 | |
| | | | |
| 20 | | Wells Fargo Advantage Adjustable Rate Government Fund | | Portfolio of investments—February 28, 2014 (unaudited) |
| | | | | | | | | | | | | | | | |
| Security name | | Interest rate | | | Maturity date | | | Principal | | | Value | |
| | | | | | | | | | | | | | | | |
| | | | |
Agency Securities (continued) | | | | | | | | | | | | | | | | |
GNMA ± | | | 3.50 | % | | | 10-20-2017 | | | $ | 257 | | | $ | 259 | |
GNMA ± | | | 3.50 | | | | 11-20-2017 | | | | 38,433 | | | | 40,473 | |
GNMA ± | | | 3.50 | | | | 2-20-2018 | | | | 29,182 | | | | 30,714 | |
GNMA ± | | | 3.50 | | | | 3-20-2018 | | | | 3,589 | | | | 3,777 | |
GNMA ± | | | 3.50 | | | | 4-20-2018 | | | | 5,804 | | | | 6,117 | |
GNMA ± | | | 3.50 | | | | 5-20-2018 | | | | 1,324 | | | | 1,338 | |
GNMA ± | | | 3.50 | | | | 9-20-2018 | | | | 4,425 | | | | 4,657 | |
GNMA ± | | | 3.50 | | | | 2-20-2019 | | | | 25,232 | | | | 26,561 | |
GNMA ± | | | 3.50 | | | | 9-20-2019 | | | | 35,900 | | | | 37,790 | |
GNMA ± | | | 3.50 | | | | 1-20-2020 | | | | 12,100 | | | | 12,664 | |
GNMA ± | | | 4.00 | | | | 1-20-2016 | | | | 96,053 | | | | 101,276 | |
GNMA ± | | | 4.00 | | | | 3-20-2016 | | | | 17,588 | | | | 18,546 | |
GNMA ± | | | 4.00 | | | | 4-20-2016 | | | | 2,321 | | | | 2,441 | |
GNMA ± | | | 4.00 | | | | 5-20-2016 | | | | 328 | | | | 344 | |
GNMA ± | | | 4.00 | | | | 11-20-2017 | | | | 16,155 | | | | 17,040 | |
GNMA ± | | | 4.00 | | | | 4-20-2018 | | | | 10,530 | | | | 11,060 | |
GNMA ± | | | 4.00 | | | | 11-20-2018 | | | | 60,973 | | | | 64,342 | |
GNMA ± | | | 4.00 | | | | 1-20-2019 | | | | 84,723 | | | | 86,250 | |
GNMA ± | | | 4.00 | | | | 5-20-2019 | | | | 4,468 | | | | 4,693 | |
GNMA ± | | | 4.50 | | | | 12-20-2017 | | | | 2,808 | | | | 2,987 | |
GNMA ± | | | 5.00 | | | | 8-20-2015 | | | | 2,288 | | | | 2,378 | |
GNMA ± | | | 5.00 | | | | 9-20-2015 | | | | 3,827 | | | | 3,995 | |
GNMA ± | | | 5.00 | | | | 10-20-2015 | | | | 4,030 | | | | 4,212 | |
GNMA | | | 6.45 | | | | 4-20-2025 | | | | 76,008 | | | | 84,936 | |
GNMA | | | 6.45 | | | | 5-20-2025 | | | | 34,926 | | | | 37,934 | |
GNMA | | | 6.45 | | | | 9-20-2025 | | | | 50,257 | | | | 57,959 | |
GNMA | | | 6.50 | | | | 6-20-2034 | | | | 84,827 | | | | 88,771 | |
GNMA | | | 6.50 | | | | 8-20-2034 | | | | 1,079,523 | | | | 1,287,573 | |
GNMA | | | 6.50 | | | | 8-20-2034 | | | | 122,098 | | | | 130,098 | |
GNMA | | | 6.75 | | | | 2-15-2029 | | | | 135,760 | | | | 153,254 | |
GNMA | | | 7.00 | | | | 7-20-2034 | | | | 67,206 | | | | 77,443 | |
GNMA | | | 7.25 | | | | 7-15-2017 | | | | 15,736 | | | | 15,976 | |
GNMA | | | 7.25 | | | | 8-15-2017 | | | | 35,779 | | | | 37,952 | |
GNMA | | | 7.25 | | | | 8-15-2017 | | | | 18,225 | | | | 18,558 | |
GNMA | | | 7.25 | | | | 9-15-2017 | | | | 27,674 | | | | 29,444 | |
GNMA | | | 7.25 | | | | 10-15-2017 | | | | 48,813 | | | | 51,724 | |
GNMA | | | 7.25 | | | | 10-15-2017 | | | | 23,749 | | | | 25,122 | |
GNMA | | | 7.25 | | | | 11-15-2017 | | | | 20,618 | | | | 21,622 | |
GNMA | | | 7.25 | | | | 1-15-2018 | | | | 8,083 | | | | 8,116 | |
GNMA | | | 7.25 | | | | 1-15-2018 | | | | 10,677 | | | | 10,720 | |
GNMA | | | 7.25 | | | | 2-15-2018 | | | | 21,079 | | | | 21,581 | |
GNMA | | | 7.25 | | | | 5-15-2018 | | | | 11,215 | | | | 11,261 | |
GNMA | | | 9.00 | | | | 5-15-2016 | | | | 5,963 | | | | 5,994 | |
GNMA | | | 9.00 | | | | 7-15-2016 | | | | 625 | | | | 628 | |
GNMA | | | 9.00 | | | | 8-15-2016 | | | | 8,452 | | | | 8,497 | |
GNMA | | | 9.00 | | | | 11-15-2016 | | | | 5,154 | | | | 5,182 | |
GNMA | | | 9.00 | | | | 11-15-2016 | | | | 3,224 | | | | 3,399 | |
GNMA | | | 9.00 | | | | 12-15-2016 | | | | 202 | | | | 203 | |
GNMA | | | 9.00 | | | | 2-15-2017 | | | | 5,567 | | | | 5,931 | |
GNMA | | | 9.00 | | | | 5-15-2017 | | | | 1,020 | | | | 1,025 | |
| | | | | | |
| Portfolio of investments—February 28, 2014 (unaudited) | | Wells Fargo Advantage Adjustable Rate Government Fund | | | 21 | |
| | | | | | | | | | | | | | | | |
| Security name | | Interest rate | | | Maturity date | | | Principal | | | Value | |
| | | | | | | | | | | | | | | | |
| | | | |
Agency Securities (continued) | | | | | | | | | | | | | | | | |
GNMA | | | 9.00 | % | | | 7-15-2017 | | | $ | 8,436 | | | $ | 8,482 | |
GNMA | | | 9.00 | | | | 3-15-2020 | | | | 4,149 | | | | 4,293 | |
GNMA | | | 9.00 | | | | 8-15-2021 | | | | 705 | | | | 709 | |
GNMA | | | 9.00 | | | | 7-20-2024 | | | | 1,055 | | | | 1,087 | |
GNMA | | | 9.00 | | | | 8-20-2024 | | | | 445 | | | | 504 | |
GNMA | | | 9.00 | | | | 9-20-2024 | | | | 2,583 | | | | 2,983 | |
GNMA | | | 9.00 | | | | 10-20-2024 | | | | 10,591 | | | | 11,844 | |
GNMA | | | 9.00 | | | | 11-20-2024 | | | | 582 | | | | 634 | |
GNMA | | | 9.00 | | | | 1-20-2025 | | | | 8,777 | | | | 10,224 | |
GNMA | | | 9.00 | | | | 2-20-2025 | | | | 25,141 | | | | 29,042 | |
GNMA Series 2011-H12 Class FA ± | | | 0.66 | | | | 2-20-2061 | | | | 3,406,369 | | | | 3,391,221 | |
GNMA Series 2011-H17 Class FA ± | | | 0.70 | | | | 6-20-2061 | | | | 1,857,225 | | | | 1,852,270 | |
SBA ± | | | 4.01 | | | | 9-25-2037 | | | | 12,752,064 | | | | 14,658,541 | |
| Total Agency Securities (Cost $1,465,657,494) | | | | | | | | | | | | | | | 1,492,184,255 | |
| | | | | | | | | | | | | | | | |
| | | | |
| | | Yield | | | | | | Shares | | | | |
| Short-Term Investments: 2.60% | | | | | | | | | | | | | | | | |
| | | | |
| Investment Companies: 2.54% | | | | | | | | | | | | | | | | |
Wells Fargo Advantage Government Money
Market Fund, Institutional Class (l)(u) | | | 0.01 | | | | | | | | 39,291,402 | | | | 39,291,402 | |
| | | | | | | | | | | | | | | | |
| | | | |
| | | | | | | | | Principal | | | | |
| U.S. Treasury Securities: 0.06% | | | | | | | | | | | | | | | | |
U.S. Treasury Bill #(z) | | | 0.03 | | | | 3-20-2014 | | | $ | 900,000 | | | | 899,987 | |
| | | | | | | | | | | | | | | | |
| | | | |
Total Short-Term Investments (Cost $40,191,376) | | | | | | | | | | | | | | | 40,191,389 | |
| | | | | | | | | | | | | | | | |
| | | | | | | | |
Total investments in securities (Cost $1,505,848,870) * | | | 99.33 | % | | | 1,532,375,644 | |
Other assets and liabilities, net | | | 0.67 | | | | 10,264,945 | |
| | | | | | | | |
| Total net assets | | | 100.00 | % | | $ | 1,542,640,589 | |
| | | | | | | | |
| ± | Variable rate investment. The rate shown is the rate in effect at period end. |
| (c) | Interest-only securities entitle holders to receive only the interest payments on the underlying mortgages. The principal amount shown is the notional amount of the underlying mortgages. Interest rate disclosed represents the coupon rate. |
| (l) | Investment in an affiliate |
| (u) | Rate shown is the 7-day annualized yield at period end. |
| # | All or a portion of this security is segregated as collateral for investments in derivative instruments. |
| (z) | Zero coupon security. Rate represents the current yield to maturity. |
| * | Cost for federal income tax purposes is $1,506,813,578 and unrealized appreciation (depreciation) consists of: |
| | | | |
Gross unrealized appreciation | | $ | 27,480,767 | |
Gross unrealized depreciation | | | (1,918,701 | ) |
| | | | |
Net unrealized appreciation | | $ | 25,562,066 | |
| | | | | | |
| Portfolio of investments—February 28, 2014 (unaudited) | | Wells Fargo Advantage Government Securities Fund | | | 1 | |
| | | | | | | | | | | | | | | | |
| Security name | | Interest rate | | | Maturity date | | | Principal | | | Value | |
| | | | | | | | | | | | | | | | |
| | | | |
Agency Securities: 66.43% | | | | | | | | | | | | | | | | |
FDIC Series 2010-S1 Class 1A ±144A | | | 0.71 | % | | | 2-25-2048 | | | $ | 9,668,791 | | | $ | 9,708,172 | |
FDIC Series 2013-R1 Class A 144A | | | 1.15 | | | | 3-25-2033 | | | | 6,581,242 | | | | 6,394,135 | |
FHLB | | | 5.63 | | | | 3-14-2036 | | | | 6,150,000 | | | | 7,551,616 | |
FHLMC ± | | | 0.59 | | | | 11-15-2033 | | | | 1,658,032 | | | | 1,659,561 | |
FHLMC ± | | | 2.26 | | | | 10-1-2026 | | | | 247,899 | | | | 264,680 | |
FHLMC | | | 2.38 | | | | 1-13-2022 | | | | 10,415,000 | | | | 10,263,639 | |
FHLMC ± | | | 2.38 | | | | 6-1-2032 | | | | 98,824 | | | | 104,054 | |
FHLMC ± | | | 2.53 | | | | 7-1-2029 | | | | 240,638 | | | | 253,768 | |
FHLMC ± | | | 2.53 | | | | 9-1-2031 | | | | 9,876 | | | | 10,079 | |
FHLMC ± | | | 2.53 | | | | 9-1-2031 | | | | 59,944 | | | | 60,960 | |
FHLMC ± | | | 2.62 | | | | 1-1-2038 | | | | 1,098,283 | | | | 1,177,708 | |
FHLMC ± | | | 2.95 | | | | 5-1-2026 | | | | 75,354 | | | | 78,841 | |
FHLMC ± | | | 3.05 | | | | 7-1-2032 | | | | 1,939,678 | | | | 1,987,031 | |
FHLMC %% | | | 3.50 | | | | 3-1-2044 | | | | 80,990,000 | | | | 81,888,487 | |
FHLMC %% | | | 4.00 | | | | 3-1-2044 | | | | 11,875,000 | | | | 12,413,086 | |
FHLMC | | | 4.50 | | | | 3-1-2042 | | | | 1,252,193 | | | | 1,344,009 | |
FHLMC | | | 5.00 | | | | 5-1-2018 | | | | 359,840 | | | | 384,013 | |
FHLMC | | | 5.00 | | | | 4-1-2019 | | | | 310,791 | | | | 331,891 | |
FHLMC | | | 5.00 | | | | 4-1-2019 | | | | 334,010 | | | | 356,686 | |
FHLMC | | | 5.00 | | | | 6-1-2019 | | | | 446,950 | | | | 477,406 | |
FHLMC | | | 5.00 | | | | 8-1-2019 | | | | 1,714,297 | | | | 1,830,792 | |
FHLMC | | | 5.00 | | | | 10-1-2019 | | | | 612,631 | | | | 659,960 | |
FHLMC | | | 5.00 | | | | 2-1-2020 | | | | 1,758,000 | | | | 1,894,042 | |
FHLMC | | | 5.00 | | | | 8-1-2040 | | | | 3,931,429 | | | | 4,302,298 | |
FHLMC | | | 5.50 | | | | 11-1-2023 | | | | 283,753 | | | | 309,654 | |
FHLMC | | | 5.50 | | | | 7-1-2035 | | | | 10,764,843 | | | | 11,975,290 | |
FHLMC | | | 5.50 | | | | 12-1-2038 | | | | 7,071,545 | | | | 7,751,900 | |
FHLMC | | | 6.00 | | | | 1-1-2024 | | | | 4,383,564 | | | | 4,800,183 | |
FHLMC | | | 6.00 | | | | 10-1-2032 | | | | 85,432 | | | | 96,093 | |
FHLMC | | | 6.00 | | | | 5-25-2043 | | | | 7,321,620 | | | | 8,358,002 | |
FHLMC ± | | | 6.38 | | | | 1-1-2026 | | | | 83,263 | | | | 82,287 | |
FHLMC | | | 6.50 | | | | 4-1-2018 | | | | 34,533 | | | | 36,545 | |
FHLMC | | | 6.50 | | | | 4-1-2021 | | | | 71,548 | | | | 75,650 | |
FHLMC | | | 6.50 | | | | 4-1-2022 | | | | 157,019 | | | | 175,989 | |
FHLMC | | | 6.50 | | | | 9-1-2028 | | | | 47,965 | | | | 54,504 | |
FHLMC | | | 6.50 | | | | 9-1-2028 | | | | 24,159 | | | | 27,077 | |
FHLMC | | | 6.50 | | | | 7-1-2031 | | | | 8 | | | | 9 | |
FHLMC | | | 6.50 | | | | 8-1-2037 | | | | 213,461 | | | | 231,303 | |
FHLMC | | | 7.00 | | | | 10-1-2014 | | | | 96,115 | | | | 97,458 | |
FHLMC | | | 7.00 | | | | 12-1-2023 | | | | 7,359 | | | | 8,305 | |
FHLMC | | | 7.00 | | | | 5-1-2024 | | | | 11,903 | | | | 12,218 | |
FHLMC | | | 7.00 | | | | 12-1-2026 | | | | 2,442 | | | | 2,500 | |
FHLMC | | | 7.00 | | | | 12-1-2026 | | | | 4,449 | | | | 4,824 | |
FHLMC | | | 7.00 | | | | 12-1-2026 | | | | 377 | | | | 379 | |
FHLMC | | | 7.00 | | | | 12-1-2026 | | | | 990 | | | | 1,111 | |
FHLMC | | | 7.00 | | | | 4-1-2029 | | | | 4,130 | | | | 4,631 | |
FHLMC | | | 7.00 | | | | 4-1-2029 | | | | 1,959 | | | | 1,966 | |
FHLMC | | | 7.00 | | | | 5-1-2029 | | | | 28,529 | | | | 31,942 | |
FHLMC | | | 7.00 | | | | 4-1-2032 | | | | 246,194 | | | | 280,862 | |
FHLMC | | | 7.50 | | | | 11-1-2031 | | | | 306,923 | | | | 355,125 | |
| | | | |
| 2 | | Wells Fargo Advantage Government Securities Fund | | Portfolio of investments—February 28, 2014 (unaudited) |
| | | | | | | | | | | | | | | | |
| Security name | | Interest rate | | | Maturity date | | | Principal | | | Value | |
| | | | | | | | | | | | | | | | |
| | | | |
Agency Securities (continued) | | | | | | | | | | | | | | | | |
FHLMC | | | 7.50 | % | | | 4-1-2032 | | | $ | 289,840 | | | $ | 335,170 | |
FHLMC | | | 8.00 | | | | 2-1-2017 | | | | 8,987 | | | | 9,548 | |
FHLMC | | | 8.00 | | | | 8-1-2023 | | | | 41,497 | | | | 46,040 | |
FHLMC | | | 8.00 | | | | 6-1-2024 | | | | 10,487 | | | | 12,243 | |
FHLMC | | | 8.00 | | | | 6-1-2024 | | | | 4,120 | | | | 4,273 | |
FHLMC | | | 8.00 | | | | 6-1-2024 | | | | 13,488 | | | | 15,143 | |
FHLMC | | | 8.00 | | | | 8-1-2026 | | | | 30,512 | | | | 36,716 | |
FHLMC | | | 8.00 | | | | 11-1-2026 | | | | 32,937 | | | | 39,001 | |
FHLMC | | | 8.00 | | | | 11-1-2028 | | | | 24,020 | | | | 27,532 | |
FHLMC | | | 8.50 | | | | 7-1-2022 | | | | 5,588 | | | | 6,298 | |
FHLMC | | | 8.50 | | | | 12-1-2025 | | | | 22,625 | | | | 26,306 | |
FHLMC | | | 8.50 | | | | 5-1-2026 | | | | 3,231 | | | | 3,684 | |
FHLMC | | | 8.50 | | | | 8-1-2026 | | | | 7,587 | | | | 8,016 | |
FHLMC | | | 8.50 | | | | 8-1-2026 | | | | 27,350 | | | | 27,487 | |
FHLMC | | | 9.00 | | | | 6-1-2016 | | | | 4,214 | | | | 4,263 | |
FHLMC | | | 9.00 | | | | 1-1-2017 | | | | 9,513 | | | | 9,611 | |
FHLMC | | | 9.00 | | | | 4-1-2017 | | | | 13,849 | | | | 14,727 | |
FHLMC | | | 9.00 | | | | 11-1-2018 | | | | 52,391 | | | | 55,610 | |
FHLMC | | | 9.00 | | | | 8-1-2019 | | | | 564 | | | | 615 | |
FHLMC | | | 9.00 | | | | 8-1-2019 | | | | 95 | | | | 97 | |
FHLMC | | | 9.00 | | | | 12-1-2019 | | | | 258 | | | | 286 | |
FHLMC | | | 9.00 | | | | 1-1-2020 | | | | 49 | | | | 49 | |
FHLMC | | | 9.00 | | | | 2-1-2020 | | | | 179 | | | | 200 | |
FHLMC | | | 9.00 | | | | 3-1-2020 | | | | 2,197 | | | | 2,255 | |
FHLMC | | | 9.00 | | | | 3-1-2020 | | | | 295 | | | | 307 | |
FHLMC | | | 9.00 | | | | 9-1-2020 | | | | 284 | | | | 316 | |
FHLMC | | | 9.00 | | | | 9-1-2020 | | | | 850 | | | | 894 | |
FHLMC | | | 9.00 | | | | 12-1-2020 | | | | 70 | | | | 72 | |
FHLMC | | | 9.00 | | | | 3-1-2021 | | | | 6,015 | | | | 6,684 | |
FHLMC | | | 9.00 | | | | 4-1-2021 | | | | 7,054 | | | | 7,745 | |
FHLMC | | | 9.00 | | | | 4-1-2021 | | | | 311 | | | | 353 | |
FHLMC | | | 9.00 | | | | 4-1-2021 | | | | 68,990 | | | | 74,282 | |
FHLMC | | | 9.00 | | | | 7-1-2021 | | | | 5,307 | | | | 5,335 | |
FHLMC | | | 9.00 | | | | 7-1-2021 | | | | 4,463 | | | | 4,652 | |
FHLMC | | | 9.00 | | | | 8-1-2021 | | | | 728 | | | | 832 | |
FHLMC | | | 9.00 | | | | 4-1-2022 | | | | 1,231 | | | | 1,236 | |
FHLMC | | | 9.00 | | | | 7-1-2022 | | | | 835 | | | | 893 | |
FHLMC | | | 9.00 | | | | 9-1-2024 | | | | 1,769 | | | | 1,999 | |
FHLMC | | | 9.50 | | | | 9-1-2016 | | | | 45 | | | | 48 | |
FHLMC | | | 9.50 | | | | 10-1-2016 | | | | 297 | | | | 317 | |
FHLMC | | | 9.50 | | | | 8-1-2018 | | | | 38 | | | | 38 | |
FHLMC | | | 9.50 | | | | 8-1-2019 | | | | 193 | | | | 215 | |
FHLMC | | | 9.50 | | | | 2-1-2020 | | | | 10 | | | | 11 | |
FHLMC | | | 9.50 | | | | 6-1-2020 | | | | 102 | | | | 114 | |
FHLMC | | | 9.50 | | | | 8-1-2020 | | | | 478 | | | | 538 | |
FHLMC | | | 9.50 | | | | 9-1-2020 | | | | 22 | | | | 22 | |
FHLMC | | | 9.50 | | | | 9-1-2020 | | | | 8,013 | | | | 8,717 | |
FHLMC | | | 9.50 | | | | 9-1-2020 | | | | 70 | | | | 80 | |
FHLMC | | | 9.50 | | | | 10-1-2020 | | | | 85 | | | | 96 | |
FHLMC | | | 9.50 | | | | 10-1-2020 | | | | 47 | | | | 53 | |
| | | | | | |
| Portfolio of investments—February 28, 2014 (unaudited) | | Wells Fargo Advantage Government Securities Fund | | | 3 | |
| | | | | | | | | | | | | | | | |
| Security name | | Interest rate | | | Maturity date | | | Principal | | | Value | |
| | | | | | | | | | | | | | | | |
| | | | |
Agency Securities (continued) | | | | | | | | | | | | | | | | |
FHLMC | | | 9.50 | % | | | 11-1-2020 | | | $ | 97 | | | $ | 109 | |
FHLMC | | | 9.50 | | | | 5-1-2021 | | | | 290 | | | | 331 | |
FHLMC | | | 9.50 | | | | 9-17-2022 | | | | 790,266 | | | | 884,296 | |
FHLMC | | | 9.50 | | | | 4-1-2025 | | | | 73,398 | | | | 84,431 | |
FHLMC | | | 10.00 | | | | 8-1-2017 | | | | 19 | | | | 21 | |
FHLMC | | | 10.00 | | | | 1-1-2019 | | | | 19 | | | | 21 | |
FHLMC | | | 10.00 | | | | 8-1-2019 | | | | 23 | | | | 24 | |
FHLMC | | | 10.00 | | | | 12-1-2019 | | | | 294 | | | | 332 | |
FHLMC | | | 10.00 | | | | 3-1-2020 | | | | 28 | | | | 31 | |
FHLMC | | | 10.00 | | | | 6-1-2020 | | | | 41 | | | | 47 | |
FHLMC | | | 10.00 | | | | 7-1-2020 | | | | 54 | | | | 58 | |
FHLMC | | | 10.00 | | | | 8-1-2020 | | | | 45 | | | | 52 | |
FHLMC | | | 10.00 | | | | 10-1-2021 | | | | 76,104 | | | | 85,148 | |
FHLMC | | | 10.00 | | | | 8-17-2022 | | | | 360,044 | | | | 385,542 | |
FHLMC | | | 10.00 | | | | 2-17-2025 | | | | 795,584 | | | | 869,478 | |
FHLMC | | | 10.50 | | | | 2-1-2019 | | | | 29 | | | | 30 | |
FHLMC | | | 10.50 | | | | 5-1-2019 | | | | 123 | | | | 125 | |
FHLMC | | | 10.50 | | | | 6-1-2019 | | | | 16 | | | | 18 | |
FHLMC | | | 10.50 | | | | 8-1-2019 | | | | 21,657 | | | | 24,322 | |
FHLMC | | | 10.50 | | | | 12-1-2019 | | | | 35,942 | | | | 38,394 | |
FHLMC | | | 10.50 | | | | 5-1-2020 | | | | 50,424 | | | | 57,278 | |
FHLMC | | | 10.50 | | | | 5-1-2020 | | | | 6,210 | | | | 6,451 | |
FHLMC | | | 10.50 | | | | 8-1-2020 | | | | 15,895 | | | | 15,999 | |
FHLMC | | | 10.50 | | | | 8-1-2020 | | | | 35,908 | | | | 37,823 | |
FHLMC Series 16 Class D | | | 10.00 | | | | 10-15-2019 | | | | 16,553 | | | | 17,943 | |
FHLMC Series 2882 Class TF ± | | | 0.40 | | | | 10-15-2034 | | | | 3,327,286 | | | | 3,333,412 | |
FHLMC Series 3221 Class VA | | | 5.00 | | | | 9-15-2017 | | | | 5,023,385 | | | | 5,266,080 | |
FHLMC Series 3706 Class C | | | 2.00 | | | | 8-15-2020 | | | | 6,488,207 | | | | 6,600,894 | |
FHLMC Series 3767 Class PD | | | 4.00 | | | | 7-15-2040 | | | | 538,617 | | | | 567,032 | |
FHLMC Series 3948 Class DA | | | 3.00 | | | | 12-15-2024 | | | | 1,118,302 | | | | 1,176,381 | |
FHLMC Series K020 Class X1 ±(c) | | | 1.47 | | | | 5-25-2022 | | | | 48,522,330 | | | | 4,540,865 | |
FHLMC Series T-57 Class 1A1 | | | 6.50 | | | | 7-25-2043 | | | | 1,837,924 | | | | 2,070,324 | |
FHLMC Series T-57 Class 2A1 ± | | | 3.24 | | | | 7-25-2043 | | | | 3,697,078 | | | | 3,862,415 | |
FHLMC Series T-67 Class 1A1C ± | | | 2.97 | | | | 3-25-2036 | | | | 2,041,827 | | | | 2,119,609 | |
FHLMC Series T-67 Class 2A1C ± | | | 3.00 | | | | 3-25-2036 | | | | 3,767,706 | | | | 3,939,506 | |
FHLMC Series T-75 Class A1 ± | | | 0.20 | | | | 12-25-2036 | | | | 7,114,659 | | | | 7,060,979 | |
FHLMC Series T-15 Class A6 ± | | | 0.59 | | | | 11-25-2028 | | | | 254,112 | | | | 251,676 | |
FHLMC Series T-23 Class A ± | | | 0.44 | | | | 5-25-2030 | | | | 1,117,484 | | | | 1,087,867 | |
FHLMC Series T-35 Class A ± | | | 0.44 | | | | 9-25-2031 | | | | 471,595 | | | | 439,717 | |
FHLMC Series T-42 Class A6 | | | 9.50 | | | | 2-25-2042 | | | | 1,376,457 | | | | 1,720,984 | |
FHLMC Series T-55 Class 2A1 ± | | | 2.67 | | | | 3-25-2043 | | | | 684,510 | | | | 690,729 | |
FNMA | | | 1.75 | | | | 5-30-2019 | | | | 19,000,000 | | | | 18,934,241 | |
FNMA ± | | | 1.85 | | | | 1-1-2043 | | | | 2,744,485 | | | | 2,792,715 | |
FNMA ± | | | 2.17 | | | | 12-1-2035 | | | | 2,360,201 | | | | 2,494,932 | |
FNMA ± | | | 2.20 | | | | 5-1-2036 | | | | 2,408,099 | | | | 2,550,063 | |
FNMA ± | | | 2.29 | | | | 5-1-2036 | | | | 4,040,293 | | | | 4,253,858 | |
FNMA ± | | | 2.31 | | | | 9-1-2031 | | | | 110,002 | | | | 117,542 | |
FNMA ± | | | 2.31 | | | | 11-1-2031 | | | | 214,823 | | | | 228,641 | |
FNMA ± | | | 2.34 | | | | 6-1-2032 | | | | 179,996 | | | | 184,297 | |
FNMA ± | | | 2.35 | | | | 12-1-2034 | | | | 2,119,915 | | | | 2,253,694 | |
| | | | |
| 4 | | Wells Fargo Advantage Government Securities Fund | | Portfolio of investments—February 28, 2014 (unaudited) |
| | | | | | | | | | | | | | | | |
| Security name | | Interest rate | | | Maturity date | | | Principal | | | Value | |
| | | | | | | | | | | | | | | | |
| | | | |
Agency Securities (continued) | | | | | | | | | | | | | | | | |
FNMA ± | | | 2.39 | % | | | 12-1-2040 | | | $ | 91,877 | | | $ | 98,380 | |
FNMA ± | | | 2.40 | | | | 9-1-2031 | | | | 486,764 | | | | 519,820 | |
FNMA ± | | | 2.41 | | | | 8-1-2036 | | | | 2,984,473 | | | | 3,206,362 | |
FNMA ± | | | 2.42 | | | | 6-1-2034 | | | | 826,183 | | | | 868,976 | |
FNMA ± | | | 2.44 | | | | 4-1-2032 | | | | 209,841 | | | | 224,140 | |
FNMA ± | | | 2.48 | | | | 9-1-2036 | | | | 1,836,669 | | | | 1,947,587 | |
FNMA | | | 2.50 | | | | 4-25-2039 | | | | 454,912 | | | | 464,124 | |
FNMA ± | | | 2.53 | | | | 10-1-2027 | | | | 300,975 | | | | 323,862 | |
FNMA ± | | | 2.83 | | | | 9-1-2027 | | | | 811,448 | | | | 865,251 | |
FNMA | | | 3.00 | | | | 4-1-2022 | | | | 1,605,312 | | | | 1,680,841 | |
FNMA %% | | | 3.00 | | | | 3-1-2029 | | | | 18,235,000 | | | | 18,867,527 | |
FNMA %% | | | 3.00 | | | | 3-1-2044 | | | | 81,485,000 | | | | 79,142,306 | |
FNMA ± | | | 3.05 | | | | 4-1-2033 | | | | 136,322 | | | | 145,215 | |
FNMA ± | | | 3.16 | | | | 5-1-2036 | | | | 1,698,994 | | | | 1,802,926 | |
FNMA ± | | | 3.17 | | | | 2-1-2027 | | | | 1,175,540 | | | | 1,206,144 | |
FNMA ± | | | 3.20 | | | | 7-1-2026 | | | | 570,069 | | | | 614,537 | |
FNMA ± | | | 3.22 | | | | 1-1-2033 | | | | 100,039 | | | | 100,423 | |
FNMA %% | | | 3.50 | | | | 3-1-2029 | | | | 15,180,000 | | | | 16,045,734 | |
FNMA %% | | | 3.50 | | | | 3-1-2044 | | | | 28,175,000 | | | | 28,558,005 | |
FNMA ± | | | 3.97 | | | | 9-1-2028 | | | | 473,863 | | | | 494,976 | |
FNMA | | | 4.00 | | | | 5-1-2021 | | | | 1,642,155 | | | | 1,752,255 | |
FNMA %% | | | 4.00 | | | | 3-1-2029 | | | | 12,615,000 | | | | 13,458,628 | |
FNMA %% | | | 4.00 | | | | 3-1-2044 | | | | 54,450,000 | | | | 57,049,138 | |
FNMA ± | | | 4.11 | | | | 7-1-2033 | | | | 166,146 | | | | 167,130 | |
FNMA | | | 4.15 | | | | 7-1-2014 | | | | 10,294,702 | | | | 10,302,902 | |
FNMA | | | 4.50 | | | | 8-1-2018 | | | | 1,646,044 | | | | 1,758,305 | |
FNMA | | | 4.50 | | | | 12-1-2018 | | | | 1,336,314 | | | | 1,428,224 | |
FNMA %% | | | 4.50 | | | | 3-1-2029 | | | | 11,445,000 | | | | 12,217,538 | |
FNMA %% | | | 4.50 | | | | 3-1-2044 | | | | 17,387,000 | | | | 18,671,329 | |
FNMA | | | 4.68 | | | | 2-1-2020 | | | | 3,300,626 | | | | 3,673,467 | |
FNMA | | | 4.79 | | | | 5-1-2019 | | | | 2,191,921 | | | | 2,441,885 | |
FNMA | | | 5.00 | | | | 4-1-2014 | | | | 682 | | | | 731 | |
FNMA | | | 5.00 | | | | 12-1-2018 | | | | 1,022,818 | | | | 1,096,209 | |
FNMA | | | 5.00 | | | | 6-1-2019 | | | | 1,009,083 | | | | 1,081,518 | |
FNMA | | | 5.00 | | | | 6-1-2023 | | | | 2,143,002 | | | | 2,323,769 | |
FNMA | | | 5.00 | | | | 3-1-2034 | | | | 1,518,469 | | | | 1,670,375 | |
FNMA %% | | | 5.00 | | | | 8-1-2040 | | | | 28,108,758 | | | | 30,864,115 | |
FNMA | | | 5.03 | | | | 5-1-2015 | | | | 6,266,968 | | | | 6,514,868 | |
FNMA | | | 5.22 | | | | 10-1-2015 | | | | 3,250,428 | | | | 3,409,810 | |
FNMA | | | 5.38 | | | | 5-1-2017 | | | | 722,127 | | | | 787,160 | |
FNMA | | | 5.39 | | | | 1-1-2024 | | | | 2,732,989 | | | | 3,073,725 | |
FNMA | | | 5.50 | | | | 6-1-2016 | | | | 222,895 | | | | 238,022 | |
FNMA | | | 5.50 | | | | 1-1-2025 | | | | 286,231 | | | | 312,187 | |
FNMA | | | 5.50 | | | | 1-1-2025 | | | | 1,181,157 | | | | 1,288,976 | |
FNMA | | | 5.50 | | | | 9-1-2033 | | | | 4,882,754 | | | | 5,410,277 | |
FNMA | | | 5.50 | | | | 9-1-2033 | | | | 2,219,692 | | | | 2,456,000 | |
FNMA | | | 5.50 | | | | 6-1-2034 | | | | 10,629,334 | | | | 11,795,141 | |
FNMA | | | 5.50 | | | | 8-1-2035 | | | | 1,835,845 | | | | 2,034,935 | |
FNMA | | | 5.50 | | | | 1-1-2037 | | | | 2,042,993 | | | | 2,262,884 | |
FNMA | | | 5.55 | | | | 5-1-2016 | | | | 3,096,413 | | | | 3,370,743 | |
| | | | | | |
| Portfolio of investments—February 28, 2014 (unaudited) | | Wells Fargo Advantage Government Securities Fund | | | 5 | |
| | | | | | | | | | | | | | | | |
| Security name | | Interest rate | | | Maturity date | | | Principal | | | Value | |
| | | | | | | | | | | | | | | | |
| | | | |
Agency Securities (continued) | | | | | | | | | | | | | | | | |
FNMA | | | 5.55 | % | | | 9-1-2019 | | | $ | 2,987,257 | | | $ | 3,124,773 | |
FNMA | | | 5.61 | | | | 2-1-2021 | | | | 2,877,403 | | | | 3,213,099 | |
FNMA | | | 5.63 | | | | 2-1-2018 | | | | 1,088,837 | | | | 1,222,594 | |
FNMA | | | 5.67 | | | | 3-1-2016 | | | | 6,151,311 | | | | 6,627,497 | |
FNMA | | | 5.67 | | | | 11-1-2021 | | | | 5,561,138 | | | | 6,076,313 | |
FNMA | | | 5.70 | | | | 3-1-2016 | | | | 940,280 | | | | 1,013,300 | |
FNMA | | | 5.75 | | | | 5-1-2021 | | | | 3,539,891 | | | | 4,003,775 | |
FNMA | | | 5.79 | | | | 10-1-2017 | | | | 1,080,488 | | | | 1,213,104 | |
FNMA | | | 5.95 | | | | 6-1-2024 | | | | 1,790,022 | | | | 2,060,736 | |
FNMA | | | 6.00 | | | | 5-1-2016 | | | | 102,480 | | | | 104,796 | |
FNMA | | | 6.00 | | | | 3-1-2024 | | | | 179,928 | | | | 200,205 | |
FNMA | | | 6.00 | | | | 2-1-2035 | | | | 2,438,735 | | | | 2,661,432 | |
FNMA | | | 6.00 | | | | 11-1-2037 | | | | 1,869,909 | | | | 2,083,734 | |
FNMA %% | | | 6.00 | | | | 3-1-2044 | | | | 21,385,000 | | | | 23,804,178 | |
FNMA | | | 6.08 | | | | 1-1-2019 | | | | 969,007 | | | | 1,011,712 | |
FNMA | | | 6.50 | | | | 6-1-2017 | | | | 175,314 | | | | 183,957 | |
FNMA | | | 6.50 | | | | 1-1-2024 | | | | 89,653 | | | | 100,401 | |
FNMA | | | 6.50 | | | | 3-1-2028 | | | | 45,741 | | | | 50,760 | |
FNMA | | | 6.50 | | | | 12-1-2029 | | | | 587,809 | | | | 671,771 | |
FNMA | | | 6.50 | | | | 11-1-2031 | | | | 140,782 | | | | 160,379 | |
FNMA | | | 6.50 | | | | 7-1-2036 | | | | 1,113,928 | | | | 1,246,948 | |
FNMA | | | 6.50 | | | | 7-1-2036 | | | | 801,921 | | | | 897,131 | |
FNMA | | | 6.50 | | | | 9-1-2037 | | | | 216,960 | | | | 235,839 | |
FNMA | | | 6.50 | | | | 7-25-2042 | | | | 2,557,728 | | | | 2,924,503 | |
FNMA | | | 6.65 | | | | 5-1-2016 | | | | 1,423,295 | | | | 1,576,755 | |
FNMA | | | 7.00 | | | | 11-1-2026 | | | | 17,293 | | | | 19,738 | |
FNMA | | | 7.00 | | | | 9-1-2031 | | | | 6,305 | | | | 6,371 | |
FNMA | | | 7.00 | | | | 1-1-2032 | | | | 7,025 | | | | 7,958 | |
FNMA | | | 7.00 | | | | 2-1-2032 | | | | 180,353 | | | | 208,514 | |
FNMA | | | 7.00 | | | | 2-1-2032 | | | | 8,456 | | | | 8,816 | |
FNMA | | | 7.00 | | | | 10-1-2032 | | | | 471,789 | | | | 550,257 | |
FNMA | | | 7.00 | | | | 2-1-2034 | | | | 3,896 | | | | 4,441 | |
FNMA | | | 7.00 | | | | 4-1-2034 | | | | 355,300 | | | | 406,851 | |
FNMA | | | 7.00 | | | | 12-1-2034 | | | | 43,765 | | | | 45,837 | |
FNMA | | | 7.00 | | | | 1-1-2036 | | | | 12,295 | | | | 14,023 | |
FNMA | | | 7.00 | | | | 9-1-2036 | | | | 421,006 | | | | 453,311 | |
FNMA | | | 7.50 | | | | 7-1-2015 | | | | 4,914 | | | | 4,943 | |
FNMA | | | 7.50 | | | | 9-1-2031 | | | | 160,429 | | | | 194,085 | |
FNMA | | | 7.50 | | | | 11-25-2031 | | | | 832,202 | | | | 972,289 | |
FNMA | | | 7.50 | | | | 2-1-2032 | | | | 67,284 | | | | 81,694 | |
FNMA | | | 7.50 | | | | 10-1-2037 | | | | 2,839,630 | | | | 3,361,277 | |
FNMA | | | 8.00 | | | | 8-1-2020 | | | | 5,006 | | | | 5,025 | |
FNMA | | | 8.00 | | | | 5-1-2027 | | | | 62,271 | | | | 65,655 | |
FNMA | | | 8.00 | | | | 10-1-2027 | | | | 13,478 | | | | 13,536 | |
FNMA | | | 8.00 | | | | 6-1-2028 | | | | 10,286 | | | | 11,743 | |
FNMA | | | 8.00 | | | | 2-1-2030 | | | | 198,484 | | | | 228,596 | |
FNMA | | | 8.00 | | | | 9-1-2040 | | | | 2,110,441 | | | | 2,514,065 | |
FNMA | | | 8.50 | | | | 12-1-2014 | | | | 176 | | | | 177 | |
FNMA | | | 8.50 | | | | 5-1-2017 | | | | 264,300 | | | | 283,488 | |
FNMA | | | 8.50 | | | | 5-1-2017 | | | | 4,360 | | | | 4,669 | |
| | | | |
| 6 | | Wells Fargo Advantage Government Securities Fund | | Portfolio of investments—February 28, 2014 (unaudited) |
| | | | | | | | | | | | | | | | |
| Security name | | Interest rate | | | Maturity date | | | Principal | | | Value | |
| | | | | | | | | | | | | | | | |
| | | | |
Agency Securities (continued) | | | | | | | | | | | | | | | | |
FNMA | | | 8.50 | % | | | 8-1-2024 | | | $ | 37,851 | | | $ | 43,091 | |
FNMA | | | 8.50 | | | | 5-1-2026 | | | | 244,500 | | | | 278,929 | |
FNMA | | | 8.50 | | | | 7-1-2026 | | | | 33,965 | | | | 36,684 | |
FNMA | | | 8.50 | | | | 8-1-2026 | | | | 17,205 | | | | 17,723 | |
FNMA | | | 8.50 | | | | 9-1-2026 | | | | 504 | | | | 572 | |
FNMA | | | 8.50 | | | | 10-1-2026 | | | | 37,246 | | | | 38,169 | |
FNMA | | | 8.50 | | | | 10-1-2026 | | | | 389 | | | | 413 | |
FNMA | | | 8.50 | | | | 10-1-2026 | | | | 9,879 | | | | 9,925 | |
FNMA | | | 8.50 | | | | 11-1-2026 | | | | 36,422 | | | | 37,744 | |
FNMA | | | 8.50 | | | | 11-1-2026 | | | | 12,172 | | | | 13,260 | |
FNMA | | | 8.50 | | | | 11-1-2026 | | | | 6,251 | | | | 6,280 | |
FNMA | | | 8.50 | | | | 12-1-2026 | | | | 279,653 | | | | 327,302 | |
FNMA | | | 8.50 | | | | 12-1-2026 | | | | 24,207 | | | | 27,993 | |
FNMA | | | 8.50 | | | | 12-1-2026 | | | | 344 | | | | 345 | |
FNMA | | | 8.50 | | | | 2-1-2027 | | | | 579 | | | | 673 | |
FNMA | | | 8.50 | | | | 2-1-2027 | | | | 9,295 | | | | 9,424 | |
FNMA | | | 8.50 | | | | 3-1-2027 | | | | 1,520 | | | | 1,766 | |
FNMA | | | 8.50 | | | | 3-1-2027 | | | | 3,058 | | | | 3,079 | |
FNMA | | | 8.50 | | | | 6-1-2027 | | | | 280,647 | | | | 323,902 | |
FNMA | | | 8.50 | | | | 7-1-2029 | | | | 980 | | | | 994 | |
FNMA | | | 9.00 | | | | 3-1-2021 | | | | 50,021 | | | | 55,037 | |
FNMA | | | 9.00 | | | | 6-1-2021 | | | | 249 | | | | 281 | |
FNMA | | | 9.00 | | | | 7-1-2021 | | | | 76,294 | | | | 83,755 | |
FNMA | | | 9.00 | | | | 8-1-2021 | | | | 340 | | | | 387 | |
FNMA | | | 9.00 | | | | 10-1-2021 | | | | 52,741 | | | | 57,100 | |
FNMA | | | 9.00 | | | | 1-1-2025 | | | | 3,016 | | | | 3,099 | |
FNMA | | | 9.00 | | | | 1-1-2025 | | | | 24,793 | | | | 28,643 | |
FNMA | | | 9.00 | | | | 2-1-2025 | | | | 10,366 | | | | 10,419 | |
FNMA | | | 9.00 | | | | 3-1-2025 | | | | 1,036 | | | | 1,065 | |
FNMA | | | 9.00 | | | | 3-1-2025 | | | | 4,191 | | | | 4,458 | |
FNMA | | | 9.00 | | | | 3-1-2025 | | | | 1,655 | | | | 1,664 | |
FNMA | | | 9.00 | | | | 4-1-2025 | | | | 4,052 | | | | 4,073 | |
FNMA | | | 9.00 | | | | 7-1-2028 | | | | 51,145 | | | | 58,025 | |
FNMA | | | 9.50 | | | | 11-1-2020 | | | | 223 | | | | 253 | |
FNMA | | | 9.50 | | | | 12-15-2020 | | | | 87,128 | | | | 93,567 | |
FNMA | | | 9.50 | | | | 1-1-2021 | | | | 32,025 | | | | 33,689 | |
FNMA | | | 9.50 | | | | 6-1-2022 | | | | 5,104 | | | | 5,456 | |
FNMA | | | 9.50 | | | | 7-1-2028 | | | | 76,064 | | | | 89,296 | |
FNMA | | | 10.00 | | | | 12-1-2020 | | | | 121,812 | | | | 135,847 | |
FNMA | | | 11.00 | | | | 2-1-2019 | | | | 13,701 | | | | 13,790 | |
FNMA | | | 11.00 | | | | 10-15-2020 | | | | 9,640 | | | | 10,040 | |
FNMA | | | 11.25 | | | | 2-1-2016 | | | | 2,685 | | | | 2,702 | |
FNMA Series 2000-T6 Class A2 | | | 9.50 | | | | 6-25-2030 | | | | 1,366,138 | | | | 1,570,489 | |
FNMA Series 2001-T10 Class A3 | | | 9.50 | | | | 12-25-2041 | | | | 2,072,431 | | | | 2,386,991 | |
FNMA Series 2001-T12 Class A3 | | | 9.50 | | | | 8-25-2041 | | | | 518,084 | | | | 611,557 | |
FNMA Series 2001-T8 Class A3 ± | | | 3.61 | | | | 7-25-2041 | | | | 1,443,985 | | | | 1,455,352 | |
FNMA Series 2002-T19 Class A1 | | | 6.50 | | | | 7-25-2042 | | | | 6,867,133 | | | | 7,889,986 | |
FNMA Series 2002-T5 Class A1 ± | | | 0.40 | | | | 5-25-2032 | | | | 457,916 | | | | 450,160 | |
FNMA Series 2003-T2 Class A1 ± | | | 0.44 | | | | 3-25-2033 | | | | 410,829 | | | | 397,087 | |
FNMA Series 2004-T1 Class 1A2 | | | 6.50 | | | | 1-25-2044 | | | | 1,077,653 | | | | 1,235,397 | |
| | | | | | |
| Portfolio of investments—February 28, 2014 (unaudited) | | Wells Fargo Advantage Government Securities Fund | | | 7 | |
| | | | | | | | | | | | | | | | |
| Security name | | Interest rate | | | Maturity date | | | Principal | | | Value | |
| | | | | | | | | | | | | | | | |
| | | | |
Agency Securities (continued) | | | | | | | | | | | | | | | | |
FNMA Series 1988-2 Class Z | | | 10.10 | % | | | 2-25-2018 | | | $ | 11,473 | | | $ | 12,124 | |
FNMA Series 1988-7 Class Z | | | 9.25 | | | | 4-25-2018 | | | | 31,859 | | | | 35,081 | |
FNMA Series 1989-10 Class Z | | | 9.50 | | | | 3-25-2019 | | | | 211,514 | | | | 238,666 | |
FNMA Series 1989-100 Class Z | | | 8.75 | | | | 12-25-2019 | | | | 161,900 | | | | 181,992 | |
FNMA Series 1989-12 Class Y | | | 10.00 | | | | 3-25-2019 | | | | 331,552 | | | | 374,448 | |
FNMA Series 1989-22 Class G | | | 10.00 | | | | 5-25-2019 | | | | 216,594 | | | | 247,510 | |
FNMA Series 1989-63 Class Z | | | 9.40 | | | | 10-25-2019 | | | | 31,124 | | | | 34,096 | |
FNMA Series 1989-98 Class E | | | 9.20 | | | | 12-25-2019 | | | | 80,987 | | | | 90,021 | |
FNMA Series 1990-144 Class W | | | 9.50 | | | | 12-25-2020 | | | | 140,086 | | | | 160,906 | |
FNMA Series 1990-75 Class Z | | | 9.50 | | | | 7-25-2020 | | | | 153,229 | | | | 175,911 | |
FNMA Series 1990-84 Class Y | | | 9.00 | | | | 7-25-2020 | | | | 34,563 | | | | 39,065 | |
FNMA Series 1990-96 Class Z | | | 9.67 | | | | 8-25-2020 | | | | 221,147 | | | | 254,688 | |
FNMA Series 1991-5 Class Z | | | 8.75 | | | | 1-25-2021 | | | | 67,929 | | | | 76,514 | |
FNMA Series 1991-85 Class Z | | | 8.00 | | | | 6-25-2021 | | | | 167,155 | | | | 182,181 | |
FNMA Series 1992-45 Class Z | | | 8.00 | | | | 4-25-2022 | | | | 179,677 | | | | 209,714 | |
FNMA Series 2001-T4 Class A1 | | | 7.50 | | | | 7-25-2041 | | | | 1,217,753 | | | | 1,460,521 | |
FNMA Series 2002-T12 Class A5 ± | | | 3.44 | | | | 10-25-2041 | | | | 1,672,722 | | | | 1,738,769 | |
FNMA Series 2002-W4 Class A4 | | | 6.25 | | | | 5-25-2042 | | | | 1,118,743 | | | | 1,254,658 | |
FNMA Series 2003-W1 Class 1A1 ± | | | 5.95 | | | | 12-25-2042 | | | | 999,421 | | | | 1,164,352 | |
FNMA Series 2003-W19 Class 1A6 | | | 5.29 | | | | 11-25-2033 | | | | 104,483 | | | | 104,576 | |
FNMA Series 2004-79 Class FA ± | | | 0.45 | | | | 8-25-2032 | | | | 1,628,654 | | | | 1,627,024 | |
FNMA Series 2004-W1 Class 2A2 | | | 7.00 | | | | 12-25-2033 | | | | 2,353,377 | | | | 2,724,992 | |
FNMA Series 2004-W15 Class 1A3 | | | 7.00 | | | | 8-25-2044 | | | | 2,022,663 | | | | 2,367,934 | |
FNMA Series 2005-71 Class DB | | | 4.50 | | | | 8-25-2025 | | | | 2,330,010 | | | | 2,530,552 | |
FNMA Series 2006-9 Class BM | | | 6.00 | | | | 10-25-2033 | | | | 1,509,893 | | | | 1,517,276 | |
FNMA Series 2007-2 Class FA ± | | | 0.36 | | | | 2-25-2037 | | | | 454,323 | | | | 454,384 | |
FNMA Series 2007-W10 Class 2A ± | | | 6.29 | | | | 8-25-2047 | | | | 1,223,896 | | | | 1,391,173 | |
FNMA Series 2009-108 Class DE | | | 4.50 | | | | 8-25-2027 | | | | 256,387 | | | | 261,774 | |
FNMA Series 2011-42 Class A | | | 3.00 | | | | 2-25-2024 | | | | 1,685,889 | | | | 1,751,498 | |
FNMA Series G-8 Class E | | | 9.00 | | | | 4-25-2021 | | | | 174,012 | | | | 197,545 | |
FNMA Series G92-30 Class Z | | | 7.00 | | | | 6-25-2022 | | | | 349,340 | | | | 383,975 | |
FNMA Series G93-39 Class ZQ | | | 6.50 | | | | 12-25-2023 | | | | 3,313,831 | | | | 3,711,988 | |
FNMA Series 161 Class 2 | | | 8.50 | | | | 7-25-2022 | | | | 81,389 | | | | 21,690 | |
FNMA Series 265 Class 2 | | | 9.00 | | | | 3-1-2024 | | | | 217,621 | | | | 262,265 | |
FNMA Series 1999-W6 Class A ± | | | 9.39 | | | | 9-25-2028 | | | | 29,096 | | | | 30,474 | |
FNMA Series 2003-W06 Class PT4 ± | | | 8.86 | | | | 10-25-2042 | | | | 2,671,151 | | | | 3,107,646 | |
FNMA Series 2003-W11 Class A1 ± | | | 3.29 | | | | 6-25-2033 | | | | 184,148 | | | | 182,017 | |
FNMA Series 2003-W3 Class 1A4 ± | | | 3.36 | | | | 8-25-2042 | | | | 4,217,616 | | | | 4,411,437 | |
FNMA Series 2003-W5 Class A ± | | | 0.38 | | | | 4-25-2033 | | | | 443,175 | | | | 433,860 | |
FNMA Series 2003-W6 Class 6A ± | | | 3.05 | | | | 8-25-2042 | | | | 3,033,592 | | | | 3,165,933 | |
FNMA Series 2003-W8 Class PT1 ± | | | 9.59 | | | | 12-25-2042 | | | | 1,101,553 | | | | 1,286,893 | |
FNMA Series 2003-W9 Class A ± | | | 0.40 | | | | 6-25-2033 | | | | 202,749 | | | | 195,524 | |
GNMA ± | | | 3.00 | | | | 8-20-2020 | | | | 223,522 | | | | 232,554 | |
GNMA ± | | | 3.00 | | | | 11-20-2020 | | | | 162,181 | | | | 168,898 | |
GNMA | | | 4.00 | | | | 6-20-2042 | | | | 19,790,116 | | | | 21,019,415 | |
GNMA | | | 4.00 | | | | 9-20-2042 | | | | 461,975 | | | | 490,523 | |
GNMA %% | | | 4.50 | | | | 3-1-2044 | | | | 41,770,000 | | | | 45,379,187 | |
GNMA | | | 5.00 | | | | 7-20-2040 | | | | 9,724,002 | | | | 10,781,649 | |
GNMA | | | 6.00 | | | | 8-20-2034 | | | | 374,519 | | | | 418,068 | |
GNMA | | | 6.50 | | | | 12-15-2025 | | | | 45,346 | | | | 51,142 | |
| | | | |
| 8 | | Wells Fargo Advantage Government Securities Fund | | Portfolio of investments—February 28, 2014 (unaudited) |
| | | | | | | | | | | | | | | | |
| Security name | | Interest rate | | | Maturity date | | | Principal | | | Value | |
| | | | | | | | | | | | | | | | |
| | | | |
Agency Securities (continued) | | | | | | | | | | | | | | | | |
GNMA | | | 6.50 | % | | | 4-15-2029 | | | $ | 628 | | | $ | 708 | |
GNMA | | | 6.50 | | | | 5-15-2029 | | | | 4,100 | | | | 4,625 | |
GNMA | | | 6.50 | | | | 5-15-2031 | | | | 2,667 | | | | 3,010 | |
GNMA | | | 6.50 | | | | 7-15-2032 | | | | 2,043 | | | | 2,305 | |
GNMA | | | 6.50 | | | | 9-20-2033 | | | | 105,871 | | | | 124,915 | |
GNMA | | | 7.00 | | | | 12-15-2022 | | | | 57,869 | | | | 63,628 | |
GNMA | | | 7.00 | | | | 5-15-2026 | | | | 5,530 | | | | 6,159 | |
GNMA | | | 7.00 | | | | 3-15-2028 | | | | 76,119 | | | | 85,385 | |
GNMA | | | 7.00 | | | | 1-15-2031 | | | | 492 | | | | 510 | |
GNMA | | | 7.00 | | | | 4-15-2031 | | | | 3,852 | | | | 3,971 | |
GNMA | | | 7.00 | | | | 4-15-2031 | | | | 1,325 | | | | 1,374 | |
GNMA | | | 7.00 | | | | 8-15-2031 | | | | 22,735 | | | | 24,364 | |
GNMA | | | 7.00 | | | | 3-15-2032 | | | | 16,907 | | | | 17,510 | |
GNMA | | | 7.34 | | | | 10-20-2021 | | | | 65,855 | | | | 68,700 | |
GNMA | | | 7.34 | | | | 12-20-2021 | | | | 23,441 | | | | 23,536 | |
GNMA | | | 7.34 | | | | 2-20-2022 | | | | 21,155 | | | | 21,240 | |
GNMA | | | 7.34 | | | | 4-20-2022 | | | | 28,223 | �� | | | 28,338 | |
GNMA | | | 7.34 | | | | 9-20-2022 | | | | 48,268 | | | | 52,610 | |
GNMA | | | 8.00 | | | | 4-15-2023 | | | | 1,521 | | | | 1,527 | |
GNMA | | | 8.00 | | | | 6-15-2023 | | | | 7,122 | | | | 7,995 | |
GNMA | | | 8.00 | | | | 12-15-2023 | | | | 585,401 | | | | 693,277 | |
GNMA | | | 8.00 | | | | 2-15-2024 | | | | 1,510 | | | | 1,708 | |
GNMA | | | 8.00 | | | | 9-15-2024 | | | | 5,142 | | | | 5,433 | |
GNMA | | | 8.00 | | | | 6-15-2025 | | | | 100 | | | | 101 | |
GNMA | | | 8.00 | | | | 6-15-2025 | | | | 19,534 | | | | 19,627 | |
GNMA | | | 8.35 | | | | 4-15-2020 | | | | 482,549 | | | | 550,274 | |
GNMA | | | 8.40 | | | | 5-15-2020 | | | | 223,496 | | | | 251,115 | |
GNMA | | | 8.50 | | | | 7-15-2016 | | | | 799 | | | | 803 | |
GNMA | | | 9.00 | | | | 12-15-2016 | | | | 4,245 | | | | 4,268 | |
GNMA | | | 9.00 | | | | 4-15-2021 | | | | 3,137 | | | | 3,204 | |
GNMA | | | 9.50 | | | | 10-20-2019 | | | | 101,805 | | | | 108,708 | |
GNMA | | | 10.00 | | | | 12-15-2018 | | | | 8,151 | | | | 8,202 | |
GNMA | | | 12.50 | | | | 4-15-2019 | | | | 6,386 | | | | 6,561 | |
GNMA | | | 13.00 | | | | 11-15-2014 | | | | 277 | | | | 280 | |
GNMA Series 2002-53 Class IO ±(c) | | | 0.00 | | | | 4-16-2042 | | | | 5,343,780 | | | | 53 | |
GNMA Series 2003-110 Class FT ± | | | 1.40 | | | | 12-16-2030 | | | | 2,381 | | | | 2,382 | |
GNMA Series 2005-23 Class IO ± | | | 0.35 | | | | 6-17-2045 | | | | 35,103,473 | | | | 427,560 | |
GNMA Series 2006-32 Class C ± | | | 5.51 | | | | 11-16-2038 | | | | 12,510,000 | | | | 13,531,379 | |
GNMA Series 2006-32 Class XM ± | | | 0.07 | | | | 11-16-2045 | | | | 23,373,010 | | | | 128,458 | |
GNMA Series 2006-68 Class D ± | | | 5.31 | | | | 12-16-2037 | | | | 12,520,000 | | | | 13,776,908 | |
GNMA Series 2007-35 Class NF ± | | | 0.25 | | | | 10-16-2035 | | | | 8,556,535 | | | | 8,550,691 | |
GNMA Series 2007-44 Class FP ± | | | 0.32 | | | | 3-20-2036 | | | | 5,330,632 | | | | 5,330,189 | |
GNMA Series 2007-69 Class D ± | | | 5.25 | | | | 6-16-2041 | | | | 1,000,000 | | | | 1,082,271 | |
GNMA Series 2008-22 Class XM ±(c) | | | 3.70 | | | | 2-16-2050 | | | | 70,460,278 | | | | 2,509,372 | |
SBA (a)(c)(i) | | | 1.75 | | | | 2-15-2018 | | | | 319,068 | | | | 2,056 | |
SBA Series 1992-6 Class A (a)(c)(i) | | | 2.41 | | | | 10-15-2017 | | | | 414,320 | | | | 2,847 | |
TVA | | | 5.38 | | | | 4-1-2056 | | | | 3,670,000 | | | | 4,049,228 | |
| |
Total Agency Securities (Cost $869,713,654) | | | | 886,099,311 | |
| | | | | | | | | | | | | | | | |
| | | | | | |
| Portfolio of investments—February 28, 2014 (unaudited) | | Wells Fargo Advantage Government Securities Fund | | | 9 | |
| | | | | | | | | | | | | | | | |
| Security name | | Interest rate | | | Maturity date | | | Principal | | | Value | |
| | | | | | | | | | | | | | | | |
| | | | |
Municipal Obligations: 0.60% | | | | | | | | | | | | | | | | |
| | | | |
| Arkansas: 0.00% | | | | | | | | | | | | | | | | |
Arkansas Development Finance Authority (Housing Revenue, GNMA Insured) | | | 9.75 | % | | | 11-15-2014 | | | $ | 35,015 | | | $ | 35,550 | |
| | | | | | | | | | | | | | | | |
| | | | |
| Texas: 0.60% | | | | | | | | | | | | | | | | |
Retama TX Development Corporation (Miscellaneous Revenue) | | | 10.00 | | | | 12-15-2020 | | | | 5,405,000 | | | | 8,023,398 | |
| | | | | | | | | | | | | | | | |
| |
Total Municipal Obligations (Cost $6,882,723) | | | | 8,058,948 | |
| | | | | | | | | | | | | | | | |
| | | | |
Non-Agency Mortgage Backed Securities: 6.04% | | | | | | | | | | | | | | | | |
Bear Stearns Commercial Mortgage Securities Incorporated
Series 2005-PWR-7 Class A3 ± | | | 5.12 | | | | 2-11-2041 | | | | 6,450,000 | | | | 6,655,252 | |
Citigroup Commercial Mortgage Trust Series 2006-C4 Class A3 ± | | | 5.78 | | | | 3-15-2049 | | | | 9,917,003 | | | | 10,757,122 | |
Citigroup Commercial Mortgage Trust Series 2006-C5 Class A4 | | | 5.43 | | | | 10-15-2049 | | | | 11,280,000 | | | | 12,345,983 | |
GE Capital Commercial Mortgage Corporation Series 2005-C3 Class A7A ± | | | 4.97 | | | | 7-10-2045 | | | | 9,360,000 | | | | 9,778,813 | |
Lehman Brothers UBS Commercial Mortgage Trust Series 2006-C1 Class A4 | | | 5.16 | | | | 2-15-2031 | | | | 13,165,000 | | | | 13,965,129 | |
Morgan Stanley Capital I Series 2004-HQ4 Class A7 | | | 4.97 | | | | 4-14-2040 | | | | 4,933,142 | | | | 4,962,247 | |
Morgan Stanley Capital I Series 2006-HQ8 Class A4 ± | | | 5.42 | | | | 3-12-2044 | | | | 2,439,621 | | | | 2,596,267 | |
National Credit Union Administration Board Guaranteed Notes Series 2010-C1 Class A2 | | | 2.90 | | | | 10-29-2020 | | | | 2,810,000 | | | | 2,932,465 | |
National Credit Union Administration Board Guaranteed Notes
Series 2010-C1 Class APT | | | 2.65 | | | | 10-29-2020 | | | | 8,600,617 | | | | 8,871,536 | |
National Credit Union Administration Board Guaranteed Notes
Series 2011-R4 Class 1A ± | | | 0.54 | | | | 3-6-2020 | | | | 3,289,748 | | | | 3,298,226 | |
National Credit Union Administration Board Guaranteed Notes
Series 2011-R6 Class 1A ± | | | 0.54 | | | | 5-7-2020 | | | | 3,292,090 | | | | 3,295,734 | |
Vendee Mortgage Trust Series 1995-1 Class 4 ± | | | 8.77 | | | | 2-15-2025 | | | | 418,330 | | | | 484,440 | |
Vendee Mortgage Trust Series 1995-2C Class 3A | | | 8.79 | | | | 6-15-2025 | | | | 553,766 | | | | 670,048 | |
| |
Total Non-Agency Mortgage Backed Securities (Cost $81,236,038) | | | | 80,613,262 | |
| | | | | | | | | | | | | | | | |
| | | | |
U.S. Treasury Securities: 49.23% | | | | | | | | | | | | | | | | |
U.S. Treasury Bond | | | 2.75 | | | | 8-15-2042 | | | | 10,585,000 | | | | 8,980,716 | |
U.S. Treasury Bond | | | 3.75 | | | | 8-15-2041 | | | | 20,565,000 | | | | 21,323,334 | |
U.S. Treasury Bond | | | 4.50 | | | | 2-15-2036 | | | | 7,475,000 | | | | 8,759,766 | |
U.S. Treasury Bond | | | 4.63 | | | | 2-15-2040 | | | | 20,150,000 | | | | 24,088,700 | |
U.S. Treasury Bond | | | 6.25 | | | | 8-15-2023 | | | | 18,460,000 | | | | 24,287,877 | |
U.S. Treasury Bond | | | 7.25 | | | | 8-15-2022 | | | | 4,685,000 | | | | 6,456,881 | |
U.S. Treasury Note | | | 0.13 | | | | 7-31-2014 | | | | 129,195,000 | | | | 129,215,154 | |
U.S. Treasury Note ## | | | 0.25 | | | | 5-31-2014 | | | | 129,170,000 | | | | 129,225,543 | |
U.S. Treasury Note ## | | | 0.38 | | | | 3-15-2015 | | | | 82,035,000 | | | | 82,220,891 | |
U.S. Treasury Note ## | | | 0.38 | | | | 11-15-2015 | | | | 30,605,000 | | | | 30,667,159 | |
U.S. Treasury Note ## | | | 0.50 | | | | 10-15-2014 | | | | 120,390,000 | | | | 120,681,585 | |
U.S. Treasury Note | | | 1.00 | | | | 8-31-2016 | | | | 12,240,000 | | | | 12,390,136 | |
U.S. Treasury Note | | | 1.38 | | | | 2-28-2019 | | | | 36,475,000 | | | | 36,218,544 | |
U.S. Treasury Note | | | 2.75 | | | | 11-15-2023 | | | | 21,845,000 | | | | 22,077,103 | |
| |
Total U.S. Treasury Securities (Cost $654,764,813) | | | | 656,593,389 | |
| | | | | | | | | | | | | | | | |
| | | | |
| 10 | | Wells Fargo Advantage Government Securities Fund | | Portfolio of investments—February 28, 2014 (unaudited) |
| | | | | | | | | | | | | | | | |
| Security name | | Interest rate | | | Maturity date | | | Principal | | | Value | |
| | | | | | | | | | | | | | | | |
| | | | |
Yankee Corporate Bonds and Notes: 2.91% | | | | | | | | | | | | | | | | |
| | | | |
Financials: 2.91% | | | | | | | | | | | | | | | | |
| | | | |
| Banks: 2.91% | | | | | | | | | | | | | | | | |
Bank of Nova Scotia 144A | | | 1.65 | % | | | 10-29-2015 | | | $ | 13,235,000 | | | $ | 13,496,629 | |
Canadian Imperial Bank 144A | | | 0.90 | | | | 9-19-2014 | | | | 8,355,000 | | | | 8,385,788 | |
Nordea Eiendomskreditt 144A | | | 1.88 | | | | 4-7-2014 | | | | 10,430,000 | | | | 10,445,228 | |
Royal Bank of Canada Incorporated | | | 2.00 | | | | 10-1-2018 | | | | 6,370,000 | | | | 6,437,216 | |
| | | | |
Total Yankee Corporate Bonds and Notes (Cost $38,374,786) | | | | | | | | | | | | | | | 38,764,861 | |
| | | | | | | | | | | | | | | | |
| | | | |
| | | Yield | | | | | | Shares | | | | |
| | | | |
Short-Term Investments: 4.48% | | | | | | | | | | | | | | | | |
| | | | |
| Investment Companies: 1.27% | | | | | | | | | | | | | | | | |
Wells Fargo Advantage Government Money Market Fund, Institutional
Class (u)(l)## | | | 0.01 | | | | | | | | 16,851,793 | | | | 16,851,793 | |
| | | | | | | | | �� | | | | | | | |
| | | | |
| | | Interest rate | | | | | | Principal | | | | |
| U.S. Treasury Securities: 3.21% | | | | | | | | | | | | | | | | |
Treasury Bill (z)# | | | 0.03 | | | | 3-20-2014 | | | $ | 1,400,000 | | | | 1,399,980 | |
Treasury Bill (z)# | | | 0.04 | | | | 3-20-2014 | | | | 41,450,000 | | | | 41,449,119 | |
| | | | |
| | | | | | | | | | | | | | | 42,849,099 | |
| | | | | | | | | | | | | | | | |
| | | | |
Total Short-Term Investments (Cost $59,700,871) | | | | | | | | | | | | | | | 59,700,892 | |
| | | | | | | | | | | | | | | | |
| | | | | | | | |
Total investments in securities
(Cost $1,710,672,885) * | | | 129.69 | % | | | 1,729,830,663 | |
Other assets and liabilities, net | | | (29.69 | ) | | | (396,059,275 | ) |
| | | | | | | | |
| Total net assets | | | 100.00 | % | | $ | 1,333,771,388 | |
| | | | | | | | |
| ± | Variable rate investment. The rate shown is the rate in effect at period end. |
| 144A | Security that may be resold to “qualified institutional buyers” under Rule 144A or security offered pursuant to Section 4(2) of the Securities Act of 1933, as amended. |
| %% | Security issued on a when-issued basis. |
| (c) | Interest-only securities entitle holders to receive only the interest payments on the underlying mortgages. The principal amount shown is the notional amount of the underlying mortgages. Interest rate disclosed represents the coupon rate. |
| (a) | Security is fair valued by the Management Valuation Team, and in certain instances by the Board of Trustees, in accordance with procedures approved by the Board of Trustees. |
| ## | All or a portion of this security has been segregated for when-issued securities. |
| (u) | Rate shown is the 7-day annualized yield at period end. |
| (l) | Investment in an affiliate |
| (z) | Zero coupon security. Rate represents the current yield to maturity. |
| # | All or a portion of this security is segregated as collateral for investments in derivative instruments. |
| * | Cost for federal income tax purposes is $1,712,116,317 and unrealized appreciation (depreciation) consists of: |
| | | | |
Gross unrealized appreciation | | $ | 31,158,764 | |
Gross unrealized depreciation | | | (13,444,418 | ) |
| | | | |
Net unrealized appreciation | | $ | 17,714,346 | |
| ITEM 7. | DISCLOSURE OF PROXY VOTING POLICIES AND PROCEDURES FOR CLOSED-END MANAGEMENT INVESTMENT COMPANIES |
Not applicable.
| ITEM 8. | PORTFOLIO MANAGERS OF CLOSED-END MANAGEMENT INVESTMENT COMPANIES |
Not applicable.
| ITEM 9. | PURCHASES OF EQUITY SECURITIES BY CLOSED-END MANAGEMEENT INVESTMENT COMPANY AND AFFILIATED PURCHASERS |
Not applicable.
| ITEM 10. | SUBMISSION OF MATTERS TO A VOTE OF SECURITY HOLDERS |
There have been no material changes to the procedures by which shareholders may recommend nominees to the Registrant’s board of trustees that have been implemented since the Registrant’s last provided disclosure in response to the requirements of this Item.
| ITEM 11. | CONTROLS AND PROCEDURES |
(a) The President and Treasurer have concluded that the Wells Fargo Funds Trust (the “Trust”) disclosure controls and procedures (as defined in Rule 30a-3(c) under the Investment Company Act of 1940) provide reasonable assurances that material information relating to the Trust is made known to them by the appropriate persons, based on their evaluation of these controls and procedures as of a date within 90 days of the filing of this report.
(b) There were no significant changes in the Trust’s internal controls over financial reporting (as defined in Rule 30a-3(d) under the Investment Company Act of 1940) that occurred during the second fiscal quarter of the period covered by this report that materially affected, or is reasonably likely to materially affect, the registrant’s internal control over financial reporting.
(a)(1) Not applicable.
(a)(2) Certification pursuant to Rule 30a-2(a) under the Investment Company Act of 1940 (17 CFR 270.30a-2(a)) is filed and attached hereto as Exhibit 99.CERT.
(a)(3) Not applicable.
(b) Certification pursuant to Rule 30a-2(b) under the Investment Company Act of 1940 (17 CFR 270.30a-2(b)) is filed and attached hereto as Exhibit 99.906CERT.
SIGNATURES
Pursuant to the requirements of the Securities Exchange Act of 1934 and the Investment Company Act of 1940, the registrant has duly caused this report to be signed on its behalf by the undersigned, thereunto duly authorized.
| | |
| Wells Fargo Funds Trust |
| |
| By: | |
/s/ Karla M. Rabusch |
| |
| | Karla M. Rabusch |
| | President |
| |
| Date: | | April 25, 2014 |
Pursuant to the requirements of the Securities Exchange Act of 1934 and the Investment Company Act of 1940, this report has been signed below by the following persons on behalf of the registrant and in the capacities and on the date indicated.
| | |
| Wells Fargo Funds Trust |
| |
| By: | |
/s/ Karla M. Rabusch |
| |
| | Karla M. Rabusch |
| | President |
| |
| Date: | | April 25, 2014 |
| |
| By: | |
/s/ Nancy Wiser |
| |
| | Nancy Wiser |
| | Treasurer |
| |
| Date: | | April 25, 2014 |