Exhibit (c)(3)
CONFIDENTIAL
Discussion Materials – November 9, 2009
CONFIDENTIAL
Disclaimer
This presentation and the information contained herein is confidential and has been prepared exclusively for the benefit and internal use of the Special Committee of the Board of Directors of Rubio’s Restaurants, Inc. (the “Company”), in order to assist the Special Committee in evaluating, on a preliminary basis, the feasibility of a possible transaction or transactions and other strategic alternatives and does not convey any right of publication or disclosure, in whole or in part, to any other party without the prior written consent of Cowen. This presentation is for discussion purposes only and is incomplete without reference to, and should be viewed solely in conjunction with, the oral briefing provided by Cowen to the Special Committee.
The information in this presentation is based upon management forecasts supplied to Cowen and reflects prevailing conditions and Cowen’s views as of this date, all of which are accordingly subject to change. Cowen’s estimates constitute Cowen’s judgment and should be regarded as indicative, preliminary and for illustrative purposes only. In preparing this presentation, Cowen has with your consent, assumed and relied, without independent investigation, upon the accuracy and completeness of all financial and other information provided to us by the management of the Company or which is publicly available or was otherwise reviewed by Cowen. Cowen’s analysis is not and does not purport to be appraisals of the assets, stock or business of the Company or any other entity. Cowen does not make representations as to the actual value which may be received in connection with a transaction or as to the price at which the Company’s securities may trade at any time. Cowen does not address any legal, tax or accounting effects of consummating a transaction or any other alternative. The information in this presentation does not take into account the effects of a possible transaction or transactions involving an actual or potential change of control, which may have significant valuation and other effects. This presentation does not represent a fairness opinion, recommendation, valuation or opinion of any kind. Cowen does not have any obligation to update, revise or reaffirm this presentation.
The information contained herein, as well as any other advice, services or other information provided to you by Cowen, is being provided pursuant to and subject to the terms of our engagement letter with the Board and may not be used or relied upon in any manner, nor are any duties or obligations created with respect thereto. This presentation does not constitute a commitment by Cowen or any of its affiliates to underwrite, subscribe for or place any securities to extend or arrange credit or to provide any other service.
Cowen policy mandates that no Cowen employee may directly or indirectly offer a company favorable research or threaten to change research as consideration or inducement for the receipt of business or compensation.
DISCUSSION MATERIALS
CONFIDENTIAL
Table of Contents
Page
I. Situation Overview 2
II. Restaurant Market Update 4
III. Rubio’s Overview 15
IV. Valuation Overview 32
V. Strategic Alternatives Overview 44
DISCUSSION MATERIALS
1
CONFIDENTIAL
I. Situation Overview
CONFIDENTIAL
Situation Overview
Cowen and Company, LLC is pleased to advise Rubio’s Special Committee of the Board of Directors in evaluating the Company’s alternatives
As part of this process, Cowen has considered the following Strategic Alternatives:
Status Quo
Share Repurchase
Acquisitions
Sale of the Company
I. SITUATION OVERVIEW
DISCUSSION MATERIALS
3

CONFIDENTIAL
II. Restaurant Market Update
CONFIDENTIAL
Restaurant Operating Environment Summary
Weak revenue/same-store sales trends have continued
Broader weakness now includes QSR/Fast-Casual segments
Limited visibility to near term based upon economic data
New unit growth restrained and closures taking place
Capacity growth is limited/few unit growth stories
Large systems being rationalized and smaller, independents closing stores
Commodities and cost-cuts have provided margin relief
The commodity “bubble” has burst for 2009, but 2010 looks uncertain
Internal cost-cutting/“belt tightening” has allowed for improved profitability
Restaurant stocks have rebounded strongly in 2009
After a brutal 2008, started the year at very depressed levels
EPS “beats” have helped, but top-line needs to improve from here
Anticipation of economic recovery already “baked in” or perhaps overdone
Expectations for 2010 are cloudy
Sales improvement will likely lag economic recovery
Stocks may move “sideways” for some time as valuations have returned to normalized levels
II. RESTAURANT MARKET UPDATE
DISCUSSION MATERIALS
5
CONFIDENTIAL
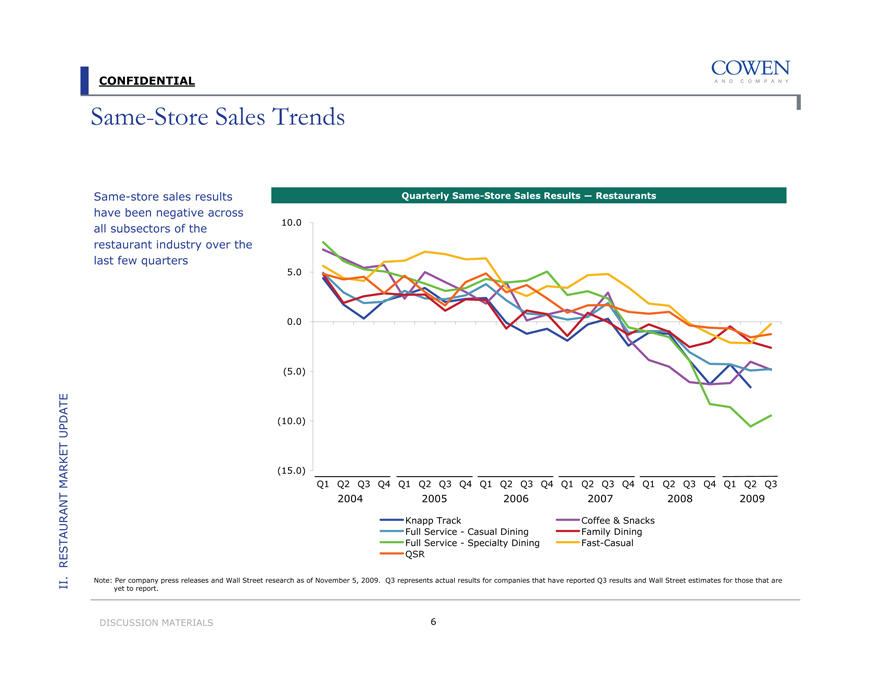
Same-Store Sales Trends
Same-store sales results have been negative across all subsectors of the restaurant industry over the last few quarters
Quarterly Same-Store Sales Results — Restaurants
10.0
5.0
0.0
(5.0)
(10.0)
(15.0)
Q1 Q2 Q3 Q4 Q1 Q2 Q3 Q4 Q1 Q2 Q3 Q4 Q1 Q2 Q3 Q4 Q1 Q2 Q3 Q4 Q1 Q2 Q3 2004 2005 2006 2007 2008 2009
Knapp Track
Coffee & Snacks
Full Service - Casual Dining
Family Dining
Full Service - Specialty Dining
Fast-Casual
QSR
II. RESTAURANT MARKET UPDATE
Note: Per company press releases and Wall Street research as of November 5, 2009. Q3 represents actual results for companies that have reported Q3 results and Wall Street estimates for those that are yet to report.
DISCUSSION MATERIALS
6
CONFIDENTIAL
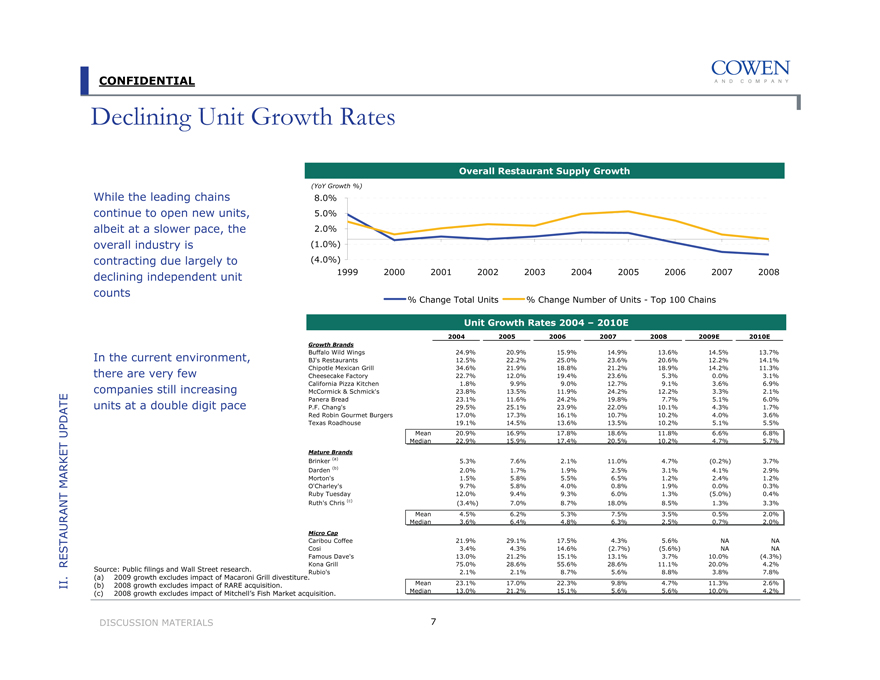
Declining Unit Growth Rates
While the leading chains continue to open new units, albeit at a slower pace, the overall industry is contracting due largely to declining independent unit counts
In the current environment, there are very few companies still increasing units at a double digit pace
Overall Restaurant Supply Growth
(YoY Growth %)
8.0%
5.0%
2.0%
(1.0%)
(4.0%)
1999 2000 2001 2002 2003 2004 2005 2006 2007 2008
% Change Total Units % Change Number of Units - Top 100 Chains
Unit Growth Rates 2004 – 2010E
2004 2005 2006 2007 2008 2009E 2010E
Growth Brands
Buffalo Wild Wings 24.9% 20.9% 15.9% 14.9% 13.6% 14.5% 13.7%
BJ’s Restaurants 12.5% 22.2% 25.0% 23.6% 20.6% 12.2% 14.1%
Chipotle Mexican Grill 34.6% 21.9% 18.8% 21.2% 18.9% 14.2% 11.3%
Cheesecake Factory 22.7% 12.0% 19.4% 23.6% 5.3% 0.0% 3.1%
California Pizza Kitchen 1.8% 9.9% 9.0% 12.7% 9.1% 3.6% 6.9%
McCormick & Schmick’s 23.8% 13.5% 11.9% 24.2% 12.2% 3.3% 2.1%
Panera Bread 23.1% 11.6% 24.2% 19.8% 7.7% 5.1% 6.0%
P.F. Chang’s 29.5% 25.1% 23.9% 22.0% 10.1% 4.3% 1.7%
Red Robin Gourmet Burgers 17.0% 17.3% 16.1% 10.7% 10.2% 4.0% 3.6%
Texas Roadhouse 19.1% 14.5% 13.6% 13.5% 10.2% 5.1% 5.5%
Mean 20.9% 16.9% 17.8% 18.6% 11.8% 6.6% 6.8%
Median 22.9% 15.9% 17.4% 20.5% 10.2% 4.7% 5.7%
Mature Brands
Brinker (a) 5.3% 7.6% 2.1% 11.0% 4.7% (0.2%) 3.7%
Darden (b) 2.0% 1.7% 1.9% 2.5% 3.1% 4.1% 2.9%
Morton’s 1.5% 5.8% 5.5% 6.5% 1.2% 2.4% 1.2%
O’Charley’s 9.7% 5.8% 4.0% 0.8% 1.9% 0.0% 0.3%
Ruby Tuesday 12.0% 9.4% 9.3% 6.0% 1.3% (5.0%) 0.4%
Ruth’s Chris (c) (3.4%) 7.0% 8.7% 18.0% 8.5% 1.3% 3.3%
Mean 4.5% 6.2% 5.3% 7.5% 3.5% 0.5% 2.0%
Median 3.6% 6.4% 4.8% 6.3% 2.5% 0.7% 2.0%
Micro Cap
Caribou Coffee 21.9% 29.1% 17.5% 4.3% 5.6% NA NA
Cosi 3.4% 4.3% 14.6% (2.7%) (5.6%) NA NA
Famous Dave’s 13.0% 21.2% 15.1% 13.1% 3.7% 10.0% (4.3%)
Kona Grill 75.0% 28.6% 55.6% 28.6% 11.1% 20.0% 4.2%
Rubio’s 2.1% 2.1% 8.7% 5.6% 8.8% 3.8% 7.8%
Mean 23.1% 17.0% 22.3% 9.8% 4.7% 11.3% 2.6%
Median 13.0% 21.2% 15.1% 5.6% 5.6% 10.0% 4.2%
Source: Public filings and Wall Street research.
(a) 2009 growth excludes impact of Macaroni Grill divestiture.
(b) 2008 growth excludes impact of RARE acquisition.
(c) 2008 growth excludes impact of Mitchell’s Fish Market acquisition.
II. RESTAURANT MARKET UPDATE
DISCUSSION MATERIALS
7
CONFIDENTIAL
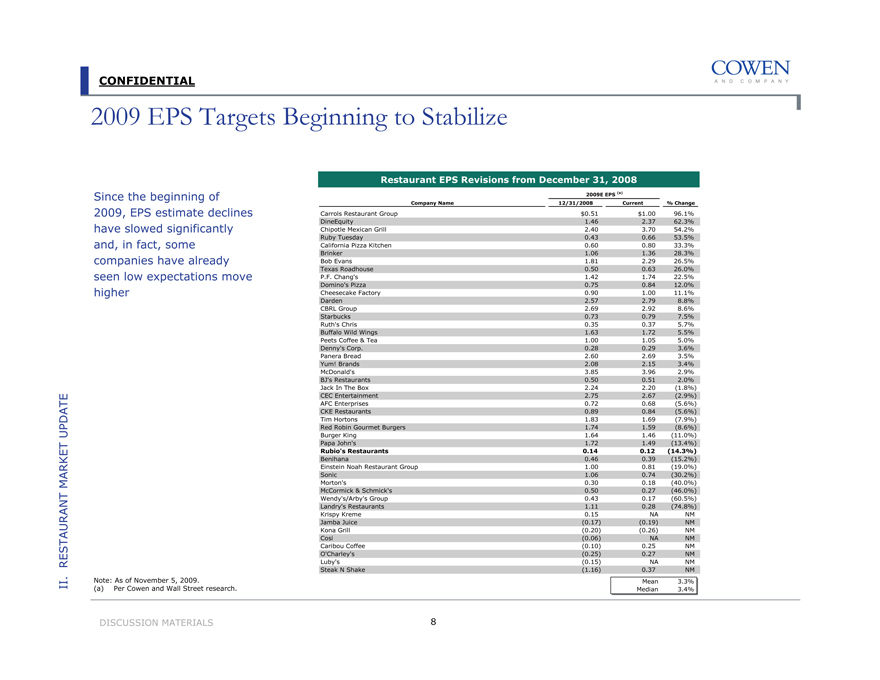
2009 EPS Targets Beginning to Stabilize
Since the beginning of 2009, EPS estimate declines have slowed significantly and, in fact, some companies have already seen low expectations move higher
Restaurant EPS Revisions from December 31, 2008
2009E EPS (a)
Company Name 12/31/2008 Current % Change
Carrols Restaurant Group $0.51 $1.00 96.1%
DineEquity 1.46 2.37 62.3%
Chipotle Mexican Grill 2.40 3.70 54.2%
Ruby Tuesday 0.43 0.66 53.5%
California Pizza Kitchen 0.60 0.80 33.3%
Brinker 1.06 1.36 28.3%
Bob Evans 1.81 2.29 26.5%
Texas Roadhouse 0.50 0.63 26.0%
P.F. Chang’s 1.42 1.74 22.5%
Domino’s Pizza 0.75 0.84 12.0%
Cheesecake Factory 0.90 1.00 11.1%
Darden 2.57 2.79 8.8%
CBRL Group 2.69 2.92 8.6%
Starbucks 0.73 0.79 7.5%
Ruth’s Chris 0.35 0.37 5.7%
Buffalo Wild Wings 1.63 1.72 5.5%
Peets Coffee & Tea 1.00 1.05 5.0%
Denny’s Corp. 0.28 0.29 3.6%
Panera Bread 2.60 2.69 3.5%
Yum! Brands 2.08 2.15 3.4%
McDonald’s 3.85 3.96 2.9%
BJ’s Restaurants 0.50 0.51 2.0%
Jack In The Box 2.24 2.20 (1.8%)
CEC Entertainment 2.75 2.67 (2.9%)
AFC Enterprises 0.72 0.68 (5.6%)
CKE Restaurants 0.89 0.84 (5.6%)
Tim Hortons 1.83 1.69 (7.9%)
Red Robin Gourmet Burgers 1.74 1.59 (8.6%)
Burger King 1.64 1.46 (11.0%)
Papa John’s 1.72 1.49 (13.4%)
Rubio’s Restaurants 0.14 0.12 (14.3%)
Benihana 0.46 0.39 (15.2%)
Einstein Noah Restaurant Group 1.00 0.81 (19.0%)
Sonic 1.06 0.74 (30.2%)
Morton’s 0.30 0.18 (40.0%)
McCormick & Schmick’s 0.50 0.27 (46.0%)
Wendy’s/Arby’s Group 0.43 0.17 (60.5%)
Landry’s Restaurants 1.11 0.28 (74.8%)
Krispy Kreme 0.15 NA NM
Jamba Juice (0.17) (0.19) NM
Kona Grill (0.20) (0.26) NM
Cosi (0.06) NA NM
Caribou Coffee (0.10) 0.25 NM
O’Charley’s (0.25) 0.27 NM
Luby’s (0.15) NA NM
Steak N Shake (1.16) 0.37 NM
Mean 3.3%
Median 3.4%
II. RESTAURANT MARKET UPDATE
Note: As of November 5, 2009.
(a) Per Cowen and Wall Street research.
DISCUSSION MATERIALS
8
CONFIDENTIAL
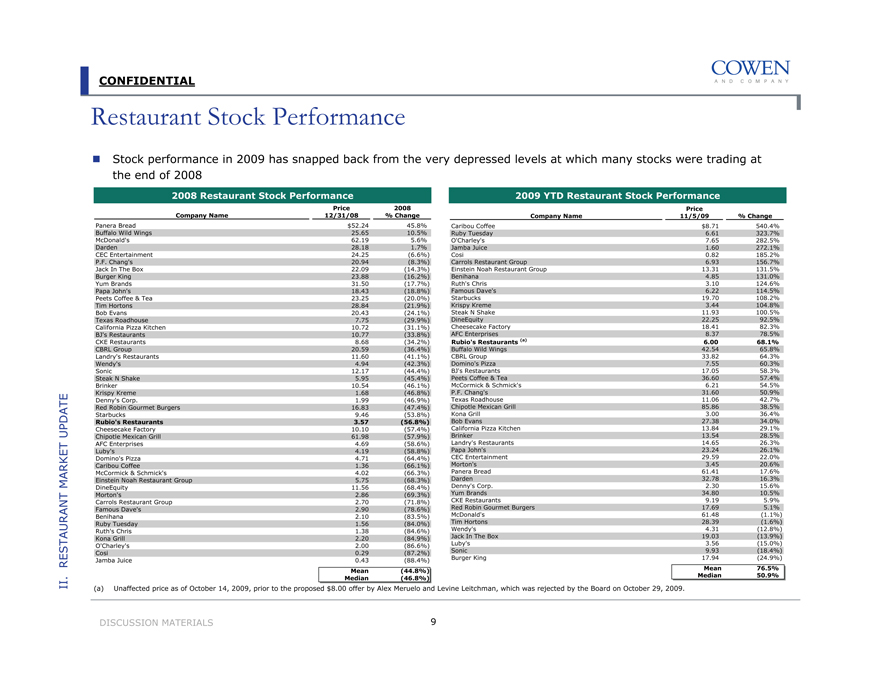
Restaurant Stock Performance
Stock performance in 2009 has snapped back from the very depressed levels at which many stocks were trading at the end of 2008
2008 Restaurant Stock Performance
Company Name Price 12/31/08 2008 % Change
Panera Bread $52.24 45.8%
Buffalo Wild Wings 25.65 10.5%
McDonald’s 62.19 5.6%
Darden 28.18 1.7%
CEC Entertainment 24.25 (6.6%)
P.F. Chang’s 20.94 (8.3%)
Jack In The Box 22.09 (14.3%)
Burger King 23.88 (16.2%)
Yum Brands 31.50 (17.7%)
Papa John’s 18.43 (18.8%)
Peets Coffee & Tea 23.25 (20.0%)
Tim Hortons 28.84 (21.9%)
Bob Evans 20.43 (24.1%)
Texas Roadhouse 7.75 (29.9%)
California Pizza Kitchen 10.72 (31.1%)
BJ’s Restaurants 10.77 (33.8%)
CKE Restaurants 8.68 (34.2%)
CBRL Group 20.59 (36.4%)
Landry’s Restaurants 11.60 (41.1%)
Wendy’s 4.94 (42.3%)
Sonic 12.17 (44.4%)
Steak N Shake 5.95 (45.4%)
Brinker 10.54 (46.1%)
Krispy Kreme 1.68 (46.8%)
Denny’s Corp. 1.99 (46.9%)
Red Robin Gourmet Burgers 16.83 (47.4%)
Starbucks 9.46 (53.8%)
Rubio’s Restaurants 3.57 (56.8%)
Cheesecake Factory 10.10 (57.4%)
Chipotle Mexican Grill 61.98 (57.9%)
AFC Enterprises 4.69 (58.6%)
Luby’s 4.19 (58.8%)
Domino’s Pizza 4.71 (64.4%)
Caribou Coffee 1.36 (66.1%)
McCormick & Schmick’s 4.02 (66.3%)
Einstein Noah Restaurant Group 5.75 (68.3%)
DineEquity 11.56 (68.4%)
Morton’s 2.86 (69.3%)
Carrols Restaurant Group 2.70 (71.8%)
Famous Dave’s 2.90 (78.6%)
Benihana 2.10 (83.5%)
Ruby Tuesday 1.56 (84.0%)
Ruth’s Chris 1.38 (84.6%)
Kona Grill 2.20 (84.9%)
O’Charley’s 2.00 (86.6%)
Cosi 0.29 (87.2%)
Jamba Juice 0.43 (88.4%)
Mean (44.8%)
Median (46.8%)
2009 YTD Restaurant Stock Performance
Company Name Price 11/5/09 % Change
Caribou Coffee $8.71 540.4%
Ruby Tuesday 6.61 323.7%
O’Charley’s 7.65 282.5%
Jamba Juice 1.60 272.1%
Cosi 0.82 185.2%
Carrols Restaurant Group 6.93 156.7%
Einstein Noah Restaurant Group 13.31 131.5%
Benihana 4.85 131.0%
Ruth’s Chris 3.10 124.6%
Famous Dave’s 6.22 114.5%
Starbucks 19.70 108.2%
Krispy Kreme 3.44 104.8%
Steak N Shake 11.93 100.5%
DineEquity 22.25 92.5%
Cheesecake Factory 18.41 82.3%
AFC Enterprises 8.37 78.5%
Rubio’s Restaurants (a) 6.00 68.1%
Buffalo Wild Wings 42.54 65.8%
CBRL Group 33.82 64.3%
Domino’s Pizza 7.55 60.3%
BJ’s Restaurants 17.05 58.3%
Peets Coffee & Tea 36.60 57.4%
McCormick & Schmick’s 6.21 54.5%
P.F. Chang’s 31.60 50.9%
Texas Roadhouse 11.06 42.7%
Chipotle Mexican Grill 85.86 38.5%
Kona Grill 3.00 36.4%
Bob Evans 27.38 34.0%
California Pizza Kitchen 13.84 29.1%
Brinker 13.54 28.5%
Landry’s Restaurants 14.65 26.3%
Papa John’s 23.24 26.1%
CEC Entertainment 29.59 22.0%
Morton’s 3.45 20.6%
Panera Bread 61.41 17.6%
Darden 32.78 16.3%
Denny’s Corp. 2.30 15.6%
Yum Brands 34.80 10.5%
CKE Restaurants 9.19 5.9%
Red Robin Gourmet Burgers 17.69 5.1%
McDonald’s 61.48 (1.1%)
Tim Hortons 28.39 (1.6%)
Wendy’s 4.31 (12.8%)
Jack In The Box 19.03 (13.9%)
Luby’s 3.56 (15.0%)
Sonic 9.93 (18.4%)
Burger King 17.94 (24.9%)
Mean 76.5%
Median 50.9%
(a) Unaffected price as of October 14, 2009, prior to the proposed $8.00 offer by Alex Meruelo and Levine Leitchman, which was rejected by the Board on October 29, 2009.
II. RESTAURANT MARKET UPDATE
DISCUSSION MATERIALS
9
CONFIDENTIAL
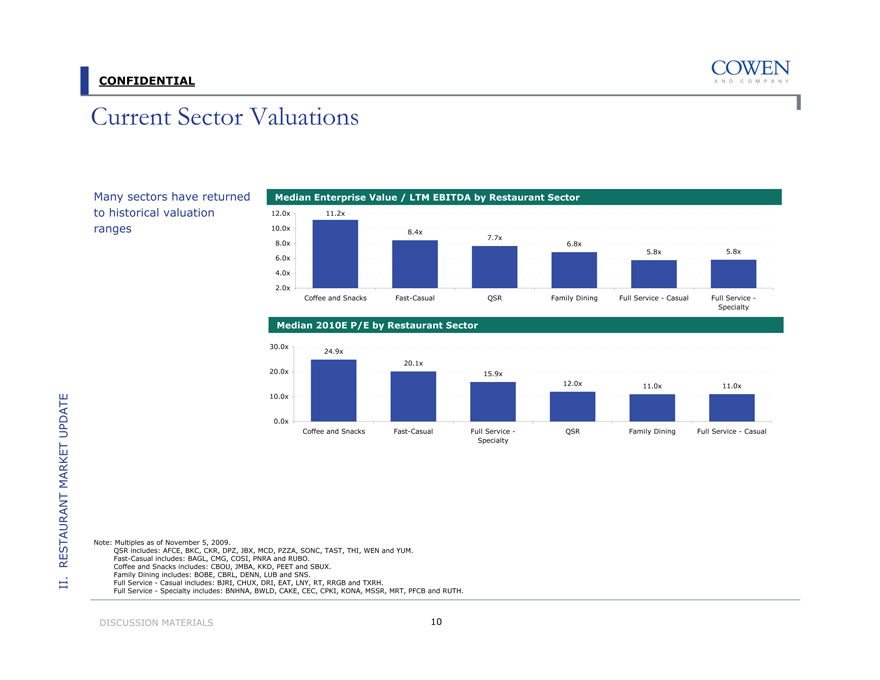
Current Sector Valuations
Many sectors have returned to historical valuation ranges
Median Enterprise Value / LTM EBITDA by Restaurant Sector
12.0x
10.0x
8.0x
6.0x
4.0x
2.0x
11.2x
8.4x
7.7x
6.8x
5.8x
5.8x
Coffee and Snacks
Fast-Casual
QSR
Family Dining
Full Service – Casual
Full Service – Specialty
Median 2010E P/E by Restaurant Sector
30.0x
20.0x
10.0x
0.0x
Coffee and Snacks
Fast-Casual
Full Service – Specialty
QSR
Family Dining
Full Service – Casual
24.9x
20.1x
15.9x
12.0x
11.0x
11.0x
Note:
Multiples as of November 5, 2009.
QSR includes: AFCE, BKC, CKR, DPZ, JBX, MCD, PZZA, SONC, TAST, THI, WEN and YUM. Fast-Casual includes: BAGL, CMG, COSI, PNRA and RUBO.
Coffee and Snacks includes: CBOU, JMBA, KKD, PEET and SBUX. Family Dining includes: BOBE, CBRL, DENN, LUB and SNS.
Full Service – Casual includes: BJRI, CHUX, DRI, EAT, LNY, RT, RRGB and TXRH.
Full Service – Specialty includes: BNHNA, BWLD, CAKE, CEC, CPKI, KONA, MSSR, MRT, PFCB and RUTH.
II. RESTAURANT MARKET UPDATE
DISCUSSION MATERIALS
10
CONFIDENTIAL
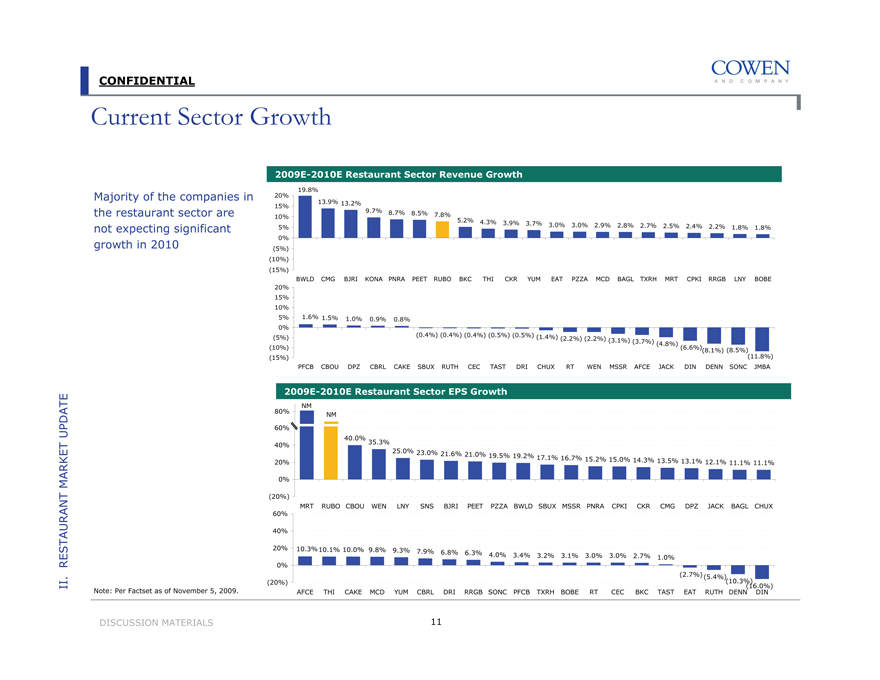
Current Sector Growth
Majority of the companies in the restaurant sector are not expecting significant growth in 2010
2009E-2010E Restaurant Sector Revenue Growth
20% 15% 10% 5% 0% (5%) (10%) (15%)
19.8% 13.9% 13.2% 9.7% 8.7% 8.5% 7.8% 5.2% 4.3% 3.9% 3.7% 3.0% 3.0% 2.9% 2.8% 2.7% 2.5% 2.4% 2.2% 1.8% 1.8%
BWLD CMG BJRI KONA PNRA PEET RUBO BKC THI CKR YUM EAT PZZA MCD BAGL TXRH MRT CPKI RRGB LNY BOBE
20% 15% 10% 5% 0% (5%) (10%) (15%)
1.6% 1.5% 1.0% 0.9% 0.8%
(0.4%) (0.4%) (0.4%) (0.5%) (0.5%) (1.4%)
(2.2%) (2.2%) (3.1%) (3.7%) (4.8%)
(6.6%) (8.1%) (8.5%) (11.8%)
PFCB CBOU DPZ CBRL CAKE SBUX RUTH CEC TAST DRI CHUX RT WEN MSSR AFCE JACK DIN DENN SONC JMBA
2009E-2010E Restaurant Sector EPS Growth
80% 60% 40% 20% 0% (20%)
NM NM
40.0%
35.3%
25.0% 23.0% 21.6%
21.0% 19.5% 19.2%
17.1% 16.7% 15.2% 15.0% 14.3% 13.5%
13.1% 12.1% 11.1% 11.1%
MRT RUBO CBOU WEN LNY SNS BJRI PEET PZZA BWLD SBUX MSSR PNRA CPKI CKR CMG DPZ JACK BAGL CHUX
60% 40% 20% 0% (20%)
10.3%10.1% 10.0% 9.8% 9.3% 7.9%
6.8% 6.3% 4.0% 3.4% 3.2%
3.1% 3.0% 3.0% 2.7% 1.0%
(2.7%) (5.4%) (10.3%) (16.0%)
AFCE THI CAKE MCD YUM CBRL DRI RRGB SONC PFCB TXRH BOBE RT CEC BKC TAST EAT RUTH DENN DIN
Note: Per Factset as of November 5, 2009.
II. RESTAURANT MARKET UPDATE
DISCUSSION MATERIALS
11
CONFIDENTIAL
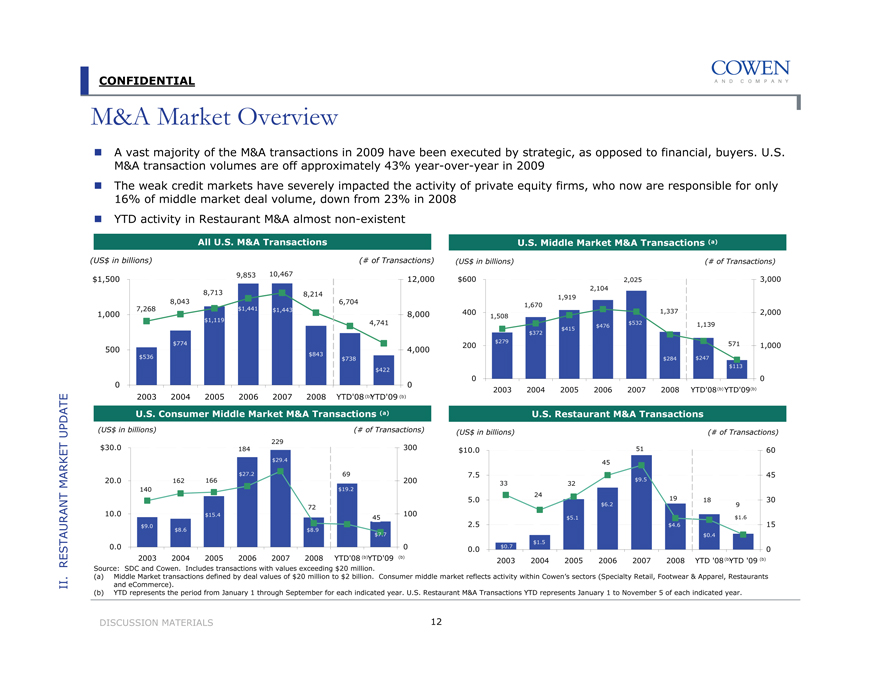
M&A Market Overview
A vast majority of the M&A transactions in 2009 have been executed by strategic, as opposed to financial, buyers. U.S. M&A transaction volumes are off approximately 43% year-over-year in 2009
The weak credit markets have severely impacted the activity of private equity firms, who now are responsible for only 16% of middle market deal volume, down from 23% in 2008
YTD activity in Restaurant M&A almost non-existent
All U.S. M&A Transactions
(US$ in billions) (# of Transactions)
9,853 10,467 $1,500 12,000 8,713 8,214 8,043 6,704 7,268 $1,441 $1,443 1,000 8,000 $1,119 4,741
$774
500 4,000 $536 $843 $738 $422
0 0 2003 2004 2005 2006 2007 2008 YTD’08 (b) YTD’09 (b)
U.S. Middle Market M&A Transactions (a)
(US$ in billions) (# of Transactions)
$600 2,025 3,000 2,104 1,919 400 1,670 1,337 2,000 1,508 $532 1,139 $476 $415 $372 $279 571 200 1,000 $284 $247 $113
0
0
2003 2004 2005 2006 2007 2008 YTD’08 (b) YTD’09(b)
U.S. Consumer Middle Market M&A Transactions (a)
(US$ in billions) (# of Transactions)
229 $30.0 184 300 $29.4
166 $27.2 69
20.0 162 200 140 $19.2
10.0 72 100 $15.4 45 $9.0 $8.6 $8.9 $7.7 0.0 0 2003 2004 2005 2006 2007 2008 YTD’08 (b)YTD’09 (b)
U.S. Restaurant M&A Transactions
(US$ in billions) (# of Transactions)
$10.0 51 60 45
7.5 45
$9.5
33 32 24
5.0 $6.2 19 18 9 30
$5.1 $1.6
2.5 $4.6 15
$0.4
$1.5
0.0 $0.7 0 2003 2004 2005 2006 2007 2008 YTD ‘08(b) YTD ‘09 (b)
Source: SDC and Cowen. Includes transactions with values exceeding $20 million.
(a) Middle Market transactions defined by deal values of $20 million to $2 billion. Consumer middle market reflects activity within Cowen’s sectors (Specialty Retail, Footwear & Apparel, Restaurants and eCommerce).
(b) YTD represents the period from January 1 through September for each indicated year. U.S. Restaurant M&A Transactions YTD represents January 1 to November 5 of each indicated year.
II. RESTAURANT MARKET UPDATE
DISCUSSION MATERIALS
12
CONFIDENTIAL
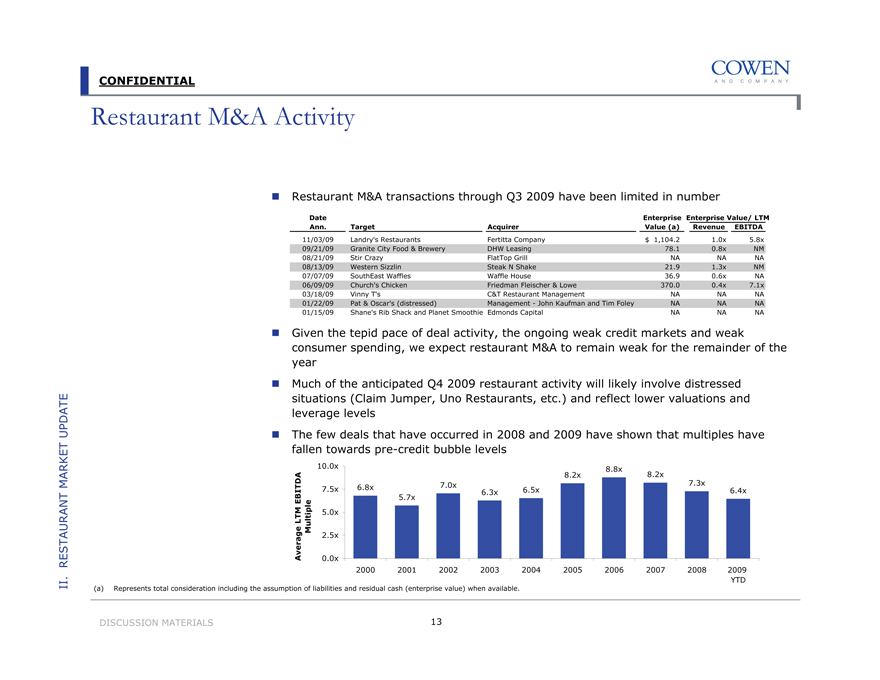
Restaurant M&A Activity
Restaurant M&A transactions through Q3 2009 have been limited in number
Enterprise Value/ LTM
Date Ann. Target Acquirer Enterprise Value (a) Revenue EBITDA
11/03/09 Landry’s Restaurants Fertitta Company $ 1,104.2 1.0x 5.8x
09/21/09 Granite City Food & Brewery DHW Leasing 78.1 0.8x NM
08/21/09 Stir Crazy FlatTop Grill NA NA NA
08/13/09 Western Sizzlin Steak N Shake 21.9 1.3x NM
07/07/09 SouthEast Waffles Waffle House 36.9 0.6x NA
06/09/09 Church’s Chicken Friedman Fleischer & Lowe 370.0 0.4x 7.1x
03/18/09 Vinny T’s C&T Restaurant Management NA NA NA
01/22/09 Pat & Oscar’s (distressed) Management - John Kaufman and Tim Foley NA NA NA
01/15/09 Shane’s Rib Shack and Planet Smoothie Edmonds Capital NA NA NA
Given the tepid pace of deal activity, the ongoing weak credit markets and weak consumer spending, we expect restaurant M&A to remain weak for the remainder of the year
Much of the anticipated Q4 2009 restaurant activity will likely involve distressed situations (Claim Jumper, Uno Restaurants, etc.) and reflect lower valuations and UPDATE leverage levels
The few deals that have occurred in 2008 and 2009 have shown that multiples have fallen towards pre-credit bubble levels
Average LTM EBITDA Multiple
10.0x 7.5x 5.0x 2.5x 0.0x
8.8x
8.2x
8.2x
7.0x
7.3x
6.8x
6.5x
6.4x
6.3x
5.7x
2000 2001 2002 2003 2004 2005 2006 2007 2008 2009 YTD
(a) Represents total consideration including the assumption of liabilities and residual cash (enterprise value) when available.
II. RESTAURANT MARKET UPDATE
DISCUSSION MATERIALS
13
CONFIDENTIAL
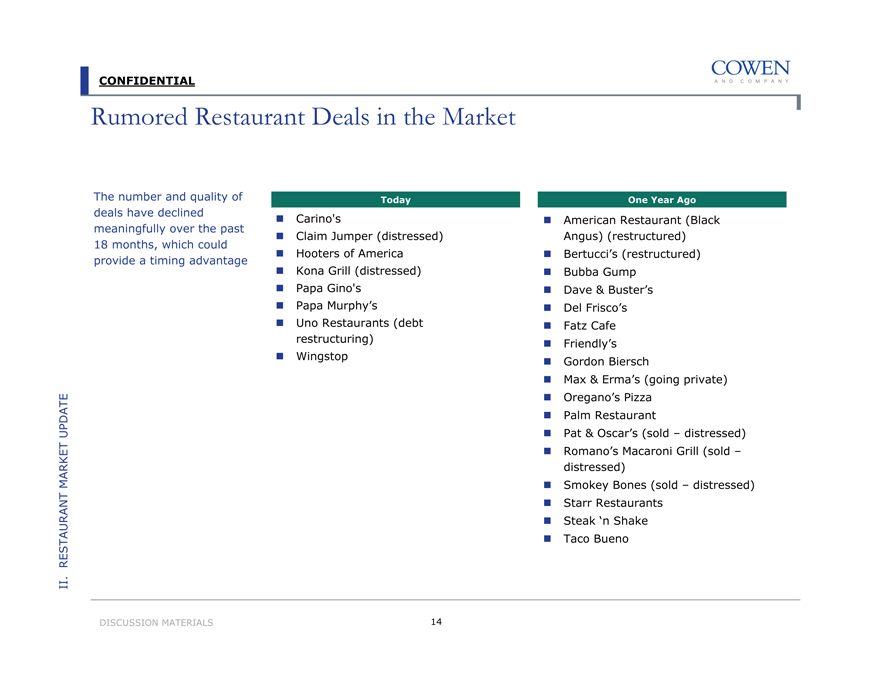
Rumored Restaurant Deals in the Market
The number and quality of deals have declined meaningfully over the past 18 months, which could provide a timing advantage
Today
Carino’s
Claim Jumper (distressed)
Hooters of America
Kona Grill (distressed)
Papa Gino’s
Papa Murphy’s
Uno Restaurants (debt restructuring)
Wingstop
One Year Ago
American Restaurant (Black Angus) (restructured)
Bertucci’s (restructured)
Bubba Gump
Dave & Buster’s
Del Frisco’s
Fatz Cafe
Friendly’s
Gordon Biersch
Max & Erma’s (going private)
Oregano’s Pizza
Palm Restaurant
Pat & Oscar’s (sold – distressed)
Romano’s Macaroni Grill (sold – distressed)
Smokey Bones (sold – distressed)
Starr Restaurants
Steak ‘n Shake
Taco Bueno
II. RESTAURANT MARKET UPDATE
DISCUSSION MATERIALS
14
CONFIDENTIAL
III. Rubio’s Overview
CONFIDENTIAL
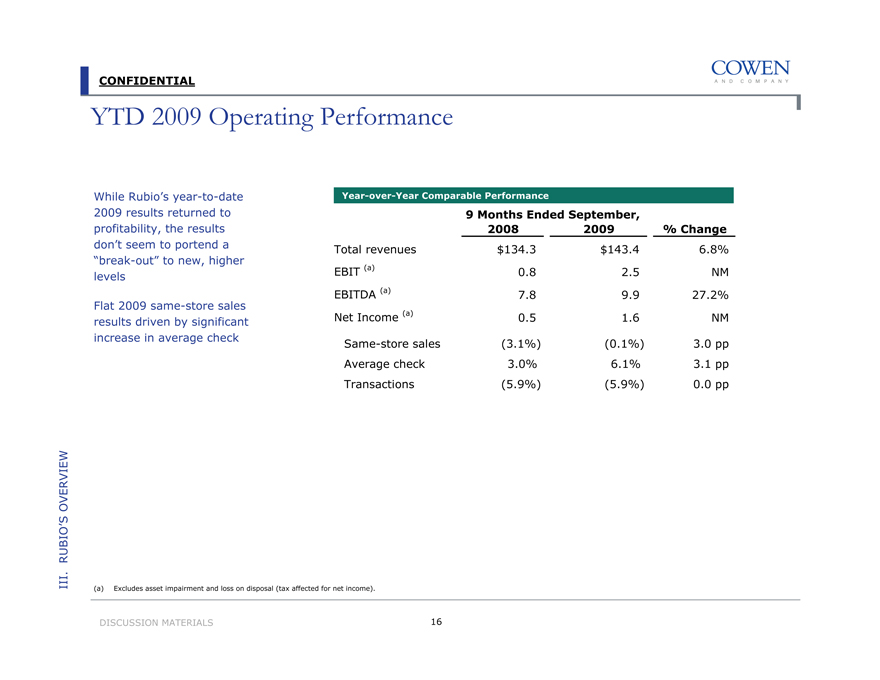
YTD 2009 Operating Performance
While Rubio’s year-to-date 2009 results returned to profitability, the results don’t seem to portend a “break-out” to new, higher levels
Flat 2009 same-store sales results driven by significant increase in average check
Year-over-Year Comparable Performance
9 Months Ended September,
2008 2009 % Change
Total revenues $134.3 $143.4 6.8%
EBIT (a) 0.8 2.5 NM
EBITDA (a) 7.8 9.9 27.2%
Net Income (a) 0.5 1.6 NM
Same-store sales (3.1%) (0.1%) 3.0 pp
Average check 3.0% 6.1% 3.1 pp
Transactions (5.9%) (5.9%) 0.0 pp
III. RUBIO’S OVERVIEW
(a) Excludes asset impairment and loss on disposal (tax affected for net income).
DISCUSSION MATERIALS
16
CONFIDENTIAL
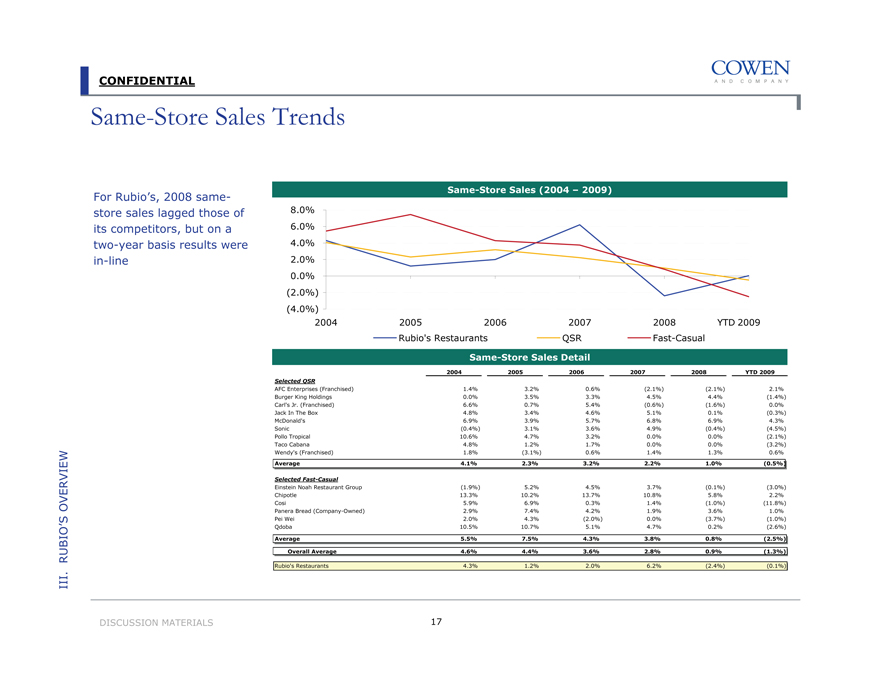
Same-Store Sales Trends
For Rubio’s, 2008 same-store sales lagged those of its competitors, but on a two-year basis results were in-line
Same-Store Sales (2004 – 2009)
8.0% 6.0% 4.0% 2.0% 0.0% (2.0%) (4.0%)
2004 2005 2006 2007 2008 YTD 2009 Rubio’s Restaurants QSR Fast-Casual
Same-Store Sales Detail
2004 2005 2006 2007 2008 YTD 2009
Selected QSR
AFC Enterprises (Franchised) 1.4% 3.2% 0.6% (2.1%) (2.1%) 2.1%
Burger King Holdings 0.0% 3.5% 3.3% 4.5% 4.4% (1.4%)
Carl’s Jr. (Franchised) 6.6% 0.7% 5.4% (0.6%) (1.6%) 0.0%
Jack In The Box 4.8% 3.4% 4.6% 5.1% 0.1% (0.3%)
McDonald’s 6.9% 3.9% 5.7% 6.8% 6.9% 4.3%
Sonic (0.4%) 3.1% 3.6% 4.9% (0.4%) (4.5%)
Pollo Tropical 10.6% 4.7% 3.2% 0.0% 0.0% (2.1%)
Taco Cabana 4.8% 1.2% 1.7% 0.0% 0.0% (3.2%)
Wendy’s (Franchised) 1.8% (3.1%) 0.6% 1.4% 1.3% 0.6%
Average 4.1% 2.3% 3.2% 2.2% 1.0% (0.5%)
Selected Fast-Casual
Einstein Noah Restaurant Group (1.9%) 5.2% 4.5% 3.7% (0.1%) (3.0%)
Chipotle 13.3% 10.2% 13.7% 10.8% 5.8% 2.2%
Cosi 5.9% 6.9% 0.3% 1.4% (1.0%) (11.8%)
Panera Bread (Company-Owned) 2.9% 7.4% 4.2% 1.9% 3.6% 1.0%
Pei Wei 2.0% 4.3% (2.0%) 0.0% (3.7%) (1.0%)
Qdoba 10.5% 10.7% 5.1% 4.7% 0.2% (2.6%)
Average 5.5% 7.5% 4.3% 3.8% 0.8% (2.5%)
Overall Average 4.6% 4.4% 3.6% 2.8% 0.9% (1.3%)
Rubio’s Restaurants 4.3% 1.2% 2.0% 6.2% (2.4%) (0.1%)
III. RUBIO’S OVERVIEW
DISCUSSION MATERIALS
17
CONFIDENTIAL
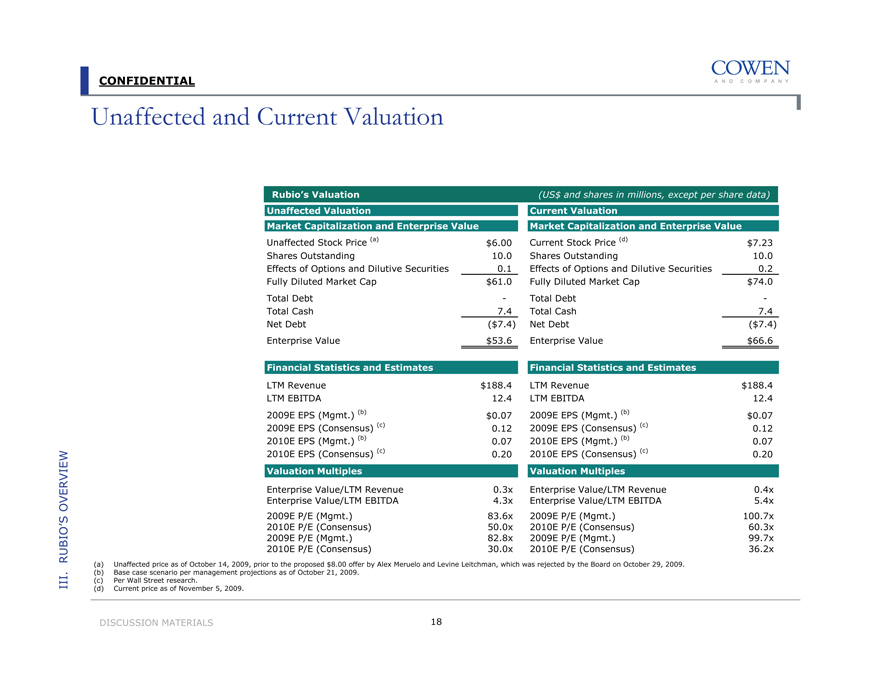
Unaffected and Current Valuation
Rubio’s Valuation
Unaffected Valuation
Market Capitalization and Enterprise Value
Unaffected Stock Price (a) $6.00
Shares Outstanding 10.0
Effects of Options and Dilutive Securities 0.1
Fully Diluted Market Cap $61.0
Total Debt -
Total Cash 7.4
Net Debt ($7.4)
Enterprise Value $53.6
Financial Statistics and Estimates
LTM Revenue $188.4
LTM EBITDA 12.4
2009E EPS (Mgmt.) (b) $0.07
2009E EPS (Consensus) (c) 0.12
2010E EPS (Mgmt.) (b) 0.07
2010E EPS (Consensus) (c) 0.20
Valuation Multiples
Enterprise Value/LTM Revenue 0.3x
Enterprise Value/LTM EBITDA 4.3x
2009E P/E (Mgmt.) 83.6x
2010E P/E (Consensus) 50.0x
2009E P/E (Mgmt.) 82.8x
2010E P/E (Consensus) 30.0x
(US$ and shares in millions, except per share data)
Current Valuation
Market Capitalization and Enterprise Value
Current Stock Price (d) $7.23
Shares Outstanding 10.0
Effects of Options and Dilutive Securities 0.2
Fully Diluted Market Cap $74.0
Total Debt -
Total Cash 7.4
Net Debt ($7.4)
Enterprise Value $66.6
Financial Statistics and Estimates
LTM Revenue $188.4
LTM EBITDA 12.4
2009E EPS (Mgmt.) (b) $0.07
2009E EPS (Consensus) (c) 0.12
2010E EPS (Mgmt.) (b) 0.07
2010E EPS (Consensus) (c) 0.20
Valuation Multiples
Enterprise Value/LTM Revenue 0.4x
Enterprise Value/LTM EBITDA 5.4x
2009E P/E (Mgmt.) 100.7x
2010E P/E (Consensus) 60.3x
2009E P/E (Mgmt.) 99.7x
2010E P/E (Consensus) 36.2x
(a) Unaffected price as of October 14, 2009, prior to the proposed $8.00 offer by Alex Meruelo and Levine Leitchman, which was rejected by the Board on October 29, 2009.
(b) Base case scenario per management projections as of October 21, 2009.
(c) Per Wall Street research.
(d) Current price as of November 5, 2009.
III. RUBIO’S OVERVIEW
DISCUSSION MATERIALS
18
CONFIDENTIAL
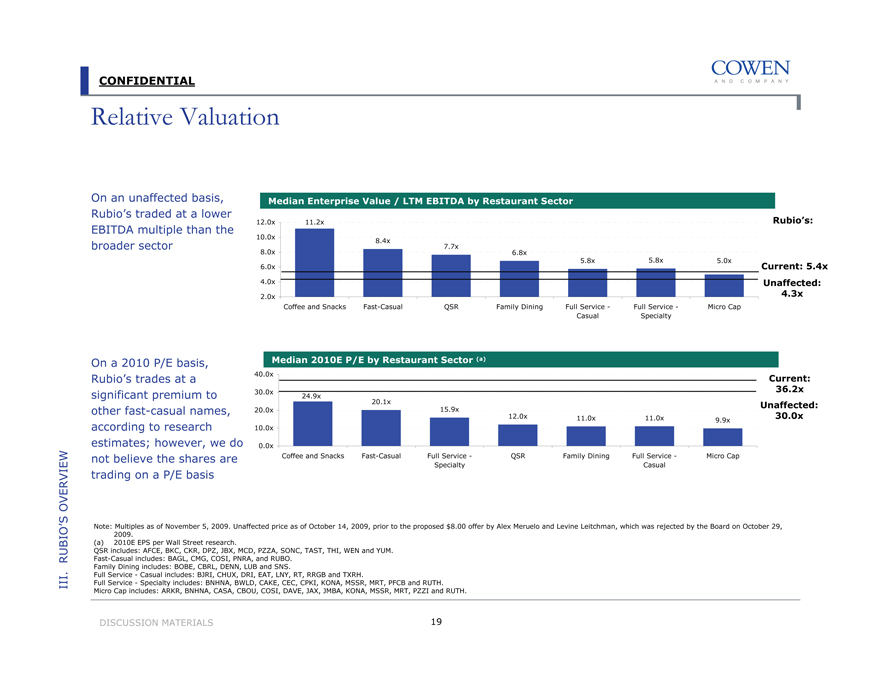
Relative Valuation
On an unaffected basis, Rubio’s traded at a lower EBITDA multiple than the broader sector
On a 2010 P/E basis, Rubio’s trades at a significant premium to other fast-casual names, according to research estimates; however, we do not believe the shares are trading on a P/E basis
Median Enterprise Value / LTM EBITDA by Restaurant Sector
12.0x 10.0x 8.0x 6.0x 4.0x 2.0x
11.2x
8.4x
7.7x
6.8x
5.8x
5.8x
5.0x
Coffee and Snacks Fast-Casual QSR Family Dining Full Service – Casual Full Service – Specialty Micro Cap
Rubio’s:
Current: 5.4x
Unaffected: 4.3x
Median 2010E P/E by Restaurant Sector (a)
40.0x 30.0x 20.0x 10.0x 0.0x
24.9x
20.1x
15.9x
12.0x
11.0x
11.0x
9.9x
Coffee and Snacks Fast-Casual Full Service – Specialty QSR Family Dining Full Service – Casual Micro Cap
Current: 36.2x
Unaffected: 30.0x
Note: Multiples as of November 5, 2009. Unaffected price as of October 14, 2009, prior to the proposed $8.00 offer by Alex Meruelo and Levine Leitchman, which was rejected by the Board on October 29, 2009.
(a) 2010E EPS per Wall Street research.
QSR includes: AFCE, BKC, CKR, DPZ, JBX, MCD, PZZA, SONC, TAST, THI, WEN and YUM. Fast-Casual includes: BAGL, CMG, COSI, PNRA, and RUBO.
Family Dining includes: BOBE, CBRL, DENN, LUB and SNS.
Full Service – Casual includes: BJRI, CHUX, DRI, EAT, LNY, RT, RRGB and TXRH.
Full Service – Specialty includes: BNHNA, BWLD, CAKE, CEC, CPKI, KONA, MSSR, MRT, PFCB and RUTH. Micro Cap includes: ARKR, BNHNA, CASA, CBOU, COSI, DAVE, JAX, JMBA, KONA, MSSR, MRT, PZZI and RUTH.
III. RUBIO’S OVERVIEW
DISCUSSION MATERIALS
19
CONFIDENTIAL
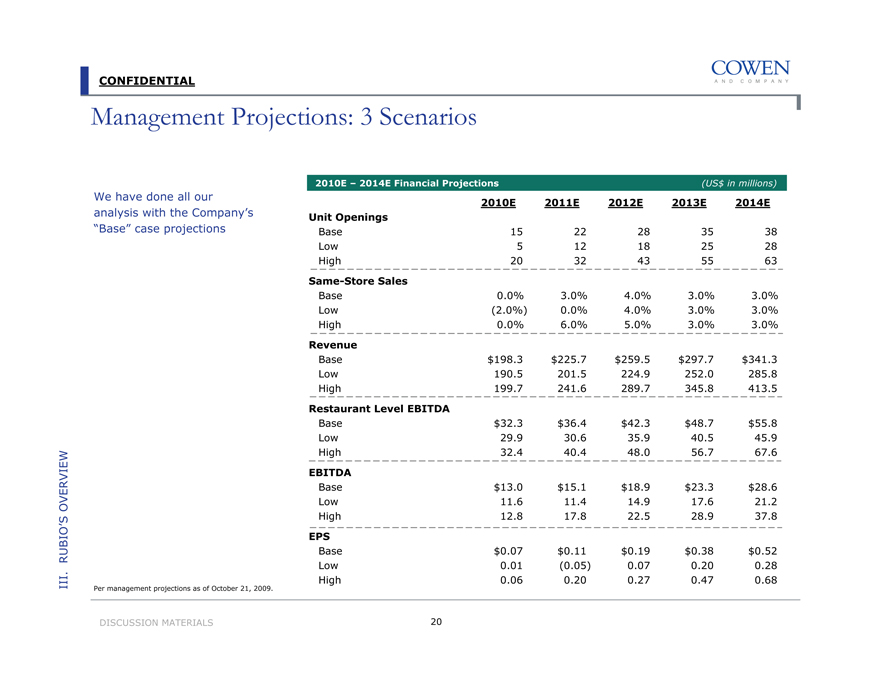
Management Projections: 3 Scenarios
We have done all our analysis with the Company’s “Base” case projections
2010E – 2014E Financial Projections (US$ in millions)
2010E 2011E 2012E 2013E 2014E
Unit Openings
Base 15 22 28 35 38
Low 5 12 18 25 28
High 20 32 43 55 63
Same-Store Sales
Base 0.0% 3.0% 4.0% 3.0% 3.0%
Low (2.0%) 0.0% 4.0% 3.0% 3.0%
High 0.0% 6.0% 5.0% 3.0% 3.0%
Revenue
Base $198.3 $225.7 $259.5 $297.7 $341.3
Low 190.5 201.5 224.9 252.0 285.8
High 199.7 241.6 289.7 345.8 413.5
Restaurant Level EBITDA
Base $32.3 $36.4 $42.3 $48.7 $55.8
Low 29.9 30.6 35.9 40.5 45.9
High 32.4 40.4 48.0 56.7 67.6
EBITDA
Base $13.0 $15.1 $18.9 $23.3 $28.6
Low 11.6 11.4 14.9 17.6 21.2
High 12.8 17.8 22.5 28.9 37.8
EPS
Base $0.07 $0.11 $0.19 $0.38 $0.52
Low 0.01 (0.05) 0.07 0.20 0.28
High 0.06 0.20 0.27 0.47 0.68
Per management projections as of October 21, 2009.
III. RUBIO’S OVERVIEW
DISCUSSION MATERIALS
20
CONFIDENTIAL
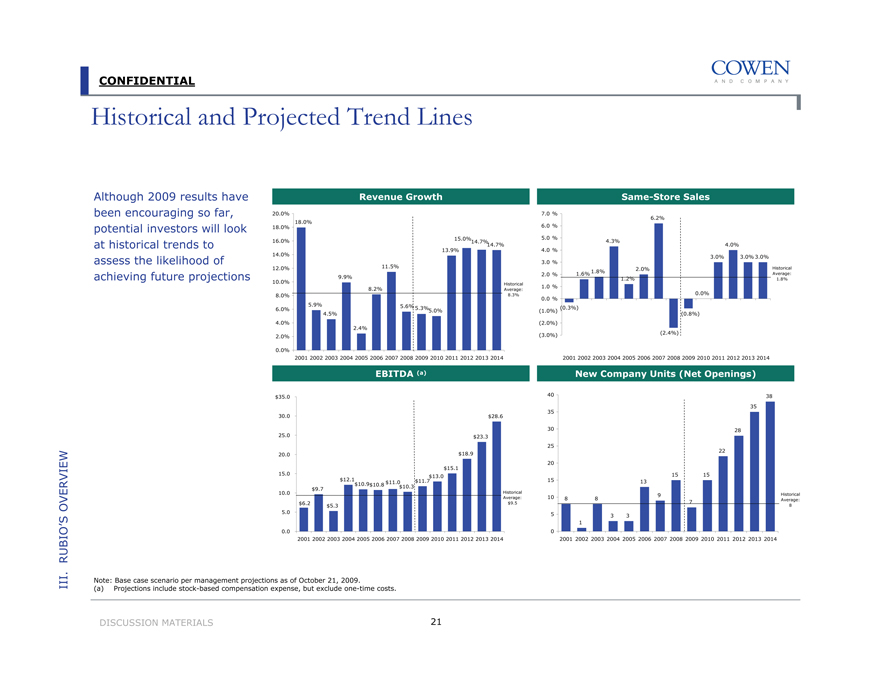
Historical and Projected Trend Lines
Although 2009 results have been encouraging so far, potential investors will look at historical trends to assess the likelihood of achieving future projections
20.0% 18.0% 16.0% 14.0% 12.0% 10.0% 8.0% 6.0% 4.0% 2.0% 0.0%
Revenue Growth
Historical Average: 8.3%
18.0%
11.5%
9.9%
8.2%
5.9%
5.6%
4.5%
5.3%
5.0%
2.4%
15.0%
14.7%
13.9%
14.7%
2001 2002 2003 2004 2005 2006 2007 2008 2009 2010 2011 2012 2013 2014
Same-Store Sales
7.0 % 6.0 % 5.0 % 4.0 % 3.0 % 2.0 % 1.0 % 0.0 % (1.0%) (2.0%) (3.0%)
6.2%
4.3%
4.0%
3.0%
3.0%
3.0%
1.6%
1.8%
2.0%
1.2%
0.0%
(0.3%)
(0.8%)
(2.4%)
Historical Average: 1.8%
EBITDA (a)
$35.0
30.0
25.0
20.0
15.0
10.0
5.0
0.0
$28.6
$23.3
$18.9
$15.1
$13.0
$12.1
$11.7
$10.9
$10.8
$11.0
$9.7
$10.3
$6.2
$5.3
Historical Average:
$9.5
2001 2002 2003 2004 2005 2006 2007 2008 2009 2010 2011 2012 2013 2014
New Company Units (Net Openings)
40 35 30 25 20 15 10 5 0
38
35
28
22
15
15
13
9
8
8
7
3
3
1
Historical Average: 8
2001 2002 2003 2004 2005 2006 2007 2008 2009 2010 2011 2012 2013 2014
Note: Base case scenario per management projections as of October 21, 2009.
(a) Projections include stock-based compensation expense, but exclude one-time costs.
III. RUBIO’S OVERVIEW
DISCUSSION MATERIALS
21
CONFIDENTIAL
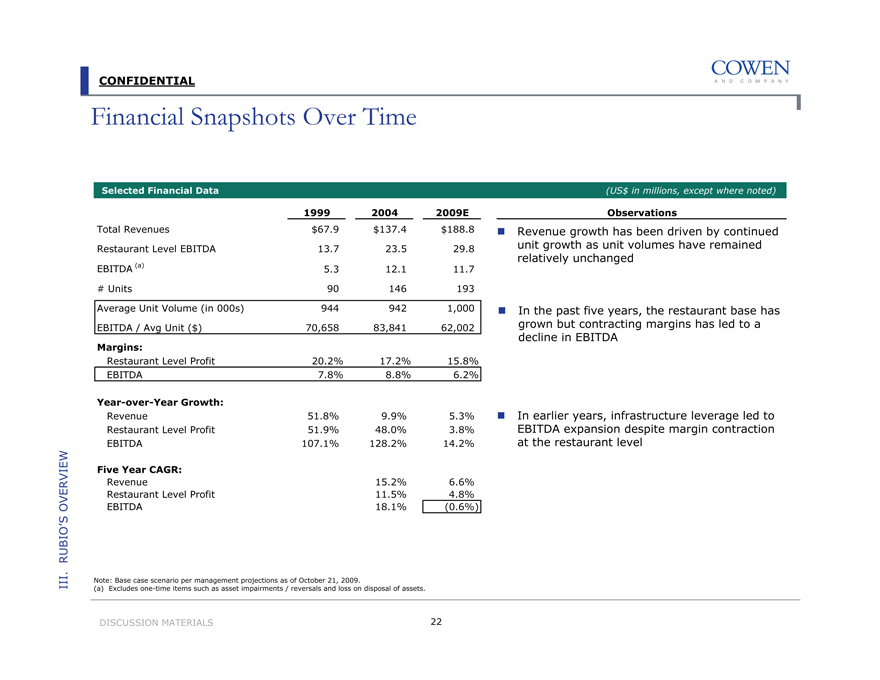
Financial Snapshots Over Time
Selected Financial Data
1999 2004 2009E
Total Revenues $67.9 $137.4 $188.8
Restaurant Level EBITDA 13.7 23.5 29.8
EBITDA (a) 5.3 12.1 11.7
# Units 90 146 193
Average Unit Volume (in 000s) 944 942 1,000
EBITDA / Avg Unit ($) 70,658 83,841 62,002
Margins:
Restaurant Level Profit 20.2% 17.2% 15.8%
EBITDA 7.8% 8.8% 6.2%
Year-over-Year Growth:
Revenue 51.8% 9.9% 5.3%
Restaurant Level Profit 51.9% 48.0% 3.8%
EBITDA 107.1% 128.2% 14.2%
Five Year CAGR:
Revenue 15.2% 6.6%
Restaurant Level Profit 11.5% 4.8%
EBITDA 18.1% (0.6%)
(US$ in millions, except where noted)
Observations
Revenue growth has been driven by continued unit growth as unit volumes have remained relatively unchanged
In the past five years, the restaurant base has grown but contracting margins has led to a decline in EBITDA
In earlier years, infrastructure leverage led to EBITDA expansion despite margin contraction at the restaurant level
Note: Base case scenario per management projections as of October 21, 2009.
(a) Excludes one-time items such as asset impairments / reversals and loss on disposal of assets.
III. RUBIO’S OVERVIEW
DISCUSSION MATERIALS
22
CONFIDENTIAL
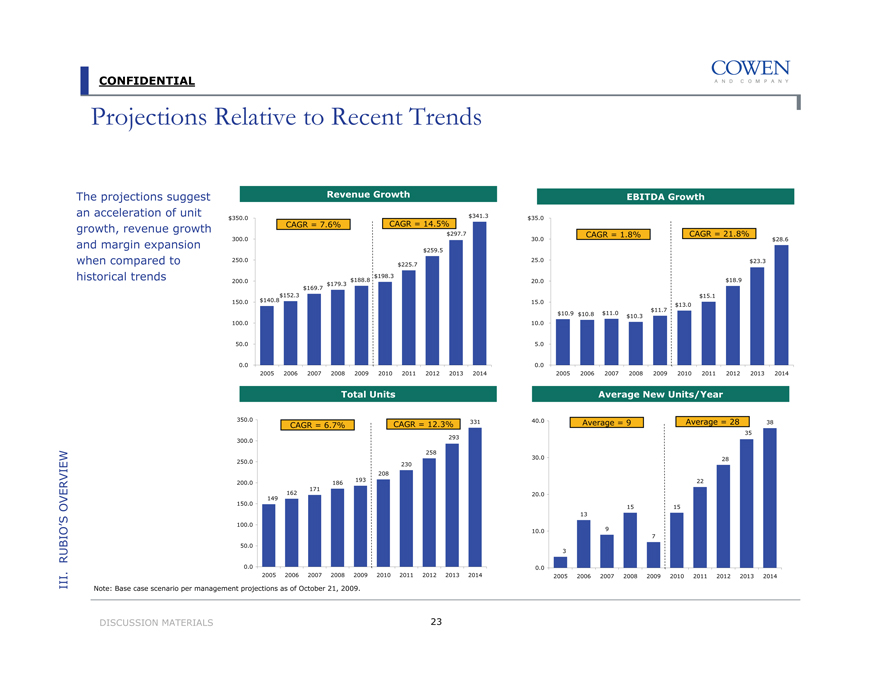
Projections Relative to Recent Trends
The projections suggest an acceleration of unit growth, revenue growth and margin expansion when compared to historical trends
Revenue Growth
$350.0 300.0 250.0 200.0 150.0 100.0 50.0 0.0
CAGR = 7.6%
CAGR = 14.5%
$297.7
$259.5
$225.7 $198.3 $188.8 $179.3 $169.7 $152.3 $140.8
$341.3
EBITDA Growth
$35.0
30.0
25.0
20.0
15.0
10.0
5.0
0.0
CAGR = 1.8%
CAGR = 21.8%
$28.6
$23.3
$18.9
$15.1
$11.7 $13.0
$10.9 $10.8 $11.0
$10.3
2005 2006 2007 2008 2009 2010 2011 2012 2013 2014
Total Units
350.0
300.0
250.0
200.0
150.0
100.0
50.0
0.0
CAGR = 6.7%
CAGR = 12.3%
331
293
258 230 208 193 186 171 149 162
2005 2006 2007 2008 2009 2010 2011 2012 2013 2014
Average New Units/Year
40.0
30.0
20.0
10.0
0.0
Average = 9
Average = 28
38
35
28
22
15
15
13
9
7
3
2005 2006 2007 2008 2009 2010 2011 2012 2013 2014
Note: Base case scenario per management projections as of October 21, 2009.
III. RUBIO’S OVERVIEW
DISCUSSION MATERIALS
23
CONFIDENTIAL
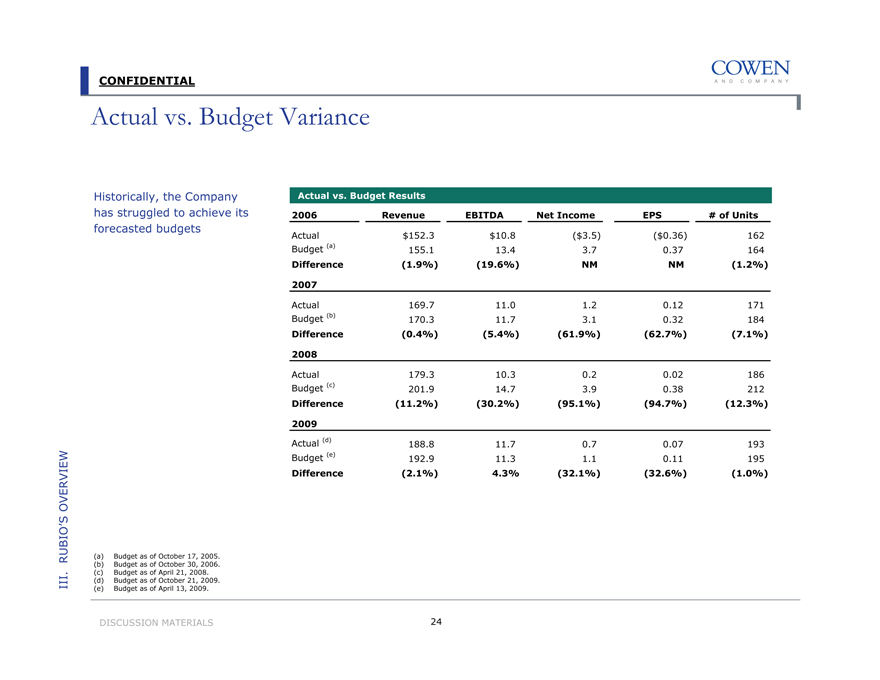
Actual vs. Budget Variance
Historically, the Company has struggled to achieve its forecasted budgets
Actual vs. Budget Results
2006 Revenue EBITDA Net Income EPS # of Units
Actual $152.3 $10.8 ($3.5) ($0.36) 162
Budget (a) 155.1 13.4 3.7 0.37 164
Difference (1.9%) (19.6%) NM NM (1.2%)
2007
Actual 169.7 11.0 1.2 0.12 171
Budget (b) 170.3 11.7 3.1 0.32 184
Difference (0.4%) (5.4%) (61.9%) (62.7%) (7.1%)
2008
Actual 179.3 10.3 0.2 0.02 186
Budget (c) 201.9 14.7 3.9 0.38 212
Difference (11.2%) (30.2%) (95.1%) (94.7%) (12.3%)
2009
Actual (d) 188.8 11.7 0.7 0.07 193
Budget (e) 192.9 11.3 1.1 0.11 195
Difference (2.1%) 4.3% (32.1%) (32.6%) (1.0%)
(a) Budget as of October 17, 2005.
(b) Budget as of October 30, 2006.
(c) Budget as of April 21, 2008.
(d) Budget as of October 21, 2009.
(e) Budget as of April 13, 2009.
III. RUBIO’S OVERVIEW
DISCUSSION MATERIALS
24
CONFIDENTIAL
Public Company Metrics
When evaluating status quo, it is also important to evaluate future prospects for trading volume, institutional ownership and research sponsorship
Stock Price (Year End)
$13.00 12.00 11.00 10.00 9.00 8.00 7.00 6.00 5.00 4.00 3.00 2.00 1.00 0.00
$12.13
$9.35
$9.85
$8.26
$8.00
$6.19
$5.98
$6.00
$3.57
$3.26
$2.56
Average: $6.83
1999 2000 2001 2002 2003 2004 2005 2006 2007 2008 2009(a)
Market Capitalization (Year End)
(US$ in millions) $120.0
100.0
80.0
60.0
40.0
20.0
0.0
$110.7
$96.3
$88.1
$82.2
$70.9
$61.0
$56.0
$54.4
$35.5
$29.1
$22.8
Average: $65.8
1999 2000 2001 2002 2003 2004 2005 2006 2007 2008 2009(a)
Average Daily Trading Volume
(in 000s)
130.0 120.0
40.0
30.0
20.0
10.0
0.0
128.0
35.6
37.5
31.4
28.1
26.8
23.0
22.2
22.4
19.9
13.6
Average:
26.0 (b)
1999 2000 2001 2002 2003 2004 2005 2006 2007 2008 2009(a)
Institutional Ownership (c)
40.0%
30.0%
20.0%
10.0%
0.0%
36.9%
30.5%
30.2%
30.0%
28.4%
27.3%
19.9%
13.4%
11.8%
8.3%
4.7%
Average: 21.9%
1999 2000 2001 2002 2003 2004 2005 2006 2007 2008 2009 (a)
Research Analyst Coverage
4
3
2
1
0
3
3
3
2
2
2
2
2
1
1
1
Average: 2
1999 2000 2001 2002 2003 2004 2005 2006 2007 2008 2009 (a)
(a) As of October 14, 2009.
(b) Average Daily Trading Volume’s average excludes 1999.
(c) Institutional ownership percentage based on basic shares outstanding.
III. RUBIO’S OVERVIEW
DISCUSSION MATERIALS
25
CONFIDENTIAL
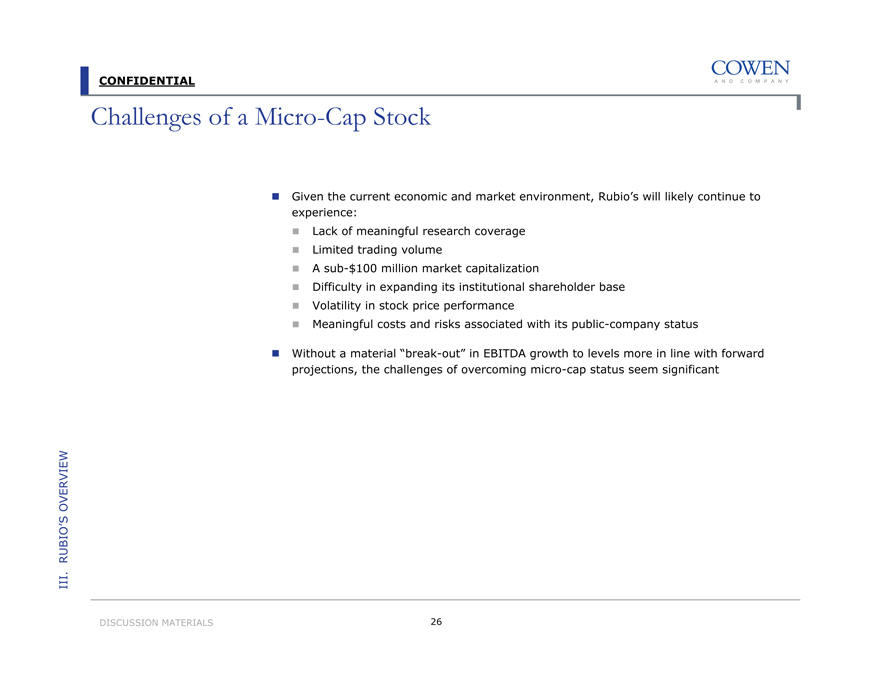
Challenges of a Micro-Cap Stock
Given the current economic and market environment, Rubio’s will likely continue to experience:
Lack of meaningful research coverage
Limited trading volume
A sub-$100 million market capitalization
Difficulty in expanding its institutional shareholder base
Volatility in stock price performance
Meaningful costs and risks associated with its public-company status
Without a material “break-out” in EBITDA growth to levels more in line with forward projections, the challenges of overcoming micro-cap status seem significant
III. RUBIO’S OVERVIEW
DISCUSSION MATERIALS
26
CONFIDENTIAL
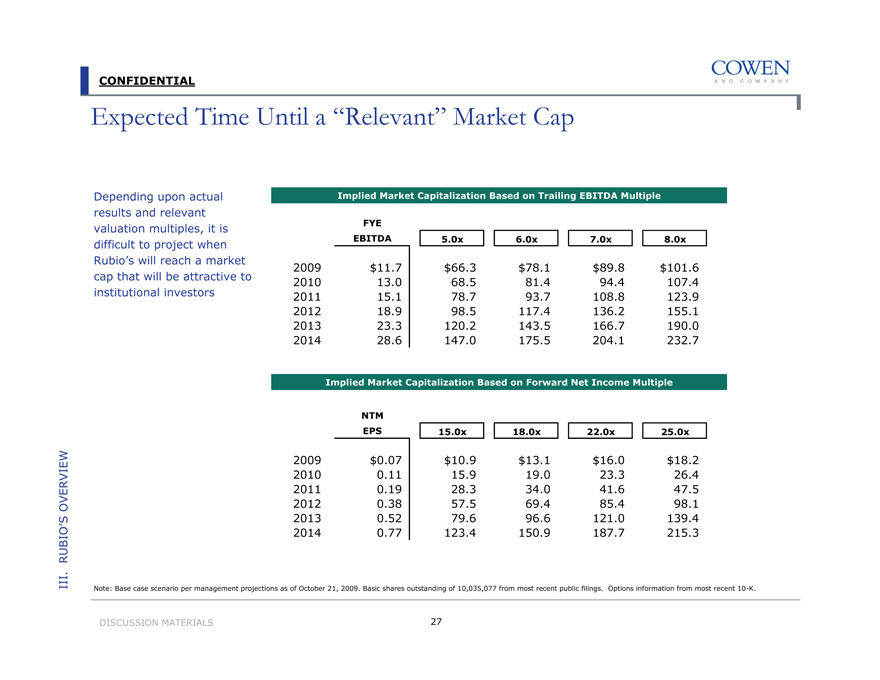
Expected Time Until a “Relevant” Market Cap
Depending upon actual results and relevant valuation multiples, it is difficult to project when Rubio’s will reach a market cap that will be attractive to institutional investors
Implied Market Capitalization Based on Trailing EBITDA Multiple
FYE EBITDA 5.0x 6.0x 7.0x 8.0x
2009 $11.7 $66.3 $78.1 $89.8 $101.6
2010 13.0 68.5 81.4 94.4 107.4
2011 15.1 78.7 93.7 108.8 123.9
2012 18.9 98.5 117.4 136.2 155.1
2013 23.3 120.2 143.5 166.7 190.0
2014 28.6 147.0 175.5 204.1 232.7
Implied Market Capitalization Based on Forward Net Income Multiple
NTM EPS 15.0x 18.0x 22.0x 25.0x
2009 $0.07 $10.9 $13.1 $16.0 $18.2
2010 0.11 15.9 19.0 23.3 26.4
2011 0.19 28.3 34.0 41.6 47.5
2012 0.38 57.5 69.4 85.4 98.1
2013 0.52 79.6 96.6 121.0 139.4
2014 0.77 123.4 150.9 187.7 215.3
Note: Base case scenario per management projections as of October 21, 2009. Basic shares outstanding of 10,035,077 from most recent public filings. Options information from most recent 10-K.
III. RUBIO’S OVERVIEW
DISCUSSION MATERIALS
27
CONFIDENTIAL
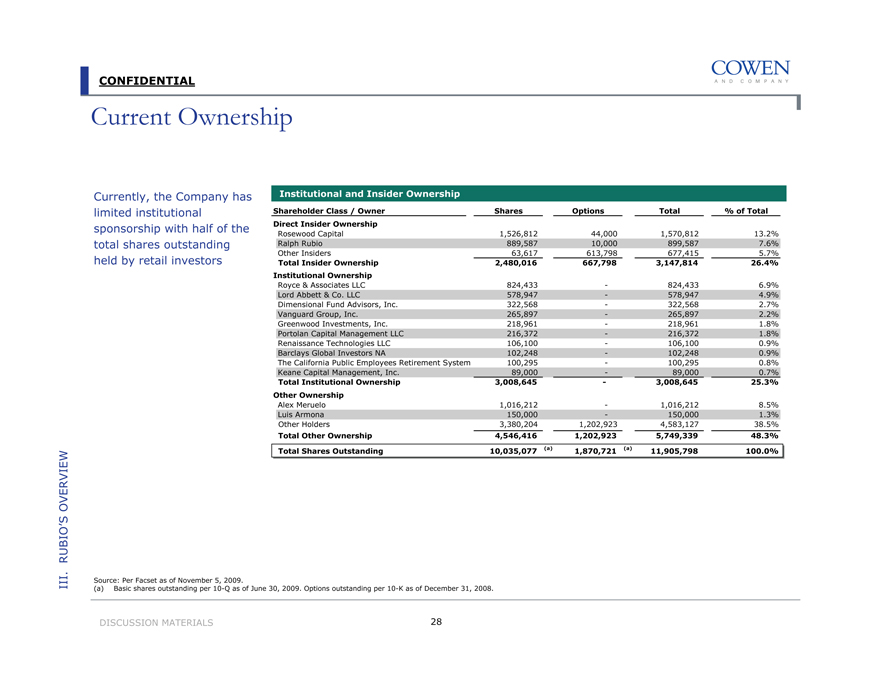
Current Ownership
Currently, the Company has limited institutional sponsorship with half of the total shares outstanding held by retail investors
Institutional and Insider Ownership
Shareholder Class / Owner Shares Options Total % of Total
Direct Insider Ownership
Rosewood Capital 1,526,812 44,000 1,570,812 13.2%
Ralph Rubio 889,587 10,000 899,587 7.6%
Other Insiders 63,617 613,798 677,415 5.7%
Total Insider Ownership 2,480,016 667,798 3,147,814 26.4%
Institutional Ownership
Royce & Associates LLC 824,433 - 824,433 6.9%
Lord Abbett & Co. LLC 578,947 - 578,947 4.9%
Dimensional Fund Advisors, Inc. 322,568 - 322,568 2.7%
Vanguard Group, Inc. 265,897 - 265,897 2.2%
Greenwood Investments, Inc. 218,961 - 218,961 1.8%
Portolan Capital Management LLC 216,372 - 216,372 1.8%
Renaissance Technologies LLC 106,100 - 106,100 0.9%
Barclays Global Investors NA 102,248 - 102,248 0.9%
The California Public Employees Retirement System 100,295 - 100,295 0.8%
Keane Capital Management, Inc. 89,000 - 89,000 0.7%
Total Institutional Ownership 3,008,645 - 3,008,645 25.3%
Other Ownership
Alex Meruelo 1,016,212 - 1,016,212 8.5%
Luis Armona 150,000 - 150,000 1.3%
Other Holders 3,380,204 1,202,923 4,583,127 38.5%
Total Other Ownership 4,546,416 1,202,923 5,749,339 48.3%
Total Shares Outstanding 10,035,077 (a) 1,870,721 (a) 11,905,798 100.0%
Source: Per Facset as of November 5, 2009.
(a) Basic shares outstanding per 10-Q as of June 30, 2009. Options outstanding per 10-K as of December 31, 2008.
III. RUBIO’S OVERVIEW
DISCUSSION MATERIALS
28
CONFIDENTIAL
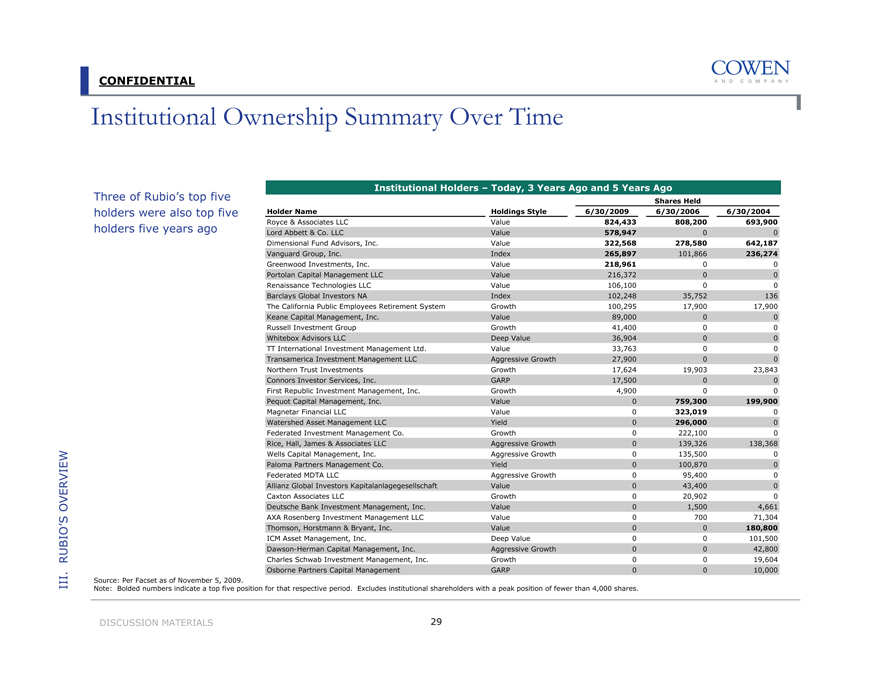
Institutional Ownership Summary Over Time
Three of Rubio’s top five holders were also top five holders five years ago
Institutional Holders – Today, 3 Years Ago and 5 Years Ago
Shares Held
Holder Name Holdings Style 6/30/2009 6/30/2006 6/30/2004
Royce & Associates LLC Value 824,433 808,200 693,900
Lord Abbett & Co. LLC Value 578,947 0 0
Dimensional Fund Advisors, Inc. Value 322,568 278,580 642,187
Vanguard Group, Inc. Index 265,897 101,866 236,274
Greenwood Investments, Inc. Value 218,961 0 0
Portolan Capital Management LLC Value 216,372 0 0
Renaissance Technologies LLC Value 106,100 0 0
Barclays Global Investors NA Index 102,248 35,752 136
The California Public Employees Retirement System Growth 100,295 17,900 17,900
Keane Capital Management, Inc. Value 89,000 0 0
Russell Investment Group Growth 41,400 0 0
Whitebox Advisors LLC Deep Value 36,904 0 0
TT International Investment Management Ltd. Value 33,763 0 0
Transamerica Investment Management LLC Aggressive Growth 27,900 0 0
Northern Trust Investments Growth 17,624 19,903 23,843
Connors Investor Services, Inc. GARP 17,500 0 0
First Republic Investment Management, Inc. Growth 4,900 0 0
Pequot Capital Management, Inc. Value 0 759,300 199,900
Magnetar Financial LLC Value 0 323,019 0
Watershed Asset Management LLC Yield 0 296,000 0
Federated Investment Management Co. Growth 0 222,100 0
Rice, Hall, James & Associates LLC Aggressive Growth 0 139,326 138,368
Wells Capital Management, Inc. Aggressive Growth 0 135,500 0
Paloma Partners Management Co. Yield 0 100,870 0
Federated MDTA LLC Aggressive Growth 0 95,400 0
Allianz Global Investors Kapitalanlagegesellschaft Value 0 43,400 0
Caxton Associates LLC Growth 0 20,902 0
Deutsche Bank Investment Management, Inc. Value 0 1,500 4,661
AXA Rosenberg Investment Management LLC Value 0 700 71,304
Thomson, Horstmann & Bryant, Inc. Value 0 0 180,800
ICM Asset Management, Inc. Deep Value 0 0 101,500
Dawson-Herman Capital Management, Inc. Aggressive Growth 0 0 42,800
Charles Schwab Investment Management, Inc. Growth 0 0 19,604
Osborne Partners Capital Management GARP 0 0 10,000
Source: Per Facset as of November 5, 2009.
Note: Bolded numbers indicate a top five position for that respective period. Excludes institutional shareholders with a peak position of fewer than 4,000 shares.
III. RUBIO’S OVERVIEW
DISCUSSION MATERIALS
29
CONFIDENTIAL
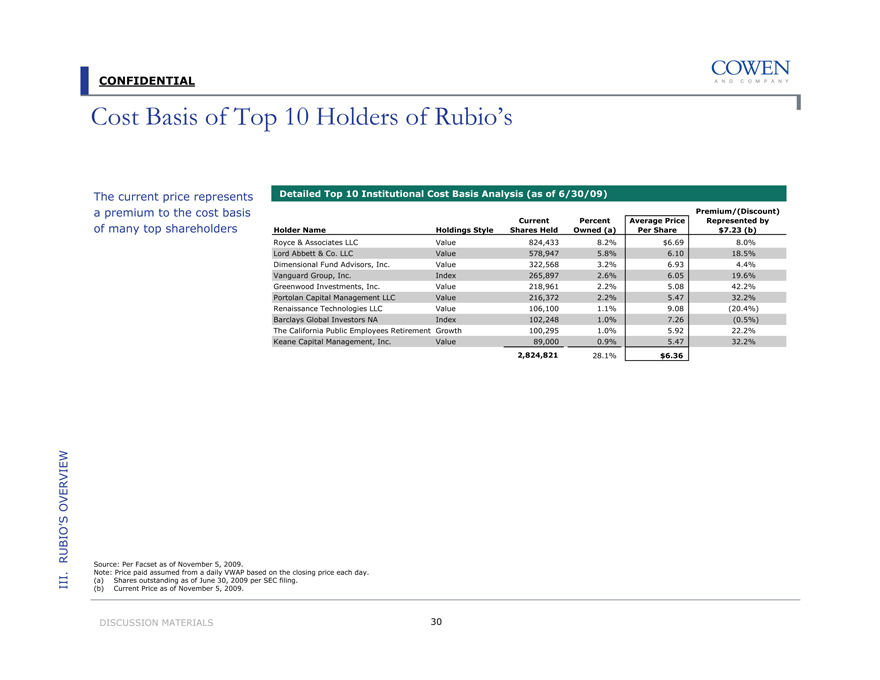
Cost Basis of Top 10 Holders of Rubio’s
The current price represents a premium to the cost basis of many top shareholders
Detailed Top 10 Institutional Cost Basis Analysis (as of 6/30/09)
Holder Name Holdings Style Current Shares Held Percent Owned (a) Average Price Per Share Premium/(Discount) Represented by $7.23 (b)
Royce & Associates LLC Value 824,433 8.2% $6.69 8.0%
Lord Abbett & Co. LLC Value 578,947 5.8% 6.10 18.5%
Dimensional Fund Advisors, Inc. Value 322,568 3.2% 6.93 4.4%
Vanguard Group, Inc. Index 265,897 2.6% 6.05 19.6%
Greenwood Investments, Inc. Value 218,961 2.2% 5.08 42.2%
Portolan Capital Management LLC Value 216,372 2.2% 5.47 32.2%
Renaissance Technologies LLC Value 106,100 1.1% 9.08 (20.4%)
Barclays Global Investors NA Index 102,248 1.0% 7.26 (0.5%)
The California Public Employees Retirement Growth 100,295 1.0% 5.92 22.2%
Keane Capital Management, Inc. Value 89,000 0.9% 5.47 32.2%
2,824,821 28.1% $6.36
Source: Per Facset as of November 5, 2009.
Note: Price paid assumed from a daily VWAP based on the closing price each day.
(a) Shares outstanding as of June 30, 2009 per SEC filing.
(b) Current Price as of November 5, 2009.
III. RUBIO’S OVERVIEW
DISCUSSION MATERIALS
30
CONFIDENTIAL
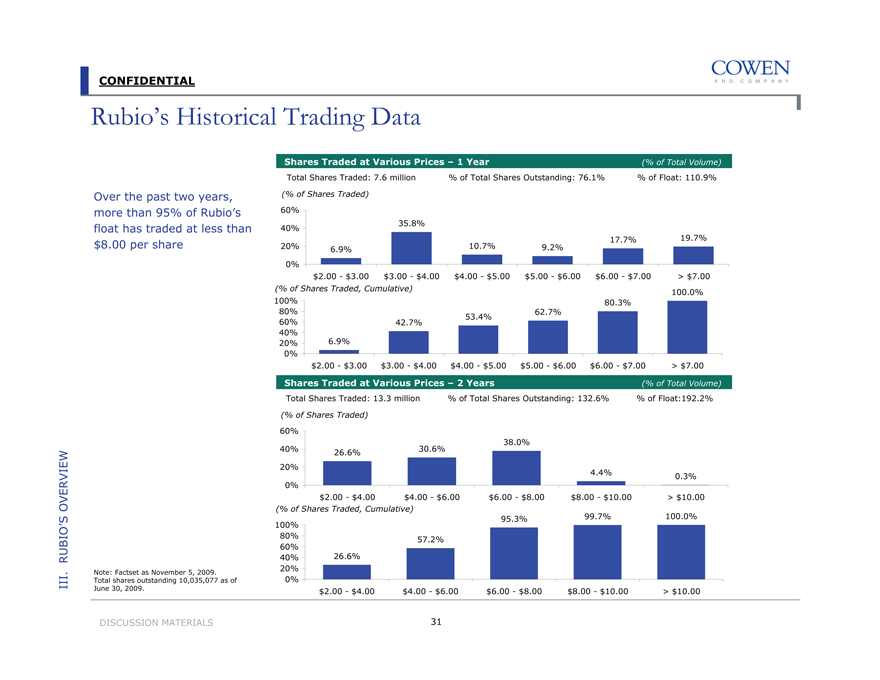
Rubio’s Historical Trading Data
Over the past two years, more than 95% of Rubio’s float has traded at less than
$8.00 per share
Shares Traded at Various Prices – 1 Year (% of Total Volume)
Total Shares Traded: 7.6 million % of Total Shares Outstanding: 76.1% % of Float: 110.9%
(% of Shares Traded)
60% 40% 20% 0%
35.8%
10.7% 17.7% 19.7%
6.9% 9.2%
$2.00 - $3.00 $3.00 - $4.00 $4.00 - $5.00 $5.00 - $6.00 $6.00 - $7.00 > $7.00
(% of Shares Traded, Cumulative)
100% 80% 60% 40% 20% 0%
100.0%
80.3%
62.7%
53.4%
42.7%
6.9%
$2.00 - $3.00 $3.00 - $4.00 $4.00 - $5.00 $5.00 - $6.00 $6.00 - $7.00 > $7.00
Shares Traded at Various Prices – 2 Years (% of Total Volume)
Total Shares Traded: 13.3 million % of Total Shares Outstanding: 132.6% % of Float:192.2%
(% of Shares Traded)
60% 40% 20% 0%
38.0%
26.6% 30.6%
4.4% 0.3%
$2.00 - $4.00 $4.00 - $6.00 $6.00 - $8.00 $8.00 - $10.00 > $10.00
(% of Shares Traded, Cumulative)
100% 80% 60% 40% 20% 0%
95.3% 99.7% 100.0%
57.2%
26.6%
$2.00 - $4.00 $4.00 - $6.00 $6.00 - $8.00 $8.00 - $10.00 > $10.00
Note: Factset as November 5, 2009. Total shares outstanding 10,035,077 as of June 30, 2009.
III. RUBIO’S OVERVIEW
DISCUSSION MATERIALS
31
CONFIDENTIAL
IV. Valuation Overview
CONFIDENTIAL
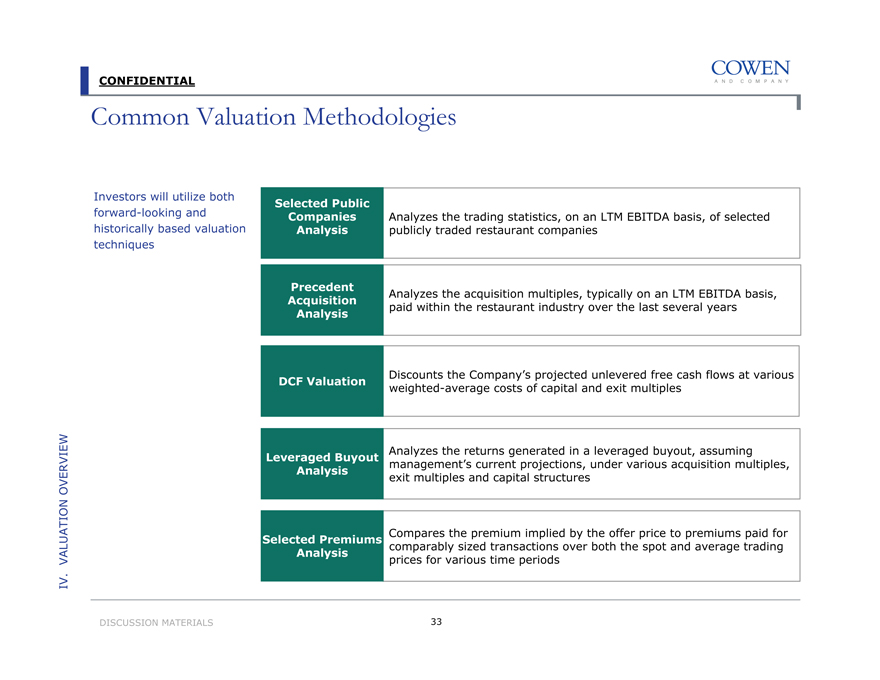
Common Valuation Methodologies
Investors will utilize both forward-looking and historically based valuation techniques
Selected Public Companies Analysis
Analyzes the trading statistics, on an LTM EBITDA basis, of selected publicly traded restaurant companies
Precedent Acquisition Analysis
Analyzes the acquisition multiples, typically on an LTM EBITDA basis, paid within the restaurant industry over the last several years
DCF Valuation
Discounts the Company’s projected unlevered free cash flows at various weighted-average costs of capital and exit multiples
Leveraged Buyout Analysis
Analyzes the returns generated in a leveraged buyout, assuming management’s current projections, under various acquisition multiples, exit multiples and capital structures
Selected Premiums Analysis
Compares the premium implied by the offer price to premiums paid for comparably sized transactions over both the spot and average trading prices for various time periods
IV. Valuation Overview
DISCUSSION MATERIALS
33
CONFIDENTIAL
Summary Statistics
Rubio’s Valuation (US$ and shares in millions, except per share data)
Unaffected (a) Current (b)
Rubio’s Price per Share $6.00 $7.23
Basic Shares Outstanding 10.035 10.035
Common Stock Equivalents 0.134 0.205
Fully Diluted Shares Outstanding 10.169 10.240
Implied Equity Value $61.0 $74.0
Plus: Total Debt - -
Less: Cash and Equivalents (7.4) (7.4)
Implied Enterprise Value $53.6 $66.6
Financial Statistics Implied Multiple Unaffected Current
Enterprise Value as a Multiple of:
LTM Revenue $188.4 0.3x 0.4x
LTM EBITDA $12.4 4.3x 5.4x
Stock Price as a Multiple of EPS
2009E EPS (Mgmt.) (c) $0.07 83.6x 100.7x
2009E EPS (Consensus) (d) 0.12 50.0x 60.3x
2010E EPS (Mgmt.) (c) 0.07 82.8x 99.7x
2010E EPS (Consensus) (d) 0.20 30.0x 36.2x
(a) Unaffected price as of October 14, 2009, prior to the proposed $8.00 offer by Alex Meruelo and Levine Leitchman, which was rejected by the Board on October 29, 2009. (b) Current Price as of November 5, 2009.
(c) Base case scenario per management projections as of October 21, 2009. (d) Wall Street research.
IV. Valuation Overview
DISCUSSION MATERIALS
34
CONFIDENTIAL
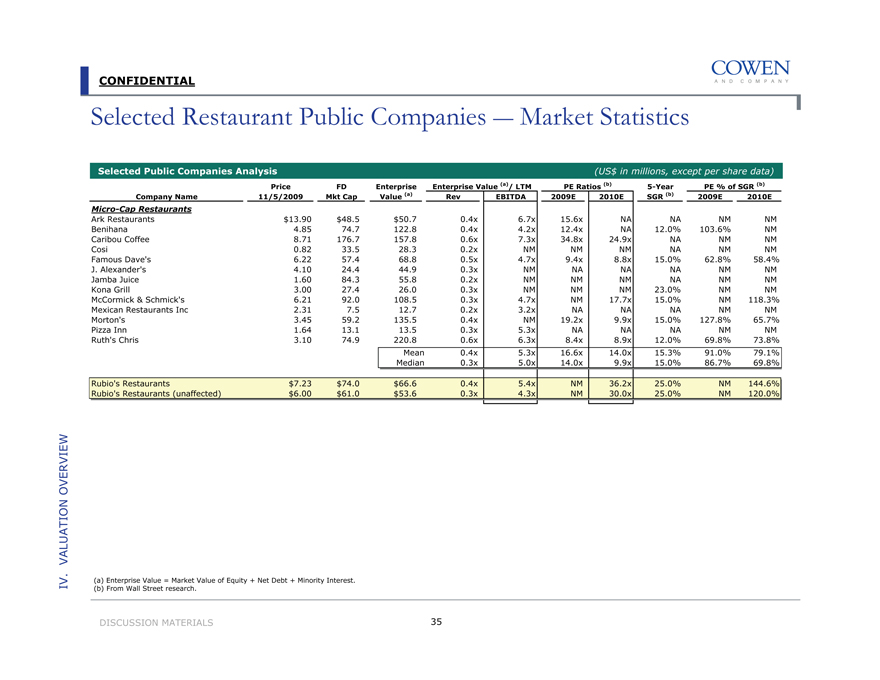
Selected Restaurant Public Companies — Market Statistics
Selected Public Companies Analysis
(US$ in millions, except per share data)
Enterprise Value (a)/ LTM PE Ratios (b) PE % of SGR (b)
Company Name Price 11/5/2009 FD Mkt Cap Enterprise Value (a) Rev EBITDA 2009E 2010E 5-Year SGR (b) 2009E 2010E
Micro-Cap Restaurants
Ark Restaurants $13.90 $48.5 $50.7 0.4x 6.7x 15.6x NA NA NM NM
Benihana 4.85 74.7 122.8 0.4x 4.2x 12.4x NA 12.0% 103.6% NM
Caribou Coffee 8.71 176.7 157.8 0.6x 7.3x 34.8x 24.9x NA NM NM
Cosi 0.82 33.5 28.3 0.2x NM NM NM NA NM NM
Famous Dave’s 6.22 57.4 68.8 0.5x 4.7x 9.4x 8.8x 15.0% 62.8% 58.4%
J. Alexander’s 4.10 24.4 44.9 0.3x NM NA NA NA NM NM
Jamba Juice 1.60 84.3 55.8 0.2x NM NM NM NA NM NM
Kona Grill 3.00 27.4 26.0 0.3x NM NM NM 23.0% NM NM
McCormick & Schmick’s 6.21 92.0 108.5 0.3x 4.7x NM 17.7x 15.0% NM 118.3%
Mexican Restaurants Inc 2.31 7.5 12.7 0.2x 3.2x NA NA NA NM NM
Morton’s 3.45 59.2 135.5 0.4x NM 19.2x 9.9x 15.0% 127.8% 65.7%
Pizza Inn 1.64 13.1 13.5 0.3x 5.3x NA NA NA NM NM
Ruth’s Chris 3.10 74.9 220.8 0.6x 6.3x 8.4x 8.9x 12.0% 69.8% 73.8%
Mean 0.4x 5.3x 16.6x 14.0x 15.3% 91.0% 79.1%
Median 0.3x 5.0x 14.0x 9.9x 15.0% 86.7% 69.8%
Rubio’s Restaurants $7.23 $74.0 $66.6 0.4x 5.4x NM 36.2x 25.0% NM 144.6%
Rubio’s Restaurants (unaffected) $6.00 $61.0 $53.6 0.3x 4.3x NM 30.0x 25.0% NM 120.0%
(a) Enterprise Value = Market Value of Equity + Net Debt + Minority Interest. (b) From Wall Street research.
IV. Valuation Overview
DISCUSSION MATERIALS
35
CONFIDENTIAL
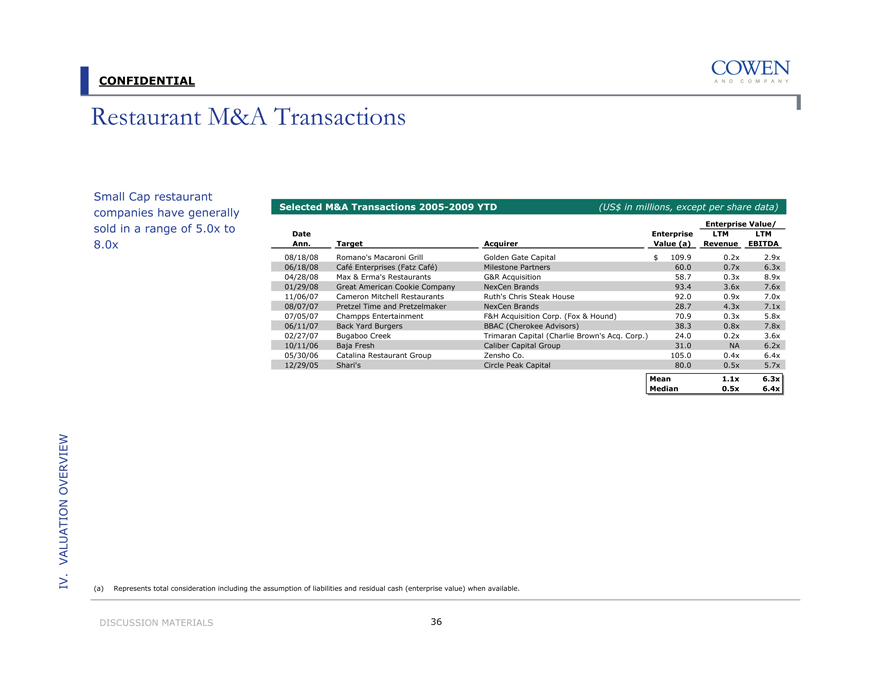
Restaurant M&A Transactions
Small Cap restaurant companies have generally sold in a range of 5.0x to 8.0x
Selected M&A Transactions 2005-2009 YTD (US$ in millions, except per share data)
Enterprise Value/
Date Ann. Target Acquirer Enterprise Value (a) LTM Revenue LTM EBITDA
08/18/08 Romano’s Macaroni Grill Golden Gate Capital $ 109.9 0.2x 2.9x
06/18/08 Café Enterprises (Fatz Café) Milestone Partners 60.0 0.7x 6.3x
04/28/08 Max & Erma’s Restaurants G&R Acquisition 58.7 0.3x 8.9x
01/29/08 Great American Cookie Company NexCen Brands 93.4 3.6x 7.6x
11/06/07 Cameron Mitchell Restaurants Ruth’s Chris Steak House 92.0 0.9x 7.0x
08/07/07 Pretzel Time and Pretzelmaker NexCen Brands 28.7 4.3x 7.1x
07/05/07 Champps Entertainment F&H Acquisition Corp. (Fox & Hound) 70.9 0.3x 5.8x
06/11/07 Back Yard Burgers BBAC (Cherokee Advisors) 38.3 0.8x 7.8x
02/27/07 Bugaboo Creek Trimaran Capital (Charlie Brown’s Acq. Corp.) 24.0 0.2x 3.6x
10/11/06 Baja Fresh Caliber Capital Group 31.0 NA 6.2x
05/30/06 Catalina Restaurant Group Zensho Co. 105.0 0.4x 6.4x
12/29/05 Shari’s Circle Peak Capital 80.0 0.5x 5.7x
Mean 1.1x 6.3x
Median 0.5x 6.4x
(a) Represents total consideration including the assumption of liabilities and residual cash (enterprise value) when available.
IV. Valuation Overview
DISCUSSION MATERIALS
36
CONFIDENTIAL
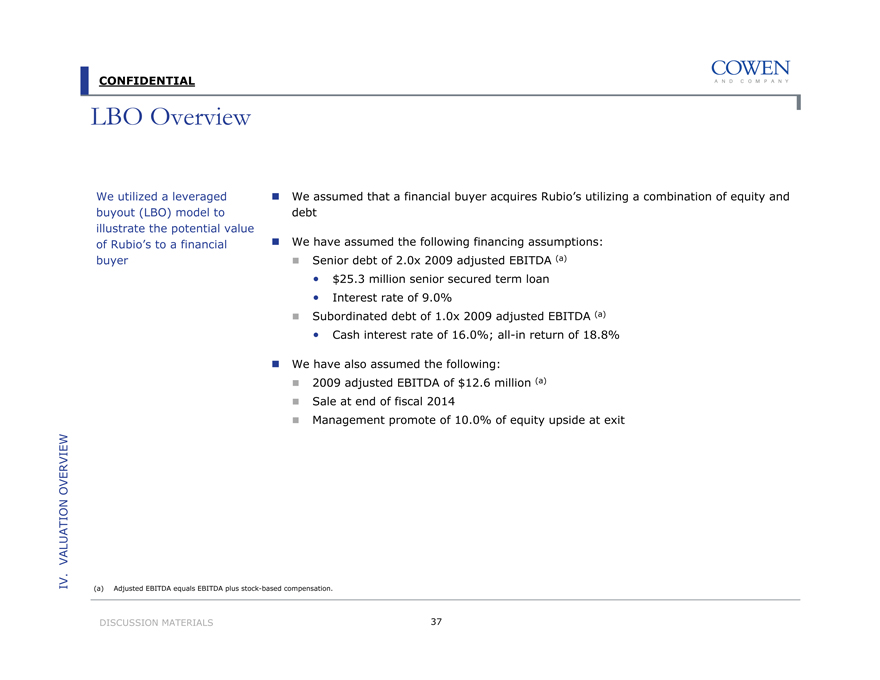
LBO Overview
We utilized a leveraged buyout (LBO) model to illustrate the potential value of Rubio’s to a financial buyer
We assumed that a financial buyer acquires Rubio’s utilizing a combination of equity and debt
We have assumed the following financing assumptions:
Senior debt of 2.0x 2009 adjusted EBITDA (a)
$25.3 million senior secured term loan
Interest rate of 9.0%
Subordinated debt of 1.0x 2009 adjusted EBITDA (a)
Cash interest rate of 16.0%; all-in return of 18.8%
We have also assumed the following:
2009 adjusted EBITDA of $12.6 million (a)
Sale at end of fiscal 2014
Management promote of 10.0% of equity upside at exit
(a) Adjusted EBITDA equals EBITDA plus stock-based compensation.
IV. Valuation Overview
DISCUSSION MATERIALS
37
CONFIDENTIAL
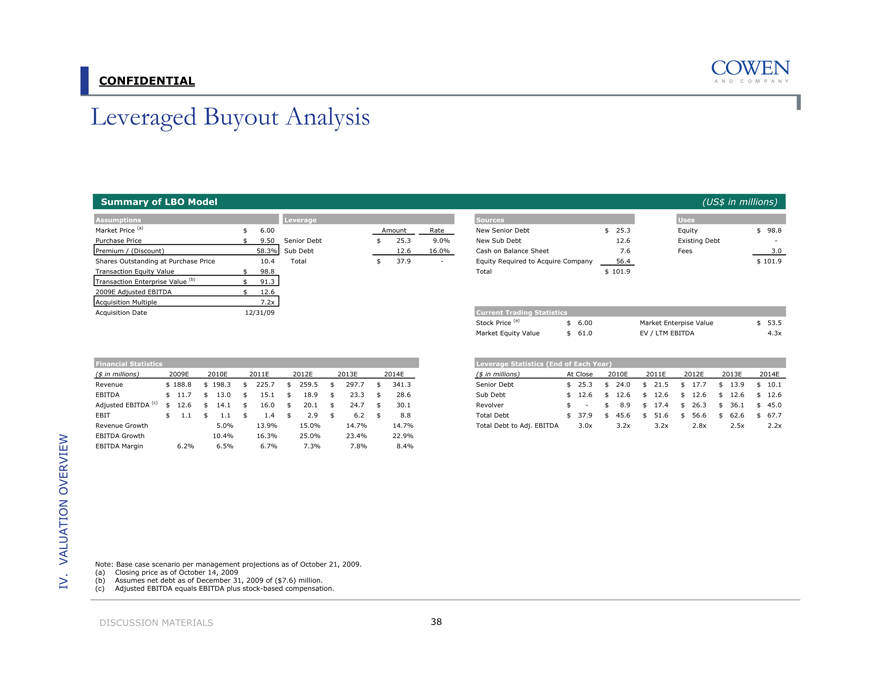
Leveraged Buyout Analysis
Summary of LBO Model
(US$ in millions)
Assumptions
Market Price (a) $ 6.00
Purchase Price $ 9.50
Premium / (Discount) 58.3%
Shares Outstanding at Purchase Price 10.4
Transaction Equity Value $ 98.8
Transaction Enterprise Value (b) $ 91.3
2009E Adjusted EBITDA $ 12.6
Acquisition Multiple 7.2x
Acquisition Date 12/31/09
Leverage
Amount Rate
Senior Debt $ 25.3 9.0%
Sub Debt 12.6 16.0%
Total $ 37.9 -
Sources
New Senior Debt $ 25.3
New Sub Debt 12.6
Cash on Balance Sheet 7.6
Equity Required to Acquire Company 56.4
Total $ 101.9
Uses
Equity $ 98.8
Existing Debt -
Fees 3.0
$ 101.9
Financial Statistics
($ in millions) 2009E 2010E 2011E 2012E 2013E 2014E
Revenue $ 188.8 $ 198.3 $ 225.7 $ 259.5 $ 297.7 $ 341.3
EBITDA $ 11.7 $ 13.0 $ 15.1 $ 18.9 $ 23.3 $ 28.6
Adjusted EBITDA (c) $ 12.6 $ 14.1 $ 16.0 $ 20.1 $ 24.7 $ 30.1
EBIT $ 1.1 $ 1.1 $ 1.4 $ 2.9 $ 6.2 $ 8.8
Revenue Growth 5.0% 13.9% 15.0% 14.7% 14.7%
EBITDA Growth 10.4% 16.3% 25.0% 23.4% 22.9%
EBITDA Margin 6.2% 6.5% 6.7% 7.3% 7.8% 8.4%
Current Trading Statistics
Stock Price (a) $ 6.00 Market Enterpise Value $ 53.5
Market Equity Value $ 61.0 EV / LTM EBITDA 4.3x
Leverage Statistics (End of Each Year)
($ in millions) At Close 2010E 2011E 2012E 2013E 2014E
Senior Debt $ 25.3 $ 24.0 $ 21.5 $ 17.7 $ 13.9 $ 10.1
Sub Debt $ 12.6 $ 12.6 $ 12.6 $ 12.6 $ 12.6 $ 12.6
Revolver $ - $ 8.9 $ 17.4 $ 26.3 $ 36.1 $ 45.0
Total Debt $ 37.9 $ 45.6 $ 51.6 $ 56.6 $ 62.6 $ 67.7
Total Debt to Adj. EBITDA 3.0x 3.2x 3.2x 2.8x 2.5x 2.2x
Note: Base case scenario per management projections as of October 21, 2009.
(a) Closing price as of October 14, 2009
(b) Assumes net debt as of December 31, 2009 of ($7.6) million.
(c) Adjusted EBITDA equals EBITDA plus stock-based compensation.
IV. Valuation Overview
DISCUSSION MATERIALS
38
CONFIDENTIAL
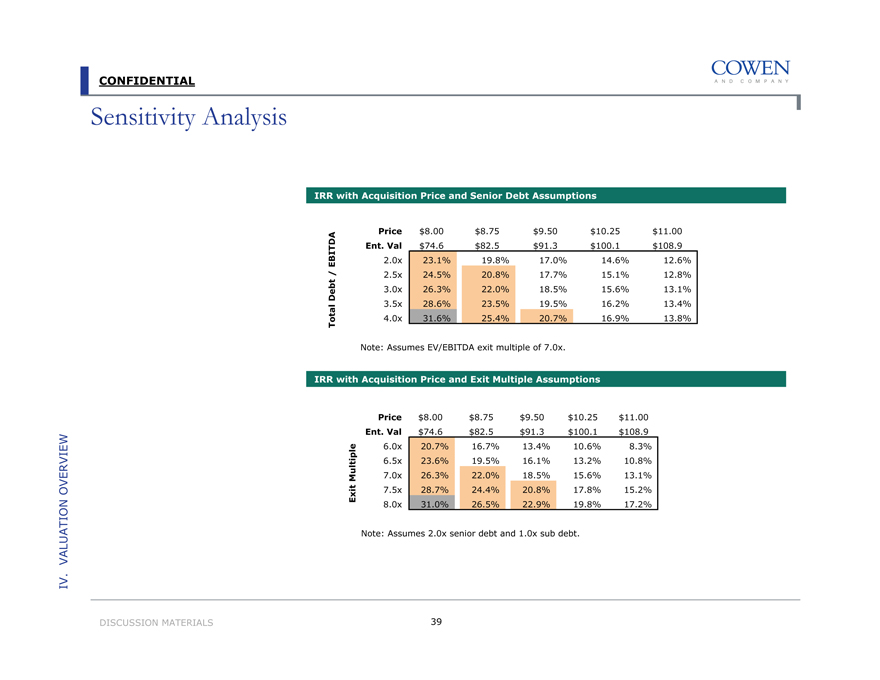
Sensitivity Analysis
IRR with Acquisition Price and Senior Debt Assumptions
Total Debt / EBITDA
Price $8.00 $8.75 $9.50 $10.25 $11.00
Ent. Val $74.6 $82.5 $91.3 $100.1 $108.9
2.0x 23.1% 19.8% 17.0% 14.6% 12.6%
2.5x 24.5% 20.8% 17.7% 15.1% 12.8%
3.0x 26.3% 22.0% 18.5% 15.6% 13.1%
3.5x 28.6% 23.5% 19.5% 16.2% 13.4%
4.0x 31.6% 25.4% 20.7% 16.9% 13.8%
Note: Assumes EV/EBITDA exit multiple of 7.0x.
IRR with Acquisition Price and Exit Multiple Assumptions
Exit Multiple
Price $8.00 $8.75 $9.50 $10.25 $11.00
Ent. Val $74.6 $82.5 $91.3 $100.1 $108.9
6.0x 20.7% 16.7% 13.4% 10.6% 8.3%
6.5x 23.6% 19.5% 16.1% 13.2% 10.8%
7.0x 26.3% 22.0% 18.5% 15.6% 13.1%
7.5x 28.7% 24.4% 20.8% 17.8% 15.2%
8.0x 31.0% 26.5% 22.9% 19.8% 17.2%
Note: Assumes 2.0x senior debt and 1.0x sub debt.
IV. Valuation Overview
DISCUSSION MATERIALS
39
CONFIDENTIAL
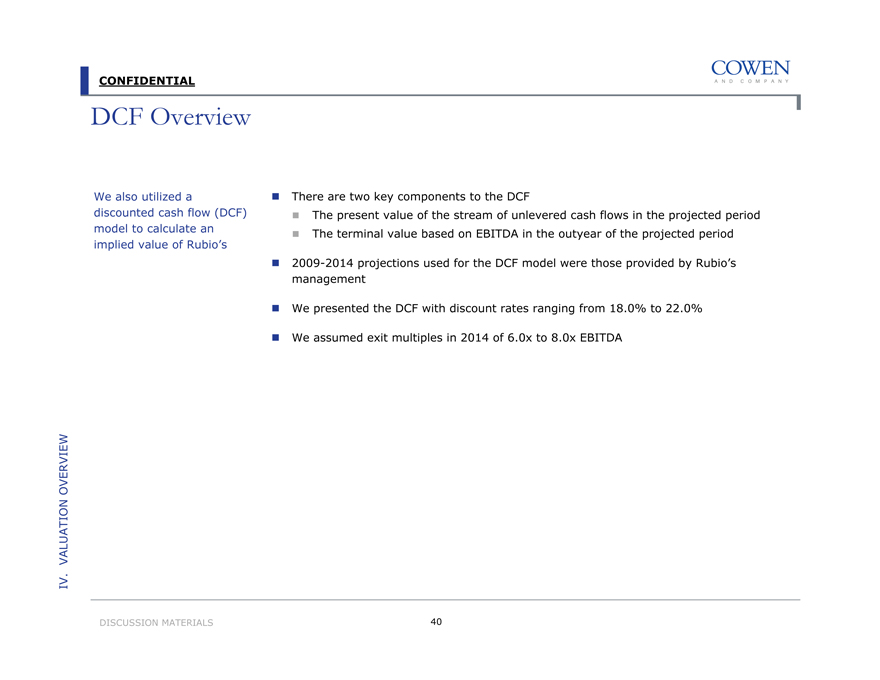
DCF Overview
We also utilized a discounted cash flow (DCF) model to calculate an implied value of Rubio’s
There are two key components to the DCF
The present value of the stream of unlevered cash flows in the projected period
The terminal value based on EBITDA in the outyear of the projected period
2009-2014 projections used for the DCF model were those provided by Rubio’s management
We presented the DCF with discount rates ranging from 18.0% to 22.0%
We assumed exit multiples in 2014 of 6.0x to 8.0x EBITDA
IV. VALUATION OVERVIEW
DISCUSSION MATERIALS
40
CONFIDENTIAL
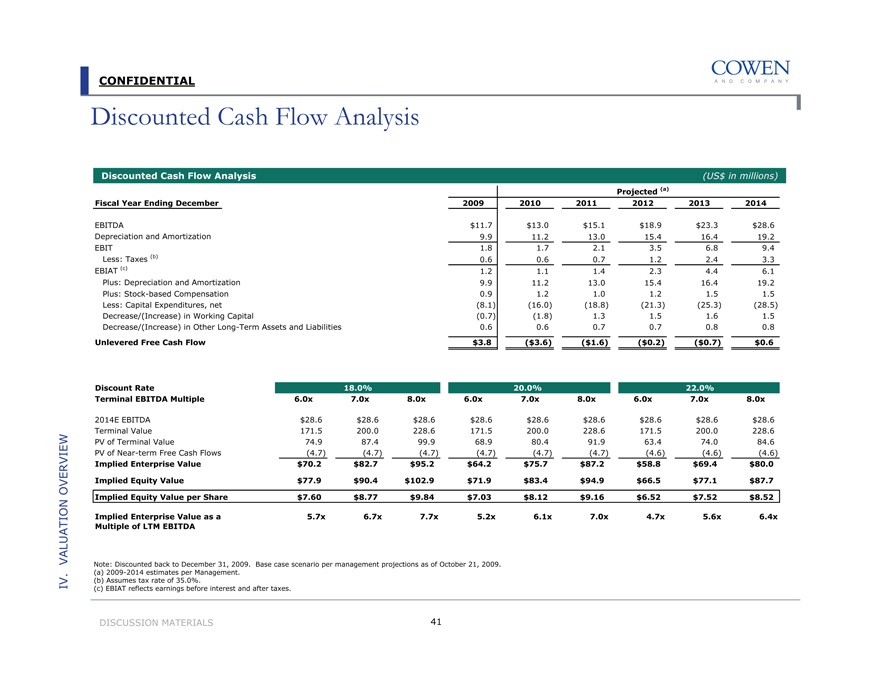
Discounted Cash Flow Analysis
Discounted Cash Flow Analysis
(US$ in millions)
Projected (a)
Fiscal Year Ending December
2009
2010
2011
2012
2013
2014
EBITDA
$11.7
$13.0
$15.1
$18.9
$23.3
$28.6
Depreciation and Amortization
9.9
11.2
13.0
15.4
16.4
19.2
EBIT
1.8
1.7
2.1
3.5
6.8
9.4
Less: Taxes (b)
0.6
0.6
0.7
1.2
2.4
3.3
EBIAT (c)
1.2
1.1
1.4
2.3
4.4
6.1
Plus: Depreciation and Amortization
9.9
11.2
13.0
15.4
16.4
19.2
Plus: Stock-based Compensation
0.9
1.2
1.0
1.2
1.5
1.5
Less: Capital Expenditures, net
(8.1)
(16.0)
(18.8)
(21.3)
(25.3)
(28.5)
Decrease/(Increase) in Working Capital
(0.7)
(1.8)
1.3
1.5
1.6
1.5
Decrease/(Increase) in Other Long-Term Assets and Liabilities
0.6
0.6
0.7
0.7
0.8
0.8
Unlevered Free Cash Flow
$3.8
($3.6)
($1.6)
($0.2)
($0.7)
$0.6
Discount Rate
18.0%
20.0%
22.0%
Terminal EBITDA Multiple
6.0x
7.0x
8.0x
6.0x
7.0x
8.0x
6.0x
7.0x
8.0x
2014E EBITDA
$28.6
$28.6
$28.6
$28.6
$28.6
$28.6
$28.6
$28.6
$28.6
Terminal Value
171.5
200.0
228.6
171.5
200.0
228.6
171.5
200.0
228.6
PV of Terminal Value
74.9
87.4
99.9
68.9
80.4
91.9
63.4
74.0
84.6
PV of Near-term Free Cash Flows
(4.7)
(4.7)
(4.7)
(4.7)
(4.7)
(4.7)
(4.6)
(4.6)
(4.6)
Implied Enterprise Value
$70.2
$82.7
$95.2
$64.2
$75.7
$87.2
$58.8
$69.4
$80.0
Implied Equity Value
$77.9
$90.4
$102.9
$71.9
$83.4
$94.9
$66.5
$77.1
$87.7
Implied Equity Value per Share
$7.60
$8.77
$9.84
$7.03
$8.12
$9.16
$6.52
$7.52
$8.52
Implied Enterprise Value as a
5.7x
6.7x
7.7x
5.2x
6.1x
7.0x
4.7x
5.6x
6.4x
Multiple of LTM EBITDA
Note: Discounted back to December 31, 2009. Base case scenario per management projections as of October 21, 2009. (a) 2009-2014 estimates per Management.
(b) |
| Assumes tax rate of 35.0%. |
(c) |
| EBIAT reflects earnings before interest and after taxes. |
IV. VALUATION OVERVIEW
DISCUSSION MATERIALS
41

CONFIDENTIAL
Valuation at Various Share Prices
Multiples at Various Share Prices
(US$ in millions)
Share Price
$6.00 (a)
$8.00
$8.50
$9.00
$9.50
$10.00
$10.50
$11.00
$11.50
$12.00
$12.50
$13.00
Premium/(Discount)
Current Price of $6.00
$0.00
33.3%
41.7%
50.0%
58.3%
66.7%
75.0%
83.3%
91.7%
100.0%
108.3%
116.7%
1-Week Average Price of $6.15
(2.5%)
30.0%
38.1%
46.3%
54.4%
62.5%
70.6%
78.8%
86.9%
95.0%
103.1%
111.3%
30-Day Average Price of $6.44
(6.8%)
24.2%
32.0%
39.8%
47.5%
55.3%
63.1%
70.8%
78.6%
86.4%
94.1%
101.9%
3-Month Average Price of $6.25
(4.0%)
28.0%
36.0%
44.0%
52.0%
60.1%
68.1%
76.1%
84.1%
92.1%
100.1%
108.1%
6-Month Average Price of $6.01
(0.1%)
33.2%
41.5%
49.9%
58.2%
66.5%
74.8%
83.2%
91.5%
99.8%
108.1%
116.5%
52-Week High of $7.85
(23.6%)
1.9%
8.3%
14.6%
21.0%
27.4%
33.8%
40.1%
46.5%
52.9%
59.2%
65.6%
52-Week Low of $2.16
177.8%
270.4%
293.5%
316.7%
339.8%
363.0%
386.1%
409.3%
432.4%
455.6%
478.7%
501.9%
Implied Equity Value
$61.0
$82.2
$87.5
$93.0
$98.8
$104.7
$110.6
$116.5
$122.4
$128.3
$134.3
$140.2
Implied Enterprise Value (b)
$53.6
$74.8
$80.1
$85.6
$91.4
$97.3
$103.2
$109.1
$115.0
$120.9
$126.8
$132.8
Fully Diluted Shares (Basic + CSEs)
10.169
10.273
10.292
10.330
10.405
10.472
10.534
10.593
10.646
10.695
10.741
10.786
Implied Enterprise Value/:
LTM EBITDA
4.3x
6.0x
6.5x
6.9x
7.4x
7.8x
8.3x
8.8x
9.3x
9.7x
10.2x
10.7x
Implied Equity Value/:
2009E EPS (Mgmt.) (c)
83.6x
111.5x
118.4x
125.4x
132.4x
139.3x
146.3x
153.3x
160.2x
167.2x
174.2x
181.1x
2009E EPS (Consensus) (d)
50.0x
66.7x
70.8x
75.0x
79.2x
83.3x
87.5x
91.7x
95.8x
100.0x
104.2x
108.3x
2010E EPS (Mgmt.) (c)
82.8x
110.4x
117.2x
124.1x
131.0x
137.9x
144.8x
151.7x
158.6x
165.5x
172.4x
179.3x
2010E EPS (Consensus) (d)
30.0x
40.0x
42.5x
45.0x
47.5x
50.0x
52.5x
55.0x
57.5x
60.0x
62.5x
65.0x
(a) Unaffected price as of October 14, 2009, prior to the proposed $8.00 offer by Alex Meruelo and Levine Leitchman, which was rejected by the Board on October 29, 2009. (b) Cash and debt figures from the period ending September 27, 2009.
(c) |
| Base case scenario per management projections as of October 21, 2009. (d) Per Wall Street Research. |
IV. VALUATION OVERVIEW
DISCUSSION MATERIALS 42
CONFIDENTIAL
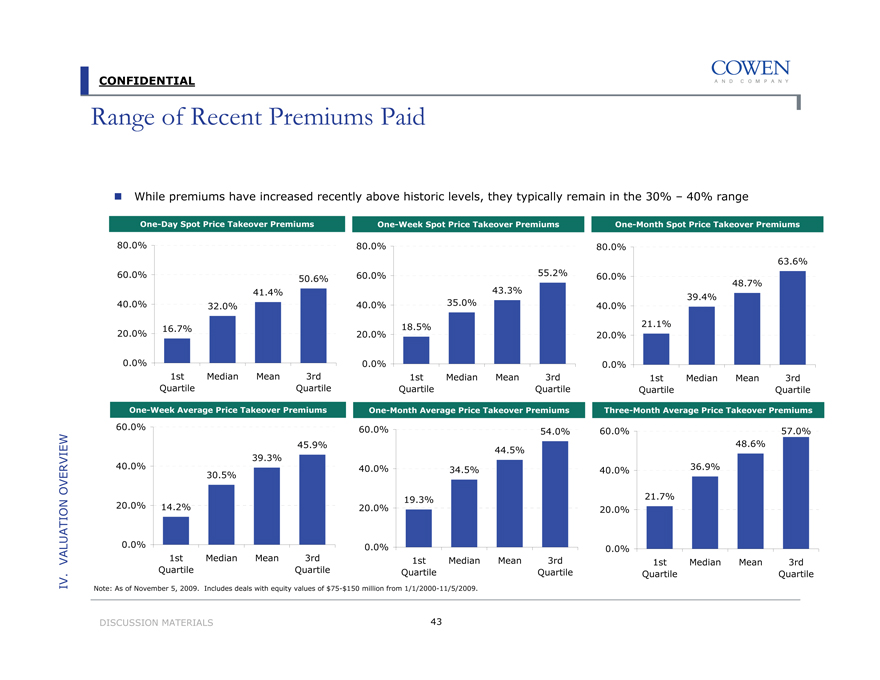
Range of Recent Premiums Paid
While premiums have increased recently above historic levels, they typically remain in the 30% – 40% range
One-Day Spot Price Takeover Premiums
80.0% 60.0% 40.0% 20.0% 0.0%
50.6%
41.4%
32.0%
16.7%
1st
Median
Mean
3rd
Quartile
Quartile
One-Week Spot Price Takeover Premiums
80.0% 60.0% 40.0% 20.0% 0.0%
55.2%
43.3%
35.0%
18.5%
1st
Median
Mean
3rd
Quartile
Quartile
One-Month Spot Price Takeover Premiums
80.0% 60.0% 40.0% 20.0% 0.0%
63.6%
48.7%
39.4%
21.1%
1st
Median
Mean
3rd
Quartile
Quartile
One-Week Average Price Takeover Premiums
60.0% 40.0% 20.0% 0.0%
45.9%
39.3%
30.5%
14.2%
5/81st
Median
Mean
3rd
Quartile
Quartile
One-Month Average Price Takeover Premiums
60.0% 40.0% 20.0% 0.0%
54.0%
44.5%
34.5%
19.3%
1st
Median
Mean
3rd
Quartile
Quartile
Three-Month Average Price Takeover Premiums
60.0% 40.0% 20.0% 0.0%
57.0%
48.6%
36.9%
21.7%
1st Median Mean 3rd Quartile Quartile
Note: As of November 5, 2009. Includes deals with equity values of $75-$150 million from 1/1/2000-11/5/2009.
IV. VALUATION OVERVIEW
DISCUSSION MATERIALS
43

CONFIDENTIAL
V. Strategic Alternatives Overview
CONFIDENTIAL
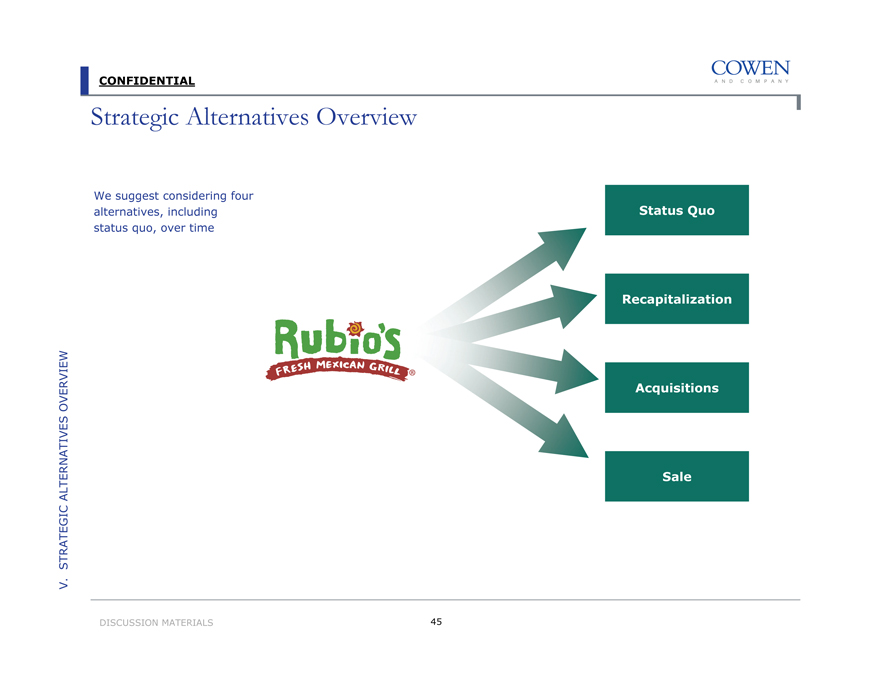
Strategic Alternatives Overview
We suggest considering four alternatives, including status quo, over time
V. STRATEGIC ALTERNATIVES OVERVIEW
DISCUSSION MATERIALS
Status Quo Recapitalization Acquisitions Sale
45
CONFIDENTIAL
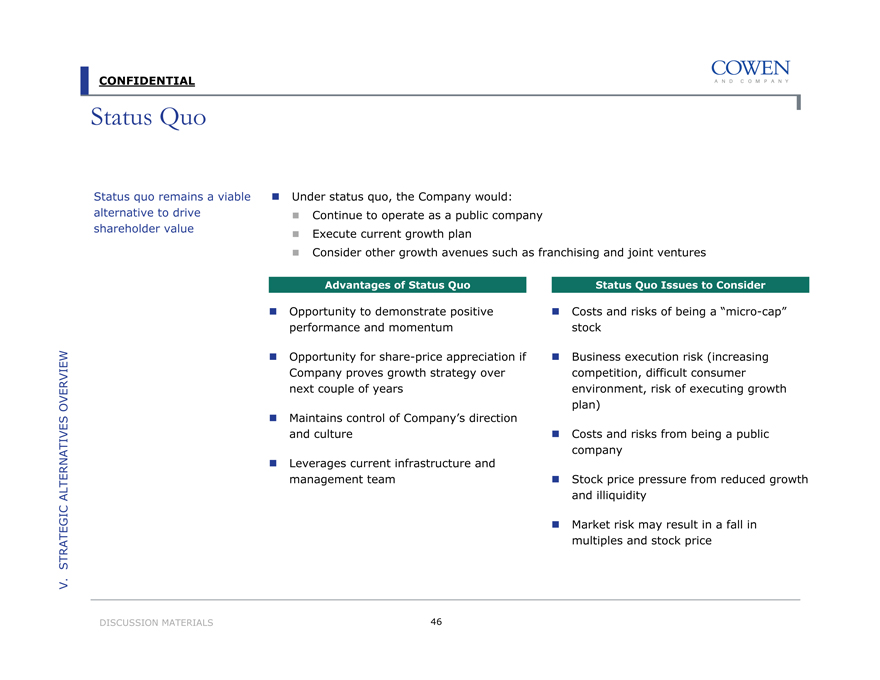
Status Quo
Status quo remains a viable alternative to drive shareholder value
Under status quo, the Company would:
Continue to operate as a public company
Execute current growth plan
Consider other growth avenues such as franchising and joint ventures
Advantages of Status Quo
Opportunity to demonstrate positive performance and momentum
Opportunity for share-price appreciation if Company proves growth strategy over next couple of years
Maintains control of Company’s direction and culture
Leverages current infrastructure and management team
Status Quo Issues to Consider
Costs and risks of being a “micro-cap” stock
Business execution risk (increasing competition, difficult consumer environment, risk of executing growth plan)
Costs and risks from being a public company
Stock price pressure from reduced growth and illiquidity
Market risk may result in a fall in multiples and stock price
V. STRATEGIC ALTERNATIVES OVERVIEW
DISCUSSION MATERIALS
46
CONFIDENTIAL
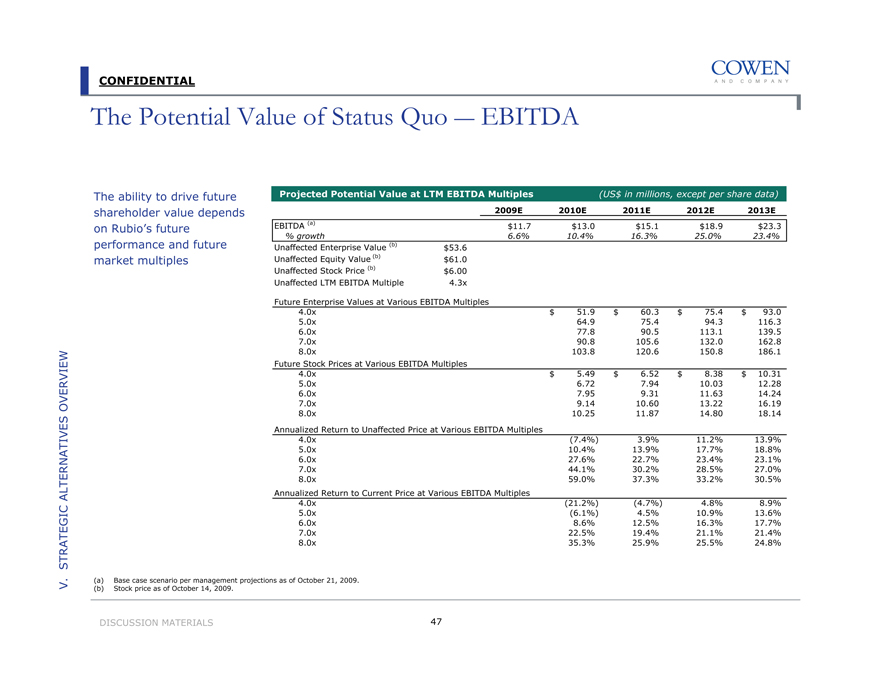
The Potential Value of Status Quo —EBITDA
The ability to drive future shareholder value depends on Rubio’s future performance and future market multiples
Projected Potential Value at LTM EBITDA Multiples
(US$ in millions, except per share data)
2009E
2010E
2011E
2012E
2013E
EBITDA (a)
$11.7
$13.0
$15.1
$18.9
$23.3
% growth
6.6%
10.4%
16.3%
25.0%
23.4%
Unaffected Enterprise Value (b)
$53.6
Unaffected Equity Value (b)
$61.0
Unaffected Stock Price (b)
$6.00
Unaffected LTM EBITDA Multiple
4.3x
Future Enterprise Values at Various EBITDA Multiples
4.0x
$ 51.9
$60.3
$75.4
$93.0
5.0x
64.9
75.4
94.3
116.3
6.0x
77.8
90.5
113.1
139.5
7.0x
90.8
105.6
132.0
162.8
8.0x
103.8
120.6
150.8
186.1
Future Stock Prices at Various EBITDA Multiples
4.0x
$ 5.49
$6.52
$8.38
$10.31
5.0x
6.72
7.94
10.03
12.28
6.0x
7.95
9.31
11.63
14.24
7.0x
9.14
10.60
13.22
16.19
8.0x
10.25
11.87
14.80
18.14
Annualized Return to Unaffected Price at Various EBITDA Multiples
4.0x
(7.4%)
3.9%
11.2%
13.9%
5.0x
10.4%
13.9%
17.7%
18.8%
6.0x
27.6%
22.7%
23.4%
23.1%
7.0x
44.1%
30.2%
28.5%
27.0%
8.0x
59.0%
37.3%
33.2%
30.5%
Annualized Return to Current Price at Various EBITDA Multiples
4.0x
(21.2%)
(4.7%)
4.8%
8.9%
5.0x
(6.1%)
4.5%
10.9%
13.6%
6.0x
8.6%
12.5%
16.3%
17.7%
7.0x
22.5%
19.4%
21.1%
21.4%
8.0x
35.3%
25.9%
25.5%
24.8%
(a) |
| Base case scenario per management projections as of October 21, 2009. (b) Stock price as of October 14, 2009. |
DISCUSSION MATERIALS 47
V. STRATEGIC ALTERNATIVES OVERVIEW
CONFIDENTIAL
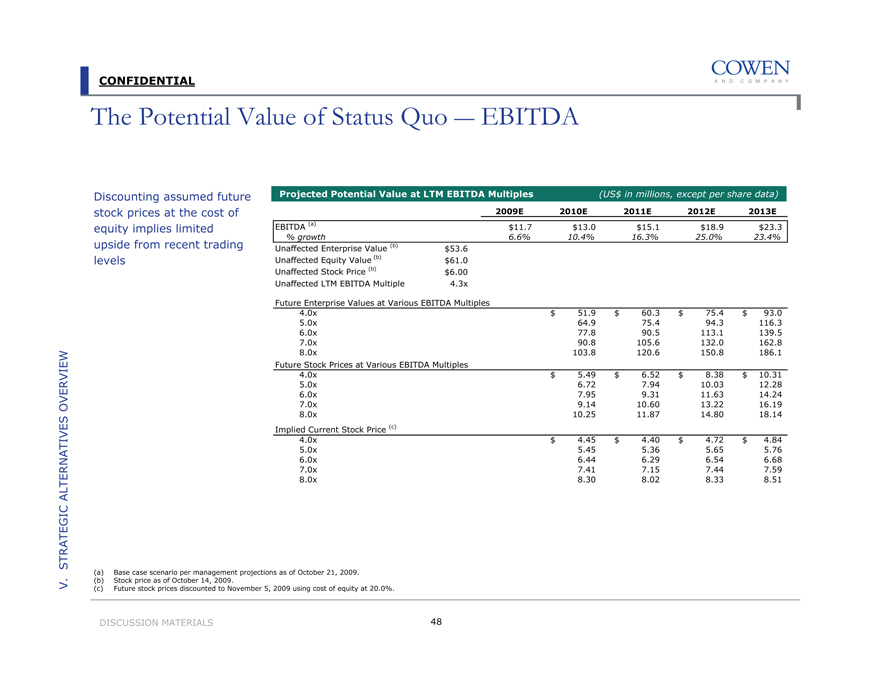
The Potential Value of Status Quo —EBITDA
Discounting assumed future stock prices at the cost of equity implies limited upside from recent trading levels
Projected Potential Value at LTM EBITDA Multiples
(US$ in millions, except per share data)
2009E
2010E
2011E
2012E
2013E
EBITDA (a)
$11.7
$13.0
$15.1
$18.9
$23.3
% growth
6.6%
10.4%
16.3%
25.0%
23.4%
Unaffected Enterprise Value (b)
$53.6
Unaffected Equity Value (b)
$61.0
Unaffected Stock Price (b)
$6.00
Unaffected LTM EBITDA Multiple
4.3x
Future Enterprise Values at Various EBITDA Multiples
4.0x
$51.9
$60.3
$75.4
$93.0
5.0x
64.9
75.4
94.3
116.3
6.0x
77.8
90.5
113.1
139.5
7.0x
90.8
105.6
132.0
162.8
8.0x
103.8
120.6
150.8
186.1
Future Stock Prices at Various EBITDA Multiples
4.0x
$5.49
$6.52
$8.38
$10.31
5.0x
6.72
7.94
10.03
12.28
6.0x
7.95
9.31
11.63
14.24
7.0x
9.14
10.60
13.22
16.19
8.0x
10.25
11.87
14.80
18.14
Implied Current Stock Price (c)
4.0x
$4.45
$4.40
$4.72
$4.84
5.0x
5.45
5.36
5.65
5.76
6.0x
6.44
6.29
6.54
6.68
7.0x
7.41
7.15
7.44
7.59
8.0x
8.30
8.02
8.33
8.51
(a) |
| Base case scenario per management projections as of October 21, 2009. (b) Stock price as of October 14, 2009. |
(c) |
| Future stock prices discounted to November 5, 2009 using cost of equity at 20.0%. |
DISCUSSION MATERIALS 48
V. STRATEGIC ALTERNATIVES OVERVIEW

CONFIDENTIAL
The Potential Value of Status Quo —Forward P/E
We believe it is unlikely the company will trade based on its current P/E multiple
A lack of significant ramp in absolute EPS until 2012 makes value creation difficult to assess
Projected Potential Value at Forward P/E Multiples
(US$ in millions, except per share data)
2009E
2010E
2011E
2012E
2013E
Forward Year EPS (a)
$0.07
$0.11
$0.19
$0.38
$0.52
% growth
(99.3%)
45.3%
78.6%
100.7%
37.0%
Unaffected Equity Value (b)
$61.0
Unaffected Stock Price (b)
$6.00
Unaffected 2010 P/E Multiple
30.0x
Future Stock Prices at Various P/E Multiples (b)
15.0x
$
1.58
$
2.82 $
5.66
$7.76
18.0x
1.90
3.39
6.80
9.31
20.0x
2.11
3.76
7.55
10.34
22.0x
2.32
4.14
8.31
11.38
25.0x
2.63
4.70
9.44
12.93
Annualized Return to Current Market Price at Various P/E Multiples
15.0x
(68.4%)
(29.5%)
(1.8%)
6.4%
18.0x
(63.0%)
(23.3%)
4.0%
11.1%
20.0x
(59.5%)
(19.4%)
7.6%
14.0%
22.0x
(56.0%)
(15.8%)
10.8%
16.6%
25.0x
(50.9%)
(10.7%)
15.4%
20.3%
Annualized Return to Current Price at Various P/E Multiples
15.0x
(73.1%)
(35.3%)
(7.4%)
1.7%
18.0x
(68.5%)
(29.6%)
(1.9%)
6.3%
20.0x
(65.5%)
(26.1%)
1.4%
9.0%
22.0x
(62.5%)
(22.8%)
4.5%
11.5%
25.0x
(58.2%)
(18.0%)
8.8%
15.0%
(a) |
| Base case scenario per management projections as of October 21, 2009. (b) Stock price as of October 14, 2009. |
DISCUSSION MATERIALS 49
V. STRATEGIC ALTERNATIVES OVERVIEW
CONFIDENTIAL
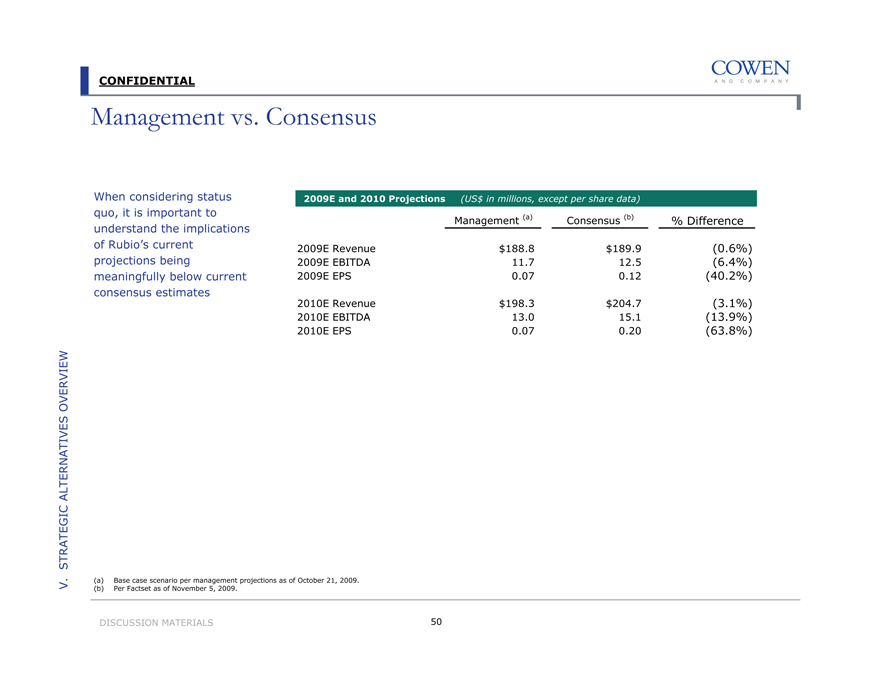
Management vs. Consensus
When considering status quo, it is important to understand the implications of Rubio’s current projections being meaningfully below current consensus estimates
2009E and 2010 Projections
(US$ in millions, except per share data)
Management (a)
Consensus (b)
% Difference
2009E
Revenue
$188.8
$189.9
(0.6%)
2009E
EBITDA
11.7
12.5
(6.4%)
2009E
EPS
0.07
0.12
(40.2%)
2010E
Revenue
$198.3
$204.7
(3.1%)
2010E
EBITDA
13.0
15.1
(13.9%)
2010E
EPS
0.07
0.20
(63.8%)
V. STRATEGIC ALTERNATIVES OVERVIEW
(a) |
| Base case scenario per management projections as of October 21, 2009. (b) Per Factset as of November 5, 2009. |
DISCUSSION MATERIALS 50
CONFIDENTIAL
Recapitalization
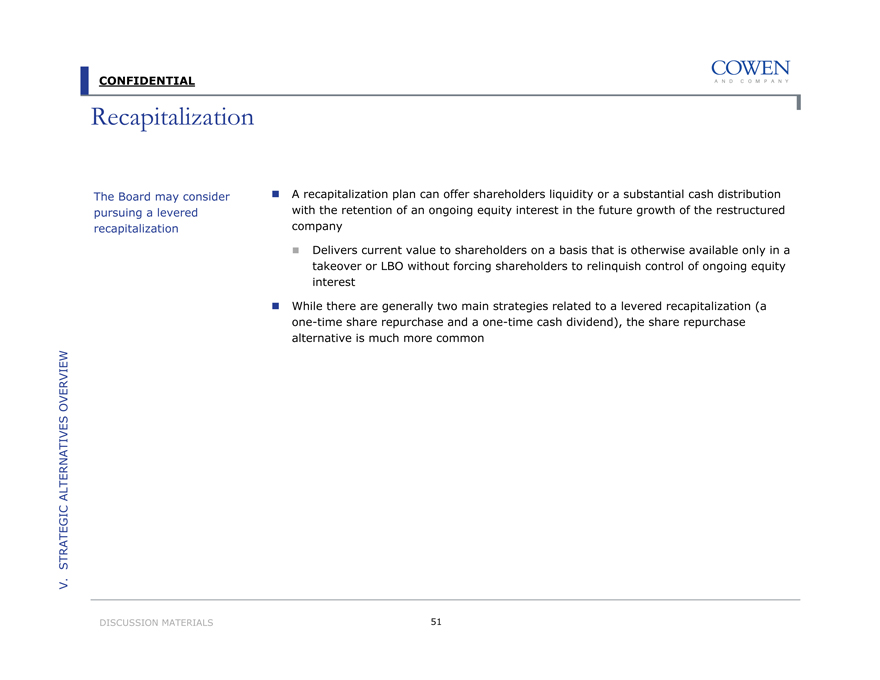
The Board may consider pursuing a levered recapitalization
A recapitalization plan can offer shareholders liquidity or a substantial cash distribution with the retention of an ongoing equity interest in the future growth of the restructured company
Delivers current value to shareholders on a basis that is otherwise available only in a takeover or LBO without forcing shareholders to relinquish control of ongoing equity interest
??While there are generally two main strategies related to a levered recapitalization (a one-time share repurchase and a one-time cash dividend), the share repurchase alternative is much more common
V. STRATEGIC ALTERNATIVES OVERVIEW
DISCUSSION MATERIALS
51
CONFIDENTIAL
Recapitalization Strategies
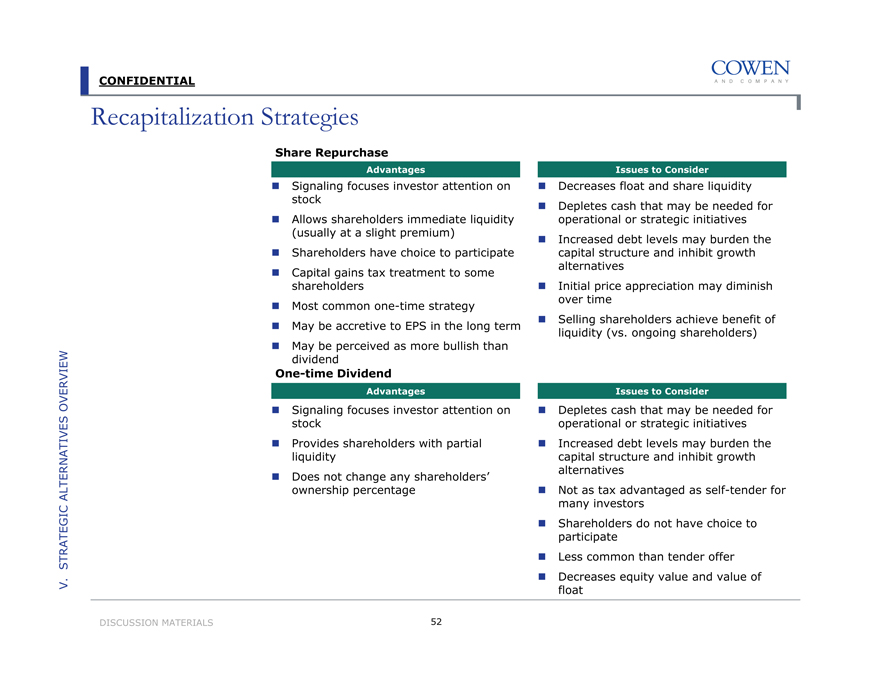
Share Repurchase
Advantages
Signaling focuses investor attention on stock
Allows shareholders immediate liquidity (usually at a slight premium)
Shareholders have choice to participate
Capital gains tax treatment to some shareholders
Most common one-time strategy
May be accretive to EPS in the long term
May be perceived as more bullish than dividend
One-time Dividend
Advantages
Signaling focuses investor attention on stock
Provides shareholders with partial liquidity
Does not change any shareholders’ ownership percentage
Issues to Consider
Decreases float and share liquidity Depletes cash that may be needed for operational or strategic initiatives Increased debt levels may burden the capital structure and inhibit growth alternatives Initial price appreciation may diminish over time Selling shareholders achieve benefit of liquidity (vs. ongoing shareholders)
Issues to Consider
Depletes cash that may be needed for operational or strategic initiatives Increased debt levels may burden the capital structure and inhibit growth alternatives Not as tax advantaged as self-tender for many investors Shareholders do not have choice to participate Less common than tender offer Decreases equity value and value of float
V. STRATEGIC ALTERNATIVES OVERVIEW
DISCUSSION MATERIALS
52
CONFIDENTIAL
Sizing a Share Repurchase
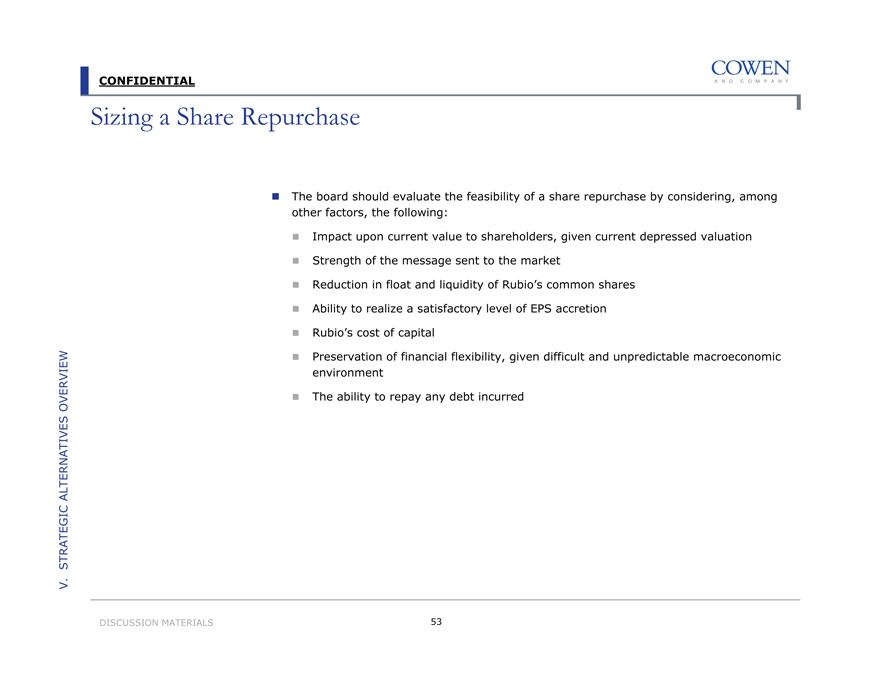
The board should evaluate the feasibility of a share repurchase by considering, among other factors, the following:
Impact upon current value to shareholders, given current depressed valuation
Strength of the message sent to the market
Reduction in float and liquidity of Rubio’s common shares
Ability to realize a satisfactory level of EPS accretion
Rubio’s cost of capital
Preservation of financial flexibility, given difficult and unpredictable macroeconomic environment
The ability to repay any debt incurred
V. STRATEGIC ALTERNATIVES OVERVIEW
DISCUSSION MATERIALS
53
CONFIDENTIAL
Analysis of a Levered Recap: Debt with a Share Repurchase
As a base case, we have assumed a $16 million share repurchase
Debt Raise Summary Pro Forma Analysis — Share Repurchase
(US$ in millions, except per share data)
Leveraged Recap Assumptions:
Repurchase Amount
$16.0
Sources:
New Debt
$11.0
Cash on Balance Sheet Utilized
5.0
LTM EBITDA (a)
12.4
Pro Forma Debt/EBITDA
0.9x
Interest Payable on Debt
6.0%
Current Share Price (b)
$7.23
Share Repurchase Premium
11.3%
Share Repurchase Price
$8.05
Shares Repurchased
1.988
Share Repurchase as a % of Market Cap
19.4%
Transaction Expenses Assumed
1.0%
V. STRATEGIC ALTERNATIVES OVERVIEW
(a) LTM EBITDA as of September 27, 2009. (b) As of November 5, 2009.
DISCUSSION MATERIALS 54
CONFIDENTIAL
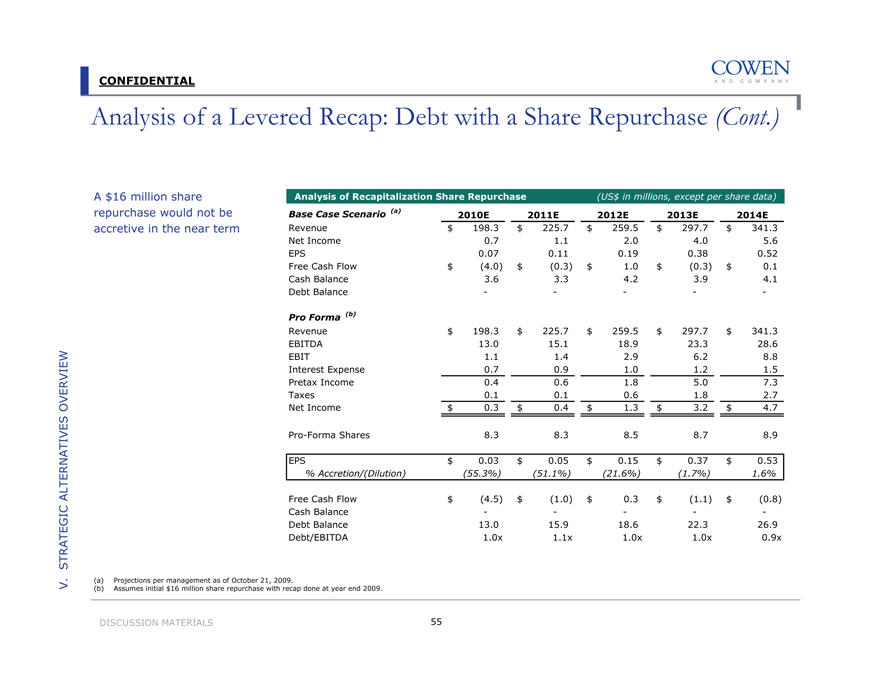
Analysis of a Levered Recap: Debt with a Share Repurchase (Cont.)
A $16 million share repurchase would not be accretive in the near term
Analysis of Recapitalization Share Repurchase
(US$ in millions, except per share data)
Base Case Scenario (a)
2010E
2011E
2012E
2013E
2014E
Revenue
$198.3
$225.7
$259.5
$297.7
$341.3
Net Income
0.7
1.1
2.0
4.0
5.6
EPS
0.07
0.11
0.19
0.38
0.52
Free Cash Flow
$(4.0)
$(0.3)
$1.0
$(0.3)
$0.1
Cash Balance
3.6
3.3
4.2
3.9
4.1
Debt Balance
—
—
—
—
—
Pro Forma (b)
Revenue
$198.3
$225.7
$259.5
$297.7
$341.3
EBITDA
13.0
15.1
18.9
23.3
28.6
EBIT
1.1
1.4
2.9
6.2
8.8
Interest Expense
0.7
0.9
1.0
1.2
1.5
Pretax Income
0.4
0.6
1.8
5.0
7.3
Taxes
0.1
0.1
0.6
1.8
2.7
Net Income
$0.3
$0.4
$1.3
$3.2
$4.7
Pro-Forma Shares
8.3
8.3
8.5
8.7
8.9
EPS
$0.03
$0.05
$0.15
$0.37
$0.53
% Accretion/(Dilution)
(55.3%)
(51.1%)
(21.6%)
(1.7%)
1.6%
Free Cash Flow
$(4.5)
$(1.0)
$0.3
$(1.1)
$(0.8)
Cash Balance
—
—
—
—
—
Debt Balance
13.0
15.9
18.6
22.3
26.9
Debt/EBITDA
1.0x
1.1x
1.0x
1.0x
0.9x
V. STRATEGIC ALTERNATIVES OVERVIEW
(a) Projections per management as of October 21, 2009.
(b) Assumes initial $16 million share repurchase with recap done at year end 2009.
DISCUSSION MATERIALS 55
CONFIDENTIAL
Rubio’s Profile Post-Tender
Post Tender Profile
(in millions)
Tender Amount
$16.0
Shares Repurchased
1.988
Pro-Forma Shares Outstanding
8.252
Pro-Forma Float as a % of Shares Outstanding
61.9%
Meruelo Current Ownership
1.166
% of Current Shares Outstanding
11.4%
% of Pro-Forma Shares Outstanding
14.1%
% of Pro-Forma Float
22.8%
Mill Road Current Ownership
0.502
% of Current Shares Outstanding
4.9%
% of Pro-Forma Shares Outstanding
6.1%
% of Pro-Forma Float
9.8%
V. STRATEGIC ALTERNATIVES OVERVIEW
DISCUSSION MATERIALS
56
CONFIDENTIAL
Acquisition of Another Company
Rubio’s could consider purchasing another company to accelerate future growth and leverage the current infrastructure
However, with limited dealflow, a low share price and a challenging debt market, the timing is not attractive
Advantages
Potentially accelerates path to public “relevancy”
Provides a new platform to fuel future growth
Leverages core competencies and attains synergies
Attractive current valuations relative to past couple years
Issues to Consider
Difficult to finance substantial transaction – low stock price and challenging debt markets
Increases default risk if debt financing utilized
Increases the complexity of business
Diversion of management’s and board’s attention
Unknown business execution and integration risks
Limited attractive and relevant targets
V. STRATEGIC ALTERNATIVES OVERVIEW
DISCUSSION MATERIALS
57
CONFIDENTIAL
Potential Concept Ideas
V. STRATEGIC ALTERNATIVES OVERVIEW
Acquisition Targets
DISCUSSION MATERIALS
58
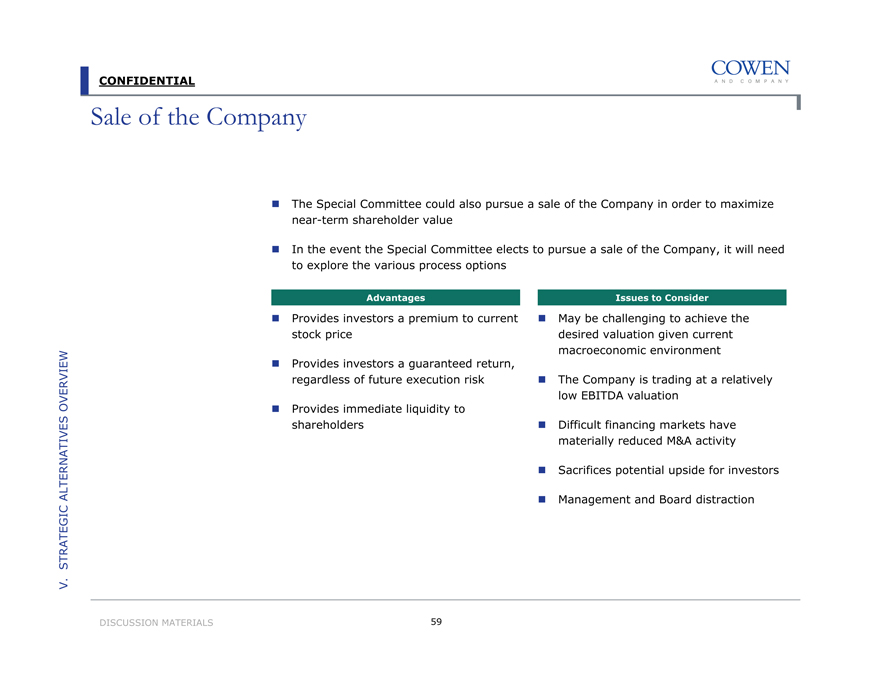
CONFIDENTIAL
Sale of the Company
The Special Committee could also pursue a sale of the Company in order to maximize near-term shareholder value
In the event the Special Committee elects to pursue a sale of the Company, it will need to explore the various process options
Advantages
Provides investors a premium to current stock price
Provides investors a guaranteed return, regardless of future execution risk
Provides immediate liquidity to shareholders
Issues to Consider
May be challenging to achieve the desired valuation given current macroeconomic environment
The Company is trading at a relatively low EBITDA valuation
Difficult financing markets have materially reduced M&A activity
Sacrifices potential upside for investors
Management and Board distraction
V STRATEGIC. ALTERNATIVES OVERVIEW
DISCUSSION MATERIALS
59
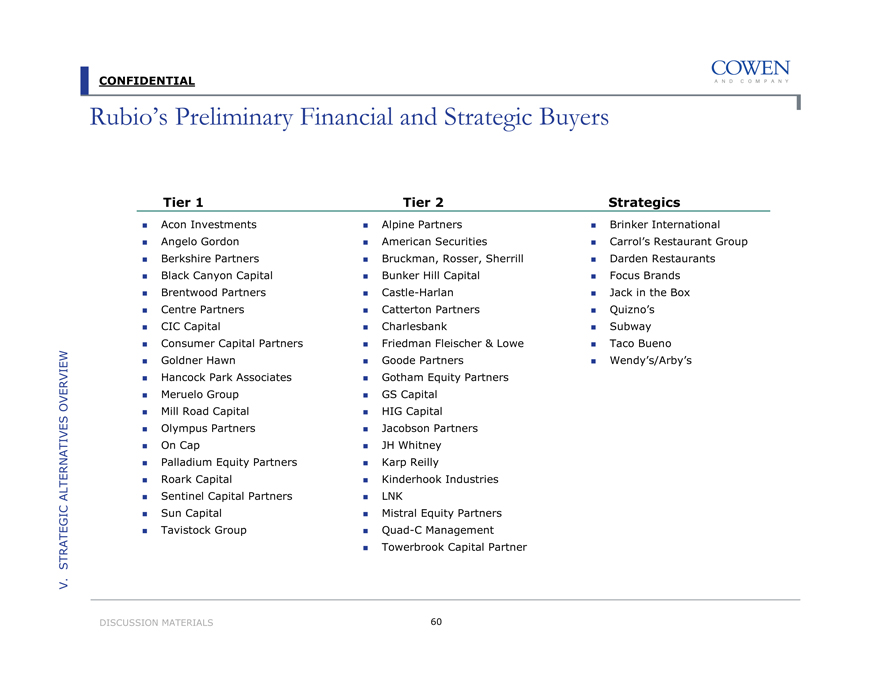
CONFIDENTIAL
Rubio’s Preliminary Financial and Strategic Buyers
Tier 1
Tier 2
Strategics
Acon Investments
Alpine Partners
Brinker International
Angelo Gordon
American Securities
Carrol’s Restaurant Group
Berkshire Partners
Bruckman, Rosser, Sherrill
Darden Restaurants
Black Canyon Capital
Bunker Hill Capital
Focus Brands
Brentwood Partners
Castle-Harlan
Jack in the Box
Centre Partners
Catterton Partners
Quizno’s
CIC Capital
Charlesbank
Subway
Consumer Capital Partners
Friedman Fleischer & Lowe
Taco Bueno
Goldner Hawn
Goode Partners
Wendy’s/Arby’s
Hancock Park Associates
Gotham Equity Partners
Meruelo Group
GS Capital
Mill Road Capital
HIG Capital
Olympus Partners
Jacobson Partners
On Cap
JH Whitney
Palladium Equity Partners
Karp Reilly
Roark Capital
Kinderhook Industries
Sentinel Capital Partners
LNK
Sun Capital
Mistral Equity Partners
Tavistock Group
Quad-C Management
Towerbrook Capital Partner
V STRATEGIC. ALTERNATIVES OVERVIEW
DISCUSSION MATERIALS
60
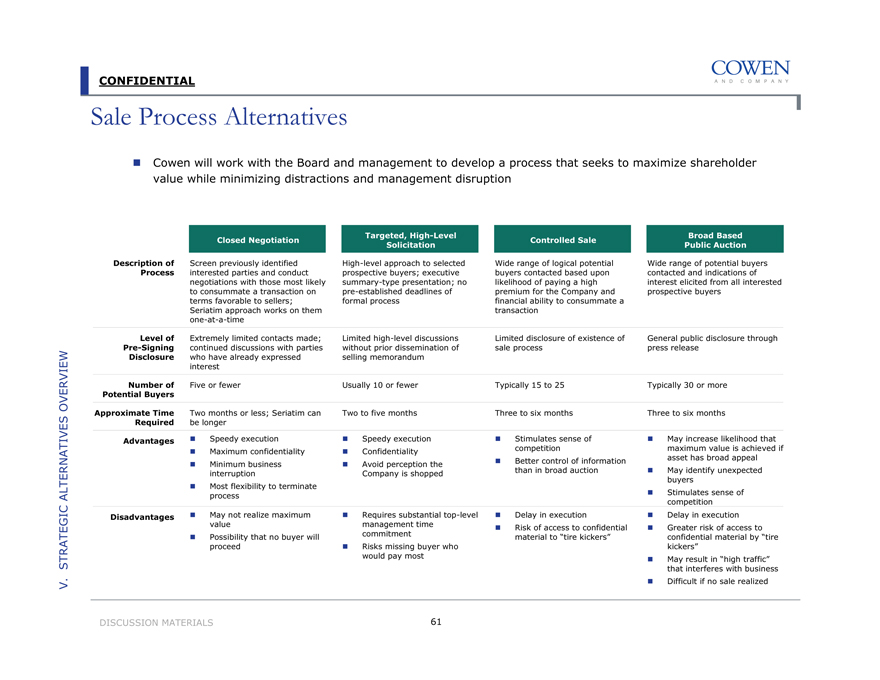
CONFIDENTIAL
Sale Process Alternatives
Cowen will work with the Board and management to develop a process that seeks to maximize shareholder value while minimizing distractions and management disruption
Description of
Process
Closed Negotiation
Targeted, High-Level Solicitation
Controlled Sale
Broad Based Public Auction
Screen previously identified interested parties and conduct negotiations with those most likely to consummate a transaction on terms favorable to sellers; Seriatim approach works on them one-at-a-time
High-level approach to selected prospective buyers; executive summary-type presentation; no pre-established deadlines of formal process
Wide range of logical potential buyers contacted based upon likelihood of paying a high premium for the Company and financial ability to consummate a transaction
Wide range of potential buyers contacted and indications of interest elicited from all interested prospective buyers
Level of
Pre-Signing
Disclosure
Extremely limited contacts made; continued discussions with parties who have already expressed interest
Limited high-level discussions without prior dissemination of selling memorandum
Limited disclosure of existence of sale process
General public disclosure through press release
Number of Potential Buyers
Five or fewer
Usually 10 or fewer
Typically 15 to 25
Typically 30 or more
Approximate Time Required
Two months or less; Seriatim can be longer
Two to five months
Three to six months
Three to six months
Advantages
Speedy execution Maximum confidentiality Minimum business interruption Most flexibility to terminate process
Speedy execution Confidentiality Avoid perception the Company is shopped
Stimulates sense of competition
Better control of information than in broad auction
May increase likelihood that maximum value is achieved if asset has broad appeal May identify unexpected buyers Stimulates sense of competition
Disadvantages
May not realize maximum value Possibility that no buyer will proceed
Requires substantial top-level management time commitment Risks missing buyer who would pay most
Delay in execution
Risk of access to confidential material to “tire kickers”
Delay in execution Greater risk of access to confidential material by “tire kickers” May result in “high traffic” that interferes with business Difficult if no sale realized
V STRATEGIC. ALTERNATIVES OVERVIEW
DISCUSSION MATERIALS
61
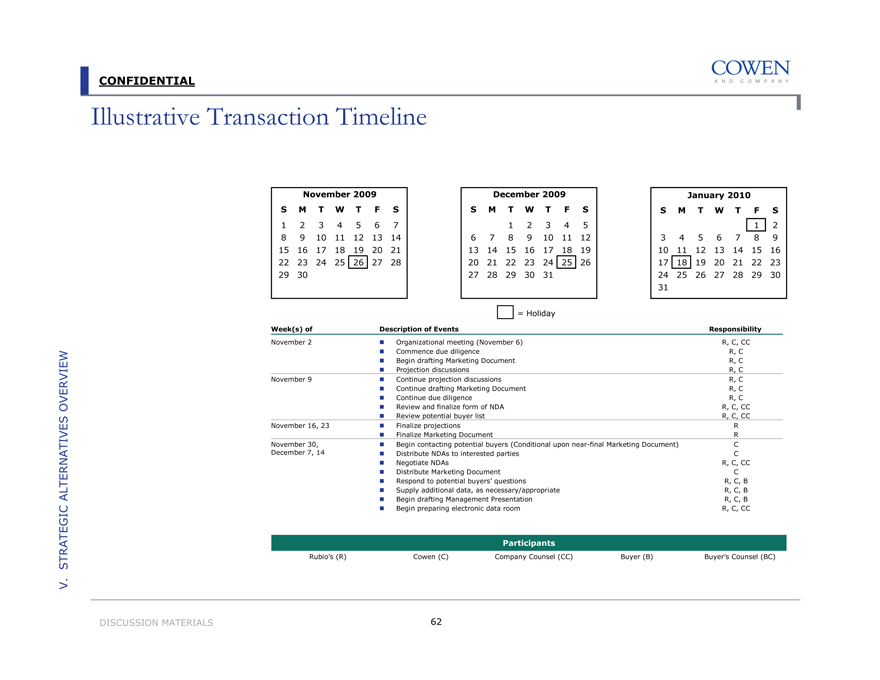
CONFIDENTIAL
Illustrative Transaction Timeline
V STRATEGIC. ALTERNATIVES OVERVIEW
November 2009
S
M
T
W
T
F
S
1
2
3
4
5
6
7
8
9
10
11
12
13
14
15
16
17
18
19
20
21
22
23
24
25
26
27
28
29
30
December 2009
S
M
T
W
T
F
S
1
2
3
4
5
6
7
8
9
10
11
12
13
14
15
16
17
18
19
20
21
22
23
24
25
26
27
28
29
30
31
January 2010
S
M
T
W
T
F
S
1
2
3
4
5
6
7
8
9
10
11
12
13
14
15
16
17
18
19
20
21
22
23
24
25
26
27
28
29
30
31
= Holiday
Week(s) of
Description of Events
Responsibility
November 2
Organizational meeting (November 6)
R, C, CC
Commence due diligence
R, C
Begin drafting Marketing Document
R, C
Projection discussions
R, C
November 9
Continue projection discussions
R, C
Continue drafting Marketing Document
R, C
Continue due diligence
R, C
Review and finalize form of NDA
R, C, CC
Review potential buyer list
R, C, CC
November 16, 23
Finalize projections
R
Finalize Marketing Document
R
November 30,
Begin contacting potential buyers (Conditional upon near-final Marketing Document)
C
December 7, 14
Distribute NDAs to interested parties
C
Negotiate NDAs
R, C, CC
Distribute Marketing Document
C
Respond to potential buyers’ questions
R, C, B
Supply additional data, as necessary/appropriate
R, C, B
Begin drafting Management Presentation
R, C, B
Begin preparing electronic data room
R, C, CC
Participants
Rubio’s (R) Cowen (C) Company Counsel (CC) Buyer (B) Buyer’s Counsel (BC)
DISCUSSION MATERIALS
62

CONFIDENTIAL
Illustrative Transaction Timeline (Cont.)
December 2009
S
M
T
W
T
F
S
1
2
3
4
5
6
7
8
9
10
11
12
13
14
15
16
17
18
19
20
21
22
23
24
25
26
27
28
29
30
31
January 2010
S
M
T
W
T
F
S
1
2
3
4
5
6
7
8
9
10
11
12
13
14
15
16
17
18
19
20
21
22
23
24
25
26
27
28
29
30
31
February 2010
S
M
T
W
T
F
S
1
2
3
4
5
6
7
8
9
10
11
12
13
14
15
16
17
18
19
20
21
22
23
24
25
26
27
28
= Holiday
Week(s) of
Description of Events
Responsibility
December 21
Deadline for Letters of Intent (December 23)
R, C, B
December 28,
Review, clarify and define terms
R, C, B
January 4
Review bids with Board/management
R, C, CC
Select second-round participants
R, C
Finalize Management Presentation
R, C
Finalize electronic data room
R, C, CC
Begin buyer due diligence
R, C, B
Begin drafting transaction documents
R, C, CC
January 11, 18, 25,
Continue buyer due diligence (including potential financing sources)
R, C, CC, B
February 1
Conduct management presentations with potential buyers
R, C, CC, B
Finalize and distribute transaction documents
R, C, CC
February 8
Finalize buyer due diligence
R, C, CC, B, BC
Final bids due
R, C, CC, B, BC
Review, clarify and define final bids
R, C, CC
February 15, 22
Select buyer
R, C, CC
Complete confirmatory due diligence
R, C, CC, B, BC
Negotiate final terms and conditions of transaction documentation
R, C, CC, B, BC
Board meeting to approve the transaction
C, CC
Sign transaction documents
R, C, CC, B, BC
Announce transaction to employees and public
R, C, CC, B, BC
Participants
Rubio’s (R) Cowen (C) Company Counsel (CC) Buyer (B) Buyer’s Counsel (BC)
V STRATEGIC. ALTERNATIVES OVERVIEW
DISCUSSION MATERIALS
63
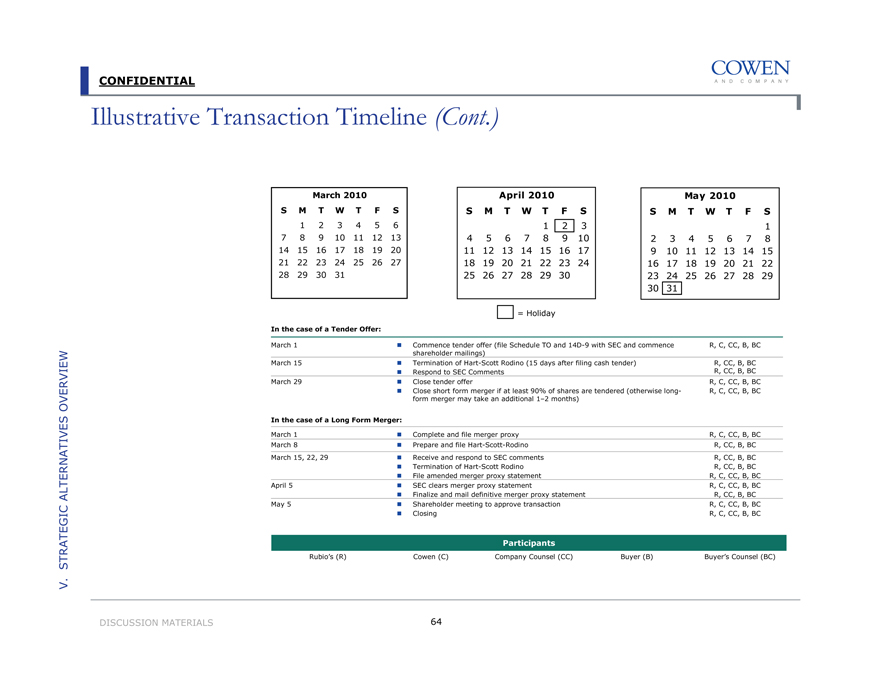
CONFIDENTIAL
Illustrative Transaction Timeline (Cont.)
March 2010
M
T
W
T
F
S
1
2
3
4
5
6
7
8
9
10
11
12
13
14
15
16
17
18
19
20
21
22
23
24
25
26
27
28
29
30
31
April 2010
S
M
T
W
T
F
S
1
2
3
4
5
6
7
8
9
10
11
12
13
14
15
16
17
18
19
20
21
22
23
24
25
26
27
28
29
30
May 2010
S
M
T
W
T
F
S
1
2
3
4
5
6
7
8
9
10
11
12
13
14
15
16
17
18
19
20
21
22
23
24
25
26
27
28
29
30
31
= Holiday
In the case of a Tender Offer:
March 1
Commence tender offer (file Schedule TO and 14D-9 with SEC and commence
R, C, CC, B, BC
shareholder mailings)
March 15
Termination of Hart-Scott Rodino (15 days after filing cash tender)
R, CC, B, BC
Respond to SEC Comments
R, CC, B, BC
March 29
Close tender offer
R, C, CC, B, BC
Close short form merger if at least 90% of shares are tendered (otherwise long-
R, C, CC, B, BC
form merger may take an additional 1–2 months)
In the case of a Long Form Merger:
March 1
Complete and file merger proxy
R, C, CC, B, BC
March 8
Prepare and file Hart-Scott-Rodino
R, CC, B, BC
March 15, 22, 29
Receive and respond to SEC comments
R, CC, B, BC
Termination of Hart-Scott Rodino
R, CC, B, BC
File amended merger proxy statement
R, C, CC, B, BC
April 5
SEC clears merger proxy statement
R, C, CC, B, BC
Finalize and mail definitive merger proxy statement
R, CC, B, BC
May 5
Shareholder meeting to approve transaction
R, C, CC, B, BC
Closing
R, C, CC, B, BC
Participants
Rubio’s (R) Cowen (C) Company Counsel (CC) Buyer (B) Buyer’s Counsel (BC)
V STRATEGIC. ALTERNATIVES OVERVIEW
DISCUSSION MATERIALS
64