Exhibit (c)(4)
|
Restaurant Market Update – December 10, 2009
|
Restaurant Environment Update
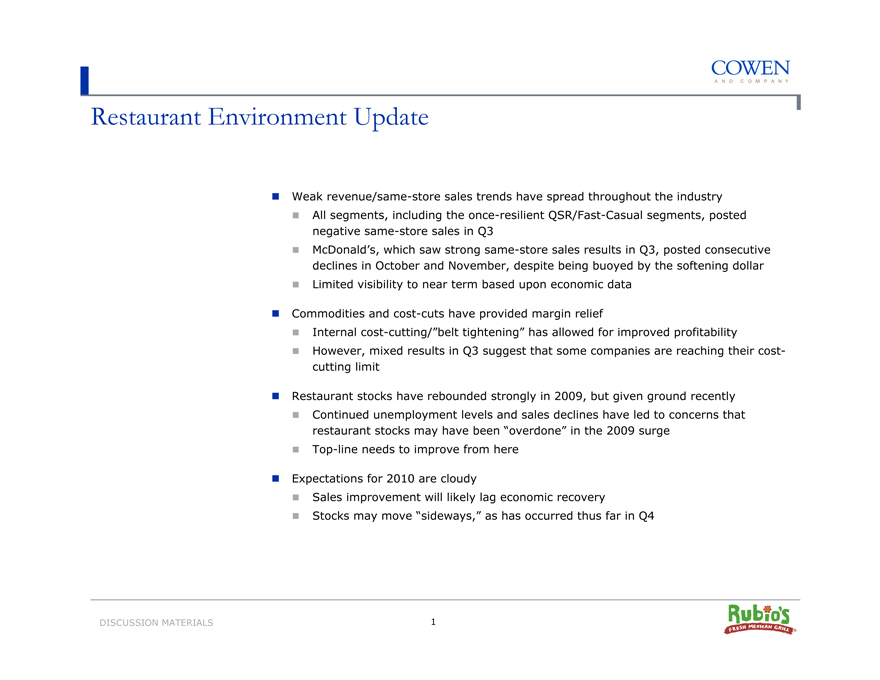
Weak revenue/same-store sales trends have spread throughout the industry
All segments, including the once-resilient QSR/Fast-Casual segments, posted negative same-store sales in Q3
McDonald’s, which saw strong same-store sales results in Q3, posted consecutive declines in October and November, despite being buoyed by the softening dollar
Limited visibility to near term based upon economic data
Commodities and cost-cuts have provided margin relief
Internal cost-cutting/“belt tightening” has allowed for improved profitability
However, mixed results in Q3 suggest that some companies are reaching their cost-cutting limit
Restaurant stocks have rebounded strongly in 2009, but given ground recently
Continued unemployment levels and sales declines have led to concerns that restaurant stocks may have been “overdone” in the 2009 surge
Top-line needs to improve from here
Expectations for 2010 are cloudy
Sales improvement will likely lag economic recovery
Stocks may move “sideways,” as has occurred thus far in Q4
DISCUSSION MATERIALS 1
|
Restaurant Stock Performance
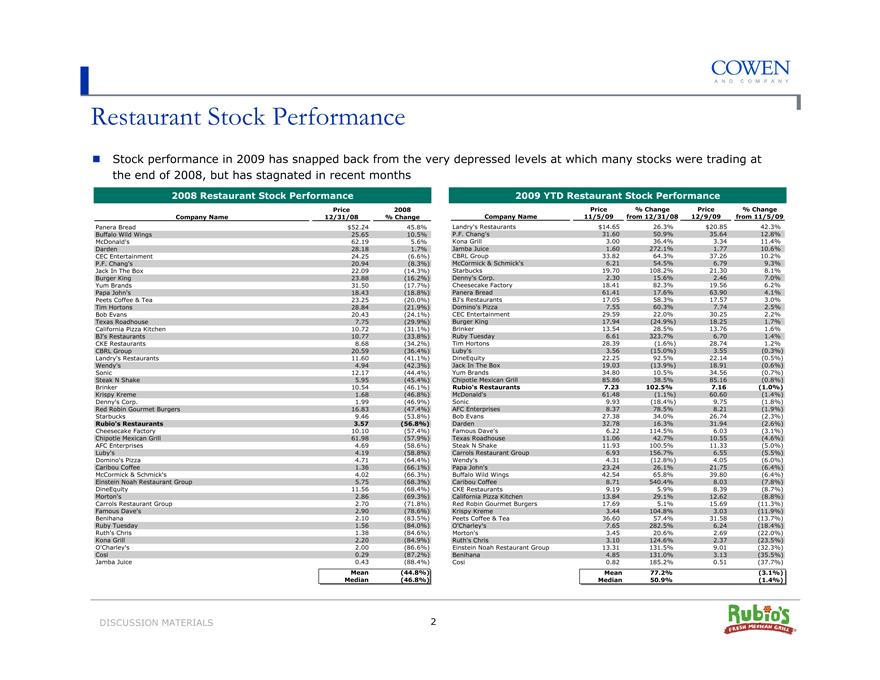
Stock performance in 2009 has snapped back from the very depressed levels at which many stocks were trading at the end of 2008, but has stagnated in recent months
2008 Restaurant Stock Performance
Company Name
Price 12/31/08
2008 % Change
Panera Bread $52.24 45.8%
Buffalo Wild Wings 25.65 10.5%
McDonald’s 62.19 5.6%
Darden 28.18 1.7%
CEC Entertainment 24.25 (6.6%)
P.F. Chang’s 20.94 (8.3%)
Jack In The Box 22.09 (14.3%)
Burger King 23.88 (16.2%)
Yum Brands 31.50 (17.7%)
Papa John’s 18.43 (18.8%)
Peets Coffee & Tea 23.25 (20.0%)
Tim Hortons 28.84 (21.9%)
Bob Evans 20.43 (24.1%)
Texas Roadhouse 7.75 (29.9%)
California Pizza Kitchen 10.72 (31.1%)
BJ’s Restaurants 10.77 (33.8%)
CKE Restaurants 8.68 (34.2%)
CBRL Group 20.59 (36.4%)
Landry’s Restaurants 11.60 (41.1%)
Wendy’s 4.94 (42.3%)
Sonic 12.17 (44.4%)
Steak N Shake 5.95 (45.4%)
Brinker 10.54 (46.1%)
Krispy Kreme 1.68 (46.8%)
Denny’s Corp. 1.99 (46.9%)
Red Robin Gourmet Burgers 16.83 (47.4%)
Starbucks 9.46 (53.8%)
Rubio’s Restaurants 3.57 (56.8%)
Cheesecake Factory 10.10 (57.4%)
Chipotle Mexican Grill 61.98 (57.9%)
AFC Enterprises 4.69 (58.6%)
Luby’s 4.19 (58.8%)
Domino’s Pizza 4.71 (64.4%)
Caribou Coffee 1.36 (66.1%)
McCormick & Schmick’s 4.02 (66.3%)
Einstein Noah Restaurant Group 5.75 (68.3%)
DineEquity 11.56 (68.4%)
Morton’s 2.86 (69.3%)
Carrols Restaurant Group 2.70 (71.8%)
Famous Dave’s 2.90 (78.6%)
Benihana 2.10 (83.5%)
Ruby Tuesday 1.56 (84.0%)
Ruth’s Chris 1.38 (84.6%)
Kona Grill 2.20 (84.9%)
O’Charley’s 2.00 (86.6%)
Cosi 0.29 (87.2%)
Jamba Juice 0.43 (88.4%)
Mean (44.8%)
Median (46.8%)
Company Name
Price 11/5/09
% Change from 12/31/08
Price from 12/9/09
% Change from 11/5/09
Landry’s Restaurants $14.65 26.3% $20.85 42.3%
P.F. Chang’s 31.60 50.9% 35.64 12.8%
Kona Grill 3.00 36.4% 3.34 11.4%
Jamba Juice 1.60 272.1% 1.77 10.6%
CBRL Group 33.82 64.3% 37.26 10.2%
McCormick & Schmick’s 6.21 54.5% 6.79 9.3%
Starbucks 19.70 108.2% 21.30 8.1%
Denny’s Corp. 2.30 15.6% 2.46 7.0%
Cheesecake Factory 18.41 82.3% 19.56 6.2%
Panera Bread 61.41 17.6% 63.90 4.1%
BJ’s Restaurants 17.05 58.3% 17.57 3.0%
Domino’s Pizza 7.55 60.3% 7.74 2.5%
CEC Entertainment 29.59 22.0% 30.25 2.2%
Burger King 17.94 (24.9%) 18.25 1.7%
Brinker 13.54 28.5% 13.76 1.6%
Ruby Tuesday 6.61 323.7% 6.70 1.4%
Tim Hortons 28.39 (1.6%) 28.74 1.2%
Luby’s 3.56 (15.0%) 3.55 (0.3%)
DineEquity 22.25 92.5% 22.14 (0.5%)
Jack In The Box 19.03 (13.9%) 18.91 (0.6%)
Yum Brands 34.80 10.5% 34.56 (0.7%)
Chipotle Mexican Grill 85.86 38.5% 85.16 (0.8%)
Rubio’s Restaurants 7.23 102.5% 7.16 (1.0%)
McDonald’s 61.48 (1.1%) 60.60 (1.4%)
Sonic 9.93 (18.4%) 9.75 (1.8%)
AFC Enterprises 8.37 78.5% 8.21 (1.9%)
Bob Evans 27.38 34.0% 26.74 (2.3%)
Darden 32.78 16.3% 31.94 (2.6%)
Famous Dave’s 6.22 114.5% 6.03 (3.1%)
Texas Roadhouse 11.06 42.7% 10.55 (4.6%)
Steak N Shake 11.93 100.5% 11.33 (5.0%)
Carrols Restaurant Group 6.93 156.7% 6.55 (5.5%)
Wendy’s 4.31 (12.8%) 4.05 (6.0%)
Papa John’s 23.24 26.1% 21.75 (6.4%)
Buffalo Wild Wings 42.54 65.8% 39.80 (6.4%)
Caribou Coffee 8.71 540.4% 8.03 (7.8%)
CKE Restaurants 9.19 5.9% 8.39 (8.7%)
California Pizza Kitchen 13.84 29.1% 12.62 (8.8%)
Red Robin Gourmet Burgers 17.69 5.1% 15.69 (11.3%)
Krispy Kreme 3.44 104.8% 3.03 (11.9%)
Peets Coffee & Tea 36.60 57.4% 31.58 (13.7%)
O’Charley’s 7.65 282.5% 6.24 (18.4%)
Morton’s 3.45 20.6% 2.69 (22.0%)
Ruth’s Chris 3.10 124.6% 2.37 (23.5%)
Einstein Noah Restaurant Group 13.31 131.5% 9.01 (32.3%)
Benihana 4.85 131.0% 3.13 (35.5%)
Cosi 0.82 185.2% 0.51 (37.7%)
Mean 77.2% (3.1%)
Median 50.9% (1.4%)
DISCUSSION MATERIALS 2
|
Current Sector Valuations
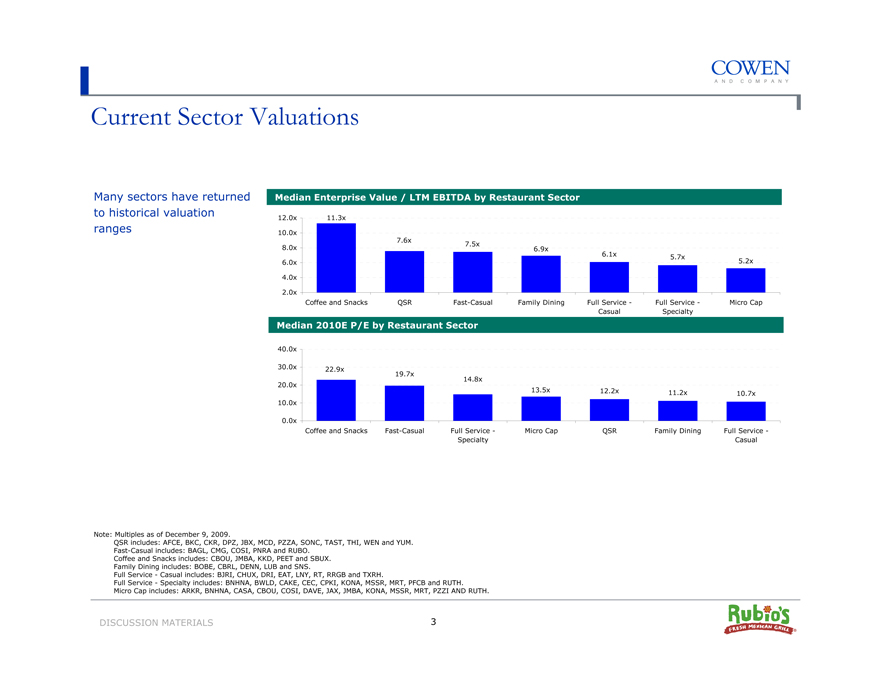
Many sectors have returned to historical valuation ranges
Median Enterprise Value / LTM EBITDA by Restaurant Sector
12.0x 10.0x 8.0x 6.0x 4.0x 2.0x
11.3x
7.6x
7.5x
6.9x
6.1x 5.7x 5.2x
Coffee and Snacks QSR Fast-Casual Family Dining Full Service - Casual Full Service - Specialty Micro Cap
Median 2010E P/E by Restaurant Sector
40.0x 30.0x 20.0x 10.0x 0.0x
22.9x
19.7x
14.8x
13.5x 12.2x 11.2x
10.7x
Coffee and Snacks Fast-Casual Full Service - Specialty Micro Cap QSR Family Dining Full Service - Casual
Note: Multiples as of December 9, 2009.
QSR includes: AFCE, BKC, CKR, DPZ, JBX, MCD, PZZA, SONC, TAST, THI, WEN and YUM.
Fast-Casual includes: BAGL, CMG, COSI, PNRA and RUBO.
Coffee and Snacks includes: CBOU, JMBA, KKD, PEET and SBUX.
Family Dining includes: BOBE, CBRL, DENN, LUB and SNS.
Full Service - Casual includes: BJRI, CHUX, DRI, EAT, LNY, RT, RRGB and TXRH.
Full Service - Specialty includes: BNHNA, BWLD, CAKE, CEC, CPKI, KONA, MSSR, MRT, PFCB and RUTH.
Micro Cap includes: ARKR, BNHNA, CASA, CBOU, COSI, DAVE, JAX, JMBA, KONA, MSSR, MRT, PZZI AND RUTH.
DISCUSSION MATERIALS 3
|
Restaurant M&A Activity
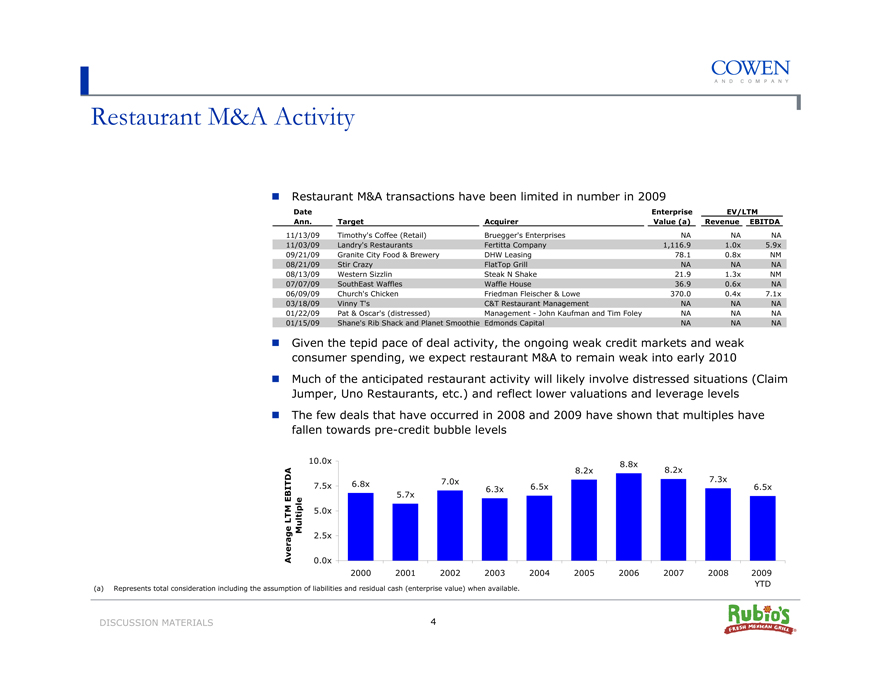
Restaurant M&A transactions have been limited in number in 2009
Date Ann.
Target
Acquirer
Enterprise Value (a)
EV/LTM
EBITDA
Revenue
11/13/09 Timothy’s Coffee (Retail) Bruegger’s Enterprises NA NA NA
11/03/09 Landry’s Restaurants Fertitta Company 1,116.9 1.0x 5.9x
09/21/09 Granite City Food & Brewery DHW Leasing 78.1 0.8x NM
08/21/09 Stir Crazy FlatTop Grill NA NA NA
08/13/09 Western Sizzlin Steak N Shake 21.9 1.3x NM
07/07/09 SouthEast Waffles Waffle House 36.9 0.6x NA
06/09/09 Church’s Chicken Friedman Fleischer & Lowe 370.0 0.4x 7.1x
03/18/09 Vinny T’s C&T Restaurant Management NA NA NA
01/22/09 Pat & Oscar’s (distressed) Management - John Kaufman and Tim Foley NA NA NA
01/15/09 Shane’s Rib Shack and Planet Smoothie Edmonds Capital NA NA NA
Given the tepid pace of deal activity, the ongoing weak credit markets and weak consumer spending, we expect restaurant M&A to remain weak into early 2010
Much of the anticipated restaurant activity will likely involve distressed situations (Claim Jumper, Uno Restaurants, etc.) and reflect lower valuations and leverage levels
The few deals that have occurred in 2008 and 2009 have shown that multiples have fallen towards pre-credit bubble levels
Average LTM EBITDA Multiple
10.0x 7.5x 5.0x 2.5x 0.0x
8.8x
8.2x 8.2x
7.0x 7.3x
6.8x 6.5x 6.5x
6.3x
5.7x
2000 2001 2002 2003 2004 2005 2006 2007 2008 2009 YTD
(a) Represents total consideration including the assumption of liabilities and residual cash (enterprise value) when available.
DISCUSSION MATERIALS 4
|
Restaurants — Market Statistics
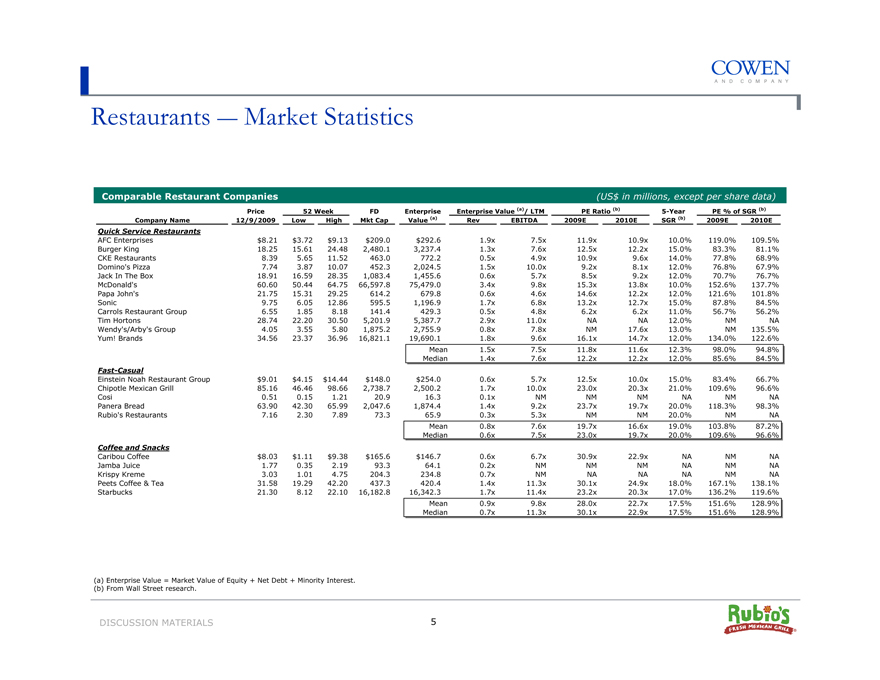
Comparable Restaurant Companies (US$ in millions, except per share data)
Company Name
Price 12/9/2009
52 Week Low High
FD Mkt Cap
Enterprise Value (a)
Enterprise Value (a)/ LTM Rev EBITDA
PE Ratio (b) 2009E 2010E
5-Year SGR (b)
PE % of SGR (b)
2009E 2010E
Quick Service Restaurants
AFC Enterprises $8.21 $3.72 $9.13 $209.0 $292.6 1.9x 7.5x 11.9x 10.9x 10.0% 119.0% 109.5%
Burger King 18.25 15.61 24.48 2,480.1 3,237.4 1.3x 7.6x 12.5x 12.2x 15.0% 83.3% 81.1%
CKE Restaurants 8.39 5.65 11.52 463.0 772.2 0.5x 4.9x 10.9x 9.6x 14.0% 77.8% 68.9%
Domino’s Pizza 7.74 3.87 10.07 452.3 2,024.5 1.5x 10.0x 9.2x 8.1x 12.0% 76.8% 67.9%
Jack In The Box 18.91 16.59 28.35 1,083.4 1,455.6 0.6x 5.7x 8.5x 9.2x 12.0% 70.7% 76.7%
McDonald’s 60.60 50.44 64.75 66,597.8 75,479.0 3.4x 9.8x 15.3x 13.8x 10.0% 152.6% 137.7%
Papa John’s 21.75 15.31 29.25 614.2 679.8 0.6x 4.6x 14.6x 12.2x 12.0% 121.6% 101.8%
Sonic 9.75 6.05 12.86 595.5 1,196.9 1.7x 6.8x 13.2x 12.7x 15.0% 87.8% 84.5%
Carrols Restaurant Group 6.55 1.85 8.18 141.4 429.3 0.5x 4.8x 6.2x 6.2x 11.0% 56.7% 56.2%
Tim Hortons 28.74 22.20 30.50 5,201.9 5,387.7 2.9x 11.0x NA NA 12.0% NM NA
Wendy’s/Arby’s Group 4.05 3.55 5.80 1,875.2 2,755.9 0.8x 7.8x NM 17.6x 13.0% NM 135.5%
Yum! Brands 34.56 23.37 36.96 16,821.1 19,690.1 1.8x 9.6x 16.1x 14.7x 12.0% 134.0% 122.6%
Mean 1.5x 7.5x 11.8x 11.6x 12.3% 98.0% 94.8%
Median 1.4x 7.6x 12.2x 12.2x 12.0% 85.6% 84.5%
Fast-Casual
Einstein Noah Restaurant Group $9.01 $4.15 $14.44 $148.0 $254.0 0.6x 5.7x 12.5x 10.0x 15.0% 83.4% 66.7%
Chipotle Mexican Grill 85.16 46.46 98.66 2,738.7 2,500.2 1.7x 10.0x 23.0x 20.3x 21.0% 109.6% 96.6%
Cosi 0.51 0.15 1.21 20.9 16.3 0.1x NM NM NM NA NM NA
Panera Bread 63.90 42.30 65.99 2,047.6 1,874.4 1.4x 9.2x 23.7x 19.7x 20.0% 118.3% 98.3%
Rubio’s Restaurants 7.16 2.30 7.89 73.3 65.9 0.3x 5.3x NM NM 20.0% NM NA
Mean 0.8x 7.6x 19.7x 16.6x 19.0% 103.8% 87.2%
Median 0.6x 7.5x 23.0x 19.7x 20.0% 109.6% 96.6%
Coffee and Snacks
Caribou Coffee $8.03 $1.11 $9.38 $165.6 $146.7 0.6x 6.7x 30.9x 22.9x NA NM NA
Jamba Juice 1.77 0.35 2.19 93.3 64.1 0.2x NM NM NM NA NM NA
Krispy Kreme 3.03 1.01 4.75 204.3 234.8 0.7x NM NA NA NA NM NA
Peets Coffee & Tea 31.58 19.29 42.20 437.3 420.4 1.4x 11.3x 30.1x 24.9x 18.0% 167.1% 138.1%
Starbucks 21.30 8.12 22.10 16,182.8 16,342.3 1.7x 11.4x 23.2x 20.3x 17.0% 136.2% 119.6%
Mean 0.9x 9.8x 28.0x 22.7x 17.5% 151.6% 128.9%
Median 0.7x 11.3x 30.1x 22.9x 17.5% 151.6% 128.9%
(a) Enterprise Value = Market Value of Equity + Net Debt + Minority Interest.
(b) From Wall Street research.
DISCUSSION MATERIALS 5
|
Restaurants — Market Statistics (Cont.)
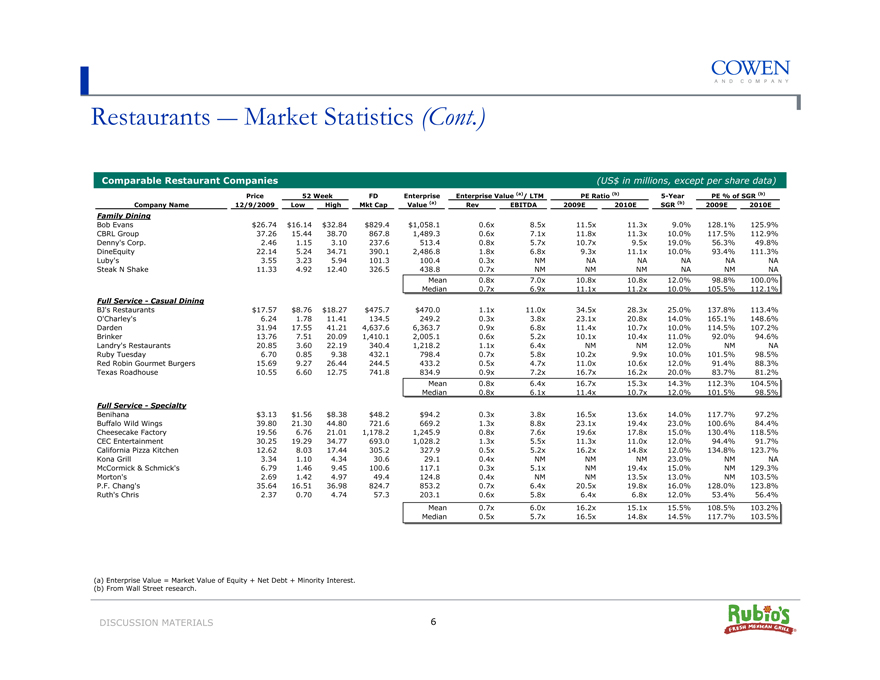
Comparable Restaurant Companies (US$ in millions, except per share data)
Company Name
Price 12/9/2009
52 Week Low High
FD Mkt Cap
Enterprise Value (a)
Enterprise Value (a)/ LTM Rev EBITDA
PE Ratio (b) 2009E 2010E
5-Year SGR (b)
PE % of SGR (b)
2009E 2010E
Family Dining
Bob Evans $26.74 $16.14 $32.84 $829.4 $1,058.1 0.6x 8.5x 11.5x 11.3x 9.0% 128.1% 125.9%
CBRL Group 37.26 15.44 38.70 867.8 1,489.3 0.6x 7.1x 11.8x 11.3x 10.0% 117.5% 112.9%
Denny’s Corp. 2.46 1.15 3.10 237.6 513.4 0.8x 5.7x 10.7x 9.5x 19.0% 56.3% 49.8%
DineEquity 22.14 5.24 34.71 390.1 2,486.8 1.8x 6.8x 9.3x 11.1x 10.0% 93.4% 111.3%
Luby’s 3.55 3.23 5.94 101.3 100.4 0.3x NM NA NA NA NA NA
Steak N Shake 11.33 4.92 12.40 326.5 438.8 0.7x NM NM NM NA NM NA
Mean 0.8x 7.0x 10.8x 10.8x 12.0% 98.8% 100.0%
Median 0.7x 6.9x 11.1x 11.2x 10.0% 105.5% 112.1%
Full Service - Casual Dining
BJ’s Restaurants $17.57 $8.76 $18.27 $475.7 $470.0 1.1x 11.0x 34.5x 28.3x 25.0% 137.8% 113.4%
O’Charley’s 6.24 1.78 11.41 134.5 249.2 0.3x 3.8x 23.1x 20.8x 14.0% 165.1% 148.6%
Darden 31.94 17.55 41.21 4,637.6 6,363.7 0.9x 6.8x 11.4x 10.7x 10.0% 114.5% 107.2%
Brinker 13.76 7.51 20.09 1,410.1 2,005.1 0.6x 5.2x 10.1x 10.4x 11.0% 92.0% 94.6%
Landry’s Restaurants 20.85 3.60 22.19 340.4 1,218.2 1.1x 6.4x NM NM 12.0% NM NA
Ruby Tuesday 6.70 0.85 9.38 432.1 798.4 0.7x 5.8x 10.2x 9.9x 10.0% 101.5% 98.5%
Red Robin Gourmet Burgers 15.69 9.27 26.44 244.5 433.2 0.5x 4.7x 11.0x 10.6x 12.0% 91.4% 88.3%
Texas Roadhouse 10.55 6.60 12.75 741.8 834.9 0.9x 7.2x 16.7x 16.2x 20.0% 83.7% 81.2%
Mean 0.8x 6.4x 16.7x 15.3x 14.3% 112.3% 104.5%
Median 0.8x 6.1x 11.4x 10.7x 12.0% 101.5% 98.5%
Full Service - Specialty
Benihana $3.13 $1.56 $8.38 $48.2 $94.2 0.3x 3.8x 16.5x 13.6x 14.0% 117.7% 97.2%
Buffalo Wild Wings 39.80 21.30 44.80 721.6 669.2 1.3x 8.8x 23.1x 19.4x 23.0% 100.6% 84.4%
Cheesecake Factory 19.56 6.76 21.01 1,178.2 1,245.9 0.8x 7.6x 19.6x 17.8x 15.0% 130.4% 118.5%
CEC Entertainment 30.25 19.29 34.77 693.0 1,028.2 1.3x 5.5x 11.3x 11.0x 12.0% 94.4% 91.7%
California Pizza Kitchen 12.62 8.03 17.44 305.2 327.9 0.5x 5.2x 16.2x 14.8x 12.0% 134.8% 123.7%
Kona Grill 3.34 1.10 4.34 30.6 29.1 0.4x NM NM NM 23.0% NM NA
McCormick & Schmick’s 6.79 1.46 9.45 100.6 117.1 0.3x 5.1x NM 19.4x 15.0% NM 129.3%
Morton’s 2.69 1.42 4.97 49.4 124.8 0.4x NM NM 13.5x 13.0% NM 103.5%
P.F. Chang’s 35.64 16.51 36.98 824.7 853.2 0.7x 6.4x 20.5x 19.8x 16.0% 128.0% 123.8%
Ruth’s Chris 2.37 0.70 4.74 57.3 203.1 0.6x 5.8x 6.4x 6.8x 12.0% 53.4% 56.4%
Mean 0.7x 6.0x 16.2x 15.1x 15.5% 108.5% 103.2%
Median 0.5x 5.7x 16.5x 14.8x 14.5% 117.7% 103.5%
(a) |
| Enterprise Value = Market Value of Equity + Net Debt + Minority Interest. |
(b) |
| From Wall Street research. |
DISCUSSION MATERIALS 6
|

Restaurants — Market Statistics (Cont.)
Comparable Restaurant Companies (US$ in millions, except per share data)
Company Name
Price 12/9/2009
52 Week Low High
FD Mkt Cap
Enterprise Value (a)
Enterprise Value (a)/ LTM Rev EBITDA
PE Ratio (b) 2009E 2010E
5-Year SGR (b)
PE % of SGR (b)
2009E 2010E
Micro-Cap
Ark Restaurants $14.25 $8.50 $19.00 $49.7 $51.9 0.4x 6.8x 16.0x NA NA NM 0.0%
Benihana 3.13 1.56 8.38 48.2 94.2 0.3x 3.8x 16.5x 13.6x 14.0% 117.7% 97.2%
Caribou Coffee 8.03 1.11 9.38 165.6 146.7 0.6x 6.7x 30.9x 22.9x NA NM NA
Cosi 0.51 0.15 1.21 20.9 16.3 0.1x NM NM NM NA NM NA
Famous Dave’s 6.03 2.00 7.25 55.8 68.5 0.5x 4.7x 9.1x 8.5x 15.0% 60.9% 56.6%
J. Alexander’s 3.72 1.90 5.99 22.1 42.6 0.3x NM NA NA NA NM 0.0%
Jamba Juice 1.77 0.35 2.19 93.3 64.1 0.2x NM NM NM NA NM NA
Kona Grill 3.34 1.10 4.34 30.6 29.1 0.4x NM NM NM 23.0% NM NA
McCormick & Schmick’s 6.79 1.46 9.45 100.6 117.1 0.3x 5.1x NM 19.4x 15.0% NM 129.3%
Mexican Restaurants Inc 2.34 1.48 4.54 7.7 12.7 0.2x 3.0x NA NA NA NM 0.0%
Morton’s 2.69 1.42 4.97 49.4 124.8 0.4x NM NM 13.5x 13.0% NM 103.5%
Pizza Inn 1.68 0.98 2.25 13.5 14.0 0.3x 5.4x NA NA NA NM 0.0%
Ruth’s Chris 2.37 0.70 4.74 57.3 203.1 0.6x 5.8x 6.4x 6.8x 12.0% 53.4% 56.4%
Mean 0.4x 5.2x 15.8x 14.1x 15.3% 77.3% 49.2%
Median 0.3x 5.2x 16.0x 13.5x 14.5% 60.9% 56.4%
(a) Enterprise Value = Market Value of Equity + Net Debt + Minority Interest.
(b) From Wall Street research.
DISCUSSION MATERIALS 7