Exhibit (c)(5)
|
CONFIDENTIAL
Discussion Materials – March 29, 2010
|
CONFIDENTIAL
Disclaimer
This presentation and the information contained herein is confidential and has been prepared exclusively for the benefit and internal use of the Special Committee of the Board of Directors of Rubio’s Restaurants, Inc. (the “Company”), in order to assist the Special Committee in evaluating, on a preliminary basis, a possible transaction or transactions and does not convey any right of publication or disclosure, in whole or in part, to any other party without the prior written consent of Cowen. This presentation is for discussion purposes only and is incomplete without reference to, and should be viewed solely in conjunction with, the oral briefing provided by Cowen to the Special Committee.
The information in this presentation is based upon management forecasts supplied to Cowen and reflects prevailing conditions and Cowen’s views as of this date, all of which are accordingly subject to change. Cowen’s estimates constitute Cowen’s judgment and should be regarded as indicative, preliminary and for illustrative purposes only. In preparing this presentation, Cowen has with your consent, assumed and relied, without independent investigation, upon the accuracy and completeness of all financial and other information provided to us by the management of the Company or which is publicly available or was otherwise reviewed by Cowen. Cowen’s analysis is not and does not purport to be appraisals of the assets, stock or business of the Company or any other entity. Cowen does not make representations as to the actual value which may be received in connection with a transaction or as to the price at which the Company’s securities may trade at any time. Cowen does not address any legal, tax or accounting effects of consummating a transaction or any other alternative. The information in this presentation does not take into account the effects of a possible transaction or transactions involving an actual or potential change of control, which may have significant valuation and other effects. This presentation does not represent a fairness opinion, recommendation, valuation or opinion of any kind. Cowen does not have any obligation to update, revise or reaffirm this presentation.
The information contained herein, as well as any other advice, services or other information provided to you by Cowen, is being provided pursuant to and subject to the terms of our engagement letter with the Board and may not be used or relied upon in any manner, nor are any duties or obligations created with respect thereto. This presentation does not constitute a commitment by Cowen or any of its affiliates to underwrite, subscribe for or place any securities to extend or arrange credit or to provide any other service.
Cowen policy mandates that no Cowen employee may directly or indirectly offer a company favorable research or threaten to change research as consideration or inducement for the receipt of business or compensation.
DISCUSSION MATERIALS
|
CONFIDENTIAL
Table of Contents
Page
I. Process Update & Bid Summary 2
II. Restaurant Market Update 9
III. Rubio’s Overview 17
IV. Valuation Overview 31
V. Discussions and Q&A 60
DISCUSSION MATERIALS 1
|
CONFIDENTIAL
I. Process Update & Bid Summary
|
CONFIDENTIAL
Summary
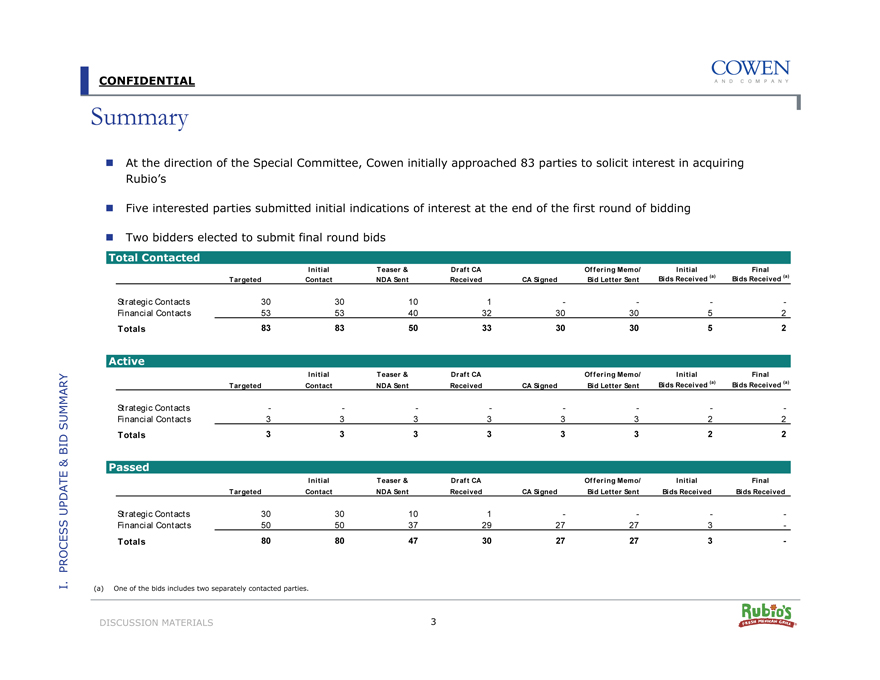
At the direction of the Special Committee, Cowen initially approached 83 parties to solicit interest in acquiring Rubio’s
Five interested parties submitted initial indications of interest at the end of the first round of bidding
Two bidders elected to submit final round bids
Total Contacted
Initial Teaser & Draft CA Offering Memo/ Initial Final
Targeted Contact NDA Sent Received CA Signed Bid Letter Sent Bids Received (a) Bids Received (a)
Strategic Contacts 30 30 10 1- - - -
Financial Contacts 53 53 40 32 30 30 5 2
Totals 83 83 50 33 30 30 5 2
Active
Initial Teaser & Draft CA Offering Memo/ Initial Final
Targeted Contact NDA Sent Received CA Signed Bid Letter Sent Bids Received (a) Bids Received (a)
Strategic Contacts - - - - - - - -
Financial Contacts 3 3 3 3 3 3 2 2
Totals 3 3 3 3 3 3 2 2
Passed
Initial Teaser & Draft CA Offering Memo/ Initial Final
Targeted Contact NDA Sent Received CA Signed Bid Letter Sent Bids Received Bids Received
Strategic Contacts 30 30 10 1 - - - -
Financial Contacts 50 50 37 29 27 27 3 -
Totals 80 80 47 30 27 27 3 -
I. PROCESS UPDATE & BID SUMMARY
(a) One of the bids includes two separately contacted parties.
DISCUSSION MATERIALS 3
|
CONFIDENTIAL
Commentary on Exited Parties
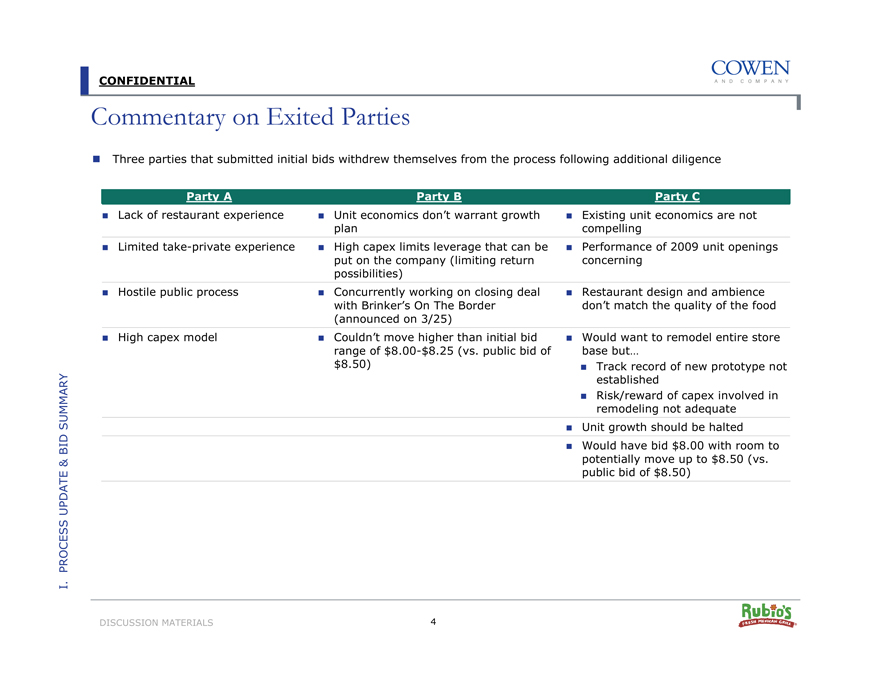
Three parties that submitted initial bids withdrew themselves from the process following additional diligence
Party A Party B Party C
Lack of restaurant experience Unit economics don’t warrant growth Existing unit economics are not
plan compelling
Limited take-private experience High capex limits leverage that can be Performance of 2009 unit openings
put on the company (limiting return concerning
possibilities)
Hostile public process Concurrently working on closing deal Restaurant design and ambience
with Brinker’s On The Border don’t match the quality of the food
(announced on 3/25)
High capex model Couldn’t move higher than initial bid Would want to remodel entire store
range of $8.00-$8.25 (vs. public bid of base but…
$8.50) ? Track record of new prototype not
established
Risk/reward of capex involved in
remodeling not adequate
Unit growth should be halted
Would have bid $8.00 with room to
potentially move up to $8.50 (vs.
public bid of $8.50)
I. PROCESS UPDATE BID& SUMMARY
DISCUSSION MATERIALS 4
|
CONFIDENTIAL
Overview of Bids
Overview of Final Bids
Meruelo/
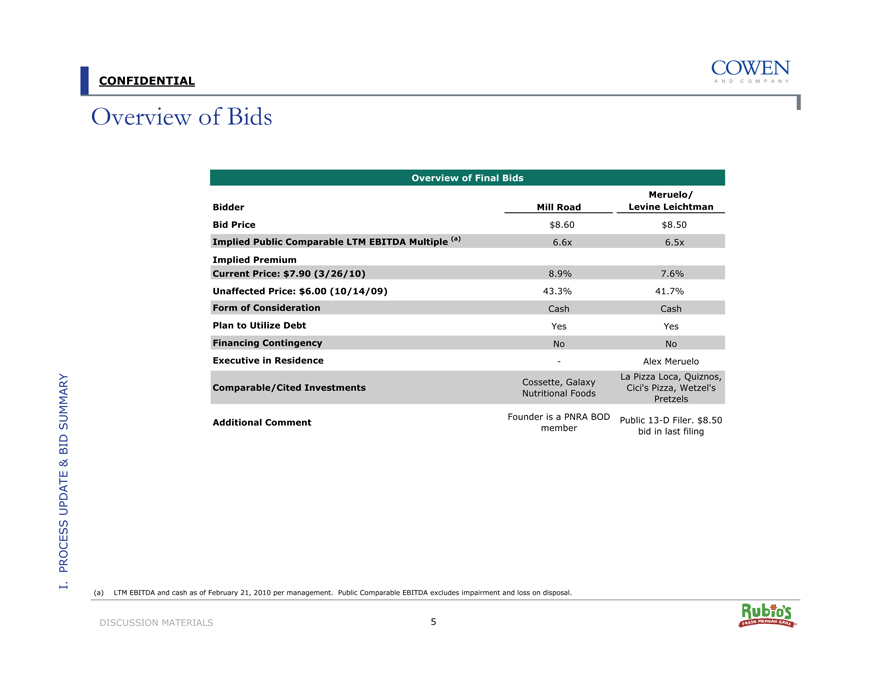
Bidder Mill Road Levine Leichtman
Bid Price $8.60 $8.50
Implied Public Comparable LTM EBITDA Multiple (a) 6.6x 6.5x
Implied Premium
Current Price: $7.90 (3/26/10) 8.9% 7.6%
Unaffected Price: $6.00 (10/14/09) 43.3% 41.7%
Form of Consideration Cash Cash
Plan to Utilize Debt Yes Yes
Financing Contingency No No
Executive in Residence—Alex Meruelo
Cossette, Galaxy La Pizza Loca, Quiznos,
Comparable/Cited Investments Cici’s Pizza, Wetzel’s
Nutritional Foods Pretzels
Additional Comment Founder is a PNRA BOD Public 13-D Filer. $8.50
member bid in last filing
I. PROCESS UPDATE BID& SUMMARY
(a) LTM EBITDA and cash as of February 21, 2010 per management. Public Comparable EBITDA excludes impairment and loss on disposal.
DISCUSSION MATERIALS 5
|
CONFIDENTIAL
Summary of Bid Terms
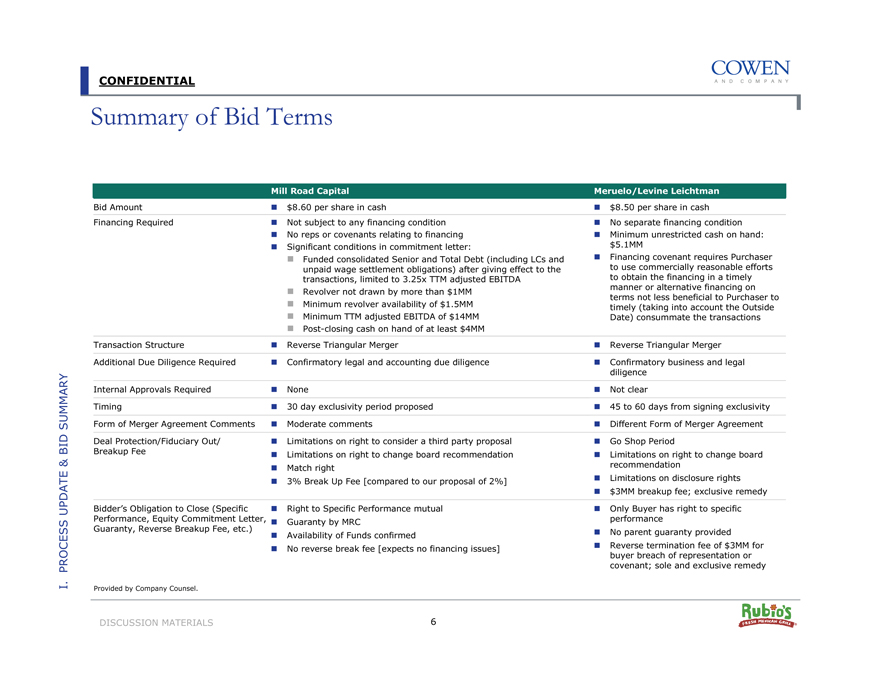
Mill Road Capital Meruelo/Levine Leichtman
Bid Amount
$8.60 per share in cash
$8.50 per share in cash
Financing Required
Not subject to any financing condition
No separate financing condition
No reps or covenants relating to financing
Minimum unrestricted cash on hand:
Significant conditions in commitment letter:
$5.1MM
Funded consolidated Senior and Total Debt (including LCs and
Financing covenant requires Purchaser
unpaid wage settlement obligations) after giving effect to the
to use commercially reasonable efforts
transactions, limited to 3.25x TTM adjusted EBITDA
to obtain the financing in a timely
Revolver not drawn by more than $1MM
manner or alternative financing on
terms not less beneficial to Purchaser to
Minimum revolver availability of $1.5MM
timely (taking into account the Outside
Minimum TTM adjusted EBITDA of $14MM
Date) consummate the transactions
Post-closing cash on hand of at least $4MM
Transaction Structure
Reverse Triangular Merger
Reverse Triangular Merger
Additional Due Diligence Required
Confirmatory legal and accounting due diligence
Confirmatory business and legal
diligence
Internal Approvals Required
None
Not clear
Timing
30 day exclusivity period proposed
45 to 60 days from signing exclusivity
Form of Merger Agreement Comments
Moderate comments
Different Form of Merger Agreement
Deal Protection/Fiduciary Out/
Limitations on right to consider a third party proposal
Go Shop Period
Breakup Fee
Limitations on right to change board recommendation
Limitations on right to change board
Match right
recommendation
3% Break Up Fee [compared to our proposal of 2%]
Limitations on disclosure rights
$3MM breakup fee; exclusive remedy
Bidder’s Obligation to Close (Specific
Right to Specific Performance mutual
Only Buyer has right to specific
Performance, Equity Commitment Letter,
Guaranty by MRC
performance
Guaranty, Reverse Breakup Fee, etc.)
Availability of Funds confirmed
No parent guaranty provided
No reverse break fee [expects no financing issues]
Reverse termination fee of $3MM for
buyer breach of representation or
covenant; sole and exclusive remedy
I. PROCESS UPDATE BID& SUMMARY
DISCUSSION MATERIALS 6
|
CONFIDENTIAL
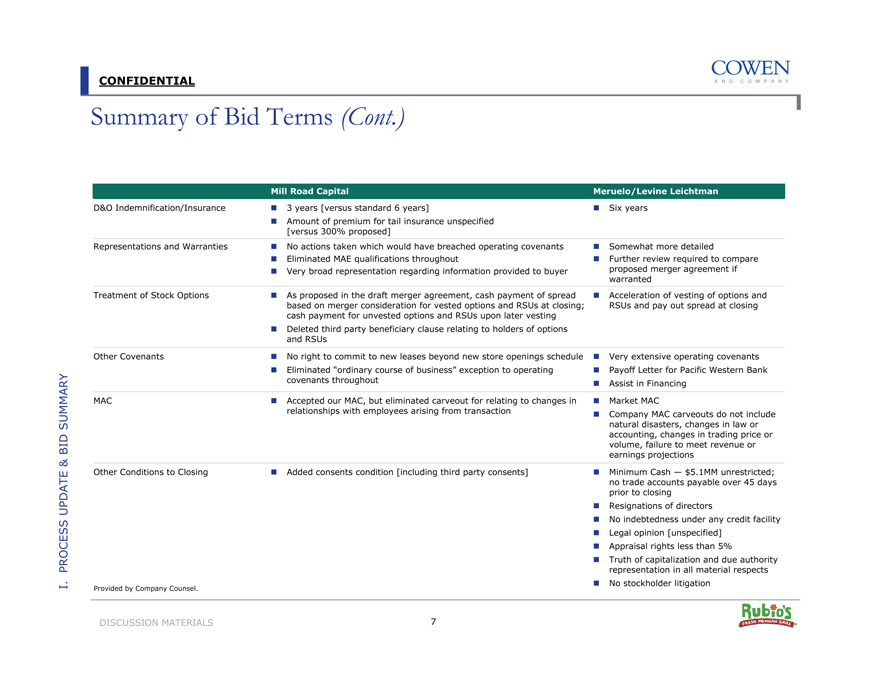
Summary of Bid Terms (Cont.)
Mill Road Capital Meruelo/Levine Leichtman
D&O Indemnification/Insurance
3 years [versus standard 6 years]
Six years
Amount of premium for tail insurance unspecified
[versus 300% proposed]
Representations and Warranties
No actions taken which would have breached operating covenants
Somewhat more detailed
Eliminated MAE qualifications throughout
Further review required to compare
Very broad representation regarding information provided to buyer
proposed merger agreement if
warranted
Treatment of Stock Options
As proposed in the draft merger agreement, cash payment of spread
Acceleration of vesting of options and
based on merger consideration for vested options and RSUs at closing;
RSUs and pay out spread at closing
cash payment for unvested options and RSUs upon later vesting
Deleted third party beneficiary clause relating to holders of options
and RSUs
Other Covenants
No right to commit to new leases beyond new store openings schedule
Very extensive operating covenants
Eliminated “ordinary course of business” exception to operating
Payoff Letter for Pacific Western Bank
covenants throughout
Assist in Financing
MAC
Accepted our MAC, but eliminated carveout for relating to changes in
Market MAC
relationships with employees arising from transaction
Company MAC carveouts do not include
natural disasters, changes in law or
accounting, changes in trading price or
volume, failure to meet revenue or
earnings projections
Other Conditions to Closing
Added consents condition [including third party consents]
Minimum Cash — $5.1MM unrestricted;
no trade accounts payable over 45 days
prior to closing
Resignations of directors
No indebtedness under any credit facility
Legal opinion [unspecified]
Appraisal rights less than 5%
Truth of capitalization and due authority
representation in all material respects
Provided by Company Counsel.
No stockholder litigation
I. PROCESS UPDATE BID& SUMMARY
DISCUSSION MATERIALS 7
|
CONFIDENTIAL
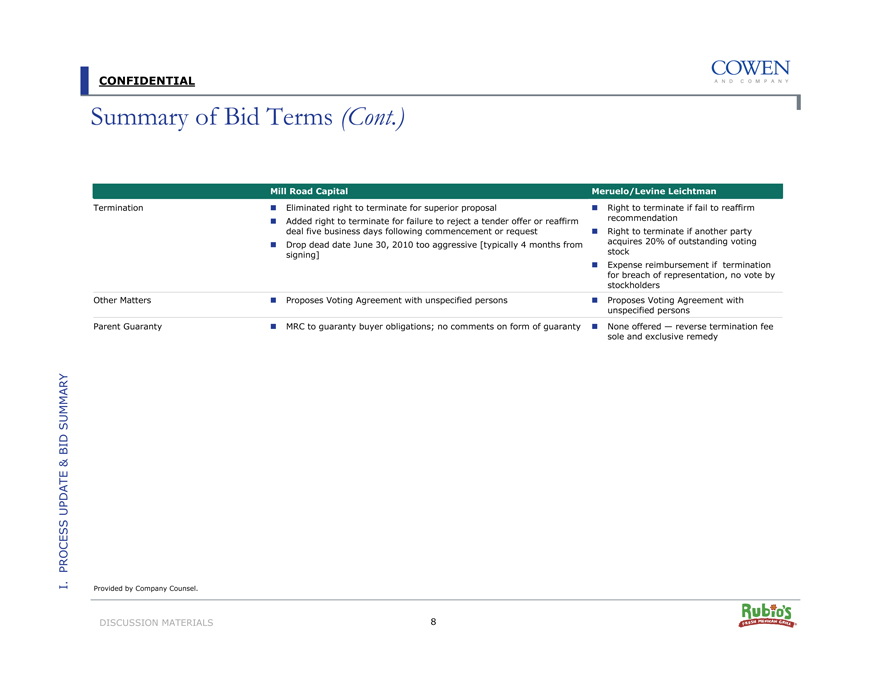
Summary of Bid Terms (Cont.)
Mill Road Capital Meruelo/Levine Leichtman
Termination
Eliminated right to terminate for superior proposal
Right to terminate if fail to reaffirm
Added right to terminate for failure to reject a tender offer or reaffirm
recommendation
deal five business days following commencement or request
Right to terminate if another party
Drop dead date June 30, 2010 too aggressive [typically 4 months from
acquires 20% of outstanding voting
signing]
stock
Expense reimbursement if termination
for breach of representation, no vote by
stockholders
Other Matters
Proposes Voting Agreement with unspecified persons
Proposes Voting Agreement with
unspecified persons
Parent Guaranty
MRC to guaranty buyer obligations; no comments on form of guaranty
None offered — reverse termination fee
sole and exclusive remedy
I. PROCESS UPDATE & BID SUMMARY
Provided by Company Counsel.
DISCUSSION MATERIALS 8
|

CONFIDENTIAL
II. Restaurant Market Update
|
CONFIDENTIAL
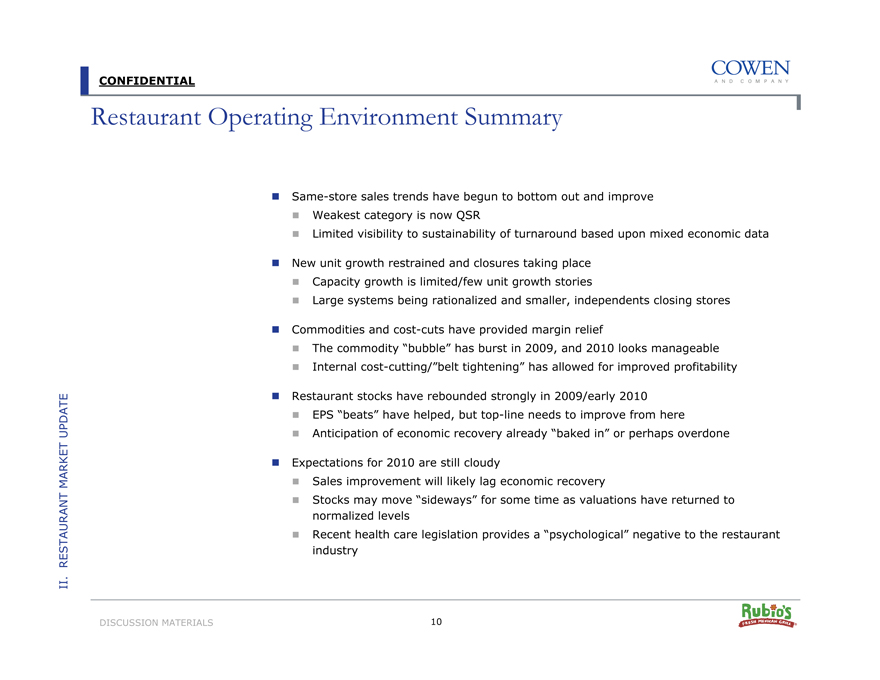
Restaurant Operating Environment Summary
Same-store sales trends have begun to bottom out and improve
Weakest category is now QSR
Limited visibility to sustainability of turnaround based upon mixed economic data
New unit growth restrained and closures taking place
Capacity growth is limited/few unit growth stories
Large systems being rationalized and smaller, independents closing stores
Commodities and cost-cuts have provided margin relief
The commodity “bubble” has burst in 2009, and 2010 looks manageable
Internal cost-cutting/“belt tightening” has allowed for improved profitability
Restaurant stocks have rebounded strongly in 2009/early 2010
EPS “beats” have helped, but top-line needs to improve from here
Anticipation of economic recovery already “baked in” or perhaps overdone
Expectations for 2010 are still cloudy
Sales improvement will likely lag economic recovery
Stocks may move “sideways” for some time as valuations have returned to normalized levels
Recent health care legislation provides a “psychological” negative to the restaurant industry
II. RESTAURANT MARKET UPDATE
DISCUSSION MATERIALS 10
|
CONFIDENTIAL
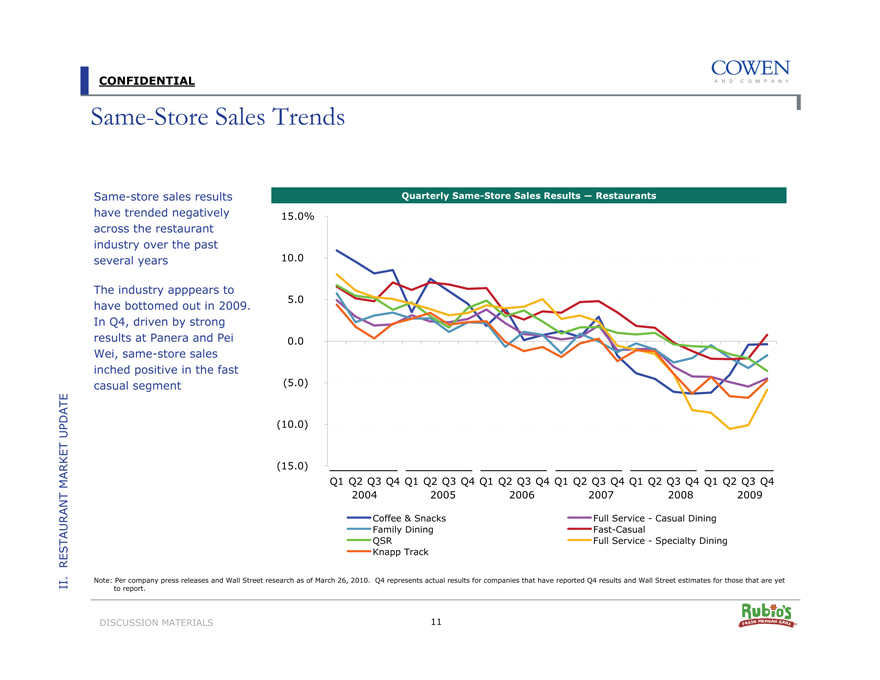
Same-Store Sales Trends
Same-store sales results have trended negatively across the restaurant industry over the past several years
The industry apppears to have bottomed out in 2009. In Q4, driven by strong results at Panera and Pei Wei, same-store sales inched positive in the fast casual segment
Quarterly Same-Store Sales Results — Restaurants
15.0% 10.0 5.0 0.0 (5.0) (10.0) (15.0)
Q1 Q2 Q3 Q4 Q1 Q2 Q3 Q4 Q1 Q2 Q3 Q4 Q1 Q2 Q3 Q4 Q1 Q2 Q3 Q4 Q1 Q2 Q3 Q4 2004 2005 2006 2007 2008 2009
Coffee & Snacks Full Service—Casual Dining Family Dining Fast-Casual QSR Full Service—Specialty Dining Knapp Track
II. RESTAURANT MARKET UPDATE
Note: Per company press releases and Wall Street research as of March 26, 2010. Q4 represents actual results for companies that have reported Q4 results and Wall Street estimates for those that are yet to report.
DISCUSSION MATERIALS 11
|
CONFIDENTIAL
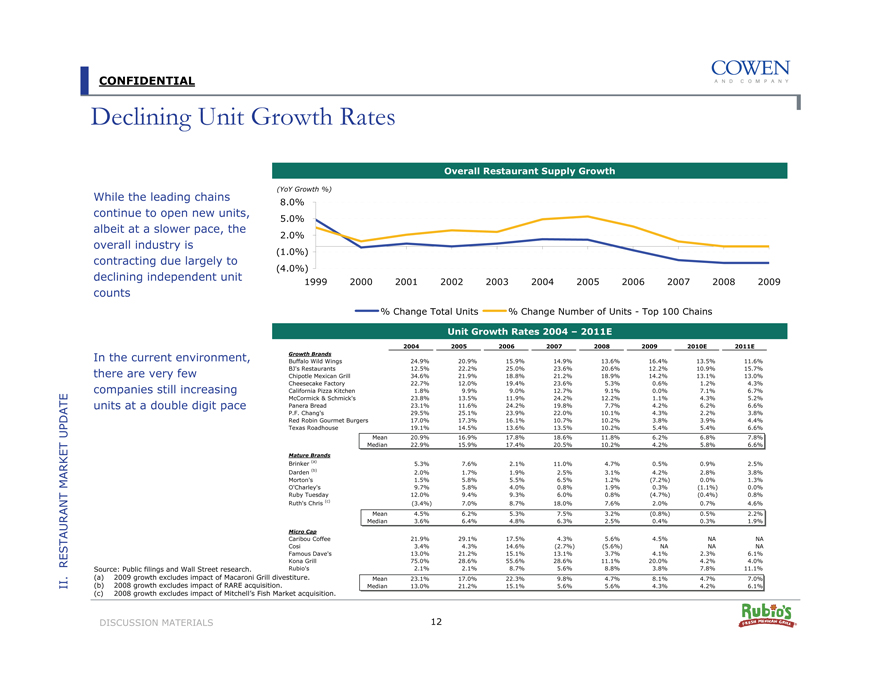
Declining Unit Growth Rates
While the leading chains continue to open new units, albeit at a slower pace, the overall industry is contracting due largely to declining independent unit counts
Overall Restaurant Supply Growth
(YoY Growth %)
8.0% 5.0% 2.0% (1.0%) (4.0%)
1999 2000 2001 2002 2003 2004 2005 2006 2007 2008 2009
% Change Total Units % Change Number of Units—Top 100 Chains
In the current environment, there are very few companies still increasing units at a double digit pace
II. RESTAURANT MARKET UPDATE
Unit Growth Rates 2004 – 2011E
2004
2005
2006
2007
2008
2009
2010E
2011E
Growth Brands
Buffalo Wild Wings
24.9%
20.9%
15.9%
14.9%
13.6%
16.4%
13.5%
11.6%
BJ’s Restaurants
12.5%
22.2%
25.0%
23.6%
20.6%
12.2%
10.9%
15.7%
Chipotle Mexican Grill
34.6%
21.9%
18.8%
21.2%
18.9%
14.2%
13.1%
13.0%
Cheesecake Factory
22.7%
12.0%
19.4%
23.6%
5.3%
0.6%
1.2%
4.3%
California Pizza Kitchen
1.8%
9.9%
9.0%
12.7%
9.1%
0.0%
7.1%
6.7%
McCormick & Schmick’s
23.8%
13.5%
11.9%
24.2%
12.2%
1.1%
4.3%
5.2%
Panera Bread
23.1%
11.6%
24.2%
19.8%
7.7%
4.2%
6.2%
6.6%
P.F. Chang’s
29.5%
25.1%
23.9%
22.0%
10.1%
4.3%
2.2%
3.8%
Red Robin Gourmet Burgers
17.0%
17.3%
16.1%
10.7%
10.2%
3.8%
3.9%
4.4%
Texas Roadhouse
19.1%
14.5%
13.6%
13.5%
10.2%
5.4%
5.4%
6.6%
Mean
20.9%
16.9%
17.8%
18.6%
11.8%
6.2%
6.8%
7.8%
Median
22.9%
15.9%
17.4%
20.5%
10.2%
4.2%
5.8%
6.6%
Mature Brands
Brinker (a)
5.3%
7.6%
2.1%
11.0%
4.7%
0.5%
0.9%
2.5%
Darden (b)
2.0%
1.7%
1.9%
2.5%
3.1%
4.2%
2.8%
3.8%
Morton’s
1.5%
5.8%
5.5%
6.5%
1.2%
(7.2%)
0.0%
1.3%
O’Charley’s
9.7%
5.8%
4.0%
0.8%
1.9%
0.3%
(1.1%)
0.0%
Ruby Tuesday
12.0%
9.4%
9.3%
6.0%
0.8%
(4.7%)
(0.4%)
0.8%
Ruth’s Chris (c)
(3.4%)
7.0%
8.7%
18.0%
7.6%
2.0%
0.7%
4.6%
Mean
4.5%
6.2%
5.3%
7.5%
3.2%
(0.8%)
0.5%
2.2%
Median
3.6%
6.4%
4.8%
6.3%
2.5%
0.4%
0.3%
1.9%
Micro Cap
Caribou Coffee
Source: Public filings and Wall Street research.
(a) 2009 growth excludes impact of Macaroni Grill divestiture. (b) 2008 growth excludes impact of RARE acquisition. (c) 2008 growth excludes impact of Mitchell’s Fish Market acquisition.
DISCUSSION MATERIALS 12
|
CONFIDENTIAL
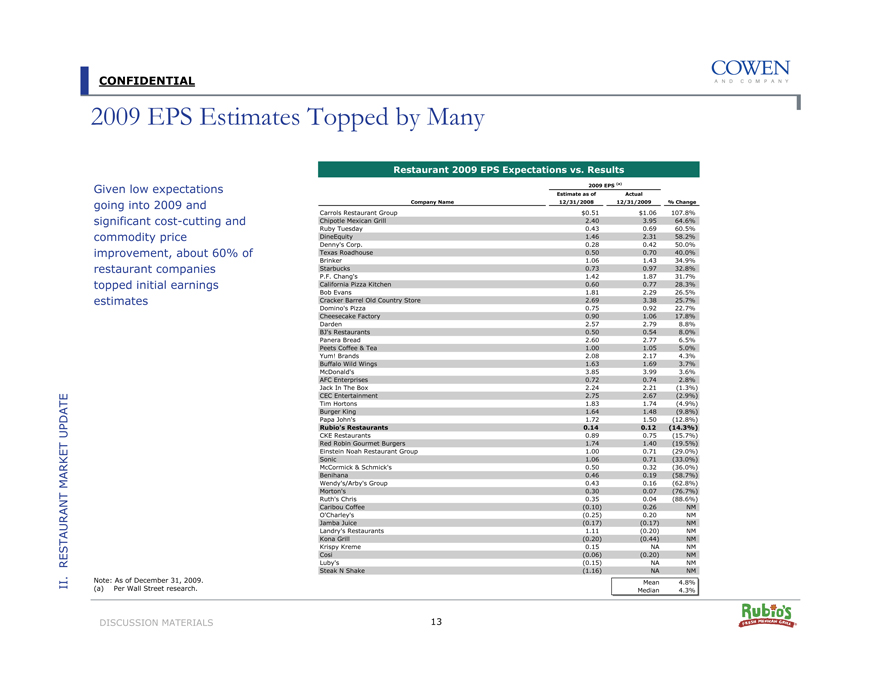
2009 EPS Estimates Topped by Many
Given low expectations going into 2009 and significant cost-cutting and commodity price improvement, about 60% of restaurant companies topped initial earnings estimates
Restaurant 2009 EPS Expectations vs. Results
2009 EPS (a)
Estimate as of
Actual
Company Name
12/31/2008
12/31/2009
% Change
Carrols Restaurant Group
$0.51
$1.06
107.8%
Chipotle Mexican Grill
2.40
3.95
64.6%
Ruby Tuesday
0.43
0.69
60.5%
DineEquity
1.46
2.31
58.2%
Denny’s Corp.
0.28
0.42
50.0%
Texas Roadhouse
0.50
0.70
40.0%
Brinker
1.06
1.43
34.9%
Starbucks
0.73
0.97
32.8%
P.F. Chang’s
1.42
1.87
31.7%
California Pizza Kitchen
0.60
0.77
28.3%
Bob Evans
1.81
2.29
26.5%
Cracker Barrel Old Country Store
2.69
3.38
25.7%
Domino’s Pizza
0.75
0.92
22.7%
Cheesecake Factory
0.90
1.06
17.8%
Darden
2.57
2.79
8.8%
BJ’s Restaurants
0.50
0.54
8.0%
Panera Bread
2.60
2.77
6.5%
Peets Coffee & Tea
1.00
1.05
5.0%
Yum! Brands
2.08
2.17
4.3%
Buffalo Wild Wings
1.63
1.69
3.7%
McDonald’s
3.85
3.99
3.6%
AFC Enterprises
0.72
0.74
2.8%
Jack In The Box
2.24
2.21
(1.3%)
CEC Entertainment
2.75
2.67
(2.9%)
Tim Hortons
1.83
1.74
(4.9%)
Burger King
1.64
1.48
(9.8%)
Papa John’s
1.72
1.50
(12.8%)
Rubio’s Restaurants
0.14
0.12
(14.3%)
CKE Restaurants
0.89
0.75
(15.7%)
Red Robin Gourmet Burgers
1.74
1.40
(19.5%)
Einstein Noah Restaurant Group
1.00
0.71
(29.0%)
Sonic
1.06
0.71
(33.0%)
McCormick & Schmick’s
0.50
0.32
(36.0%)
Benihana
0.46
0.19
(58.7%)
Wendy’s/Arby’s Group
0.43
0.16
(62.8%)
Morton’s
0.30
0.07
(76.7%)
Ruth’s Chris
0.35
0.04
(88.6%)
Caribou Coffee
(0.10)
0.26
NM
O’Charley’s
(0.25)
0.20
NM
Jamba Juice
(0.17)
(0.17)
NM
Landry’s Restaurants
1.11
(0.20)
NM
Kona Grill
(0.20)
(0.44)
NM
Krispy Kreme
0.15
NA
NM
Cosi
(0.06)
(0.20)
NM
Luby’s
(0.15)
NA
NM
Steak N Shake
(1.16)
NA
NM
Mean
4.8%
Median
4.3%
II. RESTAURANT MARKET UPDATE
Note: As of December 31, 2009. (a) Per Wall Street research.
DISCUSSION MATERIALS 13
|
CONFIDENTIAL
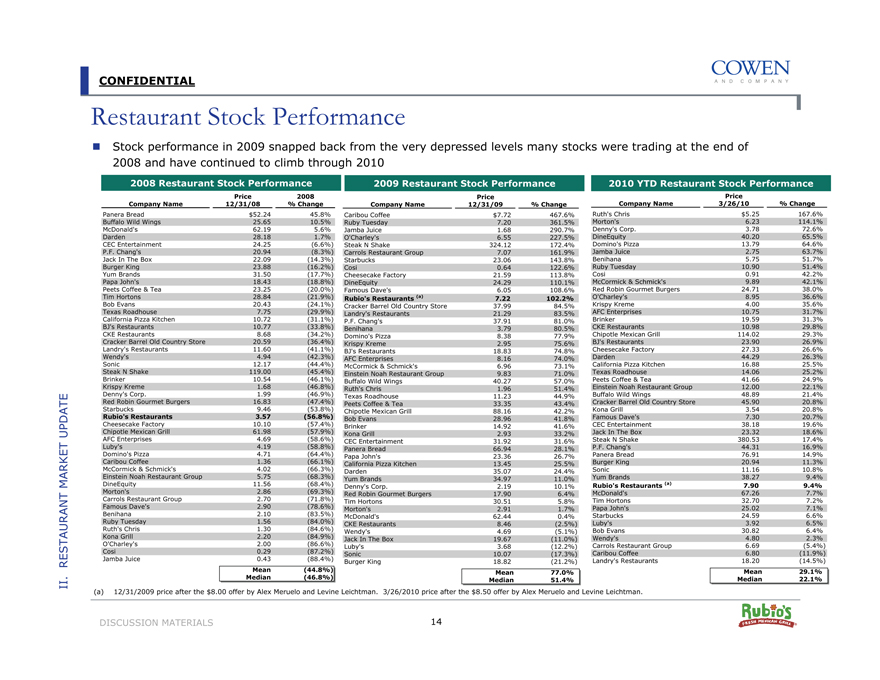
Restaurant Stock Performance
Stock performance in 2009 snapped back from the very depressed levels many stocks were trading at the end of 2008 and have continued to climb through 2010
2008 Restaurant Stock Performance
Price
2008
Company Name
12/31/08
% Change
Panera Bread
$52.24
45.8%
Buffalo Wild Wings
25.65
10.5%
McDonald’s
62.19
5.6%
Darden
28.18
1.7%
CEC Entertainment
24.25
(6.6%)
P.F. Chang’s
20.94
(8.3%)
Jack In The Box
22.09
(14.3%)
Burger King
23.88
(16.2%)
Yum Brands
31.50
(17.7%)
Papa John’s
18.43
(18.8%)
Peets Coffee & Tea
23.25
(20.0%)
Tim Hortons
28.84
(21.9%)
Bob Evans
20.43
(24.1%)
Texas Roadhouse
7.75
(29.9%)
California Pizza Kitchen
10.72
(31.1%)
BJ’s Restaurants
10.77
(33.8%)
CKE Restaurants
8.68
(34.2%)
Cracker Barrel Old Country Store
20.59
(36.4%)
Landry’s Restaurants
11.60
(41.1%)
Wendy’s
4.94
(42.3%)
Sonic
12.17
(44.4%)
Steak N Shake
119.00
(45.4%)
Brinker
10.54
(46.1%)
Krispy Kreme
1.68
(46.8%)
Denny’s Corp.
1.99
(46.9%)
Red Robin Gourmet Burgers
16.83
(47.4%)
Starbucks
9.46
(53.8%)
Rubio’s Restaurants
3.57
(56.8%)
Cheesecake Factory
10.10
(57.4%)
Chipotle Mexican Grill
61.98
(57.9%)
AFC Enterprises
4.69
(58.6%)
Luby’s
4.19
(58.8%)
Domino’s Pizza
4.71
(64.4%)
Caribou Coffee
1.36
(66.1%)
McCormick & Schmick’s
4.02
(66.3%)
Einstein Noah Restaurant Group
5.75
(68.3%)
DineEquity
11.56
(68.4%)
Morton’s
2.86
(69.3%)
Carrols Restaurant Group
2.70
(71.8%)
Famous Dave’s
2.90
(78.6%)
Benihana
2.10
(83.5%)
Ruby Tuesday
1.56
(84.0%)
Ruth’s Chris
1.30
(84.6%)
Kona Grill
2.20
(84.9%)
O’Charley’s
2.00
(86.6%)
Cosi
0.29
(87.2%)
Jamba Juice
0.43
(88.4%)
Mean
(44.8%)
Median
(46.8%)
2009 Restaurant Stock Performance
Price
Company Name
12/31/09
% Change
Caribou Coffee
$7.72
467.6%
Ruby Tuesday
7.20
361.5%
Jamba Juice
1.68
290.7%
O’Charley’s
6.55
227.5%
Steak N Shake
324.12
172.4%
Carrols Restaurant Group
7.07
161.9%
Starbucks
23.06
143.8%
Cosi
0.64
122.6%
Cheesecake Factory
21.59
113.8%
DineEquity
24.29
110.1%
Famous Dave’s
6.05
108.6%
Rubio’s Restaurants (a)
7.22
102.2%
Cracker Barrel Old Country Store
37.99
84.5%
Landry’s Restaurants
21.29
83.5%
P.F. Chang’s
37.91
81.0%
Benihana
3.79
80.5%
Domino’s Pizza
8.38
77.9%
Krispy Kreme
2.95
75.6%
BJ’s Restaurants
18.83
74.8%
AFC Enterprises
8.16
74.0%
McCormick & Schmick’s
6.96
73.1%
Einstein Noah Restaurant Group
9.83
71.0%
Buffalo Wild Wings
40.27
57.0%
Ruth’s Chris
1.96
51.4%
Texas Roadhouse
11.23
44.9%
Peets Coffee & Tea
33.35
43.4%
Chipotle Mexican Grill
88.16
42.2%
Bob Evans
28.96
41.8%
Brinker
14.92
41.6%
Kona Grill
2.93
33.2%
CEC Entertainment
31.92
31.6%
Panera Bread
66.94
28.1%
Papa John’s
23.36
26.7%
California Pizza Kitchen
13.45
25.5%
Darden
35.07
24.4%
Yum Brands
34.97
11.0%
Denny’s Corp.
2.19
10.1%
Red Robin Gourmet Burgers
17.90
6.4%
Tim Hortons
30.51
5.8%
Morton’s
2.91
1.7%
McDonald’s
62.44
0.4%
CKE Restaurants
8.46
(2.5%)
Wendy’s
4.69
(5.1%)
Jack In The Box
19.67
(11.0%)
Luby’s
3.68
(12.2%)
Sonic
10.07
(17.3%)
Burger King
18.82
(21.2%)
Mean
77.0%
Median
51.4%
2010 YTD Restaurant Stock Performance
Price
Company Name
3/26/10
% Change
Ruth’s Chris
$5.25
167.6%
Morton’s
6.23
114.1%
Denny’s Corp.
3.78
72.6%
DineEquity
40.20
65.5%
Domino’s Pizza
13.79
64.6%
Jamba Juice
2.75
63.7%
Benihana
5.75
51.7%
Ruby Tuesday
10.90
51.4%
Cosi
0.91
42.2%
McCormick & Schmick’s
9.89
42.1%
Red Robin Gourmet Burgers
24.71
38.0%
O’Charley’s
8.95
36.6%
Krispy Kreme
4.00
35.6%
AFC Enterprises
10.75
31.7%
Brinker
19.59
31.3%
CKE Restaurants
10.98
29.8%
Chipotle Mexican Grill
114.02
29.3%
BJ’s Restaurants
23.90
26.9%
Cheesecake Factory
27.33
26.6%
Darden
44.29
26.3%
California Pizza Kitchen
16.88
25.5%
Texas Roadhouse
14.06
25.2%
Peets Coffee & Tea
41.66
24.9%
Einstein Noah Restaurant Group
12.00
22.1%
Buffalo Wild Wings
48.89
21.4%
Cracker Barrel Old Country Store
45.90
20.8%
Kona Grill
3.54
20.8%
Famous Dave’s
7.30
20.7%
CEC Entertainment
38.18
19.6%
Jack In The Box
23.32
18.6%
Steak N Shake
380.53
17.4%
P.F. Chang’s
44.31
16.9%
Panera Bread
76.91
14.9%
Burger King
20.94
11.3%
Sonic
11.16
10.8%
Yum Brands
38.27
9.4%
Rubio’s Restaurants (a)
7.90
9.4%
McDonald’s
67.26
7.7%
Tim Hortons
32.70
7.2%
Papa John’s
25.02
7.1%
Starbucks
24.59
6.6%
Luby’s
3.92
6.5%
Bob Evans
30.82
6.4%
Wendy’s
4.80
2.3%
Carrols Restaurant Group
6.69
(5.4%)
Caribou Coffee
6.80
(11.9%)
Landry’s Restaurants
18.20
(14.5%)
Mean
29.1%
Median
22.1%
(a) 12/31/2009 price after the $8.00 offer by Alex Meruelo and Levine Leichtman. 3/26/2010 price after the $8.50 offer by Alex Meruelo and Levine Leichtman.
II. RESTAURANT MARKET UPDATE
DISCUSSION MATERIALS 14
|
CONFIDENTIAL
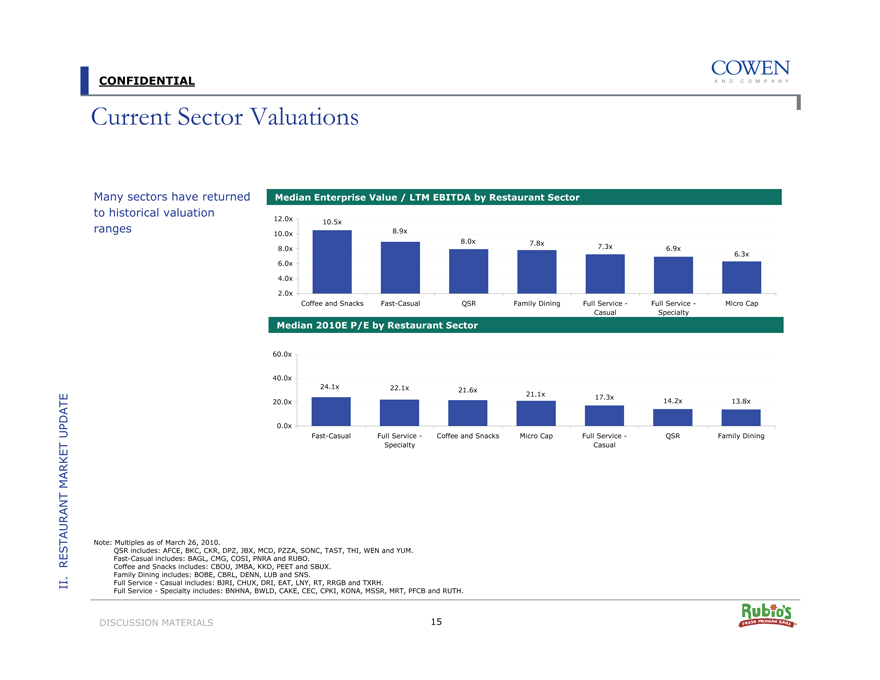
Current Sector Valuations
Many sectors have returned to historical valuation ranges
Median Enterprise Value / LTM EBITDA by Restaurant Sector
12.0x 10.5x
10.0x 8.9x
8.0x 7.8x
8.0x 7.3x 6.9x
6.3x
6.0x
4.0x
2.0x
Coffee and Snacks Fast-Casual QSR Family Dining Full Service—Full Service—Micro Cap Casual Specialty
Casual Specialty
Median 2010E P/E by Restaurant Sector
60.0x
40.0x
24.1x 22.1x 21.6x
21.1x 17.3x 14.2x 13.8x
20.0x
0.0x
Fast-Casual Full Service—Coffee and Snacks Micro Cap Full Service—QSR Family Dining Specialty Casual
II. RESTAURANT MARKET UPDATE
Note: Multiples as of March 26, 2010.
QSR includes: AFCE, BKC, CKR, DPZ, JBX, MCD, PZZA, SONC, TAST, THI, WEN and YUM. Fast-Casual includes: BAGL, CMG, COSI, PNRA and RUBO.
Coffee and Snacks includes: CBOU, JMBA, KKD, PEET and SBUX. Family Dining includes: BOBE, CBRL, DENN, LUB and SNS.
Full Service—Casual includes: BJRI, CHUX, DRI, EAT, LNY, RT, RRGB and TXRH.
Full Service—Specialty includes: BNHNA, BWLD, CAKE, CEC, CPKI, KONA, MSSR, MRT, PFCB and RUTH.
DISCUSSION MATERIALS 15
|
CONFIDENTIAL
Current Sector Growth
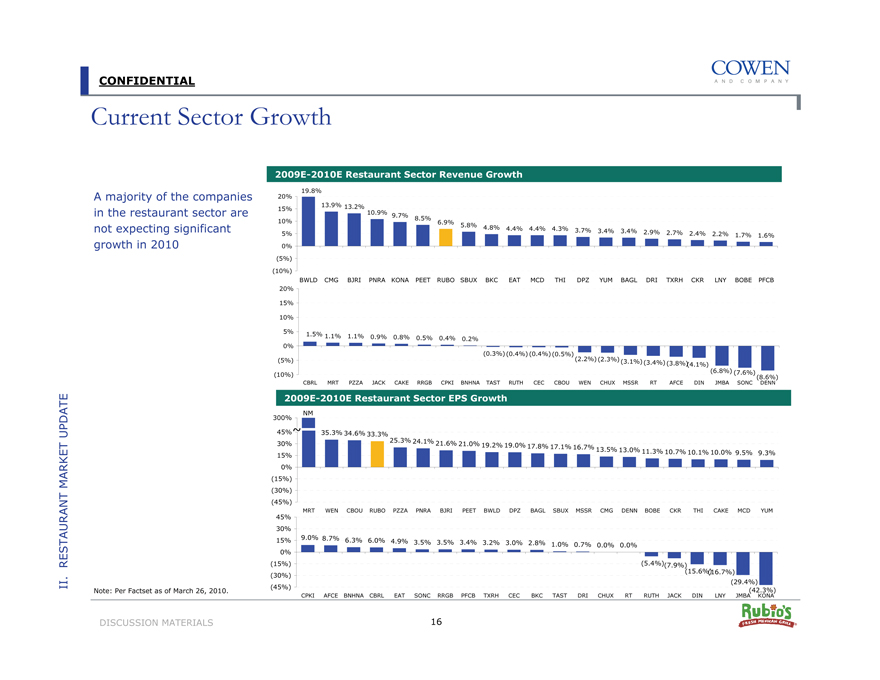
A majority of the companies in the restaurant sector are not expecting significant growth in 2010
2009E-2010E Restaurant Sector Revenue Growth
20% 15% 10% 5% 0% (5%) (10%)
19.8%
13.9% 13.2%
10.9% 9.7% 8.5%
6.9% 5.8%
4.8% 4.4% 4.4% 4.3% 3.7%
3.4% 3.4% 2.9% 2.7% 2.4% 2.2%
1.7% 1.6%
BWLD CMG BJRI PNRA KONA PEET RUBO SBUX BKC EAT MCD THI DPZ YUM BAGL DRI TXRH CKR LNY BOBE PFCB
20% 15% 10% 5% 0% (5%) (10%)
1.5% 1.1% 1.1% 0.9% 0.8%
0.5% 0.4% 0.2%
(0.3%) (0.4%) (0.4%) (0.5%)
(2.2%) (2.3%) (3.1%)
(3.4%) (3.8%) (4.1%)
(6.8%) (7.6%) (8.6%)
CBRL MRT PZZA JACK CAKE RRGB CPKI BNHNA TAST RUTH CEC CBOU WEN CHUX MSSR RT AFCE DIN JMBA SONC DENN
2009E-2010E Restaurant Sector EPS Growth
NM
300% 45% 30% 15% 0% (15%) (30%) (45%)
45% 30% 15% 0% (15%) (30%) (45%)
35.3% 34.6% 33.3%
25.3% 24.1% 21.6%
21.0% 19.2% 19.0% 17.8% 17.1%
16.7% 13.5% 13.0%
11.3% 10.7% 10.1% 10.0% 9.5% 9.3%
MRT WEN CBOU RUBO PZZA PNRA BJRI PEET BWLD DPZ BAGL SBUX MSSR CMG DENN BOBE CKR THI CAKE MCD YUM
9.0% 8.7% 6.3% 6.0%
4.9% 3.5% 3.5% 3.4% 3.2% 3.0% 2.8% 1.0%
0.7% 0.0% 0.0%
(5.4%) (7.9%)
(15.6%) (16.7%) (29.4%) (42.3%)
CPKI AFCE BNHNA CBRL EAT SONC RRGB PFCB TXRH CEC BKC TAST DRI CHUX RT RUTH JACK DIN LNY JMBA KONA
II. RESTAURANT MARKET UPDATE
Note: Per Factset as of March 26, 2010.
DISCUSSION MATERIALS 16
|
CONFIDENTIAL
III. Rubio’s Overview
|
CONFIDENTIAL
2009 Operating Performance
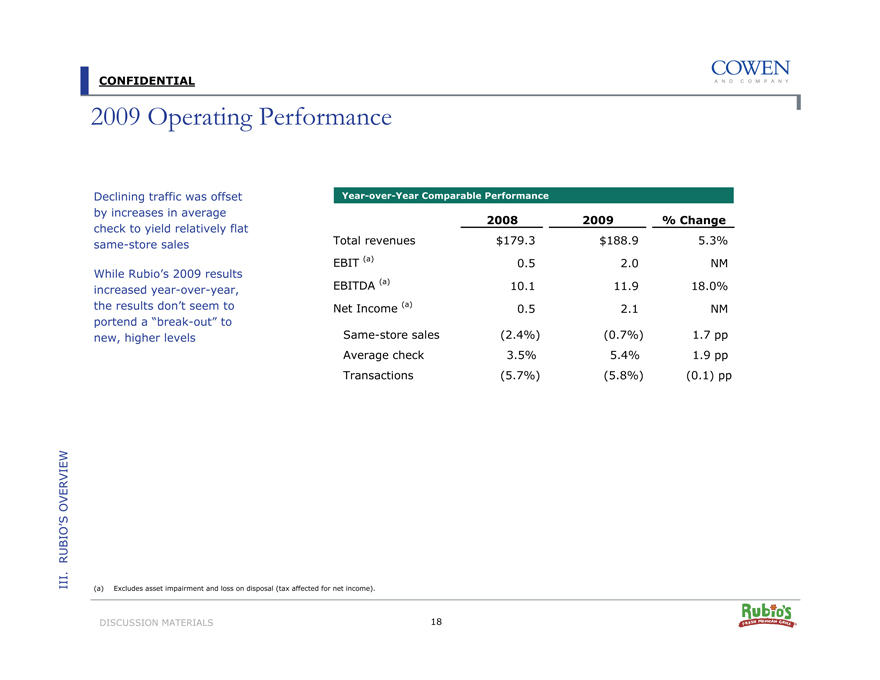
Declining traffic was offset by increases in average check to yield relatively flat same-store sales
While Rubio’s 2009 results increased year-over-year, the results don’t seem to portend a “break-out” to new, higher levels
Year-over-Year Comparable Performance
2008
2009
% Change
Total revenues
$179.3
$188.9
5.3%
EBIT (a)
0.5
2.0
NM
EBITDA (a)
10.1
11.9
18.0%
Net Income (a)
0.5
2.1
NM
Same-store sales
(2.4%)
(0.7%)
1.7 pp
Average check
3.5%
5.4%
1.9 pp
Transactions
(5.7%)
(5.8%)
(0.1) pp
III. RUBIO’S OVERVIEW
(a) Excludes asset impairment and loss on disposal (tax affected for net income).
DISCUSSION MATERIALS 18
|
CONFIDENTIAL
YTD 2010 Operating Performance
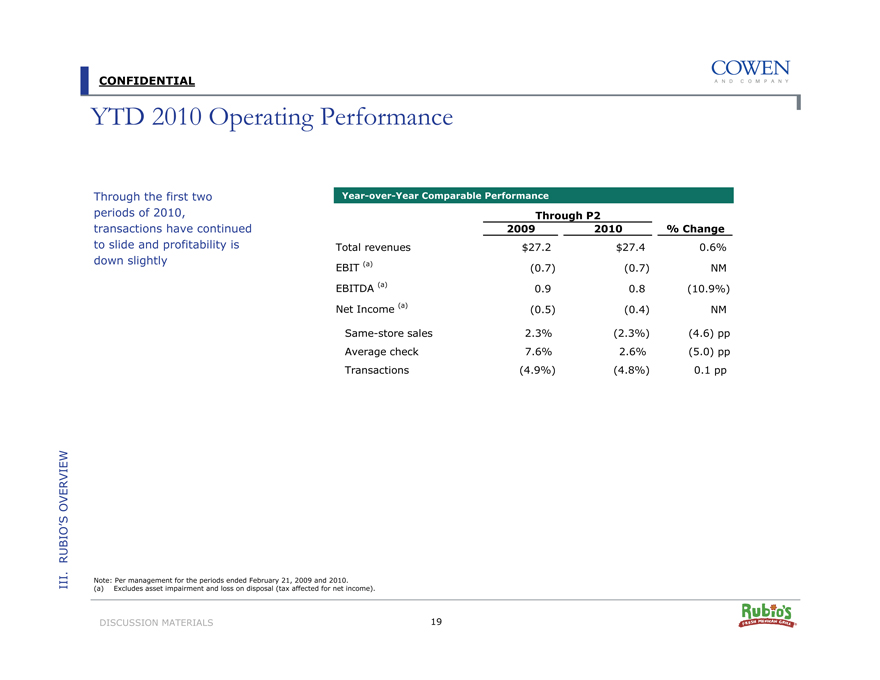
Through the first two periods of 2010, transactions have continued to slide and profitability is down slightly
Year-over-Year Comparable Performance
Through P2
2009
2010
% Change
Total revenues
$27.2
$27.4
0.6%
EBIT (a)
(0.7)
(0.7)
NM
EBITDA (a)
0.9
0.8
(10.9%)
Net Income (a)
(0.5)
(0.4)
NM
Same-store sales
2.3%
(2.3%)
(4.6) pp
Average check
7.6%
2.6%
(5.0) pp
Transactions
(4.9%)
(4.8%)
0.1 pp
III. RUBIO’S OVERVIEW
Note: Per management for the periods ended February 21, 2009 and 2010.
(a) Excludes asset impairment and loss on disposal (tax affected for net income).
DISCUSSION MATERIALS 19
|
CONFIDENTIAL
Same-Store Sales Trends
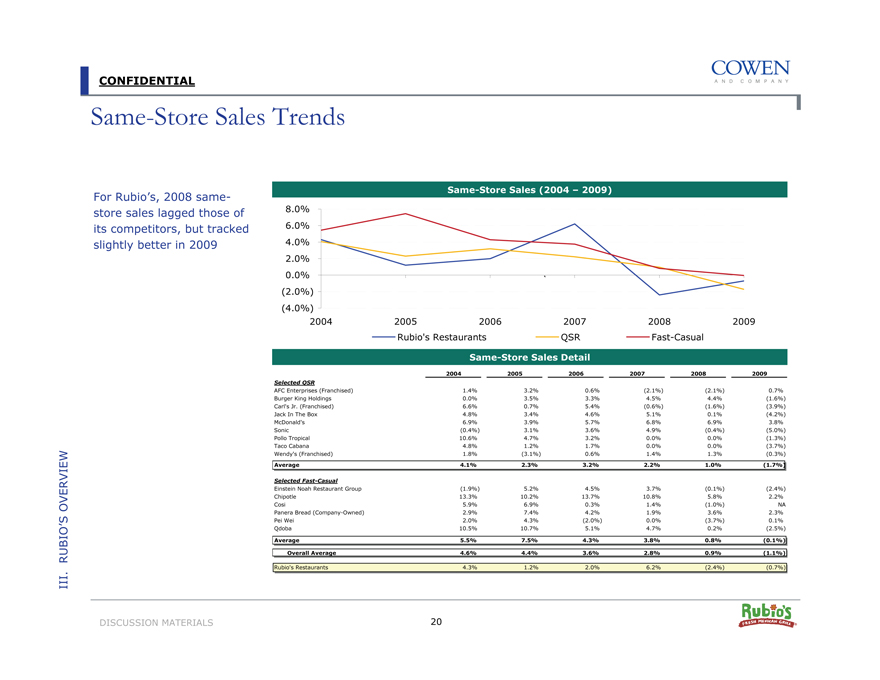
For Rubio’s, 2008 same-store sales lagged those of its competitors, but tracked slightly better in 2009
Same-Store Sales (2004 – 2009)
8.0% 6.0% 4.0% 2.0% 0.0% (2.0%) (4.0%)
2004 2005 2006 2007 2008 2009 Rubio’s Restaurants QSR Fast-Casual
Same-Store Sales Detail
2004
2005
2006
2007
2008
2009
Selected QSR
AFC Enterprises (Franchised)
1.4%
3.2%
0.6%
(2.1%)
(2.1%)
0.7%
Burger King Holdings
0.0%
3.5%
3.3%
4.5%
4.4%
(1.6%)
Carl’s Jr. (Franchised)
6.6%
0.7%
5.4%
(0.6%)
(1.6%)
(3.9%)
Jack In The Box
4.8%
3.4%
4.6%
5.1%
0.1%
(4.2%)
McDonald’s
6.9%
3.9%
5.7%
6.8%
6.9%
3.8%
Sonic
(0.4%)
3.1%
3.6%
4.9%
(0.4%)
(5.0%)
Pollo Tropical
10.6%
4.7%
3.2%
0.0%
0.0%
(1.3%)
Taco Cabana
4.8%
1.2%
1.7%
0.0%
0.0%
(3.7%)
Wendy’s (Franchised)
1.8%
(3.1%)
0.6%
1.4%
1.3%
(0.3%)
Average
4.1%
2.3%
3.2%
2.2%
1.0%
(1.7%)
Selected Fast-Casual
Einstein Noah Restaurant Group
(1.9%)
5.2%
4.5%
3.7%
(0.1%)
(2.4%)
Chipotle
13.3%
10.2%
13.7%
10.8%
5.8%
2.2%
Cosi
5.9%
6.9%
0.3%
1.4%
(1.0%)
NA
Panera Bread (Company-Owned)
2.9%
7.4%
4.2%
1.9%
3.6%
2.3%
Pei Wei
2.0%
4.3%
(2.0%)
0.0%
(3.7%)
0.1%
Qdoba
10.5%
10.7%
5.1%
4.7%
0.2%
(2.5%)
Average
5.5%
7.5%
4.3%
3.8%
0.8%
(0.1%)
Overall Average
4.6%
4.4%
3.6%
2.8%
0.9%
(1.1%)
Rubio’s Restaurants
4.3%
1.2%
2.0%
6.2%
(2.4%)
(0.7%)
III. RUBIO’S OVERVIEW
DISCUSSION MATERIALS 20
|
CONFIDENTIAL
Rubio’s 3-Year Same-Store Sales Breakdown
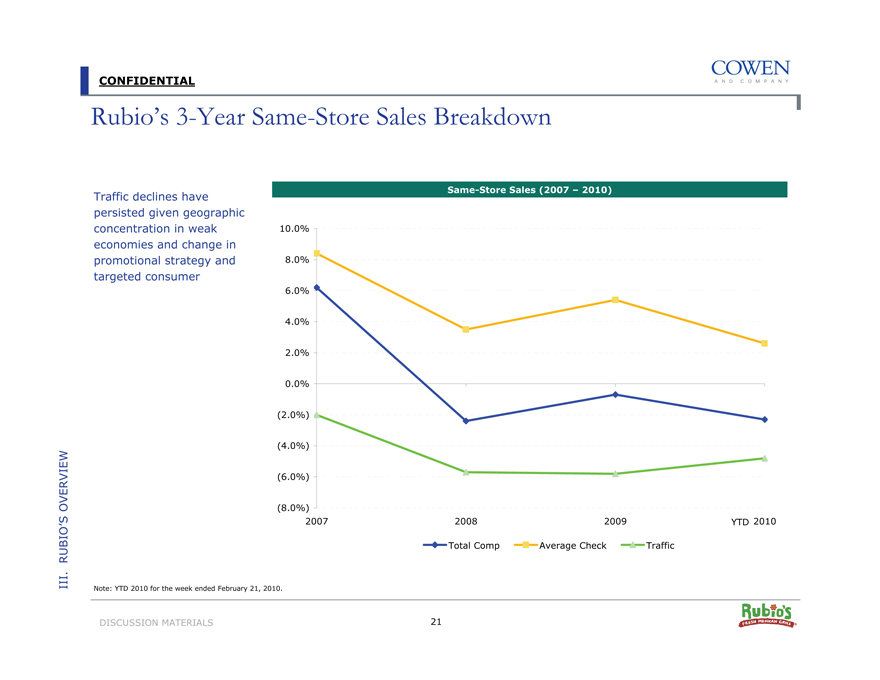
Traffic declines have persisted given geographic concentration in weak economies and change in promotional strategy and targeted consumer
Same-Store Sales (2007 – 2010)
10.0% 8.0% 6.0% 4.0% 2.0% 0.0% (2.0%) (4.0%) (6.0%) (8.0%)
2007 2008 2009 YTD 2010
Total Comp Average Check Traffic
III. RUBIO’S OVERVIEW
Note: YTD 2010 for the week ended February 21, 2010.
DISCUSSION MATERIALS 21
|
CONFIDENTIAL
Financial Snapshots Over Time
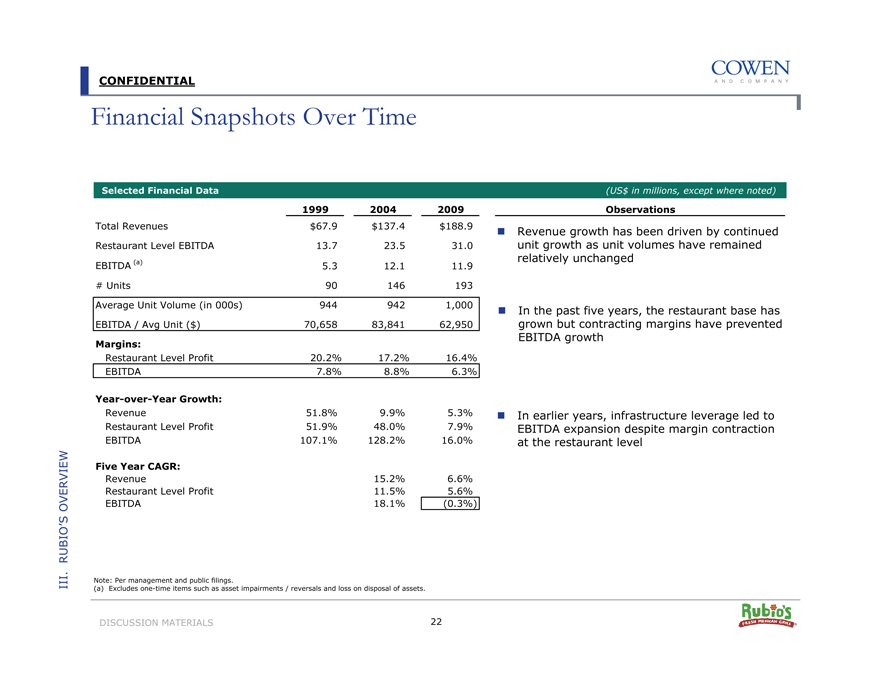
Selected Financial Data
1999
2004
2009
Total Revenues
$67.9
$137.4
$188.9
Restaurant Level EBITDA
13.7
23.5
31.0
EBITDA (a)
5.3
12.1
11.9
# Units
90
146
193
Average Unit Volume (in 000s)
944
942
1,000
EBITDA / Avg Unit ($)
70,658
83,841
62,950
Margins:
Restaurant Level Profit
20.2%
17.2%
16.4%
EBITDA
7.8%
8.8%
6.3%
Year-over-Year Growth:
Revenue
51.8%
9.9%
5.3%
Restaurant Level Profit
51.9%
48.0%
7.9%
EBITDA
107.1%
128.2%
16.0%
Five Year CAGR:
Revenue
15.2%
6.6%
Restaurant Level Profit
11.5%
5.6%
EBITDA
18.1%
(0.3%)
(US$ in millions, except where noted)
Observations
Revenue growth has been driven by continued unit growth as unit volumes have remained relatively unchanged
In the past five years, the restaurant base has grown but contracting margins have prevented EBITDA growth
In earlier years, infrastructure leverage led to EBITDA expansion despite margin contraction at the restaurant level
III. RUBIO’S OVERVIEW
Note: Per management and public filings.
(a) Excludes one-time items such as asset impairments / reversals and loss on disposal of assets.
DISCUSSION MATERIALS 22
|
CONFIDENTIAL
Performance of Recent Openings
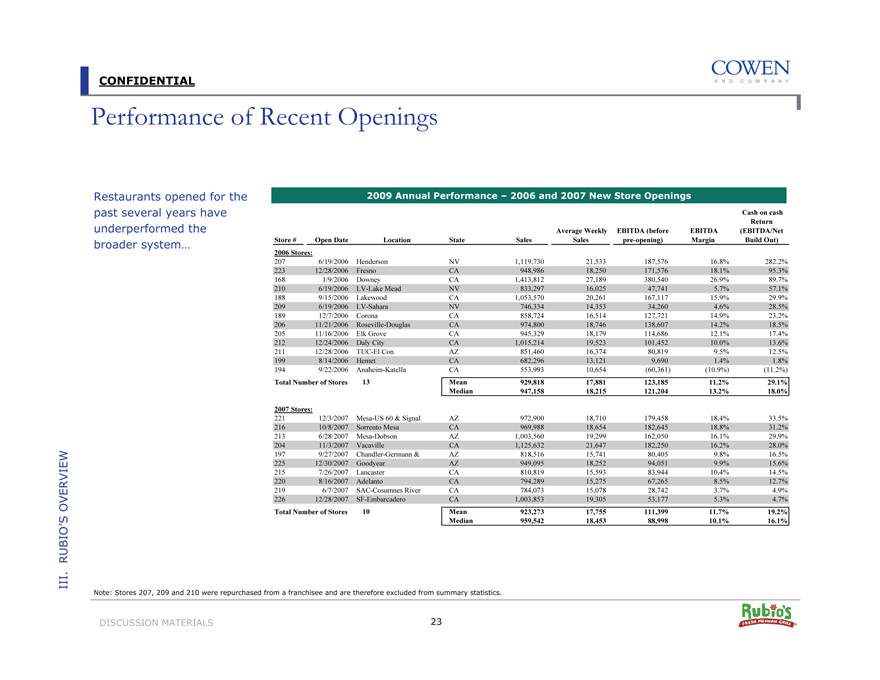
Restaurants opened for the past several years have underperformed the broader system…
2009 Annual Performance – 2006 and 2007 New Store Openings
Cash on cash
Return
Average Weekly EBITDA (before
EBITDA
(EBITDA/Net
Store #
Open Date
Location
State
Sales
Sales
pre-opening)
Margin
Build Out)
2006 Stores:
207
6/19/2006
Henderson
NV
1,119,730
21,533
187,576
16.8%
282.2%
223
12/28/2006
Fresno
CA
948,986
18,250
171,576
18.1%
95.3%
168
1/9/2006
Downey
CA
1,413,812
27,189
380,540
26.9%
89.7%
210
6/19/2006
LV-Lake Mead
NV
833,297
16,025
47,741
5.7%
57.1%
188
9/15/2006
Lakewood
CA
1,053,570
20,261
167,117
15.9%
29.9%
209
6/19/2006
LV-Sahara
NV
746,334
14,353
34,260
4.6%
28.5%
189
12/7/2006
Corona
CA
858,724
16,514
127,721
14.9%
23.2%
206
11/21/2006
Roseville-Douglas
CA
974,800
18,746
138,607
14.2%
18.5%
205
11/16/2006
Elk Grove
CA
945,329
18,179
114,686
12.1%
17.4%
212
12/24/2006
Daly City
CA
1,015,214
19,523
101,452
10.0%
13.6%
211
12/28/2006
TUC-El Con
AZ
851,460
16,374
80,819
9.5%
12.5%
199
8/14/2006
Hemet
CA
682,296
13,121
9,690
1.4%
1.8%
194
9/22/2006
Anaheim-Katella
CA
553,993
10,654
(60,361)
(10.9%)
(11.2%)
Total Number of Stores
13
Mean
929,818
17,881
123,185
11.2%
29.1%
Median
947,158
18,215
121,204
13.2%
18.0%
2007 Stores:
221
12/3/2007
Mesa-US 60 & Signal
AZ
972,900
18,710
179,458
18.4%
33.5%
216
10/8/2007
Sorrento Mesa
CA
969,988
18,654
182,645
18.8%
31.2%
213
6/28/2007
Mesa-Dobson
AZ
1,003,560
19,299
162,050
16.1%
29.9%
204
11/3/2007
Vacaville
CA
1,125,632
21,647
182,250
16.2%
28.0%
197
9/27/2007
Chandler-Germann &
AZ
818,516
15,741
80,405
9.8%
16.5%
225
12/30/2007
Goodyear
AZ
949,095
18,252
94,051
9.9%
15.6%
215
7/26/2007
Lancaster
CA
810,819
15,593
83,944
10.4%
14.5%
220
8/16/2007
Adelanto
CA
794,289
15,275
67,265
8.5%
12.7%
219
6/7/2007
SAC-Cosumnes River
CA
784,073
15,078
28,742
3.7%
4.9%
226
12/28/2007
SF-Embarcadero
CA
1,003,853
19,305
53,177
5.3%
4.7%
Total Number of Stores
10
Mean
923,273
17,755
111,399
11.7%
19.2%
Median
959,542
18,453
88,998
10.1%
16.1%
III. RUBIO’S OVERVIEW
Note: Stores 207, 209 and 210 were repurchased from a franchisee and are therefore excluded from summary statistics.
DISCUSSION MATERIALS 237
|
CONFIDENTIAL
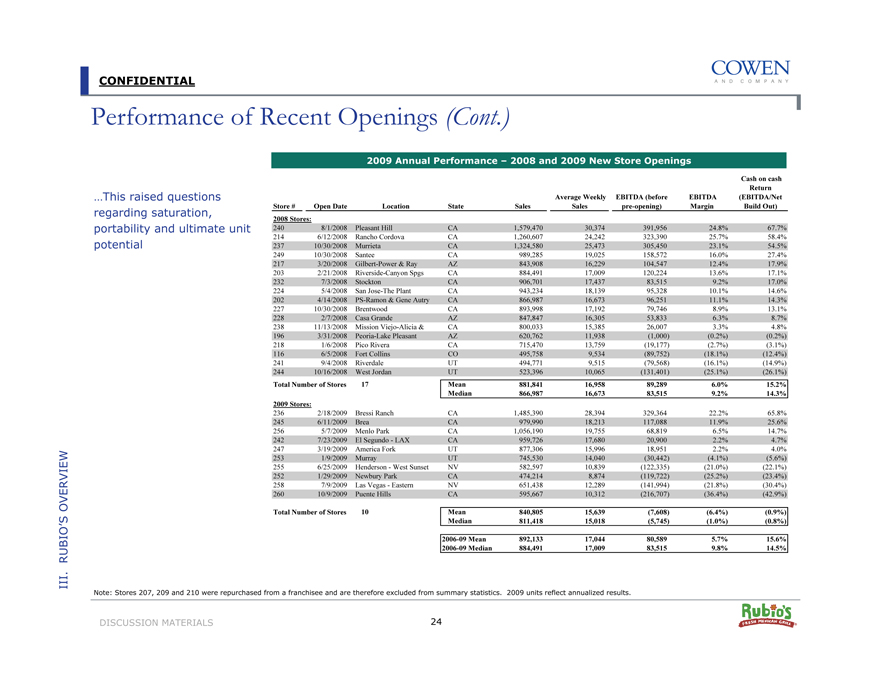
Performance of Recent Openings (Cont.)
2009 Annual Performance – 2008 and 2009 New Store Openings
…This raised questions regarding saturation, portability and ultimate unit potential
Store #
Open Date
Location
State
Sales
Average Weekly EBITDA (before Sales
pre-opening)
EBITDA Margin
Cash on cash Return (EBITDA/Net Build Out)
2008 Stores:
240
8/1/2008
Pleasant Hill
CA
1,579,470
30,374
391,956
24.8%
67.7%
214
6/12/2008
Rancho Cordova
CA
1,260,607
24,242
323,390
25.7%
58.4%
237
10/30/2008
Murrieta
CA
1,324,580
25,473
305,450
23.1%
54.5%
249
10/30/2008
Santee
CA
989,285
19,025
158,572
16.0%
27.4%
217
3/20/2008
Gilbert-Power & Ray
AZ
843,908
16,229
104,547
12.4%
17.9%
203
2/21/2008
Riverside-Canyon Spgs
CA
884,491
17,009
120,224
13.6%
17.1%
232
7/3/2008
Stockton
CA
906,701
17,437
83,515
9.2%
17.0%
224
5/4/2008
San Jose-The Plant
CA
943,234
18,139
95,328
10.1%
14.6%
202
4/14/2008
PS-Ramon & Gene Autry
CA
866,987
16,673
96,251
11.1%
14.3%
227
10/30/2008
Brentwood
CA
893,998
17,192
79,746
8.9%
13.1%
228
2/7/2008
Casa Grande
AZ
847,847
16,305
53,833
6.3%
8.7%
238
11/13/2008
Mission Viejo-Alicia &
CA
800,033
15,385
26,007
3.3%
4.8%
196
3/31/2008
Peoria-Lake Pleasant
AZ
620,762
11,938
(1,000)
(0.2%)
(0.2%)
218
1/6/2008
Pico Rivera
CA
715,470
13,759
(19,177)
(2.7%)
(3.1%)
116
6/5/2008
Fort Collins
CO
495,758
9,534
(89,752)
(18.1%)
(12.4%)
241
9/4/2008
Riverdale
UT
494,771
9,515
(79,568)
(16.1%)
(14.9%)
244
10/16/2008
West Jordan
UT
523,396
10,065
(131,401)
(25.1%)
(26.1%)
Total Number of Stores
17
Mean
881,841
16,958
89,289
6.0%
15.2%
Median
866,987
16,673
83,515
9.2%
14.3%
2009 Stores:
236
2/18/2009
Bressi Ranch
CA
1,485,390
28,394
329,364
22.2%
65.8%
245
6/11/2009
Brea
CA
979,990
18,213
117,088
11.9%
25.6%
256
5/7/2009
Menlo Park
CA
1,056,190
19,755
68,819
6.5%
14.7%
242
7/23/2009
El Segundo - LAX
CA
959,726
17,680
20,900
2.2%
4.7%
247
3/19/2009
America Fork
UT
877,306
15,996
18,951
2.2%
4.0%
253
1/9/2009
Murray
UT
745,530
14,040
(30,442)
(4.1%)
(5.6%)
255
6/25/2009
Henderson - West Sunset
NV
582,597
10,839
(122,335)
(21.0%)
(22.1%)
252
1/29/2009
Newbury Park
CA
474,214
8,874
(119,722)
(25.2%)
(23.4%)
258
7/9/2009
Las Vegas - Eastern
NV
651,438
12,289
(141,994)
(21.8%)
(30.4%)
260
10/9/2009
Puente Hills
CA
595,667
10,312
(216,707)
(36.4%)
(42.9%)
Total Number of Stores
10
Mean
840,805
15,639
(7,608)
(6.4%)
(0.9%)
Median
811,418
15,018
(5,745)
(1.0%)
(0.8%)
2006-09 Mean
892,133
17,044
80,589
5.7%
15.6%
2006-09 Median
884,491
17,009
83,515
9.8%
14.5%
III. RUBIO’S OVERVIEW
Note: Stores 207, 209 and 210 were repurchased from a franchisee and are therefore excluded from summary statistics. 2009 units reflect annualized results.
DISCUSSION MATERIALS 24
|
CONFIDENTIAL
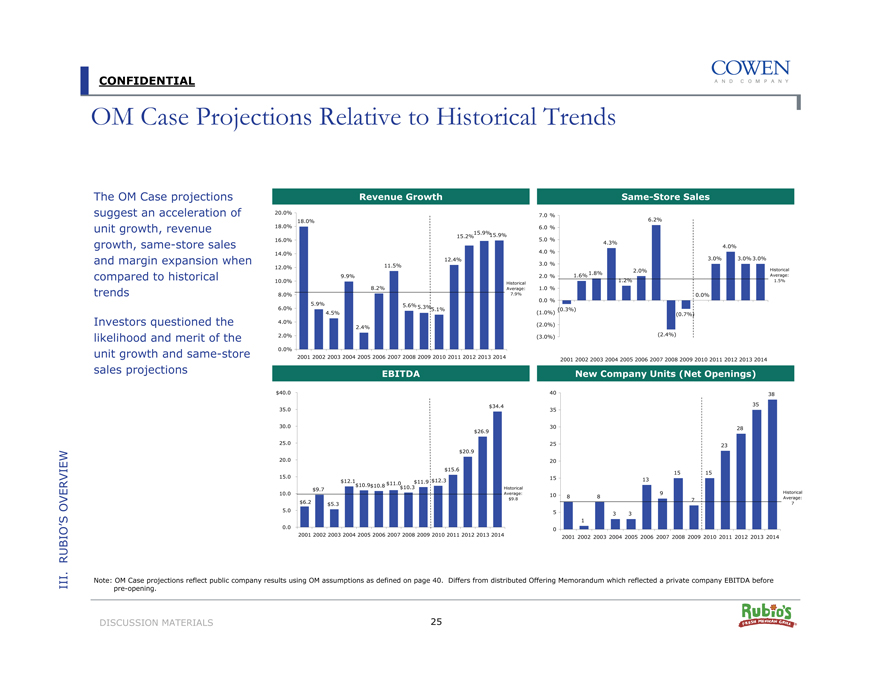
OM Case Projections Relative to Historical Trends
The OM Case projections suggest an acceleration of unit growth, revenue growth, same-store sales and margin expansion when compared to historical trends
Investors questioned the likelihood and merit of the unit growth and same-store sales projections
Revenue Growth
20.0%
18.0% 18.0%
15.9%15.9%
15.2%
16.0%
14.0%
12.4%
12.0% 11.5%
10.0% 9.9%
8.2% Historical Average:
8.0% 7.9%
5.9% 5.6%
6.0% 5.3%5.1%
4.5%
4.0% 2.4%
2.0%
0.0%
2001 2002 2003 2004 2005 2006 2007 2008 2009 2010 2011 2012 2013 2014
Same-Store Sales
7.0 %
6.2%
6.0 %
5.0 %
4.3%
4.0 % 4.0%
3.0 % 3.0% 3.0% 3.0%
2.0% Historical
1.6% 1.8% Average:
2.0 % 1.5%
1.2%
1.0 %
0.0 % 0.0%
(0.3%)
(1.0%) (0.7%)
(2.0%)
(3.0%) (2.4%)
2001 2002 2003 2004 2005 2006 2007 2008 2009 2010 2011 2012 2013 2014
EBITDA
$40.0
$34.4
35.0
30.0 $26.9
25.0
$20.9
20.0
$15.6
15.0
$12.1 $11.9 $12.3
$10.9$10.8 $11.0
$9.7 $10.3 Historical
10.0 Average:
$9.8
$6.2 $5.3
5.0
0.0
2001 2002 2003 2004 2005 2006 2007 2008 2009 2010 2011 2012 2013 2014
New Company Units (Net Openings)
40 38
35 35
30 28
25 23 20
15 15 15 13
9 Historical
10 8 8
7 Average: 7
5 3 3 1 0
2001 2002 2003 2004 2005 2006 2007 2008 2009 2010 2011 2012 2013 2014
III. RUBIO’S OVERVIEW
Note: OM Case projections reflect public company results using OM assumptions as defined on page 40. Differs from distributed Offering Memorandum which reflected a private company EBITDA before pre-opening.
DISCUSSION MATERIALS 25
|
CONFIDENTIAL
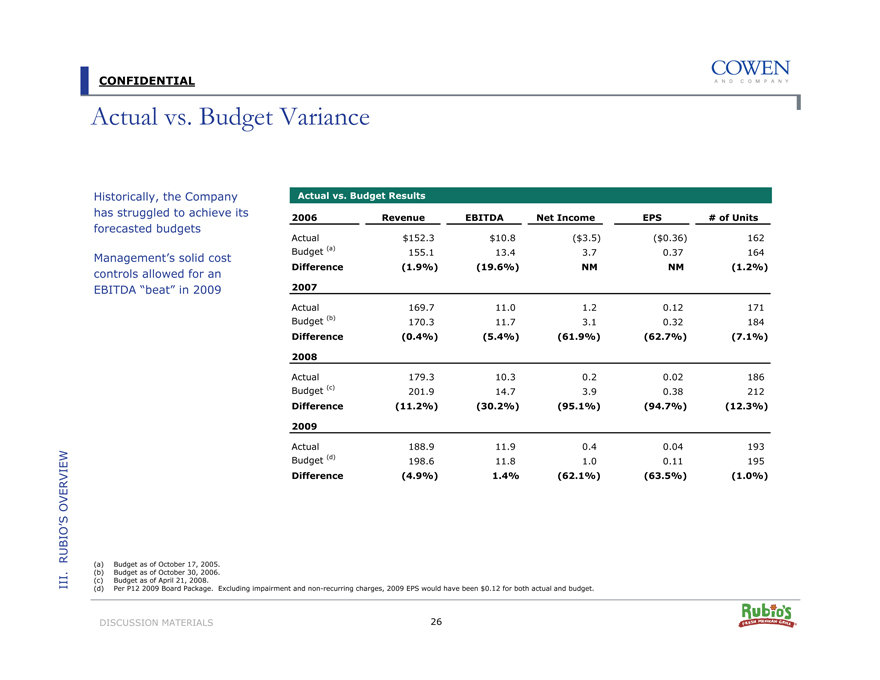
Actual vs. Budget Variance
Historically, the Company has struggled to achieve its forecasted budgets
Management’s solid cost controls allowed for an EBITDA “beat” in 2009
Actual vs. Budget Results
2006
Revenue
EBITDA
Net Income
EPS
# of Units
Actual
$152.3
$10.8
($3.5)
($0.36)
162
Budget (a)
155.1
13.4
3.7
0.37
164
Difference
(1.9%)
(19.6%)
NM
NM
(1.2%)
2007
Actual
169.7
11.0
1.2
0.12
171
Budget (b)
170.3
11.7
3.1
0.32
184
Difference
(0.4%)
(5.4%)
(61.9%)
(62.7%)
(7.1%)
2008
Actual
179.3
10.3
0.2
0.02
186
Budget (c)
201.9
14.7
3.9
0.38
212
Difference
(11.2%)
(30.2%)
(95.1%)
(94.7%)
(12.3%)
2009
Actual
188.9
11.9
0.4
0.04
193
Budget (d)
198.6
11.8
1.0
0.11
195
Difference
(4.9%)
1.4%
(62.1%)
(63.5%)
(1.0%)
III. RUBIO’S OVERVIEW
(a) |
| Budget as of October 17, 2005. (b) Budget as of October 30, 2006. (c) Budget as of April 21, 2008. |
(d) Per P12 2009 Board Package. Excluding impairment and non-recurring charges, 2009 EPS would have been $0.12 for both actual and budget.
DISCUSSION MATERIALS 26
|
CONFIDENTIAL
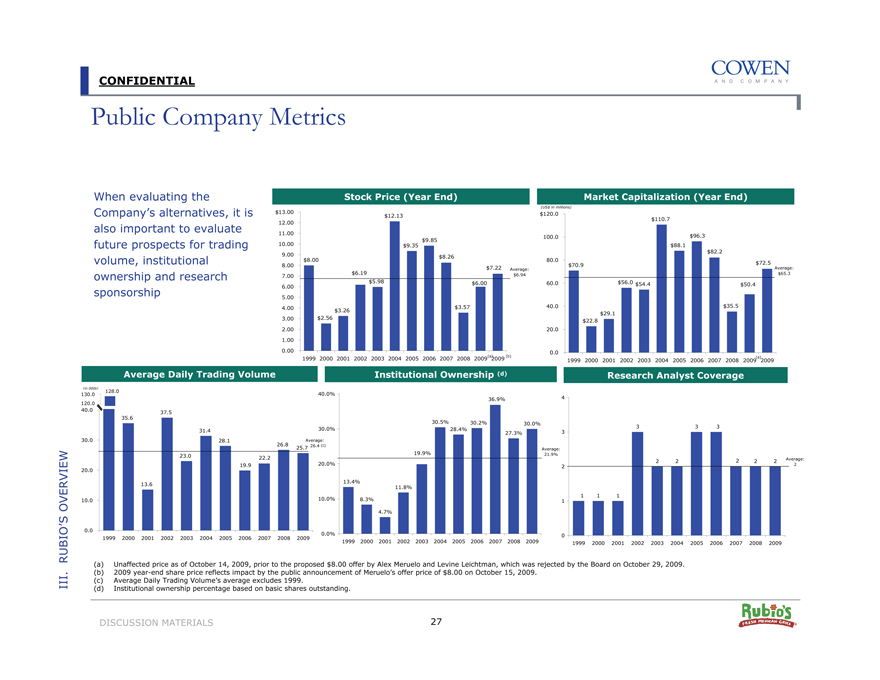
Public Company Metrics
When evaluating the Company’s alternatives, it is also important to evaluate future prospects for trading volume, institutional ownership and research sponsorship
Stock Price (Year End)
$13.00
$12.13
12.00
11.00
$9.85
10.00 $9.35
9.00 $8.00 $8.26
8.00 $7.22
Average:
$6.19 $6.94
7.00 $5.98
$6.00
6.00
5.00
4.00 $3.57
$3.26
3.00 $2.56
2.00
1.00
0.00
1999 2000 2001 2002 2003 2004 2005 2006 2007 2008 2009(a) 2009 (b)
Market Capitalization (Year End)
(US$ in millions) $120.0 $110.7
100.0 $96.3
$88.1
$82.2
80.0
$70.9 $72.5 Average:
$65.3
60.0 $56.0 $54.4 $50.4
40.0 $35.5
$29.1
$22.8
20.0
0.0 (a) 1999 2000 2001 2002 2003 2004 2005 2006 2007 2008 2009 2009
Average Daily Trading Volume
(in 000s)
128.0 130.0 120.0
40.0 37.5
35.6
31.4
30.0 28.1
26.8
25.7
23.0 22.2
20.0 19.9
13.6
10.0
0.0
1999 2000 2001 2002 2003 2004 2005 2006 2007 2008 2009
Institutional Ownership (d)
Average:
.7 26.4 (c)
40.0%
30.0%
20.0% 10.0% 0.0%
36.9%
30.5% 30.2% 30.0%
28.4%
27.3%
Average:
19.9% 21.9%
13.4% 11.8%
8.3%
4.7%
1999 2000 2001 2002 2003 2004 2005 2006 2007 2008 2009
Research Analyst Coverage
4
3 3 3 3
2 2 2 2 2 Average:
2 2
1 1 1 1
0
1999 2000 2001 2002 2003 2004 2005 2006 2007 2008 2009
III. RUBIO’S OVERVIEW
(a) Unaffected price as of October 14, 2009, prior to the proposed $8.00 offer by Alex Meruelo and Levine Leichtman, which was rejected by the Board on October 29, 2009. (b) 2009 year-end share price reflects impact by the public announcement of Meruelo’s offer price of $8.00 on October 15, 2009.
(c) Average Daily Trading Volume’s average excludes 1999.
(d) Institutional ownership percentage based on basic shares outstanding.
DISCUSSION MATERIALS 27
|
CONFIDENTIAL
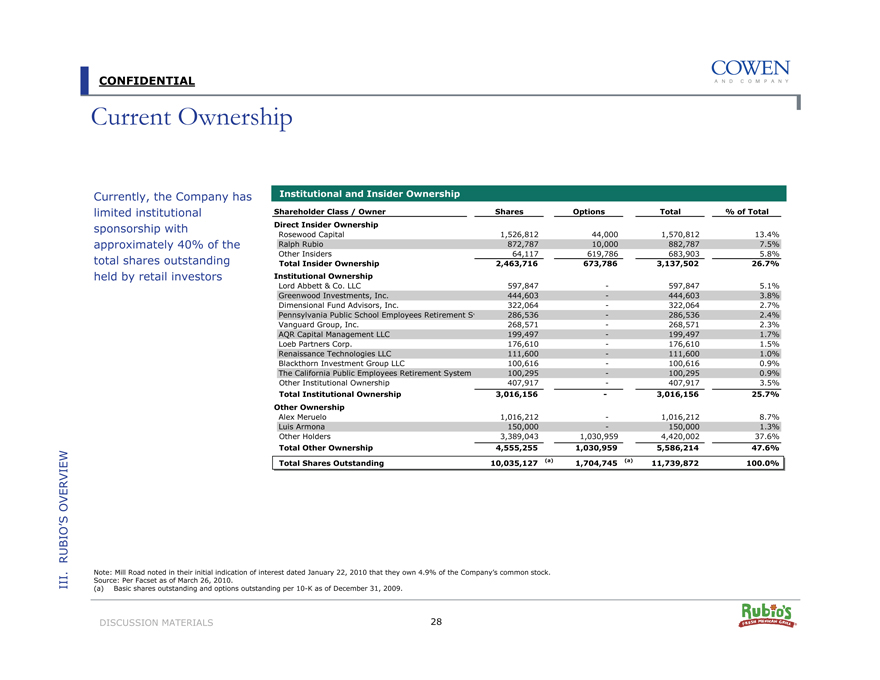
Current Ownership
Currently, the Company has limited institutional sponsorship with approximately 40% of the total shares outstanding held by retail investors
Institutional and Insider Ownership
Shareholder Class / Owner
Shares
Options
Total
% of Total
Direct Insider Ownership
Rosewood Capital
1,526,812
44,000
1,570,812
13.4%
Ralph Rubio
872,787
10,000
882,787
7.5%
Other Insiders
64,117
619,786
683,903
5.8%
Total Insider Ownership
2,463,716
673,786
3,137,502
26.7%
Institutional Ownership
Lord Abbett & Co. LLC
597,847
—
597,847
5.1%
Greenwood Investments, Inc.
444,603
—
444,603
3.8%
Dimensional Fund Advisors, Inc.
322,064
—
322,064
2.7%
Pennsylvania Public School Employees Retirement Sy
286,536
—
286,536
2.4%
Vanguard Group, Inc.
268,571
—
268,571
2.3%
AQR Capital Management LLC
199,497
—
199,497
1.7%
Loeb Partners Corp.
176,610
—
176,610
1.5%
Renaissance Technologies LLC
111,600
—
111,600
1.0%
Blackthorn Investment Group LLC
100,616
—
100,616
0.9%
The California Public Employees Retirement System
100,295
—
100,295
0.9%
Other Institutional Ownership
407,917
—
407,917
3.5%
Total Institutional Ownership
3,016,156
—
3,016,156
25.7%
Other Ownership
Alex Meruelo
1,016,212
—
1,016,212
8.7%
Luis Armona
150,000
—
150,000
1.3%
Other Holders
3,389,043
1,030,959
4,420,002
37.6%
Total Other Ownership
4,555,255
1,030,959
5,586,214
47.6%
Total Shares Outstanding
10,035,127 (a)
1,704,745 (a)
11,739,872
100.0%
III. RUBIO’S OVERVIEW
Note: Mill Road noted in their initial indication of interest dated January 22, 2010 that they own 4.9% of the Company’s common stock. Source: Per Facset as of March 26, 2010.
(a) |
| Basic shares outstanding and options outstanding per 10-K as of December 31, 2009. |
DISCUSSION MATERIALS 28
|

CONFIDENTIAL
Institutional Ownership Summary Over Time
Two of Rubio’s top five holders were also top five holders five years ago
Of note, Royce Associates, previously the largest institutional shareholder of the company, liquidated its position during the second half of 2009 when the stock passed its average cost basis of $6.69
Institutional Holders – Today, 1 Year Ago, 3 Years Ago and 5 Years Ago
Shares Held
Holder Name
Holdings Style
12/31/2009
12/31/2008
12/31/2006
12/31/2004
Lord Abbett & Co. LLC
Value
597,847
504,547
0
0
Dimensional Fund Advisors, Inc.
Deep Value
322,064
341,404
291,505
525,187
Pennsylvania Public School Employees Retirement System
GARP
286,536
0
0
0
Vanguard Group, Inc.
Index
268,571
262,665
102,516
222,272
AQR Capital Management LLC
Value
199,497
0
0
0
Loeb Partners Corp.
Value
176,610
0
0
0
Renaissance Technologies LLC
Value
111,600
93,100
0
0
Blackthorn Investment Group LLC
Value
100,616
0
0
0
The California Public Employees Retirement System
GARP
100,295
100,295
17,900
17,900
Kennedy Capital Management, Inc.
Deep Value
87,182
0
0
0
Portolan Capital Management LLC
Value
75,600
0
0
0
Keane Capital Management, Inc.
Value
66,800
0
0
0
Russell Investment Group
Value
38,100
41,400
0
0
CNH Partners LLC
GARP
36,279
0
0
0
Discovery Group I LLC
Value
31,881
0
0
0
Northern Trust Investments
GARP
22,618
24,165
19,903
26,752
BlackRock Global Investors
Index
18,264
99,105
36,469
4,734
Credit Agricole Structured Asset Management Advisers LLC
Value
11,725
0
0
0
Connors Investor Services, Inc.
GARP
11,300
17,500
0
0
Royce & Associates LLC
Value
0
870,330
858,200
557,500
Pequot Capital Management, Inc.
Deep Value
0
150,000
360,400
493,900
Wells Capital Management, Inc.
Growth
0
135,500
135,500
0
Spark LP
Value
0
15,200
0
0
Roxbury Capital Management LLC
Growth
0
7,783
0
0
AXA Rosenberg Investment Management LLC
Value
0
2,123
19,704
88,522
Watershed Asset Management LLC
GARP
0
0
296,000
0
Magnetar Financial LLC
Value
0
0
241,173
0
Federated Investment Management Co.
Growth
0
0
222,100
0
Rice, Hall, James & Associates LLC
GARP
0
0
129,705
152,008
Paloma Partners Management Co.
Value
0
0
116,058
0
AXA Investment Managers (Paris) SA
Value
0
0
700
700
Nicholas-Applegate Capital Management
Value
0
0
0
183,700
Morgan Stanley & Co., Inc.
GARP
0
0
0
0
Thomson, Horstmann & Bryant, Inc.
Value
0
0
0
138,700
Numeric Investors LP
Value
0
0
0
129,500
Driehaus Capital Management LLC
Growth
0
0
0
85,912
Calamos Advisors LLC
Growth
0
0
0
67,000
Charles Schwab Investment Management, Inc.
GARP
0
0
0
30,522
Dawson-Herman Capital Management, Inc.
Growth
0
0
0
25,200
Osborne Partners Capital Management
GARP
0
0
0
10,000
Source: Per Facset as of December 31, 2009.
Note: Bolded numbers indicate a top five position for that respective period. Excludes institutional shareholders with a peak position of fewer than 4,000 shares.
III. RUBIO’S OVERVIEW
DISCUSSION MATERIALS 29
|
CONFIDENTIAL
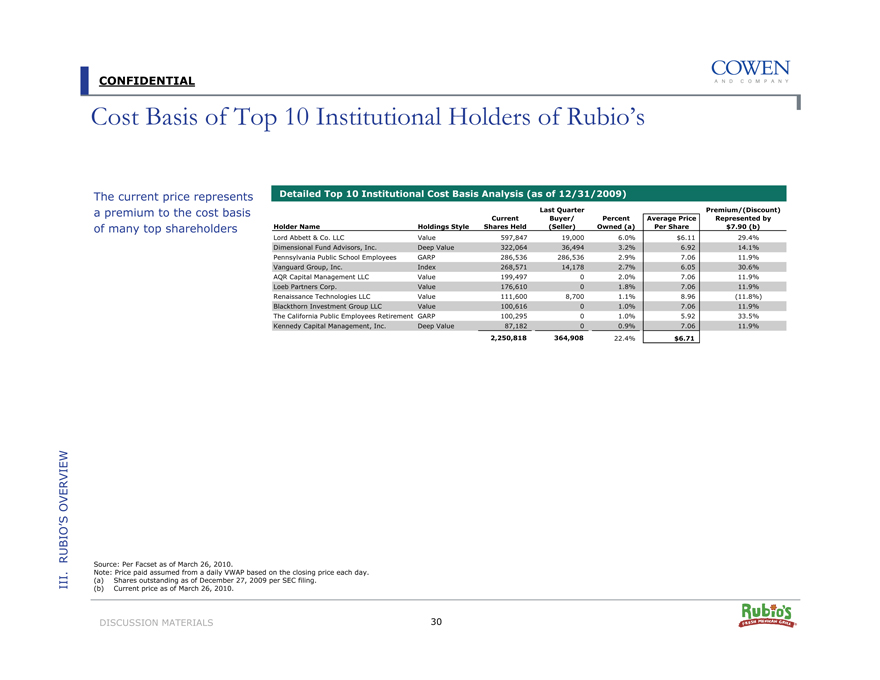
Cost Basis of Top 10 Institutional Holders of Rubio’s
The current price represents a premium to the cost basis of many top shareholders
Detailed Top 10 Institutional Cost Basis Analysis (as of 12/31/2009)
Last Quarter
Premium/(Discount)
Current
Buyer/
Percent Average Price
Represented by
Holder Name
Holdings Style
Shares Held
(Seller)
Owned (a)
Per Share
$7.90 (b)
Lord Abbett & Co. LLC
Value
597,847
19,000
6.0%
$6.11
29.4%
Dimensional Fund Advisors, Inc.
Deep Value
322,064
36,494
3.2%
6.92
14.1%
Pennsylvania Public School Employees
GARP
286,536
286,536
2.9%
7.06
11.9%
Vanguard Group, Inc.
Index
268,571
14,178
2.7%
6.05
30.6%
AQR Capital Management LLC
Value
199,497
0
2.0%
7.06
11.9%
Loeb Partners Corp.
Value
176,610
0
1.8%
7.06
11.9%
Renaissance Technologies LLC
Value
111,600
8,700
1.1%
8.96
(11.8%)
Blackthorn Investment Group LLC
Value
100,616
0
1.0%
7.06
11.9%
The California Public Employees Retirement GARP
100,295
0
1.0%
5.92
33.5%
Kennedy Capital Management, Inc.
Deep Value
87,182
0
0.9%
7.06
11.9%
2,250,818
364,908
22.4%
$6.71
III. RUBIO’S OVERVIEW
Source: Per Facset as of March 26, 2010.
Note: Price paid assumed from a daily VWAP based on the closing price each day. (a) Shares outstanding as of December 27, 2009 per SEC filing.
(b) |
| Current price as of March 26, 2010. |
DISCUSSION MATERIALS 30
|
CONFIDENTIAL
IV. Valuation Overview
|
CONFIDENTIAL
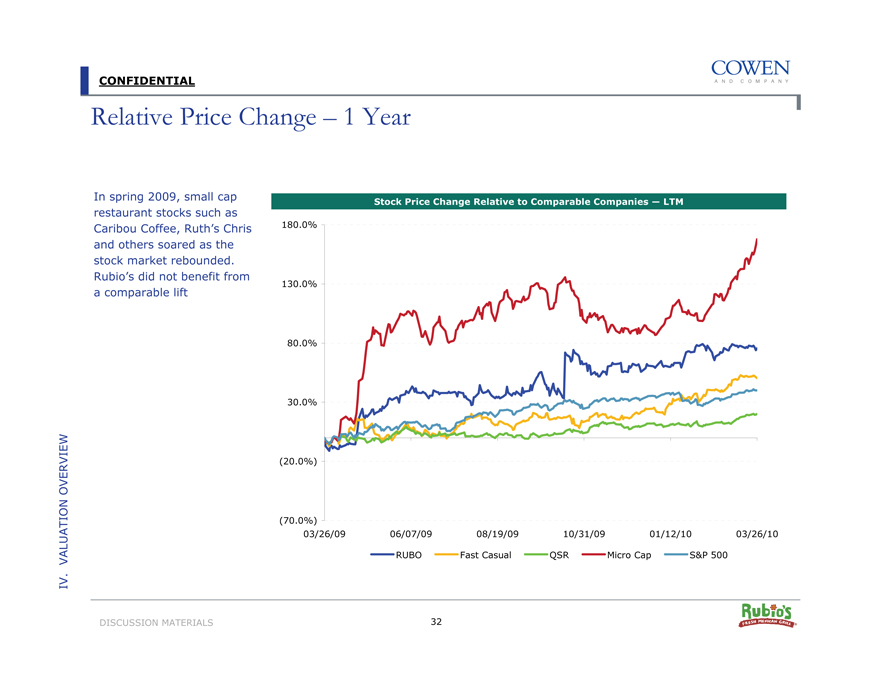
Relative Price Change – 1 Year
In spring 2009, small cap restaurant stocks such as Caribou Coffee, Ruth’s Chris and others soared as the stock market rebounded. Rubio’s did not benefit from a comparable lift
Stock Price Change Relative to Comparable Companies — LTM
180.0% 130.0% 80.0% 30.0% (20.0%) (70.0%)
03/26/09 06/07/09 08/19/09 10/31/09 01/12/10 03/26/10
RUBO Fast Casual QSR Micro Cap S&P 500
IV VALUATION. OVERVIEW
DISCUSSION MATERIALS 32
|
CONFIDENTIAL
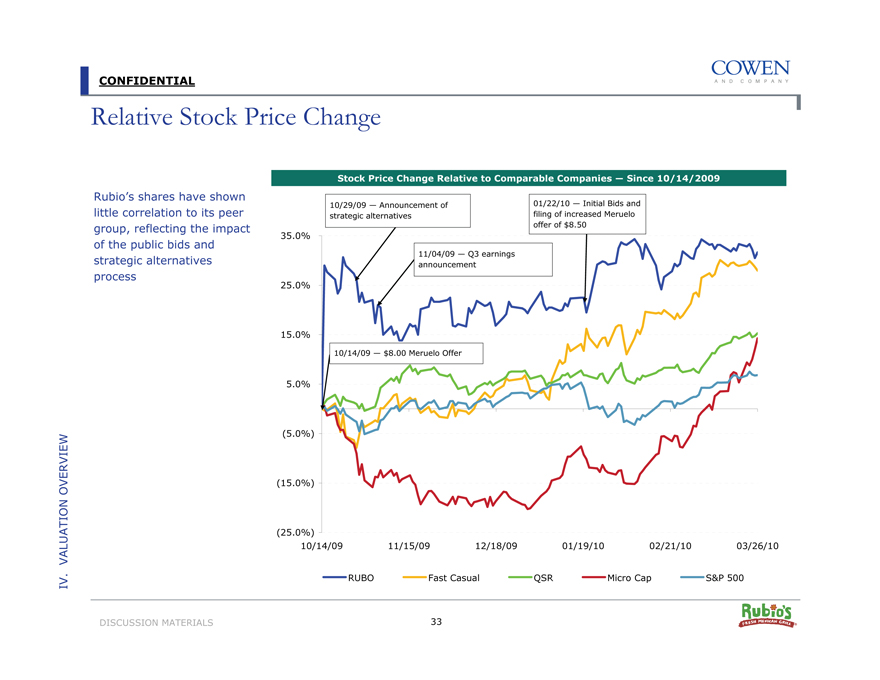
Relative Stock Price Change
Rubio’s shares have shown little correlation to its peer group, reflecting the impact of the public bids and strategic alternatives process
Stock Price Change Relative to Comparable Companies — Since 10/14/2009
10/29/09 — Announcement of strategic alternatives
01/22/10 — Initial Bids and filing of increased Meruelo offer of $8.50
35.0% 25.0% 15.0% 5.0% (5.0%) (15.0%) (25.0%)
10/14/09 11/15/09 12/18/09 01/19/10 02/21/10 03/26/10
RUBO Fast Casual QSR Micro Cap S&P 500
IV VALUATION. OVERVIEW
DISCUSSION MATERIALS 33
|
CONFIDENTIAL
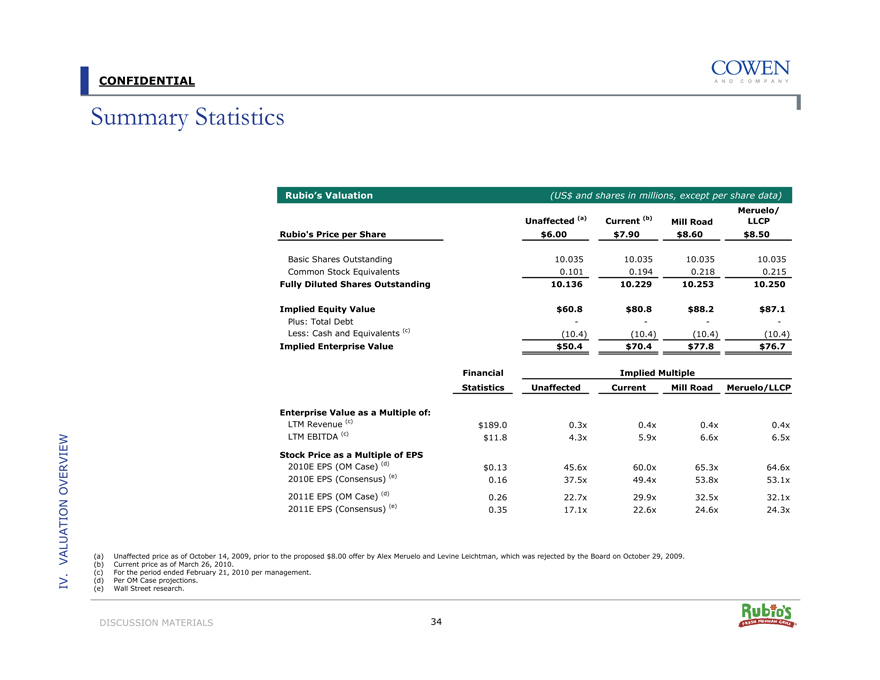
Summary Statistics
Rubio’s Valuation
(US$ and shares in millions, except per share data)
Meruelo/
Unaffected (a)
Current (b)
Mill Road
LLCP
Rubio’s Price per Share
$6.00
$7.90
$8.60
$8.50
Basic Shares Outstanding
10.035
10.035
10.035
10.035
Common Stock Equivalents
0.101
0.194
0.218
0.215
Fully Diluted Shares Outstanding
10.136
10.229
10.253
10.250
Implied Equity Value
$60.8
$80.8
$88.2
$87.1
Plus: Total Debt
—
—
—
—
Less: Cash and Equivalents (c)
(10.4)
(10.4)
(10.4)
(10.4)
Implied Enterprise Value
$50.4
$70.4
$77.8
$76.7
Financial
Implied Multiple
Statistics
Unaffected
Current
Mill Road
Meruelo/LLCP
Enterprise Value as a Multiple of:
LTM Revenue (c)
$189.0
0.3x
0.4x
0.4x
0.4x
LTM EBITDA (c)
$11.8
4.3x
5.9x
6.6x
6.5x
Stock Price as a Multiple of EPS
2010E EPS (OM Case) (d)
$0.13
45.6x
60.0x
65.3x
64.6x
2010E EPS (Consensus) (e)
0.16
37.5x
49.4x
53.8x
53.1x
2011E EPS (OM Case) (d)
0.26
22.7x
29.9x
32.5x
32.1x
2011E EPS (Consensus) (e)
0.35
17.1x
22.6x
24.6x
24.3x
IV VALUATION. OVERVIEW
(a) Unaffected price as of October 14, 2009, prior to the proposed $8.00 offer by Alex Meruelo and Levine Leichtman, which was rejected by the Board on October 29, 2009. (b) Current price as of March 26, 2010.
(c) |
| For the period ended February 21, 2010 per management. (d) Per OM Case projections. |
(e) |
| Wall Street research. |
DISCUSSION MATERIALS 34
|
CONFIDENTIAL
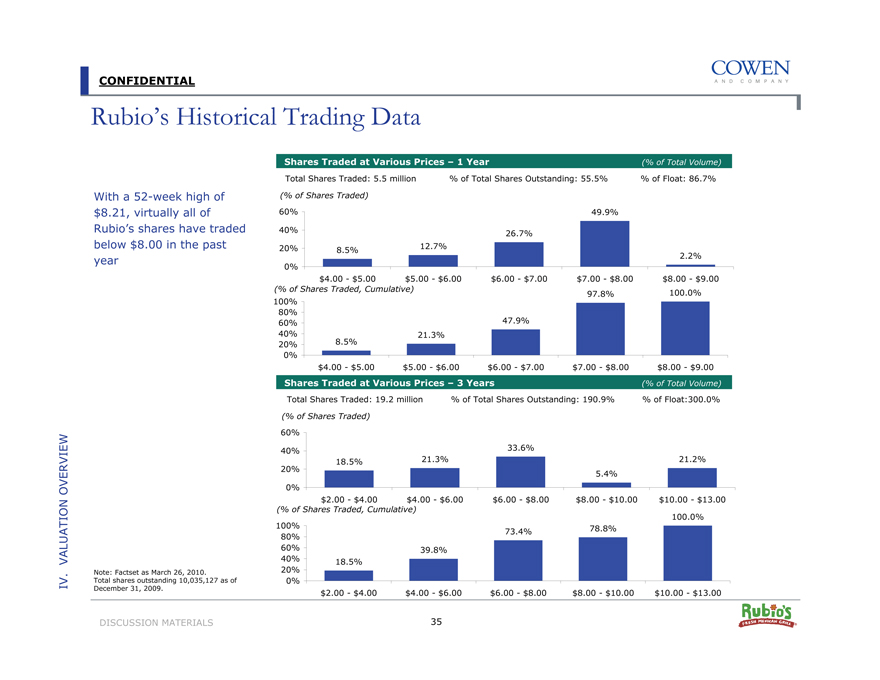
Rubio’s Historical Trading Data
With a 52-week high of $8.21, virtually all of Rubio’s shares have traded below $8.00 in the past year
Shares Traded at Various Prices – 1 Year (% of Total Volume)
Total Shares Traded: 5.5 million % of Total Shares Outstanding: 55.5% % of Float: 86.7%
(% of Shares Traded)
60% 40% 20% 0%
49.9%
26.7%
8.5% 12.7%
2.2%
$4.00 - $5.00 $5.00 - $6.00 $6.00 - $7.00 $7.00 - $8.00 $8.00 - $9.00
(% of Shares Traded, Cumulative)
100% 80% 60% 40% 20% 0%
47.9%
21.3%
8.5%
97.8% 100.0%
$4.00 - $5.00 $5.00 - $6.00 $6.00 - $7.00 $7.00 - $8.00 $8.00 - $9.00
Shares Traded at Various Prices – 3 Years (% of Total Volume)
Total Shares Traded: 19.2 million % of Total Shares Outstanding: 190.9% % of Float:300.0%
(% of Shares Traded)
60% 40% 20% 0%
33.6%
18.5% 21.3% 21.2%
5.4%
$2.00 - $4.00 $4.00 - $6.00 $6.00 - $8.00 $8.00 - $10.00 $10.00 - $13.00
(% of Shares Traded, Cumulative)
100% 80% 60% 40% 20% 0%
39.8%
18.5%
100.0% 73.4% 78.8%
$2.00 - $4.00 $4.00 - $6.00 $6.00 - $8.00 $8.00 - $10.00 $10.00 - $13.00
IV VALUATION. OVERVIEW
Note: Factset as March 26, 2010.
Total shares outstanding 10,035,127 as of December 31, 2009.
DISCUSSION MATERIALS 35
|
CONFIDENTIAL
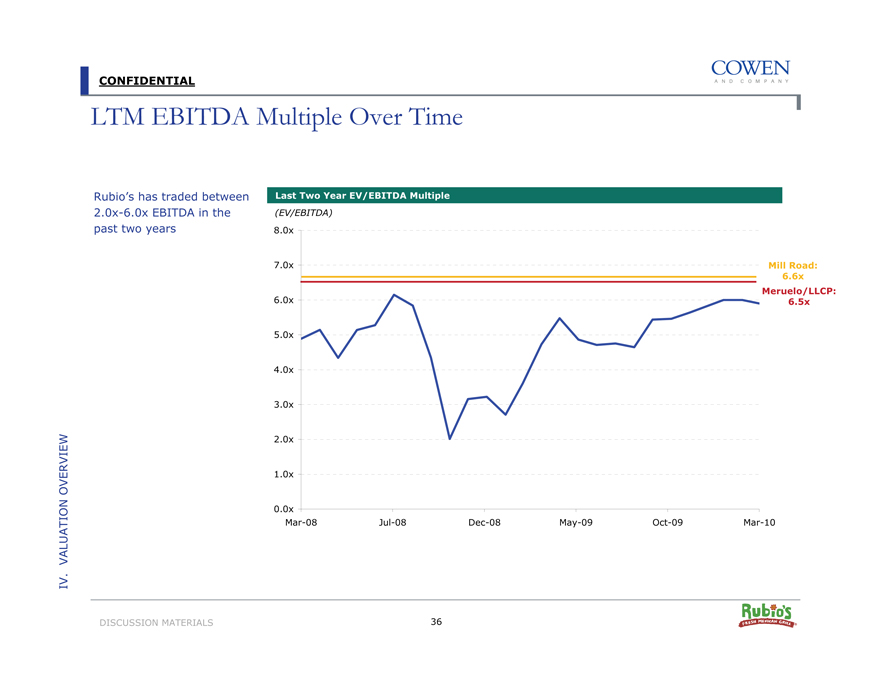
LTM EBITDA Multiple Over Time
Rubio’s has traded between 2.0x-6.0x EBITDA in the past two years
Last Two Year EV/EBITDA Multiple
(EV/EBITDA)
8.0x 7.0x 6.0x 5.0x 4.0x 3.0x 2.0x 1.0x 0.0x
Mar-08 Jul-08 Dec-08 May-09 Oct-09 Mar-10
Mill Road: 6.6x Meruelo/LLCP: 6.5x
IV VALUATION. OVERVIEW
DISCUSSION MATERIALS
36
|
CONFIDENTIAL
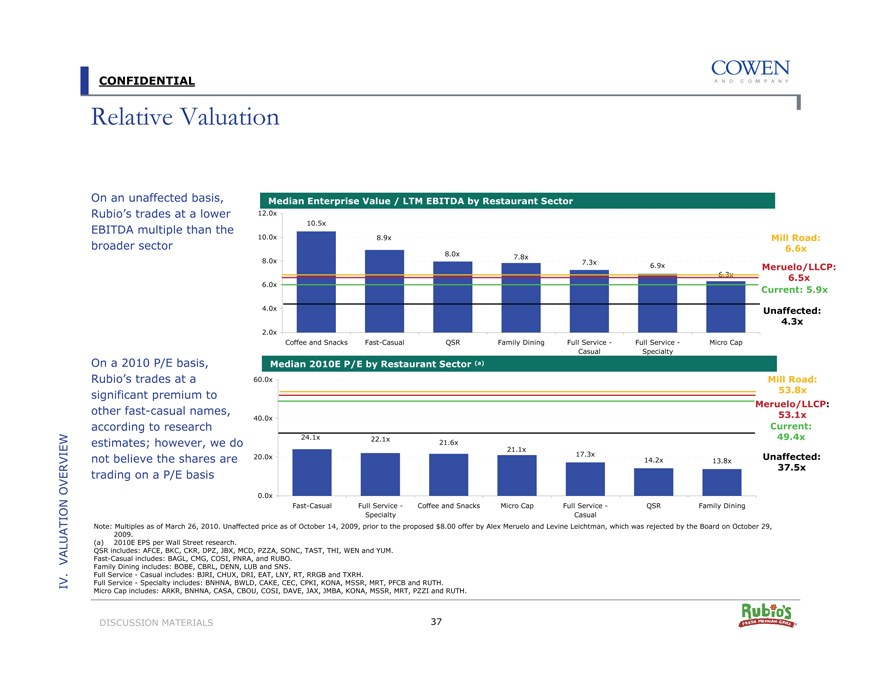
Relative Valuation
On an unaffected basis, Rubio’s trades at a lower EBITDA multiple than the broader sector
Median Enterprise Value / LTM EBITDA by Restaurant Sector
12.0x 10.0x 8.0x 6.0x 4.0x 2.0x
10.5x
8.9x
8.0x 7.8x
7.3x 6.9x
6.3x
Coffee and Snacks Fast-Casual QSR Family Dining Full Service—Full Service—Micro Cap Casual Specialty
Mill Road: 6.6x Meruelo/LLCP: 6.5x Current: 5.9x
Unaffected: 4.3x
Median 2010E P/E by Restaurant Sector (a)
On a 2010 P/E basis, Rubio’s trades at a significant premium to other fast-casual names, according to research estimates; however, we do not believe the shares are trading on a P/E basis
60.0x 40.0x 20.0x 0.0x
24.1x 22.1x
21.6x 21.1x
17.3x
14.2x 13.8x
Fast-Casual Full Service—Coffee and Snacks Micro Cap Full Service—QSR Family Dining Specialty Casual
Mill Road: 53.8x Meruelo/LLCP: 53.1x Current: 49.4x Unaffected: 37.5x
Note: Multiples as of March 26, 2010. Unaffected price as of October 14, 2009, prior to the proposed $8.00 offer by Alex Meruelo and Levine Leichtman, which was rejected by the Board on October 29, 2009.
(a) 2010E EPS per Wall Street research.
QSR includes: AFCE, BKC, CKR, DPZ, JBX, MCD, PZZA, SONC, TAST, THI, WEN and YUM. Fast-Casual includes: BAGL, CMG, COSI, PNRA, and RUBO.
Family Dining includes: BOBE, CBRL, DENN, LUB and SNS.
Full Service—Casual includes: BJRI, CHUX, DRI, EAT, LNY, RT, RRGB and TXRH.
Full Service—Specialty includes: BNHNA, BWLD, CAKE, CEC, CPKI, KONA, MSSR, MRT, PFCB and RUTH. Micro Cap includes: ARKR, BNHNA, CASA, CBOU, COSI, DAVE, JAX, JMBA, KONA, MSSR, MRT, PZZI and RUTH.
IV VALUATION. OVERVIEW
DISCUSSION MATERIALS
37
|
CONFIDENTIAL
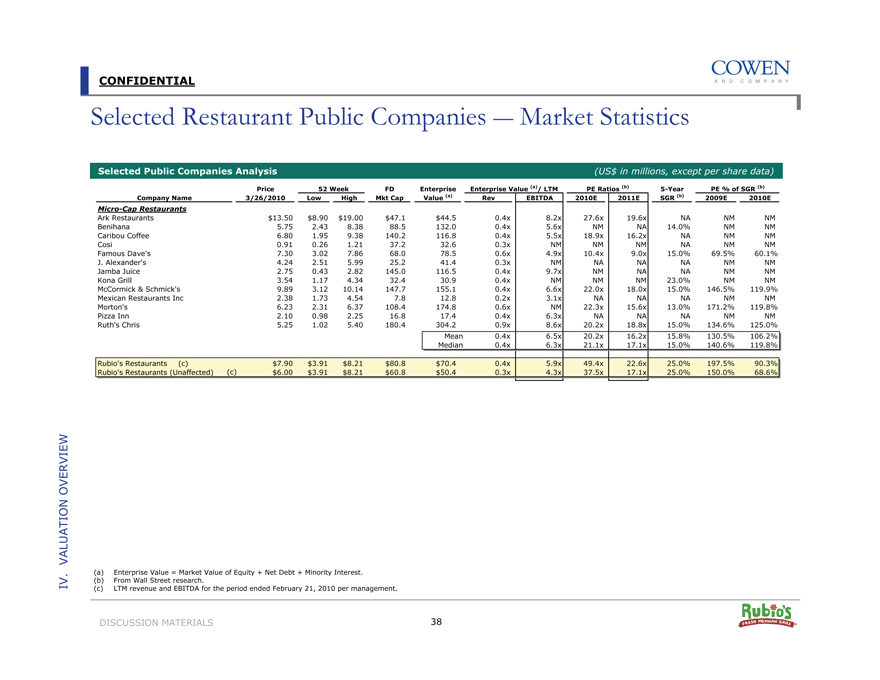
Selected Restaurant Public Companies —Market Statistics
Selected Public Companies Analysis
(US$ in millions, except per share data)
Price
52 Week
FD
Enterprise
Enterprise Value (a)/ LTM
PE Ratios (b)
5-Year
PE % of SGR (b)
Company Name
3/26/2010
Low
High
Mkt Cap
Value (a)
Rev
EBITDA
2010E
2011E
SGR (b)
2009E
2010E
Micro-Cap Restaurants
Ark Restaurants
$13.50
$8.90
$19.00
$47.1
$44.5
0.4x
8.2x
27.6x
19.6x
NA
NM
NM
Benihana
5.75
2.43
8.38
88.5
132.0
0.4x
5.6x
NM
NA
14.0%
NM
NM
Caribou Coffee
6.80
1.95
9.38
140.2
116.8
0.4x
5.5x
18.9x
16.2x
NA
NM
NM
Cosi
0.91
0.26
1.21
37.2
32.6
0.3x
NM
NM
NM
NA
NM
NM
Famous Dave’s
7.30
3.02
7.86
68.0
78.5
0.6x
4.9x
10.4x
9.0x
15.0%
69.5%
60.1%
J. Alexander’s
4.24
2.51
5.99
25.2
41.4
0.3x
NM
NA
NA
NA
NM
NM
Jamba Juice
2.75
0.43
2.82
145.0
116.5
0.4x
9.7x
NM
NA
NA
NM
NM
Kona Grill
3.54
1.17
4.34
32.4
30.9
0.4x
NM
NM
NM
23.0%
NM
NM
McCormick & Schmick’s
9.89
3.12
10.14
147.7
155.1
0.4x
6.6x
22.0x
18.0x
15.0%
146.5%
119.9%
Mexican Restaurants Inc
2.38
1.73
4.54
7.8
12.8
0.2x
3.1x
NA
NA
NA
NM
NM
Morton’s
6.23
2.31
6.37
108.4
174.8
0.6x
NM
22.3x
15.6x
13.0%
171.2%
119.8%
Pizza Inn
2.10
0.98
2.25
16.8
17.4
0.4x
6.3x
NA
NA
NA
NM
NM
Ruth’s Chris
5.25
1.02
5.40
180.4
304.2
0.9x
8.6x
20.2x
18.8x
15.0%
134.6%
125.0%
Mean
0.4x
6.5x
20.2x
16.2x
15.8%
130.5%
106.2%
Median
0.4x
6.3x
21.1x
17.1x
15.0%
140.6%
119.8%
Rubio’s Restaurants (c)
$7.90
$3.91
$8.21
$80.8
$70.4
0.4x
5.9x
49.4x
22.6x
25.0%
197.5%
90.3%
Rubio’s Restaurants (Unaffected) (c)
$6.00
$3.91
$8.21
$60.8
$50.4
0.3x
4.3x
37.5x
17.1x
25.0%
150.0%
68.6%
(a) |
| Enterprise Value = Market Value of Equity + Net Debt + Minority Interest. (b) From Wall Street research. |
(c) |
| LTM revenue and EBITDA for the period ended February 21, 2010 per management. |
DISCUSSION MATERIALS
IV VALUATION. OVERVIEW
38
|
CONFIDENTIAL
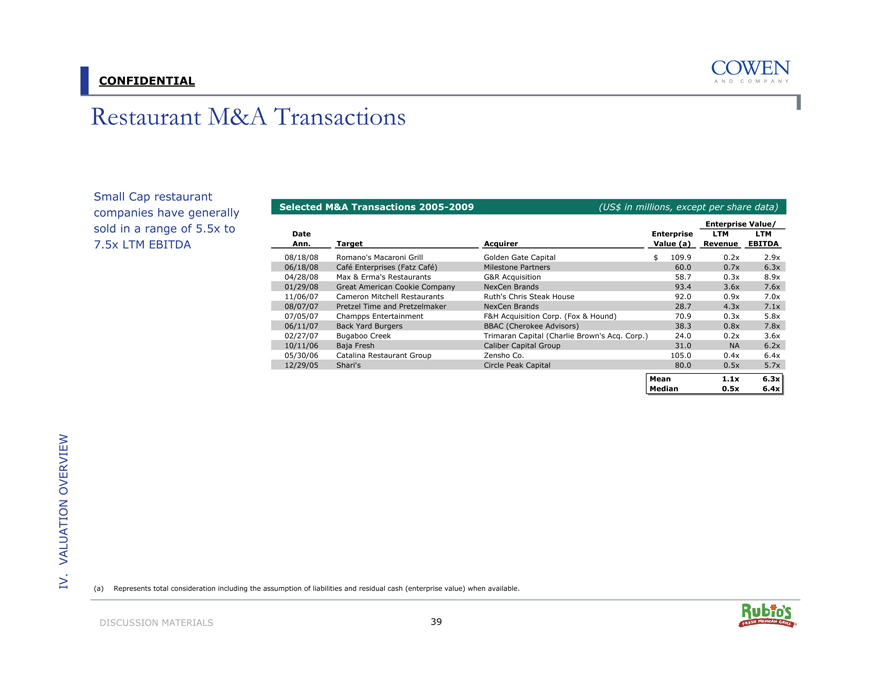
Restaurant M&A Transactions
Small Cap restaurant companies have generally sold in a range of 5.5x to 7.5x LTM EBITDA
Selected M&A Transactions 2005-2009 (US$ in millions, except per share data)
Enterprise Value/
Date
Enterprise
LTM
LTM
Ann.
Target
Acquirer
Value (a) Revenue EBITDA
08/18/08
Romano’s Macaroni Grill
Golden Gate Capital
$109.9
0.2x
2.9x
06/18/08
Café Enterprises (Fatz Café)
Milestone Partners
60.0
0.7x
6.3x
04/28/08
Max & Erma’s Restaurants
G&R Acquisition
58.7
0.3x
8.9x
01/29/08
Great American Cookie Company
NexCen Brands
93.4
3.6x
7.6x
11/06/07
Cameron Mitchell Restaurants
Ruth’s Chris Steak House
92.0
0.9x
7.0x
08/07/07
Pretzel Time and Pretzelmaker
NexCen Brands
28.7
4.3x
7.1x
07/05/07
Champps Entertainment
F&H Acquisition Corp. (Fox & Hound)
70.9
0.3x
5.8x
06/11/07
Back Yard Burgers
BBAC (Cherokee Advisors)
38.3
0.8x
7.8x
02/27/07
Bugaboo Creek
Trimaran Capital (Charlie Brown’s Acq. Corp.)
24.0
0.2x
3.6x
10/11/06
Baja Fresh
Caliber Capital Group
31.0
NA
6.2x
05/30/06
Catalina Restaurant Group
Zensho Co.
105.0
0.4x
6.4x
12/29/05
Shari’s
Circle Peak Capital
80.0
0.5x
5.7x
Mean
1.1x
6.3x
Median
0.5x
6.4x
(a) Represents total consideration including the assumption of liabilities and residual cash (enterprise value) when available.
DISCUSSION MATERIALS 39
IV. VALUATION OVERVIEW
|
CONFIDENTIAL
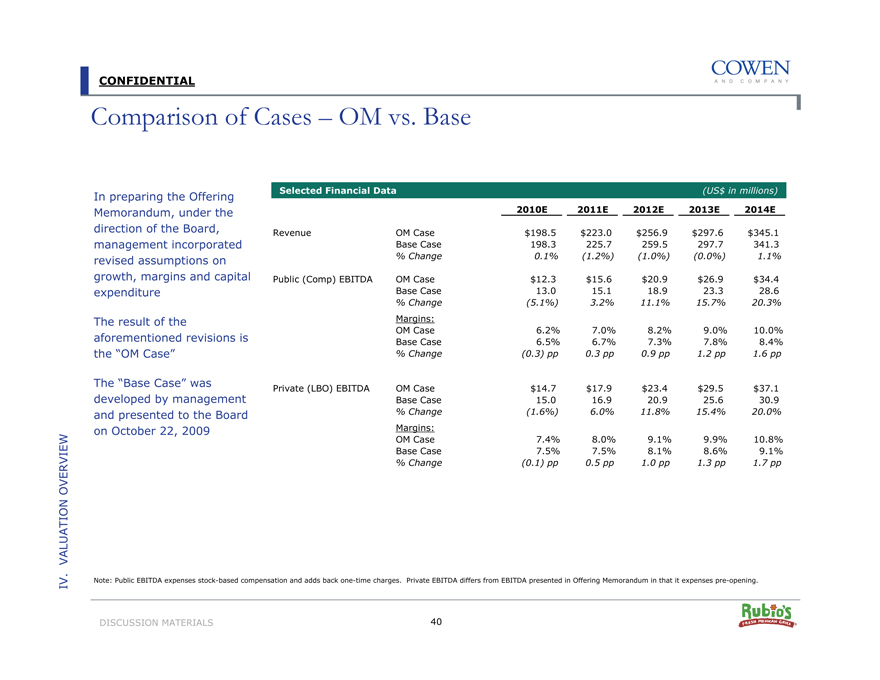
Comparison of Cases – OM vs. Base
In preparing the Offering
Selected Financial Data
(US$ in millions)
Memorandum, under the
2010E
2011E
2012E
2013E
2014E
direction of the Board,
Revenue
OM Case
$198.5
$223.0
$256.9
$297.6
$345.1
management incorporated
Base Case
198.3
225.7
259.5
297.7
341.3
revised assumptions on
% Change
0.1%
(1.2%)
(1.0%)
(0.0%)
1.1%
growth, margins and capital
Public (Comp) EBITDA
OM Case
$12.3
$15.6
$20.9
$26.9
$34.4
expenditure
Base Case
13.0
15.1
18.9
23.3
28.6
% Change
(5.1%)
3.2%
11.1%
15.7%
20.3%
The result of the
Margins:
OM Case
6.2%
7.0%
8.2%
9.0%
10.0%
aforementioned revisions is
Base Case
6.5%
6.7%
7.3%
7.8%
8.4%
the “OM Case”
% Change
(0.3) pp
0.3 pp
0.9 pp
1.2 pp
1.6 pp
The “Base Case” was
Private (LBO) EBITDA
OM Case
$14.7
$17.9
$23.4
$29.5
$37.1
developed by management
Base Case
15.0
16.9
20.9
25.6
30.9
and presented to the Board
% Change
(1.6%)
6.0%
11.8%
15.4%
20.0%
on October 22, 2009
Margins:
OM Case
7.4%
8.0%
9.1%
9.9%
10.8%
Base Case
7.5%
7.5%
8.1%
8.6%
9.1%
% Change
(0.1) pp
0.5 pp
1.0 pp
1.3 pp
1.7 pp
IV. VALUATION OVERVIEW
Note: Public EBITDA expenses stock-based compensation and adds back one-time charges. Private EBITDA differs from EBITDA presented in Offering Memorandum in that it expenses pre-opening.
DISCUSSION MATERIALS
40
|
CONFIDENTIAL
LBO Overview
We utilized a leveraged buyout (LBO) analysis to illustrate the potential value of Rubio’s to a financial buyer
We assumed that a financial buyer acquires Rubio’s utilizing a combination of equity and debt
We ran the LBO analysis using both the OM Case and the Base Case models
We have assumed the following financing assumptions:
Senior debt of 2.0x 2010 LTM EBITDA
• $28.0 million senior secured term loan
• Interest rate of 8.0%
Subordinated debt of 0.5x 2010 LTM EBITDA
• Cash interest rate of 15%
We have also assumed the following:
LTM EBITDA of $14.0 million (a)
Sale at end of fiscal 2014
Management promote of 10.0% of equity upside at exit
Buyer requires anticipated 20-30% IRR
IV. VALUATION OVERVIEW
(a) As of February 21, 2010 per management. Assumes private company EBITDA, which adds back stock-based compensation and public company costs.
DISCUSSION MATERIALS
41
|
CONFIDENTIAL
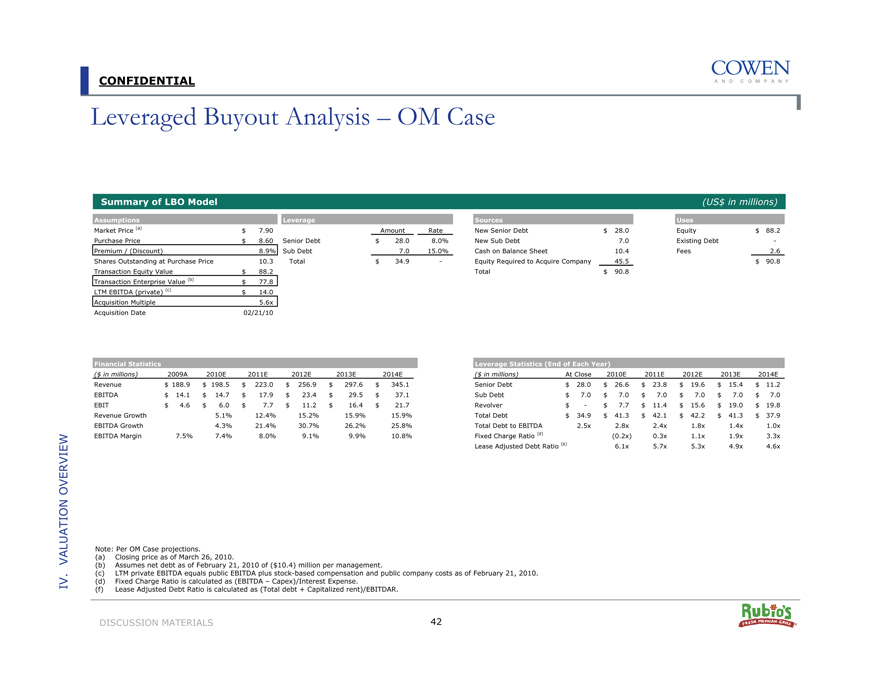
Leveraged Buyout Analysis – OM Case
Summary of LBO Model (US$ in millions)
Assumptions
Market Price (a)
$7.90
Purchase Price
$8.60
Premium / (Discount)
8.9%
Shares Outstanding at Purchase Price
10.3
Transaction Equity Value
$88.2
Transaction Enterprise Value (b)
$77.8
LTM EBITDA (private) (c)
$14.0
Acquisition Multiple
5.6x
Acquisition Date
02/21/10
Leverage
Amount
Rate
Senior Debt
$28.0
8.0%
Sub Debt
7.0
15.0%
Total
$34.9
—
Sources
New Senior Debt
$28.0
New Sub Debt
7.0
Cash on Balance Sheet
10.4
Equity Required to Acquire Company
45.5
Total
$90.8
Uses
Equity
$88.2
Existing Debt
—
Fees
2.6
$90.8
Financial Statistics
($ in millions)
2009A
2010E
2011E
2012E
2013E
2014E
Revenue
$188.9
$198.5
$223.0
$256.9
$297.6
$345.1
EBITDA
$14.1
$14.7
$17.9
$23.4
$29.5
$37.1
EBIT
$4.6
$6.0
$7.7
$11.2
$16.4
$21.7
Revenue Growth
5.1%
12.4%
15.2%
15.9%
15.9%
EBITDA Growth
4.3%
21.4%
30.7%
26.2%
25.8%
EBITDA Margin
7.5%
7.4%
8.0%
9.1%
9.9%
10.8%
Leverage Statistics (End of Each Year)
($ in millions)
At Close
2010E
2011E
2012E
2013E
2014E
Senior Debt
$28.0
$26.6
$23.8
$19.6
$15.4
$11.2
Sub Debt
$7.0
$7.0
$7.0
$7.0
$7.0
$7.0
Revolver
$—
$7.7
$11.4
$15.6
$19.0
$19.8
Total Debt
$34.9
$41.3
$42.1
$42.2
$41.3
$37.9
Total Debt to EBITDA
2.5x
2.8x
2.4x
1.8x
1.4x
1.0x
Fixed Charge Ratio (d)
(0.2x)
0.3x
1.1x
1.9x
3.3x
Lease Adjusted Debt Ratio (e)
6.1x
5.7x
5.3x
4.9x
4.6x
Note: Per OM Case projections.
(a) |
| Closing price as of March 26, 2010. |
(b) |
| Assumes net debt as of February 21, 2010 of ($10.4) million per management. |
(c) LTM private EBITDA equals public EBITDA plus stock-based compensation and public company costs as of February 21, 2010. (d) Fixed Charge Ratio is calculated as (EBITDA – Capex)/Interest Expense.
(f) |
| Lease Adjusted Debt Ratio is calculated as (Total debt + Capitalized rent)/EBITDAR. |
DISCUSSION MATERIALS 42
IV. VALUATION OVERVIEW
|

CONFIDENTIAL
Leveraged Buyout Analysis – Base Case
Summary of LBO Model
Assumptions
Market Price (a)
$7.90
Purchase Price
$8.60
Premium / (Discount)
8.9%
Shares Outstanding at Purchase Price
10.3
Transaction Equity Value
$88.2
Transaction Enterprise Value (b)
$77.8
LTM EBITDA (private) (c)
$14.0
Acquisition Multiple
5.6x
Acquisition Date
12/31/09
Leverage
Amount
Rate
Senior Debt
$28.0
8.0%
Sub Debt
7.0
15.0%
Total
$34.9
—
Sources
New Senior Debt
$28.0
New Sub Debt
7.0
Cash on Balance Sheet
10.4
Equity Required to Acquire Company
45.5
Total
$90.8
(US$ in millions)
Uses
Equity
$88.2
Existing Debt
—
Fees
2.6
$90.8
Financial Statistics
($ in millions)
2009A
2010E
2011E
2012E
2013E
2014E
Revenue
$188.9
$198.3
$225.7
$259.5
$297.7
$341.3
EBITDA
$14.1
$15.0
$16.9
$20.9
$25.6
$30.9
EBIT
$4.6
$3.7
$3.9
$5.5
$9.1
$11.8
Revenue Growth
5.0%
13.9%
15.0%
14.7%
14.7%
EBITDA Growth
6.0%
12.7%
24.0%
22.2%
21.1%
EBITDA Margin
7.5%
7.5%
7.5%
8.1%
8.6%
9.1%
Leverage Statistics (End of Each Year)
($ in millions)
At Close
2010E
2011E
2012E
2013E
2014E
Senior Debt
$28.0
$26.6
$23.8
$19.6
$15.4
$11.2
Sub Debt
$7.0
$7.0
$7.0
$7.0
$7.0
$7.0
Revolver
$—
$7.8
$15.2
$22.9
$31.5
$39.2
Total Debt
$34.9
$41.3
$45.9
$49.5
$53.9
$57.4
Total Debt to EBITDA
2.5x
2.8x
2.7x
2.4x
2.1x
1.9x
Fixed Charge Ratio (d)
(0.3x)
(0.5x)
(0.1x)
0.1x
0.5x
Lease Adjusted Coverage Ratio (e)
5.9x
5.9x
5.7x
5.5x
5.3x
IV. VALUATION OVERVIEW
Note: Per Base Case projections. Acquisition date of 12/31/09 was used since monthly breakout was unavailable. (a) Closing price as of March 26, 2010.
(b) |
| Assumes net debt as of February 21, 2010 of ($10.4) million per management. |
(c) LTM private EBITDA equals public EBITDA plus stock-based compensation and public company costs as of February 21, 2010. (d) Fixed Charge Ratio is calculated as (EBITDA – Capex)/Interest Expense.
(f) |
| Lease Adjusted Debt Ratio is calculated as (Total debt + Capitalized rent)/EBITDAR. |
DISCUSSION MATERIALS
43
|
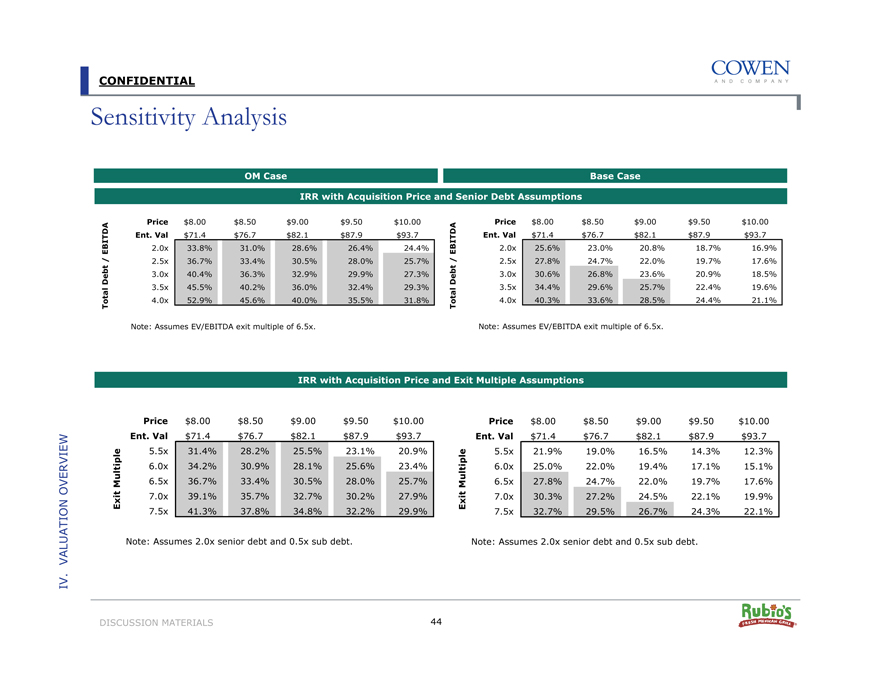
CONFIDENTIAL
Sensitivity Analysis
OM Case
Base Case
IRR with Acquisition Price and Senior Debt Assumptions
Total Debt / EBITDA
Price
$8.00
$8.50
$9.00
$9.50
$10.00
Ent. Val
$71.4
$76.7
$82.1
$87.9
$93.7
2.0x
33.8%
31.0%
28.6%
26.4%
24.4%
2.5x
36.7%
33.4%
30.5%
28.0%
25.7%
3.0x
40.4%
36.3%
32.9%
29.9%
27.3%
3.5x
45.5%
40.2%
36.0%
32.4%
29.3%
4.0x
52.9%
45.6%
40.0%
35.5%
31.8%
Total Debt / EBITDA
Price
$8.00
$8.50
$9.00
$9.50
$10.00
Ent. Val
$71.4
$76.7
$82.1
$87.9
$93.7
2.0x
25.6%
23.0%
20.8%
18.7%
16.9%
2.5x
27.8%
24.7%
22.0%
19.7%
17.6%
3.0x
30.6%
26.8%
23.6%
20.9%
18.5%
3.5x
34.4%
29.6%
25.7%
22.4%
19.6%
4.0x
40.3%
33.6%
28.5%
24.4%
21.1%
Note: Assumes EV/EBITDA exit multiple of 6.5x.
Note: Assumes EV/EBITDA exit multiple of 6.5x.
IRR with Acquisition Price and Exit Multiple Assumptions
Exit Multiple
Price
$8.00
$8.50
$9.00
$9.50
$10.00
Ent. Val
$71.4
$76.7
$82.1
$87.9
$93.7
5.5x
31.4%
28.2%
25.5%
23.1%
20.9%
6.0x
34.2%
30.9%
28.1%
25.6%
23.4%
6.5x
36.7%
33.4%
30.5%
28.0%
25.7%
7.0x
39.1%
35.7%
32.7%
30.2%
27.9%
7.5x
41.3%
37.8%
34.8%
32.2%
29.9%
Note: Assumes 2.0x senior debt and 0.5x sub debt.
Exit Multiple
Price
$8.00
$8.50
$9.00
$9.50
$10.00
Ent. Val
$71.4
$76.7
$82.1
$87.9
$93.7
5.5x
21.9%
19.0%
16.5%
14.3%
12.3%
6.0x
25.0%
22.0%
19.4%
17.1%
15.1%
6.5x
27.8%
24.7%
22.0%
19.7%
17.6%
7.0x
30.3%
27.2%
24.5%
22.1%
19.9%
7.5x
32.7%
29.5%
26.7%
24.3%
22.1%
Note: Assumes 2.0x senior debt and 0.5x sub debt.
IV. VALUATION OVERVIEW
DISCUSSION MATERIALS
44
|
CONFIDENTIAL
DCF Overview
We also utilized a discounted cash flow (DCF) model to calculate an implied value of Rubio’s
There are two key components to the DCF
??The present value of the stream of unlevered cash flows in the projected period
??The terminal value based on EBITDA in the outyear of the projected period
2010-2014 projections used for the DCF model were provided by Rubio’s management; we have shown both the OM Case and the Base Case
We presented the DCF with discount rates ranging from 19.0% to 23.0%
We assumed exit multiples in 2014 of 5.5x to 7.5x EBITDA
IV. VALUATION OVERVIEW
DISCUSSION MATERIALS
45
|
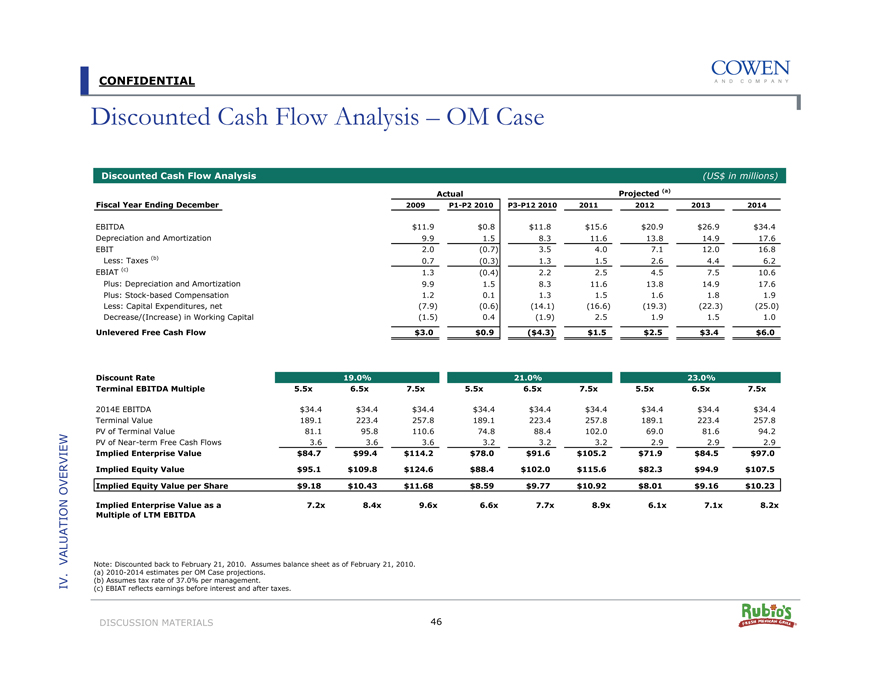
CONFIDENTIAL
Discounted Cash Flow Analysis – OM Case
Discounted Cash Flow Analysis
(US$ in millions)
Actual
Fiscal Year Ending December
2009
P1-P2 2010 P3-P12 2010
2011
2012
2013
2014
EBITDA
$11.9
$0.8
$11.8
$15.6
$20.9
$26.9
$34.4
Depreciation and Amortization
9.9
1.5
8.3
11.6
13.8
14.9
17.6
EBIT
2.0
(0.7)
3.5
4.0
7.1
12.0
16.8
Less: Taxes (b)
0.7
(0.3)
1.3
1.5
2.6
4.4
6.2
EBIAT (c)
1.3
(0.4)
2.2
2.5
4.5
7.5
10.6
Plus: Depreciation and Amortization
9.9
1.5
8.3
11.6
13.8
14.9
17.6
Plus: Stock-based Compensation
1.2
0.1
1.3
1.5
1.6
1.8
1.9
Less: Capital Expenditures, net
(7.9)
(0.6)
(14.1)
(16.6)
(19.3)
(22.3)
(25.0)
Decrease/(Increase) in Working Capital
(1.5)
0.4
(1.9)
2.5
1.9
1.5
1.0
Unlevered Free Cash Flow
$3.0
$0.9
($4.3)
$1.5
$2.5
$3.4
$6.0
Discount Rate
19.0%
21.0%
23.0%
Terminal EBITDA Multiple
5.5x
6.5x
7.5x
5.5x
6.5x
7.5x
5.5x
6.5x
7.5x
2014E EBITDA
$34.4
$34.4
$34.4
$34.4
$34.4
$34.4
$34.4
$34.4
$34.4
Terminal Value
189.1
223.4
257.8
189.1
223.4
257.8
189.1
223.4
257.8
PV of Terminal Value
81.1
95.8
110.6
74.8
88.4
102.0
69.0
81.6
94.2
PV of Near-term Free Cash Flows
3.6
3.6
3.6
3.2
3.2
3.2
2.9
2.9
2.9
Implied Enterprise Value
$84.7
$99.4
$114.2
$78.0
$91.6
$105.2
$71.9
$84.5
$97.0
Implied Equity Value
$95.1
$109.8
$124.6
$88.4
$102.0
$115.6
$82.3
$94.9
$107.5
Implied Equity Value per Share
$9.18
$10.43
$11.68
$8.59
$9.77
$10.92
$8.01
$9.16
$10.23
Implied Enterprise Value as a
7.2x
8.4x
9.6x
6.6x
7.7x
8.9x
6.1x
7.1x
8.2x
Multiple of LTM EBITDA
IV. VALUATION OVERVIEW
Note: Discounted back to February 21, 2010. Assumes balance sheet as of February 21, 2010. (a) 2010-2014 estimates per OM Case projections.
(b) |
| Assumes tax rate of 37.0% per management. |
(c) |
| EBIAT reflects earnings before interest and after taxes. |
DISCUSSION MATERIALS 46
|
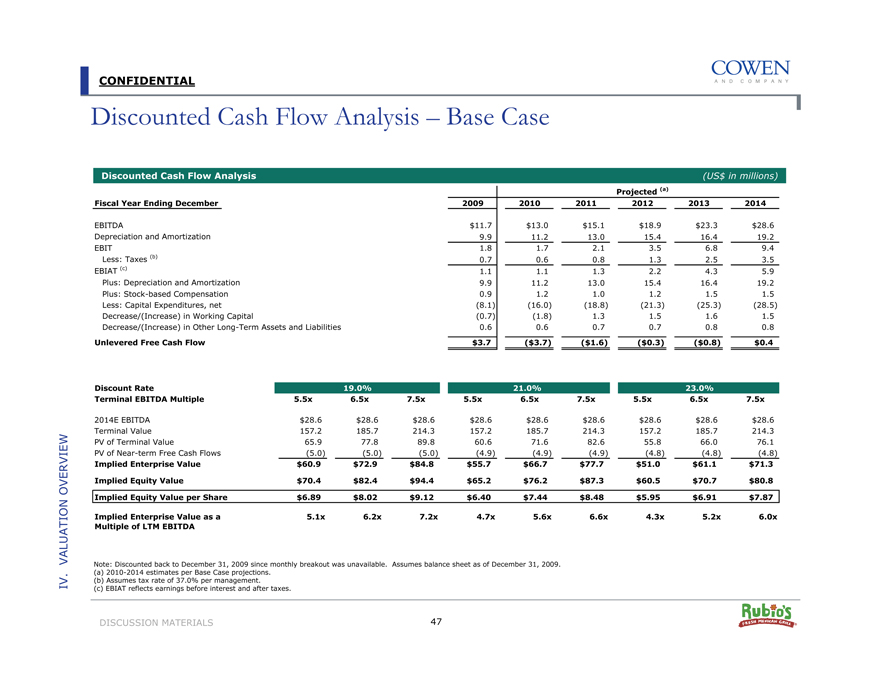
CONFIDENTIAL
Discounted Cash Flow Analysis – Base Case
Discounted Cash Flow Analysis (US$ in millions)
Projected (a)
Fiscal Year Ending December
2009
2010
2011
2012
2013
2014
EBITDA
$11.7
$13.0
$15.1
$18.9
$23.3
$28.6
Depreciation and Amortization
9.9
11.2
13.0
15.4
16.4
19.2
EBIT
1.8
1.7
2.1
3.5
6.8
9.4
Less: Taxes (b)
0.7
0.6
0.8
1.3
2.5
3.5
EBIAT (c)
1.1
1.1
1.3
2.2
4.3
5.9
Plus: Depreciation and Amortization
9.9
11.2
13.0
15.4
16.4
19.2
Plus: Stock-based Compensation
0.9
1.2
1.0
1.2
1.5
1.5
Less: Capital Expenditures, net
(8.1)
(16.0)
(18.8)
(21.3)
(25.3)
(28.5)
Decrease/(Increase) in Working Capital
(0.7)
(1.8)
1.3
1.5
1.6
1.5
Decrease/(Increase) in Other Long-Term Assets and Liabilities
0.6
0.6
0.7
0.7
0.8
0.8
Unlevered Free Cash Flow
$3.7
($3.7)
($1.6)
($0.3)
($0.8)
$0.4
Discount Rate
19.0%
21.0%
23.0%
Terminal EBITDA Multiple
5.5x
6.5x
7.5x
5.5x
6.5x
7.5x
5.5x
6.5x
7.5x
2014E EBITDA
$28.6
$28.6
$28.6
$28.6
$28.6
$28.6
$28.6
$28.6
$28.6
Terminal Value
157.2
185.7
214.3
157.2
185.7
214.3
157.2
185.7
214.3
PV of Terminal Value
65.9
77.8
89.8
60.6
71.6
82.6
55.8
66.0
76.1
PV of Near-term Free Cash Flows
(5.0)
(5.0)
(5.0)
(4.9)
(4.9)
(4.9)
(4.8)
(4.8)
(4.8)
Implied Enterprise Value
$60.9
$72.9
$84.8
$55.7
$66.7
$77.7
$51.0
$61.1
$71.3
Implied Equity Value
$70.4
$82.4
$94.4
$65.2
$76.2
$87.3
$60.5
$70.7
$80.8
Implied Equity Value per Share
$6.89
$8.02
$9.12
$6.40
$7.44
$8.48
$5.95
$6.91
$7.87
Implied Enterprise Value as a
5.1x
6.2x
7.2x
4.7x
5.6x
6.6x
4.3x
5.2x
6.0x
Multiple of LTM EBITDA
IV. VALUATION OVERVIEW
Note: Discounted back to December 31, 2009 since monthly breakout was unavailable. Assumes balance sheet as of December 31, 2009. (a) 2010-2014 estimates per Base Case projections.
(b) |
| Assumes tax rate of 37.0% per management. (c) EBIAT reflects earnings before interest and after taxes. |
DISCUSSION MATERIALS 47
|
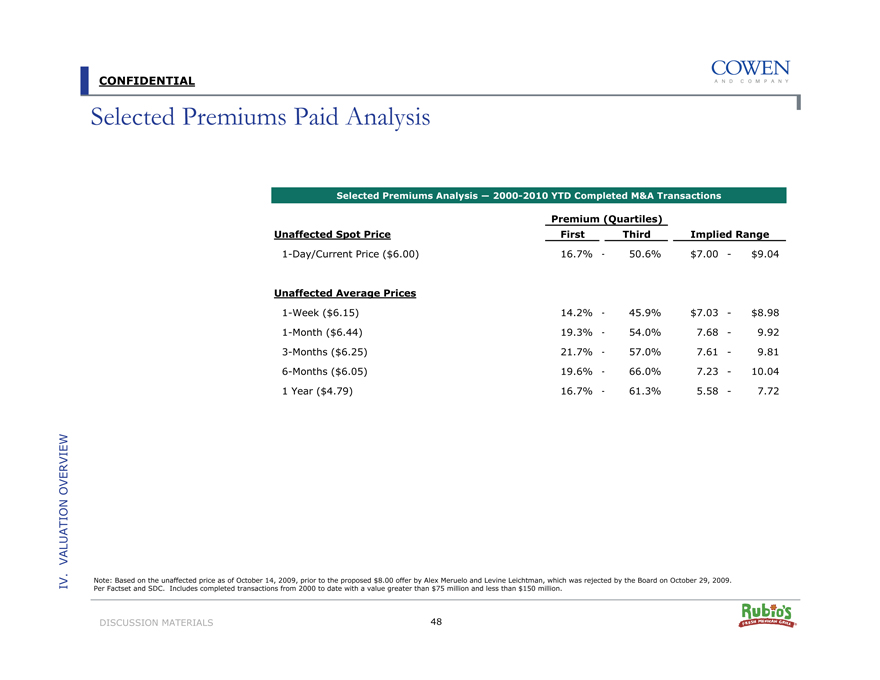
CONFIDENTIAL
Selected Premiums Paid Analysis
Selected Premiums Analysis — 2000-2010 YTD Completed M&A Transactions
Premium (Quartiles)
Unaffected Spot Price
First
Third
Implied Range
1-Day/Current Price ($6.00)
16.7%
—
50.6%
$7.00
—
$9.04
Unaffected Average Prices
1-Week ($6.15)
14.2%
—
45.9%
$7.03
—
$8.98
1-Month ($6.44)
19.3%
—
54.0%
7.68
—
9.92
3-Months ($6.25)
21.7%
—
57.0%
7.61
—
9.81
6-Months ($6.05)
19.6%
—
66.0%
7.23
—
10.04
1 Year ($4.79)
16.7%
—
61.3%
5.58
—
7.72
IV VALUATION OVERVIEW.
Note: Based on the unaffected price as of October 14, 2009, prior to the proposed $8.00 offer by Alex Meruelo and Levine Leichtman, which was rejected by the Board on October 29, 2009. Per Factset and SDC. Includes completed transactions from 2000 to date with a value greater than $75 million and less than $150 million.
DISCUSSION MATERIALS 48
|
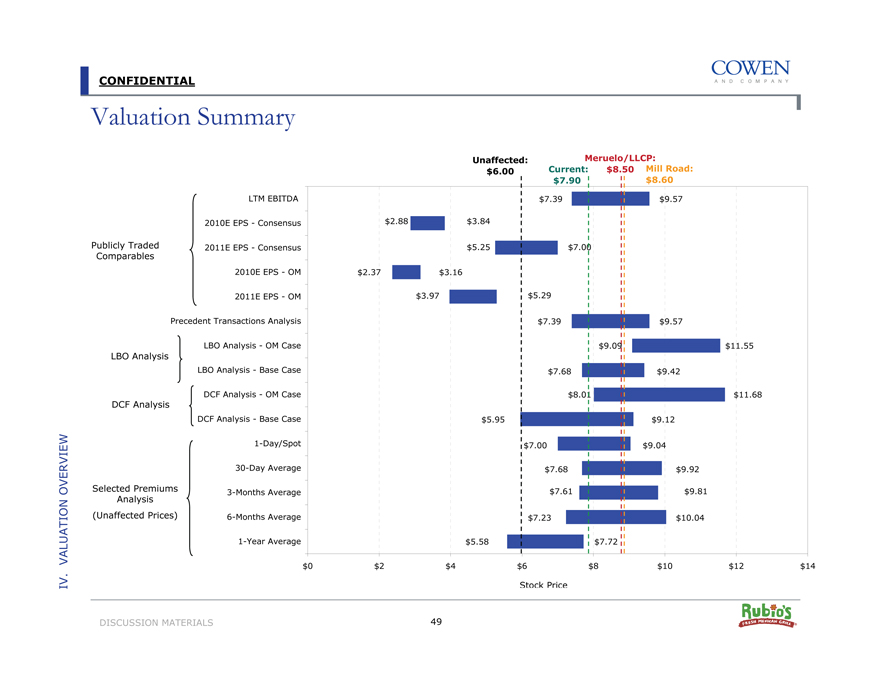
CONFIDENTIAL
Valuation Summary
LTM EBITDA
2010E EPS - Consensus
Publicly Traded
2011E EPS - Consensus
Comparables
2010E EPS - OM
2011E EPS - OM
Precedent Transactions Analysis
LBO Analysis - OM Case
LBO Analysis
LBO Analysis - Base Case
DCF Analysis - OM Case
DCF Analysis
DCF Analysis - Base Case
1-Day/Spot
30-Day Average
Selected Premiums
3-Months Average
Analysis
(Unaffected Prices)
6-Months Average
1-Year Average
Unaffected: $6.00
Meruelo/LLCP: $8.50 Current: $7.90 Mill Road: $8.60
$7.39
$9.57
$2.88
$3.84
$5.25
$7.00
$2.37
$3.16
$3.97
$5.29
$7.39
$9.57
$9.09
$11.55
$7.68
$9.42
$8.01
$11.68
$5.95
$9.12
$7.00
$9.04
$7.68
$9.92
$7.61
$9.81
$7.23
$10.04
$5.58
$7.72
$0 $2 $4 $6 $8 $10 $12 $14 Stock Price
IV VALUATION OVERVIEW.
DISCUSSION MATERIALS 49
|
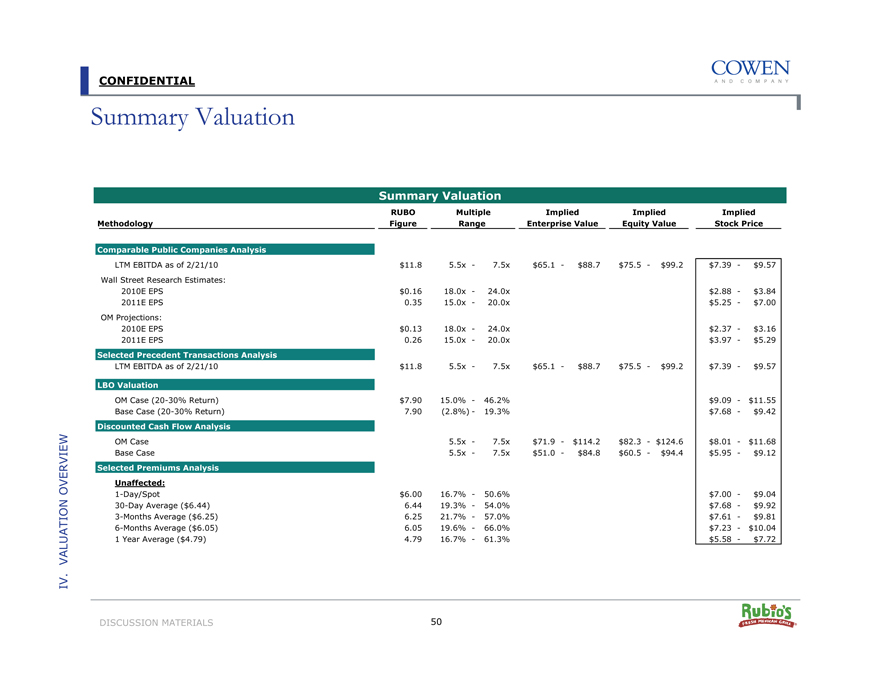
CONFIDENTIAL
Summary Valuation
Summary Valuation
RUBO
Multiple
Implied
Implied
Implied
Methodology
Figure
Range
Enterprise Value
Equity Value
Stock Price
Comparable Public Companies Analysis
LTM EBITDA as of 2/21/10
$11.8
5.5x
—
7.5x
$65.1
—
$88.7
$75.5
—
$99.2
$7.39
—
$9.57
Wall Street Research Estimates:
2010E EPS
$0.16
18.0x
—
24.0x
$2.88
—
$3.84
2011E EPS
0.35
15.0x
—
20.0x
$5.25
—
$7.00
OM Projections:
2010E EPS
$0.13
18.0x
—
24.0x
$2.37
—
$3.16
2011E EPS
0.26
15.0x
—
20.0x
$3.97
—
$5.29
Selected Precedent Transactions Analysis
LTM EBITDA as of 2/21/10
$11.8
5.5x
—
7.5x
$65.1
—
$88.7
$75.5
—
$99.2
$7.39
—
$9.57
LBO Valuation
OM Case (20-30% Return)
$7.90
15.0%
—
46.2%
$9.09
—
$11.55
Base Case (20-30% Return)
7.90
(2.8%) -
19.3%
$7.68
—
$9.42
Discounted Cash Flow Analysis
OM Case
5.5x
—
7.5x
$71.9
—
$114.2
$82.3
—
$124.6
$8.01
—
$11.68
Base Case
5.5x
—
7.5x
$51.0
—
$84.8
$60.5
—
$94.4
$5.95
—
$9.12
Selected Premiums Analysis
Unaffected:
1-Day/Spot
$6.00
16.7%
—
50.6%
$7.00
—
$9.04
30-Day Average ($6.44)
6.44
19.3%
—
54.0%
$7.68
—
$9.92
3-Months Average ($6.25)
6.25
21.7%
—
57.0%
$7.61
—
$9.81
6-Months Average ($6.05)
6.05
19.6%
—
66.0%
$7.23
—
$10.04
1 Year Average ($4.79)
4.79
16.7%
—
61.3%
$5.58
—
$7.72
IV VALUATION OVERVIEW.
DISCUSSION MATERIALS 50
|
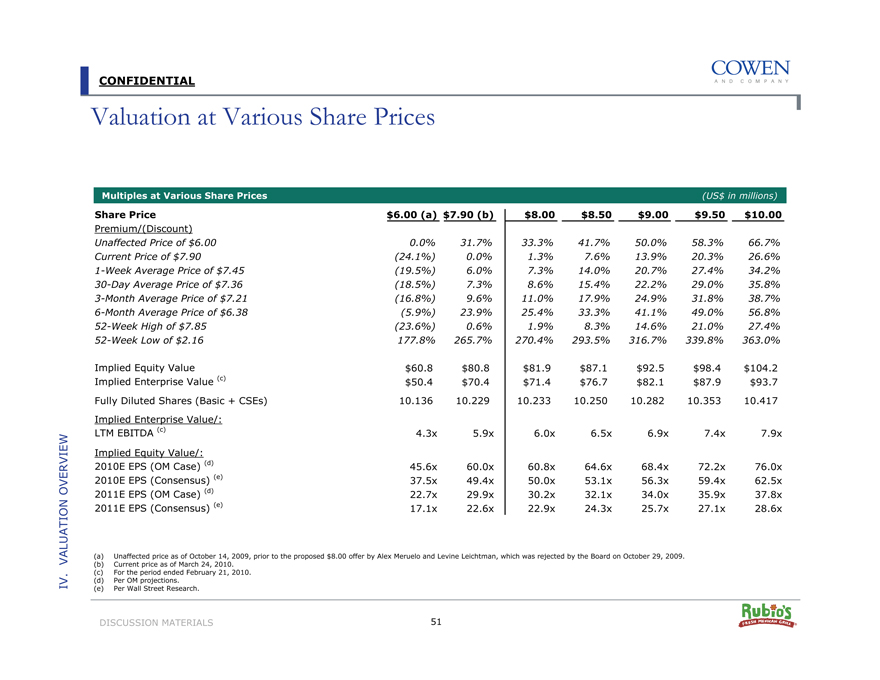
CONFIDENTIAL
Valuation at Various Share Prices
Multiples at Various Share Prices
(US$ in millions)
Share Price
$6.00 (a) $7.90 (b)
$8.00
$8.50
$9.00
$9.50
$10.00
Premium/(Discount)
Unaffected Price of $6.00
0.0%
31.7%
33.3%
41.7%
50.0%
58.3%
66.7%
Current Price of $7.90
(24.1%)
0.0%
1.3%
7.6%
13.9%
20.3%
26.6%
1-Week Average Price of $7.45
(19.5%)
6.0%
7.3%
14.0%
20.7%
27.4%
34.2%
30-Day Average Price of $7.36
(18.5%)
7.3%
8.6%
15.4%
22.2%
29.0%
35.8%
3-Month Average Price of $7.21
(16.8%)
9.6%
11.0%
17.9%
24.9%
31.8%
38.7%
6-Month Average Price of $6.38
(5.9%)
23.9%
25.4%
33.3%
41.1%
49.0%
56.8%
52-Week High of $7.85
(23.6%)
0.6%
1.9%
8.3%
14.6%
21.0%
27.4%
52-Week Low of $2.16
177.8%
265.7%
270.4%
293.5%
316.7%
339.8%
363.0%
Implied Equity Value
$60.8
$80.8
$81.9
$87.1
$92.5
$98.4
$104.2
Implied Enterprise Value (c)
$50.4
$70.4
$71.4
$76.7
$82.1
$87.9
$93.7
Fully Diluted Shares (Basic + CSEs)
10.136
10.229
10.233
10.250
10.282
10.353
10.417
Implied Enterprise Value/:
LTM EBITDA (c)
4.3x
5.9x
6.0x
6.5x
6.9x
7.4x
7.9x
Implied Equity Value/:
2010E EPS (OM Case) (d)
45.6x
60.0x
60.8x
64.6x
68.4x
72.2x
76.0x
2010E EPS (Consensus) (e)
37.5x
49.4x
50.0x
53.1x
56.3x
59.4x
62.5x
2011E EPS (OM Case) (d)
22.7x
29.9x
30.2x
32.1x
34.0x
35.9x
37.8x
2011E EPS (Consensus) (e)
17.1x
22.6x
22.9x
24.3x
25.7x
27.1x
28.6x
IV VALUATION OVERVIEW.
(a) Unaffected price as of October 14, 2009, prior to the proposed $8.00 offer by Alex Meruelo and Levine Leichtman, which was rejected by the Board on October 29, 2009. (b) Current price as of March 24, 2010.
(c) |
| For the period ended February 21, 2010. (d) Per OM projections. |
(e) |
| Per Wall Street Research. |
DISCUSSION MATERIALS 51
|
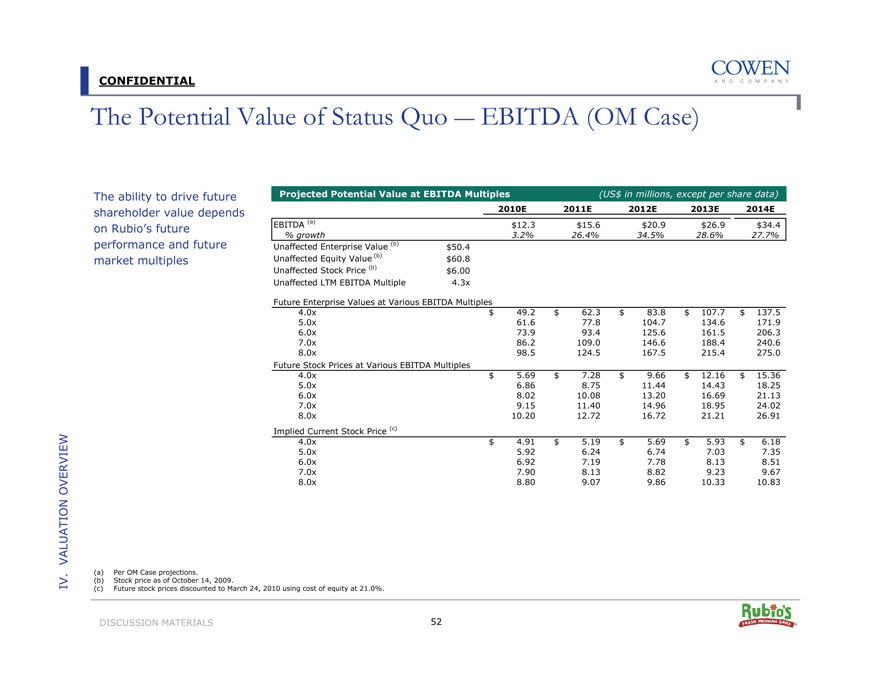
CONFIDENTIAL
The Potential Value of Status Quo —EBITDA (OM Case)
The ability to drive future shareholder value depends on Rubio’s future performance and future market multiples
Projected Potential Value at EBITDA Multiples
(US$ in millions, except per share data)
2010E
2011E
2012E
2013E
2014E
EBITDA (a)
$12.3
$15.6
$20.9
$26.9
$34.4
% growth
3.2%
26.4%
34.5%
28.6%
27.7%
Unaffected Enterprise Value (b)
$50.4
Unaffected Equity Value (b)
$60.8
Unaffected Stock Price (b)
$6.00
Unaffected LTM EBITDA Multiple
4.3x
Future Enterprise Values at Various EBITDA Multiples
4.0x
$49.2
$62.3
$83.8
$107.7
$137.5
5.0x
61.6
77.8
104.7
134.6
171.9
6.0x
73.9
93.4
125.6
161.5
206.3
7.0x
86.2
109.0
146.6
188.4
240.6
8.0x
98.5
124.5
167.5
215.4
275.0
Future Stock Prices at Various EBITDA Multiples
4.0x
$5.69
$7.28
$9.66
$12.16
$15.36
5.0x
6.86
8.75
11.44
14.43
18.25
6.0x
8.02
10.08
13.20
16.69
21.13
7.0x
9.15
11.40
14.96
18.95
24.02
8.0x
10.20
12.72
16.72
21.21
26.91
Implied Current Stock Price (c)
4.0x
$4.91
$5.19
$5.69
$5.93
$6.18
5.0x
5.92
6.24
6.74
7.03
7.35
6.0x
6.92
7.19
7.78
8.13
8.51
7.0x
7.90
8.13
8.82
9.23
9.67
8.0x
8.80
9.07
9.86
10.33
10.83
IV VALUATION OVERVIEW.
(a) |
| Per OM Case projections. |
(b) |
| Stock price as of October 14, 2009. |
(c) |
| Future stock prices discounted to March 24, 2010 using cost of equity at 21.0%. |
DISCUSSION MATERIALS 52
|
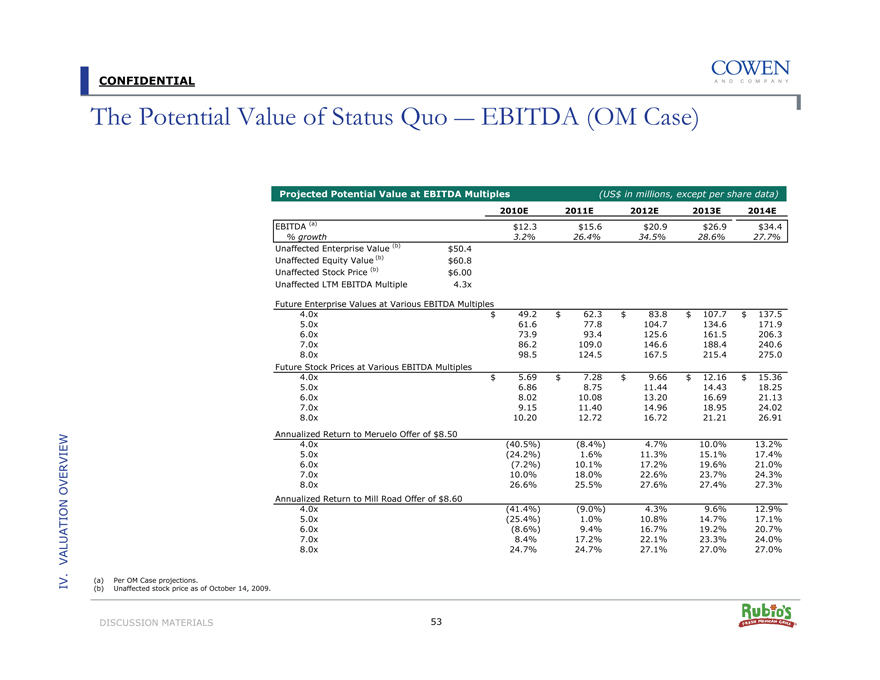
CONFIDENTIAL
The Potential Value of Status Quo —EBITDA (OM Case)
Projected Potential Value at EBITDA Multiples
(US$ in millions, except per share data)
2010E
2011E
2012E
2013E
2014E
EBITDA (a)
$12.3
$15.6
$20.9
$26.9
$34.4
% growth
3.2%
26.4%
34.5%
28.6%
27.7%
Unaffected Enterprise Value (b)
$50.4
Unaffected Equity Value (b)
$60.8
Unaffected Stock Price (b)
$6.00
Unaffected LTM EBITDA Multiple
4.3x
Future Enterprise Values at Various EBITDA Multiples
4.0x
$49.2
$62.3
$83.8
$107.7
$137.5
5.0x
61.6
77.8
104.7
134.6
171.9
6.0x
73.9
93.4
125.6
161.5
206.3
7.0x
86.2
109.0
146.6
188.4
240.6
8.0x
98.5
124.5
167.5
215.4
275.0
Future Stock Prices at Various EBITDA Multiples
4.0x
$5.69
$7.28
$9.66
$12.16
$15.36
5.0x
6.86
8.75
11.44
14.43
18.25
6.0x
8.02
10.08
13.20
16.69
21.13
7.0x
9.15
11.40
14.96
18.95
24.02
8.0x
10.20
12.72
16.72
21.21
26.91
Annualized Return to Meruelo Offer of $8.50
4.0x
(40.5%)
(8.4%)
4.7%
10.0%
13.2%
5.0x
(24.2%)
1.6%
11.3%
15.1%
17.4%
6.0x
(7.2%)
10.1%
17.2%
19.6%
21.0%
7.0x
10.0%
18.0%
22.6%
23.7%
24.3%
8.0x
26.6%
25.5%
27.6%
27.4%
27.3%
Annualized Return to Mill Road Offer of $8.60
4.0x
(41.4%)
(9.0%)
4.3%
9.6%
12.9%
5.0x
(25.4%)
1.0%
10.8%
14.7%
17.1%
6.0x
(8.6%)
9.4%
16.7%
19.2%
20.7%
7.0x
8.4%
17.2%
22.1%
23.3%
24.0%
8.0x
24.7%
24.7%
27.1%
27.0%
27.0%
IV VALUATION OVERVIEW.
(a) |
| Per OM Case projections. |
(b) |
| Unaffected stock price as of October 14, 2009. |
DISCUSSION MATERIALS 53
|
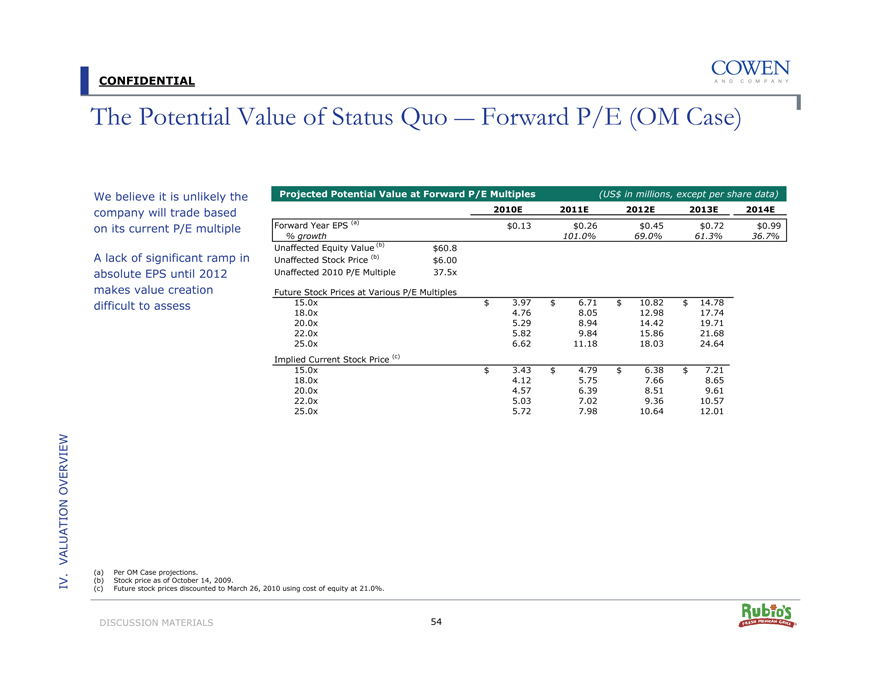
CONFIDENTIAL
The Potential Value of Status Quo —Forward P/E (OM Case)
We believe it is unlikely the company will trade based on its current P/E multiple
A lack of significant ramp in absolute EPS until 2012 makes value creation difficult to assess
IV VALUATION OVERVIEW.
Projected Potential Value at Forward P/E Multiples
(US$ in millions, except per share data)
2010E
2011E
2012E
2013E
2014E
Forward Year EPS (a)
$0.13
$0.26
$0.45
$0.72
$0.99
% growth
101.0%
69.0%
61.3%
36.7%
Unaffected Equity Value (b)
$60.8
Unaffected Stock Price (b)
$6.00
Unaffected 2010 P/E Multiple
37.5x
Future Stock Prices at Various P/E Multiples
15.0x
$3.97
$6.71
$10.82
$14.78
18.0x
4.76
8.05
12.98
17.74
20.0x
5.29
8.94
14.42
19.71
22.0x
5.82
9.84
15.86
21.68
25.0x
6.62
11.18
18.03
24.64
Implied Current Stock Price (c)
15.0x
$3.43
$4.79
$6.38
$7.21
18.0x
4.12
5.75
7.66
8.65
20.0x
4.57
6.39
8.51
9.61
22.0x
5.03
7.02
9.36
10.57
25.0x
5.72
7.98
10.64
12.01
(a) |
| Per OM Case projections. |
(b) |
| Stock price as of October 14, 2009. |
(c) |
| Future stock prices discounted to March 26, 2010 using cost of equity at 21.0%. |
DISCUSSION MATERIALS 54
|
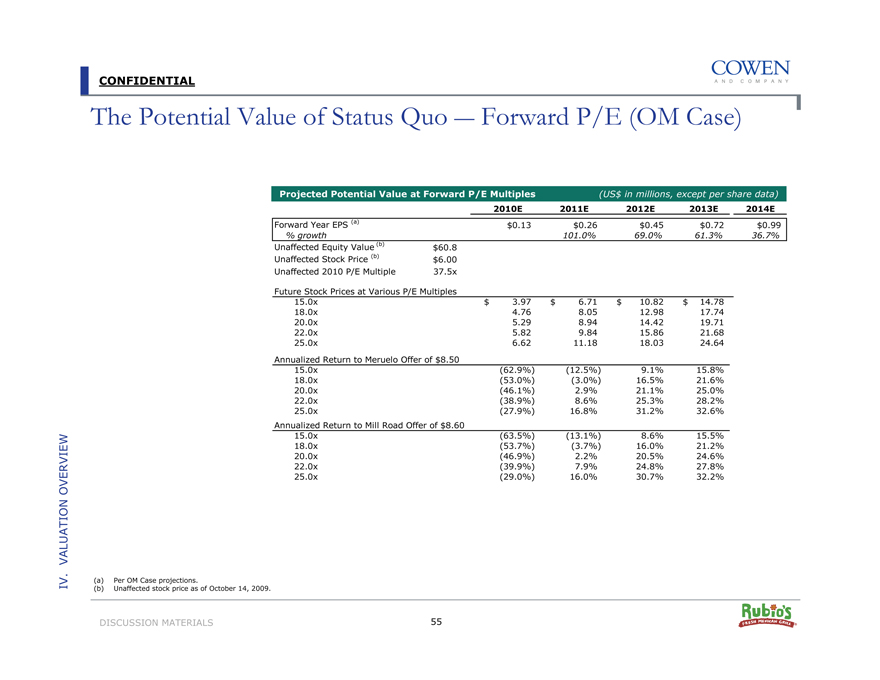
CONFIDENTIAL
The Potential Value of Status Quo —Forward P/E (OM Case)
Projected Potential Value at Forward P/E Multiples
(US$ in millions, except per share data)
2010E
2011E
2012E
2013E
2014E
Forward Year EPS (a)
$0.13
$0.26
$0.45
$0.72
$0.99
% growth
101.0%
69.0%
61.3%
36.7%
Unaffected Equity Value (b)
$60.8
Unaffected Stock Price (b)
$6.00
Unaffected 2010 P/E Multiple
37.5x
Future Stock Prices at Various P/E Multiples
15.0x
$3.97
$6.71
$10.82
$14.78
18.0x
4.76
8.05
12.98
17.74
20.0x
5.29
8.94
14.42
19.71
22.0x
5.82
9.84
15.86
21.68
25.0x
6.62
11.18
18.03
24.64
Annualized Return to Meruelo Offer of $8.50
15.0x
(62.9%)
(12.5%)
9.1%
15.8%
18.0x
(53.0%)
(3.0%)
16.5%
21.6%
20.0x
(46.1%)
2.9%
21.1%
25.0%
22.0x
(38.9%)
8.6%
25.3%
28.2%
25.0x
(27.9%)
16.8%
31.2%
32.6%
Annualized Return to Mill Road Offer of $8.60
15.0x
(63.5%)
(13.1%)
8.6%
15.5%
18.0x
(53.7%)
(3.7%)
16.0%
21.2%
20.0x
(46.9%)
2.2%
20.5%
24.6%
22.0x
(39.9%)
7.9%
24.8%
27.8%
25.0x
(29.0%)
16.0%
30.7%
32.2%
IV. VALUATION OVERVIEW
(a) |
| Per OM Case projections. |
(b) |
| Unaffected stock price as of October 14, 2009. |
DISCUSSION MATERIALS 55
|
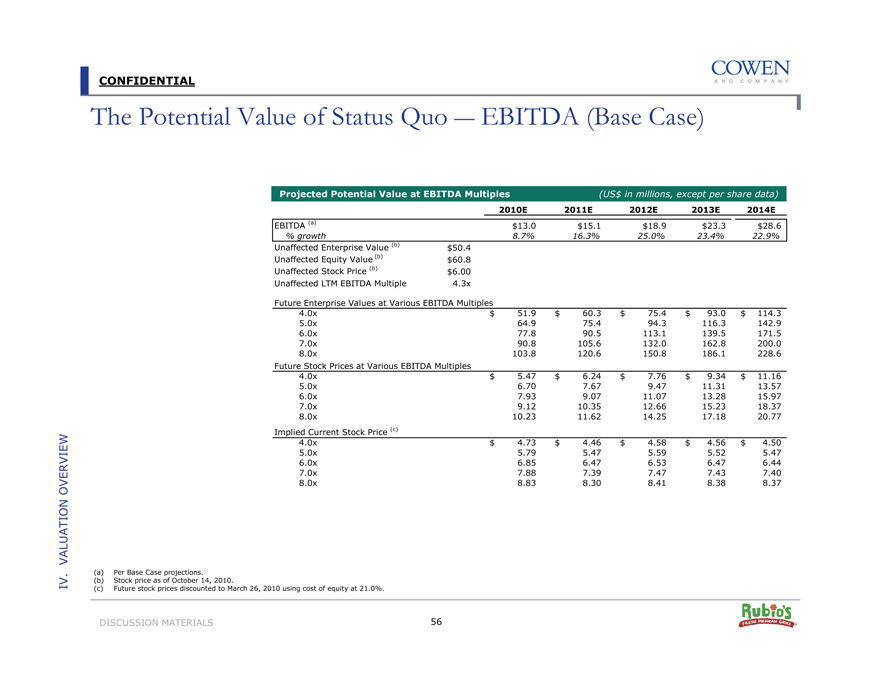
CONFIDENTIAL
The Potential Value of Status Quo —EBITDA (Base Case)
Projected Potential Value at EBITDA Multiples
(US$ in millions, except per share data)
2010E
2011E
2012E
2013E
2014E
EBITDA (a)
$13.0
$15.1
$18.9
$23.3
$28.6
% growth
8.7%
16.3%
25.0%
23.4%
22.9%
Unaffected Enterprise Value (b)
$50.4
Unaffected Equity Value (b)
$60.8
Unaffected Stock Price (b)
$6.00
Unaffected LTM EBITDA Multiple
4.3x
Future Enterprise Values at Various EBITDA Multiples
4.0x
$51.9
$60.3
$75.4
$93.0
$114.3
5.0x
64.9
75.4
94.3
116.3
142.9
6.0x
77.8
90.5
113.1
139.5
171.5
7.0x
90.8
105.6
132.0
162.8
200.0
8.0x
103.8
120.6
150.8
186.1
228.6
Future Stock Prices at Various EBITDA Multiples
4.0x
$5.47
$6.24
$7.76
$9.34
$11.16
5.0x
6.70
7.67
9.47
11.31
13.57
6.0x
7.93
9.07
11.07
13.28
15.97
7.0x
9.12
10.35
12.66
15.23
18.37
8.0x
10.23
11.62
14.25
17.18
20.77
Implied Current Stock Price (c)
4.0x
$4.73
$4.46
$4.58
$4.56
$4.50
5.0x
5.79
5.47
5.59
5.52
5.47
6.0x
6.85
6.47
6.53
6.47
6.44
7.0x
7.88
7.39
7.47
7.43
7.40
8.0x
8.83
8.30
8.41
8.38
8.37
IV. VALUATION OVERVIEW
(a) |
| Per Base Case projections. (b) Stock price as of October 14, 2010. |
(c) |
| Future stock prices discounted to March 26, 2010 using cost of equity at 21.0%. |
DISCUSSION MATERIALS 56
|
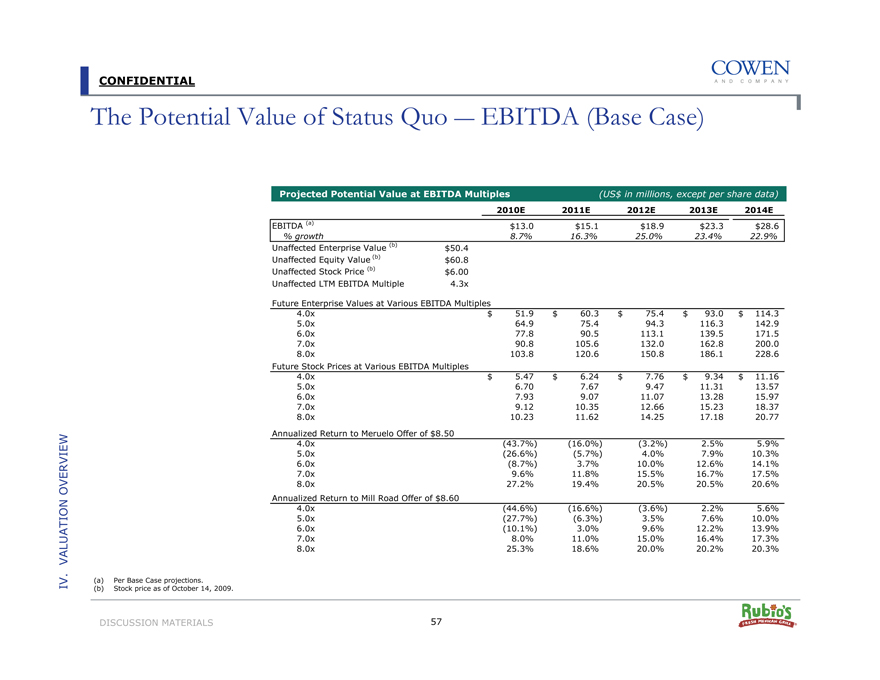
CONFIDENTIAL
The Potential Value of Status Quo —EBITDA (Base Case)
Projected Potential Value at EBITDA Multiples
(US$ in millions, except per share data)
2010E
2011E
2012E
2013E
2014E
EBITDA (a)
$13.0
$15.1
$18.9
$23.3
$28.6
% growth
8.7%
16.3%
25.0%
23.4%
22.9%
Unaffected Enterprise Value (b)
$50.4
Unaffected Equity Value (b)
$60.8
Unaffected Stock Price (b)
$6.00
Unaffected LTM EBITDA Multiple
4.3x
Future Enterprise Values at Various EBITDA Multiples
4.0x
$51.9
$60.3
$75.4
$93.0
$114.3
5.0x
64.9
75.4
94.3
116.3
142.9
6.0x
77.8
90.5
113.1
139.5
171.5
7.0x
90.8
105.6
132.0
162.8
200.0
8.0x
103.8
120.6
150.8
186.1
228.6
Future Stock Prices at Various EBITDA Multiples
4.0x
$5.47
$6.24
$7.76
$9.34
$11.16
5.0x
6.70
7.67
9.47
11.31
13.57
6.0x
7.93
9.07
11.07
13.28
15.97
7.0x
9.12
10.35
12.66
15.23
18.37
8.0x
10.23
11.62
14.25
17.18
20.77
Annualized Return to Meruelo Offer of $8.50
4.0x
(43.7%)
(16.0%)
(3.2%)
2.5%
5.9%
5.0x
(26.6%)
(5.7%)
4.0%
7.9%
10.3%
6.0x
(8.7%)
3.7%
10.0%
12.6%
14.1%
7.0x
9.6%
11.8%
15.5%
16.7%
17.5%
8.0x
27.2%
19.4%
20.5%
20.5%
20.6%
Annualized Return to Mill Road Offer of $8.60
4.0x
(44.6%)
(16.6%)
(3.6%)
2.2%
5.6%
5.0x
(27.7%)
(6.3%)
3.5%
7.6%
10.0%
6.0x
(10.1%)
3.0%
9.6%
12.2%
13.9%
7.0x
8.0%
11.0%
15.0%
16.4%
17.3%
8.0x
25.3%
18.6%
20.0%
20.2%
20.3%
IV. VALUATION OVERVIEW
(a) |
| Per Base Case projections. (b) Stock price as of October 14, 2009. |
DISCUSSION MATERIALS 57
|
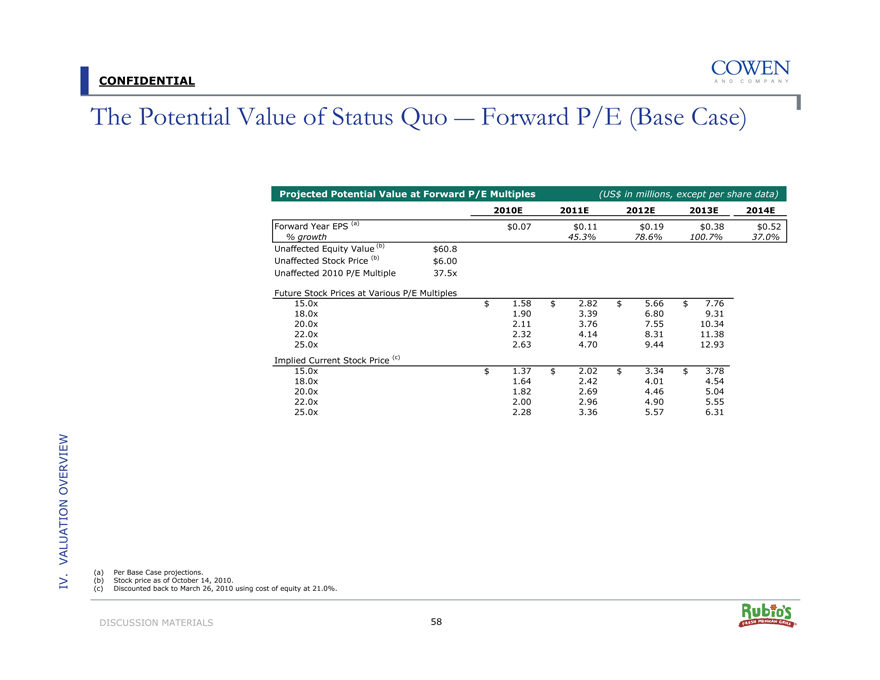
CONFIDENTIAL
The Potential Value of Status Quo — Forward P/E (Base Case)
Projected Potential Value at Forward P/E Multiples
(US$ in millions, except per share data)
2010E
2011E
2012E
2013E
2014E
Forward Year EPS (a)
$0.07
$0.11
$0.19
$0.38
$0.52
% growth
45.3%
78.6%
100.7%
37.0%
Unaffected Equity Value (b)
$60.8
Unaffected Stock Price (b)
$6.00
6Unaffected 2010 P/E Multiple
37.5x
Future Stock Prices at Various P/E Multiples
15.0x
$1.58
$2.82
$5.66
$7.76
18.0x
1.90
3.39
6.80
9.31
20.0x
2.11
3.76
7.55
10.34
22.0x
2.32
4.14
8.31
11.38
25.0x
2.63
4.70
9.44
12.93
Implied Current Stock Price (c)
15.0x
$1.37
$2.02
$3.34
$3.78
18.0x
1.64
2.42
4.01
4.54
20.0x
1.82
2.69
4.46
5.04
22.0x
2.00
2.96
4.90
5.55
25.0x
2.28
3.36
5.57
6.31
IV. VALUATION OVERVIEW
(a) |
| Per Base Case projections. (b) Stock price as of October 14, 2010. |
(c) |
| Discounted back to March 26, 2010 using cost of equity at 21.0%. |
DISCUSSION MATERIALS 58
|

CONFIDENTIAL
The Potential Value of Status Quo — Forward P/E (Base Case)
Projected Potential Value at Forward P/E Multiples
(US$ in millions, except per share data)
2010E
2011E
2012E
2013E
2014E
Forward Year EPS (a)
$0.07
$0.11
$0.19
$0.38
$0.52
% growth
45.3%
78.6%
100.7%
37.0%
Unaffected Equity Value (b)
$60.8
Unaffected Stock Price (b)
$6.00
Unaffected 2010 P/E Multiple
37.5x
Future Stock Prices at Various P/E Multiples
15.0x
$1.58
$
2.82 $
5.66
$7.76
18.0x
1.90
3.39
6.80
9.31
20.0x
2.11
3.76
7.55
10.34
22.0x
2.32
4.14
8.31
11.38
25.0x
2.63
4.70
9.44
12.93
Annualized Return to Meruelo Offer of $8.50
15.0x
(88.8%)
(46.4%)
(13.6%)
(2.4%)
18.0x
(85.8%)
(40.6%)
(7.8%)
2.4%
20.0x
(83.8%)
(36.9%)
(4.2%)
5.3%
22.0x
(81.6%)
(33.4%)
(0.8%)
8.0%
25.0x
(78.3%)
(28.4%)
3.9%
11.8%
Annualized Return to Mill Road Offer of $8.60
15.0x
(89.0%)
(46.8%)
(14.0%)
(2.7%)
18.0x
(86.1%)
(41.0%)
(8.2%)
2.1%
20.0x
(84.0%)
(37.4%)
(4.6%)
5.0%
22.0x
(81.9%)
(33.9%)
(1.2%)
7.7%
25.0x
(78.6%)
(28.9%)
3.4%
11.4%
IV. VALUATION OVERVIEW
(a) |
| Per Base Case projections. (b) Stock price as of October 14, 2009. |
DISCUSSION MATERIALS 59
|
CONFIDENTIAL
V. Discussions and Q&A