| | OMB APPROVAL |
| | OMB Number: | 3235-0570 |
| | Expires: | April 30, 2008 |
| UNITED STATES | Estimated average burden hours per response. . . . . . . . . . . . . . . . .19.4 |
| SECURITIES AND EXCHANGE COMMISSION | |
| Washington, D.C. 20549 | |
| | | | |
FORM N-CSR
CERTIFIED SHAREHOLDER REPORT OF REGISTERED
MANAGEMENT INVESTMENT COMPANIES
Investment Company Act file number | 811-9477 |
|
ING Variable Insurance Trust |
(Exact name of registrant as specified in charter) |
|
7337 E. Doubletree Ranch Rd., Scottsdale, AZ | | 85258 |
(Address of principal executive offices) | | (Zip code) |
|
The Corporation Trust Company, 1209 Orange Street, Wilmington, DE 19801 |
(Name and address of agent for service) |
|
Registrant’s telephone number, including area code: | 1-800-992-0180 | |
|
Date of fiscal year end: | December 31 | |
|
Date of reporting period: | January 1, 2007 to June 30, 2007 | |
| | | | | | | | | |
ITEM 1. REPORTS TO STOCKHOLDERS.
The following is a copy of the report transmitted to stockholders pursuant to Rule 30e-1 under the Act (17 CFR 270.30e-1):

Funds
Semi-Annual Report
June 30, 2007
ING VP Global Equity Dividend Portfolio
This report is submitted for general information to shareholders of the ING Funds. It is not authorized for distribution to prospective shareholders unless accompanied or preceded by a prospectus which includes details regarding the funds' investment objectives, risks, charges, expenses and other information. This information should be read carefully.

TABLE OF CONTENTS
| President's Letter | | | 1 | | |
|
| Market Perspective | | | 2 | | |
|
| Shareholder Expense Example | | | 4 | | |
|
| Statement of Assets and Liabilities | | | 5 | | |
|
| Statement of Operations | | | 6 | | |
|
| Statements of Changes in Net Assets | | | 7 | | |
|
| Financial Highlights | | | 8 | | |
|
| Notes to Financial Statements | | | 9 | | |
|
| Portfolio of Investments | | | 18 | | |
|
PROXY VOTING INFORMATION
A description of the policies and procedures that the Portfolio uses to determine how to vote proxies related to portfolio securities is available (1) without charge, upon request, by calling Shareholder Services toll-free at (800) 992-0180; (2) on the ING Funds' website at www.ingfunds.com; and (3) on the SEC's website at www.sec.gov. Information regarding how the Portfolio voted proxies related to portfolio securities during the most recent 12-month period ended June 30 is available without charge on the Funds' website at www.ingfunds.com and on the SEC's website at www.sec.gov.
QUARTERLY PORTFOLIO HOLDINGS
The Portfolio files its complete schedule of portfolio holdings with the SEC for the first and third quarters of each fiscal year on Form N-Q. The Portfolio's Forms N-Q are available on the SEC's website at www.sec.gov. The Portfolio's Forms N-Q may be reviewed and copied at the SEC's Public Reference Room in Washington, DC, and information on the operation of the Public Reference Room may be obtained by calling (800)SEC-0330; and is available upon request from the Portfolio by calling Shareholder Services toll-free at (800) 992-0180.
(THIS PAGE INTENTIONALLY LEFT BLANK)
PRESIDENT'S LETTER

Dear Shareholder,
So far, it has been a volatile year in the markets. In February, we saw an unprecedented, single-day freefall in Chinese stocks that sent tremors throughout global markets. Closer to home, we witnessed a downturn in the U.S. sub-prime mortgage industry that continues to impact fixed income investments as well as real estate and equity markets worldwide.
When friends and colleagues in the industry voice concerns about the market's recent volatility, I remind them that such ongoing events are fairly normal and that they underscore the importance of a well-diversified investment strategy. Studies have shown that an investment strategy allocated across a diverse group of asset classes and investment sectors can help provide an investor with solid footing for the long-term despite the short-term commotions.
We at ING Funds remain committed to providing our clients with a diverse and comprehensive line-up of innovative investment products — all designed to offer solutions to your investment needs. Whatever your investing goals, we look forward to continuing to serve you.

Shaun P. Mathews
President
ING Funds
August 10, 2007
The views expressed in the President's Letter reflect those of the President as of the date of the letter. Any such views are subject to change at any time based upon market or other conditions and ING Funds disclaims any responsibility to update such views. These views may not be relied on as investment advice and because investment decisions for an ING Fund are based on numerous factors, may not be relied on as an indication of investment intent on behalf of any ING Fund. Reference to specific company securities should not be construed as recommendations or investment advice.
International investing does pose special risks including currency fluctuation, economic and political risks not found in investments that are solely domestic.
1
MARKET PERSPECTIVE: SIX MONTHS ENDED JUNE 30, 2007
Investors will remember early 2007 for the well-anticipated shocks and corrections that finally struck. But global equities markets soon recovered their poise and provided good gains through May 2007 before some nervousness returned in June 2007. For the six months ended June 30, 2007, the Morgan Stanley Capital International World IndexSM(1) ("MSCI World Index") measured in local currencies, including net reinvested dividends ("MSCI" for regions discussed below) added 8.2%. In currencies, the dollar's early strides were retraced on the (perceived) certainty that European interest rates were on the way up while those in the U.S. were not. The euro made a new closing high and the pound reached the best level in 25 years against the dollar. The yen however buckled under the "carry trade", in which speculators borrow in yen at low interest and buy higher yielding securities in other currencies. For the six months ended June 30, 2007, the dollar fell 2.5% against the euro and the pound, but gained 3.5% on the yen.
U.S. markets entered 2007 against a backdrop of a stable federal funds rate since June 2007. A slowing economy dragged by a slumping housing market seemed to be on the rebound in December 2006. The early reports in 2007 sustained this view, with unexpectedly strong employment, retail sales and confidence readings, as well as robust increases in housing starts and pending home sales. The first estimate of fourth quarter gross domestic product ("GDP") growth was an impressive 3.5%.
But from February 2007, it soon became apparent that the improvement in housing figures only reflected the mild weather of early winter. New starts, sales and prices were now falling. GDP growth was sharply revised down to 2.5%. To make matters worse, the country's largest sub-prime mortgage lenders were reporting major losses.
February 2007 was an unsettling month in other ways. The China stock market had practically doubled in 2006 and the long expected pull back eventually came on February 27th when the index fell 9%. The effect on sentiment was to shake relative risk strategies generally.
The housing gloom continued into the second quarter. Foreclosures in May 2007 were 90% higher than one year earlier. Existing housing prices fell in the first quarter year over year for the first time since 1991. The sub-prime dragon reared its head again in June 2007 when the investment bank, Bear Stearns, had to rescue two of its hedge funds in distress over holdings in mortgage bonds. The effect on GDP was clear. Growth in the latest quarter was finalized at just 0.69% annualized, the lowest since 2003.
Yet the feeling persisted that while the sub-prime debacle was serious, the chance of it tripping the economy into recession was remote. Unemployment remained light at 4.5%. The consumer was still spending, although as June ended high gasoline prices were weighing on consumer confidence. And the chances of a rate cut had all but vanished as the Federal Open Market Committee ("FOMC") in leaving the federal funds rate at 5.25%, made it clear that "...a sustained moderation in inflation pressures has yet to be convincingly demonstrated."
In U.S. fixed income markets the yield curve became steeper, with the yield on the ten-year Treasury Note making a five-year high before slipping to 5.03%, up 32 basis points (0.32%) for the six months ended June 30, 2007, while that on the three-month Bill fell 22 basis points (0.22%) to 4.67%. This surely reflected the confidence-shaking events of February 2007, as well as the FOMC's somewhat curious removal of its tightening bias on March 21, 2007, while still citing inflation as the predominant concern. For the six months ended June 30, 2007, the Lehman Brothers® Aggregate Bond Index(2) ("LBAB") of investment grade bonds r eturned just 98 basis points (0.98%).
U.S. equities, represented by the Standard & Poor's 500® Composite Stock Price Index(3) ("S&P 500® Index") including dividends, rose 7.0%, finally breaching its March 2000 record. Investors might have been depressed in anticipation of the first quarter in fifteen with less than double-digit year-over-year percentage profits growth for companies that make up the S&P 500® Index. But the earnings growth rate of 8.6% that emerged was much better than had been feared. Sentiment was also boosted by takeover activity, much of it from private equity firms able to draw from an apparently bottomless well of liquidity. By early June 2007 however, nerves were getting frayed as 10-year bond yields pushed through 5% and on the Bear Stearns' news, unlikely to be an isolated case. Led by financials and the interest sensitive utilities sectors, the S&P 500® Index gave back 1.7% in June.
Internationally, the MSCI Japan® Index(4) rose 6.6% for the six months ended June 30, 2007, amid the usual contradictory mix of economic statistics. GDP growth held up well after the fastest quarterly expansion in three years. Unemployment remained at a nine-year low. But consumer prices and wages started falling again, forcing the Bank of Japan, which raised interest
2
MARKET PERSPECTIVE: SIX MONTHS ENDED JUNE 30, 2007
rates in February 2007 to a still wafer-thin 0.5%, to leave them there, keeping the carry trade in business. The MSCI Europe ex UK® Index(5) surged 11.2% on the basis of high consumer and business confidence, the lowest Eurozone unemployment since records began, the fastest GDP growth in years and continuing merger and acquisition activity. But June 2007 saw sentiment tail off somewhat as the ascending euro threatened exports and the European Central Bank raised rates for the eighth time since late 2005. In the UK, a housing boom and r obust service sector had raised year over year GDP growth to 3.0% amid buoyant retail sales, confident consumers and record profits for non-financial companies. The MSCI UK® Index(6) advanced 8.1% for the six months ended June 30, 2007, although again slipping in June as home price inflation and retail sales cooled after the Bank of England raised rates to 5.5%, a six-year high.
(1) The MSCI World IndexSM is an unmanaged index that measures the performance of over 1,400 securities listed on exchanges in the U.S., Europe, Canada, Australia, New Zealand and the Far East.
(2) The LBAB Index is a widely recognized, unmanaged index of publicly issued investment grade U.S. Government, mortgage-backed, asset-backed and corporate debt securities.
(3) The S&P 500® Index is an unmanaged index that measures the performance of securities of approximately 500 of the largest companies in the United States.
(4) The MSCI Japan® Index is a free float-adjusted market capitalization index that is designed to measure developed market equity performance in Japan.
(5) The MSCI Europe ex UK® Index is a free float rising adjusted market capitalization index that is designed to measure developed market equity performance in Europe, excluding the UK.
(6) The MSCI UK® Index is a free float-adjusted market capitalization index that is designed to measure developed market equity performance in the UK.
All indices are unmanaged and investors cannot invest directly in an index.
Past performance does not guarantee future results. The performance quoted represents past performance. Investment return and principal value of an investment will fluctuate, and shares, when redeemed, may be worth more or less than their original cost. The Portfolios' performance is subject to change since the period's end and may be lower or higher than the performance data shown. Please call (800) 992-0180 or log on to www.ingfunds.com to obtain performance data current to the most recent month end.
Market Perspective reflects the views of ING's Chief Investment Risk Officer only through the end of the period, and is subject to change based on market and other conditions.
3
SHAREHOLDER EXPENSE EXAMPLE (UNAUDITED)
As a shareholder of a Portfolio, you incur two types of costs: (1) transaction costs, including redemption fees and exchange fees; and (2) ongoing costs, including management fees, distribution and/or service (12b–1) fees, and other Portfolio expenses. These Examples are intended to help you understand your ongoing costs (in dollars) of investing in a Portfolio and to compare these costs with the ongoing costs of investing in other mutual funds.
The Examples are based on an investment of $1,000 invested at the beginning of the period and held for the entire period from January 1, 2007 to June 30, 2007. The Portfolio's expenses are shown without the imposition of any charges which are, or may be, imposed under your annuity contract. Expenses would have been higher if such charges were included.
Actual Expenses
The first section of the table shown, "Actual Portfolio Return," provides information about actual account values and actual expenses. You may use the information in this section, together with the amount you invested, to estimate the expenses that you paid over the period. Simply divide your account value by $1,000 (for example, an $8,600 account value divided by $1,000 = 8.6), then multiply the result by the number in the first section under the heading entitled "Expenses Paid During Period" to estimate the expenses you paid on your account during this period.
Hypothetical Example for Comparison Purposes
The second section of the table shown, "Hypothetical 5% Return", provides information about hypothetical account values and hypothetical expenses based on the Portfolio's actual expense ratio and an assumed rate of return of 5% per year before expenses, which is not the Portfolio's actual return. The hypothetical account values and expenses may not be used to estimate the actual ending account balance or expenses you paid for the period. You may use this information to compare the ongoing costs of investing in the Portfolio and other mutual funds. To do so, compare this 5% hypothetical example with the 5% hypothetical examples that appear in the shareholder reports of the other mutual funds.
Please note that the expenses shown in the table are meant to highlight your ongoing costs only and do not reflect any transactional costs, such as redemption fees or exchange fees. Therefore, the hypothetical lines of the table are useful in comparing ongoing costs only, and will not help you determine the relative total costs of owning different mutual funds. In addition, if these transactional costs were included, your costs would have been higher.
| ING VP Global Equity Dividend Portfolio | | Beginning
Account
Value
January 1, 2007 | | Ending
Account
Value
June 30, 2007 | | Expenses Paid
During the
Period Ended
June 30, 2007* | |
| Actual Portfolio Return | | $ | 1,000.00 | | | $ | 1,069.50 | | | $ | 5.90 | | |
| Hypothetical (5% return before expenses) | | $ | 1,000.00 | | | $ | 1,019.09 | | | $ | 5.76 | | |
* Expenses are equal to the Portfolio's annualized expense ratio of 1.15% multiplied by the average account value over the period, multiplied by 181/365 to reflect the most recent fiscal half-year.
4
STATEMENT OF ASSETS AND LIABILITIES AS OF JUNE 30, 2007 (UNAUDITED)
| | | ING
VP Global
Equity Dividend
Portfolio | |
| ASSETS: | |
| Investments in securities at value+* | | $ | 58,835,969 | | |
| Short-term investments at amortized cost | | | 10,809,000 | | |
| Cash | | | 1,246,329 | | |
| Foreign currencies at value** | | | 137,151 | | |
| Receivables: | |
| Dividends and interest | | | 250,850 | | |
| Prepaid expenses | | | 281 | | |
| Reimbursement due from manager | | | 11,833 | | |
| Total assets | | | 71,291,413 | | |
| LIABILITIES: | |
| Payable for investment securities purchased | | | 20,171 | | |
| Payable for fund shares redeemed | | | 39,995 | | |
| Payable upon receipt of securities loaned | | | 10,809,000 | | |
| Payable to affiliates | | | 50,224 | | |
| Payable for trustee fees | | | 1,152 | | |
| Other accrued expenses and liabilities | | | 44,747 | | |
| Total liabilities | | | 10,965,289 | | |
| NET ASSETS (equivalent to $9.87 per share on 6,113,488 shares outstanding) | | $ | 60,326,124 | | |
| NET ASSETS WERE COMPRISED OF: | |
| Paid-in capital — shares of beneficial interest $0.001 par value (unlimited shares authorized) | | $ | 41,985,072 | | |
| Undistributed net investment income | | | 900,521 | | |
| Accumulated net realized gain on investments and foreign currency related transactions | | | 7,948,365 | | |
| Net unrealized appreciation on investments and foreign currency related transactions | | | 9,492,166 | | |
| NET ASSETS | | $ | 60,326,124 | | |
| + Including securities loaned at value | | $ | 10,439,153 | | |
| * Cost of investments in securities | | $ | 49,347,357 | | |
| ** Cost of foreign currencies | | $ | 135,200 | | |
See Accompanying Notes to Financial Statements
5
STATEMENT OF OPERATIONS FOR THE SIX MONTHS ENDED JUNE 30, 2007 (UNAUDITED)
| | | ING
VP Global
Equity Dividend
Portfolio | |
| INVESTMENT INCOME: | |
| Dividends, net of foreign taxes withheld* | | $ | 1,686,518 | | |
| Interest | | | 4,026 | | |
| Securities lending income | | | 27,565 | | |
| Total investment income | | | 1,718,109 | | |
| EXPENSES: | |
| Investment management fees | | | 304,844 | | |
| Transfer agent fees | | | 91 | | |
| Shareholder reporting expense | | | 28,331 | | |
| Registration fees | | | 321 | | |
| Professional fees | | | 19,265 | | |
| Custody and accounting expense | | | 14,028 | | |
| Trustee fees | | | 767 | | |
| Miscellaneous expense | | | 1,996 | | |
| Total expenses | | | 369,643 | | |
| Net waived and reimbursed fees | | | (19,031 | ) | |
| Net expenses | | | 350,612 | | |
| Net investment income | | | 1,367,497 | | |
REALIZED AND UNREALIZED GAIN (LOSS) ON INVESTMENTS AND
FOREIGN CURRENCY RELATED TRANSACTIONS: | |
| Net realized gain on: | |
| Investments | | | 3,584,887 | | |
| Foreign currency related transactions | | | 13,949 | | |
| Net realized gain on investments and foreign currency related transactions | | | 3,598,836 | | |
| Net change in unrealized appreciation or depreciation on: | |
| Investments | | | (886,473 | ) | |
| Foreign currency related transactions | | | 318 | | |
| Net change in unrealized appreciation or depreciation on investments | | | (886,155 | ) | |
Net realized and unrealized gain on investments and
foreign currency related transactions | | | 2,712,681 | | |
| Increase in net assets resulting from operations | | $ | 4,080,178 | | |
| * Foreign taxes withheld | | $ | 131,546 | | |
See Accompanying Notes to Financial Statements
6
STATEMENTS OF CHANGES IN NET ASSETS (UNAUDITED)
| | | ING VP Global Equity Dividend Portfolio | |
| | | Six Months Ended
June 30,
2007 | | Year Ended
December 31,
2006 | |
| FROM OPERATIONS: | |
| Net investment income | | $ | 1,367,497 | | | $ | 2,334,169 | | |
Net realized gain on investments and foreign currency
related transactions | | | 3,598,836 | | | | 4,936,886 | | |
Net change in unrealized appreciation or depreciation on investments
and foreign currency related transactions | | | (886,155 | ) | | | 7,599,196 | | |
| Net increase in net assets resulting from operations | | | 4,080,178 | | | | 14,870,251 | | |
| FROM DISTRIBUTIONS TO SHAREHOLDERS: | |
| Net investment income | | | (918,097 | ) | | | (2,342,990 | ) | |
| Total distributions | | | (918,097 | ) | | | (2,342,990 | ) | |
| FROM CAPITAL SHARE TRANSACTIONS: | |
| Net proceeds from sale of shares | | | 40 | | | | 929,971 | | |
| Dividends reinvested | | | 918,097 | | | | 2,342,990 | | |
| | | | 918,137 | | | | 3,272,961 | | |
| Cost of shares redeemed | | | (6,588,719 | ) | | | (13,941,491 | ) | |
| Net decrease in net assets resulting from capital share transactions | | | (5,670,582 | ) | | | (10,668,530 | ) | |
| Net increase (decrease) in net assets | | | (2,508,501 | ) | | | 1,858,731 | | |
| NET ASSETS: | |
| Beginning of period | | | 62,834,625 | | | | 60,975,894 | | |
| End of period | | $ | 60,326,124 | | | $ | 62,834,625 | | |
| Undistributed net investment income at end of period | | $ | 900,521 | | | $ | 451,121 | | |
See Accompanying Notes to Financial Statements
7
ING VP GLOBAL EQUITY DIVIDEND PORTFOLIO (UNAUDITED)
FINANCIAL
HIGHLIGHTS
Selected data for a share of beneficial interest outstanding throughout each period.
| | | Six Months
Ended
June 30, | | Year Ended December 31, | |
| | | 2007 | | 2006 | | 2005 | | 2004 | | 2003 | | 2002 | |
| Per Share Operating Performance: | |
| Net asset value, beginning of period | | $ | 9.37 | | | | 7.65 | | | | 7.56 | | | | 6.96 | | | | 5.39 | | | | 7.18 | | |
| Income from investment operations: | |
| Net investment income | | $ | 0.21 | * | | | 0.33 | | | | 0.21 | | | | 0.04 | | | | 0.01 | | | | 0.00 | ** | |
Net realized and unrealized gain (loss)
on investments and foreign currencies | | $ | 0.44 | | | | 1.72 | | | | 0.11 | | | | 0.61 | | | | 1.56 | | | | (1.79 | ) | |
| Total from investment operations | | $ | 0.65 | | | | 2.05 | | | | 0.32 | | | | 0.65 | | | | 1.57 | | | | (1.79 | ) | |
| Less distributions from: | |
| Net investment income | | $ | 0.15 | | | | 0.33 | | | | 0.23 | | | | 0.05 | | | | — | | | | 0.00 | ** | |
| Total distributions | | $ | 0.15 | | | | 0.33 | | | | 0.23 | | | | 0.05 | | | | — | | | | 0.00 | ** | |
| Net asset value, end of the period | | $ | 9.87 | | | | 9.37 | | | | 7.65 | | | | 7.56 | | | | 6.96 | | | | 5.39 | | |
| Total Return(1) | | % | 6.95 | | | | 27.29 | | | | 4.39 | | | | 9.44 | | | | 29.13 | | | | (24.92 | ) | |
| Ratios and Supplemental Data: | |
| Net assets, end of the period (000s) | | $ | 60,326 | | | | 62,835 | | | | 60,976 | | | | 56,941 | | | | 50,752 | | | | 27,745 | | |
| Ratios to average net assets: | |
Gross expenses prior to expense reimbursement/
recoupment and brokerage
commission recapture(2) | | % | 1.21 | | | | 1.17 | | | | 1.24 | | | | 1.20 | | | | 1.75 | | | | 2.07 | | |
Net expenses after expense reimbursement/
recoupment prior to brokerage
commission recapture(2)(3) | | % | 1.15 | | | | 1.15 | | | | 1.16 | | | | 1.23 | | | | 1.23 | | | | 1.23 | | |
Net expenses after expense reimbursement/
recoupment and brokerage
commission recapture(2)(3) | | % | 1.15 | | | | 1.15 | | | | 1.16 | | | | 1.23 | | | | 1.23 | | | | 1.23 | | |
Net investment income (loss) after expense
reimbursement/recoupment and brokerage
commission recapture(2)(3) | | % | 4.49 | | | | 3.79 | | | | 2.91 | | | | 0.62 | | | | 0.23 | | | | (0.01 | ) | |
| Portfolio turnover rate | | % | 14 | | | | 31 | | | | 183 | | | | 122 | | | | 111 | | | | 279 | | |
(1) Total return is calculated assuming reinvestment of all dividends and capital gain distributions at net asset value and does not reflect the effect of insurance contract charges. Total return for periods less than one year is not annualized.
(2) Annualized for periods less than one year.
(3) The Investment Adviser has agreed to limit expenses, (excluding interest, taxes, brokerage and extraordinary expenses) subject to possible recoupment by the Investment Adviser within three years of being incurred.
* Calculated using the average number of shares outstanding throughout the period.
** Amount is less than $0.005.
See Accompanying Notes to Financial Statements.
8
NOTES TO FINANCIAL STATEMENTS AS OF JUNE 30, 2007 (UNAUDITED)
NOTE 1 — ORGANIZATION
Organization. The ING Variable Insurance Trust (the ''Trust'') was organized as a Delaware statutory trust on July 15, 1999 and is registered with the U.S. Securities and Exchange Commission ("SEC") under the Investment Company Act of 1940, as amended ("1940 Act"), as an open-end management investment company. There are fifteen separate investment series which comprise the Trust. This report is for the ING VP Global Equity Dividend Portfolio (the ''Portfolio''), a diversified series of the Trust. The investment objective of the Portfolio is to seek growth of capital with dividend income as a secondary consideration.
Shares of the Portfolio may be offered to segregated asset accounts of insurance companies as investment options under variable annuity contracts and variable life insurance policies ("Variable Contracts"). Shares may also be offered to qualified pension and retirement plans and to certain investment advisers and their affiliates.
Participating insurance companies and other designated organizations are authorized to receive purchase orders on the Portfolio's behalf.
NOTE 2 — SIGNIFICANT ACCOUNTING POLICIES
The following significant accounting policies are consistently followed by the Portfolio in the preparation of its financial statements, and such policies are in conformity with U.S. generally accepted accounting principles for investment companies.
A. Security Valuation. Investments in equity securities traded on a national securities exchange are valued at the last reported sale price. Securities reported by NASDAQ are valued at the NASDAQ official closing prices. Securities traded on an exchange or NASDAQ for which there has been no sale and equity securities traded in the over-the-counter-market are valued at the mean between the last reported bid and asked prices. All investments quoted in foreign currencies will be valued daily in U.S. dollars on the basis of the foreign currency exchange rates prevailing at that time. Debt securities are valued at prices obtained from independent services or from one or more dealers making markets in the securities and may be adjusted based on the Portfolio's valuation procedures. U.S. government obligations are valued by using market quotations or independent pricing services which use prices provided by market-makers or estimates of market values obtained from yield data relating to instruments or securities with similar characteristics.
Securities and assets for which market quotations are not readily available (which may include certain restricted securities which are subject to limitations as to their sale) or deemed unreliable are valued at their fair values as determined in good faith by or under the supervision of the Portfolio's Board of Trustees ("Board"), in accordance with methods that are speciÞcally authorized by the Board. Securities traded on exchanges, including foreign exchanges, which close earlier than the time that the Portfolio calculates its net asset value ("NAV") may also be valued at their fair values as determined in good faith by or under the supervision of the Portfolio's Board, in accordance with methods that are speciÞcally authorized by the Board. The valuation techniques applied in any specific instance are likely to vary from case to case. With respect to a restricted security, for example, consideration is generally given to the cos t of the investment, the market value of any unrestricted securities of the same class at the time of valuation, the potential expiration of restrictions on the security, the existence of any registration rights, the costs to the Portfolio related to registration of the security, as well as factors relevant to the issuer itself. Consideration may also be given to the price and extent of any public trading in similar securities of the issuer or comparable companies' securities.
The value of a foreign security traded on an exchange outside the United States is generally based on the price of a foreign security on the principal foreign exchange where it trades as of the time a Portfolio determines its NAV or if the foreign exchange closes prior to the time the Portfolio determines its NAV, the most recent closing price of the foreign security on its principal exchange. Trading in certain non-U.S. securities may not take place on all days on which the New York Stock Exchange ("NYSE") is open. Further, trading takes place in various foreign markets on days on which the NYSE is not open. Consequently, the calculation of the Portfolio's NAV may not take place contemporaneously with the determination of the prices of securities held by the Portfolio in foreign securities markets. Further, the value of the Portfolio's assets may be significantly affected by foreign trading on days when a shareholder cannot purchase or rede em shares of the Portfolio. In calculating the Portfolio's NAV, foreign securities in foreign currency are converted to U.S. dollar equivalents.
9
NOTES TO FINANCIAL STATEMENTS AS OF JUNE 30, 2007 (UNAUDITED) (CONTINUED)
NOTE 2 — SIGNIFICANT ACCOUNTING POLICIES (continued)
If an event occurs after the time at which the market for foreign securities held by the Portfolio closes but before the time that the Portfolio's NAV is calculated, such event may cause the closing price on the foreign exchange to not represent a readily available reliable market value quotation for such securities at the time the Portfolio determines its NAV. In such a case, the Portfolio will use the fair value of such securities as determined under the Portfolio's valuation procedures. Events after the close of trading on a foreign market that could require the Portfolio to fair value some or all of its foreign securities include, among others, securities trading in the U.S. and other markets, corporate announcements, natural and other disasters, and political and other events. Among other elements of analysis in the determination of a security's fair value, the Board has authorized the use of one or more independent research services to assist with such determinations. An independent research service may use statistical analyses and quantitative models to help determine fair value as of the time the Portfolio calculates its NAV. There can be no assurance that such models accurately reßect the behavior of the applicable markets or the effect of the behavior of such markets on the fair value of securities, or that such markets will continue to behave in a fashion that is consistent with such models. Unlike the closing price of a security on an exchange, fair value determinations employ elements of judgment. Consequently, the fair value assigned to a security may not represent the actual value that the Portfolio could obtain if it were to sell the security at the time of the close of the NYSE. Pursuant to procedures adopted by the Board, the Portfolio is not obligated to use the fair valuations suggested by any research service, and valuation recommendations provided by such research services may be overridden if other events have occurr ed or if other fair valuations are determined in good faith to be more accurate. Unless an event is such that it causes the Portfolio to determine that the closing prices for one or more securities do not represent readily available reliable market value quotations at the time the Portfolio determines its NAV, events that occur between the time of the close of the foreign market on which they are traded and the close of regular trading on the NYSE will not be reflected in the Portfolio's NAV. Investments in securities maturing in 60 days or less are valued at amortized cost, which, when combined with accrued interest, approximates market value.
B. Security Transactions and Revenue Recognition. Security transactions are recorded on the trade date. Realized gains or losses on sales of investments are calculated on the identified cost basis. Interest income is recorded on the accrual basis. Premium amortization and discount accretion are determined using the effective yield method. Dividend income is recorded on the ex-dividend date or when notified for certain foreign securities.
C. Foreign Currency Translation. The books and records of the Portfolio are maintained in U.S. dollars. Any foreign currency amounts are translated into U.S. dollars on the following basis:
(1) Market value of investment securities, other assets and liabilities — at the exchange rates prevailing at the end of the day.
(2) Purchases and sales of investment securities, income and expenses — at the rates of exchange prevailing on the respective dates of such transactions.
Although the net assets and the market values are presented at the foreign exchange rates at the end of the day, the Portfolio does not isolate the portion of the results of operations resulting from changes in foreign exchange rates on investments from the fluctuations arising from changes in market prices of securities held. Such fluctuations are included with the net realized and unrealized gains or losses from investments. For securities which are subject to foreign withholding tax upon disposition, liabilities are recorded on the Statement of Assets and Liabilities for the estimated tax withholding based on the securities current market value. Upon disposition, realized gains or losses on such securities are recorded net of foreign withholding tax.
Reported net realized foreign exchange gains or losses arise from sales of foreign currencies, currency gains or losses realized between the trade and settlement dates on securities transactions, the difference between the amounts of dividends, interest, and foreign withholding taxes recorded on the Portfolio's books and the U.S. dollar equivalent of the amounts actually received or paid. Net unrealized foreign exchange gains and losses arise from changes in the value of assets and liabilities other than investments in securities at period end, resulting from changes in the exchange rate. Foreign security and currency transactions may involve certain considerations and risks not typically associated with investing in
10
NOTES TO FINANCIAL STATEMENTS AS OF JUNE 30, 2007 (UNAUDITED) (CONTINUED)
NOTE 2 — SIGNIFICANT ACCOUNTING POLICIES (continued)
U.S. companies and U.S. government securities. These risks include, but are not limited to, revaluation of currencies and future adverse political and economic developments which could cause securities and their markets to be less liquid and prices more volatile than those of comparable U.S. companies and U.S. government securities.
D. Forward Foreign Currency Contracts. The Portfolio may enter into forward foreign currency contracts primarily to hedge against foreign currency exchange rate risks on their non-U.S. dollar denominated investment securities. When entering into a currency forward contract, the Portfolio agrees to receive or deliver a fixed quantity of foreign currency for an agreed-upon price on an agreed future date. These contracts are valued daily and the Portfolio's net equity therein, representing unrealized gain or loss on the contracts as measured by the difference between the forward foreign exchange rates at the dates of entry into the contracts and the forward rates at the reporting date, is included in the Statement of Assets and Liabilities. Realized and unrealized gains and losses are included on the Statement of Operations. These instruments involve market and/or credit risk in excess of the amount recognized in the Statement of Assets and Liabilities. Risks arise from the possible inability of counterparties to meet the terms of their contracts and from movement in currency and securities values and interest rates.
E. Distributions to Shareholders. Dividends from net investment income and net realized gains, if any are declared and paid quarterly by the Portfolio. Distributions are determined annually in accordance with federal tax principles which may differ from U.S. generally accepted accounting principles for investment companies. The Portfolio may make distributions on a more frequent basis to comply with the distribution requirements of the Internal Revenue Code. Distributions are recorded on the ex-dividend date.
F. Federal Income Taxes. It is the policy of the Portfolio to comply with subchapter M of the Internal Revenue Code and related excise tax provisions applicable to regulated investment companies and to distribute substantially all of its net investment income and any net realized capital gains to its shareholders. Therefore, no federal income tax provision is required. No capital gain distributions shall be made until any capital loss carryforwards have been fully utilized or expired.
G. Use of Estimates. The preparation of financial statements in conformity with U.S. generally accepted accounting principles requires management to make estimates and assumptions that affect the reported amounts of assets and liabilities and disclosure of contingent assets and liabilities at the date of the financial statements and the reported amounts of increases and decreases in net assets from operations during the reporting period. Actual results could differ from those estimates.
H. Repurchase Agreements. The Portfolio may invest in repurchase agreements only with government securities dealers recognized by the Board of Governors of the Federal Reserve System. Under such agreements, the seller of the security agrees to repurchase it at a mutually agreed upon time and price. The resale price is in excess of the purchase price and reflects an agreed upon interest rate for the period of time the agreement is outstanding. The period of the repurchase agreements is usually short, from overnight to one week, while the underlying securities generally have longer maturities. The Portfolio will receive as collateral securities acceptable to it whose market value is equal to at least 100% of the carrying amount of the repurchase agreements, plus accrued interest, bein g invested by the Portfolio. The underlying collateral is valued daily on a mark to market basis to assure that the value, including accrued interest, is at least equal to the repurchase price. There would be potential loss to the Portfolio in the event the Portfolio is delayed or prevented from exercising its right to dispose of the collateral and it might incur disposition costs in liquidating the collateral.
I. Securities Lending. The Portfolio has the option to temporarily loan up to 30% of its total assets to brokers, dealers or other financial institutions in exchange for a negotiated lender's fee. The borrower is required to fully collateralize the loans with cash or U.S. government securities. Generally, in the event of counterparty default, the Portfolio has the right to use collateral to offset losses incurred. There would be potential loss to the Portfolio in the event the Portfolio is delayed or prevented from exercising its right to dispose of the collateral. The Portfolio bears the risk of loss with respect to the investment of collateral. Engaging in securities lending could have a leveraging effect, which may intensify the credit, market and other risks associated with inve sting in the Portfolio.
J. Indemnifications. In the normal course of business, the Trust may enter into contracts that provide certain indemnifications. The Trust's maximum exposure under these arrangements is dependent
11
NOTES TO FINANCIAL STATEMENTS AS OF JUNE 30, 2007 (UNAUDITED) (CONTINUED)
NOTE 2 — SIGNIFICANT ACCOUNTING POLICIES (continued)
on future claims that may be made against the Portfolio and, therefore, cannot be estimated; however, based on experience, the risk of loss from such claims is considered remote.
NOTE 3 — INVESTMENT MANAGEMENT FEE
The Trust entered into an investment management agreement ("Management Agreement") with ING Investments ("ING Investments" or the "Investment Adviser"), on behalf of the Portfolio. The Portfolio pays the Investment Adviser for its services under the Management Agreement, a fee, payable monthly, based on an annual rate of 1.00% of the average daily net assets of the Portfolio.
The Investment Adviser has entered into an expense limitation agreement ("Expense Limitation Agreement") with the Portfolio, under which it will limit expenses of the Portfolio to the extent of 1.23% of the value of the Portfolio's average daily net assets, excluding interest, taxes, brokerage and extraordinary expenses. Fee waivers and/or reimbursements by the Investment Adviser may vary in order to achieve such contractually obligated expense limit.
The Expense Limitation Agreement is contractual and shall renew automatically for one-year terms unless ING Investments provides written notice of the termination of the Expense Limitation Agreement within 90 days of the end of the then current term.
The Investment Adviser may at a later date recoup from the Portfolio management fees waived and other expenses assumed by the Investment Adviser during the previous 36 months, but only if, after such reimbursement, the Portfolio's expense ratio does not exceed the percentage described above. Waived and reimbursed fees net of any recoupment by the Investment Adviser of such waived and reimbursed fees, are reflected on the accompanying Statement of Operations.
Effective January 1, 2006, pursuant to a side agreement, the Investment Adviser lowered the expense limit for the Portfolio to 1.15% through December 31, 2006. Effective January 1, 2007, pursuant to a side agreement, the Investment Adviser has lowered the expense limit for the Portfolio to 1.15% through December 31, 2007. There is no guarantee that this side agreement will continue after that date. If after December 31, 2007, the Investment Manager elects not to renew the side agreement, the expense limit will revert to the limitation under the Portfolio's expense limitation agreement of 1.23%. The Portfolio waived $19,031 pursuant to the side agreement during the six months ended June 30, 2007. Any fees waived pursuant to the side agreement shall not be eligible for recoupment.
As of June 30, 2007, there are no amounts eligible for recoupment.
ING Funds Services, LLC (the "Administrator") serves as Administrator to the Portfolio. There is no fee paid to the Administrator.
ING Investments has engaged ING Investment Management Advisors B.V. ("IIMA") to serve as sub-adviser to the Portfolio pursuant to a sub-advisory agreement with the Investment Adviser.
The Investment Adviser, IIMA, and the Administrator are indirect, wholly-owned subsidiaries of ING Groep N.V. ("ING Groep"). ING Groep is one of the largest financial services organizations in the world, and offers an array of banking, insurance and asset management services to both individuals and institutional investors.
NOTE 4 — OTHER TRANSACTIONS WITH AFFILIATED AND RELATED PARTIES
The Investment Adviser may direct the Portfolio's sub-adviser to use their best efforts (subject to obtaining best execution of each transaction) to allocate the Portfolio's equity security transactions through certain designated broker-dealers. The designated broker-dealer, in turn, will reimburse a portion of the brokerage commissions to pay certain expenses of the Portfolio. There was no brokerage commission recapture during the six months ended June 30, 2007.
At June 30, 2007, the Portfolio had the following amounts recorded in payable to affiliates on the accompanying Statement of Assets and Liabilities:
Accrued
Investment
Management
Fees | |
| $ | 50,224 | | |
The Trust has adopted a Retirement Policy ("Policy") covering all Independent Trustees of the Trust who will have served as an Independent Trustee for at least five years at the time of retirement. Benefits under this Policy are based on an annual rate as defined in the Policy.
At June 30, 2007, the following indirect, wholly-owned subsidiary of ING Groep owned more than 5% of the Portfolio:
ING USA Annuity and Life Insurance Company (99.47%).
NOTE 5 — OTHER ACCRUED EXPENSES AND LIABLITIES
At June 30, 2007, the Portfolio had the following payables included in Other Accrued Expenses and Liablities on the Statements of Assets and Liabilities that exceeded 5% of total liabilities.
Payable for
Custody Fees | | Payable for
Audit Fees | | Payable for
Postage Fees | |
| $ | 11,696 | | | $ | 12,599 | | | $ | 11,260 | | |
12
NOTES TO FINANCIAL STATEMENTS AS OF JUNE 30, 2007 (UNAUDITED) (CONTINUED)
NOTE 6 — PURCHASES AND SALES OF INVESTMENT SECURITIES
The cost of purchases and proceeds from sales of investments for the six months ended June 30, 2007, excluding short-term securities, were $8,240,336 and $14,243,982, respectively.
NOTE 7 — LINE OF CREDIT
The Portfolio, in addition to certain other funds managed by the Investment Adviser, has entered into an unsecured committed revolving line of credit agreement (the "Credit Agreement") with The Bank of New York Mellon Corporation ("BNY") for an aggregate amount of $125,000,000. The proceeds may be used to: (1) temporarily finance the purchase and sale of securities; (2) finance the redemption of shares of an investor in the funds; and (3) enable the funds to meet other emergency expenses as defined in the Credit Agreement. The funds to which the line of credit is available pay a commitment fee equal to 0.09% per annum on the daily unused portion of the committed line amount payable quarterly in arrears. For the six months ended June 30, 2007, the Portfolio did not utilize the line of credit.
NOTE 8 — CAPITAL SHARE TRANSACTIONS
Transactions in capital shares and dollars, were as follows:
| | | Six Months
Ended
June 30,
2007 | | Year
Ended
December 31,
2006 | |
VP Global Equity Dividend
(Number of Shares) | |
| Shares sold | | | 4 | | | | 114,483 | | |
| Dividends reinvested | | | 96,744 | | | | 276,652 | | |
| Shares redeemed | | | (685,842 | ) | | | (1,660,987 | ) | |
| Net decrease in shares outstanding | | | (589,094 | ) | | | (1,269,852 | ) | |
| VP Global Equity Dividend ($) | |
| Shares sold | | $ | 40 | | | $ | 929,971 | | |
| Dividends reinvested | | | 918,097 | | | | 2,342,990 | | |
| Shares redeemed | | | (6,588,719 | ) | | | (13,941,491 | ) | |
| Net decrease | | $ | (5,670,582 | ) | | $ | (10,668,530 | ) | |
NOTE 9 — CONCENTRATION OF INVESTMENT RISKS
Foreign Securities. The Portfolio makes significant investments in foreign securities. Investments in foreign securities may entail risks not present in domestic investments. Since investments in securities are denominated in foreign currencies, changes in the relationship of these foreign currencies to the U.S. dollar can significantly affect the value of the investments and earnings of the Portfolio. Foreign investments may also subject the Portfolio to foreign government exchange restrictions, expropriation, taxation or other political, social or economic developments, as well as changes vis-a-vis the U.S. dollar from movements in currency, security value and interest rate, all of which could affect the market and/or credit risk of the investments.
Diversification. The Portfolio is "diversified" within the meaning of the 1940 Act. In order to qualify as diversified, the Portfolio must diversify its holdings so that at all times at least 75% of the value of its total assets is represented by cash and cash items (including receivables), securities issued or guaranteed as to principal or interest by the United States or its agencies or instrumentalities, securities of other investment companies, and other securities (for this purpose other securities of any one issuer are limited to an amount not greater than 5% of the value of the total assets of the Portfolio and to not more than 10% of the outstanding voting securities of the issuer).
NOTE 10 — SECURITIES LENDING
Under an agreement with BNY, the Portfolio can lend its securities to approved brokers, dealers and other financial institutions. Loans are collateralized by cash and U.S. government securities. The collateral must be in an amount equal to at least 105% of the market value of non-U.S. securities loaned and 102% of the market value of U.S. securities loaned. The cash collateral received is invested in approved investments as defined in the Securities Lending Agreement with BNY (the "Agreement"). The securities purchased with cash collateral received are reflected in the Portfolio of Investments. Generally, in the event of counterparty default, the Portfolio has the right to use the collateral to offset losses incurred. The Agreement contains certain guarantees by BNY in the event of counterparty default and/or a borrower's failure to return a loaned security, however there would be a potential loss to the Portfolio in the event the Portfolio is delayed or prevented from exercising its right to dispose of the collateral. The Portfolio bears the risk of loss with respect to the investment of collateral. Engaging in securities lending could have a leveraging effect, which may intensify the credit, market and other risks associated with investing in the Portfolio. At June 30, 2007, the Portfolio had securities on loan valued at $10,439,153 with collateral valued at $10,809,000.
NOTE 11 — FEDERAL INCOME TAXES
The amount of distributions from net investment income and net realized capital gains are determined in accordance with federal income tax regulations, which may differ from U.S. generally accepted accounting principles for investment companies. These book/tax differences may be either temporary or permanent. Permanent differences are reclassified within the capital accounts based on their federal tax-basis treatment; temporary differences are not reclassified. Key differences include the treatment of short-term capital gains, foreign currency
13
NOTES TO FINANCIAL STATEMENTS AS OF JUNE 30, 2007 (UNAUDITED) (CONTINUED)
| NOTE 11 — FEDERAL INCOME TAXES (continued) | |
transactions, and wash sale deferrals. Distributions in excess of net investment income and/or net realized capital gains for tax purposes are reported as distributions of paid-in capital.
Dividends paid by the Portfolio from net investment income and distributions of net realized short-term capital gains are, for federal income tax purposes, taxable as ordinary income to shareholders.
The tax composition of dividends and distributions to shareholders was as follows:
Six Months Ended
June 30, 2007 | | Year Ended
December 31, 2006 | |
Ordinary
Income | | Ordinary
Income | |
| $ | 918,097 | | | $ | 2,342,990 | | |
The tax-basis components of distributable earnings as of December 31, 2006 were:
Undistributed
Ordinary Income | | Undistributed
Long Term Capital Gains | | Unrealized
Appreciation | | Post-October Currency
Losses Deferred | |
| $ | 3,757,015 | | | $ | 1,561,994 | | | $ | 9,867,146 | | | $ | (7,184 | ) | |
NOTE 12 — OTHER ACCOUNTING PRONOUNCEMENTS
In June 2006, the Financial Accounting Standards Board ("FASB") issued FASB Interpretation No. 48 ("FIN 48"), "Accounting for Uncertainty in Income Taxes." This standard defines the threshold for recognizing the benefits of tax-return positions in the financial statements as "more-likely-than-not" to be sustained upon challenge by the taxing authority and requires measurement of a tax position meeting the more-likely-than-not criterion, based on the largest benefit that is more than 50 percent likely to be realized. FIN 48 is effective for fiscal years beginning after December 15, 2006, with early application permitted if no interim financial statements have been issued. However, acknowledging the unique issues that FIN 48 presents for investment companies that calculate NAVs, the SEC has indicated that they would not object if a fund implements FIN 48 in its NAV calculation as late as its last NAV calculation in the first required financial statement reporting period for its fiscal year beginning after December 15, 2006. For calendar year-end funds, this would be no later than their June 29, 2007 NAV and the effects of FIN 48 would be reflected in the funds' semi-annual financial statements contained in their Form N-CSR filing. At adoption, companies must adjust their financial statements to reflect only those tax positions that are more likely-than-not to be sustained as of the adoption date. Management of the Portfolio has analyzed the tax positions of the Portfolio. To date, this analysis reflects no uncertain tax positions that have not met the more likely-than-not standard.
On September 15, 2006, the FASB issued Statement of Financial Accounting Standards No. 157 ("SFAS No. 157"), "Fair Value Measurements." The new accounting statement defines fair value, establishes a framework for measuring fair value in generally accepted accounting principles ("GAAP"), and expands disclosures about fair value measurements. SFAS No. 157 defines fair value as the price that would be received to sell an asset or paid to transfer a liability in an orderly transaction between market participants at the measurement date (an exit price). SFAS No. 157 also stipulates that, as a market-based measurement, fair value measurement should be determined based on the assumptions that market participants would use in pricing the asset or liability, and establishes a fair value hierarchy that distinguishes between (a) market participant assumptions developed based on market data obtained from sources independent of the reporting entity (obse rvable inputs) and (b) the reporting entity's own assumptions about market participant assumptions developed based on the best information available in the circumstances (unobservable inputs). SFAS No. 157 is effective for financial statements issued for fiscal years beginning after November 15, 2007. As of June 30, 2007, management of the Portfolio is currently assessing the impact, if any, that will result from adopting SFAS No. 157.
14
NOTES TO FINANCIAL STATEMENTS AS OF JUNE 30, 2007 (UNAUDITED) (CONTINUED)
NOTE 13 — INFORMATION REGARDING TRADING OF ING'S U.S. MUTUAL FUNDS
ING Investments reported to the Boards of Directors/Trustees (the "Boards") of the ING Funds that, like many U.S. financial services companies, ING Investments and certain of its U.S. affiliates have received informal and formal requests for information since September 2003 from various governmental and self-regulatory agencies in connection with investigations related to mutual funds and variable insurance products. ING Investments has advised the Boards that it and its affiliates have cooperated fully with each request.
In addition to responding to regulatory and governmental requests, ING Investments reported that management of U.S. affiliates of ING Groep, including ING Investments (collectively, "ING"), on their own initiative, have conducted, through independent special counsel and a national accounting firm, an extensive internal review of trading in ING insurance, retirement, and mutual fund products. The goal of this review was to identify any instances of inappropriate trading in those products by third parties or by ING investment professionals and other ING personnel. ING's internal review related to mutual fund trading is now substantially completed. ING has reported that, of the millions of customer relationships that ING maintains, the internal review identified several isolated arrangements allowing third parties to engage in frequent trading of mutual funds within ING's variable insurance and mutual fund products, and identified other circums tances where frequent trading occurred, despite measures taken by ING intended to combat market timing. ING further reported that each of these arrangements has been terminated and fully disclosed to regulators. The results of the internal review were also reported to the independent members of the Boards.
ING Investments has advised the Boards that most of the identified arrangements were initiated prior to ING's acquisition of the businesses in question in the U.S. ING Investments further reported that the companies in question did not receive special benefits in return for any of these arrangements, which have all been terminated.
Based on the internal review, ING Investments has advised the Boards that the identified arrangements do not represent a systemic problem in any of the companies that were involved.
In September 2005, IFD, the distributor of certain ING Funds, settled an administrative proceeding with the NASD regarding three arrangements, dating from 1995, 1996 and 1998, under which the administrator to the then-Pilgrim Funds, which subsequently became part of the ING Funds, entered into formal and informal arrangements that permitted frequent trading. Under the terms of the Letter of Acceptance, Waiver and Consent ("AWC") with the NASD, under which IFD neither admitted nor denied the allegations or findings, IFD consented to the following sanctions: (i) a censure; (ii) a fine of $1.5 million; (iii) restitution of approximately $1.44 million to certain ING Funds for losses attributable to excessive trading described in the AWC; and (iv) agreement to make certification to NASD regarding the review and establishment of certain procedures.
In addition to the arrangements discussed above, ING Investments reported to the Boards that, at this time, these instances include the following, in addition to the arrangements subject to the AWC discussed above:
• Aeltus Investment Management, Inc. (a predecessor entity to ING Investment Management Co.) identified two investment professionals who engaged in extensive frequent trading in certain ING Funds. One was subsequently terminated for cause and incurred substantial financial penalties in connection with this conduct and the second has been disciplined.
• ReliaStar Life Insurance Company ("ReliaStar") entered into agreements seven years ago permitting the owner of policies issued by the insurer to engage in frequent trading and to submit orders until 4pm Central Time. In 2001 ReliaStar also entered into a selling agreement with a broker-dealer that engaged in frequent trading. Employees of ING affiliates were terminated and/or disciplined in connection with these matters.
• In 1998, Golden American Life Insurance Company entered into arrangements permitting a broker-dealer to frequently trade up to certain specific limits in a fund available in an ING variable annuity product. No employee responsible for this arrangement remains at the company.
For additional information regarding these matters, you may consult the Form 8-K and Form 8-K/A for each of four life insurance companies, ING USA Annuity and Life Insurance Company, ILIAC, ING Insurance Company of America, and ReliaStar Life Insurance Company of New York, each filed with the SEC on October 29, 2004 and September 8, 2004. These Forms 8-K and Forms 8-K/A can be accessed through the SEC's Web site at
15
NOTES TO FINANCIAL STATEMENTS AS OF JUNE 30, 2007 (UNAUDITED) (CONTINUED)
NOTE 13 — INFORMATION REGARDING TRADING OF ING'S U.S. MUTUAL FUNDS (continued)
http://www.sec.gov. Despite the extensive internal review conducted through independent special counsel and a national accounting firm, there can be no assurance that the instances of inappropriate trading reported to the Boards are the only instances of such trading respecting the ING Funds.
ING Investments reported to the Boards that ING is committed to conducting its business with the highest standards of ethical conduct with zero tolerance for noncompliance. Accordingly, ING Investments advised the Boards that ING management was disappointed that its voluntary internal review identified these situations. Viewed in the context of the breadth and magnitude of its U.S. business as a whole, ING management does not believe that ING's acquired companies had systemic ethical or compliance issues in these areas. Nonetheless, Investments reported that given ING's refusal to tolerate any lapses, it has taken the steps noted below, and will continue to seek opportunities to further strengthen the internal controls of its affiliates.
• ING has agreed with the ING Funds to indemnify and hold harmless the ING Funds from all damages resulting from wrongful conduct by ING or its employees or from ING's internal investigation, any investigations conducted by any governmental or self-regulatory agencies, litigation or other formal proceedings, including any proceedings by the SEC. ING Investments reported to the Boards that ING management believes that the total amount of any indemnification obligations will not be material to ING or its U.S. business.
• ING updated its Code of Conduct for employees reinforcing its employees' obligation to conduct personal trading activity consistent with the law, disclosed limits, and other requirements.
• The ING Funds, upon a recommendation from ING, updated their respective Codes of Ethics applicable to investment professionals with ING entities and certain other fund personnel, requiring such personnel to pre-clear any purchases or sales of ING Funds that are not systematic in nature (i.e., dividend reinvestment), and imposing minimum holding periods for shares of ING Funds.
• ING instituted excessive trading policies for all customers in its variable insurance and retirement products and for shareholders of the ING Funds sold to the public through financial intermediaries. ING does not make exceptions to these policies.
• ING reorganized and expanded its U.S. Compliance Department, and created an Enterprise Compliance team to enhance controls and consistency in regulatory compliance.
Other Regulatory Matters
The New York Attorney General (the "NYAG") and other federal and state regulators are also conducting broad inquiries and investigations involving the insurance industry. These initiatives currently focus on, among other things, compensation and other sales incentives; potential conflicts of interest; potential anti-competitive activity; reinsurance; marketing practices (including suitability); specific product types (including group annuities and indexed annuities); fund selection for investment products and brokerage sales; and disclosure. It is likely that the scope of these industry investigations will further broaden before they conclude. ING has received formal and informal requests in connection with such investigations, and is cooperating fully with each request. In connection with one such investigation, affiliates of ING Investments were named in a petition for relief and cease and desist order filed by the New Hampshire Bureau of Securities Regulation (the "NH Bureau") concerning their administration of the New Hampshire state employees deferred compensation plan.
On October 10, 2006, an affiliate of ING Investments entered into an assurance of discontinuance with the NYAG (the "NYAG Agreement") regarding the endorsement of its products by the New York State United Teachers Union Member Benefits Trust ("NYSUT") and the sale of their products to NYSUT members. Under the terms of the NYAG Agreement, the affiliate of ING Investments, without admitting or denying the NYAG's findings, will distribute $30 million to NYSUT members, and/or former NYSUT members, who participated in the NYSUT-endorsed products at any point between January 1, 2001 and June 30, 2006. The affiliate also agreed with the NYAG's office to develop a one-page disclosure that will further improve transparency and disclosure regarding retirement product fees (the "One-Page Disclosure"). Pursuant to the terms of the NYAG Agreement, the affiliate has agreed for a five year period to provide its retirement product customers with the One-Pag e Disclosure.
16
NOTES TO FINANCIAL STATEMENTS AS OF JUNE 30, 2007 (UNAUDITED) (CONTINUED)
NOTE 13 — INFORMATION REGARDING TRADING OF ING'S U.S. MUTUAL FUNDS (continued)
In addition, on the same date, these affiliates of ING Investments entered into a consent agreement with the NH Bureau (the "NH Agreement") to resolve this petition for relief and cease and desist order. Under the terms of the NH Agreement, these affiliates of ING Investments, without admitting or denying the NH Bureau's claims, have agreed to pay $3 million to resolve the matter, and for a five year period to provide their retirement product customers with the One-Page Disclosure described above.
Other federal and state regulators could initiate similar actions in this or other areas of ING's businesses.
These regulatory initiatives may result in new legislation and regulation that could significantly affect the financial services industry, including businesses in which ING is engaged.
In light of these and other developments, ING continuously reviews whether modifications to its business practices are appropriate.
At this time, in light of the current regulatory factors, ING U.S. is actively engaged in reviewing whether any modifications in our practices are appropriate for the future.
There can be no assurance that these matters, or the adverse publicity associated with them, will not result in increased fund redemptions, reduced sale of fund shares, or other adverse consequences to ING Funds.
NOTE 14 — SUBSEQUENT EVENTS
Dividends: Subsequent to June 30, 2007, the Portfolio declared dividends and distributions of:
| PER SHARE AMOUNTS | | | | | |
Net Investment
Income | | Short-Term
Capital Gains | | Long-Term
Capital Gains | | Payable
Date | | Record
Date | |
| $ | 0.1517 | | | $ | 0.5556 | | | $ | 0.2619 | | | August 3, 2007 | | July 31, 2007 | |
17
PORTFOLIO OF INVESTMENTS
ING VP GLOBAL EQUITY DIVIDEND PORTFOLIO AS OF JUNE 30, 2007 (UNAUDITED)
| Shares | | | | | | Value | |
| COMMON STOCK: 95.3% | | | |
| | | | | Australia: 8.2% | |
| | 26,686 | | | | | Australia & New Zealand
Banking Group Ltd. | | $ | 655,440 | | |
| | 39,854 | | | | | Coca-Cola Amatil Ltd. | | | 321,773 | | |
| | 112,512 | | | | | Foster's Group Ltd. | | | 607,152 | | |
| | 124,742 | | | | | Insurance Australia Group Ltd. | | | 601,700 | | |
| | 20,006 | | | | | Publishing & Broadcasting Ltd. | | | 331,533 | | |
| | 45,519 | | | | | Stockland | | | 313,584 | | |
| | 26,109 | | | | | Suncorp-Metway Ltd. | | | 445,922 | | |
| | 22,376 | | | | | TABCORP Holdings Ltd. | | | 325,117 | | |
| | 19,196 | | | L | | Wesfarmers Ltd. | | | 743,273 | | |
| | 35,594 | | | L | | Westfield Group | | | 600,587 | | |
| | | | 4,946,081 | | |
| | | | | Belgium: 2.6% | |
| | 13,819 | | | | | Belgacom SA | | | 611,608 | | |
| | 8,047 | | | | | Elia System Operator SA | | | 327,034 | | |
| | 14,974 | | | L | | Fortis | | | 635,260 | | |
| | | | 1,573,902 | | |
| | | | | Brazil: 2.6% | |
| | 5,666 | | | L | | Cia Siderurgica Nacional
SA ADR | | | 293,046 | | |
| | 6,343 | | | | | Petroleo Brasileiro SA ADR | | | 676,671 | | |
| | 32,089 | | | L | | Tele Norte Leste Participacoes
SA ADR | | | 608,728 | | |
| | | | 1,578,445 | | |
| | | | | Canada: 5.9% | |
| | 24,870 | | | | | BCE, Inc. | | | 941,803 | | |
| | 2,836 | | | @,#,X | | Bell Aliant Regional
Communications Income Fund | | | 83,463 | | |
| Shares | | | | | | Value | |
| | 10,547 | | | | | Bell Aliant Regional
Communications Income Fund | | $ | 310,395 | | |
| | 7,495 | | | | | Enerplus Resources Fund | | | 352,865 | | |
| | 12,816 | | | L | | Fording Canadian Coal Trust | | | 420,621 | | |
| | 31,365 | | | | | Precision Drilling Trust | | | 765,539 | | |
| | 20,108 | | | L | | TransCanada Corp. | | | 691,628 | | |
| | | | 3,566,314 | | |
| | | | | China: 1.2% | |
| | 497,417 | | | | | PetroChina Co., Ltd. | | | 738,836 | | |
| | | | 738,836 | | |
| | | | | Denmark: 1.0% | |
| | 14,343 | | | | | Danske Bank A/S | | | 586,517 | | |
| | | | 586,517 | | |
| | | | | France: 4.0% | |
| | 5,111 | | | | | BNP Paribas | | | 607,103 | | |
| | 19,942 | | | L | | France Telecom SA | | | 546,938 | | |
| | 3,194 | | | | | Societe Generale | | | 591,779 | | |
| | 15,284 | | | | | Vivendi | | | 657,483 | | |
| | | | 2,403,303 | | |
| | | | | Germany: 1.0% | |
| | 32,462 | | | | | Deutsche Telekom AG | | | 597,869 | | |
| | | | 597,869 | | |
| | | | | Greece: 1.0% | |
| | 16,210 | | | | | OPAP SA | | | 572,752 | | |
| | | | 572,752 | | |
| | | | | Hong Kong: 1.1% | |
| | 71,362 | | | | | Citic Pacific Ltd. | | | 357,693 | | |
| | 40,808 | | | | | CLP Holdings Ltd. | | | 273,934 | | |
| | | | 631,627 | | |
| | | | | Hungary: 1.1% | |
| | 24,306 | | | | | Magyar Telekom
Telecommunications PLC ADR | | | 677,165 | | |
| | | | 677,165 | | |
| | | | | Ireland: 0.9% | |
| | 20,767 | | | | | Allied Irish Banks PLC | | | 567,489 | | |
| | | | 567,489 | | |
| | | | | Israel: 0.6% | |
| | 74,173 | | | | | Bank Hapoalim BM | | | 361,363 | | |
| | | | 361,363 | | |
| | | | | Italy: 7.8% | |
| | 68,926 | | | L | | Enel S.p.A. | | | 740,888 | | |
| | 26,557 | | | | | ENI S.p.A. | | | 962,888 | | |
| | 83,616 | | | | | Intesa Sanpaolo S.p.A. | | | 623,419 | | |
| | 58,700 | | | L | | Mediaset S.p.A. | | | 606,365 | | |
| | 102,092 | | | | | Snam Rete Gas S.p.A. | | | 603,680 | | |
| | 271,439 | | | | | Telecom Italia S.p.A. RNC | | | 601,575 | | |
| | 64,857 | | | | | UniCredito Italiano S.p.A. | | | 579,277 | | |
| | | | 4,718,092 | | |
| | | | | Netherlands: 2.2% | |
| | 13,889 | | | | | ABN Amro Holding NV | | | 636,843 | | |
| | 15,713 | | | | | Royal Dutch Shell PLC | | | 639,492 | | |
| | 708 | | | L | | Royal Dutch Shell PLC - Class A | | | 28,823 | | |
| | | | 1,305,158 | | |
See Accompanying Notes to Financial Statements
18
PORTFOLIO OF INVESTMENTS
ING VP GLOBAL EQUITY DIVIDEND PORTFOLIO AS OF JUNE 30, 2007 (UNAUDITED) (CONTINUED)
| Shares | | | | | | Value | |
| | | | | New Zealand: 0.5% | |
| | 91,655 | | | | | Telecom Corp. of
New Zealand Ltd. | | $ | 321,489 | | |
| | | | 321,489 | | |
| | | | | Norway: 1.0% | |
| | 46,264 | | | | | DNB NOR ASA | | | 595,079 | | |
| | | | 595,079 | | |
| | | | | Poland: 1.2% | |
| | 83,110 | | | | | Telekomunikacja Polska SA | | | 723,638 | | |
| | | | 723,638 | | |
| | | | | Singapore: 1.0% | |
| | 40,000 | | | L | | United Overseas Bank Ltd. | | | 575,022 | | |
| | | | 575,022 | | |
| | | | | South Africa: 0.8% | |
| | 19,582 | | | | | Telkom SA Ltd. | | | 493,050 | | |
| | | | 493,050 | | |
| | | | | South Korea: 1.1% | |
| | 13,188 | | | | | KT Corp. ADR | | | 309,390 | | |
| | 4,582 | | | | | S-Oil Corp. | | | 352,643 | | |
| | | | 662,033 | | |
| | | | | Sweden: 0.9% | |
| | 34,134 | | | | | Svenska Cellulosa AB | | | 570,821 | | |
| | | | 570,821 | | |
| | | | | Taiwan: 1.0% | |
| | 56,553 | | | L | | Taiwan Semiconductor
Manufacturing Co., Ltd. ADR | | | 629,435 | | |
| | | | 629,435 | | |
| | | | | Thailand: 0.9% | |
| | 110,100 | | | | | Advanced Info Service PCL | | | 270,964 | | |
| | 36,100 | | | | | Siam Cement PCL | | | 280,306 | | |
| | | | 551,270 | | |
| | | | | United Kingdom: 16.8% | |
| | 36,997 | | | | | Aviva PLC | | | 549,210 | | |
| | 41,353 | | | | | Barclays PLC | | | 575,341 | | |
| | 57,143 | | | | | BBA Aviation PLC | | | 310,174 | | |
| | 55,075 | | | | | BP PLC | | | 662,680 | | |
| | 18,412 | | | | | British American Tobacco PLC | | | 627,950 | | |
| | 28,698 | | | | | Diageo PLC | | | 596,485 | | |
| | 180,624 | | | | | DSG International PLC | | | 572,503 | | |
| | 24,521 | | | | | GlaxoSmithKline PLC | | | 638,772 | | |
| | 53,845 | | | | | Hiscox Ltd. | | | 307,402 | | |
| | 33,679 | | | | | HSBC Holdings PLC | | | 616,679 | | |
| | 196,429 | | | | | Legal & General Group PLC | | | 589,299 | | |
| | 52,866 | | | | | Lloyds TSB Group PLC | | | 587,677 | | |
| | 14,994 | | | | | Provident Financial PLC | | | 209,865 | | |
| | 73,968 | | | | | Royal Bank of Scotland
Group PLC | | | 935,953 | | |
| | 48,064 | | | | | Scottish & Newcastle PLC | | | 616,129 | | |
| | 20,050 | | | | | Severn Trent PLC | | | 553,721 | | |
| | 52,000 | | | | | Tate & Lyle PLC | | | 590,110 | | |
| | 40,965 | | | | | United Utilities PLC | | | 581,939 | | |
| | | | 10,121,889 | | |
| Shares | | | | | | Value | |
| | | | | United States: 28.9% | |
| | 7,559 | | | | | AGL Resources, Inc. | | $ | 305,988 | | |
| | 13,022 | | | | | Altria Group, Inc. | | | 913,363 | | |
| | 11,476 | | | L | | Ameren Corp. | | | 562,439 | | |
| | 9,658 | | | L | | American Capital Strategies Ltd. | | | 410,658 | | |
| | 10,978 | | | L | | Arthur J Gallagher & Co. | | | 306,067 | | |
| | 16,517 | | | | | AT&T, Inc. | | | 685,456 | | |
| | 18,418 | | | | | Bank of America Corp. | | | 900,456 | | |
| | 21,550 | | | | | Bristol-Myers Squibb Co. | | | 680,118 | | |
| | 16,913 | | | | | Citigroup, Inc. | | | 867,468 | | |
| | 41,647 | | | | | Citizens Communications Co. | | | 635,950 | | |
| | 12,601 | | | | | Consolidated Edison, Inc. | | | 568,557 | | |
| | 3,607 | | | | | Developers Diversified
Realty Corp. | | | 190,125 | | |
| | 13,575 | | | | | Dow Chemical Co. | | | 600,287 | | |
| | 15,443 | | | | | Duke Energy Corp. | | | 282,607 | | |
| | 6,281 | | | | | Duke Realty Corp. | | | 224,043 | | |
| | 12,496 | | | L | | Energy East Corp. | | | 326,021 | | |
| | 7,710 | | | | | Fifth Third Bancorp. | | | 306,627 | | |
| | 15,410 | | | L | | First Horizon National Corp. | | | 600,990 | | |
| | 7,010 | | | | | Hospitality Properties Trust | | | 290,845 | | |
| | 6,448 | | | | | iStar Financial, Inc. | | | 285,840 | | |
| | 17,209 | | | | | Keycorp. | | | 590,785 | | |
| | 8,490 | | | | | Kinder Morgan Energy
Partners LP | | | 468,563 | | |
| | 4,720 | | | | | Liberty Property Trust | | | 207,350 | | |
| | 28,302 | | | | | NiSource, Inc. | | | 586,134 | | |
| | 33,788 | | | | | Pfizer, Inc. | | | 863,959 | | |
| | 7,246 | | | | | Rayonier, Inc. | | | 327,084 | | |
| | 9,670 | | | L | | Reynolds American, Inc. | | | 630,484 | | |
| | 16,937 | | | L | | Southern Co. | | | 580,770 | | |
| | 11,550 | | | | | Spectra Energy Corp. | | | 299,838 | | |
| | 17,452 | | | | | US Bancorp. | | | 575,043 | | |
| | 17,221 | | | | | UST, Inc. | | | 924,940 | | |
| | 10,814 | | | | | Wachovia Corp. | | | 554,218 | | |
| | 20,599 | | | L | | Washington Mutual, Inc. | | | 878,341 | | |
| | | | 17,431,414 | | |
| | | Total Common Stock
(Cost $48,147,884 ) | | | 57,500,053 | | |
| EQUITY-LINKED SECURITIES: 0.6% | | | |
| | | | | Luxembourg: 0.6% | |
| | 153,298 | | | @,X | | Formosa Chemicals & Fibre
Corp. (Counterparty: Merrill) | | | 354,118 | | |
| | | Total Equity-Linked Securities
(Cost $229,323 ) | | | 354,118 | | |
| WARRANTS: 1.6% | | | |
| | | | | Ireland: 0.5% | |
| | 439,000 | | | @,X | | Mega Financial Holding Co., Ltd | | | 298,520 | | |
| | | | 298,520 | | |
| | | | | Luxembourg: 1.1% | |
| | 258,037 | | | @,#,X | | Lite-On Technology Corp. | | | 332,868 | | |
| | 67,000 | | | @,X | | Novatek Microelectronics
Corp., Ltd. | | | 350,410 | | |
| | | | 683,278 | | |
| | | Total Warrants
(Cost $970,150 ) | | | 981,798 | | |
| | | Total Long-Term Investments
(Cost $49,347,357) | | | 58,835,969 | | |
See Accompanying Notes to Financial Statements
19
PORTFOLIO OF INVESTMENTS
ING VP GLOBAL EQUITY DIVIDEND PORTFOLIO AS OF JUNE 30, 2007 (UNAUDITED) (CONTINUED)
Principal
Amount | | | | | | Value | |
| SHORT-TERM INVESTMENTS: 17.9% | |
| Securities Lending Collateralcc: 17.9% | |
| $ | 10,809,000 | | | The Bank of New York
Institutional Cash
Reserves Fund | | | | | | $ | 10,809,000 | | |
| | | Total Short-Term Investments
(Cost $10,809,000) | | | | | | | 10,809,000 | | |
| | | Total Investments in
Securities
(Cost $60,156,357)* | | | 115.4 | % | | | $69,644,969 | | |
| | | Other Assets and
Liabilities-Net | | | (15.4 | ) | | | (9,318,845 | ) | |
| | | Net Assets | | | 100.0 | % | | $ | 60,326,124 | | |
@ Non-income producing security
ADR American Depositary Receipt
# Securities with purchases pursuant to Rule 144A, under the Securities Act of 1933 and may not be resold subject to that rule except to qualified institutional buyers. Unless otherwise footnoted, these securities have been determined to be liquid under the guidelines established by the Funds' Board of Directors/Trustees.
cc Securities purchased with cash collateral for securities loaned.
L Loaned security, a portion or all of the security is on loan at June 30, 2007.
X Fair value determined by ING Funds Valuation Committee appointed by the Funds' Board of Directors/Trustees.
* Cost for federal income tax purposes is $60,448,648.
Net unrealized appreciation consists of:
| Gross Unrealized Appreciation | | $ | 9,845,037 | | |
| Gross Unrealized Depreciation | | | (648,716 | ) | |
| Net Unrealized Appreciation | | $ | 9,196,321 | | |
| Industry | | Percentage of
Net Assets | |
| Aerospace/Defense | | | 0.5 | % | |
| Agriculture | | | 5.1 | | |
| Banks | | | 22.7 | | |
| Beverages | | | 3.6 | | |
| Building Materials | | | 0.5 | | |
| Chemicals | | | 1.6 | | |
| Coal | | | 0.7 | | |
| Computers | | | 0.5 | | |
| Diversified Financial Services | | | 2.3 | | |
| Electric | | | 6.1 | | |
| Entertainment | | | 1.5 | | |
| Food | | | 1.0 | | |
| Forest Products & Paper | | | 0.9 | | |
| Gas | | | 2.5 | | |
| Holding Companies - Diversified | | | 0.6 | | |
| Insurance | | | 3.9 | | |
| Investment Companies | | | 0.7 | | |
| Iron/Steel | | | 0.5 | | |
| Media | | | 2.6 | | |
| Miscellaneous Manufacturing | | | 1.2 | | |
| Oil & Gas | | | 8.6 | | |
| Pharmaceuticals | | | 3.6 | | |
| Pipelines | | | 2.4 | | |
| Real Estate | | | 1.5 | | |
| Real Estate Investment Trusts | | | 2.5 | | |
| Retail | | | 0.9 | | |
| Savings & Loans | | | 1.5 | | |
| Semiconductors | | | 1.6 | | |
| Telecommunications | | | 14.0 | | |
| Water | | | 1.9 | | |
| Short-Term Investments | | | 17.9 | | |
| Other Assets and Liabilities - Net | | | (15.4 | ) | |
| Net Assets | | | 100.0 | % | |
See Accompanying Notes to Financial Statements
20
(THIS PAGE INTENTIONALLY LEFT BLANK)
(THIS PAGE INTENTIONALLY LEFT BLANK)
Investment Adviser
ING Investments, LLC
7337 East Doubletree Ranch Road
Scottsdale, Arizona 85258
Administrator
ING Funds Services, LLC
7337 East Doubletree Ranch Road
Scottsdale, Arizona 85258
Distributor
ING Funds Distributor, LLC
7337 East Doubletree Ranch Road
Scottsdale, Arizona 85258
Transfer Agent
DST Systems, Inc.
P.O. Box 419368
Kansas City, Missouri 64141
Custodian
The Bank of New York Mellon Corporation
One Wall Street
New York, New York 10286
Legal Counsel
Dechert LLP
1775 I Street, N.W.
Washington, D.C. 20006
Before investing, carefully consider the investment objectives, risks, charges and expenses of the variable annuity contract and the underlying variable investment options. This and other information is contained in the prospectus for the variable annuity contract and the underlying variable investment options. Obtain these prospectuses from your agent/registered representative and read them carefully before investing.

VPSAR-UGED (0607-082107)

Funds
Semi-Annual Report
June 30, 2007
ING GET U.S. Core Portfolio
This report is submitted for general information to shareholders of the ING Funds. It is not authorized for distribution to prospective shareholders unless accompanied or preceded by a prospectus which includes details regarding the funds’ investment objectives, risks, charges, expenses and other information. This information should be read carefully.

TABLE OF CONTENTS
PROXY VOTING INFORMATION
A description of the policies and procedures that the Series use to determine how to vote proxies related to portfolio securities is available (1) without charge, upon request by calling Shareholder Services toll-free at (800) 992-0180; (2) on the ING Funds’ website at www.ingfunds.com; and (3) on the SEC website at www.sec.gov. Information regarding how the Series voted proxies related to portfolio securities during the most recent 12-month period ended June 30 is available without charge on the ING Funds’ website at www.ingfunds.com and on the SEC’s website at www.sec.gov.
QUARTERLY PORTFOLIO HOLDINGS
The Series files their complete schedule of portfolio holdings with the SEC for the first and third quarters of each fiscal year on Form N-Q. The Series’ Forms N-Q are available on the SEC’s website at www.sec.gov. The Series’ Forms N-Q may be reviewed and copied at the SEC’s Public Reference Room in Washington, DC, and information on the operation of the Public Reference Room may be obtained by calling (800) SEC-0330; and is available upon request from the Portfolios by calling Shareholder Services toll-free at (800) 992-0180.
PRESIDENT’S LETTER

Dear Shareholder,
So far, it has been a volatile year in the markets. In February, we saw an unprecedented, single-day freefall in Chinese stocks that sent tremors throughout global markets. Closer to home, we witnessed a downturn in the U.S. sub-prime mortgage industry that continues to impact fixed income investments as well as real estate and equity markets worldwide.
When friends and colleagues in the industry voice concerns about the market’s recent volatility, I remind them that such ongoing events are fairly normal and that they underscore the importance of a well-diversified investment strategy. Studies have shown that an investment strategy allocated across a diverse group of asset classes and investment sectors can help provide an investor with solid footing for the long-term despite the short-term commotions.
We at ING Funds remain committed to providing our clients with a diverse and
comprehensive line-up of innovative investment products — all designed to offer solutions to your investment needs. Whatever your investing goals, we look forward to continuing to serve you.

Shaun Mathews
President
ING Funds
August 10, 2007
The views expressed in the President’s Letter reflect those of the President as of the date of the letter. Any such views are subject to change at any time based upon market or other conditions and ING Funds disclaims any responsibility to update such views. These views may not be relied on as investment advice and because investment decisions for an ING Fund are based on numerous factors, may not be relied on as an indication of investment intent on behalf of any ING Fund. Reference to specific company securities should not be construed as recommendations or investment advice.
International investing does pose special risks including currency fluctuation, economic and political risks not found in investments that are solely domestic.
1
MARKET PERSPECTIVE: SIX MONTHS ENDED JUNE 30, 2007
Investors will remember early 2007 for the well-anticipated shocks and corrections that finally struck. But global equities markets soon recovered their poise and provided good gains through May 2007 before some nervousness returned in June 2007. For the six months ended June 30, 2007, the Morgan Stanley Capital International World IndexSM(1) (“MSCI World Index”) measured in local currencies, including net reinvested dividends (“MSCI” for regions discussed below) added 8.2%. In currencies, the dollar’s early strides were retraced on the (perceived) certainty that European interest rates were on the way up, while those in the U.S. were not. The euro made a new closing high and the pound reached the best level in 25 years against the dollar. The yen however buckled under the “carry trade”, in which speculators borrow in yen at low interest and buy higher yielding securities in other currencies. For the six months ended June 30, 2007, the dollar fell 2.5% against the euro and the pound, but gained 3.5% on the yen.
U.S. markets entered 2007 against a backdrop of a stable federal funds rate since June 2007. A slowing economy dragged by a slumping housing market seemed to be on the rebound in December 2006. The early reports in 2007 sustained this view, with unexpectedly strong employment, retail sales and confidence readings, as well as robust increases in housing starts and pending home sales. The first estimate of fourth quarter gross domestic product (“GDP”) growth was an impressive 3.5%.
But from February 2007, it soon became apparent that the improvement in housing figures only reflected the mild weather of early winter. New starts, sales and prices were now falling. GDP growth was sharply revised down to 2.5%. To make matters worse, the country’s largest sub-prime mortgage lenders were reporting major losses.
February 2007 was an unsettling month in other ways. The China stock market had practically doubled in 2006 and the long expected pull back eventually came on February 27th when the index fell 9%. The effect on sentiment was to shake relative risk strategies generally.
The housing gloom continued into the second quarter. Foreclosures in May 2007 were 90% higher than one year earlier. Existing housing prices fell in the first quarter year over year for the first time since 1991. The sub-prime dragon reared its head again in June 2007 when the investment bank, Bear Stearns, had to rescue two of its hedge funds in distress over holdings in mortgage bonds. The effect on GDP was clear. Growth
in the latest quarter was finalized at just 0.69% annualized, the lowest since 2003.
Yet the feeling persisted that while the sub-prime debacle was serious, the chance of it tripping the economy into recession was remote. Unemployment remained light at 4.5%. The consumer was still spending, although as June ended high gasoline prices were weighing on consumer confidence. And the chances of a rate cut had all but vanished as the Federal Open Market Committee (“FOMC”) in leaving the federal funds rate at 5.25%, made it clear that “…a sustained moderation in inflation pressures has yet to be convincingly demonstrated.”
In U.S. fixed income markets the yield curve became steeper, with the yield on the ten-year Treasury Note making a five-year high before slipping to 5.03%, up 32 basis points (0.32%) for the six months ended June 30, 2007, while that on the three-month Bill fell 22 basis points (0.22%) to 4.67%. This surely reflected the confidence-shaking events of February 2007, as well as the FOMC’s somewhat curious removal of its tightening bias on March 21, 2007, while still citing inflation as the predominant concern. For the six months ended June 30, 2007, the Lehman Brothers® Aggregate Bond Index(2) (“LBAB”) of investment grade bonds returned just 98 basis points (0.98%).
U.S. equities, represented by the Standard & Poor’s 500® Composite Stock Price Index(3) (“S&P 500® Index”) including dividends, rose 7.0%, finally breaching its March 2000 record. Investors might have been depressed in anticipation of the first quarter in fifteen with less than double-digit year-over-year percentage profits growth for companies that make up the S&P 500® Index. But the earnings growth rate of 8.6% that emerged was much better than had been feared. Sentiment was also boosted by takeover activity, much of it from private equity firms able to draw from an apparently bottomless well of liquidity. By early June 2007 however, nerves were getting frayed as 10-year bond yields pushed through 5% and on the Bear Stearns’ news, unlikely to be an isolated case. Led by financials and the interest sensitive utilities sectors, the S&P 500® Index gave back 1.7% in June.
Internationally, the MSCI Japan® Index(4) rose 6.6% for the six month ended June 30, 2007, amid the usual contradictory mix of economic statistics. GDP growth held up well after the fastest quarterly expansion in three years. Unemployment remained at a nine-year low. But consumer prices and wages started falling again, forcing the Bank of Japan, which raised interest
2
MARKET PERSPECTIVE: SIX MONTHS ENDED JUNE 30, 2007
rates in February 2007 to a still wafer-thin 0.5%, to leave them there, keeping the carry trade in business. The MSCI Europe ex UK® Index(5) surged 11.2% on the basis of high consumer and business confidence, the lowest Eurozone unemployment since records began, the fastest GDP growth in years and continuing merger and acquisition activity. But June 2007 saw sentiment tail off somewhat as the ascending euro threatened exports and the European Central Bank raised rates for the eighth time since late 2005. In the UK, a housing boom and robust service sector had raised year over year GDP growth to 3.0% amid buoyant retail sales, confident consumers and record profits for non-financial companies. The MSCI UK® Index(6) advanced 8.1% for the six months ended June 30, 2007, although again slipping in June as home price inflation and retail sales cooled after the Bank of England raised rates to 5.5%, a six-year high.
(1) The MSCI World IndexSM is an unmanaged index that measures the performance of over 1,400 securities listed on exchanges in the U.S., Europe, Canada, Australia, New Zealand and the Far East.
(2) The LBAB Index is a widely recognized, unmanaged index of publicly issued investment grade U.S. Government, mortgage-backed, asset-backed and corporate debt securities.
(3) The S&P 500® Index is an unmanaged index that measures the performance of securities of approximately 500 of the largest companies in the United States.
(4) The MSCI Japan® Index is a free float-adjusted market capitalization index that is designed to measure developed market equity performance in Japan.
(5) The MSCI Europe ex UK® Index is a free float rising adjusted market capitalization index that is designed to measure developed market equity performance in Europe, excluding the UK.
(6) The MSCI UK® Index is a free float-adjusted market capitalization index that is designed to measure developed market equity performance in the UK.
All indices are unmanaged and investors cannot invest directly in an index.
Past performance does not guarantee future results. The performance quoted represents past performance. Investment return and principal value of an investment will fluctuate, and shares, when redeemed, may be worth more or less than their original cost. The Portfolios’ performance is subject to change since the period’s end and may be lower or higher than the performance data shown. Please call (800) 992-0180 or log on to www.ingfunds.com to obtain performance data current to the most recent month end.
Market Perspective reflects the views of ING’s Chief Investment Risk Officer only through the end of the period, and is subject to change based on market and other conditions.
3
| | |
| ING GET U.S. CORE PORTFOLIO | | INVESTMENT STRATEGY AND PRINCIPAL RISKS |
What is the Investment Strategy During the Guarantee Period?
ING GET U.S. Core Portfolio — Series 1, 2, 3, 4, 5, 6, 7, 8, 9, 10, 11, 12, 13, 14 (“Series”) do not implement an “investment strategy” in a conventional sense. Rather, the Series’ asset allocation strategy seeks to optimize the exposure of the Series to the equity component (“Equity Component”) while protecting Series assets. Assets allocated to the Equity Component may be reduced or eliminated in order to conserve assets at a level equal to or above the present value of the guarantee (“Guarantee”). The Series allocate their assets among the following asset classes:
During the Guarantee Period, the Series’ assets will be allocated between the:
| | • | | Equity Component, consisting of common stocks included in the Standard & Poor’s 500® Composite Stock Price Index (“S&P 500® Index”) futures contracts on the S&P 500® Index, and when the Equity Component’s market value is $5 million or less, investments in exchange traded funds (“ETFs”) that can reasonably be expected to have at least a 95% correlation ratio with the S&P 500® Index, in S&P 500® Index futures, or in a combination of S&P 500® Index futures and ETFs, subject to any limitation on the Series’ investments in such securities and the |
| | • | | Fixed component (“Fixed Component”) consisting primarily of short-to intermediate-duration U.S. government securities. |
The Series’ asset allocation strategy is implemented by allocating assets appropriately to the Equity Component and to the Fixed Component to optimize exposure to the Equity Component while controlling the risk that an insurance company may be required to make payment under the Guarantee. Consequently, there can be no assurance as to the percentage of assets, if any, allocated to the Equity Component, even when the equity market is doing well, or to any investment returns generated by the Series.
How does the Series’ Asset Allocation work?
ING Investment Management Co. (“ING IM” or “Sub-Adviser”), the Sub-Adviser to the Series, uses a proprietary computer model to determine on a daily basis the percentage of assets allocated to the Equity Component and to the Fixed Component. The model evaluates a number of factors, including the then current market value of the Series, the then prevailing level of interest rates, equity market volatility, the Series’ total annual expenses, insurance company separate account expenses, and the maturity date (“Maturity Date”). The model determines the initial allocation between the Equity Component and the Fixed Component on the first day of the Guarantee Period and provides direction for any reallocations on a daily basis thereafter. Generally, as the value of the Equity Component rises, more assets are allocated to the Equity Component; as the value of the Equity Component declines, more assets are allocated to the Fixed Component. The amount directed to the Equity Component is always restricted so that even if it were to experience a “material decline” in value on a given day and before being redirected to the Fixed Component, the remaining assets would still be sufficient to meet the Guarantee. At the commencement of the Guarantee Period, the Series will define a “material decline” in value as a decline in the value of the Equity Component of at least 20% but no more than 30%. In the event the Series defines the “material decline” at 20%, more assets will likely be allocated to the Equity Component than if the “material decline” is defined at 30%. The allocation to the Equity Component or the Fixed Component may be zero under certain circumstances.
Equity Component: ING IM manages the Equity Component by overweighting those stocks in the S&P 500® Index that it believes will outperform the S&P 500® Index and underweighting (or avoiding altogether) those stocks it believes will underperform the S&P 500® Index (“Enhanced Index Strategy”). Stocks ING IM believes are likely to match the performance of the S&P 500® Index are invested in proportion to their representation in the Index. To determine which stocks to weight more or less heavily, ING IM uses internally developed quantitative computer models to evaluate various criteria, such as the financial strength of each company and its potential for strong, sustained earnings growth. ING IM expects that there will be a close correlation between the performance of the Equity Component and that of the S&P 500® Index in both rising and falling markets.
Under normal market conditions, up to 20% of the Equity Component’s net assets may be invested in futures contracts for hedging purposes or to maintain liquidity to meet shareholder redemptions and minimize trading costs. Futures contracts provide for the future sale by one party and purchase by another party of a specified amount of a
4
| | |
| INVESTMENT STRATEGY AND PRINCIPAL RISKS | | ING GET U.S. CORE PORTFOLIO |
financial instrument or a specific stock market index for a specified price on a designated date. During the Guarantee Period, the Series may only invest in futures contracts on the S&P 500® Index and futures contracts on U.S. Treasury securities.
If the Equity Component’s market value is $5 million or less, in order to replicate an investment in stocks listed in the S&P 500® Index, ING IM may invest the entire amount of the Equity Component’s assets in S&P 500® Index futures, in ETFs, or in a combination of S&P 500® Index futures and ETFs, subject to any limitation on the Series’ investment in such securities (subject to restrictions imposed by the Investment Company Act of 1940, as amended “1940 Act”). ETFs are passively managed investment companies traded on a securities exchange whose goal is to track or replicate a desired index. ING IM will not employ an enhanced index strategy when it invests in S&P 500® Index futures and ETFs.
Fixed Component: ING IM seeks to select investments for the Fixed Component with financial characteristics that will, at any point in time, closely resemble those of a portfolio of zero coupon bonds which mature within three months of the Maturity Date. Generally, at least 55% of the Fixed Component will consist of securities issued or guaranteed by the U.S. government, its agencies or instrumentalities, including STRIPS (Separate Trading of Registered Interest and Principal of Securities). Although the Series invest in securities insured or guaranteed by the U.S. government, the Series shares are not issued or guaranteed. STRIPS are created by the Federal Reserve Bank by separating the interest and principal components of an outstanding U.S. Treasury or agency bond and selling them as individual securities. The Fixed Component may also consist of mortgage-backed securities (including commercial mortgage-backed securities) which are rated AAA or Aaa at the time of purchase by Standard & Poor’s (“S&P®“) or Moody’s Investors Service, Inc. (“Moody’s®“), respectively, and corporate obligations which are rated at the time of purchase A- or higher by S&P® and/or Aa3 or higher by Moody’s®. The Fixed Component may also include U.S. Treasury futures and money market instruments. The Series may also invest in other investment companies to the extent permitted under the 1940 Act, and the rules and regulations thus under.
What are the Principal Guarantee Period Risks?
Allocation Risk: If, at the inception of, or any time during, the Guarantee Period interest rates are low, the Series’ assets may be largely invested in the Fixed Component in order to decrease the likelihood that an insurance company would be required to make any payment under the Guarantee. The effect of low interest rates on the Series would likely be more pronounced at the inception of the Guarantee Period, as the initial allocation of assets would include more fixed-income securities. In addition, if during the Guarantee Period the equity markets experienced a material decline, the Series’ assets may become largely invested in the Fixed Component. In fact, if the value of the Equity Component were to decline by a significant amount, a complete reallocation to the Fixed Component would likely occur. In the event of a reallocation of 100% of the assets to the Fixed Component, the Series would not reallocate any assets into the Equity Component prior to the Maturity Date. Use of the Fixed Component reduces the Series’ ability to participate as fully in upward equity market movements, and therefore represents some loss of opportunity, or opportunity cost, compared to a portfolio that is fully invested in equities.
Active Asset Allocation May Underperform Static Strategies: The asset allocation process results in transaction costs. Volatile periods in the market may increase these costs. This process can have an adverse effect on the performance of the Series during periods of increased equity market volatility. In addition, a high portfolio turnover rate, which may also have an adverse effect on the performance of the Series, may increase the Series’ transaction costs.
Opportunity Costs: There are substantial opportunity costs associated with an investment in the Series. The Series may allocate a substantial portion, and under certain circumstances all, of the Series’ assets to the Fixed Component in order to conserve Series assets to a level equal to or above the present value of the Guarantee.
Initially, if interest rates are low, the allocation to the Fixed Component may be over 70% of the Series’ assets. If the market value of the Equity Component rises, the percentage of the Series’ assets allocated to the Equity Component generally will also rise. However, the relative volatility of these two Components as well as the past performance of the Series will affect these allocations. For example, if the Series incurs early losses, the Series may allocate 100% of the Series’ assets to the Fixed Component for the entire Guarantee Period, irrespective of the subsequent upward movements in the equity markets and/or the Equity Component.
The extent to which the Series participates in upward movements in the Equity Component during the Guarantee Period will depend on the performance of the Series, the performance and volatility of the Fixed and Equity
5
| | |
| ING GET U.S. CORE PORTFOLIO | | INVESTMENT STRATEGY AND PRINCIPAL RISKS |
Components, interest rates, expenses of the Series and the separate account under the variable annuity contract, and other factors. The Series might capture a material portion, very little or none of any Equity Component increase.
It is possible that on the Maturity Date, a contract- holder or participant could receive only the guaranteed amount even though the equity markets, as well as the Equity Component, has had significant positive performance during the Guarantee Period.
When you hold your investment until the end of the 5-year or 7-year Guarantee Period, on the Guarantee Maturity Date your account will be worth no less than your investment at the inception of the Guarantee Period, less any redemptions and distributions you have received in cash, and certain Series expenses, such as interest, taxes and extraordinary expenses. If you sell shares during the Guarantee Period, shares are redeemed at the current net asset value (“NAV”) which may be worth more or less than your original investment and/or the NAV at the inception of the Guarantee Period. The guarantee is based on the beginning NAV on the first day of the Guarantee Period, not the public offering price, and does not apply to any earnings realized during the Guarantee Period. The guarantee is backed by insurance companies offering the Series. As with the sale of any securities, a taxable event may occur if the Series liquidates fixed-income securities at the end of the Guarantee Period.
Worst Case Scenarios for the Series’ Equity Participation: The opportunity cost of not allocating assets to the Equity Component will be particularly high if early in the Guarantee Period: (a) the Series’ NAV decreases; or (b) the value of the Equity Component declines. In either case, all or substantially all of the Series’ assets could be allocated to the Fixed Component for the remainder of the Guarantee Period.
Impact of Annuity Charges and Other Expenses: Contract-holders and Participants with interest in the Series through separate accounts are not subject to identical separate account charges. In its proprietary computer model, the Sub-Adviser uses an expense factor designed to have the Series produce a return which may cover some portion of these charges. The expense factor will be determined at the inception of the Guarantee Period. If the expense factor is set to cover the higher charges, the initial asset allocation to the Equity Component will be lower. Accordingly, the level of the expense factor chosen by the Series may represent a greater opportunity cost to Contract-holders and Participants with lower separate account charges. Regardless of where the expense factor is set, it will not affect the Guarantee payable by the insurance company.
Stock and Bond Investments: The risks associated with investing in stocks include sudden and unpredictable drops in the value of the market as a whole and periods of lackluster or negative performance. The performance of the Equity Component also depends significantly on ING IM’s skill in determining which securities to overweight, underweight or avoid altogether.
The principal risk associated with investing in bonds is that interest rates may rise, which generally causes bond prices to fall. The market prices of STRIPS generally are more volatile than the market prices of other fixed-income securities with similar maturities that pay interest periodically. With corporate bonds, there is a risk that the issuer will default on the payment of principal or interest.
With mortgage-backed securities, there is a risk of prepayment of the underlying mortgage. Because prepayments of principal generally occur when interest rates are declining, it is likely that the Series may have to reinvest the proceeds of prepayments at lower yields. In addition, with credit risk, the Series could lose money if the issuer of a debt security is unable to meet its financial obligations or goes bankrupt. This Series is subject to less credit risk than other funds because it principally invests in debt securities issued or guaranteed by the U.S. government or its agencies.
Declining Interest Rates: A decline in prevailing U.S. interest rates could materially increase the opportunity costs. Any such decline would increase the present value of the Guarantee, potentially causing the Series to allocate all or substantially all of the Series’ assets to the Fixed Component in order to assure that such assets do not fall below the Guarantee.
Futures Contracts: The Series may invest in futures contracts, which provide for the future sale by one party and purchase by another party of a specified amount of a financial instrument or a specific stock market index for a specified price on a designated date. The Series uses futures for hedging purposes or to temporarily increase or limit exposure to a particular asset class. The main risk with futures contracts is that they can amplify a gain or loss, potentially earning or losing substantially more money than the actual investment made in the futures contract.
6
| | |
| INVESTMENT STRATEGY AND PRINCIPAL RISKS | | ING GET U.S. CORE PORTFOLIO |
Other Investment Companies: The GET Series may invest in other investment companies to the extent permitted by the 1940 Act and the rules and regulations thereunder. These may include exchange-traded funds (“ETFs”) and Holding Company Depositary Receipts (“HOLDRs”), among others. ETFs are exchange-traded investment companies that are designed to provide investment results corresponding to an equity index and include, among others, Standard & Poor’s Depositary Receipts (“SPDRs”), PowerShares QQQ™ (“QQQ”), Dow Jones Industrial Average Tracking Stocks (“Diamonds”) and iShares exchange-traded funds (“iShares”). The main risk of investing in other investment companies (including ETFs) is that the value of the underlying securities held by the investment company might decrease. The value of the underlying securities can fluctuate in response to activities of individual companies or in response to general market and/or economic conditions. Because the Series may invest in other investment companies, you will pay a proportionate share of expenses of that investment company. Additional risks of investments in ETFs include: (i) an active trading market for an ETF’s shares may not develop or be maintained or (ii) trading may be halted if the listing exchange’s officials deem such action appropriate, the shares are delisted from the exchange, or the activation of market-wide “circuit breakers” (which are tied to large decreases in stock prices) halts trading generally. Because HOLDRs concentrate in the stocks of a particular industry, trends in that industry may have a dramatic impact on their value.
To seek to achieve a return on uninvested cash or for other reasons, the Series may invest its assets in ING Institutional Prime Money Market Fund and/or one or more other money market funds advised by ING affiliates (“ING Money Market Funds”). The Series’ purchase of shares of an ING Money Market Fund will result in the Series paying a proportionate share of the expenses of the ING Money Market Fund. The Adviser will waive its fee in an amount equal to the advisory fee received by the adviser of the ING Money Market Fund in which the Series invests resulting from the Series’ investment into the ING Money Market Fund.
Risks of Using Derivatives: Certain securities in which the Series may invest, including futures contracts, are derivative instruments. In general terms, a derivative instrument is a financial contract whose value is derived, at least in part, from the performance of an underlying asset, interest rate, or index. If the issuer of a derivative does not pay the amount owed on the contract when due, the Series can lose money on the investment. The underlying investment on which the derivative is based, and the derivative itself, might not perform in the manner the Sub-Adviser expected, which could cause the Series’ share price to decline. Markets underlying securities may move in a direction not anticipated by the Sub-Adviser, which may result in the Series realizing a lower return than expected on an investment.
7
SHAREHOLDER EXPENSE EXAMPLES (UNAUDITED)
As a shareholder of a Series, you incur two types of costs: (1) transaction costs, including redemption fees, and exchange fees; and (2) ongoing costs, including management fees, distribution and/or service (12b-1) fees, and other Series expenses. These Examples are intended to help you understand your ongoing costs (in dollars) of investing in a Series and to compare these costs with the ongoing costs of investing in other mutual funds.
The Examples are based on an investment of $1,000 invested at the beginning of the period and held for the entire period from January 1, 2007 to June 30, 2007, unless otherwise indicated. The Series’ expenses are shown without the imposition of any charges which are, or may be, imposed under your annuity contract. Expenses would have been higher if such charges were included.
Actual Expenses
The first section of the table shown, “Actual Series Return,” provides information about actual account values and actual expenses. You may use the information in this section, together with the amount you invested, to estimate the expenses that you paid over the period. Simply divide your account value by $1,000 (for example, an $8,600 account value divided by $1,000 = 8.6), then multiply the result by the number in the first section under the heading entitled “Expenses Paid During Period” to estimate the expenses you paid on your account during this period.
Hypothetical Example for Comparison Purposes
The second section of the table shown, “Hypothetical 5% Return”, provides information about hypothetical account values and hypothetical expenses based on the Series actual expense ratio and an assumed rate of return of 5% per year before expenses, which is not the Series actual return. The hypothetical account values and expenses may not be used to estimate the actual ending account balance or expenses you paid for the period. You may use this information to compare the ongoing costs of investing in the Series and other mutual funds. To do so, compare this 5% hypothetical example with the 5% hypothetical examples that appear in the shareholder reports of the other funds.
Please note that the expenses shown in the table are meant to highlight your ongoing costs only and do not reflect any transactional costs, redemption fees or exchange fees. Therefore, the hypothetical lines of the table are useful in comparing ongoing costs only, and will not help you determine the relative total costs of owning different mutual funds. In addition, if these transactional costs were included, your costs would have been higher.
8
SHAREHOLDER EXPENSE EXAMPLES (UNAUDITED) (CONTINUED)
| | | | | | | | | | | | | | | | |
| | | ING GET U.S. Core Portfolio | | Beginning
Account
Value
January 1, 2007 | | Ending
Account
Value
June 30, 2007 | | Annualized
Expense
Ratio | | | Expenses Paid
During the
Period Ended
June 30, 2007* | | |
| | Actual Series Return | | | | | | | | | | | | | | |
| | Series 1 | | $ | 1,000.00 | | $ | 1,039.90 | | 1.00 | % | | $ | 5.06 | | |
| | Series 2 | | | 1,000.00 | | | 1,033.60 | | 1.00 | | | | 5.04 | | |
| | Series 3 | | | 1,000.00 | | | 1,036.00 | | 1.00 | | | | 5.05 | | |
| | Series 4 | | | 1,000.00 | | | 1,039.80 | | 0.97 | | | | 4.91 | | |
| | Series 5 | | | 1,000.00 | | | 1,049.50 | | 0.97 | | | | 4.93 | | |
| | Series 6 | | | 1,000.00 | | | 1,043.70 | | 0.99 | | | | 5.02 | | |
| | Series 7 | | | 1,000.00 | | | 1,047.30 | | 1.00 | | | | 5.08 | | |
| | Series 8 | | | 1,000.00 | | | 1,048.90 | | 1.00 | | | | 5.08 | | |
| | Series 9 | | | 1,000.00 | | | 1,048.90 | | 1.00 | | | | 5.08 | | |
| | Series 10 | | | 1,000.00 | | | 1,043.00 | | 1.00 | | | | 5.07 | | |
| | Series 11 | | | 1,000.00 | | | 1,042.90 | | 1.00 | | | | 5.07 | | |
| | Series 12 | | | 1,000.00 | | | 1,050.20 | | 1.00 | | | | 5.08 | | |
| | Series 13 | | | 1,000.00 | | | 1,036.70 | | 1.00 | | | | 5.05 | | |
| | Series 14† | | | 1,000.00 | | | 999.00 | | 0.71 | | | | 3.52 | | |
| | Hypothetical (5% return before expenses) | | | | | | | | | | | | | | |
| | Series 1 | | $ | 1,000.00 | | $ | 1,019.84 | | 1.00 | % | | $ | 5.01 | | |
| | Series 2 | | | 1,000.00 | | | 1,019.84 | | 1.00 | | | | 5.01 | | |
| | Series 3 | | | 1,000.00 | | | 1,019.84 | | 1.00 | | | | 5.01 | | |
| | Series 4 | | | 1,000.00 | | | 1,019.98 | | 0.97 | | | | 4.86 | | |
| | Series 5 | | | 1,000.00 | | | 1,019.98 | | 0.97 | | | | 4.86 | | |
| | Series 6 | | | 1,000.00 | | | 1,019.89 | | 0.99 | | | | 4.96 | | |
| | Series 7 | | | 1,000.00 | | | 1,019.84 | | 1.00 | | | | 5.01 | | |
| | Series 8 | | | 1,000.00 | | | 1,019.84 | | 1.00 | | | | 5.01 | | |
| | Series 9 | | | 1,000.00 | | | 1,019.84 | | 1.00 | | | | 5.01 | | |
| | Series 10 | | | 1,000.00 | | | 1,019.84 | | 1.00 | | | | 5.01 | | |
| | Series 11 | | | 1,000.00 | | | 1,019.84 | | 1.00 | | | | 5.01 | | |
| | Series 12 | | | 1,000.00 | | | 1,019.84 | | 1.00 | | | | 5.01 | | |
| | Series 13 | | | 1,000.00 | | | 1,019.84 | | 1.00 | | | | 5.01 | | |
| | Series 14 | | | 1,000.00 | | | 1,021.27 | | 0.71 | | | | 3.56 | | |
| | | | | | | | | | | | | | | | |
| † | | Performance for Series 14 used in the calculation is the return since the date the Series entered the guarantee period, June 21, 2007. |
| * | | Expenses are equal to each Series’ respective annualized expense ratios multiplied by the average account value over the period, multiplied by 181/365 to reflect the most recent fiscal half-year. |
9
STATEMENTS OF ASSETS AND LIABILITIESASOF JUNE 30, 2007 (UNAUDITED)
| | | | | | | | | | | | |
| | | ING GET U.S. Core Portfolio |
| | | Series 1 | | Series 2 | | Series 3 | | Series 4 |
ASSETS: | | | | | | | | | | | | |
Investments in securities at value* | | $ | 101,929,936 | | $ | 76,408,896 | | $ | 107,886,873 | | $ | 49,369,400 |
Short-term investments in affiliates at amortized cost | | | — | | | 400,000 | | | 100,000 | | | 20,000 |
Short-term investments at amortized cost | | | 565,000 | | | 370,000 | | | 268,000 | | | 110,000 |
Cash | | | 749 | | | 892 | | | 5,958 | | | 1,157 |
Receivables: | | | | | | | | | | | | |
Investment securities sold | | | 29,328 | | | 3,408,203 | | | 25,662 | | | 14,664 |
Dividends and interest | | | 66,037 | | | 42,661 | | | 53,163 | | | 36,489 |
Prepaid expenses | | | 559 | | | 450 | | | 646 | | | 271 |
Reimbursement due from manager | | | — | | | 432 | | | 846 | | | — |
| | | | | | | | | | | | |
Total assets | | | 102,591,609 | | | 80,631,534 | | | 108,341,148 | | | 49,551,981 |
| | | | | | | | | | | | |
LIABILITIES: | | | | | | | | | | | | |
Payable for investment securities purchased | | | — | | | 3,316,520 | | | — | | | — |
Payable for fund shares redeemed | | | 22,901 | | | 340,996 | | | 97,256 | | | 3,098 |
Payable to affiliates | | | 77,706 | | | 58,023 | | | 81,815 | | | 37,994 |
Payable for trustee fees | | | 3,011 | | | 6,207 | | | 7,029 | | | 11,650 |
Other accrued expenses and liabilities | | | 50,054 | | | 49,682 | | | 58,719 | | | 29,814 |
| | | | | | | | | | | | |
Total liabilities | | | 153,672 | | | 3,771,428 | | | 244,819 | | | 82,556 |
| | | | | | | | | | | | |
NET ASSETS | | $ | 102,437,937 | | $ | 76,860,106 | | $ | 108,096,329 | | $ | 49,469,425 |
| | | | | | | | | | | | |
NET ASSETS WERE COMPRISED OF: | | | | | | | | | | | | |
Paid-in capital | | $ | 93,533,049 | | $ | 72,072,083 | | $ | 102,753,263 | | $ | 44,146,048 |
Undistributed net investment income | | | 915,187 | | | 755,296 | | | 977,626 | | | 583,774 |
Accumulated net realized gain on investments | | | 2,697,497 | | | 2,393,362 | | | 588,274 | | | 2,020,728 |
Net unrealized appreciation on investments | | | 5,292,204 | | | 1,639,365 | | | 3,777,166 | | | 2,718,875 |
| | | | | | | | | | | | |
NET ASSETS | | $ | 102,437,937 | | $ | 76,860,106 | | $ | 108,096,329 | | $ | 49,469,425 |
| | | | | | | | | | | | |
| | | | | | | | | | | | |
* Cost of investments in securities | | $ | 96,637,732 | | $ | 74,769,531 | | $ | 104,109,707 | | $ | 46,650,525 |
| | | | | | | | | | | | |
Shares authorized | | | unlimited | | | unlimited | | | unlimited | | | unlimited |
Par value | | $ | 0.001 | | $ | 0.001 | | $ | 0.001 | | $ | 0.001 |
Shares outstanding | | | 9,890,916 | | | 7,512,882 | | | 10,352,515 | | | 4,667,490 |
Net asset value and redemption price per share | | $ | 10.36 | | $ | 10.23 | | $ | 10.44 | | $ | 10.60 |
See Accompanying Notes to Financial Statements
10
STATEMENTS OF ASSETS AND LIABILITIESASOF JUNE 30, 2007 (UNAUDITED)
| | | | | | | | | | | | |
| | | ING GET U.S. Core Portfolio |
| | | Series 5 | | Series 6 | | Series 7 | | Series 8 |
ASSETS: | | | | | | | | | | | | |
Investments in securities at value* | | $ | 33,967,855 | | $ | 69,234,256 | | $ | 48,595,172 | | $ | 31,138,748 |
Short-term investments in affiliates at amortized cost | | | 5,000 | | | 100,000 | | | 5,000 | | | 74,000 |
Short-term investments at amortized cost | | | 120,000 | | | 228,000 | | | 385,000 | | | 171,000 |
Cash | | | 971 | | | 2,818 | | | 2,835 | | | 2,738 |
Receivables: | | | | | | | | | | | | |
Investment securities sold | | | 243,329 | | | 3,609,380 | | | 20,163 | | | 1,605,503 |
Dividends and interest | | | 37,444 | | | 69,413 | | | 49,669 | | | 32,606 |
Prepaid expenses | | | 169 | | | 398 | | | 312 | | | 187 |
Reimbursement due from manager | | | — | | | — | | | — | | | 1,924 |
| | | | | | | | | | | | |
Total assets | | | 34,374,768 | | | 73,244,265 | | | 49,058,151 | | | 33,026,706 |
| | | | | | | | | | | | |
LIABILITIES: | | | | | | | | | | | | |
Payable for investment securities purchased | | | — | | | 3,274,536 | | | — | | | 1,501,728 |
Payable for fund shares redeemed | | | 11,959 | | | 4,065 | | | 6,332 | | | 144,170 |
Payable to affiliates | | | 26,203 | | | 58,911 | | | 37,894 | | | 23,860 |
Payable for trustee fees | | | 5,835 | | | 3,500 | | | 3,205 | | | 2,324 |
Other accrued expenses and liabilities | | | 35,472 | | | 42,439 | | | 41,770 | | | 30,261 |
| | | | | | | | | | | | |
Total liabilities | | | 79,469 | | | 3,383,451 | | | 89,201 | | | 1,702,343 |
| | | | | | | | | | | | |
NET ASSETS | | $ | 34,295,299 | | $ | 69,860,814 | | $ | 48,968,950 | | $ | 31,324,363 |
| | | | | | | | | | | | |
NET ASSETS WERE COMPRISED OF: | | | | | | | | | | | | |
Paid-in capital | | $ | 29,661,094 | | $ | 61,594,001 | | $ | 42,166,308 | | $ | 27,145,598 |
Undistributed net investment income | | | 206,181 | | | 493,888 | | | 359,172 | | | 223,406 |
Accumulated net realized gain on investments | | | 1,574,686 | | | 3,291,454 | | | 2,699,139 | | | 1,840,881 |
Net unrealized appreciation on investments | | | 2,853,338 | | | 4,481,471 | | | 3,744,331 | | | 2,114,478 |
| | | | | | | | | | | | |
NET ASSETS | | $ | 34,295,299 | | $ | 69,860,814 | | $ | 48,968,950 | | $ | 31,324,363 |
| | | | | | | | | | | | |
| | | | | | | | | | | | |
* Cost of investments in securities | | $ | 31,114,517 | | $ | 64,752,785 | | $ | 44,850,841 | | $ | 29,024,270 |
| | | | | | | | | | | | |
Shares authorized | | | unlimited | | | unlimited | | | unlimited | | | unlimited |
Par value | | $ | 0.001 | | $ | 0.001 | | $ | 0.001 | | $ | 0.001 |
Shares outstanding | | | 3,152,244 | | | 6,525,739 | | | 4,495,183 | | | 2,881,121 |
Net asset value and redemption price per share | | $ | 10.88 | | $ | 10.71 | | $ | 10.89 | | $ | 10.87 |
See Accompanying Notes to Financial Statements
11
STATEMENTS OF ASSETS AND LIABILITIESASOF JUNE 30, 2007 (UNAUDITED)
| | | | | | | | | |
| | | ING GET U.S. Core Portfolio |
| | | Series 9 | | Series 10 | | Series 11 |
ASSETS: | | | | | | | | | |
Investments in securities at value* | | $ | 23,715,918 | | $ | 25,860,087 | | $ | 27,862,867 |
Short-term investments in affiliates at amortized cost | | | 10,000 | �� | | 43,000 | | | 50,000 |
Short-term investments at amortized cost | | | 187,000 | | | 267,000 | | | 137,000 |
Cash | | | 2,454 | | | 2,339 | | | 3,726 |
Receivables: | | | | | | | | | |
Investment securities sold | | | 1,354,313 | | | 9,165 | | | 10,998 |
Dividends and interest | | | 25,035 | | | 25,853 | | | 28,395 |
Prepaid expenses | | | 157 | | | 136 | | | 203 |
Reimbursement due from manager | | | — | | | 5,003 | | | — |
| | | | | | | | | |
Total assets | | | 25,294,877 | | | 26,212,583 | | | 28,093,189 |
| | | | | | | | | |
LIABILITIES: | | | | | | | | | |
Payable for investment securities purchased | | | 1,290,546 | | | — | | | — |
Payable for fund shares redeemed | | | 23,550 | | | 1,882 | | | 1,538 |
Payable to affiliates | | | 19,940 | | | 20,010 | | | 23,847 |
Payable for trustee fees | | | 3,092 | | | 2,934 | | | 884 |
Other accrued expenses and liabilities | | | 27,385 | | | 34,861 | | | 35,958 |
| | | | | | | | | |
Total liabilities | | | 1,364,513 | | | 59,687 | | | 62,227 |
| | | | | | | | | |
NET ASSETS | | $ | 23,930,364 | | $ | 26,152,896 | | $ | 28,030,962 |
| | | | | | | | | |
NET ASSETS WERE COMPRISED OF: | | | | | | | | | |
Paid-in capital | | $ | 20,697,510 | | $ | 23,468,520 | | $ | 24,973,894 |
Undistributed net investment income | | | 196,372 | | | 203,400 | | | 252,073 |
Accumulated net realized gain on investments | | | 1,683,225 | | | 1,210,321 | | | 1,626,521 |
Net unrealized appreciation on investments | | | 1,353,257 | | | 1,270,655 | | | 1,178,474 |
| | | | | | | | | |
NET ASSETS | | $ | 23,930,364 | | $ | 26,152,896 | | $ | 28,030,962 |
| | | | | | | | | |
* Cost of investments in securities | | $ | 22,362,661 | | $ | 24,589,432 | | $ | 26,684,393 |
| | | | | | | | | |
Shares authorized | | | unlimited | | | unlimited | | | unlimited |
Par value | | $ | 0.001 | | $ | 0.001 | | $ | 0.001 |
Shares outstanding | | | 2,192,515 | | | 2,386,733 | | | 2,618,874 |
Net asset value and redemption price per share | | $ | 10.91 | | $ | 10.96 | | $ | 10.70 |
See Accompanying Notes to Financial Statements
12
STATEMENTS OF ASSETS AND LIABILITIESASOF JUNE 30, 2007 (UNAUDITED)
| | | | | | | | | | |
| | | ING GET U.S. Core Portfolio | |
| | | Series 12 | | Series 13 | | Series 14 | |
ASSETS: | | | | | | | | | | |
Investments in securities at value* | | $ | 51,142,466 | | $ | 77,447,440 | | $ | 138,347,885 | |
Short-term investments in affiliates at amortized cost | | | 34,000 | | | 505,000 | | | — | |
Short-term investments at amortized cost | | | 373,000 | | | 205,000 | | | 164,000 | |
Cash | | | 9,467 | | | 12,789 | | | 276 | |
Receivables: | | | | | | | | | | |
Investment securities sold | | | 21,995 | | | 29,328 | | | 7,324,705 | |
Dividends and interest | | | 55,630 | | | 71,729 | | | 21,918 | |
Prepaid expenses | | | 273 | | | 617 | | | 10,617 | |
Reimbursement due from manager | | | 7,770 | | | — | | | 9,082 | |
| | | | | | | | | | |
Total assets | | | 51,644,601 | | | 78,271,903 | | | 145,878,483 | |
| | | | | | | | | | |
LIABILITIES: | | | | | | | | | | |
Payable for investment securities purchased | | | — | | | — | | | 6,380,361 | |
Payable for fund shares redeemed | | | 16,065 | | | 72,389 | | | 491,915 | |
Payable to affiliates | | | 39,116 | | | 80,825 | | | 55,847 | |
Payable for trustee fees | | | 210 | | | 4,927 | | | 1,514 | |
Other accrued expenses and liabilities | | | 18,211 | | | 55,460 | | | 20,762 | |
| | | | | | | | | | |
Total liabilities | | | 73,602 | | | 213,601 | | | 6,950,399 | |
| | | | | | | | | | |
NET ASSETS | | $ | 51,570,999 | | $ | 78,058,302 | | $ | 138,928,084 | |
| | | | | | | | | | |
NET ASSETS WERE COMPRISED OF: | | | | | | | | | | |
Paid-in capital | | $ | 43,896,737 | | $ | 75,020,658 | | $ | 138,277,673 | |
Undistributed net investment income | | | 244,936 | | | 408,531 | | | 933,626 | |
Accumulated net realized gain (loss) on investments | | | 3,985,995 | | | 710,180 | | | (108,409 | ) |
Net unrealized appreciation or depreciation on investments | | | 3,443,331 | | | 1,918,933 | | | (174,806 | ) |
| | | | | | | | | | |
NET ASSETS | | $ | 51,570,999 | | $ | 78,058,302 | | $ | 138,928,084 | |
| | | | | | | | | | |
| | | | | | | | | | |
* Cost of investments in securities | | $ | 47,699,135 | | $ | 75,528,507 | | $ | 138,522,691 | |
| | | | | | | | | | |
Shares authorized | | | unlimited | | | unlimited | | | unlimited | |
Par value | | $ | 0.001 | | $ | 0.001 | | $ | 0.001 | |
Shares outstanding | | | 4,480,419 | | | 7,455,673 | | | 13,605,725 | |
Net asset value and redemption price per share | | $ | 11.51 | | $ | 10.47 | | $ | 10.21 | |
See Accompanying Notes to Financial Statements
13
STATEMENTS OF OPERATIONSFORTHE SIX MONTHS ENDED JUNE 30, 2007 (UNAUDITED)
| | | | | | | | | | | | | | | | |
| | | ING GET U.S. Core Portfolio | |
| | | Series 1 | | | Series 2 | | | Series 3 | | | Series 4 | |
INVESTMENT INCOME: | | | | | | | | | | | | | | | | |
Dividends | | $ | 535,908 | | | $ | 338,047 | | | $ | 436,594 | | | $ | 282,278 | |
Interest(1) | | | 912,484 | | | | 820,449 | | | | 1,122,407 | | | | 565,955 | |
| | | | | | | | | | | | | | | | |
Total investment income | | | 1,448,392 | | | | 1,158,496 | | | | 1,559,001 | | | | 848,233 | |
| | | | | | | | | | | | | | | | |
EXPENSES: | | | | | | | | | | | | | | | | |
Investment management fees | | | 319,068 | | | | 241,456 | | | | 348,074 | | | | 164,050 | |
Distribution fees | | | 132,944 | | | | 100,606 | | | | 145,030 | | | | 68,354 | |
Transfer agent fees | | | 67 | | | | 103 | | | | 103 | | | | 60 | |
Administrative service fees | | | 29,247 | | | | 22,133 | | | | 31,906 | | | | 15,037 | |
Shareholder reporting expense | | | 9,413 | | | | 7,180 | | | | 9,592 | | | | 1,813 | |
Registration fees | | | 272 | | | | — | | | | — | | | | — | |
Professional fees | | | 29,367 | | | | 14,922 | | | | 29,853 | | | | 6,611 | |
Custody and accounting expense | | | 12,540 | | | | 11,041 | | | | 13,756 | | | | 4,050 | |
Trustee fees | | | 2,715 | | | | 3,530 | | | | 2,715 | | | | 2,172 | |
Miscellaneous expense | | | 3,472 | | | | 3,932 | | | | 5,751 | | | | 2,167 | |
| | | | | | | | | | | | | | | | |
Total expenses | | | 539,105 | | | | 404,903 | | | | 586,780 | | | | 264,314 | |
Net waived and reimbursed fees | | | (6,497 | ) | | | (1,734 | ) | | | (6,011 | ) | | | (49 | ) |
| | | | | | | | | | | | | | | | |
Net expenses | | | 532,608 | | | | 403,169 | | | | 580,769 | | | | 264,265 | |
| | | | | | | | | | | | | | | | |
Net investment income | | | 915,784 | | | | 755,327 | | | | 978,232 | | | | 583,968 | |
| | | | | | | | | | | | | | | | |
REALIZED AND UNREALIZED GAIN (LOSS) ON INVESTMENTS: | | | | | | | | | | | | | | | | |
Net realized gain on investments | | | 3,435,835 | | | | 2,765,916 | | | | 1,379,894 | | | | 2,301,923 | |
Net change in unrealized appreciation or depreciation on investments | | | (163,021 | ) | | | (809,191 | ) | | | 1,820,523 | | | | (718,271 | ) |
| | | | | | | | | | | | | | | | |
Net realized and unrealized gain on investments | | | 3,272,814 | | | | 1,956,725 | | | | 3,200,417 | | | | 1,583,652 | |
| | | | | | | | | | | | | | | | |
Increase in net assets resulting from operations | | $ | 4,188,598 | | | $ | 2,712,052 | | | $ | 4,178,649 | | | $ | 2,167,620 | |
| | | | | | | | | | | | | | | | |
| | | | | | | | | | | | | | | | |
(1) Affiliated Income | | $ | 3,648 | | | $ | 3,284 | | | $ | 5,978 | | | $ | 3,248 | |
See Accompanying Notes to Financial Statements
14
STATEMENTS OF OPERATIONSFORTHE SIX MONTHS ENDED JUNE 30, 2007 (UNAUDITED)
| | | | | | | | | | | | | | | | |
| | | ING GET U.S. Core Portfolio | |
| | | Series 5 | | | Series 6 | | | Series 7 | | | Series 8 | |
INVESTMENT INCOME: | | | | | | | | | | | | | | | | |
Dividends | | $ | 303,125 | | | $ | 567,384 | | | $ | 416,583 | | | $ | 285,005 | |
Interest(1) | | | 74,407 | | | | 285,948 | | | | 210,136 | | | | 113,617 | |
| | | | | | | | | | | | | | | | |
Total investment income | | | 377,532 | | | | 853,332 | | | | 626,719 | | | | 398,622 | |
| | | | | | | | | | | | | | | | |
EXPENSES: | | | | | | | | | | | | | | | | |
Investment management fees | | | 106,123 | | | | 218,416 | | | | 160,463 | | | | 104,952 | |
Distribution fees | | | 44,218 | | | | 91,006 | | | | 66,859 | | | | 43,730 | |
Transfer agent fees | | | 60 | | | | 63 | | | | 54 | | | | 63 | |
Administrative service fees | | | 9,728 | | | | 20,021 | | | | 14,709 | | | | 9,620 | |
Shareholder reporting expense | | | 905 | | | | 4,545 | | | | 5,430 | | | | 3,984 | |
Professional fees | | | 4,218 | | | | 12,100 | | | | 17,639 | | | | 8,846 | |
Custody and accounting expense | | | 3,840 | | | | 7,765 | | | | 9,995 | | | | 9,955 | |
Trustee fees | | | 905 | | | | 2,556 | | | | 1,810 | | | | 905 | |
Miscellaneous expense | | | 1,182 | | | | 3,013 | | | | 2,499 | | | | 2,116 | |
| | | | | | | | | | | | | | | | |
Total expenses | | | 171,179 | | | | 359,485 | | | | 279,458 | | | | 184,171 | |
Net waived and reimbursed fees | | | (17 | ) | | | (29 | ) | | | (11,968 | ) | | | (9,215 | ) |
| | | | | | | | | | | | | | | | |
Net expenses | | | 171,162 | | | | 359,456 | | | | 267,490 | | | | 174,956 | |
| | | | | | | | | | | | | | | | |
Net investment income | | | 206,370 | | | | 493,876 | | | | 359,229 | | | | 223,666 | |
| | | | | | | | | | | | | | | | |
REALIZED AND UNREALIZED GAIN (LOSS) ON INVESTMENTS: | | | | | | | | | | | | | | | | |
Net realized gain on investments | | | 2,024,643 | | | | 4,233,991 | | | | 3,405,053 | | | | 2,222,458 | |
Net change in unrealized appreciation or depreciation on investments | | | (496,583 | ) | | | (1,653,309 | ) | | | (1,240,488 | ) | | | (848,912 | ) |
| | | | | | | | | | | | | | | | |
Net realized and unrealized gain on investments | | | 1,528,060 | | | | 2,580,682 | | | | 2,164,565 | | | | 1,373,546 | |
| | | | | | | | | | | | | | | | |
Increase in net assets resulting from operations | | $ | 1,734,430 | | | $ | 3,074,558 | | | $ | 2,523,794 | | | $ | 1,597,212 | |
| | | | | | | | | | | | | | | | |
| | | | | | | | | | | | | | | | |
(1) Affiliated Income | | $ | 1,139 | | | $ | 1,931 | | | $ | 8,007 | | | $ | 694 | |
See Accompanying Notes to Financial Statements
15
STATEMENTS OF OPERATIONSFORTHE SIX MONTHS ENDED JUNE 30, 2007 (UNAUDITED)
| | | | | | | | | | | | |
| | | ING GET U.S. Core Portfolio | |
| | | Series 9 | | | Series 10 | | | Series 11 | |
INVESTMENT INCOME: | | | | | | | | | | | | |
Dividends | | $ | 224,210 | | | $ | 199,464 | | | $ | 220,977 | |
Interest(1) | | | 115,673 | | | | 139,868 | | | | 191,630 | |
| | | | | | | | | | | | |
Total investment income | | | 339,883 | | | | 339,332 | | | | 412,607 | |
| | | | | | | | | | | | |
EXPENSES: | | | | | | | | | | | | |
Investment management fees | | | 85,930 | | | | 81,028 | | | | 96,193 | |
Distribution fees | | | 35,804 | | | | 33,761 | | | | 40,080 | |
Transfer agent fees | | | 54 | | | | 270 | | | | 60 | |
Administrative service fees | | | 7,877 | | | | 7,427 | | | | 8,817 | |
Shareholder reporting expense | | | 4,143 | | | | 4,703 | | | | 5,370 | |
Professional fees | | | 5,885 | | | | 8,056 | | | | 14,071 | |
Custody and accounting expense | | | 9,050 | | | | 8,326 | | | | 11,936 | |
Trustee fees | | | 1,097 | | | | 1,201 | | | | 543 | |
Offering expense | | | — | | | | — | | | | 2,465 | |
Miscellaneous expense | | | 1,885 | | | | 2,834 | | | | 1,738 | |
| | | | | | | | | | | | |
Total expenses | | | 151,725 | | | | 147,606 | | | | 181,273 | |
Net waived and reimbursed fees | | | (8,459 | ) | | | (11,754 | ) | | | (20,946 | ) |
| | | | | | | | | | | | |
Net expenses | | | 143,266 | | | | 135,852 | | | | 160,327 | |
| | | | | | | | | | | | |
Net investment income | | | 196,617 | | | | 203,480 | | | | 252,280 | |
| | | | | | | | | | | | |
REALIZED AND UNREALIZED GAIN (LOSS) ON INVESTMENTS: | | | | | | | | | | | | |
Net realized gain on investments | | | 2,016,411 | | | | 1,468,524 | | | | 1,928,474 | |
Net change in unrealized appreciation or depreciation on investments | | | (773,502 | ) | | | (520,776 | ) | | | (787,351 | ) |
| | | | | | | | | | | | |
Net realized and unrealized gain on investments | | | 1,242,909 | | | | 947,748 | | | | 1,141,123 | |
| | | | | | | | | | | | |
Increase in net assets resulting from operations | | $ | 1,439,526 | | | $ | 1,151,228 | | | $ | 1,393,403 | |
| | | | | | | | | | | | |
| | | | | | | | | | | | |
(1) Affiliated Income | | $ | 1,425 | | | $ | 1,110 | | | $ | 1,486 | |
See Accompanying Notes to Financial Statements
16
STATEMENTS OF OPERATIONSFORTHE SIX MONTHS ENDED JUNE 30, 2007 (UNAUDITED)
| | | | | | | | | | | | |
| | | ING GET U.S. Core Portfolio | |
| | | Series 12 | | | Series 13 | | | Series 14 | |
INVESTMENT INCOME: | | | | | | | | | | | | |
Dividends | | $ | 436,797 | | | $ | 586,315 | | | $ | 21,870 | |
Interest(1) | | | 73,886 | | | | 306,637 | | | | 1,058,754 | |
| | | | | | | | | | | | |
Total investment income | | | 510,683 | | | | 892,952 | | | | 1,080,624 | |
| | | | | | | | | | | | |
EXPENSES: | | | | | | | | | | | | |
Investment management fees | | | 159,255 | | | | 290,373 | | | | 64,963 | |
Distribution fees | | | 66,356 | | | | 120,988 | | | | 51,507 | |
Transfer agent fees | | | 231 | | | | 968 | | | | 412 | |
Administrative service fees | | | 14,598 | | | | 26,617 | | | | 11,331 | |
Shareholder reporting expense | | | 1,648 | | | | 12,140 | | | | 3,924 | |
Registration fees | | | — | | | | 77 | | | | — | |
Professional fees | | | 20,287 | | | | 22,214 | | | | 8,263 | |
Custody and accounting expense | | | 8,181 | | | | 9,541 | | | | 2,969 | |
Trustee fees | | | 370 | | | | 2,334 | | | | 1,648 | |
Offering expense | | | 26,613 | | | | 13,178 | | | | 9,383 | |
Miscellaneous expense | | | 1,310 | | | | 3,001 | | | | 1,680 | |
| | | | | | | | | | | | |
Total expenses | | | 298,849 | | | | 501,431 | | | | 156,080 | |
Net waived and reimbursed fees | | | (33,373 | ) | | | (17,610 | ) | | | (9,082 | ) |
| | | | | | | | | | | | |
Net expenses | | | 265,476 | | | | 483,821 | | | | 146,998 | |
| | | | | | | | | | | | |
Net investment income | | | 245,207 | | | | 409,131 | | | | 933,626 | |
| | | | | | | | | | | | |
REALIZED AND UNREALIZED GAIN (LOSS) ON INVESTMENTS: | | | | | | | | | | | | |
Net realized gain (loss) on investments | | | 4,035,959 | | | | 710,696 | | | | (108,409 | ) |
Net change in unrealized appreciation or depreciation on investments | | | (1,647,279 | ) | | | 2,538,249 | | | | (174,806 | ) |
| | | | | | | | | | | | |
Net realized and unrealized gain (loss) on investments | | | 2,388,680 | | | | 3,248,945 | | | | (283,215 | ) |
| | | | | | | | | | | | |
Increase in net assets resulting from operations | | $ | 2,633,887 | | | $ | 3,658,076 | | | $ | 650,411 | |
| | | | | | | | | | | | |
| | | | | | | | | | | | |
(1) Affiliated Income | | $ | — | | | $ | 4,174 | | | $ | — | |
See Accompanying Notes to Financial Statements
17
STATEMENTS OF CHANGES IN NET ASSETS (UNAUDITED)
| | | | | | | | | | | | | | | | |
| | | ING GET U.S. Core
Portfolio Series 1 | | | ING GET U.S. Core
Portfolio Series 2 | |
| | | Six Months
Ended
June 30,
2007 | | | Year Ended
December 31,
2006 | | | Six Months
Ended
June 30,
2007 | | | Year Ended
December 31,
2006 | |
FROM OPERATIONS: | | | | | | | | | | | | | | | | |
Net investment income | | $ | 915,784 | | | $ | 2,606,162 | | | $ | 755,327 | | | $ | 2,249,937 | |
Net realized gain on investments | | | 3,435,835 | | | | 2,215,351 | | | | 2,765,916 | | | | 1,129,314 | |
Net change in unrealized appreciation or depreciation on investments | | | (163,021 | ) | | | 4,432,897 | | | | (809,191 | ) | | | 3,003,859 | |
| | | | | | | | | | | | | | | | |
Net increase in net assets resulting from operations | | | 4,188,598 | | | | 9,254,410 | | | | 2,712,052 | | | | 6,383,110 | |
| | | | | | | | | | | | | | | | |
FROM DISTRIBUTIONS TO SHAREHOLDERS: | | | | | | | | | | | | | | | | |
Net investment income | | | (2,600,803 | ) | | | (3,352,843 | ) | | | (2,245,332 | ) | | | (2,988,412 | ) |
Net realized gains | | | (1,835,124 | ) | | | (2,572,044 | ) | | | (622,760 | ) | | | (1,009,414 | ) |
| | | | | | | | | | | | | | | | |
Total distributions | | | (4,435,927 | ) | | | (5,924,887 | ) | | | (2,868,092 | ) | | | (3,997,826 | ) |
| | | | | | | | | | | | | | | | |
FROM CAPITAL SHARE TRANSACTIONS: | | | | | | | | | | | | | | | | |
Dividends reinvested | | | 4,435,927 | | | | 5,924,887 | | | | 2,868,092 | | | | 3,997,826 | |
Cost of shares redeemed | | | (14,227,733 | ) | | | (49,626,519 | ) | | | (12,532,754 | ) | | | (42,573,997 | ) |
| | | | | | | | | | | | | | | | |
Net decrease in net assets resulting from capital share transactions | | | (9,791,806 | ) | | | (43,701,632 | ) | | | (9,664,662 | ) | | | (38,576,171 | ) |
| | | | | | | | | | | | | | | | |
Net decrease in net assets | | | (10,039,135 | ) | | | (40,372,109 | ) | | | (9,820,702 | ) | | | (36,190,887 | ) |
| | | | | | | | | | | | | | | | |
NET ASSETS: | | | | | | | | | | | | | | | | |
Beginning of period | | | 112,477,072 | | | | 152,849,181 | | | | 86,680,808 | | | | 122,871,695 | |
| | | | | | | | | | | | | | | | |
End of period | | $ | 102,437,937 | | | $ | 112,477,072 | | | $ | 76,860,106 | | | $ | 86,680,808 | |
| | | | | | | | | | | | | | | | |
Undistributed net investment income at end of period | | $ | 915,187 | | | $ | 2,600,206 | | | $ | 755,296 | | | $ | 2,245,301 | |
| | | | | | | | | | | | | | | | |
See Accompanying Notes to Financial Statements
18
STATEMENTS OF CHANGES IN NET ASSETS (UNAUDITED)
| | | | | | | | | | | | | | | | |
| | | ING GET U.S. Core
Portfolio Series 3 | | | ING GET U.S. Core
Portfolio Series 4 | |
| | | Six Months
Ended
June 30,
2007 | | | Year Ended
December 31,
2006 | | | Six Months
Ended
June 30,
2007 | | | Year Ended
December 31,
2006 | |
FROM OPERATIONS: | | | | | | | | | | | | | | | | |
Net investment income | | $ | 978,232 | | | $ | 2,808,263 | | | $ | 583,968 | | | $ | 1,481,242 | |
Net realized gain on investments | | | 1,379,894 | | | | 1,503,956 | | | | 2,301,923 | | | | 1,409,789 | |
Net change in unrealized appreciation or depreciation on investments | | | 1,820,523 | | | | 4,448,491 | | | | (718,271 | ) | | | 1,748,833 | |
| | | | | | | | | | | | | | | | |
Net increase in net assets resulting from operations | | | 4,178,649 | | | | 8,760,710 | | | | 2,167,620 | | | | 4,639,864 | |
| | | | | | | | | | | | | | | | |
FROM DISTRIBUTIONS TO SHAREHOLDERS: | | | | | | | | | | | | | | | | |
Net investment income | | | (2,803,620 | ) | | | (3,868,485 | ) | | | (1,477,787 | ) | | | (1,721,080 | ) |
Net realized gains | | | (39,356 | ) | | | (81,209 | ) | | | (1,148,098 | ) | | | (1,121,509 | ) |
| | | | | | | | | | | | | | | | |
Total distributions | | | (2,842,976 | ) | | | (3,949,694 | ) | | | (2,625,885 | ) | | | (2,842,589 | ) |
| | | | | | | | | | | | | | | | |
FROM CAPITAL SHARE TRANSACTIONS: | | | | | | | | | | | | | | | | |
Dividends reinvested | | | 2,842,976 | | | | 3,949,694 | | | | 2,625,885 | | | | 2,842,589 | |
Cost of shares redeemed | | | (23,633,450 | ) | | | (60,611,583 | ) | | | (11,076,702 | ) | | | (17,083,194 | ) |
| | | | | | | | | | | | | | | | |
Net decrease in net assets resulting from capital share transactions | | | (20,790,474 | ) | | | (56,661,889 | ) | | | (8,450,817 | ) | | | (14,240,605 | ) |
| | | | | | | | | | | | | | | | |
Net decrease in net assets | | | (19,454,801 | ) | | | (51,850,873 | ) | | | (8,909,082 | ) | | | (12,443,330 | ) |
| | | | | | | | | | | | | | | | |
NET ASSETS: | | | | | | | | | | | | | | | | |
Beginning of period | | | 127,551,130 | | | | 179,402,003 | | | | 58,378,507 | | | | 70,821,837 | |
| | | | | | | | | | | | | | | | |
End of period | | $ | 108,096,329 | | | $ | 127,551,130 | | | $ | 49,469,425 | | | $ | 58,378,507 | |
| | | | | | | | | | | | | | | | |
Undistributed net investment income at end of period | | $ | 977,626 | | | $ | 2,803,014 | | | $ | 583,774 | | | $ | 1,477,593 | |
| | | | | | | | | | | | | | | | |
See Accompanying Notes to Financial Statements
19
STATEMENTS OF CHANGES IN NET ASSETS (UNAUDITED)
| | | | | | | | | | | | | | | | |
| | | ING GET U.S. Core
Portfolio Series 5 | | | ING GET U.S. Core
Portfolio Series 6 | |
| | | Six Months
Ended
June 30,
2007 | | | Year Ended
December 31,
2006 | | | Six Months
Ended
June 30,
2007 | | | Year Ended
December 31,
2006 | |
FROM OPERATIONS: | | | | | | | | | | | | | | | | |
Net investment income | | $ | 206,370 | | | $ | 591,988 | | | $ | 493,876 | | | $ | 1,680,604 | |
Net realized gain on investments | | | 2,024,643 | | | | 1,752,627 | | | | 4,233,991 | | | | 3,961,083 | |
Net change in unrealized appreciation or depreciation on investments | | | (496,583 | ) | | | 1,741,732 | | | | (1,653,309 | ) | | | 3,355,251 | |
| | | | | | | | | | | | | | | | |
Net increase in net assets resulting from operations | | | 1,734,430 | | | | 4,086,347 | | | | 3,074,558 | | | | 8,996,938 | |
| | | | | | | | | | | | | | | | |
FROM DISTRIBUTIONS TO SHAREHOLDERS: | | | | | | | | | | | | | | | | |
Net investment income | | | (588,139 | ) | | | (769,337 | ) | | | (1,673,498 | ) | | | (2,438,793 | ) |
Net realized gains | | | (1,515,062 | ) | | | (1,611,245 | ) | | | (3,686,983 | ) | | | (704,735 | ) |
| | | | | | | | | | | | | | | | |
Total distributions | | | (2,103,201 | ) | | | (2,380,582 | ) | | | (5,360,481 | ) | | | (3,143,528 | ) |
| | | | | | | | | | | | | | | | |
FROM CAPITAL SHARE TRANSACTIONS: | | | | | | | | | | | | | | | | |
Dividends reinvested | | | 2,103,201 | | | | 2,380,582 | | | | 5,360,481 | | | | 3,143,528 | |
Cost of shares redeemed | | | (3,957,622 | ) | | | (14,257,722 | ) | | | (11,943,117 | ) | | | (50,157,566 | ) |
| | | | | | | | | | | | | | | | |
Net decrease in net assets resulting from capital share transactions | | | (1,854,421 | ) | | | (11,877,140 | ) | | | (6,582,636 | ) | | | (47,014,038 | ) |
| | | | | | | | | | | | | | | | |
Net decrease in net assets | | | (2,223,192 | ) | | | (10,171,375 | ) | | | (8,868,559 | ) | | | (41,160,628 | ) |
| | | | | | | | | | | | | | | | |
NET ASSETS: | | | | | | | | | | | | | | | | |
Beginning of period | | | 36,518,491 | | | | 46,689,866 | | | | 78,729,373 | | | | 119,890,001 | |
| | | | | | | | | | | | | | | | |
End of period | | $ | 34,295,299 | | | $ | 36,518,491 | | | $ | 69,860,814 | | | $ | 78,729,373 | |
| | | | | | | | | | | | | | | | |
Undistributed net investment income at end of period | | $ | 206,181 | | | $ | 587,950 | | | $ | 493,888 | | | $ | 1,673,510 | |
| | | | | | | | | | | | | | | | |
See Accompanying Notes to Financial Statements
20
STATEMENTS OF CHANGES IN NET ASSETS (UNAUDITED)
| | | | | | | | | | | | | | | | |
| | | ING GET U.S. Core
Portfolio Series 7 | | | ING GET U.S. Core
Portfolio Series 8 | |
| | | Six Months
Ended
June 30,
2007 | | | Year Ended
December 31,
2006 | | | Six Months
Ended
June 30,
2007 | | | Year Ended
December 31,
2006 | |
FROM OPERATIONS: | | | | | | | | | | | | | | | | |
Net investment income | | $ | 359,229 | | | $ | 1,261,518 | | | $ | 223,666 | | | $ | 706,433 | |
Net realized gain on investments | | | 3,405,053 | | | | 2,338,456 | | | | 2,222,458 | | | | 1,416,943 | |
Net change in unrealized appreciation or depreciation on investments | | | (1,240,488 | ) | | | 3,285,996 | | | | (848,912 | ) | | | 2,273,601 | |
| | | | | | | | | | | | | | | | |
Net increase in net assets resulting from operations | | | 2,523,794 | | | | 6,885,970 | | | | 1,597,212 | | | | 4,396,977 | |
| | | | | | | | | | | | | | | | |
FROM DISTRIBUTIONS TO SHAREHOLDERS: | | | | | | | | | | | | | | | | |
Net investment income | | | (1,255,700 | ) | | | (1,732,860 | ) | | | (702,883 | ) | | | (810,342 | ) |
Net realized gains | | | (1,633,428 | ) | | | — | | | | (1,364,224 | ) | | | (173,353 | ) |
| | | | | | | | | | | | | | | | |
Total distributions | | | (2,889,128 | ) | | | (1,732,860 | ) | | | (2,067,107 | ) | | | (983,695 | ) |
| | | | | | | | | | | | | | | | |
FROM CAPITAL SHARE TRANSACTIONS: | | | | | | | | | | | | | | | | |
Dividends reinvested | | | 2,889,128 | | | | 1,732,860 | | | | 2,067,107 | | | | 983,695 | |
Cost of shares redeemed | | | (12,609,179 | ) | | | (38,403,731 | ) | | | (11,444,507 | ) | | | (15,185,745 | ) |
| | | | | | | | | | | | | | | | |
Net decrease in net assets resulting from capital share transactions | | | (9,720,051 | ) | | | (36,670,871 | ) | | | (9,377,400 | ) | | | (14,202,050 | ) |
| | | | | | | | | | | | | | | | |
Net decrease in net assets | | | (10,085,385 | ) | | | (31,517,761 | ) | | | (9,847,295 | ) | | | (10,788,768 | ) |
| | | | | | | | | | | | | | | | |
NET ASSETS: | | | | | | | | | | | | | | | | |
Beginning of period | | | 59,054,335 | | | | 90,572,096 | | | | 41,171,658 | | | | 51,960,426 | |
| | | | | | | | | | | | | | | | |
End of period | | $ | 48,968,950 | | | $ | 59,054,335 | | | $ | 31,324,363 | | | $ | 41,171,658 | |
| | | | | | | | | | | | | | | | |
Undistributed net investment income at end of period | | $ | 359,172 | | | $ | 1,255,643 | | | $ | 223,406 | | | $ | 702,623 | |
| | | | | | | | | | | | | | | | |
See Accompanying Notes to Financial Statements
21
STATEMENTS OF CHANGES IN NET ASSETS (UNAUDITED)
| | | | | | | | | | | | | | | | |
| | | ING GET U.S. Core
Portfolio Series 9 | | | ING GET U.S. Core
Portfolio Series 10 | |
| | | Six Months
Ended
June 30,
2007 | | | Year Ended
December 31,
2006 | | | Six Months
Ended
June 30,
2007 | | | Year Ended
December 31, 2006 | |
FROM OPERATIONS: | | | | | | | | | | | | | | | | |
Net investment income | | $ | 196,617 | | | $ | 646,697 | | | $ | 203,480 | | | $ | 488,610 | |
Net realized gain on investments | | | 2,016,411 | | | | 687,657 | | | | 1,468,524 | | | | 303,293 | |
Net change in unrealized appreciation or depreciation on investments | | | (773,502 | ) | | | 2,070,330 | | | | (520,776 | ) | | | 2,043,177 | |
| | | | | | | | | | | | | | | | |
Net increase in net assets resulting from operations | | | 1,439,526 | | | | 3,404,684 | | | | 1,151,228 | | | | 2,835,080 | |
| | | | | | | | | | | | | | | | |
FROM DISTRIBUTIONS TO SHAREHOLDERS: | | | | | | | | | | | | | | | | |
Net investment income | | | (643,348 | ) | | | (470,241 | ) | | | (490,048 | ) | | | (234,640 | ) |
Net realized gains | | | (662,732 | ) | | | — | | | | (529,452 | ) | | | (24,066 | ) |
| | | | | | | | | | | | | | | | |
Total distributions | | | (1,306,080 | ) | | | (470,241 | ) | | | (1,019,500 | ) | | | (258,706 | ) |
| | | | | | | | | | | | | | | | |
FROM CAPITAL SHARE TRANSACTIONS: | | | | | | | | | | | | | | | | |
Dividends reinvested | | | 1,306,080 | | | | 470,241 | | | | 1,019,500 | | | | 258,706 | |
Cost of shares redeemed | | | (8,203,545 | ) | | | (14,292,233 | ) | | | (2,692,093 | ) | | | (12,278,534 | ) |
| | | | | | | | | | | | | | | | |
Net decrease in net assets resulting from capital share transactions | | | (6,897,465 | ) | | | (13,821,992 | ) | | | (1,672,593 | ) | | | (12,019,828 | ) |
| | | | | | | | | | | | | | | | |
Net decrease in net assets | | | (6,764,019 | ) | | | (10,887,549 | ) | | | (1,540,865 | ) | | | (9,443,454 | ) |
| | | | | | | | | | | | | | | | |
NET ASSETS: | | | | | | | | | | | | | | | | |
Beginning of period | | | 30,694,383 | | | | 41,581,932 | | | | 27,693,761 | | | | 37,137,215 | |
| | | | | | | | | | | | | | | | |
End of period | | $ | 23,930,364 | | | $ | 30,694,383 | | | $ | 26,152,896 | | | $ | 27,693,761 | |
| | | | | | | | | | | | | | | | |
Undistributed net investment income at end of period | | $ | 196,372 | | | $ | 643,103 | | | $ | 203,400 | | | $ | 489,968 | |
| | | | | | | | | | | | | | | | |
See Accompanying Notes to Financial Statements
22
STATEMENTS OF CHANGES IN NET ASSETS (UNAUDITED)
| | | | | | | | | | | | | | | | |
| | | ING GET U.S. Core
Portfolio Series 11 | | | ING GET U.S. Core
Portfolio Series 12 | |
| | | Six Months
Ended
June 30,
2007 | | | Year Ended
December 31,
2006 | | | Six Months
Ended
June 30,
2007 | | | March 2,
2006(1) to
December 31,
2006 | |
FROM OPERATIONS: | | | | | | | | | | | | | | | | |
Net investment income | | $ | 252,280 | | | $ | 902,469 | | | $ | 245,207 | | | $ | 637,339 | |
Net realized gain on investments | | | 1,928,474 | | | | 203,828 | | | | 4,035,959 | | | | 1,191,679 | |
Net change in unrealized appreciation or depreciation on investments | | | (787,351 | ) | | | 1,968,628 | | | | (1,647,279 | ) | | | 5,090,610 | |
| | | | | | | | | | | | | | | | |
Net increase in net assets resulting from operations | | | 1,393,403 | | | | 3,074,925 | | | | 2,633,887 | | | | 6,919,628 | |
| | | | | | | | | | | | | | | | |
FROM DISTRIBUTIONS TO SHAREHOLDERS: | | | | | | | | | | | | | | | | |
Net investment income | | | (920,871 | ) | | | (52,607 | ) | | | (648,914 | ) | | | — | |
Net realized gains | | | (507,718 | ) | | | — | | | | (1,244,119 | ) | | | — | |
| | | | | | | | | | | | | | | | |
Total distributions | | | (1,428,589 | ) | | | (52,607 | ) | | | (1,893,033 | ) | | | — | |
| | | | | | | | | | | | | | | | |
FROM CAPITAL SHARE TRANSACTIONS: | | | | | | | | | | | | | | | | |
Net proceeds from sale of shares | | | — | | | | 25,561,609 | | | | — | | | | 70,369,417 | |
Dividends reinvested | | | 1,428,589 | | | | 52,607 | | | | 1,893,033 | | | | — | |
| | | | | | | | | | | | | | | | |
| | | 1,428,589 | | | | 25,614,216 | | | | 1,893,033 | | | | 70,369,417 | |
Cost of shares redeemed | | | (8,835,068 | ) | | | (19,005,866 | ) | | | (5,956,380 | ) | | | (22,395,553 | ) |
| | | | | | | | | | | | | | | | |
Net increase (decrease) in net assets resulting from capital share transactions | | | (7,406,479 | ) | | | 6,608,350 | | | | (4,063,347 | ) | | | 47,973,864 | |
| | | | | | | | | | | | | | | | |
Net increase (decrease) in net assets | | | (7,441,665 | ) | | | 9,630,668 | | | | (3,322,493 | ) | | | 54,893,492 | |
| | | | | | | | | | | | | | | | |
NET ASSETS: | | | | | | | | | | | | | | | | |
Beginning of period | | | 35,472,627 | | | | 25,841,959 | | | | 54,893,492 | | | | — | |
| | | | | | | | | | | | | | | | |
End of period | | $ | 28,030,962 | | | $ | 35,472,627 | | | $ | 51,570,999 | | | $ | 54,893,492 | |
| | | | | | | | | | | | | | | | |
Undistributed net investment income at end of period | | $ | 252,073 | | | $ | 920,664 | | | $ | 244,936 | | | $ | 648,643 | |
| | | | | | | | | | | | | | | | |
(1) | | Commencement of operations |
See Accompanying Notes to Financial Statements
23
STATEMENTS OF CHANGES IN NET ASSETS (UNAUDITED)
| | | | | | | | | | | | | | | |
| | | ING GET U.S. Core
Portfolio Series 13 | | | ING GET U.S. Core
Portfolio Series 14 |
| | | Six Months
Ended
June 30,
2007 | | | June 22,
2006(1) to
December 31,
2006 | | | Six Months
Ended
June 30,
2007 | | | December 21,
2006(1) to
December 31,
2006 |
FROM OPERATIONS: | | | | | | | | | | | | | | | |
Net investment income | | $ | 409,131 | | | $ | 571,556 | | | $ | 933,626 | | | $ | — |
Net realized gain (loss) on investments | | | 710,696 | | | | — | | | | (108,409 | ) | | | — |
Net change in unrealized appreciation or depreciation on investments | | | 2,538,249 | | | | (619,316 | ) | | | (174,806 | ) | | | — |
| | | | | | | | | | | | | | | |
Net increase (decrease) in net assets resulting from operations | | | 3,658,076 | | | | (47,760 | ) | | | 650,411 | | | | — |
| | | | | | | | | | | | | | | |
FROM DISTRIBUTIONS TO SHAREHOLDERS: | | | | | | | | | | | | | | | |
Net investment income | | | (571,994 | ) | | | — | | | | — | | | | |
Net realized gains | | | (1,807 | ) | | | — | | | | — | | | | |
| | | | | | | | | | | | | | | |
Total distributions | | | (573,801 | ) | | | — | | | | — | | | | — |
| | | | | | | | | | | | | | | |
FROM CAPITAL SHARE TRANSACTIONS: | | | | | | | | | | | | | | | |
Net proceeds from sale of shares | | | — | | | | 116,423,613 | | | | 158,080,046 | | | | 85,252 |
Dividends reinvested | | | 573,801 | | | | — | | | | — | | | | — |
| | | | | | | | | | | | | | | |
| | | 573,801 | | | | 116,423,613 | | | | 158,080,046 | | | | 85,252 |
Cost of shares redeemed | | | (32,814,593 | ) | | | (9,161,034 | ) | | | (19,887,625 | ) | | | — |
| | | | | | | | | | | | | | | |
Net increase (decrease) in net assets resulting from capital share transactions | | | (32,240,792 | ) | | | 107,262,579 | | | | 138,192,421 | | | | 85,252 |
| | | | | | | | | | | | | | | |
Net increase (decrease) in net assets | | | (29,156,517 | ) | | | 107,214,819 | | | | 138,842,832 | | | | 85,252 |
| | | | | | | | | | | | | | | |
NET ASSETS: | | | | | | | | | | | | | | | |
Beginning of period | | | 107,214,819 | | | | — | | | | 85,252 | | | | — |
| | | | | | | | | | | | | | | |
End of period | | $ | 78,058,302 | | | $ | 107,214,819 | | | $ | 138,928,084 | | | $ | 85,252 |
| | | | | | | | | | | | | | | |
Undistributed net investment income at end of period | | $ | 408,531 | | | $ | 571,394 | | | $ | 933,626 | | | $ | — |
| | | | | | | | | | | | | | | |
(1) | | Commencement of operations |
See Accompanying Notes to Financial Statements
24
| | |
| ING GET U.S. CORE PORTFOLIO SERIES 1 (UNAUDITED) | | FINANCIAL HIGHLIGHTS |
Selected data for a share of beneficial interest outstanding throughout each period.
| | | | | | | | | | | | | | | | |
| | | | | Six Months
Ended
June 30,
2007 | | | Year Ended December 31, | | June 13,
2003(1) to
December 31,
2003 | |
| | | | 2006 | | | 2005 | | | 2004 | |
Per Share Operating Performance: | | | | | | | | | | | | | | | | |
| Net asset value, beginning of period | | $ | | 10.40 | | | 10.09 | | | 10.62 | | | 10.35 | | 10.00 | |
| Income (loss) from investment operations: | | | | | | | | | | | | | | | | |
| Net investment income | | $ | | 0.09 | * | | 0.20 | * | | 0.20 | * | | 0.24 | | 0.06 | |
| Net realized and unrealized gain (loss) on investments | | $ | | 0.33 | | | 0.55 | | | (0.04 | ) | | 0.11 | | 0.29 | |
| Total from investment operations | | $ | | 0.42 | | | 0.75 | | | 0.16 | | | 0.35 | | 0.35 | |
| Less distributions from: | | | | | | | | | | | | | | | | |
| Net investment income | | $ | | 0.27 | | | 0.25 | | | 0.26 | | | 0.07 | | — | |
| Net realized gains on investments | | $ | | 0.19 | | | 0.19 | | | 0.43 | | | 0.01 | | — | |
| Total distributions | | $ | | 0.46 | | | 0.44 | | | 0.69 | | | 0.08 | | — | |
| Net asset value, end of period | | $ | | 10.36 | | | 10.40 | | | 10.09 | | | 10.62 | | 10.35 | |
Total Return(2) | | % | | 3.99 | | | 7.72 | | | 1.58 | | | 3.45 | | 3.40 | ** |
Ratios and Supplemental Data: | | | | | | | | | | | | | | | | |
| Net assets, end of period (000’s) | | $ | | 102,438 | | | 112,477 | | | 152,849 | | | 200,727 | | 254,534 | |
| Ratio of expenses to average net assets: | | | | | | | | | | | | | | | | |
| Gross expenses prior to expense reimbursement(3) | | % | | 1.01 | | | 0.98 | | | 0.96 | | | 0.97 | | 0.99 | |
| Net expenses after expense reimbursement(3)(4) | | % | | 1.00 | # | | 0.98 | | | 0.96 | | | 0.97 | | 0.99 | |
| Net investment income after expense reimbursement(3)(4) | | % | | 1.72 | # | | 1.97 | | | 1.93 | | | 1.92 | | 1.81 | |
| Portfolio turnover rate | | % | | 42 | | | 57 | | | 49 | | | 79 | | 29 | |
(1) | | Commencement of operations. |
(2) | | Total return is calculated assuming reinvestment of all dividends and capital gain distributions at net asset value and does not reflect the effect of insurance contract charges. Total return for periods less than one year is not annualized. |
(3) | | Annualized for periods less than one year. |
(4) | | The Investment Adviser has agreed to limit expenses, (excluding interest, taxes, brokerage and extraordinary expenses) subject to possible recoupment by the Investment Adviser within three years of being incurred. |
| * | | Calculated using average number of shares outstanding throughout the period. |
| ** | | Total return calculation began on September 12, 2003, the first day of the Guarantee Period. Total return from commencement of operations was 3.50%. |
| # | | Impact of waiving the advisory fee for the ING Institutional Prime Money Market Fund holding has less than 0.01% impact on the expense ratio. |
See Accompanying Notes to Financial Statements.
25
| | |
| ING GET U.S. CORE PORTFOLIO SERIES 2 (UNAUDITED) | | FINANCIAL HIGHLIGHTS |
Selected data for a share of beneficial interest outstanding throughout each period.
| | | | | | | | | | | | | | | | |
| | | | | Six Months
Ended
June 30,
2007 | | | Year Ended December 31, | | September 12,
2003(1) to
December 31,
2003 | |
| | | | | 2006 | | | 2005 | | | 2004 | |
Per Share Operating Performance: | | | | | | | | | | | | | | | | |
| Net asset value, beginning of period | | $ | | 10.27 | | | 10.01 | | | 10.44 | | | 10.08 | | 10.00 | |
| Income (loss) from investment operations: | | | | | | | | | | | | | | | | |
| Net investment income | | $ | | 0.10 | | | 0.22 | * | | 0.22 | * | | 0.25 | | 0.01 | |
| Net realized and unrealized gain (loss) on investments | | $ | | 0.24 | | | 0.43 | | | (0.13 | ) | | 0.12 | | 0.07 | |
| Total from investment operations | | $ | | 0.34 | | | 0.65 | | | 0.09 | | | 0.37 | | 0.08 | |
| Less distributions from: | | | | | | | | | | | | | | | | |
| Net investment income | | $ | | 0.30 | | | 0.29 | | | 0.29 | | | 0.01 | | — | |
| Net realized gains on investments | | $ | | 0.08 | | | 0.10 | | | 0.23 | | | — | | — | |
| Total distributions | | $ | | 0.38 | | | 0.39 | | | 0.52 | | | 0.01 | | — | |
| Net asset value, end of period | | $ | | 10.23 | | | 10.27 | | | 10.01 | | | 10.44 | | 10.08 | |
Total Return(2) | | % | | 3.36 | | | 6.64 | | | 0.90 | | | 3.68 | | 0.70 | ** |
Ratios and Supplemental Data: | | | | | | | | | | | | | | | | |
| Net assets, end of period (000’s) | | $ | | 76,860 | | | 86,681 | | | 122,872 | | | 160,135 | | 223,003 | |
| Ratio of expenses to average net assets: | | | | | | | | | | | | | | | | |
| Gross expenses prior to expense reimbursement/recoupment(3) | | % | | 1.01 | | | 0.98 | | | 0.97 | | | 0.97 | | 1.06 | |
| Net expenses after expense reimbursement/recoupment(3)(4) | | % | | 1.00 | # | | 0.98 | | | 0.97 | | | 0.97 | | 1.00 | |
| Net investment income after expense reimbursement/recoupment(3)(4) | | % | | 1.88 | # | | 2.15 | | | 2.12 | | | 2.10 | | 1.16 | |
| Portfolio turnover rate | | % | | 49 | | | 59 | | | 51 | | | 56 | | — | |
(1) | | Commencement of operations. |
(2) | | Total return is calculated assuming reinvestment of all dividends and capital gain distributions at net asset value and does not reflect the effect of insurance contract charges. Total return for periods less than one year is not annualized. |
(3) | | Annualized for periods less than one year. |
(4) | | The Investment Adviser has agreed to limit expenses, (excluding interest, taxes, brokerage and extraordinary expenses) subject to possible recoupment by the Investment Adviser within three years of being incurred. |
| * | | Calculated using average number of shares outstanding throughout the period. |
| ** | | Total return calculation began on December 12, 2003, the first day of the Guarantee Period. Total return from commencement of operations was 0.80%. |
| # | | Impact of waiving the advisory fee for the ING Institutional Prime Money Market Fund holding has less than 0.01% impact on the expense ratio. |
See Accompanying Notes to Financial Statements.
26
| | |
| ING GET U.S. CORE PORTFOLIO SERIES 3 (UNAUDITED) | | FINANCIAL HIGHLIGHTS |
Selected data for a share of beneficial interest outstanding throughout each period.
| | | | | | | | | | | | | | | | | |
| | | | | Six Months
Ended
June 30,
2007 | | | Year Ended December 31, | | | December 12,
2003(1) to
December 31,
2003 | |
| | | | | | 2006 | | | 2005 | | | 2004 | | |
Per Share Operating Performance: | | | | | | | | | | | | | | | | | |
| Net asset value, beginning of period | | $ | | 10.34 | | | 9.99 | | | 10.13 | | | 10.01 | | | 10.00 | |
| Income (loss) from investment operations: | | | | | | | | | | | | | | | | | |
| Net investment income | | $ | | 0.09 | * | | 0.19 | * | | 0.18 | * | | 0.17 | | | 0.01 | |
| Net realized and unrealized gain (loss) on investments | | $ | | 0.28 | | | 0.43 | | | (0.11 | ) | | (0.05 | ) | | 0.00 | ** |
| Total from investment operations | | $ | | 0.37 | | | 0.62 | | | 0.07 | | | 0.12 | | | 0.01 | |
| Less distributions from: | | | | | | | | | | | | | | | | | |
| Net investment income | | $ | | 0.27 | | | 0.26 | | | 0.20 | | | — | | | — | |
| Net realized gains on investments | | $ | | 0.00 | ** | | 0.01 | | | 0.01 | | | — | | | — | |
| Total distributions | | $ | | 0.27 | | | 0.27 | | | 0.21 | | | — | | | — | |
| Net asset value, end of period | | $ | | 10.44 | | | 10.34 | | | 9.99 | | | 10.13 | | | 10.01 | |
Total Return(2) | | % | | 3.60 | | | 6.34 | | | 0.79 | | | 1.20†† | | | — † | |
Ratios and Supplemental Data: | | | | | | | | | | | | | | | | | |
| Net assets, end of period (000’s) | | $ | | 108,096 | | | 127,551 | | | 179,402 | | | 253,835 | | | 10,730 | |
| Ratio of expenses to average net assets: | | | | | | | | | | | | | | | | | |
| Gross expenses prior to expense reimbursement/recoupment(3) | | % | | 1.01 | | | 0.98 | | | 0.97 | | | 0.93 | | | 4.31 | |
| Net expenses after expense reimbursement/recoupment(3)(4) | | % | | 1.00 | # | | 0.98 | | | 0.97 | | | 0.93 | | | 0.65 | |
| Net investment income after expense reimbursement/recoupment(3)(4) | | % | | 1.69 | # | | 1.88 | | | 1.82 | | | 1.81 | | | 0.46 | |
| Portfolio turnover rate | | % | | 29 | | | 51 | | | 65 | | | 65 | | | — | |
(1) | | Commencement of operations. |
(2) | | Total return is calculated assuming reinvestment of all dividends and capital gain distributions at net asset value and does not reflect the effect of insurance contract charges. Total return for periods less than one year is not annualized. |
(3) | | Annualized for periods less than one year. |
(4) | | The Investment Adviser has agreed to limit expenses, (excluding interest, taxes, brokerage and extraordinary expenses) subject to possible recoupment by the Investment Adviser within three years of being incurred. |
| * | | Calculated using average number of shares outstanding throughout the period. |
| ** | | Amount represents less than $0.005 per share. |
| † | | As of December 31, 2003, the Portfolio was in its Offering Period. Total return calculation will begin on the commencement date of the Guarantee Period (March 12, 2004). Total return from commencement of operations was 0.10% |
| †† | | Total return calculation began on March 12, 2004, the first day of the Guarantee Period. Total return for the year ended December 31, 2004 was also 1.20%. |
| # | | Impact of waiving the advisory fee for the ING Institutional Prime Money Market Fund holding has less than 0.01% impact on the expense ratio. |
See Accompanying Notes to Financial Statements.
27
| | |
| ING GET U.S. CORE PORTFOLIO SERIES 4 (UNAUDITED) | | FINANCIAL HIGHLIGHTS |
Selected data for a share of beneficial interest outstanding throughout each period.
| | | | | | | | | | | | | | |
| | | | | Six Months
Ended
June 30,
2007 | | | Year Ended December 31, | | | March 12,
2004(1) to
December 31,
2004 | |
| | | | | 2006 | | | 2005 | | |
Per Share Operating Performance: | | | | | | | | | | | | | | |
| Net asset value, beginning of period | | $ | | 10.73 | | | 10.42 | | | 10.52 | | | 10.00 | |
| Income (loss) from investment operations: | | | | | | | | | | | | | | |
| Net investment income | | $ | | 0.11 | * | | 0.25 | * | | 0.23 | * | | 0.15 | |
| Net realized and unrealized gain (loss) on investments | | $ | | 0.33 | | | 0.54 | | | (0.09 | ) | | 0.37 | |
| Total from investment operations | | $ | | 0.44 | | | 0.79 | | | 0.14 | | | 0.52 | |
| Less distributions from: | | | | | | | | | | | | | | |
| Net investment income | | $ | | 0.32 | | | 0.29 | | | 0.18 | | | — | |
| Net realized gains on investments | | $ | | 0.25 | | | 0.19 | | | 0.06 | | | — | |
| Total distributions | | $ | | 0.57 | | | 0.48 | | | 0.24 | | | — | |
| Net asset value, end of period | | $ | | 10.60 | | | 10.73 | | | 10.42 | | | 10.52 | |
Total Return(2) | | % | | 3.98 | | | 7.89 | | | 1.29 | | | 5.09 | ** |
Ratios and Supplemental Data: | | | | | | | | | | | | | | |
| Net assets, end of period (000’s) | | $ | �� | 49,469 | | | 58,379 | | | 70,822 | | | 90,297 | |
| Ratio of expenses to average net assets: | | | | | | | | | | | | | | |
| Gross expenses prior to expense reimbursement(3) | | % | | 0.97 | | | 0.99 | | | 1.00 | | | 0.98 | |
| Net expenses after expense reimbursement(3)(4) | | % | | 0.97 | # | | 0.99 | | | 1.00 | | | 0.98 | |
| Net investment income after expense reimbursement(3)(4) | | % | | 2.14 | # | | 2.36 | | | 2.19 | | | 2.36 | |
| Portfolio turnover rate | | % | | 45 | | | 40 | | | 41 | | | 48 | |
(1) | | Commencement of operations. |
(2) | | Total return is calculated assuming reinvestment of all dividends and capital gain distributions at net asset value and does not reflect the effect of insurance contract charges. Total return for periods less than one year is not annualized. |
(3) | | Annualized for periods less than one year. |
(4) | | The Investment Adviser has agreed to limit expenses, (excluding interest, taxes, brokerage and extraordinary expenses) subject to possible recoupment by the Investment Adviser within three years of being incurred. |
| * | | Calculated using average number of shares outstanding throughout the period. |
| ** | | Total return calculation began on June 11, 2004, the first day of the Guarantee Period. Total return from commencement of operations was 5.20%. |
| # | | Impact of waiving the advisory fee for the ING Institutional Prime Money Market Fund holding has less than 0.01% impact on the expense ratio. |
See Accompanying Notes to Financial Statements.
28
| | |
| ING GET U.S. CORE PORTFOLIO SERIES 5 (UNAUDITED) | | FINANCIAL HIGHLIGHTS |
Selected data for a share of beneficial interest outstanding throughout each period.
| | | | | | | | | | | | | | |
| | | | | Six Months
Ended
June 30,
2007 | | | Year Ended December 31, | | | June 11,
2004(1) to
December 31,
2004 | |
| | | | | | 2006 | | | 2005 | | |
Per Share Operating Performance: | | | | | | | | | | | | | | |
| Net asset value, beginning of period | | $ | | 11.01 | | | 10.56 | | | 10.57 | | | 10.00 | |
| Income from investment operations: | | | | | | | | | | | | | | |
| Net investment income | | $ | | 0.06 | * | | 0.16 | * | | 0.16 | * | | 0.09 | |
| Net realized and unrealized gain on investments | | $ | | 0.50 | | | 0.96 | | | 0.12 | | | 0.48 | |
| Total from investment operations | | $ | | 0.56 | | | 1.12 | | | 0.28 | | | 0.57 | |
| Less distributions from: | | | | | | | | | | | | | | |
| Net investment income | | $ | | 0.19 | | | 0.22 | | | 0.11 | | | — | |
| Net realized gains on investments | | $ | | 0.50 | | | 0.45 | | | 0.18 | | | — | |
| Total distributions | | $ | | 0.69 | | | 0.67 | | | 0.29 | | | — | |
| Net asset value, end of period | | $ | | 10.88 | | | 11.01 | | | 10.56 | | | 10.57 | |
Total Return(2) | | % | | 4.95 | | | 11.23 | | | 2.67 | | | 5.49 | ** |
Ratios and Supplemental Data: | | | | | | | | | | | | | | |
| Net assets, end of period (000’s) | | $ | | 34,295 | | | 36,518 | | | 46,690 | | | 54,922 | |
| Ratio of expenses to average net assets: | | | | | | | | | | | | | | |
| Gross expenses prior to expense reimbursement(3) | | % | | 0.97 | | | 1.01 | | | 1.05 | | | 1.04 | |
| Net expenses after expense reimbursement(3)(4) | | % | | 0.97 | # | | 1.00 | | | 1.00 | | | 0.98 | |
| Net investment income after expense reimbursement(3)(4) | | % | | 1.17 | # | | 1.51 | | | 1.57 | | | 2.33 | |
| Portfolio turnover rate | | % | | 70 | | | 90 | | | 111 | | | 71 | |
(1) | | Commencement of operations. |
(2) | | Total return is calculated assuming reinvestment of all dividends and capital gain distributions at net asset value and does not reflect the effect of insurance contract charges. Total return for periods less than one year is not annualized. |
(3) | | Annualized for periods less than one year. |
(4) | | The Investment Adviser has agreed to limit expenses, (excluding interest, taxes, brokerage and extraordinary expenses) subject to possible recoupment by the Investment Adviser within three years of being incurred. |
| * | | Calculated using average number of shares outstanding throughout the period. |
| ** | | Total return calculation began on September 10, 2004, the first day of the Guarantee Period. Total return from commencement of operations was 5.70%. |
| # | | Impact of waiving the advisory fee for the ING Institutional Prime Money Market Fund holding has less than 0.01% impact on the expense ratio. |
See Accompanying Notes to Financial Statements.
29
| | |
| ING GET U.S. CORE PORTFOLIO SERIES 6 (UNAUDITED) | | FINANCIAL HIGHLIGHTS |
Selected data for a share of beneficial interest outstanding throughout each period.
| | | | | | | | | | | | | |
| | | | | Six Months
Ended
June 30,
2007 | | | Year Ended December 31, | | | September 10,
2004(1) to
December 31,
2004 |
| | | | | | 2006 | | | 2005 | | |
Per Share Operating Performance: | | | | | | | | | | | | | |
| Net asset value, beginning of period | | $ | | 11.08 | | | 10.35 | | | 10.12 | | | 10.00 |
| Income from investment operations: | | | | | | | | | | | | | |
| Net investment income | | $ | | 0.08 | * | | 0.18 | * | | 0.18 | | | 0.03 |
| Net realized and unrealized gain on investments | | $ | | 0.42 | | | 0.87 | | | 0.09 | | | 0.09 |
| Total from investment operations | | $ | | 0.50 | | | 1.05 | | | 0.27 | | | 0.12 |
| Less distributions from: | | | | | | | | | | | | | |
| Net investment income | | $ | | 0.27 | | | 0.25 | | | 0.04 | | | — |
| Net realized gains on investments | | $ | | 0.60 | | | 0.07 | | | 0.00 | ** | | — |
| Total distributions | | $ | | 0.87 | | | 0.32 | | | 0.04 | | | — |
| Net asset value, end of period | | $ | | 10.71 | | | 11.08 | | | 10.35 | | | 10.12 |
Total Return(2) | | % | | 4.37 | | | 10.48 | | | 2.68 | | | 0.90† |
Ratios and Supplemental Data: | | | | | | | | | | | | | |
| Net assets, end of period (000’s) | | $ | | 69,861 | | | 78,729 | | | 119,890 | | | 159,478 |
| Ratio of expenses to average net assets: | | | | | | | | | | | | | |
| Gross expenses prior to expense reimbursement(3) | | % | | 0.99 | | | 0.99 | | | 0.97 | | | 0.77 |
| Net expenses after expense reimbursement(3)(4) | | % | | 0.99 | # | | 0.99 | | | 0.97 | | | 0.77 |
| Net investment income after expense reimbursement(3)(4) | | % | | 1.36 | # | | 1.71 | | | 1.77 | | | 1.36 |
| Portfolio turnover rate | | % | | 79 | | | 84 | | | 81 | | | 6 |
(1) | | Commencement of operations. |
(2) | | Total return is calculated assuming reinvestment of all dividends and capital gain distributions at net asset value and does not reflect the effect of insurance contract charges. Total return for periods less than one year is not annualized. |
(3) | | Annualized for periods less than one year. |
(4) | | The Investment Adviser has agreed to limit expenses, (excluding interest, taxes, brokerage and extraordinary expenses) subject to possible recoupment by the Investment Adviser within three years of being incurred. |
| * | | Calculated using average number of shares outstanding throughout the period. |
| ** | | Amount is less than $0.005 per share. |
| † | | Total return calculation began on December 10, 2004, the first day of the Guarantee Period. Total return from commencement of operations was 1.20%. |
| # | | Impact of waiving the advisory fee for the ING Institutional Prime Money Market Fund holding has less than 0.01% impact on the expense ratio. |
See Accompanying Notes to Financial Statements.
30
| | |
| ING GET U.S. CORE PORTFOLIO SERIES 7 (UNAUDITED) | | FINANCIAL HIGHLIGHTS |
Selected data for a share of beneficial interest outstanding throughout each period.
| | | | | | | | | | | | | | |
| | | | | Six Months
Ended
June 30,
2007 | | | Year Ended December 31, | | | December 10, 2004(1) to December 31, 2004 | |
| | | | | | 2006 | | | 2005 | | |
Per Share Operating Performance: | | | | | | | | | | | | | | |
| Net asset value, beginning of period | | $ | | 11.01 | | | 10.23 | | | 10.01 | | | 10.00 | |
| Income from investment operations: | | | | | | | | | | | | | | |
| Net investment income | | $ | | 0.07 | * | | 0.18 | * | | 0.19 | * | | 0.01 | |
| Net realized and unrealized gain on investments | | $ | | 0.46 | | | 0.85 | | | 0.04 | | | 0.00 | ** |
| Total from investment operations | | $ | | 0.53 | | | 1.03 | | | 0.23 | | | 0.01 | |
| Less distributions from: | | | | | | | | | | | | | | |
| Net investment income | | $ | | 0.28 | | | 0.25 | | | 0.01 | | | — | |
| Net realized gains on investments | | $ | | 0.37 | | | — | | | — | | | — | |
| Total distributions | | $ | | 0.65 | | | 0.25 | | | 0.01 | | | — | |
| Net asset value, end of period | | $ | | 10.89 | | | 11.01 | | | 10.23 | | | 10.01 | |
Total Return(2): | | % | | 4.73 | | | 10.26 | | | 1.95†† | | | — † | |
Ratios and Supplemental Data: | | | | | | | | | | | | | | |
| Net assets, end of period (000’s) | | $ | | 48,969 | | | 59,054 | | | 90,572 | | | 62,522 | |
| Ratio of expenses to average net assets: | | | | | | | | | | | | | | |
| Gross expense prior to expense reimbursement(3) | | % | | 1.04 | | | 1.01 | | | 0.94 | | | 0.65 | |
| Net expenses after expense reimbursement(3)(4) | | % | | 1.00 | # | | 1.00 | | | 0.94 | | | 0.65 | |
| Net investment income after expense reimbursement(3)(4) | | % | | 1.34 | # | | 1.71 | | | 1.80 | | | 1.85 | |
| Portfolio turnover rate | | % | | 68 | | | 78 | | | 126 | | | — | |
(1) | | Commencement of operations. |
(2) | | Total return is calculated assuming reinvestment of all dividends and capital gain distributions at net asset value and does not reflect the effect of insurance contract charges. Total return for periods less than one year is not annualized. |
(3) | | Annualized for periods less than one year. |
(4) | | The Investment Adviser has agreed to limit expenses, (excluding interest, taxes, brokerage and extraordinary expenses) subject to possible recoupment by the Investment Adviser within three years of being incurred. |
| * | | Calculated using average number of shares outstanding throughout the period. |
| ** | | Amount is less than $0.005. |
| † | | As of December 31, 2004, the Portfolio was in its Offering Period. Total return calculation will begin on the commencement date of the Guarantee Period (March 9, 2005). Total return from commencement of operations was 0.10%. |
| †† | | Total return calculation began on March 9, 2005, the first day of the Guarantee Period. Total return for the year ended December 31, 2005, was 2.26%. |
| # | | Impact of waiving the advisory fee for the ING Institutional Prime Money Market Fund holding has less than 0.01% impact on the expense ratio. |
See Accompanying Notes to Financial Statements.
31
| | |
| ING GET U.S. CORE PORTFOLIO SERIES 8 (UNAUDITED) | | FINANCIAL HIGHLIGHTS |
Selected data for a share of beneficial interest outstanding throughout each period.
| | | | | | | | | | | |
| | | | | Six Months
Ended June 30,
2007 | | | Year Ended
December 31,
2006 | | | March 9 2005(1) to
December 31,
2005 | |
Per Share Operating Performance: | | | | | | | | | | | |
| Net asset value, beginning of period | | $ | | 11.06 | | | 10.23 | | | 10.00 | |
| Income from investment operations: | | | | | | | | | | | |
| Net investment income | | $ | | 0.07 | * | | 0.17 | * | | 0.15 | * |
| Net realized and unrealized gain on investments | | $ | | 0.48 | | | 0.90 | | | 0.08 | |
| Total from investment operations | | $ | | 0.55 | | | 1.07 | | | 0.23 | |
| Less distributions from: | | | | | | | | | | | |
| Net investment income | | $ | | 0.25 | | | 0.20 | | | — | |
| Net realized gains on investments | | $ | | 0.49 | | | 0.04 | | | — | |
| Total distributions | | $ | | 0.74 | | | 0.24 | | | — | |
| Net asset value, end of period | | $ | | 10.87 | | | 11.06 | | | 10.23 | |
Total Return(2) | | % | | 4.89 | | | 10.70 | | | 1.69† | |
Ratios and Supplemental Data: | | | | | | | | | | | |
| Net assets, end of period (000’s) | | $ | | 31,324 | | | 41,172 | | | 51,960 | |
| Ratio of expenses to average net assets: | | | | | | | | | | | |
| Gross expense prior to expense reimbursement(3) | | % | | 1.05 | | | 1.04 | | | 0.94 | |
| Net expenses after expense reimbursement(3)(4) | | % | | 1.00 | # | | 1.00 | | | 0.91 | |
| Net investment income after expense reimbursement(3)(4) | | % | | 1.28 | # | | 1.60 | | | 1.87 | |
| Portfolio turnover rate | | % | | 78 | | | 101 | | | 131 | |
(1) | | Commencement of operations. |
(2) | | Total return is calculated assuming reinvestment of all dividends and capital gain distributions at net asset value and does not reflect the effect of insurance contract charges. Total return for periods less than one year is not annualized. |
(3) | | Annualized for periods less than one year. |
(4) | | The Investment Adviser has agreed to limit expenses, (excluding interest, taxes, brokerage and extraordinary expenses) subject to possible recoupment by the Investment Adviser within three years of being incurred. |
| * | | Calculated using average number of shares outstanding throughout the period. |
| † | | Total return calculation began on June 8, 2005, the first day of the Guarantee Period. Total return from commencement of operations was 2.30%. |
| # | | Impact of waiving the advisory fee for the ING Institutional Prime Money Market Fund holding has less than 0.01% impact on the expense ratio. |
See Accompanying Notes to Financial Statements.
32
| | |
| ING GET U.S. CORE PORTFOLIO SERIES 9 (UNAUDITED) | | FINANCIAL HIGHLIGHTS |
Selected data for a share of beneficial interest outstanding throughout each period.
| | | | | | | | | | | |
| | | | | Six Months
Ended June 30,
2007 | | | Year Ended
December 31,
2006 | | | June 8, 2005(1) to
December 31,
2005 | |
Per Share Operating Performance: | | | | | | | | | | | |
| Net asset value, beginning of period | | $ | | 10.93 | | | 10.06 | | | 10.00 | |
| Income (loss) from investment operations: | | | | | | | | | | | |
| Net investment income | | $ | | 0.08 | * | | 0.18 | * | | 0.13 | * |
| Net realized and unrealized gain (loss) on investments | | $ | | 0.47 | | | 0.82 | | | (0.07 | ) |
| Total from investment operations | | $ | | 0.55 | | | 1.00 | | | 0.06 | |
| Less distributions from: | | | | | | | | | | | |
| Net investment income | | $ | | 0.28 | | | 0.13 | | | — | |
| Net realized gains on investments | | $ | | 0.29 | | | — | | | — | |
| Total distributions | | $ | | 0.57 | | | 0.13 | | | — | |
| Net asset value, end of period | | $ | | 10.91 | | | 10.93 | | | 10.06 | |
Total Return(2) | | % | | 4.89 | | | 10.11 | | | 0.00† | |
Ratios and Supplemental Data: | | | | | | | | | | | |
| Net assets, end of period (000’s) | | $ | | 23,930 | | | 30,694 | | | 41,582 | |
| Ratio of expenses to average net assets: | | | | | | | | | | | |
| Gross expense prior to expense reimbursement(3) | | % | | 1.06 | | | 1.09 | | | 0.96 | |
| Net expenses after expense reimbursement(3)(4) | | % | | 1.00 | # | | 1.00 | | | 0.87 | |
| Net investment income after expense reimbursement(3)(4) | | % | | 1.37 | # | | 1.79 | | | 2.21 | |
| Portfolio turnover rate | | % | | 87 | | | 89 | | | 188 | |
(1) | | Commencement of operations. |
(2) | | Total return is calculated assuming reinvestment of all dividends and capital gain distributions at net asset value and does not reflect the effect of insurance contract charges. Total return for periods less than one year is not annualized. |
(3) | | Annualized for periods less than one year. |
(4) | | The Investment Adviser has agreed to limit expenses, (excluding interest, taxes, brokerage and extraordinary expenses) subject to possible recoupment by the Investment Adviser within three years of being incurred. |
| * | | Calculated using average number of shares outstanding throughout the period. |
| † | | Total return calculation began on September 7, 2005 the first day of the Guarantee Period. Total return from commencement of operations was 0.60%. |
| # | | Impact of waiving the advisory fee for the ING Institutional Prime Money Market Fund holding has less than 0.01% impact on the expense ratio. |
See Accompanying Notes to Financial Statements.
33
| | |
| ING GET U.S. CORE PORTFOLIO SERIES 10 (UNAUDITED) | | FINANCIAL HIGHLIGHTS |
Selected data for a share of beneficial interest outstanding throughout each period.
| | | | | | | | | | | |
| | | | | Six Months
Ended June 30,
2007 | | | Year Ended
December 31,
2006 | | | September 7, 2005(1) to
December 31,
2005 | |
Per Share Operating Performance: | | | | | | | | | | | |
| Net asset value, beginning of period | | $ | | 10.91 | | | 10.02 | | | 10.00 | |
| Income (loss) from investment operations: | | | | | | | | | | | |
| Net investment income | | $ | | 0.08 | * | | 0.16 | * | | 0.09 | * |
| Net realized and unrealized gain (loss) on investments | | $ | | 0.40 | | | 0.81 | | | (0.07 | ) |
| Total from investment operations | | $ | | 0.48 | | | 0.97 | | | 0.02 | |
| Less distributions from: | | | | | | | | | | | |
| Net investment income | | $ | | 0.21 | | | 0.07 | | | — | |
| Net realized gains on investments | | $ | | 0.22 | | | 0.01 | | | — | |
| Total distributions | | $ | | 0.43 | | | 0.08 | | | — | |
| Net asset value, end of period | | $ | | 10.96 | | | 10.91 | | | 10.02 | |
Total Return(2) | | % | | 4.30 | | | 9.78 | | | (0.60 | )† |
Ratios and Supplemental Data: | | | | | | | | | | | |
| Net assets, end of period (000’s) | | $ | | 26,153 | | | 27,694 | | | 37,137 | |
| Ratio of expenses to average net assets: | | | | | | | | | | | |
| Gross expense prior to expense reimbursement(3) | | % | | 1.09 | | | 1.14 | | | 0.82 | |
| Net expenses after expense reimbursement(3)(4) | | % | | 1.00 | # | | 1.00 | | | 0.76 | |
| Net investment income after expense reimbursement(3)(4) | | % | | 1.51 | # | | 1.54 | | | 2.77 | |
| Portfolio turnover rate | | % | | 79 | | | 93 | | | 80 | |
(1) | | Commencement of operations. |
(2) | | Total return is calculated assuming reinvestment of all dividends and capital gain distributions at net asset value and does not reflect the effect of insurance contract charges. Total return for periods less than one year is not annualized. |
(3) | | Annualized for periods less than one year. |
(4) | | The Investment Adviser has agreed to limit expenses, (excluding interest, taxes, brokerage and extraordinary expenses) subject to possible recoupment by the Investment Adviser within three years of being incurred. |
| * | | Calculated using average number of shares outstanding throughout the period. |
| † | | Total return calculation began on December 6, 2005 the first day of the Guarantee Period. Total return from commencement of operations was 0.20%. |
| # | | Impact of waiving the advisory fee for the ING Institutional Prime Money Market Fund holding has less than 0.01% impact on the expense ratio. |
See Accompanying Notes to Financial Statements.
34
| | |
| ING GET U.S. CORE PORTFOLIO SERIES 11 (UNAUDITED) | | FINANCIAL HIGHLIGHTS |
Selected data for a share of beneficial interest outstanding throughout each period.
| | | | | | | | | | | |
| | | | | Six Months
Ended June 30,
2007 | | | Year Ended
December 31,
2006 | | | December 6, 2005(1) to
December 31,
2005 | |
Per Share Operating Performance: | | | | | | | | | | | |
| Net asset value, beginning of period | | $ | | 10.79 | | | 10.02 | | | 10.00 | |
| Income (loss) from investment operations: | | | | | | | | | | | |
| Net investment income | | $ | | 0.09 | * | | 0.23 | * | | 0.03 | * |
| Net realized and unrealized gain (loss) on investments | | $ | | 0.38 | | | 0.55 | | | (0.01 | ) |
| Total from investment operations | | $ | | 0.47 | | | 0.78 | | | 0.02 | |
| Less distributions from: | | | | | | | | | | | |
| Net investment income | | $ | | 0.36 | | | 0.01 | | | — | |
| Net realized gains on investments | | $ | | 0.20 | | | — | | | — | |
| Total distributions | | $ | | 0.56 | | | 0.01 | | | — | |
| Net asset value, end of period | | $ | | 10.70 | | | 10.79 | | | 10.02 | |
Total Return(2) | | % | | 4.29 | | | 7.06†† | | | — † | |
Ratios and Supplemental Data: | | | | | | | | | | | |
| Net assets, end of period (000’s) | | $ | | 28,031 | | | 35,473 | | | 25,842 | |
| Ratio of expenses to average net assets: | | | | | | | | | | | |
| Gross expenses prior to reimbursement(3) | | % | | 1.13 | | | 1.03 | | | 0.65 | |
| Net expenses after reimbursement(3)(4) | | % | | 1.00 | # | | 0.96 | | | 0.65 | |
| Net investment income after expense reimbursement(3)(4) | | % | | 1.57 | # | | 2.22 | | | 3.95 | |
| Portfolio turnover rate | | % | | 100 | | | 114 | | | — | |
(1) | | Commencement of operations. |
(2) | | Total return is calculated assuming reinvestment of all dividends and capital gain distributions at net asset value and does not reflect the effect of insurance contract charges. Total return for periods less than one year is not annualized. |
(3) | | Annualized for periods less than one year. |
(4) | | The Investment Adviser has agreed to limit expenses, (excluding interest, taxes, brokerage and extraordinary expenses) subject to possible recoupment by the Investment Adviser within three years of being incurred. |
| * | | Calculated using average number of shares outstanding throughout the period. |
| † | | As of December 31, 2005, the Portfolio was in its Offering Period. Total return calculation will begin on the commencement date of the Guarantee Period (March 2, 2006). Total return from commencement of operations was 0.20%. |
| †† | | Total return calculation began on March 2, 2006, the first day of the Guarantee Period. Total return for the entire calendar year was 7.81%. |
| # | | Impact of waiving the advisory fee for the ING Institutional Prime Money Market Fund holding has less than 0.01% impact on the expense ratio. |
See Accompanying Notes to Financial Statements.
35
| | |
| ING GET U.S. CORE PORTFOLIO SERIES 12 (UNAUDITED) | | FINANCIAL HIGHLIGHTS |
Selected data for a share of beneficial interest outstanding throughout each period.
| | | | | | | |
| | | | | Six Months
Ended
June 30,
2007 | | | March 2,
2006(1) to
December 31,
2006 |
Per Share Operating Performance: | | | | | | | |
| Net asset value, beginning of period | | $ | | 11.36 | | | 10.00 |
| Income from investment operations: | | | | | | | |
| Net investment income | | $ | | 0.05 | * | | 0.13 |
| Net realized and unrealized gain on investments | | $ | | 0.53 | | | 1.23 |
| Total from investment operations | | $ | | 0.58 | | | 1.36 |
| Less distributions from: | | | | | | | |
| Net investment income | | $ | | 0.15 | | | — |
| Net realized gains on investments | | $ | | 0.28 | | | — |
| Total distributions | | $ | | 0.43 | | | |
| Net asset value, end of period | | $ | | 11.51 | | | 11.36 |
Total Return(2) | | % | | 5.02 | | | 12.25† |
Ratios and Supplemental Data: | | | | | | | |
| Net assets, end of period (000’s) | | $ | | 51,571 | | | 54,893 |
| Ratio of expenses to average net assets: | | | | | | | |
| Gross expense prior to expense reimbursement(3) | | % | | 1.13 | | | 0.94 |
| Net expenses after expense reimbursement(3)(4) | | % | | 1.00 | # | | 0.85 |
| Net investment income after expense reimbursement(3)(4) | | % | | 0.92 | # | | 1.72 |
| Portfolio turnover rate | | % | | 79 | | | 57 |
(1) | | Commencement of operations. |
(2) | | Total return in calculated assuming reinvestment of all dividends and capital gain distributions at net asset value and does not reflect the effect of insurance contract charges. Total return for periods less than one year is not annualized. |
(3) | | Annualized for periods less than one year. |
(4) | | The Investment Adviser has agreed to limit expenses, (excluding interest, taxes, brokerage and extraordinary expenses) subject to possible recoupment by the Investment Adviser within three years of being incurred. |
| * | | Calculated using average number of shares outstanding throughout the period. |
| † | | Total return calculation began June 22, 2006 the first day of the Guarantee Period. Total return from commencement of operations was 13.60%. |
| # | | Impact of waiving the advisory fee for the ING Institutional Prime Money Market Fund holding has less than 0.01% impact on the expense ratio. |
See Accompanying Notes to Financial Statements.
36
| | |
| ING GET U.S. CORE PORTFOLIO SERIES 13 (UNAUDITED) | | FINANCIAL HIGHLIGHTS |
Selected data for a share of beneficial interest outstanding throughout each period.
| | | | | | | | |
| | | | | Six Months
Ended
June 30,
2007 | | | June 22,
2006(1) to
December 31,
2006 | |
Per Share Operating Performance: | | | | | | | | |
| Net asset value, beginning of period | | $ | | 10.16 | | | 10.00 | |
| Income (loss) from investment operations: | | | | | | | | |
| Net investment income | | $ | | 0.04 | * | | 0.22 | * |
| Net realized and unrealized gain (loss) on investments | | $ | | 0.33 | | | (0.06 | ) |
| Total from investment operations | | $ | | 0.37 | | | 0.16 | |
| Less distributions from: | | | | | | | | |
| Net investment income | | $ | | 0.06 | | | — | |
| Net realized gains on investments | | $ | | 0.00 | ** | | — | |
| Total distributions | | $ | | 0.06 | | | — | |
| Net asset value, end of period | | $ | | 10.47 | | | 10.16 | |
Total Return(2) | | % | | 3.67 | | | (0.59 | )† |
Ratios and Supplemental Data: | | | | | | | | |
| Net assets, end of period (000’s) | | $ | | 78,058 | | | 107,215 | |
| Ratio of expenses to average net assets: | | | | | | | | |
| Gross expense prior to expense reimbursement(3) | | % | | 1.04 | | | 1.02 | |
| Net expense after expense reimbursement(3)(4) | | % | | 1.00 | # | | 0.73 | |
| Net investment income after expense reimbursement(3)(4) | | % | | 0.85 | # | | 4.15 | |
| Portfolio turnover rate | | % | | 66 | | | — | |
(1) | | Commencement of operations. |
(2) | | Total return is calculated assuming reinvestment of all dividends and capital gain distributions at net asset value and does not reflect the effect of insurance contract charges. Total return for periods less than one year is not annualized. |
(3) | | Annualized for periods less than one year. |
(4) | | The Investment Adviser has agreed to limit expenses, (excluding interest, taxes, brokerage and extraordinary expenses) subject to possible recoupment by the Investment Adviser within three years of being incurred. |
| * | | Calculated using average number of shares outstanding throughout the period. |
| ** | | Amount is less than $0.005. |
| † | | Total return calculation began December 21, 2006 the first day of the Guarantee Period. Total return from commencement of operations was 1.60%. |
| # | | Impact of waiving the advisory fee for the ING Institutional Prime Money Market Fund holding has less than 0.01% impact on the expense ratio. |
See Accompanying Notes to Financial Statements.
37
| | |
| ING GET U.S. CORE PORTFOLIO SERIES 14 (UNAUDITED) | | FINANCIAL HIGHLIGHTS |
Selected data for a share of beneficial interest outstanding throughout each period.
| | | | | | | | |
| | | | | Six Months
Ended
June 30,
2007 | | | December 21,
2006(1) to
December 31,
2006 | |
Per Share Operating Performance: | | | | | | | | |
| Net asset value, beginning of period | | $ | | 10.00 | | | 10.00 | |
| Income (loss) from investment operations: | | | | | | | | |
| Net investment income (loss) | | $ | | 0.23 | * | | (0.00 | )** |
| Net realized and unrealized loss on investments | | $ | | (0.02 | ) | | — | |
| Total from investment operations | | $ | | 0.21 | | | (0.00 | )** |
| Net asset value, end of period | | $ | | 10.21 | | | 10.00 | |
Total Return(2) | | % | | (0.10 | )†† | | — † | |
Ratios and Supplemental Data: | | | | | | | | |
| Net assets, end of period (000’s) | | $ | | 138,928 | | | 85 | |
| Ratio of expenses to average net assets: | | | | | | | | |
| Gross expense prior to expense reimbursement(3) | | % | | 0.76 | | | — | |
| Net expense after expense reimbursement(3)(4) | | % | | 0.71 | | | 0.58 | |
| Net investment income after expense reimbursement(3)(4) | | % | | 4.53 | | | (0.58 | ) |
| Portfolio turnover rate (loss) | | % | | 5 | | | — | |
(1) | | Commencement of operations. |
(2) | | Total return is calculated assuming reinvestment of all dividends and capital gain distributions at net asset value and does not reflect the effect of insurance contract charges. Total return for periods less than one year is not annualized. |
(3) | | Annualized for periods less than one year. |
(4) | | The Investment Adviser has agreed to limit expenses, (excluding interest, taxes, brokerage and extraordinary expenses) subject to possible recoupment by the Investment Adviser within three years of being incurred. |
| * | | Calculated using average number of shares outstanding throughout the period. |
| ** | | Amount is more than $(0.005). |
| † | | As of December 31, 2006, the Portfolio was in its offering period. Total return calculation will begin on the commencement date of the Guarantee Period (June 21, 2007.) Total return from commencement of operations was 0.00%. |
| †† | | Total return calculation began on June 21, 2007 the first day of the Guarantee Period. Total return for the six months ended June 30, 2007 was 2.10%. |
See Accompanying Notes to Financial Statements.
38
NOTES TO FINANCIAL STATEMENTSASOF JUNE 30, 2007 (UNAUDITED)
NOTE 1 — ORGANIZATION
Organization. The ING Variable Insurance Trust (the “Trust”) was organized as a Delaware statutory trust on July 15, 1999 and is registered with the U.S. Securities and Exchange Commission (“SEC”) under the Investment Company Act of 1940, as amended (“1940 Act”) as a diversified open-end management investment company. There are fifteen separate investment Series which comprise the Trust. The fourteen that are in this report are as follows: ING GET U.S. Core Portfolio Series 1 (“Series 1”), ING GET U.S. Core Portfolio Series 2 (“Series 2”), ING GET U.S. Core Portfolio Series 3 (“Series 3”), ING GET U.S. Core Portfolio Series 4 (“Series 4”), ING GET U.S. Core Portfolio Series 5 (“Series 5”), ING GET U.S. Core Portfolio Series 6 (“Series 6”), ING GET U.S. Core Portfolio Series 7 (“Series 7”), ING GET U.S. Core Portfolio Series 8 (“Series 8”), ING GET U.S. Core Portfolio Series 9 (“Series 9”), ING GET U.S. Core Portfolio Series 10 (“Series 10”), ING GET U.S. Core Portfolio Series 11 (“Series 11”), ING GET U.S. Core Portfolio Series 12 (“Series 12”), ING GET U.S. Core Portfolio Series 13 (“Series 13”) and ING GET U.S. Core Portfolio Series 14 (“Series 14”) (each, a “Series” and collectively, “the Series”).
During the Guarantee Period, the Series seek to achieve maximum total return and minimal exposure of the Series’ assets to a market value loss by participating, to the extent possible, in favorable equity market performance.
If during the Guarantee Period the equity markets experience a major decline, the Series’ assets may become largely or entirely invested in the Fixed Component. Use of the Fixed Component reduces the Series’ ability to participate as fully in upward equity market movements, and therefore represents some loss of opportunity, or opportunity cost, compared to a portfolio that is more heavily invested in equities. The insurance companies offering these Series currently are ING Life Insurance & Annuity Company (“ILIAC”) and ING USA Annuity and Life Insurance Company (“ING USA”). The insurance companies offering these Series guarantee Contract holders and Participants that on the Maturity Date they will receive no less than the value of their separate account investment directed to the Series as of the last day of the Offering Period, adjusted for certain charges (the “Guarantee”). The value of dividends and distributions made by the Series throughout the Guarantee Period is included in determining whether, for purposes of the Guarantee, the value of a shareholder’s investment on the Maturity
Date is no less than the value of their investment as of the last day of the Offering Period. Amounts withdrawn prior to the Maturity Date do not get the benefit of the Guarantee. The following information is related to the Series:
| | | | | | |
| | | Offering Period | | Guarantee Period | | Maturity Date |
Series 1* | | 06/13/03 — 09/11/03 | | 09/12/03 — 09/12/08 | | 09/12/08 |
Series 2* | | 09/12/03 — 12/11/03 | | 12/12/03 — 12/12/08 | | 12/12/08 |
Series 3* | | 12/12/03 —03/11/04 | | 03/12/04 — 03/13/09 | | 03/13/09 |
Series 4* | | 03/12/04 — 06/10/04 | | 06/11/04 — 06/12/09 | | 06/12/09 |
Series 5* | | 06/11/04 — 09/09/04 | | 09/10/04 — 09/09/11 | | 09/09/11 |
Series 6* | | 09/10/04 — 12/09/04 | | 12/10/04 — 12/09/11 | | 12/09/11 |
Series 7* | | 12/10/04 — 03/08/05 | | 03/09/05 — 03/08/12 | | 03/08/12 |
Series 8* | | 03/09/05 — 06/07/05 | | 06/08/05 — 06/07/12 | | 06/07/12 |
Series 9* | | 06/08/05 — 09/06/05 | | 09/07/05 — 09/06/12 | | 09/06/12 |
Series 10* | | 09/07/05 — 12/05/05 | | 12/06/05 — 12/05/12 | | 12/05/12 |
Series 11* | | 12/06/05 — 03/01/06 | | 03/02/06 — 02/28/13 | | 02/28/13 |
Series 12* | | 03/02/06 — 06/21/06 | | 06/22/06 — 06/20/13 | | 06/20/13 |
Series 13* | | 06/22/06 — 12/20/06 | | 12/21/06 — 12/19/13 | | 12/19/13 |
Series 14* | | 12/21/06 — 06/20/07 | | 06/21/07 — 06/19/14 | | 06/19/14 |
| * | Closed to new investors. |
Shares of the Series are offered to insurance company separate accounts that fund both annuity and life insurance contracts and certain tax-qualified retirement plans. At June 30, 2007, separate accounts of ILIAC and ING USA and their affiliates held all the shares outstanding of the Series.
NOTE 2 — SIGNIFICANT ACCOUNTING POLICIES
The following significant accounting policies are consistently followed by the Series in the preparation of their financial statements, and such policies are in conformity with U.S. generally accepted accounting principles (“GAAP”) for investment companies.
| A. | Security Valuation. Investments in equity securities traded on a national securities exchange are valued at the last reported sale price. Securities reported by NASDAQ will be valued at the NASDAQ official closing prices. Securities traded on an exchange or NASDAQ for which there has been no sale and securities traded in the over-the-counter-market are valued at the mean between the last reported bid and ask prices. All investments quoted in foreign currencies will be valued daily in U.S. dollars on the basis of the foreign currency exchange rates prevailing at that time. Debt securities are valued at prices obtained from independent services or from one or more dealers making markets in the securities and may be adjusted based on the Series’ valuation procedures. U.S. government obligations are valued by using market quotations or independent pricing services that use prices provided by market-makers or estimates of market |
39
NOTES TO FINANCIAL STATEMENTSASOF JUNE 30, 2007 (UNAUDITED) (CONTINUED)
NOTE 2 — SIGNIFICANT ACCOUNTING POLICIES (continued)
| | values obtained from yield data relating to instruments or securities with similar characteristics. |
Securities and assets for which market quotations are not readily available (which may include certain restricted securities which are subject to limitations as to their sale) are valued at their fair values as determined in good faith by or under the supervision of the Series’ Board of Trustees (the “Board”), in accordance with methods that are specifically authorized by the Board. Securities traded on exchanges, including foreign exchanges, which close earlier than the time that a Series calculates its net asset value (“NAV”) may also be valued at their fair values as determined in good faith by or under the supervision of a Series’ Board, in accordance with methods that are specifically authorized by the Board. The valuation techniques applied in any specific instance are likely to vary from case to case. With respect to a restricted security, for example, consideration is generally given to the cost of the investment, the market value of any unrestricted securities of the same class at the time of valuation, the potential expiration of restrictions on the security, the existence of any registration rights, the costs to the Series related to registration of the security, as well as factors relevant to the issuer itself. Consideration may also be given to the price and extent of any public trading in similar securities of the issuer or comparable companies’ securities. The value of a foreign security traded on an exchange outside the United States is generally based on the price of a foreign security on the principal foreign exchange where it trades as of the time the Series determines its NAV or if the foreign exchange closes prior to the time the Series determines its NAV, the most recent closing price of the foreign security on its principal exchange. Trading in certain non-U.S. securities may not take place on all days on which the New York Stock Exchange (“NYSE”) is open. Further, trading takes place in various foreign markets on days on which the NYSE is not open. Consequently, the calculation of the Series’ NAV may not take place contemporaneously with the determination of the prices of securities held by the Series in foreign securities markets. Further, the value of the Series’ assets may be significantly affected by foreign trading on days when a shareholder cannot purchase or redeem
shares of the Series. In calculating the Series’ NAV, foreign securities in foreign currency are converted to U.S. dollar equivalents. If an event occurs after the time at which the market for foreign securities held by the Series closes but before the time that the Series’ NAV in calculated, such event may cause the closing price on the foreign exchange to not represent a readily available reliable market value quotation for such securities at the time the Series determines its NAV. In such a case, the Series will use the fair value of such securities as determined under the Series’ valuation procedures. Events after the close of trading on a foreign market that could require the Series to fair value some or all of its foreign securities include, among others, securities trading in the U.S. and other markets, corporate announcements, natural and other disasters, and political and other events. Among other elements of analysis in the determination of a security’s fair value, the Board has authorized the use of one or more independent research services to assist with such determinations. An independent research service may use statistical analyses and quantitative models to help determine fair value as of the time a Series calculates its NAV. There can be no assurance that such models accurately reflect the behavior of the applicable markets or the effect of the behavior of such markets on the fair value of securities, or that such markets will continue to behave in a fashion that is consistent with such models. Unlike the closing price of a security on an exchange, fair value determinations employ elements of judgment. Consequently, the fair value assigned to a security may not represent the actual value that the Series could obtain if it were to sell the security at the time of the close of the NYSE. Pursuant to procedures adopted by the Board, the Series is not obligated to use the fair valuations suggested by any research service, and valuation recommendations provided by such research services may be overridden if other events have occurred or if other fair valuations are determined in good faith to be more accurate. Unless an event is such that it causes the Series to determine that the closing prices for one or more securities do not represent readily available reliable market value quotations at the time the Series determines its NAV, events that occur between the time of the close of the foreign market on which they are traded and the close of regular trading on the NYSE will not be reflected in the Series’ NAV. Investments in securities maturing in 60 days or less
40
NOTES TO FINANCIAL STATEMENTSASOF JUNE 30, 2007 (UNAUDITED) (CONTINUED)
NOTE 2 — SIGNIFICANT ACCOUNTING POLICIES (continued)
are valued at amortized cost, which, when combined with accrued interest, approximates market value.
| B. | Security Transactions and Revenue Recognition. Security transactions are recorded on the trade date. Realized gains or losses on sales of investments are calculated on the identified cost basis. Interest income is recorded on the accrual basis. Premium amortization and discount accretion are determined using the effective yield method. Dividend income is recorded on the ex-dividend date. |
| C. | Foreign Currency Translation. The books and records of the Series are maintained in U.S. dollars. Any foreign currency amounts are translated into U.S. dollars on the following basis: |
| | (1) | Market value of investment securities, other assets and liabilities — at the exchange rates prevailing at the end of the day. |
| | (2) | Purchases and sales of investment securities, income and expenses — at the rates of exchange prevailing on the respective dates of such transactions. |
Although the net assets and the market values are presented at the foreign exchange rates at the end of the day, the Series do not isolate the portion of the results of operations resulting from changes in foreign exchange rates on investments from the fluctuations arising from changes in market prices of securities held. Such fluctuations are included with the net realized and unrealized gains or losses from investments. For securities, which are subject to foreign withholding tax upon disposition, liabilities are recorded on the Statements of Assets and Liabilities for the estimated tax withholding based on the securities current market value. Upon disposition, realized gains or losses on such securities are recorded net of foreign withholding tax.
Reported net realized foreign exchange gains or losses arise from sales of foreign currencies, currency gains or losses realized between the trade and settlement dates on securities transactions, the difference between the amounts of dividends, interest, and foreign withholding taxes recorded on the Series’ books and the U.S. dollar equivalent of the amounts actually received or paid. Net unrealized foreign exchange gains and losses arise
from changes in the value of assets and liabilities other than investments in securities at fiscal year end, resulting from changes in the exchange rate. Foreign security and currency transactions may involve certain considerations and risks not typically associated with investing in U.S. companies and U.S. government securities. These risks include, but are not limited to, revaluation of currencies and future adverse political and economic developments which could cause securities and their markets to be less liquid and prices more volatile than those of comparable U.S. companies and U.S. government securities.
| D. | Forward Foreign Currency Contracts. The Series may enter into forward foreign currency contracts primarily to hedge against foreign currency exchange rate risks on their non-U.S. dollar denominated investment securities. When entering into a currency forward contract, the Series agrees to receive or deliver a fixed quantity of foreign currency for an agreed-upon price on an agreed future date. These contracts are valued daily and the Series’ net equity therein, representing unrealized gain or loss on the contracts as measured by the difference between the forward foreign exchange rates at the dates of entry into the contracts and the forward rates at the reporting date, is included in the Statements of Assets and Liabilities. Realized and unrealized gains and losses are included in the Statements of Operations. These instruments involve market and/or credit risk in excess of the amount recognized in the Statements of Assets and Liabilities. Risks arise from the possible inability of counterparties to meet the terms of their contracts and from movement in currency and securities values and interest rates. At December 31, 2006, the Series did not have any open forward foreign currency contracts. |
| E. | Distributions to Shareholders. Dividends from net investment income and net realized gains, if any, are declared and paid annually by the Series. Distributions are determined annually in accordance with federal tax principles, which may differ from U.S. generally accepted accounting principles for investment companies. The Series may make distributions on a more frequent basis to comply with the distribution requirements of the Internal Revenue Code. Distributions are recorded on the ex-dividend date. The characteristics of income and gains are determined in accordance with income tax regulations, which |
41
NOTES TO FINANCIAL STATEMENTSASOF JUNE 30, 2007 (UNAUDITED) (CONTINUED)
NOTE 2 — SIGNIFICANT ACCOUNTING POLICIES (continued)
| | may differ from accounting principles generally accepted in the United States of America for investment companies. |
| F. | Federal Income Taxes. It is the Series’ policy to comply with subchapter M of the Internal Revenue Code and related excise tax provisions applicable to regulated investment companies and to distribute substantially all of their net investment income and any net realized capital gains to their shareholders. Therefore, no federal income tax provision is required. No capital gain distributions shall be made until any capital loss carryforwards have been fully utilized or expire. |
| G. | Use of Estimates. The preparation of financial statements in conformity with U.S. generally accepted accounting principles requires management to make estimates and assumptions that affect the reported amounts of assets and liabilities and disclosure of contingent assets and liabilities at the date of the financial statements and the reported amounts of increases and decreases in net assets from operations during the reporting period. Actual results could differ from those estimates. |
| H. | Repurchase Agreements. Each Series may invest in repurchase agreements only with government securities dealers recognized by the Board of Governors of the Federal Reserve System. Under such agreements, the seller of the security agrees to repurchase it at a mutually agreed upon time and price. The resale price is in excess of the purchase price and reflects an agreed upon interest rate for the period of time the agreement is outstanding. The period of the repurchase agreements is usually short, from overnight to one week, while the underlying securities generally have longer maturities. Each Series will receive as collateral cash or securities whose market value is equal to at least 100% of the carrying amount of the repurchase agreements, plus accrued interest, being invested by the Series. The underlying collateral is valued daily on a mark-to-market basis to assure that the value, including accrued interest is at least equal to the repurchase price. There would be potential loss to the Series in the event the Series is delayed or prevented from exercising its right to dispose of the collateral, and it might incur disposition costs in liquidating the collateral. |
| I. | Delayed Delivery Transactions. A Series may purchase or sell securities on a when-issued or forward commitment basis. The price of the underlying securities and date when the securities will be delivered and paid for are fixed at the time the transaction is negotiated. The market value of such is identified in the Series’ Portfolio of Investments. Losses may arise due to changes in the market value of the securities or from the inability of counterparties to meet the terms of the contract. In connection with such purchases, the Series are required to hold liquid assets as collateral with the Series’ custodian sufficient to cover the purchase price. |
| J. | Organization Expenses and Offering Costs. Costs incurred with the organization of the Series were expensed as incurred. Costs incurred with the offering of shares of the Series are deferred and amortized over a twelve-month period starting on the first day of the Guarantee Period on a straight-line basis. |
| K. | Indemnifications. In the normal course of business, the Trust may enter into contracts that provide certain indemnifications. The Trust’s maximum exposure under these arrangements is dependent on future claims that may be made against the Series and, therefore, cannot be estimated; however, based on experience, the risk of loss from such claims is considered remote. |
NOTE 3 — INVESTMENT TRANSACTIONS
For the six months ended June 30, 2007, the cost of purchases and proceeds of sales of securities, excluding short-term and U.S. government securities, were as follows:
| | | | | | |
| | | Purchases | | Sales |
Series 1 | | $ | 28,916,616 | | $ | 26,030,974 |
Series 2 | | | 21,040,602 | | | 23,823,833 |
Series 3 | | | 15,759,461 | | | 15,665,354 |
Series 4 | | | 24,735,876 | | | 22,070,258 |
Series 5 | | | 17,925,773 | | | 18,152,094 |
Series 6 | | | 37,696,929 | | | 41,154,481 |
Series 7 | | | 23,216,411 | | | 37,980,387 |
Series 8 | | | 13,517,358 | | | 21,623,383 |
Series 9 | | | 13,873,182 | | | 18,796,348 |
Series 10 | | | 21,237,890 | | | 20,036,917 |
Series 11 | | | 19,646,086 | | | 20,470,017 |
Series 12 | | | 41,848,705 | | | 47,960,944 |
Series 13 | | | 63,296,589 | | | 92,782,525 |
Series 14 | | | 96,977,007 | | | 7,325,875 |
42
NOTES TO FINANCIAL STATEMENTSASOF JUNE 30, 2007 (UNAUDITED) (CONTINUED)
NOTE 3 — INVESTMENT TRANSACTIONS (continued)
U.S. government securities not included above were as follows:
| | | | | | |
| | | Purchases | | Sales |
Series 1 | | $ | 16,042,004 | | $ | 32,652,574 |
Series 2 | | | 18,543,532 | | | 28,339,481 |
Series 3 | | | 18,482,587 | | | 42,560,649 |
Series 4 | | | — | | | 13,477,544 |
Series 5 | | | 6,954,313 | | | 12,249,725 |
Series 6 | | | 20,098,806 | | | 28,730,961 |
Series 7 | | | 13,253,979 | | | 10,771,008 |
Series 8 | | | 13,905,186 | | | 17,028,885 |
Series 9 | | | 10,865,157 | | | 13,903,749 |
Series 10 | | | — | | | 3,882,482 |
Series 11 | | | 12,071,702 | | | 19,854,214 |
Series 14 | | | 49,125,034 | | | 212,832 |
NOTE 4 — INVESTMENT MANAGEMENT AND ADMINISTRATION FEES
Each of the Series has entered into an investment management agreement (“Investment Management Agreement”) with ING Investments, LLC (the “Investment Adviser”). The Investment Management Agreement compensates the Investment Adviser with a fee, computed daily and payable monthly, based on the average daily net assets of each Series. The fee for each Series is 0.25% during its Offering Period and 0.60% during its Guarantee Period.
Effective November 1, 2006, certain ING Funds sub-advised by ING IM are permitted to invest end-of-day cash balances into ING Institutional Prime Money Market Fund. Investment Management fees paid by the funds will be reduced by an amount equal to the management fees paid indirectly to ING Institutional Prime Money Market with respect to assets invested by the funds. As of June 30, 2007, the Series waived the following amounts, which are not subject to recoupment:
| | | |
Series 1 | | $ | 56 |
Series 2 | | | 49 |
Series 3 | | | 91 |
Series 4 | | | 49 |
Series 5 | | | 17 |
Series 6 | | | 29 |
Series 7 | | | 123 |
Series 8 | | | 10 |
Series 9 | | | 22 |
Series 10 | | | 17 |
Series 11 | | | 23 |
Series 12 | | | 27 |
Series 13 | | | 63 |
The Investment Adviser has engaged ING Investment Management Co. (“ING IM”), to serve as sub-adviser to each Series. ING IM is responsible for managing the
assets of each Series in accordance with its investment objective and policies, subject to such policies as the Board of the Investment Adviser may determine.
ING Funds Services, LLC (the “Administrator”) acts as the administrator and provides certain administrative and shareholder services necessary for each Series’ operations and is responsible for the supervision of other service providers. For its services, the Administrator is entitled to receive from each Series a fee at an annual rate of 0.055% on the first $5 billion of average daily net assets and 0.030% thereafter.
The Investment Adviser, ING IM and the Administrator are indirect, wholly-owned subsidiaries of ING Groep N.V., (“ING Groep”). ING Groep is one of the largest financial services organizations in the world, and offers an array of banking, insurance and asset management services to both individuals and institutional investors.
NOTE 5 — DISTRIBUTION FEES
The Series have adopted a Distribution Plan pursuant to Rule 12b-1 under the 1940 Act (the “12b-1 Plan”), whereby ING Funds Distributor, LLC (“IFD” or the “Distributor”) is compensated by the Series for expenses incurred in the distribution of each Series’ shares (“Distribution Fees”). Pursuant to the 12b-1 Plan, the Distributor is entitled to a payment each month to compensate for expenses incurred in the distribution and promotion of the Series’ shares, including expenses incurred in printing prospectuses and reports used for sales purposes, expenses incurred in preparing and printing sales literature and other such distribution related expenses, including distribution or shareholder servicing fees (“Servicing Fees”) paid to securities dealers who have executed a distribution agreement with the Distributor. Under the 12b-1 Plan, the Series pays the Distributor a Distribution Fee rate of 0.25% based on average daily net assets.
43
NOTES TO FINANCIAL STATEMENTSASOF JUNE 30, 2007 (UNAUDITED) (CONTINUED)
NOTE 6 — OTHER TRANSACTIONS WITH AFFILIATED AND RELATED PARTIES
At June 30, 2007, the Series had the following amounts recorded in payable to affiliates on the accompanying Statements of Assets and Liabilities:
| | | | | | | | | | | | | | | |
Portfolio | | Accrued
Investment
Management
Fees | | Accrued
Administrative
Fees | | Accrued
Shareholder
Service and
Distribution
Fees | | Accrued
Recoupment | | Total |
Series 1 | | $ | 51,188 | | $ | 4,693 | | $ | 21,334 | | $ | 491 | | $ | 77,706 |
Series 2 | | | 38,463 | | | 3,527 | | | 16,033 | | | — | | | 58,023 |
Series 3 | | | 54,236 | | | 4,973 | | | 22,606 | | | — | | | 81,815 |
Series 4 | | | 25,186 | | | 2,310 | | | 10,498 | | | — | | | 37,994 |
Series 5 | | | 17,370 | | | 1,593 | | | 7,240 | | | — | | | 26,203 |
Series 6 | | | 35,021 | | | 3,211 | | | 14,597 | | | 6,082 | | | 58,911 |
Series 7 | | | 24,873 | | | 2,280 | | | 10,366 | | | 375 | | | 37,894 |
Series 8 | | | 15,818 | | | 1,450 | | | 6,592 | | | — | | | 23,860 |
Series 9 | | | 12,567 | | | 1,152 | | | 5,237 | | | 984 | | | 19,940 |
Series 10 | | | 13,265 | | | 1,216 | | | 5,529 | | | — | | | 20,010 |
Series 11 | | | 14,074 | | | 1,291 | | | 5,868 | | | 2,614 | | | 23,847 |
Series 12 | | | 25,931 | | | 2,378 | | | 10,807 | | | — | | | 39,116 |
Series 13 | | | 43,334 | | | 3,974 | | | 18,065 | | | 15,452 | | | 80,825 |
Series 14 | | | 32,551 | | | 4,201 | | | 19,095 | | | — | | | 55,847 |
The Trust has adopted a Retirement Policy (“Policy”) covering all independent trustees of the Series who will have served as an independent Trustee for at least five years at the time of retirement. Benefits under this policy are based on an annual rate as defined in the policy agreement.
At June 30, 2007, the following indirect, wholly owned subsidiaries of ING Groep owned the following Series:
ING Life Insurance and Annuity Company — Series 1 (16.10%); Series 2 (18.21%); Series 3 (46.41%); Series 4 (9.49%); Series 5 (10.39%); Series 6 (56.51%); Series 7 (53.91%); Series 8 (60.32%); Series 9 (62.62%); Series 10 (67.09%); Series 11 (63.93%); Series 12 (91.45%); and Series 13 (47.62%).
ING USA Annuity and Life Insurance Company — Series 1 (80.63%); Series 2 (74.83%); Series 3 (50.93%); Series 4 (84.24%); Series 5 (78.07%); Series 6 (41.02%); Series 7 (39.23%); Series 8 (34.08%); Series 9 (35.58%); Series 10 (29.01%); Series 11 (35.04%); Series 12 (8.42%); Series 13 (51.44%); and Series 14 (70.62%).
ReliaStar Life Insurance Company of New York — Series 2 (6.97%); Series 4 (6.27%); Series 5 (11.53%); Series 7 (6.85%); and Series 14 (7.64%).
NOTE 7 — OTHER ACCRUED EXPENSES AND LIABILITIES
At June 30, 2007, the Series had the following payables included in Other Accrued Expenses and Liabilities on the Statements of Assets and Liabilities that exceeded 5% of total liabilities.
| | | | | | | | | | | | |
| | | Payable for
Custody
Fees | | Payable for
Professional
Fees | | Payable for
Shareholder
Reporting
Expense | | Payable for
Offering
Expenses |
Series 1 | | $ | 11,296 | | $ | 20,569 | | $ | 13,365 | | $ | — |
Series 3 | | | 15,217 | | | 18,875 | | | 14,437 | | | — |
Series 4 | | | 9,278 | | | 10,896 | | | 7,173 | | | — |
Series 5 | | | 9,537 | | | 9,153 | | | 10,086 | | | — |
Series 7 | | | 12,730 | | | 13,168 | | | 9,517 | | | — |
Series 10 | | | 8,945 | | | 9,714 | | | 13,515 | | | — |
Series 11 | | | 14,861 | | | 4,832 | | | 5,401 | | | 7,233 |
Series 12 | | | 8,494 | | | 6,462 | | | — | | | — |
Series 13 | | | — | | | 11,676 | | | 17,914 | | | — |
NOTE 8 — EXPENSE LIMITATIONS
ING Investments, LLC has entered into a written expense limitation agreement (“Expense Limitation Agreement”) with each Series whereby the Investment Adviser has agreed to limit expenses, excluding interest, taxes, brokerage and extraordinary expenses (and “Acquired Fund Fees and Expenses” stemming from investments in other investment companies) to 0.65% during the Offering Period and 1.00% during the Guarantee Period.
The Investment Adviser may at a later date recoup from a Series for management fees waived and other expenses assumed by the Investment Adviser during the previous 36 months, but only if, after such reimbursement, the Series’ expense ratio does not exceed the percentage described above. Waived and reimbursed fees net of any recoupment by the Investment Adviser of such waived and reimbursed fees, are reflected on the accompanying Statements of Operations for each Series. Amounts payable by the Investment Adviser are reflected in the Statements of Assets and Liabilities for each Series.
44
NOTES TO FINANCIAL STATEMENTSASOF JUNE 30, 2007 (UNAUDITED) (CONTINUED)
NOTE 8 — EXPENSE LIMITATIONS (continued)
As of June 30, 2007, the amounts of waived and reimbursed fees that are subject to possible recoupment by the Investment Adviser and the related expiration dates are as follows:
| | | | | | | | | | | | |
| | | June 30, | | |
| | | 2008 | | 2009 | | 2010 | | Total |
Series 1 | | $ | — | | $ | — | | $ | 6,441 | | $ | 6,441 |
Series 2 | | | — | | | — | | | 1,685 | | | 1,685 |
Series 3 | | | — | | | — | | | 5,920 | | | 5,920 |
Series 4 | | | — | | | 3,050 | | | — | | | 3,050 |
Series 5 | | | 17,315 | | | 21,696 | | | 266 | | | 39,277 |
Series 7 | | | — | | | — | | | 22,451 | | | 22,451 |
Series 8 | | | 947 | | | 14,270 | | | 19,858 | | | 35,075 |
Series 9 | | | — | | | 38,087 | | | 18,636 | | | 56,723 |
Series 10 | | | — | | | 19,908 | | | 42,196 | | | 62,104 |
Series 11 | | | — | | | 11,263 | | | 37,886 | | | 49,149 |
Series 12 | | | — | | | 647 | | | 65,202 | | | 65,849 |
Series 13 | | | — | | | — | | | 57,005 | | | 57,005 |
Series 14 | | | — | | | — | | | 9,082 | | | 9,082 |
The Expense Limitation Agreement is contractual and shall renew automatically for one-year terms unless ING Investments provides written notice of the termination of the Expense Limitation Agreement within 90 days of the end of the then current term.
NOTE 9 — CAPITAL SHARES
Transactions in capital shares and dollars were as follows:
| | | | | | | | | | | | | | | | |
| | | Series 1 | | | Series 2 | |
| | | Six Months
Ended
June 30,
2007 | | | Year
Ended
December 31,
2006 | | | Six Months
Ended
June 30,
2007 | | | Year
Ended
December 31,
2006 | |
(Number of Shares) | | | | | | | | | | | | | | | | |
Dividends reinvested | | | 423,680 | | | | 609,556 | | | | 277,916 | | | | 413,426 | |
Shares redeemed | | | (1,351,818 | ) | | | (4,939,906 | ) | | | (1,208,856 | ) | | | (4,243,635 | ) |
| | | | | | | | | | | | | | | | |
Net decrease in shares outstanding | | | (928,138 | ) | | | (4,330,350 | ) | | | (930,940 | ) | | | (3,830,209 | ) |
| | | | | | | | | | | | | | | | |
($) | | | | | | | | | | | | | | | | |
Dividends reinvested | | $ | 4,435,927 | | | $ | 5,924,887 | | | $ | 2,868,092 | | | $ | 3,997,826 | |
Shares redeemed | | | (14,227,733 | ) | | | (49,626,519 | ) | | | (12,532,754 | ) | | | (42,573,997 | ) |
| | | | | | | | | | | | | | | | |
Net decrease | | $ | (9,791,806 | ) | | $ | (43,701,632 | ) | | $ | (9,664,662 | ) | | $ | (38,576,171 | ) |
| | | | | | | | | | | | | | | | |
| | | | | | | | | | | | | | | | |
| | | Series 3 | | | Series 4 | |
| | | Six Months
Ended
June 30,
2007 | | | Year
Ended
December 31,
2006 | | | Six Months
Ended
June 30,
2007 | | | Year
Ended
December 31,
2006 | |
(Number of Shares) | | | | | | | | | | | | | | | | |
Dividends reinvested | | | 270,502 | | | | 404,682 | | | | 244,496 | | | | 284,829 | |
Shares redeemed | | | (2,257,392 | ) | | | (6,015,901 | ) | | | (1,016,438 | ) | | | (1,642,472 | ) |
| | | | | | | | | | | | | | | | |
Net decrease in shares outstanding | | | (1,986,890 | ) | | | (5,611,219 | ) | | | (771,942 | ) | | | (1,357,643 | ) |
| | | | | | | | | | | | | | | | |
($) | | | | | | | | | | | | | | | | |
Dividends reinvested | | $ | 2,842,976 | | | $ | 3,949,694 | | | $ | 2,625,885 | | | $ | 2,842,589 | |
Shares redeemed | | | (23,633,450 | ) | | | (60,611,583 | ) | | | (11,076,702 | ) | | | (17,083,194 | ) |
| | | | | | | | | | | | | | | | |
Net decrease | | $ | (20,790,474 | ) | | $ | (56,661,889 | ) | | $ | (8,450,817 | ) | | $ | (14,240,605 | ) |
| | | | | | | | | | | | | | | | |
45
NOTES TO FINANCIAL STATEMENTSASOF JUNE 30, 2007 (UNAUDITED) (CONTINUED)
NOTE 9 — CAPITAL SHARES (continued)
| | | | | | | | | | | | | | | | |
| | | Series 5 | | | Series 6 | |
| | | Six Months
Ended
June 30,
2007 | | | Year
Ended
December 31,
2006 | | | Six Months
Ended
June 30,
2007 | | | Year
Ended
December 31,
2006 | |
(Number of Shares) | | | | | | | | | | | | | | | | |
Dividends reinvested | | | 189,307 | | | | 239,014 | | | | 490,437 | | | | 311,858 | |
Shares redeemed | | | (354,395 | ) | | | (1,345,150 | ) | | | (1,071,024 | ) | | | (4,791,859 | ) |
| | | | | | | | | | | | | | | | |
Net decrease in shares outstanding | | | (165,088 | ) | | | (1,106,136 | ) | | | (580,587 | ) | | | (4,480,001 | ) |
| | | | | | | | | | | | | | | | |
($) | | | | | | | | | | | | | | | | |
Dividends reinvested | | $ | 2,103,201 | | | $ | 2,380,582 | | | $ | 5,360,481 | | | $ | 3,143,528 | |
Shares redeemed | | | (3,957,622 | ) | | | (14,257,722 | ) | | | (11,943,117 | ) | | | (50,157,566 | ) |
| | | | | | | | | | | | | | | | |
Net decrease | | $ | (1,854,421 | ) | | $ | (11,877,140 | ) | | $ | (6,582,636 | ) | | $ | (47,014,038 | ) |
| | | | | | | | | | | | | | | | |
| | | | | | | | | | | | | | | | |
| | | Series 7 | | | Series 8 | |
| | | Six Months
Ended
June 30,
2007 | | | Year
Ended
December 31,
2006 | | | Six Months
Ended
June 30,
2007 | | | Year
Ended
December 31,
2006 | |
(Number of Shares) | | | | | | | | | | | | | | | | |
Dividends reinvested | | | 260,282 | | | | 173,113 | | | | 186,226 | | | | 97,978 | |
Shares redeemed | | | (1,129,028 | ) | | | (3,660,560 | ) | | | (1,026,514 | ) | | | (1,454,894 | ) |
| | | | | | | | | | | | | | | | |
Net decrease in shares outstanding | | | (868,746 | ) | | | (3,487,447 | ) | | | (840,288 | ) | | | (1,356,916 | ) |
| | | | | | | | | | | | | | | | |
($) | | | | | | | | | | | | | | | | |
Dividends reinvested | | $ | 2,889,128 | | | $ | 1,732,860 | | | $ | 2,067,107 | | | $ | 983,695 | |
Shares redeemed | | | (12,609,179 | ) | | | (38,403,731 | ) | | | (11,444,507 | ) | | | (15,185,745 | ) |
| | | | | | | | | | | | | | | | |
Net decrease | | $ | (9,720,051 | ) | | $ | (36,670,871 | ) | | $ | (9,377,400 | ) | | $ | (14,202,050 | ) |
| | | | | | | | | | | | | | | | |
| | | | | | | | | | | | | | | | |
| | | Series 9 | | | Series 10 | |
| | | Six Months
Ended
June 30,
2007 | | | Year
Ended
December 31,
2006 | | | Six Months
Ended
June 30,
2007 | | | Year
Ended
December 31,
2006 | |
(Number of Shares) | | | | | | | | | | | | | | | | |
Dividends reinvested | | | 117,242 | | | | 47,260 | | | | 91,271 | | | | 26,027 | |
Shares redeemed | | | (732,523 | ) | | | (1,372,243 | ) | | | (242,748 | ) | | | (1,193,870 | ) |
| | | | | | | | | | | | | | | | |
Net decrease in shares outstanding | | | (615,281 | ) | | | (1,324,983 | ) | | | (151,477 | ) | | | (1,167,843 | ) |
| | | | | | | | | | | | | | | | |
($) | | | | | | | | | | | | | | | | |
Dividends reinvested | | $ | 1,306,080 | | | $ | 470,241 | | | $ | 1,019,500 | | | $ | 258,706 | |
Shares redeemed | | | (8,203,545 | ) | | | (14,292,233 | ) | | | (2,692,093 | ) | | | (12,278,534 | ) |
| | | | | | | | | | | | | | | | |
Net decrease | | $ | (6,897,465 | ) | | $ | (13,821,992 | ) | | $ | (1,672,593 | ) | | $ | (12,019,828 | ) |
| | | | | | | | | | | | | | | | |
| | | | | | | | | | | | | | | | |
| | | Series 11 | | | Series 12 | |
| | | Six Months
Ended
June 30,
2007 | | | Year
Ended
December 31,
2006 | | | Six Months
Ended
June 30,
2007 | | | March 2,
2006(1) to
December 31,
2006 | |
(Number of Shares) | | | | | | | | | | | | | | | | |
Shares sold | | | — | | | | 2,535,040 | | | | — | | | | 6,991,806 | |
Dividends reinvested | | | 130,703 | | | | 5,335 | | | | 160,972 | | | | — | |
Shares redeemed | | | (798,153 | ) | | | (1,831,927 | ) | | | (512,344 | ) | | | (2,160,015 | ) |
| | | | | | | | | | | | | | | | |
Net increase (decrease) in shares outstanding | | | (667,450 | ) | | | 708,448 | | | | (351,372 | ) | | | 4,831,791 | |
| | | | | | | | | | | | | | | | |
($) | | | | | | | | | | | | | | | | |
Shares sold | | $ | — | | | $ | 25,561,609 | | | $ | — | | | $ | 70,369,417 | |
Dividends reinvested | | | 1,428,589 | | | | 52,607 | | | | 1,893,033 | | | | — | |
Shares redeemed | | | (8,835,068 | ) | | | (19,005,866 | ) | | | (5,956,380 | ) | | | (22,395,553 | ) |
| | | | | | | | | | | | | | | | |
Net increase (decrease) | | $ | (7,406,479 | ) | | $ | 6,608,350 | | | $ | (4,063,347 | ) | | $ | 47,973,864 | |
| | | | | | | | | | | | | | | | |
46
NOTES TO FINANCIAL STATEMENTSASOF JUNE 30, 2007 (UNAUDITED) (CONTINUED)
NOTE 9 — CAPITAL SHARES (continued)
| | | | | | | | | | | | | | | |
| | | Series 13 | | | Series 14 |
| | | Six Months
Ended
June 30,
2007 | | | June 22,
2006(1) to
December 31,
2006 | | | Six Months
Ended
June 30,
2007 | | | December 21,
2006(1) to
December 31,
2006 |
(Number of Shares) | | | | | | | | | | | | | | | |
Shares sold | | | — | | | | 11,453,014 | | | | 15,554,316 | | | | 8,525 |
Dividends reinvested | | | 53,979 | | | | — | | | | — | | | | — |
Shares redeemed | | | (3,148,630 | ) | | | (902,690 | ) | | | (1,957,116 | ) | | | — |
| | | | | | | | | | | | | | | |
Net increase (decrease) in shares outstanding | | | (3,094,651 | ) | | | 10,550,324 | | | | 13,597,200 | | | | 8,525 |
| | | | | | | | | | | | | | | |
($) | | | | | | | | | | | | | | | |
Shares sold | | $ | — | | | $ | 116,423,613 | | | $ | 158,080,046 | | | $ | 85,252 |
Dividends reinvested | | | 573,801 | | | | — | | | | — | | | | — |
Shares redeemed | | | (32,814,593 | ) | | | (9,161,034 | ) | | | (19,887,625 | ) | | | — |
| | | | | | | | | | | | | | | |
Net increase (decrease) | | $ | (32,240,792 | ) | | $ | 107,262,579 | | | $ | 138,192,421 | | | $ | 85,252 |
| | | | | | | | | | | | | | | |
(1) | | Commencement of operations |
NOTE 10 — LINE OF CREDIT
The Series, in addition to certain other funds managed by the Investment Adviser, have entered into an unsecured committed revolving line of credit agreement (the “Credit Agreement”) with The Bank of New York for an aggregate amount of $125,000,000. The proceeds may be used to: (1) temporarily finance the purchase and sale of securities; (2) finance the redemption of shares of an investor in the funds; and (3) enable the funds to meet other emergency expenses as defined in the Credit Agreement. The funds to which the line of credit is available pay a commitment fee equal to 0.09% per annum on the daily unused portion of the committed line amount payable quarterly in arrears. The Series did not utilize the line of credit during the six months ended June 30, 2007.
NOTE 11 — FEDERAL INCOME TAXES
The amount of distributions from net investment income and net realized capital gains are determined in accordance with federal income tax regulations, which may differ from U.S. generally accepted accounting principles for investment companies. These book/tax differences may be either temporary or permanent. Permanent differences are reclassified within the capital accounts based on their federal tax-basis treatment; temporary differences are not reclassified. Key differences include the treatment of short-term capital gains, foreign currency transactions, and wash sale deferrals. Distributions in excess of net investment income and/or net realized capital gains for tax purposes are reported as distributions of paid-in capital.
Dividends paid by the Portfolios from net investment income and distributions of net realized short-term
capital gains are, for federal income tax purposes, taxable as ordinary income to shareholders.
The tax composition of dividends and distributions to shareholders was as follows:
| | | | | | | | | | | | |
| | | Six Months Ended
June 30, 2007 | | Year Ended
December 31, 2006 |
| | | Ordinary
Income | | Long-Term
Capital Gains | | Ordinary
Income | | Long-Term
Capital Gains |
Series 1 | | $ | 2,896,853 | | $ | 1,539,074 | | $ | 4,309,254 | | $ | 1,615,633 |
Series 2 | | | 2,431,274 | | | 436,818 | | | 3,956,946 | | | 40,880 |
Series 3 | | | 2,842,976 | | | — | | | 3,949,694 | | | — |
Series 4 | | | 1,669,834 | | | 956,051 | | | 2,713,598 | | | 128,991 |
Series 5 | | | 840,548 | | | 1,262,653 | | | 2,067,413 | | | 313,169 |
Series 6 | | | 2,219,444 | | | 3,141,037 | | | 2,791,648 | | | 351,880 |
Series 7 | | | 1,510,025 | | | 1,379,103 | | | 1,732,860 | | | — |
Series 8 | | | 1,559,747 | | | 507,360 | | | 983,695 | | | — |
Series 9 | | | 1,026,173 | | | 279,907 | | | 470,241 | | | — |
Series 10 | | | 994,663 | | | 24,837 | | | 258,706 | | | — |
Series 11 | | | 1,426,566 | | | 2,023 | | | 52,607 | | | — |
Series 12 | | | 1,890,392 | | | 2,641 | | | — | | | — |
Series 13 | | | 571,994 | | | 1,807 | | | — | | | — |
The tax-basis components of distributable earnings as of December 31, 2006 were:
| | | | | | | | | | | | | | |
| | | Undistributed Ordinary Income | | Undistributed Long Term
Capital Gains | | Unrealized
Appreciation/ (Depreciation) | | | Post-October Capital Losses Deferred | |
Series 1 | | $ | 2,895,228 | | $ | 1,538,660 | | $ | 4,718,329 | | | $ | — | |
Series 2 | | | 2,431,053 | | | 436,225 | | | 2,076,786 | | | | — | |
Series 3 | | | 2,841,330 | | | — | | | 1,253,918 | | | | (87,854 | ) |
Series 4 | | | 1,669,414 | | | 955,856 | | | 3,156,371 | | | | — | |
Series 5 | | | 840,047 | | | 1,262,343 | | | 2,900,586 | | | | — | |
Series 6 | | | 2,219,068 | | | 3,140,928 | | | 5,192,740 | | | | — | |
Series 7 | | | 1,509,533 | | | 1,378,744 | | | 4,279,699 | | | | — | |
Series 8 | | | 1,559,338 | | | 507,175 | | | 2,582,147 | | | | — | |
Series 9 | | | 1,025,808 | | | 279,809 | | | 1,793,791 | | | | — | |
Series 10 | | | 994,462 | | | 24,767 | | | 1,533,419 | | | | — | |
Series 11 | | | 1,426,137 | | | 1,827 | | | 1,664,290 | | | | — | |
Series 12 | | | 1,889,690 | | | 2,460 | | | 5,041,258 | | | | — | |
Series 13 | | | 571,394 | | | 1,291 | | | (619,316 | ) | | | — | |
47
NOTES TO FINANCIAL STATEMENTSASOF JUNE 30, 2007 (UNAUDITED) (CONTINUED)
NOTE 12 — OTHER ACCOUNTING PRONOUNCEMENTS
In June 2006, the Financial Accounting Standards Board (“FASB”) issued FASB Interpretation No. 48 (“FIN 48”), “Accounting for Uncertainty in Income Taxes.” This standard defines the threshold for recognizing the benefits of tax-return positions in the financial statements as “more-likely-than-not” to be sustained upon challenge by the taxing authority and requires measurement of a tax position meeting the more-likely-than-not criterion, based on the largest benefit that is more than 50 percent likely to be realized. FIN 48 is effective for fiscal years beginning after December 15, 2006, with early application permitted if no interim financial statements have been issued. However, acknowledging the unique issues that FIN 48 presents for investment companies that calculate NAVs, the U.S. Securities and Exchange Commission (the “SEC”) has indicated that they would not object if a fund implements FIN 48 in its NAV calculation as late as its last NAV calculation in the first required financial statement reporting period for its fiscal year beginning after December 15, 2006. For calendar year-end funds, this would be no later than their June 29, 2007 NAV and the effects of FIN 48 would be reflected in the funds’ semi-annual financial statements contained in their Form N-CSR filing. At adoption, companies must adjust their financial statements to reflect only those tax positions that are more likely-than-not to be sustained as of the adoption date. Management of the Portfolios has analyzed the tax positions of the Portfolio’s. To date, this analysis reflects no uncertain tax positions that have not met the more likely-than-not standard.
On September 15, 2006, the FASB issued Statement of Financial Accounting Standards No. 157 (“SFAS No. 157”), “Fair Value Measurements.” The new accounting statement defines fair value, establishes a framework for measuring fair value in generally accepted accounting principles (“GAAP”), and expands disclosures about fair value measurements. SFAS No. 157 defines fair value as the price that would be received to sell an asset or paid to transfer a liability in an orderly transaction between market participants at the measurement date (an exit price). SFAS No. 157 also stipulates that, as a market-based measurement, fair value measurement should be determined based on the assumptions that market participants would use in pricing the asset or liability, and establishes a fair value hierarchy that distinguishes between (a) market participant assumptions developed based on market data obtained from sources independent of the reporting entity (observable inputs) and (b) the
reporting entity’s own assumptions about market participant assumptions developed based on the best information available in the circumstances (unobservable inputs). SFAS No. 157 is effective for financial statements issued for fiscal years beginning after November 15, 2007. As of June 30, 2007, management of the Portfolios is currently assessing the impact, if any, that will result from adopting SFAS No. 157.
NOTE 13 — INFORMATION REGARDING TRADING OF ING’S U.S. MUTUAL FUNDS
In 2004, ING Investments reported to the Boards of Directors/Trustees (the “Boards”) of the ING Funds that, like many U.S. financial services companies, ING Investments and certain of its U.S. affiliates have received informal and formal requests for information since September 2003 from various governmental and self-regulatory agencies in connection with investigations related to mutual funds and variable insurance products. ING Investments has advised the Boards that it and its affiliates have cooperated fully with each request.
In addition to responding to regulatory and governmental requests, ING Investments reported that management of U.S. affiliates of ING Groep, including ING Investments (collectively, “ING”), on their own initiative, have conducted, through independent special counsel and a national accounting firm, an extensive internal review of trading in ING insurance, retirement, and mutual fund products. The goal of this review was to identify any instances of inappropriate trading in those products by third parties or by ING investment professionals and other ING personnel. ING’s internal review related to mutual fund trading is now substantially completed. ING has reported that, of the millions of customer relationships that ING maintains, the internal review identified several isolated arrangements allowing third parties to engage in frequent trading of mutual funds within ING’s variable insurance and mutual fund products, and identified other circumstances where frequent trading occurred, despite measures taken by ING intended to combat market timing. ING further reported that each of these arrangements has been terminated and fully disclosed to regulators. The results of the internal review were also reported to the independent members of the Boards.
ING Investments has advised the Boards that most of the identified arrangements were initiated prior to ING’s acquisition of the businesses in question in the
48
NOTES TO FINANCIAL STATEMENTSASOF JUNE 30, 2007 (UNAUDITED) (CONTINUED)
NOTE 13 — INFORMATION REGARDING TRADING OF ING’S U.S. MUTUAL FUNDS (continued)
U.S. ING Investments further reported that the companies in question did not receive special benefits in return for any of these arrangements, which have all been terminated.
Based on the internal review, ING Investments has advised the Boards that the identified arrangements do not represent a systemic problem in any of the companies that were involved.
In September 2005, IFD, the distributor of certain ING Funds, settled an administrative proceeding with the National Association of Securities Dealers (“NASD”) regarding three arrangements, dating from 1995, 1996 and 1998, under which the administrator to the then-Pilgrim Funds, which subsequently became part of the ING Funds, entered into formal and informal arrangements that permitted frequent trading. Under the terms of the Letter of Acceptance, Waiver and Consent (“AWC”) with the NASD, under which IFD neither admitted nor denied the allegations or findings, IFD consented to the following sanctions: (i) a censure; (ii) a fine of $1.5 million; (iii) restitution of approximately $1.44 million to certain ING Funds for losses attributable to excessive trading described in the AWC; and (iv) agreement to make certification to NASD regarding the review and establishment of certain procedures.
In addition to the arrangements discussed above, in 2004, ING Investments reported to the Boards that, at that time, these instances include the following, in addition to the arrangements subject to the AWC discussed above:
| • | | Aeltus Investment Management, Inc. (a predecessor entity to ING IM) identified two investment professionals who engaged in extensive frequent trading in certain ING Funds. One was subsequently terminated for cause and incurred substantial financial penalties in connection with this conduct and the second has been disciplined. |
| • | | ReliaStar Life Insurance Company (“ReliaStar”) entered into agreements seven years ago permitting the owner of policies issued by the insurer to engage in frequent trading and to submit orders until 4pm Central Time. In 2001 ReliaStar also entered into a selling agreement with a broker-dealer that engaged in frequent trading. Employees of ING affiliates were terminated and/or disciplined in connection with these matters. |
| • | | In 1998, Gloden American Life Insurance Company entered into arrangements permitting a broker-dealer to frequently trade up to certain specific limits in a fund available in an ING variable annuity product. No employee responsible for this arrangement remains at the company. |
For additional information regarding these matters, you may consult the Form 8-K and Form 8-K/A for each of four life insurance companies, ING USA Annuity and Life Insurance Company, ING Life Insurance and Annuity Company, ING Insurance Company of America, and ReliaStar Life Insurance Company of New York, each filed with the SEC on October 29, 2004 and September 8, 2004. These Forms 8-K and Forms 8-K/A can be accessed through the SEC’s web site at http://www.sec.gov. Despite the extensive internal review conducted through independent special counsel and a national accounting firm, there can be no assurance that the instances of inappropriate trading reported to the Board are the only instances of such trading respecting the ING Funds.
ING Investments reported to the Boards that ING is committed to conducting its business with the highest standards of ethical conduct with zero tolerance for noncompliance. Accordingly, ING Investments advised the Boards that ING management was disappointed that its voluntary internal review identified these situations. Viewed in the context of the breadth and magnitude of its U.S. business as a whole, ING management does not believe that ING’s acquired companies had systemic ethical or compliance issues in these areas. Nonetheless, ING Investments reported that given ING’s refusal to tolerate any lapses, it has taken the steps noted below, and will continue to seek opportunities to further strengthen the internal controls of its affiliates.
| • | | ING has agreed with the ING Funds to indemnify and hold harmless the ING Funds from all damages resulting from wrongful conduct by ING or its employees or from ING’s internal investigation, any investigations conducted by any governmental or self-regulatory agencies, litigation or other formal proceedings, including any proceedings by the SEC. ING investments reported to the Board that ING management believes that the total amount of any indemnification obligations will not be material to ING or its U.S. business. |
| • | | ING updated its Code of Conduct for employees reinforcing its employees’ obligation to conduct personal trading activity consistent with the law, disclosed limits, and other requirements. |
49
NOTES TO FINANCIAL STATEMENTSASOF JUNE 30, 2007 (UNAUDITED) (CONTINUED)
NOTE 13 — INFORMATION REGARDING TRADING OF ING’S U.S. MUTUAL FUNDS (continued)
| • | | The ING Funds, upon a recommendation from ING, updated their respective Codes of Ethics applicable to investment professionals with ING entities and certain other fund personnel, requiring such personnel to pre-clear any purchases or sales of ING Funds that are not systematic in nature (i.e., dividend reinvestment), and imposing minimum holding periods for shares of ING Funds. |
| • | | ING instituted excessive trading policies for all customers in its variable insurance and retirement products and for shareholders of the ING Funds sold to the public through financial intermediaries. ING does not make exceptions to these policies. |
| • | | ING reorganized and expanded its U.S. Compliance Department, and created an Enterprise Compliance team to enhance controls and consistency in regulatory compliance. |
Other Regulatory Matters
The New York Attorney General (the “NYAG”) and other federal and state regulators are also conducting broad inquiries and investigations involving the insurance industry. These initiatives currently focus on, among other things, compensation and other sales incentives; potential conflicts of interest; potential anti-competitive activity; reinsurance; marketing practices (including suitability); specific product types (including group annuities and indexed annuities); fund selection for investment products and brokerage sales; and disclosure. It is likely that the scope of these industry investigations will further broaden before they conclude. ING has received formal and informal requests in connection with such investigations, and is cooperating fully with each request. In connection with one such investigation, affiliates of ING Investments were named in a petition for relief and cease and desist order filed by the New Hampshire Bureau of Securities Regulation (the “NH Bureau”) concerning their administration of the New Hampshire state employees deferred compensation plan.
On October 10, 2006, an affiliate of ING Investments entered into an assurance of discontinuance with the NYAG (the “NYAG Agreement”) regarding the
endorsement of its products by the New York State United Teachers Union Member Benefits Trust (“NYSUT”) and the sale of their products to NYSUT members. Under the terms of the NYGA Agreement, the affiliate of ING Investments, without admitting or denying the NYAG’s findings, will distribute $30 million to NYSUT members, and/or former NYSUT members, who participated in the NYSUT-endorsed products at any point between January 1, 2001 and June 30, 2006. The affiliate also agreed with the NYAG’s office to develop a one-page disclosure that will further improve transparency and disclosure regarding retirement product fees (the “One-Page Disclosure”). Pursuant to the terms of the NYAG Agreement, the affiliate has
agreed for a five year period to provide its retirement product customers with the One-Page Disclosure.
In addition, on the same date, these affiliates of ING Investments entered into a consent agreement with the NH Bureau (the “NH Agreement”) to resolve this petition for relief and cease and desist order. Under the terms of the NH Agreement, these affiliates of ING Investments, without admitting or denying the NH Bureau’s claims, have agreed to pay $3 million to resolve the matter, and for a five year period to provide their retirement product customers with the One-Page Disclosure described above.
Other federal and state regulators could initiate similar actions in this or other areas of ING’s businesses.
These regulatory initiatives may result in new legislation and regulation that could significantly affect the financial services industry, including businesses in which ING is engaged.
In light of these and other developments, ING continuously reviews whether modifications to its business practices are appropriate.
At this time, in light of the current regulatory factors, ING U.S. is actively engaged in reviewing whether any modifications in our practices are appropriate for the future.
There can be no assurance that these matters, or the adverse publicity associated with them, will not result in increased fund redemptions, reduced sale of fund shares, or other adverse consequences to ING Funds.
50
| | |
| ING GET U.S. CORE PORTFOLIO SERIES 1 | | PORTFOLIO OF INVESTMENTS ASOF JUNE 30, 2007 (UNAUDITED) |
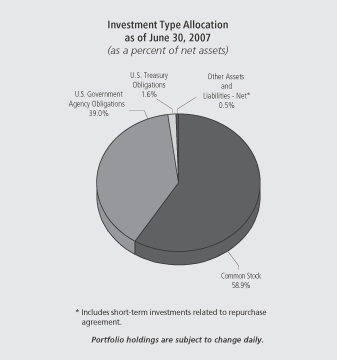
| | | | | | | |
| Shares | | | | | | Value |
| | | | | | | |
| COMMON STOCK: 58.9% | | | |
| Advertising: 0.1% | | | |
| 2,600 | | | | Omnicom Group | | $ | 137,592 |
| | | | | | | |
| | | | | | | 137,592 |
| | | | | | | |
| Aerospace/Defense: 1.4% | | | |
| 3,450 | | | | Boeing Co. | | | 331,752 |
| 2,300 | | | | General Dynamics Corp. | | | 179,906 |
| 500 | | | | Goodrich Corp. | | | 29,780 |
| 650 | | | | L-3 Communications Holdings, Inc. | | | 63,304 |
| 2,160 | | | | Lockheed Martin Corp. | | | 203,321 |
| 1,243 | | | | Northrop Grumman Corp. | | | 96,792 |
| 3,365 | | | | Raytheon Co. | | | 181,340 |
| 5,300 | | | | United Technologies Corp. | | | 375,929 |
| | | | | | | |
| | | | | | | 1,462,124 |
| | | | | | | |
| Agriculture: 0.9% | | | |
| 9,600 | | | | Altria Group, Inc. | | | 673,344 |
| 2,770 | | | | Archer-Daniels-Midland Co. | | | 91,659 |
| 980 | | | | Reynolds American, Inc. | | | 63,896 |
| 1,200 | | | | UST, Inc. | | | 64,452 |
| | | | | | | |
| | | | | | | 893,351 |
| | | | | | | |
| Apparel: 0.3% | | | |
| 2,600 | | @ | | Coach, Inc. | | | 123,214 |
| 2,240 | | | | Nike, Inc. | | | 130,570 |
| 400 | | | | Polo Ralph Lauren Corp. | | | 39,244 |
| | | | | | | |
| | | | | | | 293,028 |
| | | | | | | |
| Auto Manufacturers: 0.3% | | | |
| 9,700 | | | | Ford Motor Co. | | | 91,374 |
| 2,100 | | | | General Motors Corp. | | | 79,380 |
| | | | | | | |
| Shares | | | | | | Value |
| | | | | | | |
| 1,500 | | | | Paccar, Inc. | | $ | 130,560 |
| | | | | | | |
| | | | | | | 301,314 |
| | | | | | | |
| Auto Parts & Equipment: 0.1% | | | |
| 900 | | @ | | Goodyear Tire & Rubber Co. | | | 31,284 |
| 700 | | | | Johnson Controls, Inc. | | | 81,039 |
| | | | | | | |
| | | | | | | 112,323 |
| | | | | | | |
| Banks: 3.6% | | | |
| 20,920 | | | | Bank of America Corp. | | | 1,022,779 |
| 3,200 | | @ | | Bank of New York Co., Inc. | | | 132,608 |
| 2,360 | | | | BB&T Corp. | | | 96,005 |
| 1,751 | | | | Capital One Financial Corp. | | | 137,348 |
| 1,200 | | | | Comerica, Inc. | | | 71,364 |
| 500 | | | | Compass Bancshares, Inc. | | | 34,490 |
| 1,200 | | | | Fifth Third Bancorp. | | | 47,724 |
| 4,950 | | | | Huntington Bancshares, Inc. | | | 112,563 |
| 3,850 | | | | Keycorp. | | | 132,171 |
| 1,300 | | | | Marshall & Ilsley Corp. | | | 61,919 |
| 2,500 | | | | Mellon Financial Corp. | | | 110,000 |
| 2,460 | | | | National City Corp. | | | 81,967 |
| 500 | | | | Northern Trust Corp. | | | 32,120 |
| 1,000 | | | | PNC Financial Services Group, Inc. | | | 71,580 |
| 4,636 | | | | Regions Financial Corp. | | | 153,452 |
| 1,500 | | | | State Street Corp. | | | 102,600 |
| 1,100 | | | | SunTrust Banks, Inc. | | | 94,314 |
| 5,200 | | | | US Bancorp. | | | 171,340 |
| 9,486 | | | | Wachovia Corp. | | | 486,158 |
| 16,700 | | | | Wells Fargo & Co. | | | 587,339 |
| | | | | | | |
| | | | | | | 3,739,841 |
| | | | | | | |
| Beverages: 1.2% | | | |
| 2,900 | | | | Anheuser-Busch Cos., Inc. | | | 151,264 |
| 8,900 | | | | Coca-Cola Co. | | | 465,559 |
| 1,950 | | | | Pepsi Bottling Group, Inc. | | | 65,676 |
| 7,670 | | | | PepsiCo, Inc. | | | 497,400 |
| | | | | | | |
| | | | | | | 1,179,899 |
| | | | | | | |
| Biotechnology: 0.5% | | | |
| 5,100 | | @ | | Amgen, Inc. | | | 281,979 |
| 1,300 | | @ | | Biogen Idec, Inc. | | | 69,550 |
| 1,460 | | @ | | Celgene Corp. | | | 83,702 |
| 1,350 | | @ | | Genzyme Corp. | | | 86,940 |
| | | | | | | |
| | | | | | | 522,171 |
| | | | | | | |
| Building Materials: 0.1% | | | |
| 600 | | | | American Standard Cos., Inc. | | | 35,388 |
| 3,250 | | | | Masco Corp. | | | 92,528 |
| | | | | | | |
| | | | | | | 127,916 |
| | | | | | | |
| Chemicals: 1.0% | | | |
| 350 | | | | Air Products & Chemicals, Inc. | | | 28,130 |
| 700 | | | | Ashland, Inc. | | | 44,765 |
| 4,000 | | | | Dow Chemical Co. | | | 176,880 |
| 800 | | | | Ecolab, Inc. | | | 34,160 |
| 3,200 | | | | EI DuPont de Nemours & Co. | | | 162,688 |
| 1,300 | | | | International Flavors & Fragrances, Inc. | | | 67,782 |
| 2,680 | | | | Monsanto Co. | | | 181,007 |
| 1,350 | | | | PPG Industries, Inc. | | | 102,749 |
| 700 | | | | Praxair, Inc. | | | 50,393 |
| 950 | | | | Sherwin-Williams Co. | | | 63,147 |
| 1,800 | | | | Sigma-Aldrich Corp. | | | 76,806 |
| | | | | | | |
| | | | | | | 988,507 |
| | | | | | | |
See Accompanying Notes to Financial Statements
51
| | |
| ING GET U.S. CORE PORTFOLIO SERIES 1 | | PORTFOLIO OF INVESTMENTS ASOF JUNE 30, 2007 (UNAUDITED) (CONTINUED) |
| | | | | | | |
| Shares | | | | | | Value |
| | | | | | | |
| Coal: 0.1% | | | | | |
| 800 | | | | Consol Energy, Inc. | | $ | 36,888 |
| 1,110 | | | | Peabody Energy Corp. | | | 53,702 |
| | | | | | | |
| | | | | | | 90,590 |
| | | | | | | |
| Commercial Services: 0.4% | | | |
| 800 | | @ | | Apollo Group, Inc. | | | 46,744 |
| 1,800 | | @ | | Convergys Corp. | | | 43,632 |
| 850 | | | | Equifax, Inc. | | | 37,757 |
| 1,720 | | | | McKesson Corp. | | | 102,581 |
| 1,000 | | | | Moody’s Corp. | | | 62,200 |
| 750 | | | | Robert Half International, Inc. | | | 27,375 |
| 1,200 | | | | RR Donnelley & Sons Co. | | | 52,212 |
| 2,870 | | | | Western Union Co. | | | 59,782 |
| | | | | | | |
| | | | | | | 432,283 |
| | | | | | | |
| Computers: 2.6% | | | |
| 400 | | @ | | Affiliated Computer Services, Inc. | | | 22,688 |
| 4,000 | | @ | | Apple, Inc. | | | 488,160 |
| 300 | | @ | | Cognizant Technology Solutions Corp. | | | 22,527 |
| 900 | | @ | | Computer Sciences Corp. | | | 53,235 |
| 11,400 | | @ | | Dell, Inc. | | | 325,470 |
| 2,800 | | | | Electronic Data Systems Corp. | | | 77,644 |
| 11,700 | | @ | | EMC Corp. | | | 211,770 |
| 12,400 | | | | Hewlett-Packard Co. | | | 553,288 |
| 6,500 | | | | International Business Machines Corp. | | | 684,125 |
| 750 | | @ | | Lexmark International, Inc. | | | 36,983 |
| 700 | | @ | | NCR Corp. | | | 36,778 |
| 1,950 | | @ | | Network Appliance, Inc. | | | 56,940 |
| 1,000 | | @ | | Sandisk Corp. | | | 48,940 |
| 14,000 | | @ | | Sun Microsystems, Inc. | | | 73,640 |
| | | | | | | |
| | | | | | | 2,692,188 |
| | | | | | | |
| Cosmetics/Personal Care: 1.1% | | | |
| 1,300 | | | | Avon Products, Inc. | | | 47,775 |
| 2,150 | | | | Colgate-Palmolive Co. | | | 139,428 |
| 800 | | | | Estee Lauder Cos., Inc. | | | 36,408 |
| 15,176 | | | | Procter & Gamble Co. | | | 928,619 |
| | | | | | | |
| | | | | | | 1,152,230 |
| | | | | | | |
| Distribution/Wholesale: 0.0% | | | |
| 550 | | | | WW Grainger, Inc. | | | 51,178 |
| | | | | | | |
| | | | | | | 51,178 |
| | | | | | | |
| Diversified Financial Services: 4.8% | | | |
| 5,200 | | | | American Express Co. | | | 318,136 |
| 1,240 | | | | Ameriprise Financial, Inc. | | | 78,827 |
| 600 | | | | Bear Stearns Cos., Inc. | | | 84,000 |
| 4,050 | | | | Charles Schwab Corp. | | | 83,106 |
| 150 | | | | Chicago Mercantile Exchange Holdings, Inc. | | | 80,154 |
| 1,150 | | | | CIT Group, Inc. | | | 63,055 |
| 21,750 | | | | Citigroup, Inc. | | | 1,115,558 |
| 2,708 | | | | Countrywide Financial Corp. | | | 98,436 |
| 1,200 | | @ | | E*Trade Financial Corp. | | | 26,508 |
| 3,900 | | | | Fannie Mae | | | 254,787 |
| 700 | | | | Franklin Resources, Inc. | | | 92,729 |
| 3,000 | | | | Freddie Mac | | | 182,100 |
| 2,050 | | | | Goldman Sachs Group, Inc. | | | 444,338 |
| 1,200 | | | | Janus Capital Group, Inc. | | | 33,408 |
| 16,900 | | | | JP Morgan Chase & Co. | | | 818,805 |
| 300 | | | | Legg Mason, Inc. | | | 29,514 |
| 2,520 | | | | Lehman Brothers Holdings, Inc. | | | 187,790 |
| 4,500 | | | | Merrill Lynch & Co., Inc. | | | 376,110 |
| | | | | | | |
| Shares | | | | | | Value |
| | | | | | | |
| 5,350 | | | | Morgan Stanley | | $ | 448,758 |
| 1,800 | | | | SLM Corp. | | | 103,644 |
| 600 | | | | T. Rowe Price Group, Inc. | | | 31,134 |
| | | | | | | |
| | | | | | | 4,950,897 |
| | | | | | | |
| Electric: 2.0% | | | |
| 2,660 | | @ | | AES Corp. | | | 58,201 |
| 1,250 | | | | American Electric Power Co., Inc. | | | 56,300 |
| 1,700 | | | | CMS Energy Corp. | | | 29,240 |
| 1,150 | | | | Constellation Energy Group, Inc. | | | 100,246 |
| 1,800 | | | | Dominion Resources, Inc. | | | 155,358 |
| 2,300 | | | | DTE Energy Co. | | | 110,906 |
| 1,800 | | | | Duke Energy Corp. | | | 32,940 |
| 3,100 | | | | Edison International | | | 173,972 |
| 2,200 | | | | Entergy Corp. | | | 236,170 |
| 3,200 | | | | Exelon Corp. | | | 232,320 |
| 2,510 | | | | FirstEnergy Corp. | | | 162,472 |
| 3,100 | | | | FPL Group, Inc. | | | 175,894 |
| 2,800 | | | | PG&E Corp. | | | 126,840 |
| 700 | | | | PPL Corp. | | | 32,753 |
| 1,600 | | | | Public Service Enterprise Group, Inc. | | | 140,448 |
| 1,800 | | | | TECO Energy, Inc. | | | 30,924 |
| 2,140 | | | | TXU Corp. | | | 144,022 |
| | | | | | | |
| | | | | | | 1,999,006 |
| | | | | | | |
| Electrical Components & Equipment: 0.1% | | | |
| 2,800 | | | | Emerson Electric Co. | | | 131,040 |
| | | | | | | |
| | | | | | | 131,040 |
| | | | | | | |
| Electronics: 0.2% | | | |
| 1,350 | | @ | | Agilent Technologies, Inc. | | | 51,894 |
| 1,300 | | | | Tektronix, Inc. | | | 43,862 |
| 2,200 | | @ | | Thermo Electron Corp. | | | 113,784 |
| 550 | | @ | | Waters Corp. | | | 32,648 |
| | | | | | | |
| | | | | | | 242,188 |
| | | | | | | |
| Engineering & Construction: 0.0% | | | |
| 300 | | | | Fluor Corp. | | | 33,411 |
| | | | | | | |
| | | | | | | 33,411 |
| | | | | | | |
| Entertainment: 0.0% | | | |
| 1,050 | | | | International Game Technology | | | 41,685 |
| | | | | | | |
| | | | | | | 41,685 |
| | | | | | | |
| Environmental Control: 0.2% | | | |
| 2,200 | | @ | | Allied Waste Industries, Inc. | | | 29,612 |
| 3,400 | | | | Waste Management, Inc. | | | 132,770 |
| | | | | | | |
| | | | | | | 162,382 |
| | | | | | | |
| Food: 1.0% | | | |
| 1,550 | | | | Campbell Soup Co. | | | 60,156 |
| 800 | | @ | | Dean Foods Co. | | | 25,496 |
| 3,200 | | | | General Mills, Inc. | | | 186,944 |
| 600 | | | | Hershey Co. | | | 30,372 |
| 3,550 | | | | HJ Heinz Co. | | | 168,519 |
| 1,100 | | | | Kellogg Co. | | | 56,969 |
| 5,451 | | | | Kraft Foods, Inc. | | | 192,148 |
| 3,500 | | | | Kroger Co. | | | 98,455 |
| 2,000 | | | | Safeway, Inc. | | | 68,060 |
| 700 | | | | Supervalu, Inc. | | | 32,424 |
| 800 | | | | Sysco Corp. | | | 26,392 |
| 600 | | | | Whole Foods Market, Inc. | | | 22,980 |
| 500 | | | | WM Wrigley Jr. Co. | | | 27,655 |
| | | | | | | |
| | | | | | | 996,570 |
| | | | | | | |
See Accompanying Notes to Financial Statements
52
| | |
| ING GET U.S. CORE PORTFOLIO SERIES 1 | | PORTFOLIO OF INVESTMENTS ASOF JUNE 30, 2007 (UNAUDITED) (CONTINUED) |
| | | | | | | |
| Shares | | | | | | Value |
| | | | | | | |
| Forest Products & Paper: 0.2% | | | |
| 2,200 | | | | International Paper Co. | | $ | 85,910 |
| 1,000 | | | | Temple-Inland, Inc. | | | 61,530 |
| 400 | | | | Weyerhaeuser Co. | | | 31,572 |
| | | | | | | |
| | | | | | | 179,012 |
| | | | | | | |
| Gas: 0.1% | | | |
| 700 | | | | KeySpan Corp. | | | 29,386 |
| 1,500 | | | | Sempra Energy | | | 88,845 |
| | | | | | | |
| | | | | | | 118,231 |
| | | | | | | |
| Hand/Machine Tools: 0.1% | | | |
| 650 | | | | Black & Decker Corp. | | | 57,402 |
| 750 | | | | Snap-On, Inc. | | | 37,883 |
| 850 | | | | Stanley Works | | | 51,595 |
| | | | | | | |
| | | | | | | 146,880 |
| | | | | | | |
| Healthcare - Products: 1.7% | | | |
| 3,300 | | | | Baxter International, Inc. | | | 185,922 |
| 1,240 | | | | Becton Dickinson & Co. | | | 92,380 |
| 1,000 | | | | Biomet, Inc. | | | 45,720 |
| 4,600 | | @ | | Boston Scientific Corp. | | | 70,564 |
| 600 | | | | CR Bard, Inc. | | | 49,578 |
| 14,100 | | | | Johnson & Johnson | | | 868,842 |
| 4,700 | | | | Medtronic, Inc. | | | 243,742 |
| 1,100 | | @ | | St. Jude Medical, Inc. | | | 45,639 |
| 1,100 | | | | Stryker Corp. | | | 69,399 |
| 500 | | @ | | Varian Medical Systems, Inc. | | | 21,255 |
| 1,000 | | @ | | Zimmer Holdings, Inc. | | | 84,890 |
| | | | | | | |
| | | | | | | 1,777,931 |
| | | | | | | |
| Healthcare - Services: 0.8% | | | |
| 2,540 | | | | Aetna, Inc. | | | 125,476 |
| 910 | | @ | | Coventry Health Care, Inc. | | | 52,462 |
| 900 | | @ | | Humana, Inc. | | | 54,819 |
| 450 | | @ | | Laboratory Corp. of America Holdings | | | 35,217 |
| 6,520 | | | | UnitedHealth Group, Inc. | | | 333,433 |
| 2,770 | | @ | | WellPoint, Inc. | | | 221,129 |
| | | | | | | |
| | | | | | | 822,536 |
| | | | | | | |
| Home Builders: 0.1% | | | |
| 1,000 | | | | Centex Corp. | | | 40,100 |
| 1,100 | | | | KB Home | | | 43,307 |
| 600 | | | | Lennar Corp. | | | 21,936 |
| | | | | | | |
| | | | | | | 105,343 |
| | | | | | | |
| Home Furnishings: 0.1% | | | |
| 300 | | | | Harman International Industries, Inc. | | | 35,040 |
| 300 | | | | Whirlpool Corp. | | | 33,360 |
| | | | | | | |
| | | | | | | 68,400 |
| | | | | | | |
| Household Products/Wares: 0.2% | | | |
| 400 | | | | Clorox Co. | | | 24,840 |
| 2,750 | | | | Kimberly-Clark Corp. | | | 183,948 |
| | | | | | | |
| | | | | | | 208,788 |
| | | | | | | |
| Housewares: 0.0% | | | |
| 1,200 | | | | Newell Rubbermaid, Inc. | | | 35,316 |
| | | | | | | |
| | | | | | | 35,316 |
| | | | | | | |
| Insurance: 3.3% | | | |
| 1,840 | | @@ | | ACE Ltd. | | | 115,037 |
| 2,350 | | | | Aflac, Inc. | | | 120,790 |
| 3,730 | | | | Allstate Corp. | | | 229,432 |
| 350 | | | | AMBAC Financial Group, Inc. | | | 30,517 |
| | | | | | | |
| Shares | | | | | | Value |
| | | | | | | |
| 12,100 | | | | American International Group, Inc. | | $ | 847,363 |
| 1,650 | | | | AON Corp. | | | 70,307 |
| 700 | | | | Assurant, Inc. | | | 41,244 |
| 2,680 | | | | Chubb Corp. | | | 145,095 |
| 1,530 | | | | Cigna Corp. | | | 79,897 |
| 3,000 | | | | Genworth Financial, Inc. | | | 103,200 |
| 1,800 | | | | Hartford Financial Services Group, Inc. | | | 177,318 |
| 1,128 | | | | Lincoln National Corp. | | | 80,032 |
| 1,760 | | | | Loews Corp. | | | 89,725 |
| 2,000 | | | | Marsh & McLennan Cos., Inc. | | | 61,760 |
| 800 | | | | MBIA, Inc. | | | 49,776 |
| 3,940 | | | | Metlife, Inc. | | | 254,051 |
| 400 | | | | MGIC Investment Corp. | | | 22,744 |
| 1,850 | | | | Principal Financial Group | | | 107,837 |
| 4,420 | | | | Progressive Corp. | | | 105,771 |
| 2,530 | | | | Prudential Financial, Inc. | | | 245,992 |
| 630 | | | | Safeco Corp. | | | 39,224 |
| 600 | | | | Torchmark Corp. | | | 40,200 |
| 3,170 | | | | Travelers Cos., Inc. | | | 169,595 |
| 1,100 | | | | UnumProvident Corp. | | | 28,721 |
| 1,000 | | @@ | | XL Capital Ltd. | | | 84,290 |
| | | | | | | |
| | | | | | | 3,339,918 |
| | | | | | | |
| Internet: 1.1% | | | |
| 1,500 | | @ | | Amazon.com, Inc. | | | 102,615 |
| 5,350 | | @ | | eBay, Inc. | | | 172,163 |
| 1,000 | | @ | | Google, Inc. | | | 523,380 |
| 1,200 | | @ | | IAC/InterActiveCorp. | | | 41,532 |
| 5,059 | | @ | | Symantec Corp. | | | 102,192 |
| 1,200 | | @ | | VeriSign, Inc. | | | 38,076 |
| 5,500 | | @ | | Yahoo!, Inc. | | | 149,215 |
| | | | | | | |
| | | | | | | 1,129,173 |
| | | | | | | |
| Iron/Steel: 0.2% | | | |
| 400 | | | | Allegheny Technologies, Inc. | | | 41,952 |
| 1,800 | | | | Nucor Corp. | | | 105,570 |
| 700 | | | | United States Steel Corp. | | | 76,125 |
| | | | | | | |
| | | | | | | 223,647 |
| | | | | | | |
| Leisure Time: 0.2% | | | |
| 1,850 | | | | Carnival Corp. | | | 90,225 |
| 1,200 | | | | Harley-Davidson, Inc. | | | 71,532 |
| | | | | | | |
| | | | | | | 161,757 |
| | | | | | | |
| Lodging: 0.2% | | | |
| 800 | | | | Harrah’s Entertainment, Inc. | | | 68,208 |
| 900 | | | | Hilton Hotels Corp. | | | 30,123 |
| 1,000 | | | | Marriott International, Inc. | | | 43,240 |
| 600 | | | | Starwood Hotels & Resorts Worldwide, Inc. | | | 40,242 |
| | | | | | | |
| | | | | | | 181,813 |
| | | | | | | |
| Machinery - Construction & Mining: 0.3% | | | |
| 3,300 | | | | Caterpillar, Inc. | | | 258,390 |
| 400 | | @ | | Terex Corp. | | | 32,520 |
| | | | | | | |
| | | | | | | 290,910 |
| | | | | | | |
| Machinery - Diversified: 0.3% | | | |
| 900 | | | | Cummins, Inc. | | | 91,089 |
| 1,200 | | | | Deere & Co. | | | 144,888 |
| 650 | | | | Rockwell Automation, Inc. | | | 45,136 |
| | | | | | | |
| | | | | | | 281,113 |
| | | | | | | |
See Accompanying Notes to Financial Statements
53
| | |
| ING GET U.S. CORE PORTFOLIO SERIES 1 | | PORTFOLIO OF INVESTMENTS ASOF JUNE 30, 2007 (UNAUDITED) (CONTINUED) |
| | | | | | | |
| Shares | | | | | | Value |
| | | | | | | |
| Media: 1.7% | | | |
| 3,375 | | | | CBS Corp. - Class B | | $ | 112,455 |
| 2,000 | | | | Clear Channel Communications, Inc. | | | 75,640 |
| 11,100 | | @ | | Comcast Corp. - Class A | | | 312,132 |
| 4,400 | | @ | | DIRECTV Group, Inc. | | | 101,684 |
| 1,300 | | | | Gannett Co., Inc. | | | 71,435 |
| 2,520 | | | | McGraw-Hill Cos., Inc. | | | 171,562 |
| 11,300 | | | | News Corp., Inc. - Class A | | | 239,673 |
| 13,000 | | | | Time Warner, Inc. | | | 273,520 |
| 2,700 | | @ | | Viacom - Class B | | | 112,401 |
| 9,350 | | | | Walt Disney Co. | | | 319,209 |
| | | | | | | |
| | | | | | | 1,789,711 |
| | | | | | | |
| Metal Fabricate/Hardware: 0.0% | | | |
| 300 | | | | Precision Castparts Corp. | | | 36,408 |
| | | | | | | |
| | | | | | | 36,408 |
| | | | | | | |
| Mining: 0.3% | | | |
| 3,900 | | | | Alcoa, Inc. | | | 158,067 |
| 1,762 | | | | Freeport-McMoRan Copper & Gold, Inc. | | | 145,929 |
| 1,300 | | | | Newmont Mining Corp. | | | 50,778 |
| | | | | | | |
| | | | | | | 354,774 |
| | | | | | | |
| Miscellaneous Manufacturing: 3.2% | | | |
| 3,550 | | | | 3M Co. | | | 308,105 |
| 1,200 | | | | Cooper Industries Ltd. | | | 68,508 |
| 1,050 | | | | Danaher Corp. | | | 79,275 |
| 2,600 | | | | Eastman Kodak Co. | | | 72,358 |
| 1,550 | | | | Eaton Corp. | | | 144,150 |
| 43,750 | | | | General Electric Co. | | | 1,674,727 |
| 3,400 | | | | Honeywell International, Inc. | | | 191,352 |
| 2,600 | | | | Illinois Tool Works, Inc. | | | 140,894 |
| 1,400 | | | | ITT Corp. | | | 95,592 |
| 700 | | | | Pall Corp. | | | 32,193 |
| 1,050 | | | | Parker Hannifin Corp. | | | 102,806 |
| 300 | | | | Textron, Inc. | | | 33,033 |
| 9,100 | | @ | | Tyco International Ltd. | | | 307,489 |
| | | | | | | |
| | | | | | | 3,250,482 |
| | | | | | | |
| Office/Business Equipment: 0.1% | | | |
| 5,300 | | @ | | Xerox Corp. | | | 97,944 |
| | | | | | | |
| | | | | | | 97,944 |
| | | | | | | |
| Oil & Gas: 5.4% | | | |
| 2,400 | | | | Anadarko Petroleum Corp. | | | 124,776 |
| 900 | | | | Apache Corp. | | | 73,431 |
| 1,800 | | | | Chesapeake Energy Corp. | | | 62,280 |
| 10,776 | | | | Chevron Corp. | | | 907,770 |
| 8,034 | | | | ConocoPhillips | | | 630,669 |
| 2,300 | | | | Devon Energy Corp. | | | 180,067 |
| 1,100 | | | | ENSCO International, Inc. | | | 67,111 |
| 500 | | | | EOG Resources, Inc. | | | 36,530 |
| 26,800 | | | | ExxonMobil Corp. | | | 2,247,984 |
| 1,000 | | | | Hess Corp. | | | 58,960 |
| 4,300 | | | | Marathon Oil Corp. | | | 257,828 |
| 500 | | | | Murphy Oil Corp. | | | 29,720 |
| 1,300 | | @, @@ | | Nabors Industries Ltd. | | | 43,394 |
| 700 | | | | Noble Corp. | | | 68,264 |
| 4,300 | | | | Occidental Petroleum Corp. | | | 248,884 |
| 900 | | | | Sunoco, Inc. | | | 71,712 |
| 1,300 | | @ | | Transocean, Inc. | | | 137,774 |
| | | | | | | |
| Shares | | | | | | Value |
| | | | | | | |
| 2,750 | | | | Valero Energy Corp. | | $ | 203,115 |
| 1,200 | | | | XTO Energy, Inc. | | | 72,120 |
| | | | | | | |
| | | | | | | 5,522,389 |
| | | | | | | |
| Oil & Gas Services: 0.9% | | | |
| 1,200 | | | | Baker Hughes, Inc. | | | 100,956 |
| 5,400 | | | | Halliburton Co. | | | 186,300 |
| 1,200 | | @ | | National Oilwell Varco, Inc. | | | 125,088 |
| 5,000 | | | | Schlumberger Ltd. | | | 424,700 |
| 800 | | @ | | Weatherford International Ltd. | | | 44,192 |
| | | | | | | |
| | | | | | | 881,236 |
| | | | | | | |
| Packaging & Containers: 0.2% | | | |
| 600 | | | | Ball Corp. | | | 31,902 |
| 800 | | | | Bemis Co. | | | 26,544 |
| 2,100 | | @ | | Pactiv Corp. | | | 66,969 |
| 1,600 | | | | Sealed Air Corp. | | | 49,632 |
| | | | | | | |
| | | | | | | 175,047 |
| | | | | | | |
| Pharmaceuticals: 3.3% | | | |
| 5,800 | | | | Abbott Laboratories | | | 310,590 |
| 1,620 | | | | AmerisourceBergen Corp. | | | 80,141 |
| 500 | | @ | | Barr Pharmaceuticals, Inc. | | | 25,115 |
| 8,700 | | | | Bristol-Myers Squibb Co. | | | 274,572 |
| 1,770 | | | | Cardinal Health, Inc. | | | 125,033 |
| 3,800 | | | | Eli Lilly & Co. | | | 212,344 |
| 820 | | @ | | Express Scripts, Inc. | | | 41,008 |
| 1,800 | | @ | | Forest Laboratories, Inc. | | | 82,170 |
| 4,000 | | @ | | Gilead Sciences, Inc. | | | 155,080 |
| 1,500 | | @ | | King Pharmaceuticals, Inc. | | | 30,690 |
| 1,100 | | @ | | Medco Health Solutions, Inc. | | | 85,789 |
| 9,850 | | | | Merck & Co., Inc. | | | 490,530 |
| 1,800 | | | | Mylan Laboratories | | | 32,742 |
| 32,450 | | | | Pfizer, Inc. | | | 829,747 |
| 7,300 | | | | Schering-Plough Corp. | | | 222,212 |
| 1,000 | | @ | | Watson Pharmaceuticals, Inc. | | | 32,530 |
| 5,950 | | | | Wyeth | | | 341,173 |
| | | | | | | |
| | | | | | | 3,371,466 |
| | | | | | | |
| Pipelines: 0.2% | | | |
| 2,600 | | | | El Paso Corp. | | | 44,798 |
| 800 | | | | Questar Corp. | | | 42,280 |
| 2,400 | | | | Spectra Energy Corp. | | | 62,304 |
| 2,450 | | | | Williams Cos., Inc. | | | 77,469 |
| | | | | | | |
| | | | | | | 226,851 |
| | | | | | | |
| Real Estate Investment Trusts: 0.5% |
| 350 | | | | Apartment Investment & Management Co. | | | 17,647 |
| 850 | | | | Archstone-Smith Trust | | | 50,244 |
| 600 | | | | Boston Properties, Inc. | | | 61,278 |
| 710 | | | | Developers Diversified Realty Corp. | | | 37,424 |
| 600 | | | | Equity Residential | | | 27,378 |
| 1,700 | | | | Host Hotels & Resorts, Inc. | | | 39,304 |
| 800 | | | | Kimco Realty Corp. | | | 30,456 |
| 1,200 | | | | Prologis | | | 68,280 |
| 800 | | | | Simon Property Group, Inc. | | | 74,432 |
| 600 | | | | Vornado Realty Trust | | | 65,904 |
| | | | | | | |
| | | | | | | 472,347 |
| | | | | | | |
| Retail: 3.3% |
| 500 | | @ | | Autozone, Inc. | | | 68,310 |
| 700 | | @ | | Bed Bath & Beyond, Inc. | | | 25,193 |
| 2,105 | | | | Best Buy Co., Inc. | | | 98,240 |
See Accompanying Notes to Financial Statements
54
| | |
| ING GET U.S. CORE PORTFOLIO SERIES 1 | | PORTFOLIO OF INVESTMENTS ASOF JUNE 30, 2007 (UNAUDITED) (CONTINUED) |
| | | | | | | |
| Shares | | | | | | Value |
| | | | | | | |
| Retail (continued) |
| 900 | | @ | | Big Lots, Inc. | | $ | 26,478 |
| 2,400 | | | | Costco Wholesale Corp. | | | 140,448 |
| 5,555 | | | | CVS Corp. | | | 202,480 |
| 840 | | | | Darden Restaurants, Inc. | | | 36,952 |
| 1,300 | | | | Dollar General Corp. | | | 28,496 |
| 1,550 | | | | Family Dollar Stores, Inc. | | | 53,196 |
| 2,800 | | | | Gap, Inc. | | | 53,480 |
| 7,920 | | | | Home Depot, Inc. | | | 311,652 |
| 1,250 | | | | JC Penney Co., Inc. | | | 90,475 |
| 1,350 | | @ | | Kohl’s Corp. | | | 95,891 |
| 6,900 | | | | Lowe’s Cos., Inc. | | | 211,761 |
| 3,126 | | | | Macy’s, Inc. | | | 124,352 |
| 6,300 | | | | McDonald’s Corp. | | | 319,788 |
| 1,600 | | | | Nordstrom, Inc. | | | 81,792 |
| 950 | | @ | | Office Depot, Inc. | | | 28,785 |
| 1,300 | | | | RadioShack Corp. | | | 43,082 |
| 420 | | @ | | Sears Holding Corp. | | | 71,190 |
| 2,385 | | | | Staples, Inc. | | | 56,596 |
| 2,900 | | @ | | Starbucks Corp. | | | 76,096 |
| 3,700 | | | | Target Corp. | | | 235,320 |
| 2,350 | | | | TJX Cos., Inc. | | | 64,625 |
| 4,640 | | | | Walgreen Co. | | | 202,026 |
| 10,400 | | | | Wal-Mart Stores, Inc. | | | 500,344 |
| 1,100 | | | | Wendy’s International, Inc. | | | 40,425 |
| 2,700 | | | | Yum! Brands, Inc. | | | 88,344 |
| | | | | | | |
| | | | | | | 3,375,817 |
| | | | | | | |
| Savings & Loans: 0.3% |
| 2,400 | | | | Hudson City Bancorp., Inc. | | | 29,328 |
| 1,300 | | | | Sovereign Bancorp., Inc. | | | 27,482 |
| 4,949 | | | | Washington Mutual, Inc. | | | 211,025 |
| | | | | | | |
| | | | | | | 267,835 |
| | | | | | | |
| Semiconductors: 1.5% |
| 2,000 | | @ | | Advanced Micro Devices, Inc. | | | 28,600 |
| 2,200 | | | | Altera Corp. | | | 48,686 |
| 1,200 | | | | Analog Devices, Inc. | | | 45,168 |
| 3,750 | | | | Applied Materials, Inc. | | | 74,513 |
| 1,500 | | @ | | Broadcom Corp. | | | 43,875 |
| 25,610 | | | | Intel Corp. | | | 608,494 |
| 1,400 | | | | KLA-Tencor Corp. | | | 76,930 |
| 1,400 | | | | Linear Technology Corp. | | | 50,652 |
| 2,700 | | @ | | LSI Logic Corp. | | | 20,277 |
| 1,150 | | | | Maxim Integrated Products | | | 38,422 |
| 1,000 | | @ | | MEMC Electronic Materials, Inc. | | | 61,120 |
| 2,800 | | @ | | Micron Technology, Inc. | | | 35,084 |
| 1,150 | | | | National Semiconductor Corp. | | | 32,511 |
| 1,200 | | @ | | Novellus Systems, Inc. | | | 34,044 |
| 1,300 | | @ | | Nvidia Corp. | | | 53,703 |
| 1,800 | | @ | | Teradyne, Inc. | | | 31,644 |
| 5,800 | | | | Texas Instruments, Inc. | | | 218,254 |
| 1,200 | | | | Xilinx, Inc. | | | 32,124 |
| | | | | | | |
| | | | | | | 1,534,101 |
| | | | | | | |
| Software: 2.3% |
| 2,300 | | @ | | Adobe Systems, Inc. | | | 92,345 |
| 1,220 | | @ | | Autodesk, Inc. | | | 57,438 |
| 2,750 | | | | Automatic Data Processing, Inc. | | | 133,293 |
| 1,300 | | @ | | BMC Software, Inc. | | | 39,390 |
| 3,150 | | | | CA, Inc. | | | 81,365 |
| 1,400 | | @ | | Citrix Systems, Inc. | | | 47,138 |
| 3,550 | | @ | | Compuware Corp. | | | 42,103 |
| 1,150 | | @ | | Electronic Arts, Inc. | | | 54,418 |
| | | | | | | |
| Shares | | | | | | Value |
| | | | | | | |
| 3,570 | | | | First Data Corp. | | $ | 116,632 |
| 1,150 | | @ | | Fiserv, Inc. | | | 65,320 |
| 2,300 | | @ | | Intuit, Inc. | | | 69,184 |
| 36,650 | | | | Microsoft Corp. | | | 1,080,076 |
| 3,700 | | @ | | Novell, Inc. | | | 28,823 |
| 16,510 | | @ | | Oracle Corp. | | | 325,412 |
| 1,900 | | | | Paychex, Inc. | | | 74,328 |
| | | | | | | |
| | | | | | | 2,307,265 |
| | | | | | | |
| Telecommunications: 3.8% |
| 1,200 | | @@ | | Allergan, Inc. | | | 69,168 |
| 1,400 | | | | Alltel Corp. | | | 94,570 |
| 27,975 | | | | AT&T, Inc. | | | 1,160,963 |
| 2,150 | | @ | | Avaya, Inc. | | | 36,206 |
| 1,300 | | | | CenturyTel, Inc. | | | 63,765 |
| 28,350 | | @ | | Cisco Systems, Inc. | | | 789,548 |
| 3,800 | | | | Citizens Communications Co. | | | 58,026 |
| 7,550 | | @ | | Corning, Inc. | | | 192,903 |
| 887 | | | | Embarq Corp. | | | 56,209 |
| 2,200 | | @ | | Juniper Networks, Inc. | | | 55,374 |
| 10,400 | | | | Motorola, Inc. | | | 184,080 |
| 7,350 | | | | Qualcomm, Inc. | | | 318,917 |
| 7,500 | | @ | | Qwest Communications International, Inc. | | | 72,750 |
| 11,552 | | | | Sprint Nextel Corp. | | | 239,242 |
| 2,700 | | @ | | Tellabs, Inc. | | | 29,052 |
| 11,700 | | | | Verizon Communications, Inc. | | | 481,689 |
| | | | | | | |
| | | | | | | 3,902,462 |
| | | | | | | |
| Toys/Games/Hobbies: 0.1% |
| 1,300 | | | | Hasbro, Inc. | | | 40,833 |
| 2,800 | | | | Mattel, Inc. | | | 70,812 |
| | | | | | | |
| | | | | | | 111,645 |
| | | | | | | |
| Transportation: 0.9% |
| 1,100 | | | | Burlington Northern Santa Fe Corp. | | | 93,654 |
| 500 | | | | CH Robinson Worldwide, Inc. | | | 26,260 |
| 1,860 | | | | CSX Corp. | | | 83,849 |
| 1,500 | | | | FedEx Corp. | | | 166,455 |
| 1,900 | | | | Norfolk Southern Corp. | | | 99,883 |
| 1,150 | | | | Union Pacific Corp. | | | 132,423 |
| 4,000 | | | | United Parcel Service, Inc. | | | 292,000 |
| | | | | | | |
| | | | | | | 894,524 |
| | | | | | | |
| | | | Total Common Stock
(Cost $54,204,994) | | | 60,376,786 |
| | | | | | | |
| | | | | | | |
| | | |
Principal
Amount | | | | | | Value |
| | U.S. GOVERNMENT AGENCY OBLIGATIONS: 39.0% |
| | Federal Home Loan Bank: 12.5% |
| $ | 13,550,000 | | Z | | 5.340%, due 09/12/08 | | 12,728,518 |
| | | | | | | |
| | | | | | | 12,728,518 |
| | | | | | | |
| | Federal Home Loan Mortgage Corporation: 10.5% |
| | 11,500,000 | | ^^ | | 5.200%, due 10/15/08 | | 10,770,728 |
| | | | | | | |
| | | | | | | 10,770,728 |
| | | | | | | |
See Accompanying Notes to Financial Statements
55
| | |
| ING GET U.S. CORE PORTFOLIO SERIES 1 | | PORTFOLIO OF INVESTMENTS ASOF JUNE 30, 2007 (UNAUDITED) (CONTINUED) |
| | | | | | | | |
Principal
Amount | | | | | | Value |
| | | | | | | | |
| | Other U.S. Agency Obligations: 16.0% |
| $ | 17,600,000 | | Z | | Tennessee Valley Authority, 5.280%, due 11/13/08 | | $ | 16,400,683 |
| | | | | | | | |
| | | | | | | | 16,400,683 |
| | | | | | | | |
| | | | | Total U.S. Government Agency Obligations
(Cost $40,778,194) | | | 39,899,929 |
| | | | | | | | |
| | U.S. TREASURY OBLIGATIONS: 1.6% |
| | U.S. Treasury STRIP: 1.6% |
| | 1,747,000 | | ^^ | | 5.020%, due 08/15/08 | | | 1,653,221 |
| | | | | | | | |
| | | | | Total U.S. Treasury Obligations
(Cost $1,654,544) | | | 1,653,221 |
| | | | | | | | |
| | | | | Total Long-Term Investments
(Cost $96,637,732) | | | 101,929,936 |
| | | | | | | | |
| | | | | | | | | |
| SHORT-TERM INVESTMENTS: 0.6% | |
| Repurchase Agreement: 0.6% | |
| 565,000 | | Morgan Stanley Repurchase Agreement dated 06/29/07, 5.300%, due 07/02/07, $565,250 to be received upon repurchase (Collateralized by $1,195,000 Resolution Funding Corporation, Discount Note, Market Value $577,352, due 10/15/20) | | | | 565,000 | |
| | | | | | | | | |
| | Total Short-Term Investments (Cost $565,000) | | | | | | 565,000 | |
| | | | | | | | | |
| | Total Investments in Securities
(Cost $97,202,732)* | | 100.1 | % | | $ | 102,494,936 | |
| | Other Assets and
Liabilities - Net | | (0.1 | ) | | | (56,999 | ) |
| | | | | | | | | |
| | Net Assets | | 100.0 | % | | $ | 102,437,937 | |
| | | | | | | | | |
| @ | Non-income producing security |
| STRIP | Separate Trading of Registered Interest and Principal of Securities |
| ^^ | Principal Only (PO) Security |
| Z | Indicates Zero Coupon Bond; rate shown reflects effective yield on the date of purchase |
| * | Cost for federal income tax purposes is $97,875,073. |
| | | | |
Net unrealized appreciation consists of: | | | | |
Gross Unrealized Appreciation | | $ | 6,374,669 | |
Gross Unrealized Depreciation | | | (1,754,806 | ) |
| | | | |
Net Unrealized Appreciation | | $ | 4,619,863 | |
| | | | |
See Accompanying Notes to Financial Statements
56
| | |
| ING GET U.S. CORE PORTFOLIO SERIES 2 | | PORTFOLIO OF INVESTMENTS ASOF JUNE 30, 2007 (UNAUDITED) |
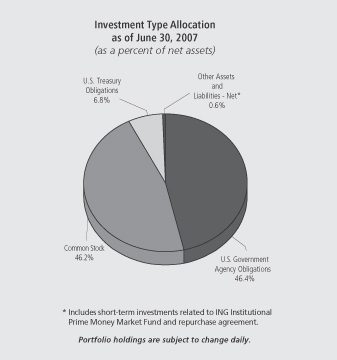
| | | | | | | |
| Shares | | | | | | Value |
| | | | | | | |
| | | | | | | |
| COMMON STOCK: 46.2% |
| Advertising: 0.1% |
| 1,600 | | | | Omnicom Group | | $ | 84,672 |
| | | | | | | |
| | | | | | | 84,672 |
| | | | | | | |
| Aerospace/Defense: 1.1% |
| 1,760 | | | | Boeing Co. | | | 169,242 |
| 1,350 | | | | General Dynamics Corp. | | | 105,597 |
| 300 | | | | Goodrich Corp. | | | 17,868 |
| 400 | | | | L-3 Communications Holdings, Inc. | | | 38,956 |
| 1,210 | | | | Lockheed Martin Corp. | | | 113,897 |
| 808 | | | | Northrop Grumman Corp. | | | 62,919 |
| 1,924 | | | | Raytheon Co. | | | 103,684 |
| 2,780 | | | | United Technologies Corp. | | | 197,185 |
| | | | | | | |
| | | | | | | 809,348 |
| | | | | | | |
| Agriculture: 0.7% |
| 5,410 | | | | Altria Group, Inc. | | | 379,457 |
| 1,750 | | | | Archer-Daniels-Midland Co. | | | 57,908 |
| 840 | | | | Reynolds American, Inc. | | | 54,768 |
| 900 | | | | UST, Inc. | | | 48,339 |
| | | | | | | |
| | | | | | | 540,472 |
| | | | | | | |
| Apparel: 0.2% |
| 1,660 | | @ | | Coach, Inc. | | | 78,667 |
| 1,280 | | | | Nike, Inc. | | | 74,611 |
| 300 | | | | Polo Ralph Lauren Corp. | | | 29,433 |
| | | | | | | |
| | | | | | | 182,711 |
| | | | | | | |
| | | | | | | |
| Shares | | | | | | Value |
| | | | | | | |
| Auto Manufacturers: 0.3% |
| 7,570 | | | | Ford Motor Co. | | $ | 71,309 |
| 1,300 | | | | General Motors Corp. | | | 49,140 |
| 1,000 | | | | Paccar, Inc. | | | 87,040 |
| | | | | | | |
| | | | | | | 207,489 |
| | | | | | | |
| Auto Parts & Equipment: 0.1% |
| 600 | | @ | | Goodyear Tire & Rubber Co. | | | 20,856 |
| 450 | | | | Johnson Controls, Inc. | | | 52,097 |
| | | | | | | |
| | | | | | | 72,953 |
| | | | | | | |
| Banks: 2.9% |
| 11,744 | | | | Bank of America Corp. | | | 574,164 |
| 1,760 | | @ | | Bank of New York Co., Inc. | | | 72,934 |
| 1,611 | | | | BB&T Corp. | | | 65,535 |
| 1,109 | | | | Capital One Financial Corp. | | | 86,990 |
| 840 | | | | Comerica, Inc. | | | 49,955 |
| 300 | | | | Compass Bancshares, Inc. | | | 20,694 |
| 700 | | | | Fifth Third Bancorp. | | | 27,839 |
| 3,060 | | | | Huntington Bancshares, Inc. | | | 69,584 |
| 2,620 | | | | Keycorp. | | | 89,945 |
| 900 | | | | Marshall & Ilsley Corp. | | | 42,867 |
| 1,600 | | | | Mellon Financial Corp. | | | 70,400 |
| 1,640 | | | | National City Corp. | | | 54,645 |
| 300 | | | | Northern Trust Corp. | | | 19,272 |
| 730 | | | | PNC Financial Services Group, Inc. | | | 52,253 |
| 2,649 | | | | Regions Financial Corp. | | | 87,682 |
| 930 | | | | State Street Corp. | | | 63,612 |
| 690 | | | | SunTrust Banks, Inc. | | | 59,161 |
| 2,960 | | | | US Bancorp. | | | 97,532 |
| 5,239 | | | | Wachovia Corp. | | | 268,499 |
| 9,520 | | | | Wells Fargo & Co. | | | 334,818 |
| | | | | | | |
| | | | | | | 2,208,381 |
| | | | | | | |
| Beverages: 0.9% |
| 1,850 | | | | Anheuser-Busch Cos., Inc. | | | 96,496 |
| 5,020 | | | | Coca-Cola Co. | | | 262,596 |
| 1,180 | | | | Pepsi Bottling Group, Inc. | | | 39,742 |
| 4,290 | | | | PepsiCo, Inc. | | | 278,207 |
| | | | | | | |
| | | | | | | 677,041 |
| | | | | | | |
| Biotechnology: 0.4% |
| 2,940 | | @ | | Amgen, Inc. | | | 162,553 |
| 900 | | @ | | Biogen Idec, Inc. | | | 48,150 |
| 810 | | @ | | Celgene Corp. | | | 46,437 |
| 800 | | @ | | Genzyme Corp. | | | 51,520 |
| | | | | | | |
| | | | | | | 308,660 |
| | | | | | | |
| Building Materials: 0.1% |
| 400 | | | | American Standard Cos., Inc. | | | 23,592 |
| 2,100 | | | | Masco Corp. | | | 59,787 |
| | | | | | | |
| | | | | | | 83,379 |
| | | | | | | |
| Chemicals: 0.8% |
| 200 | | | | Air Products & Chemicals, Inc. | | | 16,074 |
| 700 | | | | Ashland, Inc. | | | 44,765 |
| 2,360 | | | | Dow Chemical Co. | | | 104,359 |
| 600 | | | | Ecolab, Inc. | | | 25,620 |
| 1,800 | | | | EI DuPont de Nemours & Co. | | | 91,512 |
| 920 | | | | International Flavors & Fragrances, Inc. | | | 47,969 |
| 1,500 | | | | Monsanto Co. | | | 101,310 |
| 890 | | | | PPG Industries, Inc. | | | 67,738 |
| 600 | | | | Praxair, Inc. | | | 43,194 |
See Accompanying Notes to Financial Statements
57
| | |
| ING GET U.S. CORE PORTFOLIO SERIES 2 | | PORTFOLIO OF INVESTMENTS ASOF JUNE 30, 2007 (UNAUDITED) (CONTINUED) |
| | | | | | | |
| Shares | | | | | | Value |
| | | | | | | |
| Chemicals (continued) |
| 680 | | | | Sherwin-Williams Co. | | $ | 45,200 |
| 1,200 | | | | Sigma-Aldrich Corp. | | | 51,204 |
| | | | | | | |
| | | | | | | 638,945 |
| | | | | | | |
| Coal: 0.1% | | | |
| 400 | | | | Consol Energy, Inc. | | | 18,444 |
| 640 | | | | Peabody Energy Corp. | | | 30,963 |
| | | | | | | |
| | | | | | | 49,407 |
| | | | | | | |
| Commercial Services: 0.4% | | | |
| 700 | | @ | | Apollo Group, Inc. | | | 40,901 |
| 1,100 | | @ | | Convergys Corp. | | | 26,664 |
| 580 | | | | Equifax, Inc. | | | 25,764 |
| 1,010 | | | | McKesson Corp. | | | 60,236 |
| 580 | | | | Moody’s Corp. | | | 36,076 |
| 650 | | | | Robert Half International, Inc. | | | 23,725 |
| 800 | | | | RR Donnelley & Sons Co. | | | 34,808 |
| 1,838 | | | | Western Union Co. | | | 38,286 |
| | | | | | | |
| | | | | | | 286,460 |
| | | | | | | |
| Computers: 2.1% | | | |
| 300 | | @ | | Affiliated Computer Services, Inc. | | | 17,016 |
| 2,300 | | @ | | Apple, Inc. | | | 280,692 |
| 300 | | @ | | Cognizant Technology Solutions Corp. | | | 22,527 |
| 700 | | @ | | Computer Sciences Corp. | | | 41,405 |
| 6,420 | | @ | | Dell, Inc. | | | 183,291 |
| 2,000 | | | | Electronic Data Systems Corp. | | | 55,460 |
| 6,740 | | @ | | EMC Corp. | | | 121,994 |
| 6,970 | | | | Hewlett-Packard Co. | | | 311,001 |
| 3,690 | | | | International Business Machines Corp. | | | 388,373 |
| 340 | | @ | | Lexmark International, Inc. | | | 16,765 |
| 390 | | @ | | NCR Corp. | | | 20,491 |
| 1,360 | | @ | | Network Appliance, Inc. | | | 39,712 |
| 700 | | @ | | Sandisk Corp. | | | 34,258 |
| 10,000 | | @ | | Sun Microsystems, Inc. | | | 52,600 |
| | | | | | | |
| | | | | | | 1,585,585 |
| | | | | | | |
| Cosmetics/Personal Care: 0.9% | | | |
| 900 | | | | Avon Products, Inc. | | | 33,075 |
| 1,170 | | | | Colgate-Palmolive Co. | | | 75,875 |
| 600 | | | | Estee Lauder Cos., Inc. | | | 27,306 |
| 8,687 | | | | Procter & Gamble Co. | | | 531,558 |
| | | | | | | |
| | | | | | | 667,814 |
| | | | | | | |
| Distribution/Wholesale: 0.0% | | | |
| 350 | | | | WW Grainger, Inc. | | | 32,568 |
| | | | | | | |
| | | | | | | 32,568 |
| | | | | | | |
| Diversified Financial Services: 3.7% | | | |
| 2,890 | | | | American Express Co. | | | 176,810 |
| 838 | | | | Ameriprise Financial, Inc. | | | 53,272 |
| 350 | | | | Bear Stearns Cos., Inc. | | | 49,000 |
| 2,850 | | | | Charles Schwab Corp. | | | 58,482 |
| 90 | | | | Chicago Mercantile Exchange Holdings, Inc. | | | 48,092 |
| 800 | | | | CIT Group, Inc. | | | 43,864 |
| 12,240 | | | | Citigroup, Inc. | | | 627,790 |
| 1,760 | | | | Countrywide Financial Corp. | | | 63,976 |
| 900 | | @ | | E*Trade Financial Corp. | | | 19,881 |
| 2,320 | | | | Fannie Mae | | | 151,566 |
| 480 | | | | Franklin Resources, Inc. | | | 63,586 |
| | | | | | | |
| Shares | | | | | | Value |
| | | | | | | |
| 1,500 | | | | Freddie Mac | | $ | 91,050 |
| 1,090 | | | | Goldman Sachs Group, Inc. | | | 236,258 |
| 800 | | | | Janus Capital Group, Inc. | | | 22,272 |
| 9,400 | | | | JP Morgan Chase & Co. | | | 455,430 |
| 200 | | | | Legg Mason, Inc. | | | 19,676 |
| 1,500 | | | | Lehman Brothers Holdings, Inc. | | | 111,780 |
| 2,510 | | | | Merrill Lynch & Co., Inc. | | | 209,786 |
| 3,030 | | | | Morgan Stanley | | | 254,156 |
| 1,100 | | | | SLM Corp. | | | 63,338 |
| 400 | | | | T. Rowe Price Group, Inc. | | | 20,756 |
| | | | | | | |
| | | | | | | 2,840,821 |
| | | | | | | |
| Electric: 1.5% | | | |
| 1,180 | | @ | | AES Corp. | | | 25,818 |
| 790 | | | | American Electric Power Co., Inc. | | | 35,582 |
| 1,100 | | | | CMS Energy Corp. | | | 18,920 |
| 590 | | | | Constellation Energy Group, Inc. | | | 51,430 |
| 1,000 | | | | Dominion Resources, Inc. | | | 86,310 |
| 1,400 | | | | DTE Energy Co. | | | 67,508 |
| 1,000 | | | | Duke Energy Corp. | | | 18,300 |
| 1,630 | | | | Edison International | | | 91,476 |
| 1,200 | | | | Entergy Corp. | | | 128,820 |
| 1,800 | | | | Exelon Corp. | | | 130,680 |
| 1,370 | | | | FirstEnergy Corp. | | | 88,680 |
| 1,700 | | | | FPL Group, Inc. | | | 96,458 |
| 1,790 | | | | PG&E Corp. | | | 81,087 |
| 400 | | | | PPL Corp. | | | 18,716 |
| 1,050 | | | | Public Service Enterprise Group, Inc. | | | 92,169 |
| 1,200 | | | | TECO Energy, Inc. | | | 20,616 |
| 1,000 | | | | TXU Corp. | | | 67,300 |
| | | | | | | |
| | | | | | | 1,119,870 |
| | | | | | | |
| Electrical Components & Equipment: 0.1% | | | |
| 1,820 | | | | Emerson Electric Co. | | | 85,176 |
| | | | | | | |
| | | | | | | 85,176 |
| | | | | | | |
| Electronics: 0.2% | | | |
| 1,030 | | @ | | Agilent Technologies, Inc. | | | 39,593 |
| 800 | | | | Tektronix, Inc. | | | 26,992 |
| 1,350 | | @ | | Thermo Electron Corp. | | | 69,822 |
| 300 | | @ | | Waters Corp. | | | 17,808 |
| | | | | | | |
| | | | | | | 154,215 |
| | | | | | | |
| Engineering & Construction: 0.0% | | | |
| 200 | | | | Fluor Corp. | | | 22,274 |
| | | | | | | |
| | | | | | | 22,274 |
| | | | | | | |
| Entertainment: 0.0% | | | |
| 650 | | | | International Game Technology | | | 25,805 |
| | | | | | | |
| | | | | | | 25,805 |
| | | | | | | |
| Environmental Control: 0.1% | | | |
| 1,500 | | @ | | Allied Waste Industries, Inc. | | | 20,190 |
| 2,130 | | | | Waste Management, Inc. | | | 83,177 |
| | | | | | | |
| | | | | | | 103,367 |
| | | | | | | |
| Food: 0.7% | | | |
| 800 | | | | Campbell Soup Co. | | | 31,048 |
| 500 | | @ | | Dean Foods Co. | | | 15,935 |
| 1,700 | | | | General Mills, Inc. | | | 99,314 |
| 400 | | | | Hershey Co. | | | 20,248 |
| 1,950 | | | | HJ Heinz Co. | | | 92,567 |
| 700 | | | | Kellogg Co. | | | 36,253 |
| 2,613 | | | | Kraft Foods, Inc. | | | 92,108 |
See Accompanying Notes to Financial Statements
58
| | |
| ING GET U.S. CORE PORTFOLIO SERIES 2 | | PORTFOLIO OF INVESTMENTS ASOF JUNE 30, 2007 (UNAUDITED) (CONTINUED) |
| | | | | | | |
| Shares | | | | | | Value |
| | | | | | | |
| Food (continued) | | | |
| 2,150 | | | | Kroger Co. | | $ | 60,480 |
| 1,300 | | | | Safeway, Inc. | | | 44,239 |
| 400 | | | | Supervalu, Inc. | | | 18,528 |
| 500 | | | | Sysco Corp. | | | 16,495 |
| 400 | | | | Whole Foods Market, Inc. | | | 15,320 |
| 300 | | | | WM Wrigley Jr. Co. | | | 16,593 |
| | | | | | | |
| | | | | | | 559,128 |
| | | | | | | |
| Forest Products & Paper: 0.1% | | | |
| 1,400 | | | | International Paper Co. | | | 54,670 |
| 400 | | | | Temple-Inland, Inc. | | | 24,612 |
| 400 | | | | Weyerhaeuser Co. | | | 31,572 |
| | | | | | | |
| | | | | | | 110,854 |
| | | | | | | |
| Gas: 0.1% | | | |
| 400 | | | | KeySpan Corp. | | | 16,792 |
| 910 | | | | Sempra Energy | | | 53,899 |
| | | | | | | |
| | | | | | | 70,691 |
| | | | | | | |
| Hand/Machine Tools: 0.1% | | | |
| 290 | | | | Black & Decker Corp. | | | 25,610 |
| 600 | | | | Snap-On, Inc. | | | 30,306 |
| 550 | | | | Stanley Works | | | 33,385 |
| | | | | | | |
| | | | | | | 89,301 |
| | | | | | | |
| Healthcare - Products: 1.3% | | | |
| 1,810 | | | | Baxter International, Inc. | | | 101,975 |
| 600 | | | | Becton Dickinson & Co. | | | 44,700 |
| 600 | | | | Biomet, Inc. | | | 27,432 |
| 3,300 | | @ | | Boston Scientific Corp. | | | 50,622 |
| 400 | | | | CR Bard, Inc. | | | 33,052 |
| 7,670 | | | | Johnson & Johnson | | | 472,625 |
| 2,700 | | | | Medtronic, Inc. | | | 140,022 |
| 700 | | @ | | St. Jude Medical, Inc. | | | 29,043 |
| 800 | | | | Stryker Corp. | | | 50,472 |
| 300 | | @ | | Varian Medical Systems, Inc. | | | 12,753 |
| 700 | | @ | | Zimmer Holdings, Inc. | | | 59,423 |
| | | | | | | |
| | | | | | | 1,022,119 |
| | | | | | | |
| Healthcare - Services: 0.7% | | | |
| 1,620 | | | | Aetna, Inc. | | | 80,028 |
| 780 | | @ | | Coventry Health Care, Inc. | | | 44,967 |
| 790 | | @ | | Humana, Inc. | | | 48,119 |
| 200 | | @ | | Laboratory Corp. of America Holdings | | | 15,652 |
| 3,640 | | | | UnitedHealth Group, Inc. | | | 186,150 |
| 1,650 | | @ | | WellPoint, Inc. | | | 131,720 |
| | | | | | | |
| | | | | | | 506,636 |
| | | | | | | |
| Home Builders: 0.1% | | | |
| 700 | | | | Centex Corp. | | | 28,070 |
| 700 | | | | KB Home | | | 27,559 |
| 400 | | | | Lennar Corp. | | | 14,624 |
| | | | | | | |
| | | | | | | 70,253 |
| | | | | | | |
| Home Furnishings: 0.1% | | | |
| 200 | | | | Harman International Industries, Inc. | | | 23,360 |
| 150 | | | | Whirlpool Corp. | | | 16,680 |
| | | | | | | |
| | | | | | | 40,040 |
| | | | | | | |
| Household Products/Wares: 0.2% | | | |
| 300 | | | | Clorox Co. | | | 18,630 |
| 1,540 | | | | Kimberly-Clark Corp. | | | 103,011 |
| | | | | | | |
| | | | | | | 121,641 |
| | | | | | | |
| | | | | | | |
| Shares | | | | | | Value |
| | | | | | | |
| Housewares: 0.0% | | | |
| 700 | | | | Newell Rubbermaid, Inc. | | $ | 20,601 |
| | | | | | | |
| | | | | | | 20,601 |
| | | | | | | |
| Insurance: 2.6% | | | |
| 1,050 | | @@ | | ACE Ltd. | | | 65,646 |
| 1,720 | | | | Aflac, Inc. | | | 88,408 |
| 2,130 | | | | Allstate Corp. | | | 131,016 |
| 170 | | | | AMBAC Financial Group, Inc. | | | 14,822 |
| 6,570 | | | | American International Group, Inc. | | | 460,097 |
| 950 | | | | AON Corp. | | | 40,480 |
| 400 | | | | Assurant, Inc. | | | 23,568 |
| 1,780 | | | | Chubb Corp. | | | 96,369 |
| 810 | | | | Cigna Corp. | | | 42,298 |
| 2,000 | | | | Genworth Financial, Inc. | | | 68,800 |
| 1,100 | | | | Hartford Financial Services Group, Inc. | | | 108,361 |
| 814 | | | | Lincoln National Corp. | | | 57,753 |
| 1,120 | | | | Loews Corp. | | | 57,098 |
| 1,300 | | | | Marsh & McLennan Cos., Inc. | | | 40,144 |
| 290 | | | | MBIA, Inc. | | | 18,044 |
| 2,280 | | | | Metlife, Inc. | | | 147,014 |
| 330 | | | | MGIC Investment Corp. | | | 18,764 |
| 1,300 | | | | Principal Financial Group | | | 75,777 |
| 3,220 | | | | Progressive Corp. | | | 77,055 |
| 1,540 | | | | Prudential Financial, Inc. | | | 149,734 |
| 550 | | | | Safeco Corp. | | | 34,243 |
| 390 | | | | Torchmark Corp. | | | 26,130 |
| 1,760 | | | | Travelers Cos., Inc. | | | 94,160 |
| 700 | | | | UnumProvident Corp. | | | 18,277 |
| 700 | | @@ | | XL Capital Ltd. | | | 59,003 |
| | | | | | | |
| | | | | | | 2,013,061 |
| | | | | | | |
| Internet: 0.8% | | | |
| 1,000 | | @ | | Amazon.com, Inc. | | | 68,410 |
| 2,960 | | @ | | eBay, Inc. | | | 95,253 |
| 500 | | @ | | Google, Inc. | | | 261,690 |
| 700 | | @ | | IAC/InterActiveCorp. | | | 24,227 |
| 3,301 | | @ | | Symantec Corp. | | | 66,680 |
| 800 | | @ | | VeriSign, Inc. | | | 25,384 |
| 3,200 | | @ | | Yahoo!, Inc. | | | 86,816 |
| | | | | | | |
| | | | | | | 628,460 |
| | | | | | | |
| Iron/Steel: 0.2% | | | |
| 300 | | | | Allegheny Technologies, Inc. | | | 31,464 |
| 1,170 | | | | Nucor Corp. | | | 68,621 |
| 360 | | | | United States Steel Corp. | | | 39,150 |
| | | | | | | |
| | | | | | | 139,235 |
| | | | | | | |
| Leisure Time: 0.1% | | | |
| 1,280 | | | | Carnival Corp. | | | 62,426 |
| 840 | | | | Harley-Davidson, Inc. | | | 50,072 |
| | | | | | | |
| | | | | | | 112,498 |
| | | | | | | |
| Lodging: 0.2% | | | |
| 500 | | | | Harrah’s Entertainment, Inc. | | | 42,630 |
| 500 | | | | Hilton Hotels Corp. | | | 16,735 |
| 680 | | | | Marriott International, Inc. | | | 29,403 |
| 430 | | | | Starwood Hotels & Resorts Worldwide, Inc. | | | 28,840 |
| | | | | | | |
| | | | | | | 117,608 |
| | | | | | | |
See Accompanying Notes to Financial Statements
59
| | |
| ING GET U.S. CORE PORTFOLIO SERIES 2 | | PORTFOLIO OF INVESTMENTS ASOF JUNE 30, 2007 (UNAUDITED) (CONTINUED) |
| | | | | | | |
| Shares | | | | | | Value |
| | | | | | | |
| Machinery - Construction & Mining: 0.2% | | | |
| 1,800 | | | | Caterpillar, Inc. | | $ | 140,940 |
| 300 | | @ | | Terex Corp. | | | 24,390 |
| | | | | | | |
| | | | | | | 165,330 |
| | | | | | | |
| Machinery - Diversified: 0.2% | | | |
| 600 | | | | Cummins, Inc. | | | 60,726 |
| 700 | | | | Deere & Co. | | | 84,518 |
| 420 | | | | Rockwell Automation, Inc. | | | 29,165 |
| | | | | | | |
| | | | | | | 174,409 |
| | | | | | | |
| Media: 1.4% | | | |
| 1,785 | | | | CBS Corp. - Class B | | | 59,476 |
| 1,400 | | | | Clear Channel Communications, Inc. | | | 52,948 |
| 5,700 | | @ | | Comcast Corp. - Class A | | | 160,284 |
| 2,800 | | @ | | DIRECTV Group, Inc. | | | 64,708 |
| 800 | | | | Gannett Co., Inc. | | | 43,960 |
| 1,420 | | | | McGraw-Hill Cos., Inc. | | | 96,674 |
| 6,350 | | | | News Corp., Inc. - Class A | | | 134,684 |
| 7,500 | | | | Time Warner, Inc. | | | 157,800 |
| 1,700 | | @ | | Viacom - Class B | | | 70,771 |
| 6,030 | | | | Walt Disney Co. | | | 205,864 |
| | | | | | | |
| | | | | | | 1,047,169 |
| | | | | | | |
| Metal Fabricate/Hardware: 0.0% | | | |
| 200 | | | | Precision Castparts Corp. | | | 24,272 |
| | | | | | | |
| | | | | | | 24,272 |
| | | | | | | |
| Mining: 0.3% | | | |
| 2,300 | | | | Alcoa, Inc. | | | 93,219 |
| 915 | | | | Freeport-McMoRan Copper & Gold, Inc. | | | 75,780 |
| 900 | | | | Newmont Mining Corp. | | | 35,154 |
| | | | | | | |
| | | | | | | 204,153 |
| | | | | | | |
| Miscellaneous Manufacturing: 2.5% | | | |
| 2,020 | | | | 3M Co. | | | 175,316 |
| 780 | | | | Cooper Industries Ltd. | | | 44,530 |
| 890 | | | | Danaher Corp. | | | 67,195 |
| 1,550 | | | | Eastman Kodak Co. | | | 43,137 |
| 1,030 | | | | Eaton Corp. | | | 95,790 |
| 24,520 | | | | General Electric Co. | | | 938,620 |
| 1,960 | | | | Honeywell International, Inc. | | | 110,309 |
| 1,700 | | | | Illinois Tool Works, Inc. | | | 92,123 |
| 960 | | | | ITT Corp. | | | 65,549 |
| 400 | | | | Pall Corp. | | | 18,396 |
| 660 | | | | Parker Hannifin Corp. | | | 64,621 |
| 200 | | | | Textron, Inc. | | | 22,022 |
| 5,300 | | @ | | Tyco International Ltd. | | | 179,087 |
| | | | | | | |
| | | | | | | 1,916,695 |
| | | | | | | |
| Office/Business Equipment: 0.1% | | | |
| 2,680 | | @ | | Xerox Corp. | | | 49,526 |
| | | | | | | |
| | | | | | | 49,526 |
| | | | | | | |
| Oil & Gas: 4.1% | | | |
| 1,640 | | | | Anadarko Petroleum Corp. | | | 85,264 |
| 600 | | | | Apache Corp. | | | 48,954 |
| 1,100 | | | | Chesapeake Energy Corp. | | | 38,060 |
| 6,113 | | | | Chevron Corp. | | | 514,959 |
| 4,466 | | | | ConocoPhillips | | | 350,581 |
| 1,150 | | | | Devon Energy Corp. | | | 90,034 |
| 800 | | | | ENSCO International, Inc. | | | 48,808 |
| 280 | | | | EOG Resources, Inc. | | | 20,457 |
| | | | | | | |
| Shares | | | | | | Value |
| | | | | | | |
| 14,920 | | | | ExxonMobil Corp. | | $ | 1,251,490 |
| 600 | | | | Hess Corp. | | | 35,376 |
| 2,320 | | | | Marathon Oil Corp. | | | 139,107 |
| 300 | | | | Murphy Oil Corp. | | | 17,832 |
| 800 | | @, @@ | | Nabors Industries Ltd. | | | 26,704 |
| 400 | | | | Noble Corp. | | | 39,008 |
| 2,380 | | | | Occidental Petroleum Corp. | | | 137,754 |
| 500 | | | | Sunoco, Inc. | | | 39,840 |
| 1,000 | | @ | | Transocean, Inc. | | | 105,980 |
| 1,700 | | | | Valero Energy Corp. | | | 125,562 |
| 800 | | | | XTO Energy, Inc. | | | 48,080 |
| | | | | | | |
| | | | | | | 3,163,850 |
| | | | | | | |
| Oil & Gas Services: 0.6% | | | |
| 800 | | | | Baker Hughes, Inc. | | | 67,304 |
| 3,000 | | | | Halliburton Co. | | | 103,500 |
| 600 | | @ | | National Oilwell Varco, Inc. | | | 62,544 |
| 2,800 | | | | Schlumberger Ltd. | | | 237,832 |
| 500 | | @ | | Weatherford International Ltd. | | | 27,620 |
| | | | | | | |
| | | | | | | 498,800 |
| | | | | | | |
| Packaging & Containers: 0.2% | | | |
| 320 | | | | Ball Corp. | | | 17,014 |
| 1,000 | | | | Bemis Co. | | | 33,180 |
| 1,200 | | @ | | Pactiv Corp. | | | 38,268 |
| 900 | | | | Sealed Air Corp. | | | 27,918 |
| | | | | | | |
| | | | | | | 116,380 |
| | | | | | | |
| Pharmaceuticals: 2.5% | | | |
| 3,000 | | | | Abbott Laboratories | | | 160,650 |
| 900 | | | | AmerisourceBergen Corp. | | | 44,523 |
| 400 | | @ | | Barr Pharmaceuticals, Inc. | | | 20,092 |
| 5,000 | | | | Bristol-Myers Squibb Co. | | | 157,800 |
| 1,080 | | | | Cardinal Health, Inc. | | | 76,291 |
| 2,100 | | | | Eli Lilly & Co. | | | 117,348 |
| 620 | | @ | | Express Scripts, Inc. | | | 31,006 |
| 1,210 | | @ | | Forest Laboratories, Inc. | | | 55,237 |
| 2,600 | | @ | | Gilead Sciences, Inc. | | | 100,802 |
| 1,000 | | @ | | King Pharmaceuticals, Inc. | | | 20,460 |
| 800 | | @ | | Medco Health Solutions, Inc. | | | 62,392 |
| 5,580 | | | | Merck & Co., Inc. | | | 277,884 |
| 1,200 | | | | Mylan Laboratories | | | 21,828 |
| 18,340 | | | | Pfizer, Inc. | | | 468,954 |
| 4,300 | | | | Schering-Plough Corp. | | | 130,892 |
| 600 | | @ | | Watson Pharmaceuticals, Inc. | | | 19,518 |
| 3,180 | | | | Wyeth | | | 182,341 |
| | | | | | | |
| | | | | | | 1,948,018 |
| | | | | | | |
| Pipelines: 0.2% | | | |
| 1,900 | | | | El Paso Corp. | | | 32,737 |
| 600 | | | | Questar Corp. | | | 31,710 |
| 2,000 | | | | Spectra Energy Corp. | | | 51,920 |
| 1,800 | | | | Williams Cos., Inc. | | | 56,916 |
| | | | | | | |
| | | | | | | 173,283 |
| | | | | | | |
| Real Estate Investment Trusts: 0.4% | | | |
| 300 | | | | Apartment Investment & Management Co. | | | 15,126 |
| 540 | | | | Archstone-Smith Trust | | | 31,919 |
| 400 | | | | Boston Properties, Inc. | | | 40,852 |
| 330 | | | | Developers Diversified Realty Corp. | | | 17,394 |
| 400 | | | | Equity Residential | | | 18,252 |
| 1,000 | | | | Host Hotels & Resorts, Inc. | | | 23,120 |
See Accompanying Notes to Financial Statements
60
| | |
| ING GET U.S. CORE PORTFOLIO SERIES 2 | | PORTFOLIO OF INVESTMENTS ASOF JUNE 30, 2007 (UNAUDITED) (CONTINUED) |
| | | | | | | |
| Shares | | | | | | Value |
| | | | | | | |
| Real Estate Investment Trusts (continued) | | | |
| 500 | | | | Kimco Realty Corp. | | $ | 19,035 |
| 700 | | | | Prologis | | | 39,830 |
| 400 | | | | Simon Property Group, Inc. | | | 37,216 |
| 300 | | | | Vornado Realty Trust | | | 32,952 |
| | | | | | | |
| | | | | | | 275,696 |
| | | | | | | |
| Retail: 2.6% | | | |
| 350 | | @ | | Autozone, Inc. | | | 47,817 |
| 400 | | @ | | Bed Bath & Beyond, Inc. | | | 14,396 |
| 1,585 | | | | Best Buy Co., Inc. | | | 73,972 |
| 600 | | @ | | Big Lots, Inc. | | | 17,652 |
| 1,330 | | | | Costco Wholesale Corp. | | | 77,832 |
| 3,453 | | | | CVS Corp. | | | 125,862 |
| 610 | | | | Darden Restaurants, Inc. | | | 26,834 |
| 800 | | | | Dollar General Corp. | | | 17,536 |
| 1,000 | | | | Family Dollar Stores, Inc. | | | 34,320 |
| 2,030 | | | | Gap, Inc. | | | 38,773 |
| 4,410 | | | | Home Depot, Inc. | | | 173,534 |
| 900 | | | | JC Penney Co., Inc. | | | 65,142 |
| 900 | | @ | | Kohl’s Corp. | | | 63,927 |
| 3,960 | | | | Lowe’s Cos., Inc. | | | 121,532 |
| 1,704 | | | | Macy’s, Inc. | | | 67,785 |
| 3,550 | | | | McDonald’s Corp. | | | 180,198 |
| 760 | | | | Nordstrom, Inc. | | | 38,851 |
| 630 | | @ | | Office Depot, Inc. | | | 19,089 |
| 800 | | | | RadioShack Corp. | | | 26,512 |
| 230 | | @ | | Sears Holding Corp. | | | 38,985 |
| 1,750 | | | | Staples, Inc. | | | 41,528 |
| 2,110 | | @ | | Starbucks Corp. | | | 55,366 |
| 2,100 | | | | Target Corp. | | | 133,560 |
| 1,590 | | | | TJX Cos., Inc. | | | 43,725 |
| 2,510 | | | | Walgreen Co. | | | 109,285 |
| 5,840 | | | | Wal-Mart Stores, Inc. | | | 280,962 |
| 700 | | | | Wendy’s International, Inc. | | | 25,725 |
| 1,560 | | | | Yum! Brands, Inc. | | | 51,043 |
| | | | | | | |
| | | | | | | 2,011,743 |
| | | | | | | |
| Savings & Loans: 0.2% | | | |
| 1,400 | | | | Hudson City Bancorp., Inc. | | | 17,108 |
| 900 | | | | Sovereign Bancorp., Inc. | | | 19,026 |
| 2,786 | | | | Washington Mutual, Inc. | | | 118,795 |
| | | | | | | |
| | | | | | | 154,929 |
| | | | | | | |
| Semiconductors: 1.2% | | | |
| 1,300 | | @ | | Advanced Micro Devices, Inc. | | | 18,590 |
| 1,260 | | | | Altera Corp. | | | 27,884 |
| 850 | | | | Analog Devices, Inc. | | | 31,994 |
| 2,460 | | | | Applied Materials, Inc. | | | 48,880 |
| 1,000 | | @ | | Broadcom Corp. | | | 29,250 |
| 14,910 | | | | Intel Corp. | | | 354,262 |
| 900 | | | | KLA-Tencor Corp. | | | 49,455 |
| 1,000 | | | | Linear Technology Corp. | | | 36,180 |
| 1,800 | | @ | | LSI Logic Corp. | | | 13,518 |
| 770 | | | | Maxim Integrated Products | | | 25,726 |
| 700 | | @ | | MEMC Electronic Materials, Inc. | | | 42,784 |
| 1,800 | | @ | | Micron Technology, Inc. | | | 22,554 |
| 740 | | | | National Semiconductor Corp. | | | 20,920 |
| 750 | | @ | | Novellus Systems, Inc. | | | 21,278 |
| 800 | | @ | | Nvidia Corp. | | | 33,048 |
| 1,100 | | @ | | Teradyne, Inc. | | | 19,338 |
| 3,300 | | | | Texas Instruments, Inc. | | | 124,179 |
| 800 | | | | Xilinx, Inc. | | | 21,416 |
| | | | | | | |
| | | | | | | 941,256 |
| | | | | | | |
| | | | | | | |
| Shares | | | | | | Value |
| | | | | | | |
| Software: 1.8% | | | |
| 1,360 | | @ | | Adobe Systems, Inc. | | $ | 54,604 |
| 840 | | @ | | Autodesk, Inc. | | | 39,547 |
| 1,830 | | | | Automatic Data Processing, Inc. | | | 88,700 |
| 850 | | @ | | BMC Software, Inc. | | | 25,755 |
| 2,240 | | | | CA, Inc. | | | 57,859 |
| 800 | | @ | | Citrix Systems, Inc. | | | 26,936 |
| 2,190 | | @ | | Compuware Corp. | | | 25,973 |
| 790 | | @ | | Electronic Arts, Inc. | | | 37,383 |
| 2,238 | | | | First Data Corp. | | | 73,115 |
| 550 | | @ | | Fiserv, Inc. | | | 31,240 |
| 1,640 | | @ | | Intuit, Inc. | | | 49,331 |
| 20,660 | | | | Microsoft Corp. | | | 608,850 |
| 2,400 | | @ | | Novell, Inc. | | | 18,696 |
| 9,680 | | @ | | Oracle Corp. | | | 190,793 |
| 1,050 | | | | Paychex, Inc. | | | 41,076 |
| | | | | | | |
| | | | | | | 1,369,858 |
| | | | | | | |
| Telecommunications: 2.9% | | | |
| 600 | | @@ | | Allergan, Inc. | | | 34,584 |
| 900 | | | | Alltel Corp. | | | 60,795 |
| 15,311 | | | | AT&T, Inc. | | | 635,407 |
| 1,380 | | @ | | Avaya, Inc. | | | 23,239 |
| 860 | | | | CenturyTel, Inc. | | | 42,183 |
| 16,060 | | @ | | Cisco Systems, Inc. | | | 447,271 |
| 1,900 | | | | Citizens Communications Co. | | | 29,013 |
| 4,240 | | @ | | Corning, Inc. | | | 108,332 |
| 652 | | | | Embarq Corp. | | | 41,317 |
| 1,300 | | @ | | Juniper Networks, Inc. | | | 32,721 |
| 5,900 | | | | Motorola, Inc. | | | 104,430 |
| 4,280 | | | | Qualcomm, Inc. | | | 185,709 |
| 4,300 | | @ | | Qwest Communications International, Inc. | | | 41,710 |
| 7,054 | | | | Sprint Nextel Corp. | | | 146,088 |
| 1,800 | | @ | | Tellabs, Inc. | | | 19,368 |
| 6,550 | | | | Verizon Communications, Inc. | | | 269,664 |
| | | | | | | |
| | | | | | | 2,221,831 |
| | | | | | | |
| Toys/Games/Hobbies: 0.1% | | | |
| 800 | | | | Hasbro, Inc. | | | 25,128 |
| 1,800 | | | | Mattel, Inc. | | | 45,522 |
| | | | | | | |
| | | | | | | 70,650 |
| | | | | | | |
| Transportation: 0.7% | | | |
| 700 | | | | Burlington Northern Santa Fe Corp. | | | 59,598 |
| 400 | | | | CH Robinson Worldwide, Inc. | | | 21,008 |
| 1,220 | | | | CSX Corp. | | | 54,998 |
| 950 | | | | FedEx Corp. | | | 105,422 |
| 1,150 | | | | Norfolk Southern Corp. | | | 60,456 |
| 800 | | | | Union Pacific Corp. | | | 92,120 |
| 2,000 | | | | United Parcel Service, Inc. | | | 146,000 |
| | | | | | | |
| | | | | | | 539,602 |
| | | | | | | |
| | | | Total Common Stock
(Cost $ 32,912,164 ) | | | 35,476,989 |
| | | | | | | |
See Accompanying Notes to Financial Statements
61
| | |
| ING GET U.S. CORE PORTFOLIO SERIES 2 | | PORTFOLIO OF INVESTMENTS ASOF JUNE 30, 2007 (UNAUDITED) (CONTINUED) |
| | | | | | | | |
| | | |
Principal
Amount | | | | | | Value |
| | U.S. GOVERNMENT AGENCY OBLIGATIONS: 46.4% | | | |
| | Federal Home Loan Mortgage Corporation: 14.0% |
| $ | 11,700,000 | | ^^ | | 5.190%, due 03/15/09 | | $ | 10,733,720 |
| | | | | | | | |
| | | | | | | | 10,733,720 |
| | | | | | | | |
| | Federal National Mortgage Corporation: 32.4% |
| | 26,900,000 | | ^^ | | 5.310%, due 12/15/08 | | | 24,941,250 |
| | | | | | | | |
| | | | | | | | 24,941,250 |
| | | | | | | | |
| | | | | Total U.S. Government Agency Obligations
(Cost $36,591,637) | | | 35,674,970 |
| | | | | | | | |
| | U.S. TREASURY OBLIGATIONS: 6.8% | | | |
| | U.S. Treasury STRIP: 6.8% | | | |
| | 5,618,000 | | ^ | | 4.940%, due 11/15/08 | | | 5,256,937 |
| | | | | | | | |
| | | | | | | | 5,256,937 |
| | | | |
| | | | | Total U.S. Treasury Obligations
(Cost $5,265,730) | | | 5,256,937 |
| | | | | | | | |
| | | | | Total Long-Term Investments
(Cost $74,769,531) | | | 76,408,896 |
| | | | | | | | |
| | | |
| Shares | | | | | | |
| | SHORT-TERM INVESTMENTS: 1.0% | | | |
| | Mutual Fund: 0.5% | | | |
| | 400,000 | | ** | | ING Institutional Prime Money Market Fund | | | 400,000 |
| | | | | | | | |
| | | | | Total Mutual Fund
(Cost $400,000) | | | 400,000 |
| | | | | | | | |
| | | | | | | | | | |
| | | |
Principal
Amount | | | | | | | | |
| | Repurchase Agreement: 0.5% | | | | | |
| $ | 370,000 | | Morgan Stanley Repurchase Agreement dated 06/29/07, 5.300%, due 07/02/07, $370,163 to be received upon repurchase (Collateralized by $795,000 Resolution Funding Corporation, Discount Note, Market Value $378,905, due 01/15/21) | | | | 370,000 | |
| | | | | | | | | | |
| | | Total Repurchase Agreement
(Cost $370,000) | | | | | | 370,000 | |
| | | | | | | | | | |
| | | Total Short-Term Investments
(Cost $770,000) | | | | | | 770,000 | |
| | | | | | | | | | |
| | | Total Investments in Securities
(Cost $75,539,531)* | | 100.4 | % | | $ | 77,178,896 | |
| | | Other Assets and
Liabilities - Net | | (0.4 | ) | | | (318,790 | ) |
| | | | | | | | | | |
| | | Net Assets | | 100.0 | % | | $ | 76,860,106 | |
| | | | | | | | | | |
| @ | Non-income producing security |
| STRIP | Separate Trading of Registered Interest and Principal of Securities |
| ** | Investment in affiliate |
| ^ | Interest Only (IO) Security |
| ^^ | Principal Only (PO) Security |
| * | Cost for federal income tax purposes is $75,889,892. |
| | | | |
Net unrealized appreciation consists of: | | | | |
Gross Unrealized Appreciation | | $ | 2,777,642 | |
Gross Unrealized Depreciation | | | (1,488,638 | ) |
| | | | |
Net Unrealized Appreciation | | $ | 1,289,004 | |
| | | | |
See Accompanying Notes to Financial Statements
62
| | |
| ING GET U.S. CORE PORTFOLIO SERIES 3 | | PORTFOLIO OF INVESTMENTS ASOF JUNE 30, 2007 (UNAUDITED) |
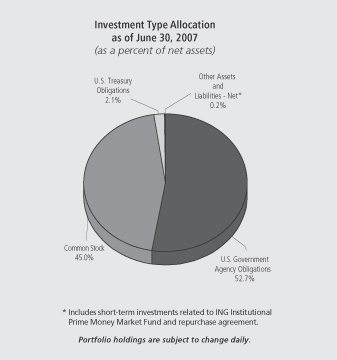
| | | | | | | |
| Shares | | | | | | Value |
| | | | | | | |
| COMMON STOCK: 45.0% | | | |
| Advertising: 0.1% | | | |
| 2,020 | | | | Omnicom Group | | $ | 106,898 |
| | | | | | | |
| | | | | | | 106,898 |
| | | | | | | |
| Aerospace/Defense: 1.1% | | | |
| 2,580 | | | | Boeing Co. | | | 248,093 |
| 1,800 | | | | General Dynamics Corp. | | | 140,796 |
| 400 | | | | Goodrich Corp. | | | 23,824 |
| 550 | | | | L-3 Communications Holdings, Inc. | | | 53,565 |
| 1,750 | | | | Lockheed Martin Corp. | | | 164,728 |
| 1,020 | | | | Northrop Grumman Corp. | | | 79,427 |
| 2,713 | | | | Raytheon Co. | | | 146,204 |
| 4,060 | | | | United Technologies Corp. | | | 287,976 |
| | | | | | | |
| | | | | | | 1,144,613 |
| | | | | | | |
| Agriculture: 0.7% | | | |
| 7,630 | | | | Altria Group, Inc. | | | 535,168 |
| 2,030 | | | | Archer-Daniels-Midland Co. | | | 67,173 |
| 1,040 | | | | Reynolds American, Inc. | | | 67,808 |
| 1,100 | | | | UST, Inc. | | | 59,081 |
| | | | | | | |
| | | | | | | 729,230 |
| | | | | | | |
| Apparel: 0.2% | | | |
| 1,820 | | @ | | Coach, Inc. | | | 86,250 |
| 1,520 | | | | Nike, Inc. | | | 88,601 |
| 300 | | | | Polo Ralph Lauren Corp. | | | 29,433 |
| | | | | | | |
| | | | | | | 204,284 |
| | | | | | | |
| | | | | | | |
| Shares | | | | | | Value |
| | | | | | | |
| Auto Manufacturers: 0.2% | | | |
| 9,500 | | | | Ford Motor Co. | | $ | 89,490 |
| 1,900 | | | | General Motors Corp. | | | 71,820 |
| 1,150 | | | | Paccar, Inc. | | | 100,096 |
| | | | | | | |
| | | | | | | 261,406 |
| | | | | | | |
| Auto Parts & Equipment: 0.1% | | | |
| 800 | | @ | | Goodyear Tire & Rubber Co. | | | 27,808 |
| 580 | | | | Johnson Controls, Inc. | | | 67,147 |
| | | | | | | |
| | | | | | | 94,955 |
| | | | | | | |
| Banks: 2.8% | | | |
| 16,824 | | | | Bank of America Corp. | | | 822,525 |
| 2,560 | | @ | | Bank of New York Co., Inc. | | | 106,086 |
| 1,843 | | | | BB&T Corp. | | | 74,973 |
| 1,331 | | | | Capital One Financial Corp. | | | 104,404 |
| 1,010 | | | | Comerica, Inc. | | | 60,065 |
| 500 | | | | Compass Bancshares, Inc. | | | 34,490 |
| 1,000 | | | | Fifth Third Bancorp. | | | 39,770 |
| 3,760 | | | | Huntington Bancshares, Inc. | | | 85,502 |
| 3,150 | | | | Keycorp. | | | 108,140 |
| 1,000 | | | | Marshall & Ilsley Corp. | | | 47,630 |
| 1,970 | | | | Mellon Financial Corp. | | | 86,680 |
| 2,530 | | | | National City Corp. | | | 84,300 |
| 400 | | | | Northern Trust Corp. | | | 25,696 |
| 850 | | | | PNC Financial Services Group, Inc. | | | 60,843 |
| 4,240 | | | | Regions Financial Corp. | | | 140,344 |
| 1,150 | | | | State Street Corp. | | | 78,660 |
| 930 | | | | SunTrust Banks, Inc. | | | 79,738 |
| 4,160 | | | | US Bancorp. | | | 137,072 |
| 7,429 | | | | Wachovia Corp. | | | 380,736 |
| 13,280 | | | | Wells Fargo & Co. | | | 467,058 |
| | | | | | | |
| | | | | | | 3,024,712 |
| | | | | | | |
| Beverages: 0.9% | | | |
| 2,330 | | | | Anheuser-Busch Cos., Inc. | | | 121,533 |
| 7,170 | | | | Coca-Cola Co. | | | 375,063 |
| 1,580 | | | | Pepsi Bottling Group, Inc. | | | 53,214 |
| 6,170 | | | | PepsiCo, Inc. | | | 400,125 |
| | | | | | | |
| | | | | | | 949,935 |
| | | | | | | |
| Biotechnology: 0.4% | | | |
| 4,000 | | @ | | Amgen, Inc. | | | 221,160 |
| 1,100 | | @ | | Biogen Idec, Inc. | | | 58,850 |
| 1,160 | | @ | | Celgene Corp. | | | 66,503 |
| 1,150 | | @ | | Genzyme Corp. | | | 74,060 |
| | | | | | | |
| | | | | | | 420,573 |
| | | | | | | |
| Building Materials: 0.1% | | | |
| 500 | | | | American Standard Cos., Inc. | | | 29,490 |
| 2,620 | | | | Masco Corp. | | | 74,591 |
| | | | | | | |
| | | | | | | 104,081 |
| | | | | | | |
| Chemicals: 0.8% | | | |
| 350 | | | | Air Products & Chemicals, Inc. | | | 28,130 |
| 800 | | | | Ashland, Inc. | | | 51,160 |
| 3,180 | | | | Dow Chemical Co. | | | 140,620 |
| 700 | | | | Ecolab, Inc. | | | 29,890 |
| 2,600 | | | | EI DuPont de Nemours & Co. | | | 132,184 |
| 1,030 | | | | International Flavors & Fragrances, Inc. | | | 53,704 |
| 2,120 | | | | Monsanto Co. | | | 143,185 |
| 1,070 | | | | PPG Industries, Inc. | | | 81,438 |
| 600 | | | | Praxair, Inc. | | | 43,194 |
See Accompanying Notes to Financial Statements
63
| | |
| ING GET U.S. CORE PORTFOLIO SERIES 3 | | PORTFOLIO OF INVESTMENTS ASOF JUNE 30, 2007 (UNAUDITED) (CONTINUED) |
| | | | | | | |
| Shares | | | | | | Value |
| | | | | | | |
| Chemicals (continued) | | | |
| 600 | | | | Sherwin-Williams Co. | | $ | 39,882 |
| 1,500 | | | | Sigma-Aldrich Corp. | | | 64,005 |
| | | | | | | |
| | | | | | | 807,392 |
| | | | | | | |
| Coal: 0.1% | | | |
| 700 | | | | Consol Energy, Inc. | | | 32,277 |
| 940 | | | | Peabody Energy Corp. | | | 45,477 |
| | | | | | | |
| | | | | | | 77,754 |
| | | | | | | |
| Commercial Services: 0.3% | | | |
| 700 | | @ | | Apollo Group, Inc. | | | 40,901 |
| 1,100 | | @ | | Convergys Corp. | | | 26,664 |
| 740 | | | | Equifax, Inc. | | | 32,871 |
| 1,300 | | | | McKesson Corp. | | | 77,532 |
| 800 | | | | Moody’s Corp. | | | 49,760 |
| 890 | | | | Robert Half International, Inc. | | | 32,485 |
| 1,000 | | | | RR Donnelley & Sons Co. | | | 43,510 |
| 2,440 | | | | Western Union Co. | | | 50,825 |
| | | | | | | |
| | | | | | | 354,548 |
| | | | | | | |
| Computers: 2.0% | | | |
| 400 | | @ | | Affiliated Computer Services, Inc. | | | 22,688 |
| 3,200 | | @ | | Apple, Inc. | | | 390,528 |
| 300 | | @ | | Cognizant Technology Solutions Corp. | | | 22,527 |
| 850 | | @ | | Computer Sciences Corp. | | | 50,278 |
| 9,150 | | @ | | Dell, Inc. | | | 261,233 |
| 2,400 | | | | Electronic Data Systems Corp. | | | 66,552 |
| 9,390 | | @ | | EMC Corp. | | | 169,959 |
| 9,880 | | | | Hewlett-Packard Co. | | | 440,846 |
| 5,270 | | | | International Business Machines Corp. | | | 554,668 |
| 620 | | @ | | Lexmark International, Inc. | | | 30,572 |
| 500 | | @ | | NCR Corp. | | | 26,270 |
| 1,710 | | @ | | Network Appliance, Inc. | | | 49,932 |
| 900 | | @ | | Sandisk Corp. | | | 44,046 |
| 12,200 | | @ | | Sun Microsystems, Inc. | | | 64,172 |
| | | | | | | |
| | | | | | | 2,194,271 |
| | | | | | | |
| Cosmetics/Personal Care: 0.9% | | | |
| 1,200 | | | | Avon Products, Inc. | | | 44,100 |
| 1,730 | | | | Colgate-Palmolive Co. | | | 112,191 |
| 600 | | | | Estee Lauder Cos., Inc. | | | 27,306 |
| 12,172 | | | | Procter & Gamble Co. | | | 744,805 |
| | | | | | | |
| | | | | | | 928,402 |
| | | | | | | |
| Distribution/Wholesale: 0.0% | | | |
| 500 | | | | WW Grainger, Inc. | | | 46,525 |
| | | | | | | |
| | | | | | | 46,525 |
| | | | | | | |
| Diversified Financial Services: 3.7% | | | |
| 4,490 | | | | American Express Co. | | | 274,698 |
| 1,078 | | | | Ameriprise Financial, Inc. | | | 68,528 |
| 450 | | | | Bear Stearns Cos., Inc. | | | 63,000 |
| 3,450 | | | | Charles Schwab Corp. | | | 70,794 |
| 130 | | | | Chicago Mercantile Exchange Holdings, Inc. | | | 69,467 |
| 850 | | | | CIT Group, Inc. | | | 46,606 |
| 17,540 | | | | Citigroup, Inc. | | | 899,627 |
| 2,130 | | | | Countrywide Financial Corp. | | | 77,426 |
| 1,200 | | @ | | E*Trade Financial Corp. | | | 26,508 |
| 3,190 | | | | Fannie Mae | | | 208,403 |
| 570 | | | | Franklin Resources, Inc. | | | 75,508 |
| 2,400 | | | | Freddie Mac | | | 145,680 |
| | | | | | | |
| Shares | | | | | | Value |
| | | | | | | |
| 1,660 | | | | Goldman Sachs Group, Inc. | | $ | 359,805 |
| 1,100 | | | | Janus Capital Group, Inc. | | | 30,624 |
| 13,700 | | | | JP Morgan Chase & Co. | | | 663,765 |
| 300 | | | | Legg Mason, Inc. | | | 29,514 |
| 2,060 | | | | Lehman Brothers Holdings, Inc. | | | 153,511 |
| 3,480 | | | | Merrill Lynch & Co., Inc. | | | 290,858 |
| 4,140 | | | | Morgan Stanley | | | 347,263 |
| 1,450 | | | | SLM Corp. | | | 83,491 |
| 500 | | | | T. Rowe Price Group, Inc. | | | 25,945 |
| | | | | | | |
| | | | | | | 4,011,021 |
| | | | | | | |
| Electric: 1.5% | | | |
| 1,430 | | @ | | AES Corp. | | | 31,288 |
| 1,030 | | | | American Electric Power Co., Inc. | | | 46,391 |
| 1,400 | | | | CMS Energy Corp. | | | 24,080 |
| 930 | | | | Constellation Energy Group, Inc. | | | 81,068 |
| 1,500 | | | | Dominion Resources, Inc. | | | 129,465 |
| 1,800 | | | | DTE Energy Co. | | | 86,796 |
| 1,400 | | | | Duke Energy Corp. | | | 25,620 |
| 2,490 | | | | Edison International | | | 139,739 |
| 1,700 | | | | Entergy Corp. | | | 182,495 |
| 2,500 | | | | Exelon Corp. | | | 181,500 |
| 1,920 | | | | FirstEnergy Corp. | | | 124,282 |
| 2,500 | | | | FPL Group, Inc. | | | 141,850 |
| 2,220 | | | | PG&E Corp. | | | 100,566 |
| 600 | | | | PPL Corp. | | | 28,074 |
| 1,300 | | | | Public Service Enterprise Group, Inc. | | | 114,114 |
| 1,400 | | | | TECO Energy, Inc. | | | 24,052 |
| 1,660 | | | | TXU Corp. | | | 111,718 |
| | | | | | | |
| | | | | | | 1,573,098 |
| | | | | | | |
| Electrical Components & Equipment: 0.1% | | | |
| 2,220 | | | | Emerson Electric Co. | | | 103,896 |
| | | | | | | |
| | | | | | | 103,896 |
| | | | | | | |
| Electronics: 0.2% | | | |
| 1,270 | | @ | | Agilent Technologies, Inc. | | | 48,819 |
| 1,100 | | | | Tektronix, Inc. | | | 37,114 |
| 1,760 | | @ | | Thermo Electron Corp. | | | 91,027 |
| 400 | | @ | | Waters Corp. | | | 23,744 |
| | | | | | | |
| | | | | | | 200,704 |
| | | | | | | |
| Engineering & Construction: 0.0% | | | |
| 200 | | | | Fluor Corp. | | | 22,274 |
| | | | | | | |
| | | | | | | 22,274 |
| | | | | | | |
| Entertainment: 0.0% | | | |
| 950 | | | | International Game Technology | | | 37,715 |
| | | | | | | |
| | | | | | | 37,715 |
| | | | | | | |
| Environmental Control: 0.1% | | | |
| 1,800 | | @ | | Allied Waste Industries, Inc. | | | 24,228 |
| 2,600 | | | | Waste Management, Inc. | | | 101,530 |
| | | | | | | |
| | | | | | | 125,758 |
| | | | | | | |
| Food: 0.7% | | | |
| 1,000 | | | | Campbell Soup Co. | | | 38,810 |
| 700 | | @ | | Dean Foods Co. | | | 22,309 |
| 2,500 | | | | General Mills, Inc. | | | 146,050 |
| 500 | | | | Hershey Co. | | | 25,310 |
| 2,870 | | | | HJ Heinz Co. | | | 136,239 |
| 900 | | | | Kellogg Co. | | | 46,611 |
| 3,841 | | | | Kraft Foods, Inc. | | | 135,395 |
| 2,700 | | | | Kroger Co. | | | 75,951 |
| 1,750 | | | | Safeway, Inc. | | | 59,553 |
See Accompanying Notes to Financial Statements
64
| | |
| ING GET U.S. CORE PORTFOLIO SERIES 3 | | PORTFOLIO OF INVESTMENTS ASOF JUNE 30, 2007 (UNAUDITED) (CONTINUED) |
| | | | | | | |
| Shares | | | | | | Value |
| | | | | | | |
| Food (continued) | | | |
| 500 | | | | Supervalu, Inc. | | $ | 23,160 |
| 700 | | | | Sysco Corp. | | | 23,093 |
| 500 | | | | Whole Foods Market, Inc. | | | 19,150 |
| 400 | | | | WM Wrigley Jr. Co. | | | 22,124 |
| | | | | | | |
| | | | | | | 773,755 |
| | | | | | | |
| Forest Products & Paper: 0.1% | | | |
| 1,700 | | | | International Paper Co. | | | 66,385 |
| 800 | | | | Temple-Inland, Inc. | | | 49,224 |
| 300 | | | | Weyerhaeuser Co. | | | 23,679 |
| | | | | | | |
| | | | | | | 139,288 |
| | | | | | | |
| Gas: 0.1% | | | |
| 600 | | | | KeySpan Corp. | | | 25,188 |
| 1,180 | | | | Sempra Energy | | | 69,891 |
| | | | | | | |
| | | | | | | 95,079 |
| | | | | | | |
| Hand/Machine Tools: 0.1% | | | |
| 400 | | | | Black & Decker Corp. | | | 35,324 |
| 690 | | | | Snap-On, Inc. | | | 34,852 |
| 670 | | | | Stanley Works | | | 40,669 |
| | | | | | | |
| | | | | | | 110,845 |
| | | | | | | |
| Healthcare - Products: 1.3% | | | |
| 2,590 | | | | Baxter International, Inc. | | | 145,921 |
| 970 | | | | Becton Dickinson & Co. | | | 72,265 |
| 900 | | | | Biomet, Inc. | | | 41,148 |
| 4,100 | | @ | | Boston Scientific Corp. | | | 62,894 |
| 500 | | | | CR Bard, Inc. | | | 41,315 |
| 11,310 | | | | Johnson & Johnson | | | 696,922 |
| 3,700 | | | | Medtronic, Inc. | | | 191,882 |
| 900 | | @ | | St. Jude Medical, Inc. | | | 37,341 |
| 900 | | | | Stryker Corp. | | | 56,781 |
| 500 | | @ | | Varian Medical Systems, Inc. | | | 21,255 |
| 800 | | @ | | Zimmer Holdings, Inc. | | | 67,912 |
| | | | | | | |
| | | | | | | 1,435,636 |
| | | | | | | |
| Healthcare - Services: 0.6% | | | |
| 1,880 | | | | Aetna, Inc. | | | 92,872 |
| 890 | | @ | | Coventry Health Care, Inc. | | | 51,309 |
| 900 | | @ | | Humana, Inc. | | | 54,819 |
| 400 | | @ | | Laboratory Corp. of America Holdings | | | 31,304 |
| 5,150 | | | | UnitedHealth Group, Inc. | | | 263,371 |
| 2,300 | | @ | | WellPoint, Inc. | | | 183,609 |
| | | | | | | |
| | | | | | | 677,284 |
| | | | | | | |
| Home Builders: 0.1% | | | |
| 800 | | | | Centex Corp. | | | 32,080 |
| 800 | | | | KB Home | | | 31,496 |
| 500 | | | | Lennar Corp. | | | 18,280 |
| | | | | | | |
| | | | | | | 81,856 |
| | | | | | | |
| Home Furnishings: 0.0% | | | |
| 200 | | | | Harman International Industries, Inc. | | | 23,360 |
| 200 | | | | Whirlpool Corp. | | | 22,240 |
| | | | | | | |
| | | | | | | 45,600 |
| | | | | | | |
| Household Products/Wares: 0.2% | | | |
| 400 | | | | Clorox Co. | | | 24,840 |
| 2,150 | | | | Kimberly-Clark Corp. | | | 143,814 |
| | | | | | | |
| | | | | | | 168,654 |
| | | | | | | |
| | | | | | | |
| Shares | | | | | | Value |
| | | | | | | |
| Housewares: 0.0% | | | |
| 1,000 | | | | Newell Rubbermaid, Inc. | | $ | 29,430 |
| | | | | | | |
| | | | | | | 29,430 |
| | | | | | | |
| Insurance: 2.5% | | | |
| 1,510 | | @@ | | ACE Ltd. | | | 94,405 |
| 2,020 | | | | Aflac, Inc. | | | 103,828 |
| 3,000 | | | | Allstate Corp. | | | 184,530 |
| 340 | | | | AMBAC Financial Group, Inc. | | | 29,645 |
| 9,690 | | | | American International Group, Inc. | | | 678,591 |
| 1,200 | | | | AON Corp. | | | 51,132 |
| 600 | | | | Assurant, Inc. | | | 35,352 |
| 2,240 | | | | Chubb Corp. | | | 121,274 |
| 1,080 | | | | Cigna Corp. | | | 56,398 |
| 2,400 | | | | Genworth Financial, Inc. | | | 82,560 |
| 1,600 | | | | Hartford Financial Services Group, Inc. | | | 157,616 |
| 1,020 | | | | Lincoln National Corp. | | | 72,369 |
| 1,370 | | | | Loews Corp. | | | 69,843 |
| 1,800 | | | | Marsh & McLennan Cos., Inc. | | | 55,584 |
| 380 | | | | MBIA, Inc. | | | 23,644 |
| 3,090 | | | | Metlife, Inc. | | | 199,243 |
| 380 | | | | MGIC Investment Corp. | | | 21,607 |
| 1,590 | | | | Principal Financial Group | | | 92,681 |
| 3,940 | | | | Progressive Corp. | | | 94,284 |
| 2,040 | | | | Prudential Financial, Inc. | | | 198,349 |
| 460 | | | | Safeco Corp. | | | 28,640 |
| 380 | | | | Torchmark Corp. | | | 25,460 |
| 2,580 | | | | Travelers Cos., Inc. | | | 138,030 |
| 1,000 | | | | UnumProvident Corp. | | | 26,110 |
| 900 | | @@ | | XL Capital Ltd. | | | 75,861 |
| | | | | | | |
| | | | | | | 2,717,036 |
| | | | | | | |
| Internet: 0.8% | | | |
| 1,200 | | @ | | Amazon.com, Inc. | | | 82,092 |
| 4,150 | | @ | | eBay, Inc. | | | 133,547 |
| 800 | | @ | | Google, Inc. | | | 418,704 |
| 1,000 | | @ | | IAC/InterActiveCorp. | | | 34,610 |
| 4,017 | | @ | | Symantec Corp. | | | 81,143 |
| 1,100 | | @ | | VeriSign, Inc. | | | 34,903 |
| 4,400 | | @ | | Yahoo!, Inc. | | | 119,372 |
| | | | | | | |
| | | | | | | 904,371 |
| | | | | | | |
| Iron/Steel: 0.2% | | | |
| 300 | | | | Allegheny Technologies, Inc. | | | 31,464 |
| 1,440 | | | | Nucor Corp. | | | 84,456 |
| 570 | | | | United States Steel Corp. | | | 61,988 |
| | | | | | | |
| | | | | | | 177,908 |
| | | | | | | |
| Leisure Time: 0.1% | | | |
| 1,500 | | | | Carnival Corp. | | | 73,155 |
| 1,250 | | | | Harley-Davidson, Inc. | | | 74,513 |
| | | | | | | |
| | | | | | | 147,668 |
| | | | | | | |
| Lodging: 0.1% | | | |
| 700 | | | | Harrah’s Entertainment, Inc. | | | 59,682 |
| 700 | | | | Hilton Hotels Corp. | | | 23,429 |
| 800 | | | | Marriott International, Inc. | | | 34,592 |
| 570 | | | | Starwood Hotels & Resorts Worldwide, Inc. | | | 38,230 |
| | | | | | | |
| | | | | | | 155,933 |
| | | | | | | |
See Accompanying Notes to Financial Statements
65
| | |
| ING GET U.S. CORE PORTFOLIO SERIES 3 | | PORTFOLIO OF INVESTMENTS ASOF JUNE 30, 2007 (UNAUDITED) (CONTINUED) |
| | | | | | | |
| Shares | | | | | | Value |
| | | | | | | |
| Machinery - Construction & Mining: 0.2% | | | |
| 2,600 | | | | Caterpillar, Inc. | | $ | 203,580 |
| 400 | | @ | | Terex Corp. | | | 32,520 |
| | | | | | | |
| | | | | | | 236,100 |
| | | | | | | |
| Machinery - Diversified: 0.2% | | | |
| 700 | | | | Cummins, Inc. | | | 70,847 |
| 1,000 | | | | Deere & Co. | | | 120,740 |
| 530 | | | | Rockwell Automation, Inc. | | | 36,803 |
| | | | | | | |
| | | | | | | 228,390 |
| | | | | | | |
| Media: 1.3% | | | |
| 2,730 | | | | CBS Corp. - Class B | | | 90,964 |
| 1,800 | | | | Clear Channel Communications, Inc. | | | 68,076 |
| 8,850 | | @ | | Comcast Corp. – Class A | | | 248,862 |
| 2,900 | | @ | | DIRECTV Group, Inc. | | | 67,019 |
| 1,100 | | | | Gannett Co., Inc. | | | 60,445 |
| 1,900 | | | | McGraw-Hill Cos., Inc. | | | 129,352 |
| 9,050 | | | | News Corp., Inc. - Class A | | | 191,951 |
| 10,100 | | | | Time Warner, Inc. | | | 212,504 |
| 2,100 | | @ | | Viacom - Class B | | | 87,423 |
| 7,540 | | | | Walt Disney Co. | | | 257,416 |
| | | | | | | |
| | | | | | | 1,414,012 |
| | | | | | | |
| Metal Fabricate/Hardware: 0.0% | | | |
| 300 | | | | Precision Castparts Corp. | | | 36,408 |
| | | | | | | |
| | | | | | | 36,408 |
| | | | | | | |
| Mining: 0.3% | | | |
| 3,100 | | | | Alcoa, Inc. | | | 125,643 |
| 1,365 | | | | Freeport-McMoRan Copper & Gold, Inc. | | | 113,049 |
| 1,200 | | | | Newmont Mining Corp. | | | 46,872 |
| | | | | | | |
| | | | | | | 285,564 |
| | | | | | | |
| Miscellaneous Manufacturing: 2.4% | | | |
| 2,870 | | | | 3M Co. | | | 249,087 |
| 980 | | | | Cooper Industries Ltd. | | | 55,948 |
| 1,020 | | | | Danaher Corp. | | | 77,010 |
| 1,800 | | | | Eastman Kodak Co. | | | 50,094 |
| 1,330 | | | | Eaton Corp. | | | 123,690 |
| 35,570 | | | | General Electric Co. | | | 1,361,603 |
| 2,730 | | | | Honeywell International, Inc. | | | 153,644 |
| 1,800 | | | | Illinois Tool Works, Inc. | | | 97,542 |
| 1,060 | | | | ITT Corp. | | | 72,377 |
| 500 | | | | Pall Corp. | | | 22,995 |
| 860 | | | | Parker Hannifin Corp. | | | 84,203 |
| 200 | | | | Textron, Inc. | | | 22,022 |
| 7,300 | | @ | | Tyco International Ltd. | | | 246,667 |
| | | | | | | |
| | | | | | | 2,616,882 |
| | | | | | | |
| Office/Business Equipment: 0.1% | | | |
| 3,420 | | @ | | Xerox Corp. | | | 63,202 |
| | | | | | | |
| | | | | | | 63,202 |
| | | | | | | |
| Oil & Gas: 4.1% | | | |
| 1,960 | | | | Anadarko Petroleum Corp. | | | 101,900 |
| 700 | | | | Apache Corp. | | | 57,113 |
| 1,200 | | | | Chesapeake Energy Corp. | | | 41,520 |
| 8,917 | | | | Chevron Corp. | | | 751,168 |
| 6,477 | | | | ConocoPhillips | | | 508,445 |
| 1,760 | | | | Devon Energy Corp. | | | 137,790 |
| 1,000 | | | | ENSCO International, Inc. | | | 61,010 |
| 420 | | | | EOG Resources, Inc. | | | 30,685 |
| | | | | | | |
| Shares | | | | | | Value |
| | | | | | | |
| 21,400 | | | | ExxonMobil Corp. | | $ | 1,795,032 |
| 600 | | | | Hess Corp. | | | 35,376 |
| 3,420 | | | | Marathon Oil Corp. | | | 205,063 |
| 400 | | | | Murphy Oil Corp. | | | 23,776 |
| 1,100 | | @, @@ | | Nabors Industries Ltd. | | | 36,718 |
| 400 | | | | Noble Corp. | | | 39,008 |
| 3,420 | | | | Occidental Petroleum Corp. | | | 197,950 |
| 700 | | | | Sunoco, Inc. | | | 55,776 |
| 1,200 | | @ | | Transocean, Inc. | | | 127,176 |
| 2,200 | | | | Valero Energy Corp. | | | 162,492 |
| 1,000 | | | | XTO Energy, Inc. | | | 60,100 |
| | | | | | | |
| | | | | | | 4,428,098 |
| | | | | | | |
| Oil & Gas Services: 0.7% | | | |
| 1,000 | | | | Baker Hughes, Inc. | | | 84,130 |
| 4,200 | | | | Halliburton Co. | | | 144,900 |
| 800 | | @ | | National Oilwell Varco, Inc. | | | 83,392 |
| 4,200 | | | | Schlumberger Ltd. | | | 356,748 |
| 700 | | @ | | Weatherford International Ltd. | | | 38,668 |
| | | | | | | |
| | | | | | | 707,838 |
| | | | | | | |
| Packaging & Containers: 0.1% | | | |
| 440 | | | | Ball Corp. | | | 23,395 |
| 700 | | | | Bemis Co. | | | 23,226 |
| 1,800 | | @ | | Pactiv Corp. | | | 57,402 |
| 1,300 | | | | Sealed Air Corp. | | | 40,326 |
| | | | | | | |
| | | | | | | 144,349 |
| | | | | | | |
| Pharmaceuticals: 2.5% | | | |
| 4,700 | | | | Abbott Laboratories | | | 251,685 |
| 1,100 | | | | AmerisourceBergen Corp. | | | 54,417 |
| 400 | | @ | | Barr Pharmaceuticals, Inc. | | | 20,092 |
| 7,000 | | | | Bristol-Myers Squibb Co. | | | 220,920 |
| 1,340 | | | | Cardinal Health, Inc. | | | 94,658 |
| 3,000 | | | | Eli Lilly & Co. | | | 167,640 |
| 820 | | @ | | Express Scripts, Inc. | | | 41,008 |
| 1,500 | | @ | | Forest Laboratories, Inc. | | | 68,475 |
| 3,400 | | @ | | Gilead Sciences, Inc. | | | 131,818 |
| 1,310 | | @ | | King Pharmaceuticals, Inc. | | | 26,803 |
| 1,000 | | @ | | Medco Health Solutions, Inc. | | | 77,990 |
| 8,040 | | | | Merck & Co., Inc. | | | 400,392 |
| 1,500 | | | | Mylan Laboratories | | | 27,285 |
| 25,780 | | | | Pfizer, Inc. | | | 659,195 |
| 6,050 | | | | Schering-Plough Corp. | | | 184,162 |
| 800 | | @ | | Watson Pharmaceuticals, Inc. | | | 26,024 |
| 4,780 | | | | Wyeth | | | 274,085 |
| | | | | | | |
| | | | | | | 2,726,649 |
| | | | | | | |
| Pipelines: 0.2% | | | |
| 2,300 | | | | El Paso Corp. | | | 39,629 |
| 800 | | | | Questar Corp. | | | 42,280 |
| 2,100 | | | | Spectra Energy Corp. | | | 54,516 |
| 1,870 | | | | Williams Cos., Inc. | | | 59,129 |
| | | | | | | |
| | | | | | | 195,554 |
| | | | | | | |
| Real Estate Investment Trusts: 0.4% | | | |
| 400 | | | | Apartment Investment & Management Co. | | | 20,168 |
| 730 | | | | Archstone-Smith Trust | | | 43,150 |
| 500 | | | | Boston Properties, Inc. | | | 51,065 |
| 440 | | | | Developers Diversified Realty Corp. | | | 23,192 |
| 500 | | | | Equity Residential | | | 22,815 |
| 1,300 | | | | Host Hotels & Resorts, Inc. | | | 30,056 |
| 700 | | | | Kimco Realty Corp. | | | 26,649 |
See Accompanying Notes to Financial Statements
66
| | |
| ING GET U.S. CORE PORTFOLIO SERIES 3 | | PORTFOLIO OF INVESTMENTS ASOF JUNE 30, 2007 (UNAUDITED) (CONTINUED) |
| | | | | | | |
| Shares | | | | | | Value |
| | | | | | | |
| Real Estate Investment Trusts (continued) | | | |
| 1,000 | | | | Prologis | | $ | 56,900 |
| 600 | | | | Simon Property Group, Inc. | | | 55,824 |
| 400 | | | | Vornado Realty Trust | | | 43,936 |
| | | | | | | |
| | | | | | | 373,755 |
| | | | | | | |
| Retail: 2.5% |
| 400 | | @ | | Autozone, Inc. | | | 54,648 |
| 600 | | @ | | Bed Bath & Beyond, Inc. | | | 21,594 |
| 1,825 | | | | Best Buy Co., Inc. | | | 85,173 |
| 800 | | @ | | Big Lots, Inc. | | | 23,536 |
| 1,880 | | | | Costco Wholesale Corp. | | | 110,018 |
| 4,471 | | | | CVS Corp. | | | 162,968 |
| 720 | | | | Darden Restaurants, Inc. | | | 31,673 |
| 1,100 | | | | Dollar General Corp. | | | 24,112 |
| 1,300 | | | | Family Dollar Stores, Inc. | | | 44,616 |
| 2,420 | | | | Gap, Inc. | | | 46,222 |
| 6,390 | | | | Home Depot, Inc. | | | 251,447 |
| 1,000 | | | | JC Penney Co., Inc. | | | 72,380 |
| 1,100 | | @ | | Kohl‘s Corp. | | | 78,133 |
| 5,580 | | | | Lowe‘s Cos., Inc. | | | 171,250 |
| 2,464 | | | | Macy‘s, Inc. | | | 98,018 |
| 5,130 | | | | McDonald‘s Corp. | | | 260,399 |
| 900 | | | | Nordstrom, Inc. | | | 46,008 |
| 870 | | @ | | Office Depot, Inc. | | | 26,361 |
| 1,100 | | | | RadioShack Corp. | | | 36,454 |
| 290 | | @ | | Sears Holding Corp. | | | 49,155 |
| 2,105 | | | | Staples, Inc. | | | 49,952 |
| 2,480 | | @ | | Starbucks Corp. | | | 65,075 |
| 3,260 | | | | Target Corp. | | | 207,336 |
| 2,070 | | | | TJX Cos., Inc. | | | 56,925 |
| 3,580 | | | | Walgreen Co. | | | 155,873 |
| 8,370 | | | | Wal-Mart Stores, Inc. | | | 402,681 |
| 900 | | | | Wendy‘s International, Inc. | | | 33,075 |
| 1,860 | | | | Yum! Brands, Inc. | | | 60,859 |
| | | | | | | |
| | | | | | | 2,725,941 |
| | | | | | | |
| Savings & Loans: 0.2% |
| 2,000 | | | | Hudson City Bancorp., Inc. | | | 24,440 |
| 1,100 | | | | Sovereign Bancorp., Inc. | | | 23,254 |
| 3,923 | | | | Washington Mutual, Inc. | | | 167,277 |
| | | | | | | |
| | | | | | | 214,971 |
| | | | | | | |
| Semiconductors: 1.2% |
| 1,800 | | @ | | Advanced Micro Devices, Inc. | | | 25,740 |
| 1,740 | | | | Altera Corp. | | | 38,506 |
| 970 | | | | Analog Devices, Inc. | | | 36,511 |
| 3,010 | | | | Applied Materials, Inc. | | | 59,809 |
| 1,300 | | @ | | Broadcom Corp. | | | 38,025 |
| 21,280 | | | | Intel Corp. | | | 505,613 |
| 1,100 | | | | KLA-Tencor Corp. | | | 60,445 |
| 1,200 | | | | Linear Technology Corp. | | | 43,416 |
| 2,400 | | @ | | LSI Logic Corp. | | | 18,024 |
| 1,040 | | | | Maxim Integrated Products | | | 34,746 |
| 800 | | @ | | MEMC Electronic Materials, Inc. | | | 48,896 |
| 2,450 | | @ | | Micron Technology, Inc. | | | 30,699 |
| 1,050 | | | | National Semiconductor Corp. | | | 29,684 |
| 1,050 | | @ | | Novellus Systems, Inc. | | | 29,789 |
| 1,200 | | @ | | Nvidia Corp. | | | 49,572 |
| 1,550 | | @ | | Teradyne, Inc. | | | 27,249 |
| 4,700 | | | | Texas Instruments, Inc. | | | 176,861 |
| 1,100 | | | | Xilinx, Inc. | | | 29,447 |
| | | | | | | |
| | | | | | | 1,283,032 |
| | | | | | | |
| | | | | | | |
| Shares | | | | | | Value |
| | | | | | | |
| Software: 1.7% |
| 1,810 | | @ | | Adobe Systems, Inc. | | $ | 72,672 |
| 1,050 | | @ | | Autodesk, Inc. | | | 49,434 |
| 2,260 | | | | Automatic Data Processing, Inc. | | | 109,542 |
| 1,170 | | @ | | BMC Software, Inc. | | | 35,451 |
| 2,740 | | | | CA, Inc. | | | 70,774 |
| 1,100 | | @ | | Citrix Systems, Inc. | | | 37,037 |
| 3,050 | | @ | | Compuware Corp. | | | 36,173 |
| 970 | | @ | | Electronic Arts, Inc. | | | 45,900 |
| 2,740 | | | | First Data Corp. | | | 89,516 |
| 1,010 | | @ | | Fiserv, Inc. | | | 57,368 |
| 2,060 | | @ | | Intuit, Inc. | | | 61,965 |
| 29,020 | | | | Microsoft Corp. | | | 855,219 |
| 3,000 | | @ | | Novell, Inc. | | | 23,370 |
| 13,430 | | @ | | Oracle Corp. | | | 264,705 |
| 1,210 | | | | Paychex, Inc. | | | 47,335 |
| | | | | | | |
| | | | | | | 1,856,461 |
| | | | | | | |
| Telecommunications: 2.9% |
| 800 | | @@ | | Allergan, Inc. | | | 46,112 |
| 1,200 | | | | Alltel Corp. | | | 81,060 |
| 22,320 | | | | AT&T, Inc. | | | 926,280 |
| 1,850 | | @ | | Avaya, Inc. | | | 31,154 |
| 1,060 | | | | CenturyTel, Inc. | | | 51,993 |
| 22,590 | | @ | | Cisco Systems, Inc. | | | 629,132 |
| 2,600 | | | | Citizens Communications Co. | | | 39,702 |
| 5,870 | | @ | | Corning, Inc. | | | 149,979 |
| 681 | | | | Embarq Corp. | | | 43,155 |
| 1,900 | | @ | | Juniper Networks, Inc. | | | 47,823 |
| 8,780 | | | | Motorola, Inc. | | | 155,406 |
| 5,940 | | | | Qualcomm, Inc. | | | 257,737 |
| 5,400 | | @ | | Qwest Communications International, Inc. | | | 52,380 |
| 9,535 | | | | Sprint Nextel Corp. | | | 197,470 |
| 2,400 | | @ | | Tellabs, Inc. | | | 25,824 |
| 9,150 | | | | Verizon Communications, Inc. | | | 376,706 |
| | | | | | | |
| | | | | | | 3,111,913 |
| | | | | | | |
| Toys/Games/Hobbies: 0.1% | | | |
| 1,000 | | | | Hasbro, Inc. | | | 31,410 |
| 2,150 | | | | Mattel, Inc. | | | 54,374 |
| | | | | | | |
| | | | | | | 85,784 |
| | | | | | | |
| Transportation: 0.7% | | | |
| 970 | | | | Burlington Northern Santa Fe Corp. | | | 82,586 |
| 500 | | | | CH Robinson Worldwide, Inc. | | | 26,260 |
| 1,420 | | | | CSX Corp. | | | 64,014 |
| 1,200 | | | | FedEx Corp. | | | 133,164 |
| 1,470 | | | | Norfolk Southern Corp. | | | 77,278 |
| 900 | | | | Union Pacific Corp. | | | 103,635 |
| 3,200 | | | | United Parcel Service, Inc. | | | 233,600 |
| | | | | | | |
| | | | | | | 720,537 |
| | | | | | | |
| | | | Total Common Stock (Cost $42,637,393) | | | 48,639,828 |
| | | | | | | |
| | | | | | | |
See Accompanying Notes to Financial Statements
67
| | |
| ING GET U.S. CORE PORTFOLIO SERIES 3 | | PORTFOLIO OF INVESTMENTS ASOF JUNE 30, 2007 (UNAUDITED) (CONTINUED) |
| | | | | | | | |
Principal
Amount | | | | | | Value |
| | | | | | | | |
| | U.S. GOVERNMENT AGENCY OBLIGATIONS: 52.7% |
| | Federal Home Loan Mortgage Corporation: 33.9% |
| $ | 2,875,000 | | ^ | | 5.180%, due 03/15/09 | | $ | 2,637,560 |
| | 37,100,000 | | ^^ | | 5.190%, due 03/15/09 | | | 34,035,985 |
| | | | | | | | |
| | | | | | | | 36,673,545 |
| | | | | | | | |
| | Federal National Mortgage Corporation: 18.8% |
| | 2,091,000 | | ^ | | 5.180%, due 06/15/09 | | | 1,894,065 |
| | 20,400,000 | | ^ | | 5.280%, due 06/15/09 | | | 18,445,129 |
| | | | | | | | |
| | | | | | | | 20,339,194 |
| | | | | | | | |
| | | | | Total U.S. Government Agency Obligations
(Cost $59,232,566) | | | 57,012,739 |
| | | | | | | | |
| | U.S. TREASURY OBLIGATIONS: 2.1% |
| | U.S. Treasury STRIP: 2.1% | | | |
| | 2,390,000 | | ^^ | | 5.010%, due 11/15/08 | | | 2,234,306 |
| | | | | | | | |
| | | | | Total U.S. Treasury Obligations (Cost $2,239,748 ) | | | 2,234,306 |
| | | | | | | | |
| | | | | Total Long-Term Investments (Cost $104,109,707) | | | 107,886,873 |
| | | | | | | | |
| | | |
| Shares | | | | | | |
| | SHORT-TERM INVESTMENTS: 0.3% |
| | Mutual Fund: 0.1% | | | |
| | 100,000 | | ** | | ING Institutional Prime Money Market Fund | | | 100,000 |
| | | | | | | | |
| | | | | Total Mutual Fund (Cost $100,000) | | | 100,000 |
| | | | | | | | |
| | | | | | | | | | |
Principal
Amount | | | | | | | Value | |
| | | | | | | | | | |
| | Repurchase Agreement: 0.2% | | | | | |
| $ | 268,000 | | Morgan Stanley Repurchase Agreement dated 06/29/07, 5.300%, due 07/02/07, $268,118 to be received upon repurchase (Collateralized by $570,000 Resolution Funding Corporation, Discount Note, Market Value $275,390, due 10/15/20) | | | | | $ | 268,000 | |
| | | | | | | | | | |
| | | Total Repurchase Agreement
(Cost $268,000) | | | | | | 268,000 | |
| | | | | | | | | | |
| | | Total Short-Term Investments (Cost $368,000) | | | | | | 368,000 | |
| | | | | | | | | | |
| | | Total Investments in Securities (Cost $104,477,707)* | | 100.1 | % | | $ | 108,254,873 | |
| | | Other Assets and Liabilities - Net | | (0.1 | ) | | | (158,544 | ) |
| | | | | | | | | | |
| | | Net Assets | | 100.0 | % | | $ | 108,096,329 | |
| | | | | | | | | | |
| @ | Non-income producing security |
| STRIP | Separate Trading of Registered Interest and Principal of Securities |
| ** | Investment in affiliate |
| ^ | Interest Only (IO) Security |
| ^^ | Principal Only (PO) Security |
| * | Cost for federal income tax purposes is $104,957,202. |
| | | | |
Net unrealized appreciation consists of: | | | | |
Gross Unrealized Appreciation | | $ | 6,238,269 | |
Gross Unrealized Depreciation | | | (2,940,598 | ) |
| | | | |
Net Unrealized Appreciation | | $ | 3,297,671 | |
| | | | |
See Accompanying Notes to Financial Statements
68
| | |
| ING GET U.S. CORE PORTFOLIO SERIES 4 | | PORTFOLIO OF INVESTMENTS ASOF JUNE 30, 2007 (UNAUDITED) |
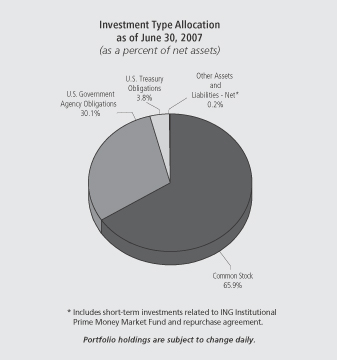
| | | | | | | |
| Shares | | | | | | Value |
| | | | | | | |
| COMMON STOCK: 65.9% | | | |
| Advertising: 0.2% | | | |
| 1,400 | | | | Omnicom Group | | $ | 74,088 |
| | | | | | | |
| | | | | | | 74,088 |
| | | | | | | |
| Aerospace/Defense: 1.6% | | | |
| 1,850 | | | | Boeing Co. | | | 177,896 |
| 1,250 | | | | General Dynamics Corp. | | | 97,775 |
| 300 | | | | Goodrich Corp. | | | 17,868 |
| 450 | | | | L-3 Communications Holdings, Inc. | | | 43,826 |
| 1,160 | | | | Lockheed Martin Corp. | | | 109,191 |
| 740 | | | | Northrop Grumman Corp. | | | 57,624 |
| 1,859 | | | | Raytheon Co. | | | 100,182 |
| 2,650 | | | | United Technologies Corp. | | | 187,965 |
| | | | | | | |
| | | | | | | 792,327 |
| | | | | | | |
| Agriculture: 1.0% | | | |
| 5,200 | | | | Altria Group, Inc. | | | 364,728 |
| 1,340 | | | | Archer-Daniels-Midland Co. | | | 44,341 |
| 800 | | | | Reynolds American, Inc. | | | 52,160 |
| 900 | | | | UST, Inc. | | | 48,339 |
| | | | | | | |
| | | | | | | 509,568 |
| | | | | | | |
| Apparel: 0.3% | | | |
| 1,440 | | @ | | Coach, Inc. | | | 68,242 |
| 1,040 | | | | Nike, Inc. | | | 60,622 |
| 300 | | | | Polo Ralph Lauren Corp. | | | 29,433 |
| | | | | | | |
| | | | | | | 158,297 |
| | | | | | | |
| Auto Manufacturers: 0.3% | | | |
| 5,700 | | | | Ford Motor Co. | | | 53,694 |
| 1,100 | | | | General Motors Corp. | | | 41,580 |
| 800 | | | | Paccar, Inc. | | | 69,632 |
| | | | | | | |
| | | | | | | 164,906 |
| | | | | | | |
| | | | | | | |
| Shares | | | | | | Value |
| | | | | | | |
| Auto Parts & Equipment: 0.1% | | | |
| 400 | | @ | | Goodyear Tire & Rubber Co. | | $ | 13,904 |
| 400 | | | | Johnson Controls, Inc. | | | 46,308 |
| | | | | | | |
| | | | | | | 60,212 |
| | | | | | | |
| Banks: 4.1% | | | |
| 11,303 | | | | Bank of America Corp. | | | 552,604 |
| 2,000 | | @ | | Bank of New York Co., Inc. | | | 82,880 |
| 1,435 | | | | BB&T Corp. | | | 58,376 |
| 869 | | | | Capital One Financial Corp. | | | 68,164 |
| 750 | | | | Comerica, Inc. | | | 44,603 |
| 300 | | | | Compass Bancshares, Inc. | | | 20,694 |
| 700 | | | | Fifth Third Bancorp. | | | 27,839 |
| 2,850 | | | | Huntington Bancshares, Inc. | | | 64,809 |
| 1,950 | | | | Keycorp. | | | 66,944 |
| 500 | | | | Marshall & Ilsley Corp. | | | 23,815 |
| 1,400 | | | | Mellon Financial Corp. | | | 61,600 |
| 1,590 | | | | National City Corp. | | | 52,979 |
| 300 | | | | Northern Trust Corp. | | | 19,272 |
| 700 | | | | PNC Financial Services Group, Inc. | | | 50,106 |
| 2,837 | | | | Regions Financial Corp. | | | 93,905 |
| 850 | | | | State Street Corp. | | | 58,140 |
| 550 | | | | SunTrust Banks, Inc. | | | 47,157 |
| 2,550 | | | | US Bancorp. | | | 84,023 |
| 5,076 | | | | Wachovia Corp. | | | 260,145 |
| 8,900 | | | | Wells Fargo & Co. | | | 313,013 |
| | | | | | | |
| | | | | | | 2,051,068 |
| | | | | | | |
| Beverages: 1.3% | | | |
| 1,550 | | | | Anheuser-Busch Cos., Inc. | | | 80,848 |
| 4,800 | | | | Coca-Cola Co. | | | 251,088 |
| 1,100 | | | | Pepsi Bottling Group, Inc. | | | 37,048 |
| 4,190 | | | | PepsiCo, Inc. | | | 271,722 |
| | | | | | | |
| | | | | | | 640,706 |
| | | | | | | |
| Biotechnology: 0.6% | | | |
| 2,700 | | @ | | Amgen, Inc. | | | 149,283 |
| 700 | | @ | | Biogen Idec, Inc. | | | 37,450 |
| 850 | | @ | | Celgene Corp. | | | 48,731 |
| 700 | | @ | | Genzyme Corp. | | | 45,080 |
| | | | | | | |
| | | | | | | 280,544 |
| | | | | | | |
| Building Materials: 0.1% | | | |
| 300 | | | | American Standard Cos., Inc. | | | 17,694 |
| 1,750 | | | | Masco Corp. | | | 49,823 |
| | | | | | | |
| | | | | | | 67,517 |
| | | | | | | |
| Chemicals: 1.1% | | | |
| 250 | | | | Air Products & Chemicals, Inc. | | | 20,093 |
| 400 | | | | Ashland, Inc. | | | 25,580 |
| 2,250 | | | | Dow Chemical Co. | | | 99,495 |
| 400 | | | | Ecolab, Inc. | | | 17,080 |
| 1,500 | | | | EI DuPont de Nemours & Co. | | | 76,260 |
| 800 | | | | International Flavors & Fragrances, Inc. | | | 41,712 |
| 1,440 | | | | Monsanto Co. | | | 97,258 |
| 810 | | | | PPG Industries, Inc. | | | 61,649 |
| 400 | | | | Praxair, Inc. | | | 28,796 |
| 450 | | | | Sherwin-Williams Co. | | | 29,912 |
| 1,200 | | | | Sigma-Aldrich Corp. | | | 51,204 |
| | | | | | | |
| | | | | | | 549,039 |
| | | | | | | |
| Coal: 0.1% | | | |
| 400 | | | | Consol Energy, Inc. | | | 18,444 |
| 580 | | | | Peabody Energy Corp. | | | 28,060 |
| | | | | | | |
| | | | | | | 46,504 |
| | | | | | | |
See Accompanying Notes to Financial Statements
69
| | |
| ING GET U.S. CORE PORTFOLIO SERIES 4 | | PORTFOLIO OF INVESTMENTS ASOF JUNE 30, 2007 (UNAUDITED) (CONTINUED) |
| | | | | | | |
| Shares | | | | | | Value |
| | | | | | | |
| Commercial Services: 0.5% | | | |
| 400 | | @ | | Apollo Group, Inc. | | $ | 23,372 |
| 1,000 | | @ | | Convergys Corp. | | | 24,240 |
| 410 | | | | Equifax, Inc. | | | 18,212 |
| 750 | | | | McKesson Corp. | | | 44,730 |
| 600 | | | | Moody’s Corp. | | | 37,320 |
| 400 | | | | Robert Half International, Inc. | | | 14,600 |
| 700 | | | | RR Donnelley & Sons Co. | | | 30,457 |
| 1,500 | | | | Western Union Co. | | | 31,245 |
| | | | | | | |
| | | | | | | 224,176 |
| | | | | | | |
| Computers: 2.9% | | | |
| 200 | | @ | | Affiliated Computer Services, Inc. | | | 11,344 |
| 2,100 | | @ | | Apple, Inc. | | | 256,284 |
| 210 | | @ | | Cognizant Technology Solutions Corp. | | | 15,769 |
| 500 | | @ | | Computer Sciences Corp. | | | 29,575 |
| 6,100 | | @ | | Dell, Inc. | | | 174,155 |
| 1,550 | | | | Electronic Data Systems Corp. | | | 42,982 |
| 6,200 | | @ | | EMC Corp. | | | 112,220 |
| 6,650 | | | | Hewlett-Packard Co. | | | 296,723 |
| 3,550 | | | | International Business Machines Corp. | | | 373,638 |
| 400 | | @ | | Lexmark International, Inc. | | | 19,724 |
| 400 | | @ | | NCR Corp. | | | 21,016 |
| 1,150 | | @ | | Network Appliance, Inc. | | | 33,580 |
| 500 | | @ | | Sandisk Corp. | | | 24,470 |
| 8,000 | | @ | | Sun Microsystems, Inc. | | | 42,080 |
| | | | | | | |
| | | | | | | 1,453,560 |
| | | | | | | |
| Cosmetics/Personal Care: 1.3% | | | |
| 700 | | | | Avon Products, Inc. | | | 25,725 |
| 1,150 | | | | Colgate-Palmolive Co. | | | 74,578 |
| 400 | | | | Estee Lauder Cos., Inc. | | | 18,204 |
| 8,237 | | | | Procter & Gamble Co. | | | 504,022 |
| | | | | | | |
| | | | | | | 622,529 |
| | | | | | | |
| Distribution/Wholesale: 0.1% | | | |
| 350 | | | | WW Grainger, Inc. | | | 32,568 |
| | | | | | | |
| | | | | | | 32,568 |
| | | | | | | |
| Diversified Financial Services: 5.5% | | | |
| 3,000 | | | | American Express Co. | | | 183,540 |
| 880 | | | | Ameriprise Financial, Inc. | | | 55,942 |
| 280 | | | | Bear Stearns Cos., Inc. | | | 39,200 |
| 2,700 | | | | Charles Schwab Corp. | | | 55,404 |
| 80 | | | | Chicago Mercantile Exchange Holdings, Inc. | | | 42,749 |
| 700 | | | | CIT Group, Inc. | | | 38,381 |
| 11,900 | | | | Citigroup, Inc. | | | 610,351 |
| 1,400 | | | | Countrywide Financial Corp. | | | 50,890 |
| 700 | | @ | | E*Trade Financial Corp. | | | 15,463 |
| 2,250 | | | | Fannie Mae | | | 146,993 |
| 400 | | | | Franklin Resources, Inc. | | | 52,988 |
| 1,500 | | | | Freddie Mac | | | 91,050 |
| 1,050 | | | | Goldman Sachs Group, Inc. | | | 227,588 |
| 700 | | | | Janus Capital Group, Inc. | | | 19,488 |
| 9,000 | | | | JP Morgan Chase & Co. | | | 436,050 |
| 200 | | | | Legg Mason, Inc. | | | 19,676 |
| 1,480 | | | | Lehman Brothers Holdings, Inc. | | | 110,290 |
| 2,350 | | | | Merrill Lynch & Co., Inc. | | | 196,413 |
| 2,800 | | | | Morgan Stanley | | | 234,864 |
| 1,050 | | | | SLM Corp. | | | 60,459 |
| 300 | | | | T. Rowe Price Group, Inc. | | | 15,567 |
| | | | | | | |
| | | | | | | 2,703,346 |
| | | | | | | |
| | | | | | | |
| Shares | | | | | | Value |
| | | | | | | |
| Electric: 2.2% | | | |
| 1,500 | | @ | | AES Corp. | | $ | 32,820 |
| 650 | | | | American Electric Power Co., Inc. | | | 29,276 |
| 900 | | | | CMS Energy Corp. | | | 15,480 |
| 600 | | | | Constellation Energy Group, Inc. | | | 52,302 |
| 1,000 | | | | Dominion Resources, Inc. | | | 86,310 |
| 1,300 | | | | DTE Energy Co. | | | 62,686 |
| 1,200 | | | | Duke Energy Corp. | | | 21,960 |
| 1,600 | | | | Edison International | | | 89,792 |
| 1,200 | | | | Entergy Corp. | | | 128,820 |
| 1,700 | | | | Exelon Corp. | | | 123,420 |
| 1,250 | | | | FirstEnergy Corp. | | | 80,913 |
| 1,700 | | | | FPL Group, Inc. | | | 96,458 |
| 1,450 | | | | PG&E Corp. | | | 65,685 |
| 400 | | | | PPL Corp. | | | 18,716 |
| 900 | | | | Public Service Enterprise Group, Inc. | | | 79,002 |
| 1,000 | | | | TECO Energy, Inc. | | | 17,180 |
| 1,080 | | | | TXU Corp. | | | 72,684 |
| | | | | | | |
| | | | | | | 1,073,504 |
| | | | | | | |
| Electrical Components & Equipment: 0.1% |
| 1,500 | | | | Emerson Electric Co. | | | 70,200 |
| | | | | | | |
| | | | | | | 70,200 |
| | | | | | | |
| Electronics: 0.3% |
| 800 | | @ | | Agilent Technologies, Inc. | | | 30,752 |
| 700 | | | | Tektronix, Inc. | | | 23,618 |
| 1,300 | | @ | | Thermo Electron Corp. | | | 67,236 |
| 350 | | @ | | Waters Corp. | | | 20,776 |
| | | | | | | |
| | | | | | | 142,382 |
| | | | | | | |
| Engineering & Construction: 0.0% |
| 200 | | | | Fluor Corp. | | | 22,274 |
| | | | | | | |
| | | | | | | 22,274 |
| | | | | | | |
| Entertainment: 0.0% |
| 600 | | | | International Game Technology | | | 23,820 |
| | | | | | | |
| | | | | | | 23,820 |
| | | | | | | |
| Environmental Control: 0.2% |
| 1,200 | | @ | | Allied Waste Industries, Inc. | | | 16,152 |
| 2,000 | | | | Waste Management, Inc. | | | 78,100 |
| | | | | | | |
| | | | | | | 94,252 |
| | | | | | | |
| Food: 1.1% |
| 800 | | | | Campbell Soup Co. | | | 31,048 |
| 400 | | @ | | Dean Foods Co. | | | 12,748 |
| 1,500 | | | | General Mills, Inc. | | | 87,630 |
| 300 | | | | Hershey Co. | | | 15,186 |
| 1,900 | | | | HJ Heinz Co. | | | 90,193 |
| 600 | | | | Kellogg Co. | | | 31,074 |
| 2,721 | | | | Kraft Foods, Inc. | | | 95,915 |
| 2,100 | | | | Kroger Co. | | | 59,073 |
| 1,200 | | | | Safeway, Inc. | | | 40,836 |
| 400 | | | | Supervalu, Inc. | | | 18,528 |
| 600 | | | | Sysco Corp. | | | 19,794 |
| 300 | | | | Whole Foods Market, Inc. | | | 11,490 |
| 300 | | | | WM Wrigley Jr. Co. | | | 16,593 |
| | | | | | | |
| | | | | | | 530,108 |
| | | | | | | |
| Forest Products & Paper: 0.2% |
| 1,300 | | | | International Paper Co. | | | 50,765 |
| 300 | | | | Temple-Inland, Inc. | | | 18,459 |
| 400 | | | | Weyerhaeuser Co. | | | 31,572 |
| | | | | | | |
| | | | | | | 100,796 |
| | | | | | | |
See Accompanying Notes to Financial Statements
70
| | |
| ING GET U.S. CORE PORTFOLIO SERIES 4 | | PORTFOLIO OF INVESTMENTS ASOF JUNE 30, 2007 (UNAUDITED) (CONTINUED) |
| | | | | | | |
| Shares | | | | | | Value |
| | | | | | | |
| Gas: 0.1% |
| 400 | | | | KeySpan Corp. | | $ | 16,792 |
| 750 | | | | Sempra Energy | | | 44,423 |
| | | | | | | |
| | | | | | | 61,215 |
| | | | | | | |
| Hand/Machine Tools: 0.1% |
| 260 | | | | Black & Decker Corp. | | | 22,961 |
| 400 | | | | Snap-On, Inc. | | | 20,204 |
| 400 | | | | Stanley Works | | | 24,280 |
| | | | | | | |
| | | | | | | 67,445 |
| | | | | | | |
| Healthcare - Products: 2.0% |
| 1,750 | | | | Baxter International, Inc. | | | 98,595 |
| 690 | | | | Becton Dickinson & Co. | | | 51,405 |
| 500 | | | | Biomet, Inc. | | | 22,860 |
| 2,500 | | @ | | Boston Scientific Corp. | | | 38,350 |
| 300 | | | | CR Bard, Inc. | | | 24,789 |
| 7,600 | | | | Johnson & Johnson | | | 468,312 |
| 2,600 | | | | Medtronic, Inc. | | | 134,836 |
| 600 | | @ | | St. Jude Medical, Inc. | | | 24,894 |
| 700 | | | | Stryker Corp. | | | 44,163 |
| 300 | | @ | | Varian Medical Systems, Inc. | | | 12,753 |
| 600 | | @ | | Zimmer Holdings, Inc. | | | 50,934 |
| | | | | | | |
| | | | | | | 971,891 |
| | | | | | | |
| Healthcare - Services: 0.8% |
| 1,290 | | | | Aetna, Inc. | | | 63,726 |
| 480 | | @ | | Coventry Health Care, Inc. | | | 27,672 |
| 450 | | @ | | Humana, Inc. | | | 27,410 |
| 200 | | @ | | Laboratory Corp. of America Holdings | | | 15,652 |
| 3,390 | | | | UnitedHealth Group, Inc. | | | 173,365 |
| 1,390 | | @ | | WellPoint, Inc. | | | 110,964 |
| | | | | | | |
| | | | | | | 418,789 |
| | | | | | | |
| Home Builders: 0.1% |
| 500 | | | | Centex Corp. | | | 20,050 |
| 700 | | | | KB Home | | | 27,559 |
| 300 | | | | Lennar Corp. | | | 10,968 |
| | | | | | | |
| | | | | | | 58,577 |
| | | | | | | |
| Home Furnishings: 0.1% | | | |
| 200 | | | | Harman International Industries, Inc. | | | 23,360 |
| 200 | | | | Whirlpool Corp. | | | 22,240 |
| | | | | | | |
| | | | | | | 45,600 |
| | | | | | | |
| Household Products/Wares: 0.2% | | | |
| 200 | | | | Clorox Co. | | | 12,420 |
| 1,500 | | | | Kimberly-Clark Corp. | | | 100,335 |
| | | | | | | |
| | | | | | | 112,755 |
| | | | | | | |
| Housewares: 0.0% | | | |
| 700 | | | | Newell Rubbermaid, Inc. | | | 20,601 |
| | | | | | | |
| | | | | | | 20,601 |
| | | | | | | |
| Insurance: 3.7% | | | |
| 1,180 | | @@ | | ACE Ltd. | | | 73,774 |
| 1,350 | | | | Aflac, Inc. | | | 69,390 |
| 1,790 | | | | Allstate Corp. | | | 110,103 |
| 200 | | | | AMBAC Financial Group, Inc. | | | 17,438 |
| 6,450 | | | | American International Group, Inc. | | | 451,694 |
| 1,000 | | | | AON Corp. | | | 42,610 |
| 400 | | | | Assurant, Inc. | | | 23,568 |
| 1,460 | | | | Chubb Corp. | | | 79,044 |
| 660 | | | | Cigna Corp. | | | 34,465 |
| 1,700 | | | | Genworth Financial, Inc. | | | 58,480 |
| | | | | | | |
| Shares | | | | | | Value |
| | | | | | | |
| 1,000 | | | | Hartford Financial Services Group, Inc. | | $ | 98,510 |
| 664 | | | | Lincoln National Corp. | | | 47,111 |
| 900 | | | | Loews Corp. | | | 45,882 |
| 1,100 | | | | Marsh & McLennan Cos., Inc. | | | 33,968 |
| 250 | | | | MBIA, Inc. | | | 15,555 |
| 2,180 | | | | Metlife, Inc. | | | 140,566 |
| 200 | | | | MGIC Investment Corp. | | | 11,372 |
| 1,050 | | | | Principal Financial Group | | | 61,205 |
| 2,680 | | | | Progressive Corp. | | | 64,132 |
| 1,360 | | | | Prudential Financial, Inc. | | | 132,233 |
| 400 | | | | Safeco Corp. | | | 24,904 |
| 300 | | | | Torchmark Corp. | | | 20,100 |
| 1,780 | | | | Travelers Cos., Inc. | | | 95,230 |
| 600 | | | | UnumProvident Corp. | | | 15,666 |
| 500 | | @@ | | XL Capital Ltd. | | | 42,145 |
| | | | | | | |
| | | | | | | 1,809,145 |
| | | | | | | |
| Internet: 1.2% | | | |
| 900 | | @ | | Amazon.com, Inc. | | | 61,569 |
| 2,400 | | @ | | eBay, Inc. | | | 77,232 |
| 500 | | @ | | Google, Inc. | | | 261,690 |
| 800 | | @ | | IAC/InterActiveCorp. | | | 27,688 |
| 2,922 | | @ | | Symantec Corp. | | | 59,024 |
| 700 | | @ | | VeriSign, Inc. | | | 22,211 |
| 2,700 | | @ | | Yahoo!, Inc. | | | 73,251 |
| | | | | | | |
| | | | | | | 582,665 |
| | | | | | | |
| Iron/Steel: 0.3% | | | |
| 200 | | | | Allegheny Technologies, Inc. | | | 20,976 |
| 1,100 | | | | Nucor Corp. | | | 64,515 |
| 400 | | | | United States Steel Corp. | | | 43,500 |
| | | | | | | |
| | | | | | | 128,991 |
| | | | | | | |
| Leisure Time: 0.2% | | | |
| 1,050 | | | | Carnival Corp. | | | 51,209 |
| 800 | | | | Harley-Davidson, Inc. | | | 47,688 |
| | | | | | | |
| | | | | | | 98,897 |
| | | | | | | |
| Lodging: 0.2% | | | |
| 500 | | | | Harrah’s Entertainment, Inc. | | | 42,630 |
| 500 | | | | Hilton Hotels Corp. | | | 16,735 |
| 540 | | | | Marriott International, Inc. | | | 23,350 |
| 350 | | | | Starwood Hotels & Resorts Worldwide, Inc. | | | 23,475 |
| | | | | | | |
| | | | | | | 106,190 |
| | | | | | | |
| Machinery - Construction & Mining: 0.3% | | | |
| 1,800 | | | | Caterpillar, Inc. | | | 140,940 |
| 300 | | @ | | Terex Corp. | | | 24,390 |
| | | | | | | |
| | | | | | | 165,330 |
| | | | | | | |
| Machinery - Diversified: 0.3% | | | |
| 500 | | | | Cummins, Inc. | | | 50,605 |
| 700 | | | | Deere & Co. | | | 84,518 |
| 350 | | | | Rockwell Automation, Inc. | | | 24,304 |
| | | | | | | |
| | | | | | | 159,427 |
| | | | | | | |
| Media: 1.9% | | | |
| 1,825 | | | | CBS Corp. - Class B | | | 60,809 |
| 1,200 | | | | Clear Channel Communications, Inc. | | | 45,384 |
| 5,450 | | @ | | Comcast Corp. – Class A | | | 153,254 |
| 1,900 | | @ | | DIRECTV Group, Inc. | | | 43,909 |
| 700 | | | | Gannett Co., Inc. | | | 38,465 |
| 1,220 | | | | McGraw-Hill Cos., Inc. | | | 83,058 |
See Accompanying Notes to Financial Statements
71
| | |
| ING GET U.S. CORE PORTFOLIO SERIES 4 | | PORTFOLIO OF INVESTMENTS ASOF JUNE 30, 2007 (UNAUDITED) (CONTINUED) |
| | | | | | | |
| Shares | | | | | | Value |
| | | | | | | |
| Media (continued) | | | |
| 6,150 | | | | News Corp., Inc. - Class A | | $ | 130,442 |
| 7,200 | | | | Time Warner, Inc. | | | 151,488 |
| 1,400 | | @ | | Viacom - Class B | | | 58,282 |
| 5,050 | | | | Walt Disney Co. | | | 172,407 |
| | | | | | | |
| | | | | | | 937,498 |
| | | | | | | |
| Metal Fabricate/Hardware: 0.0% | | | |
| 200 | | | | Precision Castparts Corp. | | | 24,272 |
| | | | | | | |
| | | | | | | 24,272 |
| | | | | | | |
| Mining: 0.4% | | | |
| 1,900 | | | | Alcoa, Inc. | | | 77,007 |
| 871 | | | | Freeport-McMoRan Copper & Gold, Inc. | | | 72,136 |
| 700 | | | | Newmont Mining Corp. | | | 27,342 |
| | | | | | | |
| | | | | | | 176,485 |
| | | | | | | |
| Miscellaneous Manufacturing: 3.5% | | | |
| 1,900 | | | | 3M Co. | | | 164,901 |
| 700 | | | | Cooper Industries Ltd. | | | 39,963 |
| 550 | | | | Danaher Corp. | | | 41,525 |
| 1,400 | | | | Eastman Kodak Co. | | | 38,962 |
| 850 | | | | Eaton Corp. | | | 79,050 |
| 23,550 | | | | General Electric Co. | | | 901,470 |
| 1,850 | | | | Honeywell International, Inc. | | | 104,118 |
| 1,200 | | | | Illinois Tool Works, Inc. | | | 65,028 |
| 700 | | | | ITT Corp. | | | 47,796 |
| 400 | | | | Pall Corp. | | | 18,396 |
| 600 | | | | Parker Hannifin Corp. | | | 58,746 |
| 200 | | | | Textron, Inc. | | | 22,022 |
| 5,100 | | @ | | Tyco International Ltd. | | | 172,329 |
| | | | | | | |
| | | | | | | 1,754,306 |
| | | | | | | |
| Office/Business Equipment: 0.1% | | | |
| 2,300 | | @ | | Xerox Corp. | | | 42,504 |
| | | | | | | |
| | | | | | | 42,504 |
| | | | | | | |
| Oil & Gas: 6.0% | | | |
| 1,300 | | | | Anadarko Petroleum Corp. | | | 67,587 |
| 500 | | | | Apache Corp. | | | 40,795 |
| 900 | | | | Chesapeake Energy Corp. | | | 31,140 |
| 5,943 | | | | Chevron Corp. | | | 500,638 |
| 4,335 | | | | ConocoPhillips | | | 340,298 |
| 1,200 | | | | Devon Energy Corp. | | | 93,948 |
| 500 | | | | ENSCO International, Inc. | | | 30,505 |
| 250 | | | | EOG Resources, Inc. | | | 18,265 |
| 14,300 | | | | ExxonMobil Corp. | | | 1,199,484 |
| 300 | | | | Hess Corp. | | | 17,688 |
| 2,200 | | | | Marathon Oil Corp. | | | 131,912 |
| 200 | | | | Murphy Oil Corp. | | | 11,888 |
| 700 | | @, @@ | | Nabors Industries Ltd. | | | 23,366 |
| 400 | | | | Noble Corp. | | | 39,008 |
| 2,400 | | | | Occidental Petroleum Corp. | | | 138,912 |
| 500 | | | | Sunoco, Inc. | | | 39,840 |
| 800 | | @ | | Transocean, Inc. | | | 84,784 |
| 1,500 | | | | Valero Energy Corp. | | | 110,790 |
| 700 | | | | XTO Energy, Inc. | | | 42,070 |
| | | | | | | |
| | | | | | | 2,962,918 |
| | | | | | | |
| Oil & Gas Services: 0.9% | | | |
| 600 | | | | Baker Hughes, Inc. | | | 50,478 |
| 2,900 | | | | Halliburton Co. | | | 100,050 |
| 500 | | @ | | National Oilwell Varco, Inc. | | | 52,120 |
| | | | | | | |
| Shares | | | | | | Value |
| | | | | | | |
| | | | | | | |
| | | | | | | |
| | | | | | | |
| | | | | | | |
| | | | | | | |
| 2,600 | | | | Schlumberger Ltd. | | $ | 220,844 |
| 400 | | @ | | Weatherford International Ltd. | | | 22,096 |
| | | | | | | |
| | | | | | | 445,588 |
| | | | | | | |
| Packaging & Containers: 0.2% | | | |
| 300 | | | | Ball Corp. | | | 15,951 |
| 700 | | | | Bemis Co. | | | 23,226 |
| 1,100 | | @ | | Pactiv Corp. | | | 35,079 |
| 1,000 | | | | Sealed Air Corp. | | | 31,020 |
| | | | | | | |
| | | | | | | 105,276 |
| | | | | | | |
| Pharmaceuticals: 3.6% | | | |
| 2,800 | | | | Abbott Laboratories | | | 149,940 |
| 680 | | | | AmerisourceBergen Corp. | | | 33,640 |
| 300 | | @ | | Barr Pharmaceuticals, Inc. | | | 15,069 |
| 4,600 | | | | Bristol-Myers Squibb Co. | | | 145,176 |
| 880 | | | | Cardinal Health, Inc. | | | 62,163 |
| 2,100 | | | | Eli Lilly & Co. | | | 117,348 |
| 620 | | @ | | Express Scripts, Inc. | | | 31,006 |
| 1,100 | | @ | | Forest Laboratories, Inc. | | | 50,215 |
| 2,200 | | @ | | Gilead Sciences, Inc. | | | 85,294 |
| 790 | | @ | | King Pharmaceuticals, Inc. | | | 16,163 |
| 700 | | @ | | Medco Health Solutions, Inc. | | | 54,593 |
| 5,200 | | | | Merck & Co., Inc. | | | 258,960 |
| 950 | | | | Mylan Laboratories | | | 17,281 |
| 17,300 | | | | Pfizer, Inc. | | | 442,361 |
| 3,950 | | | | Schering-Plough Corp. | | | 120,238 |
| 500 | | @ | | Watson Pharmaceuticals, Inc. | | | 16,265 |
| 3,100 | | | | Wyeth | | | 177,754 |
| | | | | | | |
| | | | | | | 1,793,466 |
| | | | | | | |
| Pipelines: 0.3% | | | |
| 1,400 | | | | El Paso Corp. | | | 24,122 |
| 600 | | | | Questar Corp. | | | 31,710 |
| 1,300 | | | | Spectra Energy Corp. | | | 33,748 |
| 1,350 | | | | Williams Cos., Inc. | | | 42,687 |
| | | | | | | |
| | | | | | | 132,267 |
| | | | | | | |
| Real Estate Investment Trusts: 0.5% | | | |
| 300 | | | | Apartment Investment & Management Co. | | | 15,126 |
| 410 | | | | Archstone-Smith Trust | | | 24,235 |
| 300 | | | | Boston Properties, Inc. | | | 30,639 |
| 250 | | | | Developers Diversified Realty Corp. | | | 13,178 |
| 300 | | | | Equity Residential | | | 13,689 |
| 900 | | | | Host Hotels & Resorts, Inc. | | | 20,808 |
| 300 | | | | Kimco Realty Corp. | | | 11,421 |
| 700 | | | | Prologis | | | 39,830 |
| 400 | | | | Simon Property Group, Inc. | | | 37,216 |
| 200 | | | | Vornado Realty Trust | | | 21,968 |
| | | | | | | |
| | | | | | | 228,110 |
| | | | | | | |
| Retail: 3.7% | | | |
| 300 | | @ | | Autozone, Inc. | | | 40,986 |
| 400 | | @ | | Bed Bath & Beyond, Inc. | | | 14,396 |
| 1,275 | | | | Best Buy Co., Inc. | | | 59,504 |
| 600 | | @ | | Big Lots, Inc. | | | 17,652 |
| 1,100 | | | | Costco Wholesale Corp. | | | 64,372 |
| 3,303 | | | | CVS Corp. | | | 120,394 |
| 450 | | | | Darden Restaurants, Inc. | | | 19,796 |
| 600 | | | | Dollar General Corp. | | | 13,152 |
| 900 | | | | Family Dollar Stores, Inc. | | | 30,888 |
| 1,550 | | | | Gap, Inc. | | | 29,605 |
| 4,270 | | | | Home Depot, Inc. | | | 168,025 |
| 700 | | | | JC Penney Co., Inc. | | | 50,666 |
See Accompanying Notes to Financial Statements
72
| | |
| ING GET U.S. CORE PORTFOLIO SERIES 4 | | PORTFOLIO OF INVESTMENTS ASOF JUNE 30, 2007 (UNAUDITED) (CONTINUED) |
| | | | | | | |
| Shares | | | | | | Value |
| | | | | | | |
| Retail (continued) | | | |
| 700 | | @ | | Kohl’s Corp. | | $ | 49,721 |
| 3,400 | | | | Lowe’s Cos., Inc. | | | 104,346 |
| 1,566 | | | | Macy’s, Inc. | | | 62,295 |
| 3,450 | | | | McDonald’s Corp. | | | 175,122 |
| 600 | | | | Nordstrom, Inc. | | | 30,672 |
| 500 | | @ | | Office Depot, Inc. | | | 15,150 |
| 600 | | | | RadioShack Corp. | | | 19,884 |
| 160 | | @ | | Sears Holding Corp. | | | 27,120 |
| 1,400 | | | | Staples, Inc. | | | 33,222 |
| 1,950 | | @ | | Starbucks Corp. | | | 51,168 |
| 2,200 | | | | Target Corp. | | | 139,920 |
| 1,500 | | | | TJX Cos., Inc. | | | 41,250 |
| 2,400 | | | | Walgreen Co. | | | 104,496 |
| 5,600 | | | | Wal-Mart Stores, Inc. | | | 269,416 |
| 600 | | | | Wendy’s International, Inc. | | | 22,050 |
| 1,200 | | | | Yum! Brands, Inc. | | | 39,264 |
| | | | | | | |
| | | | | | | 1,814,532 |
| | | | | | | |
| Savings & Loans: 0.3% | | | |
| 1,300 | | | | Hudson City Bancorp., Inc. | | | 15,886 |
| 700 | | | | Sovereign Bancorp., Inc. | | | 14,798 |
| 2,576 | | | | Washington Mutual, Inc. | | | 109,841 |
| | | | | | | |
| | | | | | | 140,525 |
| | | | | | | |
| Semiconductors: 1.7% | | | |
| 1,100 | | @ | | Advanced Micro Devices, Inc. | | | 15,730 |
| 1,150 | | | | Altera Corp. | | | 25,450 |
| 750 | | | | Analog Devices, Inc. | | | 28,230 |
| 2,050 | | | | Applied Materials, Inc. | | | 40,734 |
| 800 | | @ | | Broadcom Corp. | | | 23,400 |
| 14,300 | | | | Intel Corp. | | | 339,768 |
| 700 | | | | KLA-Tencor Corp. | | | 38,465 |
| 700 | | | | Linear Technology Corp. | | | 25,326 |
| 1,500 | | @ | | LSI Logic Corp. | | | 11,265 |
| 600 | | | | Maxim Integrated Products | | | 20,046 |
| 500 | | @ | | MEMC Electronic Materials, Inc. | | | 30,560 |
| 1,550 | | @ | | Micron Technology, Inc. | | | 19,422 |
| 650 | | | | National Semiconductor Corp. | | | 18,376 |
| 600 | | @ | | Novellus Systems, Inc. | | | 17,022 |
| 700 | | @ | | Nvidia Corp. | | | 28,917 |
| 950 | | @ | | Teradyne, Inc. | | | 16,701 |
| 2,800 | | | | Texas Instruments, Inc. | | | 105,364 |
| 700 | | | | Xilinx, Inc. | | | 18,739 |
| | | | | | | |
| | | | | | | 823,515 |
| | | | | | | |
| Software: 2.6% | | | |
| 1,260 | | @ | | Adobe Systems, Inc. | | | 50,589 |
| 900 | | @ | | Autodesk, Inc. | | | 42,372 |
| 1,450 | | | | Automatic Data Processing, Inc. | | | 70,282 |
| 750 | | @ | | BMC Software, Inc. | | | 22,725 |
| 1,950 | | | | CA, Inc. | | | 50,369 |
| 800 | | @ | | Citrix Systems, Inc. | | | 26,936 |
| 1,900 | | @ | | Compuware Corp. | | | 22,534 |
| 650 | | @ | | Electronic Arts, Inc. | | | 30,758 |
| 2,100 | | | | First Data Corp. | | | 68,607 |
| 500 | | @ | | Fiserv, Inc. | | | 28,400 |
| 1,200 | | @ | | Intuit, Inc. | | | 36,096 |
| 19,800 | | | | Microsoft Corp. | | | 583,506 |
| 2,000 | | @ | | Novell, Inc. | | | 15,580 |
| 9,300 | | @ | | Oracle Corp. | | | 183,303 |
| 900 | | | | Paychex, Inc. | | | 35,208 |
| | | | | | | |
| | | | | | | 1,267,265 |
| | | | | | | |
| | | | | | | | |
| Shares | | | | | | Value |
| | Telecommunications: 4.3% | | | |
| | 600 | | @@ | | Allergan, Inc. | | $ | 34,584 |
| | 900 | | | | Alltel Corp. | | | 60,795 |
| | 15,051 | | | | AT&T, Inc. | | | 624,617 |
| | 1,200 | | @ | | Avaya, Inc. | | | 20,208 |
| | 850 | | | | CenturyTel, Inc. | | | 41,693 |
| | 15,100 | | @ | | Cisco Systems, Inc. | | | 420,535 |
| | 1,600 | | | | Citizens Communications Co. | | | 24,432 |
| | 3,950 | | @ | | Corning, Inc. | | | 100,923 |
| | 352 | | | | Embarq Corp. | | | 22,306 |
| | 1,200 | | @ | | Juniper Networks, Inc. | | | 30,204 |
| | 5,510 | | | | Motorola, Inc. | | | 97,527 |
| | 4,000 | | | | Qualcomm, Inc. | | | 173,560 |
| | 4,500 | | @ | | Qwest Communications International, Inc. | | | 43,650 |
| | 6,846 | | | | Sprint Nextel Corp. | | | 141,781 |
| | 1,500 | | @ | | Tellabs, Inc. | | | 16,140 |
| | 6,300 | | | | Verizon Communications, Inc. | | | 259,371 |
| | | | | | | | |
| | | | | | | | 2,112,326 |
| | | | | | | | |
| | Toys/Games/Hobbies: 0.1% | | | |
| | 700 | | | | Hasbro, Inc. | | | 21,987 |
| | 1,350 | | | | Mattel, Inc. | | | 34,142 |
| | | | | | | | |
| | | | | | | | 56,129 |
| | | | | | | | |
| | Transportation: 1.0% | | | |
| | 550 | | | | Burlington Northern Santa Fe Corp. | | | 46,827 |
| | 300 | | | | CH Robinson Worldwide, Inc. | | | 15,756 |
| | 980 | | | | CSX Corp. | | | 44,178 |
| | 850 | | | | FedEx Corp. | | | 94,325 |
| | 1,000 | | | | Norfolk Southern Corp. | | | 52,570 |
| | 650 | | | | Union Pacific Corp. | | | 74,848 |
| | 2,000 | | | | United Parcel Service, Inc. | | | 146,000 |
| | | | | | | | |
| | | | | | | | 474,504 |
| | | | | | | | |
| | | | | Total Common Stock
(Cost $29,687,182) | | | 32,587,295 |
| | | | | | | | |
| | | |
Principal
Amount | | | | | | |
| | U.S. GOVERNMENT AGENCY OBLIGATIONS: 30.1% |
| | Federal National Mortgage Corporation: 30.1% | | | |
| $ | 16,500,000 | | ^ | | 5.280%, due 06/15/09 | | $ | 14,918,855 |
| | | | | | | | |
| | | | | Total U.S. Government Agency Obligations
(Cost $ 15,105,247 ) | | | 14,918,855 |
| | | | | | | | |
| | U.S. TREASURY OBLIGATIONS: 3.8% |
| | U.S. Treasury STRIP: 3.8% | | | |
| | 2,065,000 | | ^^ | | 4.587%, due 08/15/09 | | | 1,863,250 |
| | | | | | | | |
| | | | | Total U.S. Treasury Obligations
(Cost $1,858,096) | | | 1,863,250 |
| | | | | | | | |
| | | | | Total Long-Term Investments
(Cost $46,650,525) | | | 49,369,400 |
| | | | | | | | |
| | | |
| Shares | | | | | | |
| | SHORT-TERM INVESTMENTS: 0.3% |
| | Mutual Fund: 0.1% | | | |
| | 20,000 | | ** | | ING Institutional Prime Money Market Fund | | | 20,000 |
| | | | | | | | |
| | | | | Total Mutual Fund
(Cost $20,000) | | | 20,000 |
| | | | | | | | |
See Accompanying Notes to Financial Statements
73
| | |
| ING GET U.S. CORE PORTFOLIO SERIES 4 | | PORTFOLIO OF INVESTMENTS ASOF JUNE 30, 2007 (UNAUDITED) (CONTINUED) |
| | | | | | | | | | |
| | | |
Principal
Amount | | | | | | | Value | |
| | Repurchase Agreement: 0.2% | |
| $ | 110,000 | | Morgan Stanley Repurchase Agreement dated 06/29/07, 5.300%, due 07/02/07, $110,049 to be received upon repurchase (Collateralized by $240,000 Resolution Funding Corporation, Discount Note, Market Value $114,386, due 01/15/21) | | | | | $ | 110,000 | |
| | | | | | | | | | |
| | | Total Repurchase Agreement (Cost $110,000) | | | | | | 110,000 | |
| | | | | | | | | | |
| | | Total Short-Term Investments
(Cost $130,000) | | | | | | 130,000 | |
| | | | | | | | | | |
| | | Total Investments in Securities
(Cost $46,780,525)* | | 100.1 | % | | $ | 49,499,400 | |
| | | Other Assets and
Liabilities - Net | | (0.1 | ) | | | (29,975 | ) |
| | | | | | | | | | |
| | | Net Assets | | 100.0 | % | | $ | 49,469,425 | |
| | | | | | | | | | |
| @ | Non-income producing security |
| STRIP | Separate Trading of Registered Interest and Principal of Securities |
| ** | Investment in affiliate |
| ^ | Interest Only (IO) Security |
| ^^ | Principal Only (PO) Security |
| * | Cost for federal income tax purposes is $47,084,662. |
| | | | |
Net unrealized appreciation consists of: | |
Gross Unrealized Appreciation | | $ | 3,057,101 | |
Gross Unrealized Depreciation | | | (642,363 | ) |
| | | | |
Net Unrealized Appreciation | | $ | 2,414,738 | |
| | | | |
See Accompanying Notes to Financial Statements
74
| | |
| ING GET U.S. CORE PORTFOLIO SERIES 5 | | PORTFOLIO OF INVESTMENTS ASOF JUNE 30, 2007 (UNAUDITED) |
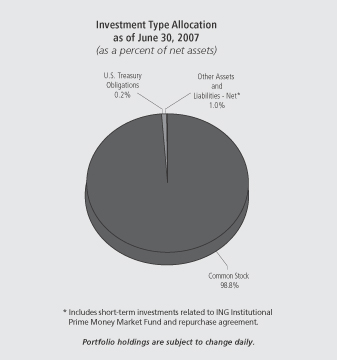
| | | | | | | |
| Shares | | | | | | Value |
| | | | | | | |
| COMMON STOCK: 98.8% | | | |
| Advertising: 0.2% | | | |
| 1,360 | | | | Omnicom Group | | $ | 71,971 |
| | | | | | | |
| | | | | | | 71,971 |
| | | | | | | |
| Aerospace/Defense: 2.4% | | | |
| 1,980 | | | | Boeing Co. | | | 190,397 |
| 1,300 | | | | General Dynamics Corp. | | | 101,686 |
| 300 | | | | Goodrich Corp. | | | 17,868 |
| 450 | | | | L-3 Communications Holdings, Inc. | | | 43,826 |
| 1,230 | | | | Lockheed Martin Corp. | | | 115,780 |
| 710 | | | | Northrop Grumman Corp. | | | 55,288 |
| 1,923 | | | | Raytheon Co. | | | 103,630 |
| 2,630 | | | | United Technologies Corp. | | | 186,546 |
| | | | | | | |
| | | | | | | 815,021 |
| | | | | | | |
| Agriculture: 1.5% | | | |
| 5,480 | | | | Altria Group, Inc. | | | 384,367 |
| 1,380 | | | | Archer-Daniels-Midland Co. | | | 45,664 |
| 700 | | | | Reynolds American, Inc. | | | 45,640 |
| 750 | | | | UST, Inc. | | | 40,283 |
| | | | | | | |
| | | | | | | 515,954 |
| | | | | | | |
| Apparel: 0.5% | | | |
| 1,260 | | @ | | Coach, Inc. | | | 59,711 |
| 1,140 | | | | Nike, Inc. | | | 66,451 |
| 300 | | | | Polo Ralph Lauren Corp. | | | 29,433 |
| | | | | | | |
| | | | | | | 155,595 |
| | | | | | | |
| | | | | | | |
| Shares | | | | | | Value |
| | | | | | | |
| Auto Manufacturers: 0.5% | | | |
| 5,320 | | | | Ford Motor Co. | | $ | 50,114 |
| 1,300 | | | | General Motors Corp. | | | 49,140 |
| 825 | | | | Paccar, Inc. | | | 71,808 |
| | | | | | | |
| | | | | | | 171,062 |
| | | | | | | |
| Auto Parts & Equipment: 0.2% | | | |
| 400 | | @ | | Goodyear Tire & Rubber Co. | | | 13,904 |
| 390 | | | | Johnson Controls, Inc. | | | 45,150 |
| | | | | | | |
| | | | | | | 59,054 |
| | | | | | | |
| Banks: 6.2% | | | |
| 11,343 | | | | Bank of America Corp. | | | 554,559 |
| 1,930 | | @ | | Bank of New York Co., Inc. | | | 79,979 |
| 1,255 | | | | BB&T Corp. | | | 51,053 |
| 896 | | | | Capital One Financial Corp. | | | 70,282 |
| 690 | | | | Comerica, Inc. | | | 41,034 |
| 300 | | | | Compass Bancshares, Inc. | | | 20,694 |
| 700 | | | | Fifth Third Bancorp. | | | 27,839 |
| 2,500 | | | | Huntington Bancshares, Inc. | | | 56,850 |
| 2,180 | | | | Keycorp. | | | 74,839 |
| 700 | | | | Marshall & Ilsley Corp. | | | 33,341 |
| 1,390 | | | | Mellon Financial Corp. | | | 61,160 |
| 1,520 | | | | National City Corp. | | | 50,646 |
| 300 | | | | Northern Trust Corp. | | | 19,272 |
| 750 | | | | PNC Financial Services Group, Inc. | | | 53,685 |
| 3,050 | | | | Regions Financial Corp. | | | 100,955 |
| 840 | | | | State Street Corp. | | | 57,456 |
| 640 | | | | SunTrust Banks, Inc. | | | 54,874 |
| 2,920 | | | | US Bancorp. | | | 96,214 |
| 5,725 | | | | Wachovia Corp. | | | 293,406 |
| 9,240 | | | | Wells Fargo & Co. | | | 324,971 |
| | | | | | | |
| | | | | | | 2,123,109 |
| | | | | | | |
| Beverages: 2.0% | | | |
| 1,690 | | | | Anheuser-Busch Cos., Inc. | | | 88,150 |
| 5,100 | | | | Coca-Cola Co. | | | 266,781 |
| 1,040 | | | | Pepsi Bottling Group, Inc. | | | 35,027 |
| 4,600 | | | | PepsiCo, Inc. | | | 298,310 |
| | | | | | | |
| | | | | | | 688,268 |
| | | | | | | |
| Biotechnology: 0.8% | | | |
| 2,730 | | @ | | Amgen, Inc. | | | 150,942 |
| 750 | | @ | | Biogen Idec, Inc. | | | 40,125 |
| 750 | | @ | | Celgene Corp. | | | 42,998 |
| 810 | | @ | | Genzyme Corp. | | | 52,164 |
| | | | | | | |
| | | | | | | 286,229 |
| | | | | | | |
| Building Materials: 0.2% | | | |
| 300 | | | | American Standard Cos., Inc. | | | 17,694 |
| 1,850 | | | | Masco Corp. | | | 52,670 |
| | | | | | | |
| | | | | | | 70,364 |
| | | | | | | |
| Chemicals: 1.6% | | | |
| 230 | | | | Air Products & Chemicals, Inc. | | | 18,485 |
| 400 | | | | Ashland, Inc. | | | 25,580 |
| 2,180 | | | | Dow Chemical Co. | | | 96,400 |
| 400 | | | | Ecolab, Inc. | | | 17,080 |
| 1,750 | | | | EI DuPont de Nemours & Co. | | | 88,970 |
| 730 | | | | International Flavors & Fragrances, Inc. | | | 38,062 |
| 1,480 | | | | Monsanto Co. | | | 99,959 |
| 800 | | | | PPG Industries, Inc. | | | 60,888 |
| 400 | | | | Praxair, Inc. | | | 28,796 |
See Accompanying Notes to Financial Statements
75
| | |
| ING GET U.S. CORE PORTFOLIO SERIES 5 | | PORTFOLIO OF INVESTMENTS ASOF JUNE 30, 2007 (UNAUDITED) (CONTINUED) |
| | | | | | | |
| Shares | | | | | | Value |
| | | | | | | |
| Chemicals (continued) | | | |
| 540 | | | | Sherwin-Williams Co. | | $ | 35,894 |
| 1,100 | | | | Sigma-Aldrich Corp. | | | 46,937 |
| | | | | | | |
| | | | | | | 557,051 |
| | | | | | | |
| Coal: 0.1% | | | |
| 400 | | | | Consol Energy, Inc. | | | 18,444 |
| 630 | | | | Peabody Energy Corp. | | | 30,479 |
| | | | | | | |
| | | | | | | 48,923 |
| | | | | | | |
| Commercial Services: 0.7% | | | |
| 400 | | @ | | Apollo Group, Inc. | | | 23,372 |
| 1,000 | | @ | | Convergys Corp. | | | 24,240 |
| 490 | | | | Equifax, Inc. | | | 21,766 |
| 860 | | | | McKesson Corp. | | | 51,290 |
| 520 | | | | Moody's Corp. | | | 32,344 |
| 610 | | | | Robert Half International, Inc. | | | 22,265 |
| 600 | | | | RR Donnelley & Sons Co. | | | 26,106 |
| 1,700 | | | | Western Union Co. | | | 35,411 |
| | | | | | | |
| | | | | | | 236,794 |
| | | | | | | |
| Computers: 4.5% | | | |
| 200 | | @ | | Affiliated Computer Services, Inc. | | | 11,344 |
| 2,300 | | @ | | Apple, Inc. | | | 280,692 |
| 230 | | @ | | Cognizant Technology Solutions Corp. | | | 17,271 |
| 540 | | @ | | Computer Sciences Corp. | | | 31,941 |
| 6,860 | | @ | | Dell, Inc. | | | 195,853 |
| 1,600 | | | | Electronic Data Systems Corp. | | | 44,368 |
| 6,470 | | @ | | EMC Corp. | | | 117,107 |
| 7,230 | | | | Hewlett-Packard Co. | | | 322,603 |
| 3,560 | | | | International Business Machines Corp. | | | 374,690 |
| 350 | | @ | | Lexmark International, Inc. | | | 17,259 |
| 360 | | @ | | NCR Corp. | | | 18,914 |
| 1,190 | | @ | | Network Appliance, Inc. | | | 34,748 |
| 550 | | @ | | Sandisk Corp. | | | 26,917 |
| 7,800 | | @ | | Sun Microsystems, Inc. | | | 41,028 |
| | | | | | | |
| | | | | | | 1,534,735 |
| | | | | | | |
| Cosmetics/Personal Care: 1.8% | | | |
| 700 | | | | Avon Products, Inc. | | | 25,725 |
| 1,250 | | | | Colgate-Palmolive Co. | | | 81,063 |
| 550 | | | | Estee Lauder Cos., Inc. | | | 25,031 |
| 8,192 | | | | Procter & Gamble Co. | | | 501,268 |
| | | | | | | |
| | | | | | | 633,087 |
| | | | | | | |
| Distribution/Wholesale: 0.1% | | | |
| 360 | | | | WW Grainger, Inc. | | | 33,498 |
| | | | | | | |
| | | | | | | 33,498 |
| | | | | | | |
| Diversified Financial Services: 8.0% | | | |
| 2,920 | | | | American Express Co. | | | 178,646 |
| 784 | | | | Ameriprise Financial, Inc. | | | 49,839 |
| 360 | | | | Bear Stearns Cos., Inc. | | | 50,400 |
| 2,600 | | | | Charles Schwab Corp. | | | 53,352 |
| 80 | | | | Chicago Mercantile Exchange Holdings, Inc. | | | 42,749 |
| 650 | | | | CIT Group, Inc. | | | 35,640 |
| 11,700 | | | | Citigroup, Inc. | | | 600,093 |
| 1,550 | | | | Countrywide Financial Corp. | | | 56,343 |
| 700 | | @ | | E*Trade Financial Corp. | | | 15,463 |
| 2,330 | | | | Fannie Mae | | | 152,219 |
| 450 | | | | Franklin Resources, Inc. | | | 59,612 |
| | | | | | | |
| Shares | | | | | | Value |
| | | | | | | |
| 1,750 | | | | Freddie Mac | | $ | 106,225 |
| 1,160 | | | | Goldman Sachs Group, Inc. | | | 251,430 |
| 750 | | | | Janus Capital Group, Inc. | | | 20,880 |
| 9,050 | | | | JP Morgan Chase & Co. | | | 438,473 |
| 200 | | | | Legg Mason, Inc. | | | 19,676 |
| 1,360 | | | | Lehman Brothers Holdings, Inc. | | | 101,347 |
| 2,490 | | | | Merrill Lynch & Co., Inc. | | | 208,114 |
| 2,870 | | | | Morgan Stanley | | | 240,736 |
| 1,000 | | | | SLM Corp. | | | 57,580 |
| 300 | | | | T. Rowe Price Group, Inc. | | | 15,567 |
| | | | | | | |
| | | | | | | 2,754,384 |
| | | | | | | |
| Electric: 3.3% | | | |
| 1,550 | | @ | | AES Corp. | | | 33,914 |
| 730 | | | | American Electric Power Co., Inc. | | | 32,879 |
| 1,000 | | | | CMS Energy Corp. | | | 17,200 |
| 610 | | | | Constellation Energy Group, Inc. | | | 53,174 |
| 1,000 | | | | Dominion Resources, Inc. | | | 86,310 |
| 1,300 | | | | DTE Energy Co. | | | 62,686 |
| 1,300 | | | | Duke Energy Corp. | | | 23,790 |
| 1,780 | | | | Edison International | | | 99,894 |
| 1,300 | | | | Entergy Corp. | | | 139,555 |
| 1,900 | | | | Exelon Corp. | | | 137,940 |
| 1,350 | | | | FirstEnergy Corp. | | | 87,386 |
| 1,900 | | | | FPL Group, Inc. | | | 107,806 |
| 1,540 | | | | PG&E Corp. | | | 69,762 |
| 400 | | | | PPL Corp. | | | 18,716 |
| 900 | | | | Public Service Enterprise Group, Inc. | | | 79,002 |
| 1,000 | | | | TECO Energy, Inc. | | | 17,180 |
| 1,220 | | | | TXU Corp. | | | 82,106 |
| | | | | | | |
| | | | | | | 1,149,300 |
| | | | | | | |
| Electrical Components & Equipment: 0.2% | | | |
| 1,600 | | | | Emerson Electric Co. | | | 74,880 |
| | | | | | | |
| | | | | | | 74,880 |
| | | | | | | |
| Electronics: 0.4% | | | |
| 830 | | @ | | Agilent Technologies, Inc. | | | 31,905 |
| 700 | | | | Tektronix, Inc. | | | 23,618 |
| 1,180 | | @ | | Thermo Electron Corp. | | | 61,030 |
| 290 | | @ | | Waters Corp. | | | 17,214 |
| | | | | | | |
| | | | | | | 133,767 |
| | | | | | | |
| Engineering & Construction: 0.1% | | | |
| 200 | | | | Fluor Corp. | | | 22,274 |
| | | | | | | |
| | | | | | | 22,274 |
| | | | | | | |
| Entertainment: 0.1% | | | |
| 650 | | | | International Game Technology | | | 25,805 |
| | | | | | | |
| | | | | | | 25,805 |
| | | | | | | |
| Environmental Control: 0.3% | | | |
| 1,300 | | @ | | Allied Waste Industries, Inc. | | | 17,498 |
| 1,780 | | | | Waste Management, Inc. | | | 69,509 |
| | | | | | | |
| | | | | | | 87,007 |
| | | | | | | |
| Food: 1.6% | | | |
| 1,100 | | | | Campbell Soup Co. | | | 42,691 |
| 400 | | @ | | Dean Foods Co. | | | 12,748 |
| 1,580 | | | | General Mills, Inc. | | | 92,304 |
| 300 | | | | Hershey Co. | | | 15,186 |
| 2,050 | | | | HJ Heinz Co. | | | 97,314 |
| 600 | | | | Kellogg Co. | | | 31,074 |
| 3,069 | | | | Kraft Foods, Inc. | | | 108,182 |
See Accompanying Notes to Financial Statements
76
| | |
| ING GET U.S. CORE PORTFOLIO SERIES 5 | | PORTFOLIO OF INVESTMENTS ASOF JUNE 30, 2007 (UNAUDITED) (CONTINUED) |
| | | | | | | |
| Shares | | | | | | Value |
| | | | | | | |
| Food (continued) | | | |
| 1,810 | | | | Kroger Co. | | $ | 50,915 |
| 1,300 | | | | Safeway, Inc. | | | 44,239 |
| 400 | | | | Supervalu, Inc. | | | 18,528 |
| 600 | | | | Sysco Corp. | | | 19,794 |
| 300 | | | | Whole Foods Market, Inc. | | | 11,490 |
| 300 | | | | WM Wrigley Jr. Co. | | | 16,593 |
| | | | | | | |
| | | | | | | 561,058 |
| | | | | | | |
| Forest Products & Paper: 0.4% | | | |
| 1,600 | | | | International Paper Co. | | | 62,480 |
| 560 | | | | Temple-Inland, Inc. | | | 34,457 |
| 400 | | | | Weyerhaeuser Co. | | | 31,572 |
| | | | | | | |
| | | | | | | 128,509 |
| | | | | | | |
| Gas: 0.2% | | | |
| 400 | | | | KeySpan Corp. | | | 16,792 |
| 810 | | | | Sempra Energy | | | 47,976 |
| | | | | | | |
| | | | | | | 64,768 |
| | | | | | | |
| Hand/Machine Tools: 0.2% | | | |
| 300 | | | | Black & Decker Corp. | | | 26,493 |
| 460 | | | | Snap-On, Inc. | | | 23,235 |
| 410 | | | | Stanley Works | | | 24,887 |
| | | | | | | |
| | | | | | | 74,615 |
| | | | | | | |
| Healthcare - Products: 2.9% | | | |
| 2,050 | | | | Baxter International, Inc. | | | 115,497 |
| 710 | | | | Becton Dickinson & Co. | | | 52,895 |
| 600 | | | | Biomet, Inc. | | | 27,432 |
| 2,550 | | @ | | Boston Scientific Corp. | | | 39,117 |
| 300 | | | | CR Bard, Inc. | | | 24,789 |
| 7,650 | | | | Johnson & Johnson | | | 471,393 |
| 2,800 | | | | Medtronic, Inc. | | | 145,208 |
| 600 | | @ | | St. Jude Medical, Inc. | | | 24,894 |
| 600 | | | | Stryker Corp. | | | 37,854 |
| 300 | | @ | | Varian Medical Systems, Inc. | | | 12,753 |
| 600 | | @ | | Zimmer Holdings, Inc. | | | 50,934 |
| | | | | | | |
| | | | | | | 1,002,766 |
| | | | | | | |
| Healthcare - Services: 1.4% | | | |
| 1,460 | | | | Aetna, Inc. | | | 72,124 |
| 465 | | @ | | Coventry Health Care, Inc. | | | 26,807 |
| 550 | | @ | | Humana, Inc. | | | 33,501 |
| 200 | | @ | | Laboratory Corp. of America Holdings | | | 15,652 |
| 3,820 | | | | UnitedHealth Group, Inc. | | | 195,355 |
| 1,540 | | @ | | WellPoint, Inc. | | | 122,938 |
| | | | | | | |
| | | | | | | 466,377 |
| | | | | | | |
| Home Builders: 0.2% | | | |
| 600 | | | | Centex Corp. | | | 24,060 |
| 600 | | | | KB Home | | | 23,622 |
| 400 | | | | Lennar Corp. | | | 14,624 |
| | | | | | | |
| | | | | | | 62,306 |
| | | | | | | |
| Home Furnishings: 0.1% | | | |
| 200 | | | | Harman International Industries, Inc. | | | 23,360 |
| 200 | | | | Whirlpool Corp. | | | 22,240 |
| | | | | | | |
| | | | | | | 45,600 |
| | | | | | | |
| Household Products/Wares: 0.3% | | | |
| 200 | | | | Clorox Co. | | | 12,420 |
| 1,600 | | | | Kimberly-Clark Corp. | | | 107,024 |
| | | | | | | |
| | | | | | | 119,444 |
| | | | | | | |
| | | | | | | |
| Shares | | | | | | Value |
| | | | | | | |
| Housewares: 0.1% | | | |
| 700 | | | | Newell Rubbermaid, Inc. | | $ | 20,601 |
| | | | | | | |
| | | | | | | 20,601 |
| | | | | | | |
| Insurance: 5.5% | | | |
| 1,090 | | @@ | | ACE Ltd. | | | 68,147 |
| 1,450 | | | | Aflac, Inc. | | | 74,530 |
| 2,020 | | | | Allstate Corp. | | | 124,250 |
| 150 | | | | AMBAC Financial Group, Inc. | | | 13,079 |
| 6,420 | | | | American International Group, Inc. | | | 449,593 |
| 950 | | | | AON Corp. | | | 40,480 |
| 400 | | | | Assurant, Inc. | | | 23,568 |
| 1,730 | | | | Chubb Corp. | | | 93,662 |
| 720 | | | | Cigna Corp. | | | 37,598 |
| 1,600 | | | | Genworth Financial, Inc. | | | 55,040 |
| 1,010 | | | | Hartford Financial Services Group, Inc. | | | 99,495 |
| 790 | | | | Lincoln National Corp. | | | 56,051 |
| 980 | | | | Loews Corp. | | | 49,960 |
| 1,200 | | | | Marsh & McLennan Cos., Inc. | | | 37,056 |
| 250 | | | | MBIA, Inc. | | | 15,555 |
| 2,420 | | | | Metlife, Inc. | | | 156,042 |
| 290 | | | | MGIC Investment Corp. | | | 16,489 |
| 1,110 | | | | Principal Financial Group | | | 64,702 |
| 2,670 | | | | Progressive Corp. | | | 63,893 |
| 1,430 | | | | Prudential Financial, Inc. | | | 139,039 |
| 470 | | | | Safeco Corp. | | | 29,262 |
| 380 | | | | Torchmark Corp. | | | 25,460 |
| 2,040 | | | | Travelers Cos., Inc. | | | 109,140 |
| 600 | | | | UnumProvident Corp. | | | 15,666 |
| 500 | | @@ | | XL Capital Ltd. | | | 42,145 |
| | | | | | | |
| | | | | | | 1,899,902 |
| | | | | | | |
| Internet: 1.8% | | | |
| 850 | | @ | | Amazon.com, Inc. | | | 58,149 |
| 2,780 | | @ | | eBay, Inc. | | | 89,460 |
| 550 | | @ | | Google, Inc. | | | 287,859 |
| 700 | | @ | | IAC/InterActiveCorp. | | | 24,227 |
| 2,798 | | @ | | Symantec Corp. | | | 56,520 |
| 650 | | @ | | VeriSign, Inc. | | | 20,625 |
| 3,000 | | @ | | Yahoo!, Inc. | | | 81,390 |
| | | | | | | |
| | | | | | | 618,230 |
| | | | | | | |
| Iron/Steel: 0.3% | | | |
| 200 | | | | Allegheny Technologies, Inc. | | | 20,976 |
| 900 | | | | Nucor Corp. | | | 52,785 |
| 350 | | | | United States Steel Corp. | | | 38,063 |
| | | | | | | |
| | | | | | | 111,824 |
| | | | | | | |
| Leisure Time: 0.3% | | | |
| 1,060 | | | | Carnival Corp. | | | 51,696 |
| 690 | | | | Harley-Davidson, Inc. | | | 41,131 |
| | | | | | | |
| | | | | | | 92,827 |
| | | | | | | |
| Lodging: 0.3% | | | |
| 500 | | | | Harrah’s Entertainment, Inc. | | | 42,630 |
| 500 | | | | Hilton Hotels Corp. | | | 16,735 |
| 530 | | | | Marriott International, Inc. | | | 22,917 |
| 360 | | | | Starwood Hotels & Resorts Worldwide, Inc. | | | 24,145 |
| | | | | | | |
| | | | | | | 106,427 |
| | | | | | | |
See Accompanying Notes to Financial Statements
77
| | |
| ING GET U.S. CORE PORTFOLIO SERIES 5 | | PORTFOLIO OF INVESTMENTS ASOF JUNE 30, 2007 (UNAUDITED) (CONTINUED) |
| | | | | | | |
| Shares | | | | | | Value |
| | | | | | | |
| Machinery - Construction & Mining: 0.5% | | | |
| 1,850 | | | | Caterpillar, Inc. | | $ | 144,855 |
| 300 | | @ | | Terex Corp. | | | 24,390 |
| | | | | | | |
| | | | | | | 169,245 |
| | | | | | | |
| Machinery - Diversified: 0.4% | | | |
| 500 | | | | Cummins, Inc. | | | 50,605 |
| 700 | | | | Deere & Co. | | | 84,518 |
| 280 | | | | Rockwell Automation, Inc. | | | 19,443 |
| | | | | | | |
| | | | | | | 154,566 |
| | | | | | | |
| Media: 3.0% | | | |
| 1,960 | | | | CBS Corp. - Class B | | | 65,307 |
| 1,200 | | | | Clear Channel Communications, Inc. | | | 45,384 |
| 6,600 | | @ | | Comcast Corp. - Class A | | | 185,592 |
| 1,900 | | @ | | DIRECTV Group, Inc. | | | 43,909 |
| 800 | | | | Gannett Co., Inc. | | | 43,960 |
| 1,280 | | | | McGraw-Hill Cos., Inc. | | | 87,142 |
| 6,800 | | | | News Corp., Inc. - Class A | | | 144,228 |
| 7,700 | | | | Time Warner, Inc. | | | 162,008 |
| 1,500 | | @ | | Viacom - Class B | | | 62,445 |
| 5,380 | | | | Walt Disney Co. | | | 183,673 |
| | | | | | | |
| | | | | | | 1,023,648 |
| | | | | | | |
| Metal Fabricate/Hardware: 0.1% | | | |
| 200 | | | | Precision Castparts Corp. | | | 24,272 |
| | | | | | | |
| | | | | | | 24,272 |
| | | | | | | |
| Mining: 0.6% | | | |
| 2,200 | | | | Alcoa, Inc. | | | 89,166 |
| 921 | | | | Freeport-McMoRan Copper & Gold, Inc. | | | 76,277 |
| 800 | | | | Newmont Mining Corp. | | | 31,248 |
| | | | | | | |
| | | | | | | 196,691 |
| | | | | | | |
| Miscellaneous Manufacturing: 5.2% | | | |
| 2,090 | | | | 3M Co. | | | 181,391 |
| 620 | | | | Cooper Industries Ltd. | | | 35,396 |
| 630 | | | | Danaher Corp. | | | 47,565 |
| 1,450 | | | | Eastman Kodak Co. | | | 40,354 |
| 810 | | | | Eaton Corp. | | | 75,330 |
| 23,430 | | | | General Electric Co. | | | 896,886 |
| 1,890 | | | | Honeywell International, Inc. | | | 106,369 |
| 1,300 | | | | Illinois Tool Works, Inc. | | | 70,447 |
| 800 | | | | ITT Corp. | | | 54,624 |
| 400 | | | | Pall Corp. | | | 18,396 |
| 600 | | | | Parker Hannifin Corp. | | | 58,746 |
| 200 | | | | Textron, Inc. | | | 22,022 |
| 5,600 | | @ | | Tyco International Ltd. | | | 189,224 |
| | | | | | | |
| | | | | | | 1,796,750 |
| | | | | | | |
| Office/Business Equipment: 0.2% | | | |
| 2,950 | | @ | | Xerox Corp. | | | 54,516 |
| | | | | | | |
| | | | | | | 54,516 |
| | | | | | | |
| Oil & Gas: 8.8% | | | |
| 1,410 | | | | Anadarko Petroleum Corp. | | | 73,306 |
| 500 | | | | Apache Corp. | | | 40,795 |
| 800 | | | | Chesapeake Energy Corp. | | | 27,680 |
| 5,775 | | | | Chevron Corp. | | | 486,486 |
| 4,401 | | | | ConocoPhillips | | | 345,479 |
| 1,210 | | | | Devon Energy Corp. | | | 94,731 |
| 600 | | | | ENSCO International, Inc. | | | 36,606 |
| 300 | | | | EOG Resources, Inc. | | | 21,918 |
| 14,240 | | | | ExxonMobil Corp. | | | 1,194,451 |
| | | | | | | |
| Shares | | | | | | Value |
| | | | | | | |
| 400 | | | | Hess Corp. | | $ | 23,584 |
| 2,360 | | | | Marathon Oil Corp. | | | 141,506 |
| 300 | | | | Murphy Oil Corp. | | | 17,832 |
| 700 | | @, @@ | | Nabors Industries Ltd. | | | 23,366 |
| 400 | | | | Noble Corp. | | | 39,008 |
| 2,600 | | | | Occidental Petroleum Corp. | | | 150,488 |
| 500 | | | | Sunoco, Inc. | | | 39,840 |
| 900 | | @ | | Transocean, Inc. | | | 95,382 |
| 1,660 | | | | Valero Energy Corp. | | | 122,608 |
| 950 | | | | XTO Energy, Inc. | | | 57,095 |
| | | | | | | |
| | | | | | | 3,032,161 |
| | | | | | | |
| Oil & Gas Services: 1.4% | | | |
| 700 | | | | Baker Hughes, Inc. | | | 58,891 |
| 3,000 | | | | Halliburton Co. | | | 103,500 |
| 700 | | @ | | National Oilwell Varco, Inc. | | | 72,968 |
| 2,700 | | | | Schlumberger Ltd. | | | 229,338 |
| 500 | | @ | | Weatherford International Ltd. | | | 27,620 |
| | | | | | | |
| | | | | | | 492,317 |
| | | | | | | |
| Packaging & Containers: 0.3% | | | |
| 280 | | | | Ball Corp. | | | 14,888 |
| 600 | | | | Bemis Co. | | | 19,908 |
| 1,150 | | @ | | Pactiv Corp. | | | 36,674 |
| 900 | | | | Sealed Air Corp. | | | 27,918 |
| | | | | | | |
| | | | | | | 99,388 |
| | | | | | | |
| Pharmaceuticals: 5.7% | �� | | |
| 3,450 | | | | Abbott Laboratories | | | 184,748 |
| 820 | | | | AmerisourceBergen Corp. | | | 40,565 |
| 350 | | @ | | Barr Pharmaceuticals, Inc. | | | 17,581 |
| 5,200 | | | | Bristol-Myers Squibb Co. | | | 164,112 |
| 910 | | | | Cardinal Health, Inc. | | | 64,282 |
| 2,300 | | | | Eli Lilly & Co. | | | 128,524 |
| 620 | | @ | | Express Scripts, Inc. | | | 31,006 |
| 1,100 | | @ | | Forest Laboratories, Inc. | | | 50,215 |
| 2,180 | | @ | | Gilead Sciences, Inc. | | | 84,519 |
| 840 | | @ | | King Pharmaceuticals, Inc. | | | 17,186 |
| 700 | | @ | | Medco Health Solutions, Inc. | | | 54,593 |
| 5,810 | | | | Merck & Co., Inc. | | | 289,338 |
| 1,000 | | | | Mylan Laboratories | | | 18,190 |
| 18,030 | | | | Pfizer, Inc. | | | 461,027 |
| 3,950 | | | | Schering-Plough Corp. | | | 120,238 |
| 500 | | @ | | Watson Pharmaceuticals, Inc. | | | 16,265 |
| 3,440 | | | | Wyeth | | | 197,250 |
| | | | | | | |
| | | | | | | 1,939,639 |
| | | | | | | |
| Pipelines: 0.4% | | | |
| 1,500 | | | | El Paso Corp. | | | 25,845 |
| 600 | | | | Questar Corp. | | | 31,710 |
| 1,400 | | | | Spectra Energy Corp. | | | 36,344 |
| 1,490 | | | | Williams Cos., Inc. | | | 47,114 |
| | | | | | | |
| | | | | | | 141,013 |
| | | | | | | |
| Real Estate Investment Trusts: 0.8% | | | |
| 300 | | | | Apartment Investment & Management Co. | | | 15,126 |
| 430 | | | | Archstone-Smith Trust | | | 25,417 |
| 400 | | | | Boston Properties, Inc. | | | 40,852 |
| 260 | | | | Developers Diversified Realty Corp. | | | 13,705 |
| 400 | | | | Equity Residential | | | 18,252 |
| 900 | | | | Host Hotels & Resorts, Inc. | | | 20,808 |
| 500 | | | | Kimco Realty Corp. | | | 19,035 |
See Accompanying Notes to Financial Statements
78
| | |
| ING GET U.S. CORE PORTFOLIO SERIES 5 | | PORTFOLIO OF INVESTMENTS ASOF JUNE 30, 2007 (UNAUDITED) (CONTINUED) |
| | | | | | | |
| Shares | | | | | | Value |
| | | | | | | |
| Real Estate Investment Trusts (continued) | | | |
| 800 | | | | Prologis | | $ | 45,520 |
| 400 | | | | Simon Property Group, Inc. | | | 37,216 |
| 300 | | | | Vornado Realty Trust | | | 32,952 |
| | | | | | | |
| | | | | | | 268,883 |
| | | | | | | |
| Retail: 5.6% | | | |
| 300 | | @ | | Autozone, Inc. | | | 40,986 |
| 400 | | @ | | Bed Bath & Beyond, Inc. | | | 14,396 |
| 1,285 | | | | Best Buy Co., Inc. | | | 59,971 |
| 600 | | @ | | Big Lots, Inc. | | | 17,652 |
| 1,190 | | | | Costco Wholesale Corp. | | | 69,639 |
| 3,486 | | | | CVS Corp. | | | 127,065 |
| 440 | | | | Darden Restaurants, Inc. | | | 19,356 |
| 700 | | | | Dollar General Corp. | | | 15,344 |
| 750 | | | | Family Dollar Stores, Inc. | | | 25,740 |
| 1,640 | | | | Gap, Inc. | | | 31,324 |
| 4,510 | | | | Home Depot, Inc. | | | 177,469 |
| 710 | | | | JC Penney Co., Inc. | | | 51,390 |
| 800 | | @ | | Kohl’s Corp. | | | 56,824 |
| 3,840 | | | | Lowe’s Cos., Inc. | | | 117,850 |
| 1,778 | | | | Macy’s, Inc. | | | 70,729 |
| 3,630 | | | | McDonald’s Corp. | | | 184,259 |
| 700 | | | | Nordstrom, Inc. | | | 35,784 |
| 490 | | @ | | Office Depot, Inc. | | | 14,847 |
| 700 | | | | RadioShack Corp. | | | 23,198 |
| 190 | | @ | | Sears Holding Corp. | | | 32,205 |
| 1,395 | | | | Staples, Inc. | | | 33,103 |
| 1,630 | | @ | | Starbucks Corp. | | | 42,771 |
| 2,380 | | | | Target Corp. | | | 151,368 |
| 1,290 | | | | TJX Cos., Inc. | | | 35,475 |
| 2,380 | | | | Walgreen Co. | | | 103,625 |
| 5,930 | | | | Wal-Mart Stores, Inc. | | | 285,292 |
| 600 | | | | Wendy’s International, Inc. | | | 22,050 |
| 1,380 | | | | Yum! Brands, Inc. | | | 45,154 |
| | | | | | | |
| | | | | | | 1,904,866 |
| | | | | | | |
| Savings & Loans: 0.4% | | | |
| 1,300 | | | | Hudson City Bancorp., Inc. | | | 15,886 |
| 800 | | | | Sovereign Bancorp., Inc. | | | 16,912 |
| 2,566 | | | | Washington Mutual, Inc. | | | 109,414 |
| | | | | | | |
| | | | | | | 142,212 |
| | | | | | | |
| Semiconductors: 2.5% | | | |
| 1,050 | | @ | | Advanced Micro Devices, Inc. | | | 15,015 |
| 990 | | | | Altera Corp. | | | 21,909 |
| 630 | | | | Analog Devices, Inc. | | | 23,713 |
| 2,110 | | | | Applied Materials, Inc. | | | 41,926 |
| 900 | | @ | | Broadcom Corp. | | | 26,325 |
| 14,030 | | | | Intel Corp. | | | 333,353 |
| 800 | | | | KLA-Tencor Corp. | | | 43,960 |
| 700 | | | | Linear Technology Corp. | | | 25,326 |
| 1,600 | | @ | | LSI Logic Corp. | | | 12,016 |
| 600 | | | | Maxim Integrated Products | | | 20,046 |
| 600 | | @ | | MEMC Electronic Materials, Inc. | | | 36,672 |
| 1,650 | | @ | | Micron Technology, Inc. | | | 20,675 |
| 650 | | | | National Semiconductor Corp. | | | 18,376 |
| 650 | | @ | | Novellus Systems, Inc. | | | 18,441 |
| 750 | | @ | | Nvidia Corp. | | | 30,983 |
| 1,000 | | @ | | Teradyne, Inc. | | | 17,580 |
| 3,200 | | | | Texas Instruments, Inc. | | | 120,416 |
| 750 | | | | Xilinx, Inc. | | | 20,078 |
| | | | | | | |
| | | | | | | 846,810 |
| | | | | | | |
| | | | | | | |
| Shares | | | | | | Value |
| | | | | | | |
| Software: 3.7% | | | |
| 1,250 | | @ | | Adobe Systems, Inc. | | $ | 50,188 |
| 670 | | @ | | Autodesk, Inc. | | | 31,544 |
| 1,560 | | | | Automatic Data Processing, Inc. | | | 75,613 |
| 730 | | @ | | BMC Software, Inc. | | | 22,119 |
| 1,840 | | | | CA, Inc. | | | 47,527 |
| 800 | | @ | | Citrix Systems, Inc. | | | 26,936 |
| 1,930 | | @ | | Compuware Corp. | | | 22,890 |
| 580 | | @ | | Electronic Arts, Inc. | | | 27,446 |
| 1,800 | | | | First Data Corp. | | | 58,806 |
| 690 | | @ | | Fiserv, Inc. | | | 39,192 |
| 1,220 | | @ | | Intuit, Inc. | | | 36,698 |
| 20,160 | | | | Microsoft Corp. | | | 594,115 |
| 2,100 | | @ | | Novell, Inc. | | | 16,359 |
| 9,870 | | @ | | Oracle Corp. | | | 194,538 |
| 910 | | | | Paychex, Inc. | | | 35,599 |
| | | | | | | |
| | | | | | | 1,279,570 |
| | | | | | | |
| Telecommunications: 6.2% | | | |
| 600 | | @@ | | Allergan, Inc. | | | 34,584 |
| 700 | | | | Alltel Corp. | | | 47,285 |
| 14,614 | | | | AT&T, Inc. | | | 606,481 |
| 1,230 | | @ | | Avaya, Inc. | | | 20,713 |
| 760 | | | | CenturyTel, Inc. | | | 37,278 |
| 16,000 | | @ | | Cisco Systems, Inc. | | | 445,600 |
| 1,700 | | | | Citizens Communications Co. | | | 25,959 |
| 3,990 | | @ | | Corning, Inc. | | | 101,945 |
| 351 | | | | Embarq Corp. | | | 22,243 |
| 1,300 | | @ | | Juniper Networks, Inc. | | | 32,721 |
| 5,740 | | | | Motorola, Inc. | | | 101,598 |
| 4,470 | | | | Qualcomm, Inc. | | | 193,953 |
| 3,500 | | @ | | Qwest Communications International, Inc. | | | 33,950 |
| 6,983 | | | | Sprint Nextel Corp. | | | 144,618 |
| 1,600 | | @ | | Tellabs, Inc. | | | 17,216 |
| 6,750 | | | | Verizon Communications, Inc. | | | 277,898 |
| | | | | | | |
| | | | | | | 2,144,042 |
| | | | | | | |
| Toys/Games/Hobbies: 0.2% | | | |
| 700 | | | | Hasbro, Inc. | | | 21,987 |
| 1,490 | | | | Mattel, Inc. | | | 37,682 |
| | | | | | | |
| | | | | | | 59,669 |
| | | | | | | |
| Transportation: 1.5% | | | |
| 610 | | | | Burlington Northern Santa Fe Corp. | | | 51,935 |
| 300 | | | | CH Robinson Worldwide, Inc. | | | 15,756 |
| 1,000 | | | | CSX Corp. | | | 45,080 |
| 810 | | | | FedEx Corp. | | | 89,886 |
| 1,090 | | | | Norfolk Southern Corp. | | | 57,301 |
| 700 | | | | Union Pacific Corp. | | | 80,605 |
| 2,300 | | | | United Parcel Service, Inc. | | | 167,900 |
| | | | | | | |
| | | | | | | 508,463 |
| | | | | | | |
| | | | Total Common Stock
(Cost $ 31,047,596 ) | | | 33,902,107 |
| | | | | | | |
See Accompanying Notes to Financial Statements
79
| | |
| ING GET U.S. CORE PORTFOLIO SERIES 5 | | PORTFOLIO OF INVESTMENTS ASOF JUNE 30, 2007 (UNAUDITED) (CONTINUED) |
| | | | | | | | |
| | | |
Principal
Amount | | | | | | Value |
| | U.S. TREASURY OBLIGATIONS: 0.2% | | | |
| | U.S. Treasury STRIP: 0.2% | | | |
| $ | 80,000 | | ^ | | 4.810%, due 08/15/11 | | $ | 65,748 |
| | | | | | | | |
| | | | | Total U.S. Treasury Obligations
(Cost $66,921) | | | 65,748 |
| | | | | | | | |
| | | | | Total Long-Term Investments
(Cost $31,114,517) | | | 33,967,855 |
| | | | | | | | |
| | | |
| Shares | | | | | | |
| | SHORT-TERM INVESTMENTS: 0.4% | | | |
| | Mutual Fund: 0.0% | | | |
| | 5,000 | | ** | | ING Institutional Prime Money Market Fund | | | 5,000 |
| | | | | | | | |
| | | | | Total Mutual Fund
(Cost $5,000) | | | 5,000 |
| | | | | | | | |
| | | | | | | | | |
| | | |
Principal
Amount | | | | | | | |
| | Repurchase Agreement: 0.4% | | | | |
| $ | 120,000 | | Morgan Stanley Repurchase Agreement dated 06/29/07, 5.300%, due 07/02/07, $120,053 to be received upon repurchase (Collateralized by $260,000 Resolution Funding Corporation, Discount Note, Market Value $123,919, due 01/15/21) | | | | 120,000 |
| | | | | | | | | |
| | | Total Repurchase Agreement
(Cost $120,000) | | | | | | 120,000 |
| | | | | | | | | |
| | | Total Short-Term Investments
(Cost $125,000) | | | | | | 125,000 |
| | | | | | | | | |
| | | Total Investments in Securities
(Cost $31,239,517)* | | 99.4 | % | | $ | 34,092,855 |
| | | Other Assets and
Liabilities - Net | | 0.6 | | | | 202,444 |
| | | | | | | | | |
| | | Net Assets | | 100.0 | % | | $ | 34,295,299 |
| | | | | | | | | |
| @ | Non-income producing security |
| STRIP | Separate Trading of Registered Interest and Principal of Securities |
| ** | Investment in affiliate |
| ^ | Interest Only (IO) Security |
| * | Cost for federal income tax purposes is $31,673,013. |
| | | | |
Net unrealized appreciation consists of: | | | | |
Gross Unrealized Appreciation | | $ | 2,850,703 | |
Gross Unrealized Depreciation | | | (430,861 | ) |
| | | | |
Net Unrealized Appreciation | | $ | 2,419,842 | |
| | | | |
See Accompanying Notes to Financial Statements
80
| | |
| ING GET U.S. CORE PORTFOLIO SERIES 6 | | PORTFOLIO OF INVESTMENTS ASOF JUNE 30, 2007 (UNAUDITED) |
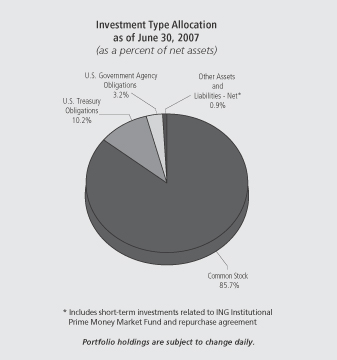
| | | | | | | |
| Shares | | | | | | Value |
| | | | | | | |
| COMMON STOCK: 85.7% | | | |
| Advertising: 0.2% | | | |
| 2,652 | | | | Omnicom Group | | $ | 140,344 |
| | | | | | | |
| | | | | | | 140,344 |
| | | | | | | |
| Aerospace/Defense: 2.1% | | | |
| 3,239 | | | | Boeing Co. | | | 311,462 |
| 2,300 | | | | General Dynamics Corp. | | | 179,906 |
| 600 | | | | Goodrich Corp. | | | 35,736 |
| 899 | | | | L-3 Communications Holdings, Inc. | | | 87,554 |
| 2,125 | | | | Lockheed Martin Corp. | | | 200,026 |
| 1,359 | | | | Northrop Grumman Corp. | | | 105,825 |
| 3,252 | | | | Raytheon Co. | | | 175,250 |
| 4,830 | | | | United Technologies Corp. | | | 342,592 |
| | | | | | | |
| | | | | | | 1,438,351 |
| | | | | | | |
| Agriculture: 1.3% | | | |
| 9,260 | | | | Altria Group, Inc. | | | 649,496 |
| 2,613 | | | | Archer-Daniels-Midland Co. | | | 86,464 |
| 1,296 | | | | Reynolds American, Inc. | | | 84,499 |
| 1,380 | | | | UST, Inc. | | | 74,120 |
| | | | | | | |
| | | | | | | 894,579 |
| | | | | | | |
| Apparel: 0.4% | | | |
| 2,578 | | @ | | Coach, Inc. | | | 122,171 |
| 1,948 | | | | Nike, Inc. | | | 113,549 |
| 700 | | | | Polo Ralph Lauren Corp. | | | 68,677 |
| | | | | | | |
| | | | | | | 304,397 |
| | | | | | | |
| Auto Manufacturers: 0.5% | | | |
| 12,401 | | | | Ford Motor Co. | | | 116,817 |
| 2,300 | | | | General Motors Corp. | | | 86,940 |
| | | | | | | |
| Shares | | | | | | Value |
| | | | | | | |
| 1,570 | | | | Paccar, Inc. | | $ | 136,653 |
| | | | | | | |
| | | | | | | 340,410 |
| | | | | | | |
| Auto Parts & Equipment: 0.2% | | | |
| 900 | | @ | | Goodyear Tire & Rubber Co. | | | 31,284 |
| 977 | | | | Johnson Controls, Inc. | | | 113,107 |
| | | | | | | |
| | | | | | | 144,391 |
| | | | | | | |
| Banks: 5.3% | | | |
| 20,169 | | | | Bank of America Corp. | | | 986,062 |
| 3,548 | | @ | | Bank of New York Co., Inc. | | | 147,029 |
| 2,380 | | | | BB&T Corp. | | | 96,818 |
| 1,571 | | | | Capital One Financial Corp. | | | 123,229 |
| 1,121 | | | | Comerica, Inc. | | | 66,666 |
| 600 | | | | Compass Bancshares, Inc. | | | 41,388 |
| 1,200 | | | | Fifth Third Bancorp. | | | 47,724 |
| 4,841 | | | | Huntington Bancshares, Inc. | | | 110,084 |
| 3,904 | | | | Keycorp. | | | 134,024 |
| 1,300 | | | | Marshall & Ilsley Corp. | | | 61,919 |
| 2,535 | | | | Mellon Financial Corp. | | | 111,540 |
| 3,322 | | | | National City Corp. | | | 110,689 |
| 500 | | | | Northern Trust Corp. | | | 32,120 |
| 1,075 | | | | PNC Financial Services Group, Inc. | | | 76,949 |
| 4,910 | | | | Regions Financial Corp. | | | 162,521 |
| 1,538 | | | | State Street Corp. | | | 105,199 |
| 1,131 | | | | SunTrust Banks, Inc. | | | 96,972 |
| 5,059 | | | | US Bancorp. | | | 166,694 |
| 9,155 | | | | Wachovia Corp. | | | 469,194 |
| 16,234 | | | | Wells Fargo & Co. | | | 570,950 |
| | | | | | | |
| | | | | | | 3,717,771 |
| | | | | | | |
| Beverages: 1.6% | | | |
| 2,705 | | | | Anheuser-Busch Cos., Inc. | | | 141,093 |
| 8,543 | | | | Coca-Cola Co. | | | 446,884 |
| 2,147 | | | | Pepsi Bottling Group, Inc. | | | 72,311 |
| 7,377 | | | | PepsiCo, Inc. | | | 478,398 |
| | | | | | | |
| | | | | | | 1,138,686 |
| | | | | | | |
| Biotechnology: 0.7% | | | |
| 4,818 | | @ | | Amgen, Inc. | | | 266,387 |
| 1,360 | | @ | | Biogen Idec, Inc. | | | 72,760 |
| 1,360 | | @ | | Celgene Corp. | | | 77,969 |
| 1,412 | | @ | | Genzyme Corp. | | | 90,933 |
| | | | | | | |
| | | | | | | 508,049 |
| | | | | | | |
| Building Materials: 0.2% | | | |
| 600 | | | | American Standard Cos., Inc. | | | 35,388 |
| 3,383 | | | | Masco Corp. | | | 96,314 |
| | | | | | | |
| | | | | | | 131,702 |
| | | | | | | |
| Chemicals: 1.4% | | | |
| 362 | | | | Air Products & Chemicals, Inc. | | | 29,094 |
| 800 | | | | Ashland, Inc. | | | 51,160 |
| 3,892 | | | | Dow Chemical Co. | | | 172,104 |
| 900 | | | | Ecolab, Inc. | | | 38,430 |
| 2,880 | | | | EI DuPont de Nemours & Co. | | | 146,419 |
| 1,555 | | | | International Flavors & Fragrances, Inc. | | | 81,078 |
| 2,738 | | | | Monsanto Co. | | | 184,925 |
| 1,453 | | | | PPG Industries, Inc. | | | 110,588 |
| 700 | | | | Praxair, Inc. | | | 50,393 |
| 793 | | | | Sherwin-Williams Co. | | | 52,711 |
| 2,000 | | | | Sigma-Aldrich Corp. | | | 85,340 |
| | | | | | | |
| | | | | | | 1,002,242 |
| | | | | | | |
See Accompanying Notes to Financial Statements
81
| | |
| ING GET U.S. CORE PORTFOLIO SERIES 6 | | PORTFOLIO OF INVESTMENTS ASOF JUNE 30, 2007 (UNAUDITED) (CONTINUED) |
| | | | | | | |
| Shares | | | | | | Value |
| | | | | | | |
| Coal: 0.1% | | | |
| 800 | | | | Consol Energy, Inc. | | $ | 36,888 |
| 1,130 | | | | Peabody Energy Corp. | | | 54,669 |
| | | | | | | |
| | | | | | | 91,557 |
| | | | | | | |
| Commercial Services: 0.6% | | | |
| 760 | | @ | | Apollo Group, Inc. | | | 44,407 |
| 1,800 | | @ | | Convergys Corp. | | | 43,632 |
| 983 | | | | Equifax, Inc. | | | 43,665 |
| 1,634 | | | | McKesson Corp. | | | 97,452 |
| 1,076 | | | | Moody's Corp. | | | 66,927 |
| 1,074 | | | | Robert Half International, Inc. | | | 39,201 |
| 1,100 | | | | RR Donnelley & Sons Co. | | | 47,861 |
| 3,057 | | | | Western Union Co. | | | 63,677 |
| | | | | | | |
| | | | | | | 446,822 |
| | | | | | | |
| Computers: 3.8% | | | |
| 400 | | @ | | Affiliated Computer Services, Inc. | | | 22,688 |
| 3,800 | | @ | | Apple, Inc. | | | 463,752 |
| 500 | | @ | | Cognizant Technology Solutions Corp. | | | 37,545 |
| 1,116 | | @ | | Computer Sciences Corp. | | | 66,011 |
| 10,923 | | @ | | Dell, Inc. | | | 311,852 |
| 3,183 | | | | Electronic Data Systems Corp. | | | 88,265 |
| 11,453 | | @ | | EMC Corp. | | | 207,299 |
| 11,953 | | | | Hewlett-Packard Co. | | | 533,343 |
| 6,270 | | | | International Business Machines Corp. | | | 659,918 |
| 827 | | @ | | Lexmark International, Inc. | | | 40,779 |
| 708 | | @ | | NCR Corp. | | | 37,198 |
| 2,162 | | @ | | Network Appliance, Inc. | | | 63,130 |
| 1,080 | | @ | | Sandisk Corp. | | | 52,855 |
| 13,520 | | @ | | Sun Microsystems, Inc. | | | 71,115 |
| | | | | | | |
| | | | | | | 2,655,750 |
| | | | | | | |
| Cosmetics/Personal Care: 1.6% | | | |
| 1,620 | | | | Avon Products, Inc. | | | 59,535 |
| 2,508 | | | | Colgate-Palmolive Co. | | | 162,644 |
| 840 | | | | Estee Lauder Cos., Inc. | | | 38,228 |
| 14,618 | | | | Procter & Gamble Co. | | | 894,475 |
| | | | | | | |
| | | | | | | 1,154,882 |
| | | | | | | |
| Distribution/Wholesale: 0.1% | | | |
| 445 | | | | WW Grainger, Inc. | | | 41,407 |
| | | | | | | |
| | | | | | | 41,407 |
| | | | | | | |
| Diversified Financial Services: 7.0% | | | |
| 4,898 | | | | American Express Co. | | | 299,660 |
| 1,375 | | | | Ameriprise Financial, Inc. | | | 87,409 |
| 586 | | | | Bear Stearns Cos., Inc. | | | 82,040 |
| 4,640 | | | | Charles Schwab Corp. | | | 95,213 |
| 190 | | | | Chicago Mercantile Exchange Holdings, Inc. | | | 101,528 |
| 1,206 | | | | CIT Group, Inc. | | | 66,125 |
| 21,055 | | | | Citigroup, Inc. | | | 1,079,911 |
| 3,040 | | | | Countrywide Financial Corp. | | | 110,504 |
| 1,500 | | @ | | E*Trade Financial Corp. | | | 33,135 |
| 3,798 | | | | Fannie Mae | | | 248,123 |
| 816 | | | | Franklin Resources, Inc. | | | 108,096 |
| 2,880 | | | | Freddie Mac | | | 174,816 |
| 2,016 | | | | Goldman Sachs Group, Inc. | | | 436,968 |
| 1,300 | | | | Janus Capital Group, Inc. | | | 36,192 |
| 16,240 | | | | JP Morgan Chase & Co. | | | 786,828 |
| 300 | | | | Legg Mason, Inc. | | | 29,514 |
| 2,494 | | | | Lehman Brothers Holdings, Inc. | | | 185,853 |
| 4,382 | | | | Merrill Lynch & Co., Inc. | | | 366,248 |
| | | | | | | |
| Shares | | | | | | Value |
| | | | | | | |
| 5,125 | | | | Morgan Stanley | | $ | 429,885 |
| 1,898 | | | | SLM Corp. | | | 109,287 |
| 600 | | | | T. Rowe Price Group, Inc. | | | 31,134 |
| | | | | | | |
| | | | | | | 4,898,469 |
| | | | | | | |
| Electric: 2.8% | | | |
| 1,946 | | @ | | AES Corp. | | | 42,578 |
| 1,315 | | | | American Electric Power Co., Inc. | | | 59,228 |
| 1,800 | | | | CMS Energy Corp. | | | 30,960 |
| 1,205 | | | | Constellation Energy Group, Inc. | | | 105,040 |
| 1,700 | | | | Dominion Resources, Inc. | | | 146,727 |
| 2,300 | | | | DTE Energy Co. | | | 110,906 |
| 2,200 | | | | Duke Energy Corp. | | | 40,260 |
| 2,890 | | | | Edison International | | | 162,187 |
| 2,100 | | | | Entergy Corp. | | | 225,435 |
| 3,160 | | | | Exelon Corp. | | | 229,416 |
| 2,652 | | | | FirstEnergy Corp. | | | 171,664 |
| 3,100 | | | | FPL Group, Inc. | | | 175,894 |
| 3,002 | | | | PG&E Corp. | | | 135,991 |
| 800 | | | | PPL Corp. | | | 37,432 |
| 1,638 | | | | Public Service Enterprise Group, Inc. | | | 143,784 |
| 1,900 | | | | TECO Energy, Inc. | | | 32,642 |
| 2,052 | | | | TXU Corp. | | | 138,100 |
| | | | | | | |
| | | | | | | 1,988,244 |
| | | | | | | |
| Electrical Components & Equipment: 0.2% | | | |
| 2,942 | | | | Emerson Electric Co. | | | 137,686 |
| | | | | | | |
| | | | | | | 137,686 |
| | | | | | | |
| Electronics: 0.4% | | | |
| 1,576 | | @ | | Agilent Technologies, Inc. | | | 60,581 |
| 1,300 | | | | Tektronix, Inc. | | | 43,862 |
| 2,247 | | @ | | Thermo Electron Corp. | | | 116,215 |
| 722 | | @ | | Waters Corp. | | | 42,858 |
| | | | | | | |
| | | | | | | 263,516 |
| | | | | | | |
| Engineering & Construction: 0.0% | | | |
| 300 | | | | Fluor Corp. | | | 33,411 |
| | | | | | | |
| | | | | | | 33,411 |
| | | | | | | |
| Entertainment: 0.1% | | | |
| 1,110 | | | | International Game Technology | | | 44,067 |
| | | | | | | |
| | | | | | | 44,067 |
| | | | | | | |
| Environmental Control: 0.2% | | | |
| 2,400 | | @ | | Allied Waste Industries, Inc. | | | 32,304 |
| 3,179 | | | | Waste Management, Inc. | | | 124,140 |
| | | | | | | |
| | | | | | | 156,444 |
| | | | | | | |
| Food: 1.4% | | | |
| 1,521 | | | | Campbell Soup Co. | | | 59,030 |
| 800 | | @ | | Dean Foods Co. | | | 25,496 |
| 2,946 | | | | General Mills, Inc. | | | 172,105 |
| 600 | | | | Hershey Co. | | | 30,372 |
| 3,388 | | | | HJ Heinz Co. | | | 160,828 |
| 1,200 | | | | Kellogg Co. | | | 62,148 |
| 4,569 | | | | Kraft Foods, Inc. | | | 161,057 |
| 3,552 | | | | Kroger Co. | | | 99,918 |
| 2,060 | | | | Safeway, Inc. | | | 70,102 |
| 700 | | | | Supervalu, Inc. | | | 32,424 |
| 800 | | | | Sysco Corp. | | | 26,392 |
| 560 | | | | Whole Foods Market, Inc. | | | 21,448 |
| 600 | | | | WM Wrigley Jr. Co. | | | 33,186 |
| | | | | | | |
| | | | | | | 954,506 |
| | | | | | | |
See Accompanying Notes to Financial Statements
82
| | |
| ING GET U.S. CORE PORTFOLIO SERIES 6 | | PORTFOLIO OF INVESTMENTS ASOF JUNE 30, 2007 (UNAUDITED) (CONTINUED) |
| | | | | | | |
| Shares | | | | | | Value |
| | | | | | | |
| Forest Products & Paper: 0.3% | | | |
| 2,240 | | | | International Paper Co. | | $ | 87,472 |
| 1,044 | | | | Temple-Inland, Inc. | | | 64,237 |
| 400 | | | | Weyerhaeuser Co. | | | 31,572 |
| | | | | | | |
| | | | | | | 183,281 |
| | | | | | | |
| Gas: 0.2% | | | |
| 700 | | | | KeySpan Corp. | | | 29,386 |
| 1,550 | | | | Sempra Energy | | | 91,807 |
| | | | | | | |
| | | | | | | 121,193 |
| | | | | | | |
| Hand/Machine Tools: 0.2% | | | |
| 726 | | | | Black & Decker Corp. | | | 64,113 |
| 859 | | | | Snap-On, Inc. | | | 43,388 |
| 808 | | | | Stanley Works | | | 49,046 |
| | | | | | | |
| | | | | | | 156,547 |
| | | | | | | |
| Healthcare - Products: 2.4% | | | |
| 3,143 | | | | Baxter International, Inc. | | | 177,077 |
| 1,304 | | | | Becton Dickinson & Co. | | | 97,148 |
| 1,100 | | | | Biomet, Inc. | | | 50,292 |
| 4,720 | | @ | | Boston Scientific Corp. | | | 72,405 |
| 600 | | | | CR Bard, Inc. | | | 49,578 |
| 13,259 | | | | Johnson & Johnson | | | 817,020 |
| 4,300 | | | | Medtronic, Inc. | | | 222,998 |
| 1,100 | | @ | | St. Jude Medical, Inc. | | | 45,639 |
| 1,100 | | | | Stryker Corp. | | | 69,399 |
| 500 | | @ | | Varian Medical Systems, Inc. | | | 21,255 |
| 1,020 | | @ | | Zimmer Holdings, Inc. | | | 86,588 |
| | | | | | | |
| | | | | | | 1,709,399 |
| | | | | | | |
| Healthcare - Services: 1.2% | | | |
| 2,684 | | | | Aetna, Inc. | | | 132,590 |
| 1,200 | | @ | | Coventry Health Care, Inc. | | | 69,180 |
| 976 | | @ | | Humana, Inc. | | | 59,448 |
| 454 | | @ | | Laboratory Corp. of America Holdings | | | 35,530 |
| 5,970 | | | | UnitedHealth Group, Inc. | | | 305,306 |
| 2,748 | | @ | | WellPoint, Inc. | | | 219,373 |
| | | | | | | |
| | | | | | | 821,427 |
| | | | | | | |
| Home Builders: 0.2% | | | |
| 1,100 | | | | Centex Corp. | | | 44,110 |
| 1,100 | | | | KB Home | | | 43,307 |
| 700 | | | | Lennar Corp. | | | 25,592 |
| | | | | | | |
| | | | | | | 113,009 |
| | | | | | | |
| Home Furnishings: 0.1% | | | |
| 340 | | | | Harman International Industries, Inc. | | | 39,712 |
| 340 | | | | Whirlpool Corp. | | | 37,808 |
| | | | | | | |
| | | | | | | 77,520 |
| | | | | | | |
| Household Products/Wares: 0.3% | | | |
| 500 | | | | Clorox Co. | | | 31,050 |
| 2,904 | | | | Kimberly-Clark Corp. | | | 194,249 |
| | | | | | | |
| | | | | | | 225,299 |
| | | | | | | |
| Housewares: 0.1% | | | |
| 1,300 | | | | Newell Rubbermaid, Inc. | | | 38,259 |
| | | | | | | |
| | | | | | | 38,259 |
| | | | | | | |
| Insurance: 4.8% | | | |
| 1,739 | | @@ | | ACE Ltd. | | | 108,722 |
| 2,856 | | | | Aflac, Inc. | | | 146,798 |
| 3,664 | | | | Allstate Corp. | | | 225,373 |
| 455 | | | | AMBAC Financial Group, Inc. | | | 39,671 |
| | | | | | | |
| Shares | | | | | | Value |
| | | | | | | |
| 11,643 | | | | American International Group, Inc. | | $ | 815,359 |
| 1,680 | | | | AON Corp. | | | 71,585 |
| 700 | | | | Assurant, Inc. | | | 41,244 |
| 2,884 | | | | Chubb Corp. | | | 156,140 |
| 1,539 | | | | Cigna Corp. | | | 80,367 |
| 2,980 | | | | Genworth Financial, Inc. | | | 102,512 |
| 1,822 | | | | Hartford Financial Services Group, Inc. | | | 179,485 |
| 1,270 | | | | Lincoln National Corp. | | | 90,107 |
| 1,801 | | | | Loews Corp. | | | 91,815 |
| 2,100 | | | | Marsh & McLennan Cos., Inc. | | | 64,848 |
| 793 | | | | MBIA, Inc. | | | 49,340 |
| 3,872 | | | | Metlife, Inc. | | | 249,667 |
| 413 | | | | MGIC Investment Corp. | | | 23,483 |
| 1,876 | | | | Principal Financial Group | | | 109,352 |
| 4,832 | | | | Progressive Corp. | | | 115,630 |
| 2,543 | | | | Prudential Financial, Inc. | | | 247,256 |
| 559 | | | | Safeco Corp. | | | 34,803 |
| 519 | | | | Torchmark Corp. | | | 34,773 |
| 3,217 | | | | Travelers Cos., Inc. | | | 172,110 |
| 1,200 | | | | UnumProvident Corp. | | | 31,332 |
| 1,000 | | @@ | | XL Capital Ltd. | | | 84,290 |
| | | | | | | |
| | | | | | | 3,366,062 |
| | | | | | | |
| Internet: 1.5% | | | |
| 1,540 | | @ | | Amazon.com, Inc. | | | 105,351 |
| 5,164 | | @ | | eBay, Inc. | | | 166,178 |
| 880 | | @ | | Google, Inc. | | | 460,574 |
| 1,000 | | @ | | IAC/InterActiveCorp. | | | 34,610 |
| 4,641 | | @ | | Symantec Corp. | | | 93,748 |
| 1,420 | | @ | | VeriSign, Inc. | | | 45,057 |
| 6,000 | | @ | | Yahoo!, Inc. | | | 162,780 |
| | | | | | | |
| | | | | | | 1,068,298 |
| | | | | | | |
| Iron/Steel: 0.4% | | | |
| 400 | | | | Allegheny Technologies, Inc. | | | 41,952 |
| 1,934 | | | | Nucor Corp. | | | 113,429 |
| 893 | | | | United States Steel Corp. | | | 97,114 |
| | | | | | | |
| | | | | | | 252,495 |
| | | | | | | |
| Leisure Time: 0.3% | | | |
| 1,964 | | | | Carnival Corp. | | | 95,784 |
| 1,676 | | | | Harley-Davidson, Inc. | | | 99,906 |
| | | | | | | |
| | | | | | | 195,690 |
| | | | | | | |
| Lodging: 0.3% | | | |
| 900 | | | | Harrah's Entertainment, Inc. | | | 76,734 |
| 900 | | | | Hilton Hotels Corp. | | | 30,123 |
| 1,022 | | | | Marriott International, Inc. | | | 44,191 |
| 665 | | | | Starwood Hotels & Resorts Worldwide, Inc. | | | 44,602 |
| | | | | | | |
| | | | | | | 195,650 |
| | | | | | | |
| Machinery - Construction & Mining: 0.4% | | | |
| 3,180 | | | | Caterpillar, Inc. | | | 248,994 |
| 500 | | @ | | Terex Corp. | | | 40,650 |
| | | | | | | |
| | | | | | | 289,644 |
| | | | | | | |
| Machinery - Diversified: 0.4% | | | |
| 908 | | | | Cummins, Inc. | | | 91,899 |
| 1,320 | | | | Deere & Co. | | | 159,377 |
| 638 | | | | Rockwell Automation, Inc. | | | 44,303 |
| | | | | | | |
| | | | | | | 295,579 |
| | | | | | | |
See Accompanying Notes to Financial Statements
83
| | |
| ING GET U.S. CORE PORTFOLIO SERIES 6 | | PORTFOLIO OF INVESTMENTS ASOF JUNE 30, 2007 (UNAUDITED) (CONTINUED) |
| | | | | | | |
| Shares | | | | | | Value |
| | | | | | | |
| Media: 2.6% | | | |
| 3,530 | | | | CBS Corp. - Class B | | $ | 117,620 |
| 2,340 | | | | Clear Channel Communications, Inc. | | | 88,499 |
| 10,270 | | @ | | Comcast Corp. - Class A | | | 288,792 |
| 4,600 | | @ | | DIRECTV Group, Inc. | | | 106,306 |
| 1,400 | | | | Gannett Co., Inc. | | | 76,930 |
| 2,600 | | | | McGraw-Hill Cos., Inc. | | | 177,008 |
| 11,540 | | | | News Corp., Inc. - Class A | | | 244,763 |
| 12,800 | | | | Time Warner, Inc. | | | 269,312 |
| 2,500 | | @ | | Viacom - Class B | | | 104,075 |
| 9,814 | | | | Walt Disney Co. | | | 335,050 |
| | | | | | | |
| | | | | | | 1,808,355 |
| | | | | | | |
| Metal Fabricate/Hardware: 0.1% | | | |
| 400 | | | | Precision Castparts Corp. | | | 48,544 |
| | | | | | | |
| | | | | | | 48,544 |
| | | | | | | |
| Mining: 0.5% | | | |
| 3,900 | | | | Alcoa, Inc. | | | 158,067 |
| 1,736 | | | | Freeport-McMoRan Copper & Gold, Inc. | | | 143,776 |
| 1,400 | | | | Newmont Mining Corp. | | | 54,684 |
| | | | | | | |
| | | | | | | 356,527 |
| | | | | | | |
| Miscellaneous Manufacturing: 4.6% | | | |
| 3,450 | | | | 3M Co. | | | 299,426 |
| 1,186 | | | | Cooper Industries Ltd. | | | 67,709 |
| 1,372 | | | | Danaher Corp. | | | 103,586 |
| 2,640 | | | | Eastman Kodak Co. | | | 73,471 |
| 1,578 | | | | Eaton Corp. | | | 146,754 |
| 42,163 | | | | General Electric Co. | | | 1,613,996 |
| 3,286 | | | | Honeywell International, Inc. | | | 184,936 |
| 2,600 | | | | Illinois Tool Works, Inc. | | | 140,894 |
| 1,364 | | | | ITT Corp. | | | 93,134 |
| 700 | | | | Pall Corp. | | | 32,193 |
| 1,226 | | | | Parker Hannifin Corp. | | | 120,038 |
| 300 | | | | Textron, Inc. | | | 33,033 |
| 9,200 | | @ | | Tyco International Ltd. | | | 310,868 |
| | | | | | | |
| | | | | | | 3,220,038 |
| | | | | | | |
| Office/Business Equipment: 0.1% | | | |
| 5,467 | | @ | | Xerox Corp. | | | 101,030 |
| | | | | | | |
| | | | | | | 101,030 |
| | | | | | | |
| Oil & Gas: 7.7% | | | |
| 2,742 | | | | Anadarko Petroleum Corp. | | | 142,557 |
| 900 | | | | Apache Corp. | | | 73,431 |
| 1,600 | | | | Chesapeake Energy Corp. | | | 55,360 |
| 10,681 | | | | Chevron Corp. | | | 899,767 |
| 7,672 | | | | ConocoPhillips | | | 602,252 |
| 2,140 | | | | Devon Energy Corp. | | | 167,541 |
| 1,100 | | | | ENSCO International, Inc. | | | 67,111 |
| 532 | | | | EOG Resources, Inc. | | | 38,868 |
| 25,595 | | | | ExxonMobil Corp. | | | 2,146,909 |
| 700 | | | | Hess Corp. | | | 41,272 |
| 4,054 | | | | Marathon Oil Corp. | | | 243,078 |
| 500 | | | | Murphy Oil Corp. | | | 29,720 |
| 1,300 | | @, @@ | | Nabors Industries Ltd. | | | 43,394 |
| 700 | | | | Noble Corp. | | | 68,264 |
| 4,064 | | | | Occidental Petroleum Corp. | | | 235,224 |
| 900 | | | | Sunoco, Inc. | | | 71,712 |
| 1,500 | | @ | | Transocean, Inc. | | | 158,970 |
| | | | | | | |
| Shares | | | | | | Value |
| | | | | | | |
| 2,666 | | | | Valero Energy Corp. | | $ | 196,911 |
| 1,260 | | | | XTO Energy, Inc. | | | 75,726 |
| | | | | | | |
| | | | | | | 5,358,067 |
| | | | | | | |
| Oil & Gas Services: 1.2% | | | |
| 1,200 | | | | Baker Hughes, Inc. | | | 100,956 |
| 5,164 | | | | Halliburton Co. | | | 178,158 |
| 1,000 | | @ | | National Oilwell Varco, Inc. | | | 104,240 |
| 5,140 | | | | Schlumberger Ltd. | | | 436,592 |
| 900 | | @ | | Weatherford International Ltd. | | | 49,716 |
| | | | | | | |
| | | | | | | 869,662 |
| | | | | | | |
| Packaging & Containers: 0.3% | | | |
| 536 | | | | Ball Corp. | | | 28,499 |
| 1,600 | | | | Bemis Co. | | | 53,088 |
| 2,100 | | @ | | Pactiv Corp. | | | 66,969 |
| 1,600 | | | | Sealed Air Corp. | | | 49,632 |
| | | | | | | |
| | | | | | | 198,188 |
| | | | | | | |
| Pharmaceuticals: 4.7% | | | |
| 5,340 | | | | Abbott Laboratories | | | 285,957 |
| 1,566 | | | | AmerisourceBergen Corp. | | | 77,470 |
| 540 | | @ | | Barr Pharmaceuticals, Inc. | | | 27,124 |
| 8,400 | | | | Bristol-Myers Squibb Co. | | | 265,104 |
| 1,703 | | | | Cardinal Health, Inc. | | | 120,300 |
| 3,800 | | | | Eli Lilly & Co. | | | 212,344 |
| 820 | | @ | | Express Scripts, Inc. | | | 41,008 |
| 1,603 | | @ | | Forest Laboratories, Inc. | | | 73,177 |
| 4,042 | | @ | | Gilead Sciences, Inc. | | | 156,708 |
| 1,599 | | @ | | King Pharmaceuticals, Inc. | | | 32,716 |
| 1,200 | | @ | | Medco Health Solutions, Inc. | | | 93,588 |
| 9,501 | | | | Merck & Co., Inc. | | | 473,150 |
| 1,900 | | | | Mylan Laboratories | | | 34,561 |
| 31,635 | | | | Pfizer, Inc. | | | 808,907 |
| 7,020 | | | | Schering-Plough Corp. | | | 213,689 |
| 1,000 | | @ | | Watson Pharmaceuticals, Inc. | | | 32,530 |
| 5,434 | | | | Wyeth | | | 311,586 |
| | | | | | | |
| | | | | | | 3,259,919 |
| | | | | | | |
| Pipelines: 0.3% | | | |
| 2,800 | | | | El Paso Corp. | | | 48,244 |
| 800 | | | | Questar Corp. | | | 42,280 |
| 2,500 | | | | Spectra Energy Corp. | | | 64,900 |
| 2,408 | | | | Williams Cos., Inc. | | | 76,141 |
| | | | | | | |
| | | | | | | 231,565 |
| | | | | | | |
| Real Estate Investment Trusts: 0.7% | | | |
| 522 | | | | Apartment Investment &
Management Co. | | | 26,319 |
| 830 | | | | Archstone-Smith Trust | | | 49,061 |
| 700 | | | | Boston Properties, Inc. | | | 71,491 |
| 700 | | | | Developers Diversified Realty Corp. | | | 36,897 |
| 700 | | | | Equity Residential | | | 31,941 |
| 1,700 | | | | Host Hotels & Resorts, Inc. | | | 39,304 |
| 800 | | | | Kimco Realty Corp. | | | 30,456 |
| 1,400 | | | | Prologis | | | 79,660 |
| 700 | | | | Simon Property Group, Inc. | | | 65,128 |
| 500 | | | | Vornado Realty Trust | | | 54,920 |
| | | | | | | |
| | | | | | | 485,177 |
| | | | | | | |
| Retail: 4.8% | | | |
| 670 | | @ | | Autozone, Inc. | | | 91,535 |
| 800 | | @ | | Bed Bath & Beyond, Inc. | | | 28,792 |
| 2,035 | | | | Best Buy Co., Inc. | | | 94,973 |
See Accompanying Notes to Financial Statements
84
| | |
| ING GET U.S. CORE PORTFOLIO SERIES 6 | | PORTFOLIO OF INVESTMENTS ASOF JUNE 30, 2007 (UNAUDITED) (CONTINUED) |
| | | | | | | |
| Shares | | | | | | Value |
| | | | | | | |
| Retail (continued) | | | |
| 1,200 | | @ | | Big Lots, Inc. | | $ | 35,304 |
| 2,634 | | | | Costco Wholesale Corp. | | | 154,142 |
| 5,435 | | | | CVS Corp. | | | 198,106 |
| 957 | | | | Darden Restaurants, Inc. | | | 42,098 |
| 1,300 | | | | Dollar General Corp. | | | 28,496 |
| 1,540 | | | | Family Dollar Stores, Inc. | | | 52,853 |
| 3,003 | | | | Gap, Inc. | | | 57,357 |
| 7,641 | | | | Home Depot, Inc. | | | 300,673 |
| 1,184 | | | | JC Penney Co., Inc. | | | 85,698 |
| 1,410 | | @ | | Kohl’s Corp. | | | 100,152 |
| 6,886 | | | | Lowe’s Cos., Inc. | | | 211,331 |
| 3,258 | | | | Macy’s, Inc. | | | 129,603 |
| 6,075 | | | | McDonald’s Corp. | | | 308,367 |
| 1,202 | | | | Nordstrom, Inc. | | | 61,446 |
| 979 | | @ | | Office Depot, Inc. | | | 29,664 |
| 1,300 | | | | RadioShack Corp. | | | 43,082 |
| 400 | | @ | | Sears Holding Corp. | | | 67,800 |
| 2,832 | | | | Staples, Inc. | | | 67,203 |
| 2,844 | | @ | | Starbucks Corp. | | | 74,627 |
| 3,954 | | | | Target Corp. | | | 251,474 |
| 2,608 | | | | TJX Cos., Inc. | | | 71,720 |
| 3,929 | | | | Walgreen Co. | | | 171,069 |
| 10,080 | | | | Wal-Mart Stores, Inc. | | | 484,949 |
| 1,200 | | | | Wendy's International, Inc. | | | 44,100 |
| 2,652 | | | | Yum! Brands, Inc. | | | 86,773 |
| | | | | | | |
| | | | | | | 3,373,387 |
| | | | | | | |
| Savings & Loans: 0.4% | | | |
| 2,500 | | | | Hudson City Bancorp., Inc. | | | 30,550 |
| 1,400 | | | | Sovereign Bancorp., Inc. | | | 29,596 |
| 4,654 | | | | Washington Mutual, Inc. | | | 198,447 |
| | | | | | | |
| | | | | | | 258,593 |
| | | | | | | |
| Semiconductors: 2.2% | | | |
| 2,100 | | @ | | Advanced Micro Devices, Inc. | | | 30,030 |
| 2,192 | | | | Altera Corp. | | | 48,509 |
| 1,102 | | | | Analog Devices, Inc. | | | 41,479 |
| 3,945 | | | | Applied Materials, Inc. | | | 78,387 |
| 1,600 | | @ | | Broadcom Corp. | | | 46,800 |
| 24,514 | | | | Intel Corp. | | | 582,453 |
| 1,400 | | | | KLA-Tencor Corp. | | | 76,930 |
| 1,500 | | | | Linear Technology Corp. | | | 54,270 |
| 2,900 | | @ | | LSI Logic Corp. | | | 21,779 |
| 1,242 | | | | Maxim Integrated Products | | | 41,495 |
| 1,100 | | @ | | MEMC Electronic Materials, Inc. | | | 67,232 |
| 2,950 | | @ | | Micron Technology, Inc. | | | 36,964 |
| 1,291 | | | | National Semiconductor Corp. | | | 36,497 |
| 1,250 | | @ | | Novellus Systems, Inc. | | | 35,463 |
| 1,400 | | @ | | Nvidia Corp. | | | 57,834 |
| 1,850 | | @ | | Teradyne, Inc. | | | 32,523 |
| 5,200 | | | | Texas Instruments, Inc. | | | 195,676 |
| 1,360 | | | | Xilinx, Inc. | | | 36,407 |
| | | | | | | |
| | | | | | | 1,520,728 |
| | | | | | | |
| Software: 3.3% | | | |
| 2,416 | | @ | | Adobe Systems, Inc. | | | 97,002 |
| 1,222 | | @ | | Autodesk, Inc. | | | 57,532 |
| 2,681 | | | | Automatic Data Processing, Inc. | | | 129,948 |
| 1,325 | | @ | | BMC Software, Inc. | | | 40,148 |
| 3,651 | | | | CA, Inc. | | | 94,305 |
| 1,400 | | @ | | Citrix Systems, Inc. | | | 47,138 |
| 3,789 | | @ | | Compuware Corp. | | | 44,938 |
| 1,231 | | @ | | Electronic Arts, Inc. | | | 58,251 |
| | | | | | | | |
| Shares | | | | | | Value |
| | | | | | | | |
| | 3,557 | | | | First Data Corp. | | $ | 116,207 |
| | 1,231 | | @ | | Fiserv, Inc. | | | 69,921 |
| | 2,472 | | @ | | Intuit, Inc. | | | 74,358 |
| | 35,564 | | | | Microsoft Corp. | | | 1,048,071 |
| | 3,900 | | @ | | Novell, Inc. | | | 30,381 |
| | 15,705 | | @ | | Oracle Corp. | | | 309,546 |
| | 1,626 | | | | Paychex, Inc. | | | 63,609 |
| | | | | | | | |
| | | | | | | | 2,281,355 |
| | | | | | | | |
| | Telecommunications: 5.4% |
| | 1,000 | | @@ | | Allergan, Inc. | | | 57,640 |
| | 1,400 | | | | Alltel Corp. | | | 94,570 |
| | 26,425 | | | | AT&T, Inc. | | | 1,096,638 |
| | 2,264 | | @ | | Avaya, Inc. | | | 38,126 |
| | 1,308 | | | | CenturyTel, Inc. | | | 64,157 |
| | 27,545 | | @ | | Cisco Systems, Inc. | | | 767,128 |
| | 3,160 | | | | Citizens Communications Co. | | | 48,253 |
| | 7,250 | | @ | | Corning, Inc. | | | 185,238 |
| | 965 | | | | Embarq Corp. | | | 61,152 |
| | 2,400 | | @ | | Juniper Networks, Inc. | | | 60,408 |
| | 10,213 | | | | Motorola, Inc. | | | 180,770 |
| | 7,134 | | | | Qualcomm, Inc. | | | 309,544 |
| | 6,600 | | @ | | Qwest Communications
International, Inc. | | | 64,020 |
| | 11,402 | | | | Sprint Nextel Corp. | | | 236,135 |
| | 2,900 | | @ | | Tellabs, Inc. | | | 31,204 |
| | 11,183 | | | | Verizon Communications, Inc. | | | 460,404 |
| | | | | | | | |
| | | | | | | | 3,755,387 |
| | | | | | | | |
| | Toys/Games/Hobbies: 0.2% |
| | 1,400 | | | | Hasbro, Inc. | | | 43,974 |
| | 2,630 | | | | Mattel, Inc. | | | 66,513 |
| | | | | | | | |
| | | | | | | | 110,487 |
| | | | | | | | |
| | Transportation: 1.3% |
| | 1,247 | | | | Burlington Northern Santa Fe Corp. | | | 106,170 |
| | 500 | | | | CH Robinson Worldwide, Inc. | | | 26,260 |
| | 1,864 | | | | CSX Corp. | | | 84,029 |
| | 1,586 | | | | FedEx Corp. | | | 175,998 |
| | 1,944 | | | | Norfolk Southern Corp. | | | 102,196 |
| | 1,120 | | | | Union Pacific Corp. | | | 128,968 |
| | 3,700 | | | | United Parcel Service, Inc. | | | 270,100 |
| | | | | | | | |
| | | | | | | | 893,721 |
| | | | | | | | |
| | | | | Total Common Stock
(Cost $55,300,830) | | | 59,867,765 |
| | | | | | | | |
| | | |
Principal
Amount | | | | | | Value |
| | U.S. GOVERNMENT AGENCY OBLIGATIONS: 3.2% |
| | Federal National Mortgage Corporation: 3.2% |
| $ | 2,840,000 | | ^ | | 5.670%, due 02/12/12 | | $ | 2,243,492 |
| | | | | | | | |
| | | | | Total U.S. Government Agency Obligations
(Cost $2,349,230 ) | | | 2,243,492 |
| | | | | | | | |
See Accompanying Notes to Financial Statements
85
| | |
| ING GET U.S. CORE PORTFOLIO SERIES 6 | | PORTFOLIO OF INVESTMENTS ASOF JUNE 30, 2007 (UNAUDITED) (CONTINUED) |
| | | | | | |
| | | |
Principal
Amount | | | | | | Value |
| | | | | | |
| U.S. TREASURY OBLIGATIONS: 10.2% |
| U.S. Treasury STRIP: 10.2% |
| $8,900,000 | | ^ | | 4.870%, due 02/15/12 | | $ 7,122,999 |
| | | | | | |
| | | | Total U.S. Treasury Obligations
(Cost $7,102,725) | | 7,122,999 |
| | | | | | |
| | | | Total Long-Term Investments
(Cost $64,752,785) | | 69,234,256 |
| | | | | | |
| | | |
| Shares | | | | | | |
| SHORT-TERM INVESTMENTS: 0.5% |
| Mutual Fund: 0.2% |
| 100,000 | | ** | | ING Institutional Prime Money Market Fund | | 100,000 |
| | | | | | |
| | | | Total Mutual Fund
(Cost $100,000) | | 100,000 |
| | | | | | |
| | | | | | | | | |
| | | |
Principal
Amount | | | | | | | |
| | Repurchase Agreement: 0.3% | | | | |
| $ | 228,000 | | Morgan Stanley Repurchase Agreement dated 06/29/07, 5.300%, due 07/02/07, $228,101 to be received upon repurchase (Collateralized by $490,000 Resolution Funding Corporation, Discount Note, Market Value $233,539, due 01/15/21) | | | | | | 228,000 |
| | | | | | | | | |
| | | Total Repurchase Agreement
(Cost $228,000) | | | | | | 228,000 |
| | | | | | | | | |
| | | Total Short-Term Investments
(Cost $328,000) | | | | | | 328,000 |
| | | | | | | | | |
| | | Total Investments in
Securities
(Cost $65,080,785)* | | 99.6 | % | | $ | 69,562,256 |
| | | Other Assets and
Liabilities - Net | | 0.4 | | | | 298,558 |
| | | | | | | | | |
| | | Net Assets | | 100.0 | % | | $ | 69,860,814 |
| | | | | | | | | |
| @ | Non-income producing security |
| STRIP | Separate Trading of Registered Interest and Principal of Securities |
| ** | Investment in affiliate |
| ^ | Interest Only (IO) Security |
| * | Cost for federal income tax purposes is $65,960,405. |
| | | | |
Net unrealized appreciation consists of: | | | | |
Gross Unrealized Appreciation | | $ | 4,508,675 | |
Gross Unrealized Depreciation | | | (906,824 | ) |
| | | | |
Net Unrealized Appreciation | | $ | 3,601,851 | |
| | | | |
See Accompanying Notes to Financial Statements
86
| | |
| ING GET U.S. CORE PORTFOLIO SERIES 7 | | PORTFOLIO OF INVESTMENTS ASOF JUNE 30, 2007 (UNAUDITED) |
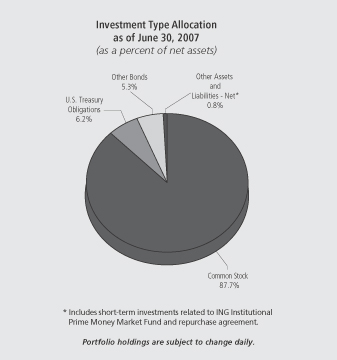
| | | | | | | |
| Shares | | | | | | Value |
| | | | | | | |
| COMMON STOCK: 87.7% | | | |
| Advertising: 0.2% | | | |
| 1,920 | | | | Omnicom Group | | $ | 101,606 |
| | | | | | | |
| | | | | | | 101,606 |
| | | | | | | |
| Aerospace/Defense: 2.1% | | | |
| 2,210 | | | | Boeing Co. | | | 212,514 |
| 1,740 | | | | General Dynamics Corp. | | | 136,103 |
| 400 | | | | Goodrich Corp. | | | 23,824 |
| 610 | | | | L-3 Communications Holdings, Inc. | | | 59,408 |
| 1,450 | | | | Lockheed Martin Corp. | | | 136,489 |
| 1,016 | | | | Northrop Grumman Corp. | | | 79,116 |
| 2,717 | | | | Raytheon Co. | | | 146,419 |
| 3,340 | | | | United Technologies Corp. | | | 236,906 |
| | | | | | | |
| | | | | | | 1,030,779 |
| | | | | | | |
| Agriculture: 1.3% | | | |
| 6,650 | | | | Altria Group, Inc. | | | 466,431 |
| 1,830 | | | | Archer-Daniels-Midland Co. | | | 60,555 |
| 940 | | | | Reynolds American, Inc. | | | 61,288 |
| 860 | | | | UST, Inc. | | | 46,191 |
| | | | | | | |
| | | | | | | 634,465 |
| | | | | | | |
| Apparel: 0.5% | | | |
| 1,810 | | @ | | Coach, Inc. | | | 85,776 |
| 1,720 | | | | Nike, Inc. | | | 100,259 |
| 500 | | | | Polo Ralph Lauren Corp. | | | 49,055 |
| | | | | | | |
| | | | | | | 235,090 |
| | | | | | | |
| Auto Manufacturers: 0.5% | | | |
| 6,950 | | | | Ford Motor Co. | | | 65,469 |
| 1,500 | | | | General Motors Corp. | | | 56,700 |
| 1,190 | | | | Paccar, Inc. | | | 103,578 |
| | | | | | | |
| | | | | | | 225,747 |
| | | | | | | |
| | | | | | | |
| Shares | | | | | | Value |
| | | | | | | |
| Auto Parts & Equipment: 0.2% | | | |
| 600 | | @ | | Goodyear Tire & Rubber Co. | | $ | 20,856 |
| 560 | | | | Johnson Controls, Inc. | | | 64,831 |
| | | | | | | |
| | | | | | | 85,687 |
| | | | | | | |
| Banks: 5.4% | | | |
| 14,275 | | | | Bank of America Corp. | | | 697,905 |
| 2,600 | | @ | | Bank of New York Co., Inc. | | | 107,744 |
| 1,740 | | | | BB&T Corp. | | | 70,783 |
| 1,194 | | | | Capital One Financial Corp. | | | 93,657 |
| 910 | | | | Comerica, Inc. | | | 54,118 |
| 400 | | | | Compass Bancshares, Inc. | | | 27,592 |
| 900 | | | | Fifth Third Bancorp. | | | 35,793 |
| 3,170 | | | | Huntington Bancshares, Inc. | | | 72,086 |
| 2,750 | | | | Keycorp. | | | 94,408 |
| 900 | | | | Marshall & Ilsley Corp. | | | 42,867 |
| 1,730 | | | | Mellon Financial Corp. | | | 76,120 |
| 1,960 | | | | National City Corp. | | | 65,307 |
| 400 | | | | Northern Trust Corp. | | | 25,696 |
| 830 | | | | PNC Financial Services Group, Inc. | | | 59,411 |
| 4,032 | | | | Regions Financial Corp. | | | 133,459 |
| 1,030 | | | | State Street Corp. | | | 70,452 |
| 650 | | | | SunTrust Banks, Inc. | | | 55,731 |
| 4,050 | | | | US Bancorp. | | | 133,448 |
| 6,546 | | | | Wachovia Corp. | | | 335,483 |
| 11,460 | | | | Wells Fargo & Co. | | | 403,048 |
| | | | | | | |
| | | | | | | 2,655,108 |
| | | | | | | |
| Beverages: 1.7% | | | |
| 2,140 | | | | Anheuser-Busch Cos., Inc. | | | 111,622 |
| 6,000 | | | | Coca-Cola Co. | | | 313,860 |
| 1,360 | | | | Pepsi Bottling Group, Inc. | | | 45,805 |
| 5,280 | | | | PepsiCo, Inc. | | | 342,408 |
| | | | | | | |
| | | | | | | 813,695 |
| | | | | | | |
| Biotechnology: 0.7% | | | |
| 3,420 | | @ | | Amgen, Inc. | | | 189,092 |
| 920 | | @ | | Biogen Idec, Inc. | | | 49,220 |
| 960 | | @ | | Celgene Corp. | | | 55,037 |
| 960 | | @ | | Genzyme Corp. | | | 61,824 |
| | | | | | | |
| | | | | | | 355,173 |
| | | | | | | |
| Building Materials: 0.2% | | | |
| 500 | | | | American Standard Cos., Inc. | | | 29,490 |
| 2,460 | | | | Masco Corp. | | | 70,036 |
| | | | | | | |
| | | | | | | 99,526 |
| | | | | | | |
| Chemicals: 1.6% | | | |
| 270 | | | | Air Products & Chemicals, Inc. | | | 21,700 |
| 700 | | | | Ashland, Inc. | | | 44,765 |
| 2,910 | | | | Dow Chemical Co. | | | 128,680 |
| 600 | | | | Ecolab, Inc. | | | 25,620 |
| 2,540 | | | | EI DuPont de Nemours & Co. | | | 129,134 |
| 890 | | | | International Flavors & Fragrances, Inc. | | | 46,405 |
| 1,880 | | | | Monsanto Co. | | | 126,975 |
| 1,080 | | | | PPG Industries, Inc. | | | 82,199 |
| 500 | | | | Praxair, Inc. | | | 35,995 |
| 680 | | | | Sherwin-Williams Co. | | | 45,200 |
| 1,700 | | | | Sigma-Aldrich Corp. | | | 72,539 |
| | | | | | | |
| | | | | | | 759,212 |
| | | | | | | |
| Coal: 0.1% | | | |
| 600 | | | | Consol Energy, Inc. | | | 27,666 |
| 840 | | | | Peabody Energy Corp. | | | 40,639 |
| | | | | | | |
| | | | | | | 68,305 |
| | | | | | | |
See Accompanying Notes to Financial Statements
87
| | |
| ING GET U.S. CORE PORTFOLIO SERIES 7 | | PORTFOLIO OF INVESTMENTS ASOF JUNE 30, 2007 (UNAUDITED) (CONTINUED) |
| | | | | | | |
| Shares | | | | | | Value |
| | | | | | | |
| Commercial Services: 0.6% | | | |
| 560 | | @ | | Apollo Group, Inc. | | $ | 32,721 |
| 1,300 | | @ | | Convergys Corp. | | | 31,512 |
| 690 | | | | Equifax, Inc. | | | 30,650 |
| 970 | | | | McKesson Corp. | | | 57,851 |
| 780 | | | | Moody’s Corp. | | | 48,516 |
| 570 | | | | Robert Half International, Inc. | | | 20,805 |
| 800 | | | | RR Donnelley & Sons Co. | | | 34,808 |
| 2,140 | | | | Western Union Co. | | | 44,576 |
| | | | | | | |
| | | | | | | 301,439 |
| | | | | | | |
| Computers: 3.9% | | | |
| 300 | | @ | | Affiliated Computer Services, Inc. | | | 17,016 |
| 2,700 | | @ | | Apple, Inc. | | | 329,508 |
| 350 | | @ | | Cognizant Technology Solutions Corp. | | | 26,282 |
| 710 | | @ | | Computer Sciences Corp. | | | 41,997 |
| 7,800 | | @ | | Dell, Inc. | | | 222,690 |
| 2,110 | | | | Electronic Data Systems Corp. | | | 58,510 |
| 8,960 | | @ | | EMC Corp. | | | 162,176 |
| 8,610 | | | | Hewlett-Packard Co. | | | 384,178 |
| 4,470 | | | | International Business Machines Corp. | | | 470,468 |
| 530 | | @ | | Lexmark International, Inc. | | | 26,134 |
| 470 | | @ | | NCR Corp. | | | 24,694 |
| 1,420 | | @ | | Network Appliance, Inc. | | | 41,464 |
| 760 | | @ | | Sandisk Corp. | | | 37,194 |
| 9,560 | | @ | | Sun Microsystems, Inc. | | | 50,286 |
| | | | | | | |
| | | | | | | 1,892,597 |
| | | | | | | |
| Cosmetics/Personal Care: 1.7% | | | |
| 1,180 | | | | Avon Products, Inc. | | | 43,365 |
| 1,660 | | | | Colgate-Palmolive Co. | | | 107,651 |
| 560 | | | | Estee Lauder Cos., Inc. | | | 25,486 |
| 10,603 | | | | Procter & Gamble Co. | | | 648,798 |
| | | | | | | |
| | | | | | | 825,300 |
| | | | | | | |
| Distribution/Wholesale: 0.1% | | | |
| 510 | | | | WW Grainger, Inc. | | | 47,456 |
| | | | | | | |
| | | | | | | 47,456 |
| | | | | | | |
| Diversified Financial Services: 7.0% | | | |
| 3,490 | | | | American Express Co. | | | 213,518 |
| 934 | | | | Ameriprise Financial, Inc. | | | 59,374 |
| 420 | | | | Bear Stearns Cos., Inc. | | | 58,800 |
| 2,880 | | | | Charles Schwab Corp. | | | 59,098 |
| 140 | | | | Chicago Mercantile Exchange Holdings, Inc. | | | 74,810 |
| 730 | | | | CIT Group, Inc. | | | 40,026 |
| 14,800 | | | | Citigroup, Inc. | | | 759,092 |
| 1,920 | | | | Countrywide Financial Corp. | | | 69,792 |
| 920 | | @ | | E*Trade Financial Corp. | | | 20,323 |
| 2,700 | | | | Fannie Mae | | | 176,391 |
| 530 | | | | Franklin Resources, Inc. | | | 70,209 |
| 2,260 | | | | Freddie Mac | | | 137,182 |
| 1,390 | | | | Goldman Sachs Group, Inc. | | | 301,283 |
| 880 | | | | Janus Capital Group, Inc. | | | 24,499 |
| 11,480 | | | | JP Morgan Chase & Co. | | | 556,206 |
| 300 | | | | Legg Mason, Inc. | | | 29,514 |
| 1,780 | | | | Lehman Brothers Holdings, Inc. | | | 132,646 |
| 3,100 | | | | Merrill Lynch & Co., Inc. | | | 259,098 |
| 3,460 | | | | Morgan Stanley | | | 290,225 |
| 1,320 | | | | SLM Corp. | | | 76,006 |
| 500 | | | | T. Rowe Price Group, Inc. | | | 25,945 |
| | | | | | | |
| | | | | | | 3,434,037 |
| | | | | | | |
| | | | | | | |
| Shares | | | | | | Value |
| | | | | | | |
| Electric: 3.0% | | | |
| 2,020 | | @ | | AES Corp. | | $ | 44,198 |
| 910 | | | | American Electric Power Co., Inc. | | | 40,986 |
| 1,300 | | | | CMS Energy Corp. | | | 22,360 |
| 930 | | | | Constellation Energy Group, Inc. | | | 81,068 |
| 1,400 | | | | Dominion Resources, Inc. | | | 120,834 |
| 1,600 | | | | DTE Energy Co. | | | 77,152 |
| 1,200 | | | | Duke Energy Corp. | | | 21,960 |
| 2,270 | | | | Edison International | | | 127,392 |
| 1,400 | | | | Entergy Corp. | | | 150,290 |
| 2,460 | | | | Exelon Corp. | | | 178,596 |
| 1,650 | | | | FirstEnergy Corp. | | | 106,805 |
| 2,500 | | | | FPL Group, Inc. | | | 141,850 |
| 2,040 | | | | PG&E Corp. | | | 92,412 |
| 500 | | | | PPL Corp. | | | 23,395 |
| 1,360 | | | | Public Service Enterprise Group, Inc. | | | 119,381 |
| 1,400 | | | | TECO Energy, Inc. | | | 24,052 |
| 1,440 | | | | TXU Corp. | | | 96,912 |
| | | | | | | |
| | | | | | | 1,469,643 |
| | | | | | | |
| Electrical Components & Equipment: 0.2% | | | |
| 2,120 | | | | Emerson Electric Co. | | | 99,216 |
| | | | | | | |
| | | | | | | 99,216 |
| | | | | | | |
| Electronics: 0.4% | | | |
| 1,260 | | @ | | Agilent Technologies, Inc. | | | 48,434 |
| 900 | | | | Tektronix, Inc. | | | 30,366 |
| 1,560 | | @ | | Thermo Electron Corp. | | | 80,683 |
| 360 | | @ | | Waters Corp. | | | 21,370 |
| | | | | | | |
| | | | | | | 180,853 |
| | | | | | | |
| Engineering & Construction: 0.0% | | | |
| 200 | | | | Fluor Corp. | | | 22,274 |
| | | | | | | |
| | | | | | | 22,274 |
| | | | | | | |
| Entertainment: 0.1% | | | |
| 770 | | | | International Game Technology | | | 30,569 |
| | | | | | | |
| | | | | | | 30,569 |
| | | | | | | |
| Environmental Control: 0.2% | | | |
| 1,700 | | @ | | Allied Waste Industries, Inc. | | | 22,882 |
| 2,280 | | | | Waste Management, Inc. | | | 89,034 |
| | | | | | | |
| | | | | | | 111,916 |
| | | | | | | |
| Food: 1.4% | | | |
| 1,430 | | | | Campbell Soup Co. | | | 55,498 |
| 600 | | @ | | Dean Foods Co. | | | 19,122 |
| 2,150 | | | | General Mills, Inc. | | | 125,603 |
| 400 | | | | Hershey Co. | | | 20,248 |
| 2,620 | | | | HJ Heinz Co. | | | 124,371 |
| 800 | | | | Kellogg Co. | | | 41,432 |
| 3,540 | | | | Kraft Foods, Inc. | | | 124,785 |
| 2,320 | | | | Kroger Co. | | | 65,262 |
| 1,480 | | | | Safeway, Inc. | | | 50,364 |
| 500 | | | | Supervalu, Inc. | | | 23,160 |
| 600 | | | | Sysco Corp. | | | 19,794 |
| 360 | | | | Whole Foods Market, Inc. | | | 13,788 |
| 400 | | | | WM Wrigley Jr. Co. | | | 22,124 |
| | | | | | | |
| | | | | | | 705,551 |
| | | | | | | |
| Forest Products & Paper: 0.3% | | | |
| 2,080 | | | | International Paper Co. | | | 81,224 |
| 440 | | | | Temple-Inland, Inc. | | | 27,073 |
| 300 | | | | Weyerhaeuser Co. | | | 23,679 |
| | | | | | | |
| | | | | | | 131,976 |
| | | | | | | |
See Accompanying Notes to Financial Statements
88
| | |
| ING GET U.S. CORE PORTFOLIO SERIES 7 | | PORTFOLIO OF INVESTMENTS ASOF JUNE 30, 2007 (UNAUDITED) (CONTINUED) |
| | | | | | | |
| Shares | | | | | | Value |
| | | | | | | |
| Gas: 0.2% | | | |
| 500 | | | | KeySpan Corp. | | $ | 20,990 |
| 1,290 | | | | Sempra Energy | | | 76,407 |
| | | | | | | |
| | | | | | | 97,397 |
| | | | | | | |
| Hand/Machine Tools: 0.2% | | | |
| 300 | | | | Black & Decker Corp. | | | 26,493 |
| 640 | | | | Snap-On, Inc. | | | 32,326 |
| 670 | | | | Stanley Works | | | 40,669 |
| | | | | | | |
| | | | | | | 99,488 |
| | | | | | | |
| Healthcare - Products: 2.6% | | | |
| 2,480 | | | | Baxter International, Inc. | | | 139,723 |
| 960 | | | | Becton Dickinson & Co. | | | 71,520 |
| 800 | | | | Biomet, Inc. | | | 36,576 |
| 3,400 | | @ | | Boston Scientific Corp. | | | 52,156 |
| 500 | | | | CR Bard, Inc. | | | 41,315 |
| 9,540 | | | | Johnson & Johnson | | | 587,855 |
| 3,500 | | | | Medtronic, Inc. | | | 181,510 |
| 800 | | @ | | St. Jude Medical, Inc. | | | 33,192 |
| 800 | | | | Stryker Corp. | | | 50,472 |
| 400 | | @ | | Varian Medical Systems, Inc. | | | 17,004 |
| 980 | | @ | | Zimmer Holdings, Inc. | | | 83,192 |
| | | | | | | |
| | | | | | | 1,294,515 |
| | | | | | | |
| Healthcare - Services: 1.2% | | | |
| 1,760 | | | | Aetna, Inc. | | | 86,944 |
| 705 | | @ | | Coventry Health Care, Inc. | | | 40,643 |
| 700 | | @ | | Humana, Inc. | | | 42,637 |
| 330 | | @ | | Laboratory Corp. of America Holdings | | | 25,826 |
| 4,260 | | | | UnitedHealth Group, Inc. | | | 217,856 |
| 2,080 | | @ | | WellPoint, Inc. | | | 166,046 |
| | | | | | | |
| | | | | | | 579,952 |
| | | | | | | |
| Home Builders: 0.2% | | | |
| 800 | | | | Centex Corp. | | | 32,080 |
| 800 | | | | KB Home | | | 31,496 |
| 500 | | | | Lennar Corp. | | | 18,280 |
| | | | | | | |
| | | | | | | 81,856 |
| | | | | | | |
| Home Furnishings: 0.1% | | | |
| 220 | | | | Harman International Industries, Inc. | | | 25,696 |
| 220 | | | | Whirlpool Corp. | | | 24,464 |
| | | | | | | |
| | | | | | | 50,160 |
| | | | | | | |
| Household Products/Wares: 0.3% | | | |
| 300 | | | | Clorox Co. | | | 18,630 |
| 2,060 | | | | Kimberly-Clark Corp. | | | 137,793 |
| | | | | | | |
| | | | | | | 156,423 |
| | | | | | | |
| Housewares: 0.1% | | | |
| 900 | | | | Newell Rubbermaid, Inc. | | | 26,487 |
| | | | | | | |
| | | | | | | 26,487 |
| | | | | | | |
| Insurance: 4.8% | | | |
| 1,360 | | @@ | | ACE Ltd. | | | 85,027 |
| 1,700 | | | | Aflac, Inc. | | | 87,380 |
| 2,300 | | | | Allstate Corp. | | | 141,473 |
| 300 | | | | AMBAC Financial Group, Inc. | | | 26,157 |
| 8,250 | | | | American International Group, Inc. | | | 577,748 |
| 920 | | | | AON Corp. | | | 39,201 |
| 500 | | | | Assurant, Inc. | | | 29,460 |
| 2,040 | �� | | | Chubb Corp. | | | 110,446 |
| 990 | | | | Cigna Corp. | | | 51,698 |
| 2,040 | | | | Genworth Financial, Inc. | | | 70,176 |
| | | | | | | |
| Shares | | | | | | Value |
| | | | | | | |
| 1,490 | | | | Hartford Financial Services Group, Inc. | | $ | 146,780 |
| 829 | | | | Lincoln National Corp. | | | 58,818 |
| 1,300 | | | | Loews Corp. | | | 66,274 |
| 1,500 | | | | Marsh & McLennan Cos., Inc. | | | 46,320 |
| 360 | | | | MBIA, Inc. | | | 22,399 |
| 2,680 | | | | Metlife, Inc. | | | 172,806 |
| 310 | | | | MGIC Investment Corp. | | | 17,627 |
| 1,260 | | | | Principal Financial Group | | | 73,445 |
| 3,420 | | | | Progressive Corp. | | | 81,841 |
| 1,740 | | | | Prudential Financial, Inc. | | | 169,180 |
| 440 | | | | Safeco Corp. | | | 27,394 |
| 510 | | | | Torchmark Corp. | | | 34,170 |
| 2,590 | | | | Travelers Cos., Inc. | | | 138,565 |
| 900 | | | | UnumProvident Corp. | | | 23,499 |
| 900 | | @@ | | XL Capital Ltd. | | | 75,861 |
| | | | | | | |
| | | | | | | 2,373,745 |
| | | | | | | |
| Internet: 1.6% | | | |
| 1,020 | | @ | | Amazon.com, Inc. | | | 69,778 |
| 4,150 | | @ | | eBay, Inc. | | | 133,547 |
| 660 | | @ | | Google, Inc. | | | 345,431 |
| 700 | | @ | | IAC/InterActiveCorp. | | | 24,227 |
| 3,575 | | @ | | Symantec Corp. | | | 72,215 |
| 920 | | @ | | VeriSign, Inc. | | | 29,192 |
| 4,300 | | @ | | Yahoo!, Inc. | | | 116,659 |
| | | | | | | |
| | | | | | | 791,049 |
| | | | | | | |
| Iron/Steel: 0.3% | | | |
| 300 | | | | Allegheny Technologies, Inc. | | | 31,464 |
| 1,160 | | | | Nucor Corp. | | | 68,034 |
| 560 | | | | United States Steel Corp. | | | 60,900 |
| | | | | | | |
| | | | | | | 160,398 |
| | | | | | | |
| Leisure Time: 0.3% | | | |
| 1,650 | | | | Carnival Corp. | | | 80,471 |
| 1,200 | | | | Harley-Davidson, Inc. | | | 71,532 |
| | | | | | | |
| | | | | | | 152,003 |
| | | | | | | |
| Lodging: 0.3% | | | |
| 600 | | | | Harrah’s Entertainment, Inc. | | | 51,156 |
| 700 | | | | Hilton Hotels Corp. | | | 23,429 |
| 720 | | | | Marriott International, Inc. | | | 31,133 |
| 470 | | | | Starwood Hotels & Resorts Worldwide, Inc. | | | 31,523 |
| | | | | | | |
| | | | | | | 137,241 |
| | | | | | | |
| Machinery - Construction & Mining: 0.5% | | | |
| 2,520 | | | | Caterpillar, Inc. | | | 197,316 |
| 400 | | @ | | Terex Corp. | | | 32,520 |
| | | | | | | |
| | | | | | | 229,836 |
| | | | | | | |
| Machinery - Diversified: 0.5% | | | |
| 680 | | | | Cummins, Inc. | | | 68,823 |
| 980 | | | | Deere & Co. | | | 118,325 |
| 470 | | | | Rockwell Automation, Inc. | | | 32,637 |
| | | | | | | |
| | | | | | | 219,785 |
| | | | | | | |
| Media: 2.6% | | | |
| 2,545 | | | | CBS Corp. – Class B | | | 84,799 |
| 1,480 | | | | Clear Channel Communications, Inc. | | | 55,974 |
| 7,830 | | @ | | Comcast Corp. – Class A | | | 220,180 |
| 2,500 | | @ | | DIRECTV Group, Inc. | | | 57,775 |
| 1,000 | | | | Gannett Co., Inc. | | | 54,950 |
| 1,610 | | | | McGraw-Hill Cos., Inc. | | | 109,609 |
See Accompanying Notes to Financial Statements
89
| | |
| ING GET U.S. CORE PORTFOLIO SERIES 7 | | PORTFOLIO OF INVESTMENTS ASOF JUNE 30, 2007 (UNAUDITED) (CONTINUED) |
| | | | | | | |
| Shares | | | | | | Value |
| | | | | | | |
| Media (continued) | | | |
| 8,250 | | | | News Corp., Inc. - Class A | | $ | 174,983 |
| 8,900 | | | | Time Warner, Inc. | | | 187,256 |
| 1,800 | | @ | | Viacom - Class B | | | 74,934 |
| 7,050 | | | | Walt Disney Co. | | | 240,687 |
| | | | | | | |
| | | | | | | 1,261,147 |
| | | | | | | |
| Metal Fabricate/Hardware: 0.1% | | | |
| 300 | | | | Precision Castparts Corp. | | | 36,408 |
| | | | | | | |
| | | | | | | 36,408 |
| | | | | | | |
| Mining: 0.5% | | | | | |
| 2,800 | | | | Alcoa, Inc. | | | 113,484 |
| 1,368 | | | | Freeport-McMoRan Copper & Gold, Inc. | | | 113,298 |
| 900 | | | | Newmont Mining Corp. | | | 35,154 |
| | | | | | | |
| | | | | | | 261,936 |
| | | | | | | |
| Miscellaneous Manufacturing: 4.7% | | | |
| 2,530 | | | | 3M Co. | | | 219,579 |
| 920 | | | | Cooper Industries Ltd. | | | 52,523 |
| 980 | | | | Danaher Corp. | | | 73,990 |
| 1,900 | | | | Eastman Kodak Co. | | | 52,877 |
| 1,130 | | | | Eaton Corp. | | | 105,090 |
| 29,800 | | | | General Electric Co. | | | 1,140,735 |
| 2,710 | | | | Honeywell International, Inc. | | | 152,519 |
| 1,900 | | | | Illinois Tool Works, Inc. | | | 102,961 |
| 980 | | | | ITT Corp. | | | 66,914 |
| 500 | | | | Pall Corp. | | | 22,995 |
| 860 | | | | Parker Hannifin Corp. | | | 84,203 |
| 200 | | | | Textron, Inc. | | | 22,022 |
| 6,500 | | @ | | Tyco International Ltd. | | | 219,635 |
| | | | | | | |
| | | | | | | 2,316,043 |
| | | | | | | |
| Office/Business Equipment: 0.1% | | | |
| 3,180 | | @ | | Xerox Corp. | | | 58,766 |
| | | | | | | |
| | | | | | | 58,766 |
| | | | | | | |
| Oil & Gas: 7.7% | | | |
| 1,620 | | | | Anadarko Petroleum Corp. | | | 84,224 |
| 700 | | | | Apache Corp. | | | 57,113 |
| 1,300 | | | | Chesapeake Energy Corp. | | | 44,980 |
| 7,395 | | | | Chevron Corp. | | | 622,955 |
| 5,262 | | | | ConocoPhillips | | | 413,067 |
| 1,480 | | | | Devon Energy Corp. | | | 115,869 |
| 800 | | | | ENSCO International, Inc. | | | 48,808 |
| 410 | | | | EOG Resources, Inc. | | | 29,955 |
| 18,060 | | | | ExxonMobil Corp. | | | 1,514,873 |
| 500 | | | | Hess Corp. | | | 29,480 |
| 2,880 | | | | Marathon Oil Corp. | | | 172,685 |
| 400 | | | | Murphy Oil Corp. | | | 23,776 |
| 900 | | @,@@ | | Nabors Industries Ltd. | | | 30,042 |
| 400 | | | | Noble Corp. | | | 39,008 |
| 3,180 | | | | Occidental Petroleum Corp. | | | 184,058 |
| 600 | | | | Sunoco, Inc. | | | 47,808 |
| 1,000 | | @ | | Transocean, Inc. | | | 105,980 |
| 2,080 | | | | Valero Energy Corp. | | | 153,629 |
| 1,220 | | | | XTO Energy, Inc. | | | 73,322 |
| | | | | | | |
| | | | | | | 3,791,632 |
| | | | | | | |
| Oil & Gas Services: 1.3% | | | |
| 1,000 | | | | Baker Hughes, Inc. | | | 84,130 |
| 4,220 | | | | Halliburton Co. | | | 145,590 |
| 700 | | @ | | National Oilwell Varco, Inc. | | | 72,968 |
| | | | | | | |
| Shares | | | | | | Value |
| | | | | | | |
| 3,360 | | | | Schlumberger Ltd. | | $ | 285,398 |
| 800 | | @ | | Weatherford International Ltd. | | | 44,192 |
| | | | | | | |
| | | | | | | 632,278 |
| | | | | | | |
| Packaging & Containers: 0.2% | | | |
| 430 | | | | Ball Corp. | | | 22,863 |
| 600 | | | | Bemis Co. | | | 19,908 |
| 1,360 | | @ | | Pactiv Corp. | | | 43,370 |
| 1,100 | | | | Sealed Air Corp. | | | 34,122 |
| | | | | | | |
| | | | | | | 120,263 |
| | | | | | | |
| Pharmaceuticals: 4.8% | | | |
| 3,820 | | | | Abbott Laboratories | | | 204,561 |
| 900 | | | | AmerisourceBergen Corp. | | | 44,523 |
| 540 | | @ | | Barr Pharmaceuticals, Inc. | | | 27,124 |
| 6,000 | | | | Bristol-Myers Squibb Co. | | | 189,360 |
| 1,320 | | | | Cardinal Health, Inc. | | | 93,245 |
| 2,900 | | | | Eli Lilly & Co. | | | 162,052 |
| 820 | | @ | | Express Scripts, Inc. | | | 41,008 |
| 1,320 | | @ | | Forest Laboratories, Inc. | | | 60,258 |
| 3,320 | | @ | | Gilead Sciences, Inc. | | | 128,716 |
| 1,100 | | @ | | King Pharmaceuticals, Inc. | | | 22,506 |
| 800 | | @ | | Medco Health Solutions, Inc. | | | 62,392 |
| 6,820 | | | | Merck & Co., Inc. | | | 339,636 |
| 1,260 | | | | Mylan Laboratories | | | 22,919 |
| 21,770 | | | | Pfizer, Inc. | | | 556,659 |
| 5,640 | | | | Schering-Plough Corp. | | | 171,682 |
| 700 | | @ | | Watson Pharmaceuticals, Inc. | | | 22,771 |
| 3,820 | | | | Wyeth | | | 219,039 |
| | | | | | | |
| | | | | | | 2,368,451 |
| | | | | | | |
| Pipelines: 0.4% | | | |
| 2,000 | | | | El Paso Corp. | | | 34,460 |
| 800 | | | | Questar Corp. | | | 42,280 |
| 1,800 | | | | Spectra Energy Corp. | | | 46,728 |
| 1,830 | | | | Williams Cos., Inc. | | | 57,865 |
| | | | | | | |
| | | | | | | 181,333 |
| | | | | | | |
| Real Estate Investment Trusts: 0.7% | | | |
| 320 | | | | Apartment Investment &
Management Co. | | | 16,134 |
| 610 | | | | Archstone-Smith Trust | | | 36,057 |
| 500 | | | | Boston Properties, Inc. | | | 51,065 |
| 570 | | | | Developers Diversified Realty Corp. | | | 30,045 |
| 500 | | | | Equity Residential | | | 22,815 |
| 1,200 | | | | Host Hotels & Resorts, Inc. | | | 27,744 |
| 600 | | | | Kimco Realty Corp. | | | 22,842 |
| 900 | | | | Prologis | | | 51,210 |
| 600 | | | | Simon Property Group, Inc. | | | 55,824 |
| 300 | | | | Vornado Realty Trust | | | 32,952 |
| | | | | | | |
| | | | | | | 346,688 |
| | | | | | | |
| Retail: 5.0% | | | |
| 520 | | @ | | Autozone, Inc. | | | 71,042 |
| 600 | | @ | | Bed Bath & Beyond, Inc. | | | 21,594 |
| 1,555 | | | | Best Buy Co., Inc. | | | 72,572 |
| 900 | | @ | | Big Lots, Inc. | | | 26,478 |
| 1,690 | | | | Costco Wholesale Corp. | | | 98,899 |
| 4,287 | | | | CVS Corp. | | | 156,261 |
| 680 | | | | Darden Restaurants, Inc. | | | 29,913 |
| 900 | | | | Dollar General Corp. | | | 19,728 |
| 1,000 | | | | Family Dollar Stores, Inc. | | | 34,320 |
| 2,150 | | | | Gap, Inc. | | | 41,065 |
| 5,420 | | | | Home Depot, Inc. | | | 213,277 |
See Accompanying Notes to Financial Statements
90
| | |
| ING GET U.S. CORE PORTFOLIO SERIES 7 | | PORTFOLIO OF INVESTMENTS ASOF JUNE 30, 2007 (UNAUDITED) (CONTINUED) |
| | | | | | | |
| Shares | | | | | | Value |
| | | | | | | |
| Retail (continued) | | | |
| 980 | | | | JC Penney Co., Inc. | | $ | 70,932 |
| 1,270 | | @ | | Kohl’s Corp. | | | 90,208 |
| 5,280 | | | | Lowe’s Cos., Inc. | | | 162,043 |
| 2,338 | | | | Macy’s, Inc. | | | 93,006 |
| 4,300 | | | | McDonald’s Corp. | | | 218,268 |
| 860 | | | | Nordstrom, Inc. | | | 43,963 |
| 660 | | @ | | Office Depot, Inc. | | | 19,998 |
| 900 | | | | RadioShack Corp. | | | 29,826 |
| 290 | | @ | | Sears Holding Corp. | | | 49,155 |
| 1,935 | | | | Staples, Inc. | | | 45,918 |
| 2,360 | | @ | | Starbucks Corp. | | | 61,926 |
| 2,770 | | | | Target Corp. | | | 176,172 |
| 1,630 | | | | TJX Cos., Inc. | | | 44,825 |
| 3,060 | | | | Walgreen Co. | | | 133,232 |
| 7,020 | | | | Wal-Mart Stores, Inc. | | | 337,732 |
| 900 | | | | Wendy’s International, Inc. | | | 33,075 |
| 1,780 | | | | Yum! Brands, Inc. | | | 58,242 |
| | | | | | | |
| | | | | | | 2,453,670 |
| | | | | | | |
| Savings & Loans: 0.4% | | | |
| 1,700 | | | | Hudson City Bancorp., Inc. | | | 20,774 |
| 1,000 | | | | Sovereign Bancorp., Inc. | | | 21,140 |
| 3,825 | | | | Washington Mutual, Inc. | | | 163,098 |
| | | | | | | |
| | | | | | | 205,012 |
| | | | | | | |
| Semiconductors: 2.2% | | | |
| 1,540 | | @ | | Advanced Micro Devices, Inc. | | | 22,022 |
| 1,600 | | | | Altera Corp. | | | 35,408 |
| 850 | | | | Analog Devices, Inc. | | | 31,994 |
| 2,850 | | | | Applied Materials, Inc. | | | 56,630 |
| 1,100 | | @ | | Broadcom Corp. | | | 32,175 |
| 17,310 | | | | Intel Corp. | | | 411,286 |
| 1,000 | | | | KLA-Tencor Corp. | | | 54,950 |
| 900 | | | | Linear Technology Corp. | | | 32,562 |
| 2,000 | | @ | | LSI Logic Corp. | | | 15,020 |
| 920 | | | | Maxim Integrated Products | | | 30,737 |
| 800 | | @ | | MEMC Electronic Materials, Inc. | | | 48,896 |
| 2,110 | | @ | | Micron Technology, Inc. | | | 26,438 |
| 920 | | | | National Semiconductor Corp. | | | 26,008 |
| 860 | | @ | | Novellus Systems, Inc. | | | 24,398 |
| 940 | | @ | | Nvidia Corp. | | | 38,831 |
| 1,300 | | @ | | Teradyne, Inc. | | | 22,854 |
| 3,900 | | | | Texas Instruments, Inc. | | | 146,757 |
| 920 | | | | Xilinx, Inc. | | | 24,628 |
| | | | | | | |
| | | | | | | 1,081,594 |
| | | | | | | |
| Software: 3.3% | | | |
| 1,800 | | @ | | Adobe Systems, Inc. | | | 72,270 |
| 880 | | @ | | Autodesk, Inc. | | | 41,430 |
| 2,000 | | | | Automatic Data Processing, Inc. | | | 96,940 |
| 950 | | @ | | BMC Software, Inc. | | | 28,785 |
| 2,370 | | | | CA, Inc. | | | 61,217 |
| 1,000 | | @ | | Citrix Systems, Inc. | | | 33,670 |
| 2,660 | | @ | | Compuware Corp. | | | 31,548 |
| 860 | | @ | | Electronic Arts, Inc. | | | 40,695 |
| 2,340 | | | | First Data Corp. | | | 76,448 |
| 910 | | @ | | Fiserv, Inc. | | | 51,688 |
| 1,620 | | @ | | Intuit, Inc. | | | 48,730 |
| 25,330 | | | | Microsoft Corp. | | | 746,475 |
| 2,800 | | @ | | Novell, Inc. | | | 21,812 |
| 11,360 | | @ | | Oracle Corp. | | | 223,906 |
| 1,110 | | | | Paychex, Inc. | | | 43,423 |
| | | | | | | |
| | | | | | | 1,619,037 |
| | | | | | | |
| | | | | | | | |
| Shares | | | | | | Value |
| | | | | | | | |
| | Telecommunications: 5.5% | | | |
| | 800 | | @@ | | Allergan, Inc. | | $ | 46,112 |
| | 1,000 | | | | Alltel Corp. | | | 67,550 |
| | 18,643 | | | | AT&T, Inc. | | | 773,685 |
| | 1,520 | | @ | | Avaya, Inc. | | | 25,597 |
| | 870 | | | | CenturyTel, Inc. | | | 42,674 |
| | 19,760 | | @ | | Cisco Systems, Inc. | | | 550,316 |
| | 2,240 | | | | Citizens Communications Co. | | | 34,205 |
| | 5,790 | | @ | | Corning, Inc. | | | 147,935 |
| | 661 | | | | Embarq Corp. | | | 41,888 |
| | 1,600 | | @ | | Juniper Networks, Inc. | | | 40,272 |
| | 7,980 | | | | Motorola, Inc. | | | 141,246 |
| | 5,120 | | | | Qualcomm, Inc. | | | 222,157 |
| | 4,500 | | @ | | Qwest Communications International, Inc. | | | 43,650 |
| | 7,943 | | | | Sprint Nextel Corp. | | | 164,500 |
| | 2,100 | | @ | | Tellabs, Inc. | | | 22,596 |
| | 7,900 | | | | Verizon Communications, Inc. | | | 325,243 |
| | | | | | | | |
| | | | | | | | 2,689,626 |
| | | | | | | | |
| | Toys/Games/Hobbies: 0.2% |
| | 1,000 | | | | Hasbro, Inc. | | | 31,410 |
| | 1,920 | | | | Mattel, Inc. | | | 48,557 |
| | | | | | | | |
| | | | | | | | 79,967 |
| | | | | | | | |
| | Transportation: 1.4% | | | |
| | 990 | | | | Burlington Northern Santa Fe Corp. | | | 84,289 |
| | 400 | | | | CH Robinson Worldwide, Inc. | | | 21,008 |
| | 1,380 | | | | CSX Corp. | | | 62,210 |
| | 1,090 | | | | FedEx Corp. | | | 120,957 |
| | 1,220 | | | | Norfolk Southern Corp. | | | 64,135 |
| | 940 | | | | Union Pacific Corp. | | | 108,241 |
| | 2,800 | | | | United Parcel Service, Inc. | | | 204,400 |
| | | | | | | | |
| | | | | | | | 665,240 |
| | | | | | | | |
| | | | | Total Common Stock | | | |
| | | | | (Cost $39,161,732 ) | | | 42,936,646 |
| | | | | | | | |
| | | |
Principal
Amount | | | | | | |
| | U.S. TREASURY OBLIGATIONS: 6.2% | | | |
| | U.S. Treasury STRIP: 6.2% | | | |
| $ | 3,805,000 | | ^ | | 4.870%, due 02/15/12 | | $ | 3,045,282 |
| | | | | | | | |
| | | | | Total U.S. Treasury Obligations | | | |
| | | | | (Cost $3,034,425 ) | | | 3,045,282 |
| | | | | | | | |
| | OTHER BONDS: 5.3% | | | |
| | Foreign Government Bonds: 5.3% | | | |
| | 3,300,000 | | @@, Z | | Israel Government International Bond, 4.900%, due 05/15/12 | | | 2,613,244 |
| | | | | | | | |
| | | | | Total Other Bonds | | | |
| | | | | (Cost $2,654,684 ) | | | 2,613,244 |
| | | | | | | | |
| | | | | Total Long-Term Investments | | | |
| | | | | (Cost $44,850,841) | | | 48,595,172 |
| | | | | | | | |
| | | |
| Shares | | | | | | |
| | SHORT-TERM INVESTMENTS: 0.8% | | | |
| | Mutual Fund: 0.0% | | | |
| | 5,000 | | ** | | ING Institutional Prime Money Market Fund | | | 5,000 |
| | | | | | | | |
| | | | | Total Mutual Fund | | | |
| | | | | (Cost $5,000) | | | 5,000 |
| | | | | | | | |
See Accompanying Notes to Financial Statements
91
| | |
| ING GET U.S. CORE PORTFOLIO SERIES 7 | | PORTFOLIO OF INVESTMENTS ASOF JUNE 30, 2007 (UNAUDITED) (CONTINUED) |
| | | | | | | | | | |
| | | |
Principal
Amount | | | | | | | Value | |
| | Repurchase Agreement: 0.8% | | | | | |
| $ | 385,000 | | Morgan Stanley Repurchase Agreement dated 06/29/07, 5.300%, due 07/02/07, $385,170 to be received upon repurchase (Collateralized by $825,000 Resolution Funding Corporation, Discount Note, Market Value $393,203, due 01/15/21) | | | $ | 385,000 | |
| | | | | | | | | | |
| | | Total Repurchase Agreement (Cost $385,000) | | | | | | 385,000 | |
| | | | | | | | | | |
| | | Total Short-Term Investments (Cost $390,000) | | | | | | 390,000 | |
| | | | | | | | | | |
| | | Total Investments in Securities | | | | | | | |
| | | (Cost $45,240,841)* | | 100.0 | % | | $ | 48,985,172 | |
| | | Other Assets and
Liabilities - Net | | (0.0 | ) | | | (16,222 | ) |
| | | | | | | | | | |
| | | Net Assets | | 100.0 | % | | $ | 48,968,950 | |
| | | | | | | | | | |
| @ | Non-income producing security |
| STRIP | Separate Trading of Registered Interest and Principal of Securities |
| ** | Investment in affiliate |
| ^ | Interest Only (IO) Security |
| Z | Indicates Zero Coupon Bond; rate shown reflects effective yield on the date of purchase |
| * | Cost for federal income tax purposes is $45,868,829. |
| | | | |
Net unrealized appreciation consists of: | | | | |
Gross Unrealized Appreciation | | $ | 3,710,856 | |
Gross Unrealized Depreciation | | | (594,513 | ) |
| | | | |
Net Unrealized Appreciation | | $ | 3,116,343 | |
| | | | |
See Accompanying Notes to Financial Statements
92
| | |
| ING GET U.S. CORE PORTFOLIO SERIES 8 | | PORTFOLIO OF INVESTMENTS ASOF JUNE 30, 2007 (UNAUDITED) |
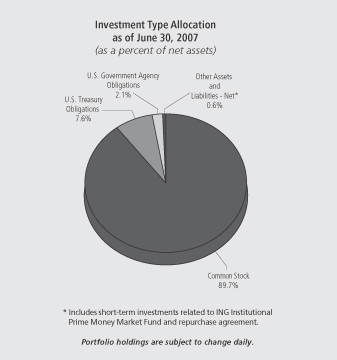
| | | | | | | |
| Shares | | | | | | Value |
| | | | | | | |
| COMMON STOCK: 89.7% | | | |
| Advertising: 0.2% | | | |
| 1,320 | | | | Omnicom Group | | $ | 69,854 |
| | | | | | | |
| | | | | | | 69,854 |
| | | | | | | |
| Aerospace/Defense: 2.1% | | | |
| 1,580 | | | | Boeing Co. | | | 151,933 |
| 1,030 | | | | General Dynamics Corp. | | | 80,567 |
| 300 | | | | Goodrich Corp. | | | 17,868 |
| 400 | | | | L-3 Communications Holdings, Inc. | | | 38,956 |
| 950 | | | | Lockheed Martin Corp. | | | 89,424 |
| 570 | | | | Northrop Grumman Corp. | | | 44,386 |
| 1,641 | | | | Raytheon Co. | | | 88,433 |
| 2,250 | | | | United Technologies Corp. | | | 159,593 |
| | | | | | | |
| | | | | | | 671,160 |
| | | | | | | |
| Agriculture: 1.4% | | | |
| 4,370 | | | | Altria Group, Inc. | | | 306,512 |
| 1,280 | | | | Archer-Daniels-Midland Co. | | | 42,355 |
| 620 | | | | Reynolds American, Inc. | | | 40,424 |
| 740 | | | | UST, Inc. | | | 39,745 |
| | | | | | | |
| | | | | | | 429,036 |
| | | | | | | |
| Apparel: 0.4% | | | |
| 1,260 | | @ | | Coach, Inc. | | | 59,711 |
| 900 | | | | Nike, Inc. | | | 52,461 |
| 200 | | | | Polo Ralph Lauren Corp. | | | 19,622 |
| | | | | | | |
| | | | | | | 131,794 |
| | | | | | | |
| Auto Manufacturers: 0.4% | | | |
| 4,730 | | | | Ford Motor Co. | | | 44,557 |
| 1,000 | | | | General Motors Corp. | | | 37,800 |
| | | | | | | |
| Shares | | | | | | Value |
| | | | | | | |
| 635 | | | | Paccar, Inc. | | $ | 55,270 |
| | | | | | | |
| | | | | | | 137,627 |
| | | | | | | |
| Auto Parts & Equipment: 0.2% | | | |
| 400 | | @ | | Goodyear Tire & Rubber Co. | | | 13,904 |
| 390 | | | | Johnson Controls, Inc. | | | 45,150 |
| | | | | | | |
| | | | | | | 59,054 |
| | | | | | | |
| Banks: 5.5% | | | |
| 9,493 | | | | Bank of America Corp. | | | 464,113 |
| 1,560 | | @ | | Bank of New York Co., Inc. | | | 64,646 |
| 1,120 | | | | BB&T Corp. | | | 45,562 |
| 723 | | | | Capital One Financial Corp. | | | 56,712 |
| 440 | | | | Comerica, Inc. | | | 26,167 |
| 300 | | | | Compass Bancshares, Inc. | | | 20,694 |
| 550 | | | | Fifth Third Bancorp. | | | 21,874 |
| 2,420 | | | | Huntington Bancshares, Inc. | | | 55,031 |
| 1,730 | | | | Keycorp. | | | 59,391 |
| 600 | | | | Marshall & Ilsley Corp. | | | 28,578 |
| 1,180 | | | | Mellon Financial Corp. | | | 51,920 |
| 1,350 | | | | National City Corp. | | | 44,982 |
| 300 | | | | Northern Trust Corp. | | | 19,272 |
| 560 | | | | PNC Financial Services Group, Inc. | | | 40,085 |
| 2,411 | | | | Regions Financial Corp. | | | 79,804 |
| 580 | | | | State Street Corp. | | | 39,672 |
| 530 | | | | SunTrust Banks, Inc. | | | 45,442 |
| 2,400 | | | | US Bancorp. | | | 79,080 |
| 4,258 | | | | Wachovia Corp. | | | 218,223 |
| 7,580 | | | | Wells Fargo & Co. | | | 266,589 |
| | | | | | | |
| | | | | | | 1,727,837 |
| | | | | | | |
| Beverages: 1.7% | | | |
| 1,410 | | | | Anheuser-Busch Cos., Inc. | | | 73,546 |
| 4,060 | | | | Coca-Cola Co. | | | 212,379 |
| 1,040 | | | | Pepsi Bottling Group, Inc. | | | 35,027 |
| 3,410 | | | | PepsiCo, Inc. | | | 221,139 |
| | | | | | | |
| | | | | | | 542,091 |
| | | | | | | |
| Biotechnology: 0.8% | | | |
| 2,240 | | @ | | Amgen, Inc. | | | 123,850 |
| 730 | | @ | | Biogen Idec, Inc. | | | 39,055 |
| 700 | | @ | | Celgene Corp. | | | 40,131 |
| 610 | | @ | | Genzyme Corp. | | | 39,284 |
| | | | | | | |
| | | | | | | 242,320 |
| | | | | | | |
| Building Materials: 0.2% | | | |
| 300 | | | | American Standard Cos., Inc. | | | 17,694 |
| 1,550 | | | | Masco Corp. | | | 44,129 |
| | | | | | | |
| | | | | | | 61,823 |
| | | | | | | |
| Chemicals: 1.5% | | | |
| 200 | | | | Air Products & Chemicals, Inc. | | | 16,074 |
| 420 | | | | Ashland, Inc. | | | 26,859 |
| 1,800 | | | | Dow Chemical Co. | | | 79,596 |
| 400 | | | | Ecolab, Inc. | | | 17,080 |
| 1,730 | | | | EI DuPont de Nemours & Co. | | | 87,953 |
| 620 | | | | International Flavors & Fragrances, Inc. | | | 32,327 |
| 1,220 | | | | Monsanto Co. | | | 82,399 |
| 560 | | | | PPG Industries, Inc. | | | 42,622 |
| 400 | | | | Praxair, Inc. | | | 28,796 |
| 420 | | | | Sherwin-Williams Co. | | | 27,917 |
| 900 | | | | Sigma-Aldrich Corp. | | | 38,403 |
| | | | | | | |
| | | | | | | 480,026 |
| | | | | | | |
See Accompanying Notes to Financial Statements
93
| | |
| ING GET U.S. CORE PORTFOLIO SERIES 8 | | PORTFOLIO OF INVESTMENTS ASOF JUNE 30, 2007 (UNAUDITED) (CONTINUED) |
| | | | | | | |
| Shares | | | | | | Value |
| | | | | | | |
| Coal: 0.1% | | | |
| 400 | | | | Consol Energy, Inc. | | $ | 18,444 |
| 580 | | | | Peabody Energy Corp. | | | 28,060 |
| | | | | | | |
| | | | | | | 46,504 |
| | | | | | | |
| Commercial Services: 0.7% | | | |
| 390 | | @ | | Apollo Group, Inc. | | | 22,788 |
| 700 | | @ | | Convergys Corp. | | | 16,968 |
| 380 | | | | Equifax, Inc. | | | 16,880 |
| 770 | | | | McKesson Corp. | | | 45,923 |
| 540 | | | | Moody’s Corp. | | | 33,588 |
| 390 | | | | Robert Half International, Inc. | | | 14,235 |
| 600 | | | | RR Donnelley & Sons Co. | | | 26,106 |
| 1,410 | | | | Western Union Co. | | | 29,370 |
| | | | | | | |
| | | | | | | 205,858 |
| | | | | | | |
| Computers: 3.9% | | | |
| 200 | | @ | | Affiliated Computer Services, Inc. | | | 11,344 |
| 1,800 | | @ | | Apple, Inc. | | | 219,672 |
| 160 | | @ | | Cognizant Technology Solutions Corp. | | | 12,014 |
| 540 | | @ | | Computer Sciences Corp. | | | 31,941 |
| 5,150 | | @ | | Dell, Inc. | | | 147,033 |
| 1,420 | | | | Electronic Data Systems Corp. | | | 39,377 |
| 4,930 | | @ | | EMC Corp. | | | 89,233 |
| 5,580 | | | | Hewlett-Packard Co. | | | 248,980 |
| 2,940 | | | | International Business Machines Corp. | | | 309,435 |
| 320 | | @ | | Lexmark International, Inc. | | | 15,779 |
| 360 | | @ | | NCR Corp. | | | 18,914 |
| 980 | | @ | | Network Appliance, Inc. | | | 28,616 |
| 490 | | @ | | Sandisk Corp. | | | 23,981 |
| 7,580 | | @ | | Sun Microsystems, Inc. | | | 39,871 |
| | | | | | | |
| | | | | | | 1,236,190 |
| | | | | | | |
| Cosmetics/Personal Care: 1.7% | | | |
| 650 | | | | Avon Products, Inc. | | | 23,888 |
| 1,020 | | | | Colgate-Palmolive Co. | | | 66,147 |
| 520 | | | | Estee Lauder Cos., Inc. | | | 23,665 |
| 6,832 | | | | Procter & Gamble Co. | | | 418,050 |
| | | | | | | |
| | | | | | | 531,750 |
| | | | | | | |
| Distribution/Wholesale: 0.1% | | | |
| 320 | | | | WW Grainger, Inc. | | | 29,776 |
| | | | | | | |
| | | | | | | 29,776 |
| | | | | | | |
| Diversified Financial Services: 7.3% | | | |
| 2,490 | | | | American Express Co. | | | 152,338 |
| 540 | | | | Ameriprise Financial, Inc. | | | 34,328 |
| 240 | | | | Bear Stearns Cos., Inc. | | | 33,600 |
| 2,290 | | | | Charles Schwab Corp. | | | 46,991 |
| 100 | | | | Chicago Mercantile Exchange Holdings, Inc. | | | 53,436 |
| 540 | | | | CIT Group, Inc. | | | 29,608 |
| 9,900 | | | | Citigroup, Inc. | | | 507,771 |
| 1,210 | | | | Countrywide Financial Corp. | | | 43,984 |
| 780 | | @ | | E*Trade Financial Corp. | | | 17,230 |
| 1,750 | | | | Fannie Mae | | | 114,328 |
| 390 | | | | Franklin Resources, Inc. | | | 51,663 |
| 1,390 | | | | Freddie Mac | | | 84,373 |
| 860 | | | | Goldman Sachs Group, Inc. | | | 186,405 |
| 660 | | | | Janus Capital Group, Inc. | | | 18,374 |
| 7,600 | | | | JP Morgan Chase & Co. | | | 368,220 |
| 200 | | | | Legg Mason, Inc. | | | 19,676 |
| | | | | | | |
| Shares | | | | | | Value |
| | | | | | | |
| 1,190 | | | | Lehman Brothers Holdings, Inc. | | $ | 88,679 |
| 2,000 | | | | Merrill Lynch & Co., Inc. | | | 167,160 |
| 2,410 | | | | Morgan Stanley | | | 202,151 |
| 930 | | | | SLM Corp. | | | 53,549 |
| 300 | | | | T. Rowe Price Group, Inc. | | | 15,567 |
| | | | | | | |
| | | | | | | 2,289,431 |
| | | | | | | |
| Electric: 3.0% | | | |
| 1,410 | | @ | | AES Corp. | | | 30,851 |
| 600 | | | | American Electric Power Co., Inc. | | | 27,024 |
| 900 | | | | CMS Energy Corp. | | | 15,480 |
| 560 | | | | Constellation Energy Group, Inc. | | | 48,815 |
| 800 | | | | Dominion Resources, Inc. | | | 69,048 |
| 1,100 | | | | DTE Energy Co. | | | 53,042 |
| 900 | | | | Duke Energy Corp. | | | 16,470 |
| 1,480 | | | | Edison International | | | 83,058 |
| 1,000 | | | | Entergy Corp. | | | 107,350 |
| 1,540 | | | | Exelon Corp. | | | 111,804 |
| 1,070 | | | | FirstEnergy Corp. | | | 69,261 |
| 1,500 | | | | FPL Group, Inc. | | | 85,110 |
| 1,230 | | | | PG&E Corp. | | | 55,719 |
| 400 | | | | PPL Corp. | | | 18,716 |
| 720 | | | | Public Service Enterprise Group, Inc. | | | 63,202 |
| 900 | | | | TECO Energy, Inc. | | | 15,462 |
| 910 | | | | TXU Corp. | | | 61,243 |
| | | | | | | |
| | | | | | | 931,655 |
| | | | | | | |
| Electrical Components & Equipment: 0.2% | | | |
| 1,360 | | | | Emerson Electric Co. | | | 63,648 |
| | | | | | | |
| | | | | | | 63,648 |
| | | | | | | |
| Electronics: 0.4% | | | |
| 870 | | @ | | Agilent Technologies, Inc. | | | 33,443 |
| 600 | | | | Tektronix, Inc. | | | 20,244 |
| 1,030 | | @ | | Thermo Electron Corp. | | | 53,272 |
| 240 | | @ | | Waters Corp. | | | 14,246 |
| | | | | | | |
| | | | | | | 121,205 |
| | | | | | | |
| Entertainment: 0.1% | | | |
| 580 | | | | International Game Technology | | | 23,026 |
| | | | | | | |
| | | | | | | 23,026 |
| | | | | | | |
| Environmental Control: 0.2% | | | |
| 1,100 | | @ | | Allied Waste Industries, Inc. | | | 14,806 |
| 1,620 | | | | Waste Management, Inc. | | | 63,261 |
| | | | | | | |
| | | | | | | 78,067 |
| | | | | | | |
| Food: 1.5% | | | |
| 590 | | | | Campbell Soup Co. | | | 22,898 |
| 400 | | @ | | Dean Foods Co. | | | 12,748 |
| 1,450 | | | | General Mills, Inc. | | | 84,709 |
| 300 | | | | Hershey Co. | | | 15,186 |
| 1,760 | | | | HJ Heinz Co. | | | 83,547 |
| 500 | | | | Kellogg Co. | | | 25,895 |
| 2,454 | | | | Kraft Foods, Inc. | | | 86,504 |
| 1,510 | | | | Kroger Co. | | | 42,476 |
| 980 | | | | Safeway, Inc. | | | 33,349 |
| 300 | | | | Supervalu, Inc. | | | 13,896 |
| 400 | | | | Sysco Corp. | | | 13,196 |
| 340 | | | | Whole Foods Market, Inc. | | | 13,022 |
| 300 | | | | WM Wrigley Jr. Co. | | | 16,593 |
| | | | | | | |
| | | | | | | 464,019 |
| | | | | | | |
See Accompanying Notes to Financial Statements
94
| | |
| ING GET U.S. CORE PORTFOLIO SERIES 8 | | PORTFOLIO OF INVESTMENTS ASOF JUNE 30, 2007 (UNAUDITED) (CONTINUED) |
| | | | | | | |
| Shares | | | | | | Value |
| | | | | | | |
| Forest Products & Paper: 0.3% | | | |
| 1,100 | | | | International Paper Co. | | $ | 42,955 |
| 320 | | | | Temple-Inland, Inc. | | | 19,690 |
| 200 | | | | Weyerhaeuser Co. | | | 15,786 |
| | | | | | | |
| | | | | | | 78,431 |
| | | | | | | |
| Gas: 0.2% | | | |
| 400 | | | | KeySpan Corp. | | | 16,792 |
| 680 | | | | Sempra Energy | | | 40,276 |
| | | | | | | |
| | | | | | | 57,068 |
| | | | | | | |
| Hand/Machine Tools: 0.2% | | | |
| 210 | | | | Black & Decker Corp. | | | 18,545 |
| 400 | | | | Snap-On, Inc. | | | 20,204 |
| 420 | | | | Stanley Works | | | 25,494 |
| | | | | | | |
| | | | | | | 64,243 |
| | | | | | | |
| Healthcare - Products: 2.7% | | | |
| 1,790 | | | | Baxter International, Inc. | | | 100,849 |
| 590 | | | | Becton Dickinson & Co. | | | 43,955 |
| 500 | | | | Biomet, Inc. | | | 22,860 |
| 2,460 | | @ | | Boston Scientific Corp. | | | 37,736 |
| 300 | | | | CR Bard, Inc. | | | 24,789 |
| 6,450 | | | | Johnson & Johnson | | | 397,449 |
| 2,200 | | | | Medtronic, Inc. | | | 114,092 |
| 400 | | @ | | St. Jude Medical, Inc. | | | 16,596 |
| 600 | | | | Stryker Corp. | | | 37,854 |
| 300 | | @ | | Varian Medical Systems, Inc. | | | 12,753 |
| 560 | | @ | | Zimmer Holdings, Inc. | | | 47,538 |
| | | | | | | |
| | | | | | | 856,471 |
| | | | | | | |
| Healthcare - Services: 1.2% | | | |
| 1,100 | | | | Aetna, Inc. | | | 54,340 |
| 500 | | @ | | Coventry Health Care, Inc. | | | 28,825 |
| 480 | | @ | | Humana, Inc. | | | 29,237 |
| 240 | | @ | | Laboratory Corp. of America Holdings | | | 18,782 |
| 2,930 | | | | UnitedHealth Group, Inc. | | | 149,840 |
| 1,270 | | @ | | WellPoint, Inc. | | | 101,384 |
| | | | | | | |
| | | | | | | 382,408 |
| | | | | | | |
| Home Builders: 0.2% | | | |
| 500 | | | | Centex Corp. | | | 20,050 |
| 500 | | | | KB Home | | | 19,685 |
| 300 | | | | Lennar Corp. | | | 10,968 |
| | | | | | | |
| | | | | | | 50,703 |
| | | | | | | |
| Home Furnishings: 0.1% | | | |
| 120 | | | | Harman International Industries, Inc. | | | 14,016 |
| 100 | | | | Whirlpool Corp. | | | 11,120 |
| | | | | | | |
| | | | | | | 25,136 |
| | | | | | | |
| Household Products/Wares: 0.3% | | | |
| 200 | | | | Clorox Co. | | | 12,420 |
| 1,200 | | | | Kimberly-Clark Corp. | | | 80,268 |
| | | | | | | |
| | | | | | | 92,688 |
| | | | | | | |
| Housewares: 0.1% | | | |
| 600 | | | | Newell Rubbermaid, Inc. | | | 17,658 |
| | | | | | | |
| | | | | | | 17,658 |
| | | | | | | |
| Insurance: 5.0% | | | |
| 840 | | @@ | | ACE Ltd. | | | 52,517 |
| 1,050 | | | | Aflac, Inc. | | | 53,970 |
| | | | | | | |
| Shares | | | | | | Value |
| | | | | | | |
| 1,880 | | | | Allstate Corp. | | $ | 115,639 |
| 190 | | | | AMBAC Financial Group, Inc. | | | 16,566 |
| 5,470 | | | | American International Group, Inc. | | | 383,064 |
| 710 | | | | AON Corp. | | | 30,253 |
| 300 | | | | Assurant, Inc. | | | 17,676 |
| 1,360 | | | | Chubb Corp. | | | 73,630 |
| 810 | | | | Cigna Corp. | | | 42,298 |
| 1,530 | | | | Genworth Financial, Inc. | | | 52,632 |
| 780 | | | | Hartford Financial Services Group, Inc. | | | 76,838 |
| 504 | | | | Lincoln National Corp. | | | 35,759 |
| 870 | | | | Loews Corp. | | | 44,353 |
| 900 | | | | Marsh & McLennan Cos., Inc. | | | 27,792 |
| 240 | | | | MBIA, Inc. | | | 14,933 |
| 1,770 | | | | Metlife, Inc. | | | 114,130 |
| 210 | | | | MGIC Investment Corp. | | | 11,941 |
| 910 | | | | Principal Financial Group | | | 53,044 |
| 2,210 | | | | Progressive Corp. | | | 52,885 |
| 1,180 | | | | Prudential Financial, Inc. | | | 114,731 |
| 320 | | | | Safeco Corp. | | | 19,923 |
| 290 | | | | Torchmark Corp. | | | 19,430 |
| 1,700 | | | | Travelers Cos., Inc. | | | 90,950 |
| 600 | | | | UnumProvident Corp. | | | 15,666 |
| 500 | | @@ | | XL Capital Ltd. | | | 42,145 |
| | | | | | | |
| | | | | | | 1,572,765 |
| | | | | | | |
| Internet: 1.7% | | | |
| 680 | | @ | | Amazon.com, Inc. | | | 46,519 |
| 2,340 | | @ | | eBay, Inc. | | | 75,301 |
| 490 | | @ | | Google, Inc. | | | 256,456 |
| 600 | | @ | | IAC/InterActiveCorp. | | | 20,766 |
| 2,441 | | @ | | Symantec Corp. | | | 49,308 |
| 770 | | @ | | VeriSign, Inc. | | | 24,432 |
| 2,700 | | @ | | Yahoo!, Inc. | | | 73,251 |
| | | | | | | |
| | | | | | | 546,033 |
| | | | | | | |
| Iron/Steel: 0.3% | | | |
| 200 | | | | Allegheny Technologies, Inc. | | | 20,976 |
| 900 | | | | Nucor Corp. | | | 52,785 |
| 320 | | | | United States Steel Corp. | | | 34,800 |
| | | | | | | |
| | | | | | | 108,561 |
| | | | | | | |
| Leisure Time: 0.3% | | | |
| 1,030 | | | | Carnival Corp. | | | 50,233 |
| 810 | | | | Harley-Davidson, Inc. | | | 48,284 |
| | | | | | | |
| | | | | | | 98,517 |
| | | | | | | |
| Lodging: 0.3% | | | |
| 400 | | | | Harrah’s Entertainment, Inc. | | | 34,104 |
| 400 | | | | Hilton Hotels Corp. | | | 13,388 |
| 480 | | | | Marriott International, Inc. | | | 20,755 |
| 340 | | | | Starwood Hotels & Resorts Worldwide, Inc. | | | 22,804 |
| | | | | | | |
| | | | | | | 91,051 |
| | | | | | | |
| Machinery - Construction & Mining: 0.4% | | | |
| 1,540 | | | | Caterpillar, Inc. | | | 120,582 |
| 200 | | @ | | Terex Corp. | | | 16,260 |
| | | | | | | |
| | | | | | | 136,842 |
| | | | | | | |
| Machinery - Diversified: 0.4% | | | |
| 400 | | | | Cummins, Inc. | | | 40,484 |
| 590 | | | | Deere & Co. | | | 71,237 |
See Accompanying Notes to Financial Statements
95
| | |
| ING GET U.S. CORE PORTFOLIO SERIES 8 | | PORTFOLIO OF INVESTMENTS ASOF JUNE 30, 2007 (UNAUDITED) (CONTINUED) |
| | | | | | | |
| Shares | | | | | | Value |
| | | | | | | |
| Machinery - Diversified: (continued) | | | |
| 290 | | | | Rockwell Automation, Inc. | | $ | 20,138 |
| | | | | | | |
| | | | | | | 131,859 |
| | | | | | | |
| Media: 2.7% | | | |
| 1,640 | | | | CBS Corp. - Class B | | | 54,645 |
| 1,020 | | | | Clear Channel Communications, Inc. | | | 38,576 |
| 5,060 | | @ | | Comcast Corp. - Class A | | | 142,287 |
| 2,200 | | @ | | DIRECTV Group, Inc. | | | 50,842 |
| 600 | | | | Gannett Co., Inc. | | | 32,970 |
| 1,080 | | | | McGraw-Hill Cos., Inc. | | | 73,526 |
| 5,110 | | | | News Corp., Inc. - Class A | | | 108,383 |
| 5,800 | | | | Time Warner, Inc. | | | 122,032 |
| 1,200 | | @ | | Viacom - Class B | | | 49,956 |
| 4,640 | | | | Walt Disney Co. | | | 158,410 |
| | | | | | | |
| | | | | | | 831,627 |
| | | | | | | |
| Metal Fabricate/Hardware: 0.1% | | | |
| 200 | | | | Precision Castparts Corp. | | | 24,272 |
| | | | | | | |
| | | | | | | 24,272 |
| | | | | | | |
| Mining: 0.5% | | | |
| 1,900 | | | | Alcoa, Inc. | | | 77,007 |
| 687 | | | | Freeport-McMoRan Copper & Gold, Inc. | | | 56,897 |
| 700 | | | | Newmont Mining Corp. | | | 27,342 |
| | | | | | | |
| | | | | | | 161,246 |
| | | | | | | |
| Miscellaneous Manufacturing: 4.8% | | | |
| 1,690 | | | | 3M Co. | | | 146,675 |
| 540 | | | | Cooper Industries Ltd. | | | 30,829 |
| 510 | | | | Danaher Corp. | | | 38,505 |
| 1,110 | | | | Eastman Kodak Co. | | | 30,891 |
| 640 | | | | Eaton Corp. | | | 59,520 |
| 20,100 | | | | General Electric Co. | | | 769,422 |
| 1,720 | | | | Honeywell International, Inc. | | | 96,802 |
| 1,300 | | | | Illinois Tool Works, Inc. | | | 70,447 |
| 540 | | | | ITT Corp. | | | 36,871 |
| 300 | | | | Pall Corp. | | | 13,797 |
| 540 | | | | Parker Hannifin Corp. | | | 52,871 |
| 4,200 | | @ | | Tyco International Ltd. | | | 141,918 |
| | | | | | | |
| | | | | | | 1,488,548 |
| | | | | | | |
| Office/Business Equipment: 0.2% | | | |
| 2,600 | | @ | | Xerox Corp. | | | 48,048 |
| | | | | | | |
| | | | | | | 48,048 |
| | | | | | | |
| Oil & Gas: 8.0% | | | |
| 1,080 | | | | Anadarko Petroleum Corp. | | | 56,149 |
| 300 | | | | Apache Corp. | | | 24,477 |
| 900 | | | | Chesapeake Energy Corp. | | | 31,140 |
| 4,877 | | | | Chevron Corp. | | | 410,838 |
| 3,643 | | | | ConocoPhillips | | | 285,976 |
| 930 | | | | Devon Energy Corp. | | | 72,810 |
| 500 | | | | ENSCO International, Inc. | | | 30,505 |
| 260 | | | | EOG Resources, Inc. | | | 18,996 |
| 12,160 | | | | ExxonMobil Corp. | | | 1,019,981 |
| 300 | | | | Hess Corp. | | | 17,688 |
| 1,860 | | | | Marathon Oil Corp. | | | 111,526 |
| 300 | | | | Murphy Oil Corp. | | | 17,832 |
| 600 | | @, @@ | | Nabors Industries Ltd. | | | 20,028 |
| 300 | | | | Noble Corp. | | | 29,256 |
| 2,080 | | | | Occidental Petroleum Corp. | | | 120,390 |
| | | | | | | |
| Shares | | | | | | Value |
| | | | | | | |
| 400 | | | | Sunoco, Inc. | | $ | 31,872 |
| 600 | | @ | | Transocean, Inc. | | | 63,588 |
| 1,350 | | | | Valero Energy Corp. | | | 99,711 |
| 610 | | | | XTO Energy, Inc. | | | 36,661 |
| | | | | | | |
| | | | | | | 2,499,424 |
| | | | | | | |
| Oil & Gas Services: 1.3% | | | |
| 600 | | | | Baker Hughes, Inc. | | | 50,478 |
| 2,400 | | | | Halliburton Co. | | | 82,800 |
| 600 | | @ | | National Oilwell Varco, Inc. | | | 62,544 |
| 2,370 | | | | Schlumberger Ltd. | | | 201,308 |
| 400 | �� | @ | | Weatherford International Ltd. | | | 22,096 |
| | | | | | | |
| | | | | | | 419,226 |
| | | | | | | |
| Packaging & Containers: 0.3% | | | |
| 290 | | | | Ball Corp. | | | 15,419 |
| 400 | | | | Bemis Co. | | | 13,272 |
| 890 | | @ | | Pactiv Corp. | | | 28,382 |
| 800 | | | | Sealed Air Corp. | | | 24,816 |
| | | | | | | |
| | | | | | | 81,889 |
| | | | | | | |
| Pharmaceuticals: 4.9% | | | |
| 2,720 | | | | Abbott Laboratories | | | 145,656 |
| 640 | | | | AmerisourceBergen Corp. | | | 31,661 |
| 320 | | @ | | Barr Pharmaceuticals, Inc. | | | 16,074 |
| 4,000 | | | | Bristol-Myers Squibb Co. | | | 126,240 |
| 670 | | | | Cardinal Health, Inc. | | | 47,329 |
| 1,900 | | | | Eli Lilly & Co. | | | 106,172 |
| 420 | | @ | | Express Scripts, Inc. | | | 21,004 |
| 860 | | @ | | Forest Laboratories, Inc. | | | 39,259 |
| 1,900 | | @ | | Gilead Sciences, Inc. | | | 73,663 |
| 730 | | @ | | King Pharmaceuticals, Inc. | | | 14,936 |
| 600 | | @ | | Medco Health Solutions, Inc. | | | 46,794 |
| 4,400 | | | | Merck & Co., Inc. | | | 219,120 |
| 960 | | | | Mylan Laboratories | | | 17,462 |
| 14,630 | | | | Pfizer, Inc. | | | 374,089 |
| 3,250 | | | | Schering-Plough Corp. | | | 98,930 |
| 500 | | @ | | Watson Pharmaceuticals, Inc. | | | 16,265 |
| 2,460 | | | | Wyeth | | | 141,056 |
| | | | | | | |
| | | | | | | 1,535,710 |
| | | | | | | |
| Pipelines: 0.4% | | | |
| 1,500 | | | | El Paso Corp. | | | 25,845 |
| 400 | | | | Questar Corp. | | | 21,140 |
| 1,100 | | | | Spectra Energy Corp. | | | 28,556 |
| 1,220 | | | | Williams Cos., Inc. | | | 38,576 |
| | | | | | | |
| | | | | | | 114,117 |
| | | | | | | |
| Real Estate Investment Trusts: 0.7% | | | |
| 220 | | | | Apartment Investment & Management Co. | | | 11,092 |
| 420 | | | | Archstone-Smith Trust | | | 24,826 |
| 300 | | | | Boston Properties, Inc. | | | 30,639 |
| 350 | | | | Developers Diversified Realty Corp. | | | 18,449 |
| 300 | | | | Equity Residential | | | 13,689 |
| 800 | | | | Host Hotels & Resorts, Inc. | | | 18,496 |
| 300 | | | | Kimco Realty Corp. | | | 11,421 |
| 600 | | | | Prologis | | | 34,140 |
| 400 | | | | Simon Property Group, Inc. | | | 37,216 |
| 200 | | | | Vornado Realty Trust | | | 21,968 |
| | | | | | | |
| | | | | | | 221,936 |
| | | | | | | |
| Retail: 5.1% | | | |
| 300 | | @ | | Autozone, Inc. | | | 40,986 |
| 400 | | @ | | Bed Bath & Beyond, Inc. | | | 14,396 |
See Accompanying Notes to Financial Statements
96
| | |
| ING GET U.S. CORE PORTFOLIO SERIES 8 | | PORTFOLIO OF INVESTMENTS ASOF JUNE 30, 2007 (UNAUDITED) (CONTINUED) |
| | | | | | | |
| Shares | | | | | | Value |
| | | | | | | |
| Retail: (continued) | | | |
| 1,040 | | | | Best Buy Co., Inc. | | $ | 48,537 |
| 600 | | @ | | Big Lots, Inc. | | | 17,652 |
| 1,120 | | | | Costco Wholesale Corp. | | | 65,542 |
| 2,483 | | | | CVS Corp. | | | 90,505 |
| 410 | | | | Darden Restaurants, Inc. | | | 18,036 |
| 600 | | | | Dollar General Corp. | | | 13,152 |
| 740 | | | | Family Dollar Stores, Inc. | | | 25,397 |
| 1,520 | | | | Gap, Inc. | | | 29,032 |
| 3,610 | | | | Home Depot, Inc. | | | 142,054 |
| 610 | | | | JC Penney Co., Inc. | | | 44,152 |
| 580 | | @ | | Kohl’s Corp. | | | 41,197 |
| 3,120 | | | | Lowe’s Cos., Inc. | | | 95,753 |
| 1,480 | | | | Macy’s, Inc. | | | 58,874 |
| 2,940 | | | | McDonald’s Corp. | | | 149,234 |
| 760 | | | | Nordstrom, Inc. | | | 38,851 |
| 480 | | @ | | Office Depot, Inc. | | | 14,544 |
| 600 | | | | RadioShack Corp. | | | 19,884 |
| 210 | | @ | | Sears Holding Corp. | | | 35,595 |
| 1,260 | | | | Staples, Inc. | | | 29,900 |
| 1,560 | | @ | | Starbucks Corp. | | | 40,934 |
| 1,780 | | | | Target Corp. | | | 113,208 |
| 1,320 | | | | TJX Cos., Inc. | | | 36,300 |
| 1,780 | | | | Walgreen Co. | | | 77,501 |
| 4,750 | | | | Wal-Mart Stores, Inc. | | | 228,523 |
| 600 | | | | Wendy’s International, Inc. | | | 22,050 |
| 1,260 | | | | Yum! Brands, Inc. | | | 41,227 |
| | | | | | | |
| | | | | | | 1,593,016 |
| | | | | | | |
| Savings & Loans: 0.4% | | | |
| 1,200 | | | | Hudson City Bancorp., Inc. | | | 14,664 |
| 700 | | | | Sovereign Bancorp., Inc. | | | 14,798 |
| 2,180 | | | | Washington Mutual, Inc. | | | 92,955 |
| | | | | | | |
| | | | | | | 122,417 |
| | | | | | | |
| Semiconductors: 2.4% | | | |
| 1,040 | | @ | | Advanced Micro Devices, Inc. | | | 14,872 |
| 1,030 | | | | Altera Corp. | | | 22,794 |
| 630 | | | | Analog Devices, Inc. | | | 23,713 |
| 1,840 | | | | Applied Materials, Inc. | | | 36,561 |
| 800 | | @ | | Broadcom Corp. | | | 23,400 |
| 12,070 | | | | Intel Corp. | | | 286,783 |
| 700 | | | | KLA-Tencor Corp. | | | 38,465 |
| 700 | | | | Linear Technology Corp. | | | 25,326 |
| 1,400 | | @ | | LSI Logic Corp. | | | 10,514 |
| 660 | | | | Maxim Integrated Products | | | 22,051 |
| 500 | | @ | | MEMC Electronic Materials, Inc. | | | 30,560 |
| 1,390 | | @ | | Micron Technology, Inc. | | | 17,417 |
| 720 | | | | National Semiconductor Corp. | | | 20,354 |
| 650 | | @ | | Novellus Systems, Inc. | | | 18,441 |
| 750 | | @ | | Nvidia Corp. | | | 30,983 |
| 900 | | @ | | Teradyne, Inc. | | | 15,822 |
| 2,700 | | | | Texas Instruments, Inc. | | | 101,601 |
| 810 | | | | Xilinx, Inc. | | | 21,684 |
| | | | | | | |
| | | | | | | 761,341 |
| | | | | | | |
| Software: 3.4% | | | |
| 1,140 | | @ | | Adobe Systems, Inc. | | | 45,771 |
| 620 | | @ | | Autodesk, Inc. | | | 29,190 |
| 1,320 | | | | Automatic Data Processing, Inc. | | | 63,980 |
| 610 | | @ | | BMC Software, Inc. | | | 18,483 |
| 1,600 | | | | CA, Inc. | | | 41,328 |
| 700 | | @ | | Citrix Systems, Inc. | | | 23,569 |
| 1,910 | | @ | | Compuware Corp. | | | 22,653 |
| | | | | | | | |
| Shares | | | | | | Value |
| | | | | | | | |
| | 610 | | @ | | Electronic Arts, Inc. | | $ | 28,865 |
| | 1,610 | | | | First Data Corp. | | | 52,599 |
| | 540 | | @ | | Fiserv, Inc. | | | 30,672 |
| | 1,080 | | @ | | Intuit, Inc. | | | 32,486 |
| | 16,700 | | | | Microsoft Corp. | | | 492,149 |
| | 1,800 | | @ | | Novell, Inc. | | | 14,022 |
| | 7,490 | | @ | | Oracle Corp. | | | 147,628 |
| | 830 | | | | Paychex, Inc. | | | 32,470 |
| | | | | | | | |
| | | | | | | | 1,075,865 |
| | | | | | | | |
| | Telecommunications: 5.7% | | | |
| | 600 | | @@ | | Allergan, Inc. | | | 34,584 |
| | 600 | | | | Alltel Corp. | | | 40,530 |
| | 12,556 | | | | AT&T, Inc. | | | 521,074 |
| | 1,140 | | @ | | Avaya, Inc. | | | 19,198 |
| | 640 | | | | CenturyTel, Inc. | | | 31,392 |
| | 12,670 | | @ | | Cisco Systems, Inc. | | | 352,860 |
| | 1,530 | | | | Citizens Communications Co. | | | 23,363 |
| | 3,170 | | @ | | Corning, Inc. | | | 80,994 |
| | 477 | | | | Embarq Corp. | | | 30,227 |
| | 1,300 | | @ | | Juniper Networks, Inc. | | | 32,721 |
| | 4,720 | | | | Motorola, Inc. | | | 83,544 |
| | 3,340 | | | | Qualcomm, Inc. | | | 144,923 |
| | 3,600 | | @ | | Qwest Communications International, Inc. | | | 34,920 |
| | 5,323 | | | | Sprint Nextel Corp. | | | 110,239 |
| | 1,400 | | @ | | Tellabs, Inc. | | | 15,064 |
| | 5,260 | | | | Verizon Communications, Inc. | | | 216,554 |
| | | | | | | | |
| | | | | | | | 1,772,187 |
| | | | | | | | |
| | Toys/Games/Hobbies: 0.2% | | | |
| | 600 | | | | Hasbro, Inc. | | | 18,846 |
| | 1,230 | | | | Mattel, Inc. | | | 31,107 |
| | | | | | | | |
| | | | | | | | 49,953 |
| | | | | | | | |
| | Transportation: 1.3% | | | |
| | 530 | | | | Burlington Northern Santa Fe Corp. | | | 45,124 |
| | 300 | | | | CH Robinson Worldwide, Inc. | | | 15,756 |
| | 880 | | | | CSX Corp. | | | 39,670 |
| | 670 | | | | FedEx Corp. | | | 74,350 |
| | 890 | | | | Norfolk Southern Corp. | | | 46,787 |
| | 570 | | | | Union Pacific Corp. | | | 65,636 |
| | 1,800 | | | | United Parcel Service, Inc. | | | 131,400 |
| | | | | | | | |
| | | | | | | | 418,723 |
| | | | | | | | |
| | | | | Total Common Stock
(Cost $25,994,625) | | | 28,103,730 |
| | | | | | | | |
| | | |
Principal
Amount | | | | | | Value |
| | U.S. GOVERNMENT AGENCY OBLIGATIONS: 2.1% |
| | Other U.S. Agency Obligations: 2.1% | | | |
| $ | 821,000 | | Z | | Financing Corp.,
5.580%, due 03/26/12 | | $ | 647,404 |
| | | | | | | | |
| | | | | Total U.S. Government Agency Obligations
(Cost $647,778) | | | 647,404 |
| | | | | | | | |
See Accompanying Notes to Financial Statements
97
| | |
| ING GET U.S. CORE PORTFOLIO SERIES 8 | | PORTFOLIO OF INVESTMENTS ASOF JUNE 30, 2007 (UNAUDITED) (CONTINUED) |
| | | | | | | | |
Principal
Amount | | | | | | Value |
| | | | | | | | |
| | U.S. TREASURY OBLIGATIONS: 7.6% | | | |
| | U.S. Treasury STRIP: 7.6% | | | |
| $ | 3,053,000 | | ^ | | 4.850%, due 08/15/12 | | $ | 2,387,614 |
| | | | | | | | |
| | | | | Total U.S. Treasury Obligations
(Cost $2,381,867) | | | 2,387,614 |
| | | | | | | | |
| | | | | Total Long-Term Investments
(Cost $29,024,270) | | | 31,138,748 |
| | | | | | | | |
| Shares | | | | | | |
| | SHORT-TERM INVESTMENTS: 0.8% | | | |
| | Mutual Fund: 0.2% | | | |
| | 74,000 | | ** | | ING Institutional Prime Money Market Fund | | | 74,000 |
| | | | | | | | |
| | | | | Total Mutual Fund
(Cost $74,000) | | | 74,000 |
| | | | | | | | |
| | | | | | | | | | |
Principal
Amount | | | | | | | | |
| | Repurchase Agreement: 0.6% | | | | | |
| $ | 171,000 | | Goldman Sachs Repurchase Agreement dated 06/29/07, 5.300%, due 07/02/07, $171,076 to be received upon repurchase (Collateralized by $174,000 Federal National Mortgage Association, 5.600%, Market Value plus accrued interest $174,743, due 02/01/17) | | | | | | 171,000 | |
| | | | | | | | | | |
| | | Total Repurchase Agreement
(Cost $171,000) | | | | | | 171,000 | |
| | | | | | | | | | |
| | | Total Short-Term Investments
(Cost $245,000) | | | | | | 245,000 | |
| | | | | | | | | | |
| | | Total Investments in Securities
(Cost $29,269,270)* | | 100.2 | % | | $ | 31,383,748 | |
| | | Other Assets and
Liabilities - Net | | (0.2 | ) | | | (59,385 | ) |
| | | | | | | | | | |
| | | Net Assets | | 100.0 | % | | $ | 31,324,363 | |
| | | | | | | | | | |
| @ | Non-income producing security |
| STRIP | Separate Trading of Registered Interest and Principal of Securities |
| ** | Investment in affiliate |
| ^ | Interest Only (IO) Security |
| Z | Indicates Zero Coupon Bond; rate shown reflects effective yield on the date of purchase |
| * | Cost for federal income tax purposes is $29,600,175. |
| | | | |
Net unrealized appreciation consists of: | | | | |
Gross Unrealized Appreciation | | $ | 2,178,472 | |
Gross Unrealized Depreciation | | | (394,899 | ) |
| | | | |
Net Unrealized Appreciation | | $ | 1,783,573 | |
| | | | |
See Accompanying Notes to Financial Statements
98
| | |
| ING GET U.S. CORE PORTFOLIO SERIES 9 | | PORTFOLIO OF INVESTMENTS ASOF JUNE 30, 2007 (UNAUDITED) (CONTINUED) |
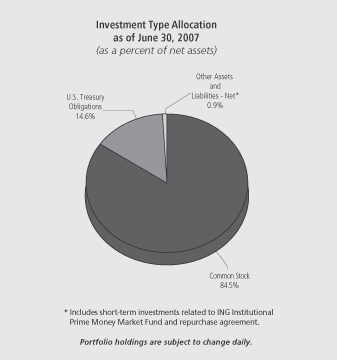
| | | | | | | |
| Shares | | | | | | Value |
| | | | | | | |
| | | | | | | | |
| COMMON STOCK: 84.5% | | | |
| Advertising: 0.2% | | | |
| 720 | | | | Omnicom Group | | $ | 38,102 |
| | | | | | | |
| | | | | | | 38,102 |
| | | | | | | |
| Aerospace/Defense: 1.8% | | | |
| 1,050 | | | | Boeing Co. | | | 100,968 |
| 520 | | | | General Dynamics Corp. | | | 40,674 |
| 200 | | | | Goodrich Corp. | | | 11,912 |
| 260 | | | | L-3 Communications Holdings, Inc. | | | 25,321 |
| 580 | | | | Lockheed Martin Corp. | | | 54,595 |
| 500 | | | | Northrop Grumman Corp. | | | 38,935 |
| 1,160 | | | | Raytheon Co. | | | 62,512 |
| 1,490 | | | | United Technologies Corp. | | | 105,686 |
| | | | | | | |
| | | | | | | 440,603 |
| | | | | | | |
| Agriculture: 1.2% | | | |
| 3,030 | | | | Altria Group, Inc. | | | 212,524 |
| 1,000 | | | | Archer-Daniels-Midland Co. | | | 33,090 |
| 380 | | | | Reynolds American, Inc. | | | 24,776 |
| 500 | | | | UST, Inc. | | | 26,855 |
| | | | | | | |
| | | | | | | 297,245 |
| | | | | | | |
| Apparel: 0.4% | | | |
| 800 | | @ | | Coach, Inc. | | | 37,912 |
| 540 | | | | Nike, Inc. | | | 31,477 |
| 200 | | | | Polo Ralph Lauren Corp. | | | 19,622 |
| | | | | | | |
| | | | | | | 89,011 |
| | | | | | | |
| Auto Manufacturers: 0.5% | | | |
| 3,520 | | | | Ford Motor Co. | | | 33,158 |
| 900 | | | | General Motors Corp. | | | 34,020 |
| 525 | | | | Paccar, Inc. | | | 45,696 |
| | | | | | | |
| | | | | | | 112,874 |
| | | | | | | |
| | | | | | | |
| Shares | | | | | | Value |
| | | | | | | |
| Auto Parts & Equipment: 0.2% | | | |
| 400 | | @ | | Goodyear Tire & Rubber Co. | | $ | 13,904 |
| 370 | | | | Johnson Controls, Inc. | | | 42,835 |
| | | | | | | |
| | | | | | | 56,739 |
| | | | | | | |
| Banks: 5.4% | | | |
| 6,647 | | | | Bank of America Corp. | | | 324,972 |
| 1,320 | | @ | | Bank of New York Co., Inc. | | | 54,701 |
| 940 | | | | BB&T Corp. | | | 38,239 |
| 532 | | | | Capital One Financial Corp. | | | 41,730 |
| 490 | | | | Comerica, Inc. | | | 29,140 |
| 200 | | | | Compass Bancshares, Inc. | | | 13,796 |
| 500 | | | | Fifth Third Bancorp. | | | 19,885 |
| 1,870 | | | | Huntington Bancshares, Inc. | | | 42,524 |
| 1,630 | | | | Keycorp. | | | 55,958 |
| 300 | | | | Marshall & Ilsley Corp. | | | 14,289 |
| 1,020 | | | | Mellon Financial Corp. | | | 44,880 |
| 1,000 | | | | National City Corp. | | | 33,320 |
| 300 | | | | Northern Trust Corp. | | | 19,272 |
| 490 | | | | PNC Financial Services Group, Inc. | | | 35,074 |
| 1,569 | | | | Regions Financial Corp. | | | 51,934 |
| 490 | | | | State Street Corp. | | | 33,516 |
| 460 | | | | SunTrust Banks, Inc. | | | 39,440 |
| 1,610 | | | | US Bancorp. | | | 53,050 |
| 3,021 | | | | Wachovia Corp. | | | 154,826 |
| 5,160 | | | | Wells Fargo & Co. | | | 181,477 |
| | | | | | | |
| | | | | | | 1,282,023 |
| | | | | | | |
| Beverages: 1.6% | | | |
| 930 | | | | Anheuser-Busch Cos., Inc. | | | 48,509 |
| 2,810 | | | | Coca-Cola Co. | | | 146,991 |
| 740 | | | | Pepsi Bottling Group, Inc. | | | 24,923 |
| 2,370 | | | | PepsiCo, Inc. | | | 153,695 |
| | | | | | | |
| | | | | | | 374,118 |
| | | | | | | |
| Biotechnology: 0.7% | | | |
| 1,500 | | @ | | Amgen, Inc. | | | 82,935 |
| 530 | | @ | | Biogen Idec, Inc. | | | 28,355 |
| 500 | | @ | | Celgene Corp. | | | 28,665 |
| 510 | | @ | | Genzyme Corp. | | | 32,844 |
| | | | | | | |
| | | | | | | 172,799 |
| | | | | | | |
| Building Materials: 0.2% | | | |
| 300 | | | | American Standard Cos., Inc. | | | 17,694 |
| 1,180 | | | | Masco Corp. | | | 33,595 |
| | | | | | | |
| | | | | | | 51,289 |
| | | | | | | |
| Chemicals: 1.5% | | | |
| 170 | | | | Air Products & Chemicals, Inc. | | | 13,663 |
| 400 | | | | Ashland, Inc. | | | 25,580 |
| 1,390 | | | | Dow Chemical Co. | | | 61,466 |
| 400 | | | | Ecolab, Inc. | | | 17,080 |
| 1,100 | | | | EI DuPont de Nemours & Co. | | | 55,924 |
| 520 | | | | International Flavors & Fragrances, Inc. | | | 27,113 |
| 820 | | | | Monsanto Co. | | | 55,383 |
| 500 | | | | PPG Industries, Inc. | | | 38,055 |
| 300 | | | | Praxair, Inc. | | | 21,597 |
| 380 | | | | Sherwin-Williams Co. | | | 25,259 |
| 700 | | | | Sigma-Aldrich Corp. | | | 29,869 |
| | | | | | | |
| | | | | | | 370,989 |
| | | | | | | |
See Accompanying Notes to Financial Statements
99
| | |
| ING GET U.S. CORE PORTFOLIO SERIES 9 | | PORTFOLIO OF INVESTMENTS ASOF JUNE 30, 2007 (UNAUDITED) (CONTINUED) |
| | | | | | | |
| Shares | | | | | | Value |
| | | | | | | |
| Coal: 0.1% |
| 200 | | | | Consol Energy, Inc. | | $ | 9,222 |
| 540 | | | | Peabody Energy Corp. | | | 26,125 |
| | | | | | | |
| | | | | | | 35,347 |
| | | | | | | |
| Commercial Services: 0.7% |
| 200 | | @ | | Apollo Group, Inc. | | | 11,686 |
| 800 | | @ | | Convergys Corp. | | | 19,392 |
| 390 | | | | Equifax, Inc. | | | 17,324 |
| 540 | | | | McKesson Corp. | | | 32,206 |
| 420 | | | | Moody’s Corp. | | | 26,124 |
| 300 | | | | Robert Half International, Inc. | | | 10,950 |
| 500 | | | | RR Donnelley & Sons Co. | | | 21,755 |
| 1,290 | | | | Western Union Co. | | | 26,871 |
| | | | | | | |
| | | | | | | 166,308 |
| | | | | | | |
| Computers: 3.8% |
| 200 | | @ | | Affiliated Computer Services, Inc. | | | 11,344 |
| 1,300 | | @ | | Apple, Inc. | | | 158,652 |
| 200 | | @ | | Cognizant Technology Solutions Corp. | | | 15,018 |
| 410 | | @ | | Computer Sciences Corp. | | | 24,252 |
| 3,590 | | @ | | Dell, Inc. | | | 102,495 |
| 1,180 | | | | Electronic Data Systems Corp. | | | 32,721 |
| 3,760 | | @ | | EMC Corp. | | | 68,056 |
| 3,910 | | | | Hewlett-Packard Co. | | | 174,464 |
| 2,060 | | | | International Business Machines Corp. | | | 216,815 |
| 280 | | @ | | Lexmark International, Inc. | | | 13,807 |
| 310 | | @ | | NCR Corp. | | | 16,287 |
| 860 | | @ | | Network Appliance, Inc. | | | 25,112 |
| 450 | | @ | | Sandisk Corp. | | | 22,023 |
| 6,100 | | @ | | Sun Microsystems, Inc. | | | 32,086 |
| | | | | | | |
| | | | | | | 913,132 |
| | | | | | | |
| Cosmetics/Personal Care: 1.6% |
| 700 | | | | Avon Products, Inc. | | | 25,725 |
| 640 | | | | Colgate-Palmolive Co. | | | 41,504 |
| 400 | | | | Estee Lauder Cos., Inc. | | | 18,204 |
| 4,764 | | | | Procter & Gamble Co. | | | 291,509 |
| | | | | | | |
| | | | | | | 376,942 |
| | | | | | | |
| Distribution/Wholesale: 0.1% |
| 290 | | | | WW Grainger, Inc. | | | 26,985 |
| | | | | | | |
| | | | | | | 26,985 |
| | | | | | | |
| Diversified Financial Services: 6.7% |
| 1,480 | | | | American Express Co. | | | 90,546 |
| 466 | | | | Ameriprise Financial, Inc. | | | 29,624 |
| 200 | | | | Bear Stearns Cos., Inc. | | | 28,000 |
| 1,950 | | | | Charles Schwab Corp. | | | 40,014 |
| 70 | | | | Chicago Mercantile Exchange Holdings, Inc. | | | 37,405 |
| 450 | | | | CIT Group, Inc. | | | 24,674 |
| 6,770 | | | | Citigroup, Inc. | | | 347,233 |
| 1,010 | | | | Countrywide Financial Corp. | | | 36,714 |
| 530 | | @ | | E*Trade Financial Corp. | | | 11,708 |
| 1,370 | | | | Fannie Mae | | | 89,502 |
| 290 | | | | Franklin Resources, Inc. | | | 38,416 |
| 950 | | | | Freddie Mac | | | 57,665 |
| 600 | | | | Goldman Sachs Group, Inc. | | | 130,050 |
| 500 | | | | Janus Capital Group, Inc. | | | 13,920 |
| 5,350 | | | | JP Morgan Chase & Co. | | | 259,208 |
| 200 | | | | Legg Mason, Inc. | | | 19,676 |
| 800 | | | | Lehman Brothers Holdings, Inc. | | | 59,616 |
| 1,410 | | | | Merrill Lynch & Co., Inc. | | | 117,848 |
| | | | | | | |
| Shares | | | | | | Value |
| | | | | | | |
| 1,550 | | | | Morgan Stanley | | $ | 130,014 |
| 540 | | | | SLM Corp. | | | 31,093 |
| 300 | | | | T. Rowe Price Group, Inc. | | | 15,567 |
| | | | | | | |
| | | | | | | 1,608,493 |
| | | | | | | |
| Electric: 2.7% |
| 730 | | @ | | AES Corp. | | | 15,972 |
| 460 | | | | American Electric Power Co., Inc. | | | 20,718 |
| 700 | | | | CMS Energy Corp. | | | 12,040 |
| 500 | | | | Constellation Energy Group, Inc. | | | 43,585 |
| 500 | | | | Dominion Resources, Inc. | | | 43,155 |
| 800 | | | | DTE Energy Co. | | | 38,576 |
| 700 | | | | Duke Energy Corp. | | | 12,810 |
| 990 | | | | Edison International | | | 55,559 |
| 600 | | | | Entergy Corp. | | | 64,410 |
| 1,050 | | | | Exelon Corp. | | | 76,230 |
| 750 | | | | FirstEnergy Corp. | | | 48,548 |
| 1,000 | | | | FPL Group, Inc. | | | 56,740 |
| 1,020 | | | | PG&E Corp. | | | 46,206 |
| 300 | | | | PPL Corp. | | | 14,037 |
| 490 | | | | Public Service Enterprise Group, Inc. | | | 43,012 |
| 700 | | | | TECO Energy, Inc. | | | 12,026 |
| 590 | | | | TXU Corp. | | | 39,707 |
| | | | | | | |
| | | | | | | 643,331 |
| | | | | | | |
| Electrical Components & Equipment: 0.2% | | | |
| 980 | | | | Emerson Electric Co. | | | 45,864 |
| | | | | | | |
| | | | | | | 45,864 |
| | | | | | | |
| Electronics: 0.4% | | | |
| 620 | | @ | | Agilent Technologies, Inc. | | | 23,833 |
| 600 | | | | Tektronix, Inc. | | | 20,244 |
| 660 | | @ | | Thermo Electron Corp. | | | 34,135 |
| 210 | | @ | | Waters Corp. | | | 12,466 |
| | | | | | | |
| | | | | | | 90,678 |
| | | | | | | |
| Engineering & Construction: 0.0% | | | |
| 100 | | | | Fluor Corp. | | | 11,137 |
| | | | | | | |
| | | | | | | 11,137 |
| | | | | | | |
| Entertainment: 0.1% | | | |
| 500 | | | | International Game Technology | | | 19,850 |
| | | | | | | |
| | | | | | | 19,850 |
| | | | | | | |
| Environmental Control: 0.3% | | | |
| 800 | | @ | | Allied Waste Industries, Inc. | | | 10,768 |
| 1,320 | | | | Waste Management, Inc. | | | 51,546 |
| | | | | | | |
| | | | | | | 62,314 |
| | | | | | | |
| Food: 1.5% | | | |
| 630 | | | | Campbell Soup Co. | | | 24,450 |
| 300 | | @ | | Dean Foods Co. | | | 9,561 |
| 980 | | | | General Mills, Inc. | | | 57,252 |
| 200 | | | | Hershey Co. | | | 10,124 |
| 1,230 | | | | HJ Heinz Co. | | | 58,388 |
| 400 | | | | Kellogg Co. | | | 20,716 |
| 1,550 | | | | Kraft Foods, Inc. | | | 54,638 |
| 1,380 | | | | Kroger Co. | | | 38,819 |
| 850 | | | | Safeway, Inc. | | | 28,926 |
| 200 | | | | Supervalu, Inc. | | | 9,264 |
| 500 | | | | Sysco Corp. | | | 16,495 |
| 300 | | | | Whole Foods Market, Inc. | | | 11,490 |
| 200 | | | | WM Wrigley Jr. Co. | | | 11,062 |
| | | | | | | |
| | | | | | | 351,185 |
| | | | | | | |
See Accompanying Notes to Financial Statements
100
| | |
| ING GET U.S. CORE PORTFOLIO SERIES 9 | | PORTFOLIO OF INVESTMENTS ASOF JUNE 30, 2007 (UNAUDITED) (CONTINUED) |
| | | | | | | |
| Shares | | | | | | Value |
| | | | | | | |
| Forest Products & Paper: 0.3% | | | |
| 900 | | | | International Paper Co. | | $ | 35,145 |
| 190 | | | | Temple-Inland, Inc. | | | 11,691 |
| 200 | | | | Weyerhaeuser Co. | | | 15,786 |
| | | | | | | |
| | | | | | | 62,622 |
| | | | | | | |
| Gas: 0.2% | | | |
| 300 | | | | KeySpan Corp. | | | 12,594 |
| 530 | | | | Sempra Energy | | | 31,392 |
| | | | | | | |
| | | | | | | 43,986 |
| | | | | | | |
| Hand/Machine Tools: 0.2% | | | |
| 210 | | | | Black & Decker Corp. | | | 18,545 |
| 300 | | | | Snap-On, Inc. | | | 15,153 |
| 390 | | | | Stanley Works | | | 23,673 |
| | | | | | | |
| | | | | | | 57,371 |
| | | | | | | |
| Healthcare - Products: 2.5% | | | |
| 1,040 | | | | Baxter International, Inc. | | | 58,594 |
| 370 | | | | Becton Dickinson & Co. | | | 27,565 |
| 500 | | | | Biomet, Inc. | | | 22,860 |
| 2,000 | | @ | | Boston Scientific Corp. | | | 30,680 |
| 300 | | | | CR Bard, Inc. | | | 24,789 |
| 4,460 | | | | Johnson & Johnson | | | 274,825 |
| 1,500 | | | | Medtronic, Inc. | | | 77,790 |
| 500 | | @ | | St. Jude Medical, Inc. | | | 20,745 |
| 500 | | | | Stryker Corp. | | | 31,545 |
| 200 | | @ | | Varian Medical Systems, Inc. | | | 8,502 |
| 400 | | @ | | Zimmer Holdings, Inc. | | | 33,956 |
| | | | | | | |
| | | | | | | 611,851 |
| | | | | | | |
| Healthcare - Services: 1.1% | | | |
| 860 | | | | Aetna, Inc. | | | 42,484 |
| 355 | | @ | | Coventry Health Care, Inc. | | | 20,466 |
| 430 | | @ | | Humana, Inc. | | | 26,191 |
| 200 | | @ | | Laboratory Corp. of America Holdings | | | 15,652 |
| 1,880 | | | | UnitedHealth Group, Inc. | | | 96,143 |
| 750 | | @ | | WellPoint, Inc. | | | 59,873 |
| | | | | | | |
| | | | | | | 260,809 |
| | | | | | | |
| Home Builders: 0.2% | | | |
| 400 | | | | Centex Corp. | | | 16,040 |
| 400 | | | | KB Home | | | 15,748 |
| 300 | | | | Lennar Corp. | | | 10,968 |
| | | | | | | |
| | | | | | | 42,756 |
| | | | | | | |
| Home Furnishings: 0.1% | | | |
| 100 | | | | Harman International Industries, Inc. | | | 11,680 |
| 80 | | | | Whirlpool Corp. | | | 8,896 |
| | | | | | | |
| | | | | | | 20,576 |
| | | | | | | |
| Household Products/Wares: 0.3% | | | |
| 200 | | | | Clorox Co. | | | 12,420 |
| 780 | | | | Kimberly-Clark Corp. | | | 52,174 |
| | | | | | | |
| | | | | | | 64,594 |
| | | | | | | |
| Housewares: 0.1% | | | |
| 500 | | | | Newell Rubbermaid, Inc. | | | 14,715 |
| | | | | | | |
| | | | | | | 14,715 |
| | | | | | | |
| Insurance: 4.6% | | | |
| 460 | | @@ | | ACE Ltd. | | | 28,759 |
| 670 | | | | Aflac, Inc. | | | 34,438 |
| 1,090 | | | | Allstate Corp. | | | 67,046 |
| | | | | | | |
| Shares | | | | | | Value |
| | | | | | | |
| 120 | | | | AMBAC Financial Group, Inc. | | $ | 10,463 |
| 3,760 | | | | American International Group, Inc. | | | 263,313 |
| 720 | | | | AON Corp. | | | 30,679 |
| 300 | | | | Assurant, Inc. | | | 17,676 |
| 890 | | | | Chubb Corp. | | | 48,185 |
| 450 | | | | Cigna Corp. | | | 23,499 |
| 1,000 | | | | Genworth Financial, Inc. | | | 34,400 |
| 520 | | | | Hartford Financial Services Group, Inc. | | | 51,225 |
| 449 | | | | Lincoln National Corp. | | | 31,857 |
| 510 | | | | Loews Corp. | | | 26,000 |
| 900 | | | | Marsh & McLennan Cos., Inc. | | | 27,792 |
| 250 | | | | MBIA, Inc. | | | 15,555 |
| 1,390 | | | | Metlife, Inc. | | | 89,627 |
| 230 | | | | MGIC Investment Corp. | | | 13,078 |
| 510 | | | | Principal Financial Group | | | 29,728 |
| 1,620 | | | | Progressive Corp. | | | 38,767 |
| 730 | | | | Prudential Financial, Inc. | | | 70,978 |
| 230 | | | | Safeco Corp. | | | 14,320 |
| 230 | | | | Torchmark Corp. | | | 15,410 |
| 1,160 | | | | Travelers Cos., Inc. | | | 62,060 |
| 500 | | | | UnumProvident Corp. | | | 13,055 |
| 400 | | @@ | | XL Capital Ltd. | | | 33,716 |
| | | | | | | |
| | | | | | | 1,091,626 |
| | | | | | | |
| Internet: 1.7% | | | |
| 500 | | @ | | Amazon.com, Inc. | | | 34,205 |
| 1,570 | | @ | | eBay, Inc. | | | 50,523 |
| 400 | | @ | | Google, Inc. | | | 209,352 |
| 400 | | @ | | IAC/InterActiveCorp. | | | 13,844 |
| 2,170 | | @ | | Symantec Corp. | | | 43,834 |
| 500 | | @ | | VeriSign, Inc. | | | 15,865 |
| 1,700 | | @ | | Yahoo!, Inc. | | | 46,121 |
| | | | | | | |
| | | | | | | 413,744 |
| | | | | | | |
| Iron/Steel: 0.3% | | | |
| 200 | | | | Allegheny Technologies, Inc. | | | 20,976 |
| 460 | | | | Nucor Corp. | | | 26,979 |
| 240 | | | | United States Steel Corp. | | | 26,100 |
| | | | | | | |
| | | | | | | 74,055 |
| | | | | | | |
| Leisure Time: 0.3% | | | |
| 730 | | | | Carnival Corp. | | | 35,602 |
| 490 | | | | Harley-Davidson, Inc. | | | 29,209 |
| | | | | | | |
| | | | | | | 64,811 |
| | | | | | | |
| Lodging: 0.3% | | | |
| 400 | | | | Harrah’s Entertainment, Inc. | | | 34,104 |
| 400 | | | | Hilton Hotels Corp. | | | 13,388 |
| 380 | | | | Marriott International, Inc. | | | 16,431 |
| 230 | | | | Starwood Hotels & Resorts Worldwide, Inc. | | | 15,426 |
| | | | | | | |
| | | | | | | 79,349 |
| | | | | | | |
| Machinery - Construction & Mining: 0.4% | | | |
| 1,000 | | | | Caterpillar, Inc. | | | 78,300 |
| 200 | | @ | | Terex Corp. | | | 16,260 |
| | | | | | | |
| | | | | | | 94,560 |
| | | | | | | |
| Machinery - Diversified: 0.4% | | | |
| 280 | | | | Cummins, Inc. | | | 28,339 |
| 500 | | | | Deere & Co. | | | 60,370 |
| 290 | | | | Rockwell Automation, Inc. | | | 20,138 |
| | | | | | | |
| | | | | | | 108,847 |
| | | | | | | |
See Accompanying Notes to Financial Statements
101
| | |
| ING GET U.S. CORE PORTFOLIO SERIES 9 | | PORTFOLIO OF INVESTMENTS ASOF JUNE 30, 2007 (UNAUDITED) (CONTINUED) |
| | | | | | | |
| Shares | | | | | | Value |
| | | | | | | |
| Media: 2.5% | | | |
| 1,030 | | | | CBS Corp. - Class B | | $ | 34,320 |
| 860 | | | | Clear Channel Communications, Inc. | | | 32,525 |
| 3,200 | | @ | | Comcast Corp. – Class A | | | 89,984 |
| 1,400 | | @ | | DIRECTV Group, Inc. | | | 32,354 |
| 500 | | | | Gannett Co., Inc. | | | 27,475 |
| 720 | | | | McGraw-Hill Cos., Inc. | | | 49,018 |
| 3,700 | | | | News Corp., Inc. - Class A | | | 78,477 |
| 3,800 | | | | Time Warner, Inc. | | | 79,952 |
| 1,000 | | @ | | Viacom - Class B | | | 41,630 |
| 3,770 | | | | Walt Disney Co. | | | 128,708 |
| | | | | | | |
| | | | | | | 594,443 |
| | | | | | | |
| Metal Fabricate/Hardware: 0.0% | | | |
| 100 | | | | Precision Castparts Corp. | | | 12,136 |
| | | | | | | |
| | | | | | | 12,136 |
| | | | | | | |
| Mining: 0.5% | | | |
| 1,500 | | | | Alcoa, Inc. | | | 60,795 |
| 521 | | | | Freeport-McMoRan Copper & Gold, Inc. | | | 43,149 |
| 500 | | | | Newmont Mining Corp. | | | 19,530 |
| | | | | | | |
| | | | | | | 123,474 |
| | | | | | | |
| Miscellaneous Manufacturing: 4.4% | | | |
| 1,190 | | | | 3M Co. | | | 103,280 |
| 500 | | | | Cooper Industries Ltd. | | | 28,545 |
| 420 | | | | Danaher Corp. | | | 31,710 |
| 700 | | | | Eastman Kodak Co. | | | 19,481 |
| 490 | | | | Eaton Corp. | | | 45,570 |
| 13,710 | | | | General Electric Co. | | | 524,805 |
| 1,150 | | | | Honeywell International, Inc. | | | 64,722 |
| 700 | | | | Illinois Tool Works, Inc. | | | 37,933 |
| 470 | | | | ITT Corp. | | | 32,092 |
| 200 | | | | Pall Corp. | | | 9,198 |
| 380 | | | | Parker Hannifin Corp. | | | 37,206 |
| 100 | | | | Textron, Inc. | | | 11,011 |
| 3,000 | | @ | | Tyco International Ltd. | | | 101,370 |
| | | | | | | |
| | | | | | | 1,046,923 |
| | | | | | | |
| Office/Business Equipment: 0.1% | | | |
| 1,600 | | @ | | Xerox Corp. | | | 29,568 |
| | | | | | | |
| | | | | | | 29,568 |
| | | | | | | |
| Oil & Gas: 7.3% | | | |
| 580 | | | | Anadarko Petroleum Corp. | | | 30,154 |
| 200 | | | | Apache Corp. | | | 16,318 |
| 600 | | | | Chesapeake Energy Corp. | | | 20,760 |
| 3,430 | | | | Chevron Corp. | | | 288,943 |
| 2,559 | | | | ConocoPhillips | | | 200,882 |
| 520 | | | | Devon Energy Corp. | | | 40,711 |
| 300 | | | | ENSCO International, Inc. | | | 18,303 |
| 250 | | | | EOG Resources, Inc. | | | 18,265 |
| 8,330 | | | | ExxonMobil Corp. | | | 698,720 |
| 300 | | | | Hess Corp. | | | 17,688 |
| 1,440 | | | | Marathon Oil Corp. | | | 86,342 |
| 200 | | | | Murphy Oil Corp. | | | 11,888 |
| 600 | | @, @@ | | Nabors Industries Ltd. | | | 20,028 |
| 200 | | | | Noble Corp. | | | 19,504 |
| 1,420 | | | | Occidental Petroleum Corp. | | | 82,190 |
| 300 | | | | Sunoco, Inc. | | | 23,904 |
| 500 | | @ | | Transocean, Inc. | | | 52,990 |
| | | | | | | |
| Shares | | | | | | Value |
| | | | | | | |
| 830 | | | | Valero Energy Corp. | | $ | 61,304 |
| 500 | | | | XTO Energy, Inc. | | | 30,050 |
| | | | | | | |
| | | | | | | 1,738,944 |
| | | | | | | |
| Oil & Gas Services: 1.2% | | | |
| 500 | | | | Baker Hughes, Inc. | | | 42,065 |
| 1,680 | | | | Halliburton Co. | | | 57,960 |
| 400 | | @ | | National Oilwell Varco, Inc. | | | 41,696 |
| 1,550 | | | | Schlumberger Ltd. | | | 131,657 |
| 200 | | @ | | Weatherford International Ltd. | | | 11,048 |
| | | | | | | |
| | | | | | | 284,426 |
| | | | | | | |
| Packaging & Containers: 0.3% | | | |
| 280 | | | | Ball Corp. | | | 14,888 |
| 400 | | | | Bemis Co. | | | 13,272 |
| 800 | | @ | | Pactiv Corp. | | | 25,512 |
| 700 | | | | Sealed Air Corp. | | | 21,714 |
| | | | | | | |
| | | | | | | 75,386 |
| | | | | | | |
| Pharmaceuticals: 4.4% | | | |
| 1,740 | | | | Abbott Laboratories | | | 93,177 |
| 500 | | | | AmerisourceBergen Corp. | | | 24,735 |
| 200 | | @ | | Barr Pharmaceuticals, Inc. | | | 10,046 |
| 2,500 | | | | Bristol-Myers Squibb Co. | | | 78,900 |
| 500 | | | | Cardinal Health, Inc. | | | 35,320 |
| 1,300 | | | | Eli Lilly & Co. | | | 72,644 |
| 420 | | @ | | Express Scripts, Inc. | | | 21,004 |
| 560 | | @ | | Forest Laboratories, Inc. | | | 25,564 |
| 1,120 | | @ | | Gilead Sciences, Inc. | | | 43,422 |
| 670 | | @ | | King Pharmaceuticals, Inc. | | | 13,708 |
| 500 | | @ | | Medco Health Solutions, Inc. | | | 38,995 |
| 2,930 | | | | Merck & Co., Inc. | | | 145,914 |
| 740 | | | | Mylan Laboratories | | | 13,461 |
| 10,040 | | | | Pfizer, Inc. | | | 256,723 |
| 2,150 | | | | Schering-Plough Corp. | | | 65,446 |
| 400 | | @ | | Watson Pharmaceuticals, Inc. | | | 13,012 |
| 1,790 | | | | Wyeth | | | 102,639 |
| | | | | | | |
| | | | | | | 1,054,710 |
| | | | | | | |
| Pipelines: 0.4% | | | |
| 1,200 | | | | El Paso Corp. | | | 20,676 |
| 400 | | | | Questar Corp. | | | 21,140 |
| 1,000 | | | | Spectra Energy Corp. | | | 25,960 |
| 1,150 | | | | Williams Cos., Inc. | | | 36,363 |
| | | | | | | |
| | | | | | | 104,139 |
| | | | | | | |
| Real Estate Investment Trusts: 0.8% | | | |
| 210 | | | | Apartment Investment & Management Co. | | | 10,588 |
| 340 | | | | Archstone-Smith Trust | | | 20,097 |
| 300 | | | | Boston Properties, Inc. | | | 30,639 |
| 300 | | | | Developers Diversified Realty Corp. | | | 15,813 |
| 200 | | | | Equity Residential | | | 9,126 |
| 500 | | | | Host Hotels & Resorts, Inc. | | | 11,560 |
| 300 | | | | Kimco Realty Corp. | | | 11,421 |
| 500 | | | | Prologis | | | 28,450 |
| 300 | | | | Simon Property Group, Inc. | | | 27,912 |
| 200 | | | | Vornado Realty Trust | | | 21,968 |
| | | | | | | |
| | | | | | | 187,574 |
| | | | | | | |
| Retail: 4.9% | | | |
| 280 | | @ | | Autozone, Inc. | | | 38,254 |
| 300 | | @ | | Bed Bath & Beyond, Inc. | | | 10,797 |
| 770 | | | | Best Buy Co., Inc. | | | 35,936 |
See Accompanying Notes to Financial Statements
102
| | |
| ING GET U.S. CORE PORTFOLIO SERIES 9 | | PORTFOLIO OF INVESTMENTS ASOF JUNE 30, 2007 (UNAUDITED) (CONTINUED) |
| | | | | | | |
| Shares | | | | | | Value |
| | | | | | | |
| Retail (continued) | | | |
| 350 | | @ | | Big Lots, Inc. | | $ | 10,297 |
| 670 | | | | Costco Wholesale Corp. | | | 39,208 |
| 1,885 | | | | CVS Corp. | | | 68,708 |
| 430 | | | | Darden Restaurants, Inc. | | | 18,916 |
| 500 | | | | Dollar General Corp. | | | 10,960 |
| 590 | | | | Family Dollar Stores, Inc. | | | 20,249 |
| 1,250 | | | | Gap, Inc. | | | 23,875 |
| 2,520 | | | | Home Depot, Inc. | | | 99,162 |
| 450 | | | | JC Penney Co., Inc. | | | 32,571 |
| 460 | | @ | | Kohl’s Corp. | | | 32,674 |
| 2,310 | | | | Lowe’s Cos., Inc. | | | 70,894 |
| 1,200 | | | | Macy’s, Inc. | | | 47,736 |
| 1,970 | | | | McDonald’s Corp. | | | 99,997 |
| 430 | | | | Nordstrom, Inc. | | | 21,982 |
| 430 | | @ | | Office Depot, Inc. | | | 13,029 |
| 500 | | | | RadioShack Corp. | | | 16,570 |
| 150 | | @ | | Sears Holding Corp. | | | 25,425 |
| 1,060 | | | | Staples, Inc. | | | 25,154 |
| 1,290 | | @ | | Starbucks Corp. | | | 33,850 |
| 1,180 | | | | Target Corp. | | | 75,048 |
| 1,010 | | | | TJX Cos., Inc. | | | 27,775 |
| 1,490 | | | | Walgreen Co. | | | 64,875 |
| 3,240 | | | | Wal-Mart Stores, Inc. | | | 155,876 |
| 400 | | | | Wendy’s International, Inc. | | | 14,700 |
| 900 | | | | Yum! Brands, Inc. | | | 29,448 |
| | | | | | | |
| | | | | | | 1,163,966 |
| | | | | | | |
| Savings & Loans: 0.4% | | | |
| 1,000 | | | | Hudson City Bancorp., Inc. | | | 12,220 |
| 500 | | | | Sovereign Bancorp., Inc. | | | 10,570 |
| 1,586 | | | | Washington Mutual, Inc. | | | 67,627 |
| | | | | | | |
| | | | | | | 90,417 |
| | | | | | | |
| Semiconductors: 2.3% | | | |
| 900 | | @ | | Advanced Micro Devices, Inc. | | | 12,870 |
| 820 | | | | Altera Corp. | | | 18,147 |
| 430 | | | | Analog Devices, Inc. | | | 16,185 |
| 1,380 | | | | Applied Materials, Inc. | | | 27,421 |
| 700 | | @ | | Broadcom Corp. | | | 20,475 |
| 8,300 | | | | Intel Corp. | | | 197,208 |
| 500 | | | | KLA-Tencor Corp. | | | 27,475 |
| 600 | | | | Linear Technology Corp. | | | 21,708 |
| 1,200 | | @ | | LSI Logic Corp. | | | 9,012 |
| 540 | | | | Maxim Integrated Products | | | 18,041 |
| 400 | | @ | | MEMC Electronic Materials, Inc. | | | 24,448 |
| 1,250 | | @ | | Micron Technology, Inc. | | | 15,663 |
| 520 | | | | National Semiconductor Corp. | | | 14,700 |
| 500 | | @ | | Novellus Systems, Inc. | | | 14,185 |
| 540 | | @ | | Nvidia Corp. | | | 22,307 |
| 800 | | @ | | Teradyne, Inc. | | | 14,064 |
| 1,600 | | | | Texas Instruments, Inc. | | | 60,208 |
| 500 | | | | Xilinx, Inc. | | | 13,385 |
| | | | | | | |
| | | | | | | 547,502 |
| | | | | | | |
| Software: 3.4% | | | |
| 1,110 | | @ | | Adobe Systems, Inc. | | | 44,567 |
| 510 | | @ | | Autodesk, Inc. | | | 24,011 |
| 950 | | | | Automatic Data Processing, Inc. | | | 46,047 |
| 710 | | @ | | BMC Software, Inc. | | | 21,513 |
| 1,390 | | | | CA, Inc. | | | 35,904 |
| 600 | | @ | | Citrix Systems, Inc. | | | 20,202 |
| 1,530 | | @ | | Compuware Corp. | | | 18,146 |
| 430 | | @ | | Electronic Arts, Inc. | | | 20,348 |
| | | | | | | | |
| Shares | | | | | | Value |
| | | | | | | | |
| | 1,390 | | | | First Data Corp. | | $ | 45,411 |
| | 330 | | @ | | Fiserv, Inc. | | | 18,744 |
| | 950 | | @ | | Intuit, Inc. | | | 28,576 |
| | 11,540 | | | | Microsoft Corp. | | | 340,084 |
| | 1,400 | | @ | | Novell, Inc. | | | 10,906 |
| | 5,470 | | @ | | Oracle Corp. | | | 107,814 |
| | 670 | | | | Paychex, Inc. | | | 26,210 |
| | | | | | | | |
| | | | | | | | 808,483 |
| | | | | | | | |
| | Telecommunications: 5.2% | | | |
| | 400 | | @@ | | Allergan, Inc. | | | 23,056 |
| | 500 | | | | Alltel Corp. | | | 33,775 |
| | 8,593 | | | | AT&T, Inc. | | | 356,610 |
| | 880 | | @ | | Avaya, Inc. | | | 14,819 |
| | 470 | | | | CenturyTel, Inc. | | | 23,054 |
| | 8,750 | | @ | | Cisco Systems, Inc. | | | 243,688 |
| | 1,300 | | | | Citizens Communications Co. | | | 19,851 |
| | 2,320 | | @ | | Corning, Inc. | | | 59,276 |
| | 342 | | | | Embarq Corp. | | | 21,673 |
| | 1,000 | | @ | | Juniper Networks, Inc. | | | 25,170 |
| | 3,370 | | | | Motorola, Inc. | | | 59,649 |
| | 2,250 | | | | Qualcomm, Inc. | | | 97,628 |
| | 2,700 | | @ | | Qwest Communications International, Inc. | | | 26,190 |
| | 3,990 | | | | Sprint Nextel Corp. | | | 82,633 |
| | 1,200 | | @ | | Tellabs, Inc. | | | 12,912 |
| | 3,640 | | | | Verizon Communications, Inc. | | | 149,859 |
| | | | | | | | |
| | | | | | | | 1,249,843 |
| | | | | | | | |
| | Toys/Games/Hobbies: 0.2% | | | |
| | 500 | | | | Hasbro, Inc. | | | 15,705 |
| | 1,120 | | | | Mattel, Inc. | | | 28,325 |
| | | | | | | | |
| | | | | | | | 44,030 |
| | | | | | | | |
| | Transportation: 1.3% | | | |
| | 520 | | | | Burlington Northern Santa Fe Corp. | | | 44,273 |
| | 300 | | | | CH Robinson Worldwide, Inc. | | | 15,756 |
| | 620 | | | | CSX Corp. | | | 27,950 |
| | 470 | | | | FedEx Corp. | | | 52,156 |
| | 480 | | | | Norfolk Southern Corp. | | | 25,234 |
| | 460 | | | | Union Pacific Corp. | | | 52,969 |
| | 1,400 | | | | United Parcel Service, Inc. | | | 102,200 |
| | | | | | | | |
| | | | | | | | 320,538 |
| | | | | | | | |
| | | | | Total Common Stock
(Cost $18,879,766 ) | | | 20,220,132 |
| | | | | | | | |
| | | |
Principal
Amount | | | | | | |
| | U.S. TREASURY OBLIGATIONS: 14.6% | | | |
| | U.S. Treasury STRIP: 14.6% | | | |
| $ | 4,470,000 | | ^ | | 4.850%, due 08/15/12 | | $ | 3,495,786 |
| | | | | | | | |
| | | | | Total U.S. Treasury Obligations
(Cost $3,482,895 ) | | | 3,495,786 |
| | | | | | | | |
| | | | | Total Long-Term Investments
(Cost $22,362,661) | | | 23,715,918 |
| | | | | | | | |
| Shares | | | | | | |
| | SHORT-TERM INVESTMENTS: 0.8% | | | |
| | Mutual Fund: 0.0% | | | |
| | 10,000 | | ** | | ING Institutional Prime Money Market Fund | | | 10,000 |
| | | | | | | | |
| | | | | Total Mutual Fund (Cost $10,000) | | | 10,000 |
| | | | | | | | |
See Accompanying Notes to Financial Statements
103
| | |
| ING GET U.S. CORE PORTFOLIO SERIES 9 | | PORTFOLIO OF INVESTMENTS ASOF JUNE 30, 2007 (UNAUDITED) (CONTINUED) |
| | | | | | | | | |
Principal
Amount | | | | | | | Value |
| | Repurchase Agreement: 0.8% | | | | | | |
| $ | 187,000 | | Goldman Sachs Repurchase Agreement dated 06/29/07, 5.300%, due 07/02/07, $187,083 to be received upon repurchase (Collateralized by $190,000 Federal National Mortgage Association, 5.600%, Market Value plus accrued interest $190,812, due 02/01/17) | | | | | $ | 187,000 |
| | | | | | | | | |
| | | Total Repurchase Agreement
(Cost $187,000) | | | | | | 187,000 |
| | | | | | | | | |
| | | Total Short-Term Investments (Cost $197,000) | | | | | | 197,000 |
| | | | | | | | | |
| | | Total Investments in Securities (Cost $22,559,661)* | | 99.9 | % | | $ | 23,912,918 |
| | | Other Assets and
Liabilities—Net | | 0.1 | | | | 17,446 |
| | | | | | | | | |
| | | Net Assets | | 100.0 | % | | $ | 23,930,364 |
| | | | | | | | | |
| @ | Non-income producing security |
| STRIP | Separate Trading of Registered Interest and Principal of Securities |
| ** | Investment in affiliate |
| ^ | Interest Only (IO) Security |
| * | Cost for federal income tax purposes is $22,870,885. |
| | | | |
Net unrealized appreciation consists of: | | | | |
Gross Unrealized Appreciation | | $ | 1,349,349 | |
Gross Unrealized Depreciation | | | (307,316 | ) |
| | | | |
Net Unrealized Appreciation | | $ | 1,042,033 | |
| | | | |
See Accompanying Notes to Financial Statements
104
| | |
| ING GET U.S. CORE PORTFOLIO SERIES 10 | | PORTFOLIO OF INVESTMENTS ASOF JUNE 30, 2007 (UNAUDITED) |
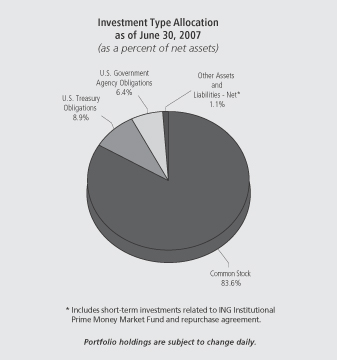
| | | | | | | |
| Shares | | | | | | Value |
| | | | | | | |
| COMMON STOCK: 83.6% | | | |
| Advertising: 0.2% | | | |
| 960 | | | | Omnicom Group | | $ | 50,803 |
| | | | | | | |
| | | | | | | 50,803 |
| | | | | | | |
| Aerospace/Defense: 2.0% | | | |
| 1,100 | | | | Boeing Co. | | | 105,776 |
| 940 | | | | General Dynamics Corp. | | | 73,527 |
| 200 | | | | Goodrich Corp. | | | 11,912 |
| 250 | | | | L-3 Communications Holdings, Inc. | | | 24,348 |
| 730 | | | | Lockheed Martin Corp. | | | 68,715 |
| 490 | | | | Northrop Grumman Corp. | | | 38,156 |
| 1,240 | | | | Raytheon Co. | | | 66,824 |
| 1,730 | | | | United Technologies Corp. | | | 122,709 |
| | | | | | | |
| | | | | | | 511,967 |
| | | | | | | |
| Agriculture: 1.3% | | | |
| 3,400 | | | | Altria Group, Inc. | | | 238,476 |
| 990 | | | | Archer-Daniels-Midland Co. | | | 32,759 |
| 540 | | | | Reynolds American, Inc. | | | 35,208 |
| 480 | | | | UST, Inc. | | | 25,781 |
| | | | | | | |
| | | | | | | 332,224 |
| | | | | | | |
| Apparel: 0.4% | | | |
| 970 | | @ | | Coach, Inc. | | | 45,968 |
| 880 | | | | Nike, Inc. | | | 51,295 |
| 200 | | | | Polo Ralph Lauren Corp. | | | 19,622 |
| | | | | | | |
| | | | | | | 116,885 |
| | | | | | | |
| | | | | | | |
| Shares | | | | | | Value |
| | | | | | | |
| Auto Manufacturers: 0.4% | | | |
| 3,560 | | | | Ford Motor Co. | | $ | 33,535 |
| 840 | | | | General Motors Corp. | | | 31,752 |
| 530 | | | | Paccar, Inc. | | | 46,131 |
| | | | | | | |
| | | | | | | 111,418 |
| | | | | | | |
| Auto Parts & Equipment: 0.2% | | | |
| 300 | | @ | | Goodyear Tire & Rubber Co. | | | 10,428 |
| 380 | | | | Johnson Controls, Inc. | | | 43,993 |
| | | | | | | |
| | | | | | | 54,421 |
| | | | | | | |
| Banks: 5.1% | | | |
| 7,222 | | | | Bank of America Corp. | | | 353,084 |
| 1,240 | | @ | | Bank of New York Co., Inc. | | | 51,386 |
| 800 | | | | BB&T Corp. | | | 32,544 |
| 563 | | | | Capital One Financial Corp. | | | 44,162 |
| 480 | | | | Comerica, Inc. | | | 28,546 |
| 200 | | | | Compass Bancshares, Inc. | | | 13,796 |
| 460 | | | | Fifth Third Bancorp. | | | 18,294 |
| 1,690 | | | | Huntington Bancshares, Inc. | | | 38,431 |
| 1,400 | | | | Keycorp. | | | 48,062 |
| 300 | | | | Marshall & Ilsley Corp. | | | 14,289 |
| 930 | | | | Mellon Financial Corp. | | | 40,920 |
| 1,200 | | | | National City Corp. | | | 39,984 |
| 200 | | | | Northern Trust Corp. | | | 12,848 |
| 420 | | | | PNC Financial Services Group, Inc. | | | 30,064 |
| 2,060 | | | | Regions Financial Corp. | | | 68,186 |
| 580 | | | | State Street Corp. | | | 39,672 |
| 390 | | | | SunTrust Banks, Inc. | | | 33,439 |
| 1,870 | | | | US Bancorp. | | | 61,617 |
| 3,249 | | | | Wachovia Corp. | | | 166,511 |
| 5,820 | | | | Wells Fargo & Co. | | | 204,689 |
| | | | | | | |
| | | | | | | 1,340,524 |
| | | | | | | |
| Beverages: 1.6% | | | |
| 1,070 | | | | Anheuser-Busch Cos., Inc. | | | 55,811 |
| 3,050 | | | | Coca-Cola Co. | | | 159,546 |
| 780 | | | | Pepsi Bottling Group, Inc. | | | 26,270 |
| 2,560 | | | | PepsiCo, Inc. | | | 166,016 |
| | | | | | | |
| | | | | | | 407,643 |
| | | | | | | |
| Biotechnology: 0.7% | | | |
| 1,650 | | @ | | Amgen, Inc. | | | 91,229 |
| 520 | | @ | | Biogen Idec, Inc. | | | 27,820 |
| 550 | | @ | | Celgene Corp. | | | 31,532 |
| 540 | | @ | | Genzyme Corp. | | | 34,776 |
| | | | | | | |
| | | | | | | 185,357 |
| | | | | | | |
| Building Materials: 0.2% | | | |
| 200 | | | | American Standard Cos., Inc. | | | 11,796 |
| 1,230 | | | | Masco Corp. | | | 35,018 |
| | | | | | | |
| | | | | | | 46,814 |
| | | | | | | |
| Chemicals: 1.5% | | | |
| 160 | | | | Air Products & Chemicals, Inc. | | | 12,859 |
| 300 | | | | Ashland, Inc. | | | 19,185 |
| 1,430 | | | | Dow Chemical Co. | | | 63,235 |
| 300 | | | | Ecolab, Inc. | | | 12,810 |
| 1,250 | | | | EI DuPont de Nemours & Co. | | | 63,550 |
| 500 | | | | International Flavors & Fragrances, Inc. | | | 26,070 |
| 1,020 | | | | Monsanto Co. | | | 68,891 |
| 500 | | | | PPG Industries, Inc. | | | 38,055 |
| 300 | | | | Praxair, Inc. | | | 21,597 |
See Accompanying Notes to Financial Statements
105
| | |
| ING GET U.S. CORE PORTFOLIO SERIES 10 | | PORTFOLIO OF INVESTMENTS ASOF JUNE 30, 2007 (UNAUDITED) (CONTINUED) |
| | | | | | | |
| Shares | | | | | | Value |
| | | | | | | |
| Chemicals: (continued) | | | |
| 300 | | | | Sherwin-Williams Co. | | $ | 19,941 |
| 800 | | | | Sigma-Aldrich Corp. | | | 34,136 |
| | | | | | | |
| | | | | | | 380,329 |
| | | | | | | |
| Coal: 0.1% | | | |
| 200 | | | | Consol Energy, Inc. | | | 9,222 |
| 360 | | | | Peabody Energy Corp. | | | 17,417 |
| | | | | | | |
| | | | | | | 26,639 |
| | | | | | | |
| Commercial Services: 0.6% | | | |
| 290 | | @ | | Apollo Group, Inc. | | | 16,945 |
| 610 | | @ | | Convergys Corp. | | | 14,786 |
| 280 | | | | Equifax, Inc. | | | 12,438 |
| 500 | | | | McKesson Corp. | | | 29,820 |
| 390 | | | | Moody’s Corp. | | | 24,258 |
| 310 | | | | Robert Half International, Inc. | | | 11,315 |
| 500 | | | | RR Donnelley & Sons Co. | | | 21,755 |
| 1,140 | | | | Western Union Co. | | | 23,746 |
| | | | | | | |
| | | | | | | 155,063 |
| | | | | | | |
| Computers: 3.8% | | | |
| 200 | | @ | | Affiliated Computer Services, Inc. | | | 11,344 |
| 1,400 | | @ | | Apple, Inc. | | | 170,856 |
| 140 | | @ | | Cognizant Technology Solutions Corp. | | | 10,513 |
| 340 | | @ | | Computer Sciences Corp. | | | 20,111 |
| 4,070 | | @ | | Dell, Inc. | | | 116,199 |
| 1,110 | | | | Electronic Data Systems Corp. | | | 30,780 |
| 4,240 | | @ | | EMC Corp. | | | 76,744 |
| 4,530 | | | | Hewlett-Packard Co. | | | 202,129 |
| 2,280 | | | | International Business Machines Corp. | | | 239,970 |
| 280 | | @ | | Lexmark International, Inc. | | | 13,807 |
| 380 | | @ | | NCR Corp. | | | 19,965 |
| 690 | | @ | | Network Appliance, Inc. | | | 20,148 |
| 430 | | @ | | Sandisk Corp. | | | 21,044 |
| 5,420 | | @ | | Sun Microsystems, Inc. | | | 28,509 |
| | | | | | | |
| | | | | | | 982,119 |
| | | | | | | |
| Cosmetics/Personal Care: 1.6% | | | |
| 440 | | | | Avon Products, Inc. | | | 16,170 |
| 950 | | | | Colgate-Palmolive Co. | | | 61,608 |
| 280 | | | | Estee Lauder Cos., Inc. | | | 12,743 |
| 5,320 | | | | Procter & Gamble Co. | | | 325,531 |
| | | | | | | |
| | | | | | | 416,052 |
| | | | | | | |
| Distribution/Wholesale: 0.1% | | | |
| 210 | | | | WW Grainger, Inc. | | | 19,541 |
| | | | | | | |
| | | | | | | 19,541 |
| | | | | | | |
| Diversified Financial Services: 6.7% | | | |
| 1,800 | | | | American Express Co. | | | 110,124 |
| 490 | | | | Ameriprise Financial, Inc. | | | 31,149 |
| 200 | | | | Bear Stearns Cos., Inc. | | | 28,000 |
| 1,710 | | | | Charles Schwab Corp. | | | 35,089 |
| 60 | | | | Chicago Mercantile Exchange
Holdings, Inc. | | | 32,062 |
| 380 | | | | CIT Group, Inc. | | | 20,835 |
| 7,530 | | | | Citigroup, Inc. | | | 386,214 |
| 1,060 | | | | Countrywide Financial Corp. | | | 38,531 |
| 630 | | @ | | E*Trade Financial Corp. | | | 13,917 |
| 1,420 | | | | Fannie Mae | | | 92,769 |
| 310 | | | | Franklin Resources, Inc. | | | 41,066 |
| 1,190 | | | | Freddie Mac | | | 72,233 |
| 660 | | | | Goldman Sachs Group, Inc. | | | 143,055 |
| 380 | | | | Janus Capital Group, Inc. | | | 10,579 |
| | | | | | | |
| Shares | | | | | | Value |
| | | | | | | |
| 5,980 | | | | JP Morgan Chase & Co. | | $ | 289,731 |
| 200 | | | | Legg Mason, Inc. | | | 19,676 |
| 1,020 | | | | Lehman Brothers Holdings, Inc. | | | 76,010 |
| 1,420 | | | | Merrill Lynch & Co., Inc. | | | 118,684 |
| 1,880 | | | | Morgan Stanley | | | 157,694 |
| 600 | | | | SLM Corp. | | | 34,548 |
| 200 | | | | T. Rowe Price Group, Inc. | | | 10,378 |
| | | | | | | |
| | | | | | | 1,762,344 |
| | | | | | | |
| Electric: 2.9% | | | |
| 1,070 | | @ | | AES Corp. | | | 23,412 |
| 480 | | | | American Electric Power Co., Inc. | | | 21,619 |
| 700 | | | | CMS Energy Corp. | | | 12,040 |
| 440 | | | | Constellation Energy Group, Inc. | | | 38,355 |
| 700 | | | | Dominion Resources, Inc. | | | 60,417 |
| 950 | | | | DTE Energy Co. | | | 45,809 |
| 600 | | | | Duke Energy Corp. | | | 10,980 |
| 1,160 | | | | Edison International | | | 65,099 |
| 680 | | | | Entergy Corp. | | | 72,998 |
| 1,220 | | | | Exelon Corp. | | | 88,572 |
| 940 | | | | FirstEnergy Corp. | | | 60,846 |
| 1,200 | | | | FPL Group, Inc. | | | 68,088 |
| 1,090 | | | | PG&E Corp. | | | 49,377 |
| 300 | | | | PPL Corp. | | | 14,037 |
| 740 | | | | Public Service Enterprise Group, Inc. | | | 64,957 |
| 700 | | | | TECO Energy, Inc. | | | 12,026 |
| 720 | | | | TXU Corp. | | | 48,456 |
| | | | | | | |
| | | | | | | 757,088 |
| | | | | | | |
| Electrical Components & Equipment: 0.2% | | | |
| 1,080 | | | | Emerson Electric Co. | | | 50,544 |
| | | | | | | |
| | | | | | | 50,544 |
| | | | | | | |
| Electronics: 0.4% | | | |
| 540 | | @ | | Agilent Technologies, Inc. | | | 20,758 |
| 500 | | | | Tektronix, Inc. | | | 16,870 |
| 870 | | @ | | Thermo Electron Corp. | | | 44,996 |
| 200 | | @ | | Waters Corp. | | | 11,872 |
| | | | | | | |
| | | | | | | 94,496 |
| | | | | | | |
| Engineering & Construction: 0.0% | | | |
| 100 | | | | Fluor Corp. | | | 11,137 |
| | | | | | | |
| | | | | | | 11,137 |
| | | | | | | |
| Entertainment: 0.1% | | | |
| 390 | | | | International Game Technology | | | 15,483 |
| | | | | | | |
| | | | | | | 15,483 |
| | | | | | | |
| Environmental Control: 0.2% | | | |
| 900 | | @ | | Allied Waste Industries, Inc. | | | 12,114 |
| 1,170 | | | | Waste Management, Inc. | | | 45,689 |
| | | | | | | |
| | | | | | | 57,803 |
| | | | | | | |
| Food: 1.4% | | | |
| 480 | | | | Campbell Soup Co. | | | 18,629 |
| 300 | | @ | | Dean Foods Co. | | | 9,561 |
| 1,200 | | | | General Mills, Inc. | | | 70,104 |
| 200 | | | | Hershey Co. | | | 10,124 |
| 1,390 | | | | HJ Heinz Co. | | | 65,983 |
| 400 | | | | Kellogg Co. | | | 20,716 |
| 1,983 | | | | Kraft Foods, Inc. | | | 69,901 |
| 1,230 | | | | Kroger Co. | | | 34,600 |
| 790 | | | | Safeway, Inc. | | | 26,884 |
| 300 | | | | Supervalu, Inc. | | | 13,896 |
| 300 | | | | Sysco Corp. | | | 9,897 |
See Accompanying Notes to Financial Statements
106
| | |
| ING GET U.S. CORE PORTFOLIO SERIES 10 | | PORTFOLIO OF INVESTMENTS ASOF JUNE 30, 2007 (UNAUDITED) (CONTINUED) |
| | | | | | | |
| Shares | | | | | | Value |
| | | | | | | |
| Food: (continued) | | | |
| 280 | | | | Whole Foods Market, Inc. | | $ | 10,724 |
| 200 | | | | WM Wrigley Jr. Co. | | | 11,062 |
| | | | | | | |
| | | | | | | 372,081 |
| | | | | | | |
| Forest Products & Paper: 0.3% | | | |
| 1,060 | | | | International Paper Co. | | | 41,393 |
| 200 | | | | Temple-Inland, Inc. | | | 12,306 |
| 300 | | | | Weyerhaeuser Co. | | | 23,679 |
| | | | | | | |
| | | | | | | 77,378 |
| | | | | | | |
| Gas: 0.2% | | | |
| 250 | | | | KeySpan Corp. | | | 10,495 |
| 600 | | | | Sempra Energy | | | 35,538 |
| | | | | | | |
| | | | | | | 46,033 |
| | | | | | | |
| Hand/Machine Tools: 0.2% | | | |
| 120 | | | | Black & Decker Corp. | | | 10,597 |
| 310 | | | | Snap-On, Inc. | | | 15,658 |
| 310 | | | | Stanley Works | | | 18,817 |
| | | | | | | |
| | | | | | | 45,072 |
| | | | | | | |
| Healthcare - Products: 2.4% | | | |
| 1,230 | | | | Baxter International, Inc. | | | 69,298 |
| 490 | | | | Becton Dickinson & Co. | | | 36,505 |
| 400 | | | | Biomet, Inc. | | | 18,288 |
| 1,690 | | @ | | Boston Scientific Corp. | | | 25,925 |
| 200 | | | | CR Bard, Inc. | | | 16,526 |
| 4,860 | | | | Johnson & Johnson | | | 299,473 |
| 1,600 | | | | Medtronic, Inc. | | | 82,976 |
| 400 | | @ | | St. Jude Medical, Inc. | | | 16,596 |
| 400 | | | | Stryker Corp. | | | 25,236 |
| 200 | | @ | | Varian Medical Systems, Inc. | | | 8,502 |
| 430 | | @ | | Zimmer Holdings, Inc. | | | 36,503 |
| | | | | | | |
| | | | | | | 635,828 |
| | | | | | | |
| Healthcare - Services: 1.2% | | | |
| 820 | | | | Aetna, Inc. | | | 40,508 |
| 390 | | @ | | Coventry Health Care, Inc. | | | 22,484 |
| 390 | | @ | | Humana, Inc. | | | 23,755 |
| 190 | | @ | | Laboratory Corp. of America Holdings | | | 14,869 |
| 2,290 | | | | UnitedHealth Group, Inc. | | | 117,111 |
| 1,160 | | @ | | WellPoint, Inc. | | | 92,603 |
| | | | | | | |
| | | | | | | 311,330 |
| | | | | | | |
| Home Builders: 0.1% | | | |
| 400 | | | | Centex Corp. | | | 16,040 |
| 400 | | | | KB Home | | | 15,748 |
| 200 | | | | Lennar Corp. | | | 7,312 |
| | | | | | | |
| | | | | | | 39,100 |
| | | | | | | |
| Home Furnishings: 0.1% | | | |
| 150 | | | | Harman International Industries, Inc. | | | 17,520 |
| 110 | | | | Whirlpool Corp. | | | 12,232 |
| | | | | | | |
| | | | | | | 29,752 |
| | | | | | | |
| Household Products/Wares: 0.3% | | | |
| 200 | | | | Clorox Co. | | | 12,420 |
| 1,040 | | | | Kimberly-Clark Corp. | | | 69,566 |
| | | | | | | |
| | | | | | | 81,986 |
| | | | | | | |
| Housewares: 0.1% | | | |
| 500 | | | | Newell Rubbermaid, Inc. | | | 14,715 |
| | | | | | | |
| | | | | | | 14,715 |
| | | | | | | |
| | | | | | | |
| Shares | | | | | | Value |
| | | | | | | |
| Insurance: 4.9% | | | |
| 800 | | @@ | | ACE Ltd. | | $ | 50,016 |
| 1,000 | | | | Aflac, Inc. | | | 51,400 |
| 1,450 | | | | Allstate Corp. | | | 89,190 |
| 100 | | | | AMBAC Financial Group, Inc. | | | 8,719 |
| 4,250 | | | | American International Group, Inc. | | | 297,628 |
| 580 | | | | AON Corp. | | | 24,714 |
| 300 | | | | Assurant, Inc. | | | 17,676 |
| 1,230 | | | | Chubb Corp. | | | 66,592 |
| 530 | | | | Cigna Corp. | | | 27,677 |
| 1,190 | | | | Genworth Financial, Inc. | | | 40,936 |
| 680 | | | | Hartford Financial Services Group, Inc. | | | 66,987 |
| 436 | | | | Lincoln National Corp. | | | 30,934 |
| 630 | | | | Loews Corp. | | | 32,117 |
| 800 | | | | Marsh & McLennan Cos., Inc. | | | 24,704 |
| 210 | | | | MBIA, Inc. | | | 13,066 |
| 1,530 | | | | Metlife, Inc. | | | 98,654 |
| 200 | | | | MGIC Investment Corp. | | | 11,372 |
| 790 | | | | Principal Financial Group | | | 46,049 |
| 1,570 | | | | Progressive Corp. | | | 37,570 |
| 860 | | | | Prudential Financial, Inc. | | | 83,618 |
| 210 | | | | Safeco Corp. | | | 13,075 |
| 200 | | | | Torchmark Corp. | | | 13,400 |
| 1,470 | | | | Travelers Cos., Inc. | | | 78,645 |
| 400 | | | | UnumProvident Corp. | | | 10,444 |
| 400 | | @@ | | XL Capital Ltd. | | | 33,716 |
| | | | | | | |
| | | | | | | 1,268,899 |
| | | | | | | |
| Internet: 1.5% | | | |
| 600 | | @ | | Amazon.com, Inc. | | | 41,046 |
| 1,930 | | @ | | eBay, Inc. | | | 62,107 |
| 330 | | @ | | Google, Inc. | | | 172,715 |
| 300 | | @ | | IAC/InterActiveCorp. | | | 10,383 |
| 1,790 | | @ | | Symantec Corp. | | | 36,158 |
| 430 | | @ | | VeriSign, Inc. | | | 13,644 |
| 2,200 | | @ | | Yahoo!, Inc. | | | 59,686 |
| | | | | | | |
| | | | | | | 395,739 |
| | | | | | | |
| Iron/Steel: 0.4% | | | |
| 200 | | | | Allegheny Technologies, Inc. | | | 20,976 |
| 760 | | | | Nucor Corp. | | | 44,574 |
| 250 | | | | United States Steel Corp. | | | 27,188 |
| | | | | | | |
| | | | | | | 92,738 |
| | | | | | | |
| Leisure Time: 0.3% | | | |
| 770 | | | | Carnival Corp. | | | 37,553 |
| 590 | | | | Harley-Davidson, Inc. | | | 35,170 |
| | | | | | | |
| | | | | | | 72,723 |
| | | | | | | |
| Lodging: 0.2% | | | |
| 300 | | | | Harrah’s Entertainment, Inc. | | | 25,578 |
| 300 | | | | Hilton Hotels Corp. | | | 10,041 |
| 320 | | | | Marriott International, Inc. | | | 13,837 |
| 200 | | | | Starwood Hotels & Resorts Worldwide, Inc. | | | 13,414 |
| | | | | | | |
| | | | | | | 62,870 |
| | | | | | | |
| Machinery - Construction & Mining: 0.4% | | | |
| 1,290 | | | | Caterpillar, Inc. | | | 101,007 |
| 200 | | @ | | Terex Corp. | | | 16,260 |
| | | | | | | |
| | | | | | | 117,267 |
| | | | | | | |
See Accompanying Notes to Financial Statements
107
| | |
| ING GET U.S. CORE PORTFOLIO SERIES 10 | | PORTFOLIO OF INVESTMENTS ASOF JUNE 30, 2007 (UNAUDITED) (CONTINUED) |
| | | | | | | |
| Shares | | | | | | Value |
| | | | | | | |
| Machinery - Diversified: 0.4% | | | |
| 320 | | | | Cummins, Inc. | | $ | 32,387 |
| 450 | | | | Deere & Co. | | | 54,333 |
| 180 | | | | Rockwell Automation, Inc. | | | 12,499 |
| | | | | | | |
| | | | | | | 99,219 |
| | | | | | | |
| Media: 2.5% | | | |
| 1,255 | | | | CBS Corp. - Class B | | | 41,817 |
| 860 | | | | Clear Channel Communications, Inc. | | | 32,525 |
| 3,620 | | @ | | Comcast Corp. - Class A | | | 101,794 |
| 1,300 | | @ | | DIRECTV Group, Inc. | | | 30,043 |
| 480 | | | | Gannett Co., Inc. | | | 26,376 |
| 930 | | | | McGraw-Hill Cos., Inc. | | | 63,314 |
| 4,380 | | | | News Corp., Inc. - Class A | | | 92,900 |
| 4,600 | | | | Time Warner, Inc. | | | 96,784 |
| 900 | | @ | | Viacom - Class B | | | 37,467 |
| 3,570 | | | | Walt Disney Co. | | | 121,880 |
| | | | | | | |
| | | | | | | 644,900 |
| | | | | | | |
| Metal Fabricate/Hardware: 0.0% | | | |
| 100 | | | | Precision Castparts Corp. | | | 12,136 |
| | | | | | | |
| | | | | | | 12,136 |
| | | | | | | |
| Mining: 0.5% | | | |
| 1,400 | | | | Alcoa, Inc. | | | 56,742 |
| 741 | | | | Freeport-McMoRan Copper & Gold, Inc. | | | 61,370 |
| 500 | | | | Newmont Mining Corp. | | | 19,530 |
| | | | | | | |
| | | | | | | 137,642 |
| | | | | | | |
| Miscellaneous Manufacturing: 4.4% | | | |
| 1,400 | | | | 3M Co. | | | 121,506 |
| 400 | | | | Cooper Industries Ltd. | | | 22,836 |
| 490 | | | | Danaher Corp. | | | 36,995 |
| 830 | | | | Eastman Kodak Co. | | | 23,099 |
| 510 | | | | Eaton Corp. | | | 47,430 |
| 15,090 | | | | General Electric Co. | | | 577,629 |
| 1,320 | | | | Honeywell International, Inc. | | | 74,290 |
| 900 | | | | Illinois Tool Works, Inc. | | | 48,771 |
| 470 | | | | ITT Corp. | | | 32,092 |
| 300 | | | | Pall Corp. | | | 13,797 |
| 400 | | | | Parker Hannifin Corp. | | | 39,164 |
| 100 | | | | Textron, Inc. | | | 11,011 |
| 3,280 | | @ | | Tyco International Ltd. | | | 110,831 |
| | | | | | | |
| | | | | | | 1,159,451 |
| | | | | | | |
| Office/Business Equipment: 0.1% | | | |
| 1,900 | | @ | | Xerox Corp. | | | 35,112 |
| | | | | | | |
| | | | | | | 35,112 |
| | | | | | | |
| Oil & Gas: 7.4% | | | |
| 810 | | | | Anadarko Petroleum Corp. | | | 42,112 |
| 200 | | | | Apache Corp. | | | 16,318 |
| 600 | | | | Chesapeake Energy Corp. | | | 20,760 |
| 3,870 | | | | Chevron Corp. | | | 326,009 |
| 2,723 | | | | ConocoPhillips | | | 213,756 |
| 870 | | | | Devon Energy Corp. | | | 68,112 |
| 400 | | | | ENSCO International, Inc. | | | 24,404 |
| 200 | | | | EOG Resources, Inc. | | | 14,612 |
| 9,140 | | | | ExxonMobil Corp. | | | 766,663 |
| 300 | | | | Hess Corp. | | | 17,688 |
| 1,540 | | | | Marathon Oil Corp. | | | 92,338 |
| 200 | | | | Murphy Oil Corp. | | | 11,888 |
| 500 | | @, @@ | | Nabors Industries Ltd. | | | 16,690 |
| 200 | | | | Noble Corp. | | | 19,504 |
| | | | | | | |
| Shares | | | | | | Value |
| | | | | | | |
| 1,510 | | | | Occidental Petroleum Corp. | | $ | 87,399 |
| 300 | | | | Sunoco, Inc. | | | 23,904 |
| 480 | | @ | | Transocean, Inc. | | | 50,870 |
| 1,050 | | | | Valero Energy Corp. | | | 77,553 |
| 620 | | | | XTO Energy, Inc. | | | 37,262 |
| | | | | | | |
| | | | | | | 1,927,842 |
| | | | | | | |
| Oil & Gas Services: 1.2% | | | |
| 400 | | | | Baker Hughes, Inc. | | | 33,652 |
| 2,130 | | | | Halliburton Co. | | | 73,485 |
| 350 | | @ | | National Oilwell Varco, Inc. | | | 36,484 |
| 1,740 | | | | Schlumberger Ltd. | | | 147,796 |
| 400 | | @ | | Weatherford International Ltd. | | | 22,096 |
| | | | | | | |
| | | | | | | 313,513 |
| | | | | | | |
| Packaging & Containers: 0.3% | | | |
| 200 | | | | Ball Corp. | | | 10,634 |
| 600 | | | | Bemis Co. | | | 19,908 |
| 830 | | @ | | Pactiv Corp. | | | 26,469 |
| 600 | | | | Sealed Air Corp. | | | 18,612 |
| | | | | | | |
| | | | | | | 75,623 |
| | | | | | | |
| Pharmaceuticals: 4.5% | | | |
| 1,980 | | | | Abbott Laboratories | | | 106,029 |
| 470 | | | | AmerisourceBergen Corp. | | | 23,251 |
| 180 | | @ | | Barr Pharmaceuticals, Inc. | | | 9,041 |
| 3,200 | | | | Bristol-Myers Squibb Co. | | | 100,992 |
| 550 | | | | Cardinal Health, Inc. | | | 38,852 |
| 1,500 | | | | Eli Lilly & Co. | | | 83,820 |
| 420 | | @ | | Express Scripts, Inc. | | | 21,004 |
| 740 | | @ | | Forest Laboratories, Inc. | | | 33,781 |
| 1,680 | | @ | | Gilead Sciences, Inc. | | | 65,134 |
| 600 | | @ | | King Pharmaceuticals, Inc. | | | 12,276 |
| 400 | | @ | | Medco Health Solutions, Inc. | | | 31,196 |
| 3,280 | | | | Merck & Co., Inc. | | | 163,344 |
| 580 | | | | Mylan Laboratories | | | 10,550 |
| 10,980 | | | | Pfizer, Inc. | | | 280,759 |
| 2,570 | | | | Schering-Plough Corp. | | | 78,231 |
| 400 | | @ | | Watson Pharmaceuticals, Inc. | | | 13,012 |
| 2,010 | | | | Wyeth | | | 115,253 |
| | | | | | | |
| | | | | | | 1,186,525 |
| | | | | | | |
| Pipelines: 0.3% | | | |
| 940 | | | | El Paso Corp. | | | 16,196 |
| 400 | | | | Questar Corp. | | | 21,140 |
| 1,000 | | | | Spectra Energy Corp. | | | 25,960 |
| 900 | | | | Williams Cos., Inc. | | | 28,458 |
| | | | | | | |
| | | | | | | 91,754 |
| | | | | | | |
| Real Estate Investment Trusts: 0.7% | | | |
| 180 | | | | Apartment Investment & Management Co. | | | 9,076 |
| 280 | | | | Archstone-Smith Trust | | | 16,551 |
| 300 | | | | Boston Properties, Inc. | | | 30,639 |
| 270 | | | | Developers Diversified Realty Corp. | | | 14,232 |
| 200 | | | | Equity Residential | | | 9,126 |
| 600 | | | | Host Hotels & Resorts, Inc. | | | 13,872 |
| 300 | | | | Kimco Realty Corp. | | | 11,421 |
| 450 | | | | Prologis | | | 25,605 |
| 300 | | | | Simon Property Group, Inc. | | | 27,912 |
| 200 | | | | Vornado Realty Trust | | | 21,968 |
| | | | | | | |
| | | | | | | 180,402 |
| | | | | | | |
See Accompanying Notes to Financial Statements
108
| | |
| ING GET U.S. CORE PORTFOLIO SERIES 10 | | PORTFOLIO OF INVESTMENTS ASOF JUNE 30, 2007 (UNAUDITED) (CONTINUED) |
| | | | | | | |
| Shares | | | | | | Value |
| | | | | | | |
| Retail: 4.7% | | | |
| 210 | | @ | | Autozone, Inc. | | $ | 28,690 |
| 300 | | @ | | Bed Bath & Beyond, Inc. | | | 10,797 |
| 890 | | | | Best Buy Co., Inc. | | | 41,536 |
| 350 | | @ | | Big Lots, Inc. | | | 10,297 |
| 820 | | | | Costco Wholesale Corp. | | | 47,986 |
| 2,271 | | | | CVS Corp. | | | 82,778 |
| 280 | | | | Darden Restaurants, Inc. | | | 12,317 |
| 400 | | | | Dollar General Corp. | | | 8,768 |
| 510 | | | | Family Dollar Stores, Inc. | | | 17,503 |
| 970 | | | | Gap, Inc. | | | 18,527 |
| 3,280 | | | | Merck & Co., Inc. | | | 163,344 |
| 2,760 | | | | Home Depot, Inc. | | | 108,606 |
| 420 | | | | JC Penney Co., Inc. | | | 30,400 |
| 550 | | @ | | Kohl’s Corp. | | | 39,067 |
| 2,480 | | | | Lowe’s Cos., Inc. | | | 76,111 |
| 1,210 | | | | Macy’s, Inc. | | | 48,134 |
| 2,260 | | | | McDonald's Corp. | | | 114,718 |
| 480 | | | | Nordstrom, Inc. | | | 24,538 |
| 360 | | @ | | Office Depot, Inc. | | | 10,908 |
| 400 | | | | RadioShack Corp. | | | 13,256 |
| 150 | | @ | | Sears Holding Corp. | | | 25,425 |
| 890 | | | | Staples, Inc. | | | 21,120 |
| 1,130 | | @ | | Starbucks Corp. | | | 29,651 |
| 1,410 | | | | Target Corp. | | | 89,676 |
| 990 | | | | TJX Cos., Inc. | | | 27,225 |
| 1,650 | | | | Walgreen Co. | | | 71,841 |
| 3,550 | | | | Wal-Mart Stores, Inc. | | | 170,791 |
| 400 | | | | Wendy's International, Inc. | | | 14,700 |
| 1,040 | | | | Yum! Brands, Inc. | | | 34,029 |
| | | | | | | |
| | | | | | | 1,229,395 |
| | | | | | | |
| Savings & Loans: 0.4% | | | |
| 900 | | | | Hudson City Bancorp., Inc. | | | 10,998 |
| 500 | | | | Sovereign Bancorp., Inc. | | | 10,570 |
| 1,830 | | | | Washington Mutual, Inc. | | | 78,031 |
| | | | | | | |
| | | | | | | 99,599 |
| | | | | | | |
| Semiconductors: 2.1% | | | |
| 740 | | @ | | Advanced Micro Devices, Inc. | | | 10,582 |
| 840 | | | | Altera Corp. | | | 18,589 |
| 440 | | | | Analog Devices, Inc. | | | 16,562 |
| 1,400 | | | | Applied Materials, Inc. | | | 27,818 |
| 600 | | @ | | Broadcom Corp. | | | 17,550 |
| 8,810 | | | | Intel Corp. | | | 209,326 |
| 500 | | | | KLA-Tencor Corp. | | | 27,475 |
| 500 | | | | Linear Technology Corp. | | | 18,090 |
| 1,000 | | @ | | LSI Logic Corp. | | | 7,510 |
| 380 | | | | Maxim Integrated Products | | | 12,696 |
| 400 | | @ | | MEMC Electronic Materials, Inc. | | | 24,448 |
| 1,070 | | @ | | Micron Technology, Inc. | | | 13,407 |
| 440 | | | | National Semiconductor Corp. | | | 12,439 |
| 410 | | @ | | Novellus Systems, Inc. | | | 11,632 |
| 470 | | @ | | Nvidia Corp. | | | 19,416 |
| 700 | | @ | | Teradyne, Inc. | | | 12,306 |
| 2,100 | | | | Texas Instruments, Inc. | | | 79,023 |
| 410 | | | | Xilinx, Inc. | | | 10,976 |
| | | | | | | |
| | | | | | | 549,845 |
| | | | | | | |
| | | | | | | |
| Shares | | | | | | Value |
| | | | | | | |
| Software: 3.2% | | | |
| 980 | | @ | | Adobe Systems, Inc. | | $ | 39,347 |
| 500 | | @ | | Autodesk, Inc. | | | 23,540 |
| 1,110 | | | | Automatic Data Processing, Inc. | | | 53,802 |
| 590 | | @ | | BMC Software, Inc. | | | 17,877 |
| 1,340 | | | | CA, Inc. | | | 34,612 |
| 500 | | @ | | Citrix Systems, Inc. | | | 16,835 |
| 1,270 | | @ | | Compuware Corp. | | | 15,062 |
| 500 | | @ | | Electronic Arts, Inc. | | | 23,660 |
| 1,340 | | | | First Data Corp. | | | 43,778 |
| 430 | | @ | | Fiserv, Inc. | | | 24,424 |
| 930 | | @ | | Intuit, Inc. | | | 27,974 |
| 12,590 | | | | Microsoft Corp. | | | 371,027 |
| 1,400 | | @ | | Novell, Inc. | | | 10,906 |
| 5,790 | | @ | | Oracle Corp. | | | 114,121 |
| 590 | | | | Paychex, Inc. | | | 23,081 |
| | | | | | | |
| | | | | | | 840,046 |
| | | | | | | |
| Telecommunications: 5.2% | | | |
| 400 | | @@ | | Allergan, Inc. | | | 23,056 |
| 500 | | | | Alltel Corp. | | | 33,775 |
| 9,403 | | | | AT&T, Inc. | | | 390,225 |
| 830 | | @ | | Avaya, Inc. | | | 13,977 |
| 510 | | | | CenturyTel, Inc. | | | 25,016 |
| 9,790 | | @ | | Cisco Systems, Inc. | | | 272,652 |
| 1,390 | | | | Citizens Communications Co. | | | 21,225 |
| 2,820 | | @ | | Corning, Inc. | | | 72,051 |
| 372 | | | | Embarq Corp. | | | 23,574 |
| 940 | | @ | | Juniper Networks, Inc. | | | 23,660 |
| 4,040 | | | | Motorola, Inc. | | | 71,508 |
| 2,380 | | | | Qualcomm, Inc. | | | 103,268 |
| 2,740 | | @ | | Qwest Communications International, Inc. | | | 26,578 |
| 4,330 | | | | Sprint Nextel Corp. | | | 89,674 |
| 1,000 | | @ | | Tellabs, Inc. | | | 10,760 |
| 4,010 | | | | Verizon Communications, Inc. | | | 165,092 |
| | | | | | | |
| | | | | | | 1,366,091 |
| | | | | | | |
| Toys/Games/Hobbies: 0.2% | | | |
| 500 | | | | Hasbro, Inc. | | | 15,705 |
| 1,010 | | | | Mattel, Inc. | | | 25,543 |
| | | | | | | |
| | | | | | | 41,248 |
| | | | | | | |
| Transportation: 1.2% | | | |
| 390 | | | | Burlington Northern Santa Fe Corp. | | | 33,205 |
| 200 | | | | CH Robinson Worldwide, Inc. | | | 10,504 |
| 700 | | | | CSX Corp. | | | 31,556 |
| 450 | | | | FedEx Corp. | | | 49,937 |
| 820 | | | | Norfolk Southern Corp. | | | 43,107 |
| 490 | | | | Union Pacific Corp. | | | 56,424 |
| 1,400 | | | | United Parcel Service, Inc. | | | 102,200 |
| | | | | | | |
| | | | | | | 326,933 |
| | | | | | | |
| | | | Total Common Stock
(Cost $20,580,928) | | | 21,867,481 |
| | | | | | | |
See Accompanying Notes to Financial Statements
109
| | |
| ING GET U.S. CORE PORTFOLIO SERIES 10 | | PORTFOLIO OF INVESTMENTS ASOF JUNE 30, 2007 (UNAUDITED) (CONTINUED) |
| | | | | | | | |
Principal
Amount | | | | | | Value |
| | | | | | | | |
| | U.S. GOVERNMENT AGENCY OBLIGATIONS: 6.4% |
| | Federal National Mortgage Corporation: 6.4% | | | |
| $ | 2,222,000 | | ^ | | 5.260%, due 01/15/13 | | $ | 1,672,028 |
| | | | | | | | |
| | | | | Total U.S. Government Agency Obligations
(Cost $1,698,352) | | | 1,672,028 |
| | | | | | | | |
| | U.S. TREASURY OBLIGATIONS: 8.9% | | | |
| | U.S. Treasury STRIP: 8.9% | | | |
| | 3,011,000 | | ^ | | 4.573%, due 11/15/12 | | | 2,320,578 |
| | | | | | | | |
| | | | | Total U.S. Treasury Obligations (Cost $2,310,152) | | | 2,320,578 |
| | | | | | | | |
| | | | | Total Long-Term Investments
(Cost $24,589,432) | | | 25,860,087 |
| | | | | | | | |
| Shares | | | | | | |
| | SHORT-TERM INVESTMENTS: 1.2% | | | |
| | Mutual Fund: 0.2% | | | |
| | 43,000 | | ** | | ING Institutional Prime Money Market Fund | | | 43,000 |
| | | | | | | | |
| | | | | Total Mutual Fund
(Cost $43,000) | | | 43,000 |
| | | | | | | | |
| | | | | | | | | | |
Principal
Amount | | | | | | | Value | |
| | | | | | | | | | |
| | Repurchase Agreement: 1.0% | | | | | |
| $ | 267,000 | | Goldman Sachs Repurchase Agreement dated 06/29/07, 5.300%, due 07/02/07, $267,118 to be received upon repurchase (Collateralized by $272,000 Federal National Mortgage Association, 5.600%, Market Value plus accrued interest $273,162, due 02/01/17) | | | $ | 267,000 | |
| | | | | | | | | | |
| | | Total Repurchase Agreement
(Cost $267,000) | | | | 267,000 | |
| | | | | | | | | | |
| | | Total Short-Term Investments
(Cost $310,000) | | | | 310,000 | |
| | | | | | | | | | |
| | | Total Investments in Securities
(Cost $24,899,432)* | | 100.1 | % | | $ | 26,170,087 | |
| | | Other Assets and
Liabilities - Net | | (0.1 | ) | | | (17,191 | ) |
| | | | | | | | | | |
| | | Net Assets | | 100.0 | % | | $ | 26,152,896 | |
| | | | | | | | | | |
| @ | Non-income producing security |
| STRIP | Separate Trading of Registered Interest and Principal of Securities |
| ** | Investment in affiliate |
| ^ | Interest Only (IO) Security |
| * | Cost for federal income tax purposes is $25,225,259. |
| | | | |
Net unrealized appreciation consists of: | | | | |
Gross Unrealized Appreciation | | $ | 1,283,279 | |
Gross Unrealized Depreciation | | | (338,451 | ) |
| | | | |
Net Unrealized Appreciation | | $ | 944,828 | |
| | | | |
See Accompanying Notes to Financial Statements
110
| | |
| ING GET U.S. CORE PORTFOLIO SERIES 11 | | PORTFOLIO OF INVESTMENTS ASOF JUNE 30, 2007 (UNAUDITED) |
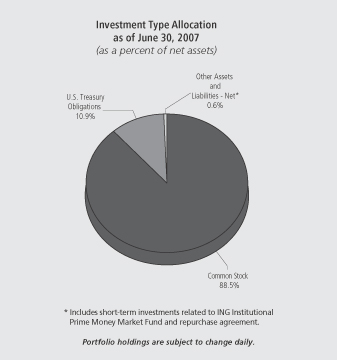
| | | | | | | |
| Shares | | | | | | Value |
| | | | | | | |
| COMMON STOCK: 88.5% | | | |
| Advertising: 0.2% | | | |
| 960 | | | | Omnicom Group | | $ | 50,803 |
| | | | | | | |
| | | | | | | 50,803 |
| | | | | | | |
| Aerospace/Defense: 2.1% | | | |
| 1,320 | | | | Boeing Co. | | | 126,931 |
| 1,080 | | | | General Dynamics Corp. | | | 84,478 |
| 200 | | | | Goodrich Corp. | | | 11,912 |
| 300 | | | | L-3 Communications Holdings, Inc. | | | 29,217 |
| 850 | | | | Lockheed Martin Corp. | | | 80,011 |
| 510 | | | | Northrop Grumman Corp. | | | 39,714 |
| 1,370 | | | | Raytheon Co. | | | 73,829 |
| 2,120 | | | | United Technologies Corp. | | | 150,372 |
| | | | | | | |
| | | | | | | 596,464 |
| | | | | | | |
| Agriculture: 1.4% | | | |
| 4,040 | | | | Altria Group, Inc. | | | 283,366 |
| 980 | | | | Archer-Daniels-Midland Co. | | | 32,428 |
| 540 | | | | Reynolds American, Inc. | | | 35,208 |
| 550 | | | | UST, Inc. | | | 29,541 |
| | | | | | | |
| | | | | | | 380,543 |
| | | | | | | |
| Apparel: 0.5% | | | |
| 1,050 | | @ | | Coach, Inc. | | | 49,760 |
| 980 | | | | Nike, Inc. | | | 57,124 |
| 200 | | | | Polo Ralph Lauren Corp. | | | 19,622 |
| | | | | | | |
| | | | | | | 126,506 |
| | | | | | | |
| | | | | | | |
| Shares | | | | | | Value |
| | | | | | | |
| Auto Manufacturers: 0.5% | | | |
| 4,870 | | | | Ford Motor Co. | | $ | 45,875 |
| 800 | | | | General Motors Corp. | | | 30,240 |
| 700 | | | | Paccar, Inc. | | | 60,928 |
| | | | | | | |
| | | | | | | 137,043 |
| | | | | | | |
| Auto Parts & Equipment: 0.2% | | | |
| 200 | | @ | | Goodyear Tire & Rubber Co. | | | 6,952 |
| 380 | | | | Johnson Controls, Inc. | | | 43,993 |
| | | | | | | |
| | | | | | | 50,945 |
| | | | | | | |
| Banks: 5.5% | | | |
| 8,610 | | | | Bank of America Corp. | | | 420,943 |
| 1,330 | | @ | | Bank of New York Co., Inc. | | | 55,115 |
| 940 | | | | BB&T Corp. | | | 38,239 |
| 719 | | | | Capital One Financial Corp. | | | 56,398 |
| 490 | | | | Comerica, Inc. | | | 29,140 |
| 200 | | | | Compass Bancshares, Inc. | | | 13,796 |
| 400 | | | | Fifth Third Bancorp. | | | 15,908 |
| 1,840 | | | | Huntington Bancshares, Inc. | | | 41,842 |
| 1,540 | | | | Keycorp. | | | 52,868 |
| 500 | | | | Marshall & Ilsley Corp. | | | 23,815 |
| 770 | | | | Mellon Financial Corp. | | | 33,880 |
| 1,140 | | | | National City Corp. | | | 37,985 |
| 200 | | | | Northern Trust Corp. | | | 12,848 |
| 410 | | | | PNC Financial Services Group, Inc. | | | 29,348 |
| 2,056 | | | | Regions Financial Corp. | | | 68,054 |
| 700 | | | | State Street Corp. | | | 47,880 |
| 460 | | | | SunTrust Banks, Inc. | | | 39,440 |
| 2,300 | | | | US Bancorp. | | | 75,785 |
| 4,015 | | | | Wachovia Corp. | | | 205,769 |
| 6,940 | | | | Wells Fargo & Co. | | | 244,080 |
| | | | | | | |
| | | | | | | 1,543,133 |
| | | | | | | |
| Beverages: 1.7% | | | |
| 1,180 | | | | Anheuser-Busch Cos., Inc. | | | 61,549 |
| 3,570 | | | | Coca-Cola Co. | | | 186,747 |
| 790 | | | | Pepsi Bottling Group, Inc. | | | 26,607 |
| 3,110 | | | | PepsiCo, Inc. | | | 201,684 |
| | | | | | | |
| | | | | | | 476,587 |
| | | | | | | |
| Biotechnology: 0.8% | | | |
| 2,200 | | @ | | Amgen, Inc. | | | 121,638 |
| 550 | | @ | | Biogen Idec, Inc. | | | 29,425 |
| 500 | | @ | | Celgene Corp. | | | 28,665 |
| 540 | | @ | | Genzyme Corp. | | | 34,776 |
| | | | | | | |
| | | | | | | 214,504 |
| | | | | | | |
| Building Materials: 0.2% | | | |
| 200 | | | | American Standard Cos., Inc. | | | 11,796 |
| 1,370 | | | | Masco Corp. | | | 39,004 |
| | | | | | | |
| | | | | | | 50,800 |
| | | | | | | |
| Chemicals: 1.4% | | | |
| 140 | | | | Air Products & Chemicals, Inc. | | | 11,252 |
| 400 | | | | Ashland, Inc. | | | 25,580 |
| 1,560 | | | | Dow Chemical Co. | | | 68,983 |
| 300 | | | | Ecolab, Inc. | | | 12,810 |
| 1,400 | | | | EI DuPont de Nemours & Co. | | | 71,176 |
| 500 | | | | International Flavors & Fragrances, Inc. | | | 26,070 |
| 1,180 | | | | Monsanto Co. | | | 79,697 |
| 490 | | | | PPG Industries, Inc. | | | 37,294 |
| 300 | | | | Praxair, Inc. | | | 21,597 |
See Accompanying Notes to Financial Statements
111
| | |
| ING GET U.S. CORE PORTFOLIO SERIES 11 | | PORTFOLIO OF INVESTMENTS ASOF JUNE 30, 2007 (UNAUDITED) (CONTINUED) |
| | | | | | | |
| Shares | | | | | | Value |
| Chemicals (continued) | | | |
| 270 | | | | Sherwin-Williams Co. | | $ | 17,947 |
| 700 | | | | Sigma-Aldrich Corp. | | | 29,869 |
| | | | | | | |
| | | | | | | 402,275 |
| | | | | | | |
| Coal: 0.1% | | | |
| 300 | | | | Consol Energy, Inc. | | | 13,833 |
| 400 | | | | Peabody Energy Corp. | | | 19,352 |
| | | | | | | |
| | | | | | | 33,185 |
| | | | | | | |
| Commercial Services: 0.6% | | | |
| 370 | | @ | | Apollo Group, Inc. | | | 21,619 |
| 700 | | @ | | Convergys Corp. | | | 16,968 |
| 290 | | | | Equifax, Inc. | | | 12,882 |
| 680 | | | | McKesson Corp. | | | 40,555 |
| 390 | | | | Moody’s Corp. | | | 24,258 |
| 380 | | | | Robert Half International, Inc. | | | 13,870 |
| 400 | | | | RR Donnelley & Sons Co. | | | 17,404 |
| 1,170 | | | | Western Union Co. | | | 24,371 |
| | | | | | | |
| | | | | | | 171,927 |
| | | | | | | |
| Computers: 3.9% | | | |
| 200 | | @ | | Affiliated Computer Services, Inc. | | | 11,344 |
| 1,500 | | @ | | Apple, Inc. | | | 183,060 |
| 110 | | @ | | Cognizant Technology Solutions Corp. | | | 8,260 |
| 380 | | @ | | Computer Sciences Corp. | | | 22,477 |
| 4,830 | | @ | | Dell, Inc. | | | 137,897 |
| 1,380 | | | | Electronic Data Systems Corp. | | | 38,267 |
| 5,090 | | @ | | EMC Corp. | | | 92,129 |
| 5,300 | | | | Hewlett-Packard Co. | | | 236,486 |
| 2,610 | | | | International Business Machines Corp. | | | 274,703 |
| 250 | | @ | | Lexmark International, Inc. | | | 12,328 |
| 280 | | @ | | NCR Corp. | | | 14,711 |
| 760 | | @ | | Network Appliance, Inc. | | | 22,192 |
| 400 | | @ | | Sandisk Corp. | | | 19,576 |
| 5,700 | | @ | | Sun Microsystems, Inc. | | | 29,982 |
| | | | | | | |
| | | | | | | 1,103,412 |
| | | | | | | |
| Cosmetics/Personal Care: 1.7% | | | |
| 550 | | | | Avon Products, Inc. | | | 20,213 |
| 880 | | | | Colgate-Palmolive Co. | | | 57,068 |
| 250 | | | | Estee Lauder Cos., Inc. | | | 11,378 |
| 6,290 | | | | Procter & Gamble Co. | | | 384,885 |
| | | | | | | |
| | | | | | | 473,544 |
| | | | | | | |
| Distribution/Wholesale: 0.1% | | | |
| 200 | | | | WW Grainger, Inc. | | | 18,610 |
| | | | | | | |
| | | | | | | 18,610 |
| | | | | | | |
| Diversified Financial Services: 7.2% | | | |
| 2,150 | | | | American Express Co. | | | 131,537 |
| 490 | | | | Ameriprise Financial, Inc. | | | 31,149 |
| 270 | | | | Bear Stearns Cos., Inc. | | | 37,800 |
| 1,770 | | | | Charles Schwab Corp. | | | 36,320 |
| 100 | | | | Chicago Mercantile Exchange Holdings, Inc. | | | 53,436 |
| 390 | | | | CIT Group, Inc. | | | 21,384 |
| 8,980 | | | | Citigroup, Inc. | | | 460,584 |
| 950 | | | | Countrywide Financial Corp. | | | 34,533 |
| 570 | | @ | | E*Trade Financial Corp. | | | 12,591 |
| 1,430 | | | | Fannie Mae | | | 93,422 |
| 270 | | | | Franklin Resources, Inc. | | | 35,767 |
| 1,170 | | | | Freddie Mac | | | 71,019 |
| 820 | | | | Goldman Sachs Group, Inc. | | | 177,735 |
| 450 | | | | Janus Capital Group, Inc. | | | 12,528 |
| | | | | | | |
| Shares | | | | | | Value |
| 6,870 | | | | JP Morgan Chase & Co. | | $ | 332,852 |
| 100 | | | | Legg Mason, Inc. | | | 9,838 |
| 1,120 | | | | Lehman Brothers Holdings, Inc. | | | 83,462 |
| 1,850 | | | | Merrill Lynch & Co., Inc. | | | 154,623 |
| 2,100 | | | | Morgan Stanley | | | 176,148 |
| 770 | | | | SLM Corp. | | | 44,337 |
| 200 | | | | T. Rowe Price Group, Inc. | | | 10,378 |
| | | | | | | |
| | | | | | | 2,021,443 |
| | | | | | | |
| Electric: 3.0% | | | |
| 1,060 | | @ | | AES Corp. | | | 23,193 |
| 560 | | | | American Electric Power Co., Inc. | | | 25,222 |
| 700 | | | | CMS Energy Corp. | | | 12,040 |
| 400 | | | | Constellation Energy Group, Inc. | | | 34,868 |
| 800 | | | | Dominion Resources, Inc. | | | 69,048 |
| 900 | | | | DTE Energy Co. | | | 43,398 |
| 800 | | | | Duke Energy Corp. | | | 14,640 |
| 1,300 | | | | Edison International | | | 72,956 |
| 800 | | | | Entergy Corp. | | | 85,880 |
| 1,370 | | | | Exelon Corp. | | | 99,462 |
| 1,150 | | | | FirstEnergy Corp. | | | 74,440 |
| 1,400 | | | | FPL Group, Inc. | | | 79,436 |
| 1,160 | | | | PG&E Corp. | | | 52,548 |
| 200 | | | | PPL Corp. | | | 9,358 |
| 740 | | | | Public Service Enterprise Group, Inc. | | | 64,957 |
| 800 | | | | TECO Energy, Inc. | | | 13,744 |
| 840 | | | | TXU Corp. | | | 56,532 |
| | | | | | | |
| | | | | | | 831,722 |
| | | | | | | |
| Electrical Components & Equipment: 0.2% | | | |
| 1,380 | | | | Emerson Electric Co. | | | 64,584 |
| | | | | | | |
| | | | | | | 64,584 |
| | | | | | | |
| Electronics: 0.4% | | | |
| 560 | | @ | | Agilent Technologies, Inc. | | | 21,526 |
| 600 | | | | Tektronix, Inc. | | | 20,244 |
| 900 | | @ | | Thermo Electron Corp. | | | 46,548 |
| 170 | | @ | | Waters Corp. | | | 10,091 |
| | | | | | | |
| | | | | | | 98,409 |
| | | | | | | |
| Engineering & Construction: 0.0% | | | |
| 100 | | | | Fluor Corp. | | | 11,137 |
| | | | | | | |
| | | | | | | 11,137 |
| | | | | | | |
| Entertainment: 0.1% | | | |
| 400 | | | | International Game Technology | | | 15,880 |
| | | | | | | |
| | | | | | | 15,880 |
| | | | | | | |
| Environmental Control: 0.2% | | | |
| 900 | | @ | | Allied Waste Industries, Inc. | | | 12,114 |
| 1,190 | | | | Waste Management, Inc. | | | 46,470 |
| | | | | | | |
| | | | | | | 58,584 |
| | | | | | | |
| Food: 1.5% | | | |
| 780 | | | | Campbell Soup Co. | | | 30,272 |
| 300 | | @ | | Dean Foods Co. | | | 9,561 |
| 1,350 | | | | General Mills, Inc. | | | 78,867 |
| 200 | | | | Hershey Co. | | | 10,124 |
| 1,500 | | | | HJ Heinz Co. | | | 71,205 |
| 500 | | | | Kellogg Co. | | | 25,895 |
| 2,018 | | | | Kraft Foods, Inc. | | | 71,135 |
| 1,370 | | | | Kroger Co. | | | 38,538 |
| 800 | | | | Safeway, Inc. | | | 27,224 |
| 300 | | | | Supervalu, Inc. | | | 13,896 |
| 400 | | | | Sysco Corp. | | | 13,196 |
See Accompanying Notes to Financial Statements
112
| | |
| ING GET U.S. CORE PORTFOLIO SERIES 11 | | PORTFOLIO OF INVESTMENTS ASOF JUNE 30, 2007 (UNAUDITED) (CONTINUED) |
| | | | | | | |
| Shares | | | | | | Value |
| Food (continued) | | | |
| 230 | | | | Whole Foods Market, Inc. | | $ | 8,809 |
| 200 | | | | WM Wrigley Jr. Co. | | | 11,062 |
| | | | | | | |
| | | | | | | 409,784 |
| | | | | | | |
| Forest Products & Paper: 0.3% | | | |
| 1,180 | | | | International Paper Co. | | | 46,079 |
| 370 | | | | Temple-Inland, Inc. | | | 22,766 |
| 300 | | | | Weyerhaeuser Co. | | | 23,679 |
| | | | | | | |
| | | | | | | 92,524 |
| | | | | | | |
| Gas: 0.2% | | | |
| 200 | | | | KeySpan Corp. | | | 8,396 |
| 630 | | | | Sempra Energy | | | 37,315 |
| | | | | | | |
| | | | | | | 45,711 |
| | | | | | | |
| Hand/Machine Tools: 0.2% | | | |
| 220 | | | | Black & Decker Corp. | | | 19,428 |
| 300 | | | | Snap-On, Inc. | | | 15,153 |
| 300 | | | | Stanley Works | | | 18,210 |
| | | | | | | |
| | | | | | | 52,791 |
| | | | | | | |
| Healthcare - Products: 2.6% | | | |
| 1,360 | | | | Baxter International, Inc. | | | 76,622 |
| 500 | | | | Becton Dickinson & Co. | | | 37,250 |
| 400 | | | | Biomet, Inc. | | | 18,288 |
| 1,750 | | @ | | Boston Scientific Corp. | | | 26,845 |
| 200 | | | | CR Bard, Inc. | | | 16,526 |
| 5,740 | | | | Johnson & Johnson | | | 353,699 |
| 2,100 | | | | Medtronic, Inc. | | | 108,906 |
| 400 | | @ | | St. Jude Medical, Inc. | | | 16,596 |
| 400 | | | | Stryker Corp. | | | 25,236 |
| 200 | | @ | | Varian Medical Systems, Inc. | | | 8,502 |
| 390 | | @ | | Zimmer Holdings, Inc. | | | 33,107 |
| | | | | | | |
| | | | | | | 721,577 |
| | | | | | | |
| Healthcare - Services: 1.2% | | | |
| 1,080 | | | | Aetna, Inc. | | | 53,352 |
| 380 | | @ | | Coventry Health Care, Inc. | | | 21,907 |
| 390 | | @ | | Humana, Inc. | | | 23,755 |
| 150 | | @ | | Laboratory Corp. of America Holdings | | | 11,739 |
| 2,630 | | | | UnitedHealth Group, Inc. | | | 134,498 |
| 1,280 | | @ | | WellPoint, Inc. | | | 102,182 |
| | | | | | | |
| | | | | | | 347,433 |
| | | | | | | |
| Home Builders: 0.1% | | | |
| 400 | | | | Centex Corp. | | | 16,040 |
| 400 | | | | KB Home | | | 15,748 |
| 200 | | | | Lennar Corp. | | | 7,312 |
| | | | | | | |
| | | | | | | 39,100 |
| | | | | | | |
| Home Furnishings: 0.1% | | | |
| 110 | | | | Harman International Industries, Inc. | | | 12,848 |
| 110 | | | | Whirlpool Corp. | | | 12,232 |
| | | | | | | |
| | | | | | | 25,080 |
| | | | | | | |
| Household Products/Wares: 0.3% | | | |
| 200 | | | | Clorox Co. | | | 12,420 |
| 1,180 | | | | Kimberly-Clark Corp. | | | 78,930 |
| | | | | | | |
| | | | | | | 91,350 |
| | | | | | | |
| Housewares: 0.1% | | | |
| 500 | | | | Newell Rubbermaid, Inc. | | | 14,715 |
| | | | | | | |
| | | | | | | 14,715 |
| | | | | | | |
| | | | | | | |
| Shares | | | | | | Value |
| Insurance: 4.9% | | | |
| 800 | | @@ | | ACE Ltd. | | $ | 50,016 |
| 1,080 | | | | Aflac, Inc. | | | 55,512 |
| 1,410 | | | | Allstate Corp. | | | 86,729 |
| 120 | | | | AMBAC Financial Group, Inc. | | | 10,463 |
| 4,870 | | | | American International Group, Inc. | | | 341,046 |
| 670 | | | | AON Corp. | | | 28,549 |
| 300 | | | | Assurant, Inc. | | | 17,676 |
| 1,250 | | | | Chubb Corp. | | | 67,675 |
| 560 | | | | Cigna Corp. | | | 29,243 |
| 1,260 | | | | Genworth Financial, Inc. | | | 43,344 |
| 750 | | | | Hartford Financial Services Group, Inc. | | | 73,883 |
| 427 | | | | Lincoln National Corp. | | | 30,296 |
| 760 | | | | Loews Corp. | | | 38,745 |
| 700 | | | | Marsh & McLennan Cos., Inc. | | | 21,616 |
| 370 | | | | MBIA, Inc. | | | 23,021 |
| 1,470 | | | | Metlife, Inc. | | | 94,786 |
| 200 | | | | MGIC Investment Corp. | | | 11,372 |
| 910 | | | | Principal Financial Group | | | 53,044 |
| 1,670 | | | | Progressive Corp. | | | 39,963 |
| 1,190 | | | | Prudential Financial, Inc. | | | 115,704 |
| 230 | | | | Safeco Corp. | | | 14,320 |
| 220 | | | | Torchmark Corp. | | | 14,740 |
| 1,360 | | | | Travelers Cos., Inc. | | | 72,760 |
| 500 | | | | UnumProvident Corp. | | | 13,055 |
| 400 | | @@ | | XL Capital Ltd. | | | 33,716 |
| | | | | | | |
| | | | | | | 1,381,274 |
| | | | | | | |
| Internet: 1.7% | | | |
| 520 | | @ | | Amazon.com, Inc. | | | 35,573 |
| 2,340 | | @ | | eBay, Inc. | | | 75,301 |
| 450 | | @ | | Google, Inc. | | | 235,521 |
| 500 | | @ | | IAC/InterActiveCorp. | | | 17,305 |
| 1,780 | | @ | | Symantec Corp. | | | 35,956 |
| 490 | | @ | | VeriSign, Inc. | | | 15,548 |
| 2,300 | | @ | | Yahoo!, Inc. | | | 62,399 |
| | | | | | | |
| | | | | | | 477,603 |
| | | | | | | |
| Iron/Steel: 0.3% | | | |
| 200 | | | | Allegheny Technologies, Inc. | | | 20,976 |
| 760 | | | | Nucor Corp. | | | 44,574 |
| 250 | | | | United States Steel Corp. | | | 27,188 |
| | | | | | | |
| | | | | | | 92,738 |
| | | | | | | |
| Leisure Time: 0.2% | | | |
| 670 | | | | Carnival Corp. | | | 32,676 |
| 610 | | | | Harley-Davidson, Inc. | | | 36,362 |
| | | | | | | |
| | | | | | | 69,038 |
| | | | | | | |
| Lodging: 0.2% | | | |
| 300 | | | | Harrah’s Entertainment, Inc. | | | 25,578 |
| 300 | | | | Hilton Hotels Corp. | | | 10,041 |
| 410 | | | | Marriott International, Inc. | | | 17,728 |
| 200 | | | | Starwood Hotels & Resorts Worldwide, Inc. | | | 13,414 |
| | | | | | | |
| | | | | | | 66,761 |
| | | | | | | |
| Machinery - Construction & Mining: 0.5% | | | |
| 1,450 | | | | Caterpillar, Inc. | | | 113,535 |
| 200 | | @ | | Terex Corp. | | | 16,260 |
| | | | | | | |
| | | | | | | 129,795 |
| | | | | | | |
See Accompanying Notes to Financial Statements
113
| | |
| ING GET U.S. CORE PORTFOLIO SERIES 11 | | PORTFOLIO OF INVESTMENTS ASOF JUNE 30, 2007 (UNAUDITED) (CONTINUED) |
| | | | | | | |
| Shares | | | | | | Value |
| | | | | | | |
| Machinery - Diversified: 0.4% | | | |
| 360 | | | | Cummins, Inc. | | $ | 36,436 |
| 440 | | | | Deere & Co. | | | 53,126 |
| 180 | | | | Rockwell Automation, Inc. | | | 12,499 |
| | | | | | | |
| | | | | | | 102,061 |
| | | | | | | |
| Media: 2.6% | | | |
| 1,430 | | | | CBS Corp. - Class B | | | 47,648 |
| 790 | | | | Clear Channel Communications, Inc. | | | 29,878 |
| 4,350 | | @ | | Comcast Corp. - Class A | | | 122,322 |
| 1,800 | | @ | | DIRECTV Group, Inc. | | | 41,598 |
| 500 | | | | Gannett Co., Inc. | | | 27,475 |
| 1,080 | | | | McGraw-Hill Cos., Inc. | | | 73,526 |
| 4,450 | | | | News Corp., Inc. - Class A | | | 94,385 |
| 5,500 | | | | Time Warner, Inc. | | | 115,720 |
| 1,000 | | @ | | Viacom - Class B | | | 41,630 |
| 3,860 | | | | Walt Disney Co. | | | 131,780 |
| | | | | | | |
| | | | | | | 725,962 |
| | | | | | | |
| Metal Fabricate/Hardware: 0.0% | | | |
| 100 | | | | Precision Castparts Corp. | | | 12,136 |
| | | | | | | |
| | | | | | | 12,136 |
| | | | | | | |
| Mining: 0.5% | | | |
| 1,600 | | | | Alcoa, Inc. | | | 64,848 |
| 727 | | | | Freeport-McMoRan Copper & Gold, Inc. | | | 60,210 |
| 600 | | | | Newmont Mining Corp. | | | 23,436 |
| | | | | | | |
| | | | | | | 148,494 |
| | | | | | | |
| Miscellaneous Manufacturing: 4.7% | | | |
| 1,370 | | | | 3M Co. | | | 118,902 |
| 420 | | | | Cooper Industries Ltd. | | | 23,978 |
| 490 | | | | Danaher Corp. | | | 36,995 |
| 1,050 | | | | Eastman Kodak Co. | | | 29,222 |
| 570 | | | | Eaton Corp. | | | 53,010 |
| 18,080 | | | | General Electric Co. | | | 692,093 |
| 1,490 | | | | Honeywell International, Inc. | | | 83,857 |
| 1,010 | | | | Illinois Tool Works, Inc. | | | 54,732 |
| 480 | | | | ITT Corp. | | | 32,774 |
| 300 | | | | Pall Corp. | | | 13,797 |
| 420 | | | | Parker Hannifin Corp. | | | 41,122 |
| 100 | | | | Textron, Inc. | | | 11,011 |
| 3,800 | | @ | | Tyco International Ltd. | | | 128,402 |
| | | | | | | |
| | | | | | | 1,319,895 |
| | | | | | | |
| Office/Business Equipment: 0.1% | | | |
| 1,960 | | @ | | Xerox Corp. | | | 36,221 |
| | | | | | | |
| | | | | | | 36,221 |
| | | | | | | |
| Oil & Gas: 8.1% | | | |
| 1,080 | | | | Anadarko Petroleum Corp. | | | 56,149 |
| 400 | | | | Apache Corp. | | | 32,636 |
| 600 | | | | Chesapeake Energy Corp. | | | 20,760 |
| 4,440 | | | | Chevron Corp. | | | 374,026 |
| 3,374 | | | | ConocoPhillips | | | 264,859 |
| 970 | | | | Devon Energy Corp. | | | 75,941 |
| 400 | | | | ENSCO International, Inc. | | | 24,404 |
| 190 | | | | EOG Resources, Inc. | | | 13,881 |
| 10,980 | | | | ExxonMobil Corp. | | | 921,002 |
| 300 | | | | Hess Corp. | | | 17,688 |
| 1,820 | | | | Marathon Oil Corp. | | | 109,127 |
| 200 | | | | Murphy Oil Corp. | | | 11,888 |
| 500 | | @, @@ | | Nabors Industries Ltd. | | | 16,690 |
| 200 | | | | Noble Corp. | | | 19,504 |
| | | | | | | |
| Shares | | | | | | Value |
| | | | | | | |
| 1,740 | | | | Occidental Petroleum Corp. | | $ | 100,711 |
| 400 | | | | Sunoco, Inc. | | | 31,872 |
| 500 | | @ | | Transocean, Inc. | | | 52,990 |
| 1,160 | | | | Valero Energy Corp. | | | 85,678 |
| 600 | | | | XTO Energy, Inc. | | | 36,060 |
| | | | | | | |
| | | | | | | 2,265,866 |
| | | | | | | |
| Oil & Gas Services: 1.3% | | | |
| 500 | | | | Baker Hughes, Inc. | | | 42,065 |
| 2,060 | | | | Halliburton Co. | | | 71,070 |
| 500 | | @ | | National Oilwell Varco, Inc. | | | 52,120 |
| 2,130 | | | | Schlumberger Ltd. | | | 180,922 |
| 400 | | @ | | Weatherford International Ltd. | | | 22,096 |
| | | | | | | |
| | | | | | | 368,273 |
| | | | | | | |
| Packaging & Containers: 0.2% | | | |
| 220 | | | | Ball Corp. | | | 11,697 |
| 300 | | | | Bemis Co. | | | 9,954 |
| 750 | | @ | | Pactiv Corp. | | | 23,918 |
| 600 | | | | Sealed Air Corp. | | | 18,612 |
| | | | | | | |
| | | | | | | 64,181 |
| | | | | | | |
| Pharmaceuticals: 5.0% | | | |
| 2,450 | | | | Abbott Laboratories | | | 131,198 |
| 510 | | | | AmerisourceBergen Corp. | | | 25,230 |
| 270 | | @ | | Barr Pharmaceuticals, Inc. | | | 13,562 |
| 3,700 | | | | Bristol-Myers Squibb Co. | | | 116,772 |
| 770 | | | | Cardinal Health, Inc. | | | 54,393 |
| 1,600 | | | | Eli Lilly & Co. | | | 89,408 |
| 420 | | @ | | Express Scripts, Inc. | | | 21,004 |
| 700 | | @ | | Forest Laboratories, Inc. | | | 31,955 |
| 1,940 | | @ | | Gilead Sciences, Inc. | | | 75,214 |
| 770 | | @ | | King Pharmaceuticals, Inc. | | | 15,754 |
| 500 | | @ | | Medco Health Solutions, Inc. | | | 38,995 |
| 4,130 | | | | Merck & Co., Inc. | | | 205,674 |
| 750 | | | | Mylan Laboratories | | | 13,643 |
| 13,160 | | | | Pfizer, Inc. | | | 336,501 |
| 3,090 | | | | Schering-Plough Corp. | | | 94,060 |
| 400 | | @ | | Watson Pharmaceuticals, Inc. | | | 13,012 |
| 2,320 | | | | Wyeth | | | 133,029 |
| | | | | | | |
| | | | | | | 1,409,404 |
| | | | | | | |
| Pipelines: 0.4% | | | |
| 1,100 | | | | El Paso Corp. | | | 18,953 |
| 400 | | | | Questar Corp. | | | 21,140 |
| 1,100 | | | | Spectra Energy Corp. | | | 28,556 |
| 1,140 | | | | Williams Cos., Inc. | | | 36,047 |
| | | | | | | |
| | | | | | | 104,696 |
| | | | | | | |
| Real Estate Investment Trusts: 0.7% | | | |
| 200 | | | | Apartment Investment &
Management Co. | | | 10,084 |
| 350 | | | | Archstone-Smith Trust | | | 20,689 |
| 300 | | | | Boston Properties, Inc. | | | 30,639 |
| 310 | | | | Developers Diversified Realty Corp. | | | 16,340 |
| 300 | | | | Equity Residential | | | 13,689 |
| 500 | | | | Host Hotels & Resorts, Inc. | | | 11,560 |
| 300 | | | | Kimco Realty Corp. | | | 11,421 |
| 500 | | | | Prologis | | | 28,450 |
| 300 | | | | Simon Property Group, Inc. | | | 27,912 |
| 200 | | | | Vornado Realty Trust | | | 21,968 |
| | | | | | | |
| | | | | | | 192,752 |
| | | | | | | |
See Accompanying Notes to Financial Statements
114
| | |
| ING GET U.S. CORE PORTFOLIO SERIES 11 | | PORTFOLIO OF INVESTMENTS ASOF JUNE 30, 2007 (UNAUDITED) (CONTINUED) |
| | | | | | | |
| Shares | | | | | | Value |
| Retail: 4.9% | | | |
| 310 | | @ | | Autozone, Inc. | | $ | 42,352 |
| 300 | | @ | | Bed Bath & Beyond, Inc. | | | 10,797 |
| 790 | | | | Best Buy Co., Inc. | | | 36,869 |
| 400 | | @ | | Big Lots, Inc. | | | 11,768 |
| 950 | | | | Costco Wholesale Corp. | | | 55,594 |
| 2,301 | | | | CVS Corp. | | | 83,871 |
| 340 | | | | Darden Restaurants, Inc. | | | 14,957 |
| 500 | | | | Dollar General Corp. | | | 10,960 |
| 700 | | | | Family Dollar Stores, Inc. | | | 24,024 |
| 1,030 | | | | Gap, Inc. | | | 19,673 |
| 3,320 | | | | Home Depot, Inc. | | | 130,642 |
| 460 | | | | JC Penney Co., Inc. | | | 33,295 |
| 560 | | @ | | Kohl’s Corp. | | | 39,777 |
| 2,940 | | | | Lowe’s Cos., Inc. | | | 90,229 |
| 1,280 | | | | Macy’s, Inc. | | | 50,918 |
| 2,530 | | | | McDonald’s Corp. | | | 128,423 |
| 500 | | | | Nordstrom, Inc. | | | 25,560 |
| 250 | | @ | | Office Depot, Inc. | | | 7,575 |
| 500 | | | | RadioShack Corp. | | | 16,570 |
| 120 | | @ | | Sears Holding Corp. | | | 20,340 |
| 1,110 | | | | Staples, Inc. | | | 26,340 |
| 1,370 | | @ | | Starbucks Corp. | | | 35,949 |
| 1,540 | | | | Target Corp. | | | 97,944 |
| 1,070 | | | | TJX Cos., Inc. | | | 29,425 |
| 1,710 | | | | Walgreen Co. | | | 74,453 |
| 4,360 | | | | Wal-Mart Stores, Inc. | | | 209,760 |
| 500 | | | | Wendy’s International, Inc. | | | 18,375 |
| 900 | | | | Yum! Brands, Inc. | | | 29,448 |
| | | | | | | |
| | | | | | | 1,375,888 |
| | | | | | | |
| Savings & Loans: 0.4% | | | |
| 900 | | | | Hudson City Bancorp., Inc. | | | 10,998 |
| 600 | | | | Sovereign Bancorp., Inc. | | | 12,684 |
| 2,080 | | | | Washington Mutual, Inc. | | | 88,691 |
| | | | | | | |
| | | | | | | 112,373 |
| | | | | | | |
| Semiconductors: 2.2% | | | |
| 870 | | @ | | Advanced Micro Devices, Inc. | | | 12,441 |
| 760 | | | | Altera Corp. | | | 16,819 |
| 360 | | | | Analog Devices, Inc. | | | 13,550 |
| 1,560 | | | | Applied Materials, Inc. | | | 30,997 |
| 700 | | @ | | Broadcom Corp. | | | 20,475 |
| 10,590 | | | | Intel Corp. | | | 251,618 |
| 600 | | | | KLA-Tencor Corp. | | | 32,970 |
| 500 | | | | Linear Technology Corp. | | | 18,090 |
| 1,300 | | @ | | LSI Logic Corp. | | | 9,763 |
| 500 | | | | Maxim Integrated Products | | | 16,705 |
| 400 | | @ | | MEMC Electronic Materials, Inc. | | | 24,448 |
| 1,000 | | @ | | Micron Technology, Inc. | | | 12,530 |
| 440 | | | | National Semiconductor Corp. | | | 12,439 |
| 450 | | @ | | Novellus Systems, Inc. | | | 12,767 |
| 710 | | @ | | Nvidia Corp. | | | 29,330 |
| 700 | | @ | | Teradyne, Inc. | | | 12,306 |
| 2,300 | | | | Texas Instruments, Inc. | | | 86,549 |
| 500 | | | | Xilinx, Inc. | | | 13,385 |
| | | | | | | |
| | | | | | | 627,182 |
| | | | | | | |
| Software: 3.4% | | | |
| 1,050 | | @ | | Adobe Systems, Inc. | | | 42,158 |
| 410 | | @ | | Autodesk, Inc. | | | 19,303 |
| 1,090 | | | | Automatic Data Processing, Inc. | | | 52,832 |
| 660 | | @ | | BMC Software, Inc. | | | 19,998 |
| 1,470 | | | | CA, Inc. | | | 37,970 |
| | | | | | | |
| Shares | | | | | | Value |
| 500 | | @ | | Citrix Systems, Inc. | | $ | 16,835 |
| 1,460 | | @ | | Compuware Corp. | | | 17,316 |
| 450 | | @ | | Electronic Arts, Inc. | | | 21,294 |
| 1,370 | | | | First Data Corp. | | | 44,758 |
| 380 | | @ | | Fiserv, Inc. | | | 21,584 |
| 1,000 | | @ | | Intuit, Inc. | | | 30,080 |
| 15,100 | | | | Microsoft Corp. | | | 444,997 |
| 1,500 | | @ | | Novell, Inc. | | | 11,685 |
| 7,160 | | @ | | Oracle Corp. | | | 141,124 |
| 550 | | | | Paychex, Inc. | | | 21,516 |
| | | | | | | |
| | | | | | | 943,450 |
| | | | | | | |
| Telecommunications: 5.7% | | | |
| 400 | | @@ | | Allergan, Inc. | | | 23,056 |
| 600 | | | | Alltel Corp. | | | 40,530 |
| 11,248 | | | | AT&T, Inc. | | | 466,792 |
| 900 | | @ | | Avaya, Inc. | | | 15,156 |
| 450 | | | | CenturyTel, Inc. | | | 22,073 |
| 11,460 | | @ | | Cisco Systems, Inc. | | | 319,161 |
| 1,250 | | | | Citizens Communications Co. | | | 19,088 |
| 3,100 | | @ | | Corning, Inc. | | | 79,205 |
| 316 | | | | Embarq Corp. | | | 20,025 |
| 1,000 | | @ | | Juniper Networks, Inc. | | | 25,170 |
| 4,600 | | | | Motorola, Inc. | | | 81,420 |
| 3,020 | | | | Qualcomm, Inc. | | | 131,038 |
| 3,100 | | @ | | Qwest Communications International, Inc. | | | 30,070 |
| 5,230 | | | | Sprint Nextel Corp. | | | 108,313 |
| 1,300 | | @ | | Tellabs, Inc. | | | 13,988 |
| 4,830 | | | | Verizon Communications, Inc. | | | 198,851 |
| | | | | | | |
| | | | | | | 1,593,936 |
| | | | | | | |
| Toys/Games/Hobbies: 0.2% | | | |
| 500 | | | | Hasbro, Inc. | | | 15,705 |
| 1,170 | | | | Mattel, Inc. | | | 29,589 |
| | | | | | | |
| | | | | | | 45,294 |
| | | | | | | |
| Transportation: 1.3% | | | |
| 460 | | | | Burlington Northern Santa Fe Corp. | | | 39,164 |
| 200 | | | | CH Robinson Worldwide, Inc. | | | 10,504 |
| 720 | | | | CSX Corp. | | | 32,458 |
| 610 | | | | FedEx Corp. | | | 67,692 |
| 860 | | | | Norfolk Southern Corp. | | | 45,210 |
| 510 | | | | Union Pacific Corp. | | | 58,727 |
| 1,600 | | | | United Parcel Service, Inc. | | | 116,800 |
| | | | | | | |
| | | | | | | 370,555 |
| | | | | | | |
| | | | Total Common Stock
(Cost $23,634,102) | | | 24,807,933 |
| | | | | | | |
| | | | | | | | |
Principal
Amount | | | | | | Value |
| | U.S. TREASURY OBLIGATIONS: 10.9% | | | |
| | U.S. Treasury STRIP: 10.9% | | | |
| $ | 4,010,000 | | ^ | | 4.890%, due 02/15/13 | | $ | 3,054,934 |
| | | | | | | | |
| | | | | Total U.S. Treasury Obligations
(Cost $3,050,291) | | | 3,054,934 |
| | | | | | | | |
| | | | | Total Long-Term Investments
(Cost $26,684,393) | | | 27,862,867 |
| | | | | | | | |
See Accompanying Notes to Financial Statements
115
| | |
| ING GET U.S. CORE PORTFOLIO SERIES 11 | | PORTFOLIO OF INVESTMENTS ASOF JUNE 30, 2007 (UNAUDITED) (CONTINUED) |
| | | | | | |
Shares | | | | | | Value |
| SHORT-TERM INVESTMENTS: 0.7% | | |
| Mutual Fund: 0.2% | | |
| 50,000 | | ** | | ING Institutional Prime Money Market Fund | | 50,000 |
| | | | | | |
| | | | Total Mutual Fund
(Cost $50,000) | | 50,000 |
| | | | | | |
| | | | | | | | | | |
Principal Amount | | | | | | | | |
| | Repurchase Agreement: 0.5% | | | | | |
| $ | 137,000 | | Morgan Stanley Repurchase Agreement dated 06/29/07, 5.300%, due 07/02/07, $137,061 to be received upon repurchase (Collateralized by $295,000 Resolution Funding Corporation, Discount Note, Market Value $140,600, due 01/15/21) | | | | | | 137,000 | |
| | | | | | | | | | |
| | | Total Repurchase Agreement
(Cost $137,000) | | | | | | 137,000 | |
| | | | | | | | | | |
| | | Total Short-Term Investments
(Cost $187,000) | | | | | | 187,000 | |
| | | | | | | | | | |
| | | Total Investments in Securities
(Cost $26,871,393)* | | 100.1 | % | | $ | 28,049,867 | |
| | | Other Assets and
Liabilities - Net | | (0.1 | ) | | | (18,905 | ) |
| | | | | | | | | | |
| | | Net Assets | | 100.0 | % | | $ | 28,030,962 | |
| | | | | | | | | | |
| @ | Non-income producing security |
| STRIP | Separate Trading of Registered Interest and Principal of Securities |
| ** | Investment in affiliate |
| ^ | Interest Only (IO) Security |
| * | Cost for federal income tax purposes is $27,285,494. |
| | | | |
Net unrealized appreciation consists of: | | | | |
Gross Unrealized Appreciation | | $ | 1,112,235 | |
Gross Unrealized Depreciation | | | (347,862 | ) |
| | | | |
Net Unrealized Appreciation | | $ | 764,373 | |
| | | | |
See Accompanying Notes to Financial Statements
116
| | |
| ING GET U.S. CORE PORTFOLIO SERIES 12 | | PORTFOLIO OF INVESTMENTS ASOF JUNE 30, 2007 (UNAUDITED) |
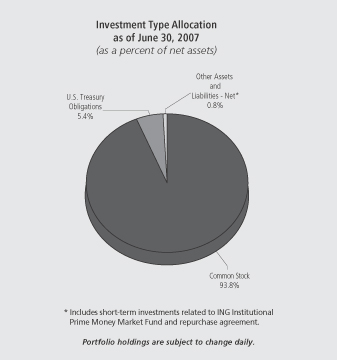
| | | | | | | |
| Shares | | | | | | Value |
| | | | | | | |
| COMMON STOCK: 93.8% |
| Advertising: 0.2% |
| 2,400 | | | | Omnicom Group | | $ | 127,008 |
| | | | | | | |
| | | | | | | 127,008 |
| | | | | | | |
| Aerospace/Defense: 2.3% |
| 2,750 | | | | Boeing Co. | | | 264,440 |
| 1,900 | | | | General Dynamics Corp. | | | 148,618 |
| 400 | | | | Goodrich Corp. | | | 23,824 |
| 600 | | | | L-3 Communications Holdings, Inc. | | | 58,434 |
| 1,800 | | | | Lockheed Martin Corp. | | | 169,434 |
| 1,050 | | | | Northrop Grumman Corp. | | | 81,764 |
| 3,050 | | | | Raytheon Co. | | | 164,365 |
| 3,850 | | | | United Technologies Corp. | | | 273,081 |
| | | | | | | |
| | | | | | | 1,183,960 |
| | | | | | | |
| Agriculture: 1.4% |
| 7,300 | | | | Altria Group, Inc. | | | 512,022 |
| 2,000 | | | | Archer-Daniels-Midland Co. | | | 66,180 |
| 1,000 | | | | Reynolds American, Inc. | | | 65,200 |
| 1,200 | | | | UST, Inc. | | | 64,452 |
| | | | | | | |
| | | | | | | 707,854 |
| | | | | | | |
| Apparel: 0.4% |
| 2,000 | | @ | | Coach, Inc. | | | 94,780 |
| 1,900 | | | | Nike, Inc. | | | 110,751 |
| 300 | | | | Polo Ralph Lauren Corp. | | | 29,433 |
| | | | | | | |
| | | | | | | 234,964 |
| | | | | | | |
| Auto Manufacturers: 0.5% |
| 7,950 | | | | Ford Motor Co. | | | 74,889 |
| 1,750 | | | | General Motors Corp. | | | 66,150 |
| 1,250 | | | | Paccar, Inc. | | | 108,800 |
| | | | | | | |
| | | | | | | 249,839 |
| | | | | | | |
| | | | | | | |
| Shares | | | | | | Value |
| | | | | | | |
| Auto Parts & Equipment: 0.2% |
| 700 | | @ | | Goodyear Tire & Rubber Co. | | $ | 24,332 |
| 600 | | | | Johnson Controls, Inc. | | | 69,462 |
| | | | | | | |
| | | | | | | 93,794 |
| | | | | | | |
| Banks: 5.9% |
| 16,000 | | | | Bank of America Corp. | | | 782,240 |
| 2,850 | | @ | | Bank of New York Co., Inc. | | | 118,104 |
| 1,950 | | | | BB&T Corp. | | | 79,326 |
| 1,453 | | | | Capital One Financial Corp. | | | 113,973 |
| 1,000 | | | | Comerica, Inc. | | | 59,470 |
| 500 | | | | Compass Bancshares, Inc. | | | 34,490 |
| 950 | | | | Fifth Third Bancorp. | | | 37,782 |
| 3,700 | | | | Huntington Bancshares, Inc. | | | 84,138 |
| 3,500 | | | | Keycorp. | | | 120,155 |
| 1,100 | | | | Marshall & Ilsley Corp. | | | 52,393 |
| 2,000 | | | | Mellon Financial Corp. | | | 88,000 |
| 2,250 | | | | National City Corp. | | | 74,970 |
| 400 | | | | Northern Trust Corp. | | | 25,696 |
| 900 | | | | PNC Financial Services Group, Inc. | | | 64,422 |
| 4,417 | | | | Regions Financial Corp. | | | 146,203 |
| 1,250 | | | | State Street Corp. | | | 85,500 |
| 950 | | | | SunTrust Banks, Inc. | | | 81,453 |
| 4,600 | | | | US Bancorp. | | | 151,570 |
| 7,343 | | | | Wachovia Corp. | | | 376,329 |
| 12,800 | | | | Wells Fargo & Co. | | | 450,176 |
| | | | | | | |
| | | | | | | 3,026,390 |
| | | | | | | |
| Beverages: 1.8% |
| 2,350 | | | | Anheuser-Busch Cos., Inc. | | | 122,576 |
| 6,950 | | | | Coca-Cola Co. | | | 363,555 |
| 1,500 | | | | Pepsi Bottling Group, Inc. | | | 50,520 |
| 6,000 | | | | PepsiCo, Inc. | | | 389,100 |
| | | | | | | |
| | | | | | | 925,751 |
| | | | | | | |
| Biotechnology: 0.8% |
| 3,900 | | @ | | Amgen, Inc. | | | 215,631 |
| 1,150 | | @ | | Biogen Idec, Inc. | | | 61,525 |
| 1,200 | | @ | | Celgene Corp. | | | 68,796 |
| 1,100 | | @ | | Genzyme Corp. | | | 70,840 |
| | | | | | | |
| | | | | | | 416,792 |
| | | | | | | |
| Building Materials: 0.2% |
| 500 | | | | American Standard Cos., Inc. | | | 29,490 |
| 2,600 | | | | Masco Corp. | | | 74,022 |
| | | | | | | |
| | | | | | | 103,512 |
| | | | | | | |
| Chemicals: 1.7% |
| 300 | | | | Air Products & Chemicals, Inc. | | | 24,111 |
| 800 | | | | Ashland, Inc. | | | 51,160 |
| 3,250 | | | | Dow Chemical Co. | | | 143,715 |
| 600 | | | | Ecolab, Inc. | | | 25,620 |
| 3,050 | | | | EI DuPont de Nemours & Co. | | | 155,062 |
| 1,100 | | | | International Flavors & Fragrances, Inc. | | | 57,354 |
| 2,100 | | | | Monsanto Co. | | | 141,834 |
| 1,300 | | | | PPG Industries, Inc. | | | 98,943 |
| 600 | | | | Praxair, Inc. | | | 43,194 |
| 800 | | | | Sherwin-Williams Co. | | | 53,176 |
| 1,600 | | | | Sigma-Aldrich Corp. | | | 68,272 |
| | | | | | | |
| | | | | | | 862,441 |
| | | | | | | |
| Coal: 0.1% | | | |
| 600 | | | | Consol Energy, Inc. | | | 27,666 |
| 990 | | | | Peabody Energy Corp. | | | 47,896 |
| | | | | | | |
| | | | | | | 75,562 |
| | | | | | | |
See Accompanying Notes to Financial Statements
117
| | |
| ING GET U.S. CORE PORTFOLIO SERIES 12 | | PORTFOLIO OF INVESTMENTS ASOF JUNE 30, 2007 (UNAUDITED) (CONTINUED) |
| | | | | | | |
| Shares | | | | | | Value |
| | | | | | | |
| Commercial Services: 0.7% | | | |
| 600 | | @ | | Apollo Group, Inc. | | $ | 35,058 |
| 1,500 | | @ | | Convergys Corp. | | | 36,360 |
| 700 | | | | Equifax, Inc. | | | 31,094 |
| 1,250 | | | | McKesson Corp. | | | 74,550 |
| 800 | | | | Moody’s Corp. | | | 49,760 |
| 800 | | | | Robert Half International, Inc. | | | 29,200 |
| 900 | | | | RR Donnelley & Sons Co. | | | 39,159 |
| 2,550 | | | | Western Union Co. | | | 53,117 |
| | | | | | | |
| | | | | | | 348,298 |
| | | | | | | |
| Computers: 4.2% | | | |
| 400 | | @ | | Affiliated Computer Services, Inc. | | | 22,688 |
| 3,000 | | @ | | Apple, Inc. | | | 366,120 |
| 420 | | @ | | Cognizant Technology Solutions Corp. | | | 31,538 |
| 800 | | @ | | Computer Sciences Corp. | | | 47,320 |
| 9,000 | | @ | | Dell, Inc. | | | 256,950 |
| 2,350 | | | | Electronic Data Systems Corp. | | | 65,166 |
| 10,300 | | @ | | EMC Corp. | | | 186,430 |
| 9,850 | | | | Hewlett-Packard Co. | | | 439,507 |
| 4,950 | | | | International Business Machines Corp. | | | 520,988 |
| 650 | | @ | | Lexmark International, Inc. | | | 32,052 |
| 500 | | @ | | NCR Corp. | | | 26,270 |
| 1,600 | | @ | | Network Appliance, Inc. | | | 46,720 |
| 900 | | @ | | Sandisk Corp. | | | 44,046 |
| 12,450 | | @ | | Sun Microsystems, Inc. | | | 65,487 |
| | | | | | | |
| | | | | | | 2,151,282 |
| | | | | | | |
| Cosmetics/Personal Care: 1.7% | | | |
| 1,100 | | | | Avon Products, Inc. | | | 40,425 |
| 1,850 | | | | Colgate-Palmolive Co. | | | 119,973 |
| 650 | | | | Estee Lauder Cos., Inc. | | | 29,582 |
| 11,600 | | | | Procter & Gamble Co. | | | 709,804 |
| | | | | | | |
| | | | | | | 899,784 |
| | | | | | | |
| Distribution/Wholesale: 0.1% | | | |
| 500 | | | | WW Grainger, Inc. | | | 46,525 |
| | | | | | | |
| | | | | | | 46,525 |
| | | | | | | |
| Diversified Financial Services: 7.6% | | | |
| 4,350 | | | | American Express Co. | | | 266,133 |
| 1,000 | | | | Ameriprise Financial, Inc. | | | 63,570 |
| 600 | | | | Bear Stearns Cos., Inc. | | | 84,000 |
| 3,850 | | | | Charles Schwab Corp. | | | 79,002 |
| 120 | | | | Chicago Mercantile Exchange Holdings, Inc. | | | 64,123 |
| 800 | | | | CIT Group, Inc. | | | 43,864 |
| 16,650 | | | | Citigroup, Inc. | | | 853,979 |
| 2,250 | | | | Countrywide Financial Corp. | | | 81,788 |
| 1,200 | | @ | | E*Trade Financial Corp. | | | 26,508 |
| 3,150 | | | | Fannie Mae | | | 205,790 |
| 600 | | | | Franklin Resources, Inc. | | | 79,482 |
| 2,700 | | | | Freddie Mac | | | 163,890 |
| 1,550 | | | | Goldman Sachs Group, Inc. | | | 335,963 |
| 1,100 | | | | Janus Capital Group, Inc. | | | 30,624 |
| 12,850 | | | | JP Morgan Chase & Co. | | | 622,583 |
| 300 | | | | Legg Mason, Inc. | | | 29,514 |
| 2,100 | | | | Lehman Brothers Holdings, Inc. | | | 156,492 |
| 3,450 | | | | Merrill Lynch & Co., Inc. | | | 288,351 |
| 4,200 | | | | Morgan Stanley | | | 352,296 |
| 1,500 | | | | SLM Corp. | | | 86,370 |
| 500 | | | | T. Rowe Price Group, Inc. | | | 25,945 |
| | | | | | | |
| | | | | | | 3,940,267 |
| | | | | | | |
| | | | | | | |
| Shares | | | | | | Value |
| | | | | | | |
| Electric: 3.2% | | | |
| 2,350 | | @ | | AES Corp. | | $ | 51,418 |
| 1,000 | | | | American Electric Power Co., Inc. | | | 45,040 |
| 1,400 | | | | CMS Energy Corp. | | | 24,080 |
| 900 | | | | Constellation Energy Group, Inc. | | | 78,453 |
| 1,500 | | | | Dominion Resources, Inc. | | | 129,465 |
| 2,100 | | | | DTE Energy Co. | | | 101,262 |
| 1,800 | | | | Duke Energy Corp. | | | 32,940 |
| 2,700 | | | | Edison International | | | 151,524 |
| 1,550 | | | | Entergy Corp. | | | 166,393 |
| 2,550 | | | | Exelon Corp. | | | 185,130 |
| 2,000 | | | | FirstEnergy Corp. | | | 129,460 |
| 2,800 | | | | FPL Group, Inc. | | | 158,872 |
| 2,500 | | | | PG&E Corp. | | | 113,250 |
| 600 | | | | PPL Corp. | | | 28,074 |
| 1,300 | | | | Public Service Enterprise Group, Inc. | | | 114,114 |
| 1,500 | | | | TECO Energy, Inc. | | | 25,770 |
| 1,700 | | | | TXU Corp. | | | 114,410 |
| | | | | | | |
| | | | | | | 1,649,655 |
| | | | | | | |
| Electrical Components & Equipment: 0.2% | | | |
| 2,300 | | | | Emerson Electric Co. | | | 107,640 |
| | | | | | | |
| | | | | | | 107,640 |
| | | | | | | |
| Electronics: 0.4% | | | |
| 1,500 | | @ | | Agilent Technologies, Inc. | | | 57,660 |
| 1,100 | | | | Tektronix, Inc. | | | 37,114 |
| 1,800 | | @ | | Thermo Electron Corp. | | | 93,096 |
| 400 | | @ | | Waters Corp. | | | 23,744 |
| | | | | | | |
| | | | | | | 211,614 |
| | | | | | | |
| Engineering & Construction: 0.0% | | | |
| 200 | | | | Fluor Corp. | | | 22,274 |
| | | | | | | |
| | | | | | | 22,274 |
| | | | | | | |
| Entertainment: 0.1% | | | |
| 950 | | | | International Game Technology | | | 37,715 |
| | | | | | | |
| | | | | | | 37,715 |
| | | | | | | |
| Environmental Control: 0.2% | | | |
| 1,800 | | @ | | Allied Waste Industries, Inc. | | | 24,228 |
| 2,750 | | | | Waste Management, Inc. | | | 107,388 |
| | | | | | | |
| | | | | | | 131,616 |
| | | | | | | |
| Food: 1.5% | | | |
| 1,200 | | | | Campbell Soup Co. | | | 46,572 |
| 700 | | @ | | Dean Foods Co. | | | 22,309 |
| 2,600 | | | | General Mills, Inc. | | | 151,892 |
| 500 | | | | Hershey Co. | | | 25,310 |
| 2,850 | | | | HJ Heinz Co. | | | 135,290 |
| 900 | | | | Kellogg Co. | | | 46,611 |
| 3,844 | | | | Kraft Foods, Inc. | | | 135,501 |
| 2,650 | | | | Kroger Co. | | | 74,545 |
| 1,700 | | | | Safeway, Inc. | | | 57,851 |
| 500 | | | | Supervalu, Inc. | | | 23,160 |
| 900 | | | | Sysco Corp. | | | 29,691 |
| 400 | | | | Whole Foods Market, Inc. | | | 15,320 |
| 400 | | | | WM Wrigley Jr. Co. | | | 22,124 |
| | | | | | | |
| | | | | | | 786,176 |
| | | | | | | |
| Forest Products & Paper: 0.3% | | | |
| 1,800 | | | | International Paper Co. | | | 70,290 |
| 830 | | | | Temple-Inland, Inc. | | | 51,070 |
| 600 | | | | Weyerhaeuser Co. | | | 47,358 |
| | | | | | | |
| | | | | | | 168,718 |
| | | | | | | |
See Accompanying Notes to Financial Statements
118
| | |
| ING GET U.S. CORE PORTFOLIO SERIES 12 | | PORTFOLIO OF INVESTMENTS ASOF JUNE 30, 2007 (UNAUDITED) (CONTINUED) |
| | | | | | | |
| Shares | | | | | | Value |
| | | | | | | |
| Gas: 0.2% | | | |
| 600 | | | | KeySpan Corp. | | $ | 25,188 |
| 1,500 | | | | Sempra Energy | | | 88,845 |
| | | | | | | |
| | | | | | | 114,033 |
| | | | | | | |
| Hand/Machine Tools: 0.2% | | | |
| 400 | | | | Black & Decker Corp. | | | 35,324 |
| 700 | | | | Snap-On, Inc. | | | 35,357 |
| 700 | | | | Stanley Works | | | 42,490 |
| | | | | | | |
| | | | | | | 113,171 |
| | | | | | | |
| Healthcare - Products: 2.8% | | | |
| 2,900 | | | | Baxter International, Inc. | | | 163,386 |
| 1,000 | | | | Becton Dickinson & Co. | | | 74,500 |
| 800 | | | | Biomet, Inc. | | | 36,576 |
| 4,200 | | @ | | Boston Scientific Corp. | | | 64,428 |
| 500 | | | | CR Bard, Inc. | | | 41,315 |
| 10,550 | | | | Johnson & Johnson | | | 650,091 |
| 3,900 | | | | Medtronic, Inc. | | | 202,254 |
| 900 | | @ | | St. Jude Medical, Inc. | | | 37,341 |
| 1,000 | | | | Stryker Corp. | | | 63,090 |
| 400 | | @ | | Varian Medical Systems, Inc. | | | 17,004 |
| 900 | | @ | | Zimmer Holdings, Inc. | | | 76,401 |
| | | | | | | |
| | | | | | | 1,426,386 |
| | | | | | | |
| Healthcare - Services: 1.3% | | | |
| 1,850 | | | | Aetna, Inc. | | | 91,390 |
| 800 | | @ | | Coventry Health Care, Inc. | | | 46,120 |
| 800 | | @ | | Humana, Inc. | | | 48,728 |
| 300 | | @ | | Laboratory Corp. of America Holdings | | | 23,478 |
| 4,900 | | | | UnitedHealth Group, Inc. | | | 250,586 |
| 2,350 | | @ | | WellPoint, Inc. | | | 187,601 |
| | | | | | | |
| | | | | | | 647,903 |
| | | | | | | |
| Home Builders: 0.2% | | | |
| 800 | | | | Centex Corp. | | | 32,080 |
| 900 | | | | KB Home | | | 35,433 |
| 500 | | | | Lennar Corp. | | | 18,280 |
| | | | | | | |
| | | | | | | 85,793 |
| | | | | | | |
| Home Furnishings: 0.1% | | | |
| 200 | | | | Harman International Industries, Inc. | | | 23,360 |
| 200 | | | | Whirlpool Corp. | | | 22,240 |
| | | | | | | |
| | | | | | | 45,600 |
| | | | | | | |
| Household Products/Wares: 0.3% | | | |
| 500 | | | | Clorox Co. | | | 31,050 |
| 2,200 | | | | Kimberly-Clark Corp. | | | 147,158 |
| | | | | | | |
| | | | | | | 178,208 |
| | | | | | | |
| Housewares: 0.1% | | | |
| 1,000 | | | | Newell Rubbermaid, Inc. | | | 29,430 |
| | | | | | | |
| | | | | | | 29,430 |
| | | | | | | |
| Insurance: 5.4% | | | |
| 1,550 | | @@ | | ACE Ltd. | | | 96,906 |
| 2,200 | | | | Aflac, Inc. | | | 113,080 |
| 3,250 | | | | Allstate Corp. | | | 199,908 |
| 250 | | | | AMBAC Financial Group, Inc. | | | 21,798 |
| 9,200 | | | | American International Group, Inc. | | | 644,276 |
| 1,150 | | | | AON Corp. | | | 49,002 |
| 600 | | | | Assurant, Inc. | | | 35,352 |
| 2,650 | | | | Chubb Corp. | | | 143,471 |
| 1,350 | | | | Cigna Corp. | | | 70,497 |
| 2,450 | | | | Genworth Financial, Inc. | | | 84,280 |
| | | | | | | |
| Shares | | | | | | Value |
| | | | | | | |
| 1,700 | | | | Hartford Financial Services Group, Inc. | | $ | 167,467 |
| 1,000 | | | | Lincoln National Corp. | | | 70,950 |
| 1,400 | | | | Loews Corp. | | | 71,372 |
| 1,800 | | | | Marsh & McLennan Cos., Inc. | | | 55,584 |
| 400 | | | | MBIA, Inc. | | | 24,888 |
| 3,150 | | | | Metlife, Inc. | | | 203,112 |
| 350 | | | | MGIC Investment Corp. | | | 19,901 |
| 1,500 | | | | Principal Financial Group | | | 87,435 |
| 3,650 | | | | Progressive Corp. | | | 87,345 |
| 2,200 | | | | Prudential Financial, Inc. | | | 213,906 |
| 450 | | | | Safeco Corp. | | | 28,017 |
| 450 | | | | Torchmark Corp. | | | 30,150 |
| 2,900 | | | | Travelers Cos., Inc. | | | 155,150 |
| 1,000 | | | | UnumProvident Corp. | | | 26,110 |
| 900 | | @@ | | XL Capital Ltd. | | | 75,861 |
| | | | | | | |
| | | | | | | 2,775,818 |
| | | | | | | |
| Internet: 1.8% | | | |
| 1,300 | | @ | | Amazon.com, Inc. | | | 88,933 |
| 4,350 | | @ | | eBay, Inc. | | | 139,983 |
| 800 | | @ | | Google, Inc. | | | 418,704 |
| 1,000 | | @ | | IAC/InterActiveCorp. | | | 34,610 |
| 4,150 | | @ | | Symantec Corp. | | | 83,830 |
| 1,100 | | @ | | VeriSign, Inc. | | | 34,903 |
| 4,500 | | @ | | Yahoo!, Inc. | | | 122,085 |
| | | | | | | |
| | | | | | | 923,048 |
| | | | | | | |
| Iron/Steel: 0.4% | | | |
| 400 | | | | Allegheny Technologies, Inc. | | | 41,952 |
| 1,550 | | | | Nucor Corp. | | | 90,908 |
| 600 | | | | United States Steel Corp. | | | 65,250 |
| | | | | | | |
| | | | | | | 198,110 |
| | | | | | | |
| Leisure Time: 0.3% | | | |
| 1,500 | | | | Carnival Corp. | | | 73,155 |
| 1,300 | | | | Harley-Davidson, Inc. | | | 77,493 |
| | | | | | | |
| | | | | | | 150,648 |
| | | | | | | |
| Lodging: 0.3% | | | |
| 700 | | | | Harrah’s Entertainment, Inc. | | | 59,682 |
| 700 | | | | Hilton Hotels Corp. | | | 23,429 |
| 850 | | | | Marriott International, Inc. | | | 36,754 |
| 400 | | | | Starwood Hotels & Resorts Worldwide, Inc. | | | 26,828 |
| | | | | | | |
| | | | | | | 146,693 |
| | | | | | | |
| Machinery - Construction & Mining: 0.5% | | | |
| 2,600 | | | | Caterpillar, Inc. | | | 203,580 |
| 400 | | @ | | Terex Corp. | | | 32,520 |
| | | | | | | |
| | | | | | | 236,100 |
| | | | | | | |
| Machinery - Diversified: 0.5% | | | |
| 700 | | | | Cummins, Inc. | | | 70,847 |
| 1,100 | | | | Deere & Co. | | | 132,814 |
| 500 | | | | Rockwell Automation, Inc. | | | 34,720 |
| | | | | | | |
| | | | | | | 238,381 |
| | | | | | | |
| Media: 2.7% | | | |
| 2,250 | | | | CBS Corp. - Class B | | | 74,970 |
| 1,700 | | | | Clear Channel Communications, Inc. | | | 64,294 |
| 7,575 | | @ | | Comcast Corp. - Class A | | | 213,009 |
| 3,600 | | @ | | DIRECTV Group, Inc. | | | 83,196 |
| 1,100 | | | | Gannett Co., Inc. | | | 60,445 |
| 1,950 | | | | McGraw-Hill Cos., Inc. | | | 132,756 |
See Accompanying Notes to Financial Statements
119
| | |
| ING GET U.S. CORE PORTFOLIO SERIES 12 | | PORTFOLIO OF INVESTMENTS ASOF JUNE 30, 2007 (UNAUDITED) (CONTINUED) |
| | | | | | | |
| Shares | | | | | | Value |
| | | | | | | |
| Media (continued) | | | |
| 9,300 | | | | News Corp., Inc. - Class A | | $ | 197,253 |
| 10,400 | | | | Time Warner, Inc. | | | 218,816 |
| 2,100 | | @ | | Viacom - Class B | | | 87,423 |
| 8,200 | | | | Walt Disney Co. | | | 279,948 |
| | | | | | | |
| | | | | | | 1,412,110 |
| | | | | | | |
| Metal Fabricate/Hardware: 0.1% | | | |
| 300 | | | | Precision Castparts Corp. | | | 36,408 |
| | | | | | | |
| | | | | | | 36,408 |
| | | | | | | |
| Mining: 0.5% | | | |
| 3,200 | | | | Alcoa, Inc. | | | 129,696 |
| 1,302 | | | | Freeport-McMoRan Copper & Gold, Inc. | | | 107,832 |
| 1,200 | | | | Newmont Mining Corp. | | | 46,872 |
| | | | | | | |
| | | | | | | 284,400 |
| | | | | | | |
| Miscellaneous Manufacturing: 5.0% | | | |
| 2,850 | | | | 3M Co. | | | 247,352 |
| 1,000 | | | | Cooper Industries Ltd. | | | 57,090 |
| 900 | | | | Danaher Corp. | | | 67,950 |
| 1,900 | | | | Eastman Kodak Co. | | | 52,877 |
| 1,300 | | | | Eaton Corp. | | | 120,900 |
| 33,500 | | | | General Electric Co. | | | 1,282,355 |
| 3,050 | | | | Honeywell International, Inc. | | | 171,654 |
| 2,200 | | | | Illinois Tool Works, Inc. | | | 119,218 |
| 1,100 | | | | ITT Corp. | | | 75,108 |
| 500 | | | | Pall Corp. | | | 22,995 |
| 850 | | | | Parker Hannifin Corp. | | | 83,224 |
| 200 | | | | Textron, Inc. | | | 22,022 |
| 7,300 | | @ | | Tyco International Ltd. | | | 246,667 |
| | | | | | | |
| | | | | | | 2,569,412 |
| | | | | | | |
| Office/Business Equipment: 0.1% | | | |
| 3,450 | | @ | | Xerox Corp. | | | 63,756 |
| | | | | | | |
| | | | | | | 63,756 |
| | | | | | | |
| Oil & Gas: 8.3% | | | |
| 1,800 | | | | Anadarko Petroleum Corp. | | | 93,582 |
| 700 | | | | Apache Corp. | | | 57,113 |
| 1,500 | | | | Chesapeake Energy Corp. | | | 51,900 |
| 8,250 | | | | Chevron Corp. | | | 694,980 |
| 6,200 | | | | ConocoPhillips | | | 486,700 |
| 1,800 | | | | Devon Energy Corp. | | | 140,922 |
| 900 | | | | ENSCO International, Inc. | | | 54,909 |
| 400 | | | | EOG Resources, Inc. | | | 29,224 |
| 20,400 | | | | ExxonMobil Corp. | | | 1,711,152 |
| 600 | | | | Hess Corp. | | | 35,376 |
| 3,400 | | | | Marathon Oil Corp. | | | 203,864 |
| 400 | | | | Murphy Oil Corp. | | | 23,776 |
| 1,100 | | @, @@ | | Nabors Industries Ltd. | | | 36,718 |
| 400 | | | | Noble Corp. | | | 39,008 |
| 3,300 | | | | Occidental Petroleum Corp. | | | 191,004 |
| 700 | | | | Sunoco, Inc. | | | 55,776 |
| 1,350 | | @ | | Transocean, Inc. | | | 143,073 |
| 2,250 | | | | Valero Energy Corp. | | | 166,185 |
| 1,050 | | | | XTO Energy, Inc. | | | 63,105 |
| | | | | | | |
| | | | | | | 4,278,367 |
| | | | | | | |
| Oil & Gas Services: 1.4% | | | |
| 1,000 | | | | Baker Hughes, Inc. | | | 84,130 |
| 4,750 | | | | Halliburton Co. | | | 163,875 |
| | | | | | | |
| Shares | | | | | | Value |
| | | | | | | |
| 900 | | @ | | National Oilwell Varco, Inc. | | $ | 93,816 |
| 4,150 | | | | Schlumberger Ltd. | | | 352,501 |
| 700 | | @ | | Weatherford International Ltd. | | | 38,668 |
| | | | | | | |
| | | | | | | 732,990 |
| | | | | | | |
| Packaging & Containers: 0.3% | | | |
| 450 | | | | Ball Corp. | | | 23,927 |
| 650 | | | | Bemis Co. | | | 21,567 |
| 1,600 | | @ | | Pactiv Corp. | | | 51,024 |
| 1,300 | | | | Sealed Air Corp. | | | 40,326 |
| | | | | | | |
| | | | | | | 136,844 |
| | | | | | | |
| Pharmaceuticals: 5.1% | | | |
| 4,000 | | | | Abbott Laboratories | | | 214,200 |
| 1,150 | | | | AmerisourceBergen Corp. | | | 56,891 |
| 450 | | @ | | Barr Pharmaceuticals, Inc. | | | 22,604 |
| 6,900 | | | | Bristol-Myers Squibb Co. | | | 217,764 |
| 1,300 | | | | Cardinal Health, Inc. | | | 91,832 |
| 3,300 | | | | Eli Lilly & Co. | | | 184,404 |
| 620 | | @ | | Express Scripts, Inc. | | | 31,006 |
| 1,450 | | @ | | Forest Laboratories, Inc. | | | 66,193 |
| 3,400 | | @ | | Gilead Sciences, Inc. | | | 131,818 |
| 1,300 | | @ | | King Pharmaceuticals, Inc. | | | 26,598 |
| 900 | | @ | | Medco Health Solutions, Inc. | | | 70,191 |
| 7,750 | | | | Merck & Co., Inc. | | | 385,950 |
| 1,400 | | | | Mylan Laboratories | | | 25,466 |
| 24,850 | | | | Pfizer, Inc. | | | 635,415 |
| 5,750 | | | | Schering-Plough Corp. | | | 175,030 |
| 800 | | @ | | Watson Pharmaceuticals, Inc. | | | 26,024 |
| 4,400 | | | | Wyeth | | | 252,296 |
| | | | | | | |
| | | | | | | 2,613,682 |
| | | | | | | |
| Pipelines: 0.4% | | | |
| 2,200 | | | | El Paso Corp. | | | 37,906 |
| 800 | | | | Questar Corp. | | | 42,280 |
| 2,000 | | | | Spectra Energy Corp. | | | 51,920 |
| 2,100 | | | | Williams Cos., Inc. | | | 66,402 |
| | | | | | | |
| | | | | | | 198,508 |
| | | | | | | |
| Real Estate Investment Trusts: 0.7% | | | |
| 350 | | | | Apartment Investment & Management Co. | | | 17,647 |
| 640 | | | | Archstone-Smith Trust | | | 37,830 |
| 500 | | | | Boston Properties, Inc. | | | 51,065 |
| 580 | | | | Developers Diversified Realty Corp. | | | 30,572 |
| 500 | | | | Equity Residential | | | 22,815 |
| 1,400 | | | | Host Hotels & Resorts, Inc. | | | 32,368 |
| 700 | | | | Kimco Realty Corp. | | | 26,649 |
| 1,000 | | | | Prologis | | | 56,900 |
| 600 | | | | Simon Property Group, Inc. | | | 55,824 |
| 400 | | | | Vornado Realty Trust | | | 43,936 |
| | | | | | | |
| | | | | | | 375,606 |
| | | | | | | |
| Retail: 5.3% | | | |
| 400 | | @ | | Autozone, Inc. | | | 54,648 |
| 600 | | @ | | Bed Bath & Beyond, Inc. | | | 21,594 |
| 1,850 | | | | Best Buy Co., Inc. | | | 86,340 |
| 900 | | @ | | Big Lots, Inc. | | | 26,478 |
| 1,900 | | | | Costco Wholesale Corp. | | | 111,188 |
| 5,254 | | | | CVS Corp. | | | 191,508 |
| 700 | | | | Darden Restaurants, Inc. | | | 30,793 |
| 1,000 | | | | Dollar General Corp. | | | 21,920 |
| 1,200 | | | | Family Dollar Stores, Inc. | | | 41,184 |
| 2,250 | | | | Gap, Inc. | | | 42,975 |
See Accompanying Notes to Financial Statements
120
| | |
| ING GET U.S. CORE PORTFOLIO SERIES 12 | | PORTFOLIO OF INVESTMENTS ASOF JUNE 30, 2007 (UNAUDITED) (CONTINUED) |
| | | | | | | |
| Shares | | | | | | Value |
| | | | | | | |
| Retail (continued) | | | |
| 6,400 | | | | Home Depot, Inc. | | $ | 251,840 |
| 1,050 | | | | JC Penney Co., Inc. | | | 75,999 |
| 1,150 | | @ | | Kohl’s Corp. | | | 81,685 |
| 6,100 | | | | Lowe’s Cos., Inc. | | | 187,209 |
| 2,450 | | | | Macy’s, Inc. | | | 97,461 |
| 4,900 | | | | McDonald’s Corp. | | | 248,724 |
| 900 | | | | Nordstrom, Inc. | | | 46,008 |
| 700 | | @ | | Office Depot, Inc. | | | 21,210 |
| 1,000 | | | | RadioShack Corp. | | | 33,140 |
| 300 | | @ | | Sears Holding Corp. | | | 50,850 |
| 2,050 | | | | Staples, Inc. | | | 48,647 |
| 2,300 | | @ | | Starbucks Corp. | | | 60,352 |
| 3,200 | | | | Target Corp. | | | 203,520 |
| 1,900 | | | | TJX Cos., Inc. | | | 52,250 |
| 3,650 | | | | Walgreen Co. | | | 158,921 |
| 8,150 | | | | Wal-Mart Stores, Inc. | | | 392,097 |
| 900 | | | | Wendy’s International, Inc. | | | 33,075 |
| 1,900 | | | | Yum! Brands, Inc. | | | 62,168 |
| | | | | | | |
| | | | | | | 2,733,784 |
| | | | | | | |
| Savings & Loans: 0.4% | | | |
| 2,000 | | | | Hudson City Bancorp., Inc. | | | 24,440 |
| 1,100 | | | | Sovereign Bancorp., Inc. | | | 23,254 |
| 4,250 | | | | Washington Mutual, Inc. | | | 181,220 |
| | | | | | | |
| | | | | | | 228,914 |
| | | | | | | |
| Semiconductors: 2.4% | | | |
| 1,700 | | @ | | Advanced Micro Devices, Inc. | | | 24,310 |
| 1,550 | | | | Altera Corp. | | | 34,302 |
| 850 | | | | Analog Devices, Inc. | | | 31,994 |
| 3,100 | | | | Applied Materials, Inc. | | | 61,597 |
| 1,300 | | @ | | Broadcom Corp. | | | 38,025 |
| 20,650 | | | | Intel Corp. | | | 490,644 |
| 1,100 | | | | KLA-Tencor Corp. | | | 60,445 |
| 1,100 | | | | Linear Technology Corp. | | | 39,798 |
| 2,300 | | @ | | LSI Logic Corp. | | | 17,273 |
| 950 | | | | Maxim Integrated Products | | | 31,740 |
| 800 | | @ | | MEMC Electronic Materials, Inc. | | | 48,896 |
| 2,450 | | @ | | Micron Technology, Inc. | | | 30,699 |
| 950 | | | | National Semiconductor Corp. | | | 26,857 |
| 1,000 | | @ | | Novellus Systems, Inc. | | | 28,370 |
| 1,150 | | @ | | Nvidia Corp. | | | 47,507 |
| 1,500 | | @ | | Teradyne, Inc. | | | 26,370 |
| 4,800 | | | | Texas Instruments, Inc. | | | 180,624 |
| 1,150 | | | | Xilinx, Inc. | | | 30,786 |
| | | | | | | |
| | | | | | | 1,250,237 |
| | | | | | | |
| Software: 3.5% | | | |
| 2,050 | | @ | | Adobe Systems, Inc. | | | 82,308 |
| 1,000 | | @ | | Autodesk, Inc. | | | 47,080 |
| 2,250 | | | | Automatic Data Processing, Inc. | | | 109,058 |
| 1,150 | | @ | | BMC Software, Inc. | | | 34,845 |
| 2,700 | | | | CA, Inc. | | | 69,741 |
| 1,200 | | @ | | Citrix Systems, Inc. | | | 40,404 |
| 2,900 | | @ | | Compuware Corp. | | | 34,394 |
| 1,000 | | @ | | Electronic Arts, Inc. | | | 47,320 |
| 2,750 | | | | First Data Corp. | | | 89,843 |
| 1,000 | | @ | | Fiserv, Inc. | | | 56,800 |
| 1,850 | | @ | | Intuit, Inc. | | | 55,648 |
| 26,400 | | | | Microsoft Corp. | | | 778,008 |
| 3,000 | | @ | | Novell, Inc. | | | 23,370 |
| | | | | | | | |
| Shares | | | | | | Value |
| | | | | | | | |
| | 13,450 | | @ | | Oracle Corp. | | $ | 265,100 |
| | 1,250 | | | | Paychex, Inc. | | | 48,900 |
| | | | | | | | |
| | | | | | | | 1,782,819 |
| | | | | | | | |
| | Telecommunications: 5.9% | | | |
| | 800 | | @@ | | Allergan, Inc. | | | 46,112 |
| | 1,300 | | | | Alltel Corp. | | | 87,815 |
| | 20,927 | | | | AT&T, Inc. | | | 868,471 |
| | 1,800 | | @ | | Avaya, Inc. | | | 30,312 |
| | 1,100 | | | | CenturyTel, Inc. | | | 53,955 |
| | 21,900 | | @ | | Cisco Systems, Inc. | | | 609,915 |
| | 2,600 | | | | Citizens Communications Co. | | | 39,702 |
| | 6,700 | | @ | | Corning, Inc. | | | 171,185 |
| | 600 | | | | Embarq Corp. | | | 38,022 |
| | 1,900 | | @ | | Juniper Networks, Inc. | | | 47,823 |
| | 8,600 | | | | Motorola, Inc. | | | 152,220 |
| | 5,450 | | | | Qualcomm, Inc. | | | 236,476 |
| | 6,200 | | @ | | Qwest Communications International, Inc. | | | 60,140 |
| | 9,850 | | | | Sprint Nextel Corp. | | | 203,994 |
| | 2,300 | | @ | | Tellabs, Inc. | | | 24,748 |
| | 9,050 | | | | Verizon Communications, Inc. | | | 372,589 |
| | | | | | | | |
| | | | | | | | 3,043,479 |
| | | | | | | | |
| | Toys/Games/Hobbies: 0.2% | | | |
| | 1,100 | | | | Hasbro, Inc. | | | 34,551 |
| | 2,200 | | | | Mattel, Inc. | | | 55,638 |
| | | | | | | | |
| | | | | | | | 90,189 |
| | | | | | | | |
| | Transportation: 1.4% | | | |
| | 850 | | | | Burlington Northern Santa Fe Corp. | | | 72,369 |
| | 400 | | | | CH Robinson Worldwide, Inc. | | | 21,008 |
| | 1,500 | | | | CSX Corp. | | | 67,620 |
| | 1,400 | | | | FedEx Corp. | | | 155,358 |
| | 1,450 | | | | Norfolk Southern Corp. | | | 76,227 |
| | 1,000 | | | | Union Pacific Corp. | | | 115,150 |
| | 2,800 | | | | United Parcel Service, Inc. | | | 204,400 |
| | | | | | | | |
| | | | | | | | 712,132 |
| | | | | | | | |
| | | | | Total Common Stock
(Cost $44,929,115 ) | | | 48,362,390 |
| | | | | | | | |
| | | |
Principal
Amount | | | | | | |
| | | | | | | | |
| | U.S. TREASURY OBLIGATIONS: 5.4% | | | |
| | U.S. Treasury STRIP: 5.4% | | | |
| $ | 3,700,000 | | ^ | | 4.623%, due 05/15/13 | | $ | 2,780,076 |
| | | | | | | | |
| | | | | Total U.S. Treasury Obligations
(Cost $2,770,020 ) | | | 2,780,076 |
| | | | | | | | |
| | | | | Total Long-Term Investments
(Cost $47,699,135) | | | 51,142,466 |
| | | | | | | | |
| Shares | | | | | | |
| | | | | | | | |
| | SHORT-TERM INVESTMENTS: 0.8% | | | |
| | Mutual Fund: 0.1% | | | |
| | 34,000 | | ** | | ING Institutional Prime Money Market Fund | | | 34,000 |
| | | | | | | | |
| | | | | Total Mutual Fund
(Cost $34,000) | | | 34,000 |
| | | | | | | | |
See Accompanying Notes to Financial Statements
121
| | |
| ING GET U.S. CORE PORTFOLIO SERIES 12 | | PORTFOLIO OF INVESTMENTS ASOF JUNE 30, 2007 (UNAUDITED) (CONTINUED) |
| | | | | | | | | |
| | | |
Principal
Amount | | | | | | | Value |
| | Repurchase Agreement: 0.7% | | | | |
| $ | 373,000 | | Morgan Stanley Repurchase Agreement dated 06/29/07, 5.300%, due 07/02/07, $373,165 to be received upon repurchase (Collateralized by $800,000 Resolution Funding Corporation, Discount Note, Market Value $381,288, due 01/15/21) | | | | | $ | 373,000 |
| | | | | | | | | |
| | | Total Repurchase Agreement
(Cost $373,000) | | | | | | 373,000 |
| | | | | | | | | |
| | | Total Short-Term Investments
(Cost $407,000) | | | | | | 407,000 |
| | | | | | | | | |
| | | Total Investments in Securities
(Cost $48,106,135)* | | 100.0 | % | | $ | 51,549,466 |
| | | Other Assets and
Liabilities - Net | | 0.0 | | | | 21,533 |
| | | | | | | | | |
| | | Net Assets | | 100.0 | % | | $ | 51,570,999 |
| | | | | | | | | |
| @ | Non-income producing security |
| STRIP | Separate Trading of Registered Interest and Principal of Securities |
| ** | Investment in affiliate |
| ^ | Interest Only (IO) Security |
| * | Cost for federal income tax purposes is $48,239,618. |
| | | | |
Net unrealized appreciation consists of: | | | | |
Gross Unrealized Appreciation | | $ | 3,894,106 | |
Gross Unrealized Depreciation | | | (584,258 | ) |
| | | | |
Net Unrealized Appreciation | | $ | 3,309,848 | |
| | | | |
See Accompanying Notes to Financial Statements
122
| | |
| ING GET U.S. CORE PORTFOLIO SERIES 13 | | PORTFOLIO OF INVESTMENTS ASOF JUNE 30, 2007 (UNAUDITED) |
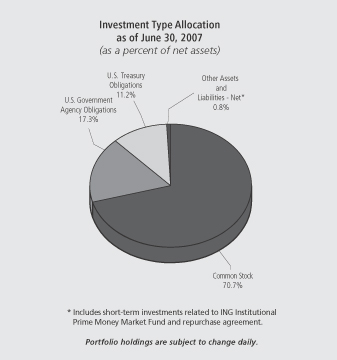
| | | | | | | |
| Shares | | | | | | Value |
| | | | | | | |
| COMMON STOCK: 70.7% | | | |
| Advertising: 0.2% | | | |
| 2,600 | | | | Omnicom Group | | $ | 137,592 |
| | | | | | | |
| | | | | | | 137,592 |
| | | | | | | |
| Aerospace/Defense: 1.7% | | | |
| 2,800 | | | | Boeing Co. | | | 269,248 |
| 2,100 | | | | General Dynamics Corp. | | | 164,262 |
| 600 | | | | Goodrich Corp. | | | 35,736 |
| 700 | | | | L-3 Communications Holdings, Inc. | | | 68,173 |
| 2,000 | | | | Lockheed Martin Corp. | | | 188,260 |
| 1,300 | | | | Northrop Grumman Corp. | | | 101,231 |
| 3,200 | | | | Raytheon Co. | | | 172,448 |
| 4,100 | | | | United Technologies Corp. | | | 290,813 |
| | | | | | | |
| | | | | | | 1,290,171 |
| | | | | | | |
| Agriculture: 1.0% | | | |
| 7,800 | | | | Altria Group, Inc. | | | 547,092 |
| 2,400 | | | | Archer-Daniels-Midland Co. | | | 79,416 |
| 1,500 | | | | Reynolds American, Inc. | | | 97,800 |
| 1,300 | | | | UST, Inc. | | | 69,823 |
| | | | | | | |
| | | | | | | 794,131 |
| | | | | | | |
| Apparel: 0.4% | | | |
| 2,700 | | @ | | Coach, Inc. | | | 127,953 |
| 2,300 | | | | Nike, Inc. | | | 134,067 |
| 700 | | | | Polo Ralph Lauren Corp. | | | 68,677 |
| | | | | | | |
| | | | | | | 330,697 |
| | | | | | | |
| Auto Manufacturers: 0.5% | | | |
| 13,400 | | | | Ford Motor Co. | | | 126,228 |
| 2,400 | | | | General Motors Corp. | | | 90,720 |
| | | | | | | |
| Shares | | | | | | Value |
| | | | | | | |
| 1,700 | | | | Paccar, Inc. | | $ | 147,968 |
| | | | | | | |
| | | | | | | 364,916 |
| | | | | | | |
| Auto Parts & Equipment: 0.2% | | | |
| 900 | | @ | | Goodyear Tire & Rubber Co. | | | 31,284 |
| 1,000 | | | | Johnson Controls, Inc. | | | 115,770 |
| | | | | | | |
| | | | | | | 147,054 |
| | | | | | | |
| Banks: 4.5% | | | |
| 17,000 | | | | Bank of America Corp. | | | 831,130 |
| 3,700 | | @ | | Bank of New York Co., Inc. | | | 153,328 |
| 2,500 | | | | BB&T Corp. | | | 101,700 |
| 1,700 | | | | Capital One Financial Corp. | | | 133,348 |
| 1,300 | | | | Comerica, Inc. | | | 77,311 |
| 600 | | | | Compass Bancshares, Inc. | | | 41,388 |
| 1,300 | | | | Fifth Third Bancorp. | | | 51,701 |
| 5,200 | | | | Huntington Bancshares, Inc. | | | 118,248 |
| 4,000 | | | | Keycorp. | | | 137,320 |
| 1,400 | | | | Marshall & Ilsley Corp. | | | 66,682 |
| 2,600 | | | | Mellon Financial Corp. | | | 114,400 |
| 2,800 | | | | National City Corp. | | | 93,296 |
| 500 | | | | Northern Trust Corp. | | | 32,120 |
| 1,100 | | | | PNC Financial Services Group, Inc. | | | 78,738 |
| 5,300 | | | | Regions Financial Corp. | | | 175,430 |
| 1,800 | | | | State Street Corp. | | | 123,120 |
| 1,200 | | | | SunTrust Banks, Inc. | | | 102,888 |
| 4,900 | | | | US Bancorp. | | | 161,455 |
| 8,000 | | | | Wachovia Corp. | | | 410,000 |
| 13,800 | | | | Wells Fargo & Co. | | | 485,346 |
| | | | | | | |
| | | | | | | 3,488,949 |
| | | | | | | |
| Beverages: 1.3% | | | |
| 2,800 | | | | Anheuser-Busch Cos., Inc. | | | 146,048 |
| 7,200 | | | | Coca-Cola Co. | | | 376,632 |
| 2,200 | | | | Pepsi Bottling Group, Inc. | | | 74,096 |
| 6,300 | | | | PepsiCo, Inc. | | | 408,555 |
| | | | | | | |
| | | | | | | 1,005,331 |
| | | | | | | |
| Biotechnology: 0.6% | | | |
| 4,300 | | @ | | Amgen, Inc. | | | 237,747 |
| 1,300 | | @ | | Biogen Idec, Inc. | | | 69,550 |
| 1,700 | | @ | | Celgene Corp. | | | 97,461 |
| 1,500 | | @ | | Genzyme Corp. | | | 96,600 |
| | | | | | | |
| | | | | | | 501,358 |
| | | | | | | |
| Building Materials: 0.2% | | | |
| 700 | | | | American Standard Cos., Inc. | | | 41,286 |
| 3,700 | | | | Masco Corp. | | | 105,339 |
| | | | | | | |
| | | | | | | 146,625 |
| | | | | | | |
| Chemicals: 1.4% | | | |
| 500 | | | | Air Products & Chemicals, Inc. | | | 40,185 |
| 1,000 | | | | Ashland, Inc. | | | 63,950 |
| 4,100 | | | | Dow Chemical Co. | | | 181,302 |
| 900 | | | | Ecolab, Inc. | | | 38,430 |
| 3,000 | | | | EI DuPont de Nemours & Co. | | | 152,520 |
| 1,600 | | | | International Flavors & Fragrances, Inc. | | | 83,424 |
| 2,700 | | | | Monsanto Co. | | | 182,358 |
| 1,500 | | | | PPG Industries, Inc. | | | 114,165 |
| 700 | | | | Praxair, Inc. | | | 50,393 |
| 900 | | | | Sherwin-Williams Co. | | | 59,823 |
| 2,100 | | | | Sigma-Aldrich Corp. | | | 89,607 |
| | | | | | | |
| | | | | | | 1,056,157 |
| | | | | | | |
See Accompanying Notes to Financial Statements
123
| | |
| ING GET U.S. CORE PORTFOLIO SERIES 13 | | PORTFOLIO OF INVESTMENTS ASOF JUNE 30, 2007 (UNAUDITED) (CONTINUED) |
| | | | | | | |
| Shares | | | | | | Value |
| | | | | | | |
| Coal: 0.1% | | | |
| 900 | | | | Consol Energy, Inc. | | $ | 41,499 |
| 1,300 | | | | Peabody Energy Corp. | | | 62,894 |
| | | | | | | |
| | | | | | | 104,393 |
| | | | | | | |
| Commercial Services: 0.6% | | | |
| 900 | | @ | | Apollo Group, Inc. | | | 52,587 |
| 1,500 | | @ | | Convergys Corp. | | | 36,360 |
| 1,000 | | | | Equifax, Inc. | | | 44,420 |
| 1,600 | | | | McKesson Corp. | | | 95,424 |
| 1,100 | | | | Moody's Corp. | | | 68,420 |
| 800 | | | | Robert Half International, Inc. | | | 29,200 |
| 1,100 | | | | RR Donnelley & Sons Co. | | | 47,861 |
| 3,300 | | | | Western Union Co. | | | 68,739 |
| | | | | | | |
| | | | | | | 443,011 |
| | | | | | | |
| Computers: 3.0% | | | |
| 400 | | @ | | Affiliated Computer Services, Inc. | | | 22,688 |
| 3,300 | | @ | | Apple, Inc. | | | 402,732 |
| 400 | | @ | | Cognizant Technology Solutions Corp. | | | 30,036 |
| 1,100 | | @ | | Computer Sciences Corp. | | | 65,065 |
| 9,400 | | @ | | Dell, Inc. | | | 268,370 |
| 3,000 | | | | Electronic Data Systems Corp. | | | 83,190 |
| 11,100 | | @ | | EMC Corp. | | | 200,910 |
| 10,400 | | | | Hewlett-Packard Co. | | | 464,048 |
| 5,300 | | | | International Business Machines Corp. | | | 557,825 |
| 800 | | @ | | Lexmark International, Inc. | | | 39,448 |
| 800 | | @ | | NCR Corp. | | | 42,032 |
| 2,100 | | @ | | Network Appliance, Inc. | | | 61,320 |
| 1,100 | | @ | | Sandisk Corp. | | | 53,834 |
| 14,500 | | @ | | Sun Microsystems, Inc. | | | 76,270 |
| | | | | | | |
| | | | | | | 2,367,768 |
| | | | | | | |
| Cosmetics/Personal Care: 1.3% | | | |
| 1,400 | | | | Avon Products, Inc. | | | 51,450 |
| 2,300 | | | | Colgate-Palmolive Co. | | | 149,155 |
| 800 | | | | Estee Lauder Cos., Inc. | | | 36,408 |
| 12,600 | | | | Procter & Gamble Co. | | | 770,994 |
| | | | | | | |
| | | | | | | 1,008,007 |
| | | | | | | |
| Distribution/Wholesale: 0.1% | | | |
| 600 | | | | WW Grainger, Inc. | | | 55,830 |
| | | | | | | |
| | | | | | | 55,830 |
| | | | | | | |
| Diversified Financial Services: 5.5% | | | |
| 4,200 | | | | American Express Co. | | | 256,956 |
| 1,300 | | | | Ameriprise Financial, Inc. | | | 82,641 |
| 500 | | | | Bear Stearns Cos., Inc. | | | 70,000 |
| 4,900 | | | | Charles Schwab Corp. | | | 100,548 |
| 200 | | | | Chicago Mercantile Exchange Holdings, Inc. | | | 106,872 |
| 1,100 | | | | CIT Group, Inc. | | | 60,313 |
| 17,600 | | | | Citigroup, Inc. | | | 902,704 |
| 2,700 | | | | Countrywide Financial Corp. | | | 98,145 |
| 1,500 | | @ | | E*Trade Financial Corp. | | | 33,135 |
| 3,300 | | | | Fannie Mae | | | 215,589 |
| 900 | | | | Franklin Resources, Inc. | | | 119,223 |
| 2,700 | | | | Freddie Mac | | | 163,890 |
| 1,700 | | | | Goldman Sachs Group, Inc. | | | 368,475 |
| 1,500 | | | | Janus Capital Group, Inc. | | | 41,760 |
| 13,800 | | | | JP Morgan Chase & Co. | | | 668,610 |
| 300 | | | | Legg Mason, Inc. | | | 29,514 |
| 2,500 | | | | Lehman Brothers Holdings, Inc. | | | 186,300 |
| | | | | | | |
| Shares | | | | | | Value |
| | | | | | | |
| 3,800 | | | | Merrill Lynch & Co., Inc. | | $ | 317,604 |
| 4,100 | | | | Morgan Stanley | | | 343,908 |
| 2,000 | | | | SLM Corp. | | | 115,160 |
| 600 | | | | T. Rowe Price Group, Inc. | | | 31,134 |
| | | | | | | |
| | | | | | | 4,312,481 |
| | | | | | | |
| Electric: 2.5% | | | |
| 2,900 | | @ | | AES Corp. | | | 63,452 |
| 1,400 | | | | American Electric Power Co., Inc. | | | 63,056 |
| 2,000 | | | | CMS Energy Corp. | | | 34,400 |
| 1,200 | | | | Constellation Energy Group, Inc. | | | 104,604 |
| 1,700 | | | | Dominion Resources, Inc. | | | 146,727 |
| 2,100 | | | | DTE Energy Co. | | | 101,262 |
| 2,400 | | | | Duke Energy Corp. | | | 43,920 |
| 2,800 | | | | Edison International | | | 157,136 |
| 1,800 | | | | Entergy Corp. | | | 193,230 |
| 2,600 | | | | Exelon Corp. | | | 188,760 |
| 2,700 | | | | FirstEnergy Corp. | | | 174,771 |
| 2,900 | | | | FPL Group, Inc. | | | 164,546 |
| 2,900 | | | | PG&E Corp. | | | 131,370 |
| 800 | | | | PPL Corp. | | | 37,432 |
| 1,700 | | | | Public Service Enterprise Group, Inc. | | | 149,226 |
| 2,000 | | | | TECO Energy, Inc. | | | 34,360 |
| 2,000 | | | | TXU Corp. | | | 134,600 |
| | | | | | | |
| | | | | | | 1,922,852 |
| | | | | | | |
| Electrical Components & Equipment: 0.2% | | | |
| 2,800 | | | | Emerson Electric Co. | | | 131,040 |
| | | | | | | |
| | | | | | | 131,040 |
| | | | | | | |
| Electronics: 0.3% | | | |
| 1,600 | | @ | | Agilent Technologies, Inc. | | | 61,504 |
| 1,400 | | | | Tektronix, Inc. | | | 47,236 |
| 2,000 | | @ | | Thermo Electron Corp. | | | 103,440 |
| 500 | | @ | | Waters Corp. | | | 29,680 |
| | | | | | | |
| | | | | | | 241,860 |
| | | | | | | |
| Engineering & Construction: 0.0% | | | |
| 300 | | | | Fluor Corp. | | | 33,411 |
| | | | | | | |
| | | | | | | 33,411 |
| | | | | | | |
| Entertainment: 0.1% | | | |
| 1,200 | | | | International Game Technology | | | 47,640 |
| | | | | | | |
| | | | | | | 47,640 |
| | | | | | | |
| Environmental Control: 0.2% | | | |
| 2,600 | | @ | | Allied Waste Industries, Inc. | | | 34,996 |
| 3,100 | | | | Waste Management, Inc. | | | 121,055 |
| | | | | | | |
| | | | | | | 156,051 |
| | | | | | | |
| Food: 1.2% | | | |
| 1,600 | | | | Campbell Soup Co. | | | 62,096 |
| 800 | | @ | | Dean Foods Co. | | | 25,496 |
| 2,700 | | | | General Mills, Inc. | | | 157,734 |
| 700 | | | | Hershey Co. | | | 35,434 |
| 3,500 | | | | HJ Heinz Co. | | | 166,145 |
| 1,200 | | | | Kellogg Co. | | | 62,148 |
| 4,335 | | | | Kraft Foods, Inc. | | | 152,809 |
| 3,700 | | | | Kroger Co. | | | 104,081 |
| 2,400 | �� | | | Safeway, Inc. | | | 81,672 |
| 700 | | | | Supervalu, Inc. | | | 32,424 |
| 800 | | | | Sysco Corp. | | | 26,392 |
| 600 | | | | Whole Foods Market, Inc. | | | 22,980 |
See Accompanying Notes to Financial Statements
124
| | |
| ING GET U.S. CORE PORTFOLIO SERIES 13 | | PORTFOLIO OF INVESTMENTS ASOF JUNE 30, 2007 (UNAUDITED) (CONTINUED) |
| | | | | | | |
| Shares | | | | | | Value |
| | | | | | | |
| Food (continued) | | | |
| 600 | | | | WM Wrigley Jr. Co. | | $ | 33,186 |
| | | | | | | |
| | | | | | | 962,597 |
| | | | | | | |
| Forest Products & Paper: 0.3% | | | |
| 3,100 | | | | International Paper Co. | | | 121,055 |
| 700 | | | | Temple-Inland, Inc. | | | 43,071 |
| 800 | | | | Weyerhaeuser Co. | | | 63,144 |
| | | | | | | |
| | | | | | | 227,270 |
| | | | | | | |
| Gas: 0.2% | | | |
| 800 | | | | KeySpan Corp. | | | 33,584 |
| 2,100 | | | | Sempra Energy | | | 124,383 |
| | | | | | | |
| | | | | | | 157,967 |
| | | | | | | |
| Hand/Machine Tools: 0.2% | | | |
| 800 | | | | Black & Decker Corp. | | | 70,648 |
| 800 | | | | Snap-On, Inc. | | | 40,408 |
| 900 | | | | Stanley Works | | | 54,630 |
| | | | | | | |
| | | | | | | 165,686 |
| | | | | | | |
| Healthcare—Products: 2.0% | | | |
| 3,000 | | | | Baxter International, Inc. | | | 169,020 |
| 1,200 | | | | Becton Dickinson & Co. | | | 89,400 |
| 1,200 | | | | Biomet, Inc. | | | 54,864 |
| 5,400 | | @ | | Boston Scientific Corp. | | | 82,836 |
| 700 | | | | CR Bard, Inc. | | | 57,841 |
| 11,400 | | | | Johnson & Johnson | | | 702,468 |
| 4,000 | | | | Medtronic, Inc. | | | 207,440 |
| 1,100 | | @ | | St. Jude Medical, Inc. | | | 45,639 |
| 1,300 | | | | Stryker Corp. | | | 82,017 |
| 500 | | @ | | Varian Medical Systems, Inc. | | | 21,255 |
| 1,000 | | @ | | Zimmer Holdings, Inc. | | | 84,890 |
| | | | | | | |
| | | | | | | 1,597,670 |
| | | | | | | |
| Healthcare—Services: 0.9% | | | |
| 2,600 | | | | Aetna, Inc. | | | 128,440 |
| 1,000 | | @ | | Coventry Health Care, Inc. | | | 57,650 |
| 1,000 | | @ | | Humana, Inc. | | | 60,910 |
| 400 | | @ | | Laboratory Corp. of America Holdings | | | 31,304 |
| 5,300 | | | | UnitedHealth Group, Inc. | | | 271,042 |
| 2,400 | | @ | | WellPoint, Inc. | | | 191,592 |
| | | | | | | |
| | | | | | | 740,938 |
| | | | | | | |
| Home Builders: 0.2% | | | |
| 1,200 | | | | Centex Corp. | | | 48,120 |
| 1,100 | | | | KB Home | | | 43,307 |
| 700 | | | | Lennar Corp. | | | 25,592 |
| | | | | | | |
| | | | | | | 117,019 |
| | | | | | | |
| Home Furnishings: 0.1% | | | |
| 400 | | | | Harman International Industries, Inc. | | | 46,720 |
| 400 | | | | Whirlpool Corp. | | | 44,480 |
| | | | | | | |
| | | | | | | 91,200 |
| | | | | | | |
| Household Products/Wares: 0.3% | | | |
| 600 | | | | Clorox Co. | | | 37,260 |
| 2,700 | | | | Kimberly-Clark Corp. | | | 180,603 |
| | | | | | | |
| | | | | | | 217,863 |
| | | | | | | |
| Housewares: 0.0% | | | |
| 1,300 | | | | Newell Rubbermaid, Inc. | | | 38,259 |
| | | | | | | |
| | | | | | | 38,259 |
| | | | | | | |
| | | | | | | |
| Shares | | | | | | Value |
| | | | | | | |
| Insurance: 3.9% | | | |
| 1,900 | | @@ | | ACE Ltd. | | $ | 118,788 |
| 2,200 | | | | Aflac, Inc. | | | 113,080 |
| 2,700 | | | | Allstate Corp. | | | 166,077 |
| 500 | | | | AMBAC Financial Group, Inc. | | | 43,595 |
| 9,700 | | | | American International Group, Inc. | | | 679,291 |
| 1,500 | | | | AON Corp. | | | 63,915 |
| 800 | | | | Assurant, Inc. | | | 47,136 |
| 2,800 | | | | Chubb Corp. | | | 151,592 |
| 1,500 | | | | Cigna Corp. | | | 78,330 |
| 3,100 | | | | Genworth Financial, Inc. | | | 106,640 |
| 1,700 | | | | Hartford Financial Services Group, Inc. | | | 167,467 |
| 1,300 | | | | Lincoln National Corp. | | | 92,235 |
| 1,900 | | | | Loews Corp. | | | 96,862 |
| 2,200 | | | | Marsh & McLennan Cos., Inc. | | | 67,936 |
| 500 | | | | MBIA, Inc. | | | 31,110 |
| 3,300 | | | | Metlife, Inc. | | | 212,784 |
| 500 | | | | MGIC Investment Corp. | | | 28,430 |
| 1,900 | | | | Principal Financial Group | | | 110,751 |
| 4,700 | | | | Progressive Corp. | | | 112,471 |
| 2,200 | | | | Prudential Financial, Inc. | | | 213,906 |
| 600 | | | | Safeco Corp. | | | 37,356 |
| 700 | | | | Torchmark Corp. | | | 46,900 |
| 3,200 | | | | Travelers Cos., Inc. | | | 171,200 |
| 1,200 | | | | UnumProvident Corp. | | | 31,332 |
| 1,100 | | @@ | | XL Capital Ltd. | | | 92,719 |
| | | | | | | |
| | | | | | | 3,081,903 |
| | | | | | | |
| Internet: 1.3% | | | |
| 1,400 | | @ | | Amazon.com, Inc. | | | 95,774 |
| 5,100 | | @ | | eBay, Inc. | | | 164,118 |
| 800 | | @ | | Google, Inc. | | | 418,704 |
| 1,000 | | @ | | IAC/InterActiveCorp. | | | 34,610 |
| 5,400 | | @ | | Symantec Corp. | | | 109,080 |
| 1,500 | | @ | | VeriSign, Inc. | | | 47,595 |
| 5,100 | | @ | | Yahoo!, Inc. | | | 138,363 |
| | | | | | | |
| | | | | | | 1,008,244 |
| | | | | | | |
| Iron/Steel: 0.3% | | | |
| 400 | | | | Allegheny Technologies, Inc. | | | 41,952 |
| 2,200 | | | | Nucor Corp. | | | 129,030 |
| 700 | | | | United States Steel Corp. | | | 76,125 |
| | | | | | | |
| | | | | | | 247,107 |
| | | | | | | |
| Leisure Time: 0.3% | | | |
| 2,100 | | | | Carnival Corp. | | | 102,417 |
| 1,800 | | | | Harley-Davidson, Inc. | | | 107,298 |
| | | | | | | |
| | | | | | | 209,715 |
| | | | | | | |
| Lodging: 0.2% | | | |
| 800 | | | | Harrah's Entertainment, Inc. | | | 68,208 |
| 900 | | | | Hilton Hotels Corp. | | | 30,123 |
| 1,100 | | | | Marriott International, Inc. | | | 47,564 |
| 700 | | | | Starwood Hotels & Resorts Worldwide, Inc. | | | 46,949 |
| | | | | | | |
| | | | | | | 192,844 |
| | | | | | | |
| Machinery—Construction & Mining: 0.3% | | | |
| 2,700 | | | | Caterpillar, Inc. | | | 211,410 |
| 500 | | @ | | Terex Corp. | | | 40,650 |
| | | | | | | |
| | | | | | | 252,060 |
| | | | | | | |
See Accompanying Notes to Financial Statements
125
| | |
| ING GET U.S. CORE PORTFOLIO SERIES 13 | | PORTFOLIO OF INVESTMENTS ASOF JUNE 30, 2007 (UNAUDITED) (CONTINUED) |
| | | | | | | |
| Shares | | | | | | Value |
| | | | | | | |
| Machinery—Diversified: 0.4% | | | |
| 1,000 | | | | Cummins, Inc. | | $ | 101,210 |
| 1,200 | | | | Deere & Co. | | | 144,888 |
| 700 | | | | Rockwell Automation, Inc. | | | 48,608 |
| | | | | | | |
| | | | | | | 294,706 |
| | | | | | | |
| Media: 2.2% | | | |
| 3,800 | | | | CBS Corp.—Class B | | | 126,616 |
| 2,200 | | | | Clear Channel Communications, Inc. | | | 83,204 |
| 9,200 | | @ | | Comcast Corp. – Class A | | | 258,704 |
| 5,000 | | @ | | DIRECTV Group, Inc. | | | 115,550 |
| 1,500 | | | | Gannett Co., Inc. | | | 82,425 |
| 2,200 | | | | McGraw-Hill Cos., Inc. | | | 149,776 |
| 9,300 | | | | News Corp., Inc.—Class A | | | 197,253 |
| 10,800 | | | | Time Warner, Inc. | | | 227,232 |
| 2,800 | | @ | | Viacom—Class B | | | 116,564 |
| 9,400 | | | | Walt Disney Co. | | | 320,916 |
| | | | | | | |
| | | | | | | 1,678,240 |
| | | | | | | |
| Metal Fabricate/Hardware: 0.1% | | | |
| 400 | | | | Precision Castparts Corp. | | | 48,544 |
| | | | | | | |
| | | | | | | 48,544 |
| | | | | | | |
| Mining: 0.4% | | | |
| 3,700 | | | | Alcoa, Inc. | | | 149,961 |
| 1,703 | | | | Freeport-McMoRan Copper & Gold, Inc. | | | 141,042 |
| 1,300 | | | | Newmont Mining Corp. | | | 50,778 |
| | | | | | | |
| | | | | | | 341,781 |
| | | | | | | |
| Miscellaneous Manufacturing: 3.7% | | | |
| 2,900 | | | | 3M Co. | | | 251,691 |
| 1,300 | | | | Cooper Industries Ltd. | | | 74,217 |
| 1,500 | | | | Danaher Corp. | | | 113,250 |
| 2,300 | | | | Eastman Kodak Co. | | | 64,009 |
| 1,600 | | | | Eaton Corp. | | | 148,800 |
| 35,600 | | | | General Electric Co. | | | 1,362,768 |
| 3,300 | | | | Honeywell International, Inc. | | | 185,724 |
| 2,600 | | | | Illinois Tool Works, Inc. | | | 140,894 |
| 1,500 | | | | ITT Corp. | | | 102,420 |
| 700 | | | | Pall Corp. | | | 32,193 |
| 1,100 | | | | Parker Hannifin Corp. | | | 107,701 |
| 300 | | | | Textron, Inc. | | | 33,033 |
| 7,900 | | @ | | Tyco International Ltd. | | | 266,941 |
| | | | | | | |
| | | | | | | 2,883,641 |
| | | | | | | |
| Office/Business Equipment:: 0.1% | | | |
| 5,700 | | @ | | Xerox Corp. | | | 105,336 |
| | | | | | | |
| | | | | | | 105,336 |
| | | | | | | |
| Oil & Gas: 6.0% | | | |
| 2,300 | | | | Anadarko Petroleum Corp. | | | 119,577 |
| 1,000 | | | | Apache Corp. | | | 81,590 |
| 1,900 | | | | Chesapeake Energy Corp. | | | 65,740 |
| 8,800 | | | | Chevron Corp. | | | 741,312 |
| 6,500 | | | | ConocoPhillips | | | 510,250 |
| 1,800 | | | | Devon Energy Corp. | | | 140,922 |
| 1,100 | | | | ENSCO International, Inc. | | | 67,111 |
| 500 | | | | EOG Resources, Inc. | | | 36,530 |
| 21,600 | | | | ExxonMobil Corp. | | | 1,811,808 |
| 700 | | | | Hess Corp. | | | 41,272 |
| 3,500 | | | | Marathon Oil Corp. | | | 209,860 |
| 500 | | | | Murphy Oil Corp. | | | 29,720 |
| 1,400 | | @, @@ | | Nabors Industries Ltd. | | | 46,732 |
| | | | | | | |
| Shares | | | | | | Value |
| | | | | | | |
| 700 | | | | Noble Corp. | | $ | 68,264 |
| 3,400 | | | | Occidental Petroleum Corp. | | | 196,792 |
| 1,000 | | | | Sunoco, Inc. | | | 79,680 |
| 1,300 | | @ | | Transocean, Inc. | | | 137,774 |
| 2,500 | | | | Valero Energy Corp. | | | 184,650 |
| 1,400 | | | | XTO Energy, Inc. | | | 84,140 |
| | | | | | | |
| | | | | | | 4,653,724 |
| | | | | | | |
| Oil & Gas Services: 1.0% | | | |
| 1,300 | | | | Baker Hughes, Inc. | | | 109,369 |
| 5,200 | | | | Halliburton Co. | | | 179,400 |
| 1,100 | | @ | | National Oilwell Varco, Inc. | | | 114,664 |
| 4,100 | | | | Schlumberger Ltd. | | | 348,254 |
| 900 | | @ | | Weatherford International Ltd. | | | 49,716 |
| | | | | | | |
| | | | | | | 801,403 |
| | | | | | | |
| Packaging & Containers: 0.2% | | | |
| 600 | | | | Ball Corp. | | | 31,902 |
| 900 | | | | Bemis Co. | | | 29,862 |
| 2,100 | | @ | | Pactiv Corp. | | | 66,969 |
| 1,700 | | | | Sealed Air Corp. | | | 52,734 |
| | | | | | | |
| | | | | | | 181,467 |
| | | | | | | |
| Pharmaceuticals: 3.7% | | | |
| 4,300 | | | | Abbott Laboratories | | | 230,265 |
| 1,500 | | | | AmerisourceBergen Corp. | | | 74,205 |
| 500 | | @ | | Barr Pharmaceuticals, Inc. | | | 25,115 |
| 7,200 | | | | Bristol-Myers Squibb Co. | | | 227,232 |
| 1,700 | | | | Cardinal Health, Inc. | | | 120,088 |
| 3,600 | | | | Eli Lilly & Co. | | | 201,168 |
| 820 | | @ | | Express Scripts, Inc. | | | 41,008 |
| 1,800 | | @ | | Forest Laboratories, Inc. | | | 82,170 |
| 3,600 | | @ | | Gilead Sciences, Inc. | | | 139,572 |
| 1,600 | | @ | | King Pharmaceuticals, Inc. | | | 32,736 |
| 1,300 | | @ | | Medco Health Solutions, Inc. | | | 101,387 |
| 8,200 | | | | Merck & Co., Inc. | | | 408,360 |
| 2,000 | | | | Mylan Laboratories | | | 36,380 |
| 26,100 | | | | Pfizer, Inc. | | | 667,377 |
| 6,100 | | | | Schering-Plough Corp. | | | 185,684 |
| 1,000 | | @ | | Watson Pharmaceuticals, Inc. | | | 32,530 |
| 4,800 | | | | Wyeth | | | 275,232 |
| | | | | | | |
| | | | | | | 2,880,509 |
| | | | | | | |
| Pipelines: 0.3% | | | |
| 3,100 | | | | El Paso Corp. | | | 53,413 |
| 800 | | | | Questar Corp. | | | 42,280 |
| 3,400 | | | | Spectra Energy Corp. | | | 88,264 |
| 2,400 | | | | Williams Cos., Inc. | | | 75,888 |
| | | | | | | |
| | | | | | | 259,845 |
| | | | | | | |
| Real Estate Investment Trusts: 0.6% | | | |
| 500 | | | | Apartment Investment & Management Co. | | | 25,210 |
| 830 | | | | Archstone-Smith Trust | | | 49,061 |
| 700 | | | | Boston Properties, Inc. | | | 71,491 |
| 500 | | | | Developers Diversified Realty Corp. | | | 26,355 |
| 700 | | | | Equity Residential | | | 31,941 |
| 1,800 | | | | Host Hotels & Resorts, Inc. | | | 41,616 |
| 800 | | | | Kimco Realty Corp. | | | 30,456 |
| 1,300 | | | | Prologis | | | 73,970 |
| 800 | | | | Simon Property Group, Inc. | | | 74,432 |
| 500 | | | | Vornado Realty Trust | | | 54,920 |
| | | | | | | |
| | | | | | | 479,452 |
| | | | | | | |
See Accompanying Notes to Financial Statements
126
| | |
| ING GET U.S. CORE PORTFOLIO SERIES 13 | | PORTFOLIO OF INVESTMENTS ASOF JUNE 30, 2007 (UNAUDITED) (CONTINUED) |
| | | | | | | |
| Shares | | | | | | Value |
| | | | | | | |
| Retail: 4.0% | | | |
| 500 | | @ | | Autozone, Inc. | | $ | 68,310 |
| 800 | | @ | | Bed Bath & Beyond, Inc. | | | 28,792 |
| 2,300 | | | | Best Buy Co., Inc. | | | 107,341 |
| 1,200 | | @ | | Big Lots, Inc. | | | 35,304 |
| 2,200 | | | | Costco Wholesale Corp. | | | 128,744 |
| 5,306 | | | | CVS Corp. | | | 193,404 |
| 1,000 | | | | Darden Restaurants, Inc. | | | 43,990 |
| 1,300 | | | | Dollar General Corp. | | | 28,496 |
| 1,500 | | | | Family Dollar Stores, Inc. | | | 51,480 |
| 3,300 | | | | Gap, Inc. | | | 63,030 |
| 6,400 | | | | Home Depot, Inc. | | | 251,840 |
| 1,200 | | | | JC Penney Co., Inc. | | | 86,856 |
| 1,600 | | @ | | Kohl's Corp. | | | 113,648 |
| 5,800 | | | | Lowe's Cos., Inc. | | | 178,002 |
| 3,000 | | | | Macy's, Inc. | | | 119,340 |
| 5,200 | | | | McDonald's Corp. | | | 263,952 |
| 1,300 | | | | Nordstrom, Inc. | | | 66,456 |
| 900 | | @ | | Office Depot, Inc. | | | 27,270 |
| 1,300 | | | | RadioShack Corp. | | | 43,082 |
| 400 | | @ | | Sears Holding Corp. | | | 67,800 |
| 2,400 | | | | Staples, Inc. | | | 56,952 |
| 3,100 | | @ | | Starbucks Corp. | | | 81,344 |
| 3,000 | | | | Target Corp. | | | 190,800 |
| 2,400 | | | | TJX Cos., Inc. | | | 66,000 |
| 4,300 | | | | Walgreen Co. | | | 187,222 |
| 8,400 | | | | Wal-Mart Stores, Inc. | | | 404,124 |
| 1,300 | | | | Wendy's International, Inc. | | | 47,775 |
| 2,800 | | | | Yum! Brands, Inc. | | | 91,616 |
| | | | | | | |
| | | | | | | 3,092,970 |
| | | | | | | |
| Savings & Loans: 0.3% | | | |
| 2,600 | | | | Hudson City Bancorp., Inc. | | | 31,772 |
| 1,500 | | | | Sovereign Bancorp., Inc. | | | 31,710 |
| 4,000 | | | | Washington Mutual, Inc. | | | 170,560 |
| | | | | | | |
| | | | | | | 234,042 |
| | | | | | | |
| Semiconductors: 1.9% | | | |
| 2,400 | | @ | | Advanced Micro Devices, Inc. | | | 34,320 |
| 2,300 | | | | Altera Corp. | | | 50,899 |
| 1,100 | | | | Analog Devices, Inc. | | | 41,404 |
| 4,200 | | | | Applied Materials, Inc. | | | 83,454 |
| 1,600 | | @ | | Broadcom Corp. | | | 46,800 |
| 20,900 | | | | Intel Corp. | | | 496,584 |
| 1,600 | | | | KLA-Tencor Corp. | | | 87,920 |
| 1,400 | | | | Linear Technology Corp. | | | 50,652 |
| 2,900 | | @ | | LSI Logic Corp. | | | 21,779 |
| 1,400 | | | | Maxim Integrated Products | | | 46,774 |
| 1,200 | | @ | | MEMC Electronic Materials, Inc. | | | 73,344 |
| 3,100 | | @ | | Micron Technology, Inc. | | | 38,843 |
| 1,400 | | | | National Semiconductor Corp. | | | 39,578 |
| 1,400 | | @ | | Novellus Systems, Inc. | | | 39,718 |
| 1,500 | | @ | | Nvidia Corp. | | | 61,965 |
| 1,900 | | @ | | Teradyne, Inc. | | | 33,402 |
| 4,800 | | | | Texas Instruments, Inc. | | | 180,624 |
| 1,500 | | | | Xilinx, Inc. | | | 40,155 |
| | | | | | | |
| | | | | | | 1,468,215 |
| | | | | | | |
| Software: 2.7% | | | |
| 2,800 | | @ | | Adobe Systems, Inc. | | | 112,420 |
| 1,400 | | @ | | Autodesk, Inc. | | | 65,912 |
| 2,800 | | | | Automatic Data Processing, Inc. | | | 135,716 |
| 1,400 | | @ | | BMC Software, Inc. | | | 42,420 |
| | | | | | | | |
| Shares | | | | | | Value |
| | | | | | | | |
| | 3,400 | | | | CA, Inc. | | $ | 87,822 |
| | 1,500 | | @ | | Citrix Systems, Inc. | | | 50,505 |
| | 2,900 | | @ | | Compuware Corp. | | | 34,394 |
| | 1,300 | | @ | | Electronic Arts, Inc. | | | 61,516 |
| | 3,700 | | | | First Data Corp. | | | 120,879 |
| | 1,200 | | @ | | Fiserv, Inc. | | | 68,160 |
| | 2,400 | | @ | | Intuit, Inc. | | | 72,192 |
| | 29,800 | | | | Microsoft Corp. | | | 878,206 |
| | 4,200 | | @ | | Novell, Inc. | | | 32,718 |
| | 13,800 | | @ | | Oracle Corp. | | | 271,998 |
| | 1,700 | | | | Paychex, Inc. | | | 66,504 |
| | | | | | | | |
| | | | | | | | 2,101,362 |
| | | | | | | | |
| | Telecommunications: 4.3% | | | |
| | 1,400 | | @@ | | Allergan, Inc. | | | 80,696 |
| | 1,400 | | | | Alltel Corp. | | | 94,570 |
| | 22,220 | | | | AT&T, Inc. | | | 922,130 |
| | 2,400 | | @ | | Avaya, Inc. | | | 40,416 |
| | 1,400 | | | | CenturyTel, Inc. | | | 68,670 |
| | 22,800 | | @ | | Cisco Systems, Inc. | | | 634,980 |
| | 3,200 | | | | Citizens Communications Co. | | | 48,864 |
| | 6,800 | | @ | | Corning, Inc. | | | 173,740 |
| | 1,000 | | | | Embarq Corp. | | | 63,370 |
| | 2,500 | | @ | | Juniper Networks, Inc. | | | 62,925 |
| | 9,900 | | | | Motorola, Inc. | | | 175,230 |
| | 6,100 | | | | Qualcomm, Inc. | | | 264,679 |
| | 7,200 | | @ | | Qwest Communications International, Inc. | | | 69,840 |
| | 9,700 | | | | Sprint Nextel Corp. | | | 200,887 |
| | 2,900 | | @ | | Tellabs, Inc. | | | 31,204 |
| | 9,600 | | | | Verizon Communications, Inc. | | | 395,232 |
| | | | | | | | |
| | | | | | | | 3,327,433 |
| | | | | | | | |
| | Toys/Games/Hobbies: 0.1% | | | |
| | 1,500 | | | | Hasbro, Inc. | | | 47,115 |
| | 2,700 | | | | Mattel, Inc. | | | 68,283 |
| | | | | | | | |
| | | | | | | | 115,398 |
| | | | | | | | |
| | Transportation: 1.1% | | | |
| | 1,200 | | | | Burlington Northern Santa Fe Corp. | | | 102,168 |
| | 500 | | | | CH Robinson Worldwide, Inc. | | | 26,260 |
| | 2,100 | | | | CSX Corp. | | | 94,668 |
| | 1,600 | | | | FedEx Corp. | | | 177,552 |
| | 2,100 | | | | Norfolk Southern Corp. | | | 110,397 |
| | 1,200 | | | | Union Pacific Corp. | | | 138,180 |
| | 3,000 | | | | United Parcel Service, Inc. | | | 219,000 |
| | | | | | | | |
| | | | | | | | 868,225 |
| | | | | | | | |
| | | | | Total Common Stock
(Cost $53,156,951) | | | 55,211,960 |
| | | | | | | | |
| | | |
Principal
Amount | | | | | | Value |
| | U.S. GOVERNMENT AGENCY OBLIGATIONS: 17.3% |
| | Federal National Mortgage Corporation: 17.3% |
| $ | 11,000,000 | | ^ | | 4.972%, due 11/15/13 | | | 7,897,648 |
| | 7,820,000 | | ^ | | 4.984%, due 01/15/14 | | | 5,563,789 |
| | | | | | | | |
| | | | | Total U.S. Government Agency Obligations
(Cost $13,647,269 ) | | | 13,461,437 |
| | | | | | | | |
See Accompanying Notes to Financial Statements
127
| | |
| ING GET U.S. CORE PORTFOLIO SERIES 13 | | PORTFOLIO OF INVESTMENTS ASOF JUNE 30, 2007 (UNAUDITED) (CONTINUED) |
| | | | | | | | |
Principal
Amount | | | | | | Value |
| | | | | | | | |
| | U.S. TREASURY OBLIGATIONS: 11.2% |
| | U.S. Treasury STRIP: 11.2% |
| $ | 11,995,000 | | ^ | | 4.624%, due 11/15/13 | | $ | 8,774,043 |
| | | | | | | | |
| | | | | Total U.S. Treasury Obligations
(Cost $ 8,724,287 ) | | | 8,774,043 |
| | | | | | | | |
| | | | | Total Long-Term Investments
(Cost $75,528,507) | | | 77,447,440 |
| | | | | | | | |
| Shares | | | | | | |
| | SHORT-TERM INVESTMENTS: 0.9% |
| | Mutual Fund: 0.6% | | | |
| | 505,000 | | ** | | ING Institutional Prime Money Market Fund | | | 505,000 |
| | | | | | | | |
| | | | | Total Mutual Fund
(Cost $505,000) | | | 505,000 |
| | | | | | | | |
Principal
Amount | | | | | | |
| | | | | | | | | | |
| | Repurchase Agreement: 0.3% | | | | | |
| $ | 205,000 | | Morgan Stanley Repurchase Agreement dated 06/29/07, 5.300%, due 07/02/07, $205,091 to be received upon repurchase (Collateralized by $440,000 Resolution Funding Corporation, Discount Note, Market Value $209,708, due 01/15/21) | | | | 205,000 | |
| | | | | | | | | | |
| | | Total Repurchase Agreement
(Cost $205,000) | | | | | | 205,000 | |
| | | | | | | | | | |
| | | Total Short-Term Investments
(Cost $710,000) | | | | | | 710,000 | |
| | | | | | | | | | |
| | | Total Investments in Securities
(Cost $76,238,507)* | | 100.1 | % | | $ | 78,157,440 | |
| | | Other Assets and
Liabilities - Net | | (0.1 | ) | | | (99,138 | ) |
| | | | | | | | | | |
| | | Net Assets | | 100.0 | % | | $ | 78,058,302 | |
| | | | | | | | | | |
| @ | Non-income producing security |
| STRIP | Separate Trading of Registered Interest and Principal of Securities |
| ** | Investment in affiliate |
| ^ | Interest Only (IO) Security |
| * | Cost for federal income tax purposes is $76,814,888. |
| | | | |
Net unrealized appreciation consists of: | | | | |
Gross Unrealized Appreciation | | $ | 2,584,799 | |
Gross Unrealized Depreciation | | | (1,242,247 | ) |
| | | | |
Net Unrealized Appreciation | | $ | 1,342,552 | |
| | | | |
See Accompanying Notes to Financial Statements
128
| | |
| ING GET U.S. CORE PORTFOLIO SERIES 14 | | PORTFOLIO OF INVESTMENTS ASOF JUNE 30, 2007 (UNAUDITED) |
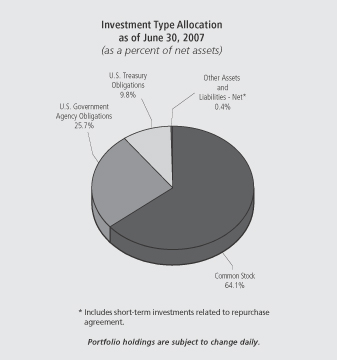
| | | | | | | |
| Shares | | | | | | Value |
| | | | | | | |
| COMMON STOCK: 64.1% | | | |
| Advertising: 0.1% | | | |
| 3,900 | | | | Omnicom Group | | $ | 206,388 |
| | | | | | | |
| | | | | | | 206,388 |
| | | | | | | |
| Aerospace/Defense: 1.5% | | | |
| 4,800 | | | | Boeing Co. | | | 461,568 |
| 3,700 | | | | General Dynamics Corp. | | | 289,414 |
| 900 | | | | Goodrich Corp. | | | 53,604 |
| 1,100 | | | | L-3 Communications Holdings, Inc. | | | 107,129 |
| 3,000 | | | | Lockheed Martin Corp. | | | 282,390 |
| 2,100 | | | | Northrop Grumman Corp. | | | 163,527 |
| 4,800 | | | | Raytheon Co. | | | 258,672 |
| 7,500 | | | | United Technologies Corp. | | | 531,975 |
| | | | | | | |
| | | | | | | 2,148,279 |
| | | | | | | |
| Agriculture: 1.0% | | | |
| 13,800 | | | | Altria Group, Inc. | | | 967,932 |
| 3,600 | | | | Archer-Daniels-Midland Co. | | | 119,124 |
| 1,700 | | | | Reynolds American, Inc. | | | 110,840 |
| 2,600 | | | | UST, Inc. | | | 139,646 |
| | | | | | | |
| | | | | | | 1,337,542 |
| | | | | | | |
| Apparel: 0.3% | | | |
| 3,700 | | @ | | Coach, Inc. | | | 175,343 |
| 3,100 | | | | Nike, Inc. | | | 180,699 |
| 1,100 | | | | Polo Ralph Lauren Corp. | | | 107,921 |
| | | | | | | |
| | | | | | | 463,963 |
| | | | | | | |
| Auto Manufacturers: 0.4% | | | |
| 18,100 | | | | Ford Motor Co. | | | 170,502 |
| 3,600 | | | | General Motors Corp. | | | 136,080 |
| 2,100 | | | | Paccar, Inc. | | | 182,784 |
| | | | | | | |
| | | | | | | 489,366 |
| | | | | | | |
| | | | | | | |
| Shares | | | | | | Value |
| Auto Parts & Equipment: 0.2% | | | |
| 1,400 | | @ | | Goodyear Tire & Rubber Co. | | $ | 48,664 |
| 1,400 | | | | Johnson Controls, Inc. | | | 162,078 |
| | | | | | | |
| | | | | | | 210,742 |
| | | | | | | |
| Banks: 4.0% | | | |
| 30,200 | | | | Bank of America Corp. | | | 1,476,478 |
| 4,900 | | @ | | Bank of New York Co., Inc. | | | 203,056 |
| 3,700 | | | | BB&T Corp. | | | 150,516 |
| 2,500 | | | | Capital One Financial Corp. | | | 196,100 |
| 2,300 | | | | Comerica, Inc. | | | 136,781 |
| 1,000 | | | | Compass Bancshares, Inc. | | | 68,980 |
| 2,500 | | | | Fifth Third Bancorp. | | | 99,425 |
| 7,500 | | | | Huntington Bancshares, Inc. | | | 170,550 |
| 4,800 | | | | Keycorp. | | | 164,784 |
| 500 | | | | M&T Bank Corp. | | | 53,450 |
| 1,500 | | | | Marshall & Ilsley Corp. | | | 71,445 |
| 3,500 | | | | Mellon Financial Corp. | | | 154,000 |
| 4,600 | | | | National City Corp. | | | 153,272 |
| 800 | �� | | | Northern Trust Corp. | | | 51,392 |
| 1,400 | | | | PNC Financial Services Group, Inc. | | | 100,212 |
| 7,900 | | | | Regions Financial Corp. | | | 261,490 |
| 2,300 | | | | State Street Corp. | | | 157,320 |
| 1,800 | | | | SunTrust Banks, Inc. | | | 154,332 |
| 7,500 | | | | US Bancorp. | | | 247,125 |
| 14,000 | | | | Wachovia Corp. | | | 717,500 |
| 23,700 | | | | Wells Fargo & Co. | | | 833,529 |
| | | | | | | |
| | | | | | | 5,621,737 |
| | | | | | | |
| Beverages: 1.2% | | | |
| 3,900 | | | | Anheuser-Busch Cos., Inc. | | | 203,424 |
| 12,400 | | | | Coca-Cola Co. | | | 648,644 |
| 3,000 | | | | Pepsi Bottling Group, Inc. | | | 101,040 |
| 11,300 | | | | PepsiCo, Inc. | | | 732,805 |
| | | | | | | |
| | | | | | | 1,685,913 |
| | | | | | | |
| Biotechnology: 0.6% | | | |
| 7,100 | | @ | | Amgen, Inc. | | | 392,559 |
| 2,600 | | @ | | Biogen Idec, Inc. | | | 139,100 |
| 2,500 | | @ | | Celgene Corp. | | | 143,325 |
| 1,900 | | @ | | Genzyme Corp. | | | 122,360 |
| | | | | | | |
| | | | | | | 797,344 |
| | | | | | | |
| Building Materials: 0.2% | | | |
| 900 | | | | American Standard Cos., Inc. | | | 53,082 |
| 6,000 | | | | Masco Corp. | | | 170,820 |
| | | | | | | |
| | | | | | | 223,902 |
| | | | | | | |
| Chemicals: 1.1% | | | |
| 600 | | | | Air Products & Chemicals, Inc. | | | 48,222 |
| 1,400 | | | | Ashland, Inc. | | | 89,530 |
| 6,100 | | | | Dow Chemical Co. | | | 269,742 |
| 1,300 | | | | Ecolab, Inc. | | | 55,510 |
| 4,700 | | | | EI DuPont de Nemours & Co. | | | 238,948 |
| 2,000 | | | | International Flavors & Fragrances, Inc. | | | 104,280 |
| 3,800 | | | | Monsanto Co. | | | 256,652 |
| 2,600 | | | | PPG Industries, Inc. | | | 197,886 |
| 1,100 | | | | Praxair, Inc. | | | 79,189 |
| 1,100 | | | | Sherwin-Williams Co. | | | 73,117 |
| 3,300 | | | | Sigma-Aldrich Corp. | | | 140,811 |
| | | | | | | |
| | | | | | | 1,553,887 |
| | | | | | | |
See Accompanying Notes to Financial Statements
129
| | |
| ING GET U.S. CORE PORTFOLIO SERIES 14 | | PORTFOLIO OF INVESTMENTS ASOF JUNE 30, 2007 (UNAUDITED) (CONTINUED) |
| | | | | | | |
| Shares | | | | | | Value |
| Coal: 0.1% | | | |
| 1,100 | | | | Consol Energy, Inc. | | $ | 50,721 |
| 1,900 | | | | Peabody Energy Corp. | | | 91,922 |
| | | | | | | |
| | | | | | | 142,643 |
| | | | | | | |
| Commercial Services: 0.5% | | | |
| 1,000 | | @ | | Apollo Group, Inc. | | | 58,430 |
| 3,000 | | @ | | Convergys Corp. | | | 72,720 |
| 1,100 | | | | Equifax, Inc. | | | 48,862 |
| 2,400 | | | | McKesson Corp. | | | 143,136 |
| 1,400 | | | | Moody’s Corp. | | | 87,080 |
| 1,400 | | | | Robert Half International, Inc. | | | 51,100 |
| 1,900 | | | | RR Donnelley & Sons Co. | | | 82,669 |
| 4,500 | | | | Western Union Co. | | | 93,735 |
| | | | | | | |
| | | | | | | 637,732 |
| | | | | | | |
| Computers: 2.9% | | | |
| 700 | | @ | | Affiliated Computer Services, Inc. | | | 39,704 |
| 5,600 | | @ | | Apple, Inc. | | | 683,424 |
| 700 | | @ | | Cognizant Technology Solutions Corp. | | | 52,563 |
| 1,900 | | @ | | Computer Sciences Corp. | | | 112,385 |
| 17,100 | | @ | | Dell, Inc. | | | 488,205 |
| 4,900 | | | | Electronic Data Systems Corp. | | | 135,877 |
| 15,600 | | @ | | EMC Corp. | | | 282,360 |
| 17,600 | | | | Hewlett-Packard Co. | | | 785,312 |
| 9,300 | | | | International Business Machines Corp. | | | 978,825 |
| 1,100 | | @ | | Lexmark International, Inc. | | | 54,241 |
| 1,500 | | @ | | NCR Corp. | | | 78,810 |
| 3,600 | | @ | | Network Appliance, Inc. | | | 105,120 |
| 1,900 | | @ | | Sandisk Corp. | | | 92,986 |
| 24,100 | | @ | | Sun Microsystems, Inc. | | | 126,766 |
| | | | | | | |
| | | | | | | 4,016,578 |
| | | | | | | |
| Cosmetics/Personal Care: 1.2% | | | |
| 2,400 | | | | Avon Products, Inc. | | | 88,200 |
| 3,200 | | | | Colgate-Palmolive Co. | | | 207,520 |
| 1,200 | | | | Estee Lauder Cos., Inc. | | | 54,612 |
| 21,600 | | | | Procter & Gamble Co. | | | 1,321,704 |
| | | | | | | |
| | | | | | | 1,672,036 |
| | | | | | | |
| Distribution/Wholesale: 0.1% | | | |
| 1,000 | | | | Genuine Parts Co. | | | 49,600 |
| 800 | | | | WW Grainger, Inc. | | | 74,440 |
| | | | | | | |
| | | | | | | 124,040 |
| | | | | | | |
| Diversified Financial Services: 5.3% | | | |
| 7,600 | | | | American Express Co. | | | 464,968 |
| 1,800 | | | | Ameriprise Financial, Inc. | | | 114,426 |
| 800 | | | | Bear Stearns Cos., Inc. | | | 112,000 |
| 7,100 | | | | Charles Schwab Corp. | | | 145,692 |
| 200 | | | | Chicago Mercantile Exchange Holdings, Inc. | | | 106,872 |
| 1,900 | | | | CIT Group, Inc. | | | 104,177 |
| 31,600 | | | | Citigroup, Inc. | | | 1,620,764 |
| 4,500 | | | | Countrywide Financial Corp. | | | 163,575 |
| 2,200 | | @ | | E*Trade Financial Corp. | | | 48,598 |
| 5,700 | | | | Fannie Mae | | | 372,381 |
| 1,200 | | | | Franklin Resources, Inc. | | | 158,964 |
| 4,600 | | | | Freddie Mac | | | 279,220 |
| 3,000 | | | | Goldman Sachs Group, Inc. | | | 650,250 |
| 1,700 | | | | Janus Capital Group, Inc. | | | 47,328 |
| 24,700 | | | | JP Morgan Chase & Co. | | | 1,196,715 |
| 800 | | | | Legg Mason, Inc. | | | 78,704 |
| | | | | | | |
| Shares | | | | | | Value |
| 4,000 | | | | Lehman Brothers Holdings, Inc. | | $ | 298,080 |
| 6,400 | | | | Merrill Lynch & Co., Inc. | | | 534,912 |
| 7,400 | | | | Morgan Stanley | | | 620,712 |
| 3,000 | | | | SLM Corp. | | | 172,740 |
| 900 | | | | T. Rowe Price Group, Inc. | | | 46,701 |
| | | | | | | |
| | | | | | | 7,337,779 |
| | | | | | | |
| Electric: 2.1% | | | |
| 3,100 | | @ | | AES Corp. | | | 67,828 |
| 1,800 | | | | American Electric Power Co., Inc. | | | 81,072 |
| 1,300 | | | | Constellation Energy Group, Inc. | | | 113,321 |
| 2,000 | | | | Dominion Resources, Inc. | | | 172,620 |
| 3,600 | | | | DTE Energy Co. | | | 173,592 |
| 2,700 | | | | Duke Energy Corp. | | | 49,410 |
| 4,400 | | | | Edison International | | | 246,928 |
| 2,600 | | | | Entergy Corp. | | | 279,110 |
| 4,500 | | | | Exelon Corp. | | | 326,700 |
| 3,400 | | | | FirstEnergy Corp. | | | 220,082 |
| 4,600 | | | | FPL Group, Inc. | | | 261,004 |
| 3,800 | | | | PG&E Corp. | | | 172,140 |
| 3,900 | | | | PPL Corp. | | | 182,481 |
| 2,300 | | | | Public Service Enterprise Group, Inc. | | | 201,894 |
| 5,200 | | | | TECO Energy, Inc. | | | 89,336 |
| 3,000 | | | | TXU Corp. | | | 201,900 |
| 2,300 | | | | Xcel Energy, Inc. | | | 47,081 |
| | | | | | | |
| | | | | | | 2,886,499 |
| | | | | | | |
| Electrical Components & Equipment: 0.1% | | | |
| 4,200 | | | | Emerson Electric Co. | | | 196,560 |
| | | | | | | |
| | | | | | | 196,560 |
| | | | | | | |
| Electronics: 0.3% | | | |
| 3,100 | | @ | | Agilent Technologies, Inc. | | | 119,164 |
| 2,100 | | | | Tektronix, Inc. | | | 70,854 |
| 2,900 | | @ | | Thermo Electron Corp. | | | 149,988 |
| 800 | | @ | | Waters Corp. | | | 47,488 |
| | | | | | | |
| | | | | | | 387,494 |
| | | | | | | |
| Engineering & Construction: 0.0% | | | |
| 500 | | | | Fluor Corp. | | | 55,685 |
| | | | | | | |
| | | | | | | 55,685 |
| | | | | | | |
| Entertainment: 0.1% | | | |
| 2,600 | | | | International Game Technology | | | 103,220 |
| | | | | | | |
| | | | | | | 103,220 |
| | | | | | | |
| Environmental Control: 0.2% | | | |
| 3,600 | | @ | | Allied Waste Industries, Inc. | | | 48,456 |
| 4,800 | | | | Waste Management, Inc. | | | 187,440 |
| | | | | | | |
| | | | | | | 235,896 |
| | | | | | | |
| Food: 1.1% | | | |
| 3,100 | | | | Campbell Soup Co. | | | 120,311 |
| 1,600 | | @ | | Dean Foods Co. | | | 50,992 |
| 4,500 | | | | General Mills, Inc. | | | 262,890 |
| 1,000 | | | | Hershey Co. | | | 50,620 |
| 5,000 | | | | HJ Heinz Co. | | | 237,350 |
| 2,800 | | | | Kellogg Co. | | | 145,012 |
| 6,500 | | | | Kraft Foods, Inc. | | | 229,125 |
| 5,300 | | | | Kroger Co. | | | 149,089 |
| 3,400 | | | | Safeway, Inc. | | | 115,702 |
| 1,100 | | | | Supervalu, Inc. | | | 50,952 |
| 1,400 | | | | Sysco Corp. | | | 46,186 |
| 1,200 | | | | Whole Foods Market, Inc. | | | 45,960 |
| 900 | | | | WM Wrigley Jr. Co. | | | 49,779 |
| | | | | | | |
| | | | | | | 1,553,968 |
| | | | | | | |
See Accompanying Notes to Financial Statements
130
| | |
| ING GET U.S. CORE PORTFOLIO SERIES 14 | | PORTFOLIO OF INVESTMENTS ASOF JUNE 30, 2007 (UNAUDITED) (CONTINUED) |
| | | | | | | |
| Shares | | | | | | Value |
| Forest Products & Paper: 0.2% | | | |
| 4,100 | | | | International Paper Co. | | $ | 160,105 |
| 800 | | | | Temple-Inland, Inc. | | | 49,224 |
| 1,000 | | | | Weyerhaeuser Co. | | | 78,930 |
| | | | | | | |
| | | | | | | 288,259 |
| | | | | | | |
| Gas: 0.1% | | | |
| 1,300 | | | | KeySpan Corp. | | | 54,574 |
| 2,500 | | | | Sempra Energy | | | 148,075 |
| | | | | | | |
| | | | | | | 202,649 |
| | | | | | | |
| Hand/Machine Tools: 0.2% | | | |
| 1,100 | | | | Black & Decker Corp. | | | 97,141 |
| 1,200 | | | | Snap-On, Inc. | | | 60,612 |
| 1,400 | | | | Stanley Works | | | 84,980 |
| | | | | | | |
| | | | | | | 242,733 |
| | | | | | | |
| Healthcare — Products: 1.9% | | | |
| 4,700 | | | | Baxter International, Inc. | | | 264,798 |
| 1,900 | | | | Becton Dickinson & Co. | | | 141,550 |
| 1,800 | | | | Biomet, Inc. | | | 82,296 |
| 7,100 | | @ | | Boston Scientific Corp. | | | 108,914 |
| 900 | | | | CR Bard, Inc. | | | 74,367 |
| 19,700 | | | | Johnson & Johnson | | | 1,213,914 |
| 7,100 | | | | Medtronic, Inc. | | | 368,206 |
| 1,600 | | @ | | St. Jude Medical, Inc. | | | 66,384 |
| 1,700 | | | | Stryker Corp. | | | 107,253 |
| 1,200 | | @ | | Varian Medical Systems, Inc. | | | 51,012 |
| 1,600 | | @ | | Zimmer Holdings, Inc. | | | 135,824 |
| | | | | | | |
| | | | | | | 2,614,518 |
| | | | | | | |
| Healthcare — Services: 0.8% | | | |
| 3,200 | | | | Aetna, Inc. | | | 158,080 |
| 1,400 | | @ | | Coventry Health Care, Inc. | | | 80,710 |
| 1,400 | | @ | | Humana, Inc. | | | 85,274 |
| 9,000 | | | | UnitedHealth Group, Inc. | | | 460,260 |
| 3,900 | | @ | | WellPoint, Inc. | | | 311,337 |
| | | | | | | |
| | | | | | | 1,095,661 |
| | | | | | | |
| Home Builders: 0.1% | | | |
| 1,700 | | | | Centex Corp. | | | 68,170 |
| 1,700 | | | | KB Home | | | 66,929 |
| 1,200 | | | | Lennar Corp. | | | 43,872 |
| | | | | | | |
| | | | | | | 178,971 |
| | | | | | | |
| Home Furnishings: 0.1% | | | |
| 500 | | | | Harman International Industries, Inc. | | | 58,400 |
| 400 | | | | Whirlpool Corp. | | | 44,480 |
| | | | | | | |
| | | | | | | 102,880 |
| | | | | | | |
| Household Products/Wares: 0.2% | | | |
| 4,300 | | | | Kimberly-Clark Corp. | | | 287,627 |
| | | | | | | |
| | | | | | | 287,627 |
| | | | | | | |
| Housewares: 0.1% | | | |
| 2,900 | | | | Newell Rubbermaid, Inc. | | | 85,347 |
| | | | | | | |
| | | | | | | 85,347 |
| | | | | | | |
| Insurance: 3.5% | | | |
| 3,100 | | @@ | | ACE Ltd. | | | 193,812 |
| 3,200 | | | | Aflac, Inc. | | | 164,480 |
| 5,400 | | | | Allstate Corp. | | | 332,154 |
| 700 | | | | AMBAC Financial Group, Inc. | | | 61,033 |
| 17,200 | | | | American International Group, Inc. | | | 1,204,516 |
| | | | | | | |
| Shares | | | | | | Value |
| 2,400 | | | | AON Corp. | | $ | 102,264 |
| 1,400 | | | | Assurant, Inc. | | | 82,488 |
| 4,100 | | | | Chubb Corp. | | | 221,974 |
| 2,300 | | | | Cigna Corp. | | | 120,106 |
| 4,100 | | | | Genworth Financial, Inc. | | | 141,040 |
| 2,300 | | | | Hartford Financial Services Group, Inc. | | | 226,573 |
| 2,000 | | | | Lincoln National Corp. | | | 141,900 |
| 2,600 | | | | Loews Corp. | | | 132,548 |
| 3,000 | | | | Marsh & McLennan Cos., Inc. | | | 92,640 |
| 1,200 | | | | MBIA, Inc. | | | 74,664 |
| 5,700 | | | | Metlife, Inc. | | | 367,536 |
| 800 | | | | MGIC Investment Corp. | | | 45,488 |
| 2,900 | | | | Principal Financial Group | | | 169,041 |
| 5,800 | | | | Progressive Corp. | | | 138,794 |
| 3,400 | | | | Prudential Financial, Inc. | | | 330,582 |
| 900 | | | | Safeco Corp. | | | 56,034 |
| 800 | | | | Torchmark Corp. | | | 53,600 |
| 5,200 | | | | Travelers Cos., Inc. | | | 278,200 |
| 2,000 | | | | UnumProvident Corp. | | | 52,220 |
| 1,700 | | @@ | | XL Capital Ltd. | | | 143,293 |
| | | | | | | |
| | | | | | | 4,926,980 |
| | | | | | | |
| Internet: 1.1% | | | |
| 2,100 | | @ | | Amazon.com, Inc. | | | 143,661 |
| 7,100 | | @ | | eBay, Inc. | | | 228,478 |
| 1,300 | | @ | | Google, Inc. | | | 680,394 |
| 1,800 | | @ | | IAC/InterActiveCorp. | | | 62,298 |
| 7,900 | | @ | | Symantec Corp. | | | 159,580 |
| 2,200 | | @ | | VeriSign, Inc. | | | 69,806 |
| 7,100 | | @ | | Yahoo!, Inc. | | | 192,623 |
| | | | | | | |
| | | | | | | 1,536,840 |
| | | | | | | |
| Iron/Steel: 0.3% | | | |
| 700 | | | | Allegheny Technologies, Inc. | | | 73,416 |
| 2,900 | | | | Nucor Corp. | | | 170,085 |
| 1,000 | | | | United States Steel Corp. | | | 108,750 |
| | | | | | | |
| | | | | | | 352,251 |
| | | | | | | |
| Leisure Time: 0.2% | | | |
| 3,800 | | | | Carnival Corp. | | | 185,326 |
| 2,500 | | | | Harley-Davidson, Inc. | | | 149,025 |
| | | | | | | |
| | | | | | | 334,351 |
| | | | | | | |
| Lodging: 0.2% | | | |
| 1,300 | | | | Harrah's Entertainment, Inc. | | | 110,838 |
| 1,400 | | | | Hilton Hotels Corp. | | | 46,858 |
| 1,000 | | | | Starwood Hotels & Resorts Worldwide, Inc. | | | 67,070 |
| | | | | | | |
| | | | | | | 224,766 |
| | | | | | | |
| Machinery — Construction & Mining: 0.3% | | | |
| 4,300 | | | | Caterpillar, Inc. | | | 336,690 |
| 700 | | @ | | Terex Corp. | | | 56,910 |
| | | | | | | |
| | | | | | | 393,600 |
| | | | | | | |
| Machinery — Diversified: 0.3% | | | |
| 1,300 | | | | Cummins, Inc. | | | 131,573 |
| 1,600 | | | | Deere & Co. | | | 193,184 |
| 800 | | | | Rockwell Automation, Inc. | | | 55,552 |
| | | | | | | |
| | | | | | | 380,309 |
| | | | | | | |
| Media: 1.7% | | | |
| 4,700 | | | | CBS Corp.—Class B | | | 156,604 |
| 3,600 | | | | Clear Channel Communications, Inc. | | | 136,152 |
See Accompanying Notes to Financial Statements
131
| | |
| ING GET U.S. CORE PORTFOLIO SERIES 14 | | PORTFOLIO OF INVESTMENTS ASOF JUNE 30, 2007 (UNAUDITED) (CONTINUED) |
| | | | | | | |
| Shares | | | | | | Value |
| Media (continued) | | | |
| 17,700 | | @ | | Comcast Corp. – Class A | | $ | 497,724 |
| 6,500 | | @ | | DIRECTV Group, Inc. | | | 150,215 |
| 2,300 | | | | Gannett Co., Inc. | | | 126,385 |
| 3,300 | | | | McGraw-Hill Cos., Inc. | | | 224,664 |
| 18,400 | | | | News Corp., Inc.—Class A | | | 390,264 |
| 21,000 | | | | Time Warner, Inc. | | | 441,840 |
| 4,400 | | @ | | Viacom—Class B | | | 183,172 |
| | | | | | | |
| | | | | | | 2,307,020 |
| | | | | | | |
| Metal Fabricate/Hardware: 0.0% | | | |
| 500 | | | | Precision Castparts Corp. | | | 60,680 |
| | | | | | | |
| | | | | | | 60,680 |
| | | | | | | |
| Mining: 0.4% | | | |
| 5,600 | | | | Alcoa, Inc. | | | 226,968 |
| 2,500 | | | | Freeport-McMoRan Copper & Gold, Inc. | | | 207,050 |
| 2,200 | | | | Newmont Mining Corp. | | | 85,932 |
| | | | | | | |
| | | | | | | 519,950 |
| | | | | | | |
| Miscellaneous Manufacturing: 3.3% | | | |
| 5,000 | | | | 3M Co. | | | 433,950 |
| 1,500 | | | | Cooper Industries Ltd. | | | 85,635 |
| 1,300 | | | | Danaher Corp. | | | 98,150 |
| 2,500 | | | | Eastman Kodak Co. | | | 69,575 |
| 2,100 | | | | Eaton Corp. | | | 195,300 |
| 62,100 | | | | General Electric Co. | | | 2,377,188 |
| 5,200 | | | | Honeywell International, Inc. | | | 292,656 |
| 3,100 | | | | Illinois Tool Works, Inc. | | | 167,989 |
| 2,200 | | | | ITT Corp. | | | 150,216 |
| 1,100 | | | | Pall Corp. | | | 50,589 |
| 1,700 | | | | Parker Hannifin Corp. | | | 166,447 |
| 500 | | | | Textron, Inc. | | | 55,055 |
| 14,100 | | @ | | Tyco International Ltd. | | | 476,439 |
| | | | | | | |
| | | | | | | 4,619,189 |
| | | | | | | |
| Office/Business Equipment: 0.1% | | | |
| 6,700 | | @ | | Xerox Corp. | | | 123,816 |
| | | | | | | |
| | | | | | | 123,816 |
| | | | | | | |
| Oil & Gas: 5.7% | | | |
| 3,300 | | | | Anadarko Petroleum Corp. | | | 171,567 |
| 1,800 | | | | Apache Corp. | | | 146,862 |
| 1,900 | | | | Chesapeake Energy Corp. | | | 65,740 |
| 15,700 | | | | Chevron Corp. | | | 1,322,568 |
| 11,500 | | | | ConocoPhillips | | | 902,750 |
| 2,400 | | | | Devon Energy Corp. | | | 187,896 |
| 1,400 | | | | ENSCO International, Inc. | | | 85,414 |
| 700 | | | | EOG Resources, Inc. | | | 51,142 |
| 37,900 | | | | ExxonMobil Corp. | | | 3,179,052 |
| 1,500 | | | | Hess Corp. | | | 88,440 |
| 5,700 | | | | Marathon Oil Corp. | | | 341,772 |
| 1,500 | | | | Murphy Oil Corp. | | | 89,160 |
| 2,100 | | @, @@ | | Nabors Industries Ltd. | | | 70,098 |
| 900 | | | | Noble Corp. | | | 87,768 |
| 6,400 | | | | Occidental Petroleum Corp. | | | 370,432 |
| 1,400 | | | | Sunoco, Inc. | | | 111,552 |
| 1,900 | | @ | | Transocean, Inc. | | | 201,362 |
| 4,000 | | | | Valero Energy Corp. | | | 295,440 |
| 2,300 | | | | XTO Energy, Inc. | | | 138,230 |
| | | | | | | |
| | | | | | | 7,907,245 |
| | | | | | | |
| | | | | | | |
| Shares | | | | | | Value |
| Oil & Gas Services: 0.9% | | | |
| 1,900 | | | | Baker Hughes, Inc. | | $ | 159,847 |
| 7,200 | | | | Halliburton Co. | | | 248,400 |
| 1,400 | | @ | | National Oilwell Varco, Inc. | | | 145,936 |
| 7,300 | | | | Schlumberger Ltd. | | | 620,062 |
| 1,200 | | @ | | Weatherford International Ltd. | | | 66,288 |
| | | | | | | |
| | | | | | | 1,240,533 |
| | | | | | | |
| Packaging & Containers: 0.2% | | | |
| 900 | | | | Ball Corp. | | | 47,853 |
| 1,500 | | | | Bemis Co. | | | 49,770 |
| 3,000 | | @ | | Pactiv Corp. | | | 95,670 |
| 2,300 | | | | Sealed Air Corp. | | | 71,346 |
| | | | | | | |
| | | | | | | 264,639 |
| | | | | | | |
| Pharmaceuticals: 3.5% | | | |
| 8,100 | | | | Abbott Laboratories | | | 433,755 |
| 2,000 | | | | AmerisourceBergen Corp. | | | 98,940 |
| 900 | | @ | | Barr Pharmaceuticals, Inc. | | | 45,207 |
| 13,600 | | | | Bristol-Myers Squibb Co. | | | 429,216 |
| 2,500 | | | | Cardinal Health, Inc. | | | 176,600 |
| 5,300 | | | | Eli Lilly & Co. | | | 296,164 |
| 1,800 | | @ | | Express Scripts, Inc. | | | 90,018 |
| 3,100 | | @ | | Forest Laboratories, Inc. | | | 141,515 |
| 6,100 | | @ | | Gilead Sciences, Inc. | | | 236,497 |
| 3,600 | | @ | | King Pharmaceuticals, Inc. | | | 73,656 |
| 1,900 | | @ | | Medco Health Solutions, Inc. | | | 148,181 |
| 14,000 | | | | Merck & Co., Inc. | | | 697,200 |
| 2,600 | | | | Mylan Laboratories | | | 47,294 |
| 45,500 | | | | Pfizer, Inc. | | | 1,163,435 |
| 10,000 | | | | Schering-Plough Corp. | | | 304,400 |
| 1,600 | | @ | | Watson Pharmaceuticals, Inc. | | | 52,048 |
| 8,500 | | | | Wyeth | | | 487,390 |
| | | | | | | |
| | | | | | | 4,921,516 |
| | | | | | | |
| Pipelines: 0.3% | | | |
| 3,000 | | | | El Paso Corp. | | | 51,690 |
| 1,700 | | | | Questar Corp. | | | 89,845 |
| 4,300 | | | | Spectra Energy Corp. | | | 111,628 |
| 4,600 | | | | Williams Cos., Inc. | | | 145,452 |
| | | | | | | |
| | | | | | | 398,615 |
| | | | | | | |
| Real Estate Investment Trusts: 0.5% | | | |
| 1,600 | | | | Archstone-Smith Trust | | | 94,576 |
| 900 | | | | Boston Properties, Inc. | | | 91,917 |
| 1,200 | | | | Developers Diversified Realty Corp. | | | 63,252 |
| 1,100 | | | | Equity Residential | | | 50,193 |
| 3,000 | | | | Host Hotels & Resorts, Inc. | | | 69,360 |
| 1,200 | | | | Kimco Realty Corp. | | | 45,684 |
| 1,700 | | | | Prologis | | | 96,730 |
| 1,700 | | | | Simon Property Group, Inc. | | | 158,168 |
| 700 | | | | Vornado Realty Trust | | | 76,888 |
| | | | | | | |
| | | | | | | 746,768 |
| | | | | | | |
| Retail: 3.6% | | | |
| 800 | | @ | | Autozone, Inc. | | | 109,296 |
| 1,700 | | @ | | Bed Bath & Beyond, Inc. | | | 61,183 |
| 3,000 | | | | Best Buy Co., Inc. | | | 140,010 |
| 1,900 | | @ | | Big Lots, Inc. | | | 55,898 |
| 4,500 | | | | Costco Wholesale Corp. | | | 263,340 |
| 9,000 | | | | CVS Corp. | | | 328,050 |
| 1,300 | | | | Darden Restaurants, Inc. | | | 57,187 |
| 2,300 | | | | Dollar General Corp. | | | 50,416 |
| 2,800 | | | | Family Dollar Stores, Inc. | | | 96,096 |
See Accompanying Notes to Financial Statements
132
| | |
| ING GET U.S. CORE PORTFOLIO SERIES 14 | | PORTFOLIO OF INVESTMENTS ASOF JUNE 30, 2007 (UNAUDITED) (CONTINUED) |
| | | | | | | |
| Shares | | | | | | Value |
| Retail (continued) | | | |
| 5,100 | | | | Gap, Inc. | | $ | 97,410 |
| 10,700 | | | | Home Depot, Inc. | | | 421,045 |
| 2,200 | | | | JC Penney Co., Inc. | | | 159,236 |
| 2,200 | | @ | | Kohl's Corp. | | | 156,266 |
| 9,100 | | | | Lowe's Cos., Inc. | | | 279,279 |
| 3,500 | | | | Macy's, Inc. | | | 139,230 |
| 9,000 | | | | McDonald's Corp. | | | 456,840 |
| 1,800 | | | | Nordstrom, Inc. | | | 92,016 |
| 1,500 | | @ | | Office Depot, Inc. | | | 45,450 |
| 1,700 | | | | RadioShack Corp. | | | 56,338 |
| 600 | | @ | | Sears Holding Corp. | | | 101,700 |
| 3,800 | | | | Staples, Inc. | | | 90,174 |
| 4,900 | | @ | | Starbucks Corp. | | | 128,576 |
| 5,400 | | | | Target Corp. | | | 343,440 |
| 4,000 | | | | TJX Cos., Inc. | | | 110,000 |
| 6,200 | | | | Walgreen Co. | | | 269,948 |
| 14,800 | | | | Wal-Mart Stores, Inc. | | | 712,028 |
| 1,800 | | | | Wendy's International, Inc. | | | 66,150 |
| 3,600 | | | | Yum! Brands, Inc. | | | 117,792 |
| | | | | | | |
| | | | | | | 5,004,394 |
| | | | | | | |
| Savings & Loans: 0.2% | | | |
| 3,900 | | | | Hudson City Bancorp., Inc. | | | 47,658 |
| 5,900 | | | | Washington Mutual, Inc. | | | 251,576 |
| | | | | | | |
| | | | | | | 299,234 |
| | | | | | | |
| Semiconductors: 1.7% | | | |
| 3,600 | | @ | | Advanced Micro Devices, Inc. | | | 51,480 |
| 3,800 | | | | Altera Corp. | | | 84,094 |
| 1,400 | | | | Analog Devices, Inc. | | | 52,696 |
| 7,000 | | | | Applied Materials, Inc. | | | 139,090 |
| 2,600 | | @ | | Broadcom Corp. | | | 76,050 |
| 37,000 | | | | Intel Corp. | | | 879,120 |
| 2,300 | | | | KLA-Tencor Corp. | | | 126,385 |
| 5,900 | | @ | | LSI Logic Corp. | | | 44,309 |
| 1,900 | | | | Maxim Integrated Products | | | 63,479 |
| 1,600 | | @ | | MEMC Electronic Materials, Inc. | | | 97,792 |
| 4,000 | | @ | | Micron Technology, Inc. | | | 50,120 |
| 3,100 | | | | National Semiconductor Corp. | | | 87,637 |
| 1,800 | | @ | | Novellus Systems, Inc. | | | 51,066 |
| 2,600 | | @ | | Nvidia Corp. | | | 107,406 |
| 2,900 | | @ | | Teradyne, Inc. | | | 50,982 |
| 7,900 | | | | Texas Instruments, Inc. | | | 297,277 |
| 1,800 | | | | Xilinx, Inc. | | | 48,186 |
| | | | | | | |
| | | | | | | 2,307,169 |
| | | | | | | |
| Software: 2.4% | | | |
| 3,800 | | @ | | Adobe Systems, Inc. | | | 152,570 |
| 2,400 | | @ | | Autodesk, Inc. | | | 112,992 |
| 3,800 | | | | Automatic Data Processing, Inc. | | | 184,186 |
| 2,900 | | @ | | BMC Software, Inc. | | | 87,870 |
| 5,600 | | | | CA, Inc. | | | 144,648 |
| 1,700 | | @ | | Citrix Systems, Inc. | | | 57,239 |
| 2,100 | | @ | | Electronic Arts, Inc. | | | 99,372 |
| 5,400 | | | | First Data Corp. | | | 176,418 |
| 1,600 | | @ | | Fiserv, Inc. | | | 90,880 |
| 3,000 | | @ | | Intuit, Inc. | | | 90,240 |
| 52,200 | | | | Microsoft Corp. | | | 1,538,334 |
| 6,100 | | @ | | Novell, Inc. | | | 47,519 |
| 24,800 | | @ | | Oracle Corp. | | | 488,808 |
| 2,400 | | | | Paychex, Inc. | | | 93,888 |
| | | | | | | |
| | | | | | | 3,364,964 |
| | | | | | | |
| | | | | | | | |
| Shares | | | | | | Value |
| | Telecommunications: 4.3% | | | |
| | 1,800 | | @@ | | Allergan, Inc. | | $ | 103,752 |
| | 2,200 | | | | Alltel Corp. | | | 148,610 |
| | 43,200 | | | | AT&T, Inc. | | | 1,792,800 |
| | 3,200 | | @ | | Avaya, Inc. | | | 53,888 |
| | 2,300 | | | | CenturyTel, Inc. | | | 112,815 |
| | 40,600 | | @ | | Cisco Systems, Inc. | | | 1,130,710 |
| | 5,200 | | | | Citizens Communications Co. | | | 79,404 |
| | 10,200 | | @ | | Corning, Inc. | | | 260,610 |
| | 1,600 | | | | Embarq Corp. | | | 101,392 |
| | 4,100 | | @ | | Juniper Networks, Inc. | | | 103,197 |
| | 15,500 | | | | Motorola, Inc. | | | 274,350 |
| | 11,500 | | | | Qualcomm, Inc. | | | 498,985 |
| | 13,700 | | @ | | Qwest Communications International, Inc. | | | 132,890 |
| | 19,200 | | | | Sprint Nextel Corp. | | | 397,632 |
| | 4,500 | | @ | | Tellabs, Inc. | | | 48,420 |
| | 18,500 | | | | Verizon Communications, Inc. | | | 761,645 |
| | | | | | | | |
| | | | | | | | 6,001,100 |
| | | | | | | | |
| | Toys/Games/Hobbies: 0.1% | | | |
| | 2,300 | | | | Hasbro, Inc. | | | 72,243 |
| | 4,400 | | | | Mattel, Inc. | | | 111,276 |
| | | | | | | | 183,519 |
| | Transportation: 1.0% | | | |
| | 2,100 | | | | Burlington Northern Santa Fe Corp. | | | 178,794 |
| | 900 | | | | CH Robinson Worldwide, Inc. | | | 47,268 |
| | 2,900 | | | | CSX Corp. | | | 130,732 |
| | 2,100 | | | | FedEx Corp. | | | 233,037 |
| | 3,000 | | | | Norfolk Southern Corp. | | | 157,710 |
| | 900 | | | | Ryder System, Inc. | | | 48,420 |
| | 1,800 | | | | Union Pacific Corp. | | | 207,270 |
| | 5,600 | | | | United Parcel Service, Inc. | | | 408,800 |
| | | | | | | | |
| | | | | | | | 1,412,031 |
| | | | | | | | |
| | | | | Total Common Stock | | | |
| | | | | (Cost $ 89,542,678 ) | | | 89,019,317 |
| | | | | | | | |
Principal
Amount | | | | | | Value |
| | U.S. GOVERNMENT AGENCY OBLIGATIONS: 25.7% |
| | Federal National Mortgage Corporation: 25.7% | | | |
| $ | 20,000,000 | | ^ | | 6.210%, due 05/15/14 | | $ | 13,953,300 |
| | 31,500,000 | | Z | | 6.260%, due 07/05/14 | | | 21,786,471 |
| | | | | | | | |
| | | | | | | | |
| | | | | Total U.S. Government Agency Obligations
(Cost $ 35,457,337 ) | | | 35,739,771 |
| | | | | | | | |
| | U.S. TREASURY OBLIGATIONS: 9.8% | | | |
| | U.S. Treasury STRIP: 9.8% | | | |
| | 19,090,000 | | ^ | | 5.800%, due 05/15/14 | | | 13,588,797 |
| | | | | | | | |
| | | | | Total U.S. Treasury Obligations (Cost $ 13,522,676 ) | | | 13,588,797 |
| | | | | | | | |
| | | | | Total Long-Term Investments (Cost $138,522,691) | | | 138,347,885 |
| | | | | | | | |
See Accompanying Notes to Financial Statements
133
| | |
| ING GET U.S. CORE PORTFOLIO SERIES 14 | | PORTFOLIO OF INVESTMENTS ASOF JUNE 30, 2007 (UNAUDITED) (CONTINUED) |
| | | | | | | | | |
Principal
Amount | | | | | | | Value |
| | SHORT-TERM INVESTMENTS: 0.1% | | | | |
| | Repurchase Agreement: 0.1% | | | | |
| $ | 164,000 | | Morgan Stanley Repurchase Agreement dated 06/29/07, 5.300%, due 07/02/07, $164,072 to be received upon repurchase (Collateralized by $355,000 Resolution Funding Corporation, Discount Note, Market Value $169,197, due 01/15/21) | | | $ | 164,000 |
| | | | | | | | | |
| | | Total Short-Term Investments (Cost $164,000) | | | | 164,000 |
| | | | | | | | | |
| | | Total Investments in Securities
(Cost $138,686,691)* | | 99.7 | % | | $ | 138,511,885 |
| | | Other Assets and
Liabilities - Net | | 0.3 | | | | 416,199 |
| | | | | | | | | |
| | | Net Assets | | 100.0 | % | | $ | 138,928,084 |
| | | | | | | | | |
| @ | Non-income producing security |
| STRIP | Separate Trading of Registered Interest and Principal of Securities |
| ^ | Interest Only (IO) Security |
| Z | Indicates Zero Coupon Bond; rate shown reflects effective yield on the date of purchase |
| * | Cost for federal income tax purposes is the same as for financial statement purposes. |
| | | | |
Net unrealized depreciation consists of: | |
Gross Unrealized Appreciation | | $ | 997,820 | |
Gross Unrealized Depreciation | | | (1,172,626 | ) |
| | | | |
Net Unrealized Depreciation | | $ | (174,806 | ) |
| | | | |
See Accompanying Notes to Financial Statements
134
ADVISORY CONTRACT APPROVAL DISCUSSION (UNAUDITED)
BOARD CONSIDERATION AND APPROVAL OF NEW INVESTMENT MANAGEMENT AND SUB-ADVISORY AGREEMENTS FOR ING GET U.S. CORE PORTFOLIO
Section 15 of the Investment Company Act of 1940 (the “1940 Act”) mandates that, when a series of ING Variable Insurance Trust (“IVIT”) enters into a new advisory or sub-advisory arrangement, the Board of Trustees (the “Board”) of IVIT, including a majority of the Trustees who have no direct or indirect interest in the Investment Management and Sub-Advisory Agreements governing those arrangements, and who are not “interested persons” of the series, as such term is defined under the 1940 Act (the “IVIT Non-Interested Trustees”), must approve the new arrangement. Therefore, in order for a new series of IVIT to be launched, the Board must approve an Investment Management Agreement and Sub-Advisory Agreement for that series prior to the commencement of its operations.
At a meeting held on January 19, 2006, the Board considered the approval of new Management and Sub-Advisory Agreements for ING GET U.S. Core Portfolio – Series 14 (“GET U.S. Core Portfolio” or the “Portfolio”), a new series of IVIT with an Offering Period that ran from December 21, 2006 to June 20, 2007. GET U.S. Core Portfolio commenced its Offering Period on June 21, 2007.
After its deliberations, the Board voted to approve the Management and Sub-Advisory Agreements for GET U.S. Core Portfolio for an initial term that ends on November 30, 2007. In reaching this decision, the Board took into account information furnished throughout the year at regular Board meetings with respect to ING Investments, LLC (“ING Investments”), GET U.S. Core Portfolio’s investment adviser, and ING Investment Management Co. (“ING IM”), its sub-adviser, as well as information prepared specifically in connection with the Board’s deliberations with respect to the approval of the advisory and sub-advisory arrangements for GET U.S. Core Portfolio. The Board’s determination took into account a number of factors that its members believed, in light of the legal advice furnished to them by Kirkpatrick & Lockhart Preston Gates Ellis LLP (formerly named Kirkpatrick & Lockhart Nicholson Graham LLP) (“K&LNG”), their independent legal counsel, and their own business judgment, to be relevant. Further, while the Portfolio’s Investment Management Agreement and Sub-Advisory Agreement were considered at the same Board meeting, the Trustees considered the Portfolio’s advisory and sub-advisory relationships separately.
Provided below is a discussion of certain factors the Board considered at the January 19, 2006 meeting in considering the new advisory and sub-advisory arrangements for GET U.S. Core Portfolio. While the Board gave its attention to the information furnished, at its request, that was most relevant to its deliberations, discussed below are a number of the primary factors relevant to the Board’s consideration as to whether to approve the Investment Management and Sub-Advisory Agreements for GET U.S. Core Portfolio’s initial term ending November 30, 2007. Each Trustee may have accorded different weight to the various factors in reaching his or her conclusions with respect to GET U.S. Core Portfolio’s advisory and sub-advisory arrangements.
Overview of the Contract Approval Process
In 2003, the Board determined to undertake steps to further enhance the process under which the Board determines whether to approve new advisory and sub-advisory arrangements. Among the measures the Board implemented was to retain the services of an independent consultant with experience in the mutual fund industry to assist the IVIT Non-Interested Trustees in working with the personnel employed by ING Investments, or its affiliates who administer GET U.S. Core Portfolio (“Management”), to identify the types of information presented to the Trustees when considering advisory and sub-advisory relationships and to establish the format in which the information requested by the Board in this context is provided to the Board. The end result was the implementation of the current process relied upon by the Board to analyze information in connection with its review and approval of new advisory and sub-advisory relationships.
Since this process was implemented, the Board has continuously reviewed and refined the process. In addition, the Board established a Contracts Committee and two Investment Review Committees, including the International/Balance/Fixed Income Fund Investment Review Committee (formerly named the International Equity and Fixed Income Fund Investment Review Committee) (the “IE & FI IRC”). The type and format of the information provided to the Board or its counsel to inform deliberations with respect to Investment Management and Sub-Advisory Agreements has been codified in the ING Funds 15(c) Methodology Guide (the “Methodology Guide”). The Methodology Guide was developed under the direction of the Board, and sets out a written blueprint under which
135
ADVISORY CONTRACT APPROVAL DISCUSSION (UNAUDITED) (CONTINUED)
the Board requests certain information necessary to facilitate a thorough and informed review in connection with deliberations regarding advisory and sub-advisory relationships. Management provides certain Portfolio-specific information to the Board based on the Methodology Guide through “Fund Analysis and Comparison Tables” or “FACT” sheets prior to the Board’s review of new Investment Management and Sub-Advisory Agreements.
On its own and as part of a regular on-going process, the Board’s Contracts Committee recommends or considers recommendations from Management for refinements and other changes to the Methodology Guide. The Investment Review Committees, including the IE & FI IRC, also meet regularly with ING Investments and ING IM. The Board employed its process for reviewing contracts when considering whether to approve the Portfolio’s Investment Management and Sub-Advisory Agreements.
Nature, Extent and Quality of Service
In determining whether to approve GET U.S. Core Portfolio’s Investment Management and Sub-Advisory Agreements for its initial term ending November 30, 2007, the Board received and evaluated such information as it deemed necessary regarding the nature, extent and quality of services to be provided to the Portfolio by ING Investments and ING IM. This included information about ING Investments and ING IM provided throughout the year at regular Board meetings in the context of their services to other Funds in the ING Funds complex, as well as information furnished for the January 19, 2006 meeting.
The materials requested by and provided to the Board and/or its legal counsel prior to the January 19, 2006 meeting included the following items: (1) FACT sheets for GET U.S. Core Portfolio that provide information about the proposed expenses of the Portfolio and other, similarly managed funds in a selected peer group (“Selected Peer Group”), as well as information about the Portfolio’s proposed objective and strategies; (2) responses to a detailed series of questions from K&LNG, legal counsel to the IVIT Non-Interested Trustees; (3) copies of the forms of proposed Investment Management Agreement and Sub-Advisory Agreement; (4) drafts of a narrative summary addressing key factors the Board could consider in determining whether to approve the new Investment Management and Sub-Advisory Agreements; and (5) other information relevant to the Board’s evaluations.
In arriving at its conclusions with respect to the advisory arrangements with ING Investments, the Board was mindful of the “manager-of-managers” platform of the ING Funds. The Board considered the techniques that ING Investments developed, in response to the direction of the Board, to screen and perform due diligence on sub-advisers that are recommended to the Board to manage the Funds in the ING Funds complex.
The Board reviewed the level of staffing, quality and experience of GET U.S. Core Portfolio’s proposed portfolio management team. The Board took into account the respective resources and reputations of ING Investments and ING IM, and evaluated the ability of ING Investments and ING IM to attract and retain qualified investment advisory personnel.
Based on their deliberations and the materials presented to them, the Board concluded that the advisory and related services to be provided by ING Investments and ING IM would be appropriate in light of GET U.S. Core Portfolio’s anticipated operations, the competitive landscape of the investment company business, and investor needs, and that the nature and quality of the overall services provided by ING Investments and ING IM would be appropriate.
Economies of Scale
In considering the reasonableness of the proposed advisory fees, the Board considered whether economies of scale will be realized by ING Investments as the Portfolio grows larger and the extent to which this is reflected in the level of management fee rate to be charged. As GET U.S. Core Portfolio does not have breakpoint discounts on advisory fees, but does benefit from limits on expenses, the Board also considered the extent to which economies of scale could effectively be realized through such expense reductions.
Fee Rate and Profitability
The Board reviewed and considered the Portfolio’s proposed contractual investment advisory fee rate, combined with the administrative fee rate, payable to ING Investments. The Board also considered the proposed contractual sub-advisory fee rate payable by ING Investments to ING IM for sub-advisory services.
136
ADVISORY CONTRACT APPROVAL DISCUSSION (UNAUDITED) (CONTINUED)
The Board considered GET U.S. Core Portfolio’s fee structure as it relates to the services to be provided under the proposed Agreements, and the potential fall-out benefits to the ING Investments and ING IM, and their respective affiliates, from their association with GET U.S. Core Portfolio. The Board determined that the fees payable to ING Investments and ING IM are reasonable for their services to the Portfolio, which were considered in light of the nature and quality of the services that each is expected to perform through the initial term ending November 30, 2007.
For each Portfolio, the Board considered information on estimated revenues, costs and profits for ING Investments projected for the first two years of the Portfolio’s operations. In analyzing the projected profitability of ING Investments in connection with its services to a Portfolio, the Board took into account the sub-advisory fee rate payable by the ING Investments to ING IM. The Board also considered information that it requested and was provided by Management with respect to the profitability of service providers affiliated with ING Investments.
The Board determined that it had requested and received sufficient information to gain a reasonable understanding regarding ING Investments’ profitability. The Board also recognized that profitability analysis is not an exact science and there is no uniform methodology for determining profitability for this purpose. In this context, the Board realized that Management’s calculations regarding its costs incurred in establishing the infrastructure necessary for the Portfolio’s operations may not be fully reflected in the expenses allocated to the Portfolio in determining profitability, and that the information presented may not portray all of the costs borne by Management nor capture Management’s entrepreneurial risk associated with offering and managing a mutual fund complex in today’s regulatory environment.
Based on the information on revenues, costs, and ING Investments’ profitability considered by the Board, after considering the factors described in this section the Board concluded that the profits, if any, to be realized by ING Investments would not be excessive.
Other Factors Considered
The following paragraphs outline certain of the specific factors that the Board considered, and the conclusions reached, at its January 19, 2006 meeting in relation to approving the Investment Management and Sub-Advisory Agreements for GET U.S. Core Portfolio’s initial term ending November 30, 2007. These specific factors are in addition to those considerations discussed above. The Portfolio’s proposed management fee and estimated expense ratio were compared to the fees and expense ratios of the funds in its Selected Peer Group.
In determining whether to approve the Investment Management and Sub-Advisory Agreements for GET U.S. Core Portfolio, the Board received and evaluated such information as it deemed necessary for an informed determination of whether each Agreement, and the proposed policies and procedures for GET U.S. Core Portfolio, should be approved. The materials provided to the Board and/or its legal counsel in support of the proposed advisory and sub-advisory arrangements included the following: (1) a memorandum presenting Management’s rationale for requesting the launch of GET U.S. Core Portfolio that discusses, among other things, the performance of ING IM in managing similar GET portfolios, with such performance being compared against the Portfolio’s Morningstar Category average and proposed primary benchmark; (2) information about GET U.S. Core Portfolio’s proposed investment objective and strategies and anticipated portfolio characteristics; (3) FACT sheets for the Portfolio that compare its performance against that of the Portfolio’s Selected Peer Group and its Morningstar category median; (4) responses from ING Investments and ING IM to questions posed by K&LNG, independent legal counsel, on behalf of the IVIT Non-Interested Trustees; (5) supporting documentation, including copies of the forms of Investment Management and Sub-Advisory Agreements for GET U.S. Core Portfolio; and (6) other information relevant to the Board’s evaluation. In addition, the Board considered the information provided periodically throughout the year in presentations to the Board by ING Investments in the context of ING Investments’ oversight of other sub-advisers managing Funds in the ING Funds complex, and by ING IM in connection with its management of other Funds in the complex, including other GET products.
At the January 19, 2006 meeting, the Board considered that GET U.S. Core Portfolio would be subject to the standard policies and procedures of IVIT previously approved by the Board for other Series of IVIT and approved in accordance with Rule 38a-1 under the 1940 Act. The Board also noted that, in managing GET U.S. Core Portfolio, ING
137
ADVISORY CONTRACT APPROVAL DISCUSSION (UNAUDITED) (CONTINUED)
Investments and ING IM each would be subject to procedures adopted pursuant to Rule 206(4)-7 under the Investment Advisers Act of 1940 that had been previously approved by the Board in connection with other Funds.
The Board’s consideration of whether to approve the Investment Management Agreement with ING Investments on behalf of GET U.S. Core Portfolio took into account several factors including, but not limited to, the following: (1) the nature and quality of the services to be provided by ING Investments to GET U.S. Core Portfolio under the proposed Investment Management Agreement; (2) ING Investments’ experience as a manager-of-managers overseeing sub-advisers to other Funds within the ING Funds complex, including its oversight of ING IM in managing other GET Fund offerings; (3) ING Investments’ strength and reputation within the industry; (4) the fairness of the compensation under the proposed Investment Management Agreement in light of the services to be provided to GET U.S. Core Portfolio and taking into account the sub-advisory fees payable by ING Investments to ING IM; (5) the fairness of ING Investments’ compensation under an Investment Management Agreement with level fees that does not include breakpoints; (6) the pricing structure (including the estimated expense ratio to be borne by shareholders) of GET U.S. Core Portfolio as compared to other similarly-managed funds in its Selected Peer Group, including Management’s analysis that: (a) the proposed management fee (inclusive of a 0.055% administration fee) is above the median and average management fees of the funds in the Portfolio’s Selected Peer Group; and (b) the estimated expense ratio for GET U.S. Core Portfolio is equal to the median and above the average expense ratios of the funds in the Portfolio’s Selected Peer Group; (7) the projected profitability of ING Investments when sub-advisory fees payable by ING Investments to ING IM are taken into account; (8) the personnel, operations, financial condition, and investment management capabilities, methodologies and resources of ING Investments, including its management team’s expertise in the management of other Funds in the ING Funds complex; (9) ING Investments’ compliance capabilities, as demonstrated by, among other things, its policies and procedures designed to prevent violations of the Federal securities laws, which had previously been approved by the Board in connection with their oversight of other Funds in the ING Funds complex; (10) the information that had been provided by ING Investments at regular Board meetings, and in anticipation of the January meeting, with respect to its capabilities as a manager-of-managers; and (11) “fall-out” benefits to ING Investments and its affiliates that were anticipated to arise from ING Investments’ management of GET U.S. Core Portfolio.
In reviewing the proposed Sub-Advisory Agreement with ING IM, the Board considered a number of factors, including, but not limited to, the following: (1) ING Investments’ view of ING IM’s capabilities in managing in the strategy to be employed by GET U.S. Core Portfolio; (2) ING IM’s strength and reputation in the industry; (3) the nature and quality of the services to be provided by ING IM under the proposed Sub-Advisory Agreement; (4) the performance of other GET Series, compared to the Portfolio’s Morningstar Category average, Morningstar Category median, its proposed primary benchmark and the performance of the funds in GET U.S. Core Portfolio’s Selected Peer Group; (5) the personnel, operations, financial condition, and investment management capabilities, methodologies and resources of ING IM and its fit among the stable of managers in the ING Funds line-up; (6) the fairness of the compensation under the proposed Sub-Advisory Agreement in light of the services to be provided by and the projected profitability of ING IM as GET U.S. Core Portfolio’s sub-adviser; (7) the costs for the services to be provided by ING IM, including that it would charge a level fee with no breakpoints; (8) ING IM’s operations and compliance program, including its policies and procedures intended to assure compliance with the Federal securities laws, which had previously been approved by the Board as part of its oversight of other Funds in the ING Funds complex; (9) ING IM’s financial condition; (10) the appropriateness of the selection of ING IM in light of GET U.S. Core Portfolio’s proposed investment objective and prospective investor base; and (11) ING IM’s Code of Ethics, which has previously been approved for other ING Funds, and related procedures for complying with that Code.
After its deliberation, the Board reached the following conclusions: (1) GET U.S. Core Portfolio’s proposed management fee rate is reasonable in the context of all factors considered by the Board; (2) GET U.S. Core Portfolio’s estimated expense ratio is reasonable in the context of all factors considered by the Board; (3) the sub-advisory fee rate payable by ING Investments to ING IM is reasonable in the context of all factors considered by the Board; and (4) each of ING Investments and ING IM maintains an appropriate compliance program, with this conclusion based upon the Board’s previous and ongoing review of the compliance program. Based on these conclusions and other factors, the Board voted to approve the Investment Management and Sub-Advisory Agreements for GET U.S. Core Portfolio. During its deliberations, different Board members may have given different weight to different individual factors and related conclusions.
138
Investment Adviser
ING Investments, LLC
7337 East Doubletree Ranch Road
Scottsdale, Arizona 85258
Administrator
ING Funds Services, LLC
7337 East Doubletree Ranch Road
Scottsdale, Arizona 85258
Transfer Agent
DST Systems, Inc.
P.O. Box 219368
Kansas City, Missouri 64141
Custodian
The Bank of New York Mellon Corporation
One Wall Street
New York, New York 10286
Legal Counsel
Dechert LLP
1775 I Street, N.W.
Washington, D.C. 20006
Before investing, carefully consider the investment objectives, risks, charges and expenses of the variable annuity contract and the underlying variable investment options. This and other information is contained in the prospectus for the variable annuity contract and the underlying variable investment options. Obtain these prospectuses from your agent/registered representative and read them carefully before investing.
| | | | |
 | | VPSAR-UGCORE | | (0607-082307) |
ITEM 2. CODE OF ETHICS.
Not required for semi-annual filing.
ITEM 3. AUDIT COMMITTEE FINANCIAL EXPERT.
Not required for semi-annual filing.
ITEM 4. PRINCIPAL ACCOUNTANT FEES AND SERVICES.
Not required for semi-annual filing.
ITEM 5. AUDIT COMMITTEE OF LISTED REGISTRANTS.
Not required for semi-annual filing.
ITEM 6. SCHEDULE OF INVESTMENTS.
Schedule is included as part of the report to shareholders filed under Item 1 of this Form.
ITEM 7. DISCLOSURE OF PROXY VOTING POLICIES AND PROCEDURES FOR CLOSED-END MANAGEMENT INVESTMENT COMPANIES.
Not applicable.
ITEM 8. PORTFOLIO MANAGERS OF CLOSED-END MANAGEMENT INVESTMENT COMPANIES.
Not applicable.
ITEM 9. PURCHASES OF EQUITY SECURITIES BY CLOSED-END MANAGEMENT INVESTMENT COMPANY AND AFFILIATED PURCHASERS.
Not applicable.
ITEM 10. SUBMISSION OF MATTERS TO A VOTE OF SECURITY HOLDERS.
The Board has a Nominating Committee for the purpose of considering and presenting to the Board candidates it proposes for nomination to fill Independent Trustee vacancies on the Board. The Committee currently consists of all Independent Trustees of the Board (6 individuals). The Nominating Committee operates pursuant to a Charter approved by the Board. The primary purpose of the Nominating Committee is to consider and present to the Board the candidates it proposes for nomination to fill vacancies on the Board. In evaluating candidates, the Nominating Committee may consider a variety of factors, but it has not at this time set any specific minimum qualifications that must be met. Specific qualifications of candidates for Board membership will be based on the needs of the Board at the time of nomination.
The Nominating Committee is willing to consider nominations received from shareholders and shall assess shareholder nominees in the same manner as it reviews its own nominees. A shareholder nominee for director should be submitted in writing to the Fund’s Secretary. Any such shareholder nomination should include at a minimum the following information as to each individual proposed for nomination as trustee: such individual’s written consent to be named in the proxy statement as a nominee (if nominated) and to serve as a trustee (if elected), and all information relating to such individual that is required to be disclosed in the solicitation of proxies for election of trustees, or is otherwise required, in each case under applicable federal securities laws, rules and regulations.
The Secretary shall submit all nominations received in a timely manner to the Nominating Committee. To be timely, any such submission must be delivered to the Fund’s Secretary not earlier than the 90th day prior to such meeting and not later than the close of business on the later of the 60th day prior to such meeting or the 10th day following the day on which public announcement of the date of the meeting is first made, by either disclosure in a press release or in a document publicly filed by the Fund with the Securities and Exchange Commission.
ITEM 11. CONTROLS AND PROCEDURES.
(a) Based on our evaluation conducted within 90 days of the filing date, hereof, the design and operation of the registrant’s disclosure controls and procedures are effective to ensure that material information relating to the registrant is made known to the certifying officers by others within the appropriate entities, particularly during the period in which Forms N-CSR are being prepared, and the registrant’s disclosure controls and procedures allow timely preparation and review of the information for the registrant’s Form N-CSR and the officer certifications of such Form N-CSR.
(b) There were no significant changes in the registrant’s internal controls that occurred during the second fiscal quarter of the period covered by this report that has materially affected, or is reasonably likely to materially affect, the registrant’s internal control over financial reporting.
ITEM 12. EXHIBITS.
(a)(1) The Code of Ethics is not required for the semi-annual filing.
(a)(2) A separate certification for each principal executive officer and principal financial officer of the registrant as required by Rule 30a-2 under the Act (17 CFR 270.30a-2) is attached hereto as EX-99.CERT.
(a)(3) Not required for semi-annual filing.
(b) The officer certifications required by Section 906 of the Sarbanes-Oxley Act of 2002 are attached hereto as EX-99.906CERT
SIGNATURES
Pursuant to the requirements of the Securities Exchange Act of 1934 and the Investment Company Act of 1940, the registrant has duly caused this report to be signed on its behalf by the undersigned, thereunto duly authorized.
(Registrant): ING Variable Insurance Trust
By | /s/ Shaun P. Mathews | |
| Shaun P. Mathews | |
| President and Chief Executive Officer |
| | |
Date: | September 5, 2007 | |
Pursuant to the requirements of the Securities Exchange Act of 1934 and the Investment Company Act of 1940, this report has been signed below by the following persons on behalf of the registrant and in the capacities and on the dates indicated.
By | /s/ Shaun P. Mathews | |
| Shaun P. Mathews | |
| President and Chief Executive Officer |
| | |
Date: | September 5, 2007 | |
| | |
By | /s/ Todd Modic | |
| Todd Modic | |
| Senior Vice President and Chief Financial Officer |
| | |
Date: | September 5, 2007 | |