| | |
| | | OMB APPROVAL |
| | OMB Number: 3235-0570 |
| | Expires: August 31, 2011 |
| | Estimated average burden hours per response. . . . .18.9 |
UNITED STATES
SECURITIES AND EXCHANGE COMMISSION
Washington, D.C. 20549
FORM N-CSR
CERTIFIED SHAREHOLDER REPORT OF REGISTERED
MANAGEMENT INVESTMENT COMPANIES
Investment Company Act file number 811-9477
ING Variable Insurance Trust
(Exact name of registrant as specified in charter)
| | |
7337 E. Doubletree Ranch Rd., Scottsdale, AZ | | 85258 |
| (Address of principal executive offices) | | (Zip code) |
The Corporation Trust Company, 1209 Orange Street, Wilmington, DE 19801
(Name and address of agent for service)
Registrant’s telephone number, including area code: 1-800-992-0180
Date of fiscal year end: December 31
Date of reporting period: January 1, 2008 to June 30, 2008
| ITEM 1. | REPORTS TO STOCKHOLDERS. |
The following is a copy of the report transmitted to stockholders pursuant to Rule 30e-1 under the Act (17 CFR 270.30e-1):

Semi-Annual Report
June 30, 2008
ING GET U.S. Core Portfolio
This report is submitted for general information to shareholders of the ING Funds. It is not authorized for distribution to prospective shareholders unless accompanied or preceded by a prospectus which includes details regarding the funds’ investment objectives, risks, charges, expenses and other information. This information should be read carefully.

TABLE OF CONTENTS
PROXY VOTING INFORMATION
A description of the policies and procedures that the Series use to determine how to vote proxies related to portfolio securities is available: (1) without charge, upon request by calling Shareholder Services toll-free at (800) 992-0180; (2) on the ING Funds’ website at www.ingfunds.com; and (3) on the U.S. Securities and Exchange Commission’s (“SEC”) website at www.sec.gov. Information regarding how the Series voted proxies related to portfolio securities during the most recent 12-month period ended June 30 is available without charge on the ING Funds’ website at www.ingfunds.com and on the SEC’s website at www.sec.gov.
QUARTERLY PORTFOLIO HOLDINGS
The Series files their complete schedule of portfolio holdings with the SEC for the first and third quarters of each fiscal year on Form N-Q. The Series’ Forms N-Q are available on the SEC’s website at www.sec.gov. The Series’ Forms N-Q may be reviewed and copied at the SEC’s Public Reference Room in Washington, DC, and information on the operation of the Public Reference Room may be obtained by calling (800) SEC-0330; and is available upon request from the Portfolios by calling Shareholder Services toll-free at (800) 992-0180.
PRESIDENT’S LETTER

Dear Shareholder,
The first half of the year has been a challenging period for investors. We have seen a variety of industries impacted by an economic uncertainty and market volatility.
Often what happens in these situations is that anxiety clouds sound investment principles. Market corrections are a natural part of the investing and attempts to “time” buy-and-sell decisions often backfire and, in fact, hinder achieving long-term investment goals. Research bears this out. Based on Bloomberg research, if you were fully invested in domestic equities between December 1997 and December 2007, a $10,000 investment would have grown to more than $17,000. However, had you missed the “best” 10 days of that ten-year period, your $10,000 would have grown to less than $12,000. Missing the “best” 20 days of that ten-year cycle would have been even costlier, resulting in your original $10,000 investment being worth less than $8,000.(1)
No one knows when those “best” days will occur, but history tells us that, when investing, staying focused on the long term may be the prudent strategy.
ING encourages you to take this opportunity to meet with your financial professionals to ensure your portfolio reflects your goals and risk tolerance. In doing this, many investors discover that building a well-diversified investment portfolio, one made up of allocations to a wide range of asset classes, may be the best way to withstand market volatility.
At ING Funds we strive to offer our clients quality investments. I thank you for your continued support and confidence and we look forward to serving you in the future.
Sincerely,

Shaun Mathews,
CEO
ING Funds
August 8, 2008
The views expressed in the President’s Letter reflect those of the President as of the date of the letter. Any such views are subject to change at any time based upon market or other conditions and ING Funds disclaims any responsibility to update such views. These views may not be relied on as investment advice and because investment decisions for an ING Fund are based on numerous factors, may not be relied on as an indication of investment intent on behalf of any ING Fund. Reference to specific company securities should not be construed as recommendations or investment advice. Consider the fund’s investment objectives, risks, and charges and expenses carefully before investing. The prospectus contains this information and other information about the fund.
International investing poses special risks including currency fluctuation, economic and political risks not found in investments that are solely domestic.
(1) | | Bloomberg calculations based on performance of the Standard & Poor’s 500® Composite Stock Price Index (“S&P 500® Index”) between December 31, 1997 and December 31, 2007. |
1
MARKET PERSPECTIVE: SIX MONTHS ENDED JUNE 30, 2008
The first half of 2008 carried on where 2007 left off, with mutually reinforcing financial dislocation and economic weakness driving investors from risky assets. A six-week rally fizzled in mid-May and global equities in the form of the Morgan Stanley Capital International (“MSCI”) World® Index(1) measured in local currencies, including net reinvested dividends (“MSCI” for regions discussed below) declined, returning (12.8)% through June 30, 2008. In currencies, the dollar fell 6.8% and 5.5% against the euro and yen respectively, but edged up 0.1% against the pound, as the UK economy faced challenges roughly similar to those in the United States.
It was clear that the credit crisis that surfaced in 2007 had its roots in the real economy, as the drumbeat of news was monotonously bad.
The housing market continued its inexorable march down. By the end of June, house prices were down 15.3% year-over-year, by one measure. The pace of new home sales was the second lowest since 1991, and although existing home sales rebounded from the slowest pace in nine years, it was pointed out that about one-third of purchases reflected foreclosures or other distressed sales.
The February 2008 payrolls report showed the first fall in over four years. Payrolls fell again in the next four reports. The June unemployment report disclosed the biggest increase in two decades: by 0.5% to 5.5%.
First quarter gross domestic product (“GDP”) grew at just 0.96% annualized, with profits from current production down for the third straight quarter.
Back in the financial sector, write-downs of asset-backed securities continued apace, but with some unsettling variations on the theme. Merrill Lynch’s $10 to $20 billion of write-downs included the guarantees of monoline insurers. Moody’s Investors Service (“Moody’s”) put their Aaa ratings up for review on January 17, 2008. Now the status and viability of insured municipal debt, which reflects the credit rating of the insurers, was in doubt.
The following Monday, with U.S. exchanges closed for a holiday, major international stock markets sold off by about 6%. On Tuesday, the Federal Reserve Board (the “Fed”) acted, cutting the federal funds and discount rates by 75 basis points. Eight days later, at their regular meeting, the Federal Open Market Committee (“FOMC”) cut the federal funds and discount rates again, this time by 50 basis points.
Despite stubbornly high inflation, there was now no doubt about the required direction of policy. Congress agreed in February 2008 to spend $117 billion in tax rebates as part of a $168 billion plan to stimulate the economy. In March 2008, the Fed reduced the discount rate further, by 100 basis points to 2.5% and the federal funds rate by 75 basis points to 2.25%. Events took another remarkable turn when Bear Stearns, an investment bank near the eye of the storm since the credit crisis blew in, was laid low in days by rumors of insolvency due to liquidity problems. Over a weekend, the Fed brokered the sale of Bear Stearns, a $90 stock in December 2007, to JP Morgan for just $10 per share.
The trauma of Bear Stearns’ forced sale proved that some market players were indeed too connected to fail. The Fed followed this up by opening the discount window to other primary dealers. This might at least draw a line under the threat of systemic failure that Bear Stearns may have posed. The relief rally was sustained on the last day of April 2008 when the FOMC reduced the federal funds rate by 0.25% to 2%, and barely hinted that they might be done.
However, the underlying problems had not disappeared and the rally soon failed. The price of oil was still moving up and on the second to last day of June settled above $140 per barrel for the first time. But it was really all commodities, as well as food, whose prices were on the rise. It was little surprise when headline Consumer Price Index (“CPI”) inflation was reported in June at 4.2% year-over-year, and June ended with consumer confidence the lowest since May 1980.
In U.S. fixed income markets, a flight to safety in the first quarter was partly reversed. Treasury Bill yields fell 143 basis points to 1.71%, while 10-year Treasury Note yields lost 5 basis points to 3.98%. The Lehman Brothers® U.S. Aggregate Bond (“LBAB”) Index(2) of investment grade bonds returned 1.13% through June 30, 2008, but the Lehman Brothers® High Yield Bond — 2% Issuer Constrained Composite Index(3) returned (1.08)% for the same period.
U.S. equities, represented by the Standard & Poor’s 500® (“S&P 500®”) Composite Stock Price Index(4) including dividends, returned (11.9)% through June 30, 2008. Profits for S&P 500® companies suffered their third straight quarter of decline, latterly by more than 25%. In both returns and profits, it was the financials within the S&P 500® Index that led the way down, often cutting dividends along the way.
2
MARKET PERSPECTIVE: SIX MONTHS ENDED JUNE 30, 2008
In international markets, the MSCI Japan® Index(5) returned (10.4)% through June 30, 2008. While there was some encouraging news like quarterly GDP growth of 1%, its main source, exports, faced the twin threats of a slowing world economy and a higher yen. The MSCI Europe ex UK® Index(6) returned (19.6)% through June 30, 2008. Business and consumer confidence faded as banks continued to write down asset-backed securities in huge volumes and toughened credit standards. Consumer price inflation driven by food and energy surged to 4.0%, a 16-year high, and the European Central Bank threatened a July rate increase. In the UK, the MSCI UK® Index(7) returned (11.2)% through June 30, 2008. The country remained in the grip of the worst housing slump since the early 1990s and house prices fell year-over-year at the fastest rate since 1992. The Bank of England (the “Bank”) cut rates twice to 5.0%, but with inflation now up to 3.3%, it was clear that the Bank was out of ammunition.
(1) The MSCI World® Index is an unmanaged index that measures the performance of over 1,400 securities listed on exchanges in the U.S., Europe, Canada, Australia, New Zealand and the Far East.
(2) The LBAB Index is an unmanaged index of publicly issued investment grade U.S. Government, mortgage-backed, asset-backed and corporate debt securities.
(3) The Lehman Brothers® High Yield Bond — 2% Issuer Constrained Composite Index is an unmanaged index that measures the performance of fixed-income securities.
(4) The S&P 500® Index is an unmanaged index that measures the performance of securities of approximately 500 large-capitalization companies whose securities are traded on major U.S. stock markets.
(5) The MSCI Japan® Index is a free float-adjusted market capitalization index that is designed to measure developed market equity performance in Japan.
(6) The MSCI Europe ex UK® Index is a free float adjusted market capitalization index that is designed to measure developed market equity performance in Europe, excluding the UK.
(7) The MSCI UK® Index is a free float-adjusted market capitalization index that is designed to measure developed market equity performance in the UK.
All indices are unmanaged and investors cannot invest directly in an index.
Past performance does not guarantee future results. The performance quoted represents past performance. Investment return and principal value of an investment will fluctuate, and shares, when redeemed, may be worth more or less than their original cost. The Portfolios’ performance is subject to change since the period’s end and may be lower or higher than the performance data shown. Please call (800) 992-0180 or log on to www.ingfunds.com to obtain performance data current to the most recent month end.
Market Perspective reflects the views of ING’s Chief Investment Risk Officer only through the end of the period, and is subject to change based on market and other conditions.
3
| | |
| ING GET U.S. CORE PORTFOLIO | | INVESTMENT STRATEGY AND PRINCIPAL RISKS |
What is the Investment Strategy During the Guarantee Period?
ING GET U.S. Core Portfolio — Series 1, 2, 3, 4, 5, 6, 7, 8, 9, 10, 11, 12, 13, 14 (“Series”) do not implement an “investment strategy” in a conventional sense. Rather, the Series’ asset allocation strategy seeks to optimize the exposure of the Series to the equity component (“Equity Component”) while protecting Series assets. Assets allocated to the Equity Component may be reduced or eliminated in order to conserve assets at a level equal to or above the present value of the guarantee (“Guarantee”). The Series allocate their assets among the following asset classes:
During the Guarantee Period, the Series’ assets will be allocated between the:
| | • | | Equity Component, consisting of common stocks included in the Standard & Poor’s 500® Composite Stock Price Index (“S&P 500® Index”) futures contracts on the S&P 500® Index, and when the Equity Component’s market value is $5 million or less, investments in exchange traded funds (“ETFs”) that can reasonably be expected to have at least a 95% correlation ratio with the S&P 500® Index, in S&P 500® Index futures, or in a combination of S&P 500® Index futures and ETFs, subject to any limitation on the Series’ investments in such securities and the |
| | • | | Fixed component (“Fixed Component”) consisting primarily of short-to-intermediate-duration U.S. government securities. |
The Series’ asset allocation strategy is implemented by allocating assets appropriately to the Equity Component and to the Fixed Component to optimize exposure to the Equity Component while controlling the risk that an insurance company may be required to make payment under the Guarantee. Consequently, there can be no assurance as to the percentage of assets, if any, allocated to the Equity Component, even when the equity market is doing well, or to any investment returns generated by the Series.
How does the Series’ Asset Allocation work?
ING Investment Management Co. (“ING IM” or “Sub-Adviser”), the Sub-Adviser to the Series, uses a proprietary computer model to determine on a daily basis the percentage of assets allocated to the Equity Component and to the Fixed Component. The model evaluates a number of factors, including the then current market value of the Series, the then prevailing level of interest rates, equity market volatility, the Series’ total annual expenses, insurance company separate account expenses, and the maturity date (“Maturity Date”). The model determines the initial allocation between the Equity Component and the Fixed Component on the first day of the Guarantee Period and provides direction for any reallocations on a daily basis thereafter. Generally, as the value of the Equity Component rises, more assets are allocated to the Equity Component; as the value of the Equity Component declines, more assets are allocated to the Fixed Component. The amount directed to the Equity Component is always restricted so that even if it were to experience a “material decline” in value on a given day and before being redirected to the Fixed Component, the remaining assets would still be sufficient to meet the Guarantee. At the commencement of the Guarantee Period, the Series will define a “material decline” in value as a decline in the value of the Equity Component of at least 20% but no more than 30%. In the event the Series defines the “material decline” at 20%, more assets will likely be allocated to the Equity Component than if the “material decline” is defined at 30%. The allocation to the Equity Component or the Fixed Component may be zero under certain circumstances.
Equity Component: ING IM manages the Equity Component by overweighting those stocks in the S&P 500® Index that it believes will outperform the S&P 500® Index and underweighting (or avoiding altogether) those stocks it believes will underperform the S&P 500® Index (“Enhanced Index Strategy”). Stocks ING IM believes are likely to match the performance of the S&P 500® Index are invested in proportion to their representation in the S&P 500® Index. To determine which stocks to weight more or less heavily, ING IM uses internally developed quantitative computer models to evaluate various criteria, such as the financial strength of each company and its potential for strong, sustained earnings growth. ING IM expects that there will be a close correlation between the performance of the Equity Component and that of the S&P 500® Index in both rising and falling markets.
Under normal market conditions, up to 20% of the Equity Component’s net assets may be invested in futures contracts for hedging purposes or to maintain liquidity to meet shareholder redemptions and minimize trading costs. Futures contracts provide for the future sale by one party and purchase by another party of a specified amount of a
4
| | |
| INVESTMENT STRATEGY AND PRINCIPAL RISKS | | ING GET U.S. CORE PORTFOLIO |
financial instrument or a specific stock market index for a specified price on a designated date. During the Guarantee Period, the Series may only invest in futures contracts on the S&P 500® Index and futures contracts on U.S. Treasury securities.
If the Equity Component’s market value is $5 million or less, in order to replicate an investment in stocks listed in the S&P 500® Index, ING IM may invest the entire amount of the Equity Component’s assets in S&P 500® Index futures, in ETFs, or in a combination of S&P 500® Index futures and ETFs, subject to any limitation on the Series’ investment in such securities (subject to restrictions imposed by the Investment Company Act of 1940, as amended “1940 Act”). ETFs are passively managed investment companies traded on a securities exchange whose goal is to track or replicate a desired index. ING IM will not employ an Enhanced Index Strategy when it invests in S&P 500® Index futures and ETFs.
Fixed Component: ING IM seeks to select investments for the Fixed Component with financial characteristics that will, at any point in time, closely resemble those of a portfolio of zero coupon bonds which mature within three months of the Maturity Date. Generally, at least 55% of the Fixed Component will consist of securities issued or guaranteed by the U.S. government, its agencies or instrumentalities, including Separate Trading of Registered Interest and Principal of Securities (“STRIPS”). Although the Series invest in securities insured or guaranteed by the U.S. government, the Series shares are not issued or guaranteed. STRIPS are created by the Federal Reserve Bank by separating the interest and principal components of an outstanding U.S. Treasury or agency bond and selling them as individual securities. The Fixed Component may also consist of mortgage-backed securities (including commercial mortgage-backed securities) which are rated AAA or Aaa at the time of purchase by Standard & Poor’s (“S&P®“) or Moody’s Investors Service, Inc. (“Moody’s®“), respectively, and corporate obligations which are rated at the time of purchase A- or higher by S&P® and/or Aa3 or higher by Moody’s®. The Fixed Component may also include U.S. Treasury futures and money market instruments. The Series may also invest in other investment companies to the extent permitted under the 1940 Act, and the rules and regulations thereunder.
What are the Principal Guarantee Period Risks?
Allocation Risk: If, at the inception of, or any time during, the Guarantee Period interest rates are low, the Series’ assets may be largely invested in the Fixed Component in order to decrease the likelihood that an insurance company would be required to make any payment under the Guarantee. The effect of low interest rates on the Series would likely be more pronounced at the inception of the Guarantee Period, as the initial allocation of assets would include more fixed-income securities. In addition, if during the Guarantee Period the equity markets experienced a material decline, the Series’ assets may become largely invested in the Fixed Component. In fact, if the value of the Equity Component were to decline by a significant amount, a complete reallocation to the Fixed Component would likely occur. In the event of a reallocation of 100% of the assets to the Fixed Component, the Series would not reallocate any assets into the Equity Component prior to the Maturity Date. Use of the Fixed Component reduces the Series’ ability to participate as fully in upward equity market movements, and therefore represents some loss of opportunity, or opportunity cost, compared to a portfolio that is fully invested in equities.
Active Asset Allocation May Underperform Static Strategies: The asset allocation process results in transaction costs. Volatile periods in the market may increase these costs. This process can have an adverse effect on the performance of the Series during periods of increased equity market volatility. In addition, a high portfolio turnover rate, which may also have an adverse effect on the performance of the Series, may increase the Series’ transaction costs.
Opportunity Costs: There are substantial opportunity costs associated with an investment in the Series. The Series may allocate a substantial portion, and under certain circumstances all, of the Series’ assets to the Fixed Component in order to conserve Series assets to a level equal to or above the present value of the Guarantee.
Initially, if interest rates are low, the allocation to the Fixed Component may be over 70% of the Series’ assets. If the market value of the Equity Component rises, the percentage of the Series’ assets allocated to the Equity Component generally will also rise. However, the relative volatility of these two Components as well as the past performance of the Series will affect these allocations. For example, if the Series incurs early losses, the Series may allocate 100% of the Series’ assets to the Fixed Component for the entire Guarantee Period, irrespective of the subsequent upward movements in the equity markets and/or the Equity Component.
The extent to which the Series participates in upward movements in the Equity Component during the Guarantee Period will depend on the performance of the Series, the performance and volatility of the Fixed and Equity
5
| | |
| ING GET U.S. CORE PORTFOLIO | | INVESTMENT STRATEGY AND PRINCIPAL RISKS |
Components, interest rates, expenses of the Series and the separate account under the variable annuity contract, and other factors. The Series might capture a material portion, very little or none of any Equity Component increase.
It is possible that on the Maturity Date, a contract- holder or participant could receive only the guaranteed amount even though the equity markets, as well as the Equity Component, has had significant positive performance during the Guarantee Period.
When you hold your investment until the end of the 5-year or 7-year Guarantee Period, on the Maturity Date your account will be worth no less than your investment at the inception of the Guarantee Period, less any redemptions and distributions you have received in cash, and certain Series expenses, such as interest, taxes and extraordinary expenses. If you sell shares during the Guarantee Period, shares are redeemed at the current net asset value (“NAV”) which may be worth more or less than your original investment and/or the NAV at the inception of the Guarantee Period. The guarantee is based on the beginning NAV on the first day of the Guarantee Period, not the public offering price, and does not apply to any earnings realized during the Guarantee Period. The guarantee is backed by insurance companies offering the Series. As with the sale of any securities, a taxable event may occur if the Series liquidates fixed-income securities at the end of the Guarantee Period.
Worst Case Scenarios for the Series’ Equity Participation: The opportunity cost of not allocating assets to the Equity Component will be particularly high if early in the Guarantee Period: (a) the Series’ NAV decreases; or (b) the value of the Equity Component declines. In either case, all or substantially all of the Series’ assets could be allocated to the Fixed Component for the remainder of the Guarantee Period.
Impact of Annuity Charges and Other Expenses: Contract-holders and Participants with interest in the Series through separate accounts are not subject to identical separate account charges. In its proprietary computer model, the Sub-Adviser uses an expense factor designed to have the Series produce a return which may cover some portion of these charges. The expense factor will be determined at the inception of the Guarantee Period. If the expense factor is set to cover the higher charges, the initial asset allocation to the Equity Component will be lower. Accordingly, the level of the expense factor chosen by the Series may represent a greater opportunity cost to Contract-holders and Participants with lower separate account charges. Regardless of where the expense factor is set, it will not affect the Guarantee payable by the insurance company.
Stock and Bond Investments: The risks associated with investing in stocks include sudden and unpredictable drops in the value of the market as a whole and periods of lackluster or negative performance. The performance of the Equity Component also depends significantly on ING IM’s skill in determining which securities to overweight, underweight or avoid altogether.
The principal risk associated with investing in bonds is that interest rates may rise, which generally causes bond prices to fall. The market prices of STRIPS generally are more volatile than the market prices of other fixed-income securities with similar maturities that pay interest periodically. With corporate bonds, there is a risk that the issuer will default on the payment of principal or interest.
With mortgage-backed securities, there is a risk of prepayment of the underlying mortgage. Because prepayments of principal generally occur when interest rates are declining, it is likely that the Series may have to reinvest the proceeds of prepayments at lower yields. In addition, with credit risk, the Series could lose money if the issuer of a debt security is unable to meet its financial obligations or goes bankrupt. This Series is subject to less credit risk than other funds because it principally invests in debt securities issued or guaranteed by the U.S. government or its agencies.
Declining Interest Rates: A decline in prevailing U.S. interest rates could materially increase the opportunity costs. Any such decline would increase the present value of the Guarantee, potentially causing the Series to allocate all or substantially all of the Series’ assets to the Fixed Component in order to assure that such assets do not fall below the Guarantee.
Futures Contracts: The Series may invest in futures contracts, which provide for the future sale by one party and purchase by another party of a specified amount of a financial instrument or a specific stock market index for a specified price on a designated date. The Series uses futures for hedging purposes or to temporarily increase or limit exposure to a particular asset class. The main risk with futures contracts is that they can amplify a gain or loss, potentially earning or losing substantially more money than the actual investment made in the futures contract.
6
| | |
| INVESTMENT STRATEGY AND PRINCIPAL RISKS | | ING GET U.S. CORE PORTFOLIO |
Other Investment Companies: The GET Series may invest in other investment companies to the extent permitted by the 1940 Act and the rules and regulations thereunder. These may include exchange-traded funds (“ETFs”) and Holding Company Depositary Receipts (“HOLDRs”), among others. ETFs are exchange-traded investment companies that are designed to provide investment results corresponding to an equity index and include, among others, Standard & Poor’s Depositary Receipts (“SPDRs”), PowerShares QQQ™ (“QQQQ”), Dow Jones Industrial Average Tracking Stocks (“Diamonds”) and iShares exchange-traded funds (“iShares”). The main risk of investing in other investment companies (including ETFs) is that the value of the underlying securities held by the investment company might decrease. The value of the underlying securities can fluctuate in response to activities of individual companies or in response to general market and/or economic conditions. Because the Series may invest in other investment companies, you will pay a proportionate share of expenses of that investment company. Additional risks of investments in ETFs include: (i) an active trading market for an ETF’s shares may not develop or be maintained or (ii) trading may be halted if the listing exchange’s officials deem such action appropriate, the shares are delisted from the exchange, or the activation of market-wide “circuit breakers” (which are tied to large decreases in stock prices) halts trading generally. Because HOLDRs concentrate in the stocks of a particular industry, trends in that industry may have a dramatic impact on their value.
To seek to achieve a return on uninvested cash or for other reasons, the Series may invest its assets in ING Institutional Prime Money Market Fund and/or one or more other money market funds advised by ING affiliates (“ING Money Market Funds”). The Series’ purchase of shares of an ING Money Market Fund will result in the Series paying a proportionate share of the expenses of the ING Money Market Fund. The investment adviser of the Series will waive its fee in an amount equal to the advisory fee received by the adviser of the ING Money Market Fund in which the Series invests resulting from the Series’ investment into the ING Money Market Fund.
Risks of Using Derivatives: Certain securities in which the Series may invest, including futures contracts, are derivative instruments. In general terms, a derivative instrument is a financial contract whose value is derived, at least in part, from the performance of an underlying asset, interest rate, or index. If the issuer of a derivative does not pay the amount owed on the contract when due, the Series can lose money on the investment. The underlying investment on which the derivative is based, and the derivative itself, might not perform in the manner the Sub-Adviser expected, which could cause the Series’ share price to decline. Markets underlying securities may move in a direction not anticipated by the Sub-Adviser, which may result in the Series realizing a lower return than expected on an investment.
7
SHAREHOLDER EXPENSE EXAMPLES (UNAUDITED)
As a shareholder of a Series, you incur two types of costs: (1) transaction costs, including redemption fees, and exchange fees; and (2) ongoing costs, including management fees, distribution and/or service (12b-1) fees, and other Series expenses. These Examples are intended to help you understand your ongoing costs (in dollars) of investing in a Series and to compare these costs with the ongoing costs of investing in other mutual funds.
The Examples are based on an investment of $1,000 invested at the beginning of the period and held for the entire period from January 1, 2008 to June 30, 2008, unless otherwise indicated. The Series’ expenses are shown without the imposition of any charges which are, or may be, imposed under your annuity contract. Expenses would have been higher if such charges were included.
Actual Expenses
The first section of the table shown, “Actual Series Return,” provides information about actual account values and actual expenses. You may use the information in this section, together with the amount you invested, to estimate the expenses that you paid over the period. Simply divide your account value by $1,000 (for example, an $8,600 account value divided by $1,000 = 8.6), then multiply the result by the number in the first section under the heading entitled ��Expenses Paid During the Period” to estimate the expenses you paid on your account during this period.
Hypothetical Example for Comparison Purposes
The second section of the table shown, “Hypothetical (5% return before expenses)”, provides information about hypothetical account values and hypothetical expenses based on the Series actual expense ratio and an assumed rate of return of 5% per year before expenses, which is not the Series actual return. The hypothetical account values and expenses may not be used to estimate the actual ending account balance or expenses you paid for the period. You may use this information to compare the ongoing costs of investing in the Series and other mutual funds. To do so, compare this 5% hypothetical example with the 5% hypothetical examples that appear in the shareholder reports of the other funds.
Please note that the expenses shown in the table are meant to highlight your ongoing costs only and do not reflect any transactional costs, redemption fees or exchange fees. Therefore, the hypothetical lines of the table are useful in comparing ongoing costs only, and will not help you determine the relative total costs of owning different mutual funds. In addition, if these transactional costs were included, your costs would have been higher.
| | | | | | | | | | | | | | | | |
| | | ING GET U.S. Core Portfolio | | Beginning
Account
Value
January 1, 2008 | | Ending
Account
Value
June 30, 2008 | | Annualized
Expense
Ratio | | | Expenses Paid
During the
Period Ended
June 30, 2008* | | |
| | Actual Series Return | | | | | | | | | | | | | | |
| | Series 1 | | $ | 1,000.00 | | $ | 961.90 | | 1.00 | % | | $ | 4.88 | | |
| | Series 2 | | $ | 1,000.00 | | $ | 972.70 | | 1.00 | % | | $ | 4.90 | | |
| | Series 3 | | $ | 1,000.00 | | $ | 979.60 | | 1.00 | % | | $ | 4.92 | | |
| | Series 4 | | $ | 1,000.00 | | $ | 961.40 | | 1.00 | % | | $ | 4.88 | | |
| | Series 5 | | $ | 1,000.00 | | $ | 918.20 | | 1.00 | % | | $ | 4.77 | | |
| | Series 6 | | $ | 1,000.00 | | $ | 930.40 | | 1.00 | % | | $ | 4.80 | | |
| | Series 7 | | $ | 1,000.00 | | $ | 933.50 | | 1.00 | % | | $ | 4.81 | | |
| | Series 8 | | $ | 1,000.00 | | $ | 928.20 | | 1.00 | % | | $ | 4.79 | | |
| | Series 9 | | $ | 1,000.00 | | $ | 930.40 | | 1.00 | % | | $ | 4.80 | | |
| | Series 10 | | $ | 1,000.00 | | $ | 942.40 | | 1.00 | % | | $ | 4.83 | | |
| | Series 11 | | $ | 1,000.00 | | $ | 943.00 | | 1.01 | % | | $ | 4.88 | | |
| | Series 12 | | $ | 1,000.00 | | $ | 923.90 | | 1.00 | % | | $ | 4.78 | | |
| | Series 13 | | $ | 1,000.00 | | $ | 964.00 | | 1.00 | % | | $ | 4.88 | | |
| | Series 14 | | $ | 1,000.00 | | $ | 966.40 | | 1.00 | % | | $ | 4.89 | | |
| | | | | | | | | | | | | | | | |
| * | | Expenses are equal to each Series' respective annualized expense ratios multiplied by the average account value over the period, multiplied by 182/366 to reflect the most recent fiscal half-year. |
8
SHAREHOLDER EXPENSE EXAMPLES (UNAUDITED) (CONTINUED)
| | | | | | | | | | | | | | | | |
| | | ING GET U.S. Core Portfolio | | Beginning
Account
Value
January 1, 2008 | | Ending
Account
Value
June 30, 2008 | | Annualized
Expense
Ratio | | | Expenses Paid
During the
Period Ended
June 30, 2008* | | |
| | Hypothetical (5% return before expenses) | | | | | | | | | | | | | | |
| | Series 1 | | $ | 1,000.00 | | $ | 1,019.89 | | 1.00 | % | | $ | 5.02 | | |
| | Series 2 | | $ | 1,000.00 | | $ | 1,019.89 | | 1.00 | % | | $ | 5.02 | | |
| | Series 3 | | $ | 1,000.00 | | $ | 1,019.89 | | 1.00 | % | | $ | 5.02 | | |
| | Series 4 | | $ | 1,000.00 | | $ | 1,019.89 | | 1.00 | % | | $ | 5.02 | | |
| | Series 5 | | $ | 1,000.00 | | $ | 1,019.89 | | 1.00 | % | | $ | 5.02 | | |
| | Series 6 | | $ | 1,000.00 | | $ | 1,019.89 | | 1.00 | % | | $ | 5.02 | | |
| | Series 7 | | $ | 1,000.00 | | $ | 1,019.89 | | 1.00 | % | | $ | 5.02 | | |
| | Series 8 | | $ | 1,000.00 | | $ | 1,019.89 | | 1.00 | % | | $ | 5.02 | | |
| | Series 9 | | $ | 1,000.00 | | $ | 1,019.89 | | 1.00 | % | | $ | 5.02 | | |
| | Series 10 | | $ | 1,000.00 | | $ | 1,019.89 | | 1.00 | % | | $ | 5.02 | | |
| | Series 11 | | $ | 1,000.00 | | $ | 1,019.84 | | 1.01 | % | | $ | 5.07 | | |
| | Series 12 | | $ | 1,000.00 | | $ | 1,019.89 | | 1.00 | % | | $ | 5.02 | | |
| | Series 13 | | $ | 1,000.00 | | $ | 1,019.89 | | 1.00 | % | | $ | 5.02 | | |
| | Series 14 | | $ | 1,000.00 | | $ | 1,019.89 | | 1.00 | % | | $ | 5.02 | | |
| | | | | | | | | | | | | | | | |
| * | | Expenses are equal to each Series' respective annualized expense ratios multiplied by the average account value over the period, multiplied by 182/366 to reflect the most recent fiscal half-year. |
9
STATEMENTS OF ASSETS AND LIABILITIESASOF JUNE 30, 2008 (UNAUDITED)
| | | | | | | | | | | | | | | | |
| | | ING
GET U.S. Core Portfolio
Series 1 | | | ING
GET U.S. Core Portfolio
Series 2 | | | ING
GET U.S. Core Portfolio
Series 3 | | | ING
GET U.S. Core Portfolio
Series 4 | |
ASSETS: | | | | | | | | | | | | | | | | |
Investments in securities at value* | | $ | 77,889,931 | | | $ | 57,614,411 | | | $ | 85,225,018 | | | $ | 36,249,427 | |
Short-term investments in affiliates at amortized cost | | | 75,000 | | | | 250,000 | | | | 75,000 | | | | — | |
Short-term investments at amortized cost | | | 284,000 | | | | 284,000 | | | | 237,000 | | | | 161,000 | |
Cash | | | 849 | | | | 309 | | | | 611 | | | | 716 | |
Receivables: | | | | | | | | | | | | | | | | |
Investment securities sold | | | 3,524,852 | | | | — | | | | — | | | | 2,060,331 | |
Dividends and interest | | | 26,649 | | | | 15,866 | | | | 17,883 | | | | 12,207 | |
Prepaid expenses | | | 885 | | | | 670 | | | | 949 | | | | 416 | |
Reimbursement due from manager | | | — | | | | — | | | | — | | | | 1,895 | |
| | | | | | | | | | | | | | | | |
Total assets | | | 81,802,166 | | | | 58,165,256 | | | | 85,556,461 | | | | 38,485,992 | |
| | | | | | | | | | | | | | | | |
LIABILITIES: | | | | | | | | | | | | | | | | |
Payable for investment securities purchased | | | 3,124,272 | | | | — | | | | — | | | | 2,083,483 | |
Payable for fund shares redeemed | | | 36,392 | | | | 20,236 | | | | 67,862 | | | | 58,551 | |
Payable to affiliates | | | 60,618 | | | | 45,768 | | | | 65,645 | | | | 27,689 | |
Payable for trustee fees | | | 2,221 | | | | 6,160 | | | | 6,374 | | | | 2,283 | |
Other accrued expenses and liabilities | | | 38,160 | | | | 43,890 | | | | 54,100 | | | | 36,030 | |
| | | | | | | | | | | | | | | | |
Total liabilities | | | 3,261,663 | | | | 116,054 | | | | 193,981 | | | | 2,208,036 | |
| | | | | | | | | | | | | | | | |
NET ASSETS | | $ | 78,540,503 | | | $ | 58,049,202 | | | $ | 85,362,480 | | | $ | 36,277,956 | |
| | | | | | | | | | | | | | | | |
NET ASSETS WERE COMPRISED OF: | | | | | | | | | | | | | | | | |
Paid-in capital | | $ | 82,447,843 | | | $ | 59,983,810 | | | $ | 86,812,257 | | | $ | 38,538,556 | |
Undistributed net investment income | | | 825,883 | | | | 600,752 | | | | 763,750 | | | | 422,785 | |
Accumulated net realized loss on investments | | | (2,962,336 | ) | | | (1,507,665 | ) | | | (844,871 | ) | | | (2,130,221 | ) |
Net unrealized depreciation on investments | | | (1,770,887 | ) | | | (1,027,695 | ) | | | (1,368,656 | ) | | | (553,164 | ) |
| | | | | | | | | | | | | | | | |
NET ASSETS | | $ | 78,540,503 | | | $ | 58,049,202 | | | $ | 85,362,480 | | | $ | 36,277,956 | |
| | | | | | | | | | | | | | | | |
| | | | | | | | | | | | | | | | |
* Cost of investments in securities | | $ | 79,660,818 | | | $ | 58,642,106 | | | $ | 86,593,674 | | | $ | 36,802,591 | |
| | | | |
Shares authorized | | | unlimited | | | | unlimited | | | | unlimited | | | | unlimited | |
Par value | | $ | 0.001 | | | $ | 0.001 | | | $ | 0.001 | | | $ | 0.001 | |
Shares outstanding | | | 8,917,091 | | | | 6,384,388 | | | | 8,864,148 | | | | 4,226,122 | |
Net asset value and redemption price per share | | $ | 8.81 | | | $ | 9.09 | | | $ | 9.63 | | | $ | 8.58 | |
See Accompanying Notes to Financial Statements
10
STATEMENTS OF ASSETS AND LIABILITIESASOF JUNE 30, 2008 (UNAUDITED)
| | | | | | | | | | | | | | | | |
| | | ING GET U.S. Core Portfolio Series 5 | | | ING GET U.S. Core Portfolio Series 6 | | | ING GET U.S. Core Portfolio Series 7 | | | ING GET U.S. Core Portfolio Series 8 | |
ASSETS: | | | | | | | | | | | | | | | | |
Investments in securities at value* | | $ | 24,155,211 | | | $ | 49,015,163 | | | $ | 32,755,701 | | | $ | 21,307,210 | |
Short-term investments in affiliates at amortized cost | | | 125,000 | | | | 83,000 | | | | 26,000 | | | | 50,000 | |
Short-term investments at amortized cost | | | 138,000 | | | | — | | | | — | | | | 103,000 | |
Cash | | | 830 | | | | 653 | | | | 646 | | | | 730 | |
Receivables: | | | | | | | | | | | | | | | | |
Investment securities sold | | | 1,116,751 | | | | 3,141,686 | | | | 2,601,244 | | | | 1,300,384 | |
Dividends and interest | | | 14,361 | | | | 29,568 | | | | 19,254 | | | | 13,468 | |
Prepaid expenses | | | 290 | | | | 588 | | | | 401 | | | | — | |
Reimbursement due from manager | | | 3,957 | | | | 4,454 | | | | 4,089 | | | | 2,957 | |
| | | | | | | | | | | | | | | | |
Total assets | | | 25,554,400 | | | | 52,275,112 | | | | 35,407,335 | | | | 22,777,749 | |
| | | | | | | | | | | | | | | | |
LIABILITIES: | | | | | | | | | | | | | | | | |
Payable for investment securities purchased | | | 1,059,187 | | | | 2,896,204 | | | | 2,227,850 | | | | 1,204,892 | |
Payable for fund shares redeemed | | | 21,510 | | | | 77,584 | | | | 13,455 | | | | 37,948 | |
Payable to affiliates | | | 18,581 | | | | 37,752 | | | | 25,234 | | | | 16,335 | |
Payable for trustee fees | | | 2,844 | | | | 1,806 | | | | 3,265 | | | | 2,310 | |
Other accrued expenses and liabilities | | | 19,430 | | | | 31,127 | | | | 32,987 | | | | 28,404 | |
| | | | | | | | | | | | | | | | |
Total liabilities | | | 1,121,552 | | | | 3,044,473 | | | | 2,302,791 | | | | 1,289,889 | |
| | | | | | | | | | | | | | | | |
NET ASSETS | | $ | 24,432,848 | | | $ | 49,230,639 | | | $ | 33,104,544 | | | $ | 21,487,860 | |
| | | | | | | | | | | | | | | | |
NET ASSETS WERE COMPRISED OF: | | | | | | | | | | | | | | | | |
Paid-in capital | | $ | 28,012,501 | | | $ | 54,968,493 | | | $ | 36,940,604 | | | $ | 24,105,063 | |
Undistributed net investment income | | | 187,255 | | | | 434,214 | | | | 317,406 | | | | 196,159 | |
Accumulated net realized loss on investments | | | (2,881,385 | ) | | | (4,749,224 | ) | | | (3,432,432 | ) | | | (2,124,103 | ) |
Net unrealized depreciation on investments | | | (885,523 | ) | | | (1,422,844 | ) | | | (721,034 | ) | | | (689,259 | ) |
| | | | | | | | | | | | | | | | |
NET ASSETS | | $ | 24,432,848 | | | $ | 49,230,639 | | | $ | 33,104,544 | | | $ | 21,487,860 | |
| | | | | | | | | | | | | | | | |
| | | | | | | | | | | | | | | | |
* Cost of investments in securities | | $ | 25,040,734 | | | $ | 50,438,007 | | | $ | 33,476,735 | | | $ | 21,996,469 | |
| | | | | | | | | | | | | | | | |
Shares authorized | | | unlimited | | | | unlimited | | | | unlimited | | | | unlimited | |
Par value | | $ | 0.001 | | | $ | 0.001 | | | $ | 0.001 | | | $ | 0.001 | |
Shares outstanding | | | 3,120,022 | | | | 6,089,706 | | | | 4,206,489 | | | | 2,716,675 | |
Net asset value and redemption price per share | | $ | 7.83 | | | $ | 8.08 | | | $ | 7.87 | | | $ | 7.91 | |
See Accompanying Notes to Financial Statements
11
STATEMENTS OF ASSETS AND LIABILITIESASOF JUNE 30, 2008 (UNAUDITED)
| | | | | | | | | | | | |
| | | ING GET U.S. Core Portfolio
Series 9 | | | ING GET U.S. Core Portfolio
Series 10 | | | ING GET U.S. Core Portfolio
Series 11 | |
ASSETS: | | | | | | | | | | | | |
Investments in securities at value* | | $ | 15,681,217 | | | $ | 14,423,233 | | | $ | 16,921,550 | |
Short-term investments in affiliates at amortized cost | | | 42,000 | | | | — | | | | 25,000 | |
Short-term investments at amortized cost | | | — | | | | 103,000 | | | | 115,000 | |
Cash | | | 4,378 | | | | 363 | | | | 857 | |
Receivables: | | | | | | | | | | | | |
Investment securities sold | | | 944,350 | | | | 1,453,509 | | | | — | |
Dividends and interest | | | 9,151 | | | | 8,462 | | | | 1,622 | |
Prepaid expenses | | | — | | | | — | | | | 189 | |
Reimbursement due from manager | | | 2,955 | | | | 1,606 | | | | — | |
| | | | | | | | | | | | |
Total assets | | | 16,684,051 | | | | 15,990,173 | | | | 17,064,218 | |
| | | | | | | | | | | | |
LIABILITIES: | | | | | | | | | | | | |
Payable for investment securities purchased | | | 803,261 | | | | 1,444,902 | | | | — | |
Payable for fund shares redeemed | | | 1,321 | | | | 2,705 | | | | 139,767 | |
Payable to affiliates | | | 12,107 | | | | 10,969 | | | | 15,085 | |
Payable for trustee fees | | | 2,959 | | | | 1,474 | | | | 1,363 | |
Other accrued expenses and liabilities | | | 23,722 | | | | 27,816 | | | | 28,221 | |
| | | | | | | | | | | | |
Total liabilities | | | 843,370 | | | | 1,487,866 | | | | 184,436 | |
| | | | | | | | | | | | |
NET ASSETS | | $ | 15,840,681 | | | $ | 14,502,307 | | | $ | 16,879,782 | |
| | | | | | | | | | | | |
NET ASSETS WERE COMPRISED OF: | | | | | | | | | | | | |
Paid-in capital | | $ | 17,874,568 | | | $ | 15,955,904 | | | $ | 19,252,378 | |
Undistributed net investment income | | | 152,087 | | | | 164,209 | | | | 165,268 | |
Accumulated net realized loss on investments | | | (1,706,311 | ) | | | (1,326,241 | ) | | | (2,144,874 | ) |
Net unrealized depreciation on investments | | | (479,663 | ) | | | (291,565 | ) | | | (392,990 | ) |
| | | | | | | | | | | | |
NET ASSETS | | $ | 15,840,681 | | | $ | 14,502,307 | | | $ | 16,879,782 | |
| | | | | | | | | | | | |
| | | | | | | | | | | | |
* Cost of investments in securities | | $ | 16,160,880 | | | $ | 14,714,798 | | | $ | 17,314,540 | |
| | | |
Shares authorized | | | unlimited | | | | unlimited | | | | unlimited | |
Par value | | $ | 0.001 | | | $ | 0.001 | | | $ | 0.001 | |
Shares outstanding | | | 2,036,242 | | | | 1,778,194 | | | | 2,187,246 | |
Net asset value and redemption price per share | | $ | 7.78 | | | $ | 8.16 | | | $ | 7.72 | |
See Accompanying Notes to Financial Statements
12
STATEMENTS OF ASSETS AND LIABILITIESASOF JUNE 30, 2008 (UNAUDITED)
| | | | | | | | | | | | |
| | | ING GET U.S. Core Portfolio
Series 12 | | | ING GET U.S. Core Portfolio
Series 13 | | | ING GET U.S. Core Portfolio
Series 14 | |
ASSETS: | | | | | | | | | | | | |
Investments in securities at value* | | $ | 30,800,160 | | | $ | 65,457,656 | | | $ | 110,823,114 | |
Short-term investments in affiliates at amortized cost | | | 96,000 | | | | 150,000 | | | | — | |
Short-term investments at amortized cost | | | — | | | | 270,000 | | | | 370,000 | |
Cash | | | 675 | | | | 211 | | | | 583 | |
Receivables: | | | | | | | | | | | | |
Investment securities sold | | | 1,408,564 | | | | 2,910,567 | | | | — | |
Dividends and interest | | | 20,853 | | | | 11,347 | | | | 8,314 | |
Prepaid expenses | | | — | | | | 681 | | | | — | |
Reimbursement due from manager | | | 4,998 | | | | 10,185 | | | | 13,490 | |
| | | | | | | | | | | | |
Total assets | | | 32,331,250 | | | | 68,810,647 | | | | 111,215,501 | |
| | | | | | | | | | | | |
LIABILITIES: | | | | | | | | | | | | |
Payable for investment securities purchased | | | 1,227,221 | | | | 5,859,769 | | | | — | |
Payable for fund shares redeemed | | | 107,332 | | | | 82,038 | | | | 23,359 | |
Payable to affiliates | | | 24,053 | | | | 46,740 | | | | 82,283 | |
Payable for trustee fees | | | 550 | | | | 1,593 | | | | 698 | |
Other accrued expenses and liabilities | | | 28,669 | | | | 36,913 | | | | 38,481 | |
| | | | | | | | | | | | |
Total liabilities | | | 1,387,825 | | | | 6,027,053 | | | | 144,821 | |
| | | | | | | | | | | | |
NET ASSETS | | $ | 30,943,425 | | | $ | 62,783,594 | | | $ | 111,070,680 | |
| | | | | | | | | | | | |
NET ASSETS WERE COMPRISED OF: | | | | | | | | | | | | |
Paid-in capital | | $ | 35,633,721 | | | $ | 66,236,387 | | | $ | 114,671,254 | |
Undistributed net investment income | | | 368,067 | | | | 737,507 | | | | 1,749,260 | |
Accumulated net realized loss on investments | | | (3,893,488 | ) | | | (4,533,333 | ) | | | (6,248,997 | ) |
Net unrealized appreciation or depreciation on investments | | | (1,164,875 | ) | | | 343,033 | | | | 899,163 | |
| | | | | | | | | | | | |
NET ASSETS | | $ | 30,943,425 | | | $ | 62,783,594 | | | $ | 111,070,680 | |
| | | | | | | | | | | | |
| | | | | | | | | | | | |
* Cost of investments in securities | | $ | 31,965,035 | | | $ | 65,114,623 | | | $ | 109,923,951 | |
| | | |
Shares authorized | | | unlimited | | | | unlimited | | | | unlimited | |
Par value | | $ | 0.001 | | | $ | 0.001 | | | $ | 0.001 | |
Shares outstanding | | | 3,930,936 | | | | 6,667,286 | | | | 11,321,304 | |
Net asset value and redemption price per share | | $ | 7.87 | | | $ | 9.42 | | | $ | 9.81 | |
See Accompanying Notes to Financial Statements
13
STATEMENTS OF OPERATIONSFORTHE SIX MONTHS ENDED JUNE 30, 2008 (UNAUDITED)
| | | | | | | | | | | | | | | | |
| | | ING
GET U.S. Core Portfolio
Series 1 | | | ING
GET U.S. Core Portfolio
Series 2 | | | ING
GET U.S. Core Portfolio
Series 3 | | | ING
GET U.S. Core Portfolio
Series 4 | |
INVESTMENT INCOME: | | | | | | | | | | | | | | | | |
Dividends(1) | | $ | 240,277 | | | $ | 141,549 | | | $ | 157,068 | | | $ | 107,344 | |
Interest | | | 1,007,226 | | | | 771,700 | | | | 1,064,294 | | | | 513,684 | |
| | | | | | | | | | | | | | | | |
Total investment income | | | 1,247,503 | | | | 913,249 | | | | 1,221,362 | | | | 621,028 | |
| | | | | | | | | | | | | | | | |
EXPENSES: | | | | | | | | | | | | | | | | |
Investment management fees | | | 252,510 | | | | 186,870 | | | | 273,934 | | | | 118,307 | |
Distribution and service fees | | | 105,213 | | | | 77,863 | | | | 114,139 | | | | 49,295 | |
Transfer agent fees | | | 63 | | | | 96 | | | | 96 | | | | 56 | |
Administrative service fees | | | 23,146 | | | | 17,129 | | | | 25,110 | | | | 10,845 | |
Shareholder reporting expense | | | 6,370 | | | | 5,326 | | | | 6,810 | | | | 3,008 | |
Professional fees | | | 20,886 | | | | 14,999 | | | | 22,568 | | | | 13,443 | |
Custody and accounting expense | | | 12,320 | | | | 10,787 | | | | 10,738 | | | | 9,624 | |
Trustee fees | | | 364 | | | | 1,792 | | | | 2,240 | | | | 1,294 | |
Miscellaneous expense | | | 2,201 | | | | 2,930 | | | | 2,254 | | | | 2,509 | |
| | | | | | | | | | | | | | | | |
Total expenses | | | 423,073 | | | | 317,792 | | | | 457,889 | | | | 208,381 | |
Net waived and reimbursed fees | | | (2,028 | ) | | | (6,017 | ) | | | (1,076 | ) | | | (11,113 | ) |
| | | | | | | | | | | | | | | | |
Net expenses | | | 421,045 | | | | 311,775 | | | | 456,813 | | | | 197,268 | |
| | | | | | | | | | | | | | | | |
Net investment income | | | 826,458 | | | | 601,474 | | | | 764,549 | | | | 423,760 | |
| | | | | | | | | | | | | | | | |
REALIZED AND UNREALIZED LOSS ON INVESTMENTS | | | | | | | | | | | | | | | | |
Net realized loss on investments | | | (2,056,494 | ) | | | (1,023,956 | ) | | | (268,180 | ) | | | (1,432,307 | ) |
| | | | | | | | | | | | | | | | |
Net change in unrealized appreciation or depreciation on investments | | | (2,142,839 | ) | | | (1,318,493 | ) | | | (2,415,968 | ) | | | (570,276 | ) |
| | | | | | | | | | | | | | | | |
Net realized and unrealized loss on investments | | | (4,199,333 | ) | | | (2,342,449 | ) | | | (2,684,148 | ) | | | (2,002,583 | ) |
| | | | | | | | | | | | | | | | |
Decrease in net assets resulting from operations | | $ | (3,372,875 | ) | | $ | (1,740,975 | ) | | $ | (1,919,599 | ) | | $ | (1,578,823 | ) |
| | | | | | | | | | | | | | | | |
| | | | | | | | | | | | | | | | |
(1) Dividends from affiliates | | $ | 4,017 | | | $ | 2,559 | | | $ | 3,334 | | | $ | — | |
See Accompanying Notes to Financial Statements
14
STATEMENTS OF OPERATIONSFORTHE SIX MONTHS ENDED JUNE 30, 2008 (UNAUDITED)
| | | | | | | | | | | | | | | | |
| | | ING
GET U.S. Core Portfolio
Series 5 | | | ING
GET U.S. Core Portfolio
Series 6 | | | ING
GET U.S. Core Portfolio
Series 7 | | | ING
GET U.S. Core Portfolio
Series 8 | |
INVESTMENT INCOME: | | | | | | | | | | | | | | | | |
Dividends(1) | | $ | 128,441 | | | $ | 249,327 | | | $ | 164,788 | | | $ | 114,903 | |
Interest | | | 193,180 | | | | 457,249 | | | | 337,528 | | | | 201,071 | |
| | | | | | | | | | | | | | | | |
Total investment income | | | 321,621 | | | | 706,576 | | | | 502,316 | | | | 315,974 | |
| | | | | | | | | | | | | | | | |
EXPENSES: | | | | | | | | | | | | | | | | |
Investment management fees | | | 79,765 | | | | 162,865 | | | | 110,371 | | | | 71,226 | |
Distribution and service fees | | | 33,236 | | | | 67,862 | | | | 45,988 | | | | 29,678 | |
Transfer agent fees | | | 61 | | | | 68 | | | | 74 | | | | 65 | |
Administrative service fees | | | 7,312 | | | | 14,929 | | | | 10,117 | | | | 6,529 | |
Shareholder reporting expense | | | 2,193 | | | | 6,387 | | | | 4,295 | | | | 2,235 | |
Professional fees | | | 9,512 | | | | 17,862 | | | | 15,100 | | | | 8,860 | |
Custody and accounting expense | | | 10,819 | | | | 12,935 | | | | 14,175 | | | | 13,645 | |
Trustee fees | | | 1,077 | | | | 1,950 | | | | 850 | | | | 407 | |
Miscellaneous expense | | | 1,772 | | | | 2,590 | | | | 1,819 | | | | 2,036 | |
| | | | | | | | | | | | | | | | |
Total expenses | | | 145,747 | | | | 287,448 | | | | 202,789 | | | | 134,681 | |
Net waived and reimbursed fees | | | (12,422 | ) | | | (15,830 | ) | | | (18,721 | ) | | | (15,810 | ) |
| | | | | | | | | | | | | | | | |
Net expenses | | | 133,325 | | | | 271,618 | | | | 184,068 | | | | 118,871 | |
| | | | | | | | | | | | | | | | |
Net investment income | | | 188,296 | | | | 434,958 | | | | 318,248 | | | | 197,103 | |
| | | | | | | | | | | | | | | | |
REALIZED AND UNREALIZED LOSS ON INVESTMENTS | | | | | | | | | | | | | | | | |
Net realized loss on investments | | | (1,824,991 | ) | | | (3,349,945 | ) | | | (2,244,037 | ) | | | (1,385,794 | ) |
| | | | | | | | | | | | | | | | |
Net change in unrealized appreciation or depreciation on investments | | | (709,664 | ) | | | (1,002,395 | ) | | | (641,187 | ) | | | (613,730 | ) |
| | | | | | | | | | | | | | | | |
Net realized and unrealized loss on investments | | | (2,534,655 | ) | | | (4,352,340 | ) | | | (2,885,224 | ) | | | (1,999,524 | ) |
| | | | | | | | | | | | | | | | |
Decrease in net assets resulting from operations | | $ | (2,346,359 | ) | | $ | (3,917,382 | ) | | $ | (2,566,976 | ) | | $ | (1,802,421 | ) |
| | | | | | | | | | | | | | | | |
| | | | | | | | | | | | | | | | |
(1) Dividends from affiliates | | $ | 1,794 | | | $ | 2,120 | | | $ | 1,538 | | | $ | 890 | |
See Accompanying Notes to Financial Statements
15
STATEMENTS OF OPERATIONSFORTHE SIX MONTHS ENDED JUNE 30, 2008 (UNAUDITED)
| | | | | | | | | | | | |
| | | ING GET U.S. Core Portfolio
Series 9 | | | ING GET U.S. Core Portfolio
Series 10 | | | ING GET U.S. Core Portfolio
Series 11 | |
INVESTMENT INCOME: | | | | | | | | | | | | |
Dividends(1) | | $ | 78,998 | | | $ | 67,879 | | | $ | 27,524 | |
Interest | | | 162,634 | | | | 175,979 | | | | 230,511 | |
| | | | | | | | | | | | |
Total investment income | | | 241,632 | | | | 243,858 | | | | 258,035 | |
| | | | | | | | | | | | |
EXPENSES: | | | | | | | | | | | | |
Investment management fees | | | 53,029 | | | | 47,182 | | | | 54,400 | |
Distribution and service fees | | | 22,094 | | | | 19,658 | | | | 22,667 | |
Transfer agent fees | | | 74 | | | | 59 | | | | 63 | |
Administrative service fees | | | 4,861 | | | | 4,325 | | | | 4,987 | |
Shareholder reporting expense | | | 1,687 | | | | 211 | | | | 2,554 | |
Professional fees | | | 8,054 | | | | 6,788 | | | | 3,862 | |
Custody and accounting expense | | | 13,070 | | | | 11,195 | | | | 13,594 | |
Trustee fees | | | 257 | | | | 452 | | | | 556 | |
Miscellaneous expense | | | 1,757 | | | | 2,034 | | | | 1,590 | |
Interest expense | | | — | | | | — | | | | 1,111 | |
| | | | | | | | | | | | |
Total expenses | | | 104,883 | | | | 91,904 | | | | 105,384 | |
Net waived and reimbursed fees | | | (16,363 | ) | | | (13,206 | ) | | | (13,542 | ) |
| | | | | | | | | | | | |
Net expenses | | | 88,520 | | | | 78,698 | | | | 91,842 | |
| | | | | | | | | | | | |
Net investment income | | | 153,112 | | | | 165,160 | | | | 166,193 | |
| | | | | | | | | | | | |
REALIZED AND UNREALIZED LOSS ON INVESTMENTS | | | | | | | | | | | | |
Net realized loss on investments | | | (1,029,518 | ) | | | (757,038 | ) | | | (1,125,467 | ) |
| | | | | | | | | | | | |
Net change in unrealized appreciation or depreciation on investments | | | (409,167 | ) | | | (339,224 | ) | | | (170,903 | ) |
| | | | | | | | | | | | |
Net realized and unrealized loss on investments | | | (1,438,685 | ) | | | (1,096,262 | ) | | | (1,296,370 | ) |
| | | | | | | | | | | | |
Decrease in net assets resulting from operations | | $ | (1,285,573 | ) | | $ | (931,102 | ) | | $ | (1,130,177 | ) |
| | | | | | | | | | | | |
| | | | | | | | | | | | |
(1) Dividends from affiliates | | $ | 771 | | | $ | — | | | $ | 2,038 | |
See Accompanying Notes to Financial Statements
16
STATEMENTS OF OPERATIONSFORTHE SIX MONTHS ENDED JUNE 30, 2008 (UNAUDITED)
| | | | | | | | | | | | |
| | | ING GET U.S. Core Portfolio
Series 12 | | | ING GET U.S. Core Portfolio
Series 13 | | | ING GET U.S. Core Portfolio
Series 14 | |
INVESTMENT INCOME: | | | | | | | | | | | | |
Dividends(1) | | $ | 188,561 | | | $ | 117,843 | | | $ | 118,087 | |
Interest | | | 373,062 | | | | 951,371 | | | | 2,216,380 | |
| | | | | | | | | | | | |
Total investment income | | | 561,623 | | | | 1,069,214 | | | | 2,334,467 | |
| | | | | | | | | | | | |
EXPENSES: | | | | | | | | | | | | |
Investment management fees | | | 115,019 | | | | 198,542 | | | | 350,599 | |
Distribution and service fees | | | 47,996 | | | | 82,725 | | | | 146,083 | |
Transfer agent fees | | | 74 | | | | 75 | | | | 74 | |
Administrative service fees | | | 10,559 | | | | 18,199 | | | | 32,138 | |
Shareholder reporting expense | | | 4,220 | | | | 5,225 | | | | 8,483 | |
Professional fees | | | 14,081 | | | | 17,658 | | | | 35,550 | |
Custody and accounting expense | | | 21,367 | | | | 21,154 | | | | 20,265 | |
Trustee fees | | | 743 | | | | 546 | | | | 1,674 | |
Miscellaneous expense | | | 1,795 | | | | 797 | | | | 3,147 | |
Interest expense | | | 303 | | | | 771 | | | | 378 | |
| | | | | | | | | | | | |
Total expenses | | | 216,157 | | | | 345,692 | | | | 598,391 | |
Net waived and reimbursed fees | | | (23,521 | ) | | | (14,642 | ) | | | (13,729 | ) |
| | | | | | | | | | | | |
Net expenses | | | 192,636 | | | | 331,050 | | | | 584,662 | |
| | | | | | | | | | | | |
Net investment income | | | 368,987 | | | | 738,164 | | | | 1,749,805 | |
| | | | | | | | | | | | |
REALIZED AND UNREALIZED LOSS ON INVESTMENTS | | | | | | | | | | | | |
Net realized loss on investments | | | (2,617,081 | ) | | | (2,906,440 | ) | | | (3,653,764 | ) |
| | | | | | | | | | | | |
Net change in unrealized appreciation or depreciation on investments | | | (800,931 | ) | | | (245,913 | ) | | | (2,026,139 | ) |
| | | | | | | | | | | | |
Net realized and unrealized loss on investments | | | (3,418,012 | ) | | | (3,152,353 | ) | | | (5,679,903 | ) |
| | | | | | | | | | | | |
Decrease in net assets resulting from operations | | $ | (3,049,025 | ) | | $ | (2,414,189 | ) | | $ | (3,930,098 | ) |
| | | | | | | | | | | | |
| | | | | | | | | | | | |
(1) Dividends from affiliates | | $ | 1,313 | | | $ | 4,220 | | | $ | — | |
See Accompanying Notes to Financial Statements
17
STATEMENTS OF CHANGES IN NET ASSETS (UNAUDITED)
| | | | | | | | | | | | | | | | |
| | | ING GET U.S. Core Portfolio Series 1 | | | ING GET U.S. Core Portfolio Series 2 | |
| | | Six Months Ended June 30, 2008 | | | Year Ended December 31, 2007 | | | Six Months Ended June 30, 2008 | | | Year Ended December 31, 2007 | |
FROM OPERATIONS: | | | | | | | | | | | | | | | | |
Net investment income | | $ | 826,458 | | | $ | 1,822,420 | | | $ | 601,474 | | | $ | 1,489,086 | |
Net realized gain (loss) on investments | | | (2,056,494 | ) | | | 7,520,490 | | | | (1,023,956 | ) | | | 4,246,451 | |
Net change in unrealized appreciation or depreciation on investments | | | (2,142,839 | ) | | | (5,083,273 | ) | | | (1,318,493 | ) | | | (2,157,758 | ) |
| | | | | | | | | | | | | | | | |
Increase (decrease) in net assets resulting from operations | | | (3,372,875 | ) | | | 4,259,637 | | | | (1,740,975 | ) | | | 3,577,779 | |
| | | | | | | | | | | | | | | | |
FROM DISTRIBUTIONS TO SHAREHOLDERS: | | | | | | | | | | | | | | | | |
Net investment income | | | (1,818,662 | ) | | | (2,600,803 | ) | | | (1,487,611 | ) | | | (2,245,332 | ) |
Net realized gains | | | (7,691,730 | ) | | | (1,835,124 | ) | | | (4,359,772 | ) | | | (622,760 | ) |
| | | | | | | | | | | | | | | | |
Total distributions | | | (9,510,392 | ) | | | (4,435,927 | ) | | | (5,847,383 | ) | | | (2,868,092 | ) |
| | | | | | | | | | | | | | | | |
FROM CAPITAL SHARE TRANSACTIONS: | | | | | | | | | | | | | | | | |
Reinvestment of distributions | | | 9,510,392 | | | | 4,435,927 | | | | 5,847,383 | | | | 2,868,092 | |
Cost of shares redeemed | | | (9,756,677 | ) | | | (25,066,654 | ) | | | (8,812,829 | ) | | | (21,655,581 | ) |
| | | | | | | | | | | | | | | | |
Net decrease in net assets resulting from capital share transactions | | | (246,285 | ) | | | (20,630,727 | ) | | | (2,965,446 | ) | | | (18,787,489 | ) |
| | | | | | | | | | | | | | | | |
Net decrease in net assets | | | (13,129,552 | ) | | | (20,807,017 | ) | | | (10,553,804 | ) | | | (18,077,802 | ) |
| | | | | | | | | | | | | | | | |
NET ASSETS: | | | | | | | | | | | | | | | | |
Beginning of period | | | 91,670,055 | | | | 112,477,072 | | | | 68,603,006 | | | | 86,680,808 | |
| | | | | | | | | | | | | | | | |
End of period | | $ | 78,540,503 | | | $ | 91,670,055 | | | $ | 58,049,202 | | | $ | 68,603,006 | |
| | | | | | | | | | | | | | | | |
Undistributed net investment income at end of period | | $ | 825,883 | | | $ | 1,818,087 | | | $ | 600,752 | | | $ | 1,486,889 | |
| | | | | | | | | | | | | | | | |
See Accompanying Notes to Financial Statements
18
STATEMENTS OF CHANGES IN NET ASSETS (UNAUDITED)
| | | | | | | | | | | | | | | | |
| | | ING GET U.S. Core
Portfolio Series 3 | | | ING GET U.S. Core
Portfolio Series 4 | |
| | | Six Months Ended
June 30, 2008 | | | Year Ended
December 31, 2007 | | | Six Months Ended
June 30, 2008 | | | Year Ended
December 31, 2007 | |
FROM OPERATIONS: | | | | | | | | | | | | | | | | |
Net investment income | | $ | 764,549 | | | $ | 1,892,555 | | | $ | 423,760 | | | $ | 1,071,111 | |
Net realized gain (loss) on investments | | | (268,180 | ) | | | 4,578,146 | | | | (1,432,307 | ) | | | 4,410,725 | |
Net change in unrealized appreciation or depreciation on investments | | | (2,415,968 | ) | | | (909,331 | ) | | | (570,276 | ) | | | (3,420,034 | ) |
| | | | | | | | | | | | | | | | |
Increase (decrease) in net assets resulting from operations | | | (1,919,599 | ) | | | 5,561,370 | | | | (1,578,823 | ) | | | 2,061,802 | |
| | | | | | | | | | | | | | | | |
FROM DISTRIBUTIONS TO SHAREHOLDERS: | | | | | | | | | | | | | | | | |
Net investment income | | | (1,889,928 | ) | | | (2,803,620 | ) | | | (1,069,913 | ) | | | (1,477,787 | ) |
Net realized gains | | | (4,366,037 | ) | | | (39,356 | ) | | | (4,829,423 | ) | | | (1,148,098 | ) |
| | | | | | | | | | | | | | | | |
Total distributions | | | (6,255,965 | ) | | | (2,842,976 | ) | | | (5,899,336 | ) | | | (2,625,885 | ) |
| | | | | | | | | | | | | | | | |
FROM CAPITAL SHARE TRANSACTIONS: | | | | | | | | | | | | | | | | |
Reinvestment of distributions | | | 6,255,965 | | | | 2,842,976 | | | | 5,899,336 | | | | 2,625,885 | |
Cost of shares redeemed | | | (11,338,238 | ) | | | (34,492,183 | ) | | | (5,072,766 | ) | | | (17,510,764 | ) |
| | | | | | | | | | | | | | | | |
Net increase (decrease) in net assets resulting from capital share transactions | | | (5,082,273 | ) | | | (31,649,207 | ) | | | 826,570 | | | | (14,884,879 | ) |
| | | | | | | | | | | | | | | | |
Net decrease in net assets | | | (13,257,837 | ) | | | (28,930,813 | ) | | | (6,651,589 | ) | | | (15,448,962 | ) |
| | | | | | | | | | | | | | | | |
NET ASSETS: | | | | | | | | | | | | | | | | |
Beginning of period | | | 98,620,317 | | | | 127,551,130 | | | | 42,929,545 | | | | 58,378,507 | |
| | | | | | | | | | | | | | | | |
End of period | | $ | 85,362,480 | | | $ | 98,620,317 | | | $ | 36,277,956 | | | $ | 42,929,545 | |
| | | | | | | | | | | | | | | | |
Undistributed net investment income at end of period | | $ | 763,750 | | | $ | 1,889,129 | | | $ | 422,785 | | | $ | 1,068,938 | |
| | | | | | | | | | | | | | | | |
See Accompanying Notes to Financial Statements
19
STATEMENTS OF CHANGES IN NET ASSETS (UNAUDITED)
| | | | | | | | | | | | | | | | |
| | | ING GET U.S. Core Portfolio Series 5 | | | ING GET U.S. Core Portfolio Series 6 | |
| | | Six Months Ended June 30, 2008 | | | Year Ended December 31, 2007 | | | Six Months Ended June 30, 2008 | | | Year Ended December 31, 2007 | |
FROM OPERATIONS: | | | | | | | | | | | | | | | | |
Net investment income | | $ | 188,296 | | | $ | 396,643 | | | $ | 434,958 | | | $ | 998,726 | |
Net realized gain (loss) on investments | | | (1,824,991 | ) | | | 3,995,605 | | | | (3,349,945 | ) | | | 7,969,603 | |
Net change in unrealized appreciation or depreciation on investments | | | (709,664 | ) | | | (3,525,780 | ) | | | (1,002,395 | ) | | | (6,555,229 | ) |
| | | | | | | | | | | | | | | | |
Increase (decrease) in net assets resulting from operations | | | (2,346,359 | ) | | | 866,468 | | | | (3,917,382 | ) | | | 2,413,100 | |
| | | | | | | | | | | | | | | | |
FROM DISTRIBUTIONS TO SHAREHOLDERS: | | | | | | | | | | | | | | | | |
Net investment income | | | (395,353 | ) | | | (588,139 | ) | | | (995,560 | ) | | | (1,673,498 | ) |
Net realized gains | | | (4,604,184 | ) | | | (1,515,062 | ) | | | (8,430,267 | ) | | | (3,686,983 | ) |
| | | | | | | | | | | | | | | | |
Total distributions | | | (4,999,537 | ) | | | (2,103,201 | ) | | | (9,425,827 | ) | | | (5,360,481 | ) |
| | | | | | | | | | | | | | | | |
FROM CAPITAL SHARE TRANSACTIONS: | | | | | | | | | | | | | | | | |
Reinvestment of distributions | | | 4,999,537 | | | | 2,103,201 | | | | 9,425,827 | | | | 5,360,481 | |
Cost of shares redeemed | | | (3,276,973 | ) | | | (7,328,779 | ) | | | (7,426,082 | ) | | | (20,568,370 | ) |
| | | | | | | | | | | | | | | | |
Net increase (decrease) in net assets resulting from capital share transactions | | | 1,722,564 | | | | (5,225,578 | ) | | | 1,999,745 | | | | (15,207,889 | ) |
| | | | | | | | | | | | | | | | |
Net decrease in net assets | | | (5,623,332 | ) | | | (6,462,311 | ) | | | (11,343,464 | ) | | | (18,155,270 | ) |
| | | | | | | | | | | | | | | | |
NET ASSETS: | | | | | | | | | | | | | | | | |
Beginning of period | | | 30,056,180 | | | | 36,518,491 | | | | 60,574,103 | | | | 78,729,373 | |
| | | | | | | | | | | | | | | | |
End of period | | $ | 24,432,848 | | | $ | 30,056,180 | | | $ | 49,230,639 | | | $ | 60,574,103 | |
| | | | | | | | | | | | | | | | |
Undistributed net investment income at end of period | | $ | 187,255 | | | $ | 394,312 | | | $ | 434,214 | | | $ | 994,816 | |
| | | | | | | | | | | | | | | | |
See Accompanying Notes to Financial Statements
20
STATEMENTS OF CHANGES IN NET ASSETS (UNAUDITED)
| | | | | | | | | | | | | | | | |
| | | ING GET U.S. Core
Portfolio Series 7 | | | ING GET U.S. Core
Portfolio Series 8 | |
| | | Six Months Ended
June 30, 2008 | | | Year Ended
December 31, 2007 | | | Six Months Ended
June 30, 2008 | | | Year Ended
December 31, 2007 | |
FROM OPERATIONS: | | | | | | | | | | | | | | | | |
Net investment income | | $ | 318,248 | | | $ | 701,831 | | | $ | 197,103 | | | $ | 439,288 | |
Net realized gain (loss) on investments | | | (2,244,037 | ) | | | 6,295,863 | | | | (1,385,794 | ) | | | 3,864,110 | |
Net change in unrealized appreciation or depreciation on investments | | | (641,187 | ) | | | (5,064,666 | ) | | | (613,730 | ) | | | (3,038,919 | ) |
| | | | | | | | | | | | | | | | |
Increase (decrease) in net assets resulting from operations | | | (2,566,976 | ) | | | 1,933,028 | | | | (1,802,421 | ) | | | 1,264,479 | |
| | | | | | | | | | | | | | | | |
FROM DISTRIBUTIONS TO SHAREHOLDERS: | | | | | | | | | | | | | | | | |
Net investment income | | | (699,849 | ) | | | (1,255,700 | ) | | | (438,217 | ) | | | (702,883 | ) |
Net realized gains | | | (6,781,111 | ) | | | (1,633,428 | ) | | | (4,222,597 | ) | | | (1,364,224 | ) |
| | | | | | | | | | | | | | | | |
Total distributions | | | (7,480,960 | ) | | | (2,889,128 | ) | | | (4,660,814 | ) | | | (2,067,107 | ) |
| | | | | | | | | | | | | | | | |
FROM CAPITAL SHARE TRANSACTIONS: | | | | | | | | | | | | | | | | |
Reinvestment of distributions | | | 7,480,960 | | | | 2,889,128 | | | | 4,660,814 | | | | 2,067,107 | |
Cost of shares redeemed | | | (5,614,791 | ) | | | (19,701,052 | ) | | | (3,530,822 | ) | | | (15,615,034 | ) |
| | | | | | | | | | | | | | | | |
Net increase (decrease) in net assets resulting from capital share transactions | | | 1,866,169 | | | | (16,811,924 | ) | | | 1,129,992 | | | | (13,547,927 | ) |
| | | | | | | | | | | | | | | | |
Net decrease in net assets | | | (8,181,767 | ) | | | (17,768,024 | ) | | | (5,333,243 | ) | | | (14,350,555 | ) |
| | | | | | | | | | | | | | | | |
NET ASSETS: | | | | | | | | | | | | | | | | |
Beginning of period | | | 41,286,311 | | | | 59,054,335 | | | | 26,821,103 | | | | 41,171,658 | |
| | | | | | | | | | | | | | | | |
End of period | | $ | 33,104,544 | | | $ | 41,286,311 | | | $ | 21,487,860 | | | $ | 26,821,103 | |
| | | | | | | | | | | | | | | | |
Undistributed net investment income at end of period | | $ | 317,406 | | | $ | 699,007 | | | $ | 196,159 | | | $ | 437,273 | |
| | | | | | | | | | | | | | | | |
See Accompanying Notes to Financial Statements
21
STATEMENTS OF CHANGES IN NET ASSETS (UNAUDITED)
| | | | | | | | | | | | | | | | |
| | | ING GET U.S. Core
Portfolio Series 9 | | | ING GET U.S. Core
Portfolio Series 10 | |
| | | Six Months Ended
June 30, 2008 | | | Year Ended
December 31, 2007 | | | Six Months Ended
June 30, 2008 | | | Year Ended
December 31, 2007 | |
FROM OPERATIONS: | | | | | | | | | | | | | | | | |
Net investment income | | $ | 153,112 | | | $ | 366,621 | | | $ | 165,160 | | | $ | 386,303 | |
Net realized gain (loss) on investments | | | (1,029,518 | ) | | | 3,077,520 | | | | (757,038 | ) | | | 2,389,273 | |
Net change in unrealized appreciation or depreciation on investments | | | (409,167 | ) | | | (2,197,255 | ) | | | (339,224 | ) | | | (1,743,772 | ) |
| | | | | | | | | | | | | | | | |
Increase (decrease) in net assets resulting from operations | | | (1,285,573 | ) | | | 1,246,886 | | | | (931,102 | ) | | | 1,031,804 | |
| | | | | | | | | | | | | | | | |
FROM DISTRIBUTIONS TO SHAREHOLDERS: | | | | | | | | | | | | | | | | |
Net investment income | | | (365,946 | ) | | | (643,348 | ) | | | (385,842 | ) | | | (490,048 | ) |
Net realized gains | | | (3,422,582 | ) | | | (662,732 | ) | | | (2,701,605 | ) | | | (529,452 | ) |
| | | | | | | | | | | | | | | | |
Total distributions | | | (3,788,528 | ) | | | (1,306,080 | ) | | | (3,087,447 | ) | | | (1,019,500 | ) |
| | | | | | | | | | | | | | | | |
FROM CAPITAL SHARE TRANSACTIONS: | | | | | | | | | | | | | | | | |
Reinvestment of distributions | | | 3,788,528 | | | | 1,306,080 | | | | 3,087,447 | | | | 1,019,500 | |
Cost of shares redeemed | | | (2,680,219 | ) | | | (12,134,796 | ) | | | (1,693,235 | ) | | | (11,598,921 | ) |
| | | | | | | | | | | | | | | | |
Net increase (decrease) in net assets resulting from capital share transactions | | | 1,108,309 | | | | (10,828,716 | ) | | | 1,394,212 | | | | (10,579,421 | ) |
| | | | | | | | | | | | | | | | |
Net decrease in net assets | | | (3,965,792 | ) | | | (10,887,910 | ) | | | (2,624,337 | ) | | | (10,567,117 | ) |
| | | | | | | | | | | | | | | | |
NET ASSETS: | | | | | | | | | | | | | | | | |
Beginning of period | | | 19,806,473 | | | | 30,694,383 | | | | 17,126,644 | | | | 27,693,761 | |
| | | | | | | | | | | | | | | | |
End of period | | $ | 15,840,681 | | | $ | 19,806,473 | | | $ | 14,502,307 | | | $ | 17,126,644 | |
| | | | | | | | | | | | | | | | |
Undistributed net investment income at end of period | | $ | 152,087 | | | $ | 364,921 | | | $ | 164,209 | | | $ | 384,891 | |
| | | | | | | | | | | | | | | | |
See Accompanying Notes to Financial Statements
22
STATEMENTS OF CHANGES IN NET ASSETS (UNAUDITED)
| | | | | | | | | | | | | | | | |
| | | ING GET U.S. Core Portfolio Series 11 | | | ING GET U.S. Core Portfolio Series 12 | |
| | | Six Months Ended
June 30, 2008 | | | Year Ended
December 31, 2007 | | | Six Months Ended
June 30, 2008 | | | Year Ended
December 31, 2007 | |
FROM OPERATIONS: | | | | | | | | | | | | | | | | |
Net investment income | | $ | 166,193 | | | $ | 429,446 | | | $ | 368,987 | | | $ | 567,024 | |
Net realized gain (loss) on investments | | | (1,125,467 | ) | | | 2,634,571 | | | | (2,617,081 | ) | | | 6,587,695 | |
Net change in unrealized appreciation or depreciation on investments | | | (170,903 | ) | | | (2,187,912 | ) | | | (800,931 | ) | | | (5,454,554 | ) |
| | | | | | | | | | | | | | | | |
Increase (decrease) in net assets resulting from operations | | | (1,130,177 | ) | | | 876,105 | | | | (3,049,025 | ) | | | 1,700,165 | |
| | | | | | | | | | | | | | | | |
FROM DISTRIBUTIONS TO SHAREHOLDERS: | | | | | | | | | | | | | | | | |
Net investment income | | | (428,660 | ) | | | (920,871 | ) | | | (564,736 | ) | | | (648,914 | ) |
Net realized gains | | | (3,353,529 | ) | | | (507,718 | ) | | | (7,817,075 | ) | | | (1,244,119 | ) |
| | | | | | | | | | | | | | | | |
Total distributions | | | (3,782,189 | ) | | | (1,428,589 | ) | | | (8,381,811 | ) | | | (1,893,033 | ) |
| | | | | | | | | | | | | | | | |
FROM CAPITAL SHARE TRANSACTIONS: | | | | | | | | | | | | | | | | |
Reinvestment of distributions | | | 3,782,189 | | | | 1,428,589 | | | | 8,381,811 | | | | 1,893,033 | |
Cost of shares redeemed | | | (2,554,413 | ) | | | (15,784,360 | ) | | | (12,161,524 | ) | | | (10,439,683 | ) |
| | | | | | | | | | | | | | | | |
Net increase (decrease) in net assets resulting from capital share transactions | | | 1,227,776 | | | | (14,355,771 | ) | | | (3,779,713 | ) | | | (8,546,650 | ) |
| | | | | | | | | | | | | | | | |
Net decrease in net assets | | | (3,684,590 | ) | | | (14,908,255 | ) | | | (15,210,549 | ) | | | (8,739,518 | ) |
| | | | | | | | | | | | | | | | |
NET ASSETS: | | | | | | | | | | | | | | | | |
Beginning of period | | | 20,564,372 | | | | 35,472,627 | | | | 46,153,974 | | | | 54,893,492 | |
| | | | | | | | | | | | | | | | |
End of period | | $ | 16,879,782 | | | $ | 20,564,372 | | | $ | 30,943,425 | | | $ | 46,153,974 | |
| | | | | | | | | | | | | | | | |
Undistributed net investment income at end of period | | $ | 165,268 | | | $ | 427,735 | | | $ | 368,067 | | | $ | 563,816 | |
| | | | | | | | | | | | | | | | |
See Accompanying Notes to Financial Statements
23
STATEMENTS OF CHANGES IN NET ASSETS (UNAUDITED)
| | | | | | | | | | | | | | | | |
| | | ING GET U.S. Core Portfolio Series 13 | | | ING GET U.S. Core Portfolio Series 14 | |
| | | Six Months Ended June 30, 2008 | | | Year Ended December 31, 2007 | | | Six Months Ended June 30, 2008 | | | Year Ended
December 31, 2007 | |
FROM OPERATIONS: | | | | | | | | | | | | | | | | |
Net investment income | | $ | 738,164 | | | $ | 1,237,041 | | | $ | 1,749,805 | | | $ | 2,167,529 | |
Net realized gain (loss) on investments | | | (2,906,440 | ) | | | 2,123,136 | | | | (3,653,764 | ) | | | (1,972,184 | ) |
Net change in unrealized appreciation or depreciation on investments | | | (245,913 | ) | | | 1,208,262 | | | | (2,026,139 | ) | | | 2,925,302 | |
| | | | | | | | | | | | | | | | |
Increase (decrease) in net assets resulting from operations | | | (2,414,189 | ) | | | 4,568,439 | | | | (3,930,098 | ) | | | 3,120,647 | |
| | | | | | | | | | | | | | | | |
FROM DISTRIBUTIONS TO SHAREHOLDERS: | | | | | | | | | | | | | | | | |
Net investment income | | | (1,233,488 | ) | | | (571,994 | ) | | | (2,168,262 | ) | | | — | |
Net realized gains | | | (3,753,123 | ) | | | (1,807 | ) | | | (625,075 | ) | | | — | |
| | | | | | | | | | | | | | | | |
Total distributions | | | (4,986,611 | ) | | | (573,801 | ) | | | (2,793,337 | ) | | | — | |
| | | | | | | | | | | | | | | | |
FROM CAPITAL SHARE TRANSACTIONS: | | | | | | | | | | | | | | | | |
Net proceeds from sale of shares | | | — | | | | — | | | | — | | | | 153,381,979 | |
Reinvestment of distributions | | | 4,986,611 | | | | 573,801 | | | | 2,793,337 | | | | — | |
| | | | | | | | | | | | | | | | |
| | | 4,986,611 | | | | 573,801 | | | | 2,793,337 | | | | 153,381,979 | |
Cost of shares redeemed | | | (5,040,158 | ) | | | (41,545,317 | ) | | | (9,488,784 | ) | | | (32,098,316 | ) |
| | | | | | | | | | | | | | | | |
Net increase (decrease) in net assets resulting from capital share transactions | | | (53,547 | ) | | | (40,971,516 | ) | | | (6,695,447 | ) | | | 121,283,663 | |
| | | | | | | | | | | | | | | | |
Net increase (decrease) in net assets | | | (7,454,347 | ) | | | (36,976,878 | ) | | | (13,418,882 | ) | | | 124,404,310 | |
| | | | | | | | | | | | | | | | |
NET ASSETS: | | | | | | | | | | | | | | | | |
Beginning of period | | | 70,237,941 | | | | 107,214,819 | | | | 124,489,562 | | | | 85,252 | |
| | | | | | | | | | | | | | | | |
End of period | | $ | 62,783,594 | | | $ | 70,237,941 | | | $ | 111,070,680 | | | $ | 124,489,562 | |
| | | | | | | | | | | | | | | | |
Undistributed net investment income at end of period | | $ | 737,507 | | | $ | 1,232,831 | | | $ | 1,749,260 | | | $ | 2,167,717 | |
| | | | | | | | | | | | | | | | |
See Accompanying Notes to Financial Statements
24
| | |
| ING GET U.S. CORE PORTFOLIO SERIES 1 (UNAUDITED) | | FINANCIAL HIGHLIGHTS |
Selected data for a share of beneficial interest outstanding throughout each period.
| | | | | | | | | | | | | | | | | | | |
| | | | | Six Months
Ended
June 30,
2008 | | | Year Ended December 31, | | June 13,
2003(1) to
December 31,
2003 | |
| | | | 2007 | | | 2006 | | | 2005 | | | 2004 | |
Per Share Operating Performance: | | | | | | | | | | | | | | | | | | | |
| Net asset value, beginning of period | | $ | | 10.36 | | | 10.40 | | | 10.09 | | | 10.62 | | | 10.35 | | 10.00 | |
| Income (loss) from investment operations: | | | | | | | | | | | | | | | | | | | |
| Net investment income | | $ | | 0.11 | | | 0.19 | * | | 0.20 | * | | 0.20 | * | | 0.24 | | 0.06 | |
| Net realized and unrealized gain (loss) on investments | | $ | | (0.48 | ) | | 0.23 | | | 0.55 | | | (0.04 | ) | | 0.11 | | 0.29 | |
| Total from investment operations | | $ | | (0.37 | ) | | 0.42 | | | 0.75 | | | 0.16 | | | 0.35 | | 0.35 | |
| Less distributions from: | | | | | | | | | | | | | | | | | | | |
| Net investment income | | $ | | 0.23 | | | 0.27 | | | 0.25 | | | 0.26 | | | 0.07 | | — | |
| Net realized gains on investments | | $ | | 0.95 | | | 0.19 | | | 0.19 | | | 0.43 | | | 0.01 | | — | |
| Total distributions | | $ | | 1.18 | | | 0.46 | | | 0.44 | | | 0.69 | | | 0.08 | | — | |
| Net asset value, end of period | | $ | | 8.81 | | | 10.36 | | | 10.40 | | | 10.09 | | | 10.62 | | 10.35 | |
Total Return(2) | | % | | (3.81 | ) | | 3.99 | | | 7.72 | | | 1.58 | | | 3.45 | | 3.40 | ** |
Ratios and Supplemental Data: | | | | | | | | | | | | | | | | | | | |
| Net assets, end of period (000’s) | | $ | | 78,541 | | | 91,670 | | | 112,477 | | | 152,849 | | | 200,727 | | 254,534 | |
| Ratio of expenses to average net assets: | | | | | | | | | | | | | | | | | | | |
| Gross expenses prior to expense reimbursement(3) | | % | | 1.01 | | | 1.00 | | | 0.98 | | | 0.96 | | | 0.97 | | 0.99 | |
| Net expenses after expense reimbursement(3)(4) | | % | | 1.00 | # | | 1.00 | # | | 0.98 | | | 0.96 | | | 0.97 | | 0.99 | |
| Net investment income after expense reimbursement(3)(4) | | % | | 1.96 | # | | 1.79 | # | | 1.97 | | | 1.93 | | | 1.92 | | 1.81 | |
| Portfolio turnover rate | | % | | 9 | | | 86 | | | 57 | | | 49 | | | 79 | | 29 | |
(1) | | Commencement of operations. |
(2) | | Total return is calculated assuming reinvestment of all dividends and capital gain distributions at net asset value and does not reflect the effect of insurance contract charges. Total return for periods less than one year is not annualized. |
(3) | | Annualized for periods less than one year. |
(4) | | The Investment Adviser has agreed to limit expenses, (excluding interest, taxes, brokerage and extraordinary expenses) subject to possible recoupment by the Investment Adviser within three years of being incurred. |
| * | | Calculated using average number of shares outstanding throughout the period. |
| ** | | Total return calculation began on September 12, 2003, the first day of the Guarantee Period. Total return from commencement of operations was 3.50%. |
| # | | Impact of waiving the advisory fee for the ING Institutional Prime Money Market Fund holding has less than 0.005% impact on the expense ratio and net investment ratio. |
See Accompanying Notes to Financial Statements
25
| | |
| ING GET U.S. CORE PORTFOLIO SERIES 2 (UNAUDITED) | | FINANCIAL HIGHLIGHTS |
Selected data for a share of beneficial interest outstanding throughout each period.
| | | | | | | | | | | | | | | | | | | |
| | | | | Six Months
Ended
June 30,
2008 | | | Year Ended December 31, | | September 12,
2003(1) to
December 31,
2003 | |
| | | | | 2007 | | | 2006 | | | 2005 | | | 2004 | |
Per Share Operating Performance: | | | | | | | | | | | | | | | | | | | |
| Net asset value, beginning of period | | $ | | 10.35 | | | 10.27 | | | 10.01 | | | 10.44 | | | 10.08 | | 10.00 | |
| Income (loss) from investment operations: | | | | | | | | | | | | | | | | | | | |
| Net investment income | | $ | | 0.10 | * | | 0.20 | | | 0.22 | * | | 0.22 | * | | 0.25 | | 0.01 | |
| Net realized and unrealized gain (loss) on investments | | $ | | (0.37 | ) | | 0.26 | | | 0.43 | | | (0.13 | ) | | 0.12 | | 0.07 | |
| Total from investment operations | | $ | | (0.27 | ) | | 0.46 | | | 0.65 | | | 0.09 | | | 0.37 | | 0.08 | |
| Less distributions from: | | | | | | | | | | | | | | | | | | | |
| Net investment income | | $ | | 0.25 | | | 0.30 | | | 0.29 | | | 0.29 | | | 0.01 | | — | |
| Net realized gains on investments | | $ | | 0.74 | | | 0.08 | | | 0.10 | | | 0.23 | | | — | | — | |
| Total distributions | | $ | | 0.99 | | | 0.38 | | | 0.39 | | | 0.52 | | | 0.01 | | — | |
| Net asset value, end of period | | $ | | 9.09 | | | 10.35 | | | 10.27 | | | 10.01 | | | 10.44 | | 10.08 | |
Total Return(2) | | % | | (2.73 | ) | | 4.58 | | | 6.64 | | | 0.90 | | | 3.68 | | 0.70 | ** |
Ratios and Supplemental Data: | | | | | | | | | | | | | | | | | | | |
| Net assets, end of period (000’s) | | $ | | 58,049 | | | 68,603 | | | 86,681 | | | 122,872 | | | 160,135 | | 223,003 | |
| Ratio of expenses to average net assets: | | | | | | | | | | | | | | | | | | | |
| Gross expenses prior to expense reimbursement/recoupment(3) | | % | | 1.02 | | | 1.00 | | | 0.98 | | | 0.97 | | | 0.97 | | 1.06 | |
| Net expenses after expense reimbursement/recoupment(3)(4) | | % | | 1.00 | # | | 1.00 | # | | 0.98 | | | 0.97 | | | 0.97 | | 1.00 | |
| Net investment income after expense reimbursement/recoupment(3)(4) | | % | | 1.93 | # | | 1.93 | # | | 2.15 | | | 2.12 | | | 2.10 | | 1.16 | |
| Portfolio turnover rate | | % | | 8 | | | 83 | | | 59 | | | 51 | | | 56 | | — | |
(1) | | Commencement of operations. |
(2) | | Total return is calculated assuming reinvestment of all dividends and capital gain distributions at net asset value and does not reflect the effect of insurance contract charges. Total return for periods less than one year is not annualized. |
(3) | | Annualized for periods less than one year. |
(4) | | The Investment Adviser has agreed to limit expenses, (excluding interest, taxes, brokerage and extraordinary expenses) subject to possible recoupment by the Investment Adviser within three years of being incurred. |
| * | | Calculated using average number of shares outstanding throughout the period. |
| ** | | Total return calculation began on December 12, 2003, the first day of the Guarantee Period. Total return from commencement of operations was 0.80%. |
| # | | Impact of waiving the advisory fee for the ING Institutional Prime Money Market Fund holding and other expenses has less than 0.005% impact on the expense ratio and net investment ratio. |
See Accompanying Notes to Financial Statements
26
| | |
| ING GET U.S. CORE PORTFOLIO SERIES 3 (UNAUDITED) | | FINANCIAL HIGHLIGHTS |
Selected data for a share of beneficial interest outstanding throughout each period.
| | | | | | | | | | | | | | | | | | | | |
| | | | | Six Months
Ended
June 30,
2008 | | | Year Ended December 31, | | | December 12,
2003(1) to
December 31,
2003 | |
| | | | | | 2007 | | | 2006 | | | 2005 | | | 2004 | | |
Per Share Operating Performance: | | | | | | | | | | | | | | | | | | | | |
| Net asset value, beginning of period | | $ | | 10.58 | | | 10.34 | | | 9.99 | | | 10.13 | | | 10.01 | | | 10.00 | |
| Income (loss) from investment operations: | | | | | | | | | | | | | | | | | | | | |
| Net investment income | | $ | | 0.09 | * | | 0.18 | * | | 0.19 | * | | 0.18 | * | | 0.17 | | | 0.01 | |
| Net realized and unrealized gain (loss) on investments | | $ | | (0.30 | ) | | 0.33 | | | 0.43 | | | (0.11 | ) | | (0.05 | ) | | 0.00 | ** |
| Total from investment operations | | $ | | (0.21 | ) | | 0.51 | | | 0.62 | | | 0.07 | | | 0.12 | | | 0.01 | |
| Less distributions from: | | | | | | | | | | | | | | | | | | | | |
| Net investment income | | $ | | 0.22 | | | 0.27 | | | 0.26 | | | 0.20 | | | — | | | — | |
| Net realized gains on investments | | $ | | 0.52 | | | 0.00 | ** | | 0.01 | | | 0.01 | | | — | | | — | |
| Total distributions | | $ | | 0.74 | | | 0.27 | | | 0.27 | | | 0.21 | | | — | | | — | |
| Net asset value, end of period | | $ | | 9.63 | | | 10.58 | | | 10.34 | | | 9.99 | | | 10.13 | | | 10.01 | |
Total Return(2) | | % | | (2.04 | ) | | 4.99 | | | 6.34 | | | 0.79 | | | 1.20 | †† | | — | † |
Ratios and Supplemental Data: | | | | | | | | | | | | | | | | | | | | |
| Net assets, end of period (000’s) | | $ | | 85,362 | | | 98,620 | | | 127,551 | | | 179,402 | | | 253,835 | | | 10,730 | |
| Ratio of expenses to average net assets: | | | | | | | | | | | | | | | | | | | | |
| Gross expenses prior to expense reimbursement/recoupment(3) | | % | | 1.00 | | | 1.00 | | | 0.98 | | | 0.97 | | | 0.93 | | | 4.31 | |
| Net expenses after expense reimbursement/recoupment(3)(4) | | % | | 1.00 | # | | 1.00 | # | | 0.98 | | | 0.97 | | | 0.93 | | | 0.65 | |
| Net investment income after expense reimbursement/recoupment(3)(4) | | % | | 1.67 | # | | 1.72 | # | | 1.88 | | | 1.82 | | | 1.81 | | | 0.46 | |
| Portfolio turnover rate | | % | | 22 | | | 65 | | | 51 | | | 65 | | | 65 | | | — | |
(1) | | Commencement of operations. |
(2) | | Total return is calculated assuming reinvestment of all dividends and capital gain distributions at net asset value and does not reflect the effect of insurance contract charges. Total return for periods less than one year is not annualized. |
(3) | | Annualized for periods less than one year. |
(4) | | The Investment Adviser has agreed to limit expenses, (excluding interest, taxes, brokerage and extraordinary expenses) subject to possible recoupment by the Investment Adviser within three years of being incurred. |
| * | | Calculated using average number of shares outstanding throughout the period. |
| ** | | Amount represents less than $0.005 per share. |
| † | | As of December 31, 2003, the Portfolio was in its Offering Period. Total return calculation will begin on the commencement date of the Guarantee Period (March 12, 2004). Total return from commencement of operations was 0.10% |
| †† | | Total return calculation began on March 12, 2004, the first day of the Guarantee Period. Total return for the year ended December 31, 2004 was also 1.20%. |
| # | | Impact of waiving the advisory fee for the ING Institutional Prime Money Market Fund holding and other expenses has less than 0.005% impact on the expense ratio and net investment income ratio. |
See Accompanying Notes to Financial Statements
27
| | |
| ING GET U.S. CORE PORTFOLIO SERIES 4 (UNAUDITED) | | FINANCIAL HIGHLIGHTS |
Selected data for a share of beneficial interest outstanding throughout each period.
| | | | | | | | | | | | | | | | | |
| | | | | Six Months
Ended
June 30,
2008 | | | Year Ended December 31, | | | March 12,
2004(1) to
December 31,
2004 | |
| | | | | 2007 | | | 2006 | | | 2005 | | |
Per Share Operating Performance: | | | | | | | | | | | | | | | | | |
| Net asset value, beginning of period | | $ | | 10.57 | | | 10.73 | | | 10.42 | | | 10.52 | | | 10.00 | |
| Income (loss) from investment operations: | | | | | | | | | | | | | | | | | |
| Net investment income | | $ | | 0.11 | * | | 0.23 | * | | 0.25 | * | | 0.23 | * | | 0.15 | |
| Net realized and unrealized gain (loss) on investments | | $ | | (0.49 | ) | | 0.18 | | | 0.54 | | | (0.09 | ) | | 0.37 | |
| Total from investment operations | | $ | | (0.38 | ) | | 0.41 | | | 0.79 | | | 0.14 | | | 0.52 | |
| Less distributions from: | | | | | | | | | | | | | | | | | |
| Net investment income | | $ | | 0.29 | | | 0.32 | | | 0.29 | | | 0.18 | | | — | |
| Net realized gains on investments | | $ | | 1.32 | | | 0.25 | | | 0.19 | | | 0.06 | | | — | |
| Total distributions | | $ | | 1.61 | | | 0.57 | | | 0.48 | | | 0.24 | | | — | |
| Net asset value, end of period | | $ | | 8.58 | | | 10.57 | | | 10.73 | | | 10.42 | | | 10.52 | |
Total Return(2) | | % | | (3.86 | ) | | 3.69 | | | 7.89 | | | 1.29 | | | 5.09 | ** |
Ratios and Supplemental Data: | | | | | | | | | | | | | | | | | |
| Net assets, end of period (000’s) | | $ | | 36,278 | | | 42,930 | | | 58,379 | | | 70,822 | | | 90,297 | |
| Ratio of expenses to average net assets: | | | | | | | | | | | | | | | | | |
| Gross expenses prior to expense reimbursement(3) | | % | | 1.06 | | | 0.99 | | | 0.99 | | | 1.00 | | | 0.98 | |
| Net expenses after expense reimbursement(3)(4) | | % | | 1.00 | # | | 0.99 | # | | 0.99 | | | 1.00 | | | 0.98 | |
| Net investment income after expense reimbursement(3)(4) | | % | | 2.15 | # | | 2.12 | # | | 2.36 | | | 2.19 | | | 2.36 | |
| Portfolio turnover rate | | % | | 52 | | | 129 | | | 40 | | | 41 | | | 48 | |
(1) | | Commencement of operations. |
(2) | | Total return is calculated assuming reinvestment of all dividends and capital gain distributions at net asset value and does not reflect the effect of insurance contract charges. Total return for periods less than one year is not annualized. |
(3) | | Annualized for periods less than one year. |
(4) | | The Investment Adviser has agreed to limit expenses, (excluding interest, taxes, brokerage and extraordinary expenses) subject to possible recoupment by the Investment Adviser within three years of being incurred. |
| * | | Calculated using average number of shares outstanding throughout the period. |
| ** | | Total return calculation began on June 11, 2004, the first day of the Guarantee Period. Total return from commencement of operations was 5.20%. |
| # | | Impact of waiving the advisory fee for the ING Institutional Prime Money Market Fund holding has less than 0.005% impact on the expense ratio and net investment income ratio. |
See Accompanying Notes to Financial Statements
28
| | |
| ING GET U.S. CORE PORTFOLIO SERIES 5 (UNAUDITED) | | FINANCIAL HIGHLIGHTS |
Selected data for a share of beneficial interest outstanding throughout each period.
| | | | | | | | | | | | | | | | | |
| | | | | Six Months
Ended
June 30,
2008 | | | Year Ended December 31, | | | June 11,
2004(1) to
December 31,
2004 | |
| | | | | | 2007 | | | 2006 | | | 2005 | | |
Per Share Operating Performance: | | | | | | | | | | | | | | | | | |
| Net asset value, beginning of period | | $ | | 10.59 | | | 11.01 | | | 10.56 | | | 10.57 | | | 10.00 | |
| Income (loss) from investment operations: | | | | | | | | | | | | | | | | | |
| Net investment income | | $ | | 0.08 | | | 0.13 | * | | 0.16 | * | | 0.16 | * | | 0.09 | |
| Net realized and unrealized gain (loss) on investments | | $ | | (0.89 | ) | | 0.14 | | | 0.96 | | | 0.12 | | | 0.48 | |
| Total from investment operations | | $ | | (0.81 | ) | | 0.27 | | | 1.12 | | | 0.28 | | | 0.57 | |
| Less distributions from: | | | | | | | | | | | | | | | | | |
| Net investment income | | $ | | 0.15 | | | 0.19 | | | 0.22 | | | 0.11 | | | — | |
| Net realized gains on investments | | $ | | 1.80 | | | 0.50 | | | 0.45 | | | 0.18 | | | — | |
| Total distributions | | $ | | 1.95 | | | 0.69 | | | 0.67 | | | 0.29 | | | — | |
| Net asset value, end of period | | $ | | 7.83 | | | 10.59 | | | 11.01 | | | 10.56 | | | 10.57 | |
Total Return(2) | | % | | (8.18 | ) | | 2.15 | | | 11.23 | | | 2.67 | | | 5.49 | ** |
Ratios and Supplemental Data: | | | | | | | | | | | | | | | | | |
| Net assets, end of period (000’s) | | $ | | 24,433 | | | 30,056 | | | 36,518 | | | 46,690 | | | 54,922 | |
| Ratio of expenses to average net assets: | | | | | | | | | | | | | | | | | |
| Gross expenses prior to expense reimbursement(3) | | % | | 1.10 | | | 0.97 | | | 1.01 | | | 1.05 | | | 1.04 | |
| Net expenses after expense reimbursement(3)(4) | | % | | 1.00 | # | | 1.00 | # | | 1.00 | | | 1.00 | | | 0.98 | |
| Net investment income after expense reimbursement(3)(4) | | % | | 1.42 | # | | 1.16 | # | | 1.51 | | | 1.57 | | | 2.33 | |
| Portfolio turnover rate | | % | | 101 | | | 230 | | | 90 | | | 111 | | | 71 | |
(1) | | Commencement of operations. |
(2) | | Total return is calculated assuming reinvestment of all dividends and capital gain distributions at net asset value and does not reflect the effect of insurance contract charges. Total return for periods less than one year is not annualized. |
(3) | | Annualized for periods less than one year. |
(4) | | The Investment Adviser has agreed to limit expenses, (excluding interest, taxes, brokerage and extraordinary expenses) subject to possible recoupment by the Investment Adviser within three years of being incurred. |
| * | | Calculated using average number of shares outstanding throughout the period. |
| ** | | Total return calculation began on September 10, 2004, the first day of the Guarantee Period. Total return from commencement of operations was 5.70%. |
| # | | Impact of waiving the advisory fee for the ING Institutional Prime Money Market Fund holding has less than 0.005% impact on the expense ratio and net investment income ratio. |
See Accompanying Notes to Financial Statements
29
| | |
| ING GET U.S. CORE PORTFOLIO SERIES 6 (UNAUDITED) | | FINANCIAL HIGHLIGHTS |
Selected data for a share of beneficial interest outstanding throughout each period.
| | | | | | | | | | | | | | | | | |
| | | | | Six Months
Ended
June 30,
2008 | | | Year Ended December 31, | | | September 10,
2004(1) to
December 31,
2004 | |
| | | | | | 2007 | | | 2006 | | | 2005 | | |
Per Share Operating Performance: | | | | | | | | | | | | | | | | | |
| Net asset value, beginning of period | | $ | | 10.60 | | | 11.08 | | | 10.35 | | | 10.12 | | | 10.00 | |
| Income (loss) from investment operations: | | | | | | | | | | | | | | | | | |
| Net investment income | | $ | | 0.09 | | | 0.16 | * | | 0.18 | * | | 0.18 | | | 0.03 | |
| Net realized and unrealized gain (loss) on investments | | $ | | (0.77 | ) | | 0.23 | | | 0.87 | | | 0.09 | | | 0.09 | |
| Total from investment operations | | $ | | (0.68 | ) | | 0.39 | | | 1.05 | | | 0.27 | | | 0.12 | |
| Less distributions from: | | | | | | | | | | | | | | | | | |
| Net investment income | | $ | | 0.19 | | | 0.27 | | | 0.25 | | | 0.04 | | | — | |
| Net realized gains on investments | | $ | | 1.65 | | | 0.60 | | | 0.07 | | | 0.00 | ** | | — | |
| Total distributions | | $ | | 1.84 | | | 0.87 | | | 0.32 | | | 0.04 | | | — | |
| Net asset value, end of period | | $ | | 8.08 | | | 10.60 | | | 11.08 | | | 10.35 | | | 10.12 | |
Total Return(2) | | % | | (6.96 | ) | | 3.30 | | | 10.48 | | | 2.68 | | | 0.90 | † |
Ratios and Supplemental Data: | | | | | | | | | | | | | | | | | |
| Net assets, end of period (000’s) | | $ | | 49,231 | | | 60,574 | | | 78,729 | | | 119,890 | | | 159,478 | |
| Ratio of expenses to average net assets: | | | | | | | | | | | | | | | | | |
| Gross expenses prior to expense reimbursement(3) | | % | | 1.06 | | | 1.00 | | | 0.99 | | | 0.97 | | | 0.77 | |
| Net expenses after expense reimbursement(3)(4) | | % | | 1.00 | # | | 1.00 | # | | 0.99 | | | 0.97 | | | 0.77 | |
| Net investment income after expense reimbursement(3)(4) | | % | | 1.60 | # | | 1.44 | # | | 1.71 | | | 1.77 | | | 1.36 | |
| Portfolio turnover rate | | % | | 122 | | | 191 | | | 84 | | | 81 | | | 6 | |
(1) | | Commencement of operations. |
(2) | | Total return is calculated assuming reinvestment of all dividends and capital gain distributions at net asset value and does not reflect the effect of insurance contract charges. Total return for periods less than one year is not annualized. |
(3) | | Annualized for periods less than one year. |
(4) | | The Investment Adviser has agreed to limit expenses, (excluding interest, taxes, brokerage and extraordinary expenses) subject to possible recoupment by the Investment Adviser within three years of being incurred. |
| * | | Calculated using average number of shares outstanding throughout the period. |
| ** | | Amount is less than $0.005 per share. |
| † | | Total return calculation began on December 10, 2004, the first day of the Guarantee Period. Total return from commencement of operations was 1.20%. |
| # | | Impact of waiving the advisory fee for the ING Institutional Prime Money Market Fund holding and other expenses has less than 0.005% impact on the expense ratio and net investment income ratio. |
See Accompanying Notes to Financial Statements
30
| | |
| ING GET U.S. CORE PORTFOLIO SERIES 7 (UNAUDITED) | | FINANCIAL HIGHLIGHTS |
Selected data for a share of beneficial interest outstanding throughout each period.
| | | | | | | | | | | | | | | | | |
| | | | | Six Months
Ended
June 30,
2008 | | | Year Ended December 31, | | | December 10,
2004(1) to
December 31,
2004 | |
| | | | | | 2007 | | | 2006 | | | 2005 | | |
Per Share Operating Performance: | | | | | | | | | | | | | | | | | |
| Net asset value, beginning of period | | $ | | 10.74 | | | 11.01 | | | 10.23 | | | 10.01 | | | 10.00 | |
| Income (loss) from investment operations: | | | | | | | | | | | | | | | | | |
| Net investment income | | $ | | 0.10 | | | 0.16 | * | | 0.18 | * | | 0.19 | * | | 0.01 | |
| Net realized and unrealized gain (loss) on investments | | $ | | (0.74 | ) | | 0.22 | | | 0.85 | | | 0.04 | | | 0.00 | ** |
| Total from investment operations | | $ | | (0.64 | ) | | 0.38 | | | 1.03 | | | 0.23 | | | 0.01 | |
| Less distributions from: | | | | | | | | | | | | | | | | | |
| Net investment income | | $ | | 0.21 | | | 0.28 | | | 0.25 | | | 0.01 | | | — | |
| Net realized gains on investments | | $ | | 2.02 | | | 0.37 | | | — | | | — | | | — | |
| Total distributions | | $ | | 2.23 | | | 0.65 | | | 0.25 | | | 0.01 | | | — | |
| Net asset value, end of period | | $ | | 7.87 | | | 10.74 | | | 11.01 | | | 10.23 | | | 10.01 | |
Total Return(2) | | % | | (6.65 | ) | | 3.29 | | | 10.26 | | | 1.95 | †† | | — † | |
Ratios and Supplemental Data: | | | | | | | | | | | | | | | | | |
| Net assets, end of period (000’s) | | $ | | 33,105 | | | 41,286 | | | 59,054 | | | 90,572 | | | 62,522 | |
| Ratio of expenses to average net assets: | | | | | | | | | | | | | | | | | |
| Gross expense prior to expense reimbursement(3) | | % | | 1.10 | | | 1.03 | | | 1.01 | | | 0.94 | | | 0.65 | |
| Net expenses after expense reimbursement(3)(4) | | % | | 1.00 | # | | 1.00 | # | | 1.00 | | | 0.94 | | | 0.65 | |
| Net investment income after expense reimbursement(3)(4) | | % | | 1.73 | # | | 1.41 | # | | 1.71 | | | 1.80 | | | 1.85 | |
| Portfolio turnover rate | | % | | 126 | | | 208 | | | 78 | | | 126 | | | — | |
(1) | | Commencement of operations. |
(2) | | Total return is calculated assuming reinvestment of all dividends and capital gain distributions at net asset value and does not reflect the effect of insurance contract charges. Total return for periods less than one year is not annualized. |
(3) | | Annualized for periods less than one year. |
(4) | | The Investment Adviser has agreed to limit expenses, (excluding interest, taxes, brokerage and extraordinary expenses) subject to possible recoupment by the Investment Adviser within three years of being incurred. |
| * | | Calculated using average number of shares outstanding throughout the period. |
| ** | | Amount is less than $0.005. |
| † | | As of December 31, 2004, the Portfolio was in its Offering Period. Total return calculation will begin on the commencement date of the Guarantee Period (March 9, 2005). Total return from commencement of operations was 0.10%. |
| †† | | Total return calculation began on March 9, 2005, the first day of the Guarantee Period. Total return for the year ended December 31, 2005, was 2.26%. |
| # | | Impact of waiving the advisory fee for the ING Institutional Prime Money Market Fund holding has less than 0.005% impact on the expense ratio and net investment income ratio. |
See Accompanying Notes to Financial Statements
31
| | |
| ING GET U.S. CORE PORTFOLIO SERIES 8 (UNAUDITED) | | FINANCIAL HIGHLIGHTS |
Selected data for a share of beneficial interest outstanding throughout each period.
| | | | | | | | | | | | | | |
| | | | | Six Months
Ended
June 30,
2008 | | | Year Ended December 31, | | | March 9
2005(1) to
December 31,
2005 | |
| | | | | | 2007 | | | 2006 | | |
Per Share Operating Performance: | | | | | | | | | | | | | | |
| Net asset value, beginning of period | | $ | | 10.74 | | | 11.06 | | | 10.23 | | | 10.00 | |
| Income (loss) from investment operations: | | | | | | | | | | | | | | |
| Net investment income | | $ | | 0.10 | | | 0.15 | * | | 0.17 | * | | 0.15 | * |
| Net realized and unrealized gain (loss) on investments | | $ | | (0.80 | ) | | 0.27 | | | 0.90 | | | 0.08 | |
| Total from investment operations | | $ | | (0.70 | ) | | 0.42 | | | 1.07 | | | 0.23 | |
| Less distributions from: | | | | | | | | | | | | | | |
| Net investment income | | $ | | 0.20 | | | 0.25 | | | 0.20 | | | — | |
| Net realized gains on investments | | $ | | 1.93 | | | 0.49 | | | 0.04 | | | — | |
| Total distributions | | $ | | 2.13 | | | 0.74 | | | 0.24 | | | — | |
| Net asset value, end of period | | $ | | 7.91 | | | 10.74 | | | 11.06 | | | 10.23 | |
Total Return(2) | | % | | (7.18 | ) | | 3.64 | | | 10.70 | | | 1.69 | † |
Ratios and Supplemental Data: | | | | | | | | | | | | | | |
| Net assets, end of period (000’s) | | $ | | 21,488 | | | 26,821 | | | 41,172 | | | 51,960 | |
| Ratio of expenses to average net assets: | | | | | | | | | | | | | | |
| Gross expense prior to expense reimbursement(3) | | % | | 1.13 | | | 1.05 | | | 1.04 | | | 0.94 | |
| Net expenses after expense reimbursement(3)(4) | | % | | 1.00 | # | | 1.00 | # | | 1.00 | | | 0.91 | |
| Net investment income after expense reimbursement(3)(4) | | % | | 1.66 | # | | 1.36 | # | | 1.60 | | | 1.87 | |
| Portfolio turnover rate | | % | | 97 | | | 215 | | | 101 | | | 131 | |
(1) | | Commencement of operations. |
(2) | | Total return is calculated assuming reinvestment of all dividends and capital gain distributions at net asset value and does not reflect the effect of insurance contract charges. Total return for periods less than one year is not annualized. |
(3) | | Annualized for periods less than one year. |
(4) | | The Investment Adviser has agreed to limit expenses, (excluding interest, taxes, brokerage and extraordinary expenses) subject to possible recoupment by the Investment Adviser within three years of being incurred. |
| * | | Calculated using average number of shares outstanding throughout the period. |
| † | | Total return calculation began on June 8, 2005, the first day of the Guarantee Period. Total return from commencement of operations was 2.30%. |
| # | | Impact of waiving the advisory fee for the ING Institutional Prime Money Market Fund holding has less than 0.005% impact on the expense ratio and net investment income ratio. |
See Accompanying Notes to Financial Statements
32
| | |
| ING GET U.S. CORE PORTFOLIO SERIES 9 (UNAUDITED) | | FINANCIAL HIGHLIGHTS |
Selected data for a share of beneficial interest outstanding throughout each period.
| | | | | | | | | | | | | | |
| | | | | Six Months
Ended
June 30,
2008 | | | Year Ended December 31, | | | June 8,
2005(1) to
December 31,
2005 | |
| | | | | | 2007 | | | 2006 | | |
Per Share Operating Performance: | | | | | | | | | | | | | | |
| Net asset value, beginning of period | | $ | | 10.81 | | | 10.93 | | | 10.06 | | | 10.00 | |
| Income (loss) from investment operations: | | | | | | | | | | | | | | |
| Net investment income | | $ | | 0.10 | | | 0.16 | * | | 0.18 | * | | 0.13 | * |
| Net realized and unrealized gain (loss) on investments | | $ | | (0.77 | ) | | 0.29 | | | 0.82 | | | (0.07 | ) |
| Total from investment operations | | $ | | (0.67 | ) | | 0.45 | | | 1.00 | | | 0.06 | |
| Less distributions from: | | | | | | | | | | | | | | |
| Net investment income | | $ | | 0.23 | | | 0.28 | | | 0.13 | | | — | |
| Net realized gains on investments | | $ | | 2.13 | | | 0.29 | | | — | | | — | |
| Total distributions | | $ | | 2.36 | | | 0.57 | | | 0.13 | | | — | |
| Net asset value, end of period | | $ | | 7.78 | | | 10.81 | | | 10.93 | | | 10.06 | |
Total Return(2) | | % | | (6.96 | ) | | 3.93 | | | 10.11 | | | 0.00 | † |
Ratios and Supplemental Data: | | | | | | | | | | | | | | |
| Net assets, end of period (000’s) | | $ | | 15,841 | | | 19,806 | | | 30,694 | | | 41,582 | |
| Ratio of expenses to average net assets: | | | | | | | | | | | | | | |
| Gross expense prior to expense reimbursement(3) | | % | | 1.19 | | | 1.06 | | | 1.09 | | | 0.96 | |
| Net expenses after expense reimbursement(3)(4) | | % | | 1.00 | # | | 1.00 | # | | 1.00 | | | 0.87 | |
| Net investment income after expense reimbursement(3)(4) | | % | | 1.73 | # | | 1.45 | # | | 1.79 | | | 2.21 | |
| Portfolio turnover rate | | % | | 150 | | | 233 | | | 89 | | | 188 | |
(1) | | Commencement of operations. |
(2) | | Total return is calculated assuming reinvestment of all dividends and capital gain distributions at net asset value and does not reflect the effect of insurance contract charges. Total return for periods less than one year is not annualized. |
(3) | | Annualized for periods less than one year. |
(4) | | The Investment Adviser has agreed to limit expenses, (excluding interest, taxes, brokerage and extraordinary expenses) subject to possible recoupment by the Investment Adviser within three years of being incurred. |
| * | | Calculated using average number of shares outstanding throughout the period. |
| † | | Total return calculation began on September 7, 2005 the first day of the Guarantee Period. Total return from commencement of operations was 0.60%. |
| # | | Impact of waiving the advisory fee for the ING Institutional Prime Money Market Fund holding has less than 0.005% impact on the expense ratio and net investment income ratio. |
See Accompanying Notes to Financial Statements
33
| | |
| ING GET U.S. CORE PORTFOLIO SERIES 10 (UNAUDITED) | | FINANCIAL HIGHLIGHTS |
Selected data for a share of beneficial interest outstanding throughout each period.
| | | | | | | | | | | | | | |
| | | | | Six Months
Ended
June 30,
2008 | | | Year Ended December 31, | | | September 7,
2005(1) to
December 31,
2005 | |
| | | | | | 2007 | | | 2006 | | |
Per Share Operating Performance: | | | | | | | | | | | | | | |
| Net asset value, beginning of period | | $ | | 10.89 | | | 10.91 | | | 10.02 | | | 10.00 | |
| Income (loss) from investment operations: | | | | | | | | | | | | | | |
| Net investment income | | $ | | 0.12 | | | 0.18 | * | | 0.16 | * | | 0.09 | * |
| Net realized and unrealized gain (loss) on investments | | $ | | (0.68 | ) | | 0.23 | | | 0.81 | | | (0.07 | ) |
| Total from investment operations | | $ | | (0.56 | ) | | 0.41 | | | 0.97 | | | 0.02 | |
| Less distributions from: | | | | | | | | | | | | | | |
| Net investment income | | $ | | 0.27 | | | 0.21 | | | 0.07 | | | — | |
| Net realized gains on investments | | $ | | 1.90 | | | 0.22 | | | 0.01 | | | — | |
| Total distributions | | $ | | 2.17 | | | 0.43 | | | 0.08 | | | — | |
| Net asset value, end of period | | $ | | 8.16 | | | 10.89 | | | 10.91 | | | 10.02 | |
Total Return(2) | | % | | (5.76 | ) | | 3.63 | | | 9.78 | | | (0.60 | )† |
Ratios and Supplemental Data: | | | | | | | | | | | | | | |
| Net assets, end of period (000’s) | | $ | | 14,502 | | | 17,127 | | | 27,694 | | | 37,137 | |
| Ratio of expenses to average net assets: | | | | | | | | | | | | | | |
| Gross expense prior to expense reimbursement(3) | | % | | 1.17 | | | 1.07 | | | 1.14 | | | 0.82 | |
| Net expenses after expense reimbursement(3)(4) | | % | | 1.00 | | | 1.00 | # | | 1.00 | | | 0.76 | |
| Net investment income after expense reimbursement(3)(4) | | % | | 2.10 | | | 1.62 | # | | 1.54 | | | 2.77 | |
| Portfolio turnover rate | | % | | 178 | | | 194 | | | 93 | | | 80 | |
(1) | | Commencement of operations. |
(2) | | Total return is calculated assuming reinvestment of all dividends and capital gain distributions at net asset value and does not reflect the effect of insurance contract charges. Total return for periods less than one year is not annualized. |
(3) | | Annualized for periods less than one year. |
(4) | | The Investment Adviser has agreed to limit expenses, (excluding interest, taxes, brokerage and extraordinary expenses) subject to possible recoupment by the Investment Adviser within three years of being incurred. |
| * | | Calculated using average number of shares outstanding throughout the period. |
| † | | Total return calculation began on December 6, 2005 the first day of the Guarantee Period. Total return from commencement of operations was 0.20%. |
| # | | Impact of waiving the advisory fee for the ING Institutional Prime Money Market Fund holding has less than 0.005% impact on the expense ratio and net investment income ratio. |
See Accompanying Notes to Financial Statements
34
| | |
| ING GET U.S. CORE PORTFOLIO SERIES 11 (UNAUDITED) | | FINANCIAL HIGHLIGHTS |
Selected data for a share of beneficial interest outstanding throughout each period.
| | | | | | | | | | | | | | |
| | | | | Six Months
Ended
June 30,
2008 | | | Year Ended December 31, | | | December 6,
2005(1) to
December 31,
2005 | |
| | | | | | 2007 | | | 2006 | | |
Per Share Operating Performance: | | | | | | | | | | | | | | |
| Net asset value, beginning of period | | $ | | 10.47 | | | 10.79 | | | 10.02 | | | 10.00 | |
| Income (loss) from investment operations: | | | | | | | | | | | | | | |
| Net investment income | | $ | | 0.10 | | | 0.16 | * | | 0.23 | * | | 0.03 | * |
| Net realized and unrealized gain (loss) on investments | | $ | | (0.68 | ) | | 0.08 | | | 0.55 | | | (0.01 | ) |
| Total from investment operations | | $ | | (0.58 | ) | | 0.24 | | | 0.78 | | | 0.02 | |
| Less distributions from: | | | | | | | | | | | | | | |
| Net investment income | | $ | | 0.25 | | | 0.36 | | | 0.01 | | | — | |
| Net realized gains on investments | | $ | | 1.92 | | | 0.20 | | | — | | | — | |
| Total distributions | | $ | | 2.17 | | | 0.56 | | | 0.01 | | | — | |
| Net asset value, end of period | | $ | | 7.72 | | | 10.47 | | | 10.79 | | | 10.02 | |
Total Return(2) | | % | | (5.70 | ) | | 2.05 | | | 7.06 | †† | | — | † |
Ratios and Supplemental Data: | | | | | | | | | | | | | | |
| Net assets, end of period (000’s) | | $ | | 16,880 | | | 20,564 | | | 35,473 | | | 25,842 | |
| Ratio of expenses to average net assets: | | | | | | | | | | | | | | |
| Gross expenses prior to reimbursement(3) | | % | | 1.16 | | | 1.10 | | | 1.03 | | | 0.65 | |
| Net expenses after reimbursement(3)(4) | | % | | 1.01 | # | | 1.00 | # | | 0.96 | | | 0.65 | |
| Net investment income after expense reimbursement(3)(4) | | % | | 1.83 | # | | 1.49 | # | | 2.22 | | | 3.95 | |
| Portfolio turnover rate | | % | | 136 | | | 267 | | | 114 | | | — | |
(1) | | Commencement of operations. |
(2) | | Total return is calculated assuming reinvestment of all dividends and capital gain distributions at net asset value and does not reflect the effect of insurance contract charges. Total return for periods less than one year is not annualized. |
(3) | | Annualized for periods less than one year. |
(4) | | The Investment Adviser has agreed to limit expenses, (excluding interest, taxes, brokerage and extraordinary expenses) subject to possible recoupment by the Investment Adviser within three years of being incurred. |
| * | | Calculated using average number of shares outstanding throughout the period. |
| † | | As of December 31, 2005, the Portfolio was in its Offering Period. Total return calculation will begin on the commencement date of the Guarantee Period (March 2, 2006). Total return from commencement of operations was 0.20%. |
| †† | | Total return calculation began on March 2, 2006, the first day of the Guarantee Period. Total return for the entire calendar year was 7.81%. |
| # | | Impact of waiving the advisory fee for the ING Institutional Prime Money Market Fund holding has less than 0.005% impact on the expense ratio and net investment income ratio. |
See Accompanying Notes to Financial Statements
35
| | |
| ING GET U.S. CORE PORTFOLIO SERIES 12 (UNAUDITED) | | FINANCIAL HIGHLIGHTS |
Selected data for a share of beneficial interest outstanding throughout each period.
| | | | | | | | | | | |
| | | | | Six Months
Ended
June 30,
2008 | | | Year
Ended
December 31,
2007 | | | March 2,
2006(1) to
December 31,
2006 | |
Per Share Operating Performance: | | | | | | | | | | | |
| Net asset value, beginning of period | | $ | | 11.29 | | | 11.36 | | | 10.00 | |
| Income (loss) from investment operations: | | | | | | | | | | | |
| Net investment income | | $ | | 0.10 | * | | 0.13 | * | | 0.13 | |
| Net realized and unrealized gain (loss) on investments | | $ | | (0.86 | ) | | 0.23 | | | 1.23 | |
| Total from investment operations | | $ | | (0.76 | ) | | 0.36 | | | 1.36 | |
| Less distributions from: | | | | | | | | | | | |
| Net investment income | | $ | | 0.18 | | | 0.15 | | | — | |
| Net realized gains on investments | | $ | | 2.48 | | | 0.28 | | | — | |
| Total distributions | | $ | | 2.66 | | | 0.43 | | | | |
| Net asset value, end of period | | $ | | 7.87 | | | 11.29 | | | 11.36 | |
Total Return(2) | | % | | (7.61 | ) | | 3.02 | | | 12.25 | † |
Ratios and Supplemental Data: | | | | | | | | | | | |
| Net assets, end of period (000’s) | | $ | | 30,943 | | | 46,154 | | | 54,893 | |
| Ratio of expenses to average net assets: | | | | | | | | | | | |
| Gross expense prior to expense reimbursement(3) | | % | | 1.13 | | | 1.09 | | | 0.94 | |
| Net expenses after expense reimbursement(3)(4) | | % | | 1.00 | # | | 1.00 | # | | 0.85 | |
| Net investment income after expense reimbursement(3)(4) | | % | | 1.92 | # | | 1.11 | # | | 1.72 | |
| Portfolio turnover rate | | % | | 133 | | | 231 | | | 57 | |
(1) | | Commencement of operations. |
(2) | | Total return in calculated assuming reinvestment of all dividends and capital gain distributions at net asset value and does not reflect the effect of insurance contract charges. Total return for periods less than one year is not annualized. |
(3) | | Annualized for periods less than one year. |
(4) | | The Investment Adviser has agreed to limit expenses, (excluding interest, taxes, brokerage and extraordinary expenses) subject to possible recoupment by the Investment Adviser within three years of being incurred. |
| * | | Calculated using average number of shares outstanding throughout the period. |
| † | | Total return calculation began June 22, 2006 the first day of the Guarantee Period. Total return from commencement of operations was 13.60%. |
| # | | Impact of waiving the advisory fee for the ING Institutional Prime Money Market Fund holding has less than 0.005% impact on the expense ratio and net investment income ratio. |
See Accompanying Notes to Financial Statements
36
| | |
| ING GET U.S. CORE PORTFOLIO SERIES 13 (UNAUDITED) | | FINANCIAL HIGHLIGHTS |
Selected data for a share of beneficial interest outstanding throughout each period.
| | | | | | | | | | | |
| | | | | Six Months
Ended
June 30,
2008 | | | Year
Ended
December 31,
2007 | | | June 22,
2006(1) to
December 31,
2006 | |
Per Share Operating Performance: | | | | | | | | | | | |
| Net asset value, beginning of period | | $ | | 10.60 | | | 10.16 | | | 10.00 | |
| Income (loss) from investment operations: | | | | | | | | | | | |
| Net investment income | | $ | | 0.12 | | | 0.15 | * | | 0.22 | * |
| Net realized and unrealized gain (loss) on investments | | $ | | (0.49 | ) | | 0.35 | | | (0.06 | ) |
| Total from investment operations | | $ | | (0.37 | ) | | 0.50 | | | 0.16 | |
| Less distributions from: | | | | | | | | | | | |
| Net investment income | | $ | | 0.20 | | | 0.06 | | | — | |
| Net realized gains on investments | | $ | | 0.61 | | | 0.00 | ** | | — | |
| Total distributions | | $ | | 0.81 | | | 0.06 | | | — | |
| Net asset value, end of period | | $ | | 9.42 | | | 10.60 | | | 10.16 | |
Total Return(2) | | % | | (3.60 | ) | | 4.95 | | | (0.59 | )† |
Ratios and Supplemental Data: | | | | | | | | | | | |
| Net assets, end of period (000’s) | | $ | | 62,784 | | | 70,238 | | | 107,215 | |
| Ratio of expenses to average net assets: | | | | | | | | | | | |
| Gross expense prior to expense reimbursement(3) | | % | | 1.04 | | | 1.00 | | | 1.02 | |
| Net expense after expense reimbursement(3)(4) | | % | | 1.00 | # | | 1.00 | # | | 0.73 | |
| Net investment income after expense reimbursement(3)(4) | | % | | 2.23 | # | | 1.44 | # | | 4.15 | |
| Portfolio turnover rate | | % | | 295 | | | 168 | | | — | |
(1) | | Commencement of operations. |
(2) | | Total return is calculated assuming reinvestment of all dividends and capital gain distributions at net asset value and does not reflect the effect of insurance contract charges. Total return for periods less than one year is not annualized. |
(3) | | Annualized for periods less than one year. |
(4) | | The Investment Adviser has agreed to limit expenses, (excluding interest, taxes, brokerage and extraordinary expenses) subject to possible recoupment by the Investment Adviser within three years of being incurred. |
| * | | Calculated using average number of shares outstanding throughout the period. |
| ** | | Amount is less than $0.005. |
| † | | Total return calculation began December 21, 2006 the first day of the Guarantee Period. Total return from commencement of operations was 1.60%. |
| # | | Impact of waiving the advisory fee for the ING Institutional Prime Money Market Fund holding has less than 0.005% impact on the expense ratio and net investment income ratio. |
See Accompanying Notes to Financial Statements
37
| | |
| ING GET U.S. CORE PORTFOLIO SERIES 14 (UNAUDITED) | | FINANCIAL HIGHLIGHTS |
Selected data for a share of beneficial interest outstanding throughout each period.
| | | | | | | | | | | |
| | | | | Six Months
Ended
June 30,
2008 | | | Year
Ended
December 31,
2007 | | | December 21,
2006(1) to
December 31,
2006 | |
Per Share Operating Performance: | | | | | | | | | | | |
| Net asset value, beginning of period | | $ | | 10.41 | | | 10.00 | | | 10.00 | |
| Income (loss) from investment operations: | | | | | | | | | | | |
| Net investment income (loss) | | $ | | 0.17 | | | 0.26 | * | | (0.00 | )** |
| Net realized and unrealized gain (loss) on investments | | $ | | (0.52 | ) | | 0.15 | | | — | |
| Total from investment operations | | $ | | (0.35 | ) | | 0.41 | | | (0.00 | )** |
| Less distributions from: | | | | | | | | | | | |
| Net investment income | | $ | | 0.19 | | | — | | | — | |
| Net realized gains on investments | | $ | | 0.06 | | | — | | | — | |
| Total distributions | | $ | | 0.25 | | | — | | | — | |
| Net asset value, end of period | | $ | | 9.81 | | | 10.41 | | | 10.00 | |
Total Return(2) | | % | | (3.36 | ) | | 1.86 | †† | | — | † |
Ratios and Supplemental Data: | | | | | | | | | | | |
| Net assets, end of period (000’s) | | $ | | 111,071 | | | 124,490 | | | 85 | |
| Ratio of expenses to average net assets: | | | | | | | | | | | |
| Gross expense prior to expense reimbursement(3) | | % | | 1.02 | | | 0.95 | | | — | |
| Net expense after expense reimbursement(3)(4) | | % | | 1.00 | | | 0.93 | | | 0.58 | |
| Net investment income (loss) after expense reimbursement(3)(4) | | % | | 2.99 | | | 2.52 | | | (0.58 | ) |
| Portfolio turnover rate | | % | | 226 | | | 120 | | | — | |
(1) | | Commencement of operations. |
(2) | | Total return is calculated assuming reinvestment of all dividends and capital gain distributions at net asset value and does not reflect the effect of insurance contract charges. Total return for periods less than one year is not annualized. |
(3) | | Annualized for periods less than one year. |
(4) | | The Investment Adviser has agreed to limit expenses, (excluding interest, taxes, brokerage and extraordinary expenses) subject to possible recoupment by the Investment Adviser within three years of being incurred. |
| * | | Calculated using average number of shares outstanding throughout the period. |
| ** | | Amount is more than $(0.005). |
| † | | As of December 31, 2006, the Portfolio was in its offering period. Total return calculation will begin on the commencement date of the Guarantee Period (June 21, 2007.) Total return from commencement of operations was 0.00%. |
| †† | | Total return calculation began on June 21, 2007 the first day of the Guarantee Period. Total return for the year ended December 31, 2007 was 4.10%. |
See Accompanying Notes to Financial Statements
38
NOTES TO FINANCIAL STATEMENTSASOF JUNE 30, 2008 (UNAUDITED)
NOTE 1 — ORGANIZATION
Organization. The ING Variable Insurance Trust (the “Trust”) was organized as a Delaware statutory trust on July 15, 1999 and is registered with the SEC under the Investment Company Act of 1940, as amended (“1940 Act”) as a diversified open-end management investment company. There are fourteen separate investment Series which comprise the Trust. The fourteen that are in this report are as follows: ING GET U.S. Core Portfolio Series 1 (“Series 1”), ING GET U.S. Core Portfolio Series 2 (“Series 2”), ING GET U.S. Core Portfolio Series 3 (“Series 3”), ING GET U.S. Core Portfolio Series 4 (“Series 4”), ING GET U.S. Core Portfolio Series 5 (“Series 5”), ING GET U.S. Core Portfolio Series 6 (“Series 6”), ING GET U.S. Core Portfolio Series 7 (“Series 7”), ING GET U.S. Core Portfolio Series 8 (“Series 8”), ING GET U.S. Core Portfolio Series 9 (“Series 9”), ING GET U.S. Core Portfolio Series 10 (“Series 10”), ING GET U.S. Core Portfolio Series 11 (“Series 11”), ING GET U.S. Core Portfolio Series 12 (“Series 12”), ING GET U.S. Core Portfolio Series 13 (“Series 13”) and ING GET U.S. Core Portfolio Series 14 (“Series 14”) (each, a “Series” and collectively, “the Series”).
During the Guarantee Period, the Series seek to achieve maximum total return and minimal exposure of the Series’ assets to a market value loss by participating, to the extent possible, in favorable equity market performance.
If during the Guarantee Period the equity markets experience a major decline, the Series’ assets may become largely or entirely invested in the Fixed Component. Use of the Fixed Component reduces the Series’ ability to participate as fully in upward equity market movements, and therefore represents some loss of opportunity, or opportunity cost, compared to a portfolio that is more heavily invested in equities. The insurance companies offering these Series currently are ING Life Insurance & Annuity Company (“ILIAC”) and ING USA Annuity and Life Insurance Company (“ING USA”). The insurance companies offering these Series guarantee Contract holders and Participants that on the Maturity Date they will receive no less than the value of their separate account investment directed to the Series as of the last day of the Offering Period, adjusted for certain charges. The value of dividends and distributions made by the Series throughout the Guarantee Period is included in determining whether, for purposes of the Guarantee, the value of a shareholder’s investment on the Maturity Date is no less than the value of their investment as of the last day
of the Offering Period. Amounts withdrawn prior to the Maturity Date do not get the benefit of the Guarantee. The following information is related to the Series:
| | | | | | |
| | | Offering Period | | Guarantee Period | | Maturity Date |
Series 1* | | 06/13/03 — 09/11/03 | | 09/12/03 — 09/12/08 | | 09/12/08 |
Series 2* | | 09/12/03 — 12/11/03 | | 12/12/03 — 12/12/08 | | 12/12/08 |
Series 3* | | 12/12/03 —03/11/04 | | 03/12/04 — 03/13/09 | | 03/13/09 |
Series 4* | | 03/12/04 — 06/10/04 | | 06/11/04 — 06/12/09 | | 06/12/09 |
Series 5* | | 06/11/04 — 09/09/04 | | 09/10/04 — 09/09/11 | | 09/09/11 |
Series 6* | | 09/10/04 — 12/09/04 | | 12/10/04 — 12/09/11 | | 12/09/11 |
Series 7* | | 12/10/04 — 03/08/05 | | 03/09/05 — 03/08/12 | | 03/08/12 |
Series 8* | | 03/09/05 — 06/07/05 | | 06/08/05 — 06/07/12 | | 06/07/12 |
Series 9* | | 06/08/05 — 09/06/05 | | 09/07/05 — 09/06/12 | | 09/06/12 |
Series 10* | | 09/07/05 — 12/05/05 | | 12/06/05 — 12/05/12 | | 12/05/12 |
Series 11* | | 12/06/05 — 03/01/06 | | 03/02/06 — 02/28/13 | | 02/28/13 |
Series 12* | | 03/02/06 — 06/21/06 | | 06/22/06 — 06/20/13 | | 06/20/13 |
Series 13* | | 06/22/06 — 12/20/06 | | 12/21/06 — 12/19/13 | | 12/19/13 |
Series 14* | | 12/21/06 — 06/20/07 | | 06/21/07 — 06/19/14 | | 06/19/14 |
| * | Closed to new investors. |
Shares of the Series are offered to insurance company separate accounts that fund both annuity and life insurance contracts and certain tax-qualified retirement plans. At June 30, 2008 separate accounts of ILIAC and ING USA and their affiliates held all the shares outstanding of the Series.
In accordance with the original fund prospectuses, Series 1 will liquidate during the fiscal year on the Maturity Date listed above. Accounting rules require that financial statements for entities in liquidation, or for which liquidation appears imminent, be prepared on a liquidation basis of accounting. As the U.S. generally accepted accounting principles for investment companies are materially consistent with the liquidation basis of accounting, the financial statement for Series 1 has been prepared in conformity with both accounting methods.
NOTE 2 — SIGNIFICANT ACCOUNTING POLICIES
The following significant accounting policies are consistently followed by the Series in the preparation of their financial statements, and such policies are in conformity with U.S. generally accepted accounting principles (“GAAP”) for investment companies.
| A. | Security Valuation. Investments in equity securities traded on a national securities exchange are valued at the last reported sale price. Securities reported by NASDAQ will be valued at the NASDAQ official closing prices. Securities traded on an exchange or NASDAQ for which there has been no sale and securities traded in the over-the-counter-market are valued at the mean between the last reported bid and ask prices. All investments quoted in foreign |
39
NOTES TO FINANCIAL STATEMENTSASOF JUNE 30, 2008 (UNAUDITED) (CONTINUED)
NOTE 2 — SIGNIFICANT ACCOUNTING POLICIES (continued)
| | currencies will be valued daily in U.S. dollars on the basis of the foreign currency exchange rates prevailing at that time. Debt securities are valued at prices obtained from independent services or from one or more dealers making markets in the securities and may be adjusted based on the Series’ valuation procedures. U.S. government obligations are valued by using market quotations or independent pricing services that use prices provided by market-makers or estimates of market values obtained from yield data relating to instruments or securities with similar characteristics. |
Securities and assets for which market quotations are not readily available (which may include certain restricted securities which are subject to limitations as to their sale) are valued at their fair values as determined in good faith by or under the supervision of the Series’ Board of Trustees (the “Board”), in accordance with methods that are specifically authorized by the Board. Securities traded on exchanges, including foreign exchanges, which close earlier than the time that a Series calculates its NAV may also be valued at their fair values as determined in good faith by or under the supervision of a Series’ Board, in accordance with methods that are specifically authorized by the Board. The valuation techniques applied in any specific instance are likely to vary from case to case. With respect to a restricted security, for example, consideration is generally given to the cost of the investment, the market value of any unrestricted securities of the same class at the time of valuation, the potential expiration of restrictions on the security, the existence of any registration rights, the costs to the Series related to registration of the security, as well as factors relevant to the issuer itself. Consideration may also be given to the price and extent of any public trading in similar securities of the issuer or comparable companies’ securities. The value of a foreign security traded on an exchange outside the United States is generally based on the price of a foreign security on the principal foreign exchange where it trades as of the time the Series determines its NAV or if the foreign exchange closes prior to the time the Series determines its NAV, the most recent closing price of the foreign security on its principal exchange. Trading in certain non-U.S. securities may not take
place on all days on which the New York Stock Exchange (“NYSE”) is open. Further, trading takes place in various foreign markets on days on which the NYSE is not open. Consequently, the calculation of the Series’ NAV may not take place contemporaneously with the determination of the prices of securities held by the Series in foreign securities markets. Further, the value of the Series’ assets may be significantly affected by foreign trading on days when a shareholder cannot purchase or redeem shares of the Series. In calculating the Series’ NAV, foreign securities in foreign currency are converted to U.S. dollar equivalents. If an event occurs after the time at which the market for foreign securities held by the Series closes but before the time that the Series’ NAV in calculated, such event may cause the closing price on the foreign exchange to not represent a readily available reliable market value quotation for such securities at the time the Series determines its NAV. In such a case, the Series will use the fair value of such securities as determined under the Series’ valuation procedures. Events after the close of trading on a foreign market that could require the Series to fair value some or all of its foreign securities include, among others, securities trading in the U.S. and other markets, corporate announcements, natural and other disasters, and political and other events. Among other elements of analysis in the determination of a security’s fair value, the Board has authorized the use of one or more independent research services to assist with such determinations. An independent research service may use statistical analyses and quantitative models to help determine fair value as of the time a Series calculates its NAV. There can be no assurance that such models accurately reflect the behavior of the applicable markets or the effect of the behavior of such markets on the fair value of securities, or that such markets will continue to behave in a fashion that is consistent with such models. Unlike the closing price of a security on an exchange, fair value determinations employ elements of judgment. Consequently, the fair value assigned to a security may not represent the actual value that the Series could obtain if it were to sell the security at the time of the close of the NYSE. Pursuant to procedures adopted by the Board, the Series is not obligated to use the fair valuations suggested by any research service, and valuation recommendations provided by such
40
NOTES TO FINANCIAL STATEMENTSASOF JUNE 30, 2008 (UNAUDITED) (CONTINUED)
NOTE 2 — SIGNIFICANT ACCOUNTING POLICIES (continued)
research services may be overridden if other events have occurred or if other fair valuations are determined in good faith to be more accurate. Unless an event is such that it causes the Series to determine that the closing prices for one or more securities do not represent readily available reliable market value quotations at the time the Series determines its NAV, events that occur between the time of the close of the foreign market on which they are traded and the close of regular trading on the NYSE will not be reflected in the Series’ NAV. Investments in securities maturing in 60 days or less from date of acquisition are valued at amortized cost which approximates market value.
Effective for fiscal years beginning after November 15, 2007, Financial Accounting Standards Board (“FASB”) Statement of Financial Accounting Standards No. 157, “Fair Value Measurements”, establishes a hierarchy for measuring fair value of assets and liabilities. As required by the standard, each investment asset or liability of the Portfolios is assigned a level at measurement date based on the significance and source of the inputs to its valuation. Quoted prices in active markets for identical securities are classified as “Level 1”, inputs other than quoted prices for an asset that are observable are classified as “Level 2” and unobservable inputs, including the sub-adviser’s judgment about the assumptions that a market participant would use in pricing an asset or liability are classified as “Level 3”. The inputs used for valuing securities are not necessarily an indication of the risks associated with investing in those securities. A table summarizing the Portfolios’ investments under these levels of classification is included following the Portfolios of Investments.
| B. | Security Transactions and Revenue Recognition. Security transactions are recorded on the trade date. Realized gains or losses on sales of investments are calculated on the identified cost basis. Interest income is recorded on the accrual basis. Premium amortization and discount accretion are determined using the effective yield method. Dividend income is recorded on the ex-dividend date. |
| C. | Foreign Currency Translation. The books and records of the Series are maintained in U.S. dollars. Any foreign currency amounts are translated into U.S. dollars on the following basis: |
| | (1) | Market value of investment securities, other assets and liabilities — at the exchange rates prevailing at the end of the day. |
| | (2) | Purchases and sales of investment securities, income and expenses — at the rates of exchange prevailing on the respective dates of such transactions. |
Although the net assets and the market values are presented at the foreign exchange rates at the end of the day, the Series do not isolate the portion of the results of operations resulting from changes in foreign exchange rates on investments from the fluctuations arising from changes in market prices of securities held. Such fluctuations are included with the net realized and unrealized gains or losses from investments. For securities, which are subject to foreign withholding tax upon disposition, liabilities are recorded on the Statements of Assets and Liabilities for the estimated tax withholding based on the securities current market value. Upon disposition, realized gains or losses on such securities are recorded net of foreign withholding tax.
Reported net realized foreign exchange gains or losses arise from sales of foreign currencies, currency gains or losses realized between the trade and settlement dates on securities transactions, the difference between the amounts of dividends, interest, and foreign withholding taxes recorded on the Series’ books and the U.S. dollar equivalent of the amounts actually received or paid. Net unrealized foreign exchange gains and losses arise from changes in the value of assets and liabilities other than investments in securities at fiscal year end, resulting from changes in the exchange rate. Foreign security and currency transactions may involve certain considerations and risks not typically associated with investing in U.S. companies and U.S. government securities. These risks include, but are not limited to, revaluation of currencies and future adverse political and economic developments which could cause securities and their markets to be less liquid and prices more volatile than those of comparable U.S. companies and U.S. government securities.
| D. | Futures Contracts. The Series may enter into futures contracts involving foreign currency, interest rates, securities and securities indices. A futures contract obligates the seller of the contract to deliver and the purchaser of the contract to take delivery of the type of foreign currency, financial |
41
NOTES TO FINANCIAL STATEMENTSASOF JUNE 30, 2008 (UNAUDITED) (CONTINUED)
NOTE 2 — SIGNIFICANT ACCOUNTING POLICIES (continued)
| | instrument or security called for in the contract at a specified future time for a specified price. Upon entering into such a contract, a Series is required to deposit and maintain as collateral such initial margin as required by the exchange on which the contract is traded. Pursuant to the contract, the Series agrees to receive from or pay to the broker an amount equal to the daily fluctuations in the value of the contract. Such receipts or payments are known as variation margins and are recorded as unrealized gains or losses by the Series. When the contract is closed, the Series records a realized gain or loss equal to the difference between the value of the contract at the time it was opened and the value at the time it was closed. |
| E. | Distributions to Shareholders. Dividends from net investment income and net realized gains, if any, are declared and paid annually by the Series. Distributions are determined annually in accordance with federal tax principles, which may differ from U.S. generally accepted accounting principles for investment companies. The Series may make distributions on a more frequent basis to comply with the distribution requirements of the Internal Revenue Code. Distributions are recorded on the ex-dividend date. The characteristics of income and gains are determined in accordance with income tax regulations, which may differ from accounting principles generally accepted in the United States of America for investment companies. |
| F. | Federal Income Taxes. It is the Series’ policy to comply with subchapter M of the Internal Revenue Code and related excise tax provisions applicable to regulated investment companies and to distribute substantially all of their net investment income and any net realized capital gains to their shareholders. Therefore, no federal income tax provision is required. No capital gain distributions shall be made until any capital loss carryforwards have been fully utilized or expire. |
| G. | Use of Estimates. The preparation of financial statements in conformity with U.S. generally accepted accounting principles requires management to make estimates and assumptions that affect the reported amounts of assets and liabilities and disclosure of contingent assets and liabilities at the date of the financial statements |
| | and the reported amounts of increases and decreases in net assets from operations during the reporting period. Actual results could differ from those estimates. |
| H. | Repurchase Agreements. Each Series may invest in repurchase agreements only with government securities dealers recognized by the Board of Governors of the Federal Reserve System. Under such agreements, the seller of the security agrees to repurchase it at a mutually agreed upon time and price. The resale price is in excess of the purchase price and reflects an agreed upon interest rate for the period of time the agreement is outstanding. The period of the repurchase agreements is usually short, from overnight to one week, while the underlying securities generally have longer maturities. Each Series will receive as collateral cash or securities whose market value is equal to at least 100% of the carrying amount of the repurchase agreements, plus accrued interest, being invested by the Series. The underlying collateral is valued daily on a mark-to-market basis to assure that the value, including accrued interest is at least equal to the repurchase price. There would be potential loss to the Series in the event the Series is delayed or prevented from exercising its right to dispose of the collateral, and it might incur disposition costs in liquidating the collateral. |
| I. | Delayed Delivery Transactions. A Series may purchase or sell securities on a when-issued or forward commitment basis. The price of the underlying securities and date when the securities will be delivered and paid for are fixed at the time the transaction is negotiated. The market value of such is identified in the Series’ Portfolio of Investments. Losses may arise due to changes in the market value of the securities or from the inability of counterparties to meet the terms of the contract. In connection with such purchases, the Series are required to hold liquid assets as collateral with the Series’ custodian sufficient to cover the purchase price. |
| J. | Indemnifications. In the normal course of business, the Trust may enter into contracts that provide certain indemnifications. The Trust’s maximum exposure under these arrangements is dependent on future claims that may be made against the Series and, therefore, cannot be estimated; however, based on experience, the risk of loss from such claims is considered remote. |
42
NOTES TO FINANCIAL STATEMENTSASOF JUNE 30, 2008 (UNAUDITED) (CONTINUED)
NOTE 3 — INVESTMENT TRANSACTIONS
For the six months ended June 30, 2008, the cost of purchases and proceeds of sales of securities, excluding short-term and U.S. government securities, were as follows:
| | | | | | |
| | | Purchases | | Sales |
Series 1 | | $ | 7,873,680 | | $ | 29,300,034 |
Series 2 | | | 5,093,095 | | | 19,197,705 |
Series 3 | | | 5,703,185 | | | 21,695,074 |
Series 4 | | | 15,083,074 | | | 25,297,962 |
Series 5 | | | 8,449,725 | | | 21,856,131 |
Series 6 | | | 22,098,153 | | | 41,346,059 |
Series 7 | | | 15,704,280 | | | 29,044,522 |
Series 8 | | | 8,945,345 | | | 17,309,678 |
Series 9 | | | 7,582,696 | | | 13,586,529 |
Series 10 | | | 22,596,319 | | | 28,590,999 |
Series 11 | | | 4,802,445 | | | 17,897,445 |
Series 12 | | | 37,812,708 | | | 63,388,443 |
Series 13 | | | 159,381,598 | | | 197,804,179 |
Series 14 | | | 153,302,413 | | | 197,319,001 |
U.S. government securities not included above were as follows:
| | | | | |
| | | Purchases | | Sales |
Series 2 | | $ | — | | 4,840,830 |
Series 3 | | | 14,135,882 | | 6,775,556 |
Series 4 | | | 5,370,475 | | — |
Series 5 | | | 18,497,028 | | 8,453,695 |
Series 6 | | | 44,055,268 | | 31,983,697 |
Series 7 | | | 30,861,619 | | 23,182,465 |
Series 8 | | | 14,242,286 | | 9,565,550 |
Series 9 | | | 18,971,940 | | 15,815,772 |
Series 10 | | | 5,132,460 | | — |
Series 11 | | | 18,984,855 | | 8,525,573 |
Series 12 | | | 13,509,440 | | — |
Series 13 | | | 36,211,221 | | — |
Series 14 | | | 100,428,025 | | 65,651,752 |
NOTE 4 — INVESTMENT MANAGEMENT AND ADMINISTRATION FEES
Each Series has entered into an investment management agreement (“Investment Management Agreement”) with ING Investments, LLC (the “Investment Adviser”). The Investment Management Agreement compensates the Investment Adviser with a fee, computed daily and payable monthly, based on the average daily net assets of each Series. The fee for each Series is 0.25% during its Offering Period and 0.60% during its Guarantee Period.
ING Funds sub-advised by ING IM are permitted to invest end-of-day cash balances into ING Institutional Prime Money Market Fund. Investment Management fees paid by the funds will be reduced by an amount equal to the management fees paid indirectly to ING Institutional Prime Money Market with respect to assets
invested by the funds. For the six months ended June 30, 2008, the Series waived the following amounts, which are not subject to recoupment:
| | | |
Series 1 | | $ | 93 |
Series 2 | | | 62 |
Series 3 | | | 80 |
Series 4 | | | 42 |
Series 5 | | | 44 |
Series 6 | | | 53 |
Series 7 | | | 36 |
Series 8 | | | 21 |
Series 9 | | | 16 |
Series 10 | | | 36 |
Series 11 | | | 44 |
Series 12 | | | 27 |
Series 13 | | | 104 |
The Investment Adviser has engaged ING IM, to serve as sub-adviser to each Series. ING IM is responsible for managing the assets of each Series in accordance with its investment objective and policies, subject to such policies as the Board of the Investment Adviser may determine.
ING Funds Services, LLC (the “Administrator”) acts as the administrator and provides certain administrative and shareholder services necessary for each Series’ operations and is responsible for the supervision of other service providers. For its services, the Administrator is entitled to receive from each Series a fee at an annual rate of 0.055% on the first $5 billion of average daily net assets and 0.030% thereafter.
The Investment Adviser, ING IM and the Administrator are indirect, wholly-owned subsidiaries of ING Groep N.V., (“ING Groep”). ING Groep is a global financial institution of Dutch origin offering banking, investments, life insurance and retirement services to over 75 million private, corporate and institutional clients in more than 50 countries. With a diverse workforce of about 125,000 people, ING Groep comprises a broad spectrum of prominent companies that increasingly serve their clients under the ING brand.
NOTE 5 — DISTRIBUTION FEES
The Series have adopted a Distribution Plan pursuant to Rule 12b-1 under the 1940 Act (the “12b-1 Plan”), whereby ING Funds Distributor, LLC (“IFD” or the “Distributor”) is compensated by the Series for expenses incurred in the distribution of each Series’ shares (“Distribution Fees”). Pursuant to the 12b-1 Plan, the Distributor is entitled to a payment each month to compensate for expenses incurred in the distribution and promotion of the Series’ shares, including expenses
43
NOTES TO FINANCIAL STATEMENTSASOF JUNE 30, 2008 (UNAUDITED) (CONTINUED)
NOTE 5 — DISTRIBUTION FEES (continued)
incurred in printing prospectuses and reports used for sales purposes, expenses incurred in preparing and printing sales literature and other such distribution related expenses, including distribution or shareholder servicing fees (“Servicing Fees”) paid to securities dealers who have executed a distribution agreement with the Distributor. Under the 12b-1 Plan, the Series pays the Distributor a Distribution Fee rate of 0.25% based on average daily net assets.
NOTE 6 — OTHER TRANSACTIONS WITH AFFILIATED AND RELATED PARTIES
At June 30, 2008, the Series had the following amounts recorded in payable to affiliates on the accompanying Statements of Assets and Liabilities:
| | | | | | | | | | | | | | | |
Series | | Accrued Investment Management Fees | | Accrued Administrative Fees | | Accrued Shareholder Service and Distribution Fees | | Accrued Recoupment | | Total |
Series 1 | | $ | 39,558 | | $ | 3,627 | | $ | 16,485 | | $ | 948 | | $ | 60,618 |
Series 2 | | | 29,009 | | | 2,660 | | | 12,089 | | | 2,010 | | | 45,768 |
Series 3 | | | 42,783 | | | 3,923 | | | 17,831 | | | 1,108 | | | 65,645 |
Series 4 | | | 18,356 | | | 1,683 | | | 7,650 | | | — | | | 27,689 |
Series 5 | | | 12,318 | | | 1,129 | | | 5,134 | | | — | | | 18,581 |
Series 6 | | | 25,026 | | | 2,295 | | | 10,431 | | | — | | | 37,752 |
Series 7 | | | 16,728 | | | 1,534 | | | 6,972 | | | — | | | 25,234 |
Series 8 | | | 10,828 | | | 993 | | | 4,514 | | | — | | | 16,335 |
Series 9 | | | 8,026 | | | 736 | | | 3,345 | | | — | | | 12,107 |
Series 10 | | | 7,272 | | | 667 | | | 3,030 | | | — | | | 10,969 |
Series 11 | | | 8,407 | | | 771 | | | 3,503 | | | 2,404 | | | 15,085 |
Series 12 | | | 15,888 | | | 1,472 | | | 6,693 | | | — | | | 24,053 |
Series 13 | | | 30,982 | | | 2,842 | | | 12,916 | | | — | | | 46,740 |
Series 14 | | | 54,552 | | | 5,001 | | | 22,730 | | | — | | | 82,283 |
The Trust has adopted a Retirement Policy (“Policy”) covering all independent trustees of the Series who will have served as an independent Trustee for at least five years at the time of retirement. Benefits under this policy are based on an annual rate as defined in the policy agreement. The Trust has also adopted a deferred compensation plan.
At June 30, 2008, the following indirect, wholly owned subsidiaries of ING Groep owned the following Series:
ING Life Insurance and Annuity Company — Series 1 (16.77%); Series 2 (16.47%); Series 3 (46.34%); Series 4 (8.34%); Series 5 (10.24%); Series 6 (55.30%); Series 7 (51.70%); Series 8 (60.13%); Series 9 (57.84%); Series 10 (56.82%); Series 11 (51.92%); Series 12 (89.11%); Series 13 (46.69%); and Series 14 (20.27%).
ING USA Annuity and Life Insurance Company — Series 1 (79.59%); Series 2 (75.45%); Series 3 (50.81%); Series 4 (83.84%); Series 5 (76.68%); Series 6 (41.81%); Series 7 (40.16%); Series 8 (37.11%); Series 9 (40.69%); Series 10 (36.83%); Series 11 (46.69%); Series 12 (10.71%); Series 13 (52.23%); and Series 14 (71.32%).
ReliaStar Life Insurance Company of New York — Series 2 (8.08%); Series 4 (7.82%); Series 5 (13.08%); Series 7 (8.14%); Series 10 (6.35%); and Series 14 (8.41%).
NOTE 7 — OTHER ACCRUED EXPENSES AND LIABILITIES
At June 30, 2008, the Series had the following payables included in Other Accrued Expenses and Liabilities on the Statements of Assets and Liabilities that exceeded 5% of total liabilities.
| | | | | |
Series | | Expense | | Amount |
Series 2 | | Custody | | $ | 9,754 |
| | Professional | | | 16,046 |
| | Postage | | | 7,690 |
Series 3 | | Custody | | | 9,909 |
| | Professional | | | 19,096 |
| | Postage | | | 11,925 |
Series 11 | | Custody | | | 10,548 |
| | Professional | | | 10,406 |
Series 14 | | Professional | | | 7,912 |
| | Legal | | | 8,959 |
| | Postage | | | 8,586 |
NOTE 8 — EXPENSE LIMITATIONS
ING Investments, LLC has entered into a written expense limitation agreement (“Expense Limitation Agreement”) with each Series whereby the Investment Adviser has agreed to limit expenses, excluding interest, taxes, brokerage and extraordinary expenses (and “Acquired Fund Fees and Expenses” stemming from investments in other investment companies) to 0.65% during the Offering Period and 1.00% during the Guarantee Period.
The Investment Adviser may at a later date recoup from a Series for management fees waived and other expenses assumed by the Investment Adviser during the previous 36 months, but only if, after such recoupment, the Series’ expense ratio does not exceed the percentage described above. Waived and reimbursed fees net of any recoupment by the Investment Adviser of such waived and reimbursed fees, are reflected on the accompanying Statements of Operations for each Series. Amounts payable by the Investment Adviser are reflected in the Statements of Assets and Liabilities for each Series.
44
NOTES TO FINANCIAL STATEMENTSASOF JUNE 30, 2008 (UNAUDITED) (CONTINUED)
NOTE 8 — EXPENSE LIMITATIONS (continued)
As of June 30, 2008, the amounts of waived and reimbursed fees that are subject to possible recoupment by the Investment Adviser and the related expiration dates are as follows:
| | | | | | | | | | |
| | | June 30, |
| | | 2009 | | 2010 | | 2011 | | Total |
Series 1 | | — | | — | | $ | 1,935 | | $ | 1,935 |
Series 2 | | — | | 892 | | | 5,955 | | | 6,847 |
Series 3 | | — | | 1,622 | | | 996 | | | 2,618 |
Series 4 | | 3,050 | | — | | | 11,071 | | | 14,121 |
Series 5 | | 21,696 | | 266 | | | 12,378 | | | 34,340 |
Series 6 | | — | | — | | | 16,795 | | | 16,795 |
Series 7 | | — | | 22,451 | | | 20,428 | | | 42,879 |
Series 8 | | 14,270 | | 19,858 | | | 23,165 | | | 57,293 |
Series 9 | | 38,087 | | 18,636 | | | 24,061 | | | 80,784 |
Series 10 | | 19,908 | | 42,196 | | | 17,112 | | | 79,216 |
Series 11 | | 11,263 | | 37,886 | | | 22,348 | | | 71,497 |
Series 12 | | 647 | | 65,202 | | | 36,198 | | | 102,047 |
Series 13 | | — | | 41,214 | | | 14,538 | | | 55,752 |
Series 14 | | — | | 9,082 | | | 20,732 | | | 29,814 |
The Expense Limitation Agreement is contractual and shall renew automatically for one-year terms unless ING Investments provides written notice of the termination of the Expense Limitation Agreement within 90 days of the end of the then current term.
NOTE 9 — CAPITAL SHARES
Transactions in capital shares and dollars were as follows:
| | | | | | | | |
| | | Series 1 | |
| | | Six Months Ended June 30, 2008 | | | Year Ended December 31, 2007 | |
(Number of Shares) | | | | | | | | |
Dividends reinvested | | | 1,060,244 | | | | 423,680 | |
Shares redeemed | | | (992,294 | ) | | | (2,393,593 | ) |
| | | | | | | | |
Net increase (decrease) in shares outstanding | | | 67,950 | | | | (1,969,913 | ) |
| | | | | | | | |
($) | | | | | | | | |
Dividends reinvested | | $ | 9,510,392 | | | $ | 4,435,927 | |
Shares redeemed | | | (9,756,677 | ) | | | (25,066,654 | ) |
| | | | | | | | |
Net decrease | | $ | (246,285 | ) | | $ | (20,630,727 | ) |
| | | | | | | | |
| | | | | | | | |
| | | Series 2 | |
| | | Six Months Ended June 30, 2008 | | | Year Ended December 31, 2007 | |
(Number of Shares) | | | | | | | | |
Dividends reinvested | | | 633,520 | | | | 277,916 | |
Shares redeemed | | | (880,012 | ) | | | (2,090,858 | ) |
| | | | | | | | |
Net decrease in shares outstanding | | | (246,492 | ) | | | (1,812,942 | ) |
| | | | | | | | |
($) | | | | | | | | |
Dividends reinvested | | $ | 5,847,383 | | | $ | 2,868,092 | |
Shares redeemed | | | (8,812,829 | ) | | | (21,655,581 | ) |
| | | | | | | | |
Net decrease | | $ | (2,965,446 | ) | | $ | (18,787,489 | ) |
| | | | | | | | |
| | | | | | | | |
| | | Series 3 | |
| | | Six Months Ended June 30, 2008 | | | Year Ended December 31, 2007 | |
(Number of Shares) | | | | | | | | |
Dividends reinvested | | | 642,296 | | | | 270,502 | |
Shares redeemed | | | (1,098,960 | ) | | | (3,289,095 | ) |
| | | | | | | | |
Net decrease in shares outstanding | | | (456,664 | ) | | | (3,018,593 | ) |
| | | | | | | | |
($) | | | | | | | | |
Dividends reinvested | | $ | 6,255,965 | | | $ | 2,842,976 | |
Shares redeemed | | | (11,338,238 | ) | | | (34,492,183 | ) |
| | | | | | | | |
Net decrease | | $ | (5,082,273 | ) | | $ | (31,649,207 | ) |
| | | | | | | | |
| | | | | | | | |
| | | Series 4 | |
| | | Six Months Ended June 30, 2008 | | | Year Ended December 31, 2007 | |
(Number of Shares) | | | | | | | | |
Dividends reinvested | | | 674,210 | | | | 244,496 | |
Shares redeemed | | | (508,388 | ) | | | (1,623,628 | ) |
| | | | | | | | |
Net increase (decrease) in shares outstanding | | | 165,822 | | | | (1,379,132 | ) |
| | | | | | | | |
($) | | | | | | | | |
Dividends reinvested | | $ | 5,899,336 | | | $ | 2,625,885 | |
Shares redeemed | | | (5,072,766 | ) | | | (17,510,764 | ) |
| | | | | | | | |
Net increase (decrease) | | $ | 826,570 | | | $ | (14,884,879 | ) |
| | | | | | | | |
| | | | | | | | |
| | | Series 5 | |
| | | Six Months Ended June 30, 2008 | | | Year Ended December 31, 2007 | |
(Number of Shares) | | | | | | | | |
Dividends reinvested | | | 617,990 | | | | 189,307 | |
Shares redeemed | | | (335,581 | ) | | | (669,026 | ) |
| | | | | | | | |
Net increase (decrease) in shares outstanding | | | 282,409 | | | | (479,719 | ) |
| | | | | | | | |
($) | | | | | | | | |
Dividends reinvested | | $ | 4,999,537 | | | $ | 2,103,201 | |
Shares redeemed | | | (3,276,973 | ) | | | (7,328,779 | ) |
| | | | | | | | |
Net increase (decrease) | | $ | 1,722,564 | | | $ | (5,225,578 | ) |
| | | | | | | | |
| | | | | | | | |
| | | Series 6 | |
| | | Six Months Ended June 30, 2008 | | | Year Ended December 31, 2007 | |
(Number of Shares) | | | | | | | | |
Dividends reinvested | | | 1,128,841 | | | | 490,437 | |
Shares redeemed | | | (756,227 | ) | | | (1,879,671 | ) |
| | | | | | | | |
Net increase (decrease) in shares outstanding | | | 372,614 | | | | (1,389,234 | ) |
| | | | | | | | |
($) | | | | | | | | |
Dividends reinvested | | $ | 9,425,827 | | | $ | 5,360,481 | |
Shares redeemed | | | (7,426,082 | ) | | | (20,568,370 | ) |
| | | | | | | | |
Net increase (decrease) | | $ | 1,999,745 | | | $ | (15,207,889 | ) |
| | | | | | | | |
45
NOTES TO FINANCIAL STATEMENTSASOF JUNE 30, 2008 (UNAUDITED) (CONTINUED)
NOTE 9 — CAPITAL SHARES (continued)
| | | | | | | | |
| | | Series 7 | |
| | | Six Months Ended June 30, 2008 | | | Year Ended December 31, 2007 | |
(Number of Shares) | | | | | | | | |
Dividends reinvested | | | 920,167 | | | | 260,282 | |
Shares redeemed | | | (556,498 | ) | | | (1,781,391 | ) |
| | | | | | | | |
Net increase (decrease) in shares outstanding | | | 363,669 | | | | (1,521,109 | ) |
| | | | | | | | |
($) | | | | | | | | |
Dividends reinvested | | $ | 7,480,960 | | | $ | 2,889,128 | |
Shares redeemed | | | (5,614,791 | ) | | | (19,701,052 | ) |
| | | | | | | | |
Net increase (decrease) | | $ | 1,866,169 | | | $ | (16,811,924 | ) |
| | | | | | | | |
| | | | | | | | |
| | | Series 8 | |
| | | Six Months Ended June 30, 2008 | | | Year Ended December 31, 2007 | |
(Number of Shares) | | | | | | | | |
Dividends reinvested | | | 569,782 | | | | 186,226 | |
Shares redeemed | | | (349,671 | ) | | | (1,411,071 | ) |
| | | | | | | | |
Net increase (decrease) in shares outstanding | | | 220,111 | | | | (1,224,845 | ) |
| | | | | | | | |
($) | | | | | | | | |
Dividends reinvested | | $ | 4,660,814 | | | $ | 2,067,107 | |
Shares redeemed | | | (3,530,822 | ) | | | (15,615,034 | ) |
| | | | | | | | |
Net increase (decrease) | | $ | 1,129,992 | | | $ | (13,547,927 | ) |
| | | | | | | | |
| | | | | | | | |
| | | Series 9 | |
| | | Six Months Ended June 30, 2008 | | | Year Ended December 31, 2007 | |
(Number of Shares) | | | | | | | | |
Dividends reinvested | | | 471,210 | | | | 117,242 | |
Shares redeemed | | | (267,178 | ) | | | (1,092,828 | ) |
| | | | | | | | |
Net increase (decrease) in shares outstanding | | | 204,032 | | | | (975,586 | ) |
| | | | | | | | |
($) | | | | | | | | |
Dividends reinvested | | $ | 3,788,528 | | | $ | 1,306,080 | |
Shares redeemed | | | (2,680,219 | ) | | | (12,134,796 | ) |
| | | | | | | | |
Net increase (decrease) | | $ | 1,108,309 | | | $ | (10,828,716 | ) |
| | | | | | | | |
| | | | | | | | |
| | | | | | | | |
| | | Series 10 | |
| | | Six Months Ended June 30, 2008 | | | Year Ended December 31, 2007 | |
(Number of Shares) | | | | | | | | |
Dividends reinvested | | | 366,245 | | | | 91,271 | |
Shares redeemed | | | (161,147 | ) | | | (1,056,385 | ) |
| | | | | | | | |
Net increase (decrease) in shares outstanding | | | 205,098 | | | | (965,114 | ) |
| | | | | | | | |
($) | | | | | | | | |
Dividends reinvested | | $ | 3,087,447 | | | $ | 1,019,500 | |
Shares redeemed | | | (1,693,235 | ) | | | (11,598,921 | ) |
| | | | | | | | |
Net increase (decrease) | | $ | 1,394,212 | | | $ | (10,579,421 | ) |
| | | | | | | | |
| | | | | | | | |
| | | Series 11 | |
| | | Six Months Ended June 30, 2008 | | | Year Ended December 31, 2007 | |
(Number of Shares) | | | | | | | | |
Dividends reinvested | | | 486,768 | | | | 130,703 | |
Shares redeemed | | | (263,496 | ) | | | (1,453,053 | ) |
| | | | | | | | |
Net increase (decrease) in shares outstanding | | | 223,272 | | | | (1,322,350 | ) |
| | | | | | | | |
($) | | | | | | | | |
Dividends reinvested | | $ | 3,782,189 | | | $ | 1,428,589 | |
Shares redeemed | | | (2,554,413 | ) | | | (15,784,360 | ) |
| | | | | | | | |
Net increase (decrease) | | $ | 1,227,776 | | | $ | (14,355,771 | ) |
| | | | | | | | |
| | | | | | | | |
| | | Series 12 | |
| | | Six Months Ended June 30, 2008 | | | Year Ended December 31, 2007 | |
(Number of Shares) | | | | | | | | |
Dividends reinvested | | | 1,025,925 | | | | 160,972 | |
Shares redeemed | | | (1,181,508 | ) | | | (906,244 | ) |
| | | | | | | | |
Net decrease in shares outstanding | | | (155,583 | ) | | | (745,272 | ) |
| | | | | | | | |
($) | | | | | | | | |
Dividends reinvested | | $ | 8,381,811 | | | $ | 1,893,033 | |
Shares redeemed | | | (12,161,524 | ) | | | (10,439,683 | ) |
| | | | | | | | |
Net decrease | | $ | (3,779,713 | ) | | $ | (8,546,650 | ) |
| | | | | | | | |
| | | | | | | | |
46
NOTES TO FINANCIAL STATEMENTSASOF JUNE 30, 2008 (UNAUDITED) (CONTINUED)
NOTE 9 — CAPITAL SHARES (continued)
| | | | | | | | |
| | | Series 13 | |
| | | Six Months Ended June 30, 2008 | | | Year Ended December 31, 2007 | |
(Number of Shares) | | | | | | | | |
Dividends reinvested | | | 524,906 | | | | 53,979 | |
Shares redeemed | | | (485,843 | ) | | | (3,976,080 | ) |
| | | | | | | | |
Net increase (decrease) in shares outstanding | | | 39,063 | | | | (3,922,101 | ) |
| | | | | | | | |
($) | | | | | | | | |
Dividends reinvested | | $ | 4,986,611 | | | $ | 573,801 | |
Shares redeemed | | | (5,040,158 | ) | | | (41,545,317 | ) |
| | | | | | | | |
Net decrease | | $ | (53,547 | ) | | $ | (40,971,516 | ) |
| | | | | | | | |
| | | | | | | | |
| | | Series 14 | |
| | | Six Months Ended June 30, 2008 | | | Year
Ended December 31, 2007 | |
(Number of Shares) | | | | | | | | |
Shares sold | | | — | | | | 15,094,703 | |
Dividends reinvested | | | 284,164 | | | | — | |
Shares redeemed | | | (926,230 | ) | | | (3,139,858 | ) |
| | | | | | | | |
Net increase (decrease) in shares outstanding | | | (642,066 | ) | | | 11,954,845 | |
| | | | | | | | |
($) | | | | | | | | |
Shares sold | | $ | — | | | $ | 153,381,979 | |
Dividends reinvested | | | 2,793,337 | | | | — | |
Shares redeemed | | | (9,488,784 | ) | | | (32,098,316 | ) |
| | | | | | | | |
Net increase (decrease) | | $ | (6,695,447 | ) | | $ | 121,283,663 | |
| | | | | | | | |
NOTE 10 — LINE OF CREDIT
The Series, in addition to certain other funds managed by the Investment Adviser, have entered into an unsecured committed revolving line of credit agreement (the “Credit Agreement”) with The Bank of New York Mellon Corporation for an aggregate amount of $125,000,000. The proceeds may be used to: (1) temporarily finance the purchase and sale of securities; (2) finance the redemption of shares of an investor in the funds; and (3) enable the funds to meet other emergency expenses as defined in the Credit Agreement. The funds to which the line of credit is available pay a commitment fee equal to 0.07% per annum on the daily unused portion of the committed line amount payable quarterly in arrears.
The following Series utilized the line of credit during the six months ended June 30, 2008:
| | | | | | | | |
Series | | Days Utilized | | Approximate Average Daily Balance For Days Utilized | | Approximate Weighted Average Interest Rate For Days Utilized | |
Series 11 | | 4 | | $ | 2,742,500 | | 3.65 | % |
Series 12 | | 1 | | | 2,730,000 | | 3.62 | |
Series 13 | | 3 | | | 2,250,000 | | 2.95 | |
Series 14 | | 2 | | | 2,010,000 | | 2.51 | |
NOTE 11 — FEDERAL INCOME TAXES
The amount of distributions from net investment income and net realized capital gains are determined in accordance with federal income tax regulations, which may differ from U.S. generally accepted accounting principles for investment companies. These book/tax differences may be either temporary or permanent. Permanent differences are reclassified within the capital accounts based on their federal tax-basis treatment; temporary differences are not reclassified. Key differences include the treatment of short-term capital gains, foreign currency transactions, and wash sale deferrals. Distributions in excess of net investment income and/or net realized capital gains for tax purposes are reported as return of capital.
Dividends paid by the Series from net investment income and distributions of net realized short-term capital gains are, for federal income tax purposes, taxable as ordinary income to shareholders.
The tax composition of dividends and distributions to shareholders was as follows:
| | | | | | | | | | | | |
| | | Six Months Ended
June 30, 2008 | | Year Ended
December 31, 2007 |
| | | Ordinary Income | | Long-Term
Capital Gains | | Ordinary Income | | Long-Term
Capital Gains |
Series 1 | | $ | 3,070,711 | | $ | 6,439,681 | | $ | 2,896,853 | | $ | 1,539,074 |
Series 2 | | | 2,441,072 | | | 3,406,311 | | | 2,431,274 | | | 436,818 |
Series 3 | | | 2,684,136 | | | 3,571,829 | | | 2,842,976 | | | — |
Series 4 | | | 2,117,147 | | | 3,782,189 | | | 1,669,834 | | | 956,051 |
Series 5 | | | 1,985,452 | | | 3,014,085 | | | 840,548 | | | 1,262,653 |
Series 6 | | | 3,894,712 | | | 5,531,115 | | | 2,219,444 | | | 3,141,037 |
Series 7 | | | 2,833,666 | | | 4,647,294 | | | 1,510,025 | | | 1,379,103 |
Series 8 | | | 2,305,125 | | | 2,355,689 | | | 1,559,747 | | | 507,360 |
Series 9 | | | 1,862,723 | | | 1,925,805 | | | 1,026,173 | | | 279,907 |
Series 10 | | | 1,613,715 | | | 1,473,732 | | | 994,663 | | | 24,837 |
Series 11 | | | 2,497,083 | | | 1,285,106 | | | 1,426,566 | | | 2,023 |
Series 12 | | | 6,470,662 | | | 1,911,149 | | | 1,890,392 | | | 2,641 |
Series 13 | | | 4,984,752 | | | 1,859 | | | 571,994 | | | 1,807 |
Series 14 | | | 2,792,223 | | | 1,114 | | | — | | | — |
The tax-basis components of distributable earnings as of December 31, 2007 were:
| | | | | | | | | | | | | | |
| | | Undistributed Ordinary Income | | Undistributed Long-Term
Capital Gains | | Unrealized
Appreciation/
(Depreciation) | | | Post-October Capital
Losses
Deferred | |
Series 1 | | $ | 3,069,180 | | $ | 6,438,848 | | $ | (532,101 | ) | | $ | — | |
Series 2 | | | 2,439,263 | | | 3,405,135 | | | (190,648 | ) | | | — | |
Series 3 | | | 2,682,260 | | | 3,570,680 | | | 472,847 | | | | — | |
Series 4 | | | 2,115,181 | | | 3,781,011 | | | (678,633 | ) | | | — | |
Series 5 | | | 1,983,287 | | | 3,013,211 | | | (1,230,255 | ) | | | — | |
Series 6 | | | 3,892,869 | | | 5,530,340 | | | (1,817,854 | ) | | | — | |
Series 7 | | | 2,831,723 | | | 4,646,416 | | | (1,244,663 | ) | | | (21,600 | ) |
Series 8 | | | 2,303,198 | | | 2,354,684 | | | (779,351 | ) | | | (32,499 | ) |
Series 9 | | | 1,860,682 | | | 1,924,849 | | | (641,377 | ) | | | (103,940 | ) |
Series 10 | | | 1,611,790 | | | 1,472,723 | | | (479,597 | ) | | | (39,964 | ) |
Series 11 | | | 2,495,161 | | | 1,284,110 | | | (1,013,347 | ) | | | (226,154 | ) |
Series 12 | | | 6,468,802 | | | 1,910,248 | | | (1,589,574 | ) | | | (48,936 | ) |
Series 13 | | | 4,982,736 | | | 1,071 | | | (1,028,203 | ) | | | (7,597 | ) |
Series 14 | | | 2,791,128 | | | 731 | | | 331,002 | | | | — | |
47
NOTES TO FINANCIAL STATEMENTSASOF JUNE 30, 2008 (UNAUDITED) (CONTINUED)
NOTE 11 — FEDERAL INCOME TAXES (continued)
The Portfolios’ major tax jurisdictions are federal and Arizona. The earliest tax year that remains subject to examination by these jurisdictions is 2003.
NOTE 12 — OTHER ACCOUNTING PRONOUNCEMENTS
In June 2006, the Financial Accounting Standards Board issued FASB Interpretation No. 48 (“FIN 48”), “Accounting for Uncertainty in Income Taxes.” This standard defines the threshold for recognizing the benefits of tax-return positions in the financial statements as “more-likely-than-not” to be sustained upon challenge by the taxing authority and requires measurement of a tax position meeting the more-likely-than-not criterion, based on the largest benefit that is more than 50 percent likely to be realized. FIN 48 was effective for fiscal years beginning after December 15, 2006, with early application permitted if no interim financial statements had been issued. Acknowledging the unique issues that FIN 48 presents for investment companies that calculate NAVs, the SEC indicated that they would not object if a fund implemented FIN 48 in its NAV calculation as late as its last NAV calculation in the first required financial statement reporting period for its fiscal year beginning after December 15, 2006. At adoption, companies must adjust their financial statements to reflect only those tax positions that are more likely-than-not to be sustained as of the adoption date. Management of the Portfolios has analyzed the tax positions of the Portfolios. Upon adoption of FIN 48 on June 29, 2007, management identified no uncertain tax positions that have not met the more likely-than-not standard.
On March 19, 2008, the FASB issued Statement of Financial Accounting Standards No. 161 (“SFAS No. 161”), “Disclosure about Derivative Instruments and Hedging Activities.” This new accounting statement requires enhanced disclosures about an entity’s derivative and hedging activities. Entities are required to provide enhanced disclosures about (a) how and why an entity invests in derivatives, (b) how derivatives are accounted for under SFAS No. 133, and (c) how derivatives affect an entity’s financial position, financial performance, and cash flows. SFAS No. 161 also requires enhanced disclosures regarding credit-risk-related contingent features of derivative instruments. SFAS No. 161 is effective for financial statements issued for fiscal years and interim periods beginning after November 15, 2008. As of June 30, 2008, management of the Portfolios is currently assessing the impact of the expanded financial statement disclosures that will result from adopting SFAS No. 161.
NOTE 13 — INFORMATION REGARDING TRADING OF ING’S U.S. MUTUAL FUNDS
As discussed in earlier supplements that were previously filed with the SEC, ING Investments, the adviser to the ING Funds, has reported to the Boards of Directors/Trustees (the “Boards”) of the ING Funds that, like many U.S. financial services companies, ING Investments and certain of its U.S. affiliates have received informal and formal requests for information since September 2003 from various governmental and self-regulatory agencies in connection with investigations related to mutual funds and variable insurance products. ING Investments has advised the Boards that it and its affiliates have cooperated fully with each request.
In addition to responding to regulatory and governmental requests, ING Investments reported that management of U.S. affiliates of ING Groep N.V., including ING Investments (collectively, “ING”), on their own initiative, have conducted, through independent special counsel and a national accounting firm, an extensive internal review of trading in ING insurance, retirement, and mutual fund products. The goal of this review was to identify any instances of inappropriate trading in those products by third parties or by ING investment professionals and other ING personnel. ING’s internal review related to mutual fund trading is now substantially completed. ING has reported that, of the millions of customer relationships that ING maintains, the internal review identified several isolated arrangements allowing third partes to engage in frequent trading of mutual funds within ING’s variable insurance and mutual fund products, and identified other circumstances where frequent trading occurred, despite measures taken by ING intended to combat market timing. ING further reported that each of these arrangements has been terminated and fully disclosed to regulators. The results of the internal review were also reported to the independent members of the Boards.
ING Investments has advised the Boards that most of the identified arrangements were initiated prior to ING’s acquisition of the businesses in question in the U.S. ING Investments further reported that the companies in question did not receive special benefits in return for any of these arrangements, which have all been terminated.
Based on the internal review, ING Investments advised the Boards that the identified arrangements do not represent a systemic problem in any of the companies that were involved.
48
NOTES TO FINANCIAL STATEMENTSASOF JUNE 30, 2008 (UNAUDITED) (CONTINUED)
NOTE 13 — INFORMATION REGARDING TRADING OF ING’S U.S. MUTUAL FUNDS (continued)
Despite the extensive internal review conducted through independent special counsel and a national accounting firm, there can be no assurance that the instances of inappropriate trading reported to the Boards are the only instances of such trading respecting the ING Funds.
ING Investments reported to the Boards that ING is committed to conducting its business with the highest standards of ethical conduct with zero tolerance for noncompliance. Accordingly, ING Investments advised the Boards that ING management was disappointed that its voluntary internal review identified these situations. Viewed in the context of the breadth and magnitude of its U.S. business as a whole, ING management does not believe that ING’s acquired companies had systemic ethical or compliance issues in these areas. Nonetheless, ING Investments reported that given ING’s refusal to tolerate any lapses, it has taken the steps noted below, and will continue to seek opportunities to further strengthen the internal controls of its affiliates.
| • | | ING has agreed with the ING Funds to indemnify and hold harmless the ING Funds from all damages resulting from wrongful conduct by ING or its employees or from ING’s internal investigation, any investigations conducted by any governmental or self-regulatory agencies, litigation or other formal proceedings, including any proceedings by the SEC. ING Investments reported to the Boards that ING management believes that the total amount of any indemnification obligations will not be material to ING or its U.S. business. |
| • | | ING updated its Code of Conduct for employees reinforcing its employees’ obligation to conduct personal trading activity consistent with the law, disclosed limits, and other requirements. |
Other Regulatory Matters
The New York Attorney General and other federal and state regulators are also conducting broad inquiries and investigations involving the insurance industry. These initiatives currently focus on, among other things, compensation and other sales incentives; potential conflicts of interest; potential anti-competitive activity; reinsurance; marketing practices (including suitability); specific product types (including group annuities and indexed annuities); fund selection for investment products and brokerage sales; and disclosure. It is likely that the scope of these industry investigations will further broaden before they conclude. ING has received formal and informal requests in connection with such investigations, and is cooperating fully with each request.
Other federal and state regulators could initiate similar actions in this or other areas of ING’s businesses. These regulatory initiatives may result in new legislation and regulation that could significantly affect the financial services industry, including businesses in which ING is engaged. In light of these and other developments, ING continuously reviews whether modifications to its business practices are appropriate. At this time, in light of the current regulatory factors, ING U.S. is actively engaged in reviewing whether any modifications in our practices are appropriate for the future.
There can be no assurance that these matters, or the adverse publicity associated with them, will not result in increased fund redemptions, reduced sale of fund shares, or other adverse consequences to ING Funds.
NOTE 14 — SUBSEQUENT EVENTS
In August 2008, an affiliate of the Investment Adviser and ING IM made the following payments to the Series to reimburse for certain investment transactions associated with the correction of an allocation between the Equity and Fixed Components of the Series:
| | | |
Series 1 | | $ | 254,224 |
Series 2 | | | 341,515 |
Series 4 | | | 278,815 |
Series 5 | | | 353,476 |
Series 11 | | | 221,529 |
49
| | |
| ING GET U.S. CORE PORTFOLIO SERIES 1 | | PORTFOLIO OF INVESTMENTS ASOF JUNE 30, 2008 (UNAUDITED) |
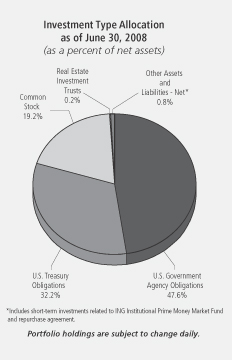
| | | | | | | |
| Shares | | | | | | Value |
| | | | | | | |
| COMMON STOCK: 19.2% |
| Advertising: 0.1% |
| 2,300 | | @ | | Interpublic Group of Cos., Inc. | | $ | 19,780 |
| 900 | | | | Omnicom Group | | | 40,392 |
| | | | | | | |
| | | | | | | 60,172 |
| | | | | | | |
| Aerospace/Defense: 0.5% |
| 1,350 | | | | Boeing Co. | | | 88,721 |
| 450 | | | | General Dynamics Corp. | | | 37,890 |
| 400 | | | | Goodrich Corp. | | | 18,984 |
| 250 | | | | L-3 Communications Holdings, Inc. | | | 22,718 |
| 660 | | | | Lockheed Martin Corp. | | | 65,116 |
| 743 | | | | Northrop Grumman Corp. | | | 49,707 |
| 200 | | | | Raytheon Co. | | | 11,256 |
| 200 | | | | Rockwell Collins, Inc. | | | 9,592 |
| 1,400 | | | | United Technologies Corp. | | | 86,380 |
| | | | | | | |
| | | | | | | 390,364 |
| | | | | | | |
| Agriculture: 0.3% |
| 2,750 | | | | Altria Group, Inc. | | | 56,540 |
| 1,070 | | | | Archer-Daniels-Midland Co. | | | 36,113 |
| 351 | | @ | | Lorillard, Inc. | | | 24,275 |
| 2,750 | | | | Philip Morris International, Inc. | | | 135,823 |
| 280 | | | | Reynolds American, Inc. | | | 13,068 |
| | | | | | | |
| | | | | | | 265,819 |
| | | | | | | |
| Airlines: 0.0% |
| 1,200 | | | | Southwest Airlines Co. | | | 15,648 |
| | | | | | | |
| | | | | | | 15,648 |
| | | | | | | |
| Apparel: 0.1% |
| 850 | | @ | | Coach, Inc. | | | 24,548 |
| 690 | | | | Nike, Inc. | | | 41,131 |
| | | | | | | |
| Shares | | | | | | Value |
| | | | | | | |
| 250 | | | | Polo Ralph Lauren Corp. | | $ | 15,695 |
| 200 | | | | VF Corp. | | | 14,236 |
| | | | | | | |
| | | | | | | 95,610 |
| | | | | | | |
| Auto Manufacturers: 0.0% |
| 2,813 | | @ | | Ford Motor Co. | | | 13,531 |
| 650 | | | | General Motors Corp. | | | 7,475 |
| | | | | | | |
| | | | | | | 21,006 |
| | | | | | | |
| Auto Parts & Equipment: 0.1% |
| 300 | | @ | | Goodyear Tire & Rubber Co. | | | 5,349 |
| 1,500 | | | | Johnson Controls, Inc. | | | 43,020 |
| | | | | | | |
| | | | | | | 48,369 |
| | | | | | | |
| Banks: 0.7% |
| 6,170 | | | | Bank of America Corp. | | | 147,278 |
| 2,000 | | | | Bank of New York Mellon Corp. | | | 75,660 |
| 700 | | | | BB&T Corp. | | | 15,939 |
| 501 | | | | Capital One Financial Corp. | | | 19,043 |
| 650 | | | | Fifth Third Bancorp. | | | 6,617 |
| 200 | | | | M&T Bank Corp. | | | 14,108 |
| 349 | | | | Marshall & Ilsley Corp. | | | 5,350 |
| 400 | | | | Northern Trust Corp. | | | 27,428 |
| 2,036 | | | | Regions Financial Corp. | | | 22,213 |
| 750 | | | | State Street Corp. | | | 47,993 |
| 1,500 | | | | US Bancorp. | | | 41,835 |
| 2,536 | | | | Wachovia Corp. | | | 39,384 |
| 4,150 | | | | Wells Fargo & Co. | | | 98,563 |
| 600 | | | | Zions Bancorp. | | | 18,894 |
| | | | | | | |
| | | | | | | 580,305 |
| | | | | | | |
| Beverages: 0.4% |
| 200 | | | | Anheuser-Busch Cos., Inc. | | | 12,424 |
| 3,050 | | | | Coca-Cola Co. | | | 158,539 |
| 400 | | | | Coca-Cola Enterprises, Inc. | | | 6,920 |
| 900 | | | | Pepsi Bottling Group, Inc. | | | 25,128 |
| 1,970 | | | | PepsiCo, Inc. | | | 125,272 |
| | | | | | | |
| | | | | | | 328,283 |
| | | | | | | |
| Biotechnology: 0.3% |
| 1,650 | | @ | | Amgen, Inc. | | | 77,814 |
| 400 | | @ | | Biogen Idec, Inc. | �� | | 22,356 |
| 610 | | @ | | Celgene Corp. | | | 38,961 |
| 150 | | @ | | Genzyme Corp. | | | 10,803 |
| 1,250 | | @ | | Gilead Sciences, Inc. | | | 66,188 |
| | | | | | | |
| | | | | | | 216,122 |
| | | | | | | |
| Chemicals: 0.5% |
| 500 | | | | Air Products & Chemicals, Inc. | | | 49,430 |
| 1,450 | | | | Dow Chemical Co. | | | 50,620 |
| 100 | | | | Eastman Chemical Co. | | | 6,886 |
| 250 | | | | Ecolab, Inc. | | | 10,748 |
| 1,650 | | | | EI Du Pont de Nemours & Co. | | | 70,769 |
| 600 | | | | Hercules, Inc. | | | 10,158 |
| 600 | | | | International Flavors & Fragrances, Inc. | | | 23,436 |
| 780 | | | | Monsanto Co. | | | 98,623 |
| 200 | | | | PPG Industries, Inc. | | | 11,474 |
| 200 | | | | Praxair, Inc. | | | 18,848 |
| 300 | | | | Rohm & Haas Co. | | | 13,932 |
| 650 | | | | Sigma-Aldrich Corp. | | | 35,009 |
| | | | | | | |
| | | | | | | 399,933 |
| | | | | | | |
See Accompanying Notes to Financial Statements
50
| | |
| ING GET U.S. CORE PORTFOLIO SERIES 1 | | PORTFOLIO OF INVESTMENTS ASOF JUNE 30, 2008 (UNAUDITED) (CONTINUED) |
| | | | | | | |
| Shares | | | | | | Value |
| | | | | | | |
| Coal: 0.1% |
| 200 | | | | Consol Energy, Inc. | | $ | 22,474 |
| 140 | | | | Massey Energy Co. | | | 13,125 |
| 300 | | | | Peabody Energy Corp. | | | 26,415 |
| | | | | | | |
| | | | | | | 62,014 |
| | | | | | | |
| Commercial Services: 0.2% |
| 200 | | @ | | Apollo Group, Inc. - Class A | | | 8,852 |
| 200 | | | | Automatic Data Processing, Inc. | | | 8,380 |
| 800 | | | | H&R Block, Inc. | | | 17,120 |
| 370 | | | | McKesson Corp. | | | 20,687 |
| 200 | | | | Moody’s Corp. | | | 6,888 |
| 600 | | | | Robert Half International, Inc. | | | 14,382 |
| 800 | | | | RR Donnelley & Sons Co. | | | 23,752 |
| 1,020 | | | | Western Union Co. | | | 25,214 |
| | | | | | | |
| | | | | | | 125,275 |
| | | | | | | |
| Computers: 1.0% |
| 450 | | @ | | Affiliated Computer Services, Inc. | | | 24,071 |
| 1,100 | | @ | | Apple, Inc. | | | 184,184 |
| 250 | | @ | | Cognizant Technology Solutions Corp. | | | 8,128 |
| 250 | | @ | | Computer Sciences Corp. | | | 11,710 |
| 3,550 | | @ | | Dell, Inc. | | | 77,674 |
| 3,150 | | @ | | EMC Corp. | | | 46,274 |
| 3,650 | | | | Hewlett-Packard Co. | | | 161,367 |
| 2,000 | | | | International Business Machines Corp. | | | 237,060 |
| 450 | | @ | | Lexmark International, Inc. | | | 15,044 |
| 550 | | @ | | NetApp, Inc. | | | 11,913 |
| 400 | | @ | | Sandisk Corp. | | | 7,480 |
| 1,075 | | @ | | Sun Microsystems, Inc. | | | 11,696 |
| 300 | | @ | | Teradata Corp. | | | 6,942 |
| | | | | | | |
| | | | | | | 803,543 |
| | | | | | | |
| Cosmetics/Personal Care: 0.4% |
| 700 | | | | Avon Products, Inc. | | | 25,214 |
| 550 | | | | Colgate-Palmolive Co. | | | 38,005 |
| 4,526 | | | | Procter & Gamble Co. | | | 275,226 |
| | | | | | | |
| | | | | | | 338,445 |
| | | | | | | |
| Distribution/Wholesale: 0.0% |
| 700 | | | | Genuine Parts Co. | | | 27,776 |
| | | | | | | |
| | | | | | | 27,776 |
| | | | | | | |
| Diversified Financial Services: 1.0% |
| 1,450 | | | | American Express Co. | | | 54,622 |
| 240 | | | | Ameriprise Financial, Inc. | | | 9,761 |
| 700 | | | | Charles Schwab Corp. | | | 14,378 |
| 600 | | | | CIT Group, Inc. | | | 4,086 |
| 7,150 | | | | Citigroup, Inc. | | | 119,834 |
| 50 | | | | CME Group, Inc. | | | 19,160 |
| 1,008 | | | | Countrywide Financial Corp. | | | 4,284 |
| 925 | | | | Discover Financial Services | | | 12,182 |
| 2,200 | | @ | | E*Trade Financial Corp. | | | 6,908 |
| 950 | | | | Federal Home Loan Mortgage Corporation | | | 15,580 |
| 1,500 | | | | Federal National Mortgage Association | | | 29,265 |
| 650 | | | | Goldman Sachs Group, Inc. | | | 113,685 |
| 100 | | @ | | IntercontinentalExchange, Inc. | | | 11,400 |
| 4,789 | | | | JPMorgan Chase & Co. | | | 164,311 |
| 200 | | | | Legg Mason, Inc. | | | 8,714 |
| 970 | | | | Lehman Brothers Holdings, Inc. | | | 19,216 |
| | | | | | | |
| Shares | | | | | | Value |
| | | | | | | |
| 1,850 | | | | Merrill Lynch & Co., Inc. | | $ | 58,664 |
| 1,850 | | | | Morgan Stanley | | | 66,730 |
| 360 | | | | NYSE Euronext | | | 18,238 |
| 650 | | @ | | SLM Corp. | | | 12,578 |
| 200 | | | | T. Rowe Price Group, Inc. | | | 11,294 |
| | | | | | | |
| | | | | | | 774,890 |
| | | | | | | |
| Electric: 0.7% |
| 1,300 | | @ | | AES Corp. | | | 24,973 |
| 1,800 | | | | American Electric Power Co., Inc. | | | 72,414 |
| 1,200 | | | | Centerpoint Energy, Inc. | | | 19,260 |
| 1,000 | | | | Dominion Resources, Inc. | | | 47,490 |
| 1,100 | | | | DTE Energy Co. | | | 46,684 |
| 4,000 | | | | Duke Energy Corp. | | | 69,520 |
| 1,200 | | | | Edison International | | | 61,656 |
| 250 | | | | Entergy Corp. | | | 30,120 |
| 350 | | | | Exelon Corp. | | | 31,486 |
| 650 | | | | FPL Group, Inc. | | | 42,627 |
| 1,300 | | | | Pepco Holdings, Inc. | | | 33,345 |
| 200 | | | | PG&E Corp. | | | 7,938 |
| 350 | | | | PPL Corp. | | | 18,295 |
| 400 | | | | Public Service Enterprise Group, Inc. | | | 18,372 |
| | | | | | | |
| | | | | | | 524,180 |
| | | | | | | |
| Electrical Components & Equipment: 0.1% |
| 950 | | | | Emerson Electric Co. | | | 46,978 |
| 400 | | | | Molex, Inc. | | | 9,764 |
| | | | | | | |
| | | | | | | 56,742 |
| | | | | | | |
| Electronics: 0.2% |
| 800 | | @ | | Agilent Technologies, Inc. | | | 28,432 |
| 450 | | | | Applera Corp. - Applied Biosystems Group | | | 15,066 |
| 700 | | | | Jabil Circuit, Inc. | | | 11,487 |
| 500 | | | | PerkinElmer, Inc. | | | 13,925 |
| 850 | | @ | | Thermo Electron Corp. | | | 47,371 |
| 775 | | @@ | | Tyco Electronics Ltd. | | | 27,761 |
| 200 | | @ | | Waters Corp. | | | 12,900 |
| | | | | | | |
| | | | | | | 156,942 |
| | | | | | | |
| Engineering & Construction: 0.1% |
| 250 | | | | Fluor Corp. | | | 46,520 |
| 150 | | @ | | Jacobs Engineering Group, Inc. | | | 12,105 |
| | | | | | | |
| | | | | | | 58,625 |
| | | | | | | |
| Environmental Control: 0.1% |
| 950 | | @ | | Allied Waste Industries, Inc. | | | 11,989 |
| 600 | | | | Waste Management, Inc. | | | 22,626 |
| | | | | | | |
| | | | | | | 34,615 |
| | | | | | | |
| Food: 0.3% |
| 900 | | | | ConAgra Foods, Inc. | | | 17,352 |
| 600 | | | | General Mills, Inc. | | | 36,462 |
| 400 | | | | HJ Heinz Co. | | | 19,140 |
| 600 | | | | Kellogg Co. | | | 28,812 |
| 1,551 | | | | Kraft Foods, Inc. | | | 44,126 |
| 650 | | | | Kroger Co. | | | 18,766 |
| 2,300 | | | | Sara Lee Corp. | | | 28,175 |
| 600 | | | | Supervalu, Inc. | | | 18,534 |
| 400 | | | | Sysco Corp. | | | 11,004 |
| 400 | | | | WM Wrigley Jr. Co. | | | 31,112 |
| | | | | | | |
| | | | | | | 253,483 |
| | | | | | | |
See Accompanying Notes to Financial Statements
51
| | |
| ING GET U.S. CORE PORTFOLIO SERIES 1 | | PORTFOLIO OF INVESTMENTS ASOF JUNE 30, 2008 (UNAUDITED) (CONTINUED) |
| | | | | | | |
| Shares | | | | | | Value |
| | | | | | | |
| Gas: 0.1% |
| 650 | | | | Sempra Energy | | $ | 36,693 |
| | | | | | | |
| | | | | | | 36,693 |
| | | | | | | |
| Hand/Machine Tools: 0.1% |
| 200 | | | | Black & Decker Corp. | | | 11,502 |
| 200 | | | | Snap-On, Inc. | | | 10,402 |
| 250 | | | | Stanley Works | | | 11,208 |
| | | | | | | |
| | | | | | | 33,112 |
| | | | | | | |
| Healthcare - Products: 0.7% |
| 650 | | | | Baxter International, Inc. | | | 41,561 |
| 200 | | | | Becton Dickinson & Co. | | | 16,260 |
| 2,250 | | @ | | Boston Scientific Corp. | | | 27,653 |
| 625 | | @@ | | Covidien Ltd. | | | 29,931 |
| 150 | | | | CR Bard, Inc. | | | 13,193 |
| 100 | | @ | | Intuitive Surgical, Inc. | | | 26,940 |
| 3,100 | | | | Johnson & Johnson | | | 199,454 |
| 1,800 | | | | Medtronic, Inc. | | | 93,150 |
| 500 | | @ | | Patterson Cos., Inc. | | | 14,695 |
| 650 | | @ | | St. Jude Medical, Inc. | | | 26,572 |
| 200 | | | | Stryker Corp. | | | 12,576 |
| 200 | | @ | | Varian Medical Systems, Inc. | | | 10,370 |
| 150 | | @ | | Zimmer Holdings, Inc. | | | 10,208 |
| | | | | | | |
| | | | | | | 522,563 |
| | | | | | | |
| Healthcare - Services: 0.2% |
| 840 | | | | Aetna, Inc. | | | 34,045 |
| 330 | | | | Cigna Corp. | | | 11,679 |
| 200 | | @ | | Humana, Inc. | | | 7,954 |
| 200 | | @ | | Laboratory Corp. of America Holdings | | | 13,926 |
| 200 | | | | Quest Diagnostics | | | 9,694 |
| 1,420 | | | | UnitedHealth Group, Inc. | | | 37,275 |
| 670 | | @ | | WellPoint, Inc. | | | 31,932 |
| | | | | | | |
| | | | | | | 146,505 |
| | | | | | | |
| Home Builders: 0.0% |
| 700 | | | | D.R. Horton, Inc. | | | 7,595 |
| 500 | | | | Lennar Corp. | | | 6,170 |
| | | | | | | |
| | | | | | | 13,765 |
| | | | | | | |
| Household Products/Wares: 0.2% |
| 200 | | | | Avery Dennison Corp. | | | 8,786 |
| 650 | | | | Clorox Co. | | | 33,930 |
| 400 | | | | Fortune Brands, Inc. | | | 24,964 |
| 800 | | | | Kimberly-Clark Corp. | | | 47,824 |
| | | | | | | |
| | | | | | | 115,504 |
| | | | | | | |
| Insurance: 0.7% |
| 640 | | @@ | | ACE Ltd. | | | 35,258 |
| 650 | | | | Aflac, Inc. | | | 40,820 |
| 680 | | | | Allstate Corp. | | | 31,001 |
| 3,500 | | | | American International Group, Inc. | | | 92,611 |
| 200 | | | | AON Corp. | | | 9,188 |
| 200 | | | | Assurant, Inc. | | | 13,192 |
| 980 | | | | Chubb Corp. | | | 48,030 |
| 500 | | | | Cincinnati Financial Corp. | | | 12,700 |
| 600 | | | | Genworth Financial, Inc. | | | 10,686 |
| 500 | | | | Hartford Financial Services Group, Inc. | | | 32,285 |
| 500 | | | | Lincoln National Corp. | | | 22,660 |
| 183 | | | | Loews Corp. | | | 8,583 |
| 400 | | | | Marsh & McLennan Cos., Inc. | | | 10,620 |
| 1,440 | | | | Metlife, Inc. | | | 75,989 |
| | | | | | | |
| Shares | | | | | | Value |
| | | | | | | |
| 620 | | | | Progressive Corp. | | $ | 11,606 |
| 880 | | | | Prudential Financial, Inc. | | | 52,571 |
| 200 | | | | Torchmark Corp. | | | 11,730 |
| 1,020 | | | | Travelers Cos., Inc. | | | 44,268 |
| 700 | | | | UnumProvident Corp. | | | 14,315 |
| 200 | | @@ | | XL Capital Ltd. | | | 4,112 |
| | | | | | | |
| | | | | | | 582,225 |
| | | | | | | |
| Internet: 0.4% |
| 200 | | @ | | Akamai Technologies, Inc. | | | 6,958 |
| 400 | | @ | | Amazon.com, Inc. | | | 29,332 |
| 1,450 | | @ | | eBay, Inc. | | | 39,629 |
| 300 | | @ | | Expedia, Inc. | | | 5,514 |
| 300 | | @ | | Google, Inc. - Class A | | | 157,926 |
| 400 | | @ | | IAC/InterActiveCorp. | | | 7,712 |
| 1,459 | | @ | | Symantec Corp. | | | 28,232 |
| 1,650 | | @ | | Yahoo!, Inc. | | | 34,089 |
| | | | | | | |
| | | | | | | 309,392 |
| | | | | | | |
| Iron/Steel: 0.1% |
| 100 | | | | Allegheny Technologies, Inc. | | | 5,928 |
| 600 | | | | Nucor Corp. | | | 44,802 |
| 250 | | | | United States Steel Corp. | | | 46,195 |
| | | | | | | |
| | | | | | | 96,925 |
| | | | | | | |
| Lodging: 0.0% |
| 250 | | | | Starwood Hotels & Resorts Worldwide, Inc. | | | 10,018 |
| | | | | | | |
| | | | | | | 10,018 |
| | | | | | | |
| Machinery - Construction & Mining: 0.1% |
| 1,050 | | | | Caterpillar, Inc. | | | 77,511 |
| 250 | | @ | | Terex Corp. | | | 12,843 |
| | | | | | | |
| | | | | | | 90,354 |
| | | | | | | |
| Machinery - Diversified: 0.1% |
| 200 | | | | Cummins, Inc. | | | 13,104 |
| 650 | | | | Deere & Co. | | | 46,885 |
| 200 | | | | Manitowoc Co., Inc. | | | 6,506 |
| 200 | | | | Rockwell Automation, Inc. | | | 8,746 |
| | | | | | | |
| | | | | | | 75,241 |
| | | | | | | |
| Media: 0.5% |
| 400 | | | | CBS Corp. - Class B | | | 7,796 |
| 650 | | | | Clear Channel Communications, Inc. | | | 22,880 |
| 3,300 | | | | Comcast Corp. - Class A | | | 62,601 |
| 1,050 | | @ | | DIRECTV Group, Inc. | | | 27,206 |
| 3,900 | | | | News Corp. - Class A | | | 58,656 |
| 4,050 | | | | Time Warner, Inc. | | | 59,940 |
| 1,050 | | @ | | Viacom - Class B | | | 32,067 |
| 2,700 | | | | Walt Disney Co. | | | 84,240 |
| | | | | | | |
| | | | | | | 355,386 |
| | | | | | | |
| Metal Fabricate/Hardware: 0.0% |
| 200 | | | | Precision Castparts Corp. | | | 19,274 |
| | | | | | | |
| | | | | | | 19,274 |
| | | | | | | |
| Mining: 0.1% |
| 400 | | | | Alcoa, Inc. | | | 14,248 |
| 612 | | | | Freeport-McMoRan Copper & Gold, Inc. | | | 71,720 |
| 400 | | | | Newmont Mining Corp. | | | 20,864 |
| | | | | | | |
| | | | | | | 106,832 |
| | | | | | | |
See Accompanying Notes to Financial Statements
52
| | |
| ING GET U.S. CORE PORTFOLIO SERIES 1 | | PORTFOLIO OF INVESTMENTS ASOF JUNE 30, 2008 (UNAUDITED) (CONTINUED) |
| | | | | | | |
| Shares | | | | | | Value |
| | | | | | | |
| Miscellaneous Manufacturing: 0.9% |
| 850 | | | | 3M Co. | | $ | 59,152 |
| 400 | | | | Cooper Industries Ltd. | | | 15,800 |
| 950 | | | | Dover Corp. | | | 45,952 |
| 500 | | | | Eaton Corp. | | | 42,485 |
| 13,700 | | | | General Electric Co. | | | 365,653 |
| 1,200 | | | | Honeywell International, Inc. | | | 60,336 |
| 700 | | | | Illinois Tool Works, Inc. | | | 33,257 |
| 600 | | | | Leggett & Platt, Inc. | | | 10,062 |
| 275 | | | | Parker Hannifin Corp. | | | 19,613 |
| 650 | | | | Textron, Inc. | | | 31,155 |
| 225 | | @@ | | Tyco International Ltd. | | | 9,009 |
| | | | | | | |
| | | | | | | 692,474 |
| | | | | | | |
| Office/Business Equipment: 0.1% |
| 1,100 | | | | Pitney Bowes, Inc. | | | 37,510 |
| 1,750 | | | | Xerox Corp. | | | 23,730 |
| | | | | | | |
| | | | | | | 61,240 |
| | | | | | | |
| Oil & Gas: 2.6% |
| 850 | | | | Anadarko Petroleum Corp. | | | 63,614 |
| 600 | | | | Apache Corp. | | | 83,400 |
| 170 | | | | Cabot Oil & Gas Corp. | | | 11,514 |
| 650 | | | | Chesapeake Energy Corp. | | | 42,874 |
| 3,176 | | | | Chevron Corp. | | | 314,837 |
| 2,284 | | | | ConocoPhillips | | | 215,587 |
| 750 | | | | Devon Energy Corp. | | | 90,120 |
| 200 | | | | ENSCO International, Inc. | | | 16,148 |
| 300 | | | | EOG Resources, Inc. | | | 39,360 |
| 7,700 | | | | ExxonMobil Corp. | | | 678,601 |
| 400 | | | | Hess Corp. | | | 50,476 |
| 900 | | | | Marathon Oil Corp. | | | 46,683 |
| 350 | | | | Murphy Oil Corp. | | | 34,318 |
| 300 | | @, @@ | | Nabors Industries Ltd. | | | 14,769 |
| 250 | | | | Noble Corp. | | | 16,240 |
| 330 | | | | Noble Energy, Inc. | | | 33,185 |
| 1,250 | | | | Occidental Petroleum Corp. | | | 112,325 |
| 200 | | | | Questar Corp. | | | 14,208 |
| 200 | | | | Range Resources Corp. | | | 13,108 |
| 500 | | @ | | Southwestern Energy Co. | | | 23,805 |
| 200 | | | | Sunoco, Inc. | | | 8,138 |
| 439 | | @ | | Transocean, Inc. | | | 66,899 |
| 550 | | | | Valero Energy Corp. | | | 22,649 |
| 650 | | | | XTO Energy, Inc. | | | 44,532 |
| | | | | | | |
| | | | | | | 2,057,390 |
| | | | | | | |
| Oil & Gas Services: 0.4% |
| 350 | | | | Baker Hughes, Inc. | | | 30,569 |
| 750 | | | | Halliburton Co. | | | 39,803 |
| 450 | | @ | | National Oilwell Varco, Inc. | | | 39,924 |
| 1,500 | | | | Schlumberger Ltd. | | | 161,145 |
| 200 | | | | Smith International, Inc. | | | 16,628 |
| 500 | | @ | | Weatherford International Ltd. | | | 24,795 |
| | | | | | | |
| | | | | | | 312,864 |
| | | | | | | |
| Packaging & Containers: 0.0% |
| 450 | | | | Ball Corp. | | | 21,483 |
| | | | | | | |
| | | | | | | 21,483 |
| | | | | | | |
| Pharmaceuticals: 0.9% |
| 1,550 | | | | Abbott Laboratories | | | 82,104 |
| 200 | | | | Allergan, Inc. | | | 10,410 |
| 400 | | | | AmerisourceBergen Corp. | | | 15,996 |
| 2,350 | | | | Bristol-Myers Squibb Co. | | | 48,246 |
| 220 | | | | Cardinal Health, Inc. | | | 11,348 |
| | | | | | | |
| Shares | | | | | | Value |
| | | | | | | |
| 1,600 | | | | Eli Lilly & Co. | | $ | 73,856 |
| 420 | | @ | | Express Scripts, Inc. | | | 26,342 |
| 400 | | @ | | Forest Laboratories, Inc. | | | 13,896 |
| 927 | | @ | | King Pharmaceuticals, Inc. | | | 9,706 |
| 600 | | @ | | Medco Health Solutions, Inc. | | | 28,320 |
| 3,150 | | | | Merck & Co., Inc. | | | 118,724 |
| 8,200 | | | | Pfizer, Inc. | | | 143,254 |
| 2,650 | | | | Schering-Plough Corp. | | | 52,179 |
| 500 | | @ | | Watson Pharmaceuticals, Inc. | | | 13,585 |
| 1,900 | | | | Wyeth | | | 91,124 |
| | | | | | | |
| | | | | | | 739,090 |
| | | | | | | |
| Pipelines: 0.1% |
| 1,100 | | | | El Paso Corp. | | | 23,914 |
| 1,100 | | | | Spectra Energy Corp. | | | 31,614 |
| 800 | | | | Williams Cos., Inc. | | | 32,248 |
| | | | | | | |
| | | | | | | 87,776 |
| | | | | | | |
| Retail: 1.1% |
| 150 | | | | Abercrombie & Fitch Co. | | | 9,402 |
| 250 | | @ | | Autozone, Inc. | | | 30,253 |
| 705 | | | | Best Buy Co., Inc. | | | 27,918 |
| 600 | | @ | | Big Lots, Inc. | | | 18,744 |
| 500 | | | | Costco Wholesale Corp. | | | 35,070 |
| 1,855 | | | | CVS Caremark Corp. | | | 73,402 |
| 590 | | | | Darden Restaurants, Inc. | | | 18,845 |
| 750 | | | | Family Dollar Stores, Inc. | | | 14,955 |
| 400 | | @ | | GameStop Corp. | | | 16,160 |
| 1,250 | | | | Gap, Inc. | | | 20,838 |
| 1,620 | | | | Home Depot, Inc. | | | 37,940 |
| 200 | | | | JC Penney Co., Inc. | | | 7,258 |
| 1,100 | | | | Limited Brands, Inc. | | | 18,535 |
| 1,550 | | | | Lowe’s Cos., Inc. | | | 32,163 |
| 300 | | | | Macy’s, Inc. | | | 5,826 |
| 1,800 | | | | McDonald’s Corp. | | | 101,196 |
| 1,035 | | | | Staples, Inc. | | | 24,581 |
| 950 | | | | Target Corp. | | | 44,166 |
| 400 | | | | Tiffany & Co. | | | 16,300 |
| 1,300 | | | | TJX Cos., Inc. | | | 40,911 |
| 900 | | | | Walgreen Co. | | | 29,259 |
| 3,500 | | | | Wal-Mart Stores, Inc. | | | 196,700 |
| 700 | | | | Yum! Brands, Inc. | | | 24,563 |
| | | | | | | |
| | | | | | | 844,985 |
| | | | | | | |
| Savings & Loans: 0.0% |
| 650 | | | | Hudson City Bancorp., Inc. | | | 10,842 |
| 1,149 | | | | Washington Mutual, Inc. | | | 5,665 |
| | | | | | | |
| | | | | | | 16,507 |
| | | | | | | |
| Semiconductors: 0.5% |
| 400 | | | | Altera Corp. | | | 8,280 |
| 500 | | | | Analog Devices, Inc. | | | 15,885 |
| 1,850 | | | | Applied Materials, Inc. | | | 35,317 |
| 650 | | @ | | Broadcom Corp. | | | 17,739 |
| 7,960 | | | | Intel Corp. | | | 170,981 |
| 400 | | | | KLA-Tencor Corp. | | | 16,284 |
| 200 | | | | Linear Technology Corp. | | | 6,514 |
| 1,500 | | @ | | LSI Logic Corp. | | | 9,210 |
| 200 | | @ | | MEMC Electronic Materials, Inc. | | | 12,308 |
| 650 | | | | National Semiconductor Corp. | | | 13,351 |
| 1,000 | | @ | | Nvidia Corp. | | | 18,720 |
| 650 | | @ | | QLogic Corp. | | | 9,484 |
| 2,200 | | | | Texas Instruments, Inc. | | | 61,952 |
| 300 | | | | Xilinx, Inc. | | | 7,575 |
| | | | | | | |
| | | | | | | 403,600 |
| | | | | | | |
See Accompanying Notes to Financial Statements
53
| | |
| ING GET U.S. CORE PORTFOLIO SERIES 1 | | PORTFOLIO OF INVESTMENTS ASOF JUNE 30, 2008 (UNAUDITED) (CONTINUED) |
| | | | | | | |
| Shares | | | | | | Value |
| | | | | | | |
| Software: 0.7% |
| 650 | | @ | | Adobe Systems, Inc. | | $ | 25,604 |
| 320 | | @ | | Autodesk, Inc. | | | 10,819 |
| 200 | | @ | | BMC Software, Inc. | | | 7,200 |
| 1,000 | | | | CA, Inc. | | | 23,090 |
| 1,100 | | @ | | Compuware Corp. | | | 10,494 |
| 250 | | @ | | Electronic Arts, Inc. | | | 11,108 |
| 200 | | | | Fidelity National Information Services, Inc. | | | 7,382 |
| 500 | | @ | | Fiserv, Inc. | | | 22,685 |
| 1,000 | | | | IMS Health, Inc. | | | 23,300 |
| 11,200 | | | | Microsoft Corp. | | | 308,112 |
| 5,260 | | @ | | Oracle Corp. | | | 110,460 |
| | | | | | | |
| | | | | | | 560,254 |
| | | | | | | |
| Telecommunications: 1.1% |
| 7,575 | | | | AT&T, Inc. | | | 255,202 |
| 300 | | | | CenturyTel, Inc. | | | 10,677 |
| 8,100 | | @ | | Cisco Systems, Inc. | | | 188,406 |
| 2,150 | | | | Corning, Inc. | | | 49,558 |
| 237 | | | | Embarq Corp. | | | 11,203 |
| 750 | | @ | | JDS Uniphase Corp. | | | 8,520 |
| 600 | | @ | | Juniper Networks, Inc. | | | 13,308 |
| 1,400 | | | | Motorola, Inc. | | | 10,276 |
| 1,850 | | | | Qualcomm, Inc. | | | 82,085 |
| 3,000 | | | | Qwest Communications International, Inc. | | | 11,790 |
| 1,752 | | | | Sprint Nextel Corp. | | | 16,644 |
| 4,000 | | | | Verizon Communications, Inc. | | | 141,600 |
| 2,500 | | | | Windstream Corp. | | | 30,850 |
| | | | | | | |
| | | | | | | 830,119 |
| | | | | | | |
| Textiles: 0.0% |
| 300 | | | | Cintas Corp. | | | 7,953 |
| | | | | | | |
| | | | | | | 7,953 |
| | | | | | | |
| Toys/Games/Hobbies: 0.0% |
| 600 | | | | Hasbro, Inc. | | | 21,432 |
| | | | | | | |
| | | | | | | 21,432 |
| | | | | | | |
| Transportation: 0.3% |
| 350 | | | | Burlington Northern Santa Fe Corp. | | | 34,962 |
| 250 | | | | CH Robinson Worldwide, Inc. | | | 13,710 |
| 310 | | | | CSX Corp. | | | 19,471 |
| 250 | | | | Expeditors International Washington, Inc. | | | 10,750 |
| 200 | | | | FedEx Corp. | | | 15,758 |
| 200 | | | | Norfolk Southern Corp. | | | 12,534 |
| 400 | | | | Ryder System, Inc. | | | 27,552 |
| 400 | | | | Union Pacific Corp. | | | 30,200 |
| 1,000 | | | | United Parcel Service, Inc. - Class B | | | 61,470 |
| | | | | | | |
| | | | | | | 226,407 |
| | | | | | | |
| | | | Total Common Stock
(Cost $16,948,580) | | | 15,035,524 |
| | | | | | | |
| REAL ESTATE INVESTMENT TRUSTS: 0.2% |
| Apartments: 0.0% |
| 400 | | | | Equity Residential | | | 15,308 |
| | | | | | | |
| | | | | | | 15,308 |
| | | | | | | |
| Diversified: 0.0% |
| 200 | | | | Vornado Realty Trust | | | 17,600 |
| | | | | | | |
| | | | | | | 17,600 |
| | | | | | | |
| | | | | | | | |
| Shares | | | | | | Value |
| | | | | | | | |
| | Health Care: 0.0% |
| | 600 | | | | HCP, Inc. | | $ | 19,086 |
| | | | | | | | |
| | | | | | | | 19,086 |
| | | | | | | | |
| | Hotels: 0.1% |
| | 1,650 | | | | Host Hotels & Resorts, Inc. | | | 22,523 |
| | | | | | | | |
| | | | | | | | 22,523 |
| | | | | | | | |
| | Regional Malls: 0.1% |
| | 350 | | | | General Growth Properties, Inc. | | | 12,261 |
| | 200 | | | | Simon Property Group, Inc. | | | 17,978 |
| | | | | | | | |
| | | | | | | | 30,239 |
| | | | | | | | |
| | Storage: 0.0% |
| | 200 | | | | Public Storage, Inc. | | | 16,158 |
| | | | | | | | |
| | | | | | | | 16,158 |
| | | | | | | | |
| | Warehouse/Industrial: 0.0% |
| | 400 | | | | Prologis | | | 21,740 |
| | | | | | | | |
| | | | | | | | 21,740 |
| | | | | | | | |
| | | | | Total Real Estate Investment Trusts
(Cost $156,260) | | | 142,654 |
| | | | | | | | |
| | | |
Principal
Amount | | | | | | Value |
| | U.S. GOVERNMENT AGENCY OBLIGATIONS: 47.6% |
| | Federal Home Loan Bank: 17.2% |
| $ | 13,550,000 | | Z | | 1.980%, due 09/12/08 | | $ | 13,496,423 |
| | | | | | | | |
| | | | | | | | 13,496,423 |
| | | | | | | | |
| | Federal Home Loan Mortgage Corporation: 8.2% |
| | 6,500,000 | | ^^, Z | | 2.260%, due 10/15/08 | | | 6,457,666 |
| | | | | | | | |
| | | | | | | | 6,457,666 |
| | | | | | | | |
| | Other U.S. Agency Obligations: 22.2% |
| | 17,600,000 | | Z | | Tennessee Valley Authority, 2.400%, due 11/13/08 | | | 17,445,859 |
| | | | | | | | |
| | | | | | | | 17,445,859 |
| | | | | | | | |
| | | | | Total U.S. Government Agency Obligations
(Cost $37,268,499) | | | 37,399,948 |
| | | | | | | | |
| | U.S. TREASURY OBLIGATIONS: 32.2% |
| | U.S. Treasury STRIP: 32.2% |
| | 25,371,000 | | ^^ | | 1.870%, due 08/15/08 | | | 25,311,805 |
| | | | | | | | |
| | | | | Total U.S. Treasury Obligations
(Cost $25,287,479) | | | 25,311,805 |
| | | | | | | | |
| | | | | Total Long-Term Investments
(Cost $79,660,818) | | | 77,889,931 |
| | | | | | | | |
| | | |
| Shares | | | | | | Value |
| | SHORT-TERM INVESTMENTS: 0.4% |
| | Mutual Fund: 0.1% |
| | 75,000 | | ** | | ING Institutional Prime Money Market Fund | | $ | 75,000 |
| | | | | | | | |
| | | | | Total Mutual Fund
(Cost $75,000) | | | 75,000 |
| | | | | | | | |
See Accompanying Notes to Financial Statements
54
| | |
| ING GET U.S. CORE PORTFOLIO SERIES 1 | | PORTFOLIO OF INVESTMENTS ASOF JUNE 30, 2008 (UNAUDITED) (CONTINUED) |
| | | | | | | | | |
Principal
Amount | | | | | | | Value |
| | | | | | | | | |
| | Repurchase Agreement: 0.3% |
| $ | 284,000 | | Goldman Sachs Repurchase Agreement dated 06/30/08, 2.350%, due 07/01/08, $284,019 to be received upon repurchase (Collateralized by $284,800 U.S. Treasury, 3.500%, Market Value plus accrued interest $289,703, due 12/15/09) | | | | | $ | 284,000 |
| | | | | | | | | |
| | | Total Repurchase Agreement
(Cost $284,000) | | | | | | 284,000 |
| | | | | | | | | |
| | | Total Short-Term Investments
(Cost $359,000) | | | | | | 359,000 |
| | | | | | | | | |
| | | Total Investments in Securities
(Cost $80,019,818)* | | 99.6 | % | | $ | 78,248,931 |
| | | Other Assets and
Liabilities - Net | | 0.4 | | | | 291,572 |
| | | | | | | | | |
| | | Net Assets | | 100.0 | % | | $ | 78,540,503 |
| | | | | | | | | |
| @ | Non-income producing security |
| STRIP | Separate Trading of Registered Interest and Principal of Securities |
| ** | Investment in affiliate |
| ^^ | Principal only securities represent the right to receive the monthly principal payments on an underlying pool of mortgage loans. No payments of interest on the pool are passed through the principal only security. |
| Z | Indicates Zero Coupon Bond; rate shown reflects current effective yield. |
| * | Cost for federal income tax purposes is $80,736,585. |
| | | | |
Net unrealized depreciation consists of: | | | | |
Gross Unrealized Appreciation | | $ | 53,424 | |
Gross Unrealized Depreciation | | | (2,541,078 | ) |
| | | | |
Net Unrealized Depreciation | | $ | (2,487,654 | ) |
| | | | |
Fair Value Measurements — Effective January 1, 2008, the Portfolio adopted Financial Accounting Standards Board Statement of Financial Accounting Standards No. 157 (“SFAS 157”), “Fair Value Measurements.” This new accounting statement defines fair value, establishes a framework for measuring fair value in generally accepted accounting principles (“GAAP”), and expands disclosures about fair value measurements. The three levels of the fair value hierarchy are as follows:
| | • | | Level 1 — quoted prices in active markets for identical investments |
| | • | | Level 2 — other significant observable inputs (including quoted prices for similar investments, interest rates, prepayment speeds, credit risk, etc.) |
| | • | | Level 3 — significant unobservable inputs (including the Portfolio’s own assumption in determining the fair value of investments) |
The inputs or methodology used in valuing securities are not necessarily an indication of the risk associated with investing in those securities.
The following is a summary of the inputs used as of June 30, 2008 in valuing the Portfolio’s investments at fair value:
| | | | | | |
| | | Investments in Securities | | Other Financial Instruments* |
Level 1 — Quoted Prices | | $ | 15,253,178 | | $ | — |
Level 2 — Other Significant Observable Inputs | | | 62,995,753 | | | — |
Level 3 — Significant Unobservable Inputs | | | — | | | — |
| | | | | | |
Total | | $ | 78,248,931 | | $ | — |
| | | | | | |
| * | | Other financial instruments may include forward foreign currency contracts, futures, swaps, and written options. |
See Accompanying Notes to Financial Statements
55
| | |
| ING GET U.S. CORE PORTFOLIO SERIES 2 | | PORTFOLIO OF INVESTMENTS ASOF JUNE 30, 2008 (UNAUDITED) |
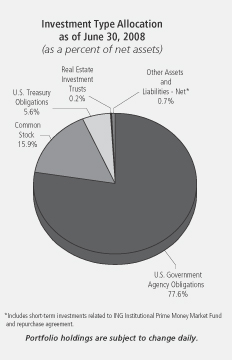
| | | | | | | |
| Shares | | | | | | Value |
| | | | | | | |
| COMMON STOCK: 15.9% | | | |
| Advertising: 0.1% | | | |
| 1,500 | | @ | | Interpublic Group of Cos., Inc. | | $ | 12,900 |
| 500 | | | | Omnicom Group | | | 22,440 |
| | | | | | | |
| | | | | | | 35,340 |
| | | | | | | |
| Aerospace/Defense: 0.4% | | | |
| 860 | | | | Boeing Co. | | | 56,519 |
| 200 | | | | General Dynamics Corp. | | | 16,840 |
| 250 | | | | Goodrich Corp. | | | 11,865 |
| 150 | | | | L-3 Communications Holdings, Inc. | | | 13,631 |
| 360 | | | | Lockheed Martin Corp. | | | 35,518 |
| 458 | | | | Northrop Grumman Corp. | | | 30,640 |
| 100 | | | | Raytheon Co. | | | 5,628 |
| 100 | | | | Rockwell Collins, Inc. | | | 4,796 |
| 880 | | | | United Technologies Corp. | | | 54,296 |
| | | | | | | |
| | | | | | | 229,733 |
| | | | | | | |
| Agriculture: 0.3% | | | |
| 1,760 | | | | Altria Group, Inc. | | | 36,186 |
| 600 | | | | Archer-Daniels-Midland Co. | | | 20,250 |
| 175 | | @ | | Lorillard, Inc. | | | 12,103 |
| 1,760 | | | | Philip Morris International, Inc. | | | 86,926 |
| 190 | | | | Reynolds American, Inc. | | | 8,867 |
| | | | | | | |
| | | | | | | 164,332 |
| | | | | | | |
| Airlines: 0.0% | | | |
| 700 | | | | Southwest Airlines Co. | | | 9,128 |
| | | | | | | |
| | | | | | | 9,128 |
| | | | | | | |
| | | | | | | |
| Shares | | | | | | Value |
| | | | | | | |
| Apparel: 0.1% | | | |
| 560 | | @ | | Coach, Inc. | | $ | 16,173 |
| 480 | | | | Nike, Inc. | | | 28,613 |
| 50 | | | | Polo Ralph Lauren Corp. | | | 3,139 |
| 200 | | | | VF Corp. | | | 14,236 |
| | | | | | | |
| | | | | | | 62,161 |
| | | | | | | |
| Auto Manufacturers: 0.0% | | | |
| 1,815 | | @ | | Ford Motor Co. | | | 8,730 |
| 450 | | | | General Motors Corp. | | | 5,175 |
| | | | | | | |
| | | | | | | 13,905 |
| | | | | | | |
| Auto Parts & Equipment: 0.0% | | | |
| 300 | | @ | | Goodyear Tire & Rubber Co. | | | 5,349 |
| 750 | | | | Johnson Controls, Inc. | | | 21,510 |
| | | | | | | |
| | | | | | | 26,859 |
| | | | | | | |
| Banks: 0.6% | | | |
| 3,894 | | | | Bank of America Corp. | | | 92,950 |
| 1,250 | | | | Bank of New York Mellon Corp. | | | 47,288 |
| 500 | | | | BB&T Corp. | | | 11,385 |
| 309 | | | | Capital One Financial Corp. | | | 11,745 |
| 600 | | | | Fifth Third Bancorp. | | | 6,108 |
| 100 | | | | M&T Bank Corp. | | | 7,054 |
| 149 | | | | Marshall & Ilsley Corp. | | | 2,284 |
| 200 | | | | Northern Trust Corp. | | | 13,714 |
| 1,299 | | | | Regions Financial Corp. | | | 14,172 |
| 430 | | | | State Street Corp. | | | 27,516 |
| 1,000 | | | | US Bancorp. | | | 27,890 |
| 1,539 | | | | Wachovia Corp. | | | 23,901 |
| 2,570 | | | | Wells Fargo & Co. | | | 61,038 |
| 300 | | | | Zions Bancorp. | | | 9,447 |
| | | | | | | |
| | | | | | | 356,492 |
| | | | | | | |
| Beverages: 0.4% | | | |
| 150 | | | | Anheuser-Busch Cos., Inc. | | | 9,318 |
| 1,820 | | | | Coca-Cola Co. | | | 94,604 |
| 200 | | | | Coca-Cola Enterprises, Inc. | | | 3,460 |
| 630 | | | | Pepsi Bottling Group, Inc. | | | 17,590 |
| 1,240 | | | | PepsiCo, Inc. | | | 78,852 |
| | | | | | | |
| | | | | | | 203,824 |
| | | | | | | |
| Biotechnology: 0.2% | | | |
| 990 | | @ | | Amgen, Inc. | | | 46,688 |
| 250 | | @ | | Biogen Idec, Inc. | | | 13,973 |
| 310 | | @ | | Celgene Corp. | | | 19,800 |
| 100 | | @ | | Genzyme Corp. | | | 7,202 |
| 800 | | @ | | Gilead Sciences, Inc. | | | 42,360 |
| | | | | | | |
| | | | | | | 130,023 |
| | | | | | | |
| Chemicals: 0.4% | | | |
| 300 | | | | Air Products & Chemicals, Inc. | | | 29,658 |
| 860 | | | | Dow Chemical Co. | | | 30,023 |
| 100 | | | | Eastman Chemical Co. | | | 6,886 |
| 100 | | | | Ecolab, Inc. | | | 4,299 |
| 1,050 | | | | EI Du Pont de Nemours & Co. | | | 45,035 |
| 300 | | | | Hercules, Inc. | | | 5,079 |
| 300 | | | | International Flavors & Fragrances, Inc. | | | 11,718 |
| 550 | | | | Monsanto Co. | | | 69,542 |
| 140 | | | | PPG Industries, Inc. | | | 8,032 |
| 100 | | | | Praxair, Inc. | | | 9,424 |
| 200 | | | | Rohm & Haas Co. | | | 9,288 |
| 450 | | | | Sigma-Aldrich Corp. | | | 24,237 |
| | | | | | | |
| | | | | | | 253,221 |
| | | | | | | |
See Accompanying Notes to Financial Statements
56
| | |
| ING GET U.S. CORE PORTFOLIO SERIES 2 | | PORTFOLIO OF INVESTMENTS ASOF JUNE 30, 2008 (UNAUDITED) (CONTINUED) |
| | | | | | | |
| Shares | | | | | | Value |
| | | | | | | |
| Coal: 0.1% | | | |
| 150 | | | | Consol Energy, Inc. | | $ | 16,856 |
| 90 | | | | Massey Energy Co. | | | 8,438 |
| 150 | | | | Peabody Energy Corp. | | | 13,208 |
| | | | | | | |
| | | | | | | 38,502 |
| | | | | | | |
| Commercial Services: 0.1% | | | |
| 150 | | @ | | Apollo Group, Inc. - Class A | | | 6,639 |
| 600 | | | | H&R Block, Inc. | | | 12,840 |
| 210 | | | | McKesson Corp. | | | 11,741 |
| 130 | | | | Moody’s Corp. | | | 4,477 |
| 200 | | | | Robert Half International, Inc. | | | 4,794 |
| 550 | | | | RR Donnelley & Sons Co. | | | 16,330 |
| 788 | | | | Western Union Co. | | | 19,479 |
| | | | | | | |
| | | | | | | 76,300 |
| | | | | | | |
| Computers: 0.9% | | | |
| 250 | | @ | | Affiliated Computer Services, Inc. | | | 13,373 |
| 750 | | @ | | Apple, Inc. | | | 125,580 |
| 200 | | @ | | Cognizant Technology Solutions Corp. | | | 6,502 |
| 150 | | @ | | Computer Sciences Corp. | | | 7,026 |
| 2,220 | | @ | | Dell, Inc. | | | 48,574 |
| 1,940 | | @ | | EMC Corp. | | | 28,499 |
| 2,270 | | | | Hewlett-Packard Co. | | | 100,357 |
| 1,240 | | | | International Business Machines Corp. | | | 146,977 |
| 240 | | @ | | Lexmark International, Inc. | | | 8,023 |
| 300 | | @ | | NetApp, Inc. | | | 6,498 |
| 200 | | @ | | Sandisk Corp. | | | 3,740 |
| 750 | | @ | | Sun Microsystems, Inc. | | | 8,160 |
| 200 | | @ | | Teradata Corp. | | | 4,628 |
| | | | | | | |
| | | | | | | 507,937 |
| | | | | | | |
| Cosmetics/Personal Care: 0.4% | | | |
| 450 | | | | Avon Products, Inc. | | | 16,209 |
| 320 | | | | Colgate-Palmolive Co. | | | 22,112 |
| 2,787 | | | | Procter & Gamble Co. | | | 169,477 |
| | | | | | | |
| | | | | | | 207,798 |
| | | | | | | |
| Distribution/Wholesale: 0.0% | | | |
| 500 | | | | Genuine Parts Co. | | | 19,840 |
| | | | | | | |
| | | | | | | 19,840 |
| | | | | | | |
| Diversified Financial Services: 0.8% | | | |
| 890 | | | | American Express Co. | | | 33,526 |
| 188 | | | | Ameriprise Financial, Inc. | | | 7,646 |
| 450 | | | | Charles Schwab Corp. | | | 9,243 |
| 400 | | | | CIT Group, Inc. | | | 2,724 |
| 4,390 | | | | Citigroup, Inc. | | | 73,576 |
| 90 | | | | CME Group, Inc. | | | 34,487 |
| 810 | | | | Countrywide Financial Corp. | | | 3,443 |
| 565 | | | | Discover Financial Services | | | 7,441 |
| 1,400 | | @ | | E*Trade Financial Corp. | | | 4,396 |
| 550 | | | | Federal Home Loan Mortgage Corporation | | | 9,020 |
| 970 | | | | Federal National Mortgage Association | | | 18,925 |
| 340 | | | | Goldman Sachs Group, Inc. | | | 59,466 |
| 100 | | @ | | IntercontinentalExchange, Inc. | | | 11,400 |
| 2,952 | | | | JPMorgan Chase & Co. | | | 101,283 |
| 100 | | | | Legg Mason, Inc. | | | 4,357 |
| 600 | | | | Lehman Brothers Holdings, Inc. | | | 11,886 |
| 1,160 | | | | Merrill Lynch & Co., Inc. | | | 36,784 |
| 1,130 | | | | Morgan Stanley | | | 40,759 |
| 170 | | | | NYSE Euronext | | | 8,612 |
| | | | | | | |
| Shares | | | | | | Value |
| | | | | | | |
| 300 | | @ | | SLM Corp. | | $ | 5,805 |
| 100 | | | | T. Rowe Price Group, Inc. | | | 5,647 |
| | | | | | | |
| | | | | | | 490,426 |
| | | | | | | |
| Electric: 0.5% | | | |
| 800 | | @ | | AES Corp. | | | 15,368 |
| 1,000 | | | | American Electric Power Co., Inc. | | | 40,230 |
| 700 | | | | Centerpoint Energy, Inc. | | | 11,235 |
| 600 | | | | Dominion Resources, Inc. | | | 28,494 |
| 700 | | | | DTE Energy Co. | | | 29,708 |
| 2,600 | | | | Duke Energy Corp. | | | 45,188 |
| 700 | | | | Edison International | | | 35,966 |
| 100 | | | | Entergy Corp. | | | 12,048 |
| 150 | | | | Exelon Corp. | | | 13,494 |
| 400 | | | | FPL Group, Inc. | | | 26,232 |
| 800 | | | | Pepco Holdings, Inc. | | | 20,520 |
| 200 | | | | PG&E Corp. | | | 7,938 |
| 150 | | | | PPL Corp. | | | 7,841 |
| 200 | | | | Public Service Enterprise Group, Inc. | | | 9,186 |
| | | | | | | |
| | | | | | | 303,448 |
| | | | | | | |
| Electrical Components & Equipment: 0.1% | | | |
| 570 | | | | Emerson Electric Co. | | | 28,187 |
| 200 | | | | Molex, Inc. | | | 4,882 |
| | | | | | | |
| | | | | | | 33,069 |
| | | | | | | |
| Electronics: 0.2% | | | |
| 530 | | @ | | Agilent Technologies, Inc. | | | 18,836 |
| 200 | | | | Applera Corp. - Applied Biosystems Group | | | 6,696 |
| 400 | | | | Jabil Circuit, Inc. | | | 6,564 |
| 300 | | | | PerkinElmer, Inc. | | | 8,355 |
| 550 | | @ | | Thermo Electron Corp. | | | 30,652 |
| 475 | | @@ | | Tyco Electronics Ltd. | | | 17,015 |
| 150 | | @ | | Waters Corp. | | | 9,675 |
| | | | | | | |
| | | | | | | 97,793 |
| | | | | | | |
| Engineering & Construction: 0.1% | | | |
| 100 | | | | Fluor Corp. | | | 18,608 |
| 150 | | @ | | Jacobs Engineering Group, Inc. | | | 12,105 |
| | | | | | | |
| | | | | | | 30,713 |
| | | | | | | |
| Environmental Control: 0.0% | | | |
| 600 | | @ | | Allied Waste Industries, Inc. | | | 7,572 |
| 400 | | | | Waste Management, Inc. | | | 15,084 |
| | | | | | | |
| | | | | | | 22,656 |
| | | | | | | |
| Food: 0.3% | | | |
| 600 | | | | ConAgra Foods, Inc. | | | 11,568 |
| 350 | | | | General Mills, Inc. | | | 21,270 |
| 200 | | | | HJ Heinz Co. | | | 9,570 |
| 500 | | | | Kellogg Co. | | | 24,010 |
| 863 | | | | Kraft Foods, Inc. | | | 24,552 |
| 400 | | | | Kroger Co. | | | 11,548 |
| 1,400 | | | | Sara Lee Corp. | | | 17,150 |
| 200 | | | | Supervalu, Inc. | | | 6,178 |
| 200 | | | | Sysco Corp. | | | 5,502 |
| 200 | | | | WM Wrigley Jr. Co. | | | 15,556 |
| | | | | | | |
| | | | | | | 146,904 |
| | | | | | | |
| Gas: 0.0% | | | |
| 400 | | | | Sempra Energy | | | 22,580 |
| | | | | | | |
| | | | | | | 22,580 |
| | | | | | | |
See Accompanying Notes to Financial Statements
57
| | |
| ING GET U.S. CORE PORTFOLIO SERIES 2 | | PORTFOLIO OF INVESTMENTS ASOF JUNE 30, 2008 (UNAUDITED) (CONTINUED) |
| | | | | | | |
| Shares | | | | | | Value |
| | | | | | | |
| Hand/Machine Tools: 0.0% | | | |
| 140 | | | | Black & Decker Corp. | | $ | 8,051 |
| 150 | | | | Snap-On, Inc. | | | 7,802 |
| 200 | | | | Stanley Works | | | 8,966 |
| | | | | | | |
| | | | | | | 24,819 |
| | | | | | | |
| Healthcare - Products: 0.5% | | | |
| 410 | | | | Baxter International, Inc. | | | 26,215 |
| 200 | | | | Becton Dickinson & Co. | | | 16,260 |
| 1,400 | | @ | | Boston Scientific Corp. | | | 17,206 |
| 225 | | @@ | | Covidien Ltd. | | | 10,775 |
| 50 | | | | CR Bard, Inc. | | | 4,398 |
| 1,870 | | | | Johnson & Johnson | | | 120,316 |
| 1,100 | | | | Medtronic, Inc. | | | 56,925 |
| 300 | | @ | | Patterson Cos., Inc. | | | 8,817 |
| 400 | | @ | | St. Jude Medical, Inc. | | | 16,352 |
| 150 | | | | Stryker Corp. | | | 9,432 |
| 200 | | @ | | Varian Medical Systems, Inc. | | | 10,370 |
| 50 | | @ | | Zimmer Holdings, Inc. | | | 3,403 |
| | | | | | | |
| | | | | | | 300,469 |
| | | | | | | |
| Healthcare - Services: 0.2% | | | |
| 470 | | | | Aetna, Inc. | | | 19,049 |
| 160 | | | | Cigna Corp. | | | 5,662 |
| 190 | | @ | | Humana, Inc. | | | 7,556 |
| 150 | | @ | | Laboratory Corp. of America Holdings | | | 10,445 |
| 200 | | | | Quest Diagnostics | | | 9,694 |
| 890 | | | | UnitedHealth Group, Inc. | | | 23,363 |
| 400 | | @ | | WellPoint, Inc. | | | 19,064 |
| | | | | | | |
| | | | | | | 94,833 |
| | | | | | | |
| Home Builders: 0.0% | | | |
| 450 | | | | D.R. Horton, Inc. | | | 4,883 |
| 300 | | | | Lennar Corp. | | | 3,702 |
| | | | | | | |
| | | | | | | 8,585 |
| | | | | | | |
| Household Products/Wares: 0.1% | | | |
| 300 | | | | Clorox Co. | | | 15,660 |
| 200 | | | | Fortune Brands, Inc. | | | 12,482 |
| 590 | | | | Kimberly-Clark Corp. | | | 35,270 |
| | | | | | | |
| | | | | | | 63,412 |
| | | | | | | |
| Insurance: 0.7% | | | |
| 400 | | @@ | | ACE Ltd. | | | 22,036 |
| 420 | | | | Aflac, Inc. | | | 26,376 |
| 530 | | | | Allstate Corp. | | | 24,163 |
| 2,220 | | | | American International Group, Inc. | | | 58,741 |
| 150 | | | | AON Corp. | | | 6,891 |
| 200 | | | | Assurant, Inc. | | | 13,192 |
| 580 | | | | Chubb Corp. | | | 28,426 |
| 300 | | | | Cincinnati Financial Corp. | | | 7,620 |
| 400 | | | | Genworth Financial, Inc. | | | 7,124 |
| 350 | | | | Hartford Financial Services Group, Inc. | | | 22,600 |
| 200 | | | | Lincoln National Corp. | | | 9,064 |
| 92 | | | | Loews Corp. | | | 4,315 |
| 200 | | | | Marsh & McLennan Cos., Inc. | | | 5,310 |
| 930 | | | | Metlife, Inc. | | | 49,076 |
| 470 | | | | Progressive Corp. | | | 8,798 |
| 540 | | | | Prudential Financial, Inc. | | | 32,260 |
| 190 | | | | Torchmark Corp. | | | 11,144 |
| 610 | | | | Travelers Cos., Inc. | | | 26,474 |
| | | | | | | |
| Shares | | | | | | Value |
| | | | | | | |
| 450 | | | | UnumProvident Corp. | | $ | 9,203 |
| 200 | | @@ | | XL Capital Ltd. | | | 4,112 |
| | | | | | | |
| | | | | | | 376,925 |
| | | | | | | |
| Internet: 0.3% | | | |
| 200 | | @ | | Akamai Technologies, Inc. | | | 6,958 |
| 200 | | @ | | Amazon.com, Inc. | | | 14,666 |
| 960 | | @ | | eBay, Inc. | | | 26,237 |
| 150 | | @ | | Expedia, Inc. | | | 2,757 |
| 150 | | @ | | Google, Inc. - Class A | | | 78,963 |
| 200 | | @ | | IAC/InterActiveCorp. | | | 3,856 |
| 751 | | @ | | Symantec Corp. | | | 14,532 |
| 950 | | @ | | Yahoo!, Inc. | | | 19,627 |
| | | | | | | |
| | | | | | | 167,596 |
| | | | | | | |
| Iron/Steel: 0.1% | | | |
| 100 | | | | Allegheny Technologies, Inc. | | | 5,928 |
| 320 | | | | Nucor Corp. | | | 23,894 |
| 110 | | | | United States Steel Corp. | | | 20,326 |
| | | | | | | |
| | | | | | | 50,148 |
| | | | | | | |
| Lodging: 0.0% | | | |
| 230 | | | | Starwood Hotels & Resorts Worldwide, Inc. | | | 9,216 |
| | | | | | | |
| | | | | | | 9,216 |
| | | | | | | |
| Machinery - Construction & Mining: 0.1% | | | |
| 600 | | | | Caterpillar, Inc. | | | 44,292 |
| 150 | | @ | | Terex Corp. | | | 7,706 |
| | | | | | | |
| | | | | | | 51,998 |
| | | | | | | |
| Machinery - Diversified: 0.1% | | | |
| 200 | | | | Cummins, Inc. | | | 13,104 |
| 400 | | | | Deere & Co. | | | 28,852 |
| 200 | | | | Manitowoc Co., Inc. | | | 6,506 |
| 100 | | | | Rockwell Automation, Inc. | | | 4,373 |
| | | | | | | |
| | | | | | | 52,835 |
| | | | | | | |
| Media: 0.4% | | | |
| 200 | | | | CBS Corp. - Class B | | | 3,898 |
| 350 | | | | Clear Channel Communications, Inc. | | | 12,320 |
| 1,900 | | | | Comcast Corp. - Class A | | | 36,043 |
| 550 | | @ | | DIRECTV Group, Inc. | | | 14,251 |
| 2,450 | | | | News Corp. - Class A | | | 36,848 |
| 2,550 | | | | Time Warner, Inc. | | | 37,740 |
| 600 | | @ | | Viacom - Class B | | | 18,324 |
| 1,630 | | | | Walt Disney Co. | | | 50,856 |
| | | | | | | |
| | | | | | | 210,280 |
| | | | | | | |
| Metal Fabricate/Hardware: 0.0% | | | |
| 200 | | | | Precision Castparts Corp. | | | 19,274 |
| | | | | | | |
| | | | | | | 19,274 |
| | | | | | | |
| Mining: 0.1% | | | |
| 150 | | | | Alcoa, Inc. | | | 5,343 |
| 365 | | | | Freeport-McMoRan Copper & Gold, Inc. | | | 42,774 |
| 250 | | | | Newmont Mining Corp. | | | 13,040 |
| | | | | | | |
| | | | | | | 61,157 |
| | | | | | | |
| Miscellaneous Manufacturing: 0.7% | | | |
| 570 | | | | 3M Co. | | | 39,666 |
| 200 | | | | Cooper Industries Ltd. | | | 7,900 |
| 550 | | | | Dover Corp. | | | 26,604 |
See Accompanying Notes to Financial Statements
58
| | |
| ING GET U.S. CORE PORTFOLIO SERIES 2 | | PORTFOLIO OF INVESTMENTS ASOF JUNE 30, 2008 (UNAUDITED) (CONTINUED) |
| | | | | | | |
| Shares | | | | | | Value |
| | | | | | | |
| Miscellaneous Manufacturing: (continued) | | | |
| 330 | | | | Eaton Corp. | | $ | 28,040 |
| 8,570 | | | | General Electric Co. | | | 228,733 |
| 760 | | | | Honeywell International, Inc. | | | 38,213 |
| 350 | | | | Illinois Tool Works, Inc. | | | 16,629 |
| 400 | | | | Leggett & Platt, Inc. | | | 6,708 |
| 240 | | | | Parker Hannifin Corp. | | | 17,117 |
| 350 | | | | Textron, Inc. | | | 16,776 |
| 175 | | @@ | | Tyco International Ltd. | | | 7,007 |
| | | | | | | |
| | | | | | | 433,393 |
| | | | | | | |
| Office/Business Equipment: 0.1% | | | |
| 600 | | | | Pitney Bowes, Inc. | | | 20,460 |
| 1,050 | | | | Xerox Corp. | | | 14,238 |
| | | | | | | |
| | | | | | | 34,698 |
| | | | | | | |
| Oil & Gas: 2.2% | | | |
| 540 | | | | Anadarko Petroleum Corp. | | | 40,414 |
| 300 | | | | Apache Corp. | | | 41,700 |
| 110 | | | | Cabot Oil & Gas Corp. | | | 7,450 |
| 400 | | | | Chesapeake Energy Corp. | | | 26,384 |
| 1,963 | | | | Chevron Corp. | | | 194,592 |
| 1,466 | | | | ConocoPhillips | | | 138,376 |
| 450 | | | | Devon Energy Corp. | | | 54,072 |
| 150 | | | | ENSCO International, Inc. | | | 12,111 |
| 200 | | | | EOG Resources, Inc. | | | 26,240 |
| 4,770 | | | | ExxonMobil Corp. | | | 420,380 |
| 200 | | | | Hess Corp. | | | 25,238 |
| 570 | | | | Marathon Oil Corp. | | | 29,566 |
| 150 | | | | Murphy Oil Corp. | | | 14,708 |
| 200 | | @, @@ | | Nabors Industries Ltd. | | | 9,846 |
| 150 | | | | Noble Corp. | | | 9,744 |
| 190 | | | | Noble Energy, Inc. | | | 19,106 |
| 830 | | | | Occidental Petroleum Corp. | | | 74,584 |
| 150 | | | | Questar Corp. | | | 10,656 |
| 200 | | | | Range Resources Corp. | | | 13,108 |
| 300 | | @ | | Southwestern Energy Co. | | | 14,283 |
| 100 | | | | Sunoco, Inc. | | | 4,069 |
| 209 | | @ | | Transocean, Inc. | | | 31,850 |
| 350 | | | | Valero Energy Corp. | | | 14,413 |
| 300 | | | | XTO Energy, Inc. | | | 20,553 |
| | | | | | | |
| | | | | | | 1,253,443 |
| | | | | | | |
| Oil & Gas Services: 0.4% | | | |
| 250 | | | | Baker Hughes, Inc. | | | 21,835 |
| 500 | | | | Halliburton Co. | | | 26,535 |
| 300 | | @ | | National Oilwell Varco, Inc. | | | 26,616 |
| 900 | | | | Schlumberger Ltd. | | | 96,687 |
| 200 | | | | Smith International, Inc. | | | 16,628 |
| 300 | | @ | | Weatherford International Ltd. | | | 14,877 |
| | | | | | | |
| | | | | | | 203,178 |
| | | | | | | |
| Packaging & Containers: 0.0% | | | |
| 320 | | | | Ball Corp. | | | 15,277 |
| | | | | | | |
| | | | | | | 15,277 |
| | | | | | | |
| Pharmaceuticals: 0.8% | | | |
| 1,000 | | | | Abbott Laboratories | | | 52,970 |
| 150 | | | | Allergan, Inc. | | | 7,808 |
| 200 | | | | AmerisourceBergen Corp. | | | 7,998 |
| 1,450 | | | | Bristol-Myers Squibb Co. | | | 29,769 |
| 130 | | | | Cardinal Health, Inc. | | | 6,705 |
| 950 | | | | Eli Lilly & Co. | | | 43,852 |
| 270 | | @ | | Express Scripts, Inc. | | | 16,934 |
| | | | | | | |
| Shares | | | | | | Value |
| | | | | | | |
| 200 | | @ | | Forest Laboratories, Inc. | | $ | 6,948 |
| 416 | | @ | | King Pharmaceuticals, Inc. | | | 4,356 |
| 300 | | @ | | Medco Health Solutions, Inc. | | | 14,160 |
| 1,980 | | | | Merck & Co., Inc. | | | 74,626 |
| 5,140 | | | | Pfizer, Inc. | | | 89,796 |
| 1,600 | | | | Schering-Plough Corp. | | | 31,504 |
| 200 | | @ | | Watson Pharmaceuticals, Inc. | | | 5,434 |
| 1,330 | | | | Wyeth | | | 63,787 |
| | | | | | | |
| | | | | | | 456,647 |
| | | | | | | |
| Pipelines: 0.1% | | | |
| 600 | | | | El Paso Corp. | | | 13,044 |
| 600 | | | | Spectra Energy Corp. | | | 17,244 |
| 550 | | | | Williams Cos., Inc. | | | 22,171 |
| | | | | | | |
| | | | | | | 52,459 |
| | | | | | | |
| Retail: 0.9% | | | |
| 150 | | | | Abercrombie & Fitch Co. | | | 9,402 |
| 200 | | @ | | Autozone, Inc. | | | 24,202 |
| 435 | | | | Best Buy Co., Inc. | | | 17,226 |
| 300 | | @ | | Big Lots, Inc. | | | 9,372 |
| 330 | | | | Costco Wholesale Corp. | | | 23,146 |
| 1,053 | | | | CVS Caremark Corp. | | | 41,667 |
| 310 | | | | Darden Restaurants, Inc. | | | 9,901 |
| 300 | | | | Family Dollar Stores, Inc. | | | 5,982 |
| 200 | | @ | | GameStop Corp. | | | 8,080 |
| 980 | | | | Gap, Inc. | | | 16,337 |
| 1,010 | | | | Home Depot, Inc. | | | 23,654 |
| 200 | | | | JC Penney Co., Inc. | | | 7,258 |
| 600 | | | | Limited Brands, Inc. | | | 10,110 |
| 1,060 | | | | Lowe’s Cos., Inc. | | | 21,995 |
| 200 | | | | Macy’s, Inc. | | | 3,884 |
| 1,200 | | | | McDonald’s Corp. | | | 67,464 |
| 600 | | | | Staples, Inc. | | | 14,250 |
| 550 | | | | Target Corp. | | | 25,570 |
| 200 | | | | Tiffany & Co. | | | 8,150 |
| 740 | | | | TJX Cos., Inc. | | | 23,288 |
| 550 | | | | Walgreen Co. | | | 17,881 |
| 2,190 | | | | Wal-Mart Stores, Inc. | | | 123,078 |
| 410 | | | | Yum! Brands, Inc. | | | 14,387 |
| | | | | | | |
| | | | | | | 526,284 |
| | | | | | | |
| Savings & Loans: 0.0% | | | |
| 400 | | | | Hudson City Bancorp., Inc. | | | 6,672 |
| 736 | | | | Washington Mutual, Inc. | | | 3,628 |
| | | | | | | |
| | | | | | | 10,300 |
| | | | | | | |
| Semiconductors: 0.4% | | | |
| 200 | | | | Altera Corp. | | | 4,140 |
| 300 | | | | Analog Devices, Inc. | | | 9,531 |
| 960 | | | | Applied Materials, Inc. | | | 18,326 |
| 350 | | @ | | Broadcom Corp. | | | 9,552 |
| 4,960 | | | | Intel Corp. | | | 106,541 |
| 250 | | | | KLA-Tencor Corp. | | | 10,178 |
| 200 | | | | Linear Technology Corp. | | | 6,514 |
| 1,000 | | @ | | LSI Logic Corp. | | | 6,140 |
| 150 | | @ | | MEMC Electronic Materials, Inc. | | | 9,231 |
| 390 | | | | National Semiconductor Corp. | | | 8,011 |
| 600 | | @ | | Nvidia Corp. | | | 11,232 |
| 400 | | @ | | QLogic Corp. | | | 5,836 |
| 1,400 | | | | Texas Instruments, Inc. | | | 39,424 |
| 200 | | | | Xilinx, Inc. | | | 5,050 |
| | | | | | | |
| | | | | | | 249,706 |
| | | | | | | |
See Accompanying Notes to Financial Statements
59
| | |
| ING GET U.S. CORE PORTFOLIO SERIES 2 | | PORTFOLIO OF INVESTMENTS ASOF JUNE 30, 2008 (UNAUDITED) (CONTINUED) |
| | | | | | | |
| Shares | | | | | | Value |
| | | | | | | |
| Software: 0.6% | | | |
| 410 | | @ | | Adobe Systems, Inc. | | $ | 16,150 |
| 340 | | @ | | Autodesk, Inc. | | | 11,495 |
| 150 | | @ | | BMC Software, Inc. | | | 5,400 |
| 590 | | | | CA, Inc. | | | 13,623 |
| 700 | | @ | | Compuware Corp. | | | 6,678 |
| 150 | | @ | | Electronic Arts, Inc. | | | 6,665 |
| 200 | | | | Fidelity National Information Services, Inc. | | | 7,382 |
| 300 | | @ | | Fiserv, Inc. | | | 13,611 |
| 600 | | | | IMS Health, Inc. | | | 13,980 |
| 6,960 | | | | Microsoft Corp. | | | 191,470 |
| 3,330 | | @ | | Oracle Corp. | | | 69,930 |
| | | | | | | |
| | | | | | | 356,384 |
| | | | | | | |
| Telecommunications: 0.9% | | | |
| 4,811 | | | | AT&T, Inc. | | | 162,083 |
| 210 | | | | CenturyTel, Inc. | | | 7,474 |
| 5,210 | | @ | | Cisco Systems, Inc. | | | 121,185 |
| 1,440 | | | | Corning, Inc. | | | 33,192 |
| 202 | | | | Embarq Corp. | | | 9,549 |
| 350 | | @ | | JDS Uniphase Corp. | | | 3,976 |
| 400 | | @ | | Juniper Networks, Inc. | | | 8,872 |
| 800 | | | | Motorola, Inc. | | | 5,872 |
| 1,230 | | | | Qualcomm, Inc. | | | 54,575 |
| 1,850 | | | | Qwest Communications International, Inc. | | | 7,271 |
| 1,054 | | | | Sprint Nextel Corp. | | | 10,013 |
| 2,400 | | | | Verizon Communications, Inc. | | | 84,960 |
| 1,500 | | | | Windstream Corp. | | | 18,510 |
| | | | | | | |
| | | | | | | 527,532 |
| | | | | | | |
| Textiles: 0.0% | | | |
| 200 | | | | Cintas Corp. | | | 5,302 |
| | | | | | | |
| | | | | | | 5,302 |
| | | | | | | |
| Toys/Games/Hobbies: 0.0% | | | |
| 400 | | | | Hasbro, Inc. | | | 14,288 |
| | | | | | | |
| | | | | | | 14,288 |
| | | | | | | |
| Transportation: 0.2% | | | |
| 150 | | | | Burlington Northern Santa Fe Corp. | | | 14,984 |
| 150 | | | | CH Robinson Worldwide, Inc. | | | 8,226 |
| 220 | | | | CSX Corp. | | | 13,818 |
| 150 | | | | Expeditors International Washington, Inc. | | | 6,450 |
| 150 | | | | FedEx Corp. | | | 11,819 |
| 200 | | | | Norfolk Southern Corp. | | | 12,534 |
| 200 | | | | Ryder System, Inc. | | | 13,776 |
| 200 | | | | Union Pacific Corp. | | | 15,100 |
| 600 | | | | United Parcel Service, Inc. - Class B | | | 36,882 |
| | | | | | | |
| | | | | | | 133,589 |
| | | | | | | |
| | | | Total Common Stock
(Cost $10,473,144) | | | 9,247,011 |
| | | | | | | |
| REAL ESTATE INVESTMENT TRUSTS: 0.2% | | | |
| Apartments: 0.0% | | | |
| 200 | | | | Equity Residential | | | 7,654 |
| | | | | | | |
| | | | | | | 7,654 |
| | | | | | | |
| Diversified: 0.1% | | | |
| 200 | | | | Vornado Realty Trust | | | 17,600 |
| | | | | | | |
| | | | | | | 17,600 |
| | | | | | | |
| | | | | | | | |
| Shares | | | | | | Value |
| | | | | | | | |
| | Health Care: 0.0% | | | |
| | 200 | | | | HCP, Inc. | | $ | 6,362 |
| | | | | | | | |
| | | | | | | | 6,362 |
| | | | | | | | |
| | Hotels: 0.0% | | | |
| | 950 | | | | Host Hotels & Resorts, Inc. | | | 12,968 |
| | | | | | | | |
| | | | | | | | 12,968 |
| | | | | | | | |
| | Regional Malls: 0.1% | | | |
| | 200 | | | | General Growth Properties, Inc. | | | 7,006 |
| | 150 | | | | Simon Property Group, Inc. | | | 13,484 |
| | | | | | | | |
| | | | | | | | 20,490 |
| | | | | | | | |
| | Storage: 0.0% | | | |
| | 100 | | | | Public Storage, Inc. | | | 8,079 |
| | | | | | | | |
| | | | | | | | 8,079 |
| | | | | | | | |
| | Warehouse/Industrial: 0.0% | | | |
| | 150 | | | | Prologis | | | 8,153 |
| | | | | | | | |
| | | | | | | | 8,153 |
| | | | | | | | |
| | | | | Total Real Estate Investment Trusts
(Cost $88,133) | | | 81,306 |
| | | | | | | | |
| | | |
Principal
Amount | | | | | | Value |
| | U.S. GOVERNMENT AGENCY OBLIGATIONS: 77.6% |
| | Federal Home Loan Mortgage Corporation: 19.8% |
| $ | 11,700,000 | | ^^, Z | | 2.440%, due 03/15/09 | | $ | 11,498,772 |
| | | | | | | | |
| | | | | | | | 11,498,772 |
| | | | | | | | |
| | Federal National Mortgage Association: 45.9% | | | |
| | 26,900,000 | | ^^, Z | | 2.400%, due 12/15/08 | | | 26,608,301 |
| | | | | | | | |
| | | | | | | | 26,608,301 |
| | | | | | | | |
| | Other U.S. Agency Obligations: 11.9% | | | |
| | 7,000,000 | | ^, Z | | Resolution Funding Corp., 2.030%, due 01/15/09 | | | 6,922,146 |
| | | | | | | | |
| | | | | | | | 6,922,146 |
| | | | | | | | |
| | | | | Total U.S. Government Agency Obligations
(Cost $44,826,707) | | | 45,029,219 |
| | | | | | | | |
| | U.S. TREASURY OBLIGATIONS: 5.6% | | | |
| | U.S. Treasury STRIP: 5.6% | | | |
| | 3,281,000 | | ^ | | 1.980%, due 11/15/08 | | | 3,256,875 |
| | | | | | | | |
| | | | | Total U.S. Treasury Obligations
(Cost $3,254,122) | | | 3,256,875 |
| | | | | | | | |
| | | | | Total Long-Term Investments
(Cost $58,642,106) | | | 57,614,411 |
| | | | | | | | |
| | | |
| Shares | | | | | | Value |
| | SHORT-TERM INVESTMENTS: 0.9% | | | |
| | Mutual Fund: 0.4% | | | |
| | 250,000 | | ** | | ING Institutional Prime Money Market Fund | | $ | 250,000 |
| | | | | | | | |
| | | | | Total Mutual Fund
(Cost $250,000) | | | 250,000 |
| | | | | | | | |
See Accompanying Notes to Financial Statements
60
| | |
| ING GET U.S. CORE PORTFOLIO SERIES 2 | | PORTFOLIO OF INVESTMENTS ASOF JUNE 30, 2008 (UNAUDITED) (CONTINUED) |
| | | | | | | | | | |
Principal
Amount | | | | | | | Value | |
| | Repurchase Agreement: 0.5% | | | | | |
| $ | 284,000 | | Goldman Sachs Repurchase Agreement dated 06/30/08, 2.350%, due 07/01/08, $284,019 to be received upon repurchase (Collateralized by $284,800 U.S. Treasury, 3.500%, Market Value plus accrued interest $289,703,
due 12/15/09) | | | | | $ | 284,000 | |
| | | | | | | | | | |
| | | Total Repurchase Agreement
(Cost $284,000) | | | | | | 284,000 | |
| | | | | | | | | | |
| | | Total Short-Term Investments
(Cost $534,000) | | | | | | 534,000 | |
| | | | | | | | | | |
| | | Total Investments in Securities
(Cost $59,176,106)* | | 100.2 | % | | $ | 58,148,411 | |
| | | Other Assets and
Liabilities - Net | | (0.2 | ) | | | (99,209 | ) |
| | | | | | | | | | |
| | | Net Assets | | 100.0 | % | | $ | 58,049,202 | |
| | | | | | | | | | |
| @ | Non-income producing security |
| STRIP | Separate Trading of Registered Interest and Principal of Securities |
| ** | Investment in affiliate |
| ^ | Interest only securities represent the right to receive the monthly interest payments on an underlying pool of mortgage loans. Principal amount shown represents the notional amount on which current interest is calculated. Payments of principal on the pool reduce the value of the interest only security. |
| ^^ | Principal only securities represent the right to receive the monthly principal payments on an underlying pool of mortgage loans. No payments of interest on the pool are passed through the principal only security. |
| Z | Indicates Zero Coupon Bond; rate shown reflects current effective yield. |
| * | Cost for federal income tax purposes is $59,620,359. |
| | | | |
Net unrealized depreciation consists of: | | | | |
Gross Unrealized Appreciation | | $ | 139,810 | |
Gross Unrealized Depreciation | | | (1,611,758 | ) |
| | | | |
Net Unrealized Depreciation | | $ | (1,471,948 | ) |
| | | | |
Fair Value Measurements — Effective January 1, 2008, the Portfolio adopted Financial Accounting Standards Board Statement of Financial Accounting Standards No. 157 (“SFAS 157”), “Fair Value Measurements.” This new accounting statement defines fair value, establishes a framework for measuring fair value in generally accepted accounting principles (“GAAP”), and expands disclosures about fair value measurements. The three levels of the fair value hierarchy are as follows:
| | • | | Level 1 — quoted prices in active markets for identical investments |
| | • | | Level 2 — other significant observable inputs (including quoted prices for similar investments, interest rates, prepayment speeds, credit risk, etc.) |
| | • | | Level 3 — significant unobservable inputs (including the Portfolio’s own assumption in determining the fair value of investments) |
The inputs or methodology used in valuing securities are not necessarily an indication of the risk associated with investing in those securities.
The following is a summary of the inputs used as of June 30, 2008 in valuing the Portfolio’s investments at fair value:
| | | | | | |
| | | Investments in Securities | | Other Financial Instruments* |
Level 1 — Quoted Prices | | $ | 9,578,317 | | $ | — |
Level 2 — Other Significant Observable Inputs | | | 48,570,094 | | | — |
Level 3 — Significant Unobservable Inputs | | | — | | | — |
| | | | | | |
Total | | $ | 58,148,411 | | $ | — |
| | | | | | |
| * | | Other financial instruments may include forward foreign currency contracts, futures, swaps, and written options. |
See Accompanying Notes to Financial Statements
61
| | |
| ING GET U.S. CORE PORTFOLIO SERIES 3 | | PORTFOLIO OF INVESTMENTS ASOF JUNE 30, 2008 (UNAUDITED) |
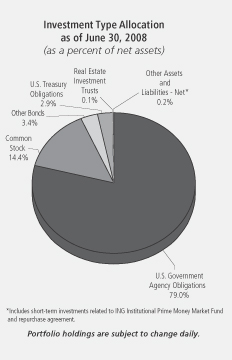
| | | | | | | |
| Shares | | | | | | Value |
| | | | | | | |
| COMMON STOCK: 14.4% | | | |
| Advertising: 0.1% | | | |
| 1,900 | | @ | | Interpublic Group of Cos., Inc. | | $ | 16,340 |
| 620 | | | | Omnicom Group | | | 27,826 |
| | | | | | | |
| | | | | | | 44,166 |
| | | | | | | |
| Aerospace/Defense: 0.4% | | | |
| 1,080 | | | | Boeing Co. | | | 70,978 |
| 300 | | | | General Dynamics Corp. | | | 25,260 |
| 400 | | | | Goodrich Corp. | | | 18,984 |
| 150 | | | | L-3 Communications Holdings, Inc. | | | 13,631 |
| 550 | | | | Lockheed Martin Corp. | | | 54,263 |
| 520 | | | | Northrop Grumman Corp. | | | 34,788 |
| 200 | | | | Raytheon Co. | | | 11,256 |
| 100 | | | | Rockwell Collins, Inc. | | | 4,796 |
| 1,160 | | | | United Technologies Corp. | | | 71,572 |
| | | | | | | |
| | | | | | | 305,528 |
| | | | | | | |
| Agriculture: 0.3% | | | |
| 2,330 | | | | Altria Group, Inc. | | | 47,905 |
| 830 | | | | Archer-Daniels-Midland Co. | | | 28,013 |
| 275 | | @ | | Lorillard, Inc. | | | 19,019 |
| 2,330 | | | | Philip Morris International, Inc. | | | 115,079 |
| 240 | | | | Reynolds American, Inc. | | | 11,201 |
| | | | | | | |
| | | | | | | 221,217 |
| | | | | | | |
| Airlines: 0.0% | | | |
| 1,000 | | | | Southwest Airlines Co. | | | 13,040 |
| | | | | | | |
| | | | | | | 13,040 |
| | | | | | | |
| Apparel: 0.1% | | | |
| 720 | | @ | | Coach, Inc. | | | 20,794 |
| 620 | | | | Nike, Inc. | | | 36,958 |
| | | | | | | |
| Shares | | | | | | Value |
| | | | | | | |
| 100 | | | | Polo Ralph Lauren Corp. | | $ | 6,278 |
| 200 | | | | VF Corp. | | | 14,236 |
| | | | | | | |
| | | | | | | 78,266 |
| | | | | | | |
| Auto Manufacturers: 0.0% | | | |
| 2,342 | | @ | | Ford Motor Co. | | | 11,265 |
| 600 | | | | General Motors Corp. | | | 6,900 |
| | | | | | | |
| | | | | | | 18,165 |
| | | | | | | |
| Auto Parts & Equipment: 0.0% | | | |
| 400 | | @ | | Goodyear Tire & Rubber Co. | | | 7,132 |
| 1,040 | | | | Johnson Controls, Inc. | | | 29,827 |
| | | | | | | |
| | | | | | | 36,959 |
| | | | | | | |
| Banks: 0.6% | | | |
| 5,124 | | | | Bank of America Corp. | | | 122,310 |
| 1,700 | | | | Bank of New York Mellon Corp. | | | 64,311 |
| 600 | | | | BB&T Corp. | | | 13,662 |
| 331 | | | | Capital One Financial Corp. | | | 12,581 |
| 600 | | | | Fifth Third Bancorp. | | | 6,108 |
| 200 | | | | M&T Bank Corp. | | | 14,108 |
| 300 | | | | Marshall & Ilsley Corp. | | | 4,599 |
| 300 | | | | Northern Trust Corp. | | | 20,571 |
| 1,640 | | | | Regions Financial Corp. | | | 17,892 |
| 550 | | | | State Street Corp. | | | 35,195 |
| 1,200 | | | | US Bancorp. | | | 33,468 |
| 2,129 | | | | Wachovia Corp. | | | 33,063 |
| 3,380 | | | | Wells Fargo & Co. | | | 80,275 |
| 400 | | | | Zions Bancorp. | | | 12,596 |
| | | | | | | |
| | | | | | | 470,739 |
| | | | | | | |
| Beverages: 0.3% | | | |
| 130 | | | | Anheuser-Busch Cos., Inc. | | | 8,076 |
| 2,470 | | | | Coca-Cola Co. | | | 128,391 |
| 300 | | | | Coca-Cola Enterprises, Inc. | | | 5,190 |
| 680 | | | | Pepsi Bottling Group, Inc. | | | 18,986 |
| 1,670 | | | | PepsiCo, Inc. | | | 106,195 |
| | | | | | | |
| | | | | | | 266,838 |
| | | | | | | |
| Biotechnology: 0.2% | | | |
| 1,300 | | @ | | Amgen, Inc. | | | 61,308 |
| 300 | | @ | | Biogen Idec, Inc. | | | 16,767 |
| 460 | | @ | | Celgene Corp. | | | 29,380 |
| 150 | | @ | | Genzyme Corp. | | | 10,803 |
| 1,000 | | @ | | Gilead Sciences, Inc. | | | 52,950 |
| | | | | | | |
| | | | | | | 171,208 |
| | | | | | | |
| Chemicals: 0.4% | | | |
| 400 | | | | Air Products & Chemicals, Inc. | | | 39,544 |
| 1,180 | | | | Dow Chemical Co. | | | 41,194 |
| 100 | | | | Eastman Chemical Co. | | | 6,886 |
| 100 | | | | Ecolab, Inc. | | | 4,299 |
| 1,500 | | | | EI Du Pont de Nemours & Co. | | | 64,335 |
| 500 | | | | Hercules, Inc. | | | 8,465 |
| 400 | | | | International Flavors & Fragrances, Inc. | | | 15,624 |
| 620 | | | | Monsanto Co. | | | 78,393 |
| 70 | | | | PPG Industries, Inc. | | | 4,016 |
| 100 | | | | Praxair, Inc. | | | 9,424 |
| 300 | | | | Rohm & Haas Co. | | | 13,932 |
| 600 | | | | Sigma-Aldrich Corp. | | | 32,316 |
| | | | | | | |
| | | | | | | 318,428 |
| | | | | | | |
See Accompanying Notes to Financial Statements
62
| | |
| ING GET U.S. CORE PORTFOLIO SERIES 3 | | PORTFOLIO OF INVESTMENTS ASOF JUNE 30, 2008 (UNAUDITED) (CONTINUED) |
| | | | | | | |
| Shares | | | | | | Value |
| | | | | | | |
| Coal: 0.1% |
| 200 | | | | Consol Energy, Inc. | | $ | 22,474 |
| 90 | | | | Massey Energy Co. | | | 8,438 |
| 200 | | | | Peabody Energy Corp. | | | 17,610 |
| | | | | | | |
| | | | | | | 48,522 |
| | | | | | | |
| Commercial Services: 0.1% |
| 200 | | @ | | Apollo Group, Inc. - Class A | | | 8,852 |
| 200 | | | | Automatic Data Processing, Inc. | | | 8,380 |
| 700 | | | | H&R Block, Inc. | | | 14,980 |
| 300 | | | | McKesson Corp. | | | 16,773 |
| 200 | | | | Moody’s Corp. | | | 6,888 |
| 400 | | | | Robert Half International, Inc. | | | 9,588 |
| 600 | | | | RR Donnelley & Sons Co. | | | 17,814 |
| 940 | | | | Western Union Co. | | | 23,237 |
| | | | | | | |
| | | | | | | 106,512 |
| | | | | | | |
| Computers: 0.8% |
| 300 | | @ | | Affiliated Computer Services, Inc. | | | 16,047 |
| 900 | | @ | | Apple, Inc. | | | 150,696 |
| 200 | | @ | | Cognizant Technology Solutions Corp. | | | 6,502 |
| 250 | | @ | | Computer Sciences Corp. | | | 11,710 |
| 2,750 | | @ | | Dell, Inc. | | | 60,170 |
| 2,690 | | @ | | EMC Corp. | | | 39,516 |
| 3,080 | | | | Hewlett-Packard Co. | | | 136,167 |
| 1,670 | | | | International Business Machines Corp. | | | 197,945 |
| 320 | | @ | | Lexmark International, Inc. | | | 10,698 |
| 400 | | @ | | NetApp, Inc. | | | 8,664 |
| 200 | | @ | | Sandisk Corp. | | | 3,740 |
| 800 | | @ | | Sun Microsystems, Inc. | | | 8,704 |
| 300 | | @ | | Teradata Corp. | | | 6,942 |
| | | | | | | |
| | | | | | | 657,501 |
| | | | | | | |
| Cosmetics/Personal Care: 0.3% |
| 600 | | | | Avon Products, Inc. | | | 21,612 |
| 430 | | | | Colgate-Palmolive Co. | | | 29,713 |
| 3,672 | | | | Procter & Gamble Co. | | | 223,294 |
| | | | | | | |
| | | | | | | 274,619 |
| | | | | | | |
| Distribution/Wholesale: 0.0% |
| 600 | | | | Genuine Parts Co. | | | 23,808 |
| | | | | | | |
| | | | | | | 23,808 |
| | | | | | | |
| Diversified Financial Services: 0.7% |
| 1,190 | | | | American Express Co. | | | 44,827 |
| 378 | | | | Ameriprise Financial, Inc. | | | 15,373 |
| 650 | | | | Charles Schwab Corp. | | | 13,351 |
| 450 | | | | CIT Group, Inc. | | | 3,065 |
| 5,940 | | | | Citigroup, Inc. | | | 99,554 |
| 30 | | | | CME Group, Inc. | | | 11,496 |
| 730 | | | | Countrywide Financial Corp. | | | 3,103 |
| 770 | | | | Discover Financial Services | | | 10,141 |
| 1,800 | | @ | | E*Trade Financial Corp. | | | 5,652 |
| 700 | | | | Federal Home Loan Mortgage Corporation | | | 11,480 |
| 1,090 | | | | Federal National Mortgage Association | | | 21,266 |
| 460 | | | | Goldman Sachs Group, Inc. | | | 80,454 |
| 100 | | @ | | IntercontinentalExchange, Inc. | | | 11,400 |
| 3,974 | | | | JPMorgan Chase & Co. | | | 136,348 |
| 860 | | | | Lehman Brothers Holdings, Inc. | | | 17,037 |
| 1,480 | | | | Merrill Lynch & Co., Inc. | | | 46,931 |
| | | | | | | |
| Shares | | | | | | Value |
| | | | | | | |
| 1,540 | | | | Morgan Stanley | | $ | 55,548 |
| 330 | | | | NYSE Euronext | | | 16,718 |
| 450 | | @ | | SLM Corp. | | | 8,708 |
| 100 | | | | T. Rowe Price Group, Inc. | | | 5,647 |
| | | | | | | |
| | | | | | | 618,099 |
| | | | | | | |
| Electric: 0.5% |
| 1,000 | | @ | | AES Corp. | | | 19,210 |
| 1,500 | | | | American Electric Power Co., Inc. | | | 60,345 |
| 1,000 | | | | Centerpoint Energy, Inc. | | | 16,050 |
| 800 | | | | Dominion Resources, Inc. | | | 37,992 |
| 800 | | | | DTE Energy Co. | | | 33,952 |
| 3,400 | | | | Duke Energy Corp. | | | 59,092 |
| 1,000 | | | | Edison International | | | 51,380 |
| 200 | | | | Entergy Corp. | | | 24,096 |
| 300 | | | | Exelon Corp. | | | 26,988 |
| 500 | | | | FPL Group, Inc. | | | 32,790 |
| 1,100 | | | | Pepco Holdings, Inc. | | | 28,215 |
| 200 | | | | PG&E Corp. | | | 7,938 |
| 300 | | | | PPL Corp. | | | 15,681 |
| 200 | | | | Public Service Enterprise Group, Inc. | | | 9,186 |
| | | | | | | |
| | | | | | | 422,915 |
| | | | | | | |
| Electrical Components & Equipment: 0.1% |
| 820 | | | | Emerson Electric Co. | | | 40,549 |
| 300 | | | | Molex, Inc. | | | 7,323 |
| | | | | | | |
| | | | | | | 47,872 |
| | | | | | | |
| Electronics: 0.2% |
| 770 | | @ | | Agilent Technologies, Inc. | | | 27,366 |
| 400 | | | | Applera Corp. - Applied Biosystems Group | | | 13,392 |
| 500 | | | | Jabil Circuit, Inc. | | | 8,205 |
| 400 | | | | PerkinElmer, Inc. | | | 11,140 |
| 660 | | @ | | Thermo Electron Corp. | | | 36,782 |
| 625 | | @@ | | Tyco Electronics Ltd. | | | 22,388 |
| 200 | | @ | | Waters Corp. | | | 12,900 |
| | | | | | | |
| | | | | | | 132,173 |
| | | | | | | |
| Engineering & Construction: 0.0% |
| 100 | | | | Fluor Corp. | | | 18,608 |
| 100 | | @ | | Jacobs Engineering Group, Inc. | | | 8,070 |
| | | | | | | |
| | | | | | | 26,678 |
| | | | | | | |
| Environmental Control: 0.0% |
| 800 | | @ | | Allied Waste Industries, Inc. | | | 10,096 |
| 500 | | | | Waste Management, Inc. | | | 18,855 |
| | | | | | | |
| | | | | | | 28,951 |
| | | | | | | |
| Food: 0.2% |
| 700 | | | | ConAgra Foods, Inc. | | | 13,496 |
| 500 | | | | General Mills, Inc. | | | 30,385 |
| 370 | | | | HJ Heinz Co. | | | 17,705 |
| 500 | | | | Kellogg Co. | | | 24,010 |
| 1,241 | | | | Kraft Foods, Inc. | | | 35,306 |
| 600 | | | | Kroger Co. | | | 17,322 |
| 1,500 | | | | Sara Lee Corp. | | | 18,375 |
| 500 | | | | Supervalu, Inc. | | | 15,445 |
| 300 | | | | Sysco Corp. | | | 8,253 |
| 200 | | | | WM Wrigley Jr. Co. | | | 15,556 |
| | | | | | | |
| | | | | | | 195,853 |
| | | | | | | |
| Gas: 0.0% |
| 600 | | | | Sempra Energy | | | 33,870 |
| | | | | | | |
| | | | | | | 33,870 |
| | | | | | | |
See Accompanying Notes to Financial Statements
63
| | |
| ING GET U.S. CORE PORTFOLIO SERIES 3 | | PORTFOLIO OF INVESTMENTS ASOF JUNE 30, 2008 (UNAUDITED) (CONTINUED) |
| | | | | | | |
| Shares | | | | | | Value |
| | | | | | | |
| Hand/Machine Tools: 0.0% |
| 100 | | | | Black & Decker Corp. | | $ | 5,751 |
| 90 | | | | Snap-On, Inc. | | | 4,681 |
| 270 | | | | Stanley Works | | | 12,104 |
| | | | | | | |
| | | | | | | 22,536 |
| | | | | | | |
| Healthcare - Products: 0.5% |
| 490 | | | | Baxter International, Inc. | | | 31,331 |
| 200 | | | | Becton Dickinson & Co. | | | 16,260 |
| 1,800 | | @ | | Boston Scientific Corp. | | | 22,122 |
| 325 | | @@ | | Covidien Ltd. | | | 15,564 |
| 100 | | | | CR Bard, Inc. | | | 8,795 |
| 2,510 | | | | Johnson & Johnson | | | 161,493 |
| 1,500 | | | | Medtronic, Inc. | | | 77,625 |
| 300 | | @ | | Patterson Cos., Inc. | | | 8,817 |
| 500 | | @ | | St. Jude Medical, Inc. | | | 20,440 |
| 200 | | | | Stryker Corp. | | | 12,576 |
| 300 | | @ | | Varian Medical Systems, Inc. | | | 15,555 |
| 100 | | @ | | Zimmer Holdings, Inc. | | | 6,805 |
| | | | | | | |
| | | | | | | 397,383 |
| | | | | | | |
| Healthcare - Services: 0.1% |
| 580 | | | | Aetna, Inc. | | | 23,507 |
| 280 | | | | Cigna Corp. | | | 9,909 |
| 300 | | @ | | Humana, Inc. | | | 11,931 |
| 200 | | @ | | Laboratory Corp. of America Holdings | | | 13,926 |
| 200 | | | | Quest Diagnostics | | | 9,694 |
| 1,150 | | | | UnitedHealth Group, Inc. | | | 30,188 |
| 500 | | @ | | WellPoint, Inc. | | | 23,830 |
| | | | | | | |
| | | | | | | 122,985 |
| | | | | | | |
| Home Builders: 0.0% |
| 400 | | | | D.R. Horton, Inc. | | | 4,340 |
| 700 | | | | Lennar Corp. | | | 8,638 |
| | | | | | | |
| | | | | | | 12,978 |
| | | | | | | |
| Household Products/Wares: 0.1% |
| 500 | | | | Clorox Co. | | | 26,100 |
| 300 | | | | Fortune Brands, Inc. | | | 18,723 |
| 750 | | | | Kimberly-Clark Corp. | | | 44,835 |
| | | | | | | |
| | | | | | | 89,658 |
| | | | | | | |
| Insurance: 0.6% |
| 510 | | @@ | | ACE Ltd. | | | 28,096 |
| 520 | | | | Aflac, Inc. | | | 32,656 |
| 600 | | | | Allstate Corp. | | | 27,354 |
| 2,890 | | | | American International Group, Inc. | | | 76,469 |
| 200 | | | | AON Corp. | | | 9,188 |
| 200 | | | | Assurant, Inc. | | | 13,192 |
| 740 | | | | Chubb Corp. | | | 36,267 |
| 400 | | | | Cincinnati Financial Corp. | | | 10,160 |
| 500 | | | | Genworth Financial, Inc. | | | 8,905 |
| 400 | | | | Hartford Financial Services Group, Inc. | | | 25,828 |
| 400 | | | | Lincoln National Corp. | | | 18,128 |
| 92 | | | | Loews Corp. | | | 4,315 |
| 400 | | | | Marsh & McLennan Cos., Inc. | | | 10,620 |
| 1,190 | | | | Metlife, Inc. | | | 62,796 |
| 340 | | | | Progressive Corp. | | | 6,365 |
| 640 | | | | Prudential Financial, Inc. | | | 38,234 |
| 180 | | | | Torchmark Corp. | | | 10,557 |
| 780 | | | | Travelers Cos., Inc. | | | 33,852 |
| | | | | | | |
| Shares | | | | | | Value |
| | | | | | | |
| 500 | | | | UnumProvident Corp. | | $ | 10,225 |
| 200 | | @@ | | XL Capital Ltd. | | | 4,112 |
| | | | | | | |
| | | | | | | 467,319 |
| | | | | | | |
| Internet: 0.3% |
| 200 | | @ | | Akamai Technologies, Inc. | | | 6,958 |
| 300 | | @ | | Amazon.com, Inc. | | | 21,999 |
| 1,150 | | @ | | eBay, Inc. | | | 31,430 |
| 300 | | @ | | Expedia, Inc. | | | 5,514 |
| 300 | | @ | | Google, Inc. - Class A | | | 157,926 |
| 300 | | @ | | IAC/InterActiveCorp. | | | 5,784 |
| 1,017 | | @ | | Symantec Corp. | | | 19,679 |
| 1,400 | | @ | | Yahoo!, Inc. | | | 28,924 |
| | | | | | | |
| | | | | | | 278,214 |
| | | | | | | |
| Iron/Steel: 0.1% |
| 100 | | | | Allegheny Technologies, Inc. | | | 5,928 |
| 440 | | | | Nucor Corp. | | | 32,855 |
| 170 | | | | United States Steel Corp. | | | 31,413 |
| | | | | | | |
| | | | | | | 70,196 |
| | | | | | | |
| Lodging: 0.0% |
| 270 | | | | Starwood Hotels & Resorts Worldwide, Inc. | | | 10,819 |
| | | | | | | |
| | | | | | | 10,819 |
| | | | | | | |
| Machinery - Construction & Mining: 0.1% |
| 800 | | | | Caterpillar, Inc. | | | 59,056 |
| 200 | | @ | | Terex Corp. | | | 10,274 |
| | | | | | | |
| | | | | | | 69,330 |
| | | | | | | |
| Machinery - Diversified: 0.1% |
| 200 | | | | Cummins, Inc. | | | 13,104 |
| 500 | | | | Deere & Co. | | | 36,065 |
| 200 | | | | Manitowoc Co., Inc. | | | 6,506 |
| 100 | | | | Rockwell Automation, Inc. | | | 4,373 |
| | | | | | | |
| | | | | | | 60,048 |
| | | | | | | |
| Media: 0.3% |
| 300 | | | | CBS Corp. - Class B | | | 5,847 |
| 600 | | | | Clear Channel Communications, Inc. | | | 21,120 |
| 2,550 | | | | Comcast Corp. - Class A | | | 48,374 |
| 800 | | @ | | DIRECTV Group, Inc. | | | 20,728 |
| 3,250 | | | | News Corp. - Class A | | | 48,880 |
| 3,400 | | | | Time Warner, Inc. | | | 50,320 |
| 900 | | @ | | Viacom - Class B | | | 27,486 |
| 2,140 | | | | Walt Disney Co. | | | 66,768 |
| | | | | | | |
| | | | | | | 289,523 |
| | | | | | | |
| Metal Fabricate/Hardware: 0.0% |
| 200 | | | | Precision Castparts Corp. | | | 19,274 |
| | | | | | | |
| | | | | | | 19,274 |
| | | | | | | |
| Mining: 0.1% |
| 400 | | | | Alcoa, Inc. | | | 14,248 |
| 465 | | | | Freeport-McMoRan Copper & Gold, Inc. | | | 54,493 |
| 400 | | | | Newmont Mining Corp. | | | 20,864 |
| | | | | | | |
| | | | | | | 89,605 |
| | | | | | | |
| Miscellaneous Manufacturing: 0.7% |
| 770 | | | | 3M Co. | | | 53,584 |
| 400 | | | | Cooper Industries Ltd. | | | 15,800 |
| 800 | | | | Dover Corp. | | | 38,696 |
See Accompanying Notes to Financial Statements
64
| | |
| ING GET U.S. CORE PORTFOLIO SERIES 3 | | PORTFOLIO OF INVESTMENTS ASOF JUNE 30, 2008 (UNAUDITED) (CONTINUED) |
| | | | | | | |
| Shares | | | | | | Value |
| | | | | | | |
| Miscellaneous Manufacturing: (continued) |
| 430 | | | | Eaton Corp. | | $ | 36,537 |
| 11,270 | | | | General Electric Co. | | | 300,796 |
| 1,030 | | | | Honeywell International, Inc. | | | 51,788 |
| 600 | | | | Illinois Tool Works, Inc. | | | 28,506 |
| 700 | | | | Leggett & Platt, Inc. | | | 11,739 |
| 340 | | | | Parker Hannifin Corp. | | | 24,249 |
| 500 | | | | Textron, Inc. | | | 23,965 |
| 125 | | @@ | | Tyco International Ltd. | | | 5,005 |
| | | | | | | |
| | | | | | | 590,665 |
| | | | | | | |
| Office/Business Equipment: 0.1% |
| 700 | | | | Pitney Bowes, Inc. | | | 23,870 |
| 1,400 | | | | Xerox Corp. | | | 18,984 |
| | | | | | | |
| | | | | | | 42,854 |
| | | | | | | |
| Oil & Gas: 2.0% |
| 660 | | | | Anadarko Petroleum Corp. | | | 49,394 |
| 500 | | | | Apache Corp. | | | 69,500 |
| 110 | | | | Cabot Oil & Gas Corp. | | | 7,450 |
| 600 | | | | Chesapeake Energy Corp. | | | 39,576 |
| 2,617 | | | | Chevron Corp. | | | 259,423 |
| 1,877 | | | | ConocoPhillips | | | 177,170 |
| 660 | | | | Devon Energy Corp. | | | 79,306 |
| 200 | | | | ENSCO International, Inc. | | | 16,148 |
| 300 | | | | EOG Resources, Inc. | | | 39,360 |
| 6,300 | | | | ExxonMobil Corp. | | | 555,219 |
| 300 | | | | Hess Corp. | | | 37,857 |
| 720 | | | | Marathon Oil Corp. | | | 37,346 |
| 300 | | | | Murphy Oil Corp. | | | 29,415 |
| 300 | | @, @@ | | Nabors Industries Ltd. | | | 14,769 |
| 200 | | | | Noble Corp. | | | 12,992 |
| 240 | | | | Noble Energy, Inc. | | | 24,134 |
| 1,020 | | | | Occidental Petroleum Corp. | | | 91,657 |
| 200 | | | | Questar Corp. | | | 14,208 |
| 200 | | | | Range Resources Corp. | | | 13,108 |
| 400 | | @ | | Southwestern Energy Co. | | | 19,044 |
| 200 | | | | Sunoco, Inc. | | | 8,138 |
| 399 | | @ | | Transocean, Inc. | | | 60,804 |
| 500 | | | | Valero Energy Corp. | | | 20,590 |
| 500 | | | | XTO Energy, Inc. | | | 34,255 |
| | | | | | | |
| | | | | | | 1,710,863 |
| | | | | | | |
| Oil & Gas Services: 0.3% |
| 300 | | | | Baker Hughes, Inc. | | | 26,202 |
| 600 | | | | Halliburton Co. | | | 31,842 |
| 400 | | @ | | National Oilwell Varco, Inc. | | | 35,488 |
| 1,200 | | | | Schlumberger Ltd. | | | 128,916 |
| 200 | | | | Smith International, Inc. | | | 16,628 |
| 400 | | @ | | Weatherford International Ltd. | | | 19,836 |
| | | | | | | |
| | | | | | | 258,912 |
| | | | | | | |
| Packaging & Containers: 0.0% |
| 340 | | | | Ball Corp. | | | 16,232 |
| | | | | | | |
| | | | | | | 16,232 |
| | | | | | | |
| Pharmaceuticals: 0.7% |
| 1,300 | | | | Abbott Laboratories | | | 68,861 |
| 200 | | | | Allergan, Inc. | | | 10,410 |
| 300 | | | | AmerisourceBergen Corp. | | | 11,997 |
| 1,900 | | | | Bristol-Myers Squibb Co. | | | 39,007 |
| 140 | | | | Cardinal Health, Inc. | | | 7,221 |
| 1,300 | | | | Eli Lilly & Co. | | | 60,008 |
| 320 | | @ | | Express Scripts, Inc. | | | 20,070 |
| | | | | | | |
| Shares | | | | | | Value |
| | | | | | | |
| 300 | | @ | | Forest Laboratories, Inc. | | $ | 10,422 |
| 624 | | @ | | King Pharmaceuticals, Inc. | | | 6,533 |
| 600 | | @ | | Medco Health Solutions, Inc. | | | 28,320 |
| 2,640 | | | | Merck & Co., Inc. | | | 99,502 |
| 6,780 | | | | Pfizer, Inc. | | | 118,447 |
| 2,150 | | | | Schering-Plough Corp. | | | 42,334 |
| 200 | | @ | | Watson Pharmaceuticals, Inc. | | | 5,434 |
| 1,680 | | | | Wyeth | | | 80,573 |
| | | | | | | |
| | | | | | | 609,139 |
| | | | | | | |
| Pipelines: 0.1% |
| 900 | | | | El Paso Corp. | | | 19,566 |
| 900 | | | | Spectra Energy Corp. | | | 25,866 |
| 870 | | | | Williams Cos., Inc. | | | 35,070 |
| | | | | | | |
| | | | | | | 80,502 |
| | | | | | | |
| Retail: 0.8% |
| 200 | | | | Abercrombie & Fitch Co. | | | 12,536 |
| 200 | | @ | | Autozone, Inc. | | | 24,202 |
| 525 | | | | Best Buy Co., Inc. | | | 20,790 |
| 400 | | @ | | Big Lots, Inc. | | | 12,496 |
| 380 | | | | Costco Wholesale Corp. | | | 26,653 |
| 1,471 | | | | CVS Caremark Corp. | | | 58,207 |
| 420 | | | | Darden Restaurants, Inc. | | | 13,415 |
| 400 | | | | Family Dollar Stores, Inc. | | | 7,976 |
| 300 | | @ | | GameStop Corp. | | | 12,120 |
| 1,220 | | | | Gap, Inc. | | | 20,337 |
| 1,290 | | | | Home Depot, Inc. | | | 30,212 |
| 200 | | | | JC Penney Co., Inc. | | | 7,258 |
| 900 | | | | Limited Brands, Inc. | | | 15,165 |
| 1,280 | | | | Lowe’s Cos., Inc. | | | 26,560 |
| 300 | | | | Macy’s, Inc. | | | 5,826 |
| 1,530 | | | | McDonald’s Corp. | | | 86,017 |
| 805 | | | | Staples, Inc. | | | 19,119 |
| 760 | | | | Target Corp. | | | 35,332 |
| 300 | | | | Tiffany & Co. | | | 12,225 |
| 1,070 | | | | TJX Cos., Inc. | | | 33,673 |
| 800 | | | | Walgreen Co. | | | 26,008 |
| 2,870 | | | | Wal-Mart Stores, Inc. | | | 161,294 |
| 560 | | | | Yum! Brands, Inc. | | | 19,650 |
| | | | | | | |
| | | | | | | 687,071 |
| | | | | | | |
| Savings & Loans: 0.0% |
| 600 | | | | Hudson City Bancorp., Inc. | | | 10,008 |
| 1,023 | | | | Washington Mutual, Inc. | | | 5,043 |
| | | | | | | |
| | | | | | | 15,051 |
| | | | | | | |
| Semiconductors: 0.4% |
| 300 | | | | Altera Corp. | | | 6,210 |
| 400 | | | | Analog Devices, Inc. | | | 12,708 |
| 1,310 | | | | Applied Materials, Inc. | | | 25,008 |
| 400 | | @ | | Broadcom Corp. | | | 10,916 |
| 6,380 | | | | Intel Corp. | | | 137,042 |
| 300 | | | | KLA-Tencor Corp. | | | 12,213 |
| 200 | | | | Linear Technology Corp. | | | 6,514 |
| 1,300 | | @ | | LSI Logic Corp. | | | 7,982 |
| 200 | | @ | | MEMC Electronic Materials, Inc. | | | 12,308 |
| 550 | | | | National Semiconductor Corp. | | | 11,297 |
| 600 | | @ | | Nvidia Corp. | | | 11,232 |
| 600 | | @ | | QLogic Corp. | | | 8,754 |
| 1,800 | | | | Texas Instruments, Inc. | | | 50,688 |
| 300 | | | | Xilinx, Inc. | | | 7,575 |
| | | | | | | |
| | | | | | | 320,447 |
| | | | | | | |
See Accompanying Notes to Financial Statements
65
| | |
| ING GET U.S. CORE PORTFOLIO SERIES 3 | | PORTFOLIO OF INVESTMENTS ASOF JUNE 30, 2008 (UNAUDITED) (CONTINUED) |
| | | | | | | |
| Shares | | | | | | Value |
| | | | | | | |
| Software: 0.6% |
| 610 | | @ | | Adobe Systems, Inc. | | $ | 24,028 |
| 450 | | @ | | Autodesk, Inc. | | | 15,215 |
| 270 | | @ | | BMC Software, Inc. | | | 9,720 |
| 840 | | | | CA, Inc. | | | 19,396 |
| 900 | | @ | | Compuware Corp. | | | 8,586 |
| 200 | | @ | | Electronic Arts, Inc. | | | 8,886 |
| 200 | | | | Fidelity National Information Services, Inc. | | | 7,382 |
| 400 | | @ | | Fiserv, Inc. | | | 18,148 |
| 800 | | | | IMS Health, Inc. | | | 18,640 |
| 9,220 | | | | Microsoft Corp. | | | 253,642 |
| 4,430 | | @ | | Oracle Corp. | | | 93,030 |
| | | | | | | |
| | | | | | | 476,673 |
| | | | | | | |
| Telecommunications: 0.8% |
| 6,220 | | | | AT&T, Inc. | | | 209,552 |
| 260 | | | | CenturyTel, Inc. | | | 9,253 |
| 6,790 | | @ | | Cisco Systems, Inc. | | | 157,935 |
| 1,870 | | | | Corning, Inc. | | | 43,104 |
| 281 | | | | Embarq Corp. | | | 13,283 |
| 600 | | @ | | JDS Uniphase Corp. | | | 6,816 |
| 400 | | @ | | Juniper Networks, Inc. | | | 8,872 |
| 1,080 | | | | Motorola, Inc. | | | 7,927 |
| 1,540 | | | | Qualcomm, Inc. | | | 68,330 |
| 3,000 | | | | Qwest Communications International, Inc. | | | 11,790 |
| 1,935 | | | | Sprint Nextel Corp. | | | 18,383 |
| 3,250 | | | | Verizon Communications, Inc. | | | 115,050 |
| 2,000 | | | | Windstream Corp. | | | 24,680 |
| | | | | | | |
| | | | | | | 694,975 |
| | | | | | | |
| Textiles: 0.0% |
| 300 | | | | Cintas Corp. | | | 7,953 |
| | | | | | | |
| | | | | | | 7,953 |
| | | | | | | |
| Toys/Games/Hobbies: 0.0% |
| 500 | | | | Hasbro, Inc. | | | 17,860 |
| | | | | | | |
| | | | | | | 17,860 |
| | | | | | | |
| Transportation: 0.2% |
| 300 | | | | Burlington Northern Santa Fe Corp. | | | 29,967 |
| 200 | | | | CH Robinson Worldwide, Inc. | | | 10,968 |
| 320 | | | | CSX Corp. | | | 20,099 |
| 200 | | | | Expeditors International Washington, Inc. | | | 8,600 |
| 200 | | | | FedEx Corp. | | | 15,758 |
| 270 | | | | Norfolk Southern Corp. | | | 16,921 |
| 200 | | | | Ryder System, Inc. | | | 13,776 |
| 300 | | | | Union Pacific Corp. | | | 22,650 |
| 800 | | | | United Parcel Service, Inc. - Class B | | | 49,176 |
| | | | | | | |
| | | | | | | 187,915 |
| | | | | | | |
| | | | Total Common Stock
(Cost $13,801,151) | | | 12,278,907 |
| | | | | | | |
| REAL ESTATE INVESTMENT TRUSTS: 0.1% |
| Apartments: 0.0% |
| 300 | | | | Equity Residential | | | 11,481 |
| | | | | | | |
| | | | | | | 11,481 |
| | | | | | | |
| Diversified: 0.0% |
| 200 | | | | Vornado Realty Trust | | | 17,600 |
| | | | | | | |
| | | | | | | 17,600 |
| | | | | | | |
| | | | | | | | |
| Shares | | | | | | Value |
| | | | | | | | |
| | Health Care: 0.0% |
| | 300 | | | | HCP, Inc. | | $ | 9,543 |
| | | | | | | | |
| | | | | | | | 9,543 |
| | | | | | | | |
| | Hotels: 0.0% |
| | 1,400 | | | | Host Hotels & Resorts, Inc. | | | 19,110 |
| | | | | | | | |
| | | | | | | | 19,110 |
| | | | | | | | |
| | Regional Malls: 0.1% |
| | 200 | | | | General Growth Properties, Inc. | | | 7,006 |
| | 200 | | | | Simon Property Group, Inc. | | | 17,978 |
| | | | | | | | |
| | | | | | | | 24,984 |
| | | | | | | | |
| | Storage: 0.0% |
| | 100 | | | | Public Storage, Inc. | | | 8,079 |
| | | | | | | | |
| | | | | | | | 8,079 |
| | | | | | | | |
| | Warehouse/Industrial: 0.0% |
| | 300 | | | | Prologis | | | 16,305 |
| | | | | | | | |
| | | | | | | | 16,305 |
| | | | | | | | |
| | | | | Total Real Estate Investment Trusts
(Cost $118,625) | | | 107,102 |
| | | | | | | | |
| | | |
Principal
Amount | | | | | | Value |
| | U.S. GOVERNMENT AGENCY OBLIGATIONS: 79.0% |
| | Federal Home Loan Mortgage Corporation: 40.0% |
| $ | 31,900,000 | | ^^, Z | | 2.440%, due 03/15/09 | | $ | 31,351,344 |
| | 2,875,000 | | ^, Z | | 2.480%, due 03/15/09 | | | 2,825,553 |
| | | | | | | | |
| | | | | | | | 34,176,897 |
| | | | | | | | |
| | Federal National Mortgage Association: 25.7% |
| | 2,091,000 | | ^, Z | | 2.660%, due 06/15/09 | | | 2,039,106 |
| | 20,400,000 | | ^, Z | | 2.690%, due 06/15/09 | | | 19,886,430 |
| | | | | | | | |
| | | | | | | | 21,925,536 |
| | | | | | | | |
| | Other U.S. Agency Obligations: 13.3% |
| | 11,500,000 | | ^, Z | | Resolution Funding Corp., 2.220%, due 04/15/09 | | | 11,302,074 |
| | | | | | | | |
| | | | | | | | 11,302,074 |
| | | | | | | | |
| | | | | Total U.S. Government Agency Obligations
(Cost $67,246,988) | | | 67,404,507 |
| | | | | | | | |
| | U.S. TREASURY OBLIGATIONS: 2.9% |
| | U.S. Treasury STRIP: 2.9% |
| | 2,517,000 | | ^^ | | 2.000%, due 11/15/08 | | | 2,498,309 |
| | | | | | | | |
| | | | | Total U.S. Treasury Obligations
(Cost $2,494,877) | | | 2,498,309 |
| | | | | | | | |
| | OTHER BONDS: 3.4% |
| | Sovereign: 3.4% |
| | 3,000,000 | | Z | | Israel Trust Certificates, 2.450%, due 05/15/09 | | | 2,936,193 |
| | | | | | | | |
| | | | | Total Other Bonds
(Cost $2,932,033) | | | 2,936,193 |
| | | | | | | | |
| | | | | Total Long-Term Investments
(Cost $86,593,674) | | | 85,225,018 |
| | | | | | | | |
See Accompanying Notes to Financial Statements
66
| | |
| ING GET U.S. CORE PORTFOLIO SERIES 3 | | PORTFOLIO OF INVESTMENTS ASOF JUNE 30, 2008 (UNAUDITED) (CONTINUED) |
| | | | | | | |
| Shares | | | | | | Value |
| | | | | | | |
| SHORT-TERM INVESTMENTS: 0.4% |
| Mutual Fund: 0.1% |
| 75,000 | | ** | | ING Institutional Prime Money Market Fund | | $ | 75,000 |
| | | | | | | |
| | | | Total Mutual Fund
(Cost $75,000) | | | 75,000 |
| | | | | | | |
| | | | | | | | | | |
| | | |
Principal
Amount | | | | | | | Value | |
| | | | | | | | | | |
| | Repurchase Agreement: 0.3% | |
| $ | 237,000 | | Morgan Stanley Repurchase Agreement dated 06/30/08, 2.400%, due 07/01/08, $237,016 to be received upon repurchase (Collateralized by $245,000 Federal Home Loan Bank, 4.650%, Market Value plus accrued interest $246,201, due 03/24/15) | | | | | $ | 237,000 | |
| | | | | | | | | | |
| | | Total Repurchase Agreement
(Cost $237,000) | | | | | | 237,000 | |
| | | | | | | | | | |
| | | Total Short-Term Investments
(Cost $312,000) | | | | | | 312,000 | |
| | | | | | | | | | |
| | | Total Investments in Securities
(Cost $86,905,674)* | | 100.2 | % | | $ | 85,537,018 | |
| | | Other Assets and
Liabilities - Net | | (0.2 | ) | | | (174,538 | ) |
| | | | | | | | | | |
| | | Net Assets | | 100.0 | % | | $ | 85,362,480 | |
| | | | | | | | | | |
| @ | Non-income producing security |
| STRIP | Separate Trading of Registered Interest and Principal of Securities |
| ** | Investment in affiliate |
| ^ | Interest only securities represent the right to receive the monthly interest payments on an underlying pool of mortgage loans. Principal amount shown represents the notional amount on which current interest is calculated. Payments of principal on the pool reduce the value of the interest only security. |
| ^^ | Principal only securities represent the right to receive the monthly principal payments on an underlying pool of mortgage loans. No payments of interest on the pool are passed through the principal only security. |
| Z | Indicates Zero Coupon Bond; rate shown reflects current effective yield. |
| * | Cost for federal income tax purposes is $87,293,178. |
| | | | |
Net unrealized depreciation consists of: | | | | |
Gross Unrealized Appreciation | | $ | 363,179 | |
Gross Unrealized Depreciation | | | (2,119,339 | ) |
| | | | |
Net Unrealized Depreciation | | $ | (1,756,160 | ) |
| | | | |
Fair Value Measurements — Effective January 1, 2008, the Portfolio adopted Financial Accounting Standards Board Statement of Financial Accounting Standards No. 157 (“SFAS 157”), “Fair Value Measurements.” This new accounting statement defines fair value, establishes a framework for measuring fair value in generally accepted accounting principles (“GAAP”), and expands disclosures about fair value measurements. The three levels of the fair value hierarchy are as follows:
| | • | | Level 1 — quoted prices in active markets for identical investments |
| | • | | Level 2 — other significant observable inputs (including quoted prices for similar investments, interest rates, prepayment speeds, credit risk, etc.) |
| | • | | Level 3 — significant unobservable inputs (including the Portfolio’s own assumption in determining the fair value of investments) |
The inputs or methodology used in valuing securities are not necessarily an indication of the risk associated with investing in those securities.
The following is a summary of the inputs used as of June 30, 2008 in valuing the Portfolio’s investments at fair value:
| | | | | | |
| | | Investments in Securities | | Other Financial Instruments* |
Level 1 — Quoted Prices | | $ | 12,461,009 | | $ | — |
Level 2 — Other Significant Observable Inputs | | | 73,076,009 | | | — |
Level 3 — Significant Unobservable Inputs | | | — | | | — |
| | | | | | |
Total | | $ | 85,537,018 | | $ | — |
| | | | | | |
| * | | Other financial instruments may include forward foreign currency contracts, futures, swaps, and written options. |
See Accompanying Notes to Financial Statements
67
| | |
| ING GET U.S. CORE PORTFOLIO SERIES 4 | | PORTFOLIO OF INVESTMENTS ASOF JUNE 30, 2008 (UNAUDITED) |
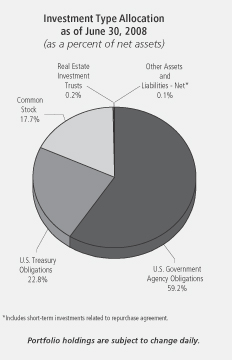
| | | | | | | |
| Shares | | | | | | Value |
| | | | | | | |
| COMMON STOCK: 17.7% |
| Advertising: 0.1% |
| 980 | | @ | | Interpublic Group of Cos., Inc. | | $ | 8,428 |
| 300 | | | | Omnicom Group | | | 13,464 |
| | | | | | | |
| | | | | | | 21,892 |
| | | | | | | |
| Aerospace/Defense: 0.4% |
| 570 | | | | Boeing Co. | | | 37,460 |
| 190 | | | | General Dynamics Corp. | | | 15,998 |
| 160 | | | | Goodrich Corp. | | | 7,594 |
| 110 | | | | L-3 Communications Holdings, Inc. | | | 9,996 |
| 280 | | | | Lockheed Martin Corp. | | | 27,625 |
| 260 | | | | Northrop Grumman Corp. | | | 17,394 |
| 80 | | | | Raytheon Co. | | | 4,502 |
| 80 | | | | Rockwell Collins, Inc. | | | 3,837 |
| 570 | | | | United Technologies Corp. | | | 35,169 |
| | | | | | | |
| | | | | | | 159,575 |
| | | | | | | |
| Agriculture: 0.3% |
| 1,200 | | | | Altria Group, Inc. | | | 24,672 |
| 400 | | | | Archer-Daniels-Midland Co. | | | 13,500 |
| 135 | | @ | | Lorillard, Inc. | | | 9,337 |
| 1,200 | | | | Philip Morris International, Inc. | | | 59,268 |
| 160 | | | | Reynolds American, Inc. | | | 7,467 |
| | | | | | | |
| | | | | | | 114,244 |
| | | | | | | |
| Airlines: 0.0% |
| 520 | | | | Southwest Airlines Co. | | | 6,781 |
| | | | | | | |
| | | | | | | 6,781 |
| | | | | | | |
| Apparel: 0.1% |
| 400 | | @ | | Coach, Inc. | | | 11,552 |
| 340 | | | | Nike, Inc. | | | 20,267 |
| | | | | | | |
| Shares | | | | | | Value |
| | | | | | | |
| 80 | | | | Polo Ralph Lauren Corp. | | $ | 5,022 |
| 80 | | | | VF Corp. | | | 5,694 |
| | | | | | | |
| | | | | | | 42,535 |
| | | | | | | |
| Auto Manufacturers: 0.0% |
| 891 | | @ | | Ford Motor Co. | | | 4,286 |
| 300 | | | | General Motors Corp. | | | 3,450 |
| | | | | | | |
| | | | | | | 7,736 |
| | | | | | | |
| Auto Parts & Equipment: 0.1% |
| 160 | | @ | | Goodyear Tire & Rubber Co. | | | 2,853 |
| 600 | | | | Johnson Controls, Inc. | | | 17,208 |
| | | | | | | |
| | | | | | | 20,061 |
| | | | | | | |
| Banks: 0.7% |
| 2,643 | | | | Bank of America Corp. | | | 63,088 |
| 840 | | | | Bank of New York Mellon Corp. | | | 31,777 |
| 300 | | | | BB&T Corp. | | | 6,831 |
| 269 | | | | Capital One Financial Corp. | | | 10,225 |
| 300 | | | | Fifth Third Bancorp. | | | 3,054 |
| 80 | | | | M&T Bank Corp. | | | 5,643 |
| 159 | | | | Marshall & Ilsley Corp. | | | 2,437 |
| 160 | | | | Northern Trust Corp. | | | 10,971 |
| 857 | | | | Regions Financial Corp. | | | 9,350 |
| 330 | | | | State Street Corp. | | | 21,117 |
| 600 | | | | US Bancorp. | | | 16,734 |
| 1,036 | | | | Wachovia Corp. | | | 16,089 |
| 1,740 | | | | Wells Fargo & Co. | | | 41,325 |
| 220 | | | | Zions Bancorp. | | | 6,928 |
| | | | | | | |
| | | | | | | 245,569 |
| | | | | | | |
| Beverages: 0.4% |
| 30 | | | | Anheuser-Busch Cos., Inc. | | | 1,864 |
| 1,280 | | | | Coca-Cola Co. | | | 66,534 |
| 160 | | | | Coca-Cola Enterprises, Inc. | | | 2,768 |
| 380 | | | | Pepsi Bottling Group, Inc. | | | 10,610 |
| 830 | | | | PepsiCo, Inc. | | | 52,780 |
| | | | | | | |
| | | | | | | 134,556 |
| | | | | | | |
| Biotechnology: 0.3% |
| 680 | | @ | | Amgen, Inc. | | | 32,069 |
| 160 | | @ | | Biogen Idec, Inc. | | | 8,942 |
| 270 | | @ | | Celgene Corp. | | | 17,245 |
| 80 | | @ | | Genzyme Corp. | | | 5,762 |
| 520 | | @ | | Gilead Sciences, Inc. | | | 27,534 |
| | | | | | | |
| | | | | | | 91,552 |
| | | | | | | |
| Chemicals: 0.5% |
| 220 | | | | Air Products & Chemicals, Inc. | | | 21,749 |
| 570 | | | | Dow Chemical Co. | | | 19,899 |
| 80 | | | | Eastman Chemical Co. | | | 5,509 |
| 160 | | | | Ecolab, Inc. | | | 6,878 |
| 760 | | | | EI Du Pont de Nemours & Co. | | | 32,596 |
| 220 | | | | Hercules, Inc. | | | 3,725 |
| 220 | | | | International Flavors & Fragrances, Inc. | | | 8,593 |
| 340 | | | | Monsanto Co. | | | 42,990 |
| 90 | | | | PPG Industries, Inc. | | | 5,163 |
| 80 | | | | Praxair, Inc. | | | 7,539 |
| 160 | | | | Rohm & Haas Co. | | | 7,430 |
| 300 | | | | Sigma-Aldrich Corp. | | | 16,158 |
| | | | | | | |
| | | | | | | 178,229 |
| | | | | | | |
See Accompanying Notes to Financial Statements
68
| | |
| ING GET U.S. CORE PORTFOLIO SERIES 4 | | PORTFOLIO OF INVESTMENTS ASOF JUNE 30, 2008 (UNAUDITED) (CONTINUED) |
| | | | | | | |
| Shares | | | | | | Value |
| | | | | | | |
| Coal: 0.1% |
| 80 | | | | Consol Energy, Inc. | | $ | 8,990 |
| 40 | | | | Massey Energy Co. | | | 3,750 |
| 80 | | | | Peabody Energy Corp. | | | 7,044 |
| | | | | | | |
| | | | | | | 19,784 |
| | | | | | | |
| Commercial Services: 0.1% |
| 80 | | @ | | Apollo Group, Inc. - Class A | | | 3,541 |
| 80 | | | | Automatic Data Processing, Inc. | | | 3,352 |
| 380 | | | | H&R Block, Inc. | | | 8,132 |
| 110 | | | | McKesson Corp. | | | 6,150 |
| 80 | | | | Moody’s Corp. | | | 2,755 |
| 160 | | | | Robert Half International, Inc. | | | 3,835 |
| 380 | | | | RR Donnelley & Sons Co. | | | 11,282 |
| 380 | | | | Western Union Co. | | | 9,394 |
| | | | | | | |
| | | | | | | 48,441 |
| | | | | | | |
| Computers: 1.0% |
| 160 | | @ | | Affiliated Computer Services, Inc. | | | 8,558 |
| 520 | | @ | | Apple, Inc. | | | 87,069 |
| 160 | | @ | | Cognizant Technology Solutions Corp. | | | 5,202 |
| 160 | | @ | | Computer Sciences Corp. | | | 7,494 |
| 1,360 | | @ | | Dell, Inc. | | | 29,757 |
| 1,280 | | @ | | EMC Corp. | | | 18,803 |
| 1,550 | | | | Hewlett-Packard Co. | | | 68,526 |
| 870 | | | | International Business Machines Corp. | | | 103,121 |
| 160 | | @ | | Lexmark International, Inc. | | | 5,349 |
| 160 | | @ | | NetApp, Inc. | | | 3,466 |
| 160 | | @ | | Sandisk Corp. | | | 2,992 |
| 465 | | @ | | Sun Microsystems, Inc. | | | 5,059 |
| 160 | | @ | | Teradata Corp. | | | 3,702 |
| | | | | | | |
| | | | | | | 349,098 |
| | | | | | | |
| Cosmetics/Personal Care: 0.4% |
| 300 | | | | Avon Products, Inc. | | | 10,806 |
| 190 | | | | Colgate-Palmolive Co. | | | 13,129 |
| 1,917 | | | | Procter & Gamble Co. | | | 116,573 |
| | | | | | | |
| | | | | | | 140,508 |
| | | | | | | |
| Distribution/Wholesale: 0.0% |
| 300 | | | | Genuine Parts Co. | | | 11,904 |
| | | | | | | |
| | | | | | | 11,904 |
| | | | | | | |
| Diversified Financial Services: 0.9% |
| 600 | | | | American Express Co. | | | 22,602 |
| 140 | | | | Ameriprise Financial, Inc. | | | 5,694 |
| 300 | | | | Charles Schwab Corp. | | | 6,162 |
| 160 | | | | CIT Group, Inc. | | | 1,090 |
| 3,020 | | | | Citigroup, Inc. | | | 50,615 |
| 60 | | | | CME Group, Inc. | | | 22,991 |
| 380 | | | | Countrywide Financial Corp. | | | 1,615 |
| 300 | | | | Discover Financial Services | | | 3,951 |
| 900 | | @ | | E*Trade Financial Corp. | | | 2,826 |
| 460 | | | | Federal Home Loan Mortgage Corporation | | | 7,544 |
| 650 | | | | Federal National Mortgage Association | | | 12,682 |
| 270 | | | | Goldman Sachs Group, Inc. | | | 47,223 |
| 2,048 | | | | JPMorgan Chase & Co. | | | 70,267 |
| 80 | | | | Legg Mason, Inc. | | | 3,486 |
| 440 | | | | Lehman Brothers Holdings, Inc. | | | 8,716 |
| 790 | | | | Merrill Lynch & Co., Inc. | | | 25,051 |
| 760 | | | | Morgan Stanley | | | 27,413 |
| | | | | | | |
| Shares | | | | | | Value |
| | | | | | | |
| 190 | | | | NYSE Euronext | | $ | 9,625 |
| 270 | | @ | | SLM Corp. | | | 5,225 |
| 80 | | | | T. Rowe Price Group, Inc. | | | 4,518 |
| | | | | | | |
| | | | | | | 339,296 |
| | | | | | | |
| Electric: 0.6% |
| 520 | | @ | | AES Corp. | | | 9,989 |
| 760 | | | | American Electric Power Co., Inc. | | | 30,575 |
| 520 | | | | Centerpoint Energy, Inc. | | | 8,346 |
| 460 | | | | Dominion Resources, Inc. | | | 21,845 |
| 460 | | | | DTE Energy Co. | | | 19,522 |
| 1,740 | | | | Duke Energy Corp. | | | 30,241 |
| 520 | | | | Edison International | | | 26,718 |
| 80 | | | | Entergy Corp. | | | 9,638 |
| 160 | | | | Exelon Corp. | | | 14,394 |
| 220 | | | | FPL Group, Inc. | | | 14,428 |
| 520 | | | | Pepco Holdings, Inc. | | | 13,338 |
| 160 | | | | PG&E Corp. | | | 6,350 |
| 160 | | | | PPL Corp. | | | 8,363 |
| 160 | | | | Public Service Enterprise Group, Inc. | | | 7,349 |
| | | | | | | |
| | | | | | | 221,096 |
| | | | | | | |
| Electrical Components & Equipment: 0.1% |
| 380 | | | | Emerson Electric Co. | | | 18,791 |
| 160 | | | | Molex, Inc. | | | 3,906 |
| | | | | | | |
| | | | | | | 22,697 |
| | | | | | | |
| Electronics: 0.2% |
| 380 | | @ | | Agilent Technologies, Inc. | | | 13,505 |
| 160 | | | | Applera Corp. - Applied Biosystems Group | | | 5,357 |
| 300 | | | | Jabil Circuit, Inc. | | | 4,923 |
| 220 | | | | PerkinElmer, Inc. | | | 6,127 |
| 380 | | @ | | Thermo Electron Corp. | | | 21,177 |
| 355 | | @@ | | Tyco Electronics Ltd. | | | 12,716 |
| 110 | | @ | | Waters Corp. | | | 7,095 |
| | | | | | | |
| | | | | | | 70,900 |
| | | | | | | |
| Engineering & Construction: 0.1% |
| 80 | | | | Fluor Corp. | | | 14,886 |
| 80 | | @ | | Jacobs Engineering Group, Inc. | | | 6,456 |
| | | | | | | |
| | | | | | | 21,342 |
| | | | | | | |
| Environmental Control: 0.0% |
| 520 | | @ | | Allied Waste Industries, Inc. | | | 6,562 |
| 220 | | | | Waste Management, Inc. | | | 8,296 |
| | | | | | | |
| | | | | | | 14,858 |
| | | | | | | |
| Food: 0.3% |
| 380 | | | | ConAgra Foods, Inc. | | | 7,326 |
| 220 | | | | General Mills, Inc. | | | 13,369 |
| 160 | | | | HJ Heinz Co. | | | 7,656 |
| 300 | | | | Kellogg Co. | | | 14,406 |
| 701 | | | | Kraft Foods, Inc. | | | 19,943 |
| 300 | | | | Kroger Co. | | | 8,661 |
| 900 | | | | Sara Lee Corp. | | | 11,025 |
| 160 | | | | Supervalu, Inc. | | | 4,942 |
| 160 | | | | Sysco Corp. | | | 4,402 |
| 160 | | | | WM Wrigley Jr. Co. | | | 12,445 |
| | | | | | | |
| | | | | | | 104,175 |
| | | | | | | |
| Gas: 0.0% |
| 300 | | | | Sempra Energy | | | 16,935 |
| | | | | | | |
| | | | | | | 16,935 |
| | | | | | | |
See Accompanying Notes to Financial Statements
69
| | |
| ING GET U.S. CORE PORTFOLIO SERIES 4 | | PORTFOLIO OF INVESTMENTS ASOF JUNE 30, 2008 (UNAUDITED) (CONTINUED) |
| | | | | | | |
| Shares | | | | | | Value |
| | | | | | | |
| Hand/Machine Tools: 0.0% |
| 40 | | | | Black & Decker Corp. | | $ | 2,300 |
| 80 | | | | Snap-On, Inc. | | | 4,161 |
| 160 | | | | Stanley Works | | | 7,173 |
| | | | | | | |
| | | | | | | 13,634 |
| | | | | | | |
| Healthcare - Products: 0.6% |
| 270 | | | | Baxter International, Inc. | | | 17,264 |
| 160 | | | | Becton Dickinson & Co. | | | 13,008 |
| 900 | | @ | | Boston Scientific Corp. | | | 11,061 |
| 215 | | @@ | | Covidien Ltd. | | | 10,296 |
| 80 | | | | CR Bard, Inc. | | | 7,036 |
| 1,280 | | | | Johnson & Johnson | | | 82,355 |
| 760 | | | | Medtronic, Inc. | | | 39,330 |
| 220 | | @ | | Patterson Cos., Inc. | | | 6,466 |
| 300 | | @ | | St. Jude Medical, Inc. | | | 12,264 |
| 80 | | | | Stryker Corp. | | | 5,030 |
| 80 | | @ | | Varian Medical Systems, Inc. | | | 4,148 |
| 80 | | @ | | Zimmer Holdings, Inc. | | | 5,444 |
| | | | | | | |
| | | | | | | 213,702 |
| | | | | | | |
| Healthcare - Services: 0.2% |
| 290 | | | | Aetna, Inc. | | | 11,754 |
| 200 | | | | Cigna Corp. | | | 7,078 |
| 110 | | @ | | Humana, Inc. | | | 4,375 |
| 160 | | @ | | Laboratory Corp. of America Holdings | | | 11,141 |
| 160 | | | | Quest Diagnostics | | | 7,755 |
| 590 | | | | UnitedHealth Group, Inc. | | | 15,488 |
| 290 | | @ | | WellPoint, Inc. | | | 13,821 |
| | | | | | | |
| | | | | | | 71,412 |
| | | | | | | |
| Home Builders: 0.0% |
| 220 | | | | D.R. Horton, Inc. | | | 2,387 |
| 220 | | | | Lennar Corp. | | | 2,715 |
| | | | | | | |
| | | | | | | 5,102 |
| | | | | | | |
| Household Products/Wares: 0.1% |
| 80 | | | | Avery Dennison Corp. | | | 3,514 |
| 220 | | | | Clorox Co. | | | 11,484 |
| 160 | | | | Fortune Brands, Inc. | | | 9,986 |
| 380 | | | | Kimberly-Clark Corp. | | | 22,716 |
| | | | | | | |
| | | | | | | 47,700 |
| | | | | | | |
| Insurance: 0.7% |
| 280 | | @@ | | ACE Ltd. | | | 15,425 |
| 270 | | | | Aflac, Inc. | | | 16,956 |
| 370 | | | | Allstate Corp. | | | 16,868 |
| 1,470 | | | | American International Group, Inc. | | | 38,896 |
| 160 | | | | AON Corp. | | | 7,350 |
| 80 | | | | Assurant, Inc. | | | 5,277 |
| 420 | | | | Chubb Corp. | | | 20,584 |
| 220 | | | | Cincinnati Financial Corp. | | | 5,588 |
| 300 | | | | Genworth Financial, Inc. | | | 5,343 |
| 220 | | | | Hartford Financial Services Group, Inc. | | | 14,205 |
| 160 | | | | Lincoln National Corp. | | | 7,251 |
| 72 | | | | Loews Corp. | | | 3,377 |
| 160 | | | | Marsh & McLennan Cos., Inc. | | | 4,248 |
| 580 | | | | Metlife, Inc. | | | 30,607 |
| 280 | | | | Progressive Corp. | | | 5,242 |
| 340 | | | | Prudential Financial, Inc. | | | 20,312 |
| 80 | | | | Torchmark Corp. | | | 4,692 |
| | | | | | | |
| Shares | | | | | | Value |
| | | | | | | |
| 440 | | | | Travelers Cos., Inc. | | $ | 19,096 |
| 300 | | | | UnumProvident Corp. | | | 6,135 |
| | | | | | | |
| | | | | | | 247,452 |
| | | | | | | |
| Internet: 0.4% |
| 80 | | @ | | Akamai Technologies, Inc. | | | 2,783 |
| 160 | | @ | | Amazon.com, Inc. | | | 11,733 |
| 680 | | @ | | eBay, Inc. | | | 18,584 |
| 160 | | @ | | Expedia, Inc. | | | 2,941 |
| 160 | | @ | | Google, Inc. - Class A | | | 84,227 |
| 160 | | @ | | IAC/InterActiveCorp. | | | 3,085 |
| 622 | | @ | | Symantec Corp. | | | 12,036 |
| 680 | | @ | | Yahoo!, Inc. | | | 14,049 |
| | | | | | | |
| | | | | | | 149,438 |
| | | | | | | |
| Iron/Steel: 0.1% |
| 80 | | | | Allegheny Technologies, Inc. | | | 4,742 |
| 220 | | | | Nucor Corp. | | | 16,427 |
| 80 | | | | United States Steel Corp. | | | 14,782 |
| | | | | | | |
| | | | | | | 35,951 |
| | | | | | | |
| Lodging: 0.0% |
| 110 | | | | Starwood Hotels & Resorts Worldwide, Inc. | | | 4,408 |
| | | | | | | |
| | | | | | | 4,408 |
| | | | | | | |
| Machinery - Construction & Mining: 0.1% |
| 460 | | | | Caterpillar, Inc. | | | 33,957 |
| 80 | | @ | | Terex Corp. | | | 4,110 |
| | | | | | | |
| | | | | | | 38,067 |
| | | | | | | |
| Machinery - Diversified: 0.1% |
| 80 | | | | Cummins, Inc. | | | 5,242 |
| 300 | | | | Deere & Co. | | | 21,639 |
| 80 | | | | Manitowoc Co., Inc. | | | 2,602 |
| 80 | | | | Rockwell Automation, Inc. | | | 3,498 |
| | | | | | | |
| | | | | | | 32,981 |
| | | | | | | |
| Media: 0.4% |
| 160 | | | | CBS Corp. - Class B | | | 3,118 |
| 300 | | | | Clear Channel Communications, Inc. | | | 10,560 |
| 1,390 | | | | Comcast Corp. - Class A | | | 26,368 |
| 520 | | @ | | DIRECTV Group, Inc. | | | 13,473 |
| 1,690 | | | | News Corp. - Class A | | | 25,418 |
| 1,740 | | | | Time Warner, Inc. | | | 25,752 |
| 460 | | @ | | Viacom - Class B | | | 14,048 |
| 1,090 | | | | Walt Disney Co. | | | 34,008 |
| | | | | | | |
| | | | | | | 152,745 |
| | | | | | | |
| Metal Fabricate/Hardware: 0.0% |
| 80 | | | | Precision Castparts Corp. | | | 7,710 |
| | | | | | | |
| | | | | | | 7,710 |
| | | | | | | |
| Mining: 0.1% |
| 160 | | | | Alcoa, Inc. | | | 5,699 |
| 271 | | | | Freeport-McMoRan Copper & Gold, Inc. | | | 31,758 |
| 220 | | | | Newmont Mining Corp. | | | 11,475 |
| | | | | | | |
| | | | | | | 48,932 |
| | | | | | | |
| Miscellaneous Manufacturing: 0.8% |
| 380 | | | | 3M Co. | | | 26,444 |
| 220 | | | | Cooper Industries Ltd. | | | 8,690 |
| 380 | | | | Dover Corp. | | | 18,381 |
See Accompanying Notes to Financial Statements
70
| | |
| ING GET U.S. CORE PORTFOLIO SERIES 4 | | PORTFOLIO OF INVESTMENTS ASOF JUNE 30, 2008 (UNAUDITED) (CONTINUED) |
| | | | | | | |
| Shares | | | | | | Value |
| | | | | | | |
| Miscellaneous Manufacturing: (continued) |
| 190 | | | | Eaton Corp. | | $ | 16,144 |
| 5,850 | | | | General Electric Co. | | | 156,137 |
| 570 | | | | Honeywell International, Inc. | | | 28,660 |
| 300 | | | | Illinois Tool Works, Inc. | | | 14,253 |
| 380 | | | | Leggett & Platt, Inc. | | | 6,373 |
| 160 | | | | Parker Hannifin Corp. | | | 11,411 |
| 300 | | | | Textron, Inc. | | | 14,379 |
| 55 | | @@ | | Tyco International Ltd. | | | 2,202 |
| | | | | | | |
| | | | | | | 303,074 |
| | | | | | | |
| Office/Business Equipment: 0.1% |
| 460 | | | | Pitney Bowes, Inc. | | | 15,686 |
| 760 | | | | Xerox Corp. | | | 10,306 |
| | | | | | | |
| | | | | | | 25,992 |
| | | | | | | |
| Oil & Gas: 2.4% |
| 380 | | | | Anadarko Petroleum Corp. | | | 28,439 |
| 220 | | | | Apache Corp. | | | 30,580 |
| 60 | | | | Cabot Oil & Gas Corp. | | | 4,064 |
| 300 | | | | Chesapeake Energy Corp. | | | 19,788 |
| 1,323 | | | | Chevron Corp. | | | 131,149 |
| 1,015 | | | | ConocoPhillips | | | 95,806 |
| 300 | | | | Devon Energy Corp. | | | 36,048 |
| 80 | | | | ENSCO International, Inc. | | | 6,459 |
| 160 | | | | EOG Resources, Inc. | | | 20,992 |
| 3,320 | | | | ExxonMobil Corp. | | | 292,592 |
| 160 | | | | Hess Corp. | | | 20,190 |
| 380 | | | | Marathon Oil Corp. | | | 19,711 |
| 160 | | | | Murphy Oil Corp. | | | 15,688 |
| 160 | | @, @@ | | Nabors Industries Ltd. | | | 7,877 |
| 80 | | | | Noble Corp. | | | 5,197 |
| 110 | | | | Noble Energy, Inc. | | | 11,062 |
| 520 | | | | Occidental Petroleum Corp. | | | 46,727 |
| 160 | | | | Questar Corp. | | | 11,366 |
| 80 | | | | Range Resources Corp. | | | 5,243 |
| 220 | | @ | | Southwestern Energy Co. | | | 10,474 |
| 80 | | | | Sunoco, Inc. | | | 3,255 |
| 159 | | @ | | Transocean, Inc. | | | 24,230 |
| 160 | | | | Valero Energy Corp. | | | 6,589 |
| 215 | | | | XTO Energy, Inc. | | | 14,730 |
| | | | | | | |
| | | | | | | 868,256 |
| | | | | | | |
| Oil & Gas Services: 0.4% |
| 160 | | | | Baker Hughes, Inc. | | | 13,974 |
| 380 | | | | Halliburton Co. | | | 20,167 |
| 220 | | @ | | National Oilwell Varco, Inc. | | | 19,518 |
| 600 | | | | Schlumberger Ltd. | | | 64,458 |
| 80 | | | | Smith International, Inc. | | | 6,651 |
| 160 | | @ | | Weatherford International Ltd. | | | 7,934 |
| | | | | | | |
| | | | | | | 132,702 |
| | | | | | | |
| Packaging & Containers: 0.0% |
| 220 | | | | Ball Corp. | | | 10,503 |
| | | | | | | |
| | | | | | | 10,503 |
| | | | | | | |
| Pharmaceuticals: 0.9% |
| 680 | | | | Abbott Laboratories | | | 36,020 |
| 80 | | | | Allergan, Inc. | | | 4,164 |
| 160 | | | | AmerisourceBergen Corp. | | | 6,398 |
| 980 | | | | Bristol-Myers Squibb Co. | | | 20,119 |
| 60 | | | | Cardinal Health, Inc. | | | 3,095 |
| 680 | | | | Eli Lilly & Co. | | | 31,389 |
| 160 | | @ | | Express Scripts, Inc. | | | 10,035 |
| | | | | | | |
| Shares | | | | | | Value |
| | | | | | | |
| 160 | | @ | | Forest Laboratories, Inc. | | $ | 5,558 |
| 316 | | @ | | King Pharmaceuticals, Inc. | | | 3,309 |
| 220 | | @ | | Medco Health Solutions, Inc. | | | 10,384 |
| 1,360 | | | | Merck & Co., Inc. | | | 51,258 |
| 3,540 | | | | Pfizer, Inc. | | | 61,844 |
| 1,090 | | | | Schering-Plough Corp. | | | 21,462 |
| 220 | | @ | | Watson Pharmaceuticals, Inc. | | | 5,977 |
| 900 | | | | Wyeth | | | 43,164 |
| | | | | | | |
| | | | | | | 314,176 |
| | | | | | | |
| Pipelines: 0.1% |
| 460 | | | | El Paso Corp. | | | 10,000 |
| 380 | | | | Spectra Energy Corp. | | | 10,921 |
| 410 | | | | Williams Cos., Inc. | | | 16,527 |
| | | | | | | |
| | | | | | | 37,448 |
| | | | | | | |
| Retail: 1.0% |
| 80 | | | | Abercrombie & Fitch Co. | | | 5,014 |
| 80 | | @ | | Autozone, Inc. | | | 9,681 |
| 275 | | | | Best Buy Co., Inc. | | | 10,890 |
| 220 | | @ | | Big Lots, Inc. | | | 6,873 |
| 220 | | | | Costco Wholesale Corp. | | | 15,431 |
| 823 | | | | CVS Caremark Corp. | | | 32,566 |
| 190 | | | | Darden Restaurants, Inc. | | | 6,069 |
| 300 | | | | Family Dollar Stores, Inc. | | | 5,982 |
| 160 | | @ | | GameStop Corp. | | | 6,464 |
| 570 | | | | Gap, Inc. | | | 9,502 |
| 650 | | | | Home Depot, Inc. | | | 15,223 |
| 80 | | | | JC Penney Co., Inc. | | | 2,903 |
| 460 | | | | Limited Brands, Inc. | | | 7,751 |
| 680 | | | | Lowe’s Cos., Inc. | | | 14,110 |
| 160 | | | | Macy’s, Inc. | | | 3,107 |
| 790 | | | | McDonald’s Corp. | | | 44,414 |
| 460 | | | | Staples, Inc. | | | 10,925 |
| 380 | | | | Target Corp. | | | 17,666 |
| 160 | | | | Tiffany & Co. | | | 6,520 |
| 520 | | | | TJX Cos., Inc. | | | 16,364 |
| 380 | | | | Walgreen Co. | | | 12,354 |
| 1,500 | | | | Wal-Mart Stores, Inc. | | | 84,300 |
| 300 | | | | Yum! Brands, Inc. | | | 10,527 |
| | | | | | | |
| | | | | | | 354,636 |
| | | | | | | |
| Savings & Loans: 0.0% |
| 300 | | | | Hudson City Bancorp., Inc. | | | 5,004 |
| 516 | | | | Washington Mutual, Inc. | | | 2,544 |
| | | | | | | |
| | | | | | | 7,548 |
| | | | | | | |
| Semiconductors: 0.5% |
| 160 | | | | Altera Corp. | | | 3,312 |
| 160 | | | | Analog Devices, Inc. | | | 5,083 |
| 710 | | | | Applied Materials, Inc. | | | 13,554 |
| 300 | | @ | | Broadcom Corp. | | | 8,187 |
| 3,320 | | | | Intel Corp. | | | 71,314 |
| 160 | | | | KLA-Tencor Corp. | | | 6,514 |
| 160 | | | | Linear Technology Corp. | | | 5,211 |
| 680 | | @ | | LSI Logic Corp. | | | 4,175 |
| 160 | | @ | | MEMC Electronic Materials, Inc. | | | 9,846 |
| 330 | | | | National Semiconductor Corp. | | | 6,778 |
| 410 | | @ | | Nvidia Corp. | | | 7,675 |
| 300 | | @ | | QLogic Corp. | | | 4,377 |
| 900 | | | | Texas Instruments, Inc. | | | 25,344 |
| 160 | | | | Xilinx, Inc. | | | 4,040 |
| | | | | | | |
| | | | | | | 175,410 |
| | | | | | | |
See Accompanying Notes to Financial Statements
71
| | |
| ING GET U.S. CORE PORTFOLIO SERIES 4 | | PORTFOLIO OF INVESTMENTS ASOF JUNE 30, 2008 (UNAUDITED) (CONTINUED) |
| | | | | | | |
| Shares | | | | | | Value |
| | | | | | | |
| Software: 0.7% |
| 340 | | @ | | Adobe Systems, Inc. | | $ | 13,393 |
| 220 | | @ | | Autodesk, Inc. | | | 7,438 |
| 110 | | @ | | BMC Software, Inc. | | | 3,960 |
| 410 | | | | CA, Inc. | | | 9,467 |
| 460 | | @ | | Compuware Corp. | | | 4,388 |
| 160 | | @ | | Electronic Arts, Inc. | | | 7,109 |
| 80 | | | | Fidelity National Information Services, Inc. | | | 2,953 |
| 220 | | @ | | Fiserv, Inc. | | | 9,981 |
| 460 | | | | IMS Health, Inc. | | | 10,718 |
| 4,840 | | | | Microsoft Corp. | | | 133,148 |
| 2,260 | | @ | | Oracle Corp. | | | 47,460 |
| | | | | | | |
| | | | | | | 250,015 |
| | | | | | | |
| Telecommunications: 1.0% |
| 3,211 | | | | AT&T, Inc. | | | 108,179 |
| 190 | | | | CenturyTel, Inc. | | | 6,762 |
| 3,480 | | @ | | Cisco Systems, Inc. | | | 80,945 |
| 950 | | | | Corning, Inc. | | | 21,898 |
| 112 | | | | Embarq Corp. | | | 5,294 |
| 300 | | @ | | JDS Uniphase Corp. | | | 3,408 |
| 220 | | @ | | Juniper Networks, Inc. | | | 4,880 |
| 530 | | | | Motorola, Inc. | | | 3,890 |
| 840 | | | | Qualcomm, Inc. | | | 37,271 |
| 1,280 | | | | Qwest Communications International, Inc. | | | 5,030 |
| 1,026 | | | | Sprint Nextel Corp. | | | 9,747 |
| 1,660 | | | | Verizon Communications, Inc. | | | 58,764 |
| 1,060 | | | | Windstream Corp. | | | 13,080 |
| | | | | | | |
| | | | | | | 359,148 |
| | | | | | | |
| Textiles: 0.0% |
| 160 | | | | Cintas Corp. | | | 4,242 |
| | | | | | | |
| | | | | | | 4,242 |
| | | | | | | |
| Toys/Games/Hobbies: 0.0% |
| 300 | | | | Hasbro, Inc. | | | 10,716 |
| | | | | | | |
| | | | | | | 10,716 |
| | | | | | | |
| Transportation: 0.3% |
| 160 | | | | Burlington Northern Santa Fe Corp. | | | 15,982 |
| 80 | | | | CH Robinson Worldwide, Inc. | | | 4,387 |
| 140 | | | | CSX Corp. | | | 8,793 |
| 160 | | | | Expeditors International Washington, Inc. | | | 6,880 |
| 110 | | | | FedEx Corp. | | | 8,667 |
| 160 | | | | Norfolk Southern Corp. | | | 10,027 |
| 160 | | | | Ryder System, Inc. | | | 11,021 |
| 160 | | | | Union Pacific Corp. | | | 12,080 |
| 380 | | | | United Parcel Service, Inc. - Class B | | | 23,359 |
| | | | | | | |
| | | | | | | 101,196 |
| | | | | | | |
| | | | Total Common Stock
(Cost $7,226,301) | | | 6,428,060 |
| | | | | | | |
| REAL ESTATE INVESTMENT TRUSTS: 0.2% |
| Apartments: 0.0% |
| 160 | | | | Equity Residential | | | 6,123 |
| | | | | | | |
| | | | | | | 6,123 |
| | | | | | | |
| | | | | | | | |
| Shares | | | | | | Value |
| | | | | | | | |
| | Diversified: 0.1% |
| | 160 | | | | Vornado Realty Trust | | $ | 14,080 |
| | | | | | | | |
| | | | | | | | 14,080 |
| | | | | | | | |
| | Health Care: 0.0% |
| | 220 | | | | HCP, Inc. | | | 6,998 |
| | | | | | | | |
| | | | | | | | 6,998 |
| | | | | | | | |
| | Hotels: 0.0% |
| | 680 | | | | Host Hotels & Resorts, Inc. | | | 9,282 |
| | | | | | | | |
| | | | | | | | 9,282 |
| | | | | | | | |
| | Regional Malls: 0.1% |
| | 80 | | | | General Growth Properties, Inc. | | | 2,802 |
| | 80 | | | | Simon Property Group, Inc. | | | 7,191 |
| | | | | | | | |
| | | | | | | | 9,993 |
| | | | | | | | |
| | Storage: 0.0% |
| | 80 | | | | Public Storage, Inc. | | | 6,463 |
| | | | | | | | |
| | | | | | | | 6,463 |
| | | | | | | | |
| | Warehouse/Industrial: 0.0% |
| | 160 | | | | Prologis | | | 8,696 |
| | | | | | | | |
| | | | | | | | 8,696 |
| | | | | | | | |
| | | | | Total Real Estate Investment Trusts
(Cost $68,099) | | | 61,635 |
| | | | | | | | |
| | | |
Principal
Amount | | | | | | Value |
| | U.S. GOVERNMENT AGENCY OBLIGATIONS: 59.2% |
| | Federal National Mortgage Association: 44.3% |
| $ | 16,500,000 | | ^, Z | | 2.690%, due 06/15/09 | | $ | 16,084,619 |
| | | | | | | | |
| | | | | | | | 16,084,619 |
| | | | | | | | |
| | Other U.S. Agency Obligations: 14.9% |
| | 5,500,000 | | ^, Z | | Resolution Funding Corp., 2.220%, due 04/15/09 | | | 5,405,340 |
| | | | | | | | |
| | | | | | | | 5,405,340 |
| | | | | | | | |
| | | | | Total U.S. Government Agency Obligations
(Cost $21,216,750) | | | 21,489,959 |
| | | | | | | | |
| | U.S. TREASURY OBLIGATIONS: 22.8% |
| | U.S. Treasury STRIP: 22.8% |
| | 8,497,000 | | ^^ | | 1.963%, due 08/15/09 | | | 8,269,773 |
| | | | | | | | |
| | | | | Total U.S. Treasury Obligations
(Cost $8,291,441) | | | 8,269,773 |
| | | | | | | | |
| | | | | Total Long-Term Investments
(Cost $36,802,591) | | | 36,249,427 |
| | | | | | | | |
See Accompanying Notes to Financial Statements
72
| | |
| ING GET U.S. CORE PORTFOLIO SERIES 4 | | PORTFOLIO OF INVESTMENTS ASOF JUNE 30, 2008 (UNAUDITED) (CONTINUED) |
| | | | | | | | | |
Principal
Amount | | | | | | | Value | |
| | | | | | | | | |
| SHORT-TERM INVESTMENTS: 0.5% | |
| Repurchase Agreement: 0.5% | |
| 161,000 | | Morgan Stanley Repurchase Agreement dated 06/30/08, 2.399%, due 07/01/08,
$161,011 to be received upon repurchase (Collateralized by $170,000 Federal Home Loan Mortgage Corporation,
Discount Note, Market
Value $167,824, due 12/30/08) | | | | | $ | 161,000 | |
| | | | | | | | | |
| | Total Short-Term Investments
(Cost $161,000) | | | | | | 161,000 | |
| | | | | | | | | |
| | Total Investments in Securities
(Cost $36,963,591)* | | 100.4 | % | | $ | 36,410,427 | |
| | Other Assets and
Liabilities - Net | | (0.4 | ) | | | (132,471 | ) |
| | | | | | | | | |
| | Net Assets | | 100.0 | % | | $ | 36,277,956 | |
| | | | | | | | | |
| @ | Non-income producing security |
| STRIP | Separate Trading of Registered Interest and Principal of Securities |
| ^ | Interest only securities represent the right to receive the monthly interest payments on an underlying pool of mortgage loans. Principal amount shown represents the notional amount on which current interest is calculated. Payments of principal on the pool reduce the value of the interest only security. |
| ^^ | Principal only securities represent the right to receive the monthly principal payments on an underlying pool of mortgage loans. No payments of interest on the pool are passed through the principal only security. |
| Z | Indicates Zero Coupon Bond; rate shown reflects current effective yield. |
| * | Cost for federal income tax purposes is $37,415,376. |
| | | | |
Net unrealized depreciation consists of: | | | | |
Gross Unrealized Appreciation | | $ | 73,721 | |
Gross Unrealized Depreciation | | | (1,078,670 | ) |
| | | | |
Net Unrealized Depreciation | | $ | (1,004,949 | ) |
| | | | |
Fair Value Measurements — Effective January 1, 2008, the Portfolio adopted Financial Accounting Standards Board Statement of Financial Accounting Standards No. 157 (“SFAS 157”), “Fair Value Measurements.” This new accounting statement defines fair value, establishes a framework for measuring fair value in generally accepted accounting principles (“GAAP”), and expands disclosures about fair value measurements. The three levels of the fair value hierarchy are as follows:
| | • | | Level 1 — quoted prices in active markets for identical investments |
| | • | | Level 2 — other significant observable inputs (including quoted prices for similar investments, interest rates, prepayment speeds, credit risk, etc.) |
| | • | | Level 3 — significant unobservable inputs (including the Portfolio’s own assumption in determining the fair value of investments) |
The inputs or methodology used in valuing securities are not necessarily an indication of the risk associated with investing in those securities.
The following is a summary of the inputs used as of June 30, 2008 in valuing the Portfolio’s investments at fair value:
| | | | | | |
| | | Investments in Securities | | Other Financial Instruments* |
Level 1 — Quoted Prices | | $ | 6,489,695 | | $ | — |
Level 2 — Other Significant Observable Inputs | | | 29,920,732 | | | — |
Level 3 — Significant Unobservable Inputs | | | — | | | — |
| | | | | | |
Total | | $ | 36,410,427 | | $ | — |
| | | | | | |
| * | | Other financial instruments may include forward foreign currency contracts, futures, swaps, and written options. |
See Accompanying Notes to Financial Statements
73
| | |
| ING GET U.S. CORE PORTFOLIO SERIES 5 | | PORTFOLIO OF INVESTMENTS ASOF JUNE 30, 2008 (UNAUDITED) |
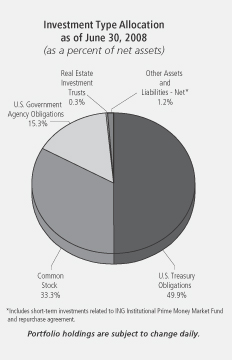
| | | | | | | |
| Shares | | | | | | Value |
| | | | | | | |
| COMMON STOCK: 33.3% | | | |
| Advertising: 0.1% | | | |
| 1,320 | | @ | | Interpublic Group of Cos., Inc. | | $ | 11,352 |
| 400 | | | | Omnicom Group | | | 17,952 |
| | | | | | | |
| | | | | | | 29,304 |
| | | | | | | |
| Aerospace/Defense: 0.8% | | | |
| 780 | | | | Boeing Co. | | | 51,262 |
| 260 | | | | General Dynamics Corp. | | | 21,892 |
| 260 | | | | Goodrich Corp. | | | 12,340 |
| 130 | | | | L-3 Communications Holdings, Inc. | | | 11,813 |
| 290 | | | | Lockheed Martin Corp. | | | 28,611 |
| 370 | | | | Northrop Grumman Corp. | | | 24,753 |
| 80 | | | | Raytheon Co. | | | 4,502 |
| 80 | | | | Rockwell Collins, Inc. | | | 3,837 |
| 780 | | | | United Technologies Corp. | | | 48,126 |
| | | | | | | |
| | | | | | | 207,136 |
| | | | | | | |
| Agriculture: 0.6% | | | |
| 1,480 | | | | Altria Group, Inc. | | | 30,429 |
| 550 | | | | Archer-Daniels-Midland Co. | | | 18,563 |
| 235 | | @ | | Lorillard, Inc. | | | 16,253 |
| 1,480 | | | | Philip Morris International, Inc. | | | 73,097 |
| 230 | | | | Reynolds American, Inc. | | | 10,734 |
| | | | | | | |
| | | | | | | 149,076 |
| | | | | | | |
| Airlines: 0.0% | | | |
| 700 | | | | Southwest Airlines Co. | | | 9,128 |
| | | | | | | |
| | | | | | | 9,128 |
| | | | | | | |
| Apparel: 0.2% | | | |
| 450 | | @ | | Coach, Inc. | | | 12,996 |
| 350 | | | | Nike, Inc. | | | 20,864 |
| | | | | | | |
| Shares | | | | | | Value |
| | | | | | | |
| 50 | | | | Polo Ralph Lauren Corp. | | $ | 3,139 |
| 180 | | | | VF Corp. | | | 12,812 |
| | | | | | | |
| | | | | | | 49,811 |
| | | | | | | |
| Auto Manufacturers: 0.1% | | | |
| 1,520 | | @ | | Ford Motor Co. | | | 7,311 |
| 440 | | | | General Motors Corp. | | | 5,060 |
| | | | | | | |
| | | | | | | 12,371 |
| | | | | | | |
| Auto Parts & Equipment: 0.1% | | | |
| 260 | | @ | | Goodyear Tire & Rubber Co. | | | 4,636 |
| 820 | | | | Johnson Controls, Inc. | | | 23,518 |
| | | | | | | |
| | | | | | | 28,154 |
| | | | | | | |
| Banks: 1.3% | | | |
| 3,383 | | | | Bank of America Corp. | | | 80,752 |
| 1,110 | | | | Bank of New York Mellon Corp. | | | 41,991 |
| 360 | | | | BB&T Corp. | | | 8,197 |
| 256 | | | | Capital One Financial Corp. | | | 9,731 |
| 360 | | | | Fifth Third Bancorp. | | | 3,665 |
| 80 | | | | M&T Bank Corp. | | | 5,643 |
| 179 | | | | Marshall & Ilsley Corp. | | | 2,744 |
| 260 | | | | Northern Trust Corp. | | | 17,828 |
| 1,110 | | | | Regions Financial Corp. | | | 12,110 |
| 380 | | | | State Street Corp. | | | 24,316 |
| 800 | | | | US Bancorp. | | | 22,312 |
| 1,425 | | | | Wachovia Corp. | | | 22,130 |
| 2,240 | | | | Wells Fargo & Co. | | | 53,200 |
| 310 | | | | Zions Bancorp. | | | 9,762 |
| | | | | | | |
| | | | | | | 314,381 |
| | | | | | | |
| Beverages: 0.7% | | | |
| 120 | | | | Anheuser-Busch Cos., Inc. | | | 7,454 |
| 1,580 | | | | Coca-Cola Co. | | | 82,128 |
| 260 | | | | Coca-Cola Enterprises, Inc. | | | 4,498 |
| 530 | | | | Pepsi Bottling Group, Inc. | | | 14,798 |
| 1,060 | | | | PepsiCo, Inc. | | | 67,405 |
| | | | | | | |
| | | | | | | 176,283 |
| | | | | | | |
| Biotechnology: 0.5% | | | |
| 860 | | @ | | Amgen, Inc. | | | 40,558 |
| 260 | | @ | | Biogen Idec, Inc. | | | 14,531 |
| 310 | | @ | | Celgene Corp. | | | 19,800 |
| 90 | | @ | | Genzyme Corp. | | | 6,482 |
| 680 | | @ | | Gilead Sciences, Inc. | | | 36,006 |
| | | | | | | |
| | | | | | | 117,377 |
| | | | | | | |
| Chemicals: 0.8% | | | |
| 260 | | | | Air Products & Chemicals, Inc. | | | 25,704 |
| 830 | | | | Dow Chemical Co. | | | 28,975 |
| 80 | | | | Eastman Chemical Co. | | | 5,509 |
| 80 | | | | Ecolab, Inc. | | | 3,439 |
| 830 | | | | EI Du Pont de Nemours & Co. | | | 35,599 |
| 260 | | | | Hercules, Inc. | | | 4,402 |
| 260 | | | | International Flavors & Fragrances, Inc. | | | 10,156 |
| 370 | | | | Monsanto Co. | | | 46,783 |
| 80 | | | | PPG Industries, Inc. | | | 4,590 |
| 80 | | | | Praxair, Inc. | | | 7,539 |
| 180 | | | | Rohm & Haas Co. | | | 8,359 |
| 310 | | | | Sigma-Aldrich Corp. | | | 16,697 |
| | | | | | | |
| | | | | | | 197,752 |
| | | | | | | |
See Accompanying Notes to Financial Statements
74
| | |
| ING GET U.S. CORE PORTFOLIO SERIES 5 | | PORTFOLIO OF INVESTMENTS ASOF JUNE 30, 2008 (UNAUDITED) (CONTINUED) |
| | | | | | | |
| Shares | | | | | | Value |
| | | | | | | |
| Coal: 0.1% | | | |
| 80 | | | | Consol Energy, Inc. | | $ | 8,990 |
| 80 | | | | Massey Energy Co. | | | 7,500 |
| 180 | | | | Peabody Energy Corp. | | | 15,849 |
| | | | | | | |
| | | | | | | 32,339 |
| | | | | | | |
| Commercial Services: 0.3% | | | |
| 130 | | @ | | Apollo Group, Inc. - Class A | | | 5,754 |
| 440 | | | | H&R Block, Inc. | | | 9,416 |
| 220 | | | | McKesson Corp. | | | 12,300 |
| 100 | | | | Moody’s Corp. | | | 3,444 |
| 260 | | | | Robert Half International, Inc. | | | 6,232 |
| 520 | | | | RR Donnelley & Sons Co. | | | 15,439 |
| 570 | | | | Western Union Co. | | | 14,090 |
| | | | | | | |
| | | | | | | 66,675 |
| | | | | | | |
| Computers: 1.8% | | | |
| 260 | | @ | | Affiliated Computer Services, Inc. | | | 13,907 |
| 620 | | @ | | Apple, Inc. | | | 103,813 |
| 180 | | @ | | Cognizant Technology Solutions Corp. | | | 5,852 |
| 170 | | @ | | Computer Sciences Corp. | | | 7,963 |
| 1,820 | | @ | | Dell, Inc. | | | 39,822 |
| 1,570 | | @ | | EMC Corp. | | | 23,063 |
| 1,970 | | | | Hewlett-Packard Co. | | | 87,094 |
| 1,070 | | | | International Business Machines Corp. | | | 126,827 |
| 230 | | @ | | Lexmark International, Inc. | | | 7,689 |
| 230 | | @ | | NetApp, Inc. | | | 4,982 |
| 230 | | @ | | Sandisk Corp. | | | 4,301 |
| 570 | | @ | | Sun Microsystems, Inc. | | | 6,202 |
| 180 | | @ | | Teradata Corp. | | | 4,165 |
| | | | | | | |
| | | | | | | 435,680 |
| | | | | | | |
| Cosmetics/Personal Care: 0.7% | | | |
| 360 | | | | Avon Products, Inc. | | | 12,967 |
| 260 | | | | Colgate-Palmolive Co. | | | 17,966 |
| 2,422 | | | | Procter & Gamble Co. | | | 147,282 |
| | | | | | | |
| | | | | | | 178,215 |
| | | | | | | |
| Distribution/Wholesale: 0.1% | | | |
| 440 | | | | Genuine Parts Co. | | | 17,459 |
| | | | | | | |
| | | | | | | 17,459 |
| | | | | | | |
| Diversified Financial Services: 1.8% | | | |
| 820 | | | | American Express Co. | | | 30,889 |
| 164 | | | | Ameriprise Financial, Inc. | | | 6,670 |
| 390 | | | | Charles Schwab Corp. | | | 8,011 |
| 230 | | | | CIT Group, Inc. | | | 1,566 |
| 3,800 | | | | Citigroup, Inc. | | | 63,688 |
| 80 | | | | CME Group, Inc. | | | 30,655 |
| 440 | | | | Countrywide Financial Corp. | | | 1,870 |
| 525 | | | | Discover Financial Services | | | 6,914 |
| 1,240 | | @ | | E*Trade Financial Corp. | | | 3,894 |
| 490 | | | | Federal Home Loan Mortgage Corporation | | | 8,036 |
| 830 | | | | Federal National Mortgage Association | | | 16,193 |
| 320 | | | | Goldman Sachs Group, Inc. | | | 55,968 |
| 80 | | @ | | IntercontinentalExchange, Inc. | | | 9,120 |
| 2,490 | | | | JPMorgan Chase & Co. | | | 85,432 |
| 80 | | | | Legg Mason, Inc. | | | 3,486 |
| 530 | | | | Lehman Brothers Holdings, Inc. | | | 10,499 |
| 1,000 | | | | Merrill Lynch & Co., Inc. | | | 31,710 |
| | | | | | | |
| Shares | | | | | | Value |
| | | | | | | |
| 980 | | | | Morgan Stanley | | $ | 35,349 |
| 210 | | | | NYSE Euronext | | | 10,639 |
| 260 | | @ | | SLM Corp. | | | 5,031 |
| 80 | | | | T. Rowe Price Group, Inc. | | | 4,518 |
| | | | | | | |
| | | | | | | 430,138 |
| | | | | | | |
| Electric: 1.2% | | | |
| 700 | | @ | | AES Corp. | | | 13,447 |
| 980 | | | | American Electric Power Co., Inc. | | | 39,425 |
| 700 | | | | Centerpoint Energy, Inc. | | | 11,235 |
| 620 | | | | Dominion Resources, Inc. | | | 29,444 |
| 490 | | | | DTE Energy Co. | | | 20,796 |
| 2,250 | | | | Duke Energy Corp. | | | 39,105 |
| 620 | | | | Edison International | | | 31,856 |
| 80 | | | | Entergy Corp. | | | 9,638 |
| 230 | | | | Exelon Corp. | | | 20,691 |
| 310 | | | | FPL Group, Inc. | | | 20,330 |
| 700 | | | | Pepco Holdings, Inc. | | | 17,955 |
| 180 | | | | PG&E Corp. | | | 7,144 |
| 180 | | | | PPL Corp. | | | 9,409 |
| 260 | | | | Public Service Enterprise Group, Inc. | | | 11,942 |
| | | | | | | |
| | | | | | | 282,417 |
| | | | | | | |
| Electrical Components & Equipment: 0.1% | | | |
| 520 | | | | Emerson Electric Co. | | | 25,714 |
| 180 | | | | Molex, Inc. | | | 4,394 |
| | | | | | | |
| | | | | | | 30,108 |
| | | | | | | |
| Electronics: 0.4% | | | |
| 520 | | @ | | Agilent Technologies, Inc. | | | 18,481 |
| 260 | | | | Applera Corp. - Applied Biosystems Group | | | 8,705 |
| 440 | | | | Jabil Circuit, Inc. | | | 7,220 |
| 260 | | | | PerkinElmer, Inc. | | | 7,241 |
| 370 | | @ | | Thermo Electron Corp. | | | 20,620 |
| 390 | | @@ | | Tyco Electronics Ltd. | | | 13,970 |
| 170 | | @ | | Waters Corp. | | | 10,965 |
| | | | | | | |
| | | | | | | 87,202 |
| | | | | | | |
| Engineering & Construction: 0.1% | | | |
| 80 | | | | Fluor Corp. | | | 14,886 |
| 80 | | @ | | Jacobs Engineering Group, Inc. | | | 6,456 |
| | | | | | | |
| | | | | | | 21,342 |
| | | | | | | |
| Environmental Control: 0.1% | | | |
| 700 | | @ | | Allied Waste Industries, Inc. | | | 8,834 |
| 260 | | | | Waste Management, Inc. | | | 9,805 |
| | | | | | | |
| | | | | | | 18,639 |
| | | | | | | |
| Food: 0.5% | | | |
| 440 | | | | ConAgra Foods, Inc. | | | 8,483 |
| 290 | | | | General Mills, Inc. | | | 17,623 |
| 230 | | | | HJ Heinz Co. | | | 11,006 |
| 360 | | | | Kellogg Co. | | | 17,287 |
| 819 | | | | Kraft Foods, Inc. | | | 23,301 |
| 320 | | | | Kroger Co. | | | 9,238 |
| 1,140 | | | | Sara Lee Corp. | | | 13,965 |
| 260 | | | | Supervalu, Inc. | | | 8,031 |
| 260 | | | | Sysco Corp. | | | 7,153 |
| 180 | | | | WM Wrigley Jr. Co. | | | 14,000 |
| | | | | | | |
| | | | | | | 130,087 |
| | | | | | | |
See Accompanying Notes to Financial Statements
75
| | |
| ING GET U.S. CORE PORTFOLIO SERIES 5 | | PORTFOLIO OF INVESTMENTS ASOF JUNE 30, 2008 (UNAUDITED) (CONTINUED) |
| | | | | | | |
| Shares | | | | | | Value |
| | | | | | | |
| Gas: 0.1% | | | |
| 360 | | | | Sempra Energy | | $ | 20,322 |
| | | | | | | |
| | | | | | | 20,322 |
| | | | | | | |
| Hand/Machine Tools: 0.1% | | | |
| 50 | | | | Black & Decker Corp. | | | 2,876 |
| 90 | | | | Snap-On, Inc. | | | 4,681 |
| 140 | | | | Stanley Works | | | 6,276 |
| | | | | | | |
| | | | | | | 13,833 |
| | | | | | | |
| Healthcare - Products: 1.1% | | | |
| 360 | | | | Baxter International, Inc. | | | 23,018 |
| 180 | | | | Becton Dickinson & Co. | | | 14,634 |
| 1,140 | | @ | | Boston Scientific Corp. | | | 14,011 |
| 260 | | @@ | | Covidien Ltd. | | | 12,451 |
| 50 | | | | CR Bard, Inc. | | | 4,398 |
| 1,630 | | | | Johnson & Johnson | | | 104,874 |
| 930 | | | | Medtronic, Inc. | | | 48,128 |
| 260 | | @ | | Patterson Cos., Inc. | | | 7,641 |
| 260 | | @ | | St. Jude Medical, Inc. | | | 10,629 |
| 180 | | | | Stryker Corp. | | | 11,318 |
| 80 | | @ | | Varian Medical Systems, Inc. | | | 4,148 |
| 80 | | @ | | Zimmer Holdings, Inc. | | | 5,444 |
| | | | | | | |
| | | | | | | 260,694 |
| | | | | | | |
| Healthcare - Services: 0.3% | | | |
| 370 | | | | Aetna, Inc. | | | 14,996 |
| 230 | | | | Cigna Corp. | | | 8,140 |
| 80 | | @ | | Humana, Inc. | | | 3,182 |
| 180 | | @ | | Laboratory Corp. of America Holdings | | | 12,533 |
| 180 | | | | Quest Diagnostics | | | 8,725 |
| 820 | | | | UnitedHealth Group, Inc. | | | 21,525 |
| 250 | | @ | | WellPoint, Inc. | | | 11,915 |
| | | | | | | |
| | | | | | | 81,016 |
| | | | | | | |
| Home Builders: 0.0% | | | |
| 260 | | | | D.R. Horton, Inc. | | | 2,821 |
| 440 | | | | Lennar Corp. | | | 5,430 |
| | | | | | | |
| | | | | | | 8,251 |
| | | | | | | |
| Household Products/Wares: 0.3% | | | |
| 80 | | | | Avery Dennison Corp. | | | 3,514 |
| 260 | | | | Clorox Co. | | | 13,572 |
| 260 | | | | Fortune Brands, Inc. | | | 16,227 |
| 490 | | | | Kimberly-Clark Corp. | | | 29,292 |
| | | | | | | |
| | | | | | | 62,605 |
| | | | | | | |
| Insurance: 1.3% | | | |
| 300 | | @@ | | ACE Ltd. | | | 16,527 |
| 310 | | | | Aflac, Inc. | | | 19,468 |
| 380 | | | | Allstate Corp. | | | 17,324 |
| 1,960 | | | | American International Group, Inc. | | | 51,862 |
| 130 | | | | AON Corp. | | | 5,972 |
| 180 | | | | Assurant, Inc. | | | 11,873 |
| 470 | | | | Chubb Corp. | | | 23,035 |
| 260 | | | | Cincinnati Financial Corp. | | | 6,604 |
| 260 | | | | Genworth Financial, Inc. | | | 4,631 |
| 270 | | | | Hartford Financial Services Group, Inc. | | | 17,434 |
| 260 | | | | Lincoln National Corp. | | | 11,783 |
| 72 | | | | Loews Corp. | | | 3,377 |
| 180 | | | | Marsh & McLennan Cos., Inc. | | | 4,779 |
| 820 | | | | Metlife, Inc. | | | 43,271 |
| | | | | | | |
| Shares | | | | | | Value |
| | | | | | | |
| 230 | | | | Progressive Corp. | | $ | 4,306 |
| 420 | | | | Prudential Financial, Inc. | | | 25,091 |
| 110 | | | | Torchmark Corp. | | | 6,452 |
| 560 | | | | Travelers Cos., Inc. | | | 24,304 |
| 310 | | | | UnumProvident Corp. | | | 6,340 |
| 180 | | @@ | | XL Capital Ltd. | | | 3,701 |
| | | | | | | |
| | | | | | | 308,134 |
| | | | | | | |
| Internet: 0.9% | | | |
| 180 | | @ | | Akamai Technologies, Inc. | | | 6,262 |
| 230 | | @ | | Amazon.com, Inc. | | | 16,866 |
| 830 | | @ | | eBay, Inc. | | | 22,684 |
| 180 | | @ | | Expedia, Inc. | | | 3,308 |
| 230 | | @ | | Google, Inc. - Class A | | | 121,077 |
| 260 | | @ | | IAC/InterActiveCorp. | | | 5,013 |
| 798 | | @ | | Symantec Corp. | | | 15,441 |
| 880 | | @ | | Yahoo!, Inc. | | | 18,181 |
| | | | | | | |
| | | | | | | 208,832 |
| | | | | | | |
| Iron/Steel: 0.2% | | | |
| 80 | | | | Allegheny Technologies, Inc. | | | 4,742 |
| 260 | | | | Nucor Corp. | | | 19,414 |
| 130 | | | | United States Steel Corp. | | | 24,021 |
| | | | | | | |
| | | | | | | 48,177 |
| | | | | | | |
| Lodging: 0.0% | | | |
| 220 | | | | Starwood Hotels & Resorts Worldwide, Inc. | | | 8,815 |
| | | | | | | |
| | | | | | | 8,815 |
| | | | | | | |
| Machinery - Construction & Mining: 0.2% | | | |
| 570 | | | | Caterpillar, Inc. | | | 42,077 |
| 180 | | @ | | Terex Corp. | | | 9,247 |
| | | | | | | |
| | | | | | | 51,324 |
| | | | | | | |
| Machinery - Diversified: 0.1% | | | |
| 130 | | | | Cummins, Inc. | | | 8,518 |
| 310 | | | | Deere & Co. | | | 22,360 |
| 80 | | | | Rockwell Automation, Inc. | | | 3,498 |
| | | | | | | |
| | | | | | | 34,376 |
| | | | | | | |
| Media: 0.8% | | | |
| 180 | | | | CBS Corp. - Class B | | | 3,508 |
| 390 | | | | Clear Channel Communications, Inc. | | | 13,728 |
| 1,730 | | | | Comcast Corp. - Class A | | | 32,818 |
| 520 | | @ | | DIRECTV Group, Inc. | | | 13,473 |
| 2,120 | | | | News Corp. - Class A | | | 31,885 |
| 2,250 | | | | Time Warner, Inc. | | | 33,300 |
| 620 | | @ | | Viacom - Class B | | | 18,935 |
| 1,400 | | | | Walt Disney Co. | | | 43,680 |
| | | | | | | |
| | | | | | | 191,327 |
| | | | | | | |
| Metal Fabricate/Hardware: 0.1% | | | |
| 180 | | | | Precision Castparts Corp. | | | 17,347 |
| | | | | | | |
| | | | | | | 17,347 |
| | | | | | | |
| Mining: 0.2% | | | |
| 260 | | | | Alcoa, Inc. | | | 9,261 |
| 281 | | | | Freeport-McMoRan Copper & Gold, Inc. | | | 32,930 |
| 260 | | | | Newmont Mining Corp. | | | 13,562 |
| | | | | | | |
| | | | | | | 55,753 |
| | | | | | | |
See Accompanying Notes to Financial Statements
76
| | |
| ING GET U.S. CORE PORTFOLIO SERIES 5 | | PORTFOLIO OF INVESTMENTS ASOF JUNE 30, 2008 (UNAUDITED) (CONTINUED) |
| | | | | | | |
| Shares | | | | | | Value |
| | | | | | | |
| Miscellaneous Manufacturing: 1.5% | | | |
| 480 | | | | 3M Co. | | $ | 33,403 |
| 260 | | | | Cooper Industries Ltd. | | | 10,270 |
| 390 | | | | Dover Corp. | | | 18,864 |
| 270 | | | | Eaton Corp. | | | 22,942 |
| 7,480 | | | | General Electric Co. | | | 199,641 |
| 690 | | | | Honeywell International, Inc. | | | 34,693 |
| 260 | | | | Illinois Tool Works, Inc. | | | 12,353 |
| 260 | | | | Leggett & Platt, Inc. | | | 4,360 |
| 230 | | | | Parker Hannifin Corp. | | | 16,404 |
| 310 | | | | Textron, Inc. | | | 14,858 |
| 80 | | @@ | | Tyco International Ltd. | | | 3,203 |
| | | | | | | |
| | | | | | | 370,991 |
| | | | | | | |
| Office/Business Equipment: 0.2% | | | |
| 620 | | | | Pitney Bowes, Inc. | | | 21,142 |
| 1,110 | | | | Xerox Corp. | | | 15,052 |
| | | | | | | |
| | | | | | | 36,194 |
| | | | | | | |
| Oil & Gas: 4.6% | | | |
| 450 | | | | Anadarko Petroleum Corp. | | | 33,678 |
| 260 | | | | Apache Corp. | | | 36,140 |
| 80 | | | | Cabot Oil & Gas Corp. | | | 5,418 |
| 360 | | | | Chesapeake Energy Corp. | | | 23,746 |
| 1,705 | | | | Chevron Corp. | | | 169,017 |
| 1,271 | | | | ConocoPhillips | | | 119,970 |
| 400 | | | | Devon Energy Corp. | | | 48,064 |
| 80 | | | | ENSCO International, Inc. | | | 6,459 |
| 180 | | | | EOG Resources, Inc. | | | 23,616 |
| 4,180 | | | | ExxonMobil Corp. | | | 368,383 |
| 260 | | | | Hess Corp. | | | 32,809 |
| 500 | | | | Marathon Oil Corp. | | | 25,935 |
| 260 | | | | Murphy Oil Corp. | | | 25,493 |
| 180 | | @, @@ | | Nabors Industries Ltd. | | | 8,861 |
| 130 | | | | Noble Corp. | | | 8,445 |
| 190 | | | | Noble Energy, Inc. | | | 19,106 |
| 750 | | | | Occidental Petroleum Corp. | | | 67,395 |
| 130 | | | | Questar Corp. | | | 9,235 |
| 80 | | | | Range Resources Corp. | | | 5,243 |
| 260 | | @ | | Southwestern Energy Co. | | | 12,379 |
| 80 | | | | Sunoco, Inc. | | | 3,255 |
| 299 | | @ | | Transocean, Inc. | | | 45,565 |
| 270 | | | | Valero Energy Corp. | | | 11,119 |
| 272 | | | | XTO Energy, Inc. | | | 18,635 |
| | | | | | | |
| | | | | | | 1,127,966 |
| | | | | | | |
| Oil & Gas Services: 0.7% | | | |
| 260 | | | | Baker Hughes, Inc. | | | 22,708 |
| 440 | | | | Halliburton Co. | | | 23,351 |
| 260 | | @ | | National Oilwell Varco, Inc. | | | 23,067 |
| 830 | | | | Schlumberger Ltd. | | | 89,167 |
| 80 | | | | Smith International, Inc. | | | 6,651 |
| 260 | | @ | | Weatherford
International Ltd. | | | 12,893 |
| | | | | | | |
| | | | | | | 177,837 |
| | | | | | | |
| Packaging & Containers: 0.0% | | | |
| 240 | | | | Ball Corp. | | | 11,458 |
| | | | | | | |
| | | | | | | 11,458 |
| | | | | | | |
| Pharmaceuticals: 1.6% | | | |
| 830 | | | | Abbott Laboratories | | | 43,965 |
| 180 | | | | Allergan, Inc. | | | 9,369 |
| 260 | | | | AmerisourceBergen Corp. | | | 10,397 |
| | | | | | | |
| Shares | | | | | | Value |
| | | | | | | |
| 1,420 | | | | Bristol-Myers Squibb Co. | | $ | 29,153 |
| 60 | | | | Cardinal Health, Inc. | | | 3,095 |
| 800 | | | | Eli Lilly & Co. | | | 36,928 |
| 280 | | @ | | Express Scripts, Inc. | | | 17,562 |
| 260 | | @ | | Forest Laboratories, Inc. | | | 9,032 |
| 536 | | @ | | King Pharmaceuticals, Inc. | | | 5,612 |
| 260 | | @ | | Medco Health Solutions, Inc. | | | 12,272 |
| 1,590 | | | | Merck & Co., Inc. | | | 59,927 |
| 4,530 | | | | Pfizer, Inc. | | | 79,139 |
| 1,370 | | | | Schering-Plough Corp. | | | 26,975 |
| 180 | | @ | | Watson Pharmaceuticals, Inc. | | | 4,891 |
| 1,130 | | | | Wyeth | | | 54,195 |
| | | | | | | |
| | | | | | | 402,512 |
| | | | | | | |
| Pipelines: 0.2% | | | |
| 620 | | | | El Paso Corp. | | | 13,479 |
| 520 | | | | Spectra Energy Corp. | | | 14,945 |
| 430 | | | | Williams Cos., Inc. | | | 17,333 |
| | | | | | | |
| | | | | | | 45,757 |
| | | | | | | |
| Retail: 1.8% | | | |
| 130 | | | | Abercrombie & Fitch Co. | | | 8,148 |
| 80 | | @ | | Autozone, Inc. | | | 9,681 |
| 245 | | | | Best Buy Co., Inc. | | | 9,702 |
| 260 | | @ | | Big Lots, Inc. | | | 8,122 |
| 300 | | | | Costco Wholesale Corp. | | | 21,042 |
| 866 | | | | CVS Caremark Corp. | | | 34,268 |
| 220 | | | | Darden Restaurants, Inc. | | | 7,027 |
| 390 | | | | Family Dollar Stores, Inc. | | | 7,777 |
| 180 | | @ | | GameStop Corp. | | | 7,272 |
| 660 | | | | Gap, Inc. | | | 11,002 |
| 840 | | | | Home Depot, Inc. | | | 19,673 |
| 620 | | | | Limited Brands, Inc. | | | 10,447 |
| 820 | | | | Lowe’s Cos., Inc. | | | 17,015 |
| 180 | | | | Macy’s, Inc. | | | 3,496 |
| 990 | | | | McDonald’s Corp. | | | 55,658 |
| 615 | | | | Staples, Inc. | | | 14,606 |
| 470 | | | | Target Corp. | | | 21,850 |
| 180 | | | | Tiffany & Co. | | | 7,335 |
| 610 | | | | TJX Cos., Inc. | | | 19,197 |
| 520 | | | | Walgreen Co. | | | 16,905 |
| 1,920 | | | | Wal-Mart Stores, Inc. | | | 107,904 |
| 420 | | | | Yum! Brands, Inc. | | | 14,738 |
| | | | | | | |
| | | | | | | 432,865 |
| | | | | | | |
| Savings & Loans: 0.0% | | | |
| 310 | | | | Hudson City Bancorp., Inc. | | | 5,171 |
| 666 | | | | Washington Mutual, Inc. | | | 3,283 |
| | | | | | | |
| | | | | | | 8,454 |
| | | | | | | |
| Semiconductors: 0.9% | | | |
| 260 | | | | Altera Corp. | | | 5,382 |
| 180 | | | | Analog Devices, Inc. | | | 5,719 |
| 890 | | | | Applied Materials, Inc. | | | 16,990 |
| 310 | | @ | | Broadcom Corp. | | | 8,460 |
| 4,220 | | | | Intel Corp. | | | 90,646 |
| 260 | | | | KLA-Tencor Corp. | | | 10,585 |
| 180 | | | | Linear Technology Corp. | | | 5,863 |
| 980 | | @ | | LSI Logic Corp. | | | 6,017 |
| 180 | | @ | | MEMC Electronic Materials, Inc. | | | 11,077 |
| 390 | | | | National Semiconductor Corp. | | | 8,011 |
| 545 | | @ | | Nvidia Corp. | | | 10,202 |
| 440 | | @ | | QLogic Corp. | | | 6,420 |
See Accompanying Notes to Financial Statements
77
| | |
| ING GET U.S. CORE PORTFOLIO SERIES 5 | | PORTFOLIO OF INVESTMENTS ASOF JUNE 30, 2008 (UNAUDITED) (CONTINUED) |
| | | | | | | |
| Shares | | | | | | Value |
| | | | | | | |
| Semiconductors: (continued) | | | |
| 1,190 | | | | Texas Instruments, Inc. | | $ | 33,510 |
| 180 | | | | Xilinx, Inc. | | | 4,545 |
| | | | | | | |
| | | | | | | 223,427 |
| | | | | | | |
| Software: 1.3% | | | |
| 440 | | @ | | Adobe Systems, Inc. | | | 17,332 |
| 230 | | @ | | Autodesk, Inc. | | | 7,776 |
| 160 | | @ | | BMC Software, Inc. | | | 5,760 |
| 610 | | | | CA, Inc. | | | 14,085 |
| 620 | | @ | | Compuware Corp. | | | 5,915 |
| 180 | | @ | | Electronic Arts, Inc. | | | 7,997 |
| 260 | | @ | | Fiserv, Inc. | | | 11,796 |
| 620 | | | | IMS Health, Inc. | | | 14,446 |
| 5,960 | | | | Microsoft Corp. | | | 163,960 |
| 3,100 | | @ | | Oracle Corp. | | | 65,100 |
| | | | | | | |
| | | | | | | 314,167 |
| | | | | | | |
| Telecommunications: 1.8% | | | |
| 4,074 | | | | AT&T, Inc. | | | 137,253 |
| 190 | | | | CenturyTel, Inc. | | | 6,762 |
| 4,450 | | @ | | Cisco Systems, Inc. | | | 103,507 |
| 1,280 | | | | Corning, Inc. | | | 29,504 |
| 131 | | | | Embarq Corp. | | | 6,192 |
| 440 | | @ | | JDS Uniphase Corp. | | | 4,998 |
| 260 | | @ | | Juniper Networks, Inc. | | | 5,767 |
| 790 | | | | Motorola, Inc. | | | 5,799 |
| 980 | | | | Qualcomm, Inc. | | | 43,483 |
| 1,860 | | | | Qwest Communications International, Inc. | | | 7,310 |
| 913 | | | | Sprint Nextel Corp. | | | 8,674 |
| 2,120 | | | | Verizon Communications, Inc. | | | 75,048 |
| 1,320 | | | | Windstream Corp. | | | 16,289 |
| | | | | | | |
| | | | | | | 450,586 |
| | | | | | | |
| Textiles: 0.0% | | | |
| 180 | | | | Cintas Corp. | | | 4,772 |
| | | | | | | |
| | | | | | | 4,772 |
| | | | | | | |
| Toys/Games/Hobbies: 0.1% | | | |
| 440 | | | | Hasbro, Inc. | | | 15,717 |
| | | | | | | |
| | | | | | | 15,717 |
| | | | | | | |
| Transportation: 0.5% | | | |
| 180 | | | | Burlington Northern Santa Fe Corp. | | | 17,980 |
| 80 | | | | CH Robinson Worldwide, Inc. | | | 4,387 |
| 260 | | | | CSX Corp. | | | 16,331 |
| 180 | | | | Expeditors International Washington, Inc. | | | 7,740 |
| 90 | | | | FedEx Corp. | | | 7,091 |
| 170 | | | | Norfolk Southern Corp. | | | 10,654 |
| 180 | | | | Ryder System, Inc. | | | 12,398 |
| 260 | | | | Union Pacific Corp. | | | 19,630 |
| 520 | | | | United Parcel Service, Inc. - Class B | | | 31,964 |
| | | | | | | |
| | | | | | | 128,175 |
| | | | | | | |
| | | | Total Common Stock
(Cost $8,855,908) | | | 8,142,758 |
| | | | | | | |
| REAL ESTATE INVESTMENT TRUSTS: 0.3% | | | |
| Apartments: 0.0% | | | |
| 180 | | | | Equity Residential | | | 6,889 |
| | | | | | | |
| | | | | | | 6,889 |
| | | | | | | |
| | | | | | | | |
| Shares | | | | | | Value |
| | | | | | | | |
| | Diversified: 0.1% | | | |
| | 180 | | | | Vornado Realty Trust | | $ | 15,840 |
| | | | | | | | |
| | | | | | | | 15,840 |
| | | | | | | | |
| | Health Care: 0.0% | | | |
| | 260 | | | | HCP, Inc. | | | 8,271 |
| | | | | | | | |
| | | | | | | | 8,271 |
| | | | | | | | |
| | Hotels: 0.0% | | | |
| | 880 | | | | Host Hotels & Resorts, Inc. | | | 12,012 |
| | | | | | | | |
| | | | | | | | 12,012 |
| | | | | | | | |
| | Regional Malls: 0.1% | | | |
| | 230 | | | | General Growth Properties, Inc. | | | 8,057 |
| | 80 | | | | Simon Property Group, Inc. | | | 7,191 |
| | | | | | | | |
| | | | | | | | 15,248 |
| | | | | | | | |
| | Storage: 0.0% | | | |
| | 80 | | | | Public Storage, Inc. | | | 6,463 |
| | | | | | | | |
| | | | | | | | 6,463 |
| | | | | | | | |
| | Warehouse/Industrial: 0.1% | | | |
| | 230 | | | | Prologis | | | 12,501 |
| | | | | | | | |
| | | | | | | | 12,501 |
| | | | | | | | |
| | | | | Total Real Estate Investment Trusts
(Cost $86,820) | | | 77,224 |
| | | | | | | | |
| | | |
Principal
Amount | | | | | | Value |
| | U.S. GOVERNMENT AGENCY OBLIGATIONS: 15.3% |
| | Other U.S. Agency Obligations: 15.3% | | | |
| $ | 4,164,000 | | Z | | Financing Corp.,
3.440%, due 10/06/11 | | $ | 3,737,740 |
| | | | | | | | |
| | | | | Total U.S. Government Agency Obligations
(Cost $3,774,628) | | | 3,737,740 |
| | | | | | | | |
| | U.S. TREASURY OBLIGATIONS: 49.9% | | | |
| | U.S. Treasury STRIP: 49.9% | | | |
| | 13,353,000 | | ^ | | 2.920%, due 08/15/11 | | | 12,197,489 |
| | | | | | | | |
| | | | | Total U.S. Treasury Obligations
(Cost $12,323,378) | | | 12,197,489 |
| | | | | | | | |
| | | | | Total Long-Term Investments
(Cost $25,040,734) | | | 24,155,211 |
| | | | | | | | |
| | | |
| Shares | | | | | | Value |
| | SHORT-TERM INVESTMENTS: 1.1% | | | |
| | Mutual Fund: 0.5% | | | |
| | 125,000 | | ** | | ING Institutional Prime Money Market Fund | | $ | 125,000 |
| | | | | | | | |
| | | | | Total Mutual Fund
(Cost $125,000) | | | 125,000 |
| | | | | | | | |
See Accompanying Notes to Financial Statements
78
| | |
| ING GET U.S. CORE PORTFOLIO SERIES 5 | | PORTFOLIO OF INVESTMENTS ASOF JUNE 30, 2008 (UNAUDITED) (CONTINUED) |
| | | | | | | | | |
Principal
Amount | | | | | | | Value |
| | Repurchase Agreement: 0.6% | | | | |
| $ | 138,000 | | Morgan Stanley Repurchase Agreement dated 06/30/08, 2.400%, due 07/01/08,
$138,009 to be received upon repurchase (Collateralized by $145,000 Federal Home Loan Mortgage Corporation, Discount Note, Market
Value $143,144, due 12/30/08) | | | | | $ | 138,000 |
| | | | | | | | | |
| | | Total Repurchase Agreement
(Cost $138,000) | | | | | | 138,000 |
| | | | | | | | | |
| | | Total Short-Term Investments
(Cost $263,000) | | | | | | 263,000 |
| | | | | | | | | |
| | | Total Investments in Securities
(Cost $25,303,734)* | | 99.9 | % | | $ | 24,418,211 |
| | | Other Assets and
Liabilities - Net | | 0.1 | | | | 14,637 |
| | | | | | | | | |
| | | Net Assets | | 100.0 | % | | $ | 24,432,848 |
| | | | | | | | | |
| @ | Non-income producing security |
| STRIP | Separate Trading of Registered Interest and Principal of Securities |
| ** | Investment in affiliate |
| ^ | Interest only securities represent the right to receive the monthly interest payments on an underlying pool of mortgage loans. Principal amount shown represents the notional amount on which current interest is calculated. Payments of principal on the pool reduce the value of the interest only security. |
| Z | Indicates Zero Coupon Bond; rate shown reflects current effective yield. |
| * | Cost for federal income tax purposes is $26,291,179. |
| | | | |
Net unrealized depreciation consists of: | | | | |
Gross Unrealized Appreciation | | $ | 294,472 | |
Gross Unrealized Depreciation | | | (2,167,440 | ) |
| | | | |
Net Unrealized Depreciation | | $ | (1,872,968 | ) |
| | | | |
Fair Value Measurements — Effective January 1, 2008, the Portfolio adopted Financial Accounting Standards Board Statement of Financial Accounting Standards No. 157 (“SFAS 157”), “Fair Value Measurements.” This new accounting statement defines fair value, establishes a framework for measuring fair value in generally accepted accounting principles (“GAAP”), and expands disclosures about fair value measurements. The three levels of the fair value hierarchy are as follows:
| | • | | Level 1 — quoted prices in active markets for identical investments |
| | • | | Level 2 — other significant observable inputs (including quoted prices for similar investments, interest rates, prepayment speeds, credit risk, etc.) |
| | • | | Level 3 — significant unobservable inputs (including the Portfolio’s own assumption in determining the fair value of investments) |
The inputs or methodology used in valuing securities are not necessarily an indication of the risk associated with investing in those securities.
The following is a summary of the inputs used as of June 30, 2008 in valuing the Portfolio’s investments at fair value:
| | | | | | |
| | | Investments in Securities | | Other Financial Instruments* |
Level 1 — Quoted Prices | | $ | 8,344,982 | | $ | — |
Level 2 — Other Significant Observable Inputs | | | 16,073,229 | | | — |
Level 3 — Significant Unobservable Inputs | | | — | | | — |
| | | | | | |
Total | | $ | 24,418,211 | | $ | — |
| | | | | | |
| * | | Other financial instruments may include forward foreign currency contracts, futures, swaps, and written options. |
See Accompanying Notes to Financial Statements
79
| | |
| ING GET U.S. CORE PORTFOLIO SERIES 6 | | PORTFOLIO OF INVESTMENTS ASOF JUNE 30, 2008 (UNAUDITED) |
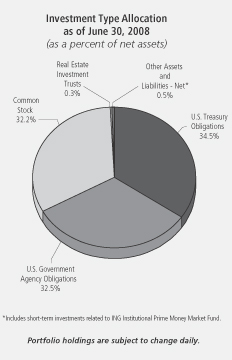
| | | | | | | |
| Shares | | | | | | Value |
| | | | | | | |
| COMMON STOCK: 32.2% |
| Advertising: 0.1% |
| 2,500 | | @ | | Interpublic Group of Cos., Inc. | | $ | 21,500 |
| 902 | | | | Omnicom Group | | | 40,482 |
| | | | | | | |
| | | | | | | 61,982 |
| | | | | | | |
| Aerospace/Defense: 0.8% |
| 1,389 | | | | Boeing Co. | | | 91,285 |
| 400 | | | | General Dynamics Corp. | | | 33,680 |
| 350 | | | | Goodrich Corp. | | | 16,611 |
| 249 | | | | L-3 Communications Holdings, Inc. | | | 22,627 |
| 675 | | | | Lockheed Martin Corp. | | | 66,596 |
| 809 | | | | Northrop Grumman Corp. | | | 54,122 |
| 150 | | | | Raytheon Co. | | | 8,442 |
| 150 | | | | Rockwell Collins, Inc. | | | 7,194 |
| 1,430 | | | | United Technologies Corp. | | | 88,231 |
| | | | | | | |
| | | | | | | 388,788 |
| | | | | | | |
| Agriculture: 0.6% |
| 2,960 | | | | Altria Group, Inc. | | | 60,858 |
| 1,113 | | | | Archer-Daniels-Midland Co. | | | 37,564 |
| 401 | | @ | | Lorillard, Inc. | | | 27,733 |
| 3,060 | | | | Philip Morris International, Inc. | | | 151,133 |
| 396 | | | | Reynolds American, Inc. | | | 18,481 |
| | | | | | | |
| | | | | | | 295,769 |
| | | | | | | |
| Airlines: 0.0% |
| 1,250 | | | | Southwest Airlines Co. | | | 16,300 |
| | | | | | | |
| | | | | | | 16,300 |
| | | | | | | |
| Apparel: 0.2% |
| 978 | | @ | | Coach, Inc. | | | 28,245 |
| 798 | | | | Nike, Inc. | | | 47,569 |
| | | | | | | |
| Shares | | | | | | Value |
| | | | | | | |
| 150 | | | | Polo Ralph Lauren Corp. | | $ | 9,417 |
| 350 | | | | VF Corp. | | | 24,913 |
| | | | | | | |
| | | | | | | 110,144 |
| | | | | | | |
| Auto Manufacturers: 0.1% |
| 2,516 | | @ | | Ford Motor Co. | | | 12,102 |
| 1,000 | | | | General Motors Corp. | | | 11,500 |
| | | | | | | |
| | | | | | | 23,602 |
| | | | | | | |
| Auto Parts & Equipment: 0.1% |
| 350 | | @ | | Goodyear Tire & Rubber Co. | | | 6,241 |
| 1,531 | | | | Johnson Controls, Inc. | | | 43,909 |
| | | | | | | |
| | | | | | | 50,150 |
| | | | | | | |
| Banks: 1.3% |
| 6,569 | | | | Bank of America Corp. | | | 156,802 |
| 2,150 | | | | Bank of New York Mellon Corp. | | | 81,335 |
| 750 | | | | BB&T Corp. | | | 17,078 |
| 371 | | | | Capital One Financial Corp. | | | 14,102 |
| 850 | | | | Fifth Third Bancorp. | | | 8,653 |
| 250 | | | | M&T Bank Corp. | | | 17,635 |
| 498 | | | | Marshall & Ilsley Corp. | | | 7,634 |
| 400 | | | | Northern Trust Corp. | | | 27,428 |
| 2,160 | | | | Regions Financial Corp. | | | 23,566 |
| 788 | | | | State Street Corp. | | | 50,424 |
| 1,600 | | | | US Bancorp. | | | 44,624 |
| 2,705 | | | | Wachovia Corp. | | | 42,009 |
| 4,384 | | | | Wells Fargo & Co. | | | 104,120 |
| 650 | | | | Zions Bancorp. | | | 20,469 |
| | | | | | | |
| | | | | | | 615,879 |
| | | | | | | |
| Beverages: 0.7% |
| 155 | | | | Anheuser-Busch Cos., Inc. | | | 9,629 |
| 3,143 | | | | Coca-Cola Co. | | | 163,373 |
| 500 | | | | Coca-Cola Enterprises, Inc. | | | 8,650 |
| 947 | | | | Pepsi Bottling Group, Inc. | | | 26,440 |
| 2,177 | | | | PepsiCo, Inc. | | | 138,435 |
| | | | | | | |
| | | | | | | 346,527 |
| | | | | | | |
| Biotechnology: 0.5% |
| 1,668 | | @ | | Amgen, Inc. | | | 78,663 |
| 460 | | @ | | Biogen Idec, Inc. | | | 25,709 |
| 660 | | @ | | Celgene Corp. | | | 42,154 |
| 162 | | @ | | Genzyme Corp. | | | 11,667 |
| 1,392 | | @ | | Gilead Sciences, Inc. | | | 73,706 |
| | | | | | | |
| | | | | | | 231,899 |
| | | | | | | |
| Chemicals: 0.8% |
| 500 | | | | Air Products & Chemicals, Inc. | | | 49,430 |
| 1,492 | | | | Dow Chemical Co. | | | 52,086 |
| 100 | | | | Eastman Chemical Co. | | | 6,886 |
| 150 | | | | Ecolab, Inc. | | | 6,449 |
| 1,730 | | | | EI Du Pont de Nemours & Co. | | | 74,200 |
| 650 | | | | Hercules, Inc. | | | 11,005 |
| 600 | | | | International Flavors & Fragrances, Inc. | | | 23,436 |
| 888 | | | | Monsanto Co. | | | 112,279 |
| 103 | | | | PPG Industries, Inc. | | | 5,909 |
| 150 | | | | Praxair, Inc. | | | 14,136 |
| 350 | | | | Rohm & Haas Co. | | | 16,254 |
| 750 | | | | Sigma-Aldrich Corp. | | | 40,395 |
| | | | | | | |
| | | | | | | 412,465 |
| | | | | | | |
See Accompanying Notes to Financial Statements
80
| | |
| ING GET U.S. CORE PORTFOLIO SERIES 6 | | PORTFOLIO OF INVESTMENTS ASOF JUNE 30, 2008 (UNAUDITED) (CONTINUED) |
| | | | | | | |
| Shares | | | | | | Value |
| | | | | | | |
| Coal: 0.1% |
| 250 | | | | Consol Energy, Inc. | | $ | 28,093 |
| 110 | | | | Massey Energy Co. | | | 10,313 |
| 350 | | | | Peabody Energy Corp. | | | 30,818 |
| | | | | | | |
| | | | | | | 69,224 |
| | | | | | | |
| Commercial Services: 0.3% |
| 210 | | @ | | Apollo Group, Inc. - Class A | | | 9,295 |
| 250 | | | | Automatic Data Processing, Inc. | | | 10,475 |
| 900 | | | | H&R Block, Inc. | | | 19,260 |
| 384 | | | | McKesson Corp. | | | 21,469 |
| 226 | | | | Moody’s Corp. | | | 7,783 |
| 600 | | | | Robert Half International, Inc. | | | 14,382 |
| 900 | | | | RR Donnelley & Sons Co. | | | 26,721 |
| 1,207 | | | | Western Union Co. | | | 29,837 |
| | | | | | | |
| | | | | | | 139,222 |
| | | | | | | |
| Computers: 1.7% |
| 400 | | @ | | Affiliated Computer Services, Inc. | | | 21,396 |
| 1,150 | | @ | | Apple, Inc. | | | 192,556 |
| 250 | | @ | | Cognizant Technology Solutions Corp. | | | 8,128 |
| 366 | | @ | | Computer Sciences Corp. | | | 17,143 |
| 3,423 | | @ | | Dell, Inc. | | | 74,895 |
| 3,053 | | @ | | EMC Corp. | | | 44,849 |
| 3,803 | | | | Hewlett-Packard Co. | | | 168,131 |
| 2,170 | | | | International Business Machines Corp. | | | 257,210 |
| 377 | | @ | | Lexmark International, Inc. | | | 12,603 |
| 600 | | @ | | NetApp, Inc. | | | 12,996 |
| 380 | | @ | | Sandisk Corp. | | | 7,106 |
| 1,255 | | @ | | Sun Microsystems, Inc. | | | 13,654 |
| 350 | | @ | | Teradata Corp. | | | 8,099 |
| | | | | | | |
| | | | | | | 838,766 |
| | | | | | | |
| Cosmetics/Personal Care: 0.7% |
| 850 | | | | Avon Products, Inc. | | | 30,617 |
| 508 | | | | Colgate-Palmolive Co. | | | 35,103 |
| 4,718 | | | | Procter & Gamble Co. | | | 286,902 |
| | | | | | | |
| | | | | | | 352,622 |
| | | | | | | |
| Distribution/Wholesale: 0.1% |
| 750 | | | | Genuine Parts Co. | | | 29,760 |
| | | | | | | |
| | | | | | | 29,760 |
| | | | | | | |
| Diversified Financial Services: 1.7% |
| 1,498 | | | | American Express Co. | | | 56,430 |
| 325 | | | | Ameriprise Financial, Inc. | | | 13,218 |
| 790 | | | | Charles Schwab Corp. | | | 16,227 |
| 656 | | | | CIT Group, Inc. | | | 4,467 |
| 7,555 | | | | Citigroup, Inc. | | | 126,622 |
| 90 | | | | CME Group, Inc. | | | 34,487 |
| 1,640 | | | | Countrywide Financial Corp. | | | 6,970 |
| 1,162 | | | | Discover Financial Services | | | 15,304 |
| 2,600 | | @ | | E*Trade Financial Corp. | | | 8,164 |
| 730 | | | | Federal Home Loan Mortgage Corporation | | | 11,972 |
| 1,598 | | | | Federal National Mortgage Association | | | 31,177 |
| 616 | | | | Goldman Sachs Group, Inc. | | | 107,738 |
| 100 | | @ | | IntercontinentalExchange, Inc. | | | 11,400 |
| 5,122 | | | | JPMorgan Chase & Co. | | | 175,736 |
| 150 | | | | Legg Mason, Inc. | | | 6,536 |
| 994 | | | | Lehman Brothers Holdings, Inc. | | | 19,691 |
| | | | | | | |
| Shares | | | | | | Value |
| | | | | | | |
| 1,982 | | | | Merrill Lynch & Co., Inc. | | $ | 62,849 |
| 1,925 | | | | Morgan Stanley | | | 69,435 |
| 380 | | | | NYSE Euronext | | | 19,251 |
| 398 | | @ | | SLM Corp. | | | 7,701 |
| 150 | | | | T. Rowe Price Group, Inc. | | | 8,471 |
| | | | | | | |
| | | | | | | 813,846 |
| | | | | | | |
| Electric: 1.1% |
| 1,350 | | @ | | AES Corp. | | | 25,934 |
| 1,650 | | | | American Electric Power Co., Inc. | | | 66,380 |
| 1,250 | | | | Centerpoint Energy, Inc. | | | 20,063 |
| 1,150 | | | | Dominion Resources, Inc. | | | 54,614 |
| 1,150 | | | | DTE Energy Co. | | | 48,806 |
| 4,250 | | | | Duke Energy Corp. | | | 73,865 |
| 1,250 | | | | Edison International | | | 64,225 |
| 250 | | | | Entergy Corp. | | | 30,120 |
| 350 | | | | Exelon Corp. | | | 31,486 |
| 650 | | | | FPL Group, Inc. | | | 42,627 |
| 1,400 | | | | Pepco Holdings, Inc. | | | 35,910 |
| 350 | | | | PG&E Corp. | | | 13,892 |
| 350 | | | | PPL Corp. | | | 18,295 |
| 376 | | | | Public Service Enterprise Group, Inc. | | | 17,270 |
| | | | | | | |
| | | | | | | 543,487 |
| | | | | | | |
| Electrical Components & Equipment: 0.1% |
| 1,042 | | | | Emerson Electric Co. | | | 51,527 |
| 500 | | | | Molex, Inc. | | | 12,205 |
| | | | | | | |
| | | | | | | 63,732 |
| | | | | | | |
| Electronics: 0.3% |
| 976 | | @ | | Agilent Technologies, Inc. | | | 34,687 |
| 400 | | | | Applera Corp. - Applied Biosystems Group | | | 13,392 |
| 900 | | | | Jabil Circuit, Inc. | | | 14,769 |
| 500 | | | | PerkinElmer, Inc. | | | 13,925 |
| 897 | | @ | | Thermo Electron Corp. | | | 49,990 |
| 850 | | @@ | | Tyco Electronics Ltd. | | | 30,447 |
| 172 | | @ | | Waters Corp. | | | 11,094 |
| | | | | | | |
| | | | | | | 168,304 |
| | | | | | | |
| Engineering & Construction: 0.1% |
| 250 | | | | Fluor Corp. | | | 46,520 |
| 150 | | @ | | Jacobs Engineering Group, Inc. | | | 12,105 |
| | | | | | | |
| | | | | | | 58,625 |
| | | | | | | |
| Environmental Control: 0.1% |
| 1,250 | | @ | | Allied Waste Industries, Inc. | | | 15,775 |
| 650 | | | | Waste Management, Inc. | | | 24,512 |
| | | | | | | |
| | | | | | | 40,287 |
| | | | | | | |
| Food: 0.5% |
| 1,000 | | | | ConAgra Foods, Inc. | | | 19,280 |
| 546 | | | | General Mills, Inc. | | | 33,180 |
| 388 | | | | HJ Heinz Co. | | | 18,566 |
| 650 | | | | Kellogg Co. | | | 31,213 |
| 1,669 | | | | Kraft Foods, Inc. | | | 47,483 |
| 452 | | | | Kroger Co. | | | 13,049 |
| 2,500 | | | | Sara Lee Corp. | | | 30,625 |
| 500 | | | | Supervalu, Inc. | | | 15,445 |
| 400 | | | | Sysco Corp. | | | 11,004 |
| 350 | | | | WM Wrigley Jr. Co. | | | 27,223 |
| | | | | | | |
| | | | | | | 247,068 |
| | | | | | | |
See Accompanying Notes to Financial Statements
81
| | |
| ING GET U.S. CORE PORTFOLIO SERIES 6 | | PORTFOLIO OF INVESTMENTS ASOF JUNE 30, 2008 (UNAUDITED) (CONTINUED) |
| | | | | | | |
| Shares | | | | | | Value |
| | | | | | | |
| Gas: 0.1% |
| 750 | | | | Sempra Energy | | $ | 42,338 |
| | | | | | | |
| | | | | | | 42,338 |
| | | | | | | |
| Hand/Machine Tools: 0.1% |
| 176 | | | | Black & Decker Corp. | | | 10,122 |
| 309 | | | | Snap-On, Inc. | | | 16,071 |
| 358 | | | | Stanley Works | | | 16,049 |
| | | | | | | |
| | | | | | | 42,242 |
| | | | | | | |
| Healthcare - Products: 1.1% |
| 693 | | | | Baxter International, Inc. | | | 44,310 |
| 350 | | | | Becton Dickinson & Co. | | | 28,455 |
| 2,350 | | @ | | Boston Scientific Corp. | | | 28,882 |
| 600 | | @@ | | Covidien Ltd. | | | 28,734 |
| 250 | | | | CR Bard, Inc. | | | 21,988 |
| 100 | | @ | | Intuitive Surgical, Inc. | | | 26,940 |
| 3,209 | | | | Johnson & Johnson | | | 206,467 |
| 1,900 | | | | Medtronic, Inc. | | | 98,325 |
| 500 | | @ | | Patterson Cos., Inc. | | | 14,695 |
| 650 | | @ | | St. Jude Medical, Inc. | | | 26,572 |
| 250 | | | | Stryker Corp. | | | 15,720 |
| 250 | | @ | | Varian Medical Systems, Inc. | | | 12,963 |
| 120 | | @ | | Zimmer Holdings, Inc. | | | 8,166 |
| | | | | | | |
| | | | | | | 562,217 |
| | | | | | | |
| Healthcare - Services: 0.3% |
| 734 | | | | Aetna, Inc. | | | 29,749 |
| 439 | | | | Cigna Corp. | | | 15,536 |
| 226 | | @ | | Humana, Inc. | | | 8,988 |
| 304 | | @ | | Laboratory Corp. of America Holdings | | | 21,168 |
| 350 | | | | Quest Diagnostics | | | 16,965 |
| 1,470 | | | | UnitedHealth Group, Inc. | | | 38,588 |
| 648 | | @ | | WellPoint, Inc. | | | 30,884 |
| | | | | | | |
| | | | | | | 161,878 |
| | | | | | | |
| Home Builders: 0.0% |
| 600 | | | | D.R. Horton, Inc. | | | 6,510 |
| 1,100 | | | | Lennar Corp. | | | 13,574 |
| | | | | | | |
| | | | | | | 20,084 |
| | | | | | | |
| Household Products/Wares: 0.2% |
| 150 | | | | Avery Dennison Corp. | | | 6,590 |
| 600 | | | | Clorox Co. | | | 31,320 |
| 350 | | | | Fortune Brands, Inc. | | | 21,844 |
| 1,004 | | | | Kimberly-Clark Corp. | | | 60,019 |
| | | | | | | |
| | | | | | | 119,773 |
| | | | | | | |
| Insurance: 1.2% |
| 639 | | @@ | | ACE Ltd. | | | 35,203 |
| 706 | | | | Aflac, Inc. | | | 44,337 |
| 914 | | | | Allstate Corp. | | | 41,669 |
| 3,693 | | | | American International Group, Inc. | | | 97,717 |
| 330 | | | | AON Corp. | | | 15,160 |
| 150 | | | | Assurant, Inc. | | | 9,894 |
| 984 | | | | Chubb Corp. | | | 48,226 |
| 500 | | | | Cincinnati Financial Corp. | | | 12,700 |
| 750 | | | | Genworth Financial, Inc. | | | 13,358 |
| 522 | | | | Hartford Financial Services Group, Inc. | | | 33,706 |
| 500 | | | | Lincoln National Corp. | | | 22,660 |
| 133 | | | | Loews Corp. | | | 6,238 |
| 350 | | | | Marsh & McLennan Cos., Inc. | | | 9,293 |
| 1,572 | | | | Metlife, Inc. | | | 82,954 |
| | | | | | | |
| Shares | | | | | | Value |
| | | | | | | |
| 532 | | | | Progressive Corp. | | $ | 9,959 |
| 893 | | | | Prudential Financial, Inc. | | | 53,348 |
| 269 | | | | Torchmark Corp. | | | 15,777 |
| 1,017 | | | | Travelers Cos., Inc. | | | 44,138 |
| 600 | | | | UnumProvident Corp. | | | 12,270 |
| 250 | | @@ | | XL Capital Ltd. | | | 5,140 |
| | | | | | | |
| | | | | | | 613,747 |
| | | | | | | |
| Internet: 0.7% |
| 150 | | @ | | Akamai Technologies, Inc. | | | 5,219 |
| 390 | | @ | | Amazon.com, Inc. | | | 28,599 |
| 1,664 | | @ | | eBay, Inc. | | | 45,477 |
| 600 | | @ | | Expedia, Inc. | | | 11,028 |
| 330 | | @ | | Google, Inc. - Class A | | | 173,719 |
| 350 | | @ | | IAC/InterActiveCorp. | | | 6,748 |
| 1,541 | | @ | | Symantec Corp. | | | 29,818 |
| 1,650 | | @ | | Yahoo!, Inc. | | | 34,089 |
| | | | | | | |
| | | | | | | 334,697 |
| | | | | | | |
| Iron/Steel: 0.2% |
| 100 | | | | Allegheny Technologies, Inc. | | | 5,928 |
| 434 | | | | Nucor Corp. | | | 32,407 |
| 243 | | | | United States Steel Corp. | | | 44,902 |
| | | | | | | |
| | | | | | | 83,237 |
| | | | | | | |
| Lodging: 0.0% |
| 365 | | | | Starwood Hotels & Resorts Worldwide, Inc. | | | 14,626 |
| | | | | | | |
| | | | | | | 14,626 |
| | | | | | | |
| Machinery - Construction & Mining: 0.2% |
| 980 | | | | Caterpillar, Inc. | | | 72,344 |
| 150 | | @ | | Terex Corp. | | | 7,706 |
| | | | | | | |
| | | | | | | 80,050 |
| | | | | | | |
| Machinery - Diversified: 0.2% |
| 266 | | | | Cummins, Inc. | | | 17,428 |
| 690 | | | | Deere & Co. | | | 49,770 |
| 250 | | | | Manitowoc Co., Inc. | | | 8,133 |
| 150 | | | | Rockwell Automation, Inc. | | | 6,560 |
| | | | | | | |
| | | | | | | 81,891 |
| | | | | | | |
| Media: 0.8% |
| 600 | | | | CBS Corp. - Class B | | | 11,694 |
| 690 | | | | Clear Channel Communications, Inc. | | | 24,288 |
| 3,470 | | | | Comcast Corp. - Class A | | | 65,826 |
| 1,000 | | @ | | DIRECTV Group, Inc. | | | 25,910 |
| 4,140 | | | | News Corp. - Class A | | | 62,266 |
| 4,350 | | | | Time Warner, Inc. | | | 64,380 |
| 1,000 | | @ | | Viacom - Class B | | | 30,540 |
| 2,864 | | | | Walt Disney Co. | | | 89,357 |
| | | | | | | |
| | | | | | | 374,261 |
| | | | | | | |
| Metal Fabricate/Hardware: 0.1% |
| 250 | | | | Precision Castparts Corp. | | | 24,093 |
| | | | | | | |
| | | | | | | 24,093 |
| | | | | | | |
| Mining: 0.2% |
| 350 | | | | Alcoa, Inc. | | | 12,467 |
| 636 | | | | Freeport-McMoRan Copper & Gold, Inc. | | | 74,533 |
| 500 | | | | Newmont Mining Corp. | | | 26,080 |
| | | | | | | |
| | | | | | | 113,080 |
| | | | | | | |
See Accompanying Notes to Financial Statements
82
| | |
| ING GET U.S. CORE PORTFOLIO SERIES 6 | | PORTFOLIO OF INVESTMENTS ASOF JUNE 30, 2008 (UNAUDITED) (CONTINUED) |
| | | | | | | |
| Shares | | | | | | Value |
| | | | | | | |
| Miscellaneous Manufacturing: 1.5% |
| 950 | | | | 3M Co. | | $ | 66,111 |
| 400 | | | | Cooper Industries Ltd. | | | 15,800 |
| 900 | | | | Dover Corp. | | | 43,533 |
| 478 | | | | Eaton Corp. | | | 40,616 |
| 14,513 | | | | General Electric Co. | | | 387,352 |
| 1,336 | | | | Honeywell International, Inc. | | | 67,174 |
| 650 | | | | Illinois Tool Works, Inc. | | | 30,882 |
| 650 | | | | Leggett & Platt, Inc. | | | 10,901 |
| 389 | | | | Parker Hannifin Corp. | | | 27,743 |
| 650 | | | | Textron, Inc. | | | 31,155 |
| 250 | | @@ | | Tyco International Ltd. | | | 10,010 |
| | | | | | | |
| | | | | | | 731,277 |
| | | | | | | |
| Office/Business Equipment: 0.1% |
| 1,000 | | | | Pitney Bowes, Inc. | | | 34,100 |
| 1,900 | | | | Xerox Corp. | | | 25,764 |
| | | | | | | |
| | | | | | | 59,864 |
| | | | | | | |
| Oil & Gas: 4.4% |
| 942 | | | | Anadarko Petroleum Corp. | | | 70,499 |
| 600 | | | | Apache Corp. | | | 83,400 |
| 140 | | | | Cabot Oil & Gas Corp. | | | 9,482 |
| 650 | | | | Chesapeake Energy Corp. | | | 42,874 |
| 3,331 | | | | Chevron Corp. | | | 330,202 |
| 2,422 | | | | ConocoPhillips | | | 228,613 |
| 790 | | | | Devon Energy Corp. | | | 94,926 |
| 350 | | | | ENSCO International, Inc. | | | 28,259 |
| 350 | | | | EOG Resources, Inc. | | | 45,920 |
| 8,195 | | | | ExxonMobil Corp. | | | 722,225 |
| 400 | | | | Hess Corp. | | | 50,476 |
| 954 | | | | Marathon Oil Corp. | | | 49,484 |
| 350 | | | | Murphy Oil Corp. | | | 34,318 |
| 400 | | @, @@ | | Nabors Industries Ltd. | | | 19,692 |
| 150 | | | | Noble Corp. | | | 9,744 |
| 320 | | | | Noble Energy, Inc. | | | 32,179 |
| 1,314 | | | | Occidental Petroleum Corp. | | | 118,076 |
| 350 | | | | Questar Corp. | | | 24,864 |
| 250 | | | | Range Resources Corp. | | | 16,385 |
| 500 | | @ | | Southwestern Energy Co. | | | 23,805 |
| 150 | | | | Sunoco, Inc. | | | 6,104 |
| 409 | | @ | | Transocean, Inc. | | | 62,328 |
| 566 | | | | Valero Energy Corp. | | | 23,308 |
| 475 | | | | XTO Energy, Inc. | | | 32,542 |
| | | | | | | |
| | | | | | | 2,159,705 |
| | | | | | | |
| Oil & Gas Services: 0.7% |
| 400 | | | | Baker Hughes, Inc. | | | 34,936 |
| 914 | | | | Halliburton Co. | | | 48,506 |
| 400 | | @ | | National Oilwell Varco, Inc. | | | 35,488 |
| 1,540 | | | | Schlumberger Ltd. | | | 165,442 |
| 250 | | | | Smith International, Inc. | | | 20,785 |
| 600 | | @ | | Weatherford International Ltd. | | | 29,754 |
| | | | | | | |
| | | | | | | 334,911 |
| | | | | | | |
| Packaging & Containers: 0.0% |
| 436 | | | | Ball Corp. | | | 20,815 |
| | | | | | | |
| | | | | | | 20,815 |
| | | | | | | |
| Pharmaceuticals: 1.6% |
| 1,690 | | | | Abbott Laboratories | | | 89,519 |
| 350 | | | | Allergan, Inc. | | | 18,218 |
| 400 | | | | AmerisourceBergen Corp. | | | 15,996 |
| 2,400 | | | | Bristol-Myers Squibb Co. | | | 49,272 |
| | | | | | | |
| Shares | | | | | | Value |
| | | | | | | |
| 153 | | | | Cardinal Health, Inc. | | $ | 7,892 |
| 1,600 | | | | Eli Lilly & Co. | | | 73,856 |
| 420 | | @ | | Express Scripts, Inc. | | | 26,342 |
| 400 | | @ | | Forest Laboratories, Inc. | | | 13,896 |
| 927 | | @ | | King Pharmaceuticals, Inc. | | | 9,706 |
| 600 | | @ | | Medco Health Solutions, Inc. | | | 28,320 |
| 3,351 | | | | Merck & Co., Inc. | | | 126,299 |
| 8,785 | | | | Pfizer, Inc. | | | 153,474 |
| 2,770 | | | | Schering-Plough Corp. | | | 54,541 |
| 350 | | @ | | Watson Pharmaceuticals, Inc. | | | 9,510 |
| 2,184 | | | | Wyeth | | | 104,745 |
| | | | | | | |
| | | | | | | 781,586 |
| | | | | | | |
| Pipelines: 0.2% |
| 1,150 | | | | El Paso Corp. | | | 25,001 |
| 900 | | | | Spectra Energy Corp. | | | 25,866 |
| 1,008 | | | | Williams Cos., Inc. | | | 40,632 |
| | | | | | | |
| | | | | | | 91,499 |
| | | | | | | |
| Retail: 1.8% |
| 150 | | | | Abercrombie & Fitch Co. | | | 9,402 |
| 220 | | @ | | Autozone, Inc. | | | 26,622 |
| 685 | | | | Best Buy Co., Inc. | | | 27,126 |
| 400 | | @ | | Big Lots, Inc. | | | 12,496 |
| 534 | | | | Costco Wholesale Corp. | | | 37,455 |
| 1,935 | | | | CVS Caremark Corp. | | | 76,568 |
| 457 | | | | Darden Restaurants, Inc. | | | 14,597 |
| 540 | | | | Family Dollar Stores, Inc. | | | 10,768 |
| 400 | | @ | | GameStop Corp. | | | 16,160 |
| 1,253 | | | | Gap, Inc. | | | 20,888 |
| 1,691 | | | | Home Depot, Inc. | | | 39,603 |
| 250 | | | | JC Penney Co., Inc. | | | 9,073 |
| 1,100 | | | | Limited Brands, Inc. | | | 18,535 |
| 1,636 | | | | Lowe’s Cos., Inc. | | | 33,947 |
| 650 | | | | Macy’s, Inc. | | | 12,623 |
| 1,925 | | | | McDonald’s Corp. | | | 108,224 |
| 1,032 | | | | Staples, Inc. | | | 24,510 |
| 954 | | | | Target Corp. | | | 44,351 |
| 350 | | | | Tiffany & Co. | | | 14,263 |
| 1,358 | | | | TJX Cos., Inc. | | | 42,736 |
| 1,000 | | | | Walgreen Co. | | | 32,510 |
| 3,730 | | | | Wal-Mart Stores, Inc. | | | 209,626 |
| 702 | | | | Yum! Brands, Inc. | | | 24,633 |
| | | | | | | |
| | | | | | | 866,716 |
| | | | | | | |
| Savings & Loans: 0.0% |
| 850 | | | | Hudson City Bancorp., Inc. | | | 14,178 |
| 1,454 | | | | Washington Mutual, Inc. | | | 7,168 |
| | | | | | | |
| | | | | | | 21,346 |
| | | | | | | |
| Semiconductors: 0.9% |
| 350 | | | | Altera Corp. | | | 7,245 |
| 500 | | | | Analog Devices, Inc. | | | 15,885 |
| 2,045 | | | | Applied Materials, Inc. | | | 39,039 |
| 600 | | @ | | Broadcom Corp. | | | 16,374 |
| 8,264 | | | | Intel Corp. | | | 177,511 |
| 400 | | | | KLA-Tencor Corp. | | | 16,284 |
| 250 | | | | Linear Technology Corp. | | | 8,143 |
| 1,600 | | @ | | LSI Logic Corp. | | | 9,824 |
| 250 | | @ | | MEMC Electronic Materials, Inc. | | | 15,385 |
| 641 | | | | National Semiconductor Corp. | | | 13,166 |
| 1,050 | | @ | | Nvidia Corp. | | | 19,656 |
| 650 | | @ | | QLogic Corp. | | | 9,484 |
See Accompanying Notes to Financial Statements
83
| | |
| ING GET U.S. CORE PORTFOLIO SERIES 6 | | PORTFOLIO OF INVESTMENTS ASOF JUNE 30, 2008 (UNAUDITED) (CONTINUED) |
| | | | | | | |
| Shares | | | | | | Value |
| | | | | | | |
| Semiconductors: (continued) |
| 2,250 | | | | Texas Instruments, Inc. | | $ | 63,360 |
| 400 | | | | Xilinx, Inc. | | | 10,100 |
| | | | | | | |
| | | | | | | 421,456 |
| | | | | | | |
| Software: 1.3% |
| 866 | | @ | | Adobe Systems, Inc. | | | 34,112 |
| 422 | | @ | | Autodesk, Inc. | | | 14,268 |
| 375 | | @ | | BMC Software, Inc. | | | 13,500 |
| 1,051 | | | | CA, Inc. | | | 24,268 |
| 1,350 | | @ | | Compuware Corp. | | | 12,879 |
| 250 | | @ | | Electronic Arts, Inc. | | | 11,108 |
| 250 | | | | Fidelity National Information Services, Inc. | | | 9,228 |
| 500 | | @ | | Fiserv, Inc. | | | 22,685 |
| 1,000 | | | | IMS Health, Inc. | | | 23,300 |
| 12,014 | | | | Microsoft Corp. | | | 330,505 |
| 5,955 | | @ | | Oracle Corp. | | | 125,055 |
| | | | | | | |
| | | | | | | 620,908 |
| | | | | | | |
| Telecommunications: 1.8% |
| 7,975 | | | | AT&T, Inc. | | | 268,678 |
| 358 | | | | CenturyTel, Inc. | | | 12,741 |
| 8,795 | | @ | | Cisco Systems, Inc. | | | 204,572 |
| 2,300 | | | | Corning, Inc. | | | 53,015 |
| 315 | | | | Embarq Corp. | | | 14,890 |
| 750 | | @ | | JDS Uniphase Corp. | | | 8,520 |
| 600 | | @ | | Juniper Networks, Inc. | | | 13,308 |
| 1,613 | | | | Motorola, Inc. | | | 11,839 |
| 2,034 | | | | Qualcomm, Inc. | | | 90,249 |
| 3,100 | | | | Qwest Communications International, Inc. | | | 12,183 |
| 1,852 | | | | Sprint Nextel Corp. | | | 17,594 |
| 4,183 | | | | Verizon Communications, Inc. | | | 148,078 |
| 2,600 | | | | Windstream Corp. | | | 32,084 |
| | | | | | | |
| | | | | | | 887,751 |
| | | | | | | |
| Textiles: 0.0% |
| 400 | | | | Cintas Corp. | | | 10,604 |
| | | | | | | |
| | | | | | | 10,604 |
| | | | | | | |
| Toys/Games/Hobbies: 0.0% |
| 650 | | | | Hasbro, Inc. | | | 23,218 |
| | | | | | | |
| | | | | | | 23,218 |
| | | | | | | |
| Transportation: 0.5% |
| 350 | | | | Burlington Northern Santa Fe Corp. | | | 34,962 |
| 150 | | | | CH Robinson Worldwide, Inc. | | | 8,226 |
| 364 | | | | CSX Corp. | | | 22,863 |
| 350 | | | | Expeditors International Washington, Inc. | | | 15,050 |
| 236 | | | | FedEx Corp. | | | 18,594 |
| 294 | | | | Norfolk Southern Corp. | | | 18,425 |
| 350 | | | | Ryder System, Inc. | | | 24,108 |
| 390 | | | | Union Pacific Corp. | | | 29,445 |
| 1,000 | | | | United Parcel Service, Inc. - Class B | | | 61,470 |
| | | | | | | |
| | | | | | | 233,143 |
| | | | | | | |
| | | | Total Common Stock
(Cost $16,892,131) | | | 15,851,461 |
| | | | | | | |
| | | | | | | | |
| Shares | | | | | | Value |
| | | | | | | | |
| | REAL ESTATE INVESTMENT TRUSTS: 0.3% |
| | Apartments: 0.0% |
| | 350 | | | | Equity Residential | | $ | 13,395 |
| | | | | | | | |
| | | | | | | | 13,395 |
| | | | | | | | |
| | Diversified: 0.1% |
| | 350 | | | | Vornado Realty Trust | | | 30,800 |
| | | | | | | | |
| | | | | | | | 30,800 |
| | | | | | | | |
| | Health Care: 0.0% |
| | 400 | | | | HCP, Inc. | | | 12,724 |
| | | | | | | | |
| | | | | | | | 12,724 |
| | | | | | | | |
| | Hotels: 0.1% |
| | 1,650 | | | | Host Hotels & Resorts, Inc. | | | 22,523 |
| | | | | | | | |
| | | | | | | | 22,523 |
| | | | | | | | |
| | Regional Malls: 0.1% |
| | 250 | | | | General Growth Properties, Inc. | | | 8,758 |
| | 250 | | | | Simon Property Group, Inc. | | | 22,473 |
| | | | | | | | |
| | | | | | | | 31,231 |
| | | | | | | | |
| | Storage: 0.0% |
| | 150 | | | | Public Storage, Inc. | | | 12,119 |
| | | | | | | | |
| | | | | | | | 12,119 |
| | | | | | | | |
| | Warehouse/Industrial: 0.0% |
| | 400 | | | | Prologis | | | 21,740 |
| | | | | | | | |
| | | | | | | | 21,740 |
| | | | | | | | |
| | | | | Total Real Estate Investment Trusts
(Cost $157,410) | | | 144,532 |
| | | | | | | | |
| | | |
Principal
Amount | | | | | | Value |
| | U.S. GOVERNMENT AGENCY OBLIGATIONS: 32.5% |
| | Federal Home Loan Mortgage Corporation: 27.4% |
| $ | 15,000,000 | | ^^, Z | | 3.330%, due 09/15/11 | | $ | 13,503,615 |
| | | | | | | | |
| | | | | | | | 13,503,615 |
| | | | | | | | |
| | Federal National Mortgage Association: 5.1% |
| | 2,840,000 | | ^, Z | | 3.680%, due 02/12/12 | | | 2,502,142 |
| | | | | | | | |
| | | | | | | | 2,502,142 |
| | | | | | | | |
| | | | | Total U.S. Government Agency Obligations
(Cost $16,037,238) | | | 16,005,757 |
| | | | | | | | |
| | U.S. TREASURY OBLIGATIONS: 34.5% |
| | U.S. Treasury STRIP: 34.5% |
| | 19,080,000 | | ^ | | 3.190%, due 02/15/12 | | | 17,013,413 |
| | | | | | | | |
| | | | | Total U.S. Treasury Obligations
(Cost $17,351,228) | | | 17,013,413 |
| | | | | | | | |
| | | | | Total Long-Term Investments
(Cost $50,438,007) | | | 49,015,163 |
| | | | | | | | |
See Accompanying Notes to Financial Statements
84
| | |
| ING GET U.S. CORE PORTFOLIO SERIES 6 | | PORTFOLIO OF INVESTMENTS ASOF JUNE 30, 2008 (UNAUDITED) (CONTINUED) |
| | | | | | | | | | |
| Shares | | | | | | | | | Value |
| | | | | | | | | | |
| SHORT-TERM INVESTMENTS: 0.2% |
| Mutual Fund: 0.2% |
| 83,000 | | ** | | ING Institutional Prime Money Market Fund | | | | | $ | 83,000 |
| | | | | | | | | | |
| | | | Total Short-Term Investments
(Cost $83,000) | | | | | | 83,000 |
| | | | | | | | | | |
| | | | Total Investments in Securities
(Cost $50,521,007)* | | 99.7 | % | | $ | 49,098,163 |
| | | | Other Assets and
Liabilities - Net | | 0.3 | | | | 132,476 |
| | | | | | | | | | |
| | | | Net Assets | | 100.0 | % | | $ | 49,230,639 |
| | | | | | | | | | |
| @ | Non-income producing security |
| STRIP | Separate Trading of Registered Interest and Principal of Securities |
| ** | Investment in affiliate |
| ^ | Interest only securities represent the right to receive the monthly interest payments on an underlying pool of mortgage loans. Principal amount shown represents the notional amount on which current interest is calculated. Payments of principal on the pool reduce the value of the interest only security. |
| ^^ | Principal only securities represent the right to receive the monthly principal payments on an underlying pool of mortgage loans. No payments of interest on the pool are passed through the principal only security. |
| Z | Indicates Zero Coupon Bond; rate shown reflects current effective yield. |
| * | Cost for federal income tax purposes is $52,718,211. |
| | | | |
Net unrealized depreciation consists of: | | | | |
Gross Unrealized Appreciation | | $ | 653,043 | |
Gross Unrealized Depreciation | | | (4,273,091 | ) |
| | | | |
Net Unrealized Depreciation | | $ | (3,620,048 | ) |
| | | | |
Fair Value Measurements — Effective January 1, 2008, the Portfolio adopted Financial Accounting Standards Board Statement of Financial Accounting Standards No. 157 (“SFAS 157”), “Fair Value Measurements.” This new accounting statement defines fair value, establishes a framework for measuring fair value in generally accepted accounting principles (“GAAP”), and expands disclosures about fair value measurements. The three levels of the fair value hierarchy are as follows:
| | • | | Level 1 — quoted prices in active markets for identical investments |
| | • | | Level 2 — other significant observable inputs (including quoted prices for similar investments, interest rates, prepayment speeds, credit risk, etc.) |
| | • | | Level 3 — significant unobservable inputs (including the Portfolio’s own assumption in determining the fair value of investments) |
The inputs or methodology used in valuing securities are not necessarily an indication of the risk associated with investing in those securities.
The following is a summary of the inputs used as of June 30, 2008 in valuing the Portfolio’s investments at fair value:
| | | | | | |
| | | Investments in Securities | | Other Financial Instruments* |
Level 1 — Quoted Prices | | $ | 16,078,993 | | $ | — |
Level 2 — Other Significant Observable Inputs | | | 33,019,170 | | | — |
Level 3 — Significant Unobservable Inputs | | | — | | | — |
| | | | | | |
Total | | $ | 49,098,163 | | $ | — |
| | | | | | |
| * | | Other financial instruments may include forward foreign currency contracts, futures, swaps, and written options. |
See Accompanying Notes to Financial Statements
85
| | |
| ING GET U.S. CORE PORTFOLIO SERIES 7 | | PORTFOLIO OF INVESTMENTS ASOF JUNE 30, 2008 (UNAUDITED) |
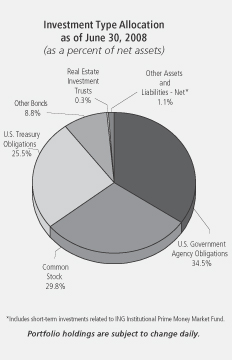
| | | | | | | |
| Shares | | | | | | Value |
| | | | | | | |
| COMMON STOCK: 29.8% |
| Advertising: 0.1% |
| 1,600 | | @ | | Interpublic Group of Cos., Inc. | | $ | 13,760 |
| 570 | | | | Omnicom Group | | | 25,582 |
| | | | | | | |
| | | | | | | 39,342 |
| | | | | | | |
| Aerospace/Defense: 0.8% |
| 960 | | | | Boeing Co. | | | 63,091 |
| 340 | | | | General Dynamics Corp. | | | 28,628 |
| 250 | | | | Goodrich Corp. | | | 11,865 |
| 160 | | | | L-3 Communications Holdings, Inc. | | | 14,539 |
| 450 | | | | Lockheed Martin Corp. | | | 44,397 |
| 416 | | | | Northrop Grumman Corp. | | | 27,830 |
| 200 | | | | Raytheon Co. | | | 11,256 |
| 940 | | | | United Technologies Corp. | | | 57,998 |
| | | | | | | |
| | | | | | | 259,604 |
| | | | | | | |
| Agriculture: 0.6% |
| 1,850 | | | | Altria Group, Inc. | | | 38,036 |
| 630 | | | | Archer-Daniels-Midland Co. | | | 21,263 |
| 175 | | @ | | Lorillard, Inc. | | | 12,103 |
| 1,950 | | | | Philip Morris International, Inc. | | | 96,311 |
| 290 | | | | Reynolds American, Inc. | | | 13,534 |
| | | | | | | |
| | | | | | | 181,247 |
| | | | | | | |
| Airlines: 0.0% |
| 800 | | | | Southwest Airlines Co. | | | 10,432 |
| | | | | | | |
| | | | | | | 10,432 |
| | | | | | | |
| Apparel: 0.2% |
| 560 | | @ | | Coach, Inc. | | | 16,173 |
| 470 | | | | Nike, Inc. | | | 28,017 |
| | | | | | | |
| Shares | | | | | | Value |
| | | | | | | |
| 150 | | | | Polo Ralph Lauren Corp. | | $ | 9,417 |
| 200 | | | | VF Corp. | | | 14,236 |
| | | | | | | |
| | | | | | | 67,843 |
| | | | | | | |
| Auto Manufacturers: 0.0% |
| 1,503 | | @ | | Ford Motor Co. | | | 7,229 |
| 400 | | | | General Motors Corp. | | | 4,600 |
| | | | | | | |
| | | | | | | 11,829 |
| | | | | | | |
| Auto Parts & Equipment: 0.1% |
| 200 | | @ | | Goodyear Tire & Rubber Co. | | | 3,566 |
| 830 | | | | Johnson Controls, Inc. | | | 23,804 |
| | | | | | | |
| | | | | | | 27,370 |
| | | | | | | |
| Banks: 1.1% |
| 4,025 | | | | Bank of America Corp. | | | 96,077 |
| 1,300 | | | | Bank of New York Mellon Corp. | | | 49,179 |
| 500 | | | | BB&T Corp. | | | 11,385 |
| 294 | | | | Capital One Financial Corp. | | | 11,175 |
| 550 | | | | Fifth Third Bancorp. | | | 5,599 |
| 200 | | | | M&T Bank Corp. | | | 14,108 |
| 248 | | | | Marshall & Ilsley Corp. | | | 3,802 |
| 200 | | | | Northern Trust Corp. | | | 13,714 |
| 1,332 | | | | Regions Financial Corp. | | | 14,532 |
| 430 | | | | State Street Corp. | | | 27,516 |
| 1,000 | | | | US Bancorp. | | | 27,890 |
| 1,646 | | | | Wachovia Corp. | | | 25,562 |
| 2,760 | | | | Wells Fargo & Co. | | | 65,550 |
| 350 | | | | Zions Bancorp. | | | 11,022 |
| | | | | | | |
| | | | | | | 377,111 |
| | | | | | | |
| Beverages: 0.7% |
| 190 | | | | Anheuser-Busch Cos., Inc. | | | 11,803 |
| 1,950 | | | | Coca-Cola Co. | | | 101,361 |
| 300 | | | | Coca-Cola Enterprises, Inc. | | | 5,190 |
| 610 | | | | Pepsi Bottling Group, Inc. | | | 17,031 |
| 1,380 | | | | PepsiCo, Inc. | | | 87,754 |
| | | | | | | |
| | | | | | | 223,139 |
| | | | | | | |
| Biotechnology: 0.4% |
| 1,020 | | @ | | Amgen, Inc. | | | 48,103 |
| 270 | | @ | | Biogen Idec, Inc. | | | 15,090 |
| 310 | | @ | | Celgene Corp. | | | 19,800 |
| 110 | | @ | | Genzyme Corp. | | | 7,922 |
| 870 | | @ | | Gilead Sciences, Inc. | | | 46,067 |
| | | | | | | |
| | | | | | | 136,982 |
| | | | | | | |
| Chemicals: 0.8% |
| 300 | | | | Air Products & Chemicals, Inc. | | | 29,658 |
| 960 | | | | Dow Chemical Co. | | | 33,514 |
| 100 | | | | Eastman Chemical Co. | | | 6,886 |
| 200 | | | | Ecolab, Inc. | | | 8,598 |
| 1,140 | | | | EI Du Pont de Nemours & Co. | | | 48,895 |
| 400 | | | | Hercules, Inc. | | | 6,772 |
| 300 | | | | International Flavors & Fragrances, Inc. | | | 11,718 |
| 580 | | | | Monsanto Co. | | | 73,335 |
| 130 | | | | PPG Industries, Inc. | | | 7,458 |
| 100 | | | | Praxair, Inc. | | | 9,424 |
| 200 | | | | Rohm & Haas Co. | | | 9,288 |
| 400 | | | | Sigma-Aldrich Corp. | | | 21,544 |
| | | | | | | |
| | | | | | | 267,090 |
| | | | | | | |
See Accompanying Notes to Financial Statements
86
| | |
| ING GET U.S. CORE PORTFOLIO SERIES 7 | | PORTFOLIO OF INVESTMENTS ASOF JUNE 30, 2008 (UNAUDITED) (CONTINUED) |
| | | | | | | |
| Shares | | | | | | Value |
| | | | | | | |
| Coal: 0.1% |
| 150 | | | | Consol Energy, Inc. | | $ | 16,856 |
| 100 | | | | Massey Energy Co. | | | 9,375 |
| 150 | | | | Peabody Energy Corp. | | | 13,208 |
| | | | | | | |
| | | | | | | 39,439 |
| | | | | | | |
| Commercial Services: 0.3% |
| 210 | | @ | | Apollo Group, Inc. - Class A | | | 9,295 |
| 200 | | | | Automatic Data Processing, Inc. | | | 8,380 |
| 600 | | | | H&R Block, Inc. | | | 12,840 |
| 220 | | | | McKesson Corp. | | | 12,300 |
| 230 | | | | Moody’s Corp. | | | 7,921 |
| 350 | | | | Robert Half International, Inc. | | | 8,390 |
| 500 | | | | RR Donnelley & Sons Co. | | | 14,845 |
| 790 | | | | Western Union Co. | | | 19,529 |
| | | | | | | |
| | | | | | | 93,500 |
| | | | | | | |
| Computers: 1.6% |
| 200 | | @ | | Affiliated Computer Services, Inc. | | | 10,698 |
| 750 | | @ | | Apple, Inc. | | | 125,580 |
| 250 | | @ | | Cognizant Technology Solutions Corp. | | | 8,128 |
| 160 | | @ | | Computer Sciences Corp. | | | 7,494 |
| 2,150 | | @ | | Dell, Inc. | | | 47,042 |
| 1,810 | | @ | | EMC Corp. | | | 26,589 |
| 2,510 | | | | Hewlett-Packard Co. | | | 110,967 |
| 1,320 | | | | International Business Machines Corp. | | | 156,460 |
| 280 | | @ | | Lexmark International, Inc. | | | 9,360 |
| 200 | | @ | | NetApp, Inc. | | | 4,332 |
| 210 | | @ | | Sandisk Corp. | | | 3,927 |
| 765 | | @ | | Sun Microsystems, Inc. | | | 8,323 |
| 200 | | @ | | Teradata Corp. | | | 4,628 |
| | | | | | | |
| | | | | | | 523,528 |
| | | | | | | |
| Cosmetics/Personal Care: 0.7% |
| 450 | | | | Avon Products, Inc. | | | 16,209 |
| 310 | | | | Colgate-Palmolive Co. | | | 21,421 |
| 2,903 | | | | Procter & Gamble Co. | | | 176,531 |
| | | | | | | |
| | | | | | | 214,161 |
| | | | | | | |
| Distribution/Wholesale: 0.1% |
| 500 | | | | Genuine Parts Co. | | | 19,840 |
| | | | | | | |
| | | | | | | 19,840 |
| | | | | | | |
| Diversified Financial Services: 1.5% |
| 990 | | | | American Express Co. | | | 37,293 |
| 284 | | | | Ameriprise Financial, Inc. | | | 11,550 |
| 480 | | | | Charles Schwab Corp. | | | 9,859 |
| 530 | | | | CIT Group, Inc. | | | 3,609 |
| 4,600 | | | | Citigroup, Inc. | | | 77,096 |
| 40 | | | | CME Group, Inc. | | | 15,328 |
| 1,220 | | | | Countrywide Financial Corp. | | | 5,185 |
| 480 | | | | Discover Financial Services | | | 6,322 |
| 1,600 | | @ | | E*Trade Financial Corp. | | | 5,024 |
| 560 | | | | Federal Home Loan Mortgage Corporation | | | 9,184 |
| 950 | | | | Federal National Mortgage Association | | | 18,535 |
| 390 | | | | Goldman Sachs Group, Inc. | | | 68,211 |
| 100 | | @ | | IntercontinentalExchange, Inc. | | | 11,400 |
| 3,104 | | | | JPMorgan Chase & Co. | | | 106,498 |
| 630 | | | | Lehman Brothers Holdings, Inc. | | | 12,480 |
| 1,250 | | | | Merrill Lynch & Co., Inc. | | | 39,638 |
| | | | | | | |
| Shares | | | | | | Value |
| | | | | | | |
| 1,260 | | | | Morgan Stanley | | $ | 45,448 |
| 260 | | | | NYSE Euronext | | | 13,172 |
| 320 | | @ | | SLM Corp. | | | 6,192 |
| | | | | | | |
| | | | | | | 502,024 |
| | | | | | | |
| Electric: 1.0% |
| 900 | | @ | | AES Corp. | | | 17,289 |
| 1,000 | | | | American Electric Power Co., Inc. | | | 40,230 |
| 800 | | | | Centerpoint Energy, Inc. | | | 12,840 |
| 600 | | | | Dominion Resources, Inc. | | | 28,494 |
| 750 | | | | DTE Energy Co. | | | 31,830 |
| 2,750 | | | | Duke Energy Corp. | | | 47,795 |
| 800 | | | | Edison International | | | 41,104 |
| 200 | | | | Entergy Corp. | | | 24,096 |
| 250 | | | | Exelon Corp. | | | 22,490 |
| 350 | | | | FPL Group, Inc. | | | 22,953 |
| 900 | | | | Pepco Holdings, Inc. | | | 23,085 |
| 200 | | | | PG&E Corp. | | | 7,938 |
| 250 | | | | PPL Corp. | | | 13,068 |
| 220 | | | | Public Service Enterprise Group, Inc. | | | 10,105 |
| | | | | | | |
| | | | | | | 343,317 |
| | | | | | | |
| Electrical Components & Equipment: 0.1% |
| 620 | | | | Emerson Electric Co. | | | 30,659 |
| 200 | | | | Molex, Inc. | | | 4,882 |
| | | | | | | |
| | | | | | | 35,541 |
| | | | | | | |
| Electronics: 0.3% |
| 510 | | @ | | Agilent Technologies, Inc. | | | 18,125 |
| 300 | | | | Applera Corp. - Applied Biosystems Group | | | 10,044 |
| 600 | | | | Jabil Circuit, Inc. | | | 9,846 |
| 300 | | | | PerkinElmer, Inc. | | | 8,355 |
| 610 | | @ | | Thermo Electron Corp. | | | 33,995 |
| 525 | | @@ | | Tyco Electronics Ltd. | | | 18,806 |
| 210 | | @ | | Waters Corp. | | | 13,545 |
| | | | | | | |
| | | | | | | 112,716 |
| | | | | | | |
| Engineering & Construction: 0.1% |
| 200 | | | | Fluor Corp. | | | 37,216 |
| 100 | | @ | | Jacobs Engineering Group, Inc. | | | 8,070 |
| | | | | | | |
| | | | | | | 45,286 |
| | | | | | | |
| Environmental Control: 0.1% |
| 950 | | @ | | Allied Waste Industries, Inc. | | | 11,989 |
| 300 | | | | Waste Management, Inc. | | | 11,313 |
| | | | | | | |
| | | | | | | 23,302 |
| | | | | | | |
| Food: 0.4% |
| 600 | | | | ConAgra Foods, Inc. | | | 11,568 |
| 300 | | | | General Mills, Inc. | | | 18,231 |
| 270 | | | | HJ Heinz Co. | | �� | 12,920 |
| 350 | | | | Kellogg Co. | | | 16,807 |
| 940 | | | | Kraft Foods, Inc. | | | 26,743 |
| 470 | | | | Kroger Co. | | | 13,569 |
| 1,400 | | | | Sara Lee Corp. | | | 17,150 |
| 300 | | | | Supervalu, Inc. | | | 9,267 |
| 300 | | | | Sysco Corp. | | | 8,253 |
| 150 | | | | WM Wrigley Jr. Co. | | | 11,667 |
| | | | | | | |
| | | | | | | 146,175 |
| | | | | | | |
| Gas: 0.1% |
| 450 | | | | Sempra Energy | | | 25,403 |
| | | | | | | |
| | | | | | | 25,403 |
| | | | | | | |
See Accompanying Notes to Financial Statements
87
| | |
| ING GET U.S. CORE PORTFOLIO SERIES 7 | | PORTFOLIO OF INVESTMENTS ASOF JUNE 30, 2008 (UNAUDITED) (CONTINUED) |
| | | | | | | |
| Shares | | | | | | Value |
| | | | | | | |
| Hand/Machine Tools: 0.1% |
| 150 | | | | Black & Decker Corp. | | $ | 8,627 |
| 190 | | | | Snap-On, Inc. | | | 9,882 |
| 220 | | | | Stanley Works | | | 9,863 |
| | | | | | | |
| | | | | | | 28,372 |
| | | | | | | |
| Healthcare - Products: 1.0% |
| 430 | | | | Baxter International, Inc. | | | 27,494 |
| 200 | | | | Becton Dickinson & Co. | | | 16,260 |
| 1,450 | | @ | | Boston Scientific Corp. | | | 17,821 |
| 325 | | @@ | | Covidien Ltd. | | | 15,564 |
| 150 | | | | CR Bard, Inc. | | | 13,193 |
| 1,990 | | | | Johnson & Johnson | | | 128,037 |
| 1,200 | | | | Medtronic, Inc. | | | 62,100 |
| 300 | | @ | | Patterson Cos., Inc. | | | 8,817 |
| 400 | | @ | | St. Jude Medical, Inc. | | | 16,352 |
| 150 | | | | Stryker Corp. | | | 9,432 |
| 200 | | @ | | Varian Medical Systems, Inc. | | | 10,370 |
| 80 | | @ | | Zimmer Holdings, Inc. | | | 5,444 |
| | | | | | | |
| | | | | | | 330,884 |
| | | | | | | |
| Healthcare - Services: 0.3% |
| 460 | | | | Aetna, Inc. | | | 18,644 |
| 290 | | | | Cigna Corp. | | | 10,263 |
| 150 | | @ | | Humana, Inc. | | | 5,966 |
| 180 | | @ | | Laboratory Corp. of America Holdings | | | 12,533 |
| 200 | | | | Quest Diagnostics | | | 9,694 |
| 1,010 | | | | UnitedHealth Group, Inc. | | | 26,513 |
| 480 | | @ | | WellPoint, Inc. | | | 22,877 |
| | | | | | | |
| | | | | | | 106,490 |
| | | | | | | |
| Home Builders: 0.0% |
| 600 | | | | D.R. Horton, Inc. | | | 6,510 |
| 600 | | | | Lennar Corp. | | | 7,404 |
| | | | | | | |
| | | | | | | 13,914 |
| | | | | | | |
| Household Products/Wares: 0.2% |
| 200 | | | | Avery Dennison Corp. | | | 8,786 |
| 400 | | | | Clorox Co. | | | 20,880 |
| 200 | | | | Fortune Brands, Inc. | | | 12,482 |
| 560 | | | | Kimberly-Clark Corp. | | | 33,477 |
| | | | | | | |
| | | | | | | 75,625 |
| | | | | | | |
| Insurance: 1.2% |
| 460 | | @@ | | ACE Ltd. | | | 25,341 |
| 400 | | | | Aflac, Inc. | | | 25,120 |
| 500 | | | | Allstate Corp. | | | 22,795 |
| 2,350 | | | | American International Group, Inc. | | | 62,181 |
| 220 | | | | AON Corp. | | | 10,107 |
| 150 | | | | Assurant, Inc. | | | 9,894 |
| 640 | | | | Chubb Corp. | | | 31,366 |
| 200 | | | | Cincinnati Financial Corp. | | | 5,080 |
| 500 | | | | Genworth Financial, Inc. | | | 8,905 |
| 340 | | | | Hartford Financial Services Group, Inc. | | | 21,954 |
| 300 | | | | Lincoln National Corp. | | | 13,596 |
| 92 | | | | Loews Corp. | | | 4,315 |
| 350 | | | | Marsh & McLennan Cos., Inc. | | | 9,293 |
| 930 | | | | Metlife, Inc. | | | 49,076 |
| 320 | | | | Progressive Corp. | | | 5,990 |
| 490 | | | | Prudential Financial, Inc. | | | 29,273 |
| 160 | | | | Torchmark Corp. | | | 9,384 |
| 640 | | | | Travelers Cos., Inc. | | | 27,776 |
| | | | | | | |
| Shares | | | | | | Value |
| | | | | | | |
| 500 | | | | UnumProvident Corp. | | $ | 10,225 |
| 200 | | @@ | | XL Capital Ltd. | | | 4,112 |
| | | | | | | |
| | | | | | | 385,783 |
| | | | | | | |
| Internet: 0.6% |
| 200 | | @ | | Akamai Technologies, Inc. | | | 6,958 |
| 270 | | @ | | Amazon.com, Inc. | | | 19,799 |
| 1,000 | | @ | | eBay, Inc. | | | 27,330 |
| 250 | | @ | | Expedia, Inc. | | | 4,595 |
| 210 | | @ | | Google, Inc. - Class A | | | 110,548 |
| 200 | | @ | | IAC/InterActiveCorp. | | | 3,856 |
| 825 | | @ | | Symantec Corp. | | | 15,964 |
| 1,000 | | @ | | Yahoo!, Inc. | | | 20,660 |
| | | | | | | |
| | | | | | | 209,710 |
| | | | | | | |
| Iron/Steel: 0.2% |
| 100 | | | | Allegheny Technologies, Inc. | | | 5,928 |
| 260 | | | | Nucor Corp. | | | 19,414 |
| 160 | | | | United States Steel Corp. | | | 29,565 |
| | | | | | | |
| | | | | | | 54,907 |
| | | | | | | |
| Lodging: 0.0% |
| 170 | | | | Starwood Hotels & Resorts Worldwide, Inc. | | | 6,812 |
| | | | | | | |
| | | | | | | 6,812 |
| | | | | | | |
| Machinery - Construction & Mining: 0.2% |
| 620 | | | | Caterpillar, Inc. | | | 45,768 |
| 200 | | @ | | Terex Corp. | | | 10,274 |
| | | | | | | |
| | | | | | | 56,042 |
| | | | | | | |
| Machinery - Diversified: 0.1% |
| 160 | | | | Cummins, Inc. | | | 10,483 |
| 360 | | | | Deere & Co. | | | 25,967 |
| 200 | | | | Manitowoc Co., Inc. | | | 6,506 |
| 100 | | | | Rockwell Automation, Inc. | | | 4,373 |
| | | | | | | |
| | | | | | | 47,329 |
| | | | | | | |
| Media: 0.7% |
| 200 | | | | CBS Corp. - Class B | | | 3,898 |
| 480 | | | | Clear Channel Communications, Inc. | | | 16,896 |
| 2,080 | | | | Comcast Corp. - Class A | | | 39,458 |
| 850 | | @ | | DIRECTV Group, Inc. | | | 22,024 |
| 2,550 | | | | News Corp. - Class A | | | 38,352 |
| 2,650 | | | | Time Warner, Inc. | | | 39,220 |
| 600 | | @ | | Viacom - Class B | | | 18,324 |
| 1,750 | | | | Walt Disney Co. | | | 54,600 |
| | | | | | | |
| | | | | | | 232,772 |
| | | | | | | |
| Metal Fabricate/Hardware: 0.1% |
| 200 | | | | Precision Castparts Corp. | | | 19,274 |
| | | | | | | |
| | | | | | | 19,274 |
| | | | | | | |
| Mining: 0.2% |
| 250 | | | | Alcoa, Inc. | | | 8,905 |
| 368 | | | | Freeport-McMoRan Copper & Gold, Inc. | | | 43,126 |
| 250 | | | | Newmont Mining Corp. | | | 13,040 |
| | | | | | | |
| | | | | | | 65,071 |
| | | | | | | |
| Miscellaneous Manufacturing: 1.4% |
| 530 | | | | 3M Co. | | | 36,883 |
| 300 | | | | Cooper Industries Ltd. | | | 11,850 |
| 600 | | | | Dover Corp. | | | 29,022 |
See Accompanying Notes to Financial Statements
88
| | |
| ING GET U.S. CORE PORTFOLIO SERIES 7 | | PORTFOLIO OF INVESTMENTS ASOF JUNE 30, 2008 (UNAUDITED) (CONTINUED) |
| | | | | | | |
| Shares | | | | | | Value |
| | | | | | | |
| Miscellaneous Manufacturing: (continued) |
| 330 | | | | Eaton Corp. | | $ | 28,040 |
| 8,950 | | | | General Electric Co. | | | 238,876 |
| 860 | | | | Honeywell International, Inc. | | | 43,241 |
| 500 | | | | Illinois Tool Works, Inc. | | | 23,755 |
| 400 | | | | Leggett & Platt, Inc. | | | 6,708 |
| 240 | | | | Parker Hannifin Corp. | | | 17,117 |
| 250 | | | | Textron, Inc. | | | 11,983 |
| 225 | | @@ | | Tyco International Ltd. | | | 9,009 |
| | | | | | | |
| | | | | | | 456,484 |
| | | | | | | |
| Office/Business Equipment: 0.1% |
| 600 | | | | Pitney Bowes, Inc. | | | 20,460 |
| 1,200 | | | | Xerox Corp. | | | 16,272 |
| | | | | | | |
| | | | | | | 36,732 |
| | | | | | | |
| Oil & Gas: 4.1% |
| 570 | | | | Anadarko Petroleum Corp. | | | 42,659 |
| 350 | | | | Apache Corp. | | | 48,650 |
| 130 | | | | Cabot Oil & Gas Corp. | | | 8,805 |
| 450 | | | | Chesapeake Energy Corp. | | | 29,682 |
| 2,095 | | | | Chevron Corp. | | | 207,677 |
| 1,512 | | | | ConocoPhillips | | | 142,718 |
| 530 | | | | Devon Energy Corp. | | | 63,685 |
| 150 | | | | ENSCO International, Inc. | | | 12,111 |
| 200 | | | | EOG Resources, Inc. | | | 26,240 |
| 5,010 | | | | ExxonMobil Corp. | | | 441,531 |
| 250 | | | | Hess Corp. | | | 31,548 |
| 530 | | | | Marathon Oil Corp. | | | 27,491 |
| 200 | | | | Murphy Oil Corp. | | | 19,610 |
| 200 | | @, @@ | | Nabors Industries Ltd. | | | 9,846 |
| 150 | | | | Noble Corp. | | | 9,744 |
| 210 | | | | Noble Energy, Inc. | | | 21,118 |
| 880 | | | | Occidental Petroleum Corp. | | | 79,077 |
| 150 | | | | Questar Corp. | | | 10,656 |
| 200 | | | | Range Resources Corp. | | | 13,108 |
| 300 | | @ | | Southwestern Energy Co. | | | 14,283 |
| 200 | | | | Sunoco, Inc. | | | 8,138 |
| 289 | | @ | | Transocean, Inc. | | | 44,041 |
| 280 | | | | Valero Energy Corp. | | | 11,530 |
| 337 | | | | XTO Energy, Inc. | | | 23,088 |
| | | | | | | |
| | | | | | | 1,347,036 |
| | | | | | | |
| Oil & Gas Services: 0.6% |
| 250 | | | | Baker Hughes, Inc. | | | 21,835 |
| 470 | | | | Halliburton Co. | | | 24,943 |
| 300 | | @ | | National Oilwell Varco, Inc. | | | 26,616 |
| 960 | | | | Schlumberger Ltd. | | | 103,133 |
| 200 | | | | Smith International, Inc. | | | 16,628 |
| 300 | | @ | | Weatherford International Ltd. | | | 14,877 |
| | | | | | | |
| | | | | | | 208,032 |
| | | | | | | |
| Packaging & Containers: 0.1% |
| 330 | | | | Ball Corp. | | | 15,754 |
| | | | | | | |
| | | | | | | 15,754 |
| | | | | | | |
| Pharmaceuticals: 1.5% |
| 970 | | | | Abbott Laboratories | | | 51,381 |
| 250 | | | | Allergan, Inc. | | | 13,013 |
| 300 | | | | AmerisourceBergen Corp. | | | 11,997 |
| 1,500 | | | | Bristol-Myers Squibb Co. | | | 30,795 |
| 170 | | | | Cardinal Health, Inc. | | | 8,769 |
| 950 | | | | Eli Lilly & Co. | | | 43,852 |
| 270 | | @ | | Express Scripts, Inc. | | | 16,934 |
| | | | | | | |
| Shares | | | | | | Value |
| | | | | | | |
| 300 | | @ | | Forest Laboratories, Inc. | | $ | 10,422 |
| 518 | | @ | | King Pharmaceuticals, Inc. | | | 5,423 |
| 300 | | @ | | Medco Health Solutions, Inc. | | | 14,160 |
| 2,020 | | | | Merck & Co., Inc. | | | 76,134 |
| 5,370 | | | | Pfizer, Inc. | | | 93,814 |
| 1,690 | | | | Schering-Plough Corp. | | | 33,276 |
| 200 | | @ | | Watson Pharmaceuticals, Inc. | | | 5,434 |
| 1,320 | | | | Wyeth | | | 63,307 |
| | | | | | | |
| | | | | | | 478,711 |
| | | | | | | |
| Pipelines: 0.2% |
| 700 | | | | El Paso Corp. | | | 15,218 |
| 600 | | | | Spectra Energy Corp. | | | 17,244 |
| 630 | | | | Williams Cos., Inc. | | | 25,395 |
| | | | | | | |
| | | | | | | 57,857 |
| | | | | | | |
| Retail: 1.7% |
| 150 | | | | Abercrombie & Fitch Co. | | | 9,402 |
| 170 | | @ | | Autozone, Inc. | | | 20,572 |
| 505 | | | | Best Buy Co., Inc. | | | 19,998 |
| 300 | | @ | | Big Lots, Inc. | | | 9,372 |
| 340 | | | | Costco Wholesale Corp. | | | 23,848 |
| 1,187 | | | | CVS Caremark Corp. | | | 46,970 |
| 280 | | | | Darden Restaurants, Inc. | | | 8,943 |
| 550 | | | | Family Dollar Stores, Inc. | | | 10,967 |
| 200 | | @ | | GameStop Corp. | | | 8,080 |
| 900 | | | | Gap, Inc. | | | 15,003 |
| 970 | | | | Home Depot, Inc. | | | 22,717 |
| 200 | | | | JC Penney Co., Inc. | | | 7,258 |
| 700 | | | | Limited Brands, Inc. | | | 11,795 |
| 1,030 | | | | Lowe’s Cos., Inc. | | | 21,373 |
| 400 | | | | Macy’s, Inc. | | | 7,768 |
| 1,250 | | | | McDonald’s Corp. | | | 70,275 |
| 585 | | | | Staples, Inc. | | | 13,894 |
| 570 | | | | Target Corp. | | | 26,499 |
| 200 | | | | Tiffany & Co. | | | 8,150 |
| 830 | | | | TJX Cos., Inc. | | | 26,120 |
| 650 | | | | Walgreen Co. | | | 21,132 |
| 2,220 | | | | Wal-Mart Stores, Inc. | | | 124,764 |
| 480 | | | | Yum! Brands, Inc. | | | 16,843 |
| | | | | | | |
| | | | | | | 551,743 |
| | | | | | | |
| Savings & Loans: 0.0% |
| 400 | | | | Hudson City Bancorp., Inc. | | | 6,672 |
| 875 | | | | Washington Mutual, Inc. | | | 4,314 |
| | | | | | | |
| | | | | | | 10,986 |
| | | | | | | |
| Semiconductors: 0.8% |
| 200 | | | | Altera Corp. | | | 4,140 |
| 200 | | | | Analog Devices, Inc. | | | 6,354 |
| 1,250 | | | | Applied Materials, Inc. | | | 23,863 |
| 350 | | @ | | Broadcom Corp. | | | 9,552 |
| 5,160 | | | | Intel Corp. | | | 110,837 |
| 250 | | | | KLA-Tencor Corp. | | | 10,178 |
| 200 | | | | Linear Technology Corp. | | | 6,514 |
| 1,000 | | @ | | LSI Logic Corp. | | | 6,140 |
| 150 | | @ | | MEMC Electronic Materials, Inc. | | | 9,231 |
| 520 | | | | National Semiconductor Corp. | | | 10,681 |
| 560 | | @ | | Nvidia Corp. | | | 10,483 |
| 400 | | @ | | QLogic Corp. | | | 5,836 |
| 1,450 | | | | Texas Instruments, Inc. | | | 40,832 |
| 200 | | | | Xilinx, Inc. | | | 5,050 |
| | | | | | | |
| | | | | | | 259,691 |
| | | | | | | |
See Accompanying Notes to Financial Statements
89
| | |
| ING GET U.S. CORE PORTFOLIO SERIES 7 | | PORTFOLIO OF INVESTMENTS ASOF JUNE 30, 2008 (UNAUDITED) (CONTINUED) |
| | | | | | | |
| Shares | | | | | | Value |
| | | | | | | |
| Software: 1.1% |
| 500 | | @ | | Adobe Systems, Inc. | | $ | 19,695 |
| 230 | | @ | | Autodesk, Inc. | | | 7,776 |
| 150 | | @ | | BMC Software, Inc. | | | 5,400 |
| 670 | | | | CA, Inc. | | | 15,470 |
| 800 | | @ | | Compuware Corp. | | | 7,632 |
| 150 | | @ | | Electronic Arts, Inc. | | | 6,665 |
| 200 | | | | Fidelity National Information Services, Inc. | | | 7,382 |
| 300 | | @ | | Fiserv, Inc. | | | 13,611 |
| 600 | | | | IMS Health, Inc. | | | 13,980 |
| 7,230 | | | | Microsoft Corp. | | | 198,897 |
| 3,610 | | @ | | Oracle Corp. | | | 75,810 |
| | | | | | | |
| | | | | | | 372,318 |
| | | | | | | |
| Telecommunications: 1.7% |
| 4,893 | | | | AT&T, Inc. | | | 164,845 |
| 270 | | | | CenturyTel, Inc. | | | 9,609 |
| 5,310 | | @ | | Cisco Systems, Inc. | | | 123,511 |
| 1,490 | | | | Corning, Inc. | | | 34,345 |
| 161 | | | | Embarq Corp. | | | 7,610 |
| 500 | | @ | | JDS Uniphase Corp. | | | 5,680 |
| 300 | | @ | | Juniper Networks, Inc. | | | 6,654 |
| 980 | | | | Motorola, Inc. | | | 7,193 |
| 1,320 | | | | Qualcomm, Inc. | | | 58,568 |
| 2,400 | | | | Qwest Communications International, Inc. | | | 9,432 |
| 1,193 | | | | Sprint Nextel Corp. | | | 11,334 |
| 2,450 | | | | Verizon Communications, Inc. | | | 86,730 |
| 1,600 | | | | Windstream Corp. | | | 19,744 |
| | | | | | | |
| | | | | | | 545,255 |
| | | | | | | |
| Textiles: 0.0% |
| 200 | | | | Cintas Corp. | | | 5,302 |
| | | | | | | |
| | | | | | | 5,302 |
| | | | | | | |
| Toys/Games/Hobbies: 0.0% |
| 400 | | | | Hasbro, Inc. | | | 14,288 |
| | | | | | | |
| | | | | | | 14,288 |
| | | | | | | |
| Transportation: 0.4% |
| 200 | | | | Burlington Northern Santa Fe Corp. | | | 19,978 |
| 150 | | | | CH Robinson Worldwide, Inc. | | | 8,226 |
| 230 | | | | CSX Corp. | | | 14,446 |
| 200 | | | | Expeditors International Washington, Inc. | | | 8,600 |
| 140 | | | | FedEx Corp. | | | 11,031 |
| 220 | | | | Norfolk Southern Corp. | | | 13,787 |
| 200 | | | | Ryder System, Inc. | | | 13,776 |
| 280 | | | | Union Pacific Corp. | | | 21,140 |
| 550 | | | | United Parcel Service, Inc. - Class B | | | 33,809 |
| | | | | | | |
| | | | | | | 144,793 |
| | | | | | | |
| | | | Total Common Stock
(Cost $10,405,133) | | | 9,864,188 |
| | | | | | | |
| REAL ESTATE INVESTMENT TRUSTS: 0.3% |
| Apartments: 0.0% |
| 200 | | | | Equity Residential | | | 7,654 |
| | | | | | | |
| | | | | | | 7,654 |
| | | | | | | |
| | | | | | | | |
| Shares | | | | | | Value |
| | | | | | | | |
| | Diversified: 0.1% |
| | 200 | | | | Vornado Realty Trust | | $ | 17,600 |
| | | | | | | | |
| | | | | | | | 17,600 |
| | | | | | | | |
| | Health Care: 0.0% |
| | 300 | | | | HCP, Inc. | | | 9,543 |
| | | | | | | | |
| | | | | | | | 9,543 |
| | | | | | | | |
| | Hotels: 0.1% |
| | 1,000 | | | | Host Hotels & Resorts, Inc. | | | 13,650 |
| | | | | | | | |
| | | | | | | | 13,650 |
| | | | | | | | |
| | Regional Malls: 0.1% |
| | 150 | | | | General Growth Properties, Inc. | | | 5,255 |
| | 200 | | | | Simon Property Group, Inc. | | | 17,978 |
| | | | | | | | |
| | | | | | | | 23,233 |
| | | | | | | | |
| | Storage: 0.0% |
| | 100 | | | | Public Storage, Inc. | | | 8,079 |
| | | | | | | | |
| | | | | | | | 8,079 |
| | | | | | | | |
| | Warehouse/Industrial: 0.0% |
| | 200 | | | | Prologis | | | 10,870 |
| | | | | | | | |
| | | | | | | | 10,870 |
| | | | | | | | |
| | | | | Total Real Estate Investment Trusts
(Cost $ 98,598) | | | 90,629 |
| | | | | | | | |
| | | |
Principal
Amount | | | | | | Value |
| | U.S. GOVERNMENT AGENCY OBLIGATIONS: 34.5% |
| | Federal National Mortgage Association: 34.5% |
| $ | 13,000,000 | | Z | | 3.630%, due 03/15/12 | | $ | 11,437,204 |
| | | | | | | | |
| | | | | Total U.S. Government Agency Obligations
(Cost $11,589,945) | | | 11,437,204 |
| | | | | | | | |
| | U.S. TREASURY OBLIGATIONS: 25.5% |
| | U.S. Treasury STRIP: 25.5% |
| | 9,477,000 | | ^ | | 3.190%, due 02/15/12 | | | 8,450,546 |
| | | | | | | | |
| | | | | Total U.S. Treasury Obligations
(Cost $8,607,068) | | | 8,450,546 |
| | | | | | | | |
| | OTHER BONDS: 8.8% |
| | Foreign Government Bonds: 8.8% |
| | 3,300,000 | | Z | | Israel Government International Bond,
3.270%, due 05/15/12 | | | 2,913,134 |
| | | | | | | | |
| | | | | Total Other Bonds
(Cost $2,775,991) | | | 2,913,134 |
| | | | | | | | |
| | | | | Total Long-Term Investments
(Cost $33,476,735) | | | 32,755,701 |
| | | | | | | | |
See Accompanying Notes to Financial Statements
90
| | |
| ING GET U.S. CORE PORTFOLIO SERIES 7 | | PORTFOLIO OF INVESTMENTS ASOF JUNE 30, 2008 (UNAUDITED) (CONTINUED) |
| | | | | | | | | |
| | | |
| Shares | | | | | | | | Value |
| SHORT-TERM INVESTMENTS: 0.1% |
| Mutual Fund: 0.1% |
| 26,000 | ** | | ING Institutional Prime Money Market Fund | | | | | $ | 26,000 |
| | | | | | | | | |
| | | Total Short-Term Investments
(Cost $26,000) | | | | | | 26,000 |
| | | | | | | | | |
| | | Total Investments in Securities
(Cost $33,502,735)* | | 99.0 | % | | $ | 32,781,701 |
| | | Other Assets and
Liabilities - Net | | 1.0 | | | | 322,843 |
| | | | | | | | | |
| | | Net Assets | | 100.0 | % | | $ | 33,104,544 |
| | | | | | | | | |
| @ | Non-income producing security |
| STRIP | Separate Trading of Registered Interest and Principal of Securities |
| ** | Investment in affiliate |
| ^ | Interest only securities represent the right to receive the monthly interest payments on an underlying pool of mortgage loans. Principal amount shown represents the notional amount on which current interest is calculated. Payments of principal on the pool reduce the value of the interest only security. |
| Z | Indicates Zero Coupon Bond; rate shown reflects current effective yield. |
| * | Cost for federal income tax purposes is $35,105,220. |
| | | | |
Net unrealized depreciation consists of: | | | | |
Gross Unrealized Appreciation | | $ | 538,721 | |
Gross Unrealized Depreciation | | | (2,862,240 | ) |
| | | | |
Net Unrealized Depreciation | | $ | (2,323,519 | ) |
| | | | |
Fair Value Measurements — Effective January 1, 2008, the Portfolio adopted Financial Accounting Standards Board Statement of Financial Accounting Standards No. 157 (“SFAS 157”), “Fair Value Measurements.” This new accounting statement defines fair value, establishes a framework for measuring fair value in generally accepted accounting principles (“GAAP”), and expands disclosures about fair value measurements. The three levels of the fair value hierarchy are as follows:
| | • | | Level 1 — quoted prices in active markets for identical investments |
| | • | | Level 2 — other significant observable inputs (including quoted prices for similar investments, interest rates, prepayment speeds, credit risk, etc.) |
| | • | | Level 3 — significant unobservable inputs (including the Portfolio’s own assumption in determining the fair value of investments) |
The inputs or methodology used in valuing securities are not necessarily an indication of the risk associated with investing in those securities.
The following is a summary of the inputs used as of June 30, 2008 in valuing the Portfolio’s investments at fair value:
| | | | | | |
| | | Investments in Securities | | Other Financial Instruments* |
Level 1 — Quoted Prices | | $ | 9,980,817 | | $ | — |
Level 2 — Other Significant Observable Inputs | | | 22,800,884 | | | — |
Level 3 — Significant Unobservable Inputs | | | — | | | — |
| | | | | | |
Total | | $ | 32,781,701 | | $ | — |
| | | | | | |
| * | | Other financial instruments may include forward foreign currency contracts, futures, swaps, and written options. |
See Accompanying Notes to Financial Statements
91
| | |
| ING GET U.S. CORE PORTFOLIO SERIES 8 | | PORTFOLIO OF INVESTMENTS ASOF JUNE 30, 2008 (UNAUDITED) |

| | | | | | | |
| Shares | | | | | | Value |
| | | | | | | |
| COMMON STOCK: 35.8% |
| Advertising: 0.1% |
| 1,200 | | @ | | Interpublic Group of Cos., Inc. | | $ | 10,320 |
| 370 | | | | Omnicom Group | | | 16,606 |
| | | | | | | |
| | | | | | | 26,926 |
| | | | | | | |
| Aerospace/Defense: 0.9% |
| 680 | | | | Boeing Co. | | | 44,690 |
| 230 | | | | General Dynamics Corp. | | | 19,366 |
| 300 | | | | Goodrich Corp. | | | 14,238 |
| 100 | | | | L-3 Communications Holdings, Inc. | | | 9,087 |
| 300 | | | | Lockheed Martin Corp. | | | 29,598 |
| 320 | | | | Northrop Grumman Corp. | | | 21,408 |
| 100 | | | | Raytheon Co. | | | 5,628 |
| 100 | | | | Rockwell Collins, Inc. | | | 4,796 |
| 750 | | | | United Technologies Corp. | | | 46,275 |
| | | | | | | |
| | | | | | | 195,086 |
| | | | | | | |
| Agriculture: 0.7% |
| 1,370 | | | | Altria Group, Inc. | | | 28,167 |
| 430 | | | | Archer-Daniels-Midland Co. | | | 14,513 |
| 275 | | @ | | Lorillard, Inc. | | | 19,019 |
| 1,370 | | | | Philip Morris International, Inc. | | | 67,664 |
| 220 | | | | Reynolds American, Inc. | | | 10,267 |
| | | | | | | |
| | | | | | | 139,630 |
| | | | | | | |
| Airlines: 0.0% |
| 550 | | | | Southwest Airlines Co. | | | 7,172 |
| | | | | | | |
| | | | | | | 7,172 |
| | | | | | | |
| Apparel: 0.3% |
| 410 | | @ | | Coach, Inc. | | | 11,841 |
| 350 | | | | Nike, Inc. | | | 20,864 |
| | | | | | | |
| Shares | | | | | | Value |
| | | | | | | |
| 100 | | | | Polo Ralph Lauren Corp. | | $ | 6,278 |
| 200 | | | | VF Corp. | | | 14,236 |
| | | | | | | |
| | | | | | | 53,219 |
| | | | | | | |
| Auto Manufacturers: 0.0% |
| 1,047 | | @ | | Ford Motor Co. | | | 5,036 |
| 250 | | | | General Motors Corp. | | | 2,875 |
| | | | | | | |
| | | | | | | 7,911 |
| | | | | | | |
| Auto Parts & Equipment: 0.1% |
| 200 | | @ | | Goodyear Tire & Rubber Co. | | | 3,566 |
| 770 | | | | Johnson Controls, Inc. | | | 22,084 |
| | | | | | | |
| | | | | | | 25,650 |
| | | | | | | |
| Banks: 1.4% |
| 3,143 | | | | Bank of America Corp. | | | 75,023 |
| 950 | | | | Bank of New York Mellon Corp. | | | 35,939 |
| 300 | | | | BB&T Corp. | | | 6,831 |
| 273 | | | | Capital One Financial Corp. | | | 10,377 |
| 350 | | | | Fifth Third Bancorp. | | | 3,563 |
| 100 | | | | M&T Bank Corp. | | | 7,054 |
| 198 | | | | Marshall & Ilsley Corp. | | | 3,035 |
| 250 | | | | Northern Trust Corp. | | | 17,143 |
| 1,061 | | | | Regions Financial Corp. | | | 11,576 |
| 330 | | | | State Street Corp. | | | 21,117 |
| 750 | | | | US Bancorp. | | | 20,918 |
| 1,258 | | | | Wachovia Corp. | | | 19,537 |
| 2,030 | | | | Wells Fargo & Co. | | | 48,213 |
| 350 | | | | Zions Bancorp. | | | 11,022 |
| | | | | | | |
| | | | | | | 291,348 |
| | | | | | | |
| Beverages: 0.8% |
| 110 | | | | Anheuser-Busch Cos., Inc. | | | 6,833 |
| 1,510 | | | | Coca-Cola Co. | | | 78,490 |
| 300 | | | | Coca-Cola Enterprises, Inc. | | | 5,190 |
| 390 | | | | Pepsi Bottling Group, Inc. | | | 10,889 |
| 1,010 | | | | PepsiCo, Inc. | | | 64,226 |
| | | | | | | |
| | | | | | | 165,628 |
| | | | | | | |
| Biotechnology: 0.5% |
| 840 | | @ | | Amgen, Inc. | | | 39,614 |
| 280 | | @ | | Biogen Idec, Inc. | | | 15,649 |
| 250 | | @ | | Celgene Corp. | | | 15,968 |
| 110 | | @ | | Genzyme Corp. | | | 7,922 |
| 600 | | @ | | Gilead Sciences, Inc. | | | 31,770 |
| | | | | | | |
| | | | | | | 110,923 |
| | | | | | | |
| Chemicals: 1.0% |
| 300 | | | | Air Products & Chemicals, Inc. | | | 29,658 |
| 700 | | | | Dow Chemical Co. | | | 24,437 |
| 100 | | | | Eastman Chemical Co. | | | 6,886 |
| 200 | | | | Ecolab, Inc. | | | 8,598 |
| 830 | | | | EI Du Pont de Nemours & Co. | | | 35,599 |
| 250 | | | | Hercules, Inc. | | | 4,233 |
| 250 | | | | International Flavors & Fragrances, Inc. | | | 9,765 |
| 370 | | | | Monsanto Co. | | | 46,783 |
| 110 | | | | PPG Industries, Inc. | | | 6,311 |
| 100 | | | | Praxair, Inc. | | | 9,424 |
| 200 | | | | Rohm & Haas Co. | | | 9,288 |
| 300 | | | | Sigma-Aldrich Corp. | | | 16,158 |
| | | | | | | |
| | | | | | | 207,140 |
| | | | | | | |
See Accompanying Notes to Financial Statements
92
| | |
| ING GET U.S. CORE PORTFOLIO SERIES 8 | | PORTFOLIO OF INVESTMENTS ASOF JUNE 30, 2008 (UNAUDITED) (CONTINUED) |
| | | | | | | |
| Shares | | | | | | Value |
| | | | | | | |
| Coal: 0.2% |
| 100 | | | | Consol Energy, Inc. | | $ | 11,237 |
| 70 | | | | Massey Energy Co. | | | 6,563 |
| 200 | | | | Peabody Energy Corp. | | | 17,610 |
| | | | | | | |
| | | | | | | 35,410 |
| | | | | | | |
| Commercial Services: 0.3% |
| 190 | | @ | | Apollo Group, Inc. - Class A | | | 8,409 |
| 100 | | | | Automatic Data Processing, Inc. | | | 4,190 |
| 400 | | | | H&R Block, Inc. | | | 8,560 |
| 270 | | | | McKesson Corp. | | | 15,096 |
| 90 | | | | Moody’s Corp. | | | 3,100 |
| 250 | | | | Robert Half International, Inc. | | | 5,993 |
| 350 | | | | RR Donnelley & Sons Co. | | | 10,392 |
| 460 | | | | Western Union Co. | | | 11,371 |
| | | | | | | |
| | | | | | | 67,111 |
| | | | | | | |
| Computers: 1.9% |
| 300 | | @ | | Affiliated Computer Services, Inc. | | | 16,047 |
| 600 | | @ | | Apple, Inc. | | | 100,464 |
| 200 | | @ | | Cognizant Technology Solutions Corp. | | | 6,502 |
| 190 | | @ | | Computer Sciences Corp. | | | 8,900 |
| 1,700 | | @ | | Dell, Inc. | | | 37,196 |
| 1,630 | | @ | | EMC Corp. | | | 23,945 |
| 1,830 | | | | Hewlett-Packard Co. | | | 80,904 |
| 990 | | | | International Business Machines Corp. | | | 117,345 |
| 220 | | @ | | Lexmark International, Inc. | | | 7,355 |
| 250 | | @ | | NetApp, Inc. | | | 5,415 |
| 140 | | @ | | Sandisk Corp. | | | 2,618 |
| 445 | | @ | | Sun Microsystems, Inc. | | | 4,842 |
| 200 | | @ | | Teradata Corp. | | | 4,628 |
| | | | | | | |
| | | | | | | 416,161 |
| | | | | | | |
| Cosmetics/Personal Care: 0.8% |
| 300 | | | | Avon Products, Inc. | | | 10,806 |
| 270 | | | | Colgate-Palmolive Co. | | | 18,657 |
| 2,232 | | | | Procter & Gamble Co. | | | 135,728 |
| | | | | | | |
| | | | | | | 165,191 |
| | | | | | | |
| Distribution/Wholesale: 0.1% |
| 350 | | | | Genuine Parts Co. | | | 13,888 |
| | | | | | | |
| | | | | | | 13,888 |
| | | | | | | |
| Diversified Financial Services: 1.8% |
| 690 | | | | American Express Co. | | | 25,992 |
| 190 | | | | Ameriprise Financial, Inc. | | | 7,727 |
| 290 | | | | Charles Schwab Corp. | | | 5,957 |
| 290 | | | | CIT Group, Inc. | | | 1,975 |
| 3,600 | | | | Citigroup, Inc. | | | 60,336 |
| 810 | | | | Countrywide Financial Corp. | | | 3,443 |
| 455 | | | | Discover Financial Services | | | 5,992 |
| 1,100 | | @ | | E*Trade Financial Corp. | | | 3,454 |
| 340 | | | | Federal Home Loan Mortgage Corporation | | | 5,576 |
| 750 | | | | Federal National Mortgage Association | | | 14,633 |
| 310 | | | | Goldman Sachs Group, Inc. | | | 54,219 |
| 100 | | @ | | IntercontinentalExchange, Inc. | | | 11,400 |
| 2,430 | | | | JPMorgan Chase & Co. | | | 83,373 |
| 100 | | | | Legg Mason, Inc. | | | 4,357 |
| 440 | | | | Lehman Brothers Holdings, Inc. | | | 8,716 |
| 950 | | | | Merrill Lynch & Co., Inc. | | | 30,125 |
| 910 | | | | Morgan Stanley | | | 32,824 |
| | | | | | | |
| Shares | | | | | | Value |
| | | | | | | |
| 230 | | | | NYSE Euronext | | $ | 11,652 |
| 280 | | @ | | SLM Corp. | | | 5,418 |
| 100 | | | | T. Rowe Price Group, Inc. | | | 5,647 |
| | | | | | | |
| | | | | | | 382,816 |
| | | | | | | |
| Electric: 1.3% |
| 650 | | @ | | AES Corp. | | | 12,487 |
| 850 | | | | American Electric Power Co., Inc. | | | 34,196 |
| 600 | | | | Centerpoint Energy, Inc. | | | 9,630 |
| 550 | | | | Dominion Resources, Inc. | | | 26,120 |
| 550 | | | | DTE Energy Co. | | | 23,342 |
| 2,050 | | | | Duke Energy Corp. | | | 35,629 |
| 550 | | | | Edison International | | | 28,259 |
| 100 | | | | Entergy Corp. | | | 12,048 |
| 250 | | | | Exelon Corp. | | | 22,490 |
| 350 | | | | FPL Group, Inc. | | | 22,953 |
| 700 | | | | Pepco Holdings, Inc. | | | 17,955 |
| 200 | | | | PG&E Corp. | | | 7,938 |
| 250 | | | | PPL Corp. | | | 13,068 |
| 240 | | | | Public Service Enterprise Group, Inc. | | | 11,023 |
| | | | | | | |
| | | | | | | 277,138 |
| | | | | | | |
| Electrical Components & Equipment: 0.1% |
| 460 | | | | Emerson Electric Co. | | | 22,747 |
| 200 | | | | Molex, Inc. | | | 4,882 |
| | | | | | | |
| | | | | | | 27,629 |
| | | | | | | |
| Electronics: 0.4% |
| 420 | | @ | | Agilent Technologies, Inc. | | | 14,927 |
| 250 | | | | Applera Corp. - Applied Biosystems Group | | | 8,370 |
| 250 | | | | Jabil Circuit, Inc. | | | 4,103 |
| 300 | | | | PerkinElmer, Inc. | | | 8,355 |
| 380 | | @ | | Thermo Electron Corp. | | | 21,177 |
| 300 | | @@ | | Tyco Electronics Ltd. | | | 10,746 |
| 140 | | @ | | Waters Corp. | | | 9,030 |
| | | | | | | |
| | | | | | | 76,708 |
| | | | | | | |
| Engineering & Construction: 0.1% |
| 100 | | | | Fluor Corp. | | | 18,608 |
| 100 | | @ | | Jacobs Engineering Group, Inc. | | | 8,070 |
| | | | | | | |
| | | | | | | 26,678 |
| | | | | | | |
| Environmental Control: 0.1% |
| 600 | | @ | | Allied Waste Industries, Inc. | | | 7,572 |
| 350 | | | | Waste Management, Inc. | | | 13,199 |
| | | | | | | |
| | | | | | | 20,771 |
| | | | | | | |
| Food: 0.6% |
| 400 | | | | ConAgra Foods, Inc. | | | 7,712 |
| 300 | | | | General Mills, Inc. | | | 18,231 |
| 310 | | | | HJ Heinz Co. | | | 14,834 |
| 350 | | | | Kellogg Co. | | | 16,807 |
| 854 | | | | Kraft Foods, Inc. | | | 24,296 |
| 260 | | | | Kroger Co. | | | 7,506 |
| 1,100 | | | | Sara Lee Corp. | | | 13,475 |
| 300 | | | | Supervalu, Inc. | | | 9,267 |
| 300 | | | | Sysco Corp. | | | 8,253 |
| 200 | | | | WM Wrigley Jr. Co. | | | 15,556 |
| | | | | | | |
| | | | | | | 135,937 |
| | | | | | | |
| Gas: 0.1% |
| 350 | | | | Sempra Energy | | | 19,758 |
| | | | | | | |
| | | | | | | 19,758 |
| | | | | | | |
See Accompanying Notes to Financial Statements
93
| | |
| ING GET U.S. CORE PORTFOLIO SERIES 8 | | PORTFOLIO OF INVESTMENTS ASOF JUNE 30, 2008 (UNAUDITED) (CONTINUED) |
| | | | | | | |
| Shares | | | | | | Value |
| | | | | | | |
| Hand/Machine Tools: 0.1% |
| 110 | | | | Black & Decker Corp. | | $ | 6,326 |
| 100 | | | | Snap-On, Inc. | | | 5,201 |
| 220 | | | | Stanley Works | | | 9,863 |
| | | | | | | |
| | | | | | | 21,390 |
| | | | | | | |
| Healthcare - Products: 1.2% |
| 340 | | | | Baxter International, Inc. | | | 21,740 |
| 200 | | | | Becton Dickinson & Co. | | | 16,260 |
| 1,100 | | @ | | Boston Scientific Corp. | | | 13,519 |
| 300 | | @@ | | Covidien Ltd. | | | 14,367 |
| 100 | | | | CR Bard, Inc. | | | 8,795 |
| 1,500 | | | | Johnson & Johnson | | | 96,510 |
| 900 | | | | Medtronic, Inc. | | | 46,575 |
| 250 | | @ | | Patterson Cos., Inc. | | | 7,348 |
| 350 | | @ | | St. Jude Medical, Inc. | | | 14,308 |
| 100 | | | | Stryker Corp. | | | 6,288 |
| 100 | | @ | | Varian Medical Systems, Inc. | | | 5,185 |
| 60 | | @ | | Zimmer Holdings, Inc. | | | 4,083 |
| | | | | | | |
| | | | | | | 254,978 |
| | | | | | | |
| Healthcare - Services: 0.4% |
| 350 | | | | Aetna, Inc. | | | 14,186 |
| 210 | | | | Cigna Corp. | | | 7,432 |
| 130 | | @ | | Humana, Inc. | | | 5,170 |
| 140 | | @ | | Laboratory Corp. of America Holdings | | | 9,748 |
| 200 | | | | Quest Diagnostics | | | 9,694 |
| 730 | | | | UnitedHealth Group, Inc. | | | 19,163 |
| 320 | | @ | | WellPoint, Inc. | | | 15,251 |
| | | | | | | |
| | | | | | | 80,644 |
| | | | | | | |
| Home Builders: 0.0% |
| 250 | | | | D.R. Horton, Inc. | | | 2,713 |
| 450 | | | | Lennar Corp. | | | 5,553 |
| | | | | | | |
| | | | | | | 8,266 |
| | | | | | | |
| Household Products/Wares: 0.2% |
| 100 | | | | Avery Dennison Corp. | | | 4,393 |
| 250 | | | | Clorox Co. | | | 13,050 |
| 200 | | | | Fortune Brands, Inc. | | | 12,482 |
| 350 | | | | Kimberly-Clark Corp. | | | 20,923 |
| | | | | | | |
| | | | | | | 50,848 |
| | | | | | | |
| Insurance: 1.3% |
| 290 | | @@ | | ACE Ltd. | | | 15,976 |
| 300 | | | | Aflac, Inc. | | | 18,840 |
| 330 | | | | Allstate Corp. | | | 15,045 |
| 1,820 | | | | American International Group, Inc. | | | 48,157 |
| 210 | | | | AON Corp. | | | 9,647 |
| 200 | | | | Assurant, Inc. | | | 13,192 |
| 410 | | | | Chubb Corp. | | | 20,094 |
| 250 | | | | Cincinnati Financial Corp. | | | 6,350 |
| 250 | | | | Genworth Financial, Inc. | | | 4,453 |
| 230 | | | | Hartford Financial Services Group, Inc. | | | 14,851 |
| 250 | | | | Lincoln National Corp. | | | 11,330 |
| 92 | | | | Loews Corp. | | | 4,315 |
| 250 | | | | Marsh & McLennan Cos., Inc. | | | 6,638 |
| 770 | | | | Metlife, Inc. | | | 40,633 |
| 260 | | | | Progressive Corp. | | | 4,867 |
| 330 | | | | Prudential Financial, Inc. | | | 19,714 |
| 90 | | | | Torchmark Corp. | | | 5,279 |
| 450 | | | | Travelers Cos., Inc. | | | 19,530 |
| | | | | | | |
| Shares | | | | | | Value |
| | | | | | | |
| 250 | | | | UnumProvident Corp. | | $ | 5,113 |
| 200 | | @@ | | XL Capital Ltd. | | | 4,112 |
| | | | | | | |
| | | | | | | 288,136 |
| | | | | | | |
| Internet: 0.9% |
| 200 | | @ | | Akamai Technologies, Inc. | | | 6,958 |
| 230 | | @ | | Amazon.com, Inc. | | | 16,866 |
| 840 | | @ | | eBay, Inc. | | | 22,957 |
| 200 | | @ | | Expedia, Inc. | | | 3,676 |
| 190 | | @ | | Google, Inc. - Class A | | | 100,020 |
| 300 | | @ | | IAC/InterActiveCorp. | | | 5,784 |
| 841 | | @ | | Symantec Corp. | | | 16,273 |
| 800 | | @ | | Yahoo!, Inc. | | | 16,528 |
| | | | | | | |
| | | | | | | 189,062 |
| | | | | | | |
| Iron/Steel: 0.2% |
| 100 | | | | Allegheny Technologies, Inc. | | | 5,928 |
| 250 | | | | Nucor Corp. | | | 18,668 |
| 120 | | | | United States Steel Corp. | | | 22,174 |
| | | | | | | |
| | | | | | | 46,770 |
| | | | | | | |
| Lodging: 0.0% |
| 190 | | | | Starwood Hotels & Resorts Worldwide, Inc. | | | 7,613 |
| | | | | | | |
| | | | | | | 7,613 |
| | | | | | | |
| Machinery - Construction & Mining: 0.2% |
| 490 | | | | Caterpillar, Inc. | | | 36,172 |
| 100 | | @ | | Terex Corp. | | | 5,137 |
| | | | | | | |
| | | | | | | 41,309 |
| | | | | | | |
| Machinery - Diversified: 0.2% |
| 100 | | | | Cummins, Inc. | | | 6,552 |
| 330 | | | | Deere & Co. | | | 23,803 |
| 100 | | | | Rockwell Automation, Inc. | | | 4,373 |
| | | | | | | |
| | | | | | | 34,728 |
| | | | | | | |
| Media: 0.8% |
| 250 | | | | CBS Corp. - Class B | | | 4,873 |
| 370 | | | | Clear Channel Communications, Inc. | | | 13,024 |
| 1,760 | | | | Comcast Corp. - Class A | | | 33,387 |
| 600 | | @ | | DIRECTV Group, Inc. | | | 15,546 |
| 1,910 | | | | News Corp. - Class A | | | 28,726 |
| 2,050 | | | | Time Warner, Inc. | | | 30,340 |
| 450 | | @ | | Viacom - Class B | | | 13,743 |
| 1,290 | | | | Walt Disney Co. | | | 40,248 |
| | | | | | | |
| | | | | | | 179,887 |
| | | | | | | |
| Metal Fabricate/Hardware: 0.0% |
| 100 | | | | Precision Castparts Corp. | | | 9,637 |
| | | | | | | |
| | | | | | | 9,637 |
| | | | | | | |
| Mining: 0.2% |
| 250 | | | | Alcoa, Inc. | | | 8,905 |
| 237 | | | | Freeport-McMoRan Copper & Gold, Inc. | | | 27,774 |
| 250 | | | | Newmont Mining Corp. | | | 13,040 |
| | | | | | | |
| | | | | | | 49,719 |
| | | | | | | |
| Miscellaneous Manufacturing: 1.6% |
| 340 | | | | 3M Co. | | | 23,661 |
| 300 | | | | Cooper Industries Ltd. | | | 11,850 |
| 350 | | | | Dover Corp. | | | 16,930 |
| 290 | | | | Eaton Corp. | | | 24,641 |
See Accompanying Notes to Financial Statements
94
| | |
| ING GET U.S. CORE PORTFOLIO SERIES 8 | | PORTFOLIO OF INVESTMENTS ASOF JUNE 30, 2008 (UNAUDITED) (CONTINUED) |
| | | | | | | |
| Shares | | | | | | Value |
| | | | | | | |
| Miscellaneous Manufacturing: (continued) |
| 6,900 | | | | General Electric Co. | | $ | 184,161 |
| 670 | | | | Honeywell International, Inc. | | | 33,688 |
| 350 | | | | Illinois Tool Works, Inc. | | | 16,629 |
| 250 | | | | Leggett & Platt, Inc. | | | 4,193 |
| 210 | | | | Parker Hannifin Corp. | | | 14,977 |
| 300 | | | | Textron, Inc. | | | 14,379 |
| 100 | | @@ | | Tyco International Ltd. | | | 4,004 |
| | | | | | | |
| | | | | | | 349,113 |
| | | | | | | |
| Office/Business Equipment: 0.1% |
| 450 | | | | Pitney Bowes, Inc. | | | 15,345 |
| 800 | | | | Xerox Corp. | | | 10,848 |
| | | | | | | |
| | | | | | | 26,193 |
| | | | | | | |
| Oil & Gas: 4.9% |
| 330 | | | | Anadarko Petroleum Corp. | | | 24,697 |
| 250 | | | | Apache Corp. | | | 34,750 |
| 90 | | | | Cabot Oil & Gas Corp. | | | 6,096 |
| 350 | | | | Chesapeake Energy Corp. | | | 23,086 |
| 1,577 | | | | Chevron Corp. | | | 156,328 |
| 1,193 | | | | ConocoPhillips | | | 112,607 |
| 280 | | | | Devon Energy Corp. | | | 33,645 |
| 100 | | | | ENSCO International, Inc. | | | 8,074 |
| 200 | | | | EOG Resources, Inc. | | | 26,240 |
| 3,860 | | | | ExxonMobil Corp. | | | 340,182 |
| 300 | | | | Hess Corp. | | | 37,857 |
| 410 | | | | Marathon Oil Corp. | | | 21,267 |
| 200 | | | | Murphy Oil Corp. | | | 19,610 |
| 200 | | @, @@ | | Nabors Industries Ltd. | | | 9,846 |
| 100 | | | | Noble Corp. | | | 6,496 |
| 210 | | | | Noble Energy, Inc. | | | 21,118 |
| 680 | | | | Occidental Petroleum Corp. | | | 61,105 |
| 200 | | | | Questar Corp. | | | 14,208 |
| 100 | | | | Range Resources Corp. | | | 6,554 |
| 300 | | @ | | Southwestern Energy Co. | | | 14,283 |
| 100 | | | | Sunoco, Inc. | | | 4,069 |
| 299 | | @ | | Transocean, Inc. | | | 45,565 |
| 300 | | | | Valero Energy Corp. | | | 12,354 |
| 312 | | | | XTO Energy, Inc. | | | 21,375 |
| | | | | | | |
| | | | | | | 1,061,412 |
| | | | | | | |
| Oil & Gas Services: 0.8% |
| 300 | | | | Baker Hughes, Inc. | | | 26,202 |
| 350 | | | | Halliburton Co. | | | 18,575 |
| 250 | | @ | | National Oilwell Varco, Inc. | | | 22,180 |
| 770 | | | | Schlumberger Ltd. | | | 82,721 |
| 100 | | | | Smith International, Inc. | | | 8,314 |
| 300 | | @ | | Weatherford International Ltd. | | | 14,877 |
| | | | | | | |
| | | | | | | 172,869 |
| | | | | | | |
| Packaging & Containers: 0.1% |
| 240 | | | | Ball Corp. | | | 11,458 |
| | | | | | | |
| | | | | | | 11,458 |
| | | | | | | |
| Pharmaceuticals: 1.8% |
| 820 | | | | Abbott Laboratories | | | 43,435 |
| 200 | | | | Allergan, Inc. | | | 10,410 |
| 300 | | | | AmerisourceBergen Corp. | | | 11,997 |
| 1,150 | | | | Bristol-Myers Squibb Co. | | | 23,610 |
| 70 | | | | Cardinal Health, Inc. | | | 3,611 |
| 800 | | | | Eli Lilly & Co. | | | 36,928 |
| 320 | | @ | | Express Scripts, Inc. | | | 20,070 |
| 300 | | @ | | Forest Laboratories, Inc. | | | 10,422 |
| 263 | | @ | | King Pharmaceuticals, Inc. | | | 2,754 |
| | | | | | | |
| Shares | | | | | | Value |
| | | | | | | |
| 250 | | @ | | Medco Health Solutions, Inc. | | $ | 11,800 |
| 1,500 | | | | Merck & Co., Inc. | | | 56,535 |
| 4,080 | | | | Pfizer, Inc. | | | 71,278 |
| 1,300 | | | | Schering-Plough Corp. | | | 25,597 |
| 150 | | @ | | Watson Pharmaceuticals, Inc. | | | 4,076 |
| 1,060 | | | | Wyeth | | | 50,838 |
| | | | | | | |
| | | | | | | 383,361 |
| | | | | | | |
| Pipelines: 0.2% |
| 500 | | | | El Paso Corp. | | | 10,870 |
| 550 | | | | Spectra Energy Corp. | | | 15,807 |
| 370 | | | | Williams Cos., Inc. | | | 14,915 |
| | | | | | | |
| | | | | | | 41,592 |
| | | | | | | |
| Retail: 2.0% |
| 100 | | | | Abercrombie & Fitch Co. | | | 6,268 |
| 100 | | @ | | Autozone, Inc. | | | 12,101 |
| 290 | | | | Best Buy Co., Inc. | | | 11,484 |
| 250 | | @ | | Big Lots, Inc. | | | 7,810 |
| 270 | | | | Costco Wholesale Corp. | | | 18,938 |
| 983 | | | | CVS Caremark Corp. | | | 38,897 |
| 210 | | | | Darden Restaurants, Inc. | | | 6,707 |
| 290 | | | | Family Dollar Stores, Inc. | | | 5,783 |
| 300 | | @ | | GameStop Corp. | | | 12,120 |
| 770 | | | | Gap, Inc. | | | 12,836 |
| 810 | | | | Home Depot, Inc. | | | 18,970 |
| 500 | | | | Limited Brands, Inc. | | | 8,425 |
| 820 | | | | Lowe’s Cos., Inc. | | | 17,015 |
| 300 | | | | Macy’s, Inc. | | | 5,826 |
| 940 | | | | McDonald’s Corp. | | | 52,847 |
| 410 | | | | Staples, Inc. | | | 9,738 |
| 430 | | | | Target Corp. | | | 19,991 |
| 200 | | | | Tiffany & Co. | | | 8,150 |
| 670 | | | | TJX Cos., Inc. | | | 21,085 |
| 350 | | | | Walgreen Co. | | | 11,379 |
| 1,850 | | | | Wal-Mart Stores, Inc. | | | 103,970 |
| 310 | | | | Yum! Brands, Inc. | | | 10,878 |
| | | | | | | |
| | | | | | | 421,218 |
| | | | | | | |
| Savings & Loans: 0.0% |
| 350 | | | | Hudson City Bancorp., Inc. | | | 5,838 |
| 580 | | | | Washington Mutual, Inc. | | | 2,859 |
| | | | | | | |
| | | | | | | 8,697 |
| | | | | | | |
| Semiconductors: 1.0% |
| 300 | | | | Altera Corp. | | | 6,210 |
| 200 | | | | Analog Devices, Inc. | | | 6,354 |
| 790 | | | | Applied Materials, Inc. | | | 15,081 |
| 250 | | @ | | Broadcom Corp. | | | 6,823 |
| 3,970 | | | | Intel Corp. | | | 85,276 |
| 300 | | | | KLA-Tencor Corp. | | | 12,213 |
| 200 | | | | Linear Technology Corp. | | | 6,514 |
| 700 | | @ | | LSI Logic Corp. | | | 4,298 |
| 200 | | @ | | MEMC Electronic Materials, Inc. | | | 12,308 |
| 370 | | | | National Semiconductor Corp. | | | 7,600 |
| 325 | | @ | | Nvidia Corp. | | | 6,084 |
| 250 | | @ | | QLogic Corp. | | | 3,648 |
| 1,050 | | | | Texas Instruments, Inc. | | | 29,568 |
| 200 | | | | Xilinx, Inc. | | | 5,050 |
| | | | | | | |
| | | | | | | 207,027 |
| | | | | | | |
| Software: 1.3% |
| 290 | | @ | | Adobe Systems, Inc. | | | 11,423 |
| 220 | | @ | | Autodesk, Inc. | | | 7,438 |
| 160 | | @ | | BMC Software, Inc. | | | 5,760 |
See Accompanying Notes to Financial Statements
95
| | |
| ING GET U.S. CORE PORTFOLIO SERIES 8 | | PORTFOLIO OF INVESTMENTS ASOF JUNE 30, 2008 (UNAUDITED) (CONTINUED) |
| | | | | | | |
| Shares | | | | | | Value |
| | | | | | | |
| Software: (continued) |
| 450 | | | | CA, Inc. | | $ | 10,391 |
| 600 | | @ | | Compuware Corp. | | | 5,724 |
| 200 | | @ | | Electronic Arts, Inc. | | | 8,886 |
| 300 | | @ | | Fiserv, Inc. | | | 13,611 |
| 450 | | | | IMS Health, Inc. | | | 10,485 |
| 5,650 | | | | Microsoft Corp. | | | 155,432 |
| 2,640 | | @ | | Oracle Corp. | | | 55,440 |
| | | | | | | |
| | | | | | | 284,590 |
| | | | | | | |
| Telecommunications: 2.0% |
| 3,856 | | | | AT&T, Inc. | | | 129,909 |
| 290 | | | | CenturyTel, Inc. | | | 10,321 |
| 4,170 | | @ | | Cisco Systems, Inc. | | | 96,994 |
| 1,020 | | | | Corning, Inc. | | | 23,511 |
| 177 | | | | Embarq Corp. | | | 8,367 |
| 450 | | @ | | JDS Uniphase Corp. | | | 5,112 |
| 250 | | @ | | Juniper Networks, Inc. | | | 5,545 |
| 720 | | | | Motorola, Inc. | | | 5,285 |
| 990 | | | | Qualcomm, Inc. | | | 43,926 |
| 1,850 | | | | Qwest Communications International, Inc. | | | 7,271 |
| 823 | | | | Sprint Nextel Corp. | | | 7,819 |
| 1,910 | | | | Verizon Communications, Inc. | | | 67,614 |
| 1,200 | | | | Windstream Corp. | | | 14,808 |
| | | | | | | |
| | | | | | | 426,482 |
| | | | | | | |
| Textiles: 0.0% |
| 200 | | | | Cintas Corp. | | | 5,302 |
| | | | | | | |
| | | | | | | 5,302 |
| | | | | | | |
| Toys/Games/Hobbies: 0.1% |
| 350 | | | | Hasbro, Inc. | | | 12,502 |
| | | | | | | |
| | | | | | | 12,502 |
| | | | | | | |
| Transportation: 0.6% |
| 200 | | | | Burlington Northern Santa Fe Corp. | | | 19,978 |
| 100 | | | | CH Robinson Worldwide, Inc. | | | 5,484 |
| 280 | | | | CSX Corp. | | | 17,587 |
| 200 | | | | Expeditors International Washington, Inc. | | | 8,600 |
| 120 | | | | FedEx Corp. | | | 9,455 |
| 190 | | | | Norfolk Southern Corp. | | | 11,907 |
| 200 | | | | Ryder System, Inc. | | | 13,776 |
| 240 | | | | Union Pacific Corp. | | | 18,120 |
| 450 | | | | United Parcel Service, Inc. - Class B | | | 27,662 |
| | | | | | | |
| | | | | | | 132,569 |
| | | | | | | |
| | | | Total Common Stock
(Cost $8,198,226) | | | 7,703,201 |
| | | | | | | |
| REAL ESTATE INVESTMENT TRUSTS: 0.4% |
| Apartments: 0.0% |
| 250 | | | | Equity Residential | | | 9,568 |
| | | | | | | |
| | | | | | | 9,568 |
| | | | | | | |
| Diversified: 0.1% |
| 200 | | | | Vornado Realty Trust | | | 17,600 |
| | | | | | | |
| | | | | | | 17,600 |
| | | | | | | |
| Health Care: 0.0% |
| 250 | | | | HCP, Inc. | | | 7,953 |
| | | | | | | |
| | | | | | | 7,953 |
| | | | | | | |
| | | | | | | | |
| Shares | | | | | | Value |
| | | | | | | | |
| | Hotels: 0.1% |
| | 800 | | | | Host Hotels & Resorts, Inc. | | $ | 10,920 |
| | | | | | | | |
| | | | | | | | 10,920 |
| | | | | | | | |
| | Regional Malls: 0.1% |
| | 200 | | | | General Growth Properties, Inc. | | | 7,006 |
| | 100 | | | | Simon Property Group, Inc. | | | 8,989 |
| | | | | | | | |
| | | | | | | | 15,995 |
| | | | | | | | |
| | Storage: 0.0% |
| | 50 | | | | Public Storage, Inc. | | | 4,040 |
| | | | | | | | |
| | | | | | | | 4,040 |
| | | | | | | | |
| | Warehouse/Industrial: 0.1% |
| | 200 | | | | Prologis | | | 10,870 |
| | | | | | | | |
| | | | | | | | 10,870 |
| | | | | | | | |
| | | | | Total Real Estate Investment Trusts
(Cost $ 86,311) | | | 76,946 |
| | | | | | | | |
| | | |
Principal
Amount | | | | | | Value |
| | U.S. GOVERNMENT AGENCY OBLIGATIONS: 16.9% |
| | Other U.S. Agency Obligations: 16.9% |
| $ | 4,118,000 | | Z | | Financing Corp.,
3.620%, due 03/26/12 | | $ | 3,621,015 |
| | | | | | | | |
| | | | | Total U.S. Government Agency Obligations
(Cost $3,612,515) | | | 3,621,015 |
| | | | | | | | |
| | U.S. TREASURY OBLIGATIONS: 46.1% |
| | U.S. Treasury STRIP: 46.1% |
| | 11,337,000 | | ^ | | 3.330%, due 08/15/12 | | | 9,906,048 |
| | | | | | | | |
| | | | | Total U.S. Treasury Obligations
(Cost $10,099,417) | | | 9,906,048 |
| | | | | | | | |
| | | | | Total Long-Term Investments
(Cost $21,996,469) | | | 21,307,210 |
| | | | | | | | |
| | | |
| Shares | | | | | | Value |
| | SHORT-TERM INVESTMENTS: 0.7% |
| | Mutual Fund: 0.2% |
| | 50,000 | | ** | | ING Institutional Prime Money Market Fund | | $ | 50,000 |
| | | | | | | | |
| | | | | Total Mutual Fund
(Cost $50,000) | | | 50,000 |
| | | | | | | | |
See Accompanying Notes to Financial Statements
96
| | |
| ING GET U.S. CORE PORTFOLIO SERIES 8 | | PORTFOLIO OF INVESTMENTS ASOF JUNE 30, 2008 (UNAUDITED) (CONTINUED) |
| | | | | | | | | |
| | | |
Principal
Amount | | | | | | | Value |
| | | | | | | | | |
| | Repurchase Agreement: 0.5% |
| $ | 103,000 | | Morgan Stanley Repurchase Agreement dated 06/30/08, 2.401%, due 07/01/08, $103,007 to be received upon repurchase (Collateralized by $110,000 Federal Home Loan Mortgage Corporation, Discount Note, Market Value $108,592, due 12/30/08) | | | | | $ | 103,000 |
| | | | | | | | | |
| | | Total Repurchase Agreement
(Cost $103,000) | | | | | | 103,000 |
| | | | | | | | | |
| | | Total Short-Term Investments
(Cost $153,000) | | | | | | 153,000 |
| | | | | | | | | |
| | | Total Investments in Securities
(Cost $22,149,469)* | | 99.9 | % | | $ | 21,460,210 |
| | | Other Assets and
Liabilities - Net | | 0.1 | | | | 27,650 |
| | | | | | | | | |
| | | Net Assets | | 100.0 | % | | $ | 21,487,860 |
| | | | | | | | | |
| @ | Non-income producing security |
| STRIP | Separate Trading of Registered Interest and Principal of Securities |
| ** | Investment in affiliate |
| ^ | Interest only securities represent the right to receive the monthly interest payments on an underlying pool of mortgage loans. Principal amount shown represents the notional amount on which current interest is calculated. Payments of principal on the pool reduce the value of the interest only security. |
| Z | Indicates Zero Coupon Bond; rate shown reflects current effective yield. |
| * | Cost for federal income tax purposes is $23,121,386. |
| | | | |
Net unrealized depreciation consists of: | | | | |
Gross Unrealized Appreciation | | $ | 332,589 | |
Gross Unrealized Depreciation | | | (1,993,765 | ) |
| | | | |
Net Unrealized Depreciation | | $ | (1,661,176 | ) |
| | | | |
Fair Value Measurements — Effective January 1, 2008, the Portfolio adopted Financial Accounting Standards Board Statement of Financial Accounting Standards No. 157 (“SFAS 157”), “Fair Value Measurements.” This new accounting statement defines fair value, establishes a framework for measuring fair value in generally accepted accounting principles (“GAAP”), and expands disclosures about fair value measurements. The three levels of the fair value hierarchy are as follows:
| | • | | Level 1 — quoted prices in active markets for identical investments |
| | • | | Level 2 — other significant observable inputs (including quoted prices for similar investments, interest rates, prepayment speeds, credit risk, etc.) |
| | • | | Level 3 — significant unobservable inputs (including the Portfolio’s own assumption in determining the fair value of investments) |
The inputs or methodology used in valuing securities are not necessarily an indication of the risk associated with investing in those securities.
The following is a summary of the inputs used as of June 30, 2008 in valuing the Portfolio’s investments at fair value:
| | | | | | |
| | | Investments in Securities | | Other Financial Instruments* |
Level 1 — Quoted Prices | | $ | 7,830,147 | | $ | — |
Level 2 — Other Significant Observable Inputs | | | 13,630,063 | | | — |
Level 3 — Significant Unobservable Inputs | | | — | | | — |
| | | | | | |
Total | | $ | 21,460,210 | | $ | — |
| | | | | | |
| * | | Other financial instruments may include forward foreign currency contracts, futures, swaps, and written options. |
See Accompanying Notes to Financial Statements
97
| | |
| ING GET U.S. CORE PORTFOLIO SERIES 9 | | PORTFOLIO OF INVESTMENTS ASOF JUNE 30, 2008 (UNAUDITED) |
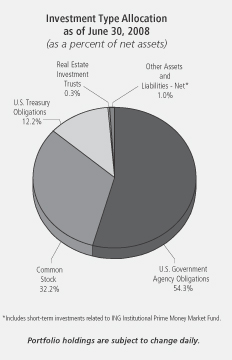
| | | | | | | |
| Shares | | | | | | Value |
| | | | | | | |
| COMMON STOCK: 32.2% | | | |
| Advertising: 0.1% | | | |
| 800 | | @ | | Interpublic Group of Cos., Inc. | | $ | 6,880 |
| 320 | | | | Omnicom Group | | | 14,362 |
| | | | | | | |
| | | | | | | 21,242 |
| | | | | | | |
| Aerospace/Defense: 0.8% | | | |
| 400 | | | | Boeing Co. | | | 26,288 |
| 170 | | | | General Dynamics Corp. | | | 14,314 |
| 150 | | | | Goodrich Corp. | | | 7,119 |
| 60 | | | | L-3 Communications Holdings, Inc. | | | 5,452 |
| 280 | | | | Lockheed Martin Corp. | | | 27,625 |
| 200 | | | | Northrop Grumman Corp. | | | 13,380 |
| 100 | | | | Raytheon Co. | | | 5,628 |
| 100 | | | | Rockwell Collins, Inc. | | | 4,796 |
| 440 | | | | United Technologies Corp. | | | 27,148 |
| | | | | | | |
| | | | | | | 131,750 |
| | | | | | | |
| Agriculture: 0.5% | | | |
| 880 | | | | Altria Group, Inc. | | | 18,093 |
| 300 | | | | Archer-Daniels-Midland Co. | | | 10,125 |
| 106 | | @ | | Lorillard, Inc. | | | 7,331 |
| 880 | | | | Philip Morris International, Inc. | | | 43,463 |
| 130 | | | | Reynolds American, Inc. | | | 6,067 |
| | | | | | | |
| | | | | | | 85,079 |
| | | | | | | |
| Airlines: 0.0% | | | |
| 400 | | | | Southwest Airlines Co. | | | 5,216 |
| | | | | | | |
| | | | | | | 5,216 |
| | | | | | | |
| Apparel: 0.2% | | | |
| 300 | | @ | | Coach, Inc. | | | 8,664 |
| 240 | | | | Nike, Inc. | | | 14,306 |
| | | | | | | |
| Shares | | | | | | Value |
| | | | | | | |
| 100 | | | | Polo Ralph Lauren Corp. | | $ | 6,278 |
| 100 | | | | VF Corp. | | | 7,118 |
| | | | | | | |
| | | | | | | 36,366 |
| | | | | | | |
| Auto Manufacturers: 0.0% | | | |
| 697 | | @ | | Ford Motor Co. | | | 3,353 |
| 300 | | | | General Motors Corp. | | | 3,450 |
| | | | | | | |
| | | | | | | 6,803 |
| | | | | | | |
| Auto Parts & Equipment: 0.1% | | | |
| 100 | | @ | | Goodyear Tire & Rubber Co. | | | 1,783 |
| 410 | | | | Johnson Controls, Inc. | | | 11,759 |
| | | | | | | |
| | | | | | | 13,542 |
| | | | | | | |
| Banks: 1.2% | | | |
| 1,947 | | | | Bank of America Corp. | | | 46,475 |
| 650 | | | | Bank of New York Mellon Corp. | | | 24,590 |
| 300 | | | | BB&T Corp. | | | 6,831 |
| 182 | | | | Capital One Financial Corp. | | | 6,918 |
| 300 | | | | Fifth Third Bancorp. | | | 3,054 |
| 100 | | | | M&T Bank Corp. | | | 7,054 |
| 98 | | | | Marshall & Ilsley Corp. | | | 1,502 |
| 150 | | | | Northern Trust Corp. | | | 10,286 |
| 719 | | | | Regions Financial Corp. | | | 7,844 |
| 290 | | | | State Street Corp. | | | 18,557 |
| 450 | | | | US Bancorp. | | | 12,551 |
| 871 | | | | Wachovia Corp. | | | 13,527 |
| 1,310 | | | | Wells Fargo & Co. | | | 31,113 |
| 150 | | | | Zions Bancorp. | | | 4,724 |
| | | | | | | |
| | | | | | | 195,026 |
| | | | | | | |
| Beverages: 0.7% | | | |
| 80 | | | | Anheuser-Busch Cos., Inc. | | | 4,970 |
| 910 | | | | Coca-Cola Co. | | | 47,302 |
| 150 | | | | Coca-Cola Enterprises, Inc. | | | 2,595 |
| 240 | | | | Pepsi Bottling Group, Inc. | | | 6,701 |
| 670 | | | | PepsiCo, Inc. | | | 42,605 |
| | | | | | | |
| | | | | | | 104,173 |
| | | | | | | |
| Biotechnology: 0.5% | | | |
| 550 | | @ | | Amgen, Inc. | | | 25,938 |
| 130 | | @ | | Biogen Idec, Inc. | | | 7,266 |
| 250 | | @ | | Celgene Corp. | | | 15,968 |
| 110 | | @ | | Genzyme Corp. | | | 7,922 |
| 370 | | @ | | Gilead Sciences, Inc. | | | 19,592 |
| | | | | | | |
| | | | | | | 76,686 |
| | | | | | | |
| Chemicals: 0.9% | | | |
| 150 | | | | Air Products & Chemicals, Inc. | | | 14,829 |
| 390 | | | | Dow Chemical Co. | | | 13,615 |
| 100 | | | | Ecolab, Inc. | | | 4,299 |
| 550 | | | | EI Du Pont de Nemours & Co. | | | 23,590 |
| 150 | | | | Hercules, Inc. | | | 2,540 |
| 150 | | | | International Flavors & Fragrances, Inc. | | | 5,859 |
| 320 | | | | Monsanto Co. | | | 40,461 |
| 100 | | | | PPG Industries, Inc. | | | 5,737 |
| 100 | | | | Praxair, Inc. | | | 9,424 |
| 150 | | | | Rohm & Haas Co. | | | 6,966 |
| 250 | | | | Sigma-Aldrich Corp. | | | 13,465 |
| | | | | | | |
| | | | | | | 140,785 |
| | | | | | | |
See Accompanying Notes to Financial Statements
98
| | |
| ING GET U.S. CORE PORTFOLIO SERIES 9 | | PORTFOLIO OF INVESTMENTS ASOF JUNE 30, 2008 (UNAUDITED) (CONTINUED) |
| | | | | | | |
| Shares | | | | | | Value |
| | | | | | | |
| Coal: 0.2% | | | |
| 100 | | | | Consol Energy, Inc. | | $ | 11,237 |
| 50 | | | | Massey Energy Co. | | | 4,688 |
| 100 | | | | Peabody Energy Corp. | | | 8,805 |
| | | | | | | |
| | | | | | | 24,730 |
| | | | | | | |
| Commercial Services: 0.3% | | | |
| 100 | | @ | | Apollo Group, Inc. - Class A | | | 4,426 |
| 100 | | | | Automatic Data Processing, Inc. | | | 4,190 |
| 250 | | | | H&R Block, Inc. | | | 5,350 |
| 140 | | | | McKesson Corp. | | | 7,827 |
| 70 | | | | Moody’s Corp. | | | 2,411 |
| 150 | | | | Robert Half International, Inc. | | | 3,596 |
| 300 | | | | RR Donnelley & Sons Co. | | | 8,907 |
| 340 | | | | Western Union Co. | | | 8,405 |
| | | | | | | |
| | | | | | | 45,112 |
| | | | | | | |
| Computers: 1.6% | | | |
| 150 | | @ | | Affiliated Computer Services, Inc. | | | 8,024 |
| 350 | | @ | | Apple, Inc. | | | 58,604 |
| 150 | | @ | | Cognizant Technology Solutions Corp. | | | 4,877 |
| 110 | | @ | | Computer Sciences Corp. | | | 5,152 |
| 1,140 | | @ | | Dell, Inc. | | | 24,943 |
| 910 | | @ | | EMC Corp. | | | 13,368 |
| 1,160 | | | | Hewlett-Packard Co. | | | 51,284 |
| 660 | | | | International Business Machines Corp. | | | 78,230 |
| 130 | | @ | | Lexmark International, Inc. | | | 4,346 |
| 150 | | @ | | NetApp, Inc. | | | 3,249 |
| 150 | | @ | | Sandisk Corp. | | | 2,805 |
| 300 | | @ | | Sun Microsystems, Inc. | | | 3,264 |
| 150 | | @ | | Teradata Corp. | | | 3,471 |
| | | | | | | |
| | | | | | | 261,617 |
| | | | | | | |
| Cosmetics/Personal Care: 0.7% | | | |
| 250 | | | | Avon Products, Inc. | | | 9,005 |
| 140 | | | | Colgate-Palmolive Co. | | | 9,674 |
| 1,414 | | | | Procter & Gamble Co. | | | 85,985 |
| | | | | | | |
| | | | | | | 104,664 |
| | | | | | | |
| Distribution/Wholesale: 0.1% | | | |
| 250 | | | | Genuine Parts Co. | | | 9,920 |
| | | | | | | |
| | | | | | | 9,920 |
| | | | | | | |
| Diversified Financial Services: 1.6% | | | |
| 380 | | | | American Express Co. | | | 14,315 |
| 116 | | | | Ameriprise Financial, Inc. | | | 4,718 |
| 250 | | | | Charles Schwab Corp. | | | 5,135 |
| 150 | | | | CIT Group, Inc. | | | 1,022 |
| 2,270 | | | | Citigroup, Inc. | | | 38,045 |
| 20 | | | | CME Group, Inc. | | | 7,664 |
| 310 | | | | Countrywide Financial Corp. | | | 1,318 |
| 275 | | | | Discover Financial Services | | | 3,622 |
| 750 | | @ | | E*Trade Financial Corp. | | | 2,355 |
| 300 | | | | Federal Home Loan Mortgage Corporation | | | 4,920 |
| 370 | | | | Federal National Mortgage Association | | | 7,219 |
| 250 | | | | Goldman Sachs Group, Inc. | | | 43,725 |
| 1,487 | | | | JPMorgan Chase & Co. | | | 51,019 |
| 100 | | | | Legg Mason, Inc. | | | 4,357 |
| 280 | | | | Lehman Brothers Holdings, Inc. | | | 5,547 |
| 610 | | | | Merrill Lynch & Co., Inc. | | | 19,343 |
| | | | | | | |
| Shares | | | | | | Value |
| | | | | | | |
| 600 | | | | Morgan Stanley | | $ | 21,642 |
| 130 | | | | NYSE Euronext | | | 6,586 |
| 140 | | @ | | SLM Corp. | | | 2,709 |
| 100 | | | | T. Rowe Price Group, Inc. | | | 5,647 |
| | | | | | | |
| | | | | | | 250,908 |
| | | | | | | |
| Electric: 1.1% | | | |
| 400 | | @ | | AES Corp. | | | 7,684 |
| 550 | | | | American Electric Power Co., Inc. | | | 22,127 |
| 400 | | | | Centerpoint Energy, Inc. | | | 6,420 |
| 300 | | | | Dominion Resources, Inc. | | | 14,247 |
| 350 | | | | DTE Energy Co. | | | 14,854 |
| 1,400 | | | | Duke Energy Corp. | | | 24,332 |
| 350 | | | | Edison International | | | 17,983 |
| 100 | | | | Entergy Corp. | | | 12,048 |
| 150 | | | | Exelon Corp. | | | 13,494 |
| 200 | | | | FPL Group, Inc. | | | 13,116 |
| 400 | | | | Pepco Holdings, Inc. | | | 10,260 |
| 100 | | | | PG&E Corp. | | | 3,969 |
| 150 | | | | PPL Corp. | | | 7,841 |
| 130 | | | | Public Service Enterprise Group, Inc. | | | 5,971 |
| | | | | | | |
| | | | | | | 174,346 |
| | | | | | | |
| Electrical Components & Equipment: 0.1% | | | |
| 330 | | | | Emerson Electric Co. | | | 16,319 |
| 150 | | | | Molex, Inc. | | | 3,662 |
| | | | | | | |
| | | | | | | 19,981 |
| | | | | | | |
| Electronics: 0.3% | | | |
| 270 | | @ | | Agilent Technologies, Inc. | | | 9,596 |
| 150 | | | | Applera Corp. - Applied Biosystems Group | | | 5,022 |
| 250 | | | | Jabil Circuit, Inc. | | | 4,103 |
| 150 | | | | PerkinElmer, Inc. | | | 4,178 |
| 260 | | @ | | Thermo Electron Corp. | | | 14,490 |
| 250 | | @@ | | Tyco Electronics Ltd. | | | 8,955 |
| 110 | | @ | | Waters Corp. | | | 7,095 |
| | | | | | | |
| | | | | | | 53,439 |
| | | | | | | |
| Engineering & Construction: 0.2% | | | |
| 100 | | | | Fluor Corp. | | | 18,608 |
| 100 | | @ | | Jacobs Engineering Group, Inc. | | | 8,070 |
| | | | | | | |
| | | | | | | 26,678 |
| | | | | | | |
| Environmental Control: 0.1% | | | |
| 400 | | @ | | Allied Waste Industries, Inc. | | | 5,048 |
| 150 | | | | Waste Management, Inc. | | | 5,657 |
| | | | | | | |
| | | | | | | 10,705 |
| | | | | | | |
| Food: 0.5% | | | |
| 250 | | | | ConAgra Foods, Inc. | | | 4,820 |
| 180 | | | | General Mills, Inc. | | | 10,939 |
| 180 | | | | HJ Heinz Co. | | | 8,613 |
| 250 | | | | Kellogg Co. | | | 12,005 |
| 500 | | | | Kraft Foods, Inc. | | | 14,225 |
| 230 | | | | Kroger Co. | | | 6,640 |
| 650 | | | | Sara Lee Corp. | | | 7,963 |
| 150 | | | | Supervalu, Inc. | | | 4,634 |
| 150 | | | | Sysco Corp. | | | 4,127 |
| 150 | | | | WM Wrigley Jr. Co. | | | 11,667 |
| | | | | | | |
| | | | | | | 85,633 |
| | | | | | | |
See Accompanying Notes to Financial Statements
99
| | |
| ING GET U.S. CORE PORTFOLIO SERIES 9 | | PORTFOLIO OF INVESTMENTS ASOF JUNE 30, 2008 (UNAUDITED) (CONTINUED) |
| | | | | | | |
| Shares | | | | | | Value |
| | | | | | | |
| Gas: 0.1% | | | |
| 300 | | | | Sempra Energy | | $ | 16,935 |
| | | | | | | |
| | | | | | | 16,935 |
| | | | | | | |
| Hand/Machine Tools: 0.1% | | | |
| 60 | | | | Black & Decker Corp. | | | 3,451 |
| 100 | | | | Snap-On, Inc. | | | 5,201 |
| 90 | | | | Stanley Works | | | 4,035 |
| | | | | | | |
| | | | | | | 12,687 |
| | | | | | | |
| Healthcare - Products: 1.1% | | | |
| 240 | | | | Baxter International, Inc. | | | 15,346 |
| 100 | | | | Becton Dickinson & Co. | | | 8,130 |
| 750 | | @ | | Boston Scientific Corp. | | | 9,218 |
| 200 | | @@ | | Covidien Ltd. | | | 9,578 |
| 960 | | | | Johnson & Johnson | | | 61,766 |
| 650 | | | | Medtronic, Inc. | | | 33,638 |
| 150 | | @ | | Patterson Cos., Inc. | | | 4,409 |
| 250 | | @ | | St. Jude Medical, Inc. | | | 10,220 |
| 100 | | | | Stryker Corp. | | | 6,288 |
| 100 | | @ | | Varian Medical Systems, Inc. | | | 5,185 |
| 100 | | @ | | Zimmer Holdings, Inc. | | | 6,805 |
| | | | | | | |
| | | | | | | 170,583 |
| | | | | | | |
| Healthcare - Services: 0.3% | | | |
| 260 | | | | Aetna, Inc. | | | 10,538 |
| 150 | | | | Cigna Corp. | | | 5,309 |
| 130 | | @ | | Humana, Inc. | | | 5,170 |
| 100 | | @ | | Laboratory Corp. of America Holdings | | | 6,963 |
| 100 | | | | Quest Diagnostics | | | 4,847 |
| 380 | | | | UnitedHealth Group, Inc. | | | 9,975 |
| 250 | | @ | | WellPoint, Inc. | | | 11,915 |
| | | | | | | |
| | | | | | | 54,717 |
| | | | | | | |
| Home Builders: 0.0% | | | |
| 150 | | | | D.R. Horton, Inc. | | | 1,628 |
| 250 | | | | Lennar Corp. | | | 3,085 |
| | | | | | | |
| | | | | | | 4,713 |
| | | | | | | |
| Household Products/Wares: 0.2% | | | |
| 100 | | | | Avery Dennison Corp. | | | 4,393 |
| 150 | | | | Clorox Co. | | | 7,830 |
| 150 | | | | Fortune Brands, Inc. | | | 9,362 |
| 280 | | | | Kimberly-Clark Corp. | | | 16,738 |
| | | | | | | |
| | | | | | | 38,323 |
| | | | | | | |
| Insurance: 1.3% | | | |
| 260 | | @@ | | ACE Ltd. | | | 14,323 |
| 270 | | | | Aflac, Inc. | | | 16,956 |
| 240 | | | | Allstate Corp. | | | 10,942 |
| 1,210 | | | | American International Group, Inc. | | | 32,017 |
| 120 | | | | AON Corp. | | | 5,513 |
| 100 | | | | Assurant, Inc. | | | 6,596 |
| 290 | | | | Chubb Corp. | | | 14,213 |
| 150 | | | | Cincinnati Financial Corp. | | | 3,810 |
| 250 | | | | Genworth Financial, Inc. | | | 4,453 |
| 220 | | | | Hartford Financial Services Group, Inc. | | | 14,205 |
| 150 | | | | Lincoln National Corp. | | | 6,798 |
| 69 | | | | Loews Corp. | | | 3,236 |
| 150 | | | | Marsh & McLennan Cos., Inc. | | | 3,983 |
| 490 | | | | Metlife, Inc. | | | 25,857 |
| 320 | | | | Progressive Corp. | | | 5,990 |
| | | | | | | |
| Shares | | | | | | Value |
| | | | | | | |
| 330 | | | | Prudential Financial, Inc. | | $ | 19,714 |
| 80 | | | | Torchmark Corp. | | | 4,692 |
| 310 | | | | Travelers Cos., Inc. | | | 13,454 |
| 250 | | | | UnumProvident Corp. | | | 5,113 |
| 100 | | @@ | | XL Capital Ltd. | | | 2,056 |
| | | | | | | |
| | | | | | | 213,921 |
| | | | | | | |
| Internet: 0.8% | | | |
| 100 | | @ | | Akamai Technologies, Inc. | | | 3,479 |
| 150 | | @ | | Amazon.com, Inc. | | | 11,000 |
| 470 | | @ | | eBay, Inc. | | | 12,845 |
| 150 | | @ | | Expedia, Inc. | | | 2,757 |
| 150 | | @ | | Google, Inc. - Class A | | | 78,963 |
| 150 | | @ | | IAC/InterActiveCorp. | | | 2,892 |
| 420 | | @ | | Symantec Corp. | | | 8,127 |
| 550 | | @ | | Yahoo!, Inc. | | | 11,363 |
| | | | | | | |
| | | | | | | 131,426 |
| | | | | | | |
| Iron/Steel: 0.2% | | | |
| 100 | | | | Allegheny Technologies, Inc. | | | 5,928 |
| 160 | | | | Nucor Corp. | | | 11,947 |
| 40 | | | | United States Steel Corp. | | | 7,391 |
| | | | | | | |
| | | | | | | 25,266 |
| | | | | | | |
| Lodging: 0.0% | | | |
| 130 | | | | Starwood Hotels & Resorts Worldwide, Inc. | | | 5,209 |
| | | | | | | |
| | | | | | | 5,209 |
| | | | | | | |
| Machinery - Construction & Mining: 0.2% | | | |
| 300 | | | | Caterpillar, Inc. | | | 22,146 |
| 100 | | @ | | Terex Corp. | | | 5,137 |
| | | | | | | |
| | | | | | | 27,283 |
| | | | | | | |
| Machinery - Diversified: 0.2% | | | |
| 110 | | | | Cummins, Inc. | | | 7,207 |
| 250 | | | | Deere & Co. | | | 18,033 |
| 100 | | | | Manitowoc Co., Inc. | | | 3,253 |
| 100 | | | | Rockwell Automation, Inc. | | | 4,373 |
| | | | | | | |
| | | | | | | 32,866 |
| | | | | | | |
| Media: 0.7% | | | |
| 150 | | | | CBS Corp. - Class B | | | 2,924 |
| 260 | | | | Clear Channel Communications, Inc. | | | 9,152 |
| 1,000 | | | | Comcast Corp. - Class A | | | 18,970 |
| 250 | | @ | | DIRECTV Group, Inc. | | | 6,478 |
| 1,250 | | | | News Corp. - Class A | | | 18,800 |
| 1,350 | | | | Time Warner, Inc. | | | 19,980 |
| 350 | | @ | | Viacom - Class B | | | 10,689 |
| 820 | | | | Walt Disney Co. | | | 25,584 |
| | | | | | | |
| | | | | | | 112,577 |
| | | | | | | |
| Metal Fabricate/Hardware: 0.1% | | | |
| 100 | | | | Precision Castparts Corp. | | | 9,637 |
| | | | | | | |
| | | | | | | 9,637 |
| | | | | | | |
| Mining: 0.3% | | | |
| 150 | | | | Alcoa, Inc. | | | 5,343 |
| 221 | | | | Freeport-McMoRan Copper & Gold, Inc. | | | 25,899 |
| 200 | | | | Newmont Mining Corp. | | | 10,432 |
| | | | | | | |
| | | | | | | 41,674 |
| | | | | | | |
See Accompanying Notes to Financial Statements
100
| | |
| ING GET U.S. CORE PORTFOLIO SERIES 9 | | PORTFOLIO OF INVESTMENTS ASOF JUNE 30, 2008 (UNAUDITED) (CONTINUED) |
| | | | | | | |
| Shares | | | | | | Value |
| | | | | | | |
| Miscellaneous Manufacturing: 1.4% | | | |
| 290 | | | | 3M Co. | | $ | 20,181 |
| 150 | | | | Cooper Industries Ltd. | | | 5,925 |
| 300 | | | | Dover Corp. | | | 14,511 |
| 140 | | | | Eaton Corp. | | | 11,896 |
| 4,410 | | | | General Electric Co. | | | 117,703 |
| 400 | | | | Honeywell International, Inc. | | | 20,112 |
| 200 | | | | Illinois Tool Works, Inc. | | | 9,502 |
| 300 | | | | Leggett & Platt, Inc. | | | 5,031 |
| 120 | | | | Parker Hannifin Corp. | | | 8,558 |
| 250 | | | | Textron, Inc. | | | 11,983 |
| 50 | | @@ | | Tyco International Ltd. | | | 2,002 |
| | | | | | | |
| | | | | | | 227,404 |
| | | | | | | |
| Office/Business Equipment: 0.1% | | | |
| 300 | | | | Pitney Bowes, Inc. | | | 10,230 |
| 550 | | | | Xerox Corp. | | | 7,458 |
| | | | | | | |
| | | | | | | 17,688 |
| | | | | | | |
| Oil & Gas: 4.5% | | | |
| 330 | | | | Anadarko Petroleum Corp. | | | 24,697 |
| 250 | | | | Apache Corp. | | | 34,750 |
| 60 | | | | Cabot Oil & Gas Corp. | | | 4,064 |
| 250 | | | | Chesapeake Energy Corp. | | | 16,490 |
| 980 | | | | Chevron Corp. | | | 97,147 |
| 809 | | | | ConocoPhillips | | | 76,362 |
| 320 | | | | Devon Energy Corp. | | | 38,451 |
| 50 | | | | ENSCO International, Inc. | | | 4,037 |
| 150 | | | | EOG Resources, Inc. | | | 19,680 |
| 2,480 | | | | ExxonMobil Corp. | | | 218,562 |
| 150 | | | | Hess Corp. | | | 18,929 |
| 240 | | | | Marathon Oil Corp. | | | 12,449 |
| 150 | | | | Murphy Oil Corp. | | | 14,708 |
| 100 | | @, @@ | | Nabors Industries Ltd. | | | 4,923 |
| 100 | | | | Noble Corp. | | | 6,496 |
| 110 | | | | Noble Energy, Inc. | | | 11,062 |
| 370 | | | | Occidental Petroleum Corp. | | | 33,248 |
| 150 | | | | Questar Corp. | | | 10,656 |
| 100 | | | | Range Resources Corp. | | | 6,554 |
| 150 | | @ | | Southwestern Energy Co. | | | 7,142 |
| 100 | | | | Sunoco, Inc. | | | 4,069 |
| 144 | | @ | | Transocean, Inc. | | | 21,944 |
| 130 | | | | Valero Energy Corp. | | | 5,353 |
| 225 | | | | XTO Energy, Inc. | | | 15,415 |
| | | | | | | |
| | | | | | | 707,188 |
| | | | | | | |
| Oil & Gas Services: 0.7% | | | |
| 150 | | | | Baker Hughes, Inc. | | | 13,101 |
| 280 | | | | Halliburton Co. | | | 14,860 |
| 150 | | @ | | National Oilwell Varco, Inc. | | | 13,308 |
| 450 | | | | Schlumberger Ltd. | | | 48,344 |
| 100 | | | | Smith International, Inc. | | | 8,314 |
| 150 | | @ | | Weatherford International Ltd. | | | 7,439 |
| | | | | | | |
| | | | | | | 105,366 |
| | | | | | | |
| Packaging & Containers: 0.1% | | | |
| 230 | | | | Ball Corp. | | | 10,980 |
| | | | | | | |
| | | | | | | 10,980 |
| | | | | | | |
| Pharmaceuticals: 1.5% | | | |
| 450 | | | | Abbott Laboratories | | | 23,837 |
| 100 | | | | Allergan, Inc. | | | 5,205 |
| 150 | | | | AmerisourceBergen Corp. | | | 5,999 |
| 800 | | | | Bristol-Myers Squibb Co. | | | 16,424 |
| | | | | | | |
| Shares | | | | | | Value |
| | | | | | | |
| 100 | | | | Cardinal Health, Inc. | | $ | 5,158 |
| 450 | | | | Eli Lilly & Co. | | | 20,772 |
| 120 | | @ | | Express Scripts, Inc. | | | 7,526 |
| 150 | | @ | | Forest Laboratories, Inc. | | | 5,211 |
| 258 | | @ | | King Pharmaceuticals, Inc. | | | 2,701 |
| 250 | | @ | | Medco Health Solutions, Inc. | | | 11,800 |
| 930 | | | | Merck & Co., Inc. | | | 35,052 |
| 2,690 | | | | Pfizer, Inc. | | | 46,994 |
| 850 | | | | Schering-Plough Corp. | | | 16,737 |
| 150 | | @ | | Watson Pharmaceuticals, Inc. | | | 4,076 |
| 640 | | | | Wyeth | | | 30,694 |
| | | | | | | |
| | | | | | | 238,186 |
| | | | | | | |
| Pipelines: 0.2% | | | |
| 350 | | | | El Paso Corp. | | | 7,609 |
| 250 | | | | Spectra Energy Corp. | | | 7,185 |
| 300 | | | | Williams Cos., Inc. | | | 12,093 |
| | | | | | | |
| | | | | | | 26,887 |
| | | | | | | |
| Retail: 1.8% | | | |
| 100 | | | | Abercrombie & Fitch Co. | | | 6,268 |
| 80 | | @ | | Autozone, Inc. | | | 9,681 |
| 270 | | | | Best Buy Co., Inc. | | | 10,692 |
| 150 | | @ | | Big Lots, Inc. | | | 4,686 |
| 170 | | | | Costco Wholesale Corp. | | | 11,924 |
| 585 | | | | CVS Caremark Corp. | | | 23,148 |
| 180 | | | | Darden Restaurants, Inc. | | | 5,749 |
| 240 | | | | Family Dollar Stores, Inc. | | | 4,786 |
| 150 | | @ | | GameStop Corp. | | | 6,060 |
| 450 | | | | Gap, Inc. | | | 7,502 |
| 450 | | | | Home Depot, Inc. | | | 10,539 |
| 100 | | | | JC Penney Co., Inc. | | | 3,629 |
| 350 | | | | Limited Brands, Inc. | | | 5,898 |
| 560 | | | | Lowe’s Cos., Inc. | | | 11,620 |
| 250 | | | | Macy’s, Inc. | | | 4,855 |
| 620 | | | | McDonald’s Corp. | | | 34,856 |
| 310 | | | | Staples, Inc. | | | 7,363 |
| 280 | | | | Target Corp. | | | 13,017 |
| 100 | | | | Tiffany & Co. | | | 4,075 |
| 360 | | | | TJX Cos., Inc. | | | 11,329 |
| 250 | | | | Walgreen Co. | | | 8,128 |
| 1,140 | | | | Wal-Mart Stores, Inc. | | | 64,068 |
| 250 | | | | Yum! Brands, Inc. | | | 8,773 |
| | | | | | | |
| | | | | | | 278,646 |
| | | | | | | |
| Savings & Loans: 0.0% | | | |
| 300 | | | | Hudson City Bancorp., Inc. | | | 5,004 |
| 386 | | | | Washington Mutual, Inc. | | | 1,903 |
| | | | | | | |
| | | | | | | 6,907 |
| | | | | | | |
| Semiconductors: 0.9% | | | |
| 150 | | | | Altera Corp. | | | 3,105 |
| 150 | | | | Analog Devices, Inc. | | | 4,766 |
| 500 | | | | Applied Materials, Inc. | | | 9,545 |
| 250 | | @ | | Broadcom Corp. | | | 6,823 |
| 2,600 | | | | Intel Corp. | | | 55,848 |
| 100 | | | | KLA-Tencor Corp. | | | 4,071 |
| 100 | | | | Linear Technology Corp. | | | 3,257 |
| 650 | | @ | | LSI Logic Corp. | | | 3,991 |
| 100 | | @ | | MEMC Electronic Materials, Inc. | | | 6,154 |
| 270 | | | | National Semiconductor Corp. | | | 5,546 |
| 260 | | @ | | Nvidia Corp. | | | 4,867 |
| 300 | | @ | | QLogic Corp. | | | 4,377 |
See Accompanying Notes to Financial Statements
101
| | |
| ING GET U.S. CORE PORTFOLIO SERIES 9 | | PORTFOLIO OF INVESTMENTS ASOF JUNE 30, 2008 (UNAUDITED) (CONTINUED) |
| | | | | | | |
| Shares | | | | | | Value |
| | | | | | | |
| Semiconductors: (continued) | | | |
| 800 | | | | Texas Instruments, Inc. | | $ | 22,528 |
| 100 | | | | Xilinx, Inc. | | | 2,525 |
| | | | | | | |
| | | | | | | 137,403 |
| | | | | | | |
| Software: 1.2% | | | |
| 310 | | @ | | Adobe Systems, Inc. | | | 12,211 |
| 160 | | @ | | Autodesk, Inc. | | | 5,410 |
| 110 | | @ | | BMC Software, Inc. | | | 3,960 |
| 290 | | | | CA, Inc. | | | 6,696 |
| 400 | | @ | | Compuware Corp. | | | 3,816 |
| 100 | | @ | | Electronic Arts, Inc. | | | 4,443 |
| 100 | | | | Fidelity National Information Services, Inc. | | | 3,691 |
| 150 | | @ | | Fiserv, Inc. | | | 6,806 |
| 250 | | | | IMS Health, Inc. | | | 5,825 |
| 3,690 | | | | Microsoft Corp. | | | 101,512 |
| 1,720 | | @ | | Oracle Corp. | | | 36,120 |
| | | | | | | |
| | | | | | | 190,490 |
| | | | | | | |
| Telecommunications: 1.7% | | | |
| 2,443 | | | | AT&T, Inc. | | | 82,305 |
| 120 | | | | CenturyTel, Inc. | | | 4,271 |
| 2,600 | | @ | | Cisco Systems, Inc. | | | 60,476 |
| 820 | | | | Corning, Inc. | | | 18,901 |
| 42 | | | | Embarq Corp. | | | 1,985 |
| 300 | | @ | | JDS Uniphase Corp. | | | 3,408 |
| 150 | | @ | | Juniper Networks, Inc. | | | 3,327 |
| 370 | | | | Motorola, Inc. | | | 2,716 |
| 650 | | | | Qualcomm, Inc. | | | 28,841 |
| 800 | | | | Qwest Communications International, Inc. | | | 3,144 |
| 640 | | | | Sprint Nextel Corp. | | | 6,080 |
| 1,290 | | | | Verizon Communications, Inc. | | | 45,666 |
| 650 | | | | Windstream Corp. | | | 8,021 |
| | | | | | | |
| | | | | | | 269,141 |
| | | | | | | |
| Textiles: 0.0% | | | |
| 100 | | | | Cintas Corp. | | | 2,651 |
| | | | | | | |
| | | | | | | 2,651 |
| | | | | | | |
| Toys/Games/Hobbies: 0.1% | | | |
| 300 | | | | Hasbro, Inc. | | | 10,716 |
| | | | | | | |
| | | | | | | 10,716 |
| | | | | | | |
| Transportation: 0.6% | | | |
| 150 | | | | Burlington Northern Santa Fe Corp. | | | 14,984 |
| 100 | | | | CH Robinson Worldwide, Inc. | | | 5,484 |
| 170 | | | | CSX Corp. | | | 10,678 |
| 100 | | | | Expeditors International Washington, Inc. | | | 4,300 |
| 120 | | | | FedEx Corp. | | | 9,455 |
| 130 | | | | Norfolk Southern Corp. | | | 8,147 |
| 100 | | | | Ryder System, Inc. | | | 6,888 |
| 170 | | | | Union Pacific Corp. | | | 12,835 |
| 250 | | | | United Parcel Service, Inc. - Class B | | | 15,368 |
| | | | | | | |
| | | | | | | 88,139 |
| | | | | | | |
| | | | Total Common Stock
(Cost $5,361,593) | | | 5,100,010 |
| | | | | | | |
| | | | | | | | |
| Shares | | | | | | Value |
| | | | | | | | |
| | REAL ESTATE INVESTMENT TRUSTS: 0.3% |
| | Apartments: 0.0% | | | |
| | 150 | | | | Equity Residential | | $ | 5,741 |
| | | | | | | | |
| | | | | | | | 5,741 |
| | | | | | | | |
| | Diversified: 0.1% | | | |
| | 100 | | | | Vornado Realty Trust | | | 8,800 |
| | | | | | | | |
| | | | | | | | 8,800 |
| | | | | | | | |
| | Health Care: 0.0% | | | |
| | 150 | | | | HCP, Inc. | | | 4,772 |
| | | | | | | | |
| | | | | | | | 4,772 |
| | | | | | | | |
| | Hotels: 0.0% | | | |
| | 400 | | | | Host Hotels & Resorts, Inc. | | | 5,460 |
| | | | | | | | |
| | | | | | | | 5,460 |
| | | | | | | | |
| | Regional Malls: 0.1% | | | |
| | 100 | | | | General Growth Properties, Inc. | | | 3,503 |
| | 100 | | | | Simon Property Group, Inc. | | | 8,989 |
| | | | | | | | |
| | | | | | | | 12,492 |
| | | | | | | | |
| | Storage: 0.1% | | | |
| | 100 | | | | Public Storage, Inc. | | | 8,079 |
| | | | | | | | |
| | | | | | | | 8,079 |
| | | | | | | | |
| | Warehouse/Industrial: 0.0% | | | |
| | 100 | | | | Prologis | | | 5,435 |
| | | | | | | | |
| | | | | | | | 5,435 |
| | | | | | | | |
| | | | | Total Real Estate Investment Trusts (Cost $55,204) | | | 50,779 |
| | | | | | | | |
| | | |
Principal
Amount | | | | | | Value |
| | U.S. GOVERNMENT AGENCY OBLIGATIONS: 54.3% |
| | Federal Home Loan Mortgage Corporation: 54.3% |
| $ | 10,000,000 | | Z | | 3.830%, due 09/15/12 | | $ | 8,592,377 |
| | | | | | | | |
| | | | | Total U.S. Government Agency Obligations
(Cost $8,793,923) | | | 8,592,377 |
| | | | | | | | |
| | U.S. TREASURY OBLIGATIONS: 12.2% | | | |
| | U.S. Treasury STRIP: 12.2% | | | |
| | 2,218,000 | | ^ | | 3.300%, due 08/15/12 | | | 1,938,051 |
| | | | | | | | |
| | | | | Total U.S. Treasury Obligations
(Cost $1,950,160) | | | 1,938,051 |
| | | | | | | | |
| | | | | Total Long-Term Investments
(Cost $16,160,880) | | | 15,681,217 |
| | | | | | | | |
See Accompanying Notes to Financial Statements
102
| | |
| ING GET U.S. CORE PORTFOLIO SERIES 9 | | PORTFOLIO OF INVESTMENTS ASOF JUNE 30, 2008 (UNAUDITED) (CONTINUED) |
| | | | | | | |
| Shares | | | | | | Value |
| | | | | | | |
| SHORT-TERM INVESTMENTS: 0.3% |
| Mutual Fund: 0.3% | | | |
| 42,000 | | ** | | ING Institutional Prime Money Market Fund | | $ | 42,000 |
| | | | | | | |
| | | | Total Short-Term Investments
(Cost $42,000) | | | 42,000 |
| | | | | | | |
| | | | | | | | |
| | Total Investments in Securities
(Cost $16,202,880)* | | 99.3 | % | | $ | 15,723,217 |
| | Other Assets and
Liabilities - Net | | 0.7 | | | | 117,464 |
| | | | | | | | |
| | Net Assets | | 100.0 | % | | $ | 15,840,681 |
| | | | | | | | |
| @ | Non-income producing security |
| STRIP | Separate Trading of Registered Interest and Principal of Securities |
| ** | Investment in affiliate |
| ^ | Interest only securities represent the right to receive the monthly interest payments on an underlying pool of mortgage loans. Principal amount shown represents the notional amount on which current interest is calculated. Payments of principal on the pool reduce the value of the interest only security. |
| Z | Indicates Zero Coupon Bond; rate shown reflects current effective yield. |
| * | Cost for federal income tax purposes is $16,980,713. |
| | | | |
Net unrealized depreciation consists of: | | | | |
Gross Unrealized Appreciation | | $ | 231,419 | |
Gross Unrealized Depreciation | | | (1,488,915 | ) |
| | | | |
Net Unrealized Depreciation | | $ | (1,257,496 | ) |
| | | | |
Fair Value Measurements — Effective January 1, 2008, the Portfolio adopted Financial Accounting Standards Board Statement of Financial Accounting Standards No. 157 (“SFAS 157”), “Fair Value Measurements.” This new accounting statement defines fair value, establishes a framework for measuring fair value in generally accepted accounting principles (“GAAP”), and expands disclosures about fair value measurements. The three levels of the fair value hierarchy are as follows:
| | • | | Level 1 — quoted prices in active markets for identical investments |
| | • | | Level 2 — other significant observable inputs (including quoted prices for similar investments, interest rates, prepayment speeds, credit risk, etc.) |
| | • | | Level 3 — significant unobservable inputs (including the Portfolio’s own assumption in determining the fair value of investments) |
The inputs or methodology used in valuing securities are not necessarily an indication of the risk associated with investing in those securities.
The following is a summary of the inputs used as of June 30, 2008 in valuing the Portfolio’s investments at fair value:
| | | | | | |
| | | Investments in Securities | | Other Financial Instruments* |
Level 1 — Quoted Prices | | $ | 5,192,789 | | $ | — |
Level 2 — Other Significant Observable Inputs | | | 10,530,428 | | | — |
Level 3 — Significant Unobservable Inputs | | | — | | | — |
| | | | | | |
Total | | $ | 15,723,217 | | $ | — |
| | | | | | |
| * | | Other financial instruments may include forward foreign currency contracts, futures, swaps, and written options. |
See Accompanying Notes to Financial Statements
103
| | |
| ING GET U.S. CORE PORTFOLIO SERIES 10 | | PORTFOLIO OF INVESTMENTS ASOF JUNE 30, 2008 (UNAUDITED) |
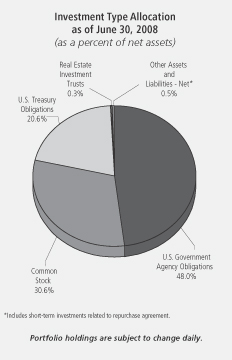
| | | | | | | |
| Shares | | | | | | Value |
| | | | | | | |
| COMMON STOCK: 30.6% |
| Advertising: 0.1% |
| 650 | | @ | | Interpublic Group of Cos., Inc. | | $ | 5,590 |
| 230 | | | | Omnicom Group | | | 10,322 |
| | | | | | | |
| | | | | | | 15,912 |
| | | | | | | |
| Aerospace/Defense: 0.8% |
| 360 | | | | Boeing Co. | | | 23,659 |
| 140 | | | | General Dynamics Corp. | | | 11,788 |
| 170 | | | | Goodrich Corp. | | | 8,068 |
| 50 | | | | L-3 Communications Holdings, Inc. | | | 4,544 |
| 220 | | | | Lockheed Martin Corp. | | | 21,705 |
| 160 | | | | Northrop Grumman Corp. | | | 10,704 |
| 100 | | | | Raytheon Co. | | | 5,628 |
| 100 | | | | Rockwell Collins, Inc. | | | 4,796 |
| 390 | | | | United Technologies Corp. | | | 24,063 |
| | | | | | | |
| | | | | | | 114,955 |
| | | | | | | |
| Agriculture: 0.5% |
| 670 | | | | Altria Group, Inc. | | | 13,775 |
| 260 | | | | Archer-Daniels-Midland Co. | | | 8,775 |
| 145 | | @ | | Lorillard, Inc. | | | 10,028 |
| 770 | | | | Philip Morris International, Inc. | | | 38,030 |
| 140 | | | | Reynolds American, Inc. | | | 6,534 |
| | | | | | | |
| | | | | | | 77,142 |
| | | | | | | |
| Airlines: 0.0% |
| 350 | | | | Southwest Airlines Co. | | | 4,564 |
| | | | | | | |
| | | | | | | 4,564 |
| | | | | | | |
| Apparel: 0.2% |
| 240 | | @ | | Coach, Inc. | | | 6,931 |
| 250 | | | | Nike, Inc. | | | 14,903 |
| | | | | | | |
| Shares | | | | | | Value |
| | | | | | | |
| 20 | | | | Polo Ralph Lauren Corp. | | $ | 1,256 |
| 120 | | | | VF Corp. | | | 8,542 |
| | | | | | | |
| | | | | | | 31,632 |
| | | | | | | |
| Auto Manufacturers: 0.0% |
| 879 | | @ | | Ford Motor Co. | | | 4,228 |
| 230 | | | | General Motors Corp. | | | 2,645 |
| | | | | | | |
| | | | | | | 6,873 |
| | | | | | | |
| Auto Parts & Equipment: 0.1% |
| 120 | | @ | | Goodyear Tire & Rubber Co. | | | 2,140 |
| 350 | | | | Johnson Controls, Inc. | | | 10,038 |
| | | | | | | |
| | | | | | | 12,178 |
| | | | | | | |
| Banks: 1.2% |
| 1,692 | | | | Bank of America Corp. | | | 40,388 |
| 580 | | | | Bank of New York Mellon Corp. | | | 21,941 |
| 240 | | | | BB&T Corp. | | | 5,465 |
| 213 | | | | Capital One Financial Corp. | | | 8,096 |
| 230 | | | | Fifth Third Bancorp. | | | 2,341 |
| 100 | | | | M&T Bank Corp. | | | 7,054 |
| 108 | | | | Marshall & Ilsley Corp. | | | 1,656 |
| 120 | | | | Northern Trust Corp. | | | 8,228 |
| 560 | | | | Regions Financial Corp. | | | 6,110 |
| 250 | | | | State Street Corp. | | | 15,998 |
| 420 | | | | US Bancorp. | | | 11,714 |
| 739 | | | | Wachovia Corp. | | | 11,477 |
| 1,110 | | | | Wells Fargo & Co. | | | 26,363 |
| 170 | | | | Zions Bancorp. | | | 5,353 |
| | | | | | | |
| | | | | | | 172,184 |
| | | | | | | |
| Beverages: 0.6% |
| 30 | | | | Anheuser-Busch Cos., Inc. | | | 1,864 |
| 780 | | | | Coca-Cola Co. | | | 40,544 |
| 150 | | | | Coca-Cola Enterprises, Inc. | | | 2,595 |
| 250 | | | | Pepsi Bottling Group, Inc. | | | 6,980 |
| 540 | | | | PepsiCo, Inc. | | | 34,339 |
| | | | | | | |
| | | | | | | 86,322 |
| | | | | | | |
| Biotechnology: 0.4% |
| 430 | | @ | | Amgen, Inc. | | | 20,279 |
| 110 | | @ | | Biogen Idec, Inc. | | | 6,148 |
| 200 | | @ | | Celgene Corp. | | | 12,774 |
| 40 | | @ | | Genzyme Corp. | | | 2,881 |
| 290 | | @ | | Gilead Sciences, Inc. | | | 15,356 |
| | | | | | | |
| | | | | | | 57,438 |
| | | | | | | |
| Chemicals: 0.8% |
| 170 | | | | Air Products & Chemicals, Inc. | | | 16,806 |
| 370 | | | | Dow Chemical Co. | | | 12,917 |
| 120 | | | | Ecolab, Inc. | | | 5,159 |
| 430 | | | | EI Du Pont de Nemours & Co. | | | 18,443 |
| 150 | | | | Hercules, Inc. | | | 2,540 |
| 170 | | | | International Flavors & Fragrances, Inc. | | | 6,640 |
| 210 | | | | Monsanto Co. | | | 26,552 |
| 20 | | | | PPG Industries, Inc. | | | 1,147 |
| 100 | | | | Praxair, Inc. | | | 9,424 |
| 100 | | | | Rohm & Haas Co. | | | 4,644 |
| 170 | | | | Sigma-Aldrich Corp. | | | 9,156 |
| | | | | | | |
| | | | | | | 113,428 |
| | | | | | | |
See Accompanying Notes to Financial Statements
104
| | |
| ING GET U.S. CORE PORTFOLIO SERIES 10 | | PORTFOLIO OF INVESTMENTS ASOF JUNE 30, 2008 (UNAUDITED) (CONTINUED) |
| | | | | | | |
| Shares | | | | | | Value |
| | | | | | | |
| Coal: 0.2% |
| 100 | | | | Consol Energy, Inc. | | $ | 11,237 |
| 50 | | | | Massey Energy Co. | | | 4,688 |
| 120 | | | | Peabody Energy Corp. | | | 10,566 |
| | | | | | | |
| | | | | | | 26,491 |
| | | | | | | |
| Commercial Services: 0.3% |
| 110 | | @ | | Apollo Group, Inc. - Class A | | | 4,869 |
| 100 | | | | Automatic Data Processing, Inc. | | | 4,190 |
| 150 | | | | H&R Block, Inc. | | | 3,210 |
| 120 | | | | McKesson Corp. | | | 6,709 |
| 110 | | | | Moody’s Corp. | | | 3,788 |
| 170 | | | | Robert Half International, Inc. | | | 4,075 |
| 270 | | | | RR Donnelley & Sons Co. | | | 8,016 |
| 350 | | | | Western Union Co. | | | 8,652 |
| | | | | | | |
| | | | | | | 43,509 |
| | | | | | | |
| Computers: 1.5% |
| 120 | | @ | | Affiliated Computer Services, Inc. | | | 6,419 |
| 270 | | @ | | Apple, Inc. | | | 45,209 |
| 120 | | @ | | Cognizant Technology Solutions Corp. | | | 3,901 |
| 140 | | @ | | Computer Sciences Corp. | | | 6,558 |
| 830 | | @ | | Dell, Inc. | | | 18,160 |
| 810 | | @ | | EMC Corp. | | | 11,899 |
| 1,050 | | | | Hewlett-Packard Co. | | | 46,421 |
| 560 | | | | International Business Machines Corp. | | | 66,377 |
| 100 | | @ | | Lexmark International, Inc. | | | 3,343 |
| 120 | | @ | | NetApp, Inc. | | | 2,599 |
| 120 | | @ | | Sandisk Corp. | | | 2,244 |
| 340 | | @ | | Sun Microsystems, Inc. | | | 3,699 |
| 120 | | @ | | Teradata Corp. | | | 2,777 |
| | | | | | | |
| | | | | | | 219,606 |
| | | | | | | |
| Cosmetics/Personal Care: 0.6% |
| 270 | | | | Avon Products, Inc. | | | 9,725 |
| 120 | | | | Colgate-Palmolive Co. | | | 8,292 |
| 1,250 | | | | Procter & Gamble Co. | | | 76,013 |
| | | | | | | |
| | | | | | | 94,030 |
| | | | | | | |
| Distribution/Wholesale: 0.0% |
| 170 | | | | Genuine Parts Co. | | | 6,746 |
| | | | | | | |
| | | | | | | 6,746 |
| | | | | | | |
| Diversified Financial Services: 1.7% |
| 360 | | | | American Express Co. | | | 13,561 |
| 110 | | | | Ameriprise Financial, Inc. | | | 4,474 |
| 220 | | | | Charles Schwab Corp. | | | 4,519 |
| 150 | | | | CIT Group, Inc. | | | 1,022 |
| 1,890 | | | | Citigroup, Inc. | | | 31,676 |
| 60 | | | | CME Group, Inc. | | | 22,991 |
| 250 | | | | Countrywide Financial Corp. | | | 1,063 |
| 230 | | | | Discover Financial Services | | | 3,029 |
| 650 | | @ | | E*Trade Financial Corp. | | | 2,041 |
| 260 | | | | Federal Home Loan Mortgage Corporation | | | 4,264 |
| 380 | | | | Federal National Mortgage Association | | | 7,414 |
| 230 | | | | Goldman Sachs Group, Inc. | | | 40,227 |
| 1,297 | | | | JPMorgan Chase & Co. | | | 44,500 |
| 100 | | | | Legg Mason, Inc. | | | 4,357 |
| 230 | | | | Lehman Brothers Holdings, Inc. | | | 4,556 |
| 560 | | | | Merrill Lynch & Co., Inc. | | | 17,758 |
| 540 | | | | Morgan Stanley | | | 19,478 |
| | | | | | | |
| Shares | | | | | | Value |
| | | | | | | |
| 110 | | | | NYSE Euronext | | $ | 5,573 |
| 120 | | @ | | SLM Corp. | | | 2,322 |
| 100 | | | | T. Rowe Price Group, Inc. | | | 5,647 |
| | | | | | | |
| | | | | | | 240,472 |
| | | | | | | |
| Electric: 1.1% |
| 350 | | @ | | AES Corp. | | | 6,724 |
| 520 | | | | American Electric Power Co., Inc. | | | 20,920 |
| 350 | | | | Centerpoint Energy, Inc. | | | 5,618 |
| 270 | | | | Dominion Resources, Inc. | | | 12,822 |
| 300 | | | | DTE Energy Co. | | | 12,732 |
| 1,110 | | | | Duke Energy Corp. | | | 19,292 |
| 270 | | | | Edison International | | | 13,873 |
| 100 | | | | Entergy Corp. | | | 12,048 |
| 120 | | | | Exelon Corp. | | | 10,795 |
| 170 | | | | FPL Group, Inc. | | | 11,149 |
| 350 | | | | Pepco Holdings, Inc. | | | 8,978 |
| 100 | | | | PG&E Corp. | | | 3,969 |
| 120 | | | | PPL Corp. | | | 6,272 |
| 150 | | | | Public Service Enterprise Group, Inc. | | | 6,890 |
| | | | | | | |
| | | | | | | 152,082 |
| | | | | | | |
| Electrical Components & Equipment: 0.1% |
| 250 | | | | Emerson Electric Co. | | | 12,363 |
| 120 | | | | Molex, Inc. | | | 2,929 |
| | | | | | | |
| | | | | | | 15,292 |
| | | | | | | |
| Electronics: 0.3% |
| 230 | | @ | | Agilent Technologies, Inc. | | | 8,174 |
| 120 | | | | Applera Corp. - Applied Biosystems Group | | | 4,018 |
| 170 | | | | Jabil Circuit, Inc. | | | 2,790 |
| 150 | | | | PerkinElmer, Inc. | | | 4,178 |
| 240 | | @ | | Thermo Electron Corp. | | | 13,375 |
| 210 | | @@ | | Tyco Electronics Ltd. | | | 7,522 |
| 100 | | @ | | Waters Corp. | | | 6,450 |
| | | | | | | |
| | | | | | | 46,507 |
| | | | | | | |
| Engineering & Construction: 0.2% |
| 100 | | | | Fluor Corp. | | | 18,608 |
| 100 | | @ | | Jacobs Engineering Group, Inc. | | | 8,070 |
| | | | | | | |
| | | | | | | 26,678 |
| | | | | | | |
| Environmental Control: 0.1% |
| 370 | | @ | | Allied Waste Industries, Inc. | | | 4,669 |
| 170 | | | | Waste Management, Inc. | | | 6,411 |
| | | | | | | |
| | | | | | | 11,080 |
| | | | | | | |
| Food: 0.6% |
| 270 | | | | ConAgra Foods, Inc. | | | 5,206 |
| 170 | | | | General Mills, Inc. | | | 10,331 |
| 160 | | | | HJ Heinz Co. | | | 7,656 |
| 270 | | | | Kellogg Co. | | | 12,965 |
| 443 | | | | Kraft Foods, Inc. | | | 12,603 |
| 220 | | | | Kroger Co. | | | 6,351 |
| 630 | | | | Sara Lee Corp. | | | 7,718 |
| 170 | | | | Supervalu, Inc. | | | 5,251 |
| 150 | | | | Sysco Corp. | | | 4,127 |
| 120 | | | | WM Wrigley Jr. Co. | | | 9,334 |
| | | | | | | |
| | | | | | | 81,542 |
| | | | | | | |
| Gas: 0.1% |
| 270 | | | | Sempra Energy | | | 15,242 |
| | | | | | | |
| | | | | | | 15,242 |
| | | | | | | |
See Accompanying Notes to Financial Statements
105
| | |
| ING GET U.S. CORE PORTFOLIO SERIES 10 | | PORTFOLIO OF INVESTMENTS ASOF JUNE 30, 2008 (UNAUDITED) (CONTINUED) |
| | | | | | | |
| Shares | | | | | | Value |
| | | | | | | |
| Hand/Machine Tools: 0.1% |
| 60 | | | | Black & Decker Corp. | | $ | 3,451 |
| 110 | | | | Snap-On, Inc. | | | 5,721 |
| 100 | | | | Stanley Works | | | 4,483 |
| | | | | | | |
| | | | | | | 13,655 |
| | | | | | | |
| Healthcare - Products: 1.0% |
| 220 | | | | Baxter International, Inc. | | | 14,067 |
| 100 | | | | Becton Dickinson & Co. | | | 8,130 |
| 710 | | @ | | Boston Scientific Corp. | | | 8,726 |
| 210 | | @@ | | Covidien Ltd. | | | 10,057 |
| 870 | | | | Johnson & Johnson | | | 55,976 |
| 460 | | | | Medtronic, Inc. | | | 23,805 |
| 170 | | @ | | Patterson Cos., Inc. | | | 4,996 |
| 270 | | @ | | St. Jude Medical, Inc. | | | 11,038 |
| 120 | | | | Stryker Corp. | | | 7,546 |
| 100 | | @ | | Varian Medical Systems, Inc. | | | 5,185 |
| 30 | | @ | | Zimmer Holdings, Inc. | | | 2,042 |
| | | | | | | |
| | | | | | | 151,568 |
| | | | | | | |
| Healthcare - Services: 0.4% |
| 210 | | | | Aetna, Inc. | | | 8,511 |
| 130 | | | | Cigna Corp. | | | 4,601 |
| 110 | | @ | | Humana, Inc. | | | 4,375 |
| 110 | | @ | | Laboratory Corp. of America Holdings | | | 7,659 |
| 100 | | | | Quest Diagnostics | | | 4,847 |
| 370 | | | | UnitedHealth Group, Inc. | | | 9,713 |
| 230 | | @ | | WellPoint, Inc. | | | 10,962 |
| | | | | | | |
| | | | | | | 50,668 |
| | | | | | | |
| Home Builders: 0.0% |
| 170 | | | | D.R. Horton, Inc. | | | 1,845 |
| 250 | | | | Lennar Corp. | | | 3,085 |
| | | | | | | |
| | | | | | | 4,930 |
| | | | | | | |
| Household Products/Wares: 0.2% |
| 100 | | | | Avery Dennison Corp. | | | 4,393 |
| 170 | | | | Clorox Co. | | | 8,874 |
| 100 | | | | Fortune Brands, Inc. | | | 6,241 |
| 230 | | | | Kimberly-Clark Corp. | | | 13,749 |
| | | | | | | |
| | | | | | | 33,257 |
| | | | | | | |
| Insurance: 1.1% |
| 170 | | @@ | | ACE Ltd. | | | 9,365 |
| 170 | | | | Aflac, Inc. | | | 10,676 |
| 220 | | | | Allstate Corp. | | | 10,030 |
| 990 | | | | American International Group, Inc. | | | 26,195 |
| 100 | | | | AON Corp. | | | 4,594 |
| 120 | | | | Assurant, Inc. | | | 7,915 |
| 220 | | | | Chubb Corp. | | | 10,782 |
| 120 | | | | Cincinnati Financial Corp. | | | 3,048 |
| 170 | | | | Genworth Financial, Inc. | | | 3,028 |
| 150 | | | | Hartford Financial Services Group, Inc. | | | 9,686 |
| 120 | | | | Lincoln National Corp. | | | 5,438 |
| 55 | | | | Loews Corp. | | | 2,580 |
| 120 | | | | Marsh & McLennan Cos., Inc. | | | 3,186 |
| 390 | | | | Metlife, Inc. | | | 20,580 |
| 140 | | | | Progressive Corp. | | | 2,621 |
| 230 | | | | Prudential Financial, Inc. | | | 13,740 |
| 120 | | | | Torchmark Corp. | | | 7,038 |
| 240 | | | | Travelers Cos., Inc. | | | 10,416 |
| | | | | | | |
| Shares | | | | | | Value |
| | | | | | | |
| 170 | | | | UnumProvident Corp. | | $ | 3,477 |
| 100 | | @@ | | XL Capital Ltd. | | | 2,056 |
| | | | | | | |
| | | | | | | 166,451 |
| | | | | | | |
| Internet: 0.8% |
| 100 | | @ | | Akamai Technologies, Inc. | | | 3,479 |
| 120 | | @ | | Amazon.com, Inc. | | | 8,800 |
| 390 | | @ | | eBay, Inc. | | | 10,659 |
| 120 | | @ | | Expedia, Inc. | | | 2,206 |
| 130 | | @ | | Google, Inc. - Class A | | | 68,435 |
| 300 | | @ | | Symantec Corp. | | | 5,805 |
| 460 | | @ | | Yahoo!, Inc. | | | 9,504 |
| | | | | | | |
| | | | | | | 108,888 |
| | | | | | | |
| Iron/Steel: 0.2% |
| 210 | | | | Nucor Corp. | | | 15,681 |
| 50 | | | | United States Steel Corp. | | | 9,239 |
| | | | | | | |
| | | | | | | 24,920 |
| | | | | | | |
| Lodging: 0.0% |
| 120 | | | | Starwood Hotels & Resorts Worldwide, Inc. | | | 4,808 |
| | | | | | | |
| | | | | | | 4,808 |
| | | | | | | |
| Machinery - Construction & Mining: 0.2% |
| 260 | | | | Caterpillar, Inc. | | | 19,193 |
| 120 | | @ | | Terex Corp. | | | 6,164 |
| | | | | | | |
| | | | | | | 25,357 |
| | | | | | | |
| Machinery - Diversified: 0.2% |
| 80 | | | | Cummins, Inc. | | | 5,242 |
| 170 | | | | Deere & Co. | | | 12,262 |
| 100 | | | | Manitowoc Co., Inc. | | | 3,253 |
| 100 | | | | Rockwell Automation, Inc. | | | 4,373 |
| | | | | | | |
| | | | | | | 25,130 |
| | | | | | | |
| Media: 0.7% |
| 120 | | | | CBS Corp. - Class B | | | 2,339 |
| 230 | | | | Clear Channel Communications, Inc. | | | 8,096 |
| 840 | | | | Comcast Corp. - Class A | | | 15,935 |
| 210 | | @ | | DIRECTV Group, Inc. | | | 5,441 |
| 1,100 | | | | News Corp. - Class A | | | 16,544 |
| 1,190 | | | | Time Warner, Inc. | | | 17,612 |
| 270 | | @ | | Viacom - Class B | | | 8,246 |
| 720 | | | | Walt Disney Co. | | | 22,464 |
| | | | | | | |
| | | | | | | 96,677 |
| | | | | | | |
| Metal Fabricate/Hardware: 0.1% |
| 100 | | | | Precision Castparts Corp. | | | 9,637 |
| | | | | | | |
| | | | | | | 9,637 |
| | | | | | | |
| Mining: 0.2% |
| 120 | | | | Alcoa, Inc. | | | 4,274 |
| 131 | | | | Freeport-McMoRan Copper & Gold, Inc. | | | 15,352 |
| 170 | | | | Newmont Mining Corp. | | | 8,867 |
| | | | | | | |
| | | | | | | 28,493 |
| | | | | | | |
| Miscellaneous Manufacturing: 1.3% |
| 270 | | | | 3M Co. | | | 18,789 |
| 150 | | | | Cooper Industries Ltd. | | | 5,925 |
| 270 | | | | Dover Corp. | | | 13,060 |
| 100 | | | | Eaton Corp. | | | 8,497 |
| 3,770 | | | | General Electric Co. | | | 100,621 |
See Accompanying Notes to Financial Statements
106
| | |
| ING GET U.S. CORE PORTFOLIO SERIES 10 | | PORTFOLIO OF INVESTMENTS ASOF JUNE 30, 2008 (UNAUDITED) (CONTINUED) |
| | | | | | | |
| Shares | | | | | | Value |
| | | | | | | |
| Miscellaneous Manufacturing: (continued) |
| 310 | | | | Honeywell International, Inc. | | $ | 15,587 |
| 170 | | | | Illinois Tool Works, Inc. | | | 8,077 |
| 170 | | | | Leggett & Platt, Inc. | | | 2,851 |
| 120 | | | | Parker Hannifin Corp. | | | 8,558 |
| 170 | | | | Textron, Inc. | | | 8,148 |
| 60 | | @@ | | Tyco International Ltd. | | | 2,402 |
| | | | | | | |
| | | | | | | 192,515 |
| | | | | | | |
| Office/Business Equipment: 0.1% |
| 270 | | | | Pitney Bowes, Inc. | | | 9,207 |
| 480 | | | | Xerox Corp. | | | 6,509 |
| | | | | | | |
| | | | | | | 15,716 |
| | | | | | | |
| Oil & Gas: 4.2% |
| 200 | | | | Anadarko Petroleum Corp. | | | 14,968 |
| 170 | | | | Apache Corp. | | | 23,630 |
| 60 | | | | Cabot Oil & Gas Corp. | | | 4,064 |
| 270 | | | | Chesapeake Energy Corp. | | | 17,809 |
| 860 | | | | Chevron Corp. | | | 85,252 |
| 673 | | | | ConocoPhillips | | | 63,524 |
| 240 | | | | Devon Energy Corp. | | | 28,838 |
| 120 | | | | ENSCO International, Inc. | | | 9,689 |
| 100 | | | | EOG Resources, Inc. | | | 13,120 |
| 2,190 | | | | ExxonMobil Corp. | | | 193,005 |
| 120 | | | | Hess Corp. | | | 15,143 |
| 230 | | | | Marathon Oil Corp. | | | 11,930 |
| 120 | | | | Murphy Oil Corp. | | | 11,766 |
| 120 | | @, @@ | | Nabors Industries Ltd. | | | 5,908 |
| 100 | | | | Noble Corp. | | | 6,496 |
| 110 | | | | Noble Energy, Inc. | | | 11,062 |
| 320 | | | | Occidental Petroleum Corp. | | | 28,755 |
| 120 | | | | Questar Corp. | | | 8,525 |
| 100 | | | | Range Resources Corp. | | | 6,554 |
| 150 | | @ | | Southwestern Energy Co. | | | 7,142 |
| 100 | | | | Sunoco, Inc. | | | 4,069 |
| 165 | | @ | | Transocean, Inc. | | | 25,144 |
| 120 | | | | Valero Energy Corp. | | | 4,942 |
| 200 | | | | XTO Energy, Inc. | | | 13,702 |
| | | | | | | |
| | | | | | | 615,037 |
| | | | | | | |
| Oil & Gas Services: 0.7% |
| 120 | | | | Baker Hughes, Inc. | | | 10,481 |
| 220 | | | | Halliburton Co. | | | 11,675 |
| 170 | | @ | | National Oilwell Varco, Inc. | | | 15,082 |
| 420 | | | | Schlumberger Ltd. | | | 45,121 |
| 100 | | | | Smith International, Inc. | | | 8,314 |
| 140 | | @ | | Weatherford International Ltd. | | | 6,943 |
| | | | | | | |
| | | | | | | 97,616 |
| | | | | | | |
| Packaging & Containers: 0.1% |
| 170 | | | | Ball Corp. | | | 8,116 |
| | | | | | | |
| | | | | | | 8,116 |
| | | | | | | |
| Pharmaceuticals: 1.4% |
| 440 | | | | Abbott Laboratories | | | 23,307 |
| 120 | | | | Allergan, Inc. | | | 6,246 |
| 150 | | | | AmerisourceBergen Corp. | | | 5,999 |
| 650 | | | | Bristol-Myers Squibb Co. | | | 13,345 |
| 50 | | | | Cardinal Health, Inc. | | | 2,579 |
| 360 | | | | Eli Lilly & Co. | | | 16,618 |
| 110 | | @ | | Express Scripts, Inc. | | | 6,899 |
| 150 | | @ | | Forest Laboratories, Inc. | | | 5,211 |
| 176 | | @ | | King Pharmaceuticals, Inc. | | | 1,843 |
| | | | | | | |
| Shares | | | | | | Value |
| | | | | | | |
| 170 | | @ | | Medco Health Solutions, Inc. | | $ | 8,024 |
| 850 | | | | Merck & Co., Inc. | | | 32,037 |
| 2,380 | | | | Pfizer, Inc. | | | 41,579 |
| 700 | | | | Schering-Plough Corp. | | | 13,783 |
| 120 | | @ | | Watson Pharmaceuticals, Inc. | | | 3,260 |
| 590 | | | | Wyeth | | | 28,296 |
| | | | | | | |
| | | | | | | 209,026 |
| | | | | | | |
| Pipelines: 0.2% |
| 250 | | | | El Paso Corp. | | | 5,435 |
| 270 | | | | Spectra Energy Corp. | | | 7,760 |
| 270 | | | | Williams Cos., Inc. | | | 10,884 |
| | | | | | | |
| | | | | | | 24,079 |
| | | | | | | |
| Retail: 1.7% |
| 100 | | | | Abercrombie & Fitch Co. | | | 6,268 |
| 110 | | @ | | Autozone, Inc. | | | 13,311 |
| 160 | | | | Best Buy Co., Inc. | | | 6,336 |
| 170 | | @ | | Big Lots, Inc. | | | 5,311 |
| 110 | | | | Costco Wholesale Corp. | | | 7,715 |
| 551 | | | | CVS Caremark Corp. | | | 21,803 |
| 150 | | | | Darden Restaurants, Inc. | | | 4,791 |
| 200 | | | | Family Dollar Stores, Inc. | | | 3,988 |
| 120 | | @ | | GameStop Corp. | | | 4,848 |
| 380 | | | | Gap, Inc. | | | 6,335 |
| 390 | | | | Home Depot, Inc. | | | 9,134 |
| 100 | | | | JC Penney Co., Inc. | | | 3,629 |
| 250 | | | | Limited Brands, Inc. | | | 4,213 |
| 480 | | | | Lowe’s Cos., Inc. | | | 9,960 |
| 120 | | | | Macy’s, Inc. | | | 2,330 |
| 540 | | | | McDonald’s Corp. | | | 30,359 |
| 260 | | | | Staples, Inc. | | | 6,175 |
| 200 | | | | Target Corp. | | | 9,298 |
| 100 | | | | Tiffany & Co. | | | 4,075 |
| 360 | | | | TJX Cos., Inc. | | | 11,329 |
| 270 | | | | Walgreen Co. | | | 8,778 |
| 970 | | | | Wal-Mart Stores, Inc. | | | 54,514 |
| 230 | | | | Yum! Brands, Inc. | | | 8,071 |
| | | | | | | |
| | | | | | | 242,571 |
| | | | | | | |
| Savings & Loans: 0.0% |
| 230 | | | | Hudson City Bancorp., Inc. | | | 3,836 |
| 380 | | | | Washington Mutual, Inc. | | | 1,873 |
| | | | | | | |
| | | | | | | 5,709 |
| | | | | | | |
| Semiconductors: 0.8% |
| 150 | | | | Altera Corp. | | | 3,105 |
| 170 | | | | Analog Devices, Inc. | | | 5,401 |
| 480 | | | | Applied Materials, Inc. | | | 9,163 |
| 170 | | @ | | Broadcom Corp. | | | 4,639 |
| 2,160 | | | | Intel Corp. | | | 46,397 |
| 120 | | | | KLA-Tencor Corp. | | | 4,885 |
| 100 | | | | Linear Technology Corp. | | | 3,257 |
| 360 | | @ | | LSI Logic Corp. | | | 2,210 |
| 120 | | @ | | MEMC Electronic Materials, Inc. | | | 7,385 |
| 130 | | | | National Semiconductor Corp. | | | 2,670 |
| 225 | | @ | | Nvidia Corp. | | | 4,212 |
| 170 | | @ | | QLogic Corp. | | | 2,480 |
| 650 | | | | Texas Instruments, Inc. | | | 18,304 |
| 170 | | | | Xilinx, Inc. | | | 4,293 |
| | | | | | | |
| | | | | | | 118,401 |
| | | | | | | |
See Accompanying Notes to Financial Statements
107
| | |
| ING GET U.S. CORE PORTFOLIO SERIES 10 | | PORTFOLIO OF INVESTMENTS ASOF JUNE 30, 2008 (UNAUDITED) (CONTINUED) |
| | | | | | | |
| Shares | | | | | | Value |
| | | | | | | |
| Software: 1.2% |
| 250 | | @ | | Adobe Systems, Inc. | | $ | 9,848 |
| 170 | | @ | | Autodesk, Inc. | | | 5,748 |
| 110 | | @ | | BMC Software, Inc. | | | 3,960 |
| 250 | | | | CA, Inc. | | | 5,773 |
| 350 | | @ | | Compuware Corp. | | | 3,339 |
| 120 | | @ | | Electronic Arts, Inc. | | | 5,332 |
| 100 | | | | Fidelity National Information Services, Inc. | | | 3,691 |
| 150 | | @ | | Fiserv, Inc. | | | 6,806 |
| 270 | | | | IMS Health, Inc. | | | 6,291 |
| 3,100 | | | | Microsoft Corp. | | | 85,281 |
| 1,530 | | @ | | Oracle Corp. | | | 32,130 |
| | | | | | | |
| | | | | | | 168,199 |
| | | | | | | |
| Telecommunications: 1.6% |
| 2,153 | | | | AT&T, Inc. | | | 72,535 |
| 100 | | | | CenturyTel, Inc. | | | 3,559 |
| 2,260 | | @ | | Cisco Systems, Inc. | | | 52,568 |
| 620 | | | | Corning, Inc. | | | 14,291 |
| 92 | | | | Embarq Corp. | | | 4,349 |
| 170 | | @ | | JDS Uniphase Corp. | | | 1,931 |
| 130 | | @ | | Juniper Networks, Inc. | | | 2,883 |
| 190 | | | | Motorola, Inc. | | | 1,395 |
| 580 | | | | Qualcomm, Inc. | | | 25,735 |
| 840 | | | | Qwest Communications International, Inc. | | | 3,301 |
| 530 | | | | Sprint Nextel Corp. | | | 5,035 |
| 1,080 | | | | Verizon Communications, Inc. | | | 38,232 |
| 620 | | | | Windstream Corp. | | | 7,651 |
| | | | | | | |
| | | | | | | 233,465 |
| | | | | | | |
| Textiles: 0.0% |
| 120 | | | | Cintas Corp. | | | 3,181 |
| | | | | | | |
| | | | | | | 3,181 |
| | | | | | | |
| Toys/Games/Hobbies: 0.1% |
| 270 | | | | Hasbro, Inc. | | | 9,644 |
| | | | | | | |
| | | | | | | 9,644 |
| | | | | | | |
| Transportation: 0.5% |
| 120 | | | | Burlington Northern Santa Fe Corp. | | | 11,987 |
| 100 | | | | CH Robinson Worldwide, Inc. | | | 5,484 |
| 120 | | | | CSX Corp. | | | 7,537 |
| 120 | | | | Expeditors International Washington, Inc. | | | 5,160 |
| 50 | | | | FedEx Corp. | | | 3,940 |
| 120 | | | | Norfolk Southern Corp. | | | 7,520 |
| 120 | | | | Ryder System, Inc. | | | 8,266 |
| 120 | | | | Union Pacific Corp. | | | 9,060 |
| 210 | | | | United Parcel Service, Inc. - Class B | | | 12,909 |
| | | | | | | |
| | | | | | | 71,863 |
| | | | | | | |
| | | | Total Common Stock
(Cost $4,677,105) | | | 4,431,482 |
| | | | | | | |
| REAL ESTATE INVESTMENT TRUSTS: 0.3% |
| Apartments: 0.0% |
| 120 | | | | Equity Residential | | | 4,592 |
| | | | | | | |
| | | | | | | 4,592 |
| | | | | | | |
| | | | | | | | |
| Shares | | | | | | Value |
| | | | | | | | |
| | Diversified: 0.1% |
| | 100 | | | | Vornado Realty Trust | | $ | 8,800 |
| | | | | | | | |
| | | | | | | | 8,800 |
| | | | | | | | |
| | Health Care: 0.0% |
| | 150 | | | | HCP, Inc. | | | 4,772 |
| | | | | | | | |
| | | | | | | | 4,772 |
| | | | | | | | |
| | Hotels: 0.1% |
| | 460 | | | | Host Hotels & Resorts, Inc. | | | 6,279 |
| | | | | | | | |
| | | | | | | | 6,279 |
| | | | | | | | |
| | Regional Malls: 0.1% |
| | 120 | | | | General Growth Properties, Inc. | | | 4,204 |
| | 100 | | | | Simon Property Group, Inc. | | | 8,989 |
| | | | | | | | |
| | | | | | | | 13,193 |
| | | | | | | | |
| | Storage: 0.0% |
| | 20 | | | | Public Storage, Inc. | | | 1,616 |
| | | | | | | | |
| | | | | | | | 1,616 |
| | | | | | | | |
| | Warehouse/Industrial: 0.0% |
| | 100 | | | | Prologis | | | 5,435 |
| | | | | | | | |
| | | | | | | | 5,435 |
| | | | | | | | |
| | | | | Total Real Estate Investment Trusts
(Cost $48,538) | | | 44,687 |
| | | | | | | | |
| | | |
Principal
Amount | | | | | | Value |
| | U.S. GOVERNMENT AGENCY OBLIGATIONS: 48.0% |
| | Federal Home Loan Mortgage Corporation: 35.0% |
| $ | 6,000,000 | | ^, Z | | 3.700%, due 01/15/13 | | $ | 5,078,774 |
| | | | | | | | |
| | | | | | | | 5,078,774 |
| | | | | | | | |
| | Federal National Mortgage Association: 13.0% |
| | 2,222,000 | | ^, Z | | 3.750%, due 01/15/13 | | | 1,880,039 |
| | | | | | | | |
| | | | | | | | 1,880,039 |
| | | | | | | | |
| | | | | Total U.S. Government Agency Obligations
(Cost $6,966,466) | | | 6,958,813 |
| | | | | | | | |
| | U.S. TREASURY OBLIGATIONS: 20.6% |
| | U.S. Treasury STRIP: 20.6% |
| | 3,448,000 | | ^ | | 2.754%, due 11/15/12 | | | 2,988,251 |
| | | | | | | | |
| | | | | Total U.S. Treasury Obligations
(Cost $3,022,689) | | | 2,988,251 |
| | | | | | | | |
| | | | | Total Long-Term Investments
(Cost $14,714,798) | | | 14,423,233 |
| | | | | | | | |
See Accompanying Notes to Financial Statements
108
| | |
| ING GET U.S. CORE PORTFOLIO SERIES 10 | | PORTFOLIO OF INVESTMENTS ASOF JUNE 30, 2008 (UNAUDITED) (CONTINUED) |
| | | | | | | | | | |
Principal
Amount | | | | | | | Value | |
| | | | | | | | | | |
| | SHORT-TERM INVESTMENTS: 0.7% | |
| | Repurchase Agreement: 0.7% | |
| $ | 103,000 | | Goldman Sachs Repurchase Agreement dated 06/30/08, 2.350%, due 07/01/08, $103,007 to be received upon repurchase (Collateralized by $103,300 U.S. Treasury, 3.500%, Market Value plus accrued interest $105,078, due 12/15/09) | | | | | $ | 103,000 | |
| | | | | | | | | | |
| | | Total Short-Term Investments
(Cost $103,000) | | | | | | 103,000 | |
| | | | | | | | | | |
| | | Total Investments in Securities
(Cost $14,817,798)* | | 100.2 | % | | $ | 14,526,233 | |
| | | Other Assets and
Liabilities - Net | | (0.2 | ) | | | (23,926 | ) |
| | | | | | | | | | |
| | | Net Assets | | 100.0 | % | | $ | 14,502,307 | |
| | | | | | | | | | |
| @ | Non-income producing security |
| STRIP | Separate Trading of Registered Interest and Principal of Securities |
| ^ | Interest only securities represent the right to receive the monthly interest payments on an underlying pool of mortgage loans. Principal amount shown represents the notional amount on which current interest is calculated. Payments of principal on the pool reduce the value of the interest only security. |
| Z | Indicates Zero Coupon Bond; rate shown reflects current effective yield. |
| * | Cost for federal income tax purposes is $15,442,517. |
| | | | |
Net unrealized depreciation consists of: | | | | |
Gross Unrealized Appreciation | | $ | 244,332 | |
Gross Unrealized Depreciation | | | (1,160,616 | ) |
| | | | |
Net Unrealized Depreciation | | $ | (916,284 | ) |
| | | | |
Fair Value Measurements — Effective January 1, 2008, the Portfolio adopted Financial Accounting Standards Board Statement of Financial Accounting Standards No. 157 (“SFAS 157”), “Fair Value Measurements.” This new accounting statement defines fair value, establishes a framework for measuring fair value in generally accepted accounting principles (“GAAP”), and expands disclosures about fair value measurements. The three levels of the fair value hierarchy are as follows:
| | • | | Level 1 — quoted prices in active markets for identical investments |
| | • | | Level 2 — other significant observable inputs (including quoted prices for similar investments, interest rates, prepayment speeds, credit risk, etc.) |
| | • | | Level 3 — significant unobservable inputs (including the Portfolio’s own assumption in determining the fair value of investments) |
The inputs or methodology used in valuing securities are not necessarily an indication of the risk associated with investing in those securities.
The following is a summary of the inputs used as of June 30, 2008 in valuing the Portfolio’s investments at fair value:
| | | | | | |
| | | Investments in Securities | | Other Financial Instruments* |
Level 1 — Quoted Prices | | $ | 4,476,169 | | $ | — |
Level 2 — Other Significant Observable Inputs | | | 10,050,064 | | | — |
Level 3 — Significant Unobservable Inputs | | | — | | | — |
| | | | | | |
Total | | $ | 14,526,233 | | $ | — |
| | | | | | |
| * | | Other financial instruments may include forward foreign currency contracts, futures, swaps, and written options. |
See Accompanying Notes to Financial Statements
109
| | |
| ING GET U.S. CORE PORTFOLIO SERIES 11 | | PORTFOLIO OF INVESTMENTS ASOF JUNE 30, 2008 (UNAUDITED) |
Investment Type Allocation as of June 30, 2008
(as a percent of net assets)
| | |
U.S. Government Agency Obligations | | 57.3% |
U.S. Treasury Obligations | | 36.2% |
Common Stock | | 6.8% |
Real Estate Investment Trusts | | 0.0% |
Other Assets and Liabilities - Net* | | (0.3)% |
| | |
Net Assets | | 100.0% |
| | |
| | * | Includes short-term investments related to ING Institutional Prime Money Market Fund and repurchase agreement. | |
Portfolio holdings are subject to change daily.
| | | | | | | |
| Shares | | | | | | Value |
| | | | | | | |
| COMMON STOCK: 6.8% |
| Advertising: 0.0% |
| 200 | | @ | | Interpublic Group of Cos., Inc. | | $ | 1,720 |
| 70 | | | | Omnicom Group | | | 3,142 |
| | | | | | | |
| | | | | | | 4,862 |
| | | | | | | |
| Aerospace/Defense: 0.2% |
| 80 | | | | Boeing Co. | | | 5,258 |
| 60 | | | | General Dynamics Corp. | | | 5,052 |
| 10 | | | | Goodrich Corp. | | | 475 |
| 20 | | | | L-3 Communications Holdings, Inc. | | | 1,817 |
| 30 | | | | Lockheed Martin Corp. | | | 2,960 |
| 60 | | | | Northrop Grumman Corp. | | | 4,014 |
| 10 | | | | Raytheon Co. | | | 563 |
| 110 | | | | United Technologies Corp. | | | 6,787 |
| | | | | | | |
| | | | | | | 26,926 |
| | | | | | | |
| Agriculture: 0.1% |
| 220 | | | | Altria Group, Inc. | | | 4,523 |
| 60 | | | | Archer-Daniels-Midland Co. | | | 2,025 |
| 14 | | @ | | Lorillard, Inc. | | | 968 |
| 220 | | | | Philip Morris International, Inc. | | | 10,866 |
| 50 | | | | Reynolds American, Inc. | | | 2,334 |
| | | | | | | |
| | | | | | | 20,716 |
| | | | | | | |
| Airlines: 0.0% |
| 70 | | | | Southwest Airlines Co. | | | 913 |
| | | | | | | |
| | | | | | | 913 |
| | | | | | | |
| Apparel: 0.0% |
| 80 | | @ | | Coach, Inc. | | | 2,310 |
| 60 | | | | Nike, Inc. | | | 3,577 |
| 10 | | | | Polo Ralph Lauren Corp. | | | 628 |
| | | | | | | |
| | | | | | | 6,515 |
| | | | | | | |
| Auto Manufacturers: 0.0% |
| 154 | | @ | | Ford Motor Co. | | | 741 |
| 60 | | | | General Motors Corp. | | | 690 |
| | | | | | | |
| | | | | | | 1,431 |
| | | | | | | |
| Auto Parts & Equipment: 0.0% |
| 100 | | | | Johnson Controls, Inc. | | | 2,868 |
| | | | | | | |
| | | | | | | 2,868 |
| | | | | | | |
| | | | | | | |
| Shares | | | | | | Value |
| | | | | | | |
| Banks: 0.3% |
| 500 | | | | Bank of America Corp. | | $ | 11,935 |
| 190 | | | | Bank of New York Mellon Corp. | | | 7,188 |
| 60 | | | | BB&T Corp. | | | 1,366 |
| 19 | | | | Capital One Financial Corp. | | | 722 |
| 50 | | | | Fifth Third Bancorp. | | | 509 |
| 29 | | | | Marshall & Ilsley Corp. | | | 445 |
| 20 | | | | Northern Trust Corp. | | | 1,371 |
| 206 | | | | Regions Financial Corp. | | | 2,247 |
| 40 | | | | State Street Corp. | | | 2,560 |
| 120 | | | | US Bancorp. | | | 3,347 |
| 235 | | | | Wachovia Corp. | | | 3,650 |
| 350 | | | | Wells Fargo & Co. | | | 8,313 |
| 20 | | | | Zions Bancorp. | | | 630 |
| | | | | | | |
| | | | | | | 44,283 |
| | | | | | | |
| Beverages: 0.2% |
| 270 | | | | Coca-Cola Co. | | | 14,035 |
| 70 | | | | Pepsi Bottling Group, Inc. | | | 1,954 |
| 200 | | | | PepsiCo, Inc. | | | 12,718 |
| | | | | | | |
| | | | | | | 28,707 |
| | | | | | | |
| Biotechnology: 0.1% |
| 130 | | @ | | Amgen, Inc. | | | 6,131 |
| 20 | | @ | | Biogen Idec, Inc. | | | 1,118 |
| 50 | | @ | | Celgene Corp. | | | 3,194 |
| 30 | | @ | | Genzyme Corp. | | | 2,161 |
| 100 | | @ | | Gilead Sciences, Inc. | | | 5,295 |
| | | | | | | |
| | | | | | | 17,899 |
| | | | | | | |
| Chemicals: 0.1% |
| 90 | | | | Dow Chemical Co. | | | 3,142 |
| 60 | | | | Ecolab, Inc. | | | 2,579 |
| 120 | | | | EI Du Pont de Nemours & Co. | | | 5,147 |
| 100 | | | | Hercules, Inc. | | | 1,693 |
| 50 | | | | Monsanto Co. | | | 6,322 |
| 20 | | | | PPG Industries, Inc. | | | 1,147 |
| 70 | | | | Sigma-Aldrich Corp. | | | 3,770 |
| | | | | | | |
| | | | | | | 23,800 |
| | | | | | | |
| Coal: 0.0% |
| 20 | | | | Consol Energy, Inc. | | | 2,247 |
| 10 | | | | Massey Energy Co. | | | 938 |
| 20 | | | | Peabody Energy Corp. | | | 1,761 |
| | | | | | | |
| | | | | | | 4,946 |
| | | | | | | |
| Commercial Services: 0.1% |
| 20 | | @ | | Apollo Group, Inc. - Class A | | | 885 |
| 100 | | | | H&R Block, Inc. | | | 2,140 |
| 50 | | | | McKesson Corp. | | | 2,796 |
| 10 | | | | Moody’s Corp. | | | 344 |
| 50 | | | | Robert Half International, Inc. | | | 1,199 |
| 60 | | | | RR Donnelley & Sons Co. | | | 1,781 |
| 100 | | | | Western Union Co. | | | 2,472 |
| | | | | | | |
| | | | | | | 11,617 |
| | | | | | | |
| Computers: 0.4% |
| 10 | | @ | | Affiliated Computer Services, Inc. | | | 535 |
| 90 | | @ | | Apple, Inc. | | | 15,070 |
| 20 | | @ | | Cognizant Technology Solutions Corp. | | | 650 |
| 20 | | @ | | Computer Sciences Corp. | | | 937 |
| 250 | | @ | | Dell, Inc. | | | 5,470 |
| 250 | | @ | | EMC Corp. | | | 3,673 |
| 270 | | | | Hewlett-Packard Co. | | | 11,937 |
See Accompanying Notes to Financial Statements
110
| | |
| ING GET U.S. CORE PORTFOLIO SERIES 11 | | PORTFOLIO OF INVESTMENTS ASOF JUNE 30, 2008 (UNAUDITED) (CONTINUED) |
| | | | | | | |
| Shares | | | | | | Value |
| | | | | | | |
| Computers: (continued) |
| 140 | | | | International Business Machines Corp. | | $ | 16,594 |
| 50 | | @ | | Lexmark International, Inc. | | | 1,672 |
| 50 | | @ | | NetApp, Inc. | | | 1,083 |
| 50 | | @ | | Sandisk Corp. | | | 935 |
| 100 | | @ | | Sun Microsystems, Inc. | | | 1,088 |
| | | | | | | |
| | | | | | | 59,644 |
| | | | | | | |
| Cosmetics/Personal Care: 0.2% |
| 20 | | | | Avon Products, Inc. | | | 720 |
| 50 | | | | Colgate-Palmolive Co. | | | 3,455 |
| 420 | | | | Procter & Gamble Co. | | | 25,540 |
| | | | | | | |
| | | | | | | 29,715 |
| | | | | | | |
| Distribution/Wholesale: 0.0% |
| 50 | | | | Genuine Parts Co. | | | 1,984 |
| | | | | | | |
| | | | | | | 1,984 |
| | | | | | | |
| Diversified Financial Services: 0.3% |
| 80 | | | | American Express Co. | | | 3,014 |
| 20 | | | | Ameriprise Financial, Inc. | | | 813 |
| 70 | | | | Charles Schwab Corp. | | | 1,438 |
| 40 | | | | CIT Group, Inc. | | | 272 |
| 590 | | | | Citigroup, Inc. | | | 9,888 |
| 90 | | | | Countrywide Financial Corp. | | | 383 |
| 60 | | | | Discover Financial Services | | | 790 |
| 200 | | @ | | E*Trade Financial Corp. | | | 628 |
| 60 | | | | Federal Home Loan Mortgage Corporation | | | 984 |
| 90 | | | | Federal National Mortgage Association | | | 1,756 |
| 40 | | | | Goldman Sachs Group, Inc. | | | 6,996 |
| 401 | | | | JPMorgan Chase & Co. | | | 13,758 |
| 50 | | | | Lehman Brothers Holdings, Inc. | | | 991 |
| 170 | | | | Merrill Lynch & Co., Inc. | | | 5,391 |
| 190 | | | | Morgan Stanley | | | 6,853 |
| 20 | | | | NYSE Euronext | | | 1,013 |
| 50 | | @ | | SLM Corp. | | | 968 |
| | | | | | | |
| | | | | | | 55,936 |
| | | | | | | |
| Electric: 0.3% |
| 100 | | @ | | AES Corp. | | | 1,921 |
| 200 | | | | American Electric Power Co., Inc. | | | 8,046 |
| 100 | | | | Centerpoint Energy, Inc. | | | 1,605 |
| 70 | | | | Dominion Resources, Inc. | | | 3,324 |
| 50 | | | | DTE Energy Co. | | | 2,122 |
| 310 | | | | Duke Energy Corp. | | | 5,388 |
| 60 | | | | Edison International | | | 3,083 |
| 20 | | | | Entergy Corp. | | | 2,410 |
| 50 | | | | Exelon Corp. | | | 4,498 |
| 80 | | | | FPL Group, Inc. | | | 5,246 |
| 100 | | | | Pepco Holdings, Inc. | | | 2,565 |
| 40 | | | | Public Service Enterprise Group, Inc. | | | 1,837 |
| | | | | | | |
| | | | | | | 42,045 |
| | | | | | | |
| Electrical Components & Equipment: 0.0% |
| 70 | | | | Emerson Electric Co. | | | 3,462 |
| 20 | | | | Molex, Inc. | | | 488 |
| | | | | | | |
| | | | | | | 3,950 |
| | | | | | | |
| Electronics: 0.1% |
| 60 | | @ | | Agilent Technologies, Inc. | | | 2,132 |
| 20 | | | | Applera Corp. - Applied Biosystems Group | | | 670 |
| | | | | | | |
| Shares | | | | | | Value |
| | | | | | | |
| 50 | | | | Jabil Circuit, Inc. | | $ | 821 |
| 50 | | @ | | Thermo Electron Corp. | | | 2,787 |
| 50 | | @@ | | Tyco Electronics Ltd. | | | 1,791 |
| 20 | | @ | | Waters Corp. | | | 1,290 |
| | | | | | | |
| | | | | | | 9,491 |
| | | | | | | |
| Engineering & Construction: 0.0% |
| 10 | | @ | | Jacobs Engineering Group, Inc. | | | 807 |
| | | | | | | |
| | | | | | | 807 |
| | | | | | | |
| Environmental Control: 0.0% |
| 100 | | @ | | Allied Waste Industries, Inc. | | | 1,262 |
| 60 | | | | Waste Management, Inc. | | | 2,263 |
| | | | | | | |
| | | | | | | 3,525 |
| | | | | | | |
| Food: 0.1% |
| 100 | | | | ConAgra Foods, Inc. | | | 1,928 |
| 60 | | | | General Mills, Inc. | | | 3,646 |
| 20 | | | | HJ Heinz Co. | | | 957 |
| 30 | | | | Kellogg Co. | | | 1,441 |
| 88 | | | | Kraft Foods, Inc. | | | 2,504 |
| 100 | | | | Kroger Co. | | | 2,887 |
| 200 | | | | Sara Lee Corp. | | | 2,450 |
| 50 | | | | Supervalu, Inc. | | | 1,545 |
| 20 | | | | WM Wrigley Jr. Co. | | | 1,556 |
| | | | | | | |
| | | | | | | 18,914 |
| | | | | | | |
| Gas: 0.0% |
| 60 | | | | Sempra Energy | | | 3,387 |
| | | | | | | |
| | | | | | | 3,387 |
| | | | | | | |
| Hand/Machine Tools: 0.0% |
| 10 | | | | Black & Decker Corp. | | | 575 |
| 20 | | | | Snap-On, Inc. | | | 1,040 |
| 20 | | | | Stanley Works | | | 897 |
| | | | | | | |
| | | | | | | 2,512 |
| | | | | | | |
| Healthcare - Products: 0.3% |
| 70 | | | | Baxter International, Inc. | | | 4,476 |
| 200 | | @ | | Boston Scientific Corp. | | | 2,458 |
| 30 | | @@ | | Covidien Ltd. | | | 1,437 |
| 10 | | | | CR Bard, Inc. | | | 880 |
| 290 | | | | Johnson & Johnson | | | 18,659 |
| 200 | | | | Medtronic, Inc. | | | 10,350 |
| 20 | | @ | | St. Jude Medical, Inc. | | | 818 |
| 20 | | | | Stryker Corp. | | | 1,258 |
| 10 | | @ | | Varian Medical Systems, Inc. | | | 519 |
| 10 | | @ | | Zimmer Holdings, Inc. | | | 681 |
| | | | | | | |
| | | | | | | 41,536 |
| | | | | | | |
| Healthcare - Services: 0.1% |
| 60 | | | | Aetna, Inc. | | | 2,432 |
| 30 | | | | Cigna Corp. | | | 1,062 |
| 20 | | @ | | Humana, Inc. | | | 795 |
| 10 | | @ | | Laboratory Corp. of America Holdings | | | 696 |
| 130 | | | | UnitedHealth Group, Inc. | | | 3,413 |
| 60 | | @ | | WellPoint, Inc. | | | 2,860 |
| | | | | | | |
| | | | | | | 11,258 |
| | | | | | | |
| Home Builders: 0.0% |
| 70 | | | | D.R. Horton, Inc. | | | 760 |
| 100 | | | | Lennar Corp. | | | 1,234 |
| | | | | | | |
| | | | | | | 1,994 |
| | | | | | | |
See Accompanying Notes to Financial Statements
111
| | |
| ING GET U.S. CORE PORTFOLIO SERIES 11 | | PORTFOLIO OF INVESTMENTS ASOF JUNE 30, 2008 (UNAUDITED) (CONTINUED) |
| | | | | | | |
| Shares | | | | | | Value |
| | | | | | | |
| Household Products/Wares: 0.0% |
| 10 | | | | Clorox Co. | | $ | 522 |
| 80 | | | | Kimberly-Clark Corp. | | | 4,782 |
| | | | | | | |
| | | | | | | 5,304 |
| | | | | | | |
| Insurance: 0.3% |
| 40 | | @@ | | ACE Ltd. | | | 2,204 |
| 40 | | | | Aflac, Inc. | | | 2,512 |
| 60 | | | | Allstate Corp. | | | 2,735 |
| 330 | | | | American International Group, Inc. | | | 8,732 |
| 20 | | | | AON Corp. | | | 919 |
| 10 | | | | Assurant, Inc. | | | 660 |
| 60 | | | | Chubb Corp. | | | 2,941 |
| 10 | | | | Cincinnati Financial Corp. | | | 254 |
| 40 | | | | Genworth Financial, Inc. | | | 712 |
| 40 | | | | Hartford Financial Services Group, Inc. | | | 2,583 |
| 50 | | | | Lincoln National Corp. | | | 2,266 |
| 40 | | | | Marsh & McLennan Cos., Inc. | | | 1,062 |
| 170 | | | | Metlife, Inc. | | | 8,971 |
| 50 | | | | Progressive Corp. | | | 936 |
| 50 | | | | Prudential Financial, Inc. | | | 2,987 |
| 20 | | | | Torchmark Corp. | | | 1,173 |
| 70 | | | | Travelers Cos., Inc. | | | 3,038 |
| 40 | | | | UnumProvident Corp. | | | 818 |
| | | | | | | |
| | | | | | | 45,503 |
| | | | | | | |
| Internet: 0.1% |
| 30 | | @ | | Amazon.com, Inc. | | | 2,200 |
| 120 | | @ | | eBay, Inc. | | | 3,280 |
| 30 | | @ | | Expedia, Inc. | | | 551 |
| 20 | | @ | | Google, Inc. - Class A | | | 10,528 |
| 100 | | @ | | Symantec Corp. | | | 1,935 |
| 130 | | @ | | Yahoo!, Inc. | | | 2,686 |
| | | | | | | |
| | | | | | | 21,180 |
| | | | | | | |
| Iron/Steel: 0.0% |
| 10 | | | | Allegheny Technologies, Inc. | | | 593 |
| 30 | | | | Nucor Corp. | | | 2,240 |
| 20 | | | | United States Steel Corp. | | | 3,696 |
| | | | | | | |
| | | | | | | 6,529 |
| | | | | | | |
| Lodging: 0.0% |
| 50 | | | | Starwood Hotels & Resorts Worldwide, Inc. | | | 2,004 |
| | | | | | | |
| | | | | | | 2,004 |
| | | | | | | |
| Machinery - Construction & Mining: 0.0% |
| 70 | | | | Caterpillar, Inc. | | | 5,167 |
| 10 | | @ | | Terex Corp. | | | 514 |
| | | | | | | |
| | | | | | | 5,681 |
| | | | | | | |
| Machinery - Diversified: 0.0% |
| 30 | | | | Cummins, Inc. | | | 1,966 |
| 30 | | | | Deere & Co. | | | 2,164 |
| | | | | | | |
| | | | | | | 4,130 |
| | | | | | | |
| Media: 0.2% |
| 70 | | | | CBS Corp. - Class B | | | 1,364 |
| 60 | | | | Clear Channel Communications, Inc. | | | 2,112 |
| 290 | | | | Comcast Corp. - Class A | | | 5,501 |
| 100 | | @ | | DIRECTV Group, Inc. | | | 2,591 |
| 300 | | | | News Corp. - Class A | | | 4,512 |
| 390 | | | | Time Warner, Inc. | | | 5,772 |
| | | | | | | |
| Shares | | | | | | Value |
| | | | | | | |
| 80 | | @ | | Viacom - Class B | | $ | 2,443 |
| 210 | | | | Walt Disney Co. | | | 6,552 |
| | | | | | | |
| �� | | | | | | 30,847 |
| | | | | | | |
| Metal Fabricate/Hardware: 0.0% |
| 10 | | | | Precision Castparts Corp. | | | 964 |
| | | | | | | |
| | | | | | | 964 |
| | | | | | | |
| Mining: 0.1% |
| 30 | | | | Alcoa, Inc. | | | 1,069 |
| 47 | | | | Freeport-McMoRan Copper & Gold, Inc. | | | 5,508 |
| 30 | | | | Newmont Mining Corp. | | | 1,565 |
| | | | | | | |
| | | | | | | 8,142 |
| | | | | | | |
| Miscellaneous Manufacturing: 0.3% |
| 70 | | | | 3M Co. | | | 4,871 |
| 50 | | | | Dover Corp. | | | 2,419 |
| 20 | | | | Eaton Corp. | | | 1,699 |
| 1,180 | | | | General Electric Co. | | | 31,494 |
| 80 | | | | Honeywell International, Inc. | | | 4,022 |
| 50 | | | | Illinois Tool Works, Inc. | | | 2,376 |
| 50 | | | | Leggett & Platt, Inc. | | | 839 |
| 20 | | | | Parker Hannifin Corp. | | | 1,426 |
| 20 | | | | Textron, Inc. | | | 959 |
| | | | | | | |
| | | | | | | 50,105 |
| | | | | | | |
| Office/Business Equipment: 0.0% |
| 110 | | | | Pitney Bowes, Inc. | | | 3,751 |
| 180 | | | | Xerox Corp. | | | 2,441 |
| | | | | | | |
| | | | | | | 6,192 |
| | | | | | | |
| Oil & Gas: 0.9% |
| 60 | | | | Anadarko Petroleum Corp. | | | 4,490 |
| 20 | | | | Apache Corp. | | | 2,780 |
| 10 | | | | Cabot Oil & Gas Corp. | | | 677 |
| 20 | | | | Chesapeake Energy Corp. | | | 1,319 |
| 230 | | | | Chevron Corp. | | | 22,800 |
| 174 | | | | ConocoPhillips | | | 16,424 |
| 60 | | | | Devon Energy Corp. | | | 7,210 |
| 30 | | | | ENSCO International, Inc. | | | 2,422 |
| 10 | | | | EOG Resources, Inc. | | | 1,312 |
| 690 | | | | ExxonMobil Corp. | | | 60,810 |
| 20 | | | | Hess Corp. | | | 2,524 |
| 80 | | | | Marathon Oil Corp. | | | 4,150 |
| 10 | | | | Murphy Oil Corp. | | | 981 |
| 10 | | | | Noble Corp. | | | 650 |
| 30 | | | | Noble Energy, Inc. | | | 3,017 |
| 100 | | | | Occidental Petroleum Corp. | | | 8,986 |
| 30 | | | | Questar Corp. | | | 2,131 |
| 24 | | @ | | Transocean, Inc. | | | 3,657 |
| 60 | | | | Valero Energy Corp. | | | 2,471 |
| 30 | | | | XTO Energy, Inc. | | | 2,055 |
| | | | | | | |
| | | | | | | 150,866 |
| | | | | | | |
| Oil & Gas Services: 0.1% |
| 20 | | | | Baker Hughes, Inc. | | | 1,747 |
| 60 | | | | Halliburton Co. | | | 3,184 |
| 50 | | @ | | National Oilwell Varco, Inc. | | | 4,436 |
| 90 | | | | Schlumberger Ltd. | | | 9,669 |
| 20 | | @ | | Weatherford International Ltd. | | | 992 |
| | | | | | | |
| | | | | | | 20,028 |
| | | | | | | |
| Packaging & Containers: 0.0% |
| 30 | | | | Ball Corp. | | | 1,432 |
| | | | | | | |
| | | | | | | 1,432 |
| | | | | | | |
See Accompanying Notes to Financial Statements
112
| | |
| ING GET U.S. CORE PORTFOLIO SERIES 11 | | PORTFOLIO OF INVESTMENTS ASOF JUNE 30, 2008 (UNAUDITED) (CONTINUED) |
| | | | | | | |
| Shares | | | | | | Value |
| | | | | | | |
| Pharmaceuticals: 0.4% |
| 130 | | | | Abbott Laboratories | | $ | 6,886 |
| 20 | | | | Allergan, Inc. | | | 1,041 |
| 220 | | | | Bristol-Myers Squibb Co. | | | 4,517 |
| 20 | | | | Cardinal Health, Inc. | | | 1,032 |
| 130 | | | | Eli Lilly & Co. | | | 6,001 |
| 20 | | @ | | Express Scripts, Inc. | | | 1,254 |
| 60 | | @ | | King Pharmaceuticals, Inc. | | | 628 |
| 50 | | @ | | Medco Health Solutions, Inc. | | | 2,360 |
| 230 | | | | Merck & Co., Inc. | | | 8,669 |
| 700 | | | | Pfizer, Inc. | | | 12,229 |
| 230 | | | | Schering-Plough Corp. | | | 4,529 |
| 210 | | | | Wyeth | | | 10,072 |
| | | | | | | |
| | | | | | | 59,218 |
| | | | | | | |
| Pipelines: 0.1% |
| 100 | | | | El Paso Corp. | | | 2,174 |
| 120 | | | | Spectra Energy Corp. | | | 3,449 |
| 70 | | | | Williams Cos., Inc. | | | 2,822 |
| | | | | | | |
| | | | | | | 8,445 |
| | | | | | | |
| Retail: 0.4% |
| 10 | | | | Abercrombie & Fitch Co. | | | 627 |
| 10 | | @ | | Autozone, Inc. | | | 1,210 |
| 50 | | | | Best Buy Co., Inc. | | | 1,980 |
| 50 | | @ | | Big Lots, Inc. | | | 1,562 |
| 70 | | | | Costco Wholesale Corp. | | | 4,910 |
| 131 | | | | CVS Caremark Corp. | | | 5,184 |
| 20 | | | | Darden Restaurants, Inc. | | | 639 |
| 20 | | | | Family Dollar Stores, Inc. | | | 399 |
| 20 | | @ | | GameStop Corp. | | | 808 |
| 70 | | | | Gap, Inc. | | | 1,167 |
| 110 | | | | Home Depot, Inc. | | | 2,576 |
| 100 | | | | Limited Brands, Inc. | | | 1,685 |
| 130 | | | | Lowe’s Cos., Inc. | | | 2,698 |
| 100 | | | | Macy’s, Inc. | | | 1,942 |
| 130 | | | | McDonald’s Corp. | | | 7,309 |
| 70 | | | | Staples, Inc. | | | 1,663 |
| 60 | | | | Target Corp. | | | 2,789 |
| 70 | | | | TJX Cos., Inc. | | | 2,203 |
| 60 | | | | Walgreen Co. | | | 1,951 |
| 330 | | | | Wal-Mart Stores, Inc. | | | 18,546 |
| 80 | | | | Yum! Brands, Inc. | | | 2,807 |
| | | | | | | |
| | | | | | | 64,655 |
| | | | | | | |
| Savings & Loans: 0.0% |
| 50 | | | | Hudson City Bancorp., Inc. | | | 834 |
| 90 | | | | Washington Mutual, Inc. | | | 444 |
| | | | | | | |
| | | | | | | 1,278 |
| | | | | | | |
| Semiconductors: 0.2% |
| 150 | | | | Applied Materials, Inc. | | | 2,864 |
| 60 | | @ | | Broadcom Corp. | | | 1,637 |
| 700 | | | | Intel Corp. | | | 15,036 |
| 20 | | | | KLA-Tencor Corp. | | | 814 |
| 100 | | @ | | LSI Logic Corp. | | | 614 |
| 20 | | @ | | MEMC Electronic Materials, Inc. | | | 1,231 |
| 50 | | | | National Semiconductor Corp. | | | 1,027 |
| 65 | | @ | | Nvidia Corp. | | | 1,217 |
| 60 | | @ | | QLogic Corp. | | | 875 |
| 230 | | | | Texas Instruments, Inc. | | | 6,477 |
| | | | | | | |
| | | | | | | 31,792 |
| | | | | | | |
| Software: 0.3% |
| 50 | | @ | | Adobe Systems, Inc. | | | 1,970 |
| 30 | | @ | | Autodesk, Inc. | | | 1,014 |
| 50 | | @ | | BMC Software, Inc. | | | 1,800 |
| | | | | | | |
| Shares | | | | | | Value |
| | | | | | | |
| 100 | | | | CA, Inc. | | $ | 2,309 |
| 100 | | @ | | Compuware Corp. | | | 954 |
| 20 | | @ | | Electronic Arts, Inc. | | | 889 |
| 50 | | | | IMS Health, Inc. | | | 1,165 |
| 910 | | | | Microsoft Corp. | | | 25,034 |
| 490 | | @ | | Oracle Corp. | | | 10,290 |
| | | | | | | |
| | | | | | | 45,425 |
| | | | | | | |
| Telecommunications: 0.4% |
| 598 | | | | AT&T, Inc. | | | 20,147 |
| 60 | | | | CenturyTel, Inc. | | | 2,135 |
| 710 | | @ | | Cisco Systems, Inc. | | | 16,515 |
| 170 | | | | Corning, Inc. | | | 3,919 |
| 16 | | | | Embarq Corp. | | | 756 |
| 60 | | @ | | JDS Uniphase Corp. | | | 682 |
| 60 | | @ | | Juniper Networks, Inc. | | | 1,331 |
| 130 | | | | Motorola, Inc. | | | 954 |
| 160 | | | | Qualcomm, Inc. | | | 7,099 |
| 270 | | | | Qwest Communications International, Inc. | | | 1,061 |
| 200 | | | | Sprint Nextel Corp. | | | 1,900 |
| 330 | | | | Verizon Communications, Inc. | | | 11,682 |
| 200 | | | | Windstream Corp. | | | 2,468 |
| | | | | | | |
| | | | | | | 70,649 |
| | | | | | | |
| Toys/Games/Hobbies: 0.0% |
| 100 | | | | Hasbro, Inc. | | | 3,572 |
| | | | | | | |
| | | | | | | 3,572 |
| | | | | | | |
| Transportation: 0.1% |
| 20 | | | | Burlington Northern Santa Fe Corp. | | | 1,998 |
| 10 | | | | CH Robinson Worldwide, Inc. | | | 548 |
| 60 | | | | CSX Corp. | | | 3,769 |
| 10 | | | | Expeditors International Washington, Inc. | | | 430 |
| 30 | | | | FedEx Corp. | | | 2,364 |
| 40 | | | | Norfolk Southern Corp. | | | 2,507 |
| 20 | | | | Union Pacific Corp. | | | 1,510 |
| 90 | | | | United Parcel Service, Inc. - Class B | | | 5,532 |
| | | | | | | |
| | | | | | | 18,658 |
| | | | | | | |
| | | | Total Common Stock
(Cost $1,178,868) | | | 1,144,780 |
| | | | | | | |
| REAL ESTATE INVESTMENT TRUSTS: 0.0% |
| Hotels: 0.0% |
| 90 | | | | Host Hotels & Resorts, Inc. | | | 1,229 |
| | | | | | | |
| | | | | | | 1,229 |
| | | | | | | |
| Regional Malls: 0.0% |
| 20 | | | | General Growth Properties, Inc. | | | 701 |
| 10 | | | | Simon Property Group, Inc. | | | 899 |
| | | | | | | |
| | | | | | | 1,600 |
| | | | | | | |
| Warehouse/Industrial: 0.0% |
| 20 | | | | Prologis | | | 1,087 |
| | | | | | | |
| | | | | | | 1,087 |
| | | | | | | |
| | | | Total Real Estate Investment Trusts
(Cost $4,516) | | | 3,916 |
| | | | | | | |
See Accompanying Notes to Financial Statements
113
| | |
| ING GET U.S. CORE PORTFOLIO SERIES 11 | | PORTFOLIO OF INVESTMENTS ASOF JUNE 30, 2008 (UNAUDITED) (CONTINUED) |
| | | | | | | | |
Principal
Amount | | | | | | Value |
| | | | | | | | |
| | U.S. GOVERNMENT AGENCY OBLIGATIONS: 57.3% |
| | Federal Home Loan Mortgage Corporation: 15.1% |
| $ | 3,000,000 | | ^, Z | | 3.700%, due 01/15/13 | | $ | 2,539,398 |
| | | | | | | | |
| | | | | | | | 2,539,398 |
| | | | | | | | |
| | Federal National Mortgage Association: 17.5% |
| | 3,500,000 | | ^^, Z | | 3.700%, due 02/21/13 | | | 2,956,475 |
| | | | | | | | |
| | | | | | | | 2,956,475 |
| | | | | | | | |
| | Other U.S. Agency Obligations: 24.7% |
| | 1,210,000 | | Z | | Financing Corp.,
4.060%, due 05/11/13 | | | 1,008,249 |
| | 2,500,000 | | Z | | Resolution Funding Corp.,
3.610%, due 01/15/13 | | | 2,143,188 |
| | 1,200,000 | | ^, Z | | Resolution Funding Corp.,
3.710%, due 04/15/13 | | | 1,016,719 |
| | | | | | | | |
| | | | | | | | 4,168,156 |
| | | | | | | | |
| | | | | Total U.S. Government Agency Obligations
(Cost $9,836,061) | | | 9,664,029 |
| | | | | | | | |
| | U.S. TREASURY OBLIGATIONS: 36.2% |
| | U.S. Treasury STRIP: 36.2% |
| | 7,139,000 | | ^ | | 3.400%, due 02/15/13 | | | 6,108,825 |
| | | | | | | | |
| | | | | Total U.S. Treasury Obligations
(Cost $6,295,095) | | | 6,108,825 |
| | | | | | | | |
| | | | | Total Long-Term Investments
(Cost $17,314,540) | | | 16,921,550 |
| | | | | | | | |
| | | |
| Shares | | | | | | Value |
| | SHORT-TERM INVESTMENTS: 0.8% |
| | Mutual Fund: 0.1% |
| | 25,000 | | ** | | ING Institutional Prime Money Market Fund | | $ | 25,000 |
| | | | | | | | |
| | | | | Total Mutual Fund
(Cost $25,000) | | | 25,000 |
| | | | | | | | |
| | | | | | | | | | |
Principal
Amount | | | | | | | Value | |
| | | | | | | | | | |
| | Repurchase Agreement: 0.7% | |
| $ | 115,000 | | Goldman Sachs Repurchase Agreement dated 06/30/08, 2.350%, due 07/01/08, $115,008 to be received upon repurchase (Collateralized by $115,400 U.S. Treasury, 3.500%, Market Value plus accrued interest $117,387, due 12/15/09) | | | | | $ | 115,000 | |
| | | | | | | | | | |
| | | Total Repurchase Agreement
(Cost $115,000) | | | | | | 115,000 | |
| | | | | | | | | | |
| | | Total Short-Term Investments
(Cost $140,000) | | | | | | 140,000 | |
| | | | | | | | | | |
| | | Total Investments in Securities
(Cost $17,454,540)* | | 101.1 | % | | $ | 17,061,550 | |
| | | Other Assets and
Liabilities - Net | | (1.1 | ) | | | (181,768 | ) |
| | | | | | | | | | |
| | | Net Assets | | 100.0 | % | | $ | 16,879,782 | |
| | | | | | | | | | |
| @ | Non-income producing security |
| STRIP | Separate Trading of Registered Interest and Principal of Securities |
| ** | Investment in affiliate |
| ^ | Interest only securities represent the right to receive the monthly interest payments on an underlying pool of mortgage loans. Principal amount shown represents the notional amount on which current interest is calculated. Payments of principal on the pool reduce the value of the interest only security. |
| ^^ | Principal only securities represent the right to receive the monthly principal payments on an underlying pool of mortgage loans. No payments of interest on the pool are passed through the principal only security. |
| Z | Indicates Zero Coupon Bond; rate shown reflects current effective yield. |
| * | Cost for federal income tax purposes is $17,644,531. |
| | | | |
Net unrealized depreciation consists of: | | | | |
Gross Unrealized Appreciation | | $ | 57,905 | |
Gross Unrealized Depreciation | | | (640,886 | ) |
| | | | |
Net Unrealized Depreciation | | $ | (582,981 | ) |
| | | | |
Fair Value Measurements — Effective January 1, 2008, the Portfolio adopted Financial Accounting Standards Board Statement of Financial Accounting Standards No. 157 (“SFAS 157”), “Fair Value Measurements.” This new accounting statement defines fair value, establishes a framework for measuring fair value in generally accepted accounting principles (“GAAP”), and expands disclosures about fair value measurements. The three levels of the fair value hierarchy are as follows:
| | • | | Level 1 — quoted prices in active markets for identical investments |
| | • | | Level 2 — other significant observable inputs (including quoted prices for similar investments, interest rates, prepayment speeds, credit risk, etc.) |
See Accompanying Notes to Financial Statements
114
| | |
| ING GET U.S. CORE PORTFOLIO SERIES 11 | | PORTFOLIO OF INVESTMENTS ASOF JUNE 30, 2008 (UNAUDITED) (CONTINUED) |
| | • | | Level 3 — significant unobservable inputs (including the Portfolio’s own assumption in determining the fair value of investments) |
The inputs or methodology used in valuing securities are not necessarily an indication of the risk associated with investing in those securities.
The following is a summary of the inputs used as of June 30, 2008 in valuing the Portfolio’s investments at fair value:
| | | | | | |
| | | Investments in Securities | | Other Financial Instruments* |
Level 1 — Quoted Prices | | $ | 1,173,696 | | $ | — |
Level 2 — Other Significant Observable Inputs | | | 15,887,854 | | | — |
Level 3 — Significant Unobservable Inputs | | | — | | | — |
| | | | | | |
Total | | $ | 17,061,550 | | $ | — |
| | | | | | |
| * | | Other financial instruments may include forward foreign currency contracts, futures, swaps, and written options. |
115
| | |
| ING GET U.S. CORE PORTFOLIO SERIES 12 | | PORTFOLIO OF INVESTMENTS ASOF JUNE 30, 2008 (UNAUDITED) |
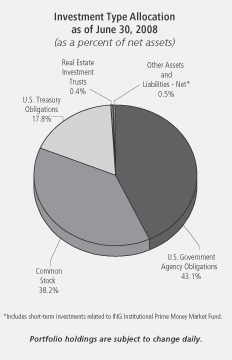
| | | | | | | |
| Shares | | | | | | Value |
| | | | | | | |
| COMMON STOCK: 38.2% | | | |
| Advertising: 0.1% | | | |
| 1,900 | | @ | | Interpublic Group of Cos., Inc. | | $ | 16,340 |
| 650 | | | | Omnicom Group | | | 29,172 |
| | | | | | | |
| | | | | | | 45,512 |
| | | | | | | |
| Aerospace/Defense: 0.9% | | | |
| 1,050 | | | | Boeing Co. | | | 69,006 |
| 400 | | | | General Dynamics Corp. | | | 33,680 |
| 350 | | | | Goodrich Corp. | | | 16,611 |
| 250 | | | | L-3 Communications Holdings, Inc. | | | 22,718 |
| 400 | | | | Lockheed Martin Corp. | | | 39,464 |
| 450 | | | | Northrop Grumman Corp. | | | 30,105 |
| 200 | | | | Raytheon Co. | | | 11,256 |
| 1,100 | | | | United Technologies Corp. | | | 67,870 |
| | | | | | | |
| | | | | | | 290,710 |
| | | | | | | |
| Agriculture: 0.7% | | | |
| 2,150 | | | | Altria Group, Inc. | | | 44,204 |
| 800 | | | | Archer-Daniels-Midland Co. | | | 27,000 |
| 313 | | @ | | Lorillard, Inc. | | | 21,647 |
| 2,150 | | | | Philip Morris International, Inc. | | | 106,189 |
| 350 | | | | Reynolds American, Inc. | | | 16,335 |
| | | | | | | |
| | | | | | | 215,375 |
| | | | | | | |
| Airlines: 0.0% | | | |
| 1,000 | | | | Southwest Airlines Co. | | | 13,040 |
| | | | | | | |
| | | | | | | 13,040 |
| | | | | | | |
| Apparel: 0.2% | | | |
| 650 | | @ | | Coach, Inc. | | | 18,772 |
| 500 | | | | Nike, Inc. | | | 29,805 |
| | | | | | | |
| Shares | | | | | | Value |
| | | | | | | |
| 100 | | | | Polo Ralph Lauren Corp. | | $ | 6,278 |
| 300 | | | | VF Corp. | | | 21,354 |
| | | | | | | |
| | | | | | | 76,209 |
| | | | | | | |
| Auto Manufacturers: 0.1% | | | |
| 1,991 | | @ | | Ford Motor Co. | | | 9,577 |
| 500 | | | | General Motors Corp. | | | 5,750 |
| | | | | | | |
| | | | | | | 15,327 |
| | | | | | | |
| Auto Parts & Equipment: 0.1% | | | |
| 400 | | @ | | Goodyear Tire & Rubber Co. | | | 7,132 |
| 1,000 | | | | Johnson Controls, Inc. | | | 28,680 |
| | | | | | | |
| | | | | | | 35,812 |
| | | | | | | |
| Banks: 1.5% | | | |
| 4,800 | | | | Bank of America Corp. | | | 114,576 |
| 1,500 | | | | Bank of New York Mellon Corp. | | | 56,745 |
| 500 | | | | BB&T Corp. | | | 11,385 |
| 403 | | | | Capital One Financial Corp. | | | 15,318 |
| 500 | | | | Fifth Third Bancorp. | | | 5,090 |
| 200 | | | | M&T Bank Corp. | | | 14,108 |
| 300 | | | | Marshall & Ilsley Corp. | | | 4,599 |
| 400 | | | | Northern Trust Corp. | | | 27,428 |
| 1,617 | | | | Regions Financial Corp. | | | 17,641 |
| 500 | | | | State Street Corp. | | | 31,995 |
| 1,200 | | | | US Bancorp. | | | 33,468 |
| 2,093 | | | | Wachovia Corp. | | | 32,504 |
| 3,050 | | | | Wells Fargo & Co. | | | 72,438 |
| 350 | | | | Zions Bancorp. | | | 11,022 |
| | | | | | | |
| | | | | | | 448,317 |
| | | | | | | |
| Beverages: 0.8% | | | |
| 250 | | | | Anheuser-Busch Cos., Inc. | | | 15,530 |
| 2,300 | | | | Coca-Cola Co. | | | 119,554 |
| 400 | | | | Coca-Cola Enterprises, Inc. | | | 6,920 |
| 800 | | | | Pepsi Bottling Group, Inc. | | | 22,336 |
| 1,500 | | | | PepsiCo, Inc. | | | 95,385 |
| | | | | | | |
| | | | | | | 259,725 |
| | | | | | | |
| Biotechnology: 0.5% | | | |
| 1,150 | | @ | | Amgen, Inc. | | | 54,234 |
| 350 | | @ | | Biogen Idec, Inc. | | | 19,562 |
| 450 | | @ | | Celgene Corp. | | | 28,742 |
| 150 | | @ | | Genzyme Corp. | | | 10,803 |
| 950 | | @ | | Gilead Sciences, Inc. | | | 50,303 |
| | | | | | | |
| | | | | | | 163,644 |
| | | | | | | |
| Chemicals: 1.0% | | | |
| 400 | | | | Air Products & Chemicals, Inc. | | | 39,544 |
| 1,150 | | | | Dow Chemical Co. | | | 40,147 |
| 100 | | | | Eastman Chemical Co. | | | 6,886 |
| 150 | | | | Ecolab, Inc. | | | 6,449 |
| 1,200 | | | | EI Du Pont de Nemours & Co. | | | 51,468 |
| 400 | | | | Hercules, Inc. | | | 6,772 |
| 400 | | | | International Flavors & Fragrances, Inc. | | | 15,624 |
| 600 | | | | Monsanto Co. | | | 75,864 |
| 150 | | | | PPG Industries, Inc. | | | 8,606 |
| 200 | | | | Praxair, Inc. | | | 18,848 |
| 300 | | | | Rohm & Haas Co. | | | 13,932 |
| 500 | | | | Sigma-Aldrich Corp. | | | 26,930 |
| | | | | | | |
| | | | | | | 311,070 |
| | | | | | | |
See Accompanying Notes to Financial Statements
116
| | |
| ING GET U.S. CORE PORTFOLIO SERIES 12 | | PORTFOLIO OF INVESTMENTS ASOF JUNE 30, 2008 (UNAUDITED) (CONTINUED) |
| | | | | | | |
| Shares | | | | | | Value |
| | | | | | | |
| Coal: 0.2% | | | |
| 150 | | | | Consol Energy, Inc. | | $ | 16,856 |
| 120 | | | | Massey Energy Co. | | | 11,250 |
| 250 | | | | Peabody Energy Corp. | | | 22,013 |
| | | | | | | |
| | | | | | | 50,119 |
| | | | | | | |
| Commercial Services: 0.3% | | | |
| 150 | | @ | | Apollo Group, Inc. - Class A | | | 6,639 |
| 200 | | | | Automatic Data Processing, Inc. | | | 8,380 |
| 600 | | | | H&R Block, Inc. | | | 12,840 |
| 300 | | | | McKesson Corp. | | | 16,773 |
| 150 | | | | Moody’s Corp. | | | 5,166 |
| 450 | | | | Robert Half International, Inc. | | | 10,787 |
| 600 | | | | RR Donnelley & Sons Co. | | | 17,814 |
| 850 | | | | Western Union Co. | | | 21,012 |
| | | | | | | |
| | | | | | | 99,411 |
| | | | | | | |
| Computers: 2.1% | | | |
| 400 | | @ | | Affiliated Computer Services, Inc. | | | 21,396 |
| 950 | | @ | | Apple, Inc. | | | 159,068 |
| 250 | | @ | | Cognizant Technology Solutions Corp. | | | 8,128 |
| 300 | | @ | | Computer Sciences Corp. | | | 14,052 |
| 2,500 | | @ | | Dell, Inc. | | | 54,700 |
| 2,150 | | @ | | EMC Corp. | | | 31,584 |
| 2,750 | | | | Hewlett-Packard Co. | | | 121,578 |
| 1,550 | | | | International Business Machines Corp. | | | 183,722 |
| 300 | | @ | | Lexmark International, Inc. | | | 10,029 |
| 350 | | @ | | NetApp, Inc. | | | 7,581 |
| 350 | | @ | | Sandisk Corp. | | | 6,545 |
| 812 | | @ | | Sun Microsystems, Inc. | | | 8,835 |
| 300 | | @ | | Teradata Corp. | | | 6,942 |
| | | | | | | |
| | | | | | | 634,160 |
| | | | | | | |
| Cosmetics/Personal Care: 0.8% | | | |
| 500 | | | | Avon Products, Inc. | | | 18,010 |
| 350 | | | | Colgate-Palmolive Co. | | | 24,185 |
| 3,500 | | | | Procter & Gamble Co. | | | 212,835 |
| | | | | | | |
| | | | | | | 255,030 |
| | | | | | | |
| Distribution/Wholesale: 0.1% | | | |
| 500 | | | | Genuine Parts Co. | | | 19,840 |
| | | | | | | |
| | | | | | | 19,840 |
| | | | | | | |
| Diversified Financial Services: 1.8% | | | |
| 1,150 | | | | American Express Co. | | | 43,321 |
| 350 | | | | Ameriprise Financial, Inc. | | | 14,235 |
| 600 | | | | Charles Schwab Corp. | | | 12,324 |
| 550 | | | | CIT Group, Inc. | | | 3,746 |
| 5,350 | | | | Citigroup, Inc. | | | 89,666 |
| 20 | | | | CME Group, Inc. | | | 7,664 |
| 650 | | | | Countrywide Financial Corp. | | | 2,763 |
| 800 | | | | Discover Financial Services | | | 10,536 |
| 1,700 | | @ | | E*Trade Financial Corp. | | | 5,338 |
| 700 | | | | Federal Home Loan Mortgage Corporation | | | 11,480 |
| 1,200 | | | | Federal National Mortgage Association | | | 23,412 |
| 400 | | | | Goldman Sachs Group, Inc. | | | 69,960 |
| 100 | | @ | | IntercontinentalExchange, Inc. | | | 11,400 |
| 3,567 | | | | JPMorgan Chase & Co. | | | 122,384 |
| 700 | | | | Lehman Brothers Holdings, Inc. | | | 13,867 |
| 1,400 | | | | Merrill Lynch & Co., Inc. | | | 44,394 |
| | | | | | | |
| Shares | | | | | | Value |
| | | | | | | |
| 1,350 | | | | Morgan Stanley | | $ | 48,695 |
| 400 | | | | NYSE Euronext | | | 20,264 |
| 400 | | @ | | SLM Corp. | | | 7,740 |
| | | | | | | |
| | | | | | | 563,189 |
| | | | | | | |
| Electric: 1.4% | | | |
| 700 | | @ | | AES Corp. | | | 13,447 |
| 1,300 | | | | American Electric Power Co., Inc. | | | 52,299 |
| 700 | | | | Centerpoint Energy, Inc. | | | 11,235 |
| 950 | | | | Dominion Resources, Inc. | | | 45,116 |
| 1,000 | | | | DTE Energy Co. | | | 42,440 |
| 3,150 | | | | Duke Energy Corp. | | | 54,747 |
| 900 | | | | Edison International | | | 46,242 |
| 200 | | | | Entergy Corp. | | | 24,096 |
| 400 | | | | Exelon Corp. | | | 35,984 |
| 400 | | | | FPL Group, Inc. | | | 26,232 |
| 1,200 | | | | Pepco Holdings, Inc. | | | 30,780 |
| 300 | | | | PG&E Corp. | | | 11,907 |
| 350 | | | | PPL Corp. | | | 18,295 |
| 300 | | | | Public Service Enterprise Group, Inc. | | | 13,779 |
| | | | | | | |
| | | | | | | 426,599 |
| | | | | | | |
| Electrical Components & Equipment: 0.1% | | | |
| 700 | | | | Emerson Electric Co. | | | 34,615 |
| 300 | | | | Molex, Inc. | | | 7,323 |
| | | | | | | |
| | | | | | | 41,938 |
| | | | | | | |
| Electronics: 0.4% | | | |
| 550 | | @ | | Agilent Technologies, Inc. | | | 19,547 |
| 350 | | | | Applera Corp. - Applied Biosystems Group | | | 11,718 |
| 800 | | | | Jabil Circuit, Inc. | | | 13,128 |
| 400 | | | | PerkinElmer, Inc. | | | 11,140 |
| 700 | | @ | | Thermo Electron Corp. | | | 39,011 |
| 575 | | @@ | | Tyco Electronics Ltd. | | | 20,597 |
| 150 | | @ | | Waters Corp. | | | 9,675 |
| | | | | | | |
| | | | | | | 124,816 |
| | | | | | | |
| Engineering & Construction: 0.2% | | | |
| 200 | | | | Fluor Corp. | | | 37,216 |
| 150 | | @ | | Jacobs Engineering Group, Inc. | | | 12,105 |
| | | | | | | |
| | | | | | | 49,321 |
| | | | | | | |
| Environmental Control: 0.1% | | | |
| 1,200 | | @ | | Allied Waste Industries, Inc. | | | 15,144 |
| 400 | | | | Waste Management, Inc. | | | 15,084 |
| | | | | | | |
| | | | | | | 30,228 |
| | | | | | | |
| Food: 0.6% | | | |
| 700 | | | | ConAgra Foods, Inc. | | | 13,496 |
| 400 | | | | General Mills, Inc. | | | 24,308 |
| 350 | | | | HJ Heinz Co. | | | 16,748 |
| 450 | | | | Kellogg Co. | | | 21,609 |
| 1,144 | | | | Kraft Foods, Inc. | | | 32,547 |
| 400 | | | | Kroger Co. | | | 11,548 |
| 1,800 | | | | Sara Lee Corp. | | | 22,050 |
| 400 | | | | Supervalu, Inc. | | | 12,356 |
| 400 | | | | Sysco Corp. | | | 11,004 |
| 250 | | | | WM Wrigley Jr. Co. | | | 19,445 |
| | | | | | | |
| | | | | | | 185,111 |
| | | | | | | |
| Gas: 0.1% | | | |
| 550 | | | | Sempra Energy | | | 31,048 |
| | | | | | | |
| | | | | | | 31,048 |
| | | | | | | |
See Accompanying Notes to Financial Statements
117
| | |
| ING GET U.S. CORE PORTFOLIO SERIES 12 | | PORTFOLIO OF INVESTMENTS ASOF JUNE 30, 2008 (UNAUDITED) (CONTINUED) |
| | | | | | | |
| Shares | | | | | | Value |
| | | | | | | |
| Hand/Machine Tools: 0.1% | | | |
| 150 | | | | Black & Decker Corp. | | $ | 8,627 |
| 150 | | | | Snap-On, Inc. | | | 7,802 |
| 300 | | | | Stanley Works | | | 13,449 |
| | | | | | | |
| | | | | | | 29,878 |
| | | | | | | |
| Healthcare - Products: 1.4% | | | |
| 500 | | | | Baxter International, Inc. | | | 31,970 |
| 300 | | | | Becton Dickinson & Co. | | | 24,390 |
| 1,950 | | @ | | Boston Scientific Corp. | | | 23,966 |
| 375 | | @@ | | Covidien Ltd. | | | 17,959 |
| 150 | | | | CR Bard, Inc. | | | 13,193 |
| 100 | | @ | | Intuitive Surgical, Inc. | | | 26,940 |
| 2,350 | | | | Johnson & Johnson | | | 151,199 |
| 1,250 | | | | Medtronic, Inc. | | | 64,688 |
| 400 | | @ | | Patterson Cos., Inc. | | | 11,756 |
| 550 | | @ | | St. Jude Medical, Inc. | | | 22,484 |
| 250 | | | | Stryker Corp. | | | 15,720 |
| 200 | | @ | | Varian Medical Systems, Inc. | | | 10,370 |
| 100 | | @ | | Zimmer Holdings, Inc. | | | 6,805 |
| | | | | | | |
| | | | | | | 421,440 |
| | | | | | | |
| Healthcare - Services: 0.4% | | | |
| 450 | | | | Aetna, Inc. | | | 18,239 |
| 400 | | | | Cigna Corp. | | | 14,156 |
| 150 | | @ | | Humana, Inc. | | | 5,966 |
| 250 | | @ | | Laboratory Corp. of America Holdings | | | 17,408 |
| 300 | | | | Quest Diagnostics | | | 14,541 |
| 1,100 | | | | UnitedHealth Group, Inc. | | | 28,875 |
| 350 | | @ | | WellPoint, Inc. | | | 16,681 |
| | | | | | | |
| | | | | | | 115,866 |
| | | | | | | |
| Home Builders: 0.0% | | | |
| 400 | | | | D.R. Horton, Inc. | | | 4,340 |
| 700 | | | | Lennar Corp. | | | 8,638 |
| | | | | | | |
| | | | | | | 12,978 |
| | | | | | | |
| Household Products/Wares: 0.3% | | | |
| 200 | | | | Avery Dennison Corp. | | | 8,786 |
| 400 | | | | Clorox Co. | | | 20,880 |
| 400 | | | | Fortune Brands, Inc. | | | 24,964 |
| 650 | | | | Kimberly-Clark Corp. | | | 38,857 |
| | | | | | | |
| | | | | | | 93,487 |
| | | | | | | |
| Insurance: 1.5% | | | |
| 400 | | @@ | | ACE Ltd. | | | 22,036 |
| 450 | | | | Aflac, Inc. | | | 28,260 |
| 550 | | | | Allstate Corp. | | | 25,075 |
| 2,750 | | | | American International Group, Inc. | | | 72,765 |
| 300 | | | | AON Corp. | | | 13,782 |
| 250 | | | | Assurant, Inc. | | | 16,490 |
| 650 | | | | Chubb Corp. | | | 31,857 |
| 400 | | | | Cincinnati Financial Corp. | | | 10,160 |
| 500 | | | | Genworth Financial, Inc. | | | 8,905 |
| 350 | | | | Hartford Financial Services Group, Inc. | | | 22,600 |
| 400 | | | | Lincoln National Corp. | | | 18,128 |
| 138 | | | | Loews Corp. | | | 6,472 |
| 350 | | | | Marsh & McLennan Cos., Inc. | | | 9,293 |
| 1,200 | | | | Metlife, Inc. | | | 63,324 |
| 350 | | | | Progressive Corp. | | | 6,552 |
| 500 | | | | Prudential Financial, Inc. | | | 29,870 |
| 200 | | | | Torchmark Corp. | | | 11,730 |
| | | | | | | |
| Shares | | | | | | Value |
| | | | | | | |
| 850 | | | | Travelers Cos., Inc. | | $ | 36,890 |
| 550 | | | | UnumProvident Corp. | | | 11,248 |
| 200 | | @@ | | XL Capital Ltd. | | | 4,112 |
| | | | | | | |
| | | | | | | 449,549 |
| | | | | | | |
| Internet: 0.8% | | | |
| 200 | | @ | | Akamai Technologies, Inc. | | | 6,958 |
| 350 | | @ | | Amazon.com, Inc. | | | 25,666 |
| 1,250 | | @ | | eBay, Inc. | | | 34,163 |
| 300 | | @ | | Expedia, Inc. | | | 5,514 |
| 250 | | @ | | Google, Inc. - Class A | | | 131,605 |
| 400 | | @ | | IAC/InterActiveCorp. | | | 7,712 |
| 1,000 | | @ | | Symantec Corp. | | | 19,350 |
| 1,200 | | @ | | Yahoo!, Inc. | | | 24,792 |
| | | | | | | |
| | | | | | | 255,760 |
| | | | | | | |
| Iron/Steel: 0.2% | | | |
| 100 | | | | Allegheny Technologies, Inc. | | | 5,928 |
| 400 | | | | Nucor Corp. | | | 29,868 |
| 150 | | | | United States Steel Corp. | | | 27,717 |
| | | | | | | |
| | | | | | | 63,513 |
| | | | | | | |
| Lodging: 0.0% | | | |
| 350 | | | | Starwood Hotels & Resorts Worldwide, Inc. | | | 14,025 |
| | | | | | | |
| | | | | | | 14,025 |
| | | | | | | |
| Machinery - Construction & Mining: 0.2% | | | |
| 800 | | | | Caterpillar, Inc. | | | 59,056 |
| 200 | | @ | | Terex Corp. | | | 10,274 |
| | | | | | | |
| | | | | | | 69,330 |
| | | | | | | |
| Machinery - Diversified: 0.2% | | | |
| 150 | | | | Cummins, Inc. | | | 9,828 |
| 450 | | | | Deere & Co. | | | 32,459 |
| 200 | | | | Manitowoc Co., Inc. | | | 6,506 |
| 100 | | | | Rockwell Automation, Inc. | | | 4,373 |
| | | | | | | |
| | | | | | | 53,166 |
| | | | | | | |
| Media: 0.9% | | | |
| 300 | | | | CBS Corp. - Class B | | | 5,847 |
| 400 | | | | Clear Channel Communications, Inc. | | | 14,080 |
| 2,775 | | | | Comcast Corp. - Class A | | | 52,642 |
| 800 | | @ | | DIRECTV Group, Inc. | | | 20,728 |
| 3,000 | | | | News Corp. - Class A | | | 45,120 |
| 3,100 | | | | Time Warner, Inc. | | | 45,880 |
| 950 | | @ | | Viacom - Class B | | | 29,013 |
| 2,000 | | | | Walt Disney Co. | | | 62,400 |
| | | | | | | |
| | | | | | | 275,710 |
| | | | | | | |
| Metal Fabricate/Hardware: 0.1% | | | |
| 200 | | | | Precision Castparts Corp. | | | 19,274 |
| | | | | | | |
| | | | | | | 19,274 |
| | | | | | | |
| Mining: 0.3% | | | |
| 400 | | | | Alcoa, Inc. | | | 14,248 |
| 402 | | | | Freeport-McMoRan Copper & Gold, Inc. | | | 47,110 |
| 400 | | | | Newmont Mining Corp. | | | 20,864 |
| | | | | | | |
| | | | | | | 82,222 |
| | | | | | | |
| Miscellaneous Manufacturing: 1.7% | | | |
| 650 | | | | 3M Co. | | | 45,234 |
| 400 | | | | Cooper Industries Ltd. | | | 15,800 |
See Accompanying Notes to Financial Statements
118
| | |
| ING GET U.S. CORE PORTFOLIO SERIES 12 | | PORTFOLIO OF INVESTMENTS ASOF JUNE 30, 2008 (UNAUDITED) (CONTINUED) |
| | | | | | | |
| Shares | | | | | | Value |
| | | | | | | |
| Miscellaneous Manufacturing: (continued) | | | |
| 600 | | | | Dover Corp. | | $ | 29,022 |
| 350 | | | | Eaton Corp. | | | 29,740 |
| 10,550 | | | | General Electric Co. | | | 281,544 |
| 1,050 | | | | Honeywell International, Inc. | | | 52,794 |
| 400 | | | | Illinois Tool Works, Inc. | | | 19,004 |
| 500 | | | | Leggett & Platt, Inc. | | | 8,385 |
| 325 | | | | Parker Hannifin Corp. | | | 23,179 |
| 350 | | | | Textron, Inc. | | | 16,776 |
| 325 | | @@ | | Tyco International Ltd. | | | 13,013 |
| | | | | | | |
| | | | | | | 534,491 |
| | | | | | | |
| Office/Business Equipment: 0.1% | | | |
| 800 | | | | Pitney Bowes, Inc. | | | 27,280 |
| 1,200 | | | | Xerox Corp. | | | 16,272 |
| | | | | | | |
| | | | | | | 43,552 |
| | | | | | | |
Oil & Gas: 5.3%
| | | |
| 550 | | | | Anadarko Petroleum Corp. | | | 41,162 |
| 350 | | | | Apache Corp. | | | 48,650 |
| 150 | | | | Cabot Oil & Gas Corp. | | | 10,160 |
| 550 | | | | Chesapeake Energy Corp. | | | 36,278 |
| 2,450 | | | | Chevron Corp. | | | 242,869 |
| 1,800 | | | | ConocoPhillips | | | 169,902 |
| 500 | | | | Devon Energy Corp. | | | 60,080 |
| 150 | | | | ENSCO International, Inc. | | | 12,111 |
| 300 | | | | EOG Resources, Inc. | | | 39,360 |
| 5,900 | | | | ExxonMobil Corp. | | | 519,967 |
| 350 | | | | Hess Corp. | | | 44,167 |
| 750 | | | | Marathon Oil Corp. | | | 38,903 |
| 350 | | | | Murphy Oil Corp. | | | 34,318 |
| 300 | | @, @@ | | Nabors Industries Ltd. | | | 14,769 |
| 200 | | | | Noble Corp. | | | 12,992 |
| 370 | | | | Noble Energy, Inc. | | | 37,207 |
| 1,050 | | | | Occidental Petroleum Corp. | | | 94,353 |
| 300 | | | | Questar Corp. | | | 21,312 |
| 200 | | | | Range Resources Corp. | | | 13,108 |
| 400 | | @ | | Southwestern Energy Co. | | | 19,044 |
| 200 | | | | Sunoco, Inc. | | | 8,138 |
| 414 | | @ | | Transocean, Inc. | | | 63,089 |
| 350 | | | | Valero Energy Corp. | | | 14,413 |
| 437 | | | | XTO Energy, Inc. | | | 29,939 |
| | | | | | | |
| | | | | | | 1,626,291 |
| | | | | | | |
| Oil & Gas Services: 0.8% | | | |
| 350 | | | | Baker Hughes, Inc. | | | 30,569 |
| 550 | | | | Halliburton Co. | | | 29,189 |
| 400 | | @ | | National Oilwell Varco, Inc. | | | 35,488 |
| 1,200 | | | | Schlumberger Ltd. | | | 128,916 |
| 200 | | | | Smith International, Inc. | | | 16,628 |
| 400 | | @ | | Weatherford International Ltd. | | | 19,836 |
| | | | | | | |
| | | | | | | 260,626 |
| | | | | | | |
| Packaging & Containers: 0.1% | | | |
| 400 | | | | Ball Corp. | | | 19,096 |
| | | | | | | |
| | | | | | | 19,096 |
| �� | | | | | | |
| Pharmaceuticals: 1.9% | | | |
| 1,150 | | | | Abbott Laboratories | | | 60,916 |
| 350 | | | | Allergan, Inc. | | | 18,218 |
| 400 | | | | AmerisourceBergen Corp. | | | 15,996 |
| 2,000 | | | | Bristol-Myers Squibb Co. | | | 41,060 |
| 200 | | | | Cardinal Health, Inc. | | | 10,316 |
| 1,200 | | | | Eli Lilly & Co. | | | 55,392 |
| | | | | | | |
| Shares | | | | | | Value |
| | | | | | | |
| 370 | | @ | | Express Scripts, Inc. | | $ | 23,206 |
| 400 | | @ | | Forest Laboratories, Inc. | | | 13,896 |
| 919 | | @ | | King Pharmaceuticals, Inc. | | | 9,622 |
| 400 | | @ | | Medco Health Solutions, Inc. | | | 18,880 |
| 2,400 | | | | Merck & Co., Inc. | | | 90,456 |
| 6,400 | | | | Pfizer, Inc. | | | 111,808 |
| 2,000 | | | | Schering-Plough Corp. | | | 39,380 |
| 300 | | @ | | Watson Pharmaceuticals, Inc. | | | 8,151 |
| 1,550 | | | | Wyeth | | | 74,338 |
| | | | | | | |
| | | | | | | 591,635 |
| | | | | | | |
| Pipelines: 0.3% | | | |
| 1,000 | | | | El Paso Corp. | | | 21,740 |
| 800 | | | | Spectra Energy Corp. | | | 22,992 |
| 800 | | | | Williams Cos., Inc. | | | 32,248 |
| | | | | | | |
| | | | | | | 76,980 |
| | | | | | | |
| Retail: 2.1% | | | |
| 150 | | | | Abercrombie & Fitch Co. | | | 9,402 |
| 150 | | @ | | Autozone, Inc. | | | 18,152 |
| 550 | | | | Best Buy Co., Inc. | | | 21,780 |
| 400 | | @ | | Big Lots, Inc. | | | 12,496 |
| 400 | | | | Costco Wholesale Corp. | | | 28,056 |
| 1,404 | | | | CVS Caremark Corp. | | | 55,556 |
| 350 | | | | Darden Restaurants, Inc. | | | 11,179 |
| 350 | | | | Family Dollar Stores, Inc. | | | 6,979 |
| 300 | | @ | | GameStop Corp. | | | 12,120 |
| 1,150 | | | | Gap, Inc. | | | 19,171 |
| 1,200 | | | | Home Depot, Inc. | | | 28,104 |
| 200 | | | | JC Penney Co., Inc. | | | 7,258 |
| 800 | | | | Limited Brands, Inc. | | | 13,480 |
| 1,300 | | | | Lowe’s Cos., Inc. | | | 26,975 |
| 400 | | | | Macy’s, Inc. | | | 7,768 |
| 1,500 | | | | McDonald’s Corp. | | | 84,330 |
| 950 | | | | Staples, Inc. | | | 22,563 |
| 700 | | | | Target Corp. | | | 32,543 |
| 300 | | | | Tiffany & Co. | | | 12,225 |
| 950 | | | | TJX Cos., Inc. | | | 29,897 |
| 850 | | | | Walgreen Co. | | | 27,634 |
| 2,750 | | | | Wal-Mart Stores, Inc. | | | 154,550 |
| 350 | | | | Yum! Brands, Inc. | | | 12,282 |
| | | | | | | |
| | | | | | | 654,500 |
| | | | | | | |
| Savings & Loans: 0.0% | | | |
| 500 | | | | Hudson City Bancorp., Inc. | | | 8,340 |
| 1,150 | | | | Washington Mutual, Inc. | | | 5,670 |
| | | | | | | |
| | | | | | | 14,010 |
| | | | | | | |
| Semiconductors: 1.0% | | | |
| 400 | | | | Altera Corp. | | | 8,280 |
| 400 | | | | Analog Devices, Inc. | | | 12,708 |
| 1,200 | | | | Applied Materials, Inc. | | | 22,908 |
| 450 | | @ | | Broadcom Corp. | | | 12,281 |
| 5,900 | | | | Intel Corp. | | | 126,732 |
| 250 | | | | KLA-Tencor Corp. | | | 10,178 |
| 200 | | | | Linear Technology Corp. | | | 6,514 |
| 1,400 | | @ | | LSI Logic Corp. | | | 8,596 |
| 250 | | @ | | MEMC Electronic Materials, Inc. | | | 15,385 |
| 600 | | | | National Semiconductor Corp. | | | 12,324 |
| 525 | | @ | | Nvidia Corp. | | | 9,828 |
| 600 | | @ | | QLogic Corp. | | | 8,754 |
| 1,950 | | | | Texas Instruments, Inc. | | | 54,912 |
| 300 | | | | Xilinx, Inc. | | | 7,575 |
| | | | | | | |
| | | | | | | 316,975 |
| | | | | | | |
See Accompanying Notes to Financial Statements
119
| | |
| ING GET U.S. CORE PORTFOLIO SERIES 12 | | PORTFOLIO OF INVESTMENTS ASOF JUNE 30, 2008 (UNAUDITED) (CONTINUED) |
| | | | | | | |
| Shares | | | | | | Value |
| | | | | | | |
| Software: 1.5% | | | |
| 600 | | @ | | Adobe Systems, Inc. | | $ | 23,634 |
| 350 | | @ | | Autodesk, Inc. | | | 11,834 |
| 300 | | @ | | BMC Software, Inc. | | | 10,800 |
| 950 | | | | CA, Inc. | | | 21,936 |
| 1,100 | | @ | | Compuware Corp. | | | 10,494 |
| 200 | | @ | | Electronic Arts, Inc. | | | 8,886 |
| 200 | | | | Fidelity National Information Services, Inc. | | | 7,382 |
| 400 | | @ | | Fiserv, Inc. | | | 18,148 |
| 800 | | | | IMS Health, Inc. | | | 18,640 |
| 8,600 | | | | Microsoft Corp. | | | 236,586 |
| 4,150 | | @ | | Oracle Corp. | | | 87,150 |
| | | | | | | |
| | | | | | | 455,490 |
| | | | | | | |
| Telecommunications: 2.1% | | | |
| 5,877 | | | | AT&T, Inc. | | | 197,996 |
| 300 | | | | CenturyTel, Inc. | | | 10,677 |
| 6,400 | | @ | | Cisco Systems, Inc. | | | 148,864 |
| 1,650 | | | | Corning, Inc. | | | 38,033 |
| 300 | | | | Embarq Corp. | | | 14,181 |
| 600 | | @ | | JDS Uniphase Corp. | | | 6,816 |
| 400 | | @ | | Juniper Networks, Inc. | | | 8,872 |
| 1,150 | | | | Motorola, Inc. | | | 8,441 |
| 1,450 | | | | Qualcomm, Inc. | | | 64,337 |
| 2,750 | | | | Qwest Communications International, Inc. | | | 10,808 |
| 1,450 | | | | Sprint Nextel Corp. | | | 13,775 |
| 2,900 | | | | Verizon Communications, Inc. | | | 102,660 |
| 2,000 | | | | Windstream Corp. | | | 24,680 |
| | | | | | | |
| | | | | | | 650,140 |
| | | | | | | |
| Textiles: 0.0% | | | |
| 300 | | | | Cintas Corp. | | | 7,953 |
| | | | | | | |
| | | | | | | 7,953 |
| | | | | | | |
| Toys/Games/Hobbies: 0.1% | | | |
| 600 | | | | Hasbro, Inc. | | | 21,432 |
| | | | | | | |
| | | | | | | 21,432 |
| | | | | | | |
| Transportation: 0.7% | | | |
| 300 | | | | Burlington Northern Santa Fe Corp. | | | 29,967 |
| 200 | | | | CH Robinson Worldwide, Inc. | | | 10,968 |
| 400 | | | | CSX Corp. | | | 25,124 |
| 300 | | | | Expeditors International Washington, Inc. | | | 12,900 |
| 150 | | | | FedEx Corp. | | | 11,819 |
| 300 | | | | Norfolk Southern Corp. | | | 18,801 |
| 300 | | | | Ryder System, Inc. | | | 20,664 |
| 400 | | | | Union Pacific Corp. | | | 30,200 |
| 700 | | | | United Parcel Service, Inc. - Class B | | | 43,029 |
| | | | | | | |
| | | | | | | 203,472 |
| | | | | | | |
| | | | Total Common Stock
(Cost $12,618,352) | | | 11,818,392 |
| | | | | | | |
| REAL ESTATE INVESTMENT TRUSTS: 0.4% | | | |
| Apartments: 0.0% | | | |
| 400 | | | | Equity Residential | | | 15,308 |
| | | | | | | |
| | | | | | | 15,308 |
| | | | | | | |
| Diversified: 0.1% | | | |
| 300 | | | | Vornado Realty Trust | | | 26,400 |
| | | | | | | |
| | | | | | | 26,400 |
| | | | | | | |
| | | | | | | | |
| Shares | | | | | | Value |
| | | | | | | | |
| | Health Care: 0.0% | | | |
| | 400 | | | | HCP, Inc. | | $ | 12,724 |
| | | | | | | | |
| | | | | | | | 12,724 |
| | | | | | | | |
| | Hotels: 0.1% | | | |
| | 1,200 | | | | Host Hotels & Resorts, Inc. | | | 16,380 |
| | | | | | | | |
| | | | | | | | 16,380 |
| | | | | | | | |
| | Regional Malls: 0.1% | | | |
| | 250 | | | | General Growth Properties, Inc. | | | 8,758 |
| | 200 | | | | Simon Property Group, Inc. | | | 17,978 |
| | | | | | | | |
| | | | | | | | 26,736 |
| | | | | | | | |
| | Storage: 0.0% | | | |
| | 100 | | | | Public Storage, Inc. | | | 8,079 |
| | | | | | | | |
| | | | | | | | 8,079 |
| | | | | | | | |
| | Warehouse/Industrial: 0.1% | | | |
| | 350 | | | | Prologis | | | 19,023 |
| | | | | | | | |
| | | | | | | | 19,023 |
| | | | | | | | |
| | | | | Total Real Estate Investment Trusts
(Cost $135,858) | | | 124,650 |
| | | | | | | | |
| | | |
Principal
Amount | | | | | | Value |
| | U.S. GOVERNMENT AGENCY OBLIGATIONS: 43.1% |
| | Federal National Mortgage Association: 26.7% | | | |
| $ | 10,000,000 | | ^, Z | | 4.080%, due 07/15/13 | | $ | 8,272,190 |
| | | | | | | | |
| | | | | | | | 8,272,190 |
| | | | | | | | |
| | Other U.S. Agency Obligations: 16.4% | | | |
| | 6,000,000 | | ^, Z | | Resolution Funding Corp., 3.710%, due 04/15/13 | | | 5,083,596 |
| | | | | | | | |
| | | | | | | | 5,083,596 |
| | | | | | | | |
| | | | | Total U.S. Government Agency Obligations
(Cost $13,684,879) | | | 13,355,786 |
| | | | | | | | |
| | U.S. TREASURY OBLIGATIONS: 17.8% | | | |
| | U.S. Treasury STRIP: 17.8% | | | |
| | 6,499,000 | | ^ | | 2.734%, due 05/15/13 | | | 5,501,332 |
| | | | | | | | |
| | | | | Total U.S. Treasury Obligations (Cost $5,525,946) | | | 5,501,332 |
| | | | | | | | |
| | | | | Total Long-Term Investments (Cost $31,965,035) | | | 30,800,160 |
| | | | | | | | |
| | | | | | | | | | |
| | | | |
| Shares | | | | | | | | | Value |
| | | | | | | | | | |
| SHORT-TERM INVESTMENTS: 0.3% | | | | | | |
| Mutual Fund: 0.3% | | | | | | |
| 96,000 | | ** | | ING Institutional Prime Money Market Fund | | | | | $ | 96,000 |
| | | | | | | | | | |
| | | | Total Short-Term Investments (Cost $96,000) | | | | | | 96,000 |
| | | | | | | | | | |
| | | | Total Investments in Securities
(Cost $32,061,035)* | | 99.8 | % | | $ | 30,896,160 |
| | | | Other Assets and
Liabilities - Net | | 0.2 | | | | 47,265 |
| | | | | | | | | | |
| | | | Net Assets | | 100.0 | % | | $ | 30,943,425 |
| | | | | | | | | | |
See Accompanying Notes to Financial Statements
120
| | |
| ING GET U.S. CORE PORTFOLIO SERIES 12 | | PORTFOLIO OF INVESTMENTS ASOF JUNE 30, 2008 (UNAUDITED) (CONTINUED) |
| @ | Non-income producing security |
| STRIP | Separate Trading of Registered Interest and Principal of Securities |
| ** | Investment in affiliate |
| ^ | Interest only securities represent the right to receive the monthly interest payments on an underlying pool of mortgage loans. Principal amount shown represents the notional amount on which current interest is calculated. Payments of principal on the pool reduce the value of the interest only security. |
| Z | Indicates Zero Coupon Bond; rate shown reflects current effective yield. |
| * | Cost for federal income tax purposes is $33,996,648. |
| | | | |
Net unrealized depreciation consists of: | | | | |
Gross Unrealized Appreciation | | $ | 477,179 | |
Gross Unrealized Depreciation | | | (3,577,667 | ) |
| | | | |
Net Unrealized Depreciation | | $ | (3,100,488 | ) |
| | | | |
Fair Value Measurements ��� Effective January 1, 2008, the Portfolio adopted Financial Accounting Standards Board Statement of Financial Accounting Standards No. 157 (“SFAS 157”), “Fair Value Measurements.” This new accounting statement defines fair value, establishes a framework for measuring fair value in generally accepted accounting principles (“GAAP”), and expands disclosures about fair value measurements. The three levels of the fair value hierarchy are as follows:
| | • | | Level 1 — quoted prices in active markets for identical investments |
| | • | | Level 2 — other significant observable inputs (including quoted prices for similar investments, interest rates, prepayment speeds, credit risk, etc.) |
| | • | | Level 3 — significant unobservable inputs (including the Portfolio’s own assumption in determining the fair value of investments) |
The inputs or methodology used in valuing securities are not necessarily an indication of the risk associated with investing in those securities.
The following is a summary of the inputs used as of June 30, 2008 in valuing the Portfolio’s investments at fair value:
| | | | | | |
| | | Investments in Securities | | Other Financial Instruments* |
Level 1 — Quoted Prices | | $ | 12,039,042 | | $ | — |
Level 2 — Other Significant Observable Inputs | | | 18,857,118 | | | — |
Level 3 — Significant Unobservable Inputs | | | — | | | — |
| | | | | | |
Total | | $ | 30,896,160 | | $ | — |
| | | | | | |
| * | | Other financial instruments may include forward foreign currency contracts, futures, swaps, and written options. |
See Accompanying Notes to Financial Statements
121
| | |
| ING GET U.S. CORE PORTFOLIO SERIES 13 | | PORTFOLIO OF INVESTMENTS ASOF JUNE 30, 2008 (UNAUDITED) |
Investment Type Allocation as of June 30, 2008
(as a percent of net assets)
| | |
U.S. Government Agency Obligations | | 77.2% |
U.S. Treasury Obligations | | 20.3% |
Common Stock | | 6.7% |
Real Estate Investment Trusts | | 0.0% |
Other Assets and Liabilities - Net* | | (4.2)% |
| | |
Net Assets | | 100.0% |
| | |
| | * | Includes short-term investments related to ING Institutional Prime Money Market Fund and repurchase agreement. | |
Portfolio holdings are subject to change daily.
| | | | | | | |
| Shares | | | | | | Value |
| | | | | | | |
| COMMON STOCK: 6.7% | | | |
| Advertising: 0.0% | | | |
| 450 | | @ | | Interpublic Group of Cos., Inc. | | $ | 3,870 |
| 250 | | | | Omnicom Group | | | 11,220 |
| | | | | | | |
| | | | | | | 15,090 |
| | | | | | | |
| Aerospace/Defense: 0.2% | | | |
| 300 | | | | Boeing Co. | | | 19,716 |
| 150 | | | | General Dynamics Corp. | | | 12,630 |
| 150 | | | | Goodrich Corp. | | | 7,119 |
| 100 | | | | L-3 Communications Holdings, Inc. | | | 9,087 |
| 160 | | | | Lockheed Martin Corp. | | | 15,786 |
| 200 | | | | Northrop Grumman Corp. | | | 13,380 |
| 50 | | | | Raytheon Co. | | | 2,814 |
| 100 | | | | Rockwell Collins, Inc. | | | 4,796 |
| 380 | | | | United Technologies Corp. | | | 23,446 |
| | | | | | | |
| | | | | | | 108,774 |
| | | | | | | |
| Agriculture: 0.1% | | | |
| 670 | | | | Altria Group, Inc. | | | 13,775 |
| 250 | | | | Archer-Daniels-Midland Co. | | | 8,438 |
| 42 | | @ | | Lorillard, Inc. | | | 2,905 |
| 770 | | | | Philip Morris International, Inc. | | | 38,030 |
| 100 | | | | Reynolds American, Inc. | | | 4,667 |
| | | | | | | |
| | | | | | | 67,815 |
| | | | | | | |
| Airlines: 0.0% | | | |
| 310 | | | | Southwest Airlines Co. | | | 4,042 |
| | | | | | | |
| | | | | | | 4,042 |
| | | | | | | |
| Apparel: 0.1% | | | |
| 250 | | @ | | Coach, Inc. | | | 7,220 |
| 250 | | | | Nike, Inc. | | | 14,903 |
| 50 | | | | Polo Ralph Lauren Corp. | | | 3,139 |
| 50 | | | | VF Corp. | | | 3,559 |
| | | | | | | |
| | | | | | | 28,821 |
| | | | | | | |
| Auto Manufacturers: 0.0% | | | |
| 503 | | @ | | Ford Motor Co. | | | 2,419 |
| 150 | | | | General Motors Corp. | | | 1,725 |
| | | | | | | |
| | | | | | | 4,144 |
| | | | | | | |
| | | | | | | |
| Shares | | | | | | Value |
| | | | | | | |
| Auto Parts & Equipment: 0.0% | | | |
| 150 | | @ | | Goodyear Tire & Rubber Co. | | $ | 2,675 |
| 300 | | | | Johnson Controls, Inc. | | | 8,604 |
| | | | | | | |
| | | | | | | 11,279 |
| | | | | | | |
| Banks: 0.3% | | | |
| 1,650 | | | | Bank of America Corp. | | | 39,386 |
| 460 | | | | Bank of New York Mellon Corp. | | | 17,402 |
| 300 | | | | BB&T Corp. | | | 6,831 |
| 180 | | | | Capital One Financial Corp. | | | 6,842 |
| 160 | | | | Fifth Third Bancorp. | | | 1,629 |
| 100 | | | | M&T Bank Corp. | | | 7,054 |
| 100 | | | | Marshall & Ilsley Corp. | | | 1,533 |
| 50 | | | | Northern Trust Corp. | | | 3,429 |
| 500 | | | | Regions Financial Corp. | | | 5,455 |
| 240 | | | | State Street Corp. | | | 15,358 |
| 300 | | | | US Bancorp. | | | 8,367 |
| 630 | | | | Wachovia Corp. | | | 9,784 |
| 1,100 | | | | Wells Fargo & Co. | | | 26,125 |
| 150 | | | | Zions Bancorp. | | | 4,724 |
| | | | | | | |
| | | | | | | 153,919 |
| | | | | | | |
| Beverages: 0.2% | | | |
| 100 | | | | Anheuser-Busch Cos., Inc. | | | 6,212 |
| 870 | | | | Coca-Cola Co. | | | 45,223 |
| 100 | | | | Coca-Cola Enterprises, Inc. | | | 1,730 |
| 250 | | | | Pepsi Bottling Group, Inc. | | | 6,980 |
| 470 | | | | PepsiCo, Inc. | | | 29,887 |
| | | | | | | |
| | | | | | | 90,032 |
| | | | | | | |
| Biotechnology: 0.1% | | | |
| 450 | | @ | | Amgen, Inc. | | | 21,222 |
| 140 | | @ | | Biogen Idec, Inc. | | | 7,825 |
| 150 | | @ | | Celgene Corp. | | | 9,581 |
| 50 | | @ | | Genzyme Corp. | | | 3,601 |
| 350 | | @ | | Gilead Sciences, Inc. | | | 18,533 |
| | | | | | | |
| | | | | | | 60,762 |
| | | | | | | |
| Chemicals: 0.2% | | | |
| 130 | | | | Air Products & Chemicals, Inc. | | | 12,852 |
| 450 | | | | Dow Chemical Co. | | | 15,710 |
| 50 | | | | Eastman Chemical Co. | | | 3,443 |
| 50 | | | | Ecolab, Inc. | | | 2,150 |
| 460 | | | | EI Du Pont de Nemours & Co. | | | 19,729 |
| 250 | | | | Hercules, Inc. | | | 4,233 |
| 100 | | | | International Flavors & Fragrances, Inc. | | | 3,906 |
| 300 | | | | Monsanto Co. | | | 37,932 |
| 50 | | | | PPG Industries, Inc. | | | 2,869 |
| 100 | | | | Praxair, Inc. | | | 9,424 |
| 100 | | | | Rohm & Haas Co. | | | 4,644 |
| 200 | | | | Sigma-Aldrich Corp. | | | 10,772 |
| | | | | | | |
| | | | | | | 127,664 |
| | | | | | | |
| Coal: 0.0% | | | |
| 50 | | | | Consol Energy, Inc. | | | 5,619 |
| 60 | | | | Massey Energy Co. | | | 5,625 |
| 50 | | | | Peabody Energy Corp. | | | 4,403 |
| | | | | | | |
| | | | | | | 15,647 |
| | | | | | | |
| Commercial Services: 0.1% | | | |
| 50 | | @ | | Apollo Group, Inc. - Class A | | | 2,213 |
| 100 | | | | Automatic Data Processing, Inc. | | | 4,190 |
| 300 | | | | H&R Block, Inc. | | | 6,420 |
| 120 | | | | McKesson Corp. | | | 6,709 |
See Accompanying Notes to Financial Statements
122
| | |
| ING GET U.S. CORE PORTFOLIO SERIES 13 | | PORTFOLIO OF INVESTMENTS ASOF JUNE 30, 2008 (UNAUDITED) (CONTINUED) |
| | | | | | | |
| Shares | | | | | | Value |
| | | | | | | |
| Commercial Services: (continued) | | | |
| 50 | | | | Moody’s Corp. | | $ | 1,722 |
| 150 | | | | Robert Half International, Inc. | | | 3,596 |
| 300 | | | | RR Donnelley & Sons Co. | | | 8,907 |
| 350 | | | | Western Union Co. | | | 8,652 |
| | | | | | | |
| | | | | | | 42,409 |
| | | | | | | |
| Computers: 0.3% | | | |
| 100 | | @ | | Affiliated Computer Services, Inc. | | | 5,349 |
| 300 | | @ | | Apple, Inc. | | | 50,232 |
| 50 | | @ | | Cognizant Technology Solutions Corp. | | | 1,626 |
| 100 | | @ | | Computer Sciences Corp. | | | 4,684 |
| 1,000 | | @ | | Dell, Inc. | | | 21,880 |
| 800 | | @ | | EMC Corp. | | | 11,752 |
| 1,000 | | | | Hewlett-Packard Co. | | | 44,210 |
| 450 | | | | International Business Machines Corp. | | | 53,339 |
| 50 | | @ | | Lexmark International, Inc. | | | 1,672 |
| 150 | | @ | | NetApp, Inc. | | | 3,249 |
| 100 | | @ | | Sandisk Corp. | | | 1,870 |
| 250 | | @ | | Sun Microsystems, Inc. | | | 2,720 |
| 50 | | @ | | Teradata Corp. | | | 1,157 |
| | | | | | | |
| | | | | | | 203,740 |
| | | | | | | |
| Cosmetics/Personal Care: 0.1% | | | |
| 300 | | | | Avon Products, Inc. | | | 10,806 |
| 150 | | | | Colgate-Palmolive Co. | | | 10,365 |
| 1,130 | | | | Procter & Gamble Co. | | | 68,715 |
| | | | | | | |
| | | | | | | 89,886 |
| | | | | | | |
| Distribution/Wholesale: 0.0% | | | |
| 190 | | | | Genuine Parts Co. | | | 7,539 |
| | | | | | | |
| | | | | | | 7,539 |
| | | | | | | |
| Diversified Financial Services: 0.3% | | | |
| 370 | | | | American Express Co. | | | 13,938 |
| 100 | | | | Ameriprise Financial, Inc. | | | 4,067 |
| 250 | | | | Charles Schwab Corp. | | | 5,135 |
| 50 | | | | CIT Group, Inc. | | | 341 |
| 1,850 | | | | Citigroup, Inc. | | | 31,006 |
| 30 | | | | CME Group, Inc. | | | 11,496 |
| 150 | | | | Countrywide Financial Corp. | | | 638 |
| 300 | | | | Discover Financial Services | | | 3,951 |
| 600 | | @ | | E*Trade Financial Corp. | | | 1,884 |
| 250 | | | | Federal Home Loan Mortgage Corporation | | | 4,100 |
| 370 | | | | Federal National Mortgage Association | | | 7,219 |
| 180 | | | | Goldman Sachs Group, Inc. | | | 31,482 |
| 30 | | @ | | IntercontinentalExchange, Inc. | | | 3,420 |
| 1,281 | | | | JPMorgan Chase & Co. | | | 43,951 |
| 100 | | | | Legg Mason, Inc. | | | 4,357 |
| 240 | | | | Lehman Brothers Holdings, Inc. | | | 4,754 |
| 440 | | | | Merrill Lynch & Co., Inc. | | | 13,952 |
| 470 | | | | Morgan Stanley | | | 16,953 |
| 70 | | | | NYSE Euronext | | | 3,546 |
| 150 | | @ | | SLM Corp. | | | 2,903 |
| 100 | | | | T. Rowe Price Group, Inc. | | | 5,647 |
| | | | | | | |
| | | | | | | 214,740 |
| | | | | | | |
| Electric: 0.2% | | | |
| 450 | | @ | | AES Corp. | | | 8,645 |
| 480 | | | | American Electric Power Co., Inc. | | | 19,310 |
| 250 | | | | Centerpoint Energy, Inc. | | | 4,013 |
| | | | | | | |
| Shares | | | | | | Value |
| | | | | | | |
| 270 | | | | Dominion Resources, Inc. | | $ | 12,822 |
| 350 | | | | DTE Energy Co. | | | 14,854 |
| 1,200 | | | | Duke Energy Corp. | | | 20,856 |
| 300 | | | | Edison International | | | 15,414 |
| 110 | | | | Entergy Corp. | | | 13,253 |
| 100 | | | | Exelon Corp. | | | 8,996 |
| 150 | | | | FPL Group, Inc. | | | 9,837 |
| 300 | | | | Pepco Holdings, Inc. | | | 7,695 |
| 100 | | | | PG&E Corp. | | | 3,969 |
| 50 | | | | PPL Corp. | | | 2,614 |
| 100 | | | | Public Service Enterprise Group, Inc. | | | 4,593 |
| | | | | | | |
| | | | | | | 146,871 |
| | | | | | | |
| Electrical Components & Equipment: 0.0% | | | |
| 210 | | | | Emerson Electric Co. | | | 10,385 |
| 100 | | | | Molex, Inc. | | | 2,441 |
| | | | | | | |
| | | | | | | 12,826 |
| | | | | | | |
| Electronics: 0.1% | | | |
| 250 | | @ | | Agilent Technologies, Inc. | | | 8,885 |
| 100 | | | | Applera Corp. - Applied Biosystems Group | | | 3,348 |
| 150 | | | | Jabil Circuit, Inc. | | | 2,462 |
| 200 | | | | PerkinElmer, Inc. | | | 5,570 |
| 300 | | @ | | Thermo Electron Corp. | | | 16,719 |
| 275 | | @@ | | Tyco Electronics Ltd. | | | 9,851 |
| 50 | | @ | | Waters Corp. | | | 3,225 |
| | | | | | | |
| | | | | | | 50,060 |
| | | | | | | |
| Engineering & Construction: 0.0% | | | |
| 40 | | | | Fluor Corp. | | | 7,443 |
| 40 | | @ | | Jacobs Engineering Group, Inc. | | | 3,228 |
| | | | | | | |
| | | | | | | 10,671 |
| | | | | | | |
| Environmental Control: 0.0% | | | |
| 300 | | @ | | Allied Waste Industries, Inc. | | | 3,786 |
| 200 | | | | Waste Management, Inc. | | | 7,542 |
| | | | | | | |
| | | | | | | 11,328 |
| | | | | | | |
| Food: 0.1% | | | |
| 300 | | | | ConAgra Foods, Inc. | | | 5,784 |
| 150 | | | | General Mills, Inc. | | | 9,116 |
| 150 | | | | HJ Heinz Co. | | | 7,178 |
| 270 | | | | Kellogg Co. | | | 12,965 |
| 335 | | | | Kraft Foods, Inc. | | | 9,531 |
| 270 | | | | Kroger Co. | | | 7,795 |
| 600 | | | | Sara Lee Corp. | | | 7,350 |
| 100 | | | | Supervalu, Inc. | | | 3,089 |
| 100 | | | | Sysco Corp. | | | 2,751 |
| 100 | | | | WM Wrigley Jr. Co. | | | 7,778 |
| | | | | | | |
| | | | | | | 73,337 |
| | | | | | | |
| Gas: 0.0% | | | |
| 200 | | | | Sempra Energy | | | 11,290 |
| | | | | | | |
| | | | | | | 11,290 |
| | | | | | | |
| Hand/Machine Tools: 0.0% | | | |
| 100 | | | | Black & Decker Corp. | | | 5,751 |
| 50 | | | | Snap-On, Inc. | | | 2,601 |
| 100 | | | | Stanley Works | | | 4,483 |
| | | | | | | |
| | | | | | | 12,835 |
| | | | | | | |
See Accompanying Notes to Financial Statements
123
| | |
| ING GET U.S. CORE PORTFOLIO SERIES 13 | | PORTFOLIO OF INVESTMENTS ASOF JUNE 30, 2008 (UNAUDITED) (CONTINUED) |
| | | | | | | |
| Shares | | | | | | Value |
| | | | | | | |
| Healthcare - Products: 0.2% | | | |
| 200 | | | | Baxter International, Inc. | | $ | 12,788 |
| 50 | | | | Becton Dickinson & Co. | | | 4,065 |
| 650 | | @ | | Boston Scientific Corp. | | | 7,989 |
| 125 | | @@ | | Covidien Ltd. | | | 5,986 |
| 10 | | | | CR Bard, Inc. | | | 880 |
| 820 | | | | Johnson & Johnson | | | 52,759 |
| 450 | | | | Medtronic, Inc. | | | 23,288 |
| 170 | | @ | | Patterson Cos., Inc. | | | 4,996 |
| 250 | | @ | | St. Jude Medical, Inc. | | | 10,220 |
| 40 | | | | Stryker Corp. | | | 2,515 |
| 100 | | @ | | Varian Medical Systems, Inc. | | | 5,185 |
| 40 | | @ | | Zimmer Holdings, Inc. | | | 2,722 |
| | | | | | | |
| | | | | | | 133,393 |
| | | | | | | |
| Healthcare - Services: 0.1% | | | |
| 200 | | | | Aetna, Inc. | | | 8,106 |
| 100 | | | | Cigna Corp. | | | 3,539 |
| 100 | | @ | | Humana, Inc. | | | 3,977 |
| 50 | | @ | | Laboratory Corp. of America Holdings | | | 3,482 |
| 100 | | | | Quest Diagnostics | | | 4,847 |
| 450 | | | | UnitedHealth Group, Inc. | | | 11,813 |
| 170 | | @ | | WellPoint, Inc. | | | 8,102 |
| | | | | | | |
| | | | | | | 43,866 |
| | | | | | | |
| Home Builders: 0.0% | | | |
| 100 | | | | D.R. Horton, Inc. | | | 1,085 |
| 200 | | | | Lennar Corp. | | | 2,468 |
| | | | | | | |
| | | | | | | 3,553 |
| | | | | | | |
| Household Products/Wares: 0.1% | | | |
| 100 | | | | Avery Dennison Corp. | | | 4,393 |
| 150 | | | | Clorox Co. | | | 7,830 |
| 100 | | | | Fortune Brands, Inc. | | | 6,241 |
| 300 | | | | Kimberly-Clark Corp. | | | 17,934 |
| | | | | | | |
| | | | | | | 36,398 |
| | | | | | | |
| Insurance: 0.3% | | | |
| 250 | | @@ | | ACE Ltd. | | | 13,773 |
| 250 | | | | Aflac, Inc. | | | 15,700 |
| 300 | | | | Allstate Corp. | | | 13,677 |
| 940 | | | | American International Group, Inc. | | | 24,872 |
| 100 | | | | AON Corp. | | | 4,594 |
| 110 | | | | Assurant, Inc. | | | 7,256 |
| 250 | | | | Chubb Corp. | | | 12,253 |
| 50 | | | | Cincinnati Financial Corp. | | | 1,270 |
| 150 | | | | Genworth Financial, Inc. | | | 2,672 |
| 100 | | | | Hartford Financial Services Group, Inc. | | | 6,457 |
| 50 | | | | Lincoln National Corp. | | | 2,266 |
| 50 | | | | Loews Corp. | | | 2,345 |
| 150 | | | | Marsh & McLennan Cos., Inc. | | | 3,983 |
| 380 | | | | Metlife, Inc. | | | 20,053 |
| 150 | | | | Progressive Corp. | | | 2,808 |
| 300 | | | | Prudential Financial, Inc. | | | 17,922 |
| 100 | | | | Torchmark Corp. | | | 5,865 |
| 250 | | | | Travelers Cos., Inc. | | | 10,850 |
| 150 | | | | UnumProvident Corp. | | | 3,068 |
| 100 | | @@ | | XL Capital Ltd. | | | 2,056 |
| | | | | | | |
| | | | | | | 173,740 |
| | | | | | | |
| | | | | | | |
| Shares | | | | | | Value |
| | | | | | | |
| Internet: 0.2% | | | |
| 50 | | @ | | Akamai Technologies, Inc. | | $ | 1,740 |
| 50 | | @ | | Amazon.com, Inc. | | | 3,667 |
| 520 | | @ | | eBay, Inc. | | | 14,212 |
| 100 | | @ | | Expedia, Inc. | | | 1,838 |
| 120 | | @ | | Google, Inc. - Class A | | | 63,170 |
| 100 | | @ | | IAC/InterActiveCorp. | | | 1,928 |
| 350 | | @ | | Symantec Corp. | | | 6,773 |
| 500 | | @ | | Yahoo!, Inc. | | | 10,330 |
| | | | | | | |
| | | | | | | 103,658 |
| | | | | | | |
| Iron/Steel: 0.0% | | | |
| 40 | | | | Allegheny Technologies, Inc. | | | 2,371 |
| 150 | | | | Nucor Corp. | | | 11,201 |
| 50 | | | | United States Steel Corp. | | | 9,239 |
| | | | | | | |
| | | | | | | 22,811 |
| | | | | | | |
| Lodging: 0.0% | | | |
| 100 | | | | Starwood Hotels & Resorts Worldwide, Inc. | | | 4,007 |
| | | | | | | |
| | | | | | | 4,007 |
| | | | | | | |
| Machinery - Construction & Mining: 0.0% | | | |
| 250 | | | | Caterpillar, Inc. | | | 18,455 |
| 50 | | @ | | Terex Corp. | | | 2,569 |
| | | | | | | |
| | | | | | | 21,024 |
| | | | | | | |
| Machinery - Diversified: 0.1% | | | |
| 100 | | | | Cummins, Inc. | | | 6,552 |
| 230 | | | | Deere & Co. | | | 16,590 |
| 100 | | | | Manitowoc Co., Inc. | | | 3,253 |
| 50 | | | | Rockwell Automation, Inc. | | | 2,187 |
| | | | | | | |
| | | | | | | 28,582 |
| | | | | | | |
| Media: 0.2% | | | |
| 150 | | | | CBS Corp. - Class B | | | 2,924 |
| 200 | | | | Clear Channel Communications, Inc. | | | 7,040 |
| 850 | | | | Comcast Corp. - Class A | | | 16,125 |
| 360 | | @ | | DIRECTV Group, Inc. | | | 9,328 |
| 1,050 | | | | News Corp. - Class A | | | 15,792 |
| 1,150 | | | | Time Warner, Inc. | | | 17,020 |
| 300 | | @ | | Viacom - Class B | | | 9,162 |
| 700 | | | | Walt Disney Co. | | | 21,840 |
| | | | | | | |
| | | | | | | 99,231 |
| | | | | | | |
| Metal Fabricate/Hardware: 0.0% | | | |
| 50 | | | | Precision Castparts Corp. | | | 4,819 |
| | | | | | | |
| | | | | | | 4,819 |
| | | | | | | |
| Mining: 0.1% | | | |
| 100 | | | | Alcoa, Inc. | | | 3,562 |
| 153 | | | | Freeport-McMoRan Copper & Gold, Inc. | | | 17,930 |
| 150 | | | | Newmont Mining Corp. | | | 7,824 |
| | | | | | | |
| | | | | | | 29,316 |
| | | | | | | |
| Miscellaneous Manufacturing: 0.3% | | | |
| 250 | | | | 3M Co. | | | 17,398 |
| 150 | | | | Cooper Industries Ltd. | | | 5,925 |
| 250 | | | | Dover Corp. | | | 12,093 |
| 100 | | | | Eaton Corp. | | | 8,497 |
| 3,710 | | | | General Electric Co. | | | 99,020 |
| 450 | | | | Honeywell International, Inc. | | | 22,626 |
| 180 | | | | Illinois Tool Works, Inc. | | | 8,552 |
See Accompanying Notes to Financial Statements
124
| | |
| ING GET U.S. CORE PORTFOLIO SERIES 13 | | PORTFOLIO OF INVESTMENTS ASOF JUNE 30, 2008 (UNAUDITED) (CONTINUED) |
| | | | | | | |
| Shares | | | | | | Value |
| | | | | | | |
| Miscellaneous Manufacturing: (continued) | | | |
| 200 | | | | Leggett & Platt, Inc. | | $ | 3,354 |
| 100 | | | | Parker Hannifin Corp. | | | 7,132 |
| 200 | | | | Textron, Inc. | | | 9,586 |
| 125 | | @@ | | Tyco International Ltd. | | | 5,005 |
| | | | | | | |
| | | | | | | 199,188 |
| | | | | | | |
| Office/Business Equipment: 0.0% | | | |
| 250 | | | | Pitney Bowes, Inc. | | | 8,525 |
| 650 | | | | Xerox Corp. | | | 8,814 |
| | | | | | | |
| | | | | | | 17,339 |
| | | | | | | |
| Oil & Gas: 0.9% | | | |
| 280 | | | | Anadarko Petroleum Corp. | | | 20,955 |
| 150 | | | | Apache Corp. | | | 20,850 |
| 70 | | | | Cabot Oil & Gas Corp. | | | 4,741 |
| 250 | | | | Chesapeake Energy Corp. | | | 16,490 |
| 850 | | | | Chevron Corp. | | | 84,261 |
| 620 | | | | ConocoPhillips | | | 58,522 |
| 290 | | | | Devon Energy Corp. | | | 34,846 |
| 100 | | | | ENSCO International, Inc. | | | 8,074 |
| 50 | | | | EOG Resources, Inc. | | | 6,560 |
| 2,130 | | | | ExxonMobil Corp. | | | 187,717 |
| 110 | | | | Hess Corp. | | | 13,881 |
| 250 | | | | Marathon Oil Corp. | | | 12,968 |
| 50 | | | | Murphy Oil Corp. | | | 4,903 |
| 50 | | @, @@ | | Nabors Industries Ltd. | | | 2,462 |
| 50 | | | | Noble Corp. | | | 3,248 |
| 110 | | | | Noble Energy, Inc. | | | 11,062 |
| 460 | | | | Occidental Petroleum Corp. | | | 41,336 |
| 40 | | | | Questar Corp. | | | 2,842 |
| 100 | | | | Range Resources Corp. | | | 6,554 |
| 100 | | @ | | Southwestern Energy Co. | | | 4,761 |
| 50 | | | | Sunoco, Inc. | | | 2,035 |
| 79 | | @ | | Transocean, Inc. | | | 12,039 |
| 100 | | | | Valero Energy Corp. | | | 4,118 |
| 150 | | | | XTO Energy, Inc. | | | 10,277 |
| | | | | | | |
| | | | | | | 575,502 |
| | | | | | | |
| Oil & Gas Services: 0.2% | | | |
| 100 | | | | Baker Hughes, Inc. | | | 8,734 |
| 280 | | | | Halliburton Co. | | | 14,860 |
| 150 | | @ | | National Oilwell Varco, Inc. | | | 13,308 |
| 450 | | | | Schlumberger Ltd. | | | 48,344 |
| 50 | | | | Smith International, Inc. | | | 4,157 |
| 100 | | @ | | Weatherford International Ltd. | | | 4,959 |
| | | | | | | |
| | | | | | | 94,362 |
| | | | | | | |
| Packaging & Containers: 0.0% | | | |
| 150 | | | | Ball Corp. | | | 7,161 |
| | | | | | | |
| | | | | | | 7,161 |
| | | | | | | |
| Pharmaceuticals: 0.3% | | | |
| 450 | | | | Abbott Laboratories | | | 23,837 |
| 120 | | | | Allergan, Inc. | | | 6,246 |
| 100 | | | | AmerisourceBergen Corp. | | | 3,999 |
| 600 | | | | Bristol-Myers Squibb Co. | | | 12,318 |
| 50 | | | | Cardinal Health, Inc. | | | 2,579 |
| 450 | | | | Eli Lilly & Co. | | | 20,772 |
| 80 | | @ | | Express Scripts, Inc. | | | 5,018 |
| 100 | | @ | | Forest Laboratories, Inc. | | | 3,474 |
| 319 | | @ | | King Pharmaceuticals, Inc. | | | 3,340 |
| 200 | | @ | | Medco Health Solutions, Inc. | | | 9,440 |
| 860 | | | | Merck & Co., Inc. | | | 32,413 |
| 2,300 | | | | Pfizer, Inc. | | | 40,181 |
| | | | | | | |
| Shares | | | | | | Value |
| | | | | | | |
| 660 | | | | Schering-Plough Corp. | | $ | 12,995 |
| 100 | | @ | | Watson Pharmaceuticals, Inc. | | | 2,717 |
| 450 | | | | Wyeth | | | 21,582 |
| | | | | | | |
| | | | | | | 200,911 |
| | | | | | | |
| Pipelines: 0.0% | | | |
| 300 | | | | El Paso Corp. | | | 6,522 |
| 300 | | | | Spectra Energy Corp. | | | 8,622 |
| 240 | | | | Williams Cos., Inc. | | | 9,674 |
| | | | | | | |
| | | | | | | 24,818 |
| | | | | | | |
| Retail: 0.4% | | | |
| 50 | | | | Abercrombie & Fitch Co. | | | 3,134 |
| 50 | | @ | | Autozone, Inc. | | | 6,051 |
| 200 | | | | Best Buy Co., Inc. | | | 7,920 |
| 150 | | @ | | Big Lots, Inc. | | | 4,686 |
| 90 | | | | Costco Wholesale Corp. | | | 6,313 |
| 486 | | | | CVS Caremark Corp. | | | 19,231 |
| 60 | | | | Darden Restaurants, Inc. | | | 1,916 |
| 250 | | | | Family Dollar Stores, Inc. | | | 4,985 |
| 100 | | @ | | GameStop Corp. | | | 4,040 |
| 300 | | | | Gap, Inc. | | | 5,001 |
| 450 | | | | Home Depot, Inc. | | | 10,539 |
| 100 | | | | JC Penney Co., Inc. | | | 3,629 |
| 300 | | | | Limited Brands, Inc. | | | 5,055 |
| 500 | | | | Lowe’s Cos., Inc. | | | 10,375 |
| 200 | | | | Macy’s, Inc. | | | 3,884 |
| 490 | | | | McDonald’s Corp. | | | 27,548 |
| 300 | | | | Staples, Inc. | | | 7,125 |
| 300 | | | | Target Corp. | | | 13,947 |
| 100 | | | | Tiffany & Co. | | | 4,075 |
| 350 | | | | TJX Cos., Inc. | | | 11,015 |
| 250 | | | | Walgreen Co. | | | 8,128 |
| 980 | | | | Wal-Mart Stores, Inc. | | | 55,076 |
| 170 | | | | Yum! Brands, Inc. | | | 5,965 |
| | | | | | | |
| | | | | | | 229,638 |
| | | | | | | |
| Savings & Loans: 0.0% | | | |
| 200 | | | | Hudson City Bancorp., Inc. | | | 3,336 |
| 250 | | | | Washington Mutual, Inc. | | | 1,233 |
| | | | | | | |
| | | | | | | 4,569 |
| | | | | | | |
| Semiconductors: 0.2% | | | |
| 100 | | | | Altera Corp. | | | 2,070 |
| 100 | | | | Analog Devices, Inc. | | | 3,177 |
| 500 | | | | Applied Materials, Inc. | | | 9,545 |
| 150 | | @ | | Broadcom Corp. | | | 4,094 |
| 2,150 | | | | Intel Corp. | | | 46,182 |
| 100 | | | | KLA-Tencor Corp. | | | 4,071 |
| 100 | | | | Linear Technology Corp. | | | 3,257 |
| 250 | | @ | | LSI Logic Corp. | | | 1,535 |
| 50 | | @ | | MEMC Electronic Materials, Inc. | | | 3,077 |
| 150 | | | | National Semiconductor Corp. | | | 3,081 |
| 200 | | @ | | Nvidia Corp. | | | 3,744 |
| 100 | | @ | | QLogic Corp. | | | 1,459 |
| 600 | | | | Texas Instruments, Inc. | | | 16,896 |
| 100 | | | | Xilinx, Inc. | | | 2,525 |
| | | | | | | |
| | | | | | | 104,713 |
| | | | | | | |
| Software: 0.2% | | | |
| 200 | | @ | | Adobe Systems, Inc. | | | 7,878 |
| 100 | | @ | | Autodesk, Inc. | | | 3,381 |
| 50 | | @ | | BMC Software, Inc. | | | 1,800 |
| 250 | | | | CA, Inc. | | | 5,773 |
| 200 | | @ | | Compuware Corp. | | | 1,908 |
See Accompanying Notes to Financial Statements
125
| | |
| ING GET U.S. CORE PORTFOLIO SERIES 13 | | PORTFOLIO OF INVESTMENTS ASOF JUNE 30, 2008 (UNAUDITED) (CONTINUED) |
| | | | | | | |
| Shares | | | | | | Value |
| | | | | | | |
| Software: (continued) | | | |
| 50 | | @ | | Electronic Arts, Inc. | | $ | 2,222 |
| 100 | | | | Fidelity National Information Services, Inc. | | | 3,691 |
| 100 | | @ | | Fiserv, Inc. | | | 4,537 |
| 250 | | | | IMS Health, Inc. | | | 5,825 |
| 2,900 | | | | Microsoft Corp. | | | 79,779 |
| 1,450 | | @ | | Oracle Corp. | | | 30,450 |
| | | | | | | |
| | | | | | | 147,244 |
| | | | | | | |
| Telecommunications: 0.4% | | | |
| 2,070 | | | | AT&T, Inc. | | | 69,738 |
| 100 | | | | CenturyTel, Inc. | | | 3,559 |
| 2,280 | | @ | | Cisco Systems, Inc. | | | 53,033 |
| 600 | | | | Corning, Inc. | | | 13,830 |
| 50 | | | | Embarq Corp. | | | 2,364 |
| 100 | | @ | | JDS Uniphase Corp. | | | 1,136 |
| 150 | | @ | | Juniper Networks, Inc. | | | 3,327 |
| 250 | | | | Motorola, Inc. | | | 1,835 |
| 500 | | | | Qualcomm, Inc. | | | 22,185 |
| 900 | | | | Qwest Communications International, Inc. | | | 3,537 |
| 650 | | | | Sprint Nextel Corp. | | | 6,175 |
| 1,090 | | | | Verizon Communications, Inc. | | | 38,586 |
| 650 | | | | Windstream Corp. | | | 8,021 |
| | | | | | | |
| | | | | | | 227,326 |
| | | | | | | |
| Textiles: 0.0% | | | |
| 50 | | | | Cintas Corp. | | | 1,326 |
| | | | | | | |
| | | | | | | 1,326 |
| | | | | | | |
| Toys/Games/Hobbies: 0.0% | | | |
| 250 | | | | Hasbro, Inc. | | | 8,930 |
| | | | | | | |
| | | | | | | 8,930 |
| | | | | | | |
| Transportation: 0.1% | | | |
| 50 | | | | Burlington Northern Santa Fe Corp. | | | 4,995 |
| 50 | | | | CH Robinson Worldwide, Inc. | | | 2,742 |
| 100 | | | | CSX Corp. | | | 6,281 |
| 100 | | | | Expeditors International Washington, Inc. | | | 4,300 |
| 100 | | | | FedEx Corp. | | | 7,879 |
| 100 | | | | Norfolk Southern Corp. | | | 6,267 |
| 100 | | | | Ryder System, Inc. | | | 6,888 |
| 100 | | | | Union Pacific Corp. | | | 7,550 |
| 280 | | | | United Parcel Service, Inc. - Class B | | | 17,212 |
| | | | | | | |
| | | | | | | 64,114 |
| | | | | | | |
| | | | Total Common Stock
(Cost $4,396,084) | | | 4,187,060 |
| | | | | | | |
| REAL ESTATE INVESTMENT TRUSTS: 0.0% | | | |
| Apartments: 0.0% | | | |
| 50 | | | | Equity Residential | | | 1,914 |
| | | | | | | |
| | | | | | | 1,914 |
| | | | | | | |
| Diversified: 0.0% | | | |
| 50 | | | | Vornado Realty Trust | | | 4,400 |
| | | | | | | |
| | | | | | | 4,400 |
| | | | | | | |
| Health Care: 0.0% | | | |
| 50 | | | | HCP, Inc. | | | 1,591 |
| | | | | | | |
| | | | | | | 1,591 |
| | | | | | | |
| | | | | | | | |
| Shares | | | | | | Value |
| | | | | | | | |
| | Hotels: 0.0% | | | |
| | 450 | | | | Host Hotels & Resorts, Inc. | | $ | 6,143 |
| | | | | | | | |
| | | | | | | | 6,143 |
| | | | | | | | |
| | Regional Malls: 0.0% | | | |
| | 100 | | | | General Growth Properties, Inc. | | | 3,503 |
| | 50 | | | | Simon Property Group, Inc. | | | 4,495 |
| | | | | | | | |
| | | | | | | | 7,998 |
| | | | | | | | |
| | Storage: 0.0% | | | |
| | 100 | | | | Public Storage, Inc. | | | 8,079 |
| | | | | | | | |
| | | | | | | | 8,079 |
| | | | | | | | |
| | Warehouse/Industrial: 0.0% | | | |
| | 90 | | | | Prologis | | | 4,892 |
| | | | | | | | |
| | | | | | | | 4,892 |
| | | | | | | | |
| | | | | Total Real Estate Investment Trusts
(Cost $37,378) | | | 35,017 |
| | | | | | | | |
| | | |
Principal
Amount | | | | | | Value |
| | U.S. GOVERNMENT AGENCY OBLIGATIONS: 77.2% |
| | Federal Home Loan Mortgage Corporation: 17.5% |
| $ | 13,000,000 | | Z | | 3.150%, due 11/15/13 | | $ | 11,004,058 |
| | | | | | | | |
| | | | | | | | 11,004,058 |
| | | | | | | | |
| | Federal National Mortgage Association: 24.3% | | | |
| | 11,000,000 | | ^, Z | | 3.132%, due 11/15/13 | | | 8,946,366 |
| | 7,820,000 | | ^, Z | | 3.214%, due 01/15/14 | | | 6,309,856 |
| | | | | | | | |
| | | | | | | | 15,256,222 |
| | | | | | | | |
| | Other U.S. Agency Obligations: 35.4% | | | |
| | 7,150,000 | | Z | | Financing Corp.,
3.910%, due 11/11/13 | | | 5,820,635 |
| | 20,000,000 | | ^, Z | | Resolution Funding Corp.,
3.900%, due 01/15/14 | | | 16,398,780 |
| | | | | | | | |
| | | | | | | | 22,219,415 |
| | | | | | | | |
| | | | | Total U.S. Government Agency Obligations
(Cost $47,957,465) | | | 48,479,695 |
| | | | | | | | |
| | U.S. TREASURY OBLIGATIONS: 20.3% | | | |
| | U.S. Treasury STRIP: 20.3% | | | |
| | 15,394,000 | | ^ | | 2.793%, due 11/15/13 | | | 12,755,884 |
| | | | | | | | |
| | | | | Total U.S. Treasury Obligations
(Cost $12,723,696) | | | 12,755,884 |
| | | | | | | | |
| | | | | Total Long-Term Investments
(Cost $65,114,623) | | | 65,457,656 |
| | | | | | | | |
| | | |
| Shares | | | | | | Value |
| | SHORT-TERM INVESTMENTS: 0.7% | | | |
| | Mutual Fund: 0.3% | | | |
| | 150,000 | | ** | | ING Institutional Prime Money Market Fund | | $ | 150,000 |
| | | | | | | | |
| | | | | Total Mutual Fund
(Cost $150,000) | | | 150,000 |
| | | | | | | | |
See Accompanying Notes to Financial Statements
126
| | |
| ING GET U.S. CORE PORTFOLIO SERIES 13 | | PORTFOLIO OF INVESTMENTS ASOF JUNE 30, 2008 (UNAUDITED) (CONTINUED) |
| | | | | | | | | | |
| | | |
Principal
Amount | | | | | | | Value | |
| | | | | | | | | | |
| | Repurchase Agreement: 0.4% | | | | | | | |
| $ | 270,000 | | Goldman Sachs Repurchase Agreement dated 06/30/08, 2.350%, due 07/01/08,
$270,018 to be received upon repurchase (Collateralized by $270,800 U.S. Treasury, 3.500%, Market Value plus accrued interest $275,462,
due 12/15/09) | | | | | $ | 270,000 | |
| | | | | | | | | | |
| | | Total Repurchase Agreement
(Cost $270,000) | | | | | | 270,000 | |
| | | | | | | | | | |
| | | Total Short-Term Investments
(Cost $420,000) | | | | | | 420,000 | |
| | | | | | | | | | |
| | | Total Investments in Securities
(Cost $65,534,623)* | | 104.9 | % | | $ | 65,877,656 | |
| | | Other Assets and
Liabilities - Net | | (4.9 | ) | | | (3,094,062 | ) |
| | | | | | | | | | |
| | | Net Assets | | 100.0 | % | | $ | 62,783,594 | |
| | | | | | | | | | |
| @ | Non-income producing security |
| STRIP | Separate Trading of Registered Interest and Principal of Securities |
| ** | Investment in affiliate |
| ^ | Interest only securities represent the right to receive the monthly interest payments on an underlying pool of mortgage loans. Principal amount shown represents the notional amount on which current interest is calculated. Payments of principal on the pool reduce the value of the interest only security. |
| Z | Indicates Zero Coupon Bond; rate shown reflects current effective yield. |
| * | Cost for federal income tax purposes is $67,202,477. |
| | | | |
Net unrealized depreciation consists of: | | | | |
Gross Unrealized Appreciation | | $ | 1,278,869 | |
Gross Unrealized Depreciation | | | (2,603,690 | ) |
| | | | |
Net Unrealized Depreciation | | $ | (1,324,821 | ) |
| | | | |
Fair Value Measurements — Effective January 1, 2008, the Portfolio adopted Financial Accounting Standards Board Statement of Financial Accounting Standards No. 157 (“SFAS 157”), “Fair Value Measurements.” This new accounting statement defines fair value, establishes a framework for measuring fair value in generally accepted accounting principles (“GAAP”), and expands disclosures about fair value measurements. The three levels of the fair value hierarchy are as follows:
| | • | | Level 1 — quoted prices in active markets for identical investments |
| | • | | Level 2 — other significant observable inputs (including quoted prices for similar investments, interest rates, prepayment speeds, credit risk, etc.) |
| | • | | Level 3 — significant unobservable inputs (including the Portfolio’s own assumption in determining the fair value of investments) |
The inputs or methodology used in valuing securities are not necessarily an indication of the risk associated with investing in those securities.
The following is a summary of the inputs used as of June 30, 2008 in valuing the Portfolio’s investments at fair value:
| | | | | | |
| | | Investments in Securities | | Other Financial Instruments* |
Level 1 — Quoted Prices | | $ | 4,372,077 | | $ | — |
Level 2 — Other Significant Observable Inputs | | | 61,505,579 | | | — |
Level 3 — Significant Unobservable Inputs | | | — | | | — |
| | | | | | |
Total | | $ | 65,877,656 | | $ | — |
| | | | | | |
| * | | Other financial instruments may include forward foreign currency contracts, futures, swaps, and written options. |
See Accompanying Notes to Financial Statements
127
| | |
| ING GET U.S. CORE PORTFOLIO SERIES 14 | | PORTFOLIO OF INVESTMENTS ASOF JUNE 30, 2008 (UNAUDITED) (CONTINUED) |
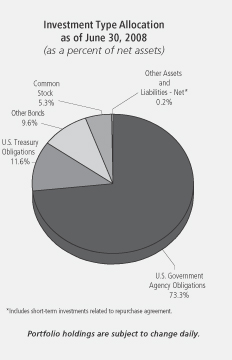
| | | | | | | |
| Shares | | | | | | Value |
| | | | | | | |
| COMMON STOCK: 5.3% |
| Advertising: 0.0% |
| 900 | | @ | | Interpublic Group of Cos., Inc. | | $ | 7,740 |
| 350 | | | | Omnicom Group | | | 15,708 |
| | | | | | | |
| | | | | | | 23,448 |
| | | | | | | |
| Aerospace/Defense: 0.1% |
| 510 | | | | Boeing Co. | | | 33,517 |
| 130 | | | | General Dynamics Corp. | | | 10,946 |
| 200 | | | | Goodrich Corp. | | | 9,492 |
| 50 | | | | L-3 Communications Holdings, Inc. | | | 4,544 |
| 240 | | | | Lockheed Martin Corp. | | | 23,678 |
| 300 | | | | Northrop Grumman Corp. | | | 20,070 |
| 100 | | | | Raytheon Co. | | | 5,628 |
| 100 | | | | Rockwell Collins, Inc. | | | 4,796 |
| 550 | | | | United Technologies Corp. | | | 33,935 |
| | | | | | | |
| | | | | | | 146,606 |
| | | | | | | |
| Agriculture: 0.1% |
| 1,150 | | | | Altria Group, Inc. | | | 23,644 |
| 400 | | | | Archer-Daniels-Midland Co. | | | 13,500 |
| 137 | | @ | | Lorillard, Inc. | | | 9,475 |
| 1,150 | | | | Philip Morris International, Inc. | | | 56,799 |
| 130 | | | | Reynolds American, Inc. | | | 6,067 |
| | | | | | | |
| | | | | | | 109,485 |
| | | | | | | |
| Airlines: 0.0% |
| 520 | | | | Southwest Airlines Co. | | | 6,781 |
| | | | | | | |
| | | | | | | 6,781 |
| | | | | | | |
| Apparel: 0.0% |
| 300 | | @ | | Coach, Inc. | | | 8,664 |
| 250 | | | | Nike, Inc. | | | 14,903 |
| 100 | | | | VF Corp. | | | 7,118 |
| | | | | | | |
| | | | | | | 30,685 |
| | | | | | | |
| | | | | | | |
| Shares | | | | | | Value |
| | | | | | | |
| Auto Manufacturers: 0.0% |
| 781 | | @ | | Ford Motor Co. | | $ | 3,757 |
| 200 | | | | General Motors Corp. | | | 2,300 |
| | | | | | | |
| | | | | | | 6,057 |
| | | | | | | |
| Auto Parts & Equipment: 0.0% |
| 200 | | @ | | Goodyear Tire & Rubber Co. | | | 3,566 |
| 500 | | | | Johnson Controls, Inc. | | | 14,340 |
| | | | | | | |
| | | | | | | 17,906 |
| | | | | | | |
| Banks: 0.2% |
| 2,490 | | | | Bank of America Corp. | | | 59,436 |
| 740 | | | | Bank of New York Mellon Corp. | | | 27,994 |
| 290 | | | | BB&T Corp. | | | 6,603 |
| 210 | | | | Capital One Financial Corp. | | | 7,982 |
| 280 | | | | Fifth Third Bancorp. | | | 2,850 |
| 100 | | | | M&T Bank Corp. | | | 7,054 |
| 149 | | | | Marshall & Ilsley Corp. | | | 2,284 |
| 100 | | | | Northern Trust Corp. | | | 6,857 |
| 850 | | | | Regions Financial Corp. | | | 9,274 |
| 310 | | | | State Street Corp. | | | 19,837 |
| 600 | | | | US Bancorp. | | | 16,734 |
| 950 | | | | Wachovia Corp. | | | 14,754 |
| 1,560 | | | | Wells Fargo & Co. | | | 37,050 |
| 250 | | | | Zions Bancorp. | | | 7,873 |
| | | | | | | |
| | | | | | | 226,582 |
| | | | | | | |
| Beverages: 0.1% |
| 70 | | | | Anheuser-Busch Cos., Inc. | | | 4,348 |
| 1,130 | | | | Coca-Cola Co. | | | 58,737 |
| 200 | | | | Coca-Cola Enterprises, Inc. | | | 3,460 |
| 400 | | | | Pepsi Bottling Group, Inc. | | | 11,168 |
| 830 | | | | PepsiCo, Inc. | | | 52,780 |
| | | | | | | |
| | | | | | | 130,493 |
| | | | | | | |
| Biotechnology: 0.1% |
| 650 | | @ | | Amgen, Inc. | | | 30,654 |
| 160 | | @ | | Biogen Idec, Inc. | | | 8,942 |
| 250 | | @ | | Celgene Corp. | | | 15,968 |
| 50 | | @ | | Genzyme Corp. | | | 3,601 |
| 450 | | @ | | Gilead Sciences, Inc. | | | 23,828 |
| | | | | | | |
| | | | | | | 82,993 |
| | | | | | | |
| Chemicals: 0.2% |
| 200 | | | | Air Products & Chemicals, Inc. | | | 19,772 |
| 550 | | | | Dow Chemical Co. | | | 19,201 |
| 130 | | | | Ecolab, Inc. | | | 5,589 |
| 700 | | | | EI Du Pont de Nemours & Co. | | | 30,023 |
| 200 | | | | Hercules, Inc. | | | 3,386 |
| 200 | | | | International Flavors & Fragrances, Inc. | | | 7,812 |
| 300 | | | | Monsanto Co. | | | 37,932 |
| 100 | | | | PPG Industries, Inc. | | | 5,737 |
| 100 | | | | Praxair, Inc. | | | 9,424 |
| 100 | | | | Rohm & Haas Co. | | | 4,644 |
| 300 | | | | Sigma-Aldrich Corp. | | | 16,158 |
| | | | | | | |
| | | | | | | 159,678 |
| | | | | | | |
| Coal: 0.0% |
| 100 | | | | Consol Energy, Inc. | | | 11,237 |
| 40 | | | | Massey Energy Co. | | | 3,750 |
| 50 | | | | Peabody Energy Corp. | | | 4,403 |
| | | | | | | |
| | | | | | | 19,390 |
| | | | | | | |
| Commercial Services: 0.1% |
| 150 | | @ | | Apollo Group, Inc. - Class A | | | 6,639 |
| 100 | | | | Automatic Data Processing, Inc. | | | 4,190 |
See Accompanying Notes to Financial Statements
128
| | |
| ING GET U.S. CORE PORTFOLIO SERIES 14 | | PORTFOLIO OF INVESTMENTS ASOF JUNE 30, 2008 (UNAUDITED) (CONTINUED) |
| | | | | | | |
| Shares | | | | | | Value |
| | | | | | | |
| Commercial Services: (continued) |
| 200 | | | | H&R Block, Inc. | | $ | 4,280 |
| 180 | | | | McKesson Corp. | | | 10,064 |
| 50 | | | | Moody’s Corp. | | | 1,722 |
| 150 | | | | Robert Half International, Inc. | | | 3,596 |
| 300 | | | | RR Donnelley & Sons Co. | | | 8,907 |
| 400 | | | | Western Union Co. | | | 9,888 |
| | | | | | | |
| | | | | | | 49,286 |
| | | | | | | |
| Computers: 0.3% |
| 150 | | @ | | Affiliated Computer Services, Inc. | | | 8,024 |
| 410 | | @ | | Apple, Inc. | | | 68,650 |
| 100 | | @ | | Cognizant Technology Solutions Corp. | | | 3,251 |
| 100 | | @ | | Computer Sciences Corp. | | | 4,684 |
| 1,400 | | @ | | Dell, Inc. | | | 30,632 |
| 1,200 | | @ | | EMC Corp. | | | 17,628 |
| 1,450 | | | | Hewlett-Packard Co. | | | 64,105 |
| 750 | | | | International Business Machines Corp. | | | 88,898 |
| 150 | | @ | | Lexmark International, Inc. | | | 5,015 |
| 200 | | @ | | NetApp, Inc. | | | 4,332 |
| 150 | | @ | | Sandisk Corp. | | | 2,805 |
| 475 | | @ | | Sun Microsystems, Inc. | | | 5,168 |
| 100 | | @ | | Teradata Corp. | | | 2,314 |
| | | | | | | |
| | | | | | | 305,506 |
| | | | | | | |
| Cosmetics/Personal Care: 0.1% |
| 300 | | | | Avon Products, Inc. | | | 10,806 |
| 160 | | | | Colgate-Palmolive Co. | | | 11,056 |
| 1,800 | | | | Procter & Gamble Co. | | | 109,458 |
| | | | | | | |
| | | | | | | 131,320 |
| | | | | | | |
| Distribution/Wholesale: 0.0% |
| 300 | | | | Genuine Parts Co. | | | 11,904 |
| | | | | | | |
| | | | | | | 11,904 |
| | | | | | | |
| Diversified Financial Services: 0.3% |
| 550 | | | | American Express Co. | | | 20,719 |
| 80 | | | | Ameriprise Financial, Inc. | | | 3,254 |
| 300 | | | | Charles Schwab Corp. | | | 6,162 |
| 350 | | | | CIT Group, Inc. | | | 2,384 |
| 2,820 | | | | Citigroup, Inc. | | | 47,263 |
| 30 | | | | CME Group, Inc. | | | 11,496 |
| 300 | | | | Countrywide Financial Corp. | | | 1,275 |
| 300 | | | | Discover Financial Services | | | 3,951 |
| 900 | | @ | | E*Trade Financial Corp. | | | 2,826 |
| 300 | | | | Federal Home Loan Mortgage Corporation | | | 4,920 |
| 540 | | | | Federal National Mortgage Association | | | 10,535 |
| 260 | | | | Goldman Sachs Group, Inc. | | | 45,474 |
| 50 | | @ | | IntercontinentalExchange, Inc. | | | 5,700 |
| 1,837 | | | | JPMorgan Chase & Co. | | | 63,027 |
| 100 | | | | Legg Mason, Inc. | | | 4,357 |
| 340 | | | | Lehman Brothers Holdings, Inc. | | | 6,735 |
| 750 | | | | Merrill Lynch & Co., Inc. | | | 23,783 |
| 750 | | | | Morgan Stanley | | | 27,053 |
| 140 | | | | NYSE Euronext | | | 7,092 |
| 200 | | @ | | SLM Corp. | | | 3,870 |
| 100 | | | | T. Rowe Price Group, Inc. | | | 5,647 |
| | | | | | | |
| | | | | | | 307,523 |
| | | | | | | |
| Electric: 0.2% |
| 500 | | @ | | AES Corp. | | | 9,605 |
| 660 | | | | American Electric Power Co., Inc. | | | 26,552 |
| | | | | | | |
| Shares | | | | | | Value |
| | | | | | | |
| 400 | | | | Centerpoint Energy, Inc. | | $ | 6,420 |
| 440 | | | | Dominion Resources, Inc. | | | 20,896 |
| 450 | | | | DTE Energy Co. | | | 19,098 |
| 1,750 | | | | Duke Energy Corp. | | | 30,415 |
| 500 | | | | Edison International | | | 25,690 |
| 70 | | | | Entergy Corp. | | | 8,434 |
| 100 | | | | Exelon Corp. | | | 8,996 |
| 200 | | | | FPL Group, Inc. | | | 13,116 |
| 500 | | | | Pepco Holdings, Inc. | | | 12,825 |
| 100 | | | | PG&E Corp. | | | 3,969 |
| 100 | | | | PPL Corp. | | | 5,227 |
| 160 | | | | Public Service Enterprise Group, Inc. | | | 7,349 |
| | | | | | | |
| | | | | | | 198,592 |
| | | | | | | |
| Electrical Components & Equipment: 0.0% |
| 350 | | | | Emerson Electric Co. | | | 17,308 |
| 100 | | | | Molex, Inc. | | | 2,441 |
| | | | | | | |
| | | | | | | 19,749 |
| | | | | | | |
| Electronics: 0.1% |
| 300 | | @ | | Agilent Technologies, Inc. | | | 10,662 |
| 150 | | | | Applera Corp. - Applied Biosystems Group | | | 5,022 |
| 300 | | | | Jabil Circuit, Inc. | | | 4,923 |
| 200 | | | | PerkinElmer, Inc. | | | 5,570 |
| 280 | | @ | | Thermo Electron Corp. | | | 15,604 |
| 275 | | @@ | | Tyco Electronics Ltd. | | | 9,851 |
| 150 | | @ | | Waters Corp. | | | 9,675 |
| | | | | | | |
| | | | | | | 61,307 |
| | | | | | | |
| Engineering & Construction: 0.0% |
| 40 | | | | Fluor Corp. | | | 7,443 |
| 100 | | @ | | Jacobs Engineering Group, Inc. | | | 8,070 |
| | | | | | | |
| | | | | | | 15,513 |
| | | | | | | |
| Environmental Control: 0.0% |
| 550 | | @ | | Allied Waste Industries, Inc. | | | 6,941 |
| 200 | | | | Waste Management, Inc. | | | 7,542 |
| | | | | | | |
| | | | | | | 14,483 |
| | | | | | | |
| Food: 0.1% |
| 300 | | | | ConAgra Foods, Inc. | | | 5,784 |
| 190 | | | | General Mills, Inc. | | | 11,546 |
| 200 | | | | HJ Heinz Co. | | | 9,570 |
| 250 | | | | Kellogg Co. | | | 12,005 |
| 600 | | | | Kraft Foods, Inc. | | | 17,070 |
| 250 | | | | Kroger Co. | | | 7,218 |
| 800 | | | | Sara Lee Corp. | | | 9,800 |
| 150 | | | | Supervalu, Inc. | | | 4,634 |
| 200 | | | | Sysco Corp. | | | 5,502 |
| 150 | | | | WM Wrigley Jr. Co. | | | 11,667 |
| | | | | | | |
| | | | | | | 94,796 |
| | | | | | | |
| Gas: 0.0% |
| 300 | | | | Sempra Energy | | | 16,935 |
| | | | | | | |
| | | | | | | 16,935 |
| | | | | | | |
| Hand/Machine Tools: 0.0% |
| 100 | | | | Black & Decker Corp. | | | 5,751 |
| 50 | | | | Snap-On, Inc. | | | 2,601 |
| 100 | | | | Stanley Works | | | 4,483 |
| | | | | | | |
| | | | | | | 12,835 |
| | | | | | | |
See Accompanying Notes to Financial Statements
129
| | |
| ING GET U.S. CORE PORTFOLIO SERIES 14 | | PORTFOLIO OF INVESTMENTS ASOF JUNE 30, 2008 (UNAUDITED) (CONTINUED) |
| | | | | | | |
| Shares | | | | | | Value |
| | | | | | | |
| Healthcare - Products: 0.2% |
| 300 | | | | Baxter International, Inc. | | $ | 19,182 |
| 100 | | | | Becton Dickinson & Co. | | | 8,130 |
| 810 | | @ | | Boston Scientific Corp. | | | 9,955 |
| 175 | | @@ | | Covidien Ltd. | | | 8,381 |
| 50 | | | | CR Bard, Inc. | | | 4,398 |
| 1,200 | | | | Johnson & Johnson | | | 77,208 |
| 750 | | | | Medtronic, Inc. | | | 38,813 |
| 230 | | @ | | Patterson Cos., Inc. | | | 6,760 |
| 290 | | @ | | St. Jude Medical, Inc. | | | 11,855 |
| 100 | | | | Stryker Corp. | | | 6,288 |
| 100 | | @ | | Varian Medical Systems, Inc. | | | 5,185 |
| 50 | | @ | | Zimmer Holdings, Inc. | | | 3,403 |
| | | | | | | |
| | | | | | | 199,558 |
| | | | | | | |
| Healthcare - Services: 0.1% |
| 300 | | | | Aetna, Inc. | | | 12,159 |
| 150 | | | | Cigna Corp. | | | 5,309 |
| 100 | | @ | | Humana, Inc. | | | 3,977 |
| 100 | | @ | | Laboratory Corp. of America Holdings | | | 6,963 |
| 100 | | | | Quest Diagnostics | | | 4,847 |
| 600 | | | | UnitedHealth Group, Inc. | | | 15,750 |
| 260 | | @ | | WellPoint, Inc. | | | 12,392 |
| | | | | | | |
| | | | | | | 61,397 |
| | | | | | | |
| Home Builders: 0.0% |
| 300 | | | | D.R. Horton, Inc. | | | 3,255 |
| 400 | | | | Lennar Corp. | | | 4,936 |
| | | | | | | |
| | | | | | | 8,191 |
| | | | | | | |
| Household Products/Wares: 0.0% |
| 100 | | | | Avery Dennison Corp. | | | 4,393 |
| 200 | | | | Clorox Co. | | | 10,440 |
| 100 | | | | Fortune Brands, Inc. | | | 6,241 |
| 350 | | | | Kimberly-Clark Corp. | | | 20,923 |
| | | | | | | |
| | | | | | | 41,997 |
| | | | | | | |
| Insurance: 0.2% |
| 240 | | @@ | | ACE Ltd. | | | 13,222 |
| 300 | | | | Aflac, Inc. | | | 18,840 |
| 300 | | | | Allstate Corp. | | | 13,677 |
| 1,470 | | | | American International Group, Inc. | | | 38,896 |
| 100 | | | | AON Corp. | | | 4,594 |
| 100 | | | | Assurant, Inc. | | | 6,596 |
| 350 | | | | Chubb Corp. | | | 17,154 |
| 100 | | | | Cincinnati Financial Corp. | | | 2,540 |
| 200 | | | | Genworth Financial, Inc. | | | 3,562 |
| 230 | | | | Hartford Financial Services Group, Inc. | | | 14,851 |
| 200 | | | | Lincoln National Corp. | | | 9,064 |
| 46 | | | | Loews Corp. | | | 2,157 |
| 150 | | | | Marsh & McLennan Cos., Inc. | | | 3,983 |
| 540 | | | | Metlife, Inc. | | | 28,496 |
| 200 | | | | Progressive Corp. | | | 3,744 |
| 350 | | | | Prudential Financial, Inc. | | | 20,909 |
| 50 | | | | Torchmark Corp. | | | 2,933 |
| 360 | | | | Travelers Cos., Inc. | | | 15,624 |
| 200 | | | | UnumProvident Corp. | | | 4,090 |
| 100 | | @@ | | XL Capital Ltd. | | | 2,056 |
| | | | | | | |
| | | | | | | 226,988 |
| | | | | | | |
| Internet: 0.1% |
| 100 | | @ | | Akamai Technologies, Inc. | | | 3,479 |
| 150 | | @ | | Amazon.com, Inc. | | | 11,000 |
| | | | | | | |
| Shares | | | | | | Value |
| | | | | | | |
| 650 | | @ | | eBay, Inc. | | $ | 17,765 |
| 100 | | @ | | Expedia, Inc. | | | 1,838 |
| 130 | | @ | | Google, Inc. - Class A | | | 68,435 |
| 550 | | @ | | Symantec Corp. | | | 10,643 |
| 700 | | @ | | Yahoo!, Inc. | | | 14,462 |
| | | | | | | |
| | | | | | | 127,622 |
| | | | | | | |
| Iron/Steel: 0.0% |
| 50 | | | | Allegheny Technologies, Inc. | | | 2,964 |
| 170 | | | | Nucor Corp. | | | 12,694 |
| 100 | | | | United States Steel Corp. | | | 18,478 |
| | | | | | | |
| | | | | | | 34,136 |
| | | | | | | |
| Lodging: 0.0% |
| 100 | | | | Starwood Hotels & Resorts Worldwide, Inc. | | | 4,007 |
| | | | | | | |
| | | | | | | 4,007 |
| | | | | | | |
| Machinery - Construction & Mining: 0.0% |
| 410 | | | | Caterpillar, Inc. | | | 30,266 |
| 50 | | @ | | Terex Corp. | | | 2,569 |
| | | | | | | |
| | | | | | | 32,835 |
| | | | | | | |
| Machinery - Diversified: 0.0% |
| 100 | | | | Cummins, Inc. | | | 6,552 |
| 200 | | | | Deere & Co. | | | 14,426 |
| 100 | | | | Manitowoc Co., Inc. | | | 3,253 |
| 100 | | | | Rockwell Automation, Inc. | | | 4,373 |
| | | | | | | |
| | | | | | | 28,604 |
| | | | | | | |
| Media: 0.1% |
| 140 | | | | CBS Corp. - Class B | | | 2,729 |
| 290 | | | | Clear Channel Communications, Inc. | | | 10,208 |
| 1,200 | | | | Comcast Corp. - Class A | | | 22,764 |
| 350 | | @ | | DIRECTV Group, Inc. | | | 9,069 |
| 1,520 | | | | News Corp. - Class A | | | 22,861 |
| 1,600 | | | | Time Warner, Inc. | | | 23,680 |
| 400 | | @ | | Viacom - Class B | | | 12,216 |
| 1,050 | | | | Walt Disney Co. | | | 32,760 |
| | | | | | | |
| | | | | | | 136,287 |
| | | | | | | |
| Metal Fabricate/Hardware: 0.0% |
| 40 | | | | Precision Castparts Corp. | | | 3,855 |
| | | | | | | |
| | | | | | | 3,855 |
| | | | | | | |
| Mining: 0.0% |
| 110 | | | | Alcoa, Inc. | | | 3,918 |
| 250 | | | | Freeport-McMoRan Copper & Gold, Inc. | | | 29,298 |
| 150 | | | | Newmont Mining Corp. | | | 7,824 |
| | | | | | | |
| | | | | | | 41,040 |
| | | | | | | |
| Miscellaneous Manufacturing: 0.3% |
| 300 | | | | 3M Co. | | | 20,877 |
| 200 | | | | Cooper Industries Ltd. | | | 7,900 |
| 360 | | | | Dover Corp. | | | 17,413 |
| 160 | | | | Eaton Corp. | | | 13,595 |
| 5,410 | | | | General Electric Co. | | | 144,393 |
| 500 | | | | Honeywell International, Inc. | | | 25,140 |
| 230 | | | | Illinois Tool Works, Inc. | | | 10,927 |
| 200 | | | | Leggett & Platt, Inc. | | | 3,354 |
| 170 | | | | Parker Hannifin Corp. | | | 12,124 |
| 280 | | | | Textron, Inc. | | | 13,420 |
| 75 | | @@ | | Tyco International Ltd. | | | 3,003 |
| | | | | | | |
| | | | | | | 272,146 |
| | | | | | | |
See Accompanying Notes to Financial Statements
130
| | |
| ING GET U.S. CORE PORTFOLIO SERIES 14 | | PORTFOLIO OF INVESTMENTS ASOF JUNE 30, 2008 (UNAUDITED) (CONTINUED) |
| | | | | | | |
| Shares | | | | | | Value |
| | | | | | | |
| Office/Business Equipment: 0.0% |
| 400 | | | | Pitney Bowes, Inc. | | $ | 13,640 |
| 750 | | | | Xerox Corp. | | | 10,170 |
| | | | | | | |
| | | | | | | 23,810 |
| | | | | | | |
| Oil & Gas: 0.8% |
| 300 | | | | Anadarko Petroleum Corp. | | | 22,452 |
| 250 | | | | Apache Corp. | | | 34,750 |
| 50 | | | | Cabot Oil & Gas Corp. | | | 3,387 |
| 250 | | | | Chesapeake Energy Corp. | | | 16,490 |
| 1,270 | | | | Chevron Corp. | | | 125,895 |
| 930 | | | | ConocoPhillips | | | 87,783 |
| 250 | | | | Devon Energy Corp. | | | 30,040 |
| 90 | | | | ENSCO International, Inc. | | | 7,267 |
| 150 | | | | EOG Resources, Inc. | | | 19,680 |
| 3,050 | | | | ExxonMobil Corp. | | | 268,797 |
| 170 | | | | Hess Corp. | | | 21,452 |
| 350 | | | | Marathon Oil Corp. | | | 18,155 |
| 100 | | | | Murphy Oil Corp. | | | 9,805 |
| 100 | | @, @@ | | Nabors Industries Ltd. | | | 4,923 |
| 100 | | | | Noble Corp. | | | 6,496 |
| 180 | | | | Noble Energy, Inc. | | | 18,101 |
| 500 | | | | Occidental Petroleum Corp. | | | 44,930 |
| 150 | | | | Questar Corp. | | | 10,656 |
| 100 | | | | Range Resources Corp. | | | 6,554 |
| 200 | | @ | | Southwestern Energy Co. | | | 9,522 |
| 100 | | | | Sunoco, Inc. | | | 4,069 |
| 219 | | @ | | Transocean, Inc. | | | 33,373 |
| 200 | | | | Valero Energy Corp. | | | 8,236 |
| 275 | | | | XTO Energy, Inc. | | | 18,840 |
| | | | | | | |
| | | | | | | 831,653 |
| | | | | | | |
| Oil & Gas Services: 0.1% |
| 200 | | | | Baker Hughes, Inc. | | | 17,468 |
| 380 | | | | Halliburton Co. | | | 20,167 |
| 220 | | @ | | National Oilwell Varco, Inc. | | | 19,518 |
| 600 | | | | Schlumberger Ltd. | | | 64,458 |
| 100 | | | | Smith International, Inc. | | | 8,314 |
| 200 | | @ | | Weatherford International Ltd. | | | 9,918 |
| | | | | | | |
| | | | | | | 139,843 |
| | | | | | | |
| Packaging & Containers: 0.0% |
| 250 | | | | Ball Corp. | | | 11,935 |
| | | | | | | |
| | | | | | | 11,935 |
| | | | | | | |
| Pharmaceuticals: 0.3% |
| 600 | | | | Abbott Laboratories | | | 31,782 |
| 90 | | | | Allergan, Inc. | | | 4,685 |
| 200 | | | | AmerisourceBergen Corp. | | | 7,998 |
| 950 | | | | Bristol-Myers Squibb Co. | | | 19,504 |
| 100 | | | | Cardinal Health, Inc. | | | 5,158 |
| 550 | | | | Eli Lilly & Co. | | | 25,388 |
| 150 | | @ | | Express Scripts, Inc. | | | 9,408 |
| 200 | | @ | | Forest Laboratories, Inc. | | | 6,948 |
| 208 | | @ | | King Pharmaceuticals, Inc. | | | 2,178 |
| 200 | | @ | | Medco Health Solutions, Inc. | | | 9,440 |
| 1,250 | | | | Merck & Co., Inc. | | | 47,113 |
| 3,250 | | | | Pfizer, Inc. | | | 56,778 |
| 920 | | | | Schering-Plough Corp. | | | 18,115 |
| 100 | | @ | | Watson Pharmaceuticals, Inc. | | | 2,717 |
| 800 | | | | Wyeth | | | 38,368 |
| | | | | | | |
| | | | | | | 285,580 |
| | | | | | | |
| Pipelines: 0.0% |
| 400 | | | | El Paso Corp. | | | 8,696 |
| 400 | | | | Spectra Energy Corp. | | | 11,496 |
| | | | | | | |
| Shares | | | | | | Value |
| | | | | | | |
| 390 | | | | Williams Cos., Inc. | | $ | 15,721 |
| | | | | | | |
| | | | | | | 35,913 |
| | | | | | | |
| Retail: 0.3% |
| 100 | | | | Abercrombie & Fitch Co. | | | 6,268 |
| 50 | | @ | | Autozone, Inc. | | | 6,051 |
| 210 | | | | Best Buy Co., Inc. | | | 8,316 |
| 200 | | @ | | Big Lots, Inc. | | | 6,248 |
| 180 | | | | Costco Wholesale Corp. | | | 12,625 |
| 750 | | | | CVS Caremark Corp. | | | 29,678 |
| 150 | | | | Darden Restaurants, Inc. | | | 4,791 |
| 250 | | | | Family Dollar Stores, Inc. | | | 4,985 |
| 200 | | @ | | GameStop Corp. | | | 8,080 |
| 550 | | | | Gap, Inc. | | | 9,169 |
| 600 | | | | Home Depot, Inc. | | | 14,052 |
| 100 | | | | JC Penney Co., Inc. | | | 3,629 |
| 400 | | | | Limited Brands, Inc. | | | 6,740 |
| 650 | | | | Lowe’s Cos., Inc. | | | 13,488 |
| 100 | | | | Macy’s, Inc. | | | 1,942 |
| 750 | | | | McDonald’s Corp. | | | 42,165 |
| 350 | | | | Staples, Inc. | | | 8,313 |
| 400 | | | | Target Corp. | | | 18,596 |
| 100 | | | | Tiffany & Co. | | | 4,075 |
| 450 | | | | TJX Cos., Inc. | | | 14,162 |
| 380 | | | | Walgreen Co. | | | 12,354 |
| 1,350 | | | | Wal-Mart Stores, Inc. | | | 75,870 |
| 250 | | | | Yum! Brands, Inc. | | | 8,773 |
| | | | | | | |
| | | | | | | 320,370 |
| | | | | | | |
| Savings & Loans: 0.0% |
| 280 | | | | Hudson City Bancorp., Inc. | | | 4,670 |
| 400 | | | | Washington Mutual, Inc. | | | 1,972 |
| | | | | | | |
| | | | | | | 6,642 |
| | | | | | | |
| Semiconductors: 0.2% |
| 200 | | | | Altera Corp. | | | 4,140 |
| 200 | | | | Analog Devices, Inc. | | | 6,354 |
| 650 | | | | Applied Materials, Inc. | | | 12,409 |
| 250 | | @ | | Broadcom Corp. | | | 6,823 |
| 3,180 | | | | Intel Corp. | | | 68,306 |
| 100 | | | | KLA-Tencor Corp. | | | 4,071 |
| 100 | | | | Linear Technology Corp. | | | 3,257 |
| 500 | | @ | | LSI Logic Corp. | | | 3,070 |
| 150 | | @ | | MEMC Electronic Materials, Inc. | | | 9,231 |
| 250 | | | | National Semiconductor Corp. | | | 5,135 |
| 400 | | @ | | Nvidia Corp. | | | 7,488 |
| 350 | | @ | | QLogic Corp. | | | 5,107 |
| 900 | | | | Texas Instruments, Inc. | | | 25,344 |
| 200 | | | | Xilinx, Inc. | | | 5,050 |
| | | | | | | |
| | | | | | | 165,785 |
| | | | | | | |
| Software: 0.2% |
| 300 | | @ | | Adobe Systems, Inc. | | | 11,817 |
| 150 | | @ | | Autodesk, Inc. | | | 5,072 |
| 100 | | @ | | BMC Software, Inc. | | | 3,600 |
| 400 | | | | CA, Inc. | | | 9,236 |
| 400 | | @ | | Compuware Corp. | | | 3,816 |
| 100 | | @ | | Electronic Arts, Inc. | | | 4,443 |
| 100 | | | | Fidelity National Information Services, Inc. | | | 3,691 |
| 200 | | @ | | Fiserv, Inc. | | | 9,074 |
| 300 | | | | IMS Health, Inc. | | | 6,990 |
| 4,400 | | | | Microsoft Corp. | | | 121,044 |
| 2,230 | | @ | | Oracle Corp. | | | 46,830 |
| | | | | | | |
| | | | | | | 225,613 |
| | | | | | | |
See Accompanying Notes to Financial Statements
131
| | |
| ING GET U.S. CORE PORTFOLIO SERIES 14 | | PORTFOLIO OF INVESTMENTS ASOF JUNE 30, 2008 (UNAUDITED) (CONTINUED) |
| | | | | | | |
| Shares | | | | | | Value |
| | | | | | | |
| Telecommunications: 0.3% |
| 3,020 | | | | AT&T, Inc. | | $ | 101,744 |
| 100 | | | | CenturyTel, Inc. | | | 3,559 |
| 3,300 | | @ | | Cisco Systems, Inc. | | | 76,758 |
| 850 | | | | Corning, Inc. | | | 19,593 |
| 50 | | | | Embarq Corp. | | | 2,364 |
| 250 | | @ | | JDS Uniphase Corp. | | | 2,840 |
| 200 | | @ | | Juniper Networks, Inc. | | | 4,436 |
| 550 | | | | Motorola, Inc. | | | 4,037 |
| 790 | | | | Qualcomm, Inc. | | | 35,052 |
| 1,200 | | | | Qwest Communications International, Inc. | | | 4,716 |
| 750 | | | | Sprint Nextel Corp. | | | 7,125 |
| 1,500 | | | | Verizon Communications, Inc. | | | 53,100 |
| 800 | | | | Windstream Corp. | | | 9,872 |
| | | | | | | |
| | | | | | | 325,196 |
| | | | | | | |
| Textiles: 0.0% |
| 100 | | | | Cintas Corp. | | | 2,651 |
| | | | | | | |
| | | | | | | 2,651 |
| | | | | | | |
| Toys/Games/Hobbies: 0.0% |
| 300 | | | | Hasbro, Inc. | | | 10,716 |
| | | | | | | |
| | | | | | | 10,716 |
| | | | | | | |
| Transportation: 0.1% |
| 150 | | | | Burlington Northern Santa Fe Corp. | | | 14,984 |
| 100 | | | | CH Robinson Worldwide, Inc. | | | 5,484 |
| 200 | | | | CSX Corp. | | | 12,562 |
| 150 | | | | Expeditors International Washington, Inc. | | | 6,450 |
| 50 | | | | FedEx Corp. | | | 3,940 |
| 150 | | | | Norfolk Southern Corp. | | | 9,401 |
| 100 | | | | Ryder System, Inc. | | | 6,888 |
| 120 | | | | Union Pacific Corp. | | | 9,060 |
| 380 | | | | United Parcel Service, Inc. - Class B | | | 23,359 |
| | | | | | | |
| | | | | | | 92,128 |
| | | | | | | |
| | | | Total Common Stock
(Cost $6,491,484) | | | 5,896,351 |
| | | | | | | |
| REAL ESTATE INVESTMENT TRUSTS: 0.0% |
| Apartments: 0.0% |
| 100 | | | | Equity Residential | | | 3,827 |
| | | | | | | |
| | | | | | | 3,827 |
| | | | | | | |
| Diversified: 0.0% |
| 100 | | | | Vornado Realty Trust | | | 8,800 |
| | | | | | | |
| | | | | | | 8,800 |
| | | | | | | |
| Health Care: 0.0% |
| 200 | | | | HCP, Inc. | | | 6,362 |
| | | | | | | |
| | | | | | | 6,362 |
| | | | | | | |
| Hotels: 0.0% |
| 550 | | | | Host Hotels & Resorts, Inc. | | | 7,508 |
| | | | | | | |
| | | | | | | 7,508 |
| | | | | | | |
| Regional Malls: 0.0% |
| 100 | | | | General Growth Properties, Inc. | | | 3,503 |
| 100 | | | | Simon Property Group, Inc. | | | 8,989 |
| | | | | | | |
| | | | | | | 12,492 |
| | | | | | | |
| Storage: 0.0% |
| 100 | | | | Public Storage, Inc. | | | 8,079 |
| | | | | | | |
| | | | | | | 8,079 |
| | | | | | | |
| | | | | | | | |
| Shares | | | | | | Value |
| | | | | | | | |
| | Warehouse/Industrial: 0.0% |
| | 110 | | | | Prologis | | $ | 5,979 |
| | | | | | | | |
| | | | | | | | 5,979 |
| | | | | | | | |
| | | | | Total Real Estate Investment Trusts
(Cost $61,899) | | | 53,047 |
| | | | | | | | |
| | | |
Principal
Amount | | | | | | Value |
| | U.S. GOVERNMENT AGENCY OBLIGATIONS: 73.3% |
| | Federal Home Loan Mortgage Corporation: 14.2% |
| $ | 20,000,000 | | ^^, Z | | 4.390%, due 07/15/14 | | $ | 15,758,160 |
| | | | | | | | |
| | | | | | | | 15,758,160 |
| | | | | | | | |
| | Federal National Mortgage Association: 36.7% |
| | 20,000,000 | | ^, Z | | 4.340%, due 05/15/14 | | | 15,887,511 |
| | 31,500,000 | | Z | | 4.380%, due 07/05/14 | | | 24,852,713 |
| | | | | | | | |
| | | | | | | | 40,740,224 |
| | | | | | | | |
| | Other U.S. Agency Obligations: 22.4% |
| | 31,000,000 | | ^, Z | | Resolution Funding Corp., 4.030%, due 07/15/14 | | | 24,861,380 |
| | | | | | | | |
| | | | | | | | 24,861,380 |
| | | | | | | | |
| | | | | Total U.S. Government Agency Obligations
(Cost $79,164,776) | | | 81,359,764 |
| | | | | | | | |
| | U.S. TREASURY OBLIGATIONS: 11.6% |
| | U.S. Treasury STRIP: 11.6% |
| | 15,865,000 | | ^ | | 3.910%, due 05/15/14 | | | 12,866,087 |
| | | | | | | | |
| | | | | Total U.S. Treasury Obligations (Cost $13,021,922) | | | 12,866,087 |
| | | | | | | | |
| | OTHER BONDS: 9.6% |
| | Sovereign: 9.6% |
| | 3,666,000 | | Z | | AID-Israel, 4.140%, due 05/15/14 | | | 2,940,341 |
| | 9,724,000 | | Z | | AID-Israel, 4.210%, due 08/15/14 | | | 7,707,524 |
| | | | | | | | |
| | | | | Total Other Bonds
(Cost $11,183,870) | | | 10,647,865 |
| | | | | | | | |
| | | | | Total Long-Term Investments (Cost $ 109,923,951) | | | 110,823,114 |
| | | | | | | | |
| | | | | | | | | |
| SHORT-TERM INVESTMENTS: 0.3% | |
| Repurchase Agreement: 0.3% | |
| 370,000 | | Morgan Stanley Repurchase Agreement dated 06/30/08, 2.400%, due 07/01/08, $370,025 to be received upon repurchase (Collateralized by $385,000 Federal Home Loan Mortgage Corporation, Discount Note, Market Value $380,072, due 12/30/08) | | | | | | 370,000 | |
| | | | | | | | | |
| | Total Short-Term Investments (Cost $370,000) | | | | | | 370,000 | |
| | | | | | | | | |
| | Total Investments in Securities
(Cost $110,293,951)* | | 100.1 | % | | $ | 111,193,114 | |
| | Other Assets and Liabilities - Net | | (0.1 | ) | | | (122,434 | ) |
| | | | | | | | | |
| | Net Assets | | 100.0 | % | | $ | 111,070,680 | |
| | | | | | | | | |
See Accompanying Notes to Financial Statements
132
| | |
| ING GET U.S. CORE PORTFOLIO SERIES 14 | | PORTFOLIO OF INVESTMENTS ASOF JUNE 30, 2008 (UNAUDITED) (CONTINUED) |
| @ | Non-income producing security |
| STRIP | Separate Trading of Registered Interest and Principal of Securities |
| ^ | Interest only securities represent the right to receive the monthly interest payments on an underlying pool of mortgage loans. Principal amount shown represents the notional amount on which current interest is calculated. Payments of principal on the pool reduce the value of the interest only security. |
| ^^ | Principal only securities represent the right to receive the monthly principal payments on an underlying pool of mortgage loans. No payments of interest on the pool are passed through the principal only security. |
| Z | Indicates Zero Coupon Bond; rate shown reflects current effective yield. |
| * | Cost for federal income tax purposes is $112,122,642. |
| | | | |
Net unrealized depreciation consists of: | | | | |
Gross Unrealized Appreciation | | $ | 1,242,563 | |
Gross Unrealized Depreciation | | | (2,172,091 | ) |
| | | | |
Net Unrealized Depreciation | | $ | (929,528 | ) |
| | | | |
Fair Value Measurements — Effective January 1, 2008, the Portfolio adopted Financial Accounting Standards Board Statement of Financial Accounting Standards No. 157 (“SFAS 157”), “Fair Value Measurements.” This new accounting statement defines fair value, establishes a framework for measuring fair value in generally accepted accounting principles (“GAAP”), and expands disclosures about fair value measurements. The three levels of the fair value hierarchy are as follows:
| | • | | Level 1 — quoted prices in active markets for identical investments |
| | • | | Level 2 — other significant observable inputs (including quoted prices for similar investments, interest rates, prepayment speeds, credit risk, etc.) |
| | • | | Level 3 — significant unobservable inputs (including the Portfolio’s own assumption in determining the fair value of investments) |
The inputs or methodology used in valuing securities are not necessarily an indication of the risk associated with investing in those securities.
The following is a summary of the inputs used as of June 30, 2008 in valuing the Portfolio’s investments at fair value:
| | | | | | |
| | | Investments in Securities | | Other Financial Instruments* |
Level 1 — Quoted Prices | | $ | 5,949,398 | | $ | — |
Level 2 — Other Significant Observable Inputs | | | 105,243,716 | | | — |
Level 3 — Significant Unobservable Inputs | | | — | | | — |
| | | | | | |
Total | | $ | 111,193,114 | | $ | — |
| | | | | | |
| * | | Other financial instruments may include forward foreign currency contracts, futures, swaps, and written options. |
See Accompanying Notes to Financial Statements
133
Investment Adviser
ING Investments, LLC
7337 East Doubletree Ranch Road
Scottsdale, Arizona 85258
Administrator
ING Funds Services, LLC
7337 East Doubletree Ranch Road
Scottsdale, Arizona 85258
Transfer Agent
DST Systems, Inc.
P.O. Box 219368
Kansas City, Missouri 64141
Custodian
The Bank of New York Mellon Corporation
One Wall Street
New York, New York 10286
Legal Counsel
Dechert LLP
1775 I Street, N.W.
Washington, D.C. 20006
Before investing, carefully consider the investment objectives, risks, charges and expenses of the variable annuity contract and the underlying variable investment options. This and other information is contained in the prospectus for the variable annuity contract and the underlying variable investment options. Obtain these prospectuses from your agent/registered representative and read them carefully before investing.
| | | | |
 | | VPSAR-UGCORE | | (0608-082008) |
Not required for semi-annual filing.
| ITEM 3. | AUDIT COMMITTEE FINANCIAL EXPERT. |
Not required for semi-annual filing.
| ITEM 4. | PRINCIPAL ACCOUNTANT FEES AND SERVICES. |
Not required for semi-annual filing.
| ITEM 5. | AUDIT COMMITTEE OF LISTED REGISTRANTS. |
Not required for semi-annual filing.
| ITEM 6. | SCHEDULE OF INVESTMENTS. |
Schedule is included as part of the report to shareholders filed under Item 1 of this Form.
| ITEM 7. | DISCLOSURE OF PROXY VOTING POLICIES AND PROCEDURES FOR CLOSED-END MANAGEMENT INVESTMENT COMPANIES. |
Not applicable.
| ITEM 8. | PORTFOLIO MANAGERS OF CLOSED-END MANAGEMENT INVESTMENT COMPANIES. |
Not applicable.
| ITEM 9. | PURCHASES OF EQUITY SECURITIES BY CLOSED-END MANAGEMENT INVESTMENT COMPANY AND AFFILIATED PURCHASERS. |
Not applicable.
| ITEM 10. | SUBMISSION OF MATTERS TO A VOTE OF SECURITY HOLDERS. |
The Board has a Nominating Committee for the purpose of considering and presenting to the Board candidates it proposes for nomination to fill Independent Trustee vacancies on the Board. The Committee currently consists of all Independent Trustees of the Board (6 individuals). The Nominating Committee operates pursuant to a Charter approved by the Board. The primary purpose of the Nominating Committee is to consider and present to the Board the candidates it proposes for nomination to fill vacancies on the Board. In evaluating candidates, the Nominating Committee may consider a variety of factors, but it has not at this time set any specific minimum qualifications that must be met. Specific qualifications of candidates for Board membership will be based on the needs of the Board at the time of nomination.
The Nominating Committee is willing to consider nominations received from shareholders and shall assess shareholder nominees in the same manner as it reviews its own nominees. A shareholder nominee for director should be submitted in writing to the Fund’s Secretary. Any such shareholder nomination should include at a minimum the following information as to each individual proposed for nomination as trustee: such individual’s written consent to be named in the proxy statement as a nominee (if nominated) and to serve as a trustee (if elected), and all information relating to such individual that is required to be disclosed in the solicitation of proxies for election of trustees, or is otherwise required, in each case under applicable federal securities laws, rules and regulations.
The Secretary shall submit all nominations received in a timely manner to the Nominating Committee. To be timely, any such submission must be delivered to the Fund’s Secretary not earlier than the 90th day prior to such meeting and not later than the close of business on the later of the 60th day prior to such meeting or the 10th day following the day on which public announcement of the date of the meeting is first made, by either disclosure in a press release or in a document publicly filed by the Fund with the Securities and Exchange Commission.
| ITEM 11. | CONTROLS AND PROCEDURES. |
| (a) | Based on our evaluation conducted within 90 days of the filing date, hereof, the design and operation of the registrant’s disclosure controls and procedures are effective to ensure that material information relating to the registrant is made known to the certifying officers by others within the appropriate entities, particularly during the period in which Forms N-CSR are being prepared, and the registrant’s disclosure controls and procedures allow timely preparation and review of the information for the registrant’s Form N-CSR and the officer certifications of such Form N-CSR. |
| (b) | There were no significant changes in the registrant’s internal controls that occurred during the second fiscal quarter of the period covered by this report that has materially affected, or is reasonably likely to materially affect, the registrant’s internal control over financial reporting. |
| (a)(1) | The Code of Ethics is not required for the semi-annual filing. |
| (a)(2) | A separate certification for each principal executive officer and principal financial officer of the registrant as required by Rule 30a-2 under the Act (17 CFR 270.30a-2) is attached hereto as EX-99.CERT. |
| (a)(3) | Not required for semi-annual filing. |
| (b) | The officer certifications required by Section 906 of the Sarbanes-Oxley Act of 2002 are attached hereto as EX-99.906CERT |
SIGNATURES
Pursuant to the requirements of the Securities Exchange Act of 1934 and the Investment Company Act of 1940, the registrant has duly caused this report to be signed on its behalf by the undersigned, thereunto duly authorized.
(Registrant): ING Variable Insurance Trust
| | |
| By | | /s/ Shaun P. Mathews |
| | Shaun P. Mathews |
| | President and Chief Executive Officer |
| |
| Date: | | September 5, 2008 |
Pursuant to the requirements of the Securities Exchange Act of 1934 and the Investment Company Act of 1940, this report has been signed below by the following persons on behalf of the registrant and in the capacities and on the dates indicated.
| | |
| By | | /s/ Shaun P. Mathews |
| | Shaun P. Mathews |
| | President and Chief Executive Officer |
| |
| Date: | | September 5, 2008 |
| |
| By | | /s/ Todd Modic |
| | Todd Modic |
| | Senior Vice President and Chief Financial Officer |
| |
| Date: | | September 5, 2008 |