Table of Contents
OMB APPROVAL | ||
| OMB Number: 3235-0570 | ||
| Expires: August 31, 2011 | ||
| Estimated average burden hours per response. . . . .18.9 |
UNITED STATES
SECURITIES AND EXCHANGE COMMISSION
Washington, D.C. 20549
FORM N-CSR
CERTIFIED SHAREHOLDER REPORT OF REGISTERED
MANAGEMENT INVESTMENT COMPANIES
Investment Company Act file number 811-9477
ING Variable Insurance Trust
(Exact name of registrant as specified in charter)
7337 E. Doubletree Ranch Rd., Scottsdale, AZ | 85258 | |
| (Address of principal executive offices) | (Zip code) |
The Corporation Trust Company, 1209 Orange Street, Wilmington, DE 19801
(Name and address of agent for service)
Registrant’s telephone number, including area code: 1-800-992-0180
Date of fiscal year end: December 31
Date of reporting period: January 1, 2009 to June 30, 2009
Table of Contents
Item 1. Reports to Stockholders.
The following is a copy of the report transmitted to stockholders pursuant to Rule 30e-1 under the Act (17 CFR 270.30e-1):
Table of Contents

Semi-Annual Report
June 30, 2009
ING GET U.S. Core Portfolio
| n | Series 5 |
| n | Series 6 |
| n | Series 7 |
| n | Series 8 |
| n | Series 9 |
| n | Series 10 |
| n | Series 11 |
| n | Series 12 |
| n | Series 13 |
| n | Series 14 |
 | E-Delivery Sign-up – details inside |
This report is submitted for general information to shareholders of the ING Funds. It is not authorized for distribution to prospective shareholders unless accompanied or preceded by a prospectus which includes details regarding the funds’ investment objectives, risks, charges, expenses and other information. This information should be read carefully.
MUTUAL FUNDS
|

Table of Contents
| 1 | ||
| 2 | ||
| 4 | ||
| 8 | ||
| 9 | ||
| 12 | ||
| 15 | ||
| 20 | ||
| 23 | ||
| 33 | ||
| Go Paperless with E-Delivery! | | ||
Sign up now for on-line prospectuses, fund reports, and proxy statements. In less than five minutes, you can help reduce paper mail and lower fund costs.
Just go to www.ingfunds.com, click on the E-Delivery icon from the home page, follow the directions and complete the quick 5 Steps to Enroll.
You will be notified by e-mail when these communications become available on the internet. Documents that are not available on the internet will continue to be sent by mail.
| ||||
PROXY VOTING INFORMATION
A description of the policies and procedures that the Series use to determine how to vote proxies related to portfolio securities is available: (1) without charge, upon request by calling Shareholder Services toll-free at (800) 992-0180; (2) on the ING Funds’ website at www.ingfunds.com; and (3) on the U.S. Securities and Exchange Commission’s (“SEC”) website at www.sec.gov. Information regarding how the Series voted proxies related to portfolio securities during the most recent 12-month period ended June 30 is available without charge on the ING Funds’ website at www.ingfunds.com and on the SEC’s website at www.sec.gov.
QUARTERLY PORTFOLIO HOLDINGS
The Series files their complete schedule of portfolio holdings with the SEC for the first and third quarters of each fiscal year on Form N-Q. The Series’ Forms N-Q are available on the SEC’s website at www.sec.gov. The Series’ Forms N-Q may be reviewed and copied at the SEC’s Public Reference Room in Washington, DC, and information on the operation of the Public Reference Room may be obtained by calling (800) SEC-0330; and is available upon request from the Series by calling Shareholder Services toll-free at (800) 992-0180.
Table of Contents

Dear Shareholder,
As we enter the third quarter of 2009, we look forward hopefully to the end of the recession, at least in the United States. While recent economic news can best be characterized as less bad (as opposed to good), there is a chance that recovery could begin sometime in the third quarter.
Could this be the hour before the dawn? The financial markets seem to have factored in expectations of recovery, as evidenced by recent gains. The stock market, as measured by the S&P 500® Index(1), has advanced into the mid-900 range, a substantial climb from its mid-600s low in early March. The Dow Jones Industrial Average(2) recently broke through 9,000 to reach its highest level since January of this year. As investors become less risk-averse, they are shifting back into stocks.
Should you be doing the same? The answer depends on several important factors
unique to your situation: your long-term investment goals, your tolerance for risk and your current portfolio allocation. If you made any changes to your portfolio allocation over the past year or so — perhaps in an effort to avoid losses during a time of high uncertainty or to feel more comfortable with your investments — your portfolio now may be out of alignment with your long-term goals. On the other hand, your current portfolio may now be better suited to your tolerance for risk. You may still want to reallocate your portfolio, but you should first rethink your goals in the context of the volatility you are willing to bear. This is particularly important in that the market may continue to experience periods of volatility as economic conditions stabilize and recover.
As always, we encourage you to discuss these matters thoroughly with your financial advisor before making any changes to your portfolio. Thank you for your continued confidence in ING Funds. We look forward to serving your investment needs in the future.
Sincerely,

Shaun Mathews
President & Chief Executive Officer
ING Funds
June 30, 2009
The views expressed in the President’s Letter reflect those of the President as of the date of the letter. Any such views are subject to change at any time based upon market or other conditions and ING Funds disclaim any responsibility to update such views. These views may not be relied on as investment advice and because investment decisions for an ING Fund are based on numerous factors, may not be relied on as an indication of investment intent on behalf of any ING Fund. Reference to specific company securities should not be construed as recommendations or investment advice. Consider the fund’s investment objectives, risks, and charges and expenses carefully before investing. The prospectus contains this information and other information about the fund.
International investing poses special risks including currency fluctuation, economic and political risks not found in investments that are solely domestic.
1
| (1) | The S&P 500® Index is an unmanaged index that measures the performance of securities of approximately 500 of the largest companies in the United States. |
| (2) | The Dow Jones Industrial Average is a widely followed measurement of the stock market. The average is comprised of 30 stocks that represent leading companies in major industries. |
Table of Contents
MARKET PERSPECTIVE: SIX MONTHS ENDED JUNE 30, 2009
Many were hopeful as the year started that the newly elected U.S. president’s promised $1 trillion stimulus package, a federal funds rate now reduced to 0% —0.25%, and record low mortgage rates would help to put a base under slumping economies and markets. But global equities in the form of the MSCI World® Index,(1) measured in local currencies, including net reinvested dividends (“MSCI” for regions discussed below), soon resumed their slide and by March 9, 2009, the index had dropped nearly 22% for the year to date, to the previous cycle lows of late 2002. Abruptly however, markets recovered, surging by 34%, to record a gain of 4.8% for the six-month period ended June 30, 2009. Markets generally wavered somewhat at the end of the period, as the World Bank raised its estimate for the drop in global gross domestic product (“GDP”) for 2009. In currencies, the dollar was initially strong but then fell back, gaining 0.3% on the euro, 5.7% against the yen, but losing 12.4% against the pound.
While credit markets had improved since the dark days of late 2008, most banks had tightened lending standards despite large capital infusions under the Troubled Asset Relief Program (“TARP”). The problem remained the enormous volumes of distressed loans and toxic assets of indeterminate value on bank balance sheets. The Administration soon announced a Public-Private Investment Program to buy these assets up. The Federal Reserve would also expand its purchases of agency mortgage-backed securities and buy up to $300 billion in longer dated Treasuries to push mortgage interest rates lower. Another $750 billion beyond TARP would be made available. A $75 billion plan would cut mortgage payments for struggling homeowners. Much of this was set out in the president’s first budget, which projected a $1.75 trillion deficit!
While policy initiatives helped on balance, the reasons for the collective resurgence of equities after March 9, 2009 are hard to pin down. Troubled Citigroup’s claim on March 10 that the year 2009 had been profitable so far was one catalyst. More generally, the economic reports from which markets seemed to be taking heart were only improving weakly and erratically. Nonetheless they were soon being referred to as “green shoots”.
In housing, the Standard & Poor’s (“S&P”) /Case-Shiller National U.S. Home Price Index(2) of house prices in 20 cities sank a record 19% year-over-year in January. But from there the declines moderated to 18.1% in the most recent report. By the end of June
2009, sales of existing homes had risen for two months and the proportion of distressed sales was down to about one-third, from nearly half earlier in the year.
A flimsier (but welcome) green shoot emerged in the final employment report, where May payrolls fell by the smallest number in eight months, even as the rate increased to 9.4%, a 25-year record. The fall in the 2009 first quarter GDP was revised down to 5.5% annualized, having first been reported near the 2008 fourth quarter’s decades high 6.3%.
Consumer demand was weak, evidenced by the largest annual drop in the consumer price index, 1.3%, since 1950. But the government’s stimulus plan boosted incomes by 1.4% in May 2009, sending the savings rate to 6.9%, the most in 15 years. Still, retail sales were reported higher, the first increase in three months.
U.S. fixed income markets at first sight had an undistinguished first half. The Barclays Capital U.S. Aggregate Bond Index(3 ) of investment grade bonds returned 1.90%. But within this figure improved risk appetite propelled the index of investment grade corporate bonds to an 8.32% gain amid surging new issuances. Conversely, the Treasury index lost 4.30%, weighed by concerns about massive government borrowing, and the excess yield on 10-year Treasuries over 2-year issues briefly reached a record 275 basis points (“bp”). The star performers however, were high yield bonds, represented by the Barclays Capital High Yield Bond — 2% Issuer Constrained Index(4), which returned a remarkable 30.92%. By contrast, the yield on the 90-day Treasury Bills remained in the range of 6bp to 31bp throughout the period.
U.S. equities, represented by the S&P 500® Index,(5) including dividends, returned 3.2% in the first six months of 2009. As with stock markets generally, March 9, 2009, marked the low point for the index, closing at September 1996 levels. Profits for S&P 500® Index companies would be certain to suffer their eighth straight quarter of decline, but from March 9, 2009, investors only had eyes for green shoots and from there the market returned 36.9%, led by the financials component which soared 93.1%. The index broke through its 200-day moving average on June 1, 2009, but then drifted back, finally returning the last of the month’s gains on June 30, 2009, as a reading of consumer confidence disappointed.
2
Table of Contents
MARKET PERSPECTIVE: SIX MONTHS ENDED JUNE 30, 2009
In international markets, the MSCI Japan® Index(6) rose 9.2% for the six months through June 30, 2009. The slump in exports stabilized during the period and despite two consecutive quarterly falls in GDP of 3.8%, there were hopes that stimulus packages in China and in Japan itself would speed a recovery. The MSCI Europe ex UK® Index(7) added 3.8%. Despite a bigger than expected drop in GDP of 2.5% in the first quarter and the first annual decline in consumer prices for 48 years, confidence proved resilient. The European Central Bank cut rates to 1% and finally embarked on a program to lend unlimited amounts to banks for one year at this interest rate. The MSCI UK® Index(8) lost 1.3%. The Bank of England reduced rates three times, to 0.5%, the lowest since it was founded in 1694, as the UK suffered the largest annual fall in GDP, 4.9%, since records began in 1948.
(1) The MSCI World® Index is an unmanaged index that measures the performance of over 1,400 securities listed on exchanges in the U.S., Europe, Canada, Australia, New Zealand and the Far East.
(2) The S&P/Case-Shiller National U.S. Home Price Index tracks the value of single-family housing within the United States. The index is a composite of single-family home price indices for the nine U.S. Census divisions and is calculated quarterly.
(3) The Barclays Capital U.S. Aggregate Bond Index is an unmanaged index of publicly issued investment grade U.S. Government, mortgage-backed, asset-backed and corporate debt securities.
(4) The Barclays Capital High Yield Bond — 2% Issuer Constrained Composite Index is an unmanaged index that measures the performance of non-investment grade fixed-income securities.
(5) The S&P 500® Index is an unmanaged index that measures the performance of securities of approximately 500 of the largest companies in the United States.
(6) The MSCI Japan® Index is a free float-adjusted market capitalization index that is designed to measure developed market equity performance in Japan.
(7) The MSCI Europe ex UK® Index is a free float-adjusted market capitalization index that is designed to measure developed market equity performance in Europe, excluding the UK.
(8) The MSCI UK® Index is a free float-adjusted market capitalization index that is designed to measure developed market equity performance in the UK.
Parentheses denote a negative number.
All indices are unmanaged and investors cannot invest directly in an index.
Past performance does not guarantee future results. The performance quoted represents past performance. Investment return and principal value of an investment will fluctuate, and shares, when redeemed, may be worth more or less than their original cost. The Series’ performance is subject to change since the period’s end and may be lower or higher than the performance data shown. Please call (800) 992-0180 or log on to www.ingfunds.com to obtain performance data current to the most recent month end.
Market Perspective reflects the views of ING’s Chief Investment Risk Officer only through the end of the period, and is subject to change based on market and other conditions.
3
Table of Contents
| ING GET U.S. CORE PORTFOLIO | INVESTMENT STRATEGY AND PRINCIPAL RISKS |
What is the Investment Strategy During the Guarantee Period?
ING GET U.S. Core Portfolio — Series 5, 6, 7, 8, 9, 10, 11, 12, 13, 14 (“Series”) do not implement an “investment strategy” in a conventional sense. Rather, the Series’ asset allocation strategy seeks to optimize the exposure of the Series to the equity component (“Equity Component”) while protecting Series assets. Assets allocated to the Equity Component may be reduced or eliminated in order to conserve assets at a level equal to or above the present value of the guarantee (“Guarantee”). The Series allocate their assets among the following asset classes:
During the Guarantee Period, the Series’ assets will be allocated between the:
| • | Equity Component, consisting of common stocks included in the Standard & Poor’s 500® Composite Stock Price Index (“S&P 500® Index”) futures contracts on the S&P 500® Index, and when the Equity Component’s market value is $5 million or less, investments in exchange traded funds (“ETFs”) that can reasonably be expected to have at least a 95% correlation ratio with the S&P 500® Index, in S&P 500® Index futures, or in a combination of S&P 500® Index futures and ETFs, subject to any limitation on the Series’ investments in such securities and the |
| • | Fixed component (“Fixed Component”) consisting primarily of short-to-intermediate-duration U.S. government securities. |
The Series’ asset allocation strategy is implemented by allocating assets appropriately to the Equity Component and to the Fixed Component to optimize exposure to the Equity Component while controlling the risk that an insurance company may be required to make payment under the Guarantee. Consequently, there can be no assurance as to the percentage of assets, if any, allocated to the Equity Component, even when the equity market is doing well, or to any investment returns generated by the Series.
How does the Series’ Asset Allocation work?
ING Investment Management Co. (“ING IM” or “Sub-Adviser”), the Sub-Adviser to the Series, uses a proprietary computer model to determine on a daily basis the percentage of assets allocated to the Equity Component and to the Fixed Component. The model evaluates a number of factors, including the then current market value of the Series, the then prevailing level of interest rates, equity market volatility, the Series’ total annual expenses, insurance company separate account expenses, and the maturity date (“Maturity Date”). The model determines the initial allocation between the Equity Component and the Fixed Component on the first day of the Guarantee Period and provides direction for any reallocations on a daily basis thereafter. Generally, as the value of the Equity Component rises, more assets are allocated to the Equity Component; as the value of the Equity Component declines, more assets are allocated to the Fixed Component. The amount directed to the Equity Component is always restricted so that even if it were to experience a “material decline” in value on a given day and before being redirected to the Fixed Component, the remaining assets would still be sufficient to meet the Guarantee. At the commencement of the Guarantee Period, the Series will define a “material decline” in value as a decline in the value of the Equity Component of at least 20% but no more than 30%. In the event the Series defines the “material decline” at 20%, fewer assets will likely be allocated to the Equity Component than if the “material decline” is defined at 30%. The allocation to the Equity Component or the Fixed Component may be zero under certain circumstances.
Equity Component: ING IM manages the Equity Component by overweighting those stocks in the S&P 500® Index that it believes will outperform the S&P 500® Index and underweighting (or avoiding altogether) those stocks it believes will underperform the S&P 500® Index (“Enhanced Index Strategy”). Stocks ING IM believes are likely to match the performance of the S&P 500® Index are invested in proportion to their representation in the S&P 500® Index. To determine which stocks to weight more or less heavily, ING IM uses internally developed quantitative computer models to evaluate various criteria, such as the financial strength of each company and its potential for strong, sustained earnings growth. ING IM expects that there will be a close correlation between the performance of the Equity Component and that of the S&P 500® Index in both rising and falling markets.
Under normal market conditions, up to 20% of the Equity Component’s net assets may be invested in futures contracts for hedging purposes or to maintain liquidity to meet shareholder redemptions and minimize trading costs. Futures contracts provide for the future sale by one party and purchase by another party of a specified amount of a
4
Table of Contents
| INVESTMENT STRATEGY AND PRINCIPAL RISKS | ING GET U.S. CORE PORTFOLIO |
financial instrument or a specific stock market index for a specified price on a designated date. During the Guarantee Period, the Series may only invest in futures contracts on the S&P 500® Index and futures contracts on U.S. Treasury securities.
If the Equity Component’s market value is $5 million or less, in order to replicate an investment in stocks listed in the S&P 500® Index, ING IM may invest the entire amount of the Equity Component’s assets in S&P 500® Index futures, in ETFs, or in a combination of S&P 500® Index futures and ETFs, subject to any limitation on the Series’ investment in such securities (subject to restrictions imposed by the Investment Company Act of 1940, as amended “1940 Act”). ETFs are passively managed investment companies traded on a securities exchange whose goal is to track or replicate a desired index. ING IM will not employ an Enhanced Index Strategy when it invests in S&P 500® Index futures and ETFs.
Fixed Component: ING IM seeks to select investments for the Fixed Component with financial characteristics that will, at any point in time, closely resemble those of a portfolio of zero coupon bonds which mature within three months of the Maturity Date. Generally, at least 55% of the Fixed Component will consist of securities issued or guaranteed by the U.S. government, its agencies or instrumentalities, including Separate Trading of Registered Interest and Principal of Securities (“STRIPS”). Although the Series invest in securities insured or guaranteed by the U.S. government, the Series shares are not issued or guaranteed. STRIPS are created by the Federal Reserve Bank by separating the interest and principal components of an outstanding U.S. Treasury or agency bond and selling them as individual securities. The Fixed Component may also consist of mortgage-backed securities (including commercial mortgage-backed securities) which are rated AAA or Aaa at the time of purchase by Standard & Poor’s (“S&P®“) or Moody’s Investors Service, Inc. (“Moody’s®“), respectively, and corporate obligations which are rated at the time of purchase A- or higher by S&P® and/or Aa3 or higher by Moody’s®. The Fixed Component may also include U.S. Treasury futures and money market instruments. The Series may also invest in other investment companies to the extent permitted under the 1940 Act, and the rules and regulations thereunder.
What are the Principal Guarantee Period Risks?
Allocation Risk: If, at the inception of, or any time during, the Guarantee Period interest rates are low, the Series’ assets may be largely invested in the Fixed Component in order to decrease the likelihood that an insurance company would be required to make any payment under the Guarantee. The effect of low interest rates on the Series would likely be more pronounced at the inception of the Guarantee Period, as the initial allocation of assets would include more fixed-income securities. In addition, if during the Guarantee Period the equity markets experienced a material decline, the Series’ assets may become largely invested in the Fixed Component. In fact, if the value of the Equity Component were to decline by a significant amount, a complete reallocation to the Fixed Component would likely occur. In the event of a reallocation of 100% of the assets to the Fixed Component, the Series would not reallocate any assets into the Equity Component prior to the Maturity Date. Use of the Fixed Component reduces the Series’ ability to participate as fully in upward equity market movements, and therefore represents some loss of opportunity, or opportunity cost, compared to a portfolio that is fully invested in equities.
Active Asset Allocation May Underperform Static Strategies: The asset allocation process results in transaction costs. Volatile periods in the market may increase these costs. This process can have an adverse effect on the performance of the Series during periods of increased equity market volatility. In addition, a high portfolio turnover rate, which may also have an adverse effect on the performance of the Series, may increase the Series’ transaction costs.
Opportunity Costs: There are substantial opportunity costs associated with an investment in the Series. The Series may allocate a substantial portion, and under certain circumstances all, of the Series’ assets to the Fixed Component in order to conserve Series assets to a level equal to or above the present value of the Guarantee.
Initially, if interest rates are low, the allocation to the Fixed Component may be over 70% of the Series’ assets. If the market value of the Equity Component rises, the percentage of the Series’ assets allocated to the Equity Component generally will also rise. However, the relative volatility of these two Components as well as the past performance of the Series will affect these allocations. For example, if the Series incurs early losses, the Series may allocate 100% of the Series’ assets to the Fixed Component for the entire Guarantee Period, irrespective of the subsequent upward movements in the equity markets and/or the Equity Component.
The extent to which the Series participates in upward movements in the Equity Component during the Guarantee Period will depend on the performance of the Series, the performance and volatility of the Fixed and Equity
5
Table of Contents
| ING GET U.S. CORE PORTFOLIO | INVESTMENT STRATEGY AND PRINCIPAL RISKS |
Components, interest rates, expenses of the Series and the separate account under the variable annuity contract, and other factors. The Series might capture a material portion, very little or none of any Equity Component increase.
It is possible that on the Maturity Date, a contract- holder or participant could receive only the guaranteed amount even though the equity markets, as well as the Equity Component, has had significant positive performance during the Guarantee Period.
When you hold your investment until the end of the 5-year or 7-year Guarantee Period, on the Maturity Date your account will be worth no less than your investment at the inception of the Guarantee Period, less any redemptions and distributions you have received in cash, and certain Series expenses, such as interest, taxes and extraordinary expenses. If you sell shares during the Guarantee Period, shares are redeemed at the current net asset value (“NAV”) which may be worth more or less than your original investment and/or the NAV at the inception of the Guarantee Period. The guarantee is based on the beginning NAV on the first day of the Guarantee Period, not the public offering price, and does not apply to any earnings realized during the Guarantee Period. The guarantee is backed by insurance companies offering the Series. As with the sale of any securities, a taxable event may occur if the Series liquidates fixed-income securities at the end of the Guarantee Period.
Worst Case Scenarios for the Series’ Equity Participation: The opportunity cost of not allocating assets to the Equity Component will be particularly high if early in the Guarantee Period: (a) the Series’ NAV decreases; or (b) the value of the Equity Component declines. In either case, all or substantially all of the Series’ assets could be allocated to the Fixed Component for the remainder of the Guarantee Period.
Impact of Annuity Charges and Other Expenses: Contract-holders and Participants with interest in the Series through separate accounts are not subject to identical separate account charges. In its proprietary computer model, the Sub-Adviser uses an expense factor designed to have the Series produce a return which may cover some portion of these charges. The expense factor will be determined at the inception of the Guarantee Period. If the expense factor is set to cover the higher charges, the initial asset allocation to the Equity Component will be lower. Accordingly, the level of the expense factor chosen by the Series may represent a greater opportunity cost to Contract-holders and Participants with lower separate account charges. Regardless of where the expense factor is set, it will not affect the Guarantee payable by the insurance company.
Stock and Bond Investments: The risks associated with investing in stocks include sudden and unpredictable drops in the value of the market as a whole and periods of lackluster or negative performance. The performance of the Equity Component also depends significantly on ING IM’s skill in determining which securities to overweight, underweight or avoid altogether.
The principal risk associated with investing in bonds is that interest rates may rise, which generally causes bond prices to fall. The market prices of STRIPS generally are more volatile than the market prices of other fixed-income securities with similar maturities that pay interest periodically. With corporate bonds, there is a risk that the issuer will default on the payment of principal or interest.
With mortgage-backed securities, there is a risk of prepayment of the underlying mortgage. Because prepayments of principal generally occur when interest rates are declining, it is likely that the Series may have to reinvest the proceeds of prepayments at lower yields. In addition, with credit risk, the Series could lose money if the issuer of a debt security is unable to meet its financial obligations or goes bankrupt. This Series is subject to less credit risk than other funds because it principally invests in debt securities issued or guaranteed by the U.S. government or its agencies.
Declining Interest Rates: A decline in prevailing U.S. interest rates could materially increase the opportunity costs. Any such decline would increase the present value of the Guarantee, potentially causing the Series to allocate all or substantially all of the Series’ assets to the Fixed Component in order to assure that such assets do not fall below the Guarantee.
Futures Contracts: The Series may invest in futures contracts, which provide for the future sale by one party and purchase by another party of a specified amount of a financial instrument or a specific stock market index for a specified price on a designated date. The Series uses futures for hedging purposes or to temporarily increase or limit exposure to a particular asset class. The main risk with futures contracts is that they can amplify a gain or loss, potentially earning or losing substantially more money than the actual investment made in the futures contract.
6
Table of Contents
| INVESTMENT STRATEGY AND PRINCIPAL RISKS | ING GET U.S. CORE PORTFOLIO |
Other Investment Companies: The GET Series may invest in other investment companies to the extent permitted by the 1940 Act and the rules and regulations thereunder. These may include exchange-traded funds (“ETFs”) and Holding Company Depositary Receipts (“HOLDRs”), among others. ETFs are exchange-traded investment companies that are designed to provide investment results corresponding to an equity index and include, among others, Standard & Poor’s Depositary Receipts (“SPDRs”), PowerShares QQQ™ (“QQQQ”), Dow Jones Industrial Average Tracking Stocks (“Diamonds”) and iShares exchange-traded funds (“iShares”). The main risk of investing in other investment companies (including ETFs) is that the value of the underlying securities held by the investment company might decrease. The value of the underlying securities can fluctuate in response to activities of individual companies or in response to general market and/or economic conditions. Because the Series may invest in other investment companies, you will pay a proportionate share of expenses of that investment company. Additional risks of investments in ETFs include: (i) an active trading market for an ETF’s shares may not develop or be maintained or (ii) trading may be halted if the listing exchange’s officials deem such action appropriate, the shares are delisted from the exchange, or the activation of market-wide “circuit breakers” (which are tied to large decreases in stock prices) halts trading generally. Because HOLDRs concentrate in the stocks of a particular industry, trends in that industry may have a dramatic impact on their value.
To seek to achieve a return on uninvested cash or for other reasons, the Series may invest its assets in ING Institutional Prime Money Market Fund and/or one or more other money market funds advised by ING affiliates (“ING Money Market Funds”). The Series’ purchase of shares of an ING Money Market Fund will result in the Series paying a proportionate share of the expenses of the ING Money Market Fund. The investment adviser of the Series will waive its fee in an amount equal to the advisory fee received by the adviser of the ING Money Market Fund in which the Series invests resulting from the Series’ investment into the ING Money Market Fund.
Risks of Using Derivatives: Certain securities in which the Series may invest, including futures contracts, are derivative instruments. In general terms, a derivative instrument is a financial contract whose value is derived, at least in part, from the performance of an underlying asset, interest rate, or index. If the issuer of a derivative does not pay the amount owed on the contract when due, the Series can lose money on the investment. The underlying investment on which the derivative is based, and the derivative itself, might not perform in the manner the Sub-Adviser expected, which could cause the Series’ share price to decline. Markets underlying securities may move in a direction not anticipated by the Sub-Adviser, which may result in the Series realizing a lower return than expected on an investment. Some derivatives are also subject to the risk that counterparties will not perform their duties.
7
Table of Contents
SHAREHOLDER EXPENSE EXAMPLES (UNAUDITED)
As a shareholder of a Series, you incur two types of costs: (1) transaction costs, including redemption fees and exchange fees; and (2) ongoing costs, including management fees, distribution and/or service (12b-1) fees, and other Series expenses. These Examples are intended to help you understand your ongoing costs (in dollars) of investing in a Series and to compare these costs with the ongoing costs of investing in other mutual funds.
The Examples are based on an investment of $1,000 invested at the beginning of the period and held for the entire period from January 1, 2009 to June 30, 2009, unless otherwise indicated. The Series’ expenses are shown without the imposition of any charges which are, or may be, imposed under your annuity contract. Expenses would have been higher if such charges were included.
Actual Expenses
The first section of the table shown, “Actual Series Return,” provides information about actual account values and actual expenses. You may use the information in this section, together with the amount you invested, to estimate the expenses that you paid over the period. Simply divide your account value by $1,000 (for example, an $8,600 account value divided by $1,000 = 8.6), then multiply the result by the number in the first section under the heading entitled “Expenses Paid During the Period” to estimate the expenses you paid on your account during this period.
Hypothetical Example for Comparison Purposes
The second section of the table shown, “Hypothetical (5% return before expenses)”, provides information about hypothetical account values and hypothetical expenses based on a Series actual expense ratio and an assumed rate of return of 5% per year before expenses, which is not a Series actual return. The hypothetical account values and expenses may not be used to estimate the actual ending account balance or expenses you paid for the period. You may use this information to compare the ongoing costs of investing in a Series and other mutual funds. To do so, compare this 5% hypothetical example with the 5% hypothetical examples that appear in the shareholder reports of the other funds.
Please note that the expenses shown in the table are meant to highlight your ongoing costs only and do not reflect any transactional costs, redemption fees or exchange fees. Therefore, the hypothetical lines of the table are useful in comparing ongoing costs only, and will not help you determine the relative total costs of owning different mutual funds. In addition, if these transactional costs were included, your costs would have been higher.
| Actual Series Return | Hypothetical (5% return before expenses) | |||||||||||||||||||||||
ING GET | Beginning | Ending | Annualized | Expenses Paid | Beginning | Ending | Annualized | Expenses Paid | ||||||||||||||||
Series 5 | $ | 1,000.00 | $ | 990.20 | 1.00 | % | $ | 4.93 | $ | 1,000.00 | $ | 1,019.84 | 1.00 | % | $ | 5.01 | ||||||||
Series 6 | $ | 1,000.00 | $ | 991.50 | 1.00 | % | $ | 4.94 | $ | 1,000.00 | $ | 1,019.84 | 1.00 | % | $ | 5.01 | ||||||||
Series 7 | $ | 1,000.00 | $ | 988.00 | 1.00 | % | $ | 4.93 | $ | 1,000.00 | $ | 1,019.84 | 1.00 | % | $ | 5.01 | ||||||||
Series 8 | $ | 1,000.00 | $ | 989.60 | 1.00 | % | $ | 4.93 | $ | 1,000.00 | $ | 1,019.84 | 1.00 | % | $ | 5.01 | ||||||||
Series 9 | $ | 1,000.00 | $ | 983.30 | 1.00 | % | $ | 4.92 | $ | 1,000.00 | $ | 1,019.84 | 1.00 | % | $ | 5.01 | ||||||||
Series 10 | $ | 1,000.00 | $ | 970.10 | 1.00 | % | $ | 4.88 | $ | 1,000.00 | $ | 1,019.84 | 1.00 | % | $ | 5.01 | ||||||||
Series 11 | $ | 1,000.00 | $ | 967.00 | 1.00 | % | $ | 4.88 | $ | 1,000.00 | $ | 1,019.84 | 1.00 | % | $ | 5.01 | ||||||||
Series 12 | $ | 1,000.00 | $ | 961.80 | 1.00 | % | $ | 4.86 | $ | 1,000.00 | $ | 1,019.84 | 1.00 | % | $ | 5.01 | ||||||||
Series 13 | $ | 1,000.00 | $ | 951.30 | 1.00 | % | $ | 4.84 | $ | 1,000.00 | $ | 1,019.84 | 1.00 | % | $ | 5.01 | ||||||||
Series 14 | $ | 1,000.00 | $ | 965.70 | 1.00 | % | $ | 4.87 | $ | 1,000.00 | $ | 1,019.84 | 1.00 | % | $ | 5.01 | ||||||||
| * | Expenses are equal to each Series' respective annualized expense ratios multiplied by the average account value over the period, multiplied by 181/365 to reflect the most recent fiscal half-year. |
8
Table of Contents
STATEMENTS OF ASSETS AND LIABILITIESASOF JUNE 30, 2009 (UNAUDITED)
ING GET U.S. Core Portfolio Series 5 | ING GET U.S. Core Portfolio Series 6 | ING GET U.S. Core Portfolio Series 7 | ING GET U.S. Core Portfolio Series 8 | |||||||||||||
ASSETS: | ||||||||||||||||
Investments in securities at value* | $ | 20,038,980 | $ | 39,494,160 | $ | 26,147,966 | $ | 16,795,621 | ||||||||
Short-term investments in affiliates** | 81,000 | 321,000 | 222,000 | 146,000 | ||||||||||||
Cash | 2,557 | 970 | 849 | 724 | ||||||||||||
Cash collateral for futures | 21,075 | — | — | — | ||||||||||||
Receivables: | ||||||||||||||||
Investment securities sold | 329,097 | — | — | — | ||||||||||||
Dividends and interest | 5,507 | 9,542 | 4,903 | 5,201 | ||||||||||||
Prepaid expenses | 188 | 382 | 251 | 167 | ||||||||||||
Reimbursement due from manager | 2,395 | 2,990 | — | — | ||||||||||||
Total assets | 20,480,799 | 39,829,044 | 26,375,969 | 16,947,713 | ||||||||||||
LIABILITIES: | ||||||||||||||||
Payable for fund shares redeemed | 1,162 | 2,238 | 1,396 | 836 | ||||||||||||
Payable to affiliates | 15,370 | 29,704 | 22,891 | 15,665 | ||||||||||||
Payable for trustee fees | 2,449 | 2,268 | 2,610 | 2,008 | ||||||||||||
Other accrued expenses and liabilities | 29,729 | 35,830 | 25,876 | 20,404 | ||||||||||||
Total liabilities | 48,710 | 70,040 | 52,773 | 38,913 | ||||||||||||
NET ASSETS | $ | 20,432,089 | $ | 39,759,004 | $ | 26,323,196 | $ | 16,908,800 | ||||||||
NET ASSETS WERE COMPRISED OF: | ||||||||||||||||
Paid-in capital | $ | 24,773,169 | $ | 46,418,683 | $ | 30,646,248 | $ | 19,996,536 | ||||||||
Undistributed net investment income (distributions in excess of net investment income) | (198,301 | ) | 362,287 | 248,642 | 163,462 | |||||||||||
Accumulated net realized loss on investments and futures | (4,515,366 | ) | (7,920,144 | ) | (5,184,677 | ) | (3,550,672 | ) | ||||||||
Net unrealized appreciation on investments and futures | 372,587 | 898,178 | 612,983 | 299,474 | ||||||||||||
NET ASSETS | $ | 20,432,089 | $ | 39,759,004 | $ | 26,323,196 | $ | 16,908,800 | ||||||||
| ||||||||||||||||
* Cost of investments in securities | $ | 19,663,013 | $ | 38,595,982 | $ | 25,534,983 | $ | 16,496,147 | ||||||||
** Cost of short-term investments in affiliates | $ | 81,000 | $ | 321,000 | $ | 222,000 | $ | 146,000 | ||||||||
Net assets | $ | 20,432,089 | $ | 39,759,004 | $ | 26,323,196 | $ | 16,908,800 | ||||||||
Shares authorized | unlimited | unlimited | unlimited | unlimited | ||||||||||||
Par value | $ | 0.001 | $ | 0.001 | $ | 0.001 | $ | 0.001 | ||||||||
Shares outstanding | 2,706,425 | 5,025,521 | 3,407,224 | 2,192,159 | ||||||||||||
Net asset value and redemption price per share | $ | 7.55 | $ | 7.91 | $ | 7.73 | $ | 7.71 | ||||||||
See Accompanying Notes to Financial Statements
9
Table of Contents
STATEMENTS OF ASSETS AND LIABILITIESASOF JUNE 30, 2009 (UNAUDITED)
ING GET U.S. Core Portfolio Series 9 | ING GET U.S. Core Portfolio Series 10 | ING GET U.S. Core Portfolio Series 11 | ||||||||||
ASSETS: | ||||||||||||
Investments in securities at value* | $ | 13,153,134 | $ | 10,820,958 | $ | 13,808,780 | ||||||
Short-term investments in affiliates** | 53,000 | 15,000 | 135,000 | |||||||||
Cash | 259 | 388 | 10 | |||||||||
Receivables: | ||||||||||||
Investment securities sold | 80,543 | 94,640 | — | |||||||||
Dividends and interest | 2,971 | 12 | 5 | |||||||||
Prepaid expenses | 125 | 106 | 135 | |||||||||
Total assets | 13,290,032 | 10,931,104 | 13,943,930 | |||||||||
LIABILITIES: | ||||||||||||
Payable for fund shares redeemed | 651 | 686 | 728 | |||||||||
Payable to affiliates | 12,743 | 10,575 | 12,224 | |||||||||
Payable for trustee fees | 1,952 | 1,402 | 1,540 | |||||||||
Other accrued expenses and liabilities | 19,443 | 18,366 | 18,899 | |||||||||
Total liabilities | 34,789 | 31,029 | 33,391 | |||||||||
NET ASSETS | $ | 13,255,243 | $ | 10,900,075 | $ | 13,910,539 | ||||||
NET ASSETS WERE COMPRISED OF: | ||||||||||||
Paid-in capital | $ | 15,557,406 | $ | 12,791,979 | $ | 16,291,530 | ||||||
Undistributed net investment income (distributions in excess of net investment income) | 125,050 | 118,967 | (76,380 | ) | ||||||||
Accumulated net realized loss on investments | (2,521,512 | ) | (2,118,468 | ) | (2,256,331 | ) | ||||||
Net unrealized appreciation or depreciation on investments | 94,299 | 107,597 | (48,280 | ) | ||||||||
NET ASSETS | $ | 13,255,243 | $ | 10,900,075 | $ | 13,910,539 | ||||||
| ||||||||||||
* Cost of investments in securities | $ | 13,058,835 | $ | 10,713,361 | $ | 13,857,060 | ||||||
** Cost of short-term investments in affiliates | $ | 53,000 | $ | 15,000 | $ | 135,000 | ||||||
Net assets | $ | 13,255,243 | $ | 10,900,075 | $ | 13,910,539 | ||||||
Shares authorized | unlimited | unlimited | unlimited | |||||||||
Par value | $ | 0.001 | $ | 0.001 | $ | 0.001 | ||||||
Shares outstanding | 1,738,691 | 1,388,979 | 1,818,776 | |||||||||
Net asset value and redemption price per share | $ | 7.62 | $ | 7.85 | $ | 7.65 | ||||||
See Accompanying Notes to Financial Statements
10
Table of Contents
STATEMENTS OF ASSETS AND LIABILITIESASOF JUNE 30, 2009 (UNAUDITED)
ING GET U.S. Core Portfolio Series 12 | ING GET U.S. Core Portfolio Series 13 | ING GET U.S. Core Portfolio Series 14 | ||||||||||
ASSETS: | ||||||||||||
Investments in securities at value* | $ | 19,114,300 | $ | 34,461,162 | $ | 75,461,060 | ||||||
Short-term investments in affiliates** | 194,000 | 131,000 | — | |||||||||
Cash | — | 252 | 71,047 | |||||||||
Receivables: | ||||||||||||
Investment securities sold | 286,581 | 217,514 | 690,981 | |||||||||
Dividends and interest | 2,997 | 35 | 19 | |||||||||
Prepaid expenses | 206 | 449 | 906 | |||||||||
Reimbursement due from manager | — | — | 1,777 | |||||||||
Total assets | 19,598,084 | 34,810,412 | 76,225,790 | |||||||||
LIABILITIES: | ||||||||||||
Payable for fund shares redeemed | 110,945 | 26,646 | 200,558 | |||||||||
Payable to affiliates | 17,018 | 30,248 | 57,611 | |||||||||
Payable to custodian due to bank overdraft | 286,527 | — | — | |||||||||
Payable for trustee fees | 1,258 | 1,639 | 1,434 | |||||||||
Other accrued expenses and liabilities | 28,675 | 39,496 | 43,741 | |||||||||
Total liabilities | 444,423 | 98,029 | 303,344 | |||||||||
NET ASSETS | $ | 19,153,661 | $ | 34,712,383 | $ | 75,922,446 | ||||||
NET ASSETS WERE COMPRISED OF: | ||||||||||||
Paid-in capital | $ | 25,045,055 | $ | 38,173,148 | $ | 79,375,471 | ||||||
Undistributed net investment income | 254,366 | 374,731 | 1,316,505 | |||||||||
Accumulated net realized loss on investments | (6,158,008 | ) | (3,955,722 | ) | (5,786,151 | ) | ||||||
Net unrealized appreciation on investments | 12,248 | 120,226 | 1,016,621 | |||||||||
NET ASSETS | $ | 19,153,661 | $ | 34,712,383 | $ | 75,922,446 | ||||||
| ||||||||||||
* Cost of investments in securities | $ | 19,102,052 | $ | 34,340,936 | $ | 74,444,439 | ||||||
** Cost of short-term investments in affiliates | $ | 194,000 | $ | 131,000 | $ | — | ||||||
Net assets | $ | 19,153,661 | $ | 34,712,383 | $ | 75,922,446 | ||||||
Shares authorized | unlimited | unlimited | unlimited | |||||||||
Par value | $ | 0.001 | $ | 0.001 | $ | 0.001 | ||||||
Shares outstanding | 2,575,459 | 3,785,007 | 7,850,274 | |||||||||
Net asset value and redemption price per share | $ | 7.44 | $ | 9.17 | $ | 9.67 | ||||||
See Accompanying Notes to Financial Statements
11
Table of Contents
STATEMENTS OF OPERATIONSFORTHE SIX MONTHS ENDED JUNE 30, 2009 (UNAUDITED)
ING GET U.S. Core Portfolio Series 5 | ING GET U.S. Core Portfolio Series 6 | ING GET U.S. Core Portfolio Series 7 | ING GET U.S. Core Portfolio Series 8 | |||||||||||||
INVESTMENT INCOME: | ||||||||||||||||
Dividends(1) | $ | 14,937 | $ | 22,269 | $ | 11,539 | $ | 12,112 | ||||||||
Interest | 246,365 | 547,776 | 374,900 | 242,103 | ||||||||||||
Total investment income | 261,302 | 570,045 | 386,439 | 254,215 | ||||||||||||
EXPENSES: | ||||||||||||||||
Investment management fees | 63,190 | 124,064 | 81,913 | 53,660 | ||||||||||||
Distribution and service fees | 26,329 | 51,693 | 34,130 | 22,358 | ||||||||||||
Transfer agent fees | 81 | 117 | 97 | 80 | ||||||||||||
Administrative service fees | 5,792 | 11,372 | 7,508 | 4,919 | ||||||||||||
Shareholder reporting expense | 1,157 | 3,258 | 1,888 | 921 | ||||||||||||
Registration fees | 10 | 19 | 12 | — | ||||||||||||
Professional fees | 8,523 | 11,780 | 9,538 | 8,326 | ||||||||||||
Custody and accounting expense | 13,078 | 15,591 | 7,758 | 7,214 | ||||||||||||
Directors fees | 181 | 959 | 181 | 181 | ||||||||||||
Miscellaneous expense | 1,816 | 2,045 | 2,085 | 1,344 | ||||||||||||
Interest expense | — | — | — | 47 | ||||||||||||
Total expenses | 120,157 | 220,898 | 145,110 | 99,050 | ||||||||||||
Net waived and reimbursed fees | (15,150 | ) | (13,929 | ) | (8,283 | ) | (9,397 | ) | ||||||||
Net expenses | 105,007 | 206,969 | 136,827 | 89,653 | ||||||||||||
Net investment income | 156,295 | 363,076 | 249,612 | 164,562 | ||||||||||||
REALIZED AND UNREALIZED GAIN (LOSS) ON INVESTMENTS AND FUTURES | ||||||||||||||||
Net realized loss on: | ||||||||||||||||
Investments | (462,641 | ) | (461,598 | ) | (239,873 | ) | (237,363 | ) | ||||||||
Futures | 29,410 | — | — | — | ||||||||||||
Net realized loss on investments and futures | (433,231 | ) | (461,598 | ) | (239,873 | ) | (237,363 | ) | ||||||||
Net change in unrealized appreciation or depreciation on: | ||||||||||||||||
Investments | 51,606 | (283,048 | ) | (393,947 | ) | (145,391 | ) | |||||||||
Futures | (3,380 | ) | — | — | — | |||||||||||
Net change in unrealized appreciation or depreciation on investments and futures | 48,226 | (283,048 | ) | (393,947 | ) | (145,391 | ) | |||||||||
Net realized and unrealized loss on investments and futures | (385,005 | ) | (744,646 | ) | (633,820 | ) | (382,754 | ) | ||||||||
Decrease in net assets resulting from operations | $ | (228,710 | ) | $ | (381,570 | ) | $ | (384,208 | ) | $ | (218,192 | ) | ||||
| ||||||||||||||||
(1) Dividends from affiliates | $ | 529 | $ | 473 | $ | 349 | $ | 182 | ||||||||
See Accompanying Notes to Financial Statements
12
Table of Contents
STATEMENTS OF OPERATIONSFORTHE SIX MONTHS ENDED JUNE 30, 2009 (UNAUDITED)
ING GET U.S. Core Portfolio Series 9 | ING GET U.S. Core Portfolio Series 10 | ING GET U.S. Core Portfolio Series 11 | ||||||||||
INVESTMENT INCOME: | ||||||||||||
Dividends(1) | $ | 6,949 | $ | 675 | $ | 218 | ||||||
Interest | 186,829 | 177,130 | 219,867 | |||||||||
Total investment income | 193,778 | 177,805 | 220,085 | |||||||||
EXPENSES: | ||||||||||||
Investment management fees | 40,559 | 34,710 | 44,380 | |||||||||
Distribution and service fees | 16,899 | 14,462 | 18,491 | |||||||||
Transfer agent fees | 87 | 83 | 113 | |||||||||
Administrative service fees | 3,718 | 3,182 | 4,068 | |||||||||
Shareholder reporting expense | 1,513 | 373 | 662 | |||||||||
Professional fees | 6,516 | 6,532 | 6,657 | |||||||||
Custody and accounting expense | 6,471 | 5,020 | 3,996 | |||||||||
Directors fees | 805 | 181 | 346 | |||||||||
Miscellaneous expense | 1,768 | 981 | 988 | |||||||||
Total expenses | 78,336 | 65,524 | 79,701 | |||||||||
Net waived and reimbursed fees | (10,532 | ) | (7,621 | ) | (5,845 | ) | ||||||
Net expenses | 67,804 | 57,903 | 73,856 | |||||||||
Net investment income | 125,974 | 119,902 | 146,229 | |||||||||
REALIZED AND UNREALIZED GAIN (LOSS) ON INVESTMENTS | ||||||||||||
Net realized gain (loss) on investments | (112,461 | ) | (100,536 | ) | 63,152 | |||||||
Net change in unrealized appreciation or depreciation on investments | (251,341 | ) | (403,806 | ) | (733,207 | ) | ||||||
Net realized and unrealized loss on investments | (363,802 | ) | (504,342 | ) | (670,055 | ) | ||||||
Decrease in net assets resulting from operations | $ | (237,828 | ) | $ | (384,440 | ) | $ | (523,826 | ) | |||
| ||||||||||||
(1) Dividends from affiliates | $ | 167 | $ | 146 | $ | 218 | ||||||
See Accompanying Notes to Financial Statements
13
Table of Contents
STATEMENTS OF OPERATIONSFORTHE SIX MONTHS ENDED JUNE 30, 2009 (UNAUDITED)
ING GET U.S. Core Portfolio Series 12 | ING GET U.S. Core Portfolio Series 13 | ING GET U.S. Core Portfolio Series 14 | ||||||||||
INVESTMENT INCOME: | ||||||||||||
Dividends(1) | $ | 7,014 | $ | 696 | $ | — | ||||||
Interest | 354,224 | 566,770 | 1,777,786 | |||||||||
Total investment income | 361,238 | 567,466 | 1,777,786 | |||||||||
EXPENSES: | ||||||||||||
Investment management fees | 63,411 | 114,940 | 275,724 | |||||||||
Distribution and service fees | 26,421 | 47,891 | 114,884 | |||||||||
Transfer agent fees | 102 | 131 | 152 | |||||||||
Administrative service fees | 5,812 | 10,536 | 25,274 | |||||||||
Shareholder reporting expense | 2,236 | 3,750 | 7,000 | |||||||||
Registration fees | — | 23 | — | |||||||||
Professional fees | 8,917 | 12,856 | 31,172 | |||||||||
Custody and accounting expense | 6,339 | 8,312 | 8,978 | |||||||||
Directors fees | 676 | 1,026 | 1,818 | |||||||||
Miscellaneous expense | 1,553 | 3,089 | 2,622 | |||||||||
Interest expense | — | — | 126 | |||||||||
Total expenses | 115,467 | 202,554 | 467,750 | |||||||||
Net waived and reimbursed fees | (9,619 | ) | (10,711 | ) | (7,642 | ) | ||||||
Net expenses | 105,848 | 191,843 | 460,108 | |||||||||
Net investment income | 255,390 | 375,623 | 1,317,678 | |||||||||
REALIZED AND UNREALIZED GAIN (LOSS) ON INVESTMENTS | ||||||||||||
Net realized gain (loss) on investments | (88,371 | ) | (21,678 | ) | 858,678 | |||||||
Net change in unrealized appreciation or depreciation on investments | (1,051,410 | ) | (2,342,763 | ) | (5,577,125 | ) | ||||||
Net realized and unrealized loss on investments | (1,139,781 | ) | (2,364,441 | ) | (4,718,447 | ) | ||||||
Decrease in net assets resulting from operations | $ | (884,391 | ) | $ | (1,988,818 | ) | $ | (3,400,769 | ) | |||
| ||||||||||||
(1) Dividends from affiliates | $ | 219 | $ | 308 | $ | — | ||||||
See Accompanying Notes to Financial Statements
14
Table of Contents
STATEMENTS OF CHANGES IN NET ASSETS (UNAUDITED)
ING GET U.S. Core Portfolio Series 5 | ING GET U.S. Core Portfolio Series 6 | |||||||||||||||
Six Months Ended June 30, 2009 | Year Ended December 31, 2008 | Six Months Ended June 30, 2009 | Year Ended December 31, 2008 | |||||||||||||
FROM OPERATIONS: | ||||||||||||||||
Net investment income | $ | 156,295 | $ | 376,690 | $ | 363,076 | $ | 857,188 | ||||||||
Net realized loss on investments and futures | (433,231 | ) | (3,028,647 | ) | (461,598 | ) | (6,062,860 | ) | ||||||||
Net change in unrealized appreciation or depreciation on investments and futures | 48,226 | 500,220 | (283,048 | ) | 1,601,675 | |||||||||||
Decrease in net assets resulting from operations | (228,710 | ) | (2,151,737 | ) | (381,570 | ) | (3,603,997 | ) | ||||||||
FROM DISTRIBUTIONS TO SHAREHOLDERS: | ||||||||||||||||
Net investment income | (727,338 | ) | (395,353 | ) | (853,639 | ) | (995,560 | ) | ||||||||
Net realized gains | — | (4,604,185 | ) | — | (8,430,268 | ) | ||||||||||
Total distributions | (727,338 | ) | (4,999,538 | ) | (853,639 | ) | (9,425,828 | ) | ||||||||
FROM CAPITAL SHARE TRANSACTIONS: | ||||||||||||||||
Reinvestment of distributions | 727,338 | 4,999,538 | 853,639 | 9,425,828 | ||||||||||||
Cost of shares redeemed | (1,512,173 | ) | (5,731,471 | ) | (4,613,902 | ) | (12,215,630 | ) | ||||||||
Net decrease in net assets resulting from capital share transactions | (784,835 | ) | (731,933 | ) | (3,760,263 | ) | (2,789,802 | ) | ||||||||
Net decrease in net assets | (1,740,883 | ) | (7,883,208 | ) | (4,995,472 | ) | (15,819,627 | ) | ||||||||
NET ASSETS: | ||||||||||||||||
Beginning of period | 22,172,972 | 30,056,180 | 44,754,476 | 60,574,103 | ||||||||||||
End of period | $ | 20,432,089 | $ | 22,172,972 | $ | 39,759,004 | $ | 44,754,476 | ||||||||
Undistributed net investment income (distributions in excess of net investment income) at end of period | $ | (198,301 | ) | $ | 372,742 | $ | 362,287 | $ | 852,850 | |||||||
See Accompanying Notes to Financial Statements
15
Table of Contents
STATEMENTS OF CHANGES IN NET ASSETS (UNAUDITED)
ING GET U.S. Core Portfolio Series 7 | ING GET U.S. Core Portfolio Series 8 | |||||||||||||||
Six Months Ended June 30, 2009 | Year Ended December 31, 2008 | Six Months Ended June 30, 2009 | Year Ended December 31, 2008 | |||||||||||||
FROM OPERATIONS: | ||||||||||||||||
Net investment income | $ | 249,612 | $ | 621,386 | $ | 164,562 | $ | 391,316 | ||||||||
Net realized loss on investments | (239,873 | ) | (3,759,450 | ) | (237,363 | ) | (2,577,758 | ) | ||||||||
Net change in unrealized appreciation or depreciation on investments | (393,947 | ) | 1,086,777 | (145,391 | ) | 520,394 | ||||||||||
Decrease in net assets resulting from operations | (384,208 | ) | (2,051,287 | ) | (218,192 | ) | (1,666,048 | ) | ||||||||
FROM DISTRIBUTIONS TO SHAREHOLDERS: | ||||||||||||||||
Net investment income | (618,472 | ) | (699,849 | ) | (388,714 | ) | (438,217 | ) | ||||||||
Net realized gains | — | (6,781,112 | ) | — | (4,222,597 | ) | ||||||||||
Total distributions | (618,472 | ) | (7,480,961 | ) | (388,714 | ) | (4,660,814 | ) | ||||||||
FROM CAPITAL SHARE TRANSACTIONS: | ||||||||||||||||
Reinvestment of distributions | 618,472 | 7,480,961 | 388,714 | 4,660,814 | ||||||||||||
Cost of shares redeemed | (2,545,966 | ) | (9,981,654 | ) | (2,356,245 | ) | (5,671,818 | ) | ||||||||
Net decrease in net assets resulting from capital share transactions | (1,927,494 | ) | (2,500,693 | ) | (1,967,531 | ) | (1,011,004 | ) | ||||||||
Net decrease in net assets | (2,930,174 | ) | (12,032,941 | ) | (2,574,437 | ) | (7,337,866 | ) | ||||||||
NET ASSETS: | ||||||||||||||||
Beginning of period | 29,253,370 | 41,286,311 | 19,483,237 | 26,821,103 | ||||||||||||
End of period | $ | 26,323,196 | $ | 29,253,370 | $ | 16,908,800 | $ | 19,483,237 | ||||||||
Undistributed net investment income at end of period | $ | 248,642 | $ | 617,502 | $ | 163,462 | $ | 387,614 | ||||||||
See Accompanying Notes to Financial Statements
16
Table of Contents
STATEMENTS OF CHANGES IN NET ASSETS (UNAUDITED)
ING GET U.S. Core Portfolio Series 9 | ING GET U.S. Core Portfolio Series 10 | |||||||||||||||
Six Months Ended June 30, 2009 | Year Ended December 31, 2008 | Six Months Ended June 30, 2009 | Year Ended December 31, 2008 | |||||||||||||
FROM OPERATIONS: | ||||||||||||||||
Net investment income | $ | 125,974 | $ | 305,854 | $ | 119,902 | $ | 308,631 | ||||||||
Net realized loss on investments | (112,461 | ) | (1,734,782 | ) | (100,536 | ) | (1,451,208 | ) | ||||||||
Net change in unrealized appreciation or depreciation on investments | (251,341 | ) | 416,136 | (403,806 | ) | 463,744 | ||||||||||
Decrease in net assets resulting from operations | (237,828 | ) | (1,012,792 | ) | (384,440 | ) | (678,833 | ) | ||||||||
FROM DISTRIBUTIONS TO SHAREHOLDERS: | ||||||||||||||||
Net investment income | (303,230 | ) | (365,946 | ) | (306,136 | ) | (385,842 | ) | ||||||||
Net realized gains | — | (3,422,581 | ) | — | (2,701,605 | ) | ||||||||||
Total distributions | (303,230 | ) | (3,788,527 | ) | (306,136 | ) | (3,087,447 | ) | ||||||||
FROM CAPITAL SHARE TRANSACTIONS: | ||||||||||||||||
Reinvestment of distributions | 303,230 | 3,788,527 | 306,136 | 3,087,447 | ||||||||||||
Cost of shares redeemed | (1,089,008 | ) | (4,211,602 | ) | (1,360,626 | ) | (3,802,670 | ) | ||||||||
Net decrease in net assets resulting from capital share transactions | (785,778 | ) | (423,075 | ) | (1,054,490 | ) | (715,223 | ) | ||||||||
Net decrease in net assets | (1,326,836 | ) | (5,224,394 | ) | (1,745,066 | ) | (4,481,503 | ) | ||||||||
NET ASSETS: | ||||||||||||||||
Beginning of period | 14,582,079 | 19,806,473 | 12,645,141 | 17,126,644 | ||||||||||||
End of period | $ | 13,255,243 | $ | 14,582,079 | $ | 10,900,075 | $ | 12,645,141 | ||||||||
Undistributed net investment income at end of period | $ | 125,050 | $ | 302,306 | $ | 118,967 | $ | 305,201 | ||||||||
See Accompanying Notes to Financial Statements
17
Table of Contents
STATEMENTS OF CHANGES IN NET ASSETS (UNAUDITED)
ING GET U.S. Core Portfolio Series 11 | ING GET U.S. Core Portfolio Series 12 | |||||||||||||||
Six Months Ended June 30, 2009 | Year Ended December 31, 2008 | Six Months Ended June 30, 2009 | Year Ended December 31, 2008 | |||||||||||||
FROM OPERATIONS: | ||||||||||||||||
Net investment income | $ | 146,229 | $ | 333,533 | $ | 255,390 | $ | 642,510 | ||||||||
Net realized gain (loss) on investments | 63,152 | (1,302,126 | ) | (88,371 | ) | (4,796,209 | ) | |||||||||
Net change in unrealized appreciation or depreciation on investments | (733,207 | ) | 907,014 | (1,051,410 | ) | 1,427,602 | ||||||||||
Decrease in net assets resulting from operations | (523,826 | ) | (61,579 | ) | (884,391 | ) | (2,726,097 | ) | ||||||||
FROM DISTRIBUTIONS TO SHAREHOLDERS: | ||||||||||||||||
Net investment income | (553,167 | ) | (428,660 | ) | (639,636 | ) | (564,736 | ) | ||||||||
Net realized gains | — | (3,353,529 | ) | — | (7,817,074 | ) | ||||||||||
Total distributions | (553,167 | ) | (3,782,189 | ) | (639,636 | ) | (8,381,810 | ) | ||||||||
FROM CAPITAL SHARE TRANSACTIONS: | ||||||||||||||||
Reinvestment of distributions | 553,167 | 3,782,189 | 639,636 | 8,381,810 | ||||||||||||
Cost of shares redeemed | (1,684,714 | ) | (4,383,714 | ) | (3,207,191 | ) | (20,182,634 | ) | ||||||||
Net decrease in net assets resulting from capital share transactions | (1,131,547 | ) | (601,525 | ) | (2,567,555 | ) | (11,800,824 | ) | ||||||||
Net decrease in net assets | (2,208,540 | ) | (4,445,293 | ) | (4,091,582 | ) | (22,908,731 | ) | ||||||||
NET ASSETS: | ||||||||||||||||
Beginning of period | 16,119,079 | 20,564,372 | 23,245,243 | 46,153,974 | ||||||||||||
End of period | $ | 13,910,539 | $ | 16,119,079 | $ | 19,153,661 | $ | 23,245,243 | ||||||||
Undistributed net investment income (distributions in excess of net investment income) at end of period | $ | (76,380 | ) | $ | 330,558 | $ | 254,366 | $ | 638,612 | |||||||
See Accompanying Notes to Financial Statements
18
Table of Contents
STATEMENTS OF CHANGES IN NET ASSETS (UNAUDITED)
ING GET U.S. Core Portfolio Series 13 | ING GET U.S. Core Portfolio Series 14 | |||||||||||||||
Six Months Ended June 30, 2009 | Year Ended December 31, 2008 | Six Months Ended June 30, 2009 | Year Ended December 31, 2008 | |||||||||||||
FROM OPERATIONS: | ||||||||||||||||
Net investment income | $ | 375,623 | $ | 1,300,768 | $ | 1,317,678 | $ | 3,454,370 | ||||||||
Net realized gain (loss) on investments | (21,678 | ) | (2,309,895 | ) | 858,678 | (4,050,951 | ) | |||||||||
Net change in unrealized appreciation or depreciation on investments | (2,342,763 | ) | 1,874,043 | (5,577,125 | ) | 3,668,444 | ||||||||||
Increase (decrease) in net assets resulting from operations | (1,988,818 | ) | 864,916 | (3,400,769 | ) | 3,071,863 | ||||||||||
FROM DISTRIBUTIONS TO SHAREHOLDERS: | ||||||||||||||||
Net investment income | (1,298,259 | ) | (1,233,488 | ) | (3,453,643 | ) | (2,168,262 | ) | ||||||||
Net realized gains | — | (3,753,123 | ) | — | (625,075 | ) | ||||||||||
Total distributions | (1,298,259 | ) | (4,986,611 | ) | (3,453,643 | ) | (2,793,337 | ) | ||||||||
FROM CAPITAL SHARE TRANSACTIONS: | ||||||||||||||||
Reinvestment of distributions | 1,298,259 | 4,986,611 | 3,453,643 | 2,793,337 | ||||||||||||
Cost of shares redeemed | (6,538,854 | ) | (27,862,802 | ) | (27,719,673 | ) | (20,518,537 | ) | ||||||||
Net decrease in net assets resulting from capital share transactions | (5,240,595 | ) | (22,876,191 | ) | (24,266,030 | ) | (17,725,200 | ) | ||||||||
Net decrease in net assets | (8,527,672 | ) | (26,997,886 | ) | (31,120,442 | ) | (17,446,674 | ) | ||||||||
NET ASSETS: | ||||||||||||||||
Beginning of period | 43,240,055 | 70,237,941 | 107,042,888 | 124,489,562 | ||||||||||||
End of period | $ | 34,712,383 | $ | 43,240,055 | $ | 75,922,446 | $ | 107,042,888 | ||||||||
Undistributed net investment income at end of period | $ | 374,731 | $ | 1,297,367 | $ | 1,316,505 | $ | 3,452,470 | ||||||||
See Accompanying Notes to Financial Statements
19
Table of Contents
FINANCIAL HIGHLIGHTS (UNAUDITED)
Selected data for a share of beneficial interest outstanding throughout each year or period.
| Income (loss) from investment operations | Less distributions | Ratios to average net assets | Supplemental data | |||||||||||||||||||||||||||||||||||||
| Net asset value, beginning of year or period | Net investment income (loss) | Net realized and unrealized gain (loss) | Total from investment operations | From net investment income | From net realized gains | From return of capital | Total distributions | Net asset value, end of year or period | Total Return (1) | Expenses before reductions/ additions(2) | Expenses net of fee waivers and/or recoupments, if any (2)(3) | Expenses net of all reductions/ additions(2)(3) | Net investment income (loss)(2)(3) | Net assets, end of year or period | Portfolio turnover rate | |||||||||||||||||||||||||
Year or period ended | ($) | ($) | ($) | ($) | ($) | ($) | ($) | ($) | ($) | (%) | (%) | (%) | (%) | (%) | ($000's) | (%) | ||||||||||||||||||||||||
ING GET U.S. Core | ||||||||||||||||||||||||||||||||||||||||
Series 5 | ||||||||||||||||||||||||||||||||||||||||
06-30-09 | 7.90 | 0.07 | (0.15 | ) | (0.08 | ) | 0.27 | — | — | 0.27 | 7.55 | (0.98 | ) | 1.14 | 1.00 | † | 1.00 | † | 1.48 | † | 20,432 | 5 | ||||||||||||||||||
12-31-08 | 10.59 | 0.15 | (0.89 | ) | (0.74 | ) | 0.15 | 1.80 | — | 1.95 | 7.90 | (7.36 | )†† | 1.12 | 1.00 | † | 1.00 | † | 1.52 | † | 22,173 | 240 | ||||||||||||||||||
12-31-07 | 11.01 | 0.13 | • | 0.14 | 0.27 | 0.19 | 0.50 | — | 0.69 | 10.59 | 2.15 | 0.97 | 1.00 | † | 1.00 | † | 1.16 | † | 30,056 | 230 | ||||||||||||||||||||
12-30-06 | 10.56 | 0.16 | • | 0.96 | 1.12 | 0.22 | 0.45 | — | 0.67 | 11.01 | 11.23 | 1.01 | 1.00 | 1.00 | 1.51 | 36,518 | 90 | |||||||||||||||||||||||
12-30-05 | 10.57 | 0.16 | • | 0.12 | 0.28 | 0.11 | 0.18 | — | 0.29 | 10.56 | 2.67 | 1.05 | 1.00 | 1.00 | 1.57 | 46,690 | 111 | |||||||||||||||||||||||
06-11-04(4) - | 10.00 | 0.09 | 0.48 | 0.57 | — | — | — | — | 10.57 | 5.49 | (a) | 1.04 | 0.98 | 0.98 | 2.33 | 54,922 | 71 | |||||||||||||||||||||||
Series 6 | ||||||||||||||||||||||||||||||||||||||||
06-30-09 | 8.15 | 0.07 | • | (0.14 | ) | (0.07 | ) | 0.17 | — | — | 0.17 | 7.91 | (0.85 | ) | 1.07 | 1.00 | † | 1.00 | † | 1.76 | † | 39,759 | 4 | |||||||||||||||||
12-31-08 | 10.60 | 0.18 | (0.79 | ) | (0.61 | ) | 0.19 | 1.65 | — | 1.84 | 8.15 | (6.16 | ) | 1.06 | 1.00 | † | 1.00 | † | 1.69 | † | 44,754 | 224 | ||||||||||||||||||
12-31-07 | 11.08 | 0.16 | • | 0.23 | 0.39 | 0.27 | 0.60 | — | 0.87 | 10.60 | 3.30 | 1.00 | 1.00 | † | 1.00 | † | 1.44 | † | 60,574 | 191 | ||||||||||||||||||||
12-31-06 | 10.35 | 0.18 | • | 0.87 | 1.05 | 0.25 | 0.07 | — | 0.32 | 11.08 | 10.48 | 0.99 | 0.99 | 0.99 | 1.71 | 78,729 | 84 | |||||||||||||||||||||||
12-31-05 | 10.12 | 0.18 | • | 0.09 | 0.27 | 0.04 | 0.00 | * | — | 0.04 | 10.35 | 2.68 | 0.97 | 0.97 | 0.97 | 1.77 | 119,890 | 81 | ||||||||||||||||||||||
09-10-04(4) - | 10.00 | 0.03 | 0.09 | 0.12 | — | — | — | — | 10.12 | 0.90 | (a) | 0.77 | 0.77 | 0.77 | 1.36 | 159,478 | 6 | |||||||||||||||||||||||
Series 7 | ||||||||||||||||||||||||||||||||||||||||
06-30-09 | 8.01 | 0.07 | • | (0.17 | ) | (0.10 | ) | 0.18 | — | — | 0.18 | 7.73 | (1.20 | ) | 1.06 | 1.00 | † | 1.00 | † | 1.83 | † | 26,323 | 3 | |||||||||||||||||
12-31-08 | 10.74 | 0.20 | (0.70 | ) | (0.50 | ) | 0.21 | 2.02 | — | 2.23 | 8.01 | (4.99 | ) | 1.07 | 1.00 | † | 1.00 | † | 1.84 | † | 29,253 | 219 | ||||||||||||||||||
12-31-07 | 11.01 | 0.16 | • | 0.22 | 0.38 | 0.28 | 0.37 | — | 0.65 | 10.74 | 3.29 | 1.03 | 1.00 | † | 1.00 | † | 1.41 | † | 41,286 | 208 | ||||||||||||||||||||
12-31-06 | 10.23 | 0.18 | • | 0.85 | 1.03 | 0.25 | — | — | 0.25 | 11.01 | 10.26 | 1.01 | 1.00 | 1.00 | 1.71 | 59,054 | 78 | |||||||||||||||||||||||
12-31-05 | 10.01 | 0.19 | • | 0.04 | 0.23 | 0.01 | — | — | 0.01 | 10.23 | 1.95 | (b) | 0.94 | 0.94 | 0.94 | 1.80 | 90,572 | 126 | ||||||||||||||||||||||
12-10-04(4) - | 10.00 | 0.01 | 0.00 | * | 0.01 | — | — | — | — | 10.01 | — | (c) | 0.65 | 0.65 | 0.65 | 1.85 | 62,522 | — | ||||||||||||||||||||||
Series 8 | ||||||||||||||||||||||||||||||||||||||||
06-30-09 | 7.97 | 0.07 | • | (0.15 | ) | (0.08 | ) | 0.18 | — | — | 0.18 | 7.71 | (1.04 | ) | 1.11 | 1.00 | † | 1.00 | † | 1.84 | † | 16,909 | 5 | |||||||||||||||||
12-31-08 | 10.74 | 0.18 | (0.82 | ) | (0.64 | ) | 0.20 | 1.93 | — | 2.13 | 7.97 | (6.47 | ) | 1.08 | 1.00 | † | 1.00 | † | 1.77 | † | 19,483 | 235 | ||||||||||||||||||
12-31-07 | 11.06 | 0.15 | • | 0.27 | 0.42 | 0.25 | 0.49 | — | 0.74 | 10.74 | 3.64 | 1.05 | 1.00 | † | 1.00 | † | 1.36 | † | 26,821 | 215 | ||||||||||||||||||||
12-31-06 | 10.23 | 0.17 | • | 0.90 | 1.07 | 0.20 | 0.04 | — | 0.24 | 11.06 | 10.70 | 1.04 | 1.00 | 1.00 | 1.60 | 41,172 | 101 | |||||||||||||||||||||||
03-09-05(4) - | 10.00 | 0.15 | • | 0.08 | 0.23 | — | — | — | — | 10.23 | 1.69 | (b) | 0.94 | 0.91 | 0.91 | 1.87 | 51,960 | 131 | ||||||||||||||||||||||
Series 9 | ||||||||||||||||||||||||||||||||||||||||
06-30-09 | 7.93 | 0.07 | • | (0.20 | ) | (0.13 | ) | 0.18 | — | — | 0.18 | 7.62 | (1.67 | ) | 1.16 | 1.00 | † | 1.00 | † | 1.86 | † | 13,255 | 3 | |||||||||||||||||
12-31-08 | 10.81 | 0.19 | (0.71 | ) | (0.52 | ) | 0.23 | 2.13 | — | 2.36 | 7.93 | (5.16 | ) | 1.12 | 1.00 | † | 1.00 | † | 1.86 | † | 14,582 | 301 | ||||||||||||||||||
12-31-07 | 10.93 | 0.16 | • | 0.29 | 0.45 | 0.28 | 0.29 | — | 0.57 | 10.81 | 3.93 | 1.06 | 1.00 | † | 1.00 | † | 1.45 | † | 19,806 | 233 | ||||||||||||||||||||
12-31-06 | 10.06 | 0.18 | • | 0.82 | 1.00 | 0.13 | — | — | 0.13 | 10.93 | 10.11 | 1.09 | 1.00 | 1.00 | 1.79 | 30,694 | 89 | |||||||||||||||||||||||
06-08-05(4) - | 10.00 | 0.13 | • | (0.07 | ) | 0.06 | — | — | — | — | 10.06 | 0.00 | (b) | 0.96 | 0.87 | 0.87 | 2.21 | 41,582 | 188 | |||||||||||||||||||||
Series 10 | ||||||||||||||||||||||||||||||||||||||||
06-30-09 | 8.32 | 0.08 | • | (0.33 | ) | (0.25 | ) | 0.22 | — | — | 0.22 | 7.85 | (2.99 | ) | 1.13 | 1.00 | † | 1.00 | † | 2.07 | † | 10,900 | 29 | |||||||||||||||||
12-31-08 | 10.89 | 0.23 | (0.63 | ) | (0.40 | ) | 0.27 | 1.90 | — | 2.17 | 8.32 | (3.91 | ) | 1.12 | 1.00 | † | 1.00 | † | 2.13 | † | 12,645 | 302 | ||||||||||||||||||
12-31-07 | 10.91 | 0.18 | • | 0.23 | 0.41 | 0.21 | 0.22 | — | 0.43 | 10.89 | 3.63 | 1.07 | 1.00 | † | 1.00 | † | 1.62 | † | 17,127 | 194 | ||||||||||||||||||||
12-31-06 | 10.02 | 0.16 | • | 0.81 | 0.97 | 0.07 | 0.01 | — | 0.08 | 10.91 | 9.78 | 1.14 | 1.00 | 1.00 | 1.54 | 27,694 | 93 | |||||||||||||||||||||||
09-07-05(4) - | 10.00 | 0.09 | • | (0.07 | ) | 0.02 | — | — | — | — | 10.02 | (0.60 | )(b) | 0.82 | 0.76 | 0.76 | 2.77 | 37,137 | 80 | |||||||||||||||||||||
See Accompanying Notes to Financial Statements
20
Table of Contents
FINANCIAL HIGHLIGHTS (UNAUDITED) (CONTINUED)
Selected data for a share of beneficial interest outstanding throughout each year or period.
| Income (loss) from investment operations | Less distributions | Ratios to average net assets | Supplemental data | |||||||||||||||||||||||||||||||||||||
| Net asset value, beginning of year or period | Net investment income (loss) | Net realized and unrealized gain (loss) | Total from investment operations | From net investment income | From net realized gains | From return of capital | Total distributions | Net asset value, end of year or period | Total Return (1) | Expenses before reductions/ additions(2) | Expenses net of fee waivers and/or recoupments, if any (2)(3) | Expenses net of all reductions/ additions(2)(3) | Net investment income (loss)(2)(3) | Net assets, end of year or period | Portfolio turnover rate | |||||||||||||||||||||||||
Year or period ended | ($) | ($) | ($) | ($) | ($) | ($) | ($) | ($) | ($) | (%) | (%) | (%) | (%) | (%) | ($000's) | (%) | ||||||||||||||||||||||||
ING GET U.S. Core | ||||||||||||||||||||||||||||||||||||||||
Series 11 | ||||||||||||||||||||||||||||||||||||||||
06-30-09 | 8.23 | 0.08 | • | (0.35 | ) | (0.27 | ) | 0.31 | — | — | 0.31 | 7.65 | (3.30 | ) | 1.08 | 1.00 | † | 1.00 | † | 1.98 | † | 13,911 | — | |||||||||||||||||
12-31-08 | 10.47 | 0.20 | (0.27 | ) | (0.07 | ) | 0.25 | 1.92 | — | 2.17 | 8.23 | 0.53 | †† | 1.06 | 1.01 | † | 1.01 | † | 1.92 | † | 16,119 | 198 | ||||||||||||||||||
12-31-07 | 10.79 | 0.16 | • | 0.08 | 0.24 | 0.36 | 0.20 | — | 0.56 | 10.47 | 2.05 | 1.10 | 1.00 | † | 1.00 | † | 1.49 | † | 20,564 | 267 | ||||||||||||||||||||
12-31-06 | 10.02 | 0.23 | • | 0.55 | 0.78 | 0.01 | — | — | 0.01 | 10.79 | 7.06 | (d) | 1.03 | 0.96 | 0.96 | 2.22 | 35,473 | 114 | ||||||||||||||||||||||
12-06-05(4) - | 10.00 | 0.03 | • | (0.01 | ) | 0.02 | — | — | — | — | 10.02 | — | (c) | 0.65 | 0.65 | 0.65 | 3.95 | 25,842 | — | |||||||||||||||||||||
Series 12 | ||||||||||||||||||||||||||||||||||||||||
06-30-09 | 7.99 | 0.09 | • | (0.40 | ) | (0.31 | ) | 0.24 | — | — | 0.24 | 7.44 | (3.82 | ) | 1.09 | 1.00 | † | 1.00 | † | 2.42 | † | 19,154 | 12 | |||||||||||||||||
12-31-08 | 11.29 | 0.26 | (0.90 | ) | (0.64 | ) | 0.18 | 2.48 | — | 2.66 | 7.99 | (6.20 | ) | 1.12 | 1.00 | † | 1.00 | † | 1.99 | † | 23,245 | 280 | ||||||||||||||||||
12-31-07 | 11.36 | 0.13 | • | 0.23 | 0.36 | 0.15 | 0.28 | — | 0.43 | 11.29 | 3.02 | 1.09 | 1.00 | † | 1.00 | † | 1.11 | † | 46,154 | 231 | ||||||||||||||||||||
03-02-06(4) - | 10.00 | 0.13 | 1.23 | 1.36 | — | — | — | — | 11.36 | 12.25 | (d) | 0.94 | 0.85 | 0.85 | 1.72 | 54,893 | 57 | |||||||||||||||||||||||
Series 13 | ||||||||||||||||||||||||||||||||||||||||
06-30-09 | 10.00 | 0.09 | • | (0.58 | ) | (0.49 | ) | 0.34 | — | — | 0.34 | 9.17 | (4.87 | ) | 1.06 | 1.00 | † | 1.00 | † | 1.96 | † | 34,712 | 1 | |||||||||||||||||
12-31-08 | 10.60 | 0.21 | • | (0.00 | )* | 0.21 | 0.20 | 0.61 | — | 0.81 | 10.00 | 2.33 | 1.05 | 1.00 | † | 1.00 | † | 2.14 | † | 43,240 | 386 | |||||||||||||||||||
12-31-07 | 10.16 | 0.15 | • | 0.35 | 0.50 | 0.06 | 0.00 | * | — | 0.06 | 10.60 | 4.95 | 1.00 | 1.00 | † | 1.00 | † | 1.44 | † | 70,238 | 168 | |||||||||||||||||||
06-22-06(4) - | 10.00 | 0.22 | • | (0.06 | ) | 0.16 | — | — | — | — | 10.16 | (0.59 | )(d) | 1.02 | 0.73 | 0.73 | 4.15 | 107,215 | — | |||||||||||||||||||||
Series 14 | ||||||||||||||||||||||||||||||||||||||||
06-30-09 | 10.46 | 0.14 | • | (0.50 | ) | (0.36 | ) | 0.43 | — | — | 0.43 | 9.67 | (3.43 | ) | 1.02 | 1.00 | 1.00 | 2.87 | 75,922 | — | ||||||||||||||||||||
12-31-08 | 10.41 | 0.31 | • | (0.01 | ) | 0.30 | 0.19 | 0.06 | — | 0.25 | 10.46 | 3.04 | 1.02 | 1.00 | 1.00 | 3.05 | 107,043 | 293 | ||||||||||||||||||||||
12-31-07 | 10.00 | 0.26 | • | 0.15 | 0.41 | — | — | — | — | 10.41 | 1.86 | (d) | 0.95 | 0.93 | 0.93 | 2.52 | 124,490 | 120 | ||||||||||||||||||||||
12-21-06(4) - | 10.00 | (0.00 | )* | — | (0.00 | )* | — | — | — | — | 10.00 | — | (c) | — | 0.58 | 0.58 | (0.58 | ) | 85 | — | ||||||||||||||||||||
| (1) | Total return is calculated assuming reinvestment of all dividends and capital gain distributions at net asset value and does not reflect the effect of insurance contract charges. Total return for periods less than one year is not annualized. |
| (2) | Annualized for periods less than one year. |
| (3) | Expense ratios reflect operating expenses of a Series. Expenses before reductions do not reflect amounts reimbursed by the Investment Adviser and/or Distributor or reductions from brokerage commission recapture arrangements or other expense offset arrangements and do not represent the amount paid by a Series during periods when reimbursements or reductions occur. Expenses net of fee waivers reflect expenses after reimbursement by the Investment Adviser and/or Distributor but prior to reductions from brokerage commission recapture arrangements or other expense offset arrangements. Expenses net of all reductions represent the net expenses paid by a Series. Net investment income (loss) is net of all such additions or reductions. |
| (4) | Commencement of operations. |
| * | Amount is less than $0.005 or more than $(0.005). |
| · | Calculated using average number of shares outstanding throughout the period. |
| † | Impact of waiving the advisory fee for the ING Institutional Prime Money Market Fund holding has less than 0.005% impact on the expense ratio and net investment income or less ratio. |
See Accompanying Notes to Financial Statements
21
Table of Contents
FINANCIAL HIGHLIGHTS (UNAUDITED) (CONTINUED)
| †† | In August 2008, an affiliate of the Investment adviser and ING IM fully reimbursed ING GET U.S. Core Portfolio Series 5 and ING GET U.S. Core Portfolio Series 11 for a loss on certain investment transactions, which otherwise would have had a 1.46% and 1.39% impact on the Portfolios respective total returns. Excluding the reimbursement, total return would have been (8.82)% and (0.86)%, respectively. |
| (a) | For ING GET U.S. Core Portfolio Series 5 and ING GET U.S. Core Portfolio Series 6 — total return calculation began on September 10, 2004 and December 10, 2004, respectively, the first day of each Guarantee Period. |
| For ING GET U.S. Core Portfolio Series 5 and ING GET U.S. Core Portfolio Series 6 — total return from each commencement of operations was 5.70% and 1.20%, respectively. |
| (b) | For ING GET U.S. Core Portfolio Series 7, ING GET U.S. Core Portfolio Series 8, ING GET U.S. Core Portfolio Series 9 and ING GET U.S. Core Portfolio Series 10 — total return calculation began on March 9, 2005, June 8, 2005, September 7, 2005 and December 6, 2005, respectively, the first day of each Guarantee Period. |
| For ING GET U.S. Core Portfolio Series 7, ING GET U.S. Core Portfolio Series 8, ING GET U.S. Core Portfolio Series 9 and ING GET U.S. Core Portfolio Series 10 — total return from each commencement of operations was 2.26%, 2.30%, 0.60%, and 0.20%, respectively. |
| (c) | As of December 31, 2003, ING GET U.S. Core Portfolio Series 7 was in its Offering Period. Total return calculation began on the commencement date of the Guarantee Period (March 9, 2005). Total return from commencement of operations was 0.10%. |
| As of December 31, 2005, ING GET U.S. Core Portfolio Series 11 was in its Offering Period. Total return calculation began on the commencement date of the Guarantee Period (March 2, 2006). Total return from commencement of operations was 0.20%. |
| As of December 31, 2006, ING GET U.S. Core Portfolio Series 14 was in its Offering Period. Total return calculation began on the commencement date of the Guarantee Period (June 21, 2007.) Total return from commencement of operations was 0.00%. |
| (d) | For ING GET U.S. Core Portfolio Series 11, ING GET U.S. Core Portfolio Series 12, ING GET U.S. Core Portfolio Series 13, and ING GET U.S. Core Portfolio Series 14 — total return calculation began on March 2, 2006, June 22, 2006, December 21, 2006 and June 21, 2007, respectively, the first day of each Guarantee Period. |
| For ING GET U.S. Core Portfolio Series 11 total return for the year ended December 31, 2006 was 7.81% and for ING GET U.S. Core Portfolio Series 14 total return for the year ended December 31, 2007 was 4.10%. For ING GET U.S. Core Portfolio Series 12 and ING GET U.S. Core Portfolio Series 13 — total return from each commencement of operations was 13.60% and 1.60%, respectively. |
See Accompanying Notes to Financial Statements
22
Table of Contents
NOTES TO FINANCIAL STATEMENTSASOF JUNE 30, 2009 (UNAUDITED)
NOTE 1 — ORGANIZATION
Organization. ING Variable Insurance Trust (the “Trust”) was organized as a Delaware statutory trust on July 15, 1999 and is registered with the SEC under the Investment Company Act of 1940, as amended (“1940 Act” or “Act”) as a diversified open-end management investment company. There are ten separate investment Series which comprise the Trust. The ten that are in this report are as follows: ING GET U.S. Core Portfolio Series 5 (“Series 5”), ING GET U.S. Core Portfolio Series 6 (“Series 6”), ING GET U.S. Core Portfolio Series 7 (“Series 7”), ING GET U.S. Core Portfolio Series 8 (“Series 8”), ING GET U.S. Core Portfolio Series 9 (“Series 9”), ING GET U.S. Core Portfolio Series 10 (“Series 10”), ING GET U.S. Core Portfolio Series 11 (“Series 11”), ING GET U.S. Core Portfolio Series 12 (“Series 12”), ING GET U.S. Core Portfolio Series 13 (“Series 13”) and ING GET U.S. Core Portfolio Series 14 (“Series 14”) (each, a “Series” and collectively, “Series”).
During the Guarantee Period, each Series seeks to achieve maximum total return and minimal exposure of the Series’ assets to a market value loss by participating, to the extent possible, in favorable equity market performance.
If during the Guarantee Period the equity markets experience a major decline, the Series’ assets may become largely or entirely invested in the Fixed Component. Use of the Fixed Component reduces the Series’ ability to participate as fully in upward equity market movements, and therefore represents some loss of opportunity, or opportunity cost, compared to a portfolio that is more heavily invested in equities. The insurance companies offering these Series currently are ING Life Insurance & Annuity Company (“ILIAC”) and ING USA Annuity and Life Insurance Company (“ING USA”). The insurance companies offering these Series guarantee Contract holders and Participants that on the Maturity Date they will receive no less than the value of their separate account investment directed to the Series as of the last day of the Offering Period, adjusted for certain charges. The value of dividends and distributions made by the Series throughout the Guarantee Period is included in determining whether, for purposes of the Guarantee, the value of a shareholder’s investment on the Maturity Date is no less than the value of their investment as of the last day of the Offering Period. Amounts withdrawn prior to the Maturity Date do not get the benefit of the Guarantee. The following information is related to the Series:
Offering Period | Guarantee Period | Maturity Date | ||||
Series 5* | 06/11/04 — 09/09/04 | 09/10/04 — 09/09/11 | 09/09/11 | |||
Series 6* | 09/10/04 — 12/09/04 | 12/10/04 — 12/09/11 | 12/09/11 | |||
Series 7* | 12/10/04 — 03/08/05 | 03/09/05 — 03/08/12 | 03/08/12 | |||
Series 8* | 03/09/05 — 06/07/05 | 06/08/05 — 06/07/12 | 06/07/12 | |||
Series 9* | 06/08/05 — 09/06/05 | 09/07/05 — 09/06/12 | 09/06/12 | |||
Series 10* | 09/07/05 — 12/05/05 | 12/06/05 — 12/05/12 | 12/05/12 | |||
Series 11* | 12/06/05 — 03/01/06 | 03/02/06 — 02/28/13 | 02/28/13 | |||
Series 12* | 03/02/06 — 06/21/06 | 06/22/06 — 06/20/13 | 06/20/13 | |||
Series 13* | 06/22/06 — 12/20/06 | 12/21/06 — 12/19/13 | 12/19/13 | |||
Series 14* | 12/21/06 — 06/20/07 | 06/21/07 — 06/19/14 | 06/19/14 |
| * | Closed to new investors. |
Shares of the Series are offered to insurance company separate accounts that fund both annuity and life insurance contracts and certain tax-qualified retirement plans. At June 30, 2009 separate accounts of ILIAC and ING USA and their affiliates held all the shares outstanding of the Series.
NOTE 2 — SIGNIFICANT ACCOUNTING POLICIES
The following significant accounting policies are consistently followed by the Series in the preparation of their financial statements, and such policies are in conformity with U.S. generally accepted accounting principles (“GAAP”) for investment companies.
| A. | Security Valuation. Investments in equity securities traded on a national securities exchange are valued at the last reported sale price. Securities reported by NASDAQ are valued at the NASDAQ official closing prices. Securities traded on an exchange or NASDAQ for which there has been no sale and securities traded in the over-the-counter-market are valued at the mean between the last reported bid and ask prices. All investments quoted in foreign currencies will be valued daily in U.S. dollars on the basis of the foreign currency exchange rates prevailing at that time. Debt securities acquired with more than 60 days to maturity are fair valued using matrix pricing methods determined by an independent pricing service which takes into consideration such factors as yields, maturities, liquidity, ratings and traded prices in similar or identical securities. Securities for which valuations are not readily available from an independent pricing service may be valued by brokers which use prices provided by market makers or estimates of fair market value obtained from yield data relating to investments or securities with similar characteristics. U.S. government obligations are valued by using market quotations or independent pricing services that use prices provided by market-makers or estimates of market values obtained from yield data relating to instruments or securities with similar characteristics. Investments in open-end mutual funds are valued at net asset value. |
23
Table of Contents
NOTES TO FINANCIAL STATEMENTSASOF JUNE 30, 2009 (UNAUDITED) (CONTINUED)
NOTE 2 — SIGNIFICANT ACCOUNTING POLICIES (continued)
Securities and assets for which market quotations are not readily available (which may include certain restricted securities which are subject to limitations as to their sale) are valued at their fair values, as defined by the 1940 Act, and as determined in good faith by or under the supervision of the Series’ Board of Trustees (the “Board”), in accordance with methods that are specifically authorized by the Board. Securities traded on exchanges, including foreign exchanges, which close earlier than the time that a Series calculates its NAV may also be valued at their fair values as defined by the 1940 Act, and as determined in good faith by or under the supervision of the Board, in accordance with methods that are specifically authorized by the Board. The valuation techniques applied in any specific instance are likely to vary from case to case. With respect to a restricted security, for example, consideration is generally given to the cost of the investment, the market value of any unrestricted securities of the same class at the time of valuation, the potential expiration of restrictions on the security, the existence of any registration rights, the costs to the Series related to registration of the security, as well as factors relevant to the issuer itself. Consideration may also be given to the price and extent of any public trading in similar securities of the issuer or comparable companies’ securities. The value of a foreign security traded on an exchange outside the United States is generally based on the price of a foreign security on the principal foreign exchange where it trades as of the time the Series determines its NAV or if the foreign exchange closes prior to the time the Series determines its NAV, the most recent closing price of the foreign security on its principal exchange. Trading in certain non-U.S. securities may not take place on all days on which the New York Stock Exchange (“NYSE”) is open. Further, trading takes place in various foreign markets on days on which the NYSE is not open. Consequently, the calculation of the Series’ NAV may not take place contemporaneously with the determination of the prices of securities held by a Series in foreign securities markets. Further, the value of the Series’ assets may be significantly affected by foreign trading on days when a shareholder cannot purchase or redeem shares of the Series. In calculating the Series’ NAV, foreign securities in
foreign currency are converted to U.S. dollar equivalents. If an event occurs after the time at which the market for foreign securities held by the Series closes but before the time that the Series’ NAV in calculated, such event may cause the closing price on the foreign exchange to not represent a readily available reliable market value quotation for such securities at the time the Series determines its NAV. In such a case, the Series will use the fair value of such securities as determined under the Series’ valuation procedures. Events after the close of trading on a foreign market that could require the Series to fair value some or all of its foreign securities include, among others, securities trading in the U.S. and other markets, corporate announcements, natural and other disasters, and political and other events. Among other elements of analysis in the determination of a security’s fair value, the Board has authorized the use of one or more independent research services to assist with such determinations. An independent research service may use statistical analyses and quantitative models to help determine fair value as of the time a Series calculates its NAV. There can be no assurance that such models accurately reflect the behavior of the applicable markets or the effect of the behavior of such markets on the fair value of securities, or that such markets will continue to behave in a fashion that is consistent with such models. Unlike the closing price of a security on an exchange, fair value determinations employ elements of judgment. Consequently, the fair value assigned to a security may not represent the actual value that a Series could obtain if it were to sell the security at the time of the close of the NYSE. Pursuant to procedures adopted by the Board, a Series is not obligated to use the fair valuations suggested by any research service, and valuation recommendations provided by such research services may be overridden if other events have occurred or if other fair valuations are determined in good faith to be more accurate. Unless an event is such that it causes a Series to determine that the closing prices for one or more securities do not represent readily available reliable market value quotations at the time a Series determines its NAV, events that occur between the time of the close of the foreign market on which they are traded and the close of regular trading on the NYSE will not be reflected in a Series’ NAV. Investments in securities maturing in 60 days or less from date of acquisition are valued at amortized cost which approximates market value.
24
Table of Contents
NOTES TO FINANCIAL STATEMENTSASOF JUNE 30, 2009 (UNAUDITED) (CONTINUED)
NOTE 2 — SIGNIFICANT ACCOUNTING POLICIES (continued)
Effective for fiscal years beginning after November 15, 2007, Financial Accounting Standards Board (“FASB”) Statement of Financial Accounting Standards No. 157, “Fair Value Measurements”, establishes a hierarchy for measuring fair value of assets and liabilities. As required by the standard, each investment asset or liability of the Series is assigned a level at measurement date based on the significance and source of the inputs to its valuation. Quoted prices in active markets for identical securities are classified as “Level 1”, inputs other than quoted prices for an asset or liability that are observable are classified as “Level 2” and unobservable inputs, including the sub-adviser’s judgment about the assumptions that a market participant would use in pricing an asset or liability are classified as “Level 3”. The inputs used for valuing securities are not necessarily an indication of the risks associated with investing in those securities. A table summarizing the Series’ investments under these levels of classification is included following the Portfolios of Investments. For the six months ended June 30, 2009, there have been no significant changes to the fair valuation methodologies.
On April 9, 2009, the FASB issued FASB Staff Position No. FAS 157-4, Determining Fair Value When the Volume and Level of Activity for the Asset or Liability Have Significantly Decreased and Identifying Transactions That Are Not Orderly (“FSP 157-4”). FSP 157-4 requires enhanced disclosures about the inputs and valuation technique(s) used to measure fair value and a discussion of changes in valuation techniques and related inputs, if any, during the period. In addition, the three-level hierarchy disclosure and the level three roll-forward disclosure are to be expanded for each major category of equity and debt securities. There was no change to the financial position of the Portfolios and the results of their operations due to the adoption of FSP 157-4 and all disclosures have been made for the current period as part of the Notes to Financial Statements and Portfolio of Investments.
On March 19, 2008, the FASB issued Statement of Financial Accounting Standards No. 161 (“SFAS No. 161”), “Disclosure about Derivative Instruments and Hedging Activities.” This new accounting statement requires enhanced disclosures about an
entity’s derivative and hedging activities. Entities are required to provide enhanced disclosures about (a) how and why an entity invests in derivatives, (b) how derivatives are accounted for under SFAS No. 133, and (c) how derivatives affect an entity’s financial position, financial performance, and cash flows. SFAS No. 161 also requires enhanced disclosures regarding credit-risk-related contingent features of derivative instruments. All changes to disclosures have been made in accordance with SFAS 161 and have been incorporated for the current period as part of the Notes to Financial Statements and Portfolio of Investments.
| B. | Security Transactions and Revenue Recognition. Security transactions are recorded on the trade date. Realized gains or losses on sales of investments are calculated on the identified cost basis. Interest income is recorded on the accrual basis. Premium amortization and discount accretion are determined using the effective yield method. Dividend income is recorded on the ex-dividend date. |
| C. | Foreign Currency Translation. The books and records of the Series are maintained in U.S. dollars. Any foreign currency amounts are translated into U.S. dollars on the following basis: |
| (1) | Market value of investment securities, other assets and liabilities — at the exchange rates prevailing at the end of the day. |
| (2) | Purchases and sales of investment securities, income and expenses — at the rates of exchange prevailing on the respective dates of such transactions. |
Although the net assets and the market values are presented at the foreign exchange rates at the end of the day, the Series do not isolate the portion of the results of operations resulting from changes in foreign exchange rates on investments from the fluctuations arising from changes in market prices of securities held. Such fluctuations are included with the net realized and unrealized gains or losses from investments. For securities, which are subject to foreign withholding tax upon disposition, liabilities are recorded on the Statements of Assets and Liabilities for the estimated tax withholding based on the securities current market value. Upon disposition, realized gains or losses on such securities are recorded net of foreign withholding tax.
25
Table of Contents
NOTES TO FINANCIAL STATEMENTSASOF JUNE 30, 2009 (UNAUDITED) (CONTINUED)
NOTE 2 — SIGNIFICANT ACCOUNTING POLICIES (continued)
Reported net realized foreign exchange gains or losses arise from sales of foreign currencies, currency gains or losses realized between the trade and settlement dates on securities transactions, the difference between the amounts of dividends, interest, and foreign withholding taxes recorded on the Series’ books and the U.S. dollar equivalent of the amounts actually received or paid. Net unrealized foreign exchange gains and losses arise from changes in the value of assets and liabilities other than investments in securities at fiscal year end, resulting from changes in the exchange rate. Foreign security and currency transactions may involve certain considerations and risks not typically associated with investing in U.S. companies and U.S. government securities. These risks include, but are not limited to, revaluation of currencies and future adverse political and economic developments which could cause securities and their markets to be less liquid and prices more volatile than those of comparable U.S. companies and U.S. government securities.
| D. | Risk Exposures and the use of Derivative Instruments. Each Series’ investment objectives permit them to enter into various types of derivatives contracts, including, but not limited to, futures contracts, forward foreign currency exchange contracts, credit default swaps, interest rate swaps, total return swaps, and purchased and written options. In doing so, the Series will employ strategies in differing combinations to permit it to increase or decrease the level of risk, or change the level or types of exposure to market risk factors. This may allow the Series to pursue its objectives more quickly, and efficiently than if it were to make direct purchases or sales of securities capable of affecting a similar response to market factors. |
Market Risk Factors. In pursuit of its investment objectives, a Series may seek to use derivatives to increase or decrease its exposure to the following market risk factors:
Credit Risk. Credit risk relates to the ability of the issuer to meet interest and principal payments, or both, as they come due. In general, lower-grade, higher-yield bonds are subject to credit risk to a greater extent than lower-yield, higher-quality bonds.
Equity Risk. Equity risk relates to the change in value of equity securities as they relate to increases or decreases in the general market.
Foreign Exchange Rate Risk. Foreign exchange rate risk relates to the change in U.S. dollar value of a security held that is denominated in a foreign currency. The U.S. dollar value of a foreign currency denominated security will decrease as the dollar appreciates against the currency, while the U.S. dollar value will increase as the dollar depreciates against the currency.
Interest Rate Risk. Interest rate risk refers to the fluctuations in value of fixed-income securities resulting from the inverse relationship between price and yield. For example, an increase in general interest rates will tend to reduce the market value of already issued fixed-income investments, and a decline in general interest rates will tend to increase their value. In addition, debt securities with longer maturities, which tend to have higher yields, are subject to potentially greater fluctuations in value from changes in interest rates than obligations with shorter maturities.
Risks of Investing in Derivatives. Each Series’ use of derivatives can result in losses due to unanticipated changes in the market risk factors and the overall market. In instances where a Series is using derivatives to decrease, or hedge, exposures to market risk factors for securities held by a Portfolio, there are also risks that those derivatives may not perform as expected resulting in losses for the combined or hedged positions.
The use of these strategies involves certain special risks, including a possible imperfect correlation, or even no correlation, between price movements of derivative instruments and price movements of related investments. While some strategies involving derivative instruments can reduce the risk of loss, they can also reduce the opportunity for gain or even result in losses by offsetting favorable price movements in related investments or otherwise, due to the possible inability of a Series to purchase or sell a portfolio security at a time that otherwise would be favorable or the possible need to sell a portfolio security at a disadvantageous time because the Series is required to maintain asset coverage or offsetting positions in connection with transactions in derivative instruments. Additional associated risks from investing in derivatives also exist and
26
Table of Contents
NOTES TO FINANCIAL STATEMENTSASOF JUNE 30, 2009 (UNAUDITED) (CONTINUED)
NOTE 2 — SIGNIFICANT ACCOUNTING POLICIES (continued)
potentially could have significant effects on the valuation of the derivative and a Series. Associated risks are not the risks that a Series is attempting to increase or decrease exposure to, per their investment objectives, but are the additional risks from investing in derivatives. Examples of these associated risks are liquidity risk, which is the risk that a Portfolio will not be able to sell the derivative in the open market in a timely manner, and counterparty credit risk, which is the risk that the counterparty will not fulfill its obligation to a Series. Associated risks can be different for each type of derivative and are discussed by each derivative type in the following notes.
| E. | Futures Contracts. Each Series may enter into futures contracts involving foreign currency, interest rates, securities and security indices. A futures contract is a commitment to buy or sell a specific amount of a financial instrument at a negotiated price on a stipulated future date. Each Series may buy and sell futures contracts. Futures contracts traded on a commodities or futures exchange will be valued at the final settlement price or official closing price on the principal exchange as reported by such principal exchange at its trading session ending at, or most recently prior to, the time when the Series assets are valued. |
Upon entering into a futures contract, each Series is required to deposit either cash or securities (initial margin) in an amount equal to a certain percentage of the contract value. Subsequent payments (variation margin) are made or received by the Series each day. The variation margin payments are equal to the daily changes in the contract value and are recorded as unrealized gains and losses. Open futures contracts are reported on a table following the each Portfolio of Investments. Securities held in collateralized accounts to cover initial margin requirements on open futures contracts are footnoted in the Portfolio of Investments. Cash collateral held by the broker to cover initial margin requirements on open futures contracts are noted in each Series Statement of Assets and Liabilities. The net change in unrealized appreciation and depreciation is reported in each Series Statement of Operations. Realized gains (losses) are reported in each Series Statement of Operations at the closing or expiration of futures contracts.
Futures contracts are exposed to the market risk factor of the underlying financial instrument. During the six months ended June 30, 2009, Series 5 purchased futures contracts on various equity indexes to increase exposure to equity risk. Additional associated risks of entering into futures contracts include the possibility that there may be an illiquid market where each Series is unable to liquidate the contract or enter into an offsetting position and, if used for hedging purposes, the risk that the price of the contract will correlate imperfectly with the prices of each Series’ securities.
Each Series invests in derivatives only if the expected risks and rewards are consistent with its investment objectives, and overall risk profile as described in the accompanying Notes to Financial Statements. For the six months ended June 30, 2009, the total number of open futures contracts for Series 5 as presented following the Portfolio of Investments is indicative of the volume of this derivative type.
| F. | Distributions to Shareholders. Dividends from net investment income and net realized gains, if any, are declared and paid annually by the Series. Distributions are determined annually in accordance with federal tax principles, which may differ from U.S. generally accepted accounting principles for investment companies. The Series may make distributions on a more frequent basis to comply with the distribution requirements of the Internal Revenue Code. Distributions are recorded on the ex-dividend date. The characteristics of income and gains are determined in accordance with income tax regulations, which may differ from accounting principles generally accepted in the United States for investment companies. |
| G. | Federal Income Taxes. It is the Series’ policy to comply with subchapter M of the Internal Revenue Code and related excise tax provisions applicable to regulated investment companies and to distribute substantially all of their net investment income and any net realized capital gains to their shareholders. Therefore, no federal income tax provision is required. Management has considered the sustainability of the Series’ tax positions taken on federal income tax returns for all open tax years in making this determination. No capital gain distributions shall be made until any capital loss carryforwards have been fully utilized or expired. |
27
Table of Contents
NOTES TO FINANCIAL STATEMENTSASOF JUNE 30, 2009 (UNAUDITED) (CONTINUED)
NOTE 2 — SIGNIFICANT ACCOUNTING POLICIES (continued)
| H. | Use of Estimates. The preparation of financial statements in conformity with U.S. generally accepted accounting principles requires management to make estimates and assumptions that affect the reported amounts of assets and liabilities and disclosure of contingent assets and liabilities at the date of the financial statements and the reported amounts of increases and decreases in net assets from operations during the reporting period. Actual results could differ from those estimates. |
| I. | Indemnifications. In the normal course of business, the Trust may enter into contracts that provide certain indemnifications. The Trust’s maximum exposure under these arrangements is dependent on future claims that may be made against the Series and, therefore, cannot be estimated; however, based on experience, the risk of loss from such claims is considered remote. |
NOTE 3 — INVESTMENT TRANSACTIONS
For the six months ended June 30, 2009, the cost of purchases and proceeds of sales of securities, excluding short-term and U.S. government securities, were as follows:
Purchases | Sales | |||||
Series 5 | $ | 1,068,571 | $ | 1,433,869 | ||
Series 6 | 1,504,209 | 1,501,767 | ||||
Series 7 | 772,657 | 772,942 | ||||
Series 8 | 821,971 | 820,041 | ||||
Series 9 | 468,524 | 466,616 | ||||
Series 10 | 706,963 | 1,827,028 | ||||
Series 11 | — | — | ||||
Series 12 | 468,524 | 2,400,373 | ||||
Series 13 | 287,686 | 4,621,836 | ||||
Series 14 | — | — | ||||
U.S. government securities not included above were as follows:
Purchases | Sales | |||||
Series 5 | $ | — | $ | 1,381,757 | ||
Series 6 | — | 5,056,344 | ||||
Series 7 | — | 2,726,069 | ||||
Series 8 | — | 2,434,858 | ||||
Series 9 | — | 1,201,779 | ||||
Series 10 | 2,653,952 | 2,936,504 | ||||
Series 11 | — | 1,961,053 | ||||
Series 12 | 2,154,594 | 3,475,124 | ||||
Series 13 | — | 2,319,958 | ||||
Series 14 | — | 28,131,249 | ||||
NOTE 4 — INVESTMENT MANAGEMENT AND ADMINISTRATION FEES
Each Series has entered into an investment management agreement (“Investment Management Agreement”) with ING Investments, LLC (the “Investment Adviser”). The Investment Management Agreement compensates the Investment Adviser with a fee, computed daily and payable monthly, based on the average daily net assets of each Series. The fee for each Series is 0.25% during its Offering Period and 0.60% during its Guarantee Period.
ING Funds are permitted to invest end-of-day cash balances into ING Institutional Prime Money Market Fund. Investment Management fees paid by the Series will be reduced by an amount equal to the management fees paid indirectly to ING Institutional Prime Money Market with respect to assets invested by the Series. For the six months ended June 30, 2009, the Series waived the following amounts, which are not subject to recoupment:
Series 5 | $ | 118 | |
Series 6 | 115 | ||
Series 7 | 78 | ||
Series 8 | 40 | ||
Series 9 | 36 | ||
Series 10 | 32 | ||
Series 11 | 45 | ||
Series 12 | 50 | ||
Series 13 | 76 | ||
Series 14 | — |
The Investment Adviser has engaged ING IM, to serve as sub-adviser to each Series. ING IM is responsible for managing the assets of each Series in accordance with its investment objective and policies, subject to such policies as the Board of the Investment Adviser may determine.
ING Funds Services, LLC (the “Administrator”) acts as the administrator and provides certain administrative and shareholder services necessary for each Series’ operations and is responsible for the supervision of other service providers. For its services, the Administrator is entitled to receive from each Series a fee at an annual rate of 0.055% on the first $5 billion of average daily net assets and 0.030% thereafter.
The Investment Adviser, ING IM and the Administrator are indirect, wholly-owned subsidiaries of ING Groep N.V., (“ING Groep”). ING Groep is a global financial institution of Dutch origin offering banking, investments, life insurance and retirement services.
28
Table of Contents
NOTES TO FINANCIAL STATEMENTSASOF JUNE 30, 2009 (UNAUDITED) (CONTINUED)
NOTE 4 — INVESTMENT MANAGEMENT AND ADMINISTRATION FEES (continued)
On October 19, 2008, ING Groep announced that it reached an agreement with the Dutch government to strengthen its capital position. ING Groep issued non-voting core Tier-1 securities for a total consideration of EUR 10 billion to the Dutch State. The transaction boosts ING Bank’s core Tier-1 ratio, strengthens the insurance balance sheet and reduces ING Groep’s Debt/Equity ratio.
NOTE 5 — DISTRIBUTION FEES
The Series have adopted a Distribution Plan pursuant to Rule 12b-1 under the 1940 Act (the “12b-1 Plan”), whereby ING Funds Distributor, LLC (“IFD” or the “Distributor”) is compensated by the Series for expenses incurred in the distribution of each Series’ shares (“Distribution Fees”). Pursuant to the 12b-1 Plan, the Distributor is entitled to a payment each month to compensate for expenses incurred in the distribution and promotion of the Series’ shares, including expenses incurred in printing prospectuses and reports used for sales purposes, expenses incurred in preparing and printing sales literature and other such distribution related expenses, including distribution or shareholder servicing fees (“Servicing Fees”) paid to securities dealers who have executed a distribution agreement with the Distributor. Under the 12b-1 Plan, the Series pays the Distributor a Distribution Fee rate of 0.25% based on average daily net assets.
NOTE 6 — OTHER TRANSACTIONS WITH AFFILIATED AND RELATED PARTIES
At June 30, 2009, the Series had the following amounts recorded in payable to affiliates on the accompanying Statements of Assets and Liabilities:
Fund | Accrued Investment Management Fees | Accrued Administrative Fees | Accrued Shareholder Service and Distribution Fees | Total | ||||||||
Series 5 | $ | 10,183 | $ | 935 | $ | 4,252 | $ | 15,370 | ||||
Series 6 | 19,687 | 1,806 | 8,211 | 29,704 | ||||||||
Series 7 | 16,281 | 1,192 | 5,418 | 22,891 | ||||||||
Series 8 | 11,396 | 770 | 3,499 | 15,665 | ||||||||
Series 9 | 9,431 | 597 | 2,715 | 12,743 | ||||||||
Series 10 | 7,846 | 492 | 2,237 | 10,575 | ||||||||
Series 11 | 8,721 | 632 | 2,871 | 12,224 | ||||||||
Series 12 | 12,073 | 892 | 4,053 | 17,018 | ||||||||
Series 13 | 21,454 | 1,586 | 7,208 | 30,248 | ||||||||
Series 14 | 38,195 | 3,501 | 15,915 | 57,611 | ||||||||
The Trust has adopted a Retirement Policy (“Policy”) covering all independent trustees of the Series who will have served as an independent Trustee for at least five years at the time of retirement. Benefits under this policy are based on an annual rate as defined in the policy agreement. The Trust has also adopted a deferred compensation plan.
At June 30, 2009, the following indirect, wholly owned subsidiaries of ING Groep owned the following Series:
ING Life Insurance and Annuity Company — Series 5 (10.00%); Series 6 (54.80%); Series 7 (48.90%); Series 8 (58.10%); Series 9 (56.70%); Series 10 (48.40%); Series 11 (50.00%); Series 12 (86.80%); Series 13 (46.60%); and Series 14 (18.90%)
ING USA Annuity and Life Insurance Company — Series 5 (77.70%); Series 6 (41.80%); Series 7 (41.50%); Series 8 (39.60); Series 9 (41.50%); Series 10 (43.50%); Series 11 (48.30%); Series 12 (12.80%); Series 13 (51.40%); and Series 14 (69.10%)
Reliastar Life Insurance Company of New York — Series 5 (12.10%); Series 7 (9.40%); Series 10 (8.00%); and Series 14 (11.80%)
Control is defined by the 1940 Act as the beneficial ownership, either directly or through one or more controlled companies, of more than 25% of the voting securities of a company. The 1940 Act defines affiliates as companies that are under common control. Therefore, because the Series have a common owner that owns over 25% of the outstanding securities of the Series, they may be deemed to be affiliates of each other. Investment activities of these shareholders could have a material impact on the Series.
29
Table of Contents
NOTES TO FINANCIAL STATEMENTSASOF JUNE 30, 2009 (UNAUDITED) (CONTINUED)
NOTE 7 — OTHER ACCRUED EXPENSES AND LIABILITIES
At June 30, 2009, each applicable Series had the following payables included in Other Accrued Expenses and Liabilities on the Statements of Assets and Liabilities that exceeded 5% of total liabilities.
Fund | Accrued Expenses | Amount | |||
Series 5 | Custody | $ | 14,100 | ||
| Audit | 8,833 | ||||
| Postage | 3,551 | ||||
Series 6 | Custody | 18,786 | |||
| Audit | 10,112 | ||||
| Postage | 3,993 | ||||
Series 7 | Custody | 10,378 | |||
| Audit | 9,076 | ||||
| Postage | 5,283 | ||||
Series 8 | Custody | 7,498 | |||
| Audit | 7,000 | ||||
| Postage | 3,189 | ||||
Series 9 | Custody | 7,688 | |||
| Audit | 6,274 | ||||
| Postage | 3,295 | ||||
Series 10 | Custody | 7,554 | |||
| Audit | 5,546 | ||||
| Legal | 1,699 | ||||
| Postage | 3,000 | ||||
Series 11 | Custody | 6,650 | |||
| Audit | 6,649 | ||||
| Postage | 3,233 | ||||
Series 13 | Custody | 14,766 | |||
| Audit | 14,964 | ||||
| Postage | 6,100 | ||||
Series 14 | Audit | 18,181 | |||
NOTE 8 — EXPENSE LIMITATION AGREEMENT
ING Investments, LLC has entered into a written expense limitation agreement (“Expense Limitation Agreement”) with each Series whereby the Investment Adviser has agreed to limit expenses, excluding interest, taxes, brokerage commissions and extraordinary expenses (and acquired fund fees and expenses stemming from investments in other investment companies) to 0.65% during the Offering Period and 1.00% during the Guarantee Period.
The Investment Adviser may at a later date recoup from a Series for management fees waived and other expenses assumed by the Investment Adviser during the previous 36 months, but only if, after such recoupment, the Series’ expense ratio does not exceed the percentage described above. Waived and reimbursed fees net of any recoupment by the Investment Adviser of such waived and reimbursed fees, are reflected on the accompanying Statements of Operations for each Series. Amounts payable by the Investment Adviser are reflected in the Statements of Assets and Liabilities for each Series.
As of June 30, 2009, the amounts of waived and reimbursed fees that are subject to possible recoupment by the Investment Adviser and the related expiration dates are as follows:
| December 31, | ||||||||||||
2010 | 2011 | 2012 | Total | |||||||||
Series 5 | $ | 266 | $ | 12,379 | $ | 30,807 | $ | 43,452 | ||||
Series 6 | — | 16,796 | 25,646 | 42,442 | ||||||||
Series 7 | 22,451 | 20,429 | 11,288 | 54,168 | ||||||||
Series 8 | 19,858 | 23,165 | 11,618 | 54,641 | ||||||||
Series 9 | 18,636 | 24,061 | 14,430 | 57,127 | ||||||||
Series 10 | 42,196 | 17,112 | 11,725 | 71,033 | ||||||||
Series 11 | 37,886 | 19,294 | 5,800 | 62,980 | ||||||||
Series 12 | 65,202 | 36,198 | 23,023 | 124,423 | ||||||||
Series 13 | 41,214 | 14,539 | 27,217 | 82,970 | ||||||||
Series 14 | — | 29,814 | 18,962 | 48,776 | ||||||||
The Expense Limitation Agreement is contractual and shall renew automatically for one-year terms unless ING Investments provides written notice of the termination of the Expense Limitation Agreement within 90 days of the end of the then current term.
30
Table of Contents
NOTES TO FINANCIAL STATEMENTSASOF JUNE 30, 2009 (UNAUDITED) (CONTINUED)
NOTE 9 — CAPITAL SHARES
Transactions in capital shares and dollars were as follows:
| Reinvestment of distributions | Shares redeemed | Net increase (decrease) in shares outstanding | Reinvestment of distributions | Shares redeemed | Net increase (decrease) in shares outstanding | |||||||||||||
Year or period ended | # | # | # | ($) | ($) | ($) | ||||||||||||
Series 5 | ||||||||||||||||||
06-30-09 | 96,209 | (196,036 | ) | (99,827 | ) | 727,338 | (1,512,173 | ) | (784,835 | ) | ||||||||
12-31-08 | 617,990 | (649,351 | ) | (31,361 | ) | 4,999,538 | (5,731,471 | ) | (731,933 | ) | ||||||||
Series 6 | ||||||||||||||||||
06-30-09 | 107,783 | (576,007 | ) | (468,224 | ) | 853,639 | (4,613,902 | ) | (3,760,263 | ) | ||||||||
12-31-08 | 1,128,841 | (1,352,188 | ) | (223,347 | ) | 9,425,828 | (12,215,630 | ) | (2,789,802 | ) | ||||||||
Series 7 | ||||||||||||||||||
06-30-09 | 80,113 | (324,695 | ) | (244,582 | ) | 618,472 | (2,545,966 | ) | (1,927,494 | ) | ||||||||
12-31-08 | 920,167 | (1,111,181 | ) | (191,014 | ) | 7,480,961 | (9,981,654 | ) | (2,500,693 | ) | ||||||||
Series 8 | ||||||||||||||||||
06-30-09 | 50,416 | (302,075 | ) | (251,659 | ) | 388,714 | (2,356,245 | ) | (1,967,531 | ) | ||||||||
12-31-08 | 569,782 | (622,528 | ) | (52,746 | ) | 4,660,814 | (5,671,818 | ) | (1,011,004 | ) | ||||||||
Series 9 | ||||||||||||||||||
06-30-09 | 39,899 | (140,599 | ) | (100,700 | ) | 303,230 | (1,089,008 | ) | (785,778 | ) | ||||||||
12-31-08 | 471,210 | (464,029 | ) | 7,181 | 3,788,527 | (4,211,602 | ) | (423,075 | ) | |||||||||
Series 10 | ||||||||||||||||||
06-30-09 | 39,197 | (169,347 | ) | (130,150 | ) | 306,136 | (1,360,626 | ) | (1,054,490 | ) | ||||||||
12-31-08 | 366,245 | (420,212 | ) | (53,967 | ) | 3,087,447 | (3,802,670 | ) | (715,223 | ) | ||||||||
Series 11 | ||||||||||||||||||
06-30-09 | 72,594 | (212,534 | ) | (139,940 | ) | 553,167 | (1,684,714 | ) | (1,131,547 | ) | ||||||||
12-31-08 | 486,768 | (492,026 | ) | (5,258 | ) | 3,782,189 | (4,383,714 | ) | (601,525 | ) | ||||||||
Series 12 | ||||||||||||||||||
06-30-09 | 86,204 | (419,189 | ) | (332,985 | ) | 639,636 | (3,207,191 | ) | (2,567,555 | ) | ||||||||
12-31-08 | 1,025,925 | (2,204,000 | ) | (1,178,075 | ) | 8,381,810 | (20,182,634 | ) | (11,800,824 | ) | ||||||||
Series 13 | ||||||||||||||||||
06-30-09 | 142,042 | (680,384 | ) | (538,342 | ) | 1,298,259 | (6,538,854 | ) | (5,240,595 | ) | ||||||||
12-31-08 | 524,906 | (2,829,780 | ) | (2,304,874 | ) | 4,986,611 | (27,862,802 | ) | (22,876,191 | ) | ||||||||
Series 14 | ||||||||||||||||||
06-30-09 | 359,380 | (2,738,486 | ) | (2,379,106 | ) | 3,453,643 | (27,719,673 | ) | (24,266,030 | ) | ||||||||
12-31-08 | 284,164 | (2,018,154 | ) | (1,733,990 | ) | 2,793,337 | (20,518,537 | ) | (17,725,200 | ) |
NOTE 10 — LINE OF CREDIT
The Series, in addition to certain other funds managed by the Investment Adviser, have entered into an unsecured committed revolving line of credit agreement (the “Credit Agreement”) with The Bank of New York Mellon (“BNYM”) for an aggregate amount of $125,000,000. The proceeds may be used to: (1) temporarily finance the purchase or sale of securities; and (2) finance the redemption of shares of an investor in the funds. The Series to which the line of credit is available pay a commitment fee equal to
0.07% and effective June 2, 2009, 0.15% per annum on the daily unused portion of the committed line amount payable quarterly in arrears.
The following Series utilized the line of credit during the six months ended June 30, 2009:
Fund | Days Utilized | Approximate Average Daily Balance For Days Utilized | Approximate Weighted Average Interest Rate For Days Utilized | |||||
Series 8 | 1 | $ | 2,670,000 | 0.64 | % | |||
Series 14 | 8 | 768,750 | 0.75 | |||||
31
Table of Contents
NOTES TO FINANCIAL STATEMENTSASOF JUNE 30, 2009 (UNAUDITED) (CONTINUED)
NOTE 11 — FEDERAL INCOME TAXES
The amount of distributions from net investment income and net realized capital gains are determined in accordance with federal income tax regulations, which may differ from U.S. generally accepted accounting principles for investment companies. These book/tax differences may be either temporary or permanent. Permanent differences are reclassified within the capital accounts based on their federal tax-basis treatment; temporary differences are not reclassified. Key differences include the treatment of short-term capital gains, foreign currency transactions, and wash sale deferrals. Distributions in excess of net investment income and/or net realized capital gains for tax purposes are reported as return of capital.
Dividends paid by the Series from net investment income and distributions of net realized short-term capital gains are, for federal income tax purposes, taxable as ordinary income to shareholders.
The tax composition of dividends and distributions to shareholders was as follows:
| Six Months Ended June 30, 2009 | Year Ended December 31, 2008 | ||||||||
Ordinary | Ordinary | Long-Term | |||||||
Series 5 | $ | 727,338 | $ | 1,986,327 | $ | 3,013,211 | |||
Series 6 | 853,639 | 3,895,488 | 5,530,340 | ||||||
Series 7 | 618,472 | 2,834,545 | 4,646,416 | ||||||
Series 8 | 388,714 | 2,306,130 | 2,354,684 | ||||||
Series 9 | 303,230 | 1,863,678 | 1,924,849 | ||||||
Series 10 | 306,136 | 1,614,724 | 1,472,723 | ||||||
Series 11 | 553,167 | 2,498,079 | 1,284,110 | ||||||
Series 12 | 639,636 | 6,471,562 | 1,910,248 | ||||||
Series 13 | 1,298,259 | 4,985,540 | 1,071 | ||||||
Series 14 | 3,453,643 | 2,792,606 | 731 | ||||||
The tax-basis components of distributable earnings and the expiration dates of the capital loss carryforwards which may be used to offset future realized capital gains for federal income tax purposes as of December 31, 2008 were:
Undistributed | Unrealized | Post-October | Capital Loss | Expiration | |||||||||||||
Series 5 | $ | 372,742 | $ | (131,677 | ) | $ | (77,046 | ) | $ | (3,549,051 | ) | 2016 | |||||
Series 6 | 852,850 | 549,395 | (33,354 | ) | (6,793,361 | ) | 2016 | ||||||||||
Series 7 | 617,502 | 689,179 | (25,271 | ) | (4,601,782 | ) | 2016 | ||||||||||
Series 8 | 387,614 | 174,835 | (16,089 | ) | (3,027,190 | ) | 2016 | ||||||||||
Series 9 | 302,306 | 187,349 | (18,486 | ) | (2,232,274 | ) | 2016 | ||||||||||
Series 10 | 305,201 | 391,038 | (29,510 | ) | (1,868,057 | ) | 2016 | ||||||||||
Series 11 | 330,558 | 646,268 | — | (2,280,824 | ) | 2016 | |||||||||||
Series 12 | 638,612 | 707,179 | (206,633 | ) | (5,506,525 | ) | 2016 | ||||||||||
Series 13 | 1,297,367 | 2,429,863 | (2,881 | ) | (3,898,037 | ) | 2016 | ||||||||||
Series 14 | 3,452,470 | 6,339,513 | (18,380 | ) | (6,372,216 | ) | 2016 | ||||||||||
The Series’ major tax jurisdictions are federal and Arizona. The earliest tax year that remains subject to examination by these jurisdictions is 2004.
As of June 30, 2009, no provisions for income tax would be required in the Series’ financial statements as a result of tax positions taken on federal income tax returns for open tax years. The Series’ federal and state income and federal excise tax returns for tax years for which the applicable statutes of limitations have not expired are subject to examination by the Internal Revenue Service and state department of revenue.
NOTE 12 — PAYMENTS BY AFFILIATES
In August 2008, an affiliate of the Investment Adviser and ING IM made the following payments to the Series to reimburse for certain investment transactions associated with the correction of an allocation between the Equity and Fixed Components of the Series:
Series 4 | $ | 278,815 | |
Series 5 | 353,476 | ||
Series 11 | 221,529 |
NOTE 13 — SUBSEQUENT EVENTS
The Series have evaluated events occurring after the balance sheet date (subsequent events) through August 20, 2009, the date the financial statements were available to be issued, to determine whether any subsequent events necessitated adjustment to or disclosure in the financial statements. No such subsequent events were identified.
32
Table of Contents
| ING GET U.S. CORE PORTFOLIO SERIES 5 | ASOF JUNE 30, 2009 (UNAUDITED) |
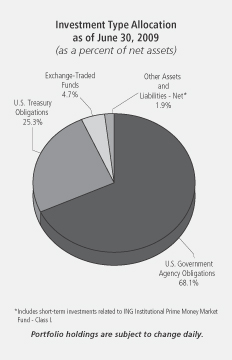
| Shares | Value | |||||||
| EXCHANGE-TRADED FUNDS: 4.7% | |||||||
| Exchange-Traded Funds: 4.7% | |||||||
| 10,500 | SPDR Trust Series 1 | $ | 965,160 | |||||
Total Exchange-Traded Funds | 965,160 | |||||||
| Principal Amount | Value | |||||||
| U.S. GOVERNMENT AGENCY OBLIGATIONS: 68.1% | |||||||
| Federal Home Loan Mortgage Corporation##: 11.0% | |||||||
| $ | 2,366,000 | ^, Z | 2.360%, due 09/15/11 | $ | 2,247,056 | |||
| 2,247,056 | ||||||||
| Federal National Mortgage Association##: 23.7% | |||||||
| 5,000,000 | ^, Z | 1.800%, due 05/15/11 | 4,834,565 | |||||
| 4,834,565 | ||||||||
| Other U.S. Agency Obligations: 33.4% | |||||||
| 4,164,000 | Z | Financing Corp., | 3,935,359 | |||||
| 3,000,000 | ^, Z | Tennessee Valley Authority, 1.720%, due 07/15/11 | 2,897,052 | |||||
| 6,832,411 | ||||||||
Total U.S. Government Agency Obligations | 13,914,032 | |||||||
| Principal Amount | Value | |||||||
| U.S. TREASURY OBLIGATIONS: 25.3% | |||||||
| U.S. Treasury STRIP COUPON: 25.3% | |||||||
| $ | 5,285,000 | S, Z | 1.130%, due 08/15/11 | $ | 5,159,788 | |||
Total U.S. Treasury Obligations | 5,159,788 | |||||||
Total Long-Term Investments | 20,038,980 | |||||||
| Shares | Value | |||||||
| SHORT-TERM INVESTMENTS: 0.4% | |||||||
| Affiliated Mutual Fund: 0.4% | |||||||
| 81,000 | S | ING Institutional Prime Money Market Fund - Class I | $ | 81,000 | ||||
Total Short-Term Investments | 81,000 | |||||||
Total Investments in Securities | 98.5 | % | $ | 20,119,980 | ||||||||
Other Assets and Liabilities - Net | 1.5 | 312,109 | ||||||||||
Net Assets | 100.0 | % | $ | 20,432,089 | ||||||||
| STRIP | Separate Trading of Registered Interest and Principal of Securities |
| ## | On September 7, 2008, the Federal Housing Finance Agency placed the Federal National Mortgage Association and the Federal Home Loan Mortgage Corporation into conservatorship and the U.S. Treasury guaranteed the debt issued by those organizations. |
| S | All or a portion of this security is segregated to cover collateral requirements for applicable futures, options, swaps, foreign forward currency contracts and/or when-issued or delayed-delivery securities. |
| ^ | Interest only securities represent the right to receive the monthly interest payments on an underlying pool of mortgage loans. Principal amount shown represents the notional amount on which current interest is calculated. Payments of principal on the pool reduce the value of the interest only security. |
| Z | Indicates Zero Coupon Bond; rate shown reflects current effective yield. |
| * | Cost for federal income tax purposes is the same as for financial statement purposes. |
Net unrealized appreciation consists of: | ||||
Gross Unrealized Appreciation | $ | 380,657 | ||
Gross Unrealized Depreciation | (4,690 | ) | ||
Net Unrealized Appreciation | $ | 375,967 | ||
See Accompanying Notes to Financial Statements
33
Table of Contents
| ING GET U.S. CORE PORTFOLIO SERIES 5 | PORTFOLIO OF INVESTMENTS ASOF JUNE 30, 2009 (UNAUDITED) (CONTINUED) |
Fair Value Measurements*
The following is a summary of the inputs used as of June 30, 2009 in determining the Portfolio’s investments at fair value for purposes of SFAS 157:
Quoted Prices in Active Markets for Identical Investments (Level 1) | Significant Other Observable Inputs (Level 2) | Significant Unobservable Inputs (Level 3) | ||||||||
Exchange-Traded Funds | $ | 965,160 | $ | — | $ | — | ||||
U.S. Government Agency Obligations | — | 13,914,032 | — | |||||||
U.S. Treasury Obligations | — | 5,159,788 | — | |||||||
Short-Term Investments | 81,000 | — | — | |||||||
Total | $ | 1,046,160 | $ | 19,073,820 | $ | — | ||||
Other Financial Instruments** | (3,380 | ) | — | — | ||||||
Total | $ | (3,380 | ) | $ | — | $ | — | |||
“Fair value” for purposes of SFAS 157 is different from “fair value” as used in the 1940 Act. The former generally implies market value, and can include market quotations as a source of value, and the latter refers to determinations of value in absence of available market quotations.
| * | See NOTE 2, “Significant Accounting Policies” in the Notes to Financial Statements for additional information. |
| ** | Other financial instruments may include open forward foreign currency contracts, futures, swaps, and written options. Forward foreign currency contracts and futures are reported at their unrealized gain/loss at period end. Swaps and written options are reported at their market value at period end. |
ING GET U.S. Core Portfolio — Series 5
Open Futures Contracts on June 30, 2009:
Contract Description | Number | Expiration Date | Unrealized | |||||
Long Contracts | ||||||||
S&P 500 E-Mini | 5 | 09/18/09 | $ | (3,380 | ) | |||
| $ | (3,380 | ) | ||||||
For the six months ended June 30, 2009, net realized gain (loss) on futures and the net change in unrealized gain (loss) on futures can be found on the Series Statement of Operations. For additional information on the reason(s) why the Portfolio may enter into futures contracts and the risks associated with futures contracts, please refer to NOTE 2 in the accompanying Notes to Financial Statements.
See Accompanying Notes to Financial Statements
34
Table of Contents
| ING GET U.S. CORE PORTFOLIO SERIES 6 | PORTFOLIO OF INVESTMENTS ASOF JUNE 30, 2009 (UNAUDITED) |
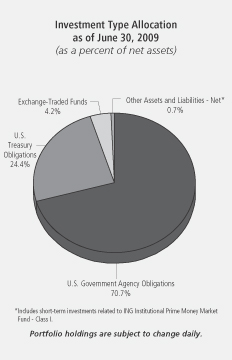
| Shares | Value | |||||||
| EXCHANGE-TRADED FUNDS: 4.2% | |||||||
| Exchange-Traded Funds: 4.2% | |||||||
| 18,300 | SPDR Trust Series 1 | $ | 1,682,136 | |||||
Total Exchange-Traded Funds | 1,682,136 | |||||||
| Principal Amount | Value | |||||||
| U.S. GOVERNMENT AGENCY OBLIGATIONS: 70.7% | |||||||
| Federal Home Loan Mortgage Corporation##: 35.2% | |||||||
| $ | 14,749,000 | ^^, Z | 2.360%, due 09/15/11 | $ | 14,007,848 | |||
| 14,007,848 | ||||||||
| Federal National Mortgage Association##: 12.7% | |||||||
| 2,500,000 | ^, Z | 2.210%, due 11/15/11 | 2,373,433 | |||||
| 2,840,000 | ^, Z | 2.610%, due 02/12/12 | 2,655,985 | |||||
| 5,029,418 | ||||||||
| Other U.S. Agency Obligations: 22.8% | |||||||
| 1,666,000 | Z | Financing Corp., | 1,566,730 | |||||
| 2,638,000 | Z | Financing Corp., | 2,478,493 | |||||
| 5,169,000 | Z | Resolution Funding Corp., Interest STRIP, | 5,013,987 | |||||
| 9,059,210 | ||||||||
Total U.S. Government Agency Obligations | 28,096,476 | |||||||
| Principal Amount | Value | |||||||
| U.S. TREASURY OBLIGATIONS: 24.4% | |||||||
| U.S. Treasury STRIP COUPON: 24.4% | |||||||
| $ | 10,092,000 | Z | 1.450%, due 02/15/12 | $ | 9,715,548 | |||
Total U.S. Treasury Obligations | 9,715,548 | |||||||
Total Long-Term Investments | 39,494,160 | |||||||
| Shares | Value | |||||||
| SHORT-TERM INVESTMENTS: 0.8% | |||||||
| Affiliated Mutual Fund: 0.8% | |||||||
| 321,000 | ING Institutional Prime Money Market Fund - Class I | $ | 321,000 | |||||
Total Short-Term Investments | 321,000 | |||||||
Total Investments in Securities | 100.1 | % | $ | 39,815,160 | |||||||||
Other Assets and | (0.1 | ) | (56,156 | ) | |||||||||
Net Assets | 100.0 | % | $ | 39,759,004 | |||||||||
| STRIP | Separate Trading of Registered Interest and Principal of Securities |
| ## | On September 7, 2008, the Federal Housing Finance Agency placed the Federal National Mortgage Association and the Federal Home Loan Mortgage Corporation into conservatorship and the U.S. Treasury guaranteed the debt issued by those organizations. |
| ^ | Interest only securities represent the right to receive the monthly interest payments on an underlying pool of mortgage loans. Principal amount shown represents the notional amount on which current interest is calculated. Payments of principal on the pool reduce the value of the interest only security. |
| ^^ | Principal only securities represent the right to receive the monthly principal payments on an underlying pool of mortgage loans. No payments of interest on the pool are passed through the principal only security. |
| Z | Indicates Zero Coupon Bond; rate shown reflects current effective yield. |
| * | Cost for federal income tax purposes is $38,972,831. |
Net unrealized appreciation consists of: | ||||
Gross Unrealized Appreciation | $ | 914,956 | ||
Gross Unrealized Depreciation | (72,627 | ) | ||
Net Unrealized Appreciation | $ | 842,329 | ||
See Accompanying Notes to Financial Statements
35
Table of Contents
| ING GET U.S. CORE PORTFOLIO SERIES 6 | PORTFOLIO OF INVESTMENTS ASOF JUNE 30, 2009 (UNAUDITED) (CONTINUED) |
Fair Value Measurements*
The following is a summary of the inputs used as of June 30, 2009 in determining the Portfolio’s investments at fair value for purposes of SFAS 157:
Quoted Prices in Active Markets for Identical Investments (Level 1) | Significant Other Observable Inputs (Level 2) | Significant Unobservable Inputs (Level 3) | |||||||
Exchange-Traded Funds | $ | 1,682,136 | $ | — | $ | — | |||
U.S. Government Agency Obligations | — | 28,096,476 | — | ||||||
U.S. Treasury Obligations | — | 9,715,548 | — | ||||||
Short-Term Investments | 321,000 | — | — | ||||||
Total | $ | 2,003,136 | $ | 37,812,024 | $ | — | |||
Other Financial Instruments** | — | — | — | ||||||
Total | $ | — | $ | — | $ | — | |||
“Fair value” for purposes of SFAS 157 is different from “fair value” as used in the 1940 Act. The former generally implies market value, and can include market quotations as a source of value, and the latter refers to determinations of value in absence of available market quotations.
| * | See NOTE 2, “Significant Accounting Policies” in the Notes to Financial Statements for additional information. |
| ** | Other financial instruments may include open forward foreign currency contracts, futures, swaps, and written options. Forward foreign currency contracts and futures are reported at their unrealized gain/loss at period end. Swaps and written options are reported at their market value at period end. |
See Accompanying Notes to Financial Statements
36
Table of Contents
| ING GET U.S. CORE PORTFOLIO SERIES 7 | PORTFOLIO OF INVESTMENTS ASOF JUNE 30, 2009 (UNAUDITED) |
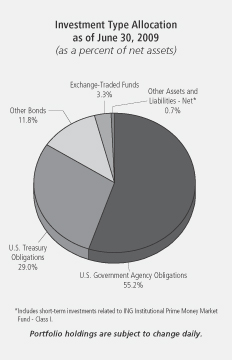
| Shares | Value | |||||||
| EXCHANGE-TRADED FUNDS: 3.3% | |||||||
| Exchange-Traded Funds: 3.3% | |||||||
| 9,400 | SPDR Trust Series 1 | $ | 864,048 | |||||
Total Exchange-Traded Funds | 864,048 | |||||||
| Principal Amount | Value | |||||||
| U.S. GOVERNMENT AGENCY OBLIGATIONS: 55.2% | |||||||
| Federal Home Loan Mortgage Corporation##: 10.4% | |||||||
| $ | 3,000,000 | ^, Z | 2.950%, due 07/15/12 | $ | 2,749,884 | |||
| 2,749,884 | ||||||||
| Federal National Mortgage Association##: 33.7% | |||||||
| 9,513,000 | Z | 2.630%, due 03/15/12 | 8,871,120 | |||||
| 8,871,120 | ||||||||
| Other U.S. Agency Obligations: 11.1% | |||||||
| 3,000,000 | Z | Resolution Funding Corp., Interest STRIP, 1.350%, due 10/15/11 | 2,910,033 | |||||
| 2,910,033 | ||||||||
Total U.S. Government Agency Obligations | 14,531,037 | |||||||
| U.S. TREASURY OBLIGATIONS: 29.0% | |||||||
| U.S. Treasury STRIP COUPON: 29.0% | |||||||
| 7,940,000 | Z | 1.450%, due 02/15/12 | 7,643,822 | |||||
Total U.S. Treasury Obligations | 7,643,822 | |||||||
| Principal Amount | Value | |||||||
| OTHER BONDS: 11.8% | |||||||
| Foreign Government Bonds: 11.8% | |||||||
| $ | 3,300,000 | Z | Israel Government International Bond, 2.100%, due 05/15/12 | $ | 3,109,059 | |||
Total Other Bonds | 3,109,059 | |||||||
Total Long-Term Investments | 26,147,966 | |||||||
| Shares | Value | ||||||||
SHORT-TERM INVESTMENTS: 0.9% |
| ||||||||
Affiliated Mutual Fund: 0.9% |
| ||||||||
| 222,000 | ING Institutional Prime Money Market Fund - Class I | $ | 222,000 | ||||||
Total Short-Term Investments | 222,000 | ||||||||
Total Investments in | 100.2 | % | $ | 26,369,966 | |||||
Other Assets and | (0.2 | ) | (46,770 | ) | |||||
Net Assets | 100.0 | % | $ | 26,323,196 | |||||
| STRIP | Separate Trading of Registered Interest and Principal of Securities |
| ## | On September 7, 2008, the Federal Housing Finance Agency placed the Federal National Mortgage Association and the Federal Home Loan Mortgage Corporation into conservatorship and the U.S. Treasury guaranteed the debt issued by those organizations. |
| ^ | Interest only securities represent the right to receive the monthly interest payments on an underlying pool of mortgage loans. Principal amount shown represents the notional amount on which current interest is calculated. Payments of principal on the pool reduce the value of the interest only security. |
| Z | Indicates Zero Coupon Bond; rate shown reflects current effective yield. |
| * | Cost for federal income tax purposes is $25,790,048. |
Net unrealized appreciation consists of: | ||||
Gross Unrealized Appreciation | $ | 700,362 | ||
Gross Unrealized Depreciation | (120,444 | ) | ||
Net Unrealized Appreciation | $ | 579,918 | ||
See Accompanying Notes to Financial Statements
37
Table of Contents
| ING GET U.S. CORE PORTFOLIO SERIES 7 | PORTFOLIO OF INVESTMENTS ASOF JUNE 30, 2009 (UNAUDITED) (CONTINUED) |
Fair Value Measurements*
The following is a summary of the inputs used as of June 30, 2009 in determining the Portfolio’s investments at fair value for purposes of SFAS 157:
Quoted Prices in Active Markets for Identical Investments (Level 1) | Significant Other Observable Inputs (Level 2) | Significant Unobservable Inputs (Level 3) | |||||||
Exchange-Traded Funds | $ | 864,048 | $ | — | $ | — | |||
U.S. Government Agency Obligations | — | 14,531,037 | — | ||||||
U.S. Treasury Obligations | — | 7,643,822 | — | ||||||
Other Bonds | — | 3,109,059 | — | ||||||
Short-Term Investments | 222,000 | — | — | ||||||
Total | $ | 1,086,048 | $ | 25,283,918 | $ | — | |||
Other Financial Instruments** | — | — | — | ||||||
Total | $ | — | $ | — | $ | — | |||
“Fair value” for purposes of SFAS 157 is different from “fair value” as used in the 1940 Act. The former generally implies market value, and can include market quotations as a source of value, and the latter refers to determinations of value in absence of available market quotations.
| * | See NOTE 2, “Significant Accounting Policies” in the Notes to Financial Statements for additional information. |
| ** | Other financial instruments may include open forward foreign currency contracts, futures, swaps, and written options. Forward foreign currency contracts and futures are reported at their unrealized gain/loss at period end. Swaps and written options are reported at their market value at period end. |
See Accompanying Notes to Financial Statements
38
Table of Contents
| ING GET U.S. CORE PORTFOLIO SERIES 8 | PORTFOLIO OF INVESTMENTS ASOF JUNE 30, 2009 (UNAUDITED) |
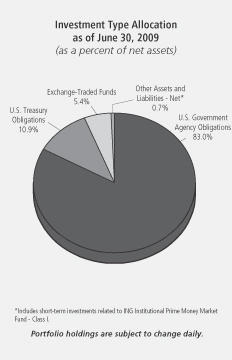
| Shares | Value | |||||||
| EXCHANGE-TRADED FUNDS: 5.4% | |||||||
| Exchange-Traded Funds: 5.4% | |||||||
| 10,000 | SPDR Trust Series 1 | $ | 919,200 | |||||
Total Exchange-Traded Funds | 919,200 | |||||||
| Principal Amount | Value | |||||||
| U.S. GOVERNMENT AGENCY OBLIGATIONS: 83.0% | |||||||
| Federal Home Loan Mortgage Corporation##: 15.6% | |||||||
| $ | 2,831,000 | ^, Z | 2.720%, due 03/15/12 | $ | 2,634,138 | |||
| 2,634,138 | ||||||||
| Federal National Mortgage Association##: 16.5% | |||||||
| 3,000,000 | Z | 2.630%, due 03/15/12 | 2,797,578 | |||||
| 2,797,578 | ||||||||
| Other U.S. Agency Obligations: 50.9% | |||||||
| 4,118,000 | Z | Financing Corp., | 3,811,900 | |||||
| 5,050,000 | Z | Resolution Funding Corp., | 4,796,263 | |||||
| 8,608,163 | ||||||||
Total U.S. Government Agency Obligations | 14,039,879 | |||||||
| Principal Amount | Value | |||||||
| U.S. TREASURY OBLIGATIONS: 10.9% | |||||||
| U.S. Treasury STRIP COUPON: 10.9% | |||||||
| $ | 1,940,000 | Z | 1.760%, due 08/15/12 | $ | 1,836,542 | |||
Total U.S. Treasury Obligations | 1,836,542 | |||||||
Total Long-Term Investments | 16,795,621 | |||||||
| Shares | Value | ||||||||
SHORT-TERM INVESTMENTS: 0.9% |
| ||||||||
Affiliated Mutual Fund: 0.9% |
| ||||||||
| 146,000 | ING Institutional Prime Money Market Fund - Class I | $ | 146,000 | ||||||
Total Short-Term Investments | 146,000 | ||||||||
Total Investments in | 100.2 | % | $ | 16,941,621 | |||||
Other Assets and | (0.2 | ) | (32,821 | ) | |||||
Net Assets | 100.0 | % | $ | 16,908,800 | |||||
| STRIP | Separate Trading of Registered Interest and Principal of Securities |
| ## | On September 7, 2008, the Federal Housing Finance Agency placed the Federal National Mortgage Association and the Federal Home Loan Mortgage Corporation into conservatorship and the U.S. Treasury guaranteed the debt issued by those organizations. |
| ^ | Interest only securities represent the right to receive the monthly interest payments on an underlying pool of mortgage loans. Principal amount shown represents the notional amount on which current interest is calculated. Payments of principal on the pool reduce the value of the interest only security. |
| Z | Indicates Zero Coupon Bond; rate shown reflects current effective yield. |
| * | Cost for federal income tax purposes is the same as for financial statement purposes. |
Net unrealized appreciation consists of: | ||||
Gross Unrealized Appreciation | $ | 358,581 | ||
Gross Unrealized Depreciation | (59,107 | ) | ||
Net Unrealized Appreciation | $ | 299,474 | ||
See Accompanying Notes to Financial Statements
39
Table of Contents
| ING GET U.S. CORE PORTFOLIO SERIES 8 | PORTFOLIO OF INVESTMENTS ASOF JUNE 30, 2009 (UNAUDITED) (CONTINUED) |
Fair Value Measurements*
The following is a summary of the inputs used as of June 30, 2009 in determining the Portfolio’s investments at fair value for purposes of SFAS 157:
Quoted Prices in Active Markets for Identical Investments (Level 1) | Significant Other Observable Inputs (Level 2) | Significant Unobservable Inputs (Level 3) | |||||||
Exchange-Traded Funds | $ | 919,200 | $ | — | $ | — | |||
U.S. Government Agency Obligations | — | 14,039,879 | — | ||||||
U.S. Treasury Obligations | — | 1,836,542 | — | ||||||
Short-Term Investments | 146,000 | — | — | ||||||
Total | $ | 1,065,200 | $ | 15,876,421 | $ | — | |||
Other Financial Instruments** | — | — | — | ||||||
Total | $ | — | $ | — | $ | — | |||
“Fair value” for purposes of SFAS 157 is different from “fair value” as used in the 1940 Act. The former generally implies market value, and can include market quotations as a source of value, and the latter refers to determinations of value in absence of available market quotations.
| * | See NOTE 2, “Significant Accounting Policies” in the Notes to Financial Statements for additional information. |
| ** | Other financial instruments may include open forward foreign currency contracts, futures, swaps, and written options. Forward foreign currency contracts and futures are reported at their unrealized gain/loss at period end. Swaps and written options are reported at their market value at period end. |
See Accompanying Notes to Financial Statements
40
Table of Contents
| ING GET U.S. CORE PORTFOLIO SERIES 9 | PORTFOLIO OF INVESTMENTS ASOF JUNE 30, 2009 (UNAUDITED) |
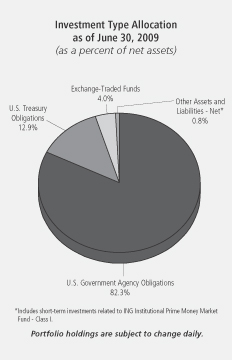
| Shares | Value | |||||||
| EXCHANGE-TRADED FUNDS: 4.0% | |||||||
| Exchange-Traded Funds: 4.0% | |||||||
| 5,700 | SPDR Trust Series 1 | $ | 523,944 | |||||
Total Exchange-Traded Funds | 523,944 | |||||||
| Principal Amount | Value | |||||||
| U.S. GOVERNMENT AGENCY OBLIGATIONS: 82.3% | |||||||
| Federal Home Loan Mortgage Corporation##: 17.5% | |||||||
| $ | 2,555,000 | Z | 3.120%, due 09/15/12 | $ | 2,318,900 | |||
| 2,318,900 | ||||||||
| Federal National Mortgage Association##: 26.7% | |||||||
| 3,871,000 | ^, Z | 2.960%, due 07/15/12 | 3,547,226 | |||||
| 3,547,226 | ||||||||
| Other U.S. Agency Obligations: 38.1% | |||||||
| 3,000,000 | Z | Financing Corp., | 2,700,236 | |||||
| 2,500,000 | Z | Resolution Funding Corp., Interest STRIP, 2.110%, due 07/15/12 | 2,349,353 | |||||
| 5,049,589 | ||||||||
Total U.S. Government Agency Obligations | 10,915,715 | |||||||
| Principal Amount | Value | |||||||
| U.S. TREASURY OBLIGATIONS: 12.9% | |||||||
| U.S. Treasury STRIP COUPON: 12.9% | |||||||
| $ | 1,810,000 | Z | 1.760%, due 08/15/12 | $ | 1,713,475 | |||
Total U.S. Treasury Obligations | 1,713,475 | |||||||
Total Long-Term Investments | 13,153,134 | |||||||
| Shares | Value | |||||||
| SHORT-TERM INVESTMENTS: 0.4% | |||||||
| Affiliated Mutual Fund: 0.4% | |||||||
| 53,000 | ING Institutional Prime Money Market Fund - Class I | $ | 53,000 | |||||
Total Short-Term Investments | 53,000 | |||||||
Total Investments in Securities | 99.6 | % | $ | 13,206,134 | ||||||||
Other Assets and | 0.4 | 49,109 | ||||||||||
Net Assets | 100.0 | % | $ | 13,255,243 | ||||||||
| STRIP | Separate Trading of Registered Interest and Principal of Securities |
| ## | On September 7, 2008, the Federal Housing Finance Agency placed the Federal National Mortgage Association and the Federal Home Loan Mortgage Corporation into conservatorship and the U.S. Treasury guaranteed the debt issued by those organizations. |
| ^ | Interest only securities represent the right to receive the monthly interest payments on an underlying pool of mortgage loans. Principal amount shown represents the notional amount on which current interest is calculated. Payments of principal on the pool reduce the value of the interest only security. |
| Z | Indicates Zero Coupon Bond; rate shown reflects current effective yield. |
| * | Cost for federal income tax purposes is $13,115,211. |
Net unrealized appreciation consists of: | ||||
Gross Unrealized Appreciation | $ | 132,344 | ||
Gross Unrealized Depreciation | (41,421 | ) | ||
Net Unrealized Appreciation | $ | 90,923 | ||
See Accompanying Notes to Financial Statements
41
Table of Contents
| ING GET U.S. CORE PORTFOLIO SERIES 9 | PORTFOLIO OF INVESTMENTS ASOF JUNE 30, 2009 (UNAUDITED) (CONTINUED) |
Fair Value Measurements*
The following is a summary of the inputs used as of June 30, 2009 in determining the Portfolio’s investments at fair value for purposes of SFAS 157:
Quoted Prices in Active Markets for Identical Investments (Level 1) | Significant Other Observable Inputs (Level 2) | Significant Unobservable Inputs (Level 3) | |||||||
Exchange-Traded Funds | $ | 523,944 | $ | — | $ | — | |||
U.S. Government Agency Obligations | — | 10,915,715 | — | ||||||
U.S. Treasury Obligations | — | 1,713,475 | — | ||||||
Short-Term Investments | 53,000 | — | — | ||||||
Total | $ | 576,944 | $ | 12,629,190 | $ | — | |||
Other Financial Instruments** | — | — | — | ||||||
Total | $ | — | $ | — | $ | — | |||
“Fair value” for purposes of SFAS 157 is different from “fair value” as used in the 1940 Act. The former generally implies market value, and can include market quotations as a source of value, and the latter refers to determinations of value in absence of available market quotations.
| * | See NOTE 2, “Significant Accounting Policies” in the Notes to Financial Statements for additional information. |
| ** | Other financial instruments may include open forward foreign currency contracts, futures, swaps, and written options. Forward foreign currency contracts and futures are reported at their unrealized gain/loss at period end. Swaps and written options are reported at their market value at period end. |
See Accompanying Notes to Financial Statements
42
Table of Contents
| ING GET U.S. CORE PORTFOLIO SERIES 10 | PORTFOLIO OF INVESTMENTS ASOF JUNE 30, 2009 (UNAUDITED) |
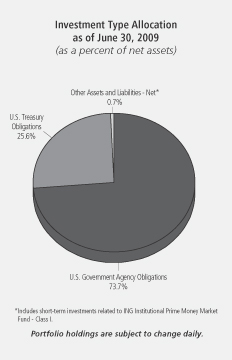
| Principal Amount | Value | |||||||
| U.S. GOVERNMENT AGENCY OBLIGATIONS: 73.7% | |||||||
| Federal Home Loan Mortgage Corporation##: 24.5% | |||||||
| $ | 3,000,000 | ^, Z | 3.270%, due 01/15/13 | $ | 2,674,626 | |||
| 2,674,626 | ||||||||
| Federal National Mortgage Association##: 18.2% | |||||||
| 2,222,000 | ^, Z | 3.300%, due 01/15/13 | 1,980,332 | |||||
| 1,980,332 | ||||||||
| Other U.S. Agency Obligations: 31.0% | |||||||
| 1,200,000 | Z | Financing Corp., | 1,080,094 | |||||
| 2,500,000 | Z | Resolution Funding Corp., | 2,293,908 | |||||
| 3,374,002 | ||||||||
Total U.S. Government Agency Obligations (Cost $7,889,231) | 8,028,960 | |||||||
| U.S. TREASURY OBLIGATIONS: 25.6% | |||||||
| U.S. Treasury STRIP COUPON: 2.7% | |||||||
| 319,000 | Z | 6.603%, due 11/15/12 | 298,743 | |||||
| 298,743 | ||||||||
| U.S. Treasury STRIP PRINCIPAL: 22.9% | |||||||
| 2,651,000 | Z | 1.850%, due 11/15/12 | 2,493,255 | |||||
| 2,493,255 | ||||||||
Total U.S. Treasury Obligations | 2,791,998 | |||||||
Total Long-Term Investments | 10,820,958 | |||||||
| Shares | Value | ||||||
SHORT-TERM INVESTMENTS: 0.1% | |||||||
Affiliated Mutual Fund: 0.1% | |||||||
| 15,000 | ING Institutional Prime Money | $ | 15,000 | ||||
Total Short-Term Investments | 15,000 | ||||||
Total Investments in Securities | 99.4 | % | $ | 10,835,958 | ||||||||
Other Assets and | 0.6 | 64,117 | ||||||||||
Net Assets | 100.0 | % | $ | 10,900,075 | ||||||||
| STRIP | Separate Trading of Registered Interest and Principal of Securities |
| ## | On September 7, 2008, the Federal Housing Finance Agency placed the Federal National Mortgage Association and the Federal Home Loan Mortgage Corporation into conservatorship and the U.S. Treasury guaranteed the debt issued by those organizations. |
| ^ | Interest only securities represent the right to receive the monthly interest payments on an underlying pool of mortgage loans. Principal amount shown represents the notional amount on which current interest is calculated. Payments of principal on the pool reduce the value of the interest only security. |
| Z | Indicates Zero Coupon Bond; rate shown reflects current effective yield. |
| * | Cost for federal income tax purposes is the same as for financial statement purposes. |
Net unrealized appreciation consists of: | ||||
Gross Unrealized Appreciation | $ | 146,546 | ||
Gross Unrealized Depreciation | (38,949 | ) | ||
Net Unrealized Appreciation | $ | 107,597 | ||
See Accompanying Notes to Financial Statements
43
Table of Contents
| ING GET U.S. CORE PORTFOLIO SERIES 10 | PORTFOLIO OF INVESTMENTS ASOF JUNE 30, 2009 (UNAUDITED) (CONTINUED) |
Fair Value Measurements*
The following is a summary of the inputs used as of June 30, 2009 in determining the Portfolio’s investments at fair value for purposes of SFAS 157:
Quoted Prices in Active Markets for Identical Investments (Level 1) | Significant Other Observable Inputs (Level 2) | Significant Unobservable Inputs (Level 3) | |||||||
U.S. Government Agency Obligations | $ | — | $ | 8,028,960 | $ | — | |||
U.S. Treasury Obligations | — | 2,791,998 | — | ||||||
Short-Term Investments | 15,000 | — | — | ||||||
Total | $ | 15,000 | $ | 10,820,958 | $ | — | |||
Other Financial Instruments** | — | — | — | ||||||
Total | $ | — | $ | — | $ | — | |||
“Fair value” for purposes of SFAS 157 is different from “fair value” as used in the 1940 Act. The former generally implies market value, and can include market quotations as a source of value, and the latter refers to determinations of value in absence of available market quotations.
| * | See NOTE 2, “Significant Accounting Policies” in the Notes to Financial Statements for additional information. |
| ** | Other financial instruments may include open forward foreign currency contracts, futures, swaps, and written options. Forward foreign currency contracts and futures are reported at their unrealized gain/loss at period end. Swaps and written options are reported at their market value at period end. |
See Accompanying Notes to Financial Statements
44
Table of Contents
| ING GET U.S. CORE PORTFOLIO SERIES 11 | PORTFOLIO OF INVESTMENTS ASOF JUNE 30, 2009 (UNAUDITED) |
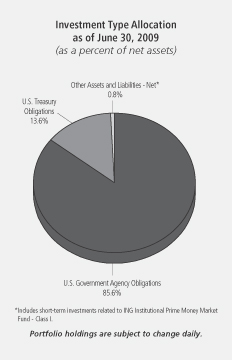
| Principal Amount | Value | |||||||
| U.S. GOVERNMENT AGENCY OBLIGATIONS: 85.6% | |||||||
| Federal Home Loan Mortgage Corporation##: 19.2% | |||||||
| $ | 3,000,000 | ^, Z | 3.270%, due 01/15/13 | $ | 2,674,626 | |||
| 2,674,626 | ||||||||
| Federal National Mortgage Association##: 19.2% | |||||||
| 3,000,000 | ^^, Z | 3.280%, due 02/21/13 | 2,667,309 | |||||
| 2,667,309 | ||||||||
| Other U.S. Agency Obligations: 47.2% | |||||||
| 1,210,000 | Z | Financing Corp., | 1,054,380 | |||||
| 2,500,000 | Z | Financing Corp., | 2,134,488 | |||||
| 2,500,000 | Z | Resolution Funding Corp., 2.500%, due 01/15/13 | 2,293,908 | |||||
| 1,200,000 | Z | Resolution Funding Corp., Interest STRIP, | 1,088,964 | |||||
| 6,571,740 | ||||||||
Total U.S. Government Agency Obligations | 11,913,675 | |||||||
| Principal Amount | Value | |||||||
| U.S. TREASURY OBLIGATIONS: 13.6% | |||||||
| U.S. Treasury STRIP COUPON: 13.6% | |||||||
| $ | 2,044,000 | Z | 2.100%, due 02/15/13 | $ | 1,895,105 | |||
Total U.S. Treasury Obligations | 1,895,105 | |||||||
Total Long-Term Investments | 13,808,780 | |||||||
| Shares | Value | |||||||
| SHORT-TERM INVESTMENTS: 1.0% | |||||||
| Affiliated Mutual Fund: 1.0% | |||||||
| 135,000 | ING Institutional Prime Money Market Fund - Class I | $ | 135,000 | |||||
Total Short-Term Investments | 135,000 | |||||||
Total Investments in Securities | 100.2 | % | $ | 13,943,780 | |||||||||
Other Assets and | (0.2 | ) | (33,241 | ) | |||||||||
Net Assets | 100.0 | % | $ | 13,910,539 | |||||||||
| STRIP | Separate Trading of Registered Interest and Principal of Securities |
| ## | On September 7, 2008, the Federal Housing Finance Agency placed the Federal National Mortgage Association and the Federal Home Loan Mortgage Corporation into conservatorship and the U.S. Treasury guaranteed the debt issued by those organizations. |
| ^ | Interest only securities represent the right to receive the monthly interest payments on an underlying pool of mortgage loans. Principal amount shown represents the notional amount on which current interest is calculated. Payments of principal on the pool reduce the value of the interest only security. |
| ^^ | Principal only securities represent the right to receive the monthly principal payments on an underlying pool of mortgage loans. No payments of interest on the pool are passed through the principal only security. |
| Z | Indicates Zero Coupon Bond; rate shown reflects current effective yield. |
| * | Cost for federal income tax purposes is $14,002,318. |
Net unrealized depreciation consists of: | ||||
Gross Unrealized Appreciation | $ | 120,555 | ||
Gross Unrealized Depreciation | (179,093 | ) | ||
Net Unrealized Depreciation | $ | (58,538 | ) | |
See Accompanying Notes to Financial Statements
45
Table of Contents
| ING GET U.S. CORE PORTFOLIO SERIES 11 | PORTFOLIO OF INVESTMENTS ASOF JUNE 30, 2009 (UNAUDITED) (CONTINUED) |
Fair Value Measurements*
The following is a summary of the inputs used as of June 30, 2009 in determining the Portfolio’s investments at fair value for purposes of SFAS 157:
Quoted Prices in Active Markets for Identical Investments (Level 1) | Significant Other Observable Inputs (Level 2) | Significant Unobservable Inputs (Level 3) | |||||||
U.S. Government Agency Obligations | $ | — | $ | 11,913,675 | $ | — | |||
U.S. Treasury Obligations | — | 1,895,105 | — | ||||||
Short-Term Investments | 135,000 | — | — | ||||||
Total | $ | 135,000 | $ | 13,808,780 | $ | — | |||
Other Financial Instruments** | — | — | — | ||||||
Total | $ | — | $ | — | $ | — | |||
“Fair value” for purposes of SFAS 157 is different from “fair value” as used in the 1940 Act. The former generally implies market value, and can include market quotations as a source of value, and the latter refers to determinations of value in absence of available market quotations.
| * | See NOTE 2, “Significant Accounting Policies” in the Notes to Financial Statements for additional information. |
| ** | Other financial instruments may include open forward foreign currency contracts, futures, swaps, and written options. Forward foreign currency contracts and futures are reported at their unrealized gain/loss at period end. Swaps and written options are reported at their market value at period end. |
See Accompanying Notes to Financial Statements
46
Table of Contents
| ING GET U.S. CORE PORTFOLIO SERIES 12 | PORTFOLIO OF INVESTMENTS ASOF JUNE 30, 2009 (UNAUDITED) |
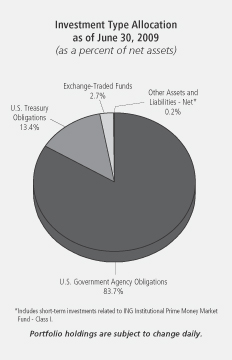
| Shares | Value | |||||||
| EXCHANGE-TRADED FUNDS: 2.7% | |||||||
| Exchange-Traded Funds: 2.7% | |||||||
| 5,700 | SPDR Trust Series 1 | $ | 523,944 | |||||
Total Exchange-Traded Funds | 523,944 | |||||||
| Principal Amount | Value | |||||||
| U.S. GOVERNMENT AGENCY OBLIGATIONS: 83.7% | |||||||
| Federal Home Loan Mortgage Corporation##: 10.3% | |||||||
| $ | 2,291,000 | Z | 3.790%, due 09/15/13 | $ | 1,971,667 | |||
| 1,971,667 | ||||||||
| Federal National Mortgage Association##: 23.3% | |||||||
| 5,140,000 | ^, Z | 3.730%, due 07/15/13 | 4,457,927 | |||||
| 4,457,927 | ||||||||
| Other U.S. Agency Obligations: 50.1% | |||||||
| 5,687,000 | Z | Financing Corp., | 4,934,206 | |||||
| 5,140,000 | Z | Resolution Funding Corp., Interest STRIP, 2.650%, due 04/15/13 | 4,664,396 | |||||
| 9,598,602 | ||||||||
Total U.S. Government Agency Obligations | 16,028,196 | |||||||
| Principal Amount | Value | |||||||
| U.S. TREASURY OBLIGATIONS: 13.4% | |||||||
| U.S. Treasury STRIP COUPON: 2.3% | |||||||
| $ | 481,000 | Z | 2.218%, due 05/15/13 | $ | 441,537 | |||
| 441,537 | ||||||||
| U.S. Treasury STRIP PRINCIPAL: 11.1% | |||||||
| 2,300,000 | Z | 2.150%, due 05/15/13 | 2,120,623 | |||||
| 2,120,623 | ||||||||
Total U.S. Treasury Obligations (Cost $2,602,525) | 2,562,160 | |||||||
Total Long-Term Investments | 19,114,300 | |||||||
| Shares | Value | |||||||
| SHORT-TERM INVESTMENTS: 1.0% | |||||||
| Affiliated Mutual Fund: 1.0% | |||||||
| 194,000 | ING Institutional Prime Money Market Fund - Class I | $ | 194,000 | |||||
Total Short-Term Investments | 194,000 | |||||||
Total Investments in Securities (Cost $19,296,052)* | 100.8 | % | $ | 19,308,300 | |||||||||
Other Assets and | (0.8 | ) | (154,639 | ) | |||||||||
Net Assets | 100.0 | % | $ | 19,153,661 | |||||||||
| STRIP | Separate Trading of Registered Interest and Principal of Securities |
| ## | On September 7, 2008, the Federal Housing Finance Agency placed the Federal National Mortgage Association and the Federal Home Loan Mortgage Corporation into conservatorship and the U.S. Treasury guaranteed the debt issued by those organizations. |
| ^ | Interest only securities represent the right to receive the monthly interest payments on an underlying pool of mortgage loans. Principal amount shown represents the notional amount on which current interest is calculated. Payments of principal on the pool reduce the value of the interest only security. |
| Z | Indicates Zero Coupon Bond; rate shown reflects current effective yield. |
| * | Cost for federal income tax purposes is $19,307,102. |
Net unrealized appreciation consists of: | ||||
Gross Unrealized Appreciation | $ | 125,036 | ||
Gross Unrealized Depreciation | (123,838 | ) | ||
Net Unrealized Appreciation | $ | 1,198 | ||
See Accompanying Notes to Financial Statements
47
Table of Contents
| ING GET U.S. CORE PORTFOLIO SERIES 12 | PORTFOLIO OF INVESTMENTS ASOF JUNE 30, 2009 (UNAUDITED) (CONTINUED) |
Fair Value Measurements*
The following is a summary of the inputs used as of June 30, 2009 in determining the Portfolio’s investments at fair value for purposes of SFAS 157:
Quoted Prices in Active Markets for Identical Investments (Level 1) | Significant Other Observable Inputs (Level 2) | Significant Unobservable Inputs (Level 3) | |||||||
Exchange-Traded Funds | $ | 523,944 | $ | — | $ | — | |||
U.S. Government Agency Obligations | — | 16,028,196 | — | ||||||
U.S. Treasury Obligations | — | 2,562,160 | — | ||||||
Short-Term Investments | 194,000 | — | — | ||||||
Total | $ | 717,944 | $ | 18,590,356 | $ | — | |||
Other Financial Instruments** | — | — | — | ||||||
Total | $ | — | $ | — | $ | — | |||
“Fair value” for purposes of SFAS 157 is different from “fair value” as used in the 1940 Act. The former generally implies market value, and can include market quotations as a source of value, and the latter refers to determinations of value in absence of available market quotations.
| * | See NOTE 2, “Significant Accounting Policies” in the Notes to Financial Statements for additional information. |
| ** | Other financial instruments may include open forward foreign currency contracts, futures, swaps, and written options. Forward foreign currency contracts and futures are reported at their unrealized gain/loss at period end. Swaps and written options are reported at their market value at period end. |
See Accompanying Notes to Financial Statements
48
Table of Contents
| ING GET U.S. CORE PORTFOLIO SERIES 13 | PORTFOLIO OF INVESTMENTS ASOF JUNE 30, 2009 (UNAUDITED) |
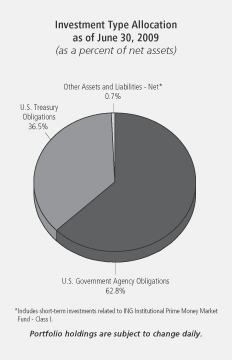
| Principal Amount | Value | |||||||
| U.S. GOVERNMENT AGENCY OBLIGATIONS: 62.8% | |||||||
| Federal National Mortgage Association##: 19.1% | |||||||
| $ | 7,820,000 | ^, Z | 3.970%, due 01/15/14 | $ | 6,621,350 | |||
| 6,621,350 | ||||||||
| Other U.S. Agency Obligations: 43.7% | |||||||
| 7,150,000 | Z | Financing Corp., | 6,067,548 | |||||
| 10,464,000 | Z | Resolution Funding Corp., Interest STRIP, | 9,120,862 | |||||
| 15,188,410 | ||||||||
Total U.S. Government Agency Obligations | 21,809,760 | |||||||
| U.S. TREASURY OBLIGATIONS: 36.5% | |||||||
| U.S. Treasury Bonds: 26.7% | |||||||
| 10,856,000 | Z | 3.670%, due 11/15/13 | 9,269,439 | |||||
| 9,269,439 | ||||||||
| U.S. Treasury STRIP COUPON: 9.8% | |||||||
| 3,779,000 | Z | 2.562%, due 11/15/13 | 3,381,963 | |||||
| 3,381,963 | ||||||||
Total U.S. Treasury Obligations | 12,651,402 | |||||||
Total Long-Term Investments | 34,461,162 | |||||||
| Shares | Value | |||||||
SHORT-TERM INVESTMENTS: 0.4% |
| |||||||
Affiliated Mutual Fund: 0.4% | ||||||||
| 131,000 | ING Institutional Prime Money Market Fund - Class I | $ | 131,000 | |||||
Total Short-Term Investments | 131,000 | |||||||
Total Investments in | 99.7 | % | $ | 34,592,162 | ||||
Other Assets and | 0.3 | 120,221 | ||||||
Net Assets | 100.0 | % | $ | 34,712,383 | ||||
| STRIP | Separate Trading of Registered Interest and Principal of Securities |
| ## | On September 7, 2008, the Federal Housing Finance Agency placed the Federal National Mortgage Association and the Federal Home Loan Mortgage Corporation into conservatorship and the U.S. Treasury guaranteed the debt issued by those organizations. |
| ^ | Interest only securities represent the right to receive the monthly interest payments on an underlying pool of mortgage loans. Principal amount shown represents the notional amount on which current interest is calculated. Payments of principal on the pool reduce the value of the interest only security. |
| Z | Indicates Zero Coupon Bond; rate shown reflects current effective yield. |
| * | Cost for federal income tax purposes is the same as for financial statement purposes. |
Net unrealized appreciation consists of: | ||||
Gross Unrealized Appreciation | $ | 555,865 | ||
Gross Unrealized Depreciation | (435,639 | ) | ||
Net Unrealized Appreciation | $ | 120,226 | ||
See Accompanying Notes to Financial Statements
49
Table of Contents
| ING GET U.S. CORE PORTFOLIO SERIES 13 | PORTFOLIO OF INVESTMENTS ASOF JUNE 30, 2009 (UNAUDITED) (CONTINUED) |
Fair Value Measurements*
The following is a summary of the inputs used as of June 30, 2009 in determining the Portfolio’s investments at fair value for purposes of SFAS 157:
Quoted Prices in Active Markets for Identical Investments (Level 1) | Significant Other Observable Inputs (Level 2) | Significant Unobservable Inputs (Level 3) | |||||||
U.S. Government Agency Obligations | $ | — | $ | 21,809,760 | $ | — | |||
U.S. Treasury Obligations | — | 12,651,402 | — | ||||||
Short-Term Investments | 131,000 | — | — | ||||||
Total | $ | 131,000 | $ | 34,461,162 | $ | — | |||
Other Financial Instruments** | — | — | — | ||||||
Total | $ | — | $ | — | $ | — | |||
“Fair value” for purposes of SFAS 157 is different from “fair value” as used in the 1940 Act. The former generally implies market value, and can include market quotations as a source of value, and the latter refers to determinations of value in absence of available market quotations.
| * | See NOTE 2, “Significant Accounting Policies” in the Notes to Financial Statements for additional information. |
| ** | Other financial instruments may include open forward foreign currency contracts, futures, swaps, and written options. Forward foreign currency contracts and futures are reported at their unrealized gain/loss at period end. Swaps and written options are reported at their market value at period end. |
See Accompanying Notes to Financial Statements
50
Table of Contents
| ING GET U.S. CORE PORTFOLIO SERIES 14 | PORTFOLIO OF INVESTMENTS ASOF JUNE 30, 2009 (UNAUDITED) |
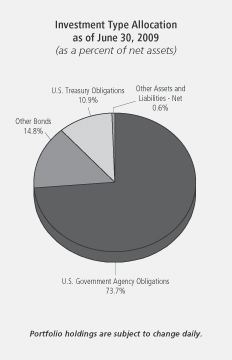
| Principal Amount | Value | |||||||
| U.S. GOVERNMENT AGENCY OBLIGATIONS: 73.7% | |||||||
| Federal National Mortgage Association##: 44.4% | |||||||
| $ | 16,000,000 | ^, Z | 3.970%, due 05/15/14 | $ | 13,371,904 | |||
| 20,000,000 | ^^, Z | 3.990%, due 07/15/14 | 16,611,980 | |||||
| 4,500,000 | Z | 3.990%, due 07/05/14 | 3,741,111 | |||||
| 33,724,995 | ||||||||
| Other U.S. Agency Obligations: 29.3% | |||||||
| 26,133,000 | Z | Resolution Funding Corp., Interest STRIP, | 22,237,929 | |||||
| 22,237,929 | ||||||||
Total U.S. Government Agency Obligations | 55,962,924 | |||||||
| U.S. TREASURY OBLIGATIONS: 10.9% | |||||||
| U.S. Treasury STRIP COUPON: 10.9% | |||||||
| ^, Z | 2.920%, due 05/15/14 | 8,242,430 | ||||||
Total U.S. Treasury Obligations (Cost $8,069,927) | 8,242,430 | |||||||
| Principal Amount | Value | ||||||||||
| OTHER BONDS: 14.8% | ||||||||||
| Sovereign: 14.8% | ||||||||||
| $ | 3,666,000 | Z | Israel Government International Bond, | $ | 3,110,135 | ||||||
| 9,724,000 | Z | Israel Government International Bond, | 8,145,571 | ||||||||
Total Other Bonds | 11,255,706 | ||||||||||
Total Investments in Securities | 99.4 | % | $75,461,060 | ||||||||
Other Assets and | 0.6 | 461,386 | |||||||||
Net Assets | 100.0% | $75,922,446 | |||||||||
| STRIP | Separate Trading of Registered Interest and Principal of Securities |
| ## | On September 7, 2008, the Federal Housing Finance Agency placed the Federal National Mortgage Association and the Federal Home Loan Mortgage Corporation into conservatorship and the U.S. Treasury guaranteed the debt issued by those organizations. |
| ^ | Interest only securities represent the right to receive the monthly interest payments on an underlying pool of mortgage loans. Principal amount shown represents the notional amount on which current interest is calculated. Payments of principal on the pool reduce the value of the interest only security. |
| ^^ | Principal only securities represent the right to receive the monthly principal payments on an underlying pool of mortgage loans. No payments of interest on the pool are passed through the principal only security. |
| Z | Indicates Zero Coupon Bond; rate shown reflects current effective yield. |
| * | Cost for federal income tax purposes is the same as for financial statement purposes. |
Net unrealized appreciation consists of: | ||||
Gross Unrealized Appreciation | $ | 1,338,020 | ||
Gross Unrealized Depreciation | (321,399 | ) | ||
Net Unrealized Appreciation | $ | 1,016,621 | ||
See Accompanying Notes to Financial Statements
51
Table of Contents
| ING GET U.S. CORE PORTFOLIO SERIES 14 | PORTFOLIO OF INVESTMENTS ASOF JUNE 30, 2009 (UNAUDITED) (CONTINUED) |
Fair Value Measurements*
The following is a summary of the inputs used as of June 30, 2009 in determining the Portfolio’s investments at fair value for purposes of SFAS 157:
Quoted Prices in Active Markets for Identical Investments (Level 1) | Significant Other Observable Inputs (Level 2) | Significant Unobservable Inputs (Level 3) | |||||||
U.S. Government Agency Obligations | $ | — | $ | 55,962,924 | $ | — | |||
U.S. Treasury Obligations | — | 8,242,430 | — | ||||||
Sovereign Bonds | — | 11,255,706 | — | ||||||
Total | $ | — | $ | 75,461,060 | $ | — | |||
Other Financial Instruments** | — | — | — | ||||||
Total | $ | — | $ | — | $ | — | |||
“Fair value” for purposes of SFAS 157 is different from “fair value” as used in the 1940 Act. The former generally implies market value, and can include market quotations as a source of value, and the latter refers to determinations of value in absence of available market quotations.
| * | See NOTE 2, “Significant Accounting Policies” in the Notes to Financial Statements for additional information. |
| ** | Other financial instruments may include open forward foreign currency contracts, futures, swaps, and written options. Forward foreign currency contracts and futures are reported at their unrealized gain/loss at period end. Swaps and written options are reported at their market value at period end. |
See Accompanying Notes to Financial Statements
52
Table of Contents
Investment Adviser
ING Investments, LLC
7337 East Doubletree Ranch Road
Scottsdale, Arizona 85258
Administrator
ING Funds Services, LLC
7337 East Doubletree Ranch Road
Scottsdale, Arizona 85258
Transfer Agent
PNC Global Investment Servicing (U.S.) Inc.
301 Bellevue Parkway
Wilmington, Delaware 19809
Custodian
The Bank of New York Mellon
One Wall Street
New York, New York 10286
Legal Counsel
Dechert LLP
1775 I Street, N.W.
Washington, D.C. 20006
Before investing, carefully consider the investment objectives, risks, charges and expenses of the variable annuity contract and the underlying variable investment options. This and other information is contained in the prospectus for the variable annuity contract and the underlying variable investment options. Obtain these prospectuses from your agent/registered representative and read them carefully before investing.
 | VPSAR-UGCORE | (0609-082809) |
Table of Contents
| ITEM 2. | CODE OF ETHICS. |
Not required for semi-annual filing.
| ITEM 3. | AUDIT COMMITTEE FINANCIAL EXPERT. |
Not required for semi-annual filing.
| ITEM 4. | PRINCIPAL ACCOUNTANT FEES AND SERVICES. |
Not required for semi-annual filing.
| ITEM 5. | AUDIT COMMITTEE OF LISTED REGISTRANTS. |
Not required for semi-annual filing.
| ITEM 6. | SCHEDULE OF INVESTMENTS. |
Schedule is included as part of the report to shareholders filed under Item 1 of this Form.
| ITEM 7. | DISCLOSURE OF PROXY VOTING POLICIES AND PROCEDURES FOR CLOSED-END MANAGEMENT INVESTMENT COMPANIES. |
Not applicable.
| ITEM 8. | PORTFOLIO MANAGERS OF CLOSED-END MANAGEMENT INVESTMENT COMPANIES. |
Not applicable.
| ITEM 9. | PURCHASES OF EQUITY SECURITIES BY CLOSED-END MANAGEMENT INVESTMENT COMPANY AND AFFILIATED PURCHASERS. |
Not applicable.
| ITEM 10. | SUBMISSION OF MATTERS TO A VOTE OF SECURITY HOLDERS. |
The Board has a Nominating Committee for the purpose of considering and presenting to the Board candidates it proposes for nomination to fill Independent Trustee vacancies on the Board. The Committee currently consists of all Independent Trustees of the Board (6 individuals). The Nominating Committee operates pursuant to a Charter approved by the Board. The primary purpose of the Nominating Committee is to consider and present to the Board the candidates it proposes for nomination to fill vacancies on the Board. In evaluating candidates, the Nominating Committee may consider a variety of factors, but it has not at this time set any specific minimum qualifications that must be met. Specific qualifications of candidates for Board membership will be based on the needs of the Board at the time of nomination.
The Nominating Committee is willing to consider nominations received from shareholders and shall assess shareholder nominees in the same manner as it reviews its own nominees. A shareholder nominee for director should be submitted in writing to the Fund’s Secretary. Any such shareholder nomination should include at a minimum the following information as to each individual proposed for nomination as trustee: such individual’s written consent to be named in the proxy statement as a nominee (if nominated) and to serve as a trustee (if elected), and all information relating to such individual that is required to be disclosed in the solicitation of proxies for election of trustees, or is otherwise required, in each case under applicable federal securities laws, rules and regulations.
Table of Contents
The Secretary shall submit all nominations received in a timely manner to the Nominating Committee. To be timely, any such submission must be delivered to the Fund’s Secretary not earlier than the 90th day prior to such meeting and not later than the close of business on the later of the 60th day prior to such meeting or the 10th day following the day on which public announcement of the date of the meeting is first made, by either disclosure in a press release or in a document publicly filed by the Fund with the Securities and Exchange Commission.
| ITEM 11. | CONTROLS AND PROCEDURES. |
| (a) | Based on our evaluation conducted within 90 days of the filing date, hereof, the design and operation of the registrant’s disclosure controls and procedures are effective to ensure that material information relating to the registrant is made known to the certifying officers by others within the appropriate entities, particularly during the period in which Forms N-CSR are being prepared, and the registrant’s disclosure controls and procedures allow timely preparation and review of the information for the registrant’s Form N-CSR and the officer certifications of such Form N-CSR. |
| (b) | There were no significant changes in the registrant’s internal controls that occurred during the second fiscal quarter of the period covered by this report that has materially affected, or is reasonably likely to materially affect, the registrant’s internal control over financial reporting. |
| ITEM 12. | EXHIBITS. |
| (a)(1) | The Code of Ethics is not required for the semi-annual filing. |
| (a)(2) | A separate certification for each principal executive officer and principal financial officer of the registrant as required by Rule 30a-2 under the Act (17 CFR 270.30a-2) is attached hereto as EX-99.CERT. |
| (a)(3) | Not required for semi-annual filing. |
| (b) | The officer certifications required by Section 906 of the Sarbanes-Oxley Act of 2002 are attached hereto as EX-99.906CERT |
Table of Contents
SIGNATURES
Pursuant to the requirements of the Securities Exchange Act of 1934 and the Investment Company Act of 1940, the registrant has duly caused this report to be signed on its behalf by the undersigned, thereunto duly authorized.
(Registrant): ING Variable Insurance Trust
| By | /s/ Shaun P. Mathews | |
| Shaun P. Mathews | ||
| President and Chief Executive Officer | ||
| Date: | September 3, 2009 | |
Pursuant to the requirements of the Securities Exchange Act of 1934 and the Investment Company Act of 1940, this report has been signed below by the following persons on behalf of the registrant and in the capacities and on the dates indicated.
| By | /s/ Shaun P. Mathews | |
| Shaun P. Mathews | ||
| President and Chief Executive Officer | ||
| Date: | September 3, 2009 | |
| By | /s/ Todd Modic | |
| Todd Modic | ||
| Senior Vice President and Chief Financial Officer | ||
| Date: | September 3, 2009 | |