| Item 1. | Reports to Shareholders. |
Table of Contents
Page | |
Letter to Shareholders | 2 |
Fund Summaries | |
Century Shares Trust | 5 |
Century Small Cap Select Fund | 8 |
Century Growth Opportunities Fund | 11 |
Portfolio of Investments | |
Century Shares Trust | 14 |
Century Small Cap Select Fund | 16 |
Century Growth Opportunities Fund | 18 |
Statements of Assets and Liabilities | 20 |
Statements of Operations | 21 |
Statements of Changes in Net Assets | 22 |
Financial Highlights | |
Century Shares Trust | 24 |
Century Small Cap Select Fund | 25 |
Century Growth Opportunities Fund | 27 |
Notes to Financial Statements | 28 |
Disclosure of Fund Expenses | 37 |
Privacy Policy | 38 |
This report is submitted for the general information of the shareholders of Century Shares Trust, Century Small Cap Select Fund, and Century Growth Opportunities Fund (each a “Fund” and collectively, the “Funds”). It is not authorized for distribution to prospective investors in a Fund unless it is preceded by or accompanied by the Fund’s current prospectus. The prospectus includes important information about the Fund’s objective, risks, charges and expenses, experience of its management, and other information. Please read the prospectus carefully before you invest.
The views expressed in this report are those of the Funds’ Portfolio Managers as of April 30, 2016, the end of the reporting period. Any such views are subject to change at any time and may not reflect the Portfolio Managers’ views on the date that this report is first published or anytime thereafter. These views are intended to assist shareholders in understanding their investments, do not constitute investment advice, and are not intended to predict the performance of any investment. There is no assurance that the Funds will continue to invest in the securities mentioned in this report.
Semi-Annual Report | April 30, 2016 | 1 |
| Letter to Shareholders |
April 30, 2016 (Unaudited) |

Dear Fellow Shareholders,
As we write this semi-annual report at halftime of the 2016 U.S. Presidential election season, the domestic economy has continued to chug along at a slow but steady pace, despite the dramatic Presidential primaries and overseas concerns that have dominated the news headlines. This election year has certainly been unpredictable and divisive, and the political climate seems likely to remain very polarizing beyond the November ballot. As we discussed previously, this sustained and resilient recovery seems unloved, despite the American economy being stronger than most other developed nations.
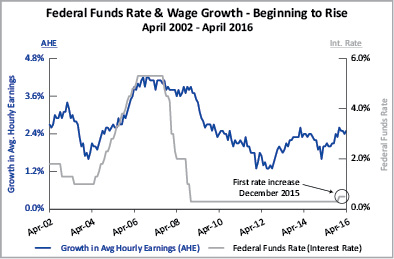
There are always things to worry about: Stock and bond markets have been volatile this year, as investors wavered between domestic optimism and global concern. On balance, the economy seemed stronger than the skittish equity markets, which declined about 10% to start 2016 before rebounding in February and March (see chart to the right). The positives include continued strength in U.S. employment and consumer confidence (see chart below). Additionally, low energy and commodity prices reduced inflation fears and saved consumers money at the gasoline pump. Employees also benefited from higher wages. The negatives include lackluster domestic GDP growth, rising global terrorism, European immigration, ‘Brexit’ concerns and China’s slowing economy.
After almost a decade of stimulating growth in response to the financial meltdown of 2008, the U.S. Federal Reserve finally began raising interest rates to 0.50% on December 16th. However, we will now see how well the Fed navigates the delicate process of 1) raising rates further without slowing this recovery’s growth and 2) staying above the political fray during an election year.
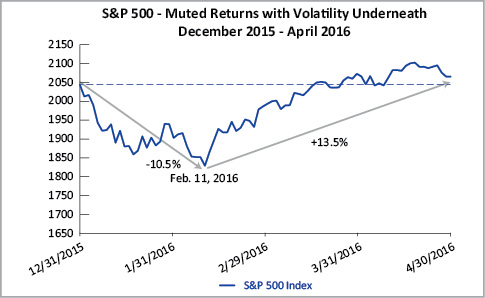
Source: Factset (Data as of 4/30/16; Date Range: 12/31/15-4/30/16)
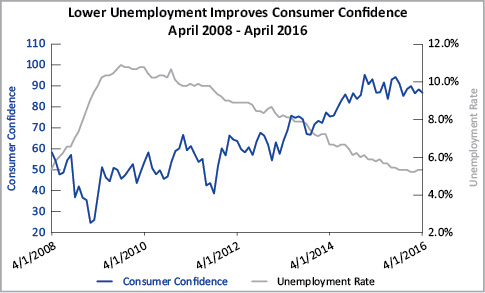
Source: Factset (Data as of 4/30/16; Date Range: 4/30/08-4/30/16)
Past performance is not indicative of future results.
2 | centuryfunds.com |
| Letter to Shareholders |
April 30, 2016 (Unaudited) |
The Fed Funds rate increase decouples the Fed and the U.S. from other nations. In fact, central banks in Japan and Europe have lowered interest rates below zero. These negative interest rates are unprecedented and may perversely encourage investors to buy riskier asset classes. We emphasize that divergent interest rates are an important global issue to monitor this year.
Overall, corporate profit margins remained robust, while earnings have declined over the last few months, due primarily to the drop in the energy sector and the strength of the dollar (which hurts exports). Now that oil prices appear stable and rising, we believe earnings growth will return back to 7%-10% growth over the coming year (see chart to the right). These are encouraging developments that we believe investors may be missing.
Stingy spending in the U.S.? Consumers and corporations seem more cautious in their spending patterns, despite the savings from lower energy prices. Consumers have shifted toward spending more on health care expenses and less in retail stores. Companies reacted to the recent headwinds of rising wage pressures and a strong dollar by investing less in capital expenditures. If consumer wages keep growing above inflation and corporations keep adding jobs, the domestic economy should be able to continue growing at an attractive pace.
The global economic outlook remained weak, which contributed to a global resurgence in authoritarian and populist political leaders. The Eurozone continued to struggle with anemic economic growth, despite multiple rounds of stimulus over the past several years. While lower oil prices and a falling unemployment rate have been positive developments, they have not resulted in significant economic progress. In addition to its economic woes, European headlines were still dominated by the migrant crisis, terrorism and concerns about countries exiting the European Union.
Further east, growth has slowed. China, the world’s second largest economy, continued to battle with slowing GDP, high levels of debt and excess capacity. Japan continued to stagnate as GDP contracted in two of the past four quarters. In an effort to spur economic activity, the Bank of Japan introduced the negative interest rates in late January that we cited earlier.
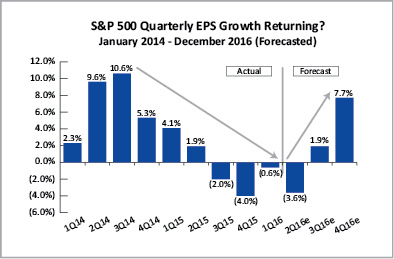
Source: Factset
(Data as of 4/29/16; Date Range: 1/1/14-12/31/16; 2Q16 – 4Q16 are estimates)
Source: Factset
(Data as of 4/29/16; Date Range: 4/30/02-4/29/16)
Past performance is not indicative of future results.
Semi-Annual Report | April 30, 2016 | 3 |
| Letter to Shareholders |
April 30, 2016 (Unaudited) |
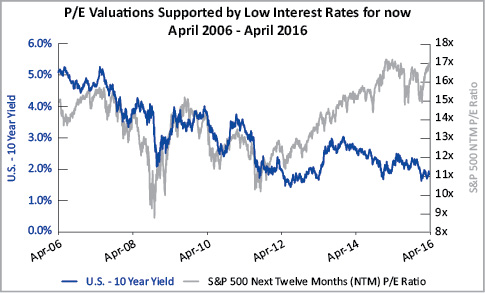
While we are cautious on the global outlook for growth, we continue to be encouraged by the U.S. economy. Current valuations appear fairly full, although we are hopeful that earnings growth will return to historical averages (7%-8% annually) over the coming year. As interest rates are also expected to rise over the next year, investors will focus on the Fed’s ability to manage its dual mandate of full employment and price stability without impeding the domestic economy’s current growth.
In addition, we are confident that the democratic system of free-market capitalism and regulatory transparency remains the most robust and dynamic foundation on which to nurture great ideas into innovative and efficient businesses. The recent rise of authoritarian and populist governments reminds us that the political pendulum continues to shift our view of the world. This stimulating environment of constant change and analysis is the reason why our Century investment team comes to work each day. With interest rates near their lowest levels since World War I, we believe that owning entrepreneurial companies with superior management teams will provide solid investor returns over the next decade. We view a quality-bias and long-term investment horizon as strategic advantages in our investment process.
In the meantime, we believe that success starts with demanding our political leaders to 1) think beyond the next couple elections and 2) be courageous about choosing long-term tax and spending priorities above short-term popularity.
Source: Factset
(Data as of 4/29/16; Date Range: 4/28/06-4/29/16)
Respectfully submitted,

Alexander L. Thorndike
Chairman of the Century Funds
Past performance is not indicative of future results.
4 | centuryfunds.com |
| Fund Commentary |
Century Shares trust | April 30, 2016 (Unaudited) |
HOW DID THE PORTFOLIO PERFORM?
For the six-month period ended April 30, 2016, Century Shares Trust’s shares returned -3.13%, underperforming the Russell 1000 Growth Index (R1000G), the Fund’s benchmark, which returned -1.37%.
WHAT FACTORS INFLUENCED PERFORMANCE?
The top contributors to relative performance on a sector basis were Financials, Consumer Discretionary and Information Technology, resulting mainly from stock selection. The top performing stocks included AT&T, Inc. (telecommunications), Equinix, Inc. (data center services), Dollar Tree, Inc. (discount stores), Panera Bread Company (restaurants) and Verisk Analytics, Inc. (business services). AT&T rallied on their combination with DirecTV uniquely positioning the company across the U.S. and Mexico. Equinix continued to benefit from increased demand for corporate data center space. Dollar Tree lifted from lower energy prices positively impacting their customer base. Panera Bread rose on reports of improving sales. Verisk Analytics benefited from a solid growth outlook.
The top detractors from relative performance on a sector basis were Health Care, Industrials and Materials, resulting mainly from stock selection. The worst performing stocks included Allergan Plc. (pharmaceutical), Apple, Inc. (consumer electronics), Cerner Corp. (health care), Boeing Company (aerospace) and Celgene Corp. (pharmaceutical). Allergan underperformed as the potential acquisition by Pfizer was called off due to the political debate surrounding tax inversions. Apple sold off as iPhone unit sales estimates were reduced. Cerner lagged due to revenue growth concerns. Boeing weakened due to possible accounting probes, competitive pricing pressure and an unexpected layoff announcement. Celgene declined over concerns of its application for the expanded use of the Revlimid drug.
HOW WAS THE PORTFOLIO POSITIONED AT PERIOD END?
The portfolio is diversified across almost every sector while maintaining its largest overweight positions in the Financials and Information Technology sectors. Conversely, the portfolio holds its largest underweight positions in the Health Care and Consumer Staples sectors.
We believe the domestic economy has remained stable. GDP growth has been steady, consumer confidence was high and companies generally continued to generate solid earnings. While the unemployment rate did rise slightly, it is low by historical standards, and there are few signs of inflation. During its March meeting, the Federal Reserve maintained its accommodative positioning, leaving interest rates unchanged after raising them slightly in December.
The Eurozone continued to struggle. Economic growth remained sluggish across the region despite several rounds of monetary stimulus over the past few years. While lower oil prices and a falling unemployment rate are positive developments, they have been insufficient to spur meaningful economic progress. Geopolitically, European headlines continued to be dominated by the migrant crisis and threats by ISIS.
Further east, growth also decelerated. China, the world’s second largest economy, continued to battle with slowing growth, high levels of debt and excess capacity. Japan continued to stagnate despite an extremely accommodating central bank, which introduced negative interest rates in late January with hopes of sparking economic growth.
Despite the challenges to global growth, we remain optimistic about the state of the domestic economy and remain focused on investing in high quality U.S. based companies. Should we see an increase in market volatility, we will approach it as an opportunity to further enhance our portfolio holdings.
Past performance is not indicative of future results. Current performance may be lower or higher than the performance data quoted.
Semi-Annual Report | April 30, 2016 | 5 |
| Fund Commentary |
Century Shares trust | April 30, 2016 (Unaudited) |
Risks: The Fund may invest a significant portion of assets in a limited number of companies or in companies within the same market sector. As a result, the Fund may be more susceptible to financial, market and economic events affecting particular companies or sectors and therefore may experience greater price volatility than funds with more diversified portfolios. Please read the Fund’s prospectus for details regarding the Fund’s risk profile.
Ten Largest Holdings* | |
ALPHABET, INC. Internet Software & Services | 6.06% |
EQUINIX, INC. Real Estate Investment Trust (REITs) | 4.76% |
AMERICAN TOWER CORP. Real Estate Investment Trust (REITs) | 4.72% |
WESTERN UNION CO. IT Services | 4.45% |
VISA, INC., CLASS A IT Services | 4.19% |
UNITED PARCEL SERVICE, INC., CLASS B Air Freight & Logistics | 4.17% |
TWENTY-FIRST CENTURY FOX, INC., CLASS A Media | 4.07% |
APPLE, INC. Technology Hardware, Storage & Peripherals | 4.06% |
VERISK ANALYTICS, INC. Professional Services | 3.99% |
CERNER CORP. Health Care Technology | 3.98% |
Sector Allocation* | |
Information Technology | 26.8% |
Consumer Discretionary | 21.0% |
Financials | 13.3% |
Health Care | 11.2% |
Industrials | 10.9% |
Consumer Staples | 8.7% |
Materials | 2.9% |
Telecommunication Services | 2.1% |
Cash, Cash Equivalents, & Other Net Assets | 3.1% |
*Based on the Fund’s net assets at April 30, 2016 and subject to change.
6 | centuryfunds.com |
| Performance Summary |
Century Shares trust | April 30, 2016 (Unaudited) |
Institutional Shares
The returns shown below represent past performance. Past performance does not guarantee future results. Investment return and principal value of an investment will fluctuate so that an investor’s shares, when sold or redeemed, may be worth more or less than the original cost. Current performance may be higher or lower than the Fund’s past performance. For the most recent month-end performance, please call 800-303-1928.
As stated in the Fund’s current prospectus, the total (gross) operating expenses are 1.11% for the Institutional Shares. The Fund’s total returns include the reinvestment of dividend and capital gain distributions, but have not been adjusted to reflect the deduction of taxes that a shareholder would pay on these distributions or the redemption of Fund shares. Shares held less than 90 days may be subject to a 1% redemption fee.
Average Annual Total Returns April 30, 2016 | ||||
1 Year | 3 Years | 5 Years | 10 Years | |
Century Shares Trust - Institutional Shares (CENSX) | -1.59% | 13.27% | 10.49% | 6.81% |
Russell 1000® Growth Index | 1.07% | 12.47% | 11.44% | 8.20% |
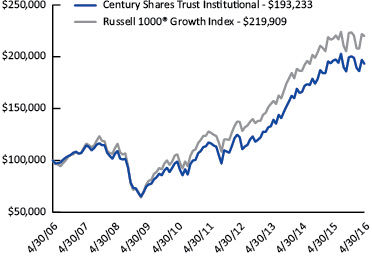
Growth of $100,000 for the 10 year period ended April 30, 2016
| The graph and table reflect the change in value of a hypothetical investment in the Fund, including reinvestment of dividends and distributions, compared with the index. Index returns assume reinvestment of dividends and, unlike Fund returns, do not reflect any fees or expenses. It is not possible to invest directly in an index. Minimum initial investment for Institutional Shares is $100,000. The Russell 1000® Growth Index measures the performance of the large-cap growth segment of the U.S. equity universe. It includes those Russell 1000® companies with higher price-to-book ratios and higher forecasted growth values. |
Semi-Annual Report | April 30, 2016 | 7 |
| Fund Commentary |
Century Small cap select fund | April 30, 2016 (Unaudited) |
HOW DID THE PORTFOLIO PERFORM?
For the six-month period ended April 30, 2016, Century Small Cap Select Fund Institutional Shares returned -6.75% and the Investor Shares returned -6.86%, underperforming the Russell 2000 Growth Index (R2000G), the Fund’s benchmark, which returned -4.97%.
WHAT FACTORS INFLUENCED PERFORMANCE?
The top contributors to relative performance on a sector basis were Health Care (stock selection), Financials (stock selection) and Consumer Staples (sector allocation). The top performing stocks included Cohen & Steers, Inc. (investment management), AMN Healthcare Services, Inc. (health staffing), VCA, Inc. (veterinary services), HMS Holdings Corp. (health IT services) and M/A-COM Technology Solutions Holdings, Inc. (semiconductors). Cohen & Steers reported positive asset flows into their real estate strategies. AMN Healthcare Services rose as demand grew for their physicians and nurses. VCA reported strong operating results. HMS reported a favorable legal settlement and continued momentum in the company’s core growth business. M/A-COM Technology Solutions outperformed as investors recognized the potential revenue growth, and earnings leverage inherent in their business model.
The top detractors from relative performance on a sector basis were Information Technology (stock selection), Industrials (stock selection) and Energy (sector allocation). The worst performing stocks included Anacor Pharmaceuticals, Inc. (pharmaceutical), Demandware, Inc. (IT services), Infinera Corp. (telecommunications), On Assignment, Inc. (staffing) and Greatbatch, Inc. (medical devices). Anacor saw detrimental Medicare reimbursement changes for its Kerydin drug. Demandware reported that new contracts and free cash flow margins were below expectations. Infinera reduced guidance due to slower demand for their optical switches. On Assignment faltered despite delivering favorable earnings results as investors worried that the U.S. employment picture could get worse. Greatbatch delivered weaker than expected earnings results following the recent acquisition of Lakes Region Medical.
HOW WAS THE PORTFOLIO POSITIONED AT PERIOD END?
The portfolio is diversified while currently maintaining its largest overweight positions in the Health Care and Consumer Discretionary sectors. Conversely, the portfolio is most underweight in the Industrials and Consumer Staples sectors.
The U.S. economy has continued to make slow headway despite volatile markets and news headlines. While GDP growth remained below 2%, unemployment and consumer confidence continued to improve. Seven years into this recovery, we are beginning to see more cautious behavior from consumers and corporations, despite lower energy prices. Consumers are saving more and companies are seeing wage pressure rise. As expected, the upcoming 2016 election is increasing political rhetoric and discord. On balance, the economy seemed to be on a stronger foundation than suggested by the skittish equity markets which declined 10% to start the year, before rebounding in March.
The Eurozone, however, has continued to struggle with anemic economic growth. Despite multiple rounds of stimulus over the past several years, the region has yet to see substantial GDP growth. While lower oil prices and a falling unemployment rate are positive developments, they haven’t resulted in significant economic progress. In addition to its economic woes, European headlines remained dominated by the migrant crisis, terrorism and concerns about countries exiting the European Union.
Further east, growth also remained elusive. China, the world’s second largest economy, continued to battle with slowing GDP, high levels of debt and excess capacity. Japan continued to stagnate as GDP contracted in two of the past four quarters. In an effort to spur economic activity, the Bank of Japan introduced negative interest rates in late January.
While we are cautious on the global outlook for growth, we continue to be encouraged by the U.S. economy. Current valuations appear fairly full, and we are hopeful that earnings growth will return to historical averages (7%-8% annually) over the coming year. We are optimistic about the prospects of well run and innovative companies and remain focused on investing in high quality domestic growth corporations.
Past performance is not indicative of future results. Current performance may be lower or higher than the performance data quoted.
8 | centuryfunds.com |
| Fund Commentary |
Century Small cap select fund | April 30, 2016 (Unaudited) |
Risks: The Fund invests in smaller companies which pose greater risks than those associated with larger, more established companies. The Fund may invest a significant portion of assets in securities of companies within the same market sector. If the Fund’s portfolio is over weighted in a sector, any negative development affecting that sector will have a greater impact on the Fund than a fund that is not over weighted in that sector. Please read the Fund’s prospectus for details regarding the Fund’s risk profile.
Ten Largest Holdings* | |
ACADIA HEALTHCARE CO., INC. Health Care Providers & Services | 2.60% |
CYBERARK SOFTWARE LTD. Software | 2.56% |
WNS HOLDINGS LTD., SPONSORED ADR IT Services | 2.45% |
PAYCOM SOFTWARE, INC. Software | 2.35% |
HERMAN MILLER, INC. Commercial Services & Supplies | 2.35% |
ON ASSIGNMENT, INC. Professional Services | 2.31% |
CALATLANTIC GROUP, INC. Household Durables | 2.31% |
AMN HEALTHCARE SERVICES, INC. Health Care Providers & Services | 2.30% |
GRAND CANYON EDUCATION, INC. Diversified Consumer Services | 2.30% |
SONIC CORP. Hotels, Restaurants & Leisure | 2.29% |
Sector Allocation* | |
Health Care | 27.4% |
Information Technology | 23.0% |
Consumer Discretionary | 19.8% |
Industrials | 11.0% |
Financials | 7.0% |
Materials | 4.1% |
Consumer Staples | 2.1% |
Energy | 1.5% |
Cash, Cash Equivalents, & Other Net Assets | 4.1% |
*Based on the Fund’s net assets at April 30, 2016 and subject to change.
Semi-Annual Report | April 30, 2016 | 9 |
| Performance Summary |
Century Small cap select fund | April 30, 2016 (Unaudited) |
Institutional Shares and Investor Shares
The returns shown below represent past performance. Past performance does not guarantee future results. Investment return and principal value of an investment will fluctuate so that an investor’s shares, when sold or redeemed, may be worth more or less than the original cost. Current performance may be higher or lower than the Fund’s past performance. For the most recent month-end performance, please call 800-303-1928.
As stated in the Fund’s current prospectus, the total (gross) operating expenses are 1.13% for the Institutional Shares and 1.42% for the Investor Shares. Returns would have been lower during the 10 year period if certain fees had not been waived or expenses reimbursed. The Fund’s total returns include the reinvestment of dividend and capital gain distributions, but have not been adjusted to reflect the deduction of taxes that a shareholder would pay on these distributions or the redemption of Fund shares. Shares held less than 90 days may be subject to a 1% redemption fee.
Average Annual Total Returns April 30, 2016 | ||||
1 Year | 3 Years | 5 Years | 10 Years | |
Century Small Cap Select Fund - Institutional Shares (CSMCX) | -11.10% | 5.69% | 4.84% | 4.75% |
Century Small Cap Select Fund - Investor Shares (CSMVX) | -11.37% | 5.37% | 4.50% | 4.40% |
Russell 2000® Growth Index | -8.27% | 8.50% | 7.15% | 6.14% |
Growth of $100,000 for the 10 year period ended April 30, 2016
Institutional Shares
| Growth of $10,000 for the 10 year period ended April 30, 2016
|
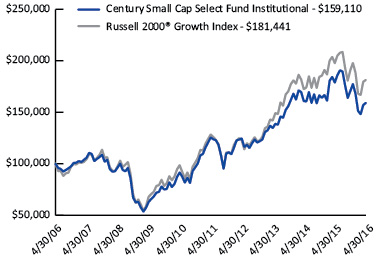
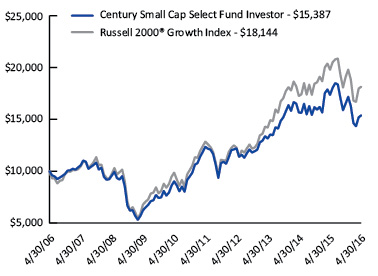
The graphs and table reflect the change in value of a hypothetical investment in the Fund, including reinvestment of dividends and distributions, compared with the index. Index returns assume reinvestment of dividends and, unlike Fund returns, do not reflect any fees or expenses. It is not possible to invest directly in an index. Minimum initial investment for Institutional Shares is $100,000.
The Russell 2000® Growth Index measures the performance of the small-cap growth segment of the U.S. equity universe. It includes those Russell 2000® companies with higher price-to-value ratios and higher forecasted growth values. Index returns assume reinvestment of dividends but, unlike Fund returns, do not reflect fees or expenses. One cannot invest directly in an index.
10 | centuryfunds.com |
| Fund Commentary |
Century growth opportunities fund | April 30, 2016 (Unaudited) |
HOW DID THE PORTFOLIO PERFORM?
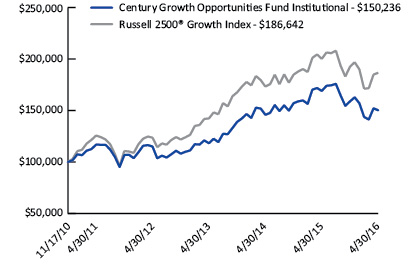
For the six-month period ended April 30, 2016, Century Growth Opportunities Fund Institutional Shares returned -5.42%, underperforming the Russell 2500 Growth Index (R2500G), which returned -3.05%.
WHAT FACTORS INFLUENCED PERFORMANCE?
The top contributors to relative performance on a sector basis were Health Care, Telecommunication Services and Energy, resulting mainly from stock selection. Top performing stocks on an absolute basis included Lululemon Athletica, Inc. (apparel), Jarden Corp. (consumer products), HMS Holdings Corp. (health IT services), Cogent Communications Holdings, Inc. (telecommunication services) and BroadSoft, Inc. (telecommunication services). Luluemon has been benefitting from the increasing trend of consumers wearing athletic apparel for everyday use. Jarden was acquired by Newell Rubbermaid. HMS reported a favorable legal settlement and continued momentum in the company’s core growth business. Cogent reported better than expected earnings driven by increasing demand for high speed bandwidth. BroadSoft, Inc. reported better than expected earnings driven by the adoption of unified communications software platforms as replacements for hardware-based voice switches.
The top detractors from relative performance on a sector basis were Information Technology (stock selection), Industrials (stock selection) and Materials (sector allocation). The worst performing stocks on an absolute basis included PRA Group, Inc. (business services), Eagle Pharmaceuticals, Inc. (pharmaceutical), Anacor Pharmaceuticals, Inc. (pharmaceutical), Infinera Corp. (networking) and Greatbatch, Inc. (medical devices). PRA Group lagged due to weaker than expected earnings results. Eagle declined based on two disappointing FDA decisions. Anacor saw detrimental Medicare reimbursement changes for its Kerydin drug. Infinera reduced guidance due to slower demand for their optical switches from service providers. Greatbatch delivered weaker than expected earnings results following its recent acquisition of Lakes Region Medical.
HOW WAS THE PORTFOLIO POSITIONED AT PERIOD END?
The portfolio is diversified while currently maintaining its largest overweight positions in the Information Technology and Health Care sectors. Conversely, the portfolio is most underweight in the Materials and Financials sectors.
From our perspective, the U.S. economy remains in better shape than the rest of the world. At the start of the year, the Federal Reserve implied that they would raise interest rates multiple times over the course of 2016. Recent pronouncements suggest that rate increases will now be limited to one or two at most during the year. This shift has resulted in a recent decline of the U.S. dollar. Additionally, more speculative market segments, including biotechnology, have recently rebounded, buoyed by the continued prospects of a low interest rate environment.
European economic data has continued to reflect tepid growth, while the Japanese economy has continued to muddle along. It remains to be seen if the current round of stimulus measures in Japan (Abenomics) will be successful in accelerating economic growth.
The Chinese economy has become an increasing source of concern, which is also impacting emerging markets that depend upon commodity exports to China. Lower energy prices should continue to aid consumer spending, although oil prices have recently bounced from their February lows. With these factors in mind, we continue to search for companies with sustainable secular growth drivers that we believe are trading at reasonable valuations.
Past performance is not indicative of future results. Current performance may be lower or higher than the performance data quoted.
Semi-Annual Report | April 30, 2016 | 11 |
| Fund Commentary |
Century growth opportunities fund | April 30, 2016 (Unaudited) |
Risks: The Fund invests mainly in small-cap and mid-cap companies, which, historically, have been more volatile in price than the stocks of large-cap companies. The Fund may invest in foreign companies, which involves risks not associated with investing solely in U.S. companies, such as currency fluctuations, unfavorable political developments, or economic instability. These risks are magnified in emerging markets. Please read the Fund’s prospectus for details regarding the Fund’s risk profile.
Ten Largest Holdings* | |
HMS HOLDINGS CORP. Health Care Technology | 2.51% |
UNIVERSAL HEALTH SERVICES, INC., CLASS B Health Care Providers & Services | 2.30% |
PAYCOM SOFTWARE, INC. Software | 2.26% |
CAMBREX CORP. Life Sciences Tools & Services | 2.23% |
CARDTRONICS, INC. IT Services | 2.22% |
ARAMARK Hotels, Restaurants & Leisure | 2.22% |
SENSIENT TECHNOLOGIES CORP. Chemicals | 2.19% |
GLOBUS MEDICAL, INC., CLASS A Health Care Equipment & Supplies | 2.17% |
STERIS PLC Health Care Equipment & Supplies | 2.17% |
GRAND CANYON EDUCATION, INC. Diversified Consumer Services | 2.16% |
Sector Allocation* | |
Information Technology | 26.7% |
Health Care | 21.3% |
Consumer Discretionary | 19.2% |
Industrials | 14.5% |
Financials | 6.3% |
Consumer Staples | 2.7% |
Energy | 2.6% |
Materials | 2.2% |
Telecommunication Services | 2.1% |
Cash, Cash Equivalents, & Other Net Assets | 2.4% |
*Based on the Fund’s net assets at April 30, 2016 and subject to change.
12 | centuryfunds.com |
| Performance Summary |
Century growth opportunities fund | April 30, 2016 (Unaudited) |
Institutional Shares
The returns shown below represent past performance. Past performance does not guarantee future results. Investment return and principal value of an investment will fluctuate so that an investor’s shares, when sold or redeemed, may be worth more or less than the original cost. Current performance may be higher or lower than the Fund’s past performance. For the most recent month-end performance, please call 800-303-1928.
As stated in the Fund’s current prospectus, the total (gross) operating expenses are 1.12%. The Adviser has agreed contractually to limit the operating expenses for the Fund’s Institutional Shares to 0.99% through February 28, 2017. Returns would have been lower during all periods if certain fees had not been waived or expenses reimbursed. The Fund’s total returns include the reinvestment of dividend and capital gain distributions, but have not been adjusted to reflect the deduction of taxes that a shareholder would pay on these distributions or the redemption of Fund shares. Shares held less than 90 days may be subject to a 1% redemption fee.
Average Annual Total Returns April 30, 2016 | ||||
1 Year | 3 Years | 5 Years | Since Inception* | |
Century Growth Opportunities Fund - Institutional Shares (CGOIX) | -11.11% | 8.32% | 5.16% | 7.76% |
Russell 2500® Growth Index | -6.76% | 9.47% | 8.23% | 12.13% |
* Fund inception date of November 17, 2010.
Growth of $100,000 for the period ended April 30, 2016
| The graph and table reflect the change in value of a hypothetical investment in the Fund, including reinvestment of dividends and distributions, compared with the index. Index returns assume reinvestment of dividends and, unlike Fund returns, do not reflect any fees or expenses. It is not possible to invest directly in an index. Minimum initial investment for Institutional Shares is $100,000.
The Russell 2500® Growth Index measures the performance of the small- to mid-cap growth segment of the U.S. equity universe. It includes those Russell 2500 companies with higher price-to-book ratios and higher forecasted growth values. Index returns assume reinvestment of dividends but, unlike Fund returns, do not reflect fees or expenses. One cannot invest directly in an index. |
Semi-Annual Report | April 30, 2016 | 13 |
| Portfolio of Investments |
Century Shares trust | April 30, 2016 (Unaudited) |
| Shares | Value | ||||||
| COMMON STOCKS - 96.9% | |||||||
| Consumer Discretionary - 21.0% | |||||||
| Auto Components - 3.4% | |||||||
| 199,910 | BorgWarner, Inc. | $ | 7,180,767 | ||||
| Hotels, Restaurants & Leisure - 4.9% | |||||||
| 19,171 | Panera Bread Co., Class A(a) | 4,111,988 | |||||
| 109,846 | Starbucks Corp. | 6,176,640 | |||||
| 10,288,628 | |||||||
| Internet & Catalog Retail - 3.6% | |||||||
| 11,579 | Amazon.com, Inc.(a) | 7,637,393 | |||||
| Media - 4.1% | |||||||
| 282,494 | Twenty-First Century Fox, Inc., Class A | 8,548,268 | |||||
| Multiline Retail - 2.3% | |||||||
| 60,753 | Dollar Tree, Inc.(a) | 4,842,622 | |||||
| Specialty Retail - 2.7% | |||||||
| 41,995 | Home Depot, Inc. | 5,622,711 | |||||
| Total Consumer Discretionary | 44,120,389 | ||||||
| Consumer Staples - 8.7% | |||||||
| Beverages - 3.1% | |||||||
| 63,109 | PepsiCo, Inc. | 6,497,703 | |||||
| Food & Staples Retailing - 2.5% | |||||||
| 52,964 | CVS Health Corp. | 5,322,882 | |||||
| Food Products - 3.1% | |||||||
| 153,296 | Hain Celestial Group, Inc.(a) | 6,416,970 | |||||
| Total Consumer Staples | 18,237,555 | ||||||
| Financials - 13.3% | |||||||
| Diversified Financial Services - 3.8% | |||||||
| 4 | Berkshire Hathaway, Inc., Class A(a) | 876,000 | |||||
| 75,358 | Moody’s Corp. | 7,213,268 | |||||
| 8,089,268 | |||||||
| Real Estate Investment Trust (REITs) - 9.5% | |||||||
| 94,473 | American Tower Corp. | 9,908,328 | |||||
| 30,224 | Equinix, Inc. | 9,984,498 | |||||
| 19,892,826 | |||||||
| Total Financials | 27,982,094 | ||||||
| Health Care - 11.2% | |||||||
| Biotechnology - 2.5% | |||||||
| 49,875 | Celgene Corp.(a) | 5,157,574 | |||||
| Health Care Providers & Services - 1.8% | |||||||
| 52,351 | Express Scripts Holding Co.(a) | 3,859,839 | |||||
| Health Care Technology - 4.0% | |||||||
| 148,942 | Cerner Corp.(a) | 8,361,604 | |||||
| Pharmaceuticals - 2.9% | |||||||
| 28,578 | Allergan PLC(a) | 6,188,852 | |||||
| Total Health Care | 23,567,869 | ||||||
| Industrials - 10.9% | |||||||
| Air Freight & Logistics - 4.2% | |||||||
| 83,218 | United Parcel Service, Inc., Class B | 8,743,715 | |||||
| Professional Services - 6.7% | |||||||
| 150,379 | Robert Half International, Inc. | 5,761,020 | |||||
| 107,988 | Verisk Analytics, Inc.(a) | 8,377,709 | |||||
| 14,138,729 | |||||||
| Total Industrials | 22,882,444 | ||||||
| Information Technology - 26.8% | |||||||
| Internet Software & Services - 6.1% | |||||||
| 8,952 | Alphabet, Inc., Class A(a) | 6,336,942 | |||||
| 9,212 | Alphabet, Inc., Class C(a) | 6,384,008 | |||||
| 12,720,950 | |||||||
| IT Services - 8.6% | |||||||
| 113,940 | Visa, Inc., Class A | 8,800,725 | |||||
| 466,595 | Western Union Co. | 9,331,900 | |||||
| 18,132,625 | |||||||
| Software - 8.0% | |||||||
| 54,872 | Adobe Systems, Inc.(a) | 5,170,040 | |||||
| 62,681 | Citrix Systems, Inc.(a) | 5,129,813 | |||||
| 131,194 | Microsoft Corp. | 6,542,645 | |||||
| 16,842,498 | |||||||
| Technology Hardware, Storage & Peripherals - 4.1% | |||||||
| 91,015 | Apple, Inc. | 8,531,746 | |||||
| Total Information Technology | 56,227,819 | ||||||
See Notes to Financial Statements | |
14 | centuryfunds.com |
| Portfolio of Investments |
Century Shares trust | April 30, 2016 (Unaudited) |
| Shares | Value | ||||||
| Materials - 2.9% | |||||||
| Chemicals - 2.9% | |||||||
| 73,386 | LyondellBasell Industries NV, Class A | $ | 6,066,821 | ||||
| Telecommunication Services - 2.1% | |||||||
| Diversified Telecommunication Services - 2.1% | |||||||
| 112,616 | AT&T, Inc. | 4,371,753 | |||||
| TOTAL COMMON STOCKS | |||||||
| (Cost $150,700,484) | 203,456,744 | ||||||
| SHORT-TERM INVESTMENTS - 3.2% | |||||||
| Money Market Fund - 3.2% | |||||||
| 6,665,219 | State Street Institutional U.S. Government Money Market Fund - Investment Class (0.34% 7 Day Yield) | 6,665,219 | |||||
| TOTAL SHORT-TERM INVESTMENTS | |||||||
| (Cost $6,665,219) | 6,665,219 | ||||||
| TOTAL INVESTMENTS - 100.1% | |||||||
| (Cost, $157,365,703) | 210,121,963 | ||||||
| Liabilities in Excess of Other Assets - (0.1%) | (194,612 | ) | |||||
| NET ASSETS - 100.0% | $ | 209,927,351 | |||||
(a) | Non-income producing security. |
| Abbreviations: | ||
| NV | - | Naamloze Vennootschap (Dutch: Limited Liability Company) |
| PLC | - | Public Limited Company |
See Notes to Financial Statements | |
Semi-Annual Report | April 30, 2016 | 15 |
| Portfolio of Investments |
Century Small cap select fund | April 30, 2016 (Unaudited) |
| Shares | Value | ||||||
| COMMON STOCKS - 95.9% | |||||||
| Consumer Discretionary - 19.8% | |||||||
| Auto Components - 2.6% | |||||||
| 65,965 | Gentherm, Inc.(a) | $ | 2,423,554 | ||||
| 141,801 | Metaldyne Performance Group, Inc. | 2,258,890 | |||||
| 4,682,444 | |||||||
| Diversified Consumer Services - 3.4% | |||||||
| 30,080 | Bright Horizons Family Solutions, Inc.(a) | 1,973,850 | |||||
| 95,650 | Grand Canyon Education, Inc.(a) | 4,182,774 | |||||
| 6,156,624 | |||||||
| Hotels, Restaurants & Leisure - 5.9% | |||||||
| 186,382 | Ruth’s Hospitality Group, Inc. | 2,959,746 | |||||
| 121,260 | Sonic Corp. | 4,167,706 | |||||
| 27,637 | Vail Resorts, Inc. | 3,582,861 | |||||
| 10,710,313 | |||||||
| Household Durables - 2.3% | |||||||
| 129,783 | CalAtlantic Group, Inc. | 4,201,076 | |||||
| Multiline Retail - 1.7% | |||||||
| 68,504 | Big Lots, Inc. | 3,141,594 | |||||
| Specialty Retail - 1.9% | |||||||
| 32,120 | Burlington Stores, Inc.(a) | 1,829,876 | |||||
| 70,996 | DSW, Inc., Class A | 1,744,372 | |||||
| 3,574,248 | |||||||
| Textiles, Apparel & Luxury Goods - 2.0% | |||||||
| 62,427 | Columbia Sportswear Co. | 3,656,349 | |||||
| Total Consumer Discretionary | 36,122,648 | ||||||
| Consumer Staples - 2.1% | |||||||
| Food & Staples Retailing - 2.1% | |||||||
| 34,583 | Casey’s General Stores, Inc. | 3,873,296 | |||||
| Energy - 1.5% | |||||||
| Energy Equipment & Services - 0.4% | |||||||
| 48,338 | Superior Energy Services, Inc. | 814,979 | |||||
| Oil, Gas & Consumable Fuels - 1.1% | |||||||
| 92,430 | Matador Resources Co.(a) | 1,991,866 | |||||
| Total Energy | 2,806,845 | ||||||
| Financials - 7.0% | |||||||
| Banks - 2.1% | |||||||
| 141,556 | Berkshire Hills Bancorp, Inc. | 3,841,830 | |||||
| Capital Markets - 1.7% | |||||||
| 79,176 | Cohen & Steers, Inc. | 3,109,241 | |||||
| Consumer Finance - 0.9% | |||||||
| 50,014 | PRA Group, Inc.(a) | 1,659,465 | |||||
| Real Estate Investment Trusts (REITs) - 2.3% | |||||||
| 83,604 | QTS Realty Trust, Inc., Class A | 4,048,106 | |||||
| Total Financials | 12,658,642 | ||||||
| Health Care - 27.4% | |||||||
| Biotechnology - 1.3% | |||||||
| 38,787 | Anacor Pharmaceuticals, Inc.(a) | 2,433,496 | |||||
| Health Care Equipment & Supplies - 5.4% | |||||||
| 118,388 | Globus Medical, Inc., Class A(a) | 2,964,436 | |||||
| 42,891 | Inogen, Inc.(a) | 2,095,654 | |||||
| 122,709 | Merit Medical Systems, Inc.(a) | 2,484,857 | |||||
| 30,952 | West Pharmaceutical Services, Inc. | 2,203,783 | |||||
| 9,748,730 | |||||||
| Health Care Providers & Services - 13.0% | |||||||
| 74,916 | Acadia Healthcare Co., Inc.(a) | 4,733,942 | |||||
| 50,294 | Adeptus Health, Inc., Class A(a) | 3,426,027 | |||||
| 87,916 | Almost Family, Inc.(a) | 3,693,351 | |||||
| 118,039 | AMN Healthcare Services, Inc.(a) | 4,191,565 | |||||
| 63,061 | Diplomat Pharmacy, Inc.(a) | 1,910,118 | |||||
| 104,614 | PharMerica Corp.(a) | 2,473,075 | |||||
| 51,849 | VCA, Inc.(a) | 3,264,932 | |||||
| 23,693,010 | |||||||
| Health Care Technology - 1.8% | |||||||
| 190,366 | HMS Holdings Corp.(a) | 3,215,282 | |||||
| Life Sciences Tools & Services - 5.2% | |||||||
| 77,191 | Cambrex Corp.(a) | 3,723,694 | |||||
| 38,423 | Charles River Laboratories International, Inc.(a) | 3,045,791 | |||||
| 39,857 | ICON PLC(a) | 2,693,536 | |||||
| 9,463,021 | |||||||
| Pharmaceuticals - 0.7% | |||||||
| 51,708 | Dermira, Inc.(a) | 1,307,695 | |||||
| Total Health Care | 49,861,234 | ||||||
See Notes to Financial Statements | |
16 | centuryfunds.com |
| Portfolio of Investments |
Century Small cap select fund | April 30, 2016 (Unaudited) |
| Shares | Value | ||||||
| Industrials - 11.0% | |||||||
| Building Products - 1.0% | |||||||
| 50,506 | Simpson Manufacturing Co., Inc. | $ | 1,899,026 | ||||
| Commercial Services & Supplies - 2.3% | |||||||
| 141,721 | Herman Miller, Inc. | 4,275,722 | |||||
| Construction & Engineering - 1.2% | |||||||
| 48,496 | Granite Construction, Inc. | 2,162,437 | |||||
| Machinery - 1.1% | |||||||
| 21,320 | Greenbrier Companies, Inc. | 639,387 | |||||
| 21,628 | Proto Labs, Inc.(a) | 1,294,003 | |||||
| 1,933,390 | |||||||
| Professional Services - 2.3% | |||||||
| 116,575 | On Assignment, Inc.(a) | 4,203,694 | |||||
| Road & Rail - 2.0% | |||||||
| 123,848 | Saia, Inc.(a) | 3,581,684 | |||||
| Trading Companies & Distributors - 1.1% | |||||||
| 26,282 | MSC Industrial Direct Co., Inc., Class A | 2,036,855 | |||||
| Total Industrials | 20,092,808 | ||||||
| Information Technology - 23.0% | |||||||
| Communications Equipment - 1.1% | |||||||
| 161,129 | Infinera Corp.(a) | 1,915,824 | |||||
| Internet Software & Services - 1.9% | |||||||
| 53,237 | j2 Global, Inc. | 3,381,614 | |||||
| IT Services - 5.9% | |||||||
| 35,844 | EPAM Systems, Inc.(a) | 2,614,103 | |||||
| 265,416 | PFSweb, Inc.(a) | 3,742,366 | |||||
| 140,880 | WNS Holdings Ltd., Sponsored ADR(a) | 4,464,487 | |||||
| 10,820,956 | |||||||
| Semiconductors & Semiconductor Equipment - 4.3% | |||||||
| 104,175 | Inphi Corp.(a) | 3,090,872 | |||||
| 61,793 | Integrated Device Technology, Inc.(a) | 1,191,369 | |||||
| 85,720 | M/A-COM Technology Solutions Holdings, Inc.(a) | 3,505,091 | |||||
| 7,787,332 | |||||||
| Software - 9.8% | |||||||
| 113,928 | CyberArk Software Ltd.(a) | 4,652,820 | |||||
| 95,593 | Gigamon, Inc.(a) | 3,115,376 | |||||
| 112,187 | Paycom Software, Inc.(a) | 4,286,665 | |||||
| 146,955 | RingCentral, Inc., Class A(a) | 2,803,901 | |||||
| 174,161 | VASCO Data Security International, Inc.(a) | 3,018,210 | |||||
| 17,876,972 | |||||||
| Total Information Technology | 41,782,698 | ||||||
| Materials - 4.1% | |||||||
| Chemicals - 4.1% | |||||||
| 62,894 | Balchem Corp. | 3,859,176 | |||||
| 51,617 | The Scotts Miracle-Gro Co., Class A | 3,653,451 | |||||
| 7,512,627 | |||||||
| Total Materials | 7,512,627 | ||||||
| TOTAL COMMON STOCKS | |||||||
| (Cost $151,657,837) | 174,710,798 | ||||||
| SHORT-TERM INVESTMENTS - 3.2% | |||||||
| Money Market Fund - 3.2% | |||||||
| 5,726,271 | State Street Institutional U.S. Government Money Market Fund - Investment Class (0.34% 7 Day Yield) | 5,726,271 | |||||
| TOTAL SHORT-TERM INVESTMENTS | |||||||
| (Cost $5,726,271) | 5,726,271 | ||||||
| TOTAL INVESTMENTS - 99.1% | |||||||
| (Cost, $157,384,108) | 180,437,069 | ||||||
| Other Assets in Excess of Liabilities - 0.9% | 1,664,235 | ||||||
| NET ASSETS - 100.0% | $ | 182,101,304 | |||||
(a) | Non-income producing security. |
| Abbreviations: | ||
| ADR | - | American Depositary Receipt |
| Ltd. | - | Limited |
| PLC | - | Public Limited Company |
See Notes to Financial Statements | |
Semi-Annual Report | April 30, 2016 | 17 |
| Portfolio of Investments |
Century growth opportunities Fund | April 30, 2016 (Unaudited) |
| Shares | Value | ||||||
| COMMON STOCKS - 97.6% | |||||||
| Consumer Discretionary - 19.2% | |||||||
| Diversified Consumer Services - 4.2% | |||||||
| 38,608 | Grand Canyon Education, Inc.(a) | $ | 1,688,328 | ||||
| 41,746 | ServiceMaster Global Holdings, Inc.(a) | 1,599,707 | |||||
| 3,288,035 | |||||||
| Hotels, Restaurants & Leisure - 3.2% | |||||||
| 51,804 | Aramark | 1,735,952 | |||||
| 14,797 | Choice Hotels International, Inc. | 749,616 | |||||
| 2,485,568 | |||||||
| Household Durables - 1.4% | |||||||
| 62,240 | PulteGroup, Inc. | 1,144,594 | |||||
| Media - 2.1% | |||||||
| 125,826 | Gray Television, Inc.(a) | 1,616,864 | |||||
| Specialty Retail - 4.2% | |||||||
| 46,982 | Francesca’s Holdings Corp.(a) | 779,901 | |||||
| 37,973 | GNC Holdings, Inc., Class A | 925,022 | |||||
| 7,602 | Ulta Salon, Cosmetics & Fragrance, Inc.(a) | 1,583,345 | |||||
| 3,288,268 | |||||||
| Textiles, Apparel & Luxury Goods - 4.1% | |||||||
| 53,622 | Hanesbrands, Inc. | 1,556,646 | |||||
| 25,554 | lululemon athletica, Inc.(a) | 1,675,065 | |||||
| 3,231,711 | |||||||
| Total Consumer Discretionary | 15,055,040 | ||||||
| Consumer Staples - 2.7% | |||||||
| Food & Staples Retailing - 1.7% | |||||||
| 37,402 | United Natural Foods, Inc.(a) | 1,334,129 | |||||
| Food Products - 1.0% | |||||||
| 18,784 | WhiteWave Foods Co.(a) | 755,305 | |||||
| Total Consumer Staples | 2,089,434 | ||||||
| Energy - 2.6% | |||||||
| Energy Equipment & Services - 1.1% | |||||||
| 52,483 | Superior Energy Services, Inc. | 884,863 | |||||
| Oil, Gas & Consumable Fuels - 1.5% | |||||||
| 54,394 | Matador Resources Co.(a) | 1,172,191 | |||||
| Total Energy | 2,057,054 | ||||||
| Financials - 6.3% | |||||||
| Banks - 2.1% | |||||||
| 40,236 | PrivateBancorp, Inc. | 1,674,220 | |||||
| Real Estate Investment Trusts (REITs) - 4.2% | |||||||
| 26,754 | CubeSmart | 792,186 | |||||
| 27,086 | Healthcare Trust of America, Inc., Class A | 782,515 | |||||
| 26,956 | Lamar Advertising Co., Class A | 1,672,350 | |||||
| 3,247,051 | |||||||
| Total Financials | 4,921,271 | ||||||
| Health Care - 21.3% | |||||||
| Biotechnology - 1.1% | |||||||
| 13,182 | Anacor Pharmaceuticals, Inc.(a) | 827,039 | |||||
| Health Care Equipment & Supplies - 8.4% | |||||||
| 10,148 | Cooper Companies, Inc. | 1,553,456 | |||||
| 67,911 | Globus Medical, Inc., Class A(a) | 1,700,491 | |||||
| 20,000 | Masimo Corp.(a) | 867,000 | |||||
| 36,193 | Merit Medical Systems, Inc.(a) | 732,908 | |||||
| 23,989 | STERIS PLC | 1,695,303 | |||||
| 6,549,158 | |||||||
| Health Care Providers & Services - 7.1% | |||||||
| 15,726 | Adeptus Health, Inc., Class A(a) | 1,071,255 | |||||
| 25,232 | Almost Family, Inc.(a) | 1,059,996 | |||||
| 13,455 | Universal Health Services, Inc., Class B | 1,798,665 | |||||
| 26,337 | VCA, Inc.(a) | 1,658,441 | |||||
| 5,588,357 | |||||||
| Health Care Technology - 2.5% | |||||||
| 116,231 | HMS Holdings Corp.(a) | 1,963,141 | |||||
| Life Sciences Tools & Services - 2.2% | |||||||
| 36,109 | Cambrex Corp.(a) | 1,741,898 | |||||
| Total Health Care | 16,669,593 | ||||||
| Industrials - 14.5% | |||||||
| Building Products - 3.2% | |||||||
| 25,681 | Allegion PLC | 1,680,821 | |||||
| 21,951 | Simpson Manufacturing Co., Inc. | 825,358 | |||||
| 2,506,179 | |||||||
See Notes to Financial Statements | |
18 | centuryfunds.com |
| Portfolio of Investments |
Century growth opportunities Fund | April 30, 2016 (Unaudited) |
| Shares | Value | ||||||
| Commercial Services & Supplies - 2.0% | |||||||
| 21,775 | G&K Services, Inc., Class A | $ | 1,538,404 | ||||
| Construction & Engineering - 1.5% | |||||||
| 26,748 | Granite Construction, Inc. | 1,192,693 | |||||
| Machinery - 3.9% | |||||||
| 10,177 | Nordson Corp. | 780,881 | |||||
| 12,299 | Proto Labs, Inc.(a) | 735,849 | |||||
| 9,519 | Snap-on, Inc. | 1,516,187 | |||||
| 3,032,917 | |||||||
| Road & Rail - 3.9% | |||||||
| 16,212 | Kansas City Southern | 1,536,087 | |||||
| 23,386 | Old Dominion Freight Line, Inc.(a) | 1,544,645 | |||||
| 3,080,732 | |||||||
| Total Industrials | 11,350,925 | ||||||
| Information Technology - 26.7% | |||||||
| Communications Equipment - 1.6% | |||||||
| 105,373 | Infinera Corp.(a) | 1,252,885 | |||||
| Electronic Equipment, Instruments & Components - 1.2% | |||||||
| 10,587 | IPG Photonics Corp.(a) | 917,575 | |||||
| IT Services - 8.4% | |||||||
| 44,114 | Cardtronics, Inc.(a) | 1,738,974 | |||||
| 21,649 | EPAM Systems, Inc.(a) | 1,578,862 | |||||
| 21,542 | Global Payments, Inc. | 1,554,901 | |||||
| 52,758 | WNS Holdings Ltd., Sponsored ADR(a) | 1,671,901 | |||||
| 6,544,638 | |||||||
| Semiconductors & Semiconductor Equipment - 3.8% | |||||||
| 49,573 | Inphi Corp.(a) | 1,470,831 | |||||
| 37,987 | M/A-COM Technology Solutions Holdings, Inc.(a) | 1,553,289 | |||||
| 3,024,120 | |||||||
| Software - 11.7% | |||||||
| 39,818 | BroadSoft, Inc.(a) | 1,559,472 | |||||
| 39,829 | CyberArk Software Ltd.(a) | 1,626,616 | |||||
| 40,278 | Fleetmatics Group PLC(a) | 1,460,078 | |||||
| 47,438 | Gigamon, Inc.(a) | 1,546,004 | |||||
| 46,298 | Paycom Software, Inc.(a) | 1,769,047 | |||||
| 69,761 | VASCO Data Security International, Inc.(a) | 1,208,958 | |||||
| 9,170,175 | |||||||
| Total Information Technology | 20,909,393 | ||||||
| Materials - 2.2% | |||||||
| Chemicals - 2.2% | |||||||
| 25,525 | Sensient Technologies Corp. | 1,716,556 | |||||
| Telecommunication Services - 2.1% | |||||||
| Diversified Telecommunication Services - 2.1% | |||||||
| 41,457 | Cogent Communications Holdings, Inc. | 1,604,386 | |||||
| TOTAL COMMON STOCKS | |||||||
| (Cost $67,504,270) | 76,373,652 | ||||||
| SHORT-TERM INVESTMENTS - 2.8% | |||||||
| Money Market Fund - 2.8% | |||||||
| 2,185,093 | State Street Institutional U.S. Government Money Market Fund - Investment Class (0.34% 7 Day Yield) | 2,185,093 | |||||
| TOTAL SHORT-TERM INVESTMENTS | |||||||
| (Cost $2,185,093) | 2,185,093 | ||||||
| TOTAL INVESTMENTS - 100.4% | |||||||
| (Cost, $69,689,363) | 78,558,745 | ||||||
| Liabilities in Excess of Other Assets - (0.4%) | (328,853 | ) | |||||
| NET ASSETS - 100.0% | $ | 78,229,892 | |||||
(a) | Non-income producing security. |
| Abbreviations: | ||
| ADR | - | American Depositary Receipt |
| Ltd. | - | Limited |
| PLC | - | Public Limited Company |
See Notes to Financial Statements | |
Semi-Annual Report | April 30, 2016 | 19 |
| Statements of Assets and Liabilities |
April 30, 2016 (Unaudited) |
Century | Century | Century Growth Opportunities | ||||||||||
ASSETS: | ||||||||||||
Investments, at value (Note 1) (cost - see below) | $ | 210,121,963 | $ | 180,437,069 | $ | 78,558,745 | ||||||
Receivable for investments sold | – | 3,832,227 | 1,507,905 | |||||||||
Receivable for fund shares subscribed | 4,143 | 246,489 | 72,596 | |||||||||
Dividends receivable | 104,370 | 20,833 | 3,529 | |||||||||
Prepaid expenses | 17,321 | 21,427 | 6,519 | |||||||||
Total Assets | 210,247,797 | 184,558,045 | 80,149,294 | |||||||||
LIABILITIES: | ||||||||||||
Payable to Affiliates: | ||||||||||||
Investment adviser fees (Note 4) | 141,069 | 143,201 | 42,313 | |||||||||
Administration fees (Note 5) | 17,634 | – | 6,503 | |||||||||
Distribution and service fees (Note 6) | – | 27,693 | – | |||||||||
Payable for investments purchased | – | 2,094,948 | 1,819,725 | |||||||||
Payable for shares redeemed | 79,249 | 80,763 | – | |||||||||
Payable to trustees | 14,319 | 29,975 | 6,894 | |||||||||
Payable for professional fees | 34,463 | 38,100 | 29,401 | |||||||||
Accrued expenses and other liabilities | 33,712 | 42,061 | 14,566 | |||||||||
Total Liabilities | 320,446 | 2,456,741 | 1,919,402 | |||||||||
NET ASSETS | $ | 209,927,351 | $ | 182,101,304 | $ | 78,229,892 | ||||||
NET ASSETS CONSIST OF: | ||||||||||||
Paid-in capital | $ | 154,166,766 | $ | 175,276,548 | $ | 76,816,421 | ||||||
Accumulated net investment income/(loss) | 75,082 | (1,419,129 | ) | (133,614 | ) | |||||||
Accumulated net realized gain/(loss) on investments | 2,929,243 | (14,809,076 | ) | (7,322,297 | ) | |||||||
Unrealized appreciation in value of investments | 52,756,260 | 23,052,961 | 8,869,382 | |||||||||
NET ASSETS | $ | 209,927,351 | $ | 182,101,304 | $ | 78,229,892 | ||||||
Net Assets: | ||||||||||||
Institutional Shares | $ | 209,927,351 | $ | 102,715,662 | $ | 78,229,892 | ||||||
Investor Shares | N/A | $ | 79,385,642 | N/A | ||||||||
Shares Outstanding (Note 2): | ||||||||||||
Institutional Shares | 10,630,973 | 4,687,269 | 7,332,073 | |||||||||
Investor Shares | N/A | 3,871,337 | N/A | |||||||||
Net Asset Value Per Share | ||||||||||||
(Represents both the offering and redemption price)(a) | ||||||||||||
Institutional Shares | $ | 19.75 | $ | 21.91 | $ | 10.67 | ||||||
Investor Shares | N/A | $ | 20.51 | N/A | ||||||||
Cost of investments | $ | 157,365,703 | $ | 157,384,108 | $ | 69,689,363 | ||||||
(a) | A redemption fee may be assessed for shares redeemed within 90 days after purchase. (Note 1) |
See Notes to Financial Statements | |
20 | centuryfunds.com |
| Statements of Operations |
For the Six Months Ended April 30, 2016 (Unaudited) |
Century | Century | Century Growth Opportunities | ||||||||||
INVESTMENT INCOME: | ||||||||||||
Dividends | $ | 1,435,284 | $ | 920,457 | $ | 256,069 | ||||||
Total Investment Income | 1,435,284 | 920,457 | 256,069 | |||||||||
EXPENSES: | ||||||||||||
Investment adviser fees (Notes 4 and 7) | 851,461 | 997,408 | 315,062 | |||||||||
Distribution and service fees (Note 6): | – | 92,793 | – | |||||||||
Investor Shares | ||||||||||||
Administrative fees | 106,433 | – | 39,383 | |||||||||
Transfer agency fees | 68,478 | 92,812 | 6,564 | |||||||||
Fund accounting fees | 17,238 | 17,399 | �� | 7,857 | ||||||||
Custodian fees | 9,360 | 12,510 | 12,055 | |||||||||
Insurance fees | 9,699 | 14,526 | 3,717 | |||||||||
Professional fees | 39,238 | 41,851 | 30,190 | |||||||||
Registration fees | 14,898 | 16,347 | 9,184 | |||||||||
Trustee fees | 49,949 | 58,677 | 19,105 | |||||||||
Printing fees | 13,923 | 10,690 | 1,284 | |||||||||
Other expenses | 6,440 | 11,177 | 3,810 | |||||||||
Total Expenses | 1,187,117 | 1,366,190 | 448,211 | |||||||||
Adviser waivers/reimbursements (Note 7) | – | – | (58,528 | ) | ||||||||
Net Expenses | 1,187,117 | 1,366,190 | 389,683 | |||||||||
NET INVESTMENT INCOME/(LOSS) | 248,167 | (445,733 | ) | (133,614 | ) | |||||||
REALIZED AND UNREALIZED GAIN/(LOSS) ON INVESTMENTS: | ||||||||||||
Net realized gain/(loss) on investments | 2,930,395 | (14,295,695 | ) | (5,759,981 | ) | |||||||
Net change in unrealized appreciation/(depreciation) of investments | (10,092,711 | ) | (3,588,234 | ) | 1,327,146 | |||||||
NET REALIZED AND UNREALIZED LOSS ON INVESTMENTS | (7,162,316 | ) | (17,883,929 | ) | (4,432,835 | ) | ||||||
NET DECREASE IN NET ASSETS RESULTING FROM OPERATIONS | $ | (6,914,149 | ) | $ | (18,329,662 | ) | $ | (4,566,449 | ) | |||
See Notes to Financial Statements | |
Semi-Annual Report | April 30, 2016 | 21 |
|
Century Shares Trust | ||||||||
For the Six | For the | |||||||
OPERATIONS: | ||||||||
Net investment income/(loss) | $ | 248,167 | $ | 262,549 | ||||
Net realized gain/(loss) on investments | 2,930,395 | 7,397,854 | ||||||
Change in net unrealized appreciation/(depreciation) | (10,092,711 | ) | 17,286,786 | |||||
Net increase/(decrease) in net assets resulting from operations | (6,914,149 | ) | 24,947,189 | |||||
DISTRIBUTIONS TO SHAREHOLDERS: | ||||||||
Institutional Shares | ||||||||
From net investment income | (468,505 | ) | – | |||||
From net realized gains on investments | (7,353,203 | ) | (53,335,537 | ) | ||||
Investor Shares | ||||||||
From net realized gains on investments | – | – | ||||||
Total distributions | (7,821,708 | ) | (53,335,537 | ) | ||||
CAPITAL SHARE TRANSACTIONS: | ||||||||
Increase/(decrease) in net assets from capital share transactions (Note 2) | (696,576 | ) | 31,196,795 | |||||
Redemption fees | 17 | 188 | ||||||
Net increase/(decrease) from share transactions | (696,559 | ) | 31,196,983 | |||||
Total increase/(decrease) | (15,432,416 | ) | 2,808,635 | |||||
NET ASSETS: | ||||||||
Beginning of period | 225,359,767 | 222,551,132 | ||||||
End of period* | $ | 209,927,351 | $ | 225,359,767 | ||||
*Including accumulated net investment income/(loss) | $ | 75,082 | $ | 295,420 | ||||
See Notes to Financial Statements | |
22 | centuryfunds.com |
Statement of Changes in Net Assets |
Century Small Cap Select Fund | Century Growth Opportunities Fund | |||||||||||||
For the Six April 30, 2016 (Unaudited) | For the | For the Six April 30, 2016 (Unaudited) | For the | |||||||||||
$ | (445,733 | ) | $ | (1,971,630 | ) | $ | (133,614 | ) | $ | (634,644 | ) | |||
(14,295,695 | ) | 57,511,187 | (5,759,981 | ) | 8,678,417 | |||||||||
(3,588,234 | ) | (49,085,133 | ) | 1,327,146 | (7,291,195 | ) | ||||||||
(18,329,662 | ) | 6,454,424 | (4,566,449 | ) | 752,578 | |||||||||
– | – | – | – | |||||||||||
(34,271,035 | ) | (33,970,609 | ) | (8,065,392 | ) | (17,660,595 | ) | |||||||
(21,543,723 | ) | (18,018,773 | ) | – | – | |||||||||
(55,814,758 | ) | (51,989,382 | ) | (8,065,392 | ) | (17,660,595 | ) | |||||||
(8,627,565 | ) | (73,851,491 | ) | 5,892,058 | 14,457,587 | |||||||||
12,350 | 22,054 | – | – | |||||||||||
(8,615,215 | ) | (73,829,437 | ) | 5,892,058 | 14,457,587 | |||||||||
(82,759,635 | ) | (119,364,395 | ) | (6,739,783 | ) | (2,450,430 | ) | |||||||
264,860,939 | 384,225,334 | 84,969,675 | 87,420,105 | |||||||||||
$ | 182,101,304 | $ | 264,860,939 | $ | 78,229,892 | $ | 84,969,675 | |||||||
$ | (1,419,129 | ) | $ | (973,396 | ) | $ | (133,614 | ) | $ | – | ||||
See Notes to Financial Statements | |
Semi-Annual Report | April 30, 2016 | 23 |
| Financial Highlights |
Century Shares trust | For a share outstanding throughout the periods presented |
For the Six Months Ended April 30, 2016 | For the Year Ended October 31, | |||||||||||||||||||||||
(Unaudited) | 2015 | 2014 | 2013 | 2012 | 2011 | |||||||||||||||||||
NET ASSET VALUE, BEGINNING | $ | 21.14 | $ | 24.78 | $ | 22.41 | $ | 19.81 | $ | 20.66 | $ | 19.65 | ||||||||||||
INCOME/(LOSS) FROM OPERATIONS: | ||||||||||||||||||||||||
Net investment income/(loss)(a) | 0.02 | 0.02 | (0.02 | ) | 0.03 | 0.05 | (0.02 | ) | ||||||||||||||||
Net realized and unrealized gain/(loss) | (0.67 | ) | 2.39 | 3.72 | 5.09 | 1.28 | 1.93 | |||||||||||||||||
Total income/(loss) from investment operations | (0.65 | ) | 2.41 | 3.70 | 5.12 | 1.33 | 1.91 | |||||||||||||||||
LESS DISTRIBUTIONS FROM: | ||||||||||||||||||||||||
Net investment income | (0.04 | ) | – | – | (0.05 | ) | (0.06 | ) | (0.01 | ) | ||||||||||||||
Net realized gain on investment transactions | (0.70 | ) | (6.05 | ) | (1.33 | ) | (2.47 | ) | (2.12 | ) | (0.89 | ) | ||||||||||||
Total distributions | (0.74 | ) | (6.05 | ) | (1.33 | ) | (2.52 | ) | (2.18 | ) | (0.90 | ) | ||||||||||||
REDEMPTION FEES | 0.00 | (b) | 0.00 | (b) | 0.00 | (b) | 0.00 | (b) | 0.00 | (b) | 0.00 | (b) | ||||||||||||
NET ASSET VALUE, END OF PERIOD | $ | 19.75 | $ | 21.14 | $ | 24.78 | $ | 22.41 | $ | 19.81 | $ | 20.66 | ||||||||||||
Total Return | (3.13 | %)(c) | 11.76 | % | 17.29 | % | 28.85 | % | 7.63 | % | 9.79 | % | ||||||||||||
RATIOS AND SUPPLEMENTAL DATA | ||||||||||||||||||||||||
Net assets, end of period (000's) | $ | 209,927 | $ | 225,360 | $ | 222,551 | $ | 201,271 | $ | 174,534 | $ | 178,201 | ||||||||||||
Ratio of expenses to average net assets | 1.12 | %(d) | 1.11 | % | 1.09 | % | 1.11 | % | 1.12 | % | 1.13 | % | ||||||||||||
Ratio of net investment income/(loss) to average net assets | 0.23 | %(d) | 0.12 | % | (0.06 | %) | 0.16 | % | 0.24 | % | (0.10 | %) | ||||||||||||
Portfolio Turnover Rate | 15 | %(c) | 46 | % | 126 | % | 39 | % | 79 | % | 72 | % | ||||||||||||
(a) | Per share numbers have been calculated using the average shares method. |
(b) | Less than $0.005 per share. |
(c) | Not annualized. |
(d) | Annualized. |
See Notes to Financial Statements | |
24 | centuryfunds.com |
| Financial Highlights |
CENTURY SMALL CAP SELECT FUND | For a share outstanding throughout the periods presented |
For the Six Months Ended April 30, 2016 | For the Year Ended October 31, | |||||||||||||||||||||||
(Unaudited) | 2015 | 2014 | 2013 | 2012 | 2011 | |||||||||||||||||||
NET ASSET VALUE, BEGINNING | $ | 30.00 | $ | 34.46 | $ | 33.94 | $ | 26.27 | $ | 23.91 | $ | 20.99 | ||||||||||||
INCOME/(LOSS) FROM OPERATIONS: | ||||||||||||||||||||||||
Net investment loss(a) | (0.03 | ) | (0.17 | ) | (0.24 | ) | (0.04 | ) | (0.12 | ) | (0.09 | ) | ||||||||||||
Net realized and unrealized gain/(loss) on investments | (1.71 | ) | 0.87 | 2.48 | 7.71 | 2.48 | 3.01 | |||||||||||||||||
Total income/(loss) from investment operations | (1.74 | ) | 0.70 | 2.24 | 7.67 | 2.36 | 2.92 | |||||||||||||||||
LESS DISTRIBUTIONS FROM: | ||||||||||||||||||||||||
Net realized gain on investment transactions | (6.35 | ) | (5.16 | ) | (1.72 | ) | – | – | – | |||||||||||||||
Total distributions | (6.35 | ) | (5.16 | ) | (1.72 | ) | – | – | – | |||||||||||||||
REDEMPTION FEES | 0.00 | (b) | 0.00 | (b) | 0.00 | (b) | 0.00 | (b) | 0.00 | (b) | 0.00 | (b) | ||||||||||||
NET ASSET VALUE, END OF PERIOD | $ | 21.91 | $ | 30.00 | $ | 34.46 | $ | 33.94 | $ | 26.27 | $ | 23.91 | ||||||||||||
Total Return | (6.75 | %)(c) | 2.48 | % | 6.79 | % | 29.20 | % | 9.87 | % | 13.86 | % | ||||||||||||
RATIOS AND SUPPLEMENTAL DATA | ||||||||||||||||||||||||
Net assets, end of period (000's) | $ | 102,716 | $ | 164,141 | $ | 266,045 | $ | 300,833 | $ | 281,480 | $ | 254,724 | ||||||||||||
Ratio of expenses to average net assets | 1.17 | %(d) | 1.13 | % | 1.11 | % | 1.12 | % | 1.10 | % | 1.11 | % | ||||||||||||
Ratio of net investment loss to average net assets | (0.26 | %)(d) | (0.52 | %) | (0.71 | %) | (0.14 | %) | (0.48 | %) | (0.37 | %) | ||||||||||||
Portfolio Turnover Rate | 40 | %(c) | 69 | % | 97 | % | 91 | % | 53 | % | 75 | % | ||||||||||||
(a) | Per share numbers have been calculated using the average shares method. |
(b) | Less than $0.005 per share. |
(c) | Not annualized. |
(d) | Annualized. |
See Notes to Financial Statements | |
Semi-Annual Report | April 30, 2016 | 25 |
| Financial Highlights |
CENTURY SMALL CAP SELECT FUND | For a share outstanding throughout the periods presented |
For the Six Months Ended April 30, 2016 | For the Year Ended October 31, | |||||||||||||||||||||||
(Unaudited) | 2015 | 2014 | 2013 | 2012 | 2011 | |||||||||||||||||||
NET ASSET VALUE, BEGINNING | $ | 28.53 | $ | 33.12 | $ | 32.78 | $ | 25.45 | $ | 23.25 | $ | 20.49 | ||||||||||||
INCOME/(LOSS) FROM OPERATIONS: | ||||||||||||||||||||||||
Net investment loss(a) | (0.07 | ) | (0.26 | ) | (0.33 | ) | (0.13 | ) | (0.21 | ) | (0.17 | ) | ||||||||||||
Net realized and unrealized gain/(loss) on investments | (1.60 | ) | 0.83 | 2.39 | 7.46 | 2.41 | 2.92 | |||||||||||||||||
Total income/(loss) from investment operations | (1.67 | ) | 0.57 | 2.06 | 7.33 | (2.20 | ) | 2.75 | ||||||||||||||||
LESS DISTRIBUTIONS FROM: | ||||||||||||||||||||||||
Net realized gain on investment transactions | (6.35 | ) | (5.16 | ) | (1.72 | ) | – | – | – | |||||||||||||||
Total distributions | (6.35 | ) | (5.16 | ) | (1.72 | ) | – | – | – | |||||||||||||||
REDEMPTION FEES | 0.00 | (b) | 0.00 | (b) | 0.00 | (b) | 0.00 | (b) | 0.00 | (b) | 0.01 | |||||||||||||
NET ASSET VALUE, END OF PERIOD | $ | 20.51 | $ | 28.53 | $ | 33.12 | $ | 32.78 | $ | 25.45 | $ | 23.25 | ||||||||||||
Total Return | (6.86 | %)(c) | 2.14 | % | 6.47 | % | 28.80 | % | 9.46 | % | 13.47 | % | ||||||||||||
RATIOS AND SUPPLEMENTAL DATA | ||||||||||||||||||||||||
Net assets, end of period (000's) | $ | 79,386 | $ | 100,720 | $ | 118,181 | $ | 128,029 | $ | 111,965 | $ | 116,678 | ||||||||||||
Ratio of expenses to average net assets | 1.50 | %(d) | 1.42 | % | 1.40 | % | 1.41 | % | 1.47 | % | 1.48 | % | ||||||||||||
Ratio of net investment loss to average net assets | (0.66 | %)(d) | (0.85 | %) | (1.00 | %) | (0.44 | %) | (0.84 | %) | (0.71 | %) | ||||||||||||
Portfolio Turnover Rate | 40 | %(c) | 69 | % | 97 | % | 91 | % | 53 | % | 75 | % | ||||||||||||
(a) | Per share numbers have been calculated using the average shares method. |
(b) | Less than $0.005 per share. |
(c) | Not annualized. |
(d) | Annualized. |
See Notes to Financial Statements | |
26 | centuryfunds.com |
| Financial Highlights |
Century growth opportunities fund | For a share outstanding throughout the periods presented |
For the Six Months Ended April 30, 2016 | For the Year Ended October 31, | For the Period November 17, 2010 (Inception) to October 31, | ||||||||||||||||||||||
(Unaudited) | 2015 | 2014 | 2013 | 2012 | 2011 | |||||||||||||||||||
NET ASSET VALUE, BEGINNING | $ | 12.50 | $ | 15.51 | $ | 13.87 | $ | 10.81 | $ | 10.67 | $ | 10.00 | ||||||||||||
INCOME/(LOSS) FROM OPERATIONS: | ||||||||||||||||||||||||
Net investment loss(a) | (0.02 | ) | (0.10 | ) | (0.11 | ) | (0.03 | ) | (0.02 | ) | (0.07 | ) | ||||||||||||
Net realized and unrealized gain/(loss) on investments | (0.61 | ) | 0.30 | 1.90 | 3.11 | 0.16 | 0.74 | |||||||||||||||||
Total income/(loss) from investment operations | (0.63 | ) | 0.20 | 1.79 | 3.08 | 0.14 | 0.67 | |||||||||||||||||
LESS DISTRIBUTIONS FROM: | ||||||||||||||||||||||||
Net investment income | – | – | – | (0.02 | ) | – | – | |||||||||||||||||
Net realized gain on investment transactions | (1.20 | ) | (3.21 | ) | (0.15 | ) | – | – | – | |||||||||||||||
Total distributions | (1.20 | ) | (3.21 | ) | (0.15 | ) | (0.02 | ) | – | – | ||||||||||||||
REDEMPTION FEES | – | – | 0.00 | (b) | 0.00 | (b) | 0.00 | (b) | 0.00 | (b) | ||||||||||||||
NET ASSET VALUE, END OF PERIOD | $ | 10.67 | $ | 12.50 | $ | 15.51 | $ | 13.87 | $ | 10.81 | $ | 10.67 | ||||||||||||
Total Return | (5.42 | %)(c) | 1.13 | % | 13.04 | % | 28.54 | % | 1.31 | % | 6.70 | %(c) | ||||||||||||
RATIOS AND SUPPLEMENTAL DATA | ||||||||||||||||||||||||
Net assets, end of period (000's) | $ | 78,230 | $ | 84,970 | $ | 87,420 | $ | 93,413 | $ | 94,285 | $ | 7,323 | ||||||||||||
Ratio of expenses to average net assets without giving effect to contractual expense agreement | 1.14 | %(d) | 1.12 | % | 1.10 | % | 1.12 | % | 1.20 | % | 3.62 | %(d) | ||||||||||||
Ratio of expenses to average net assets | 0.99 | %(d) | 1.09 | %(e) | 1.10 | % | 1.10 | % | 1.10 | % | 1.10 | %(d) | ||||||||||||
Ratio of net investment loss to average net assets | (0.34 | %)(d) | (0.71 | %) | (0.77 | %) | (0.27 | %) | (0.18 | %) | (0.64 | %)(d) | ||||||||||||
Portfolio Turnover Rate | 75 | %(c) | 141 | % | 165 | % | 155 | % | 148 | % | 119 | %(c) | ||||||||||||
(a) | Per share numbers have been calculated using the average shares method. |
(b) | Less than $0.005 per share. |
(c) | Not annualized. |
(d) | Annualized. |
(e) | Contractual expense limitation change from 1.10% to 0.99% effective October 1, 2015. |
See Notes to Financial Statements | |
Semi-Annual Report | April 30, 2016 | 27 |
| Notes to Financial Statements |
April 30, 2016 (Unaudited) |
1. SIGNIFICANT ACCOUNTING POLICIES
Century Capital Management Trust (the “Trust”) is registered under the Investment Company Act of 1940, as amended (“1940 Act”) as an open-end management investment company organized as a Massachusetts business trust. Century Shares Trust, Century Small Cap Select Fund, and Century Growth Opportunities Fund (each a “Fund” and, collectively, the “Funds”) are diversified series of the Trust. The following are significant accounting policies consistently followed by the Funds and are in conformity with accounting principles generally accepted in the United States (“GAAP”). Each Fund is considered an investment company for financial reporting purposes under GAAP.
The investment objective of each of Century Shares Trust, Century Small Cap Select Fund and Century Growth Opportunities Fund is to seek long-term capital growth.
A. Security Valuations — Equity securities are valued at the last reported sale price or official closing price on the primary exchange or market on which they are traded, as reported by an independent pricing service. If no sale price or official closing price is reported, market value is generally determined based on quotes or closing prices obtained from a quotation reporting system, established market maker, or reputable pricing service. For unlisted securities and for exchange-listed securities for which there are no reported sales or official closing prices, fair value is generally determined using closing bid prices. In the absence of readily available market quotes, securities and other assets will be valued at fair value, as determined in good faith under procedures established by and under the general supervision of the Funds’ Board of Trustees. Short-term obligations, maturing in 60 days or less, are valued at amortized cost, which approximates fair value unless particular circumstances dictate otherwise (for example, if the issuer’s creditworthiness has become impaired). Investments in open-end mutual funds are valued at their closing net asset value each business day.
A three-tier hierarchy has been established to classify fair value measurements for disclosure purposes. Inputs refer broadly to the assumptions that market participants would use in pricing the asset or liability, including assumptions about risk. Inputs may be observable or unobservable. Observable inputs are inputs that reflect the assumptions market participants would use in pricing the asset or liability that are developed based on market data obtained from sources independent of the reporting entity. Unobservable inputs are inputs that reflect the reporting entity’s own assumptions about the assumptions market participants would use in pricing the asset or liability that are developed based on the best information available.
Various inputs are used in determining the value of each Fund’s investments as of the reporting period end. These inputs are categorized in the following hierarchy under applicable financial accounting standards:
| Level 1 — | Unadjusted quoted prices in active markets for identical, unrestricted assets or liabilities that the Funds have the ability to access at the measurement date; |
| Level 2 — | Quoted prices which are not active, quoted prices for similar assets or liabilities in active markets or inputs other than quoted prices that are observable (either directly or indirectly) for substantially the full term of the asset or liability; |
| Level 3 — | Significant unobservable prices or inputs (including the Fund’s own assumptions in determining the fair value of investments) where there is little or no market activity for the asset or liability at the measurement date. |
The availability of observable inputs can vary from security to security and is affected by a wide variety of factors, including, for example, the type of security, whether the security is new and not yet established in the marketplace, the liquidity of markets, and other characteristics particular to the security. To the extent that valuation is based on models or inputs that are less observable or unobservable in the market, the determination of fair value requires more judgment. Accordingly, the degree of judgment exercised in determining fair value is greatest for instruments categorized in Level 3.
28 | centuryfunds.com |
| Notes to Financial Statements |
April 30, 2016 (Unaudited) |
The following is a summary of the inputs used as of April 30, 2016 in valuing the Funds’ investments carried at fair value:
Century Shares Trust | ||||||||||||||||
Investments in Securities at Value* | Level 1 - Quoted Prices | Level 2 - Other Significant Observable Inputs | Level 3 - Significant Unobservable Inputs | Total | ||||||||||||
Common Stocks | $ | 203,456,744 | $ | – | $ | – | $ | 203,456,744 | ||||||||
Short-Term Investments | 6,665,219 | – | – | 6,665,219 | ||||||||||||
TOTAL | $ | 210,121,963 | $ | – | $ | – | $ | 210,121,963 | ||||||||
Century Small Cap Select Fund | ||||||||||||||||
Investments in Securities at Value* | Level 1 - Quoted Prices | Level 2 - Other Significant Observable Inputs | Level 3 - Significant Unobservable Inputs | Total | ||||||||||||
Common Stocks | $ | 174,710,798 | $ | – | $ | – | $ | 174,710,798 | ||||||||
Short-Term Investments | 5,726,271 | – | – | 5,726,271 | ||||||||||||
TOTAL | $ | 180,437,069 | $ | – | $ | – | $ | 180,437,069 | ||||||||
Century Growth Opportunities Fund | ||||||||||||||||
Investments in Securities at Value* | Level 1 - Quoted Prices | Level 2 - Other Significant Observable Inputs | Level 3 - Significant Unobservable Inputs | Total | ||||||||||||
Common Stocks | $ | 76,373,652 | $ | – | $ | – | $ | 76,373,652 | ||||||||
Short-Term Investments | 2,185,093 | – | – | 2,185,093 | ||||||||||||
TOTAL | $ | 78,558,745 | $ | – | $ | – | $ | 78,558,745 | ||||||||
* At April 30, 2016 the Funds held investments in common stocks classified as Level 1, with corresponding major categories as shown on each Fund’s Portfolio of Investments.
Semi-Annual Report | April 30, 2016 | 29 |
| Notes to Financial Statements |
April 30, 2016 (Unaudited) |
The Funds recognize transfers into and out of all levels at the end of the reporting period. There were no transfers into or out of Levels 1 and 2 during the period.
There were no securities classified as Level 3 securities during the period, thus, a reconciliation of assets in which significant unobservable inputs (Level 3) were used is not applicable for these Funds.
B. Security Transactions — Security transactions are recorded on a trade date basis. Gain or loss on sales is determined by the use of the highest cost-method, for both financial reporting and federal income tax purposes. Dividend income is recorded on the ex-dividend date. Payments received from certain investments held by the Funds may be comprised of dividends, capital gains and return of capital. The Funds originally estimate the expected classification of such payments. The amounts may subsequently be reclassified upon receipt of information from the issuer. The Funds may invest in equity securities issued or guaranteed by companies organized and based in countries outside of the United States. These securities may be traded on foreign securities exchanges or in foreign over-the-counter markets. Foreign dividend income is recorded on ex-dividend date or as soon as practicable after the Fund determines the existence of a dividend declaration after exercising reasonable due diligence. Foreign income and capital gain on some foreign securities may be subject to foreign withholding taxes, which are accrued as applicable. Interest income is recorded daily on an accrual basis.
C. Use of Estimates — The preparation of these financial statements in accordance with GAAP incorporates estimates made by management in determining the reported amounts of assets, liabilities, income and expenses of the Funds. Actual results could differ from those estimates.
D. Risks and Uncertainty — Century Shares Trust may invest a significant portion of assets in a limited number of companies. As a result, the Fund may be more susceptible to financial, market and economic events affecting particular companies and therefore may experience greater price volatility than funds with more diversified portfolios.
Century Small Cap Select Fund invests in smaller companies, which generally involves greater risk than investing in larger, more established companies.
Century Growth Opportunities Fund invests mainly in small-cap and mid-cap companies, which, historically, have been more volatile in price than the stocks of large-cap companies.
Foreign investing involves certain risks and increased volatility not associated with investing solely in the U.S. These risks include currency fluctuations, economic or financial instability, lack of timely or reliable financial information or unfavorable political or legal developments.
At any given time, a significant portion of the assets of each Fund may be invested in securities of companies within the same market sector of the economy. Companies within the same sector often face similar issues and, consequently, may react similarly to changes in market conditions. If a Fund has a significant weighting in one or more sectors, it may be subject to more risk and price volatility.
E. Multiple Classes of Shares — Century Small Cap Select Fund offers two classes of shares, which differ in their respective distribution and service fees. Investment income, realized and unrealized capital gains and losses, the common expenses of the Fund, and certain fund-level expense reductions, if any, are allocated on a pro rata basis to each class based on the relative net assets of each class to the total net assets of the Fund. Certain expense reductions may differ by class. Because transfer agent fees include a per account fee, each class differs with respect to transfer agent fees incurred.
30 | centuryfunds.com |
| Notes to Financial Statements |
April 30, 2016 (Unaudited) |
F. Redemption Fees — In general, shares of each Fund may be redeemed at net asset value. However, upon the redemption of shares held less than 90 days, a redemption fee of 1% of the current net asset value of the shares may be assessed and retained by each share class of each Fund for the benefit of the Fund’s remaining shareholders. The redemption fee is accounted for as an addition to paid-in-capital and amounts are shown on the Statement of Changes in Net Assets.
G. Income Tax Information and Distributions to Shareholders — Each year, each Fund intends to qualify as a regulated investment company by distributing all of its taxable income and sufficient net investment income and net realized gains, if any, under Subchapter M of the Internal Revenue Code of 1986 (“Code”), as amended. As a result, no provision for income taxes is required in the accompanying financial statements. Foreign taxes are provided for based on each Fund’s understanding of the tax rules and rates class. Distributions are recorded on the ex-dividend date. Income and capital gain distributions are determined in accordance with income tax regulations, which may differ from generally accepted accounting principles. Capital accounts within the financial statements are adjusted for permanent book and tax differences. Generally accepted accounting principles require that any distributions in excess of tax basis earnings and profits be reported in the financial statements as a tax return of capital.
The net unrealized appreciation/depreciation of investments based on federal tax cost as of April 30, 2016 was as follows:
Century Shares Trust | Century Small Cap Select Fund | Century Growth Opportunities Fund | ||||||||||
Gross appreciation on investments (excess of value over tax cost) | $ | 55,345,996 | $ | 29,006,832 | $ | 8,646,686 | ||||||
Gross depreciation on investments (excess of tax cost over value) | (2,589,736 | ) | (6,638,899 | ) | (2,074,151 | ) | ||||||
Net unrealized appreciation | $ | 52,756,260 | $ | 22,367,933 | $ | 6,572,535 | ||||||
Cost of investments for federal income tax purposes | $ | 157,365,703 | $ | 158,069,136 | $ | 71,986,210 | ||||||
The tax character of distributions paid by the Funds during the year ended October 31, 2015, were as follows:
Distributions Paid From: | Century Shares Trust | Century Small Cap Select Fund | Century Growth Opportunities Fund | |||||||||
Ordinary income | $ | 5,003,338 | $ | 1,161,133 | $ | 3,565,399 | ||||||
Long-term capital gains | 48,332,199 | 50,828,249 | 14,095,196 | |||||||||
Total | $ | 53,335,537 | $ | 51,989,382 | $ | 17,660,595 | ||||||
The tax character of distributions paid by the Funds during the period ended April 30, 2016, will be determined at the Funds’ fiscal year end October 31, 2016.
As of October 31, 2015, each of the Funds had utilized all capital loss carryforwards available.
Semi-Annual Report | April 30, 2016 | 31 |
| Notes to Financial Statements |
April 30, 2016 (Unaudited) |
The Century Small Cap Select Fund elects to defer to the period ending October 31, 2016, late year ordinary losses in the amount of $950,608.
As of April 30, 2016, the funds had no uncertain tax positions that would require financial statement recognition or disclosure. The Funds file U.S. federal, state, and local tax returns as required. The Funds’ tax returns are subject to examination by the relevant tax authorities until expiration of the applicable statute of limitations which is generally three years after the filing of a tax return, but may extend to four years in certain jurisdictions. Tax returns for open years have incorporated no uncertain positions that require a provision for income taxes.
H. Indemnifications — In the normal course of business, the Funds enter into agreements with service providers that may contain indemnification clauses. The Funds maximum exposure under these arrangements is unknown as this would involve future claims that may be made against the Funds that have not yet occurred.
2. TRANSACTIONS IN SHARES
Century Shares Trust — The number of authorized shares is unlimited. Transactions in Institutional Class shares were as follows:
Institutional | ||||||||||||||||
For the Six Months Ended | For the Year Ended October 31, 2015 | |||||||||||||||
Shares | Amount | Shares | Amount | |||||||||||||
Sold | 64,782 | $ | 1,278,582 | 194,080 | $ | 3,935,550 | ||||||||||
Issued to shareholders in reinvestment of distributions | 355,390 | 7,146,898 | 2,487,747 | 48,511,068 | ||||||||||||
420,172 | 8,425,480 | 2,681,827 | 52,446,618 | |||||||||||||
Repurchased | (451,799 | ) | (9,122,056 | ) | (1,001,585 | ) | (21,249,823 | ) | ||||||||
Net Increase/(Decrease) | (31,627 | ) | $ | (696,576 | ) | 1,680,242 | $ | 31,196,795 | ||||||||
32 | centuryfunds.com |
| Notes to Financial Statements |
April 30, 2016 (Unaudited) |
Century Small Cap Select Fund — The number of authorized shares is unlimited. Transactions in each class of shares were as follows:
Institutional | ||||||||||||||||
For the Six Months Ended | For the Year Ended October 31, 2015 | |||||||||||||||
Shares | Amount | Shares | Amount | |||||||||||||
Sold | 372,172 | $ | 8,794,619 | 1,010,831 | $ | 32,451,401 | ||||||||||
Issued to shareholders in reinvestment of distributions | 1,444,718 | 33,112,940 | 1,134,797 | 33,033,944 | ||||||||||||
1,816,890 | 41,907,559 | 2,145,628 | 65,485,345 | |||||||||||||
Repurchased | (2,601,130 | ) | (57,500,804 | ) | (4,395,083 | ) | (137,236,009 | ) | ||||||||
Net Increase/(Decrease) | (784,240 | ) | $ | (15,593,245 | ) | (2,249,455 | ) | $ | (71,750,664 | ) | ||||||
Investor | ||||||||||||||||
For the Six Months Ended | For the Year Ended October 31, 2015 | |||||||||||||||
Shares | Amount | Shares | Amount | |||||||||||||
Sold | 124,625 | $ | 2,692,730 | 410,619 | $ | 12,543,011 | ||||||||||
Issued to shareholders in reinvestment of distributions | 994,743 | 21,357,127 | 642,483 | 17,835,340 | ||||||||||||
1,119,368 | 24,049,857 | 1,053,102 | 30,378,351 | |||||||||||||
Repurchased | (778,000 | ) | (17,084,177 | ) | (1,091,291 | ) | (32,479,178 | ) | ||||||||
Net Increase/(Decrease) | 341,368 | $ | 6,965,680 | (38,189 | ) | $ | (2,100,827 | ) | ||||||||
Semi-Annual Report | April 30, 2016 | 33 |
| Notes to Financial Statements |
April 30, 2016 (Unaudited) |
Century Growth Opportunities Fund — The number of authorized shares is unlimited. Transactions in Institutional Class shares were as follows:
Institutional | ||||||||||||||||
For the Six Months Ended | For the Year Ended October 31, 2015 | |||||||||||||||
Shares | Amount | Shares | Amount | |||||||||||||
Sold | 216,420 | $ | 2,301,600 | 644,141 | $ | 8,727,088 | ||||||||||
Issued to shareholders in reinvestment of distributions | 727,923 | 8,065,392 | 1,401,448 | 17,658,239 | ||||||||||||
944,343 | 10,366,992 | 2,045,589 | 26,385,327 | |||||||||||||
Repurchased | (409,370 | ) | (4,474,934 | ) | (886,126 | ) | (11,927,740 | ) | ||||||||
Net Increase/(Decrease) | 534,973 | $ | 5,892,058 | 1,159,463 | $ | 14,457,587 | ||||||||||
3. INVESTMENT SECURITIES TRANSACTIONS
Century Shares Trust purchases and sales of investment securities (excluding short-term securities and U.S. Government obligations) aggregated $31,688,785 and $33,543,570, respectively, during the six months ended April 30, 2016.
Century Small Cap Select Fund purchases and sales of investment securities (excluding short-term securities and U.S. Government obligations) aggregated $83,142,263 and $147,537,906, respectively, during the six months ended April 30, 2016.
Century Growth Opportunities Fund purchases and sales of investment securities (excluding short-term securities and U.S. Government obligations) aggregated $59,607,934 and $62,599,080, respectively, during the six months ended April 30, 2016.
4. INVESTMENT ADVISER FEE
Century Shares Trust: The Trust has entered into an Investment Advisory Agreement (the “Agreement”) with Century Capital Management, LLC (“CCM”) pursuant to which CCM provides an investment program for Century Shares Trust. Under the Agreement, the Fund pays a management fee based on the Fund’s average daily net assets computed at the following annual rates: 0.80% of the first $500 million and 0.70% of the amounts exceeding $500 million.
Century Small Cap Select Fund: The Trust has entered into an Investment Advisory and Management Services Agreement (the “Agreement”) with CCM pursuant to which CCM provides investment advisory, management and administrative services to Century Small Cap Select Fund. Under the Agreement, the Fund pays a monthly management fee at the annual rate of 0.95% of the Fund’s average daily net assets.
Century Growth Opportunities Fund: The Trust has entered into an Investment Advisory Agreement (the “Agreement”) with CCM pursuant to which CCM provides investment advisory services to Century Growth Opportunities Fund. Under the Agreement, the Fund pays a management fee based on the Fund’s average daily net assets at the following annual rates: 0.80% of the first $500 million and 0.75% thereafter.
34 | centuryfunds.com |
| Notes to Financial Statements |
April 30, 2016 (Unaudited) |
5. ADMINISTRATION FEES
Century Shares Trust: The Trust has entered into an Administration Agreement with CCM pursuant to which CCM provides certain administrative services to Century Shares Trust at the annual rate of 0.10% of the Fund’s average daily net assets.
Century Small Cap Select Fund: Per the Investment Advisory and Management Services Agreement between the Trust and CCM, Century Small Cap Select Fund may reimburse CCM for expenses associated with having the adviser’s personnel perform shareholder service functions and certain financial, accounting, administrative and clerical services. No reimbursements were paid to CCM during the six months ended April 30, 2016.
Century Growth Opportunities Fund: The Trust has entered into an Administration Agreement with CCM pursuant to which CCM provides certain administrative services to Century Growth Opportunities Fund at the annual rate of 0.10% of the Fund’s average daily net assets.
CCM has entered into a Sub-Administration Agreement with ALPS Fund Services, Inc. (“ALPS”) pursuant to which ALPS provides certain administrative services to each Fund on behalf of CCM. CCM pays ALPS a sub-administration fee for sub-administration services provided to each Fund.
6. DISTRIBUTION FEES and other payments to financial intermediaries
The Trust has adopted a Distribution and Service Plan (the “Plan”) pursuant to Rule 12b-1 under the 1940 Act on behalf of Century Small Cap Select Fund. The Plan authorizes the Fund to pay up to 0.25% of the average daily net assets of the Fund’s Investor Shares class for distribution and shareholder services. The Plan may be terminated at any time by the vote of a majority of the independent Trustees or by the vote of the holders of a majority of the outstanding shares of the Investor Shares.
The Trust has entered into agreements with financial intermediaries to provide recordkeeping, processing, shareholder communications and other services to customers of the intermediaries and has agreed to compensate the intermediaries for providing such services. Certain services would be provided by the Funds if the shares of each customer were registered directly with the Funds’ transfer agent.
7. ADVISER REIMBURSEMENTS
Century Growth Opportunities Fund: CCM contractually agreed to limit the operating expenses of Century Growth Opportunities Fund to 0.99% of average daily net assets of the Institutional Shares. The agreement will remain in effect through February 28, 2017 and may not be terminated prior to that date without the approval of the Board of Trustees.
For the six months ended April 30, 2016, the fee waivers and/or reimbursements were $58,528.
CCM is permitted to recoup amounts of prior fee reductions or expense reimbursements within thirty-six months after the day on which CCM earned the fee or incurred the expense if the class’s total annual operating expenses have fallen to a level below the lower of the limit described above or any limit then in effect.
Semi-Annual Report | April 30, 2016 | 35 |
| Notes to Financial Statements |
April 30, 2016 (Unaudited) |
As of April 30, 2016, the maximum amounts subject to recoupment by the Fund in each fiscal year, pursuant to the aforementioned conditions are as follows:
Expires on or before October 31, | |||
2016 | 2017 | 2018 | 2019 |
$3,690 | $3,288 | $25,507 | $58,528 |
8. TRUSTEE AND OFFICER FEES
As of April 30, 2016, there were seven Trustees, six of whom are not “interested persons” (within the meaning of the 1940 Act) of the Trust (the “Independent Trustees”). Each Independent Trustee receives a retainer of $4,000 per calendar quarter from the Trust for his or her services. The chairperson of the Audit Committee receives an additional retainer of $1,125 per calendar quarter; the Lead Independent Trustee receives an additional retainer of $750 per calendar quarter; and the Chairpersons of the Oversight and Governance Committee and Nominating Committee each receive an additional retainer of $375 per calendar quarter. In addition, each Independent Trustee is paid a fee of $5,500 for each meeting of the Board of Trustees attended or participated in, as the case may be. The Independent Trustees are not paid an additional fee from the Trust for attendance at and/or participation in meetings of the various committees of the Board. The Independent Trustees are also reimbursed for meeting-related expenses. Officers of the Trust and Trustees who are interested persons of the Trust receive no salary or fees from the Trust.
36 | centuryfunds.com |
| Disclosure of Fund Expenses |
April 30, 2016 (Unaudited) |
As a shareholder of a Fund, you incur two types of costs: direct costs, such as short-term redemption fees and wire fees, and indirect costs, including management fees, and other fund operating expenses. This example is intended to help you understand your indirect costs, also referred to as “ongoing costs” (in dollars), of investing in the Fund and to compare these costs with the ongoing costs of investing in other mutual funds.
This example is based on an investment of $1,000 invested at the beginning of the period and held for the entire period as indicated below.
Actual Expenses The first line of the table below provides information about actual account values and actual expenses. You may use the information in this line, together with the amount you invested at the beginning of the period, to estimate the expenses that you paid over the period. Simply divide your account value by $1,000 (for example, an $8,600 account value divided by $1,000 = 8.6), then multiply the result by the number in the first line under the heading “Expenses Paid During Period” to estimate the expenses you paid on your account during this period.
Hypothetical Example for Comparison Purposes The second line of the table provides information about hypothetical account values and hypothetical expenses based on the Fund’s actual expense ratio and an assumed rate of return of 5% per year before expenses, which is not the Fund’s actual return. The hypothetical account values and expenses may not be used to estimate the actual ending account balance or expenses you paid for the period. You may use this information to compare ongoing costs of investing in the Fund and other funds. To do so, compare this 5% hypothetical example with the 5% hypothetical examples that appear in the shareholder reports of other funds.
Please note that the expenses shown in the table are meant to highlight your ongoing costs only and do not reflect any direct costs, such as wire fees or low balance fees. Therefore, the second line of the table is useful in comparing ongoing costs only and will not help you determine the relative total costs of owning different funds. In addition, if these direct costs were included, your costs would be higher.
Beginning Account Value November 1, 2015 | Ending Account Value April 30, 2016 | Expense | Expenses Paid During period November 1, 2015 to April 30, 2016(b) | |
Century Shares Trust | ||||
Institutional Shares | ||||
Actual | $1,000.00 | $968.70 | 1.12% | $5.48 |
Hypothetical (5% return before expenses) | $1,000.00 | $1,019.29 | 1.12% | $5.62 |
Century Small Cap Select Fund | ||||
Institutional Shares | ||||
Actual | $1,000.00 | $932.50 | 1.17% | $5.62 |
Hypothetical (5% return before expenses) | $1,000.00 | $1,019.05 | 1.17% | $5.87 |
Investor Shares | ||||
Actual | $1,000.00 | $931.40 | 1.50% | $7.20 |
Hypothetical (5% return before expenses) | $1,000.00 | $1,017.40 | 1.50% | $7.52 |
Century Growth Opportunities Fund | ||||
Institutional Shares | ||||
Actual | $1,000.00 | $945.80 | 0.99% | $4.79 |
Hypothetical (5% return before expenses) | $1,000.00 | $1,019.94 | 0.99% | $4.97 |
(a) | The Fund’s expense ratios have been based on the Fund’s most recent fiscal half year expenses. |
(b) | Expenses are equal to the Fund’s annualized expense ratio multiplied by the average account value over the period, multiplied by the number of days in the most recent fiscal half year (182), divided by 366. |
Semi-Annual Report | April 30, 2016 | 37 |
| Privacy Policy |
April 30, 2016 (Unaudited) |
Century Capital Management and the Century Funds are committed to maintaining the confidentiality, integrity and security of your personal information and financial data. We consider this information to be private and held in confidence between you and Century. This is to inform you of our policies to protect the privacy of your nonpublic personal information.
Information We Collect
When you invest in the Century Funds, we collect certain nonpublic personal information about you, which we use to open and service your account and respond to your requests. This information includes your name, address, tax identification number, birth date, investment selection, beneficiary information and possibly personal bank account information. It also includes information about your transactions and account history, as well as information that we may receive from third parties, such as financial advisers, consumer reporting agencies, and consultants.
Disclosure Policy
We do not disclose nonpublic personal information about current or former shareholders or customers to any third parties except as necessary to process a transaction, service an account, or as otherwise permitted by law. For example, the Century Funds use a third party transfer agent who uses your information only to process or analyze transactions that you have requested. Our contracts with such parties contain provisions restricting their use of your nonpublic personal information to those purposes for which they were hired. We do not sell non-public personal information to anyone.
Confidentiality and Security
We restrict access to nonpublic personal information about you to those employees and service providers involved in administering or servicing your account or helping us meet our regulatory obligations. We maintain physical, electronic and procedural safeguards that comply with federal standards to protect your nonpublic personal information.
38 | centuryfunds.com |
Intentionally Left Blank
Fund Information
PORTFOLIO HOLDINGS
Each fund files a complete schedule of its portfolio holdings with the SEC for the first and third quarters of the fund’s fiscal year on Form N-Q. The Forms N-Q are available on the SEC’s website at www.sec.gov, and they may be reviewed and copied at the SEC’s Public Reference Room in Washington, DC. Information on the operation of the SEC’s Public Reference Room may be obtained by calling 1-800-SEC-0330.
PROXY VOTING
A description of the policies and procedures that each fund uses to determine how to vote proxies relating to portfolio securities and each fund’s proxy voting record for the 12-month period ended June 30 are available, without charge, upon request, by calling 1-800-321-1928. You may also obtain a copy of the funds’ proxy voting policies and procedures and proxy voting record on the SEC’s website at www.sec.gov.
FOR MORE INFORMATION
For more information about the Century Funds, please call 1-800-303-1928 or visit www.centuryfunds.com.
Regular Mailing Address: Century Funds P.O. Box 588 Portland, ME 04112
Investment Adviser Century Capital Management, LLC 100 Federal Street Boston, MA 02110 | Overnight Mailing Address: Century Funds c/o Atlantic Shareholder Services, LLC 3 Canal Plaza, Ground Floor Portland, ME 04101
Distributor ALPS Distributors, Inc. 1290 Broadway, Suite 1100 Denver, CO 80203 |

| Item 2. | Code of Ethics. |
| Item 3. | Audit Committee Financial Expert. |
| Item 4. | Principal Accountant Fees and Services. |
| Item 5. | Audit Committee of Listed Registrants. |
| Item 6. | Investments. |
| Item 7. | Disclosure of Proxy Voting Policies and Procedures for Closed-End Management Investment Companies. |
| Item 8. | Portfolio Managers of Closed-End Management Investment Companies. |
| Item 9. | Purchases of Equity Securities by Closed-End Management Investment Company and Affiliated Purchasers. |
| Item 10. | Submission of Matters to a Vote of Security Holders. |
| Item 11. | Controls and Procedures. |
| Item 12. | Exhibits. |
| (a)(1) | Not applicable to semi-annual reports. |
| (a)(2) | Certification pursuant to Rule 30a-2(a) under the Investment Company Act of 1940 (17 CFR 270.30a-2(a)) is filed and attached hereto as Exhibit EX‑99.CERT. |
| (a)(3) | Not applicable. |
| (b) | Certification pursuant to Rule 30a-2(b) under the Investment Company Act of 1940 (17 CFR 270.30a-2(b)) is filed and attached hereto as Exhibit EX‑99.906CERT |
| By: | /s/ Alexander L. Thorndike | |
| Alexander L. Thorndike, Chairman | ||
| Date: | July 1, 2016 |
| By: | /s/ Alexander L. Thorndike | |
| Alexander L. Thorndike, Principal Executive Officer | ||
| Date: | July 1, 2016 | |
| By: | /s/ Julie Smith | |
| Julie Smith, Principal Financial Officer | ||
| Date: | July 1, 2016 |