UNITED STATES
SECURITIES AND EXCHANGE COMMISSION
Washington, D.C. 20549
FORM N-CSR
CERTIFIED SHAREHOLDER REPORT OF REGISTERED
MANAGEMENT INVESTMENT COMPANIES
811-09561
(Investment Company Act File Number)
Century Capital Management Trust
(Exact Name of Registrant as Specified in Charter)
c/o Century Capital Management, LLC
100 Federal Street, Boston, MA 02110
(Address of Principal Executive Offices)
Jennifer Mortimer
Century Capital Management, LLC
100 Federal Street, Boston, MA 02110
(Name and Address of Agent for Service)
(617) 482-3060
(Registrant’s Telephone Number)
Date of Fiscal Year End: October 31
Date of Reporting Period: April 30, 2014
| Item 1. | Reports to Shareholders. |
Table of Contents
| Page | |
| Letter to Shareholders | 1 |
| Fund Summaries | |
| Century Shares Trust | 5 |
| Century Small Cap Select Fund | 8 |
| Century Growth Opportunities Fund | 11 |
| Portfolio of Investments | |
| Century Shares Trust | 14 |
| Century Small Cap Select Fund | 16 |
| Century Growth Opportunities Fund | 18 |
| Statements of Assets and Liabilities | 20 |
| Statements of Operations | 21 |
| Statements of Changes in Net Assets | 22 |
| Financial Highlights | |
| Century Shares Trust | 24 |
| Century Small Cap Select Fund | 25 |
| Century Growth Opportunities Fund | 27 |
| Notes to Financial Statements | 28 |
| Disclosure of Fund Expenses | 36 |
| Privacy Policy | 37 |
This report is submitted for the general information of the shareholders of Century Shares Trust, Century Small Cap Select Fund, and Century Growth Opportunities Fund (each a “Fund” and collectively, the “Funds”). It is not authorized for distribution to prospective investors in a Fund unless it is preceded by or accompanied by the Fund’s current prospectus. The prospectus includes important information about the Fund’s objective, risks, charges and expenses, experience of its management, and other information. Please read the prospectus carefully before you invest.
The views expressed in this report are those of the Funds’ Portfolio Managers as of April 30, 2014, the end of the reporting period. Any such views are subject to change at any time and may not reflect the Portfolio Managers’ views on the date that this report is first published or anytime thereafter. These views are intended to assist shareholders in understanding their investments and do not constitute investment advice. There is no assurance that the Funds will continue to invest in the securities mentioned in this report.
| CENTURY FUNDS | Letter to Shareholders |
| April 30, 2014 (Unaudited) |
| Semi-Annual Report | April 30, 2014 |
Dear Fellow Shareholders,
The S&P500 Index posted healthy returns of 32.4% in calendar 2013 and has started 2014 by advancing 2.6% through April 30, 2014. More importantly, U.S. equity indices have compounded annual returns above 19.0% over the last five years and have fully recovered the ground lost from the financial crisis of 2008-2009. Some things never change: stock market returns are variable in the short-term, but long-term investors were rewarded if they remain invested through each downturn and the ensuing recovery. The economy continued to improve at a slow and steady pace, even though current investor sentiment seems mixed. We would be nervous if there is too much financial optimism.
Each of the Century Funds outperformed its benchmark during the six-month period ended April 30, 2014. Please review the Funds Commentary section to learn how each fund performed and our current positioning and outlook.
Blaming weather
The economy started the year with Q1 Real Gross Domestic Product (GDP) increasing at a slow annual rate of 0.1%, down from a Q4 increase of 2.6%. In large part, this deceleration was due to harsh weather conditions across much of the United States. We are suspicious when companies blame poor weather for weakness in their results, but severe storms significantly impacted productivity during the winter months. We are encouraged that recent corporate commentary indicates that the economy improved in April and May.
Consumer confidence continued to move higher and the unemployment rate has fallen to 6.3%, the lowest level since September of 2008. Employment is an important psychological barometer of investor optimism. Additionally, The Conference Board’s index of leading economic indicators (LEI) continued its rise.

Earnings growth continues
In our experience, equity returns usually follow earnings and corporate earnings growth continued its momentum into the new year. 75% of S&P 500 Index companies have reported Q1 earnings above median estimates, as of May 15, 2014. The blended earnings growth for Q1 earnings is 2.1% with Telecommunication Services and Utilities leading the way. Earnings increases continue to be driven by margin expansion rather than revenue growth.
| Semi-Annual Report | April 30, 2014 | 1 |
| CENTURY FUNDS | Letter to Shareholders |
| April 30, 2014 (Unaudited) |
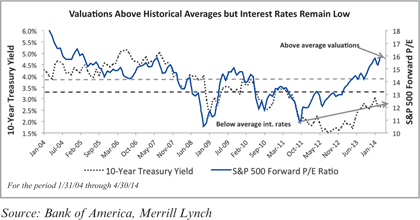
Valuations above historical averages while interest rates remain low
In our opinion, equities appear to be fairly valued at current levels, although interest rate yields remain at very low levels and tend to support higher equity valuations, as investors seek higher returning asset classes. The S&P 500 Index is trading at 15.8X next twelve months’ (NTM) earnings estimates, compared to 14.2X NTM estimates a year ago and above the ten year average of 14.1X.
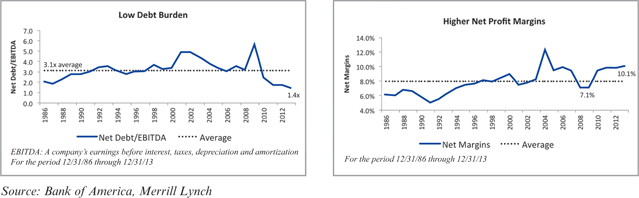
We also think that most corporations are financially strong versus history (see charts below). Companies are enjoying a far higher profit margin and lower debt leverage than in the recent past. The ratio of total debt/EBITDA in the S&P 500 was at 1.4X as of Q4 2013; down from an average of 3.1X since 1986 and from a peak of 5.7X following the financial crisis of 2008. Conversely, net margins rose from 7.1% in 2008 to 10.1% as of Q4 2013, an increase of 42% from the 2008 low.
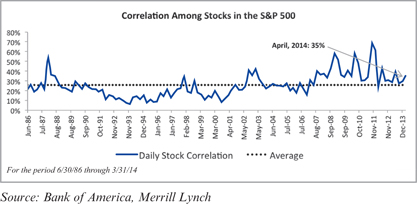
With the continued growth in earnings and rising valuations over the past several years, we are also seeing a different trading environment for equities. Correlations between stocks have decreased and now approach more normal levels (see chart on next page). After the financial crisis of 2008 and the Sovereign debt crisis of 2010, equities tended to alternate between a “risk on/risk off” framework. As markets have recovered, there has been a larger delineation between good companies and bad companies, and stocks are trading more on business fundamentals, as opposed to macroeconomic forces in the news headlines. Periods of lower correlations among stocks are generally favorable for bottom up stock-pickers.
The domestic economic recovery seems to be intact and America is now benefitting from lower energy prices than most other developed countries. Multinational corporations continue to navigate the global economic landscape well with another solid
| 2 | centuryfunds.com |
| CENTURY FUNDS | Letter to Shareholders |
| April 30, 2014 (Unaudited) |
quarter of earnings and low leverage profiles. Globally, improving economic outlooks in Europe and Asia are finally contributing to North American growth. The recent Russian aggression in Ukraine is an important reminder that the democratic G-7 Nations will see more regional conflict with the expansionary ambitions of China and Russia. A synchronized global expansion in 2015 needs geopolitical calm to ensure growth.
Equity ownership among young Americans
Despite the backdrop of a recovering global economic landscape and positive equity returns over the past 1 year, 5 year and 10 year periods, many investors are still underweight stock ownership, due in part to the shock of two significant recessions during the 2000-2010 decade. The Millenial generation (under 35 years of age) appears to be as risk-averse as the Depression-era generation that was born around 1900, having reached adulthood in a period of high unemployment, mounting student loan debt and capital markets volatility.
We believe the investment industry has not made it easy for investors to feel comfortable as shareholders in public companies. It is our responsibility to help prepare younger generations to reach their future educational and retirement goals, through a prudent combination of consistent savings and investment diversification. Alongside regulators and corporations, we need to ensure these younger investors that our capital markets are fair, transparent and capable of helping safeguard shareholder interests, while providing the necessary capital for companies to adapt and grow over time.
Equity returns over time |
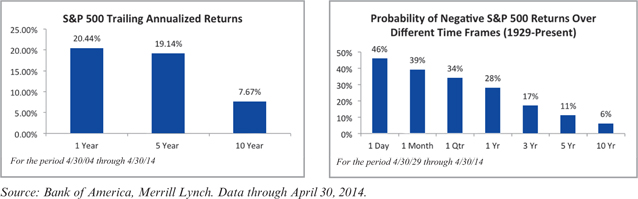 |
| Semi-Annual Report | April 30, 2014 | 3 |
| CENTURY FUNDS | Letter to Shareholders |
| April 30, 2014 (Unaudited) |
Life is about finding the right balance of risk and return in the choices we make. At Century, we feel the same way about investing and recognize the fiduciary role we play in our shareholders’ overall financial roadmap. We remain committed to investing in high-quality growth companies that we believe will deliver solid results in normal and nervous markets and provide an attractive return profile over a full market cycle.
As always, it is a great privilege to navigate the investment landscape with you, and we thank you for your continued support and partnership.
Respectfully submitted,

Alexander L. Thorndike
Chairman of the Century Funds
Past performance is not indicative of future results.
S&P 500® Index which is a broad-based, unmanaged measurement of changes in stock market conditions based on the average of 500 widely held common stocks. One cannot invest directly in an index.
Correlation is a statistical measure of how an index moves in relation to another index or model portfolio. A correlation ranges from -1 to 1. A correlation of 1 means the two indexes have moved in lockstep with each other. A correlation of -1 means the two indexes have moved in exactly the opposite direction.
| 4 | centuryfunds.com |
| CENTURY FUNDS | Fund Commentary |
| CENTURY SHARES TRUST | April 30, 2014 (Unaudited) |
HOW DID THE PORTFOLIO PERFORM?
For the six-month period ended April 30, 2014, Century Shares Trust’s Institutional shares returned 9.15%, outperforming the Russell 1000 Growth Index (R1000G), the Fund’s benchmark, which returned 6.95%. The S&P 500 Index gained 8.36%.
WHAT FACTORS INFLUENCED PERFORMANCE?
The two primary drivers of performance over the past six months were strong stock market appreciation and portfolio stock selection. The Fund continued to benefit from strong performance of domestic equity markets. In fact, performance of the R1000G was fairly broad-based with 5 of the 10 sectors generating returns of over 9% and only 1 sector (Telecom Services) generating a negative return for the six-month period. In terms of the Fund, the Consumer Discretionary and Healthcare sectors performed best, while the Industrial and Financial sectors were the weakest.
Century Shares Trust’s performance was positively impacted by several stocks. Specifically, Actavis plc (pharmaceutical), LyondellBasell Industries N.V. (chemical), and Allergan, Inc. (specialty pharmaceutical) contributed to performance over the past six months. Actavis benefited from an accretive deal to acquire Forest Laboratories. LyondellBasell has continued to benefit from inexpensive raw materials and operational improvements. Allergan’s stock price increased when Valeant Pharmaceuticals International, Inc. and Pershing Square Capital made a joint bid to acquire the company; no deal has been reached.
Conversely, Dollar General Corp. (discount retailing), Stericycle, Inc. (medical waste management), and Celgene Corp. (biotechnology) all detracted from performance. Dollar General was weaker as harsh winter weather negatively impacted sales trends. Stericycle traded down on concerns that new business opportunities will pressure both gross and operating margins. Celgene was weaker on patent expiration issues.
HOW WAS THE PORTFOLIO POSITIONED AT PERIOD END?
We are confident in the Fund’s current portfolio positioning, believing the companies we own will do well in a slow growth environment. The Fund is diversified across almost every sector, while maintaining overweight positions in the Materials, Health Care, Financial and Energy sectors. We have a bias toward higher quality growth companies, believing these companies will generate solid growth and returns over time.
With the stock market continuing to generate attractive returns over the past six months, we continue to re-evaluate our portfolio holdings as they reach their price targets. We have sold or trimmed many of these positions. As a result, our weighting in the Consumer Discretionary and Technology sectors has declined. While new investment opportunities are not as plentiful as they were a year ago, we are still able to find attractive stocks to buy.
Past performance is not indicative of future results. Current performance may be lower or higher than the performance data quoted.
| Semi-Annual Report | April 30, 2014 | 5 |
| CENTURY FUNDS | Fund Commentary |
| CENTURY SHARES TRUST | April 30, 2014 (Unaudited) |
Risks: The Fund may invest a significant portion of assets in a limited number of companies or in companies within the same market sector. As a result, the Fund may be more susceptible to financial, market and economic events affecting particular companies or sectors and therefore may experience greater price volatility than funds with more diversified portfolios. Please read the Fund’s prospectus for details regarding the Fund’s risk profile.
| Ten Largest Holdings* | |
LYONDELLBASELL INDUSTRIES NV, CLASS A Chemicals | 4.61% |
ACTAVIS PLC Pharmaceuticals | 4.03% |
B/E AEROSPACE, INC. Aerospace & Defense | 3.83% |
FMC TECHNOLOGIES, INC. Energy Equipment & Services | 3.72% |
INTERNATIONAL BUSINESS MACHINES CORP. IT Services | 3.60% |
D.R. HORTON, INC. Household Durables | 3.55% |
AMERICAN TOWER CORP. Real Estate Investment Trust (REITs) | 3.54% |
CBRE GROUP, INC., CLASS A Real Estate Management & Development | 3.51% |
UNION PACIFIC CORP. Road & Rail | 3.19% |
EXPRESS SCRIPTS HOLDING CO. Health Care Providers & Services | 3.04% |
| Portfolio Composition* | |
| Information Technology | 23.7% |
| Health Care | 14.7% |
| Consumer Discretionary | 13.5% |
| Industrials | 9.9% |
| Consumer Staples | 8.0% |
| Materials | 7.6% |
| Financials | 7.4% |
| Energy | 6.7% |
| Cash, Cash Equivalents, & Other Net Assets | 8.5% |
*Based on the Fund’s net assets at April 30, 2014 and subject to change.
| 6 | centuryfunds.com |
| CENTURY FUNDS | Performance Summary |
| CENTURY SHARES TRUST | April 30, 2014 (Unaudited) |
Institutional Shares
The returns shown below represent past performance. Past performance does not guarantee future results. Investment return and principal value of an investment will fluctuate so that an investor’s shares, when sold or redeemed, may be worth more or less than the original cost. Current performance may be higher or lower than the Fund’s past performance. For the most recent month-end performance, please call 800-303-1928.
As stated in the Fund’s current prospectus, the total (gross) operating expenses are 1.11% for the Institutional Shares. The Fund’s total returns include the reinvestment of dividend and capital gain distributions, but have not been adjusted to reflect the deduction of taxes that a shareholder would pay on these distributions or the redemption of Fund shares. Shares held less than 90 days may be subject to a 1% redemption fee.
| Average Annual Total Returns April 30, 2014 | ||||
| 1 Year | 3 Years | 5 Years | 10 Years | |
| Century Shares Trust - Institutional Shares | 24.92% | 12.28% | 17.31% | 6.84% |
Russell 1000® Growth Index | 20.66% | 13.37% | 19.47% | 7.99% |
Growth of $100,000 for the period ended April 30, 2014
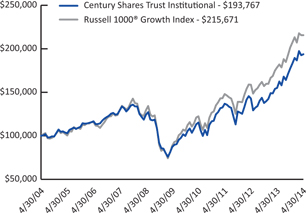
The graph and table reflect the change in value of a hypothetical investment in the Fund, including reinvest of dividends and distributions, compared with the listed indices. Index returns assume reinvestment of dividends and, unlike Fund returns, do not reflect any fees or expenses. It is not possible to invest directly in an index. Minimum initial investment for Institutional Shares is $100,000.
The Russell 1000® Growth Index measures the performance of the large-cap growth segment of the U.S. equity universe. It includes those Russell 1000® companies with higher price-to-book ratios and higher forecasted growth values.
| Semi-Annual Report | April 30, 2014 | 7 |
| CENTURY FUNDS | Fund Commentary |
| CENTURY SMALL CAP SELECT FUND | April 30, 2014 (Unaudited) |
HOW DID THE PORTFOLIO PERFORM?
For the six-month period ended April 30, 2014, Century Small Cap Select Fund’s Institutional Shares returned 3.21% and the Investor Shares returned 3.07%, outperforming the Russell 2000 Growth Index (R2000G), the Fund’s benchmark, which returned 1.27%.
WHAT FACTORS INFLUENCED PERFORMANCE?
With the R2000G up only 1.27%, stock selection was the primary driver of performance over the past six months. Stock selection strength was led by Health Care, followed by the Energy and Industrial sectors. Strength in these sectors was partially offset by weakness in Information Technology. The top performing stocks included Basic Energy Services, Inc. (energy), Jazz Pharmaceuticals plc (biotechnology), and Gentherm, Inc. (heating/cooling technologies). Basic Energy benefited from higher oil prices, which is expected to lead to increased demand. Jazz Pharmaceuticals’ partnership with Aerial BioPharma, LLC improved its product offering and sales growth profile. Gentherm has continued to generate strong revenue growth, due to strong automotive volume and increased penetration.
Conversely, Proofpoint, Inc. (security software), DSW, Inc. (footwear retailer), and Movado Group, Inc. (watchmaker) were underperformers. Proofpoint traded down as investors grew concerned about decelerating growth in addition to a broader trend of downward pressure on highly valued technology companies. DSW sold off on pricing pressures from aggressive retailers and a general weakening of trends in women’s fashion shoes. Movado was weaker due to a competitive threat from Smart Watches and gross margins being pressured by the repositioning of the Coach brand.
HOW WAS THE PORTFOLIO POSITIONED AT PERIOD END?
We believe the Fund is well positioned to generate attractive returns given its focus on investing in quality growth franchises. The Fund is diversified across almost every sector. Sector allocation within the Portfolio has changed only modestly over the past six months. For example, the Health Care industry exposure decreased from an over-weight to a market-weight. Century’s bottom up investment approach drives our investment decisions.
We expect earnings growth to be the primary driver of market appreciation over the next year and believe this environment plays to Century’s strength of focusing on in-depth fundamental research. By investing time and effort, we believe we gain a strong understanding of the levers that drive growth at our portfolio companies and are able to make more informed decisions that will generate attractive risk-adjusted returns over time. We are confident that we will be able to find attractive investment opportunities among well-run companies with underappreciated growth, despite the overall equity markets being fairly valued today.
Past performance is not indicative of future results. Current performance may be lower or higher than the performance data quoted.
| 8 | centuryfunds.com |
| CENTURY FUNDS | Fund Commentary |
| CENTURY SMALL CAP SELECT FUND | April 30, 2014 (Unaudited) |
Risks: The Fund concentrates its investments in the financial services and health care group of industries. Concentration in a particular industry subjects the Fund to the risks associated with that industry, and as a result, the Fund may be subject to greater price volatility than funds with less concentrated portfolios. In addition, the Fund invests in smaller companies which pose greater risks than those associated with larger, more established companies. Please read the Fund’s prospectus for details regarding the Fund’s risk profile.
| Ten Largest Holdings* | |
CAI INTERNATIONAL, INC. Trading Companies & Distributors | 3.56% |
COHEN & STEERS, INC. Capital Markets | 3.39% |
GENERAC HOLDINGS, INC. Electrical Equipment | 2.95% |
HERMAN MILLER, INC. Commercial Services & Supplies | 2.88% |
KFORCE, INC. Professional Services | 2.82% |
J2 GLOBAL, INC. Internet Software & Services | 2.73% |
SAIA, INC. Road & Rail | 2.60% |
RYLAND GROUP, INC. Household Durables | 2.59% |
DEALERTRACK TECHNOLOGIES, INC. Internet Software & Services | 2.53% |
HANESBRANDS, INC. Textiles, Apparel & Luxury Goods | 2.43% |
| Portfolio Composition* | |
| Health Care | 21.1% |
| Information Technology | 20.4% |
| Industrials | 18.1% |
| Consumer Discretionary | 16.5% |
| Financials | 6.9% |
| Energy | 6.5% |
| Materials | 3.5% |
| Consumer Staples | 3.0% |
| Cash, Cash Equivalents, & Other Net Assets | 4.0% |
*Based on the Fund’s net assets at April 30, 2014 and subject to change.
| Semi-Annual Report | April 30, 2014 | 9 |
| CENTURY FUNDS | Performance Summary |
| CENTURY SMALL CAP SELECT FUND | April 30, 2014 (Unaudited) |
Institutional Shares and Investor Shares
The returns shown below represent past performance. Past performance does not guarantee future results. Investment return and principal value of an investment will fluctuate so that an investor’s shares, when sold or redeemed, may be worth more or less than the original cost. Current performance may be higher or lower than the Fund’s past performance. For the most recent month-end performance, please call 800-303-1928.
As stated in the Fund’s current prospectus, the total (gross) operating expenses are 1.12% for the Institutional Shares and 1.41% for the Investor Shares. Returns would have been lower during the 10 year period if certain fees had not been waived or expenses reimbursed. The Fund’s total returns include the reinvestment of dividend and capital gain distributions, but have not been adjusted to reflect the deduction of taxes that a shareholder would pay on these distributions or the redemption of Fund shares. Shares held less than 90 days may be subject to a 1% redemption fee.
| Average Annual Total Returns April 30, 2014 | ||||
| 1 Year | 3 Years | 5 Years | 10 Years | |
| Century Small Cap Select Fund - Institutional Shares | 19.39% | 8.60% | 20.64% | 7.36% |
| Century Small Cap Select Fund - Investor Shares | 19.05% | 8.25% | 20.23% | 7.00% |
Russell 2000® Growth Index | 21.46% | 10.33% | 20.50% | 8.85% |
| Growth of $100,000 for the period ended April 30, 2014 Institutional Shares | Growth of $10,000 for the period ended April 30, 2014 Investor Shares |
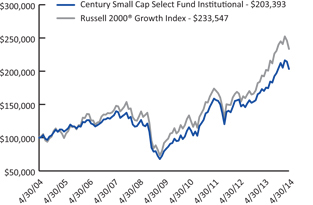 | 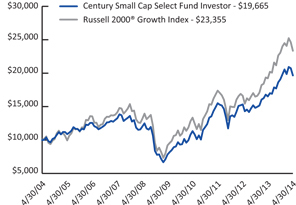 |
The graphs and table reflect the change in value of a hypothetical investment in the Fund, including reinvest of dividends and distributions, compared with the index. Index returns assume reinvestment of dividends and, unlike Fund returns, do not reflect any fees or expenses. It is not possible to invest directly in an index. Minimum initial investment for Institutional Shares is $100,000.
The Russell 2000® Growth Index measures the performance of the small-cap growth segment of the U.S. equity universe. It includes those Russell 2000® companies with higher price-to-value ratios and higher forecasted growth values. Index returns assume reinvestment of dividends but, unlike Fund returns, do not reflect fees or expenses. One cannot invest directly in an index.
| 10 | centuryfunds.com |
| CENTURY FUNDS | Fund Commentary |
| CENTURY GROWTH OPPORTUNITIES FUND | April 30, 2014 (Unaudited) |
HOW DID THE PORTFOLIO PERFORM?
For the six-month period ended April 30, 2014, Century Growth Opportunities Fund’s Institutional Shares returned 4.95%, beating the Russell 2500 Growth Index (R2500G), which returned 3.35%.
WHAT FACTORS INFLUENCED PERFORMANCE?
The Fund’s outperformance was primarily a result of stock selection. The Healthcare, Industrials and Energy sectors were the largest contributors to portfolio attribution as Jazz Pharmaceuticals plc, (biotechnology), Salix Pharmaceuticals, Ltd. (medical devices), and United Rentals, Inc. (equipment rental) fared well. Jazz Pharmaceuticals’ partnership with Aerial BioPharma, LLC improved Jazz’s product offering and sales growth profile. Salix Pharmaceuticals lifted from an accretive acquisition of Santarus, Inc. United Rentals has benefited from the trend of renting as opposed to owning industrial machinery.
Conversely, Materials, Consumer Discretionary and Information Technology detracted from performance as ULTA Salon, Cosmetics & Fragrance, Inc. (retail store), Mercadolibre, Inc. (commerce platform), and BroadSoft, Inc. (software) traded down. ULTA missed earnings as their new CEO decided to reinvest in the business and reset earnings expectations. Mercadolibre traded down on Venezuela devaluation concerns and an overall slowing South American economy. Broadsoft suffered from fundamental deterioration and missed earnings as new competitors emerged.
HOW WAS THE PORTFOLIO POSITIONED AT PERIOD END?
Although the markets have traded down recently, we continue to be encouraged by accommodating monetary policy, the improving, albeit slowly, domestic economy and strong corporate balance sheets. However, a fair amount of uncertainty still surrounds markets as investors contemplate rising valuations, the unwinding of federal stimulus and the potential for additional geopolitical conflict.
Given strong equity market returns in 2013 and rising equity valuations we are investing in companies with the expectation that future earnings growth will drive more stock price appreciation than multiple expansion. The current market environment requires deep fundamental research which is a core tenant of our investment process. Currently, the portfolio’s largest weightings are in the Information Technology, Industrials and Healthcare sectors as we continue to invest in companies with attractive secular growth trends at reasonable valuations.
Past performance is not indicative of future results. Current performance may be lower or higher than the performance data quoted.
| Semi-Annual Report | April 30, 2014 | 11 |
| CENTURY FUNDS | Fund Commentary |
| CENTURY GROWTH OPPORTUNITIES FUND | April 30, 2014 (Unaudited) |
Risks: The Fund invests mainly in small-cap and mid-cap companies, which, historically, have been more volatile in price than the stocks of large-cap companies. The Fund may invest in foreign companies, which involves risks not associated with investing solely in U.S. companies, such as currency fluctuations, unfavorable political developments, or economic instability. These risks are magnified in emerging markets. Please read the Fund’s prospectus for details regarding the Fund’s risk profile.
| Ten Largest Holdings* | |
GREENBRIER COMPANIES, INC. Machinery | 2.44% |
PENN VIRGINIA CORP. Oil, Gas & Consumable Fuels | 2.44% |
HANESBRANDS, INC. Textiles, Apparel & Luxury Goods | 2.36% |
B/E AEROSPACE, INC. Aerospace & Defense | 2.22% |
GENERAC HOLDINGS, INC. Electrical Equipment | 2.21% |
SALIX PHARMACEUTICALS LTD. Pharmaceuticals | 2.18% |
COOPER COMPANIES, INC. Health Care Equipment & Supplies | 2.16% |
NXP SEMICONDUCTOR NV Semiconductors & Semiconductor Equipment | 2.15% |
UNIVERSAL HEALTH SERVICES, INC., CLASS B Health Care Providers & Services | 2.13% |
UNITED RENTALS, INC. Trading Companies & Distributors | 2.11% |
| Portfolio Composition* | |
| Industrials | 21.9% |
| Health Care | 19.2% |
| Information Technology | 17.3% |
| Consumer Discretionary | 17.2% |
| Energy | 10.0% |
| Consumer Staples | 3.9% |
| Financials | 3.6% |
| Materials | 2.9% |
| Telecommunication Services | 1.8% |
| Cash, Cash Equivalents, & Other Net Assets | 2.2% |
*Based on the Fund’s net assets at April 30, 2014 and subject to change.
| 12 | centuryfunds.com |
| CENTURY FUNDS | Performance Summary |
| CENTURY GROWTH OPPORTUNITIES FUND | April 30, 2014 (Unaudited) |
Institutional Shares
The returns shown below represent past performance. Past performance does not guarantee future results. Investment return and principal value of an investment will fluctuate so that an investor’s shares, when sold or redeemed, may be worth more or less than the original cost. Current performance may be higher or lower than the Fund’s past performance. For the most recent month-end performance, please call 800-303-1928.
As stated in the Fund’s current prospectus, the total (gross) operating expenses are 1.12%. The Adviser has agreed contractually to limit the operating expenses for the Fund’s Institutional Shares to 1.10% through February 28, 2015. Returns would have been lower during all periods if certain fees had not been waived or expenses reimbursed. The Fund’s total returns include the reinvestment of dividend and capital gain distributions, but have not been adjusted to reflect the deduction of taxes that a shareholder would pay on these distributions or the redemption of Fund shares. Shares held less than 90 days may be subject to a 1% redemption fee.
| Average Annual Total Returns April 30, 2014 | |||
| 1 Year | 3 Years | Since Inception* | |
| Century Growth Opportunities Fund - Institutional Shares | 23.36% | 7.68% | 11.56% |
Russell 2500® Growth Index | 21.77% | 11.30% | 17.27% |
* Fund inception date of November 17, 2010.
Growth of $100,000 for the period ended April 30, 2014
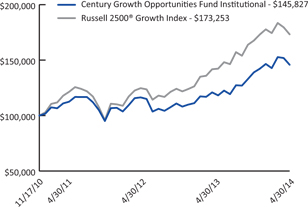
The graph and table reflect the change in value of a hypothetical investment in the Fund, including reinvest of dividends and distributions, compared with the listed indices. Index returns assume reinvestment of dividends and, unlike Fund returns, do not reflect any fees or expenses. It is not possible to invest directly in an index. Minimum initial investment for Institutional Shares is $100,000.
The Russell 2500® Growth Index measures the performance of the small- to mid-cap growth segment of the U.S. equity universe. It includes those Russell 2500 companies with higher price-to-book ratios and higher forecasted growth values. Index returns assume reinvestment of dividends but, unlike Fund returns, do not reflect fees or expenses. One cannot invest directly in an index.
| Semi-Annual Report | April 30, 2014 | 13 |
| CENTURY FUNDS | Portfolio of Investments |
| CENTURY SHARES TRUST | April 30, 2014 (Unaudited) |
| Shares | Value | |||||
| COMMON STOCKS - 91.5% | ||||||
| Consumer Discretionary - 13.5% | ||||||
| Hotels, Restaurants & Leisure - 2.8% | ||||||
| 104,455 | Marriott International, Inc., Class A | $ | 6,051,078 | |||
| Household Durables - 6.0% | ||||||
| 338,870 | D.R. Horton, Inc. | 7,550,023 | ||||
| 172,180 | Newell Rubbermaid, Inc. | 5,184,340 | ||||
| 12,734,363 | ||||||
| Internet & Catalog Retail - 2.0% | ||||||
| 3,593 | Priceline.com, Inc.(a) | 4,159,796 | ||||
| Media - 2.7% | ||||||
| 74,465 | DIRECTV(a) | 5,778,484 | ||||
| Total Consumer Discretionary | 28,723,721 | |||||
| Consumer Staples - 8.0% | ||||||
| Beverages - 3.0% | ||||||
| 73,639 | PepsiCo, Inc. | 6,324,854 | ||||
| Food & Staples Retailing - 2.6% | ||||||
| 75,823 | CVS Caremark Corp. | 5,513,849 | ||||
| Household Products - 2.4% | ||||||
| 62,106 | Procter & Gamble Co. | 5,126,850 | ||||
| Total Consumer Staples | 16,965,553 | |||||
| Energy - 6.7% | ||||||
| Energy Equipment & Services - 3.7% | ||||||
| 139,745 | FMC Technologies, Inc.(a) | 7,923,541 | ||||
| Oil, Gas & Consumable Fuels - 3.0% | ||||||
| 112,235 | Valero Energy Corp. | 6,416,475 | ||||
| Total Energy | 14,340,016 | |||||
| Financials - 7.4% | ||||||
| Diversified Financial Services - 0.4% | ||||||
| 4 | Berkshire Hathaway, Inc., Class A(a) | 773,100 | ||||
| Real Estate Investment Trust (REITs) - 3.5% | ||||||
| 90,115 | American Tower Corp. | 7,526,405 | ||||
| Real Estate Management & Development - 3.5% | ||||||
| 280,085 | CBRE Group, Inc., Class A(a) | 7,461,464 | ||||
| Total Financials | 15,760,969 | |||||
| Shares | Value | |||||
| Health Care - 14.7% | ||||||
| Biotechnology - 6.2% | ||||||
| 28,564 | Alexion Pharmaceuticals, Inc.(a) | $ | 4,518,825 | |||
| 29,131 | Celgene Corp.(a) | 4,282,548 | ||||
| 105,728 | Grifols SA, Sponsored ADR, Class B | 4,339,077 | ||||
| 13,140,450 | ||||||
| Health Care Providers & Services - 3.0% | ||||||
| 97,233 | Express Scripts Holding Co.(a) | 6,473,773 | ||||
| Pharmaceuticals - 5.5% | ||||||
| 41,937 | Actavis PLC(a) | 8,568,988 | ||||
| 18,881 | Allergan, Inc. | 3,131,225 | ||||
| 11,700,213 | ||||||
| Total Health Care | 31,314,436 | |||||
| Industrials - 9.9% | ||||||
| Aerospace & Defense - 3.9% | ||||||
| 92,793 | B/E Aerospace, Inc.(a) | 8,144,442 | ||||
| Construction & Engineering - 2.8% | ||||||
| 79,426 | Fluor Corp. | 6,012,548 | ||||
| Road & Rail - 3.2% | ||||||
| 35,681 | Union Pacific Corp. | 6,794,733 | ||||
| Total Industrials | 20,951,723 | |||||
| Information Technology - 23.7% | ||||||
| Internet Software & Services - 7.4% | ||||||
| 120,230 | eBay, Inc.(a) | 6,231,521 | ||||
| 8,952 | Google, Inc., Class A(a) | 4,714,660 | ||||
| 8,952 | Google, Inc., Class C(a) | 4,788,246 | ||||
| 15,734,427 | ||||||
| IT Services - 6.0% | ||||||
| 38,996 | International Business Machines Corp. | 7,661,544 | ||||
| 25,363 | Visa, Inc., Class A | 5,138,797 | ||||
| 12,800,341 | ||||||
| Semiconductors & Semiconductor Equipment - 3.0% | ||||||
| 401,310 | Marvell Technology Group Ltd. | 6,364,777 | ||||
See Notes to Financial Statements
| 14 | centuryfunds.com |
| CENTURY FUNDS | Portfolio of Investments |
| CENTURY SHARES TRUST | April 30, 2014 (Unaudited) |
| Shares | Value | |||||
| Information Technology - 23.7% (continued) | ||||||
| Software - 4.5% | ||||||
| 49,952 | Adobe Systems, Inc.(a) | $ | 3,081,539 | |||
| 157,841 | Oracle Corp. | 6,452,540 | ||||
| 9,534,079 | ||||||
| Technology Hardware, Storage & Peripherals - 2.8% | ||||||
| 10,267 | Apple, Inc. | 6,058,454 | ||||
| Total Information Technology | 50,492,078 | |||||
| Materials - 7.6% | ||||||
| Chemicals - 7.6% | ||||||
| 106,153 | LyondellBasell Industries NV, Class A | 9,819,152 | ||||
| 57,134 | Monsanto Co. | 6,324,734 | ||||
| Total Materials | 16,143,886 | |||||
| TOTAL COMMON STOCKS | ||||||
| (Cost $142,667,140) | 194,692,382 | |||||
| SHORT-TERM INVESTMENTS - 3.7% | ||||||
| Money Market Mutual Funds - 3.7% | ||||||
| 7,889,018 | State Street Institutional U.S. Government Money Market Fund - Investment Class (0.00%(b) 7 Day Yield) | 7,889,018 | ||||
| TOTAL SHORT-TERM INVESTMENTS | ||||||
| (Cost $7,889,018) | 7,889,018 | |||||
| TOTAL INVESTMENTS - 95.2% | ||||||
| (Cost, $150,556,158) | 202,581,400 | |||||
| Other Assets in Excess of Liabilities - 4.8% | 10,265,489 | |||||
| NET ASSETS - 100.0% | $ | 212,846,889 | ||||
| (a) | Non-income producing security. |
| (b) | Less than 0.005%. |
| Abbreviations: | ||
| ADR | - | American Depositary Receipt |
| Ltd. | - | Limited |
| NV | - | Naamloze Vennootschap (Dutch: Limited Liability Company) |
| PLC | - | Public Limited Company |
| SA | - | Generally designated corporations in various countries, mostly those employing civil law |
See Notes to Financial Statements
| Semi-Annual Report | April 30, 2014 | 15 |
| CENTURY FUNDS | Portfolio of Investments |
| CENTURY SMALL CAP SELECT FUND | April 30, 2014 (Unaudited) |
| Shares | Value | |||||
| COMMON STOCKS - 96.0% | ||||||
| Consumer Discretionary - 16.5% | ||||||
| Auto Components - 2.0% | ||||||
| 230,774 | Gentherm, Inc.(a) | $ | 8,388,635 | |||
| Hotels, Restaurants & Leisure - 2.7% | ||||||
| 91,992 | Bally Technologies, Inc.(a) | 5,989,599 | ||||
| 20,997 | Buffalo Wild Wings, Inc.(a) | 3,068,082 | ||||
| 171,067 | Ruth’s Hospitality Group, Inc. | 2,153,733 | ||||
| 11,211,414 | ||||||
| Household Durables - 2.6% | ||||||
| 276,224 | Ryland Group, Inc. | 10,604,239 | ||||
| Internet & Catalog Retail - 1.7% | ||||||
| 209,224 | HomeAway, Inc.(a) | 6,824,887 | ||||
| Media - 1.7% | ||||||
| 1,088,936 | Cumulus Media, Inc., Class A(a) | 6,980,080 | ||||
| Specialty Retail - 1.1% | ||||||
| 131,378 | DSW, Inc., Class A | 4,386,712 | ||||
| Textiles, Apparel & Luxury Goods - 4.7% | ||||||
| 120,993 | Hanesbrands, Inc. | 9,932,315 | ||||
| 232,178 | Movado Group, Inc. | 9,119,952 | ||||
| 19,052,267 | ||||||
| Total Consumer Discretionary | 67,448,234 | |||||
| Consumer Staples - 3.0% | ||||||
| Food & Staples Retailing - 3.0% | ||||||
| 42,847 | PriceSmart, Inc. | 4,115,026 | ||||
| 104,671 | Susser Holdings Corp.(a) | 8,099,442 | ||||
| Total Consumer Staples | 12,214,468 | |||||
| Energy - 6.5% | ||||||
| Energy Equipment & Services - 3.9% | ||||||
| 149,654 | Basic Energy Services, Inc.(a) | 3,953,859 | ||||
| 137,064 | C&J Energy Services, Inc.(a) | 4,120,144 | ||||
| 794,082 | Key Energy Services, Inc.(a) | 7,972,583 | ||||
| 16,046,586 | ||||||
| Oil, Gas & Consumable Fuels - 2.6% | ||||||
| 354,568 | Penn Virginia Corp.(a) | 5,900,012 | ||||
| 111,263 | Western Refining, Inc. | 4,839,940 | ||||
| 10,739,952 | ||||||
| Total Energy | 26,786,538 | |||||
| Shares | Value | |||||
| Financials - 6.9% | ||||||
| Banks - 1.6% | ||||||
| 196,244 | Eagle Bancorp, Inc.(a) | $ | 6,552,587 | |||
| Capital Markets - 3.4% | ||||||
| 342,037 | Cohen & Steers, Inc. | 13,855,919 | ||||
| Diversified Financial Services - 1.1% | ||||||
| 264,835 | Marlin Business Services Corp. | 4,547,217 | ||||
| Insurance - 0.8% | ||||||
| 134,364 | American Equity Investment Life Holding Co. | 3,133,368 | ||||
| Total Financials | 28,089,091 | |||||
| Health Care - 21.1% | ||||||
| Biotechnology - 1.5% | ||||||
| 236,906 | NPS Pharmaceuticals, Inc.(a) | 6,306,438 | ||||
| Health Care Equipment & Supplies - 3.4% | ||||||
| 107,371 | Cyberonics, Inc.(a) | 6,352,068 | ||||
| 314,792 | Globus Medical, Inc., Class A(a) | 7,687,221 | ||||
| 14,039,289 | ||||||
| Health Care Providers & Services - 7.9% | ||||||
| 233,388 | Acadia Healthcare Co., Inc.(a) | 9,806,964 | ||||
| 143,512 | Air Methods Corp.(a) | 7,989,313 | ||||
| 282,553 | Brookdale Senior Living, Inc.(a) | 8,996,487 | ||||
| 70,703 | Molina Healthcare, Inc.(a) | 2,644,292 | ||||
| 100,915 | PharMerica Corp.(a) | 2,743,879 | ||||
| 32,180,935 | ||||||
| Life Sciences Tools & Services - 4.3% | ||||||
| 201,160 | Bruker Corp.(a) | 4,155,966 | ||||
| 285,998 | Cambrex Corp.(a) | 5,860,099 | ||||
| 220,564 | WuXi PharmaTech (Cayman), Inc., Sponsored ADR(a) | 7,499,176 | ||||
| 17,515,241 | ||||||
| Pharmaceuticals - 4.0% | ||||||
| 127,045 | Akorn, Inc.(a) | 3,204,075 | ||||
| 224,305 | Depomed, Inc.(a) | 3,142,513 | ||||
| 17,443 | Jazz Pharmaceuticals PLC(a) | 2,353,061 | ||||
| 145,543 | Lannett Co., Inc.(a) | 5,025,600 | ||||
| 629,592 | TherapeuticsMD, Inc.(a) | 2,644,286 | ||||
| 16,369,535 | ||||||
| Total Health Care | 86,411,438 | |||||
See Notes to Financial Statements
| 16 | centuryfunds.com |
| CENTURY FUNDS | Portfolio of Investments |
| CENTURY SMALL CAP SELECT FUND | April 30, 2014 (Unaudited) |
| Shares | Value | |||||
| Industrials - 18.1% | ||||||
| Building Products - 1.9% | ||||||
| 157,124 | Universal Forest Products, Inc. | $ | 7,933,191 | |||
| Commercial Services & Supplies - 2.9% | ||||||
| 382,563 | Herman Miller, Inc. | 11,794,417 | ||||
| Electrical Equipment - 3.0% | ||||||
| 205,050 | Generac Holdings, Inc. | 12,073,344 | ||||
| Professional Services - 2.8% | ||||||
| 499,706 | Kforce, Inc. | 11,553,203 | ||||
| Road & Rail - 2.6% | ||||||
| 258,647 | Saia, Inc.(a) | 10,648,497 | ||||
| Trading Companies & Distributors - 4.9% | ||||||
| 670,300 | CAI International, Inc.(a) | 14,579,025 | ||||
| 49,411 | DXP Enterprises, Inc.(a) | 5,593,819 | ||||
| 20,172,844 | ||||||
| Total Industrials | 74,175,496 | |||||
| Information Technology - 20.4% | ||||||
| Communications Equipment - 2.8% | ||||||
| 62,855 | Palo Alto Networks, Inc.(a) | 3,996,321 | ||||
| 192,717 | Ubiquiti Networks, Inc.(a) | 7,463,930 | ||||
| 11,460,251 | ||||||
| Internet Software & Services - 9.9% | ||||||
| 196,490 | Constant Contact, Inc.(a) | 5,081,231 | ||||
| 226,685 | Dealertrack Technologies, Inc.(a) | 10,357,238 | ||||
| 30,194 | Demandware, Inc.(a) | 1,498,528 | ||||
| 240,885 | j2 Global, Inc. | 11,167,429 | ||||
| 159,479 | SciQuest, Inc.(a) | 3,824,306 | ||||
| 281,163 | Web.com Group, Inc.(a) | 8,634,516 | ||||
| 40,563,248 | ||||||
| IT Services - 1.0% | ||||||
| 134,709 | Acxiom Corp.(a) | 3,804,182 | ||||
| Semiconductors & Semiconductor Equipment - 4.1% | ||||||
| 700,613 | Integrated Device Technology, Inc.(a) | 8,176,154 | ||||
| 125,598 | Mellanox Technologies Ltd.(a) | 4,392,162 | ||||
| 113,185 | Monolithic Power Systems, Inc.(a) | 4,199,163 | ||||
| 16,767,479 | ||||||
| Software - 2.6% | ||||||
| 429,122 | Callidus Software, Inc.(a) | 4,095,969 | ||||
| 65,191 | Proofpoint, Inc.(a) | 1,658,459 | ||||
| Shares | Value | |||||
| Information Technology - 20.4% (continued) | ||||||
| Software - 2.6% (continued) | ||||||
| 60,378 | Tyler Technologies, Inc.(a) | $ | 4,929,864 | |||
| 10,684,292 | ||||||
| Total Information Technology | 83,279,452 | |||||
| Materials - 3.5% | ||||||
| Chemicals - 0.2% | ||||||
| 53,871 | American Vanguard Corp. | 959,442 | ||||
| Construction Materials - 1.3% | ||||||
| 64,799 | Eagle Materials, Inc. | 5,399,701 | ||||
| Metals & Mining - 2.0% | ||||||
| 175,554 | U.S. Silica Holdings, Inc. | 7,929,774 | ||||
| Total Materials | 14,288,917 | |||||
| TOTAL COMMON STOCKS | ||||||
| (Cost $317,467,541) | 392,693,634 | |||||
| SHORT-TERM INVESTMENTS - 3.0% | ||||||
| Money Market Mutual Funds - 3.0% | ||||||
| 12,144,655 | State Street Institutional U.S. Government Money Market Fund - Investment Class (0.00%(b) 7 Day Yield) | 12,144,655 | ||||
| TOTAL SHORT-TERM INVESTMENTS | ||||||
| (Cost $12,144,655) | 12,144,655 | |||||
| TOTAL INVESTMENTS - 99.0% | ||||||
| (Cost, $329,612,196) | 404,838,289 | |||||
| Other Assets in Excess of Liabilities - 1.0% | 4,281,761 | |||||
| NET ASSETS - 100.0% | $ | 409,120,050 | ||||
| (a) | Non-income producing security. |
| (b) | Less than 0.005%. |
| Abbreviations: | ||
| ADR | - | American Depositary Receipt |
| Ltd. | - | Limited |
| PLC | - | Public Limited Company |
See Notes to Financial Statements
| Semi-Annual Report | April 30, 2014 | 17 |
| CENTURY FUNDS | Portfolio of Investments |
| CENTURY GROWTH OPPORTUNITIES FUND | April 30, 2014 (Unaudited) |
| Shares | Value | |||||
| COMMON STOCKS - 97.8% | ||||||
| Consumer Discretionary - 17.2% | ||||||
| Auto Components - 1.0% | ||||||
| 23,749 | Gentherm, Inc.(a) | $ | 863,276 | |||
| Diversified Consumer Services - 2.0% | ||||||
| 40,945 | Grand Canyon Education, Inc.(a) | 1,765,548 | ||||
| Hotels, Restaurants & Leisure - 2.1% | ||||||
| 12,232 | Buffalo Wild Wings, Inc.(a) | 1,787,340 | ||||
| Household Durables - 3.0% | ||||||
| 40,426 | D.R. Horton, Inc. | 900,691 | ||||
| 28,838 | Jarden Corp.(a) | 1,648,092 | ||||
| 2,548,783 | ||||||
| Internet & Catalog Retail - 1.0% | ||||||
| 10,743 | TripAdvisor, Inc.(a) | 867,390 | ||||
| Multiline Retail - 1.0% | ||||||
| 22,186 | Big Lots, Inc.(a) | 876,347 | ||||
| Specialty Retail - 1.4% | ||||||
| 13,272 | Ulta Salon, Cosmetics & Fragrance, Inc.(a) | 1,164,087 | ||||
| Textiles, Apparel & Luxury Goods - 5.7% | ||||||
| 21,306 | Deckers Outdoor Corp.(a) | 1,682,109 | ||||
| 24,760 | Hanesbrands, Inc. | 2,032,548 | ||||
| 35,092 | Kate Spade & Co.(a) | 1,220,149 | ||||
| 4,934,806 | ||||||
| Total Consumer Discretionary | 14,807,577 | |||||
| Consumer Staples - 3.9% | ||||||
| Food & Staples Retailing - 1.9% | ||||||
| 23,480 | United Natural Foods, Inc.(a) | 1,620,824 | ||||
| Food Products - 2.0% | ||||||
| 62,245 | WhiteWave Foods Co., Class A(a) | 1,723,564 | ||||
| Total Consumer Staples | 3,344,388 | |||||
| Energy - 10.0% | ||||||
| Energy Equipment & Services - 4.5% | ||||||
| 65,856 | Basic Energy Services, Inc.(a) | 1,739,916 | ||||
| 6,434 | CARBO Ceramics, Inc. | 900,181 | ||||
| 129,175 | Key Energy Services, Inc.(a) | 1,296,917 | ||||
| 3,937,014 | ||||||
| Oil, Gas & Consumable Fuels - 5.5% | ||||||
| 23,869 | Gulfport Energy Corp.(a) | 1,758,429 | ||||
| 126,443 | Penn Virginia Corp.(a) | 2,104,012 | ||||
| Shares | Value | |||||
| Energy - 10.0% (continued) | ||||||
| Oil, Gas & Consumable Fuels - 5.5% (continued) | ||||||
| 19,767 | Western Refining, Inc. | $ | 859,864 | |||
| 4,722,305 | ||||||
| Total Energy | 8,659,319 | |||||
| Financials - 3.6% | ||||||
| Banks - 2.0% | ||||||
| 60,869 | PrivateBancorp, Inc. | 1,678,159 | ||||
| Capital Markets - 1.6% | ||||||
| 20,956 | Waddell & Reed Financial, Inc., Class A | 1,413,482 | ||||
| Total Financials | 3,091,641 | |||||
| Health Care - 19.2% | ||||||
| Biotechnology - 2.0% | ||||||
| 37,089 | Alkermes PLC(a) | 1,715,737 | ||||
| Health Care Equipment & Supplies - 6.6% | ||||||
| 14,135 | Cooper Companies, Inc. | 1,864,548 | ||||
| 26,436 | Cyberonics, Inc.(a) | 1,563,954 | ||||
| 68,720 | Globus Medical, Inc., Class A(a) | 1,678,142 | ||||
| 12,591 | West Pharmaceutical Services, Inc. | 546,198 | ||||
| 5,652,842 | ||||||
| Health Care Providers & Services - 4.2% | ||||||
| 30,500 | MEDNAX, Inc.(a) | 1,807,125 | ||||
| 22,480 | Universal Health Services, Inc., Class B | 1,838,639 | ||||
| 3,645,764 | ||||||
| Life Sciences Tools & Services - 1.2% | ||||||
| 49,461 | Cambrex Corp.(a) | 1,013,456 | ||||
| Pharmaceuticals - 5.2% | ||||||
| 27,833 | Endo International PLC(a) | 1,751,948 | ||||
| 25,830 | Lannett Co., Inc.(a) | 891,910 | ||||
| 17,134 | Salix Pharmaceuticals Ltd.(a) | 1,884,740 | ||||
| 4,528,598 | ||||||
| Total Health Care | 16,556,397 | |||||
| Industrials - 21.9% | ||||||
| Aerospace & Defense - 2.2% | ||||||
| 21,785 | B/E Aerospace, Inc.(a) | 1,912,069 | ||||
See Notes to Financial Statements
| 18 | centuryfunds.com |
| CENTURY FUNDS | Portfolio of Investments |
| CENTURY GROWTH OPPORTUNITIES FUND | April 30, 2014 (Unaudited) |
| Shares | Value | |||||
| Industrials - 21.9% (continued) | ||||||
| Airlines - 2.0% | ||||||
| 30,399 | Spirit Airlines, Inc.(a) | $ | 1,727,879 | |||
| Construction & Engineering - 2.1% | ||||||
| 22,182 | Chicago Bridge & Iron Co., NV | 1,776,113 | ||||
| Electrical Equipment - 3.9% | ||||||
| 12,028 | Acuity Brands, Inc. | 1,498,328 | ||||
| 32,303 | Generac Holdings, Inc. | 1,902,001 | ||||
| 3,400,329 | ||||||
| Machinery - 5.5% | ||||||
| 40,138 | Greenbrier Companies, Inc.(a) | 2,104,837 | ||||
| 41,622 | ITT Corp. | 1,795,573 | ||||
| 7,578 | Snap-on, Inc. | 879,048 | ||||
| 4,779,458 | ||||||
| Professional Services - 2.0% | ||||||
| 21,270 | Manpowergroup, Inc. | 1,730,102 | ||||
| Trading Companies & Distributors - 4.2% | ||||||
| 19,463 | MSC Industrial Direct Co., Inc., Class A | 1,772,301 | ||||
| 19,434 | United Rentals, Inc.(a) | 1,823,492 | ||||
| 3,595,793 | ||||||
| Total Industrials | 18,921,743 | |||||
| Information Technology - 17.3% | ||||||
| Communications Equipment - 2.4% | ||||||
| 6,569 | Palo Alto Networks, Inc.(a) | 417,657 | ||||
| 42,847 | Ubiquiti Networks, Inc.(a) | 1,659,464 | ||||
| 2,077,121 | ||||||
| Internet Software & Services - 2.1% | ||||||
| 8,516 | Demandware, Inc.(a) | 422,649 | ||||
| 46,425 | Web.com Group, Inc.(a) | 1,425,712 | ||||
| 1,848,361 | ||||||
| IT Services - 6.4% | ||||||
| 3,539 | Alliance Data Systems Corp.(a) | 856,084 | ||||
| 45,664 | Cardtronics, Inc.(a) | 1,528,831 | ||||
| 11,725 | FleetCor Technologies, Inc.(a) | 1,338,174 | ||||
| 41,253 | MAXIMUS, Inc. | 1,756,140 | ||||
| 5,479,229 | ||||||
| Semiconductors & Semiconductor Equipment - 6.4% | ||||||
| 147,089 | Integrated Device Technology, Inc.(a) | 1,716,529 | ||||
| 31,571 | Mellanox Technologies Ltd.(a) | 1,104,038 | ||||
| 31,163 | NXP Semiconductor NV(a) | 1,857,938 | ||||
| Shares | Value | |||||
| Information Technology - 17.3% (continued) | ||||||
| Semiconductors & Semiconductor Equipment - 6.4% (continued) | ||||||
| 17,011 | Power Integrations, Inc. | $ | 803,429 | |||
| 5,481,934 | ||||||
| Total Information Technology | 14,886,645 | |||||
| Materials - 2.9% | ||||||
| Chemicals - 2.9% | ||||||
| 14,738 | Cabot Corp. | 851,856 | ||||
| 127,861 | Ferro Corp.(a) | 1,659,636 | ||||
| Total Materials | 2,511,492 | |||||
| Telecommunication Services - 1.8% | ||||||
| Diversified Telecommunication Services - 1.8% | ||||||
| 45,504 | Cogent Communications Group, Inc. | 1,568,523 | ||||
| TOTAL COMMON STOCKS | ||||||
| (Cost $68,983,490) | 84,347,725 | |||||
| SHORT-TERM INVESTMENTS - 2.4% | ||||||
| Money Market Mutual Funds - 2.4% | ||||||
| 2,114,611 | State Street Institutional U.S. Government Money Market Fund - Investment Class (0.00%(b) 7 Day Yield) | 2,114,611 | ||||
| TOTAL SHORT-TERM INVESTMENTS | ||||||
| (Cost $2,114,611) | 2,114,611 | |||||
| TOTAL INVESTMENTS - 100.2% | ||||||
| (Cost, $71,098,101) | 86,462,336 | |||||
| Liabilities in Excess of Other Assets - (0.2%) | (204,006 | ) | ||||
| NET ASSETS - 100.0% | $ | 86,258,330 | ||||
| (a) | Non-income producing security. |
| (b) | Less than 0.005%. |
| Abbreviations: | ||
| Ltd. | - | Limited |
| NV | - | Naamloze Vennootschap (Dutch: Limited Liability Company) |
| PLC | - | Public Limited Company |
See Notes to Financial Statements
| Semi-Annual Report | April 30, 2014 | 19 |
| CENTURY FUNDS | Statements of Assets and Liabilities |
| April 30, 2014 (Unaudited) |
Century Shares Trust | Century Small Cap Select Fund | Century Growth Opportunities Fund | ||||||||||
| ASSETS: | ||||||||||||
| Investments, at value (Note 1) (cost - see below) | $ | 202,581,400 | $ | 404,838,289 | $ | 86,462,336 | ||||||
| Receivable for investments sold | 10,330,260 | 5,840,400 | 1,754,003 | |||||||||
| Receivable for fund shares subscribed | 14,771 | 398,691 | 64,354 | |||||||||
| Dividends receivable | 155,557 | 6,480 | 12,335 | |||||||||
| Prepaid expenses | 13,073 | 25,932 | 5,407 | |||||||||
| Total Assets | 213,095,061 | 411,109,792 | 88,298,435 | |||||||||
| LIABILITIES: | ||||||||||||
| Payable to Affiliates: | ||||||||||||
| Investment adviser fees (Note 4) | 138,622 | 321,586 | 53,217 | |||||||||
| Administration fees (Note 5) | 17,328 | – | 7,152 | |||||||||
| Distribution and service fees (Note 6) | – | 21,624 | – | |||||||||
| Payable for investments purchased | – | 1,471,210 | 1,861,932 | |||||||||
| Payable for shares redeemed | 13,383 | 47,229 | 61,099 | |||||||||
| Payable to trustees | 12,750 | 31,428 | 7,460 | |||||||||
| Accrued expenses and other liabilities | 66,089 | 96,665 | 49,245 | |||||||||
| Total Liabilities | 248,172 | 1,989,742 | 2,040,105 | |||||||||
| NET ASSETS | $ | 212,846,889 | $ | 409,120,050 | $ | 86,258,330 | ||||||
| NET ASSETS CONSIST OF: | ||||||||||||
| Paid-in capital | $ | 129,671,268 | $ | 295,562,614 | $ | 61,684,025 | ||||||
| Accumulated net investment loss | (266,407 | ) | (4,007,617 | ) | (907,459 | ) | ||||||
| Accumulated net realized gain on investments | 31,416,786 | 42,338,960 | 10,117,529 | |||||||||
| Unrealized appreciation in value of investments | 52,025,242 | 75,226,093 | 15,364,235 | |||||||||
| NET ASSETS | $ | 212,846,889 | $ | 409,120,050 | $ | 86,258,330 | ||||||
| Net Assets: | ||||||||||||
| Institutional Shares | $ | 212,846,889 | $ | 286,873,267 | $ | 86,258,330 | ||||||
| Investor Shares | N/A | $ | 122,246,783 | N/A | ||||||||
| Shares Outstanding (Note 2): | ||||||||||||
| Institutional Shares | 9,231,127 | 8,612,009 | 5,991,010 | |||||||||
| Investor Shares | N/A | 3,812,147 | N/A | |||||||||
| Net Asset Value Per Share | ||||||||||||
(Represents both the offering and redemption price)(a) | ||||||||||||
| Institutional Shares | $ | 23.06 | $ | 33.31 | $ | 14.40 | ||||||
| Investor Shares | N/A | $ | 32.07 | N/A | ||||||||
| Cost of investments | $ | 150,556,158 | $ | 329,612,196 | $ | 71,098,101 | ||||||
| (a) | A redemption fee may be assessed for shares redeemed within 90 days after purchase. (Note 1) |
See Notes to Financial Statements
| 20 | centuryfunds.com |
| CENTURY FUNDS | Statements of Operations |
| For the Six Months Ended April 30, 2014 (Unaudited) |
Century Shares Trust | Century Small Cap Select Fund | Century Growth Opportunities Fund | ||||||||||
| INVESTMENT INCOME: | ||||||||||||
| Dividends | $ | 1,048,122 | $ | 1,212,609 | $ | 154,887 | ||||||
| Foreign taxes withheld | (3,862 | ) | – | (446 | ) | |||||||
| Total Investment Income | 1,044,260 | 1,212,609 | 154,441 | |||||||||
| EXPENSES: | ||||||||||||
| Investment adviser fees (Notes 4 and 7) | 830,940 | 2,025,119 | 365,130 | |||||||||
| Distribution and service fees (Note 6): | ||||||||||||
| Investor Shares | – | 134,343 | – | |||||||||
| Administrative fees | 103,868 | – | 45,641 | |||||||||
| Transfer agency fees: | ||||||||||||
| Institutional Shares | 51,917 | 69,550 | 12,308 | |||||||||
| Investor Shares | – | 79,960 | – | |||||||||
| Fund accounting fees | 12,527 | 24,852 | 6,793 | |||||||||
| Custodian fees | 8,558 | 16,985 | 18,161 | |||||||||
| Insurance fees | 6,088 | 14,252 | 3,386 | |||||||||
| Professional fees | 30,953 | 38,842 | 27,247 | |||||||||
| Registration fees | 13,742 | 21,371 | 10,597 | |||||||||
| Trustee fees | 35,006 | 74,304 | 16,145 | |||||||||
| Printing fees | 24,146 | 27,826 | 1,668 | |||||||||
| Other expenses | 26,416 | 29,780 | 5,835 | |||||||||
| Total Expenses | 1,144,161 | 2,557,184 | 512,911 | |||||||||
| Adviser waivers/reimbursements (Note 7) | – | – | (11,041 | ) | ||||||||
| Net Expenses | 1,144,161 | 2,557,184 | 501,870 | |||||||||
| NET INVESTMENT LOSS | (99,901 | ) | (1,344,575 | ) | (347,429 | ) | ||||||
| REALIZED AND UNREALIZED GAIN ON INVESTMENTS: | ||||||||||||
| Net realized gain on investments | 31,506,054 | 43,377,938 | 11,006,323 | |||||||||
| Net change in unrealized depreciation of investments | (13,225,387 | ) | (27,650,617 | ) | (6,039,877 | ) | ||||||
| NET REALIZED AND UNREALIZED GAIN ON INVESTMENTS | 18,280,667 | 15,727,321 | 4,966,446 | |||||||||
| NET INCREASE IN NET ASSETS RESULTING FROM OPERATIONS | $ | 18,180,766 | $ | 14,382,746 | $ | 4,619,017 | ||||||
See Notes to Financial Statements
| Semi-Annual Report | April 30, 2014 | 21 |
| CENTURY FUNDS | |
| Century Shares Trust | ||||||||
For the Six Months Ended April 30, 2014 (Unaudited) | For the Year Ended October 31, 2013 | |||||||
| OPERATIONS: | ||||||||
| Net investment income/(loss) | $ | (99,901 | ) | $ | 290,829 | |||
| Net realized gain on investments | 31,506,054 | 11,876,647 | ||||||
| Change in net unrealized appreciation/(depreciation) | (13,225,387 | ) | 34,752,330 | |||||
| Net increase in net assets resulting from operations | 18,180,766 | 46,919,806 | ||||||
| DISTRIBUTIONS TO SHAREHOLDERS: | ||||||||
| Institutional Shares | ||||||||
| From net investment income | – | (399,960 | ) | |||||
| From net realized gains on investments | (11,893,455 | ) | (21,366,224 | ) | ||||
| Investor Shares | ||||||||
| From net investment income | – | – | ||||||
| From net realized gains on investments | – | – | ||||||
| Total distributions | (11,893,455 | ) | (21,766,184 | ) | ||||
| CAPITAL SHARE TRANSACTIONS: | ||||||||
| Increase/(decrease) in net assets from capital share transactions (Note 2) | 5,288,643 | 1,582,539 | ||||||
| Redemption fees | 4 | 441 | ||||||
| Net increase/(decrease) from share transactions | 5,288,647 | 1,582,980 | ||||||
| Total increase/(decrease) | 11,575,958 | 26,736,602 | ||||||
| NET ASSETS: | ||||||||
| Beginning of period | 201,270,931 | 174,534,329 | ||||||
| End of period* | $ | 212,846,889 | $ | 201,270,931 | ||||
| *Including accumulated net investment loss | $ | (266,407 | ) | $ | (166,506 | ) | ||
See Notes to Financial Statements
| 22 | centuryfunds.com |
| Statements of Changes in Net Assets | |
| Century Small Cap Select Fund | Century Growth Opportunities Fund | |||||||||||||
For the Six Months Ended April 30, 2014 (Unaudited) | For the Year Ended October 31, 2013 | For the Six Months Ended April 30, 2014 (Unaudited) | For the Year Ended October 31, 2013 | |||||||||||
| $ | (1,344,575 | ) | $ | (962,493 | ) | $ | (347,429 | ) | $ | (273,374 | ) | |||
| 43,377,938 | 64,324,461 | 11,006,323 | 8,886,734 | |||||||||||
| (27,650,617 | ) | 45,785,839 | (6,039,877 | ) | 16,179,917 | |||||||||
| 14,382,746 | 109,147,807 | 4,619,017 | 24,793,277 | |||||||||||
| – | – | – | (173,998 | ) | ||||||||||
| (14,835,365 | ) | – | (987,358 | ) | – | |||||||||
| – | – | – | – | |||||||||||
| (6,531,756 | ) | – | – | – | ||||||||||
| (21,367,121 | ) | – | (987,358 | ) | (173,998 | ) | ||||||||
| (12,758,357 | ) | (73,741,581 | ) | (10,786,253 | ) | (25,491,806 | ) | |||||||
| 878 | 11,434 | – | – | |||||||||||
| (12,757,479 | ) | (73,730,147 | ) | (10,786,253 | ) | (25,491,806 | ) | |||||||
| (19,741,854 | ) | 35,417,660 | (7,154,594 | ) | (872,527 | ) | ||||||||
| 428,861,904 | 393,444,244 | 93,412,924 | 94,285,451 | |||||||||||
| $ | 409,120,050 | $ | 428,861,904 | $ | 86,258,330 | $ | 93,412,924 | |||||||
| $ | (4,007,617 | ) | $ | (2,663,042 | ) | $ | (907,459 | ) | $ | (560,030 | ) | |||
| Semi-Annual Report | April 30, 2014 | 23 |
| CENTURY FUNDS | Financial Highlights |
CENTURY SHARES TRUST INSTITUTIONAL SHARES | For a share outstanding throughout the periods presented |
| For the Six Months Ended April 30, 2014 | For the Year Ended October 31, | |||||||||||||||||||
| (Unaudited) | 2013 | 2012 | 2011 | 2010 | ||||||||||||||||
| NET ASSET VALUE, BEGINNING OF PERIOD | $ | 22.41 | $ | 19.81 | $ | 20.66 | $ | 19.65 | $ | 16.84 | ||||||||||
| INCOME/(LOSS) FROM OPERATIONS: | ||||||||||||||||||||
Net investment income/(loss)(a) | (0.01 | ) | 0.03 | 0.05 | (0.02 | ) | (0.01 | ) | ||||||||||||
| Net realized and unrealized gain on investments | 1.99 | 5.09 | 1.28 | 1.93 | 2.82 | |||||||||||||||
| Total income from investment operations | 1.98 | 5.12 | 1.33 | 1.91 | 2.81 | |||||||||||||||
| LESS DISTRIBUTIONS FROM: | ||||||||||||||||||||
| Net investment income | – | (0.05 | ) | (0.06 | ) | (0.01 | ) | (0.00 | )(b) | |||||||||||
| Net realized gain on investment transactions | (1.33 | ) | (2.47 | ) | (2.12 | ) | (0.89 | ) | – | |||||||||||
| Total distributions | (1.33 | ) | (2.52 | ) | (2.18 | ) | (0.90 | ) | (0.00 | )(b) | ||||||||||
| REDEMPTION FEES | 0.00 | (b) | 0.00 | (b) | 0.00 | (b) | 0.00 | (b) | 0.00 | (b) | ||||||||||
| NET ASSET VALUE, END OF PERIOD | $ | 23.06 | $ | 22.41 | $ | 19.81 | $ | 20.66 | $ | 19.65 | ||||||||||
| TOTAL RETURN | 9.15 | %(c) | 28.85 | % | 7.63 | % | 9.79 | % | 16.72 | % | ||||||||||
| RATIOS AND SUPPLEMENTAL DATA | ||||||||||||||||||||
| Net assets, end of period (000's) | $ | 212,847 | $ | 201,271 | $ | 174,534 | $ | 178,201 | $ | 177,042 | ||||||||||
| Ratio of expenses to average net assets | 1.10 | %(d) | 1.11 | % | 1.12 | % | 1.13 | % | 1.15 | % | ||||||||||
| Ratio of net investment income/(loss) to average net assets | (0.10 | %)(d) | 0.16 | % | 0.24 | % | (0.10 | %) | (0.05 | %) | ||||||||||
| PORTFOLIO TURNOVER RATE | 52 | %(c) | 39 | % | 79 | % | 72 | % | 67 | % | ||||||||||
| (a) | Per share numbers have been calculated using the average shares method. |
| (b) | Less than $0.005 per share. |
| (c) | Not annualized. |
| (d) | Annualized. |
See Notes to Financial Statements
| 24 | centuryfunds.com |
| CENTURY FUNDS | Financial Highlights |
| CENTURY SMALL CAP SELECT FUND INSTITUTIONAL SHARES | For a share outstanding throughout the periods presented |
| For the Six Months Ended April 30, 2014 | For the Year Ended October 31, | |||||||||||||||||||
| (Unaudited) | 2013 | 2012 | 2011 | 2010 | ||||||||||||||||
| NET ASSET VALUE, BEGINNING OF PERIOD | $ | 33.94 | $ | 26.27 | $ | 23.91 | $ | 20.99 | $ | 16.34 | ||||||||||
| INCOME/(LOSS) FROM OPERATIONS: | ||||||||||||||||||||
Net investment loss(a) | (0.09 | ) | (0.04 | ) | (0.12 | ) | (0.09 | ) | (0.05 | ) | ||||||||||
| Net realized and unrealized gain on investments | 1.18 | 7.71 | 2.48 | 3.01 | 4.70 | |||||||||||||||
| Total income from investment operations | 1.09 | 7.67 | 2.36 | 2.92 | 4.65 | |||||||||||||||
| LESS DISTRIBUTIONS FROM: | ||||||||||||||||||||
| Net realized gain on investment transactions | (1.72 | ) | – | – | – | – | ||||||||||||||
| Total distributions | (1.72 | ) | – | – | – | – | ||||||||||||||
| REDEMPTION FEES | 0.00 | (b) | 0.00 | (b) | 0.00 | (b) | 0.00 | (b) | 0.00 | (b) | ||||||||||
| NET ASSET VALUE, END OF PERIOD | $ | 33.31 | $ | 33.94 | $ | 26.27 | $ | 23.91 | $ | 20.99 | ||||||||||
| TOTAL RETURN | 3.21 | %(c) | 29.20 | % | 9.87 | % | 13.86 | % | 28.52 | % | ||||||||||
| RATIOS AND SUPPLEMENTAL DATA | ||||||||||||||||||||
| Net assets, end of period (000's) | $ | 286,873 | $ | 300,833 | $ | 281,480 | $ | 254,724 | $ | 249,429 | ||||||||||
| Ratio of expenses to average net assets | 1.11 | %(d) | 1.12 | % | 1.10 | % | 1.11 | % | 1.13 | % | ||||||||||
| Ratio of net investment loss to average net assets | (0.54 | %)(d) | (0.14 | %) | (0.48 | %) | (0.37 | %) | (0.25 | %) | ||||||||||
| PORTFOLIO TURNOVER RATE | 51 | %(c) | 91 | % | 53 | % | 75 | % | 85 | % | ||||||||||
| (a) | Per share numbers have been calculated using the average shares method. |
| (b) | Less than $0.005 per share. |
| (c) | Not annualized. |
| (d) | Annualized. |
See Notes to Financial Statements
| Semi-Annual Report | April 30, 2014 | 25 |
| CENTURY FUNDS | Financial Highlights |
CENTURY SMALL CAP SELECT FUND INVESTOR SHARES | For a share outstanding throughout the periods presented |
| For the Six Months Ended April 30, 2014 | For the Year Ended October 31, | |||||||||||||||||||
| (Unaudited) | 2013 | 2012 | 2011 | 2010 | ||||||||||||||||
| NET ASSET VALUE, BEGINNING OF PERIOD | $ | 32.78 | $ | 25.45 | $ | 23.25 | $ | 20.49 | $ | 16.00 | ||||||||||
| INCOME/(LOSS) FROM OPERATIONS: | ||||||||||||||||||||
Net investment loss(a) | (0.14 | ) | (0.13 | ) | (0.21 | ) | (0.17 | ) | (0.11 | ) | ||||||||||
| Net realized and unrealized gain on investments | 1.15 | 7.46 | 2.41 | 2.92 | 4.60 | |||||||||||||||
| Total income from investment operations | 1.01 | 7.33 | 2.20 | 2.75 | 4.49 | |||||||||||||||
| LESS DISTRIBUTIONS FROM: | ||||||||||||||||||||
| Net realized gain on investment transactions | (1.72 | ) | – | – | – | – | ||||||||||||||
| Total distributions | (1.72 | ) | – | – | – | – | ||||||||||||||
| REDEMPTION FEES | 0.00 | (b) | 0.00 | (b) | 0.00 | (b) | 0.01 | 0.00 | (b) | |||||||||||
| NET ASSET VALUE, END OF PERIOD | $ | 32.07 | $ | 32.78 | $ | 25.45 | $ | 23.25 | $ | 20.49 | ||||||||||
| TOTAL RETURN | 3.07 | %(c) | 28.80 | % | 9.46 | % | 13.47 | % | 28.06 | % | ||||||||||
| RATIOS AND SUPPLEMENTAL DATA | ||||||||||||||||||||
| Net assets, end of period (000's) | $ | 122,247 | $ | 128,029 | $ | 111,965 | $ | 116,678 | $ | 92,618 | ||||||||||
| Ratio of expenses to average net assets | 1.41 | %(d) | 1.41 | % | 1.47 | % | 1.48 | % | 1.50 | % | ||||||||||
| Ratio of net investment loss to average net assets | (0.84 | %)(d) | (0.44 | %) | (0.84 | %) | (0.71 | %) | (0.61 | %) | ||||||||||
| PORTFOLIO TURNOVER RATE | 51 | %(c) | 91 | % | 53 | % | 75 | % | 85 | % | ||||||||||
| (a) | Per share numbers have been calculated using the average shares method. |
| (b) | Less than $0.005 per share. |
| (c) | Not annualized. |
| (d) | Annualized. |
See Notes to Financial Statements
| 26 | centuryfunds.com |
| CENTURY FUNDS | Financial Highlights |
CENTURY GROWTH OPPORTUNITIES FUND INSTITUTIONAL SHARES | For a share outstanding throughout the periods presented |
For the Six Months Ended April 30, 2014 | For the Year Ended October 31, | For the Period November 17, 2010 (Inception) to October 31, | ||||||||||||||
| (Unaudited) | 2013 | 2012 | 2011 | |||||||||||||
| NET ASSET VALUE, BEGINNING OF PERIOD | $ | 13.87 | $ | 10.81 | $ | 10.67 | $ | 10.00 | ||||||||
| INCOME/(LOSS) FROM OPERATIONS: | ||||||||||||||||
Net investment loss(a) | (0.05 | ) | (0.03 | ) | (0.02 | ) | (0.07 | ) | ||||||||
| Net realized and unrealized gain on investments | 0.73 | 3.11 | 0.16 | 0.74 | ||||||||||||
| Total income from investment operations | 0.68 | 3.08 | 0.14 | 0.67 | ||||||||||||
| LESS DISTRIBUTIONS FROM: | ||||||||||||||||
| Net investment income | – | (0.02 | ) | – | – | |||||||||||
| Net realized gain on investment transactions | (0.15 | ) | – | – | – | |||||||||||
| Total distributions | (0.15 | ) | (0.02 | ) | – | – | ||||||||||
| REDEMPTION FEES | – | 0.00 | (b) | 0.00 | (b) | 0.00 | (b) | |||||||||
| NET ASSET VALUE, END OF PERIOD | $ | 14.40 | $ | 13.87 | $ | 10.81 | $ | 10.67 | ||||||||
| TOTAL RETURN | 4.95 | %(c) | 28.54 | % | 1.31 | % | 6.70 | %(c) | ||||||||
| RATIOS AND SUPPLEMENTAL DATA | ||||||||||||||||
| Net assets, end of period (000's) | $ | 86,258 | $ | 93,413 | $ | 94,285 | $ | 7,323 | ||||||||
| Ratio of expenses to average net assets without giving effect to contractual expense agreement | 1.12 | %(d) | 1.12 | % | 1.20 | % | 3.62 | %(d) | ||||||||
| Ratio of expenses to average net assets | 1.10 | %(d) | 1.10 | % | 1.10 | % | 1.10 | %(d) | ||||||||
| Ratio of net investment loss to average net assets | (0.76 | %)(d) | (0.27 | %) | (0.18 | %) | (0.64 | %)(d) | ||||||||
| PORTFOLIO TURNOVER RATE | 77 | %(c) | 155 | % | 148 | % | 119 | %(c) | ||||||||
| (a) | Per share numbers have been calculated using the average shares method. |
| (b) | Less than $0.005 per share. |
| (c) | Not annualized. |
| (d) | Annualized. |
See Notes to Financial Statements
| Semi-Annual Report | April 30, 2014 | 27 |
| CENTURY FUNDS | Notes to Financial Statements |
| April 30, 2014 (Unaudited) |
1. SIGNIFICANT ACCOUNTING POLICIES
Century Capital Management Trust (the “Trust”) is registered under the Investment Company Act of 1940 (“1940 Act”), as amended, as an open-end management investment company organized as a Massachusetts business trust. Century Shares Trust, Century Small Cap Select Fund, and Century Growth Opportunities Fund (each a “Fund” and, collectively, the “Funds”) are diversified series of the Trust. The following are significant accounting policies consistently followed by the Funds and are in conformity with accounting principles generally accepted in the United States (GAAP).
The investment objective of Century Shares Trust is to seek long-term growth of principal and income. The investment objective of each of Century Small Cap Select Fund and Century Growth Opportunities Fund is to seek long-term capital growth.
A. Security Valuations — Equity securities are valued at the last reported sale price or official closing price on the primary exchange or market on which they are traded, as reported by an independent pricing service. If no sale price or official closing price is reported, market value is generally determined based on quotes or closing prices obtained from a quotation reporting system, established market maker, or reputable pricing service. For unlisted securities and for exchange-listed securities for which there are no reported sales or official closing prices, fair value is generally determined using closing bid prices. In the absence of readily available market quotes, securities and other assets will be valued at fair value, as determined in good faith under procedures established by and under the general supervision of the Funds’ Board of Trustees. Short-term obligations, maturing in 60 days or less, are valued at amortized cost, which approximates fair value. Investments in open-end mutual funds are valued at their closing net asset value each business day.
A three-tier hierarchy has been established to classify fair value measurements for disclosure purposes. Inputs refer broadly to the assumptions that market participants would use in pricing the asset or liability, including assumptions about risk. Inputs may be observable or unobservable. Observable inputs are inputs that reflect the assumptions market participants would use in pricing the asset or liability that are developed based on market data obtained from sources independent of the reporting entity. Unobservable inputs are inputs that reflect the reporting entity’s own assumptions about the assumptions market participants would use in pricing the asset or liability that are developed based on the best information available.
Various inputs are used in determining the value of each Fund’s investments as of the reporting period end. These inputs are categorized in the following hierarchy under applicable financial accounting standards:
| Level 1 | — | Unadjusted quoted prices in active markets for identical, unrestricted assets or liabilities that the Funds have the ability to access at the measurement date; |
| Level 2 | — | Quoted prices which are not active, quoted prices for similar assets or liabilities in active markets or inputs other than quoted prices that are observable (either directly or indirectly) for substantially the full term of the asset or liability; |
| Level 3 | — | Significant unobservable prices or inputs (including the Fund’s own assumptions in determining the fair value of investments) where there is little or no market activity for the asset or liability at the measurement date. |
The availability of observable inputs can vary from security to security and is affected by a wide variety of factors, including, for example, the type of security, whether the security is new and not yet established in the marketplace, the liquidity of markets, and other characteristics particular to the security. To the extent that valuation is based on models or inputs that are less observable or unobservable in the market, the determination of fair value requires more judgment. Accordingly, the degree of judgment exercised in determining fair value is greatest for instruments categorized in Level 3.
| 28 | centuryfunds.com |
| CENTURY FUNDS | Notes to Financial Statements |
| April 30, 2014 (Unaudited) |
The following is a summary of the inputs used as of April 30, 2014 in valuing the Funds’ investments carried at fair value:
| Century Shares Trust | ||||||||||||||||
| Investments in Securities at Value* | Level 1 - Quoted Prices | Level 2 - Other Significant Observable Inputs | Level 3 - Significant Unobservable Inputs | Total | ||||||||||||
| Common Stocks | $ | 194,692,382 | $ | – | $ | – | $ | 194,692,382 | ||||||||
| Short-Term Investments | 7,889,018 | – | – | 7,889,018 | ||||||||||||
| TOTAL | $ | 202,581,400 | $ | – | $ | – | $ | 202,581,400 | ||||||||
| Century Small Cap Select Fund | ||||||||||||||||
| Investments in Securities at Value* | Level 1 - Quoted Prices | Level 2 - Other Significant Observable Inputs | Level 3 - Significant Unobservable Inputs | Total | ||||||||||||
| Common Stocks | $ | 392,693,634 | $ | – | $ | – | $ | 392,693,634 | ||||||||
| Short-Term Investments | 12,144,655 | – | – | 12,144,655 | ||||||||||||
| TOTAL | $ | 404,838,289 | $ | – | $ | – | $ | 404,838,289 | ||||||||
| Century Growth Opportunities Fund | ||||||||||||||||
| Investments in Securities at Value* | Level 1 - Quoted Prices | Level 2 - Other Significant Observable Inputs | Level 3 - Significant Unobservable Inputs | Total | ||||||||||||
| Common Stocks | $ | 84,347,725 | $ | – | $ | – | $ | 84,347,725 | ||||||||
| Short-Term Investments | 2,114,611 | – | – | 2,114,611 | ||||||||||||
| TOTAL | $ | 86,462,336 | $ | – | $ | – | $ | 86,462,336 | ||||||||
| * | At April 30, 2014 the Funds held investments in common stocks classified as Level 1, with corresponding major categories as shown on each Fund’s Portfolio of Investments. |
The Funds recognize transfers into and out of all levels at the end of the reporting period. There were no transfers into or out of Levels 1 and 2 during the period.
There were no securities classified as Level 3 securities during the period, thus, a reconciliation of assets in which significant unobservable inputs (Level 3) were used is not applicable for these Funds.
B. Security Transactions — Security transactions are recorded on a trade date basis. Gain or loss on sales is determined by the use of the highest cost-method, for both financial reporting and federal income tax purposes. Dividend income is recorded on the ex-dividend date. Payments received from certain investments held by the Funds may be comprised of dividends, capital gains and return of capital. The Funds originally estimate the expected classification of such payments. The amounts may
| Semi-Annual Report | April 30, 2014 | 29 |
| CENTURY FUNDS | Notes to Financial Statements |
| April 30, 2014 (Unaudited) |
subsequently be reclassified upon receipt of information from the issuer. The Funds may invest in equity securities issued or guaranteed by companies organized and based in countries outside of the United States. These securities may be traded on foreign securities exchanges or in foreign over-the-counter markets. Foreign dividend income is recorded on ex-dividend date or as soon as practicable after the Fund determines the existence of a dividend declaration after exercising reasonable due diligence. Foreign income and capital gain on some foreign securities may be subject to foreign withholding taxes, which are accrued as applicable. Interest income is recorded daily on an accrual basis.
C. Use of Estimates — The preparation of these financial statements in accordance with GAAP incorporates estimates made by management in determining the reported amounts of assets, liabilities, income and expenses of the Funds. Actual results could differ from those estimates.
D. Risks and Uncertainty — Century Shares Trust may invest a significant portion of assets in a limited number of companies. As a result, the Fund may be more susceptible to financial, market and economic events affecting particular companies and therefore may experience greater price volatility than funds with more diversified portfolios.
Century Small Cap Select Fund concentrates its investments in certain industries detailed in the Portfolio of Investments, which subjects the Fund to the risks associated with those industries and may result in greater fluctuation in share value than is experienced in more diversified portfolios. In addition, the Fund invests in smaller companies, which generally involves greater risk than investing in larger, more established companies.
Century Growth Opportunities Fund invests mainly in small-cap and mid-cap companies, which, historically, have been more volatile in price than the stocks of large-cap companies.
Foreign investing involves certain risks and increased volatility not associated with investing solely in the U.S. These risks include currency fluctuations, economic or financial instability, lack of timely or reliable financial information or unfavorable political or legal developments.
At any given time, a significant portion of the assets of each Fund may be invested in securities of companies within the same market sector of the economy. Companies within the same sector often face similar issues and, consequently, may react similarly to changes in market conditions. If a Fund has a significant weighting in one or more sectors, it may be subject to more risk and price volatility.
E. Multiple Classes of Shares — Century Small Cap Select Fund offers two classes of shares, which differ in their respective distribution and service fees. Investment income, realized and unrealized capital gains and losses, the common expenses of the Fund, and certain fund-level expense reductions, if any, are allocated on a pro rata basis to each class based on the relative net assets of each class to the total net assets of the Fund. Certain expense reductions may differ by class. Because transfer agent fees include a per account fee, each class differs with respect to transfer agent fees incurred.
F. Redemption Fees — In general, shares of each Fund may be redeemed at net asset value. However, upon the redemption of shares held less than 90 days, a redemption fee of 1% of the current net asset value of the shares may be assessed and retained by each share class of each Fund for the benefit of the Fund’s remaining shareholders. The redemption fee is accounted for as an addition to paid-in-capital and amounts are shown on the Statement of Changes in Net Assets.
| 30 | centuryfunds.com |
| CENTURY FUNDS | Notes to Financial Statements |
| April 30, 2014 (Unaudited) |
G. Income Tax Information and Distributions to Shareholders — Each year, each Fund intends to qualify as a regulated investment company by distributing all of its taxable income and sufficient net investment income and net realized gains, if any, under Subchapter M of the Internal Revenue Code of 1986 (“Code”), as amended. As a result, no provision for income taxes is required in the accompanying financial statements. Foreign taxes are provided for based on each Fund’s understanding of the tax rules and rates class. Distributions are recorded on the ex-dividend date. Income and capital gain distributions are determined in accordance with income tax regulations, which may differ from generally accepted accounting principles. Capital accounts within the financial statements are adjusted for permanent book and tax differences. Generally accepted accounting principles require that any distributions in excess of tax basis earnings and profits be reported in the financial statements as a tax return of capital.
The net unrealized appreciation/depreciation of investments based on federal tax cost as of April 30, 2014 was as follows:
| Century Shares Trust | Century Small Cap Select Fund | Century Growth Opportunities Fund | ||||||||||
| Gross appreciation on investments (excess of value over tax cost) | $ | 52, 745,225 | $ | 86,762,479 | $ | 16,495,006 | ||||||
| Gross depreciation on investments (excess of tax cost over value) | (719,983 | ) | (12,432,062 | ) | (1,694,899 | ) | ||||||
| Net unrealized appreciation | $ | 52,025,242 | $ | 74,330,417 | $ | 14,800,107 | ||||||
| Cost of investments for federal income tax purposes | $ | 150,556,158 | $ | 330,507,872 | $ | 71,662,229 | ||||||
The tax character of distributions paid by the Funds during the year ended October 31, 2013, were as follows:
| Distributions Paid From: | Century Shares Trust | Century Small Cap Select Fund | Century Growth Opportunities Fund | |||||||||
| Ordinary Income | $ | 391,587 | $ | 0 | $ | 169,177 | ||||||
Long‐term capital gains | 21,374,597 | 0 | 4,821 | |||||||||
| Total | $ | 21,766,184 | $ | 0 | $ | 173,998 | ||||||
The tax character of distributions paid by the Funds during the period ended April 30, 2014, will be determined at the Funds’ fiscal year end, October 31, 2014.
During the year ended October 31, 2013, the funds utilized the following capital loss carryforwards:
| Used October 31, 2013 | Century Shares Trust | Century Small Cap Select Fund | Century Growth Opportunities Fund | |||||||||
| $ | – | $ | (43,614,763 | ) | $ | (501,921 | ) | |||||
As of October 31, 2013, each of the Funds had utilized all capital loss carryforwards available.
| Semi-Annual Report | April 30, 2014 | 31 |
| CENTURY FUNDS | Notes to Financial Statements |
| April 30, 2014 (Unaudited) |
The Funds elect to defer to the period ending October 31, 2014, late year ordinary losses in the amounts of $166,506 for Century Shares Trust, $2,663,042 for Century Small Cap Select Fund and $560,030 for Century Growth Opportunities Fund.
As of April 30, 2014, the Funds had no uncertain tax positions that would require financial statement recognition or disclosure. The Funds’ federal tax returns filed for the fiscal years ended October 31, 2010, October 31, 2011, October 31, 2012, and returns to be filed for the year ended October 31, 2013, remain subject to examination by the Internal Revenue Service.
H. Indemnifications — In the normal course of business, the Funds enter into agreements with service providers that may contain indemnification clauses. The Funds maximum exposure under these arrangements is unknown as this would involve future claims that may be made against the Funds that have not yet occurred.
2. TRANSACTIONS IN SHARES
Century Shares Trust —The number of authorized shares is unlimited. Transactions in Institutional Class shares were as follows:
| Institutional | ||||||||||||||||
For the Six Months Ended April 30, 2014 (Unaudited) | For the Year Ended October 31, 2013 | |||||||||||||||
| Shares | Amount | Shares | Amount | |||||||||||||
| Sold | 103,006 | $ | 2,349,604 | 76,251 | $ | 1,482,250 | ||||||||||
| Issued to shareholders in reinvestment of distributions | 488,619 | 10,734,961 | 1,095,688 | 19,733,349 | ||||||||||||
| 591,625 | 13,084,565 | 1,171,939 | 21,215,599 | |||||||||||||
| Repurchased | (343,252 | ) | (7,795,922 | ) | (998,357 | ) | (19,633,060 | ) | ||||||||
| Net Increase | 248,373 | $ | 5,288,643 | 173,582 | $ | 1,582,539 | ||||||||||
Century Small Cap Select Fund — The number of authorized shares is unlimited. Transactions in each class of shares were as follows:
| Institutional | ||||||||||||||||
For the Six Months Ended April 30, 2014 (Unaudited) | For the Year Ended October 31, 2013 | |||||||||||||||
| Shares | Amount | Shares | Amount | |||||||||||||
| Sold | 477,675 | $ | 16,433,926 | 1,565,973 | $ | 45,639,628 | ||||||||||
| Issued to shareholders in reinvestment of distribution | 432,124 | 14,381,100 | – | – | ||||||||||||
| 909,799 | 30,815,026 | 1,565,973 | 45,639,628 | |||||||||||||
| Repurchased | (1,162,576 | ) | (40,174,090 | ) | (3,415,043 | ) | (105,149,014 | ) | ||||||||
| Net Decrease | (252,777 | ) | $ | (9,359,064 | ) | (1,849,070 | ) | $ | (59,509,386 | ) | ||||||
| 32 | centuryfunds.com |
| CENTURY FUNDS | Notes to Financial Statements |
| April 30, 2014 (Unaudited) |
| Investor | ||||||||||||||||
For the Six Months Ended April 30, 2014 (Unaudited) | For the Year Ended October 31, 2013 | |||||||||||||||
| Shares | Amount | Shares | Amount | |||||||||||||
| Sold | 135,586 | $ | 4,476,920 | 462,270 | $ | 13,100,017 | ||||||||||
| Issued to shareholders in reinvestment of distribution | 202,017 | 6,480,700 | – | – | ||||||||||||
| 337,603 | 10,957,620 | 462,270 | 13,100,017 | |||||||||||||
| Repurchased | (431,445 | ) | (14,356,912 | ) | (954,995 | ) | (27,332,212 | ) | ||||||||
| Net Decrease | (93,842 | ) | $ | (3,399,292 | ) | (492,725 | ) | $ | (14,232,195 | ) | ||||||
Century Growth Opportunities Fund —The number of authorized shares is unlimited. Transactions in Institutional Class shares were as follows:
| Institutional | ||||||||||||||||
For the Six Months Ended April 30, 2014 (Unaudited) | For the Year Ended October 31, 2013 | |||||||||||||||
| Shares | Amount | Shares | Amount | |||||||||||||
| Sold | 207,727 | $ | 2,998,117 | 1,322,762 | $ | 16,005,747 | ||||||||||
| Issued to shareholders in reinvestment of distributions | 70,523 | 987,328 | 15,506 | 173,198 | ||||||||||||
| 278,250 | 3,985,445 | 1,338,268 | 16,178,945 | |||||||||||||
| Repurchased | (1,023,001 | ) | (14,771,698 | ) | (3,327,149 | ) | (41,670,751 | ) | ||||||||
| Net Decrease | (744,751 | ) | $ | (10,786,253 | ) | (1,988,881 | ) | $ | (25,491,806 | ) | ||||||
3. INVESTMENT SECURITIES TRANSACTIONS
Century Shares Trust purchases and sales of investment securities (excluding short-term securities and U.S. Government obligations) aggregated $104,505,314 and $125,987,870, respectively, during the six months ended April 30, 2014.
Century Small Cap Select Fund purchases and sales of investment securities (excluding short-term securities and U.S. Government obligations) aggregated $212,016,326 and $248,438,961, respectively, during the six months ended April 30, 2014.
Century Growth Opportunities Fund purchases and sales of investment securities (excluding short-term securities and U.S. Government obligations) aggregated $69,250,269 and $81,821,635, respectively, during the six months ended April 30, 2014.
4. INVESTMENT ADVISER FEE
Century Shares Trust: The Trust has entered into an Investment Advisory Agreement (the “Agreement”) with Century Capital Management, LLC (“CCM”) pursuant to which CCM provides an investment program for Century Shares Trust. Under the Agreement, the Fund pays a management fee based on the Fund’s average daily net assets computed at the following annual rates: 0.80% of the first $500 million and 0.70% of the amounts exceeding $500 million.
| Semi-Annual Report | April 30, 2014 | 33 |
| CENTURY FUNDS | Notes to Financial Statements |
| April 30, 2014 (Unaudited) |
Century Small Cap Select Fund: The Trust has entered into an Investment Advisory and Management Services Agreement (the “Agreement”) with CCM pursuant to which CCM provides investment advisory, management and administrative services to Century Small Cap Select Fund. Under the Agreement, the Fund pays a monthly management fee at the annual rate of 0.95% of the Fund’s average daily net assets.
Century Growth Opportunities Fund: The Trust has entered into an Investment Advisory Agreement (the “Agreement”) with CCM pursuant to which CCM provides investment advisory services to Century Growth Opportunities Fund. Under the Agreement, the Fund pays a management fee based on the Fund’s average daily net assets at the following annual rates: 0.80% of the first $500 million and 0.75% thereafter.
5. ADMINISTRATION FEES
Century Shares Trust: The Trust has entered into an Administration Agreement with CCM pursuant to which CCM provides certain administrative services to Century Shares Trust at the annual rate of 0.10% of the Fund’s average daily net assets.
Century Small Cap Select Fund: Per the Investment Advisory and Management Services Agreement between the Trust and CCM, Century Small Cap Select Fund may reimburse CCM for expenses associated with having the adviser’s personnel perform shareholder service functions and certain financial, accounting, administrative and clerical services. No reimbursements were paid to CCM during the six months ended April 30, 2014.
Century Growth Opportunities Fund: The Trust has entered into an Administration Agreement with CCM pursuant to which CCM provides certain administrative services to Century Growth Opportunities Fund at the annual rate of 0.10% of the Fund’s average daily net assets.
CCM has entered into a Sub-Administration Agreement with ALPS Fund Services, Inc. (“ALPS”) pursuant to which ALPS provides certain administrative services to each Fund on behalf of CCM. CCM pays ALPS a sub-administration fee for sub-administration services provided to each Fund.
6. DISTRIBUTION AND OTHER FEES
The Trust has adopted a Distribution and Service Plan (the “Plan”) pursuant to Rule 12b-1 under the 1940 Act on behalf of Century Small Cap Select Fund. The Plan authorizes the Fund to pay up to 0.25% of the average daily net assets of the Fund’s Investor Shares class for distribution and shareholder services. The Plan may be terminated at any time by the vote of a majority of the independent Trustees or by the vote of the holders of a majority of the outstanding shares of the Investor Shares.
The Trust has entered into agreements with financial intermediaries to provide recordkeeping, processing, shareholder communications and other services to customers of the intermediaries and has agreed to compensate the intermediaries for providing such services. Certain services would be provided by the Funds if the shares of each customer were registered directly with the Funds’ transfer agent. Each Fund pays a portion of the intermediary fees attributable to shares of the Fund not exceeding the estimated expense the Fund would have paid its transfer agent had each customer’s shares been registered directly with the transfer agent instead of held through the intermediary accounts.
| 34 | centuryfunds.com |
| CENTURY FUNDS | Notes to Financial Statements |
| April 30, 2014 (Unaudited) |
7. ADVISER REIMBURSEMENTS
Century Growth Opportunities Fund: CCM contractually agreed to limit the operating expenses of Century Growth Opportunities Fund to 1.10% of average daily net assets of the Institutional Shares. The agreement will remain in effect through February 28, 2015 and may not be terminated prior to that date without the approval of the Board of Trustees.
For the six months ended April 30, 2014, the fee waivers and/or reimbursements were $11,041.
CCM is permitted to recoup amounts of prior fee reductions or expense reimbursements within thirty-six months after the day on which CCM earned the fee or incurred the expense if the class’s total annual operating expenses have fallen to a level below the lower of the limit described above or any limit then in effect.
As of April 30 2014, the maximum amounts subject to recoupment by the Fund in each fiscal year, pursuant to the aforementioned conditions are as follows:
| Expires on or before October 31, | |||
| 2014 | 2015 | 2016 | 2017 |
| $66,408 | $73,469 | $21,059 | $11,041 |
8. TRUSTEE AND OFFICER FEES
As of April 30, 2014, there were seven Trustees, six of whom are not “interested persons” (within the meaning of the 1940 Act) of the Trust (the “Independent Trustees”). Each Independent Trustee receives a retainer of $4,000 per calendar quarter from the Trust for his or her services. The chairperson of the Audit Committee receives an additional retainer of $1,125 per calendar quarter; the Lead Independent Trustee receives an additional retainer of $750 per calendar quarter; and the Chairpersons of the Oversight and Governance Committee and Nominating Committee each receive an additional retainer of $375 per calendar quarter. In addition, each Independent Trustee is paid a fee of $5,500 for each meeting of the Board of Trustees attended or participated in, as the case may be. The Independent Trustees are not paid an additional fee from the Trust for attendance at and/or participation in meetings of the various committees of the Board. The Independent Trustees are also reimbursed for meeting-related expenses. Officers of the Trust and Trustees who are interested persons of the Trust receive no salary or fees from the Trust.
9. RECENT ACCOUNTING PRONOUNCEMENTS
In June 2013, the Financial Accounting Standards Board (the “FASB”) issued Accounting Standards Update (“ASU”) No. 2013-08, Financial Services-Investment Companies (Topic 946): Amendments to the Scope, Measurement, and Disclosure Requirements. The FASB standard identifies characteristics a company must assess to determine whether it is considered an investment company for financial reporting purposes. This ASU is effective for fiscal years beginning after December 15, 2013. The Funds believe the adoption of this ASU will not have a material impact on the financial statements.
| Semi-Annual Report | April 30, 2014 | 35 |
| CENTURY FUNDS | Disclosure of Fund Expenses |
| April 30, 2014 (Unaudited) |
As a shareholder of a Fund, you incur two types of costs: direct costs, such as short‐term redemption fees and wire fees, and indirect costs, including management fees, and other fund operating expenses. This example is intended to help you understand your indirect costs, also referred to as “ongoing costs” (in dollars), of investing in the Fund and to compare these costs with the ongoing costs of investing in other mutual funds.
This example is based on an investment of $1,000 invested at the beginning of the period and held for the entire period as indicated below.
Actual Expenses The first line of the table below provides information about actual account values and actual expenses. You may use the information in this line, together with the amount you invested at the beginning of the period, to estimate the expenses that you paid over the period. Simply divide your account value by $1,000 (for example, an $8,600 account value divided by $1,000 = 8.6), then multiply the result by the number in the first line under the heading “Expenses Paid During Period” to estimate the expenses you paid on your account during this period.
Hypothetical Example for Comparison Purposes The second line of the table provides information about hypothetical account values and hypothetical expenses based on the Fund’s actual expense ratio and an assumed rate of return of 5% per year before expenses, which is not the Fund’s actual return. The hypothetical account values and expenses may not be used to estimate the actual ending account balance or expenses you paid for the period. You may use this information to compare ongoing costs of investing in the Fund and other funds. To do so, compare this 5% hypothetical example with the 5% hypothetical examples that appear in the shareholder reports of other funds.
Please note that the expenses shown in the table are meant to highlight your ongoing costs only and do not reflect any direct costs, such as wire fees or low balance fees. Therefore, the second line of the table is useful in comparing ongoing costs only and will not help you determine the relative total costs of owning different funds. In addition, if these direct costs were included, your costs would be higher.
Beginning Account Value November 1, 2013 | Ending Account Value April 30, 2014 | Expense Ratio(a) | Expenses Paid During Period November 1, 2013 to April 30, 2014(b) | |
| Century Shares Trust | ||||
| Institutional Shares | ||||
Actual | $1,000.00 | $1,091.50 | 1.10% | $5.70 |
Hypothetical (5% return before expenses) | $1,000.00 | $1,019.34 | 1.10% | $5.51 |
| Century Small Cap Select Fund | ||||
| Institutional Shares | ||||
Actual | $1,000.00 | $1,032.10 | 1.11% | $5.59 |
Hypothetical (5% return before expenses) | $1,000.00 | $1,019.29 | 1.11% | $5.56 |
| Investor Shares | ||||
Actual | $1,000.00 | $1,030.70 | 1.41% | $7.10 |
Hypothetical (5% return before expenses) | $1,000.00 | $1,017.80 | 1.41% | $7.05 |
| Century Growth Opportunities Fund | ||||
| Institutional Shares | ||||
Actual | $1,000.00 | $1,049.50 | 1.10% | $5.59 |
Hypothetical (5% return before expenses) | $1,000.00 | $1,019.34 | 1.10% | $5.51 |
| (a) | The Fund’s expense ratios have been based on the Fund’s most recent fiscal half year expenses. |
| (b) | Expenses are equal to the Fund’s annualized expense ratio multiplied by the average account value over the period, multiplied by the number of days in the most recent fiscal half year (181), divided by 365. |
| 36 | centuryfunds.com |
| CENTURY FUNDS | Privacy Policy |
| April 30, 2014 (Unaudited) |
Century Capital Management and the Century Funds are committed to maintaining the confidentiality, integrity and security of your personal information and financial data. We consider this information to be private and held in confidence between you and Century. This is to inform you of our policies to protect the privacy of your nonpublic personal information.
Information We Collect
When you invest in the Century Funds, we collect certain nonpublic personal information about you, which we use to open and service your account and respond to your requests. This information includes your name, address, tax identification number, birth date, investment selection, beneficiary information and possibly personal bank account information. It also includes information about your transactions and account history, as well as information that we may receive from third parties, such as financial advisers, consumer reporting agencies, and consultants.
Disclosure Policy
We do not disclose nonpublic personal information about current or former shareholders or customers to any third parties except as necessary to process a transaction, service an account, or as otherwise permitted by law. For example, the Century Funds use a third party transfer agent who uses your information only to process or analyze transactions that you have requested. Our contracts with such parties contain provisions restricting their use of your nonpublic personal information to those purposes for which they were hired. We do not sell non‐public personal information to anyone.
Confidentiality and Security
We restrict access to nonpublic personal information about you to those employees and service providers involved in administering or servicing your account or helping us meet our regulatory obligations. We maintain physical, electronic and procedural safeguards that comply with federal standards to protect your nonpublic personal information.
| Semi-Annual Report | April 30, 2014 | 37 |
Intentionally Left Blank
Intentionally Left Blank
Fund Information
PORTFOLIO HOLDINGS
Each fund files a complete schedule of its portfolio holdings with the SEC for the first and third quarters of the fund’s fiscal year on Form N-Q. The Forms N-Q are available on the SEC’s website at http://www.sec.gov, and they may be reviewed and copied at the SEC’s Public Reference Room in Washington, DC. Information on the operation of the SEC’s Public Reference Room may be obtained by calling 1-800-SEC-0330.
PROXY VOTING
A description of the policies and procedures that each fund uses to determine how to vote proxies relating to portfolio securities and each fund’s proxy voting record for the 12-month period ended June 30 are available, without charge, upon request, by calling 1-800-321-1928. You may also obtain a copy of the funds’ proxy voting policies and procedures and proxy voting record on the SEC’s website at http://www.sec.gov.
FOR MORE INFORMATION
For more information about the Century Funds, please call 1-800-303-1928.
Regular Mailing Address: Century Funds P.O. Box 588 Portland, ME 04112 | Overnight Mailing Address: Century Funds c/o Atlantic Shareholder Services, LLC 3 Canal Plaza, Ground Floor Portland, ME 04101 |
Investment Adviser Century Capital Management, LLC 100 Federal Street Boston, MA 02110 | Distributor ALPS Distributors, Inc. 1290 Broadway, Suite 1100 Denver, CO 80203 |

| Item 2. | Code of Ethics. |
Not applicable to semi-annual reports.
| Item 3. | Audit Committee Financial Expert. |
Not applicable to semi-annual reports.
| Item 4. | Principal Accountant Fees and Services. |
Not applicable to semi-annual reports.
| Item 5. | Audit Committee of Listed Registrants. |
Not applicable.
| Item 6. | Investments. |
The registrant’s “Schedule I – Investments in securities of unaffiliated issuers” (as set forth in 17 CFR 210.12-12) is included in Item 1 of this Form N-CSR.
| Item 7. | Disclosure of Proxy Voting Policies and Procedures for Closed-End Management Investment Companies. |
Not applicable.
| Item 8. | Portfolio Managers of Closed-End Management Investment Companies. |
Not applicable.
| Item 9. | Purchases of Equity Securities by Closed-End Management Investment Company and Affiliated Purchasers. |
Not applicable.
| Item 10. | Submission of Matters to a Vote of Security Holders. |
There have been no material changes to the procedures by which shareholders may recommend nominees to the Trust's Board of Trustees since the Trust last provided disclosure as to such procedures in response to the requirements of Item 407(c)(2)(iv) of Regulation S-K (as required by Item 22(b)(15) of Schedule 14A), or this Item.
| Item 11. | Controls and Procedures. |
(a) The registrant's principal executive officer and principal financial officer, after evaluating the effectiveness of the registrant's "disclosure controls and procedures" (as defined in the Investment Company Act of 1940 Rule 30-a-2(c) under the Act (17 CFR 270.30a-2(c))) as of a date (the "Evaluation Date") within 90 days of the filing date of this report, have concluded that, as of the Evaluation Date, the registrant's disclosure controls and procedures were adequately designed to ensure that the information required to be disclosed by the registrant in this Form N-CSR is recorded, processed, summarized and reported within the time periods specified in the Commission's rules and forms.
(b) There were no changes in the registrant's internal control over financial reporting (as defined in Rule 30a-3(d) under the Act (17 CFR 270.30a-3(d))) that occurred during the registrant's second fiscal quarter of the period covered by this report that has materially affected, or is reasonably likely to materially affect, the registrant's internal control over financial reporting.
| Item 12. | Exhibits. |
| (a)(1) | Not applicable to semi-annual reports. |
| (a)(2) | Certification pursuant to Rule 30a-2(a) under the Investment Company Act of 1940 (17 CFR 270.30a-2(a)) is filed and attached hereto as Exhibit EX-99.CERT. |
| (a)(3) | Not applicable. |
| (b) | Certification pursuant to Rule 30a-2(b) under the Investment Company Act of 1940 (17 CFR 270.30a-2(b)) is filed and attached hereto as Exhibit EX-99.906CERT |
SIGNATURES
Pursuant to the requirements of the Securities Exchange Act of 1934 and the Investment Company Act of 1940, the registrant has duly caused this report to be signed on its behalf by the undersigned, thereunto duly authorized.
Century Capital Management Trust
| By: | /s/ Alexander L. Thorndike | |
| Alexander L. Thorndike, Chairman | ||
| Date: | July 7, 2014 |
Pursuant to the requirements of the Securities Exchange Act of 1934 and the Investment Company Act of 1940, this report has been signed below by the following persons on behalf of the registrant and in the capacities and on the dates indicated.
| By: | /s/ Alexander L. Thorndike | |
| Alexander L. Thorndike, Principal Executive Officer | ||
| Date: | July 7, 2014 |
| By: | /s/ Julie Smith | |
| Julie Smith, Principal Financial Officer | ||
| Date: | July 7, 2014 |