UNITED STATES
SECURITIES AND EXCHANGE COMMISSION
Washington, D.C. 20549
FORM N-CSR
CERTIFIED SHAREHOLDER REPORT OF REGISTERED
MANAGEMENT INVESTMENT COMPANIES
811-09561
(Investment Company Act File Number)
Century Capital Management Trust
(Exact Name of Registrant as Specified in Charter)
c/o Century Capital Management, LLC
100 Federal Street, Boston, MA 02110
(Address of Principal Executive Offices)
Jennifer Mortimer
Century Capital Management, LLC
100 Federal Street, Boston, MA 02110
(Name and Address of Agent for Service)
(617) 482-3060
(Registrant’s Telephone Number)
Date of Fiscal Year End: October 31
Date of Reporting Period: November 1, 2014 - April 30, 2015
Item 1. Reports to Shareholders.

Table of Contents
| Page | |
| Letter to Shareholders | 1 |
| Fund Summaries | |
| Century Shares Trust | 5 |
| Century Small Cap Select Fund | 8 |
| Century Growth Opportunities Fund | 11 |
| Portfolio of Investments | |
| Century Shares Trust | 14 |
| Century Small Cap Select Fund | 16 |
| Century Growth Opportunities Fund | 18 |
| Statements of Assets and Liabilities | 20 |
| Statements of Operations | 21 |
| Statements of Changes in Net Assets | 22 |
| Financial Highlights | |
| Century Shares Trust | 24 |
| Century Small Cap Select Fund | 25 |
| Century Growth Opportunities Fund | 27 |
| Notes to Financial Statements | 28 |
| Disclosure of Fund Expenses | 36 |
| Privacy Policy | 37 |
This report is submitted for the general information of the shareholders of Century Shares Trust, Century Small Cap Select Fund, and Century Growth Opportunities Fund (each a “Fund” and collectively, the “Funds”). It is not authorized for distribution to prospective investors in a Fund unless it is preceded by or accompanied by the Fund’s current prospectus. The prospectus includes important information about the Fund’s objective, risks, charges and expenses, experience of its management, and other information. Please read the prospectus carefully before you invest.
The views expressed in this report are those of the Funds’ Portfolio Managers as of April 30, 2015, the end of the reporting period. Any such views are subject to change at any time and may not reflect the Portfolio Managers’ views on the date that this report is first published or anytime thereafter. These views are intended to assist shareholders in understanding their investments and do not constitute investment advice. There is no assurance that the Funds will continue to invest in the securities mentioned in this report.
 | Letter to Shareholders |
| April 30, 2015 (Unaudited) |
Dear Fellow Shareholders,
At the halfway point of 2015, global financial markets seem to be engaged in a game of “follow the leader”, with the US economy still out in front. Equity markets have continued their leadership with the S&P 500 Index up 4.40% over the last six months and up 95.23%, cumulatively, over the last five years ending April 30, 2015.
The US economy is firmly rooted in a classic mid-cycle recovery, supported by strong domestic consumption and historically low interest rates. Globally, European and Asian economies have struggled, despite taking a page from the US monetary policy playbook in an effort to revitalize growth in their regions.
Domestic Mid-Cycle Recovery Intact
Five years into this recovery, we have seen several signs that this favorable trend can continue before inflation becomes more of a national concern. Gross Domestic Product (GDP) growth has continued to march forward with steady job creation and corporate revenue growth. Earnings results have generally been solid as companies continued to beat Wall Street expectations, and the mergers and acquisitions cycle has picked up steam. Further, consumer confidence has risen above pre-crisis levels, having benefited from lower energy prices, and there are early signs of wage growth which we view as an important inflation barometer to rising interest rates.
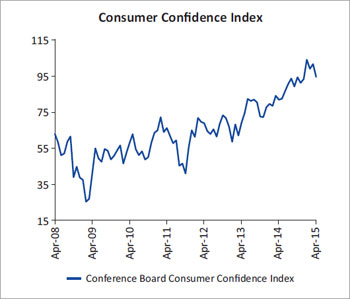 | 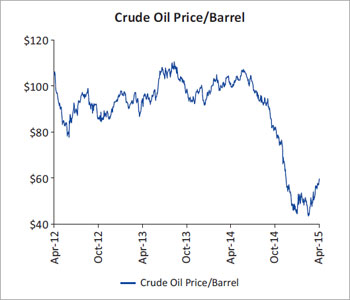 | |
| Source: Bloomberg data as of 4/30/2015; date range 4/30/2008 through 4/30/2015. | Source: Bloomberg data as of 4/30/2015; date range 4/30/2012 through 4/30/2015. |
Past performance is not indicative of future results.
The Consumer Confidence Index measures the level of confidence individual households have in the performance of the economy. One cannot invest directly in an index.
| Semi‐Annual Report | April 30, 2015 | 1 |
| Letter to Shareholders |
| April 30, 2015 (Unaudited) |
Global Woes Persist
Global economic growth has remained tepid. The Eurozone has continued to battle anemic GDP growth, negative interest rates and a fragmented political environment. Germany, Europe’s largest economy, slowed more than expected in the first quarter of this year, recording growth of only 0.3% compared with 0.7% a year earlier. In late May, Portugal auctioned debt with a negative yield of -0.002%, unprecedented in its history. As seen in the charts below, yields across European bonds have been dropping after the European Central Bank (ECB) announced an aggressive policy of buying €60 billion bonds every month to stimulate growth; this initiative closely resembles the US Quantitative Easing (QE) bond buying program that ended late last year. Investors remain focused on Greece and whether it will remain a member of the Eurozone. Greece has continued to resist unpopular austerity measures and a heavy debt burden incurred during its bailout in 2010.
Further east, China has continued to slow as its first quarter GDP growth rate dropped to 7%. While a 7% growth rate is something the US economy would envy, China was previously growing approximately 10% per year over the past few decades. There are several structural issues behind China’s slowdown, but excess debt incurred during the 2008-2009 financial crisis is the most important factor. China’s total debt has climbed to roughly 250% of GDP, an increase of 100 percentage points since 2008. This has also saddled local governments and organizations with a heavy cost burden.
We find ourselves repeating the comment that our domestic economy remains the safest port among the storm of concerns affecting other continents, and global investors have been rushing to buy US dollar assets. Certainly, US dollar strength has several benefits, such as a higher demand for US Treasuries, lower borrowing costs for the US government, and increased foreign demand for US stock and bond assets. However, a strong dollar also poses challenges as it makes exports for US goods more expensive, a headwind for corporations looking to sell their products overseas.
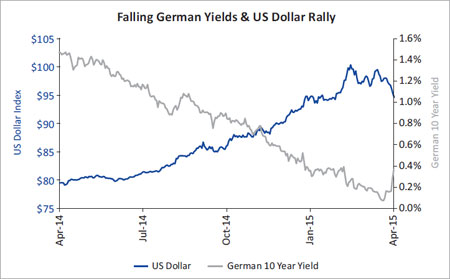
| Source: Bloomberg data as of 4/30/2015; date range 4/30/2014 through 4/30/2015. |
Past performance is not indicative of future results.
| 2 | centuryfunds.com |
| Letter to Shareholders |
| April 30, 2015 (Unaudited) |
Favorable Outlook and Full Valuations
As a result of continued economic growth, we have seen rising stock valuations, which seem fully valued at current levels. However, looking at price-to-earning valuations as an isolated measure of how “cheap” or “expensive” stocks are can be misleading. Stock valuations must also be viewed from the perspective of interest rates and other asset classes. Despite having moved up, equity valuations are being supported by historically low rates. The Federal Reserve is keeping a close eye on this dynamic as it considers raising rates in the second half of the year.
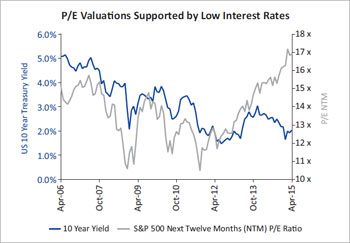
Source: Bloomberg data as of 4/30/2015; date range 4/30/2006 through 4/30/2015.
Following the Leader
In 2008, the global financial crisis was initiated by the American mortgage system meltdown. Seven years later, the US economy has bounced back faster than the rest of the world, which struggles to keep their economies from stagnating. As a result, the US monetary playbook has been borrowed by European and Asian governments to boost growth. While the US continues to benefit from its favorable competitive position, the rest of the world is likely to narrow the leadership gap we have achieved over the last few years.
At Century, we understand that economic cycles ebb and flow. We view these periods as an opportunity to enhance our portfolio holdings in quality growth enterprises. Despite periods of volatility, equity markets usually perform well in the long term and have proven to be an excellent asset class to build wealth for patient investors.
Past performance is not indicative of future results.
Price to earnings (P/E) ratio is the value of a company’s stock price to company earnings. S&P 500® Index is a broad-based, unmanaged measurement of changes in stock market conditions based on the average of 500 widely held common stocks. One cannot invest directly in an index.
| Semi‐Annual Report | April 30, 2015 | 3 |
| Letter to Shareholders |
| April 30, 2015 (Unaudited) |
Century Funds Update
As you may know, Century Capital Management manages the Century Funds on behalf of you, our fellow shareholders. We are excited to share with you that we plan to contact you regarding our plan to simplify our corporate structure, which we believe will benefit the Century Funds and our shareholders. Century currently has two distinct business units: the Public Securities Group, which provides investment advisory services to the Century Funds and institutional investors, and the Private Equity Group, which provides investment management services to private equity vehicles exempt from registration under the Investment Company Act of 1940, as amended.
We have entered into an agreement to split the two business units. This proposed change will have no impact on your Fund’s investment strategies or the investment team, client service professionals or other employees of Century that serve your Fund.
As always, we hope to continue to earn your trust and wish you a wonderful summer.
Sincerely,

Alexander L. Thorndike
Chairman of the Century Funds
The foregoing is not a solicitation of any proxy.
| 4 | centuryfunds.com |
| Fund Commentary |
| CENTURY SHARES TRUST | April 30, 2015 (Unaudited) |
HOW DID THE PORTFOLIO PERFORM?
For the six-month period ended April 30, 2015, Century Shares Trust’s shares returned 10.02%, outperforming the Russell 1000 Growth Index (R1000G), the Fund’s benchmark, which returned 6.54%.
WHAT FACTORS INFLUENCED PERFORMANCE?
The Fund’s outperformance was primarily a result of stock selection with the Consumer Discretionary, Information Technology and Industrials sectors contributing the most to performance. The top performing stocks included Amazon.com, Inc. (e-commerce retailer), Dollar Tree, Inc. (discount stores), Western Union Company (money transfers & payment services), Apple, Inc. (consumer electronics) and Actavis, Plc. (specialty pharmaceuticals). Amazon displayed an increased focus on profitability which was appreciated by investors. Dollar Tree lifted from strong earnings results and expected synergies from the pending acquisition of Family Dollar. Western Union outperformed given its attractive valuation and consistent operating improvements. Apple appreciated due to continued strong demand for the iPhone 6 and iPhone 6 Plus as well as demand for higher memory density phones. Actavis performed well due to its strong sales and earnings growth.
Conversely, the Consumer Staples, Financials and Utilities sectors were the largest detractors. The worst performing stocks included FMC Technologies, Inc. (oil & gas services), Alexion Pharmaceuticals, Inc. (biotechnology), Union Pacific Corp. (railroads), Google, Inc. (internet advertising) and American Tower Corp. (tower REIT). FMC Technologies was negatively impacted by the recent decline in energy prices. Alexion Pharmaceuticals depreciated on poor earnings and slowing growth rates. Union Pacific declined due to deteriorating volume trends from weaker coal, crude by rail and frac sand volumes compared to prior assumptions. Google sold off as investors became concerned over decelerating revenue growth and higher expenses. American Tower traded down on concerns about slowing organic sales growth in 2015 and financial pressure from a stronger US dollar.
HOW WAS THE PORTFOLIO POSITIONED AT PERIOD END?
We believe that the portfolio is well positioned for the current environments as it is diversified across almost every sector. The portfolio maintains its largest overweight in the Industrials, Financials and Energy sectors. Conversely, the Fund is underweight in the Consumer Staples, Telecommunications Services and Health Care sectors.
The stock market has continued to generate attractive returns over the past six months. Despite a weaker Q1 GDP report, unemployment has dropped to pre-crisis lows, consumer confidence has come back and inflation remains at bay. Further, corporations are generally well capitalized and beating Wall Street estimates. While valuations appear full at this point in the market cycle, they seem to be buoyed by historically low interest rates. With that being said, we continue to find high quality growth stocks that we believe are trading at reasonable valuations. Additionally, we recognize that markets do not move in a straight line and expect to utilize periods of volatility to enhance our portfolio holdings.
Past performance is not indicative of future results. Current performance may be lower or higher than the performance data quoted.
| Semi‐Annual Report | April 30, 2015 | 5 |
| Fund Commentary |
| CENTURY SHARES TRUST | April 30, 2015 (Unaudited) |
Risks: The Fund may invest a significant portion of assets in a limited number of companies or in companies within the same market sector. As a result, the Fund may be more susceptible to financial, market and economic events affecting particular companies or sectors and therefore may experience greater price volatility than funds with more diversified portfolios. Please read the Fund’s prospectus for details regarding the Fund’s risk profile.
| Ten Largest Holdings* | ||||
| APPLE, INC. | 4.97% | |||
| Technology Hardware, Storage & Peripherals | ||||
| ACTAVIS PLC | 4.45% | |||
| Pharmaceuticals | ||||
| WESTERN UNION CO. | 4.37% | |||
| IT Services | ||||
| GOOGLE, INC. | 4.25% | |||
| Internet Software & Services | ||||
| AMERICAN TOWER CORP. | 3.72% | |||
| Real Estate Investment Trust (REITs) | ||||
| AMAZON.COM, INC. | 3.72% | |||
| Internet & Catalog Retail | ||||
| EQUINIX, INC. | 3.56% | |||
| Internet Software & Services | ||||
| VERISK ANALYTICS INC., CLASS A | 3.54% | |||
| Professional Services | ||||
| CERNER CORP. | 3.52% | |||
| Health Care Technology | ||||
| DIRECTV | 3.46% | |||
| Media | ||||
| Sector Allocation* | ||||
| Information Technology | 28.2% | |||
| Consumer Discretionary | 20.6% | |||
| Industrials | 13.9% | |||
| Health Care | 12.5% | |||
| Financials | 7.3% | |||
| Energy | 6.9% | |||
| Consumer Staples | 6.6% | |||
| Materials | 2.7% | |||
| Cash, Cash Equivalents, & Other Net Assets | 1.3% | |||
* Based on the Fund’s net assets at April 30, 2015 and subject to change.
| 6 | centuryfunds.com |
| Performance Summary |
| CENTURY SHARES TRUST | April 30, 2015 (Unaudited) |
Institutional Shares
The returns shown below represent past performance. Past performance does not guarantee future results. Investment return and principal value of an investment will fluctuate so that an investor’s shares, when sold or redeemed, may be worth more or less than the original cost. Current performance may be higher or lower than the Fund’s past performance. For the most recent month‐end performance, please call 800‐303‐1928.
As stated in the Fund’s current prospectus, the total (gross) operating expenses are 1.09% for the Institutional Shares. The Fund’s total returns include the reinvestment of dividend and capital gain distributions, but have not been adjusted to reflect the deduction of taxes that a shareholder would pay on these distributions or the redemption of Fund shares. Shares held less than 90 days may be subject to a 1% redemption fee.
Average Annual Total Returns April 30, 2015
| 1 Year | 3 Years | 5 Years | 10 Years | |
| Century Shares Trust ‐ Institutional Shares | 18.22% | 17.03% | 14.71% | 8.32% |
Russell 1000® Growth Index | 16.67% | 16.60% | 15.49% | 9.62% |
Growth of $100,000 for the period ended April 30, 2015
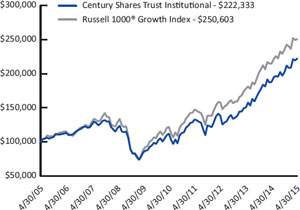
The graph and table reflect the change in value of a hypothetical investment in the Fund, including reinvestment of dividends and distributions, compared with the index. Index returns assume reinvestment of dividends and, unlike Fund returns, do not reflect any fees or expenses. It is not possible to invest directly in an index. Minimum initial investment for Institutional Shares is $100,000.
The Russell 1000® Growth Index measures the performance of the large-cap growth segment of the U.S. equity universe. It includes those Russell 1000® companies with higher price- to-book ratios and higher forecasted growth values.
| Semi‐Annual Report | April 30, 2015 | 7 |
| Fund Commentary |
| CENTURY SMALL CAP SELECT FUND | April 30, 2015 (Unaudited) |
HOW DID THE PORTFOLIO PERFORM?
For the six-month period ended April 30, 2015, Century Small Cap Select Fund Institutional Shares returned 7.50% and the Investor Shares returned 7.34%, outperforming the Russell 2000 Growth Index (R2000G), the Fund’s benchmark, which returned +7.25%.
WHAT FACTORS INFLUENCED PERFORMANCE?
The Fund’s outperformance was driven by both sector allocation and stock selection. The top contributing sectors included Health Care, Consumer Discretionary and Consumer Staples as Cambrex Corp. (biotechnology), Anacor Pharmaceuticals, Inc. (biotechnology), AMN Healthcare Services, Inc. (medical care), j2 Global, Inc. (software) and Gentherm, Inc. (auto parts) all fared well. Cambrex, AMN Healthcares Services and Gentherm all traded up on strong financial results. Anacor Pharmaceuticals outperformed as prescriptions for its first product were higher than expected and the company communicated encouraging expectations for its next product. j2 Global benefited on news that recent acquisitions were performing better than expected, resulting in upward earnings revisions.
The Information Technology, Industrials and Financials sectors all weighed on returns. The worst performing stocks included U.S. Silica Holdings, Inc. (industrial minerals), HomeAway, Inc. (internet leisure content), Penn Virginia, Corp. (oil and gas), Dealertrack Technologies, Inc. (internet vehicle content), and Movado Group, Inc. (watch retailer). Movado traded down on slowing growth and poor earnings along with the introduction of the Apple watch given its potential of taking market share from traditional watchmakers. Dealertrack underperformed following an acquisition announcement by the company that will be dilutive near team but potentially accretive mid-to-longer term. Homeaway depreciated on disappointing expense management as investors grew concerned about mounting marketing expenses. Penn Virginia and U.S. Silica were both negatively impacted by declining energy prices.
HOW WAS THE PORTFOLIO POSITIONED AT PERIOD END?
The Fund currently maintains its largest overweight positions in the Energy, Consumer Discretionary and Information Technology sectors. The Fund is most underweight the Consumer Staples, Materials and Industrials sectors.
We feel that the US economic recovery is intact despite weaker GDP growth in the first quarter. Consumer confidence remains high as Americans have benefited from falling unemployment and lower energy prices. Generally, corporations are well capitalized with ample levels of cash, low debt and solid earnings. As we would expect at this point in the market cycle, mergers and acquisition activity has accelerated. As a result of sustained market appreciation, valuations seem full but continue to be supported by historically low interest rates.
Globally, the picture isn’t quite as pretty. Europe has continued to suffer from anemic growth and uncertainty around Greece remaining in the Eurozone. Japan has been muddling through mediocre economic growth, while China continued to grow at slower rates than anticipated a year ago.
We believe the Fund is positioned appropriately for the current environment and that we will be able to find attractive investment opportunities among well-run companies with underappreciated growth, despite the increase in overall equity market valuations.
Past performance is not indicative of future results. Current performance may be lower or higher than the performance data quoted.
| 8 | centuryfunds.com |
| Fund Commentary |
| CENTURY SMALL CAP SELECT FUND | April 30, 2015 (Unaudited) |
Risks: The Fund concentrates its investments in the financial services and health care group of industries (at least 25% of the Fund’s assets in the aggregate). Concentration in a particular industry subjects the Fund to the risks associated with that industry, and as a result, the Fund may be subject to greater price volatility than funds with less concentrated portfolios. In addition, the Fund invests in smaller companies which pose greater risks than those associated with larger, more established companies. Please read the Fund’s prospectus for details regarding the Fund’s risk profile.
| Ten Largest Holdings* | ||||
| EAGLE BANCORP, INC. | 3.29% | |||
| Banks | ||||
| GREENBRIAR COMPANIES, INC. | 2.93% | |||
| Machinery | ||||
| COMSCORE, INC. | 2.81% | |||
| Internet Software & Services | ||||
| AMN HEALTHCARE SERVICES, INC. | 2.77% | |||
| Health Care Providers & Services | ||||
| J2 GLOBAL, INC. | 2.53% | |||
| Internet Software & Services | ||||
| ACADIA HEALTHCARE CO., INC. | 2.45% | |||
| Health Care Providers & Services | ||||
| COHEN & STEERS, INC. | 2.44% | |||
| Capital Markets | ||||
| CAI INTERNATIONAL, INC. | 2.44% | |||
| Trading Companies & Distributors | ||||
| BROOKDALE SENIOR LIVING, INC. | 2.41% | |||
| Health Care Providers & Services | ||||
| PHARMERICA CORP. | 2.40% | |||
| Health Care Providers & Services | ||||
| Sector Allocation* | ||||
| Information Technology | 27.1% | |||
| Health Care | 24.1% | |||
| Consumer Discretionary | 17.1% | |||
| Industrials | 12.4% | |||
| Financials | 7.0% | |||
| Energy | 5.8% | |||
| Materials | 1.9% | |||
| Consumer Staples | 0.9% | |||
| Cash, Cash Equivalents, & Other Net Assets | 3.7% | |||
* Based on the Fund’s net assets at April 30, 2015 and subject to change.
| Semi‐Annual Report | April 30, 2015 | 9 |
| Performance Summary |
| CENTURY SMALL CAP SELECT FUND | April 30, 2015 (Unaudited) |
Institutional Shares and Investor Shares
The returns shown below represent past performance. Past performance does not guarantee future results. Investment return and principal value of an investment will fluctuate so that an investor’s shares, when sold or redeemed, may be worth more or less than the original cost. Current performance may be higher or lower than the Fund’s past performance. For the most recent month‐end performance, please call 800‐303‐1928.
As stated in the Fund’s current prospectus, the total (gross) operating expenses are 1.11% for the Institutional Shares and 1.40% for the Investor Shares. Returns would have been lower during the 10 year period if certain fees had not been waived or expenses reimbursed. The Fund’s total returns include the reinvestment of dividend and capital gain distributions, but have not been adjusted to reflect the deduction of taxes that a shareholder would pay on these distributions or the redemption of Fund shares. Shares held less than 90 days may be subject to a 1% redemption fee.
| Average Annual Total Returns April 30, 2015 | ||||
| 1 Year | 3 Years | 5 Years | 10 Years | |
| Century Small Cap Select Fund - Institutional Shares | 11.23% | 12.84% | 14.36% | 7.56% |
| Century Small Cap Select Fund - Investor Shares | 10.87% | 12.47% | 13.98% | 7.20% |
Russell 2000® Growth Index | 14.65% | 17.22% | 14.94% | 10.41% |
| Growth of $100,000 for the period ended April 30, 2015 | Growth of $10,000 for the period ended April 30, 2015 | |
| Institutional Shares | Investor Shares | |
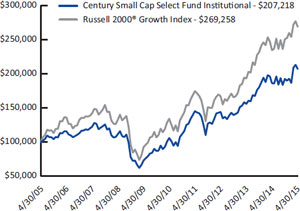 | 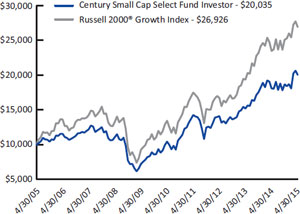 |
The graphs and table reflect the change in value of a hypothetical investment in the Fund, including reinvestment of dividends and distributions, compared with the index. Index returns assume reinvestment of dividends and, unlike Fund returns, do not reflect any fees or expenses. It is not possible to invest directly in an index. Minimum initial investment for Institutional Shares is $100,000.
The Russell 2000® Growth Index measures the performance of the small-cap growth segment of the U.S. equity universe. It includes those Russell 2000® companies with higher price-to-value ratios and higher forecasted growth values. Index returns assume reinvestment of dividends but, unlike Fund returns, do not reflect fees or expenses. One cannot invest directly in an index.
| 10 | centuryfunds.com |
| Fund Commentary |
| CENTURY GROWTH OPPORTUNITIES FUND | April 30, 2015 (Unaudited) |
HOW DID THE PORTFOLIO PERFORM?
For the six‐month period ended April 30, 2015, Century Growth Opportunities Fund Institutional Shares returned +7.61%, underperforming the Russell 2500 Growth Index (R2500G), which returned +8.31%.
WHAT FACTORS INFLUENCED PERFORMANCE?
The Fund’s performance was primarily a result of stock selection. The Health Care, Financials and Energy sectors were the largest contributors. Top performing stocks included Cambrex Corp. (biotechnology), ServiceMaster Global Holdings, Inc. (business services), NXP Semiconductors NV (semiconductors), MAXIMUS, Inc. (business services), and Burlington Stores, Inc. (discount stores). Cambrex delivered better than expected earnings results and raised guidance. ServiceMaster continued to perform well on the back of several quarters of strong financial results. NXP Semiconductors appreciated following the announcement of the company’s acquisition of Freescale Semiconductor, Ltd. MAXIMUS continued to be an Affordable Care Act beneficiary. Burlington Stores lifted on strong financial results.
Conversely, the Industrials, Information Technology and Consumer Staples sectors all detracted from performance. Underperforming stocks included Greenbrier Companies, Inc. (railroads), Gentherm, Inc. (auto parts), United Rentals, Inc. (retail and leasing services), Ubiquiti Networks, Inc. (communication equipment), and Spirit Airlines, Inc. (airlines). Ubiquiti Networks experienced a deceleration in growth due to its exposure to Eastern European and Middle Eastern economies, which have been impacted by various conflicts in addition to slow European economic growth. Greenbrier Companies declined on profit taking and news that safety requirement regulations for oil tankers would be delayed. Gentherm depreciated on growing concerns over 2015 guidance and the sustainability of strong earnings growth. Spirit Airlines lagged due to declining passenger yields. United Rentals depreciated due to the deceleration of company fundamentals and exposure to the energy sector which remains weak.
HOW WAS THE PORTFOLIO POSITIONED AT PERIOD END?
The Fund maintains its largest overweight positions in the Information Technology, Health Care and Energy sectors and is most underweight the Materials, Financials and Consumer Staples sectors.
The domestic economy has exhibited modest economic growth. Unemployment has fallen to pre‐crisis levels, corporations remain generally well capitalized and lower energy prices have led to enhanced consumer confidence. GDP has continued to grow, albeit at lower rates than we would like, and interest rates remain at historic lows as foreign investors seek safe haven and higher yields in US Treasuries.
Globally, economic growth has continued to face challenges. Europe faces slow growth and a politically complex environment as speculation over Greece’s participation in the Eurozone remains in question. Japan, looking to jump‐start growth, has engaged in another round of monetary stimulus. China, however, has continued to grow but at lower levels than anticipated previously.
In our view, the portfolio is well positioned for the current environment and we remain focused on finding high quality companies that we believe are trading at reasonable valuations.
Past performance is not indicative of future results. Current performance may be lower or higher than the performance data quoted.
| Semi-Annual Report | April 30, 2015 | 11 |
| Fund Commentary |
| CENTURY GROWTH OPPORTUNITIES FUND | April 30, 2015 (Unaudited) |
Risks: The Fund invests mainly in small‐cap and mid‐cap companies, which, historically, have been more volatile in price than the stocks of large‐cap companies. The Fund may invest in foreign companies, which involves risks not associated with investing solely in U.S. companies, such as currency fluctuations, unfavorable political developments, or economic instability. These risks are magnified in emerging markets. Please read the Fund’s prospectus for details regarding the Fund’s risk profile.
| Ten Largest Holdings* | ||||
| UNIVERSAL HEALTH SERVICES, INC., CLASS B Health Care Providers & Services | 2.31 | % | ||
| SERVICEMASTER GLOBAL HOLDINGS, INC. Diversified Consumer Services | 2.21 | % | ||
| UNITED RENTALS, INC. Trading Companies & Distributors | 2.14 | % | ||
| GRAND CANYON EDUCATION, INC. Diversified Consumer Services | 2.12 | % | ||
| SNAP‐ON, INC. Machinery | 2.12 | % | ||
| ZEBRA TECHNOLOGIES CORP., CLASS A Electronic Equipment, Instruments & Components | 2.12 | % | ||
| PRIVATBANCORP, INC. Banks | 2.10 | % | ||
| OMNICARE, INC. Health Care Providers & Services | 2.08 | % | ||
| ULTA SALON, COSMETICS & FRAGRANCE, INC. Specialty Retail | 2.08 | % | ||
| JARDEN CORP. Household Durables | 2.06 | % | ||
| Sector Allocation* | ||||
| Information Technology | 26.8 | % | ||
| Health Care | 21.9 | % | ||
| Consumer Discretionary | 18.9 | % | ||
| Industrials | 16.7 | % | ||
| Energy | 4.5 | % | ||
| Financials | 4.1 | % | ||
| Consumer Staples | 1.7 | % | ||
| Telecommunication Services | 1.2 | % | ||
| Materials | 1.0 | % | ||
| Cash, Cash Equivalents, & Other Net Assets | 3.2 | % | ||
* Based on the Fund’s net assets at April 30, 2015 and subject to change.
| 12 | centuryfunds.com |
| Performance Summary |
| CENTURY GROWTH OPPORTUNITIES FUND | April 30, 2015 (Unaudited) |
Institutional Shares
The returns shown below represent past performance. Past performance does not guarantee future results. Investment return and principal value of an investment will fluctuate so that an investor’s shares, when sold or redeemed, may be worth more or less than the original cost. Current performance may be higher or lower than the Fund’s past performance. For the most recent month‐end performance, please call 800‐303‐1928.
As stated in the Fund’s current prospectus, the total (gross) operating expenses are 1.10%. The Adviser has agreed contractually to limit the operating expenses for the Fund’s Institutional Shares to 1.10% through February 28, 2016. Returns would have been lower during all periods if certain fees had not been waived or expenses reimbursed. The Fund’s total returns include the reinvestment of dividend and capital gain distributions, but have not been adjusted to reflect the deduction of taxes that a shareholder would pay on these distributions or the redemption of Fund shares. Shares held less than 90 days may be subject to a 1% redemption fee.
| Average Annual Total Returns April 30, 2015 | |||
| 1 Year | 3 Years | Since Inception* | |
| Century Growth Opportunities Fund ‐ Institutional Shares | 15.90% | 13.70% | 12.52% |
Russell 2500® Growth Index | 15.54% | 17.42% | 16.88% |
* Fund inception date of November 17, 2010.
Growth of $100,000 for the period ended April 30, 2015
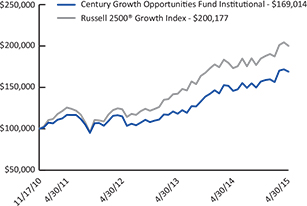
The graph and table reflect the change in value of a hypothetical investment in the Fund, including reinvestment of dividends and distributions, compared with the index. Index returns assume reinvestment of dividends and, unlike Fund returns, do not reflect any fees or expenses. It is not possible to invest directly in an index. Minimum initial investment for Institutional Shares is $100,000.
The Russell 2500® Growth Index measures the performance of the small- to mid-cap growth segment of the U.S. equity universe. It includes those Russell 2500 companies with higher price-to-book ratios and higher forecasted growth values. Index returns assume reinvestment of dividends but, unlike Fund returns, do not reflect fees or expenses. One cannot invest directly in an index.
| Semi-Annual Report | April 30, 2015 | 13 |
| Portfolio of Investments |
| CENTURY SHARES TRUST | April 30, 2015 (Unaudited) |
| Shares | Value | ||||||
| COMMON STOCKS - 98.7% | |||||||
| Consumer Discretionary - 20.6% | |||||||
| Hotels, Restaurants & Leisure - 3.9% | |||||||
| 19,171 | Panera Bread Co., Class A(a) | $ | 3,498,324 | ||||
| 109,846 | Starbucks Corp. | 5,446,165 | |||||
| 8,944,489 | |||||||
| Household Durables - 1.4% | |||||||
| 18,018 | Whirlpool Corp. | 3,163,961 | |||||
| Internet & Catalog Retail - 3.7% | |||||||
| 20,180 | Amazon.com, Inc.(a) | 8,511,520 | |||||
| Media - 3.4% | |||||||
| 87,308 | DIRECTV(a) | 7,919,272 | |||||
| Multiline Retail - 2.8% | |||||||
| 84,407 | Dollar Tree, Inc.(a) | 6,449,539 | |||||
| Specialty Retail - 5.4% | |||||||
| 143,474 | Dick’s Sporting Goods, Inc. | 7,784,899 | |||||
| 41,995 | Home Depot, Inc. | 4,492,625 | |||||
| 12,277,524 | |||||||
| Total Consumer Discretionary | 47,266,305 | ||||||
| Consumer Staples - 6.6% | |||||||
| Beverages - 3.4% | |||||||
| 81,428 | PepsiCo, Inc. | 7,745,431 | |||||
| Food & Staples Retailing - 1.2% | |||||||
| 27,240 | CVS Health Corp. | 2,704,659 | |||||
| Household Products - 2.0% | |||||||
| 67,899 | Colgate-Palmolive Co. | 4,568,245 | |||||
| Total Consumer Staples | 15,018,335 | ||||||
| Energy - 6.9% | |||||||
| Energy Equipment & Services - 4.6% | |||||||
| 114,357 | Halliburton Co. | 5,597,775 | |||||
| 62,040 | Helmerich & Payne, Inc. | 4,837,259 | |||||
| 10,435,034 | |||||||
| Oil, Gas & Consumable Fuels - 2.3% | |||||||
| 78,730 | Devon Energy Corp. | 5,370,173 | |||||
| Total Energy | 15,805,207 | ||||||
| Shares | Value | ||||||
| Financials - 7.3% | |||||||
| Diversified Financial Services - 3.6% | |||||||
| 4 | Berkshire Hathaway, Inc., Class A(a) | $ | 853,600 | ||||
| 69,329 | Moody’s Corp. | 7,454,254 | |||||
| 8,307,854 | |||||||
| Real Estate Investment Trust (REITs) - 3.7% | |||||||
| 90,115 | American Tower Corp. | 8,518,571 | |||||
| Total Financials | 16,826,425 | ||||||
| Health Care - 12.5% | |||||||
| Biotechnology - 3.3% | |||||||
| 15,730 | Alexion Pharmaceuticals, Inc.(a) | 2,661,988 | |||||
| 44,761 | Celgene Corp.(a) | 4,836,873 | |||||
| 7,498,861 | |||||||
| Health Care Providers & Services - 1.3% | |||||||
| 33,666 | Express Scripts Holding Co.(a) | 2,908,742 | |||||
| Health Care Technology - 3.5% | |||||||
| 112,397 | Cerner Corp.(a) | 8,071,229 | |||||
| Pharmaceuticals - 4.4% | |||||||
| 36,081 | Actavis PLC(a) | 10,205,872 | |||||
| Total Health Care | 28,684,704 | ||||||
| Industrials - 13.9% | |||||||
| Aerospace & Defense - 3.3% | |||||||
| 52,149 | Boeing Co. | 7,475,038 | |||||
| Construction & Engineering - 2.6% | |||||||
| 97,715 | Fluor Corp. | 5,876,580 | |||||
| Professional Services - 3.5% | |||||||
| 107,988 | Verisk Analytics, Inc., Class A(a) | 8,103,419 | |||||
| Road & Rail - 2.7% | |||||||
| 59,425 | Union Pacific Corp. | 6,312,718 | |||||
| Trading Companies & Distributors - 1.8% | |||||||
| 42,003 | United Rentals, Inc.(a) | 4,056,650 | |||||
| Total Industrials | 31,824,405 | ||||||
| Information Technology - 28.2% | |||||||
| Internet Software & Services - 7.8% | |||||||
| 31,836 | Equinix, Inc. | 8,147,787 | |||||
| See Notes to Financial Statements | |
| 14 | centuryfunds.com |
| Portfolio of Investments |
| CENTURY SHARES TRUST | April 30, 2015 (Unaudited) |
| Shares | Value | ||||||
| Information Technology - 28.2% (continued) | |||||||
| Internet Software & Services - 7.8% (continued) | |||||||
| 8,952 | Google, Inc., Class A(a) | $ | 4,912,589 | ||||
| 8,977 | Google, Inc., Class C(a) | 4,823,476 | |||||
| 17,883,852 | |||||||
| IT Services - 10.1% | |||||||
| 110,276 | Cognizant Technology | ||||||
Solutions Corp., Class A(a) | 6,455,557 | ||||||
| 101,452 | Visa, Inc., Class A | 6,700,905 | |||||
| 493,649 | Western Union Co. | 10,011,202 | |||||
| 23,167,664 | |||||||
| Software - 5.3% | |||||||
| 49,952 | Adobe Systems, Inc.(a) | 3,799,349 | |||||
| 53,923 | Citrix Systems, Inc.(a) | 3,621,469 | |||||
| 96,382 | Microsoft Corp. | 4,688,020 | |||||
| 12,108,838 | |||||||
| Technology Hardware, Storage & Peripherals - 5.0% | |||||||
| 91,015 | Apple, Inc. | 11,390,527 | |||||
| Total Information Technology | 64,550,881 | ||||||
| Materials - 2.7% | |||||||
| Chemicals - 2.7% | |||||||
| 60,309 | LyondellBasell Industries | ||||||
| NV, Class A | 6,243,188 | ||||||
| TOTAL COMMON STOCKS (Cost $164,962,514) | 226,219,450 | ||||||
| SHORT-TERM INVESTMENTS - 1.4% | |||||||
| Money Market Mutual Funds - 1.4% | |||||||
| 3,225,912 | State Street Institutional U.S. Government Money Market Fund - Investment Class (0.00%(b) 7 Day Yield) | 3,225,912 | |||||
| TOTAL SHORT-TERM INVESTMENTS (Cost $3,225,912) | 3,225,912 | ||||||
| Value | ||||
| TOTAL INVESTMENTS - 100.1% (Cost, $168,188,426) | $ | 229,445,362 | ||
| Liabilities in Excess of Other Assets - (0.1%) | (331,987 | ) | ||
| NET ASSETS - 100.0% | $ | 229,113,375 | ||
(a) | Non-income producing security. |
(b) | Less than 0.005%. |
Abbreviations:
| NV | - | Naamloze Vennootschap (Dutch: Limited Liability Company) |
| PLC | - | Public Limited Company |
| See Notes to Financial Statements | |
| Semi‐Annual Report | April 30, 2015 | 15 |
| Portfolio of Investments |
| CENTURY SMALL CAP SELECT FUND | April 30, 2015 (Unaudited) |
| Shares | Value | ||||||
| COMMON STOCKS - 96.3% | |||||||
| Consumer Discretionary -17.1% | |||||||
| Auto Components - 2.2% | |||||||
| 124,422 | Gentherm, Inc.(a) | $ | 6,560,772 | ||||
| Diversified Consumer Services - 3.3% | |||||||
| 103,862 | Grand Canyon Education, Inc.(a) | 4,702,871 | |||||
| 113,463 | Sotheby’s | 4,846,005 | |||||
| 9,548,876 | |||||||
| Hotels, Restaurants & Leisure - 5.7% | |||||||
| 213,260 | La Quinta Holdings, Inc.(a) | 5,135,301 | |||||
| 88,867 | Papa John’s International, Inc. | 5,453,768 | |||||
| 279,233 | Ruth’s Hospitality Group, Inc. | 4,062,840 | |||||
| 68,185 | Sonic Corp. | 1,953,500 | |||||
| 16,605,409 | |||||||
| Household Durables - 2.5% | |||||||
| 113,994 | Ryland Group, Inc. | 4,698,833 | |||||
| 46,683 | Universal Electronics, Inc.(a) | 2,518,081 | |||||
| 7,216,914 | |||||||
| Multiline Retail - 1.1% | |||||||
| 62,930 | Burlington Stores, Inc.(a) | 3,245,300 | |||||
| Specialty Retail - 0.5% | |||||||
| 98,779 | Tilly’s, Inc., Class A(a) | 1,317,712 | |||||
| Textiles, Apparel & Luxury Goods - 1.8% | |||||||
| 84,500 | Columbia Sportswear Co. | 5,298,150 | |||||
| Total Consumer Discretionary | 49,793,133 | ||||||
| Consumer Staples - 0.9% | |||||||
| Food & Staples Retailing - 0.9% | |||||||
| 79,013 | Fresh Market, Inc.(a) | 2,776,517 | |||||
| Energy - 5.8% | |||||||
| Energy Equipment & Services - 3.1% | |||||||
| 324,834 | Basic Energy Services, Inc.(a) | 3,310,059 | |||||
| 173,260 | Patterson-UTI Energy, Inc. | 3,872,361 | |||||
| 51,826 | U.S. Silica Holdings, Inc. | 1,935,701 | |||||
| 9,118,121 | |||||||
| Oil, Gas & Consumable Fuels - 2.7% | |||||||
| 127,739 | Matador Resources Co.(a) | 3,540,925 | |||||
| 82,443 | Rice Energy, Inc.(a) | 2,030,571 | |||||
| 236,136 | Scorpio Tankers, Inc. | 2,205,510 | |||||
| 7,777,006 | |||||||
| Total Energy | 16,895,127 | ||||||
| Shares | Value | ||||||
| Financials - 7.0% | |||||||
| Banks - 3.3% | |||||||
| 260,125 | Eagle Bancorp, Inc.(a) | $ | 9,588,208 | ||||
| Capital Markets - 2.4% | |||||||
| 187,991 | Cohen & Steers, Inc. | 7,117,339 | |||||
| Diversified Financial Services - 1.3% | |||||||
| 186,724 | Marlin Business Services Corp. | 3,728,878 | |||||
| Total Financials | 20,434,425 | ||||||
| Health Care - 24.1% | |||||||
| Biotechnology - 5.2% | |||||||
| 107,973 | AMAG Pharmaceuticals, Inc.(a) | 5,503,384 | |||||
| 75,650 | Anacor Pharmaceuticals, Inc.(a) | 3,985,998 | |||||
| 25,598 | Auspex Pharmaceuticals, Inc.(a) | 2,582,582 | |||||
| 31,880 | Eagle Pharmaceuticals, Inc.(a) | 1,680,076 | |||||
| 67,599 | ProQR Therapeutics NV(a) | 1,282,353 | |||||
| 15,034,393 | |||||||
| Health Care Equipment & Supplies - 0.5% | |||||||
| 43,605 | Masimo Corp.(a) | 1,472,105 | |||||
| Health Care Providers & Services - 10.9% | |||||||
| 104,468 | Acadia Healthcare Co., Inc.(a) | ||||||
| 354,154 | AMN Healthcare | ||||||
Services, Inc.(a) | 8,078,253 | ||||||
| 193,699 | Brookdale Senior Living, Inc.(a) | 7,017,715 | |||||
| 221,538 | Cross Country | ||||||
Healthcare, Inc.(a) | 2,459,072 | ||||||
| 243,625 | PharMerica Corp.(a) | 6,982,292 | |||||
| 31,693,390 | |||||||
| Health Care Technology - 0.8% | |||||||
| 65,144 | Omnicell, Inc.(a) | 2,314,566 | |||||
| Life Sciences Tools & Services - 4.2% | |||||||
| 137,538 | Cambrex Corp.(a) | 5,293,838 | |||||
| 108,307 | ICON PLC(a) | 6,968,472 | |||||
| 12,262,310 | |||||||
| Pharmaceuticals - 2.5% | |||||||
| 128,137 | Akorn, Inc.(a) | 5,335,625 | |||||
| 34,451 | ANI Pharmaceuticals, Inc.(a) | 2,100,822 | |||||
| 7,436,447 | |||||||
| Total Health Care | 70,213,211 | ||||||
| Industrials - 12.4% | |||||||
| Air Freight & Logistics - 0.7% | |||||||
| 42,263 | Forward Air Corp. | 2,128,787 | |||||
| See Notes to Financial Statements | |
| 16 | centuryfunds.com |
| Portfolio of Investments |
| CENTURY SMALL CAP SELECT FUND | April 30, 2015 (Unaudited) |
| Shares | Value | ||||||
| Industrials - 12.4% (continued) | |||||||
| Building Products - 1.9% | |||||||
| 359,484 | NCI Building Systems, Inc.(a) | $ | 5,564,812 | ||||
| Commercial Services & Supplies - 1.9% | |||||||
| 205,939 | Herman Miller, Inc. | 5,644,788 | |||||
| Machinery - 2.9% | |||||||
| 147,968 | Greenbrier Companies, Inc. | 8,536,274 | |||||
| Professional Services - 1.5% | |||||||
| 129,299 | On Assignment, Inc.(a) | 4,350,912 | |||||
| Road & Rail - 1.0% | |||||||
| 68,268 | Saia, Inc.(a) | 2,781,921 | |||||
| Trading Companies & Distributors - 2.5% | |||||||
| 298,699 | CAI International, Inc.(a) | 7,115,010 | |||||
| Total Industrials | 36,122,504 | ||||||
| Information Technology - 27.1% | |||||||
| Communications Equipment - 3.8% | |||||||
| 33,194 | Arista Networks, Inc.(a) | 2,124,748 | |||||
| 196,776 | Infinera Corp.(a) | 3,699,389 | |||||
| 35,588 | Palo Alto Networks, Inc.(a) | 5,257,059 | |||||
| 11,081,196 | |||||||
| Internet Software & Services - 11.2% | |||||||
| 156,367 | comScore, Inc.(a) | 8,187,376 | |||||
| 97,704 | Constant Contact, Inc.(a) | 3,404,984 | |||||
| 174,786 | Dealertrack Technologies, Inc.(a) | 6,870,838 | |||||
| 54,507 | Demandware, Inc.(a) | 3,357,631 | |||||
| 106,459 | j2 Global, Inc. | 7,385,061 | |||||
| 227,347 | TrueCar, Inc.(a) | 3,505,691 | |||||
| 32,711,581 | |||||||
| Semiconductors & Semiconductor Equipment - 8.3% | |||||||
| 59,324 | Cavium, Inc.(a) | 3,843,602 | |||||
| 278,286 | Inphi Corp.(a) | 5,969,235 | |||||
| 149,850 | Integrated Device Technology, Inc.(a) | 2,725,771 | |||||
| 107,599 | M/A-COM Technology Solutions Holdings, Inc.(a) | 3,278,542 | |||||
| 143,552 | Mellanox Technologies Ltd.(a) | 6,673,732 | |||||
| 29,555 | Monolithic Power Systems, Inc. | 1,531,836 | |||||
| 24,022,718 | |||||||
| Software - 3.8% | |||||||
| 95,153 | Proofpoint, Inc.(a) | 5,136,359 | |||||
| Shares | Value | ||||||
| Information Technology - 27.1% (continued) | |||||||
| Software - 3.8% (continued) | |||||||
| 235,572 | VASCO Data Security International, Inc.(a) | $ | 5,988,240 | ||||
| 11,124,599 | |||||||
| Total Information Technology | 78,940,094 | ||||||
| Materials - 1.9% | |||||||
| Chemicals - 0.4% | |||||||
| 25,745 | Balchem Corp. | 1,349,553 | |||||
| Construction Materials - 1.5% | |||||||
| 52,422 | Eagle Materials, Inc. | 4,371,471 | |||||
| Total Materials | 5,721,024 | ||||||
| TOTAL COMMON STOCKS (Cost $218,428,184) | 280,896,035 | ||||||
| SHORT-TERM INVESTMENTS - 5.1% | |||||||
| Money Market Mutual Funds - 5.1% | |||||||
| 14,814,690 | State Street Institutional U.S. Government Money Market Fund - Investment Class (0.00%(b) 7 Day Yield) | 14,814,690 | |||||
| TOTAL SHORT-TERM INVESTMENTS (Cost $14,814,690) | 14,814,690 | ||||||
| TOTAL INVESTMENTS - 101.4% (Cost, $233,242,874) | 295,710,725 | ||||||
| Liabilities in Excess of Other Assets - (1.4%) | (4,169,643 | ) | |||||
| NET ASSETS - 100.0% | $ | 291,541,082 | |||||
(a) | Non-income producing security. |
(b) | Less than 0.005%. |
Abbreviations:
| Ltd. | - | Limited |
| NV | - | Naamloze Vennootschap (Dutch: Limited Liability Company |
| PLC | - | Public Limited Company |
| See Notes to Financial Statements | |
| Semi‐Annual Report | April 30, 2015 | 17 |
| Portfolio of Investments |
| CENTURY GROWTH OPPORTUNITIES FUND | April 30, 2015 (Unaudited) |
| Shares | Value | ||||||
| COMMON STOCKS - 96.8% | |||||||
| Consumer Discretionary - 18.9% | |||||||
| Auto Components - 1.3% | |||||||
| 27,556 | Cooper Tire & Rubber Co. | $ | 1,170,855 | ||||
| Diversified Consumer Services - 4.3% | |||||||
| 42,189 | Grand Canyon Education, Inc.(a) | 1,910,318 | |||||
| 57,703 | ServiceMaster Global Holdings, Inc.(a) | 1,994,216 | |||||
| 3,904,534 | |||||||
| Hotels, Restaurants & Leisure - 2.7% | |||||||
| 28,266 | Choice Hotels International, Inc. | 1,692,285 | |||||
| 13,789 | Fiesta Restaurant Group, Inc.(a) | 697,034 | |||||
| 2,389,319 | |||||||
| Household Durables - 2.1% | |||||||
| 36,317 | Jarden Corp.(a) | 1,858,704 | |||||
| Multiline Retail - 0.9% | |||||||
| 16,582 | Burlington Stores, Inc.(a) | 855,134 | |||||
| Specialty Retail - 4.1% | |||||||
| 107,001 | Francesca’s Holdings Corp.(a) | 1,811,527 | |||||
| 12,411 | Ulta Salon, Cosmetics & Fragrance, Inc.(a) | 1,875,178 | |||||
| 3,686,705 | |||||||
| Textiles, Apparel & Luxury Goods - 3.5% | |||||||
| 57,938 | Hanesbrands, Inc. | 1,800,713 | |||||
| 20,924 | lululemon athletica, Inc.(a) | 1,331,603 | |||||
| 3,132,316 | |||||||
| Total Consumer Discretionary | 16,997,567 | ||||||
| Consumer Staples - 1.7% | |||||||
| Food & Staples Retailing - 1.1% | |||||||
| 13,860 | United Natural Foods, Inc.(a) | 934,995 | |||||
| Food Products - 0.6% | |||||||
| 12,874 | WhiteWave Foods Co.(a) | 566,070 | |||||
| Total Consumer Staples | 1,501,065 | ||||||
| Energy - 4.5% | |||||||
| Energy Equipment & Services - 1.8% | |||||||
| 42,481 | Patterson-UTI Energy, Inc. | 949,450 | |||||
| 26,774 | Superior Energy Services, Inc. | 682,737 | |||||
| 1,632,187 | |||||||
| Shares | Value | ||||||
| Energy - 4.5% (continued) | |||||||
| Oil, Gas & Consumable Fuels - 2.7% | |||||||
| 18,655 | Gulfport Energy Corp.(a) | $ | 912,976 | ||||
| 56,100 | Matador Resources Co.(a) | 1,555,092 | |||||
| 2,468,068 | |||||||
| Total Energy | 4,100,255 | ||||||
| Financials - 4.1% | |||||||
| Banks - 2.1% | |||||||
| 51,113 | PrivateBancorp, Inc. | 1,894,759 | |||||
| Real Estate Investment Trusts (REITs) - 2.0% | |||||||
| 30,587 | Lamar Advertising Co., Class A | 1,772,822 | |||||
| Total Financials | 3,667,581 | ||||||
| Health Care - 21.9% | |||||||
| Biotechnology - 4.5% | |||||||
| 16,021 | Alkermes PLC(a) | 887,083 | |||||
| 33,123 | AMAG Pharmaceuticals, Inc.(a) | 1,688,279 | |||||
| 7,013 | Anacor Pharmaceuticals, Inc.(a) | 369,515 | |||||
| 21,638 | Dyax Corp.(a) | 517,365 | |||||
| 10,689 | Eagle Pharmaceuticals, Inc.(a) | 563,310 | |||||
| 4,025,552 | |||||||
| Health Care Equipment & Supplies - 4.9% | |||||||
| 9,738 | Cooper Companies, Inc. | 1,734,046 | |||||
| 14,223 | Cyberonics, Inc.(a) | 866,323 | |||||
| 14,351 | ResMed, Inc. | 917,603 | |||||
| 13,442 | STERIS Corp. | 893,893 | |||||
| 4,411,865 | |||||||
| Health Care Providers & Services - 6.4% | |||||||
| 21,340 | Omnicare, Inc. | 1,877,493 | |||||
| 31,045 | Team Health Holdings, Inc.(a) | 1,849,351 | |||||
| 17,810 | Universal Health Services, Inc., Class B | 2,082,879 | |||||
| 5,809,723 | |||||||
| Life Sciences Tools & Services - 2.3% | |||||||
| 41,477 | Cambrex Corp.(a) | 1,596,450 | |||||
| 8,113 | PAREXEL International Corp.(a) | 515,784 | |||||
| 2,112,234 | |||||||
| Pharmaceuticals - 3.8% | |||||||
| 39,216 | Akorn, Inc.(a) | 1,632,954 | |||||
| 20,970 | Endo International PLC(a) | 1,762,843 | |||||
| 3,395,797 | |||||||
| Total Health Care | 19,755,171 | ||||||
| See Notes to Financial Statements | |
| 18 | centuryfunds.com |
| Portfolio of Investments |
| CENTURY GROWTH OPPORTUNITIES FUND | April 30, 2015 (Unaudited) |
| Shares | Value | ||||||
| Industrials - 16.7% | |||||||
| Aerospace & Defense - 1.9% | |||||||
| 27,846 | B/E Aerospace, Inc. | $ | 1,664,912 | ||||
| Airlines - 1.8% | |||||||
| 23,418 | Spirit Airlines, Inc.(a) | 1,603,431 | |||||
| Commercial Services & Supplies - 3.9% | |||||||
| 25,605 | G&K Services, Inc., Class A | 1,807,713 | |||||
| 36,418 | U.S. Ecology, Inc. | 1,708,368 | |||||
| 3,516,081 | |||||||
| Machinery - 5.0% | |||||||
| 14,867 | Greenbrier Companies, Inc. | 857,677 | |||||
| 24,964 | Proto Labs, Inc.(a) | 1,747,480 | |||||
| 12,752 | Snap-on, Inc. | 1,907,062 | |||||
| 4,512,219 | |||||||
| Professional Services - 2.0% | |||||||
| 44,025 | FTI Consulting, Inc.(a) | 1,809,868 | |||||
| Trading Companies & Distributors - 2.1% | |||||||
| 19,936 | United Rentals, Inc.(a) | 1,925,419 | |||||
| Total Industrials | 15,031,930 | ||||||
| Information Technology - 26.8% | |||||||
| Communications Equipment - 3.8% | |||||||
| 11,031 | F5 Networks, Inc.(a) | 1,346,002 | |||||
| 60,466 | Infinera Corp.(a) | 1,136,761 | |||||
| 6,376 | Palo Alto Networks, Inc.(a) | 941,863 | |||||
| 3,424,626 | |||||||
| Electronic Equipment, Instruments & Components - 2.1% | |||||||
| 20,708 | Zebra Technologies Corp., Class A(a) | 1,906,793 | |||||
| Internet Software & Services - 3.2% | |||||||
| 29,130 | Demandware, Inc.(a) | 1,794,408 | |||||
| 7,464 | MercadoLibre, Inc. | 1,062,351 | |||||
| 2,856,759 | |||||||
| IT Services - 8.0% | |||||||
| 48,244 | Cardtronics, Inc.(a) | 1,820,246 | |||||
| 28,232 | MAXIMUS, Inc. | 1,807,130 | |||||
| 51,356 | VeriFone Systems, Inc.(a) | 1,837,004 | |||||
| 44,278 | Virtusa Corp.(a) | 1,762,265 | |||||
| 7,226,645 | |||||||
| Semiconductors & Semiconductor Equipment - 5.9% | |||||||
| 22,528 | Cavium, Inc.(a) | 1,459,589 | |||||
| 50,223 | Integrated Device Technology, Inc.(a) | 913,556 | |||||
| Shares | Value | ||||||
| Information Technology - 26.8% (continued) | |||||||
| Semiconductors & Semiconductor Equipment - 5.9% (continued) | |||||||
| 37,928 | Mellanox Technologies Ltd.(a) | $ | 1,763,273 | ||||
| 12,527 | NXP Semiconductors NV(a) | 1,204,095 | |||||
| 5,340,513 | |||||||
| Software - 3.8% | |||||||
| 13,406 | BroadSoft, Inc.(a) | 424,166 | |||||
| 20,803 | Proofpoint, Inc.(a) | 1,122,946 | |||||
| 72,769 | VASCO Data Security International, Inc.(a) | 1,849,788 | |||||
| 3,396,900 | |||||||
| Total Information Technology | 24,152,236 | ||||||
| Materials - 1.0% | |||||||
| Chemicals - 1.0% | |||||||
| 11,133 | Valspar Corp. | 902,886 | |||||
| Telecommunication Services - 1.2% | |||||||
| Diversified Telecommunication Services - 1.2% | |||||||
| 32,531 | Cogent Communications Holdings, Inc. | 1,138,260 | |||||
| TOTAL COMMON STOCKS (Cost $70,756,345) | 87,246,951 | ||||||
| SHORT-TERM INVESTMENTS - 2.2% | |||||||
| Money Market Mutual Funds - 2.2% | |||||||
| 1,958,670 | State Street Institutional U.S. Government Money Market Fund - Investment Class (0.00%(b) 7 Day Yield) | 1,958,670 | |||||
| TOTAL SHORT-TERM INVESTMENTS (Cost $1,958,670) | 1,958,670 | ||||||
| TOTAL INVESTMENTS - 99.0% (Cost, $72,715,015) | 89,205,621 | ||||||
| Other Assets in Excess of Liabilities - 1.0% | 888,110 | ||||||
| NET ASSETS - 100.0% | $ | 90,093,731 | |||||
(a) | Non-income producing security. |
(b) | Less than 0.005%. |
Abbreviations:
| Ltd. | - | Limited |
| NV | - | Naamloze Vennootschap (Dutch: Limited Liability Company) |
| PLC | - | Public Limited Company |
| See Notes to Financial Statements | |
| Semi‐Annual Report | April 30, 2015 | 19 |
| | Statements of Assets and Liabilities |
| April 30, 2015 (Unaudited) |
Century Shares Trust | Century Small Cap Select Fund | Century Growth Opportunities Fund | ||||||||||
| ASSETS: | ||||||||||||
| Investments, at value (Note 1) (cost ‐ see below) | $ | 229,445,362 | $ | 295,710,725 | $ | 89,205,621 | ||||||
| Receivable for investments sold | – | 5,046,917 | 2,821,613 | |||||||||
| Receivable for fund shares subscribed | 1,684 | 857,489 | 146,460 | |||||||||
| Dividends receivable | 35,336 | 27,437 | 4,345 | |||||||||
| Prepaid expenses | 14,647 | 22,109 | 5,620 | |||||||||
| Total Assets | 229,497,029 | 301,664,677 | 92,183,659 | |||||||||
| LIABILITIES: | ||||||||||||
| Payable to Affiliates: | ||||||||||||
| Investment adviser fees (Note 4) | 151,336 | 236,602 | 57,849 | |||||||||
| Administration fees (Note 5) | 18,917 | – | 7,550 | |||||||||
| Distribution and service fees (Note 6) | – | 31,930 | – | |||||||||
| Payable for investments purchased | – | 9,545,887 | 1,976,013 | |||||||||
| Payable for shares redeemed | 127,929 | 155,407 | 197 | |||||||||
| Payable to trustees | 12,337 | 30,484 | 5,863 | |||||||||
| Accrued expenses and other liabilities | 73,135 | 123,285 | 42,456 | |||||||||
| Total Liabilities | 383,654 | 10,123,595 | 2,089,928 | |||||||||
| NET ASSETS | $ | 229,113,375 | $ | 291,541,082 | $ | 90,093,731 | ||||||
| NET ASSETS CONSIST OF: | ||||||||||||
| Paid-in capital | $ | 162,067,011 | $ | 196,274,952 | $ | 70,594,850 | ||||||
| Accumulated net investment loss | (141,517 | ) | (971,475 | ) | (862,039 | ) | ||||||
| Accumulated net realized gain on investments | 5,930,945 | 33,769,754 | 3,870,314 | |||||||||
| Unrealized appreciation in value of investments | 61,256,936 | 62,467,851 | 16,490,606 | |||||||||
| NET ASSETS | $ | 229,113,375 | $ | 291,541,082 | $ | 90,093,731 | ||||||
| Net Assets: | ||||||||||||
| Institutional Shares | $ | 229,113,375 | $ | 175,798,873 | $ | 90,093,731 | ||||||
| Investor Shares | N/A | $ | 115,742,209 | N/A | ||||||||
| Shares Outstanding (Note 2): | ||||||||||||
| Institutional Shares | 11,008,511 | 5,585,867 | 6,775,838 | |||||||||
| Investor Shares | N/A | 3,860,861 | N/A | |||||||||
| Net Asset Value Per Share | ||||||||||||
(Represents both the offering and redemption price)(a) | ||||||||||||
| Institutional Shares | $ | 20.81 | $ | 31.47 | $ | 13.30 | ||||||
| Investor Shares | N/A | $ | 29.98 | N/A | ||||||||
| Cost of investments | $ | 168,188,426 | $ | 233,242,874 | $ | 72,715,015 | ||||||
(a) | A redemption fee may be assessed for shares redeemed within 90 days after purchase. (Note 1) |
| See Notes to Financial Statements | |
| 20 | centuryfunds.com |
| | Statements of Operations |
| For the Six Months Ended April 30, 2015 (Unaudited) |
Century Shares Trust | Century Small Cap Select Fund | Century Growth Opportunities Fund | ||||||||||
| INVESTMENT INCOME: | ||||||||||||
| Dividends | $ | 1,090,325 | $ | 1,012,916 | $ | 209,766 | ||||||
| Total Investment Income | 1,090,325 | 1,012,916 | 209,766 | |||||||||
| EXPENSES: | ||||||||||||
| Investment adviser fees (Notes 4 and 7) | 894,755 | 1,497,064 | 345,779 | |||||||||
| Distribution and service fees (Note 6): | ||||||||||||
| Investor Shares | – | 118,582 | – | |||||||||
| Administrative fees | 111,844 | – | 43,222 | |||||||||
| Transfer agency fees | 62,718 | 136,747 | 6,376 | |||||||||
| Fund accounting fees | 14,394 | 20,175 | 6,959 | |||||||||
| Custodian fees | 9,367 | 17,779 | 15,255 | |||||||||
| Insurance fees | 8,893 | 15,573 | 3,628 | |||||||||
| Professional fees | 39,843 | 48,567 | 30,094 | |||||||||
| Registration fees | 16,287 | 19,888 | 9,439 | |||||||||
| Trustee fees | 43,376 | 64,078 | 16,496 | |||||||||
| Printing fees | 19,938 | 22,013 | 2,601 | |||||||||
| Other expenses | 10,427 | 23,925 | 5,866 | |||||||||
| Total Expenses | 1,231,842 | 1,984,391 | 485,715 | |||||||||
| Adviser waivers/reimbursements (Note 7) | – | – | (10,271 | ) | ||||||||
| Net Expenses | 1,231,842 | 1,984,391 | 475,444 | |||||||||
| NET INVESTMENT LOSS | (141,517 | ) | (971,475 | ) | (265,678 | ) | ||||||
| REALIZED AND UNREALIZED GAIN/(LOSS) ON INVESTMENTS: | ||||||||||||
| Net realized gain on investments | 5,943,878 | 34,981,330 | 4,814,649 | |||||||||
| Net change in unrealized appreciation/(depreciation) of investments | 15,694,751 | (13,258,477 | ) | 1,657,175 | ||||||||
| NET REALIZED AND UNREALIZED GAIN ON INVESTMENTS | 21,638,629 | 21,722,853 | 6,471,824 | |||||||||
| NET INCREASE IN NET ASSETS RESULTING FROM OPERATIONS | $ | 21,497,112 | $ | 20,751,378 | $ | 6,206,146 | ||||||
| See Notes to Financial Statements | |
| Semi-Annual Report | April 30, 2015 | 21 |
| |
| Century Shares Trust | ||||||||
| For the Six | ||||||||
| Months Ended | For the | |||||||
| April 30, 2015 | Year Ended | |||||||
| (Unaudited) | October 31, 2014 | |||||||
| OPERATIONS: | ||||||||
| Net investment loss | $ | (141,517 | ) | $ | (139,136 | ) | ||
| Net realized gain on investments | 5,943,878 | 53,680,617 | ||||||
| Long-term capital gains from other investment companies | – | 36,899 | ||||||
| Change in net unrealized appreciation/(depreciation) | 15,694,751 | (19,688,444 | ) | |||||
| Net increase in net assets resulting from operations | 21,497,112 | 33,889,936 | ||||||
| DISTRIBUTIONS TO SHAREHOLDERS: | ||||||||
| Institutional Shares | ||||||||
| From net investment income | – | – | ||||||
| From net realized gains on investments | (53,335,538 | ) | (11,893,456 | ) | ||||
| Investor Shares | ||||||||
| From net investment income | – | – | ||||||
| From net realized gains on investments | – | – | ||||||
| Total distributions | (53,335,538 | ) | (11,893,456 | ) | ||||
| CAPITAL SHARE TRANSACTIONS: | ||||||||
| Increase/(decrease) in net assets from capital share transactions (Note 2) | 38,400,523 | (716,312 | ) | |||||
| Redemption fees | 146 | 33 | ||||||
| Net increase/(decrease) from share transactions | 38,400,669 | (716,279 | ) | |||||
| Total increase/(decrease) | 6,562,243 | 21,280,201 | ||||||
| NET ASSETS: | ||||||||
| Beginning of period | 222,551,132 | 201,270,931 | ||||||
| End of period* | $ | 229,113,375 | $ | 222,551,132 | ||||
| * Including accumulated net investment loss | $ | (141,517 | ) | $ | – | |||
| See Notes to Financial Statements | |
| 22 | centuryfunds.com |
| Statements of Changes in Net Assets |
| Century Small Cap Select Fund | Century Growth Opportunities Fund | |||||||||||||||
| For the Six | For the Six | |||||||||||||||
| Months Ended | For the | Months Ended | For the | |||||||||||||
| April 30, 2015 | Year Ended | April 30, 2015 | Year Ended | |||||||||||||
| (Unaudited) | October 31, 2014 | (Unaudited) | October 31, 2014 | |||||||||||||
| $ | (971,475 | ) | $ | (3,286,711 | ) | $ | (265,678 | ) | $ | (691,768 | ) | |||||
| 34,981,330 | 57,842,711 | 4,814,649 | 18,260,490 | |||||||||||||
| – | – | – | – | |||||||||||||
| (13,258,477 | ) | (27,150,382 | ) | 1,657,175 | (6,570,681 | ) | ||||||||||
| 20,751,378 | 27,405,618 | 6,206,146 | 10,998,041 | |||||||||||||
| – | – | – | – | |||||||||||||
| (33,970,609 | ) | (14,887,988 | ) | (17,660,594 | ) | (987,358 | ) | |||||||||
| – | – | – | – | |||||||||||||
| (18,018,773 | ) | (6,555,307 | ) | – | – | |||||||||||
| (51,989,382 | ) | (21,443,295 | ) | (17,660,594 | ) | (987,358 | ) | |||||||||
| (61,457,268 | ) | (50,603,727 | ) | 14,128,074 | (16,003,874 | ) | ||||||||||
| 11,020 | 4,834 | – | 372 | |||||||||||||
| (61,446,248 | ) | (50,598,893 | ) | 14,128,074 | (16,003,502 | ) | ||||||||||
| (92,684,252 | ) | (44,636,570 | ) | 2,673,626 | (5,992,819 | ) | ||||||||||
| 384,225,334 | 428,861,904 | 87,420,105 | 93,412,924 | |||||||||||||
| $ | 291,541,082 | $ | 384,225,334 | $ | 90,093,731 | $ | 87,420,105 | |||||||||
| $ | (971,475 | ) | $ | – | $ | (862,039 | ) | $ | (596,361 | ) | ||||||
| Semi-Annual Report | April 30, 2015 | 23 |
| | Financial Highlights |
| CENTURY SHARES TRUST | For a share outstanding throughout the periods presented |
| INSTITUTIONAL SHARES |
| For the Six | ||||||||||||||||||||
| Months Ended | ||||||||||||||||||||
| April 30, 2015 | For the Year Ended October 31, | |||||||||||||||||||
| (Unaudited) | 2014 | 2013 | 2012 | 2011 | ||||||||||||||||
| NET ASSET VALUE, BEGINNING OF PERIOD | $ | 24.78 | $ | 22.41 | $ | 19.81 | $ | 20.66 | $ | 19.65 | ||||||||||
| INCOME/(LOSS) FROM OPERATIONS: | ||||||||||||||||||||
Net investment income/(loss)(a) | (0.01 | ) | (0.02 | ) | 0.03 | 0.05 | (0.02 | ) | ||||||||||||
| Net realized and unrealized gain on investments | 2.09 | 3.72 | 5.09 | 1.28 | 1.93 | |||||||||||||||
| Total income from investment operations | 2.08 | 3.70 | 5.12 | 1.33 | 1.91 | |||||||||||||||
| LESS DISTRIBUTIONS FROM: | ||||||||||||||||||||
| Net investment income | – | – | (0.05 | ) | (0.06 | ) | (0.01 | ) | ||||||||||||
| Net realized gain on investment transactions | (6.05 | ) | (1.33 | ) | (2.47 | ) | (2.12 | ) | (0.89 | ) | ||||||||||
| Total distributions | (6.05 | ) | (1.33 | ) | (2.52 | ) | (2.18 | ) | (0.90 | ) | ||||||||||
| REDEMPTION FEES | 0.00 | (b) | 0.00 | (b) | 0.00 | (b) | 0.00 | (b) | 0.00 | (b) | ||||||||||
| NET ASSET VALUE, END OF PERIOD | $ | 20.81 | $ | 24.78 | $ | 22.41 | $ | 19.81 | $ | 20.66 | ||||||||||
| TOTAL RETURN | 10.02 | %(c) | 17.29 | % | 28.85 | % | 7.63 | % | 9.79 | % | ||||||||||
| RATIOS AND SUPPLEMENTAL DATA | ||||||||||||||||||||
| Net assets, end of period (000’s) | $ | 229,113 | $ | 222,551 | $ | 201,271 | $ | 174,534 | $ | 178,201 | ||||||||||
| Ratio of expenses to average net assets | 1.10 | %(d) | 1.09 | % | 1.11 | % | 1.12 | % | 1.13 | % | ||||||||||
| Ratio of net investment income/(loss) to average net assets | (0.13 | %)(d) | (0.06 | %) | 0.16 | % | 0.24 | % | (0.10 | %) | ||||||||||
| PORTFOLIO TURNOVER RATE | 15 | %(c) | 126 | % | 39 | % | 79 | % | 72 | % | ||||||||||
(a) | Per share numbers have been calculated using the average shares method. |
(b) | Less than $0.005 per share. |
(c) | Not annualized. |
(d) | Annualized. |
| See Notes to Financial Statements | |
| 24 | centuryfunds.com |
| | Financial Highlights |
| CENTURY SMALL CAP SELECT FUND | For a share outstanding throughout the periods presented |
| INSTITUTIONAL SHARES |
| For the Six | ||||||||||||||||||||
| Months Ended | ||||||||||||||||||||
| April 30, 2015 | For the Year Ended October 31, | |||||||||||||||||||
| (Unaudited) | 2014 | 2013 | 2012 | 2011 | ||||||||||||||||
| NET ASSET VALUE, BEGINNING OF PERIOD | $ | 34.46 | $ | 33.94 | $ | 26.27 | $ | 23.91 | $ | 20.99 | ||||||||||
| INCOME/(LOSS) FROM OPERATIONS: | ||||||||||||||||||||
Net investment loss(a) | (0.08 | ) | (0.24 | ) | (0.04 | ) | (0.12 | ) | (0.09 | ) | ||||||||||
| Net realized and unrealized gain on investments | 2.25 | 2.48 | 7.71 | 2.48 | 3.01 | |||||||||||||||
| Total income from investment operations | 2.17 | 2.24 | 7.67 | 2.36 | 2.92 | |||||||||||||||
| LESS DISTRIBUTIONS FROM: | ||||||||||||||||||||
| Net realized gain on investment transactions | (5.16 | ) | (1.72 | ) | – | – | – | |||||||||||||
| Total distributions | (5.16 | ) | (1.72 | ) | – | – | – | |||||||||||||
| REDEMPTION FEES | 0.00 | (b) | 0.00 | (b) | 0.00 | (b) | 0.00 | (b) | 0.00 | (b) | ||||||||||
| NET ASSET VALUE, END OF PERIOD | $ | 31.47 | $ | 34.46 | $ | 33.94 | $ | 26.27 | $ | 23.91 | ||||||||||
| TOTAL RETURN | 7.50 | %(c) | 6.79 | % | 29.20 | % | 9.87 | % | 13.86 | % | ||||||||||
| RATIOS AND SUPPLEMENTAL DATA | ||||||||||||||||||||
| Net assets, end of period (000’s) | $ | 175,799 | $ | 266,045 | $ | 300,833 | $ | 281,480 | $ | 254,724 | ||||||||||
| Ratio of expenses to average net assets | 1.16 | %(d) | 1.11 | % | 1.12 | % | 1.10 | % | 1.11 | % | ||||||||||
| Ratio of net investment loss to average net assets | (0.50 | %)(d) | (0.71 | %) | (0.14 | %) | (0.48 | %) | (0.37 | %) | ||||||||||
| PORTFOLIO TURNOVER RATE | 32 | %(c) | 97 | % | 91 | % | 53 | % | 75 | % | ||||||||||
(a) | Per share numbers have been calculated using the average shares method. |
(b) | Less than $0.005 per share. |
(c) | Not annualized. |
(d) | Annualized. |
| See Notes to Financial Statements | |
| Semi-Annual Report | April 30, 2015 | 25 |
| | Financial Highlights |
| CENTURY SMALL CAP SELECT FUND | For a share outstanding throughout the periods presented |
| INVESTOR SHARES |
| For the Six | ||||||||||||||||||||
| Months Ended | ||||||||||||||||||||
| April 30, 2015 | For the Year Ended October 31, | |||||||||||||||||||
| (Unaudited) | 2014 | 2013 | 2012 | 2011 | ||||||||||||||||
| NET ASSET VALUE, BEGINNING OF PERIOD | $ | 33.12 | $ | 32.78 | $ | 25.45 | $ | 23.25 | $ | 20.49 | ||||||||||
| INCOME/(LOSS) FROM OPERATIONS: | ||||||||||||||||||||
Net investment loss(a) | (0.12 | ) | (0.33 | ) | (0.13 | ) | (0.21 | ) | (0.17 | ) | ||||||||||
| Net realized and unrealized gain on investments | 2.14 | 2.39 | 7.46 | 2.41 | 2.92 | |||||||||||||||
| Total income from investment operations | 2.02 | 2.06 | 7.33 | 2.20 | 2.75 | |||||||||||||||
| LESS DISTRIBUTIONS FROM: | ||||||||||||||||||||
| Net realized gain on investment transactions | (5.16 | ) | (1.72 | ) | – | – | – | |||||||||||||
| Total distributions | (5.16 | ) | (1.72 | ) | – | – | – | |||||||||||||
| REDEMPTION FEES | 0.00 | (b) | 0.00 | (b) | 0.00 | (b) | 0.00 | (b) | 0.01 | |||||||||||
| NET ASSET VALUE, END OF PERIOD | $ | 29.98 | $ | 33.12 | $ | 32.78 | $ | 25.45 | $ | 23.25 | ||||||||||
| TOTAL RETURN | 7.34 | %(c) | 6.47 | % | 28.80 | % | 9.46 | % | 13.47 | % | ||||||||||
| RATIOS AND SUPPLEMENTAL DATA | ||||||||||||||||||||
| Net assets, end of period (000’s) | $ | 115,742 | $ | 118,181 | $ | 128,029 | $ | 111,965 | $ | 116,678 | ||||||||||
| Ratio of expenses to average net assets | 1.44 | %(d) | 1.40 | % | 1.41 | % | 1.47 | % | 1.48 | % | ||||||||||
| Ratio of net investment loss to average net assets | (0.82 | %)(d) | (1.00 | %) | (0.44 | %) | (0.84 | %) | (0.71 | %) | ||||||||||
| PORTFOLIO TURNOVER RATE | 32 | %(c) | 97 | % | 91 | % | 53 | % | 75 | % | ||||||||||
(a) | Per share numbers have been calculated using the average shares method. |
(b) | Less than $0.005 per share. |
(c) | Not annualized. |
(d) | Annualized. |
| See Notes to Financial Statements | |
| 26 | centuryfunds.com |
| | Financial Highlights |
| CENTURY GROWTH OPPORTUNITIES FUND | For a share outstanding throughout the periods presented |
| INSTITUTIONAL SHARES |
| For the Period | ||||||||||||||||||||
| November 17, | ||||||||||||||||||||
For the Six Months Ended | 2010 (Inception) to | |||||||||||||||||||
| April 30, 2015 | For the Year Ended October 31, | October 31, | ||||||||||||||||||
| (Unaudited) | 2014 | 2013 | 2012 | 2011 | ||||||||||||||||
| NET ASSET VALUE, BEGINNING OF PERIOD | $ | 15.51 | $ | 13.87 | $ | 10.81 | $ | 10.67 | $ | 10.00 | ||||||||||
| INCOME/(LOSS) FROM OPERATIONS: | ||||||||||||||||||||
Net investment loss(a) | (0.04 | ) | (0.11 | ) | (0.03 | ) | (0.02 | ) | (0.07 | ) | ||||||||||
| Net realized and unrealized gain on investments | 1.04 | 1.90 | 3.11 | 0.16 | 0.74 | |||||||||||||||
| Total income from investment operations | 1.00 | 1.79 | 3.08 | 0.14 | 0.67 | |||||||||||||||
| LESS DISTRIBUTIONS FROM: | ||||||||||||||||||||
| Net investment income | – | – | (0.02 | ) | – | – | ||||||||||||||
| Net realized gain on investment transactions | (3.21 | ) | (0.15 | ) | – | – | – | |||||||||||||
| Total distributions | (3.21 | ) | (0.15 | ) | (0.02 | ) | – | – | ||||||||||||
| REDEMPTION FEES | – | 0.00 | (b) | 0.00 | (b) | 0.00 | (b) | 0.00 | (b) | |||||||||||
| NET ASSET VALUE, END OF PERIOD | $ | 13.30 | $ | 15.51 | $ | 13.87 | $ | 10.81 | $ | 10.67 | ||||||||||
| TOTAL RETURN | 7.61 | %(c) | 13.04 | % | 28.54 | % | 1.31 | % | 6.70 | %(c) | ||||||||||
| RATIOS AND SUPPLEMENTAL DATA | ||||||||||||||||||||
| Net assets, end of period (000’s) | $ | 90,094 | $ | 87,420 | $ | 93,413 | $ | 94,285 | $ | 7,323 | ||||||||||
| Ratio of expenses to average net assets without giving effect to contractual expense agreement | 1.12 | %(d) | 1.10 | % | 1.12 | % | 1.20 | % | 3.62 | %(d) | ||||||||||
| Ratio of expenses to average net assets | 1.10 | %(d) | 1.10 | % | 1.10 | % | 1.10 | % | 1.10 | %(d) | ||||||||||
| Ratio of net investment loss to average net assets | (0.61 | %)(d) | (0.77 | %) | (0.27 | %) | (0.18 | %) | (0.64 | %)(d) | ||||||||||
| PORTFOLIO TURNOVER RATE | 67 | %(c) | 165 | % | 155 | % | 148 | % | 119 | %(c) | ||||||||||
(a) | Per share numbers have been calculated using the average shares method. |
(b) | Less than $0.005 per share. |
(c) | Not annualized. |
(d) | Annualized. |
| See Notes to Financial Statements | |
| Semi-Annual Report | April 30, 2015 | 27 |
| | Notes to Financial Statements |
| April 30, 2015 (Unaudited) |
| 1. | SIGNIFICANT ACCOUNTING POLICIES |
Century Capital Management Trust (the “Trust”) is registered under the Investment Company Act of 1940, as amended (“1940 Act”) as an open‐end management investment company organized as a Massachusetts business trust. Century Shares Trust, Century Small Cap Select Fund, and Century Growth Opportunities Fund (each a “Fund” and, collectively, the “Funds”) are diversified series of the Trust. The following are significant accounting policies consistently followed by the Funds and are in conformity with accounting principles generally accepted in the United States (GAAP). Each Fund is considered an investment company for financial reporting purposes under GAAP.
The investment objective of Century Shares Trust is to seek long‐term growth of principal and income. The investment objective of each of Century Small Cap Select Fund and Century Growth Opportunities Fund is to seek long‐term capital growth.
A. Security Valuations — Equity securities are valued at the last reported sale price or official closing price on the primary exchange or market on which they are traded, as reported by an independent pricing service. If no sale price or official closing price is reported, market value is generally determined based on quotes or closing prices obtained from a quotation reporting system, established market maker, or reputable pricing service. For unlisted securities and for exchange‐listed securities for which there are no reported sales or official closing prices, fair value is generally determined using closing bid prices. In the absence of readily available market quotes, securities and other assets will be valued at fair value, as determined in good faith under procedures established by and under the general supervision of the Funds’ Board of Trustees. Short‐term obligations, maturing in 60 days or less, are valued at amortized cost, which approximates fair value unless particular circumstances dictate otherwise (for example, if the issuer’s creditworthiness has become impaired). Investments in open‐end mutual funds are valued at their closing net asset value each business day.
A three‐tier hierarchy has been established to classify fair value measurements for disclosure purposes. Inputs refer broadly to the assumptions that market participants would use in pricing the asset or liability, including assumptions about risk. Inputs may be observable or unobservable. Observable inputs are inputs that reflect the assumptions market participants would use in pricing the asset or liability that are developed based on market data obtained from sources independent of the reporting entity. Unobservable inputs are inputs that reflect the reporting entity’s own assumptions about the assumptions market participants would use in pricing the asset or liability that are developed based on the best information available.
Various inputs are used in determining the value of each Fund’s investments as of the reporting period end. These inputs are categorized in the following hierarchy under applicable financial accounting standards:
| Level 1 | — | Unadjusted quoted prices in active markets for identical, unrestricted assets or liabilities that the Funds have the ability to access at the measurement date; | |
| Level 2 | — | Quoted prices which are not active, quoted prices for similar assets or liabilities in active markets or inputs other than quoted prices that are observable (either directly or indirectly) for substantially the full term of the asset or liability; | |
| Level 3 | — | Significant unobservable prices or inputs (including the Fund’s own assumptions in determining the fair value of investments) where there is little or no market activity for the asset or liability at the measurement date. |
The availability of observable inputs can vary from security to security and is affected by a wide variety of factors, including, for example, the type of security, whether the security is new and not yet established in the marketplace, the liquidity of markets, and other characteristics particular to the security. To the extent that valuation is based on models or inputs that are less observable or unobservable in the market, the determination of fair value requires more judgment. Accordingly, the degree of judgment exercised in determining fair value is greatest for instruments categorized in Level 3.
| 28 | centuryfunds.com |
| Notes to Financial Statements |
| April 30, 2015 (Unaudited) |
The following is a summary of the inputs used as of April 30, 2015 in valuing the Funds’ investments carried at fair value:
Century Shares Trust
| Investments in Securities at Value* | Level 1 ‐ Quoted Prices | Level 2 ‐ Other Significant Observable Inputs | Level 3 ‐ Significant Unobservable Inputs | Total | ||||||||||||
| Common Stocks | $ | 226,219,450 | $ | – | $ | – | $ | 226,219,450 | ||||||||
| Short‐Term Investments | 3,225,912 | – | – | 3,225,912 | ||||||||||||
| TOTAL | $ | 229,445,362 | $ | – | $ | – | $ | 229,445,362 | ||||||||
Century Small Cap Select Fund
| Investments in Securities at Value* | Level 1 ‐ Quoted Prices | Level 2 ‐ Other Significant Observable Inputs | Level 3 ‐ Significant Unobservable Inputs | Total | ||||||||||||
| Common Stocks | $ | 280,896,035 | $ | – | $ | – | $ | 280,896,035 | ||||||||
| Short‐Term Investments | 14,814,690 | – | – | 14,814,690 | ||||||||||||
| TOTAL | $ | 295,710,725 | $ | – | $ | – | $ | 295,710,725 | ||||||||
Century Growth Opportunities Fund
| Investments in Securities at Value* | Level 1 ‐ Quoted Prices | Level 2 ‐ Other Significant Observable Inputs | Level 3 ‐ Significant Unobservable Inputs | Total | ||||||||||||
| Common Stocks | $ | 87,246,951 | $ | – | $ | – | $ | 87,246,951 | ||||||||
| Short‐Term Investments | 1,958,670 | – | – | 1,958,670 | ||||||||||||
| TOTAL | $ | 89,205,621 | $ | – | $ | – | $ | 89,205,621 | ||||||||
| * | At April 30, 2015 the Funds held investments in common stocks classified as Level 1, with corresponding major categories as shown on each Fund’s Portfolio of Investments. |
The Funds recognize transfers into and out of all levels at the end of the reporting period. There were no transfers into or out of Levels 1 and 2 during the period.
There were no securities classified as Level 3 securities during the period, thus, a reconciliation of assets in which significant unobservable inputs (Level 3) were used is not applicable for these Funds.
| Semi-Annual Report | April 30, 2015 | 29 |
| Notes to Financial Statements |
| April 30, 2015 (Unaudited) |
B. Security Transactions — Security transactions are recorded on a trade date basis. Gain or loss on sales is determined by the use of the highest cost‐method, for both financial reporting and federal income tax purposes. Dividend income is recorded on the ex‐dividend date. Payments received from certain investments held by the Funds may be comprised of dividends, capital gains and return of capital. The Funds originally estimate the expected classification of such payments. The amounts may subsequently be reclassified upon receipt of information from the issuer. The Funds may invest in equity securities issued or guaranteed by companies organized and based in countries outside of the United States. These securities may be traded on foreign securities exchanges or in foreign over‐the‐counter markets. Foreign dividend income is recorded on ex‐dividend date or as soon as practicable after the Fund determines the existence of a dividend declaration after exercising reasonable due diligence. Foreign income and capital gain on some foreign securities may be subject to foreign withholding taxes, which are accrued as applicable. Interest income is recorded daily on an accrual basis.
C. Use of Estimates — The preparation of these financial statements in accordance with GAAP incorporates estimates made by management in determining the reported amounts of assets, liabilities, income and expenses of the Funds. Actual results could differ from those estimates.
D. Risks and Uncertainty — Century Shares Trust may invest a significant portion of assets in a limited number of companies. As a result, the Fund may be more susceptible to financial, market and economic events affecting particular companies and therefore may experience greater price volatility than funds with more diversified portfolios.
Century Small Cap Select Fund concentrates its investments in certain industries detailed in the Portfolio of Investments, which subjects the Fund to the risks associated with those industries and may result in greater fluctuation in share value than is experienced in more diversified portfolios. In addition, the Fund invests in smaller companies, which generally involves greater risk than investing in larger, more established companies.
Century Growth Opportunities Fund invests mainly in small‐cap and mid‐cap companies, which, historically, have been more volatile in price than the stocks of large‐cap companies.
Foreign investing involves certain risks and increased volatility not associated with investing solely in the U.S. These risks include currency fluctuations, economic or financial instability, lack of timely or reliable financial information or unfavorable political or legal developments.
At any given time, a significant portion of the assets of each Fund may be invested in securities of companies within the same market sector of the economy. Companies within the same sector often face similar issues and, consequently, may react similarly to changes in market conditions. If a Fund has a significant weighting in one or more sectors, it may be subject to more risk and price volatility.
E. Multiple Classes of Shares — Century Small Cap Select Fund offers two classes of shares, which differ in their respective distribution and service fees. Investment income, realized and unrealized capital gains and losses, the common expenses of the Fund, and certain fund‐level expense reductions, if any, are allocated on a pro rata basis to each class based on the relative net assets of each class to the total net assets of the Fund. Certain expense reductions may differ by class. Because transfer agent fees include a per account fee, each class differs with respect to transfer agent fees incurred.
| 30 | centuryfunds.com |
| Notes to Financial Statements |
| April 30, 2015 (Unaudited) |
F. Redemption Fees — In general, shares of each Fund may be redeemed at net asset value. However, upon the redemption of shares held less than 90 days, a redemption fee of 1% of the current net asset value of the shares may be assessed and retained by each share class of each Fund for the benefit of the Fund’s remaining shareholders. The redemption fee is accounted for as an addition to paid-in-capital and amounts are shown on the Statement of Changes in Net Assets.
G. Income Tax Information and Distributions to Shareholders — Each year, each Fund intends to qualify as a regulated investment company by distributing all of its taxable income and sufficient net investment income and net realized gains, if any, under Subchapter M of the Internal Revenue Code of 1986 (“Code”), as amended. As a result, no provision for income taxes is required in the accompanying financial statements. Foreign taxes are provided for based on each Fund’s understanding of the tax rules and rates class. Distributions are recorded on the ex-dividend date. Income and capital gain distributions are determined in accordance with income tax regulations, which may differ from generally accepted accounting principles. Capital accounts within the financial statements are adjusted for permanent book and tax differences. Generally accepted accounting principles require that any distributions in excess of tax basis earnings and profits be reported in the financial statements as a tax return of capital.
The net unrealized appreciation/depreciation of investments based on federal tax cost as of April 30, 2015 was as follows:
Century Shares Trust | Century Small Cap Select Fund | Century Growth Opportunities Fund | ||||||||||
| Gross appreciation on investments (excess of value over tax cost) | $ | 61,362,458 | $ | 68,604,241 | $ | 16,262,593 | ||||||
| Gross depreciation on investments (excess of tax cost over value) | (118,374 | ) | (6,518,683 | ) | (936,907 | ) | ||||||
| Net unrealized appreciation | $ | 61,244,084 | $ | 62,085,558 | $ | 15,325,686 | ||||||
| Cost of investments for federal income tax purposes | $ | 168,201,278 | $ | 233,625,167 | $ | 73,879,935 | ||||||
The tax character of distributions paid by the Funds during the year ended October 31, 2014, were as follows:
| Distributions Paid From: | Century Shares Trust | Century Small Cap Select Fund | Century Growth Opportunities Fund | |||||||||
| Long-term capital gains | $ | 11,893,456 | $ | 21,443,295 | $ | 987,358 | ||||||
| Total | $ | 11,893,456 | $ | 21,443,295 | $ | 987,358 | ||||||
The tax character of distributions paid by the Funds during the period ended April 30, 2015, will be determined at the Funds’ fiscal year end October 31, 2015.
As of October 31, 2014, each of the Funds had utilized all capital loss carryforwards available.
The Century Growth Opportunities Fund elects to defer to the period ending October 31, 2015, late year ordinary losses in the amount of $582,957.
| Semi-Annual Report | April 30, 2015 | 31 |
| Notes to Financial Statements |
| April 30, 2015 (Unaudited) |
As of April 30, 2015, the funds had no uncertain tax positions that would require financial statement recognition or disclosure. The Funds file U.S. federal, state, and local tax returns as required. The Funds’ tax returns are subject to examination by the relevant tax authorities until expiration of the applicable statute of limitations which is generally three years after the filing of a tax return, but may extend to four years in certain jurisdictions. Tax returns for open years have incorporated no uncertain positions that require a provision for income taxes.
H. Indemnifications — In the normal course of business, the Funds enter into agreements with service providers that may contain indemnification clauses. The Funds maximum exposure under these arrangements is unknown as this would involve future claims that may be made against the Funds that have not yet occurred.
| 2. TRANSACTIONS IN SHARES |
Century Shares Trust — The number of authorized shares is unlimited. Transactions in Institutional Class shares were as follows:
| Institutional | ||||||||||||||||
For the Six Months Ended April 30, 2015 (Unaudited) | For the Year Ended October 31, 2014 | |||||||||||||||
| Shares | Amount | Shares | Amount | |||||||||||||
| Sold | 106,262 | $ | 2,123,489 | 130,045 | $ | 2,996,632 | ||||||||||
| Issued to shareholders in reinvestment of distributions | 2,487,747 | 48,511,068 | 488,619 | 10,734,961 | ||||||||||||
| 2,594,009 | 50,634,557 | 618,664 | 13,731,593 | |||||||||||||
| Repurchased | (567,856 | ) | (12,234,034 | ) | (619,060 | ) | (14,447,905 | ) | ||||||||
| Net Increase/(Decrease) | 2,026,153 | $ | 38,400,523 | (396 | ) | $ | (716,312 | ) | ||||||||
Century Small Cap Select Fund — The number of authorized shares is unlimited. Transactions in each class of shares were as follows:
| Institutional | ||||||||||||||||
For the Six Months Ended April 30, 2015 (Unaudited) | For the Year Ended October 31, 2014 | |||||||||||||||
| Shares | Amount | Shares | Amount | |||||||||||||
| Sold | 376,010 | $ | 11,844,936 | 996,377 | $ | 33,757,130 | ||||||||||
| Issued to shareholders in reinvestment of distributions | 1,134,797 | 33,033,944 | 433,612 | 14,432,225 | ||||||||||||
| 1,510,807 | 44,878,880 | 1,429,989 | 48,189,355 | |||||||||||||
| Repurchased | (3,645,904 | ) | (114,034,679 | ) | (2,573,811 | ) | (87,508,528 | ) | ||||||||
| Net Decrease | (2,135,097 | ) | $ | (69,155,799 | ) | (1,143,822 | ) | $ | (39,319,173 | ) | ||||||
| 32 | centuryfunds.com |
| Notes to Financial Statements |
| April 30, 2015 (Unaudited) |
| Investor | ||||||||||||||||
For the Six Months Ended April 30, 2015 (Unaudited) | For the Year Ended October 31, 2014 | |||||||||||||||
| Shares | Amount | Shares | Amount | |||||||||||||
| Sold | 197,915 | $ | 6,006,568 | 257,497 | $ | 8,422,456 | ||||||||||
| Issued to shareholders in reinvestment of distributions | 642,483 | 17,835,340 | 202,724 | 6,504,077 | ||||||||||||
| 840,398 | 23,841,908 | 460,221 | 14,926,533 | |||||||||||||
| Repurchased | (547,695 | ) | (16,143,377 | ) | (798,051 | ) | (26,211,087 | ) | ||||||||
| Net Increase/(Decrease) | 292,703 | $ | 7,698,531 | (337,830 | ) | $ | (11,284,554 | ) | ||||||||
Century Growth Opportunities Fund — The number of authorized shares is unlimited. Transactions in Institutional Class shares were as follows:
| Institutional | ||||||||||||||||
For the Six Months Ended April 30, 2015 (Unaudited) | For the Year Ended October 31, 2014 | |||||||||||||||
| Shares | Amount | Shares | Amount | |||||||||||||
| Sold | 363,265 | $ | 4,966,843 | 375,051 | $ | 5,492,245 | ||||||||||
| Issued to shareholders in reinvestment of distributions | 1,401,447 | 17,658,239 | 70,524 | 987,328 | ||||||||||||
| 1,764,712 | 22,625,082 | 445,575 | 6,479,573 | |||||||||||||
| Repurchased | (626,511 | ) | (8,497,008 | ) | (1,543,699 | ) | (22,483,447 | ) | ||||||||
| Net Increase/(Decrease) | 1,138,201 | $ | 14,128,074 | (1,098,124 | ) | $ | (16,003,874 | ) | ||||||||
| 3. INVESTMENT SECURITIES TRANSACTIONS |
Century Shares Trust purchases and sales of investment securities (excluding short-term securities and U.S. Government obligations) aggregated $31,829,155 and $41,307,438, respectively, during the six months ended April 30, 2015.
Century Small Cap Select Fund purchases and sales of investment securities (excluding short‐term securities and U.S. Government obligations) aggregated $100,464,617 and $214,559,344, respectively, during the six months ended April 30, 2015.
Century Growth Opportunities Fund purchases and sales of investment securities (excluding short‐term securities and U.S. Government obligations) aggregated $57,183,451 and $62,639,799, respectively, during the six months ended April 30, 2015.
| Semi-Annual Report | April 30, 2015 | 33 |
| Notes to Financial Statements |
| April 30, 2015 (Unaudited) |
| 4. INVESTMENT ADVISER FEE |
Century Shares Trust: The Trust has entered into an Investment Advisory Agreement (the “Agreement”) with Century Capital Management, LLC (“CCM”) pursuant to which CCM provides an investment program for Century Shares Trust. Under the Agreement, the Fund pays a management fee based on the Fund’s average daily net assets computed at the following annual rates: 0.80% of the first $500 million and 0.70% of the amounts exceeding $500 million.
Century Small Cap Select Fund: The Trust has entered into an Investment Advisory and Management Services Agreement (the “Agreement”) with CCM pursuant to which CCM provides investment advisory, management and administrative services to Century Small Cap Select Fund. Under the Agreement, the Fund pays a monthly management fee at the annual rate of 0.95% of the Fund’s average daily net assets.
Century Growth Opportunities Fund: The Trust has entered into an Investment Advisory Agreement (the “Agreement”) with CCM pursuant to which CCM provides investment advisory services to Century Growth Opportunities Fund. Under the Agreement, the Fund pays a management fee based on the Fund’s average daily net assets at the following annual rates: 0.80% of the first $500 million and 0.75% thereafter.
| 5. ADMINISTRATION FEES |
Century Shares Trust: The Trust has entered into an Administration Agreement with CCM pursuant to which CCM provides certain administrative services to Century Shares Trust at the annual rate of 0.10% of the Fund’s average daily net assets.
Century Small Cap Select Fund: Per the Investment Advisory and Management Services Agreement between the Trust and CCM, Century Small Cap Select Fund may reimburse CCM for expenses associated with having the adviser’s personnel perform shareholder service functions and certain financial, accounting, administrative and clerical services. No reimbursements were paid to CCM during the six months ended April 30, 2015.
Century Growth Opportunities Fund: The Trust has entered into an Administration Agreement with CCM pursuant to which CCM provides certain administrative services to Century Growth Opportunities Fund at the annual rate of 0.10% of the Fund’s average daily net assets.
CCM has entered into a Sub‐Administration Agreement with ALPS Fund Services, Inc. (“ALPS”) pursuant to which ALPS provides certain administrative services to each Fund on behalf of CCM. CCM pays ALPS a sub-administration fee for sub-administration services provided to each Fund.
| 6. DISTRIBUTION AND OTHER FEES |
The Trust has adopted a Distribution and Service Plan (the “Plan”) pursuant to Rule 12b‐1 under the 1940 Act on behalf of Century Small Cap Select Fund. The Plan authorizes the Fund to pay up to 0.25% of the average daily net assets of the Fund’s Investor Shares class for distribution and shareholder services. The Plan may be terminated at any time by the vote of a majority of the independent Trustees or by the vote of the holders of a majority of the outstanding shares of the Investor Shares.
The Trust has entered into agreements with financial intermediaries to provide recordkeeping, processing, shareholder communications and other services to customers of the intermediaries and has agreed to compensate the intermediaries for providing such services. Certain services would be provided by the Funds if the shares of each customer were registered directly with the Funds’ transfer agent. Each Fund pays a portion of the intermediary fees attributable to shares of the Fund not exceeding the estimated expense the Fund would have paid its transfer agent had each customer’s shares been registered directly with the transfer agent instead of held through the intermediary accounts.
| 34 | centuryfunds.com |
| Notes to Financial Statements |
| April 30, 2015 (Unaudited) |
| 7. ADVISER REIMBURSEMENTS |
Century Growth Opportunities Fund: CCM contractually agreed to limit the operating expenses of Century Growth Opportunities Fund to 1.10% of average daily net assets of the Institutional Shares. The agreement will remain in effect through February 28, 2016 and may not be terminated prior to that date without the approval of the Board of Trustees.
For the six months ended April 30, 2015, the fee waivers and/or reimbursements were $10,271.
CCM is permitted to recoup amounts of prior fee reductions or expense reimbursements within thirty-six months after the day on which CCM earned the fee or incurred the expense if the class’s total annual operating expenses have fallen to a level below the lower of the limit described above or any limit then in effect.
As of April 30, 2015, the maximum amounts subject to recoupment by the Fund in each fiscal year, pursuant to the aforementioned conditions are as follows:
| Expires on or before October 31, | |||
| 2015 | 2016 | 2017 | 2018 |
| $19,185 | $21,059 | $3,288 | $10,271 |
| 8. TRUSTEE AND OFFICER FEES |
As of April 30, 2015, there were seven Trustees, six of whom are not “interested persons” (within the meaning of the 1940 Act) of the Trust (the “Independent Trustees”). Each Independent Trustee receives a retainer of $4,000 per calendar quarter from the Trust for his or her services. The chairperson of the Audit Committee receives an additional retainer of $1,125 per calendar quarter; the Lead Independent Trustee receives an additional retainer of $750 per calendar quarter; and the Chairpersons of the Oversight and Governance Committee and Nominating Committee each receive an additional retainer of $375 per calendar quarter. In addition, each Independent Trustee is paid a fee of $5,500 for each meeting of the Board of Trustees attended or participated in, as the case may be. The Independent Trustees are not paid an additional fee from the Trust for attendance at and/or participation in meetings of the various committees of the Board. The Independent Trustees are also reimbursed for meeting‐related expenses. Officers of the Trust and Trustees who are interested persons of the Trust receive no salary or fees from the Trust.
| Semi-Annual Report | April 30, 2015 | 35 |
| Disclosure of Fund Expenses |
| April 30, 2015 (Unaudited) |
As a shareholder of a Fund, you incur two types of costs: direct costs, such as short-term redemption fees and wire fees, and indirect costs, including management fees, and other fund operating expenses. This example is intended to help you understand your indirect costs, also referred to as “ongoing costs” (in dollars), of investing in the Fund and to compare these costs with the ongoing costs of investing in other mutual funds.
This example is based on an investment of $1,000 invested at the beginning of the period and held for the entire period as indicated below.
Actual Expenses The first line of the table below provides information about actual account values and actual expenses. You may use the information in this line, together with the amount you invested at the beginning of the period, to estimate the expenses that you paid over the period. Simply divide your account value by $1,000 (for example, an $8,600 account value divided by $1,000 = 8.6), then multiply the result by the number in the first line under the heading “Expenses Paid During Period” to estimate the expenses you paid on your account during this period.
Hypothetical Example for Comparison Purposes The second line of the table provides information about hypothetical account values and hypothetical expenses based on the Fund’s actual expense ratio and an assumed rate of return of 5% per year before expenses, which is not the Fund’s actual return. The hypothetical account values and expenses may not be used to estimate the actual ending account balance or expenses you paid for the period. You may use this information to compare ongoing costs of investing in the Fund and other funds. To do so, compare this 5% hypothetical example with the 5% hypothetical examples that appear in the shareholder reports of other funds.
Please note that the expenses shown in the table are meant to highlight your ongoing costs only and do not reflect any direct costs, such as wire fees or low balance fees. Therefore, the second line of the table is useful in comparing ongoing costs only and will not help you determine the relative total costs of owning different funds. In addition, if these direct costs were included, your costs would be higher.
Beginning Account Value November 1, 2014 | Ending Account Value April 30, 2015 | Expense Ratio(a) | Expenses Paid During period November 1, 2014 to April 30, 2015(b) | |
| Century Shares Trust | ||||
| Institutional Shares | ||||
| Actual | $1,000.00 | $1,100.20 | 1.10% | $5.73 |
| Hypothetical (5% return before expenses) | $1,000.00 | $1,019.34 | 1.10% | $5.51 |
| Century Small Cap Select Fund | ||||
| Institutional Shares | ||||
| Actual | $1,000.00 | $1,075.00 | 1.16% | $5.97 |
| Hypothetical (5% return before expenses) | $1,000.00 | $1,019.04 | 1.16% | $5.81 |
| Investor Shares | ||||
| Actual | $1,000.00 | $1,073.40 | 1.44% | $7.40 |
| Hypothetical (5% return before expenses) | $1,000.00 | $1,017.65 | 1.44% | $7.20 |
| Century Growth Opportunities Fund | ||||
| Institutional Shares | ||||
| Actual | $1,000.00 | $1,076.10 | 1.10% | $5.66 |
| Hypothetical (5% return before expenses) | $1,000.00 | $1,019.34 | 1.10% | $5.51 |
(a) The Fund’s expense ratios have been based on the Fund’s most recent fiscal half year expenses.
(b) Expenses are equal to the Fund’s annualized expense ratio multiplied by the average account value over the period, multiplied by the number of days in the most recent fiscal half year (181), divided by 365.
| 36 | centuryfunds.com |
| Privacy Policy |
| April 30, 2015 (Unaudited) |
Century Capital Management and the Century Funds are committed to maintaining the confidentiality, integrity and security of your personal information and financial data. We consider this information to be private and held in confidence between you and Century. This is to inform you of our policies to protect the privacy of your nonpublic personal information.
Information We Collect
When you invest in the Century Funds, we collect certain nonpublic personal information about you, which we use to open and service your account and respond to your requests. This information includes your name, address, tax identification number, birth date, investment selection, beneficiary information and possibly personal bank account information. It also includes information about your transactions and account history, as well as information that we may receive from third parties, such as financial advisers, consumer reporting agencies, and consultants.
Disclosure Policy
We do not disclose nonpublic personal information about current or former shareholders or customers to any third parties except as necessary to process a transaction, service an account, or as otherwise permitted by law. For example, the Century Funds use a third party transfer agent who uses your information only to process or analyze transactions that you have requested. Our contracts with such parties contain provisions restricting their use of your nonpublic personal information to those purposes for which they were hired. We do not sell non-public personal information to anyone.
Confidentiality and Security
We restrict access to nonpublic personal information about you to those employees and service providers involved in administering or servicing your account or helping us meet our regulatory obligations. We maintain physical, electronic and procedural safeguards that comply with federal standards to protect your nonpublic personal information.
| Semi‐Annual Report | April 30, 2015 | 37 |
Intentionally Left Blank
Intentionally Left Blank
Fund Information
PORTFOLIO HOLDINGS
Each fund files a complete schedule of its portfolio holdings with the SEC for the first and third quarters of the fund’s fiscal year on Form N-Q. The Forms N-Q are available on the SEC’s website at http://www.sec.gov, and they may be reviewed and copied at the SEC’s Public Reference Room in Washington, DC. Information on the operation of the SEC’s Public Reference Room may be obtained by calling 1-800-SEC-0330.
PROXY VOTING
A description of the policies and procedures that each fund uses to determine how to vote proxies relating to portfolio securities and each fund’s proxy voting record for the 12-month period ended June 30 are available, without charge, upon request, by calling 1-800-321-1928. You may also obtain a copy of the funds’ proxy voting policies and procedures and proxy voting record on the SEC’s website at http://www.sec.gov.
FOR MORE INFORMATION
For more information about the Century Funds, please call 1-800-303-1928.
| Regular Mailing Address: | Overnight Mailing Address: |
| Century Funds | Century Funds |
| P.O. Box 588 | c/o Atlantic Shareholder Services, LLC |
| Portland, ME 04112 | 3 Canal Plaza, Ground Floor |
| Portland, ME 04101 | |
| Investment Adviser | Distributor |
| Century Capital Management, LLC | ALPS Distributors, Inc. |
| 100 Federal Street | 1290 Broadway, Suite 1100 |
| Boston, MA 02110 | Denver, CO 80203 |

Item 2. Code of Ethics.
Not applicable to semi-annual reports.
Item 3. Audit Committee Financial Expert.
Not applicable to semi-annual reports.
Item 4. Principal Accountant Fees and Services.
Not applicable to semi-annual reports.
Item 5. Audit Committee of Listed Registrants.
Not applicable.
Item 6. Investments.
The registrant’s “Schedule I – Investments in securities of unaffiliated issuers” (as set forth in 17 CFR 210.12-12) is included in Item 1 of this Form N-CSR.
| Item 7. | Disclosure of Proxy Voting Policies and Procedures for Closed-End Management Investment Companies. |
Not applicable.
Item 8. Portfolio Managers of Closed-End Management Investment Companies.
Not applicable.
| Item 9. | Purchases of Equity Securities by Closed-End Management Investment Company and Affiliated Purchasers. |
Not applicable.
Item 10. Submission of Matters to a Vote of Security Holders.
There have been no material changes to the procedures by which shareholders may recommend nominees to the Trust’s Board of Trustees since the Trust last provided disclosure as to such procedures in response to the requirements of Item 407(c)(2)(iv) of Regulation S-K (as required by Item 22(b)(15) of Schedule 14A), or this Item.
Item 11. Controls and Procedures.
(a) The registrant’s principal executive officer and principal financial officer, after evaluating the effectiveness of the registrant’s “disclosure controls and procedures” (as defined in the Investment Company Act of 1940 Rule 30-a-2(c) under the Act (17 CFR 270.30a-2(c))) as of a date (the “Evaluation Date”) within 90 days of the filing date of this report, have concluded that, as of the Evaluation Date, the registrant’s disclosure controls and procedures were adequately designed to ensure that the information required to be disclosed by the registrant in this Form N-CSR is recorded, processed, summarized and reported within the time periods specified in the Commission’s rules and forms.
(b) There were no changes in the registrant’s internal control over financial reporting (as defined in Rule 30a-3(d) under the Act (17 CFR 270.30a-3(d))) that occurred during the registrant’s second fiscal quarter of the period covered by this report that has materially affected, or is reasonably likely to materially affect, the registrant’s internal control over financial reporting.
Item 12. Exhibits.
| (a)(1) | Not applicable to semi-annual reports. |
| (a)(2) | Certification pursuant to Rule 30a-2(a) under the Investment Company Act of 1940 (17 CFR 270.30a-2(a)) is filed and attached hereto as Exhibit EX‑99.CERT. |
| (a)(3) | Not applicable. |
| (b) | Certification pursuant to Rule 30a-2(b) under the Investment Company Act of 1940 (17 CFR 270.30a-2(b)) is filed and attached hereto as Exhibit EX‑99.906CERT |
SIGNATURES
Pursuant to the requirements of the Securities Exchange Act of 1934 and the Investment Company Act of 1940, the registrant has duly caused this report to be signed on its behalf by the undersigned, thereunto duly authorized.
Century Capital Management Trust
| By: | /s/ Alexander L. Thorndike | |
| Alexander L. Thorndike, Chairman |
| Date: | July 7, 2015 |
Pursuant to the requirements of the Securities Exchange Act of 1934 and the Investment Company Act of 1940, this report has been signed below by the following persons on behalf of the registrant and in the capacities and on the dates indicated.
| By: | /s/ Alexander L. Thorndike | |
| Alexander L. Thorndike, Principal Executive Officer |
| Date: | July 7, 2015 |
| By: | /s/ Julie Smith | |
| Julie Smith, Principal Financial Officer |
| Date: | July 7, 2015 |