Exhibit (c) (2)
PRELIMINARY DRAFT, CONFIDENTIAL
Project Aurora
Special Committee Discussion Materials
Goldman Sachs (Asia) L.L.C. March 21, 2012
PRELIMINARY DRAFT, CONFIDENTIAL
Disclaimer
Goldman Sachs (Asia) L.L.C. (“GS”) has prepared and provided these materials and GS’s related presentation (the “Confidential Information”) solely for the information and assistance of the Special Committee of the Board of Directors (the “Special Committee”) of Aurora (the “Company”) in connection with its consideration of the matters referred to herein. Without GS’s prior written consent, the Confidential Information may not be circulated or referred to publicly, disclosed to or relied upon by any other person, or used or relied upon for any other purpose. Notwithstanding anything hereinto the contrary, the Company may disclose to any person the US federal income and state income tax treatment and tax structure of any transaction described herein and all materials of any kind (including tax opinions and other tax analyses) that are provided to the Company relating to such tax treatment and tax structure, without GS imposing any limitation of any kind. The Confidential Information, including this disclaimer, is subject to, and governed by, any written agreement between the Company, the Board and/or any committee thereof, on the one hand, and GS, on the other hand.
GS and its affiliates are engaged in investment banking, commercial banking and financial advisory services, securities trading, investment management, principal investment, financial planning, benefits counseling, risk management, hedging, financing, brokerage activities and other financial and non-financial activities and services for various persons and entities. In the ordinary course of these activities and services, GS and its affiliates may at any time make or hold long or short positions and investments, as well as actively trade or effect transactions, in the equity, debt and other securities (or related derivative securities) and financial instruments (including bank loans and other obligations) of third parties, the Company, any other party to any transaction and any of their respective affiliates or any currency or commodity that may be involved in any transaction for their own account and for the accounts of their customers.
The Confidential Information has been prepared and based on information obtained by GS from publicly available sources, the Company’s management and/or other sources. In preparing the Confidential Information, GS has relied upon and assumed, without assuming any responsibility for independent verification, the accuracy and completeness of all of the financial, legal, regulatory, tax, accounting and other information provided to, discussed with or reviewed by GS, and GS does not assume any liability for any such information. GS does not provide accounting, tax, legal or regulatory advice. GS’s role in any due diligence review is limited solely to performing such a review as it shall deem necessary to
support its own advice and analysis and shall not be on behalf of the Company. Analyses based upon forecasts of future results are not necessarily indicative of actual future results, which may be significantly more or less favorable than suggested by these analyses, and GS does not assume responsibility if future results are materially different from those forecast.
GS has not made an independent evaluation or appraisal of the assets and liabilities of the Company or any other person and has no obligation to evaluate the solvency of the Company or any person under any law. The analyses in the Confidential Information are not appraisals nor do they necessarily reflect the prices at which businesses or securities actually may be sold or purchased. The Confidential Information does not address the underlying business decision of the Company to engage in any transaction, or the relative merits of any strategic alternative referred to herein as compared to any other alternative that may be available to the Company. The Confidential Information is necessarily based on economic, monetary, market and other conditions as in effect on, and the information made available to GS as of, the date of such Confidential Information and GS assumes no responsibility for updating or revising the Confidential Information.
PRELIMINARY DRAFT, CONFIDENTIAL
Table of Contents
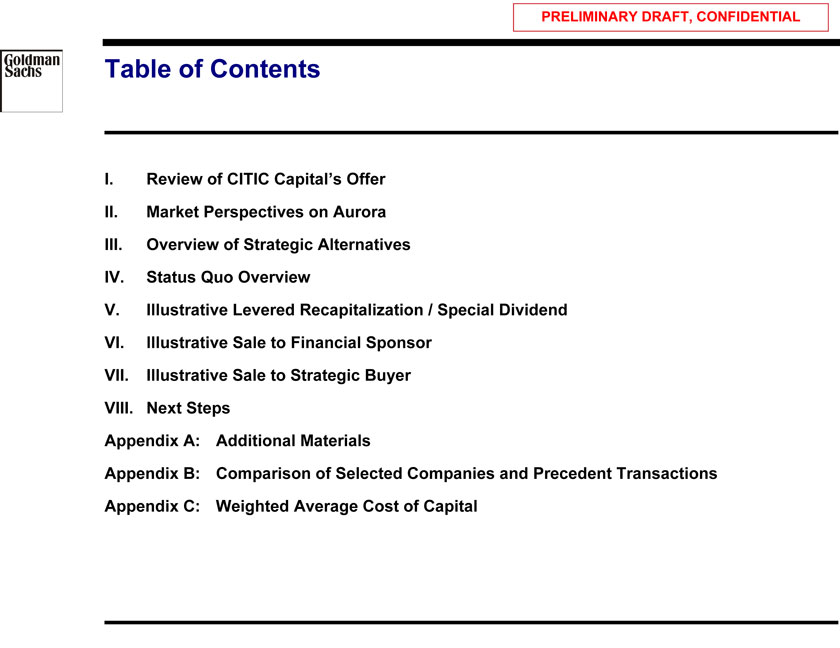
I. Review of CITIC Capital’s Offer II. Market Perspectives on Aurora III. Overview of Strategic Alternatives IV. Status Quo Overview
V. Illustrative Levered Recapitalization / Special Dividend VI. lllustrative Sale to Financial Sponsor VII. Illustrative Sale to Strategic Buyer VIII. Next Steps Appendix A: Additional Materials
Appendix B: Comparison of Selected Companies and Precedent Transactions Appendix C: Weighted Average Cost of Capital
PRELIMINARY DRAFT, CONFIDENTIAL
I. Review of CITIC Capital’s Offer
Review of CITIC Capital’s Offer 1
PRELIMINARY DRAFT, CONFIDENTIAL
Key Terms of CITIC Capital’s Offer
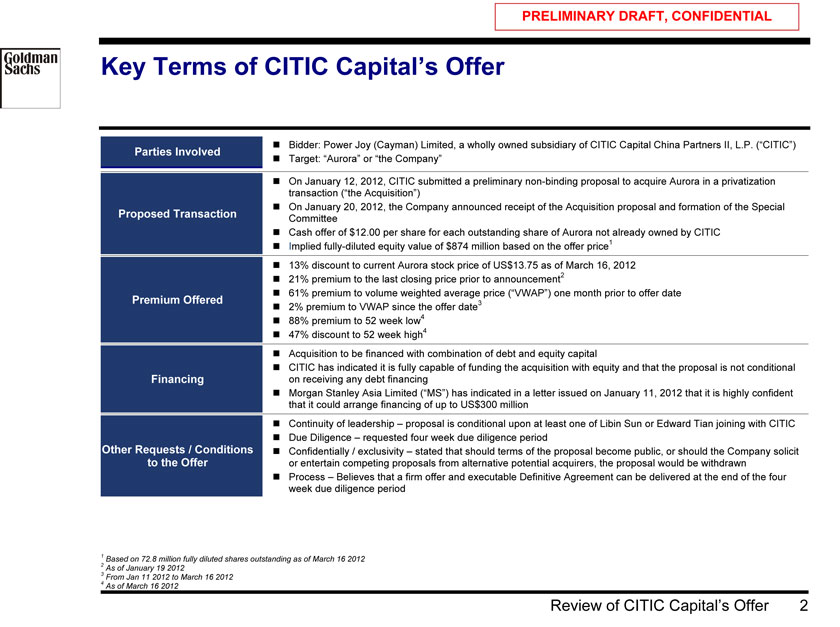
? Bidder: Power Joy (Cayman) Limited, a wholly owned subsidiary of CITIC Capital China Partners II, L.P. (“CITIC”)
Parties Involved
? Target: “Aurora” or “the Company”
? On January 12, 2012, CITIC submitted a preliminary non-binding proposal to acquire Aurora in a privatization transaction (“the Acquisition”) ? On January 20, 2012, the Company announced receipt of the Acquisition proposal and formation of the Special
Proposed Transaction Committee
? Cash offer of $12.00 per share for each outstanding share of Aurora not already owned by CITIC ? Implied fully-diluted equity value of $874 million based on the offer price1 ? 13% discount to current Aurora stock price of US$13.75 as of March 16, 2012 ? 21% premium to the last closing price prior to announcement2 ? 61% premium to volume weighted average price (“VWAP”) one month prior to offer date
Premium Offered 3
? 2% premium to VWAP since the offer date ? 88% premium to 52 week low4 ? 47% discount to 52 week high4
? Acquisition to be financed with combination of debt and equity capital
? CITIC has indicated it is fully capable of funding the acquisition with equity and that the proposal is not conditional Financing on receiving any debt financing ? Morgan Stanley Asia Limited (“MS”) has indicated in a letter issued on January 11, 2012 that it is highly confident that it could arrange financing of up to US$300 million ? Continuity of leadership – proposal is conditional upon at least one of Libin Sun or Edward Tian joining with CITIC
? Due Diligence – requested four week due diligence period
Other Requests / Conditions ? Confidentially / exclusivity – stated that should terms of the proposal become public, or should the Company solicit to the Offer or entertain competing proposals from alternative potential acquirers, the proposal would be withdrawn ? Process – Believes that a firm offer and executable Definitive Agreement can be delivered at the end of the four week due diligence period
2 | | Based on 72.8 million fully diluted shares outstanding as of March 16 2012 |
4 | | From Jan 11 2012 to March 16 2012 As of March 16 2012 |
Review of CITIC Capital’s Offer 2
PRELIMINARY DRAFT, CONFIDENTIAL
Illustrative Offer Price Premium and Multiples
($ in millions, except per share amounts)
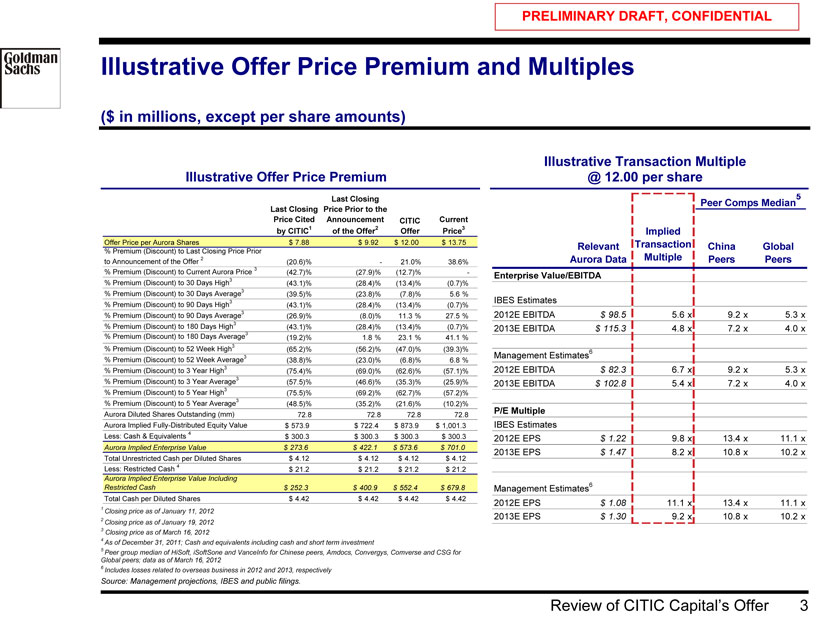
Illustrative Transaction Multiple Illustrative Offer Price Premium @ 12.00 per share
Last Closing 5
Peer Comps Median
Last Closing Price Prior to the
Price Cited Announcement CITIC Current by CITIC1 of the Offer2 Offer Price3 Implied
Offer Price per Aurora Shares $ 7.88 $ 9.92 $ 12.00 $ 13.75 Relevant Transaction China Global
% Premium (Discount) to Last Closing Price Prior to Announcement of the Offer 2 (20.6)% —21.0% 38.6% Aurora Data Multiple Peers Peers
% Premium (Discount) to Current Aurora Price 3 (42.7)% (27.9)% (12.7)% —Enterprise Value/EBITDA
% Premium (Discount) to 30 Days High3 (43.1)% (28.4)% (13.4)% (0.7)%
% Premium (Discount) to 30 Days Average3 (39.5)% (23.8)% (7.8)% 5.6 %
% Premium (Discount) to 90 Days High (43.1)% (28.4)% (13.4)% (0.7)%
% Premium (Discount) to 90 Days Average3 (26.9)% (8.0)% 11.3 % 27.5 % 2012E EBITDA $98.5 5.6 x 9.2 x 5.3 x
% Premium (Discount) to 180 Days High3 (43.1)% (28.4)% (13.4)% (0.7)%
2013E EBITDA $115.3 4.8 x 7.2 x 4.0 x
% Premium (Discount) to 180 Days Average3
(19.2)% 1.8 % 23.1 % 41.1 %
% Premium (Discount) to 52 Week High3 (65.2)% (56.2)% (47.0)% (39.3)%
% Premium (Discount) to 52 Week Average (38.8)% (23.0)% (6.8)% 6.8 %
% Premium (Discount) to 3 Year High3 (75.4)% (69.0)% (62.6)% (57.1)% 2012E EBITDA $82.3 6.7 x 9.2 x 5.3 x
% Premium (Discount) to 3 Year Average3 (57.5)% (46.6)% (35.3)% (25.9)%
3 | | 2013E EBITDA $102.8 5.4 x 7.2 x 4.0 x |
% Premium (Discount) to 5 Year High (75.5)% (69.2)% (62.7)% (57.2)%
% Premium (Discount) to 5 Year Average3 (48.5)% (35.2)% (21.6)% (10.2)%
Aurora Diluted Shares Outstanding (mm) P/E Multiple
72.8 72.8 72.8 72.8
Aurora Implied Fully-Distributed Equity Value $ 573.9 $ 722.4 $ 873.9 $ 1,001.3 IBES Estimates Less: Cash & Equivalents 4 $ 300.3 $ 300.3 $ 300.3 $ 300.3
2012E EPS $1.22 9.8 x 13.4 x 11.1 x
Aurora Implied Enterprise Value $ 273.6 $ 422.1 $ 573.6 $ 701.0
2013E EPS $1.47 8.2 x 10.8 x 10.2 x
Total Unrestricted Cash per Diluted Shares $ 4.12 $ 4.12 $ 4.12 $ 4.12 Less: Restricted Cash 4 $ 21.2 $ 21.2 $ 21.2 $ 21.2
Aurora Implied Enterprise Value Including 6 Restricted Cash $ 252.3 $ 400.9 $ 552.4 $ 679.8 Management Estimates
Total Cash per Diluted Shares $ 4.42 $ 4.42 $ 4.42 $ 4.42 2012E EPS $1.08 11.1 x 13.4 x 11.1 x
1 | | Closing price as of January 11, 2012 |
2 | | 2013E EPS $1.30 9.2 x 10.8 x 10.2 x |
Closing price as of January 19, 2012
3 | | Closing price as of March 16, 2012 |
4 | | As of December 31, 2011; Cash and equivalents including cash and short term investment |
5 Peer group median of HiSoft, iSoftSone and VanceInfo for Chinese peers, Amdocs, Convergys, Comverse and CSG for Global peers; data as of March 16, 2012
6 | | Includes losses related to overseas business in 2012 and 2013, respectively |
Source: Management projections, IBES and public filings.
Review of CITIC Capital’s Offer 3
PRELIMINARY DRAFT, CONFIDENTIAL
II. Market Perspectives on Aurora
Market Perspectives on Aurora 4
PRELIMINARY DRAFT, CONFIDENTIAL
Situation Assessment
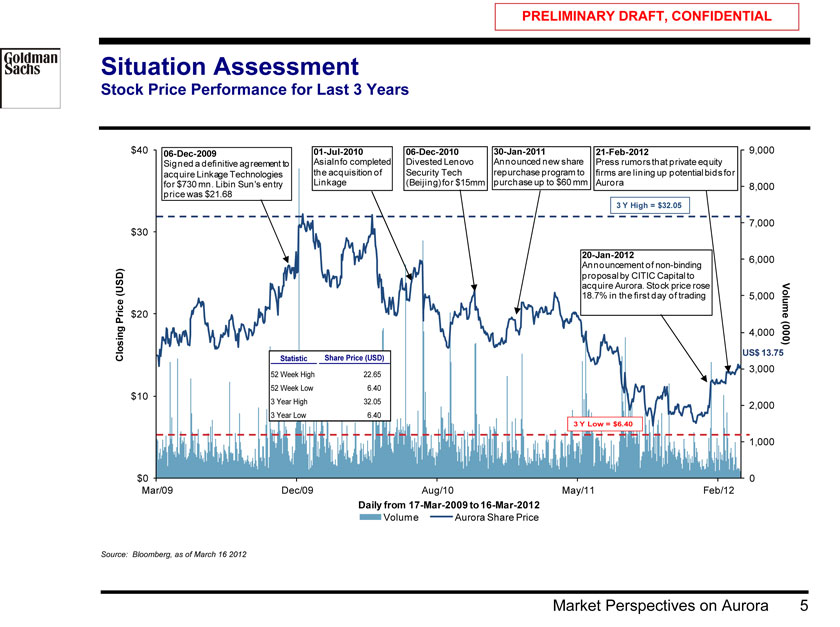
Stock Price Performance for Last 3 Years
$40 06-Dec-2009 01-Jul-2010 06-Dec-2010 30-Jan-2011 21-Feb-2012 9,000
Signed a definitive agreement to AsiaInfo completed Divested Lenovo Announced new share Press rumors that private equity acquire Linkage Technologies the acquisition of Security Tech repurchase program to firms are lining up potential bids for for $730 mn. Libin Sun’s entry Linkage (Beijing) for $15mm purchase up to $60 mm Aurora 8,000 price was $21.68
$30 7,000
20-Jan-2012 6,000
Announcement of non-binding proposal by CITIC Capital to (USD) acquire Aurora. Stock price rose
18.7% in the first day of trading 5,000
$20 Volume Price
4,000 (000)
US$ 13.75
Closing Statistic Share Price (USD)
3,000
52 Week High 22.65
$10 52 Week Low 6.40
1,000
$0 0 Mar/09 Dec/09 Aug/10 May/11 Feb/12
Daily from 17-Mar-2009 to 16-Mar-2012
Volume Aurora Share Price
Source: Bloomberg, as of March 16 2012
Market Perspectives on Aurora 5
PRELIMINARY DRAFT, CONFIDENTIAL
Situation Assessment
Recent Trading Performance
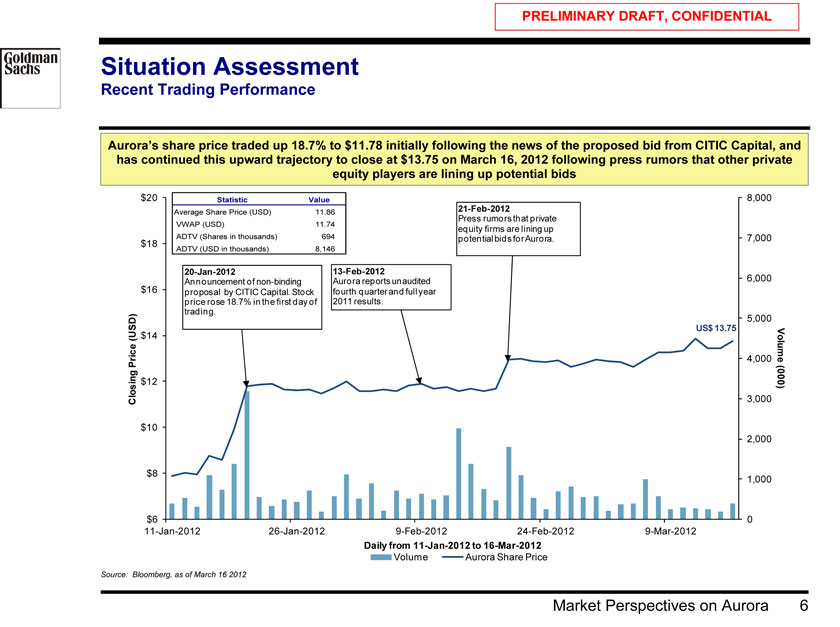
Aurora’s share price traded up 18.7% to $11.78 initially following the news of the proposed bid from CITIC Capital, and has continued this upward trajectory to close at $13.75 on March 16, 2012 following press rumors that other private equity players are lining up potential bids
$20 Statistic Value 8,000
Average Share Price (USD) 11.86 21-Feb-2012
Press rumors that private
VWAP (USD) 11.74 equity firms are lining up
ADTV (Shares in thousands) 694 potential bids for Aurora. 7,000 $18
ADTV (USD in thousands) 8,146
20-Jan-2012 13-Feb-2012
Announcement of non-binding Aurora reports unaudited 6,000 $16 proposal by CITIC Capital. Stock fourth quarter and full year price rose 18.7% in the first day of 2011 results. trading.
5,000
US$ 13.75
(USD) $14
4,000 Volume Price
$12 (000) Closing 3,000 $10 2,000
$8
1,000
$6 0
11-Jan-2012 26-Jan-2012 9-Feb-2012 24-Feb-2012 9-Mar-2012
Daily from 11-Jan-2012 to 16-Mar-2012
Volume Aurora Share Price
Source: Bloomberg, as of March 16 2012
Market Perspectives on Aurora 6
PRELIMINARY DRAFT, CONFIDENTIAL
Situation Assessment
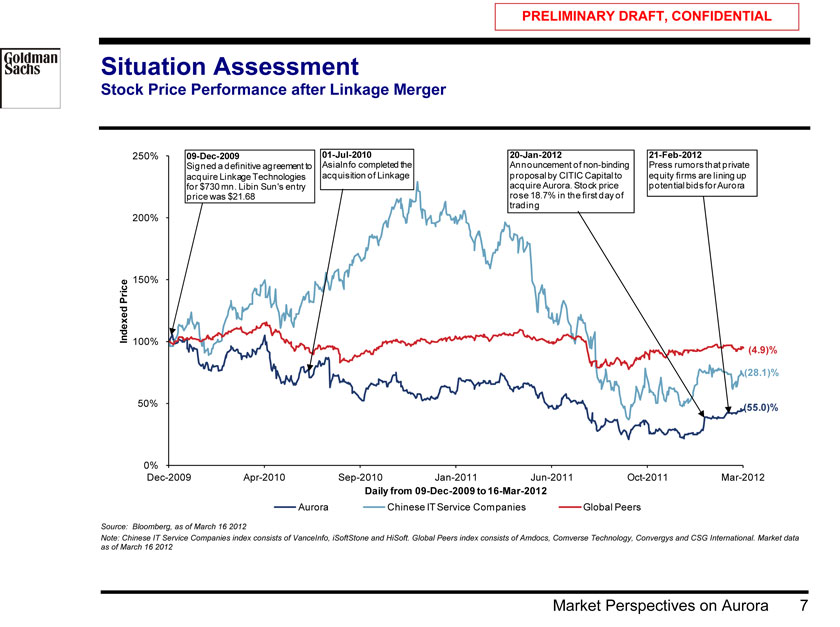
Stock Price Performance after Linkage Merger
250% 09-Dec-2009 01-Jul-2010 20-Jan-2012 21-Feb-2012
Signed a definitive agreement to AsiaInfo completed the Announcement of non-binding Press rumors that private acquire Linkage Technologies acquisition of Linkage proposal by CITIC Capital to equity firms are lining up for $730 mn. Libin Sun’s entry acquire Aurora. Stock price potential bids for Aurora price was $21.68 rose 18.7% in the first day of trading
200%
150%
Price Indexed 100%
(4.9)% (28.1)%
50% (55.0)%
0%
Dec-2009 Apr-2010 Sep-2010 Jan-2011 Jun-2011 Oct-2011 Mar-2012
Daily from 09-Dec-2009 to 16-Mar-2012
Aurora Chinese IT Service Companies Global Peers
Source: Bloomberg, as of March 16 2012
Note: Chinese IT Service Companies index consists of VanceInfo, iSoftStone and HiSoft. Global Peers index consists of Amdocs, Comverse Technology, Convergys and CSG International. Market data as of March 16 2012
Market Perspectives on Aurora 7
PRELIMINARY DRAFT, CONFIDENTIAL
Comparable Trading Multiples
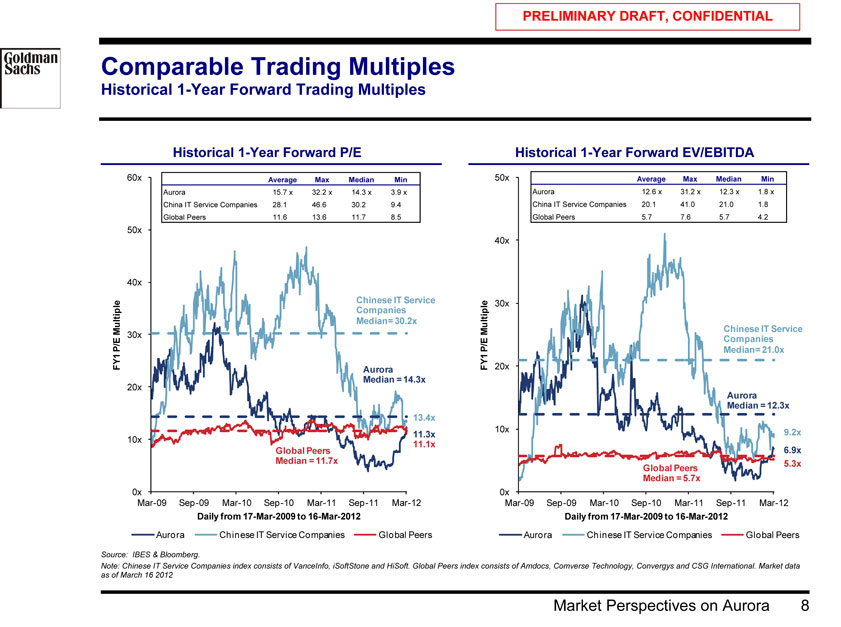
Historical 1-Year Forward Trading Multiples
Historical 1-Year Forward P/E Historical 1-Year Forward EV/EBITDA
60x Average Max Median Min 50x Average Max Median Min
Aurora 15.7 x 32.2 x 14.3 x 3.9 x Aurora 12.6 x 31.2 x 12.3 x 1.8 x
China IT Service Companies 28.1 46.6 30.2 9.4 China IT Service Companies 20.1 41.0 21.0 1.8
Global Peers 11.6 13.6 11.7 8.5 Global Peers 5.7 7.6 5.7 4.2
50x
40x
40x
Chinese IT Service 30x Companies
Multiple Median= 30.2x Multiple Chinese IT Service P/E 30x P/E Companies Median= 21.0x FY1 Aurora FY1 20x 20x Median = 14.3x Aurora Median = 12.3x
13.4x
10x 9.2x
11.3x
10x
11.1x
Global Peers 6.9x Median = 11.7x 5.3x Global Peers Median = 5.7x
0x 0x
Mar-09 Sep-09 Mar-10 Sep-10 Mar-11 Sep-11 Mar-12 Mar-09 Sep-09 Mar-10 Sep-10 Mar-11 Sep-11 Mar-12
Daily from 17-Mar-2009 to 16-Mar-2012 Daily from 17-Mar-2009 to 16-Mar-2012
Aurora Chinese IT Service Companies Global Peers Aurora Chinese IT Service Companies Global Peers
Source: IBES & Bloomberg.
Note: Chinese IT Service Companies index consists of VanceInfo, iSoftStone and HiSoft. Global Peers index consists of Amdocs, Comverse Technology, Convergys and CSG International. Market data as of March 16 2012
Market Perspectives on Aurora 8
PRELIMINARY DRAFT, CONFIDENTIAL
Historical Trading Performance Analysis
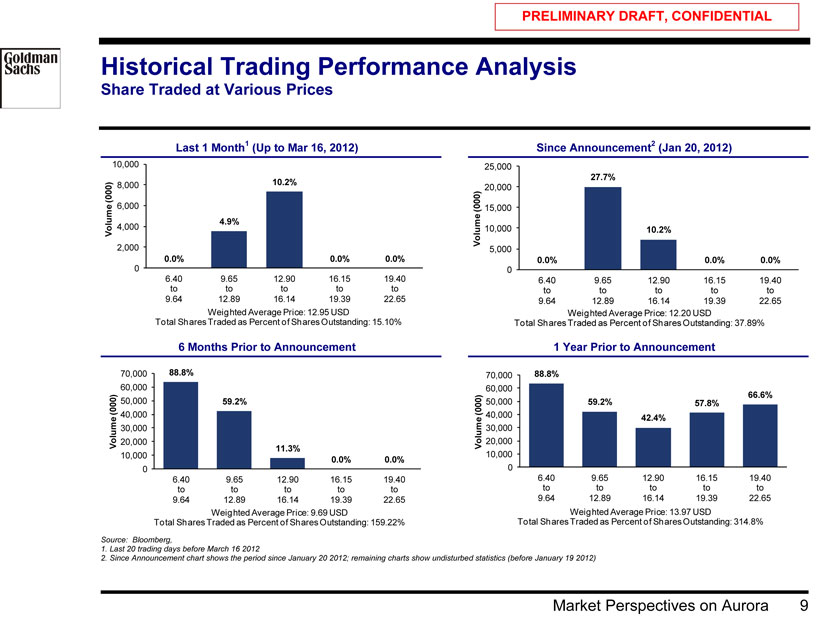
Share Traded at Various Prices
Last 1 Month1 (Up to Mar 16, 2012) Since Announcement2 (Jan 20, 2012)
10,000 25,000
27.7%
8,000 10.2%
(000) 20,000 6,000 (000) 15,000
4.9%
Volume 4,000 Volume 10,000 10.2%
2,000 5,000
0.0% 0.0% 0.0% 0.0% 0.0% 0.0%
0 0
6.40 9.65 12.90 16.15 19.40 6.40 9.65 12.90 16.15 19.40 to to to to to to to to to to
9.64 12.89 16.14 19.39 22.65 9.64 12.89 16.14 19.39 22.65
Weighted Average Price: 12.95 USD Weighted Average Price: 12.20 USD
Total Shares Traded as Percent of Shares Outstanding: 15.10% Total Shares Traded as Percent of Shares Outstanding: 37.89%
6 | | Months Prior to Announcement 1 Year Prior to Announcement |
70,000 88.8% 70,000 88.8%
60,000 60,000 66.6% (000) 50,000 59.2% (000) 50,000 59.2% 57.8% 40,000 40,000 42.4% 30,000 30,000
Volume 20,000 Volume 20,000
11.3%
10,000 10,000
0.0% 0.0% 0 0
6.40 9.65 12.90 16.15 19.40 6.40 9.65 12.90 16.15 19.40 to to to to to to to to to to
9.64 12.89 16.14 19.39 22.65 9.64 12.89 16.14 19.39 22.65 Weighted Average Price: 9.69 USD Weighted Average Price: 13.97 USD
Total Shares Traded as Percent of Shares Outstanding: 159.22% Total Shares Traded as Percent of Shares Outstanding: 314.8%
Source: Bloomberg,
1. Last 20 trading days before March 16 2012
2. Since Announcement chart shows the period since January 20 2012; remaining charts show undisturbed statistics (before January 19 2012)
Market Perspectives on Aurora 9
PRELIMINARY DRAFT, CONFIDENTIAL
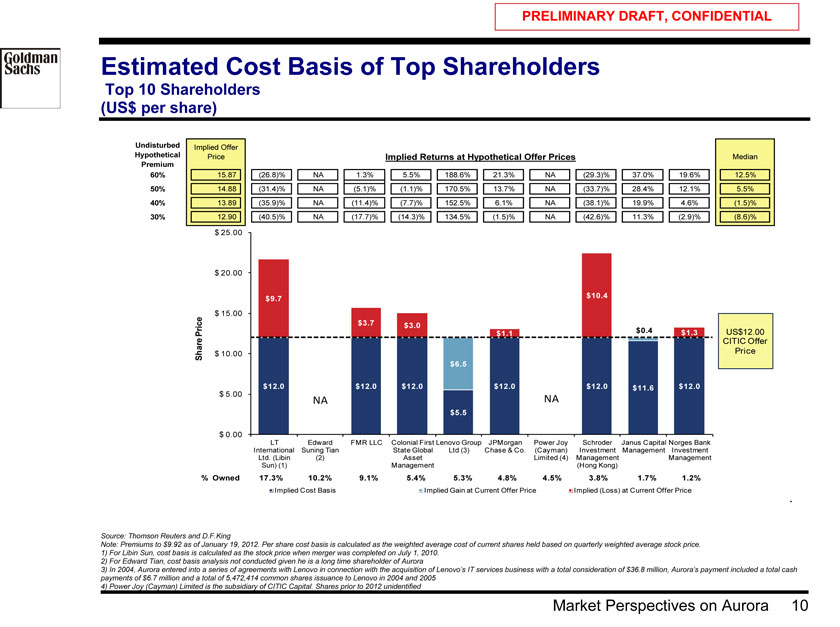
Estimated Cost Basis of Top Shareholders
Top 10 Shareholders (US$ per share)
Undisturbed Implied Offer
Hypothetical Price Implied Returns at Hypothetical Offer Prices Median
Premium
60% 15.87 (26.8)% NA 1.3% 5.5% 188.6% 21.3% NA (29.3)% 37.0% 19.6% 12.5% 50% 14.88 (31.4)% NA (5.1)% (1.1)% 170.5% 13.7% NA (33.7)% 28.4% 12.1% 5.5% 40% 13.89 (35.9)% NA (11.4)% (7.7)% 152.5% 6.1% NA (38.1)% 19.9% 4.6% (1.5)% 30% 12.90 (40.5)% NA (17.7)% (14.3)% 134.5% (1.5)% NA (42.6)% 11.3% (2.9)% (8.6)%
$ 25.00
$ 20.00
$9.7 $10.4
$ 15.00
$3.7 $3.0
Price $1.1 $0.4 $1.3 US$12.00
CITIC Offer
Share $ 10.00 Price
$6.5
$12.0 $12.0 $12.0 $12.0 $12.0 $11.6 $12.0 $ 5.00
NA NA
$0.0
$5.5
$ 0.00
LT Edward FMR LLC Colonial First Lenovo Group JPMorgan Power Joy Schroder Janus Capital Norges Bank International Suning Tian State Global Ltd (3) Chase & Co. (Cayman) Investment Management Investment Ltd. (Libin (2) Asset Limited (4) Management Management Sun) (1) Management (Hong Kong)
% Owned 17.3% 10.2% 9.1% 5.4% 5.3% 4.8% 4.5% 3.8% 1.7% 1.2%
Implied Cost Basis Implied Gain at Current Offer Price Implied (Loss) at Current Offer Price
.
Source: Thomson Reuters and D.F.King
Note: Premiums to $9.92 as of January 19, 2012. Per share cost basis is calculated as the weighted average cost of current shares held based on quarterly weighted average stock price.
1) For Libin Sun, cost basis is calculated as the stock price when merger was completed on July 1, 2010.
2) For Edward Tian, cost basis analysis not conducted given he is a long time shareholder of Aurora
3) In 2004, Aurora entered into a series of agreements with Lenovo in connection with the acquisition of Lenovo’s IT services business with a total consideration of $36.8 million, Aurora’s payment included a total cash payments of $6.7 million and a total of 5,472,414 common shares issuance to Lenovo in 2004 and 2005
4) Power Joy (Cayman) Limited is the subsidiary of CITIC Capital. Shares prior to 2012 unidentified
Market Perspectives on Aurora 10
PRELIMINARY DRAFT, CONFIDENTIAL
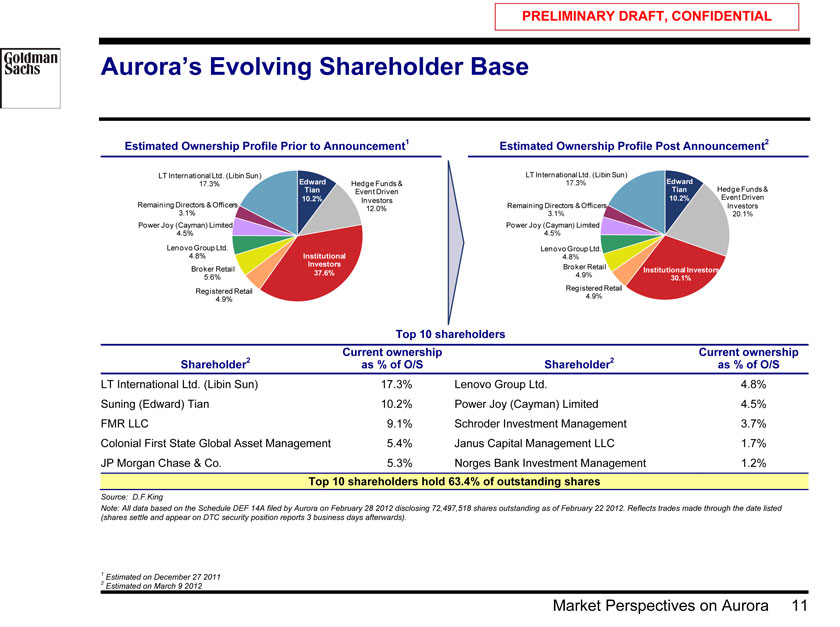
Aurora’s Evolving Shareholder Base
Estimated Ownership Profile Prior to Announcement1 Estimated Ownership Profile Post Announcement2
LT International Ltd. (Libin Sun) Edward LT International Ltd. (Libin Sun) Edward
17.3% Tian Hedge Funds & 17.3% Tian Hedge Funds & Event Driven
10.2% Investors 10.2% Event Driven Remaining Directors & Officers Remaining Directors & Officers Investors
12.0%
3.1% 3.1% 20.1%
Power Joy (Cayman) Limited Power Joy (Cayman) Limited
4.5% 4.5%
Lenovo Group Ltd. Lenovo Group Ltd.
4.8% Institutional 4.8%
Investors Broker Retail
Broker Retail Institutional Investors
37.6% 4.9%
5.6% 30.1%
Registered Retail Registered Retail
4.9% 4.9%
Top 10 shareholders
2 | | Current ownership 2 Current ownership Shareholder as % of O/S Shareholder as % of O/S |
LT International Ltd. (Libin Sun) 17.3% Lenovo Group Ltd. 4.8% Suning (Edward) Tian 10.2% Power Joy (Cayman) Limited 4.5% FMR LLC 9.1% Schroder Investment Management 3.7% Colonial First State Global Asset Management 5.4% Janus Capital Management LLC 1.7% JP Morgan Chase & Co. 5.3% Norges Bank Investment Management 1.2%
Top 10 shareholders hold 63.4% of outstanding shares
Source: D.F.King
Note: All data based on the Schedule DEF 14A filed by Aurora on February 28 2012 disclosing 72,497,518 shares outstanding as of February 22 2012. Reflects trades made through the date listed (shares settle and appear on DTC security position reports 3 business days afterwards).
1 | | Estimated on December 27 2011 |
2 | | Estimated on March 9 2012 |
Market Perspectives on Aurora 11
PRELIMINARY DRAFT, CONFIDENTIAL
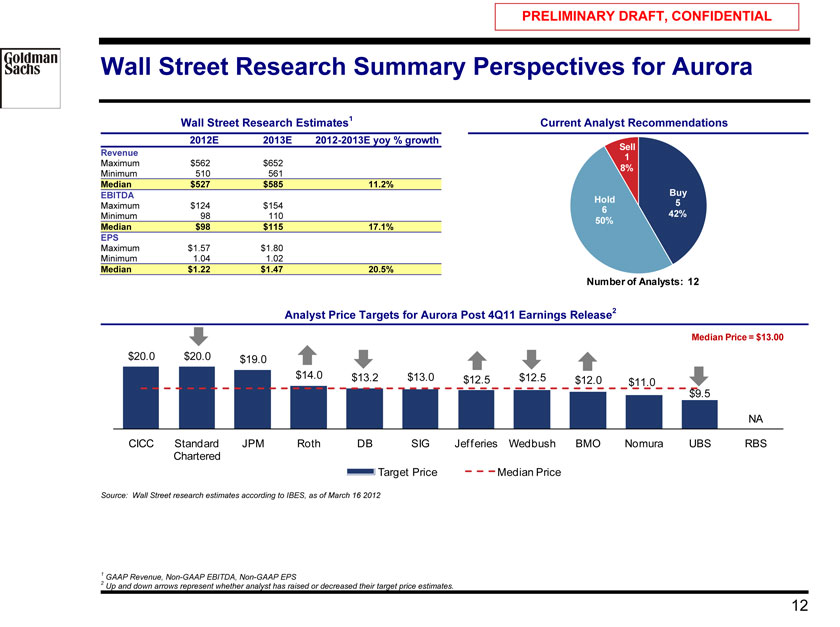
Wall Street Research Summary Perspectives for Aurora
Wall Street Research Estimates1 Current Analyst Recommendations
2012E 2013E 2012-2013E yoy % growth
Sell
Revenue 1
Maximum $562 $652
8%
Minimum 510 561
Median $527 $585 11.2% Buy EBITDA
Hold 5
Maximum $124 $154 6 42% Minimum 98 110
50%
Median $98 $115 17.1% EPS
Maximum $1.57 $1.80 Minimum 1.04 1.02
Median $1.22 $1.47 20.5%
Number of Analysts: 12
Analyst Price Targets for Aurora Post 4Q11 Earnings Release2
Median Price = $13.00
$20.0 $20.0 $19.0
$14.0 $13.2 $13.0 $12.5 $12.5
$12.0 $11.0 $9.5
NA
CICC Standard JPM Roth DB SIG Jefferies Wedbush BMO Nomura UBS RBS Chartered Target Price Median Price
Source: Wall Street research estimates according to IBES, as of March 16 2012
2 | | GAAP Revenue, Non-GAAP EBITDA, Non-GAAP EPS |
Up and down arrows represent whether analyst has raised or decreased their target price estimates.
12
PRELIMINARY DRAFT, CONFIDENTIAL
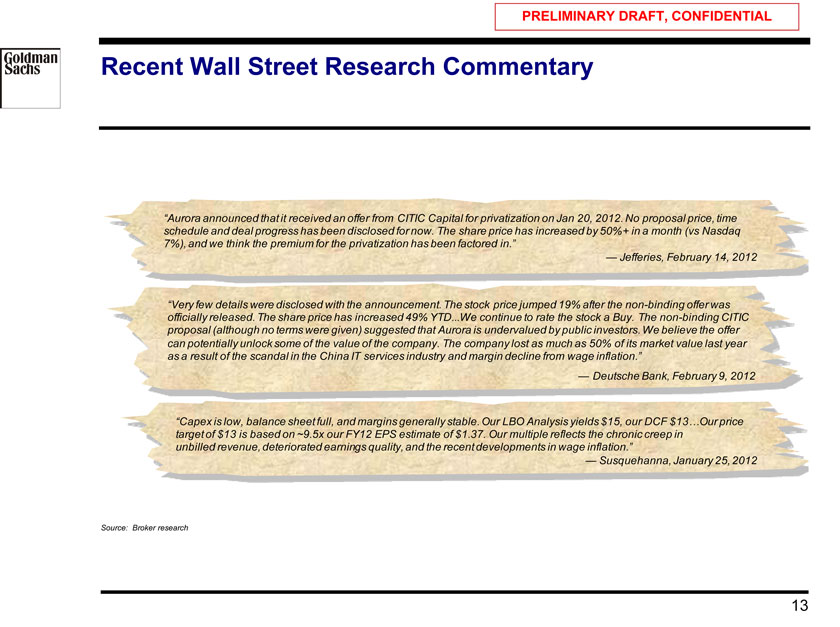
Recent Wall Street Research Commentary
“Aurora announced that it received an offer from CITIC Capital for privatization on Jan 20, 2012. No proposal price, time schedule and deal progress has been disclosed for now. The share price has increased by 50%+ in a month (vs Nasdaq 7%), and we think the premium for the privatization has been factored in.”
— Jefferies, February 14, 2012
“Very few details were disclosed with the announcement. The stock price jumped 19% after the non-binding offer was officially released. The share price has increased 49% YTD.We continue to rate the stock a Buy. The non-binding CITIC proposal (although no terms were given) suggested that Aurora is undervalued by public investors. We believe the offer can potentially unlock some of the value of the company. The company lost as much as 50% of its market value last year as a result of the scandal in the China IT services industry and margin decline from wage inflation.”
— Deutsche Bank, February 9, 2012
“Capex is low, balance sheet full, and margins generally stable. Our LBO Analysis yields $15, our DCF $13…Our price target of $13 is based on ~9.5x our FY12 EPS estimate of $1.37. Our multiple reflects the chronic creep in unbilled revenue, deteriorated earnings quality, and the recent developments in wage inflation.”
— Susquehanna, January 25, 2012
Source: Broker research
13
PRELIMINARY DRAFT, CONFIDENTIAL
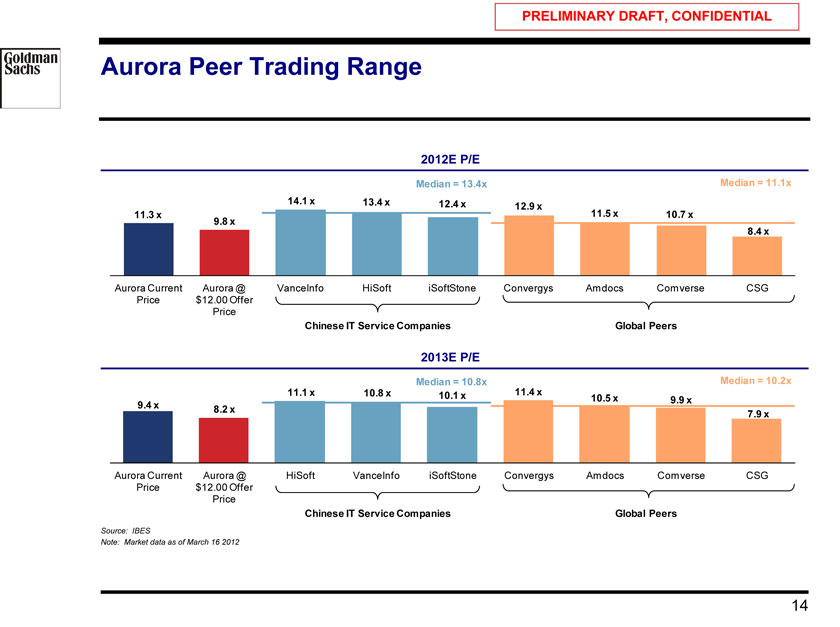
Aurora Peer Trading Range
2012E P/E
Median = 13.4x Median = 11.1x
14.1 x 13.4 x 12.4 x
12.9 x
11.3 x 11.5 x 10.7 x
9.8 x
8.4 x
Aurora Current Aurora @ VanceInfo HiSoft iSoftStone Convergys Amdocs Comverse CSG Price $12.00 Offer Price
Chinese IT Service Companies Global Peers
2013E P/E
Median = 10.8x Median = 10.2x
11.1 x 10.8 x 10.1 x 11.4 x
10.5 x 9.9 x
9.4 x 8.2 x 7.9 x
Aurora Current Aurora @ HiSoft VanceInfo iSoftStone Convergys Amdocs Comverse CSG Price $12.00 Offer Price
Chinese IT Service Companies Global Peers
Source: IBES
Note: Market data as of March 16 2012
14
PRELIMINARY DRAFT, CONFIDENTIAL
III. Overview of Strategic Alternatives
Overview of Strategic Alternatives 15
PRELIMINARY DRAFT, CONFIDENTIAL
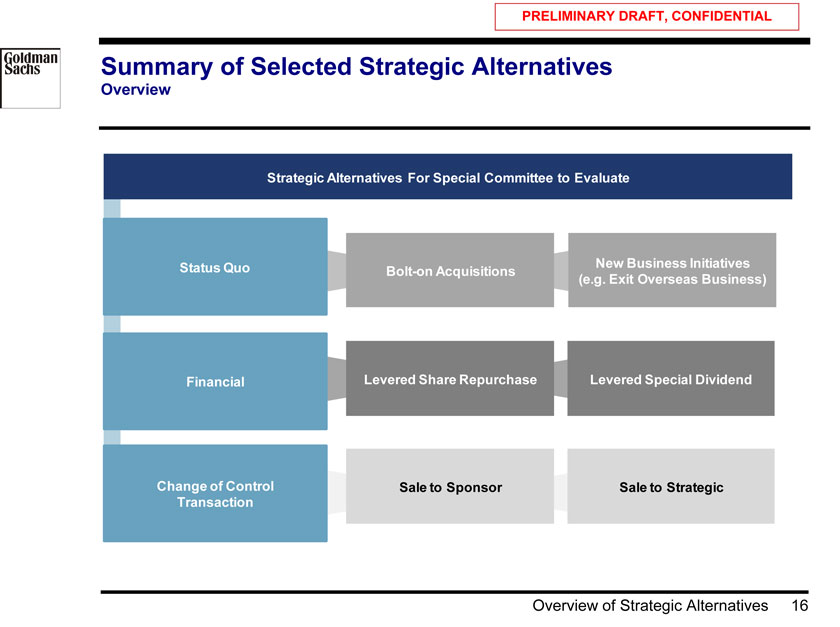
Summary of Selected Strategic Alternatives
Overview
Strategic Alternatives For Special Committee to Evaluate
Status Quo New Business Initiatives Bolt-on Acquisitions
(e.g. Exit Overseas Business) Financial Levered Share Repurchase Levered Special Dividend
Change of Control Sale to Sponsor Sale to Strategic Transaction
Overview of Strategic Alternatives 16
PRELIMINARY DRAFT, CONFIDENTIAL
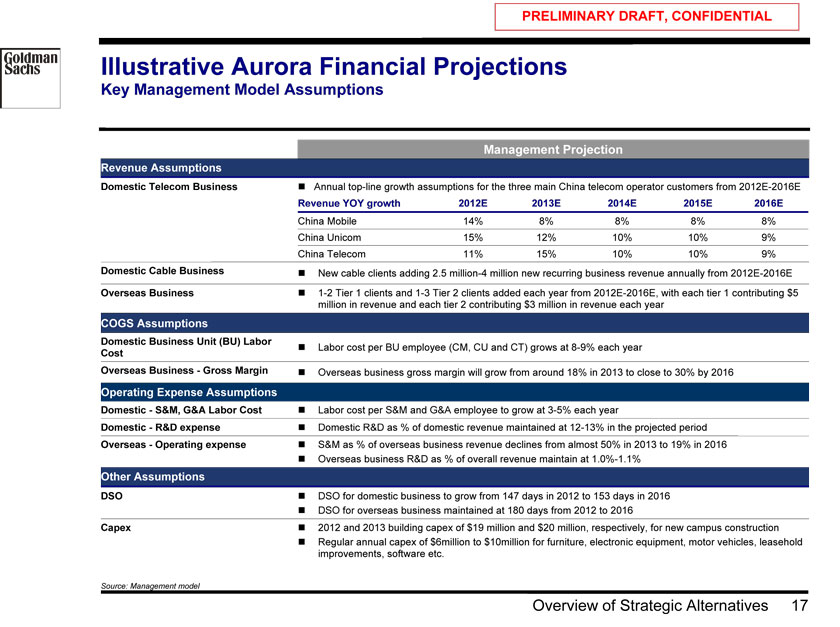
Illustrative Aurora Financial Projections
Key Management Model Assumptions
Management Projection
Revenue Assumptions
Domestic Telecom Business ? Annual top-line growth assumptions for the three main China telecom operator customers from 2012E-2016E
Revenue YOY growth 2012E 2013E 2014E 2015E 2016E
China Mobile 14% 8% 8% 8% 8% China Unicom 15% 12% 10% 10% 9% China Telecom 11% 15% 10% 10% 9% Domestic Cable Business ? New cable clients adding 2.5 million-4 million new recurring business revenue annually from 2012E-2016E Overseas Business ? 1-2 Tier 1 clients and 1-3 Tier 2 clients added each year from 2012E-2016E, with each tier 1 contributing $5 million in revenue and each tier 2 contributing $3 million in revenue each year
COGS Assumptions
Domestic Business Unit (BU) Labor
? Labor cost per BU employee (CM, CU and CT) grows at 8-9% each year
Cost
Overseas Business—Gross Margin ? Overseas business gross margin will grow from around 18% in 2013 to close to 30% by 2016
Operating Expense Assumptions
Domestic—S&M, G&A Labor Cost ? Labor cost per S&M and G&A employee to grow at 3-5% each year
Domestic—R&D expense ? Domestic R&D as % of domestic revenue maintained at 12-13% in the projected period Overseas—Operating expense ? S&M as % of overseas business revenue declines from almost 50% in 2013 to 19% in 2016 ? Overseas business R&D as % of overall revenue maintain at 1.0%-1.1%
Other Assumptions
DSO ? DSO for domestic business to grow from 147 days in 2012 to 153 days in 2016 ? DSO for overseas business maintained at 180 days from 2012 to 2016
Capex ? 2012 and 2013 building capex of $19 million and $20 million, respectively, for new campus construction ? Regular annual capex of $6million to $10million for furniture, electronic equipment, motor vehicles, leasehold improvements, software etc.
Source: Management model
Overview of Strategic Alternatives 17
PRELIMINARY DRAFT, CONFIDENTIAL
Summary of Aurora Financial Projections
Projected Management Model ($ in millions)
Net Revenue EBITDA (Non-GAAP)
11A-16E CAGR : 12.0% 11A-16E CAGR : 10.8%
15.7%
12.2% 21.4% 19.9% 20.3%
13.9% 11.3% 10.8% 10.0% 19.0%
17.1%
15.3% $166.0 $741.7 $815.9 $147.9 $669.4 $127.4 $601.7 $99.4 $102.8 $536.5 $463.8 $82.3
2011A 2012E 2013E 2014E 2015E 2016E 2011A 1 2012E 2013E 2014E 2015E 2016E Net Revenue YoY Growth EBITDA (Non-GAAP) EBITDA Margin
Fully Diluted EPS2 ($ USD) Free Cash Flow 3
11A-16E CAGR : 9.2% 11A-16E CAGR : 19.0%
12.6% 12.9%
11.5% $1.80 $2.00 $105.2 $1.56 9.5% $1.34 $93.3 $1.30 6.9%
$76.7 $1.08 5.4%
$44.0 $41.4
$29.2
2011A 1 2012E 2013E 2014E 2015E 2016E
Fully Diluted EPS 2011A 2012E 2013E 2014E 2015E 2016E FCF FCF as % of Net Revenue
Source: 1 Management model
2 Use Normalized EBITDA and Net Income for 2011. Normalized 2011 financials exclude the impact of one-time items related to the Linkage acquisition (e.g., accrued salaries, taxes, etc.)
3 | | Use Normalized non-GAAP net income divided by fully diluted share of 72.8mm |
Free Cash Flow = Tax Effected Non-GAAP EBIT+ D&A + Share based compensation—Capex + (Increase)/Decrease in Working Capital
Overview of Strategic Alternatives 18
PRELIMINARY DRAFT, CONFIDENTIAL
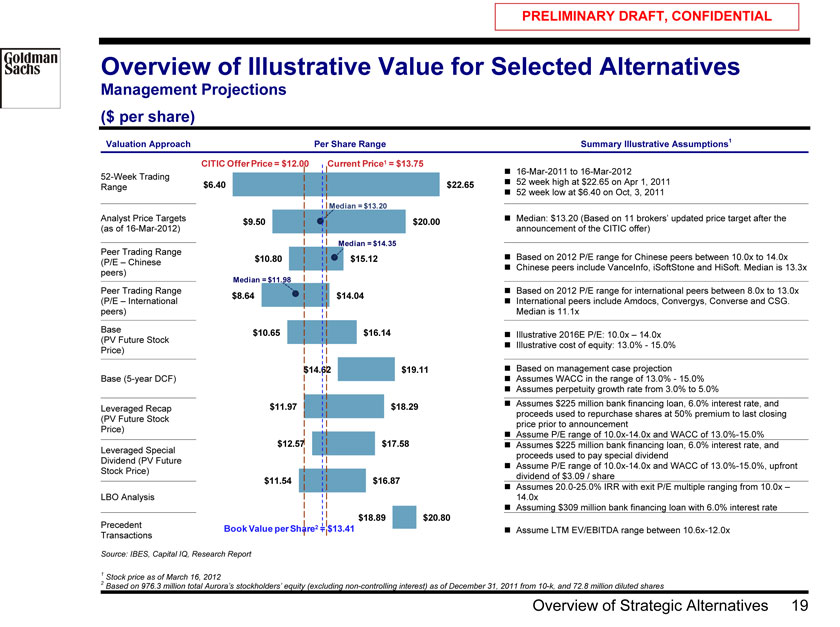
Overview of Illustrative Value for Selected Alternatives
Management Projections ($ per share)
Valuation Approach Per Share Range Summary Illustrative Assumptions1
CITIC Offer Price = $12.00 Current Price1 = $13.75
? 16-Mar-2011 to 16-Mar-2012
52-Week Trading $6.40 $22.65? 52 week high at $22.65 on Apr 1, 2011 Range ? 52 week low at $6.40 on Oct, 3, 2011
Median = $13.20
Analyst Price Targets $9.50 $20.00? Median: $13.20 (Based on 11 brokers’ updated price target after the (as of 16-Mar-2012) announcement of the CITIC offer)
Median = $14.35
Peer Trading Range
$10.80 $15.12? Based on 2012 P/E range for Chinese peers between 10.0x to 14.0x (P/E – Chinese ? Chinese peers include VanceInfo, iSoftStone and HiSoft. Median is 13.3x peers) Median = $11.98
Peer Trading Range ? Based on 2012 P/E range for international peers between 8.0x to 13.0x $8.64 $14.04
(P/E – International ? International peers include Amdocs, Convergys, Converse and CSG. peers) Median is 11.1x
Base $10.65 $16.14
? Illustrative 2016E P/E: 10.0x – 14.0x (PV Future Stock ? Illustrative cost of equity: 13.0%—15.0% Price)
$14.62 $19.11? Based on management case projection Base (5-year DCF) ? Assumes WACC in the range of 13.0%—15.0% ? Assumes perpetuity growth rate from 3.0% to 5.0%
$11.97 $18.29? Assumes $225 million bank financing loan, 6.0% interest rate, and Leveraged Recap proceeds used to repurchase shares at 50% premium to last closing (PV Future Stock price prior to announcement Price) ? Assume P/E range of 10.0x-14.0x and WACC of 13.0%-15.0%
$12.57 $17.58? Assumes $225 million bank financing loan, 6.0% interest rate, and Leveraged Special proceeds used to pay special dividend Dividend (PV Future ? Assume P/E range of 10.0x-14.0x and WACC of 13.0%-15.0%, upfront Stock Price) dividend of $3.09 / share
$11.54 $16.87
? Assumes 20.0-25.0% IRR with exit P/E multiple ranging from 10.0x – LBO Analysis 14.0x ? Assuming $309 million bank financing loan with 6.0% interest rate
$18.89 $20.80 Precedent Book Value per Share2 = $13.41
? Assume LTM EV/EBITDA range between 10.6x-12.0x Transactions
Source: IBES, Capital IQ, Research Report
1 | | Stock price as of March 16, 2012 |
2 Based on 976.3 million total Aurora’s stockholders’ equity (excluding non-controlling interest) as of December 31, 2011 from 10-k, and 72.8 million diluted shares
Overview of Strategic Alternatives 19
PRELIMINARY DRAFT, CONFIDENTIAL
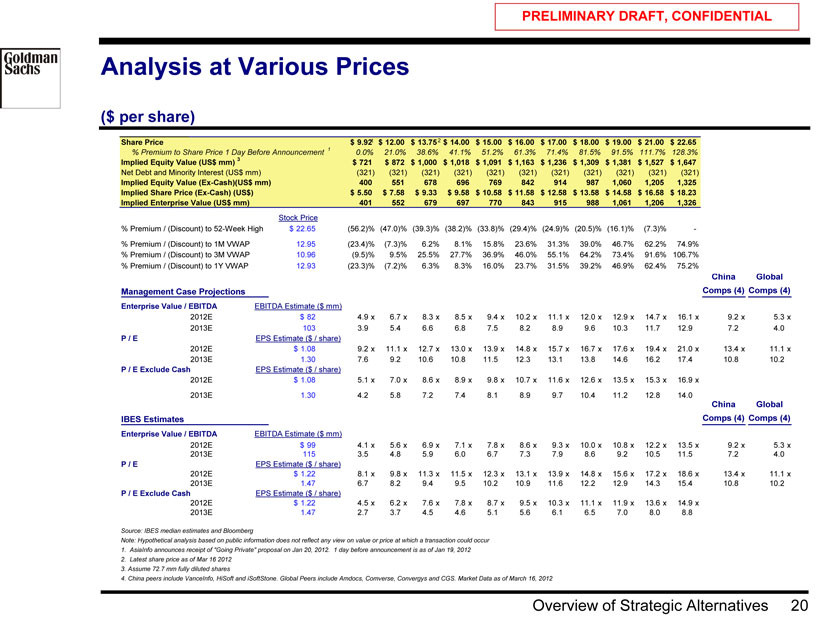
Analysis at Various Prices
($ per share)
Share Price $ 9.921 $ 12.00 $ 13.752 $ 14.00 $ 15.00 $ 16.00 $ 17.00 $ 18.00 $ 19.00 $ 21.00 $ 22.65
% Premium to Share Price 1 Day Before Announcement 1 0.0% 21.0% 38.6% 41.1% 51.2% 61.3% 71.4% 81.5% 91.5% 111.7% 128.3%
Implied Equity Value (US$ mm) 3 $ 721 $ 872 $ 1,000 $ 1,018 $ 1,091 $ 1,163 $ 1,236 $ 1,309 $ 1,381 $ 1,527 $ 1,647
Net Debt and Minority Interest (US$ mm) (321) (321) (321) (321) (321) (321) (321) (321) (321) (321) (321)
Implied Equity Value (Ex-Cash)(US$ mm) 400 551 678 696 769 842 914 987 1,060 1,205 1,325 Implied Share Price (Ex-Cash) (US$) $ 5.50 $ 7.58 $ 9.33 $ 9.58 $ 10.58 $ 11.58 $ 12.58 $ 13.58 $ 14.58 $ 16.58 $ 18.23 Implied Enterprise Value (US$ mm) 401 552 679 697 770 843 915 988 1,061 1,206 1,326
Stock Price
% Premium / (Discount) to 52-Week High $ 22.65 (56.2)% (47.0)% (39.3)% (38.2)% (33.8)% (29.4)% (24.9)% (20.5)% (16.1)% (7.3)% —
% Premium / (Discount) to 1M VWAP 12.95 (23.4)% (7.3)% 6.2% 8.1% 15.8% 23.6% 31.3% 39.0% 46.7% 62.2% 74.9%
% Premium / (Discount) to 3M VWAP 10.96 (9.5)% 9.5% 25.5% 27.7% 36.9% 46.0% 55.1% 64.2% 73.4% 91.6% 106.7%
% Premium / (Discount) to 1Y VWAP 12.93 (23.3)% (7.2)% 6.3% 8.3% 16.0% 23.7% 31.5% 39.2% 46.9% 62.4% 75.2%
China Global Management Case Projections Comps (4) Comps (4)
Enterprise Value / EBITDA EBITDA Estimate ($ mm)
2012E $ 82 4.9 x 6.7 x 8.3 x 8.5 x 9.4 x 10.2 x 11.1 x 12.0 x 12.9 x 14.7 x 16.1 x 9.2 x 5.3 x 2013E 103 3.9 5.4 6.6 6.8 7.5 8.2 8.9 9.6 10.3 11.7 12.9 7.2 4.0 P / E EPS Estimate ($ / share) 2012E $ 1.08 9.2 x 11.1 x 12.7 x 13.0 x 13.9 x 14.8 x 15.7 x 16.7 x 17.6 x 19.4 x 21.0 x 13.4 x 11.1 x 2013E 1.30 7.6 9.2 10.6 10.8 11.5 12.3 13.1 13.8 14.6 16.2 17.4 10.8 10.2 P / E Exclude Cash EPS Estimate ($ / share) 2012E $ 1.08 5.1 x 7.0 x 8.6 x 8.9 x 9.8 x 10.7 x 11.6 x 12.6 x 13.5 x 15.3 x 16.9 x 2013E 1.30 4.2 5.8 7.2 7.4 8.1 8.9 9.7 10.4 11.2 12.8 14.0
China Global IBES Estimates Comps (4) Comps (4)
Enterprise Value / EBITDA EBITDA Estimate ($ mm)
2012E $ 99 4.1 x 5.6 x 6.9 x 7.1 x 7.8 x 8.6 x 9.3 x 10.0 x 10.8 x 12.2 x 13.5 x 9.2 x 5.3 x 2013E 115 3.5 4.8 5.9 6.0 6.7 7.3 7.9 8.6 9.2 10.5 11.5 7.2 4.0 P / E EPS Estimate ($ / share) 2012E $ 1.22 8.1 x 9.8 x 11.3 x 11.5 x 12.3 x 13.1 x 13.9 x 14.8 x 15.6 x 17.2 x 18.6 x 13.4 x 11.1 x 2013E 1.47 6.7 8.2 9.4 9.5 10.2 10.9 11.6 12.2 12.9 14.3 15.4 10.8 10.2 P / E Exclude Cash EPS Estimate ($ / share) 2012E $ 1.22 4.5 x 6.2 x 7.6 x 7.8 x 8.7 x 9.5 x 10.3 x 11.1 x 11.9 x 13.6 x 14.9 x 2013E 1.47 2.7 3.7 4.5 4.6 5.1 5.6 6.1 6.5 7.0 8.0 8.8
Source: IBES median estimates and Bloomberg
Note: Hypothetical analysis based on public information does not reflect any view on value or price at which a transaction could occur
1. AsiaInfo announces receipt of “Going Private” proposal on Jan 20, 2012. 1 day before announcement is as of Jan 19, 2012
2. Latest share price as of Mar 16 2012
3. Assume 72.7 mm fully diluted shares
4. China peers include VanceInfo, HiSoft and iSoftStone. Global Peers include Amdocs, Comverse, Convergys and CGS. Market Data as of March 16, 2012
Overview of Strategic Alternatives 20
PRELIMINARY DRAFT, CONFIDENTIAL
IV. Status Quo Overview
Status Quo Overview 21
PRELIMINARY DRAFT, CONFIDENTIAL
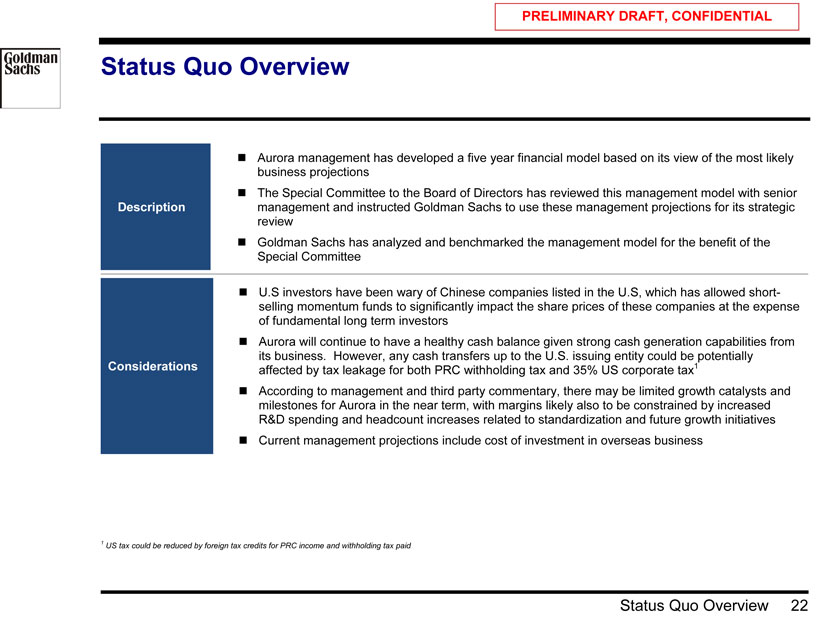
Status Quo Overview
? Aurora management has developed a five year financial model based on its view of the most likely business projections ? The Special Committee to the Board of Directors has reviewed this management model with senior Description management and instructed Goldman Sachs to use these management projections for its strategic review ? Goldman Sachs has analyzed and benchmarked the management model for the benefit of the Special Committee
? U.S investors have been wary of Chinese companies listed in the U.S, which has allowed short-selling momentum funds to significantly impact the share prices of these companies at the expense of fundamental long term investors ? Aurora will continue to have a healthy cash balance given strong cash generation capabilities from its business. However, any cash transfers up to the U.S. issuing entity could be potentially Considerations affected by tax leakage for both PRC withholding tax and 35% US corporate tax1 ? According to management and third party commentary, there may be limited growth catalysts and milestones for Aurora in the near term, with margins likely also to be constrained by increased R&D spending and headcount increases related to standardization and future growth initiatives ? Current management projections include cost of investment in overseas business
1 | | US tax could be reduced by foreign tax credits for PRC income and withholding tax paid |
Status Quo Overview 22
PRELIMINARY DRAFT, CONFIDENTIAL
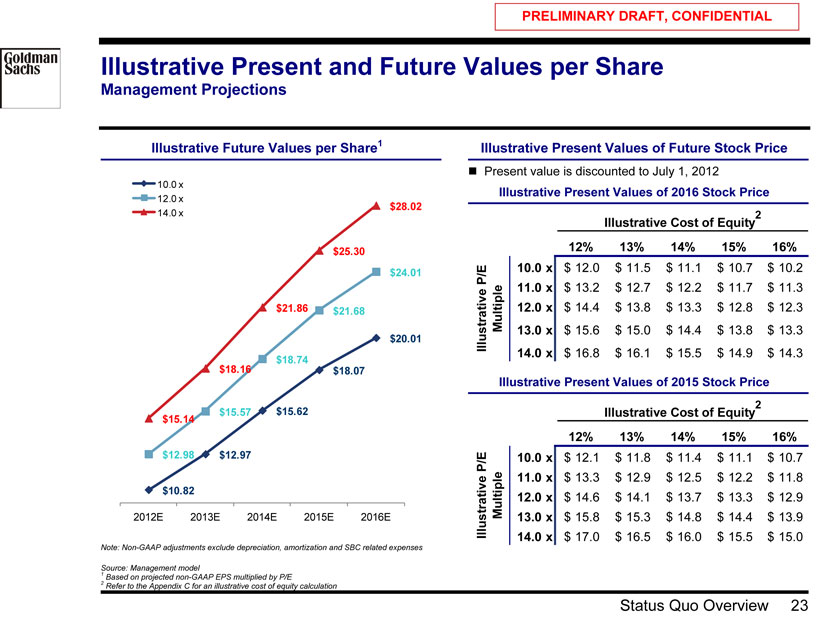
Illustrative Present and Future Values per Share
Management Projections
Illustrative Future Values per Share1 Illustrative Present Values of Future Stock Price
? Present value is discounted to July 1, 2012
10.0 x
Illustrative Present Values of 2016 Stock Price
12.0 x
$28.02
14.0 x 2
Illustrative Cost of Equity
$25.30 ##### 12% 13% 14% 15% 16%
10.0 x $ 12.0 $ 11.5 $ 11.1 $ 10.7 $ 10.2
$24.01 P/E
11.0 x $ 13.2 $ 12.7 $ 12.2 $ 11.7 $ 11.3
$21.86 $21.68 Multiple 12.0 x $ 14.4 $ 13.8 $ 13.3 $ 12.8 $ 12.3
13.0 x $ 15.6 $ 15.0 $ 14.4 $ 13.8 $ 13.3
$20.01 Illustrative
14.0 x $ 16.8 $ 16.1 $ 15.5 $ 14.9 $ 14.3
$18.16 $18.74
$18.07 Illustrative Present Values of 2015 Stock Price
$15.57 $15.62 Illustrative Cost of Equity
$15.14
##### 12% 13% 14% 15% 16%
$12.98 $12.97
P/E 10.0 x $ 12.1 $ 11.8 $ 11.4 $ 11.1 $ 10.7
11.0 x $ 13.3 $ 12.9 $ 12.5 $ 12.2 $ 11.8
$10.82
Multiple 12.0 x $ 14.6 $ 14.1 $ 13.7 $ 13.3 $ 12.9
2012E 2013E 2014E 2015E 2016E Illustrative 13.0 x $ 15.8 $ 15.3 $ 14.8 $ 14.4 $ 13.9
14.0 x $ 17.0 $ 16.5 $ 16.0 $ 15.5 $ 15.0
Note: Non-GAAP adjustments exclude depreciation, amortization and SBC related expenses
Source: 1 Management model
2 | | Based on projected non-GAAP EPS multiplied by P/E |
Refer to the Appendix C for an illustrative cost of equity calculation
Status Quo Overview 23
PRELIMINARY DRAFT, CONFIDENTIAL
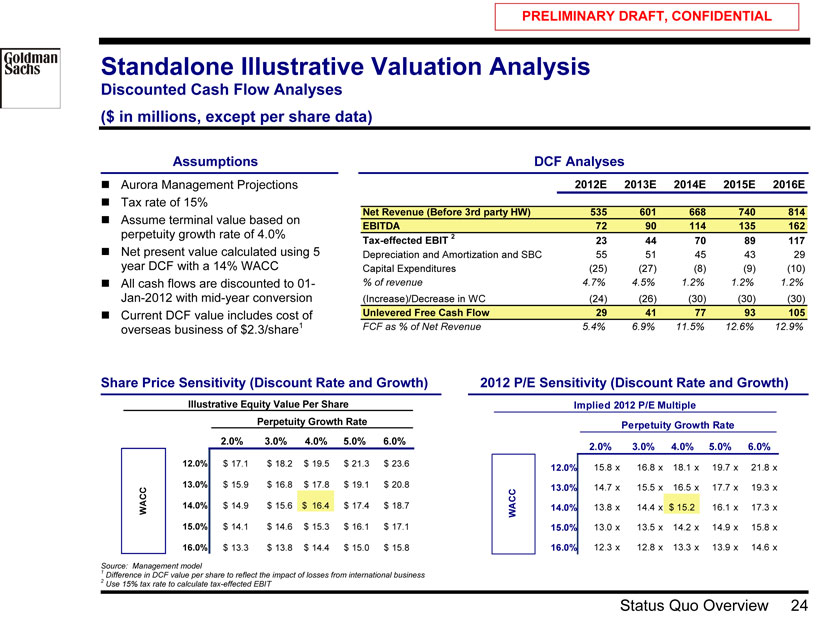
Standalone Illustrative Valuation Analysis
Discounted Cash Flow Analyses ($ in millions, except per share data)
Assumptions DCF Analyses
? Aurora Management Projections 2012E 2013E 2014E 2015E 2016E
? Tax rate of 15% Net Revenue (Before 3rd party HW) 535 601 668 740 814
? Assume terminal value based on
EBITDA 72 90 114 135 162 perpetuity growth rate of 4.0% 2
Tax-effected EBIT 23 44 70 89 117
? Net present value calculated using 5 Depreciation and Amortization and SBC 55 51 45 43 29 year DCF with a 14% WACC Capital Expenditures (25) (27) (8) (9) (10)
? All cash flows are discounted to 01—% of revenue 4.7% 4.5% 1.2% 1.2% 1.2%
Jan-2012 with mid-year conversion (Increase)/Decrease in WC (24) (26) (30) (30) (30)
? Current DCF value includes cost of Unlevered Free Cash Flow 29 41 77 93 105 overseas business of $2.3/share1 FCF as % of Net Revenue 5.4% 6.9% 11.5% 12.6% 12.9%
Share Price Sensitivity (Discount Rate and Growth) 2012 P/E Sensitivity (Discount Rate and Growth)
Illustrative Equity Value Per Share Implied 2012 P/E Multiple Perpetuity Growth Rate Perpetuity Growth Rate
$16.42 2.0% 3.0% 4.0% 5.0% 6.0%
15.2 x 2.0% 3.0% 4.0% 5.0% 6.0%
12.0% $ 17.1 $ 18.2 $ 19.5 $ 21.3 $ 23.6 15.8 x 16.8 x 18.1 x 19.7 x 21.8 x
12.0%
13.0% $ 15.9 $ 16.8 $ 17.8 $ 19.1 $ 20.8 13.0% 14.7 x 15.5 x 16.5 x 17.7 x 19.3 x WACC 14.0% $ 14.9 $ 15.6 $ 16.4 $ 17.4 $ 18.7 WACC 14.0% 13.8 x 14.4 x $ 15.2 16.1 x 17.3 x
15.0% $ 14.1 $ 14.6 $ 15.3 $ 16.1 $ 17.1 15.0% 13.0 x 13.5 x 14.2 x 14.9 x 15.8 x
16.0% $ 13.3 $ 13.8 $ 14.4 $ 15.0 $ 15.8 16.0% 12.3 x 12.8 x 13.3 x 13.9 x 14.6 x
1 | | Source: Management model |
2 Difference in DCF value per share to reflect the impact of losses from international business Use 15% tax rate to calculate tax-effected EBIT
Status Quo Overview 24
PRELIMINARY DRAFT, CONFIDENTIAL
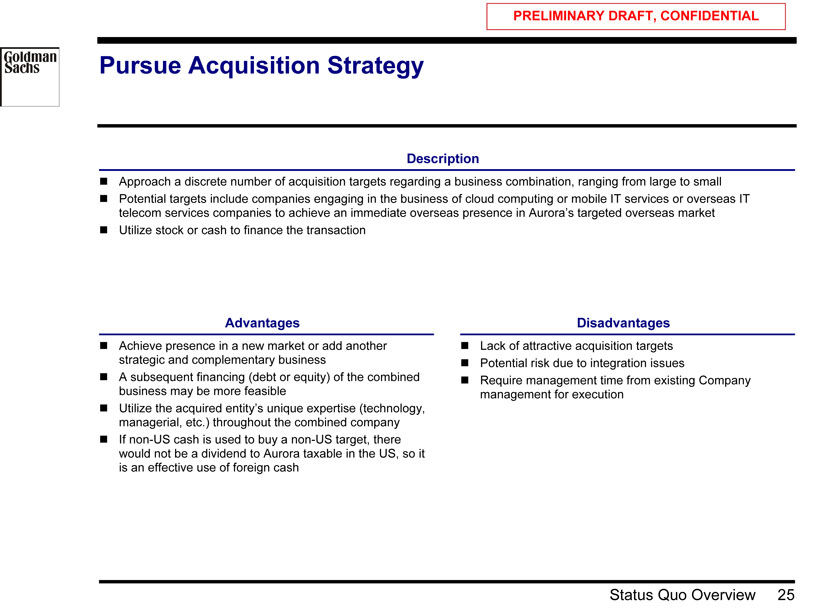
Pursue Acquisition Strategy
Description
? Approach a discrete number of acquisition targets regarding a business combination, ranging from large to small ? Potential targets include companies engaging in the business of cloud computing or mobile IT services or overseas IT telecom services companies to achieve an immediate overseas presence in Aurora’s targeted overseas market ? Utilize stock or cash to finance the transaction
Advantages Disadvantages
? Achieve presence in a new market or add another ? Lack of attractive acquisition targets strategic and complementary business ? Potential risk due to integration issues
? A subsequent financing (debt or equity) of the combined ? Require management time from existing Company business may be more feasible management for execution ? Utilize the acquired entity’s unique expertise (technology, managerial, etc.) throughout the combined company ? If non-US cash is used to buy a non-US target, there would not be a dividend to Aurora taxable in the US, so it is an effective use of foreign cash
Status Quo Overview 25
PRELIMINARY DRAFT, CONFIDENTIAL
V. Illustrative Levered Recapitalization / Special Dividend
Illustrative Levered Recapitalization / Special Dividend 26
PRELIMINARY DRAFT, CONFIDENTIAL
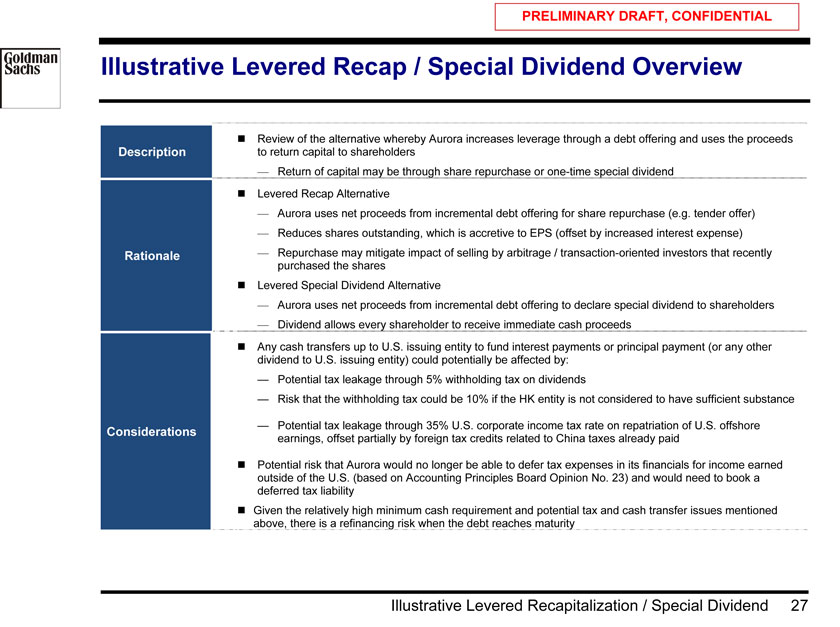
Illustrative Levered Recap / Special Dividend Overview
? Review of the alternative whereby Aurora increases leverage through a debt offering and uses the proceeds Description to return capital to shareholders
— Return of capital may be through share repurchase or one-time special dividend ? Levered Recap Alternative
— Aurora uses net proceeds from incremental debt offering for share repurchase (e.g. tender offer)
— Reduces shares outstanding, which is accretive to EPS (offset by increased interest expense) Rationale — Repurchase may mitigate impact of selling by arbitrage / transaction-oriented investors that recently purchased the shares ? Levered Special Dividend Alternative
— Aurora uses net proceeds from incremental debt offering to declare special dividend to shareholders
— Dividend allows every shareholder to receive immediate cash proceeds
? Any cash transfers up to U.S. issuing entity to fund interest payments or principal payment (or any other dividend to U.S. issuing entity) could potentially be affected by:
— Potential tax leakage through 5% withholding tax on dividends
— Risk that the withholding tax could be 10% if the HK entity is not considered to have sufficient substance
— Potential tax leakage through 35% U.S. corporate income tax rate on repatriation of U.S. offshore
Considerations earnings, offset partially by foreign tax credits related to China taxes already paid
? Potential risk that Aurora would no longer be able to defer tax expenses in its financials for income earned outside of the U.S. (based on Accounting Principles Board Opinion No. 23) and would need to book a deferred tax liability ? Given the relatively high minimum cash requirement and potential tax and cash transfer issues mentioned above, there is a refinancing risk when the debt reaches maturity
Illustrative Levered Recapitalization / Special Dividend 27
PRELIMINARY DRAFT, CONFIDENTIAL
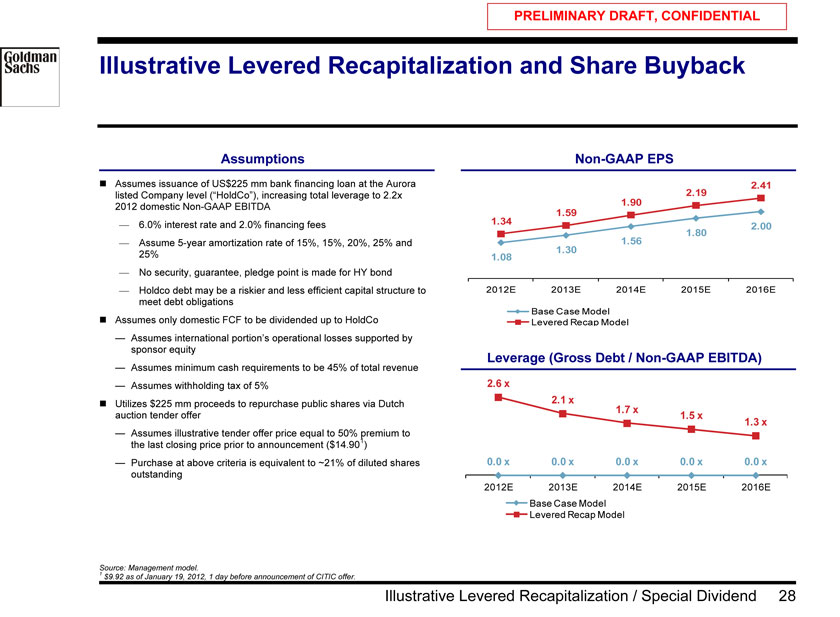
Illustrative Levered Recapitalization and Share Buyback
Assumptions Non-GAAP EPS
? Assumes issuance of US$225 mm bank financing loan at the Aurora 2.41 listed Company level (“HoldCo”), increasing total leverage to 2.2x 2.19 2012 domestic Non-GAAP EBITDA 1.90
1.34 1.59
— 6.0% interest rate and 2.0% financing fees 2.00 1.56 1.80
— Assume 5-year amortization rate of 15%, 15%, 20%, 25% and
25% 1.30 1.08
— No security, guarantee, pledge point is made for HY bond
— Holdco debt may be a riskier and less efficient capital structure to 2012E 2013E 2014E 2015E 2016E meet debt obligations ? Assumes only domestic FCF to be dividended up to HoldCo Base Case Model Levered Recap Model
— Assumes international portion’s operational losses supported by sponsor equity
— Assumes minimum cash requirements to be 45% of total revenue Leverage (Gross Debt / Non-GAAP EBITDA)
— Assumes withholding tax of 5% 2.6 x
? Utilizes $225 mm proceeds to repurchase public shares via Dutch 2.1 x 1.7 x auction tender offer 1.5 x
1.3 x
— Assumes illustrative tender offer price equal to 50% 1 premium to the last closing price prior to announcement ($14.90 )
— Purchase at above criteria is equivalent to ~21% of diluted shares 0.0 x 0.0 x 0.0 x 0.0 x 0.0 x outstanding 2012E 2013E 2014E 2015E 2016E
Base Case Model Levered Recap Model
1 | | Source: Management model. |
$9.92 as of January 19, 2012, 1 day before announcement of CITIC offer.
Illustrative Levered Recapitalization / Special Dividend 28
PRELIMINARY DRAFT, CONFIDENTIAL
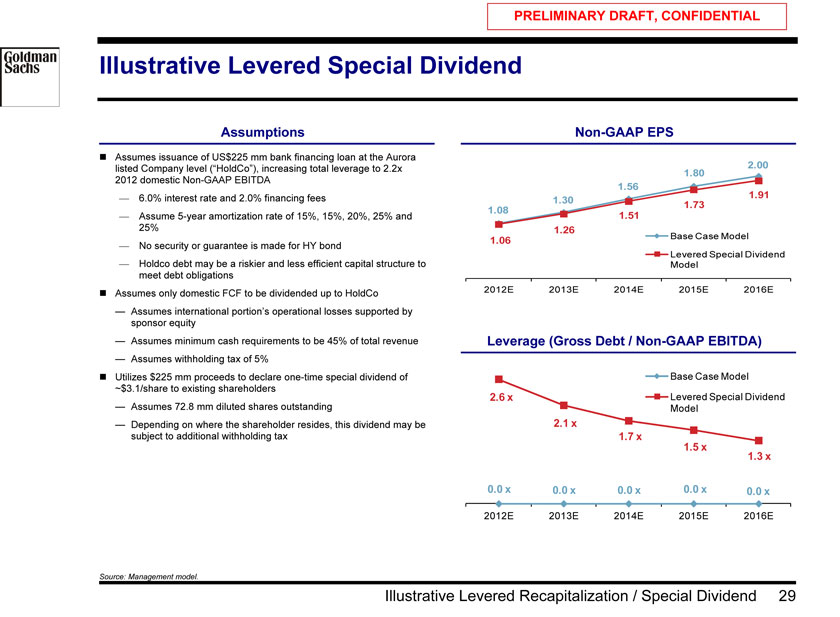
Illustrative Levered Special Dividend
Assumptions Non-GAAP EPS
? Assumes issuance of US$225 mm bank financing loan at the Aurora 2.00 listed Company level (“HoldCo”), increasing total leverage to 2.2x
1.80
2012 domestic Non-GAAP EBITDA
1.56 1.91
— 6.0% interest rate and 2.0% financing fees 1.30
1.73 1.08
— Assume 5-year amortization rate of 15%, 15%, 20%, 25% and 1.51
25% 1.26 Base Case Model
1.06
— No security or guarantee is made for HY bond Levered Special Dividend
— Holdco debt may be a riskier and less efficient capital structure to Model meet debt obligations
? Assumes only domestic FCF to be dividended up to HoldCo 2012E 2013E 2014E 2015E 2016E
— Assumes international portion’s operational losses supported by sponsor equity
— Assumes minimum cash requirements to be 45% of total revenue Leverage (Gross Debt / Non-GAAP EBITDA)
— Assumes withholding tax of 5%
? Utilizes $225 mm proceeds to declare one-time special dividend of Base Case Model
~$3.1/share to existing shareholders
2.6 x Levered Special Dividend
— Assumes 72.8 mm diluted shares outstanding Model
— Depending on where the shareholder resides, this dividend may be 2.1 x subject to additional withholding tax 1.7 x
1.5 x 1.3 x 0.0 x 0.0 x 0.0 x 0.0 x 0.0 x
2012E 2013E 2014E 2015E 2016E
Source: Management model.
Illustrative Levered Recapitalization / Special Dividend 29
PRELIMINARY DRAFT, CONFIDENTIAL
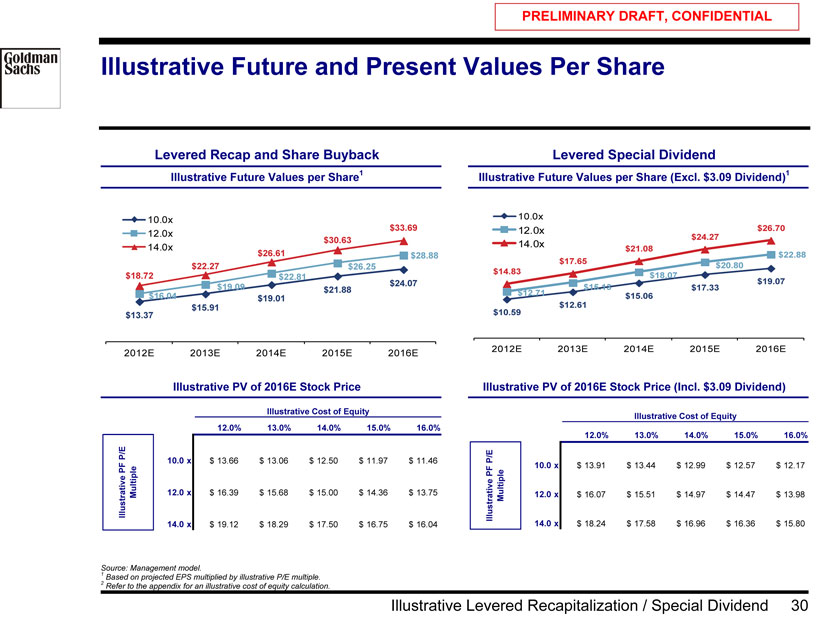
Illustrative Future and Present Values Per Share
Levered Recap and Share Buyback Levered Special Dividend
Illustrative Future Values per Share1 Illustrative Future Values per Share (Excl. $3.09 Dividend)1
10.0x 10.0x
$33.69 12.0x $26.70
12.0x $24.27
$30.63 14.0x
14.0x $21.08
$26.61 $28.88 $17.65 $22.88
$22.27 $26.25 $20.80
$14.83
$18.72 $22.81 $18.07
$24.07 $19.07
$19.09 $21.88 $15.13 $17.33
$16.04 $12.71 $15.06
$19.01
$15.91 $10.59 $12.61
$13.37
2012E 2013E 2014E 2015E 2016E 2012E 2013E 2014E 2015E 2016E
Illustrative PV of 2016E Stock Price Illustrative PV of 2016E Stock Price (Incl. $3.09 Dividend)
Illustrative Cost of Equity
Illustrative Cost of Equity
12.0% 13.0% 14.0% 15.0% 16.0% 12.0% 13.0% 14.0% 15.0% 16.0% P/E
10.0 x $ 13.66 $ 13.06 $ 12.50 $ 11.97 $ 11.46 P/E
PF 10.0 x $ 13.91 $ 13.44 $ 12.99 $ 12.57 $ 12.17
PF
Illustrative Multiple 12.0 x $ 16.39 $ 15.68 $ 15.00 $ 14.36 $ 13.75 Illustrative Multiple 12.0 x $ 16.07 $ 15.51 $ 14.97 $ 14.47 $ 13.98
14.0 x $ 19.12 $ 18.29 $ 17.50 $ 16.75 $ 16.04 14.0 x $ 18.24 $ 17.58 $ 16.96 $ 16.36 $ 15.80
1 | | Source: Management model. |
2 Based on projected EPS multiplied by illustrative P/E multiple. Refer to the appendix for an illustrative cost of equity calculation.
Illustrative Levered Recapitalization / Special Dividend 30
PRELIMINARY DRAFT, CONFIDENTIAL
VI. lllustrative Sale to Financial Sponsor
lllustrative Sale to Financial Sponsor 31
PRELIMINARY DRAFT, CONFIDENTIAL
Illustrative Sale to Financial Sponsor
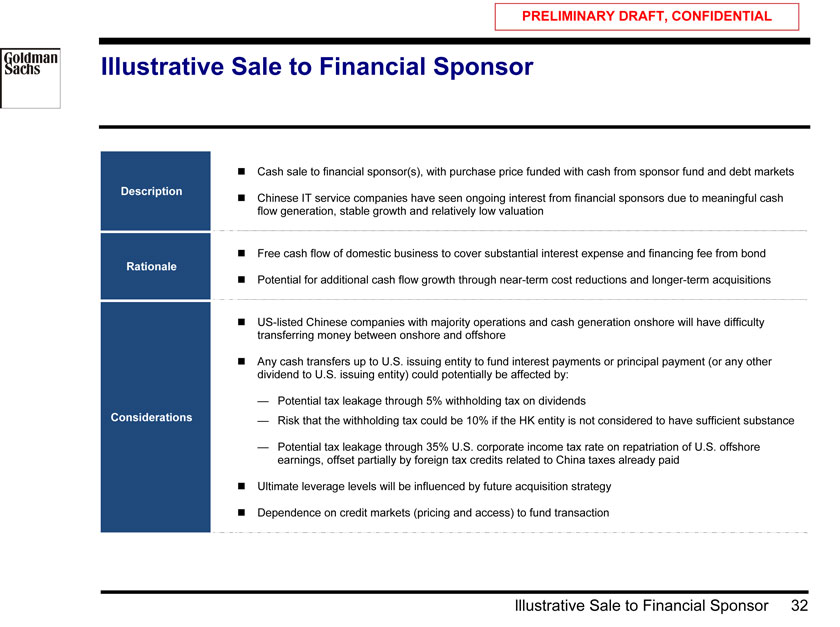
? Cash sale to financial sponsor(s), with purchase price funded with cash from sponsor fund and debt markets
Description
? Chinese IT service companies have seen ongoing interest from financial sponsors due to meaningful cash flow generation, stable growth and relatively low valuation
? Free cash flow of domestic business to cover substantial interest expense and financing fee from bond
Rationale
? Potential for additional cash flow growth through near-term cost reductions and longer-term acquisitions
? US-listed Chinese companies with majority operations and cash generation onshore will have difficulty transferring money between onshore and offshore
? Any cash transfers up to U.S. issuing entity to fund interest payments or principal payment (or any other dividend to U.S. issuing entity) could potentially be affected by:
— Potential tax leakage through 5% withholding tax on dividends
Considerations — Risk that the withholding tax could be 10% if the HK entity is not considered to have sufficient substance
— Potential tax leakage through 35% U.S. corporate income tax rate on repatriation of U.S. offshore earnings, offset partially by foreign tax credits related to China taxes already paid
? Ultimate leverage levels will be influenced by future acquisition strategy
? Dependence on credit markets (pricing and access) to fund transaction
lllustrative Sale to Financial Sponsor 32
PRELIMINARY DRAFT, CONFIDENTIAL
Illustrative LBO Assumptions
($ in millions)
Assumptions Sources and Uses of Funds
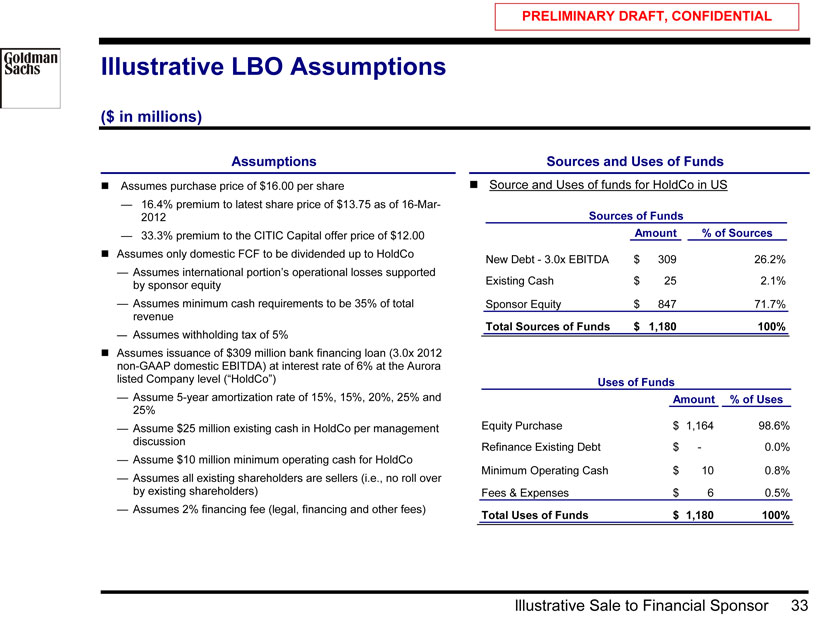
? Assumes purchase price of $16.00 per share ? Source and Uses of funds for HoldCo in US
— 16.4% premium to latest share price of $13.75 as of 16-Mar—
2012 Sources of Funds
— 33.3% premium to the CITIC Capital offer price of $12.00 Amount % of Sources? Assumes only domestic FCF to be dividended up to HoldCo
New Debt—3.0x EBITDA $ 309 26.2%
— Assumes international portion’s operational losses supported by sponsor equity Existing Cash $ 25 2.1%
— Assumes minimum cash requirements to be 35% of total Sponsor Equity $ 847 71.7% revenue Total Sources of Funds $ 1,180 100%
— Assumes withholding tax of 5% ? Assumes issuance of $309 million bank financing loan (3.0x 2012 non-GAAP domestic EBITDA) at interest rate of 6% at the Aurora listed Company level (“HoldCo”) Uses of Funds
— Assume 5-year amortization rate of 15%, 15%, 20%, 25% and Amount % of Uses 25%
— Assume $25 million existing cash in HoldCo per management Equity Purchase $ 1,164 98.6% discussion
Refinance Existing Debt $ —0.0%
— Assume $10 million minimum operating cash for HoldCo
Minimum Operating Cash $ 10 0.8%
— Assumes all existing shareholders are sellers (i.e., no roll over by existing shareholders) Fees & Expenses $ 6 0.5%
— Assumes 2% financing fee (legal, financing and other fees)
Total Uses of Funds $ 1,180 100%
lllustrative Sale to Financial Sponsor 33
PRELIMINARY DRAFT, CONFIDENTIAL
Sensitivities of Illustrative Equity Returns to Sponsor
Based on Management Model Financials ($ in millions)
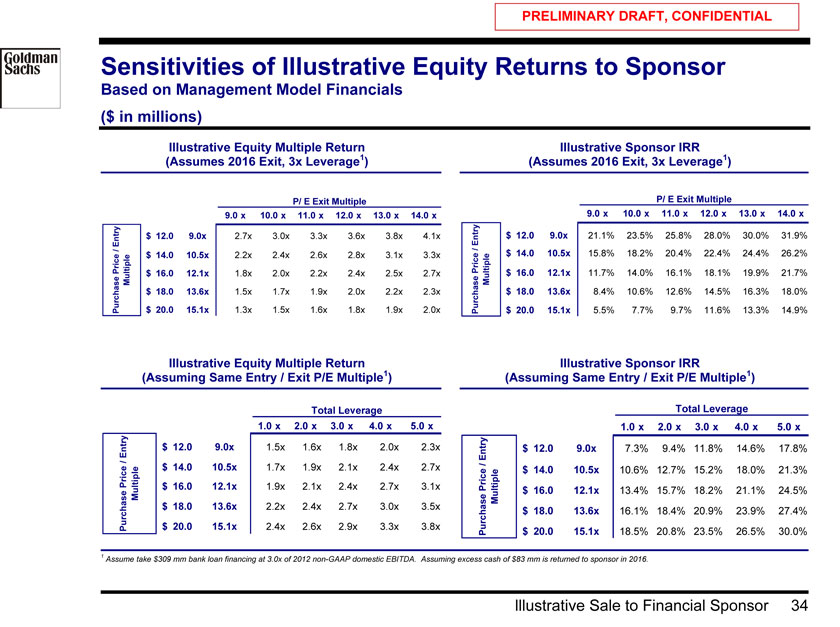
Illustrative Equity Multiple Return Illustrative Sponsor IRR (Assumes 2016 Exit, 3x Leverage1) (Assumes 2016 Exit, 3x Leverage1)
P/ E Exit Multiple P/ E Exit Multiple
0.0% 0.0% 9.0 x 10.0 x 11.0 x 12.0 x 13.0 x 14.0 x 0.0% 0.0% 9.0 x 10.0 x 11.0 x 12.0 x 13.0 x 14.0 x
Entry $ 12 .0 9.0x 2.7x 3.0x 3.3x 3.6x 3.8x 4.1x Entry $ 12.0 9.0x 21.1% 23.5% 25.8% 28.0% 30.0% 31.9%
/ / $ 14 .0 10.5x 2.2x 2.4x 2.6x 2.8x 3.1x 3.3x Price $ 14.0 10.5x 15.8% 18.2% 20.4% 22.4% 24.4% 26.2% Price Multiple $ 16 ..0 12.1x 1.8x 2.0x 2.2x 2.4x 2.5x 2.7x Multiple $ 16.0 12.1x 11.7% 14.0% 16.1% 18.1% 19.9% 21.7% $ 18 .0 13.6x 1.5x 1.7x 1.9x 2.0x 2.2x 2.3x $ 18.0 13.6x 8.4% 10.6% 12.6% 14.5% 16.3% 18.0% Purchase $ 20 .0 15.1x 1.3x 1.5x 1.6x 1.8x 1.9x 2.0x Purchase $ 20.0 15.1x 5.5% 7.7% 9.7% 11.6% 13.3% 14.9%
Illustrative Equity Multiple Return Illustrative Sponsor IRR
(Assuming Same Entry / Exit P/E Multiple1) (Assuming Same Entry / Exit P/E Multiple1)
Total Leverage Total Leverage
236.9% 1.0 x 2.0x 3.0x 4.0x 5.0x 0.0% 18.2% 1.0x 2.0x 3.0x 4.0 x 5.0x
Entry $ 12 .0 9.0x 1.5x 1.6x 1.8x 2.0x 2.3x Entry $ 12.0 9.0x 7.3% 9.4% 11.8% 14.6% 17.8%
/
Price $ 14 .0 10.5x 1.7x 1.9x 2.1x 2.4x 2.7x / $ 14.0 10.5x 10.6% 12.7% 15.2% 18.0% 21.3% $ 16 .0 12.1x 1.9x 2.1x 2.4x 2.7x 3.1x Price $ 16.0 12.1x
Multiple Multiple 13.4% 15.7% 18.2% 21.1% 24.5% $ 18 .0 13.6x 2.2x 2.4x 2.7x 3.0x 3.5x $ 18.0 13.6x 16.1% 18.4% 20.9% 23.9% 27.4%
Purchase $ 20 .0 15.1x 2.4x 2.6x 2.9x 3.3x 3.8x
Purchase $ 20.0 15.1x 18.5% 20.8% 23.5% 26.5% 30.0%
1 Assume take $309 mm bank loan financing at 3.0x of 2012 non-GAAP domestic EBITDA. Assuming excess cash of $83 mm is returned to sponsor in 2016.
lllustrative Sale to Financial Sponsor 34
PRELIMINARY DRAFT, CONFIDENTIAL
Potential Financial Buyers
Private equity players who have registered potential interest
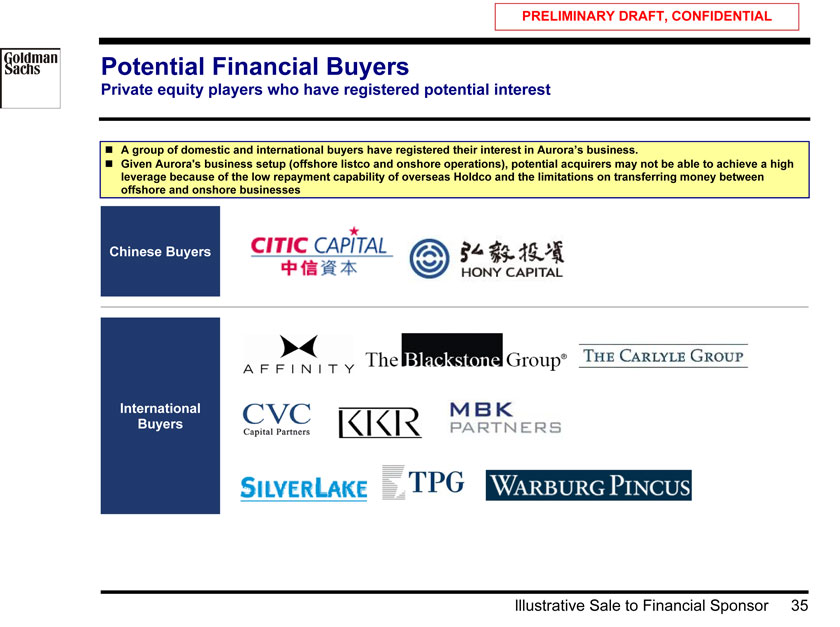
? A group of domestic and international buyers have registered their interest in Aurora’s business.
? Given Aurora’s business setup (offshore listco and onshore operations), potential acquirers may not be able to achieve a high leverage because of the low repayment capability of overseas Holdco and the limitations on transferring money between offshore and onshore businesses
Chinese Buyers
International
Buyers
lllustrative Sale to Financial Sponsor 35
PRELIMINARY DRAFT, CONFIDENTIAL
VII. Illustrative Sale to Strategic Buyer
Illustrative Sale to Strategic Buyer 36
PRELIMINARY DRAFT, CONFIDENTIAL
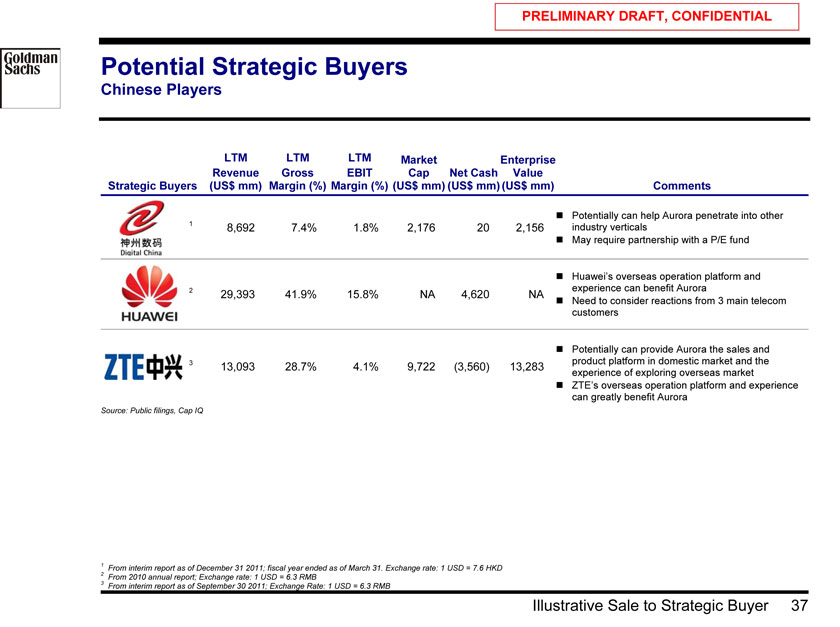
Potential Strategic Buyers
Chinese Players
LTM LTM LTM Market Enterprise Revenue Gross EBIT Cap Net Cash Value
Strategic Buyers (US$ mm) Margin (%) Margin (%) (US$ mm) (US$ mm) (US$ mm) Comments
? Potentially can help Aurora penetrate into other
1 | | 8,692 7.4% 1.8% 2,176 20 2,156 industry verticals |
? May require partnership with a P/E fund
? Huawei’s overseas operation platform and 2 experience can benefit Aurora
29,393 41.9% 15.8% NA 4,620 NA
? Need to consider reactions from 3 main telecom customers
? Potentially can provide Aurora the sales and 3 product platform in domestic market and the
13,093 28.7% 4.1% 9,722 (3,560) 13,283 experience of exploring overseas market
? ZTE’s overseas operation platform and experience can greatly benefit Aurora
Source: Public filings, Cap IQ
1 From interim report as of December 31 2011; fiscal year ended as of March 31. Exchange rate: 1 USD = 7.6 HKD 2 From 2010 annual report; Exchange rate: 1 USD = 6.3 RMB
3 | | From interim report as of September 30 2011; Exchange Rate: 1 USD = 6.3 RMB |
Illustrative Sale to Strategic Buyer 37
PRELIMINARY DRAFT, CONFIDENTIAL
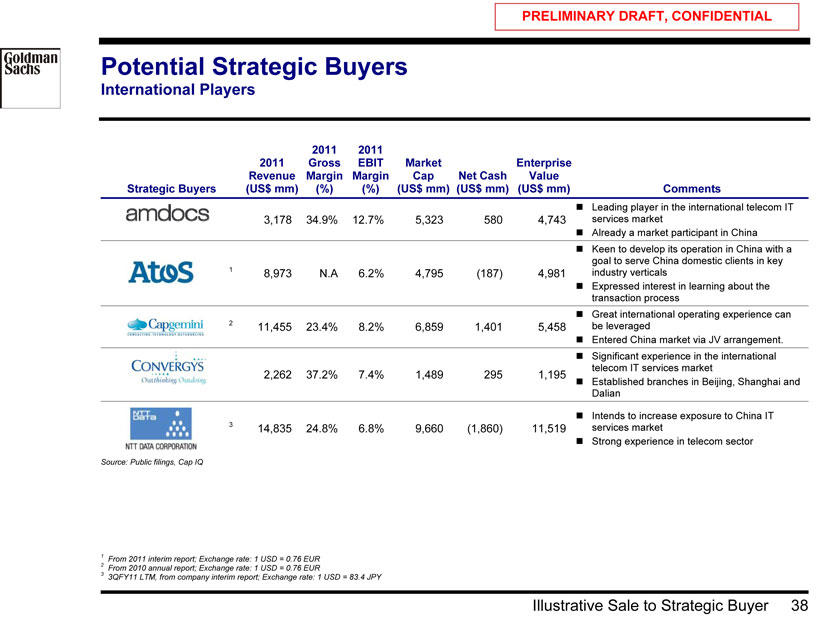
Potential Strategic Buyers
International Players
2011 2011
2011 Gross EBIT Market Enterprise Revenue Margin Margin Cap Net Cash Value
Strategic Buyers (US$ mm) (%) (%) (US$ mm) (US$ mm) (US$ mm) Comments
? Leading player in the international telecom IT 3,178 34.9% 12.7% 5,323 580 4,743 services market ? Already a market participant in China ? Keen to develop its operation in China with a goal to serve China domestic clients in key
1 | | 8,973 N.A 6.2% 4,795 (187) 4,981 industry verticals |
? Expressed interest in learning about the transaction process ? Great international operating experience can
2 | | 11,455 23.4% 8.2% 6,859 1,401 5,458 be leveraged |
? Entered China market via JV arrangement. ? Significant experience in the international telecom IT services market
2,262 37.2% 7.4% 1,489 295 1,195
? Established branches in Beijing, Shanghai and Dalian
? Intends to increase exposure to China IT
3 | | 14,835 24.8% 6.8% 9,660 (1,860) 11,519 services market |
? Strong experience in telecom sector
Source: Public filings, Cap IQ
1 From 2011 interim report; Exchange rate: 1 USD = 0.76 EUR 2 From 2010 annual report; Exchange rate: 1 USD = 0.76 EUR
3 | | 3QFY11 LTM, from company interim report; Exchange rate: 1 USD = 83.4 JPY |
Illustrative Sale to Strategic Buyer 38
PRELIMINARY DRAFT, CONFIDENTIAL
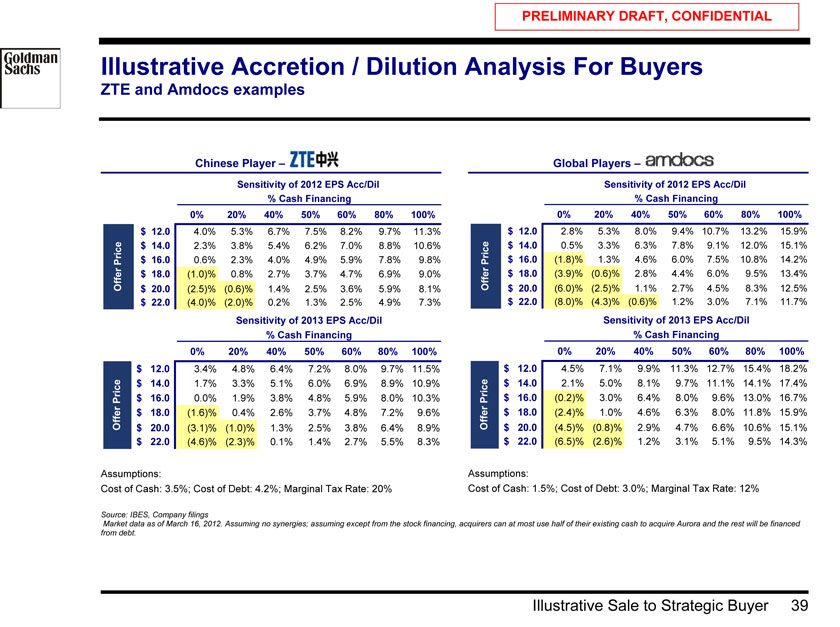
Illustrative Accretion / Dilution Analysis For Buyers
ZTE and Amdocs examples
Chinese Player – Global Players –
Sensitivity of 2012 EPS Acc/Dil Sensitivity of 2012 EPS Acc/Dil
% Cash Financing % Cash Financing
7.5% 0% 20% 40% 50% 60% 80% 100% 9.4% 0% 20% 40% 50% 60% 80% 100% $ 12.0 4.0% 5.3% 6.7% 7.5% 8.2% 9.7% 11.3% $ 12.0 2.8% 5.3% 8.0% 9.4% 10.7% 13.2% 15.9% $ 14.0 2.3% 3.8% 5.4% 6.2% 7.0% 8.8% 10.6% $ 14.0 0.5% 3.3% 6.3% 7.8% 9.1% 12.0% 15.1% Price $ 16.0 0.6% 2.3% 4.0% 4.9% 5.9% 7.8% 9.8% Price $ 16.0 (1.8)% 1.3% 4.6% 6.0% 7.5% 10.8% 14.2%
$ 18.0 (3.9)% (0.6)% 2.8% 4.4% 6.0% 9.5% 13.4% Offer $ 18.0 (1.0)% 0.8% 2.7% 3.7% 4.7% 6.9% 9.0% Offer $ 20.0 (2.5)% (0.6)% 1.4% 2.5% 3.6% 5.9% 8.1% $ 20.0 (6.0)% (2.5)% 1.1% 2.7% 4.5% 8.3% 12.5% $ 22.0 (4.0)% (2.0)% 0.2% 1.3% 2.5% 4.9% 7.3% $ 22.0 (8.0)% (4.3)% (0.6)% 1.2% 3.0% 7.1% 11.7%
Sensitivity of 2013 EPS Acc/Dil Sensitivity of 2013 EPS Acc/Dil
% Cash Financing % Cash Financing
7% 0% 20% 40% 50% 60% 80% 100% 11% 0% 20% 40% 50% 60% 80% 100%
$ 12.0 3.4% 4.8% 6.4% 7.2% 8.0% 9.7% 11.5% $ 12.0 4.5% 7.1% 9.9% 11.3% 12.7% 15.4% 18.2%
$ 14.0 1.7% 3.3% 5.1% 6.0% 6.9% 8.9% 10.9% $ 14.0 2.1% 5.0% 8.1% 9.7% 11.1% 14.1% 17.4% Price $ 16.0 0.0% 1.9% 3.8% 4.8% 5.9% 8.0% 10.3% Price $ 16.0 (0.2)% 3.0% 6.4% 8.0% 9.6% 13.0% 16.7%
$ 18.0 (2.4)% 1.0% 4.6% 6.3% 8.0% 11.8% 15.9% Offer $ 18.0 (1.6)% 0.4% 2.6% 3.7% 4.8% 7.2% 9.6% Offer
$ 20.0 (3.1)% (1.0)% 1.3% 2.5% 3.8% 6.4% 8.9% $ 20.0 (4.5)% (0.8)% 2.9% 4.7% 6.6% 10.6% 15.1%
$ 22.0 (4.6)% (2.3)% 0.1% 1.4% 2.7% 5.5% 8.3% $ 22.0 (6.5)% (2.6)% 1.2% 3.1% 5.1% 9.5% 14.3%
Assumptions: Assumptions:
Cost of Cash: 3.5%; Cost of Debt: 4.2%; Marginal Tax Rate: 20% Cost of Cash: 1.5%; Cost of Debt: 3.0%; Marginal Tax Rate: 12%
Source: IBES, Company filings
Market data as of March 16, 2012. Assuming no synergies; assuming except from the stock financing, acquirers can at most use half of their existing cash to acquire Aurora and the rest will be financed from debt.
Illustrative Sale to Strategic Buyer 39
PRELIMINARY DRAFT, CONFIDENTIAL
VIII. Next Steps
Next Steps 40
PRELIMINARY DRAFT, CONFIDENTIAL
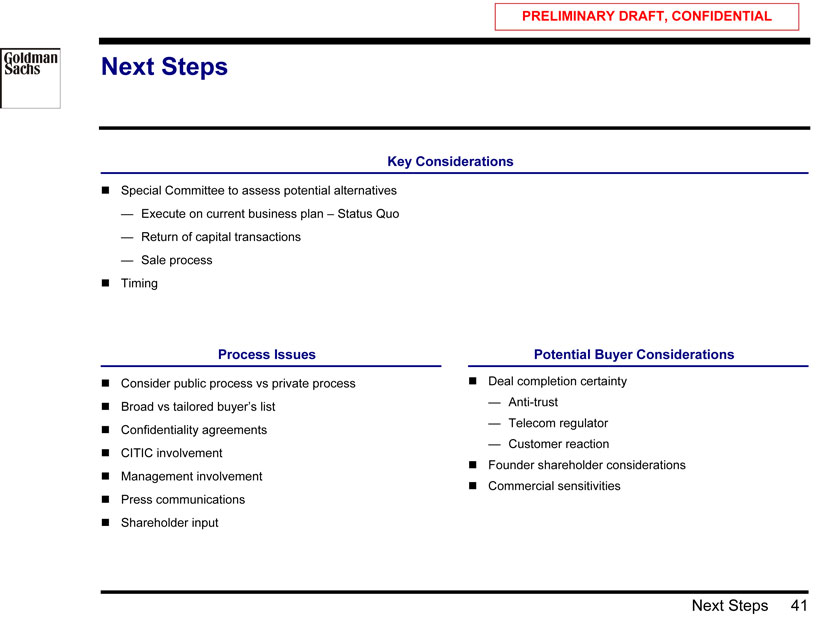
Next Steps
Key Considerations
? Special Committee to assess potential alternatives
— Execute on current business plan – Status Quo
— Return of capital transactions
— Sale process ? Timing
Process Issues Potential Buyer Considerations
? Consider public process vs private process ? Deal completion certainty ? Broad vs tailored buyer’s list — Anti-trust
— Telecom regulator ? Confidentiality agreements
— Customer reaction ? CITIC involvement
? Management involvement ? Founder shareholder considerations ? Commercial sensitivities ? Press communications ? Shareholder input
Next Steps 41
PRELIMINARY DRAFT, CONFIDENTIAL
Appendix A: Additional Materials
Additional Materials 42
PRELIMINARY DRAFT, CONFIDENTIAL
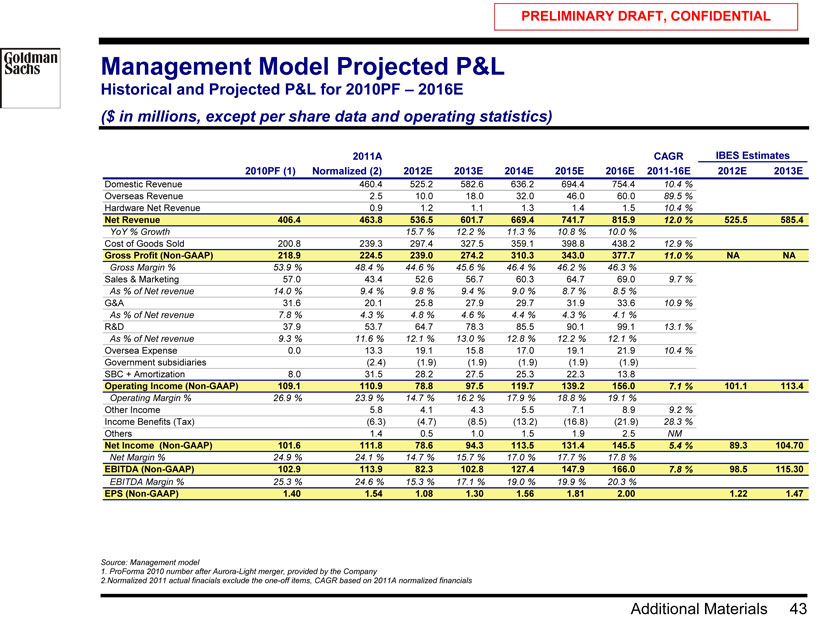
Management Model Projected P&L
Historical and Projected P&L for 2010PF – 2016E
($ in millions, except per share data and operating statistics)
2011A CAGR IBES Estimates 2010PF (1) Normalized (2) 2012E 2013E 2014E 2015E 2016E 2011-16E 2012E 2013E
Domestic Revenue 460.4 525.2 582.6 636.2 694.4 754.4 10.4 % Overseas Revenue 2.5 10.0 18.0 32.0 46.0 60.0 89.5 % Hardware Net Revenue 0.9 1.2 1.1 1.3 1.4 1.5 10.4 %
Net Revenue 406.4 463.8 536.5 601.7 669.4 741.7 815.9 12.0 % 525.5 585.4
YoY % Growth 15.7 % 12.2 % 11.3 % 10.8 % 10.0 %
Cost of Goods Sold 200.8 239.3 297.4 327.5 359.1 398.8 438.2 12.9 %
Gross Profit (Non-GAAP) 218.9 224.5 239.0 274.2 310.3 343.0 377.7 11.0 % NA NA
Gross Margin % 53.9 % 48.4 % 44.6 % 45.6 % 46.4 % 46.2 % 46.3 %
Sales & Marketing 57.0 43.4 52.6 56.7 60.3 64.7 69.0 9.7 % As % of Net revenue 14.0 % 9.4 % 9.8 % 9.4 % 9.0 % 8.7 % 8.5 %
G&A 31.6 20.1 25.8 27.9 29.7 31.9 33.6 10.9 % As % of Net revenue 7.8 % 4.3 % 4.8 % 4.6 % 4.4 % 4.3 % 4.1 %
R&D 37.9 53.7 64.7 78.3 85.5 90.1 99.1 13.1 % As % of Net revenue 9.3 % 11.6 % 12.1 % 13.0 % 12.8 % 12.2 % 12.1 %
Oversea Expense 0.0 13.3 19.1 15.8 17.0 19.1 21.9 10.4 % Government subsidiaries (2.4) (1.9) (1.9) (1.9) (1.9) (1.9) SBC + Amortization 8.0 31.5 28.2 27.5 25.3 22.3 13.8
Operating Income (Non-GAAP) 109.1 110.9 78.8 97.5 119.7 139.2 156.0 7.1 % 101.1 113.4
Operating Margin % 26.9 % 23.9 % 14.7 % 16.2 % 17.9 % 18.8 % 19.1 %
Other Income 5.8 4.1 4.3 5.5 7.1 8.9 9.2 % Income Benefits (Tax) (6.3) (4.7) (8.5) (13.2) (16.8) (21.9) 28.3 % Others 1.4 0.5 1.0 1.5 1.9 2.5 NM
Net Income (Non-GAAP) 101.6 111.8 78.6 94.3 113.5 131.4 145.5 5.4 % 89.3 104.70
Net Margin % 24.9 % 24.1 % 14.7 % 15.7 % 17.0 % 17.7 % 17.8 %
EBITDA (Non-GAAP) 102.9 113.9 82.3 102.8 127.4 147.9 166.0 7.8 % 98.5 115.30
EBITDA Margin % 25.3 % 24.6 % 15.3 % 17.1 % 19.0 % 19.9 % 20.3 %
EPS (Non-GAAP) 1.40 1.54 1.08 1.30 1.56 1.81 2.00 1.22 1.47
Source: Management model
1. ProForma 2010 number after Aurora-Light merger, provided by the Company
2.Normalized 2011 actual finacials exclude the one-off items, CAGR based on 2011A normalized financials
Additional Materials 43
PRELIMINARY DRAFT, CONFIDENTIAL
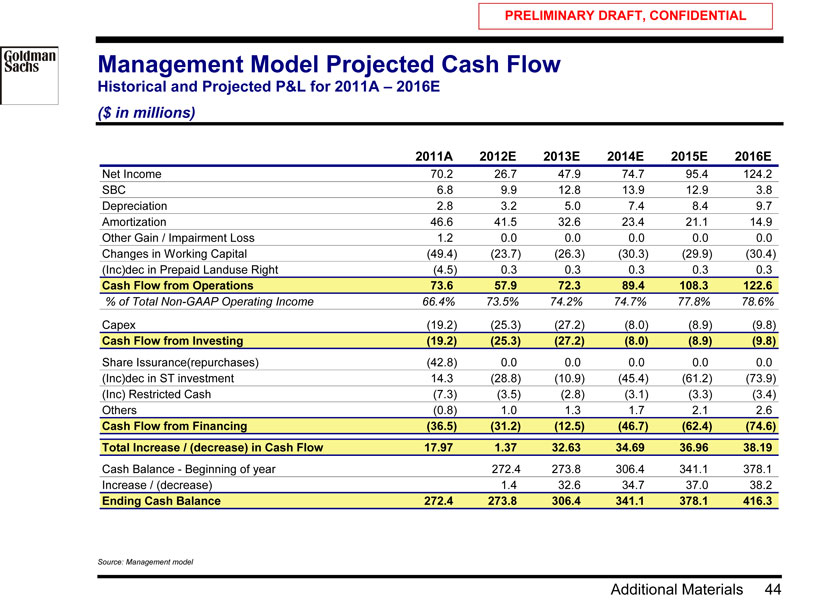
Management Model Projected Cash Flow
Historical and Projected P&L for 2011A – 2016E
($ in millions)
2011A 2012E 2013E 2014E 2015E 2016E
Net Income 70.2 26.7 47.9 74.7 95.4 124.2 SBC 6.8 9.9 12.8 13.9 12.9 3.8 Depreciation 2.8 3.2 5.0 7.4 8.4 9.7 Amortization 46.6 41.5 32.6 23.4 21.1 14.9 Other Gain / Impairment Loss 1.2 0.0 0.0 0.0 0.0 0.0 Changes in Working Capital (49.4) (23.7) (26.3) (30.3) (29.9) (30.4) (Inc)dec in Prepaid Landuse Right (4.5) 0.3 0.3 0.3 0.3 0.3
Cash Flow from Operations 73.6 57.9 72.3 89.4 108.3 122.6
% of Total Non-GAAP Operating Income 66.4% 73.5% 74.2% 74.7% 77.8% 78.6%
Capex (19.2) (25.3) (27.2) (8.0) (8.9) (9.8)
Cash Flow from Investing (19.2) (25.3) (27.2) (8.0) (8.9) (9.8)
Share Issurance(repurchases) (42.8) 0.0 0.0 0.0 0.0 0.0 (Inc)dec in ST investment 14.3 (28.8) (10.9) (45.4) (61.2) (73.9) (Inc) Restricted Cash (7.3) (3.5) (2.8) (3.1) (3.3) (3.4) Others (0.8) 1.0 1.3 1.7 2.1 2.6
Cash Flow from Financing (36.5) (31.2) (12.5) (46.7) (62.4) (74.6) Total Increase / (decrease) in Cash Flow 17.97 1.37 32.63 34.69 36.96 38.19
Cash Balance—Beginning of year 272.4 273.8 306.4 341.1 378.1 Increase / (decrease) 1.4 32.6 34.7 37.0 38.2
Ending Cash Balance 272.4 273.8 306.4 341.1 378.1 416.3
Source: Management model
Additional Materials 44
PRELIMINARY DRAFT, CONFIDENTIAL
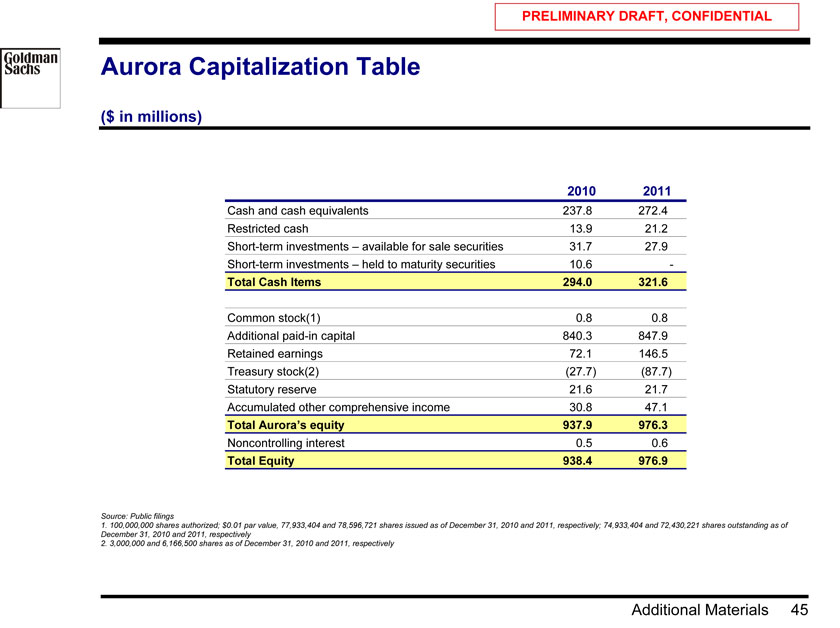
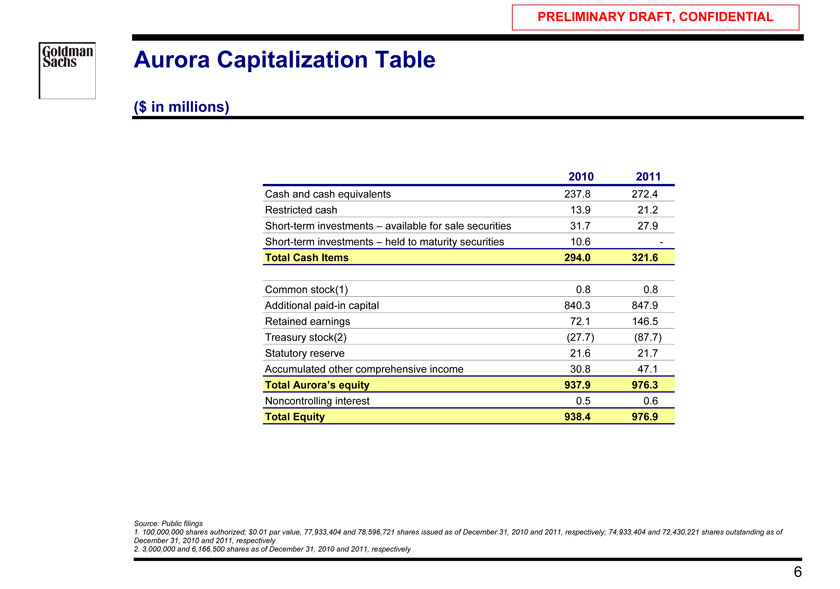
Aurora Capitalization Table
($ in millions)
2010 2011
Cash and cash equivalents 237.8 272.4 Restricted cash 13.9 21.2 Short-term investments – available for sale securities 31.7 27.9 Short-term investments – held to maturity securities 10.6 —
Total Cash Items 294.0 321.6
Common stock(1) 0.8 0.8 Additional paid-in capital 840.3 847.9 Retained earnings 72.1 146.5 Treasury stock(2) (27.7) (87.7) Statutory reserve 21.6 21.7 Accumulated other comprehensive income 30.8 47.1
Total Aurora’s equity 937.9 976.3
Noncontrolling interest 0.5 0.6
Total Equity 938.4 976.9
Source: Public filings
1. 100,000,000 shares authorized; $0.01 par value, 77,933,404 and 78,596,721 shares issued as of December 31, 2010 and 2011, respectively; 74,933,404 and 72,430,221 shares outstanding as of December 31, 2010 and 2011, respectively
2. 3,000,000 and 6,166,500 shares as of December 31, 2010 and 2011, respectively
Additional Materials 45
PRELIMINARY DRAFT, CONFIDENTIAL
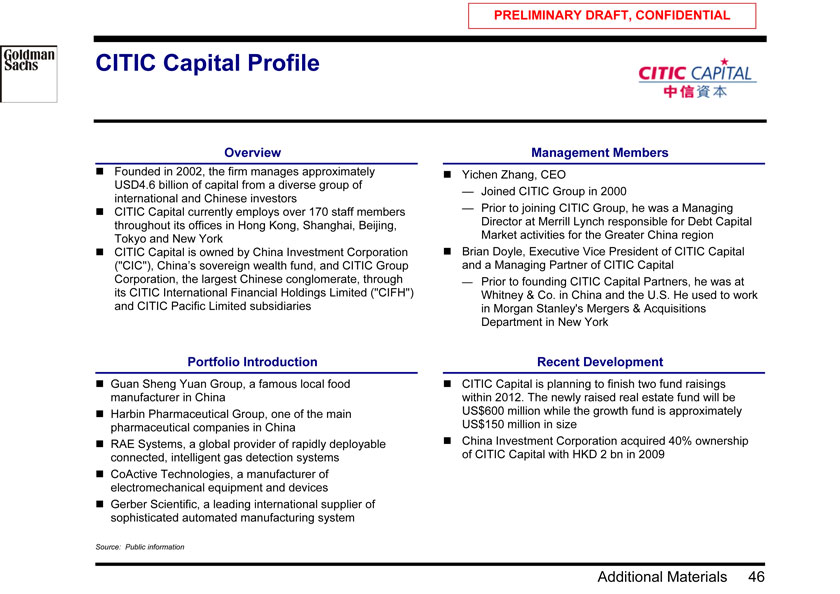
CITIC Capital Profile
Overview Management Members
? Founded in 2002, the firm manages approximately ? Yichen Zhang, CEO USD4.6 billion of capital from a diverse group of
— Joined CITIC Group in 2000 international and Chinese investors
? CITIC Capital currently employs over 170 staff members — Prior to joining CITIC Group, he was a Managing throughout its offices in Hong Kong, Shanghai, Beijing, Director at Merrill Lynch responsible for Debt Capital Tokyo and New York Market activities for the Greater China region ? CITIC Capital is owned by China Investment Corporation ? Brian Doyle, Executive Vice President of CITIC Capital (“CIC”), China’s sovereign wealth fund, and CITIC Group and a Managing Partner of CITIC Capital Corporation, the largest Chinese conglomerate, through — Prior to founding CITIC Capital Partners, he was at its CITIC International Financial Holdings Limited (“CIFH”) Whitney & Co. in China and the U.S. He used to work and CITIC Pacific Limited subsidiaries in Morgan Stanley’s Mergers & Acquisitions Department in New York
Portfolio Introduction Recent Development
? Guan Sheng Yuan Group, a famous local food ? CITIC Capital is planning to finish two fund raisings manufacturer in China within 2012. The newly raised real estate fund will be ? Harbin Pharmaceutical Group, one of the main US$600 million while the growth fund is approximately pharmaceutical companies in China US$150 million in size ? RAE Systems, a global provider of rapidly deployable ? China Investment Corporation acquired 40% ownership connected, intelligent gas detection systems of CITIC Capital with HKD 2 bn in 2009 ? CoActive Technologies, a manufacturer of electromechanical equipment and devices ? Gerber Scientific, a leading international supplier of sophisticated automated manufacturing system
Source: Public information
Additional Materials 46
PRELIMINARY DRAFT, CONFIDENTIAL
Appendix B: Comparison of Selected Companies and Precedent Transactions
Comparison of Selected Companies and Precedent Transactions 47
PRELIMINARY DRAFT, CONFIDENTIAL
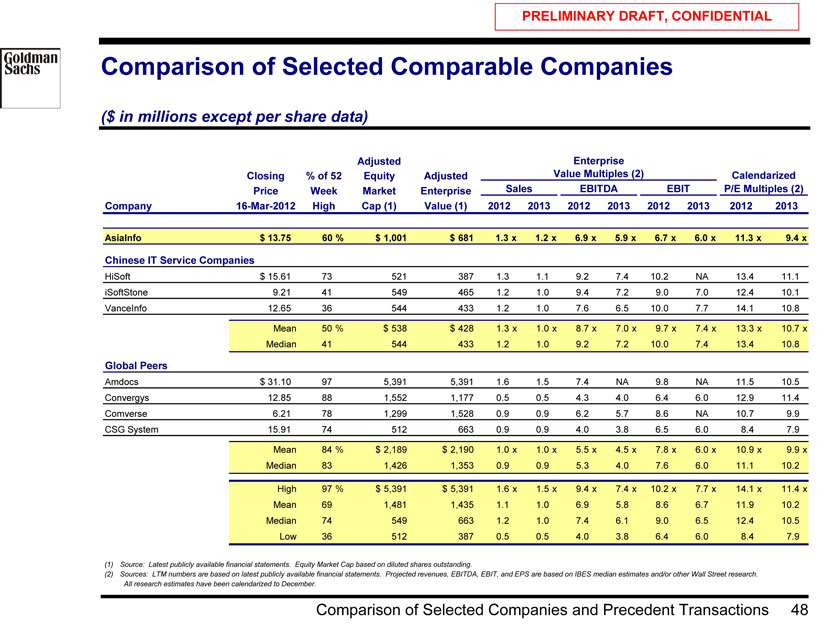
Comparison of Selected Comparable Companies
($ in millions except per share data)
Adjusted Enterprise
Closing % of 52 Equity Adjusted Value Multiples (2) Calendarized Price Week Market Enterprise Sales EBITDA EBIT P/E Multiples (2) Company 16-Mar-2012 High Cap (1) Value (1) 2012 2013 2012 2013 2012 2013 2012 2013
AsiaInfo $ 13.75 60 % $ 1,001 $ 681 1.3 x 1.2 x 6.9 x 5.9 x 6.7 x 6.0 x 11.3 x 9.4 x
Chinese IT Service Companies
HiSoft $ 15.61 73 521 387 1.3 1.1 9.2 7.4 10.2 NA 13.4 11.1 iSoftStone 9.21 41 549 465 1.2 1.0 9.4 7.2 9.0 7.0 12.4 10.1 VanceInfo 12.65 36 544 433 1.2 1.0 7.6 6.5 10.0 7.7 14.1 10.8
Mean 50 % $ 538 $ 428 1.3 x 1.0 x 8.7 x 7.0 x 9.7 x 7.4 x 13.3 x 10.7 x Median 41 544 433 1.2 1.0 9.2 7.2 10.0 7.4 13.4 10.8
Global Peers
Amdocs $ 31.10 97 5,391 5,391 1.6 1.5 7.4 NA 9.8 NA 11.5 10.5 Convergys 12.85 88 1,552 1,177 0.5 0.5 4.3 4.0 6.4 6.0 12.9 11.4 Comverse 6.21 78 1,299 1,528 0.9 0.9 6.2 5.7 8.6 NA 10.7 9.9 CSG System 15.91 74 512 663 0.9 0.9 4.0 3.8 6.5 6.0 8.4 7.9
Mean 84 % $ 2,189 $ 2,190 1.0 x 1.0 x 5.5 x 4.5 x 7.8 x 6.0 x 10.9 x 9.9 x Median 83 1,426 1,353 0.9 0.9 5.3 4.0 7.6 6.0 11.1 10.2
High 97 % $ 5,391 $ 5,391 1.6 x 1.5 x 9.4 x 7.4 x 10.2 x 7.7 x 14.1 x 11.4 x Mean 69 1,481 1,435 1.1 1.0 6.9 5.8 8.6 6.7 11.9 10.2 Median 74 549 663 1.2 1.0 7.4 6.1 9.0 6.5 12.4 10.5 Low 36 512 387 0.5 0.5 4.0 3.8 6.4 6.0 8.4 7.9
(1) | | Source: Latest publicly available financial statements. Equity Market Cap based on diluted shares outstanding. |
(2) Sources: LTM numbers are based on latest publicly available financial statements. Projected revenues, EBITDA, EBIT, and EPS are based on IBES median estimates and/or other Wall Street research. All research estimates have been calendarized to December.
Comparison of Selected Companies and Precedent Transactions 48
PRELIMINARY DRAFT, CONFIDENTIAL
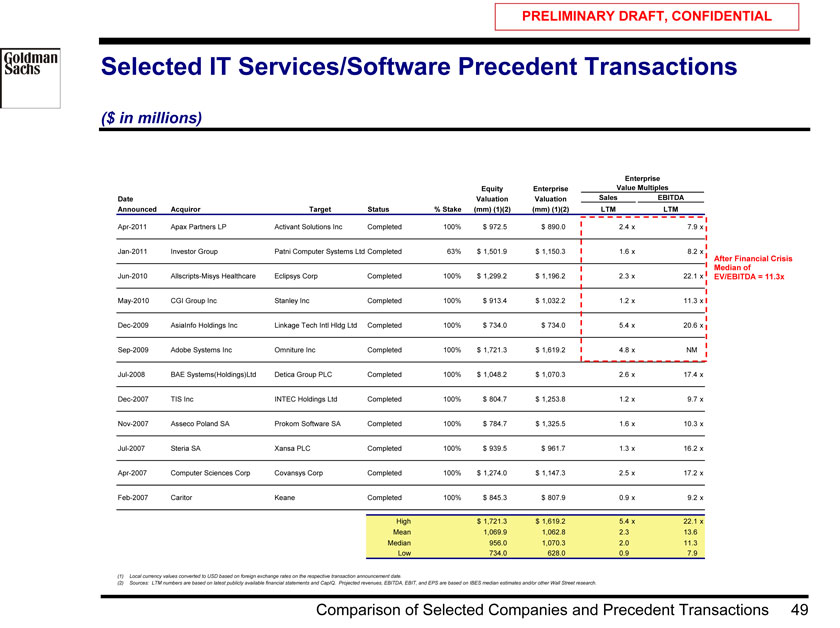
Selected IT Services/Software Precedent Transactions
($ in millions)
Enterprise Equity Enterprise Value Multiples Date Valuation Valuation Sales EBITDA Announced Acquiror Target Status % Stake (mm) (1)(2) (mm) (1)(2) LTM LTM
Apr-2011 Apax Partners LP Activant Solutions Inc Completed 100% $ 972.5 $ 890.0 2.4 x 7.9 x
Jan-2011 Investor Group Patni Computer Systems Ltd Completed 63% $ 1,501.9 $ 1,150.3 1.6 x 8.2 x After Financial Crisis Median of
Jun-2010 Allscripts-Misys Healthcare Eclipsys Corp Completed 100% $ 1,299.2 $ 1,196.2 2.3 x 22.1 x EV/EBITDA = 11.3x May-2010 CGI Group Inc Stanley Inc Completed 100% $ 913.4 $ 1,032.2 1.2 x 11.3 x Dec-2009 AsiaInfo Holdings Inc Linkage Tech Intl Hldg Ltd Completed 100% $ 734.0 $ 734.0 5.4 x 20.6 x Sep-2009 Adobe Systems Inc Omniture Inc Completed 100% $ 1,721.3 $ 1,619.2 4.8 x NM
Jul-2008 BAE Systems(Holdings)Ltd Detica Group PLC Completed 100% $ 1,048.2 $ 1,070.3 2.6 x 17.4 x Dec-2007 TIS Inc INTEC Holdings Ltd Completed 100% $ 804.7 $ 1,253.8 1.2 x 9.7 x Nov-2007 Asseco Poland SA Prokom Software SA Completed 100% $ 784.7 $ 1,325.5 1.6 x 10.3 x Jul-2007 Steria SA Xansa PLC Completed 100% $ 939.5 $ 961.7 1.3 x 16.2 x Apr-2007 Computer Sciences Corp Covansys Corp Completed 100% $ 1,274.0 $ 1,147.3 2.5 x 17.2 x Feb-2007 Caritor Keane Completed 100% $ 845.3 $ 807.9 0.9 x 9.2 x
High $ 1,721.3 $ 1,619.2 5.4 x 22.1 x Mean 1,069.9 1,062.8 2.3 13.6 Median 956.0 1,070.3 2.0 11.3 Low 734.0 628.0 0.9 7.9
(1) Local currency values converted to USD based on foreign exchange rates on the respective transaction announcement date.
(2) Sources: LTM numbers are based on latest publicly available financial statements and CapIQ. Projected revenues, EBITDA, EBIT, and EPS are based on IBES median estimates and/or other Wall Street research.
Comparison of Selected Companies and Precedent Transactions 49
PRELIMINARY DRAFT, CONFIDENTIAL
Appendix C: Weighted Average Cost of Capital
Weighted Average Cost of Capital 50
PRELIMINARY DRAFT, CONFIDENTIAL
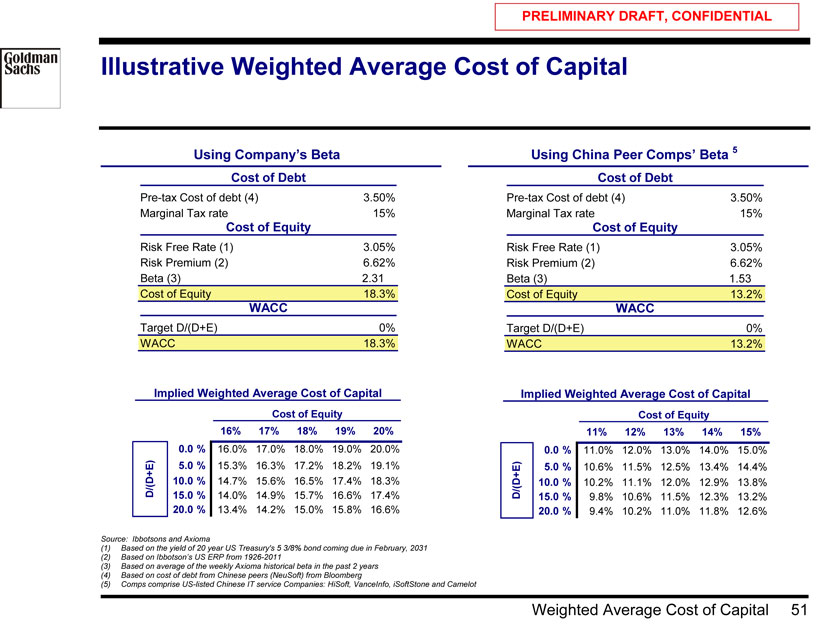
Illustrative Weighted Average Cost of Capital
Using Company’s Beta Using China Peer Comps’ Beta 5
Cost of Debt Cost of Debt
Pre-tax Cost of debt (4) 3.50% Pre-tax Cost of debt (4) 3.50% Marginal Tax rate 15% Marginal Tax rate 15%
Cost of Equity Cost of Equity
Risk Free Rate (1) 3.05% Risk Free Rate (1) 3.05% Risk Premium (2) 6.62% Risk Premium (2) 6.62% Beta (3) 2.31 Beta (3) 1.53 Cost of Equity 18.3% Cost of Equity 13.2%
WACC WACC
Target D/(D+E) 0% Target D/(D+E) 0% WACC 18.3% WACC 13.2%
Implied Weighted Average Cost of Capital Implied Weighted Average Cost of Capital
Cost of Equity Cost of Equity
18% 16% 17% 18% 19% 20% 13% 11% 12% 13% 14% 15%
0.0 % 16.0% 17.0% 18.0% 19.0% 20.0% 0.0 % 11.0% 12.0% 13.0% 14.0% 15.0% 5.0 % 15.3% 16.3% 17.2% 18.2% 19.1% 5.0 % 10.6% 11.5% 12.5% 13.4% 14.4% D/(D+E) 10.0 % 14.7% 15.6% 16.5% 17.4% 18.3% 10.0 % 10.2% 11.1% 12.0% 12.9% 13.8%
15.0 % 14.0% 14.9% 15.7% 16.6% 17.4% D/(D+E) 15.0 % 9.8% 10.6% 11.5% 12.3% 13.2%
20.0 % 13.4% 14.2% 15.0% 15.8% 16.6% 20.0 % 9.4% 10.2% 11.0% 11.8% 12.6%
Source: Ibbotsons and Axioma
(1) Based on the yield of 20 year US Treasury’s 5 3/8% bond coming due in February, 2031 (2) Based on Ibbotson’s US ERP from 1926-2011 (3) Based on average of the weekly Axioma historical beta in the past 2 years (4) Based on cost of debt from Chinese peers (NeuSoft) from Bloomberg
(5) | | Comps comprise US-listed Chinese IT service Companies: HiSoft, VanceInfo, iSoftStone and Camelot |
Weighted Average Cost of Capital 51
PRELIMINARY DRAFT, CONFIDENTIAL
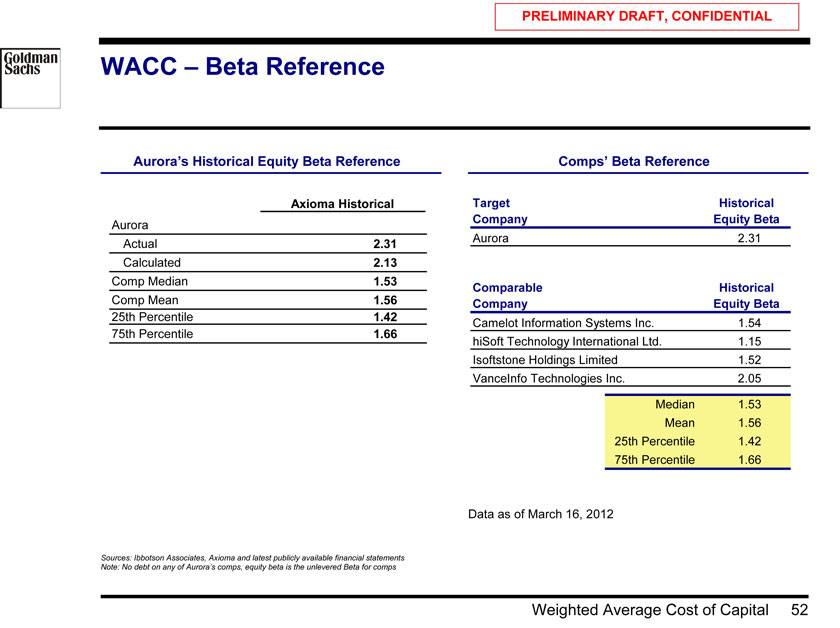
WACC – Beta Reference
Aurora’s Historical Equity Beta Reference Comps’ Beta Reference
Axioma Historical Target Historical Company Equity Beta
Aurora
Aurora 2.31
Actual 2.31 Calculated 2.13 Comp Median 1.53
Comparable Historical Comp Mean 1.56 Company Equity Beta
25th Percentile 1.42
75th Percentile 1.66 Camelot Information Systems Inc. 1.54 hiSoft Technology International Ltd. 1.15 Isoftstone Holdings Limited 1.52 VanceInfo Technologies Inc. 2.05
Median 1.53 Mean 1.56 25th Percentile 1.42 75th Percentile 1.66
Data as of March 16, 2012
Sources: Ibbotson Associates, Axioma and latest publicly available financial statements Note: No debt on any of Aurora’s comps, equity beta is the unlevered Beta for comps
Weighted Average Cost of Capital 52
PRELIMINARY DRAFT, CONFIDENTIAL
Project Aurora
Special Committee Discussion Materials
Hypothetical Sensitivities to Projections
Goldman Sachs (Asia) L.L.C. March 21, 2012
PRELIMINARY DRAFT, CONFIDENTIAL
Disclaimer
Goldman Sachs (Asia) L.L.C. (“GS”) has prepared and provided these materials and GS’s related presentation (the “Confidential Information”) solely for the information and assistance of the Special Committee of the Board of Directors (the “Special Committee”) of Aurora (the “Company”) in connection with its consideration of the matters referred to herein. Without GS’s prior written consent, the Confidential Information may not be circulated or referred to publicly, disclosed to or relied upon by any other person, or used or relied upon for any other purpose. Notwithstanding anything hereinto the contrary, the Company may disclose to any person the US federal income and state income tax
treatment and tax structure of any transaction described herein and all materials of any kind (including tax opinions and other tax analyses) that are provided to the Company relating to such tax treatment and tax structure, without GS imposing any limitation of any kind. The Confidential Information, including this disclaimer, is subject to, and governed by, any written agreement between the Company, the Board and/or any committee thereof, on the one hand, and GS, on the other hand.
GS and its affiliates are engaged in investment banking, commercial banking and financial advisory services, securities trading, investment management, principal investment, financial planning, benefits counseling, risk management, hedging, financing, brokerage activities and other financial and non-financial activities and services for various persons and entities. In the ordinary course of these activities and services, GS and its affiliates may at any time make or hold long or short positions and investments, as well as actively trade or effect transactions, in the equity, debt and other securities (or related derivative securities) and financial instruments (including bank loans and other obligations) of third parties, the Company, any other party to any transaction and any of their respective affiliates or any currency or commodity that may be involved in any transaction for their own account and for the accounts of their customers.
The Confidential Information has been prepared and based on information obtained by GS from publicly available sources, the Company’s management and/or other sources. In preparing the Confidential Information, GS has relied upon and assumed, without assuming any responsibility for independent verification, the accuracy and completeness of all of the financial, legal, regulatory, tax, accounting and other information provided to, discussed with or reviewed by GS, and GS does not assume any liability for any such information. GS does not provide accounting, tax, legal or regulatory advice. GS’s role in any due diligence review is limited solely to performing such a review as it shall deem necessary to support its own advice and analysis and shall not be on behalf of the Company. Analyses based upon forecasts of future results are not necessarily indicative of actual future results, which may be significantly more or less favorable than suggested by these analyses, and GS does not assume responsibility if future results are materially different from those forecast.
GS has not made an independent evaluation or appraisal of the assets and liabilities of the Company or any other person and has no obligation to evaluate the solvency of the Company or any person under any law. The analyses in the Confidential Information are not appraisals nor do they necessarily reflect the prices at which businesses or securities actually may be sold or purchased. The Confidential Information does not address the underlying business decision of the Company to engage in any transaction, or the relative merits of any strategic alternative referred to herein as compared to any other alternative that may be available to the Company. The Confidential Information is necessarily based on economic, monetary, market and other conditions as in effect on, and the information made available to GS as of, the date of such Confidential Information and GS assumes no responsibility for updating or revising the Confidential Information.
PRELIMINARY DRAFT, CONFIDENTIAL
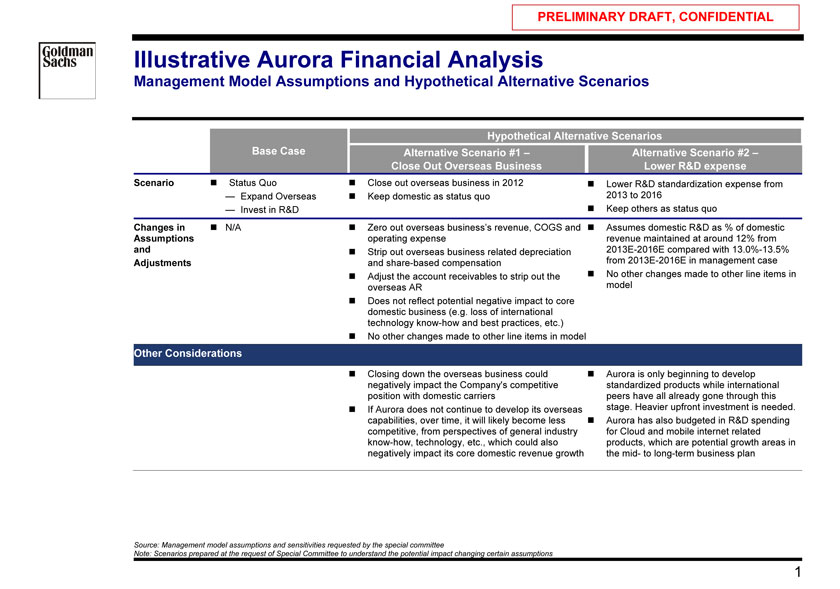
Illustrative Aurora Financial Analysis
Management Model Assumptions and Hypothetical Alternative Scenarios
Hypothetical Alternative Scenarios
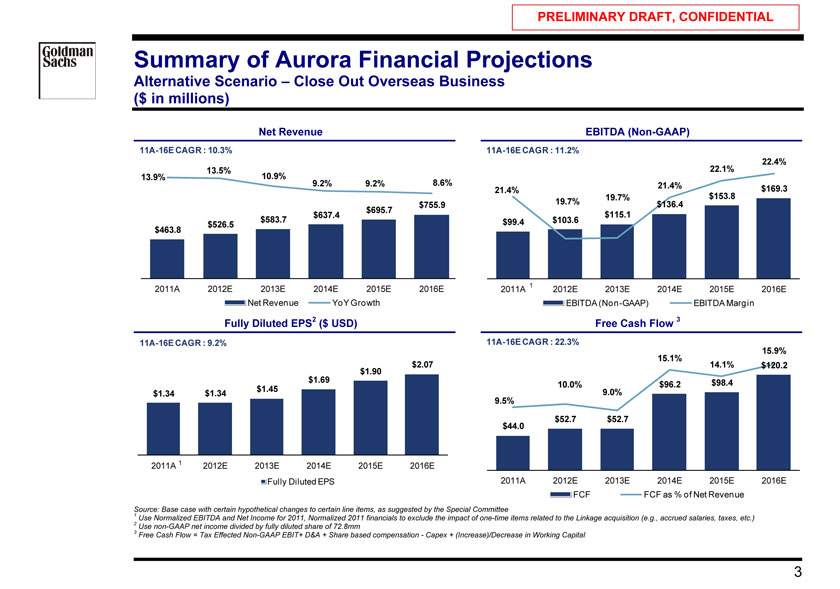
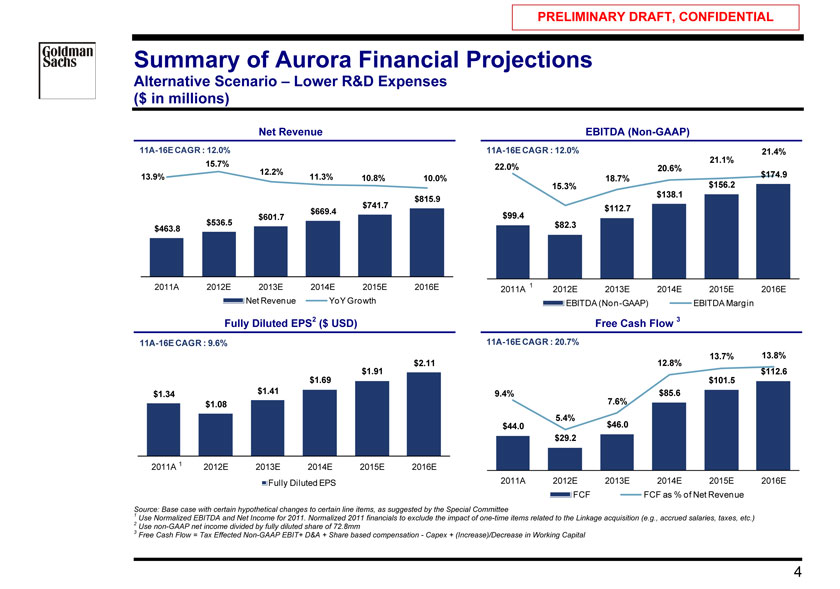
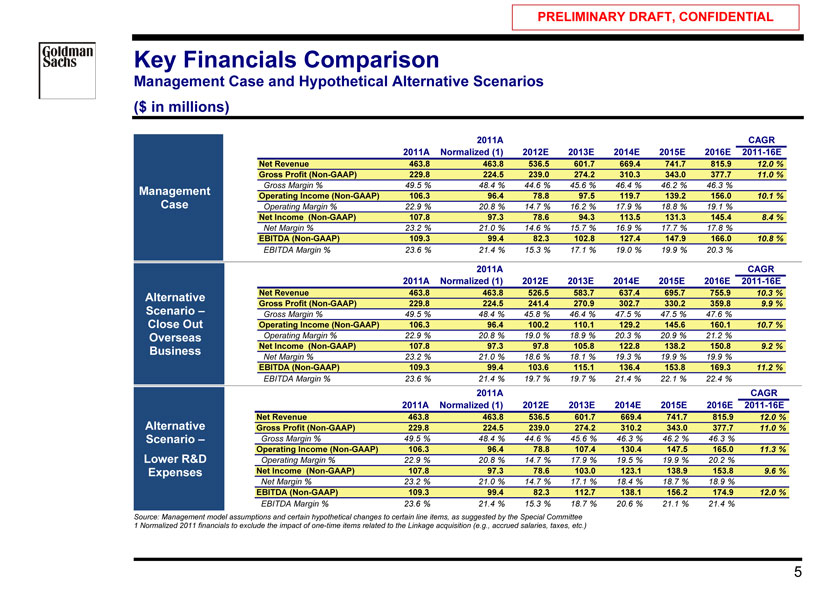
Base Case Alternative Scenario #1 – Alternative Scenario #2 – Close Out Overseas Business Lower R&D expense
Scenario ? Status Quo ? Close out overseas business in 2012 ? Lower R&D standardization expense from
— Expand Overseas ? Keep domestic as status quo 2013 to 2016
— Invest in R&D ? Keep others as status quo
Changes in ? N/A ? Zero out overseas business’s revenue, COGS and ? Assumes domestic R&D as % of domestic Assumptions operating expense revenue maintained at around 12% from and ? Strip out overseas business related depreciation 2013E-2016E compared with 13.0%-13.5% Adjustments and share-based compensation from 2013E-2016E in management case ? Adjust the account receivables to strip out the ? No other changes made to other line items in overseas AR model ? Does not reflect potential negative impact to core domestic business (e.g. loss of international technology know-how and best practices, etc.) ? No other changes made to other line items in model
Other Considerations
? Closing down the overseas business could ? Aurora is only beginning to develop negatively impact the Company’s competitive standardized products while international position with domestic carriers peers have all already gone through this ? If Aurora does not continue to develop its overseas stage. Heavier upfront investment is needed. capabilities, over time, it will likely become less ? Aurora has also budgeted in R&D spending competitive, from perspectives of general industry for Cloud and mobile internet related know-how, technology, etc., which could also products, which are potential growth areas in negatively impact its core domestic revenue growth the mid—to long-term business plan
Source: Management model assumptions and sensitivities requested by the special committee
Note: Scenarios prepared at the request of Special Committee to understand the potential impact changing certain assumptions
PRELIMINARY DRAFT, CONFIDENTIAL
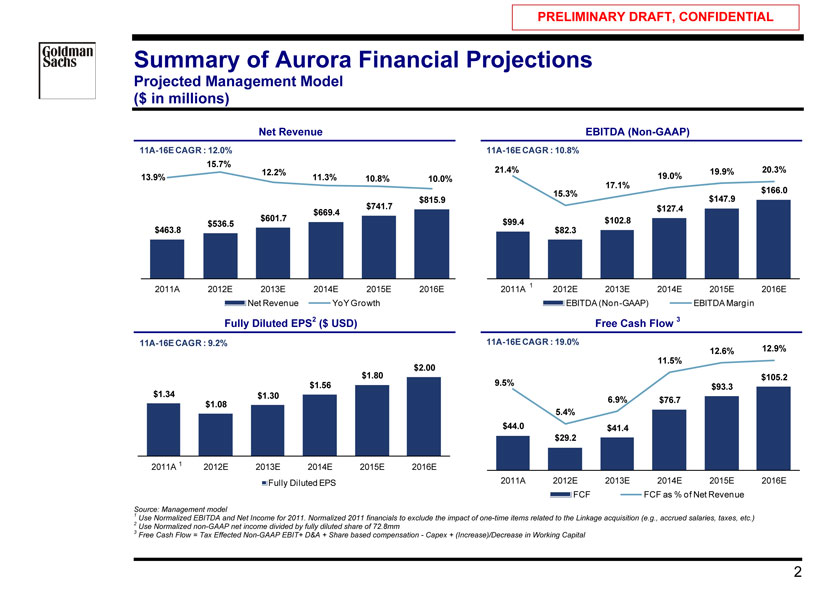
Summary of Aurora Financial Projections
Projected Management Model ($ in millions)
Net Revenue EBITDA (Non-GAAP)
11A-16E CAGR : 12.0% 11A-16E CAGR : 10.8%
15.7%
12.2% 21.4% 19.9% 20.3%
13.9% 11.3% 10.8% 10.0% 19.0%
17.1%
15.3% $166.0 $741.7 $815.9 $147.9 $669.4 $127.4 $601.7 $99.4 $102.8 $536.5 $463.8 $82.3
2011A 2012E 2013E 2014E 2015E 2016E 2011A 1 2012E 2013E 2014E 2015E 2016E Net Revenue YoY Growth EBITDA (Non-GAAP) EBITDA Margin
Fully Diluted EPS2 ($ USD) Free Cash Flow 3
11A-16E CAGR : 9.2% 11A-16E CAGR : 19.0%
12.6% 12.9%
11.5% $1.80 $2.00 $105.2 $1.56 9.5% $1.34 $93.3 $1.30 6.9%
$76.7 $1.08 5.4%
$44.0 $41.4
$29.2
2011A 1 2012E 2013E 2014E 2015E 2016E
Fully Diluted EPS 2011A 2012E 2013E 2014E 2015E 2016E FCF FCF as % of Net Revenue
Source: 1 Management model
2 Use Normalized EBITDA and Net Income for 2011. Normalized 2011 financials to exclude the impact of one-time items related to the Linkage acquisition (e.g., accrued salaries, taxes, etc.)
3 | | Use Normalized non-GAAP net income divided by fully diluted share of 72.8mm |
Free Cash Flow = Tax Effected Non-GAAP EBIT+ D&A + Share based compensation—Capex + (Increase)/Decrease in Working Capital
PRELIMINARY DRAFT, CONFIDENTIAL
Summary of Aurora Financial Projections
Alternative Scenario – Close Out Overseas Business ($ in millions)
Net Revenue EBITDA (Non-GAAP)
11A-16E CAGR : 10.3% 11A-16E CAGR : 11.2%
22.4%
13.5% 22.1%
13.9% 10.9%
9.2% 9.2% 8.6% 21.4%
21.4% $153.8 $169.3
19.7% $755.9 19.7% $136.4 $695.7 $637.4 $115.1 $583.7 $99.4 $103.6 $526.5 $463.8
2011A 2012E 2013E 2014E 2015E 2016E 2011A 1 2012E 2013E 2014E 2015E 2016E Net Revenue YoY Growth EBITDA (Non-GAAP) EBITDA Margin
Fully Diluted EPS2 ($ USD) Free Cash Flow 3
11A-16E CAGR : 9.2% 11A-16E CAGR : 22.3%
15.1% 15.9% $2.07 14.1% $120.2 $1.69 $1.90
10.0% $96.2 $98.4 $1.45 9.0% $1.34 $1.34 9.5%
$52.7 $52.7
$44.0
2011A 1 2012E 2013E 2014E 2015E 2016E
Fully Diluted EPS 2011A 2012E 2013E 2014E 2015E 2016E FCF FCF as % of Net Revenue
Source: 1 Base case with certain hypothetical changes to certain line items, as suggested by the Special Committee
2 Use Normalized EBITDA and Net Income for 2011, Normalized 2011 financials to exclude the impact of one-time items related to the Linkage acquisition (e.g., accrued salaries, taxes, etc.)
3 | | Use non-GAAP net income divided by fully diluted share of 72.8mm |
Free Cash Flow = Tax Effected Non-GAAP EBIT+ D&A + Share based compensation—Capex + (Increase)/Decrease in Working Capital
PRELIMINARY DRAFT, CONFIDENTIAL
Summary of Aurora Financial Projections
Alternative Scenario – Lower R&D Expenses ($ in millions)
Net Revenue EBITDA (Non-GAAP)
11A-16E CAGR : 12.0% 11A-16E CAGR : 12.0% 21.4%
15.7% 21.1%
22.0% 20.6%
12.2% $174.9
13.9% 11.3% 10.8% 10.0% 18.7% $156.2
15.3% $138.1 $815.9 $741.7 $112.7 $669.4 $601.7 $99.4 $536.5 $82.3 $463.8
2011A 2012E 2013E 2014E 2015E 2016E 2011A 1 2012E 2013E 2014E 2015E 2016E
Net Revenue YoY Growth EBITDA (Non-GAAP) EBITDA Margin
Fully Diluted EPS2 ($ USD) Free Cash Flow 3
11A-16E CAGR : 9.6% 11A-16E CAGR : 20.7% $2.11 12.8% 13.7% 13.8% $1.91 $112.6 $1.69 $101.5 $1.34 $1.41 9.4% $85.6 $1.08 7.6% 5.4%
$44.0 $46.0
$29.2
2011A 1 2012E 2013E 2014E 2015E 2016E
Fully Diluted EPS 2011A 2012E 2013E 2014E 2015E 2016E FCF FCF as % of Net Revenue
Source: 1 Base case with certain hypothetical changes to certain line items, as suggested by the Special Committee
2 Use Normalized EBITDA and Net Income for 2011. Normalized 2011 financials to exclude the impact of one-time items related to the Linkage acquisition (e.g., accrued salaries, taxes, etc.)
3 | | Use non-GAAP net income divided by fully diluted share of 72.8mm |
Free Cash Flow = Tax Effected Non-GAAP EBIT+ D&A + Share based compensation—Capex + (Increase)/Decrease in Working Capital
PRELIMINARY DRAFT, CONFIDENTIAL
Key Financials Comparison
Management Case and Hypothetical Alternative Scenarios ($ in millions)
2011A CAGR 2011A Normalized (1) 2012E 2013E 2014E 2015E 2016E 2011-16E
Net Revenue 463.8 463.8 536.5 601.7 669.4 741.7 815.9 12.0 % Gross Profit (Non-GAAP) 229.8 224.5 239.0 274.2 310.3 343.0 377.7 11.0 %
Gross Margin % 49.5 % 48.4 % 44.6 % 45.6 % 46.4 % 46.2 % 46.3 %
Management Operating Income (Non-GAAP) 106.3 96.4 78.8 97.5 119.7 139.2 156.0
10.1 %
Case Operating Margin % 22.9 % 20.8 % 14.7 % 16.2 % 17.9 % 18.8 % 19.1 %
Net Income (Non-GAAP) 107.8 97.3 78.6 94.3 113.5 131.3 145.4 8.4 %
Net Margin % 23.2 % 21.0 % 14.6 % 15.7 % 16.9 % 17.7 % 17.8 %
EBITDA (Non-GAAP) 109.3 99.4 82.3 102.8 127.4 147.9 166.0 10.8 %
EBITDA Margin % 23.6 % 21.4 % 15.3 % 17.1 % 19.0 % 19.9 % 20.3 %
2011A CAGR 2011A Normalized (1) 2012E 2013E 2014E 2015E 2016E 2011-16E
Alternative Net Revenue 463.8 463.8 526.5 583.7 637.4 695.7 755.9 10.3 % Gross Profit (Non-GAAP) 229.8 224.5 241.4 270.9 302.7 330.2 359.8 9.9 %
Scenario – Gross Margin % 49.5 % 48.4 % 45.8 % 46.4 % 47.5 % 47.5 % 47.6 %
Close Out Operating Income (Non-GAAP) 106.3 96.4 100.2 110.1 129.2 145.6 160.1 10.7 %
Overseas Operating Margin % 22.9 % 20.8 % 19.0 % 18.9 % 20.3 % 20.9 % 21.2 %
Business Net Income (Non-GAAP) 107.8 97.3 97.8 105.8 122.8 138.2 150.8 9.2 %
Net Margin % 23.2 % 21.0 % 18.6 % 18.1 % 19.3 % 19.9 % 19.9 %
EBITDA (Non-GAAP) 109.3 99.4 103.6 115.1 136.4 153.8 169.3 11.2 %
EBITDA Margin % 23.6 % 21.4 % 19.7 % 19.7 % 21.4 % 22.1 % 22.4 %
2011A CAGR 2011A Normalized (1) 2012E 2013E 2014E 2015E 2016E 2011-16E
Net Revenue 463.8 463.8 536.5 601.7 669.4 741.7 815.9 12.0 % Alternative Gross Profit (Non-GAAP) 229.8 224.5 239.0 274.2 310.2 343.0 377.7 11.0 %
Scenario – Gross Margin % 49.5 % 48.4 % 44.6 % 45.6 % 46.3 % 46.2 % 46.3 %
Lower R&D Operating Income (Non-GAAP) 106.3 96.4 78.8 107.4 130.4 147.5 165.0 11.3 %
Operating Margin % 22.9 % 20.8 % 14.7 % 17.9 % 19.5 % 19.9 % 20.2 %
Expenses Net Income (Non-GAAP) 107.8 97.3 78.6 103.0 123.1 138.9 153.8 9.6 %
Net Margin % 23.2 % 21.0 % 14.7 % 17.1 % 18.4 % 18.7 % 18.9 %
EBITDA (Non-GAAP) 109.3 99.4 82.3 112.7 138.1 156.2 174.9 12.0 %
EBITDA Margin % 23.6 % 21.4 % 15.3 % 18.7 % 20.6 % 21.1 % 21.4 %
Source: Management model assumptions and certain hypothetical changes to certain line items, as suggested by the Special Committee
1 Normalized 2011 financials to exclude the impact of one-time items related to the Linkage acquisition (e.g., accrued salaries, taxes, etc.)
PRELIMINARY DRAFT, CONFIDENTIAL
Aurora Capitalization Table
($ in millions)
2010 2011
Cash and cash equivalents 237.8 272.4 Restricted cash 13.9 21.2 Short-term investments – available for sale securities 31.7 27.9 Short-term investments – held to maturity securities 10.6 —
Total Cash Items 294.0 321.6
Common stock(1) 0.8 0.8 Additional paid-in capital 840.3 847.9 Retained earnings 72.1 146.5 Treasury stock(2) (27.7) (87.7) Statutory reserve 21.6 21.7 Accumulated other comprehensive income 30.8 47.1
Total Aurora’s equity 937.9 976.3
Noncontrolling interest 0.5 0.6
Total Equity 938.4 976.9
Source: Public filings
1. 100,000,000 shares authorized; $0.01 par value, 77,933,404 and 78,596,721 shares issued as of December 31, 2010 and 2011, respectively; 74,933,404 and 72,430,221 shares outstanding as of December 31, 2010 and 2011, respectively
2. 3,000,000 and 6,166,500 shares as of December 31, 2010 and 2011, respectively
