Exhibit (c) (6)
|
CONFIDENTIAL – PRELIMINARY DRAFT Project Aurora Special Committee Discussion Material Strictly Private and Confidential Goldman Sachs (Asia) LLC May 2013
|
CONFIDENTIAL – PRELIMINARY DRAFT Disclaimer Goldman Sachs (Asia) L.L.C. (“GS”) has prepared and provided these materials and GS’s related presentation (the “Confidential Information”) solely for the information and assistance of the Special Committee of the Board of Directors (the “Special Committee”) of Aurora (the “Company”) in connection with its consideration of the matters referred to herein. Without GS’s prior written consent, the Confidential Information may not be circulated or referred to publicly, disclosed to or relied upon by any other person, or used or relied upon for any other purpose. Notwithstanding anything herein to the contrary, the Company may disclose to any person the US federal income and state income tax treatment and tax structure of any transaction described herein and all materials of any kind (including tax opinions and other tax analyses) that are provided to the Company relating to such tax treatment and tax structure, without GS imposing any limitation of any kind. The Confidential Information, including this disclaimer, is subject to, and governed by, any written agreement between the Company, the Board and/or any committee thereof, on the one hand, and GS, on the other hand. GS and its affiliates are engaged in investment banking, commercial banking and financial advisory services, securities trading, investment management, principal investment, financial planning, benefits counseling, risk management, hedging, financing, brokerage activities and other financial and non-financial activities and services for various persons and entities. In the ordinary course of these activities and services, GS and its affiliates may at any time make or hold long or short positions and investments, as well as actively trade or effect transactions, in the equity, debt and other securities (or related derivative securities) and financial instruments (including bank loans and other obligations) of third parties, the Company, any other party to any transaction and any of their respective affiliates or any currency or commodity that may be involved in any transaction for their own account and for the accounts of their customers. The Confidential Information has been prepared and based on information obtained by GS from publicly available sources, the Company’s management and/or other sources. In preparing the Confidential Information, GS has relied upon and assumed, without assuming any responsibility for independent verification, the accuracy and completeness of all of the financial, legal, regulatory, tax, accounting and other information provided to, discussed with or reviewed by GS, and GS does not assume any liability for any such information discussed with or reviewed by GS. GS has assumed that all forecasts provided to, discussed with or reviewed by GS have been reasonably prepared and reflect the best currently available estimates and judgments of the Company. GS does not provide accounting, tax, legal or regulatory advice. GS’s role in any due diligence review is limited solely to performing such a review as it shall deem necessary to support its own advice and analysis and shall not be on behalf of the Company. Analyses based upon forecasts of future results are not necessarily indicative of actual future results, which may be significantly more or less favorable than suggested by these analyses, and GS does not assume responsibility if future results are materially different from those forecast. GS has not made an independent evaluation or appraisal of the assets and liabilities of the Company or any other person and has no obligation to evaluate the solvency of the Company or any person under any law. The analyses in the Confidential Information are not appraisals nor do they necessarily reflect the prices at which businesses or securities actually may be sold or purchased. The Confidential Information does not address the underlying business decision of the Company to engage in any transaction, or the relative merits of any strategic alternative referred to herein as compared to any other alternative that may be available to the Company. The Confidential Information is necessarily based on economic, monetary, market and other conditions as in effect on,
and the information made available to GS as of, the date of such Confidential Information and GS assumes no responsibility for updating or revising the Confidential Information.
1 |
|
|
CONFIDENTIAL – PRELIMINARY DRAFT Table of Contents I. Aurora Situation Overview II. Financial Analysis Appendix A: Illustrative Weighted Average Cost of Capital Calculation
|
CONFIDENTIAL – PRELIMINARY DRAFT I. Aurora Situation Overview
|
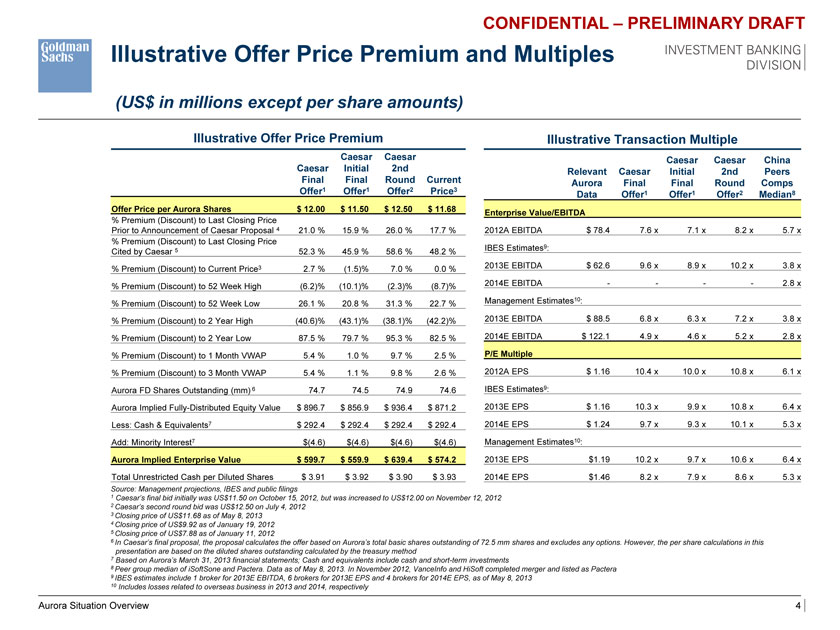
CONFIDENTIAL – PRELIMINARY DRAFT Illustrative Offer Price Premium and Multiples (US$ in millions except per share amounts) Illustrative Offer Price Premium Illustrative Transaction Multiple Caesar Caesar Caesar Caesar China Caesar Initial 2nd Relevant Caesar Initial 2nd Peers Final Final Round Current Aurora Final Final Round Comps Offer1 Offer1 Offer2 Price3 Data Offer1 Offer1 Offer2 Median8 Offer Price per Aurora Shares $ 12.00 $ 11.50 $ 12.50 $ 11.68 Enterprise Value/EBITDA % Premium (Discount) to Last Closing Price Prior to Announcement of Caesar Proposal 4 21.0 % 15.9 % 26.0 % 17.7 % 2012A EBITDA $ 78.4 7.6 x 7.1 x 8.2 x 5.7 x % Premium (Discount) to Last Closing Price Cited by Caesar 5 52.3 % 45.9 % 58.6 % 48.2 % IBES Estimates9: % Premium (Discount) to Current Price3 2.7 % (1.5)% 7.0 % 0.0 % 2013E EBITDA $ 62.6 9.6 x 8.9 x 10.2 x 3.8 x % Premium (Discount) to 52 Week High (6.2)% (10.1)% (2.3)% (8.7)% 2014E EBITDA—— 2.8 x % Premium (Discount) to 52 Week Low 26.1 % 20.8 % 31.3 % 22.7 % Management Estimates10: % Premium (Discount) to 2 Year High (40.6)% (43.1)% (38.1)% (42.2)% 2013E EBITDA $ 88.5 6.8 x 6.3 x 7.2 x 3.8 x % Premium (Discount) to 2 Year Low 87.5 % 79.7 % 95.3 % 82.5 % 2014E EBITDA $ 122.1 4.9 x 4.6 x 5.2 x 2.8 x % Premium (Discount) to 1 Month VWAP 5.4 % 1.0 % 9.7 % 2.5 % P/E Multiple % Premium (Discount) to 3 Month VWAP 5.4 % 1.1 % 9.8 % 2.6 % 2012A EPS $ 1.16 10.4 x 10.0 x 10.8 x 6.1 x Aurora FD Shares Outstanding (mm) 6 74.7 74.5 74.9 74.6 IBES Estimates9: Aurora Implied Fully-Distributed Equity Value $ 896.7 $ 856.9 $ 936.4 $ 871.2 2013E EPS $ 1.16 10.3 x 9.9 x 10.8 x 6.4 x Less: Cash & Equivalents7 $ 292.4 $ 292.4 $ 292.4 $ 292.4 2014E EPS $ 1.24 9.7 x 9.3 x 10.1 x 5.3 x Add: Minority Interest7 $(4.6) $(4.6) $(4.6) $(4.6) Management Estimates10: Aurora Implied Enterprise Value $ 599.7 $ 559.9 $ 639.4 $ 574.2 2013E EPS $1.19 10.2 x 9.7 x 10.6 x 6.4 x Total Unrestricted Cash per Diluted Shares $ 3.91 $ 3.92 $ 3.90 $ 3.93 2014E EPS $1.46 8.2 x 7.9 x 8.6 x 5.3 x Source: Management projections, IBES and public filings 1 Caesar’s final bid initially was US$11.50 on October 15, 2012, but was increased to US$12.00 on November 12, 2012 2 Caesar’s second round bid was US$12.50 on July 4, 2012 3 Closing price of US$11.68 as of May 8, 2013 4 Closing price of US$9.92 as of January 19, 2012 5 Closing price of US$7.88 as of January 11, 2012 6 In Caesar’s final proposal, the proposal calculates the offer based on Aurora’s total basic shares outstanding of 72.5 mm shares and excludes any options. However, the per share calculations in this presentation are based on the diluted shares outstanding calculated by the treasury method 7 Based on Aurora’s March 31, 2013 financial statements; Cash and equivalents include cash and short-term investments 8 Peer group median of iSoftSone and Pactera. Data as of May 8, 2013. In November 2012, VanceInfo and HiSoft completed merger and listed as Pactera 9 IBES estimates include 1 broker for 2013E EBITDA, 6 brokers for 2013E EPS and 4 brokers for 2014E EPS, as of May 8, 2013 10 Includes losses related to overseas business in 2013 and 2014, respectively Aurora Situation Overview 4
|
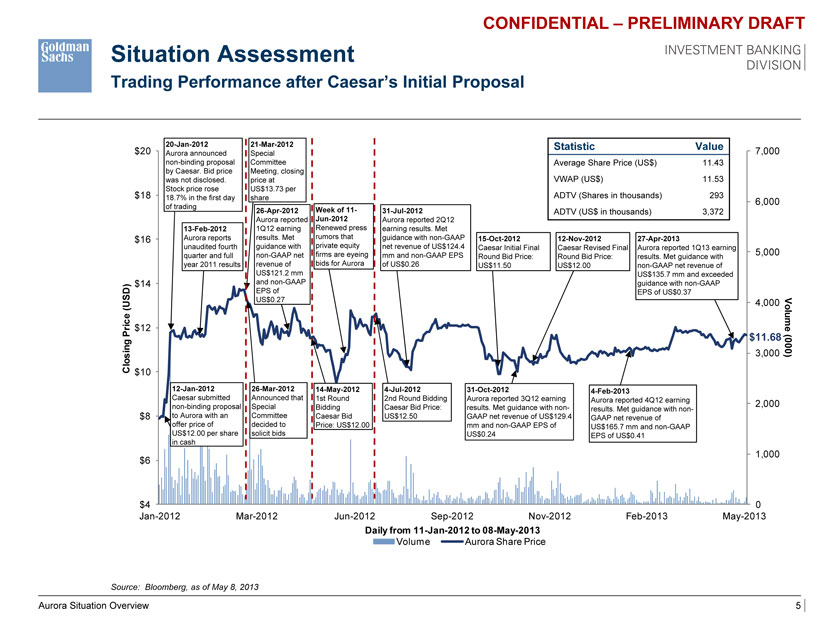
CONFIDENTIAL – PRELIMINARY DRAFT Situation Assessment Trading Performance after Caesar’s Initial Proposal 20-Jan-2012 21-Mar-2012 Statistic Value $20 Aurora announced Special 7,000 non-binding proposal Committee Average Share Price (US$) 11.43 by Caesar. Bid price Meeting, closing was not disclosed. price at VWAP (US$) 11.53 Stock price rose US$13.73 per $18 18.7% in the first day share ADTV (Shares in thousands) 293 6,000 of trading Week of 11-26-Apr-2012 31-Jul-2012 ADTV (US$ in thousands) 3,372 Aurora reported Jun-2012 Aurora reported 2Q12 13-Feb-2012 1Q12 earning Renewed press earning results. Met $16 Aurora reports results. Met rumors that guidance with non-GAAP 15-Oct-2012 12-Nov-2012 27-Apr-2013 unaudited fourth guidance with private equity net revenue of US$124.4 Caesar Initial Final Caesar Revised Final Aurora reported 1Q13 earning quarter and full non-GAAP net firms are eyeing mm and non-GAAP EPS 5,000 Round Bid Price: Round Bid Price: results. Met guidance with year 2011 results revenue of bids for Aurora of US$0.26 US$11.50 US$12.00 non-GAAP net revenue of US$121.2 mm US$135.7 mm and exceeded $14 and non-GAAP guidance with non-GAAP (USD) EPS of EPS of US$0.37 US$0.27 4,000 Volume Price $12 $11.68 ng (00 Closi 3,000 0) $10 12-Jan-2012 26-Mar-2012 14-May-2012 4-Jul-2012 31-Oct-2012 4-Feb-2013 Caesar submitted Announced that 1st Round 2nd Round Bidding Aurora reported 3Q12 earning Aurora reported 4Q12 earning non-binding proposal Special Bidding Caesar Bid Price: results. Met guidance with non—2,000 results. Met guidance with non-$8 to Aurora with an Committee Caesar Bid US$12.50 GAAP net revenue of US$129.4 GAAP net revenue of offer price of decided to Price: US$12.00 mm and non-GAAP EPS of US$165.7 mm and non-GAAP US$12.00 per share solicit bids US$0.24 EPS of US$0.41 in cash 1,000 $6 $4 0 Jan-2012 Mar-2012 Jun-2012 Sep-2012 Nov-2012 Feb-2013 May-2013 Daily from 11-Jan-2012 to 08-May-2013 Volume Aurora Share Price Source: Bloomberg, as of May 8, 2013 Aurora Situation Overview 5
|
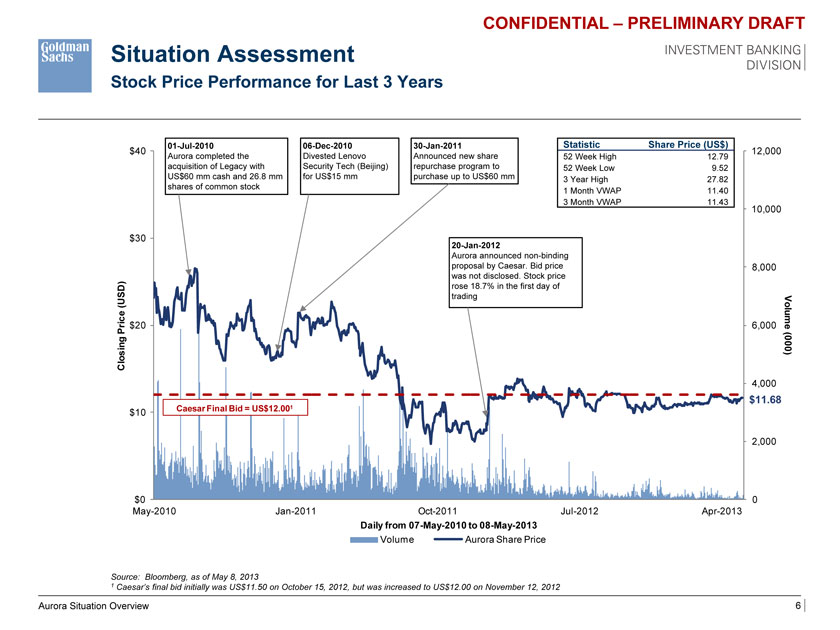
CONFIDENTIAL – PRELIMINARY DRAFT Situation Assessment Stock Price Performance for Last 3 Years 01-Jul-2010 06-Dec-2010 30-Jan-2011 Statistic Share Price (US$) $40 12,000 Aurora completed the Divested Lenovo Announced new share 52 Week High 12.79 acquisition of Legacy with Security Tech (Beijing) repurchase program to 52 Week Low 9.52 US$60 mm cash and 26.8 mm for US$15 mm purchase up to US$60 mm 3 Year High 27.82 shares of common stock 1 Month VWAP 11.40 3 Month VWAP 11.43 10,000 $30 20-Jan-2012 Aurora announced non-binding proposal by Caesar. Bid price 8,000 was not disclosed. Stock price (USD) rose 18.7% in the first day of trading Volume $20 6,000 ing Price (000 Clos ) 4,000 $11.68 $10 Caesar Final Bid = US$12.001 2,000 $0 0 May-2010 Jan-2011 Oct-2011 Jul-2012 Apr-2013 Daily from 07-May-2010 to 08-May-2013 Volume Aurora Share Price Source: Bloomberg, as of May 8, 2013 1 Caesar’s final bid initially was US$11.50 on October 15, 2012, but was increased to US$12.00 on November 12, 2012 Aurora Situation Overview 6
|
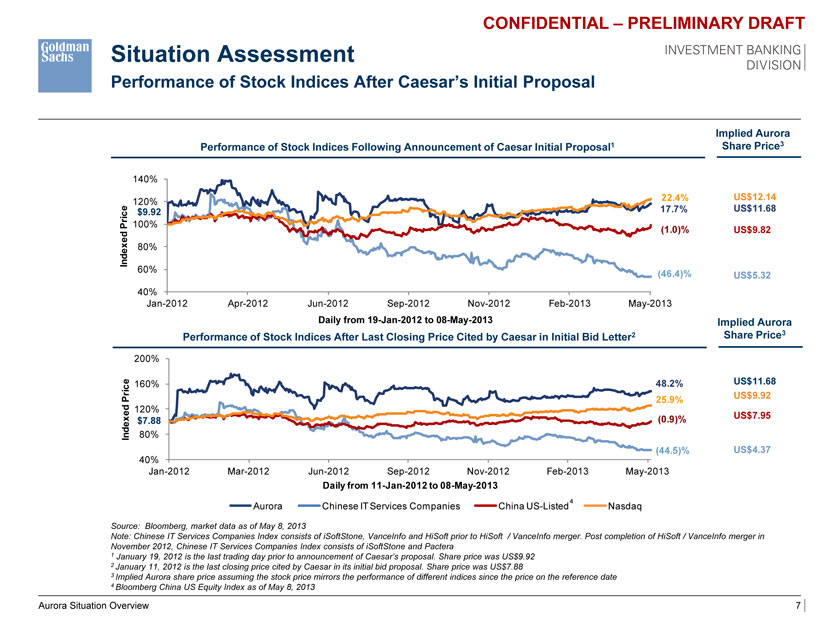
CONFIDENTIAL – PRELIMINARY DRAFT Situation Assessment Performance of Stock Indices After Caesar’s Initial Proposal Implied Aurora Performance of Stock Indices Following Announcement of Caesar Initial Proposal1 Share Price3 140% 22.4% US$12.14 120% $9.92 17.7% US$11.68 Price 100% (1.0)% US$9.82 Indexed 80% 60% (46.4)% US$5.32 40% Jan-2012 Apr-2012 Jun-2012 Sep-2012 Nov-2012 Feb-2013 May-2013 Daily from 19-Jan-2012 to 08-May-2013 Implied Aurora Performance of Stock Indices After Last Closing Price Cited by Caesar in Initial Bid Letter2 Share Price3 200% 160% 48.2% US$11.68 25.9% US$9.92 120% xed Price (0.9)% US$7.95 $7.88 Inde 80% (44.5)% US$4.37 40% Jan-2012 Mar-2012 Jun-2012 Sep-2012 Nov-2012 Feb-2013 May-2013 Daily from 11-Jan-2012 to 08-May-2013 4 Aurora Chinese IT Services Companies China US-Listed Nasdaq Source: Bloomberg, market data as of May 8, 2013 Note: Chinese IT Services Companies Index consists of iSoftStone, VanceInfo and HiSoft prior to HiSoft / VanceInfo merger. Post completion of HiSoft / VanceInfo merger in November 2012, Chinese IT Services Companies Index consists of iSoftStone and Pactera 1 January 19, 2012 is the last trading day prior to announcement of Caesar’s proposal. Share price was US$9.92 2 January 11, 2012 is the last closing price cited by Caesar in its initial bid proposal. Share price was US$7.88 3 Implied Aurora share price assuming the stock price mirrors the performance of different indices since the price on the reference date 4 Bloomberg China US Equity Index as of May 8, 2013 Aurora Situation Overview 7
|
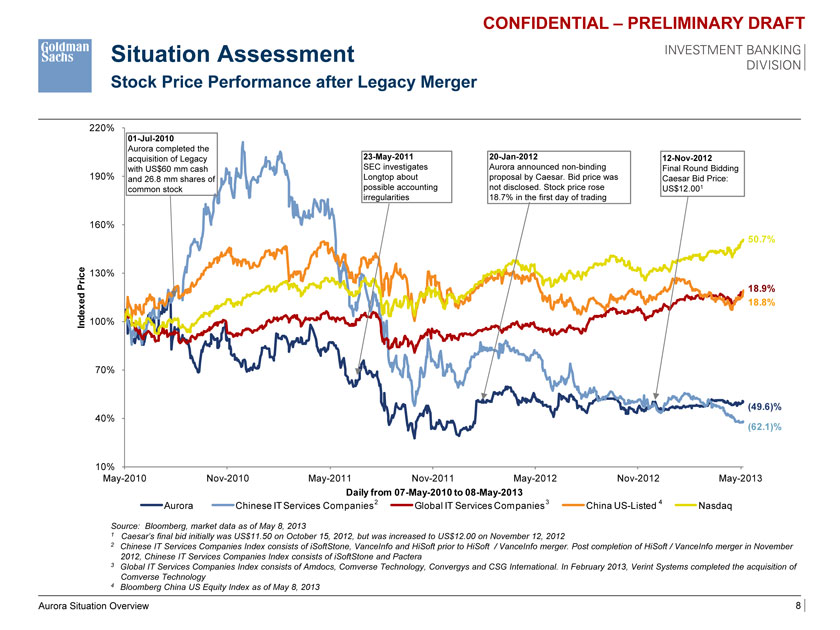
CONFIDENTIAL – PRELIMINARY DRAFT Situation Assessment Stock Price Performance after Legacy Merger 220% 01-Jul-2010 Aurora completed the acquisition of Legacy 23-May-2011 20-Jan-2012 12-Nov-2012 with US$60 mm cash SEC investigates Aurora announced non-binding Final Round Bidding 190% and 26.8 mm shares of Longtop about proposal by Caesar. Bid price was Caesar Bid Price: common stock possible accounting not disclosed. Stock price rose US$12.001 irregularities 18.7% in the first day of trading 160% 50.7% ice 130% Pr 18.9% Indexed 18.8% 100% 70% (49.6)% 40% (62.1)% 10% May-2010 Nov-2010 May-2011 Nov-2011 May-2012 Nov-2012 May-2013 Daily from 07-May-2010 to 08-May-2013 Aurora Chinese IT Services Companies2 Global IT Services Companies3 China US-Listed 4 Nasdaq Source: Bloomberg, market data as of May 8, 2013 1 Caesar’s final bid initially was US$11.50 on October 15, 2012, but was increased to US$12.00 on November 12, 2012 2 Chinese IT Services Companies Index consists of iSoftStone, VanceInfo and HiSoft prior to HiSoft / VanceInfo merger. Post completion of HiSoft / VanceInfo merger in November 2012, Chinese IT Services Companies Index consists of iSoftStone and Pactera 3 Global IT Services Companies Index consists of Amdocs, Comverse Technology, Convergys and CSG International. In February 2013, Verint Systems completed the acquisition of Comverse Technology 4 Bloomberg China US Equity Index as of May 8, 2013 Aurora Situation Overview 8
|
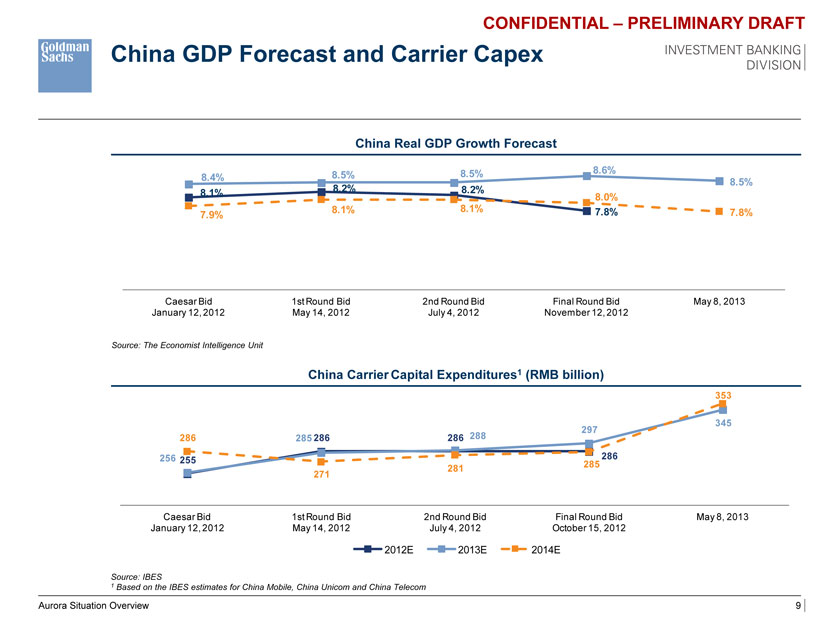
CONFIDENTIAL – PRELIMINARY DRAFT China GDP Forecast and Carrier Capex China Real GDP Growth Forecast 8.5% 8.6% 8.4% 8.5% 8.5% 8.1% 8.2% 8.2% 8.0% 8.1% 8.1% 7.8% 7.8% 7.9% Caesar Bid 1st Round Bid 2nd Round Bid Final Round Bid May 8, 2013 January 12, 2012 May 14, 2012 July 4, 2012 November 12, 2012 Source: The Economist Intelligence Unit China Carrier Capital Expenditures1 (RMB billion) 353 345 297 286 285 286 286 288 256 255 286 281 285 271 Caesar Bid 1st Round Bid 2nd Round Bid Final Round Bid May 8, 2013 January 12, 2012 May 14, 2012 July 4, 2012 October 15, 2012 2012E 2013E 2014E Source: IBES 1 Based on the IBES estimates for China Mobile, China Unicom and China Telecom Aurora Situation Overview 9
|
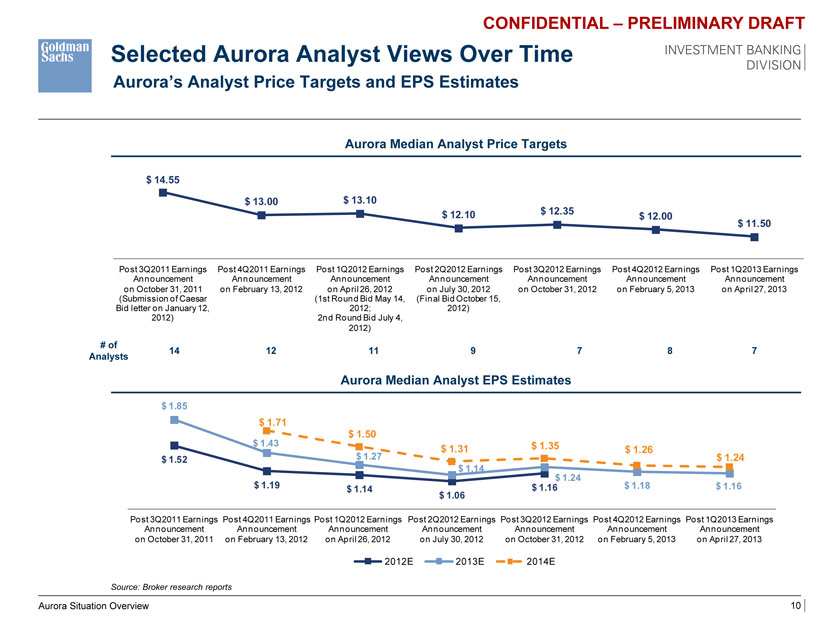
CONFIDENTIAL – PRELIMINARY DRAFT Selected Aurora Analyst Views Over Time Aurora’s Analyst Price Targets and EPS Estimates Aurora Median Analyst Price Targets $ 14.55 $ 13.00 $ 13.10 $ 12.10 $ 12.35 $ 12.00 $ 11.50 Post 3Q2011 Earnings Post 4Q2011 Earnings Post 1Q2012 Earnings Post 2Q2012 Earnings Post 3Q2012 Earnings Post 4Q2012 Earnings Post 1Q2013 Earnings Announcement Announcement Announcement Announcement Announcement Announcement Announcement on October 31, 2011 on February 13, 2012 on April 26, 2012 on July 30, 2012 on October 31, 2012 on February 5, 2013 on April 27, 2013 (Submission of Caesar (1st Round Bid May 14, (Final Bid October 15, Bid letter on January 12, 2012; 2012) 2012) 2nd Round Bid July 4, 2012) # of 14 12 11 9 7 8 7 Analysts Aurora Median Analyst EPS Estimates $ 1.85 $ 1.71 $ 1.50 $ 1.43 $ 1.35 $ 1.31 $ 1.26 $ 1.52 $ 1.27 $ 1.24 $ 1.14 $ 1.24 $ 1.19 $ 1.14 $ 1.16 $ 1.18 $ 1.16 $ 1 .06 Post 3Q2011 Earnings Post 4Q2011 Earnings Post 1Q2012 Earnings Post 2Q2012 Earnings Post 3Q2012 Earnings Post 4Q2012 Earnings Post 1Q2013 Earnings Announcement Announcement Announcement Announcement Announcement Announcement Announcement on October 31, 2011 on February 13, 2012 on April 26, 2012 on July 30, 2012 on October 31, 2012 on February 5, 2013 on April 27, 2013 2012E 2013E 2014E Source: Broker research reports Aurora Situation Overview 10
|
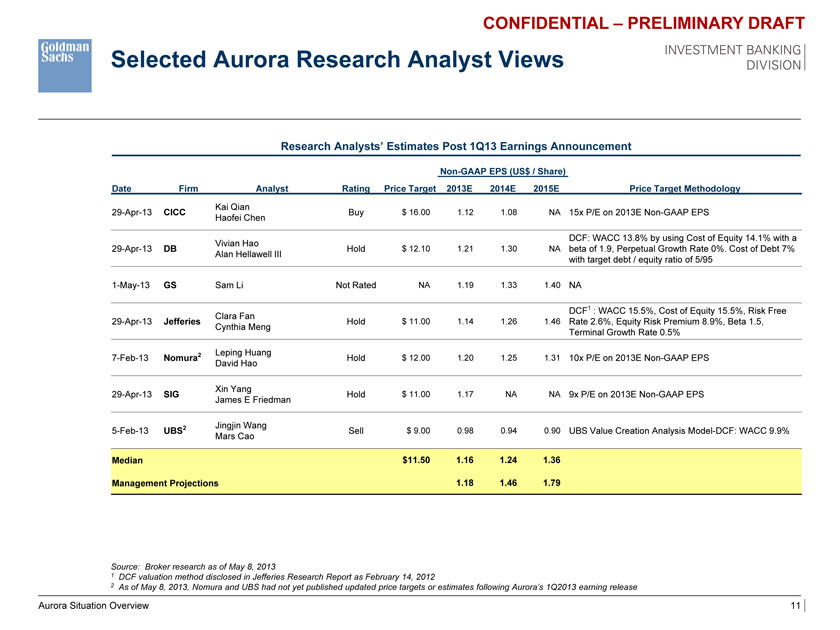
CONFIDENTIAL – PRELIMINARY DRAFT Selected Aurora Research Analyst Views Research Analysts’ Estimates Post 1Q13 Earnings Announcement Non-GAAP EPS (US$ / Share) Date Firm Analyst Rating Price Target 2013E 2014E 2015E Price Target Methodology Kai Qian 29-Apr-13 CICC Buy $ 16.00 1.12 1.08 NA 15x P/E on 2013E Non-GAAP EPS Haofei Chen DCF: WACC 13.8% by using Cost of Equity 14.1% with a Vivian Hao 29-Apr-13 DB Hold $ 12.10 1.21 1.30 NA beta of 1.9, Perpetual Growth Rate 0%. Cost of Debt 7% Alan Hellawell III with target debt / equity ratio of 5/95 1-May-13 GS Sam Li Not Rated NA 1.19 1.33 1.40 NA DCF1 : WACC 15.5%, Cost of Equity 15.5%, Risk Free Clara Fan 29-Apr-13 Jefferies Hold $ 11.00 1.14 1.26 1.46 Rate 2.6%, Equity Risk Premium 8.9%, Beta 1.5, Cynthia Meng Terminal Growth Rate 0.5% Leping Huang 7-Feb-13 Nomura2 Hold $ 12.00 1.20 1.25 1.31 10x P/E on 2013E Non-GAAP EPS David Hao Xin Yang 29-Apr-13 SIG Hold $ 11.00 1.17 NA NA 9x P/E on 2013E Non-GAAP EPS James E Friedman Jingjin Wang 5-Feb-13 UBS2 Sell $ 9.00 0.98 0.94 0.90 UBS Value Creation Analysis Model-DCF: WACC 9.9% Mars Cao Median $11.50 1.16 1.24 1.36 Management Projections 1.18 1.46 1.79 Source: Broker research as of May 8, 2013 1 DCF valuation method disclosed in Jefferies Research Report as February 14, 2012 2 As of May 8, 2013, Nomura and UBS had not yet published updated price targets or estimates following Aurora’s 1Q2013 earning release Aurora Situation Overview 11
|
CONFIDENTIAL – PRELIMINARY DRAFT II. Financial Analysis
|
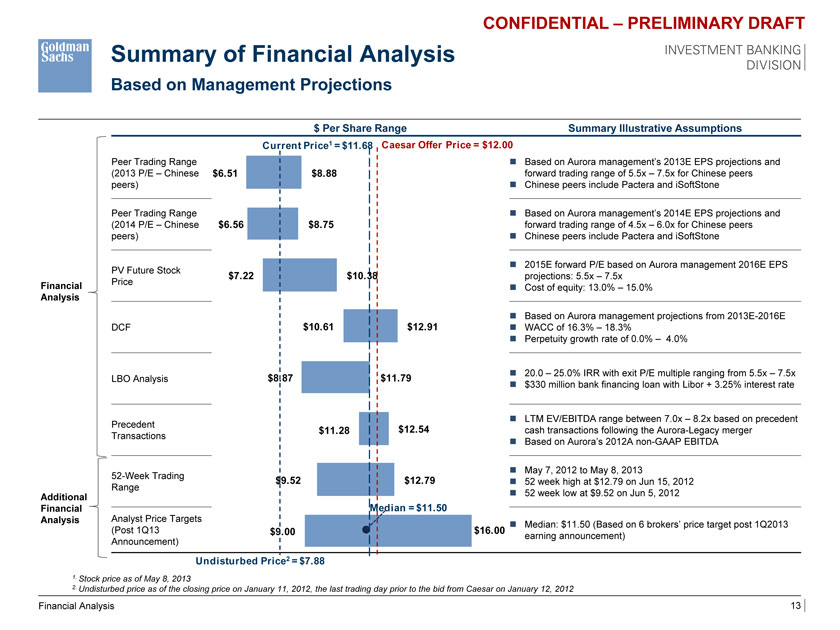
CONFIDENTIAL – PRELIMINARY DRAFT Summary of Financial Analysis Based on Management Projections $ Per Share Range Summary Illustrative Assumptions Current Price1 = $11.68 Caesar Offer Price = $12.00 Peer Trading Range ??Based on Aurora management’s 2013E EPS projections and (2013 P/E – Chinese $6.51 $8.88 forward trading range of 5.5x – 7.5x for Chinese peers peers) ??Chinese peers include Pactera and iSoftStone Peer Trading Range ??Based on Aurora management’s 2014E EPS projections and (2014 P/E – Chinese $6.56 $8.75 forward trading range of 4.5x – 6.0x for Chinese peers peers) ??Chinese peers include Pactera and iSoftStone ??2015E forward P/E based on Aurora management 2016E EPS PV Future Stock $7.22 $10.38 projections: 5.5x – 7.5x Financial Price ??Cost of equity: 13.0% – 15.0% Analysis ??Based on Aurora management projections from 2013E-2016E DCF $10.61 $12.91 ??WACC of 16.3% – 18.3%??Perpetuity growth rate of 0.0% – 4.0% ??20.0 – 25.0% IRR with exit P/E multiple ranging from 5.5x – 7.5x LBO Analysis $8.87 $11.79??$330 million bank financing loan with Libor + 3.25% interest rate ??LTM EV/EBITDA range between 7.0x – 8.2x based on precedent Precedent $11.28 $12.54 cash transactions following the Aurora-Legacy merger Transactions??Based on Aurora’s 2012A non-GAAP EBITDA ??May 7, 2012 to May 8, 2013 52-Week Trading $9.52 $12.79 ??52 week high at $12.79 on Jun 15, 2012 Range Additional ??52 week low at $9.52 on Jun 5, 2012 Financial Median = $11.50 Analysis Analyst Price Targets ??Median: $11.50 (Based on 6 brokers’ price target post 1Q2013 (Post 1Q13 $9.00 $16.00 earning announcement) Announcement) Undisturbed Price2 = $7.88 1. Stock price as of May 8, 2013 2. Undisturbed price as of the closing price on January 11, 2012, the last trading day prior to the bid from Caesar on January 12, 2012 Financial Analysis 13
|
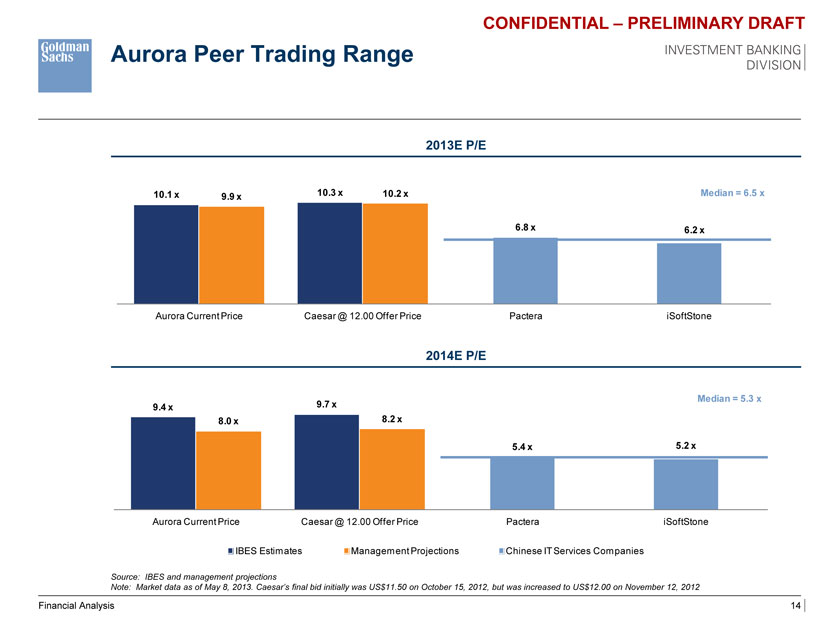
CONFIDENTIAL – PRELIMINARY DRAFT Aurora Peer Trading Range 2013E P/E 10.1 x 9.9 x 10.3 x 10.2 x Median = 6.5 x 6.8 x 6.2 x Aurora Current Price Caesar @ 12.00 Offer Price Pactera iSoftStone 2014E P/E Median = 5.3 x 9.4 x 9.7 x 8 .0 x 8.2 x 5.4 x 5.2 x Aurora Current Price Caesar @ 12.00 Offer Price Pactera iSoftStone IBES Estimates Management Projections Chinese IT Services Companies Source: IBES and management projections Note: Market data as of May 8, 2013. Caesar’s final bid initially was US$11.50 on October 15, 2012, but was increased to US$12.00 on November 12, 2012 Financial Analysis 14
|
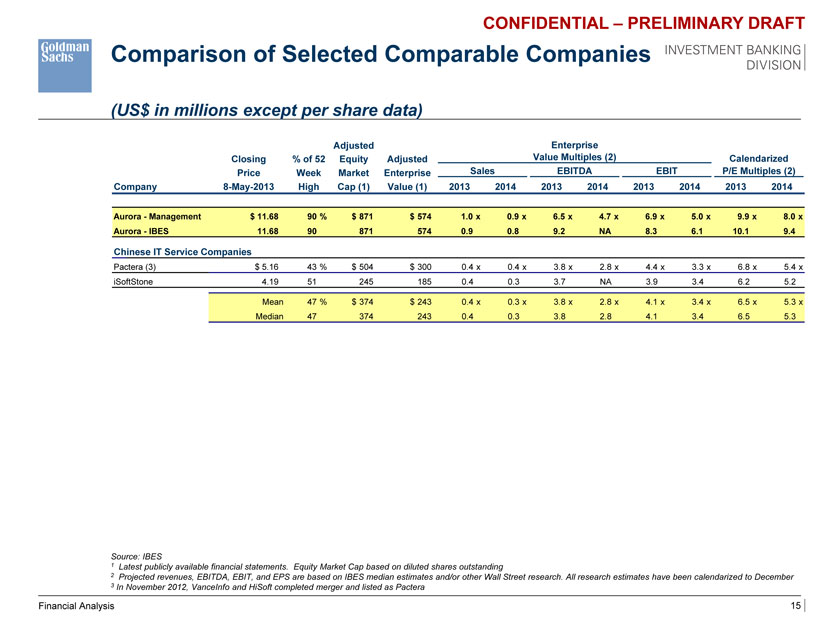
CONFIDENTIAL – PRELIMINARY DRAFT Comparison of Selected Comparable Companies (US$ in millions except per share data) Adjusted Enterprise Closing % of 52 Equity Adjusted Value Multiples (2) Calendarized Price Week Market Enterprise Sales EBITDA EBIT P/E Multiples (2) Company 8-May-2013 High Cap (1) Value (1) 2013 2014 2013 2014 2013 2014 2013 2014 Aurora—Management $ 11.68 90 % $ 871 $ 574 1.0 x 0.9 x 6.5 x 4.7 x 6.9 x 5.0 x 9.9 x 8.0 x Aurora—IBES 11.68 90 871 574 0.9 0.8 9.2 NA 8.3 6.1 10.1 9.4 Chinese IT Service Companies Pactera (3) $ 5.16 43 % $ 504 $ 300 0.4 x 0.4 x 3.8 x 2.8 x 4.4 x 3.3 x 6.8 x 5.4 x iSoftStone 4.19 51 245 185 0.4 0.3 3.7 NA 3.9 3.4 6.2 5.2 Mean 47 % $ 374 $ 243 0.4 x 0.3 x 3.8 x 2.8 x 4.1 x 3.4 x 6.5 x 5.3 x Median 47 374 243 0.4 0.3 3.8 2.8 4.1 3.4 6.5 5.3 Source: IBES 1 Latest publicly available financial statements. Equity Market Cap based on diluted shares outstanding 2 Projected revenues, EBITDA, EBIT, and EPS are based on IBES median estimates and/or other Wall Street research. All research estimates have been calendarized to December 3 In November 2012, VanceInfo and HiSoft completed merger and listed as Pactera Financial Analysis 15
|
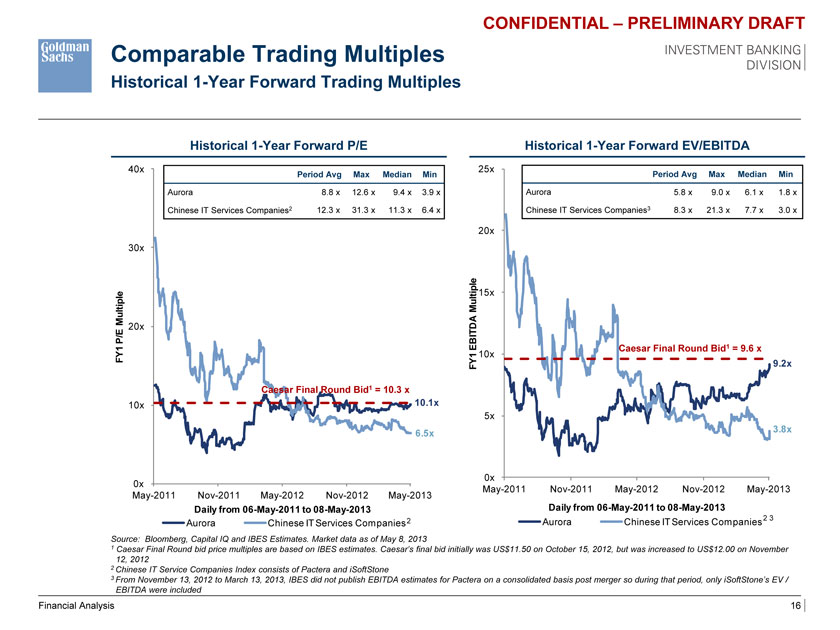
CONFIDENTIAL – PRELIMINARY DRAFT Comparable Trading Multiples Historical 1-Year Forward Trading Multiples Historical 1-Year Forward P/E Historical 1-Year Forward EV/EBITDA 40x 25x Period Avg Max Median Min Period Avg Max Median Min Aurora 8.8 x 12.6 x 9.4 x 3.9 x Aurora 5.8 x 9.0 x 6.1 x 1.8 x Chinese IT Services Companies2 12.3 x 31.3 x 11.3 x 6.4 x Chinese IT Services Companies3 8.3 x 21.3 x 7.7 x 3.0 x 20x 30x Multiple Multiple 15x EBITDA 20x 1 P/E Caesar Final Round Bid1 = 9.6 x FY 10x FY1 9.2x Caesar Final Round Bid1 = 10.3 x 10x 10.1x 5x 6.5x 3.8x 0x 0x May-2011 Nov-2011 May-2012 Nov-2012 May-2013 May-2011 Nov-2011 May-2012 Nov-2012 May-2013 Daily from 06-May-2011 to 08-May-2013 Daily from 06-May-2011 to 08-May-2013 2 Aurora Chinese IT Services Companies2 3 Aurora Chinese IT Services Companies Source: Bloomberg, Capital IQ and IBES Estimates. Market data as of May 8, 2013 1 Caesar Final Round bid price multiples are based on IBES estimates. Caesar’s final bid initially was US$11.50 on October 15, 2012, but was increased to US$12.00 on November 12, 2012 2 Chinese IT Service Companies Index consists of Pactera and iSoftStone 3 From November 13, 2012 to March 13, 2013, IBES did not publish EBITDA estimates for Pactera on a consolidated basis post merger so during that period, only iSoftStone’s EV / EBITDA were included Financial Analysis 16
|
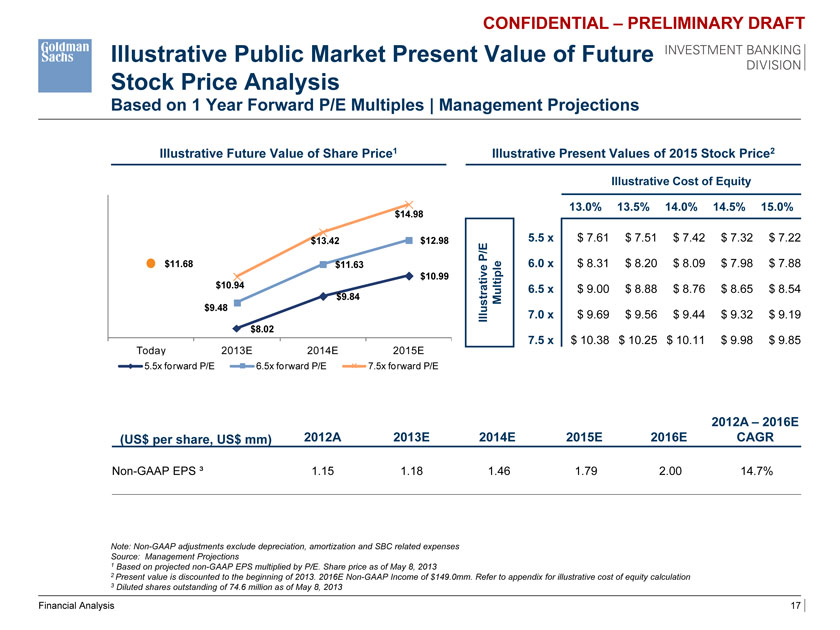
CONFIDENTIAL – PRELIMINARY DRAFT Illustrative Public Market Present Value of Future Stock Price Analysis Based on 1 Year Forward P/E Multiples | Management Projections Illustrative Future Value of Share Price1 Illustrative Present Values of 2015 Stock Price2 Illustrative Cost of Equity 13 .0% 13.5% 14.0% 14.5% 15.0% $14.98 $13.42 $12.98 5.5 x $ 7.61 $ 7.51 $ 7.42 $ 7.32 $ 7.22 $11.68 $11.63 6.0 x $ 8.31 $ 8.20 $ 8.09 $ 7.98 $ 7.88 $10.99 ive P/E iple $10.94 6.5 x $ 9.00 $ 8.88 $ 8.76 $ 8.65 $ 8.54 $9.84 Mult $9.48 Illustrat 7.0 x $ 9.69 $ 9.56 $ 9.44 $ 9.32 $ 9.19 $8.02 7.5 x $ 10.38 $ 10.25 $ 10.11 $ 9.98 $ 9.85 Today 2013E 2014E 2015E 5.5x forward P/E 6.5x forward P/E 7.5x forward P/E 2012A – 2016E (US$ per share, US$ mm) 2012A 2013E 2014E 2015E 2016E CAGR Non-GAAP EPS ³ 1.15 1.18 1.46 1.79 2.00 14.7% Note: Non-GAAP adjustments exclude depreciation, amortization and SBC related expenses Source: Management Projections 1 Based on projected non GAAP EPS multiplied by P/E. Share price as of May 8, 2013 2 Present value is discounted to the beginning of 2013. 2016E Non-GAAP Income of $149.0mm. Refer to appendix for illustrative cost of equity calculation 3 Diluted shares outstanding of 74.6 million as of May 8, 2013 Financial Analysis 17
|
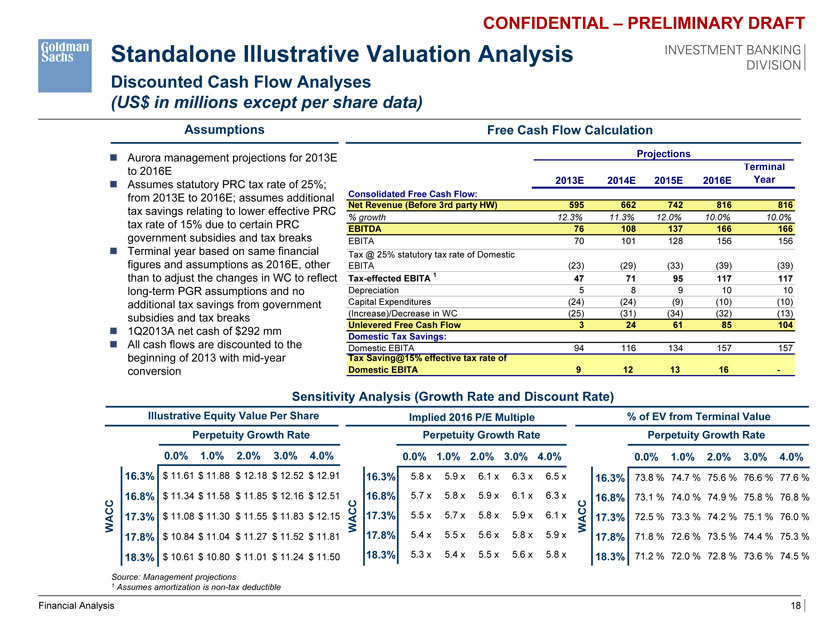
CONFIDENTIAL – PRELIMINARY DRAFT Standalone Illustrative Valuation Analysis Discounted Cash Flow Analyses (US$ in millions except per share data) Assumptions Free Cash Flow Calculation ??Aurora management projections for 2013E Projections to 2016E Terminal ??Assumes statutory PRC tax rate of 25%; 2013E 2014E 2015E 2016E Year from 2013E to 2016E; assumes additional Consolidated Free Cash Flow: Net Revenue (Before 3rd party HW) 595 662 742 816 816 tax savings relating to lower effective PRC % growth 12.3% 11.3% 12.0% 10.0% 10.0% tax rate of 15% due to certain PRC EBITDA 76 108 137 166 166 government subsidies and tax breaks EBITA 70 101 128 156 156 ??Terminal year based on same financial Tax @ 25% statutory tax rate of Domestic figures and assumptions as 2016E, other EBITA (23) (29) (33) (39) (39) than to adjust the changes in WC to reflect Tax-effected EBITA 1 47 71 95 117 117 long-term PGR assumptions and no Depreciation 5 8 9 10 10 additional tax savings from government Capital Expenditures (24) (24) (9) (10) (10) subsidies and tax breaks (Increase)/Decrease in WC (25) (31) (34) (32) (13) Unlevered Free Cash Flow 3 24 61 85 104 ??1Q2013A net cash of $292 mm Domestic Tax Savings: ??All cash flows are discounted to the Domestic EBITA 94 116 134 157 157 beginning of 2013 with mid-year Tax Saving@15% effective tax rate of conversion Domestic EBITA 9 12 13 16—Sensitivity Analysis (Growth Rate and Discount Rate) Illustrative Equity Value Per Share Implied 2016 P/E Multiple % of EV from Terminal Value Perpetuity Growth Rate Perpetuity Growth Rate Perpetuity Growth Rate 0.0% 1.0% 2.0% 3.0% 4.0% 0.0% 1.0% 2.0% 3.0% 4.0% 0.0% 1.0% 2.0% 3.0% 4.0% 16.3% $ 11.61 $ 11.88 $ 12.18 $ 12.52 $ 12.91 16.3% 5.8 x 5.9 x 6.1 x 6.3 x 6.5 x 16.3% 73.8 % 74.7��% 75.6 % 76.6 % 77.6 % 16.8% $ 11.34 $ 11. $ 11.85 $ 12.16 $ 12.51 16.8% 5.7 x 5.8 x 5.9 x 6.1 x 6.3 x 16.8% 73.1 % 74.0 % 74.9 % 75.8 % 76.8 % WACC WACC WACC 17.3% $ 11.08 $ 11.30 $ 11.55 $ 11.83 $ 12.15 17.3% 5.5 x 5.7 x 5.8 x 5.9 x 6.1 x 17.3% 72.5 % 73.3 % 74.2 % 75.1 % 76.0 % 17.8% $ 10.84 $ 11.04 $ 11.27 $ 11.52 $ 11.81 17.8% 5.4 x 5.5 x 5.6 x 5.8 x 5.9 x 17.8% 71.8 % 72.6 % 73.5 % 74.4 % 75.3 % 18.3% $ 10.61 $ 10.80 $ 11.01 $ 11.24 $ 11.50 18.3% 5.3 x 5.4 x 5.5 x 5.6 x 5.8 x 18.3% 71.2 % 72.0 % 72.8 % 73.6 % 74.5 % Source: Management projections 1 Assumes amortization is non-tax deductible Financial Analysis 18
|
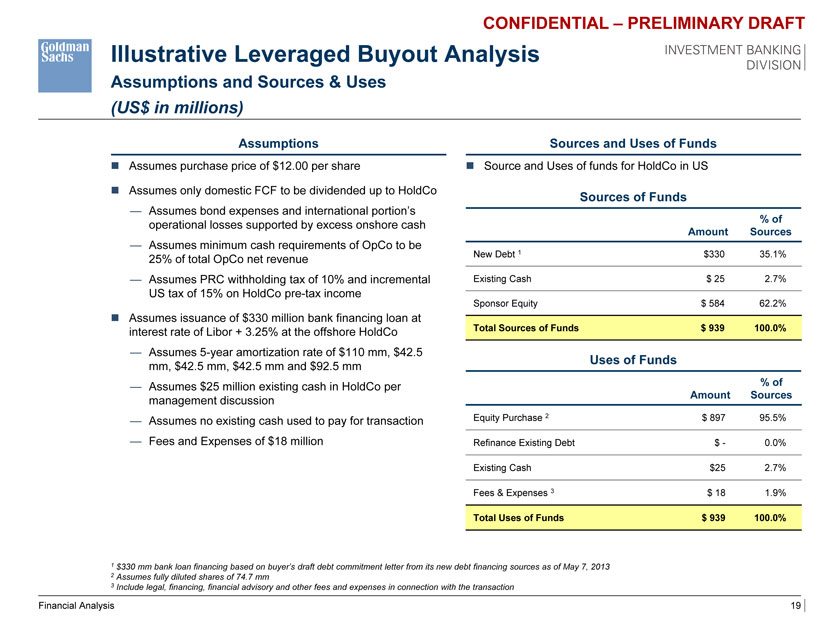
CONFIDENTIAL – PRELIMINARY DRAFT Illustrative Leveraged Buyout Analysis Assumptions and Sources & Uses (US$ in millions) Assumptions Sources and Uses of Funds ??Assumes purchase price of $12.00 per share ??Source and Uses of funds for HoldCo in US ??Assumes only domestic FCF to be dividended up to HoldCo Sources of Funds — Assumes bond expenses and international portion’s % of operational losses supported by excess onshore cash Amount Sources — Assumes minimum cash requirements of OpCo to be 25% of total OpCo net revenue New Debt 1 $330 35.1% Assumes PRC withholding tax of 10% and incremental Existing Cash $ 25 2.7% US tax of 15% on HoldCo pre-tax income Sponsor Equity $ 584 62.2% ??Assumes issuance of $330 million bank financing loan at interest rate of Libor + 3.25% at the offshore HoldCo Total Sources of Funds $ 939 100.0% Assumes 5-year amortization rate of $110 mm, $42.5 Uses of Funds mm, $42.5 mm, $42.5 mm and $92.5 mm — Assumes $25 million existing cash in HoldCo per % of Amount Sources management discussion — Assumes no existing cash used to pay for transaction Equity Purchase 2 $ 897 95.5% — Fees and Expenses of $18 million Refinance Existing Debt $—0.0% Existing Cash $25 2.7% Fees & Expenses 3 $ 18 1.9% Total Uses of Funds $ 939 100.0% 1$ 330 mm bank loan financing based on buyer’s draft debt commitment letter from its new debt financing sources as of May 7, 2013 2 Assumes fully diluted shares of 74.7 mm 3 Include legal, financing, financial advisory and other fees and expenses in connection with the transaction Financial Analysis 19
|
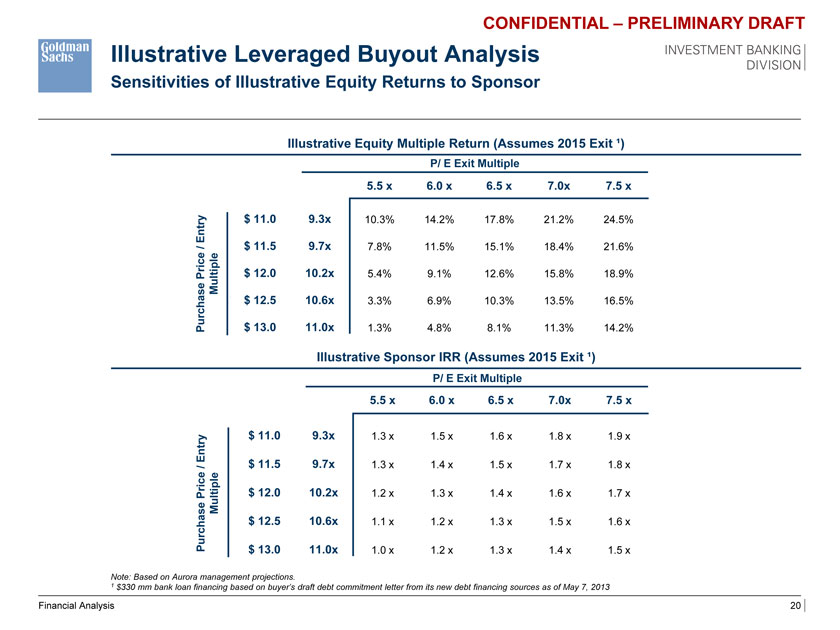
CONFIDENTIAL – PRELIMINARY DRAFT Illustrative Leveraged Buyout Analysis Sensitivities of Illustrative Equity Returns to Sponsor Illustrative Equity Multiple Return (Assumes 2015 Exit ¹) P/ E Exit Multiple 5.5 x 6.0 x 6.5 x 7.0x 7.5 x $ 11.0 9.3x 10.3% 14.2% 17.8% 21.2% 24.5% $ 11.5 9.7x 7.8% 11.5% 15.1% 18.4% 21.6% Price / Entry ltiple $ 12.0 10.2x 5.4% 9.1% 12.6% 15.8% 18.9% Purchase Mu $ 12.5 10.6x 3.3% 6.9% 10.3% 13.5% 16.5% $ 13.0 11.0x 1.3% 4.8% 8.1% 11.3% 14.2% Illustrative Sponsor IRR (Assumes 2015 Exit ¹) P/ E Exit Multiple 5.5 x 6.0 x 6.5 x 7.0x 7.5 x $ 11.0 9.3x 1.3 x 1.5 x 1.6 x 1.8 x 1.9 x rice / Entry $ 11.5 9.7x 1.3 x 1.4 x 1.5 x 1.7 x 1.8 x tiple $ 12.0 10.2x 1.2 x 1.3 x 1.4 x 1.6 x 1.7 x P Purchase Mul $ 12.5 10.6x 1.1 x 1.2 x 1.3 x 1.5 x 1.6 x $ 13.0 11.0x 1.0 x 1.2 x 1.3 x 1.4 x 1.5 x Note: Based on Aurora management projections. 1$ 330 mm bank loan financing based on buyer’s draft debt commitment letter from its new debt financing sources as of May 7, 2013 Financial Analysis 20
|
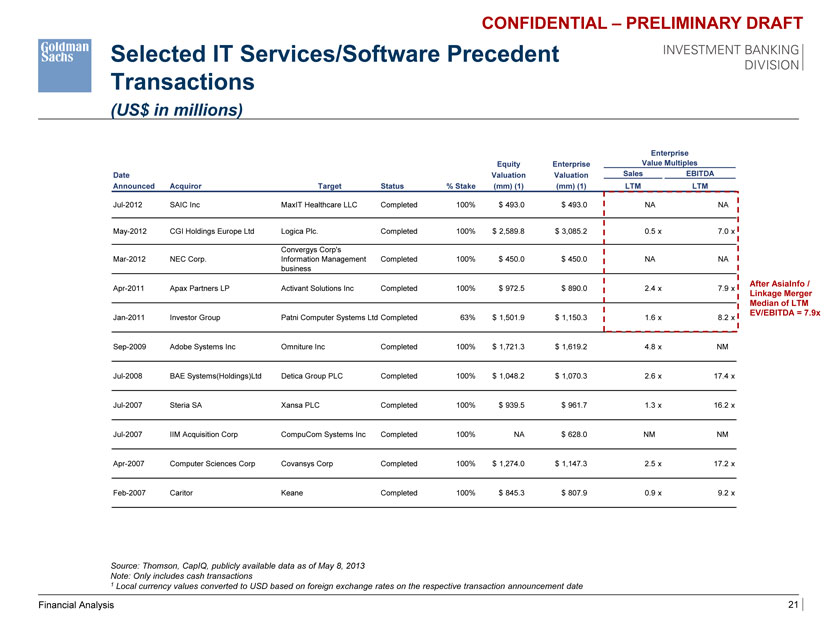
CONFIDENTIAL – PRELIMINARY DRAFT Selected IT Services/Software Precedent Transactions (US$ in millions) Enterprise Equity Enterprise Value Multiples Date Valuation Valuation Sales EBITDA Announced Acquiror Target Status % Stake (mm) (1) (mm) (1) LTM LTM Jul-2012 SAIC Inc MaxIT Healthcare LLC Completed 100% $ 493.0 $ 493.0 NA NA May-2012 CGI Holdings Europe Ltd Logica Plc. Completed 100% $ 2,589.8 $ 3,085.2 0.5 x 7.0 x Convergys Corp’s Mar-2012 NEC Corp. Information Management Completed 100% $ 450.0 $ 450.0 NA NA business After AsiaInfo / Apr-2011 Apax Partners LP Activant Solutions Inc Completed 100% $ 972.5 $ 890.0 2.4 x 7.9 x Linkage Merger Median of LTM EV/EBITDA = 7.9x Jan-2011 Investor Group Patni Computer Systems Ltd Completed 63% $ 1,501.9 $ 1,150.3 1.6 x 8.2 x Sep-2009 Adobe Systems Inc Omniture Inc Completed 100% $ 1,721.3 $ 1,619.2 4.8 x NM Jul-2008 BAE Systems(Holdings)Ltd Detica Group PLC Completed 100% $ 1,048.2 $ 1,070.3 2.6 x 17.4 x Jul-2007 Steria SA Xansa PLC Completed 100% $ 939.5 $ 961.7 1.3 x 16.2 x Jul-2007 IIM Acquisition Corp CompuCom Systems Inc Completed 100% NA $ 628.0 NM NM Apr-2007 Computer Sciences Corp Covansys Corp Completed 100% $ 1,274.0 $ 1,147.3 2.5 x 17.2 x Feb-2007 Caritor Keane Completed 100% $ 845.3 $ 807.9 0.9 x 9.2 x Source: Thomson, CapIQ, publicly available data as of May 8, 2013 Note: Only includes cash transactions 1 Local currency values converted to USD based on foreign exchange rates on the respective transaction announcement date Financial Analysis 21
|
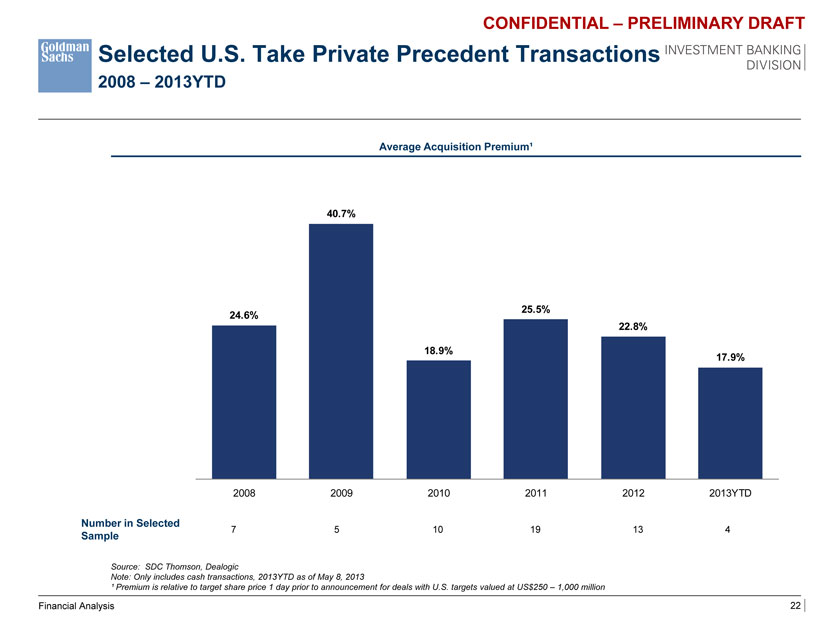
CONFIDENTIAL – PRELIMINARY DRAFT Selected U.S. Take Private Precedent Transactions 2008 – 2013YTD Average Acquisition Premium¹ 40.7% 25.5% 24.6% 22.8% 18 .9% 17.9% 2008 2009 2010 2011 2012 2013YTD Number in Selected 7 5 10 19 13 4 Sample Source: SDC Thomson, Dealogic Note: Only includes cash transactions, 2013YTD as of May 8, 2013 ¹ Premium is relative to target share price 1 day prior to announcement for deals with U.S. targets valued at US$250 – 1,000 million Financial Analysis 22
|
Appendix A: Illustrative Weighted Average Cost of Capital Calculation
|
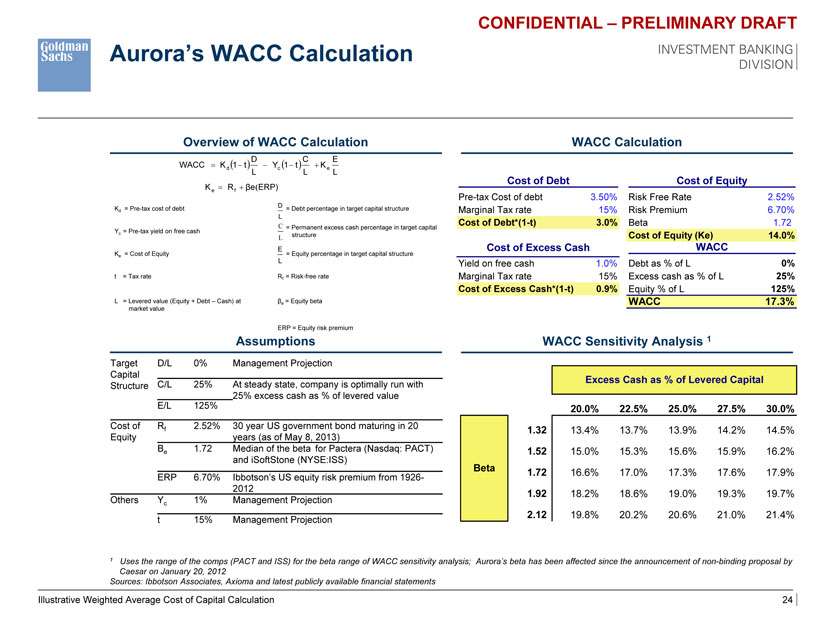
CONFIDENTIAL – PRELIMINARY DRAFT Aurora’s WACC Calculation Overview of WACC Calculation WACC Calculation D C E WACC Kd 1 t Yc 1 t Ke L L L Cost of Debt Cost of Equity Ke Rf ?e ERP) Pre-tax Cost of debt 3.50% Risk Free Rate 2.52% D Kd = Pre-tax cost of debt = Debt percentage in target capital structure Marginal Tax rate 15% Risk Premium 6.70% L C Cost of Debt*(1-t) 3.0% Beta 1.72 = Permanent excess cash percentage in target capital Yc = Pre-tax yield on free cash structure Cost of Equity (Ke) 14.0% L E Cost of Excess Cash WACC Ke = Cost of Equity = Equity percentage in target capital structure L Yield on free cash 1.0% Debt as % of L 0% t = Tax rate Rf = Risk-free rate Marginal Tax rate 15% Excess cash as % of L 25% Cost of Excess Cash*(1-t) 0.9% Equity % of L 125% L = Levered value (Equity + Debt – Cash) at ? e = Equity beta WACC 17.3% market value ERP = Equity risk premium Assumptions WACC Sensitivity Analysis 1 Target D/L 0% Management Projection Capital Excess Cash as % of Levered Capital Structure C/L 25% At steady state, company is optimally run with 25% excess cash as % of levered value E/L 125% 0.17 20.0% 22.5% 25.0% 27.5% 30.0% Cost of Rf 2.52% 30 year US government bond maturing in 20 1.32 13.4% 13.7% 13.9% 14.2% 14.5% Equity years (as of May 8, 2013) ?e 1.72 Median of the beta for Pactera (Nasdaq: PACT) 1.52 15.0% 15.3% 15.6% 15.9% 16.2% and iSoftStone (NYSE:ISS) Beta 1.72 16.6% 17.0% 17.3% 17.6% 17.9% ERP 6.70% Ibbotson’s US equity risk premium from 1926-2012 1.92 18.2% 18.6% 19.0% 19.3% 19.7% Others Yc 1% Management Projection 2.12 19.8% 20.2% 20.6% 21.0% 21.4% t 15% Management Projection 1 Uses the range of the comps (PACT and ISS) for the beta range of WACC sensitivity analysis; Aurora’s beta has been affected since the announcement of non binding proposal by Caesar on January 20, 2012 Sources: Ibbotson Associates, Axioma and latest publicly available financial statements Illustrative Weighted Average Cost of Capital Calculation 24
|
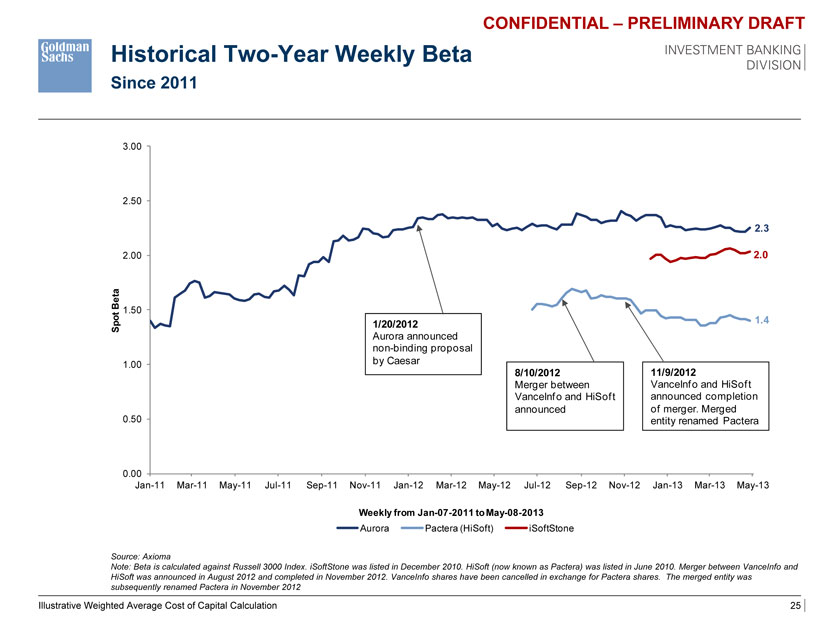
CONFIDENTIAL – PRELIMINARY DRAFT Historical Two-Year Weekly Beta Since 2011 3.00 2.50 2.3 2.00 2.0 1.50 Spot Beta 1/20/2012 1.4 Aurora announced non-binding proposal 1.00 by Caesar 8/10/2012 11/9/2012 Merger between VanceInfo and HiSoft VanceInfo and HiSoft announced completion announced of merger. Merged 0.50 entity renamed Pactera 0.00 Jan-11 Mar-11 May-11 Jul-11 Sep-11 Nov-11 Jan-12 Mar-12 May-12 Jul-12 Sep-12 Nov-12 Jan-13 Mar-13 May-13 Weekly from Jan-07-2011 to May-08-2013 Aurora Pactera (HiSoft) iSoftStone Source: Axioma Note: Beta is calculated against Russell 3000 Index. iSoftStone was listed in December 2010. HiSoft (now known as Pactera) was listed in June 2010. Merger between VanceInfo and HiSoft was announced in August 2012 and completed in November 2012. VanceInfo shares have been cancelled in exchange for Pactera shares. The merged entity was subsequently renamed Pactera in November 2012 Illustrative Weighted Average Cost of Capital Calculation 25
|
CONFIDENTIAL – PRELIMINARY DRAFT Project Aurora Supplementary Special Committee Discussion Material Strictly Private and Confidential Goldman Sachs (Asia) LLC May 2013
|

CONFIDENTIAL – PRELIMINARY DRAFT Disclaimer Goldman Sach (Asia) L.L.C. (“GS”) has prepared and provided these materials and GS’s related presentation (the “Confidential Information”) solely for the information and assistance of the Special Committee of the Board of Directors (the “Special Committee”) of Aurora (the “Company”) in connection with its consideration of the matters referred to herein. Without GS’s prior written consent, the Confidential Information may not be circulated or referred to publicly, disclosed to or relied upon by any other person, or used or relied upon for any other purpose. Notwithstanding anything herein to the contrary, the Company may disclose to any person the US federal income and state income tax treatment and tax structure of any transaction described herein and all materials of any kind (including tax opinions and other tax analyses) that are provided to the Company relating to such tax treatment and tax structure, without GS imposing any limitation of any kind. The Confidential Information, including this disclaimer, is subject to, and governed by, any written agreement between the Company, the Board and/or any committee thereof, on the one hand, and GS, on the other hand. GS and its affiliates are engaged in investment banking, commercial banking and financial advisory services, securities trading, investment management, principal investment, financial planning, benefits counseling, risk management, hedging, financing, brokerage activities and other financial and non-financial activities and services for various persons and entities. In the ordinary course of these activities and services, GS and its affiliates may at any time make or hold long or short positions and investments, as well as actively trade or effect transactions, in the equity, debt and other securities (or related derivative securities) and financial instruments (including bank loans and other obligations) of third parties, the Company, any other party to any transaction and any of their respective affiliates or any currency or commodity that may be involved in any transaction for their own account and for the accounts of their customers. The Confidential Information has been prepared and based on information obtained by GS from publicly available sources, the Company’s management and/or other sources. In preparing the Confidential Information, GS has relied upon and assumed, without assuming any responsibility for independent verification, the accuracy and completeness of all of the financial, legal, regulatory, tax, accounting and other information provided to, discussed with or reviewed by GS, and GS does not assume any liability for any such information discussed with or reviewed by GS. GS has assumed that all forecasts provided to, discussed with or reviewed by GS have been reasonably prepared and reflect the best currently available estimates and judgments of the Company. GS does not provide accounting, tax, legal or regulatory advice. GS’s role in any due diligence review is limited solely to performing such a review as it shall deem necessary to support its own advice and analysis and shall not be on behalf of the Company. Analyses based upon forecasts of future results are not necessarily indicative of actual future results, which may be significantly more or less favorable than suggested by these analyses, and GS does not assume responsibility if future results are materially different from those forecast. GS has not made an independent evaluation or appraisal of the assets and liabilities of the Company or any other person and has no obligation to evaluate the solvency of the Company or any person under any law. The analyses in the Confidential Information are not appraisals nor do they necessarily reflect the prices at which businesses or securities actually may be sold or purchased. The Confidential Information does not address the underlying business decision of the Company to engage in any transaction, or the relative merits of any strategic alternative referred to herein as compared to any other alternative that may be available to the Company. The Confidential Information is necessarily based on economic, monetary, market and other conditions as in effect on,
and the information made available to GS as of, the date of such Confidential Information and GS assumes no responsibility for updating or revising the Confidential Information.
|
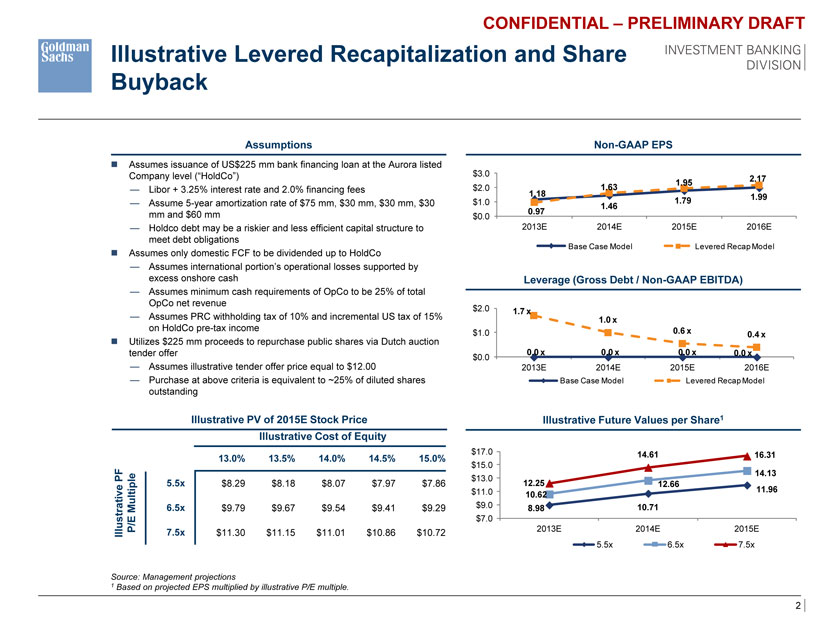
CONFIDENTIAL – PRELIMINARY DRAFT Illustrative Levered Recapitalization and Share Buyback Assumptions Non-GAAP EPS ??Assumes issuance of US$225 mm bank financing loan at the Aurora listed Company level (“HoldCo”) $3.0 1.95 2.17 — Libor + 3.25% interest rate and 2.0% financing fees $2.0 1.63 1.18 1.99 — Assume 5-year amortization rate of $75 mm, $30 mm, $30 mm, $30 $1.0 1.79 1.46 mm and $60 mm 0.97 $0.0 — Holdco debt may be a riskier and less efficient capital structure to 2013E 2014E 2015E 2016E meet debt obligations Base Case Model Levered Recap Model ??Assumes only domestic FCF to be dividended up to HoldCo — Assumes international portion’s operational losses supported by excess onshore cash Leverage (Gross Debt / Non-GAAP EBITDA) — Assumes minimum cash requirements of OpCo to be 25% of total OpCo net revenue $2.0 1.7 x — Assumes PRC withholding tax of 10% and incremental US tax of 15% 1.0 x on HoldCo pre-tax income 0.6 x $1.0 0.4 x ??Utilizes $225 mm proceeds to repurchase public shares via Dutch auction tender offer 0.0 x 0.0 x 0.0 x 0.0 x $0.0 — Assumes illustrative tender offer price equal to $12.00 2013E 2014E 2015E 2016E — Purchase at above criteria is equivalent to ~25% of diluted shares Base Case Model Levered Recap Model outstanding Illustrative PV of 2015E Stock Price Illustrative Future Values per Share1 Illustrative Cost of Equity $17.0 14.61 16.31 13.0% 13.5% 14.0% 14.5% 15.0% $15.0 14.13 $13.0 5.5x $8.29 $8.18 $8.07 $7.97 $7.86 12.25 12.66 ve PF tiple $11.0 11.96 10 .62 6.5x $9.79 $9.67 $9.54 $9.41 $9.29 $9.0 8.98 10.71 $7.0 Illustrati P/E Mul 7.5x $11.30 $11.15 $11.01 $10.86 $10.72 2013E 2014E 2015E 5.5x 6.5x 7.5x Source: Management projections 1 Based on projected EPS multiplied by illustrative P/E multiple. 2
|
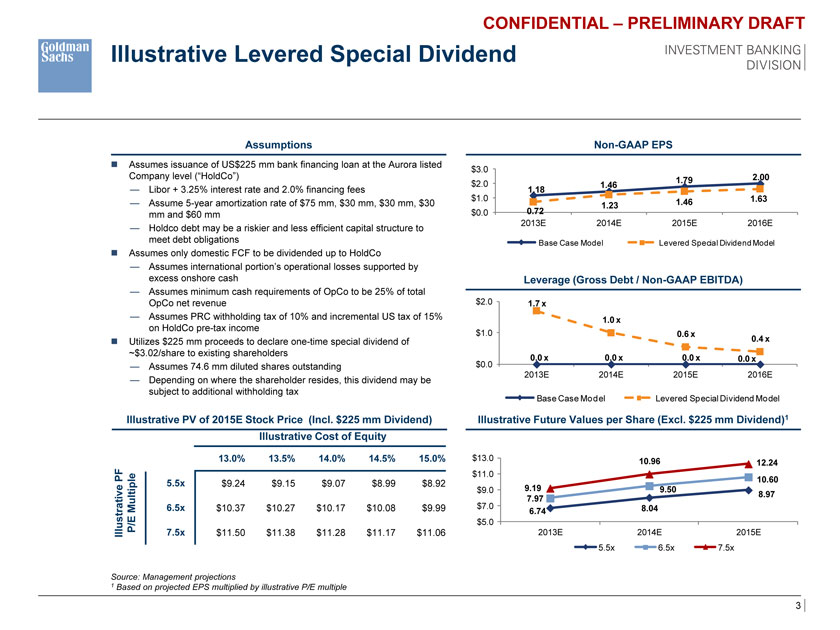
CONFIDENTIAL – PRELIMINARY DRAFT Illustrative Levered Special Dividend Assumptions Non-GAAP EPS ??Assumes issuance of US$225 mm bank financing loan at the Aurora listed $3.0 Company level (“HoldCo”) 1.79 2.00 $2.0 1.46 — Libor + 3.25% interest rate and 2.0% financing fees 1.18 $1.0 1.46 1.63 — Assume 5-year amortization rate of $75 mm, $30 mm, $30 mm, $30 1.23 mm and $60 mm $0.0 0.72 2013E 2014E 2015E 2016E — Holdco debt may be a riskier and less efficient capital structure to meet debt obligations Base Case Model Levered Special Dividend Model ??Assumes only domestic FCF to be dividended up to HoldCo — Assumes international portion’s operational losses supported by excess onshore cash Leverage (Gross Debt / Non-GAAP EBITDA) — Assumes minimum cash requirements of OpCo to be 25% of total OpCo net revenue $2.0 1.7 x — Assumes PRC withholding tax of 10% and incremental US tax of 15% 1.0 x on HoldCo pre-tax income $1.0 0.6 x ??Utilizes $225 mm proceeds to declare one-time special dividend of 0.4 x ~$ 3.02/share to existing shareholders 0.0 x 0.0 x 0.0 x 0.0 x — Assumes 74.6 mm diluted shares outstanding $0.0 2013E 2014E 2015E 2016E — Depending on where the shareholder resides, this dividend may be subject to additional withholding tax Base Case Model Levered Special Dividend Model Illustrative PV of 2015E Stock Price (Incl. $225 mm Dividend) Illustrative Future Values per Share (Excl. $225 mm Dividend)1 Illustrative Cost of Equity 13.0% 13.5% 14.0% 14.5% 15.0% $13.0 10.96 12.24 $11.0 5.5x $9.24 $9.15 $9.07 $8.99 $8.92 10.60 ve PF tiple $9.0 9.19 9.50 8.97 7.97 6.5x $10.37 $10.27 $10.17 $10.08 $9.99 $7.0 8.04 6.74 P/E Mul $5.0 Illustrati 7.5x $11.50 $11.38 $11.28 $11.17 $11.06 2013E 2014E 2015E 5.5x 6.5x 7.5x Source: Management projections 1 Based on projected EPS multiplied by illustrative P/E multiple 3
|
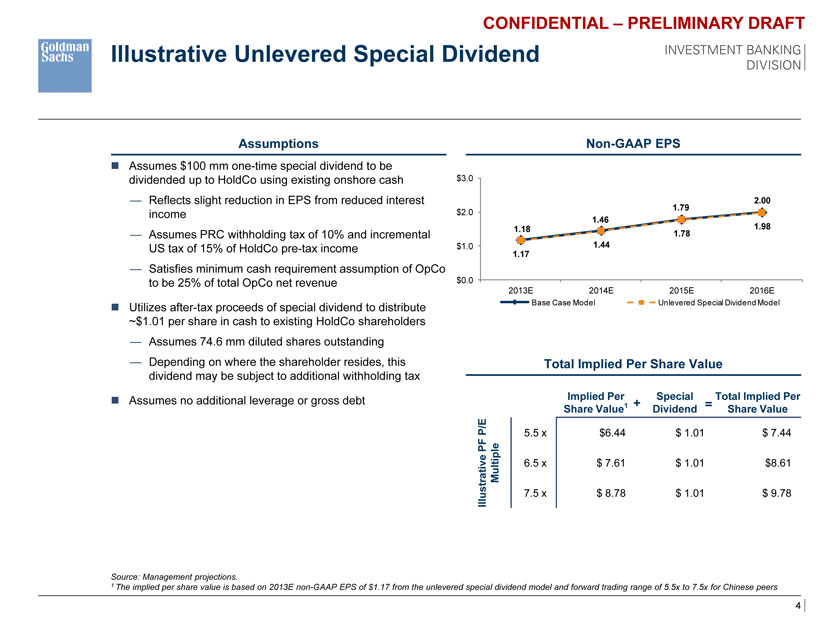
CONFIDENTIAL – PRELIMINARY DRAFT Illustrative Unlevered Special Dividend Assumptions Non-GAAP EPS ??Assumes $100 mm one-time special dividend to be dividended up to HoldCo using existing onshore cash $3.0 — Reflects slight reduction in EPS from reduced interest 2.00 1.79 income $2.0 1.46 1.18 1.98 — Assumes PRC withholding tax of 10% and incremental 1.78 US tax of 15% of HoldCo pre-tax income $1.0 1.44 1.17 — Satisfies minimum cash requirement assumption of OpCo to be 25% of total OpCo net revenue $0.0 2013E 2014E 2015E 2016E ??Utilizes after-tax proceeds of special dividend to distribute Base Case Model Unlevered Special Dividend Model ~$ 1.01 per share in cash to existing HoldCo shareholders — Assumes 74.6 mm diluted shares outstanding — Depending on where the shareholder resides, this Total Implied Per Share Value dividend may be subject to additional withholding tax ??Assumes no additional leverage or gross debt Implied Per Special Total Implied Per + = Share Value1 Dividend Share Value E PF P/ 5.5 x $6.44 $ 1.01 $ 7.44 Multiple strative 6.5 x $ 7.61 $ 1.01 $8.61 7 .5 x $ 8.78 $ 1.01 $ 9.78 Illu Source: Management projections. 1 The implied per share value is based on 2013E non-GAAP EPS of $1.17 from the unlevered special dividend model and forward trading range of 5.5x to 7.5x for Chinese peers 4