Exhibit (c) (3)
|
PRELIMINARY DRAFT, CONFIDENTIAL
Project Aurora
Special Committee Discussion Materials
Goldman Sachs (Asia) L.L.C. July, 2012
|
PRELIMINARY DRAFT, CONFIDENTIAL
Disclaimer
Goldman Sachs (Asia) L.L.C. (“GS”) has prepared and provided these materials and GS’s related presentation (the “Confidential Information”) solely for the information and assistance of the Special Committee of the Board of Directors (the “Special Committee”) of Aurora (the “Company”) in connection with its consideration of the matters referred to herein. Without GS’s prior written consent, the Confidential Information may not be circulated or referred to publicly, disclosed to or relied upon by any other person, or used or relied upon for any other purpose. Notwithstanding anything herein to the contrary, the Company may disclose to any person the US federal income and state income tax treatment and tax structure of any transaction described herein and all materials of any kind (including tax opinions and other tax analyses) that are provided to the Company relating to such tax treatment and tax structure, without GS imposing any limitation of any kind. The Confidential Information, including this disclaimer, is subject to, and governed by, any written agreement between the Company, the Board and/or any committee thereof, on the one hand, and GS, on the other hand.
GS and its affiliates are engaged in investment banking, commercial banking and financial advisory services, securities trading, investment management, principal investment, financial planning, benefits counseling, risk management, hedging, financing, brokerage activities and other financial and non-financial activities and services for various persons and entities. In the ordinary course of these activities and services, GS and its affiliates may at any time make or hold long or short positions and investments, as well as actively trade or effect transactions, in the equity, debt and other securities (or related derivative securities) and financial instruments (including bank loans and other obligations) of third parties, the Company, any other party to any transaction and any of their respective affiliates or any currency or commodity that may be involved in any transaction for their own account and for the accounts of their customers.
The Confidential Information has been prepared and based on information obtained by GS from publicly available sources, the Company’s management and/or other sources. In preparing the Confidential Information, GS has relied upon and assumed, without assuming any responsibility for independent verification, the accuracy and completeness of all of the financial, legal, regulatory, tax, accounting and other information provided to, discussed with or reviewed by GS, and GS does not assume any liability for any such information. GS does not provide accounting, tax, legal or regulatory advice. GS’s role in any due diligence review is limited solely to performing such a review as it shall deem necessary to support its own advice and analysis and shall not be on behalf of the Company. Analyses based upon forecasts of future results are not necessarily indicative of actual future results, which may be significantly more or less favorable than suggested by these analyses, and GS does not assume responsibility if future results are materially different from those forecast.
GS has not made an independent evaluation or appraisal of the assets and liabilities of the Company or any other person and has no obligation to evaluate the solvency of the Company or any person under any law. The analyses in the Confidential Information are not appraisals nor do they necessarily reflect the prices at which businesses or securities actually may be sold or purchased. The Confidential Information does not address the underlying business decision of the Company to engage in any transaction, or the relative merits of any strategic alternative referred to herein as compared to any other alternative that may be available to the Company. The Confidential Information is necessarily based on economic, monetary, market and other conditions as in effect on, and the information made available to GS as of, the date of such Confidential Information and GS assumes no responsibility for updating or revising the Confidential Information.
 |
PRELIMINARY DRAFT, CONFIDENTIAL
Recent Trading Performance
$20 8,000
20-Jan-2012 21-Feb-2012 26-Mar-2012 26-Apr-2012 Statistic Value
Announcement of non—Press rumors that Announced that Aurora reported 1Q12 Average Share Price (USD) 11.84
$19 Special Committee earning results. binding proposal by CITIC private equity firms VWAP (USD) 11.84
Capital to acquire Aurora for are lining up decided to solicit ADTV (Shares in thousands) 472 7,000
$18 $12.00 per share1 in cash. potential bids for bids.
ADTV (USD in thousands) 5,591
Stock price rose 18.7% in Aurora. $17 the first day of trading.
Week of 11-Jun-2012 6,000
$16 13-Feb-2012
Aurora reports Renewed press rumors that unaudited fourth private equity firms are $15 eyeing bids for Aurora 5,000 (USD) quarter and full year
$14 2011 results.
4,000 Volume Price
$13 US$ 12.14 (000) Closing $12 3,000
$11 21-Mar-2012
Special Committee
2,000
$10 Meeting, closing price at US$13.73 per share $9
1,000 $8
$7 0
11-Jan-2012 24-Feb-2012 9-Apr-2012 21-May-2012 3-Jul-2012
Daily from 11-Jan-2012 to 12-Jul-2012
Volume Aurora Share Price
Source: Bloomberg as of July 12 2012
2 |
|
|
PRELIMINARY DRAFT, CONFIDENTIAL
Aurora Wall Street Research Summary
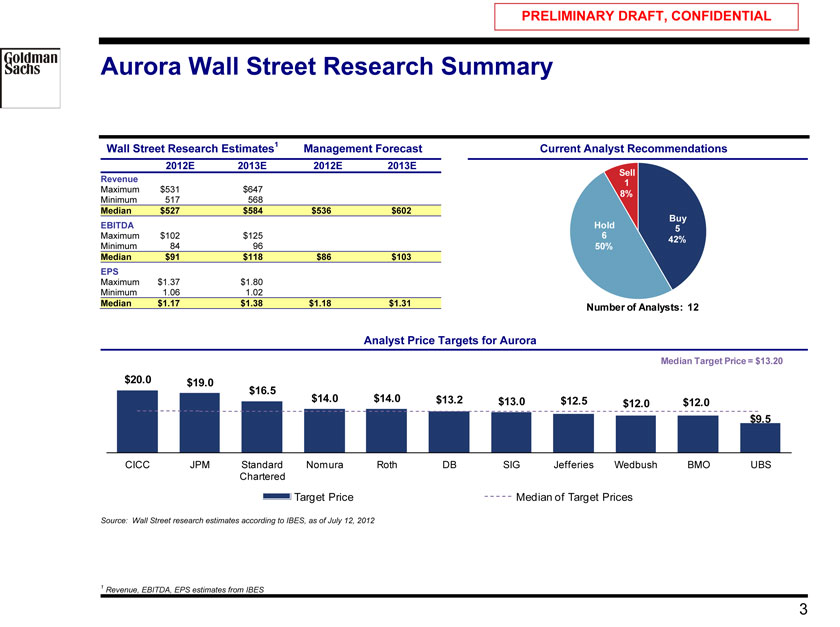
Wall Street Research Estimates1 Management Forecast Current Analyst Recommendations
2012E 2013E 2012E 2013E
Sell
Revenue 1
Maximum $531 $647 8% Minimum 517 568
Median $527 $584 $536 $602
Buy
EBITDA Hold 5
Maximum $102 $125 6 42% Minimum 84 96 50%
Median $91 $118 $86 $103 EPS
Maximum $1.37 $1.80 Minimum 1.06 1.02
Median $1.17 $1.38 $1.18 $1.31 Number of Analysts: 12
Analyst Price Targets for Aurora
Median Target Price = $13.20
$20.0 $19.0
$16.5
$14.0 $14.0 $13.2 $13.0 $12.5 $12.0
$12.0 $9.5
CICC JPM Standard Nomura Roth DB SIG Jefferies Wedbush BMO UBS Chartered
Target Price Median of Target Prices
Source: Wall Street research estimates according to IBES, as of July 12, 2012
1 |
| Revenue, EBITDA, EPS estimates from IBES |
3 |
|
|
PRELIMINARY DRAFT, CONFIDENTIAL
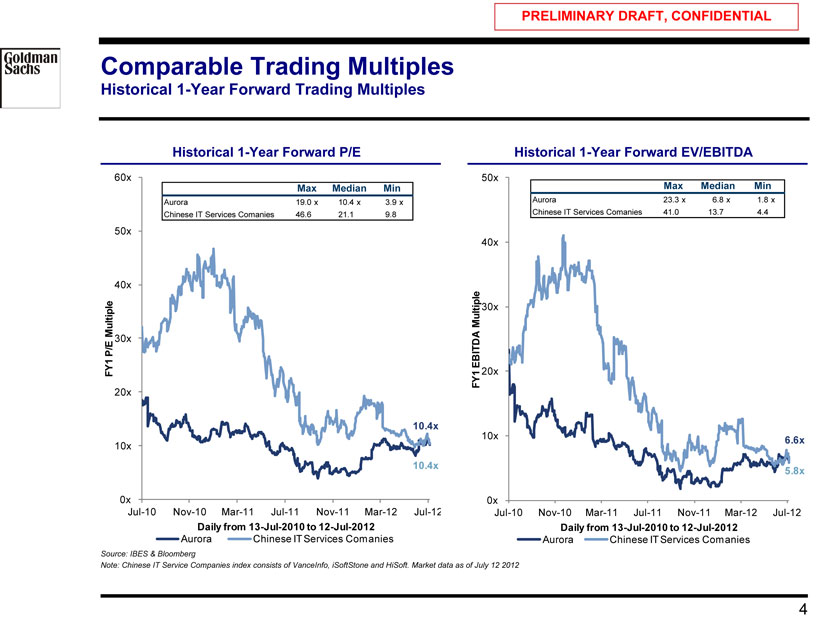
Comparable Trading Multiples
Historical 1-Year Forward Trading Multiples
Historical 1-Year Forward P/E Historical 1-Year Forward EV/EBITDA
60x 50x
Max Median Min Max Median Min
Aurora 19.0 x 10.4 x 3.9 x Aurora 23.3 x6.8 x1.8 x Chinese IT Services Comanies 46.6 21.1 9.8 Chinese IT Services Comanies 41.0 13.7 4.4
50x
40x
40x
Multiple 30x Multiple P/E 30x EBITDA FY1 FY1 20x
20x
10.4x
10x 6.6x
10x
10.4x
5.8x
0x 0x
Jul-10 Nov-10 Mar-11 Jul-11 Nov-11 Mar-12 Jul-12 Jul-10 Nov-10 Mar-11 Jul-11 Nov-11 Mar-12 Jul-12
Daily from 13-Jul-2010 to 12-Jul-2012 Daily from 13-Jul-2010 to 12-Jul-2012
Aurora Chinese IT Services Comanies Aurora Chinese IT Services Comanies
Source: IBES & Bloomberg
Note: Chinese IT Service Companies index consists of VanceInfo, iSoftStone and HiSoft. Market data as of July 12 2012
4 |
|
|
PRELIMINARY DRAFT, CONFIDENTIAL
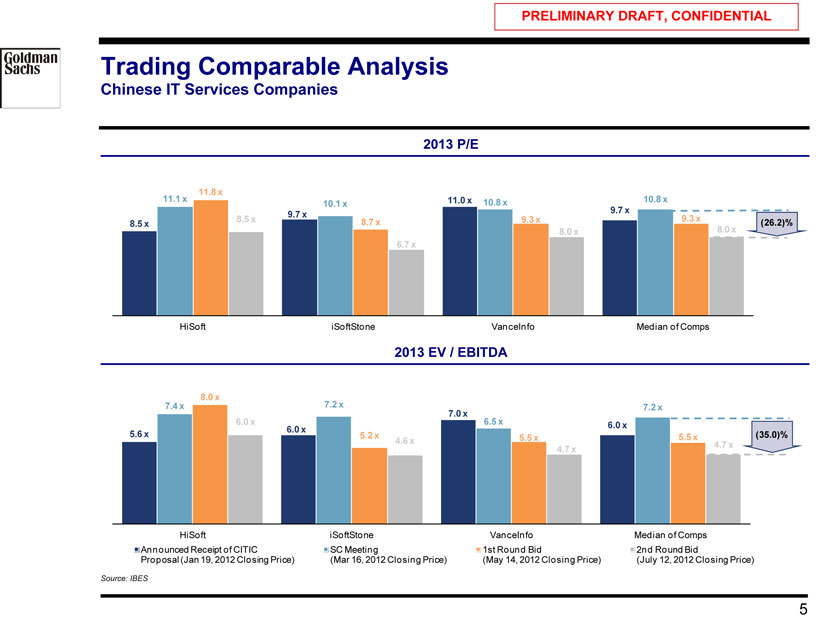
Trading Comparable Analysis
Chinese IT Services Companies
2013 P/E
11.8 x
11.1 x 11.0 x 10.8 x 10.8 x
10.1 x
9.7 x
9.7 x 9.3 x
8.5 x 8.7 x 9.3 x (26.2)% 8.5 x 8.0 x 8.0 x 6.7 x
HiSoft iSoftStone VanceInfo Median of Comps
2013 EV / EBITDA
8.0 x
7.4 x 7.2 x 7.2 x 6.0 x 7.0 x 6.5 x 6.0 x 6.0 x
5.6 x 5.2 x 5.5 x 5.5 x (35.0)% 4.6 x 4.7 x 4.7 x
HiSoft iSoftStone VanceInfo Median of Comps Announced Receipt of CITIC SC Meeting 1st Round Bid 2nd Round Bid
Proposal (Jan 19, 2012 Closing Price) (Mar 16, 2012 Closing Price) (May 14, 2012 Closing Price) (July 12, 2012 Closing Price)
Source: IBES
5 |
|
|
PRELIMINARY DRAFT, CONFIDENTIAL
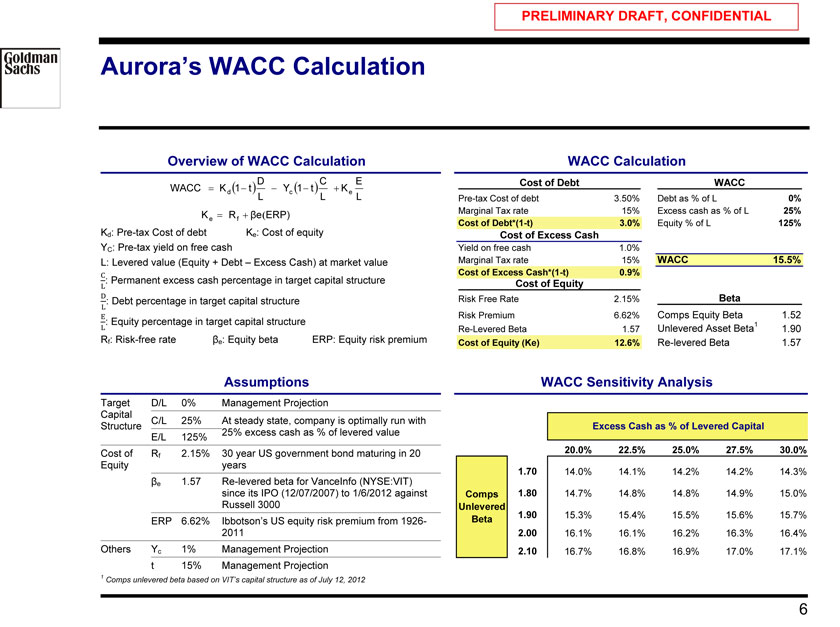
Aurora’s WACC Calculation
Overview of WACC Calculation WACC Calculation
D C E Cost of Debt WACC
WACC? Kd? 1?t?L? Yc? 1?t?L?Ke L
Pre-tax Cost of debt 3.50% Debt as % of L 0% K? R??e?ERP) Marginal Tax rate 15% Excess cash as % of L 25% e f Cost of Debt*(1-t) 3.0% Equity % of L 125%
Kd: Pre-tax Cost of debt Ke: Cost of equity Cost of Excess Cash
YC: Pre-tax yield on free cash Yield on free cash 1.0%
L: Levered value (Equity + Debt – Excess Cash) at market value Marginal Tax rate 15% WACC 15.5%
C Cost of Excess Cash*(1-t) 0.9%
: Permanent excess cash percentage in target capital structure Cost of Equity
L
D Risk Free Rate 2.15% Beta
: Debt percentage in target capital structure
L Comps Equity Beta 1.52
E Risk Premium 6.62%
: Equity percentage in target capital structure 1
L Re-Levered Beta 1.57 Unlevered Asset Beta 1.90
Rf: Risk-free rate ?e: Equity beta ERP: Equity risk premium Cost of Equity (Ke) 12.6% Re-levered Beta 1.57
Assumptions WACC Sensitivity Analysis
Target D/L 0% Management Projection Capital C/L 25% At steady state, company is optimally run with
Structure Excess Cash as % of Levered Capital
25% excess cash as % of levered value E/L 125%
Cost of R 2.15% 30 year US government bond maturing in 20 20.0% 22.5% 25.0% 27.5% 30.0%
f
Equity years
1.70 14.0% 14.1% 14.2% 14.2% 14.3%
?e 1.57 Re-levered beta for VanceInfo (NYSE:VIT) since its IPO (12/07/2007) to 1/6/2012 against Comps 1.80 14.7% 14.8% 14.8% 14.9% 15.0% Russell 3000 Unlevered
Beta 1.90 15.3% 15.4% 15.5% 15.6% 15.7%
ERP 6.62% Ibbotson’s US equity risk premium from 1926-
2011 2.00 16.1% 16.1% 16.2% 16.3% 16.4%
Others Yc 1% Management Projection 2.10 16.7% 16.8% 16.9% 17.0% 17.1% t 15% Management Projection
1 |
| Comps unlevered beta based on VIT’s capital structure as of July 12, 2012 |
6 |
|
|
PRELIMINARY DRAFT, CONFIDENTIAL
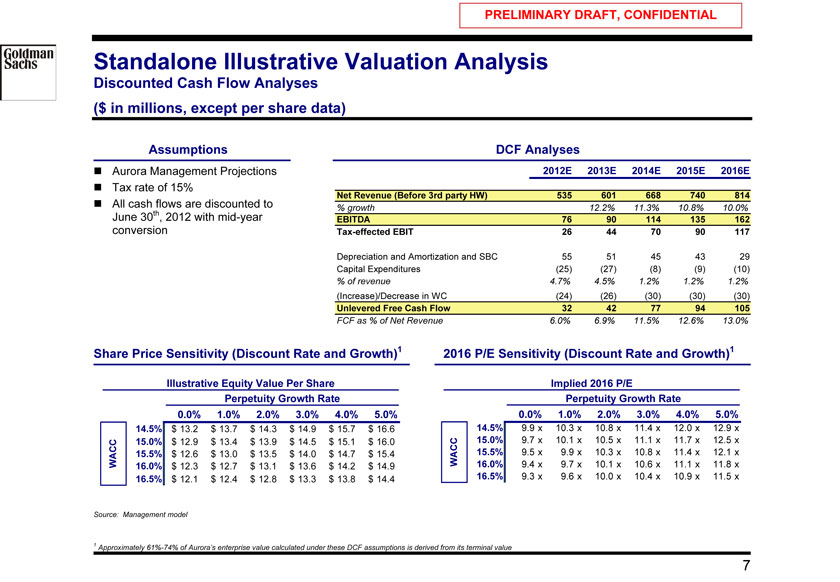
Standalone Illustrative Valuation Analysis
Discounted Cash Flow Analyses ($ in millions, except per share data)
Assumptions DCF Analyses
? Aurora Management Projections 2012E 2013E 2014E 2015E 2016E? Tax rate of 15%
Net Revenue (Before 3rd party HW) 535 601 668 740 814
? All cash flows are discounted to % growth 12.2% 11.3% 10.8% 10.0% June 30th, 2012 with mid-year
EBITDA 76 90 114 135 162 conversion Tax-effected EBIT 26 44 70 90 117
Depreciation and Amortization and SBC 55 51 45 43 29 Capital Expenditures (25) (27) (8) (9) (10)
% of revenue 4.7% 4.5% 1.2% 1.2% 1.2%
(Increase)/Decrease in WC (24) (26) (30) (30) (30)
Unlevered Free Cash Flow 32 42 77 94 105
FCF as % of Net Revenue 6.0% 6.9% 11.5% 12.6% 13.0%
Share Price Sensitivity (Discount Rate and Growth)1 2016 P/E Sensitivity (Discount Rate and Growth)1
Illustrative Equity Value Per Share Implied 2016 P/E
Perpetuity Growth Rate Perpetuity Growth Rate
$12.07 0.0% 1.0% 2.0% 3.0% 4.0% 5.0% 9.3 x 0.0% 1.0% 2.0% 3.0% 4.0% 5.0%
14.5% $ 13.2 $ 13.7 $ 14.3 $ 14.9 $ 15.7 $ 16.6 14.5% 9.9 x 10.3 x 10.8 x 11.4 x 12.0 x 12.9 x
15.0% $ 12.9 $ 13.4 $ 13.9 $ 14.5 $ 15.1 $ 16.0 15.0% 9.7 x 10.1 x 10.5 x 11.1 x 11.7 x 12.5 x
15.5% $ 12.6 $ 13.0 $ 13.5 $ 14.0 $ 14.7 $ 15.4 WACC 15.5% 9.5x 9.9x 10.3 x 10.8 x 11.4 x 12.1x WACC 16.0% $ 12.3 $ 12.7 $ 13.1 $ 13.6 $ 14.2 $ 14.9 16.0% 9.4x 9.7x 10.1 x 10.6 x 11.1 x 11.8x
16.5% $ 12.1 $ 12.4 $ 12.8 $ 13.3 $ 13.8 $ 14.4 16.5% 9.3x 9.6x 10.0 x 10.4 x 10.9 x 11.5x
Source: Management model
1 Approximately 61%-74% of Aurora’s enterprise value calculated under these DCF assumptions is derived from its terminal value
7 |
|
|
PRELIMINARY DRAFT, CONFIDENTIAL
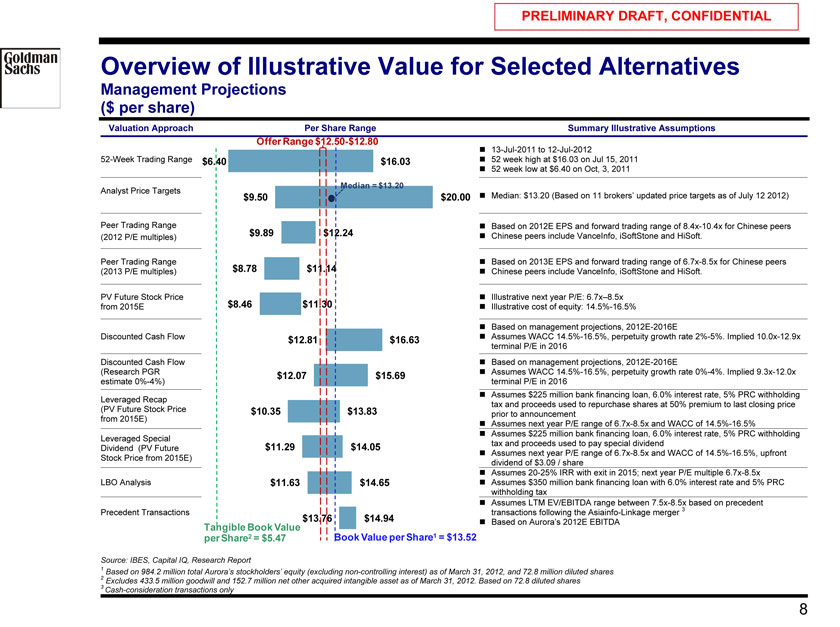
Overview of Illustrative Value for Selected Alternatives
Management Projections ($ per share)
Valuation Approach Per Share Range Summary Illustrative Assumptions1
Offer Range $12.50-$12.80? 13-Jul-2011 to 12-Jul-2012
52-Week Trading Range $6.40 $16.03? 52 week high at $16.03 on Jul 15, 2011 ? 52 week low at $6.40 on Oct, 3, 2011
Median = $13.20
Analyst Price Targets $9.50 $20.00? Median: $13.20 (Based on 11 brokers’ updated price targets as of July 12 2012)
Peer Trading Range ? Based on 2012E EPS and forward trading range of 8.4x-10.4x for Chinese peers (2012 P/E multiples) $9.89 $12.24? Chinese peers include VanceInfo, iSoftStone and HiSoft.
Peer Trading Range ? Based on 2013E EPS and forward trading range of 6.7x-8.5x for Chinese peers (2013 P/E multiples) $8.78 $11.14? Chinese peers include VanceInfo, iSoftStone and HiSoft.
PV Future Stock Price ? Illustrative next year P/E: 6.7x–8.5x from 2015E $8.46 $11.30? Illustrative cost of equity: 14.5%-16.5%
? Based on management projections, 2012E-2016E
Discounted Cash Flow $12.81 $16.63? Assumes WACC 14.5%-16.5%, perpetuity growth rate 2%-5%. Implied 10.0x-12.9x terminal P/E in 2016 Discounted Cash Flow ? Based on management projections, 2012E-2016E
(Research PGR $12.07 $15.69? Assumes WACC 14.5%-16.5%, perpetuity growth rate 0%-4%. Implied 9.3x-12.0x estimate 0%-4%) terminal P/E in 2016 ? Assumes $225 million bank financing loan, 6.0% interest rate, 5% PRC withholding Leveraged Recap tax and proceeds used to repurchase shares at 50% premium to last closing price (PV Future Stock Price $10.35 $13.83 prior to announcement from 2015E) ? Assumes next year P/E range of 6.7x-8.5x and WACC of 14.5%-16.5% ? Assumes $225 million bank financing loan, 6.0% interest rate, 5% PRC withholding Leveraged Special
$11.29 $14.05 tax and proceeds used to pay special dividend Dividend (PV Future
? Assumes next year P/E range of 6.7x-8.5x and WACC of 14.5%-16.5%, upfront Stock Price from 2015E) dividend of $3.09 / share ? Assumes 20-25% IRR with exit in 2015;
next year P/E multiple 6.7x-8.5x LBO Analysis $11.63 $14.65? Assumes $350 million bank financing loan with 6.0% interest rate and 5% PRC withholding tax ? Assumes LTM EV/EBITDA range between 7.5x-8.5x based on precedent Precedent Transactions transactions following the Asiainfo-Linkage merger 3
$13.76 $14.94? Based on Aurora’s 2012E EBITDA
Tangible Book Value per Share2 = $5.47 Book Value per Share1 = $13.52
Source: IBES, Capital IQ, Research Report
1 |
|
Based on 984.2 million total Aurora’s stockholders’ equity (excluding non-controlling interest) as of March 31, 2012, and 72.8 million diluted shares
2 Excludes 433.5 million goodwill and 152.7 million net other acquired intangible asset as of March 31, 2012. Based on 72.8 diluted shares 3 Cash-consideration transactions only
8 |
|
|
PRELIMINARY DRAFT, CONFIDENTIAL
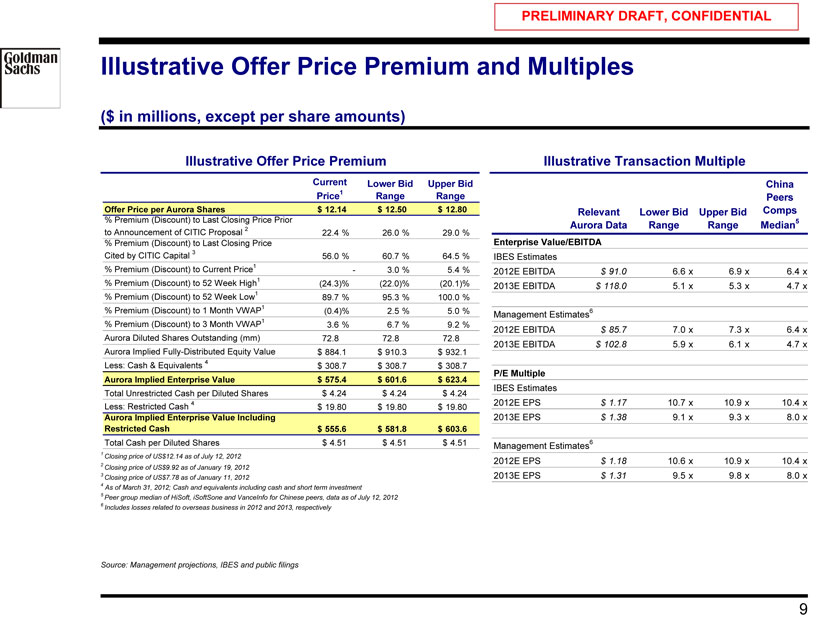
Illustrative Offer Price Premium and Multiples
($ in millions, except per share amounts)
Illustrative Offer Price Premium Illustrative Transaction Multiple
Current Lower Bid Upper Bid China Price1 Range Range Peers
Offer Price per Aurora Shares $ 12.14 $ 12.50 $ 12.80 Relevant Lower Bid Upper Bid Comps
% Premium (Discount) to Last Closing Price Prior 5
2 |
| Aurora Data Range Range Median to Announcement of CITIC Proposal 22.4 % 26.0 % 29.0 % |
% Premium (Discount) to Last Closing Price Enterprise Value/EBITDA
Cited by CITIC Capital 3 56.0 % 60.7 % 64.5 % IBES Estimates
% Premium (Discount) to Current Price1 —3.0 % 5.4 %
2012E EBITDA $91.0 6.6 x 6.9 x 6.4 x
% Premium (Discount) to 52 Week High1 (24.3)% (22.0)% (20.1)%
2013E EBITDA $118.0 5.1 x 5.3 x 4.7 x
% Premium (Discount) to 52 Week Low1 89.7 % 95.3 % 100.0 %
1 |
|
% Premium (Discount) to 1 Month VWAP (0.4)% 2.5 % 5.0 % Management Estimates6
% Premium (Discount) to 3 Month VWAP1 3.6 % 6.7 % 9.2 %
Aurora Diluted Shares Outstanding (mm) 2012E EBITDA $85.7 7.0 x 7.3 x 6.4 x
72.8 72.8 72.8
2013E EBITDA $102.8 5.9 x 6.1 x 4.7 x
Aurora Implied Fully-Distributed Equity Value $ 884.1 $ 910.3 $ 932.1 Less: Cash & Equivalents 4 $ 308.7 $ 308.7 $ 308.7
P/E Multiple
Aurora Implied Enterprise Value $ 575.4 $ 601.6 $ 623.4 IBES Estimates
Total Unrestricted Cash per Diluted Shares $ 4.24 $ 4.24 $ 4.24
Less: Restricted Cash 4 $ 19.80 $ 19.80 $ 19.80 2012E EPS $1.17 10.7 x 10.9 x 10.4 x
Aurora Implied Enterprise Value Including 2013E EPS $1.38 9.1 x 9.3 x 8.0 x Restricted Cash $ 555.6 $ 581.8 $ 603.6
Total Cash per Diluted Shares $ 4.51 $ 4.51 $ 4.51 Management Estimates6
1 |
| Closing price of US$12.14 as of July 12, 2012 |
2012E EPS $1.18 10.6 x 10.9 x 10.4 x
2 |
| Closing price of US$9.92 as of January 19, 2012 |
3 |
| Closing price of US$7.78 as of January 11, 2012 2013E EPS $1.31 9.5 x 9.8 x 8.0 x |
4 |
| As of March 31, 2012; Cash and equivalents including cash and short term investment |
5 |
| Peer group median of HiSoft, iSoftSone and VanceInfo for Chinese peers, data as of July 12, 2012 |
6 |
| Includes losses related to overseas business in 2012 and 2013, respectively |
Source: Management projections, IBES and public filings
9
|
PRELIMINARY DRAFT, CONFIDENTIAL
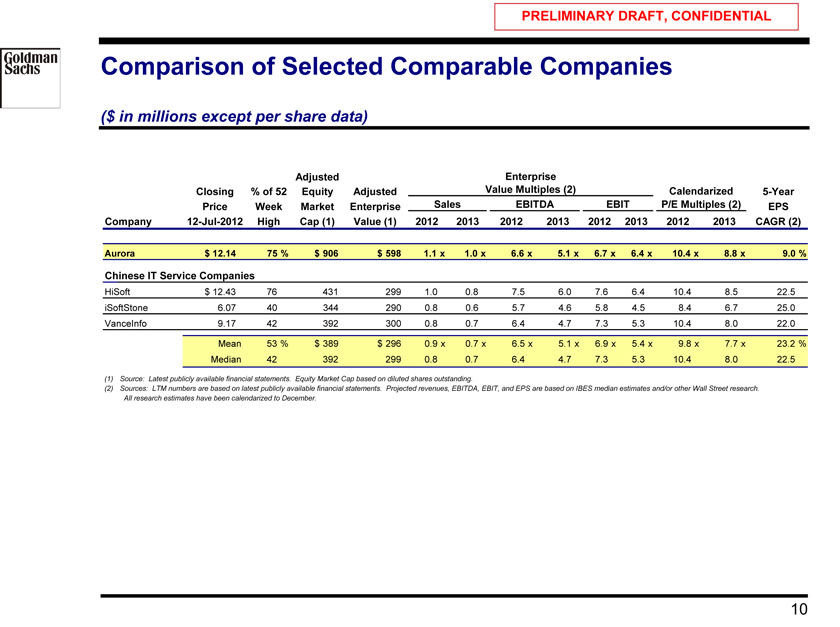
Comparison of Selected Comparable Companies
($ in millions except per share data)
Adjusted Enterprise
Closing % of 52 Equity Adjusted Value Multiples (2) Calendarized 5-Year Price Week Market Enterprise Sales EBITDA EBIT P/E Multiples (2) EPS
Company 12-Jul-2012 High Cap (1) Value (1) 2012 2013 2012 2013 2012 2013 2012 2013 CAGR (2)
Aurora $ 12.14 75 % $ 906 $ 598 1.1 x 1.0 x 6.6 x 5.1 x 6.7 x 6.4 x 10.4 x 8.8 x 9.0 %
Chinese IT Service Companies
HiSoft $ 12.43 76 431 299 1.0 0.8 7.5 6.0 7.6 6.4 10.4 8.5 22.5 iSoftStone 6.07 40 344 290 0.8 0.6 5.7 4.6 5.8 4.5 8.4 6.7 25.0 VanceInfo 9.17 42 392 300 0.8 0.7 6.4 4.7 7.3 5.3 10.4 8.0 22.0
Mean 53 % $ 389 $ 296 0.9 x 0.7 x 6.5 x 5.1 x 6.9 x 5.4 x 9.8 x 7.7 x 23.2 % Median 42 392 299 0.8 0.7 6.4 4.7 7.3 5.3 10.4 8.0 22.5
(1) |
| Source: Latest publicly available financial statements. Equity Market Cap based on diluted shares outstanding. |
(2) Sources: LTM numbers are based on latest publicly available financial statements. Projected revenues, EBITDA, EBIT, and EPS are based on IBES median estimates and/or other Wall Street research. All research estimates have been calendarized to December.
10
|
PRELIMINARY DRAFT, CONFIDENTIAL
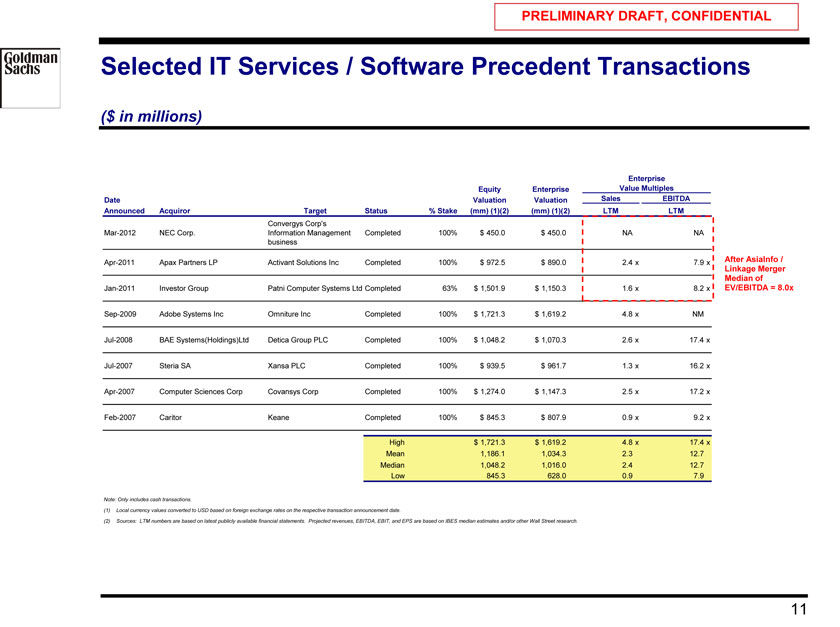
Selected IT Services / Software Precedent Transactions
($ in millions)
Enterprise Equity Enterprise Value Multiples Date Valuation Valuation Sales EBITDA Announced Acquiror Target Status % Stake (mm) (1)(2) (mm) (1)(2) LTM LTM
Convergys Corp’s
Mar-2012 NEC Corp. Information Management Completed 100% $ 450.0 $ 450.0 NA NA business
Apr-2011 Apax Partners LP Activant Solutions Inc Completed 100% $ 972.5 $ 890.0 2.4 x 7.9 x After AsiaInfo /
Linkage Merger Median of
Jan-2011 Investor Group Patni Computer Systems Ltd Completed 63% $ 1,501.9 $ 1,150.3 1.6 x 8.2 x EV/EBITDA = 8.0x
Sep-2009 Adobe Systems Inc Omniture Inc Completed 100% $ 1,721.3 $ 1,619.2 4.8 x NM
Jul-2008 BAE Systems(Holdings)Ltd Detica Group PLC Completed 100% $ 1,048.2 $ 1,070.3 2.6 x 17.4 x Jul-2007 Steria SA Xansa PLC Completed 100% $ 939.5 $ 961.7 1.3 x 16.2 x Apr-2007 Computer Sciences Corp Covansys Corp Completed 100% $ 1,274.0 $ 1,147.3 2.5 x 17.2 x Feb-2007 Caritor Keane Completed 100% $ 845.3 $ 807.9 0.9 x 9.2 x
High $ 1,721.3 $ 1,619.2 4.8 x 17.4 x Mean 1,186.1 1,034.3 2.3 12.7 Median 1,048.2 1,016.0 2.4 12.7 Low 845.3 628.0 0.9 7.9
Note: Only includes cash transactions.
(1) Local currency values converted to USD based on foreign exchange rates on the respective transaction announcement date.
(2) Sources: LTM numbers are based on latest publicly available financial statements. Projected revenues, EBITDA, EBIT, and EPS are based on IBES median estimates and/or other Wall Street research.
11