UNITED STATES
SECURITIES AND EXCHANGE COMMISSION
Washington, DC 20549
FORM N-CSR
CERTIFIED SHAREHOLDER REPORT OF REGISTERED MANAGEMENT INVESTMENT COMPANIES
Investment Company Act file number 811-09869
Franklin Floating Rate Master Trust
(Exact name of registrant as specified in charter)
One Franklin Parkway, San Mateo, CA 94403-1906
(Address of principal executive offices) (Zip code)
Craig S. Tyle, One Franklin Parkway, San Mateo, CA 94403-1906
(Name and address of agent for service)
Registrant's telephone number, including area code:650 312-2000
Date of fiscal year end: 7/31
Date of reporting period: 7/31/16
Item 1. Reports to Stockholders.
Franklin Lower Tier Floating Rate Fund Annual Report
Manager’s Discussion
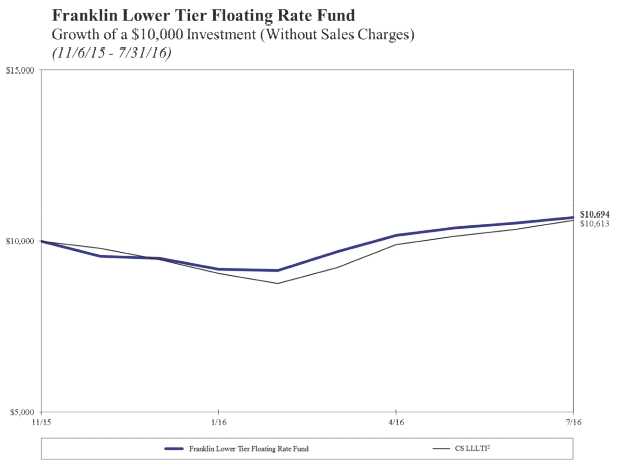
Franklin Lower Tier Floating Rate Fund was established and funded by an asset transfer-in-kind on November 6, 2015. Our focus immediately after the transfer-in-kind was to rebalance the portfolio, so it would be in full compliance with all tax and portfolio tests. Therefore, the discretionary portfolio management did not start until January 2016. During the period since the Fund’s inception on November 6, 2015, through July 31, 2016, the Fund delivered a +6.90% cumulative total return. In comparison, the Fund’s benchmark, the Credit Suisse Leveraged Loan Lower Tier Index (CS LLLTI), which is designed to mirror the lower tier (comprising companies with lower range revenues within the markets in which they operate) portion of the U.S. dollar-denominated leveraged loan market, generated a +6.14% total return for the same period.1 During the period between January 1, 2016, and July 31, 2016, when the Fund was under full discretionary management, the Fund delivered a +12.51% cumulative total return, compared with the CS LLLTI’s +12.13% total return for the same period.1
The favorable returns generated by the Fund from January 1, 2016, through July 31, 2016, were driven by the selection and weighting of individual loans relative to the benchmark. The first-and second-lien term loans of FRAM Group, an aftermarket auto products supplier, which is one of the Fund’s largest positions, notably contributed to the Fund’s performance relative to the benchmark. The loans traded higher due to the company’s improved earnings, sales growth and cost savings. Similarly, our investment in the term loan of Town Sports International, one of the largest owners and operators of fitness clubs in the Northeast and Mid-Atlantic regions, contributed to relative performance through price appreciation, as the company made significant progress in cutting costs. However, certain individual issuers detracted from the Fund’s performance relative to the benchmark. The term loan of Sungard Availability Services Capital, a provider of information technology disaster recovery and colocation services, detracted from relative performance, as its price declined after the company reported lower year-over-year revenue and earnings before interest, taxes, depreciation and amortization, which overshadowed the company’s turnaround process.
Before the end of January, the Fund’s transactions were largely focused on reducing our holdings of issuers whose market values exceeded 5% of the Fund’s total net assets, to ensure that these loans totaled less than 50%. To control losses and maintain the portfolio’s return potential, we mainly reduced our exposure to term loans, which declined relatively modestly during the market sell-off, including the term loan of a gaming company and the term loan of a packaging manufacturer. Since the beginning of February, we continued improving the Fund’s diversity by introducing new bank loans into the portfolio. We invested in a select number of bank loans from the secondary market, prioritizing companies that have demonstrated concrete progress in their business operations and revenue generation. During this period, we purchased the term loan of 99 Cents Only Stores, a regional value-based dollar store chain. We invested in the loan due to the company’s improvements across virtually all key metrics and the initiatives launched by its new management team, with the expectation that the company has reached a turning point in its performance. The second-lien term loan of Oxbow Carbon, a petcoke, calcined coke and coal company, was also among the Fund’s largest additions over the period. We were attracted to the loan as we believed in the company’s positive long-term outlook. Additionally, this second-lien loan offered what we considered strong value for its relatively short maturity, low leverage, supportive sponsor and strong liquidity.
Notes:
1. Source: Credit Suisse Group.
The index is unmanaged and includes reinvestment of any income or distributions. It does not reflect any fees, expenses or sales charges. One cannot invest directly in an index, and an index is not representative of the Fund’s portfolio.
See www.franklintempletondatasources.com for additional data provider information.
| | |
| Portfolio Breakdown | % of Total Net Assets | |
| 7/31/16 | | |
| |
| Senior Floating Rate Interests | 96.9 | % |
| Other Net Assets | 3.1 | % |
Total Return Index Comparison for a Hypothetical $10,000 Investment1
Total return represents the change in value of an investment over the periods shown. It includes any applicable maximum sales charge, Fund expenses, account fees and reinvested distributions. The unmanaged index includes reinvestment of any income or distributions. It differs from the Fund in composition and does not pay management fees or expenses. One cannot invest directly in an index.
| | |
| Average Annual Total Return1,3 | |
| 7/31/16 | | |
| Since Inception 11/6/15 | +6.90 | % |
1. The Fund has an expense reduction contractually guaranteed through 11/30/16. Fund investment results reflect the
expense reduction; without this reduction, the results would have been lower.
2. Source: Credit Suisse Group. The CS LLLTI is designed to mirror the lower tier (comprising companies with
lower range revenues within the markets in which they operate) portion of the U.S. dollar-denominated leveraged
loan market. Loans must be below investment grade and rated no higher than Baa1/BB+ or Ba1/BBB+ by
Moody’s/Standard and Poor’s® (S&P).
3. Average annual total return represents the average annual change in value of an investment over the period
indicated. Return for less than one year, if any, has not been annualized.
See www.franklintempletondatasources.com for additional data provider information.
Your Fund’s Expenses
As a Fund shareholder, you can incur two types of costs:
- Transaction costs, including sales charges (loads) on Fund purchases, if any; and
- Ongoing Fund costs, including management fees, distribution and service (12b-1) fees, if any, and other Fund expenses. All mutual funds have ongoing costs, sometimes referred to as operating expenses.
The following table shows ongoing costs of investing in the Fund and can help you understand these costs and compare them with those of other mutual funds. The table assumes a $1,000 investment held for the six months indicated.
Actual Fund Expenses
The first line (Actual) listed in the table provides actual account values and expenses. The “Ending Account Value” is derived from the Fund’s actual return, which includes the effect of Fund expenses.
You can estimate the expenses you paid during the period by following these steps. Of course, your account value and expenses will differ from those in this illustration:
1. Divide your account value by $1,000.
If an account had an $8,600 value, then $8,600¸ $1,000 = 8.6.
2. Multiply the result by the number under the heading “Expenses Paid During Period.”
If Expenses Paid During Period were $7.50, then 8.6´ $7.50 = $64.50.
In this illustration, the estimated expenses paid this period are $64.50.
Hypothetical Example for Comparison with Other Funds
Information in the second line (Hypothetical) in the table can help you compare ongoing costs of investing in the Fund with those of other mutual funds. This information may not be used to estimate the actual ending account balance or expenses you paid during the period. The hypothetical “Ending Account Value” is based on the Fund’s actual expense ratio and an assumed 5% annual rate of return before expenses, which does not represent the Fund’s actual return. The figure under the heading “Expenses Paid During Period” shows the hypothetical expenses your account would have incurred under this scenario. You can compare this figure with the 5% hypothetical examples that appear in shareholder reports of other funds.
Your Fund’s Expenses (continued)
Please note that expenses shown in the table are meant to highlight ongoing costs and do not reflect any transaction costs, such as sales charges. Therefore, the second line is useful in comparing ongoing costs only, and will not help you compare total costs of owning different funds. In addition, if transaction costs were included, your total costs would have been higher. Please refer to the Fund prospectus for additional information on operating expenses.
| | | | | | |
| | | Beginning Account | | Ending Account | | Expenses Paid During |
| | | Value 2/1/16 | | Value 7/31/16 | | Period* 2/1/16–7/31/16 |
| |
| Actual | $ | 1,000 | $ | 1,163.60 | $ | 3.23 |
| Hypothetical (5% return before expenses) | $ | 1,000 | $ | 1,021.88 | $ | 3.02 |
*Expenses are calculated using the most recent annualized six-month expense ratio, net of expense waivers, of
0.60%, multiplied by the average account value over the period, multiplied by 182/366 to reflect the one-half year
period.
Franklin Middle Tier Floating Rate Fund Annual Report
Manager’s Discussion
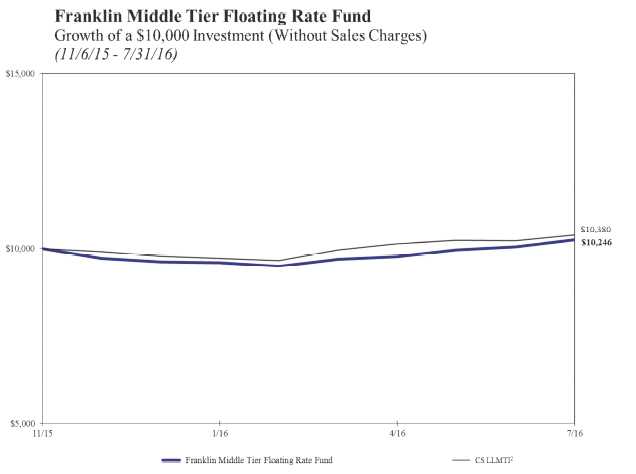
Franklin Middle Tier Floating Rate Fund was established and funded by an asset transfer-in-kind on November 6, 2015. Our focus immediately after the transfer-in-kind was to rebalance the portfolio, so it would be in full compliance with all tax and portfolio tests. Therefore, the discretionary portfolio management did not start until January 2016. During the period since the Fund’s inception on November 6, 2015, through July 31, 2016, the Fund delivered a +2.46% cumulative total return. In comparison, the Fund’s benchmark, the Credit Suisse Leveraged Loan Middle Tier Index (CS LLMTI), which is designed to mirror the middle tier (comprising companies with mid-range revenues within the markets in which they operate) portion of the U.S. dollar-denominated leveraged loan market, generated a +3.79% total return for the same period.1 During the period between January 1, 2016, and July 31, 2016, when the Fund was under full discretionary management, the Fund delivered a +6.40% cumulative total return, compared with the CS LLMTI’s +5.99% total return for the same period.1
The favorable returns generated by the Fund from January 1, 2016, through July 31, 2016, were driven by the loan selection and weighting of individual securities relative to the benchmark. The term loan of Freedom Group, a firearms and ammunition manufacturer, which is the Fund’s largest position, notably contributed to the Fund’s performance relative to the benchmark. The loan traded higher due to the company’s significantly improved year-over-year sales, which exceeded expectations. Similarly, our investment in the term loan of Cyanco Intermediate, a manufacturer of sodium cyanide, a chemical used in gold mining, contributed to relative performance through price appreciation as investors were encouraged by the company’s bullish outlook on its long-term prospects. However, certain individual issuers detracted from the Fund’s performance relative to the benchmark. The term loan of Onsite Rental Group Operations, a specialized industrial equipment rental company, detracted from relative performance as its value declined after the company reported weak financial results related to the decline of its natural resources projects in Australia. Our investment in the term loan of Cumulus, a radio broadcaster, also declined in price amid discouraging business trends and detracted from relative performance.
Before the end of January, the Fund’s transactions were largely focused on reducing the holdings of issuers whose market values exceeded 5% of the Fund’s total net assets, to ensure that these loans totaled less than 50%. Since the beginning of February, we continued improving the Fund’s diversity by introducing new bank loans into the portfolio. We invested in a select number of bank loans with solid business profiles from the primary and secondary markets, mainly at discounts to par, which we believe were typically less exposed to refinance risk.
During the reporting period, we exited our holdings in the term loan of Cengage Learning Acquisitions, a printing and publishing company, which we considered relatively risky with an aggressive dividend policy and high leverage. We also reduced our exposure to Travelport, a global distribution system provider, at a price above par and invested the proceeds into the first-lien term loan of Carestream, a medical imaging product provider. We made this new investment due to the company’s leading market position, its improved gross margin as well as earnings before interest, taxes, depreciation and amortization, and the loan’s short maturity. The term loan of Sensus USA, a manufacturer of automated metering systems for distribution of resources such as water, natural gas and electricity, was also among the Fund’s largest additions over the period, as we participated in the company’s new refinancing transaction to retire its existing first- and second-lien loans. We were attracted to the new Sensus first-lien term loan as we expected the company’s core revenue and profitability to continue to moderately improve in the near term.
Notes:
1. Source: Credit Suisse Group.
The index is unmanaged and includes reinvestment of any income or distributions. It does not reflect any fees,
expenses or sales charges. One cannot invest directly in an index, and an index is not representative of the Fund’s
portfolio.
See www.franklintempletondatasources.com for additional data provider information.
| | |
| Portfolio Breakdown | % of Total Net Assets | |
| 7/31/16 | | |
| |
| Senior Floating Rate Interests | 93.1 | % |
| Other Net Assets | 6.9 | % |
Total Return Index Comparison for a Hypothetical $10,000 Investment1
Total return represents the change in value of an investment over the periods shown. It includes any applicable maximum sales charge, Fund expenses, account fees and reinvested distributions. The unmanaged index includes reinvestment of any income or distributions. It differs from the Fund in composition and does not pay management fees or expenses. One cannot invest directly in an index.
| | |
| Average Annual Total Return1,3 | | |
| 7/31/16 | | |
| Since Inception 11/6/15 | +2.46 | % |
1. The Fund has an expense reduction contractually guaranteed through 11/30/16. Fund investment results reflect the
expense reduction; without this reduction, the results would have been lower.
2. Source: Credit Suisse Group. The CS LLMTI is designed to mirror the middle tier (comprising companies with
mid-range revenues within the markets in which they operate) portion of the U.S. dollar-denominated leveraged loan
market. Loans must be below investment grade and rated no higher than Baa1/BB+ or Ba1/BBB+ by Moody’s/S&P.
3. Average annual total return represents the average annual change in value of an investment over the period
indicated. Return for less than one year, if any, has not been annualized.
See www.franklintempletondatasources.com for additional data provider information.
Your Fund’s Expenses
As a Fund shareholder, you can incur two types of costs:
- Transaction costs, including sales charges (loads) on Fund purchases, if any; and
- Ongoing Fund costs, including management fees, distribution and service (12b-1) fees, if any, and other Fund expenses. All mutual funds have ongoing costs, sometimes referred to as operating expenses.
The following table shows ongoing costs of investing in the Fund and can help you understand these costs and compare them with those of other mutual funds. The table assumes a $1,000 investment held for the six months indicated.
Actual Fund Expenses
The first line (Actual) listed in the table provides actual account values and expenses. The “Ending Account Value” is derived from the Fund’s actual return, which includes the effect of Fund expenses.
You can estimate the expenses you paid during the period by following these steps. Of course, your account value and expenses will differ from those in this illustration:
1. Divide your account value by $1,000.
If an account had an $8,600 value, then $8,600¸ $1,000 = 8.6.
2. Multiply the result by the number under the heading “Expenses Paid During Period.”
If Expenses Paid During Period were $7.50, then 8.6´ $7.50 = $64.50.
In this illustration, the estimated expenses paid this period are $64.50.
Hypothetical Example for Comparison with Other Funds
Information in the second line (Hypothetical) in the table can help you compare ongoing costs of investing in the Fund with those of other mutual funds. This information may not be used to estimate the actual ending account balance or expenses you paid during the period. The hypothetical “Ending Account Value” is based on the Fund’s actual expense ratio and an assumed 5% annual rate of return before expenses, which does not represent the Fund’s actual return. The figure under the heading “Expenses Paid During Period” shows the hypothetical expenses your account would have incurred under this scenario. You can compare this figure with the 5% hypothetical examples that appear in shareholder reports of other funds.
Your Fund’s Expenses (continued)
Please note that expenses shown in the table are meant to highlight ongoing costs and do not reflect any transaction costs, such as sales charges. Therefore, the second line is useful in comparing ongoing costs only, and will not help you compare total costs of owning different funds. In addition, if transaction costs were included, your total costs would have been higher. Please refer to the Fund prospectus for additional information on operating expenses.
| | | | | | |
| | | Beginning Account | | Ending Account | | Expenses Paid During |
| | | Value 2/1/16 | | Value 7/31/16 | | Period* 2/1/16–7/31/16 |
| |
| Actual | $ | 1,000 | $ | 1,067.10 | $ | 3.08 |
| Hypothetical (5% return before expenses) | $ | 1,000 | $ | 1,021.88 | $ | 3.02 |
*Expenses are calculated using the most recent annualized six-month expense ratio, net of expense waivers, of
0.60%, multiplied by the average account value over the period, multiplied by 182/366 to reflect the one-half year
period.
Franklin Floating Rate Master Trust
Board Members and Officers
The name, year of birth and address of the officers and board members, as well as their affiliations, positions held with the Trust, principal occupations during at least the past five years and number of U.S. registered portfolios overseen in the Franklin Templeton Investments fund complex, are shown below. Generally, each board member serves until that person’s successor is elected and qualified.
| | | | |
| Independent Board Members | | | |
| |
| | | | Number of | |
| |
| | | | Portfolios | |
| | | | | Other |
| Name, Year | | Length of | in Fund | |
| | | | | Directorships Held |
| of Birth and | Position | Time | Complex | |
| | | | | During at Least |
| Address | | Served | Overseen | |
| | | | | the Past 5 Years |
| | | | by Board | |
| |
| | | | Member* | |
| | | | |
| Harris J. | | Trustee | Since 1999 145 | Bar-S Foods (meat |
| Ashton | | | | packing company) |
| (1932) | | | | (1981-2010). |
| One Franklin | | |
| Parkway | | | | |
| San Mateo, | | | | |
| CA 94403- | | | | |
| 1906 | | | | |
| Principal Occupation During at Least the Past | 5 Years: |
| Director of various companies; and formerly, Director, RBC Holdings, |
| Inc. (bank holding company) (until 2002); and President, Chief |
| Executive Officer and Chairman of the Board, General Host Corporation |
| (nursery and craft centers) (until 1998). | |
| | | | |
| Mary C. | | Trustee | Since 2014 119 | Avis Budget Group |
| Choksi | | | | Inc. (car rental) |
| (1950) | | | | (2007-present), |
| One Franklin | | Omnicom Group Inc. |
| Parkway | | | | (advertising and |
| San Mateo, | | | | marketing |
| CA 94403- | | | | communications |
| 1906 | | | | services) (2011- |
| | | | | present) and H.J. |
| | | | | Heinz Company |
| | | | | (processed foods |
| | | | | and allied |
| | | | | products) (1998- |
| | | | | 2006). |
| Principal Occupation During at Least the Past 5 Years: |
| Senior Advisor, Strategic Investment Group (investment management |
| group) (2015-present); director of various companies; and formerly, |
| Founding Partner and Senior Managing Director, Strategic Investment |
| Group (1987–2015); Founding Partner and Managing Director, Emerging |
| Markets Management LLC (investment management firm) (1987-2011); and |
| Loan Officer/Senior Loan Officer/Senior Pension Investment Officer, |
| World Bank Group (international financial institution) (1977-1987). |
| |
| Edith E. | | Trustee | Since 1999 145 | Hess Corporation |
| Holiday | | | | (exploration and |
| (1952) | | | | refining of oil |
| One Franklin | | and gas) (1993- |
| | | | | |
| Parkway | | | | present), Canadian | |
| San Mateo, | | | | National Railway | |
| CA 94403- | | | | (railroad) (2001- | |
| 1906 | | | | present), White | |
| | | | | Mountains | |
| | | | | Insurance Group, | |
| | | | | Ltd. (holding | |
| | | | | company) (2004- | |
| | | | | present), RTI | |
| | | | | International | |
| | | | | Metals, Inc. | |
| | | | | (manufacture and | |
| | | | | distribution of | |
| | | | | titanium) (1999- | |
| | | | | 2015) and H.J. | |
| | | | | Heinz Company | |
| | | | | (processed foods | |
| | | | | and allied | |
| | | | | products) (1994- | |
| | | | | 2013). | |
| Principal Occupation During at Least the Past 5 Years: | |
| Director or Trustee of various companies and trusts; and formerly, | |
| Assistant to the President of the United States and Secretary of the | |
| Cabinet (1990-1993); General Counsel to the United States Treasury | |
| Department | (1989-1990); and Counselor to the Secretary and Assistant | |
| Secretary for Public Affairs and Public Liaison-United States Treasury | |
| Department | (1988-1989). | | | |
| |
| J. Michael | | Trustee | Since 2009 145 | Boeing Capital | |
| Luttig | | | | Corporation | |
| (1954) | | | | (aircraft | |
| One Franklin | | financing) (2006- | |
| Parkway | | | | 2013). | |
| San Mateo, | | | | | |
| CA 94403- | | | | | |
| 1906 | | | | | |
| Principal Occupation During at Least the Past 5 Years: | |
| Executive Vice President, General Counsel and member of the Executive | |
| Council, The Boeing Company (aerospace company) (2006-present); and | |
| formerly, Federal Appeals Court Judge, U.S. Court of Appeals for the | |
| Fourth Circuit (1991-2006). | | |
| |
| Frank A. | | Trustee | Since 2005 145 | Hess Corporation | |
| Olson (1932) | | (exploration and | |
| One Franklin | | refining of oil | |
| Parkway | | | | and gas) (1998- | |
| San Mateo, | | | | 2013). | |
| CA 94403- | | | | | |
| 1906 | | | | | |
| Principal Occupation During at Least the Past 5 Years: | |
| Director of various companies; and formerly, Chairman of the Board, The | |
| Hertz Corporation (car rental) (1980-2000) and Chief Executive Officer | |
| (1977-1999); and Chairman of the Board, President and Chief Executive | |
| Officer, UAL Corporation (airlines) (June–December 1987). | |
| |
| Larry D. | | Trustee | Since 2007 145 | The Southern | |
| Thompson | | | | Company (energy | |
| (1945) | | | | company) (2014- | |
| One Franklin | | present; | |
| Parkway | | | | previously 2010- | |
| San Mateo, | | | | 2012), Graham | |
| CA 94403- | | | | Holdings Company | |
| | | | | | |
| 1906 | | | | | (education and | |
| | | | | | media | |
| | | | | | organization) | |
| | | | | | (2011-present) and | |
| | | | | | Cbeyond, Inc. | |
| | | | | | (business | |
| | | | | | communications | |
| | | | | | provider) (2010- | |
| | | | | | 2012). | |
| Principal Occupation During at Least the Past 5 Years: | |
| Director of various companies; John A. Sibley Professor of Corporate | |
| and Business Law, University of Georgia School of Law (2015-present; | |
| previously 2011-2012); and formerly, Executive Vice President - | |
| Government Affairs, General Counsel and Corporate Secretary, PepsiCo, | |
| Inc. (consumer products) (2012-2014); Senior Vice President - | |
| Government Affairs, General Counsel and Secretary, PepsiCo, Inc. (2004- | |
| 2011); Senior Fellow of The Brookings Institution (2003-2004); Visiting | |
| Professor, University of Georgia School of Law (2004); and Deputy | |
| Attorney General, U.S. Department of Justice (2001-2003). | |
| |
| John B. | | Lead | Trustee | 119 | None | |
| Wilson | | Independent | since 2007 | | | |
| (1959 | ) | Trustee | and Lead | | | |
| One Franklin | | | Independent | | |
| Parkway | | | Trustee | | | |
| San Mateo, | | | since 2008 | | | |
| CA 94403- | | | | | | |
| 1906 | | | | | | |
| Principal Occupation During at Least the Past 5 Years: | |
| President, Staples Europe (office supplies) (2012-present); President | |
| and Founder, Hyannis Port Capital, Inc. (real estate and private equity | |
| investing); serves on private and non-profit boards; and formerly, | |
| Chief Operating Officer and Executive Vice President, Gap, Inc. | |
| (retail) (1996-2000); Chief Financial Officer and Executive Vice | |
| President – Finance and Strategy, Staples, Inc. (1992-1996); Senior | |
| Vice President – Corporate Planning, Northwest Airlines, Inc. | |
| (airlines) (1990-1992); and Vice President and Partner, Bain & Company | |
| (consulting firm) (1986-1990). | | | |
| | | | | |
| Interested Board Members and Officers | | |
| | | | | Number of | |
| | | | | Portfolios | Other |
| Name, Year | | | Length of | in Fund | Directorships Held |
| of Birth and | | Position | Time | Complex | During at Least |
| Address | | | Served | Overseen | the Past 5 Years |
| | | | | by Board | |
| | | | | Member* | |
| |
| **Gregory E. | | Trustee | Since 2007 | 161 | None |
| Johnson | | | | | |
| (1961 | ) | | | | |
| One Franklin | | | | | |
| Parkway | | | | | |
| San Mateo, | | | | | |
| CA 94403- | | | | | |
| 1906 | | | | | |
| | | | | |
| Principal Occupation During at Least the Past 5 Years: |
| Chairman of the Board, Member - Office of the Chairman, Director and |
| Chief Executive Officer, Franklin Resources, Inc.; officer and/or |
| director or trustee, as the case may be, of some of the other |
| subsidiaries of Franklin Resources, Inc. and of 44 of the investment |
| companies in Franklin Templeton Investments; Vice Chairman, Investment |
| Company Institute; and formerly, President, Franklin Resources, Inc. |
| (1994-2015). | | | | | |
| |
| **Rupert H. | | Chairman of | Since 2013 | 145 | None |
| Johnson, Jr. | | the Board | | | |
| (1940 | ) | and | | | |
| One Franklin | | Trustee | | | |
| Parkway | | | | | |
| San Mateo, | | | | | |
| CA 94403- | | | | | |
| 1906 | | | | | |
| Principal Occupation During at Least the Past 5 Years: |
| Vice Chairman, Member - Office of the Chairman and Director, Franklin |
| Resources, Inc.; Director, Franklin Advisers, Inc.; Senior Vice |
| President, Franklin Advisory Services, LLC; and officer and/or director |
| or trustee, as the case may be, of some of the other subsidiaries of |
| Franklin Resources, Inc. and of 42 of the investment companies in |
| Franklin Templeton Investments. | | |
| |
| Alison E. | | Vice | Since 2012 | Not | Not Applicable |
| Baur | | President | | Applicable |
| (1964 | ) | | | | |
| One Franklin | | | | | |
| Parkway | | | | | |
| San Mateo, | | | | | |
| CA 94403- | | | | | |
| 1906 | | | | | |
| Principal Occupation During at Least the Past 5 Years: |
| Deputy General Counsel, Franklin Templeton Investments; and officer of |
| some of the other subsidiaries of Franklin Resources, Inc. and of 45 of |
| the investment companies in Franklin Templeton Investments. |
| |
| Mark | | Vice | Since 2003 | Not | Not Applicable |
| Boyadjian | | President | | Applicable |
| (1964 | ) | | | | |
| One Franklin | | | | | |
| Parkway | | | | | |
| San Mateo, | | | | | |
| CA 94403- | | | | | |
| 1906 | | | | | |
| Principal Occupation During at Least the Past 5 Years: |
| Senior Vice President, Franklin Advisers, Inc.; and officer of two of |
| the investment companies in Franklin Templeton Investments. |
| |
| Laura F. | | Chief | Since 2009 | Not | Not Applicable |
| Fergerson | | Executive | | Applicable |
| (1962 | ) | Officer - | | | |
| One Franklin | | Finance and | | | |
| Parkway | | Administrati | | |
| San Mateo, | | on | | | |
| CA 94403- | | | | | |
| 1906 | | | | | |
| | | | | |
| Principal Occupation During at Least the Past 5 Years: |
| Senior Vice President, Franklin Templeton Services, LLC; Vice |
| President, Franklin Advisers, Inc. and Franklin Templeton |
| Institutional, LLC; and officer of 45 of the investment companies in |
| Franklin Templeton Investments. | | |
| |
| Gaston | | Treasurer, | Since 2009 | Not | Not Applicable |
| Gardey | | Chief | | Applicable |
| (1967 | ) | Financial | | | |
| One Franklin | | Officer and | | | |
| Parkway | | Chief | | | |
| San Mateo, | | Accounting | | | |
| CA 94403- | | Officer | | | |
| 1906 | | | | | |
| Principal Occupation During at Least the Past 5 Years: |
| Treasurer, U.S. Fund Administration & Reporting, Franklin Templeton |
| Investments; and officer of 27 of the investment companies in Franklin |
| Templeton Investments. | | | |
| |
| Aliya S. | | Vice | Since 2009 | Not | Not Applicable |
| Gordon | | President | | Applicable |
| (1973 | ) | | | | |
| One Franklin | | | | | |
| Parkway | | | | | |
| San Mateo, | | | | | |
| CA 94403- | | | | | |
| 1906 | | | | | |
| Principal Occupation During at Least the Past 5 Years: |
| Senior Associate General Counsel, Franklin Templeton Investments; and |
| officer of 45 of the investment companies in Franklin Templeton |
| Investments. | | | | | |
| |
| Steven J. | | Vice | Since 2009 | Not | Not Applicable |
| Gray (1955) | | President | | Applicable |
| One Franklin | | | | | |
| Parkway | | | | | |
| San Mateo, | | | | | |
| CA 94403- | | | | | |
| 1906 | | | | | |
| Principal Occupation During at Least the Past 5 Years: |
| Senior Associate General Counsel, Franklin Templeton Investments; Vice |
| President, Franklin Templeton Distributors, Inc. and Franklin |
| Alternative Strategies Advisers, LLC; and officer of 45 of the |
| investment companies in Franklin Templeton Investments. |
| |
| Robert Lim | | Vice | Since May | Not | Not Applicable |
| (1948 | ) | President | 2016 | Applicable |
| One Franklin | | – AML | | | |
| Parkway | | Compliance | | | |
| San Mateo, | | | | | |
| CA 94403- | | | | | |
| 1906 | | | | | |
| Principal Occupation During at Least the Past 5 Years: |
| Vice President, Franklin Templeton Companies, LLC; Chief Compliance |
| Officer, Franklin Templeton Distributors, Inc. and Franklin Templeton |
| Investor Services, LLC; and officer of 45 of the investment companies |
| in Franklin Templeton Investments. | | |
| |
| Christopher | | President | Since 2010 | Not | Not Applicable |
| J. Molumphy | | and Chief | | Applicable |
| (1962 | ) | Executive | | | |
| One Franklin | | Officer - | | | |
| | | | | |
| Parkway | | Investment | | | |
| San Mateo, | | Management | | | |
| CA 94403- | | | | | |
| 1906 | | | | | |
| Principal Occupation During at Least the Past 5 Years: |
| Director and Executive Vice President, Franklin Advisers, Inc.; |
| Executive Vice President, Franklin Templeton Institutional, LLC; and |
| officer of some of the other subsidiaries of Franklin Resources, Inc. |
| and of 22 of the investment companies in Franklin Templeton |
| Investments. | | | | | |
| |
| Kimberly H. | | Vice | Since 2013 | Not | Not Applicable |
| Novotny | | President | | Applicable |
| (1972 | ) | | | | |
| 300 S.E. 2nd | | | | | |
| Street | | | | | |
| Fort | | | | | |
| Lauderdale, | | | | | |
| FL 33301- | | | | | |
| 1923 | | | | | |
| Principal Occupation During at Least the Past 5 Years: |
| Associate General Counsel, Franklin Templeton Investments; Vice |
| President and Corporate Secretary, Fiduciary Trust International of the |
| South; Vice President, Templeton Investment Counsel, LLC; Assistant |
| Secretary, Franklin Resources, Inc.; and officer of 45 of the |
| investment companies in Franklin Templeton Investments. |
| |
| Robert C. | | Chief | Since 2013 | Not | Not Applicable |
| Rosselot | | Compliance | | Applicable |
| (1960 | ) | Officer | | | |
| 300 S.E. 2nd | | | | | |
| Street | | | | | |
| Fort | | | | | |
| Lauderdale, | | | | | |
| FL 33301- | | | | | |
| 1923 | | | | | |
| Principal Occupation During at Least the Past 5 Years: |
| Director, Global Compliance, Franklin Templeton Investments; Vice |
| President, Franklin Templeton Companies, LLC; officer of 45 of the |
| investment companies in Franklin Templeton Investments; and formerly, |
| Senior Associate General Counsel, Franklin Templeton Investments (2007- |
| 2013); and Secretary and Vice President, Templeton Group of Funds |
| (2004-2013). | | | | | |
| |
| Karen L. | | Vice | Since 2006 | Not | Not Applicable |
| Skidmore | | President | | Applicable |
| (1952 | ) | and | | | |
| One Franklin | | Secretary | | | |
| Parkway | | | | | |
| San Mateo, | | | | | |
| CA 94403- | | | | | |
| 1906 | | | | | |
| Principal Occupation During at Least the Past 5 Years: |
| Senior Associate General Counsel, Franklin Templeton Investments; and |
| officer of 45 of the investment companies in Franklin Templeton |
| Investments. | | | | | |
| |
| Navid Tofigh | | Vice | Since | Not | Not Applicable |
| (1972 | ) | President | November | Applicable |
| One Franklin | | | 2015 | | |
| Parkway | | | | | |
| San Mateo, | | | | | |
| | | |
| CA 94403- | | | |
| 1906 | | | |
| Principal Occupation During at Least the Past 5 Years: |
| Associate General Counsel, Franklin Templeton Investments; and officer |
| of 45 of the investment companies in Franklin Templeton Investments. |
| |
| Craig S. | Vice | Since 2005 Not | Not Applicable |
| Tyle (1960) | President | Applicable |
| One Franklin | | | |
| Parkway | | | |
| San Mateo, | | | |
| CA 94403- | | | |
| 1906 | | | |
| Principal Occupation During at Least the Past 5 Years: |
| General Counsel and Executive Vice President, Franklin Resources, Inc.; |
| and officer of some of the other subsidiaries of Franklin Resources, |
| Inc. and of 45 of the investment companies in Franklin Templeton |
| Investments. | | | |
| |
| Lori A. | Vice | Since 2011 Not | Not Applicable |
| Weber (1964) | President | Applicable |
| 300 S.E. 2nd | | | |
| Street | | | |
| Fort | | | |
| Lauderdale, | | | |
| FL 33301- | | | |
| 1923 | | | |
| Principal Occupation During at Least the Past 5 Years: |
| Senior Associate General Counsel, Franklin Templeton Investments; |
| Assistant Secretary, Franklin Resources, Inc.; Vice President and |
| Secretary, Templeton Investment Counsel, LLC; and officer of 45 of the |
| investment companies in Franklin Templeton Investments. |
*We base the number of portfolios on each separate series of the U.S.
registered investment companies within the Franklin Templeton Investments
fund complex. These portfolios have a common investment manager or affiliated
investment managers.
**Gregory E. Johnson is considered to be an interested person of the Fund
under the federal securities laws due to his position as an officer and
director of Franklin Resources, Inc. (Resources), which is the parent company
of the Fund's investment manager and distributor. Rupert H. Johnson, Jr. is
considered to be an interested person of the Fund under the federal
securities laws due to his position as officer and director and major
shareholder of Resources.
Note 1: Rupert H. Johnson, Jr. is the uncle of Gregory E. Johnson.
Note 2: Officer information is current as of the date of this report. It is
possible that after this date, information about officers may change.
The Sarbanes-Oxley Act of 2002 and Rules adopted by the Securities and Exchange Commission require the
Fund to disclose whether the Fund’s Audit Committee includes at least one member who is an audit
committee financial expert within the meaning of such Act and Rules. The Fund’s Board has determined that
there is at least one such financial expert on the Audit Committee and has designated John B. Wilson as its
audit committee financial expert. The Board believes that Mr. Wilson qualifies as such an expert in view of
his extensive business background and experience, including service as chief financial officer of Staples, Inc.
from 1992 to 1996. Mr. Wilson has been a Member and Chairman of the Fund’s Audit Committee since 2007.
As a result of such background and experience, the Board believes that Mr. Wilson has acquired an
understanding of generally accepted accounting principles and financial statements, the general application
of such principles in connection with the accounting estimates, accruals and reserves, and analyzing and
evaluating financial statements that present a breadth and level of complexity of accounting issues generally
comparable to those of the Fund, as well as an understanding of internal controls and procedures for
financial reporting and an understanding of audit committee functions. Mr. Wilson is an independent Board member as that term is defined under the relevant Securities and Exchange Commission Rules and Releases.
The Statement of Additional Information (SAI) includes additional information about the board members and is available, without charge, upon request. Shareholders may call (800) DIAL BEN/342-5236 to request the SAI.
Franklin Floating Rate Master Trust
Shareholder Information
Board Approval of Investment Management Agreement
At a meeting held July 15, 2015, the Board of Trustees, including a majority of non-interested or independent Trustees, approved the investment management agreements for Franklin Lower Tier Floating Rate Fund and Franklin Middle Tier Floating Rate Fund (Funds), each a series of Franklin Floating Rate Master Trust (Trust), with Franklin Advisers, Inc. (the Manager). In reaching its decision to approve the agreements, the Board took into account that the Funds are designed to provide greater centralization of the portfolio management of floating rate instruments for the U.S. registered Franklin Templeton open-end funds that otherwise invest in floating rate instruments and thereby to reduce trading and settlement costs and other operational inefficiencies associated with managing such funds’ direct investments in such floating rate instruments separately. To this end, the Funds will be available only to other funds sold by Franklin Templeton. The Funds’ investment goal is to provide a high level of current income through investing at least 80% of net assets in income-producing floating interest rate corporate loans and corporate debt securities made to or issued by U.S. companies, non-U.S. entities and U.S. subsidiaries of non-U.S. entities. Franklin Middle Tier Floating Rate Fund will invest principally in floating rate instruments rated B or higher while Franklin Lower Tier Floating Rate Fund will focus its investment in floating rate instruments rated CCC or lower, although it may invest up to 50% of its assets in floating rate instruments rated above CCC or, if unrated, determined by the Manager to be of comparable quality. The Board considered various materials related to the investment management agreements including: (1) copies of the proposed form of agreements; (2) the biographies of the portfolio managers; (3) the Funds’ proposed use of derivative instruments; and (4) information describing the nature, quality and extent of services to be provided by the Manager, and the proposed fees payable to the Manager for such services. The Board also was provided with information relating to proposed expenses for the Funds, including comparative data provided by Lipper, Inc. (Lipper), an independent organization, which compared the expenses to those of other mutual funds deemed comparable to the Funds as selected by Lipper.
In determining that the terms of the proposed investment management agreements were fair and reasonable, the Board took into account several factors including, but not limited to, the following: (1) the nature and quality of the services to be provided by the Manager to the Funds under the proposed agreements; (2) the Manager’s experience as a manager of similar funds, including another series of the Trust; (3) the Manager’s strength and reputation within the industry; (4) the fairness of the compensation under the proposed agreements; (5) the comparative pricing structure (including the estimated expense ratio to be borne by shareholders) of the Funds; (6) the personnel, operations, financial condition, and investment management capabilities, methodologies, and resources of the Manager; (7) profitability matters; and (8) the Manager’s compliance capabilities, as demonstrated by, among other things, its policies and procedures designed to prevent violations of the federal securities laws, which had previously been approved by the Board in connection with its oversight of other funds in the FTI complex. In considering such materials, the independent Trustees received assistance and advice from and met separately with independent counsel.
The following sets forth some of the primary information and factors relevant to the Board’s decision to approve the investment management agreements. This discussion of the information and factors considered by the Board (including the information and factors discussed above) is not intended to be exhaustive, but rather summarizes certain factors considered by the Board. In
view of the wide variety of factors considered, the Board did not, unless otherwise noted, find it practicable to quantify or otherwise assign relative weights to the foregoing factors. In addition, individual Trustees may have assigned different weights to various factors.
NATURE, EXTENT AND QUALITY OF SERVICES. The Trustees reviewed the nature, extent and quality of the services to be provided by the Manager. In this regard, they reviewed the Funds’ proposed investment goals and the Manager’s proposed investment strategy and ability to implement such investment strategy, including, but not limited to, the Manager’s trading practices and investment decision processes.
The Trustees reviewed the Funds’ portfolio managers, including their performance, staffing, skills and compensation program and considered similar products advised by the Manager and their relative fees and reasons for differences with respect thereto, if any, and any potential conflicts. They also considered the nature, extent and quality of the services to be provided under the other service agreements with affiliates of the Manager.
Based on their review, the Trustees were satisfied with the nature and quality of the overall services to be provided by the Manager and its affiliates to the Funds and their shareholders and were confident in the abilities of the Manager to implement its proposed investment strategy and to provide quality services to the Funds and their shareholders.
INVESTMENT PERFORMANCE. The Board noted that, as the Funds have not yet commenced investment operations, there was no investment performance for the Funds. As noted earlier, the Board did consider the investment performance of the Manager in managing a similar fund within the Trust with similar investment goals to the investment goals of the Funds. The Board also considered the proposed performance benchmarks for the Funds and how such benchmarks were selected by the Manager and would be utilized to measure performance of the Manager.
COMPARATIVE EXPENSES AND PROFITABILITY. The Board considered the cost of the services to be provided and the profits to be realized by the Manager (and its affiliates) from its respective relationships with the Funds. The Board noted that the Manager and its affiliates could not report any financial results from their relationships with the Funds because the Funds had not yet commenced investment operations, and thus, the Board could not evaluate the Manager’s or its affiliates’ profitability with respect to the Funds. The Board considered that the Manager will provide general investment management and administrative services to the Funds for a monthly fee equal to an annual rate of 0.65% of the average daily net assets of each of the Funds, which fee will decline pursuant to a schedule as assets grow, ultimately declining to 0.37% on assets in excess of $21.5 billion. It is not anticipated that the Funds will generate significant, if any, profit for the Manager and/or its affiliates for some time.
In considering the appropriateness of the investment management fee to be charged to the Funds, the Board reviewed and considered the nature, extent and quality of the overall investment management services expected to be provided by the Manager, as more fully discussed above. The Trustees considered another similar fund that is advised by the Manager and its relative fees and reasons for differences, if any, with respect thereto and any potential conflicts. The Board considered the extent to which the Manager may derive ancillary benefits from operation of the Funds.
Consideration was also given to the information provided by Lipper on other floating rate funds in the Lipper Data (the Comparable Funds) and that the Manager’s investment management fee is at or below the average and median contractual management fee charged by Comparable
Funds. The Board also noted that the expected total expenses (both including and excluding the proposed fee waiver and expense limitation arrangements) of the Funds were within the range of or below the total expenses of the Comparable Funds (both including and excluding their proposed fee waiver and expense limitation arrangements).
Based upon its consideration of all these factors, the Board determined that the investment management fee structure for each of the Funds was fair and reasonable.
ECONOMIES OF SCALE. The Board considered economies of scale that may be realized by the Manager and its affiliates as the Funds grow larger and the extent to which they are shared with the Funds’ shareholders. Because the Funds had not yet commenced operations, the Board concluded that economies of scale were difficult to consider at this time. However, the Board noted that the Funds’ fee schedule provides for breakpoints that will benefit shareholders as assets grow.
Proxy Voting Policies and Procedures
The Trust’s investment manager has established Proxy Voting Policies and Procedures (Policies) that the Trust uses to determine how to vote proxies relating to portfolio securities. Shareholders may view the Trust’s complete Policies online at franklintempleton.com. Alternatively, shareholders may request copies of the Policies free of charge by calling the Proxy Group collect at (954) 527-7678 or by sending a written request to: Franklin Templeton Companies, LLC, 300 S.E. 2nd Street, Fort Lauderdale, FL 33301, Attention: Proxy Group. Copies of the Trust’s proxy voting records are also made available online at franklintempleton.com and posted on the U.S. Securities and Exchange Commission’s website at sec.gov and reflect the most recent 12-month period ended June 30.
Quarterly Statement of Investments
The Trust files a complete statement of investments with the U.S. Securities and Exchange Commission for the first and third quarters for each fiscal year on Form N-Q. Shareholders may view the filed Form N-Q by visiting the Commission’s website at sec.gov. The filed form may also be viewed and copied at the Commission’s Public Reference Room in Washington, DC. Information regarding the operations of the Public Reference Room may be obtained by calling (800) SEC-0330.
FRANKLIN FLOATING RATE MASTER TRUST
| | | |
| Financial Highlights | | | |
| Franklin Lower Tier Floating Rate Fund | | | |
| | | Period Ended | |
| | | July 31, 2016a | |
| Per share operating performance | | | |
| (for a share outstanding throughout the period) | | | |
| Net asset value, beginning of period | $ | 10.00 | |
| Income from investment operationsb: | | | |
| Net investment income | | 0.658 | |
| Net realized and unrealized gains (losses) | | (0.017 | ) |
| Total from investment operations | | 0.641 | |
| Less distributions from net investment income | | (0.651 | ) |
| Net asset value, end of period | $ | 9.99 | |
| |
| Total returnc | | 6.90 | % |
| |
| Ratios to average net assetsd | | | |
| Expenses before waiver and payments by affiliates | | 0.70 | %e |
| Expenses net of waiver and payments by affiliates | | 0.60 | %f |
| Net investment income | | 9.47 | % |
| |
| Supplemental data | | | |
| Net assets, end of period (000’s) | $ | 436,180 | |
| Portfolio turnover rate | | 26.40 | %g |
aFor the period November 6, 2015 (commencement of operations) to July 31, 2016.
bThe amount shown for a share outstanding throughout the period may not correlate with the Statement of Operations for the period due to the timing of sales and repurchases
of the Fund’s shares in relation to income earned and/or fluctuating fair value of the investments of the Fund.
cTotal return is not annualized for periods less than one year.
dRatios are annualized for periods less than one year.
eRatios are adjusted to exclude the effects of annualization for non-recurring expenses.
fBenefit of expense reduction rounds to less than 0.01%.
gExcludes the value of portfolio securities received from purchase in-kind. See Note 3(f).
10 Annual Report | The accompanying notes are an integral part of these financial statements.
franklintempleton.com
FRANKLIN FLOATING RATE MASTER TRUST
| | | | | |
| Statement of Investments, July 31, 2016 | | | | | |
| Franklin Lower Tier Floating Rate Fund | | | | | |
| | | | Principal | | |
| | Country | | Amount | | Value |
| a,b Senior Floating Rate Interests 96.9% | | | | | |
| Aerospace & Defense 2.8% | | | | | |
| Doncasters U.S. Finance LLC, Second Lien Term Loan, 9.50%, 10/09/20 | United States | $ | 12,763,620 | $ | 11,997,803 |
| Auto Parts & Equipment 10.3% | | | | | |
| FRAM Group Holdings Inc. (Autoparts Holdings), | | | | | |
| Second Lien Term Loan, 11.00%, 1/29/18 | United States | | 14,535,866 | | 11,919,411 |
| Term Loan, 7.00%, 7/29/17 | United States | | 35,004,954 | | 33,158,442 |
| | | | | | 45,077,853 |
| Casinos & Gaming 12.1% | | | | | |
| Caesars Entertainment Resort Properties LLC, Term B Loans, 7.00%, 10/11/20 | United States | | 19,805,933 | | 19,446,950 |
| c Cannery Casino Resorts LLC, Second Lien Term Loan, PIK, 12.50%, 10/02/19 | United States | | 14,259,198 | | 14,289,838 |
| Jack Ohio Finance LLC, Funded Term B Loans, 5.00%, 6/20/19 | United States | | 19,527,874 | | 18,999,001 |
| | | | | | 52,735,789 |
| Coal & Consumable Fuels 6.8% | | | | | |
| d Foresight Energy LLC, Term Loans, 7.50%, 8/23/20 | United States | | 9,618,410 | | 7,742,820 |
| Peabody Energy Corp., | | | | | |
| Commitment (DIP Facility), 10.00%, 4/18/17 | United States | | 4,798,677 | | 4,972,629 |
| e Term Loan, 4.25%, 9/24/20 | United States | | 24,419,941 | | 12,606,794 |
| Westmoreland Coal Co., Term Loan, 7.50%, 12/16/20 | United States | | 5,430,095 | | 4,181,173 |
| | | | | | 29,503,416 |
| Forest Products 9.7% | | | | | |
| Caraustar Industries Inc., | | | | | |
| Term Loan B, 8.00%, 5/01/19 | United States | | 18,339,630 | | 18,396,942 |
| Term Loan C, 8.00%, 5/01/19 | United States | | 24,013,466 | | 24,088,508 |
| | | | | | 42,485,450 |
| Health Care Equipment 4.7% | | | | | |
| e Carestream Health Inc., | | | | | |
| Second Lien Loan, 9.50%, 12/07/19 | United States | | 21,275,959 | | 20,637,681 |
| Term Loan, 5.00%, 6/07/19 | United States | | 33,250 | | 32,557 |
| | | | | | 20,670,238 |
| Health Care Services 0.1% | | | | | |
| Cotiviti Corp., Second Lien Initial Term Loan, 8.00%, 5/13/22 | United States | | 368,411 | | 368,872 |
| Industrial Machinery 4.4% | | | | | |
| e Alfred Fueling Systems Inc. (Wayne Fueling), Second Lien Initial Term Loan, | | | | | |
| 8.50%, 6/20/22 | United States | | 18,827,449 | | 19,015,724 |
| Internet Software & Services 1.8% | | | | | |
| BMC Software Finance Inc., Initial U.S. Term Loans, 5.00%, 9/10/20 | United States | | 8,726,797 | | 8,028,654 |
| IT Consulting & Other Services 6.5% | | | | | |
| Sungard Availability Services Capital Inc., Tranche B Term Loan, 6.00%, 3/29/19 | United States | | 32,828,406 | | 28,150,358 |
| Leisure Facilities 2.9% | | | | | |
| e Town Sports International LLC, Initial Term Loan, 4.50%, 11/15/20 | United States | | 18,615,587 | | 12,813,907 |
| Metal & Glass Containers 1.1% | | | | | |
| CD&R Millennium U.S. Acquico LLC, Second Lien Initial Term Loan, | | | | | |
| 8.75%, 7/31/22 | United States | | 4,720,613 | | 4,611,448 |
franklintempleton.com
Annual Report
11
FRANKLIN FLOATING RATE MASTER TRUST
STATEMENT OF INVESTMENTS
| | | | | |
| Franklin Lower Tier Floating Rate Fund (continued) | | | | | |
| |
| | | | Principal | | |
| | Country | | Amount | | Value |
| Senior Floating Rate Interests (continued) | | | | | |
| Oil & Gas Exploration & Production 10.8% | | | | | |
| e Fieldwood Energy LLC, Loans, 3.875%, 10/01/18 | United States | $ | 15,437,618 | $ | 13,314,946 |
| e UTEX Industries Inc., First Lien Initial Term Loan, 5.00%, 5/21/21 | United States | | 48,711,166 | | 33,854,260 |
| | | | | | 47,169,206 |
| Packaged Foods & Meats 0.7% | | | | | |
| CSM Bakery Supplies LLC, Second Lien Term Loan, 8.75%, 7/03/21 | United States | | 3,314,718 | | 3,148,982 |
| Personal Products 1.1% | | | | | |
| FGI Operating Co. LLC (Freedom Group), Term B Loans, 5.50%, 4/19/19 | United States | | 5,437,566 | | 4,717,088 |
| Specialty Chemicals 6.0% | | | | | |
| HII Holding Corp., Second Lien Term Loan, 9.75%, 12/21/20 | United States | | 9,477,092 | | 9,323,089 |
| Oxbow Carbon LLC, Second Lien Initial Term Loan, 8.00%, 1/17/20 | United States | | 15,510,000 | | 14,967,150 |
| Solenis International LP and Solenis Holdings 3 LLC, Second Lien Term Loan, | | | | | |
| 7.75%, 7/31/22 | United States | | 1,840,400 | | 1,769,085 |
| | | | | | 26,059,324 |
| Specialty Stores 15.1% | | | | | |
| 99 Cents Only Stores, Tranche B-2 Loan, 4.50%, 1/11/19 | United States | | 17,577,490 | | 13,380,864 |
| BJ’s Wholesale Club Inc., Second Lien 2013 (Nov) Replacement Loans, | | | | | |
| 8.50%, 3/26/20 | United States | | 21,244,671 | | 21,131,819 |
| Evergreen AcqCo. 1 LP (Savers), Term Loan, 5.00%, 7/09/19 | United States | | 35,795,278 | | 31,410,357 |
| | | | | | 65,923,040 |
| Total Senior Floating Rate Interests (Cost $418,369,200) | | | | | 422,477,152 |
| Other Assets, less Liabilities 3.1% | | | | | 13,703,069 |
| Net Assets 100.0% | | | | $ | 436,180,221 |
See Abbreviations on page 24.
aSee Note 1(c) regarding senior floating rate interests.
bThe coupon rate shown represents the rate at period end.
cIncome may be received in additional securities and/or cash.
dAt July 31, 2016, pursuant to the Fund’s policies and the requirements of applicable securities law, the Fund is restricted from trading this security at period end.
eA portion or all of the security purchased on a delayed delivery basis. See Note 1(b).
12 Annual Report | The accompanying notes are an integral part of these financial statements.
franklintempleton.com
FRANKLIN FLOATING RATE MASTER TRUST
| | | |
| Financial Highlights | | | |
| Franklin Middle Tier Floating Rate Fund | | | |
| | | Period Ended | |
| | | July 31, 2016a | |
| Per share operating performance | | | |
| (for a share outstanding throughout the period) | | | |
| Net asset value, beginning of period | $ | 10.00 | |
| Income from investment operationsb: | | | |
| Net investment income | | 0.403 | |
| Net realized and unrealized gains (losses) | | (0.174 | ) |
| Total from investment operations | | 0.229 | |
| Less distributions from net investment income | | (0.399 | ) |
| Net asset value, end of period | $ | 9.83 | |
| |
| Total returnc | | 2.46 | % |
| |
| Ratios to average net assetsd | | | |
| Expenses before waiver and payments by affiliates | | 0.71 | %e |
| Expenses net of waiver and payments by affiliates | | 0.60 | %f |
| Net investment income | | 5.76 | % |
| |
| Supplemental data | | | |
| Net assets, end of period (000’s) | $ | 348,682 | |
| Portfolio turnover rate | | 42.49 | %g |
aFor the period November 6, 2015 (commencement of operations) to July 31, 2016.
bThe amount shown for a share outstanding throughout the period may not correlate with the Statement of Operations for the period due to the timing of sales and repurchases
of the Fund’s shares in relation to income earned and/or fluctuating fair value of the investments of the Fund.
cTotal return is not annualized for periods less than one year.
dRatios are annualized for periods less than one year.
eRatios are adjusted to exclude the effects of annualization for non-recurring expenses.
fBenefit of expense reduction rounds to less than 0.01%.
gExcludes the value of portfolio securities received from purchase in-kind. See Note 3(f).
franklintempleton.com
The accompanying notes are an integral part of these financial statements. | Annual Report 13
FRANKLIN FLOATING RATE MASTER TRUST
| | | | |
| Statement of Investments, July 31, 2016 | | | | |
| Franklin Middle Tier Floating Rate Fund | | | | |
| | | Principal | | |
| | Country | Amount* | | Value |
| a,b Senior Floating Rate Interests 92.0% | | | | |
| Aerospace & Defense 1.3% | | | | |
| Doncasters U.S. Finance LLC, Second Lien Term Loan, 9.50%, 10/09/20 | United States | 4,931,346 | $ | 4,635,466 |
| Auto Parts & Equipment 0.2% | | | | |
| c TI Group Automotive Systems LLC, Initial U.S. Term Loan, 4.50%, 6/25/22 | United States | 617,647 | | 620,349 |
| Broadcasting 1.7% | | | | |
| Cumulus Media Holdings Inc., Term Loans, 4.25%, 12/23/20 | United States | 8,462,085 | | 6,013,369 |
| Casinos & Gaming 10.3% | | | | |
| d Cannery Casino Resorts LLC, Term Loan, PIK, 6.00% (all cash), 10/02/18 | United States | 35,931,803 | | 36,028,208 |
| Commodity Chemicals 8.7% | | | | |
| c Cyanco Intermediate Corp., Initial Term Loan, 5.50%, 5/01/20 | United States | 30,672,521 | | 30,327,455 |
| Consumer Electronics 1.1% | | | | |
| Prime Security Services Borrower LLC, Term B-1 Loans, 4.75%, 5/02/22 | United States | 3,892,888 | | 3,923,708 |
| Diversified Chemicals 3.5% | | | | |
| c The Chemours Co. LLC, Tranche B Term Loan, 3.75%, 5/12/22 | United States | 4,021,155 | | 3,918,112 |
| OCI Beaumont LLC, Term B-3 Loan, 7.75%, 8/20/19 | United States | 8,104,105 | | 8,114,236 |
| | | | | 12,032,348 |
| Electric Utilities 2.2% | | | | |
| Alinta Energy Finance Pty. Ltd., | | | | |
| Delayed Draw Term Commitments, 6.375%, 8/13/18 | Australia | 430,624 | | 428,202 |
| Term B Loans, 6.375%, 8/13/19 | Australia | 6,478,657 | | 6,442,214 |
| EFS Cogen Holdings I LLC (Linden), Term B Advance, 5.25%, 6/28/23 | United States | 758,346 | | 761,190 |
| | | | | 7,631,606 |
| Forest Products 4.5% | | | | |
| Appvion Inc., Term Loan, 6.25%, 6/28/19 | United States | 15,882,251 | | 15,723,428 |
| Health Care Equipment 3.9% | | | | |
| c Carestream Health Inc., | | | | |
| Second Lien Loan, 9.50%, 12/07/19 | United States | 7,409,383 | | 7,187,101 |
| Term Loan, 5.00%, 6/07/19 | United States | 6,593,177 | | 6,455,822 |
| | | | | 13,642,923 |
| Industrial Conglomerates 4.7% | | | | |
| Sensus USA Inc., Term Loan, 6.50%, 4/05/23 | United States | 16,458,034 | | 16,492,316 |
| Industrial Machinery 11.8% | | | | |
| Navistar Inc., Tranche B Term Loans, 6.50%, 8/07/20 | United States | 16,560,404 | | 15,690,983 |
| Onsite Rental Group Operations Pty. Ltd., Term B Loan, 5.50%, 7/30/21 | Australia | 32,941,740 | | 25,365,140 |
| | | | | 41,056,123 |
| Integrated Telecommunication Services 2.1% | | | | |
| c Global Tel*Link Corp., Term Loan, 5.00%, 5/23/20 | United States | 4,000,000 | | 3,743,332 |
| c Securus Technologies Holdings Inc., Initial Term Loan B, 6.00%, 4/17/20 | United States | 3,800,000 | | 3,596,540 |
| | | | | 7,339,872 |
| Internet Software & Services 4.7% | | | | |
| BMC Software Finance Inc., Initial U.S. Term Loans, 5.00%, 9/10/20 | United States | 17,787,213 | | 16,364,236 |
| Oil & Gas Equipment & Services 1.8% | | | | |
| c McDermott Finance LLC, Term Loan, 8.25%, 4/16/19 | United States | 6,298,183 | | 6,313,928 |
14 Annual Report
franklintempleton.com
FRANKLIN FLOATING RATE MASTER TRUST
STATEMENT OF INVESTMENTS
| | | | |
| Franklin Middle Tier Floating Rate Fund (continued) | | | | |
| | | Principal | | |
| | Country | Amount* | | Value |
| Senior Floating Rate Interests (continued) | | | | |
| Oil & Gas Exploration & Production 3.2% | | | | |
| c Fieldwood Energy LLC, Loans, 3.875%, 10/01/18 | United States | 12,771,609 | $ | 11,015,513 |
| Personal Products 18.4% | | | | |
| FGI Operating Co. LLC (Freedom Group), Term B Loans, 5.50%, 4/19/19 | United States | 73,780,969 | | 64,004,991 |
| Semiconductor Equipment 0.1% | | | | |
| MKS Instruments Inc., Tranche B-1 Term Loans, 4.25%, 4/29/23 | United States | 188,522 | | 190,053 |
| Specialized Consumer Services 2.2% | | | | |
| Travelport Finance Luxembourg S.A.R.L., Term Loan B, 5.00%, 9/02/21 | Luxembourg | 7,609,036 | | 7,639,952 |
| Specialty Chemicals 2.0% | | | | |
| Oxbow Carbon LLC, Second Lien Initial Term Loan, 8.00%, 1/17/20 | United States | 7,183,846 | | 6,932,412 |
| Specialty Stores 2.7% | | | | |
| 99 Cents Only Stores, Tranche B-2 Loan, 4.50%, 1/11/19 | United States | 12,162,068 | | 9,258,375 |
| Technology Hardware, Storage & Peripherals 1.0% | | | | |
| Western Digital Corp., U.S. Term B Loan, 6.25%, 4/29/23 | United States | 3,451,194 | | 3,491,745 |
| Total Senior Floating Rate Interests (Cost $323,687,715) | | | | 320,678,376 |
| Short Term Investments 1.1% | | | | |
| a,b Senior Floating Rate Interests (Cost $3,960,804) 1.1% | | | | |
| Industrial Machinery 1.1% | | | | |
| WireCo Worldgroup Inc., Term Loan, 6.00%, 2/15/17 | United States | 4,040,191 | | 4,031,381 |
| Total Investments (Cost $327,648,519) 93.1% | | | | 324,709,757 |
| Other Assets, less Liabilities 6.9% | | | | 23,971,996 |
| Net Assets 100.0% | | | $ | 348,681,753 |
See Abbreviations on page 24.
*The principal amount is stated in U.S. dollars unless otherwise indicated.
aSee Note 1(c) regarding senior floating rate interests.
bThe coupon rate shown represents the rate at period end.
cA portion or all of the security purchased on a delayed delivery basis. See Note 1(b).
dIncome may be received in additional securities and/or cash.
franklintempleton.com
The accompanying notes are an integral part of these financial statements. | Annual Report 15
FRANKLIN FLOATING RATE MASTER TRUST
| | | | | | |
| Financial Statements | | | | | | |
| |
| Statements of Assets and Liabilities | | | | | | |
| July 31, 2016 | | | | | | |
| |
| | | Franklin Lower | | | Franklin Middle | |
| | | Tier Floating Rate | | | Tier Floating Rate | |
| | | Fund | | | Fund | |
| Assets: | | | | | | |
| Investments in securities: | | | | | | |
| Cost | $ | 418,369,200 | | $ | 327,648,519 | |
| Value | $ | 422,477,152 | | $ | 324,709,757 | |
| Cash | | 26,737,905 | | | 30,808,572 | |
| Receivables: | | | | | | |
| Investment securities sold | | 683,248 | | | 24,014,700 | |
| Interest | | 1,807,420 | | | 1,379,298 | |
| Offering costs | | 18,413 | | | 19,085 | |
| Other assets | | 161 | | | 139 | |
| Total assets | | 451,724,299 | | | 380,931,551 | |
| Liabilities: | | | | | | |
| Payables: | | | | | | |
| Investment securities purchased | | 11,529,391 | | | 30,151,830 | |
| Management fees | | 198,091 | | | 165,552 | |
| Distributions to shareholders | | 3,801,421 | | | 1,917,543 | |
| Accrued expenses and other liabilities | | 15,175 | | | 14,873 | |
| Total liabilities | | 15,544,078 | | | 32,249,798 | |
| Net assets, at value | $ | 436,180,221 | | $ | 348,681,753 | |
| Net assets consist of: | | | | | | |
| Paid-in capital | $ | 434,135,047 | | $ | 353,661,562 | |
| Undistributed net investment income | | 359,660 | | | 178,650 | |
| Net unrealized appreciation (depreciation) | | 4,107,952 | | | (2,938,762 | ) |
| Accumulated net realized gain (loss) | | (2,422,438 | ) | | (2,219,697 | ) |
| Net assets, at value | $ | 436,180,221 | | $ | 348,681,753 | |
| Shares outstanding | | 43,641,226 | | | 35,477,730 | |
| Net asset value per share | $ | 9.99 | | $ | 9.83 | |
16 Annual Report | The accompanying notes are an integral part of these financial statements.
franklintempleton.com
FRANKLIN FLOATING RATE MASTER TRUST
FINANCIAL STATEMENTS
| | | | | | |
| Statements of Operations | | | | | | |
| for the period ended July 31, 2016* | | | | | | |
| |
| | | Franklin Lower | | | Franklin Middle | |
| | | Tier Floating Rate | | | Tier Floating Rate | |
| | | Fund | | | Fund | |
| Investment income: | | | | | | |
| Interest | $ | 30,772,315 | | $ | 15,993,387 | |
| Expenses: | | | | | | |
| Management fees (Note 3a) | | 1,986,783 | | | 1,634,898 | |
| Custodian fees (Note 4) | | 2,436 | | | 1,898 | |
| Reports to shareholders | | 4,940 | | | 4,759 | |
| Registration and filing fees | | 245 | | | 245 | |
| Professional fees | | 85,077 | | | 86,587 | |
| Trustees’ fees and expenses | | 8,909 | | | 7,531 | |
| Amortization of offering costs | | 51,596 | | | 53,478 | |
| Other | | 6,074 | | | 5,271 | |
| Total expenses | | 2,146,060 | | | 1,794,667 | |
| Expense reductions (Note 4) | | (517 | ) | | (420 | ) |
| Expenses waived/paid by affiliates (Note 3d) | | (311,438 | ) | | (285,099 | ) |
| Net expenses | | 1,834,105 | | | 1,509,148 | |
| Net investment income | | 28,938,210 | | | 14,484,239 | |
| Realized and unrealized gains (losses): | | | | | | |
| Net realized gain (loss) from investments | | (2,418,238 | ) | | (2,238,129 | ) |
| Net change in unrealized appreciation (depreciation) on investments | | 4,107,952 | | | (2,938,762 | ) |
| Net realized and unrealized gain (loss) | | 1,689,714 | | | (5,176,891 | ) |
| Net increase (decrease) in net assets resulting from operations | $ | 30,627,924 | | $ | 9,307,348 | |
*For the period November 6, 2015 (commencement of operations) to July 31, 2016.
franklintempleton.com
The accompanying notes are an integral part of these financial statements. | Annual Report 17
FRANKLIN FLOATING RATE MASTER TRUST
FINANCIAL STATEMENTS
| | | | | | |
| Statements of Changes in Net Assets | | | | | | |
| |
| | | Franklin Lower Tier | | | Franklin Middle Tier | |
| | | Floating Rate Fund | | | Floating Rate Fund | |
| |
| | | Period Ended | | | Period Ended | |
| | | July 31, 2016* | | | July 31, 2016* | |
| Increase (decrease) in net assets: | | | | | | |
| Operations: | | | | | | |
| Net investment income | $ | 28,938,210 | | $ | 14,484,239 | |
| Net realized gain (loss) | | (2,418,238 | ) | | (2,238,129 | ) |
| Net change in unrealized appreciation (depreciation) | | 4,107,952 | | | (2,938,762 | ) |
| Net increase (decrease) in net assets resulting from operations | | 30,627,924 | | | 9,307,348 | |
| Distributions to shareholders from net investment income | | (28,634,343 | ) | | (14,340,632 | ) |
| Capital share transactions (Note 2) | | 434,186,640 | | | 353,715,037 | |
| Net increase (decrease) in net assets | | 436,180,221 | | | 348,681,753 | |
| Net assets: | | | | | | |
| End of period | $ | 436,180,221 | | $ | 348,681,753 | |
| Undistributed net investment income included in net assets: | | | | | | |
| End of period | $ | 359,660 | | $ | 178,650 | |
*For the period November 6, 2015 (commencement of operations) to July 31, 2016.
18 Annual Report | The accompanying notes are an integral part of these financial statements.
franklintempleton.com
FRANKLIN FLOATING RATE MASTER TRUST
Notes to Financial Statements
1. Organization and Significant Accounting Policies
Franklin Floating Rate Master Trust (Trust) is registered under the Investment Company Act of 1940 (1940 Act) as an open-end management investment company, consisting of three separate funds, two of which are included in this report (Funds) and applies the specialized accounting and reporting guidance in U.S. Generally Accepted Accounting Principles (U.S. GAAP). The financial statements of the remaining fund in the Trust are presented separately. Effective November 6, 2015, the Funds commenced operations. The shares are issued in private placements and are exempt from registration under the Securities Act of 1933.
The following summarizes the Funds’ significant accounting policies.
a. Financial Instrument Valuation
The Funds’ investments in financial instruments are carried at fair value daily. Fair value is the price that would be received to sell an asset or paid to transfer a liability in an orderly transaction between market participants on the measurement date. The Funds calculate the net asset value (NAV) per share as of 4 p.m. Eastern time each day the New York Stock Exchange (NYSE) is open for trading. Under compliance policies and procedures approved by the Trust’s Board of Trustees (the Board), the Funds’ administrator has responsibility for oversight of valuation, including leading the cross-functional Valuation Committee (VC). The VC provides administration and oversight of the Funds’ valuation policies and procedures, which are approved annually by the Board. Among other things, these procedures allow the Funds to utilize independent pricing services, quotations from securities and financial instrument dealers, and other market sources to determine fair value.
Debt securities generally trade in the over-the-counter market rather than on a securities exchange. The Funds’ pricing services use multiple valuation techniques to determine fair value. In instances where sufficient market activity exists, the pricing services may utilize a market-based approach through which quotes from market makers are used to determine fair value. In instances where sufficient market activity may not exist or is limited, the pricing services also utilize proprietary valuation models which may consider market characteristics such as benchmark yield curves, credit spreads, estimated default rates, anticipated market interest rate volatility, coupon rates, anticipated timing of principal repayments, underlying collateral, and other unique security features in order to estimate the relevant cash flows, which are then discounted to calculate the fair value.
The Funds have procedures to determine the fair value of financial instruments for which market prices are not reliable or readily available. Under these procedures, the VC convenes on a regular basis to review such financial instruments and considers a number of factors, including significant unobservable valuation inputs, when arriving at fair value. The VC primarily employs a market-based approach which may use related or comparable assets or liabilities, recent transactions, market multiples, book values, and other relevant information for the investment to determine the fair value of the investment. An income-based valuation approach may also be used in which the anticipated future cash flows of the investment are discounted to calculate fair value. Discounts may also be applied due to the nature or duration of any restrictions on the disposition of the investments. Due to the inherent uncertainty of valuations of such investments, the fair values may differ significantly from the values that would have been used had an active market existed. The VC employs various methods for calibrating these valuation approaches including a regular review of key inputs and assumptions, transactional back-testing or disposition analysis, and reviews of any related market activity.
b. Securities Purchased on a Delayed Delivery Basis
Certain or all Funds purchase securities on a delayed delivery basis, with payment and delivery scheduled for a future date. These transactions are subject to market fluctuations and are subject to the risk that the value at delivery may be more or less than the trade date purchase price. Although the Funds will generally purchase these securities with the intention of holding the securities, they may sell the securities before the settlement date. Sufficient assets have been segregated for these securities.
c. Senior Floating Rate Interests
Certain or all Funds invest in senior secured corporate loans that pay interest at rates which are periodically reset by reference to a base lending rate plus a spread. These base lending rates are generally the prime rate offered by a designated U.S. bank or the London InterBank Offered Rate (LIBOR). Senior secured corporate loans often require prepayment of principal from excess cash flows or at the discretion of the borrower. As a result, actual maturity may be substantially less than the stated maturity. Senior secured corporate loans in which the Funds invest are generally readily marketable, but may be subject to certain restrictions on resale.
franklintempleton.com
Annual Report
19
FRANKLIN FLOATING RATE MASTER TRUST
NOTES TO FINANCIAL STATEMENTS
1. Organization and Significant Accounting
Policies (continued)
d. Income Taxes
It is each Fund’s policy to qualify as a regulated investment company under the Internal Revenue Code. Each Fund intends to distribute to shareholders substantially all of its taxable income and net realized gains to relieve it from federal income and excise taxes. As a result, no provision for U.S. federal income taxes is required.
Each Fund may recognize an income tax liability related to its uncertain tax positions under U.S. GAAP when the uncertain tax position has a less than 50% probability that it will be sustained upon examination by the tax authorities based on its technical merits. As of July 31, 2016, each Fund has determined that no tax liability is required in its financial statements related to uncertain tax positions for any open tax years (or expected to be taken in future tax years).
e. Security Transactions, Investment Income, Expenses and Distributions
Security transactions are accounted for on trade date. Realized gains and losses on security transactions are determined on a specific identification basis. Interest income and estimated expenses are accrued daily. Amortization of premium and accretion of discount on debt securities are included in interest income. Facility fees are recognized as income over the expected term of the loan. Dividends from net investment income are normally declared daily; these dividends may be reinvested or paid monthly to shareholders. Distributions to shareholders are determined according to income tax regulations (tax basis). Distributable earnings determined on a tax basis may differ from earnings recorded in accordance with U.S. GAAP. These differences may be permanent or temporary. Permanent differences are reclassified among capital accounts to reflect their tax character. These reclassifications have no impact on net assets or the results of operations. Temporary differences are not reclassified, as they may reverse in subsequent periods.
Common expenses incurred by the Trust are allocated among the Funds based on the ratio of net assets of each Fund to the combined net assets of the Trust. Fund specific expenses are charged directly to the fund that incurred the expense.
f. Offering Costs
Offering costs are amortized on a straight line basis over twelve months.
g. Accounting Estimates
The preparation of financial statements in accordance with U.S. GAAP requires management to make estimates and assumptions that affect the reported amounts of assets and liabilities at the date of the financial statements and the amounts of income and expenses during the reporting period. Actual results could differ from those estimates.
h. Guarantees and Indemnifications
Under the Trust’s organizational documents, its officers and trustees are indemnified by the Trust against certain liabilities arising out of the performance of their duties to the Trust. Additionally, in the normal course of business, the Trust, on behalf of the Funds, enters into contracts with service providers that contain general indemnification clauses. The Trust’s maximum exposure under these arrangements is unknown as this would involve future claims that may be made against the Trust that have not yet occurred. Currently, the Trust expects the risk of loss to be remote.
2. Shares of Beneficial Interest
At July 31, 2016, there were an unlimited number of shares authorized (without par value). Transactions in the Funds’ shares were as follows:
| | | | | | | | | | |
| | Franklin Lower Tier | | Franklin Middle Tier | |
| | Floating Rate Fund | | Floating Rate Fund | |
| | Shares | | | Amount | | Shares | | | Amount | |
| Period ended July 31, 2016a | | | | | | | | | | |
| Shares sold in-kind (Note 3f) | 43,615,926 | | $ | 434,631,279 | | 36,016,253 | | $ | 358,899,279 | |
| Shares issued in reinvestment of distributions | 1,076,227 | | | 9,864,962 | | 538,477 | | | 5,111,878 | |
| Shares redeemed | (1,050,927 | ) | | (10,309,601 | ) | (1,077,000 | ) | | (10,296,120 | ) |
| Net increase (decrease) | 43,641,226 | | $ | 434,186,640 | | 35,477,730 | | $ | 353,715,037 | |
aFor the period November 6, 2015 (commencement of operations) to July 31, 2016.
20 Annual Report
franklintempleton.com
FRANKLIN FLOATING RATE MASTER TRUST
NOTES TO FINANCIAL STATEMENTS
3. Transactions with Affiliates
Franklin Resources, Inc. is the holding company for various subsidiaries that together are referred to as Franklin Templeton Investments. Certain officers and trustees of the Trust are also officers, and/or directors of the following subsidiaries:
| |
| Subsidiary | Affiliation |
| Franklin Advisers, Inc. (Advisers) | Investment manager |
| Franklin Templeton Services, LLC (FT Services) | Administrative manager |
| Franklin Templeton Investor Services, LLC (Investor Services) | Transfer agent |
a. Management Fees
The Funds pay an investment management fee to Advisers based on the average daily net assets of the Funds as follows:
| | |
| Annualized Fee Rate | | Net Assets |
| 0.650 | % | Up to and including $500 million |
| 0.550 | % | Over $500 million, up to and including $1 billion |
| 0.500 | % | Over $1 billion, up to and including $1.5 billion |
| 0.450 | % | Over $1.5 billion, up to and including $6.5 billion |
| 0.425 | % | Over $6.5 billion, up to and including $11.5 billion |
| 0.400 | % | Over $11.5 billion, up to and including $16.5 billion |
| 0.390 | % | Over $16.5 billion, up to and including $19 billion |
| 0.380 | % | Over $19 billion, up to and including $21.5 billion |
| 0.370 | % | In excess of $21.5 billion |
For the period ended July 31, 2016, each Fund’s annualized effective investment management fee rate based on average daily net assets was as follows:
| | | |
| Franklin Lower Tier | | Franklin Middle Tier | |
| Floating Rate Fund | | Floating Rate Fund | |
| 0.650 | % | 0.650 | % |
b. Administrative Fees
Under an agreement with Advisers, FT Services provides administrative services to the Funds. The fee is paid by Advisers based on each of the Fund’s average daily net assets, and is not an additional expense of the Funds.
c. Transfer Agent Fees
Investor Services, under terms of an agreement, performs shareholder servicing for the Fund and is not paid by the Fund for the services.
d. Waiver and Expense Reimbursements
Advisers has contractually agreed in advance to waive or limit its fees and to assume as its own expense certain expenses otherwise payable by Funds so that the expenses (excluding acquired fund fees and expenses) for each Fund do not exceed 0.60%, based on each Fund’s average net assets (other than certain non-routine expenses or costs, including those relating to litigation, indemnification, reorganizations, and liquidations) until November 30, 2016. Total expenses waived or paid are not subject to recapture subsequent to the Fund’s fiscal year end.
franklintempleton.com
Annual Report
21
FRANKLIN FLOATING RATE MASTER TRUST
NOTES TO FINANCIAL STATEMENTS
3. Transactions with Affiliates (continued)
e. Other Affiliated Transactions
At July 31, 2016, the shares of the Funds were owned by the following investment companies:
| | | |
| | | Percentage of | |
| | | Outstanding | |
| Franklin Lower Tier Floating Rate Fund | Shares | Shares | |
| Franklin Low Duration Total Return Fund | 1,893,663 | 4.3 | % |
| Franklin Real Return Fund | 272,472 | 0.6 | % |
| Franklin Strategic Income Fund | 37,387,580 | 85.7 | %a |
| Franklin Strategic Income VIP Fund | 3,089,922 | 7.1 | % |
| Franklin Total Return Fund | 997,589 | 2.3 | % |
| Total | 43,641,226 | 100.0 | % |
| |
| | | Percentage of | |
| | | Outstanding | |
| Franklin Middle Tier Floating Rate Fund | Shares | Shares | |
| Franklin Low Duration Total Return Fund | 2,389,308 | 6.7 | % |
| Franklin Real Return Fund | 103,407 | 0.3 | % |
| Franklin Strategic Income Fund | 28,458,483 | 80.3 | %a |
| Franklin Strategic Income VIP Fund | 2,637,222 | 7.4 | % |
| Franklin Total Return Fund | 1,889,310 | 5.3 | % |
| Total | 35,477,730 | 100.0 | % |
| |
| aInvestment activities of this shareholder could have a material impact on the Fund. | | | |
f. Purchase In-Kind
During the period ended July 31, 2016, shares of the Funds were sold to affiliated management investment companies through in-kind transfers of securities as follows:
| | |
| Franklin Lower Tier Floating Rate Fund | | Market Value of Securities Transferred |
| Franklin Low Duration Total Return Fund | $ | 17,742,918 |
| Franklin Real Return Fund | | 2,519,518 |
| Franklin Strategic Income Fund | | 374,291,707 |
| Franklin Strategic Income VIP Fund | | 30,730,099 |
| Franklin Total Return Fund | | 9,347,037 |
| Total | $ | 434,631,279 |
| |
| Franklin Middle Tier Floating Rate Fund | | Market Value of Securities Transferred |
| Franklin Low Duration Total Return Fund | $ | 22,984,002 |
| Franklin Real Return Fund | | 983,344 |
| Franklin Strategic Income Fund | | 290,085,114 |
| Franklin Strategic Income VIP Fund | | 26,672,554 |
| Franklin Total Return Fund | | 18,174,265 |
| Total | $ | 358,899,279 |
g. Interfund Transactions
The Franklin Lower Tier Floating Rate Fund engaged in purchases and sales of investments with funds or other accounts that have common investment managers (or affiliated investment managers), directors, trustees or officers. During the period ended July 31, 2016, the purchase and sale transactions (excluding in-kind transactions) aggregated $2,411,124 and $9,887,500, respectively.
22 Annual Report
franklintempleton.com
FRANKLIN FLOATING RATE MASTER TRUST
NOTES TO FINANCIAL STATEMENTS
4. Expense Offset Arrangement
The Funds have entered into an arrangement with their custodian whereby credits realized as a result of uninvested cash balances are used to reduce a portion of the Funds’ custodian expenses. During the period ended July 31, 2016, the custodian fees were reduced as noted in the Statements of Operations.
5. Income Taxes
For tax purposes, capital losses may be carried over to offset future capital gains, if any. At July 31, 2016, the capital loss carryfor-wards were as follows:
| | | | |
| | | Franklin Lower Tier | | Franklin Middle Tier |
| | | Floating Rate Fund | | Floating Rate Fund |
| Capital loss carryforwards – short-term | $ | 2,422,438 | $ | 1,522,127 |
| |
| The tax character of distributions paid during the period ended July 31, 2016, was as follows: |
| | | Franklin Lower Tier | | Franklin Middle Tier |
| | | Floating Rate Fund | | Floating Rate Fund |
| Distributions paid from ordinary income | $ | 28,634,343 | $ | 14,340,632 |
At July 31, 2016, the cost of investments, net unrealized appreciation (depreciation), undistributed ordinary income for income tax purposes were as follows:
| | | | | | |
| | | Franklin Lower Tier | | | Franklin Middle Tier | |
| | | Floating Rate Fund | | | Floating Rate Fund | |
| Cost of investments | $ | 418,370,159 | | $ | 328,351,603 | |
| Unrealized appreciation | $ | 16,022,700 | | $ | 5,258,504 | |
| Unrealized depreciation | | (11,915,707 | ) | | (8,900,350 | ) |
| Net unrealized appreciation (depreciation) | $ | 4,106,993 | | $ | (3,641,846 | ) |
| Distributable earnings – undistributed ordinary | | | | | | |
| income | $ | 4,162,039 | | $ | 2,101,706 | |
Differences between income and/or capital gains as determined on a book basis and a tax basis are primarily due to differing treatments of offering costs and wash sales.
6. Investment Transactions
Purchases and sales of investments (excluding short term securities) for the period ended July 31, 2016, were as follows:
| | | | | | |
| | | Franklin Lower Tier | | | Franklin Middle Tier | |
| | | Floating Rate Fund | | | Floating Rate Fund | |
| Purchases | $ | 102,817,895 | a | $ | 131,450,770 | a |
| Sales | $ | 126,578,885 | | $ | 164,111,963 | |
| aExcludes purchases in-kind. See Note 3f. | | | | | | |
franklintempleton.com
Annual Report
23
FRANKLIN FLOATING RATE MASTER TRUST
NOTES TO FINANCIAL STATEMENTS
7. Credit Risk
At July 31, 2016, the Funds had 100% of their portfolios invested in senior secured floating rate notes rated below investment grade. These securities may be more sensitive to economic conditions causing greater price volatility and are potentially subject to a greater risk of loss due to default than higher rated securities.
8. Credit Facility
Certain or all Funds, together with other U.S. registered and foreign investment funds (collectively, Borrowers), managed by Franklin Templeton Investments, are borrowers in a joint syndicated senior unsecured credit facility totaling $2 billion (Global Credit Facility) which matures on February 10, 2017. This Global Credit Facility provides a source of funds to the Borrowers for temporary and emergency purposes, including the ability to meet future unanticipated or unusually large redemption requests.
Under the terms of the Global Credit Facility, the Funds shall, in addition to interest charged on any borrowings made by the Funds and other costs incurred by the Funds, pay their share of fees and expenses incurred in connection with the implementation and maintenance of the Global Credit Facility, based upon their relative share of the aggregate net assets of all of the Borrowers, including an annual commitment fee of 0.07% based upon the unused portion of the Global Credit Facility. Effective February 12, 2016, the annual commitment fee is 0.15%. These fees are reflected in other expenses in the Statements of Operations. During the period ended July 31, 2016, the Funds did not use the Global Credit Facility.
9. Fair Value Measurements
The Funds follow a fair value hierarchy that distinguishes between market data obtained from independent sources (observable inputs) and the Funds’ own market assumptions (unobservable inputs). These inputs are used in determining the value of the Funds’ financial instruments and are summarized in the following fair value hierarchy:
- Level 1 – quoted prices in active markets for identical financial instruments
- Level 2 – other significant observable inputs (including quoted prices for similar financial instruments, interest rates, prepayment speed, credit risk, etc.)
- Level 3 – significant unobservable inputs (including the Funds’ own assumptions in determining the fair value of financial instruments)
The input levels are not necessarily an indication of the risk or liquidity associated with financial instruments at that level.
For movements between the levels within the fair value hierarchy, the Funds have adopted a policy of recognizing the transfers as of the date of the underlying event which caused the movement.
At July 31, 2016, all of the Funds’ investments in financial instruments carried at fair value were valued using Level 2 inputs.
10. Subsequent Events
The Funds have evaluated subsequent events through the issuance of the financial statements and determined that no events have occurred that require disclosure.
| |
| Abbreviations |
| Selected Portfolio |
| DIP | Debtor-In-Possession |
| PIK | Payment-In-Kind |
24 Annual Report
franklintempleton.com
FRANKLIN FLOATING RATE MASTER TRUST
Report of Independent Registered Public Accounting Firm
To the Board of Trustees and Shareholders of Franklin Floating Rate Master Trust
In our opinion, the accompanying statement of assets and liabilities, including the statement of investments, and the related statements of operations and of changes in net assets and the financial highlights present fairly, in all material respects, the financial position of Franklin Lower Tier Floating Rate Fund and Franklin Middle Tier Floating Rate Fund (separate portfolios of Franklin Floating Rate Master Trust, hereafter referred to as the “Funds”) at July 31, 2016, and the results of each of their operations, the changes in each of their net assets and the financial highlights for the period November 6, 2015 (commencement of operations) through July 31, 2016, in conformity with accounting principles generally accepted in the United States of America. These financial statements and financial highlights (hereafter referred to as “financial statements”) are the responsibility of the Funds’ management. Our responsibility is to express an opinion on these financial statements based on our audits. We conducted our audits of these financial statements in accordance with the standards of the Public Company Accounting Oversight Board (United States). Those standards require that we plan and perform the audit to obtain reasonable assurance about whether the financial statements are free of material misstatement. An audit includes examining, on a test basis, evidence supporting the amounts and disclosures in the financial statements, assessing the accounting principles used and significant estimates made by management, and evaluating the overall financial statement presentation. We believe that our audits, which included confirmation of securities at July 31, 2016 by correspondence with the custodian, and brokers, provide a reasonable basis for our opinion.
PricewaterhouseCoopers LLP
San Francisco, California
September 16, 2016
franklintempleton.com
Annual Report
25
Item 2. Code of Ethics.
(a) The Registrant has adopted a code of ethics that applies to its principal executive officers and principal financial and accounting officer.
(c) N/A
(d) N/A
(f) Pursuant to Item 12(a)(1), the Registrant is attaching as an exhibit a copy of its code of ethics that applies to its principal executive officers and principal financial and accounting officer.
Item 3. Audit Committee Financial Expert.
(a)(1) The Registrant has an audit committee financial expert serving on its audit committee.
(2) The audit committee financial expert is John B. Wilson and he is "independent" as defined under the relevant Securities and Exchange Commission Rules and Releases.
Item 4. Principal Accountant Fees and Services.
(a) Audit Fees
The aggregate fees paid to the principal accountant for professional services rendered by the principal accountant for the audit of the registrant’s annual financial statements or for services that are normally provided by the principal accountant in connection with statutory and regulatory filings or engagements were $196,074 for the fiscal year ended July 31, 2016 and $74,477 for the fiscal year ended July 31, 2015.
(b) Audit-Related Fees
There were no fees paid to the principal accountant for assurance and related services rendered by the principal accountant to the registrant that are reasonably related to the performance of the audit of the registrant's financial statements and are not reported under paragraph (a) of Item 4.
There were no fees paid to the principal accountant for assurance and related services rendered by the principal accountant to the registrant's investment adviser and any entity controlling, controlled by or under common control with the investment adviser that provides ongoing services to the registrant that are reasonably related to the performance of the audit of their financial statements.
(c) Tax Fees
There were no fees paid to the principal accountant for professional services rendered by the principal accountant to the registrant for tax compliance, tax advice and tax planning.
There were no fees paid to the principal accountant for professional services rendered by the principal accountant to the registrant’s investment adviser and any entity controlling, controlled by or under common control with the investment adviser that provides ongoing services to the registrant for tax compliance, tax advice and tax planning.
(d) All Other Fees
The aggregate fees paid to the principal accountant for products and services rendered by the principal accountant to the registrant not reported in paragraphs (a)-(c) of Item 4 were $824 for the fiscal year ended July 31, 2016 and $0 for the fiscal year ended July 31, 2015. The services for which these fees were paid included review of materials provided to the fund Board in connection with the investment management contract renewal process.
The aggregate fees paid to the principal accountant for products and services rendered by the principal accountant to the registrant’s investment adviser and any entity controlling, controlled by or under common control with the investment adviser that provides ongoing services to the registrant, other than services reported in paragraphs (a)-(c) of Item 4 were $442,751 for the fiscal year ended July 31, 2016 and $229,400 for the fiscal year ended July 31, 2015. The services for which these fees were paid included preparation and review of materials provided to the fund Board in connection with the investment management contract renewal process and derivatives assessment, and review of system processes related to fixed income securities.
(e) (1) The registrant’s audit committee is directly responsible for approving the services to be provided by the auditors, including:
(i) pre-approval of all audit and audit related services;
(ii) pre-approval of all non-audit related services to be provided to the Fund by the auditors;
(iii) pre-approval of all non-audit related services to be provided to the registrant by the auditors to the registrant’s investment adviser or to any entity that controls, is controlled by or is under common control with the registrant’s investment adviser and that provides ongoing services to the registrant where the non-audit services relate directly to the operations or financial reporting of the registrant; and
(iv) establishment by the audit committee, if deemed necessary or appropriate, as an alternative to committee pre-approval of services to be provided by the auditors, as required by paragraphs (ii) and (iii) above, of policies and procedures to permit such services to be pre-approved by other means, such as through establishment of guidelines or by action of a designated member or members of the committee; provided the policies and procedures are detailed as to the particular service and the committee is informed of each service and such policies and procedures do not include delegation of audit committee responsibilities, as contemplated under the Securities Exchange Act of 1934, to management; subject, in the case of (ii) through (iv), to any waivers, exceptions or exemptions that may be available under applicable law or rules.
(e) (2) None of the services provided to the registrant described in paragraphs (b)-(d) of Item 4 were approved by the audit committee pursuant to paragraph (c)(7)(i)(C) of Rule 2-01 of regulation S-X.
(f) No disclosures are required by this Item 4(f).
(g) The aggregate non-audit fees paid to the principal accountant for services rendered by the principal accountant to the registrant and the registrant’s investment adviser and any entity controlling, controlled by or under common control with the investment adviser that provides ongoing services to the registrant were $443,575 for the fiscal year ended July 31, 2016 and $229,400 for the fiscal year ended July 31, 2015.
(h) The registrant’s audit committee of the board has considered whether the provision of non-audit services that were rendered to the registrant’s investment adviser (not including any sub-adviser whose role is primarily portfolio management and is subcontracted with or overseen by another investment adviser), and any entity controlling, controlled by, or under common control with the investment adviser that provides ongoing services to the registrant that were not pre-approved pursuant to paragraph (c)(7)(ii) of Rule 2-01 of Regulation S-X is compatible with maintaining the principal accountant’s independence.
Item 5. Audit Committee of Listed Registrants. N/A
Item 6. Schedule of Investments. N/A
Item 7. Disclosure of Proxy Voting Policies and Procedures for Closed-End Management Investment Companies. N/A
Item 8. Portfolio Managers of Closed-End Management Investment Companies. N/A
Item 9. Purchases of Equity Securities by Closed-End Management Investment Company and Affiliated Purchasers. N/A
Item 10. Submission of Matters to a Vote of Security Holders.
There have been no changes to the procedures by which shareholders may recommend nominees to the Registrant's Board of Trustees that would require disclosure herein.
Item 11. Controls and Procedures.
(a) Evaluation of Disclosure Controls and Procedures. The Registrant maintains disclosure controls and procedures that are designed to ensure that information required to be disclosed in the Registrant’s filings under the Securities Exchange Act of 1934 and the Investment Company Act of 1940 is recorded, processed, summarized and reported within the periods specified in the rules and forms of the Securities and Exchange Commission. Such information is accumulated and communicated to the Registrant’s management, including its principal executive officer and principal financial officer, as appropriate, to allow timely decisions regarding required disclosure. The Registrant’s management, including the principal executive officer and the principal financial officer, recognizes that any set of controls and procedures, no matter how well designed and operated, can provide only reasonable assurance of achieving the desired control objectives.
Within 90 days prior to the filing date of this Shareholder Report on Form N-CSR, the Registrant had carried out an evaluation, under the supervision and with the participation of the Registrant’s management, including the Registrant’s principal executive officer and the Registrant’s principal financial officer, of the effectiveness of the design and operation of the Registrant’s disclosure controls and procedures. Based on such evaluation, the Registrant’s principal executive officer and principal financial officer concluded that the Registrant’s disclosure controls and procedures are effective.
(b) Changes in Internal Controls. There have been no changes in the Registrant’s internal controls or in other factors that could materially affect the internal controls over financial reporting subsequent to the date of their evaluation in connection with the preparation of this Shareholder Report on Form N-CSR.
Item 12. Exhibits.
(a) (1) Code of Ethics
(a) (2) Certifications pursuant to Section 302 of the Sarbanes-Oxley Act of 2002 of Laura F. Fergerson, Chief Executive Officer - Finance and Administration, and Gaston Gardey, Chief Financial Officer and Chief Accounting Officer
(b) Certifications pursuant to Section 906 of the Sarbanes-Oxley Act of 2002 of Laura F. Fergerson, Chief Executive Officer - Finance and Administration, and Gaston Gardey, Chief Financial Officer and Chief Accounting Officer
SIGNATURES
Pursuant to the requirements of the Securities Exchange Act of 1934 and the Investment Company Act of 1940, the registrant has duly caused this report to be signed on its behalf by the undersigned, thereunto duly authorized.
FRANKLIN FLOATING RATE MASTER TRUST
By /s/Laura F. Fergerson
Laura F. Fergerson
Chief Executive Officer - Finance and Administration
Date September 26, 2016
Pursuant to the requirements of the Securities Exchange Act of 1934 and the Investment Company Act of 1940, this report has been signed below by the following persons on behalf of the registrant and in the capacities and on the dates indicated.
By /s/Laura F. Fergerson
Laura F. Fergerson
Chief Executive Officer - Finance and Administration
Date September 26, 2016
By /s/Gaston Gardey
Gaston Gardey
Chief Financial Officer and Chief Accounting Officer
Date September 26, 2016