UNITED STATES
SECURITIES AND EXCHANGE COMMISSION
Washington, DC 20549
FORM N-CSR
CERTIFIED SHAREHOLDER REPORT OF REGISTERED MANAGEMENT INVESTMENT COMPANIES
Investment Company Act file number_811-09869
__Franklin Floating Rate Master Trust
(Exact name of registrant as specified in charter)
One Franklin Parkway, San Mateo, CA 94403-1906
(Address of principal executive offices) (Zip code)
Craig S. Tyle, One Franklin Parkway, San Mateo, CA 94403-1906
(Name and address of agent for service)
Registrant's telephone number, including area code:_650 312-2000
Date of fiscal year end: 7/31
Date of reporting period: 7/31/17
Item 1. Reports to Stockholders.
Franklin Lower Tier Floating Rate Fund Annual Report
Manager’s Discussion
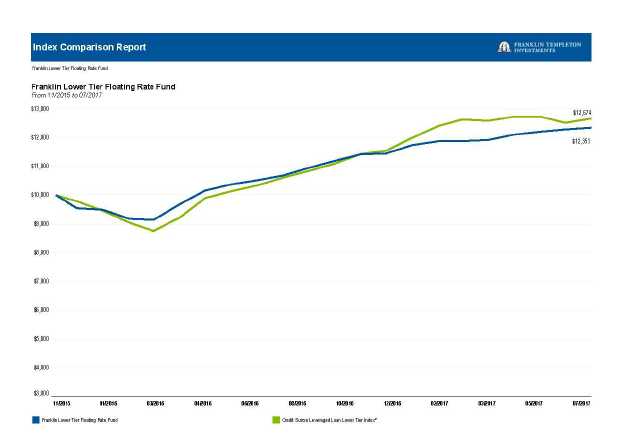
During the period under review, the Franklin Lower Tier Floating Rate Fund delivered a +15.55% cumulative total return. In comparison, the Fund’s benchmark, the Credit Suisse Leveraged Loan (CS LL) Lower Tier Index (LTI), which is designed to mirror the lower tier (comprising companies with lower range revenues within the markets in which they operate) portion of the U.S. dollar-denominated leveraged loan market, generated a +19.40% total return for the same period.1 The Fund’s relative return benefited from its loan selection in the transportation and metals and mining industries, while the food and tobacco industry detracted from relative results. Over the period in review, the CS LL Upper Tier Index, which includes loans rated BB or above, returned +4.22%; the CS LL Middle Tier Index, which includes loans rated split BB, B and split B, returned +6.90%; and the CS LL LTI, which includes loans rated CCC or lower, returned +19.40%.1
Prior to this one-year period, the extended period of depressed and declining commodity prices negatively impacted valuations, which translated into lower trade levels as defaults in energy-related sectors increased and the outlook dimmed. However, at the start of the period under review, many energy-related commodity companies rebounded significantly from trough levels. The defaulted outstanding term debt of Peabody Energy jumped higher in price following a run-up in metallurgic coal spot price levels. The positive outlook for metallurgic coal pricing resulted in the loan becoming a top contributor to total return over the period. The higher market prices for metallurgic coal fully covered the first-lien term debt, which supported the higher trade levels for the loan. We used the stabilized commodity environment and the stronger market as an opportunity to reduce our exposure to Peabody and eventually exited the position. Also in the metals and mining sector, the term debt of Foresight Energy, an Illinois-Basin coal miner, traded higher following management's release of good financial results covering the fourth quarter in 2016 that significantly improved the company’s liquidity profile. The borrower approached the primary market with a new transaction that we used to eliminate our holdings. In the transportation sector, FRAM GROUP Holdings, an aftermarket supplier of car care products and an overweight position in the Fund, achieved new financing in the primary market and retired at par the outstanding short maturity first- and second-lien term loans the Fund held.
The term loan of CSM Bakery Supplies, a leading producer of bakery goods and finished products, stumbled following a new third-party technology initiative that led to inventory tracking errors and ultimately to several canceled contracts. The company believed the temporary disruption would not persist and the lost customer contracts could be re-signed. However, during this period, the company failed to win back select lost customer contracts and the expectation of deteriorating results continued to negatively impact trading levels. In general, the loan market experienced consecutive periods of positive performance generated from material cash inflows into prime funds and the newly formed collateralized debt obligations. In addition, the limited supply of net-new loans through primary market transactions created a technical imbalance pushing loan prices in the secondary market higher and above their call
protection in some cases. As a result, the portfolio held very few loans that detracted from relative results.
During the period, we focused on purchasing discounted short-maturity loans as several discounted short-maturity positions refinanced or amended their credit agreements to extend their maturities. The term debt of Jack Ohio Finance, an operator of three Ohio based casinos, rebranded the Ohio properties including a full renovation of the Thistledown site, which grew revenues sequentially. During the period, the term loan paid down in full shortly after our discounted purchases. In addition, Cannery Casino completed its final sale to Boyd Gaming, and Alfred Fueling, a manufacturer of fuel dispensing systems, also paid down their debt in full during the period. Overall, the majority of changes to the portfolio stemmed from large paydowns as a result of take-out loans (long-term loans that replace short-term loans) and refinancings of riskier borrowers, which ultimately positively impacted the credit quality of the portfolio. In the secondary market, we added FGI Operating Company, a firearm manufacturer, as well as Sungard Availability Services Capital, a provider of disaster recovery and colocation services, both of which were priced at a discount to par and near-term maturity with zero debt maturity in front of our loan tranches. In addition, we added to several new borrowers, including two borrowers in the telecommunications sector. We purchased the second-lien tranches of Global Tel*Link and Securus Technologies, which provide prisons with telecommunications systems and payment processing, at a modest discount to par. Overall, we decreased the number of borrowers in the portfolio from 26 issuers at the beginning of the period to 23 issuers by period-end. The loan assets that paid down in full, in addition to positions actively reduced toward an exit, increased the portfolio’s credit quality. Over the same period, the loan portfolio’s weighted average rating factor modestly decreased, another indication of increased credit quality.
Notes:
1. Source: Credit Suisse Group.
The indexes are unmanaged and include reinvestment of any income or distributions. They do not reflect any fees,
expenses or sales charges. One cannot invest directly in an index, and an index is not representative of the Fund’s
portfolio.
See www.franklintempletondatasources.com for additional data provider information.
| | |
| Portfolio Breakdown | % of Total Net Assets | |
| 7/31/17 | | |
| |
| Senior Floating Rate Interests | 91.5 | % |
| Other Net Assets | 8.5 | % |
Total Return Index Comparison for a Hypothetical $10,000 Investment1
Total return represents the change in value of an investment over the periods shown. It includes any applicable maximum sales charge, Fund expenses, account fees and reinvested distributions. The unmanaged index includes reinvestment of any income or distributions. It differs from the Fund in composition and does not pay management fees or expenses. One cannot invest directly in an index.
| | |
| Average Annual Total Return3 | |
| 7/31/17 | | |
| 1-Year | +15.55 | % |
| Since Inception 11/6/15 | +12.96 | % |
1. The Fund has an expense reduction contractually guaranteed through 11/30/17. Fund investment results reflect
the expense reduction; without this reduction, the results would have been lower.
2. Source: Credit Suisse Group. The CS LL LTI is designed to mirror the lower tier (comprising companies with
lower range revenues within the markets in which they operate) portion of the U.S. dollar-denominated leveraged
loan market. Loans must be below investment grade and rated no higher than Baa1/BB+ or Ba1/BBB+ by
Moody’s/Standard and Poor’s® (S&P).
3. Average annual total return represents the average annual change in value of an investment over the period
indicated. Return for less than one year, if any, has not been annualized.
See www.franklintempletondatasources.com for additional data provider information.
Your Fund’s Expenses
As a Fund shareholder, you can incur two types of costs: (1) transaction costs, including sales charges (loads) on Fund purchases and redemptions; and (2) ongoing Fund costs, including management fees, distribution and service (12b-1) fees, and other Fund expenses. All mutual funds have ongoing costs, sometimes referred to as operating expenses. The table below shows ongoing costs of investing in the Fund and can help you understand these costs and compare them with those of other mutual funds. The table assumes a $1,000 investment held for the six months indicated.
Actual Fund Expenses
The table below provides information about actual account values and actual expenses in the columns under the heading “Actual.” In these columns the Fund’s actual return, which includes the effect of Fund expenses, is used to calculate the “Ending Account Value.” You can estimate the expenses you paid during the period by following these steps (of course, your account value and expenses will differ from those in this illustration): Divide your account value by $1,000 (if your account had an $8,600 value, then $8,600 ÷ $1,000 = 8.6). Then multiply the result by the number under the headings “Actual” and “Expenses Paid During Period” (if Actual Expenses Paid During Period were $7.50, then 8.6 x $7.50 = $64.50). In this illustration, the actual expenses paid this period are $64.50.
Hypothetical Example for Comparison with Other Funds
Under the heading “Hypothetical” in the table, information is provided about hypothetical account values and hypothetical expenses based on the Fund’s actual expense ratio and an assumed rate of return of 5% per year before expenses, which is not the Fund’s actual return. This information may not be used to estimate the actual ending account balance or expenses you paid for the period, but it can help you compare ongoing costs of investing in the Fund with those of other funds. To do so, compare this 5% hypothetical example with the 5% hypothetical examples that appear in the shareholder reports of other funds. Please note that expenses shown in the table are meant to highlight ongoing costs and do not reflect any transactional costs. Therefore, information under the heading “Hypothetical” is useful in comparing ongoing costs only, and will not help you compare total costs of owning different funds. In addition, if transactional costs were included, your total costs would have been higher.
| | | | | | | | | | | |
| | | | Actual | | | | | | Hypothetical | | |
| | (actual return after expenses) | | (5% annual return before expenses) | |
| |
| | | | | | Expenses | | | | Expenses | | |
| | Beginning | | Ending | | Paid During | | Ending | | Paid During | | |
| | Account | | Account | | Period | | Account | | Period | Net Annualized | |
| | Value 2/1/17 | | Value 7/31/17 | | 2/1/17–7/31/171,2 | | Value 7/31/17 | | 2/1/17–7/31/171,2 | Expense Ratio2 | |
| |
| $ | 1,000 | $ | 1,039.60 | $ | 3.03 | $ | 1,021.82 | $ | 3.01 | 0.60 | % |
1. Expenses are equal to the annualized expense ratio for the six-month period as indicated above—in the far right column—
multiplied by the simple average account value over the period indicated, and then multiplied by 181/365 to reflect the one-half year
period.
2. Reflects expenses after fee waivers and expense reimbursements. Does not include acquired fund fees and expenses.
.
Franklin Middle Tier Floating Rate Fund Annual Report
Manager’s Discussion
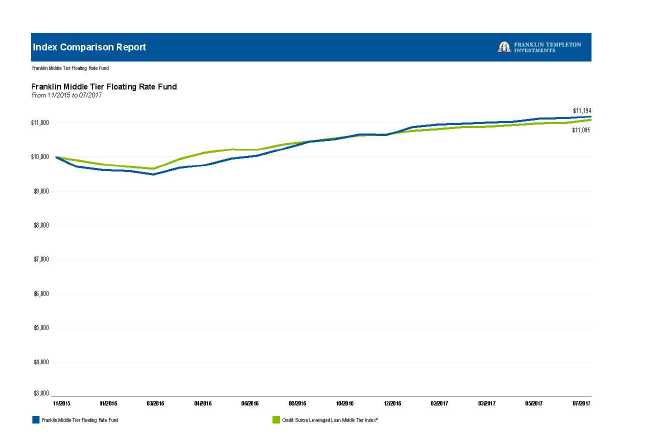
During the period under review, the Franklin Middle Tier Floating Rate Fund delivered a +9.25% cumulative total return.1 In comparison, the Fund’s benchmark, the Credit Suisse Leveraged Loan (CS LL) Middle Tier Index (MTI), which is designed to mirror the middle tier (comprising companies with mid-range revenues within the markets in which they operate) portion of the U.S. dollar-denominated leveraged loan market, generated a +6.90% total return for the same period.1 The Fund’s relative return benefited from its loan selection in the energy, consumer durables and retail sectors, but was hampered by its loan selection in the services sector. Over the period in review, the CS LL Upper Tier Index, which includes loans rated BB or above, returned +4.22%; the CS LL Middle Tier Index, which includes loans rated split BB, B and split B, returned +6.90%; and the CS LL LTI, which includes loans rated CCC or lower, returned +19.40%.1
The Fund’s top contributors primarily consisted of those loans that had traded at a discount to par at the beginning of the period but traded higher following stabilized financial results. The term loan of 99 Cents Only Stores, one of the top performing loan assets over the period, benefited from management’s guidance by further reducing shrinkage and scrap losses, improving store operations and procurement of goods, which translated into increased revenue and a much-improved leverage and liquidity profile. We purchased the term loan at a material discount to par. Another loan asset, Freedom Group, a manufacturer of firearms, appreciated in the period as the company delivered on new product introductions and finally completed a planned operations consolidation. Meanwhile, the company was able to decrease total leverage over the period through increased profit margins and lower fixed costs. Lastly, in the energy sector, the term debt of Fieldwood Energy Group traded higher following a more constructive commodity price environment and well-timed new hedges that kept the company’s free cash flow positive. The company’s improved liquidity and increased value of its oil reserves provided adequate coverage of the first-lien debt facility and supported higher trading prices over the period.
The service sector detracted from relative results, which included the term debt of Onsite Rental Group that gradually declined following mixed financial results that continued to highlight a tight liquidity condition. Overall, the borrower refrained from additional capital expenditures to preserve liquidity and failed to win a new, important contract due to liquidity constraints. In general, the loan market experienced consecutive periods of positive performance generated from material cash inflows into prime funds and newly formed collateralized debt obligations. In addition, the limited supply of net-new loans through primary market transactions created a technical imbalance pushing loan prices in the secondary market higher and above their call protection in some cases. As a result, the portfolio held very few loans that detracted from relative results.
During the period, we actively managed the Fund’s exposures and purchased new positions to help diversify our holdings and reduce individual loan assets concentrations. Mainly, we targeted discounted high-quality loan assets with short-dated maturities that require the borrower to
address the capital structure in the near term. We purchased an upper tier-rated borrower, General Nutrition Centers, which encompassed all of our desired metrics and we added to the discounted position throughout the period. In the telecommunications sector, we purchased Global Tel*Link and Securus Technologies that provide prisons with telecommunication systems and payment processing, at a slight discount to par. We reduced the term debt of Carestream Health following further pressure on the loan as a result of deteriorating fundamentals. Carestream received bids from a buyout firm to acquire the dental business unit at an attractive multiple. The news pushed the term loan price higher and we actively reduced the large exposure toward an eventual exit of the first-lien debt at prices near par. A majority of the transactions that impacted the portfolio’s composition stemmed from capital market transactions that, in most cases, retired the outstanding debt obligations of the loan asset. Over the period, Alinta Energy Finance Pty, Cannery Casino Resorts and Sensus USA exited the loan market through transactions that retired the near-term outstanding loans. Overall, we increased the number of borrowers in the portfolio by five, from 27 issuers at the beginning of the period to 32 by period-end, which improved the portfolio’s diversification. Over the same period, the loan portfolio’s weighted average rating factor increased, indicating a modest decrease in credit quality.
Notes:
1. Source: Credit Suisse Group.
The indexes are unmanaged and include reinvestment of any income or distributions. They do not reflect any fees,
expenses or sales charges. One cannot invest directly in an index, and an index is not representative of the Fund’s
portfolio.
See www.franklintempletondatasources.com for additional data provider information.
| | |
| Portfolio Breakdown | % of Total Net Assets | |
| 7/31/17 | | |
| |
| Senior Floating Rate Interests | 95.2 | % |
| Other Net Assets | 4.8 | % |
Total Return Index Comparison for a Hypothetical $10,000 Investment1
Total return represents the change in value of an investment over the periods shown. It includes any applicable maximum sales charge, Fund expenses, account fees and reinvested distributions. The unmanaged index includes reinvestment of any income or distributions. It differs from the Fund in composition and does not pay management fees or expenses. One cannot invest directly in an index.
| | |
| Average Annual Total Return3 | |
| 7/31/17 | | |
| 1-Year | +9.25 | % |
| Since Inception 11/6/15 | +6.72 | % |
1. The Fund has an expense reduction contractually guaranteed through 11/30/17. Fund investment results reflect the
expense reduction; without this reduction, the results would have been lower.
2. Source: Credit Suisse Group. The CS LL MTI is designed to mirror the middle tier (comprising companies with
mid-range revenues within the markets in which they operate) portion of the U.S. dollar-denominated leveraged loan
market. Loans must be below investment grade and rated no higher than Baa1/BB+ or Ba1/BBB+ by
Moody’s/Standard and Poor’s® (S&P).
3. Average annual total return represents the average annual change in value of an investment over the period
indicated. Return for less than one year, if any, has not been annualized.
See www.franklintempletondatasources.com for additional data provider information.
Your Fund’s Expenses
As a Fund shareholder, you can incur two types of costs: (1) transaction costs, including sales charges (loads) on Fund purchases and redemptions; and (2) ongoing Fund costs, including management fees, distribution and service (12b-1) fees, and other Fund expenses. All mutual funds have ongoing costs, sometimes referred to as operating expenses. The table below shows ongoing costs of investing in the Fund and can help you understand these costs and compare them with those of other mutual funds. The table assumes a $1,000 investment held for the six months indicated.
Actual Fund Expenses
The table below provides information about actual account values and actual expenses in the columns under the heading “Actual.” In these columns the Fund’s actual return, which includes the effect of Fund expenses, is used to calculate the “Ending Account Value.” You can estimate the expenses you paid during the period by following these steps (of course, your account value and expenses will differ from those in this illustration): Divide your account value by $1,000 (if your account had an $8,600 value, then $8,600 ÷ $1,000 = 8.6). Then multiply the result by the number under the headings “Actual” and “Expenses Paid During Period” (if Actual Expenses Paid During Period were $7.50, then 8.6 x $7.50 = $64.50). In this illustration, the actual expenses paid this period are $64.50.
Hypothetical Example for Comparison with Other Funds
Under the heading “Hypothetical” in the table, information is provided about hypothetical account values and hypothetical expenses based on the Fund’s actual expense ratio and an assumed rate of return of 5% per year before expenses, which is not the Fund’s actual return. This information may not be used to estimate the actual ending account balance or expenses you paid for the period, but it can help you compare ongoing costs of investing in the Fund with those of other funds. To do so, compare this 5% hypothetical example with the 5% hypothetical examples that appear in the shareholder reports of other funds. Please note that expenses shown in the table are meant to highlight ongoing costs and do not reflect any transactional costs. Therefore, information under the heading “Hypothetical” is useful in comparing ongoing costs only, and will not help you compare total costs of owning different funds. In addition, if transactional costs were included, your total costs would have been higher.
| | | | | | | | | | | |
| | | | Actual | | | | | | Hypothetical | | |
| | (actual return after expenses) | | (5% annual return before expenses) | |
| |
| | | | | | Expenses | | | | Expenses | | |
| | Beginning | | Ending | | Paid During | | Ending | | Paid During | | |
| | Account | | Account | | Period | | Account | | Period | Net Annualized | |
| | Value 2/1/17 | | Value 7/31/17 | | 2/1/17–7/31/171,2 | | Value 7/31/17 | | 2/1/17–7/31/171,2 | Expense Ratio2 | |
| |
| $ | 1,000 | $ | 1,021.20 | $ | 3.01 | $ | 1,021.82 | $ | 3.01 | 0.60 | % |
1. Expenses are equal to the annualized expense ratio for the six-month period as indicated above—in the far right column—
multiplied by the simple average account value over the period indicated, and then multiplied by 181/365 to reflect the one-half year
period.
2. Reflects expenses after fee waivers and expense reimbursements. Does not include acquired fund fees and expenses.
| | | | | | |
| F R A N K L I N F L O A T I N G RA T E MA S T E R T R U S T | | | | | | |
| |
| |
| Financial Highlights | | | | | | |
| Franklin Lower Tier Floating Rate Fund | | | | | | |
| | | Year Ended July 31, | |
| | | 2017 | | | 2016 | a |
| Per share operating performance | | | | | | |
| (for a share outstanding throughout the year) | | | | | | |
| Net asset value, beginning of year | $ | 9.99 | | $ | 10.00 | |
| Income from investment operationsb: | | | | | | |
| Net investment income | | 0.962 | | | 0.658 | |
| Net realized and unrealized gains (losses) | | 0.530 | | | (0.017 | ) |
| Total from investment operations | | 1.492 | | | 0.641 | |
| Less distributions from net investment income | | (0.982 | ) | | (0.651 | ) |
| Net asset value, end of year. | $ | 10.50 | | $ | 9.99 | |
| |
| Total returnc | | 15.55 | % | | 6.90 | % |
| |
| Ratios to average net assetsd | | | | | | |
| Expenses before waiver and payments by affiliates | | 0.70 | % | | 0.70 | % |
| Expenses net of waiver and payments by affiliatese | | 0.60 | % | | 0.60 | % |
| Net investment income | | 9.31 | % | | 9.47 | % |
| |
| Supplemental data | | | | | | |
| Net assets, end of year (000’s) | $ | 341,611 | | $ | 436,180 | |
| Portfolio turnover rate | | 54.26 | % | | 26.40 | %f |
aFor the period November 6, 2015 (commencement of operations) to July 31, 2016.
bThe amount shown for a share outstanding throughout the period may not correlate with the Statement of Operations for the period due to the timing of sales and
repurchases of the Fund’s shares in relation to income earned and/or fluctuating fair value of the investments of the Fund.
cTotal return is not annualized for periods less than one year.
dRatios are annualized for periods less than one year, except for non-recurring expenses, if any.
eBenefit of expense reduction rounds to less than 0.01%.
fExcludes the value of portfolio securities received from purchase in-kind. See Note 3(f).
| 13 | Annual Report | The accompanying notes are an integral part of these financial statements. |
| | | | | |
| F R A N K L I N F L O A T I N G R A T E MA S T E R T R U S T |
| |
| |
| |
| Statement of Investments, July 31, 2017 | | | | | |
| Franklin Lower Tier Floating Rate Fund | | | | | |
| | | | Principal | | |
| | Country | | Amount* | | Value |
| a,b Senior Floating Rate Interests 91.5% | | | | | |
| Aerospace & Defense 4.7% | | | | | |
| Doncasters U.S. Finance LLC, Second Lien Term Loan, 9.546%, 10/09/20 | United States | $ | 16,536,432 | $ | 16,040,339 |
| Agricultural Products 0.3% | | | | | |
| Allflex Holdings III Inc., Second Lien Initial Term Loan, 8.307%, 7/16/21. | United States | | 981,132 | | 988,338 |
| Apparel Retail 1.8% | | | | | |
| Ascena Retail Group Inc., Tranche B Term Loan, 5.75%, 8/21/22 | United States | | 7,201,876 | | 6,013,566 |
| Coal & Consumable Fuels 1.5% | | | | | |
| Bowie Resource Holdings LLC, First Lien Initial Term Loan, 6.984%, 8/14/20 | United States | | 179,744 | | 174,052 |
| Westmoreland Coal Co., Term Loan, 7.796%, 12/16/20 | United States | | 5,746,625 | | 5,107,313 |
| | | | | | 5,281,365 |
| Commodity Chemicals 4.4% | | | | | |
| Cyanco Intermediate Corp., Initial Term Loan, 5.734%, 5/01/20. | United States | | 14,954,088 | | 15,078,700 |
| Diversified Chemicals 1.6% | | | | | |
| OCI Beaumont LLC, Term B-3 Loan, 7.929%, 8/20/19 | United States | | 5,355,159 | | 5,395,323 |
| Forest Products 4.0% | | | | | |
| Appvion Inc., Term Loan, 7.75% - 7.79%, 6/28/19 | United States | | 13,882,250 | | 13,529,405 |
| General Merchandise Stores 20.0% | | | | | |
| 99 Cents Only Stores, Tranche B-2 Loan, 4.702% - 4.796%, 1/11/19 | United States | | 35,850,718 | | 34,715,433 |
| Evergreen AcqCo. 1 LP (Savers), Term Loan, 5.011% - 5.064%, 7/09/19 | United States | | 35,423,379 | | 33,475,093 |
| | | | | | 68,190,526 |
| Industrial Machinery 3.3% | | | | | |
| Onsite Rental Group Operations Pty. Ltd., Term B Loan, 5.732%, 7/31/21 | Australia | | 14,923,274 | | 11,192,455 |
| Integrated Telecommunication Services 7.1% | | | | | |
| Global Tel*Link Corp., Second Lien Term Loan, 9.046%, 11/20/20. | United States | | 5,095,856 | | 5,092,672 |
| Securus Technologies Holdings Inc., | | | | | |
| Second Lien Term Loan, 9.00%, 4/17/21 | United States | | 9,556,000 | | 9,625,682 |
| c Second Lien Term Loan, 11.50%, 6/30/25 | United States | | 9,556,000 | | 9,625,682 |
| | | | | | 24,344,036 |
| IT Consulting & Other Services 5.2% | | | | | |
| Sungard Availability Services Capital Inc., 2019 Tranche B Term Loan, 6.234%, 3/29/19 . | United States | | 18,169,110 | | 17,964,707 |
| Movies & Entertainment 1.1% | | | | | |
| c Global Eagle Entertainment Inc., Initial Term Loans, 8.456%, 1/06/23 | United States | | 3,840,000 | | 3,746,400 |
| Oil & Gas Exploration & Production 18.4% | | | | | |
| Fieldwood Energy LLC, Loans, 4.171%, 10/01/18 | United States | | 22,149,764 | | 21,332,992 |
| UTEX Industries Inc., | | | | | |
| First Lien Initial Term Loan, 5.234%, 5/21/21 | United States | | 44,468,096 | | 40,049,079 |
| Second Lien Initial Term Loan, 8.484%, 5/20/22 | United States | | 1,500,000 | | 1,336,875 |
| | | | | | 62,718,946 |
| Oil & Gas Storage & Transportation 0.7% | | | | | |
| International Seaways Inc., Initial Term Loans, 6.79%, 6/22/22 | United States | | 2,500,000 | | 2,484,375 |
| Packaged Foods & Meats 4.4% | | | | | |
| CSM Bakery Supplies LLC, Second Lien Term Loan, 9.05%, 7/03/21 | United States | | 16,927,258 | | 14,938,305 |
| Paper Packaging 4.2% | | | | | |
| Caraustar Industries Inc., Refinancing Term Loans, 6.796%, 3/14/22 | United States | | 14,236,568 | | 14,352,240 |
| Personal Products 2.0% | | | | | |
| FGI Operating Co. LLC (Freedom Group), Term B Loans, 5.50%, 4/19/19 | United States | | 7,570,216 | | 7,033,995 |
Annual Report
14
| | | | | |
| F R A N K L I N F L O A T I N G RA T E MA S T E R T R U S T | | | | | |
| S T A T E M E N T OF IN V E S T M E N T S | | | | | |
| |
| |
| |
| |
| Franklin Lower Tier Floating Rate Fund (continued) | | | | | |
| | | | Principal | | |
| | Country | | Amount* | | Value |
| a,b Senior Floating Rate Interests (continued) | | | | | |
| Specialty Chemicals 4.6% | | | | | |
| Oxbow Carbon LLC, Second Lien Initial Term Loan, 8.234%, 1/17/20 | United States | $ | 15,510,000 | $ | 15,606,938 |
| Specialty Stores 2.2% | | | | | |
| PetSmart Inc., Tranche B-2 Loans, 4.23%, 3/11/22 | United States | | 7,897,063 | | 7,507,596 |
| Total Senior Floating Rate Interests | | | | | |
| (Cost $300,596,766) | | | | | 312,407,555 |
| Other Assets, less Liabilities 8.5% | | | | | 29,203,769 |
| Net Assets 100.0% | | | | $ | 341,611,324 |
*The principal amount is stated in U.S. dollars unless otherwise indicated.
aThe coupon rate shown represents the rate at period end.
bSee Note 1(c) regarding senior floating rate interests.
cSecurity purchased on a delayed delivery basis. See Note 1(b).
| 15 | Annual Report | The accompanying notes are an integral part of these financial statements. |
| | | | | | |
| | | F R A N K L I N F L O A T I N G R A T E MA S T E R T R U S T | |
| |
| |
| Financial Highlights | | | | | | |
| Franklin Middle Tier Floating Rate Fund | | | | | | |
| | | Year Ended July 31, | |
| | | 2017 | | | 2016 | a |
| Per share operating performance | | | | | | |
| (for a share outstanding throughout the year) | | | | | | |
| Net asset value, beginning of year | $ | 9.83 | | $ | 10.00 | |
| Income from investment operationsb: | | | | | | |
| Net investment income | | 0.686 | | | 0.403 | |
| Net realized and unrealized gains (losses) | | 0.214 | | | (0.174 | ) |
| Total from investment operations | | 0.900 | | | 0.229 | |
| Less distributions from net investment income | | (0.690 | ) | | (0.399 | ) |
| Net asset value, end of year. | $ | 10.04 | | $ | 9.83 | |
| |
| Total returnc | | 9.25 | % | | 2.46 | % |
| |
| Ratios to average net assetsd | | | | | | |
| Expenses before waiver and payments by affiliates | | 0.69 | % | | 0.71 | % |
| Expenses net of waiver and payments by affiliatese | | 0.60 | % | | 0.60 | % |
| Net investment income | | 6.82 | % | | 5.76 | % |
| |
| Supplemental data | | | | | | |
| Net assets, end of year (000’s) | $ | 303,689 | | $ | 348,682 | |
| Portfolio turnover rate | | 62.11 | % | | 42.49 | %f |
aFor the period November 6, 2015 (commencement of operations) to July 31, 2016.
bThe amount shown for a share outstanding throughout the period may not correlate with the Statement of Operations for the period due to the timing of sales and
repurchases of the Fund’s shares in relation to income earned and/or fluctuating fair value of the investments of the Fund.
cTotal return is not annualized for periods less than one year.
dRatios are annualized for periods less than one year, except for non-recurring expenses, if any.
eBenefit of expense reduction rounds to less than 0.01%.
fExcludes the value of portfolio securities received from purchase in-kind. See Note 3(f).
The accompanying notes are an integral part of these financial statements. | Annual Report 16
| | | | | | |
| F R A N K L I N F L O A T I N G RA T E MA S T E R T R U S T | | | | | |
| |
| |
| |
| Statement of Investments, July 31, 2017 | | | | | |
| Franklin Middle Tier Floating Rate Fund | | | | | |
| | | | | Principal | | |
| | | Country | | Amount* | | Value |
| a,b Senior Floating Rate Interests 95.2% | | | | | |
| Aerospace & Defense 6.5% | | | | | |
| Doncasters U.S. Finance LLC, | | | | | |
| | Second Lien Term Loan, 9.546%, 10/09/20 | United States | $ | 5,623,654 | $ | 5,454,944 |
| | Term B Loans, 4.796%, 4/09/20 | United States | | 14,810,641 | | 14,181,189 |
| | | | | | | 19,636,133 |
| Air Freight & Logistics 0.1% | | | | | |
| XPO Logistics Inc., Loans, 3.554%, 11/01/21 | United States | | 394,536 | | 396,651 |
| Apparel Retail 2.0% | | | | | |
| Ascena Retail Group Inc., Tranche B Term Loan, 5.75%, 8/21/22 | United States | | 7,394,300 | | 6,174,241 |
| Auto Parts & Equipment 0.2% | | | | | |
| TI Group Automotive Systems LLC, Initial US Term Loan, 3.984%, 6/30/22 | United States | | 611,424 | | 614,099 |
| Casinos & Gaming 0.6% | | | | | |
| c Caesars Entertainment Operating Co. LLC, Term B Loans, 5.75%, 8/31/24 | United States | | 389,276 | | 390,979 |
| Kingpin Intermediate Holdings LLC., Initial Term Loans, 5.48%, 7/03/24. | United States | | 1,376,000 | | 1,394,044 |
| | | | | | | 1,785,023 |
| Commodity Chemicals 4.6% | | | | | |
| Cyanco Intermediate Corp., Initial Term Loan, 5.734%, 5/01/20. | United States | | 13,752,651 | | 13,867,251 |
| Diversified Chemicals 1.6% | | | | | |
| OCI Beaumont LLC, Term B-3 Loan, 7.929%, 8/20/19 | United States | | 4,819,570 | | 4,855,716 |
| Electric Utilities 0.2% | | | | | |
| EFS Cogen Holdings I LLC (Linden), Term B Advance, 4.80%, 6/28/23 | United States | | 695,434 | | 702,823 |
| Food Retail 1.6% | | | | | |
| Smart & Final LLC, First Lien Term Loan, 4.734% - 4.796%, 11/15/22 | United States | | 4,999,217 | | 4,895,068 |
| General Merchandise Stores 10.4% | | | | | |
| 99 Cents Only Stores, Tranche B-2 Loan, 4.702% - 4.796%, 1/11/19 | United States | | 32,651,414 | | 31,617,442 |
| Health Care Services 1.1% | | | | | |
| c U.S. Renal Care Inc., Initial Term Loan, 5.546%, 12/31/22 | United States | | 3,291,646 | | 3,241,757 |
| Household Products 0.1% | | | | | |
| Spectrum Brands Inc., USD Term Loans, 3.179% - 3.314%, 6/23/22 | United States | | 154,217 | | 155,220 |
| Industrial Machinery 9.0% | | | | | |
| Navistar Inc., Tranche B Term Loans, 5.23%, 8/07/20 | United States | | 13,864,686 | | 14,029,329 |
| Onsite Rental Group Operations Pty. Ltd., Term B Loan, 5.732%, 7/31/21 | Australia | | 17,683,181 | | 13,262,386 |
| | | | | | | 27,291,715 |
| Integrated Telecommunication Services 10.6% | | | | | |
| Consolidated Communications Inc., Initial Term Loan, 4.24%, 10/05/23 | United States | | 1,017,267 | | 1,020,319 |
| c Global Tel*Link Corp., Term Loan, 5.296%, 5/23/20 | United States | | 15,156,078 | | 15,276,857 |
| Securus Technologies Holdings Inc., | | | | | |
| | Initial Term Loan, 4.694%, 4/30/20 | United States | | 7,760,828 | | 7,848,137 |
| | c Second Lien Term Loan, 11.50%, 6/30/25 | United States | | 136,615 | | 137,611 |
| | c Term Loan B, 7.50%, 6/30/24 | United States | | 7,760,828 | | 7,848,137 |
| | | | | | | 32,131,061 |
| IT Consulting & Other Services 2.5% | | | | | |
| c Sungard Availability Services Capital Inc., 2019 Tranche B Term Loan, 6.234%, 3/29/19 . | United States | | 7,592,444 | | 7,507,029 |
| Leisure Facilities 3.8% | | | | | |
| 24 Hour Fitness Worldwide Inc., Term Loan, 5.046%, 5/28/21. | United States | | 11,683,959 | | 11,672,860 |
| Marine 2.9% | | | | | |
| Navios Maritime Partners LP, Initial Term Loan, 6.25%, 9/14/20. | Greece | | 8,887,500 | | 8,909,719 |
| |
| |
| 17 | Annual Report | | | | | |
|
| F R A N K L I N F L O A T I N G R A T E MA S T E R T R U S T |
| S T A T E M E N T O F I N V E S T M E N T S |
| | | | | |
| Franklin Middle Tier Floating Rate Fund (continued) | | | | | |
| | | | Principal | | |
| | Country | | Amount* | | Value |
| a,b Senior Floating Rate Interests (continued) | | | | | |
| Movies & Entertainment 0.3% | | | | | |
| c Global Eagle Entertainment Inc., Initial Term Loans, 8.456%, 1/06/23 | United States | $ | 960,000 | $ | 936,600 |
| Oil & Gas Exploration & Production 11.1% | | | | | |
| Fieldwood Energy LLC, Loans, 4.171%, 10/01/18 | United States | | 21,656,525 | | 20,857,940 |
| UTEX Industries Inc., First Lien Initial Term Loan, 5.234%, 5/21/21 | United States | | 14,317,579 | | 12,894,770 |
| | | | | | 33,752,710 |
| Packaged Foods & Meats 4.7% | | | | | |
| CSM Bakery Supplies LLC, | | | | | |
| Second Lien Term Loan, 9.05%, 7/03/21 | United States | | 2,000,000 | | 1,765,000 |
| Term Loans, 5.30%, 7/03/20. | United States | | 12,999,049 | | 12,614,498 |
| | | | | | 14,379,498 |
| Personal Products 10.2% | | | | | |
| FGI Operating Co. LLC (Freedom Group), Term B Loans, 5.50%, 4/19/19 | United States | | 33,327,663 | | 30,966,965 |
| Semiconductors 0.4% | | | | | |
| MACOM Technology Solutions Holdings Inc., Initial Term Loans, 3.478%, 5/07/24 | United States | | 1,069,699 | | 1,069,699 |
| Specialized Consumer Services 0.1% | | | | | |
| NVA Holdings Inc., Second Lien Term Loan, 8.296%, 8/14/22. | United States | | 333,824 | | 337,996 |
| Specialty Chemicals 2.8% | | | | | |
| Oxbow Carbon LLC, Second Lien Initial Term Loan, 8.234%, 1/17/20 | United States | | 8,517,180 | | 8,570,412 |
| Specialty Stores 7.8% | | | | | |
| General Nutrition Centers Inc., Tranche B Term Loans, 3.74%, 3/04/19 | United States | | 6,249,902 | | 6,051,987 |
| c Jo-Ann Stores Inc., Initial Loans, 8.25%, 10/21/23 | United States | | 3,778,963 | | 3,782,901 |
| c PetSmart Inc., Tranche B-2 Loans, 4.23%, 3/11/22 | United States | | 14,543,610 | | 13,826,348 |
| | | | | | 23,661,236 |
| Total Senior Floating Rate Interests | | | | | |
| (Cost $285,858,306) | | | | | 289,128,924 |
| Other Assets, less Liabilities 4.8% | | | | | 14,559,844 |
| Net Assets 100.0% | | | | $ | 303,688,768 |
See Abbreviations on page 29.
*The principal amount is stated in U.S. dollars unless otherwise indicated.
aThe coupon rate shown represents the rate at period end.
bSee Note 1(c) regarding senior floating rate interests.
cA portion or all of the security purchased on a delayed delivery basis. See Note 1(b).
The accompanying notes are an integral part of these financial statements. | Annual Report 18
| | | | | | |
| F R A N K L I N F L O A T I N G RA T E MA S T E R T R U S T | | | | | | |
| |
| Financial Statements | | | | | | |
| |
| Statements of Assets and Liabilities | | | | | | |
| July 31, 2017 | | | | | | |
| |
| | | Franklin | | | Franklin | |
| | | Lower Tier | | | Middle Tier | |
| | | Floating | | | Floating | |
| | | Rate Fund | | | Rate Fund | |
| Assets: | | | | | | |
| Investments in securities: | | | | | | |
| Cost - Unaffiliated issuers | $ | 300,596,766 | | $ | 285,858,306 | |
| Value - Unaffiliated issuers | $ | 312,407,555 | | $ | 289,128,924 | |
| Cash. | | 27,336,275 | | | 41,333,350 | |
| Receivables: | | | | | | |
| Investment securities sold | | 16,860,175 | | | — | |
| Interest | | 1,042,830 | | | 819,927 | |
| Other assets | | 222 | | | 171 | |
| Total assets | | 357,647,057 | | | 331,282,372 | |
| Liabilities: | | | | | | |
| Payables: | | | | | | |
| Investment securities purchased | | 13,166,840 | | | 25,771,732 | |
| Management fees | | 212,705 | | | 153,156 | |
| Distributions to shareholders | | 2,646,912 | | | 1,657,243 | |
| Accrued expenses and other liabilities. | | 9,276 | | | 11,473 | |
| Total liabilities | | 16,035,733 | | | 27,593,604 | |
| Net assets, at value | $ | 341,611,324 | | $ | 303,688,768 | |
| Net assets consist of: | | | | | | |
| Paid-in capital | $ | 319,942,505 | | $ | 301,079,797 | |
| Undistributed net investment income. | | — | | | 73,673 | |
| Distributions in excess of net investment income | | (363,490 | ) | | — | |
| Net unrealized appreciation (depreciation) | | 11,810,789 | | | 3,270,618 | |
| Accumulated net realized gain (loss) | | 10,221,520 | | | (735,320 | ) |
| Net assets, at value | $ | 341,611,324 | | $ | 303,688,768 | |
| Shares outstanding. | | 32,528,928 | | | 30,236,980 | |
| Net asset value per share | $ | 10.50 | | $ | 10.04 | |
| 19 | Annual Report | The accompanying notes are an integral part of these financial statements. |
| | | | | | |
| | | F R A N K L I N F L O A T I N G R A T E MA S T E R T R U S T | |
| | | F I N A N C I A L S T A T E M E N T S | |
| |
| Statements of Operations | | | | | | |
| for the year ended July 31, 2017 | | | | | | |
| | | Franklin | | | Franklin | |
| | | Lower Tier | | | Middle Tier | |
| | | Floating | | | Floating | |
| | | Rate Fund | | | Rate Fund | |
| Investment income: | | | | | | |
| Interest. | $ | 38,799,964 | | $ | 23,454,623 | |
| Expenses: | | | | | | |
| Management fees (Note 3a) | | 2,547,386 | | | 2,056,183 | |
| Custodian fees (Note 4) | | 4,629 | | | 3,270 | |
| Reports to shareholders | | 4,463 | | | 4,219 | |
| Registration and filing fees | | 219 | | | 219 | |
| Professional fees | | 131,340 | | | 66,916 | |
| Trustees’ fees and expenses | | 15,801 | | | 12,496 | |
| Amortization of offering costs | | 18,414 | | | 19,085 | |
| Other | | 11,630 | | | 12,024 | |
| Total expenses | | 2,733,882 | | | 2,174,412 | |
| Expense reductions (Note 4) | | (2,779 | ) | | (2,190 | ) |
| Expenses waived/paid by affiliates (Note 3d) | | (383,584 | ) | | (275,356 | ) |
| Net expenses | | 2,347,519 | | | 1,896,866 | |
| Net investment income | | 36,452,445 | | | 21,557,757 | |
| Realized and unrealized gains (losses): | | | | | | |
| Net realized gain (loss) from investments | | 14,294,484 | | | 1,493,949 | |
| Net change in unrealized appreciation (depreciation) on investments | | 7,702,837 | | | 6,209,380 | |
| Net realized and unrealized gain (loss) | | 21,997,321 | | | 7,703,329 | |
| Net increase (decrease) in net assets resulting from operations | $ | 58,449,766 | | $ | 29,261,086 | |
The accompanying notes are an integral part of these financial statements. | Annual Report 20
| | | | | | | | | | | | | | |
| F R A N K L I N F L O A T I N G RA T E MA S T E R T R U S T | | | | | | | | | | | | | | |
| F I N A N C I A L S T A T E M E N T S | | | | | | | | | | | | | | |
| |
| |
| Statements of Changes in Net Assets | | | | | | | | | | | | | | |
| |
| | | Franklin Lower Tier | | | Franklin Middle Tier | |
| | | Floating Rate Fund | | | Floating Rate Fund | |
| | | Year Ended July 31, | | | Year Ended July 31, | |
| | | 2017 | | | | 2016 | * | | 2017 | | | | 2016 | * |
| Increase (decrease) in net assets: | | | | | | | | | | | | | | |
| Operations: | | | | | | | | | | | | | | |
| Net investment income | $ | 36,452,445 | | $ | 28,938,210 | | $ | 21,557,757 | | $ | 14,484,239 | |
| Net realized gain (loss) | | 14,294,484 | | | | (2,418,238 | ) | | 1,493,949 | | | | (2,238,129 | ) |
| Net change in unrealized appreciation (depreciation) | | 7,702,837 | | | | 4,107,952 | | | 6,209,380 | | | | (2,938,762 | ) |
| Net increase (decrease) in net assets resulting from | | | | | | | | | | | | | | |
| operations | | 58,449,766 | | | 30,627,924 | | | 29,261,086 | | | | 9,307,348 | |
| Distributions to shareholders from net investment income | | (37,193,892 | ) | | (28,634,343 | ) | | (21,691,391 | ) | | | (14,340,632 | ) |
| Capital share transactions (Note 2) | | (115,824,771 | ) | | 434,186,640 | | | (52,562,680 | ) | | 353,715,037 | |
| Net increase (decrease) in net assets | | (94,568,897 | ) | | 436,180,221 | | | (44,992,985 | ) | | 348,681,753 | |
| Net assets: | | | | | | | | | | | | | | |
| Beginning of year | | 436,180,221 | | | | — | | | 348,681,753 | | | | — | |
| End of year | $ | 341,611,324 | | $ | 436,180,221 | | $ | 303,688,768 | | $ | 348,681,753 | |
| Undistributed net investment income included in net assets: | | | | | | | | | | | | | | |
| End of year | $ | — | | | $ | 359,660 | | $ | 73,673 | | | $ | 178,650 | |
| Distributions in excess of net investment income included in net | | | | | | | | | | | | | | |
| assets: | | | | | | | | | | | �� | | | |
| End of year | $ | (363,490 | ) | | $ | — | | $ | — | | | $ | — | |
| * | For the period November 6, 2015 (commencement of operations) to July 31, 2016. |
| 21 | Annual Report | The accompanying notes are an integral part of these financial statements. |
FRANKLIN FLOATING RATE MASTER TRUST
Notes to Financial Statements
1. Organization and Significant Accounting Policies
Franklin Floating Rate Master Trust (Trust) is registered under the Investment Company Act of 1940 (1940 Act) as an open-end management investment company, consisting of three separate funds, two of which are included in this report (Funds) and applies the specialized accounting and reporting guidance in U.S. Generally Accepted Accounting Principles (U.S. GAAP). The shares are issued in private placements and exempt from registration under the Securities Act of 1933.
The following summarizes the Funds’ significant accounting policies.
a. Financial Instrument Valuation
The Funds’ investments in financial instruments are carried at fair value daily. Fair value is the price that would be received to sell an asset or paid to transfer a liability in an orderly transaction between market participants on the measurement date. The Funds calculate the net asset value (NAV) per share as of 4 p.m. Eastern time each day the New York Stock Exchange (NYSE) is open for trading. Under compliance policies and procedures approved by the Trust’s Board of Trustees (the Board), the Funds’ administrator has responsibility for oversight of valuation, including leading the cross-functional Valuation Committee (VC). The VC provides administration and oversight of the Funds’ valuation policies and procedures, which are approved annually by the Board. Among other things, these procedures allow the Funds to utilize independent pricing services, quotations from securities and financial instrument dealers, and other market sources to determine fair value.
Debt securities generally trade in the over-the-counter market rather than on a securities exchange. The Funds’ pricing services use multiple valuation techniques to determine fair value. In instances where sufficient market activity exists, the pricing services may utilize a market-based approach through which quotes from market makers are used to determine fair value. In instances where sufficient market activity may not exist or is limited, the pricing services also utilize proprietary valuation models which may consider market characteristics such as benchmark yield curves, credit spreads, estimated default rates, anticipated market interest rate volatility, coupon rates, anticipated timing of principal repayments, underlying collateral, and other unique security features in order to estimate the relevant cash flows, which are then discounted to calculate the fair value.
The Funds have procedures to determine the fair value of financial instruments for which market prices are not reliable or readily available. Under these procedures, the VC convenes on a regular basis to review such financial instruments and considers a number of factors, including significant unobservable valuation inputs, when arriving at fair value. The VC primarily employs a market-based approach which may use related or comparable assets or liabilities, recent transactions, market multiples, book values, and other relevant information for the investment to determine the fair value of the investment. An income-based valuation approach may also be used in which the anticipated future cash flows of the investment are discounted to calculate fair value. Discounts may also be applied due to the nature or duration of any restrictions on the disposition of the investments. Due to the inherent uncertainty of valuations of such investments, the fair values may differ significantly from the values that would have been used had an active market existed. The VC employs various methods for calibrating these valuation approaches including a regular review of key inputs and assumptions, transactional back-testing or disposition analysis, and reviews of any related market activity.
b. Securities Purchased on a Delayed Delivery Basis
Certain or all Funds purchase securities on a delayed delivery basis, with payment and delivery scheduled for a future date. These transactions are subject to market fluctuations and are subject to the risk that the value at delivery may be more or less than the trade date purchase price. Although the Funds will generally purchase these securities with the intention of holding the securities, they may sell the securities before the settlement date. Sufficient assets have been segregated for these securities.
c. Senior Floating Rate Interests
Certain or all Funds invest in senior secured corporate loans that pay interest at rates which are periodically reset by reference to a base lending rate plus a spread. These base lending rates are generally the prime rate offered by a designated U.S. bank or the London InterBank Offered Rate (LIBOR). Senior secured corporate loans often require prepayment of principal from excess cash flows or at the discretion of the borrower. As a result, actual maturity may be substantially less than the stated
Annual Report
22
|
| F R A N K L I N F L O A T I N G RA T E MA S T E R T R U S T |
| N O T E S T O F I N A N C I A L S T A T E M E N T S |
1. Organization and Significant Accounting
Policies (continued)
c. Senior Floating Rate Interests (continued)
maturity. Senior secured corporate loans in which the Funds invest are generally readily marketable, but may be subject to certain restrictions on resale.
d. Income Taxes
It is each Fund’s policy to qualify as a regulated investment company under the Internal Revenue Code. Each Fund intends to distribute to shareholders substantially all of its taxable income and net realized gains to relieve it from federal income and excise taxes. As a result, no provision for U.S. federal income taxes is required.
Each Fund may recognize an income tax liability related to its uncertain tax positions under U.S. GAAP when the uncertain tax position has a less than 50% probability that it will be sustained upon examination by the tax authorities based on its technical merits. As of July 31, 2017, each Fund has determined that no tax liability is required in its financial statements related to uncertain tax positions for any open tax years (or expected to be taken in future tax years). Open tax years are those that remain subject to examination and are based on the statute of limitations in each jurisdiction in which the Fund invests.
e. Security Transactions, Investment Income, Expenses and Distributions
Security transactions are accounted for on trade date. Realized gains and losses on security transactions are determined on a specific identification basis. Interest income and estimated expenses are accrued daily. Amortization of premium and accretion of discount on debt securities are included in interest income. Facility fees are recognized as income over the expected term of the loan. Dividends from net investment income are normally declared daily; these dividends may be reinvested or paid monthly to shareholders. Distributions from realized capital gains and other distributions, if any, are recorded on the ex-dividend date. Distributable earnings are determined according to income tax regulations (tax basis) and may differ from earnings recorded in accordance with U.S. GAAP. These differences may be permanent or temporary. Permanent differences are reclassified among capital accounts to reflect their tax character. These reclassifications have no impact on net assets or the results of operations. Temporary differences are not reclassified, as they may reverse in subsequent periods.
Common expenses incurred by the Trust are allocated among the Funds based on the ratio of net assets of each Fund to the combined net assets of the Trust. Fund specific expenses are charged directly to the Fund that incurred the expense.
f. Offering Costs
Offering costs are amortized on a straight line basis over twelve months.
g. Accounting Estimates
The preparation of financial statements in accordance with U.S. GAAP requires management to make estimates and assumptions that affect the reported amounts of assets and liabilities at the date of the financial statements and the amounts of income and expenses during the reporting period. Actual results could differ from those estimates.
h. Guarantees and Indemnifications
Under the Trust’s organizational documents, its officers and trustees are indemnified by the Trust against certain liabilities arising out of the performance of their duties to the Trust. Additionally, in the normal course of business, the Trust, on behalf of the Funds, enters into contracts with service providers that contain general indemnification clauses. The Trust’s maximum exposure under these arrangements is unknown as this would involve future claims that may be made against the Trust that have not yet occurred. Currently, the Trust expects the risk of loss to be remote.
|
| F R A N K L I N F L O A T I N G R A T E MA S T E R T R U S T |
| N O T E S T O F I N A N C I A L S T A T E M E N T S |
| | | | | | | | | | |
| 2. Shares of Beneficial Interest | | | | | | | | | | |
| |
| At July 31, 2017, there were an unlimited number of shares authorized (without par value). Transactions in the Funds’ shares were | |
| as follows: | | | | | | | | | | |
| |
| | Franklin Lower Tier | | Franklin Middle Tier | |
| | Floating Rate Fund | | Floating Rate Fund | |
| | Shares | | | Amount | | Shares | | | Amount | |
| Year ended July 31, 2017 | | | | | | | | | | |
| Shares sold | 1,895,423 | | $ | 20,008,980 | | 1,989,000 | | $ | 20,007,330 | |
| Shares issued in reinvestment of distributions | 26,801 | | | 279,449 | | 7,316 | | | 73,590 | |
| Shares redeemed. | (13,034,522 | ) | | (136,113,200 | ) | (7,237,066 | ) | | (72,643,600 | ) |
| Net increase (decrease) | (11,112,298 | ) | $ | (115,824,771 | ) | (5,240,750 | ) | $ | (52,562,680 | ) |
| Year ended July 31, 2016a | | | | | | | | | | |
| Shares sold in-kind (Note 3f) | 43,615,926 | | $ | 434,631,279 | | 36,016,253 | | $ | 358,899,279 | |
| Shares issued in reinvestment of distributions | 1,076,227 | | | 9,864,962 | | 538,477 | | | 5,111,878 | |
| Shares redeemed. | (1,050,927 | ) | | (10,309,601 | ) | (1,077,000 | ) | | (10,296,120 | ) |
| Net increase (decrease) | 43,641,226 | | $ | 434,186,640 | | 35,477,730 | | $ | 353,715,037 | |
|
| aFor the period November 6, 2015 (commencement of operations) to July 31, 2016. |
| 3. Transactions with Affiliates |
| Franklin Resources, Inc. is the holding company for various subsidiaries that together are referred to as Franklin Templeton |
| Investments. Certain officers and trustees of the Trust are also officers, and/or directors of the following subsidiaries: |
| |
| Subsidiary | Affiliation |
| Franklin Advisers, Inc. (Advisers) | Investment manager |
| Franklin Templeton Services, LLC (FT Services) | Administrative manager |
| Franklin Templeton Investor Services, LLC (Investor Services) | Transfer agent |
a. Management Fees
The Funds pay an investment management fee to Advisers based on the average daily net assets of the Funds as follows:
| | |
| Annualized Fee Rate | | Net Assets |
| 0.650 | % | Up to and including $500 million |
| 0.550 | % | Over $500 million, up to and including $1 billion |
| 0.500 | % | Over $1 billion, up to and including $1.5 billion |
| 0.450 | % | Over $1.5 billion, up to and including $6.5 billion |
| 0.425 | % | Over $6.5 billion, up to and including $11.5 billion |
| 0.400 | % | Over $11.5 billion, up to and including $16.5 billion |
| 0.390 | % | Over $16.5 billion, up to and including $19 billion |
| 0.380 | % | Over $19 billion, up to and including $21.5 billion |
| 0.370 | % | In excess of $21.5 billion |
Annual Report
24
|
| F R A N K L I N F L O A T I N G RA T E MA S T E R T R U S T |
| N O T E S T O F I N A N C I A L S T A T E M E N T S |
3. Transactions with Affiliates (continued)
a. Management Fees (continued)
For the year ended July 31, 2017, each Fund’s effective investment management fee rate based on average daily net assets was as follows:
| | | |
| Franklin | | Franklin | |
| Lower Tier | | Middle Tier | |
| Floating | | Floating | |
| Rate Fund | | Rate Fund | |
| |
| 0.650 | % | 0.650 | % |
b. Administrative Fees
Under an agreement with Advisers, FT Services provides administrative services to the Funds. The fee is paid by Advisers based on each of the Fund’s average daily net assets, and is not an additional expense of the Funds.
c. Transfer Agent Fees
Investor Services, under terms of an agreement, performs shareholder servicing for the Funds and is not paid by the Funds for the services.
d. Waiver and Expense Reimbursements
Advisers has contractually agreed in advance to waive or limit its fees and to assume as its own expense certain expenses otherwise payable by the Funds so that the expenses (excluding acquired fund fees and expenses) for each Fund do not exceed 0.60% based on each Fund’s average net assets (other than certain non-routine expenses or costs, including those relating to litigation, indemnification, reorganizations, and liquidations) until November 30, 2017. Total expenses waived or paid are not subject to recapture subsequent to each Fund’s fiscal year end.
e. Other Affiliated Transactions
At July 31, 2017, the shares of the Funds were owned by the following investment companies:
| | | |
| | | Percentage of | |
| | | Outstanding | |
| Franklin Lower Tier Floating Rate Fund | Shares | Shares | |
| Franklin Floating Rate Daily Access Fund | 1,895,423 | 5.8 | % |
| Franklin Low Duration Total Return Fund | 1,893,663 | 5.8 | % |
| Franklin Real Return Fund | 299,273 | 0.9 | % |
| Franklin Strategic Income Fund | 25,361,119 | 78.0 | %a |
| Franklin Strategic Income VIP Fund | 2,081,861 | 6.4 | % |
| Franklin Total Return Fund. | 997,589 | 3.1 | % |
| Total | 32,528,928 | 100.0 | % |
|
| F R A N K L I N F L O A T I N G R A T E MA S T E R T R U S T |
| N O T E S T O F I N A N C I A L S T A T E M E N T S |
| | | | | | | |
| | | | | | | Percentage of | |
| | | | | | | Outstanding | |
| Franklin Middle Tier Floating Rate Fund | | | | Shares | | Shares | |
| Franklin Floating Rate Daily Access Fund | | | | 1,989,000 | | 6.6 | % |
| Franklin Low Duration Total Return Fund | | | | 2,389,308 | | 7.9 | % |
| Franklin Real Return Fund | | | | 110,724 | | 0.4 | % |
| Franklin Strategic Income Fund | | | | 21,833,687 | | 72.2 | %a |
| Franklin Strategic Income VIP Fund | | | | 2,024,951 | | 6.7 | % |
| Franklin Total Return Fund. | | | | 1,889,310 | | 6.2 | % |
| Total | | | | 30,236,980 | | 100.0 | % |
| aInvestment activities of this shareholder could have a material impact on the Fund. | | | | | |
| |
| f. Purchase In-Kind | | | | | | | |
| During the period ended July 31, 2016, shares of the Funds were sold to affiliated management investment companies through | |
| in-kind transfers of securities as follows: | | | | | | | |
| |
| Franklin Lower Tier Floating Rate Fund | | | | Market Value of Securities Transferred | |
| Franklin Low Duration Total Return Fund | | | | | $ | 17,742,918 | |
| Franklin Real Return Fund | | | | | | 2,519,518 | |
| Franklin Strategic Income Fund | | | | | | 374,291,707 | |
| Franklin Strategic Income VIP Fund | | | | | | 30,730,099 | |
| Franklin Total Return Fund | | | | | | 9,347,037 | |
| Total | | | | | $ | 434,631,279 | |
| |
| Franklin Middle Tier Floating Rate Fund | | | | Market Value of Securities Transferred | |
| Franklin Low Duration Total Return Fund | | | | | $ | 22,984,002 | |
| Franklin Real Return Fund | | | | | | 983,344 | |
| Franklin Strategic Income Fund | | | | | | 290,085,114 | |
| Franklin Strategic Income VIP Fund | | | | | | 26,672,554 | |
| Franklin Total Return Fund | | | | | | 18,174,265 | |
| Total | | | | | $ | 358,899,279 | |
| |
| g. Interfund Transactions | | | | | | | |
| Certain or all Funds engaged in purchases and sales of investments with funds or other accounts that have common investment | |
| managers (or affiliated investment managers), directors, trustees or officers. These purchases and sales for the year ended July 31, | |
| 2017, were as follows: | | | | | | | |
| |
| | | Franklin | | Franklin | | | |
| | | Lower Tier | | Middle Tier | | | |
| | | Floating | | Floating | | | |
| | | Rate Fund | | Rate Fund | | | |
| Purchases | $ | 26,970,014 | $ | 16,692,887 | | | |
| Sales. | $ | 16,692,887 | $ | 55,466,740 | | | |
| |
| |
| 4. Expense Offset Arrangement | | | | | | | |
| |
| The Funds have entered into an arrangement with their custodian whereby credits realized as a result of uninvested cash balances | |
| are used to reduce a portion of the Funds’ custodian expenses. During the year ended July 31, 2017, the custodian fees were reduced | |
| as noted in the Statements of Operations. | | | | | | | |
Annual Report
26
|
| F R A N K L I N F L O A T I N G RA T E MA S T E R T R U S T |
| N O T E S T O F I N A N C I A L S T A T E M E N T S |
| | | | | | | | | | | | | | |
| 5. Income Taxes | | | | | | | | | | | | | | |
| For tax purposes, capital losses may be carried over to offset future capital gains, if any. At July 31, 2017, the capital loss |
| carryforwards were as follows: | | | | | | | | | | | | | | |
| | | Franklin Middle Tier | | | | | | | | | | | | |
| | | Floating Rate Fund | | | | | | | | | | | | |
| Capital loss carryforwards not subject to | | | | | | | | | | | | | | |
| expiration – short-term | $ | 729,517 | | | | | | | | | | | | |
| During the year ended July 31, 2017, the Funds utilized capital loss carryforwards as follows: | | | | | |
| | | Franklin | | | | | Franklin | | | | | |
| | | Lower Tier | | | Middle Tier | | | | | |
| | | Floating | | | | | Floating | | | | | |
| | | Rate Fund | | | | | Rate Fund | | | | | |
| | $ | 2,422,438 | | | | $ | 792,610 | | | | | |
| The tax character of distributions paid during the years ended July 31, 2017 and 2016, was as follows: | | | | | |
| | | | | | Franklin Lower Tier | | | Franklin Middle Tier |
| | | | | | Floating Rate Fund | | | Floating Rate Fund |
| | | | | | 2017 | | 2016 | | | 2017 | | 2016 |
| Distributions paid from ordinary income. | | | | $ | 37,193,892 | $ | 28,634,343 | | $ | 21,691,391 | $ | 14,340,632 |
| |
| At July 31, 2017, the cost of investments, net unrealized appreciation (depreciation), undistributed ordinary income and | | |
| undistributed long term capital gains for income tax purposes were as follows: | | | | | | | |
| | | Franklin | | | | | Franklin | | | | | |
| | | Lower Tier | | | | | Middle Tier | | | | | |
| | | Floating | | | | | Floating | | | | | |
| | | Rate Fund | | | | | Rate Fund | | | | | |
| Cost of investments | $ | 300,611,589 | | $ | 285,863,044 | | | | | |
| |
| Unrealized appreciation | $ | 13,977,435 | | | $ | | 8,414,980 | | | | | |
| Unrealized depreciation | | (2,181,469 | ) | | | | (5,149,100 | ) | | | | |
| Net unrealized appreciation (depreciation) | $ | 11,795,966 | | | $ | | 3,265,880 | | | | | |
| |
| Undistributed ordinary income | $ | 4,599,290 | | | $ | | 1,729,849 | | | | | |
| Undistributed long term capital gains | | 7,920,479 | | | | | | | — | | | | | |
| Distributable earnings. | $ | 12,519,769 | | | $ | | 1,729,849 | | | | | |
| |
| Differences between income and/or capital gains as determined on a book basis and a tax basis are primarily due to differing |
| treatments of offering costs and wash sales. | | | | | | | | | | | | | | |
|
| F R A N K L I N F L O A T I N G R A T E MA S T E R T R U S T |
| N O T E S T O F I N A N C I A L S T A T E M E N T S |
6. Investment Transactions
Purchases and sales of investments (excluding short term securities) for the year ended July 31, 2017, were as follows:
| | | | |
| | | Franklin | | Franklin |
| | | Lower Tier | | Middle Tier |
| | | Floating | | Floating |
| | | Rate Fund | | Rate Fund |
| |
| Purchases | $ | 188,195,743 | $ | 180,889,913 |
| Sales | $ | 334,336,886 | $ | 230,908,413 |
7. Credit Risk
At July 31, 2017, the Funds had 100% of their portfolios invested in senior secured floating rate notes rated below investment grade. These securities may be more sensitive to economic conditions causing greater price volatility and are potentially subject to a greater risk of loss due to default than higher rated securities.
8. Credit Facility
The Funds, together with other U.S. registered and foreign investment funds (collectively, Borrowers), managed by Franklin Templeton Investments, are borrowers in a joint syndicated senior unsecured credit facility totaling $2 billion (Global Credit Facility) which matures on February 9, 2018. This Global Credit Facility provides a source of funds to the Borrowers for temporary and emergency purposes, including the ability to meet future unanticipated or unusually large redemption requests.
Under the terms of the Global Credit Facility, the Funds shall, in addition to interest charged on any borrowings made by the Funds and other costs incurred by the Funds, pay their share of fees and expenses incurred in connection with the implementation and maintenance of the Global Credit Facility, based upon their relative share of the aggregate net assets of all of the Borrowers, including an annual commitment fee of 0.15% based upon the unused portion of the Global Credit Facility. These fees are reflected in other expenses in the Statements of Operations. During the year ended July 31, 2017, the Funds did not use the Global Credit Facility.
9. Fair Value Measurements
The Funds follow a fair value hierarchy that distinguishes between market data obtained from independent sources (observable inputs) and the Funds’ own market assumptions (unobservable inputs). These inputs are used in determining the value of the Funds’ financial instruments and are summarized in the following fair value hierarchy:
- Level 1 – quoted prices in active markets for identical financial instruments
- Level 2 – other significant observable inputs (including quoted prices for similar financial instruments, interest rates, prepayment speed, credit risk, etc.)
- Level 3 – significant unobservable inputs (including the Funds’ own assumptions in determining the fair value of financial instruments)
The input levels are not necessarily an indication of the risk or liquidity associated with financial instruments at that level.
For movements between the levels within the fair value hierarchy, the Funds have adopted a policy of recognizing the transfers as of the date of the underlying event which caused the movement.
At July 31, 2017, all of the Funds’ investments in financial instruments carried at fair value were valued using Level 2 inputs.
Annual Report
28
|
| F R A N K L I N F L O A T I N G RA T E MA S T E R T R U S T |
| N O T E S T O F I N A N C I A L S T A T E M E N T S |
10. New Accounting Pronouncements
In March 2017, the Financial Accounting Standards Board issued Accounting Standards Update (ASU) No. 2017-08, Receivables—Nonrefundable Fees and Other Costs (Subtopic 310-20): Premium Amortization on Purchased Callable Debt Securities. The amendments in the ASU shorten the amortization period for certain callable debt securities acquired at a premium, to be amortized to the earliest call date. The ASU does not require an accounting change for securities acquired at a discount, which continues to be amortized to maturity. The ASU is effective for fiscal years and interim periods within those fiscal years beginning after December 15, 2018. Management is currently evaluating the impact, if any, of applying this provision.
11. Investment Company Reporting Modernization
In October 2016, the U.S. Securities and Exchange Commission adopted new rules and amended existing rules (together, final rules) intended to modernize the reporting and disclosure of information by registered investment companies. In part, the final rules amend Regulation S-X and require standardized, enhanced disclosures about derivatives in investment company financial statements, as well as other amendments. The compliance date for the amendments to Regulation S-X is August 1, 2017. Management has reviewed the requirements and believes the adoption of the amendments to Regulation S-X will not have a material impact on the Funds’ financial statements and related disclosures.
12. Subsequent Events
The Funds have evaluated subsequent events through the issuance of the financial statements and determined that no events have
occurred that require disclosure.
Abbreviations
Selected Portfolio
USD United States Dollar
FRANKLIN FLOATING RATE MASTER TRUST
Report of Independent Registered Public Accounting Firm
To the Board of Trustees of Franklin Floating Rate Master Trust and Shareholders of the Franklin Lower Tier Floating Rate Fund and Franklin Middle Tier Floating Rate Fund:
In our opinion, the accompanying statements of assets and liabilities, including the statements of investments, and the related statements of operations and of changes in net assets and the financial highlights present fairly, in all material respects, the financial position of the Franklin Lower Tier Floating Rate Fund and Franklin Middle Tier Floating Rate Fund (the "Funds") as of July 31, 2017, the results of each of their operations, the changes in each of their net assets and the financial highlights for each of the periods indicated, in conformity with accounting principles generally accepted in the United States of America. These financial statements and financial highlights (hereafter referred to as "financial statements") are the responsibility of the Funds’ management. Our responsibility is to express an opinion on these financial statements based on our audits. We conducted our audits of these financial statements in accordance with the standards of the Public Company Accounting Oversight Board (United States). Those standards require that we plan and perform the audit to obtain reasonable assurance about whether the financial statements are free of material misstatement. An audit includes examining, on a test basis, evidence supporting the amounts and disclosures in the financial statements, assessing the accounting principles used and significant estimates made by management, and evaluating the overall financial statement presentation. We believe that our audits, which included confirmation of securities as of July 31, 2017 by correspondence with the custodian and brokers, provide a reasonable basis for our opinion.
PricewaterhouseCoopers LLP
San Francisco, California
September 15, 2017
Annual Report
30
FRANKLIN FLOATING RATE MASTER TRUST
Tax Information
Under Section 852(b)(3)(C) of the Internal Revenue Code, the Funds hereby report the maximum amount allowable but no less than the following amounts as long term capital gain dividends for the fiscal year ended July 31, 2017:
Franklin
Lower Tier
Floating
Rate Fund
$1,650,643
Franklin Floating Rate Master Trust
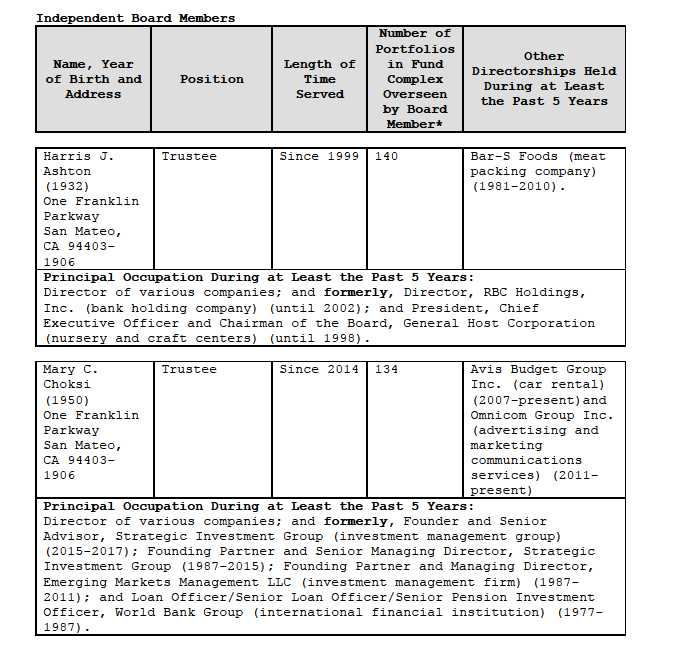
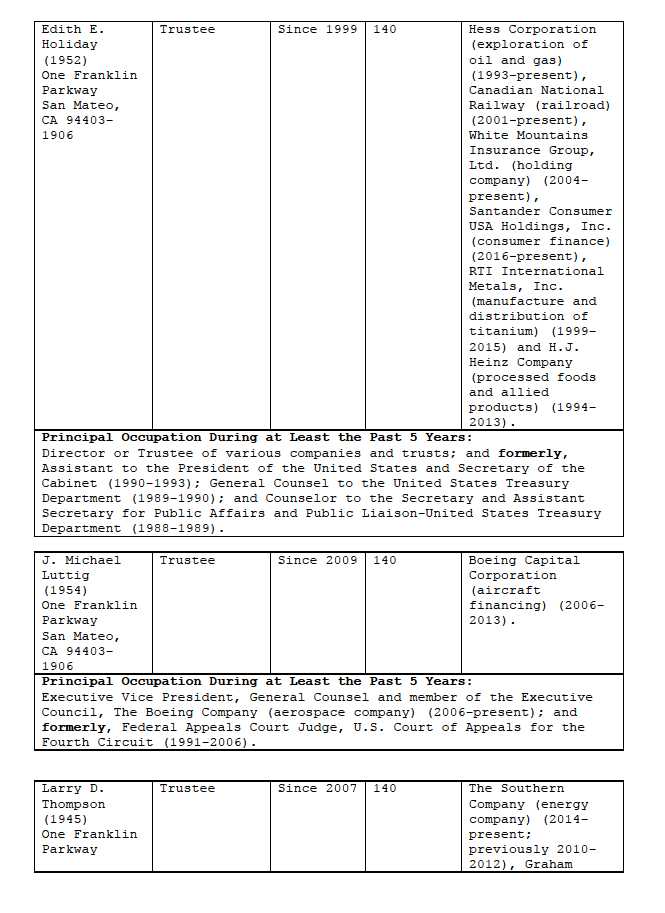
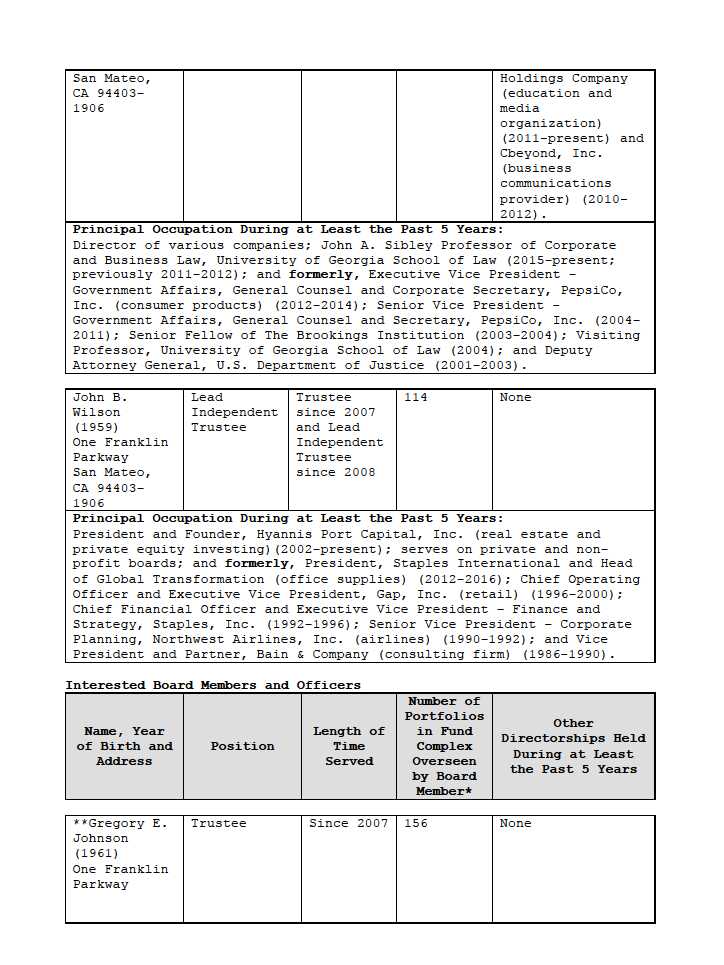
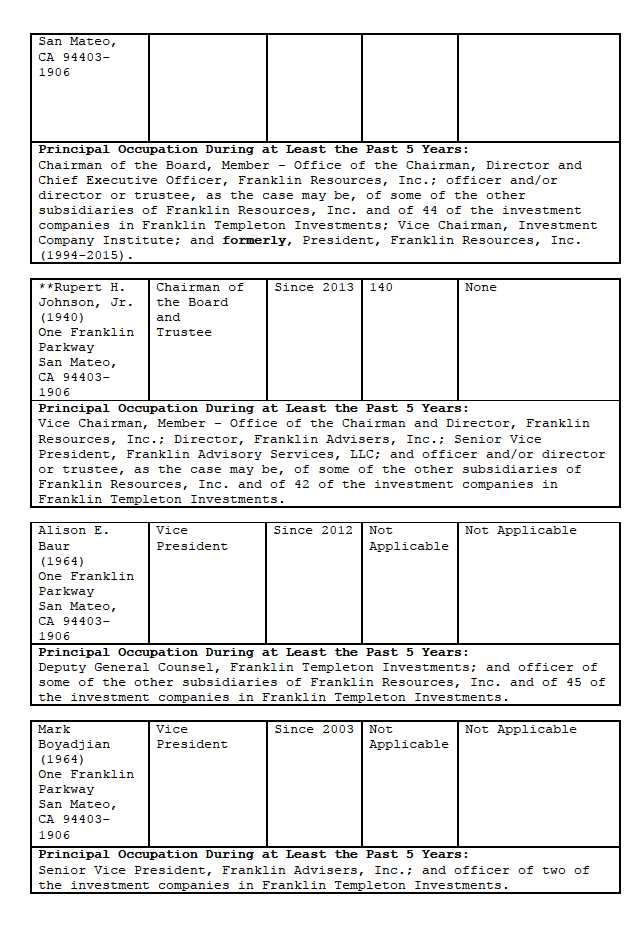
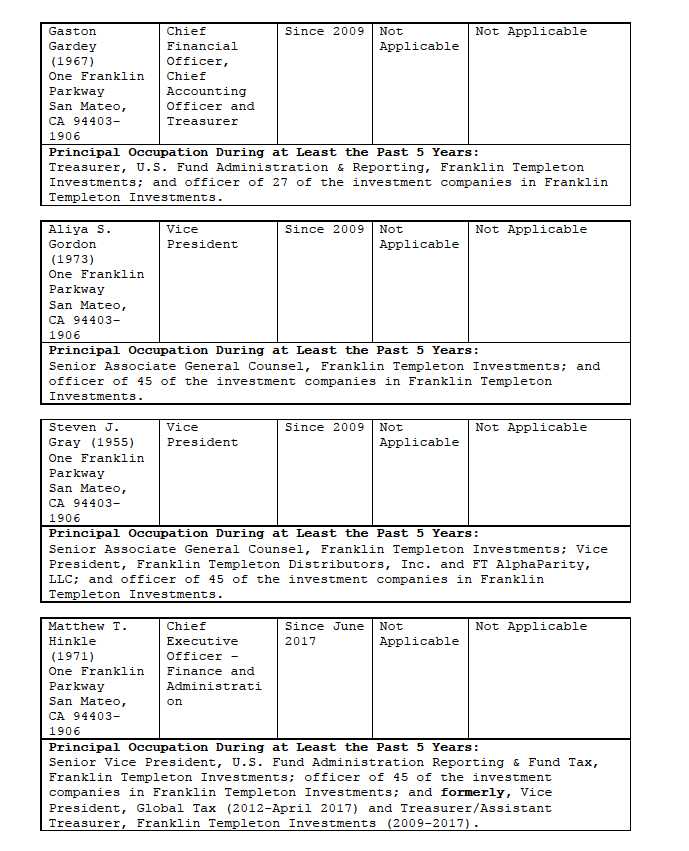
Board Members and Officers
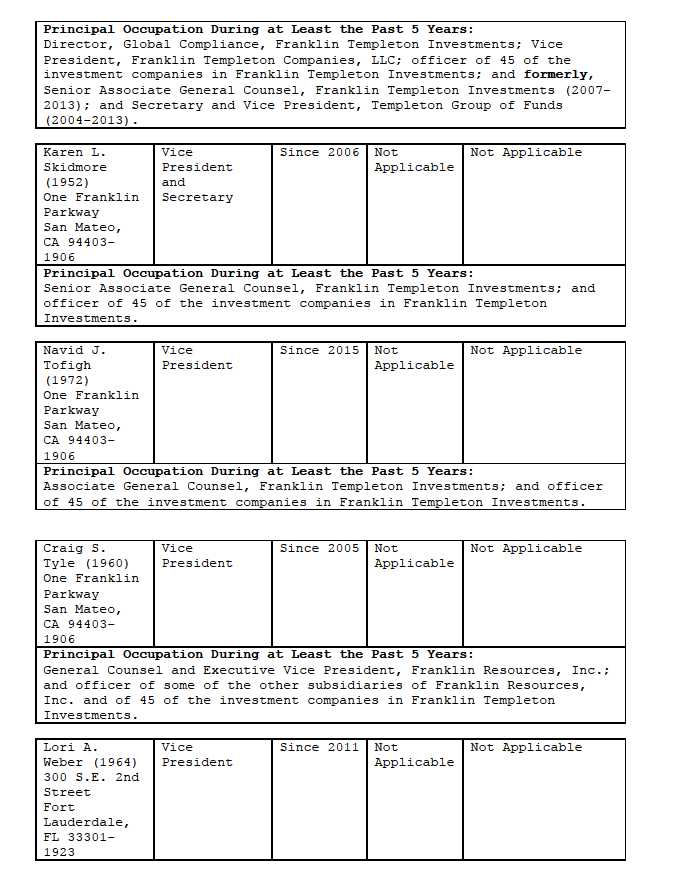
The name, year of birth and address of the officers and board members, as well as their affiliations, positions held with the Trust, principal occupations during at least the past five years and number of U.S. registered portfolios overseen in the Franklin Templeton Investments fund complex, are shown below. Generally, each board member serves until that person’s successor is elected and qualified.
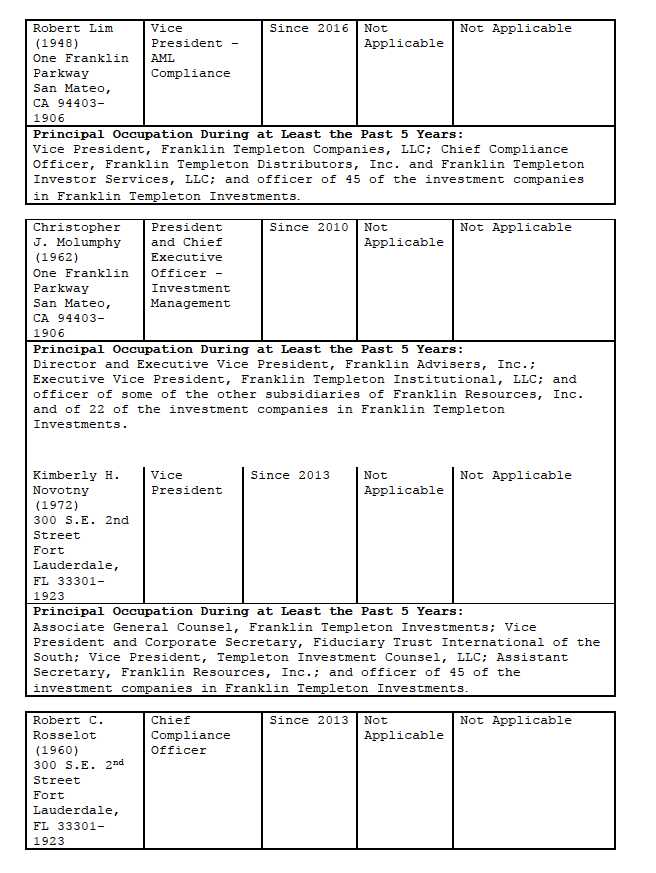
|
| Principal Occupation During at Least the Past 5 Years: |
| Senior Associate General Counsel, Franklin Templeton Investments; |
| Assistant Secretary, Franklin Resources, Inc.; Vice President and |
| Secretary, Templeton Investment Counsel, LLC; and officer of 45 of the |
| investment companies in Franklin Templeton Investments. |
*We base the number of portfolios on each separate series of the U.S.
registered investment companies within the Franklin Templeton Investments
fund complex. These portfolios have a common investment manager or affiliated
investment managers.
**Gregory E. Johnson is considered to be an interested person of the Fund
under the federal securities laws due to his position as an officer and
director of Franklin Resources, Inc. (Resources), which is the parent company
of the Fund's investment manager and distributor. Rupert H. Johnson, Jr. is
considered to be an interested person of the Fund under the federal
securities laws due to his position as officer and director and major
shareholder of Resources.
Note 1: Rupert H. Johnson, Jr. is the uncle of Gregory E. Johnson.
Note 2: Officer information is current as of the date of this report. It is
possible that after this date, information about officers may change.
Note 3: Effective November 1, 2016, Frank Olson ceased to be a trustee of the
Trust.
The Sarbanes-Oxley Act of 2002 and Rules adopted by the Securities and Exchange Commission require the
Fund to disclose whether the Fund’s Audit Committee includes at least one member who is an audit
committee financial expert within the meaning of such Act and Rules. The Fund’s Board has determined that
there is at least one such financial expert on the Audit Committee and has designated John B. Wilson as its
audit committee financial expert. The Board believes that Mr. Wilson qualifies as such an expert in view of
his extensive business background and experience, including service as chief financial officer of Staples, Inc.
from 1992 to 1996. Mr. Wilson has been a Member and Chairman of the Fund’s Audit Committee since 2007.
As a result of such background and experience, the Board believes that Mr. Wilson has acquired an
understanding of generally accepted accounting principles and financial statements, the general application
of such principles in connection with the accounting estimates, accruals and reserves, and analyzing and
evaluating financial statements that present a breadth and level of complexity of accounting issues generally
comparable to those of the Fund, as well as an understanding of internal controls and procedures for
financial reporting and an understanding of audit committee functions. Mr. Wilson is an independent Board
member as that term is defined under the relevant Securities and Exchange Commission Rules and Releases.
The Statement of Additional Information (SAI) includes additional information about the board members
and is available, without charge, upon request. Shareholders may call (800) DIAL BEN/342-5236 to request
the SAI.
Franklin Floating Rate Master Trust Franklin Lower Tier Floating Rate Fund
Shareholder Information
Board Approval of Investment Management Agreements
FRANKLIN FLOATING RATE MASTER TRUST Franklin Lower Tier Floating Rate Fund
(Fund)
At an in-person meeting held on February 28, 2017 (Meeting), the Board of Trustees (Board) of Franklin Floating Rate Master Trust, including a majority of the trustees who are not “interested persons” as defined in the Investment Company Act of 1940 (Independent Trustees), reviewed and approved the continuance of the investment management agreement between Franklin Advisers, Inc. (Manager) and the Fund (Management Agreement) for an additional one-year period. The Independent Trustees received advice from and met separately with Independent Trustee counsel in considering whether to approve the continuation of the Management Agreement.
In considering the continuation of the Management Agreement, the Board reviewed and considered information provided by the Manager at the Meeting and throughout the year at meetings of the Board and its committees. The Board also reviewed and considered information provided in response to a detailed set of requests for information submitted to the Manager by Independent Trustee counsel on behalf of the Independent Trustees in connection with the annual contract renewal process. In addition, prior to the Meeting, the Independent Trustees held a telephonic contract renewal meeting at which the Independent Trustees conferred amongst themselves and Independent Trustee counsel about contract renewal matters. The Board reviewed and considered all of the factors it deemed relevant in approving the continuance of the Management Agreement, including, but not limited to: (i) the nature, extent, and quality of the services provided by the Manager; (ii) the investment performance of the Fund; (iii) the costs of the services provided and profits realized by the Manager and its affiliates from the relationship with the Fund; (iv) the extent to which economies of scale are realized as the Fund grows; and (v) whether fee levels reflect these economies of scale for the benefit of Fund investors.
In approving the continuance of the Management Agreement, the Board, including a majority of the Independent Trustees, determined that the existing management fees are fair and reasonable and that the continuance of such Management Agreement is in the interests of the Fund and its shareholders. While attention was given to all information furnished, the following discusses some primary factors relevant to the Board’s determination.
Nature, Extent and Quality of Services
The Board reviewed and considered information regarding the nature, extent and quality of investment management services provided by the Manager and its affiliates to the Fund and its shareholders. This information included, among other things, the qualifications, background and experience of the senior management and investment personnel of the Manager; the structure of
investment personnel compensation; oversight of third-party service providers; investment performance reports and related financial information for the Fund; reports on expenses, and shareholder services; legal and compliance matters; risk controls; pricing and other services provided by the Manager and its affiliates; and management fees charged by the Manager and its affiliates to U.S. funds and other accounts, including management’s explanation of differences among accounts where relevant. The Board noted management’s continual efforts and expenditures in establishing effective business continuity plans and developing strategies to address areas of heightened concern in the mutual fund industry, such as cybersecurity, derivatives and liquidity risk management.
The Board also reviewed and considered the benefits provided to Fund shareholders of investing in a fund that is part of the Franklin Templeton family of funds. The Board noted the financial position of Franklin Resources, Inc. (FRI), the Manager’s parent, and its commitment to the mutual fund business as evidenced by its continued introduction of new funds, reassessment of the fund offerings in response to the market environment and project initiatives and capital investments relating to the services provided to the Fund by the Franklin Templeton Investments (FTI) organization.
Following consideration of such information, the Board was satisfied with the nature, extent and quality of services provided by the Manager and its affiliates to the Fund and its shareholders.
Fund Performance
The Board noted that the Fund commenced investment operations on November 6, 2015. In light of the Fund’s brief operating history, the Board concluded that additional time is needed to evaluate the performance of the Fund. In doing so, the Board noted that the Fund does not offer its shares to the public; the Fund’s investors are exclusively other proprietary funds.
Comparative Fees and Expenses
The Board reviewed and considered information regarding the Fund’s actual total expense ratio and its various components, including, as applicable, management fees; transfer agent expenses; underlying fund expenses; Rule 12b-1 and non-Rule 12b-1 service fees; and other non-management fees. The Board considered the actual total expense ratio and, separately, the contractual management fee rate, without the effect of fee waivers, if any (Management Rate) of the Fund in comparison to the median ratio and median Management Rate, respectively, of other mutual funds deemed comparable to and with a similar expense structure as the Fund selected by Broadridge (Expense Group). Broadridge fee and expense data is based upon information taken from the fund’s most recent annual report, which reflects historical asset levels that may be quite different from those currently existing, particularly in a period of market volatility. While recognizing such inherent limitation and the fact that expense ratios and Management Rates generally increase as assets decline and decrease as assets grow, the Board believed the independent analysis conducted by Broadridge to be an appropriate measure of comparative fees and expenses. The Broadridge Management Rate includes administrative charges, and the actual total expense ratio, for comparative consistency, was shown for Class A shares for funds with multiple classes of shares. The Board received a description of the methodology used by Broadridge to select the mutual funds included in an Expense Group.
The Expense Group for the Fund included the Fund and thirteen other loan participation funds. The Board noted that the Management Rate and actual total expense ratio for the Fund were below the medians of its Expense Group. The Board concluded that the Management Rate charged to the Fund is fair and reasonable. In doing so, the Board noted that the Fund’s actual total expense ratio reflected a fee waiver from management.
Profitability
The Board reviewed and considered information regarding the profits realized by the Manager and its affiliates in connection with the operation of the Fund. In this respect, the Board considered the Fund profitability analysis provided by the Manager that addresses the overall profitability of FTI’s U.S. fund business, as well as its profits in providing investment management and other services to each of the individual funds during the 12-month period ended September 30, 2016, being the most recent fiscal year-end for FRI. The Board noted that although management continually makes refinements to its methodologies used in calculating profitability in response to organizational and product related changes, the overall methodology has remained consistent with that used in the Fund’s profitability report presentations from prior years. Additionally, the Fund’s independent registered public accounting firm has been engaged by the Manager to periodically review the reasonableness of the allocation methodologies to be used solely by the Fund’s Board with respect to the profitability analysis.
The Board noted management’s belief that costs incurred in establishing the infrastructure necessary for the type of mutual fund operations conducted by the Manager and its affiliates may not be fully reflected in the expenses allocated to the Fund in determining its profitability, as well as the fact that the level of profits, to a certain extent, reflected operational cost savings and efficiencies initiated by management. The Board also noted management’s expenditures in improving shareholder services provided to the Fund, as well as the need to implement systems and meet additional regulatory and compliance requirements resulting from recent SEC and other regulatory requirements.
The Board also considered the extent to which the Manager and its affiliates might derive ancillary benefits from fund operations, including revenues generated from transfer agent services, potential benefits resulting from personnel and systems enhancements necessitated by fund growth, as well as increased leverage with service providers and counterparties. Based upon its consideration of all these factors, the Board concluded that the level of profits realized by the Manager and its affiliates from providing services to the Fund was not excessive in view of the nature, quality and extent of services provided to the Fund.
Economies of Scale
The Board reviewed and considered the extent to which the Manager may realize economies of scale, if any, as the Fund grows larger and whether the Fund’s management fee structure reflects any economies of scale for the benefit of shareholders. With respect to possible economies of scale, the Board noted the existence of management fee breakpoints, which operate generally to share any economies of scale with a Fund’s shareholders by reducing the Fund’s effective management fees as the Fund grows in size. The Board considered the Manager’s view that any analyses of potential economies of scale in managing a particular fund are inherently limited in light of the joint and common costs and investments the Manager incurs across the Franklin
Templeton family of funds as a whole. The Board concluded that to the extent economies of scale may be realized by the Manager and its affiliates, the Fund’s management fee structure provided a sharing of benefits with the Fund and its shareholders as the Fund grows.
Conclusion
Based on its review, consideration and evaluation of all factors it believed relevant, including the above-described factors and conclusions, the Board unanimously approved the continuation of the Management Agreement for an additional one-year period.
Proxy Voting Policies and Procedures
The Trust’s investment manager has established Proxy Voting Policies and Procedures (Policies) that the Trust uses to determine how to vote proxies relating to portfolio securities. Shareholders may view the Trust’s complete Policies online at franklintempleton.com. Alternatively, shareholders may request copies of the Policies free of charge by calling the Proxy Group collect at (954) 527-7678 or by sending a written request to: Franklin Templeton Companies, LLC, 300 S.E. 2nd Street, Fort Lauderdale, FL 33301, Attention: Proxy Group. Copies of the Trust’s proxy voting records are also made available online at franklintempleton.com and posted on the U.S. Securities and Exchange Commission’s website at sec.gov and reflect the most recent 12-month period ended June 30.
Quarterly Statement of Investments
The Trust, on behalf of the Fund, files a complete statement of investments with the U.S. Securities and Exchange Commission for the first and third quarters for each fiscal year on Form N-Q. Shareholders may view the filed Form N-Q by visiting the Commission’s website at sec.gov. The filed form may also be viewed and copied at the Commission’s Public Reference Room in Washington, DC. Information regarding the operations of the Public Reference Room may be obtained by calling (800) SEC-0330.
Franklin Floating Rate Master Trust Franklin Middle Tier Floating Rate Fund
Shareholder Information
Board Approval of Investment Management Agreements
FRANKLIN FLOATING RATE MASTER TRUST Franklin Middle Tier Floating Rate Fund
(Fund)
At an in-person meeting held on February 28, 2017 (Meeting), the Board of Trustees (Board) of Franklin Floating Rate Master Trust, including a majority of the trustees who are not “interested persons” as defined in the Investment Company Act of 1940 (Independent Trustees), reviewed and approved the continuance of the investment management agreement between Franklin Advisers, Inc. (Manager) and the Fund (Management Agreement) for an additional one-year period. The Independent Trustees received advice from and met separately with Independent Trustee counsel in considering whether to approve the continuation of the Management Agreement.
In considering the continuation of the Management Agreement, the Board reviewed and considered information provided by the Manager at the Meeting and throughout the year at meetings of the Board and its committees. The Board also reviewed and considered information provided in response to a detailed set of requests for information submitted to the Manager by Independent Trustee counsel on behalf of the Independent Trustees in connection with the annual contract renewal process. In addition, prior to the Meeting, the Independent Trustees held a telephonic contract renewal meeting at which the Independent Trustees conferred amongst themselves and Independent Trustee counsel about contract renewal matters. The Board reviewed and considered all of the factors it deemed relevant in approving the continuance of the Management Agreement, including, but not limited to: (i) the nature, extent, and quality of the services provided by the Manager; (ii) the investment performance of the Fund; (iii) the costs of the services provided and profits realized by the Manager and its affiliates from the relationship with the Fund; (iv) the extent to which economies of scale are realized as the Fund grows; and (v) whether fee levels reflect these economies of scale for the benefit of Fund investors.
In approving the continuance of the Management Agreement, the Board, including a majority of the Independent Trustees, determined that the existing management fees are fair and reasonable and that the continuance of such Management Agreement is in the interests of the Fund and its shareholders. While attention was given to all information furnished, the following discusses some primary factors relevant to the Board’s determination.
Nature, Extent and Quality of Services
The Board reviewed and considered information regarding the nature, extent and quality of investment management services provided by the Manager and its affiliates to the Fund and its shareholders. This information included, among other things, the qualifications, background and experience of the senior management and investment personnel of the Manager; the structure of
investment personnel compensation; oversight of third-party service providers; investment performance reports and related financial information for the Fund; reports on expenses and shareholder services; legal and compliance matters; risk controls; pricing and other services provided by the Manager and its affiliates; and management fees charged by the Manager and its affiliates to U.S. funds and other accounts, including management’s explanation of differences among accounts where relevant. The Board noted management’s continual efforts and expenditures in establishing effective business continuity plans and developing strategies to address areas of heightened concern in the mutual fund industry, such as cybersecurity, derivatives and liquidity risk management.
The Board also reviewed and considered the benefits provided to Fund shareholders of investing in a fund that is part of the Franklin Templeton family of funds. The Board noted the financial position of Franklin Resources, Inc. (FRI), the Manager’s parent, and its commitment to the mutual fund business as evidenced by its continued introduction of new funds, reassessment of the fund offerings in response to the market environment and project initiatives and capital investments relating to the services provided to the Fund by the Franklin Templeton Investments (FTI) organization.
Following consideration of such information, the Board was satisfied with the nature, extent and quality of services provided by the Manager and its affiliates to the Fund and its shareholders.
Fund Performance
The Board noted that the Fund commenced investment operations on November 6, 2015. In light of the Fund’s brief operating history, the Board concluded that additional time is needed to evaluate the performance of the Fund. In doing so, the Board noted that the Fund does not offer its shares to the public; the Fund’s investors are exclusively other proprietary funds.
Comparative Fees and Expenses
The Board reviewed and considered information regarding the Fund’s actual total expense ratio and its various components, including, as applicable, management fees; transfer agent expenses; underlying fund expenses; Rule 12b-1 and non-Rule 12b-1 service fees; and other non-management fees. The Board considered the actual total expense ratio and, separately, the contractual management fee rate, without the effect of fee waivers, if any (Management Rate) of the Fund in comparison to the median ratio and median Management Rate, respectively, of other mutual funds deemed comparable to and with a similar expense structure as the Fund selected by Broadridge (Expense Group). Broadridge fee and expense data is based upon information taken from the fund’s most recent annual report, which reflects historical asset levels that may be quite different from those currently existing, particularly in a period of market volatility. While recognizing such inherent limitation and the fact that expense ratios and Management Rates generally increase as assets decline and decrease as assets grow, the Board believed the independent analysis conducted by Broadridge to be an appropriate measure of comparative fees and expenses. The Broadridge Management Rate includes administrative charges, and the actual total expense ratio, for comparative consistency, was shown for Class A shares for funds with multiple classes of shares. The Board received a description of the methodology used by Broadridge to select the mutual funds included in an Expense Group.
The Expense Group for the Fund included the Fund and thirteen other loan participation funds. The Board noted that the Management Rate and actual total expense ratio for the Fund were below the medians of its Expense Group. The Board concluded that the Management Rate charged to the Fund is fair and reasonable. In doing so, the Board noted that the Fund’s actual total expense ratio reflected a fee waiver from management.
Profitability
The Board reviewed and considered information regarding the profits realized by the Manager and its affiliates in connection with the operation of the Fund. In this respect, the Board considered the Fund profitability analysis provided by the Manager that addresses the overall profitability of FTI’s U.S. fund business, as well as its profits in providing investment management and other services to each of the individual funds during the 12-month period ended September 30, 2016, being the most recent fiscal year-end for FRI. The Board noted that although management continually makes refinements to its methodologies used in calculating profitability in response to organizational and product related changes, the overall methodology has remained consistent with that used in the Fund’s profitability report presentations from prior years. Additionally, the Fund’s independent registered public accounting firm has been engaged by the Manager to periodically review the reasonableness of the allocation methodologies to be used solely by the Fund’s Board with respect to the profitability analysis.
The Board noted management’s belief that costs incurred in establishing the infrastructure necessary for the type of mutual fund operations conducted by the Manager and its affiliates may not be fully reflected in the expenses allocated to the Fund in determining its profitability, as well as the fact that the level of profits, to a certain extent, reflected operational cost savings and efficiencies initiated by management. The Board also noted management’s expenditures in improving shareholder services provided to the Fund, as well as the need to implement systems and meet additional regulatory and compliance requirements resulting from recent SEC and other regulatory requirements.
The Board also considered the extent to which the Manager and its affiliates might derive ancillary benefits from fund operations, including revenues generated from transfer agent services, potential benefits resulting from personnel and systems enhancements necessitated by fund growth, as well as increased leverage with service providers and counterparties. Based upon its consideration of all these factors, the Board concluded that the level of profits realized by the Manager and its affiliates from providing services to the Fund was not excessive in view of the nature, quality and extent of services provided to the Fund.
Economies of Scale
The Board reviewed and considered the extent to which the Manager may realize economies of scale, if any, as the Fund grows larger and whether the Fund’s management fee structure reflects any economies of scale for the benefit of shareholders. With respect to possible economies of scale, the Board noted the existence of management fee breakpoints, which operate generally to share any economies of scale with a Fund’s shareholders by reducing the Fund’s effective management fees as the Fund grows in size. The Board considered the Manager’s view that any analyses of potential economies of scale in managing a particular fund are inherently limited in light of the joint and common costs and investments the Manager incurs across the Franklin
Templeton family of funds as a whole. The Board concluded that to the extent economies of scale may be realized by the Manager and its affiliates, the Fund’s management fee structure provided a sharing of benefits with the Fund and its shareholders as the Fund grows.
Conclusion
Based on its review, consideration and evaluation of all factors it believed relevant, including the above-described factors and conclusions, the Board unanimously approved the continuation of the Management Agreement for an additional one-year period.
Proxy Voting Policies and Procedures
The Trust’s investment manager has established Proxy Voting Policies and Procedures (Policies) that the Trust uses to determine how to vote proxies relating to portfolio securities. Shareholders may view the Trust’s complete Policies online at franklintempleton.com. Alternatively, shareholders may request copies of the Policies free of charge by calling the Proxy Group collect at (954) 527-7678 or by sending a written request to: Franklin Templeton Companies, LLC, 300 S.E. 2nd Street, Fort Lauderdale, FL 33301, Attention: Proxy Group. Copies of the Trust’s proxy voting records are also made available online at franklintempleton.com and posted on the U.S. Securities and Exchange Commission’s website at sec.gov and reflect the most recent 12-month period ended June 30.
Quarterly Statement of Investments
The Trust, on behalf of the Fund, files a complete statement of investments with the U.S. Securities and Exchange Commission for the first and third quarters for each fiscal year on Form N-Q. Shareholders may view the filed Form N-Q by visiting the Commission’s website at sec.gov. The filed form may also be viewed and copied at the Commission’s Public Reference Room in Washington, DC. Information regarding the operations of the Public Reference Room may be obtained by calling (800) SEC-0330.
Notes:
1. Source: Credit Suisse Group.
The index is unmanaged and includes reinvestment of any income or distributions. It does not reflect any fees,
expense or sales charges. One cannot invest directly in an index, and an \aWXk \f abg eXceXfXagTg\iX bY g[X AhaWqf
portfolio.
See www.franklintempletondatasources.com for additional data provider information.
| | |
| Portfolio Composition | % of Total Net Assets | |
| 7/31/17 | | |
| |
| Senior Floating Rate Interests | 81.91 | % |
| Other Long-Term Investments* | 9.39 | % |
| Short-Term Investments & Other Net Assets | 8.70 | % |
| *Common stocks and asset-backed securities. | | |
Total Return Index Comparison for a Hypothetical $10,000 Investment1
Total return represents the change in value of an investment over the periods shown. It includes any applicable maximum sales charge, Fund expenses, account fees and reinvested distributions. The unmanaged index includes reinvestment of any income or distributions. It differs from the Fund in composition and does not pay management fees or expenses. One cannot invest directly in an index.
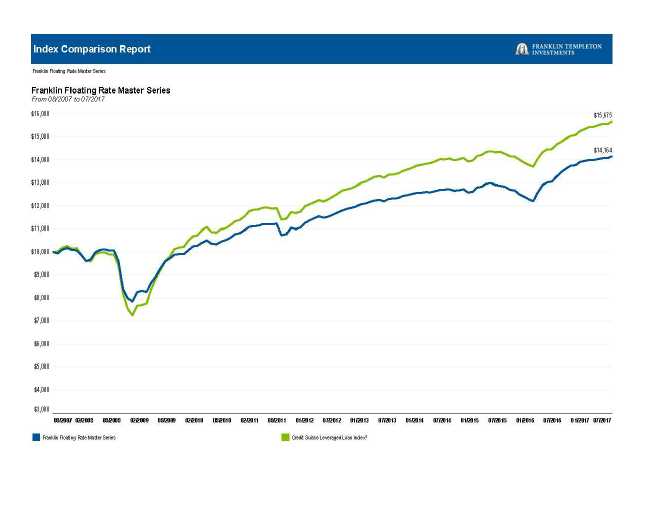
| | |
| Average Annual Total Return3 | |
| 7/31/17 | | |
| 1-Year | +6.71 | % |
| 5-Year | +21.90 | % |
| 10-Year | +41.64 | % |
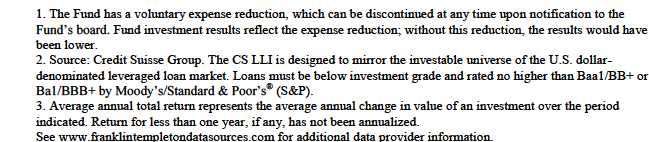
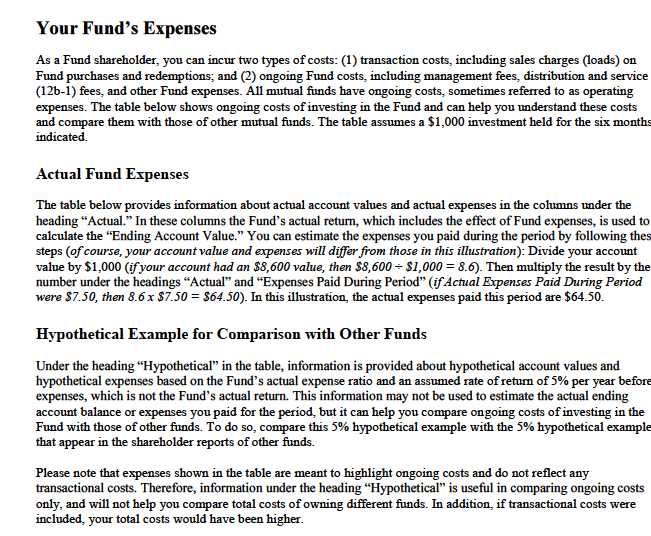
| | | | | | | | | | | |
| | | | Actual | | | | | | Hypothetical | | |
| | | | (actual return after expenses) | | (5% annual return before expenses) | |
| |
| | | | | | Expenses | | | | Expenses | | |
| | Beginning | | Ending | | Paid During | | Ending | | Paid During | | |
| | Account | | Account | | Period | | Account | | Period | Net Annualized | |
| | Value 2/1/17 | | Value 7/31/17 | | 2/1/17e7/31/171,2 | | Value 7/31/17 | | 2/1/17e7/31/171,2 | Expense Ratio2 | |
| |
| $ | 1,000 | $ | 1,014.40 | $ | 2.65 | $ | 1,022.17 | $ | 2.66 | 0.53 | % |
1. Expenses are equal to the annualized expense ratio for the six-month period as indicated aboveNin the far right columnN multiplied by the simple average account value over the period indicated, and then multiplied by 181/365 to reflect the one-half year period.
2. Reflects expenses after fee waivers and expense reimbursements. Does not include acquired fund fees and expenses.
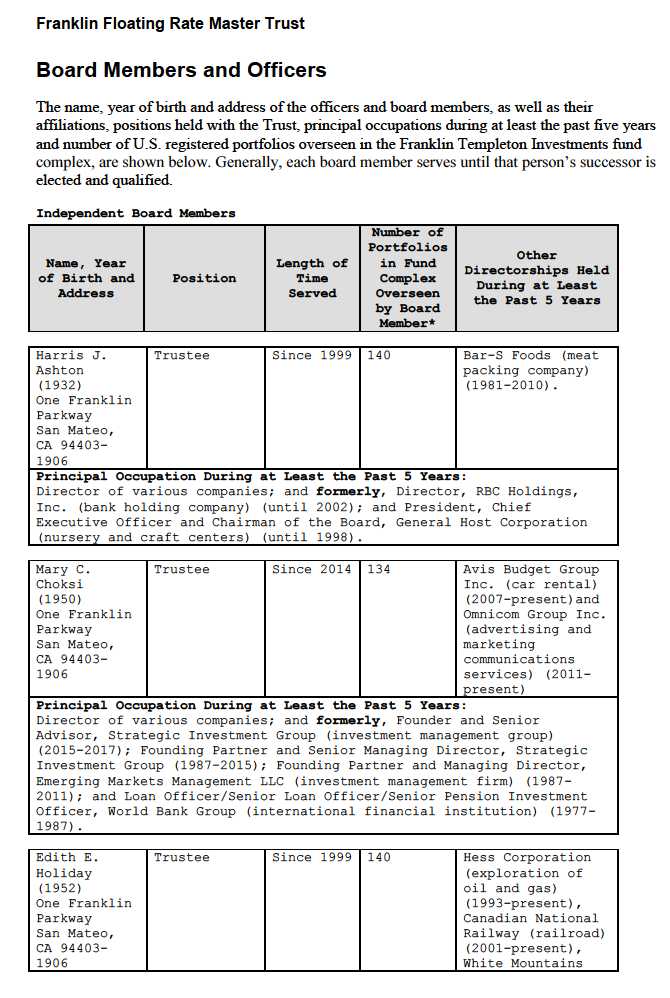
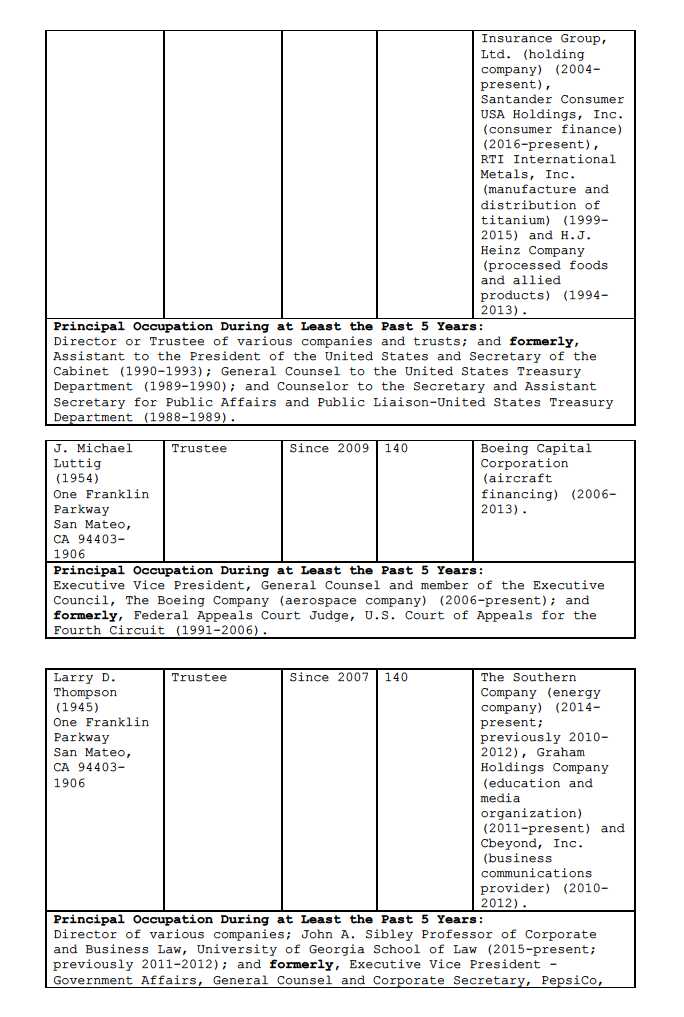
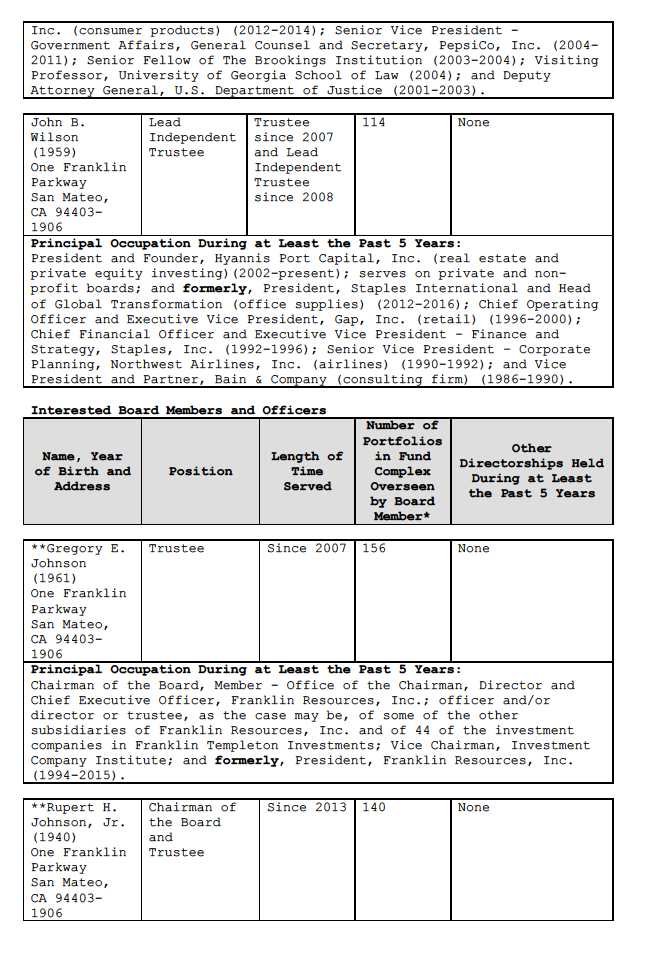
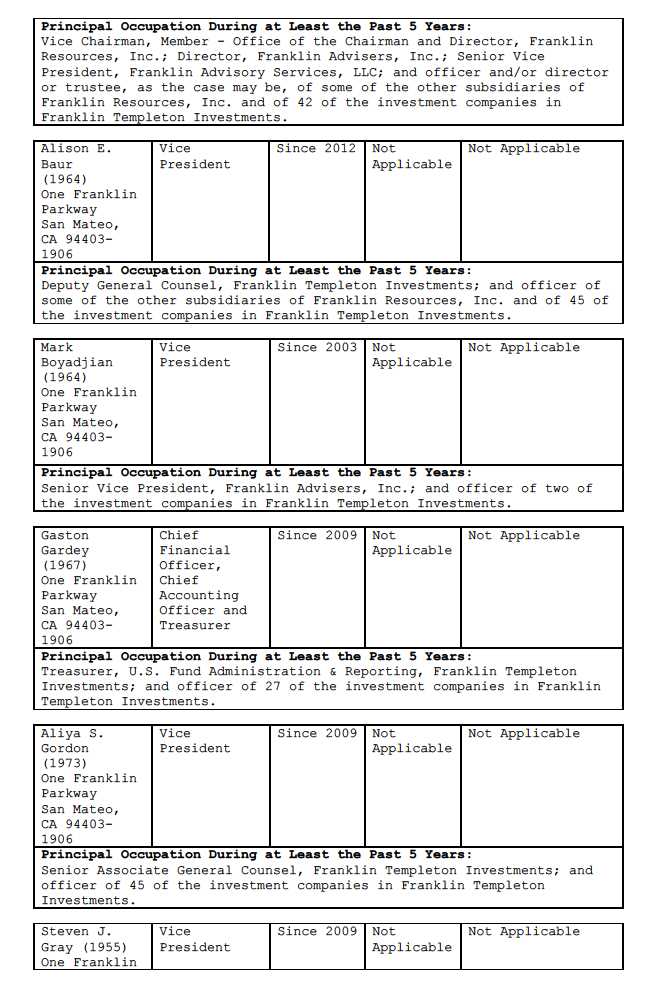

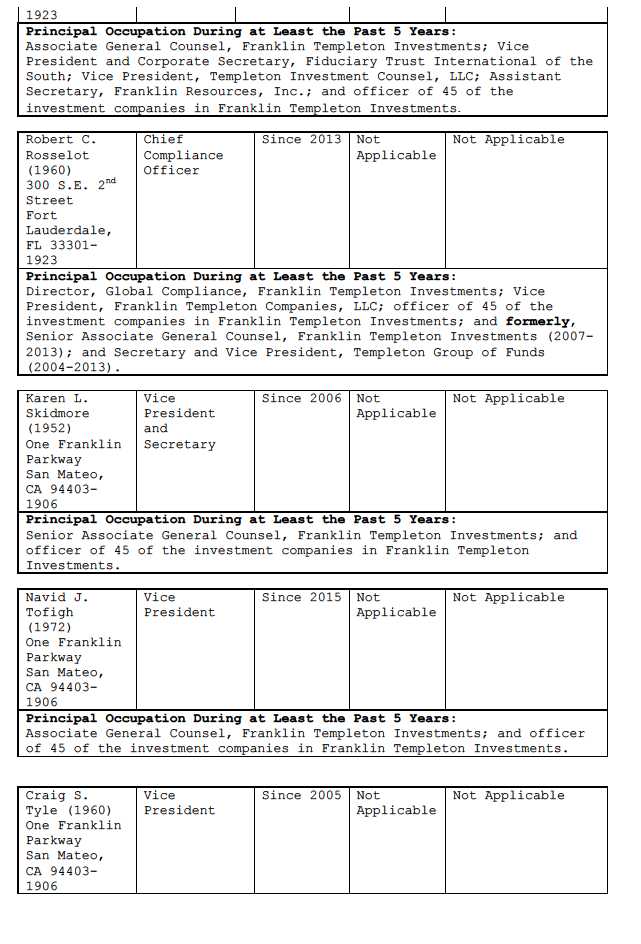
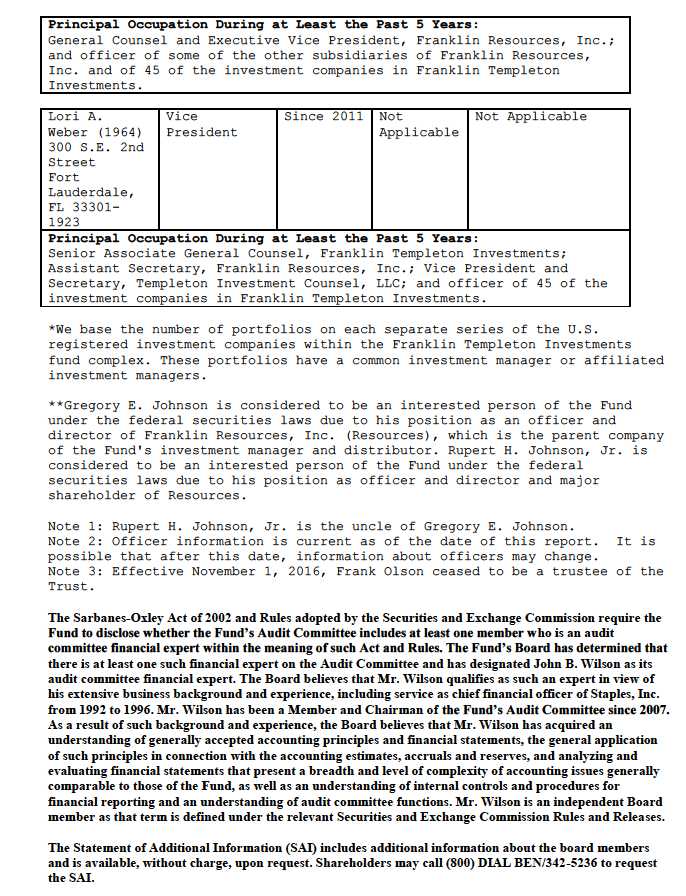
| | | | | | | | | | | | | | | | | |
| F R A N K L I N F L O A T I N G RA T E MA S T E R T R U S T | | | | | | | | | | | | | | | | | |
| |
| |
| Financial Highlights | | | | | | | | | | | | | | | | | |
| Franklin Floating Rate Master Series | | | | | | | | | | | | | | | | | |
| | | | | | Year Ended July 31, | | | | | |
| | | 2017 | | | 2016 | | | | 2015 | | | | 2014 | | | 2013 | |
| Per share operating performance | | | | | | | | | | | | | | | | | |
| (for a share outstanding throughout the year) | | | | | | | | | | | | | | | | | |
| Net asset value, beginning of year | $ | 8.47 | | $ | 8.65 | | | $ | 8.92 | | | $ | 8.93 | | $ | 8.76 | |
| Income from investment operationsa: | | | | | | | | | | | | | | | | | |
| Net investment income | | 0.332 | | | 0.419 | | | | 0.391 | | | | 0.299 | | | 0.347 | |
| Net realized and unrealized gains (losses) | | 0.221 | | | (0.184 | ) | | | (0.270 | ) | | | (0.010 | ) | | 0.169 | |
| Total from investment operations | | 0.553 | | | 0.235 | | | | 0.121 | | | | 0.289 | | | 0.516 | |
| Less distributions from net investment income | | (0.333 | ) | | (0.415 | ) | | | (0.391 | ) | | | (0.299 | ) | | (0.346 | ) |
| Net asset value, end of year. | $ | 8.69 | | $ | 8.47 | | | $ | 8.65 | | | $ | 8.92 | | $ | 8.93 | |
| |
| Total return | | 6.71 | % | | 3.07 | % | | | 1.30 | % | | | 3.28 | % | | 5.94 | % |
| |
| Ratios to average net assets | | | | | | | | | | | | | | | | | |
| Expenses before waiver and payments by affiliates | | 0.55 | % | | 0.55 | % | | | 0.77 | % | | | 0.92 | % | | 0.96 | % |
| Expenses net of waiver and payments by affiliatesb | | 0.53 | % | | 0.53 | % | | | 0.67 | % | | | 0.80 | % | | 0.80 | % |
| Net investment income | | 3.78 | % | | 5.03 | % | | | 4.43 | % | | | 3.36 | % | | 3.77 | % |
| |
| Supplemental data | | | | | | | | | | | | | | | | | |
| Net assets, end of year (000’s) | $ | 2,090,626 | | $ | 1,363,955 | | $ | 1,959,681 | | $ | 2,260,151 | | $ | 1,420,061 | |
| Portfolio turnover rate | | 67.00 | % | | 28.94 | % | | 62.43 | % | | 70.55 | % | | 61.33 | % |
aThe amount shown for a share outstanding throughout the period may not correlate with the Statement of Operations for the period due to the timing of sales and
repurchases of the Fund’s shares in relation to income earned and/or fluctuating fair value of the investments of the Fund.
bBenefit of expense reduction rounds to less than 0.01%.
| 11 | Annual Report | The accompanying notes are an integral part of these financial statements. |
| | | | | | | |
| | | F R A N K L I N F L O A T I N G R A T E MA S T E R T R U S T |
| |
| |
| |
| Statement of Investments, July 31, 2017 | | | | | | | |
| |
| Franklin Floating Rate Master Series | | | | | | | |
| | | | | | | | % of Net |
| | | Country | | Shares | | Value | Assets |
| Common Stocks | | | | | | | |
| Oil & Gas Exploration & Production | | | | | | | |
| a Samson Resources II LLC | | United States | | 155,501 | $ | 3,343,271 | 0.16 |
| Steel | | | | | | | |
| b Warrior Met Coal Inc | | United States | | 40,359 | | 854,640 | 0.04 |
| Total Common Stocks (Cost $7,937,218) | | | | | | 4,197,911 | 0.20 |
| |
| |
| | | | | Principal | | | |
| | | | | Amount* | | | |
| c,d Senior Floating Rate Interests | | | | | | | |
| Aerospace & Defense | | | | | | | |
| Avolon TLB Borrower I, Initial Term B-1 Loans, 3.478%, 7/20/20 | | United States | $ | 7,000,000 | | 7,033,747 | 0.34 |
| Delos Finance S.A.R.L. (ILFC), New Loan, 3.546%, 10/06/23. | | Luxembourg | | 32,284,435 | | 32,409,537 | 1.55 |
| Digitalglobe Inc., Term Loan B, 3.984%, 1/15/24 | | United States | | 2,527,769 | | 2,536,854 | 0.12 |
| Doncasters U.S. Finance LLC, | | | | | | | |
| Second Lien Term Loan, 9.546%, 10/09/20 | | United States | | 3,923,627 | | 3,805,919 | 0.18 |
| Term B Loans, 4.796%, 4/09/20 | | United States | | 20,712,261 | | 19,831,990 | 0.95 |
| Flying Fortress Inc. (ILFC), New Loan, 3.546%, 10/30/22. | | Luxembourg | | 18,210,912 | | 18,307,666 | 0.87 |
| Leidos (Abacus Innovations Corp.), B Term Loan, 3.50%, 8/16/23 | | United States | | 1,583,424 | | 1,598,104 | 0.08 |
| | | | | | | 85,523,817 | 4.09 |
| Agricultural Products | | | | | | | |
| Allflex Holdings III Inc., Second Lien Initial Term Loan, 8.307%, | | | | | | | |
| 7/16/21 | . | United States | | 1,717,310 | | 1,729,922 | 0.08 |
| Air Freight & Logistics | | | | | | | |
| XPO Logistics Inc., Loans, 3.554%, 11/01/21 | | United States | | 8,683,186 | | 8,729,737 | 0.42 |
| Airlines | | | | | | | |
| Air Canada, Term Loan, 3.46%, 10/06/23 | | Canada | | 17,072,526 | | 17,200,570 | 0.82 |
| American Airlines Inc., | | | | | | | |
| 2017 Replacement Term Loans, 3.233%, 6/27/20 | | United States | | 7,941,690 | | 7,962,537 | 0.38 |
| Class B Term Loans, 3.734%, 4/28/23. | | United States | | 7,229,192 | | 7,263,835 | 0.35 |
| Class B Term Loans, 3.726%, 12/14/23 | | United States | | 16,098,633 | | 16,175,777 | 0.77 |
| United Airlines Inc., Class B Term Loans, 3.561%, 4/01/24. | | United States | | 2,579,666 | | 2,597,724 | 0.13 |
| | | | | | | 51,200,443 | 2.45 |
| Apparel Retail | | | | | | | |
| Ascena Retail Group Inc., Tranche B Term Loan, 5.75%, 8/21/22 | | United States | | 51,411,396 | | 42,928,516 | 2.05 |
| Auto Parts & Equipment | | | | | | | |
| American Axle and Manufacturing Inc., Tranche B Term Loan, | | | | | | | |
| 3.49%, 4/06/24 | | United States | | 1,959,579 | | 1,959,375 | 0.09 |
| TI Group Automotive Systems LLC, Initial US Term Loan, 3.984%, | | | | | | | |
| 6/30/22 | . | United States | | 20,085,532 | | 20,173,406 | 0.97 |
| | | | | | | 22,132,781 | 1.06 |
| Automobile Manufacturers | | | | | | | |
| FCA U.S. LLC (Chrysler Group), Term Loan B, 3.23%, 12/31/18 | | United States | | 3,000,000 | | 3,020,625 | 0.15 |
| Broadcasting | | | | | | | |
| Gray Television Inc., Term B-2 Loan, 3.724%, 2/07/24 | | United States | | 10,413,142 | | 10,496,447 | 0.50 |
| Mission Broadcasting Inc., Term Loan B-2, 3.738%, 7/19/24 | | United States | | 558,701 | | 563,066 | 0.03 |
Annual Report
12
|
| F R A N K L I N F L O A T I N G RA T E MA S T E R T R U S T |
| S T A T E M E N T OF IN V E S T M E N T S |
| | | | | | | | | |
| | Franklin Floating Rate Master Series (continued) | | | | | | | | |
| | | | | | Principal | | | % of Net | |
| | | | Country | | Amount* | | Value | Assets | |
| |
| | c,d Senior Floating Rate Interests (continued) | | | | | | | | |
| | Broadcasting (continued) | | | | | | | | |
| | Nexstar Broadcasting Inc., | | | | | | | | |
| | e Term A-2 Loan, 5.75%, 7/19/22 | | United States | $ | 1,854,785 | $ | 1,857,103 | 0.09 | |
| | Term Loan B-2, 3.738%, 7/19/24 | | United States | | 4,570,136 | | 4,605,842 | 0.22 | |
| | Sinclair Television Group Inc., Tranche B Term Loans, 3.49%, | | | | | | | | |
| | 1/03/24 | . | United States | | 1,912,233 | | 1,917,404 | 0.09 | |
| eWXXA-TV LLC and WLAJ-TV LLC, Term Loan A-2, 5.25%, 7/19/22 . | | United States | | 62,666 | | 62,745 | 0.00† | |
| | | | | | | | 19,502,607 | 0.93 | |
| | Cable & Satellite | | | | | | | | |
| | Charter Communications Operating LLC (CCO Safari), Term Loan | | | | | | | | |
| A | -1, 2.99%, 5/18/21 | | United States | | 13,516,750 | | 13,546,919 | 0.65 | |
| | CSC Holdings LLC (Cablevision), March 2017 Incremental Term | | | | | | | | |
| | Loans, 3.476%, 7/17/25 | | United States | | 21,921,531 | | 21,921,531 | 1.05 | |
| | Mediacom LLC/US, Tranche K Term Loan, 3.45%, 2/15/24. | | United States | | 4,275,179 | | 4,309,914 | 0.20 | |
| | UPC Financing Partnership (UPC Broadband Holdings BV), Facility | | | | | | | | |
| | AP, 3.976%, 4/15/25. | | United States | | 12,244,000 | | 12,322,056 | 0.59 | |
| | Virgin Media Bristol LLC, I Facility, 3.976%, 1/31/25. | | United States | | 15,350,757 | | 15,443,507 | 0.74 | |
| | | | | | | | 67,543,927 | 3.23 | |
| | Casinos & Gaming | | | | | | | | |
| | Aristocrat Technologies Inc., Term B-2 Loans, 3.557%, 10/20/21 | | United States | | 4,488,189 | | 4,512,048 | 0.22 | |
| | Boyd Gaming Corp., | | | | | | | | |
| | Refinancing Term B Loans, 3.694%, 9/15/23 | | United States | | 8,690,979 | | 8,738,658 | 0.42 | |
| | Term A Loan, 2.944%, 9/15/21 | | United States | | 2,313,936 | | 2,316,828 | 0.11 | |
| | e Caesars Entertainment Operating Co. LLC, Term B Loans, 5.75%, | | | | | | | | |
| | 8/31/24 | . | United States | | 1,537,575 | | 1,544,302 | 0.07 | |
| | Eldorado Resorts Inc., Initial Term Loan, 3.563%, 4/17/24 | | United States | | 6,348,610 | | 6,347,289 | 0.30 | |
| | Greektown Holdings LLC, Initial Term Loan, 4.234%, 4/25/24 | | United States | | 8,452,193 | | 8,474,642 | 0.40 | |
| | Kingpin Intermediate Holdings LLC., Initial Term Loans, 5.48%, | | | | | | | | |
| | 7/03/24 | . | United States | | 1,600,000 | | 1,620,981 | 0.08 | |
| | Las Vegas Sands LLC, Term B Loans, 3.23%, 3/29/24. | | United States | | 787,790 | | 791,976 | 0.04 | |
| | | | | | | | 34,346,724 | 1.64 | |
| | Coal & Consumable Fuels | | | | | | | | |
| | Bowie Resource Holdings LLC, | | | | | | | | |
| | First Lien Initial Term Loan, 6.984%, 8/14/20 | | United States | | 15,824,072 | | 15,322,972 | 0.73 | |
| | Second Lien Initial Term Loan, 11.984%, 2/16/21 | | United States | | 2,232,389 | | 2,090,074 | 0.10 | |
| | e Foresight Energy LLC, Term Loans, 7.046%, 3/28/22. | | United States | | 25,077,577 | | 24,304,360 | 1.16 | |
| | Westmoreland Coal Co., Term Loan, 7.796%, 12/16/20 | | United States | | 3,710,158 | | 3,297,403 | 0.16 | |
| | | | | | | | 45,014,809 | 2.15 | |
| | Commodity Chemicals | | | | | | | | |
| | Cyanco Intermediate Corp., Initial Term Loan, 5.734%, 5/01/20 | | United States | | 27,668,409 | | 27,898,970 | 1.34 | |
| | Ineos U.S. Finance LLC, 2024 Dollar Term Loan, 4.007%, 3/31/24 | | United States | | 9,144,144 | | 9,207,723 | 0.44 | |
| | | | | | | | 37,106,693 | 1.78 | |
| | Communications Equipment | | | | | | | | |
| | Ciena Corp., Refinancing Term Loan, 3.728%, 1/28/22 | | United States | | 8,766,141 | | 8,815,450 | 0.42 | |
| | CommScope Inc., Tranche 5 Term Loans, 3.296%, 12/29/22 | | United States | | 11,044,021 | | 11,106,144 | 0.53 | |
| | | | | | | | 19,921,594 | 0.95 | |
| | Construction Machinery & Heavy Trucks | | | | | | | | |
| | Allison Transmission Inc., Term Loans, 3.24%, 9/23/22 | | United States | | 19,957,982 | | 20,109,743 | 0.96 | |
|
| F R A N K L I N F L O A T I N G R A T E MA S T E R T R U S T |
| S T A T E M E N T O F I N V E S T M E N T S |
| | | | | | | |
| Franklin Floating Rate Master Series (continued) | | | | | | | |
| | | | | Principal | | | % of Net |
| | | Country | | Amount* | | Value | Assets |
| c,d Senior Floating Rate Interests (continued) | | | | | | | |
| Data Processing & Outsourced Services | | | | | | | |
| CIBT Global Inc., Initial Term Loan, 5.202%, 6/01/24 | | United States | $ | 3,946,746 | $ | 3,971,414 | 0.19 |
| Global Payments Inc., Term A-2 Loan, 2.944%, 5/02/22. | | United States | | 9,856,007 | | 9,851,898 | 0.47 |
| MoneyGram International Inc., Term Loan, 4.546%, 3/27/20. | | United States | | 9,403,707 | | 9,411,540 | 0.45 |
| e Neustar Inc., Term Loan B1, 6.50%, 9/01/19. | | United States | | 372,000 | | 376,417 | 0.02 |
| e Wex Inc., Term Loan B, 6.00%, 7/01/23 | | United States | | 2,107,113 | | 2,131,947 | 0.10 |
| | | | | | | 25,743,216 | 1.23 |
| Diversified Chemicals | | | | | | | |
| Chemours Co., Tranche B-1 US Term Loans, 3.73%, 5/12/22 | | United States | | 22,768,041 | | 22,985,042 | 1.10 |
| Huntsman International LLC, Term Loan B, 3.984%, 10/01/21 | | United States | | 1,793,077 | | 1,805,405 | 0.09 |
| e OCI Beaumont LLC, Term B-3 Loan, 7.929%, 8/20/19 | | United States | | 16,171,128 | | 16,292,412 | 0.78 |
| Unifrax I LLC, Initial Dollar Term Loans, 5.046%, 4/04/24 | | United States | | 2,786,957 | | 2,820,052 | 0.13 |
| | | | | | | 43,902,911 | 2.10 |
| Diversified Real Estate Activities | | | | | | | |
| Realogy Group LLC, Initial Term A Loans, 3.226%, 10/23/20 | | United States | | 6,648,587 | | 6,669,198 | 0.32 |
| Diversified Support Services | | | | | | | |
| Ventia Pty. Ltd., Term B Loans (USD), 4.796%, 5/21/22 | | Australia | | 3,927,214 | | 3,976,304 | 0.19 |
| Electric Utilities | | | | | | | |
| EFS Cogen Holdings I LLC (Linden), Term B Advance, 4.80%, | | | | | | | |
| 6/28/23 | . | United States | | 2,377,871 | | 2,403,136 | 0.12 |
| Fertilizers & Agricultural Chemicals | | | | | | | |
| Mosaic Co., Term Loan A, 2.479%, 11/18/21 | | United States | | 2,299,581 | | 2,296,707 | 0.11 |
| Food Distributors | | | | | | | |
| Aramark Corp., U.S. Term A Loan, 2.984%, 3/28/22 | | United States | | 6,284,964 | | 6,320,317 | 0.30 |
| Food Retail | | | | | | | |
| Smart & Final LLC, First Lien Term Loan, 4.734% - 4.796%, | | | | | | | |
| 11/15/22 | | United States | | 5,991,237 | | 5,866,422 | 0.28 |
| Forest Products | | | | | | | |
| Appvion Inc., Term Loan, 7.75% - 7.79%, 6/28/19 | | United States | | 13,853,531 | | 13,501,416 | 0.65 |
| General Merchandise Stores | | | | | | | |
| 99 Cents Only Stores, Tranche B-2 Loan, 4.702% - 4.796%, 1/11/19. | | United States | | 23,793,963 | | 23,040,480 | 1.10 |
| Dollar Tree Inc., Term A-1 Loans, 3.00%, 7/06/20 | | United States | | 3,645,317 | | 3,637,297 | 0.17 |
| Evergreen AcqCo. 1 LP (Savers), Term Loan, 5.011% - 5.064%, | | | | | | | |
| 7/09/19 | . | United States | | 29,998,089 | | 28,348,194 | 1.36 |
| | | | | | | 55,025,971 | 2.63 |
| Health Care Distributors | | | | | | | |
| Mallinckrodt International Finance SA/CB LLC, Extended Term Loan | | | | | | | |
| B, 4.046%, 9/24/24 | | United States | | 10,334,100 | | 10,387,207 | 0.50 |
| Health Care Facilities | | | | | | | |
| HCA Inc., Tranche A-5 Term Loan, 2.734%, 6/10/20 | | United States | | 9,631,712 | | 9,652,786 | 0.46 |
| Health Care Services | | | | | | | |
| DaVita Healthcare Partners Inc., Tranche A Term Loan, 3.234%, | | | | | | | |
| 6/24/19 | . | United States | | 6,827,261 | | 6,867,801 | 0.33 |
| Envision Healthcare Corp. (Emergency Medical), Initial Term Loans, | | | | | | | |
| 4.30%, 12/01/23 | | United States | | 8,449,697 | | 8,510,957 | 0.40 |
| U.S. Renal Care Inc., Initial Term Loan, 5.546%, 12/31/22 | | United States | | 20,760,312 | | 20,445,669 | 0.98 |
| | | | | | | 35,824,427 | 1.71 |
Annual Report
14
|
| F R A N K L I N F L O A T I N G RA T E MA S T E R T R U S T |
| S T A T E M E N T OF IN V E S T M E N T S |
| | | | | | | |
| Franklin Floating Rate Master Series (continued) | | | | | | | |
| | | | | Principal | | | % of Net |
| | | Country | | Amount* | | Value | Assets |
| |
| c,d Senior Floating Rate Interests (continued) | | | | | | | |
| Hotels, Resorts & Cruise Lines | | | | | | | |
| Hilton Worldwide Finance LLC, Series B-2 Term Loans, 3.232%, | | | | | | | |
| 10/25/23 | | United States | $ | 9,965,000 | $ | 10,019,808 | 0.48 |
| e Station Casinos LLC, Revolving Commitment, 5.75%, 6/08/21 | | United States | | 4,116,000 | | 3,848,460 | 0.18 |
| | | | | | | 13,868,268 | 0.66 |
| Household Products | | | | | | | |
| Spectrum Brands Inc., USD Term Loans, 3.179% - 3.314%, 6/23/22 . | | United States | | 12,963,922 | | 13,048,188 | 0.62 |
| Independent Power Producers & Energy Traders | | | | | | | |
| Calpine Construction Finance Co. LP, Term B-1 Loan, 3.49%, | | | | | | | |
| 5/03/20 | . | United States | | 33,419,137 | | 33,492,258 | 1.60 |
| Calpine Corp., Term Loan (B5), 4.05%, 1/15/24 | | United States | | 9,197,580 | | 9,240,726 | 0.44 |
| Helix Gen Funding LLC, Term Loan, 4.96%, 6/02/24 | | United States | | 19,058,067 | | 19,284,381 | 0.92 |
| Lightstone Holdco LLC, | | | | | | | |
| Initial Term B Loan, 5.734%, 1/30/24 | | United States | | 12,298,572 | | 12,192,878 | 0.59 |
| Initial Term C Loan, 5.734%, 1/30/24. | | United States | | 766,326 | | 759,740 | 0.04 |
| NRG Energy Inc., Term Loans, 3.546%, 6/30/23 | | United States | | 40,407,909 | | 40,526,951 | 1.94 |
| | | | | | | 115,496,934 | 5.53 |
| Industrial Machinery | | | | | | | |
| Harsco Corp., Initial Term Loan, 6.25%, 11/02/23 | | United States | | 1,575,373 | | 1,607,374 | 0.08 |
| Mueller Water Products Inc., Loans, 3.734% - 3.796%, 11/25/21 | | United States | | 5,205,308 | | 5,255,191 | 0.25 |
| Navistar Inc., Tranche B Term Loans, 5.23%, 8/07/20 | | United States | | 34,624,608 | | 35,035,774 | 1.67 |
| Onsite Rental Group Operations Pty. Ltd., Term B Loan, 5.732%, | | | | | | | |
| 7/31/21 | . | Australia | | 20,624,223 | | 15,468,167 | 0.74 |
| | | | | | | 57,366,506 | 2.74 |
| Integrated Telecommunication Services | | | | | | | |
| Consolidated Communications Inc., Initial Term Loan, 4.24%, | | | | | | | |
| 10/05/23 | | United States | | 2,060,159 | | 2,066,339 | 0.10 |
| Global Tel*Link Corp., | | | | | | | |
| Second Lien Term Loan, 9.046%, 11/20/20 | | United States | | 3,374,143 | | 3,372,034 | 0.16 |
| e Term Loan, 5.296%, 5/23/20 | | United States | | 4,987,442 | | 5,027,187 | 0.24 |
| Securus Technologies Holdings Inc., | | | | | | | |
| Second Lien Term Loan, 9.00%, 4/17/21 | | United States | | 666,667 | | 671,528 | 0.03 |
| e Second Lien Term Loan, 11.50%, 6/30/25 | | United States | | 817,114 | | 823,073 | 0.04 |
| Zayo Group LLC, 2017 Incremental Refinancing B-1 Term Loan, | | | | | | | |
| 3.227%, 1/19/21 | | United States | | 44,887,500 | | 45,034,776 | 2.16 |
| | | | | | | 56,994,937 | 2.73 |
| Internet Software & Services | | | | | | | |
| e Rackspace Hosting Inc., 2017 Refinancing Term B Loans, 4.172%, | | | | | | | |
| 11/03/23 | | United States | | 5,132,219 | | 5,161,729 | 0.25 |
| Investment Banking & Brokerage | | | | | | | |
| Finco I LLC, Initial Term Loans, 1.375%, 6/10/22 | | United States | | 11,000,000 | | 11,149,534 | 0.53 |
| IT Consulting & Other Services | | | | | | | |
| Gartner Inc., Tranche A Term Loans, 3.234%, 3/20/22 | | United States | | 1,589,766 | | 1,598,709 | 0.08 |
| Sungard Availability Services Capital Inc., 2019 Tranche B Term | | | | | | | |
| Loan, 6.234%, 3/29/19 | | United States | | 26,400,995 | | 26,103,984 | 1.25 |
| | | | | | | 27,702,693 | 1.33 |
|
| F R A N K L I N F L O A T I N G R A T E MA S T E R T R U S T |
| S T A T E M E N T O F I N V E S T M E N T S |
| | | | | | | |
| Franklin Floating Rate Master Series (continued) | | | | | | | |
| | | | | Principal | | | % of Net |
| | | Country | | Amount* | | Value | Assets |
| |
| c,d Senior Floating Rate Interests (continued) | | | | | | | |
| Leisure Facilities | | | | | | | |
| 24 Hour Fitness Worldwide Inc., Term Loan, 5.046%, 5/28/21 | | United States | $ | 19,158,894 | $ | 19,140,693 | 0.92 |
| Fitness International LLC, Term A Loan, 4.484%, 4/01/20 | | United States | | 18,611,401 | | 18,628,858 | 0.89 |
| | | | | | | 37,769,551 | 1.81 |
| Life Sciences Tools & Services | | | | | | | |
| e INC Research Holdings Inc., Initial Term B Loans, 5.50%, 8/01/24 | | United States | | 6,856,663 | | 6,901,663 | 0.33 |
| Quintiles IMS Inc., Term B-1 Dollar Loans, 3.202% - 3.296%, | | | | | | | |
| 3/02/24 | . | United States | | 10,447,500 | | 10,542,186 | 0.50 |
| | | | | | | 17,443,849 | 0.83 |
| Marine | | | | | | | |
| Navios Maritime Partners LP, Initial Term Loan, 6.25%, 9/14/20 | | Greece | | 7,801,250 | | 7,820,753 | 0.37 |
| Metal & Glass Containers | | | | | | | |
| Owens-Brockway Glass Container Inc., Term A Loan, 2.976% - | | | | | | | |
| 2.984%, 4/22/20 | | United States | | 11,901,538 | | 11,916,414 | 0.57 |
| Movies & Entertainment | | | | | | | |
| AMC Entertainment Holdings Inc., 2016 Incremental Term Loans, | | | | | | | |
| 3.476%, 12/15/23 | | United States | | 1,618,209 | | 1,624,278 | 0.08 |
| Cinemark USA Inc., Amended Term Loan Facility, 3.21%, 5/08/22 | | United States | | 590,363 | | 592,577 | 0.03 |
| e Global Eagle Entertainment Inc., Initial Term Loans, 8.456%, | | | | | | | |
| 1/06/23 | . | United States | | 1,824,000 | | 1,779,540 | 0.08 |
| Lions Gate Entertainment Corp., Term A Loan, 3.234%, 12/08/21 | | United States | | 38,072,408 | | 38,227,096 | 1.83 |
| Live Nation Entertainment Inc., Term B-3 Loans, 3.50%, 10/21/23 | | United States | | 3,309,812 | | 3,332,050 | 0.16 |
| Regal Cinemas Corp., Term Loan, 3.234%, 4/01/22 | | United States | | 16,905,358 | | 16,972,709 | 0.81 |
| | | | | | | 62,528,250 | 2.99 |
| Office Services & Supplies | | | | | | | |
| Conduent Business Services LLC, Delayed Draw Term A Loan, | | | | | | | |
| 3.484%, 12/07/21 | | United States | | 4,000,000 | | 4,006,500 | 0.19 |
| Oil & Gas Exploration & Production | | | | | | | |
| Cantium LLC, Commitment, 7.26%, 6/13/20 | | United States | | 5,000,000 | | 4,975,000 | 0.24 |
| Fieldwood Energy LLC, Loans, 4.171%, 10/01/18 | | United States | | 56,133,110 | | 54,063,202 | 2.59 |
| UTEX Industries Inc., First Lien Initial Term Loan, 5.234%, 5/21/21 | | United States | | 23,520,302 | | 21,182,972 | 1.01 |
| | | | | | | 80,221,174 | 3.84 |
| Oil & Gas Storage & Transportation | | | | | | | |
| Energy Transfer Equity LP, Loans, 3.974%, 2/02/24 | | United States | | 7,611,141 | | 7,648,405 | 0.37 |
| International Seaways Inc., Initial Term Loans, 6.79%, 6/22/22 | | United States | | 3,911,076 | | 3,886,632 | 0.19 |
| OSG Bulk Ships Inc., Initial Term Loan, 5.43%, 8/05/19 | | United States | | 8,918,069 | | 8,483,313 | 0.40 |
| Strike LLC, Term Loan, 9.296%, 11/30/22 | | United States | | 3,022,500 | | 3,098,063 | 0.15 |
| | | | | | | 23,116,413 | 1.11 |
| Packaged Foods & Meats | | | | | | | |
| e American Seafoods LLC, Fitst Lien Term Loan, 6.50%, 8/21/23 | | United States | | 3,040,000 | | 3,052,668 | 0.14 |
| CSM Bakery Supplies LLC, | | | | | | | |
| Second Lien Term Loan, 9.05%, 7/03/21 | | United States | | 7,271,086 | | 6,416,733 | 0.31 |
| Term Loans, 5.30%, 7/03/20 | | United States | | 4,712,082 | | 4,572,685 | 0.22 |
| JBS USA LUX SA, New Initial Term Loans, 3.757% - 3.804%, | | | | | | | |
| 10/30/22 | | Brazil | | 28,446,035 | | 28,232,690 | 1.35 |
| Pinnacle Foods Finance LLC, Initial Term Loans, 3.227%, 2/03/24 | | United States | | 1,265,014 | | 1,271,869 | 0.06 |
| Post Holdings Inc., Series A Incremental Term Loan, 3.49%, | | | | | | | |
| 5/24/24 | . | United States | | 8,261,290 | | 8,303,885 | 0.40 |
| | | | | | | 51,850,530 | 2.48 |
Annual Report
16
|
| F R A N K L I N F L O A T I N G RA T E MA S T E R T R U S T |
| S T A T E M E N T OF IN V E S T M E N T S |
| | | | | | | |
| Franklin Floating Rate Master Series (continued) | | | | | | | |
| | | | | Principal | | | % of Net |
| | | Country | | Amount* | | Value | Assets |
| |
| c,d Senior Floating Rate Interests (continued) | | | | | | | |
| Paper Packaging | | | | | | | |
| Caraustar Industries Inc., Refinancing Term Loans, 6.796%, 3/14/22. | | United States | $ | 12,797,800 | $ | 12,901,782 | 0.62 |
| Personal Products | | | | | | | |
| Coty Inc., Term A Loan, 2.977%, 10/27/20 | | United States | | 16,655,844 | | 16,635,024 | 0.79 |
| FGI Operating Co. LLC (Freedom Group), Term B Loans, 5.50%, | | | | | | | |
| 4/19/19 | . | United States | | 44,011,849 | | 40,894,358 | 1.96 |
| | | | | | | 57,529,382 | 2.75 |
| Pharmaceuticals | | | | | | | |
| Endo Luxembourg Finance Co. I S.A.R.L. and Endo LLC, Initial Term | | | | | | | |
| Loans, 5.50%, 4/27/24 | | United States | | 20,967,217 | | 21,313,553 | 1.02 |
| Grifols Worldwide Operations USA Inc., Tranche B Term Loan, | | | | | | | |
| 3.444%, 1/31/25 | | United States | | 16,624,183 | | 16,723,363 | 0.80 |
| Horizon Pharma Inc., Second Amendment Refinancing Term Loans, | | | | | | | |
| 5.00%, 3/29/24 | | United States | | 5,969,770 | | 6,008,949 | 0.29 |
| RPI Finance Trust, | | | | | | | |
| Term A-3 Loan, 3.046%, 10/14/21 | | United States | | 4,265,322 | | 4,273,319 | 0.21 |
| Term B-6 Term Loan, 3.296%, 3/27/23 | | United States | | 5,278,478 | | 5,309,405 | 0.25 |
| Valeant Pharmaceuticals International Inc., Series F Tranche B Term | | | | | | | |
| Loan, 5.98%, 4/01/22 | | United States | | 22,213,987 | | 22,645,983 | 1.08 |
| | | | | | | 76,274,572 | 3.65 |
| Restaurants | | | | | | | |
| KFC Holding Co./Pizza Hut Holdings LLC/Taco Bell of America LLC, | | | | | | | |
| Term B Loans, 3.226%, 6/16/23 | | United States | | 4,470,769 | | 4,498,712 | 0.21 |
| NPC International Inc., Second Lien Initial Term Loan, 8.727%, | | | | | | | |
| 4/20/25 | . | United States | | 4,842,941 | | 4,921,638 | 0.24 |
| | | | | | | 9,420,350 | 0.45 |
| Retail REITs | | | | | | | |
| Capital Automotive LP, Tranche B-2 Term Loan, 4.24%, 3/24/24 | | United States | | 4,522,542 | | 4,571,159 | 0.22 |
| Semiconductor Equipment | | | | | | | |
| MKS Instruments Inc., Tranche B-3 Term Loans, 3.484%, 4/29/23 | | United States | | 1,114,678 | | 1,123,734 | 0.05 |
| Semiconductors | | | | | | | |
| e MACOM Technology Solutions Holdings Inc., Initial Term Loans, | | | | | | | |
| 3.478%, 5/07/24 | | United States | | 17,856,199 | | 17,856,199 | 0.85 |
| ON Semiconductor Corp., 2017 Replacement Term Loans, 3.484%, | | | | | | | |
| 3/31/23 | . | United States | | 9,104,029 | | 9,148,411 | 0.44 |
| | | | | | | 27,004,610 | 1.29 |
| Specialized Consumer Services | | | | | | | |
| Avis Budget Car Rental LLC, Tranche B Term Loan, 3.30%, 3/15/22 . | | United States | | 17,450,040 | | 17,412,958 | 0.83 |
| NVA Holdings Inc., | | | | | | | |
| Second Lien Term Loan, 8.296%, 8/14/22 | | United States | | 2,165,278 | | 2,192,344 | 0.10 |
| Term B-2 Loans, 4.796%, 8/14/21. | | United States | | 6,587,609 | | 6,653,485 | 0.32 |
| Sabre GLBL Inc., | | | | | | | |
| Incremental Term A Loan, 3.734%, 7/18/21 | | United States | | 12,945,253 | | 12,961,435 | 0.62 |
| Term B Loan, 3.984%, 2/22/24 | | United States | | 1,558,001 | | 1,572,190 | 0.08 |
| | | | | | | 40,792,412 | 1.95 |
|
| F R A N K L I N F L O A T I N G R A T E MA S T E R T R U S T |
| S T A T E M E N T O F I N V E S T M E N T S |
| | | | | | | | |
| | Franklin Floating Rate Master Series (continued) | | | | | | | |
| | | | | | Principal | | | % of Net |
| | | | Country | | Amount* | | Value | Assets |
| |
| | c,d Senior Floating Rate Interests (continued) | | | | | | | |
| | Specialty Chemicals | | | | | | | |
| | Ashland LLC, Term B Loan, 3.224% - 3.242%, 5/17/24 | | United States | $ | 1,955,549 | $ | 1,968,587 | 0.09 |
| | Axalta Coating Systems U.S. Holdings Inc., Term B-2 Dollar Loans, | | | | | | | |
| | 3.296%, 6/01/24 | | United States | | 7,625,927 | | 7,666,222 | 0.37 |
| | KMG Chemicals Inc., Initial Term Loan, 5.484%, 6/15/24 | | United States | | 2,474,172 | | 2,506,677 | 0.12 |
| | Oxbow Carbon LLC, | | | | | | | |
| | Second Lien Initial Term Loan, 8.234%, 1/17/20 | | United States | | 14,400,462 | | 14,490,465 | 0.69 |
| | Tranche B Term Loan, 4.734%, 1/19/20 | | United States | | 4,986,795 | | 5,049,130 | 0.24 |
| | Solenis International LP and Solenis Holdings 3 LLC, Second Lien | | | | | | | |
| | Term Loan, 7.952%, 7/31/22 | | United States | | 3,270,000 | | 3,286,860 | 0.16 |
| | | | | | | | 34,967,941 | 1.67 |
| | Specialty Stores | | | | | | | |
| | General Nutrition Centers Inc., Tranche B Term Loans, 3.74%, | | | | | | | |
| | 3/04/19 | . | United States | | 21,968,813 | | 21,273,127 | 1.02 |
| e Jo | -Ann Stores Inc., Initial Loans, 8.25%, 10/21/23 | | United States | | 3,329,275 | | 3,332,744 | 0.16 |
| | PetSmart Inc., Tranche B-2 Loans, 4.23%, 3/11/22 | | United States | | 45,101,251 | | 42,876,947 | 2.05 |
| | | | | | | | 67,482,818 | 3.23 |
| | Technology Distributors | | | | | | | |
| | Dell International LLC, | | | | | | | |
| Term A | -1 Loan, 3.24%, 12/31/18 | | United States | | 4,809,784 | | 4,816,100 | 0.23 |
| Term A | -3 Loan, 3.24%, 12/31/18 | | United States | | 37,317,997 | | 37,407,970 | 1.79 |
| | | | | | | | 42,224,070 | 2.02 |
| | Technology Hardware, Storage & Peripherals | | | | | | | |
| | Western Digital Corp., | | | | | | | |
| | Term A Loan, 3.233%, 4/29/21 | | United States | | 10,219,643 | | 10,278,406 | 0.49 |
| | US Term B-2 Loan, 3.983%, 4/29/23 | | United States | | 3,321,832 | | 3,351,675 | 0.16 |
| | | | | | | | 13,630,081 | 0.65 |
| | Tires & Rubber | | | | | | | |
| | The Goodyear Tire & Rubber Co., Second Lien Term Loan, 3.23%, | | | | | | | |
| | 4/30/19 | . | United States | | 7,437,937 | | 7,473,579 | 0.36 |
| | Trucking | | | | | | | |
| | The Hertz Corp., Tranche B-1 Term Loan, 3.99%, 6/30/23 | | United States | | 31,223,360 | | 31,201,410 | 1.49 |
| | Pilot Travel Centers LLC, Initial Tranche B Term Loans, 3.234%, | | | | | | | |
| | 5/25/23 | . | United States | | 8,059,500 | | 8,123,976 | 0.39 |
| | | | | | | | 39,325,386 | 1.88 |
| | Total Senior Floating Rate Interests | | | | | | | |
| | (Cost $1,722,826,340) | | | | | | 1,712,566,055 | 81.91 |
| |
| | Asset-Backed Securities | | | | | | | |
| | Other Diversified Financial Services | | | | | | | |
| | f Apidos CDO, 2013-14A, C2, 144A, 4.85%, 4/15/25 | | United States | | 1,110,000 | | 1,113,397 | 0.05 |
| | c,f Ballyrock CLO LLC, 2014-1A, BR, 144A, FRN, 3.407%, 10/20/26 | | United States | | 2,100,000 | | 2,104,242 | 0.10 |
| | c,f Birchwood Park CLO Ltd., 2014-1A, AR, 144A, FRN, 2.484%, | | | | | | | |
| | 7/15/26 | . | United States | | 8,625,000 | | 8,635,609 | 0.41 |
| | c,f BlueMountain CLO Ltd., 2012-2A, AR, 144A, FRN, 2.592%, | | | | | | | |
| | 11/20/28 | | United States | | 10,790,000 | | 10,835,210 | 0.52 |
| | c,f Bristol Park CLO Ltd., 2016-1A, A, 144A, FRN, 2.724%, 4/15/29. | | United States | | 22,000,000 | | 22,003,080 | 1.05 |
Annual Report
18
|
| F R A N K L I N F L O A T I N G RA T E MA S T E R T R U S T |
| S T A T E M E N T OF IN V E S T M E N T S |
| | | | | | | |
| Franklin Floating Rate Master Series (continued) | | | | | | | |
| | | | | Principal | | | % of Net |
| | | Country | | Amount* | | Value | Assets |
| |
| Asset-Backed Securities (continued) | | | | | | | |
| Other Diversified Financial Services (continued) | | | | | | | |
| c,f Carlyle Global Market Strategies CLO Ltd., | | | | | | | |
| 2014-2A, AR, 144A, FRN, 2.432%, 5/15/25 | | United States | $ | 3,200,000 | $ | 3,205,504 | 0.15 |
| 2015-2A, A1, 144A, FRN, 2.787%, 4/27/27 | | United States | | 2,800,000 | | 2,799,300 | 0.13 |
| c,f Carlyle U.S. CLO Ltd., 2017-1A, A1A, 144A, FRN, 2.461%, 4/20/31 . | | United States | | 12,600,000 | | 12,635,028 | 0.61 |
| c,f Cent CLO LP, | | | | | | | |
| 2013-17A, B, 144A, FRN, 4.311%, 1/30/25 | | United States | | 800,000 | | 801,584 | 0.04 |
| 2014-22A, A1R, 144A, FRN, 2.589%, 11/07/26 | | United States | | 7,510,000 | | 7,568,202 | 0.36 |
| 2014-22A, BR, 144A, FRN, 4.129%, 11/07/26 | | United States | | 3,200,000 | | 3,236,448 | 0.16 |
| c,f Eaton Vance CDO Ltd., 2014-1A, AR, 144A, FRN, 2.504%, 7/15/26 . | | United States | | 2,650,000 | | 2,654,902 | 0.13 |
| f Emerson Park CLO Ltd., 2013-1A, C2R, 144A, 4.055%, 7/15/25. | | United States | | 1,100,000 | | 1,105,104 | 0.05 |
| c,f Flatiron CLO Ltd., 2014-1A, A1R, 144A, FRN, 2.338%, 7/17/26 | | United States | | 21,500,000 | | 21,554,180 | 1.03 |
| f Highbridge Loan Management Ltd., 2013-2A, B2, 144A, 5.80%, | | | | | | | |
| 10/20/24 | | United States | | 1,190,000 | | 1,195,474 | 0.06 |
| c,f LCM XXI LP, 21A, A, 144A, FRN, 2.857%, 4/20/28 | | United States | | 11,630,000 | | 11,702,455 | 0.56 |
| c,f LCM XXIV Ltd., 24A, A, 144A, FRN, 2.617%, 3/20/30 | | United States | | 26,400,000 | | 26,525,664 | 1.27 |
| f,g,h LCM XXV Ltd., | | | | | | | |
| 25A, B2, 144A, FRN, 7/20/30 | | United States | | 4,075,000 | | 4,075,000 | 0.20 |
| 25A, C2, 144A, FRN, 7/20/30 | | United States | | 1,625,000 | | 1,625,000 | 0.08 |
| c,f Madison Park Funding Ltd., 2016-21A, A1, 144A, FRN, 2.844%, | | | | | | | |
| 7/25/29 | . | United States | | 7,100,000 | | 7,210,618 | 0.35 |
| c,f Magnetite XIV Ltd., 2015-14A, A, 144A, FRN, 2.694%, 7/18/28 | | United States | | 1,460,000 | | 1,470,468 | 0.07 |
| c,f Octagon Investment Partners 24 Ltd., 2015-1A, A1, 144A, FRN, | | | | | | | |
| 2.622%, 5/21/27 | | United States | | 1,530,000 | | 1,530,536 | 0.07 |
| c,f Octagon Investment Partners 30 Ltd., 144A, FRN, 2.627%, 3/17/30 . | | United States | | 11,942,857 | | 11,974,744 | 0.57 |
| c,f Octagon Investment Partners 31 LLC, 2017-1A, C, 144A, FRN, | | | | | | | |
| 3.61%, 7/20/30 | | United States | | 2,288,855 | | 2,290,137 | 0.11 |
| c,f Octagon Investment Partners XIX Ltd., 2014-14, AR, 144A, FRN, | | | | | | | |
| 2.404%, 4/15/26 | | United States | | 13,530,000 | | 13,516,064 | 0.65 |
| c,f TCI-Cent CLO Income Note Issuer Ltd., 2017-1A, B, 144A, FRN, | | | | | | | |
| 3.663%, 7/25/30 | | United States | | 3,000,000 | | 3,000,000 | 0.14 |
| c,f Voya CLO Ltd., | | | | | | | |
| 2017-3A, B, 144A, FRN, 3.668%, 7/20/30 | | United States | | 2,508,761 | | 2,507,306 | 0.12 |
| 2015-1A, A1, 144A, FRN, 2.784%, 4/18/27 | | United States | | 3,210,000 | | 3,219,277 | 0.15 |
| | | | | | | 192,094,533 | 9.19 |
| Total Asset-Backed Securities (Cost $191,551,564) . | | | | | | 192,094,533 | 9.19 |
| |
| Total Investments before Short Term Investments | | | | | | | |
| (Cost $1,922,315,122) | | | | | | 1,908,858,499 | 91.30 |
| |
| Short Term Investments | | | | | | | |
| c,d Senior Floating Rate Interests (Cost $129,530) | | | | | | | |
| Broadcasting | | | | | | | |
| e Marshall Broadcasting Group Inc., Term Loan A-2, 5.25%, 6/28/18 | | United States | | 129,628 | | 129,790 | 0.01 |
| | | | | | | | |
| | F R A N K L I N F L O A T I N G R A T E MA S T E R T R U S T | |
| | | | S T A T E M E N T O F I N V E S T M E N T S | |
| |
| |
| |
| |
| Franklin Floating Rate Master Series (continued) | | | | | | | | |
| | | | Principal | | | | % of Net | |
| | Country | | Amount* | | Value | | Assets | |
| |
| Repurchase Agreements (Cost $220,626,522) | | | | | | | | |
| i Joint Repurchase Agreement, 1.037%, 8/01/17 | | | | | | | | |
| (Maturity Value $220,632,874) | | | | | | | | |
| BNP Paribas Securities Corp. (Maturity Value $131,660,461) | | | | | | | | |
| Deutsche Bank Securities Inc. (Maturity Value $13,266,655) | | | | | | | | |
| HSBC Securities (USA) Inc. (Maturity Value $65,830,231) | | | | | | | | |
| Merrill Lynch, Pierce, Fenner & Smith Inc. | | | | | | | | |
| (Maturity Value $9,875,527) | | | | | | | | |
| Collateralized by U.S. Government Agency Securities, 1.25% - | | | | | | | | |
| 1.625%, 7/27/18 - 8/15/19; U.S. Treasury Note, 1.125% - | | | | | | | | |
| 2.625%, 11/15/20 - 2/28/21; and U.S. Treasury Note, Index | | | | | | | | |
| Linked, 0.125%, 4/15/18 (valued at $225,059,877) | United States | $ | 220,626,522 | $ | 220,626,522 | | 10.55 | |
| Total Investments (Cost $2,143,071,174) | | | | | 2,129,614,811 | | 101.86 | |
| Other Assets, less Liabilities | | | | | (38,988,472 | ) | (1.86 | ) |
| Net Assets | | | | $ | 2,090,626,339 | | 100.00 | |
†Rounds to less than 0.01% of net assets.
*The principal amount is stated in U.S. dollars unless otherwise indicated.
aNon-income producing.
bSee Note 8 regarding restricted securities.
cThe coupon rate shown represents the rate at period end.
dSee Note 1(e) regarding senior floating rate interests.
eA portion or all of the security purchased on a delayed delivery basis. See Note 1(c).
fSecurity was purchased pursuant to Rule 144A under the Securities Act of 1933 and may be sold in transactions exempt from registration only to qualified institutional buyers
or in a public offering registered under the Securities Act of 1933. These securities have been deemed liquid under guidelines approved by the Trust’s Board of Trustees.
gThe coupon rate will be determined at time of issue.
hSecurity purchased on a when-issued basis. See Note 1(c).
iSee Note 1(b) regarding joint repurchase agreement.
| | | | | | | | | | | |
| At July 31, 2017, the Fund had the following credit default swap contracts outstanding. See Note 1(d). | | | | |
| |
| Credit Default Swap Contracts | | | | | | | | |
| | | | | | | | Unamortized | | | | |
| | Periodic | | | | | | Upfront | | | | |
| | Payment | | | | Notional | Expiration | Payments Unrealized Unrealized | | | | |
| Description | Rate | | Exchange | | Amount | Date | (Receipts) Appreciation Depreciation | | Value | | Rating |
| Centrally Cleared Swap Contracts | | | | | | | | | | |
| Contracts to Buy Protection | | | | | | | | | | | |
| Traded Index | | | | | | | | | | | |
| CDX.NA.HY.26 | 5.00 | % | ICE | $ | 26,631,000 | 6/20/21 | $(1,951,821) $ — $(393,336) | $ | (2,345,157 | ) | |
| |
| |
| See Note 10 regarding other derivative information. | | | | | | | | |
| |
| See Abbreviations on page 32. | | | | | | | | | | | |
| |
| | | | The accompanying notes are an integral part of these financial statements. | Annual Report | | 20 |
FRANKLIN FLOATING RATE MASTER TRUST
| | | |
| Financial Statements | | | |
| |
| |
| Statement of Assets and Liabilities | | | |
| July 31, 2017 | | | |
| |
| Franklin Floating Rate Master Series | | | |
| |
| Assets: | | | |
| Investments in securities: | | | |
| Cost - Unaffiliated issuers | $ | 1,922,444,652 | |
| Cost - Repurchase agreements | | 220,626,522 | |
| Total cost of investments | $ | 2,143,071,174 | |
| Value - Unaffiliated issuers | $ | 1,908,988,289 | |
| Value - Repurchase agreements | | 220,626,522 | |
| Total value of investments | | 2,129,614,811 | |
| Cash. | | 2,699,619 | |
| Receivables: | | | |
| Dividends and interest | | 3,948,266 | |
| Due from brokers | | 481,198 | |
| Unrealized appreciation on unfunded loan commitments (Note 9) | | 408,925 | |
| Other assets | | 991 | |
| Total assets | | 2,137,153,810 | |
| Liabilities: | | | |
| Payables: | | | |
| Investment securities purchased | | 38,585,076 | |
| Management fees | | 990,554 | |
| Distributions to shareholders | | 6,565,726 | |
| Variation margin | | 8,694 | |
| Accrued expenses and other liabilities. | | 377,421 | |
| Total liabilities | | 46,527,471 | |
| Net assets, at value | $ | 2,090,626,339 | |
| Net assets consist of: | | | |
| Paid-in capital | $ | 2,287,596,390 | |
| Undistributed net investment income | | 1,102,329 | |
| Net unrealized appreciation (depreciation) | | (13,440,774 | ) |
| Accumulated net realized gain (loss) | | (184,631,606 | ) |
| Net assets, at value | $ | 2,090,626,339 | |
| Net asset value and maximum offering price per share ($2,090,626,339÷240,440,405 shares outstanding) | $ | 8.69 | |
| 21 | Annual Report | The accompanying notes are an integral part of these financial statements. |
FRANKLIN FLOATING RATE MASTER TRUST
FINANCIAL STATEMENTS
Statement of Operations for the year ended July 31, 2017
Franklin Floating Rate Master Series
| | | |
| Investment income: | | | |
| Dividends | $ | 136,936 | |
| Interest. | | 75,944,700 | |
| Total investment income | | 76,081,636 | |
| Expenses: | | | |
| Management fees (Note 3a) | | 9,343,561 | |
| Custodian fees (Note 4) | | 16,373 | |
| Reports to shareholders | | 6,014 | |
| Registration and filing fees | | 219 | |
| Professional fees | | 233,805 | |
| Trustees’ fees and expenses | | 60,350 | |
| Other | | 39,748 | |
| Total expenses | | 9,700,070 | |
| Expense reductions (Note 4) | | (7,734 | ) |
| Expenses waived/paid by affiliates (Note 3d) | | (348,195 | ) |
| Net expenses | | 9,344,141 | |
| Net investment income | | 66,737,495 | |
| Realized and unrealized gains (losses): | | | |
| Net realized gain (loss) from: | | | |
| Investments | | (21,072,024 | ) |
| Swap contracts | | (309,370 | ) |
| Net realized gain (loss) | | (21,381,394 | ) |
| Net change in unrealized appreciation (depreciation) on: | | | |
| Investments. | | 57,523,967 | |
| Swap contracts | | (393,336 | ) |
| Net change in unrealized appreciation (depreciation) | | 57,130,631 | |
| Net realized and unrealized gain (loss) | | 35,749,237 | |
| Net increase (decrease) in net assets resulting from operations | $ | 102,486,732 | |
The accompanying notes are an integral part of these financial statements. | Annual Report 22
| | | | | | |
| F R A N K L I N F L O A T I N G RA T E MA S T E R T R U S T | | | | | | |
| F I N A N C I A L S T A T E M E N T S | | | | | | |
| |
| |
| Statements of Changes in Net Assets | | | | | | |
| |
| Franklin Floating Rate Master Series | | | | | | |
| |
| | | Year Ended July 31, | |
| | | 2017 | | | 2016 | |
| Increase (decrease) in net assets: | | | | | | |
| Operations: | | | | | | |
| Net investment income | $ | 66,737,495 | | $ | 83,874,897 | |
| Net realized gain (loss) | | (21,381,394 | ) | | (41,087,672 | ) |
| Net change in unrealized appreciation (depreciation) | | 57,130,631 | | | (18,764,386 | ) |
| Net increase (decrease) in net assets resulting from operations | | 102,486,732 | | | 24,022,839 | |
| Distributions to shareholders from net investment income. | | (66,380,751 | ) | | (83,323,507 | ) |
| Capital share transactions (Note 2) | | 690,565,052 | | | (536,424,977 | ) |
| Net increase (decrease) in net assets | | 726,671,033 | | | (595,725,645 | ) |
| Net assets: | | | | | | |
| Beginning of year | | 1,363,955,306 | | | 1,959,680,951 | |
| End of year | $ | 2,090,626,339 | | $ | 1,363,955,306 | |
| Undistributed net investment income included in net assets: | | | | | | |
| End of year | $ | 1,102,329 | | $ | 900,126 | |
| 23 | Annual Report | The accompanying notes are an integral part of these financial statements. |
FRANKLIN FLOATING RATE MASTER TRUST
Notes to Financial Statements
Franklin Floating Rate Master Series
1. Organization and Significant Accounting Policies
Franklin Floating Rate Master Trust (Trust) is registered under the Investment Company Act of 1940 (1940 Act) as an open-end management investment company, consisting of three separate funds and applies the specialized accounting and reporting guidance in U.S. Generally Accepted Accounting Principles (U.S. GAAP). Franklin Floating Rate Master Series (Fund) is included in this report. The financial statements of the remaining funds in the Trust are presented separately. The Fund’s shares are exempt from registration under the Securities Act of 1933.
The following summarizes the Fund’s significant accounting policies.
a. Financial Instrument Valuation
The Fund’s investments in financial instruments are carried at fair value daily. Fair value is the price that would be received to sell an asset or paid to transfer a liability in an orderly transaction between market participants on the measurement date. The Fund calculates the net asset value (NAV) per share as of 4 p.m. Eastern time each day the New York Stock Exchange (NYSE) is open for trading. Under compliance policies and procedures approved by the Trust’s Board of Trustees (the Board), the Fund’s administrator has responsibility for oversight of valuation, including leading the cross-functional Valuation Committee (VC). The VC provides administration and oversight of the Fund’s valuation policies and procedures, which are approved annually by the Board. Among other things, these procedures allow the Fund to utilize independent pricing services, quotations from securities and financial instrument dealers, and other market sources to determine fair value.
Equity securities listed on an exchange or on the NASDAQ National Market System are valued at the last quoted sale price or the official closing price of the day, respectively. Over-the-counter (OTC) securities are valued within the range of the most recent quoted bid and ask prices. Securities that trade in multiple markets or on multiple exchanges are valued according to the broadest and most representative market. Certain equity securities are valued based upon fundamental characteristics or relationships to similar securities.
Debt securities generally trade in the OTC market rather than on a securities exchange. The Fund’s pricing services use multiple valuation techniques to determine fair value. In instances where sufficient market activity exists, the pricing services may utilize a market-based approach through which quotes from market makers are used to determine fair value. In instances where sufficient market activity may not exist or is limited, the pricing services also utilize proprietary valuation models which may consider market characteristics such as benchmark yield curves, credit spreads, estimated default rates, anticipated market interest rate volatility, coupon rates, anticipated timing of principal repayments, underlying collateral, and other unique security features in order to estimate the relevant cash flows, which are then discounted to calculate the fair value.
Investments in repurchase agreements are valued at cost, which approximates fair value.
Certain derivative financial instruments are centrally cleared or trade in the OTC market. The Fund’s pricing services use various techniques including industry standard option pricing models and proprietary discounted cash flow models to determine the fair value of those instruments. The Fund’s net benefit or obligation under the derivative contract, as measured by the fair value of the contract, is included in net assets.
The Fund has procedures to determine the fair value of financial instruments for which market prices are not reliable or readily available. Under these procedures, the VC convenes on a regular basis to review such financial instruments and considers a number of factors, including significant unobservable valuation inputs, when arriving at fair value. The VC primarily employs a market-based approach which may use related or comparable assets or liabilities, recent transactions, market multiples, book values, and other relevant information for the investment to determine the fair value of the investment. An income-based valuation approach may also be used in which the anticipated future cash flows of the investment are discounted to calculate fair value. Discounts may also be applied due to the nature or duration of any restrictions on the disposition of the investments. Due to the inherent uncertainty of valuations of such investments, the fair values may differ significantly from the values that would have been used had an active market existed. The VC employs various methods for calibrating these valuation approaches including a regular review of key inputs and assumptions, transactional back-testing or disposition analysis, and reviews of any related market activity.
Annual Report
24
FRANKLIN FLOATING RATE MASTER TRUST
NOTES TO FINANCIAL STATEMENTS
Franklin Floating Rate Master Series (continued)
1. Organization and Significant Accounting
Policies (continued)
b. Joint Repurchase Agreement
The Fund enters into a joint repurchase agreement whereby its uninvested cash balance is deposited into a joint cash account with other funds managed by the investment manager or an affiliate of the investment manager and is used to invest in one or more repurchase agreements. The value and face amount of the joint repurchase agreement are allocated to the funds based on their pro-rata interest. A repurchase agreement is accounted for as a loan by the Fund to the seller, collateralized by securities which are delivered to the Fund’s custodian. The fair value, including accrued interest, of the initial collateralization is required to be at least 102% of the dollar amount invested by the funds, with the value of the underlying securities marked to market daily to maintain coverage of at least 100%. Repurchase agreements are subject to the terms of Master Repurchase Agreements (MRAs) with approved counterparties (sellers). The MRAs contain various provisions, including but not limited to events of default and maintenance of collateral for repurchase agreements. In the event of default by either the seller or the Fund, certain MRAs may permit the non-defaulting party to net and close-out all transactions, if any, traded under such agreements. The Fund may sell securities it holds as collateral and apply the proceeds towards the repurchase price and any other amounts owed by the seller to the Fund in the event of default by the seller. This could involve costs or delays in addition to a loss on the securities if their value falls below the repurchase price owed by the seller. The joint repurchase agreement held by the Fund at year end, as indicated in the Statement of Investments, had been entered into on July 31, 2017.
c. Securities Purchased on a When-Issued or Delayed Delivery Basis
The Fund purchases securities on a when-issued or delayed delivery basis, with payment and delivery scheduled for a future date. These transactions are subject to market fluctuations and are subject to the risk that the value at delivery may be more or less than the trade date purchase price. Although the Fund will generally purchase these securities with the intention of holding the securities, it may sell the securities before the settlement date. Sufficient assets have been segregated for these securities.
d. Derivative Financial Instruments
The Fund invested in derivative financial instruments in order to manage risk or gain exposure to various other investments or markets. Derivatives are financial contracts based on an underlying or notional amount, require no initial investment or an initial net investment that is smaller than would normally be required to have a similar response to changes in market factors, and require or permit net settlement. Derivatives contain various risks including the potential inability of the counterparty to fulfill their obligations under the terms of the contract, the potential for an illiquid secondary market, and/or the potential for market movements which expose the Fund to gains or losses in excess of the amounts shown in the Statement of Assets and Liabilities. Realized gain and loss and unrealized appreciation and depreciation on these contracts for the period are included in the Statement of Operations.
Collateral requirements differ by type of derivative. Collateral or initial margin requirements are set by the broker or exchange clearing house for exchange traded and centrally cleared derivatives. Initial margin deposited is held at the exchange and can be in the form of cash and/or securities.
The Fund entered into credit default swap contracts primarily to manage and/or gain exposure to credit risk. A credit default swap is an agreement between the Fund and a counterparty whereby the buyer of the contract receives credit protection and the seller of the contract guarantees the credit worthiness of a referenced debt obligation. These agreements may be privately negotiated in the over-the-counter market (OTC credit default swaps) or may be executed in a multilateral trade facility platform, such as a registered exchange (centrally cleared credit default swaps). The underlying referenced debt obligation may be a single issuer of corporate or sovereign debt, a credit index, a basket of issuers or indices, or a tranche of a credit index or basket of issuers or indices. In the event of a default of the underlying referenced debt obligation, the buyer is entitled to receive the notional amount of the credit default swap contract from the seller in exchange for the referenced debt obligation, a net settlement amount equal to the notional amount of the credit default swap less the recovery value of the referenced debt obligation, or other agreed upon amount. For centrally cleared credit default swaps, required initial margins are pledged by the Fund, and the daily change in fair value is accounted for as a variation margin payable or receivable in the Statement of Assets and Liabilities. Over the term of the contract, the buyer pays the seller a periodic stream of payments, provided that no
FRANKLIN FLOATING RATE MASTER TRUST
NOTES TO FINANCIAL STATEMENTS
Franklin Floating Rate Master Series (continued)
event of default has occurred. Such periodic payments are accrued daily as an unrealized appreciation or depreciation until the payments are made, at which time they are realized. Upfront payments and receipts are reflected in the Statement of Assets and Liabilities and represent compensating factors between stated terms of the credit default swap agreement and prevailing market conditions (credit spreads and other relevant factors). These upfront payments and receipts are amortized over the term of the contract as a realized gain or loss in the Statement of Operations.
See Note 10 regarding other derivative information.
e. Senior Floating Rate Interests
The Fund invests in senior secured corporate loans that pay interest at rates which are periodically reset by reference to a base lending rate plus a spread. These base lending rates are generally the prime rate offered by a designated U.S. bank or the London InterBank Offered Rate (LIBOR). Senior secured corporate loans often require prepayment of principal from excess cash flows or at the discretion of the borrower. As a result, actual maturity may be substantially less than the stated maturity. Senior secured corporate loans in which the Fund invests are generally readily marketable, but may be subject to certain restrictions on resale.
f. Income Taxes
The Fund is a disregarded entity for U.S. income tax purposes. As such, no provision has been made for income taxes because all income, expenses, gains and losses are allocated to a non-U.S. beneficial owner for inclusion in its individual income tax return, as applicable.
g. Security Transactions, Investment Income, Expenses and Distributions
Security transactions are accounted for on trade date. Realized gains and losses on security transactions are determined on a specific identification basis. Interest income and estimated expenses are accrued daily. Amortization of premium and accretion of discount on debt securities are included in interest income. Facility fees are recognized as income over the expected term of the loan. Dividend income is recorded on the ex-dividend date. The Fund’s net investment income is allocated to the owner daily and paid monthly. Net capital gains (or losses) realized by the Fund will not be distributed. Distributions to shareholders are recorded on the ex-dividend date. Distributable earnings are determined according to income tax regulations (tax basis) and may differ from earnings recorded in accordance with U.S. GAAP. These differences may be permanent or temporary. Permanent differences are reclassified among capital accounts to reflect their tax character. These reclassifications have no impact on net assets or the results of operations. Temporary differences are not reclassified, as they may reverse in subsequent periods.
Common expenses incurred by the Trust are allocated among the Funds based on the ratio of net assets of each Fund to the combined net assets of the Trust. Fund specific expenses are charged directly to the Fund that incurred the expense.
h. Accounting Estimates
The preparation of financial statements in accordance with U.S. GAAP requires management to make estimates and assumptions that affect the reported amounts of assets and liabilities at the date of the financial statements and the amounts of income and expenses during the reporting period. Actual results could differ from those estimates.
i. Guarantees and Indemnifications
Under the Trust’s organizational documents, its officers and trustees are indemnified by the Trust against certain liabilities arising out of the performance of their duties to the Trust. Additionally, in the normal course of business, the Trust, on behalf of the Fund, enters into contracts with service providers that contain general indemnification clauses. The Trust’s maximum exposure under these arrangements is unknown as this would involve future claims that may be made against the Trust that have not yet occurred. Currently, the Trust expects the risk of loss to be remote.
Annual Report
26
|
| F R A N K L I N F L O A T I N G RA T E MA S T E R T R U S T |
| N O T E S T O F I N A N C I A L S T A T E M E N T S |
Franklin Floating Rate Master Series (continued)
2. Shares of Beneficial Interest
At July 31, 2017, there were an unlimited number of shares authorized (without par value). Transactions in the Fund’s shares were as follows:
| | | | | | | | | | |
| | | | | Year Ended July 31, | | | | |
| | | | | 2017 | | | | | 2016 | |
| | Shares | | | Amount | | Shares | | | Amount | |
| Shares sold | 96,198,198 | | $ | 835,951,774 | | 16,210,844 | | $ | 137,334,533 | |
| Shares redeemed | (16,796,844 | ) | | (145,386,722 | ) | (81,856,245 | ) | | (673,759,510 | ) |
| Net increase (decrease) | 79,401,354 | | $ | 690,565,052 | | (65,645,401 | ) | $ | (536,424,977 | ) |
3. Transactions with Affiliates
Franklin Resources, Inc. is the holding company for various subsidiaries that together are referred to as Franklin Templeton Investments. Certain officers and trustees of the Fund are also officers and/or directors of the following subsidiaries:
| |
| Subsidiary | Affiliation |
| Franklin Advisers, Inc. (Advisers) | Investment manager |
| Franklin Templeton Services, LLC (FT Services) | Administrative manager |
| Franklin Templeton Investor Services, LLC (Investor Services) | Transfer agent |
| | |
| a. Management Fees | | |
| The Fund pays an investment management fee to Advisers based on the average daily net assets of the Fund as follows: |
| Annualized Fee Rate | | Net Assets |
| 0.530% | | Up to and including $2.5 billion |
| 0.450% | | Over $2.5 billion, up to and including $6.5 billion |
| 0.430% | | Over $6.5 billion, up to and including $11.5 billion |
| 0.400% | | Over $11.5 billion, up to and including $16.5 billion |
| 0.390% | | Over $16.5 billion, up to and including $19 billion |
| 0.380% | | Over $19 billion, up to and including $21.5 billion |
| 0.370% | | In excess of $21.5 billion |
For the year ended July 31, 2017, the effective investment management fee rate was 0.530% of the Fund’s average daily net assets.
b. Administrative Fees
Under an agreement with Advisers, FT Services provides administrative services to the Fund. The fee is paid by Advisers based on the Fund’s average daily net assets, and is not an additional expense of the Fund.
c. Transfer Agent Fees
Investor Services, under terms of an agreement, performs shareholder servicing for the Fund and is not paid by the Fund for the services.
|
| F R A N K L I N F L O A T I N G R A T E MA S T E R T R U S T |
| N O T E S T O F I N A N C I A L S T A T E M E N T S |
Franklin Floating Rate Master Series (continued)
d. Waiver and Expense Reimbursements
Advisers has voluntarily agreed in advance to waive or limit its fees and to assume as its own expense certain expenses otherwise payable by the Fund so that the expenses (excluding acquired fund fees and expenses) do not exceed 0.53% based on the average net assets of the fund (other than certain non-routine expenses or costs, including those relating to litigation, indemnification, reorganizations, and liquidations). Advisers may discontinue this waiver at any time upon notice to the Board.
e. Other Affiliated Transactions
At July 31, 2017, Franklin Floating Rate Fund, PLC owned 100% of the Fund’s outstanding shares. Investment activities of this shareholder could have a material impact on the Fund.
f. Interfund Transactions
The Fund engaged in purchases and sales of investments with funds or other accounts that have common investment managers (or affiliated investment managers), directors, trustees or officers. During the year ended July 31, 2017, these purchase and sale transactions aggregated $8,621,301 and $0, respectively.
4. Expense Offset Arrangement
The Fund has entered into an arrangement with its custodian whereby credits realized as a result of uninvested cash balances are used to reduce a portion of the Fund’s custodian expenses. During the year ended July 31, 2017, the custodian fees were reduced as noted in the the Statement of Operations.
5. Income Taxes
At July 31, 2017, the cost of investments and net unrealized appreciation (depreciation) for income tax purposes were as follows:
| | | |
| Cost of investments. | $ | 2,142,552,962 | |
| |
| Unrealized appreciation | $ | 13,876,991 | |
| Unrealized depreciation | | (26,815,142 | ) |
| Net unrealized appreciation (depreciation) | $ | (12,938,151 | ) |
Differences between income and/or capital gains as determined on a book basis and a tax basis are primarily due to differing treatment of bond discounts and premiums.
6. Investment Transactions
Purchases and sales of investments (excluding short term securities) for the period ended July 31, 2017, aggregated $1,633,510,342 and $1,062,929,719, respectively.
7. Credit Risk and Defaulted Securities
At July 31, 2017, the Fund had 73.2% of its portfolio invested in high yield, senior secured floating rate notes, or other securities rated below investment grade and unrated securities, if any. These securities may be more sensitive to economic conditions causing greater price volatility and are potentially subject to a greater risk of loss due to default than higher rated securities.
Annual Report
28
| | | | | | | | | | | |
| F R A N K L I N F L O A T I N G RA T E MA S T E R T R U S T | | | | | | | | | | |
| N O T E S T O F I N A N C I A L S T A T E M E N T S | | | | | | | | | | |
| |
| |
| |
| Franklin Floating Rate Master Series (continued) | | | | | | | | | | |
| |
| 8. Restricted Securities | | | | | | | | | | | |
| |
| The Fund invests in securities that are restricted under the Securities Act of 1933 (1933 Act) or which are subject to legal, | | | |
| contractual, or other agreed upon restrictions on resale. Restricted securities are often purchased in private placement transactions, | |
| and cannot be sold without prior registration unless the sale is pursuant to an exemption under the 1933 Act. Disposal of these | |
| securities may require greater effort and expense, and prompt sale at an acceptable price may be difficult. The Fund may have | |
| registration rights for restricted securities. The issuer generally incurs all registration costs. | | | | | |
| |
| At July 31, 2017, investments in restricted securities, excluding certain securities exempt from registration under the 1933 Act | |
| deemed to be liquid, were as follows: | | | | | | | | | | |
| |
| | | | | | | Acquisition | | | | | |
| Shares Issuer | | | | | | Date | | Cost | | Value | |
| 40,359 Warrior Met Coal Inc. (Value is 0.0%† of Net Assets) | | | | | 7/31/14 - 9/19/14 | $ | 5,526,953 | $ | 854,640 | |
| |
| † Rounds to less than 0.1% of net assets. | | | | | | | | | | | |
| |
| 9. Unfunded Loan Commitments | | | | | | | | | | |
| |
| The Fund enters into certain credit agreements, all or a portion of which may be unfunded. The Fund is obligated to fund these loan | |
| commitments at the borrowers’ discretion. Unfunded loan commitments and funded portions of credit agreements are marked to | |
| market daily and any unrealized appreciation or depreciation is included in the Statement of Assets and Liabilities and the Statement | |
| of Operations. Funded portions of credit agreements are presented in the Statement of Investments. | | | | | |
| |
| At July 31, 2017, unfunded commitments were as follows: | | | | | | | | | | |
| |
| | | | | Unfunded | | | | | | | |
| Borrower | | | | Commitment | | | | | | | |
| BMC Software Finance, Inc., Non-Extended US Revolving Commitment | $ | 9,593,418 | | | | | | | |
| |
| |
| 10. Other Derivative Information | | | | | | | | | | |
| |
| At July 31, 2017, the Fund’s investments in derivative contracts are reflected in the Statement of Assets and Liabilities as follows: | |
| |
| | Asset Derivatives | | | | Liability Derivatives | | | |
| Derivative Contracts | Statement of | | | | | Statement of | | | | | |
| Not Accounted for as | Assets and Liabilities | | | | | Assets and Liabilities | | | | | |
| Hedging Instruments | Location | | | Fair Value | | Location | | | | Fair Value | |
| Credit contracts | Variation margin | | $ | — | | Variation margin | | | $ | 393,336 | a |
| aThis amount reflects the cumulative appreciation (depreciation) of centrally cleared swap contracts as reported in the Statement of Investments. Only the variation margin | |
| receivable/payable at period end is separately reported within the Statement of Assets and Liabilities. Prior variation margin movements were recorded to cash upon receipt | |
| or payment. | | | | | | | | | | | |
| For the year ended July 31, 2017, the effect of derivative contracts in the Fund’s Statement of Operations was as follows: | | | |
| |
| | | | | | | | | Net Change in | |
| | | | | | | | | | | Unrealized | |
| Derivative Contracts | | | | Net Realized | | | | Appreciation | |
| Not Accounted for as | Statement of | Gain (Loss) for | | Statement of | | (Depreciation) | |
| Hedging Instruments | Operations Locations | | | the Year | | Operations Locations | | for the Year | |
| | Net realized gain (loss) from: | | | | Net change in unrealized | | | |
| | | | | | | appreciation (depreciation) on: | | | |
| Credit contracts | Swap contracts | | $ | (309,370 | ) | Swap contracts | | | $ | (393,336 | ) |
|
| F R A N K L I N F L O A T I N G R A T E MA S T E R T R U S T |
| N O T E S T O F I N A N C I A L S T A T E M E N T S |
Franklin Floating Rate Master Series (continued)
For the year ended July 31, 2017, the average month end notional amount of swap contracts represented $12,616,728.
See Note 1(d) regarding derivative financial instruments.
11. Shareholder Distributions
For the period ended July 31, 2017, the Fund made the following distributions:
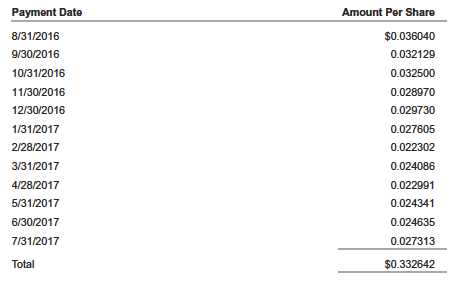
12. Credit Facility
The Fund, together with other U.S. registered and foreign investment funds (collectively, Borrowers), managed by Franklin Templeton Investments, are borrowers in a joint syndicated senior unsecured credit facility totaling $2 billion (Global Credit Facility) which matures on February 9, 2018. This Global Credit Facility provides a source of funds to the Borrowers for temporary and emergency purposes, including the ability to meet future unanticipated or unusually large redemption requests.
Under the terms of the Global Credit Facility, the Fund shall, in addition to interest charged on any borrowings made by the Fund and other costs incurred by the Fund, pay its share of fees and expenses incurred in connection with the implementation and maintenance of the Global Credit Facility, based upon its relative share of the aggregate net assets of all of the Borrowers, including an annual commitment fee of 0.15% based upon the unused portion of the Global Credit Facility. These fees are reflected in other expenses in the Statement of Operations. During the year ended July 31, 2017, the Fund did not use the Global Credit Facility.
13. Fair Value Measurements
The Fund follows a fair value hierarchy that distinguishes between market data obtained from independent sources (observable inputs) and the Fund’s own market assumptions (unobservable inputs). These inputs are used in determining the value of the Fund’s financial instruments and are summarized in the following fair value hierarchy:
• Level 1 – quoted prices in active markets for identical financial instruments
• Level 2 – other significant observable inputs (including quoted prices for similar financial instruments, interest rates, prepayment speed, credit risk, etc.)
Annual Report
30
| | | | | | | | | |
| F R A N K L I N F L O A T I N G RA T E MA S T E R T R U S T | | | | | | | | |
| N O T E S T O F I N A N C I A L S T A T E M E N T S | | | | | | | | |
| |
| |
| |
| Franklin Floating Rate Master Series (continued) | | | | | | | | |
| |
| 13. Fair Value Measurements (continued) | | | | | | | | |
| • Level 3 – significant unobservable inputs (including the Fund’s own assumptions in determining the fair value of financial instruments) |
| | | | | | | | | |
| |
| The input levels are not necessarily an indication of the risk or liquidity associated with financial instruments at that level. |
| |
| For movements between the levels within the fair value hierarchy, the Fund has adopted a policy of recognizing the transfers as of |
| the date of the underlying event which caused the movement. | | | | | | | | |
| |
| | | Level 1 | | | Level 2 | | Level 3 | | Total |
| Assets: | | | | | | | | | |
| Investments in Securities: | | | | | | | | | |
| Equity Investments:a | | | | | | | | | |
| Oil & Gas Exploration & Production | $ | — | | $ | 3,343,271 | $ | — | $ | 3,343,271 |
| Steel | | — | | | — | | 854,640 | | 854,640 |
| Senior Floating Rate Interests | | — | | 1,712,566,055 | | — | | 1,712,566,055 |
| Asset-Backed Securities. | | — | | 189,094,533 | | 3,000,000 | | 192,094,533 |
| Short Term Investments | | — | | 220,756,312 | | — | | 220,756,312 |
| Total Investments in Securities | $ | — | $ | 2,125,760,171 | $ | 3,854,640 | $ | 2,129,614,811 |
| Other Financial Instruments: | | | | | | | | | |
| Unfunded Loan Commitments. | $ | — | | $ | 408,925 | $ | — | $ | 408,925 |
| Liabilities: | | | | | | | | | |
| Other Financial Instruments: | | | | | | | | | |
| Swap Contracts. | $ | — | | $ | 393,336 | $ | — | $ | 393,336 |
| aIncludes common stocks. | | | | | | | | | |
A reconciliation of assets in which Level 3 inputs are used in determining fair value is presented when there are significant Level 3 financial instruments at the end of the year.
14. New Accounting Pronouncements
In March 2017, the Financial Accounting Standards Board (FASB) issued Accounting Standards Update (ASU) No. 2017-08, Receivables—Nonrefundable Fees and Other Costs (Subtopic 310-20): Premium Amortization on Purchased Callable Debt Securities. The amendments in the ASU shorten the amortization period for certain callable debt securities acquired at a premium, to be amortized to the earliest call date. The ASU does not require an accounting change for securities acquired at a discount, which continues to be amortized to maturity. The ASU is effective for fiscal years and interim periods within those fiscal years beginning after December 15, 2018. Management is currently evaluating the impact, if any, of applying this provision.
15. Investment Company Reporting Modernization
In October 2016, the U.S. Securities and Exchange Commission adopted new rules and amended existing rules (together, final rules) intended to modernize the reporting and disclosure of information by registered investment companies. In part, the final rules amend Regulation S-X and require standardized, enhanced disclosures about derivatives in investment company financial statements, as well as other amendments. The compliance date for the amendments to Regulation S-X is August 1, 2017. Management has reviewed the requirements and believes the adoption of the amendments to Regulation S-X will not have a material impact on the Fund’s financial statements and related disclosures.
|
| F R A N K L I N F L O A T I N G R A T E MA S T E R T R U S T |
| N O T E S T O F I N A N C I A L S T A T E M E N T S |
Franklin Floating Rate Master Series (continued)
16. Subsequent Events
The Fund has evaluated subsequent events through the issuance of the financial statements and determined that no events have occurred that require disclosure.
| | |
| Abbreviations | | |
| |
| Exchange | Selected Portfolio |
| ICE Intercontinental Exchange | CDO | Collateralized Debt Obligation |
| | CLO | Collateralized Loan Obligation |
| | FRN | Floating Rate Note |
Annual Report
32
FRANKLIN FLOATING RATE MASTER TRUST
Report of Independent Registered Public Accounting Firm
To the Board of Trustees of Franklin Floating Rate Master Trust and Shareholders of the Franklin Floating Rate Master Series
In our opinion, the accompanying statement of assets and liabilities, including the statement of investments, and the related statements of operations and of changes in net assets and the financial highlights present fairly, in all material respects, the financial position of the Franklin Floating Rate Master Series (the "Fund") as of July 31, 2017, the results of its operations for the year then ended, the changes in its net assets for each of the two years in the period then ended and the financial highlights for each of the five years in the period then ended, in conformity with accounting principles generally accepted in the United States of America. These financial statements and financial highlights (hereafter referred to as "financial statements") are the responsibility of the Fund’s management. Our responsibility is to express an opinion on these financial statements based on our audits. We conducted our audits of these financial statements in accordance with the standards of the Public Company Accounting Oversight Board (United States). Those standards require that we plan and perform the audit to obtain reasonable assurance about whether the financial statements are free of material misstatement. An audit includes examining, on a test basis, evidence supporting the amounts and disclosures in the financial statements, assessing the accounting principles used and significant estimates made by management, and evaluating the overall financial statement presentation. We believe that our audits, which included confirmation of securities as of July 31, 2017 by correspondence with the custodian and brokers, provide a reasonable basis for our opinion.
PricewaterhouseCoopers LLP
San Francisco, California September 15, 2017
Item 2. Code of Ethics.
(a) The Registrant has adopted a code of ethics that applies to its principal executive officers and principal financial and accounting officer.
(c) N/A
(d) N/A
(f) Pursuant to Item 12(a)(1), the Registrant is attaching as an exhibit a copy of its code of ethics that applies to its principal executive officers and principal financial and accounting officer.
Item 3. Audit Committee Financial Expert.
(a)(1) The Registrant has an audit committee financial expert serving on its audit committee.
(2) The audit committee financial expert is John B. Wilson and he is "independent" as defined under the relevant Securities and Exchange Commission Rules and Releases.
Item 4. Principal Accountant Fees And Services.
(a)Audit Fees
The aggregate fees paid to the principal accountant for professional services rendered by the principal accountant for the audit of the registrant’s annual financial statements or for services that are normally provided by the principal accountant in connection with statutory and regulatory filings or engagements were $194,600 for the fiscal year ended July 31, 2017 and $197,816 for the fiscal year ended July 31, 2016.
(b)Audit-Related Fees
There were no fees paid to the principal accountant for assurance and related services rendered by the principal accountant to the registrant that are reasonably related to the performance of the audit of the registrant's financial statements and are not reported under paragraph (a) of Item 4.
There were no fees paid to the principal accountant for assurance and related services rendered by the principal accountant to the registrant's investment adviser and any entity controlling, controlled by or under common control with the investment adviser that provides ongoing services to the registrant that are reasonably related to the performance of the audit of their financial statements.
(c)Tax Fees
There were no fees paid to the principal accountant for professional services rendered by the principal accountant to the registrant for tax compliance, tax advice and tax planning.
There were no fees paid to the principal accountant for professional services rendered by the principal accountant to the registrant’s investment adviser and any entity controlling, controlled by or under common control with the investment adviser that provides ongoing services to the registrant for tax compliance, tax advice and tax planning.
(d)All Other Fees
The aggregate fees paid to the principal accountant for products and services rendered by the principal accountant to the registrant not reported in paragraphs (a)-(c) of Item 4 were $0 for the fiscal year ended July 31, 2017 and $824 for the fiscal year ended July 31, 2016. The services for which these fees were paid included review of materials provided to the fund Board in connection with the investment management contract renewal process.
The aggregate fees paid to the principal accountant for products and services rendered by the principal accountant to the registrant’s investment adviser and any entity controlling, controlled by or under common control with the investment adviser that provides ongoing services to the registrant, other than services reported in paragraphs (a)-(c) of Item 4 were $255,000 for the fiscal year ended July 31, 2017 and $442,751 for the fiscal year ended July 31, 2016. The services for which these fees were paid included preparation and review of materials provided to the fund Board in connection with the investment management contract renewal process and derivatives assessment, and review of system processes related to fixed income securities.
(e)(1) The registrant’s audit committee is directly responsible for approving the services to be provided by the auditors, including:
(i) pre-approval of all audit and audit related services;
(ii) pre-approval of all non-audit related services to be provided to the Fund by the auditors;
(iii) pre-approval of all non-audit related services to be provided to the registrant by the auditors to the registrant’s investment adviser or to any entity that controls, is controlled by or is under common control with the registrant’s investment adviser and that provides ongoing services to the registrant where the non-audit services relate directly to the operations or financial reporting of the registrant; and
(iv) establishment by the audit committee, if deemed necessary or appropriate, as an alternative to committee pre-approval of services to be provided by the auditors, as required by paragraphs (ii) and (iii) above, of policies and procedures to permit such services to be pre-approved by other means, such as through establishment of guidelines or by action of a designated member or members of the committee; provided the policies and procedures are detailed as to the particular service and the committee is informed of each service and such policies and procedures do not include delegation of audit committee responsibilities, as contemplated under the Securities Exchange Act of 1934, to management; subject, in the case of (ii) through (iv), to any waivers, exceptions or exemptions that may be available under applicable law or rules.
(e) (2) None of the services provided to the registrant described in paragraphs (b)-(d) of Item 4 were approved by the audit committee pursuant to paragraph (c)(7)(i)(C) of Rule 2-01 of regulation S-X.
(f)No disclosures are required by this Item 4(f).
(g)The aggregate non-audit fees paid to the principal accountant for services rendered by the principal accountant to the registrant and the registrant’s investment adviser and any entity controlling, controlled by or under common control with the investment adviser that provides ongoing services to the registrant were $255,000 for the fiscal year ended July 31, 2017 and $443,575 for the fiscal year ended July 31, 2016.
(h) The registrant’s audit committee of the board has considered whether the provision of non-audit services that were rendered to the registrant’s investment adviser (not including any sub-adviser whose role is primarily portfolio management and is subcontracted with or overseen by another investment adviser), and any entity controlling, controlled by, or under common control with the investment adviser that provides ongoing services to the registrant that were not pre-approved pursuant to paragraph (c)(7)(ii) of Rule 2-01 of Regulation S-X is compatible with maintaining the principal accountant’s independence.
Item 5. Audit Committee of Listed Registrants. N/A
Item 6. Schedule of Investments. N/A
Item 7. Disclosure of Proxy Voting Policies and Procedures for Closed-End Management Investment Companies. N/A
Item 8. Portfolio Managers of Closed-End Management Investment Companies. N/A
Item 9. Purchases of Equity Securities by Closed-End Management Investment Company and Affiliated Purchasers. N/A
Item 10. Submission of Matters to a Vote of Security Holders.
There have been no changes to the procedures by which shareholders may recommend nominees to the Registrant's Board of Trustees that would require disclosure herein.
Item 11. Controls and Procedures.
(a) Evaluation of Disclosure Controls and Procedures. The Registrant maintains disclosure controls and procedures that are designed to ensure that information required to be disclosed in the Registrant’s filings under the Securities Exchange Act of 1934 and the Investment Company Act of 1940 is recorded, processed, summarized and reported within the periods specified in the rules and forms of the Securities and Exchange Commission. Such information is accumulated and communicated to the Registrant’s management, including its principal executive officer and principal financial officer, as appropriate, to allow timely decisions regarding required disclosure. The Registrant’s management, including the principal executive officer and the principal financial officer, recognizes that any set of controls and procedures, no matter how well designed and operated, can provide only reasonable assurance of achieving the desired control objectives.
Within 90 days prior to the filing date of this Shareholder Report on Form N-CSR, the Registrant had carried out an evaluation, under the supervision and with the participation of the Registrant’s management, including the Registrant’s principal executive officer and the Registrant’s principal financial officer, of the effectiveness of the design and operation of the Registrant’s disclosure controls and procedures. Based on such evaluation, the Registrant’s principal executive officer and principal financial officer concluded that the Registrant’s disclosure controls and procedures are effective.
(b) Changes in Internal Controls. There have been no changes in the Registrant’s internal controls or in other factors that could materially affect the internal controls over financial reporting subsequent to the date of their evaluation in connection with the preparation of this Shareholder Report on Form N-CSR.
Item 12. Exhibits.
(a) (1) Code of Ethics
(a) (2) Certifications pursuant to Section 302 of the Sarbanes-Oxley Act of 2002 of Matthew T. Hinkle, Chief Executive Officer - Finance and Administration, and Gaston Gardey, Chief Financial Officer and Chief Accounting Officer
(b) Certifications pursuant to Section 906 of the Sarbanes-Oxley Act of 2002 of Matthew T. Hinkle, Chief Executive Officer - Finance and Administration, and Gaston Gardey, Chief Financial Officer and Chief Accounting Officer
SIGNATURES
Pursuant to the requirements of the Securities Exchange Act of 1934 and the Investment Company Act of 1940, the registrant has duly caused this report to be signed on its behalf by the undersigned, thereunto duly authorized.
FRANKLIN FLOATING RATE MASTER TRUST
By _/s/Matthew T, Hinkle
Matthew T. Hinkle
Chief Executive Officer - Finance and Administration
Date September 26, 2017
Pursuant to the requirements of the Securities Exchange Act of 1934 and the Investment Company Act of 1940, this report has been signed below by the following persons on behalf of the registrant and in the capacities and on the dates indicated.
By _/s/Matthew T, Hinkle
Matthew T. Hinkle
Chief Executive Officer - Finance and Administration
Date September 26, 2017
By _/s/Gaston Gardey
Gaston Gardey
Chief Financial Officer and Chief Accounting Officer
Date September 26, 2017