UNITED STATES
SECURITIES AND EXCHANGE COMMISSION
Washington, DC 20549
FORM N-CSR
CERTIFIED SHAREHOLDER REPORT OF REGISTERED MANAGEMENT INVESTMENT COMPANIES
Investment Company Act file number_811-09869
__Franklin Floating Rate Master Trust
(Exact name of registrant as specified in charter)
One Franklin Parkway, San Mateo, CA 94403-1906
(Address of principal executive offices) (Zip code)
Craig S. Tyle, One Franklin Parkway, San Mateo, CA 94403-1906
(Name and address of agent for service)
Registrant's telephone number, including area code:_650 312-2000
Date of fiscal year end: 7/31
Date of reporting period: 7/31/15
Item 1. Reports to Stockholders.
Franklin Floating Rate Master Series Annual Report
Manager’s Discussion
During the 12 months ended July 31, 2015, the Fund delivered a +1.30% cumulative total return.1 In comparison, the Credit Suisse Leveraged Loan Index (CS LLI), which is designed to mirror the investable universe of the U.S. dollar-denominated leveraged loan market, generated a +2.29% total return.2
Fund returns during the fiscal year were driven primarily by our selection of individual loans, rather than by our allocation among credit rating tiers. The term loans of a paperboard packaging manufacturer contributed to returns following our investment in the primary market. The loans traded higher from their original issue price due to their relatively higher income generation and the company’s relatively stable performance. Furthermore, our investment in the second-lien term loan of a food manufacturer contributed to returns by providing a relatively attractive coupon and retracing declines from earlier in the period. However, certain individual issuers detracted from the Fund’s overall performance relative to the index. The term loan of a health care issuer within our portfolio detracted from performance as it declined meaningfully after the company reported financial results. Furthermore, our investment in the term loan of an oil and gas producer declined in price as investors expected falling oil prices to negatively impact drilling contractors and energy producers.
During the period, the Fund’s transactions focused on increasing the weighting of loans in the upper-tier segment of the index, with purchases made predominantly among loans with higher credit ratings trading at discounts to par, which we believe would be less impacted by refinancing activity. We executed this strategy through secondary purchases, as well as participating in select deals in the primary market related to merger and acquisition transactions. Among the top investments during the period were the new term loans of Canada-based Valeant Pharmaceuticals International, which were issued to finance the company’s acquisition of Salix Pharmaceuticals, another specialty pharmaceutical company that develops and manufactures a broad range of branded and generic pharmaceuticals. We invested in the new deal due to the company’s position as a leader in fast-growing markets, its diversified product portfolio and its track record of organic growth. The term loans of Endo International were also among the Fund’s largest investments, as we participated in the company’s primary market transaction to finance the acquisition of Par Pharmaceuticals. We were attracted to the combined company’s diversified pharmaceutical portfolio, aggregate share in the generic pharmaceutical market and pipeline of drugs with high barriers to entry.
To help manage liquidity, the Fund used iShares iBoxx $ High Yield Corporate Bond ETF,3 an exchange-traded fund (ETF) that seeks to track the high yield bond market, and PowerShares Senior Loan Portfolio, an ETF that seeks to track the leveraged loan market. We invested in these ETFs to gain liquid exposure to credit while seeking to maintain sufficient daily liquidity for our shareholders in the event of share redemptions. We also purchased and sold protection in the High Yield Credit Default Swap Index, an index of high yield bond credit default swaps providing synthetic exposure to the high yield bond market, to gain additional exposure to credit, or alternatively, to protect against further credit market volatility. Our combined exposure in all of these instruments was limited to no more than 3% of the Fund’s net assets during the period.
Notes:
1. Fund investment results reflect the voluntary expense reduction, without which the results would have been lower.
2. Source: Credit Suisse Group.
The index is unmanaged and includes reinvested interest. One cannot invest directly in an index, and an index is not
representative of the Fund’s portfolio.
3. Not held at period-end.
See www.franklintempletondatasources.com for additional data provider information.
| | |
| Portfolio Breakdown | % of Total Net Assets | |
| 7/31/15 | | |
| |
| Senior Floating Rate Interests | 92.12 | % |
| Other Long-Term Investments* | 3.43 | % |
| Short-Term Investments & Other Net Assets | 4.45 | % |
*Common stocks, ETFs, corporate bonds and asset-backed securities.
Total Return Index Comparison for a Hypothetical $10,000 Investment*
Total return represents the change in value of an investment over the periods shown. It includes any applicable maximum sales
charge, Fund expenses, account fees and reinvested distributions. The unmanaged index includes reinvestment of any income or
distributions. It differs from the Fund in composition and does not pay management fees or expenses. One cannot invest directly
in an index.
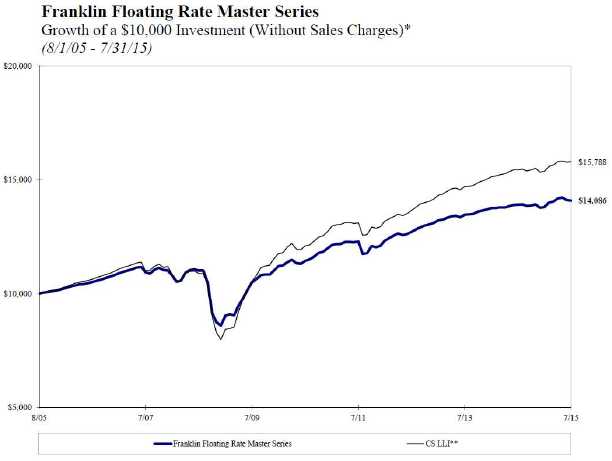
*Fund investment results reflect the voluntary expense reduction, without which the results would have been lower.
**Source: Credit Suisse Group. The CS LLI is designed to mirror the investable universe of the U.S. dollar-
denominated leveraged loan market. Loans must be below investment grade and rated no higher than Baa1/BB+ or
Ba1/BBB+ by Moody’s/S&P.
See www.franklintempletondatasources.com for additional data provider information.
|
| Average Annual Total Return* |
| 7/31/15 |
| | |
| 1-Year | +1.30 | % |
| 5-Year | +4.26 | % |
| 10-Year | +3.49 | % |
Your Fund’s Expenses
As a Fund shareholder, you can incur two types of costs:
- Transaction costs, including sales charges (loads) on Fund purchases, if any; and
- Ongoing Fund costs, including management fees, distribution and service (12b-1) fees, if any, and other Fund expenses. All mutual funds have ongoing costs, sometimes referred to as operating expenses.
The following table shows ongoing costs of investing in the Fund and can help you understand these costs and compare them with those of other mutual funds. The table assumes a $1,000 investment held for the six months indicated.
Actual Fund Expenses
The first line (Actual) listed in the table provides actual account values and expenses. The “Ending Account Value” is derived from the Fund’s actual return, which includes the effect of Fund expenses.
You can estimate the expenses you paid during the period by following these steps. Of course, your account value and expenses will differ from those in this illustration:
1. Divide your account value by $1,000.
If an account had an $8,600 value, then $8,600¸ $1,000 = 8.6.
2. Multiply the result by the number under the heading “Expenses Paid During Period.”
If Expenses Paid During Period were $7.50, then 8.6´ $7.50 = $64.50.
In this illustration, the estimated expenses paid this period are $64.50.
Hypothetical Example for Comparison with Other Funds
Information in the second line (Hypothetical) in the table can help you compare ongoing costs of investing in the Fund with those of other mutual funds. This information may not be used to estimate the actual ending account balance or expenses you paid during the period. The hypothetical “Ending Account Value” is based on the Fund’s actual expense ratio and an assumed 5% annual rate of return before expenses, which does not represent the Fund’s actual return. The figure under the heading “Expenses Paid During Period” shows the hypothetical expenses your account would have incurred under this scenario. You can compare this figure with the 5% hypothetical examples that appear in shareholder reports of other funds.
Your Fund’s Expenses (continued)
Please note that expenses shown in the table are meant to highlight ongoing costs and do not reflect any transaction costs, such as sales charges. Therefore, the second line is useful in comparing ongoing costs only, and will not help you compare total costs of owning different funds. In addition, if transaction costs were included, your total costs would have been higher. Please refer to the Fund prospectus for additional information on operating expenses.
| | | | | | |
| | | Beginning Account | | Ending Account | | Expenses Paid During |
| | | Value 2/1/15 | | Value 7/31/15 | | Period* 2/1/15–7/31/15 |
| |
| Actual | $ | 1,000 | $ | 1,020.30 | $ | 2.65 |
| Hypothetical (5% return before expenses) | $ | 1,000 | $ | 1,022.17 | $ | 2.66 |
*Expenses are calculated using the most recent annualized six-month expense ratio, net of voluntary expense
waivers, of 0.53%, multiplied by the average account value over the period, multiplied by 181/365 to reflect the one-
half year period.
Board Members and Officers
The name, year of birth and address of the officers and board members, as well as their affiliations, positions held with the Trust, principal occupations during at least the past five years and number of portfolios overseen in the Franklin Templeton Investments fund complex, are shown below. Generally, each board member serves until that person’s successor is elected and qualified.
| | | | | | |
| Independent Board Members | | | | |
| | | | | | | |
| | | | Number of | | |
| | | | | Portfolios | | |
| | | | in Fund | | |
| | | | | Complex | Other | |
| Name, Year | | | Length of | Overseen | Directorships Held | |
| of Birth and | | | Time | by Board | During at Least | |
| Address | | Position | Served | Member* | the Past 5 Years | |
| | | | | | | |
| |
| Harris J. | | Trustee | Since 1999 | 145 | Bar-S Foods (meat | |
| Ashton | | | | | packing company) | |
| (1932) | | | | | (1981-2010). | |
| One Franklin | | | | | | |
| Parkway | | | | | | |
| San Mateo, | | | | | | |
| CA 94403- | | | | | | |
| 1906 | | | | | | |
| Principal Occupation During at Least the Past 5 Years: | |
| Director of various companies; and formerly, Director, RBC Holdings, | |
| Inc. (bank holding company) (until 2002); and President, Chief | |
| Executive Officer and Chairman of the Board, General Host Corporation | |
| (nursery and craft centers) (until 1998). | | | |
| |
| Mary C. | | Trustee | Since | 119 | Avis Budget Group | |
| Choksi | | | October | | Inc. (car rental) | |
| (1950) | | | 2014 | | (2007-present), | |
| One Franklin | | | | | Omnicom Group Inc. | |
| Parkway | | | | | (advertising and | |
| San Mateo, | | | | | marketing | |
| CA 94403- | | | | | communications | |
| 1906 | | | | | services) (2011- | |
| | | | | | present) and H.J. | |
| | | | | | Heinz Company | |
| | | | | | (processed foods | |
| | | | | | and allied | |
| | | | | | products) (1998- | |
| | | | | | 2006) | |
| Principal Occupation During at Least the Past 5 Years: | |
| Founding Partner and Senior Managing Director, Strategic Investment | |
| Group (investment management group) (1987–present); director of various | |
| companies; and formerly, Founding Partner and Managing Director, | |
| Emerging Markets Management LLC (investment management firm) (1987- | |
| 2011); and Loan Officer/Senior Loan Officer/Senior Pension Investment | |
| Officer, World Bank Group (international financial institution) (1977- | |
| 1987). | | | | | | |
| | | | | |
| Edith E. | | Trustee | Since 1999 145 | Hess Corporation | |
| Holiday | | | | (exploration and | |
| (1952) | | | | refining of oil | |
| One Franklin | | and gas) (1993- | |
| Parkway | | | | present), RTI | |
| San Mateo, | | | | International | |
| CA 94403- | | | | Metals, Inc. | |
| 1906 | | | | (manufacture and | |
| | | | | distribution of | |
| | | | | titanium) (1999- | |
| | | | | present), Canadian | |
| | | | | National Railway | |
| | | | | (railroad) (2001- | |
| | | | | present), White | |
| | | | | Mountains | |
| | | | | Insurance Group, | |
| | | | | Ltd. (holding | |
| | | | | company) (2004- | |
| | | | | present) and H.J. | |
| | | | | Heinz Company | |
| | | | | (processed foods | |
| | | | | and allied | |
| | | | | products) (1994- | |
| | | | | 2013). | |
| Principal Occupation During at Least the Past 5 Years: | |
| Director or Trustee of various companies and trusts; and formerly, | |
| Assistant to the President of the United States and Secretary of the | |
| Cabinet (1990-1993); General Counsel to the United States Treasury | |
| Department (1989-1990); and Counselor to the Secretary and Assistant | |
| Secretary for Public Affairs and Public Liaison-United States Treasury | |
| Department (1988-1989). | | | |
| |
| J. Michael | | Trustee | Since 2009 145 | Boeing Capital | |
| Luttig | | | | Corporation | |
| (1954) | | | | (aircraft | |
| One Franklin | | financing) (2006- | |
| Parkway | | | | 2013). | |
| San Mateo, | | | | | |
| CA 94403- | | | | | |
| 1906 | | | | | |
| Principal Occupation During at Least the Past 5 Years: | |
| Executive Vice President, General Counsel and member of the Executive | |
| Council, The Boeing Company (aerospace company); and formerly, Federal | |
| Appeals Court Judge, U.S. Court of Appeals for the Fourth Circuit | |
| (1991-2006). | | | |
| |
| Frank A. | | Trustee | Since 2005 145 | Hess Corporation | |
| Olson (1932) | | (exploration and | |
| One Franklin | | refining of oil | |
| Parkway | | | | and gas)(1998- | |
| San Mateo, | | | | 2013). | |
| CA 94403- | | | | | |
| 1906 | | | | | |
| Principal Occupation During at Least the Past 5 Years: | |
| Director of various companies; and formerly, Chairman of the Board, The | |
| Hertz Corporation (car rental) (1980-2000) and Chief Executive Officer | |
| (1977-1999); and Chairman of the Board, President and Chief Executive | |
| Officer, UAL Corporation (airlines) (June – December 1987). | |
| | | | | | |
| Larry D. | | Trustee | Since 2007 | 145 | Cbeyond, Inc. | |
| Thompson | | | | | (business | |
| (1945) | | | | | communications | |
| One Franklin | | | | | provider) (2010- | |
| Parkway | | | | | 2012), The | |
| San Mateo, | | | | | Southern Company | |
| CA 94403- | | | | | (energy company) | |
| 1906 | | | | | (2014-present; | |
| | | | | | previously 2010- | |
| | | | | | 2012) and Graham | |
| | | | | | Holdings Company | |
| | | | | | (education and | |
| | | | | | media | |
| | | | | | organization) | |
| | | | | | (2011-present). | |
| Principal Occupation During at Least the Past 5 Years: | |
| Director of various companies; John A. Sibley Professor of Corporate | |
| and Business Law, University of Georgia School of Law (January 2015; | |
| previously 2011-2012); and formerly, Executive Vice President - | |
| Government Affairs, General Counsel and Corporate Secretary, PepsiCo, | |
| Inc. (consumer products) (2012-2014); Senior Vice President - | |
| Government Affairs, General Counsel and Secretary, PepsiCo, Inc. (2004- | |
| 2011); Senior Fellow of The Brookings Institution (2003-2004); Visiting | |
| Professor, University of Georgia School of Law (2004); and Deputy | |
| Attorney General, U.S. Department of Justice (2001-2003). | |
| |
| John B. | | Lead | Trustee | 119 | None | |
| Wilson | | Independent | since 2007 | | | |
| (1959) | | Trustee | and Lead | | | |
| One Franklin | | | Independent | | |
| Parkway | | | Trustee | | | |
| San Mateo, | | | since 2008 | | | |
| CA 94403- | | | | | | |
| 1906 | | | | | | |
| Principal Occupation During at Least the Past 5 Years: | |
| President, Staples Europe (office supplies) (2012-present); President | |
| and Founder, Hyannis Port Capital, Inc. (real estate and private equity | |
| investing); serves on private and non-profit boards; and formerly, | |
| Chief Operating Officer and Executive Vice President, Gap, Inc. | |
| (retail) (1996-2000); Chief Financial Officer and Executive Vice | |
| President – Finance and Strategy, Staples, Inc. (1992-1996); Senior | |
| Vice President – Corporate Planning, Northwest Airlines, Inc. | |
| (airlines) (1990-1992); and Vice President and Partner, Bain & Company | |
| (consulting firm) (1986-1990). | | | |
| | | | | |
| Interested Board Members and Officers | | |
| | | | | |
| | | | | |
| | | | | | |
| | | | | |
| | | | | Number of | |
| | | | Portfolios | Other |
| | | | | in Fund | Directorships Held |
| Name, Year | | | Length of | Complex | During at Least |
| of Birth and | | | Time | Overseen | the Past 5 Years |
| Address | | Position | Served | by Board | |
| | | | | Member* | |
| |
| **Gregory E. | | Trustee | Since 2007 162 | None |
| Johnson | | | | | |
| (1961 | ) | | | | |
| One Franklin | | | | | |
| Parkway | | | | | |
| San Mateo, | | | | | |
| CA 94403- | | | | | |
| 1906 | | | | | |
| Principal Occupation During at Least the Past 5 Years: |
| Chairman of the Board, Member - Office of the Chairman, Director, |
| President and Chief Executive Officer, Franklin Resources, Inc.; |
| officer and/or director or trustee, as the case may be, of some of the |
| other subsidiaries of Franklin Resources, Inc. and of 46 of the |
| investment companies in Franklin Templeton Investments; and Vice |
| Chairman, Investment Company Institute. | | |
| |
| **Rupert H. | | Chairman of | Since 2013 145 | None |
| Johnson, Jr. | | the Board | | | |
| (1940) | | and | | | |
| One Franklin | | Trustee | | | |
| Parkway | | | | | |
| San Mateo, | | | | | |
| CA 94403- | | | | | |
| 1906 | | | | | |
| Principal Occupation During at Least the Past 5 Years: |
| Vice Chairman, Member - Office of the Chairman and Director, Franklin |
| Resources, Inc.; Director, Franklin Advisers, Inc.; Senior Vice |
| President, Franklin Advisory Services, LLC; and officer and/or director |
| or trustee, as the case may be, of some of the other subsidiaries of |
| Franklin Resources, Inc. and of 43 of the investment companies in |
| Franklin Templeton Investments. | | |
| |
| Alison E. | | Vice | Since 2012 Not | Not Applicable |
| Baur | | President | | Applicable |
| (1964) | | | | | |
| One Franklin | | | | | |
| Parkway | | | | | |
| San Mateo, | | | | | |
| CA 94403- | | | | | |
| 1906 | | | | | |
| Principal Occupation During at Least the Past 5 Years: |
| Deputy General Counsel, Franklin Templeton Investments; and officer of |
| some of the other subsidiaries of Franklin Resources, Inc. and of 46 of |
| the investment companies in Franklin Templeton Investments. |
| | | | | |
| Mark | | Vice | Since 2003 | Not | Not Applicable |
| Boyadjian | | President | | Applicable |
| (1964) | | | | | |
| One Franklin | | | | | |
| Parkway | | | | | |
| San Mateo, | | | | | |
| CA 94403- | | | | | |
| 1906 | | | | | |
| Principal Occupation During at Least the Past 5 Years: |
| Senior Vice President, Franklin Advisers, Inc.; and officer of two of |
| the investment companies in Franklin Templeton Investments. |
| |
| Laura F. | | Chief | Since 2009 | Not | Not Applicable |
| Fergerson | | Executive | | Applicable |
| (1962) | | Officer - | | | |
| One Franklin | | Finance and | | | |
| Parkway | | Administrati | | |
| San Mateo, | | on | | | |
| CA 94403- | | | | | |
| 1906 | | | | | |
| Principal Occupation During at Least the Past 5 Years: |
| Senior Vice President, Franklin Templeton Services, LLC; Vice |
| President, Franklin Advisers, Inc. and Franklin Templeton |
| Institutional, LLC; and officer of 46 of the investment companies in |
| Franklin Templeton Investments. | | |
| |
| Gaston | | Treasurer, | Since 2009 | Not | Not Applicable |
| Gardey | | Chief | | Applicable |
| (1967) | | Financial | | | |
| One Franklin | | Officer and | | | |
| Parkway | | Chief | | | |
| San Mateo, | | Accounting | | | |
| CA 94403- | | Officer | | | |
| 1906 | | | | | |
| Principal Occupation During at Least the Past 5 Years: |
| Treasurer, U.S. Fund Administration & Reporting, Franklin Templeton |
| Investments; and officer of 27 of the investment companies in Franklin |
| Templeton Investments. | | | |
| |
| Aliya S. | | Vice | Since 2009 | Not | Not Applicable |
| Gordon | | President | | Applicable |
| (1973) | | | | | |
| One Franklin | | | | | |
| Parkway | | | | | |
| San Mateo, | | | | | |
| CA 94403- | | | | | |
| 1906 | | | | | |
| Principal Occupation During at Least the Past 5 Years: |
| Senior Associate General Counsel, Franklin Templeton Investments; and |
| officer of 46 of the investment companies in Franklin Templeton |
| Investments. | | | | | |
| | | | | |
| Steven J. | | Vice | Since 2009 | Not | Not Applicable |
| Gray (1955) | | President | | Applicable |
| One Franklin | | | | | |
| Parkway | | | | | |
| San Mateo, | | | | | |
| CA 94403- | | | | | |
| 1906 | | | | | |
| Principal Occupation During at Least the Past 5 Years: |
| Senior Associate General Counsel, Franklin Templeton Investments; Vice |
| President, Franklin Templeton Distributors, Inc. and Franklin |
| Alternative Strategies Advisers, LLC; and officer of 46 of the |
| investment companies in Franklin Templeton Investments. |
| |
| Selena L. | | Vice | Since 2012 | Not | Not Applicable |
| Holmes | | President | | Applicable |
| (1965) | | – AML | | | |
| 100 Fountain | | Compliance | | |
| Parkway | | | | | |
| St. | | | | | |
| Petersburg, | | | | | |
| FL 33716- | | | | | |
| 1205 | | | | | |
| Principal Occupation During at Least the Past 5 Years: |
| Director, Global Compliance Monitoring; Chief Compliance Officer, |
| Franklin Alternative Strategies Advisers, LLC; Vice President, Franklin |
| Templeton Companies, LLC; and officer of 46 of the investment companies |
| in Franklin Templeton Investments. | | |
| |
| Christopher | | President | Since 2010 | Not | Not Applicable |
| J. Molumphy | | and Chief | | Applicable |
| (1962) | | Executive | | | |
| One Franklin | | Officer - | | | |
| Parkway | | Investment | | |
| San Mateo, | | Management | | |
| CA 94403- | | | | | |
| 1906 | | | | | |
| Principal Occupation During at Least the Past 5 Years: |
| Director and Executive Vice President, Franklin Advisers, Inc.; |
| Executive Vice President, Franklin Templeton Institutional, LLC; and |
| officer of some of the other subsidiaries of Franklin Resources, Inc. |
| and of 22 of the investment companies in Franklin Templeton |
| Investments. | | | | | |
| Kimberly H. | | Vice | Since 2013 | Not | Not Applicable |
| Novotny | | President | | Applicable |
| (1972) | | | | | |
| 300 S.E. 2nd | | | | | |
| Street | | | | | |
| Fort | | | | | |
| Lauderdale, | | | | | |
| FL 33301- | | | | | |
| 1923 | | | | | |
| Principal Occupation During at Least the Past 5 Years: |
| Associate General Counsel, Franklin Templeton Investments; Vice |
| President, Fiduciary Trust International of the South; Vice President, |
| Templeton Investment Counsel, LLC; Assistant Secretary, Franklin |
| Resources, Inc.; and officer of 46 of the investment companies in |
| Franklin Templeton Investments. | | |
| | | | |
| Robert C. | | Chief | Since 2013 Not | Not Applicable |
| Rosselot | | Compliance | Applicable |
| (1960) | | Officer | | |
| 300 S.E. 2nd | | | | |
| Street | | | | |
| Fort | | | | |
| Lauderdale, | | | | |
| FL 33301- | | | | |
| 1923 | | | | |
| Principal Occupation During at Least the Past 5 Years: |
| Director, Global Compliance, Franklin Templeton Investments; Vice |
| President, Franklin Templeton Companies, LLC; officer of 46 of the |
| investment companies in Franklin Templeton Investments; and formerly, |
| Senior Associate General Counsel, Franklin Templeton Investments (2007- |
| 2013); and Secretary and Vice President, Templeton Group of Funds |
| (2004-2013). | | | | |
| |
| Karen L. | | Vice | Since 2006 Not | Not Applicable |
| Skidmore | | President | Applicable |
| (1952) | | and | | |
| One Franklin | | Secretary | | |
| Parkway | | | | |
| San Mateo, | | | | |
| CA 94403- | | | | |
| 1906 | | | | |
| Principal Occupation During at Least the Past 5 Years: |
| Senior Associate General Counsel, Franklin Templeton Investments; and |
| officer of 46 of the investment companies in Franklin Templeton |
| Investments. | | | | |
| |
| Craig S. | | Vice | Since 2005 Not | Not Applicable |
| Tyle (1960) | | President | Applicable |
| One Franklin | | | | |
| Parkway | | | | |
| San Mateo, | | | | |
| CA 94403- | | | | |
| 1906 | | | | |
| Principal Occupation During at Least the Past 5 Years: |
| General Counsel and Executive Vice President, Franklin Resources, Inc.; |
| and officer of some of the other subsidiaries of Franklin Resources, |
| Inc. and of 46 of the investment companies in Franklin Templeton |
| Investments. | | | | |
| | | |
| Lori A. | Vice | Since 2011 Not | Not Applicable |
| Weber (1964) | President | Applicable |
| 300 S.E. 2nd | | | |
| Street | | | |
| Fort | | | |
| Lauderdale, | | | |
| FL 33301- | | | |
| 1923 | | | |
| Principal Occupation During at Least the Past 5 Years: |
| Senior Associate General Counsel, Franklin Templeton Investments; |
| Assistant Secretary, Franklin Resources, Inc.; Vice President and |
| Secretary, Templeton Investment Counsel, LLC; and officer of 46 of the |
| investment companies in Franklin Templeton Investments. |
*We base the number of portfolios on each separate series of the U.S.
registered investment companies within the Franklin Templeton Investments
fund complex. These portfolios have a common investment manager or affiliated
investment managers.
**Gregory E. Johnson is considered to be an interested person of the Fund
under the federal securities laws due to his position as an officer and
director of Franklin Resources, Inc. (Resources), which is the parent company
of the Fund's investment manager and distributor. Rupert H. Johnson, Jr. is
considered to be an interested person of the Fund under the federal
securities laws due to his position as officer and director and major
shareholder of Resources.
Note 1: Rupert H. Johnson, Jr. is the uncle of Gregory E. Johnson.
Note 2: Officer information is current as of the date of this report. It is
possible that after this date, information about officers may change.
Note 3: Effective April 30, 2015, Sam Ginn ceased to be a trustee of the
Fund.
The Sarbanes-Oxley Act of 2002 and Rules adopted by the Securities and Exchange Commission require the
Fund to disclose whether the Fund’s Audit Committee includes at least one member who is an audit
committee financial expert within the meaning of such Act and Rules. The Fund’s Board has determined that
there is at least one such financial expert on the Audit Committee and has designated John B. Wilson as its
audit committee financial expert. The Board believes that Mr. Wilson qualifies as such an expert in view of
his extensive business background and experience, including service as chief financial officer of Staples, Inc.
from 1992 to 1996. Mr. Wilson has been a Member and Chairman of the Fund’s Audit Committee since 2007.
As a result of such background and experience, the Board believes that Mr. Wilson has acquired an
understanding of generally accepted accounting principles and financial statements, the general application
of such principles in connection with the accounting estimates, accruals and reserves, and analyzing and
evaluating financial statements that present a breadth and level of complexity of accounting issues generally
comparable to those of the Fund, as well as an understanding of internal controls and procedures for
financial reporting and an understanding of audit committee functions. Mr. Wilson is an independent Board
member as that term is defined under the relevant Securities and Exchange Commission Rules and Releases.
The Statement of Additional Information (SAI) includes additional information about the board members
and is available, without charge, upon request. Shareholders may call (800) DIAL BEN/342-5236 to request
the SAI.
Shareholder Information
Franklin Floating Rate Master Series
Board Review of Investment Management Agreement
At a meeting held February 24, 2015, the Board of Trustees (Board), including a majority of non-interested or independent Trustees, approved renewal of the investment management agreement for Franklin Floating Rate Master Series (Fund). In reaching this decision, the Board took into account information furnished throughout the year at regular Board meetings, as well as information prepared specifically in connection with the annual renewal review process. Information furnished and discussed throughout the year included investment performance reports and related financial information for the Fund, along with periodic reports on expenses, legal and compliance matters, pricing, brokerage commissions and execution and other services provided by the Investment Manager (Manager) and its affiliates. Information furnished specifically in connection with the renewal process included a report for the Fund prepared by Lipper Inc. (Lipper), an independent organization, as well as additional material, including a Fund profitability analysis prepared by management. The Lipper report compared the Fund’s investment performance and expenses with those of other mutual funds deemed comparable to the Fund as selected by Lipper. The Fund profitability analysis discussed the profitability to Franklin Templeton Investments (FTI) from its overall U.S. fund operations, as well as on an individual fund-by-fund basis. Additional material accompanying such profitability analysis included information on a fund-by-fund basis listing portfolio managers and other accounts they manage, as well as information on management fees charged by the Manager and its affiliates to U.S. mutual funds and other accounts, including management’s explanation of differences where relevant. Such material also included a memorandum prepared by management describing project initiatives and capital investments relating to the services provided to the Fund by the FTI organization, as well as a memorandum relating to economies of scale and an analysis concerning transfer agent fees charged by an affiliate of the Manager.
In considering such materials, the independent Trustees received assistance and advice from and met separately with independent counsel. They acknowledged the report from the Manager on efforts to obtain approvals from foreign regulators and shareholders of the Irish feeder fund relating to a change in the allocation of fees. While attention was given to all information furnished, the following discusses some primary factors relevant to the Board’s decision.
NATURE, EXTENT AND QUALITY OF SERVICE. The Board was satisfied with the nature and quality of the overall services provided by the Manager and its affiliates to the Fund and its sole shareholder. In addition to other factors, the Board’s opinion was based, in part, upon periodic reports furnished it showing that the investment policies and restrictions for the Fund were consistently complied with as well as other reports periodically furnished the Board covering matters such as the compliance of portfolio managers and other management personnel with the code of ethics adopted throughout the Franklin Templeton fund complex, the adherence to fair value pricing procedures established by the Board, and the accuracy of net asset value calculations. The Board also noted the extent of benefits provided to the Fund’s sole shareholder from being part of the Franklin Templeton family of funds. Favorable consideration was given to management’s continual efforts and expenditures in establishing effective business continuity plans and developing strategies to address persistent cybersecurity threats. Additionally, the Board noted the Manager’s continued attention to pricing and valuation issues, particularly with respect to complex securities. Among other factors taken into account by the Board were the
Manager’s best execution trading policies, including a favorable report by an independent portfolio trading analytical firm, which also covered FOREX transactions. Consideration was also given to the experience of the Fund’s portfolio management team, the number of accounts managed and general method of compensation. In this latter respect, the Board noted that a primary factor in management’s determination of a portfolio manager’s bonus compensation was the relative investment performance of the funds he or she managed and that a portion of such bonus was required to be invested in a predesignated list of funds within such person’s fund management area so as to be aligned with the interests of shareholders. Particular attention was given to management’s conservative approach and diligent risk management procedures, including continual monitoring of counterparty credit risk and attention given to derivatives and other complex instruments including expanded collateralization requirements, as applicable. The Board also took into account, among other things, management’s efforts in establishing a global credit facility for the benefit of the Fund and other accounts managed by FTI to provide a source of cash for temporary and emergency purposes or to meet unusual redemption requests as well as the strong financial position of the Manager’s parent company and its commitment to the mutual fund business as evidenced by its continued subsidization of money market funds.
INVESTMENT PERFORMANCE. The Board also considered the investment performance of the Fund in view of its importance to shareholders, and the Fund’s expenses based upon the performance information provided to them throughout the year. It was noted that the Fund’s only shareholder was an investment fund organized under the laws of Ireland and that the Board had been provided ongoing information relating to management’s efforts to comply with regulatory requirements of the European Union and its ultimate conclusion that the previously approved proposal to liquidate the Fund would not be necessary. The Lipper report prepared for the Fund showed its investment performance during 2014, as well as during the 10-year period ended December 31, 2014, in comparison to a performance universe consisting of all retail and institutional loan participation funds. The Fund’s total return was in the middle performing quintile of its performance universe in 2014, and on an annualized basis was in the second-lowest performing quintile for the previous three- and five-year periods and the middle performing quintile for the 10-year period. After discussing the Fund with management, the Board acknowledged the limited population of comparable master funds and found the Fund’s performance to be acceptable.
COMPARATIVE EXPENSES. Consideration was given to a comparative analysis of the management fees and total expense ratio of the Fund compared with those of a group of funds selected by Lipper as constituting its appropriate Lipper expense group. Lipper expense data is based upon information taken from each fund’s most recent annual report, which reflects historical asset levels that may be quite different from those currently existing, particularly in a period of market volatility. While recognizing such inherent limitation and the fact that expense ratios generally increase as assets decline and decrease as assets grow, the Board believed the independent analysis conducted by Lipper to be an appropriate measure of comparative expenses. In reviewing comparative costs, Lipper provides information on the Fund’s contractual investment management fee in comparison with the contractual investment management fee that would have been charged by other funds within its Lipper expense group assuming they were similar in size to the Fund, as well as the actual total expense ratio of the Fund in comparison with those of its expense group. The Lipper contractual investment management fee analysis includes within such fee any separate administrative fees, and Lipper total expenses, for comparative consistency, are shown by Lipper for Fund Class A shares. The results of such expense comparisons showed that the management fee was in the highest expense quartile of its Lipper expense group (even with the revised management fee to be adopted at this meeting), but
its actual total expense ratio was in the least expensive quartile of such expense group. The Board acknowledged the adoption this year of a revised fee schedule, which offers breakpoints as asset rise and reflects a lower fee. In light of the unique nature of the Fund and the efforts of management to ensure the success of the Fund, including through an expense waiver, the Board found the expenses of the Fund to be acceptable.
MANAGEMENT PROFITABILITY. The Board also considered the level of profits realized by the Manager and its affiliates in connection with the operation of the Fund. In this respect, the Board reviewed the Fund profitability analysis that addresses the overall profitability of Franklin Templeton’s U.S. fund business, as well as its profits in providing management and other services to each of the individual funds during the 12-month period ended September 30, 2014, being the most recent fiscal year-end for Franklin Resources, Inc., the Manager’s parent. In reviewing the analysis, the Board recognized that allocation methodologies are inherently subjective and various allocation methodologies may be reasonable while producing different results. In this respect, the Board noted that while management continually makes refinements to its methodologies in response to organizational and product related changes, the overall approach as defined by the primary drivers and activity measurements has remained consistent with that used in the Fund’s profitability report presentations from prior years. Additionally, the Fund’s independent registered public accounting firm had been engaged by the Manager to periodically review the reasonableness of the allocation methodologies to be used solely by the Fund’s Board in reference to the profitability analysis. In reviewing and discussing such analysis, management discussed with the Board its belief that costs incurred in establishing the infrastructure necessary for the type of mutual fund operations conducted by the Manager and its affiliates may not be fully reflected in the expenses allocated to the Fund in determining its profitability, as well as the fact that the level of profits, to a certain extent, reflected operational cost savings and efficiencies initiated by management. The Board also took into account management’s expenditures in improving shareholder services provided the Fund, as well as the need to implement systems and meet additional regulatory and compliance requirements resulting from statutes such as the Sarbanes-Oxley and Dodd-Frank Acts and recent SEC and other regulatory requirements. In addition, the Board considered a third-party study comparing the profitability of the Manager’s parent on an overall basis to other publicly held managers broken down to show profitability from management operations exclusive of distribution expenses, as well as profitability including distribution expenses. The Board also considered the extent to which the Manager and its affiliates might derive ancillary benefits from fund operations, including revenues generated from transfer agent services and potential benefits resulting from personnel and systems enhancements necessitated by fund growth, increased leverage with service providers and counterparties, allocation of fund brokerage and the use of commission dollars to pay for research. Based upon its consideration of all these factors, the Board determined that the level of profits realized by the Manager and its affiliates from providing services to the Fund was not excessive in view of the nature, quality and extent of services provided.
ECONOMIES OF SCALE. The Board also considered whether economies of scale are realized by the Manager as the Fund grows larger and the extent to which this is reflected in the level of management fees charged. While recognizing that any precise determination is inherently subjective, the Board noted that based upon the Fund profitability analysis, it appears that as some funds get larger, at some point economies of scale do result in the Manager realizing a larger profit margin on management services provided such a fund. Investment advisory services under the fee schedule approved at this meeting will be provided to the Fund at a rate of 0.53% on assets up to and including $2.5 billion; 0.45% over $2.5 billion, up to and including $6.5 billion; 0.43% over $6.5 billion, up to and including $11.5 billion; 0.40% over $11.5 billion, up
to and including $16.5 billion; 0.39% over $16.5 billion, up to and including $19.0 billion; 0.38% over $19.0 billion, up to and including $21.5 billion; and 0.37% in excess of $21.5 billion. The Board believes this new schedule of fees under the investment management agreement provides for a sharing of benefits with the Fund and its shareholders as the Fund grows.
Proxy Voting Policies and Procedures
The Fund’s investment manager has established Proxy Voting Policies and Procedures (Policies) that the Fund uses to determine how to vote proxies relating to portfolio securities. Shareholders may view the Fund’s complete Policies online at franklintempleton.com. Alternatively, shareholders may request copies of the Policies free of charge by calling the Proxy Group collect at (954) 527-7678 or by sending a written request to: Franklin Templeton Companies, LLC, 300 S.E. 2nd Street, Fort Lauderdale, FL 33301, Attention: Proxy Group. Copies of the Fund’s proxy voting records are also made available online at franklintempleton.com and posted on the U.S. Securities and Exchange Commission’s website at sec.gov and reflect the most recent 12-month period ended June 30.
Quarterly Statement of Investments
The Fund files a complete statement of investments with the U.S. Securities and Exchange Commission for the first and third quarters for each fiscal year on Form N-Q. Shareholders may view the filed Form N-Q by visiting the Commission’s website at sec.gov. The filed form may also be viewed and copied at the Commission’s Public Reference Room in Washington, DC. Information regarding the operations of the Public Reference Room may be obtained by calling (800) SEC-0330.
| | | | | | | | | | | | | | | |
| Franklin Floating Rate Master Trust | | | | | | | | | | |
| |
| Financial Highlights | | | | | | | | | | | | | | | |
| |
| Franklin Floating Rate Master Series | | | | | | | | | | | | | | | |
| | | | | | Year Ended July 31, | | | | | | | |
| | | 2015 | | | 2014 | | | 2013 | | | 2012 | | | 2011 | |
| Per share operating performance | | | | | | | | | | | | | | | |
| (for a share outstanding throughout the year) | | | | | | | | | | | | | | | |
| Net asset value, beginning of year | $ | 8.92 | | $ | 8.93 | | $ | 8.76 | | $ | 8.88 | | $ | 8.65 | |
| Income from investment operationsa : | | | | | | | | | | | | | | | |
| Net investment income | | 0.391 | | | 0.299 | | | 0.347 | | | 0.414 | | | 0.402 | |
| Net realized and unrealized gains (losses) | | (0.270 | ) | | (0.010 | ) | | 0.169 | | | (0.122 | ) | | 0.233 | |
| Total from investment operations | | 0.121 | | | 0.289 | | | 0.516 | | | 0.292 | | | 0.635 | |
| Less distributions from net investment income | | (0.391 | ) | | (0.299 | ) | | (0.346 | ) | | (0.412 | ) | | (0.405 | ) |
| Net asset value, end of year | $ | 8.65 | | $ | 8.92 | | $ | 8.93 | | $ | 8.76 | | $ | 8.88 | |
| |
| Total return | | 1.30 | % | | 3.28 | % | | 5.94 | % | | 3.44 | % | | 7.44 | % |
| |
| Ratios to average net assets | | | | | | | | | | | | | | | |
| Expenses before waiver and payments by affiliates | | 0.77 | % | | 0.92 | % | | 0.96 | % | | 0.97 | % | | 0.96 | % |
| Expenses net of waiver and payments by affiliatesb | | 0.67 | % | | 0.80 | % | | 0.80 | % | | 0.80 | % | | 0.80 | % |
| Net investment income | | 4.43 | % | | 3.36 | % | | 3.77 | % | | 4.78 | % | | 4.48 | % |
| |
| Supplemental data | | | | | | | | | | | | | | | |
| Net assets, end of year (000's) | $ | 1,959,681 | | $ | 2,260,151 | | $ | 1,420,061 | | $ | 642,804 | | $ | 943,253 | |
| Portfolio turnover rate | | 62.43 | % | | 70.55 | % | | 61.33 | % | | 69.54 | % | | 95.76 | % |
a The amount shown for a share outstanding throughout the period may not correlate with the Statement of Operations for the period due to the timing
of sales and repurchases of the Fund's shares in relation to income earned and/or fluctuating fair value of the investments of the Fund.
bBenefit of expense reduction rounds to less than 0.01%.
| | | | | | |
| Franklin Floating Rate Master Trust | | | | | | |
| |
| Statement of Investments, July 31, 2015 | | | | | | |
| |
| |
| | | | | % of Net | |
| Franklin Floating Rate Master Series | Country | Shares | | Value | Assets | |
| Common Stocks and Exchange Traded Funds | | | | | | |
| Broadcasting | | | | | | |
| a Cumulus Media Inc., A | United States | 934 | $ | 1,541 | 0.00 | † |
| Diversified Capital Markets | | | | | | |
| PowerShares Senior Loan Portfolio ETF | United States | 1,195,709 | | 28,326,346 | 1.44 | |
| Total Common Stocks and Exchange Traded Funds (Cost $28,725,771) | | | | 28,327,887 | 1.44 | |
| | | Principal Amount* | | | |
| Corporate Bonds (Cost $239,208) | | | | | | |
| Aerospace & Defense | | | | | | |
| |
| b Erickson Inc., Purchase Price Notes, 6.00%, 11/02/20 | United States | 239,208 | | 208,886 | 0.01 | |
| |
| c,d Senior Floating Rate Interests | | | | | | |
| Aerospace & Defense | | | | | | |
| CAMP International Holding Co., | | | | | | |
| 2013 Replacement Term Loan, 4.75%, 5/31/19 | United States | 9,159,448 | | 9,222,419 | 0.47 | |
| Second Lien 2013 Replacement Term Loan, 8.25%, 11/29/19 | United States | 4,923,723 | | 4,948,342 | 0.25 | |
| e Delos Finance S.A.R.L. (ILFC), Loans, 3.50%, 3/06/21 | Luxembourg | 9,700,000 | | 9,726,849 | 0.50 | |
| Doncasters U.S. Finance LLC, | | | | | | |
| Second Lien Term Loan, 9.50%, 10/09/20 | United States | 3,923,627 | | 3,939,569 | 0.20 | |
| Term B Loans, 4.50%, 4/09/20 | United States | 8,658,511 | | 8,678,357 | 0.44 | |
| Fly Funding II S.A.R.L., Loans, 3.50%, 8/09/19 | Luxembourg | 2,746,575 | | 2,743,664 | 0.14 | |
| TransDigm Inc., Tranche C Term Loan, 3.75%, 2/28/20 | United States | 17,158,017 | | 17,147,294 | 0.88 | |
| | | | | 56,406,494 | 2.88 | |
| Agricultural Products | | | | | | |
| Allflex Holdings III Inc., Second Lien Initial Term Loan, 8.00%, 7/19/21 | United States | 750,335 | | 756,667 | 0.04 | |
| Airlines | | | | | | |
| e Air Canada, Term Loan, 4.00%, 9/26/19 | Canada | 10,266,583 | | 10,327,546 | 0.53 | |
| American Airlines Inc., 2015 Term Loans, 3.25%, 6/27/20 | United States | 4,987,310 | | 4,970,388 | 0.25 | |
| e Delta Air Lines Inc., Term Loan B, 4.75%, 4/20/17 | United States | 4,545,455 | | 4,550,568 | 0.23 | |
| e Flying Fortress Inc. (ILFC), New Loan, 3.50%, 4/30/20 | United States | 3,610,346 | | 3,629,528 | 0.19 | |
| e U.S. Airways Inc., Tranche B1 Term Loan, 3.50%, 5/23/19 | United States | 10,095,327 | | 10,096,225 | 0.51 | |
| | | | | 33,574,255 | 1.71 | |
| Aluminum | | | | | | |
| Novelis Inc., Initial Term Loan, 4.00%, 6/02/22 | Canada | 10,689,825 | | 10,698,377 | 0.55 | |
| Apparel Retail | | | | | | |
| e Ascena Retail Group Inc., Tranche B Term Loan, 6.75%, 8/17/22 | United States | 20,000,000 | | 19,700,000 | 1.00 | |
| The Men's Wearhouse Inc., Tranche B Term Loan, 4.50%, 6/18/21 | United States | 8,331,893 | | 8,389,175 | 0.43 | |
| | | | | 28,089,175 | 1.43 | |
| Auto Parts & Equipment | | | | | | |
| Crowne Group LLC, Term Loan, 6.00%, 9/30/20 | United States | 5,272,278 | | 5,272,278 | 0.27 | |
| Federal-Mogul Holdings Corp., Tranche C Term Loans, 4.75%, 4/15/21 | United States | 3,839,975 | | 3,804,774 | 0.19 | |
| FRAM Group Holdings Inc. (Autoparts Holdings), Term Loan, 7.00%, 7/29/17 | United States | 6,833,050 | | 6,571,119 | 0.34 | |
| Henniges Automotive Holdings Inc., Term Loans, 5.50%, 6/12/21 | United States | 10,282,043 | | 10,307,748 | 0.53 | |
| TI Group Automotive Systems LLC, Term Loan B, 4.50%, 6/25/22 | United States | 12,917,315 | | 12,985,944 | 0.66 | |
| Tower Automotive Holdings USA LLC, Initial Term Loan, 4.00%, 4/23/20 | United States | 7,637,830 | | 7,647,378 | 0.39 | |
| UCI International Inc., Term Loan, 5.50%, 7/26/17 | United States | 570,054 | | 567,916 | 0.03 | |
| | | | | 47,157,157 | 2.41 | |
| Broadcasting | | | | | | |
| e Cumulus Media Holdings Inc., Term Loans, 4.25%, 12/23/20 | United States | 24,321,782 | | 22,497,648 | 1.15 | |
| Gray Television Inc., Term Loan B, 3.75%, 6/13/21 | United States | 9,044,050 | | 9,075,144 | 0.46 | |
| iHeartCommunications Inc., | | | | | | |
| Tranche D Term Loan, 6.94%, 1/30/19 | United States | 7,101,320 | | 6,539,130 | 0.33 | |
| Tranche E Term Loan, 7.69%, 7/30/19 | United States | 4,348,609 | | 4,057,252 | 0.21 | |
| Media General Inc., Term B Loan, 4.00%, 7/31/20 | United States | 14,099,640 | | 14,184,830 | 0.72 | |
| MediArena Acquisition BV, Second Lien Dollar Term B Loan, 10.00%, 8/13/22 | Netherlands | 1,875,000 | | 1,800,000 | 0.09 | |
Annual Report
| | | | |
| Franklin Floating Rate Master Trust | | | | |
| |
| Statement of Investments, July 31, 2015 (continued) | | | | |
| Radio One Inc., Term Loan B, 4.79%, 12/31/18 | United States | 20,500,000 | 20,897,187 | 1.07 |
| Sinclair Television Group Inc., Incremental Term Loan B-1, 3.50%, 7/31/21 | United States | 1,497,879 | 1,500,221 | 0.08 |
| | | | 80,551,412 | 4.11 |
| Cable & Satellite | | | | |
| e Charter Communications Operating LLC (CCO Safari), Term Loan H, 4.75%, | United States | 3,496,789 | 3,502,800 | 0.18 |
| 7/23/21 | | | | |
| e UPC Financing Partnership (UPC Broadband Holdings BV), Term Loan AH, | Netherlands | 9,810,123 | 9,750,565 | 0.49 |
| 3.25%, 6/30/21 | | | | |
| e Virgin Media Bristol LLC, F Facility, 3.50%, 6/30/23 | United States | 12,351,034 | 12,325,949 | 0.63 |
| | | | 25,579,314 | 1.30 |
| Casinos & Gaming | | | | |
| e Aristocrat Technologies Inc., First Lien Initial Term Loan, 4.75%, 10/20/21 | United States | 4,600,000 | 4,632,407 | 0.24 |
| Caesars Entertainment Resort Properties LLC, Term B Loans, 7.00%, 10/11/20 | United States | 30,702,287 | 28,871,110 | 1.47 |
| f Cannery Casino Resorts LLC, | | | | |
| Second Lien Term Loan, 10.00%, 10/02/19 | United States | 7,200,000 | 6,516,000 | 0.33 |
| Term Loan, 6.00%, 10/02/18 | United States | 21,684,869 | 21,458,978 | 1.10 |
| CCM Merger Inc. (MotorCity Casino), Term Loans, 4.50%, 8/06/21 | United States | 4,764,243 | 4,786,077 | 0.24 |
| MGM Resorts International, Term B Loan, 3.50%, 12/20/19 | United States | 4,875,603 | 4,866,968 | 0.25 |
| ROC Finance LLC, Funded Term B Loans, 5.00%, 6/20/19 | United States | 20,149,616 | 19,721,437 | 1.01 |
| Scientific Games International Inc., Term B-1 Loan, 6.00%, 10/18/20 | United States | 18,352,285 | 18,450,415 | 0.94 |
| Tropicana Entertainment Inc., Term Loans, 4.00%, 11/27/20 | United States | 5,063,587 | 5,069,917 | 0.26 |
| | | | 114,373,309 | 5.84 |
| Coal & Consumable Fuels | | | | |
| Bowie Resource Holdings LLC, | | | | |
| eFirst Lien Initial Term Loan, 6.75%, 8/16/20 | United States | 16,342,777 | 15,546,067 | 0.79 |
| Second Lien Initial Term Loan, 11.75%, 2/16/21 | United States | 2,232,389 | 2,126,350 | 0.11 |
| e Foresight Energy LLC, Term Loans, 5.50%, 8/21/20 | United States | 19,905,314 | 19,308,155 | 0.99 |
| e Peabody Energy Corp., Term Loan, 4.25%, 9/24/20 | United States | 43,720,045 | 33,609,784 | 1.72 |
| g Walter Energy Inc., B Term Loan, 7.25%, 4/02/18 | United States | 5,950,001 | 3,025,576 | 0.15 |
| Westmoreland Coal Co., Term Loan, 7.50%, 12/16/20 | United States | 4,868,845 | 4,528,026 | 0.23 |
| | | | 78,143,958 | 3.99 |
| Commodity Chemicals | | | | |
| Cyanco Intermediate Corp., Initial Term Loan, 5.50%, 5/01/20 | United States | 28,484,534 | 27,914,843 | 1.43 |
| e Tronox Pigments (Netherlands) BV, Term Loan, 4.25%, 3/19/20 | Netherlands | 7,831,115 | 7,508,081 | 0.38 |
| | | | 35,422,924 | 1.81 |
| Communications Equipment | | | | |
| CIENA Corp., Term Loan, 3.75%, 7/15/19 | United States | 9,715,704 | 9,758,211 | 0.50 |
| e CommScope Inc., Tranche 5 Term Loan, 3.75%, 12/29/22 | United States | 9,459,213 | 9,502,564 | 0.48 |
| | | | 19,260,775 | 0.98 |
| Construction & Engineering | | | | |
| LCS Deco LLC, Term B Loans, 5.50%, 5/21/22 | Australia | 2,489,466 | 2,511,248 | 0.13 |
| Construction Machinery & Heavy Trucks | | | | |
| Allison Transmission Inc., Term B-3 Loans, 3.50%, 8/23/19 | United States | 4,685,490 | 4,706,476 | 0.24 |
| Doosan Infracore International and Doosan Holdings Europe, Tranche B Term | United States | 3,892,777 | 3,919,540 | 0.20 |
| Loan, 4.50%, 5/28/21 | | | | |
| | | | 8,626,016 | 0.44 |
| Data Processing & Outsourced Services | | | | |
| MoneyGram International Inc., Term Loan, 4.25%, 3/27/20 | United States | 36,484,957 | 34,660,709 | 1.77 |
| Worldpay U.S. Inc., Additional Term Facility, 4.50%, 11/29/19 | United States | 690,940 | 693,531 | 0.03 |
| | | | 35,354,240 | 1.80 |
| Diversified Chemicals | | | | |
| e The Chemours Co. LLC, Tranche B Term Loan, 3.75%, 5/12/22 | United States | 19,187,914 | 18,500,353 | 0.94 |
| Ineos U.S. Finance LLC, Dollar Term Loan, 3.75%, 5/04/18 | United States | 10,611,901 | 10,620,008 | 0.54 |
| OCI Beaumont LLC, Term B-3 Loan, 5.50%, 8/20/19 | United States | 10,653,242 | 10,906,257 | 0.56 |
| OXEA GmbH, | | | | |
| First Lien Tranche B-2 Term Loan, 4.25%, 1/15/20 | Luxembourg | 1,402,580 | 1,369,269 | 0.07 |
Annual Report
| | | | |
| Franklin Floating Rate Master Trust | | | | |
| |
| Statement of Investments, July 31, 2015 (continued) | | | | |
| |
| eSecond Lien Term Loan, 8.25%, 7/15/20 | Luxembourg | 24,155,317 | 22,887,162 | 1.17 |
| | | | 64,283,049 | 3.28 |
| Diversified Metals & Mining | | | | |
| Atkore International Inc., | | | | |
| Initial Term Loan, 4.50%, 4/09/21 | United States | 2,380,800 | 2,315,328 | 0.12 |
| Second Lien Initial Term Loan, 7.75%, 10/09/21 | United States | 6,208,246 | 5,866,793 | 0.30 |
| e FMG America Finance Inc. (Fortescue Metals Group), Loans, 3.75%, 6/30/19 | Australia | 52,874,987 | 43,462,129 | 2.21 |
| | | | 51,644,250 | 2.63 |
| Diversified Support Services | | | | |
| Interactive Data Corp., Term Loan, 4.75%, 5/02/21 | United States | 14,553,000 | 14,627,584 | 0.75 |
| |
| Drug Retail | | | | |
| Rite Aid Corp., | | | | |
| Tranche 1 Term Loan, 5.75%, 8/21/20 | United States | 678,070 | 686,122 | 0.03 |
| Tranche 2 Term Loan, 4.875%, 6/21/21 | United States | 1,900,000 | 1,906,828 | 0.10 |
| | | | 2,592,950 | 0.13 |
| Electric Utilities | | | | |
| Alinta Energy Finance Pty. Ltd., | | | | |
| Delayed Draw Term Commitments, 6.375%, 8/13/18 | Australia | 2,367,760 | 2,381,820 | 0.12 |
| Term B Loans, 6.375%, 8/13/19 | Australia | 35,638,588 | 35,850,210 | 1.83 |
| | | | 38,232,030 | 1.95 |
| Electronic Equipment & Instruments | | | | |
| Oberthur Technologies of America Corp., Tranche B-2 Term Loan, 4.50%, | United States | 512,200 | 511,073 | 0.03 |
| 10/18/19 | | | | |
| Forest Products | | | | |
| f Appvion Inc., Term Loan, 5.75%, 6/28/19 | United States | 26,962,363 | 25,378,324 | 1.29 |
| Caraustar Industries Inc., | | | | |
| Term Loan B, 8.00%, 5/01/19 | United States | 13,236,552 | 13,264,124 | 0.68 |
| eTerm Loan C, 8.00%, 5/01/19 | United States | 22,320,959 | 22,367,453 | 1.14 |
| | | | 61,009,901 | 3.11 |
| General Merchandise Stores | | | | |
| Dollar Tree Inc., Term B-1 Loans, 3.50%, 3/09/22 | United States | 16,320,183 | 16,384,778 | 0.84 |
| Health Care Equipment | | | | |
| Carestream Health Inc., | | | | |
| Second Lien Loan, 9.50%, 12/07/19 | United States | 9,140,294 | 9,115,159 | 0.46 |
| Term Loan, 5.00%, 6/07/19 | United States | 3,849,750 | 3,859,374 | 0.20 |
| e Hill-Rom Holdings Inc., Term Loan B, 5.00%, 7/30/22 | United States | 4,562,306 | 4,587,969 | 0.23 |
| Kinetic Concepts Inc., Dollar Term E-1 Loan, 4.50%, 5/04/18 | United States | 11,598,393 | 11,668,169 | 0.60 |
| | | | 29,230,671 | 1.49 |
| Health Care Facilities | | | | |
| Amsurg Corp., Initial Term Loan, 3.75%, 7/16/21 | United States | 9,609,849 | 9,644,387 | 0.49 |
| Community Health Systems Inc., | | | | |
| 2018 Term F Loans, 3.534%, 12/31/18 | United States | 34,085,939 | 34,203,127 | 1.75 |
| 2019 Term G Loan, 3.75%, 12/31/19 | United States | 8,202,043 | 8,229,380 | 0.42 |
| | | | 52,076,894 | 2.66 |
| Health Care Services | | | | |
| Connolly LLC, | | | | |
| Initial Term Loan, 4.50%, 5/14/21 | United States | 6,739,071 | 6,781,191 | 0.35 |
| Second Lien Initial Term Loan, 8.00%, 5/13/22 | United States | 9,790,000 | 9,863,425 | 0.50 |
| Dialysis Newco Inc., Term Loan B, 4.50%, 4/23/21 | United States | 6,345,900 | 6,361,765 | 0.32 |
| Millennium Health LLC, Tranche B Term Loan, 5.25%, 4/16/21 | United States | 16,298,129 | 7,008,195 | 0.36 |
| National Mentor Holdings Inc., Initial Tranche B Term Loan, 4.25%, 1/31/21 | United States | 11,019,187 | 11,053,622 | 0.56 |
| Surgery Centers Holdings Inc., | | | | |
| Second Lien Term Loan, 8.50%, 11/03/21 | United States | 685,723 | 685,723 | 0.04 |
| Term Loan, 5.25%, 11/03/20 | United States | 4,507,113 | 4,518,381 | 0.23 |
| U.S. Renal Care Inc., Tranche B-2 Term Loan, 4.25%, 7/03/19 | United States | 15,687,022 | 15,721,345 | 0.80 |
| | | | 61,993,647 | 3.16 |
| Health Care Technology | | | | |
| Truven Health Analytics Inc., New Tranche B Term Loan, 4.50%, 6/06/19 | United States | 11,340,051 | 11,322,190 | 0.58 |
Annual Report
| | | | |
| Franklin Floating Rate Master Trust | | | | |
| |
| Statement of Investments, July 31, 2015 (continued) | | | | |
| Hotels, Resorts & Cruise Lines | | | | |
| Diamond Resorts Corp., Term Loans, 5.50%, 5/09/21 | United States | 5,081,519 | 5,110,103 | 0.26 |
| Four Seasons Holdings Inc., Second Lien Term Loan, 6.25%, 12/27/20 | Canada | 5,671,699 | 5,700,057 | 0.29 |
| Hilton Worldwide Finance LLC, Initial Term Loan, 3.50%, 10/26/20 | United States | 8,578,267 | 8,605,743 | 0.44 |
| | | | 19,415,903 | 0.99 |
| Household Products | | | | |
| e Spectrum Brands Inc., Initial Term Loans, 5.25%, 6/23/22 | United States | 10,116,395 | 10,173,299 | 0.52 |
| Sun Products Corp., Tranche B Term Loan, 5.50%, 3/23/20 | United States | 23,699,295 | 23,062,377 | 1.18 |
| | | | 33,235,676 | 1.70 |
| Housewares & Specialties | | | | |
| e Jarden Corp., | | | | |
| Term Loan B-1, 5.00%, 9/30/20 | United States | 1,656,443 | 1,664,208 | 0.09 |
| Term Loan B-2, 4.75%, 7/31/22 | United States | 655,831 | 655,627 | 0.03 |
| | | | 2,319,835 | 0.12 |
| Independent Power Producers & Energy Traders | | | | |
| Calpine Construction Finance Co. LP, | | | | |
| Term B-1 Loan, 3.00%, 5/03/20 | United States | 7,659,110 | 7,603,260 | 0.39 |
| Term B-2 Loan, 3.25%, 1/31/22 | United States | 2,261,743 | 2,244,779 | 0.11 |
| Calpine Corp., | | | | |
| Term Loan (B5), 3.50%, 5/27/22 | United States | 6,362,615 | 6,350,246 | 0.32 |
| Term Loan B4, 4.00%, 10/31/20 | United States | 7,157,344 | 7,188,021 | 0.37 |
| Term Loans, 4.00%, 10/09/19 | United States | 515,425 | 517,600 | 0.03 |
| | | | 23,903,906 | 1.22 |
| Industrial Machinery | | | | |
| Alfred Fueling Systems Inc. (Wayne Fueling), | | | | |
| First Lien Initial Term Loan, 4.75%, 6/18/21 | United States | 6,607,191 | 6,607,191 | 0.34 |
| Second Lien Initial Term Loan, 8.50%, 6/20/22 | United States | 9,715,882 | 9,667,303 | 0.49 |
| Husky Injection Molding Systems Ltd., Initial Term Loan, 4.25%, 6/30/21 | United States | 4,165,208 | 4,165,641 | 0.21 |
| Navistar Inc., Tranche B Term Loan, 6.75%, 8/17/17 | United States | 13,792,412 | 13,818,272 | 0.71 |
| Onsite Rental Group Operations Pty. Ltd., Term B Loan, 5.50%, 7/30/21 | Australia | 20,508,169 | 19,995,465 | 1.02 |
| RBS Global Inc. (Rexnord), Term B Loan, 4.00%, 8/21/20 | United States | 8,174,400 | 8,189,727 | 0.42 |
| Sensus USA Inc., | | | | |
| First Lien Term Loan, 4.50%, 5/09/17 | United States | 11,265,128 | 11,258,087 | 0.57 |
| eSecond Lien Term Loan, 8.50%, 5/09/18 | United States | 7,774,399 | 7,735,527 | 0.39 |
| WireCo Worldgroup Inc., Term Loan, 6.00%, 2/15/17 | United States | 1,665,052 | 1,671,296 | 0.09 |
| | | | 83,108,509 | 4.24 |
| Insurance Brokers | | | | |
| HUB International Ltd., Initial Term Loan, 4.00%, 10/02/20 | United States | 10,313,414 | 10,281,896 | 0.52 |
| Integrated Telecommunication Services | | | | |
| Intelsat Jackson Holdings SA, Tranche B-2 Term Loan, 3.75%, 6/30/19 | Luxembourg | 13,873,471 | 13,754,242 | 0.70 |
| LTS Buyer LLC, | | | | |
| First Lien Term B Loan, 4.00%, 4/13/20 | United States | 4,057,200 | 4,045,365 | 0.21 |
| Second Lien Initial Loan, 8.00%, 4/12/21 | United States | 2,407,490 | 2,403,477 | 0.12 |
| Telesat Canada/Telesat LLC, U.S. Term B-2 Loan, 3.50%, 3/28/19 | Canada | 3,979,644 | 3,982,959 | 0.20 |
| e Zayo Group LLC, 2021 Term Loans, 5.00%, 5/06/21 | United States | 2,543,614 | 2,539,162 | 0.13 |
| | | | 26,725,205 | 1.36 |
| Internet Software & Services | | | | |
| BMC Software Finance Inc., | | | | |
| eInitial U.S. Revolving Commitment, 6.25%, 9/10/18 | United States | 6,000,000 | 5,497,860 | 0.28 |
| Initial U.S. Term Loans, 5.00%, 9/10/20 | United States | 25,412,354 | 23,290,423 | 1.19 |
| | | | 28,788,283 | 1.47 |
| Investment Banking & Brokerage | | | | |
| Guggenheim Partners Investment Management Holdings LLC, Initial Term | United States | 10,788,880 | 10,851,250 | 0.55 |
| Loan, 4.25%, 7/22/20 | | | | |
| IT Consulting & Other Services | | | | |
| Sungard Availability Services Capital Inc., Tranche B Term Loan, 6.00%, | United States | 11,324,822 | 10,411,758 | 0.53 |
| 3/29/19 | | | | |
| Leisure Facilities | | | | |
| e 24 Hour Fitness Worldwide Inc., Term Loan, 4.75%, 5/28/21 | United States | 18,242,773 | 17,657,321 | 0.90 |
| Fitness International LLC, Term B Loan, 5.50%, 7/01/20 | United States | 30,267,035 | 29,160,411 | 1.49 |
| Seaworld Parks and Entertainment Inc., Term B-2 Loan, 3.00%, 5/14/20 | United States | 6,440,787 | 6,271,717 | 0.32 |
| |
| | | | Annual Report |
| | | | |
| Franklin Floating Rate Master Trust | | | | |
| |
| Statement of Investments, July 31, 2015 (continued) | | | | |
| |
| Town Sports International LLC, Initial Term Loan, 4.50%, 11/15/20 | United States | 13,588,933 | 10,395,534 | 0.53 |
| | | | 63,484,983 | 3.24 |
| Life Sciences Tools & Services | | | | |
| Pharmaceutical Product Development LLC, Term Loan, 4.00%, 12/05/18 | United States | 4,859,131 | 4,867,372 | 0.25 |
| Marine | | | | |
| Navios Maritime Partners LP, Initial Term Loan, 5.25%, 6/27/18 | Marshall Islands | 14,561,764 | 14,646,703 | 0.75 |
| Metal & Glass Containers | | | | |
| CD&R Millennium U.S. Acquico LLC, | | | | |
| Initial Dollar Term Loan, 4.50%, 7/31/21 | United States | 2,431,625 | 2,432,639 | 0.12 |
| Second Lien Initial Term Loan, 8.75%, 7/31/22 | United States | 9,037,800 | 8,947,422 | 0.46 |
| | | | 11,380,061 | 0.58 |
| Movies & Entertainment | | | | |
| Regal Cinemas Corp., Term Loan, 3.75%, 4/01/22 | United States | 4,622,438 | 4,651,809 | 0.24 |
| Zuffa LLC, Initial Term Loan, 3.75%, 2/25/20 | United States | 10,035,309 | 9,963,186 | 0.51 |
| | | | 14,614,995 | 0.75 |
| Office Services & Supplies | | | | |
| West Corp., Term Loan B-10, 3.25%, 6/30/18 | United States | 4,000,000 | 3,995,556 | 0.20 |
| Oil & Gas Drilling | | | | |
| Drillships Financing Holding Inc., Tranche B-1 Term Loan, 6.00%, 3/31/21 | Marshall Islands | 14,503,080 | 11,345,034 | 0.58 |
| Drillships Ocean Ventures Inc. and Drillships Ventures Projects Inc., Term | Marshall Islands | 12,541,644 | 10,349,465 | 0.53 |
| Loan, 5.50%, 7/25/21 | | | | |
| | | | 21,694,499 | 1.11 |
| Oil & Gas Equipment & Services | | | | |
| McJunkin Red Man Corp., 2013 Term Loan, 5.00%, 11/08/19 | United States | 708,881 | 699,577 | 0.04 |
| Oil & Gas Exploration & Production | | | | |
| Fieldwood Energy LLC, | | | | |
| eLoans, 3.875%, 10/01/18 | United States | 25,254,622 | 23,281,604 | 1.19 |
| Second Lien Loans, 8.375%, 9/30/20 | United States | 5,347,833 | 2,958,020 | 0.15 |
| Samson Investment Co., Second Lien Tranche I Term Loan, 5.00%, 9/25/18 | United States | 9,960,000 | 2,882,175 | 0.15 |
| UTEX Industries Inc., | | | | |
| eFirst Lien Initial Term Loan, 5.00%, 5/21/21 | United States | 19,547,728 | 18,163,104 | 0.92 |
| Second Lien Initial Term Loan, 8.25%, 5/20/22 | United States | 5,000,000 | 4,265,625 | 0.22 |
| | | | 51,550,528 | 2.63 |
| Oil & Gas Storage & Transportation | | | | |
| OSG Bulk Ships Inc., Initial Term Loan, 5.25%, 8/05/19 | United States | 10,008,900 | 9,996,389 | 0.51 |
| OSG International Inc. (OIN), Initial Term Loan, 5.75%, 8/05/19 | United States | 11,414,725 | 11,450,396 | 0.58 |
| | | | 21,446,785 | 1.09 |
| Packaged Foods & Meats | | | | |
| AdvancePierre Foods Inc., | | | | |
| Loans, 5.75%, 7/10/17 | United States | 3,489,977 | 3,503,937 | 0.18 |
| Second Lien Term Loan, 9.50%, 10/10/17 | United States | 9,884,439 | 10,082,128 | 0.52 |
| CSM Bakery Supplies LLC (U.S. Acquisition), Second Lien Term Loan, 8.75%, | United States | 4,346,846 | 4,151,238 | 0.21 |
| 7/03/21 | | | | |
| JBS USA LLC, Incremental Term Loan, 3.75%, 9/18/20 | United States | 2,908,200 | 2,910,890 | 0.15 |
| e Post Holdings Inc., Series A Incremental Term Loan, 3.75%, 6/02/21 | United States | 15,521,414 | 15,536,935 | 0.79 |
| | | | 36,185,128 | 1.85 |
| Paper Packaging | | | | |
| Coveris Holdings SA, Term B-1 Loans, 4.50%, 5/08/19 | Luxembourg | 13,730,466 | 13,816,282 | 0.70 |
| Personal Products | | | | |
| e FGI Operating Co. LLC (Freedom Group), Term B Loans, 5.50%, 4/19/19 | United States | 23,439,812 | 22,414,320 | 1.14 |
| Pharmaceuticals | | | | |
| Akorn Inc., Loans, 4.50%, 4/16/21 | United States | 12,391,248 | 12,448,038 | 0.63 |
| e Endo Luxembourg Finance Co. and Endo LLC, | | | | |
| Asset Sale Bridge, 5.00%, 7/01/16 | United States | 7,575,758 | 7,589,962 | 0.39 |
| Term Loan B, 3.25%, 7/01/22 | United States | 15,420,736 | 15,511,086 | 0.79 |
| Grifols Worldwide Operations USA Inc., US Tranche B Term Loan, 3.19%, | United States | 9,376,263 | 9,417,284 | 0.48 |
| 2/27/21 | | | | |
| Valeant Pharmaceuticals International Inc., | | | | |
| Series C-2 Tranche B Term Loan, 3.50%, 12/11/19 | United States | 5,237,742 | 5,251,303 | 0.27 |
| Series D-2 Tranche B Term Loan, 3.50%, 2/13/19 | United States | 6,839,072 | 6,848,476 | 0.35 |
| |
| |
| | | | Annual Report |
| | | | |
| Franklin Floating Rate Master Trust | | | | |
| |
| Statement of Investments, July 31, 2015 (continued) | | | | |
| Series E-1 Tranche B Term Loan, 3.50%, 8/05/20 | United States | 2,918,084 | 2,924,598 | 0.15 |
| Series F-1 New Term Loan, 4.00%, 4/01/22 | United States | 23,378,331 | 23,515,141 | 1.20 |
| | | | 83,505,888 | 4.26 |
| Publishing | | | | |
| Cengage Learning Acquisitions Inc., Original Term Loans, 7.00%, 3/31/20 | United States | 15,297,015 | 15,388,552 | 0.79 |
| Restaurants | | | | |
| TGI Friday's Inc., First Lien Initial Term Loan, 5.25%, 7/15/20 | United States | 2,710,199 | 2,730,526 | 0.14 |
| Retail REITs | | | | |
| Capital Automotive LP, Second Lien Term Loan, 6.00%, 4/30/20 | United States | 3,613,830 | 3,678,579 | 0.19 |
| Semiconductors | | | | |
| M/A-COM Technology Solutions Holdings Inc., Initial Term Loan, 4.50%, | United States | 6,494,400 | 6,510,636 | 0.33 |
| 5/07/21 | | | | |
| Specialized Consumer Services | | | | |
| Travelport Finance Luxembourg S.A.R.L., Initial Term Loan, 5.75%, 9/02/21 | Luxembourg | 17,701,050 | 17,787,714 | 0.91 |
| Specialty Chemicals | | | | |
| e Axalta Coating Systems U.S. Holdings Inc., 2014 Specified Refinancing Term, | United States | 6,769,996 | 6,772,819 | 0.35 |
| 3.75%, 2/01/20 | | | | |
| AZ Chem U.S. Inc., Second Lien Initial Term Loan, 7.50%, 6/10/22 | United States | 4,360,213 | 4,346,587 | 0.22 |
| Nexeo Solutions LLC, | | | | |
| Term B-1 Loan, 5.00%, 9/08/17 | United States | 7,725,932 | 7,648,673 | 0.39 |
| Term B-2 Loan, 5.00%, 9/08/17 | United States | 6,089,891 | 6,021,380 | 0.31 |
| Term B-3 Loan, 5.00%, 9/08/17 | United States | 12,449,994 | 12,304,740 | 0.63 |
| Oxbow Carbon LLC, | | | | |
| First Lien Tranche B Term Loan, 4.25%, 7/19/19 | United States | 9,319,444 | 9,299,062 | 0.47 |
| Second Lien Initial Term Loan, 8.00%, 1/17/20 | United States | 10,889,020 | 10,290,124 | 0.52 |
| Solenis International LP and Solenis Holdings, | | | | |
| First Lien Term Loan, 4.25%, 7/31/21 | United States | 4,059,939 | 4,043,870 | 0.21 |
| Second Lien Term Loan, 7.75%, 7/31/22 | United States | 3,270,000 | 3,178,031 | 0.16 |
| | | | 63,905,286 | 3.26 |
| Specialty Stores | | | | |
| e 99 Cents Only Stores, Tranche B-2 Loan, 5.75%, 1/11/19 | United States | 10,096,865 | 9,664,598 | 0.49 |
| BJ's Wholesale Club Inc., Second Lien 2013 (Nov) Replacement Loans, 8.50%, | United States | 14,452,381 | 14,587,872 | 0.75 |
| 3/26/20 | | | | |
| e Evergreen AcqCo. 1 LP (Savers), Term Loan, 5.00%, 7/09/19 | United States | 25,393,748 | 23,885,994 | 1.22 |
| | | | 48,138,464 | 2.46 |
| Systems Software | | | | |
| Vertafore Inc., Second Lien Term Loan, 9.75%, 10/27/17 | United States | 6,403,762 | 6,487,811 | 0.33 |
| Technology Distributors | | | | |
| Dell International LLC, | | | | |
| Term B-2 Loan, 4.00%, 4/29/20 | United States | 7,243,520 | 7,250,061 | 0.37 |
| eTerm Loan C, 3.75%, 10/29/18 | United States | 6,839,527 | 6,854,253 | 0.35 |
| | | | 14,104,314 | 0.72 |
| Tires & Rubber | | | | |
| The Goodyear Tire & Rubber Co., Second Lien Loans, 3.75%, 4/30/19 | United States | 10,935,835 | 11,002,478 | 0.56 |
| Trucking | | | | |
| Hertz Corp., | | | | |
| Tranche B-1 Term Loan, 3.75%, 3/11/18 | United States | 8,610,734 | 8,633,604 | 0.44 |
| Tranche B-2 Term Loan, 3.00%, 3/11/18 | United States | 13,095,968 | 13,104,153 | 0.67 |
| | | | 21,737,757 | 1.11 |
| Total Senior Floating Rate Interests (Cost $1,856,772,798) | | | 1,805,231,353 | 92.12 |
| Asset-Backed Securities and Commercial Mortgage-Backed | | | | |
| Securities | | | | |
| Other Diversified Financial Services | | | | |
| h Apidos CDO, 2013-14A, C2, 144A, 4.85%, 4/15/25 | United States | 1,110,000 | 1,103,817 | 0.06 |
| d,h Atrium IX, 9A, C, 144A, FRN, 3.536%, 2/28/24 | United States | 1,200,000 | 1,201,776 | 0.06 |
| d,h Atrium XI, 11A, C, 144A, FRN, 3.494%, 10/23/25 | Cayman Islands | 8,000,000 | 8,024,640 | 0.41 |
| d,h Ballyrock CLO LLC, 2014-1A, B, 144A, FRN, 3.487%, 10/20/26 | United States | 2,100,000 | 2,095,044 | 0.11 |
| d,h Carlyle Global Market Strategies CLO Ltd., 2014-4A, C, 144A, FRN, 3.324%, | Cayman Islands | 2,600,000 | 2,604,862 | 0.13 |
| 10/15/26 | | | | |
Annual Report
| | | | | | | |
| Franklin Floating Rate Master Trust | | | | | | | |
| |
| Statement of Investments, July 31, 2015 (continued) | | | | | | | |
| d,h Catamaran CLO Ltd., | | | | | | | |
| 2013-1A, C, 144A, FRN, 2.895%, 1/27/25 | Cayman Islands | 1,100,000 | | 1,071,356 | | 0.05 | |
| 2014-2A, B, 144A, FRN, 3.174%, 10/18/26 | United States | 3,500,000 | | 3,466,680 | | 0.18 | |
| d,h Cent CLO LP, | | | | | | | |
| 2013-17A, D, 144A, FRN, 3.174%, 1/30/25 | Cayman Islands | 800,000 | | 801,992 | | 0.04 | |
| 2014-22A, B, 144A, FRN, 3.476%, 11/07/26 | Cayman Islands | 3,200,000 | | 3,203,088 | | 0.16 | |
| d,e,h Cumberland Park CLO Ltd., 2015-2A, C, 144A, FRN, 3.145%, 7/20/26 | Cayman Islands | 800,000 | | 797,245 | | 0.04 | |
| d,h Eaton Vance CDO Ltd., 2014-1A, | | | | | | | |
| A, 144A, FRN, 1.739%, 7/15/26 | Cayman Islands | 2,650,000 | | 2,650,768 | | 0.14 | |
| B, 144A, FRN, 2.339%, 7/15/26 | United States | 2,650,000 | | 2,648,861 | | 0.14 | |
| C, 144A, FRN, 3.289%, 7/15/26 | United States | 2,290,000 | | 2,291,420 | | 0.12 | |
| h Emerson Park CLO Ltd., 2013-1A, C2, 144A, 5.64%, 7/15/25 | United States | 1,100,000 | | 1,106,864 | | 0.06 | |
| h Highbridge Loan Management Ltd., 2013-2A, B2, 144A, 5.80%, 10/20/24 | United States | 1,190,000 | | 1,195,891 | | 0.06 | |
| d,h Voya CLO Ltd., | | | | | | | |
| 2013-1A, B, 144A, FRN, 3.189%, 4/15/24 | Cayman Islands | 800,000 | | 798,056 | | 0.04 | |
| 2013-2A, B, 144A, FRN, 2.975%, 4/25/25 | United States | 800,000 | | 793,392 | | 0.04 | |
| d,h Limerock CLO III LLC, 2014-3A, B, 144A, FRN, 3.487%, 10/20/26 | Cayman Islands | 2,400,000 | | 2,398,728 | | 0.12 | |
| d,h Ziggurat CLO I Ltd., 2014-1A, C, 144A, FRN, 3.274%, 10/17/26 | United States | 480,000 | | 477,672 | | 0.02 | |
| Total Asset-Backed Securities and Commercial Mortgage-Backed Securities | | | | | | | |
| (Cost $38,569,520) | | | | 38,732,152 | | 1.98 | |
| Total Investments before Short Term Investments (Cost $1,924,307,297) | | | | 1,872,500,278 | | 95.55 | |
| |
| |
| Short Term Investments (Cost $231,622,015) | | | | | | | |
| Repurchase Agreements | | | | | | | |
| i Joint Repurchase Agreement, 0.109%, 08/03/15 (Maturity Value $231,624,112) | United States | 231,622,015 | | 231,622,015 | | 11.82 | |
| BNP Paribas Securities Corp. (Maturity Value $45,639,215) | | | | | | | |
| Credit Suisse Securities (USA) LLC (Maturity Value $68,461,139) | | | | | | | |
| HSBC Securities (USA) Inc. (Maturity Value $95,843,741) | | | | | | | |
| Merrill Lynch, Pierce, Fenner & Smith Inc. (Maturity Value $21,680,017), | | | | | | | |
| Collateralized by U.S. Government Agency Securities, 0.000% - 0.215%, | | | | | | | |
| 12/01/15 - 2/01/20; and U.S. Treasury Notes, 0.25% - 0.875%, 9/15/15 – | | | | | | | |
| 6/15/17 (valued at $236,404,574) | | | | | | | |
| Total Investments (Cost $2,155,929,312) | | | | 2,104,122,293 | | 107.37 | |
| |
| Other Assets, less Liabilities | | | | (144,441,342 | ) | (7.37 | ) |
| Net Assets | | | $ | 1,959,680,951 | | 100.00 | |
See Abbreviations on page xx.
†Rounds to less than 0.01% of net assets.
*The principal amount is stated in U.S. dollars unless otherwise indicated.
aNon-income producing.
bSecurity has been deemed illiquid because it may not be able to be sold within seven days. At July 31, 2015, the value of this security was $208,886, representing 0.01%
of net assets.
cSee Note 1(e) regarding senior floating rate interests.
dThe coupon rate shown represents the rate at period end.
eA portion or all of the security purchased on a when-issued or delayed delivery basis. See Note 1(c).
fAt July 31, 2015, pursuant to the Fund's policies and the requirements of applicable securities law, the Fund may be restricted from trading these securities for a limited or
extended period of time.
gSee Note 7 regarding defaulted security.
hSecurity was purchased pursuant to Rule 144A under the Securities Act of 1933 and may be sold in transactions exempt from registration only to qualified institutional
buyers or in a public offering registered under the Securities Act of 1933. These securities have been deemed liquid under guidelines approved by the Trust's Board of
Trustees. At July 31, 2015, the aggregate value of these securities was $38,732,152, representing 1.98% of net assets.
iSee Note 1(b) regarding joint repurchase agreement.
Annual Report
Franklin Floating Rate Master Trust
Franklin Floating Rate Master Series
Financial Statements
| | | |
| Statement of Assets and Liabilities | | | |
| July 31, 2015 | | | |
| |
| Assets: | | | |
| Investments in securities: | | | |
| Cost - Unaffiliated issuers | $ | 1,924,307,297 | |
| Cost - Repurchase agreements | | 231,622,015 | |
| Total cost of investments | $ | 2,155,929,312 | |
| Value - Unaffiliated issuers | $ | 1,872,500,278 | |
| Value - Repurchase agreements | | 231,622,015 | |
| Total value of investments | | 2,104,122,293 | |
| Cash | | 2,192,391 | |
| Receivables: | | | |
| Investment securities sold | | 24,587,297 | |
| Interest | | 6,776,119 | |
| Other assets | | 734 | |
| Total assets | | 2,137,678,834 | |
| |
| Liabilities: | | | |
| Payables: | | | |
| Investment securities purchased | | 169,888,218 | |
| Management fees | | 864,696 | |
| Distributions to shareholders | | 7,226,221 | |
| Accrued expenses and other liabilities | | 18,748 | |
| Total liabilities | | 177,997,883 | |
| Net assets, at value | $ | 1,959,680,951 | |
| |
| Net assets consist of: | | | |
| Paid-in capital | $ | 2,133,456,315 | |
| Undistributed net investment income | | 97,487 | |
| Net unrealized appreciation (depreciation) | | (51,807,019 | ) |
| Accumulated net realized gain (loss) | | (122,065,832 | ) |
| Net assets, at value | $ | 1,959,680,951 | |
| Net asset value and maximum offering price per | | | |
| share ($1,959,680,951 ÷ 226,684,452 shares | | | |
| outstanding) | $ | 8.65 | |
Annual Report The accompanying notes are an integral part of these financial statements.
Franklin Floating Rate Master Trust
Franklin Floating Rate Master Series
Financial Statements (continued)
| | | |
| Statement of Operations | | | |
| for the year ended July 31, 2015 | | | |
| |
| Investment income: | | | |
| Dividends | $ | 445,981 | |
| Interest | | 103,818,029 | |
| Total investment income | | 104,264,010 | |
| |
| Expenses: | | | |
| Management fees (Note 3a) | | 15,440,628 | |
| Custodian fees (Note 4) | | 18,334 | |
| Reports to shareholders | | 4,117 | |
| Registration and filing fees | | 1,182 | |
| Professional fees | | 119,607 | |
| Trustees' fees and expenses | | 95,173 | |
| Other | | 51,954 | |
| Total expenses | | 15,730,995 | |
| Expense reductions (Note 4) | | (735 | ) |
| Expenses waived/paid by affiliates (Note 3d) | | (1,993,791 | ) |
| Net expenses | | 13,736,469 | |
| Net investment income | | 90,527,541 | |
| |
| Realized and unrealized gains (losses): | | | |
| Net realized gain (loss) from: | | | |
| Investments | | (7,038,596 | ) |
| Swap contracts | | 237,122 | |
| Net realized gain (loss) | | (6,801,474 | ) |
| Net change in unrealized appreciation | | | |
| (depreciation) on investments | | (59,792,266 | ) |
| Net realized and unrealized gain (loss) | | (66,593,740 | ) |
| Net increase (decrease) in net assets resulting | | | |
| from operations | $ | 23,933,801 | |
Annual Report The accompanying notes are an integral part of these financial statements.
Franklin Floating Rate Master Trust
Franklin Floating Rate Master Series
Financial Statements (continued)
Statements of Changes in Net Assets
| | | | | | |
| | | Year Ended July 31, | |
| | | 2015 | | | 2014 | |
| Increase (decrease) in net assets: | | | | | | |
| Operations: | | | | | | |
| Net investment income | $ | 90,527,541 | | $ | 67,093,305 | |
| Net realized gain (loss) | | (6,801,474 | ) | | (1,192,448 | ) |
| Net change in unrealized appreciation | | | | | | |
| (depreciation) | | (59,792,266 | ) | | (3,199,329 | ) |
| Net increase (decrease) in net assets | | | | | | |
| resulting from operations | | 23,933,801 | | | 62,701,528 | |
| |
| Distributions to shareholders from net | | | | | | |
| investment income | | (90,626,711 | ) | | (67,095,747 | ) |
| Capital share transactions (Note 2) | | (233,776,882 | ) | | 844,483,546 | |
| Net increase (decrease) in net assets | | (300,469,792 | ) | | 840,089,327 | |
| Net assets: | | | | | | |
| Beginning of year | | 2,260,150,743 | | | 1,420,061,416 | |
| End of year | $ | 1,959,680,951 | | $ | 2,260,150,743 | |
| Undistributed net investment income included | | | | | | |
| in net assets: | | | | | | |
| End of year | $ | 97,487 | | $ | 67,046 | |
Annual Report The accompanying notes are an integral part of these financial statements.
Franklin Floating Rate Master Trust
Franklin Floating Rate Master Series
Notes to Financial Statements
1. ORGANIZATION AND SIGNIFICANT ACCOUNTING POLICIES
Franklin Floating Rate Master Trust (Trust) is registered under the Investment Company Act of 1940 (1940 Act) as an open-end management investment company, consisting of one fund, Franklin Floating Rate Master Series (Fund) and applies the specialized accounting and reporting guidance in U.S. Generally Accepted Accounting Principles (U.S. GAAP). The shares are exempt from registration under the Securities Act of 1933.
The following summarizes the Fund's significant accounting policies.
a. Financial Instrument Valuation
The Fund's investments in financial instruments are carried at fair value daily. Fair value is the price that would be received to sell an asset or paid to transfer a liability in an orderly transaction between market participants on the measurement date. The Fund calculates the net asset value per share at the close of the New York Stock Exchange (NYSE), generally at 4 p.m. Eastern time (NYSE close) on each day the NYSE is open for trading. Under compliance policies and procedures approved by the Trust's Board of Trustees (the Board), the Fund’s administrator has responsibility for oversight of valuation, including leading the cross-functional Valuation and Liquidity Oversight Committee (VLOC). The VLOC provides administration and oversight of the Fund's valuation policies and procedures, which are approved annually by the Board. Among other things, these procedures allow the Fund to utilize independent pricing services, quotations from securities and financial instrument dealers, and other market sources to determine fair value.
Equity securities and exchange traded funds listed on an exchange or on the NASDAQ National Market System are valued at the last quoted sale price or the official closing price of the day, respectively. Over-the-counter (OTC) securities are valued within the range of the most recent quoted bid and ask prices. Securities that trade in multiple markets or on multiple exchanges are valued according to the broadest and most representative market. Certain equity securities are valued based upon fundamental characteristics or relationships to similar securities.
Debt securities generally trade in the OTC market rather than on a securities exchange. The Fund's pricing services use multiple valuation techniques to determine fair value. In instances where sufficient market activity exists, the pricing services may utilize a market-based approach through which quotes from market makers are used to determine fair value. In instances where sufficient market activity may not exist or is limited, the pricing services also utilize proprietary valuation models which may consider market characteristics such as benchmark yield curves, credit spreads, estimated default rates, anticipated market interest rate volatility, coupon rates, anticipated timing of principal repayments, underlying collateral, and other unique security features in order to estimate the relevant cash flows, which are then discounted to calculate the fair value.
Repurchase agreements are valued at cost, which approximates market value.
Derivative financial instruments (derivatives) listed on an exchange are valued at the official closing price of the day. Certain derivatives trade in the OTC market. The Fund's pricing services use various techniques including industry standard option pricing models and proprietary discounted cash flow models to determine the fair value of those instruments. The Fund's net benefit or obligation under the derivative contract, as measured by the fair value of the contract, is included in net assets.
The Fund has procedures to determine the fair value of financial instruments for which market prices are not reliable or readily available. Under these procedures, the VLOC convenes on a regular basis to review such financial instruments and considers a number of factors, including significant unobservable valuation inputs, when arriving at fair value. The VLOC primarily employs a market-based approach which may use related or comparable assets or liabilities, recent transactions, market multiples, book values, and other relevant information for the investment to determine the fair value of the investment. An income-based valuation approach may also be used in which the anticipated future cash flows of the investment are discounted to calculate fair value. Discounts may also be applied due to the nature or duration of any restrictions on the disposition of the investments. Due to the inherent uncertainty of valuations of such investments, the fair values may differ significantly from the values that would have been used had an active market existed. The VLOC employs various methods for calibrating these valuation approaches including a regular review of key inputs and assumptions, transactional back-testing or disposition analysis, and reviews of any related market activity.
b. Joint Repurchase Agreement
The Fund enters into a joint repurchase agreement whereby its uninvested cash balance is deposited into a joint cash account with other funds managed by the investment manager or an affiliate of the investment manager and is used to invest in one or more repurchase agreements. The value and face amount of the joint repurchase agreement are allocated to the funds based on their pro-rata interest. A repurchase agreement is accounted for as a loan by the Fund to the seller, collateralized by securities which are delivered to the Fund’s custodian. The fair value, including accrued interest, of the initial collateralization is required to be at least 102% of the dollar amount invested by the funds, with the value of the underlying securities marked to market daily to maintain coverage of at least 100%. Repurchase agreements are subject to the terms of Master Repurchase Agreements (MRAs) with approved counterparties (sellers). The MRAs contain various provisions, including but not limited to events of default and maintenance of collateral for repurchase agreements. In the event of default by either the seller or the Fund, certain MRAs may permit the non-defaulting party to net and close-out all transactions, if any, traded under such agreements. The Fund may sell securities it holds as collateral and apply the proceeds towards the repurchase price and any other amounts owed by the seller to the Fund in the event of default by the seller. This could involve costs or delays in addition to a loss on the securities if their value falls below the repurchase price owed by the seller. The joint repurchase agreement held by the Fund at year end, as indicated in the Statement of Investments, had been entered into on July 31, 2015.
c. Securities Purchased on a When-Issued and Delayed Delivery Basis
The Fund purchases securities on a when-issued and delayed delivery basis, with payment and delivery scheduled for a future date. These transactions are subject to market fluctuations and are subject to the risk that the value at delivery may be more or less than the trade date purchase price. Although the Fund will generally purchase these securities with the intention of holding the securities, it may sell the securities before the settlement date. Sufficient assets have been segregated for these securities.
d. Derivative Financial Instruments
The Fund invested in derivatives in order to manage risk or gain exposure to various other investments or markets. Derivatives are financial contracts based on an underlying or notional amount, require no initial investment or an initial net investment that is smaller than would normally be required to have a similar response to changes in market factors, and require or permit net settlement. Derivatives contain various risks including the potential inability of the counterparty to fulfill their obligations under the terms of the contract, the potential for an illiquid secondary market, and/or the potential for market movements which expose the Fund to gains or losses in excess of the amounts shown in the Statement of Assets and Liabilities. Realized gain and loss and unrealized appreciation and depreciation on these contracts for the period are included in the Statement of Operations.
The Fund entered into credit default swap contracts primarily to manage and/or gain exposure to credit risk. A credit default swap is an agreement between the Fund and a counterparty whereby the buyer of the contract receives credit protection and the seller of the contract guarantees the credit worthiness of a referenced debt obligation. These agreements may be privately negotiated in the over-the-counter market (OTC credit default swaps) or may be executed in a multilateral trade facility platform, such as a registered exchange (centrally cleared credit default swaps). The underlying referenced debt obligation may be a single issuer of corporate or sovereign debt, a credit index, or a tranche of a credit index. In the event of a default of the underlying referenced debt obligation, the buyer is entitled to receive the notional amount of the credit default swap contract from the seller in exchange for the referenced debt obligation, a net settlement amount equal to the notional amount of the credit default swap less the recovery value of the referenced debt obligation, or other agreed upon amount. For centrally cleared credit default swaps, required initial margins are pledged by the Fund, and the daily change in fair value is accounted for as a variation margin payable or receivable in the Statement of Assets and Liabilities. Over the term of the contract, the buyer pays the seller a periodic stream of payments, provided that no event of default has occurred. Such periodic payments are accrued daily as an unrealized appreciation or depreciation until the payments are made, at which time they are realized. Payments received or paid to initiate a credit default swap contract are reflected in the Statement of Assets and Liabilities and represent compensating factors between stated terms of the credit default swap agreement and prevailing market conditions (credit spreads and other relevant factors). These upfront payments are amortized over the term of the contract as a realized gain or loss in the Statement of Operations.
See Note 8 regarding other derivative information.
e. Senior Floating Rate Interests
The Fund invests in senior secured corporate loans that pay interest at rates which are periodically reset by reference to a base lending rate plus a spread. These base lending rates are generally the prime rate offered by a designated U.S. bank or the London InterBank Offered Rate (LIBOR). Senior secured corporate loans often require prepayment of principal from excess cash flows or at the discretion of the borrower. As a result, actual maturity may be substantially less than the stated maturity. Senior secured corporate loans in which the Fund invests are generally readily marketable, but may be subject to certain restrictions on resale.
f. Income Taxes
The Fund has elected to be treated as a disregarded entity for U.S. income tax purposes. As such, no provision has been made for income taxes because all income, expenses, gains and losses are allocated to a non-U.S. beneficial owner for inclusion in its individual income tax return, as applicable.
g. Security Transactions, Investment Income, Expenses and Distributions
Security transactions are accounted for on trade date. Realized gains and losses on security transactions are determined on a specific identification basis. Interest income and estimated expenses are accrued daily. Amortization of premium and accretion of discount on debt securities are included in interest income. Facility fees are recognized as income over the expected term of the loan. Dividend income is recorded on the ex-dividend date. The Fund's net investment income is allocated to the owner daily and paid monthly. Net capital gains (or losses) realized by the Fund will not be distributed. Distributions to shareholders are determined according to income tax regulations (tax basis). Distributable earnings determined on a tax basis may differ from earnings recorded in accordance with U.S. GAAP. These differences may be permanent or temporary. Permanent differences are reclassified among capital accounts to reflect their tax character. These reclassifications have no impact on net assets or the results of operations. Temporary differences are not reclassified, as they may reverse in subsequent periods.
h. Accounting Estimates
The preparation of financial statements in accordance with U.S. GAAP requires management to make estimates and assumptions that affect the reported amounts of assets and liabilities at the date of the financial statements and the amounts of income and expenses during the reporting period. Actual results could differ from those estimates.
i. Guarantees and Indemnifications
Under the Trust's organizational documents, its officers and trustees are indemnified by the Trust against certain liabilities arising out of the performance of their duties to the Trust. Additionally, in the normal course of business, the Trust, on behalf of the Fund, enters into contracts with service providers that contain general indemnification clauses. The Trust's maximum exposure under these arrangements is unknown as this would involve future claims that may be made against the Trust that have not yet occurred. Currently, the Trust expects the risk of loss to be remote.
2. SHARES OF BENEFICIAL INTEREST
At July 31, 2015, there were an unlimited number of shares authorized (without par value). Transactions in the Fund's shares were as follows:
| | | | | | | | | | |
| | | | | Year Ended July 31, | | | | |
| | 2015 | | 2014 | |
| | Shares | | | Amount | | Shares | | | Amount | |
| Shares sold | 29,062,995 | | $ | 255,040,059 | | 108,182,033 | | $ | 967,233,306 | |
| Shares redeemed | (55,754,909 | ) | | (488,816,941 | ) | (13,743,729 | ) | | (122,749,760 | ) |
| Net increase (decrease) | (26,691,914 | ) | $ | (233,776,882 | ) | 94,438,304 | | $ | 844,483,546 | |
| |
| |
| |
| 3. TRANSACTIONS WITH AFFILIATES | | | | | | | | | | |
Franklin Resources, Inc. is the holding company for various subsidiaries that together are referred to as Franklin Templeton Investments. Certain officers and trustees of the Trust are also officers and/or directors of the following subsidiaries:
| |
| Subsidiary | Affiliation |
| Franklin Advisers, Inc. (Advisers) | Investment manager |
| Franklin Templeton Services, LLC (FT Services) | Administrative manager |
| Franklin Templeton Investor Services, LLC (Investor Services) | Transfer agent |
| |
| a. Management Fees | |
Effective March 1, 2015, the Fund pays an investment management fee to Advisers based on the average daily net assets of the Fund as follows:
| | |
| Annualized | | |
| Fee Rate | | Net Assets |
| 0.530 | % | Up to and including $2.5 billion |
| 0.450 | % | Over $2.5 billion, up to and including $6.5 billion |
| 0.430 | % | Over $6.5 billion, up to and including $11.5 billion |
| 0.400 | % | Over $11.5 billion, up to and including $16.5 billion |
| 0.390 | % | Over $16.5 billion, up to and including $19.0 billion |
| 0.380 | % | Over $19.0 billion, up to and including $21.5 billion |
| 0.370 | % | In excess of $21.5 billion |
Prior to March 1, 2015, the Fund paid fees to Advisers based on the average daily net assets of the Fund as follows:
| | |
| Annualized | | |
| Fee Rate | | Net Assets |
| 0.950 | % | Up to and including $200 million |
| 0.935 | % | Over $200 million, up to and including $700 million |
| 0.900 | % | Over $700 million, up to and including $1.2 billion |
| 0.875 | % | In excess of $1.2 billion |
b. Administrative Fees
Under an agreement with Advisers, FT Services provides administrative services to the Fund. The fee is paid by Advisers based on the Fund's average daily net assets, and is not an additional expense of the Fund.
c. Transfer Agent Fees
Investor Services, under terms of an agreement, performs shareholder servicing for the Fund and is not paid by the Fund for the services.
d. Waiver and Expense Reimbursements
Advisers voluntarily agreed in advance to waive or limit their fees and to assume as their own expense certain expenses otherwise payable by the Fund so that the expenses (excluding distribution fees, and acquired fund fees and expenses), do not exceed 0.53%, based on the average net assets of the fund (other than certain non-routine expenses or costs, including those relating to litigation, indemnification, reorganizations, and liquidations). Prior to January 30, 2015, expenses were limited to 0.80%.
e. Other Affiliated Transactions
At July 31, 2015, the shares of Franklin Floating Rate Fund, PLC owned 100% of the Fund's outstanding shares. Investment activities of this shareholder could have a material impact on the Fund.
4. EXPENSE OFFSET ARRANGEMENT
The Fund has entered into an arrangement with its custodian whereby credits realized as a result of uninvested cash balances are used to reduce a portion of the Fund’s custodian expenses. During the year ended July 31, 2015, the custodian fees were reduced as noted in the Statement of Operations.
5. INCOME TAXES
At July 31, 2015, the cost of investments and net unrealized appreciation (depreciation) for income tax purposes were as follows:
| | | |
| Cost of investments | $ | 2,155,950,675 | |
| |
| Unrealized appreciation | $ | 9,149,323 | |
| Unrealized depreciation | | (60,977,705 | ) |
| Net unrealized appreciation (depreciation) | $ | (51,828,382 | ) |
Differences between income and/or capital gains as determined on a book basis and a tax basis are primarily due to differing treatment of bond discounts and premiums and washsales.
6. INVESTMENT TRANSACTIONS
Purchases and sales of investments (excluding short term securities) for the year ended July 31, 2015, aggregated $1,189,980,635 and $1,292,088,574, respectively.
7. CREDIT RISK AND DEFAULTED SECURITIES
At July 31, 2015, the Fund had 85.26% of its portfolio invested in high yield, senior secured floating rate notes, or other securities rated below investment grade. These securities may be more sensitive to economic conditions causing greater price volatility and are potentially subject to a greater risk of loss due to default than higher rated securities.
The Fund held a defaulted security and/or other securities for which the income has been deemed uncollectible. At July 31, 2015, the value of this security was $3,025,576 representing 0.15% of the Fund's net assets. The Fund discontinues accruing income on securities for which income has been deemed uncollectible and provides an estimate for losses on interest receivable. The security has been identified in the accompanying Statement of Investments.
8. OTHER DERIVATIVE INFORMATION
For the year ended July 31, 2015, the effect of derivative contracts in the Fund's Statement of Operations was as follows:
| | | | | | |
| Derivative Contracts Not | | | | | | Net Change in Unrealized |
| Accounted for as | Statem ent of Operations | | Net Realized Gain | Statem ent of Operations | | Appreciation (Depreciation) |
| Hedging Instruments | Locations | | (Loss) for the Year | Locations | | for theYear |
| | | | | Net change in unrealized | | |
| | Net realized gain (loss) from: | | | appreciation (depreciation) on: | | |
| Credit contracts | Sw ap contracts | $ | 237,122 | Swap contracts | $ | - |
For the year ended July 31, 2015, the average month end fair value of derivatives was less than 0.01% of average month end net assets. The average month end number of open derivative contracts for the period was 1.
See Note 1(d) regarding derivative financial instruments.
9. SHAREHOLDER DISTRIBUTIONS
For the year ended July 31, 2015, the Fund made the following distributions:
| | |
| Payment Date | | Amount Per Share |
| 8/29/2014 | $ | 0.028654 |
| 9/30/2014 | | 0.027881 |
| 10/31/2014 | | 0.030568 |
| 11/28/2014 | | 0.032128 |
| 12/31/2014 | | 0.033301 |
| 1/30/2015 | | 0.033021 |
| 2/27/2015 | | 0.032591 |
| 3/31/2015 | | 0.036433 |
| 4/30/2015 | | 0.035587 |
| 5/29/2015 | | 0.035021 |
| 6/30/2015 | | 0.033336 |
| 7/31/2015 | | 0.032146 |
| Total | $ | 0.390667 |
| |
| 10. CREDIT FACILITY | | |
The Fund together with other U.S. registered and foreign investment funds (collectively, Borrowers), managed by Franklin Templeton Investments, are borrowers in a joint syndicated senior unsecured credit facility totaling $2 billion (Global Credit Facility) which matures on February 12, 2016. This Global Credit Facility provides a source of funds to the Borrowers for temporary and emergency purposes, including the ability to meet future unanticipated or unusually large redemption requests.
Under the terms of the Global Credit Facility, the Fund shall, in addition to interest charged on any borrowings made by the Fund and other costs incurred by the Fund, pay its share of fees and expenses incurred in connection with the implementation and maintenance of the Global Credit Facility, based upon its relative share of the aggregate net assets of all of the Borrowers, including an annual commitment fee of 0.07% based upon the unused portion of the Global Credit Facility. These fees are reflected in other expenses in the Statement of Operations. During the year ended July 31, 2015, the Fund did not use the Global Credit Facility.
11. FAIR VALUE MEASUREMENTS
The Fund follows a fair value hierarchy that distinguishes between market data obtained from independent sources (observable inputs) and the Fund’s own market assumptions (unobservable inputs). These inputs are used in determining the value of the Fund’s financial instruments and are summarized in the following fair value hierarchy:
- Level 1 – quoted prices in active markets for identical financial instruments
- Level 2 – other significant observable inputs (including quoted prices for similar financial instruments, interest rates, prepayment speed, credit risk, etc.)
- Level 3 – significant unobservable inputs (including the Fund’s own assumptions in determining the fair value of financial instruments)
The input levels are not necessarily an indication of the risk or liquidity associated with financial instruments at that level.
For movements between the levels within the fair value hierarchy, the Fund has adopted a policy of recognizing the transfers as of the date of the underlying event which caused the movement.
A summary of inputs used as of July 31, 2015, in valuing the Fund’s assets carried at fair value, is as follows:
| | | | | | | | |
| | | Level 1 | | Level 2 | | Level 3 | | Total |
| Assets: | | | | | | | | |
| Investments in Securities: | | | | | | | | |
| Equity Investmentsa,b | $ | 28,327,887 | $ | - | $ | - | $ | 28,327,887 |
| Corporate Bonds | | | | - | | 208,886 | | 208,886 |
| Senior Floating Rate Interests | | - | | 1,805,231,353 | | - | | 1,805,231,353 |
| Asset-Backed Securities and | | | | | | | | |
| Commercial Mortgage-Backed Securities | | - | | 38,732,152 | | - | | 38,732,152 |
| Short Term Investments | | - | | 231,622,015 | | - | | 231,622,015 |
| Total Investments in Securities | $ | 28,327,887 | $ | 2,075,585,520 | $ | 208,886 | $ | 2,104,122,293 |
aIncludes common stocks and exchange traded funds.
bFor detailed catagories, see the accompanying Statement of Investments.
A reconciliation of assets in which Level 3 inputs are used in determining fair value is presented when there are significant Level 3 financial instruments at the end of the year.
12. SUBSEQUENT EVENTS
The Fund has evaluated subsequent events through the issuance of the financial statements and determined that no events have occurred that require disclosure.
| |
| ABBREVIATIONS |
| |
| Selected Portfolio |
| |
| CDO | – Collateralized Debt Obligation |
| CLO | – Collateralized Loan Obligation |
| ETF | – Exchange Traded Fund |
| FRN | – Floating Rate Note |
Report of Independent Registered Public Accounting Firm
To the Board of Trustees and Shareholders of Franklin Floating Rate Master Trust
In our opinion, the accompanying statement of assets and liabilities, including the statement of investments, and the related statements of operations and of changes in net assets and the financial highlights present fairly, in all material respects, the financial position of Franklin Floating Rate Master Series (the "Fund") at July 31, 2015, the results of its operations for the year then ended, the changes in its net assets for each of the two years in the period then ended and the financial highlights for each of the five years in the period then ended, in conformity with accounting principles generally accepted in the United States of America. These financial statements and financial highlights (hereafter referred to as "financial statements") are the responsibility of the Fund's management. Our responsibility is to express an opinion on these financial statements based on our audits. We conducted our audits of these financial statements in accordance with the standards of the Public Company Accounting Oversight Board (United States). Those standards require that we plan and perform the audit to obtain reasonable assurance about whether the financial statements are free of material misstatement. An audit includes examining, on a test basis, evidence supporting the amounts and disclosures in the financial statements, assessing the accounting principles used and significant estimates made by management, and evaluating the overall financial statement presentation. We believe that our audits, which included confirmation of securities at July 31, 2015 by correspondence with the custodian and brokers, provide a reasonable basis for our opinion.
PricewaterhouseCoopers LLP
San Francisco, California September 17, 2015
Item 2. Code of Ethics.
(a) The Registrant has adopted a code of ethics that applies to its principal executive officers and principal financial and accounting officer.
(c) N/A
(d) N/A
(f) Pursuant to Item 12(a)(1), the Registrant is attaching as an exhibit a copy of its code of ethics that applies to its principal executive officers and principal financial and accounting officer.
Item 3. Audit Committee Financial Expert.
(a)(1) The Registrant has an audit committee financial expert serving on its audit committee.
(2) The audit committee financial expert is John B. Wilson and he is "independent" as defined under the relevant Securities and Exchange Commission Rules and Releases.
Item 4. Principal Accountant Fees and Services.
(a) Audit Fees
The aggregate fees paid to the principal accountant for professional services rendered by the principal accountant for the audit of the registrant’s annual financial statements or for services that are normally provided by the principal accountant in connection with statutory and regulatory filings or engagements were $73,838 for the fiscal year ended July 31, 2015 and $74,006 for the fiscal year ended July 31, 2014.
(b) Audit-Related Fees
There were no fees paid to the principal accountant for assurance and related services rendered by the principal accountant to the registrant that are reasonably related to the performance of the audit of the registrant's financial statements and are not reported under paragraph (a) of Item 4.
There were no fees paid to the principal accountant for assurance and related services rendered by the principal accountant to the registrant's investment adviser and any entity controlling, controlled by or under common control with the investment adviser that provides ongoing services to the registrant that are reasonably related to the performance of the audit of their financial statements.
(c) Tax Fees
There were no fees paid to the principal accountant for professional services rendered by the principal accountant to the registrant for tax compliance, tax advice and tax planning.
The aggregate fees paid to the principal accountant for professional services rendered by the principal accountant to the registrant’s investment adviser and any entity controlling, controlled by or under common control with the investment adviser that provides ongoing services to the registrant for tax compliance, tax advice and tax planning were $0 for the fiscal year ended July 31, 2015 and $3,830 for the fiscal year ended July 31, 2014. The services for which these fees were paid included technical tax consultation for withholding tax reporting to foreign governments and requirements on local country’s self-certification forms.
(d) All Other Fees
The aggregate fees paid to the principal accountant for products and services rendered by the principal accountant to the registrant not reported in paragraphs (a)-(c) of Item 4 were $0 for the fiscal year ended July 31, 2015 and $644 for the fiscal year ended July 31, 2014. The services for which these fees were paid included review of materials provided to the fund Board in connection with the investment management contract renewal process.
The aggregate fees paid to the principal accountant for products and services rendered by the principal accountant to the registrant’s investment adviser and any entity controlling, controlled by or under common control with the investment adviser that provides ongoing services to the registrant, other than services reported in paragraphs (a)-(c) of Item 4 were $229,400 for the fiscal year ended July 31, 2015 and $159,092 for the fiscal year ended July 31, 2014. The services for which these fees were paid included preparation and review of materials provided to the fund Board in connection with the investment management contract renewal process and derivatives assessment.
(e) (1) The registrant’s audit committee is directly responsible for approving the services to be provided by the auditors, including:
(i) pre-approval of all audit and audit related services;
(ii) pre-approval of all non-audit related services to be provided to the Fund by the auditors;
(iii) pre-approval of all non-audit related services to be provided to the registrant by the auditors to the registrant’s investment adviser or to any entity that controls, is controlled by or is under common control with the registrant’s investment adviser and that provides ongoing services to the registrant where the non-audit services relate directly to the operations or financial reporting of the registrant; and
(iv) establishment by the audit committee, if deemed necessary or appropriate, as an alternative to committee pre-approval of services to be provided by the auditors, as required by paragraphs (ii) and (iii) above, of policies and procedures to permit such services to be pre-approved by other means, such as through establishment of guidelines or by action of a designated member or members of the committee; provided the policies and procedures are detailed as to the particular service and the committee is informed of each service and such policies and procedures do not include delegation of audit committee responsibilities, as contemplated under the Securities Exchange Act of 1934, to management; subject, in the case of (ii) through (iv), to any waivers, exceptions or exemptions that may be available under applicable law or rules.
(e) (2) None of the services provided to the registrant described in paragraphs (b)-(d) of Item 4 were approved by the audit committee pursuant to paragraph (c)(7)(i)(C) of Rule 2-01 of regulation S-X.
(f) No disclosures are required by this Item 4(f).
(g) The aggregate non-audit fees paid to the principal accountant for services rendered by the principal accountant to the registrant and the registrant’s investment adviser and any entity controlling, controlled by or under common control with the investment adviser that provides ongoing services to the registrant were $229,400 for the fiscal year ended July 31, 2015 and $163,566 for the fiscal year ended July 31, 2014.
(h) The registrant’s audit committee of the board has considered whether the provision of non-audit services that were rendered to the registrant’s investment adviser (not including any sub-adviser whose role is primarily portfolio management and is subcontracted with or overseen by another investment adviser), and any entity controlling, controlled by, or under common control with the investment adviser that provides ongoing services to the registrant that were not pre-approved pursuant to paragraph (c)(7)(ii) of Rule 2-01 of Regulation S-X is compatible with maintaining the principal accountant’s independence.
Item 5. Audit Committee of Listed Registrants. N/A
Item 6. Schedule of Investments. N/A
Item 7. Disclosure of Proxy Voting Policies and Procedures for Closed-End Management Investment Companies. N/A
Item 8. Portfolio Managers of Closed-End Management Investment Companies. N/A
Item 9. Purchases of Equity Securities by Closed-End Management Investment Company and Affiliated Purchasers. N/A
Item 10. Submission of Matters to a Vote of Security Holders.
There have been no changes to the procedures by which shareholders may recommend nominees to the Registrant's Board of Trustees that would require disclosure herein.
Item 11. Controls and Procedures.
(a) Evaluation of Disclosure Controls and Procedures. The Registrant maintains disclosure controls and procedures that are designed to ensure that information required to be disclosed in the Registrant’s filings under the Securities Exchange Act of 1934 and the Investment Company Act of 1940 is recorded, processed, summarized and reported within the periods specified in the rules and forms of the Securities and Exchange Commission. Such information is accumulated and communicated to the Registrant’s management, including its principal executive officer and principal financial officer, as appropriate, to allow timely decisions regarding required disclosure. The Registrant’s management, including the principal executive officer and the principal financial officer, recognizes that any set of controls and procedures, no matter how well designed and operated, can provide only reasonable assurance of achieving the desired control objectives.
Within 90 days prior to the filing date of this Shareholder Report on Form N-CSR, the Registrant had carried out an evaluation, under the supervision and with the participation of the Registrant’s management, including the Registrant’s principal executive officer and the Registrant’s principal financial officer, of the effectiveness of the design and operation of the Registrant’s disclosure controls and procedures. Based on such evaluation, the Registrant’s principal executive officer and principal financial officer concluded that the Registrant’s disclosure controls and procedures are effective.
(b) Changes in Internal Controls. There have been no changes in the Registrant’s internal controls or in other factors that could materially affect the internal controls over financial reporting subsequent to the date of their evaluation in connection with the preparation of this Shareholder Report on Form N-CSR.
Item 12. Exhibits.
(a) (1) Code of Ethics
(a) (2) Certifications pursuant to Section 302 of the Sarbanes-Oxley Act of 2002 of Laura F. Fergerson, Chief Executive Officer - Finance and Administration, and Gaston Gardey, Chief Financial Officer and Chief Accounting Officer
(b) Certifications pursuant to Section 906 of the Sarbanes-Oxley Act of 2002 of Laura F. Fergerson, Chief Executive Officer - Finance and Administration, and Gaston Gardey, Chief Financial Officer and Chief Accounting Officer
SIGNATURES
Pursuant to the requirements of the Securities Exchange Act of 1934 and the Investment Company Act of 1940, the registrant has duly caused this report to be signed on its behalf by the undersigned, thereunto duly authorized.
FRANKLIN FLOATING RATE MASTER TRUST
By /s/Laura F. Fergerson
Laura F. Fergerson
Chief Executive Officer - Finance and Administration
Date September 24, 2015
Pursuant to the requirements of the Securities Exchange Act of 1934 and the Investment Company Act of 1940, this report has been signed below by the following persons on behalf of the registrant and in the capacities and on the dates indicated.
By /s/Laura F. Fergerson
Laura F. Fergerson
Chief Executive Officer - Finance and Administration
Date September 24, 2015
By /s/Gaston Gardey
Gaston Gardey
Chief Financial Officer and Chief Accounting Officer
Date September 24, 2015