UNITED STATES
SECURITIES AND EXCHANGE COMMISSION
Washington, DC 20549
FORM N-CSR
CERTIFIED SHAREHOLDER REPORT OF REGISTERED MANAGEMENT INVESTMENT COMPANIES
Investment Company Act file number_811-09869
__Franklin Floating Rate Master Trust
(Exact name of registrant as specified in charter)
One Franklin Parkway, San Mateo, CA 94403-1906
(Address of principal executive offices) (Zip code)
Craig S. Tyle, One Franklin Parkway, San Mateo, CA 94403-1906
(Name and address of agent for service)
Registrant's telephone number, including area code:_650 312-2000
Date of fiscal year end: 7/31
Date of reporting period: 7/31/18
Item 1. Reports to Stockholders.
Annual Report
Franklin Floating Rate Master Series
| | |
This annual report for Franklin Floating Rate Master Series covers the fiscal year ended July 31, 2018. Manager’s Discussion During the 12 months ended July 31, 2018, the Fund delivered a +2.73% cumulative total return. In comparison, its benchmark, the Credit Suisse Leveraged Loan Index (CS LLI), generated a +4.72% total return.1 The Fund maintained an overweighting in the upper tier of the index throughout the period, which detracted from performance as upper tier loans in the index returned +3.90%, middle tier loans returned +4.68%, and lower tier loans returned +9.24%. The top contributors to performance included issuers in which we had built relatively large positions, and through proactive engagement, we were able to execute transactions that contributed to returns. The term loan of a provider of oil and gas traded higher after the company completed a restructuring plan and the exit term loan also increased spread. The term loan of a specialty retailer with multiple core brands traded higher after the company reported better-than-expected earnings and the loan attracted demand from collateralized loan obligations (CLOs) due to its relatively higher spread and credit ratings. However, our term loan position in a manufacturer of firearms and ammunition detracted from performance after the company filed for bankruptcy due to weaker sales. Another term loan position, in a paper products manufacturer, similarly detracted from performance as the company also filed for bankruptcy, and the company faced price declines in its products due to competition and higher costs for a key raw material. | | rated CLO tranches. Other positions included two open-end funds, Franklin Middle Tier Floating Rate Fund and Franklin Lower Tier Floating Rate Fund, and an exchange-traded fund, Franklin Liberty Senior Loan ETF. The investments allowed the Fund to have further credit exposure, while providing additional liquidity. The Fund also held a position in a high yield credit default swap index to protect against volatility in the credit markets. |
| |
| Portfolio Composition | % of Total |
| 7/31/18 | Net Assets |
| |
| Senior Floating Rate Interests | 70.60% |
| Other Long-Term Investments* | 19.57% |
| Short-Term Investments & Other Net Assets | 9.83% |
*Common stocks and other equity interests, management investment companies, corporate bonds and asset-backed securities.
In addition to maintaining a significant overweighting in higher-rated loans, the Fund was also invested in AAA to A
1. Source: Credit Suisse Group.
The index is unmanaged and includes reinvestment of any income or distributions. It does not reflect any fees, expense or sales charges. One cannot invest directly in an index, and an index is not representative of the Fund’s portfolio.
See www.franklintempletondatasources.com for additional data provider information.
Annual Report | 1
FRANKLIN FLOATING RATE MASTER SERIES
Total Return Index Comparison for a Hypothetical $10,000 Investment1
Total return represents the change in value of an investment over the periods shown. It includes any applicable maximum sales charge, Fund expenses, account fees and reinvested distributions. The unmanaged index includes reinvestment of any income or distributions. It differs from the Fund in composition and does not pay management fees or expenses. One cannot invest directly in an index.
8/1/08–7/31/18
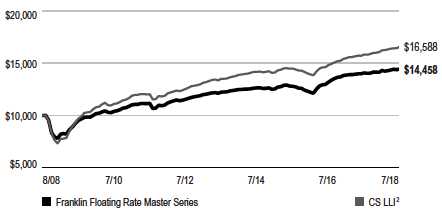
Performance as of 7/31/181
| |
| | Average |
| | Annual |
| | Total Return3 |
| 1-Year | +2.73% |
| 5-Year | +3.40% |
| 10-Year | +3.76% |
1. The Fund has a voluntary expense reduction, which can be discontinued at any time upon notification to the Fund’s board. Fund investment results reflect the expense reduction; without this reduction, the results would have been lower.
2. Source: Credit Suisse Group. The CS LLI is designed to mirror the investable universe of the US dollar-denominated leveraged loan market. Loans must be below investment grade and rated no higher than Baa1/BB+ or Ba1/BBB+ by Moody’s or Standard & Poor’s® (S&P).
3. Average annual total return represents the average annual change in value of an investment over the period indicated. Return for less than one year, if any, has not been annualized.
See www.franklintempletondatasources.com for additional data provider information.
2 | Annual Report
FRANKLIN FLOATING RATE MASTER SERIES
Your Fund’s Expenses
As a Fund shareholder, you can incur two types of costs: (1) transaction costs, including sales charges (loads) on Fund purchases and redemptions; and (2) ongoing Fund costs, including management fees, distribution and service (12b-1) fees, and other Fund expenses. All mutual funds have ongoing costs, sometimes referred to as operating expenses. The table below shows ongoing costs of investing in the Fund and can help you understand these costs and compare them with those of other mutual funds. The table assumes a $1,000 investment held for the six months indicated.
Actual Fund Expenses
The table below provides information about actual account values and actual expenses in the columns under the heading “Actual.” In these columns the Fund’s actual return, which includes the effect of Fund expenses, is used to calculate the “Ending Account Value.” You can estimate the expenses you paid during the period by following these steps (of course, your account value and expenses will differ from those in this illustration): Divide your account value by $1,000 (if your account had an $8,600 value, then $8,600 ÷ $1,000 = 8.6). Then multiply the result by the number in the row for your class of shares under the headings “Actual” and “Expenses Paid During Period” (if Actual Expenses Paid During Period were $7.50, then 8.6 x $7.50 = $64.50). In this illustration, the actual expenses paid this period are $64.50.
Hypothetical Example for Comparison with Other Funds
Under the heading “Hypothetical” in the table, information is provided about hypothetical account values and hypothetical expenses based on the Fund’s actual expense ratio and an assumed rate of return of 5% per year before expenses, which is not the Fund’s actual return. This information may not be used to estimate the actual ending account balance or expenses you paid for the period, but it can help you compare ongoing costs of investing in the Fund with those of other funds. To do so, compare this 5% hypothetical example for the class of shares you hold with the 5% hypothetical examples that appear in the shareholder reports of other funds.
Please note that expenses shown in the table are meant to highlight ongoing costs and do not reflect any transactional costs. Therefore, information under the heading “Hypothetical” is useful in comparing ongoing costs only, and will not help you compare total costs of owning different funds. In addition, if transactional costs were included, your total costs would have been higher.
| | | | | | | | | | |
| | | | Actual | | Hypothetical | |
| | | | (actual return after expenses) | | (5% annual return before expenses) | |
| |
| | | | | | | | | | | Net |
| | Beginning | | Ending | | Paid During | | Ending | | Paid During | Annualized |
| | Account | | Account | | Period | | Account | | Period | Expense |
| | Value 2/1/18 | | Value 7/31/18 | | 2/1/18–7/31/181,2 | | Value 7/31/18 | | 2/1/18–7/31/181,2 | Ratio2 |
| |
| $ 1,000 | | $ 1,010.20 | | $ 2.64 | | $ 1,022.17 | | $ 2.66 | 0.53% |
1. Expenses are equal to the annualized expense ratio for the six-month period as indicated above—in the far right column—multiplied by the simple average account value over the period indicated, and then multiplied by 181/365 to reflect the one-half year period.
2. Reflects expenses after fee waivers and expense reimbursements. Does not include acquired fund fees and expenses.
Annual Report | 3
FRANKLIN FLOATING RATE MASTER TRUST
| | | | |
| Board Members and Officers | | |
| |
| |
| The name, year of birth and address of the officers and board members, as well as their affiliations, positions held with the Trust, |
| principal occupations during at least the past five years and number of US registered portfolios overseen in the Franklin Templeton |
| Investments fund complex, are shown below. Generally, each board member serves until that person’s successor is elected and |
| qualified. | | | | |
| |
| |
| Independent Board Members | | | |
| |
| | | | Number of Portfolios in | |
| Name, Year of Birth | | Length of | Fund Complex Overseen | Other Directorships Held |
| and Address | Position | Time Served | by Board Member* | During at Least the Past 5 Years |
| |
| Harris J. Ashton (1932) | Trustee | Since 1999 | 136 | Bar-S Foods (meat packing company) |
| One Franklin Parkway | | | | (1981-2010). |
| San Mateo, CA 94403-1906 | | | | |
| Principal Occupation During at Least the Past 5 Years: | | |
| Director of various companies; and formerly, Director, RBC Holdings, Inc. (bank holding company) (until 2002); and President, Chief Executive |
| Officer and Chairman of the Board, General Host Corporation (nursery and craft centers) (until 1998). | |
| |
| Terrence J. Checki (1945) | Trustee | Since March 2018 | 112 | Hess Corporation (exploration of oil |
| One Franklin Parkway | | | | and gas) (2014-present). |
| San Mateo, CA 94403-1906 | | | | |
| Principal Occupation During at Least the Past 5 Years: | | |
| Member of the Council on Foreign Relations (1996-present); Member of the National Committee on U.S.-China Relations (1999-present); |
| member of the Board of Trustees of the Economic Club of New York (2013-present); member of the Board of Trustees of the Foreign Policy |
| Association (2005-present) and member of various other boards of trustees and advisory boards; and formerly, Executive Vice President of |
| the Federal Reserve Bank of New York and Head of its Emerging Markets and Internal Affairs Group and Member of Management Committee |
| (1995-2014); and Visiting Fellow at the Council on Foreign Relations (2014). | |
| |
| Mary C. Choksi (1950) | Trustee | Since 2014 | 136 | Avis Budget Group Inc. (car rental) |
| One Franklin Parkway | | | | (2007-present), Omnicom Group Inc. |
| San Mateo, CA 94403-1906 | | | | (advertising and marketing |
| | | | | communications services) |
| | | | | (2011-present) and White Mountains |
| | | | | Insurance Group, Ltd. (holding |
| | | | | company) (2017-present). |
| Principal Occupation During at Least the Past 5 Years: | | |
| Director of various companies; and formerly, Founder and Senior Advisor, Strategic Investment Group (investment management group) |
| (2015-2017); Founding Partner and Senior Managing Director, Strategic Investment Group (1987-2015); Founding Partner and Managing |
| Director, Emerging Markets Management LLC (investment management firm) (1987-2011); and Loan Officer/Senior Loan Officer/Senior |
| Pension Investment Officer, World Bank Group (international financial institution) (1977-1987). | |
| |
| Edith E. Holiday (1952) | Trustee | Since 1999 | 136 | Hess Corporation (exploration of oil |
| One Franklin Parkway | | | | and gas) (1993-present), Canadian |
| San Mateo, CA 94403-1906 | | | | National Railway (railroad) |
| | | | | (2001-present), White Mountains |
| | | | | Insurance Group, Ltd. (holding |
| | | | | company) (2004-present), Santander |
| | | | | Consumer USA Holdings, Inc. |
| | | | | (consumer finance) (2016-present), |
| | | | | RTI International Metals, Inc. |
| | | | | (manufacture and distribution of |
| | | | | titanium) (1999-2015) and H.J. Heinz |
| | | | | Company (processed foods and allied |
| | | | | products) (1994-2013). |
| Principal Occupation During at Least the Past 5 Years: | | |
| Director or Trustee of various companies and trusts; and formerly, Assistant to the President of the United States and Secretary of the |
| Cabinet (1990-1993); General Counsel to the United States Treasury Department (1989-1990); and Counselor to the Secretary and Assistant |
| Secretary for Public Affairs and Public Liaison-United States Treasury Department (1988-1989). | |
| |
| J. Michael Luttig (1954) | Trustee | Since 2009 | 136 | Boeing Capital Corporation (aircraft |
| One Franklin Parkway | | | | financing) (2006-2013). |
| San Mateo, CA 94403-1906 | | | | |
| Principal Occupation During at Least the Past 5 Years: | | |
| Executive Vice President, General Counsel and member of the Executive Council, The Boeing Company (aerospace company) (2006-present); |
| and formerly, Federal Appeals Court Judge, U.S. Court of Appeals for the Fourth Circuit (1991-2006). | |
4 | Annual Report
FRANKLIN FLOATING RATE MASTER TRUST
| | | | |
| Independent Board Members (continued) | | |
| |
| |
| |
| | | | Number of Portfolios in | |
| Name, Year of Birth | | Length of | Fund Complex Overseen | Other Directorships Held |
| and Address | Position | Time Served | by Board Member* | During at Least the Past 5 Years |
| |
| Larry D. Thompson | Trustee | Since 2007 | 136 | The Southern Company (energy |
| One Franklin Parkway | | | | company) (2014-present; previously |
| San Mateo, CA 94403-1906 | | | | 2010-2012), Graham Holdings |
| | | | | Company (education and media |
| | | | | organization) (2011-present) and |
| | | | | Cbeyond, Inc. (business |
| | | | | communications provider) |
| | | | | (2010-2012). |
| Principal Occupation During at Least the Past 5 Years: | | |
| Director of various companies; Counsel, Finch McCranie, LLP (law firm) (2015-present); Independent Compliance Monitor and Auditor, |
| Volkswagen AG (manufacturer of automobiles and commercial vehicles) (2017 – present); John A. Sibley Professor of Corporate and Business |
| Law, University of Georgia School of Law (2015-present; previously 2011-2012); and formerly, Executive Vice President - Government Affairs, |
| General Counsel and Corporate Secretary, PepsiCo, Inc. (consumer products) (2012-2014); Senior Vice President - Government Affairs, |
| General Counsel and Secretary, PepsiCo, Inc. (2004-2011); Senior Fellow of The Brookings Institution (2003-2004); Visiting Professor, |
| University of Georgia School of Law (2004); and Deputy Attorney General, U.S. Department of Justice (2001-2003). |
| |
| John B. Wilson (1959) | Lead | Trustee | 112 | None |
| One Franklin Parkway | Independent | since 2007 | | |
| San Mateo, CA 94403-1906 | Trustee | and Lead | | |
| | | Independent | | |
| | | Trustee | | |
| | | since 2008 | | |
| Principal Occupation During at Least the Past 5 Years: | | |
| President and Founder, Hyannis Port Capital, Inc. (real estate and private equity investing) (2002-present); Senior Advisor, McKinsey & Co. |
| (consulting) (2017-present); serves on private and non-profit boards; and formerly, President, Staples International and Head of Global |
| Transformation (office supplies) (2012-2016); Chief Operating Officer and Executive Vice President, Gap, Inc. (retail) (1996-2000); Chief |
| Financial Officer and Executive Vice President – Finance and Strategy, Staples, Inc. (1992-1996); Senior Vice President – Corporate Planning, |
| Northwest Airlines, Inc. (airlines) (1990-1992); and Vice President and Partner, Bain & Company (consulting firm) (1986-1990). |
| |
| |
| Interested Board Members and Officers | | |
| |
| | | | Number of Portfolios in | |
| Name, Year of Birth | | Length of | Fund Complex Overseen | Other Directorships Held |
| and Address | Position | Time Served | by Board Member* | During at Least the Past 5 Years |
| |
| **Gregory E. Johnson (1961) | Trustee | Since 2007 | 150 | None |
| One Franklin Parkway | | | | |
| San Mateo, CA 94403-1906 | | | | |
| Principal Occupation During at Least the Past 5 Years: | | |
| Chairman of the Board, Member - Office of the Chairman, Director and Chief Executive Officer, Franklin Resources, Inc.; officer and/or director |
| or trustee, as the case may be, of some of the other subsidiaries of Franklin Resources, Inc. and of 42 of the investment companies in Franklin |
| Templeton Investments; Vice Chairman, Investment Company Institute; and formerly, President, Franklin Resources, Inc. (1994-2015). |
| |
| **Rupert H. Johnson, Jr. (1940) | Chairman of | Since 2013 | 136 | None |
| One Franklin Parkway | the Board | | | |
| San Mateo, CA 94403-1906 | and Trustee | | | |
| Principal Occupation During at Least the Past 5 Years: | | |
| Vice Chairman, Member - Office of the Chairman and Director, Franklin Resources, Inc.; Director, Franklin Advisers, Inc.; Senior Vice |
| President, Franklin Advisory Services, LLC; and officer and/or director or trustee, as the case may be, of some of the other subsidiaries of |
| Franklin Resources, Inc. and of 40 of the investment companies in Franklin Templeton Investments. | |
| |
| Alison E. Baur (1964) | Vice President | Since 2012 | Not Applicable | Not Applicable |
| One Franklin Parkway | | | | |
| San Mateo, CA 94403-1906 | | | | |
| Principal Occupation During at Least the Past 5 Years: | | |
| Deputy General Counsel, Franklin Templeton Investments; and officer of some of the other subsidiaries of Franklin Resources, Inc. and of 44 |
| of the investment companies in Franklin Templeton Investments. | | |
Annual Report | 5
FRANKLIN FLOATING RATE MASTER TRUST
| | | | |
| Interested Board Members and Officers (continued) | |
| |
| |
| |
| | | | Number of Portfolios in | |
| Name, Year of Birth | | Length of | Fund Complex Overseen | Other Directorships Held |
| and Address | Position | Time Served | by Board Member* | During at Least the Past 5 Years |
| |
| Mark Boyadjian (1964) | Vice President | Since 2003 | Not Applicable | Not Applicable |
| One Franklin Parkway | | | | |
| San Mateo, CA 94403-1906 | | | | |
| Principal Occupation During at Least the Past 5 Years: | | |
| Senior Vice President, Franklin Advisers, Inc.; and officer of two of the investment companies in Franklin Templeton Investments. |
| |
| Gaston Gardey (1967) | Chief Financial | Since 2009 | Not Applicable | Not Applicable |
| One Franklin Parkway | Officer, | | | |
| San Mateo, CA 94403-1906 | Chief | | | |
| | Accounting | | | |
| | Officer and | | | |
| | Treasurer | | | |
| Principal Occupation During at Least the Past 5 Years: | | |
| Treasurer, U.S. Fund Administration & Reporting, Franklin Templeton Investments; and officer of 28 of the investment companies in Franklin |
| Templeton Investments. | | | | |
| |
| Aliya S. Gordon (1973) | Vice President | Since 2009 | Not Applicable | Not Applicable |
| One Franklin Parkway | | | | |
| San Mateo, CA 94403-1906 | | | | |
| Principal Occupation During at Least the Past 5 Years: | | |
| Senior Associate General Counsel, Franklin Templeton Investments; and officer of 44 of the investment companies in Franklin Templeton |
| Investments. | | | | |
| |
| Steven J. Gray (1955) | Vice President | Since 2009 | Not Applicable | Not Applicable |
| One Franklin Parkway | | | | |
| San Mateo, CA 94403-1906 | | | | |
| Principal Occupation During at Least the Past 5 Years: | | |
| Senior Associate General Counsel, Franklin Templeton Investments; Vice President, Franklin Templeton Distributors, Inc. and FASA, LLC; and |
| officer of 44 of the investment companies in Franklin Templeton Investments. | |
| |
| Matthew T. Hinkle (1971) | Chief | Since 2017 | Not Applicable | Not Applicable |
| One Franklin Parkway | Executive | | | |
| San Mateo, CA 94403-1906 | Officer – | | | |
| | Finance and | | | |
| | Administration | | | |
| Principal Occupation During at Least the Past 5 Years: | | |
| Senior Vice President, Franklin Templeton Services, LLC; officer of 44 of the investment companies in Franklin Templeton Investments; and |
| formerly, Vice President, Global Tax (2012-April 2017) and Treasurer/Assistant Treasurer, Franklin Templeton Investments (2009-2017). |
| |
| Robert Lim (1948) | Vice President | Since 2016 | Not Applicable | Not Applicable |
| One Franklin Parkway | – AML | | | |
| San Mateo, CA 94403-1906 | Compliance | | | |
| Principal Occupation During at Least the Past 5 Years: | | |
| Vice President, Franklin Templeton Companies, LLC; Chief Compliance Officer, Franklin Templeton Distributors, Inc. and Franklin Templeton |
| Investor Services, LLC; and officer of 44 of the investment companies in Franklin Templeton Investments. |
| |
| Christopher J. Molumphy | President and | Since 2010 | Not Applicable | Not Applicable |
| One Franklin Parkway | Chief Executive | | | |
| San Mateo, CA 94403-1906 | Officer - | | | |
| | Investment | | | |
| | Management | | | |
| Principal Occupation During at Least the Past 5 Years: | | |
| Director and Executive Vice President, Franklin Advisers, Inc.; Executive Vice President, Franklin Templeton Institutional, LLC; and officer of |
| some of the other subsidiaries of Franklin Resources, Inc. and of 21 of the investment companies in Franklin Templeton Investments. |
6 | Annual Report
FRANKLIN FLOATING RATE MASTER TRUST
| | | | |
| Interested Board Members and Officers (continued) | |
| |
| |
| |
| | | | Number of Portfolios in | |
| Name, Year of Birth | | Length of | Fund Complex Overseen | Other Directorships Held |
| and Address | Position | Time Served | by Board Member* | During at Least the Past 5 Years |
| |
| Kimberly H. Novotny (1972) | Vice President | Since 2013 | Not Applicable | Not Applicable |
| 300 S.E. 2nd Street | | | | |
| Fort Lauderdale, FL 33301-1923 | | | | |
| Principal Occupation During at Least the Past 5 Years: | | |
| Associate General Counsel, Franklin Templeton Investments; Vice President and Corporate Secretary, Fiduciary Trust International of the |
| South; Vice President, Templeton Investment Counsel, LLC; Assistant Secretary, Franklin Resources, Inc.; and officer of 44 of the investment |
| companies in Franklin Templeton Investments. | | | |
| |
| Robert C. Rosselot (1960) | Chief | Since 2013 | Not Applicable | Not Applicable |
| 300 S.E. 2nd Street | Compliance | | | |
| Fort Lauderdale, FL 33301-1923 | Officer | | | |
| Principal Occupation During at Least the Past 5 Years: | | |
| Director, Global Compliance, Franklin Templeton Investments; Vice President, Franklin Templeton Companies, LLC; officer of 44 of the |
| investment companies in Franklin Templeton Investments; and formerly, Senior Associate General Counsel, Franklin Templeton Investments |
| (2007-2013); and Secretary and Vice President, Templeton Group of Funds (2004-2013). | |
| |
| Karen L. Skidmore (1952) | Vice President | Since 2006 | Not Applicable | Not Applicable |
| One Franklin Parkway | and Secretary | | | |
| San Mateo, CA 94403-1906 | | | | |
| Principal Occupation During at Least the Past 5 Years: | | |
| Senior Associate General Counsel, Franklin Templeton Investments; and officer of 44 of the investment companies in Franklin Templeton |
| Investments. | | | | |
| |
| Navid J. Tofigh (1972) | Vice President | Since 2015 | Not Applicable | Not Applicable |
| One Franklin Parkway | | | | |
| San Mateo, CA 94403-1906 | | | | |
| Principal Occupation During at Least the Past 5 Years: | | |
| Associate General Counsel, Franklin Templeton Investments; and officer of 44 of the investment companies in Franklin Templeton Investments. |
| |
| Craig S. Tyle (1960) | Vice President | Since 2005 | Not Applicable | Not Applicable |
| One Franklin Parkway | | | | |
| San Mateo, CA 94403-1906 | | | | |
| Principal Occupation During at Least the Past 5 Years: | | |
| General Counsel and Executive Vice President, Franklin Resources, Inc.; and officer of some of the other subsidiaries of Franklin Resources, |
| Inc. and of 44 of the investment companies in Franklin Templeton Investments. | |
| |
| Lori A. Weber (1964) | Vice President | Since 2011 | Not Applicable | Not Applicable |
| 300 S.E. 2nd Street | | | | |
| Fort Lauderdale, FL 33301-1923 | | | | |
| Principal Occupation During at Least the Past 5 Years: | | |
| Senior Associate General Counsel, Franklin Templeton Investments; Assistant Secretary, Franklin Resources, Inc.; Vice President and |
| Secretary, Templeton Investment Counsel, LLC; and officer of 44 of the investment companies in Franklin Templeton Investments. |
Annual Report | 7
FRANKLIN FLOATING RATE MASTER TRUST
*We base the number of portfolios on each separate series of the US registered investment companies within the Franklin Templeton Investments fund complex. These portfolios have a common investment manager or affiliated investment managers.
**Gregory E. Johnson is considered to be an interested person of the Fund under the federal securities laws due to his position as an officer and director of Franklin Resources, Inc. (Resources), which is the parent company of the Fund’s investment manager and distributor. Rupert H. Johnson, Jr. is considered to be an interested person of the Fund under the federal securities laws due to his position as an officer and director and major shareholder of Resources.
Note 1: Rupert H. Johnson, Jr. is the uncle of Gregory E. Johnson.
Note 2: Officer information is current as of the date of this report. It is possible that after this date, information about officers may change.
The Sarbanes-Oxley Act of 2002 and Rules adopted by the Securities and Exchange Commission require the Fund to disclose whether the Fund’s Audit Committee includes at least one member who is an audit committee financial expert within the meaning of such Act and Rules. The Fund’s Board has determined that there is at least one such financial expert on the Audit Committee and has designated John B. Wilson as its audit committee financial expert. The Board believes that Mr. Wilson qualifies as such an expert in view of his extensive business background and experience, including service as chief financial officer of Staples, Inc. from 1992 to 1996. Mr. Wilson has been a Member and Chairman of the Fund’s Audit Committee since 2007. As a result of such background and experience, the Board believes that Mr. Wilson has acquired an understanding of generally accepted accounting principles and financial statements, the general application of such principles in connection with the accounting estimates, accruals and reserves, and analyzing and evaluating financial statements that present a breadth and level of complexity of accounting issues generally comparable to those of the Fund, as well as an understanding of internal controls and procedures for financial reporting and an understanding of audit committee functions. Mr. Wilson is an independent Board member as that term is defined under the relevant Securities and Exchange Commission Rules and Releases.
The Statement of Additional Information (SAI) includes additional information about the board members and is available, without charge, upon request.
Shareholders may call (800) DIAL BEN/342-5236 to request the SAI.
8 | Annual Report
FRANKLIN FLOATING RATE MASTER TRUST
FRANKLIN FLOATING RATE MASTER SERIES
| | |
Shareholder Information Board Approval of Investment Management Agreements FRANKLIN FLOATING RATE MASTER TRUST Franklin Floating Rate Master Series (Fund) At an in-person meeting held on February 27, 2018 (Meeting), the Board of Trustees (Board) of Franklin Floating Rate Master Trust (Trust), including a majority of the trustees who are not “interested persons” as defined in the Investment Company Act of 1940 (Independent Trustees), reviewed and approved the continuance of the investment management agreement between Franklin Advisers, Inc. (Manager) and the Trust, on behalf of the Fund (Management Agreement) for an additional one-year period. The Independent Trustees received advice from and met separately with Independent Trustee counsel in considering whether to approve the continuation of the Management Agreement. In considering the continuation of the Management Agreement, the Board reviewed and considered information provided by the Manager at the Meeting and throughout the year at meetings of the Board and its committees. The Board also reviewed and considered information provided in response to a detailed set of requests for information submitted to the Manager by Independent Trustee counsel on behalf of the Independent Trustees in connection with the annual contract renewal process. In addition, prior to the Meeting, the Independent Trustees held a telephonic contract renewal meeting at which the Independent Trustees conferred amongst themselves and Independent Trustee counsel about contract renewal matters. The Board reviewed and considered all of the factors it deemed relevant in approving the continuance of the Management Agreement, including, but not limited to: (i) the nature, extent and quality of the services provided by the Manager; (ii) the investment performance of the Fund; (iii) the costs of the services provided and profits realized by the Manager and its affiliates from the relationship with the Fund; (iv) the extent to which economies of scale are realized as the Fund grows; and (v) whether fee levels reflect these economies of scale for the benefit of Fund investors. In approving the continuance of the Management Agreement, the Board, including a majority of the Independent Trustees, determined that the terms of the Management Agreement are fair and reasonable and that the continuance of such Management Agreement is in the interests of the Fund and its shareholders. While attention was given to all information | | furnished, the following discusses some primary factors relevant to the Board’s determination. Nature, Extent and Quality of Services The Board reviewed and considered information regarding the nature, extent and quality of investment management services provided by the Manager and its affiliates to the Fund and its shareholders. This information included, among other things, the qualifications, background and experience of the senior management and investment personnel of the Manager; the structure of investment personnel compensation; oversight of third-party service providers; investment performance reports and related financial information for the Fund; reports on expenses, and shareholder services; legal and compliance matters; risk controls; pricing and other services provided by the Manager and its affiliates; and management fees charged by the Manager and its affiliates to U.S. funds and other accounts, including management’s explanation of differences among accounts where relevant. The Board also reviewed and considered an annual report on payments made by Franklin Templeton Investments (FTI) or the Fund to financial intermediaries, as well as a memorandum relating to third-party servicing arrangements in response to a guidance update in 2016 from the U.S. Securities and Exchange Commission (SEC) relating to mutual fund distribution and sub-accounting fees. The Board noted management’s continuing efforts and expenditures in establishing effective business continuity plans and developing strategies to address areas of heightened concern in the mutual fund industry, such as cybersecurity and liquidity risk management. The Board also recognized management’s commitment to facilitating Board oversight of particular areas, including derivatives and payments to intermediaries, by enhanced reporting. The Board also reviewed and considered the benefits provided to Fund shareholders of investing in a fund that is part of the Franklin Templeton family of funds. The Board noted the financial position of Franklin Resources, Inc. (FRI), the Manager’s parent, and its commitment to the mutual fund business as evidenced by its continued introduction of new funds, reassessment of the fund offerings in response to the market environment and project initiatives and capital investments relating to the services provided to the Fund by the FTI organization. Following consideration of such information, the Board was satisfied with the nature, extent and quality of services provided by the Manager and its affiliates to the Fund and its shareholders. |
Annual Report | 9
FRANKLIN FLOATING RATE MASTER TRUST
FRANKLIN FLOATING RATE MASTER SERIES
SHAREHOLDER INFORMATION
| | |
Fund Performance The Board reviewed and considered the performance results of the Fund over various time periods ended December 31, 2017. The Board considered the performance returns for the Fund in comparison to the performance returns of mutual funds deemed comparable to the Fund included in a universe (Performance Universe) selected by Broadridge Financial Solutions, Inc. (Broadridge), an independent provider of investment company data. The Board received a description of the methodology used by Broadridge to select the mutual funds included in a Performance Universe. The Board also reviewed and considered Fund performance reports provided and discussions that occurred with portfolio managers at Board meetings throughout the year. A summary of the Fund’s performance results is below. The Performance Universe for the Fund included the Fund and all retail and institutional loan participation funds. The Board noted that the Fund’s annualized total return for the one- and 10-year periods was below the median of its Performance Universe, but for the three- and five-year periods was above the median of its Performance Universe. The Board concluded that the Fund’s performance was acceptable. In doing so, the Board noted that the Fund’s annualized total return was positive for each period, the Fund does not offer its shares to the public and the Fund’s investor was exclusively an offshore Irish feeder fund. Comparative Fees and Expenses The Board reviewed and considered information regarding the Fund’s actual total expense ratio and its various components, including, as applicable, management fees; transfer agent expenses; underlying fund expenses; Rule 12b-1 and non-Rule 12b-1 service fees; and other non-management fees. The Board considered the actual total expense ratio and, separately, the contractual management fee rate, without the effect of fee waivers (Management Rate), if any, of the Fund in comparison to the median expense ratio and median Management Rate, respectively, of other mutual funds deemed comparable to and with a similar expense structure as the Fund selected by Broadridge (Expense Group). Broadridge fee and expense data is based upon information taken from each fund’s most recent annual report, which reflects historical asset levels that may be quite different from those currently existing, particularly in a period of market volatility. While recognizing such inherent limitation and the fact that expense ratios and Management Rates generally increase as assets decline and decrease as assets grow, the Board believed the independent analysis conducted by Broadridge to be an appropriate measure | | of comparative fees and expenses. The Broadridge Management Rate includes administrative charges, and the actual total expense ratio, for comparative consistency, was shown for Class A shares for funds with multiple classes of shares. The Board received a description of the methodology used by Broadridge to select the mutual funds included in an Expense Group. The Expense Group for the Fund included the Fund and 13 other loan participation funds. The Board noted that the Management Rate and actual total expense ratio for the Fund were below the medians of its Expense Group. The Board concluded that the Management Rate charged to the Fund is reasonable. In doing so, the Board noted that the Fund’s actual total expense ratio reflected a fee waiver from management. Profitability The Board reviewed and considered information regarding the profits realized by the Manager and its affiliates in connection with the operation of the Fund. In this respect, the Board considered the Fund profitability analysis provided by the Manager that addresses the overall profitability of FTI’s U.S. fund business, as well as its profits in providing investment management and other services to each of the individual funds during the 12-month period ended September 30, 2017, being the most recent fiscal year-end for FRI. The Board noted that although management continually makes refinements to its methodologies used in calculating profitability in response to organizational and product related changes, the overall methodology has remained consistent with that used in the Fund’s profitability report presentations from prior years. Additionally, PricewaterhouseCoopers LLP, auditor to Franklin Resources, Inc. and certain Franklin Templeton funds, has been engaged by the Manager to periodically review and assess the allocation methodologies to be used solely by the Fund’s Board with respect to the profitability analysis. The Board noted management’s belief that costs incurred in establishing the infrastructure necessary for the type of mutual fund operations conducted by the Manager and its affiliates may not be fully reflected in the expenses allocated to the Fund in determining its profitability, as well as the fact that the level of profits, to a certain extent, reflected operational cost savings and efficiencies initiated by management. The Board also noted management’s expenditures in improving shareholder services provided to the Fund, as well as the need to implement systems and meet additional regulatory and compliance requirements resulting from recent SEC and other regulatory requirements. |
10 | Annual Report
FRANKLIN FLOATING RATE MASTER TRUST
FRANKLIN FLOATING RATE MASTER SERIES
SHAREHOLDER INFORMATION
The Board also considered the extent to which the Manager and its affiliates might derive ancillary benefits from fund operations, including revenues generated from transfer agent services, potential benefits resulting from personnel and systems enhancements necessitated by fund growth, as well as increased leverage with service providers and counterparties. Based upon its consideration of all these factors, the Board concluded that the level of profits realized by the Manager and its affiliates from providing services to the Fund was not excessive in view of the nature, extent and quality of services provided to the Fund. Economies of Scale The Board reviewed and considered the extent to which the Manager may realize economies of scale, if any, as the Fund grows larger and whether the Fund’s management fee structure reflects any economies of scale for the benefit of shareholders. With respect to possible economies of scale, the Board noted the existence of management fee breakpoints, which operate generally to share any economies of scale with a Fund’s shareholders by reducing the Fund’s effective management fees as the Fund grows in size. The Board considered the Manager’s view that any analyses of potential economies of scale in managing a particular fund are inherently limited in light of the joint and common costs and investments the Manager incurs across the Franklin Templeton family of funds as a whole. The Board concluded that to the extent economies of scale may be realized by the Manager and its affiliates, the Fund’s management fee structure provided a sharing of benefits with the Fund and its shareholders as the Fund grows. Conclusion Based on its review, consideration and evaluation of all factors it believed relevant, including the above-described factors and conclusions, the Board unanimously approved the continuation of the Management Agreement for an additional one-year period. Proxy Voting Policies and Procedures The Fund’s investment manager has established Proxy Voting Policies and Procedures (Policies) that the Fund uses to determine how to vote proxies relating to portfolio securities. Shareholders may view the Fund’s complete Policies online at franklintempleton.com. Alternatively, shareholders may request copies of the Policies free of charge by calling the Proxy Group collect at (954) 527-7678 or by sending a written request to: Franklin Templeton Companies, LLC, 300 S.E. 2nd Street, Fort Lauderdale, FL 33301, Attention: Proxy Group. Copies of the Fund’s proxy voting records are also made available online | | at franklintempleton.com and posted on the US Securities and Exchange Commission’s website at sec.gov and reflect the most recent 12-month period ended June 30. Quarterly Consolidated Statement of Investments The Trust, on behalf of the Fund, files a complete consolidated statement of investments with the US Securities and Exchange Commission for the first and third quarters for each fiscal year on Form N-Q. Shareholders may view the filed Form N-Q by visiting the Commission’s website at sec.gov. The filed form may also be viewed and copied at the Commission’s Public Reference Room in Washington, DC. Information regarding the operations of the Public Reference Room may be obtained by calling (800) SEC-0330. |
Annual Report | 11
FRANKLIN FLOATING RATE MASTER TRUST
Financial Highlights
Franklin Floating Rate Master Series
| | | | | | | | | | | | | | | | | |
| | | | | | Year Ended July 31, | | | | | |
| | | 2018 | | | 2017 | | | | 2016 | | | | 2015 | | | 2014 | |
| Per share operating performance | | | | | | | | | | | | | | | | | |
| (for a share outstanding throughout the year) | | | | | | | | | | | | | | | | | |
| Net asset value, beginning of year | $ | 8.69 | | $ | 8.47 | | | $ | 8.65 | | | $ | 8.92 | | $ | 8.93 | |
| Income from investment operationsa: | | | | | | | | | | | | | | | | | |
| Net investment income | | 0.398 | | | 0.332 | | | | 0.419 | | | | 0.391 | | | 0.299 | |
| Net realized and unrealized gains (losses) | | (0.156 | ) | | 0.221 | | | | (0.184 | ) | | | (0.270 | ) | | (0.010 | ) |
| Total from investment operations | | 0.242 | | | 0.553 | | | | 0.235 | | | | 0.121 | | | 0.289 | |
| Less distributions from net investment income | | (0.392 | ) | | (0.333 | ) | | | (0.415 | ) | | | (0.391 | ) | | (0.299 | ) |
| Net asset value, end of year. | $ | 8.54 | | $ | 8.69 | | | $ | 8.47 | | | $ | 8.65 | | $ | 8.92 | |
| |
| Total return | | 2.73 | % | | 6.71 | % | | | 3.07 | % | | | 1.30 | % | | 3.28 | % |
| |
| Ratios to average net assets | | | | | | | | | | | | | | | | | |
| Expenses before waiver and payments by affiliates | | 0.55 | % | | 0.55 | % | | | 0.55 | % | | | 0.77 | % | | 0.92 | % |
| Expenses net of waiver and payments by affiliatesb | | 0.53 | % | | 0.53 | % | | | 0.53 | % | | | 0.67 | % | | 0.80 | % |
| Net investment income | | 4.60 | % | | 3.78 | % | | | 5.03 | % | | | 4.43 | % | | 3.36 | % |
| |
| Supplemental data | | | | | | | | | | | | | | | | | |
| Net assets, end of year (000’s) | $ | 1,760,544 | | $ | 2,090,626 | | | $ 1,363,955 | | | $ 1,959,681 | | $ | 2,260,151 | |
| Portfolio turnover rate | | 49.97 | % | | 67.00 | % | | 28.94 | % | | 62.43 | % | | 70.55 | % |
aThe amount shown for a share outstanding throughout the period may not correlate with the Statement of Operations for the period due to the timing of sales and repurchases of the Fund’s shares in relation to income earned and/or fluctuating fair value of the investments of the Fund.
bBenefit of expense reduction rounds to less than 0.01%.
12 | Annual Report | The accompanying notes are an integral part of these financial statements.
FRANKLIN FLOATING RATE MASTER TRUST
| | | | | | |
| Statement of Investments, July 31, 2018 | | | | | | |
| |
| Franklin Floating Rate Master Series | | | | | | |
| | | | Shares/ | | | % of Net |
| | Country | | Units | | Value | Assets |
| Common Stocks and Other Equity Interests | | | | | | |
| Oil & Gas Exploration & Production | | | | | | |
| Samson Resources II LLC | United States | | 155,501 | $ | 3,732,024 | 0.21 |
| Diversified Support Services | | | | | | |
| a,b,c Remington Outdoor Co. Inc | United States | | 870,865 | | 15,038,779 | 0.86 |
| a,b,c Remington Outdoor Co. Inc., Litigation Units | United States | | 81,987 | | — | 0.00 |
| | | | | | 15,038,779 | 0.86 |
| Forest Products | | | | | | |
| a,b,c Appvion Inc | United States | | 519,107 | | 5,140,480 | 0.29 |
| Total Common Stocks and Other Equity Interests | | | | | | |
| (Cost $49,304,337) | | | | | 23,911,283 | 1.36 |
| |
| Management Investment Companies | | | | | | |
| Other Diversified Financial Services | | | | | | |
| d Franklin Liberty Senior Loan ETF | United States | | 248,000 | | 6,238,787 | 0.35 |
| d Franklin Lower Tier Floating Rate Fund | United States | | 3,405,364 | | 33,304,460 | 1.89 |
| d Franklin Middle Tier Floating Rate Fund | United States | | 3,457,562 | | 32,673,956 | 1.86 |
| Total Management Investment Companies | | | | | | |
| (Cost $75,457,450) | | | | | 72,217,203 | 4.10 |
| |
| | | | Principal | | | |
| | | | Amount* | | | |
| Corporate Bonds (Cost $8,692,485) | | | | | | |
| Industrial Machinery | | | | | | |
| e Onsite Rental Group Operations Pty. Ltd., secured note, PIK, 6.10%, | | | | | | |
| 10/26/23 | Australia | $ | 10,100,685 | | 7,828,031 | 0.45 |
| |
| f,g Senior Floating Rate Interests | | | | | | |
| Aerospace & Defense | | | | | | |
| Delos Finance S.A.R.L. (AerCap), New Loans, 4.084%, (3-month | | | | | | |
| USD LIBOR + 1.75%), 10/06/23 | Luxembourg | | 32,284,435 | | 32,392,039 | 1.84 |
| Doncasters U.S. Finance LLC, | | | | | | |
| Second Lien Term Loan, 10.584%, (3-month USD LIBOR + | | | | | | |
| 8.25%), 10/09/20 | United States | | 6,096,324 | | 5,171,714 | 0.29 |
| Term B Loans, 5.834%, (3-month USD LIBOR + 3.50%), | | | | | | |
| 4/09/20 | United States | | 14,887,914 | | 13,957,419 | 0.79 |
| Flying Fortress Holdings LLC (ILFC), New Loan, 4.084%, (3-month | | | | | | |
| USD LIBOR + 1.75%), 10/30/22 | United States | | 18,210,912 | | 18,298,179 | 1.04 |
| Leidos Innovations Corp., Term Loan B, 3.875%, (1-month USD | | | | | | |
| LIBOR + 1.75%), 8/16/23 | United States | | 1,559,615 | | 1,570,825 | 0.09 |
| | | | | | 71,390,176 | 4.05 |
| Agricultural Products | | | | | | |
| Allflex Holdings III Inc., Second Lien Initial Term Loan, 9.347%, | | | | | | |
| (3-month USD LIBOR + 7.00%), 7/19/21 | United States | | 1,591,815 | | 1,601,100 | 0.09 |
| Airlines | | | | | | |
| Air Canada, Term Loan, 4.072%, (1-month USD LIBOR + 2.00%), | | | | | | |
| 10/06/23 | Canada | | 16,944,482 | | 17,022,139 | 0.97 |
| American Airlines Inc., 2018 Replacement Term Loans, 3.827%, | | | | | | |
| (1-month USD LIBOR + 1.75%), 6/27/25 | United States | | 7,941,691 | | 7,833,111 | 0.44 |
| | | | | | 24,855,250 | 1.41 |
| Apparel Retail | | | | | | |
| Ascena Retail Group Inc., Tranche B Term Loan, 6.625%, (1-month | | | | | | |
| USD LIBOR + 4.50%), 8/21/22 | United States | | 44,797,160 | | 41,129,393 | 2.34 |
13
FRANKLIN FLOATING RATE MASTER TRUST
STATEMENT OF INVESTMENTS
| | | | | | |
| Franklin Floating Rate Master Series (continued) | | | | | | |
| | | | Principal | | | % of Net |
| | Country | | Amount* | | Value | Assets |
| f,g Senior Floating Rate Interests (continued) | | | | | | |
| Auto Parts & Equipment | | | | | | |
| Allison Transmission Inc., New Term Loans, 3.84%, (1-month USD | | | | | | |
| LIBOR + 1.75%), 9/23/22 | United States | $ | 14,528,482 | $ | 14,626,854 | 0.83 |
| American Axle and Manufacturing Inc., Tranche B Term Loan, | | | | | | |
| 4.32%, (1-month USD LIBOR + 2.25%), 4/06/24 | United States | | 1,949,682 | | 1,946,432 | 0.11 |
| TI Group Automotive Systems LLC, Initial US Term Loan, 4.577%, | | | | | | |
| (1-month USD LIBOR + 2.50%), 6/30/22 | United States | | 16,310,481 | | 16,344,456 | 0.93 |
| | | | | | 32,917,742 | 1.87 |
| Broadcasting | | | | | | |
| Gray Television Inc., Term B-2 Loan, 4.34%, (1-month USD LIBOR + | | | | | | |
| 2.25%), 2/07/24. | United States | | 15,704,652 | | 15,735,732 | 0.89 |
| Mission Broadcasting Inc., Term Loan B-2, 4.592%, (1-month USD | | | | | | |
| LIBOR + 2.50%), 1/17/24 | United States | | 552,963 | | 554,345 | 0.03 |
| Nexstar Broadcasting Inc., | | | | | | |
| Term A-2 Loan, 4.092%, (1-month USD LIBOR + 2.00%), | | | | | | |
| 7/19/22 | United States | | 7,190,617 | | 7,190,617 | 0.41 |
| Term Loan B-2, 4.592%, (1-month USD LIBOR + 2.50%), | | | | | | |
| 1/17/24 | United States | | 4,147,913 | | 4,158,283 | 0.24 |
| Sinclair Television Group Inc., | | | | | | |
| Tranche B Term Loans, 4.33%, (1-month USD LIBOR + 2.25%), | | | | | | |
| 1/03/24 | United States | | 17,436,393 | | 17,447,291 | 0.99 |
| h,i Tranche B-1 Term Loans, TBD, 1/31/25 | United States | | 5,700,000 | | 5,702,109 | 0.33 |
| WXXA-TV LLC and WLAJ-TV LLC, Term Loan A-2, 4.092%, | | | | | | |
| (1-month USD LIBOR + 2.00%), 7/19/22 | United States | | 242,944 | | 242,944 | 0.01 |
| | | | | | 51,031,321 | 2.90 |
| Cable & Satellite | | | | | | |
| Charter Communications Operating LLC, Term B Loan, 4.08%, | | | | | | |
| (1-month USD LIBOR + 2.00%), 4/30/25 | United States | | 18,952,381 | | 18,984,695 | 1.08 |
| CSC Holdings LLC, March 2017 Incremental Term Loans, 4.322%, | | | | | | |
| (1-month USD LIBOR + 2.25%), 7/17/25 | United States | | 18,724,379 | | 18,655,885 | 1.06 |
| Mediacom Illinois LLC, Tranche N Term Loan, 3.70%, (1-week USD | | | | | | |
| LIBOR + 1.75%), 2/15/24 | United States | | 4,764,852 | | 4,776,764 | 0.27 |
| | | | | | 42,417,344 | 2.41 |
| Casinos & Gaming | | | | | | |
| h Aristocrat Technologies Inc., Term B-3 Loans, 4.098%, (3-month | | | | | | |
| USD LIBOR + 1.75%), 10/19/24 | United States | | 9,098,989 | | 9,101,310 | 0.52 |
| Boyd Gaming Corp., | | | | | | |
| Refinancing Term B Loans, 4.45%, (1-week USD LIBOR + | | | | | | |
| 2.50%), 9/15/23 | United States | | 7,994,008 | | 8,044,970 | 0.46 |
| Term A Loan, 4.20%, (1-week USD LIBOR + 2.25%), 9/15/21 | United States | | 2,152,643 | | 2,155,334 | 0.12 |
| Caesars Resort Collection LLC/CRC Finco Inc., Term B Loans, | | | | | | |
| 4.827%, (1-month USD LIBOR + 2.75%), 12/22/24 | United States | | 6,334,085 | | 6,337,480 | 0.36 |
| CEOC LLC, Term B Loans, 4.077%, (1-month USD LIBOR + | | | | | | |
| 2.00%), 10/06/24 | United States | | 1,529,888 | | 1,529,888 | 0.09 |
14
FRANKLIN FLOATING RATE MASTER TRUST
STATEMENT OF INVESTMENTS
| | | | | | | |
| Franklin Floating Rate Master Series (continued) | | | | | | | |
| | | | | Principal | | | % of Net |
| | | Country | | Amount* | | Value | Assets |
| f,g Senior Floating Rate Interests (continued) | | | | | | | |
| Casinos & Gaming (continued) | | | | | | | |
| Eldorado Resorts Inc., | | | | | | | |
| Initial Term Loan, 4.375%, (1-month USD LIBOR + 2.25%), | | | | | | | |
| 4/17/24 | | United States | $ | 3,614,072 | $ | 3,619,717 | 0.20 |
| Initial Term Loan, 4.438%, (2-month USD LIBOR + 2.25%), | | | | | | | |
| 4/17/24 | | United States | | 2,585,414 | | 2,589,452 | 0.15 |
| Greektown Holdings LLC, Initial Term Loan, 5.077%, (1-month USD | | | | | | | |
| LIBOR + 3.00%), 4/25/24 | | United States | | 8,367,671 | | 8,379,871 | 0.47 |
| Kingpin Intermediate Holdings LLC, Initial Term Loans, 5.58%, | | | | | | | |
| (1-month USD LIBOR + 3.50%), 7/03/24 | | United States | | 1,584,000 | | 1,600,830 | 0.09 |
| h Las Vegas Sands LLC, Term B Loans, 3.827%, (1-month USD | | | | | | | |
| LIBOR + 1.75%), 3/27/25 | | United States | | 7,568,585 | | 7,567,533 | 0.43 |
| | | | | | | 50,926,385 | 2.89 |
| Coal & Consumable Fuels | | | | | | | |
| Bowie Resource Holdings LLC, | | | | | | | |
| First Lien Initial Term Loan, 7.827%, (1-month USD LIBOR + | | | | | | | |
| 5.75%), 8/14/20 | | United States | | 18,177,382 | | 17,927,443 | 1.02 |
| Second Lien Initial Term Loan, 12.827%, (1-month USD LIBOR | | | | | | | |
| + 10.75%), 2/16/21 | | United States | | 2,232,389 | | 2,143,093 | 0.12 |
| Foresight Energy LLC, Term Loans, 7.827%, (1-month USD LIBOR | | | | | | | |
| + 5.75%), 3/28/22 | | United States | | 26,556,009 | | 26,506,216 | 1.51 |
| | | | | | | 46,576,752 | 2.65 |
| Commodity Chemicals | | | | | | | |
| Ineos U.S. Finance LLC, 2024 Dollar Term Loan, 4.169%, (2-month | | | | | | | |
| USD LIBOR + 2.00%), 3/31/24 | | United States | | 11,621,368 | | 11,617,336 | 0.66 |
| Communications Equipment | | | | | | | |
| Ciena Corp., Refinancing Term Loan, 4.586%, (1-month USD LIBOR | | | | | | | |
| + 2.50%), 1/28/22 | | United States | | 8,678,039 | | 8,726,853 | 0.50 |
| CommScope Inc., Tranche 5 Term Loans, 4.077%, (1-month USD | | | | | | | |
| LIBOR + 2.00%), 12/29/22 | | United States | | 4,898,659 | | 4,926,978 | 0.28 |
| | | | | | | 13,653,831 | 0.78 |
| Construction & Engineering | | | | | | | |
| AECOM, Term B Loans, 3.827%, (1-month USD LIBOR + 1.75%), | | | | | | | |
| 3/13/25 | . | United States | | 7,844,218 | | 7,869,986 | 0.45 |
| Data Processing & Outsourced Services | | | | | | | |
| First Data Corp., Term A Loan, 3.819%, (1-month USD LIBOR + | | | | | | | |
| 1.75%), 6/02/20. | | United States | | 16,373,668 | | 16,390,074 | 0.93 |
| Iron Mountain Information Management LLC, Term B Loan, 3.827%, | | | | | | | |
| (1-month USD LIBOR + 1.75%), 1/26/26 | | United States | | 4,612,920 | | 4,562,939 | 0.26 |
| Wex Inc., Term B-2 Loan, 4.327%, (1-month USD LIBOR + 2.25%), | | | | | | | |
| 7/01/23 | . | United States | | 9,802,242 | | 9,829,375 | 0.56 |
| | | | | | | 30,782,388 | 1.75 |
| Diversified Chemicals | | | | | | | |
| Chemours Co., Tranche B-2 US$ Term Loan, 3.83%, (1-month USD | | | | | | | |
| LIBOR + 1.75%), 4/03/25 | | United States | | 8,820,638 | | 8,798,587 | 0.50 |
| Diversified Support Services | | | | | | | |
| h Ventia Pty. Ltd., Term B Loans (USD), 5.834%, (3-month USD | | | | | | | |
| LIBOR + 3.50%), 5/21/22 | | Australia | | 4,913,144 | | 4,962,276 | 0.28 |
| Electric Utilities | | | | | | | |
| EFS Cogen Holdings I LLC (Linden), Term B Advance, 5.59%, | | | | | | | |
| (3-month USD LIBOR + 3.25%), 6/28/23 | | United States | | 4,159,778 | | 4,175,897 | 0.24 |
15
FRANKLIN FLOATING RATE MASTER TRUST
STATEMENT OF INVESTMENTS
| | | | | | | | |
| Franklin Floating Rate Master Series (continued) | | | | | | | | |
| | | | | Principal | | | % of Net | |
| | | Country | | Amount* | | Value | Assets | |
| f,g Senior Floating Rate Interests (continued) | | | | | | | | |
| Fertilizers & Agricultural Chemicals | | | | | | | | |
| Mosaic Co., Term Loan A, 3.572%, (1-month USD LIBOR + 1.50%), | | | | | | | | |
| 11/18/21 | | United States | $ | 871,925 | $ | 869,745 | 0.05 | |
| Food Distributors | | | | | | | | |
| Aramark Corp., U.S. Term B-3 Loan, 4.084%, (3-month USD LIBOR | | | | | | | | |
| + 1.75%), 3/11/25 | | United States | | 9,603,778 | | 9,636,796 | 0.55 | |
| Nutraceutical International Corp., Term Loan B, 5.327%, (1-month | | | | | | | | |
| USD LIBOR + 3.25%), 8/22/23 | | United States | | 2,904,212 | | 2,896,951 | 0.16 | |
| | | | | | | 12,533,747 | 0.71 | |
| Food Retail | | | | | | | | |
| BI-LO LLC (Southeastern Grocers), FILO Loan (ABL), 7.557%, | | | | | | | | |
| (3-month USD LIBOR + 5.25%), 5/31/22 | | United States | | 5,000,000 | | 4,925,000 | 0.28 | |
| Forest Products | | | | | | | | |
| Appvion Inc., Term Loan, 8.09%, (1-month USD LIBOR + 6.00%), | | | | | | | | |
| 6/15/26 | . | United States | | 9,539,138 | | 9,539,138 | 0.54 | |
| General Merchandise Stores | | | | | | | | |
| e 99 Cents Only Stores, First Lien Term Loan, PIK, 8.807% - 8.834%, | | | | | | | | |
| (3-month USD LIBOR + 6.50%), 1/13/22 | | United States | | 17,540,704 | | 16,619,905 | 0.95 | |
| Evergreen AcqCo. 1 LP (Savers), | | | | | | | | |
| Term Loan, 5.93%, (2-month USD LIBOR + 3.75%), 7/09/19 | | United States | | 64,188 | | 63,305 | 0.00 | † |
| Term Loan, 6.097%, (3-month USD LIBOR + 3.75%), 7/09/19 | | United States | | 24,134,791 | | 23,802,938 | 1.35 | |
| | | | | | | 40,486,148 | 2.30 | |
| Health Care Distributors | | | | | | | | |
| Mallinckrodt International Finance SA/CB LLC, Extended Term Loan | | | | | | | | |
| B, 5.203%, (6-month USD LIBOR + 2.75%), 9/24/24 | | Luxembourg | | 8,986,956 | | 8,865,884 | 0.50 | |
| Health Care Facilities | | | | | | | | |
| HCA Inc., | | | | | | | | |
| h,i Term Loan B10, TBD, 3/13/25 | | United States | | 4,472,368 | | 4,503,626 | 0.25 | |
| Term Loan B11, 3.827%, (1-month USD LIBOR + 1.75%), | | | | | | | | |
| 3/18/23 | | United States | | 2,573,550 | | 2,587,825 | 0.15 | |
| | | | | | | 7,091,451 | 0.40 | |
| Health Care Services | | | | | | | | |
| h Air Medical Group Holdings Inc., 2018 New Term Loans, 6.329%, | | | | | | | | |
| (1-month USD LIBOR + 4.25%), 3/14/25 | | United States | | 7,190,939 | | 7,114,535 | 0.41 | |
| DaVita Healthcare Partners Inc., | | | | | | | | |
| Tranche A Term Loan, 4.077%, (1-month USD LIBOR + 2.00%), | | | | | | | | |
| 6/24/19 | | United States | | 5,999,714 | | 6,018,463 | 0.34 | |
| h Tranche B Term Loan, 4.827%, (1-month USD LIBOR + 2.75%), | | | | | | | | |
| 6/24/21 | | United States | | 7,278,031 | | 7,330,345 | 0.42 | |
| Envision Healthcare Corp., Initial Term Loans, 5.08%, (1-month USD | | | | | | | | |
| LIBOR + 3.00%), 12/01/23 | | United States | | 4,794,685 | | 4,799,902 | 0.27 | |
| U.S. Renal Care Inc., Initial Term Loan, 6.584%, (3-month USD | | | | | | | | |
| LIBOR + 4.25%), 12/31/22 | | United States | | 8,935,936 | | 8,813,067 | 0.50 | |
| | | | | | | 34,076,312 | 1.94 | |
| Health Care Technology | | | | | | | | |
| IQVIA Inc., | | | | | | | | |
| h Term B-1 Dollar Loans, 4.334%, (3-month USD LIBOR + | | | | | | | | |
| 2.00%), 3/07/24 | | United States | | 5,681,250 | | 5,697,226 | 0.32 | |
| Term B-3 Dollar Loans, 4.084%, (3-month USD LIBOR + | | | | | | | | |
| 1.75%), 6/11/25 | | United States | | 3,000,000 | | 2,992,500 | 0.17 | |
| | | | | | | 8,689,726 | 0.49 | |
16
FRANKLIN FLOATING RATE MASTER TRUST
STATEMENT OF INVESTMENTS
| | | | | | | |
| Franklin Floating Rate Master Series (continued) | | | | | | | |
| | | | Principal | | | % of Net | |
| | Country | | Amount* | | Value | Assets | |
| f,g Senior Floating Rate Interests (continued) | | | | | | | |
| Hotels, Resorts & Cruise Lines | | | | | | | |
| Hilton Worldwide Finance LLC, Series B-2 Term Loans, 3.814%, | | | | | | | |
| (1-month USD LIBOR + 1.75%), 10/25/23 | United States | $ | 8,628,356 | $ | 8,667,572 | 0.49 | |
| Household Products | | | | | | | |
| Spectrum Brands Inc., | | | | | | | |
| USD Term Loans, 4.17%, (2-month USD LIBOR + 2.00%), | | | | | | | |
| 6/23/22 | United States | | 32,491 | | 32,567 | 0.00 | † |
| USD Term Loans, 4.34% - 4.363%, (3-month USD LIBOR + | | | | | | | |
| 2.00%), 6/23/22 | United States | | 12,801,467 | | 12,831,474 | 0.73 | |
| | | | | | 12,864,041 | 0.73 | |
| Independent Power Producers & Energy Traders | | | | | | | |
| Helix Gen Funding LLC, Term Loan, 5.827%, (1-month USD LIBOR | | | | | | | |
| + 3.75%), 6/02/24 | United States | | 18,327,804 | | 18,491,289 | 1.05 | |
| NRG Energy Inc., Term Loan B, 4.084%, (3-month USD LIBOR + | | | | | | | |
| 1.75%), 6/30/23. | United States | | 32,134,296 | | 32,114,372 | 1.82 | |
| | | | | | 50,605,661 | 2.87 | |
| Industrial Machinery | | | | | | | |
| Harsco Corp., Term Loan B-2, 4.375%, (1-month USD LIBOR + | | | | | | | |
| 2.25%), 12/10/24 | United States | | 9,280,471 | | 9,340,405 | 0.53 | |
| Navistar Inc., Tranche B Term Loan, 5.60%, (1-month USD LIBOR + | | | | | | | |
| 3.50%), 11/06/24 | United States | | 33,168,430 | | 33,386,081 | 1.90 | |
| Onsite Rental Group Operations Property Ltd., Term Loan, 6.564%, | | | | | | | |
| (1-month USD LIBOR + 4.50%), 10/25/22 | Australia | | 7,387,773 | | 7,313,895 | 0.41 | |
| | | | | | 50,040,381 | 2.84 | |
| Integrated Telecommunication Services | | | | | | | |
| Consolidated Communications Inc., Initial Term Loan, 5.08%, | | | | | | | |
| (1-month USD LIBOR + 3.00%), 10/05/23 | United States | | 2,042,115 | | 2,022,204 | 0.12 | |
| Global Tel*Link Corp., | | | | | | | |
| Second Lien Term Loan, 10.584%, (3-month USD LIBOR + | | | | | | | |
| 8.25%), 11/23/20 | United States | | 3,374,143 | | 3,391,014 | 0.19 | |
| Term Loan, 6.334%, (3-month USD LIBOR + 4.00%), 5/23/20 | United States | | 4,900,539 | | 4,933,466 | 0.28 | |
| Securus Technologies Holdings Inc., Second Lien Initial Loan, | | | | | | | |
| 10.327%, (1-month USD LIBOR + 8.25%), 11/01/25 | United States | | 817,114 | | 820,859 | 0.05 | |
| Zayo Group LLC, 2017 Incremental Refinancing B-1 Term Loan, | | | | | | | |
| 4.077%, (1-month USD LIBOR + 2.00%), 1/19/21 | United States | | 16,703,429 | | 16,750,398 | 0.95 | |
| | | | | | 27,917,941 | 1.59 | |
| Internet Software & Services | | | | | | | |
| h Go Daddy Operating Co. LLC, Tranche B-1 Term Loans, 4.327%, | | | | | | | |
| (1-month USD LIBOR + 2.25%), 2/15/24 | United States | | 7,913,579 | | 7,940,288 | 0.45 | |
| Legalzoom.com Inc., Initial Term Loan, 6.331%, (1-month USD | | | | | | | |
| LIBOR + 4.25%), 11/21/24 | United States | | 802,179 | | 805,187 | 0.04 | |
| Rackspace Hosting Inc., Term B Loans, 5.363%, (3-month USD | | | | | | | |
| LIBOR + 3.00%), 11/03/23 | United States | | 5,080,897 | | 5,063,444 | 0.29 | |
| | | | | | 13,808,919 | 0.78 | |
| IT Consulting & Other Services | | | | | | | |
| Gartner Inc., Tranche A Term Loans, 4.077%, (1-month USD LIBOR | | | | | | | |
| + 2.00%), 3/20/22 | United States | | 1,509,272 | | 1,511,158 | 0.09 | |
| Leisure Facilities | | | | | | | |
| 24 Hour Fitness Worldwide Inc., Term Loan, 5.572%, (1-month USD | | | | | | | |
| LIBOR + 3.50%), 5/30/25 | United States | | 7,380,422 | | 7,421,937 | 0.42 | |
| h,i Equinox Holdings Inc., Term Loan B, TBD, 3/08/24 | United States | | 880,000 | | 884,400 | 0.05 | |
| | | | | | 8,306,337 | 0.47 | |
17
FRANKLIN FLOATING RATE MASTER TRUST
STATEMENT OF INVESTMENTS
| | | | | | | |
| Franklin Floating Rate Master Series (continued) | | | | | | | |
| | | | | Principal | | | % of Net |
| | | Country | | Amount* | | Value | Assets |
| f,g Senior Floating Rate Interests (continued) | | | | | | | |
| Life Sciences Tools & Services | | | | | | | |
| Syneos Health Inc., Initial Term B Loans, 4.077%, (1-month USD | | | | | | | |
| LIBOR + 2.00%), 8/01/24 | | United States | $ | 8,278,132 | $ | 8,283,927 | 0.47 |
| Marine | | | | | | | |
| International Seaways Operating Corp., Initial Term Loans, 8.08%, | | | | | | | |
| (1-month USD LIBOR + 5.50%), 6/22/22 | | United States | | 3,127,209 | | 3,131,118 | 0.18 |
| Navios Maritime Partners LP, Initial Term Loan, 7.33%, (3-month | | | | | | | |
| USD LIBOR + 5.00%), 9/14/20 | | United States | | 8,297,396 | | 8,325,051 | 0.47 |
| | | | | | | 11,456,169 | 0.65 |
| Metal & Glass Containers | | | | | | | |
| h,i Berry Global Inc., Term Loan Q, TBD, 10/01/22 | | United States | | 1,408,801 | | 1,413,301 | 0.08 |
| Crown Americas LLC, Term B Loans, 4.077%, (1-month USD LIBOR | | | | | | | |
| + 2.00%), 4/03/25 | | United States | | 5,620,585 | | 5,645,175 | 0.32 |
| | | | | | | 7,058,476 | 0.40 |
| Movies & Entertainment | | | | | | | |
| AMC Entertainment Holdings Inc., | | | | | | | |
| 2016 Incremental Term Loans, 4.322%, (1-month USD LIBOR + | | | | | | | |
| 2.25%), 12/15/23 | | United States | | 1,601,945 | | 1,605,808 | 0.09 |
| Initial Term Loans, 4.322%, (1-month USD LIBOR + 2.25%), | | | | | | | |
| 12/15/22 | | United States | | 2,731,224 | | 2,737,809 | 0.16 |
| Lions Gate Capital Holdings LLC, Term A Loan, 3.814%, (1-month | | | | | | | |
| USD LIBOR + 1.75%), 3/22/23 | | Canada | | 12,095,329 | | 12,110,448 | 0.69 |
| Live Nation Entertainment Inc., Term B-3 Loans, 3.875%, (1-month | | | | | | | |
| USD LIBOR + 1.75%), 10/31/23 | | United States | | 5,808,699 | | 5,817,168 | 0.33 |
| | | | | | | 22,271,233 | 1.27 |
| Oil & Gas Exploration & Production | | | | | | | |
| Cantium LLC, Commitment, 8.34%, (3-month USD LIBOR + 6.00%), | | | | | | | |
| 6/13/20 | . | United States | | 4,635,416 | | 4,681,770 | 0.27 |
| Fieldwood Energy LLC, Closing Date Loans, 7.327%, (1-month USD | | | | | | | |
| LIBOR + 5.25%), 4/11/22 | | United States | | 69,684,139 | | 69,910,612 | 3.97 |
| UTEX Industries Inc., First Lien Initial Term Loan, 6.077%, (1-month | | | | | | | |
| USD LIBOR + 4.00%), 5/21/21 | | United States | | 16,641,446 | | 16,530,498 | 0.94 |
| | | | | | | 91,122,880 | 5.18 |
| Oil & Gas Storage & Transportation | | | | | | | |
| OSG Bulk Ships Inc., Initial Term Loan, 6.77%, (3-month USD | | | | | | | |
| LIBOR + 4.25%), 8/05/19 | | United States | | 9,950,458 | | 9,888,268 | 0.56 |
| Strike LLC, Term Loan, 10.453%, (6-month USD LIBOR + 8.00%), | | | | | | | |
| 11/30/22 | | United States | | 3,459,500 | | 3,511,392 | 0.20 |
| | | | | | | 13,399,660 | 0.76 |
| Other Diversified Financial Services | | | | | | | |
| Asurion LLC, | | | | | | | |
| h AM No.14 Replacement B-4 Term Loans, 5.077%, (1-month | | | | | | | |
| USD LIBOR + 3.00%), 8/04/22 | | United States | | 4,269,566 | | 4,274,903 | 0.24 |
| Replacement B-6 Term Loans, 5.077%, (1-month USD LIBOR + | | | | | | | |
| 3.00%), 11/03/23 | | United States | | 1,745,482 | | 1,746,261 | 0.10 |
| | | | | | | 6,021,164 | 0.34 |
18
FRANKLIN FLOATING RATE MASTER TRUST
STATEMENT OF INVESTMENTS
| | | | | | |
| Franklin Floating Rate Master Series (continued) | | | | | | |
| | | | Principal | | | % of Net |
| | Country | | Amount* | | Value | Assets |
| f,g Senior Floating Rate Interests (continued) | | | | | | |
| Packaged Foods & Meats | | | | | | |
| CSM Bakery Supplies LLC, | | | | | | |
| Second Lien Term Loan, 10.09%, (3-month USD LIBOR + | | | | | | |
| 7.75%), 7/03/21 | United States | $ | 7,271,086 | $ | 6,881,777 | 0.39 |
| Term Loans, 6.34%, (3-month USD LIBOR + 4.00%), 7/03/20 | United States | | 2,560,483 | | 2,499,671 | 0.14 |
| h JBS USA LUX SA, New Initial Term Loans, 4.834% - 4.835%, | | | | | | |
| (3-month USD LIBOR + 2.50%), 10/30/22 | United States | | 30,007,598 | | 30,015,640 | 1.71 |
| Pinnacle Foods Finance LLC, Initial B Term Loan, 3.84%, (1-month | | | | | | |
| USD LIBOR + 1.75%), 2/03/24 | United States | | 5,075,415 | | 5,084,932 | 0.29 |
| Post Holdings Inc., Series A Incremental Term Loans, 4.07%, | | | | | | |
| (1-month USD LIBOR + 2.00%), 5/24/24 | United States | | 17,127,786 | | 17,153,958 | 0.97 |
| | | | | | 61,635,978 | 3.50 |
| Paper Packaging | | | | | | |
| Caraustar Industries Inc., Refinancing Term Loans, 7.834%, | | | | | | |
| (3-month USD LIBOR + 5.50%), 3/14/22 | United States | | 12,669,501 | | 12,799,617 | 0.73 |
| h,i Reynolds Group Holdings Inc., Term B, TBD, 2/05/23 | United States | | 2,326,531 | | 2,336,709 | 0.13 |
| | | | | | 15,136,326 | 0.86 |
| Personal Products | | | | | | |
| b FGI Operating Co. LLC (Freedom Group), | | | | | | |
| Term Loan, 12.343%, (3-month USD LIBOR + 10.00%), | | | | | | |
| 5/15/22 | United States | | 8,563,000 | | 8,563,000 | 0.49 |
| Term Loan FILO, 8.843%, (3-month USD LIBOR + 6.50%), | | | | | | |
| 5/15/21 | United States | | 2,727,273 | | 2,618,182 | 0.15 |
| | | | | | 11,181,182 | 0.64 |
| Pharmaceuticals | | | | | | |
| Bausch Health Companies Inc., Initial Term Loans, 5.092%, | | | | | | |
| (1-month USD LIBOR + 3.00%), 6/02/25 | United States | | 6,339,820 | | 6,355,276 | 0.36 |
| Endo Luxembourg Finance Co. I S.A.R.L. and Endo LLC, Initial Term | | | | | | |
| Loans, 6.375%, (1-month USD LIBOR + 4.25%), 4/29/24 | United States | | 20,757,544 | | 20,812,676 | 1.18 |
| Grifols Worldwide Operations USA Inc., Tranche B Term Loan, | | | | | | |
| 4.20%, (1-week USD LIBOR + 2.25%), 1/31/25. | United States | | 11,507,650 | | 11,554,947 | 0.66 |
| Horizon Pharma Inc., Third Amendment Refinancing Term Loan, | | | | | | |
| 5.375%, (1-month USD LIBOR + 3.25%), 3/29/24 | United States | | 8,826,168 | | 8,844,094 | 0.50 |
| Innoviva Inc., Initial Term Loan, 6.831%, (3-month USD LIBOR + | | | | | | |
| 4.50%), 8/18/22. | United States | | 840,633 | | 844,836 | 0.05 |
| | | | | | 48,411,829 | 2.75 |
| Restaurants | | | | | | |
| KFC Holding Co./Pizza Hut Holdings LLC/Taco Bell of America LLC | | | | | | |
| (Yum Brands), Term Loan B, 3.829%, (1-month USD LIBOR + | | | | | | |
| 1.75%), 4/03/25. | United States | | 8,406,011 | | 8,417,174 | 0.48 |
| NPC International Inc., Second Lien Initial Term Loan, 9.577%, | | | | | | |
| (1-month USD LIBOR + 7.50%), 4/20/25 | United States | | 4,842,941 | | 4,915,585 | 0.28 |
| | | | | | 13,332,759 | 0.76 |
| Security & Alarm Services | | | | | | |
| h Prime Security Services Borrower LLC, Term B-1 Loans, 4.827%, | | | | | | |
| (1-month USD LIBOR + 2.75%), 5/02/22 | United States | | 4,491,184 | | 4,503,346 | 0.26 |
| Semiconductor Equipment | | | | | | |
| MKS Instruments Inc., Tranche B-4 Term Loan, 3.827%, (1-month | | | | | | |
| USD LIBOR + 1.75%), 4/29/23 | United States | | 742,028 | | 745,430 | 0.04 |
| Semiconductors | | | | | | |
| ON Semiconductor Corp., 2018 New Replacement Term B-3 Loans, | | | | | | |
| 3.827%, (1-month USD LIBOR + 1.75%), 3/31/23 | United States | | 14,139,597 | | 14,174,946 | 0.81 |
19
FRANKLIN FLOATING RATE MASTER TRUST
STATEMENT OF INVESTMENTS
| | | | | | |
| Franklin Floating Rate Master Series (continued) | | | | | | |
| | | | Principal | | | % of Net |
| | Country | | Amount* | | Value | Assets |
| f,g Senior Floating Rate Interests (continued) | | | | | | |
| Specialized Consumer Services | | | | | | |
| Avis Budget Car Rental LLC, Tranche B Term Loans, 4.34%, | | | | | | |
| (3-month USD LIBOR + 2.00%), 2/13/25 | United States | $ | 19,176,144 | $ | 19,230,125 | 1.09 |
| h NVA Holdings Inc., Term B-3 Loan, 4.827%, (1-month USD LIBOR + | | | | | | |
| 2.75%), 2/02/25. | United States | | 7,798,594 | | 7,786,413 | 0.44 |
| Sabre GLBL Inc., | | | | | | |
| 2017 Other Term A Loans, 4.077%, (1-month USD LIBOR + | | | | | | |
| 2.00%), 7/01/22 | United States | | 6,324,381 | | 6,340,192 | 0.36 |
| 2018 Other Term B Loans, 4.077%, (1-month USD LIBOR + | | | | | | |
| 2.00%), 2/22/24 | United States | | 1,542,460 | | 1,545,472 | 0.09 |
| | | | | | 34,902,202 | 1.98 |
| Specialized Finance | | | | | | |
| h,i Trans Union LLC, Term A-2 Facility, TBD, 8/09/22 | United States | | 6,752,226 | | 6,754,353 | 0.38 |
| Specialty Chemicals | | | | | | |
| h Ashland LLC, Term B Loan, 3.827% - 3.829%, (1-month USD LIBOR | | | | | | |
| + 1.75%), 5/17/24 | United States | | 9,579,020 | | 9,620,928 | 0.55 |
| Axalta Coating Systems U.S. Holdings Inc., Term B-3 Dollar Loan, | | | | | | |
| 4.084%, (3-month USD LIBOR + 1.75%), 6/01/24 | United States | | 15,782,953 | | 15,801,025 | 0.90 |
| KMG Chemicals Inc., Initial Term Loan, 4.827%, (1-month USD | | | | | | |
| LIBOR + 2.75%), 6/15/24 | United States | | 1,429,522 | | 1,438,456 | 0.08 |
| Oxbow Carbon LLC, | | | | | | |
| Second Lien Term Loan, 9.577%, (1-month USD LIBOR + | | | | | | |
| 7.50%), 1/04/24 | United States | | 7,556,614 | | 7,707,746 | 0.44 |
| Tranche A Term Loan, 4.327%, (1-month USD LIBOR + 2.50%), | | | | | | |
| 1/04/22 | United States | | 5,700,000 | | 5,721,375 | 0.32 |
| Tranche B Term Loan, 5.827%, (1-month USD LIBOR + 3.75%), | | | | | | |
| 1/04/23 | United States | | 4,797,000 | | 4,868,955 | 0.28 |
| WR Grace & Co., | | | | | | |
| Term B-1 Loans, 4.084%, (3-month USD LIBOR + 1.75%), | | | | | | |
| 4/03/25 | United States | | 1,847,640 | | 1,853,414 | 0.10 |
| Term B-2 Loans, 4.084%, (3-month USD LIBOR + 1.75%), | | | | | | |
| 4/03/25 | United States | | 3,167,384 | | 3,177,282 | 0.18 |
| | | | | | 50,189,181 | 2.85 |
| Specialty Stores | | | | | | |
| General Nutrition Centers Inc., | | | | | | |
| FILO Term Loan (ABL), 9.08%, (1-month USD LIBOR + 7.00%), | | | | | | |
| 12/31/22 | United States | | 12,691,811 | | 13,096,363 | 0.74 |
| Tranche B-2 Term Loans, 10.83%, (1-month USD LIBOR + | | | | | | |
| 8.75%), 3/04/21 | United States | | 27,104,979 | | 26,299,961 | 1.49 |
| Michaels Stores Inc., 2018 New Replacement Term B Loan, 4.572% | | | | | | |
| - 4.581%, (1-month USD LIBOR + 2.50%), 1/28/23 | United States | | 13,665,750 | | 13,675,999 | 0.78 |
| | | | | | 53,072,323 | 3.01 |
| Technology Hardware, Storage & Peripherals | | | | | | |
| Western Digital Corp., US Term B-4 Loan, 3.827%, (1-month USD | | | | | | |
| LIBOR + 1.75%), 4/29/23 | United States | | 2,992,500 | | 2,996,552 | 0.17 |
| Trucking | | | | | | |
| Hertz Corp., Tranche B-1 Term Loan, 4.83%, (1-month USD LIBOR | | | | | | |
| + 2.75%), 6/30/23 | United States | | 20,823,331 | | 20,808,692 | 1.18 |
| Total Senior Floating Rate Interests | | | | | | |
| (Cost $1,241,805,349) | | | | | 1,242,963,533 | 70.60 |
20
FRANKLIN FLOATING RATE MASTER TRUST
STATEMENT OF INVESTMENTS
| | | | | | |
| Franklin Floating Rate Master Series (continued) | | | | | | |
| | | | Principal | | | % of Net |
| | Country | | Amount* | | Value | Assets |
| |
| Asset-Backed Securities | | | | | | |
| Other Diversified Financial Services | | | | | | |
| j,k Alinea CLO Ltd., 2018-1A, C, 144A, FRN, 4.207%, (3-month USD | | | | | | |
| LIBOR + 1.90%), 7/20/31 | United States | $ | 2,600,000 | $ | 2,599,870 | 0.15 |
| j,k Annisa CLO Ltd., 2016-2A, CR, 144A, FRN, 4.348%, (3-month USD | | | | | | |
| LIBOR + 2.00%), 7/20/31 | United States | | 1,800,000 | | 1,799,604 | 0.10 |
| j,k Ares CLO Ltd., 2018-48A, C, 144A, FRN, 4.139%, (3-month USD | | | | | | |
| LIBOR + 1.80%), 7/20/30 | United States | | 3,135,000 | | 3,134,342 | 0.18 |
| j,l,m ARES XLIX CLO Ltd., 2018-49A, C, 144A, FRN, 4.293%, 7/22/30 | United States | | 3,100,000 | | 3,099,845 | 0.18 |
| j,k Ares XXXVII CLO Ltd., 2015-4A, BR, 144A, FRN, 4.139%, (3-month | | | | | | |
| USD LIBOR + 1.80%), 10/15/30 | United States | | 3,150,000 | | 3,145,086 | 0.18 |
| j,k Atrium XI, 2011A, CR, 144A, FRN, 4.497%, (3-month USD LIBOR + | | | | | | |
| 2.15%), 10/23/25 | United States | | 2,352,136 | | 2,358,393 | 0.13 |
| j,k Atrium XII, 2012A, CR, 144A, FRN, 3.997%, (3-month USD LIBOR + | | | | | | |
| 1.65%), 4/22/27. | United States | | 2,240,000 | | 2,222,909 | 0.13 |
| j,l,m Atrium XIV LLC, | | | | | | |
| 14A, B, 144A, FRN, 4.01%, 8/23/30 | United States | | 7,200,000 | | 7,200,144 | 0.41 |
| 14A, C, 144A, FRN, 4.26%, 8/23/30 | United States | | 4,000,000 | | 4,000,080 | 0.23 |
| j,k Betony CLO 2 Ltd., 2018-1A, B, 144A, FRN, 3.959%, (3-month USD | | | | | | |
| LIBOR + 1.85%), 4/30/31 | United States | | 2,400,000 | | 2,395,512 | 0.14 |
| j,k BlueMountain CLO Ltd., | | | | | | |
| 2012-2A, AR, 144A, FRN, 3.751%, (3-month USD LIBOR + | | | | | | |
| 1.42%), 11/20/28 | United States | | 10,790,000 | | 10,808,775 | 0.61 |
| 2012-2A, CR, 144A, FRN, 4.931%, (3-month USD LIBOR + | | | | | | |
| 2.60%), 11/20/28 | United States | | 1,400,000 | | 1,405,726 | 0.08 |
| j,l BlueMountain CLO XXII Ltd., | | | | | | |
| 2018-1A, B, 144A, FRN, 4.039%, 7/30/30 | United States | | 5,400,000 | | 5,400,000 | 0.31 |
| 2018-1A, C, 144A, FRN, 4.389%, 7/30/30 | United States | | 2,750,000 | | 2,750,000 | 0.16 |
| j,k BlueMountain Fuji U.S. CLO I Ltd., 2017-1A, C, 144A, FRN, 4.698%, | | | | | | |
| (3-month USD LIBOR + 2.35%), 7/20/29 | United States | | 2,275,000 | | 2,285,783 | 0.13 |
| j,k BlueMountain Fuji U.S. CLO III Ltd., 2017-3A, C, 144A, FRN, | | | | | | |
| 4.048%, (3-month USD LIBOR + 1.70%), 1/15/30 | United States | | 2,100,000 | | 2,092,671 | 0.12 |
| j,k Bristol Park CLO Ltd., 2016-1A, A, 144A, FRN, 3.759%, (3-month | | | | | | |
| USD LIBOR + 1.42%), 4/15/29 | United States | | 22,000,000 | | 22,135,520 | 1.26 |
| j,k Carlyle Global Market Strategies CLO Ltd., | | | | | | |
| 2012-4A, C1R, 144A, FRN, 4.948%, (3-month USD LIBOR + | | | | | | |
| 2.60%), 1/20/29 | United States | | 3,675,000 | | 3,697,123 | 0.21 |
| 2014-4RA, B, 144A, FRN, 3.887%, (3-month USD LIBOR + | | | | | | |
| 1.90%), 7/15/30 | United States | | 3,400,000 | | 3,375,222 | 0.19 |
| 2015-2A, A1R, 144A, FRN, 3.117%, (3-month USD LIBOR + | | | | | | |
| 0.78%), 4/27/27 | United States | | 3,596,000 | | 3,590,354 | 0.20 |
| j,k Carlyle U.S. CLO Ltd., 2017-1A, A1A, 144A, FRN, 3.648%, (3-month | | | | | | |
| USD LIBOR + 1.30%), 4/20/31 | United States | | 12,600,000 | | 12,619,278 | 0.72 |
| j,k Cent CLO LP, | | | | | | |
| 2014-22A, A1R, 144A, FRN, 3.773%, (3-month USD LIBOR + | | | | | | |
| 1.41%), 11/07/26 | United States | | 7,510,000 | | 7,521,866 | 0.43 |
| 2014-22A, BR, 144A, FRN, 5.313%, (3-month USD LIBOR + | | | | | | |
| 2.95%), 11/07/26 | United States | | 3,200,000 | | 3,205,312 | 0.18 |
| j,k Dryden 30 Senior Loan Fund, 2013-30A, A, 144A, FRN, 4.043%, | | | | | | |
| (3-month USD LIBOR + 1.70%), 11/15/28 | United States | | 2,100,000 | | 2,084,670 | 0.12 |
21
FRANKLIN FLOATING RATE MASTER TRUST
STATEMENT OF INVESTMENTS
| | | | | | |
| Franklin Floating Rate Master Series (continued) | | | | | | |
| | | | Principal | | | % of Net |
| | Country | | Amount* | | Value | Assets |
| |
| Asset-Backed Securities (continued) | | | | | | |
| Other Diversified Financial Services (continued) | | | | | | |
| j,k Dryden CLO Ltd., | | | | | | |
| 2018-55A, C, 144A, FRN, 3.941%, (3-month USD LIBOR + | | | | | | |
| 1.90%), 4/15/31 | United States | $ | 2,900,000 | $ | 2,889,125 | 0.16 |
| 2018-58A, C, 144A, FRN, 4.121%, (3-month USD LIBOR + | | | | | | |
| 1.80%), 7/17/31 | United States | | 2,500,000 | | 2,500,000 | 0.14 |
| j,k Dryden Senior Loan Fund, 2016-42A, CR, 144A, FRN, 4.389%, | | | | | | |
| (3-month USD LIBOR + 2.05%), 7/15/30 | United States | | 2,400,000 | | 2,409,039 | 0.14 |
| j,k Eaton Vance CDO Ltd., 2014-1A, AR, 144A, FRN, 3.539%, | | | | | | |
| (3-month USD LIBOR + 1.20%), 7/15/26 | United States | | 2,650,000 | | 2,651,245 | 0.15 |
| j,k Eaton Vance CLO Ltd., 2015-1A, CR, 144A, FRN, 4.248%, (3-month | | | | | | |
| USD LIBOR + 1.90%), 1/20/30 | United States | | 1,400,000 | | 1,398,488 | 0.08 |
| j Emerson Park CLO Ltd., 2013-1A, C2R, 144A, 4.055%, 7/15/25. | United States | | 1,100,000 | | 1,101,628 | 0.06 |
| j,k Flagship CLO VIII Ltd., 2014-8A, CRR, 144A, FRN, 4.139%, | | | | | | |
| (3-month USD LIBOR + 1.80%), 1/16/26 | United States | | 2,900,000 | | 2,899,977 | 0.16 |
| j,k Galaxy XVIII CLO Ltd., 2018-28A, C, 144A, FRN, 4.289%, (3-month | | | | | | |
| USD LIBOR + 1.95%), 7/15/31 | United States | | 2,700,000 | | 2,679,302 | 0.15 |
| j,l,m LCM Loan Income Fund I Income Note Issuer Ltd., 2027A, C, 144A, | | | | | | |
| FRN, 4.401%, 7/16/31 | United States | | 2,700,000 | | 2,700,054 | 0.15 |
| j,k LCM XXIV Ltd., 24A, A, 144A, FRN, 3.658%, (3-month USD LIBOR | | | | | | |
| + 1.31%), 3/20/30 | United States | | 26,400,000 | | 26,489,760 | 1.50 |
| j,k LCM XXV Ltd., | | | | | | |
| 25A, B2, 144A, FRN, 3.998%, (3-month USD LIBOR + 1.65%), | | | | | | |
| 7/20/30 | United States | | 4,075,000 | | 4,084,006 | 0.23 |
| 25A, C2, 144A, FRN, 4.648%, (3-month USD LIBOR + 2.30%), | | | | | | |
| 7/20/30 | United States | | 1,625,000 | | 1,632,166 | 0.09 |
| j,k Madison Park Funding Ltd., | | | | | | |
| 2016-21A, A1, 144A, FRN, 3.865%, (3-month USD LIBOR + | | | | | | |
| 1.53%), 7/25/29 | United States | | 7,100,000 | | 7,190,241 | 0.41 |
| 2018-28A, C, 144A, FRN, 4.187%, (3-month USD LIBOR + | | | | | | |
| 1.85%), 7/15/30 | United States | | 4,200,000 | | 4,196,892 | 0.24 |
| j,k Madison Park Funding XXIV Ltd., 2016-24A, C1, 144A, FRN, | | | | | | |
| 4.948%, (3-month USD LIBOR + 2.60%), 1/20/28 | United States | | 1,750,000 | | 1,758,768 | 0.10 |
| j,k Magnetite IX Ltd., 2014-9A, BR, 144A, FRN, 4.335%, (3-month USD | | | | | | |
| LIBOR + 2.00%), 7/25/26 | United States | | 2,793,000 | | 2,795,039 | 0.16 |
| j,k Magnetite XI Ltd., 2014-11A, BR, 144A, FRN, 4.433%, (3-month | | | | | | |
| USD LIBOR + 2.10%), 1/18/27 | United States | | 1,172,500 | | 1,175,033 | 0.07 |
| j,k Magnetite XIV Ltd., 2015-14A, A, 144A, FRN, 3.723%, (3-month | | | | | | |
| USD LIBOR + 1.39%), 7/18/28 | United States | | 1,460,000 | | 1,462,613 | 0.08 |
| j,k Neuberger Berman CLO Ltd., 2017-26A, C, 144A, FRN, 4.083%, | | | | | | |
| (3-month USD LIBOR + 1.75%), 10/18/30 | United States | | 2,100,000 | | 2,070,159 | 0.12 |
| j,k NZCG Funding Ltd., 2015-1A, A2R, 144A, FRN, 3.869%, (3-month | | | | | | |
| USD LIBOR + 1.55%), 2/26/31 | United States | | 5,810,000 | | 5,813,195 | 0.33 |
| j,k Octagon Investment Partners 26 Ltd., 2016-1A, CR, 144A, FRN, | | | | | | |
| 4.139%, (3-month USD LIBOR + 1.80%), 7/15/30 | United States | | 3,300,000 | | 3,296,799 | 0.19 |
| j,l Octagon Investment Partners 27 Ltd., 2016-1A, CR, 144A, FRN, | | | | | | |
| 4.439%, 7/15/30 | United States | | 3,500,000 | | 3,500,000 | 0.20 |
| j,k Octagon Investment Partners 30 Ltd., 144A, FRN, 3.668%, (3-month | | | | | | |
| USD LIBOR + 1.32%), 3/17/30 | United States | | 11,942,857 | | 11,998,750 | 0.68 |
| j,k Octagon Investment Partners 31 LLC, 2017-1A, C, 144A, FRN, | | | | | | |
| 4.748%, (3-month USD LIBOR + 2.40%), 7/20/30 | United States | | 2,288,855 | | 2,295,607 | 0.13 |
| j,k Octagon Investment Partners 37 Ltd., 2018-2A, B, 144A, FRN, | | | | | | |
| 4.11%, (3-month USD LIBOR + 1.75%), 7/25/30 | United States | | 3,250,000 | | 3,250,065 | 0.18 |
22
FRANKLIN FLOATING RATE MASTER TRUST
STATEMENT OF INVESTMENTS
| | | | | | |
| Franklin Floating Rate Master Series (continued) | | | | | | |
| | | | Principal | | | % of Net |
| | Country | | Amount* | | Value | Assets |
| Asset-Backed Securities (continued) | | | | | | |
| Other Diversified Financial Services (continued) | | | | | | |
| j,l,m Octagon Investment Partners 38, | | | | | | |
| 2018-1A, A3A, 144A, FRN, 3.857%, 7/20/30 | United States | $ | 4,500,000 | $ | 4,500,000 | 0.26 |
| 2018-1A, B, 144A, FRN, 4.137%, 7/20/30 | United States | | 3,900,000 | | 3,900,000 | 0.22 |
| j,k Octagon Investment Partners XVI Ltd., 2013-1A, CR, 144A, FRN, | | | | | | |
| 4.186%, (3-month USD LIBOR + 1.85%), 7/17/30 | United States | | 3,000,000 | | 3,001,770 | 0.17 |
| j,k Octagon Investment Partners XXII Ltd., 2014-1A, CRR, 144A, FRN, | | | | | | |
| 4.247%, (3-month USD LIBOR + 1.90%), 1/22/30 | United States | | 2,100,000 | | 2,097,879 | 0.12 |
| j,l Race Point X CLO Ltd., 2016-10A, C1R, 144A, FRN, 4.335%, | | | | | | |
| 7/25/31. | United States | | 2,300,000 | | 2,300,000 | 0.13 |
| j,k TCI-Cent CLO Income Note Issuer Ltd., 2017-1A, B, 144A, FRN, | | | | | | |
| 4.685%, (3-month USD LIBOR + 2.35%), 7/25/30 | United States | | 3,000,000 | | 3,006,600 | 0.17 |
| j,k Voya CLO Ltd., 2017-3A, B, 144A, FRN, 4.698%, (3-month USD | | | | | | |
| LIBOR + 2.35%), 7/20/30 | United States | | 2,508,761 | | 2,519,072 | 0.14 |
| Total Asset-Backed Securities (Cost $240,448,857) . | | | | | 240,491,357 | 13.66 |
| |
| Total Investments before Short Term Investments | | | | | | |
| (Cost $1,615,708,478) | | | | | 1,587,411,407 | 90.17 |
| |
| |
| Short Term Investments | | | | | | |
| |
| U.S. Government and Agency Securities (Cost $51,027,225) | | | | | | |
| n U.S. Treasury Bill, 3/28/19 | United States | | 51,750,000 | | 50,996,739 | 2.90 |
| Repurchase Agreements (Cost $180,369,470) | | | | | | |
| o Joint Repurchase Agreement, 1.906%, 8/01/18 | | | | | | |
| (Maturity Value $180,379,022) | | | | | | |
| BNP Paribas Securities Corp. (Maturity Value $63,951,578) | | | | | | |
| Deutsche Bank Securities Inc. (Maturity Value $20,501,880) | | | | | | |
| HSBC Securities (USA) Inc. (Maturity Value $95,925,564) | | | | | | |
| Collateralized by U.S. Government Agency Securities, 3.50% - | | | | | | |
| 4.50%, 6/20/44 - 8/20/47; nU.S. Treasury Bill, 8/02/18 - 7/18/19; | | | | | | |
| U.S. Treasury Bond, 7.875% - 9.00%, 11/15/18 - 8/15/21; U.S. | | | | | | |
| Treasury Note, 0.75% - 4.00%, 8/15/18 - 5/15/23; and U.S. | | | | | | |
| Treasury Note, Index Linked, 0.625% - 2.125%, 1/15/19 - | | | | | | |
| 4/15/23 (valued at $183,978,105 ) | United States | $ | 180,369,470 | | 180,369,470 | 10.24 |
| Total Investments (Cost $1,847,105,173) | | | | | 1,818,777,616 | 103.31 |
| Other Assets, less Liabilities | | | | | (58,233,800) | (3.31) |
| Net Assets | | | | $ | 1,760,543,816 | 100.00 |
23
FRANKLIN FLOATING RATE MASTER TRUST
STATEMENT OF INVESTMENTS
Franklin Floating Rate Master Series (continued)
†Rounds to less than 0.01% of net assets.
*The principal amount is stated in U.S. dollars unless otherwise indicated.
aNon-income producing.
bFair valued using significant unobservable inputs. See Note 13 regarding fair value measurements.
cSee Note 8 regarding restricted securities.
dSee Note 3(d) regarding investments in affiliated management investment companies.
eIncome may be received in additional securities and/or cash.
fThe coupon rate shown represents the rate at period end.
gSee Note 1(e) regarding senior floating rate interests.
hA portion or all of the security purchased on a delayed delivery basis. See Note 1(c).
iA portion or all of the security represents an unsettled loan commitment. The coupon rate is to-be determined (TBD) at the time of settlement and will be based upon a reference index/floor plus a spread.
jSecurity was purchased pursuant to Rule 144A under the Securities Act of 1933 and may be sold in transactions exempt from registration only to qualified institutional buyers or in a public offering registered under the Securities Act of 1933. These securities have been deemed liquid under guidelines approved by the Trust’s Board of Trustees. At July 31, 2018, the aggregate value of these securities was $240,491,357, representing 13.7% of net assets.
kThe coupon rate shown represents the rate inclusive of any caps or floors, if applicable, in effect at period end.
lAdjustable rate security with an interest rate that is not based on a published reference index and spread. The rate is based on the structure of the agreement and current market conditions. The coupon rate shown represents the rate at period end.
mSecurity purchased on a when-issued basis. See Note 1(c).
nThe security was issued on a discount basis with no stated coupon rate.
oSee Note 1(b) regarding joint repurchase agreement.
At July 31, 2018, the Fund had the following credit default swap contracts outstanding. See Note 1(d).
| | | | | | | | | | | | | | | | |
| Credit Default Swap Contracts | | | | | | | | | | | | | | | |
| | Periodic | | | | | | | | | | Unamortized | | | | | |
| | Payment Rate | | | | | | | | | | Upfront | | | Unrealized | | |
| | Received | | Payment | Maturity | | Notional | | | | | Payments | | | Appreciation | | |
| Description | (Paid) | | Frequency | Date | | Amount | | Value | | | (Receipts) | | | (Depreciation) | | Rating |
| Centrally Cleared Swap Contracts | | | | | | | | | | | | | | | | |
| Contracts to Buy Protectiona | | | | | | | | | | | | | | | | |
| Traded Index | | | | | | | | | | | | | | | | |
| CDX.NA.HY.26 | (5.00 | )% | Quarterly | 6/20/21 | $ | 26,362,000 | $ | (2,080,079 | ) | $ | (1,435,472 | ) | $ | (644,607 | ) | |
aPerformance triggers for settlement of contract include failure to pay or bankruptcy of the underlying securities for traded index swaps.
See Note 10 regarding other derivative information.
See Abbreviations on page 38.
24 | The accompanying notes are an integral part of these financial statements.
FRANKLIN FLOATING RATE MASTER TRUST
Financial Statements
Statement of Assets and Liabilities
July 31, 2018
| | | |
| Franklin Floating Rate Master Series | | | |
| |
| Assets: | | | |
| Investments in securities: | | | |
| Cost - Unaffiliated issuers | $ | 1,591,278,253 | |
| Cost - Non-controlled affiliates (Note 3d) | | 75,457,450 | |
| Cost - Unaffiliated repurchase agreements | | 180,369,470 | |
| Value - Unaffiliated issuers | $ | 1,566,190,943 | |
| Value - Non-controlled affiliates (Note 3d) | | 72,217,203 | |
| Value - Unaffiliated repurchase agreements | | 180,369,470 | |
| Cash | | 6,202,964 | |
| Receivables: | | | |
| Investment securities sold | | 16,578,874 | |
| Dividends and interest | | 4,720,882 | |
| Deposits with brokers for: | | | |
| Centrally cleared swap contracts | | 509,864 | |
| Unrealized appreciation on unfunded loan commitments (Note 9) | | 56,644 | |
| Other assets | | 950 | |
| Total assets | | 1,846,847,794 | |
| Liabilities: | | | |
| Payables: | | | |
| Investment securities purchased | | 78,238,767 | |
| Management fees | | 808,160 | |
| Distributions to shareholders | | 7,089,112 | |
| Variation margin on centrally cleared swap contracts | | 20,650 | |
| Accrued expenses and other liabilities. | | 147,289 | |
| Total liabilities | | 86,303,978 | |
| Net assets, at value | $ | 1,760,543,816 | |
| Net assets consist of: | | | |
| Paid-in capital | $ | 1,991,601,597 | |
| Undistributed net investment income | | 2,349,039 | |
| Net unrealized appreciation (depreciation) | | (29,065,636 | ) |
| Accumulated net realized gain (loss) | | (204,341,184 | ) |
| Net assets, at value | $ | 1,760,543,816 | |
| Shares outstanding. | | 206,205,796 | |
| Net asset value and maximum offering price per share ($1,760,543,816÷206,205,796 shares outstanding) | $ | 8.54 | |
The accompanying notes are an integral part of these financial statements. | Annual Report | 25
FRANKLIN FLOATING RATE MASTER TRUST
FINANCIAL STATEMENTS
Statement of Operations
for the year ended July 31, 2018
| | | |
| Franklin Floating Rate Master Series | | | |
| |
| Investment income: | | | |
| Dividends: (net of foreign taxes)* | | | |
| Unaffiliated issuers | $ | (8,321 | ) |
| Non-controlled affiliates (Note 3d) | | 4,375,379 | |
| Interest: | | | |
| Unaffiliated issuers | | 87,709,001 | |
| Total investment income | | 92,076,059 | |
| Expenses: | | | |
| Management fees (Note 3a) | | 9,521,551 | |
| Custodian fees (Note 4) | | 15,594 | |
| Reports to shareholders | | 4,585 | |
| Registration and filing fees | | 242 | |
| Professional fees | | 173,250 | |
| Trustees’ fees and expenses | | 70,392 | |
| Other | | 40,035 | |
| Total expenses | | 9,825,649 | |
| Expense reductions (Note 4) | | (18,307 | ) |
| Expenses waived/paid by affiliates (Note 3d and 3e) | | (315,835 | ) |
| Net expenses | | 9,491,507 | |
| Net investment income. | | 82,584,552 | |
| Realized and unrealized gains (losses): | | | |
| Net realized gain (loss) from: | | | |
| Investments: | | | |
| Unaffiliated issuers | | (19,886,650 | ) |
| Swap contracts. | | (472,787 | ) |
| Capital gain distributions from management investment companies: | | | |
| Non-controlled affiliates (Note 3d) | | 770,878 | |
| Net realized gain (loss) | | (19,588,559 | ) |
| Net change in unrealized appreciation (depreciation) on: | | | |
| Investments: | | | |
| Unaffiliated issuers | | (12,133,344 | ) |
| Non-controlled affiliates (Note 3d) | | (3,240,247 | ) |
| Swap contracts. | | (251,271 | ) |
| Net change in unrealized appreciation (depreciation) | | (15,624,862 | ) |
| Net realized and unrealized gain (loss) | | (35,213,421 | ) |
| Net increase (decrease) in net assets resulting from operations | $ | 47,371,131 | |
*Foreign taxes withheld on dividends $ 114,301
26 | Annual Report | The accompanying notes are an integral part of these financial statements.
FRANKLIN FLOATING RATE MASTER TRUST
FINANCIAL STATEMENTS
| | | | | | |
| Statements of Changes in Net Assets | | | | | | |
| |
| Franklin Floating Rate Master Series | | | | | | |
| |
| | | Year Ended July 31, | |
| | | 2018 | | | 2017 | |
| Increase (decrease) in net assets: | | | | | | |
| Operations: | | | | | | |
| Net investment income | $ | 82,584,552 | | $ | 66,737,495 | |
| Net realized gain (loss) | | (19,588,559 | ) | | (21,381,394 | ) |
| Net change in unrealized appreciation (depreciation) | | (15,624,862 | ) | | 57,130,631 | |
| Net increase (decrease) in net assets resulting from operations | | 47,371,131 | | | 102,486,732 | |
| Distributions to shareholders from: | | | | | | |
| Net investment income | | (81,458,861 | ) | | (66,380,751 | ) |
| Capital share transactions (Note 2) | | (295,994,793 | ) | | 690,565,052 | |
| Net increase (decrease) in net assets | | (330,082,523 | ) | | 726,671,033 | |
| Net assets: | | | | | | |
| Beginning of year | | 2,090,626,339 | | | 1,363,955,306 | |
| End of year | $ | 1,760,543,816 | | $ | 2,090,626,339 | |
| Undistributed net investment income included in net assets: | | | | | | |
| End of year | $ | 2,349,039 | | $ | 1,102,329 | |
The accompanying notes are an integral part of these financial statements. | Annual Report | 27
FRANKLIN FLOATING RATE MASTER TRUST
| | |
| Notes to Financial Statements | | |
| Franklin Floating Rate Master Series | | |
| |
1. Organization and Significant Accounting Policies Franklin Floating Rate Master Trust (Trust) is registered under the Investment Company Act of 1940 (1940 Act) as an open-end management investment company, consisting of three separate funds and applies the specialized accounting and reporting guidance in U.S. Generally Accepted Accounting Principles (U.S. GAAP). Franklin Floating Rate Master Series (Fund) is included in this report. The Fund’s shares are exempt from registration under the Securities Act of 1933. The following summarizes the Fund’s significant accounting policies. a. Financial Instrument Valuation The Fund’s investments in financial instruments are carried at fair value daily. Fair value is the price that would be received to sell an asset or paid to transfer a liability in an orderly transaction between market participants on the measurement date. The Fund calculates the net asset value (NAV) per share each business day as of 4 p.m. Eastern time or the regularly scheduled close of the New York Stock Exchange (NYSE), whichever is earlier. Under compliance policies and procedures approved by the Trust’s Board of Trustees (the Board), the Fund’s administrator has responsibility for oversight of valuation, including leading the cross-functional Valuation Committee (VC). The VC provides administration and oversight of the Fund’s valuation policies and procedures, which are approved annually by the Board. Among other things, these procedures allow the Fund to utilize independent pricing services, quotations from securities and financial instrument dealers, and other market sources to determine fair value. Equity securities listed on an exchange or on the NASDAQ National Market System are valued at the last quoted sale price or the official closing price of the day, respectively. Over-the-counter (OTC) securities are valued within the range of the most recent quoted bid and ask prices. Securities that trade in multiple markets or on multiple exchanges are valued according to the broadest and most representative market. Certain equity securities are valued based upon fundamental characteristics or relationships to similar securities. Debt securities generally trade in the OTC market rather than on a securities exchange. The Fund’s pricing services use multiple valuation techniques to determine fair value. In instances where sufficient market activity exists, the pricing services may utilize | | a market-based approach through which quotes from market makers are used to determine fair value. In instances where sufficient market activity may not exist or is limited, the pricing services also utilize proprietary valuation models which may consider market characteristics such as benchmark yield curves, credit spreads, estimated default rates, anticipated market interest rate volatility, coupon rates, anticipated timing of principal repayments, underlying collateral, and other unique security features in order to estimate the relevant cash flows, which are then discounted to calculate the fair value. Investments in repurchase agreements are valued at cost, which approximates fair value. Certain derivative financial instruments are centrally cleared or trade in the OTC market. The Fund’s pricing services use various techniques including industry standard option pricing models and proprietary discounted cash flow models to determine the fair value of those instruments. The Fund’s net benefit or obligation under the derivative contract, as measured by the fair value of the contract, is included in net assets. The Fund has procedures to determine the fair value of financial instruments for which market prices are not reliable or readily available. Under these procedures, the VC convenes on a regular basis to review such financial instruments and considers a number of factors, including significant unobservable valuation inputs, when arriving at fair value. The VC primarily employs a market-based approach which may use related or comparable assets or liabilities, recent transactions, market multiples, book values, and other relevant information for the investment to determine the fair value of the investment. An income-based valuation approach may also be used in which the anticipated future cash flows of the investment are discounted to calculate fair value. Discounts may also be applied due to the nature or duration of any restrictions on the disposition of the investments. Due to the inherent uncertainty of valuations of such investments, the fair values may differ significantly from the values that would have been used had an active market existed. The VC employs various methods for calibrating these valuation approaches including a regular review of key inputs and assumptions, transactional back-testing or disposition analysis, and reviews of any related market activity. |
28 | Annual Report
FRANKLIN FLOATING RATE MASTER TRUST
NOTES TO FINANCIAL STATEMENTS
Franklin Floating Rate Master Series (continued) b. Joint Repurchase Agreement The Fund enters into a joint repurchase agreement whereby its uninvested cash balance is deposited into a joint cash account with other funds managed by the investment manager or an affiliate of the investment manager and is used to invest in one or more repurchase agreements. The value and face amount of the joint repurchase agreement are allocated to the funds based on their pro-rata interest. A repurchase agreement is accounted for as a loan by the Fund to the seller, collateralized by securities which are delivered to the Fund’s custodian. The fair value, including accrued interest, of the initial collateralization is required to be at least 102% of the dollar amount invested by the funds, with the value of the underlying securities marked to market daily to maintain coverage of at least 100%. Repurchase agreements are subject to the terms of Master Repurchase Agreements (MRAs) with approved counterparties (sellers). The MRAs contain various provisions, including but not limited to events of default and maintenance of collateral for repurchase agreements. In the event of default by either the seller or the Fund, certain MRAs may permit the non-defaulting party to net and close-out all transactions, if any, traded under such agreements. The Fund may sell securities it holds as collateral and apply the proceeds towards the repurchase price and any other amounts owed by the seller to the Fund in the event of default by the seller. This could involve costs or delays in addition to a loss on the securities if their value falls below the repurchase price owed by the seller. The joint repurchase agreement held by the Fund at year end, as indicated in the Statement of Investments, had been entered into on July 31, 2018. c. Securities Purchased on a When-Issued or Delayed Delivery Basis The Fund purchases securities on a when-issued or delayed delivery basis, with payment and delivery scheduled for a future date. These transactions are subject to market fluctuations and are subject to the risk that the value at delivery may be more or less than the trade date purchase price. Although the Fund will generally purchase these securities with the intention of holding the securities, it may sell the securities before the settlement date. Sufficient assets have been segregated for these securities. d. Derivative Financial Instruments The Fund invested in derivative financial instruments in order to manage risk or gain exposure to various other investments or markets. Derivatives are financial contracts based on an | | underlying or notional amount, require no initial investment or an initial net investment that is smaller than would normally be required to have a similar response to changes in market factors, and require or permit net settlement. Derivatives contain various risks including the potential inability of the counterparty to fulfill their obligations under the terms of the contract, the potential for an illiquid secondary market, and/or the potential for market movements which expose the Fund to gains or losses in excess of the amounts shown in the Statement of Assets and Liabilities. Realized gain and loss and unrealized appreciation and depreciation on these contracts for the period are included in the Statement of Operations. Collateral requirements differ by type of derivative. Collateral or initial margin requirements are set by the broker or exchange clearing house for exchange traded and centrally cleared derivatives. Initial margin deposited is held at the exchange and can be in the form of cash and/or securities. The Fund entered into credit default swap contracts primarily to manage and/or gain exposure to credit risk. A credit default swap is an agreement between the Fund and a counterparty whereby the buyer of the contract receives credit protection and the seller of the contract guarantees the credit worthiness of a referenced debt obligation. These agreements may be privately negotiated in the over-the-counter market (OTC credit default swaps) or may be executed in a multilateral trade facility platform, such as a registered exchange (centrally cleared credit default swaps). The underlying referenced debt obligation may be a single issuer of corporate or sovereign debt, a credit index, a basket of issuers or indices, or a tranche of a credit index or basket of issuers or indices. In the event of a default of the underlying referenced debt obligation, the buyer is entitled to receive the notional amount of the credit default swap contract from the seller in exchange for the referenced debt obligation, a net settlement amount equal to the notional amount of the credit default swap less the recovery value of the referenced debt obligation, or other agreed upon amount. For centrally cleared credit default swaps, required initial margins are pledged by the Fund, and the daily change in fair value is accounted for as a variation margin payable or receivable in the Statement of Assets and Liabilities. Over the term of the contract, the buyer pays the seller a periodic stream of payments, provided that no event of default has occurred. Such periodic payments are accrued daily as an unrealized appreciation or depreciation until the payments are made, at which time they are realized. Upfront payments and receipts are reflected in the Statement of Assets |
Annual Report | 29
FRANKLIN FLOATING RATE MASTER TRUST
NOTES TO FINANCIAL STATEMENTS
| | |
Franklin Floating Rate Master Series (continued) 1. Organization and Significant Accounting Policies (continued) d. Derivative Financial Instruments (continued) and Liabilities and represent compensating factors between stated terms of the credit default swap agreement and prevailing market conditions (credit spreads and other relevant factors). These upfront payments and receipts are amortized over the term of the contract as a realized gain or loss in the Statement of Operations. See Note 10 regarding other derivative information. e. Senior Floating Rate Interests The Fund invests in senior secured corporate loans that pay interest at rates which are periodically reset by reference to a base lending rate plus a spread. These base lending rates are generally the prime rate offered by a designated U.S. bank or the London InterBank Offered Rate (LIBOR). Senior secured corporate loans often require prepayment of principal from excess cash flows or at the discretion of the borrower. As a result, actual maturity may be substantially less than the stated maturity. Senior secured corporate loans in which the Fund invests are generally readily marketable, but may be subject to certain restrictions on resale. f. Income Taxes The Fund is a disregarded entity for U.S. income tax purposes. As such, no provision has been made for income taxes because all income, expenses, gains and losses are allocated to a non-U.S. beneficial owner for inclusion in its individual income tax return, as applicable. g. Security Transactions, Investment Income, Expenses and Distributions Security transactions are accounted for on trade date. Realized gains and losses on security transactions are determined on a specific identification basis. Interest income and estimated expenses are accrued daily. Amortization of premium and accretion of discount on debt securities are included in interest income. Facility fees are recognized as income over the | | expected term of the loan. Dividend income and realized gain distributions are recorded on the ex-dividend date. The Fund’s net investment income is allocated to the owner daily and paid monthly. Net capital gains (or losses) realized by the Fund will not be distributed. Distributions to shareholders are recorded on the ex-dividend date. Distributable earnings are determined according to income tax regulations (tax basis) and may differ from earnings recorded in accordance with U.S. GAAP. These differences may be permanent or temporary. Permanent differences are reclassified among capital accounts to reflect their tax character. These reclassifications have no impact on net assets or the results of operations. Temporary differences are not reclassified, as they may reverse in subsequent periods. Common expenses incurred by the Trust are allocated among the Funds based on the ratio of net assets of each Fund to the combined net assets of the Trust or based on the ratio of number of shareholders of each Fund to the combined number of shareholders of the Trust. Fund specific expenses are charged directly to the Fund that incurred the expense. h. Accounting Estimates The preparation of financial statements in accordance with U.S. GAAP requires management to make estimates and assumptions that affect the reported amounts of assets and liabilities at the date of the financial statements and the amounts of income and expenses during the reporting period. Actual results could differ from those estimates. i. Guarantees and Indemnifications Under the Trust’s organizational documents, its officers and trustees are indemnified by the Trust against certain liabilities arising out of the performance of their duties to the Trust. Additionally, in the normal course of business, the Trust, on behalf of the Fund, enters into contracts with service providers that contain general indemnification clauses. The Trust’s maximum exposure under these arrangements is unknown as this would involve future claims that may be made against the Trust that have not yet occurred. Currently, the Trust expects the risk of loss to be remote. |
30 | Annual Report
FRANKLIN FLOATING RATE MASTER TRUST
NOTES TO FINANCIAL STATEMENTS
Franklin Floating Rate Master Series (continued)
2. Shares of Beneficial Interest
At July 31, 2018, there were an unlimited number of shares authorized (without par value). Transactions in the Fund’s shares were
as follows:
| | | | | | | | |
| | | | Year Ended July 31, | | | |
| | | | 2018 | | | | 2017 | |
| | Shares | | Amount | | Shares | | Amount | |
| Shares sold | 31,816,088 | | $ 273,788,383 | | 96,198,198 | | $ 835,951,774 | |
| Shares redeemed | (66,050,697 | ) | (569,783,176 | ) | (16,796,844 | ) | (145,386,722 | ) |
| Net increase (decrease) | (34,234,609 | ) | $ (295,994,793 | ) | 79,401,354 | | $ 690,565,052 | |
3. Transactions with Affiliates
Franklin Resources, Inc. is the holding company for various subsidiaries that together are referred to as Franklin Templeton Investments. Certain officers and trustees of the Fund are also officers and/or directors of the following subsidiaries:
| |
| Subsidiary | Affiliation |
| Franklin Advisers, Inc. (Advisers) | Investment manager |
| Franklin Templeton Services, LLC (FT Services) | Administrative manager |
| Franklin Templeton Investor Services, LLC (Investor Services) | Transfer agent |
a. Management Fees
The Fund pays an investment management fee to Advisers based on the average daily net assets of the Fund as follows:
| |
| Annualized Fee Rate | Net Assets |
| 0.530% | Up to and including $2.5 billion |
| 0.450% | Over $2.5 billion, up to and including $6.5 billion |
| 0.430% | Over $6.5 billion, up to and including $11.5 billion |
| 0.400% | Over $11.5 billion, up to and including $16.5 billion |
| 0.390% | Over $16.5 billion, up to and including $19 billion |
| 0.380% | Over $19 billion, up to and including $21.5 billion |
| 0.370% | In excess of $21.5 billion |
For the year ended July 31, 2018, the gross effective investment management fee rate was 0.530% of the Fund’s average daily net assets.
b. Administrative Fees
Under an agreement with Advisers, FT Services provides administrative services to the Fund. The fee is paid by Advisers based on the Fund’s average daily net assets, and is not an additional expense of the Fund.
c. Transfer Agent Fees
Investor Services, under terms of an agreement, performs shareholder servicing for the Fund and is not paid by the Fund for the services.
Annual Report | 31
FRANKLIN FLOATING RATE MASTER TRUST
NOTES TO FINANCIAL STATEMENTS
Franklin Floating Rate Master Series (continued)
3. Transactions with Affiliates (continued)
d. Investments in Affiliated Management Investment Companies
The Fund invests in one or more affiliated management investment companies for purposes other than exercising a controlling influence over the management or policies. Management fees paid by the Fund are waived on assets invested in the affiliated management investment companies, as noted in the Statement of Operations, in an amount not to exceed the management and administrative fees paid directly or indirectly by each affiliate. During the year ended July 31, 2018, the Fund held investments in affiliated management investment companies as follows:
| | | | | | | | | | | | | | |
| | Number of | | | Number of | | | | | | | | | Net Change in | |
| | Shares Held | | | Shares | | Value | | | | Realized | | | Unrealized | |
| | at Beginning | Gross | Gross | Held at End | | at End | | Dividend | | Gain | | | Appreciation | |
| | of Year | Additions | Reductions | of Year | | of Year | | Income | | (Loss) | | | (Depreciation) | |
| Non-Controlled Affiliates | | | | | | | | | | | | | | |
| Franklin Liberty Senior Loan ETF. | — | 248,000 | — | 248,000 | $ | 6,238,787 | $ | 23,222 | $ | — | | $ | (10,193 | ) |
| Franklin Lower Tier Floating Rate Fund | — | 3,405,364 | — | 3,405,364 | | 33,304,460 | | 2,439,253 | | 770,878 | a | | (1,891,836 | ) |
| Franklin Middle Tier Floating Rate Fund | — | 3,457,562 | — | 3,457,562 | | 32,673,956 | | 1,912,904 | | — | | | (1,338,218 | ) |
| Total Affiliated Securities | | | | | $ | 72,217,203 | $ | 4,375,379 | $ | 770,878 | | $ | (3,240,247 | ) |
| aIncludes realized gain distributions received. | | | | | | | | | | | | | | |
e. Waiver and Expense Reimbursements
Advisers has voluntarily agreed in advance to waive or limit its fees and to assume as its own expense certain expenses otherwise payable by the Fund so that the expenses (excluding acquired fund fees and expenses) do not exceed 0.53% based on the average net assets of the Fund (other than certain non-routine expenses or costs, including those relating to litigation, indemnification, reorganizations, and liquidations). Advisers may discontinue this waiver at any time upon notice to the Board.
f. Other Affiliated Transactions
At July 31, 2018, Franklin Floating Rate Fund, PLC owned 100% of the Fund’s outstanding shares. Investment activities of this shareholder could have a material impact on the Fund.
g. Interfund Transactions
The Fund engaged in purchases and sales of investments with funds or other accounts that have common investment managers (or affiliated investment managers), directors, trustees or officers. During the year ended July 31, 2018, these purchase and sale transactions aggregated $2,353,900 and $0, respectively.
4. Expense Offset Arrangement
The Fund has entered into an arrangement with its custodian whereby credits realized as a result of uninvested cash balances are used to reduce a portion of the Fund’s custodian expenses. During the year ended July 31, 2018, the custodian fees were reduced as noted in the Statement of Operations.
32 | Annual Report
FRANKLIN FLOATING RATE MASTER TRUST
NOTES TO FINANCIAL STATEMENTS
Franklin Floating Rate Master Series (continued)
5. Income Taxes
At July 31, 2018, the cost of investments and net unrealized appreciation (depreciation) for income tax purposes were as follows:
| | | |
| Cost of investments. | $ | 1,845,250,679 | |
| |
| Unrealized appreciation | $ | 11,270,209 | |
| Unrealized depreciation | | (39,973,468 | ) |
| Net unrealized appreciation (depreciation) | $ | (28,703,259 | ) |
Differences between income and/or capital gains as determined on a book basis and a tax basis are primarily due to differing treatment of bond discounts and premiums.
6. Investment Transactions
Purchases and sales of investments (excluding short term securities) for the year ended July 31, 2018, aggregated $816,071,729 and $1,100,365,707, respectively.
7. Credit Risk
At July 31, 2018, the Fund had 65.5% of its portfolio invested in high yield securities, senior secured floating rate notes, or other securities rated below investment grade and unrated securities, if any. These securities may be more sensitive to economic conditions causing greater price volatility and are potentially subject to a greater risk of loss due to default than higher rated securities.
8. Restricted Securities
The Fund invests in securities that are restricted under the Securities Act of 1933 (1933 Act) or which are subject to legal, contractual, or other agreed upon restrictions on resale. Restricted securities are often purchased in private placement transactions, and cannot be sold without prior registration unless the sale is pursuant to an exemption under the 1933 Act. Disposal of these securities may require greater effort and expense, and prompt sale at an acceptable price may be difficult. The Fund may have registration rights for restricted securities. The issuer generally incurs all registration costs.
At July 31, 2018, investments in restricted securities, excluding securities exempt from registration under the 1933 Act deemed to be liquid, were as follows:
| | | | | | |
| | | Acquisition | | | | |
| Shares | Issuer | Date | | Cost | | Value |
| 519,107 | a Appvion Inc | 6/14/18 | $ | 5,320,516 | $ | 5,140,480 |
| 870,865 | Remington Outdoor Co. Inc | 4/13/12 - 5/08/17 | | 43,284,066 | | 15,038,779 |
| 81,987 | Remington Outdoor Co. Inc., Litigation Units | 5/16/18 | | — | | — |
| | Total Restricted Securities (Value is 1.15% of Net Assets) | | $ | 48,604,582 | $ | 20,179,259 |
| |
| aThe Fund also invests in unrestricted securities of the issuer, valued at $9,539,138 as of July 31, 2018. | | | | | |
9. Unfunded Loan Commitments
The Fund enters into certain credit agreements, all or a portion of which may be unfunded. The Fund is obligated to fund these loan commitments at the borrowers’ discretion. Unfunded loan commitments and funded portions of credit agreements are marked to market daily and any unrealized appreciation or depreciation is included in the Statement of Assets and Liabilities and the Statement of Operations. Funded portions of credit agreements are presented in the Statement of Investments.
Annual Report | 33
FRANKLIN FLOATING RATE MASTER TRUST
NOTES TO FINANCIAL STATEMENTS
Franklin Floating Rate Master Series (continued)
9. Unfunded Loan Commitments (continued)
At July 31, 2018, unfunded commitments were as follows:
| | |
| | | Unfunded |
| Borrower | | Commitment |
| Franklin Floating Rate Master Series | | |
| BMC Software Finance Inc., Non-Extended US Revolving Commitment | $ | 6,435,560 |
| FGI Operating Co. LLC (Freedom Group), DDTL Filo | | 272,727 |
| | $ | 6,708,287 |
10. Other Derivative Information
At July 31, 2018, the Fund’s investments in derivative contracts are reflected in the Statement of Assets and Liabilities as follows:
| | | | | | |
| | Asset Derivatives | | | Liability Derivatives | | |
| |
| Derivative Contracts | Statement of | | | Statement of | | |
| Not Accounted for as | Assets and Liabilities | | | Assets and Liabilities | | |
| Hedging Instruments | Location | Fair Value | | Location | | Fair Value |
| |
| Credit contracts | Variation margin on centrally | $ — | | Variation margin on centrally | | $644,607a |
| | cleared swap contracts | | | cleared swap contracts | | |
aThis amount reflects the cumulative appreciation (depreciation) of centrally cleared swap contracts as reported in the Statement of Investments. Only the variation margin receivable/payable at year end is separately reported within the Statement of Assets and Liabilities. Prior variation margin movements were recorded to cash upon receipt or payment.
For the year ended July 31, 2018, the effect of derivative contracts in the Fund’s Statement of Operations was as follows:
| | | | | | | |
| | | | | | | | Net Change in |
| | | | | | | | Unrealized |
| Derivative Contracts | | | Net Realized | | | | Appreciation |
| Not Accounted for as | Statement of | | Gain (Loss) for | | Statement of | | (Depreciation) |
| Hedging Instruments | Operations Location | | the Year | | Operations Location | | for the Year |
| |
| | Net realized gain (loss) from: | | | | Net change in unrealized | | |
| | | | | | appreciation (depreciation) on: | | |
| Credit contracts | Swap contracts | | $ (472,787) | | Swap contracts | | $ (251,271) |
For the year ended July 31, 2018, the average month end notional amount of swap contracts represented $26,424,077.
See Note 1(d) regarding derivative financial instruments.
34 | Annual Report
FRANKLIN FLOATING RATE MASTER TRUST
NOTES TO FINANCIAL STATEMENTS
Franklin Floating Rate Master Series (continued)
11. Shareholder Distributions
For the period ended July 31, 2018, the Fund made the following distributions:
| | |
| Payment Date | | Amount Per Share |
| 8/31/2017 | | $ 0.028047 |
| 9/29/2017 | | 0.028132 |
| 10/31/2017 | | 0.030491 |
| 11/30/2017 | | 0.031613 |
| 12/29/2017 | | 0.031581 |
| 1/31/2018 | | 0.035123 |
| 2/28/2018 | | 0.030840 |
| 3/29/2018 | | 0.037126 |
| 4/30/2018 | | 0.037680 |
| 5/31/2018 | | 0.034465 |
| 6/29/2018 | | 0.032639 |
| 7/31/2018 | | 0.034458 |
| Total | | $ 0.392195 |
12. Credit Facility
The Fund, together with other U.S. registered and foreign investment funds (collectively, Borrowers), managed by Franklin Templeton Investments, are borrowers in a joint syndicated senior unsecured credit facility totaling $2 billion (Global Credit Facility) which matures on February 8, 2019. This Global Credit Facility provides a source of funds to the Borrowers for temporary and emergency purposes, including the ability to meet future unanticipated or unusually large redemption requests.
Under the terms of the Global Credit Facility, the Fund shall, in addition to interest charged on any borrowings made by the Fund and other costs incurred by the Fund, pay its share of fees and expenses incurred in connection with the implementation and maintenance of the Global Credit Facility, based upon its relative share of the aggregate net assets of all of the Borrowers, including an annual commitment fee of 0.15% based upon the unused portion of the Global Credit Facility.These fees are reflected in other expenses in the Statement of Operations. During the year ended July 31, 2018, the Fund did not use the Global Credit Facility.
13. Fair Value Measurements
The Fund follows a fair value hierarchy that distinguishes between market data obtained from independent sources (observable inputs) and the Fund’s own market assumptions (unobservable inputs). These inputs are used in determining the value of the Fund’s financial instruments and are summarized in the following fair value hierarchy:
- Level 1 – quoted prices in active markets for identical financial instruments
- Level 2 – other significant observable inputs (including quoted prices for similar financial instruments, interest rates, prepayment speed, credit risk, etc.)
- Level 3 – significant unobservable inputs (including the Fund’s own assumptions in determining the fair value of financial instruments)
The input levels are not necessarily an indication of the risk or liquidity associated with financial instruments at that level.
Annual Report | 35
FRANKLIN FLOATING RATE MASTER TRUST
NOTES TO FINANCIAL STATEMENTS
Franklin Floating Rate Master Series (continued)
13. Fair Value Measurements (continued)
For movements between the levels within the fair value hierarchy, the Fund has adopted a policy of recognizing the transfers as of the date of the underlying event which caused the movement.
A summary of inputs used as of July 31, 2018, in valuing the Fund’s assets and liabilities carried at fair value, is as follows:
| | | | | | | | | |
| | | Level 1 | | Level 2 | | Level 3 | | | Total |
| Assets: | | | | | | | | | |
| Investments in Securities:a | | | | | | | | | |
| Equity Investments:b | | | | | | | | | |
| Diversified Support Services | $ | — | $ | — | $ | 15,038,779 | c | $ | 15,038,779 |
| Forest Products | | — | | — | | 5,140,480 | | | 5,140,480 |
| Oil & Gas Exploration & Production | | — | | 3,732,024 | | — | | | 3,732,024 |
| All Other Equity Investments. | | 72,217,203 | | — | | — | | | 72,217,203 |
| Corporate Bonds | | — | | 7,828,031 | | — | | | 7,828,031 |
| Senior Floating Rate Interests: | | | | | | | | | |
| Personal Products | | — | | — | | 11,181,182 | | | 11,181,182 |
| All Other Senior Floating Rate Interests | | — | | 1,231,782,351 | | — | | | 1,231,782,351 |
| Asset-Backed Securities. | | — | | 240,491,357 | | — | | | 240,491,357 |
| Short Term Investments | | 50,996,739 | | 180,369,470 | | — | | | 231,366,209 |
| Total Investments in Securities | $ | 123,213,942 | $ | 1,664,203,233 | $ | 31,360,441 | | $ | 1,818,777,616 |
| |
| Other Financial Instruments: | | | | | | | | | |
| Unfunded Loan Commitments. | $ | — | $ | 57,354 | $ | — | | $ | 57,354 |
| |
| Liabilities: | | | | | | | | | |
| Other Financial Instruments: | | | | | | | | | |
| Swap Contracts. | $ | — | $ | 644,607 | $ | — | | $ | 644,607 |
| Unfunded Loan Commitments. | | — | | — | | 710 | | | 710 |
| Total Other Financial Instruments | $ | — | $ | 644,607 | $ | 710 | | $ | 645,317 |
aFor detailed categories, see the accompanying Statement of Investments.
bIncludes common stocks and management investment companies as well as other equity interests.
cIncludes securities determined to have no value at July 31, 2018.
A reconciliation of assets in which Level 3 inputs are used in determining fair value is presented when there are significant Level 3 financial instruments at the beginning and/or end of the year. At July 31, 2018, the reconciliation of assets, is as follows:
| | | | | | | | | | | | | | | | |
| | | | | | | | | | | | | | | | Net Change in | |
| | | | | | | | | | | | | | | | Unrealized | |
| | | | | | | | | | | | | | | | Appreciation | |
| | | | | | | | | | | Net | Net | | | | (Depreciation) | |
| | | Balance at | | | | Transfer | Transfer | | | Realized | Unrealized | | Balance | | on Assets | |
| | | Beginning of | | Purchases | | Into | Out of | | Cost Basis | Gain | Appreciation | | at End | | Held at | |
| | | Year | | (Sales) | | Level 3a | Level 3b | | Adjustments | (Loss) | (Depreciation) | | of Year | | Year End | |
| Assets: | | | | | | | | | | | | | | | | |
| Investments in Securities: | | | | | | | | | | | | | | | | |
| Equity Investmentsc | | | | | | | | | | | | | | | | |
| Diversified Support Services | | $ — | | $ — | | $10,813,952 | $— | | $— | $— | $ 4,224,827 | | $ 15,038,779 | d | $ 4,224,827 | |
| Forest Products | | — | | — | | 5,320,516 | — | | — | — | (180,036 | ) | 5,140,480 | | (180,036 | ) |
| Steel | | 854,640 | | — | | — | (943,997 | ) | — | — | 89,357 | | — | | — | |
| Asset-Backed Securities | | 3,000,000 | | — | | — | (2,999,940 | ) | — | — | (60 | ) | — | | — | |
| Senior Floating Rate Interests | | | | | | | | | | | | | | | | |
| Personal Products | | — | | — | | 11,181,182 | — | | — | — | — | | 11,181,182 | | — | |
| Total Investments in Securities | | $ 3,854,640 | | $ — | | $27,315,650 | $(3,943,937 | ) | $— | $— | $ 4,134,088 | | $ 31,360,441 | | $ 4,044,791 | |
36 | Annual Report
FRANKLIN FLOATING RATE MASTER TRUST
NOTES TO FINANCIAL STATEMENTS
Franklin Floating Rate Master Series (continued)
| | | | | | | | | | | | |
| | | | | | | | | | | | Net Change in | |
| | | | | | | | | | | | Unrealized | |
| | | | | | | | | | | | Appreciation | |
| | | | | | | Net | Net | | | | (Depreciation) | |
| | Balance at | | Transfer | Transfer | | Realized | Unrealized | | Balance | | on Assets | |
| | Beginning of | Purchases | Into | Out of | Cost Basis | Gain | Appreciation | | at End | | Held at | |
| | Year | (Sales) | Level 3a | Level 3b | Adjustments | (Loss) | (Depreciation) | | of Year | | Year End | |
| Liabilities: | | | | | | | | | | | | |
| Other Financial Instruments: | | | | | | | | | | | | |
| Unfunded Loan Commitments | $— | $— | $— | $— | $— | $— | $ (710 | ) | $ (710 | ) | $ (710 | ) |
aThe investments were transferred into Level 3 as a result of the unavailability of a quoted market price in an active market for identical securities and other significant observable valuation inputs. May include amounts related to a corporate action.
bThe investments were transferred out of Level 3 as a result of the availability of a quoted price in an active market for identical securities and other significant observable valuation inputs.
cIncludes common stocks as well as other equity interests.
dIncludes securities determined to have no value.
Significant unobservable valuation inputs for material Level 3 financial instruments and impact to fair value as a result of changes in unobservable valuation inputs as of July 31, 2018, are as follows:
| | | | | | | | | |
| | | | | | | | | | Impact to Fair |
| | | Fair Value at | | | | | | | Value if Input |
| Description | | End of Year | | Valuation Technique | Unobservable Input | | Amount/Range | | Increasesa |
| Assets: | | | | | | | | | |
| Investments in Securities: | | | | | | | | | |
| Equity Investments: | | | | | | | | | |
| Diversified Support | $ | 15,038,779 | | Discounted cash flow | Discount for lack of | | 20.0 | % | Decrease |
| Services | | | | | marketability | | | | |
| | | | | | Long-term revenue | | 1.0 | % | Increase |
| | | | | | growth rate | | | | |
| | | | | | Weighted average cost | | 12.8 | % | Decreaseb |
| | | | | | of capital | | | | |
| | | | | Consensus Pricing | Offered/Bid quotes | | $ 10.25 - $19.11 | | Increase |
| Forest Products | | 5,140,480 | | Market Comparables | Discount for lack of | | 20.0 | % | Decreasec |
| | | | | | marketability | | | | |
| | | | | | EV/EBITDA multiple | | 5.3 | X | Increasec |
| All other investmentsd | | 11,181,182 | e | | | | | | |
| Total | $ | 31,360,441 | | | | | | | |
| Liabilities: | | | | | | | | | |
| Other Financial Instruments | | | | | | | | | |
| Unfunded Loan | $ | 710 | | | | | | | |
| Commitmentsd | | | | | | | | | |
aRepresents the directional change in the fair value of the Level 3 financial instruments that would result from a significant and reasonable increase in the corresponding input. A significant and reasonable decrease in the input would have the opposite effect. Significant impacts, if any, to fair value and/or net assets have been indicated.
bRepresents a significant impact to fair value and net assets.
cRepresents a significant impact to fair value but not net assets.
dIncludes financial instruments with values derived using prior transaction prices or third party pricing information without adjustment for which such inputs are unobservable. May also include fair value of immaterial financial instruments developed using various valuation techniques and unobservable inputs.
eIncludes securities determined to have no value at July 31, 2018.
Annual Report | 37
FRANKLIN FLOATING RATE MASTER TRUST
NOTES TO FINANCIAL STATEMENTS
Franklin Floating Rate Master Series (continued)
Abbreviations List
| |
| EBITDA | Earnings before interest, taxes, depreciation and amortization |
| EV | Enterprise value |
14. Subsequent Events
The Fund has evaluated subsequent events through the issuance of the financial statements and determined that no events have occurred that require disclosure.
| | | | |
| Abbreviations | | | | |
| |
| Currency | Selected Portfolio | Index | |
| USD United States Dollar | CDO | Collateralized Debt Obligation | CDX.NA.HY.Series number | CDX North America High Yield Index |
| | CLO | Collateralized Loan | | |
| | FRN | Floating Rate Note | | |
| | LIBOR | London InterBank Offered | | |
| | PIK | Payment-In-Kind | | |
| | TBD | To Be Determined | | |
38 | Annual Report
FRANKLIN FLOATING RATE MASTER TRUST
Report of Independent Registered Public Accounting Firm
To the Board of Trustees of Franklin Floating Rate Master Trust and Shareholders of Franklin Floating Rate Master Series
Opinion on the Financial Statements
We have audited the accompanying statement of assets and liabilities, including the statement of investments, of Franklin Floating Rate Master Series (the "Fund") as of July 31, 2018, the related statement of operations for the year ended July 31, 2018, the statement of changes in net assets for each of the two years in the period ended July 31, 2018, including the related notes, and the financial highlights for each of the five years in the period ended July 31, 2018 (collectively referred to as the “financial statements”). In our opinion, the financial statements present fairly, in all material respects, the financial position of the Fund as of July 31, 2018, the results of its operations for the year then ended, the changes in its net assets for each of the two years in the period ended July 31, 2018 and the financial highlights for each of the five years in the period ended July 31, 2018 in conformity with accounting principles generally accepted in the United States of America.
Basis for Opinion
These financial statements are the responsibility of the Fund’s management. Our responsibility is to express an opinion on the Fund’s financial statements based on our audits. We are a public accounting firm registered with the Public Company Accounting Oversight Board (United States) (“PCAOB”) and are required to be independent with respect to the Fund in accordance with the U.S. federal securities laws and the applicable rules and regulations of the Securities and Exchange Commission and the PCAOB.
We conducted our audits of these financial statements in accordance with the standards of the PCAOB. Those standards require that we plan and perform the audit to obtain reasonable assurance about whether the financial statements are free of material misstatement, whether due to error or fraud.
Our audits included performing procedures to assess the risks of material misstatement of the financial statements, whether due to error or fraud, and performing procedures that respond to those risks. Such procedures included examining, on a test basis, evidence regarding the amounts and disclosures in the financial statements. Our audits also included evaluating the accounting principles used and significant estimates made by management, as well as evaluating the overall presentation of the financial statements. Our procedures included confirmation of securities owned as of July 31, 2018 by correspondence with the custodian and brokers; when replies were not received from brokers, we performed other auditing procedures. We believe that our audits provide a reasonable basis for our opinion.
PricewaterhouseCoopers LLP
San Francisco, California
September 18, 2018
We have served as the auditor of one or more investment companies in the Franklin Templeton funds since 1948.
Annual Report | 39
Annual Report
Franklin Lower Tier Floating Rate Fund
This annual report for Franklin Lower Tier Floating Rate Fund covers the fiscal year ended July 31, 2018. Manager’s Discussion During the one-year period under review, the Fund posted a +4.69% cumulative total return, compared with +9.24% for its benchmark, the Credit Suisse Leveraged Loan (CS LL) Lower Tier Index (CS LL LTI).1 The Fund’s performance was driven by credit-specific allocations in the consumer cyclical, capital goods and energy sectors. Over the period, the broad CS LL Index returned +4.72%.1 By rating tier, the CS LL Upper Tier Index, which includes loans rated split BBB and BB, returned +3.90%; the CS LL Middle Tier Index, which includes loans rated split BB, B and split B, returned +4.68%; and the CS LL LTI, which includes loans rated CCC or lower, returned +9.24% over the same period.1 | | near the end of 2017 and completed its restructuring in June 2018. The market value of the position fell upon conversion of the pre-petition term loan into equity. Other detractors included the term debt issued by a manufacturer of firearms and ammunition that traded lower over the period after several quarters of declining sales, reduced guidance and increased headline scrutiny over gun laws. However, after the company completed its restructuring and converted the pre-petition term loans into equity in May, the new security increased in price and was a large contributor to performance. Another portfolio holding, a thermal coal producer, traded lower over the period, driven by uncertainty over whether the company can address its near-term maturity. Given the small exposure in the portfolio, the impact on relative results was immaterial. |
| | |
| Portfolio Composition | % of Total | |
| 7/31/18 | Net Assets | |
| Senior Floating Rate Interests | 82.0 | % |
| Other Long-Term Investments* | 11.7 | % |
| Short-Term Investments & Other Net Assets | 6.3 | % |
*Common stocks and other equity interests and corporate bonds.
A top contributor to relative results included our investment in a specialty retailer providing nutritional supplements that
traded higher following an amend-to-extend transaction for its upcoming 2019 term loan maturity. The company successfully
completed the transaction with investment from lenders and a large investment from a foreign company. The portfolio
benefited from the loan’s increased coupon and the amendment fees as a result of the transaction. The term debt of an oil and
gas operator in the Gulf of Mexico traded higher after the company filed for Chapter 11 bankruptcy with a pre-packaged
exit financing plan. The exit term debt offered better loan economics for lenders, including increased yield spread and the
addition of maintenance financial covenants.
Over the period under review, the primary detractor from performance, a paper company, filed for Chapter 11 bankruptcy
1. Source: Credit Suisse Group.
The indexes are unmanaged and include reinvestment of any income or distributions. They do not reflect any fees, expenses or sales charges. One cannot invest directly in an index, and an index is not representative of the Fund’s portfolio.
See www.franklintempletondatasources.com for additional data provider information.
Annual Report | 1
FRANKLIN LOWER TIER FLOATING RATE FUND
Total Return Index Comparison for a Hypothetical $10,000 Investment1
Total return represents the change in value of an investment over the periods shown. It includes any applicable maximum sales charge, Fund expenses, account fees and reinvested distributions. The unmanaged index includes reinvestment of any income or distributions. It differs from the Fund in composition and does not pay management fees or expenses. One cannot invest directly in an index.
11/6/15–7/31/18
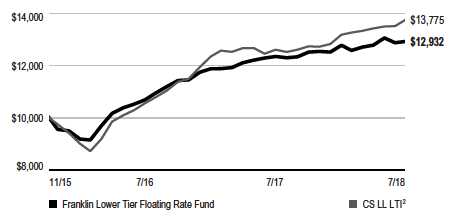
Performance as of 7/31/181
| | |
| | Average | |
| | Annual | |
| | Total Return3 | |
| |
| 1-Year | +4.69 | % |
| |
| Since Inception (11/6/15) | +9.86 | % |
1. The Fund has an expense reduction contractually guaranteed through 11/30/18. Fund investment results reflect the expense reduction; without this reduction, the results would have been lower.
2. Source: Credit Suisse Group. The CS LL LTI is designed to mirror the lower tier (comprising companies with lower range revenues within the markets in which they operate) portion of the US dollar-denominated leveraged loan market. Loans must be rated CCC, Split CCC or Default by Moody’s/Standard and Poor’s® (S&P).
3. Average annual total return represents the average annual change in value of an investment over the periods indicated. Return for less than one year, if any, has not been annualized.
See www.franklintempletondatasources.com for additional data provider information.
2 | Annual Report
FRANKLIN LOWER TIER FLOATING RATE FUND
Your Fund’s Expenses
As a Fund shareholder, you can incur two types of costs: (1) transaction costs, including sales charges (loads) on Fund purchases and redemptions; and (2) ongoing Fund costs, including management fees, distribution and service (12b-1) fees, and other Fund expenses. All mutual funds have ongoing costs, sometimes referred to as operating expenses. The table below shows ongoing costs of investing in the Fund and can help you understand these costs and compare them with those of other mutual funds. The table assumes a $1,000 investment held for the six months indicated.
Actual Fund Expenses
The table below provides information about actual account values and actual expenses in the columns under the heading “Actual.” In these columns the Fund’s actual return, which includes the effect of Fund expenses, is used to calculate the “Ending Account Value.” You can estimate the expenses you paid during the period by following these steps (of course, your account value and expenses will differ from those in this illustration): Divide your account value by $1,000 (if your account had an $8,600 value, then $8,600 ÷ $1,000 = 8.6). Then multiply the result by the number in the row for your class of shares under the headings “Actual” and “Expenses Paid During Period” (if Actual Expenses Paid During Period were $7.50, then 8.6 x $7.50 = $64.50). In this illustration, the actual expenses paid this period are $64.50.
Hypothetical Example for Comparison with Other Funds
Under the heading “Hypothetical” in the table, information is provided about hypothetical account values and hypothetical expenses based on the Fund’s actual expense ratio and an assumed rate of return of 5% per year before expenses, which is not the Fund’s actual return. This information may not be used to estimate the actual ending account balance or expenses you paid for the period, but it can help you compare ongoing costs of investing in the Fund with those of other funds. To do so, compare this 5% hypothetical example for the class of shares you hold with the 5% hypothetical examples that appear in the shareholder reports of other funds.
Please note that expenses shown in the table are meant to highlight ongoing costs and do not reflect any transactional costs. Therefore, information under the heading “Hypothetical” is useful in comparing ongoing costs only, and will not help you compare total costs of owning different funds. In addition, if transactional costs were included, your total costs would have been higher.
| | | | | | | | | | |
| | | | | | Actual | | | | Hypothetical | |
| | | | (actual return after expenses) | | (5% annual return before expenses) | |
| |
| | | | | | | | | | | Net |
| | Beginning | | Ending | | Paid During | | Ending | | Paid During | Annualized |
| | Account | | Account | | Period | | Account | | Period | Expense |
| | Value 2/1/18 | | Value 7/31/18 | | 2/1/18–7/31/181,2 | | Value 7/31/18 | | 2/1/18–7/31/181,2 | Ratio2 |
| $1,000 | | $1,011.80 | | $2.99 | | $1,021.82 | | $3.01 | 0.60% |
1. Expenses are equal to the annualized expense ratio for the six-month period as indicated above—in the far right column— multiplied by the simple average account value over the period indicated, and then multiplied by 181/365 to reflect the one-half year period.
2. Reflects expenses after fee waivers and expense reimbursements. Does not include acquired fund fees and expenses.
Annual Report | 3
Annual Report
Franklin Middle Tier Floating Rate Fund
This annual report for Franklin Middle Tier Floating Rate Fund covers the fiscal year ended July 31, 2018. Manager’s Discussion During the one-year period under review, the Fund posted a +1.30% cumulative total return, compared with +4.68% for its benchmark, the Credit Suisse Leveraged Loan (CS LL) Middle Tier Index (MTI).1 The Fund’s performance was driven by credit-specific allocations to the consumer cyclical, capital goods and energy sectors. Over the period, the broad CS LL Index returned +4.72%.1 By rating tier, the CS LL Upper Tier Index, which includes loans rated split BBB and BB, returned +3.90%; the CS LL MTI, which includes loans rated split BB, B and split B, returned +4.68%; and the CS LL Lower Tier Index, which includes loans rated CCC or lower, returned +9.24% over the same period.1 | | near the end of 2017 and completed its restructuring in June 2018. The market value of the position fell upon conversion of the pre-petition term loan into equity. Other detractors included the term debt issued by a manufacturer of firearms and ammunition that traded lower over the period after several quarters of declining sales, reduced guidance and increased headline scrutiny over gun laws. However, after the company completed its restructuring and converted the pre-petition term loans into equity in May, the new security increased in price and was a large contributor to performance. |
| | |
| Portfolio Composition | % of Total | |
| 7/31/18 | Net Assets | |
| Senior Floating Rate Interests | 81.8 | % |
| Other Long-Term Investments* | 5.9 | % |
| Short-Term Investments & Other Net Assets | 12.3 | % |
*Common stocks and other equity interests and corporate bonds.
A top contributor to relative results included our investment in a specialty retailer providing nutritional supplements that
traded higher following an amend-to-extend transaction for its upcoming 2019 term loan maturity. The company successfully
completed the transaction with investment from lenders and a large investment from a foreign company. The portfolio
benefited from the loan’s increased coupon and the amendment fees as a result of the transaction. The term debt of an oil and
gas operator in the Gulf of Mexico traded higher after the company filed for Chapter 11 bankruptcy with a pre-packaged
exit financing plan. The exit term debt offered better loan economics for lenders, including increased spread and the
addition of maintenance financial covenants.
Over the period under review, the primary detractor to performance, a paper company, filed for Chapter 11 bankruptcy
1. Source: Credit Suisse Group.
The indexes are unmanaged and include reinvestment of any income or distributions. They do not reflect any fees, expenses or sales charges. One cannot invest directly in an index, and an index is not representative of the Fund’s portfolio.
See www.franklintempletondatasources.com for additional data provider information.
4 | Annual Report
FRANKLIN MIDDLE TIER FLOATING RATE FUND
Total Return Index Comparison for a Hypothetical $10,000 Investment1
Total return represents the change in value of an investment over the periods shown. It includes any applicable maximum sales charge, Fund expenses, account fees and reinvested distributions. The unmanaged index includes reinvestment of any income or distributions. It differs from the Fund in composition and does not pay management fees or expenses. One cannot invest directly in an index.
11/6/15–7/31/18
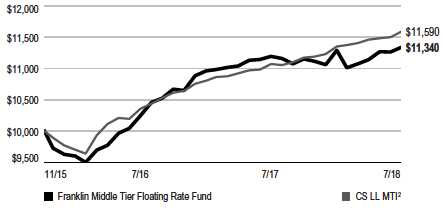
Performance as of 7/31/181
| | |
| | Average | |
| | Annual | |
| | Total Return3 | |
| |
| 1-Year | +1.30 | % |
| Since Inception (11/6/15) | +4.71 | % |
1. The Fund has an expense reduction contractually guaranteed through 11/30/18. Fund investment results reflect the expense reduction; without this reduction, the results would have been lower.
2. Source: Credit Suisse Group. The CS LL MTI is designed to mirror the middle tier (comprising companies with mid-range revenues within the markets in which they operate) portion of the US dollar-denominated leveraged loan market. Loans must be rated Split BB, B or Split B by Moody’s/Standard and Poor’s® (S&P).
3. Average annual total return represents the average annual change in value of an investment over the periods indicated. Return for less than one year, if any, has not been annualized.
See www.franklintempletondatasources.com for additional data provider information.
Annual Report | 5
FRANKLIN MIDDLE TIER FLOATING RATE FUND
Your Fund’s Expenses
As a Fund shareholder, you can incur two types of costs: (1) transaction costs, including sales charges (loads) on Fund purchases and redemptions; and (2) ongoing Fund costs, including management fees, distribution and service (12b-1) fees, and other Fund expenses. All mutual funds have ongoing costs, sometimes referred to as operating expenses. The table below shows ongoing costs of investing in the Fund and can help you understand these costs and compare them with those of other mutual funds. The table assumes a $1,000 investment held for the six months indicated.
Actual Fund Expenses
The table below provides information about actual account values and actual expenses in the columns under the heading “Actual.” In these columns the Fund’s actual return, which includes the effect of Fund expenses, is used to calculate the “Ending Account Value.” You can estimate the expenses you paid during the period by following these steps (of course, your account value and expenses will differ from those in this illustration): Divide your account value by $1,000 (if your account had an $8,600 value, then $8,600 ÷ $1,000 = 8.6). Then multiply the result by the number in the row for your class of shares under the headings “Actual” and “Expenses Paid During Period” (if Actual Expenses Paid During Period were $7.50, then 8.6 x $7.50 = $64.50). In this illustration, the actual expenses paid this period are $64.50.
Hypothetical Example for Comparison with Other Funds
Under the heading “Hypothetical” in the table, information is provided about hypothetical account values and hypothetical expenses based on the Fund’s actual expense ratio and an assumed rate of return of 5% per year before expenses, which is not the Fund’s actual return. This information may not be used to estimate the actual ending account balance or expenses you paid for the period, but it can help you compare ongoing costs of investing in the Fund with those of other funds. To do so, compare this 5% hypothetical example for the class of shares you hold with the 5% hypothetical examples that appear in the shareholder reports of other funds.
Please note that expenses shown in the table are meant to highlight ongoing costs and do not reflect any transactional costs. Therefore, information under the heading “Hypothetical” is useful in comparing ongoing costs only, and will not help you compare total costs of owning different funds. In addition, if transactional costs were included, your total costs would have been higher.
| | | | | | | | | | |
| | | | | | Actual | | | | Hypothetical | |
| | | | (actual return after expenses) | | (5% annual return before expenses) | |
| |
| | | | | | | | | | | Net |
| | Beginning | | Ending | | Paid During | | Ending | | Paid During | Annualized |
| | Account | | Account | | Period | | Account | | Period | Expense |
| | Value 2/1/18 | | Value 7/31/18 | | 2/1/18–7/31/181,2 | | Value 7/31/18 | | 2/1/18–7/31/181,2 | Ratio2 |
| $1,000 | | $1,004.30 | | $2.98 | | $1,021.82 | | $3.01 | 0.60% |
1. Expenses are equal to the annualized expense ratio for the six-month period as indicated above—in the far right column—multiplied by the simple average account value over the period indicated, and then multiplied by 181/365 to reflect the one-half year period.
2. Reflects expenses after fee waivers and expense reimbursements. Does not include acquired fund fees and expenses.
6 | Annual Report
FRANKLIN FLOATING RATE MASTER TRUST
| | | | |
| Board Members and Officers | | |
| |
| The name, year of birth and address of the officers and board members, as well as their affiliations, positions held with the Trust, |
| principal occupations during at least the past five years and number of US registered portfolios overseen in the Franklin Templeton |
| Investments fund complex, are shown below. Generally, each board member serves until that person’s successor is elected and |
| qualified. | | | | |
| |
| Independent Board Members | | | |
| |
| | | | Number of Portfolios in | |
| Name, Year of Birth | | Length of | Fund Complex Overseen | Other Directorships Held |
| and Address | Position | Time Served | by Board Member* | During at Least the Past 5 Years |
| Harris J. Ashton (1932) | Trustee | Since 1999 | 136 | Bar-S Foods (meat packing company) |
| One Franklin Parkway | | | | (1981-2010). |
| San Mateo, CA 94403-1906 | | | | |
| Principal Occupation During at Least the Past 5 Years: | | |
| Director of various companies; and formerly, Director, RBC Holdings, Inc. (bank holding company) (until 2002); and President, Chief Executive |
| Officer and Chairman of the Board, General Host Corporation (nursery and craft centers) (until 1998). | |
| |
| Terrence J. Checki (1945) | Trustee | Since March 2018 | 112 | Hess Corporation (exploration of oil |
| One Franklin Parkway | | | | and gas) (2014-present). |
| San Mateo, CA 94403-1906 | | | | |
| Principal Occupation During at Least the Past 5 Years: | | |
| Member of the Council on Foreign Relations (1996-present); Member of the National Committee on U.S.-China Relations (1999-present); |
| member of the Board of Trustees of the Economic Club of New York (2013-present); member of the Board of Trustees of the Foreign Policy |
| Association (2005-present) and member of various other boards of trustees and advisory boards; and formerly, Executive Vice President of |
| the Federal Reserve Bank of New York and Head of its Emerging Markets and Internal Affairs Group and Member of Management Committee |
| (1995-2014); and Visiting Fellow at the Council on Foreign Relations (2014). | |
| |
| Mary C. Choksi (1950) | Trustee | Since 2014 | 136 | Avis Budget Group Inc. (car rental) |
| One Franklin Parkway | | | | (2007-present), Omnicom Group Inc. |
| San Mateo, CA 94403-1906 | | | | (advertising and marketing |
| | | | | communications services) |
| | | | | (2011-present) and White Mountains |
| | | | | Insurance Group, Ltd. (holding |
| | | | | company) (2017-present). |
| Principal Occupation During at Least the Past 5 Years: | | |
| Director of various companies; and formerly, Founder and Senior Advisor, Strategic Investment Group (investment management group) |
| (2015-2017); Founding Partner and Senior Managing Director, Strategic Investment Group (1987-2015); Founding Partner and Managing |
| Director, Emerging Markets Management LLC (investment management firm) (1987-2011); and Loan Officer/Senior Loan Officer/Senior |
| Pension Investment Officer, World Bank Group (international financial institution) (1977-1987). | |
| |
| Edith E. Holiday (1952) | Trustee | Since 1999 | 136 | Hess Corporation (exploration of oil |
| One Franklin Parkway | | | | and gas) (1993-present), Canadian |
| San Mateo, CA 94403-1906 | | | | National Railway (railroad) |
| | | | | (2001-present), White Mountains |
| | | | | Insurance Group, Ltd. (holding |
| | | | | company) (2004-present), Santander |
| | | | | Consumer USA Holdings, Inc. |
| | | | | (consumer finance) (2016-present), |
| | | | | RTI International Metals, Inc. |
| | | | | (manufacture and distribution of |
| | | | | titanium) (1999-2015) and H.J. Heinz |
| | | | | Company (processed foods and allied |
| | | | | products) (1994-2013). |
| Principal Occupation During at Least the Past 5 Years: | | |
| Director or Trustee of various companies and trusts; and formerly, Assistant to the President of the United States and Secretary of the |
| Cabinet (1990-1993); General Counsel to the United States Treasury Department (1989-1990); and Counselor to the Secretary and Assistant |
| Secretary for Public Affairs and Public Liaison-United States Treasury Department (1988-1989). | |
| |
| J. Michael Luttig (1954) | Trustee | Since 2009 | 136 | Boeing Capital Corporation (aircraft |
| One Franklin Parkway | | | | financing) (2006-2013). |
| San Mateo, CA 94403-1906 | | | | |
| Principal Occupation During at Least the Past 5 Years: | | |
| Executive Vice President, General Counsel and member of the Executive Council, The Boeing Company (aerospace company) (2006-present); |
| and formerly, Federal Appeals Court Judge, U.S. Court of Appeals for the Fourth Circuit (1991-2006). | |
Annual Report | 7
FRANKLIN FLOATING RATE MASTER TRUST
| | | | |
| Independent Board Members (continued) | | |
| |
| | | | Number of Portfolios in | |
| Name, Year of Birth | | Length of | Fund Complex Overseen | Other Directorships Held |
| and Address | Position | Time Served | by Board Member* | During at Least the Past 5 Years |
| Larry D. Thompson | Trustee | Since 2007 | 136 | The Southern Company (energy |
| One Franklin Parkway | | | | company) (2014-present; previously |
| San Mateo, CA 94403-1906 | | | | 2010-2012), Graham Holdings |
| | | | | Company (education and media |
| | | | | organization) (2011-present) and |
| | | | | Cbeyond, Inc. (business |
| | | | | communications provider) |
| | | | | (2010-2012). |
| Principal Occupation During at Least the Past 5 Years: | | |
| Director of various companies; Counsel, Finch McCranie, LLP (law firm) (2015-present); Independent Compliance Monitor and Auditor, |
| Volkswagen AG (manufacturer of automobiles and commercial vehicles) (2017 – present); John A. Sibley Professor of Corporate and Business |
| Law, University of Georgia School of Law (2015-present; previously 2011-2012); and formerly, Executive Vice President - Government Affairs, |
| General Counsel and Corporate Secretary, PepsiCo, Inc. (consumer products) (2012-2014); Senior Vice President - Government Affairs, |
| General Counsel and Secretary, PepsiCo, Inc. (2004-2011); Senior Fellow of The Brookings Institution (2003-2004); Visiting Professor, |
| University of Georgia School of Law (2004); and Deputy Attorney General, U.S. Department of Justice (2001-2003). |
| |
| John B. Wilson (1959) | Lead | Trustee | 112 | None |
| One Franklin Parkway | Independent | since 2007 | | |
| San Mateo, CA 94403-1906 | Trustee | and Lead | | |
| | | Independent | | |
| | | Trustee | | |
| | | since 2008 | | |
| Principal Occupation During at Least the Past 5 Years: | | |
| President and Founder, Hyannis Port Capital, Inc. (real estate and private equity investing) (2002-present); Senior Advisor, McKinsey & Co. |
| (consulting) (2017-present); serves on private and non-profit boards; and formerly, President, Staples International and Head of Global |
| Transformation (office supplies) (2012-2016); Chief Operating Officer and Executive Vice President, Gap, Inc. (retail) (1996-2000); Chief |
| Financial Officer and Executive Vice President – Finance and Strategy, Staples, Inc. (1992-1996); Senior Vice President – Corporate Planning, |
| Northwest Airlines, Inc. (airlines) (1990-1992); and Vice President and Partner, Bain & Company (consulting firm) (1986-1990). |
| |
| |
| Interested Board Members and Officers | | |
| |
| | | | Number of Portfolios in | |
| Name, Year of Birth | | Length of | Fund Complex Overseen | Other Directorships Held |
| and Address | Position | Time Served | by Board Member* | During at Least the Past 5 Years |
| **Gregory E. Johnson (1961) | Trustee | Since 2007 | 150 | None |
| One Franklin Parkway | | | | |
| San Mateo, CA 94403-1906 | | | | |
| Principal Occupation During at Least the Past 5 Years: | | |
| Chairman of the Board, Member - Office of the Chairman, Director and Chief Executive Officer, Franklin Resources, Inc.; officer and/or director |
| or trustee, as the case may be, of some of the other subsidiaries of Franklin Resources, Inc. and of 42 of the investment companies in Franklin |
| Templeton Investments; Vice Chairman, Investment Company Institute; and formerly, President, Franklin Resources, Inc. (1994-2015). |
| |
| **Rupert H. Johnson, Jr. (1940) | Chairman of | Since 2013 | 136 | None |
| One Franklin Parkway | the Board | | | |
| San Mateo, CA 94403-1906 | and Trustee | | | |
| Principal Occupation During at Least the Past 5 Years: | | |
| Vice Chairman, Member - Office of the Chairman and Director, Franklin Resources, Inc.; Director, Franklin Advisers, Inc.; Senior Vice |
| President, Franklin Advisory Services, LLC; and officer and/or director or trustee, as the case may be, of some of the other subsidiaries of |
| Franklin Resources, Inc. and of 40 of the investment companies in Franklin Templeton Investments. | |
| |
| Alison E. Baur (1964) | Vice President | Since 2012 | Not Applicable | Not Applicable |
| One Franklin Parkway | | | | |
| San Mateo, CA 94403-1906 | | | | |
| Principal Occupation During at Least the Past 5 Years: | | |
| Deputy General Counsel, Franklin Templeton Investments; and officer of some of the other subsidiaries of Franklin Resources, Inc. and of 44 |
| of the investment companies in Franklin Templeton Investments. | | |
8 | Annual Report
FRANKLIN FLOATING RATE MASTER TRUST
| | | | |
| Interested Board Members and Officers (continued) | |
| |
| | | | Number of Portfolios in | |
| Name, Year of Birth | | Length of | Fund Complex Overseen | Other Directorships Held |
| and Address | Position | Time Served | by Board Member* | During at Least the Past 5 Years |
| Mark Boyadjian (1964) | Vice President | Since 2003 | Not Applicable | Not Applicable |
| One Franklin Parkway | | | | |
| San Mateo, CA 94403-1906 | | | | |
| Principal Occupation During at Least the Past 5 Years: | | |
| Senior Vice President, Franklin Advisers, Inc.; and officer of two of the investment companies in Franklin Templeton Investments. |
| |
| Gaston Gardey (1967) | Chief Financial | Since 2009 | Not Applicable | Not Applicable |
| One Franklin Parkway | Officer, | | | |
| San Mateo, CA 94403-1906 | Chief | | | |
| | Accounting | | | |
| | Officer and | | | |
| | Treasurer | | | |
| Principal Occupation During at Least the Past 5 Years: | | |
| Treasurer, U.S. Fund Administration & Reporting, Franklin Templeton Investments; and officer of 28 of the investment companies in Franklin |
| Templeton Investments. | | | | |
| |
| Aliya S. Gordon (1973) | Vice President | Since 2009 | Not Applicable | Not Applicable |
| One Franklin Parkway | | | | |
| San Mateo, CA 94403-1906 | | | | |
| Principal Occupation During at Least the Past 5 Years: | | |
| Senior Associate General Counsel, Franklin Templeton Investments; and officer of 44 of the investment companies in Franklin Templeton |
| Investments. | | | | |
| |
| Steven J. Gray (1955) | Vice President | Since 2009 | Not Applicable | Not Applicable |
| One Franklin Parkway | | | | |
| San Mateo, CA 94403-1906 | | | | |
| Principal Occupation During at Least the Past 5 Years: | | |
| Senior Associate General Counsel, Franklin Templeton Investments; Vice President, Franklin Templeton Distributors, Inc. and FASA, LLC; and |
| officer of 44 of the investment companies in Franklin Templeton Investments. | |
| |
| Matthew T. Hinkle (1971) | Chief | Since 2017 | Not Applicable | Not Applicable |
| One Franklin Parkway | Executive | | | |
| San Mateo, CA 94403-1906 | Officer – | | | |
| | Finance and | | | |
| | Administration | | | |
| Principal Occupation During at Least the Past 5 Years: | | |
| Senior Vice President, Franklin Templeton Services, LLC; officer of 44 of the investment companies in Franklin Templeton Investments; and |
| formerly, Vice President, Global Tax (2012-April 2017) and Treasurer/Assistant Treasurer, Franklin Templeton Investments (2009-2017). |
| |
| Robert Lim (1948) | Vice President | Since 2016 | Not Applicable | Not Applicable |
| One Franklin Parkway | – AML | | | |
| San Mateo, CA 94403-1906 | Compliance | | | |
| Principal Occupation During at Least the Past 5 Years: | | |
| Vice President, Franklin Templeton Companies, LLC; Chief Compliance Officer, Franklin Templeton Distributors, Inc. and Franklin Templeton |
| Investor Services, LLC; and officer of 44 of the investment companies in Franklin Templeton Investments. |
| |
| Christopher J. Molumphy | President and | Since 2010 | Not Applicable | Not Applicable |
| One Franklin Parkway | Chief Executive | | | |
| San Mateo, CA 94403-1906 | Officer - | | | |
| | Investment | | | |
| | Management | | | |
| Principal Occupation During at Least the Past 5 Years: | | |
| Director and Executive Vice President, Franklin Advisers, Inc.; Executive Vice President, Franklin Templeton Institutional, LLC; and officer of |
| some of the other subsidiaries of Franklin Resources, Inc. and of 21 of the investment companies in Franklin Templeton Investments. |
Annual Report | 9
FRANKLIN FLOATING RATE MASTER TRUST
| | | | |
| Interested Board Members and Officers (continued) | |
| |
| | | | Number of Portfolios in | |
| Name, Year of Birth | | Length of | Fund Complex Overseen | Other Directorships Held |
| and Address | Position | Time Served | by Board Member* | During at Least the Past 5 Years |
| Kimberly H. Novotny (1972) | Vice President | Since 2013 | Not Applicable | Not Applicable |
| 300 S.E. 2nd Street | | | | |
| Fort Lauderdale, FL 33301-1923 | | | | |
| Principal Occupation During at Least the Past 5 Years: | | |
| Associate General Counsel, Franklin Templeton Investments; Vice President and Corporate Secretary, Fiduciary Trust International of the |
| South; Vice President, Templeton Investment Counsel, LLC; Assistant Secretary, Franklin Resources, Inc.; and officer of 44 of the investment |
| companies in Franklin Templeton Investments. | | | |
| |
| Robert C. Rosselot (1960) | Chief | Since 2013 | Not Applicable | Not Applicable |
| 300 S.E. 2nd Street | Compliance | | | |
| Fort Lauderdale, FL 33301-1923 | Officer | | | |
| Principal Occupation During at Least the Past 5 Years: | | |
| Director, Global Compliance, Franklin Templeton Investments; Vice President, Franklin Templeton Companies, LLC; officer of 44 of the |
| investment companies in Franklin Templeton Investments; and formerly, Senior Associate General Counsel, Franklin Templeton Investments |
| (2007-2013); and Secretary and Vice President, Templeton Group of Funds (2004-2013). | |
| |
| Karen L. Skidmore (1952) | Vice President | Since 2006 | Not Applicable | Not Applicable |
| One Franklin Parkway | and Secretary | | | |
| San Mateo, CA 94403-1906 | | | | |
| Principal Occupation During at Least the Past 5 Years: | | |
| Senior Associate General Counsel, Franklin Templeton Investments; and officer of 44 of the investment companies in Franklin Templeton |
| Investments. | | | | |
| |
| Navid J. Tofigh (1972) | Vice President | Since 2015 | Not Applicable | Not Applicable |
| One Franklin Parkway | | | | |
| San Mateo, CA 94403-1906 | | | | |
| Principal Occupation During at Least the Past 5 Years: | | |
| Associate General Counsel, Franklin Templeton Investments; and officer of 44 of the investment companies in Franklin Templeton Investments. |
| |
| Craig S. Tyle (1960) | Vice President | Since 2005 | Not Applicable | Not Applicable |
| One Franklin Parkway | | | | |
| San Mateo, CA 94403-1906 | | | | |
| Principal Occupation During at Least the Past 5 Years: | | |
| General Counsel and Executive Vice President, Franklin Resources, Inc.; and officer of some of the other subsidiaries of Franklin Resources, |
| Inc. and of 44 of the investment companies in Franklin Templeton Investments. | |
| |
| Lori A. Weber (1964) | Vice President | Since 2011 | Not Applicable | Not Applicable |
| 300 S.E. 2nd Street | | | | |
| Fort Lauderdale, FL 33301-1923 | | | | |
| Principal Occupation During at Least the Past 5 Years: | | |
| Senior Associate General Counsel, Franklin Templeton Investments; Assistant Secretary, Franklin Resources, Inc.; Vice President and |
| Secretary, Templeton Investment Counsel, LLC; and officer of 44 of the investment companies in Franklin Templeton Investments. |
10 | Annual Report
FRANKLIN FLOATING RATE MASTER TRUST
*We base the number of portfolios on each separate series of the US registered investment companies within the Franklin Templeton Investments fund complex. These portfolios have a common investment manager or affiliated investment managers.
**Gregory E. Johnson is considered to be an interested person of the Fund under the federal securities laws due to his position as an officer and director of Franklin Resources, Inc. (Resources), which is the parent company of the Fund’s investment manager and distributor. Rupert H. Johnson, Jr. is considered to be an interested person of the Fund under the federal securities laws due to his position as an officer and director and major shareholder of Resources.
Note 1: Rupert H. Johnson, Jr. is the uncle of Gregory E. Johnson.
Note 2: Officer information is current as of the date of this report. It is possible that after this date, information about officers may change.
The Sarbanes-Oxley Act of 2002 and Rules adopted by the Securities and Exchange Commission require the Fund to disclose whether the Fund’s Audit Committee includes at least one member who is an audit committee financial expert within the meaning of such Act and Rules. The Fund’s Board has determined that there is at least one such financial expert on the Audit Committee and has designated John B. Wilson as its audit committee financial expert. The Board believes that Mr. Wilson qualifies as such an expert in view of his extensive business background and experience, including service as chief financial officer of Staples, Inc. from 1992 to 1996. Mr. Wilson has been a Member and Chairman of the Fund’s Audit Committee since 2007. As a result of such background and experience, the Board believes that Mr. Wilson has acquired an understanding of generally accepted accounting principles and financial statements, the general application of such principles in connection with the accounting estimates, accruals and reserves, and analyzing and evaluating financial statements that present a breadth and level of complexity of accounting issues generally comparable to those of the Fund, as well as an understanding of internal controls and procedures for financial reporting and an understanding of audit committee functions. Mr. Wilson is an independent Board member as that term is defined under the relevant Securities and Exchange Commission Rules and Releases.
The Statement of Additional Information (SAI) includes additional information about the board members and is available, without charge, upon request.
Shareholders may call (800) DIAL BEN/342-5236 to request the SAI.
Annual Report | 11
FRANKLIN FLOATING RATE MASTER TRUST
Shareholder Information
Board Approval of Investment Management Agreements FRANKLIN FLOATING RATE MASTER TRUST Franklin Lower Tier Floating Rate Fund (Fund) At an in-person meeting held on February 27, 2018 (Meeting), the Board of Trustees (Board) of Franklin Floating Rate Master Trust (Trust), including a majority of the trustees who are not “interested persons” as defined in the Investment Company Act of 1940 (Independent Trustees), reviewed and approved the continuance of the investment management agreement between Franklin Advisers, Inc. (Manager) and the Trust, on behalf of the Fund (Management Agreement) for an additional one-year period. The Independent Trustees received advice from and met separately with Independent Trustee counsel in considering whether to approve the continuation of the Management Agreement. In considering the continuation of the Management Agreement, the Board reviewed and considered information provided by the Manager at the Meeting and throughout the year at meetings of the Board and its committees. The Board also reviewed and considered information provided in response to a detailed set of requests for information submitted to the Manager by Independent Trustee counsel on behalf of the Independent Trustees in connection with the annual contract renewal process. In addition, prior to the Meeting, the Independent Trustees held a telephonic contract renewal meeting at which the Independent Trustees conferred amongst themselves and Independent Trustee counsel about contract renewal matters. The Board reviewed and considered all of the factors it deemed relevant in approving the continuance of the Management Agreement, including, but not limited to: (i) the nature, extent and quality of the services provided by the Manager; (ii) the investment performance of the Fund; (iii) the costs of the services provided and profits realized by the Manager and its affiliates from the relationship with the Fund; (iv) the extent to which economies of scale are realized as the Fund grows; and (v) whether fee levels reflect these economies of scale for the benefit of Fund investors. | | In approving the continuance of the Management Agreement, the Board, including a majority of the Independent Trustees, determined that the terms of the Management Agreement are fair and reasonable and that the continuance of such Management Agreement is in the interests of the Fund and its shareholders. While attention was given to all information furnished, the following discusses some primary factors relevant to the Board’s determination. Nature, Extent and Quality of Services The Board reviewed and considered information regarding the nature, extent and quality of investment management services provided by the Manager and its affiliates to the Fund and its shareholders. This information included, among other things, the qualifications, background and experience of the senior management and investment personnel of the Manager; the structure of investment personnel compensation; oversight of third-party service providers; investment performance reports and related financial information for the Fund; reports on expenses, and shareholder services; legal and compliance matters; risk controls; pricing and other services provided by the Manager and its affiliates; and management fees charged by the Manager and its affiliates to U.S. funds and other accounts, including management’s explanation of differences among accounts where relevant. The Board also reviewed and considered an annual report on payments made by Franklin Templeton Investments (FTI) or the Fund to financial intermediaries, as well as a memorandum relating to third-party servicing arrangements in response to a guidance update in 2016 from the U.S. Securities and Exchange Commission (SEC) relating to mutual fund distribution and sub-accounting fees. The Board noted management’s continuing efforts and expenditures in establishing effective business continuity plans and developing strategies to address areas of heightened concern in the mutual fund industry, such as cybersecurity and liquidity risk management. The Board also recognized management’s commitment to facilitating Board oversight of particular areas, including derivatives and payments to intermediaries, by enhanced reporting. The Board also reviewed and considered the benefits provided to Fund shareholders of investing in a fund that is part of the Franklin Templeton family of funds. The Board noted the financial position of Franklin Resources, Inc. (FRI), the Manager’s parent, and its commitment to the mutual fund |
12 | Annual Report
FRANKLIN FLOATING RATE MASTER TRUST
SHAREHOLDER INFORMATION
business as evidenced by its continued introduction of new funds, reassessment of the fund offerings in response to the market environment and project initiatives and capital investments relating to the services provided to the Fund by the FTI organization. Following consideration of such information, the Board was satisfied with the nature, extent and quality of services provided by the Manager and its affiliates to the Fund and its shareholders. Fund Performance The Board reviewed and considered the performance results of the Fund over various time periods ended December 31, 2017. The Board considered the performance returns for the Fund in comparison to the performance returns of mutual funds deemed comparable to the Fund included in a universe (Performance Universe) selected by Broadridge Financial Solutions, Inc. (Broadridge), an independent provider of investment company data. The Board received a description of the methodology used by Broadridge to select the mutual funds included in a Performance Universe. The Board also reviewed and considered Fund performance reports provided and discussions that occurred with portfolio managers at Board meetings throughout the year. A summary of the Fund’s performance results is below.The Performance Universe for the Fund included the Fund and all retail and institutional loan participation funds. The Fund commenced operations on November 6, 2015, and thus has been in operation for less than three years. The Board noted that the Fund’s annualized total return for the one-year period was above the median of its Performance Universe. The Board concluded that the Fund’s performance was satisfactory, particularly given its short period of operation. The Board further noted that the Fund does not offer its shares to the public; the Fund’s investors are exclusively other proprietary funds. Comparative Fees and Expenses The Board reviewed and considered information regarding the Fund’s actual total expense ratio and its various components, including, as applicable, management fees; transfer agent expenses; underlying fund expenses; Rule 12b-1 and non-Rule 12b-1 service fees; and other non-management fees. The Board considered the actual total expense ratio and, separately, the contractual management fee rate, without the effect of fee waivers (Management Rate), if any, of the Fund in comparison to the median expense ratio and median Management Rate, respectively, of other mutual funds deemed | | comparable to and with a similar expense structure as the Fund selected by Broadridge (Expense Group). Broadridge fee and expense data is based upon information taken from the Fund’s most recent annual report, which reflects historical asset levels that may be quite different from those currently existing, particularly in a period of market volatility. While recognizing such inherent limitation and the fact that expense ratios and Management Rates generally increase as assets decline and decrease as assets grow, the Board believed the independent analysis conducted by Broadridge to be an appropriate measure of comparative fees and expenses. The Broadridge Management Rate includes administrative charges, and the actual total expense ratio, for comparative consistency, was shown for Class A shares for funds with multiple classes of shares. The Board received a description of the methodology used by Broadridge to select the mutual funds included in an Expense Group. The Expense Group for the Fund included the Fund and 13 other loan participation funds. The Board noted that the Management Rate for the Fund was equal to the median of its Expense Group, but its actual total expense ratio was below the median of its Expense Group. The Board concluded that the Management Rate charged to the Fund is reasonable. In doing so, the Board noted that the Fund’s actual total expense ratio reflected a fee waiver from management. Profitability The Board reviewed and considered information regarding the profits realized by the Manager and its affiliates in connection with the operation of the Fund. In this respect, the Board considered the Fund profitability analysis provided by the Manager that addresses the overall profitability of FTI’s U.S. fund business, as well as its profits in providing investment management and other services to each of the individual funds during the 12-month period ended September 30, 2017, being the most recent fiscal year-end for FRI. The Board noted that although management continually makes refinements to its methodologies used in calculating profitability in response to organizational and product related changes, the overall methodology has remained consistent with that used in the Fund’s profitability report presentations from prior years. Additionally, PricewaterhouseCoopers LLP, auditor to Franklin Resources, Inc. and certain Franklin Templeton funds, has been engaged by the Manager to periodically review and assess the allocation methodologies to be used solely by the Fund’s Board with respect to the profitability analysis. |
Annual Report | 13
FRANKLIN FLOATING RATE MASTER TRUST
SHAREHOLDER INFORMATION
The Board noted management’s belief that costs incurred in establishing the infrastructure necessary for the type of mutual fund operations conducted by the Manager and its affiliates may not be fully reflected in the expenses allocated to the Fund in determining its profitability, as well as the fact that the level of profits, to a certain extent, reflected operational cost savings and efficiencies initiated by management. The Board also noted management’s expenditures in improving shareholder services provided to the Fund, as well as the need to implement systems and meet additional regulatory and compliance requirements resulting from recent SEC and other regulatory requirements. The Board also considered the extent to which the Manager and its affiliates might derive ancillary benefits from fund operations, including revenues generated from transfer agent services, potential benefits resulting from personnel and systems enhancements necessitated by fund growth, as well as increased leverage with service providers and counterparties. Based upon its consideration of all these factors, the Board concluded that the level of profits realized by the Manager and its affiliates from providing services to the Fund was not excessive in view of the nature, extent and quality of services provided to the Fund. Economies of Scale The Board reviewed and considered the extent to which the Manager may realize economies of scale, if any, as the Fund grows larger and whether the Fund’s management fee structure reflects any economies of scale for the benefit of shareholders. With respect to possible economies of scale, the Board noted the existence of management fee breakpoints, which operate generally to share any economies of scale with a Fund’s shareholders by reducing the Fund’s effective management fees as the Fund grows in size. The Board considered the Manager’s view that any analyses of potential economies of scale in managing a particular fund are inherently limited in light of the joint and common costs and investments the Manager incurs across the Franklin Templeton family of funds as a whole. The Board concluded that to the extent economies of scale may be realized by the Manager and its affiliates, the Fund’s management fee structure provided a sharing of benefits with the Fund and its shareholders as the Fund grows. Conclusion Based on its review, consideration and evaluation of all factors it believed relevant, including the above-described factors and conclusions, the Board unanimously approved the continuation of the Management Agreement for an additional one-year period. | | Board Approval of Investment Management Agreements FRANKLIN FLOATING RATE MASTER TRUST Franklin Middle Tier Floating Rate Fund (Fund) At an in-person meeting held on February 27, 2018 (Meeting), the Board of Trustees (Board) of Franklin Floating Rate Master Trust (Trust), including a majority of the trustees who are not “interested persons” as defined in the Investment Company Act of 1940 (Independent Trustees), reviewed and approved the continuance of the investment management agreement between Franklin Advisers, Inc. (Manager) and the Trust, on behalf of the Fund (Management Agreement) for an additional one-year period. The Independent Trustees received advice from and met separately with Independent Trustee counsel in considering whether to approve the continuation of the Management Agreement. In considering the continuation of the Management Agreement, the Board reviewed and considered information provided by the Manager at the Meeting and throughout the year at meetings of the Board and its committees. The Board also reviewed and considered information provided in response to a detailed set of requests for information submitted to the Manager by Independent Trustee counsel on behalf of the Independent Trustees in connection with the annual contract renewal process. In addition, prior to the Meeting, the Independent Trustees held a telephonic contract renewal meeting at which the Independent Trustees conferred amongst themselves and Independent Trustee counsel about contract renewal matters. The Board reviewed and considered all of the factors it deemed relevant in approving the continuance of the Management Agreement, including, but not limited to: (i) the nature, extent and quality of the services provided by the Manager; (ii) the investment performance of the Fund; (iii) the costs of the services provided and profits realized by the Manager and its affiliates from the relationship with the Fund; (iv) the extent to which economies of scale are realized as the Fund grows; and (v) whether fee levels reflect these economies of scale for the benefit of Fund investors. |
14 | Annual Report
FRANKLIN FLOATING RATE MASTER TRUST
SHAREHOLDER INFORMATION
In approving the continuance of the Management Agreement, the Board, including a majority of the Independent Trustees, determined that the terms of the Management Agreement are fair and reasonable and that the continuance of such Management Agreement is in the interests of the Fund and its shareholders. While attention was given to all information furnished, the following discusses some primary factors relevant to the Board’s determination. Nature, Extent and Quality of Services The Board reviewed and considered information regarding the nature, extent and quality of investment management services provided by the Manager and its affiliates to the Fund and its shareholders. This information included, among other things, the qualifications, background and experience of the senior management and investment personnel of the Manager; the structure of investment personnel compensation; oversight of third-party service providers; investment performance reports and related financial information for the Fund; reports on expenses and shareholder services; legal and compliance matters; risk controls; pricing and other services provided by the Manager and its affiliates; and management fees charged by the Manager and its affiliates to U.S. funds and other accounts, including management’s explanation of differences among accounts where relevant. The Board also reviewed and considered an annual report on payments made by Franklin Templeton Investments (FTI) or the Fund to financial intermediaries, as well as a memorandum relating to third-party servicing arrangements in response to a guidance update in 2016 from the U.S. Securities and Exchange Commission (SEC) relating to mutual fund distribution and sub-accounting fees. The Board noted management’s continuing efforts and expenditures in establishing effective business continuity plans and developing strategies to address areas of heightened concern in the mutual fund industry, such as cybersecurity and liquidity risk management. The Board also recognized management’s commitment to facilitating Board oversight of particular areas, including derivatives and payments to intermediaries, by enhanced reporting. The Board also reviewed and considered the benefits provided to Fund shareholders of investing in a fund that is part of the Franklin Templeton family of funds. The Board noted the financial position of Franklin Resources, Inc. (FRI), the Manager’s parent, and its commitment to the mutual fund | | business as evidenced by its continued introduction of new funds, reassessment of the fund offerings in response to the market environment and project initiatives and capital investments relating to the services provided to the Fund by the FTI organization. Following consideration of such information, the Board was satisfied with the nature, extent and quality of services provided by the Manager and its affiliates to the Fund and its shareholders. Fund Performance The Board reviewed and considered the performance results of the Fund over various time periods ended December 31, 2017. The Board considered the performance returns for the Fund in comparison to the performance returns of mutual funds deemed comparable to the Fund included in a universe (Performance Universe) selected by Broadridge Financial Solutions, Inc. (Broadridge), an independent provider of investment company data. The Board received a description of the methodology used by Broadridge to select the mutual funds included in a Performance Universe. The Board also reviewed and considered Fund performance reports provided and discussions that occurred with portfolio managers at Board meetings throughout the year. A summary of the Fund’s performance results is below. The Performance Universe for the Fund included the Fund and all retail and institutional loan participation funds. The Fund commenced operations on November 6, 2015, and thus has been in operation for less than three years. The Board noted that the Fund’s annualized total return for the one-year period was below the median of its Performance Universe. The Board concluded that the Fund’s performance was acceptable given its short period of operation. The Board further noted that the Fund does not offer its shares to the public; the Fund’s investors are exclusively other proprietary funds. Comparative Fees and Expenses The Board reviewed and considered information regarding the Fund’s actual total expense ratio and its various components, including, as applicable, management fees; transfer agent expenses; underlying fund expenses; Rule 12b-1 and non-Rule 12b-1 service fees; and other non-management fees. The Board considered the actual total expense ratio and, separately, the contractual management fee rate, without the effect of fee waivers (Management Rate), if any, of the Fund in comparison to the median expense ratio and median Management Rate, respectively, of other mutual funds deemed comparable to and with a similar expense structure as the Fund |
Annual Report | 15
FRANKLIN FLOATING RATE MASTER TRUST
SHAREHOLDER INFORMATION
selected by Broadridge (Expense Group). Broadridge fee and expense data is based upon information taken from the Fund’s most recent annual report, which reflects historical asset levels that may be quite different from those currently existing, particularly in a period of market volatility. While recognizing such inherent limitation and the fact that expense ratios and Management Rates generally increase as assets decline and decrease as assets grow, the Board believed the independent analysis conducted by Broadridge to be an appropriate measure of comparative fees and expenses. The Broadridge Management Rate includes administrative charges, and the actual total expense ratio, for comparative consistency, was shown for Class A shares for funds with multiple classes of shares. The Board received a description of the methodology used by Broadridge to select the mutual funds included in an Expense Group. The Expense Group for the Fund included the Fund and 15 other loan participation funds. The Board noted that the Management Rate and actual total expense ratio for the Fund were below the medians of its Expense Group. The Board concluded that the Management Rate charged to the Fund is reasonable. In doing so, the Board noted that the Fund’s actual total expense ratio reflected a fee waiver from management. Profitability The Board reviewed and considered information regarding the profits realized by the Manager and its affiliates in connection with the operation of the Fund. In this respect, the Board considered the Fund profitability analysis provided by the Manager that addresses the overall profitability of FTI’s U.S. fund business, as well as its profits in providing investment management and other services to each of the individual funds during the 12-month period ended September 30, 2017, being the most recent fiscal year-end for FRI. The Board noted that although management continually makes refinements to its methodologies used in calculating profitability in response to organizational and product related changes, the overall methodology has remained consistent with that used in the Fund’s profitability report presentations from prior years. Additionally, PricewaterhouseCoopers LLP, auditor to Franklin Resources, Inc. and certain Franklin Templeton funds, has been engaged by the Manager to periodically review and assess the allocation methodologies to be used solely by the Fund’s Board with respect to the profitability analysis. | | The Board noted management’s belief that costs incurred in establishing the infrastructure necessary for the type of mutual fund operations conducted by the Manager and its affiliates may not be fully reflected in the expenses allocated to the Fund in determining its profitability, as well as the fact that the level of profits, to a certain extent, reflected operational cost savings and efficiencies initiated by management. The Board also noted management’s expenditures in improving shareholder services provided to the Fund, as well as the need to implement systems and meet additional regulatory and compliance requirements resulting from recent SEC and other regulatory requirements. The Board also considered the extent to which the Manager and its affiliates might derive ancillary benefits from fund operations, including revenues generated from transfer agent services, potential benefits resulting from personnel and systems enhancements necessitated by fund growth, as well as increased leverage with service providers and counterparties. Based upon its consideration of all these factors, the Board concluded that the level of profits realized by the Manager and its affiliates from providing services to the Fund was not excessive in view of the nature, extent and quality of services provided to the Fund. Economies of Scale The Board reviewed and considered the extent to which the Manager may realize economies of scale, if any, as the Fund grows larger and whether the Fund’s management fee structure reflects any economies of scale for the benefit of shareholders. With respect to possible economies of scale, the Board noted the existence of management fee breakpoints, which operate generally to share any economies of scale with a Fund’s shareholders by reducing the Fund’s effective management fees as the Fund grows in size. The Board considered the Manager’s view that any analyses of potential economies of scale in managing a particular fund are inherently limited in light of the joint and common costs and investments the Manager incurs across the Franklin Templeton family of funds as a whole. The Board concluded that to the extent economies of scale may be realized by the Manager and its affiliates, the Fund’s management fee structure provided a sharing of benefits with the Fund and its shareholders as the Fund grows. Conclusion Based on its review, consideration and evaluation of all factors it believed relevant, including the above-described factors and conclusions, the Board unanimously approved the continuation of the Management Agreement for an additional one-year period. |
16 | Annual Report
FRANKLIN FLOATING RATE MASTER TRUST
SHAREHOLDER INFORMATION
Proxy Voting Policies and Procedures
The Trust’s investment manager has established Proxy Voting
Policies and Procedures (Policies) that the Trust uses to
determine how to vote proxies relating to portfolio securities.
Shareholders may view the Trust’s complete Policies online at
franklintempleton.com. Alternatively, shareholders may request
copies of the Policies free of charge by calling the Proxy Group
collect at (954) 527-7678 or by sending a written request
to: Franklin Templeton Companies, LLC, 300 S.E. 2nd Street,
Fort Lauderdale, FL 33301, Attention: Proxy Group. Copies of
the Trust’s proxy voting records are also made available online
at franklintempleton.com and posted on the US Securities and
Exchange Commission’s website at sec.gov and reflect the
most recent 12-month period ended June 30.
Quarterly Statement of Investments
The Trust files a complete statement of investments with the
US Securities and Exchange Commission for the first and third
quarters for each fiscal year on Form N-Q. Shareholders may
view the filed Form N-Q by visiting the Commission’s website
at sec.gov. The filed form may also be viewed and copied at the
Commission’s Public Reference Room in Washington, DC.
Information regarding the operations of the Public Reference
Room may be obtained by calling (800) SEC-0330.
Annual Report | 17
FRANKLIN FLOATING RATE MASTER TRUST
| | | | | | | | | |
| Financial Highlights | | | | | | | | | |
| Franklin Lower Tier Floating Rate Fund | | | | | | | | | |
| | | Year Ended July 31, | | | | |
| | | 2018 | | | 2017 | | | 2016 | a |
| Per share operating performance | | | | | | | | | |
| (for a share outstanding throughout the year) | | | | | | | | | |
| Net asset value, beginning of year. | $ | 10.50 | | $ | 9.99 | | $ | 10.00 | |
| Income from investment operationsb: | | | | | | | | | |
| Net investment income | | 0.920 | | | 0.962 | | | 0.658 | |
| Net realized and unrealized gains (losses) | | (0.445 | ) | | 0.530 | | | (0.017 | ) |
| Total from investment operations. | | 0.475 | | | 1.492 | | | 0.641 | |
| Less distributions from: | | | | | | | | | |
| Net investment income | | (0.918 | ) | | (0.982 | ) | | (0.651 | ) |
| Net realized gains | | (0.277 | ) | | — | | | — | |
| Total distributions | | (1.195 | ) | | (0.982 | ) | | (0.651 | ) |
| Net asset value, end of year | $ | 9.78 | | $ | 10.50 | | $ | 9.99 | |
| |
| Total returnc | | 4.69 | % | | 15.55 | % | | 6.90 | % |
| |
| Ratios to average net assetsd | | | | | | | | | |
| Expenses before waiver and payments by affiliates | | 0.68 | % | | 0.70 | % | | 0.70 | % |
| Expenses net of waiver and payments by affiliatese | | 0.60 | % | | 0.60 | % | | 0.60 | % |
| Net investment income. | | 9.09 | % | | 9.31 | % | | 9.47 | % |
| |
| Supplemental data | | | | | | | | | |
| Net assets, end of year (000’s) | $ | 395,983 | | $ | 341,611 | | $ | 436,180 | |
| Portfolio turnover rate | | 33.79 | % | | 54.26 | % | | 26.40 | %f |
aFor the period November 6, 2015 (commencement of operations) to July 31, 2016.
bThe amount shown for a share outstanding throughout the period may not correlate with the Statement of Operations for the period due to the timing of sales and repurchases of the Fund’s shares in relation to income earned and/or fluctuating fair value of the investments of the Fund.
cTotal return is not annualized for periods less than one year.
dRatios are annualized for periods less than one year, except for non-recurring expenses, if any.
eBenefit of expense reduction rounds to less than 0.01%.
fExcludes the value of portfolio securities received from purchase in-kind.
18 | Annual Report | The accompanying notes are an integral part of these financial statements.
FRANKLIN FLOATING RATE MASTER TRUST
| | | | | |
| Statement of Investments, July 31, 2018 | | | | | |
| Franklin Lower Tier Floating Rate Fund | | | | | |
| | | | Shares/ | | |
| | Country | | Units | | Value |
| Common Stocks and Other Equity Interests 10.3% | | | | | |
| Diversified Support Services 9.0% | | | | | |
| a,b,c Remington Outdoor Co. Inc | United States | | 2,076,237 | $ | 35,854,089 |
| a,b,c Remington Outdoor Co. Inc., Litigation Units | United States | | 195,465 | | — |
| | | | | | 35,854,089 |
| Forest Products 1.3% | | | | | |
| a,b,c Appvion Inc | United States | | 520,183 | | 5,151,135 |
| Total Common Stocks and Other Equity Interests | | | | | |
| (Cost $47,866,182) | | | | | 41,005,224 |
| |
| | | | Principal | | |
| | | | Amount* | | |
| Corporate Bonds (Cost $5,315,947) 1.4% | | | | | |
| Industrial Machinery 1.4% | | | | | |
| d Onsite Rental Group Operations Pty. Ltd., secured note, PIK, 6.10%, 10/26/23 | Australia | $ | 7,308,657 | | 5,664,208 |
| e,f Senior Floating Rate Interests 82.0% | | | | | |
| Aerospace & Defense 3.6% | | | | | |
| Doncasters U.S. Finance LLC, Second Lien Term Loan, 10.584%, (3-month USD LIBOR | | | | | |
| + 8.25%), 10/09/20. | United States | | 16,536,432 | | 14,028,401 |
| Agricultural Products 0.2% | | | | | |
| Allflex Holdings III Inc., Second Lien Initial Term Loan, 9.347%, (3-month USD LIBOR + | | | | | |
| 7.00%), 7/19/21 | United States | | 909,434 | | 914,739 |
| Apparel Retail 2.9% | | | | | |
| Ascena Retail Group Inc., Tranche B Term Loan, 6.625%, (1-month USD LIBOR + | | | | | |
| 4.50%), 8/21/22 | United States | | 12,374,760 | | 11,361,577 |
| Coal & Consumable Fuels 4.6% | | | | | |
| Bowie Resource Holdings LLC, | | | | | |
| First Lien Initial Term Loan, 7.827%, (1-month USD LIBOR + 5.75%), 8/14/20 | United States | | 154,952 | | 152,821 |
| g Second Lien Initial Term Loan, 12.827%, (1-month USD LIBOR + 10.75%), 2/16/21 . | United States | | 8,992,344 | | 8,632,650 |
| Foresight Energy LLC, Term Loans, 7.827%, (1-month USD LIBOR + 5.75%), 3/28/22 | United States | | 9,580,248 | | 9,562,285 |
| | | | | | 18,347,756 |
| Food Retail 2.5% | | | | | |
| g Smart & Final Stores LLC, First Lien Term Loan, 5.577%, (1-month USD LIBOR + | | | | | |
| 3.50%), 11/15/22 | United States | | 9,975,204 | | 9,759,071 |
| Forest Products 3.7% | | | | | |
| Appvion Inc., Term Loan, 8.09%, (1-month USD LIBOR + 6.00%), 6/15/26 | United States | | 14,600,813 | | 14,600,813 |
| General Merchandise Stores 10.4% | | | | | |
| d 99 Cents Only Stores, First Lien Term Loan, PIK, 8.807% - 8.834%, (3-month USD | | | | | |
| LIBOR + 6.50%), 1/13/22 | United States | | 24,803,939 | | 23,501,856 |
| Evergreen AcqCo. 1 LP (Savers), | | | | | |
| Term Loan, 5.93%, (2-month USD LIBOR + 3.75%), 7/09/19 | United States | | 48,001 | | 47,341 |
| Term Loan, 6.097%, (3-month USD LIBOR + 3.75%), 7/09/19 | United States | | 18,048,453 | | 17,800,287 |
| | | | | | 41,349,484 |
| Industrial Machinery 1.3% | | | | | |
| Onsite Rental Group Operations Property Ltd., Term Loan, 6.564%, (1-month USD | | | | | |
| LIBOR + 4.50%), 10/25/22 | Australia | | 5,345,644 | | 5,292,188 |
Annual Report | 19
FRANKLIN FLOATING RATE MASTER TRUST
STATEMENT OF INVESTMENTS
| | | | | |
| Franklin Lower Tier Floating Rate Fund (continued) | | | | | |
| | | | Principal | | |
| | Country | | Amount* | | Value |
| e,f Senior Floating Rate Interests (continued) | | | | | |
| Integrated Telecommunication Services 5.5% | | | | | |
| Global Tel*Link Corp., Second Lien Term Loan, 10.584%, (3-month USD LIBOR + | | | | | |
| 8.25%), 11/23/20 | United States | $ | 5,095,856 | $ | 5,121,335 |
| g Securus Technologies Holdings Inc., Second Lien Initial Loan, 10.327%, (1-month USD | | | | | |
| LIBOR + 8.25%), 11/01/25 | United States | | 16,624,308 | | 16,700,497 |
| | | | | | 21,821,832 |
| Marine 0.5% | | | | | |
| International Seaways Operating Corp., Initial Term Loans, 8.08%, (1-month USD LIBOR | | | | | |
| + 5.50%), 6/22/22 | United States | | 1,998,944 | | 2,001,443 |
| Marine Ports & Services 0.4% | | | | | |
| Commercial Barge Line Co., Initial Term Loan, 10.827%, (1-month USD LIBOR + | | | | | |
| 8.75%), 11/12/20 | United States | | 1,945,205 | | 1,596,284 |
| Oil & Gas Exploration & Production 15.4% | | | | | |
| Fieldwood Energy LLC, Closing Date Loans, 7.327%, (1-month USD LIBOR + 5.25%), | | | | | |
| 4/11/22 | United States | | 44,676,846 | | 44,822,045 |
| UTEX Industries Inc., | | | | | |
| First Lien Initial Term Loan, 6.077%, (1-month USD LIBOR + 4.00%), 5/21/21 | United States | | 14,584,410 | | 14,487,176 |
| Second Lien Initial Term Loan, 9.327%, (1-month USD LIBOR + 7.25%), 5/20/22 | United States | | 1,500,000 | | 1,478,438 |
| | | | | | 60,787,659 |
| Other Diversified Financial Services 0.3% | | | | | |
| g,h Asurion LLC, Second Lien Replacement B-2 Term Loans, TBD, 8/04/25 | United States | | 1,000,000 | | 1,016,250 |
| Packaged Foods & Meats 4.9% | | | | | |
| CSM Bakery Supplies LLC, Second Lien Term Loan, 10.09%, (3-month USD LIBOR + | | | | | |
| 7.75%), 7/03/21 | United States | | 20,441,850 | | 19,347,352 |
| Paper Packaging 3.6% | | | | | |
| Caraustar Industries Inc., Refinancing Term Loans, 7.834%, (3-month USD LIBOR + | | | | | |
| 5.50%), 3/14/22 | United States | | 14,093,846 | | 14,238,589 |
| Personal Products 15.3% | | | | | |
| b FGI Operating Co. LLC (Freedom Group), | | | | | |
| Term Loan, 12.343%, (3-month USD LIBOR + 10.00%), 5/15/22. | United States | | 21,407,500 | | 21,407,500 |
| Term Loan FILO, 8.843%, (3-month USD LIBOR + 6.50%), 5/15/21. | United States | | 40,909,091 | | 39,272,727 |
| | | | | | 60,680,227 |
| Specialty Chemicals 1.8% | | | | | |
| Oxbow Carbon LLC, Second Lien Term Loan, 9.577%, (1-month USD LIBOR + 7.50%), | | | | | |
| 1/04/24 | United States | | 7,019,188 | | 7,159,572 |
| Specialty Stores 5.1% | | | | | |
| General Nutrition Centers Inc., | | | | | |
| FILO Term Loan (ABL), 9.08%, (1-month USD LIBOR + 7.00%), 12/31/22 | United States | | 5,749,683 | | 5,932,954 |
| Tranche B-2 Term Loans, 10.83%, (1-month USD LIBOR + 8.75%), 3/04/21 | United States | | 13,906,053 | | 13,493,044 |
| PetSmart Inc., Tranche B-2 Loans, 5.10%, (1-month USD LIBOR + 3.00%), 3/11/22 | United States | | 997,423 | | 831,382 |
| | | | | | 20,257,380 |
| Total Senior Floating Rate Interests | | | | | |
| (Cost $319,846,464) | | | | | 324,560,617 |
| Total Investments before Short Term Investments | | | | | |
| (Cost $373,028,593) | | | | | 371,230,049 |
20 | Annual Report
FRANKLIN FLOATING RATE MASTER TRUST
STATEMENT OF INVESTMENTS
| | | | | |
| Franklin Lower Tier Floating Rate Fund (continued) | | | | | |
| | Country | Shares | | Value | |
| Short Term Investments (Cost $36,766,806) 9.3% | | | | | |
| Money Market Funds 9.3% | | | | | |
| i,j Institutional Fiduciary Trust Money Market Portfolio, 1.57% | United States | 36,766,806 | $ | 36,766,806 | |
| Total Investments (Cost $409,795,399) 103.0% | | | | 407,996,855 | |
| Other Assets, less Liabilities (3.0)% | | | | (12,013,905 | ) |
| Net Assets 100.0% | | | $ | 395,982,950 | |
See Abbreviations on page 42.
*The principal amount is stated in U.S. dollars unless otherwise indicated.
aNon-income producing.
bFair valued using significant unobservable inputs. See Note 12 regarding fair value measurements.
cSee Note 9 regarding restricted securities.
dIncome may be received in additional securities and/or cash.
eThe coupon rate shown represents the rate at period end.
fSee Note 1(c) regarding senior floating rate interests.
gA portion or all of the security purchased on a delayed delivery basis. See Note 1(b).
hA portion or all of the security represents an unsettled loan commitment. The coupon rate is to-be determined (TBD) at the time of settlement and will be based upon a reference index/floor plus a spread.
iSee Note 3(d) regarding investments in affiliated management investment companies.
jThe rate shown is the annualized seven-day effective yield at period end.
The accompanying notes are an integral part of these financial statements. | Annual Report | 21
FRANKLIN FLOATING RATE MASTER TRUST
| | | | | | | | | |
| Financial Highlights | | | | | | | | | |
| Franklin Middle Tier Floating Rate Fund | | | | | | | | | |
| | | Year Ended July 31, | | | | |
| | | 2018 | | | 2017 | | | 2016 | a |
| Per share operating performance | | | | | | | | | |
| (for a share outstanding throughout the year) | | | | | | | | | |
| Net asset value, beginning of year. | $ | 10.04 | | $ | 9.83 | | $ | 10.00 | |
| Income from investment operationsb: | | | | | | | | | |
| Net investment income | | 0.698 | | | 0.686 | | | 0.403 | |
| Net realized and unrealized gains (losses) | | (0.588 | ) | | 0.214 | | | (0.174 | ) |
| Total from investment operations. | | 0.110 | | | 0.900 | | | 0.229 | |
| Less distributions from net investment income | | (0.700 | ) | | (0.690 | ) | | (0.399 | ) |
| Net asset value, end of year | $ | 9.45 | | $ | 10.04 | | $ | 9.83 | |
| |
| Total returnc | | 1.30 | % | | 9.25 | % | | 2.46 | % |
| |
| Ratios to average net assetsd | | | | | | | | | |
| Expenses before waiver and payments by affiliates | | 0.68 | % | | 0.69 | % | | 0.71 | % |
| Expenses net of waiver and payments by affiliatese | | 0.60 | % | | 0.60 | % | | 0.60 | % |
| Net investment income. | | 7.25 | % | | 6.82 | % | | 5.76 | % |
| |
| Supplemental data | | | | | | | | | |
| Net assets, end of year (000’s) | $ | 363,071 | | $ | 303,689 | | $ | 348,682 | |
| Portfolio turnover rate | | 55.93 | % | | 62.11 | % | | 42.49 | %f |
aFor the period November 6, 2015 (commencement of operations) to July 31, 2016.
bThe amount shown for a share outstanding throughout the period may not correlate with the Statement of Operations for the period due to the timing of sales and repurchases of the Fund’s shares in relation to income earned and/or fluctuating fair value of the investments of the Fund.
cTotal return is not annualized for periods less than one year.
dRatios are annualized for periods less than one year, except for non-recurring expenses, if any.
eBenefit of expense reduction rounds to less than 0.01%.
fExcludes the value of portfolio securities received from purchase in-kind.
22 | Annual Report | The accompanying notes are an integral part of these financial statements.
FRANKLIN FLOATING RATE MASTER TRUST
| | | | | |
| Statement of Investments, July 31, 2018 | | | | | |
| Franklin Middle Tier Floating Rate Fund | | | | | |
| | | | Shares/ | | |
| | Country | | Units | | Value |
| Common Stocks and Other Equity Interests 4.1% | | | | | |
| Diversified Support Services 3.5% | | | | | |
| a,b,c Remington Outdoor Co. Inc | United States | | 732,184 | $ | 12,643,927 |
| a,b,c Remington Outdoor Co. Inc., Litigation Units | United States | | 68,931 | | — |
| | | | | | 12,643,927 |
| Forest Products 0.6% | | | | | |
| a,b,c Appvion Inc | United States | | 209,637 | | 2,075,940 |
| Total Common Stocks and Other Equity Interests | | | | | |
| (Cost $35,453,756) | | | | | 14,719,867 |
| |
| | | | Principal | | |
| | | | Amount* | | |
| Corporate Bonds (Cost $7,128,952) 1.8% | | | | | |
| Industrial Machinery 1.8% | | | | | |
| d Onsite Rental Group Operations Pty. Ltd., secured note, PIK, 6.10%, 10/26/23 | Australia | $ | 8,660,319 | | 6,711,747 |
| e,f Senior Floating Rate Interests 81.8% | | | | | |
| Aerospace & Defense 2.6% | | | | | |
| Doncasters U.S. Finance LLC, | | | | | |
| Second Lien Term Loan, 10.584%, (3-month USD LIBOR + 8.25%), 10/09/20 | United States | | 5,623,654 | | 4,770,732 |
| Term B Loans, 5.834%, (3-month USD LIBOR + 3.50%), 4/09/20 | United States | | 4,870,341 | | 4,565,945 |
| | | | | | 9,336,677 |
| Airlines 0.5% | | | | | |
| Air Canada, Term Loan, 4.072%, (1-month USD LIBOR + 2.00%), 10/06/23 | Canada | | 1,883,819 | | 1,892,453 |
| Apparel Retail 9.6% | | | | | |
| g Ascena Retail Group Inc., Tranche B Term Loan, 6.625%, (1-month USD LIBOR + | | | | | |
| 4.50%), 8/21/22 | United States | | 38,089,836 | | 34,971,230 |
| Auto Parts & Equipment 0.1% | | | | | |
| TI Group Automotive Systems LLC, Initial US Term Loan, 4.577%, (1-month USD | | | | | |
| LIBOR + 2.50%), 6/30/22 | United States | | 496,508 | | 497,542 |
| Cable & Satellite 0.5% | | | | | |
| CSC Holdings LLC, March 2017 Incremental Term Loans, 4.322%, (1-month USD | | | | | |
| LIBOR + 2.25%), 7/17/25 | United States | | 1,709,345 | | 1,703,092 |
| Casinos & Gaming 0.4% | | | | | |
| Kingpin Intermediate Holdings LLC, Initial Term Loans, 5.58%, (1-month USD LIBOR | | | | | |
| + 3.50%), 7/03/24 | United States | | 1,362,240 | | 1,376,714 |
| Coal & Consumable Fuels 10.3% | | | | | |
| Bowie Resource Holdings LLC, First Lien Initial Term Loan, 7.827%, (1-month USD | | | | | |
| LIBOR + 5.75%), 8/14/20 | United States | | 37,710,123 | | 37,191,609 |
| Communications Equipment 0.3% | | | | | |
| Ciena Corp., Refinancing Term Loan, 4.586%, (1-month USD LIBOR + 2.50%), | | | | | |
| 1/28/22 | United States | | 1,126,559 | | 1,132,896 |
| CommScope Inc., Tranche 5 Term Loans, 4.077%, (1-month USD LIBOR + 2.00%), | | | | | |
| 12/29/22 | United States | | 46,065 | | 46,331 |
| | | | | | 1,179,227 |
Annual Report | 23
FRANKLIN FLOATING RATE MASTER TRUST
STATEMENT OF INVESTMENTS
| | | | | |
| Franklin Middle Tier Floating Rate Fund (continued) | | | | | |
| | | | Principal | | |
| | Country | | Amount* | | Value |
| e,f Senior Floating Rate Interests (continued) | | | | | |
| Diversified Support Services 0.4% | | | | | |
| KAR Auction Services Inc., Tranche B-5 Term Loans, 4.625%, (1-month USD LIBOR | | | | | |
| + 2.50%), 3/09/23 | United States | $ | 421,090 | $ | 422,668 |
| Ventia Pty. Ltd., Term B Loans (USD), 5.834%, (3-month USD LIBOR + 3.50%), | | | | | |
| 5/21/22 | Australia | | 1,153,649 | | 1,165,186 |
| | | | | | 1,587,854 |
| Electric Utilities 0.2% | | | | | |
| EFS Cogen Holdings I LLC (Linden), Term B Advance, 5.59%, (3-month USD LIBOR | | | | | |
| + 3.25%), 6/28/23 | United States | | 661,357 | | 663,920 |
| Food Retail 1.4% | | | | | |
| Smart & Final Stores LLC, First Lien Term Loan, 5.577%, (1-month USD LIBOR + | | | | | |
| 3.50%), 11/15/22 | United States | | 4,999,217 | | 4,890,899 |
| Forest Products 4.0% | | | | | |
| Appvion Inc., Term Loan, 8.09%, (1-month USD LIBOR + 6.00%), 6/15/26 | United States | | 14,600,813 | | 14,600,813 |
| General Merchandise Stores 2.6% | | | | | |
| d 99 Cents Only Stores, First Lien Term Loan, PIK, 8.807% - 8.834%, (3-month USD | | | | | |
| LIBOR + 6.50%), 1/13/22 | United States | | 9,960,119 | | 9,437,263 |
| Health Care Services 2.5% | | | | | |
| Air Medical Group Holdings Inc., 2018 New Term Loans, 6.329%, (1-month USD | | | | | |
| LIBOR + 4.25%), 3/14/25 | United States | | 7,004,800 | | 6,930,374 |
| U.S. Renal Care Inc., Initial Term Loan, 6.584%, (3-month USD LIBOR + 4.25%), | | | | | |
| 12/31/22 | United States | | 2,196,396 | | 2,166,195 |
| | | | | | 9,096,569 |
| Health Care Technology 0.2% | | | | | |
| Quintiles IMS Inc., Term B-2 Dollar Loans, 4.334%, (3-month USD LIBOR + 2.00%), | | | | | |
| 1/20/25 | United States | | 707,216 | | 707,658 |
| Household Products 0.0%† | | | | | |
| Spectrum Brands Inc., | | | | | |
| USD Term Loans, 4.17%, (2-month USD LIBOR + 2.00%), 6/23/22 | United States | | 387 | | 388 |
| USD Term Loans, 4.34% - 4.363%, (3-month USD LIBOR + 2.00%), 6/23/22 | United States | | 152,285 | | 152,642 |
| | | | | | 153,030 |
| Independent Power Producers & Energy Traders 0.2% | | | | | |
| Helix Gen Funding LLC, Term Loan, 5.827%, (1-month USD LIBOR + 3.75%), | | | | | |
| 6/02/24 | United States | | 670,599 | | 676,581 |
| Industrial Machinery 5.5% | | | | | |
| Harsco Corp., Term Loan B-2, 4.375%, (1-month USD LIBOR + 2.25%), 12/10/24 | United States | | 140,639 | | 141,547 |
| Navistar Inc., Tranche B Term Loan, 5.60%, (1-month USD LIBOR + 3.50%), | | | | | |
| 11/06/24 | United States | | 13,281,679 | | 13,368,833 |
| Onsite Rental Group Operations Property Ltd., Term Loan, 6.564%, (1-month USD | | | | | |
| LIBOR + 4.50%), 10/25/22. | Australia | | 6,334,266 | | 6,270,924 |
| | | | | | 19,781,304 |
| Integrated Telecommunication Services 6.5% | | | | | |
| Consolidated Communications Inc., Initial Term Loan, 5.08%, (1-month USD LIBOR | | | | | |
| + 3.00%), 10/05/23 | United States | | 1,008,357 | | 998,526 |
| Global Tel*Link Corp., Term Loan, 6.334%, (3-month USD LIBOR + 4.00%), 5/23/20 . | United States | | 14,891,994 | | 14,992,053 |
| Securus Technologies Holdings Inc., Initial Term Loan B, 6.577%, (1-month USD | | | | | |
| LIBOR + 4.50%), 11/01/24. | United States | | 7,722,024 | | 7,754,201 |
| | | | | | 23,744,780 |
24 | Annual Report
FRANKLIN FLOATING RATE MASTER TRUST
STATEMENT OF INVESTMENTS
| | | | | |
| Franklin Middle Tier Floating Rate Fund (continued) | | | | | |
| | | | Principal | | |
| | Country | | Amount* | | Value |
| e,f Senior Floating Rate Interests (continued) | | | | | |
| Leisure Facilities 0.7% | | | | | |
| 24 Hour Fitness Worldwide Inc., Term Loan, 5.572%, (1-month USD LIBOR + | | | | | |
| 3.50%), 5/30/25 | United States | $ | 2,568,197 | $ | 2,582,643 |
| Life Sciences Tools & Services 0.1% | | | | | |
| Syneos Health Inc., Initial Term B Loans, 4.077%, (1-month USD LIBOR + 2.00%), | | | | | |
| 8/01/24 | United States | | 415,586 | | 415,877 |
| Marine 2.8% | | | | | |
| Navios Maritime Midstream Partners LP, Initial Term Loan, 6.83%, (3-month USD | | | | | |
| LIBOR + 4.50%), 6/18/20 | Marshall Islands | | 84,399 | | 81,761 |
| Navios Maritime Partners LP, Initial Term Loan, 7.33%, (3-month USD LIBOR + | | | | | |
| 5.00%), 9/14/20 | United States | | 10,093,308 | | 10,126,950 |
| | | | | | 10,208,711 |
| Movies & Entertainment 0.3% | | | | | |
| AMC Entertainment Holdings Inc., 2016 Incremental Term Loans, 4.322%, (1-month | | | | | |
| USD LIBOR + 2.25%), 12/15/23 | United States | | 1,024,347 | | 1,026,816 |
| Oil & Gas Exploration & Production 12.7% | | | | | |
| Fieldwood Energy LLC, Closing Date Loans, 7.327%, (1-month USD LIBOR + | | | | | |
| 5.25%), 4/11/22 | United States | | 45,933,101 | | 46,082,384 |
| Oil & Gas Storage & Transportation 0.8% | | | | | |
| Strike LLC, Term Loan, 10.453%, (6-month USD LIBOR + 8.00%), 11/30/22 | United States | | 2,853,288 | | 2,896,087 |
| Packaged Foods & Meats 2.6% | | | | | |
| CSM Bakery Supplies LLC, | | | | | |
| Second Lien Term Loan, 10.09%, (3-month USD LIBOR + 7.75%), 7/03/21 | United States | | 2,000,000 | | 1,892,916 |
| Term Loans, 6.34%, (3-month USD LIBOR + 4.00%), 7/03/20 | United States | | 7,063,510 | | 6,895,752 |
| Post Holdings Inc., Series A Incremental Term Loans, 4.07%, (1-month USD LIBOR | | | | | |
| + 2.00%), 5/24/24 | United States | | 502,886 | | 503,654 |
| | | | | | 9,292,322 |
| Pharmaceuticals 0.7% | | | | | |
| Endo Luxembourg Finance Co. I S.A.R.L. and Endo LLC, Initial Term Loans, 6.375%, | | | | | |
| (1-month USD LIBOR + 4.25%), 4/29/24 | United States | | 309,639 | | 310,461 |
| Horizon Pharma Inc., Third Amendment Refinancing Term Loan, 5.375%, (1-month | | | | | |
| USD LIBOR + 3.25%), 3/29/24 | United States | | 2,273,518 | | 2,278,136 |
| | | | | | 2,588,597 |
| Semiconductors 0.4% | | | | | |
| ON Semiconductor Corp., 2018 New Replacement Term B-3 Loans, 3.827%, | | | | | |
| (1-month USD LIBOR + 1.75%), 3/31/23 | United States | | 1,371,691 | | 1,375,120 |
| Specialized Consumer Services 0.4% | | | | | |
| Avis Budget Car Rental LLC, Tranche B Term Loans, 4.34%, (3-month USD LIBOR + | | | | | |
| 2.00%), 2/13/25 | United States | | 403,561 | | 404,697 |
| NVA Holdings Inc., Term B-3 Loan, 4.827%, (1-month USD LIBOR + 2.75%), | | | | | |
| 2/02/25 | United States | | 1,123,844 | | 1,122,089 |
| Sabre GLBL Inc., 2018 Other Term B Loans, 4.077%, (1-month USD LIBOR + | | | | | |
| 2.00%), 2/22/24 | United States | | 67,091 | | 67,222 |
| | | | | | 1,594,008 |
Annual Report | 25
FRANKLIN FLOATING RATE MASTER TRUST
STATEMENT OF INVESTMENTS
| | | | | |
| Franklin Middle Tier Floating Rate Fund (continued) | | | | | |
| | | | Principal | | |
| | Country | | Amount* | | Value |
| e,f Senior Floating Rate Interests (continued) | | | | | |
| Specialty Chemicals 1.4% | | | | | |
| Ashland LLC, Term B Loan, 3.827% - 3.829%, (1-month USD LIBOR + 1.75%), | | | | | |
| 5/17/24 | United States | $ | 152,671 | $ | 153,339 |
| Axalta Coating Systems U.S. Holdings Inc., Term B-3 Dollar Loan, 4.084%, (3-month | | | | | |
| USD LIBOR + 1.75%), 6/01/24 | United States | | 1,619,973 | | 1,621,828 |
| Oxbow Carbon LLC, Second Lien Term Loan, 9.577%, (1-month USD LIBOR + | | | | | |
| 7.50%), 1/04/24 | United States | | 3,140,163 | | 3,202,966 |
| | | | | | 4,978,133 |
| Specialty Stores 11.1% | | | | | |
| General Nutrition Centers Inc., | | | | | |
| FILO Term Loan (ABL), 9.08%, (1-month USD LIBOR + 7.00%), 12/31/22 | United States | | 3,860,510 | | 3,983,564 |
| Tranche B-2 Term Loans, 10.83%, (1-month USD LIBOR + 8.75%), 3/04/21 | United States | | 32,949,553 | | 31,970,950 |
| Jo-Ann Stores Inc., Initial Loans, 7.509%, (6-month USD LIBOR + 5.00%), 10/23/23 . | United States | | 3,669,035 | | 3,680,501 |
| PETCO Animal Supplies Stores Inc., Second Amendment Term Loans, 5.609%, | | | | | |
| (3-month USD LIBOR + 3.25%), 1/26/23 | United States | | 992,366 | | 716,571 |
| | | | | | 40,351,586 |
| Total Senior Floating Rate Interests | | | | | |
| (Cost $294,192,809) | | | | | 296,881,499 |
| Total Investments before Short Term Investments | | | | | |
| (Cost $336,775,517) | | | | | 318,313,113 |
| |
| |
| | | | Shares | | |
| |
| |
| Short Term Investments (Cost $37,776,194) 10.4% | | | | | |
| |
| Money Market Funds 10.4% | | | | | |
| h,i Institutional Fiduciary Trust Money Market Portfolio, 1.57% | United States | | 37,776,194 | | 37,776,194 |
| Total Investments (Cost $374,551,711) 98.1% | | | | | 356,089,307 |
| Other Assets, less Liabilities 1.9% | | | | | 6,981,837 |
| Net Assets 100.0%. | | | | $ | 363,071,144 |
See Abbreviations on page 42.
†Rounds to less than 0.1% of net assets.
*The principal amount is stated in U.S. dollars unless otherwise indicated.
aNon-income producing.
bFair valued using significant unobservable inputs. See Note 12 regarding fair value measurements.
cSee Note 9 regarding restricted securities.
dIncome may be received in additional securities and/or cash.
eThe coupon rate shown represents the rate at period end.
fSee Note 1(c) regarding senior floating rate interests.
gA portion or all of the security purchased on a delayed delivery basis. See Note 1(b)
hSee Note 3(d) regarding investments in affiliated management investment companies.
iThe rate shown is the annualized seven-day effective yield at period end.
26 | Annual Report | The accompanying notes are an integral part of these financial statements.
FRANKLIN FLOATING RATE MASTER TRUST
Financial Statements
Statements of Assets and Liabilities
July 31, 2018
| | | | | | |
| | | Franklin | | | Franklin | |
| | | Lower Tier | | | Middle Tier | |
| | | Floating | | | Floating | |
| | | Rate Fund | | | Rate Fund | |
| Assets: | | | | | | |
| Investments in securities: | | | | | | |
| Cost - Unaffiliated issuers | $ | 373,028,593 | | $ | 336,775,517 | |
| Cost - Non-controlled affiliates (Note 3d) | | 36,766,806 | | | 37,776,194 | |
| Value - Unaffiliated issuers | $ | 371,230,049 | | $ | 318,313,113 | |
| Value - Non-controlled affiliates (Note 3d) | | 36,766,806 | | | 37,776,194 | |
| Cash | | 485,837 | | | 960,707 | |
| Receivables: | | | | | | |
| Investment securities sold | | 11,186,407 | | | 9,088,217 | |
| Interest | | 2,717,706 | | | 1,248,195 | |
| Other assets | | 219 | | | 199 | |
| Total assets | | 422,387,024 | | | 367,386,625 | |
| Liabilities: | | | | | | |
| Payables: | | | | | | |
| Investment securities purchased | | 23,093,133 | | | 1,586,162 | |
| Management fees | | 185,122 | | | 168,870 | |
| Distributions to shareholders | | 2,893,356 | | | 2,493,353 | |
| Unrealized depreciation on unfunded loan commitments (Note 10) | | 10,653 | | | — | |
| Accrued expenses and other liabilities. | | 221,810 | | | 67,096 | |
| Total liabilities | | 26,404,074 | | | 4,315,481 | |
| Net assets, at value | $ | 395,982,950 | | $ | 363,071,144 | |
| Net assets consist of: | | | | | | |
| Paid-in capital | $ | 401,917,772 | | $ | 381,477,608 | |
| Undistributed net investment income. | | — | | | 69,405 | |
| Distributions in excess of net investment income | | (328,979 | ) | | — | |
| Net unrealized appreciation (depreciation) | | (1,809,197 | ) | | (18,462,404 | ) |
| Accumulated net realized gain (loss) | | (3,796,646 | ) | | (13,465 | ) |
| Net assets, at value | $ | 395,982,950 | | $ | 363,071,144 | |
| Shares outstanding. | | 40,468,790 | | | 38,432,313 | |
| Net asset value per share | $ | 9.78 | | $ | 9.45 | |
The accompanying notes are an integral part of these financial statements. | Annual Report | 27
FRANKLIN FLOATING RATE MASTER TRUST
FINANCIAL STATEMENTS
| | | | | | |
| Statements of Operations | | | | | | |
| for the year ended July 31, 2018 | | | | | | |
| |
| | | Franklin | | | Franklin | |
| | | Lower Tier | | | Middle Tier | |
| | | Floating | | | Floating | |
| | | Rate Fund | | | Rate Fund | |
| Investment income: | | | | | | |
| Dividends: | | | | | | |
| Non-controlled affiliates (Note 3d) | $ | 448,167 | | $ | 388,308 | |
| Interest: | | | | | | |
| Unaffiliated issuers | | 37,186,028 | | | 27,172,510 | |
| Total investment income | | 37,634,195 | | | 27,560,818 | |
| Expenses: | | | | | | |
| Management fees (Note 3a) | | 2,524,213 | | | 2,279,846 | |
| Custodian fees (Note 4) | | 2,392 | | | 3,317 | |
| Reports to shareholders | | 4,887 | | | 4,835 | |
| Registration and filing fees | | 242 | | | 242 | |
| Professional fees. | | 88,287 | | | 84,843 | |
| Trustees’ fees and expenses. | | 14,284 | | | 12,807 | |
| Other | | 9,683 | | | 8,958 | |
| Total expenses | | 2,643,988 | | | 2,394,848 | |
| Expense reductions (Note 4) | | (2,944 | ) | | (2,740 | ) |
| Expenses waived/paid by affiliates (Note 3d and 3e) | | (309,120 | ) | | (285,758 | ) |
| Net expenses | | 2,331,924 | | | 2,106,350 | |
| Net investment income | | 35,302,271 | | | 25,454,468 | |
| Realized and unrealized gains (losses): | | | | | | |
| Net realized gain (loss) from: | | | | | | |
| Investments: | | | | | | |
| Unaffiliated issuers | | (3,205,603 | ) | | 774,231 | |
| Net change in unrealized appreciation (depreciation) on: | | | | | | |
| Investments: | | | | | | |
| Unaffiliated issuers | | (13,619,986 | ) | | (21,733,022 | ) |
| Net realized and unrealized gain (loss) | | (16,825,589 | ) | | (20,958,791 | ) |
| Net increase (decrease) in net assets resulting from operations | $ | 18,476,682 | | $ | 4,495,677 | |
28 | Annual Report | The accompanying notes are an integral part of these financial statements.
FRANKLIN FLOATING RATE MASTER TRUST
FINANCIAL STATEMENTS
| | | | | | | | | | | | | | |
| Statements of Changes in Net Assets | | | | | | | | | | | | | | |
| |
| | | Franklin Lower Tier | | | Franklin Middle Tier | |
| | | Floating Rate Fund | | | Floating Rate Fund | |
| | | Year Ended July 31, | | | Year Ended July 31, | |
| | | 2018 | | | | 2017 | | | 2018 | | | | 2017 | |
| Increase (decrease) in net assets: | | | | | | | | | | | | | | |
| Operations: | | | | | | | | | | | | | | |
| Net investment income | $ | 35,302,271 | | | $ | 36,452,445 | | $ | 25,454,468 | | | $ 21,557,757 | |
| Net realized gain (loss) | | (3,205,603 | ) | | | 14,294,484 | | | 774,231 | | | | 1,493,949 | |
| Net change in unrealized appreciation (depreciation) | | (13,619,986 | ) | | | 7,702,837 | | | (21,733,022 | ) | | | 6,209,380 | |
| Net increase (decrease) in net assets resulting from | | | | | | | | | | | | | | |
| operations | | 18,476,682 | | | | 58,449,766 | | | 4,495,677 | | | | 29,261,086 | |
| Distributions to shareholders from: | | | | | | | | | | | | | | |
| Net investment income | | (35,320,548 | ) | | | (37,193,892 | ) | | (25,511,112 | ) | | | (21,691,391 | ) |
| Net realized gains | | (10,759,775 | ) | | | — | | | — | | | | — | |
| Total distributions to shareholders | | (46,080,323 | ) | | | (37,193,892 | ) | | (25,511,112 | ) | | | (21,691,391 | ) |
| Capital share transactions (Note 2) | | 81,975,267 | | | (115,824,771 | ) | | 80,397,811 | | | | (52,562,680 | ) |
| Net increase (decrease) in net assets. | | 54,371,626 | | | | (94,568,897 | ) | | 59,382,376 | | | | (44,992,985 | ) |
| Net assets: | | | | | | | | | | | | | | |
| Beginning of year | | 341,611,324 | | | 436,180,221 | | | 303,688,768 | | | 348,681,753 | |
| End of year. | $ | 395,982,950 | | | $ 341,611,324 | | $ | 363,071,144 | | | $ 303,688,768 | |
| Undistributed net investment income included in net assets: | | | | | | | | | | | | | | |
| End of year. | $ | — | | | $ | — | | $ | 69,405 | | | $ | 73,673 | |
| Distributions in excess of net investment income included in net | | | | | | | | | | | | | | |
| assets: | | | | | | | | | | | | | | |
| End of year. | $ | (328,979 | ) | | $ | (363,490 | ) | $ | — | | | $ | — | |
The accompanying notes are an integral part of these financial statements. | Annual Report | 29
FRANKLIN FLOATING RATE MASTER TRUST
FINANCIAL STATEMENTS
Statement of Cash Flows for the year ended July 31, 2018
| | | |
| | | Franklin | |
| | | Lower Tier | |
| | | Floating | |
| | | Rate Fund | |
| Cash flow from operating activities: | | | |
| Dividends, interest and other income received | $ | 25,061,524 | |
| Operating expenses paid | | (2,146,973 | ) |
| Purchases of long-term investments. | | (175,684,203 | ) |
| Sales and maturities of long-term investments | | 120,249,695 | |
| Net purchases of short-term investments | | (30,471,869 | ) |
| Cash used - operating activities | | (62,991,826 | ) |
| Cash flow from financing activities: | | | |
| Proceeds from shares sold | | 77,556,310 | |
| Payment of shares redeemed | | (3,253,058 | ) |
| Cash distributions to shareholders | | (38,161,864 | ) |
| Cash provided - financing activities | | 36,141,388 | |
| Net increase (decrease) in cash | | (26,850,438 | ) |
| Cash at beginning of year | | 27,336,275 | |
| Cash at end of year | $ | 485,837 | |
| |
| |
| Reconciliation of Net Increase (Decrease) in Net Assets resulting from Operating Activities to Net Cash Provided | | | |
| by Operating Activities | | | |
| for the year ended July 31, 2018 | | | |
| |
| Net increase (decrease) in net assets resulting from operating activities | $ | 18,476,682 | |
| Adjustments to reconcile net increase (decrease) in net assets resulting from operating activities to net cash provided by | | | |
| operating activities: | | | |
| Net amortization income | | (9,681,089 | ) |
| Reinvested dividends from non-controlled affiliates | | (448,167 | ) |
| Interest received in the form of securities | | (768,542 | ) |
| Increase in dividends and interest receivable and other assets | | (906,331 | ) |
| Increase in payable to affiliates, accrued expenses, and other liabilities | | 184,951 | |
| Decrease in receivable for investments sold | | 5,673,768 | |
| Increase in payable for investments purchased | | 9,926,293 | |
| Increase in cost of investments. | | (99,069,377 | ) |
| Decrease in unrealized appreciation on investments | | 13,619,986 | |
| Net cash used by operating activities | $ | (62,991,826 | ) |
| Non cash financing activities - reinvestment of dividends | $ | 7,672,015 | |
30 | Annual Report | The accompanying notes are an integral part of these financial statements.
FRANKLIN FLOATING RATE MASTER TRUST
Notes to Financial Statements
| | |
1. Organization and Significant Accounting Policies Franklin Floating Rate Master Trust (Trust) is registered under the Investment Company Act of 1940 (1940 Act) as an open-end management investment company, consisting of three separate funds, two of which are included in this report (Funds) and applies the specialized accounting and reporting guidance in U.S. Generally Accepted Accounting Principles (U.S. GAAP). The shares are issued in private placements and exempt from registration under the Securities Act of 1933. The following summarizes the Funds’ significant accounting policies. a. Financial Instrument Valuation The Funds’ investments in financial instruments are carried at fair value daily. Fair value is the price that would be received to sell an asset or paid to transfer a liability in an orderly transaction between market participants on the measurement date. The Funds calculate the net asset value (NAV) per share each business day as of 4 p.m. Eastern time or the regularly scheduled close of the New York Stock Exchange (NYSE), whichever is earlier. Under compliance policies and procedures approved by the Trust’s Board of Trustees (the Board), the Funds’ administrator has responsibility for oversight of valuation, including leading the cross-functional Valuation Committee (VC). The VC provides administration and oversight of the Funds’ valuation policies and procedures, which are approved annually by the Board. Among other things, these procedures allow the Funds to utilize independent pricing services, quotations from securities and financial instrument dealers, and other market sources to determine fair value. Equity securities listed on an exchange or on the NASDAQ National Market System are valued at the last quoted sale price or the official closing price of the day, respectively. Over-the-counter (OTC) securities are valued within the range of the most recent quoted bid and ask prices. Securities that trade in multiple markets or on multiple exchanges are valued according to the broadest and most representative market. Certain equity securities are valued based upon fundamental characteristics or relationships to similar securities. Debt securities generally trade in the OTC market rather than on a securities exchange. The Funds’ pricing services use multiple valuation techniques to determine fair value. In instances where sufficient market activity exists, the pricing services may utilize | | a market-based approach through which quotes from market makers are used to determine fair value. In instances where sufficient market activity may not exist or is limited, the pricing services also utilize proprietary valuation models which may consider market characteristics such as benchmark yield curves, credit spreads, estimated default rates, anticipated market interest rate volatility, coupon rates, anticipated timing of principal repayments, underlying collateral, and other unique security features in order to estimate the relevant cash flows, which are then discounted to calculate the fair value. Investments in open-end mutual funds are valued at the closing NAV. The Funds have procedures to determine the fair value of financial instruments for which market prices are not reliable or readily available. Under these procedures, the VC convenes on a regular basis to review such financial instruments and considers a number of factors, including significant unobservable valuation inputs, when arriving at fair value. The VC primarily employs a market-based approach which may use related or comparable assets or liabilities, recent transactions, market multiples, book values, and other relevant information for the investment to determine the fair value of the investment. An income-based valuation approach may also be used in which the anticipated future cash flows of the investment are discounted to calculate fair value. Discounts may also be applied due to the nature or duration of any restrictions on the disposition of the investments. Due to the inherent uncertainty of valuations of such investments, the fair values may differ significantly from the values that would have been used had an active market existed. The VC employs various methods for calibrating these valuation approaches including a regular review of key inputs and assumptions, transactional back-testing or disposition analysis, and reviews of any related market activity. b. Securities Purchased on a Delayed Delivery Basis Certain or all Funds purchase securities on a delayed delivery basis, with payment and delivery scheduled for a future date. These transactions are subject to market fluctuations and are subject to the risk that the value at delivery may be more or less than the trade date purchase price. Although the Funds will generally purchase these securities with the intention of holding the securities, they may sell the securities before the settlement date. Sufficient assets have been segregated for these securities. |
Annual Report | 31
FRANKLIN FLOATING RATE MASTER TRUST
NOTES TO FINANCIAL STATEMENTS
1. Organization and Significant Accounting Policies (continued) | | |
c. Senior Floating Rate Interests Certain or all Funds invest in senior secured corporate loans that pay interest at rates which are periodically reset by reference to a base lending rate plus a spread. These base lending rates are generally the prime rate offered by a designated U.S. bank or the London InterBank Offered Rate (LIBOR). Senior secured corporate loans often require prepayment of principal from excess cash flows or at the discretion of the borrower. As a result, actual maturity may be substantially less than the stated maturity. Senior secured corporate loans in which the Funds invest are generally readily marketable, but may be subject to certain restrictions on resale. d. Income Taxes It is each Fund’s policy to qualify as a regulated investment company under the Internal Revenue Code. Each Fund intends to distribute to shareholders substantially all of its taxable income and net realized gains to relieve it from federal income and excise taxes. As a result, no provision for U.S. federal income taxes is required. Each Fund may recognize an income tax liability related to its uncertain tax positions under U.S. GAAP when the uncertain tax position has a less than 50% probability that it will be sustained upon examination by the tax authorities based on its technical merits. As of July 31, 2018, each Fund has determined that no tax liability is required in its financial statements related to uncertain tax positions for any open tax years (or expected to be taken in future tax years). Open tax years are those that remain subject to examination and are based on the statute of limitations in each jurisdiction in which the Fund invests. e. Security Transactions, Investment Income, Expenses and Distributions Security transactions are accounted for on trade date. Realized gains and losses on security transactions are determined on a specific identification basis. Interest income and estimated expenses are accrued daily. Amortization of premium and accretion of discount on debt securities are included in interest | | income. Facility fees are recognized as income over the expected term of the loan. Dividend income is recorded on the ex-dividend date. Dividends from net investment income are normally declared daily; these dividends may be reinvested or paid monthly to shareholders. Distributions from realized capital gains and other distributions, if any, are recorded on the ex-dividend date. Distributable earnings are determined according to income tax regulations (tax basis) and may differ from earnings recorded in accordance with U.S. GAAP. These differences may be permanent or temporary. Permanent differences are reclassified among capital accounts to reflect their tax character. These reclassifications have no impact on net assets or the results of operations. Temporary differences are not reclassified, as they may reverse in subsequent periods. Common expenses incurred by the Trust are allocated among the Funds based on the ratio of net assets of each Fund to the combined net assets of the Trust or based on the ratio of number of shareholders of each Fund to the combined number of shareholders of the Trust. Fund specific expenses are charged directly to the Fund that incurred the expense. f. Accounting Estimates The preparation of financial statements in accordance with U.S. GAAP requires management to make estimates and assumptions that affect the reported amounts of assets and liabilities at the date of the financial statements and the amounts of income and expenses during the reporting period. Actual results could differ from those estimates. g. Guarantees and Indemnifications Under the Trust’s organizational documents, its officers and trustees are indemnified by the Trust against certain liabilities arising out of the performance of their duties to the Trust. Additionally, in the normal course of business, the Trust, on behalf of the Funds, enters into contracts with service providers that contain general indemnification clauses. The Trust’s maximum exposure under these arrangements is unknown as this would involve future claims that may be made against the Trust that have not yet occurred. Currently, the Trust expects the risk of loss to be remote. |
32 | Annual Report
FRANKLIN FLOATING RATE MASTER TRUST
NOTES TO FINANCIAL STATEMENTS
2. Shares of Beneficial Interest
At July 31, 2018, there were an unlimited number of shares authorized (without par value). Transactions in the Funds’ shares were as follows:
| | Franklin Lower Tier | | Franklin Middle Tier |
| | Floating Rate Fund | | Floating Rate Fund |
| | Shares | | Amount | | Shares | | Amount |
| Year ended July 31, 2018 | | | | | | | |
| Shares sold | 7,498,358 | | $ 77,556,310 | | 7,895,026 | | $ 77,520,869 |
| Shares issued in reinvestment of distributions | 763,270 | | 7,672,015 | | 415,128 | | 3,995,297 |
| Shares redeemed | (321,766) | | (3,253,058) | | (114,821) | | (1,118,355) |
| Net increase (decrease) | 7,939,862 | | $ 81,975,267 | | 8,195,333 | | $ 80,397,811 |
| Year ended July 31, 2017 | | | | | | | |
| Shares sold | 1,895,423 | | $20,008,980 | | 1,989,000 | | $ 20,007,330 |
| Shares issued in reinvestment of distributions | 26,801 | | 279,449 | | 7,316 | | 73,590 |
| Shares redeemed | (13,034,522) | | (136,113,200) | | (7,237,066) | | (72,643,600) |
| Net increase (decrease) | (11,112,298) | | $ (115,824,771) | | (5,240,750) | | $ (52,562,680) |
3. Transactions with Affiliates
Franklin Resources, Inc. is the holding company for various subsidiaries that together are referred to as Franklin Templeton Investments. Certain officers and trustees of the Trust are also officers, and/or directors of the following subsidiaries:
| Subsidiary | Affiliation |
| Franklin Advisers, Inc. (Advisers) | Investment manager |
| Franklin Templeton Services, LLC (FT Services) | Administrative manager |
| Franklin Templeton Investor Services, LLC (Investor Services) | Transfer agent |
a. Management Fees
The Funds pay an investment management fee to Advisers based on the average daily net assets of the Funds as follows:
| Annualized Fee Rate | Net Assets |
| 0.650% | Up to and including $500 million |
| 0.550% | Over $500 million, up to and including $1 billion |
| 0.500% | Over $1 billion, up to and including $1.5 billion |
| 0.450% | Over $1.5 billion, up to and including $6.5 billion |
| 0.425% | Over $6.5 billion, up to and including $11.5 billion |
| 0.400% | Over $11.5 billion, up to and including $16.5 billion |
| 0.390% | Over $16.5 billion, up to and including $19 billion |
| 0.380% | Over $19 billion, up to and including $21.5 billion |
| 0.370% | In excess of $21.5 billion |
Annual Report | 33
FRANKLIN FLOATING RATE MASTER TRUST
NOTES TO FINANCIAL STATEMENTS
3. Transactions with Affiliates (continued)
a. Management Fees (continued)
For the year ended July 31, 2018, each Fund’s gross effective investment management fee rate based on average daily net assets was as follows:
| |
| Franklin | Franklin |
| Lower Tier | Middle Tier |
| Floating | Floating |
| Rate Fund | Rate Fund |
| 0.650% | 0.650% |
b. Administrative Fees
Under an agreement with Advisers, FT Services provides administrative services to the Funds. The fee is paid by Advisers based on each of the Fund’s average daily net assets, and is not an additional expense of the Funds.
c. Transfer Agent Fees
Investor Services, under terms of an agreement, performs shareholder servicing for the Funds and is not paid by the Funds for the services.
d. Investments in Affiliated Management Investment Companies
Certain or all Funds invest in one or more affiliated management investment companies for purposes other than exercising a controlling influence over the management or policies. Management fees paid by the Funds are waived on assets invested in the affiliated management investment companies, as noted in the Statements of Operations, in an amount not to exceed the management and administrative fees paid directly or indirectly by each affiliate. During the year ended July 31, 2018, investments in affiliated management investment companies were as follows:
| | | | | | | | |
| | Number of | | | Number of | | | | Net Change in |
| | Shares Held | | | Shares | Value | | Realized | Unrealized |
| | at Beginning | Gross | Gross | Held at End | at End | Dividend | Gain | Appreciation |
| | of Year | Additions | Reductions | of Year | of Year | Income | (Loss) | (Depreciation) |
| Franklin Lower Tier Floating Rate Fund | | | | | | | | |
| Non-Controlled Affiliates | | | | | | | | |
| Institutional Fiduciary Trust Money Market | | | | | | | | |
| Portfolio, 1.57% | — | 257,242,348 | (220,475,542) | 36,766,806 | $36,766,806 | $448,167 | $ — | $ — |
| Franklin Middle Tier Floating Rate Fund | | | | | | | | |
| Non-Controlled Affiliates | | | | | | | | |
| Institutional Fiduciary Trust Money Market | | | | | | | | |
| Portfolio, 1.57% | — | 256,146,569 | (218,370,375) | 37,776,194 | $37,776,194 | $388,308 | $ — | $ — |
e. Waiver and Expense Reimbursements
Advisers has contractually agreed in advance to waive or limit its fees and to assume as its own expense certain expenses otherwise payable by the Funds so that the expenses (excluding acquired fund fees and expenses) for each of the Funds do not exceed 0.60% based on the average net assets of each Fund (other than certain non-routine expenses or costs, including those relating to litigation, indemnification, reorganizations, and liquidations) until November 30, 2018. Total expenses waived or paid are not subject to recapture subsequent to the Funds’ fiscal year end.
34 | Annual Report
FRANKLIN FLOATING RATE MASTER TRUST
NOTES TO FINANCIAL STATEMENTS
f. Other Affiliated Transactions
At July 31, 2018, the shares of the Funds were owned by the following investment companies:
| | | |
| | | Percentage of | |
| | | Outstanding | |
| Franklin Lower Tier Floating Rate Fund | Shares | Shares | |
| Franklin Floating Rate Daily Access Fund | 6,729,194 | 16.6 | % |
| Franklin Floating Rate Master Trust | 3,405,364 | 8.4 | % |
| Franklin Low Duration Total Return Fund | 1,893,663 | 4.7 | % |
| Franklin Strategic Income Fund | 25,361,119 | 62.7 | %a |
| Franklin Strategic Income VIP Fund | 2,081,861 | 5.1 | % |
| Franklin Total Return Fund. | 997,589 | 2.5 | % |
| Total | 40,468,790 | 100.0 | % |
| |
| | | Percentage of | |
| | | Outstanding | |
| Franklin Middle Tier Floating Rate Fund | Shares | Shares | |
| Franklin Floating Rate Daily Access Fund | 6,837,495 | 17.8 | % |
| Franklin Floating Rate Master Trust | 3,457,562 | 9.0 | % |
| Franklin Low Duration Total Return Fund | 2,389,308 | 6.2 | % |
| Franklin Strategic Income Fund | 21,833,687 | 56.8 | %a |
| Franklin Strategic Income VIP Fund | 2,024,951 | 5.3 | % |
| Franklin Total Return Fund. | 1,889,310 | 4.9 | % |
| Total | 38,432,313 | 100.0 | % |
aInvestment activities of this shareholder could have a material impact on the Fund.
g. Interfund Transactions
Certain or all Funds engaged in purchases and sales of investments with funds or other accounts that have common investment managers (or affiliated investment managers), directors, trustees or officers. These purchases and sales for the year ended July 31, 2018, were as follows:
| | | | |
| | | Franklin | | Franklin |
| | | Lower Tier | | Middle Tier |
| | | Floating | | Floating |
| | | Rate Fund | | Rate Fund |
| |
| Purchases | $ | 18,955,440 | $ | 49,715,611 |
| Sales. | $ | 14,626,055 | $ | — |
4. Expense Offset Arrangement
The Funds have entered into an arrangement with their custodian whereby credits realized as a result of uninvested cash balances are used to reduce a portion of the Funds’ custodian expenses. During the year ended July 31, 2018, the custodian fees were reduced as noted in the Statements of Operations.
Annual Report | 35
FRANKLIN FLOATING RATE MASTER TRUST
NOTES TO FINANCIAL STATEMENTS
5. Income Taxes
For tax purposes, capital losses may be carried over to offset future capital gains, if any. At July 31, 2018, the capital loss carryforwards were as follows:
| | |
| | | Franklin |
| | | Middle Tier |
| | | Floating |
| | | Rate Fund |
| |
| Capital loss carryforwards not subject to expiration: | | |
| Short Term | | $13,465 |
During the year ended July 31, 2018, Franklin Middle Tier Floating Rate Fund utilized $716,052 of capital loss carryforwards.
For tax purposes, the Funds may elect to defer any portion of a post-October capital loss to the first day of the following fiscal year. At July 31, 2018 , Franklin Lower Tier Floating Rate Fund deferred post-October capital losses of $3,621,489.
The tax character of distributions paid during the years ended July 31, 2018 and 2017, was as follows:
| | | | |
| | Franklin Lower Tier | Franklin Middle Tier |
| | Floating Rate Fund | Floating Rate Fund |
| | 2018 | 2017 | 2018 | 2017 |
| Distributions paid from: | | | | |
| Ordinary income | $38,159,844 | $37,193,892 | $25,511,112 | $21,691,391 |
| Long term capital gain | 7,920,479 | — | — | — |
| | $46,080,323 | $37,193,892 | $25,511,112 | $21,691,391 |
At July 31, 2018, the cost of investments, net unrealized appreciation (depreciation) and undistributed ordinary income for income tax purposes were as follows:
| | | | | | |
| | | Franklin | | | Franklin | |
| | | Lower Tier | | | Middle Tier | |
| | | Floating | | | Floating | |
| | | Rate Fund | | | Rate Fund | |
| |
| Cost of investments | $ | 411,060,704 | | $ | 375,232,170 | |
| |
| Unrealized appreciation | $ | 7,557,410 | | $ | 4,354,218 | |
| Unrealized depreciation | | (10,621,259 | ) | | (23,497,081 | ) |
| Net unrealized appreciation (depreciation) | $ | (3,063,849 | ) | $ | (19,142,863 | ) |
| Distributable earnings: | | | | | | |
| Undistributed ordinary income | $ | 3,654,525 | | $ | 3,243,218 | |
Differences between income and/or capital gains as determined on a book basis and a tax basis are primarily due to differing treatment of defaulted securities.
36 | Annual Report
FRANKLIN FLOATING RATE MASTER TRUST
NOTES TO FINANCIAL STATEMENTS
6. Investment Transactions
Purchases and sales of investments (excluding short term securities) for the year ended July 31, 2018, were as follows:
| | | | |
| | | Franklin | | Franklin |
| | | Lower Tier | | Middle Tier |
| | | Floating | | Floating |
| | | Rate Fund | | Rate Fund |
| |
| Purchases | $ | 185,610,496 | $ | 221,641,432 |
| Sales | $ | 114,584,815 | $ | 180,378,340 |
7. Credit Risk
At July 31, 2018, Franklin Lower Tier Floating Rate Fund and Franklin Middle Tier Floating Rate Fund had 91.0% and 89.3%, respectively, of their portfolio invested in senior secured floating rate notes rated below investment grade and unrated securities, if any. These securities may be more sensitive to economic conditions causing greater price volatility and are potentially subject to a greater risk of loss due to default than higher rated securities.
8. Concentration of Risk
The Funds invest a large percentage of their total assets in securities within similar businesses or sectors. Such concentration may subject the Funds to risks associated with industrial or regional matters, and economic, political or legal developments occurring within the businesses. Investing in these securities expose the Funds to heightened risks due to similar adverse economic and market events and ongoing restructuring discussions.
9. Restricted Securities
Certain or all Funds invest in securities that are restricted under the Securities Act of 1933 (1933 Act). Restricted securities are often purchased in private placement transactions, and cannot be sold without prior registration unless the sale is pursuant to an exemption under the 1933 Act. Disposal of these securities may require greater effort and expense, and prompt sale at an acceptable price may be difficult. The Funds may have registration rights for restricted securities. The issuer generally incurs all registration costs.
At July 31, 2018, investments in restricted securities, excluding securities exempt from registration under the 1933 Act deemed to be liquid, were as follows:
| | | | | | |
| Shares/ | | Acquisition | | | | |
| Units | Issuer | Date | | Cost | | Value |
| Franklin Lower Tier Floating Rate Fund | | | | | |
| 520,183 | a Appvion Inc | 6/14/18 | $ | 5,331,545 | $ | 5,151,135 |
| 2,076,237 | Remington Outdoor Co. Inc | 6/14/16 - 3/01/18 | | 42,534,637 | | 35,854,089 |
| 195,465 | Remington Outdoor Co. Inc., Litigation Units | 5/16/18 | | — | | — |
| | Total Restricted Securities (Value is 10.4% of Net Assets) | | $ | 47,866,182 | $ | 41,005,224 |
| Franklin Middle Tier Floating Rate Fund | | | | | |
| 209,637 | a Appvion Inc | 6/14/18 | $ | 2,148,646 | $ | 2,075,940 |
| 732,184 | Remington Outdoor Co. Inc | 11/06/15 - 1/26/18 | | 33,305,110 | | 12,643,927 |
| 68,931 | Remington Outdoor Co. Inc., Litigation Units | 5/16/18 | | — | | — |
| | Total Restricted Securities (Value is 4.1% of Net Assets) | | $ | 35,453,756 | $ | 14,719,867 |
| |
| aThe Fund also invests in unrestricted securities of the issuer, valued at $14,600,813 as of July 31, 2018. | | | | | |
Annual Report | 37
FRANKLIN FLOATING RATE MASTER TRUST
NOTES TO FINANCIAL STATEMENTS
10. Unfunded Loan Commitments
Certain or all Funds enter into certain credit agreements, all or a portion of which may be unfunded. The Funds are obligated to fund these loan commitments at the borrowers’ discretion. Unfunded loan commitments and funded portions of credit agreements are marked to market daily and any unrealized appreciation or depreciation is included in the Statements of Assets and Liabilities and the Statements of Operations. Funded portions of credit agreements are presented in the Statements of Investments.
At July 31, 2018, unfunded commitments were as follows:
| | |
| | | Unfunded |
| Borrower | | Commitment |
| Franklin Lower Tier Floating Rate Fund | | |
| FGI Operating Co. LLC (Freedom Group), DDTL Filo | $ | 4,090,909 |
11. Credit Facility
The Funds, together with other U.S. registered and foreign investment funds (collectively, Borrowers), managed by Franklin Templeton Investments, are borrowers in a joint syndicated senior unsecured credit facility totaling $2 billion (Global Credit Facility) which matures on February 8, 2019. This Global Credit Facility provides a source of funds to the Borrowers for temporary and emergency purposes, including the ability to meet future unanticipated or unusually large redemption requests.
Under the terms of the Global Credit Facility, the Funds shall, in addition to interest charged on any borrowings made by the Funds and other costs incurred by the Funds, pay their share of fees and expenses incurred in connection with the implementation and maintenance of the Global Credit Facility, based upon their relative share of the aggregate net assets of all of the Borrowers, including an annual commitment fee of 0.15% based upon the unused portion of the Global Credit Facility. These fees are reflected in other expenses in the Statements of Operations. During the year ended July 31, 2018, the Funds did not use the Global Credit Facility.
12. Fair Value Measurements
The Funds follow a fair value hierarchy that distinguishes between market data obtained from independent sources (observable inputs) and the Funds’ own market assumptions (unobservable inputs). These inputs are used in determining the value of the Funds’ financial instruments and are summarized in the following fair value hierarchy:
- Level 1 – quoted prices in active markets for identical financial instruments
- Level 2 – other significant observable inputs (including quoted prices for similar financial instruments, interest rates, prepayment speed, credit risk, etc.)
- Level 3 – significant unobservable inputs (including the Funds’ own assumptions in determining the fair value of financial instruments)
The input levels are not necessarily an indication of the risk or liquidity associated with financial instruments at that level.
For movements between the levels within the fair value hierarchy, the Funds have adopted a policy of recognizing the transfers as of the date of the underlying event which caused the movement.
38 | Annual Report
FRANKLIN FLOATING RATE MASTER TRUST
NOTES TO FINANCIAL STATEMENTS
A summary of inputs used as of July 31, 2018, in valuing the Funds’ assets and liabilities carried at fair value, is as follows:
| | | | | | | | | |
| | | Level 1 | | Level 2 | | Level 3 | | | Total |
| Franklin Lower Tier Floating Rate Fund | | | | | | | | | |
| Assets: | | | | | | | | | |
| Investments in Securities:a | | | | | | | | | |
| Equity Investments:b | | | | | | | | | |
| Diversified Support Services | $ | — | $ | — | $ | 35,854,089 | c | $ | 35,854,089 |
| Forest Products | | — | | — | | 5,151,135 | | | 5,151,135 |
| Corporate Bonds | | — | | 5,664,208 | | — | | | 5,664,208 |
| Senior Floating Rate Interests: | | | | | | | | | |
| Personal Products | | — | | — | | 60,680,227 | | | 60,680,227 |
| All Other Senior Floating Rate Interests | | — | | 263,880,390 | | — | | | 263,880,390 |
| Short Term Investments | | 36,766,806 | | — | | — | | | 36,766,806 |
| Total Investments in Securities | $ | 36,766,806 | $ | 269,544,598 | $ | 101,685,451 | | $ | 407,996,855 |
| |
| Liabilities: | | | | | | | | | |
| Other Financial Instruments: | | | | | | | | | |
| Unfunded Loan Commitments. | $ | — | $ | — | $ | 10,653 | | $ | 10,653 |
| |
| Franklin Middle Tier Floating Rate Fund | | | | | | | | | |
| Assets: | | | | | | | | | |
| Investments in Securities:a | | | | | | | | | |
| Equity Investments:b | | | | | | | | | |
| Diversified Support Services | $ | — | $ | — | $ | 12,643,927 | c | $ | 12,643,927 |
| Forest Products | | — | | — | | 2,075,940 | | | 2,075,940 |
| Corporate Bonds | | — | | 6,711,747 | | — | | | 6,711,747 |
| Senior Floating Rate Interests | | — | | 296,881,499 | | — | | | 296,881,499 |
| Short Term Investments | | 37,776,194 | | — | | — | | | 37,776,194 |
| Total Investments in Securities | $ | 37,776,194 | $ | 303,593,246 | $ | 14,719,867 | | $ | 356,089,307 |
aFor detailed categories, see the accompanying Statement of Investments.
bIncludes common stocks and other equity interests.
cIncludes securities determined to have no value at July 31, 2018.
A reconciliation of assets in which Level 3 inputs are used in determining fair value is presented when there are significant Level 3 financial instruments at the beginning and/or end of the year. At July 31, 2018, the reconciliations of assets and liabilities are as follows:
| | | | | | | | | | |
| | | | | | | | | | | Net Change in |
| | | | | | | | | | | Unrealized |
| | | | | | | | Net | Net | | Appreciation |
| | Balance at | | | Transfer | Transfer | | Realized | Unrealized | | (Depreciation) |
| | Beginning of | | | Into | Out of | Cost Basis | Gain | Appreciation | Balance at | on Assets Held |
| | Year | Purchases | Sales | Level 3a | Level 3 | Adjustments | (Loss) | (Depreciation) | End of Year | at Year End |
| Franklin Lower Tier Floating Rate Fund | | | | | | | | | | |
| Assets: | | | | | | | | | | |
| Investments in Securities: | | | | | | | | | | |
| Equity Investments:b | | | | | | | | | | |
| Diversified Support Services | $— | $— | $— | $25,781,639c | $— | $— | $— | $10,072,450 | $35,854,089c | $10,072,450 |
| Forest Products | — | — | — | 5,331,544 | — | — | — | (180,409) | 5,151,135 | (180,409) |
| Senior Floating Rate Interests | | | | | | | | | | |
| Personal Products | — | — | — | 60,680,227 | — | — | — | — | 60,680,227 | — |
| Total Investments in Securities | $— | $— | $— | $91,793,410 | $— | $— | $— | $9,892,041 | $101,685,451 | $9,892,041 |
| Liabilities: | | | | | | | | | | |
| Other Financial Instruments: | | | | | | | | | | |
| Unfunded Loan Commitments | $— | $— | $— | $— | $— | $— | $— | $(10,653) | $(10,653) | $(10,653) |
Annual Report | 39
FRANKLIN FLOATING RATE MASTER TRUST
NOTES TO FINANCIAL STATEMENTS
| | | | | | | | | | | | | | | | | | | | | | | | |
| 12. Fair Value Measurements (continued) | | | | | | | | | | | | | | | | | | | | |
| |
| | | | | | | | | | | | | | | | | | | | | | | | Net Change in | |
| | | | | | | | | | | | | | | | | | | | | | | | Unrealized | |
| | | | | | | | | | | | | | | | Net | | Net | | | | | | Appreciation | |
| | | Balance at | | | | | | Transfer | | | Transfer | | | | Realized | | Unrealized | | | | | | (Depreciation) | |
| | | Beginning of | | | | | | Into | | | Out of | | Cost Basis | | Gain | | Appreciation | | | Balance at | | | on Assets Held | |
| | | Year | | Purchases | | Sales | | Level 3a | | | Level 3 | | Adjustments | | (Loss) | | (Depreciation) | | | End of Year | | | at Year End | |
| Franklin Middle Tier Floating Rate Fund | | | | | | | | | | | | | | | | | | | | | | | | |
| Assets: | | | | | | | | | | | | | | | | | | | | | | | | |
| Investments in Securities: | | | | | | | | | | | | | | | | | | | | | | | | |
| Equity Investments:b | | | | | | | | | | | | | | | | | | | | | | | | |
| Diversified Support Services | $ | — | $ | — | $ | — | $ | 9,091,886 | c | $ | — | $ | — | $ | — | $ | 3,552,041 | | $ | 12,643,927 | c | $ | 3,552,041 | |
| Forest Products | | — | | — | | — | | 2,148,646 | | | — | | — | | — | | (72,706 | ) | | 2,075,940 | | | (72,706 | ) |
| Total Investments in Securities | $ | — | $ | — | $ | — | $ | 11,240,532 | | $ | — | $ | — | $ | — | $ | 3,479,335 | | $ | 14,719,867 | | $ | 3,479,335 | |
aThe investments were transferred into Level 3 as a result of the unavailability of a quoted market price in an active market for identical securities and other significant
observable valuation inputs. May include amounts related to a corporate action.
bIncludes common stocks and other equity interests.
cIncludes securities determined to have no value.
40 | Annual Report
FRANKLIN FLOATING RATE MASTER TRUST
NOTES TO FINANCIAL STATEMENTS
Significant unobservable valuation inputs for material Level 3 financial instruments and impact to fair value as a result of changes in unobservable valuation inputs as of July 31, 2018, are as follows:
| | | | | | | |
| | Fair Value | | | | | | Impact to Fair |
| | at End of | | Valuation | | | Amount/ | Value if Input |
| Description | Year | | Technique | Unobservable Inputs | | Range | Increasesa |
| Franklin Lower Tier Floating Rate Fund: | | | | | | |
| Assets: | | | | | | | |
| Investments in Securities: | | | | | | | |
| Equity Investments: | | | | | | | |
| Diversified Support | $35,854,089 | | Discounted cash flow | Discount for lack of marketability | | 20.0% | Decreaseb |
| Services | | | | | | | |
| | | | | Long-term revenue growth rate | | 1.0% | Increaseb |
| | | | | Weighted average cost of capital | | 12.8% | Decreasec |
| | | | Consensus Pricing | Offered / Bid quotes | | $10.25 - $19.11 | Increaseb |
| |
| Forest Products. | 5,151,135 | | Market Comparables | Discount for lack of marketability | | 20.0% | Decreased |
| | | | | EV/EBITDA multiple | | 5.3x | Increasec |
| |
| All other investmentse . | 60,680,227f | | | | | | |
| |
| Total | $101,685,451 | | | | | | |
| Liabilities: | | | | | | | |
| Other Financial | | | | | | | |
| Instruments: | | | | | | | |
| Unfunded Loan | | | | | | | |
| Commitmentse | $ 10,653 | | | | | | |
| Franklin Middle Tier Floating Rate Fund: | | | | | | |
| Assets: | | | | | | | |
| Investments in Securities: | | | | | | | |
| Equity Investments: | | | | | | | |
| Diversified Support | $12,643,927 | | Discounted cash flow | Discount for lack of marketability | | 20.0% | Decreaseb |
| Services | | | | | | | |
| | | | | Long-term revenue growth rate | | 1.0% | Increaseb |
| | | | | Weighted average cost of capital | | 12.8% | Decreasec |
| | | | Consensus Pricing | Offered / Bid quotes | | $10.25 - $19.11 | Increase |
| |
| Forest Products. | 2,075,940 | | Market Comparables | Discount for lack of marketability | | 20.0% | Decreased |
| | | | | EV/EBITDA multiple | | 5.3x | Increasec |
| |
| Total | $14,719,867 | | | | | | |
aRepresents the directional change in the fair value of the Level 3 financial instruments that would result from a significant and reasonable increase in the corresponding input. A significant and reasonable decrease in the input would have the opposite effect. Significant impacts, if any, to fair value and/or net assets have been indicated.
bRepresents a significant impact to net assets but not fair value.
cRepresents a significant impact to fair value and net assets.
dRepresents a significant impact to fair value but not net assets.
eIncludes financial instruments with values derived using prior transaction prices or third party pricing information without adjustment for which such inputs are unobservable. May also include fair value of immaterial financial instruments developed using various valuation techniques and unobservable inputs.
fIncludes securities determined to have no value at July 31, 2018.
Abbreviations List
EBITDA - Earnings before interest, taxes, depreciation and amortization
EV - Enterprise value
Annual Report | 41
FRANKLIN FLOATING RATE MASTER TRUST
NOTES TO FINANCIAL STATEMENTS
13. Subsequent Events
The Funds have evaluated subsequent events through the issuance of the financial statements and determined that no events have occurred that require disclosure.
| | |
| Abbreviations | | |
| Currency | Selected Portfolio |
| USD United States Dollar | LIBOR | London InterBank Offered Rate |
| | PIK | Payment-In-Kind |
42 | Annual Report
FRANKLIN FLOATING RATE MASTER TRUST
Report of Independent Registered Public Accounting Firm
To the Board of Trustees of Franklin Floating Rate Master Trust and Shareholders of Franklin Lower Tier Floating Rate Fund and Franklin Middle Tier Floating Rate Fund.
Opinions on the Financial Statements
We have audited the accompanying statements of assets and liabilities, including the statements of investments, of Franklin Lower Tier Floating Rate Fund and Franklin Middle Tier Floating Rate Fund (the "Funds") as of July 31, 2018, the related statements of operations for the year ended July 31, 2018, the statements of changes in net assets for each of the two years in the period ended July 31, 2018, and for Franklin Lower Tier Floating Rate Fund the statement of cash flows for the year ended July 31, 2018, including the related notes, and the financial highlights for each of the periods indicated therein (collectively referred to as the “financial statements”). In our opinion, the financial statements present fairly, in all material respects, the financial position of each of the Funds as of July 31, 2018, the results of each of their operations for the year then ended, the changes in each of their net assets for each of the two years in the period ended July 31, 2018, for Franklin Lower Tier Floating Rate Fund the results of its cash flows for the year then ended, and each of the financial highlights for each of the periods indicated therein in conformity with accounting principles generally accepted in the United States of America.
Basis for Opinions
These financial statements are the responsibility of the Funds’ management. Our responsibility is to express an opinion on the Funds’ financial statements based on our audits. We are a public accounting firm registered with the Public Company Accounting Oversight Board (United States) (“PCAOB”) and are required to be independent with respect to the Funds in accordance with the U.S. federal securities laws and the applicable rules and regulations of the Securities and Exchange Commission and the PCAOB.
We conducted our audits of these financial statements in accordance with the standards of the PCAOB. Those standards require that we plan and perform the audit to obtain reasonable assurance about whether the financial statements are free of material misstatement, whether due to error or fraud.
Our audits included performing procedures to assess the risks of material misstatement of the financial statements, whether due to error or fraud, and performing procedures that respond to those risks. Such procedures included examining, on a test basis, evidence regarding the amounts and disclosures in the financial statements. Our audits also included evaluating the accounting principles used and significant estimates made by management, as well as evaluating the overall presentation of the financial statements. Our procedures included confirmation of securities owned as of July 31, 2018 by correspondence with the custodian, transfer agent and brokers; when replies were not received from brokers, we performed other auditing procedures. We believe that our audits provide a reasonable basis for our opinions.
PricewaterhouseCoopers LLP
San Francisco, California
September 18, 2018
We have served as the auditor of one or more investment companies in the Franklin Templeton funds since 1948.
Annual Report | 43
FRANKLIN FLOATING RATE MASTER TRUST
Tax Information (unaudited)
Under Section 852(b)(3)(C) of the Internal Revenue Code, Franklin Lower Tier Floating Rate Fund hereby report the maximum amount allowable but no less than $7,920,479 as long term capital gain dividends for the fiscal year ended July 31, 2018:
Under Section 871(k)(2)(C) of the Internal Revenue Code, Franklin Lower Tier Floating Rate Fund hereby report the maximum amount allowable but no less than the $2,837,398 as short term capital gain dividends for purposes of the tax imposed under Section 871(a)(1)(A) of the Internal Revenue Code for the fiscal year ended July 31, 2018:
Under Section 871(k)(1)(C) of the Internal Revenue Code, the Funds hereby report the maximum amount allowable but no less than the following amounts as interest related dividends for purposes of the tax imposed under Section 871(a)(1)(A) of the Internal Revenue Code for the fiscal year ended July 31, 2018:
| |
| Franklin Lower | Franklin Middle |
| Tier Floating Rate | Tier Floating Rate |
| Fund | Fund |
| $32,903,300 | $23,631,765 |
44 | Annual Report
Item 2. Code of Ethics.
(a) The Registrant has adopted a code of ethics that applies to its principal executive officers and principal financial and accounting officer.
(c) N/A
(d) N/A
(f) Pursuant to Item 12(a)(1), the Registrant is attaching as an exhibit a copy of its code of ethics that applies to its principal executive officers and principal financial and accounting officer.
Item 3. Audit Committee Financial Expert.
(a)(1) The Registrant has an audit committee financial expert serving on its audit committee.
(2) The audit committee financial expert is John B. Wilson and he is "independent" as defined under the relevant Securities and Exchange Commission Rules and Releases.
Item 4. Principal Accountant Fees and Services.
(a) Audit Fees
The aggregate fees paid to the principal accountant for professional services rendered by the principal accountant for the audit of the registrant’s annual financial statements or for services that are normally provided by the principal accountant in connection with statutory and regulatory filings or engagements were $195,330 for the fiscal year ended July 31, 2018 and $196,740 for the fiscal year ended July 31, 2017.
(b) Audit-Related Fees
There were no fees paid to the principal accountant for assurance and related services rendered by the principal accountant to the registrant that are reasonably related to the performance of the audit of the registrant's financial statements and are not reported under paragraph (a) of Item 4.
There were no fees paid to the principal accountant for assurance and related services rendered by the principal accountant to the registrant's investment adviser and any entity controlling, controlled by or under common control with the investment adviser that provides ongoing services to the registrant that are reasonably related to the performance of the audit of their financial statements.
(c) Tax Fees
There were no fees paid to the principal accountant for professional services rendered by the principal accountant to the registrant for tax compliance, tax advice and tax planning.
The aggregate fees paid to the principal accountant for professional services rendered by the principal accountant to the registrant’s investment adviser and any entity controlling, controlled by or under common control with the investment adviser that provides ongoing services to the registrant for tax compliance, tax advice and tax planning were $5,000 for the fiscal year ended July 31, 2018 and $0 for the fiscal year ended July 31, 2017. The services for which these fees were paid included tax consulting services related to the operating agreement and term sheet for the launch of a new fund.
(d) All Other Fees
The aggregate fees paid to the principal accountant for products and services rendered by the principal accountant to the registrant not reported in paragraphs (a)-(c) of Item 4 were $915 for the fiscal year ended July 31, 2018 and $0 for the fiscal year ended July 31, 2017. The services for which these fees were paid included review of materials provided to the fund Board in connection with the investment management contract renewal process.
The aggregate fees paid to the principal accountant for products and services rendered by the principal accountant to the registrant’s investment adviser and any entity controlling, controlled by or under common control with the investment adviser that provides ongoing services to the registrant, other than services reported in paragraphs (a)-(c) of Item 4 were $30,500 for the fiscal year ended July 31, 2018 and $255,000 for the fiscal year ended July 31, 2017. The services for which these fees were paid included preparation and review of materials provided to the fund Board in connection with the investment management contract renewal process and derivatives assessment, assets under management certification, and the issuance of an Auditors’ Certificate for South Korean regulatory shareholder disclosures.
(e) (1) The registrant’s audit committee is directly responsible for approving the services to be provided by the auditors, including:
(i) pre-approval of all audit and audit related services;
(ii) pre-approval of all non-audit related services to be provided to the Fund by the auditors;
(iii) pre-approval of all non-audit related services to be provided to the registrant by the auditors to the registrant’s investment adviser or to any entity that controls, is controlled by or is under common control with the registrant’s investment adviser and that provides ongoing services to the registrant where the non-audit services relate directly to the operations or financial reporting of the registrant; and
(iv) establishment by the audit committee, if deemed necessary or appropriate, as an alternative to committee pre-approval of services to be provided by the auditors, as required by paragraphs (ii) and (iii) above, of policies and procedures to permit such services to be pre-approved by other means, such as through establishment of guidelines or by action of a designated member or members of the committee; provided the policies and procedures are detailed as to the particular service and the committee is informed of each service and such policies and procedures do not include delegation of audit committee responsibilities, as contemplated under the Securities Exchange Act of 1934, to management; subject, in the case of (ii) through (iv), to any waivers, exceptions or exemptions that may be available under applicable law or rules.
(e) (2) None of the services provided to the registrant described in paragraphs (b)-(d) of Item 4 were approved by the audit committee pursuant to paragraph (c)(7)(i)(C) of Rule 2-01 of regulation S-X.
(f) No disclosures are required by this Item 4(f).
(g) The aggregate non-audit fees paid to the principal accountant for services rendered by the principal accountant to the registrant and the registrant’s investment adviser and any entity controlling, controlled by or under common control with the investment adviser that provides ongoing services to the registrant were $36,415 for the fiscal year ended July 31, 2018 and $255,000 for the fiscal year ended July 31, 2017.
(h) The registrant’s audit committee of the board has considered whether the provision of non-audit services that were rendered to the registrant’s investment adviser (not including any sub-adviser whose role is primarily portfolio management and is subcontracted with or overseen by another investment adviser), and any entity controlling, controlled by, or under common control with the investment adviser that provides ongoing services to the registrant that were not pre-approved pursuant to paragraph (c)(7)(ii) of Rule 2-01 of Regulation S-X is compatible with maintaining the principal accountant’s independence.
Item 5. Audit Committee of Listed Registrants. N/A
Item 6. Schedule of Investments. N/A
Item 7. Disclosure of Proxy Voting Policies and Procedures for Closed-End Management Investment Companies. N/A
Item 8. Portfolio Managers of Closed-End Management Investment Companies. N/A
Item 9. Purchases of Equity Securities by Closed-End Management Investment Company and Affiliated Purchasers. N/A
Item 10. Submission of Matters to a Vote of Security Holders.
There have been no changes to the procedures by which shareholders may recommend nominees to the Registrant's Board of Trustees that would require disclosure herein.
Item 11. Controls and Procedures.
(a) Evaluation of Disclosure Controls and Procedures. The Registrant maintains disclosure controls and procedures that are designed to ensure that information required to be disclosed in the Registrant’s filings under the Securities Exchange Act of 1934 and the Investment Company Act of 1940 is recorded, processed, summarized and reported within the periods specified in the rules and forms of the Securities and Exchange Commission. Such information is accumulated and communicated to the Registrant’s management, including its principal executive officer and principal financial officer, as appropriate, to allow timely decisions regarding required disclosure. The Registrant’s management, including the principal executive officer and the principal financial officer, recognizes that any set of controls and procedures, no matter how well designed and operated, can provide only reasonable assurance of achieving the desired control objectives.
Within 90 days prior to the filing date of this Shareholder Report on Form N-CSR, the Registrant had carried out an evaluation, under the supervision and with the participation of the Registrant’s management, including the Registrant’s principal executive officer and the Registrant’s principal financial officer, of the effectiveness of the design and operation of the Registrant’s disclosure controls and procedures. Based on such evaluation, the Registrant’s principal executive officer and principal financial officer concluded that the Registrant’s disclosure controls and procedures are effective.
(b) Changes in Internal Controls. There have been no changes in the Registrant’s internal controls or in other factors that could materially affect the internal controls over financial reporting subsequent to the date of their evaluation in connection with the preparation of this Shareholder Report on Form N-CSR.
Item 12. Disclosure of Securities Lending Activities for Closed-End Management Investment Company. N/A
Item 13. Exhibits.
(a) (1) Code of Ethics
(a) (2) Certifications pursuant to Section 302 of the Sarbanes-Oxley Act of 2002 of Matthew T. Hinkle, Chief Executive Officer - Finance and Administration, and Gaston Gardey, Chief Financial Officer and Chief Accounting Officer
(b) Certifications pursuant to Section 906 of the Sarbanes-Oxley Act of 2002 of Matthew T. Hinkle, Chief Executive Officer - Finance and Administration, and Gaston Gardey, Chief Financial Officer and Chief Accounting Officer
SIGNATURES
Pursuant to the requirements of the Securities Exchange Act of 1934 and the Investment Company Act of 1940, the registrant has duly caused this report to be signed on its behalf by the undersigned, thereunto duly authorized.
FRANKLIN FLOATING RATE MASTER TRUST
By /s/ Matthew T. Hinkle
Matthew T. Hinkle
Chief Executive Officer - Finance and Administration
Date September 27, 2018
Pursuant to the requirements of the Securities Exchange Act of 1934 and the Investment Company Act of 1940, this report has been signed below by the following persons on behalf of the registrant and in the capacities and on the dates indicated.
By /s/ Matthew T. Hinkle
Matthew T. Hinkle
Chief Executive Officer - Finance and Administration
Date September 27, 2018
By /s/ Gaston Gardey
Gaston Gardey
Chief Financial Officer and Chief Accounting Officer
Date September 27, 2018