| OMB APPROVAL |
OMB Number: 3235-0570 Expires: August 31, 2011 Estimated average burden hours per response: 18.9 |
UNITED STATES
SECURITIES AND EXCHANGE COMMISSION
Washington, D.C. 20549
FORM N-CSR
CERTIFIED SHAREHOLDER REPORT OF REGISTERED
MANAGEMENT INVESTMENT COMPANIES
Investment Company Act file number ___811-09911________________________
Hussman Investment Trust
(Exact name of registrant as specified in charter)
| 5136 Dorsey Hall Drive Ellicott City, Maryland | 21042 |
| (Address of principal executive offices) | (Zip code) |
John F. Splain
Ultimus Fund Solutions, LLC 225 Pictoria Drive, Suite 450 Cincinnati, Ohio 45246
(Name and address of agent for service)
Registrant's telephone number, including area code: (513) 587-3400
Date of fiscal year end: June 30, 2010
Date of reporting period: December 31, 2009
Form N-CSR is to be used by management investment companies to file reports with the Commission not later than 10 days after the transmission to stockholders of any report that is required to be transmitted to stockholders under Rule 30e-1 under the Investment Company Act of 1940 (17 CFR 270.30e-1). The Commission may use the information provided on Form N-CSR in its regulatory, disclosure review, inspection, and policymaking roles.
A registrant is required to disclose the information specified by Form N-CSR, and the Commission will make this information public. A registrant is not required to respond to the collection of information contained in Form N-CSR unless the Form displays a currently valid Office of Management and Budget ("OMB") control number. Please direct comments concerning the accuracy of the information collection burden estimate and any suggestions for reducing the burden to Secretary, Securities and Exchange Commission, 450 Fifth Street, NW, Washington, DC 20549-0609. The OMB has reviewed this collection of information under the clearance requirements of 44 U.S.C. § 3507.
| Item 1. | Reports to Stockholders. |
HUSSMAN INVESTMENT TRUST
Hussman Strategic Growth Fund
Hussman Strategic Total Return Fund
SEMI-ANNUAL REPORT
DECEMBER 31, 2009
(UNAUDITED)
STRATEGIC GROWTH FUND
Comparison of the Change in Value of a $10,000 Investment in Hussman Strategic Growth Fund
versus the Standard & Poor's 500 Index and the Russell 2000 Index(a)
| Average Annual Total Returns(b) |
| For Periods Ended December 31, 2009 |
| | 1 Year | 3 Years | 5 Years | Since Inception(c) |
Hussman Strategic Growth Fund(d) | 4.63% | (0.28%) | 1.65% | 8.19% |
| S&P 500 Index | 26.46% | (5.63%) | 0.42% | (1.04%) |
| Russell 2000 Index | 27.17% | (6.07%) | 0.51% | 3.46% |
| (a) | Hussman Strategic Growth Fund invests in stocks listed on the New York, American, and NASDAQ exchanges, and does not specifically restrict its holdings to a particular market capitalization. The S&P 500 and Russell 2000 are indices of large and small capitalization stocks, respectively. ���HSGFX equity investments and cash equivalents only (unhedged)” reflects the performance of the Fund’s stock investments and modest day-to-day cash balances, after fees and expenses, but excluding the impact of hedging transactions. The Fund’s unhedged equity investments do not represent a separately available portfolio, and their peformance is presented solely for purposes of comparison and performance attribution. |
| (b) | Returns do not reflect the deduction of taxes a shareholder would pay on Fund distributions or the redemption of Fund shares. |
| (c) | The Fund commenced operations on July 24, 2000. |
| (d) | The Fund’s annualized expense ratio was 1.05% during the six months ended December 31, 2009. The expense ratio as disclosed in the November 1, 2009 prospectus was 1.09% |

STRATEGIC TOTAL RETURN FUND
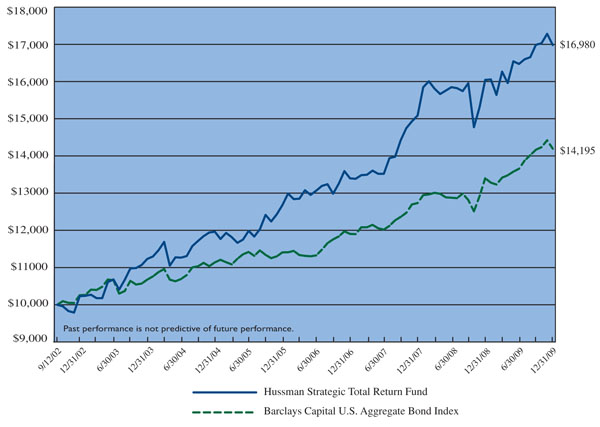
Comparison of the Change in Value of a $10,000 Investment in Hussman Strategic Total
Return Fund versus the Barclays Capital U.S. Aggregate Bond Index
| Average Annual Total Returns(a) |
| For Periods Ended December 31, 2009 |
| | 1 Year | 3 Years | 5 Years | Since Inception(b) |
Hussman Strategic Total Return Fund(c) | 5.84% | 8.22% | 7.26% | 7.52% |
Barclays Capital U.S. Aggregate Bond Index(d) | 5.93% | 6.04% | 4.97% | 4.91% |
| (a) | Returns do not reflect the deduction of taxes a shareholder would pay on Fund distributions or the redemption of Fund shares. |
| (b) | The Fund commenced operations on September 12, 2002. |
| (c) | The Fund’s annualized expense ratio was 0.68% during the six months ended December 31, 2009. The expense ratio as disclosed in the November 1, 2009 prospectus was 0.79%. |
| (d) | The Barclays Capital U.S. Aggregate Bond Index covers the U.S. investment grade fixed rate bond market, with index components for U.S. government, agency and corporate securities. |
The Hussman Funds | |
| Letter to Shareholders | February 19, 2010 |
Dear Shareholder,
The Hussman Funds ended 2009 with moderate positive returns, reflecting a continued defensive investment stance and enduring concerns about economic fundamentals and credit risks. Both Funds have substantially outperformed their respective benchmarks since inception, while maintaining contained volatility.
For the year ended December 31, 2009, Strategic Growth Fund achieved a total return of 4.63%, compared with a total return of 26.46% in the S&P 500 Index. Since the inception of the Fund on July 24, 2000 to December 31, 2009, the Fund has achieved an average annual total return of 8.19%, compared with an average annual total return of -1.04% for the S&P 500 Index over the same period. An initial $10,000 investment in the Fund on July 24, 2000 would have grown to $21,029, as compared with $9,063 if the same investment had been made in the S&P 500 Index.
For the year ended December 31, 2009, Strategic Total Return Fund achieved a total return of 5.84%, compared with a total return of 5.93% in the Barclays Capital U.S. Aggregate Bond Index. Since the inception of the Fund on September 12, 2002, the Fund has achieved an average annual total return of 7.52%, compared with an average annual total return of 4.91% for the Barclays Capital U.S. Aggregate Bond Index over the same period. An initial $10,000 investment in the Fund on September 12, 2002 would have grown to $16,980, as compared with $14,195 if a similar investment had been made in the Barclays Capital U.S. Aggregate Bond Index.
The greatest challenge we have faced over the past year has been distinguishing two very different possible states of the world. One is a world in which our economic problems are largely solved, profits are on the mend, and things will soon be back to normal, except for a large number of unemployed people whose fate appears to be of remote concern to Wall Street. The other is a world that has enjoyed a brief intermission prior to a second wave of credit losses, and in which the range of policy choices will be more restricted because we have already issued an enormous volume of government liabilities, and will steeply debase our currency if we do it again. It is not at all clear that the recent data has removed any uncertainty as to which world we face.
Our defensive investment posture continues to be driven by concern that the present economic environment is more comparable to severe multi-year debt crises (which have periodically been observed throughout history) than it
The Hussman Funds | |
| Letter to Shareholders (continued) | |
is to previous run-of-the-mill post-war recessions. A number of specific concerns are detailed later in this letter. Major debt crises have rarely been resolved quickly, and while there is a clear tendency for the stock market to enjoy large recoveries from its initial losses, these advances also have typically been followed by abrupt and often steep failure. As of December 31, 2009, the S&P 500 Index would have to retreat by -17.26%, with Strategic Growth Fund unchanged, to eliminate the 2009 performance gap between the Fund and the S&P 500. Meanwhile, even with the recent market rebound, the Fund remains substantially ahead of the S&P 500 Index since the end of 2007.
The table below presents the total returns for Strategic Growth Fund and the S&P 500 Index since the inception of the Fund. In order to assist in attributing the effects of stock selection and hedging on the Fund, the table separately presents the returns of the stock positions and cash equivalents held by the Fund (after expenses), without the impact of hedging transactions. Notably, a portion of our hedge during 2009 was tied to the Russell 2000 Index and the NASDAQ 100 Index (as some investments owned by the Fund were best correlated with these indices). Both of these indices outperformed the S&P 500 Index in 2009, with particular strength in technology stocks. As a result, the total return of the S&P 500 during 2009 was smaller than the total return of the basket of market indices that we used to hedge the Fund’s security holdings.
| Year | HSGFX | Stocks Only | S&P 500 |
| 2000* | 16.40% | 4.86% | -9.37% |
| 2001 | 14.67% | 9.13% | -11.89% |
| 2002 | 14.02% | -10.03% | -22.10% |
| 2003 | 21.08% | 37.68% | 28.68% |
| 2004 | 5.16% | 12.81% | 10.88% |
| 2005 | 5.71% | 8.43% | 4.91% |
| 2006 | 3.51% | 13.88% | 15.79% |
| 2007 | 4.16% | 0.89% | 5.49% |
| 2008 | -9.02% | -33.97% | -37.00% |
| 2009 | 4.63% | 38.12% | 26.46% |
| Since Inception (Average Annual) | 8.19% | 6.53% | -1.04% |
| * | July 24, 2000 – December 31, 2000, not annualized |
The Hussman Funds | |
| Letter to Shareholders (continued) | |
The table below presents the returns for Strategic Total Return Fund and the Barclays Capital U.S. Aggregate Bond Index since the inception of the Fund.
| Year | HSTRX | Barclays Capital U.S. Aggregate Bond Index |
| 2002* | 2.30% | 2.56% |
| 2003 | 9.80% | 4.10% |
| 2004 | 6.50% | 4.34% |
| 2005 | 6.00% | 2.43% |
| 2006 | 5.66% | 4.33% |
| 2007 | 12.61% | 6.97% |
| 2008 | 6.34% | 5.24% |
| 2009 | 5.84% | 5.93% |
| Since Inception (Average Annual) | 7.52% | 4.91% |
| * | September 12, 2002 – December 31, 2002, not annualized |
The investment objectives of the Hussman Funds are distinctly long-term and “full cycle” in nature, placing very little weight on tracking the market over short periods of time. Because of our emphasis on risk management, the Funds’ returns will periodically behave differently than various market indices. The intent of our investment strategy is to outperform the major indices over the complete market cycle (bull and bear markets combined), with added emphasis on defending capital in unfavorable market conditions.
Strategic Growth Fund
For the calendar year ended December 31, 2009, Strategic Growth Fund achieved a total return of 4.63%. The Fund maintained a largely or fully-hedged investment stance during 2009, as the attractiveness of speculative “trend following” appeared insufficient in light of weak economic fundamentals, persistent structural credit risks, dull trading volume, strenuously overbought conditions, and ultimately overvaluation.
We entered 2009 well aware that historical credit crises have generally included sharp but temporary market recoveries after the initial crash (which are typically followed by fresh losses). In hindsight, I underestimated the extent to which Wall Street would respond to the ebb-and-flow in the economic data – particularly the predictable and temporary lull in the adjustable rate mortgage reset schedule between March and November 2009 – and drive
The Hussman Funds | |
| Letter to Shareholders (continued) | |
stocks to the point where they are now not only overvalued again, but strikingly dependent on a sustained economic recovery and the achievement and maintenance of record profit margins in the years ahead. Because our primary concern is to achieve long-term returns consistent with prudent risk management, there is no likelihood, even in hindsight, that I would have responded to purely speculative factors with more than a moderate exposure to market fluctuations last year. Still, there was clearly more room to speculate than I had expected, and our defensiveness during the later months of the year proved to be unnecessary, or at least too early.
From a stock-selection perspective, Strategic Growth Fund continues to emphasize companies and industries that exhibit strong stable revenue growth and profit margins, balance sheets generally having low levels of debt, and valuations that we view as favorable based on the long-term stream of cash flows that investors can expect to receive over time. The Fund’s primary sector holdings remain in consumer-related goods, technology, and health care, with a continued avoidance of sectors that rely on credit expansion, such as financials and homebuilders.
Strategic Total Return Fund
For the calendar year ended December 31, 2009, Strategic Total Return Fund achieved a total return of 5.84%, compared with a total return of 5.93% in the Barclays Capital U.S. Aggregate Bond Index. In an environment of low and generally rising yields, the Fund achieved much of its gains last year through opportunistic trading of Treasury securities, beginning the year with a very small exposure to interest rate fluctuations, and increasing its exposure after interest rates had advanced substantially by mid-year.
Strategic Total Return Fund has the ability to hold up to 30% of its assets in alternatives to U.S. fixed income securities, including foreign government bonds, utility stocks and precious metals shares. Given that Strategic Total Return Fund seeks to preserve and enhance long-term purchasing power against inflation, precious metals have been an effective component of our investment strategy. As the prices of precious metals shares advanced, the Fund gradually liquidated the bulk of its holdings in these securities by year-end. More recently, the Fund has reestablished modest positions in precious metals shares on the price weakness observed during the first several weeks of 2010.
The Hussman Funds | |
| Letter to Shareholders (continued) | |
Portfolio composition and performance drivers
As of December 31, 2009, Strategic Growth Fund had net assets of $5,448,326,267, and held 93 stocks in a wide variety of industries. The largest sector holdings as a percentage of net assets were in consumer discretionary (35.1%), information technology (31.7%), and health care (11.9%). The smallest sector weights were in materials (0.1%) and financials (0.5%).
The Fund’s holdings of individual stocks as of December 31, 2009 accounted for $4,909,240,920, or 90.1% of net assets. Against these stock positions, the Fund also held 33,500 option combinations (long put option, short call option) on the S&P 500 Index, 8,000 option combinations on the Russell 2000 Index and 3,000 option combinations on the NASDAQ 100 Index. Each option combination behaves as a short sale on the underlying index, with a notional value of $100 times the index value. On December 31, 2009, the S&P 500 Index closed at 1,115.10, while the Russell 2000 Index and the NASDAQ 100 Index closed at 625.39 and 1,860.31, respectively. The Fund’s total hedge therefore represented a short position of $4,793,990,000, thereby hedging 97.7% of the dollar value of the Fund’s long investment positions in individual stocks.
Though the performance of Strategic Growth Fund’s diversified portfolio cannot be attributed to any narrow group of stocks, the following holdings achieved gains in excess of $50 million during the semi-annual period ended December 31, 2009: NetApp and Amazon.com. Holdings with losses in excess of $10 million during this same period were Synaptics and Research in Motion. For the full calendar year ended December 31, 2009, the Fund achieved gains in excess of $50 million in Amazon.com, Aeropostale, NetApp, Netflix, Starbucks, Research in Motion, Cisco Systems and Humana. The Fund experienced a loss greater than $10 million in General Electric, Sunpower, Citigroup, Martek Biosciences and Wal-Mart.
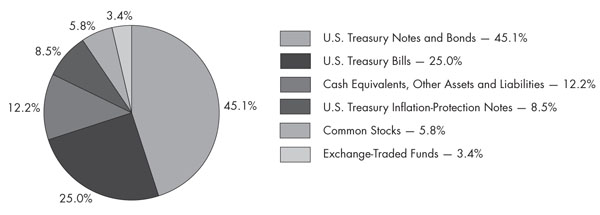
As of December 31, 2009, Strategic Total Return Fund had net assets of $1,396,177,064. Treasury Inflation Protected Securities accounted for 8.5% of the Fund’s net assets, with U.S. Treasury Bills, Notes and Bonds, representing an additional 70.1% of net assets. Exchange-traded funds, precious metals shares and utility shares accounted for 3.4%, 2.5% and 3.3% of net assets, respectively. The remaining 12.2% of net assets were in cash equivalents. The Fund carried a duration of approximately 4 years (meaning that a 1% change in interest rates would be expected to impact the Fund’s asset value by about 4% on the basis of bond price fluctuations).
The Hussman Funds | |
| Letter to Shareholders (continued) | |
In Strategic Total Return Fund, during the semi-annual period ended December 31, 2009, portfolio gains in excess of $2 million were achieved in Agnico-Eagle Mines, U.S. Treasury Inflation-Protected Note (2.625%, due 7/15/2017), U.S. Treasury Inflation-Protected Note (2.375%, due 1/15/2025), U.S. Treasury Inflation-Protected Note (2.00%, due 1/15/2016), DTE Energy, Barrick Gold and Cia De Minas Buena - ADR. Holdings with losses in excess of $2 million were U.S. Treasury Note (3.375%, due 11/15/2019) and U.S. Treasury Note (3.625%, due 8/15/2019). For the full calendar year ended December 31, 2009, the Fund achieved gains in excess of $3 million in U.S. Treasury Inflation-Protected Note (2.625%, due 7/15/2017), U.S. Treasury Inflation-Protected Note (2.00%, due 1/15/2016), U.S. Treasury Inflation-Protected Note (2.375%, due 1/15/2025), U.S. Treasury Inflation-Protected Note (2.375% due 4/15/2011), CurrencyShares British Pound Sterling Trust, Agnico-Eagle Mines, AngloGold Ashanti and U.S. Treasury Inflation-Protected Note (2.00%, due 7/15/2014). Holdings with losses in excess of $2 million during this same period were U.S. Treasury Note (3.375%, due 11/15/2019), U.S. Treasury Note (2.75%, due 2/15/2019) and U.S. Treasury Note (3.625%, due 8/15/2019).
Present conditions
As we enter 2010, the most important headwinds facing the U.S. stock market are rich valuation and continuing credit risks. Market valuations are certainly better than they were at the market peak in 2000. However, the S&P 500 Index ended 2009 at valuations which are characteristic of those found at prior market peaks including 1972 and 1987. From such valuations, durable market returns have typically not emerged, so whatever merit there might be in accepting market risk is decidedly speculative and short-term.
While near term market returns are extremely difficult to project, it is possible to calculate fairly reliable projections of long-term total returns for the S&P 500, because over the long-term, stock prices track “smooth” fundamental measures such as revenues, cash flows, and normalized (cyclically-adjusted) earnings. For example, over the past century, S&P 500 earnings have fluctuated widely due to economic expansions and recessions, yet they have followed a very well-behaved growth trend when measured from peak-to-peak across economic cycles. One historically reliable method of projecting long-term market returns is to apply a reasonable range of price/earnings multiples to those future “normalized” earnings.
The Hussman Funds | |
| Letter to Shareholders (continued) | |
Even assuming that the long-term trend of S&P 500 earnings will remain intact despite deleveraging pressures and a continuing collapse in bank lending, we estimate that the S&P 500 is currently priced to deliver annual total returns averaging just 6.1% over the coming decade. This is certainly better than the similar calculation in 2000, which correctly projected a negative total return. Unfortunately, it is also the lowest projected return that has historically been observed outside of the late-1990’s stock market bubble and a handful of previous market peaks such as 1987. This is not an argument that stocks must decline in the near-term, but it presents a difficult obstacle to risk-taking, because it suggests that further market advances may not be durable.
Meanwhile, the U.S. currently faces a predictable wave of resets on Alt-A and Option-ARM mortgages, of approximately the same size as the wave of sub-prime resets that ended in early 2009. These Alt-A and Option-ARM structures were specifically designed as “teasers” with low interest rates and temporarily optional principal payments – allowing loans to be made without documentation of creditworthiness, in return for post-reset interest terms that were generally higher than a documented lender would have paid. This “yield spread premium” tends to be particularly obnoxious at the point of reset if the mortgage itself is underwater (loan amount in excess of home value). Given that these mortgages were written during the last stages of the housing boom, at the highest prices, it is reasonable to assume that they now sport very high loan-to-value ratios. From our perspective, the combination of deeply underwater mortgages, tepid employment conditions, and a heavy mortgage reset schedule creates a large threat of further credit losses.
The loose-handed government bailout of financial institutions in early 2009 had the result of driving up the values of a wide variety of risky investments, driving the the yields of junk bonds and other low-grade debt to levels that existed in 2008, prior to the onset of major difficulties. While it might be considered natural for investors to bid up risky assets when they feel confident that the government will bail them out if they are incorrect, investors have now placed themselves in a position of relying on such bailouts, while at the same time earning low returns as compensation for the probable volatility.
Stagnant personal income and depressed corporate cash flows appear no more capable of servicing record amounts of debt today than they were at the beginning of this crisis. As a result, consumer credit and bank lending have continued to collapse, despite widespread perceptions of a fresh economic recovery. The depth of this collapse in credit is unprecedented in post-war
The Hussman Funds | |
| Letter to Shareholders (continued) | |
data. Historically, sustained economic expansions have commenced with rapid growth in debt-financed classes of spending such as housing, automobiles, durable goods, and capital spending. Recent economic growth has instead been driven primarily by temporary government stimulus, which has offset the erosion in private lending in recent quarters.
In the credit markets, the past two years have seen an enormous issuance of new government liabilities. The amount of U.S. Treasury debt held by the public (outside of agencies such as the Social Security Administration and the Federal Reserve) has already surged by more than 50%, from $5.05 trillion to $7.55 trillion, and record fiscal deficits continue to mount. Meanwhile, the Federal Reserve has expanded the U.S. monetary base from $850 billion to $2.02 trillion, fueled by aggressive purchases of Fannie Mae and Freddie Mac’s mortgage-backed securities. As Fannie Mae and Freddie Mac have deeply insolvent balance sheets, their securities can be gradually made whole only with bailout funds obtained by issuing more U.S. Treasury debt.
It is in this context that we should consider inflation risks over the coming decade. At present, inflation risks are hardly considered to be problematic by Wall Street. From the standpoint of the next few years, that complacency is probably well founded, as fresh credit concerns are likely to create additional “safe haven” demand for default-free government liabilities. From a longer-term perspective, however, I believe that inflation will be a major event in the latter part of the coming decade, with the consumer price index roughly doubling over the next ten years.
While the near-term case for inflation hedges appears fairly weak, I expect that we will gradually accept greater exposure to commodities and inflation-protected securities in Strategic Total Return Fund in the coming years, particularly in response to occasional price weakness. Historically, inflation has been much better correlated with the growth of government spending than with the growth of the monetary base itself. This is particularly true over horizons of four years and beyond. Ultimately, a massive expansion in government liabilities can do little but undermine the value of the U.S. dollar relative to real goods and services.
Our willingness to accept market risk is essentially proportional to the expected return that we anticipate as compensation. Accordingly, we look to adopt a greater exposure to market risk when the expected return from accepting risk increases, or when the expected range of outcomes becomes
The Hussman Funds | |
Letter to Shareholders (continued) | |
narrower. The past decade has been challenging in that the S&P 500 has delivered a great deal of volatility, but no net return at all. That environment has made it difficult to accept substantial market risk for any extended period of time. Presently, two things would improve this situation. One is clarity, the other is better valuation.
First and foremost, over the next few quarters, we are likely to discover the extent to which “second wave” credit risks materialize. It is not necessary for the nation to work through all of its economic problems in order for us to accept a constructive position. However, the most hostile market declines have often been associated with problems (overvaluation, credit strains) that were developing for some time but whose risks were dismissed or underestimated.
Presently, what we need most is for several latent problems to become more observable, so that we can have greater clarity about their extent. Among these are the likelihood of surging delinquencies tied to Alt-A and Option-ARM loans, the requirement beginning in January that banks and other financials bring “off balance sheet” entities onto their books, and clarity about the disposition of a mountain of mortgages that are already seriously delinquent, but where foreclosure has been temporarily delayed.
Improved valuations, combined with better clarity, can be expected to move us to a more constructive investment stance. I expect that we will resolve the “two states of the world” issue during the coming quarters, which itself will narrow the range of possible outcomes and – especially if prices retreat – allow us to accept greater amounts of risk in response to improvements in valuations and market action. I look forward to greater optimism as we move through 2010. In any event, I remain focused on our goal of outperforming the major indices over the complete (bull-bear) market cycle, while reducing the impact of periodic market losses. We continue to achieve our objective in that regard.
As always, I am grateful for your investment in the Funds, and for your trust.
Best wishes,
John P. Hussman, Ph.D.
The Hussman Funds | |
Letter to Shareholders (continued) | |
Past performance is not predictive of future performance. Investment results and principal value will fluctuate so that shares, when redeemed, may be worth more or less than their original cost. Current performance may be higher or lower than the performance data quoted.
Weekly updates regarding market conditions and investment strategy, as well as special reports, analysis, and performance data current to the most recent month end, are available at the Hussman Funds website www.hussmanfunds.com.
An investor should consider the investment objectives, risks, charges and expenses of the Funds carefully before investing. The Funds’ prospectuses contain this and other important information. To obtain a copy of the Hussman Funds’ prospectuses please visit our website at www.hussmanfunds.com or call 1-800-487-7626 and a copy will be sent to you free of charge. Please read the prospectus carefully before you invest. The Hussman Funds are distributed by Ultimus Fund Distributors, LLC.
The Letter to Shareholders seeks to describe some of the adviser’s current opinions and views of the financial markets. Although the adviser believes it has a reasonable basis for any opinions or views expressed, actual results may differ, sometimes significantly so, from those expected or expressed. The securities held by the Funds that are discussed in this Letter to Shareholders were held during the period covered by this Report. They do not comprise the entire investment portfolios of the Funds, may be sold at any time and may no longer be held by the Funds. The opinions of the Funds’ adviser with respect to those securities may change at any time.
Hussman Strategic Growth Fund Portfolio Information | |
December 31, 2009 (Unaudited) | |
Sector Allocation (% of Net Assets)
Hussman Strategic Total Return Fund Portfolio Information | |
December 31, 2009 (Unaudited) | |
Asset Allocation (% of Net Assets)
Hussman Strategic Growth Fund Schedule of Investments | |
| December 31, 2009 (Unaudited) | |
| COMMON STOCKS — 90.1% | | Shares | | | Value | |
| Consumer Discretionary — 35.1% | | | | | | |
| Hotels, Restaurants & Leisure — 9.7% | | | | | | |
| Brinker International, Inc. | | | 350,000 | | | $ | 5,222,000 | |
Cheesecake Factory, Inc. (The) (a) | | | 2,500,000 | | | | 53,975,000 | |
Chipotle Mexican Grill, Inc. - Class A (a) | | | 776,000 | | | | 68,412,160 | |
| Darden Restaurants, Inc. | | | 2,600,000 | | | | 91,182,000 | |
Panera Bread Co. - Class A (a) | | | 2,140,000 | | | | 143,315,800 | |
PF Chang’s China Bistro, Inc. (a) | | | 400,000 | | | | 15,164,000 | |
Royal Caribbean Cruises Ltd. (a) | | | 1,382,000 | | | | 34,936,960 | |
Starbucks Corp. (a) | | | 5,000,000 | | | | 115,300,000 | |
| | | | | | | | 527,507,920 | |
| Household Durables — 0.7% | | | | | | | | |
| Whirlpool Corp. | | | 460,000 | | | | 37,103,600 | |
| | | | | | | | | |
| Internet & Catalog Retail — 4.1% | | | | | | | | |
Amazon.com, Inc. (a) | | | 500,000 | | | | 67,260,000 | |
Netflix, Inc. (a) | | | 2,800,000 | | | | 154,392,000 | |
| | | | | | | | 221,652,000 | |
| Leisure Equipment & Products — 0.1% | | | | | | | | |
| Mattel, Inc. | | | 380,000 | | | | 7,592,400 | |
| | | | | | | | | |
| Media — 0.3% | | | | | | | | |
| Comcast Corp. - Class A | | | 1,050,000 | | | | 17,703,000 | |
| | | | | | | | | |
| Multiline Retail — 4.9% | | | | | | | | |
Dollar Tree, Inc. (a) | | | 1,000,000 | | | | 48,300,000 | |
Kohl’s Corp. (a) | | | 2,750,000 | | | | 148,307,500 | |
| Nordstrom, Inc. | | | 650,000 | | | | 24,427,000 | |
| Target Corp. | | | 1,000,000 | | | | 48,370,000 | |
| | | | | | | | 269,404,500 | |
| Specialty Retail — 13.0% | | | | | | | | |
AÈropostale, Inc. (a) | | | 4,500,000 | | | | 153,225,000 | |
| American Eagle Outfitters, Inc. | | | 2,000,000 | | | | 33,960,000 | |
Bed Bath & Beyond, Inc. (a) | | | 3,750,000 | | | | 144,862,500 | |
| Best Buy Co., Inc. | | | 3,750,000 | | | | 147,975,000 | |
GameStop Corp. - Class A (a) | | | 2,394,000 | | | | 52,524,360 | |
| Limited Brands, Inc. | | | 2,000,000 | | | | 38,480,000 | |
| PetSmart, Inc. | | | 750,000 | | | | 20,017,500 | |
| Ross Stores, Inc. | | | 1,500,000 | | | | 64,065,000 | |
| TJX Cos., Inc. (The) | | | 1,500,000 | | | | 54,825,000 | |
| | | | | | | | 709,934,360 | |
Hussman Strategic Growth Fund Schedule of Investments (continued) | |
| December 31, 2009 (Unaudited) | |
| COMMON STOCKS — 90.1% (continued) | | Shares | | | Value | |
| Consumer Discretionary — 35.1% (continued) | | | | | | |
| Textiles, Apparel & Luxury Goods — 2.3% | | | | | | |
| Coach, Inc. | | | 1,290,000 | | | $ | 47,123,700 | |
| NIKE, Inc. - Class B | | | 755,000 | | | | 49,882,850 | |
Under Armour, Inc. - Class A (a) | | | 955,000 | | | | 26,042,850 | |
| | | | | | | | 123,049,400 | |
| Consumer Staples — 3.9% | | | | | | | | |
| Beverages — 1.6% | | | | | | | | |
| Coca-Cola Co. (The) | | | 1,500,000 | | | | 85,500,000 | |
| | | | | | | | | |
| Food & Staples Retailing — 2.3% | | | | | | | | |
| Walgreen Co. | | | 3,500,000 | | | | 128,520,000 | |
| | | | | | | | | |
| Energy — 5.0% | | | | | | | | |
| Energy Equipment & Services — 3.4% | | | | | | | | |
| Diamond Offshore Drilling, Inc. | | | 600,000 | | | | 59,052,000 | |
Dresser-Rand Group, Inc. (a) | | | 1,090,000 | | | | 34,454,900 | |
| Noble Corp. | | | 297,000 | | | | 12,087,900 | |
Transocean Ltd. (a) | | | 943,000 | | | | 78,080,400 | |
| | | | | | | | 183,675,200 | |
| Oil, Gas & Consumable Fuels — 1.6% | | | | | | | | |
| Chevron Corp. | | | 142,000 | | | | 10,932,580 | |
| Exxon Mobil Corp. | | | 1,000,000 | | | | 68,190,000 | |
| Marathon Oil Corp. | | | 214,000 | | | | 6,681,080 | |
| | | | | | | | 85,803,660 | |
| Financials — 0.5% | | | | | | | | |
| Insurance — 0.5% | | | | | | | | |
Berkshire Hathaway, Inc. - Class A (a) | | | 250 | | | | 24,800,000 | |
| | | | | | | | | |
| Health Care — 11.9% | | | | | | | | |
| Biotechnology — 1.2% | | | | | | | | |
Amgen, Inc. (a) | | | 1,000,000 | | | | 56,570,000 | |
Martek Biosciences Corp. (a) | | | 530,000 | | | | 10,038,200 | |
| | | | | | | | 66,608,200 | |
| Health Care Equipment & Supplies — 1.4% | | | | | | | | |
Align Technology, Inc. (a) | | | 1,500,000 | | | | 26,730,000 | |
ArthroCare Corp. (a) | | | 1,060,000 | | | | 25,122,000 | |
IDEXX Laboratories, Inc. (a) | | | 500,000 | | | | 26,720,000 | |
| | | | | | | | 78,572,000 | |
Hussman Strategic Growth Fund Schedule of Investments (continued) | |
| December 31, 2009 (Unaudited) | |
| COMMON STOCKS — 90.1% (continued) | | Shares | | | Value | |
| Health Care — 11.9% (continued) | | | | | | |
| Health Care Providers & Services — 2.1% | | | | | | |
Humana, Inc. (a) | | | 2,150,000 | | | $ | 94,363,500 | |
LifePoint Hospitals, Inc. (a) | | | 470,000 | | | | 15,279,700 | |
| McKesson Corp. | | | 48,000 | | | | 3,000,000 | |
| | | | | | | | 112,643,200 | |
| Life Sciences Tools & Services — 2.3% | | | | | | | | |
Life Technologies Corp. (a) | | | 1,062,000 | | | | 55,468,260 | |
Waters Corp. (a) | | | 1,162,000 | | | | 71,997,520 | |
| | | | | | | | 127,465,780 | |
| Pharmaceuticals — 4.9% | | | | | | | | |
| AstraZeneca plc - ADR | | | 2,600,000 | | | | 122,044,000 | |
| Biovail Corp. | | | 1,578,000 | | | | 22,028,880 | |
Endo Pharmaceuticals Holdings, Inc. (a) | | | 390,000 | | | | 7,998,900 | |
Forest Laboratories, Inc. (a) | | | 150,000 | | | | 4,816,500 | |
| Johnson & Johnson | | | 1,000,000 | | | | 64,410,000 | |
| Pfizer, Inc. | | | 1,750,000 | | | | 31,832,500 | |
| Shire plc - ADR | | | 183,000 | | | | 10,742,100 | |
| | | | | | | | 263,872,880 | |
| Industrials — 1.9% | | | | | | | | |
| Commercial Services & Supplies — 0.1% | | | | | | | | |
| Cintas Corp. | | | 225,000 | | | | 5,861,250 | |
| | | | | | | | | |
| Electrical Equipment — 1.2% | | | | | | | | |
| Cooper Industries Ltd. - Class A | | | 670,000 | | | | 28,568,800 | |
SunPower Corp. - Class A (a) | | | 1,400,000 | | | | 33,152,000 | |
Thomas & Betts Corp. (a) | | | 125,000 | | | | 4,473,750 | |
| | | | | | | | 66,194,550 | |
| Machinery — 0.6% | | | | | | | | |
| Timken Co. | | | 1,420,000 | | | | 33,668,200 | |
| | | | | | | | | |
| Information Technology — 31.7% | | | | | | | | |
| Communications Equipment — 6.1% | | | | | | | | |
| ADTRAN, Inc. | | | 2,500,000 | | | | 56,375,000 | |
Cisco Systems, Inc. (a) | | | 6,000,000 | | | | 143,640,000 | |
EchoStar Corp. - Class A (a) | | | 180,000 | | | | 3,625,200 | |
Motorola, Inc. (a) | | | 3,500,000 | | | | 27,160,000 | |
Research In Motion Ltd. (a) | | | 1,500,000 | | | | 101,310,000 | |
| | | | | | | | 332,110,200 | |
Hussman Strategic Growth Fund Schedule of Investments (continued) | |
| December 31, 2009 (Unaudited) | |
| COMMON STOCKS — 90.1% (continued) | | Shares | | | Value | |
| Information Technology — 31.7% (continued) | | | | | | |
| Computers & Peripherals — 6.2% | | | | | | |
Dell, Inc. (a) | | | 1,756,000 | | | $ | 25,216,160 | |
| International Business Machines Corp. | | | 250,000 | | | | 32,725,000 | |
NetApp, Inc. (a) | | | 3,925,000 | | | | 134,980,750 | |
QLogic Corp. (a) | | | 3,320,000 | | | | 62,648,400 | |
Synaptics, Inc. (a) | | | 1,744,000 | | | | 53,453,600 | |
Western Digital Corp. (a) | | | 650,000 | | | | 28,697,500 | |
| | | | | | | | 337,721,410 | |
| Electronic Equipment, Instruments & Components — 1.8% | | | | | | | | |
| Corning, Inc. | | | 5,000,000 | | | | 96,550,000 | |
| FUJIFILM Holdings Corp. - ADR | | | 49,400 | | | | 1,491,880 | |
| | | | | | | | 98,041,880 | |
| Internet Software & Services — 2.3% | | | | | | | | |
eBay, Inc. (a) | | | 4,500,000 | | | | 105,930,000 | |
Vistaprint N.V. (a) | | | 303,000 | | | | 17,167,980 | |
| | | | | | | | 123,097,980 | |
| IT Services — 2.5% | | | | | | | | |
Amdocs Ltd. (a) | | | 988,000 | | | | 28,187,640 | |
Computer Sciences Corp. (a) | | | 1,820,000 | | | | 104,704,600 | |
Sapient Corp. (a) | | | 700,000 | | | | 5,789,000 | |
| | | | | | | | 138,681,240 | |
| Semiconductors & Semiconductor Equipment — 7.5% | | | | | | | | |
| Altera Corp. | | | 1,000,000 | | | | 22,630,000 | |
| Analog Devices, Inc. | | | 3,100,000 | | | | 97,898,000 | |
Broadcom Corp. - Class A (a) | | | 4,500,000 | | | | 141,525,000 | |
| Intel Corp. | | | 2,000,000 | | | | 40,800,000 | |
Semtech Corp. (a) | | | 1,935,000 | | | | 32,914,350 | |
| Xilinx, Inc. | | | 3,000,000 | | | | 75,180,000 | |
| | | | | | | | 410,947,350 | |
| Software — 5.3% | | | | | | | | |
Adobe Systems, Inc. (a) | | | 1,700,000 | | | | 62,526,000 | |
Autodesk, Inc. (a) | | | 290,000 | | | | 7,368,900 | |
Check Point Software Technologies Ltd. (a) | | | 916,000 | | | | 31,034,080 | |
| FactSet Research Systems, Inc. | | | 1,150,000 | | | | 75,750,500 | |
| Microsoft Corp. | | | 2,000,000 | | | | 60,980,000 | |
| Oracle Corp. | | | 2,000,000 | | | | 49,080,000 | |
| | | | | | | | 286,739,480 | |
| Materials — 0.1% | | | | | | | | |
| Chemicals — 0.1% | | | | | | | | |
| BASF SE - ADR | | | 76,800 | | | | 4,769,280 | |
| | | �� | | | | | | |
Total Common Stocks (Cost $4,034,549,815) | | | | | | $ | 4,909,240,920 | |
Hussman Strategic Growth Fund Schedule of Investments (continued) | |
| December 31, 2009 (Unaudited) | |
| PUT OPTION CONTRACTS — 2.3% | | Contracts | | | Value | |
| Nasdaq 100 Index Option, 02/20/2010 at $1,800 | | | 2,750 | | | $ | 9,185,000 | |
| Nasdaq 100 Index Option, 03/20/2010 at $1,800 | | | 250 | | | | 1,257,500 | |
| Russell 2000 Index Option, 03/20/2010 at $450 | | | 8,000 | | | | 1,560,000 | |
| S&P 500 Index Option, 02/20/2010 at $1,120 | | | 12,500 | | | | 43,812,500 | |
| S&P 500 Index Option, 03/20/2010 at $1,080 | | | 15,000 | | | | 46,995,000 | |
| S&P 500 Index Option, 03/20/2010 at $1,100 | | | 6,000 | | | | 23,016,000 | |
Total Put Option Contracts (Cost $131,154,518) | | | | | | $ | 125,826,000 | |
| | | | | | | | | |
Total Investments at Value — 92.4% (Cost $4,165,704,333) | | | | | | $ | 5,035,066,920 | |
| | | | | | | | | |
| MONEY MARKET FUNDS — 19.0% | | Shares | | | Value | |
Federated U.S. Treasury Cash Reserve Fund - Institutional Shares, 0.02% (b) | | | 707,887,267 | | | $ | 707,887,267 | |
First American Treasury Obligations Fund - Class Y, 0.00% (b) | | | 328,398,042 | | | | 328,398,042 | |
Total Money Market Funds (Cost $1,036,285,309) | | | | | | $ | 1,036,285,309 | |
| | | | | | | | | |
| Total Investments and Money Market Funds at Value — 111.4% | | | | | | | | |
| (Cost $5,201,989,642) | | | | | | $ | 6,071,352,229 | |
| | | | | | | | | |
| Liabilities in Excess of Other Assets — (11.4%) | | | | | | | (623,025,962 | ) |
| | | | | | | | | |
| Net Assets — 100.0% | | | | | | $ | 5,448,326,267 | |
ADR - American Depositary Receipt.
| (a) | Non-income producing security. |
| | |
| (b) | The rate shown is the 7-day effective yield as of December 31, 2009. |
See accompanying notes to financial statements.
Hussman Strategic Growth Fund Schedule of Open Written Option Contracts | |
| December 31, 2009 (Unaudited) | |
| WRITTEN CALL OPTION CONTRACTS | | Contracts | | | Value of Options | | | Premiums Received | |
| Nasdaq 100 Index Option, 03/20/2010 at $1,600 | | | 3,000 | | | $ | 82,170,000 | | | $ | 69,556,788 | |
| Russell 2000 Index Option, 03/20/2010 at $450 | | | 8,000 | | | | 140,080,000 | | | | 101,588,768 | |
| S&P 500 Index Option, 02/20/2010 at $1,100 | | | 12,500 | | | | 47,812,500 | | | | 52,076,200 | |
| S&P 500 Index Option, 03/20/2010 at $900 | | | 6,000 | | | | 129,048,000 | | | | 129,591,576 | |
| S&P 500 Index Option, 03/20/2010 at $1,080 | | | 15,000 | | | | 91,665,000 | | | | 98,978,940 | |
| Total Written Call Option Contracts | | | | | | $ | 490,775,500 | | | $ | 451,792,272 | |
See accompanying notes to financial statements.
Hussman Strategic Total Return Fund Schedule of Investments | |
| December 31, 2009 (Unaudited) | |
| COMMON STOCKS — 5.8% | | Shares | | | Value | |
| Materials — 2.5% | | | | | | |
| Metals & Mining — 2.5% | | | | | | |
| Agnico-Eagle Mines Ltd. | | | 55,000 | | | $ | 2,970,000 | |
| AngloGold Ashanti Ltd. - ADR | | | 55,000 | | | | 2,209,900 | |
| Barrick Gold Corp. | | | 355,000 | | | | 13,979,900 | |
| Compania de Minas Buenaventura S.A. - ADR | | | 5,000 | | | | 167,350 | |
| Goldcorp, Inc. | | | 5,000 | | | | 196,700 | |
| Harmony Gold Mining Co. Ltd. - ADR | | | 10,000 | | | | 101,700 | |
| Newmont Mining Corp. | | | 305,000 | | | | 14,429,550 | |
| Randgold Resources Ltd. - ADR | | | 5,000 | | | | 395,600 | |
Stillwater Mining Co. (a) | | | 10,000 | | | | 94,800 | |
| | | | | | | | 34,545,500 | |
| Utilities — 3.3% | | | | | | | | |
| Electric Utilities — 1.5% | | | | | | | | |
| DPL, Inc. | | | 300,000 | | | | 8,280,000 | |
| Pepco Holdings, Inc. | | | 300,000 | | | | 5,055,000 | |
| Pinnacle West Capital Corp. | | | 200,000 | | | | 7,316,000 | |
| | | | | | | | 20,651,000 | |
| Multi-Utilities — 1.8% | | | | | | | | |
| Alliant Energy Corp. | | | 100,000 | | | | 3,026,000 | |
| Ameren Corp. | | | 200,000 | | | | 5,590,000 | |
| Consolidated Edison, Inc. | | | 65,000 | | | | 2,952,950 | |
| DTE Energy Co. | | | 200,000 | | | | 8,718,000 | |
| SCANA Corp. | | | 141,200 | | | | 5,320,416 | |
| | | | | | | | 25,607,366 | |
| | | | | | | | | |
Total Common Stocks (Cost $78,900,742) | | | | | | $ | 80,803,866 | |
| | | | | | | | | |
| U.S. TREASURY OBLIGATIONS — 78.6% | | Par Value | | | Value | |
| U.S. Treasury Bills — 25.0% | | | | | | | | |
0.16% (b), due 06/17/2010 | | $ | 100,000,000 | | | $ | 99,919,400 | |
0.19% (b), due 07/01/2010 | | | 250,000,000 | | | | 249,775,000 | |
| | | | | | | | 349,694,400 | |
| U.S. Treasury Bonds — 1.7% | | | | | | | | |
| 4.25%, due 05/15/2039 | | | 25,000,000 | | | | 23,460,950 | |
| | | | | | | | | |
| U.S. Treasury Inflation-Protection Notes — 8.5% | | | | | | | | |
| 2.00%, due 04/15/2012 | | | 26,632,250 | | | | 27,863,992 | |
| 2.00%, due 07/15/2014 | | | 28,670,250 | | | | 30,408,384 | |
| 2.375%, due 01/15/2027 | | | 16,078,950 | | | | 16,960,784 | |
| 2.50%, due 01/15/2029 | | | 40,274,000 | | | | 43,297,691 | |
| | | | | | | | 118,530,851 | |
Hussman Strategic Total Return Fund Schedule of Investments (continued) | |
| December 31, 2009 (Unaudited) | |
| U.S. TREASURY OBLIGATIONS — 78.6% (continued) | | Par Value | | | Value | |
| U.S. Treasury Notes — 43.4% | | | | | | |
| 2.625%, due 05/31/2010 | | $ | 50,000,000 | | | $ | 50,509,800 | |
| 3.00%, due 08/31/2016 | | | 75,000,000 | | | | 73,787,175 | |
| 2.75%, due 02/15/2019 | | | 50,000,000 | | | | 46,046,900 | |
| 3.125%, due 05/15/2019 | | | 50,000,000 | | | | 47,367,200 | |
| 3.625%, due 08/15/2019 | | | 200,000,000 | | | | 196,687,600 | |
| 3.375%, due 11/15/2019 | | | 200,000,000 | | | | 192,438,600 | |
| | | | | | | | 606,837,275 | |
| | | | | | | | | |
Total U.S. Treasury Obligations (Cost $1,101,917,446) | | | | | | $ | 1,098,523,476 | |
| | | | | | | | | |
| EXCHANGE-TRADED FUNDS — 3.4% | | Shares | | | Value | |
| CurrencyShares British Pound Sterling Trust | | | 50,000 | | | $ | 8,056,500 | |
| CurrencyShares Euro Trust | | | 100,000 | | | | 14,291,000 | |
CurrencyShares Japanese Yen Trust (a) | | | 150,000 | | | | 15,991,500 | |
| SPDR DB International Government Inflation-Protected Bond ETF | | | 160,000 | | | | 8,937,600 | |
Total Exchange-Traded Funds (Cost $46,217,940) | | | | | | $ | 47,276,600 | |
| | | | | | | | | |
Total Investments at Value — 87.8% (Cost $1,227,036,128) | | | | | | $ | 1,226,603,942 | |
| | | | | | | | | |
| MONEY MARKET FUNDS — 30.0% | | Shares | | | Value | |
Federated U.S. Treasury Cash Reserve Fund - Institutional Shares, 0.02% (c) | | | 148,198,065 | | | $ | 148,198,065 | |
First American Treasury Obligations Fund - Class Y, 0.00% (c) | | | 270,163,315 | | | | 270,163,315 | |
Total Money Market Funds (Cost $418,361,380) | | | | | | $ | 418,361,380 | |
| | | | | | | | | |
| Total Investments and Money Market Funds at Value — 117.8% | | | | | | | | |
| (Cost $1,645,397,508) | | | | | | $ | 1,644,965,322 | |
| | | | | | | | | |
Liabilities in Excess of Other Assets(d) — (17.8%) | | | | | | | (248,788,258 | ) |
| | | | | | | | | |
| Net Assets — 100.0% | | | | | | $ | 1,396,177,064 | |
ADR - American Depositary Receipt.
| (a) | Non-income producing security. |
| | |
| (b) | Annualized yield at time of purchase, not a coupon rate. |
| | |
| (c) | The rate shown is the 7-day effective yield as of December 31, 2009. |
| | |
| (d) | Liabilities include primarily payables for unsettled security purchases which settled on 01/04/2010. See the Statement of Assets and Liabilities. |
See accompanying notes to financial statements.
Hussman Investment Trust Statements of Assets and Liabilities | |
| December 31, 2009 (Unaudited) | |
| | | Hussman Strategic Growth Fund | | | Hussman Strategic Total Return Fund | |
| ASSETS | | | | | | |
| Investments in securities: | | | | | | |
| At acquisition cost | | $ | 4,165,704,333 | | | $ | 1,227,036,128 | |
| At value (Note 1) | | $ | 5,035,066,920 | | | $ | 1,226,603,942 | |
| Investments in money market funds | | | 1,036,285,309 | | | | 418,361,380 | |
| Cash | | | 500,000 | | | | — | |
| Dividends and interest receivable | | | 1,375,864 | | | | 6,616,595 | |
| Receivable for capital shares sold | | | 8,739,372 | | | | 5,123,739 | |
| Other assets | | | 274,518 | | | | 165,215 | |
| Total Assets | | | 6,082,241,983 | | | | 1,656,870,871 | |
| | | | | | | | | |
| LIABILITIES | | | | | | | | |
| Dividends payable | | | 1,799,687 | | | | 1,012,458 | |
| Written call options, at value (Notes 1 and 4) (premiums received $451,792,272) | | | 490,775,500 | | | | — | |
| Payable for investment securities purchased | | | 129,034,331 | | | | 257,420,565 | |
| Payable for capital shares redeemed | | | 7,296,919 | | | | 1,471,523 | |
| Accrued investment advisory fees (Note 3) | | | 4,232,986 | | | | 569,049 | |
| Payable to administrator (Note 3) | | | 360,150 | | | | 110,100 | |
| Payable to Trustees | | | 8,000 | | | | 8,000 | |
| Other accrued expenses and liabilities | | | 408,143 | | | | 102,112 | |
| Total Liabilities | | | 633,915,716 | | | | 260,693,807 | |
| | | | | | | | | |
| NET ASSETS | | $ | 5,448,326,267 | | | $ | 1,396,177,064 | |
| | | | | | | | | |
| Net assets consist of: | | | | | | | | |
| Paid-in capital | | $ | 6,080,712,565 | | | $ | 1,361,133,740 | |
| Accumulated net investment income (loss) | | | (1,958,044 | ) | | | 1,899,816 | |
| Accumulated net realized gains (losses) from security transactions and option contracts | | | (1,460,807,613 | ) | | | 33,575,694 | |
| Net unrealized appreciation (depreciation) on investments and option contracts | | | 830,379,359 | | | | (432,186 | ) |
| | | | | | | | | |
| NET ASSETS | | $ | 5,448,326,267 | | | $ | 1,396,177,064 | |
| | | | | | | | | |
| Shares of beneficial interest outstanding (unlimited number of shares authorized, no par value) | | | 426,226,565 | | | | 116,655,617 | |
| | | | | | | | | |
Net asset value, offering price and redemption price per share(a) (Note 1) | | $ | 12.78 | | | $ | 11.97 | |
| (a) | Redemption price varies based on length of time shares are held. |
See accompanying notes to financial statements.
Hussman Investment Trust Statements of Operations | |
| For the Six Months Ended December 31, 2009 (Unaudited) | |
| | | Hussman Strategic Growth Fund | | | Hussman Strategic Total Return Fund | |
| INVESTMENT INCOME | | | | | | |
| Dividends | | $ | 26,234,770 | | | $ | 1,454,268 | |
| Foreign withholding taxes on dividends | | | (155,376 | ) | | | (3,032 | ) |
| Interest | | | — | | | | 15,259,959 | |
| Total Income | | | 26,079,394 | | | | 16,711,195 | |
| | | | | | | | | |
| EXPENSES | | | | | | | | |
| Investment advisory fees (Note 3) | | | 24,470,819 | | | | 3,014,679 | |
| Transfer agent, account maintenance and shareholder services fees (Note 3) | | | 1,492,998 | | | | 365,687 | |
| Administration fees (Note 3) | | | 1,108,458 | | | | 369,629 | |
| Registration and filing fees | | | 227,501 | | | | 134,932 | |
| Custodian and bank service fees | | | 186,207 | | | | 54,817 | |
| Fund accounting fees (Note 3) | | | 161,082 | | | | 58,320 | |
| Trustees’ fees and expenses | | | 68,170 | | | | 68,170 | |
| Printing of shareholder reports | | | 85,005 | | | | 30,389 | |
| Professional fees | | | 54,987 | | | | 47,089 | |
| Compliance service fees (Note 3) | | | 44,502 | | | | 12,534 | |
| Insurance expense | | | 33,359 | | | | 7,157 | |
| Other expenses | | | 103,647 | | | | 16,917 | |
| Total Expenses | | | 28,036,735 | | | | 4,180,320 | |
| | | | | | | | | |
| NET INVESTMENT INCOME (LOSS) | | | (1,957,341 | ) | | | 12,530,875 | |
| | | | | | | | | |
REALIZED AND UNREALIZED GAINS (LOSSES) ON INVESTMENTS AND OPTION CONTRACTS (Note 4) | | | | | | | | |
| Net realized gains (losses) from: | | | | | | | | |
| Security transactions | | | 322,747,686 | | | | 51,549,474 | |
| Option contracts | | | (1,208,758,214 | ) | | | — | |
| Net change in unrealized appreciation (depreciation) on: | | | | | | | | |
| Investments | | | 770,104,636 | | | | (30,592,995 | ) |
| Option contracts | | | 35,536,402 | | | | — | |
| | | | | | | | | |
| NET REALIZED AND UNREALIZED GAINS (LOSSES) ON INVESTMENTS AND OPTION CONTRACTS | | | (80,369,490 | ) | | | 20,956,479 | |
| | | | | | | | | |
| NET INCREASE (DECREASE) IN NET ASSETS FROM OPERATIONS | | $ | (82,326,831 | ) | | $ | 33,487,354 | |
See accompanying notes to financial statements.
Hussman Strategic Growth Fund Statements of Changes in Net Assets | |
| | |
| | | Six Months Ended December 31, 2009 (Unaudited) | | | Year Ended June 30, 2009 | |
| FROM OPERATIONS | | | | | | |
| Net investment income (loss) | | $ | (1,957,341 | ) | | $ | 10,748,413 | |
| Net realized gains (losses) from: | | | | | | | | |
| Security transactions | | | 322,747,686 | | | | (688,494,870 | ) |
| Option contracts | | | (1,208,758,214 | ) | | | 330,850,635 | |
| Net change in unrealized appreciation (depreciation) on: | | | | | | | | |
| Investments | | | 770,104,636 | | | | 429,851,097 | |
| Option contracts | | | 35,536,402 | | | | (250,709,448 | ) |
| Net decrease in net assets resulting from operations | | | (82,326,831 | ) | | | (167,754,173 | ) |
| | | | | | | | | |
| DISTRIBUTIONS TO SHAREHOLDERS | | | | | | | | |
| From net investment income | | | (7,151,672 | ) | | | (7,024,520 | ) |
| From net realized gains | | | — | | | | (442,790,095 | ) |
| Decrease in net assets from distributions to shareholders | | | (7,151,672 | ) | | | (449,814,615 | ) |
| | | | | | | | | |
| FROM CAPITAL SHARE TRANSACTIONS | | | | | | | | |
| Proceeds from shares sold | | | 1,568,150,706 | | | | 3,473,953,198 | |
| Net asset value of shares issued in reinvestment of distributions to shareholders | | | 5,351,985 | | | | 362,131,353 | |
| Proceeds from redemption fees collected (Note 1) | | | 289,145 | | | | 1,924,023 | |
| Payments for shares redeemed | | | (1,011,799,167 | ) | | | (1,519,635,649 | ) |
| Net increase in net assets from capital share transactions | | | 561,992,669 | | | | 2,318,372,925 | |
| | | | | | | | | |
| TOTAL INCREASE IN NET ASSETS | | | 472,514,166 | | | | 1,700,804,137 | |
| | | | | | | | | |
| NET ASSETS | | | | | | | | |
| Beginning of period | | | 4,975,812,101 | | | | 3,275,007,964 | |
| End of period | | $ | 5,448,326,267 | | | $ | 4,975,812,101 | |
| | | | | | | | | |
| ACCUMULATED NET INVESTMENT INCOME (LOSS) | | $ | (1,958,044 | ) | | $ | 7,150,969 | |
| | | | | | | | | |
| CAPITAL SHARE ACTIVITY | | | | | | | | |
| Shares sold | | | 120,726,310 | | | | 258,930,556 | |
| Shares reinvested | | | 418,778 | | | | 30,193,795 | |
| Shares redeemed | | | (78,079,953 | ) | | | (114,190,405 | ) |
| Net increase in shares outstanding | | | 43,065,135 | | | | 174,933,946 | |
| Shares outstanding at beginning of period | | | 383,161,430 | | | | 208,227,484 | |
| Shares outstanding at end of period | | | 426,226,565 | | | | 383,161,430 | |
See accompanying notes to financial statements.
Hussman Strategic Total Return Fund Statements of Changes in Net Assets | |
| | |
| | | Six Months Ended December 31, 2009 (Unaudited) | | | Year Ended June 30, 2009 | |
| FROM OPERATIONS | | | | | | |
| Net investment income | | $ | 12,530,875 | | | $ | 1,581,737 | |
| Net realized gains from security transactions | | | 51,549,474 | | | | 3,973,011 | |
| Net change in unrealized appreciation (depreciation) on investments | | | (30,592,995 | ) | | | 28,241,637 | |
| Net increase in net assets resulting from operations | | | 33,487,354 | | | | 33,796,385 | |
| | | | | | | | | |
| DISTRIBUTIONS TO SHAREHOLDERS | | | | | | | | |
| From net investment income | | | (10,672,306 | ) | | | (315,708 | ) |
| From net realized gains | | | (18,352,276 | ) | | | (21,886,570 | ) |
| Decrease in net assets from distributions to shareholders | | | (29,024,582 | ) | | | (22,202,278 | ) |
| | | | | | | | | |
| FROM CAPITAL SHARE TRANSACTIONS | | | | | | | | |
| Proceeds from shares sold | | | 599,535,851 | | | | 906,369,367 | |
| Net asset value of shares issued in reinvestment of distributions to shareholders | | | 25,439,882 | | | | 19,366,504 | |
| Proceeds from redemption fees collected (Note 1) | | | 141,659 | | | | 687,046 | |
| Payments for shares redeemed | | | (256,994,274 | ) | | | (245,390,922 | ) |
| Net increase in net assets from capital share transactions | | | 368,123,118 | | | | 681,031,995 | |
| | | | | | | | | |
| TOTAL INCREASE IN NET ASSETS | | | 372,585,890 | | | | 692,626,102 | |
| | | | | | | | | |
| NET ASSETS | | | | | | | | |
| Beginning of period | | | 1,023,591,174 | | | | 330,965,072 | |
| End of period | | $ | 1,396,177,064 | | | $ | 1,023,591,174 | |
| | | | | | | | | |
| ACCUMULATED NET INVESTMENT INCOME | | $ | 1,899,816 | | | $ | 41,247 | |
| | | | | | | | | |
| CAPITAL SHARE ACTIVITY | | | | | | | | |
| Shares sold | | | 49,586,111 | | | | 78,248,845 | |
| Shares reinvested | | | 2,097,681 | | | | 1,792,403 | |
| Shares redeemed | | | (21,247,354 | ) | | | (21,430,538 | ) |
| Net increase in shares outstanding | | | 30,436,438 | | | | 58,610,710 | |
| Shares outstanding at beginning of period | | | 86,219,179 | | | | 27,608,469 | |
| Shares outstanding at end of period | | | 116,655,617 | | | | 86,219,179 | |
See accompanying notes to financial statements.
Hussman Strategic Growth Fund Financial Highlights | |
| Selected Per Share Data and Ratios for a Share Outstanding Throughout Each Period | |
| | | Six Months Ended December 31, 2009 (Unaudited) | | | Year Ended June 30, 2009 | | | Year Ended June 30, 2008 | | | Year Ended June 30, 2007 | | | Year Ended June 30, 2006 | | | Year Ended June 30, 2005 | |
| Net asset value at beginning of period | | $ | 12.99 | | | $ | 15.73 | | | $ | 15.85 | | | $ | 16.13 | | | $ | 15.90 | | | $ | 15.89 | |
| | | | | | | | | | | | | | | | | | | | | | | | | |
| Income (loss) from investment operations: | | | | | | | | | | | | | | | | | | | | | | | | |
| Net investment income (loss) | | | (0.01 | ) | | | 0.03 | | | | 0.04 | | | | 0.14 | | | | 0.08 | | | | 0.06 | |
| Net realized and unrealized gains (losses) on investments and options | | | (0.18 | ) | | | (0.88 | ) | | | 0.55 | | | | 0.16 | | | | 0.69 | | | | 0.68 | |
| Total from investment operations | | | (0.19 | ) | | | (0.85 | ) | | | 0.59 | | | | 0.30 | | | | 0.77 | | | | 0.74 | |
| | | | | | | | | | | | | | | | | | | | | | | | | |
| Less distributions: | | | | | | | | | | | | | | | | | | | | | | | | |
| Dividends from net investment income | | | (0.02 | ) | | | (0.03 | ) | | | (0.09 | ) | | | (0.13 | ) | | | (0.05 | ) | | | (0.03 | ) |
| Distributions from net realized gains | | | — | | | | (1.87 | ) | | | (0.63 | ) | | | (0.46 | ) | | | (0.50 | ) | | | (0.71 | ) |
| Total distributions | | | (0.02 | ) | | | (1.90 | ) | | | (0.72 | ) | | | (0.59 | ) | | | (0.55 | ) | | | (0.74 | ) |
| | | | | | | | | | | | | | | | | | | | | | | | | |
| Proceeds from redemption fees collected (Note 1) | | | 0.00 | (a) | | | 0.01 | | | | 0.01 | | | | 0.01 | | | | 0.01 | | | | 0.01 | |
| | | | | | | | | | | | | | | | | | | | | | | | | |
| Net asset value at end of period | | $ | 12.78 | | | $ | 12.99 | | | $ | 15.73 | | | $ | 15.85 | | | $ | 16.13 | | | $ | 15.90 | |
| | | | | | | | | | | | | | | | | | | | | | | | | |
Total return(b) | | | (1.49% | )(c) | | | (4.35% | ) | | | 3.84% | | | | 1.98% | | | | 5.05% | | | | 4.95% | |
| | | | | | | | | | | | | | | | | | | | | | | | | |
| Net assets at end of period (000’s) | | $ | 5,448,326 | | | $ | 4,975,812 | | | $ | 3,275,008 | | | $ | 2,718,324 | | | $ | 2,816,108 | | | $ | 1,835,514 | |
| | | | | | | | | | | | | | | | | | | | | | | | | |
| Ratio of expenses to average net assets | | | 1.05% | (d) | | | 1.09% | | | | 1.11% | | | | 1.11% | | | | 1.14% | | | | 1.24% | |
| | | | | | | | | | | | | | | | | | | | | | | | | |
| Ratio of net investment income (loss) to average net assets | | | (0.07% | )(d) | | | 0.28% | | | | 0.28% | | | | 0.91% | | | | 0.63% | | | | 0.44% | |
| | | | | | | | | | | | | | | | | | | | | | | | | |
| Portfolio turnover rate | | | 39% | (c) | | | 69% | | | | 150% | | | | 106% | | | | 63% | | | | 81% | |
| (a) | Amount rounds to less than $0.01 per share. |
| | |
| (b) | Total return is a measure of the change in value of an investment in the Fund over the period covered, which assumes any dividends or capital gains distributions are reinvested in shares of the Fund. Returns do not reflect the deduction of taxes a shareholder would pay on Fund distributions or the redemption of Fund shares. |
| | |
| (c) | Not annualized. |
| | |
| (d) | Annualized. |
See accompanying notes to financial statements
Hussman Strategic Total Return Fund Financial Highlights | |
| Selected Per Share Data and Ratios for a Share Outstanding Throughout Each Period | |
| | | Six Months Ended December 31, 2009 (Unaudited) | | | Year Ended June 30, 2009 | | | Year Ended June 30, 2008 | | | Year Ended June 30, 2007 | | | Year Ended June 30, 2006 | | | Year Ended June 30, 2005 | |
| Net asset value at beginning of period | | $ | 11.87 | | | $ | 11.99 | | | $ | 10.92 | | | $ | 11.30 | | | $ | 10.94 | | | $ | 10.53 | |
| | | | | | | | | | | | | | | | | | | | | | | | | |
| Income from investment operations: | | | | | | | | | | | | | | | | | | | | | | | | |
| Net investment income | | | 0.11 | | | | 0.05 | | | | 0.24 | | | | 0.32 | | | | 0.32 | | | | 0.24 | |
| Net realized and unrealized gains on investments and foreign currencies | | | 0.26 | | | | 0.35 | | | | 1.59 | | | | 0.06 | | | | 0.65 | | | | 0.42 | |
| Total from investment operations | | | 0.37 | | | | 0.40 | | | | 1.83 | | | | 0.38 | | | | 0.97 | | | | 0.66 | |
| | | | | | | | | | | | | | | | | | | | | | | | | |
| Less distributions: | | | | | | | | | | | | | | | | | | | | | | | | |
| Dividends from net investment income | | | (0.10 | ) | | | (0.01 | ) | | | (0.23 | ) | | | (0.33 | ) | | | (0.31 | ) | | | (0.24 | ) |
| Distributions from net realized gains | | | (0.17 | ) | | | (0.53 | ) | | | (0.54 | ) | | | (0.43 | ) | | | (0.30 | ) | | | (0.02 | ) |
| Total distributions | | | (0.27 | ) | | | (0.54 | ) | | | (0.77 | ) | | | (0.76 | ) | | | (0.61 | ) | | | (0.26 | ) |
| | | | | | | | | | | | | | | | | | | | | | | | | |
| Proceeds from redemption fees collected (Note 1) | | | 0.00 | (a) | | | 0.02 | | | | 0.01 | | | | 0.00 | (a) | | | 0.00 | (a) | | | 0.01 | |
| | | | | | | | | | | | | | | | | | | | | | | | | |
| Net asset value at end of period | | $ | 11.97 | | | $ | 11.87 | | | $ | 11.99 | | | $ | 10.92 | | | $ | 11.30 | | | $ | 10.94 | |
| | | | | | | | | | | | | | | | | | | | | | | | | |
Total return(b) | | | 3.08% | (c) | | | 3.94% | | | | 17.23% | | | | 3.46% | | | | 9.01% | | | | 6.40% | |
| | | | | | | | | | | | | | | | | | | | | | | | | |
| Net assets at end of period (000’s) | | $ | 1,396,177 | | | $ | 1,023,591 | | | $ | 330,965 | | | $ | 174,480 | | | $ | 158,735 | | | $ | 128,156 | |
| | | | | | | | | | | | | | | | | | | | | | | | | |
Ratio of net expenses to average net
assets(d) | | | 0.68% | (e) | | | 0.75% | | | | 0.90% | | | | 0.90% | | | | 0.90% | | | | 0.90% | |
| | | | | | | | | | | | | | | | | | | | | | | | | |
| Ratio of net investment income to average net assets | | | 2.04% | (e) | | | 0.26% | | | | 2.05% | | | | 2.86% | | | | 2.94% | | | | 2.25% | |
| | | | | | | | | | | | | | | | | | | | | | | | | |
| Portfolio turnover rate | | | 60% | (c) | | | 36% | | | | 212% | | | | 41% | | | | 55% | | | | 64% | |
| (a) | Amount rounds to less than $0.01 per share. |
| | |
| (b) | Total return is a measure of the change in value of an investment in the Fund over the period covered, which assumes any dividends or capital gains distributions are reinvested in shares of the Fund. Returns do not reflect the deduction of taxes a shareholder would pay on Fund distributions or the redemption of Fund shares. |
| | |
| (c) | Not annualized. |
| | |
| (d) | Absent investment advisory fee reductions and expense reimbursements by the Adviser, the ratios of expenses to average net assets would have been 0.92% and 1.01% for the years ended June 30, 2006 and 2005, respectively. |
| | |
| (e) | Annualized. |
See accompanying notes to financial statements.
Hussman Investment Trust Notes to Financial Statements | |
| December 31, 2009 (Unaudited) | |
1. ORGANIZATION AND SIGNIFICANT ACCOUNTING POLICIES
Hussman Strategic Growth Fund and Hussman Strategic Total Return Fund (each, a “Fund”, and collectively, the “Funds”) are each a diversified series of Hussman Investment Trust (the “Trust”), which is registered under the Investment Company Act of 1940 as an open-end managment investment company. Each Fund is authorized to issue an unlimited number of shares. Hussman Strategic Growth Fund commenced operations on July 24, 2000. Hussman Strategic Total Return Fund commenced operations on September 12, 2002.
Hussman Strategic Growth Fund’s investment objective is to provide long-term capital appreciation, with added emphasis on protection of capital during unfavorable market conditions.
Hussman Strategic Total Return Fund’s investment objective is to provide long-term total return from income and capital appreciation, with added emphasis on protection of capital during unfavorable market conditions.
Securities and Options Valuation — The Funds’ portfolio securities are valued at market value as of the close of regular trading on the New York Stock Exchange (“NYSE”) (normally, 4:00 Eastern time) on each business day the NYSE is open. Securities, other than options, listed on the NYSE or other exchanges are valued on the basis of their last sale prices on the exchanges on which they are primarily traded. However, if the last sale price on the NYSE is different than the last sale price on any other exchange, the NYSE price will be used. If there are no sales on that day, the securities are valued at the last bid price on the NYSE or other primary exchange for that day. Securities traded on a foreign stock exchange are valued based upon the closing price on the principal exchange where the security is traded. Securities which are quoted by NASDAQ are valued at the NASDAQ Official Closing Price. If there are no sales on that day, the securities are valued at the last bid price as reported by NASDAQ. Securities traded in over-the-counter markets, other than NASDAQ quoted securities, are valued at the last sales price, or if there are no sales on that day, at the mean of the closing bid and asked prices. Values of foreign securities are translated from the local currency into U.S. dollars using currency exchange rates supplied by a pricing quotation service.
Pursuant to valuation procedures approved by the Board of Trustees, options traded on a national securities exchange are valued at prices between the closing bid and ask prices determined by Hussman Econometrics Advisors,
Hussman Investment Trust Notes to Financial Statements (continued) | |
| December 31, 2009 (Unaudited) | |
Inc. (the “Adviser”) to most closely reflect market value as of the time of computation of net asset value. As of December 31, 2009, all options held by Hussman Strategic Growth Fund have been valued in this manner. Options not traded on a national securities exchange or board of trade, but for which over-the-counter market quotations are readily available, are valued at the mean of their closing bid and ask prices. Futures contracts and options thereon, which are traded on commodities exchanges, are valued at their daily settlement value as of the close of such commodities exchanges.
Fixed income securities not traded or dealt in upon any securities exchange but for which over-the-counter market quotations are readily available generally are valued at the mean of their closing bid and asked prices. Fixed income securities may also be valued on the basis of prices provided by an independent pricing service. The Board of Trustees will review and monitor the methods used by such services to assure itself that securities are appropriately valued. The fair value of securities with remaining maturities of 60 days or less may be determined in good faith by the Board of Trustees to be represented by amortized cost value, absent unusual circumstances.
In the event that market quotations are not readily available or are determined by the Adviser to not be reflective of fair market value due to market events or developments, securities and options are valued at fair value as determined by the Adviser in accordance with procedures adopted by the Board of Trustees. Such methods of fair valuation may include, but are not limited to: multiple of earnings, multiple of book value, discount from market of a similar freely traded security, purchase price of security, subsequent private transactions in the security or related securities, or a combination of these and other factors.
Accounting principles generally accepted in the United States (“GAAP”) establish a single authoritative definition of fair value, set out a framework for measuring fair value and require additional disclosures about fair value measurement.
Various inputs are used in determining the value of each of the Fund’s investments. These inputs are summarized in the three broad levels listed below:
| | • | Level 1 – quoted prices in active markets for identical securities |
| | • | Level 2 – other significant observable inputs |
| | • | Level 3 – significant unobservable inputs |
Hussman Investment Trust Notes to Financial Statements (continued) | |
| December 31, 2009 (Unaudited) | |
For example, options contracts purchased and written by Hussman Strategic Growth Fund are classified as Level 2 since they are valued at prices between the closing bid and ask prices determined by the Adviser to most closely reflect market value, pursuant to procedures approved by the Board of Trustees. U.S. Government Agency and Treasury obligations held by Hussman Strategic Total Return Fund are classified as Level 2 since values are based on prices provided by an independent pricing service that utilizes various “other significant observable inputs” including bid and ask quotations, prices of similar securities and interest rates, among other factors. Shares of money market funds are classified as Level 2 because their shares are valued at amortized cost, which approximates fair value absent unusual circumstances. The inputs or methodology used for valuing securities are not necessarily an indication of the risks associated with investing in those securities.
The following is a summary of the inputs used to value each Fund’s investments and other financial instruments as of December 31, 2009 by security type:
Hussman Strategic Growth Fund
| | | Level 1 | | | Level 2 | | | Level 3 | | | Total | |
| Common Stocks | | $ | 4,909,240,920 | | | $ | — | | | $ | — | | | $ | 4,909,240,920 | |
| Put Option Contracts | | | — | | | | 125,826,000 | | | | — | | | | 125,826,000 | |
| Money Market Funds | | | — | | | | 1,036,285,309 | | | | — | | | | 1,036,285,309 | |
| Written Call Option Contracts | | | — | | | | (490,775,500 | ) | | | — | | | | (490,775,500 | ) |
| Total | | $ | 4,909,240,920 | | | $ | 671,335,809 | | | $ | — | | | $ | 5,580,576,729 | |
Hussman Strategic Total Return Fund
| | | Level 1 | | | Level 2 | | | Level 3 | | | Total | |
| Common Stocks | | $ | 80,803,866 | | | $ | — | | | $ | — | | | $ | 80,803,866 | |
| U.S. Treasury Obligations | | | — | | | | 1,098,523,476 | | | | — | | | | 1,098,523,476 | |
| Exchange-Traded Funds | | | 47,276,600 | | | | — | | | | — | | | | 47,276,600 | |
| Money Market Funds | | | — | | | | 418,361,380 | | | | — | | | | 418,361,380 | |
| Total | | $ | 128,080,466 | | | $ | 1,516,884,856 | | | $ | — | | | $ | 1,644,965,322 | |
Each Fund’s Schedule of Investments identifies the specific securities (by type of security and industry type) that comprise that Funds holdings within the Level 1 and Level 2 categories shown in the tables above.
Futures Contracts and Option Transactions — Hussman Strategic Growth Fund may purchase and write put and call options on broad-based stock indices. The Fund may also purchase and write call and put options on
Hussman Investment Trust Notes to Financial Statements (continued) | |
| December 31, 2009 (Unaudited) | |
individual securities. Hussman Strategic Total Return Fund may use financial futures contracts and related options to hedge against changes in the market value of its portfolio securities. The Fund may also purchase a foreign currency option to establish or modify the Fund’s exposure to foreign currencies, or an interest rate futures contract to protect against a decline in the value of its portfolio.
The Hussman Strategic Growth Fund may use futures and options contracts for the purpose of seeking to reduce the overall investment risk that would otherwise be associated with the securities in which it invests. For example, the Fund may sell a stock index futures contract in anticipation of a general market or market sector decline that might adversely affect prices of the Fund’s portfolio securities. To the extent there is a correlation between the Fund’s portfolio and a particular stock index, the sale of futures contracts on that index could reduce general market risk and permit the fund to retain its securities positions.
When a Fund writes an index option, an amount equal to the net premium (the premium less the commission) received by the Fund is recorded as a liability in the Fund’s Statement of Assets and Liabilities and is subsequently valued. If an index option expires unexercised on the stipulated expiration date or if the Fund enters into a closing purchase transaction, it will realize a gain (or a loss if the cost of a closing purchase transaction exceeds the net premium received when the option is sold) and the liability related to such option will be eliminated. If an index option is exercised, the Fund will be required to pay the difference between the closing index value and the exercise price of the option. In this event, the proceeds of the sale will be increased by the net premium originally received and the Fund will realize a gain or loss.
Repurchase Agreements — The Funds may enter into repurchase agreements with certain banks or non-bank dealers. The value of the underlying securities collateralizing these agreements is monitored on a daily basis to ensure that the value of the collateral during the term of the agreements equals or exceeds the repurchase price plus accrued interest. If the bank or dealer defaults realization of the collateral by the Fund may be delayed or limited, and the Funds may suffer a loss if the value of the collateral declines.
Foreign Currency Translation — Amounts denominated in or expected to settle in foreign currencies are translated into U.S. dollars based on exchange rates on the following basis:
Hussman Investment Trust Notes to Financial Statements (continued) | |
| December 31, 2009 (Unaudited) | |
A. The market values of investment securities and other assets and liabilities are translated at the closing rate on the London Stock Exchange each day.
B. Purchases and sales of investment securities and income and expenses are translated at the rate of exchange prevailing on the respective date of such transactions.
C. The Funds do not isolate that portion of the results of operations caused by changes in foreign exchange rates on investments from those caused by changes in market prices of securities held. Such fluctuations are included with the net realized and unrealized gains or losses on investments.
Reported net realized foreign exchange gains or losses arise from 1) purchases and sales of foreign currencies, 2) currency gains or losses realized between the trade and settlement dates on securities transactions and 3) the difference between the amounts of dividends, interest and foreign withholding taxes recorded on the Fund’s books, and the U.S. dollar equivalent of the amounts actually received or paid. Reported net unrealized foreign exchange gains and losses arise from changes in the value of assets and liabilities that result from changes in exchange rates.
Share Valuation and Redemption Fees — The net asset value per share of each Fund is calculated as of the close of regular trading on the NYSE (normally 4:00 p.m., Eastern time) on each day that the NYSE is open for business. The net asset value per share of each Fund is calculated by dividing the total value of the Fund’s assets, less its liabilities, by the number of its shares outstanding. The offering price and redemption price per share of each Fund is equal to the net asset value per share. However, shares of each Fund are generally subject to a redemption fee of 1.5%, payable to the applicable Fund, if redeemed within sixty days of the date of purchase. During the periods ended December 31, 2009 and June 30, 2009, proceeds from redemption fees totaled $289,145 and $1,924,023, respectively, for Hussman Strategic Growth Fund and $141,659 and $687,046, respectively, for Hussman Strategic Total Return Fund.
Investment Income — Interest income is accrued as earned. Dividend income is recorded on the ex-dividend date. Discounts and premiums on fixed income securities are amortized using the interest method.
Distributions to Shareholders — Dividends from net investment income, if any, are declared and paid annually to shareholders of Hussman
Hussman Investment Trust Notes to Financial Statements (continued) | |
| December 31, 2009 (Unaudited) | |
Strategic Growth Fund and are declared and paid quarterly to shareholders of Hussman Strategic Total Return Fund. Net realized short-term capital gains, if any, may be distributed throughout the year and net realized long-term capital gains, if any, are generally distributed annually. The amount of distributions from net investment income and net realized gains are determined in accordance with federal income tax regulations, which may differ from GAAP. These “book/tax” differences are either temporary or permanent in nature and are primarily due to timing differences in the recognition of capital gains or losses for option transactions, losses deferred due to wash sales and treatment for foreign currency transactions.
The tax character of distributions paid during the periods ended December 31, 2009 and June 30, 2009 was as follows:
| | Periods Ended | | Ordinary Income | | | Long-Term Capital Gains | | | Total Distributions | |
| Hussman Strategic Growth Fund | 12/31/09 | | $ | 7,151,672 | | | $ | — | | | $ | 7,151,672 | |
| | 6/30/09 | | $ | 50,652,965 | | | $ | 399,161,650 | | | $ | 449,814,615 | |
| Hussman Strategic Total Return Fund | 12/31/09 | | $ | 25,403,409 | | | $ | 3,621,173 | | | $ | 29,024,582 | |
| | 6/30/09 | | $ | 14,043,798 | | | $ | 8,158,480 | | | $ | 22,202,278 | |
Securities Transactions — For financial statement purposes, securities transactions are accounted for on trade date. Gains and losses on securities sold are determined on a specific identification basis.
Common Expenses — Expenses of the Trust not attributable solely to one of the Funds are allocated between the Funds based on relative net assets of each Fund or the nature of the expense and the relative applicability to each Fund.
Accounting Estimates — The preparation of financial statements in conformity with GAAP requires management to make estimates and assumptions that affect the reported amounts of assets and liabilities and the disclosure of contingent assets and liabilities at the date of the financial statements and the reported amounts of income and expenses during the reporting period. Actual results could differ from these estimates.
Federal Income Tax — It is each Fund’s policy to qualify as a regulated investment company under Subchapter M of the Internal Revenue Code. As provided therein, in any fiscal year in which a Fund so qualifies and distributes at least 90% of its taxable net income, the Fund (but not its
Hussman Investment Trust Notes to Financial Statements (continued) | |
| December 31, 2009 (Unaudited) | |
shareholders) will be relieved of federal income tax on the income distributed. Accordingly, no provision for income taxes has been made.
In order to avoid imposition of a Federal excise tax applicable to regulated investment companies, it is each Fund’s intention to declare and pay as dividends in each calendar year at least 98% of its net investment income (earned during the calendar year) and 98% of its net realized capital gains (earned during the twelve months ended October 31) plus undistributed amounts from prior years.
The following information is computed on a tax basis for each item as of December 31, 2009:
| | | Hussman Strategic Growth Fund | | | Hussman Strategic Total Return Fund | |
| Cost of portfolio investments and written call options | | $ | 4,722,025,235 | | | $ | 1,645,322,602 | |
| Gross unrealized appreciation | | $ | 1,022,827,978 | | | $ | 17,932,674 | |
| Gross unrealized depreciation | | | (164,276,484 | ) | | | (18,289,954 | ) |
| Net unrealized appreciation (depreciation) | | $ | 858,551,494 | | | $ | (357,280 | ) |
| Accumulated ordinary income (loss) | | | (158,357 | ) | | | 1,015,980 | |
| Post-October losses | | | (648,333,130 | ) | | | (14,424 | ) |
| Other gains (losses) | | | (840,646,618 | ) | | | 35,411,506 | |
| Other temporary differences | | | (1,799,687 | ) | | | (1,012,458 | ) |
| Total accumulated earnings (deficit) | | $ | (632,386,298 | ) | | $ | 35,043,324 | |
The difference between the federal income tax cost of portfolio investments and the financial statement cost for the Funds is due to certain timing differences in the recognition of capital gains or losses under income tax regulations and GAAP. These “book/tax” differences are temporary in nature and are primarily due to option transactions, losses deferred due to wash sales and differing treatments of realized and unrealized gains and losses on exchange-traded funds taxed as grantor trusts.
Hussman Strategic Growth Fund and Hussman Strategic Total Return Fund had net realized capital losses of $648,333,130 and $14,424, respectively, during the period November 1, 2008 through June 30, 2009, which are treated for federal income tax purposes as arising during each Fund’s tax year ending June 30, 2010. These “post-October” losses may be utilized in the current and future years to offset net realized capital gains, if any, prior to distributing such gains to shareholders.
Hussman Investment Trust Notes to Financial Statements (continued) | |
| December 31, 2009 (Unaudited) | |
For the six months ended December 31, 2009, Hussman Strategic Total Return Fund reclassified $2,808,466 of accumulated net realized gains from security transactions against accumulated net investment income on its Statement of Assets and Liabilities due to differing treatments of realized gains and losses on exchange-traded funds taxed as grantor trusts. Such reclassification, the result of permanent differences between the financial statement and income tax reporting requirements, has no effect on the Fund’s net assets or net asset value per share.
Each Fund recognizes the tax benefits or expenses of uncertain tax positions only when the position is “more likely than not” to be sustained assuming examination by tax authorities. Management has reviewed each Fund’s tax positions taken on Federal income tax returns for all open tax years (tax years ended December 31, 2006 through December 31, 2009) and has concluded that no provision for unrecognized tax benefits or expenses is required in these financial statements.
2. INVESTMENT TRANSACTIONS
During the six months ended December 31, 2009, cost of purchases and proceeds from sales and maturities of investment securities, other than short-term investments and U.S. government securities, amounted to $1,972,991,119 and $3,033,679,435, respectively, for Hussman Strategic Growth Fund and $73,431,515 and $169,217,870, respectively, for Hussman Strategic Total Return Fund.
3. TRANSACTIONS WITH AFFILIATES
One of the Trustees and certain officers of the Trust are affiliated with the Adviser or with Ultimus Fund Solutions, LLC (“Ultimus”), the Funds’ administrator, transfer agent and fund accounting agent.
Advisory Agreement
Under the terms of an Advisory Agreement between the Trust and the Adviser, Hussman Strategic Growth Fund pays a fee, which is computed and accrued daily and paid monthly, at annual rates of 0.95% of the first $2 billion of its average daily net assets; 0.90% on the next $3 billion of such assets; and 0.85% of such assets in excess of $5 billion. Under the terms of a separate Advisory Agreement between the Trust and the Adviser, Hussman Strategic Total Return Fund pays the Adviser a fee, which is computed and accrued daily and paid monthly, at annual rates of 0.50% of the first $1 billion of its average daily net assets and 0.45% of such assets in excess of $1 billion.
Hussman Investment Trust Notes to Financial Statements (continued) | |
| December 31, 2009 (Unaudited) | |
Prior to July 13, 2009, Hussman Strategic Growth Fund paid a fee, which was computed and accrued daily and paid monthly, at annual rates of 1.00% of the first $1 billion of its average daily net assets; 0.95% of the next $2 billion of such assets; and 0.90% of such assets in excess of $3 billion. Prior to July 13, 2009, Hussman Strategic Total Return Fund paid the Adviser a fee, which was computed and accrued daily and paid monthly, at annual rates of 0.55% of the first $500 million of its average daily net assets; and 0.50% of such assets in excess of $500 million.
Administration Agreement
Under the terms of an Administration Agreement, Ultimus supplies executive, administrative and regulatory services to the Trust, supervises the preparation of tax returns, and coordinates the preparation of reports to shareholders and reports to and filings with the Securities and Exchange Commission (“SEC”) and state securities authorities.
Under the terms of the Administration Agreement, Ultimus receives a monthly fee from each Fund computed at annual rates of 0.075% of the Fund’s average daily net assets up to $500 million; 0.05% of the next $1.5 billion of such assets; 0.04% of the next $1 billion of such assets; 0.03% of the next $2 billion of such assets; and 0.025% of such assets in excess of $5 billion, subject to a per Fund minimum monthly fee of $2,000.
Fund Accounting Agreement
Under the terms of a Fund Accounting Agreement between the Trust and Ultimus, Ultimus calculates the daily net asset value per share and maintains the financial books and records of the Funds. For these services, Ultimus receives from each Fund a monthly base fee of $2,500, plus an asset-based fee computed at annual rates of 0.01% of the Fund’s average daily net assets up to $500 million and 0.005% of such net assets in excess of $500 million. In addition, the Funds reimburse Ultimus for certain out-of-pocket expenses incurred in obtaining valuations of the Funds’ portfolio securities.
Transfer Agent and Shareholder Services Agreement
Under the terms of a Transfer Agent and Shareholder Services Agreement between the Trust and Ultimus, Ultimus maintains the records of each shareholder’s account, answers shareholders’ inquiries concerning their accounts, processes purchases and redemptions of each Fund’s shares, acts as dividend and distribution disbursing agent, and performs other shareholder service functions. For these services, Ultimus receives from each Fund a fee,
Hussman Investment Trust Notes to Financial Statements (continued) | |
| December 31, 2009 (Unaudited) | |
payable monthly, of $22 annually for each direct account and $12 annually for certain accounts established through financial intermediaries, subject to a per Fund minimum fee of $1,500 per month. For the six months ended December 31, 2009, such fees paid by Hussman Strategic Growth Fund and Hussman Strategic Total Return were $776,947 and $150,737, respectively. In addition, the Funds reimburse Ultimus for certain out-of-pocket expenses, including, but not limited to, postage and supplies.
For shareholder accounts held through financial intermediaries, the Funds may, in some cases, compensate these intermediaries for providing certain account maintenance and shareholder services, at an annual rate of not more than $10 per account. During the six months ended December 31, 2009, Hussman Strategic Growth Fund and Hussman Strategic Total Return Fund paid $716,051 and $214,950, respectively, to financial intermediaries for such services.
Compliance Consulting Agreement
Under the terms of a Compliance Consulting Agreement between the Trust and Ultimus, Ultimus provides an individual to serve as the Trust’s Chief Compliance Officer and to administer the Trust’s compliance policies and procedures. For these services, the Funds pay Ultimus a base fee of $1,000 per month, plus an asset-based fee computed at annual rates of .005% of the average value of their aggregate daily net assets in excess of $100 million to $500 million, .0025% of such assets from $500 million to $1 billion and .00125% of such assets in excess of $1 billion. In addition, the Funds reimburse Ultimus for reasonable out-of-pocket expenses, if any, incurred in connection with these services.
4. OPTION CONTRACTS WRITTEN
Transactions in option contracts written by Hussman Strategic Growth Fund during the six months ended December 31, 2009 were as follows:
| | | Option Contracts | | | Option Premiums | |
| Options outstanding at beginning of period | | | 54,000 | | | $ | 506,291,976 | |
| Options written | | | 175,000 | | | | 2,731,509,348 | |
| Options cancelled in a closing purchase transaction | | | (184,500 | ) | | | (2,786,009,052 | ) |
| Options outstanding at end of period | | | 44,500 | | | $ | 451,792,272 | |
No contracts were written by Hussman Strategic Total Return Fund during the six months ended December 31, 2009.
Hussman Investment Trust Notes to Financial Statements (continued) | |
| December 31, 2009 (Unaudited) | |
5. BANK LINE OF CREDIT
Hussman Strategic Growth Fund has an unsecured $10,000,000 bank line of credit. Hussman Strategic Total Return Fund has an unsecured bank line of credit in the amount of $2,000,000. Borrowings under these arrangements bear interest at a rate determined by the lending bank at the time of borrowing. During the six months ended December 31, 2009, the Funds did not borrow under their respective lines of credit.
6. CONTINGENCIES AND COMMITMENTS
The Trust’s officers and Trustees are entitled to indemnifications from the Funds for certain liabilities that may arise from their performance of their duties to the Funds. Additionally, in the normal course of business the Funds enter into contracts that contain a variety of representations and warranties and which may provide general indemnifications. The Funds’ maximum exposure under these arrangements is unknown, as this would involve potential claims for indemnification for losses that may or may not be incurred in the future. However, based on experience, the Trust believes the risk of loss to be remote.
7. SUBSEQUENT EVENTS
The Funds are required to recognize in the financial statements the effects of all subsequent events that provide additional evidence about conditions that existed as of the date of the Statement of Assets and Liabilities. For nonrecognized subsequent events that must be disclosed to keep the financial statements from being misleading, the Funds are required to disclose the nature of the event as well as an estimate of its financial effect, or a statement that such an estimate cannot be made. In addition, the Funds are required to disclose the date through which subsequent events have been evaluated. Management has evaluated subsequent events through the issuance of these financial statements on February 24, 2010 and has noted no such events.
Hussman Investment Trust About Your Fund’s Expenses (Unaudited) | |
| | |
We believe it is important for you to understand the impact of costs on your investment. As a shareholder of the Funds, you incur two types of costs: (1) transaction costs, which may include redemption fees; and (2) ongoing costs, including management fees and other Fund expenses. The following examples are intended to help you understand your ongoing costs (in dollars) of investing in the Funds and to compare these costs with the ongoing costs of investing in other mutual funds. A mutual fund’s ongoing costs are expressed as a percentage of its average net assets. This figure is known as the expense ratio.
The examples below are based on an investment of $1,000 made at the beginning of the period shown and held for the entire period (July 1, 2009 – December 31, 2009).
The table on the following page illustrates each Fund’s costs in two ways:
Actual fund return – This section helps you to estimate the actual expenses that you paid over the period. The “Ending Account Value” shown is derived from each Fund’s actual return, and the third column shows the dollar amount of operating expenses that would have been paid by an investor who started the period with $1,000 invested in that Fund. You may use the information here, together with the amount of your investment, to estimate the expenses that you paid over the period.
To do so, simply divide your account value by $1,000 (for example, an $8,600 account value divided by $1,000 = 8.6), and then multiply the result by the number given for the applicable Fund under the heading “Expenses Paid During Period.”
Hypothetical 5% return – This section is intended to help you compare each Fund’s ongoing costs with those of other mutual funds. It assumes that each Fund had an annual return of 5% before expenses during the period shown. In this case, because the return used is not each Fund’s actual return, the results do not illustrate the actual expenses associated with your investment. However, the example is useful in making comparisons because the SEC requires all mutual funds to provide an example of fund expenses based on a 5% annual return. You can assess each Fund’s ongoing costs by comparing this hypothetical example with the hypothetical examples that appear in shareholder reports of other mutual funds.
Hussman Investment Trust About Your Fund’s Expenses (Unaudited) (continued) | |
| | |
Note that expenses shown in the table are meant to highlight and help you compare ongoing costs only. The calculations assume no shares were bought or sold during the period. Your actual costs may have been higher or lower, depending on the amount of your investment and the timing of any purchases or redemptions.
More information about each Fund’s expenses, including annual expense ratios for the past five years, can be found elsewhere in this report. For additional information on operating expenses and other shareholder costs, please refer to each Fund’s prospectus.
Hussman Strategic Growth Fund
| | | Beginning Account Value July 1, 2009 | | | Ending Account Value December 31, 2009 | | | Expenses Paid During Period* | |
| Based on Actual Fund Return | | $ | 1,000.00 | | | $ | 985.10 | | | $ | 5.25 | |
| Based on Hypothetical 5% Annual Return (before expenses) | | $ | 1,000.00 | | | $ | 1,019.91 | | | $ | 5.35 | |
| * | Expenses are equal to Hussman Strategic Growth Fund’s annualized expense ratio of 1.05% for the period, multiplied by the average account value over the period, multiplied by 184/365 (to reflect the one-half year period). |
Hussman Strategic Total Return Fund
| | | Beginning Account Value July 1, 2009 | | | Ending Account Value December 31, 2009 | | | Expenses Paid During Period* | |
| Based on Actual Fund Return | | $ | 1,000.00 | | | $ | 1,030.80 | | | $ | 3.48 | |
| Based on Hypothetical 5% Annual Return (before expenses) | | $ | 1,000.00 | | | $ | 1,021.78 | | | $ | 3.47 | |
| * | Expenses are equal to Hussman Strategic Total Return Fund’s annualized expense ratio of 0.68% for the period, multiplied by the average account value over the period, multiplied by 184/365 (to reflect the one-half year period). |
Hussman Investment Trust Other Information (Unaudited) | |
| | |
A description of the policies and procedures the Funds use to determine how to vote proxies relating to portfolio securities is available without charge upon request by calling toll-free 1-800-HUSSMAN (1-800-487-7626), or on the SEC’s website at http://www.sec.gov. Information regarding how the Funds voted proxies relating to portfolio securities during the most recent 12-month period ended June 30 is also available without charge upon request by calling toll-free 1-800-HUSSMAN, or on the SEC’s website at http://www.sec.gov.
The Trust files a complete listing of portfolio holdings for each Fund with the SEC as of the end of the first and third quarters of each fiscal year on Form N-Q. The filings are available upon request, by calling 1-800-HUSSMAN (1-800-487-7626). You may also obtain copies of these filings on the SEC’s website at http://www.sec.gov. The Trust’s Forms N-Q may also be reviewed and copied at the SEC’s Public Reference Room in Washington, DC, and information on the operation of the Public Reference Room may be obtained by calling 1-800-SEC-0330.
Hussman Investment Trust Approval of Investment Advisory Agreements | |
| (Unaudited) | |
The Board of Trustees of Hussman Investment Trust, with the Trustees who are not “interested persons,” as defined by the Investment Company Act of 1940, of the Trust (the “Independent Trustees”) voting separately, have reviewed and annually approved the continuance of each Fund’s Investment Advisory Agreement (the “Agreements”) with the Adviser. The most recent approval of the Agreements took place at a meeting held on July 10, 2009, at which all of the Trustees were present in person.
The Independent Trustees were advised by independent counsel of their responsibilities in determining whether to approve the continuance of the Agreements, and the Independent Trustees requested such information from the Adviser as they deemed reasonably necessary to evaluate the terms of the Agreements and whether the Agreements continue to be in the best interests of the Funds and their shareholders. The Trustees reviewed: (i) the nature, extent and quality of the services provided by the Adviser; (ii) the investment performance of the Funds; (iii) the costs of the services provided and the profits realized by the Adviser from its relationship with the Funds; (iv) the extent to which economies of scale would be realized as the Funds grow; and (v) whether fee levels reflect these economies of scale for the benefit of the Funds’ shareholders. The Trustees reviewed the background, qualifications, education and experience of the Adviser’s investment professionals and support personnel. The Trustees also discussed and considered the quality of shareholder communications, administrative duties, and other services provided by the Adviser to the Trust, the Adviser’s compliance program, and the Adviser’s role in coordinating such services and programs. The Independent Trustees were advised and supported by independent counsel experienced in securities matters throughout the process. Prior to voting, the Independent Trustees reviewed the proposed continuance of the Agreements with management and also met in a private session with counsel at which no representatives of the Adviser were present.
The Adviser provided the Board with extensive information to assist the Trustees in analyzing both the absolute and risk-adjusted returns of the Funds over various periods. The Funds’ returns were compared to the returns of relevant indices, similarly managed mutual funds, and other pooled investment vehicles. These analyses and comparisons showed that, since the inception of Hussman Strategic Growth Fund, the Fund’s stock selection has substantially outperformed the returns of the S&P 500 Index and the Russell 2000 Index, and that the Fund’s hedging strategies have generally been successful in
Hussman Investment Trust Approval of Investment Advisory Agreements | |
| (Unaudited) (continued) | |
enhancing the total returns of the Fund while substantially reducing volatility. Based upon their review, the Trustees found that, since inception, Hussman Strategic Growth Fund has outperformed relevant securities indices with substantially less downside risk than a passive investment approach, and that certain more recent periods of moderated performance due to hedging have been consistent with the investment objectives of the Fund, and commensurate with the reduction in risk achieved. The Trustees, when reviewing the performance of Hussman Strategic Total Return, took note that during its period of operations, the Fund’s average annual total return of 7.62% from inception on September 12, 2002 through June 30, 2009 compared favorably to the 4.69% return of the Barclays Capital U.S. Aggregate Bond Index.
In reviewing the advisory fees and total expense ratios of the Funds, the Trustees were provided with comparative expense and advisory fee information for mutual funds and other pooled investment vehicles, categorized both by fund size and by investment style. The Trustees took note of the fact that, since Hussman Strategic Growth Fund’s inception, its effective advisory fee and its expense ratio have declined as a result of revised advisory fee breakpoints and economies of scale in certain expenses of the Fund. The Adviser and the Trustees agreed to an additional reduction in the advisory fee payable by Hussman Strategic Growth Fund, effective July 13, 2009. The Adviser offered this fee reduction, consistent with its prior fee initiatives, to lower expenses for the benefit of shareholders as the Fund grows. The advisory fee paid by Hussman Strategic Growth Fund had been calculated at the annual rates of 1.00% on the first $1 billion of the Fund’s average daily net assets, 0.95% on the next $2 billion of such assets, and 0.90% on such assets in excess of $3 billion. Effective July 13, 2009, the advisory fee was reduced to 0.95% on the first $2 billion of the Fund’s average daily net assets, 0.90% on the next $3 billion of such assets, and 0.85% on such assets over $5 billion. The Trustees concluded that, based upon the investment strategy and the long-term performance of Hussman Strategic Growth Fund, the advisory fees to be paid by the Fund are fair and reasonable. The Trustees noted that the fee revisions will result in an immediate reduction of more than $1,000,000 annually in the advisory fees paid by Hussman Strategic Growth Fund, further resulting in a decline in the Fund’s effective advisory fee ratio (based on the Fund’s net assets at the time of the Board meeting) from 0.94% to 0.92%. It was noted that further growth in net assets of Hussman Strategic Growth Fund would result in even further decline in the effective advisory fee rate. It was the consensus of the Independent Trustees that the breakpoints
Hussman Investment Trust Approval of Investment Advisory Agreements | |
| (Unaudited) (continued) | |
reflected in the new advisory fee schedule proposed by the Adviser are appropriate and allow Hussman Strategic Growth Fund to participate in economies of scale commensurate with asset growth.
At the Adviser’s proposal, the Trustees also approved a reduction in the advisory fee payable by Hussman Strategic Total Return Fund to the Adviser, effective July 13, 2009. The advisory fee paid by Hussman Strategic Total Return Fund had been calculated at the annual rates of 0.55% on the first $500 million of the Fund’s average daily net assets and 0.50% on such assets in excess of $500 million. Effective July 13, 2009, the advisory fee was reduced to 0.50% on the first $1 billion of the Fund’s average daily net assets and 0.45% on such assets over $1 billion. The Trustees concluded that, based upon the investment strategy and the long-term performance of Hussman Strategic Total Return Fund, the advisory fees to be paid by the Fund are fair and reasonable. The Trustees noted that the fee revisions will result in an immediate reduction of more than $250,000 annually in the advisory fees paid by Hussman Strategic Total Return Fund, further resulting in a decline in the Fund’s effective advisory fee ratio (based on the Fund’s net assets at the time of the Board meeting) from 0.525% to slightly less than 0.50%. It was noted that further growth in net assets of Hussman Strategic Total Return Fund would result in even further decline in the effective advisory fee rate. It was the consensus of the Independent Trustees that the breakpoints reflected in the new advisory fee schedule proposed by the Adviser are appropriate and allow Hussman Strategic Total Return Fund to participate in economies of scale commensurate with asset growth.
The Trustees reviewed a recent balance sheet of the Adviser, a statement of the Adviser’s revenues and expenses with respect to the Funds for the year ended December 31, 2008 and for the quarter ended March 31, 2009, and an analysis of the Adviser’s profitability with respect to each Fund covering the years 2006, 2007 and 2008. The Independent Trustees concluded, with respect to each Fund, that the Adviser’s profitability was not excessive given the high quality and scope of services provided by the Adviser and the long-term investment performance of the Funds. The Trustees also reviewed the Funds’ brokerage costs and noted that the brokerage commissions negotiated by the Adviser on behalf of the Funds are significantly less than industry averages.
The Independent Trustees concluded that: (i) based on a careful review of the investment performance and risk characteristics of the Funds, the
Hussman Investment Trust Approval of Investment Advisory Agreements | |
| (Unaudited) (continued) | |
effectiveness of the Funds in achieving their stated objectives, and the services provided by the Adviser, the Adviser has provided high quality services to the Funds; (ii) in their view, the nature of the services required by the Funds are broader and more sophisticated than those required by most investment companies because of the nature of the Funds’ investment programs, which involve extensive risk-management activities; (iii) the effective advisory fee rate of 0.92% for Hussman Strategic Growth Fund, based upon current asset levels, compares favorably to the average advisory fees of 1.19% for other “long-short” funds, as categorized by Morningstar, and, when compared to hedge funds offering similar investment programs, the Fund is much less expensive; (iv) the effective advisory fee rate of 0.50% for Hussman Strategic Total Return Fund, based upon current asset levels, compares favorably to the average advisory fee of other funds of similar size investing in similar securities; (v) the scope and quality of services provided by the Adviser, which exceed the norm, support the appropriateness of the advisory fees payable by the Funds; (vi) each Fund has participated in economies of scale of expenses under its advisory fee structure and can be expected to realize further benefits through the new advisory fee breakpoints that have been proposed by the Adviser and can be expected to further lower the effective advisory fee rates of the Funds; (vii) Hussman Strategic Growth Fund has one of the lowest total expense ratios among funds classified by Morningstar as “long-short” funds, and the total expense ratio for Hussman Strategic Total Return Fund is less than the average for “conservative allocation” funds tracked by Morningstar; and (viii) the Adviser has adopted a brokerage placement policy which seeks to obtain best execution and low commissions on all of the Funds’ brokerage transactions, and does not direct transactions to obtain “soft dollar” services, which has significantly benefited the Funds by reducing transaction costs (which are not reflected in the expense ratios) and increasing the investment returns of the Funds.
No single factor was considered in isolation or to be determinative to the decision of the Independent Trustees to approve continuance of the Agreements. Rather, the Trustees concluded, in light of a weighing and balancing of all factors considered, that the advisory fees payable by the Funds under the Agreements are fair and reasonable, and determined that it would be in the best interests of each Fund and its shareholders to renew the Agreements for an additional annual period.
THIS PAGE INTENTIONALLY LEFT BLANK
INVESTMENT ADVISER
Hussman Econometrics Advisors, Inc.
5136 Dorsey Hall Drive
Ellicott City, Maryland 21042
www.hussmanfunds.com
1-800-HUSSMAN (1-800-487-7626)
ADMINISTRATOR/TRANSFER AGENT
Ultimus Fund Solutions, LLC
225 Pictoria Drive, Suite 450
Cincinnati, Ohio 45246
CUSTODIAN
US Bank
425 Walnut Street
Cincinnati, Ohio 45202
INDEPENDENT REGISTERED
PUBLIC ACCOUNTING FIRM
Ernst & Young LLP
1900 Scripps Center
312 Walnut Street
Cincinnati, Ohio 45202
LEGAL COUNSEL
Schulte Roth & Zabel LLP
919 Third Avenue
New York, New York 10022
This Semi-Annual Report is authorized for
distribution only if accompanied or preceded
by a current Prospectus of the Funds.
HUSSMAN INVESTMENT TRUST
Hussman Strategic International Equity Fund
Semi-Annual Report
December 31, 2009 (Unaudited) |
| Hussman Investment Trust | | | |
| Hussman Strategic International Equity Fund | | | |
| Statement of Assets and Liabilities | | | |
| December 31, 2009 (Unaudited) | | |
| | | | |
| ASSETS | | | |
| Receivable for capital shares sold | | $ | 1,912,579 | |
| | | | | |
| NET ASSETS | | $ | 1,912,579 | |
| | | | | |
| Net assets consist of: | | | | |
| Paid-in capital | | $ | 1,912,579 | |
| Net assets | | $ | 1,912,579 | |
| | | | | |
| Shares of beneficial interest outstanding (unlimited number of shares | | | | |
| authorized, no par value) | | | 191,258 | |
| | | | | |
| Net asset value, offering price and redemption price per share (Note 1) | | $ | 10.00 | |
| | | | | |
| See accompanying notes to financial statements. | | | | |
| Hussman Investment Trust | | | | |
| Hussman Strategic International Equity Fund | | | | |
| Statement of Changes in Net Assets (Unaudited) | | | | |
| | | | | Period Ended December 31,
2009 (a) | |
| FROM CAPITAL SHARE TRANSACTIONS | | | | |
| | Proceeds from shares sold | | $ | 1,912,579 | |
| Increase in net assets from capital share transactions | | | 1,912,579 | |
| | | | | | |
| TOTAL INCREASE IN NET ASSETS | | | 1,912,579 | |
| | | | | | |
| NET ASSETS | | | | |
| | Beginning of period | | | - | |
| | End of period | | $ | 1,912,579 | |
| | | | | | |
| CAPITAL SHARE ACTIVITY | | | | |
| | Shares sold | | | 191,258 | |
| | Shares outstanding, beginning of period | | | - | |
| | Shares outstanding, end of period | | | 191,258 | |
| | | | | | |
| (a) | The Fund commenced operations on December 31, 2009. | | | | |
| | | | | | |
| See accompanying notes to financial statements. | | | | |
| Hussman Investment Trust | | | |
| Hussman Strategic International Equity Fund | | | |
| Financial Highlights (Unaudited) | | | |
| Per Share Data and Ratios for a Share Outstanding Throughout the Period | |
| | | Period
Ended
December 31,
2009 (a) | |
| | | | |
| Net asset value at beginning of period | | $ | 10.00 | |
| | | | | |
| Net asset value at end of period | | $ | 10.00 | |
| | | | | |
| Total return | | | 0.00% | |
| | | | | |
| Net assets at end of period (000's) | | $ | 1,913 | |
| (a) | The Fund commenced operations on December 31, 2009. |
| | |
| See accompanying notes to financial statements. |
Hussman Investment Trust
Hussman Strategic International Equity Fund
Notes to Financial Statements
December 31, 2009 (Unaudited)
1. ORGANIZATION AND SIGNIFICANT ACCOUNTING POLICIES
Hussman Strategic International Equity Fund (the “Fund”) is a diversified series of Hussman Investment Trust (the “Trust”), which is registered under the Investment Company Act of 1940 as an open-end management investment company. The Fund is authorized to issue an unlimited number of shares. The Fund commenced operations on December 31, 2009.
The Fund’s investment objective is to provide long-term capital appreciation, with added emphasis on the protection of capital during unfavorable market conditions. The Fund invests primarily in equity securities of non-U.S. issuers.
Securities and Options Valuation — The Fund’s portfolio securities are valued at market value as of the close of regular trading on the New York Stock Exchange (“NYSE”) (normally, 4:00 Eastern time) on each business day the NYSE is open. Securities, other than options, listed on the NYSE or other U.S. exchanges are valued on the basis of their last sale prices on the exchanges on which they are primarily traded. However, if the last sale price on the NYSE is different than the last sale price on any other exchange, the NYSE price will be used. If there are no sales on that day, the securities are valued at the last bid price on the NYSE or other primary exchange for that day. Securities traded on a foreign stock exchange are valued based upon the closing price on the principal exchange where the security is traded. Securities which are quoted by NASDAQ are valued at the NASDAQ Official Closing Price. If there are no sales on that day, the securities are valued at the last bid price as reported by NASDAQ. Securities traded in over-the-counter markets, other than NASDAQ quoted securities, are valued at the last sales price, or if there are no sales on that day, at the mean of the closing bid and asked prices. Because the value of foreign securities may be materially affected by events occurring before the Fund’s pricing time but after the close of the primary markets or exchanges on which such securities are traded, its portfolio securities may be priced at their fair value as determined by an independent pricing service approved by the Board of Trustees. As a result, the prices of securities used to calculate the Fund’s NAV may differ from quoted or published prices for the same securities. Values of foreign securities are translated from the local currency into U.S. dollars using currency exchange rates supplied by a pricing quotation service.
Pursuant to valuation procedures approved by the Board of Trustees, options traded on a national securities exchange are valued at prices between the closing bid and ask prices determined by Hussman Econometrics Advisors, Inc. (the “Adviser”) to most closely reflect market value as of the time of computation of net asset value. Options not traded on a national securities exchange or board of trade, but for which over-the-counter market
Hussman Investment Trust
Hussman Strategic International Equity Fund
Notes to Financial Statements (continued)
quotations are readily available, are valued at the mean of their closing bid and ask prices. Futures contracts and options thereon, which are traded on commodities exchanges, are valued at their daily settlement value as of the close of such commodities exchanges.
Fixed income securities not traded or dealt in upon any securities exchange but for which over-the-counter market quotations are readily available generally are valued at the mean of their closing bid and asked prices. Fixed income securities may also be valued on the basis of prices provided by an independent pricing service. The Board of Trustees will review and monitor the methods used by such services to assure itself that securities are appropriately valued. The fair value of securities with remaining maturities of 60 days or less may be determined in good faith by the Board of Trustees to be represented by amortized cost value, absent unusual circumstances.
In the event that market quotations are not readily available or are determined by the Adviser to not be reflective of fair market value due to market events or developments, securities and options are valued at fair value as determined by the Adviser in accordance with procedures adopted by the Board of Trustees. Such methods of fair valuation may include, but are not limited to: multiple of earnings, multiple of book value, discount from market of a similar freely traded security, purchase price of security, subsequent private transactions in the security or related securities, or a combination of these and other factors.
Accounting principles generally accepted in the United States (“GAAP”) establish a single authoritative definition of fair value, set out a framework for measuring fair value and require additional disclosures about fair value measurement.
Various inputs are used in determining the value of the Fund’s investments. These inputs are summarized in the three broad levels listed below:
• Level 1 – quoted prices in active markets for identical securities
• Level 2 – other significant observable inputs
• Level 3 – significant unobservable inputs
The inputs or methodology used for valuing securities are not necessarily an indication of the risks associated with investing in these securities.
As of December 31, 2009, the Fund did not own any portfolio securities.
Futures Contracts and Option Transactions — The Fund may purchase and write put and call options on broad-based stock indices. The Fund may also purchase and write call and put options on individual securities. The Fund may use financial futures contracts and related options to hedge against changes in the market value of its portfolio securities. The Fund may also enter into forward foreign currency contracts to hedge against the adverse impact of changes in foreign exchange rates on its investments and transactions in foreign securities.
Hussman Investment Trust
Hussman Strategic International Equity Fund
Notes to Financial Statements (continued)
When a Fund writes an index option, an amount equal to the net premium (the premium less the commission) received by the Fund is recorded as a liability in the Fund’s Statement of Assets and Liabilities and is subsequently valued. If an index option expires unexercised on the stipulated expiration date or if the Fund enters into a closing purchase transaction, it will realize a gain (or a loss if the cost of a closing purchase transaction exceeds the net premium received when the option is sold) and the liability related to such option will be eliminated. If an index option is exercised, the Fund will be required to pay the difference between the closing index value and the exercise price of the option. In this event, the proceeds of the sale will be increased by the net premium originally received and the Fund will realize a gain or loss.
Swap Agreements — Swaps are individually negotiated agreements that can be structured to adjust the Fund’s exposure to particular markets, countries, geographic regions or industry sectors. In a typical swap of the type used by the Fund, the Fund and a counterparty agree to make payments to each other based on changes in the value of a specified stock index in exchange for payments by the Fund of a specified interest rate (typically, a floating rate), applied to a stated or “notional” amount. Because swaps are over-the-counter transactions, they are subject to counterparty risk. For example, the Fund bears the risk of loss of the amount expected to be received under a swap agreement in the event of the default or bankruptcy of a swap agreement counterparty. Swap agreements also may be considered to be illiquid. The Fund’s use of swaps generally will be limited to equity swaps through which the Fund seeks to hedge its investment exposure.
Repurchase Agreements — The Fund may enter into repurchase agreements with certain banks or non-bank dealers. The value of the underlying securities collateralizing these agreements is monitored on a daily basis to ensure that the value of the collateral during the term of the agreements equals or exceeds the repurchase price plus accrued interest. If the bank or dealer defaults realization of the collateral by the Fund may be delayed or limited, and the Fund may suffer a loss if the value of the collateral declines.
Foreign Currency Translation — Amounts denominated in or expected to settle in foreign currencies are translated into U.S. dollars based on exchange rates on the following basis:
A. The market values of investment securities and other assets and liabilities are translated at the closing rate on the London Stock Exchange each day.
B. Purchases and sales of investment securities and income and expenses are translated at the rate of exchange prevailing on the respective date of such transactions.
C. The Fund does not isolate that portion of the results of operations caused by changes in foreign exchange rates on investments from those caused by changes in market prices of securities held. Such fluctuations are included with the net realized and unrealized gains or losses on investments.
Hussman Investment Trust
Hussman Strategic International Equity Fund
Notes to Financial Statements (continued)
Reported net realized foreign exchange gains or losses arise from 1) purchases and sales of foreign currencies, 2) currency gains or losses realized between the trade and settlement dates on securities transactions, and 3) the difference between the amounts of dividends, interest and foreign withholding taxes recorded on the Fund’s books, and the U.S. dollar equivalent of the amounts actually received or paid. Reported net unrealized foreign exchange gains and losses arise from changes in the value of assets and liabilities that result from changes in exchange rates.
Share Valuation and Redemption Fees — The net asset value per share of the Fund is calculated as of the close of regular trading on the NYSE (normally 4:00 p.m., Eastern time) on each day that the NYSE is open for business. The net asset value per share of the Fund is calculated by dividing the total value of the Fund’s assets, less its liabilities, by the number of its shares outstanding. The offering price and redemption price per share of the Fund is equal to the net asset value per share. However, shares of the Fund are generally subject to a redemption fee of 1.5%, payable to the Fund, if redeemed within sixty days of the date of purchase. During the period ended December 31, 2009, no redemption fees were collected.
Investment Income —Interest income is accrued as earned. Dividend income is recorded on the ex-dividend date. Discounts and premiums on fixed income securities are amortized using the interest method.
Distributions to Shareholders — Distributions to shareholders arising from net investment income are declared and paid annually. Net realized short-term capital gains, if any, may be distributed throughout the year and net realized long-term capital gains, if any, are generally distributed annually. The amount of distributions from net investment income and net realized gains are determined in accordance with federal income tax regulations, which may differ from GAAP. There were no distributions to shareholders during the period ended December 31, 2009.
Security Transactions — For financial statement purposes, securities transactions are accounted for on trade date. Gains and losses on securities sold are determined on a specific identification basis.
Common Expenses — Expenses of the Trust not attributable solely to the Fund or solely to another series of the Trust are allocated among the Fund and other series of the Trust based on relative net assets or the nature of the expense.
Accounting Estimates — The preparation of financial statements in conformity with GAAP requires management to make estimates and assumptions that affect the reported amounts of assets and liabilities and the disclosure of contingent assets and liabilities at the date of the financial statements and the reported amounts of income and expenses during the reporting period. Actual results could differ from those estimates.
Hussman Investment Trust
Hussman Strategic International Equity Fund
Notes to Financial Statements (continued)
Federal Income Tax — It is the Fund’s policy to qualify as a regulated investment company under Subchapter M of the Internal Revenue Code. As provided therein, in any fiscal year in which the Fund so qualifies and distributes at least 90% of its taxable net income, the Fund (but not its shareholders) will be relieved of federal income tax on the income distributed. Accordingly, no provision for income taxes has been made. The Fund intends to qualify as a regulated investment company with respect to the year ending June 30, 2010.
In order to avoid imposition of a Federal excise tax applicable to regulated investment companies, it is also the Fund’s intention to declare and pay as dividends in each calendar year at least 98% of its net investment income (earned during the calendar year) and 98% of its net realized capital gains (earned during the twelve months ended October 31) plus undistributed amounts from prior years.
2. TRANSACTIONS WITH AFFILIATES
One of the Trustees and certain officers of the Trust are affiliated with the Adviser or with Ultimus Fund Solutions, LLC (“Ultimus”), the Fund’s administrator, transfer agent and fund accounting agent.
Advisory Agreement
Under the terms of an Advisory Agreement between the Trust and the Adviser, the Fund pays a fee, which is computed and accrued daily and paid monthly, at annual rates of 1.00% of the first $1 billion of average daily net assets; 0.95% of the next $2 billion of such assets; and 0.90% of such assets over $3 billion, less any fee reductions.
The Adviser has contractually agreed to reduce its advisory fees or to absorb the Fund’s operating expenses to the extent necessary so that the Fund’s ordinary operating expenses do not exceed an amount equal to 2.00% annually of its average daily net assets. This Expense Limitation Agreement remains in effect until at least December 31, 2012. Any fee reductions or expense reimbursements by the Adviser, either before or after December 31, 2012, are subject to repayment by the Fund provided that such repayment does not result in the Fund’s expenses exceeding the 2.00% annual limitation and provided further that the expenses which are the subject of the repayment were incurred within three years of such repayment.
Administration Agreement
Under the terms of an Administration Agreement, Ultimus supplies executive, administrative and regulatory services to the Trust, supervises the preparation of tax returns, and coordinates the preparation of reports to shareholders and reports to and filings with the Securities and Exchange Commission (“SEC”) and state securities authorities.
Hussman Investment Trust
Hussman Strategic International Equity Fund
Notes to Financial Statements (continued)
Under the terms of the Administration Agreement, Ultimus receives a monthly fee from the Fund at annual rates of 0.075% of the Fund’s average daily net assets up to $500 million; 0.05% of the next $1.5 billion of such assets; 0.04% of the next $1 billion of such assets; 0.03% of the next $2 billion of such assets; and 0.025% of such assets in excess of $5 billion, subject to a minimum monthly fee of $2,000 per month.
Fund Accounting Agreement
Under the terms of a Fund Accounting Agreement between the Trust and Ultimus, Ultimus calculates the daily net asset value per share and maintains the financial books and records of the Fund. For these services, Ultimus receives a monthly base fee of $3,000, plus an asset-based fee computed at annual rates of 0.01% of the Fund’s average daily net assets up to $500 million and 0.005% of such assets in excess of $500 million. In addition, the Fund reimburses Ultimus for certain out-of-pocket expenses incurred in obtaining valuations of the Fund’s portfolio securities.
Transfer Agent and Shareholder Services Agreement
Under the terms of a Transfer Agent and Shareholder Services Agreement, Ultimus maintains the records of each shareholder’s account, answers shareholders’ inquiries concerning their accounts, processes purchases and redemptions of the Fund’s shares, acts as dividend and distribution disbursing agent and performs other shareholder service functions. For these services, Ultimus receives a fee from the Fund, payable monthly, of $22 annually for each direct account and $12 annually for certain accounts established through financial intermediaries, subject to a minimum monthly fee of $1,500. In addition, the Fund pays certain out-of-pocket expenses incurred by Ultimus including, but not limited to, postage and supplies.
For shareholder accounts held through financial intermediaries, the Fund may, in some cases, compensate these intermediaries for providing certain account maintenance and shareholder services, at an annual rate of not more than $10 per account.
Compliance Consulting Agreement
Under the terms of a Compliance Consulting Agreement between the Trust and Ultimus, Ultimus provides an individual to serve as the Trust’s Chief Compliance Officer and to administer the Trust’s compliance policies and procedures. For these services, the Trust pays Ultimus a base fee of $1,250 per month, plus an asset-based fee computed at annual rates of .005% of the average value of its aggregate daily net assets in excess of $100 million to $500 million, .0025% of such assets from $500 million to $1 billion and .00125% of such assets in excess of $1 billion. The Fund pays its proportionate share of such fee along with the other series of the Trust. In addition, the Trust reimburses Ultimus for reasonable out-of-pocket expenses, if any, incurred in connection with these services.
Hussman Investment Trust
Hussman Strategic International Equity Fund
Notes to Financial Statements (continued)
5. CONTINGENCIES AND COMMITMENTS
The Fund indemnifies the Trust's officers and Trustees for certain liabilities that may arise from their performance of their duties to the Fund. Additionally, in the normal course of business the Fund enters into contracts that contain a variety of representations and warranties and which provide general indemnifications. The Fund's maximum exposure under these arrangements is unknown, as this would involve future claims that may be made against the Fund that have not yet occurred. However, based on experience, the Trust believes the risk of loss to be remote.
6. SUBSEQUENT EVENTS
The Fund is required to recognize in the financial statements the effects of all subsequent events that provide additional evidence about conditions that existed as of the date of the Statement of Assets and Liabilities. For nonrecognized subsequent events that must be disclosed to keep the financial statements from being misleading, the Fund is required to disclose the nature of the event as well as an estimate of its financial effect, or a statement that such an estimate cannot be made. In addition, the Fund is required to disclose the date through which subsequent events have been evaluated. Management has evaluated subsequent events through the issuance of these financial statements on February 24, 2010 and has noted no such events.
OTHER INFORMATION (Unaudited)
A description of the policies and procedures the Fund uses to determine how to vote proxies relating to portfolio securities is available without charge upon request by calling toll-free 1-800-HUSSMAN (1-800-487-7626), or on the SEC’s website at http://www.sec.gov. Information regarding how the Fund votes proxies relating to portfolio securities during the period ending June 30, 2010 will be available without charge upon request on or before August 31, 2010 by calling toll-free 1-800-HUSSMAN, or on the SEC’s website at http://www.sec.gov.
The Trust will file a complete listing of portfolio holdings of the Fund with the SEC as of the end of the first and third quarters of each fiscal year on Form N-Q. These filings will be available upon request, by calling 1-800-HUSSMAN (1-800-487-7626). You may also obtain copies of these filings on the SEC’s website at http://www.sec.gov. The Trust’s Forms N-Q may also be reviewed and copied at the SEC’s Public Reference Room in Washington, DC, and information on the operation of the Public Reference Room may be obtained by calling 1-800-SEC-0330.
Hussman Investment Trust
Hussman Strategic International Equity Fund
Approval of Investment Advisory Agreement (Unaudited)
The Board of Trustees, including the Independent Trustees voting separately, reviewed and approved the Fund's Advisory Agreement with the Adviser at an in-person meeting held on June 12, 2008, at which all of the Trustees were present.
The Independent Trustees were advised by and met separately with independent counsel in connection with their review and consideration of the Advisory Agreement. In addition, they requested such information from the Adviser as they deemed reasonably necessary to evaluate the terms of the Advisory Agreement and to determine whether approval of the Agreement was in the best interests of the Fund and its shareholders. The Trustees considered various factors, including, among others, the nature and extent of the services to be provided by the Adviser and the fees proposed to be charged for those services.
The Trustees evaluated and reviewed the services required to be provided by the Adviser under the Advisory Agreement and the qualifications and capability of the Adviser to provide those services. In this regard, the Independent Trustees reviewed the background, education and experience of the Adviser’s key investment and operational personnel. They also considered the ability of the Adviser to render the full range of investment advisory and other related services required by the Fund and to provide high quality services, as well as the Adviser’s ability to maintain an effective compliance program and to coordinate administrative and other services provided to the Fund by its various service providers. The Independent Trustees determined that the Adviser was well-qualified to provide services to the Fund and to manage its assets in accordance with the Fund’s investment policies, and considered it significant that the Adviser had invested a great deal of time and attention towards the planning and development of the investment program and operations of the Fund, not only through modeling and research, but through testing to help assure the efficiency of the Fund's trading and operations.
In reviewing the fees payable under the Advisory Agreement, the Independent Trustees reviewed the advisory fee rates proposed to be paid by the Fund and compared them to the advisory fees of similar mutual funds. They also compared the expected total operating expense ratio of the Fund with the expense ratios of representative funds with similar investment objectives, taking into account the agreement of the Adviser to limit the ordinary operating expenses of the Fund by waiving its fee or absorbing Fund expenses. The Independent Trustees concluded that, based upon the investment strategy of the Fund and the anticipated complexity of the investment management services that will be associated with management of the Fund’s investment portfolio, the proposed advisory fees to be paid by the Fund were fair and reasonable. In this regard, the Independent Trustees took cognizance of the fact that the proposed advisory fee schedule contained several breakpoints that will allow shareholders to benefit from lower advisory fee rates to the extent that there is growth in the assets of the Fund.
Hussman Investment Trust
Hussman Strategic International Equity Fund
Approval of Investment Advisory Agreement (Unaudited) (continued)
With respect to the advisory fees that would be paid by the Fund, the Independent Trustees concluded that, although these fees were in the higher range of the fees paid by many other funds that invest in foreign equity securities, the investment process and techniques that will be used by the Adviser in pursuing the Fund's investment program are more sophisticated and complex than those generally used by other advisers of other funds that invest in foreign equities. The Independent Trustees also noted that the scope of services to be provided by the Adviser would exceed the scope of services associated with the Adviser’s management of Hussman Strategic Growth Fund, but that the advisory fee schedule would be the same as that of Hussman Strategic Growth Fund. In addition, they concluded that the Adviser's agreement to limit overall operating expenses of the Fund through fee reductions and expense reimbursements should enable the Fund to maintain a competitive overall expense ratio during the term of that agreement. The Independent Trustees did not review and consider the profitability of the Adviser with regards to its management of the Fund and did not evaluate whether the Adviser derives any ancillary benefits from its relationship with the Fund because the Fund has not yet commenced operations.
No single factor was considered in isolation or to be determinative to the decision of the Trustees to approve the Advisory Agreement. Rather, the Trustees concluded, in light of a weighing and balancing of all factors considered, that the approval of the Advisory Agreement would be in the best interests of the Fund and its shareholders.
Not required
| Item 3. | Audit Committee Financial Expert. |
Not required
| Item 4. | Principal Accountant Fees and Services. |
Not required
| Item 5. | Audit Committee of Listed Registrants. |
Not applicable
| Item 6. | Schedule of Investments. |
| (a) | Not applicable [schedule filed with Item 1] |
| Item 7. | Disclosure of Proxy Voting Policies and Procedures for Closed-End Management Investment Companies. |
| Item 8. | Portfolio Managers of Closed-End Management Investment Companies |
| Item 9. | Purchases of Equity Securities by Closed-End Management Investment Company and Affiliated Purchasers. |
| Item 10. | Submission of Matters to a Vote of Security Holders. |
The registrant has not adopted procedures by which shareholders may recommend nominees to the registrant’s board of trustees.
| Item 11. | Controls and Procedures. |
(a) Based on their evaluation of the registrant’s disclosure controls and procedures (as defined in Rule 30a-3(c) under the Investment Company Act of 1940) as of a date within 90 days of the filing date of this report, the registrant’s principal executive officer and principal financial officer have concluded that such disclosure controls and procedures are reasonably designed and are operating effectively to ensure that material information relating to the registrant, including its consolidated subsidiaries, is made known to them by others within those entities, particularly during the period in which this report is being prepared, and that the information required in filings on Form N-CSR is recorded, processed, summarized, and reported on a timely basis.
(b) There were no changes in the registrant’s internal control over financial reporting (as defined in Rule 30a-3(d) under the Investment Company Act of 1940) that occurred during the second fiscal quarter of the period covered by this report that have materially affected, or are reasonably likely to materially affect, the registrant’s internal control over financial reporting.
File the exhibits listed below as part of this Form. Letter or number the exhibits in the sequence indicated.
(a)(1) Any code of ethics, or amendment thereto, that is the subject of the disclosure required by Item 2, to the extent that the registrant intends to satisfy the Item 2 requirements through filing of an exhibit: Not required
(a)(2) A separate certification for each principal executive officer and principal financial officer of the registrant as required by Rule 30a-2(a) under the Act (17 CFR 270.30a-2(a)): Attached hereto
(a)(3) Any written solicitation to purchase securities under Rule 23c-1 under the Act (17 CFR 270.23c-1) sent or given during the period covered by the report by or on behalf of the registrant to 10 or more persons: Not applicable
(b) Certifications required by Rule 30a-2(b) under the Act (17 CFR 270.30a-2(b)): Attached hereto
| Exhibit 99.CERT | Certifications required by Rule 30a-2(a) under the Act |
| Exhibit 99.906CERT | Certifications required by Rule 30a-2(b) under the Act |
SIGNATURES
Pursuant to the requirements of the Securities Exchange Act of 1934 and the Investment Company Act of 1940, the registrant has duly caused this report to be signed on its behalf by the undersigned, thereunto duly authorized.
(Registrant) Hussman Investment Trust
| By (Signature and Title)* | /s/ John P. Hussman |
| | John P. Hussman, President |
Date March 3, 2010
Pursuant to the requirements of the Securities Exchange Act of 1934 and the Investment Company Act of 1940, this report has been signed below by the following persons on behalf of the registrant and in the capacities and on the dates indicated.
| By (Signature and Title)* | /s/ John P. Hussman |
| | John P. Hussman, President |
Date March 3, 2010
| By (Signature and Title)* | /s/ Mark J. Seger |
| | Mark J. Seger, Treasurer |
Date March 3, 2010
* Print the name and title of each signing officer under his or her signature.