Washington, D.C. 20549
John F. Splain
Form N-CSR is to be used by management investment companies to file reports with the Commission not later than 10 days after the transmission to stockholders of any report that is required to be transmitted to stockholders under Rule 30e-1 under the Investment Company Act of 1940 (17 CFR 270.30e-1). The Commission may use the information provided on Form N-CSR in its regulatory, disclosure review, inspection, and policymaking roles.
A registrant is required to disclose the information specified by Form N-CSR, and the Commission will make this information public. A registrant is not required to respond to the collection of information contained in Form N-CSR unless the Form displays a currently valid Office of Management and Budget ("OMB") control number. Please direct comments concerning the accuracy of the information collection burden estimate and any suggestions for reducing the burden to Secretary, Securities and Exchange Commission, 450 Fifth Street, NW, Washington, DC 20549-0609. The OMB has reviewed this collection of information under the clearance requirements of 44 U.S.C. § 3507.
HUSSMAN INVESTMENT TRUST
HUSSMAN STRATEGIC GROWTH FUND
HUSSMAN STRATEGIC TOTAL RETURN FUND
HUSSMAN STRATEGIC INTERNATIONAL FUND
HUSSMAN STRATEGIC DIVIDEND VALUE FUND
SEMI-ANNUAL REPORT
December 31, 2012
(Unaudited)
| Performance Information | |
| Hussman Strategic Growth Fund | 1 |
| Hussman Strategic Total Return Fund | 2 |
| Hussman Strategic International Fund | 3 |
| Hussman Strategic Dividend Value Fund | 4 |
| Letter to Shareholders | 5 |
| Portfolio Information | 16 |
| Schedules of Investments | |
| Hussman Strategic Growth Fund | 19 |
| Hussman Strategic Total Return Fund | 26 |
| Hussman Strategic International Fund | 29 |
| Hussman Strategic Dividend Value Fund | 37 |
| Statements of Assets and Liabilities | 43 |
| Statements of Operations | 45 |
| Statements of Changes in Net Assets | |
| Hussman Strategic Growth Fund | 47 |
| Hussman Strategic Total Return Fund | 48 |
| Hussman Strategic International Fund | 49 |
| Hussman Strategic Dividend Value Fund | 50 |
| Financial Highlights | |
| Hussman Strategic Growth Fund | 51 |
| Hussman Strategic Total Return Fund | 52 |
| Hussman Strategic International Fund | 53 |
| Hussman Strategic Dividend Value Fund | 54 |
| Notes to Financial Statements | 55 |
| About Your Fund’s Expenses | 78 |
| Other Information | 81 |
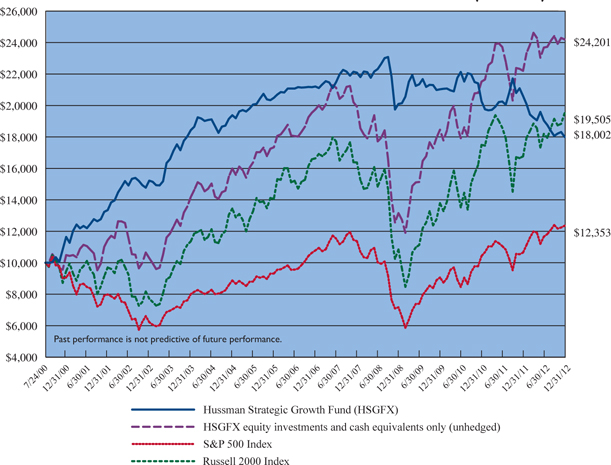
HUSSMAN STRATEGIC GROWTH FUND
Comparison of the Change in Value of a $10,000 Investment in Hussman Strategic Growth Fund
versus the Standard & Poor’s 500 Index and the Russell 2000 Index(a) (Unaudited)
Average Annual Total Returns For Periods Ended December 31, 2012 |
| | | | | | | |
Hussman Strategic Growth Fund(b)(d) | (12.62%) | (5.05%) | (4.01%) | 1.69% | 4.84% | |
| S&P 500 Index | 16.00% | 10.87% | 1.66% | 7.10% | 1.71% | |
| Russell 2000 Index | 16.35% | 12.25% | 3.56% | 9.72% | 5.52% | |
| (a) | Hussman Strategic Growth Fund invests in stocks listed on the New York, American, and NASDAQ exchanges, and does not specifically restrict its holdings to a particular market capitalization. The S&P 500 and Russell 2000 are indices of large and small capitalization stocks, respectively. “HSGFX equity investments and cash equivalents only (unhedged)” reflects the performance of the Fund’s stock investments and modest day-to-day cash balances, after fees and expenses, but excluding the impact of hedging transactions. The Fund’s unhedged equity investments do not represent a separately available portfolio, and their performance is presented solely for purposes of comparison and performance attribution. |
| | |
| (b) | Returns do not reflect the deduction of taxes a shareholder would pay on Fund distributions or the redemption of Fund shares. |
| | |
| (c) | The Fund commenced operations on July 24, 2000. |
| | |
| (d) | The Fund’s expense ratio was 1.08% for the six months ended December 31, 2012. The expense ratio as disclosed in the November 1, 2012 prospectus was 1.07% for the year ended June 30, 2012, including acquired fund fees and expenses. |
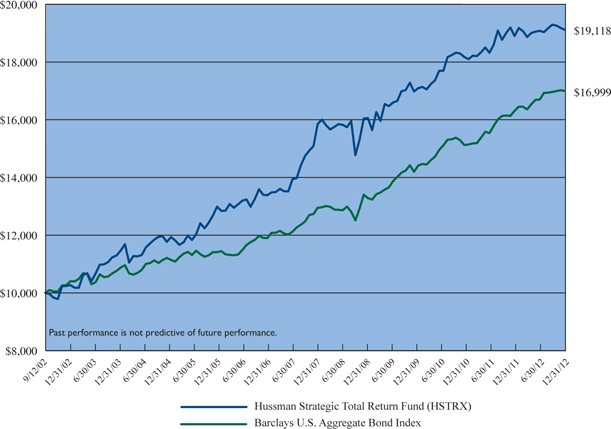
HUSSMAN STRATEGIC TOTAL RETURN FUND
Comparison of the Change in Value of a $10,000 Investment in Hussman Strategic Total Return Fund
versus the Barclays U.S. Aggregate Bond Index (Unaudited)
Average Annual Total Returns For Periods Ended December 31, 2012 |
| | | | | | |
Hussman Strategic Total Return Fund(a)(c) | 1.14% | 4.03% | 4.85% | 6.45% | 6.49% |
Barclays U.S. Aggregate Bond Index(d) | 4.22% | 6.19% | 5.95% | 5.18% | 5.28% |
| (a) | Returns do not reflect the deduction of taxes a shareholder would pay on Fund distributions or the redemption of Fund shares. |
| | |
| (b) | The Fund commenced operations on September 12, 2002. |
| | |
| (c) | The Fund’s expense ratio was 0.64% for the six months ended December 31, 2012. The expense ratio as disclosed in the November 1, 2012 prospectus was 0.66% for the year ended June 30, 2012, including acquired fund fees and expenses. |
| | |
| (d) | The Barclays U.S. Aggregate Bond Index covers the U.S. investment grade fixed rate bond market, with index components for U.S. government, agency and corporate securities. The Fund does not invest solely in securities included in the Barclays U.S. Aggregate Bond Index and may invest in other types of bonds, common stocks, etc. |
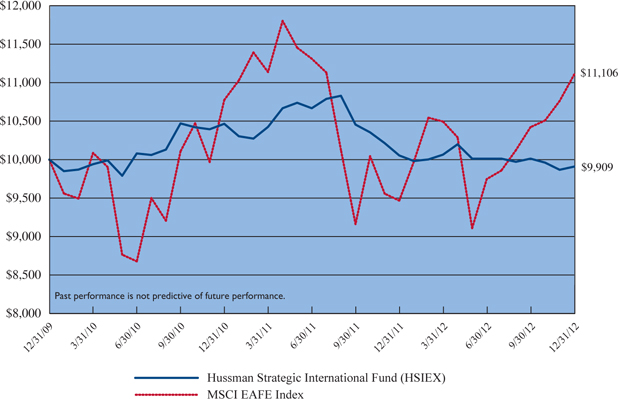
HUSSMAN STRATEGIC INTERNATIONAL FUND
Comparison of the Change in Value of a $10,000 Investment in
Hussman Strategic International Fund versus the MSCI EAFE Index (Unaudited)
Average Annual Total Returns For Periods Ended December 31, 2012 |
| | | | |
Hussman Strategic International Fund(a)(c) | (1.44%) | (0.30%) | (0.30%) |
MSCI EAFE Index(d) | 17.32% | 3.56% | 3.56% |
| (a) | Returns do not reflect the deduction of taxes a shareholder would pay on Fund distributions or the redemption of Fund shares. |
| | |
| (b) | The Fund commenced operations on December 31, 2009. |
| | |
| (c) | The Fund’s expense ratio was 1.64% for the six months ended December 31, 2012. The expense ratio as disclosed in the November 1, 2012 prospectus was 1.79% for the year ended June 30, 2012, including acquired fund fees and expenses. |
| | |
| (d) | The MSCI EAFE (Europe, Australasia, and Far East) Index is a free float-adjusted market weighted capitalization index that is designed to measure the equity market performance of developed markets, excluding the U.S. and Canada. As of December 31, 2012, the MSCI EAFE Index consisted of the following 22 developed market country indices: Australia, Austria, Belgium, Denmark, Finland, France, Germany, Greece, Hong Kong, Ireland, Israel, Italy, Japan, the Netherlands, New Zealand, Norway, Portugal, Singapore, Spain, Sweden, Switzerland and the United Kingdom. The Fund may not invest in all of the countries represented in the MSCI EAFE Index and may invest in securities that are not included in the MSCI EAFE Index. |
HUSSMAN STRATEGIC DIVIDEND VALUE FUND
Comparison of the Change in Value of a $10,000 Investment in
Hussman Strategic Dividend Value Fund versus the Standard & Poor’s 500 Index(a) (Unaudited)
Total Return For Period Ended December 31, 2012 |
| | | |
Hussman Strategic Dividend Value Fund(b)(d) | | 1.01% |
| S&P 500 Index | | 8.34% |
| (a) | Hussman Strategic Dividend Value Fund invests primarily in securities of U.S. issuers but may invest in stocks of foreign companies. There are no restrictions as to the market capitalization of companies. The S&P 500 Index is believed to be the most appropriate broad-based securities market index against which to compare the Fund’s long-term performance. However, the Fund invests in securities that are not included in the S&P 500 Index, and may vary its exposure to market fluctuations depending on market conditions. |
| | |
| (b) | The Fund’s return does not reflect the deduction of taxes a shareholder would pay on Fund distributions or the redemption of Fund shares. |
| | |
| (c) | The Fund commenced operations on February 6, 2012. |
| | |
| (d) | The Adviser has contractually agreed to defer its fee and/or to absorb or reimburse a portion of the Fund’s expenses until at least February 1, 2015 to the extent necessary to limit the Fund’s ordinary operating expenses to an amount not exceeding 1.25% annually of the Fund’s average daily net assets. The gross expense ratio as disclosed in the November 1, 2012 prospectus was 4.25%. |
For the year ended December 31, 2012, Strategic Growth Fund lost -12.62%, Strategic Total Return Fund achieved a total return of 1.14%, and Strategic International Fund lost -1.44%. From its inception on February 6, 2012 through December 31, 2012, Strategic Dividend Value achieved a total return of 1.01%. Notably, the decline in Strategic Growth Fund was primarily driven by a 7% shortfall between the performance of the Fund’s stock holdings and the performance of the S&P 500 Index – the primary index used in the Fund to hedge market risk. While the Fund’s stock selection approach has significantly outperformed the S&P 500 Index over time, a brief but similar performance lag in the Fund’s stock holdings was also observed during the advance toward the 2007 stock market peak.
The period since 2009 has been challenging, particularly for Strategic Growth Fund. By the market low of March 9, 2009, a $10,000 investment in the Fund at its inception on July 24, 2000 would have grown to $20,557, compared with a decline in value to $5,401 for a similar investment in the S&P 500 Index. The period since then has comprised a trough-to-peak bull market advance in the S&P 500, without the corresponding bear market decline that typically completes a full market cycle.
As detailed in the June 30, 2012 Hussman Funds Annual Report, we missed a substantial rebound in the stock market in 2009-early 2010 period. That “miss” did not result from applying our present methods, but resulted from the need to address a “two data sets” problem in a world where Depression-era outcomes had become possible. As economic conditions worsened beyond anything observed in the post-war period, I insisted in 2009 that our investment approach should perform well even in the most extreme conditions, including Depression-era data – despite the strong performance of our existing methods until that time. The two resulting enhancements to our approach are described in the 2012 Annual Report. It is not entirely clear whether future market cycles will invite Depression-like outcomes, rapid inflation, or unforeseen fiscal strains. What I do believe is that our approach to estimating prospective market return/risk will be able to engage those uncertainties – if they emerge – without further changes.
Unfortunately, what I saw as a necessary stress-testing response in 2009 ended up injuring not only my record, but my reputation, and the patience of those who rely on my work. I continue to believe that it was necessary, and that it made us far stronger, but time will tell, and I do not expect that we will require a great deal of it. The period since 2009 comprises what is now a mature bull market advance to rich valuations and historically overextended conditions, and the completion of the present cycle remains ahead. As detailed below, the U.S. stock market recently
|
Letter to Shareholders (continued) |
established a syndrome of hostile conditions that have been observed previously at only a handful of dates in market history, including the market peaks of 1972, 1987, 2000, and 2007.
The recent bull market advance has at least temporarily narrowed the performance gap between Strategic Growth Fund and the S&P 500 Index. Still, Strategic Growth Fund remains ahead of its benchmark since inception. The Fund has achieved an average annual total return of 4.84% from its inception on July 24, 2000 through December 31, 2012, compared with an average annual return of 1.71% for the S&P 500 Index over the same period. An initial $10,000 investment in the Fund on July 24, 2000 would have grown to $18,002, compared with $12,353 for the same investment in the S&P 500 Index. The deepest loss experienced by the Fund since inception was -23.93%, compared with a maximum loss of -55.25% for the S&P 500 Index.
Nearly every investment discipline has its own “bear markets” when a given strategy can be difficult to pursue, yet when continued discipline can be pivotal to the long-term performance of that strategy. For a passive buy-and-hold strategy in the S&P 500 Index, the most recent bear markets comprised losses of -47.41% (including dividends) in the 2000-2002 decline, and -55.25% in the 2007-2009 decline. Gains and losses in Strategic Growth Fund are often unrelated to general market fluctuations, and the recent decline in Fund value might be viewed as our own “bear market.” Still, that decline is a fraction of those experienced by the S&P 500 Index in recent cycles, and I believe that it remains essential to maintain our full-cycle investment perspective, despite the appearance that the recent market advance will never be interrupted. Our investment strategy does not require the stock market to suffer vast losses in order for us to justify a constructive investment position. But we do require a withdrawal from presently overvalued, overbought, overbullish, rising-interest rate conditions, which have historically been followed by very negative market outcomes, on average.
Strategic Total Return Fund has achieved an average annual total return of 6.49% from its inception on September 12, 2002 through December 31, 2012, compared with an average annual total return of 5.28% for the Barclays U.S. Aggregate Bond Index for that period. An initial $10,000 investment in the Fund on September 12, 2002 would have grown to $19,118, compared with $16,999 for the same investment in the Barclays U.S. Aggregate Bond Index. The deepest loss experienced by the Fund since inception was -11.52%, compared with a maximum loss of -5.08% for the Barclays U.S. Aggregate Bond Index.
|
Letter to Shareholders (continued) |
Strategic International Fund has achieved an average annual total return of -0.30% from its inception on December 31, 2009 through December 31, 2012, compared with an average annual total return of 3.56% for the MSCI EAFE Index for that period. An initial $10,000 investment in the Fund on December 31, 2009 would be valued at $9,909 on December 31, 2012, compared with $11,106 for the same investment in the MSCI EAFE Index. The deepest loss experienced by the Fund since inception was -9.59%, compared with a maximum loss of -26.48% for the MSCI EAFE Index.
From the inception of Strategic Dividend Value Fund on February 6, 2012 through December 31, 2012, the Fund achieved a cumulative total return of 1.01%, compared with a cumulative total return of 8.34% for the S&P 500 Index. An initial $10,000 investment in the Fund on February 6, 2012 would have grown to $10,101, compared with $10,834 for the same investment in the S&P 500 Index. The deepest loss experienced by the Fund since inception was -2.82%, compared with a maximum loss of -9.58% for the S&P 500 Index.
Many financial markets exhibited historically depressed yields in 2012, as promises of “unlimited” monetary easing from both the Federal Reserve and the European Central Bank encouraged investors to stretch for yield despite already elevated security prices. The yield on the 10-year U.S. Treasury bond plunged to a record low of 1.45% before rebounding slightly by year-end. Likewise, the yield on the Dow Jones Corporate Bond Index set a record low of 2.61% in November. The “Shiller P/E” of the S&P 500 – the ratio of the S&P 500 Index to the 10-year average of inflation-adjusted earnings – ended the year at 21, a level observed in less than 10% of history prior to the late-1990’s market bubble. Similarly, our estimate of likely annual total returns for the S&P 500 over the coming decade fell to 4.5% (nominal) by year-end, a level that with the exception of 1929 was never observed until the late-1990’s, and has predictably been followed by weak long-term returns for investors.
As investment yields fall, prices generally rise. Unfortunately, this process can make past investment returns seem most impressive at exactly the point where prospective future returns are most dismal. A low yield, pressed slightly lower, still produces a positive total return. Pushed to its limits, the short-term desire to stretch for yield in a low-yield environment is how investors are enticed into stocks and bonds at valuations that ultimately deliver terrible long-term outcomes. While this environment has been intentionally encouraged by the Federal Reserve, my impression is that it is likely to end no less badly than if it had emerged unintentionally.
|
Letter to Shareholders (continued) |
The compression of investment yields in 2012 was generally most beneficial to those securities associated with the greatest amount of risk and economic sensitivity. Junk-rated corporate debt, cyclical industries, and financial stocks performed particularly well. Conversely, the avoidance of these sectors resulted in lower returns, as was evident by the performance lag in the stocks held by Strategic Growth Fund, relative to the S&P 500 Index, despite a long record of the Fund’s stock selections outperforming the Index in prior years. The relative avoidance of financial, cyclical, and materials shares in Strategic Dividend Value Fund and Strategic International Fund had a similar effect on the performance of these Funds in the year ended December 31, 2012. Likewise, the avoidance of credit risk and long maturity debt muted the returns of Strategic Total Return Fund relative to the Barclays U.S. Aggregate Bond Index.
While it is clear that the intent of monetary policy is to force investors to speculate in securities with high risk and high economic sensitivity, I expect that far better opportunities to pursue higher returns at lower risk will emerge over the completion of the present market cycle. Keep in mind that a typical bear market decline in stocks erases more than half of the preceding bull market advance. The portion of surrendered gains has been even greater, on average, in bear market periods that started from valuations comparable to those we observe at present.
In my view, exposure to market risk is most appropriately taken when a decline to moderate or depressed valuations is followed by an improvement in broad measures of market action. We were comfortable to act on that opportunity in 2003, despite still-rich market valuations. In 2009, we admittedly missed that opportunity because the crisis raised stress-testing concerns (despite anticipating and avoiding most of that downturn). In contrast, as investors discovered in 2000 and again in 2007, exposure to market risk is most dangerous when an exuberant advance to multi-year highs is coupled with disproportionately optimistic sentiment among market participants, particularly when long-term interest rates are advancing. Countless investment strategies may be willing to accept market risk here, though my impression is that they are generally strategies that suffered profoundly during 2000-2002 and 2007-2009. I am convinced that stretching for yield in a low-yield environment is not intelligent investment strategy, but rather is unsound capitulation.
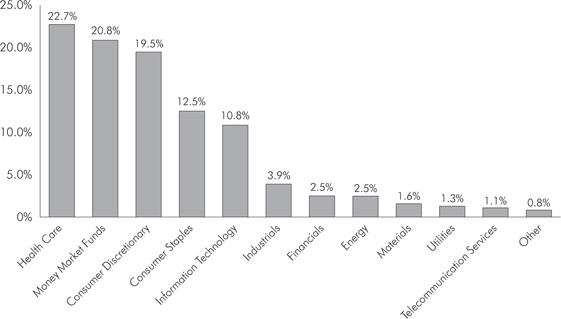
As of December 31, 2012, Strategic Growth Fund had net assets of $3,279,460,713, and held approximately 110 stocks in a wide variety of industries. The largest sector holdings as a percent of net assets were health care (29.4%),
|
Letter to Shareholders (continued) |
consumer discretionary (25.2%), consumer staples (16.2%), and information technology (14.0%). The smallest sector weights relative to the S&P 500 Index were in industrials (5.0%), energy (3.2%), financials (3.2%), materials (2.0%), utilities (1.7%) and telecommunications (1.4%). The portion of the Fund’s net assets invested in a particular sector is affected by valuation considerations and other investment characteristics of that sector. As a result, the Fund’s investments in various business sectors generally will change over time, and a significant allocation to any particular sector does not represent a fixed investment policy or strategy to invest in that sector.
The Fund’s holdings of individual stocks as of December 31, 2012 accounted for $3,322,901,792, or 101.3% of net assets (the Fund made an income distribution to shareholders on December 31, 2012, much of which was immediately reinvested in the Fund). Against these stock positions, the Fund also held 18,000 option combinations (long put option/short call option) on the S&P 500 Index, 5,000 option combinations on the Russell 2000 Index and 1,000 option combinations on the Nasdaq 100 Index. Each option combination behaves as a short sale on the underlying index, with a notional value of $100 times the index value. On December 31, 2012, the S&P 500 Index closed at 1,426.19, while the Russell 2000 Index and the Nasdaq 100 Index closed at 849.35 and 2,660.93, respectively. The Fund’s total hedge therefore represented a short position of $3,257,910,100, thereby hedging 98.0% of the dollar value of the Fund’s long investment positions in individual stocks.
Though the performance of Strategic Growth Fund’s diversified portfolio cannot be attributed to any narrow group of stocks, the following holdings achieved gains in excess of $10 million during the semi-annual period ended December 31, 2012: Walgreen, Panera Bread, Amgen, DISH Network, eBay, Eli Lilly, Procter and Gamble, Lowe’s, and Illumina. Holdings with losses in excess of $10 million during this same period were Coinstar, Humana, Aeropostale, and Intel.
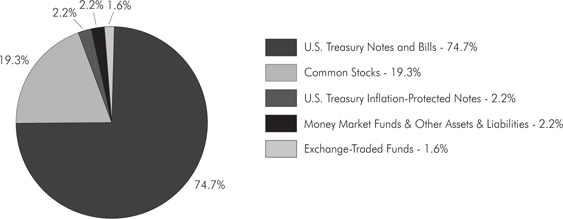
As of December 31, 2012, Strategic Total Return Fund had net assets of $2,181,511,637. Treasury bills, Treasury notes, Treasury Inflation-Protected Securities (TIPS) and shares of money market funds represented 79.1% of the Fund’s net assets. Precious metals shares, utility and energy shares, and exchange-traded funds (ETFs) accounted for 15.2%, 3.4%, 0.7% and 1.6% of net assets, respectively. The Fund carried a duration of approximately 3 years (meaning that a 1% change in interest rates would be expected to impact the Fund’s asset value by about 3% on the basis of bond price fluctuations).
|
Letter to Shareholders (continued) |
In Strategic Total Return Fund, during the semi-annual period ended December 31, 2012, portfolio gains in excess of $1 million were achieved in Agnico-Eagle Mines and U.S. Treasury Note (1.625%, due 8/15/2022). Holdings with losses in excess of $1 million during this same period were AngloGold Ashanti ADR,Goldcorp and Nustar Energy.
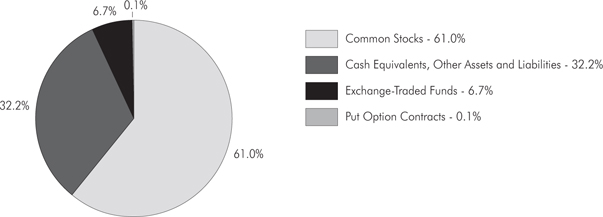
As of December 31, 2012, Strategic International Fund had net assets of $93,290,275 and held approximately 100 stocks in a wide variety of industries. The largest sectors as a percent of net assets were in consumer staples (11.5%), health care (11.0%), information technology (9.0%), consumer discretionary (8.7%), telecommunications (8.6%), and industrials (4.6%). The smallest sector weights were in energy (3.3%), utilities (3.0%), materials (0.8%) and financials (0.5%). Shares of exchange-traded funds and money market funds accounted for 6.7% and 28.7% of net assets, respectively. The total value of equities and ETF shares held by the Fund was $63,228,685.
In order to hedge the impact of general market fluctuations, as of December 31, 2012, Strategic International Fund held 150 option combinations (long put option/short call option) on the S&P 500 Index, and was short 750 futures on the Euro STOXX 50 Index and 150 futures on the FTSE 100 Index. The combined notional value of these hedges was $61,855,834, hedging 97.8% of the value of equity and ETF investments held by the Fund. When the Fund is in a hedged investment position, the primary driver of Fund returns is the difference in performance between the stocks owned by the Fund and the indices that are used to hedge.
While Strategic International Fund holds a diversified portfolio of stocks and its performance is affected by numerous investment positions, the hedging strategy of the Fund was primarily responsible for the reduced sensitivity of the Fund to market fluctuations from the Fund’s inception through December 31, 2012. Individual equity holdings having portfolio gains in excess of $200,000 during the semi-annual period ended December 31, 2012 included SAP AG – ADR, Sanofi - ADR, and Telstra Corp. Holdings with portfolio losses in excess of $100,000 during this same period included Logitech International, Yamada Denki, NetEase.com - ADR, and H. Lundbeck A/S.
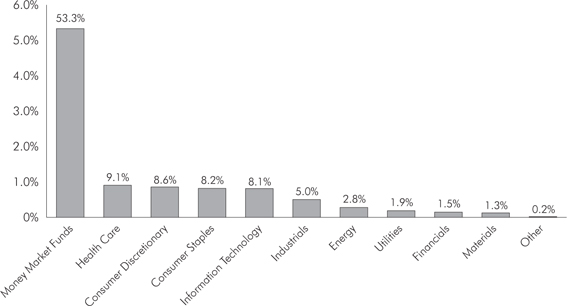
As of December 31, 2012, Strategic Dividend Value Fund had net assets of $13,825,955, and held approximately 80 stocks in a wide variety of industries. The largest sector holdings as a percentage of net assets were in health care (9.3%), consumer discretionary (8.8%), consumer staples (8.4%), and information technology (8.3%). The smallest sector weights were in industrials (5.1%), energy (2.9%), utilities (1.9%), financials (1.5%), and materials (1.3%).
|
Letter to Shareholders (continued) |
Strategic Dividend Value Fund’s holdings of individual stocks as of December 31, 2012 were valued at $6,571,318. Against these stock positions, the Fund also held 22 option combinations (long put option/short call option) on the S&P 500 Index. The combined notional value of these hedges was $3,137,618, an amount equal to 47.7% of the value of equity investments held by the Fund.
In Strategic Dividend Value Fund, during the semi-annual period ended December 31, 2012, a portfolio gain in excess of $25,000 was achieved in BASF AG - ADR. The Fund did not have any holdings with losses in excess of $25,000 during this same period.
With respect to Strategic International Fund and Strategic Dividend Value Fund, the cash positions in these funds would be expected to decline in the event of more favorable risk and return prospects.
Supplementary information including quarterly returns and equity-only performance is available on the Hussman Funds website at www.hussmanfunds.com.
Present Conditions
The U.S. economy appears suspended at the boundary between tepid growth and recession, requiring a trillion-dollar federal deficit and unprecedented monetary easing simply to maintain that position. The Federal Reserve continues a well-known and fully-announced policy of quantitative easing, on course to push the monetary base (currency and bank reserves) to 27 cents per dollar of nominal GDP. The last time the monetary base reached even 17 cents per dollar of nominal GDP was in the early 1940’s. This was not unwound by subsequent monetary tightening, but instead by a near-doubling in the consumer price index by 1952. Based on the strong relationship between the monetary base and short-term interest rates, even a normalization of short-term interest rates to 2% would tolerate no more than about 9 cents of base money per dollar of nominal GDP without inflation. As a result, an eventual normalization of Fed policy would require either a 50% contraction in the monetary base, a doubling of the consumer price index, or about 14 years of economic growth at a 5% nominal rate. It is doubtful that the Federal Reserve will be able to extricate itself smoothly from its current policy stance by any of these means.
While a few better-than-expected economic reports have encouraged the view that bond yields have nowhere to go but higher, there remain substantial risks to the U.S. economy and to global economic stability (particularly relating to European banks and Japanese fiscal conditions). It is tempting to believe that there is a one-to-one correlation between Treasury bond yields and prospective stock market
|
Letter to Shareholders (continued) |
returns, but that correlation is actually quite weak historically. The belief in a one-to-one relationship between bond yields and stock yields is largely an artifact of the disinflationary period from 1982-1998.
Federal Reserve policy is quite capable of suppressing short-term yields, and by extension, long-term yields that reflect their expected course. As a result, it appears likely that bond yields may remain reasonably well-behaved until inflationary pressures accelerate. Despite an increase in 10-year inflation expectations beyond 2.5% (based on the difference between nominal and inflation-protected Treasury yields), my impression is that significant inflationary pressures are most likely to emerge in the second half of the coming decade, and that a descent toward global recession is a more immediate concern.
I expect that U.S. Treasury securities will tend to benefit from periodic economic uncertainty and credit strains, at least until the U.S. debt burden becomes substantially larger or the Federal Reserve is forced to reverse monetary policy. In contrast, the whole-hearted embrace of the Federal Reserve’s policy of quantitative easing has resulted in a suppression of risk premiums in securities that have little to do with the course of risk-free interest rates and much more to do with credit and economic risk. These securities include corporate debt, junk-rated debt, and a wide range of equities. In these securities, there is little reason to expect risk premiums to be closely tied to the level of short-term interest rates, particularly in the event of unforeseen economic shocks. With yields on many asset classes at record-low levels, I don’t believe that this vulnerability can be overstated.
With regard to the equity market, only a handful of historical instances have featured the same hostile syndrome of overvalued, overbought, overbullish, rising yield conditions that we observe today. This syndrome has generally emerged near the most significant market peaks – and preceded the most severe market declines – in history:
| | 1. | S&P 500 Index overvalued, with the Shiller P/E (S&P 500 divided by the 10-year average of inflation-adjusted earnings) greater than 18. |
| | 2. | S&P 500 Index overbought, with the index more than 7% above its 52-week average, at least 50% above its 4-year low, and within 2% of its upper Bollinger bands (2 standard deviations above the 20-period average) at weekly and monthly resolutions. |
| | 3. | Investor sentiment overbullish, with the 2-week average of advisory bulls greater than 52% and bearishness below 28%. |
|
Letter to Shareholders (continued) |
| | 4. | Yields rising, with the 10-year Treasury yield higher than 6 months earlier. |
The exhaustive list of these instances in recent decades includes the following: November 1972 (followed by a market plunge in excess of 50%), August 1987 (followed by a market crash in excess of 30%), March 2000 (followed by a market plunge in excess of 50%), May 2007 (followed by a market plunge in excess of 50%), January 2011 (followed by a market decline limited to just under 20% as a result of central bank intervention), and today. Based on the relationship between investment advisory sentiment and prior market movements, we can impute sentiment figures for dates when this data was not yet available. On this basis, August 1929 (followed by the 85% market decline of the Great Depression) also joins the list of instances that match present conditions on the foregoing criteria.
It is important that we allow for the possibility that the present instance will be resolved differently than previous ones, but it strikes me as dangerous to rely on the expectation that this time will be different. Our own approach to this uncertainty is straightforward: we generally align our investment stance in proportion to the expected return/risk profile that we estimate in various financial markets. We do not rely on the market’s outcome in any specific instance, but instead rely on the average outcome that is associated with prevailing conditions. We tolerate moderate losses and periods where our returns do not track our benchmarks at all, but we also do everything possible to avoid major losses. We pursue our discipline instance after instance, with the confidence that deviations from our expectations in any particular instance will, on average, be corrected over the course of the full market cycle.
While the exceptional stress-testing challenges of the recent market cycle have been addressed, I expect that nearly every market cycle will present the more typical challenge of moving to a defensive stance against an enthusiastic bullish consensus, once conditions become overvalued and overextended. These are conditions that we have faced, with increasing intensity, since March 2012. The discomfort we have experienced since then is something that we would expect, at least for a time, in any market where conditions become as strenuously extended as they are at present. One can hardly admire our avoidance of separate market losses of close to 50% in 2000-2002 and 2007-2009, and yet reject our defensiveness today, because each was born of the same considerations. Fortunately, market conditions will change, and I have no doubt that much more favorable conditions will emerge over the completion of the present market cycle.
Meanwhile, keep in mind how market returns are distributed over time. We presently estimate a likely nominal total return for the S&P 500 over the coming decade of about 3.8% annually, but it is unlikely that the market’s return will be
|
Letter to Shareholders (continued) |
achieved smoothly. Instead, based on present conditions and typical market cycle norms, a reasonable 3.8% annual course over a decade might unfold like this: a 40% bear market decline, followed by an 80% bull market advance, followed by a 33% bear market loss, followed by a 100% bull market recovery by the 10-year mark. There are nearly infinite alternatives, but a smooth path with the absence of deep interim losses is among the least likely. Very large cyclical fluctuations are not implausible – they are actually the norm, and it is unlikely that the Fed can permanently eliminate those cycles. That is a very good thing, because while it implies greater risks than investors presently assume, it also implies a far wider range of opportunities in the coming years than investors presently imagine.
During the period from 2000-2009, I often noted in our Annual Reports that our investment performance was “as intended” – neither extraordinary nor disappointing relative to our expectations. Our investment approach admirably navigated the period until 2009, but despite that strong performance, I insisted that our methods should perform well even in the event of Depression-era outcomes. We solved that “two data sets” problem, but we missed a major advance in the interim. It is not enough that the resulting methods might have enabled us to successfully navigate the Depression-era, the post-war era, and even the most recent cycle. What may be more than enough, however, is also what I expect – performance that is again “as intended.” Nearly all of my own investments are, and remain, in the Hussman Funds. Despite the challenging journey behind us, I have frankly never been more confident in our investment discipline.
I remain grateful for your trust.
Sincerely,
John P. Hussman, Ph.D.
Past performance is not predictive of future performance. Investment results and principal value will fluctuate so that shares of the Funds, when redeemed, may be worth more or less than their original cost. Current performance may be higher or lower than the performance data quoted.
Weekly updates regarding market conditions and investment strategy, as well as special reports, analysis, and performance data current to the most recent month end, are available at the Hussman Funds website www.hussmanfunds.com.
|
Letter to Shareholders (continued) |
An investor should consider the investment objectives, risks, charges and expenses of the Funds carefully before investing. The Funds’ prospectuses contain this and other important information. To obtain a copy of the Hussman Funds’ prospectuses please visit our website at www.hussmanfunds.com or call 1-800-487-7626 and a copy will be sent to you free of charge. Please read the prospectus carefully before you invest. The Hussman Funds are distributed by Ultimus Fund Distributors, LLC.
Estimates of prospective return and risk for equities, bonds, and other financial markets are forward-looking statements based the analysis and reasonable beliefs of Hussman Strategic Advisors. They are not a guarantee of future performance, and are not indicative of the prospective returns of any of the Hussman Funds. Actual returns may differ substantially from the estimates provided. Estimates of prospective long-term returns for the S&P 500 reflect valuation methods focusing on the relationship between current market prices and earnings, dividends and other fundamentals, adjusted for variability over the economic cycle.
The Letter to Shareholders seeks to describe some of the adviser’s current opinions and views of the financial markets. Although the adviser believes it has a reasonable basis for any opinions or views expressed, actual results may differ, sometimes significantly so, from those expected or expressed. The securities held by the Funds that are discussed in the Letter to Shareholders were held during the period covered by this Report. They do not comprise the entire investment portfolios of the Funds, may be sold at any time and may no longer be held by the Funds. The opinions of the Funds’ adviser with respect to those securities may change at any time.
Hussman Strategic Growth Fund Portfolio Information |
December 31, 2012 (Unaudited) |
| Sector Allocation (% of Total Investments and Money Market Funds) |
Hussman Strategic Total Return Fund Portfolio Information |
December 31, 2012 (Unaudited) |
| Asset Allocation (% of Net Assets) |
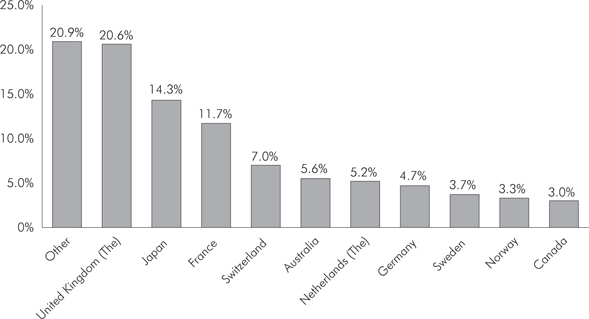
Hussman Strategic International Fund Portfolio Information |
December 31, 2012 (Unaudited) |
| Asset Allocation (% of Net Assets) |
| Country Allocation (% of Equity Holdings) |
Hussman Strategic Dividend Value Fund Portfolio Information |
December 31, 2012 (Unaudited) |
| Sector Allocation (% of Total Investments and Money Market Funds) |
Hussman Strategic Growth Fund Schedule of Investments |
December 31, 2012 (Unaudited) |
| | | | | | |
| Consumer Discretionary — 25.2% | | | | | | |
| Diversified Consumer Services — 0.5% | | | | | | |
H&R Block, Inc. | | | 1,000,000 | | | $ | 18,570,000 | |
| | | | | | | | | |
| Hotels, Restaurants & Leisure — 6.7% | | | | | | | | |
Brinker International, Inc. | | | 250,000 | | | | 7,747,500 | |
Cheesecake Factory, Inc. (The) | | | 1,000,000 | | | | 32,720,000 | |
Darden Restaurants, Inc. | | | 1,186,000 | | | | 53,453,020 | |
Jack in the Box, Inc. (a) | | | 1,673,000 | | | | 47,847,800 | |
Panera Bread Co. - Class A (a) | | | 484,000 | | | | 76,873,720 | |
| | | | | | | | 218,642,040 | |
| Internet & Catalog Retail — 0.6% | | | | | | | | |
Amazon.com, Inc. (a) | | | 75,000 | | | | 18,835,500 | |
| | | | | | | | | |
| Leisure Equipment & Products — 1.2% | | | | | | | | |
Mattel, Inc. | | | 1,100,000 | | | | 40,282,000 | |
| | | | | | | | | |
| Media — 5.2% | | | | | | | | |
Comcast Corp. - Class A | | | 1,050,000 | | | | 39,249,000 | |
DIRECTV (a) | | | 250,000 | | | | 12,540,000 | |
DISH Network Corp. - Class A | | | 1,700,000 | | | | 61,880,000 | |
McClatchy Co. (The) - Class A (a) | | | 143,000 | | | | 467,610 | |
McGraw-Hill Cos., Inc. (The) | | | 500,000 | | | | 27,335,000 | |
Scripps Networks Interactive, Inc. - Class A | | | 500,000 | | | | 28,960,000 | |
| | | | | | | | 170,431,610 | |
| Multiline Retail — 3.4% | | | | | | | | |
Family Dollar Stores, Inc. | | | 480,000 | | | | 30,436,800 | |
Kohl's Corp. | | | 500,000 | | | | 21,490,000 | |
Target Corp. | | | 1,000,000 | | | | 59,170,000 | |
| | | | | | | | 111,096,800 | |
| Specialty Retail — 6.5% | | | | | | | | |
Aéropostale, Inc. (a) | | | 3,000,000 | | | | 39,030,000 | |
American Eagle Outfitters, Inc. | | | 750,000 | | | | 15,382,500 | |
AutoZone, Inc. (a) | | | 100,000 | | | | 35,443,000 | |
Bed Bath & Beyond, Inc. (a) | | | 950,000 | | | | 53,114,500 | |
Gap, Inc. (The) | | | 1,000,000 | | | | 31,040,000 | |
Lowe's Cos., Inc. | | | 250,000 | | | | 8,880,000 | |
RadioShack Corp. | | | 850,000 | | | | 1,802,000 | |
Staples, Inc. | | | 1,500,000 | | | | 17,100,000 | |
TJX Cos., Inc. (The) | | | 250,000 | | | | 10,612,500 | |
| | | | | | | | 212,404,500 | |
Hussman Strategic Growth Fund Schedule of Investments (continued) |
December 31, 2012 (Unaudited) |
COMMON STOCKS — 101.3% (continued) | | | | | | |
| Consumer Discretionary — 25.2% (continued) | | | | | | |
| Textiles, Apparel & Luxury Goods — 1.1% | | | | | | |
NIKE, Inc. - Class B | | | 400,000 | | | $ | 20,640,000 | |
Under Armour, Inc. - Class A (a) | | | 300,000 | | | | 14,559,000 | |
| | | | | | | | 35,199,000 | |
| Consumer Staples — 16.2% | | | | | | | | |
| Beverages — 4.3% | | | | | | | | |
Coca-Cola Co. (The) | | | 2,000,000 | | | | 72,500,000 | |
PepsiCo, Inc. | | | 1,000,000 | | | | 68,430,000 | |
| | | | | | | | 140,930,000 | |
| Food & Staples Retailing — 5.7% | | | | | | | | |
CVS Caremark Corp. | | | 250,000 | | | | 12,087,500 | |
Kroger Co. (The) | | | 1,000,000 | | | | 26,020,000 | |
Sysco Corp. | | | 700,000 | | | | 22,162,000 | |
Walgreen Co. | | | 1,750,000 | | | | 64,767,500 | |
Wal-Mart Stores, Inc. | | | 900,000 | | | | 61,407,000 | |
| | | | | | | | 186,444,000 | |
| Food Products — 0.9% | | | | | | | | |
Campbell Soup Co. | | | 500,000 | | | | 17,445,000 | |
General Mills, Inc. | | | 300,000 | | | | 12,123,000 | |
| | | | | | | | 29,568,000 | |
| Household Products — 5.3% | | | | | | | | |
Clorox Co. (The) | | | 650,000 | | | | 47,593,000 | |
Colgate-Palmolive Co. | | | 650,000 | | | | 67,951,000 | |
Kimberly-Clark Corp. | | | 364,000 | | | | 30,732,520 | |
Procter & Gamble Co. (The) | | | 400,000 | | | | 27,156,000 | |
| | | | | | | | 173,432,520 | |
| Energy — 3.2% | | | | | | | | |
| Oil, Gas & Consumable Fuels — 3.2% | | | | | | | | |
Chevron Corp. | | | 250,000 | | | | 27,035,000 | |
Exxon Mobil Corp. | | | 900,000 | | | | 77,895,000 | |
| | | | | | | | 104,930,000 | |
| Financials — 3.2% | | | | | | | | |
| Commercial Banks — 0.8% | | | | | | | | |
Wells Fargo & Co. | | | 750,000 | | | | 25,635,000 | |
| | | | | | | | | |
| Consumer Finance — 1.0% | | | | | | | | |
Capital One Financial Corp. | | | 350,000 | | | | 20,275,500 | |
World Acceptance Corp. (a) | | | 190,000 | | | | 14,166,400 | |
| | | | | | | | 34,441,900 | |
Hussman Strategic Growth Fund Schedule of Investments (continued) |
December 31, 2012 (Unaudited) |
COMMON STOCKS — 101.3% (continued) | | | | | | |
| Financials — 3.2% (continued) | | | | | | |
| Insurance — 1.4% | | | | | | |
Progressive Corp. (The) | | | 1,500,000 | | | $ | 31,650,000 | |
Protective Life Corp. | | | 500,000 | | | | 14,290,000 | |
| | | | | | | | 45,940,000 | |
| Health Care — 29.4% | | | | | | | | |
| Biotechnology — 8.7% | | | | | | | | |
Amgen, Inc. | | | 900,000 | | | | 77,688,000 | |
Biogen Idec, Inc. (a) | | | 500,000 | | | | 73,335,000 | |
Celgene Corp. (a) | | | 400,000 | | | | 31,488,000 | |
Cubist Pharmaceuticals, Inc. (a) | | | 674,000 | | | | 28,348,440 | |
Gilead Sciences, Inc. (a) | | | 350,000 | | | | 25,707,500 | |
PDL BioPharma, Inc. | | | 3,000,000 | | | | 21,150,000 | |
United Therapeutics Corp. (a) | | | 500,000 | | | | 26,710,000 | |
| | | | | | | | 284,426,940 | |
| Health Care Equipment & Supplies — 7.0% | | | | | | | | |
Align Technology, Inc. (a) | | | 640,000 | | | | 17,760,000 | |
Cyberonics, Inc. (a) | | | 997,000 | | | | 52,372,410 | |
Medtronic, Inc. | | | 1,650,000 | | | | 67,683,000 | |
ResMed, Inc. | | | 300,000 | | | | 12,471,000 | |
St. Jude Medical, Inc. | | | 1,042,000 | | | | 37,657,880 | |
Varian Medical Systems, Inc. (a) | | | 133,000 | | | | 9,341,920 | |
Zimmer Holdings, Inc. | | | 500,000 | | | | 33,330,000 | |
| | | | | | | | 230,616,210 | |
| Health Care Providers & Services — 2.1% | | | | | | | | |
Laboratory Corp. of America Holdings (a) | | | 184,000 | | | | 15,938,080 | |
UnitedHealth Group, Inc. | | | 607,000 | | | | 32,923,680 | |
WellPoint, Inc. | | | 339,000 | | | | 20,651,880 | |
| | | | | | | | 69,513,640 | |
| Life Sciences Tools & Services — 1.8% | | | | | | | | |
Harvard Bioscience, Inc. (a) | | | 1,000,000 | | | | 4,380,000 | |
Illumina, Inc. (a) | | | 1,000,000 | | | | 55,590,000 | |
| | | | | | | | 59,970,000 | |
| Pharmaceuticals — 9.8% | | | | | | | | |
Abbott Laboratories | | | 400,000 | | | | 26,200,000 | |
AstraZeneca plc - ADR | | | 1,500,000 | | | | 70,905,000 | |
Bristol-Myers Squibb Co. | | | 750,000 | | | | 24,442,500 | |
Eli Lilly & Co. | | | 1,400,000 | | | | 69,048,000 | |
Endo Health Solutions, Inc. (a) | | | 1,040,000 | | | | 27,320,800 | |
GlaxoSmithKline plc - ADR | | | 500,000 | | | | 21,735,000 | |
Johnson & Johnson | | | 500,000 | | | | 35,050,000 | |
Hussman Strategic Growth Fund Schedule of Investments (continued) |
December 31, 2012 (Unaudited) |
COMMON STOCKS — 101.3% (continued) | | | | | | |
| Health Care — 29.4% (continued) | | | | | | |
| Pharmaceuticals — 9.8% (continued) | | | | | | |
Medicines Co. (The) (a) | | | 696,000 | | | $ | 16,683,120 | |
Novartis AG - ADR | | | 465,000 | | | | 29,434,500 | |
| | | | | | | | 320,818,920 | |
| Industrials — 5.0% | | | | | | | | |
| Air Freight & Logistics — 0.7% | | | | | | | | |
FedEx Corp. | | | 250,000 | | | | 22,930,000 | |
| | | | | | | | | |
| Airlines — 0.6% | | | | | | | | |
Copa Holdings S.A. - Class A | | | 35,000 | | | | 3,480,750 | |
Southwest Airlines Co. | | | 1,500,000 | | | | 15,360,000 | |
| | | | | | | | 18,840,750 | |
| Commercial Services & Supplies — 1.5% | | | | | | | | |
Cintas Corp. | | | 1,000,000 | | | | 40,900,000 | |
Tetra Tech, Inc. (a) | | | 350,000 | | | | 9,257,500 | |
| | | | | | | | 50,157,500 | |
| Electrical Equipment — 0.5% | | | | | | | | |
Generac Holdings, Inc. | | | 449,000 | | | | 15,405,190 | |
| | | | | | | | | |
| Industrial Conglomerates — 1.1% | | | | | | | | |
3M Co. | | | 400,000 | | | | 37,140,000 | |
| | | | | | | | | |
| Machinery — 0.6% | | | | | | | | |
Illinois Tool Works, Inc. | | | 300,000 | | | | 18,243,000 | |
| | | | | | | | | |
Road & Rail — 0.0%(b) | | | | | | | | |
Landstar System, Inc. | | | 34,000 | | | | 1,783,640 | |
| | | | | | | | | |
| Information Technology — 14.0% | | | | | | | | |
| Communications Equipment — 1.0% | | | | | | | | |
Cisco Systems, Inc. | | | 1,750,000 | | | | 34,387,500 | |
| | | | | | | | | |
| Computers & Peripherals — 2.5% | | | | | | | | |
Synaptics, Inc. (a) | | | 1,730,000 | | | | 51,848,100 | |
Western Digital Corp. | | | 680,000 | | | | 28,893,200 | |
| | | | | | | | 80,741,300 | |
| Electronic Equipment, Instruments & Components — 0.4% | | | | | | | | |
Dolby Laboratories, Inc. - Class A | | | 400,000 | | | | 11,732,000 | |
FUJIFILM Holdings Corp. - ADR | | | 49,400 | | | | 989,482 | |
| | | | | | | | 12,721,482 | |
Hussman Strategic Growth Fund Schedule of Investments (continued) |
December 31, 2012 (Unaudited) |
COMMON STOCKS — 101.3% (continued) | | | | | | |
| Information Technology — 14.0% (continued) | | | | | | |
| Internet Software & Services — 2.7% | | | | | | |
Akamai Technologies, Inc. (a) | | | 500,000 | | | $ | 20,455,000 | |
eBay, Inc. (a) | | | 1,250,000 | | | | 63,775,000 | |
j2 Global, Inc. | | | 91,000 | | | | 2,782,780 | |
| | | | | | | | 87,012,780 | |
| IT Services — 0.1% | | | | | | | | |
Syntel, Inc. | | | 85,000 | | | | 4,555,150 | |
| | | | | | | | | |
| Semiconductors & Semiconductor Equipment — 3.2% | | | | | | | | |
Intel Corp. | | | 3,250,000 | | | | 67,047,500 | |
OmniVision Technologies, Inc. (a) | | | 500,000 | | | | 7,040,000 | |
Skyworks Solutions, Inc. (a) | | | 750,000 | | | | 15,225,000 | |
SunPower Corp. (a) | | | 786,000 | | | | 4,417,320 | |
Ultratech, Inc. (a) | | | 57,000 | | | | 2,126,100 | |
Xilinx, Inc. | | | 250,000 | | | | 8,975,000 | |
| | | | | | | | 104,830,920 | |
| Software — 4.1% | | | | | | | | |
Adobe Systems, Inc. (a) | | | 850,000 | | | | 32,028,000 | |
BMC Software, Inc. (a) | | | 1,250,000 | | | | 49,575,000 | |
Microsoft Corp. | | | 2,000,000 | | | | 53,460,000 | |
| | | | | | | | 135,063,000 | |
| Materials — 2.0% | | | | | | | | |
| Chemicals — 1.6% | | | | | | | | |
Agrium, Inc. | | | 250,000 | | | | 24,977,500 | |
BASF SE - ADR | | | 76,800 | | | | 7,296,000 | |
CF Industries Holdings, Inc. | | | 100,000 | | | | 20,316,000 | |
| | | | | | | | 52,589,500 | |
| Paper & Forest Products — 0.4% | | | | | | | | |
International Paper Co. | | | 350,000 | | | | 13,944,000 | |
| | | | | | | | | |
| Telecommunication Services — 1.4% | | | | | | | | |
| Diversified Telecommunication Services — 0.5% | | | | | | | | |
AT&T, Inc. | | | 500,000 | | | | 16,855,000 | |
| | | | | | | | | |
| Wireless Telecommunication Services — 0.9% | | | | | | | | |
China Mobile Ltd. - ADR | | | 500,000 | | | | 29,360,000 | |
Hussman Strategic Growth Fund Schedule of Investments (continued) |
December 31, 2012 (Unaudited) |
COMMON STOCKS — 101.3% (continued) | | | | | | |
| Utilities — 1.7% | | | | | | |
| Electric Utilities — 1.7% | | | | | | |
Duke Energy Corp. | | | 500,000 | | | $ | 31,900,000 | |
Entergy Corp. | | | 350,000 | | | | 22,312,500 | |
| | | | | | | | 54,212,500 | |
| | | | | | | | | |
Total Common Stocks (Cost $3,010,840,305) | | | | | | $ | 3,322,901,792 | |
PUT OPTION CONTRACTS — 1.0% | | | | | | |
| Nasdaq 100 Index Option, 01/19/2013 at $2,550 | | | 1,000 | | | $ | 1,463,000 | |
| Russell 2000 Index Option, 03/16/2013 at $620 | | | 5,000 | | | | 495,000 | |
S&P 500 Index Option, 01/19/2013 at $980 | | | 6,500 | | | | 32,500 | |
| S&P 500 Index Option, 03/16/2013 at $1,380 | | | 11,500 | | | | 32,775,000 | |
Total Put Option Contracts (Cost $53,649,315) | | | | | | $ | 34,765,500 | |
| | | | | | | | | |
Total Investments at Value — 102.3% (Cost $3,064,489,620) | | | | | | $ | 3,357,667,292 | |
MONEY MARKET FUNDS — 27.0% | | | | | | |
Federated U.S. Treasury Cash Reserves Fund - Institutional Shares, 0.00% (c) | | | 270,870,090 | | | $ | 270,870,090 | |
First American Treasury Obligations Fund - Class Y, 0.00% (c) | | | 613,399,081 | | | | 613,399,081 | |
Total Money Market Funds (Cost $884,269,171) | | | | | | $ | 884,269,171 | |
| | | | | | | | | |
| Total Investments and Money Market Funds at Value — 129.3% | | | | | | | | |
(Cost $3,948,758,791) | | | | | | $ | 4,241,936,463 | |
| | | | | | | | | |
Written Call Options — (30.5%) | | | | | | | (1,000,921,000 | ) |
| | | | | | | | | |
Other Assets in Excess of Liabilities — 1.2% | | | | | | | 38,445,250 | |
| | | | | | | | | |
Net Assets — 100.0% | | | | | | $ | 3,279,460,713 | |
| ADR - American Depositary Receipt. |
| (a) | Non-income producing security. |
| (b) | Percentage rounds to less than 0.1%. |
| (c) | The rate shown is the 7-day effective yield as of December 31, 2012. |
| See accompanying notes to financial statements. |
Hussman Strategic Growth Fund Schedule of Open Written Option Contracts |
December 31, 2012 (Unaudited) |
WRITTEN CALL OPTION CONTRACTS | | | | | | | | | |
| Nasdaq 100 Index Option, | | | | | | | | | |
01/19/2013 at $1,800 | | | 1,000 | | | $ | 85,906,000 | | | $ | 83,998,669 | |
| Russell 2000 Index Option, | | | | | | | | | | | | |
03/16/2013 at $620 | | | 5,000 | | | | 113,295,000 | | | | 99,993,344 | |
| S&P 500 Index Option, | | | | | | | | | | | | |
01/19/2013 at $980 | | | 18,000 | | | | 801,720,000 | | | | 781,081,038 | |
Total Written Option Contracts | | | | | | $ | 1,000,921,000 | | | $ | 965,073,051 | |
| See accompanying notes to financial statements. |
Hussman Strategic Total Return Fund Schedule of Investments |
December 31, 2012 (Unaudited) |
| | | | | | |
| Energy — 0.7% | | | | | | |
| Oil, Gas & Consumable Fuels — 0.7% | | | | | | |
NuStar Energy L.P. | | | 89,000 | | | $ | 3,780,720 | |
ONEOK Partners L.P. | | | 144,000 | | | | 7,774,560 | |
Williams Partners L.P. | | | 85,000 | | | | 4,136,100 | |
| | | | | | | | 15,691,380 | |
| Materials — 15.2% | | | | | | | | |
| Metals & Mining — 15.2% | | | | | | | | |
Agnico-Eagle Mines Ltd. | | | 950,000 | | | | 49,837,000 | |
AngloGold Ashanti Ltd. - ADR | | | 1,200,000 | | | | 37,644,000 | |
Barrick Gold Corp. | | | 1,900,000 | | | | 66,519,000 | |
| Compañía de Minas Buenaventura S.A. - ADR | | | 563,000 | | | | 20,239,850 | |
Goldcorp, Inc. | | | 1,000,000 | | | | 36,700,000 | |
Gold Fields Ltd. | | | 1,250,000 | | | | 15,612,500 | |
Harmony Gold Mining Co. Ltd. - ADR | | | 1,000,000 | | | | 8,960,000 | |
Newmont Mining Corp. | | | 1,450,000 | | | | 67,338,000 | |
Randgold Resources Ltd. - ADR | | | 275,000 | | | | 27,293,750 | |
Stillwater Mining Co. (a) | | | 10,000 | | | | 127,800 | |
| | | | | | | | 330,271,900 | |
| Utilities — 3.4% | | | | | | | | |
| Electric Utilities — 1.6% | | | | | | | | |
American Electric Power Co., Inc. | | | 151,000 | | | | 6,444,680 | |
Duke Energy Corp. | | | 333 | | | | 21,245 | |
Edison International | | | 1,000 | | | | 45,190 | |
Entergy Corp. | | | 101,000 | | | | 6,438,750 | |
Exelon Corp. | | | 400,000 | | | | 11,896,000 | |
FirstEnergy Corp. | | | 83,000 | | | | 3,466,080 | |
NextEra Energy, Inc. | | | 1,000 | | | | 69,190 | |
Pepco Holdings, Inc. | | | 55,000 | | | | 1,078,550 | |
Pinnacle West Capital Corp. | | | 23,000 | | | | 1,172,540 | |
PPL Corp. | | | 100,000 | | | | 2,863,000 | |
UNS Energy Corp. | | | 56,000 | | | | 2,375,520 | |
| | | | | | | | 35,870,745 | |
| Multi-Utilities — 1.8% | | | | | | | | |
Ameren Corp. | | | 148,000 | | | | 4,546,560 | |
Dominion Resources, Inc. | | | 16,000 | | | | 828,800 | |
DTE Energy Co. | | | 67,000 | | | | 4,023,350 | |
PG&E Corp. | | | 350,000 | | | | 14,063,000 | |
Public Service Enterprise Group, Inc. | | | 400,000 | | | | 12,240,000 | |
SCANA Corp. | | | 37,000 | | | | 1,688,680 | |
Hussman Strategic Total Return Fund Schedule of Investments (continued) |
December 31, 2012 (Unaudited) |
COMMON STOCKS — 19.3% (continued) | | | | | | |
| Utilities — 3.4% (continued) | | | | | | |
| Multi-Utilities — 1.8% (continued) | | | | | | |
TECO Energy, Inc. | | | 91,000 | | | $ | 1,525,160 | |
| | | | | | | | 38,915,550 | |
| | | | | | | | | |
Total Common Stocks (Cost $428,692,991) | | | | | | $ | 420,749,575 | |
U.S. TREASURY OBLIGATIONS — 76.9% | | | | | | |
U.S. Treasury Bills (b) — 11.4% | | | | | | |
0.13%, due 06/06/2013 | | $ | 250,000,000 | | | $ | 249,892,500 | |
| | | | | | | | | |
| U.S. Treasury Inflation-Protected Notes — 2.2% | | | | | | | | |
2.00%, due 07/15/2014 | | | 30,679,500 | | | | 32,388,440 | |
2.50%, due 01/15/2029 | | | 10,774,100 | | | | 15,393,496 | |
| | | | | | | | 47,781,936 | |
| U.S. Treasury Notes — 63.3% | | | | | | | | |
0.75%, due 06/15/2014 | | | 300,000,000 | | | | 302,379,000 | |
2.25%, due 03/31/2016 | | | 200,000,000 | | | | 211,953,200 | |
2.00%, due 04/30/2016 | | | 150,000,000 | | | | 157,839,900 | |
1.75%, due 05/31/2016 | | | 100,000,000 | | | | 104,476,600 | |
3.00%, due 08/31/2016 | | | 75,000,000 | | | | 81,855,450 | |
1.75%, due 05/15/2022 | | | 100,000,000 | | | | 100,882,800 | |
1.625%, due 08/15/2022 | | | 250,000,000 | | | | 248,398,500 | |
1.625%, due 11/15/2022 | | | 175,000,000 | | | | 173,113,325 | |
| | | | | | | | 1,380,898,775 | |
| | | | | | | | | |
Total U.S. Treasury Obligations (Cost $1,640,739,614) | | | | | | $ | 1,678,573,211 | |
EXCHANGE-TRADED FUNDS — 1.6% | | | | | | |
iShares Gold Trust (a) | | | 1,500,000 | | | $ | 24,405,000 | |
| SPDR DB International Government Inflation-Protected Bond ETF | | | 160,000 | | | | 10,166,400 | |
Total Exchange-Traded Funds (Cost $32,479,295) | | | | | | $ | 34,571,400 | |
| | | | | | | | | |
Total Investments at Value — 97.8% (Cost $2,101,911,900) | | | | | | $ | 2,133,894,186 | |
Hussman Strategic Total Return Fund Schedule of Investments (continued) |
December 31, 2012 (Unaudited) |
MONEY MARKET FUNDS — 2.2% | | | | | | |
Federated U.S. Treasury Cash Reserves Fund - Institutional Shares, 0.00% (c) | | | 14,231,211 | | | $ | 14,231,211 | |
First American Treasury Obligations Fund - Class Y, 0.00% (c) | | | 34,170,301 | | | | 34,170,301 | |
Total Money Market Funds (Cost $48,401,512) | | | | | | $ | 48,401,512 | |
| | | | | | | | | |
| Total Investments and Money Market Funds at Value — 100.0% | | | | | |
(Cost $2,150,313,412) | | | | | | $ | 2,182,295,698 | |
| | | | | | | | | |
Liabilities in Excess of Other Assets — (0.0%) (d) | | | | | | | (784,061 | ) |
| | | | | | | | | |
Net Assets — 100.0% | | | | | | $ | 2,181,511,637 | |
| ADR - American Depositary Receipt. |
| (a) | Non-income producing security. |
| (b) | Rate shown is the annualized yield at time of purchase, not a coupon rate. |
| (c) | The rate shown is the 7-day effective yield as of December 31, 2012. |
| (d) | Percentage rounds to greater than (0.1%). |
| See accompanying notes to financial statements. |
Hussman Strategic International Fund Schedule of Investments |
December 31, 2012 (Unaudited) |
| | | | | | |
| Argentina — 0.3% | | | | | | |
Telecom Argentina S.A. - ADR | | | 28,000 | | | $ | 318,640 | |
| | | | | | | | | |
| Australia — 2.3% | | | | | | | | |
Cochlear Ltd. (a) | | | 3,000 | | | | 249,015 | |
Sonic Healthcare Ltd. (a) | | | 63,000 | | | | 880,513 | |
Telstra Corp. Ltd. - ADR | | | 46,000 | | | | 1,046,500 | |
| | | | | | | | 2,176,028 | |
| Austria — 0.6% | | | | | | | | |
OMV AG (a) | | | 15,000 | | | | 543,364 | |
| | | | | | | | | |
| Belgium — 0.2% | | | | | | | | |
Mobistar S.A. (a) | | | 8,000 | | | | 205,573 | |
| | | | | | | | | |
| Brazil — 0.6% | | | | | | | | |
Telefônica Brasil S.A. - ADR | | | 23,000 | | | | 553,380 | |
| | | | | | | | | |
| Canada — 0.7% | | | | | | | | |
Shoppers Drug Mart Corp. | | | 15,000 | | | | 646,767 | |
| | | | | | | | | |
| Chile — 0.2% | | | | | | | | |
Enersis S.A. - ADR | | | 8,000 | | | | 145,760 | |
| | | | | | | | | |
| China — 1.4% | | | | | | | | |
Mindray Medical International Ltd. - ADR | | | 22,500 | | | | 735,750 | |
NetEase.com, Inc. - ADR (b) | | | 8,000 | | | | 340,400 | |
Yue Yuen Industrial (Holdings) Ltd. - ADR | | | 12,000 | | | | 202,320 | |
| | | | | | | | 1,278,470 | |
| Denmark — 1.5% | | | | | | | | |
H. Lundbeck A/S | | | 45,000 | | | | 659,830 | |
William Demant Holding A/S (a) (b) | | | 8,000 | | | | 687,118 | |
| | | | | | | | 1,346,948 | |
| Finland — 1.3% | | | | | | | | |
Elisa Oyj (a) | | | 20,000 | | | | 443,250 | |
Tieto Oyj (a) | | | 40,000 | | | | 790,069 | |
| | | | | | | | 1,233,319 | |
| France — 7.9% | | | | | | | | |
Alten | | | 12,000 | | | | 414,066 | |
Casino Guichard-Perrachon S.A. (a) | | | 7,750 | | | | 742,073 | |
Cegid Group | | | 5,000 | | | | 100,944 | |
Christian Dior S.A. (a) | | | 4,000 | | | | 681,595 | |
Hussman Strategic International Fund Schedule of Investments (continued) |
December 31, 2012 (Unaudited) |
COMMON STOCKS — 61.0% (continued) | | | | | | |
| France — 7.9% (continued) | | | | | | |
Danone S.A. | | | 13,000 | | | $ | 856,060 | |
Fromageries Bel S.A. | | | 90 | | | | 21,507 | |
Iliad S.A. | | | 5,500 | | | | 943,821 | |
Infotel S.A. | | | 3,066 | | | | 224,129 | |
L'Oréal S.A. (a) | | | 3,600 | | | | 500,751 | |
Metropole Television S.A. (a) | | | 17,500 | | | | 275,012 | |
Norbert Dentressangle S.A. | | | 9,427 | | | | 727,068 | |
Sanofi - ADR | | | 22,100 | | | | 1,047,098 | |
Total S.A. - ADR | | | 16,500 | | | | 858,165 | |
| | | | | | | | 7,392,289 | |
| Germany — 3.2% | | | | | | | | |
Axel Springer AG (a) | | | 6,000 | | | | 256,776 | |
Deutsche Telekom AG (a) | | | 60,000 | | | | 682,753 | |
SAP AG - ADR | | | 13,100 | | | | 1,052,978 | |
United Internet AG (a) | | | 45,000 | | | | 972,819 | |
| | | | | | | | 2,965,326 | |
| India — 0.9% | | | | | | | | |
Wipro Ltd. - ADR | | | 100,000 | | | | 876,000 | |
| | | | | | | | | |
| Italy — 1.5% | | | | | | | | |
Enel S.P.A. (a) | | | 125,000 | | | | 519,766 | |
Eni S.P.A. - ADR | | | 10,000 | | | | 491,400 | |
Luxottica Group S.P.A. (a) | | | 10,000 | | | | 412,615 | |
| | | | | | | | 1,423,781 | |
| Japan — 9.7% | | | | | | | | |
ABC-MART, Inc. (a) | | | 13,000 | | | | 565,243 | |
AEON Co. Ltd. (a) | | | 40,000 | | | | 456,561 | |
Central Japan Railway Co. (a) | | | 3,500 | | | | 283,698 | |
Don Quijote Co. Ltd. (a) | | | 20,000 | | | | 734,784 | |
KDDI Corp. (a) | | | 9,500 | | | | 670,773 | |
Komeri Co. Ltd. (a) | | | 20,000 | | | | 504,615 | |
K's Holdings Corp. (a) | | | 14,000 | | | | 355,928 | |
Mochida Pharmaceutical Co. Ltd. (a) | | | 50,000 | | | | 613,402 | |
NAFCO Co. Ltd. (a) | | | 1,700 | | | | 25,317 | |
| Nippon Telegraph and Telephone Corp. - ADR | | | 20,000 | | | | 420,600 | |
Nitori Holdings Co. Ltd. (a) | | | 2,000 | | | | 146,347 | |
Nomura Research Institute Ltd. (a) | | | 20,000 | | | | 416,086 | |
Ryohin Keikaku Co. Ltd. (a) | | | 13,000 | | | | 726,140 | |
Sundrug Co. Ltd. (a) | | | 25,000 | | | | 854,027 | |
Takeda Pharmaceutical Co. Ltd. (a) | | | 10,500 | | | | 468,702 | |
Hussman Strategic International Fund Schedule of Investments (continued) |
December 31, 2012 (Unaudited) |
COMMON STOCKS — 61.0% (continued) | | | | | | |
| Japan — 9.7% (continued) | | | | | | |
Trend Micro, Inc. (a) | | | 15,000 | | | $ | 452,652 | |
United Arrows Ltd. (a) | | | 25,000 | | | | 574,985 | |
Yamada Denki Co. Ltd. (a) | | | 10,000 | | | | 386,020 | |
YAOKO Co., Ltd. (a) | | | 10,000 | | | | 369,988 | |
| | | | | | | | 9,025,868 | |
| Mexico — 1.0% | | | | | | | | |
| América Móvil S.A.B. de C.V. - Series A - ADR | | | 24,700 | | | | 571,805 | |
Gruma S.A.B. de C.V. - ADR (b) | | | 32,400 | | | | 394,308 | |
| | | | | | | | 966,113 | |
| Netherlands (The) — 2.1% | | | | | | | | |
ASML Holding N.V. | | | 5,630 | | | | 362,628 | |
Royal Dutch Shell plc - Class A - ADR | | | 8,000 | | | | 551,600 | |
Unilever N.V. - ADR | | | 27,000 | | | | 1,034,100 | |
| | | | | | | | 1,948,328 | |
| New Zealand — 1.1% | | | | | | | | |
Chorus Ltd. - ADR | | | 16,000 | | | | 195,200 | |
Telecom Corp. of New Zealand Ltd. - ADR | | | 92,500 | | | | 856,550 | |
| | | | | | | | 1,051,750 | |
| Norway — 2.3% | | | | | | | | |
Statoil ASA (a) | | | 20,000 | | | | 503,938 | |
Tomra Systems ASA (a) | | | 95,000 | | | | 864,166 | |
Yara International ASA (a) | | | 15,000 | | | | 747,651 | |
| | | | | | | | 2,115,755 | |
| Spain — 1.3% | | | | | | | | |
Industria de Diseño Textil S.A. (Inditex) (a) | | | 3,500 | | | | 491,613 | |
Red Electrica Corp. S.A. (a) | | | 15,000 | | | | 740,698 | |
| | | | | | | | 1,232,311 | |
| Sweden — 2.5% | | | | | | | | |
Axfood AB (a) | | | 13,000 | | | | 491,804 | |
Clas Ohlson AB - B Shares (a) | | | 55,000 | | | | 731,864 | |
Hennes & Mauritz AB - B Shares (a) | | | 14,100 | | | | 488,806 | |
NIBE Industrier AB - B Shares (a) | | | 30,000 | | | | 434,346 | |
Securitas AB - B Shares (a) | | | 25,000 | | | | 219,231 | |
| | | | | | | | 2,366,051 | |
| Switzerland — 3.4% | | | | | | | | |
Logitech International S.A. (b) | | | 61,000 | | | | 459,940 | |
Nestlé S.A. - ADR | | | 8,800 | | | | 573,496 | |
Novartis AG - ADR | | | 14,000 | | | | 886,200 | |
Roche Holding Ltd. - ADR | | | 19,000 | | | | 959,500 | |
Swisscom AG - ADR | | | 6,000 | | | | 259,500 | |
| | | | | | | | 3,138,636 | |
Hussman Strategic International Fund Schedule of Investments (continued) |
December 31, 2012 (Unaudited) |
COMMON STOCKS — 61.0% (continued) | | | | | | |
| Taiwan — 1.0% | | | | | | |
| Taiwan Semiconductor Manufacturing Co. Ltd. - ADR | | | 55,000 | | | $ | 943,800 | |
| | | | | | | | | |
| United Kingdom (The) — 14.0% | | | | | | | | |
AstraZeneca plc - ADR | | | 21,500 | | | | 1,016,305 | |
BT Group plc - ADR | | | 10,000 | | | | 380,300 | |
Dairy Crest Group plc (a) | | | 70,000 | | | | 443,665 | |
Ensco plc - Class A | | | 2,500 | | | | 148,200 | |
GlaxoSmithKline plc - ADR | | | 23,500 | | | | 1,021,545 | |
Greggs plc (a) | | | 90,000 | | | | 671,642 | |
Interserve plc (a) | | | 64,000 | | | | 408,428 | |
J Sainsbury plc (a) | | | 180,000 | | | | 1,018,778 | |
London Stock Exchange Group plc (a) | | | 25,000 | | | | 446,129 | |
Marks & Spencer Group plc (a) | | | 40,000 | | | | 251,364 | |
Mitie Group plc (a) | | | 175,000 | | | | 752,573 | |
N Brown Group plc (a) | | | 50,000 | | | | 301,914 | |
National Grid plc - ADR | | | 10,500 | | | | 603,120 | |
Reckitt Benckiser Group plc - ADR | | | 75,000 | | | | 961,500 | |
Sage Group plc (The) (a) | | | 200,000 | | | | 962,080 | |
SSE plc (a) | | | 35,000 | | | | 814,566 | |
Smith & Nephew plc - ADR | | | 19,500 | | | | 1,080,300 | |
Vodafone Group plc - ADR | | | 19,000 | | | | 478,610 | |
William Morrison Supermarkets plc (a) | | | 160,000 | | | | 687,257 | |
WS Atkins plc (a) | | | 45,000 | | | | 560,982 | |
| | | | | | | | 13,009,258 | |
| | | | | | | | | |
Total Common Stocks (Cost $53,887,674) | | | | | | $ | 56,903,515 | |
EXCHANGE-TRADED FUNDS — 6.7% | | | | | | |
iShares MSCI Australia Index Fund | | | 53,000 | | | $ | 1,332,420 | |
iShares MSCI Canada Index Fund | | | 45,000 | | | | 1,278,000 | |
iShares MSCI Netherlands Index Fund | | | 65,000 | | | | 1,333,150 | |
iShares MSCI Singapore Index Fund | | | 80,000 | | | | 1,095,200 | |
iShares MSCI Switzerland Index Fund | | | 48,000 | | | | 1,286,400 | |
Total Exchange-Traded Funds (Cost $5,912,571) | | | | | | $ | 6,325,170 | |
Hussman Strategic International Fund Schedule of Investments (continued) |
December 31, 2012 (Unaudited) |
PUT OPTION CONTRACTS — 0.1% | | | | | | |
| S&P 500 Index Option, 03/16/2013 at $1,150 (Cost $56,450) | | | 150 | | | $ | 54,000 | |
| | | | | | | | | |
Total Investments at Value — 67.8% (Cost $59,856,695) | | | | | | $ | 63,282,685 | |
MONEY MARKET FUNDS — 28.7% | | | | | | |
Northern Institutional Treasury Portfolio, 0.01% (c) (Cost $26,784,536) | | | 26,784,536 | | | $ | 26,784,536 | |
| | | | | | | | | |
| Total Investments and Money Market Funds at Value — 96.5% | | | | | |
(Cost $86,641,231) | | | | | | $ | 90,067,221 | |
| | | | | | | | | |
Written Call Options — (4.4%) | | | | | | | (4,110,000 | ) |
| | | | | | | | | |
Other Assets in Excess of Liabilities — 7.9% | | | | | | | 7,333,054 | |
| | | | | | | | | |
Net Assets — 100.0% | | | | | | $ | 93,290,275 | |
| ADR - American Depositary Receipt. |
| (a) | Fair value priced (Note 1). Fair valued securities totaled $30,481,825 at December 31, 2012, representing 32.7% of net assets. |
| (b) | Non-income producing security. |
| (c) | The rate shown is the 7-day effective yield as of December 31, 2012. |
| See accompanying notes to financial statements. |
Hussman Strategic International Fund Summary of Common Stocks by Sector and Industry |
December 31, 2012 (Unaudited) |
| | |
| Consumer Discretionary — 8.7% | | |
| | Internet & Catalog Retail | 0.3% |
| | Media | 0.6% |
| | Multiline Retail | 2.0% |
| | Specialty Retail | 4.6% |
| | Textiles, Apparel & Luxury Goods | 1.2% |
| Consumer Staples — 11.5% | | |
| | Food & Staples Retailing | 5.7% |
| | Food Products | 4.3% |
| | Household Products | 1.0% |
| | Personal Products | 0.5% |
| Energy — 3.3% | | |
| | Energy Equipment & Services | 0.1% |
| | Oil, Gas & Consumable Fuels | 3.2% |
| Financials — 0.5% | | |
| | Diversified Financial Services | 0.5% |
| Health Care — 11.0% | | |
| | Health Care Equipment & Supplies | 3.0% |
| | Health Care Providers & Services | 0.9% |
| | Pharmaceuticals | 7.1% |
| Industrials — 4.6% | | |
| | Air Freight & Logistics | 0.8% |
| | Building Products | 0.5% |
| | Commercial Services & Supplies | 2.0% |
| | Construction & Engineering | 0.4% |
| | Professional Services | 0.6% |
| | Road & Rail | 0.3% |
| Information Technology — 9.0% | | |
| | Computers & Peripherals | 0.5% |
| | Internet Software & Services | 1.4% |
| | IT Services | 2.2% |
| | Semiconductors & Semiconductor Equipment | 1.4% |
| | Software | 3.5% |
| Materials — 0.8% | | |
| | Chemicals | 0.8% |
| Telecommunication Services — 8.6% | | |
| | Diversified Telecommunication Services | 6.5% |
| | Wireless Telecommunication Services | 2.1% |
| Utilities — 3.0% | | |
| | Electric Utilities | 2.4% |
| | Multi-Utilities | |
| | | |
| See accompanying notes to financial statements. |
Hussman Strategic International Fund Schedule of Futures Contracts |
December 31, 2012 (Unaudited) |
| | | | | | Aggregate Market Value of Contracts | | | | |
Dollar Index Future | 03/18/2013 | | | 150 | | | $ | 11,979,000 | | | $ | (87,325 | ) |
| See accompanying notes to financial statements. |
Hussman Strategic International Fund Schedule of Open Written Option Contracts |
December 31, 2012 (Unaudited) |
WRITTEN CALL OPTION CONTRACTS | | | | | | | | | |
| S&P 500 Index Option, | | | | | | | | | |
03/16/2013 at $1,150 | | | 150 | | | $ | 4,110,000 | | | $ | 3,929,800 | |
| See accompanying notes to financial statements. |
Hussman Strategic International Fund Schedule of Futures Contracts Sold Short |
December 31, 2012 (Unaudited) |
FUTURES CONTRACTS SOLD SHORT | | | | | | Aggregate Market Value of Contracts | | | Unrealized Appreciation (Depreciation) | |
Euro Stoxx 50 Index Future | 03/15/2013 | | | 750 | | | $ | 25,879,132 | | | $ | (32,240 | ) |
FTSE 100 Index Future | 03/15/2013 | | | 150 | | | | 14,255,302 | | | | 92,350 | |
Total Futures Contracts Sold Short | | | | | | | $ | 40,134,434 | | | $ | 60,110 | |
| See accompanying notes to financial statements. |
Hussman Strategic Dividend Value Fund Schedule of Investments |
December 31, 2012 (Unaudited) |
| | | | | | |
| Consumer Discretionary — 8.8% | | | | | | |
| Auto Components — 0.5% | | | | | | |
Autoliv, Inc. | | | 1,100 | | | $ | 74,129 | |
| | | | | | | | | |
| Diversified Consumer Services — 1.0% | | | | | | | | |
H&R Block, Inc. | | | 4,000 | | | | 74,280 | |
Strayer Education, Inc. | | | 1,000 | | | | 56,170 | |
| | | | | | | | 130,450 | |
| Hotels, Restaurants & Leisure — 1.5% | | | | | | | | |
Carnival Corp. | | | 1,500 | | | | 55,155 | |
Darden Restaurants, Inc. | | | 1,500 | | | | 67,605 | |
McDonald's Corp. | | | 1,000 | | | | 88,210 | |
| | | | | | | | 210,970 | |
| Household Durables — 1.1% | | | | | | | | |
Garmin Ltd. | | | 2,800 | | | | 114,296 | |
Koss Corp. | | | 9,000 | | | | 43,290 | |
| | | | | | | | 157,586 | |
| Internet & Catalog Retail — 0.4% | | | | | | | | |
Nutrisystem, Inc. | | | 6,000 | | | | 49,140 | |
| | | | | | | | | |
| Leisure Equipment & Products — 0.7% | | | | | | | | |
Hasbro, Inc. | | | 2,625 | | | | 94,238 | |
| | | | | | | | | |
| Media — 1.7% | | | | | | | | |
Harte-Hanks, Inc. | | | 14,000 | | | | 82,600 | |
Meredith Corp. | | | 3,000 | | | | 103,350 | |
Omnicom Group, Inc. | | | 1,100 | | | | 54,956 | |
| | | | | | | | 240,906 | |
| Multiline Retail — 1.0% | | | | | | | | |
Kohl's Corp. | | | 2,000 | | | | 85,960 | |
Target Corp. | | | 900 | | | | 53,253 | |
| | | | | | | | 139,213 | |
| Specialty Retail — 0.9% | | | | | | | | |
Best Buy Co., Inc. | | | 2,250 | | | | 26,662 | |
Staples, Inc. | | | 8,000 | | | | 91,200 | |
| | | | | | | | 117,862 | |
| Consumer Staples — 8.4% | | | | | | | | |
| Beverages — 1.1% | | | | | | | | |
Coca-Cola Co. (The) | | | 2,250 | | | | 81,562 | |
PepsiCo, Inc. | | | 1,125 | | | | 76,984 | |
| | | | | | | | 158,546 | |
Hussman Strategic Dividend Value Fund Schedule of Investments (continued) |
December 31, 2012 (Unaudited) |
COMMON STOCKS — 47.5% (continued) | | | | | | |
| Consumer Staples — 8.4% (continued) | | | | | | |
| Food & Staples Retailing — 2.5% | | | | | | |
Kroger Co. (The) | | | 3,000 | | | $ | 78,060 | |
Safeway, Inc. | | | 3,000 | | | | 54,270 | |
Sysco Corp. | | | 1,500 | | | | 47,490 | |
Walgreen Co. | | | 3,000 | | | | 111,030 | |
Wal-Mart Stores, Inc. | | | 900 | | | | 61,407 | |
| | | | | | | | 352,257 | |
| Food Products — 2.7% | | | | | | | | |
Archer-Daniels-Midland Co. | | | 2,400 | | | | 65,736 | |
Campbell Soup Co. | | | 3,500 | | | | 122,115 | |
ConAgra Foods, Inc. | | | 2,000 | | | | 59,000 | |
General Mills, Inc. | | | 1,125 | | | | 45,461 | |
Kellogg Co. | | | 1,500 | | | | 83,775 | |
| | | | | | | | 376,087 | |
| Household Products — 1.9% | | | | | | | | |
Clorox Co. (The) | | | 1,000 | | | | 73,220 | |
Colgate-Palmolive Co. | | | 800 | | | | 83,632 | |
Procter & Gamble Co. (The) | | | 1,500 | | | | 101,835 | |
| | | | | | | | 258,687 | |
| Personal Products — 0.2% | | | | | | | | |
Avon Products, Inc. | | | 1,500 | | | | 21,540 | |
| | | | | | | | | |
| Energy — 2.9% | | | | | | | | |
| Oil, Gas & Consumable Fuels — 2.9% | | | | | | | | |
BP plc - ADR | | | 2,600 | | | | 108,264 | |
ConocoPhillips | | | 1,500 | | | | 86,985 | |
Exxon Mobil Corp. | | | 500 | | | | 43,275 | |
Murphy Oil Corp. | | | 2,100 | | | | 125,055 | |
Phillips 66 | | | 575 | | | | 30,533 | |
| | | | | | | | 394,112 | |
| Financials — 1.5% | | | | | | | | |
| Diversified Financial Services — 0.7% | | | | | | | | |
CME Group, Inc. | | | 1,900 | | | | 96,349 | |
| | | | | | | | | |
| Insurance — 0.8% | | | | | | | | |
Aflac, Inc. | | | 2,100 | | | | 111,552 | |
| | | | | | | | | |
| Health Care — 9.3% | | | | | | | | |
| Biotechnology — 0.6% | | | | | | | | |
PDL BioPharma, Inc. | | | 12,000 | | | | 84,600 | |
Hussman Strategic Dividend Value Fund Schedule of Investments (continued) |
December 31, 2012 (Unaudited) |
COMMON STOCKS — 47.5% (continued) | | | | | | |
| Health Care — 9.3% (continued) | | | | | | |
| Health Care Equipment & Supplies — 2.9% | | | | | | |
Baxter International, Inc. | | | 1,750 | | | $ | 116,655 | |
Becton, Dickinson and Co. | | | 1,125 | | | | 87,964 | |
Medtronic, Inc. | | | 2,400 | | | | 98,448 | |
St. Jude Medical, Inc. | | | 2,800 | | | | 101,192 | |
| | | | | | | | 404,259 | |
| Health Care Providers & Services — 1.1% | | | | | | | | |
Cardinal Health, Inc. | | | 2,400 | | | | 98,832 | |
Owens & Minor, Inc. | | | 2,000 | | | | 57,020 | |
| | | | | | | | 155,852 | |
| Health Care Technology — 0.4% | | | | | | | | |
Quality Systems, Inc. | | | 3,000 | | | | 52,080 | |
| | | | | | | | | |
| Pharmaceuticals — 4.3% | | | | | | | | |
Abbott Laboratories | | | 1,750 | | | | 114,625 | |
AstraZeneca plc - ADR | | | 1,500 | | | | 70,905 | |
Eli Lilly & Co. | | | 1,000 | | | | 49,320 | |
Johnson & Johnson | | | 1,750 | | | | 122,675 | |
Merck & Co., Inc. | | | 2,625 | | | | 107,467 | |
Novartis AG - ADR | | | 1,900 | | | | 120,270 | |
| | | | | | | | 585,262 | |
| Industrials — 5.1% | | | | | | | | |
| Aerospace & Defense — 0.6% | | | | | | | | |
United Technologies Corp. | | | 1,000 | | | | 82,010 | |
| | | | | | | | | |
| Air Freight & Logistics — 1.2% | | | | | | | | |
C.H. Robinson Worldwide, Inc. | | | 975 | | | | 61,640 | |
United Parcel Service, Inc. - Class B | | | 1,400 | | | | 103,222 | |
| | | | | | | | 164,862 | |
| Commercial Services & Supplies — 0.4% | | | | | | | | |
Republic Services, Inc. | | | 2,100 | | | | 61,593 | |
| | | | | | | | | |
| Electrical Equipment — 1.4% | | | | | | | | |
Eaton Corp. plc | | | 1,500 | | | | 81,300 | |
Emerson Electric Co. | | | 2,000 | | | | 105,920 | |
| | | | | | | | 187,220 | |
| Industrial Conglomerates — 0.7% | | | | | | | | |
3M Co. | | | 1,000 | | | | 92,850 | |
Hussman Strategic Dividend Value Fund Schedule of Investments (continued) |
December 31, 2012 (Unaudited) |
COMMON STOCKS — 47.5% (continued) | | | | | | |
| Industrials — 5.1% (continued) | | | | | | |
| Machinery — 0.4% | | | | | | |
Illinois Tool Works, Inc. | | | 1,000 | | | $ | 60,810 | |
| | | | | | | | | |
| Road & Rail — 0.4% | | | | | | | | |
Norfolk Southern Corp. | | | 1,000 | | | | 61,840 | |
| | | | | | | | | |
| Information Technology — 8.3% | | | | | | | | |
| Communications Equipment — 1.3% | | | | | | | | |
Comtech Telecommunications Corp. | | | 3,000 | | | | 76,140 | |
Harris Corp. | | | 2,200 | | | | 107,712 | |
| | | | | | | | 183,852 | |
| Computers & Peripherals — 0.3% | | | | | | | | |
Diebold, Inc. | | | 1,500 | | | | 45,915 | |
| | | | | | | | | |
| Electronic Equipment, Instruments & Components — 0.6% | | | | | | | | |
Molex, Inc. | | | 3,000 | | | | 81,990 | |
| | | | | | | | | |
| Office Electronics — 0.7% | | | | | | | | |
CANON, Inc. | | | 2,400 | | | | 94,104 | |
| | | | | | | | | |
| Semiconductors & Semiconductor Equipment — 4.8% | | | | | | | | |
Analog Devices, Inc. | | | 2,000 | | | | 84,120 | |
Applied Materials, Inc. | | | 5,000 | | | | 57,200 | |
Intel Corp. | | | 5,000 | | | | 103,150 | |
KLA-Tencor Corp. | | | 2,200 | | | | 105,072 | |
Linear Technology Corp. | | | 2,250 | | | | 77,175 | |
Maxim Integrated Products, Inc. | | | 2,000 | | | | 58,800 | |
Microchip Technology, Inc. | | | 3,000 | | | | 97,770 | |
Xilinx, Inc. | | | 2,250 | | | | 80,775 | |
| | | | | | | | 664,062 | |
| Software — 0.6% | | | | | | | | |
Microsoft Corp. | | | 3,000 | | | | 80,190 | |
| | | | | | | | | |
| Materials — 1.3% | | | | | | | | |
| Chemicals — 1.3% | | | | | | | | |
BASF SE - ADR | | | 1,200 | | | | 114,000 | |
Scotts Miracle-Gro Co. (The) - Class A | | | 1,500 | | | | 66,075 | |
| | | | | | | | 180,075 | |
Hussman Strategic Dividend Value Fund Schedule of Investments (continued) |
December 31, 2012 (Unaudited) |
COMMON STOCKS — 47.5% (continued) | | | | | | |
| Utilities — 1.9% | | | | | | |
| Electric Utilities — 1.5% | | | | | | |
Entergy Corp. | | | 1,600 | | | $ | 102,000 | |
PPL Corp. | | | 3,600 | | | | 103,068 | |
| | | | | | | | 205,068 | |
| Water Utilities — 0.4% | | | | | | | | |
Consolidated Water Co. Ltd. | | | 8,000 | | | | 59,200 | |
| | | | | | | | | |
Total Common Stocks (Cost $6,444,655) | | | | | | $ | 6,571,318 | |
PUT OPTION CONTRACTS — 0.2% | | | | | | |
| S&P 500 Index Option, 03/16/2013 at $1,280 (Cost $30,829) | | | 22 | | | $ | 24,354 | |
| | | | | | | | | |
Total Investments at Value — 47.7% (Cost $6,475,484) | | | | | | $ | 6,595,672 | |
MONEY MARKET FUNDS — 54.5% | | | | | | |
Federated U.S. Treasury Cash Reserves Fund - Institutional Shares, 0.00% (a) | | | 2,196,684 | | | $ | 2,196,684 | |
First American Treasury Obligations Fund - Class Y, 0.00% (a) | | | 5,338,310 | | | | 5,338,310 | |
Total Money Market Funds (Cost $7,534,994) | | | | | | $ | 7,534,994 | |
| | | | | | | | | |
| Total Investments and Money Market Funds at Value — 102.2% | | | | | |
(Cost $14,010,478) | | | | | | $ | 14,130,666 | |
| | | | | | | | | |
Written Call Options — (2.4%) | | | | | | | (332,332 | ) |
| | | | | | | | | |
Other Assets in Excess of Liabilities — 0.2% | | | | | | | 27,621 | |
| | | | | | | | | |
Net Assets — 100.0% | | | | | | $ | 13,825,955 | |
| ADR - American Depositary Receipt. |
| (a) | The rate shown is the 7-day effective yield as of December 31, 2012. |
| See accompanying notes to financial statements. |
Hussman Strategic Dividend Value Fund Schedule of Open Written Option Contracts |
December 31, 2012 (Unaudited) |
WRITTEN CALL OPTION CONTRACTS | | | | | | | | | |
| S&P 500 Index Option, | | | | | | | | | |
03/16/2013 at $1,280 | | | 22 | | | $ | 332,332 | | | $ | 314,571 | |
| See accompanying notes to financial statements. |
Hussman Investment Trust Statements of Assets and Liabilities |
December 31, 2012 (Unaudited) |
| | | Hussman Strategic Growth Fund | | | Hussman Strategic Total Return Fund | |
| ASSETS | | | | | | |
| Investments in securities: | | | | | | |
At acquisition cost | | $ | 3,064,489,620 | | | $ | 2,101,911,900 | |
At value (Note 1) | | $ | 3,357,667,292 | | | $ | 2,133,894,186 | |
Investments in money market funds | | | 884,269,171 | | | | 48,401,512 | |
Cash | | | 500,000 | | | | — | |
Dividends and interest receivable | | | 2,076,627 | | | | 5,559,210 | |
Receivable for investment securities sold | | | 71,479,275 | | | | — | |
Receivable for capital shares sold | | | 5,624,800 | | | | 1,565,630 | |
Other assets | | | 127,243 | | | | 92,553 | |
Total Assets | | | 4,321,744,408 | | | | 2,189,513,091 | |
| | | | | | | | | |
| LIABILITIES | | | | | | | | |
Dividends payable | | | 15,461,340 | | | | 466,110 | |
Written call options, at value (Notes 1 and 4)
(premiums received $965,073,051) | | | 1,000,921,000 | | | | — | |
Payable for investment securities purchased | | | 5,666 | | | | — | |
Payable for capital shares redeemed | | | 22,614,128 | | | | 6,291,959 | |
Accrued investment advisory fees (Note 3) | | | 2,660,620 | | | | 896,303 | |
Payable to administrator (Note 3) | | | 341,700 | | | | 174,100 | |
Other accrued expenses and liabilities | | | 279,241 | | | | 172,982 | |
Total Liabilities | | | 1,042,283,695 | | | | 8,001,454 | |
NET ASSETS | | $ | 3,279,460,713 | | | $ | 2,181,511,637 | |
| | | | | | | | | |
| Net assets consist of: | | | | | | | | |
Paid-in capital | | $ | 4,894,064,158 | | | $ | 2,159,555,827 | |
| Accumulated undistributed net investment income | | | 11,816 | | | | 11,283 | |
Accumulated net realized losses from
security transactions and option contracts | | | (1,871,944,984 | ) | | | (10,037,759 | ) |
| Net unrealized appreciation (depreciation) on: | | | | | | | | |
Investment securities | | | 312,061,487 | | | | 31,982,286 | |
Option contracts | | | (54,731,764 | ) | | | — | |
NET ASSETS | | $ | 3,279,460,713 | | | $ | 2,181,511,637 | |
| | | | | | | | | |
Shares of beneficial interest outstanding (unlimited number of shares
authorized, no par value) | | | 306,111,487 | | | | 180,185,569 | |
Net asset value, offering price and redemption price per share(a)
(Note 1) | | $ | 10.71 | | | $ | 12.11 | |
| (a) | Redemption fee may apply to redemptions of shares held for 60 days or less. |
| See accompanying notes to financial statements. |
Hussman Investment Trust Statements of Assets and Liabilities (continued) |
December 31, 2012 (Unaudited) |
| | | Hussman Strategic International Fund | | | Hussman Strategic Dividend Value Fund | |
| ASSETS | | | | | | |
| Investments in securities: | | | | | | |
At acquisition cost | | $ | 59,856,695 | | | $ | 6,475,484 | |
At value (Note 1) | | $ | 63,282,685 | | | $ | 6,595,672 | |
Investments in money market funds | | | 26,784,536 | | | | 7,534,994 | |
Cash | | | — | | | | 1,260 | |
Dividends receivable | | | 193,640 | | | | 8,417 | |
Receivable for capital shares sold | | | 87,946 | | | | 5,201 | |
Receivable from Adviser (Note 3) | | | — | | | | 15,130 | |
Variation margin receivable (Notes 1 and 4) | | | 1,603,677 | | | | — | |
Margin deposits for futures contracts (Cost $5,733,263)
(Notes 1 and 4) | | | 5,645,937 | | | | — | |
Other assets | | | 27,561 | | | | 20,632 | |
Total Assets | | | 97,625,982 | | | | 14,181,306 | |
| | | | | | | | | |
| LIABILITIES | | | | | | | | |
Dividends payable | | | — | | | | 57 | |
Written call options, at value (Notes 1 and 4)
(premiums received $3,929,800
and $314,571, respectively) | | | 4,110,000 | | | | 332,332 | |
Payable for capital shares redeemed | | | 86,791 | | | | 1,817 | |
Accrued investment advisory fees (Note 3) | | | 77,960 | | | | — | |
Payable to administrator (Note 3) | | | 11,400 | | | | 5,285 | |
Other accrued expenses | | | 49,556 | | | | 15,860 | |
Total Liabilities | | | 4,335,707 | | | | 355,351 | |
NET ASSETS | | $ | 93,290,275 | | | $ | 13,825,955 | |
| | | | | | | | | |
| Net assets consist of: | | | | | | | | |
Paid-in capital | | $ | 99,388,405 | | | $ | 13,792,297 | |
| Accumulated undistributed net investment income | | | 63,074 | | | | 3 | |
Accumulated net realized losses from security transactions
and option and futures contracts | | | (9,429,710 | ) | | | (68,772 | ) |
| Net unrealized appreciation (depreciation) on: | | | | | | | | |
Investment securities | | | 3,428,440 | | | | 126,663 | |
Option contracts | | | (182,650 | ) | | | (24,236 | ) |
Futures contracts | | | (27,215 | ) | | | — | |
| Translation of assets and liabilities in foreign currencies | | | 49,931 | | | | — | |
NET ASSETS | | $ | 93,290,275 | | | $ | 13,825,955 | |
| | | | | | | | | |
Shares of beneficial interest outstanding (unlimited number of shares
authorized, no par value) | | | 9,737,688 | | | | 1,377,645 | |
Net asset value, offering price and redemption price per share (a) (Note 1) | | $ | 9.58 | | | $ | 10.04 | |
| (a) | Redemption fee may apply to redemptions of shares held for 60 days or less. |
| See accompanying notes to financial statements. |
Hussman Investment Trust Statements of Operations |
For the Six Months Ended December 31, 2012 (Unaudited) |
| | | Hussman Strategic Growth Fund | | | Hussman Strategic Total Return Fund | |
| INVESTMENT INCOME | | | | | | |
Dividends | | $ | 48,536,752 | | | $ | 3,825,608 | |
Foreign withholding taxes on dividends | | | (61,465 | ) | | | (190,922 | ) |
Interest | | | — | | | | 8,977,052 | |
Total Income | | | 48,475,287 | | | | 12,611,738 | |
| | | | | | | | | |
| EXPENSES | | | | | | | | |
Investment advisory fees (Note 3) | | | 18,519,633 | | | | 5,751,047 | |
Transfer agent, account maintenance and
shareholder services fees (Note 3) | | | 1,924,832 | | | | 848,333 | |
Administration fees (Note 3) | | | 920,358 | | | | 641,731 | |
Postage and supplies | | | 149,030 | | | | 90,053 | |
Custodian and bank service fees | | | 154,446 | | | | 83,989 | |
Fund accounting fees (Note 3) | | | 130,624 | | | | 88,974 | |
Registration and filing fees | | | 56,244 | | | | 82,339 | |
Professional fees | | | 67,110 | | | | 59,614 | |
Printing of shareholder reports | | | 69,954 | | | | 42,863 | |
Trustees’ fees and expenses (Note 3) | | | 39,556 | | | | 39,556 | |
Insurance expense | | | 40,067 | | | | 21,492 | |
Compliance service fees (Note 3) | | | 34,134 | | | | 21,277 | |
Other expenses | | | 15,774 | | | | 12,534 | |
Total Expenses | | | 22,121,762 | | | | 7,783,802 | |
| | | | | | | | | |
NET INVESTMENT INCOME | | | 26,353,525 | | | | 4,827,936 | |
| | | | | | | | | |
REALIZED AND UNREALIZED GAINS (LOSSES) ON
INVESTMENTS AND OPTION CONTRACTS (Note 4) | | | | | | | | |
| Net realized gains (losses) from: | | | | | | | | |
Security transactions | | | 216,496,734 | | | | 5,697,327 | |
Option contracts | | | (484,858,622 | ) | | | — | |
| Net change in unrealized appreciation (depreciation) on: | | | | | | | | |
Investments | | | (126,290,418 | ) | | | (4,762,305 | ) |
Option contracts | | | 122,269,524 | | | | — | |
| | | | | | | | | |
NET REALIZED AND UNREALIZED GAINS (LOSSES) ON
INVESTMENTS AND OPTION CONTRACTS | | | (272,382,782 | ) | | | 935,022 | |
| | | | | | | | | |
NET INCREASE (DECREASE) IN NET ASSETS
RESULTING FROM OPERATIONS | | $ | (246,029,257 | ) | | $ | 5,762,958 | |
| See accompanying notes to financial statements. |
Hussman Investment Trust Statements of Operations (continued) |
For the Six Months Ended December 31, 2012 (Unaudited) |
| | | Hussman Strategic International Fund | | | Hussman Strategic Dividend Value Fund | |
| INVESTMENT INCOME | | | | | | |
Dividend income | | $ | 772,544 | | | $ | 92,413 | |
Foreign withholding taxes on dividends | | | (66,286 | ) | | | (582 | ) |
Total Income | | | 706,258 | | | | 91,831 | |
| EXPENSES | | | | | | | | |
Investment advisory fees (Note 3) | | | 450,915 | | | | 50,827 | |
Professional fees | | | 58,373 | | | | 35,148 | |
Trustees' fees and expenses (Note 3) | | | 39,556 | | | | 39,556 | |
Registration and filing fees | | | 38,140 | | | | 22,386 | |
Administration fees (Note 3) | | | 31,644 | | | | 9,000 | |
Fund accounting fees (Note 3) | | | 22,563 | | | | 11,645 | |
| Transfer agent, account maintenance and shareholder services fees (Note 3) | | | 24,028 | | | | 7,644 | |
Custodian fees | | | 25,000 | | | | 4,246 | |
Pricing fees | | | 15,024 | | | | 1,009 | |
Postage and supplies | | | 8,911 | | | | 6,136 | |
Printing of shareholder reports | | | 6,869 | | | | 5,688 | |
Compliance service fees (Note 3) | | | 2,952 | | | | 2,333 | |
Insurance expense | | | 922 | | | | 121 | |
Other expenses | | | 13,116 | | | | 10,064 | |
Total Expenses | | | 738,013 | | | | 205,803 | |
| Less fee reductions and expense reimbursements by the Adviser (Note 3) | | | — | | | | (142,269 | ) |
Net Expenses | | | 738,013 | | | | 63,534 | |
NET INVESTMENT INCOME (LOSS) | | | (31,755 | ) | | | 28,297 | |
REALIZED AND UNREALIZED GAINS (LOSSES) ON
INVESTMENTS AND OPTION AND FUTURES CONTRACTS (Note 4) | | | | | |
| Net realized gains (losses) from: | | | | | | | | |
Security transactions | | | 708,136 | | | | 54,369 | |
Option contracts | | | (1,685,344 | ) | | | (167,681 | ) |
Futures contracts | | | (6,666,752 | ) | | | — | |
Foreign currency transactions | | | 315,288 | | | | — | |
| Net change in unrealized appreciation (depreciation) on: | | | | | | | | |
Investments | | | 4,104,598 | | | | 157,025 | |
Option contracts | | | 500,698 | | | | 23,030 | |
Futures contracts | | | 1,864,334 | | | | — | |
Foreign currency translation | | | (27,005 | ) | | | — | |
NET REALIZED AND UNREALIZED GAINS (LOSSES) ON
INVESTMENTS AND OPTION AND FUTURES CONTRACTS | | | (886,047 | ) | | | 66,743 | |
NET INCREASE (DECREASE) IN NET ASSETS
RESULTING FROM OPERATIONS | | $ | (917,802 | ) | | $ | 95,040 | |
| See accompanying notes to financial statements. |
Hussman Strategic Growth Fund Statements of Changes in Net Assets |
|
| | | Six Months Ended December 31, 2012 (Unaudited) | | | | |
| FROM OPERATIONS | | | | | | |
Net investment income | | $ | 26,353,525 | | | $ | 36,538,161 | |
| Net realized gains (losses) from: | | | | | | | | |
Security transactions | | | 216,496,734 | | | | 563,424,602 | |
Option contracts | | | (484,858,622 | ) | | | (543,293,601 | ) |
| Net change in unrealized appreciation (depreciation) on: | | | | | | | | |
Investments | | | (126,290,418 | ) | | | (394,867,285 | ) |
Option contracts | | | 122,269,524 | | | | (6,376,918 | ) |
| Net decrease in net assets resulting from operations | | | (246,029,257 | ) | | | (344,575,041 | ) |
| | | | | | | | | |
| DISTRIBUTIONS TO SHAREHOLDERS | | | | | | | | |
From net investment income | | | (46,271,836 | ) | | | (28,671,281 | ) |
| | | | | | | | | |
| FROM CAPITAL SHARE TRANSACTIONS | | | | | | | | |
Proceeds from shares sold | | | 405,801,196 | | | | 1,927,540,093 | |
Net asset value of shares issued in reinvestment of
distributions to shareholders | | | 30,810,496 | | | | 18,603,304 | |
| Proceeds from redemption fees collected (Note 1) | | | 151,835 | | | | 585,804 | |
Payments for shares redeemed | | | (1,801,810,204 | ) | | | (2,280,740,502 | ) |
| Net decrease in net assets from capital share transactions | | | (1,365,046,677 | ) | | | (334,011,301 | ) |
| | | | | | | | | |
TOTAL DECREASE IN NET ASSETS | | | (1,657,347,770 | ) | | | (707,257,623 | ) |
| | | | | | | | | |
| NET ASSETS | | | | | | | | |
Beginning of period | | | 4,936,808,483 | | | | 5,644,066,106 | |
End of period | | $ | 3,279,460,713 | | | $ | 4,936,808,483 | |
| | | | | | | | | |
| ACCUMULATED UNDISTRIBUTED NET INVESTMENT INCOME | | $ | 11,816 | | | $ | 19,930,127 | |
| | | | | | | | | |
| CAPITAL SHARE ACTIVITY | | | | | | | | |
Shares sold | | | 36,381,382 | | | | 156,657,290 | |
Shares reinvested | | | 2,876,797 | | | | 1,496,645 | |
Shares redeemed | | | (162,955,143 | ) | | | (187,989,838 | ) |
Net decrease in shares outstanding | | | (123,696,964 | ) | | | (29,835,903 | ) |
Shares outstanding at beginning of period | | | 429,808,451 | | | | 459,644,354 | |
Shares outstanding at end of period | | | 306,111,487 | | | | 429,808,451 | |
See accompanying notes to financial statements.
Hussman Strategic Total Return Fund Statements of Changes in Net Assets |
|
| | | Six Months Ended December 31, 2012 (Unaudited) | | | | |
| FROM OPERATIONS | | | | | | |
Net investment income | | $ | 4,827,936 | | | $ | 14,959,736 | |
Net realized gains from security transactions | | | 5,697,327 | | | | 57,669,581 | |
Net change in unrealized appreciation
(depreciation) on investments | | | (4,762,305 | ) | | | 22,231,505 | |
| Net increase in net assets resulting from operations | | | 5,762,958 | | | | 94,860,822 | |
| | | | | | | | | |
| DISTRIBUTIONS TO SHAREHOLDERS | | | | | | | | |
From net investment income | | | (4,936,041 | ) | | | (15,398,805 | ) |
From net realized gains | | | (50,167,388 | ) | | | (52,505,352 | ) |
| Decrease in net assets from distributions to shareholders | | | (55,103,429 | ) | | | (67,904,157 | ) |
| | | | | | | | | |
| FROM CAPITAL SHARE TRANSACTIONS | | | | | | | | |
Proceeds from shares sold | | | 183,860,953 | | | | 1,201,863,512 | |
Net asset value of shares issued in reinvestment of
distributions to shareholders | | | 48,356,234 | | | | 57,836,822 | |
| Proceeds from redemption fees collected (Note 1) | | | 45,696 | | | | 341,140 | |
Payments for shares redeemed | | | (622,475,622 | ) | | | (1,005,222,085 | ) |
| Net increase (decrease) in net assets from capital share transactions | | | (390,212,739 | ) | | | 254,819,389 | |
| | | | | | | | | |
| TOTAL INCREASE (DECREASE) IN NET ASSETS | | | (439,553,210 | ) | | | 281,776,054 | |
| | | | | | | | | |
| NET ASSETS | | | | | | | | |
Beginning of period | | | 2,621,064,847 | | | | 2,339,288,793 | |
End of period | | $ | 2,181,511,637 | | | $ | 2,621,064,847 | |
| | | | | | | | | |
ACCUMULATED UNDISTRIBUTED/(DISTRIBUTIONS IN
EXCESS OF) NET INVESTMENT INCOME | | $ | 11,283 | | | $ | (530,673 | ) |
| | | | | | | | | |
| CAPITAL SHARE ACTIVITY | | | | | | | | |
Shares sold | | | 14,894,166 | | | | 96,216,875 | |
Shares reinvested | | | 3,983,853 | | | | 4,664,381 | |
Shares redeemed | | | (50,492,645 | ) | | | (81,041,045 | ) |
Net increase (decrease) in shares outstanding | | | (31,614,626 | ) | | | 19,840,211 | |
Shares outstanding at beginning of period | | | 211,800,195 | | | | 191,959,984 | |
Shares outstanding at end of period | | | 180,185,569 | | | | 211,800,195 | |
| See accompanying notes to financial statements. |
Hussman Strategic International Fund Statements of Changes in Net Assets |
|
| | | Six Months Ended December 31, 2012 (Unaudited) | | | | |
| FROM OPERATIONS | | | | | | |
Net investment income (loss) | | $ | (31,755 | ) | | $ | 195,385 | |
| Net realized gains (losses) from: | | | | | | | | |
Security transactions | | | 708,136 | | | | (950,813 | ) |
Option contracts | | | (1,685,344 | ) | | | (2,314,920 | ) |
Futures contracts | | | (6,666,752 | ) | | | 3,269,020 | |
Foreign currency transactions | | | 315,288 | | | | (842,231 | ) |
| Net change in unrealized appreciation (depreciation) on: | | | | | | | | |
Investments | | | 4,104,598 | | | | (2,906,677 | ) |
Option contracts | | | 500,698 | | | | (433,138 | ) |
Futures contracts | | | 1,864,334 | | | | (1,347,693 | ) |
Foreign currency translation | | | (27,005 | ) | | | (4,152 | ) |
| Net decrease in net assets resulting from operations | | | (917,802 | ) | | | (5,335,219 | ) |
| | | | | | | | | |
| DISTRIBUTIONS TO SHAREHOLDERS | | | | | | | | |
From net investment income | | | — | | | | (438,439 | ) |
From net realized gains | | | — | | | | (1,355,395 | ) |
| Decrease in net assets from distributions to shareholders | | | — | | | | (1,793,834 | ) |
| | | | | | | | | |
| FROM CAPITAL SHARE TRANSACTIONS | | | | | | | | |
Proceeds from shares sold | | | 14,325,917 | | | | 56,582,390 | |
Net asset value of shares issued in reinvestment of
distributions to shareholders | | | — | | | | 1,685,742 | |
| Proceeds from redemption fees collected (Note 1) | | | 271 | | | | 5,622 | |
Payments for shares redeemed | | | (7,837,839 | ) | | | (28,650,569 | ) |
| Net increase in net assets from capital share transactions | | | 6,488,349 | | | | 29,623,185 | |
| | | | | | | | | |
| TOTAL INCREASE IN NET ASSETS | | | 5,570,547 | | | | 22,494,132 | |
| | | | | | | | | |
| NET ASSETS | | | | | | | | |
Beginning of period | | | 87,719,728 | | | | 65,225,596 | |
End of period | | $ | 93,290,275 | | | $ | 87,719,728 | |
| | | | | | | | | |
ACCUMULATED UNDISTRIBUTED/(DISTRIBUTIONS IN
EXCESS OF) NET INVESTMENT INCOME | | $ | 63,074 | | | $ | (220,459 | ) |
| | | | | | | | | |
| CAPITAL SHARE ACTIVITY | | | | | | | | |
Shares sold | | | 1,493,885 | | | | 5,595,732 | |
Shares reinvested | | | — | | | | 169,005 | |
Shares redeemed | | | (817,107 | ) | | | (2,891,455 | ) |
Net increase in shares outstanding | | | 676,778 | | | | 2,873,282 | |
Shares outstanding at beginning of period | | | 9,060,910 | | | | 6,187,628 | |
Shares outstanding at end of period | | | 9,737,688 | | | | 9,060,910 | |
| See accompanying notes to financial statements. |
Hussman Strategic Dividend Value Fund Statements of Changes in Net Assets |
|
| | | Six Months Ended December 31, 2012 (Unaudited) | | | Period Ended June 30, 2012(a) | |
| FROM OPERATIONS | | | | | | |
Net investment income | | $ | 28,297 | | | $ | 17,654 | |
| Net realized gains (losses) from: | | | | | | | | |
Security transactions | | | 54,369 | | | | 20,145 | |
Option contracts | | | (167,681 | ) | | | 24,395 | |
| Net change in unrealized appreciation (depreciation) on: | | | | | | | | |
Investments | | | 157,025 | | | | (30,362 | ) |
Option contracts | | | 23,030 | | | | (47,266 | ) |
| Net increase (decrease) in net assets resulting from operations | | | 95,040 | | | | (15,434 | ) |
| | | | | | | | | |
| DISTRIBUTIONS TO SHAREHOLDERS | | | | | | | | |
From net investment income | | | (28,297 | ) | | | (17,651 | ) |
| | | | | | | | | |
| FROM CAPITAL SHARE TRANSACTIONS | | | | | | | | |
Proceeds from shares sold | | | 10,686,065 | | | | 5,187,616 | |
Net asset value of shares issued in reinvestment of
distributions to shareholders | | | 27,593 | | | | 17,013 | |
| Proceeds from redemption fees collected (Note 1) | | | 15 | | | | 159 | |
Payments for shares redeemed | | | (1,952,655 | ) | | | (173,509 | ) |
| Net increase in net assets from capital share transactions | | | 8,761,018 | | | | 5,031,279 | |
| | | | | | | | | |
TOTAL INCREASE IN NET ASSETS | | | 8,827,761 | | | | 4,998,194 | |
| | | | | | | | | |
| NET ASSETS | | | | | | | | |
Beginning of period | | | 4,998,194 | | | | — | |
End of period | | $ | 13,825,955 | | | $ | 4,998,194 | |
| | | | | | | | | |
| ACCUMULATED UNDISTRIBUTED NET INVESTMENT INCOME | | $ | 3 | | | $ | 3 | |
| | | | | | | | | |
| CAPITAL SHARE ACTIVITY | | | | | | | | |
Shares sold | | | 1,066,250 | | | | 519,665 | |
Shares reinvested | | | 2,749 | | | | 1,712 | |
Shares redeemed | | | (195,041 | ) | | | (17,690 | ) |
Net increase in shares outstanding | | | 873,958 | | | | 503,687 | |
Shares outstanding at beginning of period | | | 503,687 | | | | — | |
Shares outstanding at end of period | | | 1,377,645 | | | | 503,687 | |
| (a) | Represents the period from the commencement of operations (February 6, 2012) through June 30, 2012. |
| See accompanying notes to financial statements. |
Hussman Strategic Growth Fund Financial Highlights |
Selected Per Share Data and Ratios for a Share Outstanding Throughout Each Period |
| | | Six Months Ended December 31, 2012 (Unaudited) | | | | | | | | | | | | | | | | |
Net asset value at beginning of period | | $ | 11.49 | | | $ | 12.28 | | | $ | 13.45 | | | $ | 12.99 | | | $ | 15.73 | | | $ | 15.85 | |
| | | | | | | | | | | | | | | | | | | | | | | | | |
| Income (loss) from investment operations: | | | | | | | | | | | | | | | | | | | | | | | | |
Net investment income | | | 0.11 | | | | 0.08 | | | | 0.05 | | | | 0.00 | (a) | | | 0.03 | | | | 0.04 | |
Net realized and unrealized gains
(losses) on investments and
option contracts | | | (0.74 | ) | | | (0.81 | ) | | | (1.19 | ) | | | 0.48 | | | | (0.88 | ) | | | 0.55 | |
Total from investment operations | | | (0.63 | ) | | | (0.73 | ) | | | (1.14 | ) | | | 0.48 | | | | (0.85 | ) | | | 0.59 | |
| | | | | | | | | | | | | | | | | | | | | | | | | |
| Less distributions: | | | | | | | | | | | | | | | | | | | | | | | | |
Dividends from net
investment income | | | (0.15 | ) | | | (0.06 | ) | | | (0.03 | ) | | | (0.02 | ) | | | (0.03 | ) | | | (0.09 | ) |
Distributions from net realized gains | | | — | | | | — | | | | — | | | | — | | | | (1.87 | ) | | | (0.63 | ) |
Total distributions | | | (0.15 | ) | | | (0.06 | ) | | | (0.03 | ) | | | (0.02 | ) | | | (1.90 | ) | | | (0.72 | ) |
| | | | | | | | | | | | | | | | | | | | | | | | | |
| Proceeds from redemption fees collected (Note 1) | | | 0.00 | (a) | | | 0.00 | (a) | | | 0.00 | (a) | | | 0.00 | (a) | | | 0.01 | | | | 0.01 | |
| | | | | | | | | | | | | | | | | | | | | | | | | |
Net asset value at end of period | | $ | 10.71 | | | $ | 11.49 | | | $ | 12.28 | | | $ | 13.45 | | | $ | 12.99 | | | $ | 15.73 | |
| | | | | | | | | | | | | | | | | | | | | | | | | |
Total return (b) | | | (5.47% | )(c) | | | (5.97% | ) | | | (8.49% | ) | | | 3.68% | | | | (4.35% | ) | | | 3.84% | |
| | | | | | | | | | | | | | | | | | | | | | | | | |
Net assets at end of period (000’s) | | $ | 3,279,461 | | | $ | 4,936,808 | | | $ | 5,644,066 | | | $ | 6,185,342 | | | $ | 4,975,812 | | | $ | 3,275,008 | |
| | | | | | | | | | | | | | | | | | | | | | | | | |
Ratio of expenses to average net assets | | | 1.08% | (d) | | | 1.05% | | | | 1.03% | | | | 1.05% | | | | 1.09% | | | | 1.11% | |
| | | | | | | | | | | | | | | | | | | | | | | | | |
Ratio of net investment income to
average net assets | | | 1.28% | (d) | | | 0.66% | | | | 0.39% | | | | 0.04% | | | | 0.28% | | | | 0.28% | |
| | | | | | | | | | | | | | | | | | | | | | | | | |
Portfolio turnover rate | | | 44% | (c) | | | 72% | | | | 67% | | | | 111% | | | | 69% | | | | 150% | |
| (a) | Amount rounds to less than $0.01 per share. |
| (b) | Total return is a measure of the change in value of an investment in the Fund over the period covered, which assumes any dividends or capital gains distributions are reinvested in shares of the Fund. Returns do not reflect the deduction of taxes a shareholder would pay on Fund distributions or the redemption of Fund shares. |
| (c) | Not annualized. |
| (d) | Annualized. |
| See accompanying notes to financial statements. |
Hussman Strategic Total Return Fund Financial Highlights |
Selected Per Share Data and Ratios for a Share Outstanding Throughout Each Period |
| | | Six Months Ended December 31, 2012 (Unaudited) | | | | | | | | | | | | | | | | |
Net asset value at beginning of period | | $ | 12.38 | | | $ | 12.19 | | | $ | 12.41 | | | $ | 11.87 | | | $ | 11.99 | | | $ | 10.92 | |
| | | | | | | | | | | | | | | | | | | | | | | | | |
| Income from investment operations: | | | | | | | | | | | | | | | | | | | | | | | | |
Net investment income | | | 0.03 | | | | 0.07 | | | | 0.07 | | | | 0.18 | | | | 0.05 | | | | 0.24 | |
Net realized and unrealized
gains on investments and
foreign currencies | | | 0.00 | (a) | | | 0.43 | | | | 0.37 | | | | 0.69 | | | | 0.35 | | | | 1.59 | |
Total from investment operations | | | 0.03 | | | | 0.50 | | | | 0.44 | | | | 0.87 | | | | 0.40 | | | | 1.83 | |
| | | | | | | | | | | | | | | | | | | | | | | | | |
| Less distributions: | | | | | | | | | | | | | | | | | | | | | | | | |
Dividends from net
investment income | | | (0.03 | ) | | | (0.07 | ) | | | (0.12 | ) | | | (0.16 | ) | | | (0.01 | ) | | | (0.23 | ) |
Distributions from net realized gains | | | (0.27 | ) | | | (0.24 | ) | | | (0.54 | ) | | | (0.17 | ) | | | (0.53 | ) | | | (0.54 | ) |
Total distributions | | | (0.30 | ) | | | (0.31 | ) | | | (0.66 | ) | | | (0.33 | ) | | | (0.54 | ) | | | (0.77 | ) |
| | | | | | | | | | | | | | | | | | | | | | | | | |
| Proceeds from redemption fees collected (Note 1) | | | 0.00 | (a) | | | 0.00 | (a) | | | 0.00 | (a) | | | 0.00 | (a) | | | 0.02 | | | | 0.01 | |
| | | | | | | | | | | | | | | | | | | | | | | | | |
Net asset value at end of period | | $ | 12.11 | | | $ | 12.38 | | | $ | 12.19 | | | $ | 12.41 | | | $ | 11.87 | | | $ | 11.99 | |
| | | | | | | | | | | | | | | | | | | | | | | | | |
Total return (b) | | | 0.19% | (c) | | | 4.14% | | | | 3.53% | | | | 7.44% | | | | 3.94% | | | | 17.23% | |
| | | | | | | | | | | | | | | | | | | | | | | | | |
Net assets at end of period (000’s) | | $ | 2,181,512 | | | $ | 2,621,065 | | | $ | 2,339,289 | | | $ | 1,884,985 | | | $ | 1,023,591 | | | $ | 330,965 | |
| | | | | | | | | | | | | | | | | | | | | | | | | |
Ratio of expenses to average net assets | | | 0.64% | (d) | | | 0.63% | | | | 0.64% | | | | 0.67% | | | | 0.75% | | | | 0.90% | |
| | | | | | | | | | | | | | | | | | | | | | | | | |
Ratio of net investment income to
average net assets | | | 0.39% | (d) | | | 0.57% | | | | 0.61% | | | | 1.59% | | | | 0.26% | | | | 2.05% | |
| | | | | | | | | | | | | | | | | | | | | | | | | |
| Portfolio turnover rate | | | 31% | (c) | | | 78% | | | | 254% | | | | 69% | | | | 36% | | | | 212% | |
| (a) | Amount rounds to less than $0.01 per share. |
| (b) | Total return is a measure of the change in value of an investment in the Fund over the period covered, which assumes any dividends or capital gains distributions are reinvested in shares of the Fund. Returns do not reflect the deduction of taxes a shareholder would pay on Fund distributions or the redemption of Fund shares. |
| (c) | Not annualized. |
| (d) | Annualized. |
| See accompanying notes to financial statements. |
Hussman Strategic International Fund Financial Highlights |
Selected Per Share Data and Ratios for a Share Outstanding Throughout Each Period |
| | | Six Months Ended December 31, 2012 (Unaudited) | | | | | | | | | Period Ended June 30, 2010(a) | |
Net asset value at beginning of period | | $ | 9.68 | | | $ | 10.54 | | | $ | 10.08 | | | $ | 10.00 | |
| | | | | | | | | | | | | | | | | |
| Income (loss) from investment operations: | | | | | | | | | | | | | | | | |
Net investment income (loss) | | | (0.00 | )(b) | | | 0.00 | (b) | | | 0.04 | | | | (0.03 | ) |
Net realized and unrealized gains (losses) on investments
and option and futures contracts | | | (0.10 | ) | | | (0.65 | ) | | | 0.54 | | | | 0.11 | |
Total from investment operations | | | (0.10 | ) | | | (0.65 | ) | | | 0.58 | | | | 0.08 | |
| | | | | | | | | | | | | | | | | |
| Less distributions: | | | | | | | | | | | | | | | | |
Dividends from net investment income | | | — | | | | (0.05 | ) | | | — | | | | — | |
Distributions from net realized gains | | | — | | | | (0.16 | ) | | | (0.12 | ) | | | — | |
Total distributions | | | — | | | | (0.21 | ) | | | (0.12 | ) | | | — | |
| | | | | | | | | | | | | | | | | |
| Proceeds from redemption fees collected (Note 1) | | | 0.00 | (b) | | | 0.00 | (b) | | | 0.00 | (b) | | | — | |
| | | | | | | | | | | | | | | | | |
Net asset value at end of period | | $ | 9.58 | | | $ | 9.68 | | | $ | 10.54 | | | $ | 10.08 | |
| | | | | | | | | | | | | | | | | |
Total return (c) | | | (1.03% | )(d) | | | (6.14% | ) | | | 5.83% | | | | 0.80% | (d) |
| | | | | | | | | | | | | | | | | |
Net assets at end of period (000's) | | $ | 93,290 | | | $ | 87,720 | | | $ | 65,226 | | | $ | 8,802 | |
| | | | | | | | | | | | | | | | | |
Ratio of net expenses to average net assets (f) | | | 1.64% | (e) | | | 1.93% | | | | 2.00% | | | | 2.00% | (e) |
| | | | | | | | | | | | | | | | | |
| Ratio of net investment income (loss) to average net assets | | | (0.07% | )(e) | | | 0.24% | | | | 0.63% | | | | (0.67% | )(e) |
| | | | | | | | | | | | | | | | | |
Portfolio turnover rate | | | 18% | (d) | | | 51% | | | | 39% | | | | 13% | (d) |
| (a) | Represents the period from the commencement of operations (December 31, 2009) through June 30, 2010. |
| (b) | Amount rounds to less than $0.01 per share. |
| (c) | Total return is a measure of the change in value of an investment in the Fund over the period covered, which assumes any dividends or capital gains distributions are reinvested in shares of the Fund. Returns do not reflect the deduction of taxes a shareholder would pay on Fund distributions or the redemption of Fund shares. |
| (d) | Not annualized. |
| (e) | Annualized. |
| (f) | Absent investment advisory fee reductions and expense reimbursements by the Adviser, the ratios of expenses to average net assets would have been 2.14% and 5.00%(e) for the periods ended June 30, 2011 and 2010, respectively. |
| See accompanying notes to financial statements. |
Hussman Strategic Dividend Value Fund Financial Highlights |
Selected Per Share Data and Ratios for a Share Outstanding Throughout Each Period |
| | | Six Months Ended December 31, 2012 (Unaudited) | | | Period Ended June 30, 2012(a) | |
| Net asset value at beginning of period | | $ | 9.92 | | | $ | 10.00 | |
| | | | | | | | | |
| Income (loss) from investment operations: | | | | | | | | |
| Net investment income | | | 0.02 | | | | 0.04 | |
| Net realized and unrealized gains (losses) on investments and option contracts | | | 0.12 | | | | (0.08 | ) |
| Total from investment operations | | | 0.14 | | | | (0.04 | ) |
| | | | | | | | | |
| Less distributions: | | | | | | | | |
| Dividends from net investment income | | | (0.02 | ) | | | (0.04 | ) |
| | | | | | | | | |
| Proceeds from redemption fees collected (Note 1) | | | 0.00 | (b) | | | 0.00 | (b) |
| | | | | | | | | |
| Net asset value at end of period | | $ | 10.04 | | | $ | 9.92 | |
| | | | | | | | | |
Total return (c) | | | 1.43% | (d) | | | (0.41% | )(d) |
| | | | | | | | | |
| Net assets at end of period (000's) | | $ | 13,826 | | | $ | 4,998 | |
| | | | | | | | | |
Ratio of net expenses to average net assets (f) | | | 1.25% | (e) | | | 1.25% | (e) |
| | | | | | | | | |
| Ratio of net investment income to average net assets | | | 0.55% | (e) | | | 1.01% | (e) |
| | | | | | | | | |
| Portfolio turnover rate | | | 17% | (d) | | | 11% | (d) |
| (a) | Represents the period from the commencement of operations (February 6, 2012) through June 30, 2012. |
| (b) | Amount rounds to less than $0.01 per share. |
| (c) | Total return is a measure of the change in value of an investment in the Fund over the period covered, which assumes any dividends or capital gains distributions are reinvested in shares of the Fund. Returns do not reflect the deduction of taxes a shareholder would pay on Fund distributions or the redemption of Fund shares. |
| (d) | Not annualized. |
| (e) | Annualized. |
| (f) | Absent investment advisory fee reductions and expense reimbursements by the Adviser, the ratios of expenses to average net assets would have been 4.03%(e) and 7.04%(e) for the periods ended December 31, 2012 and June 30, 2012, respectively (Note 3). |
| See accompanying notes to financial statements. |
Hussman Investment Trust Notes to Financial Statements |
December 31, 2012 (Unaudited) |
| 1. | ORGANIZATION AND SIGNIFICANT ACCOUNTING POLICIES |
Hussman Strategic Growth Fund, Hussman Strategic Total Return Fund, Hussman Strategic International Fund and Hussman Strategic Dividend Value Fund (each, a “Fund,” and collectively, the “Funds”) are diversified series of Hussman Investment Trust (the “Trust”), which is registered under the Investment Company Act of 1940 as an open-end management investment company. Each Fund is authorized to issue an unlimited number of shares. Hussman Strategic Growth Fund commenced operations on July 24, 2000. Hussman Strategic Total Return Fund commenced operations on September 12, 2002. Hussman Strategic International Fund commenced operations on December 31, 2009. Hussman Strategic Dividend Value Fund commenced operations on February 6, 2012.
Hussman Strategic Growth Fund’s investment objective is to provide long-term capital appreciation, with added emphasis on protection of capital during unfavorable market conditions.
Hussman Strategic Total Return Fund’s investment objective is to provide long-term total return from income and capital appreciation, with added emphasis on protection of capital during unfavorable market conditions.
Hussman Strategic International Fund’s investment objective is to provide long-term capital appreciation, with added emphasis on the protection of capital during unfavorable market conditions. The Fund invests primarily in equity securities of non-U.S. issuers.
Hussman Strategic Dividend Value Fund’s investment objective is to provide total return through a combination of dividend income and capital appreciation, with added emphasis on protection of capital during unfavorable market conditions.
Securities, Options and Futures Valuation — The Funds’ portfolio securities are valued at market value as of the close of regular trading on the New York Stock Exchange (“NYSE”) (normally, 4:00 Eastern time) on each business day the NYSE is open. Securities, other than options, listed on the NYSE or other exchanges are valued on the basis of their last sale prices on the exchanges on which they are primarily traded. However, if the last sale price on the NYSE is different than the last sale price on any other exchange, the NYSE price will be used. If there are no sales on that day, the securities are valued at the last bid price on the NYSE or other primary exchange for that day. Securities which are quoted by NASDAQ are valued at the NASDAQ Official Closing Price. If there are no sales on that day, the securities are valued at the last bid price as reported by NASDAQ. Securities traded in over-the-counter markets, other than NASDAQ quoted securities, are valued at the last sales price, or if there
Hussman Investment Trust Notes to Financial Statements (continued) |
December 31, 2012 (Unaudited) |
are no sales on that day, at the mean of the closing bid and ask prices. Securities traded on a foreign stock exchange may be valued based upon the closing price on the principal exchange where the security is traded; however, because the value of securities traded on foreign stock exchanges may be materially affected by events occurring before the Funds’ pricing time but after the close of the primary markets or exchanges on which such securities are traded, such securities will typically be priced at their fair value as determined by an independent pricing service approved by the Board of Trustees. As a result, the prices of securities used to calculate a Fund’s net asset value may differ from quoted or published prices for the same securities. Values of foreign securities are translated from the local currency into U.S. dollars using currency exchange rates supplied by an independent pricing quotation service.
Pursuant to procedures approved by the Board of Trustees, options traded on a national securities exchange are valued at prices between the closing bid and ask prices determined by Hussman Strategic Advisors, Inc. (the “Adviser”) to most closely reflect market value as of the time of computation of net asset value. As of December 31, 2012, all options held by Hussman Strategic Growth Fund, Hussman Strategic International Fund and Hussman Strategic Dividend Value Fund have been valued in this manner. Options not traded on a national securities exchange or board of trade, but for which over-the-counter market quotations are readily available, are valued at the mean of their closing bid and ask prices. Futures contracts and options thereon, which are traded on commodities exchanges, are valued at their last sale price as of the close of regular trading on the NYSE or, if not available, at the mean of the bid and ask prices.
Fixed income securities not traded or dealt in upon any securities exchange but for which over-the-counter market quotations are readily available generally are valued at the mean of their closing bid and ask prices. Fixed income securities may also be valued on the basis of prices provided by an independent pricing service. Debt securities with remaining maturities of 60 days or less are valued at amortized cost, absent unusual circumstances.
In the event that market quotations are not readily available or are determined by the Adviser to not be reflective of fair market value due to market events or developments, securities and options are valued at fair value as determined by the Adviser in accordance with procedures adopted by the Board of Trustees. Such methods of fair valuation may include, but are not limited to: multiple of earnings, multiple of book value, discount from market of a similar freely traded security, purchase price of security, subsequent private transactions in the security or related securities, or a combination of these and other factors.
Hussman Investment Trust Notes to Financial Statements (continued) |
December 31, 2012 (Unaudited) |
Accounting principles generally accepted in the United States (“GAAP”) establish a single authoritative definition of fair value, set out a framework for measuring fair value and require additional disclosures about fair value measurements.
Various inputs are used in determining the value of each of the Funds’ investments. These inputs are summarized in the three broad levels listed below:
| | • | Level 1 – quoted unadjusted prices for identical instruments in active markets to which the Fund has access at the date of measurement. |
| | • | Level 2 – quoted prices for similar instruments in active markets; quoted prices for identical or similar instruments in markets that are not active; and model-derived valuations in which all significant inputs and significant value drivers are observable in active markets. Level 2 inputs are those in markets for which there are few transactions, the prices are not current, little public information exists or instances where prices vary substantially over time or among brokered market makers. |
| | • | Level 3 – model derived valuations in which one or more significant inputs or significant value drivers are unobservable. Unobservable inputs are those inputs that reflect the Fund’s own assumptions that market participants would use to price the asset or liability based on the best available information. |
Option contracts purchased and written by Hussman Strategic Growth Fund, Hussman Strategic International Fund and Hussman Strategic Dividend Value Fund are classified as Level 2 since they are valued using “other significant observable inputs” at prices between the closing bid and ask prices determined by the Adviser to most closely reflect market value. U.S. Treasury obligations held by Hussman Strategic Total Return Fund are classified as Level 2 since values are based on prices provided by an independent pricing service that utilizes various “other significant observable inputs” including bid and ask quotations, prices of similar securities and interest rates, among other factors. Non-U.S. equity securities actively traded in foreign markets held by Hussman Strategic International Fund may be classified as Level 2 despite the availability of closing prices because such securities are typically valued at their fair value as determined by an independent pricing service. The inputs or methodology used for valuing securities are not necessarily an indication of the risks associated with investing in those securities. The inputs used to measure the value of a particular security may fall into more than one level of the fair value hierarchy. In such cases, for disclosure purposes, the level in the fair value hierarchy within which the fair value measurement of that security is determined to fall in its entirety is the lowest level input that is significant to the fair value measurement.
Hussman Investment Trust Notes to Financial Statements (continued) |
December 31, 2012 (Unaudited) |
The following is a summary of the inputs used to value each Fund’s investments and other financial instruments as of December 31, 2012 by security type:
Hussman Strategic Growth Fund
| | | | | | | | | | | | | |
Investments in Securities and Money Market Funds: | | | | | | | | | | | | |
Common Stocks | | $ | 3,322,901,792 | | | $ | — | | | $ | — | | | $ | 3,322,901,792 | |
Put Option Contracts | | | — | | | | 34,765,500 | | | | — | | | | 34,765,500 | |
Money Market Funds | | | 884,269,171 | | | | — | | | | — | | | | 884,269,171 | |
| Total Investments in Securities and Money Market Funds | | $ | 4,207,170,963 | | | $ | 34,765,500 | | | $ | — | | | $ | 4,241,936,463 | |
| | | | | | | | | | | | | | | | | |
Other Financial Instruments: | | | | | | | | | | | | | | | | |
Written Call Option Contracts | | $ | — | | | $ | (1,000,921,000 | ) | | $ | — | | | $ | (1,000,921,000 | ) |
Total Other Financial Instruments | | $ | — | | | $ | (1,000,921,000 | ) | | $ | — | | | $ | (1,000,921,000 | ) |
Hussman Strategic Total Return Fund
| | | | | | | | | | | | | |
Investments in Securities and Money Market Funds: | | | | | | | | | | | | |
Common Stocks | | $ | 420,749,575 | | | $ | — | | | $ | — | | | $ | 420,749,575 | |
U.S. Treasury Obligations | | | — | | | | 1,678,573,211 | | | | — | | | | 1,678,573,211 | |
Exchange-Traded Funds | | | 34,571,400 | | | | — | | | | — | | | | 34,571,400 | |
Money Market Funds | | | 48,401,512 | | | | — | | | | — | | | | 48,401,512 | |
| Total Investments in Securities and Money Market Funds | | $ | 503,722,487 | | | $ | 1,678,573,211 | | | $ | — | | | $ | 2,182,295,698 | |
Hussman Investment Trust Notes to Financial Statements (continued) |
December 31, 2012 (Unaudited) |
Hussman Strategic International Fund
| | | | | | | | | | | | | |
Investments in Securities and Money Market Funds: | | | | | | | | | | | | |
Common Stocks | | $ | 26,421,690 | | | $ | 30,481,825 | | | $ | — | | | $ | 56,903,515 | |
Exchange-Traded Funds | | | 6,325,170 | | | | — | | | | — | | | | 6,325,170 | |
Put Option Contracts | | | — | | | | 54,000 | | | | — | | | | 54,000 | |
Money Market Funds | | | 26,784,536 | | | | — | | | | — | | | | 26,784,536 | |
| Total Investments in Securities and Money Market Funds | | $ | 59,531,396 | | | $ | 30,535,825 | | | $ | — | | | $ | 90,067,221 | |
| | | | | | | | | | | | | | | | | |
Other Financial Instruments: | | | | | | | | | | | | | | | | |
Futures Contracts | | $ | 11,979,000 | | | $ | — | | | $ | — | | | $ | 11,979,000 | |
Futures Contracts Sold Short | | | (40,134,434 | ) | | | — | | | | — | | | | (40,134,434 | ) |
Written Call Option Contracts | | | — | | | | (4,110,000 | ) | | | — | | | | (4,110,000 | ) |
Total Other Financial Instruments | | $ | (28,155,434 | ) | | $ | (4,110,000 | ) | | $ | — | | | $ | (32,265,434 | ) |
Hussman Strategic Dividend Value Fund
| | | | | | | | | | | | | |
Investments in Securities and Money Market Funds: | | | | | | | | | | | | |
Common Stocks | | $ | 6,571,318 | | | $ | — | | | $ | — | | | $ | 6,571,318 | |
Put Option Contracts | | | — | | | | 24,354 | | | | — | | | | 24,354 | |
Money Market Funds | | | 7,534,994 | | | | — | | | | — | | | | 7,534,994 | |
| Total Investments in Securities and Money Market Funds | | $ | 14,106,312 | | | $ | 24,354 | | | $ | — | | | $ | 14,130,666 | |
| | | | | | | | | | | | | | | | | |
Other Financial Instruments: | | | | | | | | | | | | | | | | |
Written Call Option Contracts | | $ | — | | | $ | (332,332 | ) | | $ | — | | | $ | (332,332 | ) |
Total Other Financial Instruments | | $ | — | | | $ | (332,332 | ) | | $ | — | | | $ | (332,332 | ) |
Hussman Investment Trust Notes to Financial Statements (continued) |
December 31, 2012 (Unaudited) |
Each Fund’s Schedule of Investments identifies the specific securities (by type of security and industry type or geographical region) that comprise that Fund’s holdings within the Level 1 and Level 2 categories shown in the tables above. As of December 31, 2012, Hussman Strategic Growth Fund, Hussman Total Return Fund and Hussman Strategic Dividend Value Fund did not have any transfers in and out of any Level. Transfers that occurred between Levels 1 and 2 on December 31, 2012 for Hussman Strategic International Fund due to implementation of systematic fair value procedures are as follows:
| | Transfers from Level 1 to Level 2 | Transfers from Level 2 to Level 1 |
Common Stocks | $3,925,917 | $205,573 |
In addition, the Funds did not have any assets or liabilities that were measured at fair value on a recurring basis using significant unobservable inputs (Level 3) as of December 31, 2012. It is the Funds’ policy to recognize transfers into and out of any Level at the end of the reporting period.
Futures Contracts and Option Transactions — Hussman Strategic Growth Fund, Hussman Strategic International Fund and Hussman Strategic Dividend Value Fund may purchase and write call and put options on broad-based stock indices and may also purchase and write call and put option contracts on individual securities. Each of the Funds may use financial futures contracts and related option contracts to hedge against changes in the market value of its portfolio securities. Hussman Strategic Total Return Fund and Hussman Strategic International Fund may also purchase foreign currency options to establish or modify the Funds’ exposure to foreign currencies, and Hussman Strategic Total Return Fund may purchase interest rate futures contracts to protect against a decline in the value of its portfolio. Hussman Strategic International Fund may enter into forward foreign currency contracts to hedge against the adverse impact of changes in foreign exchange rates on its investments and transactions in foreign securities.
Hussman Strategic Growth Fund, Hussman Strategic International Fund and Hussman Strategic Dividend Value Fund may each use futures and option contracts on stock indices for the purpose of seeking to reduce the market risk that would otherwise be associated with the securities in which it invests. For example, these Funds may sell a stock index futures contract to hedge the risk of a general market or market sector decline that might adversely affect prices of the Funds’ portfolio securities. To the extent there is a correlation between a Fund’s portfolio and a particular stock index, the sale of futures contracts on that index could reduce the Fund’s exposure to general market risk.
Hussman Investment Trust Notes to Financial Statements (continued) |
December 31, 2012 (Unaudited) |
When a Fund writes an index option, an amount equal to the net premium (the premium less the commission) received by the Fund is recorded as a liability in the Fund’s Statement of Assets and Liabilities and is subsequently marked-to market daily. If an index option written by the Fund expires unexercised on the stipulated expiration date or if the Fund enters into a closing purchase transaction, it will realize a gain (or a loss if the cost of a closing purchase transaction exceeds the net premium received when the option is sold) and the liability related to such option will be eliminated. If an index option written by the Fund is exercised, the Fund will be required to pay the difference between the closing index value and the exercise price of the option. In this event, the proceeds of the sale will be increased by the net premium originally received and the Fund will realize a gain or loss.
When a Fund purchases or sells a stock index futures contract, no price is paid to or received by the Fund upon the purchase or sale of the futures contract. Instead, the Fund is required to deposit in a segregated asset account an amount of cash or qualifying securities currently ranging from 3% to 11% of the contract amount. This is called the “initial margin deposit.” Subsequent payments, known as “variation margin,” are made or received by the Fund each day, depending on the daily fluctuations in the fair value of the underlying stock index. The Fund recognizes an unrealized gain or loss equal to the daily variation margin. If market conditions move unexpectedly, the Fund may not achieve the anticipated benefits of the futures contracts and may realize a loss. In addition to the possibility that there may be an imperfect correlation or no correlation at all between the movements in the stock index futures and the portion of the portfolio being hedged, the price of the stock index futures may not correlate perfectly with movements in the stock index due to certain market distortions.
Repurchase Agreements — The Funds may enter into repurchase agreements with certain banks or non-bank dealers. The value of the underlying securities collateralizing these agreements is monitored on a daily basis to ensure that the value of the collateral during the term of the agreements equals or exceeds the repurchase price plus accrued interest. If the bank or dealer defaults, realization of the collateral by the Funds may be delayed or limited, and the Funds may suffer a loss if the value of the collateral declines.
Foreign Currency Translation — Amounts denominated in or expected to settle in foreign currencies are translated into U.S. dollars based on exchange rates on the following basis:
A. The market values of investment securities and other assets and liabilities are translated at the closing rate on the London Stock Exchange each day.
Hussman Investment Trust Notes to Financial Statements (continued) |
December 31, 2012 (Unaudited) |
B. Purchases and sales of investment securities and income and expenses are translated at the rate of exchange prevailing on the respective date of such transactions.
C. The Funds do not isolate that portion of the results of operations caused by changes in foreign exchange rates on investments from those caused by changes in market prices of securities held. Such fluctuations are included with the net realized and unrealized gains or losses on investments.
Reported net realized foreign exchange gains or losses arise from 1) purchases and sales of foreign currencies, 2) currency gains or losses realized between the trade and settlement dates on securities transactions and 3) the difference between the amounts of dividends, interest and foreign withholding taxes recorded on the Fund’s books and the U.S. dollar equivalent of the amounts actually received or paid. Reported net unrealized foreign exchange gains and losses arise from changes in the value of assets and liabilities that result from changes in exchange rates.
Share Valuation and Redemption Fees — The net asset value per share of each Fund is calculated as of the close of regular trading on the NYSE (normally 4:00 p.m., Eastern time) on each day that the NYSE is open for business. The net asset value per share of each Fund is calculated by dividing the total value of the Fund’s assets, less its liabilities, by the number of its shares outstanding. The offering price and redemption price per share of each Fund is equal to the net asset value per share. However, shares of each Fund are generally subject to a redemption fee of 1.5%, payable to the applicable Fund, if redeemed 60 days or less from the date of purchase. During the periods ended December 31, 2012 and June 30, 2012, proceeds from redemption fees totaled $151,835 and $585,804, respectively, for Hussman Strategic Growth Fund; $45,696 and $341,140, respectively, for Hussman Strategic Total Return Fund; $271 and $5,622, respectively, for Hussman Strategic International Fund; and $15 and $159, respectively, for Hussman Strategic Dividend Value Fund.
Investment Income — Interest income is accrued as earned. Dividend income is recorded on the ex-dividend date. Discounts and premiums on fixed income securities are amortized using the interest method.
Distributions to Shareholders — Dividends from net investment income, if any, are declared and paid annually to shareholders of Hussman Strategic Growth Fund and Hussman Strategic International Fund and are declared and paid quarterly to shareholders of Hussman Strategic Total Return Fund and Hussman Strategic Dividend Value Fund. Net realized short-term capital gains, if any, may be distributed throughout the year and net realized long-term capital gains, if any, are generally
Hussman Investment Trust Notes to Financial Statements (continued) |
December 31, 2012 (Unaudited) |
distributed annually. The amount of distributions from net investment income and net realized gains are determined in accordance with federal income tax regulations, which may differ from GAAP. These “book/tax” differences are either temporary or permanent in nature and are primarily due to timing differences in the recognition of capital gains or losses for option and futures transactions, losses deferred due to wash sales and treatment of foreign currency transactions.
The tax character of distributions paid during the periods ended December 31, 2012 and June 30, 2012 was as follows:
| | | | | | | | | | |
| Hussman Strategic Growth Fund | 12/31/12 | | $ | 46,271,836 | | | $ | — | | | $ | 46,271,836 | |
| | 06/30/12 | | $ | 28,671,281 | | | $ | — | | | $ | 28,671,281 | |
| Hussman Strategic Total Return Fund | 12/31/12 | | $ | 55,103,429 | | | $ | — | | | $ | 55,103,429 | |
| | 06/30/12 | | $ | 37,871,060 | | | $ | 30,033,097 | | | $ | 67,904,157 | |
| Hussman Strategic International Fund | 12/31/12 | | $ | — | | | $ | — | | | $ | — | |
| | 06/30/12 | | $ | 1,793,834 | | | $ | — | | | $ | 1,793,834 | |
| Hussman Strategic Dividend Value Fund | 12/31/12 | | $ | 28,297 | | | $ | — | | | $ | 28,297 | |
| | 06/30/12 | | $ | 17,651 | | | $ | — | | | $ | 17,651 | |
Securities Transactions — Securities transactions are accounted for on trade date for financial reporting purposes. Gains and losses on securities sold are determined on a specific identification basis.
Common Expenses — Expenses of the Trust not attributable solely to one of the Funds are allocated among the Funds based on relative net assets of each Fund or the nature of the expense and the relative applicability to each Fund.
Accounting Estimates — The preparation of financial statements in conformity with GAAP requires management to make estimates and assumptions that affect the reported amounts of assets and liabilities and the disclosure of contingent assets and liabilities as of the date of the financial statements and the reported amounts of income and expenses during the reporting period. Actual results could differ from these estimates.
Federal Income Tax — It is each Fund’s policy to qualify as a regulated investment company under Subchapter M of the Internal Revenue Code. As provided therein, in any fiscal year in which a Fund so qualifies and distributes at least 90% of its taxable net income, the Fund (but not its shareholders) will be relieved of federal income tax on the income distributed. Accordingly, no provision for income taxes has been made.
Hussman Investment Trust Notes to Financial Statements (continued) |
December 31, 2012 (Unaudited) |
In order to avoid imposition of a federal excise tax applicable to regulated investment companies, it is each Fund’s intention to declare and pay as dividends in each calendar year at least 98% of its net investment income (earned during the calendar year) and 98.2% of its net realized capital gains (earned during the twelve months ended October 31) plus undistributed amounts from prior years.
The tax character of accumulated earnings (deficit) at December 31, 2012 was as follows:
| | | Hussman Strategic Growth Fund | | | Hussman Strategic Total Return Fund | | | Hussman Strategic International Fund | | | Hussman Strategic Dividend Value Fund | |
Net unrealized appreciation on investments | | $ | 307,453,523 | | | $ | 25,217,155 | | | $ | 3,423,415 | | | $ | 126,663 | |
| Net unrealized appreciation of assets and liabilities in foreign currencies | | | — | | | | — | | | | 49,931 | | | | — | |
Net unrealized depreciation on futures contracts | | | — | | | | — | | | | (27,215 | ) | | | — | |
Accumulated undistributed ordinary income | | | 15,473,156 | | | | 1,271,756 | | | | 63,075 | | | | 60 | |
Capital loss carryforwards | | | (1,272,502,734 | ) | | | — | | | | — | | | | (2,726 | ) |
Other losses | | | (649,566,050 | ) | | | (4,066,991 | ) | | | (9,607,336 | ) | | | (90,282 | ) |
Other temporary differences | | | (15,461,340 | ) | | | (466,110 | ) | | | — | | | | (57 | ) |
Total accumulated earnings (deficit) | | $ | (1,614,603,445 | ) | | $ | 21,955,810 | | | $ | (6,098,130 | ) | | $ | 33,658 | |
The following information is based upon the federal income tax cost of investment securities and money market funds as of December 31, 2012:
| | | Hussman Strategic Growth Fund | | | Hussman Strategic Total Return Fund | | | Hussman Strategic International Fund | | | Hussman Strategic Dividend Value Fund | |
Cost of portfolio investments | | $ | 3,953,366,755 | | | $ | 2,157,078,543 | | | $ | 86,641,231 | | | $ | 14,010,478 | |
Gross unrealized appreciation | | $ | 444,505,927 | | | $ | 52,136,328 | | | $ | 6,867,278 | | | $ | 354,394 | |
Gross unrealized depreciation | | | (155,936,219 | ) | | | (26,919,173 | ) | | | (3,441,288 | ) | | | (234,206 | ) |
Net unrealized appreciation | | $ | 288,569,708 | | | $ | 25,217,155 | | | $ | 3,425,990 | | | $ | 120,188 | |
Hussman Investment Trust Notes to Financial Statements (continued) |
December 31, 2012 (Unaudited) |
The difference between the federal income tax cost of portfolio investments and their financial statement cost for the Funds is due to certain timing differences in the recognition of capital gains or losses under income tax regulations and GAAP. These “book/tax” differences are temporary in nature and are primarily due to option transactions, losses deferred due to wash sales, differing treatments of realized and unrealized gains and losses on exchange-traded funds taxed as grantor trusts and adjustments to basis on publicly traded partnerships.
As of June 30, 2012, Hussman Strategic Growth Fund and Hussman Strategic Dividend Value Fund had the following capital loss carryforwards for federal income tax purposes:
| | | Hussman Strategic Growth Fund | | | Hussman Strategic Dividend Value Fund | |
Expires June 30, 2018 – short-term | | $ | 375,427,325 | | | $ | — | |
Expires June 30, 2019 – short-term | | | 824,973,031 | | | | — | |
No expiration – short-term | | | 51,762,063 | | | | — | |
No expiration – long-term | | | 20,340,315 | | | | 2,726 | |
| | | $ | 1,272,502,734 | | | $ | 2,726 | |
These capital loss carryforwards may be utilized in the current and future years to offset net realized capital gains, if any, prior to distributing such gains to shareholders.
On December 22, 2010, the Regulated Investment Company Modernization Act of 2010 (the “Act”) was enacted, which changed various technical rules governing the tax treatment of regulated investment companies. The changes are generally effective for taxable years beginning after the date of enactment. One of the more prominent changes addresses capital loss carryforwards. Under the Act, each Fund will be permitted to carry forward capital losses incurred in taxable years beginning after the date of enactment for an unlimited period. However, any losses incurred during those future taxable years will be required to be utilized prior to the losses incurred in pre-enactment taxable years, which carry an expiration date. As a result of this ordering rule, pre-enactment capital loss carryforwards may be more likely to expire unused. Additionally, post-enactment capital loss carryforwards will retain their character as either short-term or long-term capital losses, rather than being considered all short-term as required under previous regulation.
Hussman Investment Trust Notes to Financial Statements (continued) |
December 31, 2012 (Unaudited) |
For the six months ended December 31, 2012, the following reclassifications were made as a result of permanent differences between the financial statement and income tax reporting:
| | | Hussman Strategic Total Return Fund | | | Hussman Strategic International Fund | |
| Accumulated undistributed net investment income | | $ | 650,061 | | | $ | 315,288 | |
Accumulated net realized losses from security transactions and option and futures contracts | | $ | (650,061 | ) | | $ | (315,288 | ) |
Such reclassifications, the result of permanent differences between financial statement and income tax reporting requirements, have no effect on each Fund’s total net assets or net asset value per share.
Each Fund recognizes the tax benefits or expenses of uncertain tax positions only when the position is “more likely than not” to be sustained assuming examination by tax authorities. Management has reviewed each Fund’s tax positions taken on federal income tax returns for all open tax years (tax years ended June 30, 2009 through June 30, 2012) and has concluded that no provision for unrecognized tax benefits or expenses is required in these financial statements.
| 2. | INVESTMENT TRANSACTIONS |
During the six months ended December 31, 2012, cost of purchases and proceeds from sales and maturities of investment securities, other than short-term investments and U.S. government securities, amounted to $1,767,105,455 and $3,400,846,692, respectively, for Hussman Strategic Growth Fund; $964,663,070 and $422,731,006, respectively, for Hussman Strategic Total Return Fund; $11,437,687 and $11,009,887, respectively, for Hussman Strategic International Fund; and $4,056,410 and $699,060, respectively for Hussman Strategic Dividend Value Fund.
| 3. | TRANSACTIONS WITH AFFILIATES |
One of the Trustees and each of the officers of the Trust are affiliated with the Adviser or with Ultimus Fund Solutions, LLC (“Ultimus”), the Funds’ administrator, transfer agent and fund accounting agent.
Hussman Investment Trust Notes to Financial Statements (continued) |
December 31, 2012 (Unaudited) |
Advisory Agreement
Under the terms of an Advisory Agreement between the Trust and the Adviser, Hussman Strategic Growth Fund pays the Adviser a fee, which is computed and accrued daily and paid monthly, at annual rates of 0.90% of the first $5 billion of its average daily net assets and 0.85% of such assets over $5 billion. Under the terms of a separate Advisory Agreement between the Trust and the Adviser, Hussman Strategic Total Return Fund pays the Adviser a fee, which is computed and accrued daily and paid monthly, at annual rates of 0.50% of the first $1 billion of its average daily net assets; 0.45% of the next $1.5 billion of such assets; and 0.40% of such assets over $2.5 billion. Under the terms of a separate Advisory Agreement between the Trust and the Adviser, Hussman Strategic International Fund pays a fee, which is computed and accrued daily and paid monthly, at annual rates of 1.00% of the first $1 billion of average daily net assets; 0.95% of the next $2 billion of such assets; and 0.90% of such assets over $3 billion. Under the terms of a separate Advisory Agreement between the Trust and the Adviser, Hussman Strategic Dividend Value Fund pays a fee, which is computed and accrued daily and paid monthly, at annual rates of 1.00% of the first $1 billion of average daily net assets; 0.95% of the next $2 billion of such assets; and 0.90% of such assets over $3 billion, less any fee reductions.
With respect to Hussman Strategic Dividend Value Fund, the Adviser has contractually agreed to reduce its advisory fees or to absorb the Fund’s operating expenses to the extent necessary so that the Fund’s ordinary operating expenses do not exceed an amount equal to 1.25% annually of its average daily net assets. This Expense Limitation Agreement remains in effect until at least February 1, 2015. During the six months ended December 31, 2012, the Adviser did not collect any of its advisory fees from Hussman Strategic Dividend Value Fund and, in addition, the Adviser reimbursed the Fund $91,442 of operating expenses. Any fee reductions or expense reimbursements by the Adviser are subject to repayment by Hussman Strategic Dividend Value Fund provided that such repayment does not result in the Fund’s expenses exceeding the 1.25% annual limitation and provided further that the expenses which are the subject of the repayment were incurred within three years of such repayment. As of December 31, 2012, the amount of fee reductions and expense reimbursements available for recovery by the Adviser is $243,348. The Adviser may recoup a portion of this amount no later than the dates as stated below:
Hussman Investment Trust Notes to Financial Statements (continued) |
December 31, 2012 (Unaudited) |
Administration Agreement
Under the terms of an Administration Agreement between the Trust and Ultimus, Ultimus supplies executive, administrative and regulatory services to the Trust, supervises the preparation of tax returns, and coordinates the preparation of reports to shareholders and reports to and filings with the Securities and Exchange Commission (“SEC”) and state securities authorities. For these services, Ultimus receives a monthly administration fee from each Fund computed at annual rates of 0.07% of the Fund’s average daily net assets up to $500 million; 0.05% of the next $1.5 billion of such assets; 0.04% of the next $1 billion of such assets; 0.03% of the next $2 billion of such assets; 0.025% of the next $2 billion of such assets; 0.20% of the next $2 billion of such assets; and 0.015% of such assets in excess of $9 billion, subject to a per Fund minimum monthly fee of $2,000. The fee payable to Ultimus from Hussman Strategic Dividend Value Fund was discounted by 50% during the first six months of the Fund’s operations and 20% during the second six months of the Fund’s operations.
Fund Accounting Agreement
Under the terms of a Fund Accounting Agreement between the Trust and Ultimus, Ultimus calculates the daily net asset value per share and maintains the financial books and records of the Funds. For these services, Ultimus receives from each Fund a monthly base fee ($2,500 for Hussman Strategic Growth Fund, Hussman Strategic Total Return Fund and Hussman Strategic Dividend Value Fund and $3,000 for Hussman Strategic International Fund), plus an asset-based fee computed at annual rates of 0.01% of each Fund’s average daily net assets up to $500 million; 0.005% of the next $4.5 billion of such assets; and 0.0025% of such assets in excess of $5 billion. In addition, the Funds reimburse Ultimus for certain out-of-pocket expenses incurred in obtaining valuations of the Funds’ portfolio securities. The base fee and asset based fee payable to Ultimus from Hussman Strategic Dividend Value Fund was discounted by 50% during the first six months of the Fund’s operations and 20% during the second six months of the Fund’s operations.
Transfer Agent and Shareholder Services Agreement
Under the terms of a Transfer Agent and Shareholder Services Agreement between the Trust and Ultimus, Ultimus maintains the records of each shareholder’s account, answers shareholders’ inquiries concerning their accounts, processes purchases and redemptions of each Fund’s shares, acts as dividend and distribution disbursing agent, and performs other shareholder service functions. For these services, Ultimus receives from each Fund a fee, payable monthly, of $22 annually for each direct account and $12 annually for certain accounts established through financial intermediaries, subject
Hussman Investment Trust Notes to Financial Statements (continued) |
December 31, 2012 (Unaudited) |
to a per Fund minimum fee of $1,500 per month. For the six months ended December 31, 2012, such fees were $1,128,205, $346,163, $9,738 and $6,750 for Hussman Strategic Growth Fund, Hussman Total Return Fund, Hussman Strategic International Fund and Hussman Strategic Dividend Value Fund, respectively. In addition, the Funds reimburse Ultimus for certain out-of-pocket expenses, including, but not limited to, postage and supplies. The fee payable to Ultimus from Hussman Strategic Dividend Value Fund was discounted by 50% during the first six months of the Fund’s operations and 20% during the second six months of the Fund’s operations.
For shareholder accounts held through financial intermediaries, the Funds may, in some cases, compensate these intermediaries for providing certain account maintenance and shareholder services. During the six months ended December 31, 2012, Hussman Strategic Growth Fund, Hussman Strategic Total Return Fund, Hussman Strategic International Fund and Hussman Strategic Dividend Value Fund paid $796,627, $502,170, $14,290 and $894, respectively, to financial intermediaries for such services.
| Compliance Consulting Agreement |
Under the terms of a Compliance Consulting Agreement between the Trust and Ultimus, Ultimus provides an individual to serve as the Trust’s Chief Compliance Officer and to administer the Trust’s compliance policies and procedures. For these services, the Trust pays Ultimus a base fee of $18,000 per annum, plus an asset-based fee computed at annual rates of .005% of the average value of the Trust’s aggregate daily net assets from $100 million to $500 million, .0025% of such assets from $500 million to $1 billion and .00125% of such assets in excess of $1 billion. Each Fund pays its proportionate share of such fee. In addition, the Trust reimburses Ultimus for reasonable out-of-pocket expenses, if any, incurred in connection with these services.
The Trust has entered into a Distribution Agreement with Ultimus Fund Distributors, LLC (the “Distributor”), pursuant to which the Distributor provides distribution services and serves as the principal underwriter to each Fund. The Distributor is a wholly-owned subsidiary of Ultimus. The Distributor’s fees are paid by the Adviser.
Trustees and officers affiliated with the Adviser or Ultimus are not compensated by the Trust for their services (with the exception of the Chief Compliance Officer). Each Trustee who is not an affiliated person of the Adviser or Ultimus receives from the Trust
Hussman Investment Trust Notes to Financial Statements (continued) |
December 31, 2012 (Unaudited) |
an annual retainer of $60,000, payable quarterly; a fee of $15,000 for attendance at each in-person meeting of the Board of Trustees (except that such fee is $20,000 with respect to the annual meeting of the Board) and a fee of $4,000 for attendance at each telephonic meeting of the Board of Trustees; a fee of $3,000 for attendance at each meeting of any committee of the Board; plus reimbursement of travel and other expenses incurred in attending meetings.
| 4. | DERIVATIVES TRANSACTIONS |
Transactions in option contracts written by Hussman Strategic Growth Fund, Hussman Strategic International Fund and Hussman Strategic Dividend Value Fund during the six months ended December 31, 2012 were as follows:
| Hussman Strategic Growth Fund |
| | | | | | | |
Options outstanding at beginning of period | | | 36,500 | | | $ | 1,178,501,656 | |
Options written | | | 84,500 | | | | 3,401,442,751 | |
| Options cancelled in a closing purchase transaction | | | (97,000 | ) | | | (3,614,871,356 | ) |
Options outstanding at end of period | | | 24,000 | | | $ | 965,073,051 | |
| Hussman Strategic International Fund |
| | | | | | | |
Options outstanding at beginning of period | | | 150 | | | $ | 2,684,801 | |
Options written | | | 300 | | | | 8,129,601 | |
| Options cancelled in a closing purchase transaction | | | (300 | ) | | | (6,884,602 | ) |
Options outstanding at end of period | | | 150 | | | $ | 3,929,800 | |
| Hussman Strategic Dividend Value Fund |
| | | | | | | |
Options outstanding at beginning of period | | | 10 | | | $ | 75,987 | |
Options written | | | 46 | | | | 628,379 | |
| Options cancelled in a closing purchase transaction | | | (34 | ) | | | (389,795 | ) |
Options outstanding at end of period | | | 22 | | | $ | 314,571 | |
Hussman Investment Trust Notes to Financial Statements (continued) |
December 31, 2012 (Unaudited) |
The locations in the Statements of Assets and Liabilities of the derivative positions of Hussman Strategic Growth Fund, Hussman Strategic International Fund and Hussman Strategic Dividend Value Fund are as follows:
| Hussman Strategic Growth Fund |
| | | | Fair Value | | | Gross Notional Amount Outstanding | |
Type of Derivative | Location | | Asset Derivatives | | | Liability Derivatives | | | December 31, 2012 | |
| Index put options purchased | Investments in securities at value | | $ | 34,765,500 | | | $ | — | | | $ | 3,257,910,100 | |
| Index call options written | Written call options, at value | | | — | | | | (1,000,921,000 | ) | | | (3,257,910,100 | ) |
| Hussman Strategic International Fund |
| | | | Fair Value | | | Gross Notional Amount Outstanding | |
Type of Derivative | Location | | Asset Derivatives | | | Liability Derivatives | | | December 31, 2012 | |
| Index put options purchased | Investments in securities at value | | $ | 54,000 | | | $ | — | | | $ | 21,392,850 | |
| Index call options written | Written call options, at value | | | — | | | | (4,110,000 | ) | | | (21,392,850 | ) |
| Futures contracts purchased | Variation margin receivable | | | 682,815 | | | | — | | | | 11,965,350 | |
| Futures contracts sold short | Variation margin receivable | | | 920,862 | | | | — | | | | (40,462,984 | ) |
| Hussman Strategic Dividend Value Fund |
| | | | Fair Value | | | Gross Notional Amount Outstanding | |
Type of Derivative | Location | | Asset Derivatives | | | Liability Derivatives | | | December 31, 2012 | |
| Index put options purchased | Investments in securities at value | | $ | 24,354 | | | $ | — | | | $ | 3,137,618 | |
| Index call options written | Written call options, at value | | | — | | | | (332,332 | ) | | | (3,137,618 | ) |
Hussman Investment Trust Notes to Financial Statements (continued) |
December 31, 2012 (Unaudited) |
The average monthly notional amount of put options purchased and call options written during the six months ended December 31, 2012 was $3,897,098,417 and $3,897,098,417, respectively, for Hussman Strategic Growth Fund. The average monthly notional amount of put options purchased and call options written during the six months ended December 31, 2012 was $21,202,750 and $21,202,750, respectively, for Hussman Strategic International Fund. The average monthly notional amount of future contracts purchased and sold short during the six months ended December 31, 2012 was $12,090,475 and $37,819,677, respectively, for Hussman Strategic International Fund. The average monthly notional amount of put options purchased and call options written during the six months ended December 31, 2012 was $2,169,948 and $2,169,948, respectively, for Hussman Strategic Dividend Value Fund.
Transactions in derivative instruments for Hussman Strategic Growth Fund, Hussman Strategic International Fund and Hussman Strategic Dividend Value Fund during the six months ended December 31, 2012 are recorded in the following locations in the Statements of Operations:
| Hussman Strategic Growth Fund |
Type of Derivative | Location | | Realized Gains (Losses) | | Location | | Change in Unrealized Gains (Losses) | |
| Index put options purchased | Net realized gains (losses) from option contracts | | $ | (153,387,990 | ) | Net change in unrealized appreciation (depreciation) on option contracts | | $ | 655,129 | |
| Index call options purchased | Net realized gains (losses) from option contracts | | | 16,207,185 | | Net change in unrealized appreciation (depreciation) on option contracts | | | — | |
| Index call options written | Net realized gains (losses) from option contracts | | | (347,677,817 | ) | Net change in unrealized appreciation (depreciation) on option contracts | | | 121,614,395 | |
Hussman Investment Trust Notes to Financial Statements (continued) |
December 31, 2012 (Unaudited) |
| Hussman Strategic International Fund |
| Type of Derivative | Location | | Realized Gains (Losses) | | Location | | Change in Unrealized Gains (Losses) | |
| Index put options purchased | Net realized gains (losses) from option contracts | | $ | (349,547 | ) | Net change in unrealized appreciation (depreciation) on option contracts | | $ | 170,849 | |
| Index call options written | Net realized gains (losses) from option contracts | | | (1,335,797 | ) | Net change in unrealized appreciation (depreciation) on option contracts | | | 329,849 | |
| Futures contracts purchased | Net realized gains (losses) from futures contracts | | | (408,807 | ) | Net change in unrealized appreciation (depreciation) on futures contracts | | | 59,190 | |
| Futures contracts sold short | Net realized gains (losses) from futures contracts | | | (6,257,945 | ) | Net change in unrealized appreciation (depreciation) on futures contracts | | | 1,805,144 | |
| Hussman Strategic Dividend Value Fund |
| Type of Derivative | Location | | Realized Gains (Losses) | | Location | | Change in Unrealized Gains (Losses) | |
| Index put options purchased | Net realized gains (losses) from option contracts | | $ | (74,631 | ) | Net change in unrealized appreciation (depreciation) on option contracts | | $ | 19,008 | |
| Index call options written | Net realized gains (losses) from option contracts | | | (93,050 | ) | Net change in unrealized appreciation (depreciation) on option contracts | | | 4,022 | |
Hussman Strategic Total Return Fund had no transactions in derivative instruments during the six months ended December 31, 2012.
| 5. | INVESTMENTS AND STRATEGIES |
If a Fund has significant investments in the securities of issuers in industries within a particular market sector, any development generally affecting issuers within that sector will have a greater impact on the value of the net assets of the Fund than would be the case if the Fund did not have significant investments in that sector. This may increase the risk of loss of an investment in the Fund and increase the volatility of the Fund’s net asset value per share. As of December 31, 2012, Hussman
Hussman Investment Trust Notes to Financial Statements (continued) |
December 31, 2012 (Unaudited) |
Strategic Growth Fund had 29.4% and 25.2% of the value of its net assets invested in stocks of companies within the Health Care and Consumer Discretionary sectors, respectively. From time to time, circumstances may affect a particular sector and the companies within such sector. For instance, economic or market factors, regulation or deregulation, or other developments may negatively impact all companies in a particular sector and therefore the value of the Fund’s portfolio will be adversely affected.
In order to maintain sufficient liquidity to implement investment strategies, or for temporary defensive purposes, each Fund may invest a significant portion of its assets in shares of one or more money market mutual funds. As of December 31, 2012, Hussman Strategic Growth Fund, Hussman Strategic International Fund and Hussman Strategic Dividend Value Fund had 27.0%, 28.7% and 54.5%, respectively, of the value of their net assets invested in money market mutual funds registered under the Investment Company Act of 1940, including 18.7%, 28.7% and 38.6%, respectively, of the value of their net assets invested in shares of a single money market fund. An investment in a money market mutual fund is not insured or guaranteed by the Federal Deposit Insurance Corporation or any other governmental agency, entity or person. While investor losses in money market mutual funds have been rare, they are possible. In addition, the Funds will incur additional indirect expenses due to acquired fund fees and other costs to the extent they invest in shares of money market mutual funds.
Foreign Investment Risk — Compared with investing in the United States, investing in foreign markets involves a greater degree and variety of risk. Investors in international or foreign markets may face delayed settlements, currency controls and adverse economic developments as well as higher overall transaction costs. In addition, fluctuations in the U.S. dollar’s value versus other currencies may erode or reverse gains from investments denominated in foreign currencies or widen losses. Foreign governments may expropriate assets, impose capital or currency controls, impose punitive taxes, impose limits on ownership or nationalize a company or industry. Any of these actions could have a severe effect on security prices and impair a Fund’s ability to bring its capital or income back to the U.S. Exchange rate fluctuations also may impair an issuer’s ability to repay U.S. dollar denominated debt, thereby increasing credit risk of such debt. Finally, the value of foreign securities may be affected by incomplete, less frequent or inaccurate financial information about their issuers, social upheavals or political actions ranging from tax code changes to government collapse. Foreign companies may also receive less coverage than U.S. companies by market analysts and may be subject to different reporting standards or regulatory requirements than those applicable to U.S. companies.
Hussman Investment Trust Notes to Financial Statements (continued) |
December 31, 2012 (Unaudited) |
| 6. | FORWARD FOREIGN CURRENCY EXCHANGE CONTRACTS |
Hussman Strategic International Fund is subject to foreign currency exchange rate risk in the normal course of pursuing its investment objective. Hussman Strategic International Fund may enter into contracts for the purchase or sale of a specific foreign currency at a fixed price on a future date as a hedge or cross-hedge against either specific transactions or portfolio positions. The purpose of Hussman Strategic International Fund’s foreign currency hedging transactions is to reduce risk that the U.S. dollar value of the Fund’s securities denominated in foreign currency will decline in value due to changes in foreign currency exchange rates. All foreign currency exchange contracts are “marked-to-market” daily at the applicable translation rates resulting in unrealized gains or losses. Realized and unrealized gains or losses from transactions in foreign currency exchange contracts will be included in the Fund’s Statement of Assets and Liabilities and Statement of Operations. Risks may arise upon entering into these contracts from the potential inability of counterparties to meet the terms of their contracts and from unanticipated movements in the value of a foreign currency relative to the U.S. dollar. As of December 31, 2012, Hussman Strategic International Fund did not have any forward currency exchange contracts outstanding.
Hussman Strategic Growth Fund has an unsecured bank line of credit in the amount of $10,000,000. Hussman Strategic Total Return Fund has an unsecured bank line of credit in the amount of $2,000,000. Borrowings under these arrangements bear interest at a rate determined by the lending bank at the time of borrowing. During the six months ended December 31, 2012, the Funds did not borrow under their respective lines of credit. Neither Hussman Strategic International Fund nor Hussman Strategic Dividend Value Fund currently has a bank line of credit.
| 8. | CONTINGENCIES AND COMMITMENTS |
The Trust’s officers and Trustees are entitled to indemnification from the Funds for certain liabilities to which they may become subject in connection with the performance of their duties to the Funds. Additionally, in the normal course of business, the Funds enter into contracts that contain a variety of representations and warranties and which may provide general indemnifications. The Funds’ maximum exposure under these arrangements is unknown, as this would involve potential claims for indemnification for losses that may or may not be incurred in the future. However, based on experience, the Trust believes the risk of loss to be remote.
Hussman Investment Trust Notes to Financial Statements (continued) |
December 31, 2012 (Unaudited) |
Several lawsuits have been filed relating to Hussman Strategic Growth Fund’s investment in Tribune Company common stock in connection with Tribune Company’s Chapter 11 bankruptcy. The lawsuits stem from a leveraged buyout by which Tribune Company converted to a privately-held company in 2007. On November 1, 2010, the Trust and Hussman Strategic Growth Fund were named as defendants and putative members of the proposed defendant class of shareholders in an adversary proceeding brought by The Official Committee of Unsecured Creditors of Tribune Company in the U.S. Bankruptcy Court for the District of Delaware. That action was subsequently transferred to the U.S. District Court for the Southern District of New York by order of the Judicial Panel on Multidistrict Litigation, and Marc S. Kirschner, the Litigation Trustee for the Tribune Litigation Trust, became successor plaintiff to the Creditors Committee on December 31, 2012, the effective date of Tribune Company’s plan of reorganization. On June 3, 2011, the Trust and Hussman Strategic Growth Fund were named as defendants in a lawsuit filed by the indenture trustees of certain noteholders of Tribune Company in the U.S. District Court for the Southern District of Ohio. On September 28, 2011, Hussman Strategic Growth Fund was named as a defendant in a similar action in the U.S. District Court for the District of Maryland. Both of those actions have also been transferred to the U.S. District Court for the Southern District of New York for coordinated proceedings with many other similar lawsuits against former Tribune Company shareholders. The Trust and Hussman Strategic Growth Fund may also be putative defendant class members in some of these actions. The plaintiffs in all these lawsuits seek to recover amounts paid to shareholders of Tribune Company in connection with the leveraged buyout, plus interest and attorneys’ fees and expenses.
The lawsuits allege no misconduct by the Trust or Hussman Strategic Growth Fund, and the Trust and the Fund intend to defend themselves vigorously in the lawsuits. If the lawsuits were to be decided or settled in a manner adverse to Hussman Strategic Growth Fund, the payment of such judgments or settlements could adversely affect the Fund’s net asset value per share. The adverse impact to Hussman Strategic Growth Fund is not expected to exceed materially the value of the proceeds received by the Fund in connection with the leveraged buyout, which was $29,432,814 (which constitutes, as of December 31, 2012, approximately 0.9% of the Fund’s net assets), plus interest.
Hussman Investment Trust Notes to Financial Statements (continued) |
December 31, 2012 (Unaudited) |
The Funds are required to recognize in their financial statements the effects of all subsequent events that provide additional evidence about conditions that existed as of the date of the Statements of Assets and Liabilities. For non-recognized subsequent events that must be disclosed to keep the financial statements from being misleading, the Funds are required to disclose the nature of the event as well as an estimate of its financial effect, or a statement that such an estimate cannot be made. Management has evaluated subsequent events through the date of issuance of these financial statements and has noted no such events.
| 11. | RECENT ACCOUNTING PRONOUNCEMENT |
On December 16, 2011, the Financial Accounting Standards Board issued ASU 2011-11, Disclosures about Offsetting Assets and Liabilities, which creates new disclosure requirements designed to make financial statements prepared under U.S. GAAP more comparable to those prepared under International Financial Reporting Standards. The new guidance requires entities to disclose net and gross information for certain derivative instruments and financial instruments and information about the impact of collateral on offsetting arrangements and other amounts subject to a master netting agreement that are not offset on the balance sheet. ASU 2011-11 is effective January 1, 2013. Management does not expect the adoption of the new guidance to have a material effect on its financial statements.
Hussman Investment Trust About Your Fund’s Expenses (Unaudited) |
|
We believe it is important for you to understand the impact of costs on your investment. As a shareholder of the Funds, you incur two types of costs: (1) transaction costs, which may include redemption fees; and (2) ongoing costs, including management fees and other Fund expenses. The following examples are intended to help you understand your ongoing costs (in dollars) of investing in the Funds and to compare these costs with the ongoing costs of investing in other mutual funds. A mutual fund’s ongoing costs are expressed as a percentage of its average net assets. This figure is known as the expense ratio.
The examples below are based on an investment of $1,000 made at the beginning of the period shown and held for the entire period (July 1, 2012 - December 31, 2012).
The table on the following page illustrates each Fund’s ongoing costs in two ways:
Actual fund return – This section helps you to estimate the actual expenses that you paid over the period. The “Ending Account Value” shown is derived from each Fund’s actual return, and the third column shows the dollar amount of operating expenses that would have been paid by an investor who started the period with $1,000 invested in that Fund. You may use the information here, together with the amount of your investment, to estimate the expenses that you paid over the period.
To do so, simply divide your account value by $1,000 (for example, an $8,600 account value divided by $1,000 = 8.6), and then multiply the result by the number given for the applicable Fund under the heading “Expenses Paid During Period.”
Hypothetical 5% return – This section is intended to help you compare each Fund’s ongoing costs with those of other mutual funds. It assumes that each Fund had an annual return of 5% before expenses during the period shown. In this case, because the return used is not each Fund’s actual return, the results do not illustrate the actual expenses associated with your investment. However, the example is useful in making comparisons because the SEC requires all mutual funds to provide an example of fund expenses based on a 5% annual return. You can assess each Fund’s ongoing costs by comparing this hypothetical example with the hypothetical examples that appear in shareholder reports of other mutual funds.
Note that expenses shown in the table are meant to highlight and help you compare ongoing costs only. The calculations assume no shares were bought or sold during the period. Your actual costs may have been higher or lower, depending on the amount of your investment and the timing of any purchases or redemptions.
Hussman Investment Trust About Your Fund’s Expenses (Unaudited) (continued) |
| |
More information about each Fund’s expenses, including annual expense ratios, can be found elsewhere in this report. For additional information on operating expenses and other shareholder costs, please refer to each Fund’s prospectus.
| Hussman Strategic Growth Fund |
| Beginning Account Value July 1, 2012 | Ending Account Value December 31, 2012 | Expenses Paid During Period* |
| Based on Actual Fund Return | $1,000.00 | $945.30 | $5.28 |
| Based on Hypothetical 5% Annual Return (before expenses) | $1,000.00 | $1,019.71 | $5.48 |
| * | Expenses are equal to Hussman Strategic Growth Fund’s annualized expense ratio of 1.08% for the period, multiplied by the average account value over the period, multiplied by 184/366 (to reflect the one-half year period). |
| Hussman Strategic Total Return Fund |
| Beginning Account Value July 1, 2012 | Ending Account Value December 31, 2012 | Expenses Paid During Period* |
| Based on Actual Fund Return | $1,000.00 | $1,001.90 | $3.22 |
| Based on Hypothetical 5% Annual Return (before expenses) | $1,000.00 | $1,021.92 | $3.25 |
| * | Expenses are equal to Hussman Strategic Total Return Fund’s annualized expense ratio of 0.64% for the period, multiplied by the average account value over the period, multiplied by 184/366 (to reflect the one-half year period). |
| Hussman Strategic International Fund |
| Beginning Account Value July 1, 2012 | Ending Account Value December 31, 2012 | Expenses Paid During Period* |
| Based on Actual Fund Return | $1,000.00 | $989.70 | $8.20 |
| Based on Hypothetical 5% Annual Return (before expenses) | $1,000.00 | $1,016.89 | $8.31 |
| * | Expenses are equal to Hussman Strategic International Fund’s annualized expense ratio of 1.64% for the period, multiplied by the average account value over the period, multiplied by 184/366 (to reflect the one-half year period). |
Hussman Investment Trust About Your Fund’s Expenses (Unaudited) (continued) |
| |
| Hussman Strategic Dividend Value Fund |
| Beginning Account Value July 1, 2012 | Ending Account Value December 31, 2012 | Expenses Paid During Period* |
| Based on Actual Fund Return | $1,000.00 | $1,014.30 | $6.33 |
| Based on Hypothetical 5% Annual Return (before expenses) | $1,000.00 | $1,018.85 | $6.34 |
| * | Expenses are equal to Hussman Strategic Dividend Value Fund’s annualized expense ratio of 1.25% for the period, multiplied by the average account value over the period, multiplied by 184/366 (to reflect the one-half year period). |
Hussman Investment Trust Other Information (Unaudited) |
| |
A description of the policies and procedures the Funds use to determine how to vote proxies relating to portfolio securities is available without charge upon request by calling toll-free 1-800-HUSSMAN (1-800-487-7626), or on the SEC’s website at http://www.sec.gov. Information regarding how the Funds voted proxies relating to portfolio securities during the most recent 12-month period ended June 30 is also available without charge upon request by calling toll-free 1-800-HUSSMAN, or on the SEC’s website at http://www.sec.gov.
The Trust files a complete listing of portfolio holdings for each Fund with the SEC as of the end of the first and third quarters of each fiscal year on Form N-Q. The filings are available upon request, by calling 1-800-HUSSMAN (1-800-487-7626). You may also obtain copies of these filings on the SEC’s website at http://www.sec.gov. The Trust’s Forms N-Q may also be reviewed and copied at the SEC’s Public Reference Room in Washington, DC, and information on the operation of the Public Reference Room may be obtained by calling 1-800-SEC-0330.
INVESTMENT ADVISER
Hussman Strategic Advisors, Inc.
5136 Dorsey Hall Drive
Ellicott City, Maryland 21042
www.hussmanfunds.com
1-800-HUSSMAN (1-800-487-7626)
ADMINISTRATOR/TRANSFER AGENT
Ultimus Fund Solutions, LLC
225 Pictoria Drive, Suite 450
Cincinnati, Ohio 45246
CUSTODIANS
US Bank NA
425 Walnut Street
Cincinnati, Ohio 45202
The Northern Trust Company
50 South LaSalle Street
Chicago, Illinois 60675
INDEPENDENT REGISTERED
PUBLIC ACCOUNTING FIRM
Ernst & Young LLP
1900 Scripps Center
312 Walnut Street
Cincinnati, Ohio 45202
LEGAL COUNSEL
Schulte Roth & Zabel LLP
919 Third Avenue
New York, New York 10022
This Semi-Annual Report is authorized for
distribution only if accompanied or preceded
by a current Prospectus of the Funds.
The registrant has not adopted procedures by which shareholders may recommend nominees to the registrant’s board of trustees.
(a) Based on their evaluation of the registrant’s disclosure controls and procedures (as defined in Rule 30a-3(c) under the Investment Company Act of 1940) as of a date within 90 days of the filing date of this report, the registrant’s principal executive officer and principal financial officer have concluded that such disclosure controls and procedures are reasonably designed and are operating effectively to ensure that material information relating to the registrant, including its consolidated subsidiaries, is made known to them by others within those entities, particularly during the period in which this report is being prepared, and that the information required in filings on Form N-CSR is recorded, processed, summarized, and reported on a timely basis.
(b) There were no changes in the registrant’s internal control over financial reporting (as defined in Rule 30a-3(d) under the Investment Company Act of 1940) that occurred during the second fiscal quarter of the period covered by this report that have materially affected, or are reasonably likely to materially affect, the registrant’s internal control over financial reporting.
File the exhibits listed below as part of this Form. Letter or number the exhibits in the sequence indicated.
(a)(1) Any code of ethics, or amendment thereto, that is the subject of the disclosure required by Item 2, to the extent that the registrant intends to satisfy the Item 2 requirements through filing of an exhibit: Not required
(a)(2) A separate certification for each principal executive officer and principal financial officer of the registrant as required by Rule 30a-2(a) under the Act (17 CFR 270.30a-2(a)): Attached hereto
(a)(3) Any written solicitation to purchase securities under Rule 23c-1 under the Act (17 CFR 270.23c-1) sent or given during the period covered by the report by or on behalf of the registrant to 10 or more persons: Not applicable
(b) Certifications required by Rule 30a-2(b) under the Act (17 CFR 270.30a-2(b)): Attached hereto