| OMB APPROVAL |
OMB Number: 3235-0570 Expires: January 31, 2014 Estimated average burden hours per response: 20.6 |
UNITED STATES
SECURITIES AND EXCHANGE COMMISSION
Washington, D.C. 20549
FORM N-CSR
CERTIFIED SHAREHOLDER REPORT OF REGISTERED
MANAGEMENT INVESTMENT COMPANIES
Investment Company Act file number 811-09911
Hussman Investment Trust
(Exact name of registrant as specified in charter)
| 5136 Dorsey Hall Drive Ellicott City, Maryland | 21042 |
| (Address of principal executive offices) | (Zip code) |
John F. Splain
U
ltimus Fund Solutions, LLC 225 Pictoria Drive, Suite 450 Cincinnati, Ohio 45246
(Name and address of agent for service)
Registrant's telephone number, including area code: (513) 587-3400
Date of fiscal year end: June 30, 2014
Date of reporting period: December 31, 2013
Form N-CSR is to be used by management investment companies to file reports with the Commission not later than 10 days after the transmission to stockholders of any report that is required to be transmitted to stockholders under Rule 30e-1 under the Investment Company Act of 1940 (17 CFR 270.30e-1). The Commission may use the information provided on Form N-CSR in its regulatory, disclosure review, inspection, and policymaking roles.
A registrant is required to disclose the information specified by Form N-CSR, and the Commission will make this information public. A registrant is not required to respond to the collection of information contained in Form N-CSR unless the Form displays a currently valid Office of Management and Budget ("OMB") control number. Please direct comments concerning the accuracy of the information collection burden estimate and any suggestions for reducing the burden to Secretary, Securities and Exchange Commission, 450 Fifth Street, NW, Washington, DC 20549-0609. The OMB has reviewed this collection of information under the clearance requirements of 44 U.S.C. § 3507.
Item 1. Reports to Stockholders.
HUSSMAN INVESTMENT TRUST
HUSSMAN STRATEGIC GROWTH FUND
HUSSMAN STRATEGIC TOTAL RETURN FUND
HUSSMAN STRATEGIC INTERNATIONAL FUND
HUSSMAN STRATEGIC DIVIDEND VALUE FUND
SEMI-ANNUAL REPORT
December 31, 2013
(Unaudited)
| Performance Information | |
| Hussman Strategic Growth Fund | 1 |
| Hussman Strategic Total Return Fund | 2 |
| Hussman Strategic International Fund | 3 |
| Hussman Strategic Dividend Value Fund | 4 |
| Letter to Shareholders | 5 |
| Portfolio Information | 18 |
| Schedules of Investments | |
| Hussman Strategic Growth Fund | 21 |
| Hussman Strategic Total Return Fund | 28 |
| Hussman Strategic International Fund | 31 |
| Hussman Strategic Dividend Value Fund | 39 |
| Statements of Assets and Liabilities | 45 |
| Statements of Operations | 47 |
| Statements of Changes in Net Assets | |
| Hussman Strategic Growth Fund | 49 |
| Hussman Strategic Total Return Fund | 50 |
| Hussman Strategic International Fund | 51 |
| Hussman Strategic Dividend Value Fund | 52 |
| Financial Highlights | |
| Hussman Strategic Growth Fund | 53 |
| Hussman Strategic Total Return Fund | 54 |
| Hussman Strategic International Fund | 55 |
| Hussman Strategic Dividend Value Fund | 56 |
| Notes to Financial Statements | 57 |
| About Your Funds’ Expenses | 84 |
| Other Information | 87 |
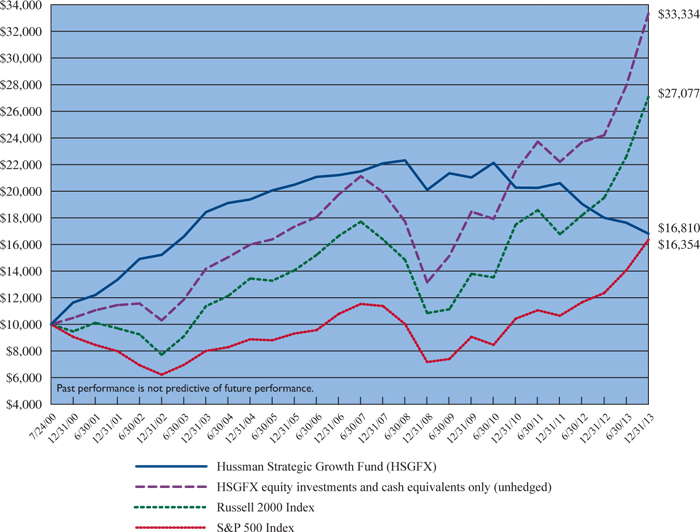
HUSSMAN STRATEGIC GROWTH FUND
Comparison of the Change in Value of a $10,000 Investment in Hussman Strategic Growth Fund
versus the Standard & Poor’s 500 Index and the Russell 2000 Index(a) (Unaudited)
Average Annual Total Returns For Periods Ended December 31, 2013 |
| | | | | | | |
Hussman Strategic Growth Fund(c)(d) | (6.62%) | (6.05%) | (3.51%) | (0.92%) | 3.94% | |
| S&P 500 Index | 32.39% | 16.18% | 17.94% | 7.41% | 3.73% | |
| Russell 2000 Index | 38.82% | 15.67% | 20.08% | 9.07% | 7.69% | |
| (a) | Hussman Strategic Growth Fund invests in stocks listed on the New York, American, and NASDAQ exchanges, and does not specifically restrict its holdings to a particular market capitalization. The S&P 500 and Russell 2000 are indices of large and small capitalization stocks, respectively. “HSGFX equity investments and cash equivalents only (unhedged)” reflects the performance of the Fund’s stock investments and modest day-to-day cash balances, after fees and expenses, but excluding the impact of hedging transactions. The Fund’s unhedged equity investments do not represent a separately available portfolio, and their peformance is presented solely for purposes of comparison and performance attribution. |
| (b) | The Fund commenced operations on July 24, 2000. |
| (c) | Returns do not reflect the deduction of taxes a shareholder would pay on Fund distributions or the redemption of Fund shares. |
| (d) | The Adviser has contractually agreed to defer its investment advisory fees and/or absorb or reimburse Fund expenses until at least November 1, 2014 to the extent necessary to limit the Fund’s annual ordinary operating expenses to an amount not exceeding 1.07% annually of the Fund’s average daily net assets. The gross expense ratio as disclosed in the November 1, 2013 prospectus was 1.14%. |
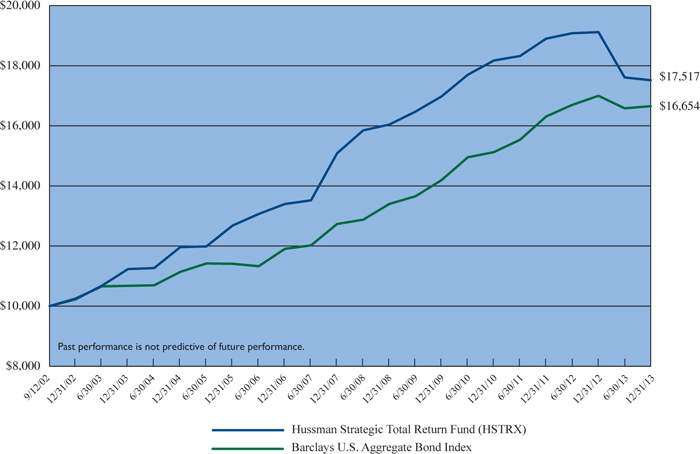
HUSSMAN STRATEGIC TOTAL RETURN FUND
Comparison of the Change in Value of a $10,000 Investment in Hussman Strategic Total Return Fund
versus the Barclays U.S. Aggregate Bond Index(a) (Unaudited)
Average Annual Total Returns For Periods Ended December 31, 2013 |
| | | | | | | |
Hussman Strategic Total Return Fund(c)(d) | (8.37%) | (1.22%) | 1.77% | 4.54% | 5.09% | |
| Barclays U.S. Aggregate Bond Index | (2.02%) | 3.26% | 4.44% | 4.55% | 4.62% | |
| (a) | The Barclays U.S.Aggregate Bond Index covers the U.S.investment grade fixed rate bond market, with index components for U.S.government, agency and corporate securities.The Fund does not invest solely in securities included in the Barclays U.S.Aggregate Bond Index and may invest in other types of bonds, as well as common stocks, exchange-traded funds and other securities. |
| (b) | The Fund commenced operations on September 12, 2002. |
| (c) | Returns do not reflect the deduction of taxes a shareholder would pay on Fund distributions or the redemption of Fund shares. |
| (d) | The Adviser has contractually agreed to defer its investment advisory fees and/or absorb or reimburse Fund expenses until at least November 1, 2014 to the extent necessary to limit the Fund’s annual ordinary operating expenses to an amount not exceeding 0.63% annually of the Fund’s average daily net assets.The gross expense ratio as disclosed in the November 1, 2013 prospectus was 0.68%. |
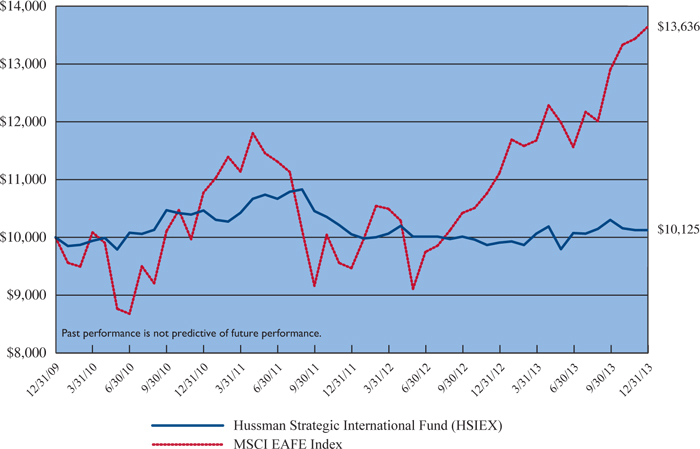
HUSSMAN STRATEGIC INTERNATIONAL FUND
Comparison of the Change in Value of a $10,000 Investment in
Hussman Strategic International Fund versus the MSCI EAFE Index(a) (Unaudited)
Average Annual Total Returns For Periods Ended December 31, 2013 |
| | | | | |
Hussman Strategic International Fund(c)(d) | 2.18% | (1.10%) | 0.31% | |
| MSCI EAFE Index | 22.78% | 8.17% | 8.06% | |
| (a) | The MSCI EAFE (Europe, Australasia, and Far East) Index is a free float-adjusted weighted capitalization index that is designed to measure the equity market performance of developed markets, excluding the U.S. and Canada. As of December 31, 2013, the MSCI EAFE Index consisted of the following 21 developed market country indices: Australia, Austria, Belgium, Denmark, Finland, France, Germany, Hong Kong, Ireland, Israel, Italy, Japan, the Netherlands, New Zealand, Norway, Portugal, Singapore, Spain, Sweden, Switzerland and the United Kingdom. The Fund may not invest in all of the countries represented in the MSCI EAFE Index and may invest in securities that are not included in the MSCI EAFE Index. |
| (b) | The Fund commenced operations on December 31, 2009. |
| (c) | Returns do not reflect the deduction of taxes a shareholder would pay on Fund distributions or the redemption of Fund shares. |
| (d) | The Fund’s expense ratio was 1.54% for the six months ended December 31, 2013. The expense ratio as disclosed in the November 1, 2013 prospectus was 1.61%. |
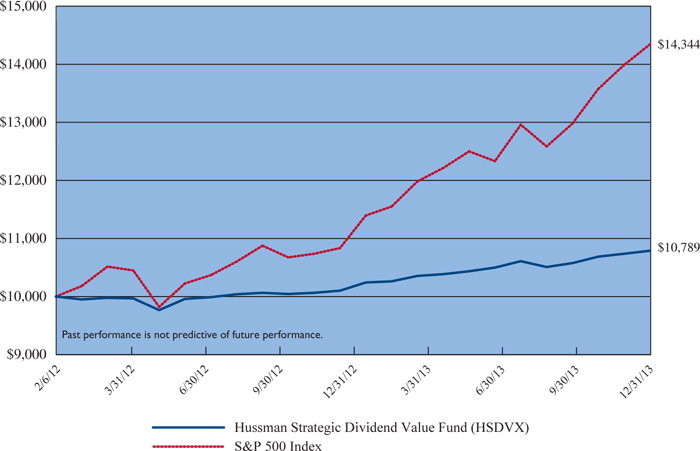
HUSSMAN STRATEGIC DIVIDEND VALUE FUND
Comparison of the Change in Value of a $10,000 Investment in
Hussman Strategic Dividend Value Fund versus the Standard & Poor’s 500 Index(a) (Unaudited)
Average Annual Total Returns For Periods Ended December 31, 2013 |
| | | | |
Hussman Strategic Dividend Value Fund(c)(d) | 6.81% | 4.07% | |
| S&P 500 Index | 32.39% | 20.89% | |
| (a) | Hussman Strategic Dividend Value Fund invests primarily in securities of U.S. issuers but may invest in stocks of foreign companies. There are no restrictions as to the market capitalization of companies in which the Fund invests. The S&P 500 Index is believed to be the appropriate broad-based securities market index against which to compare the Fund’s long-term performance. However, the Fund may invest in securities that are not included in the S&P 500 Index, and may vary its exposure to market fluctuations depending on market conditions. |
| (b) | The Fund commenced operations on February 6, 2012. |
| (c) | Returns do not reflect the deduction of taxes a shareholder would pay on Fund distributions or the redemption of Fund shares. |
| (d) | The Adviser has contractually agreed to defer its investment advisory fees and/or absorb or reimburse Fund expenses until at least February 1, 2015 to the extent necessary to limit the Fund’s annual ordinary operating expenses to an amount not exceeding 1.25% annually of the Fund’s average daily net assets. The gross expense ratio as disclosed in the November 1, 2013 prospectus was 2.77%. |
The Hussman Funds continue to pursue a disciplined, value-conscious, risk-managed and historically-informed investment approach focused on the complete market cycle. From the standpoint of a full-cycle discipline, it is essential to understand the position of the market within that cycle. In 2013, the stock market experienced what I view as the speculative crescendo of the third Fed-enabled equity bubble in 14 years. On the basis of valuation measures that are strongly correlated with subsequent total returns in stocks over the following 7-10 year period, the Standard and Poor’s 500 Index ended 2013 at fully twice its historical valuation norms prior to the late-1990’s valuation bubble. These fundamental measures include price/revenues, non-financial equity market capitalization/nominal GDP, market value/replacement cost (Tobin’s Q), and a variety of measures based on price to properly normalized earnings.
The word “normalized” is important here. Equities are a claim not to a single year of earnings, but to a very long-term stream of future cash flows that will be delivered into the hands of investors over time. Almost invariably, valuation measures that identify stocks as “reasonably” valued today are those that rely on a single year of earnings. However, profit margins remain about 70% above their historical norms. To rely on these measures is to assume that profit margins (which have historically reverted toward historical norms in nearly every economic cycle, including the two most recent ones) will remain at record highs not just for a year or two, but for several decades. The measures that we find most reliably correlated with actual subsequent market returns are those that normalize earnings by taking these wide swings in profit margins into account.
As I wrote in my weekly commentary on the Hussman Funds website in August 2007, just before a market plunge that wiped out the entire total return of the S&P 500 Index – over and above Treasury bill returns – all the way back to June 1995, “There is no evidence that historically reliable valuation measures have lost their validity. Speculators hoping for a ‘Bernanke put’ to save their assets are likely to discover - too late - that the strike price is way out of the money.”
I fully understand that investors would like to believe nearly 14 years after the 2000 bubble peak, it should be impossible that stocks could be in yet another valuation bubble. The S&P 500 Index was priced in 2000 to achieve what we estimated to be negative total returns over the following decade, and the market did exactly that. But today, a few years past that 10-year mark, the 3.17% annual total return of the S&P 500 Index from its peak on 3/24/2000 to its recent peak on 1/15/2014 has been achieved only by restoring historically severe valuations. Present valuations are certainly less severe than in 2000 for the S&P 500 Index as a whole, but are actually
|
Letter to Shareholders (continued) |
more severe for the median stock. In 2000, small capitalization stocks were much better valued than larger ones, though that didn’t prevent them from losing a large portion of their value in the bear market that followed. For investors who share a full-cycle investment discipline, we strongly encourage maintaining that discipline at present.
The perception that we maintain a permanently defensive outlook toward the equity market is largely an artifact of our response to the 2008-2009 credit crisis. While the Hussman Funds performed admirably in that period, the broader behavior of the financial markets and the economy was “out of sample” from the standpoint of the post-WWII data on which our return/risk estimates were based. I insisted on stress-testing our investment approach to increase its robustness to Depression-era outcomes, but that effort resulted in missed returns in the interim. Though investors in Strategic Growth Fund may recall that we quickly removed most of our hedges following the 2000-2002 bear market, my reputation as a “perma-bear” is a misconception born of that 2009-early 2010 stress-testing period (which I do not expect to be repeated in the future), compounded by the more recent Fed-induced speculative advance in the equity market (most or all of which I expect to be surrendered over the completion of the present market cycle).
I remain convinced that we will observe ample opportunities, over the completion of the present market cycle and beyond, to pursue investment returns at far lower levels of risk than investors presently face. Valuations, measures of market action, and a broad ensemble of other considerations have historically been effective in identifying these opportunities. Investors should not be surprised to observe the Funds establishing unhedged or aggressive investment positions at these points. Indeed, they should expect it.
For the year ended December 31, 2013, Strategic Growth Fund lost -6.62%, largely attributable to the cumulative decay in the time-value of index put options held by the Fund. Strategic Total Return Fund lost -8.37%, attributable to a general decline in the value of precious metals shares and U.S. Treasury securities. Strategic International Fund achieved a total return of 2.18%, reflecting a generally hedged investment stance in the international equity market. Strategic Dividend Value Fund achieved a total return of 6.81%, reflecting a partially hedged investment stance in dividend-paying stocks.
|
Letter to Shareholders (continued) |
From the inception of Strategic Growth Fund on July 24, 2000 through December 31, 2013, the Fund achieved an average annual total return of 3.94%, compared with an average annual total return of 3.73% for the S&P 500 Index. An initial $10,000 investment in the Fund on July 24, 2000 would have grown to $16,810, compared with $16,354 for the same investment in the S&P 500 Index. The deepest loss experienced by the Fund since inception was -28.58%, compared with a maximum loss of -55.25% for the S&P 500 Index.
It is instructive that in order to lose -55.25% (as the S&P 500 Index did following steep overvaluation in 2007 much like the present), one must first lose -28.58%, and then lose an additional -37.34%. Conversely, simply recovering from a -55.25% loss to a -28.58% loss requires an advance of 59.60%. The focus of our risk-management is not the avoidance of small or moderate losses, which we view as a necessary aspect of long-term investing, but rather the avoidance of severe declines requiring heroic recovery.
From the inception of Strategic Total Return Fund on September 12, 2002 through December 31, 2013, the Fund achieved an average annual total return of 5.08%, compared with an average annual total return of 4.62% for the Barclays U.S. Aggregate Bond Index. An initial $10,000 investment in the Fund on September 12, 2002 would have grown to $17,517, compared with $16,654 for the same investment in the Barclays U.S. Aggregate Bond Index. The deepest loss experience by the Fund since inception was -11.52%, compared with a maximum loss of -5.09% for the Barclays U.S. Aggregate Bond Index.
From the inception of Strategic International Fund on December 31, 2009 through December 31, 2013, the Fund achieved an average annual total return of 0.31%, compared with an average annual total return of 8.06% for the MSCI EAFE Index. An initial $10,000 investment in the Fund on December 31, 2009 would have grown to $10,125, compared with $13,636 for the same investment in the MSCI EAFE Index. The maximum decline of the EAFE Index was -26.48%, compared with a maximum decline of -10.45% for Strategic International Fund.
From the inception of Strategic Dividend Value Fund on February 6, 2012 through December 31, 2013, the Fund achieved an average annual total return of 4.07%, compared with an average annual total return of 20.89% for the S&P 500 Index. An initial $10,000 investment in the Fund on February 6, 2012 would be valued at $10,789, compared with $14,344 for the same investment in the S&P 500 Index. The deepest loss experienced by the Fund since inception was -2.82%, compared with a maximum loss of -9.58% for the S&P 500 Index.
|
Letter to Shareholders (continued) |
The stock selection approach of the Fund has outperformed the S&P 500 Index by 5.64% (564 basis points) annually since the inception of the Fund and in the most recent year ended December 31, 2013, the stock selection approach outperformed the S&P 500 Index by 5.35% (535 basis points). However, market conditions during the past year generally matched those that have historically been associated with strikingly negative return/risk profiles. In the face of rich valuations and strenuously extended market conditions, the Fund was fully hedged during this period, and index put options held by the Fund experienced a loss of time value. The hedging strategy of the Fund (which often offsets periodic losses in the Fund’s holdings and can contribute strongly to investment returns in unfavorable market conditions) accounted for the Fund’s -6.62% one year loss. In my view, the fact that negative market outcomes did not emerge during this period is more a reflection of uncertain timing and temporary monetary distortion than of any durable change in market structure.
Historically, the simultaneous emergence of overextended valuations, price trends and exuberant sentiment (which we generally refer to as an “overvalued, overbought, overbullish” syndrome) has created significant risk for the stock market. In the past year, this risk was not realized and the stock market instead moved to further extremes. We expect that the most reasonable opportunity to reduce hedges and establish a more constructive investment stance will emerge at the point that a material retreat in valuations is coupled with a firming of market action after such a retreat.
| Strategic Total Return Fund |
During the year ended December 31, 2013, Strategic Total Return Fund declined in value by -8.37%. The Fund held a relatively conservative position in bonds during this time, with a duration typically ranging between 2-6 years (meaning that a 100 basis point move in interest rates would be expected to affect Fund value by about 2-6% on the basis of bond price fluctuations). During 2013, the yield on 10-year U.S. Treasury bonds surged from 1.88% to 3.03%, producing negative returns for even a conservative position in bonds. An additional driver of fluctuations in the Fund during this period was its exposure to precious metals shares. While this exposure was generally modest, gold stocks as measured by the Philadelphia Gold and Silver Sector Index (XAU) plunged by -48.01% during the year.
|
Letter to Shareholders (continued) |
Since the inception of Strategic Total Return Fund, the Fund has benefited from its ability to vary its duration and exposure to precious metals shares, utility shares, and other asset classes in response to changes in valuations and yields. While the Fund was exposed to a modest portion of the significant losses in these markets, the improved valuations in precious metals shares and bonds is quite welcome, as opportunities to increase investment exposure and participate in long-term investment returns are grounded in such improvements.
| Strategic International Fund |
In the year ended December 31, 2013, Strategic International Fund gained 2.18%. The Fund remained fully hedged against the impact of general market fluctuations during this period. The Fund generally held a defensive portfolio focused on equities that we view as undervalued and having significant dividend yields. Despite a risk-seeking environment, these holdings performed generally in line with the performance of the indices used by the Fund to hedge. While value-oriented stocks tended to underperform more cyclically-sensitive securities, the Fund benefited from having about one fifth of the portfolio invested in Japanese stocks during the strong advance in the Nikkei index during the past year. The Fund has since pared this position to a slight underweight relative to the representation of Japanese stocks in the MSCI EAFE Index.
| Strategic Dividend Value Fund |
In the year ended December 31, 2013, Strategic Dividend Value Fund gained 6.81%. In the context of market conditions that have historically been hostile for equities, the Fund held a larger position in cash than we would anticipate under normal conditions. Meanwhile about 50% of the value of the Fund’s holdings have been hedged over the past year, using option combinations on the S&P 500 Index. We anticipate a significantly larger exposure to equities, coupled with a smaller hedge, as the combination of valuations and other market conditions improve over the course of the present market cycle.
As of December 31, 2013, Strategic Growth Fund had net assets of $1,269,366,224, and held 110 stocks in a wide variety of industries. The largest sector holdings as a percent of net assets were information technology (27.6%), health care (26.0%), consumer discretionary (19.0%), consumer staples (11.5%), energy (6.0%), financials (4.5%), and industrials (4.4%). The smallest sector weights were in utilities (1.5%), materials (0.5%), and telecommunication services (0.0%).
|
Letter to Shareholders (continued) |
Strategic Growth Fund’s holdings of individual stocks as of December 31, 2013 were valued at $1,282,245,965. Against these stock positions, the Fund also held 5,000 option combinations (long put option/short call option) on the S&P 500 Index, 1,500 option combinations on the Russell 2000 Index and 500 option combinations on the Nasdaq 100 Index. Each option combination behaves as a short sale on the underlying index, with a notional value of $100 times the index value. On December 30, 2013, the S&P 500 Index closed at 1,848.36, while the Russell 2000 Index and the Nasdaq 100 Index closed at 1,163.64 and 3,591.996, respectively. The Fund’s total hedge therefore represented a short position of $1,278,325,800, thereby hedging 99.7% of the dollar value of the Fund’s long investment positions in individual stocks.
Though the performance of Strategic Growth Fund’s diversified portfolio cannot be attributed to any narrow group of stocks, the following holdings achieved gains in excess of $10 million during the six months ended December 31, 2013: United Therapeutics, Deckers Outdoor, and Safeway. Holdings with losses in excess of $2 million during this same period were Laboratory Corporation of America, Valueclick, Jabil Circuit, Cisco Systems, and Cooper Tire and Rubber.
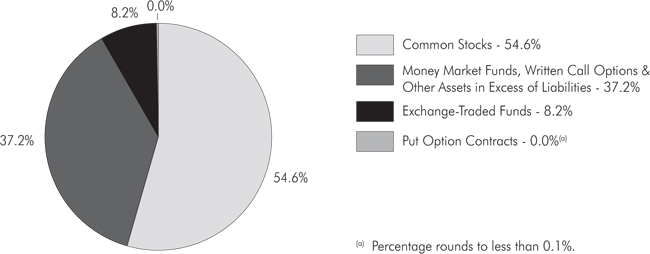
As of December 31, 2013, Strategic Total Return Fund had net assets of $702,128,254. Treasury notes, Treasury bonds, Treasury Inflation-Protected Securities (TIPS) and money market funds represented 89.6% of the Fund’s net assets. Exchange-traded funds, precious metals shares and utility shares accounted for 1.8%, 6.0% and 3.3% of net assets, respectively.
In Strategic Total Return Fund, during the six months ended December 31, 2013, portfolio gains in excess of $2 million were achieved in Agnico-Eagle Mines, Barrick Gold, Randgold Resources ADR, and Barrick Gold. Holdings with losses in excess of $2 million during this same period were U.S. Treasury Note (2.75%, due 11/15/2023), U. S. Treasury Note (1.75%, due 5/15/2022), U.S. Treasury Note (1.625%, due 11/15/2022) and U.S. Treasury Note (1.75%, due 5/15/2023).
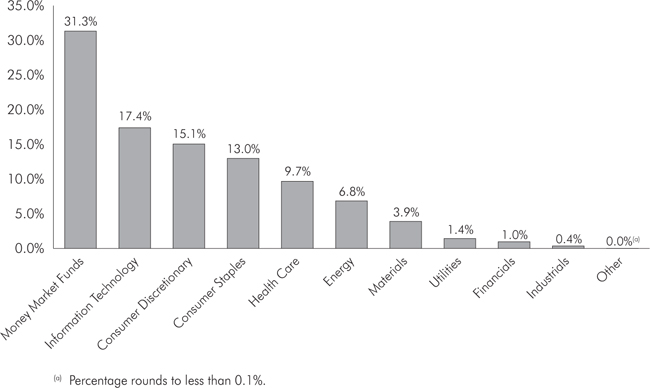
As of December 31, 2013, Strategic International Fund had net assets of $106,568,140 and held 88 stocks in a wide variety of industries. The largest sector holdings as a percent of net assets were in health care (10.9%), information technology (10.0%), consumer staples (8.2%), consumer discretionary (7.6%), utilities (6.3%), industrials (5.4%), and telecommunications (4.0%). The smallest sector weights were in financials (1.0%), energy (0.7%), and materials (0.5%). Exchange-traded funds (ETFs) and money market funds accounted for 8.2% and 35.7% of net assets, respectively. The total value of equities and exchange-traded funds held by the Fund was $66,952,868.
|
Letter to Shareholders (continued) |
In order to hedge the impact of general market fluctuations, as of December 31, 2013 Strategic International Fund held 85 option combinations (long put option/short call option) on the S&P 500 Index, and was short 800 futures on the Euro STOXX 50 Index and 150 futures on the FTSE 100 Index. The combined notional value of these hedges was $66,695,098, hedging 99.6% of the value of equity and ETF investments held by the Fund. When the Fund is in a hedged investment position, the primary driver of Fund returns is the difference in performance between the stocks owned by the Fund and the indices that are used to hedge.
While Strategic International Fund is widely diversified and its performance is affected by numerous investment positions, the hedging strategy of the Fund was primarily responsible for the reduced sensitivity of the Fund to market fluctuations from the Fund’s inception through December 31, 2013. Individual equity holdings having portfolio gains in excess of $350,000 during the six months ended December 31, 2013 included Softbank, Wuxi Pharmatech, and iShares MSCI Germany Index Fund. Holdings with portfolio losses in excess of $50,000 during this same period included Yamada Denki, Heineken, and Ricoh.
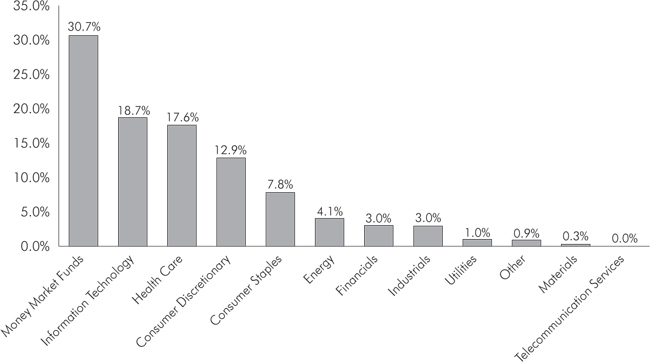
As of December 31, 2013, Strategic Dividend Value Fund had net assets of $31,492,984, and held 67 stocks in a wide variety of industries. The largest sector holdings as a percent of net assets were information technology (19.3%), consumer discretionary (16.7%), consumer staples (14.4%), health care (10.7%), and energy (7.6%). The smallest sector weights were in materials (4.4%), utilities (1.6%), financials (1.0%), industrials (0.4%) and telecommunication services (0.0%).
Strategic Dividend Value Fund’s holdings of individual stocks as of December 31, 2013 were valued at $23,963,187. Against these stock positions, the Fund also held 63 option combinations (long put option/short call option) on the S&P 500 Index. The notional value of this hedge was $11,644,668, hedging 48.6% of the value of equity investments held by the Fund.
In Strategic Dividend Value Fund, during the six months ended December 31, 2013, portfolio gains in excess of $75,000 were achieved in Safeway, John Wiley and Sons – Class A, Microsoft, Valassis Communications, CA, and Astrazeneca PLC - ADR. There were no losses greater than $50,000 during this same period.
Supplementary information including quarterly returns and equity-only performance is available on the Hussman Funds website: www.hussmanfunds.com
|
Letter to Shareholders (continued) |
Part of a good investment discipline is, and must be, to constantly seek improvements and address challenges. We’ve done a great deal of that since 2009 as a response to stress-testing demands and Fed-induced speculation. I expect the benefits of this work to be fully evident as the present cycle is completed and the next one unfolds. Still, part of a good investment discipline is also to recognize those points where discomfort is an unpleasant necessity. A change in strategy that might ease discomfort by participating in an overvalued speculative advance, but that would have left investors vulnerable to the deepest market losses on record, is no improvement at all. We’ve tolerated the frustration of remaining defensive during this speculative advance because it shares hallmarks that were shortly followed by the most punishing market losses in history. The fact that a similar consequence has been deferred in this instance does not convince us that it has been avoided.
In any event, I doubt that we’ll have much to lament by the completion of the current market cycle. We can clearly observe the risks inherent in present market conditions, and we know very well how those risks have typically been resolved throughout history.
| Quantitative Easing: Perception, Misattribution and Superstition |
What seems different this time, enough to revive the conclusion that “this time is different,” is faith in the Federal Reserve’s policy of quantitative easing. The main impact of quantitative easing is to make low-risk assets psychologically uncomfortable to hold, forcing investors to reach for yield in more speculative assets. Still, this policy requires investors to be permanently averse to low-risk assets, and to be permanently indifferent to rich valuations. We doubt that an easy Fed can hold stock prices up in the next few years any more than it did in the 2000-2002 decline or the 2007-2009 decline – both periods of persistent and aggressive Fed easing. But QE is novel, and like the internet bubble, novelty feeds imagination. That novelty is wearing thin, and in our view, most of what investors believe about QE is indeed imaginative.
When we examine the 2008-2009 credit crisis in retrospect, the central concern at that time was that massive bank failures would trigger a “global financial meltdown.” The risk of widespread failures was driven by losses in mortgage-backed securities and related assets held by major banks, and by highly leveraged financial institutions like Bear Stearns and Lehman, representing the “shadow” banking system. At some of these institutions, “leverage ratios” were 30-to-1 or higher. Given 30 times leverage, it takes a decline of just over 3% in the value of assets to completely wipe out capital and leave the institution insolvent (as the remaining value of assets
|
Letter to Shareholders (continued) |
would be unable to pay off the existing obligations to customers and bondholders). In such an environment, a “run” on one institution could force asset sales, accelerating capital losses at other institutions and increase the likelihood of insolvency.
Under existing accounting rules, banks and other financial institutions were required to report the value of the securities they held, using prevailing market prices, a requirement known as “mark-to-market.” As asset values collapsed in 2008 and early-2009 because of mortgage losses, financial institutions across the globe found themselves rapidly approaching insolvency.
As the willingness of investors to buy mortgage securities seized up, and economic activity plunged, the Federal Reserve stepped into the financial markets and became the major purchaser of existing and new mortgage securities issued by Fannie Mae and Freddie Mac. This arguably helped to support continuing activity in the housing market, but it is not what ended the crisis.
Rather, the crisis ended – and in our view, ended precisely – on March 16, 2009, when the Financial Accounting Standards Board abandoned mark-to-market rules, in response to Congressional pressure by the House Committee on Financial Services on March 12, 2009. That change immediately removed the threat of widespread insolvency by giving banks “significant judgment” in the values that they assigned to their assets. My impression is that much of the market’s confidence and oversensitivity to quantitative easing stems from misattribution of the initial recovery to QE. This has created a nearly self-fulfilling superstition that links the level of stock prices directly to the size of the Fed's balance sheet, despite the absence of any reliable or historically demonstrable transmission mechanism that relates the two with any precision at all.
The misattribution of cause and effect in 2009 created the Grand Superstition of our time – the belief that Federal Reserve policy was responsible for ending the financial crisis and sending the stock market higher. By 2010, this narrative was so fully accepted that the Fed’s announcement of further “quantitative easing” was met by equally great enthusiasm by investors.
Complicating matters, the European Central Bank forestalled a currency crisis in Europe through massive purchases of debt from credit-strained member countries. While this action was interpreted as quantitative easing, it actually functioned as a funding operation to weaker countries that was much more akin to a fiscal subsidy from stronger countries like Germany. Still, the fact that it was executed by the central bank and eased the Euro crisis helped to contribute to a perception that central bank purchases of government securities – in and of themselves – are sufficient to support
|
Letter to Shareholders (continued) |
the stock markets indefinitely. Worse, perception creates its own reality in the financial markets. If enough investors imagine something to be true, the markets will behave the same as if it really were – at least for a while.
To be clear, quantitative easing has undoubtedly been the primary driver of stock prices since 2010. But one must evaluate the extent to which there is any reliable, mechanistic link between the cause and the effect. If there is not, investors may be resting their confidence on little more than perception and superstition. This is exactly what historical data indicates.
Probably the most challenging aspect of quantitative easing is that, particularly since late-2011, overvalued, overbought, overbullish conditions usually associated with severe market losses have instead been associated with even more extreme speculation. That has made the advancing portion of this unfinished half cycle difficult. Still, my expectation is that investors will ultimately look back at the present market exuberance in hindsight and ask “after watching the market collapse following nearly identical bubbles in 2000 and 2007, despite aggressive monetary easing, how did we actually refuse to consider major losses in the belief – yet again – that this time was different?”
| Speculation and Overvaluation |
The latest data from the NYSE shows equity margin debt at a new all-time high. Relative to GDP, the current 2.6% level was eclipsed only once – at the March 2000 market peak. The issuance of low-quality “covenant lite” debt has also eclipsed the level prior to the 2008-2009 credit crisis, as investors “reach for yield” in response to the Federal Reserve’s policy of quantitative easing. In the context of the most extreme bullish sentiment in decades, and reliable valuation metrics about double their historical norms prior to the late-1990’s bubble (price/revenue, market cap/GDP, Tobin’s Q, properly normalized price/forward operating earnings, price to cyclically-adjusted earnings), we view present market conditions as dangerously speculative.
There are certainly some popular valuation measures that suggest that stocks are reasonably valued. However, as I’ve detailed in research presented on the Hussman Funds website, these measures tend to be poor indicators of actual subsequent market returns, because they essentially value stocks as if they are a claim on a single year of earnings instead of a long-term stream of future cash flows. Put another way, investors are taking current earnings at face value, as if they are representative of long-term flows, at a time when current earnings are more unrepresentative of those flows than at any time in history. The problem is not simply that earnings are likely to retreat deeply over the next few years. Rather, the problem is that investors have embedded
|
Letter to Shareholders (continued) |
the assumption of permanently elevated profit margins into stock prices, leaving the market about twice the level that would provide investors with historically adequate long-term returns.
We presently estimate prospective 10-year S&P 500 nominal total returns averaging just 2.7% annually, with negative expected total returns on every horizon shorter than 7 years. Given a 2% dividend yield, we expect the S&P 500 Index to be no higher a decade from today than it is at present. Uniformly, and across fundamentals that have reliably correlated with actual subsequent market returns, we project weak S&P 500 total returns over the coming decade. Indeed, the median price/revenue ratio of stocks in the S&P 500 is actually above the 2000 peak.
These valuation measures are the same ones that led us to correctly anticipate a decade of negative total returns in 2000, and significant market weakness in 2007. In contrast, these measures were quite favorable toward equities in 2009 (our stress-testing concerns were not driven by valuations). We estimate that a passive, equally balanced portfolio of stocks, bonds, and cash can be expected to return about 2% annually over the coming decade. If this seems to be an untenable long-term rate of return, the security prices underlying those expected returns are equally untenable.
Valuations appear less extreme in the international equity markets, but the correlation between international equities and U.S. equities tends to increase sharply during periods of weakness in the U.S. markets. We expect much greater latitude to reduce hedging in international equities once the most severe aspects of U.S. conditions are resolved.
Investment strategies that are sensitive to the changing profile of valuation and risk may not be popular in an environment where extreme valuations seem inconsequential and speculative risks are rewarded. Still, I expect that these strategies will be essential to achieving strong returns and navigating acute risks in the coming decade.
Part of the ability to sustain our investment discipline comes from understanding the profile of returns from that discipline in complete market cycles (bull markets and bear markets combined) across history. For example, investors often become convinced late in a bull market that “the greatest risk is being out of the market.” The only antidote to that is an understanding of how critical those speculative moments are from the standpoint of full-cycle investment returns. Put simply, the majority of the outperformance from risk-managed investment approaches over time comes from
|
Letter to Shareholders (continued) |
the avoidance of severe initial losses following overvalued, overbought, overbullish conditions, and from the limitation of deep and extended losses as market action subsequently deteriorates.
Though the market has advanced in the face of persistently overvalued, overbought, overbullish conditions since about late-2011, I am convinced that the result is an even more extreme and hazardous financial precipice.
Investors who believe that history has lessons to teach should take our present concerns with significant weight, but should also recognize that tendencies that repeatedly prove reliable over complete market cycles are sometimes defied over portions of those cycles.
In the face of an unusually extended period of speculation as a result of faith in quantitative easing, I continue to believe that normal historical regularities will exert themselves with a vengeance over the completion of this market cycle. Importantly, the market recently re-established the most hostile overvalued, overbought, overbullish syndrome we identify. It is tempting to ignore these concerns because we observed similarly extreme conditions in February and May of 2013. Still, prior to the past year, we have observed similarly extreme conditions only at market peaks (1929, 1972, 1987, 2000 and 2007) that investors view in hindsight as reckless speculative carnivals.
The problem is always that historical outcomes are easy to observe in hindsight, but the outcome of the present instance is still unseen – even if the underlying conditions are the same. As we saw in 2000 and again in 2007, until unseen risks become observable reality in hindsight (and by then, it is too late), all of these concerns are quickly dismissed by investors. Quantitative easing has distorted not only financial markets, but financial memory. I doubt that the awakening will be gentle.
Still, the most important message that shareholders should take from this letter is that market cycles across history have invariably produced strong investment opportunities, typically at points where significantly reduced market valuations have been joined by fresh improvements in market action. We missed that opportunity in 2009-early 2010 as a result of our stress-testing response to the credit crisis. Being comfortable with the ability of our approach to navigate even Depression-era outcomes, I expect no such demands again.
Though we would still be refraining from the recent Fed-induced speculation, the period since 2009 would undoubtedly look far different without that stress-testing miss. For exactly that reason, I believe that our experience during the incomplete half-cycle since 2009 is an aberration that should not be expected in future market cycles. I often described the performance of our investment strategy prior to 2009 with the
|
Letter to Shareholders (continued) |
phrase “as intended.” I am very excited about the prospect of pursuing our discipline – simply as intended – in the coming market cycle and beyond. As always, I remain grateful for your trust.
Sincerely,
John P. Hussman, Ph.D.
Past performance is not predictive of future performance. Investment results and principal value will fluctuate so that shares of the Funds, when redeemed, may be worth more or less than their original cost. Current performance may be higher or lower than the performance data quoted.
Weekly updates regarding market conditions and investment strategy, as well as special reports, analysis, and performance data current to the most recent month end, are available at the Hussman Funds website www.hussmanfunds.com.
An investor should consider the investment objectives, risks, charges and expenses of the Funds carefully before investing. The Funds’ prospectuses contain this and other important information. To obtain a copy of the Hussman Funds’ prospectuses please visit our website at www.hussmanfunds.com or call 1-800-487-7626 and a copy will be sent to you free of charge. Please read the prospectus carefully before you invest. The Hussman Funds are distributed by Ultimus Fund Distributors, LLC.
Estimates of prospective return and risk for equities, bonds, and other financial markets are forward-looking statements based the analysis and reasonable beliefs of Hussman Strategic Advisors. They are not a guarantee of future performance, and are not indicative of the prospective returns of any of the Hussman Funds. Actual returns may differ substantially from the estimates provided. Estimates of prospective long-term returns for the S&P 500 Index reflect valuation methods focusing on the relationship between current market prices and earnings, dividends and other fundamentals, adjusted for variability over the economic cycle.
This Letter to Shareholders seeks to describe some of the adviser’s current opinions and views of the financial markets. Although the adviser believes it has a reasonable basis for any opinions or views expressed, actual results may differ, sometimes significantly so, from those expected or expressed. The securities held by the Funds that are discussed in this Letter to Shareholders were held during the period covered by this Report. They do not comprise the entire investment portfolios of the Funds, may be sold at any time and may no longer be held by the Funds. The opinions of the Funds’ adviser with respect to those securities may change at any time.
Hussman Strategic Growth Fund Portfolio Information |
December 31, 2013 (Unaudited) |
| Sector Allocation (% of Total Investments and Money Market Funds) |
Hussman Strategic Total Return Fund Portfolio Information |
December 31, 2013 (Unaudited) |
| Asset Allocation (% of Net Assets) |
Hussman Strategic International Fund Portfolio Information |
December 31, 2013 (Unaudited) |
| Asset Allocation (% of Net Assets) |
| Country Allocation (% of Equity Holdings) |
Hussman Strategic Dividend Value Fund Portfolio Information |
December 31, 2013 (Unaudited) |
| Sector Allocation (% of Total Investments and Money Market Funds) |
Hussman Strategic Growth Fund Schedule of Investments |
December 31, 2013 (Unaudited) |
| | | | | | |
| Consumer Discretionary — 19.0% | | | | | | |
| Auto Components — 1.3% | | | | | | |
| Cooper Tire & Rubber Co. | | | 373,000 | | | $ | 8,966,920 | |
TRW Automotive Holdings Corp. (a) | | | 100,000 | | | | 7,439,000 | |
| | | | | | | | 16,405,920 | |
| Diversified Consumer Services — 3.0% | | | | | | | | |
| DeVry, Inc. | | | 208,000 | | | | 7,384,000 | |
Grand Canyon Education, Inc. (a) | | | 93,000 | | | | 4,054,800 | |
| Hillenbrand, Inc. | | | 426,000 | | | | 12,532,920 | |
Outerwall, Inc. (a) | | | 215,000 | | | | 14,463,050 | |
| | | | | | | | 38,434,770 | |
| Hotels, Restaurants & Leisure — 8.1% | | | | | | | | |
| Cheesecake Factory, Inc. (The) | | | 478,000 | | | | 23,073,060 | |
| International Game Technology | | | 500,000 | | | | 9,080,000 | |
Jack in the Box, Inc. (a) | | | 400,000 | | | | 20,008,000 | |
| McDonald's Corp. | | | 200,000 | | | | 19,406,000 | |
Panera Bread Co. - Class A (a) | | | 120,000 | | | | 21,202,800 | |
| Starbucks Corp. | | | 125,000 | | | | 9,798,750 | |
| | | | | | | | 102,568,610 | |
| Internet & Catalog Retail — 0.2% | | | | | | | | |
Shutterfly, Inc. (a) | | | 50,000 | | | | 2,546,500 | |
| | | | | | | | | |
| Leisure Equipment & Products — 0.8% | | | | | | | | |
| Hasbro, Inc. | | | 175,000 | | | | 9,626,750 | |
| | | | | | | | | |
| Media — 2.1% | | | | | | | | |
DISH Network Corp. - Class A (a) | | | 225,000 | | | | 13,032,000 | |
| Gannett Co., Inc. | | | 391,000 | | | | 11,565,780 | |
| Meredith Corp. | | | 34,000 | | | | 1,761,200 | |
| | | | | | | | 26,358,980 | |
| Multiline Retail — 0.5% | | | | | | | | |
| Target Corp. | | | 100,000 | | | | 6,327,000 | |
| | | | | | | | | |
| Specialty Retail — 2.0% | | | | | | | | |
| American Eagle Outfitters, Inc. | | | 42,000 | | | | 604,800 | |
Bed Bath & Beyond, Inc. (a) | | | 200,000 | | | | 16,060,000 | |
Murphy USA, Inc. (a) | | | 112,500 | | | | 4,675,500 | |
Urban Outfitters, Inc. (a) | | | 125,000 | | | | 4,637,500 | |
| | | | | | | | 25,977,800 | |
| Textiles, Apparel & Luxury Goods — 1.0% | | | | | | | | |
Deckers Outdoor Corp. (a) | | | 150,000 | | | | 12,669,000 | |
Hussman Strategic Growth Fund Schedule of Investments (continued) |
December 31, 2013 (Unaudited) |
COMMON STOCKS — 101.0% (continued) | | | | | | |
| Consumer Staples — 11.5% | | | | | | |
| Beverages — 2.3% | | �� | | | | |
| Coca-Cola Co. (The) | | | 150,000 | | | $ | 6,196,500 | |
| PepsiCo, Inc. | | | 275,000 | | | | 22,808,500 | |
| | | | | | | | 29,005,000 | |
| Food & Staples Retailing — 3.3% | | | | | | | | |
Rite Aid Corp. (a) | | | 1,200,000 | | | | 6,072,000 | |
| Safeway, Inc. | | | 600,000 | | | | 19,542,000 | |
| Sysco Corp. | | | 225,000 | | | | 8,122,500 | |
| Walgreen Co. | | | 150,000 | | | | 8,616,000 | |
| | | | | | | | 42,352,500 | |
| Food Products — 4.8% | | | | | | | | |
| Archer-Daniels-Midland Co. | | | 276,000 | | | | 11,978,400 | |
| Fresh Del Monte Produce, Inc. | | | 40,000 | | | | 1,132,000 | |
| General Mills, Inc. | | | 400,000 | | | | 19,964,000 | |
Green Mountain Coffee Roasters, Inc. (a) | | | 250,000 | | | | 18,895,000 | |
| Kellogg Co. | | | 150,000 | | | | 9,160,500 | |
| | | | | | | | 61,129,900 | |
| Household Products — 1.1% | | | | | | | | |
| Clorox Co. (The) | | | 150,000 | | | | 13,914,000 | |
| | | | | | | | | |
| Energy — 6.0% | | | | | | | | |
| Energy Equipment & Services — 2.6% | | | | | | | | |
| Halliburton Co. | | | 300,000 | | | | 15,225,000 | |
| Helmerich & Payne, Inc. | | | 216,000 | | | | 18,161,280 | |
| | | | | | | | 33,386,280 | |
| Oil, Gas & Consumable Fuels — 3.4% | | | | | | | | |
| Chevron Corp. | | | 171,000 | | | | 21,359,610 | |
| Exxon Mobil Corp. | | | 50,000 | | | | 5,060,000 | |
| HollyFrontier Corp. | | | 200,000 | | | | 9,938,000 | |
| Murphy Oil Corp. | | | 100,000 | | | | 6,488,000 | |
| | | | | | | | 42,845,610 | |
| Financials — 4.5% | | | | | | | | |
| Commercial Banks — 0.7% | | | | | | | | |
| Fifth Third Bancorp | | | 400,000 | | | | 8,412,000 | |
| | | | | | | | | |
| Consumer Finance — 1.5% | | | | | | | | |
| American Express Co. | | | 50,000 | | | | 4,536,500 | |
World Acceptance Corp. (a) | | | 174,000 | | | | 15,230,220 | |
| | | | | | | | 19,766,720 | |
Hussman Strategic Growth Fund Schedule of Investments (continued) |
December 31, 2013 (Unaudited) |
COMMON STOCKS — 101.0% (continued) | | | | | | |
| Financials — 4.5% (continued) | | | | | | |
| Insurance — 2.3% | | | | | | |
| Assurant, Inc. | | | 232,000 | | | $ | 15,397,840 | |
| Protective Life Corp. | | | 131,000 | | | | 6,636,460 | |
| Reinsurance Group of America, Inc. | | | 88,000 | | | | 6,812,080 | |
| | | | | | | | 28,846,380 | |
| Health Care — 26.0% | | | | | | | | |
| Biotechnology — 3.5% | | | | | | | | |
| Amgen, Inc. | | | 175,000 | | | | 19,978,000 | |
Harvard Apparatus Regenerative Technology, Inc. (a) | | | 232,500 | | | | 1,104,375 | |
| PDL BioPharma, Inc. | | | 1,052,000 | | | | 8,878,880 | |
United Therapeutics Corp. (a) | | | 134,000 | | | | 15,152,720 | |
| | | | | | | | 45,113,975 | |
| Health Care Equipment & Supplies — 7.2% | | | | | | | | |
| Baxter International, Inc. | | | 100,000 | | | | 6,955,000 | |
| Becton, Dickinson and Co. | | | 125,000 | | | | 13,811,250 | |
Cyberonics, Inc. (a) | | | 355,000 | | | | 23,256,050 | |
| Medtronic, Inc. | | | 250,000 | | | | 14,347,500 | |
| ResMed, Inc. | | | 235,000 | | | | 11,063,800 | |
| St. Jude Medical, Inc. | | | 350,000 | | | | 21,682,500 | |
| | | | | | | | 91,116,100 | |
| Health Care Providers & Services — 5.9% | | | | | | | | |
| Aetna, Inc. | | | 270,000 | | | | 18,519,300 | |
| Chemed Corp. | | | 61,000 | | | | 4,673,820 | |
| Humana, Inc. | | | 100,000 | | | | 10,322,000 | |
Laboratory Corp. of America Holdings (a) | | | 200,000 | | | | 18,274,000 | |
| UnitedHealth Group, Inc. | | | 100,000 | | | | 7,530,000 | |
WellCare Health Plans, Inc. (a) | | | 26,000 | | | | 1,830,920 | |
| WellPoint, Inc. | | | 150,000 | | | | 13,858,500 | |
| | | | | | | | 75,008,540 | |
| Life Sciences Tools & Services — 2.8% | | | | | | | | |
| Agilent Technologies, Inc. | | | 313,000 | | | | 17,900,470 | |
Harvard Bioscience, Inc. (a) | | | 930,000 | | | | 4,371,000 | |
Waters Corp. (a) | | | 135,000 | | | | 13,500,000 | |
| | | | | | | | 35,771,470 | |
| Pharmaceuticals — 6.6% | | | | | | | | |
| AbbVie, Inc. | | | 300,000 | | | | 15,843,000 | |
| GlaxoSmithKline plc - ADR | | | 400,000 | | | | 21,356,000 | |
| Johnson & Johnson | | | 100,000 | | | | 9,159,000 | |
Medicines Co. (The) (a) | | | 104,000 | | | | 4,016,480 | |
Mylan, Inc. (a) | | | 200,000 | | | | 8,680,000 | |
Hussman Strategic Growth Fund Schedule of Investments (continued) |
December 31, 2013 (Unaudited) |
COMMON STOCKS — 101.0% (continued) | | | | | | |
| Health Care — 26.0% (continued) | | | | | | |
| Pharmaceuticals — 6.6% (continued) | | | | | | |
| Novartis AG - ADR | | | 200,000 | | | $ | 16,076,000 | |
| Questcor Pharmaceuticals, Inc. | | | 150,000 | | | | 8,167,500 | |
| | | | | | | | 83,297,980 | |
| Industrials — 4.4% | | | | | | | | |
| Commercial Services & Supplies — 1.0% | | | | | | | | |
| Cintas Corp. | | | 225,000 | | | | 13,407,750 | |
| | | | | | | | | |
| Industrial Conglomerates — 1.7% | | | | | | | | |
| 3M Co. | | | 150,000 | | | | 21,037,500 | |
| | | | | | | | | |
| Machinery — 1.2% | | | | | | | | |
| Illinois Tool Works, Inc. | | | 175,000 | | | | 14,714,000 | |
| | | | | | | | | |
| Professional Services — 0.5% | | | | | | | | |
| Robert Half International, Inc. | | | 150,000 | | | | 6,298,500 | |
| | | | | | | | | |
| Information Technology — 27.6% | | | | | | | | |
| Communications Equipment — 3.1% | | | | | | | | |
| Cisco Systems, Inc. | | | 850,000 | | | | 19,082,500 | |
| Harris Corp. | | | 300,000 | | | | 20,943,000 | |
| | | | | | | | 40,025,500 | |
| Computers & Peripherals — 4.0% | | | | | | | | |
| NetApp, Inc. | | | 250,000 | | | | 10,285,000 | |
| Seagate Technology plc | | | 250,000 | | | | 14,040,000 | |
Synaptics, Inc. (a) | | | 275,000 | | | | 14,247,750 | |
| Western Digital Corp. | | | 150,000 | | | | 12,585,000 | |
| | | | | | | | 51,157,750 | |
| Electronic Equipment, Instruments & Components — 3.5% | | | | | | | | |
| Avnet, Inc. | | | 385,000 | | | | 16,982,350 | |
| FLIR Systems, Inc. | | | 650,000 | | | | 19,565,000 | |
Plexus Corp. (a) | | | 100,000 | | | | 4,329,000 | |
Sanmina Corp. (a) | | | 200,000 | | | | 3,340,000 | |
| | | | | | | | 44,216,350 | |
| Internet Software & Services — 2.3% | | | | | | | | |
| j2 Global, Inc. | | | 374,000 | | | | 18,703,740 | |
VistaPrint N.V. (a) | | | 177,000 | | | | 10,062,450 | |
| | | | | | | | 28,766,190 | |
Hussman Strategic Growth Fund Schedule of Investments (continued) |
December 31, 2013 (Unaudited) |
COMMON STOCKS — 101.0% (continued) | | | | | | |
| Information Technology — 27.6% (continued) | | | | | | |
| IT Services — 3.0% | | | | | | |
| Amdocs Ltd. | | | 144,000 | | | $ | 5,938,560 | |
| International Business Machines Corp. | | | 60,000 | | | | 11,254,200 | |
Sapient Corp. (a) | | | 453,000 | | | | 7,864,080 | |
| Western Union Co. (The) | | | 750,000 | | | | 12,937,500 | |
| | | | | | | | 37,994,340 | |
| Office Electronics — 0.3% | | | | | | | | |
Zebra Technologies Corp. - Class A (a) | | | 75,000 | | | | 4,056,000 | |
| | | | | | | | | |
| Semiconductors & Semiconductor Equipment — 6.2% | | | | | | | | |
| Avago Technologies Ltd. | | | 250,000 | | | | 13,222,500 | |
First Solar, Inc. (a) | | | 250,000 | | | | 13,660,000 | |
| Intel Corp. | | | 750,000 | | | | 19,470,000 | |
| NVIDIA Corp. | | | 500,000 | | | | 8,010,000 | |
SunEdison, Inc. (a) | | | 1,000,000 | | | | 13,050,000 | |
SunPower Corp. (a) | | | 400,000 | | | | 11,924,000 | |
| | | | | | | | 79,336,500 | |
| Software — 5.2% | | | | | | | | |
Adobe Systems, Inc. (a) | | | 225,000 | | | | 13,473,000 | |
| CA, Inc. | | | 476,000 | | | | 16,017,400 | |
| Microsoft Corp. | | | 550,000 | | | | 20,586,500 | |
| Open Text Corp. | | | 90,000 | | | | 8,276,400 | |
| Symantec Corp. | | | 300,000 | | | | 7,074,000 | |
| | | | | | | | 65,427,300 | |
| Materials — 0.5% | | | | | | | | |
| Metals & Mining — 0.5% | | | | | | | | |
| Barrick Gold Corp. | | | 200,000 | | | | 3,526,000 | |
| Newmont Mining Corp. | | | 100,000 | | | | 2,303,000 | |
| | | | | | | | 5,829,000 | |
| Utilities — 1.5% | | | | | | | | |
| Electric Utilities — 1.5% | | | | | | | | |
| Edison International | | | 250,000 | | | | 11,575,000 | |
| PPL Corp. | | | 250,000 | | | | 7,522,500 | |
| | | | | | | | 19,097,500 | |
| | | | | | | | | |
Total Common Stocks (Cost $1,091,739,090) | | | | | | $ | 1,282,245,965 | |
Hussman Strategic Growth Fund Schedule of Investments (continued) |
December 31, 2013 (Unaudited) |
PUT OPTION CONTRACTS — 1.0% | | | | | | |
| Nasdaq 100 Index Option, 03/22/2014 at $3,300 | | | 500 | | | $ | 1,253,000 | |
| Russell 2000 Index Option, 03/22/2014 at $1,100 | | | 1,500 | | | | 2,704,500 | |
| S&P 500 Index Option, 02/22/2014 at $1,800 | | | 5,000 | | | | 9,500,000 | |
Total Put Option Contracts (Cost $13,123,572) | | | | | | $ | 13,457,500 | |
CALL OPTION CONTRACTS — 0.3% | | | | | | |
| S&P 500 Index Option, 01/18/2014 at $1,870 (Cost $2,480,677) | | | 5,000 | | | $ | 3,700,000 | |
| | | | | | | | | |
Total Investments at Value — 102.3% (Cost $1,107,343,339) | | | | | | $ | 1,299,403,465 | |
MONEY MARKET FUNDS — 45.3% | | | | | | |
Federated U.S. Treasury Cash Reserves Fund - Institutional Shares, 0.00% (b) | | | 173,083,447 | | | $ | 173,083,447 | |
First American Treasury Obligations Fund - Class Y, 0.00% (b) | | | 401,447,973 | | | | 401,447,973 | |
Total Money Market Funds (Cost $574,531,420) | | | | | | $ | 574,531,420 | |
| | | | | | | | | |
| Total Investments and Money Market Funds at Value — 147.6% | | | | | | | | |
| (Cost $1,681,874,759) | | | | | | $ | 1,873,934,885 | |
| | | | | | | | | |
| Written Call Option Contracts — (46.8%) | | | | | | | (594,119,500 | ) |
| | | | | | | | | |
| Liabilities in Excess of Other Assets — (0.8%) | | | | | | | (10,449,161 | ) |
| | | | | | | | | |
| Net Assets — 100.0% | | | | | | $ | 1,269,366,224 | |
| ADR - American Depositary Receipt. |
| (a) | Non-income producing security. |
| (b) | The rate shown is the 7-day effective yield as of December 31, 2013. |
| See accompanying notes to financial statements. |
Hussman Strategic Growth Fund Schedule of Open Written Option Contracts |
December 31, 2013 (Unaudited) |
WRITTEN CALL OPTION CONTRACTS | | | | | | | | | |
| Nasdaq 100 Index Option, | | | | | | | | | |
| 03/22/2014 at $1,800 | | | 500 | | | $ | 89,173,000 | | | $ | 83,299,332 | |
| Russell 2000 Index Option, | | | | | | | | | | | | |
| 03/22/2014 at $620 | | | 1,500 | | | | 81,046,500 | | | | 75,065,497 | |
| S&P 500 Index Option, | | | | | | | | | | | | |
| 01/18/2014 at $1,000 | | | 5,000 | | | | 423,900,000 | | | | 401,243,324 | |
| Total Written Call Option Contracts | | | | | | $ | 594,119,500 | | | $ | 559,608,153 | |
| See accompanying notes to financial statements. |
Hussman Strategic Total Return Fund Schedule of Investments |
December 31, 2013 (Unaudited) |
| | | | | | |
Energy — 0.0% (a) | | | | | | |
Oil, Gas & Consumable Fuels — 0.0% (a) | | | | | | |
| NuStar Energy L.P. | | | 1,000 | | | $ | 50,990 | |
| ONEOK Partners L.P. | | | 1,000 | | | | 52,650 | |
| Williams Partners L.P. | | | 1,000 | | | | 50,860 | |
| | | | | | | | 154,500 | |
| Materials — 6.0% | | | | | | | | |
| Metals & Mining — 6.0% | | | | | | | | |
| Agnico-Eagle Mines Ltd. | | | 300,000 | | | | 7,914,000 | |
| AngloGold Ashanti Ltd. - ADR | | | 500,000 | | | | 5,860,000 | |
| Barrick Gold Corp. | | | 600,000 | | | | 10,578,000 | |
| Compañía de Minas Buenaventura S.A. - ADR | | | 100,000 | | | | 1,122,000 | |
| Gold Fields Ltd. - ADR | | | 250,000 | | | | 800,000 | |
| Goldcorp, Inc. | | | 25,000 | | | | 541,750 | |
| Harmony Gold Mining Co. Ltd. - ADR | | | 500,000 | | | | 1,265,000 | |
| Newmont Mining Corp. | | | 400,000 | | | | 9,212,000 | |
| Randgold Resources Ltd. - ADR | | | 60,000 | | | | 3,768,600 | |
| Sibanye Gold Ltd. - ADR | | | 119,000 | | | | 572,390 | |
Stillwater Mining Co. (b) | | | 10,000 | | | | 123,400 | |
| | | | | | | | 41,757,140 | |
| Utilities — 3.3% | | | | | | | | |
| Electric Utilities — 2.5% | | | | | | | | |
| American Electric Power Co., Inc. | | | 50,000 | | | | 2,337,000 | |
| Duke Energy Corp. | | | 333 | | | | 22,981 | |
| Edison International | | | 1,000 | | | | 46,300 | |
| Entergy Corp. | | | 75,000 | | | | 4,745,250 | |
| Exelon Corp. | | | 150,000 | | | | 4,108,500 | |
| FirstEnergy Corp. | | | 1,000 | | | | 32,980 | |
| NextEra Energy, Inc. | | | 1,000 | | | | 85,620 | |
| Pepco Holdings, Inc. | | | 1,000 | | | | 19,130 | |
| Pinnacle West Capital Corp. | | | 1,000 | | | | 52,920 | |
| PPL Corp. | | | 200,000 | | | | 6,018,000 | |
| UNS Energy Corp. | | | 1,000 | | | | 59,850 | |
| | | | | | | | 17,528,531 | |
| Multi-Utilities — 0.8% | | | | | | | | |
| Ameren Corp. | | | 1,000 | | | | 36,160 | |
| Dominion Resources, Inc. | | | 1,000 | | | | 64,690 | |
| DTE Energy Co. | | | 1,000 | | | | 66,390 | |
| PG&E Corp. | | | 50,000 | | | | 2,014,000 | |
| Public Service Enterprise Group, Inc. | | | 100,000 | | | | 3,204,000 | |
Hussman Strategic Total Return Fund Schedule of Investments (continued) |
December 31, 2013 (Unaudited) |
COMMON STOCKS — 9.3% (continued) | | | | | | |
| Utilities — 3.3% (continued) | | | | | | |
| Multi-Utilities — 0.8% (continued) | | | | | | |
| SCANA Corp. | | | 1,000 | | | $ | 46,930 | |
| TECO Energy, Inc. | | | 1,000 | | | | 17,240 | |
| | | | | | | | 5,449,410 | |
| | | | | | | | | |
Total Common Stocks (Cost $67,458,988) | | | | | | $ | 64,889,581 | |
U.S. TREASURY OBLIGATIONS — 79.9% | | | | | | |
| U.S. Treasury Inflation-Protected Notes — 6.3% | | | | | | |
| 2.00%, due 07/15/2014 | | $ | 30,977,500 | | | $ | 31,679,326 | |
| 2.50%, due 01/15/2029 | | | 10,878,700 | | | | 12,801,173 | |
| | | | | | | | 44,480,499 | |
| U.S. Treasury Notes — 73.6% | | | | | | | | |
| 1.75%, due 05/15/2022 | | | 100,000,000 | | | | 92,484,400 | |
| 1.625%, due 11/15/2022 | | | 200,000,000 | | | | 180,554,600 | |
| 2.50%, due 08/15/2023 | | | 50,000,000 | | | | 48,021,500 | |
| 2.75%, due 11/15/2023 | | | 200,000,000 | | | | 195,671,800 | |
| | | | | | | | 516,732,300 | |
| | | | | | | | | |
Total U.S. Treasury Obligations (Cost $586,947,101) | | | | | | $ | 561,212,799 | |
EXCHANGE-TRADED FUNDS — 1.8% | | | | | | |
iShares Gold Trust (b) | | | 150,000 | | | $ | 1,752,000 | |
| SPDR DB International Government Inflation-Protected Bond ETF | | | 160,000 | | | | 9,352,000 | |
SPDR Gold Trust (b) | | | 15,000 | | | | 1,742,550 | |
Total Exchange-Traded Funds (Cost $10,884,365) | | | | | | $ | 12,846,550 | |
| | | | | | | | | |
Total Investments at Value — 91.0% (Cost $665,290,454) | | | | | | $ | 638,948,930 | |
Hussman Strategic Total Return Fund Schedule of Investments (continued) |
December 31, 2013 (Unaudited) |
MONEY MARKET FUNDS — 9.7% | | | | | | |
Federated U.S. Treasury Cash Reserves Fund - Institutional Shares, 0.00% (c) | | | 20,348,896 | | | $ | 20,348,896 | |
First American Treasury Obligations Fund - Class Y, 0.00% (c) | | | 47,480,754 | | | | 47,480,754 | |
Total Money Market Funds (Cost $67,829,650) | | | | | | $ | 67,829,650 | |
| | | | | | | | | |
| Total Investments and Money Market Funds at Value — 100.7% | | | | | | | | |
| (Cost $733,120,104) | | | | | | $ | 706,778,580 | |
| | | | | | | | | |
| Liabilities in Excess of Other Assets — (0.7%) | | | | | | | (4,650,326 | ) |
| | | | | | | | | |
| Net Assets — 100.0% | | | | | | $ | 702,128,254 | |
| ADR - American Depositary Receipt. |
| (a) | Percentage rounds to less than 0.1%. |
| (b) | Non-income producing security. |
| (c) | The rate shown is the 7-day effective yield as of December 31, 2013. |
| See accompanying notes to financial statements. |
Hussman Strategic International Fund Schedule of Investments |
December 31, 2013 (Unaudited) |
| | | | | | |
| Australia — 1.7% | | | | | | |
Cochlear Ltd. (a) | | | 3,000 | | | $ | 158,075 | |
Seven West Media Ltd. (a) | | | 325,000 | | | | 684,893 | |
Sonic Healthcare Ltd. (a) | | | 63,000 | | | | 935,030 | |
| | | | | | | | 1,777,998 | |
| Austria — 0.7% | | | | | | | | |
| OMV AG | | | 15,000 | | | | 717,961 | |
| | | | | | | | | |
| Belgium — 0.6% | | | | | | | | |
Colruyt S.A. (a) | | | 12,000 | | | | 670,529 | |
| | | | | | | | | |
| Canada — 4.0% | | | | | | | | |
| Gildan Activewear, Inc. | | | 22,000 | | | | 1,172,436 | |
| MacDonald, Dettwiler and Associates Ltd. | | | 10,000 | | | | 774,770 | |
| Pizza Pizza Royalty Corp. | | | 10,000 | | | | 125,206 | |
| Shaw Communications, Inc. - Class B | | | 48,000 | | | | 1,168,087 | |
| Transcontinental, Inc. - Class A | | | 15,000 | | | | 206,449 | |
| WestJet Airlines Ltd. | | | 30,000 | | | | 786,538 | |
| | | | | | | | 4,233,486 | |
| China — 1.7% | | | | | | | | |
| Mindray Medical International Ltd. - ADR | | | 22,500 | | | | 818,100 | |
| NetEase.com, Inc. - ADR | | | 8,000 | | | | 628,800 | |
WuXi PharmaTech (Cayman), Inc. - ADR (b) | | | 10,000 | | | | 383,800 | |
| | | | | | | | 1,830,700 | |
| Finland — 1.4% | | | | | | | | |
| Atria plc | | | 16,860 | | | | 179,305 | |
Lassila & Tikanoja Oyj (a) (b) | | | 45,000 | | | | 942,339 | |
Tieto Oyj (a) | | | 15,000 | | | | 339,750 | |
| | | | | | | | 1,461,394 | |
| France — 6.1% | | | | | | | | |
Albioma S.A. (a) | | | 12,090 | | | | 280,404 | |
Alten (a) | | | 25,000 | | | | 1,135,132 | |
Bouygues S.A. (a) | | | 15,000 | | | | 567,278 | |
Casino Guichard-Perrachon S.A. (a) | | | 7,500 | | | | 865,458 | |
Électricité de France S.A. (a) | | | 15,000 | | | | 530,696 | |
| Infotel S.A. | | | 3,066 | | | | 297,594 | |
Metropole Television S.A. (a) | | | 12,500 | | | | 286,295 | |
Neopost S.A. (a) | | | 14,000 | | | | 1,080,424 | |
| Norbert Dentressangle S.A. | | | 2,000 | | | | 257,274 | |
| Sanofi - ADR | | | 22,100 | | | | 1,185,223 | |
| | | | | | | | 6,485,778 | |
Hussman Strategic International Fund Schedule of Investments (continued) |
December 31, 2013 (Unaudited) |
COMMON STOCKS — 54.6% (continued) | | | | | | |
| Germany — 1.6% | | | | | | |
Deutsche Telekom AG (a) | | | 60,000 | | | $ | 1,033,887 | |
Wincor Nixdorf AG (a) | | | 10,000 | | | | 694,191 | |
| | | | | | | | 1,728,078 | |
| India — 0.4% | | | | | | | | |
| Wipro Ltd. - ADR | | | 30,718 | | | | 386,740 | |
| | | | | | | | | |
| Italy — 1.3% | | | | | | | | |
Atlantia S.P.A. (a) | | | 35,000 | | | | 784,052 | |
Società Iniziative Autostradali e Servizi S.P.A. (a) | | | 60,000 | | | | 596,865 | |
| | | | | | | | 1,380,917 | |
| Japan — 11.4% | | | | | | | | |
ABC-MART, Inc. (a) | | | 20,000 | | | | 873,893 | |
Central Japan Railway Co. (a) | | | 3,500 | | | | 412,541 | |
DISCO Corp. (a) | | | 10,000 | | | | 663,825 | |
KDDI Corp. (a) | | | 19,000 | | | | 1,170,857 | |
K's Holdings Corp. (a) | | | 14,000 | | | | 404,633 | |
Mochida Pharmaceutical Co. Ltd. (a) | | | 10,000 | | | | 594,557 | |
Nitori Holdings Co. Ltd. (a) | | | 2,000 | | | | 189,381 | |
Nomura Research Institute Ltd. (a) | | | 20,000 | | | | 632,147 | |
Ricoh Co. Ltd. (a) | | | 50,000 | | | | 531,817 | |
Shionogi & Co. Ltd. (a) | | | 40,000 | | | | 868,511 | |
SoftBank Corp. (a) | | | 10,000 | | | | 877,633 | |
Sogo Medical Co. Ltd. (a) | | | 15,000 | | | | 571,323 | |
Sugi Holdings Co. Ltd. (a) | | | 23,000 | | | | 934,504 | |
Sundrug Co. Ltd. (a) | | | 25,000 | | | | 1,116,867 | |
Takeda Pharmaceutical Co. Ltd. (a) | | | 10,500 | | | | 481,652 | |
Toppan Forms Co. Ltd. (a) | | | 66,900 | | | | 613,843 | |
Trend Micro, Inc. (a) | | | 15,000 | | | | 525,722 | |
Yamada Denki Co. Ltd. (a) | | | 100,000 | | | | 327,144 | |
YAOKO Co. Ltd. (a) | | | 8,600 | | | | 338,571 | |
| | | | | | | | 12,129,421 | |
| Netherlands — 1.0% | | | | | | | | |
| Reed Elsevier N.V. - ADR | | | 15,100 | | | | 644,317 | |
Ziggo N.V. (a) | | | 10,000 | | | | 457,314 | |
| | | | | | | | 1,101,631 | |
| New Zealand — 0.9% | | | | | | | | |
| Telecom Corp. of New Zealand Ltd. - ADR | | | 92,500 | | | | 876,530 | |
Warehouse Group Ltd. (The) (a) | | | 13,442 | | | | 41,387 | |
| | | | | | | | 917,917 | |
Hussman Strategic International Fund Schedule of Investments (continued) |
December 31, 2013 (Unaudited) |
COMMON STOCKS — 54.6% (continued) | | | | | | |
| Norway — 0.9% | | | | | | |
| Ekornes ASA | | | 5,000 | | | $ | 67,811 | |
| Tomra Systems ASA | | | 95,000 | | | | 885,045 | |
| | | | | | | | 952,856 | |
| Portugal — 0.5% | | | | | | | | |
EDP Energias de Portugal S.A. (a) | | | 150,000 | | | | 551,004 | |
| | | | | | | | | |
| Spain — 4.7% | | | | | | | | |
EDP Renovàveis S.A. (a) | | | 125,000 | | | | 664,013 | |
Enagas S.A. (a) | | | 40,000 | | | | 1,044,950 | |
Iberdrola S.A. (a) | | | 175,000 | | | | 1,116,889 | |
Indra Sistemas S.A. (a) | | | 70,000 | | | | 1,171,875 | |
Red Electrica Corp. S.A. (a) | | | 15,000 | | | | 1,001,468 | |
| | | | | | | | 4,999,195 | |
| Sweden — 0.8% | | | | | | | | |
| Axfood AB | | | 6,500 | | | | 326,144 | |
Clas Ohlson AB - B Shares (a) | | | 30,000 | | | | 562,996 | |
| | | | | | | | 889,140 | |
| Switzerland — 2.1% | | | | | | | | |
Lonza Group AG (a) (b) | | | 12,000 | | | | 1,140,347 | |
| Novartis AG - ADR | | | 14,000 | | | | 1,125,320 | |
| | | | | | | | 2,265,667 | |
| Taiwan — 0.9% | | | | | | | | |
| Taiwan Semiconductor Manufacturing Co. Ltd. - ADR | | | 55,000 | | | | 959,200 | |
| | | | | | | | | |
| United Kingdom — 11.9% | | | | | | | | |
Admiral Group plc (a) | | | 48,000 | | | | 1,043,443 | |
| AstraZeneca plc - ADR | | | 21,500 | | | | 1,276,455 | |
| British Sky Broadcasting Group plc | | | 70,000 | | | | 978,389 | |
| GlaxoSmithKline plc - ADR | | | 23,500 | | | | 1,254,665 | |
Inmarsat plc (a) | | | 60,000 | | | | 752,337 | |
J Sainsbury plc (a) | | | 180,000 | | | | 1,089,460 | |
| J.D. Wetherspoon plc | | | 26,849 | | | | 338,586 | |
Marks & Spencer Group plc (a) | | | 40,000 | | | | 287,251 | |
| National Grid plc - ADR | | | 10,500 | | | | 685,860 | |
| Reckitt Benckiser Group plc - ADR | | | 75,000 | | | | 1,206,750 | |
| Smith & Nephew plc - ADR | | | 19,500 | | | | 1,398,930 | |
SSE plc (a) | | | 35,000 | | | | 795,391 | |
Tesco plc (a) | | | 190,000 | | | | 1,055,192 | |
William Morrison Supermarkets plc (a) | | | 80,000 | | | | 346,324 | |
Hussman Strategic International Fund Schedule of Investments (continued) |
December 31, 2013 (Unaudited) |
COMMON STOCKS — 54.6% (continued) | | | | | | |
| United Kingdom — 11.9% (continued) | | | | | | |
WS Atkins plc (a) | | | 10,000 | | | $ | 234,904 | |
| | | | | | | | 12,743,937 | |
| | | | | | | | | |
Total Common Stocks (Cost $47,988,844) | | | | | | $ | 58,183,549 | |
EXCHANGE-TRADED FUNDS — 8.2% | | | | | | |
| iShares MSCI Belgium Index Fund | | | 107,000 | | | $ | 1,753,719 | |
| iShares MSCI Germany Index Fund | | | 55,000 | | | | 1,746,800 | |
| iShares MSCI Netherlands Index Fund | | | 68,000 | | | | 1,763,240 | |
| iShares MSCI Sweden Index Fund | | | 49,500 | | | | 1,773,585 | |
| iShares MSCI Switzerland Index Fund | | | 52,500 | | | | 1,731,975 | |
Total Exchange-Traded Funds (Cost $7,927,293) | | | | | | $ | 8,769,319 | |
PUT OPTION CONTRACTS — 0.0% (c) | | | | | | |
| S&P 500 Index Option, 03/22/2014 at $1,150 (Cost $4,864) | | | 85 | | | $ | 6,800 | |
| | | | | | | | | |
Total Investments at Value — 62.8% (Cost $55,921,001) | | | | | | $ | 66,959,668 | |
Hussman Strategic International Fund Schedule of Investments (continued) |
December 31, 2013 (Unaudited) |
MONEY MARKET FUNDS — 35.7% | | | | | | |
Northern Institutional Treasury Portfolio, 0.01% (d)
(Cost $38,001,332) | | | 38,001,332 | | | $ | 38,001,332 | |
| | | | | | | | | |
| Total Investments and Money Market Funds at Value — 98.5% | | | | | | | | |
| (Cost $93,922,333) | | | | | | $ | 104,961,000 | |
| | | | | | | | | |
| Written Call Options — (5.5%) | | | | | | | (5,887,100 | ) |
| | | | | | | | | |
Other Assets in Excess of Liabilities — 7.0% | | | | | | | 7,494,240 | |
| | | | | | | | | |
| Net Assets — 100.0% | | | | | | $ | 106,568,140 | |
| ADR - American Depositary Receipt. |
| (a) | Fair value priced (Note 1). Fair valued securities totaled $37,071,264 at December 31, 2013, representing 34.8% of net assets. |
| (b) | Non-income producing security. |
| (c) | Percentage rounds to less than 0.1%. |
| (d) | The rate shown is the 7-day effective yield as of December 31, 2013. |
| See accompanying notes to financial statements. |
Hussman Strategic International Fund Summary of Common Stocks by Sector and Industry |
December 31, 2013 (Unaudited) |
| |
| Consumer Discretionary — 7.6% | | |
| Hotels, Restaurants & Leisure | 0.4% |
| Household Durables | 0.1% |
| Media | 3.5% |
| Multiline Retail | 0.3% |
| Specialty Retail | 2.2% |
| Textiles, Apparel & Luxury Goods | 1.1% |
| Consumer Staples — 8.2% | | |
| Food & Staples Retailing | 6.9% |
| Food Products | 0.2% |
| Household Products | 1.1% |
| Energy — 0.7% | | |
| Oil, Gas & Consumable Fuels | 0.7% |
| Financials — 1.0% | | |
| Insurance | 1.0% |
| Health Care — 10.9% | | |
| Health Care Equipment & Supplies | 2.2% |
| Health Care Providers & Services | 0.9% |
| Life Sciences Tools & Services | 1.4% |
| Pharmaceuticals | 6.4% |
| Industrials — 5.4% | | |
| Air Freight & Logistics | 0.3% |
| Airlines | 0.7% |
| Commercial Services & Supplies | 2.5% |
| Professional Services | 0.2% |
| Road & Rail | 0.4% |
| Transportation Infrastructure | 1.3% |
| Information Technology — 10.0% | | |
| Computers & Peripherals | 0.7% |
| Internet Software & Services | 1.4% |
| IT Services | 2.8% |
| Office Electronics | 1.5% |
| Semiconductors & Semiconductor Equipment | 1.5% |
| Software | 2.1% |
| Materials — 0.5% | | |
| Construction Materials | 0.5% |
| Telecommunication Services — 4.0% | | |
| Diversified Telecommunication Services | 2.9% |
| Wireless Telecommunication Services | 1.1% |
| Utilities — 6.3% | | |
| Electric Utilities | 3.8% |
| Gas Utilities | 1.0% |
| Independent Power Producers & Energy Traders | 0.9% |
| Multi-Utilities | |
| | | |
| See accompanying notes to financial statements. |
Hussman Strategic International Fund Schedule of Futures Contracts |
December 31, 2013 (Unaudited) |
| | | | | | Aggregate Market Value of Contracts | | | | |
| Dollar Index Future | 03/17/2014 | | | 150 | | | $ | 12,042,750 | | | $ | (77,375 | ) |
| See accompanying notes to financial statements. |
Hussman Strategic International Fund Schedule of Open Written Option Contracts |
December 31, 2013 (Unaudited) |
WRITTEN CALL OPTION CONTRACTS | | | | | | | | | |
| S&P 500 Index Option, | | | | | | | | | |
| 03/22/2014 at $1,150 | | | 85 | | | $ | 5,887,100 | | | $ | 5,414,562 | |
| See accompanying notes to financial statements. |
Hussman Strategic International Fund Schedule of Futures Contracts Sold Short |
December 31, 2013 (Unaudited) |
FUTURES CONTRACTS SOLD SHORT | | | | | | Aggregate Market Value of Contracts | | | | |
| Euro STOXX 50 Index Future | 03/21/2014 | | | 800 | | | $ | 34,207,883 | | | $ | (1,721,176 | ) |
| FTSE 100 Index Future | 03/21/2014 | | | 150 | | | | 16,636,996 | | | | (599,404 | ) |
Total Futures Contracts Sold Short | | | | | | �� | $ | 50,844,879 | | | $ | (2,320,580 | ) |
| See accompanying notes to financial statements. |
Hussman Strategic Dividend Value Fund Schedule of Investments |
December 31, 2013 (Unaudited) |
| | | | | | |
| Consumer Discretionary — 16.7% | | | | | | |
| Hotels, Restaurants & Leisure — 3.5% | | | | | | |
| Carnival Corp. | | | 8,000 | | | $ | 321,360 | |
| Darden Restaurants, Inc. | | | 5,500 | | | | 299,035 | |
| McDonald's Corp. | | | 5,000 | | | | 485,150 | |
| | | | | | | | 1,105,545 | |
| Household Durables — 0.2% | | | | | | | | |
| Koss Corp. | | | 15,000 | | | | 76,875 | |
| | | | | | | | | |
| Internet & Catalog Retail — 1.1% | | | | | | | | |
| PetMed Express, Inc. | | | 20,000 | | | | 332,600 | |
| | | | | | | | | |
| Media — 5.4% | | | | | | | | |
| Gannett Co., Inc. | | | 13,000 | | | | 384,540 | |
| Harte-Hanks, Inc. | | | 55,500 | | | | 434,010 | |
| John Wiley & Sons, Inc. - Class A | | | 7,200 | | | | 397,440 | |
| Valassis Communications, Inc. | | | 14,000 | | | | 479,500 | |
| | | | | | | | 1,695,490 | |
| Multiline Retail — 2.9% | | | | | | | | |
| Kohl's Corp. | | | 8,300 | | | | 471,025 | |
| Target Corp. | | | 7,000 | | | | 442,890 | |
| | | | | | | | 913,915 | |
| Specialty Retail — 1.9% | | | | | | | | |
| American Eagle Outfitters, Inc. | | | 20,000 | | | | 288,000 | |
| Staples, Inc. | | | 19,500 | | | | 309,855 | |
| | | | | | | | 597,855 | |
| Textiles, Apparel & Luxury Goods — 1.7% | | | | | | | | |
| Coach, Inc. | | | 9,500 | | | | 533,235 | |
| | | | | | | | | |
| Consumer Staples — 14.4% | | | | | | | | |
| Beverages — 4.7% | | | | | | | | |
| Coca-Cola Co. (The) | | | 12,000 | | | | 495,720 | |
| Dr Pepper Snapple Group, Inc. | | | 10,000 | | | | 487,200 | |
| PepsiCo, Inc. | | | 5,825 | | | | 483,125 | |
| | | | | | | | 1,466,045 | |
| Food & Staples Retailing — 3.6% | | | | | | | | |
| Safeway, Inc. | | | 15,000 | | | | 488,550 | |
| Sysco Corp. | | | 3,000 | | | | 108,300 | |
| Wal-Mart Stores, Inc. | | | 6,700 | | | | 527,223 | |
| | | | | | | | 1,124,073 | |
Hussman Strategic Dividend Value Fund Schedule of Investments (continued) |
December 31, 2013 (Unaudited) |
COMMON STOCKS — 76.1% (continued) | | | | | | |
| Consumer Staples — 14.4% (continued) | | | | | | |
| Food Products — 2.7% | | | | | | |
| Campbell Soup Co. | | | 10,500 | | | $ | 454,440 | |
| General Mills, Inc. | | | 8,000 | | | | 399,280 | |
| | | | | | | | 853,720 | |
| Household Products — 3.4% | | | | | | | | |
| Clorox Co. (The) | | | 6,000 | | | | 556,560 | |
| Procter & Gamble Co. (The) | | | 6,500 | | | | 529,165 | |
| | | | | | | | 1,085,725 | |
| Energy — 7.6% | | | | | | | | |
| Energy Equipment & Services — 2.2% | | | | | | | | |
| Ensco plc - Class A | | | 8,000 | | | | 457,440 | |
| Transocean Ltd. | | | 5,000 | | | | 247,100 | |
| | | | | | | | 704,540 | |
| Oil, Gas & Consumable Fuels — 5.4% | | | | | | | | |
| BP plc - ADR | | | 2,600 | | | | 126,386 | |
| Chevron Corp. | | | 3,000 | | | | 374,730 | |
| Exxon Mobil Corp. | | | 5,600 | | | | 566,720 | |
| HollyFrontier Corp. | | | 7,000 | | | | 347,830 | |
| Kinder Morgan, Inc. | | | 7,500 | | | | 270,000 | |
| | | | | | | | 1,685,666 | |
| Financials — 1.0% | | | | | | | | |
| Insurance — 1.0% | | | | | | | | |
| Aflac, Inc. | | | 5,000 | | | | 334,000 | |
| | | | | | | | | |
| Health Care — 10.7% | | | | | | | | |
| Biotechnology — 0.9% | | | | | | | | |
| PDL BioPharma, Inc. | | | 35,000 | | | | 295,400 | |
| | | | | | | | | |
| Health Care Equipment & Supplies — 2.5% | | | | | | | | |
| Baxter International, Inc. | | | 7,450 | | | | 518,148 | |
| Meridian Bioscience, Inc. | | | 10,000 | | | | 265,300 | |
| | | | | | | | 783,448 | |
| Health Care Providers & Services — 0.7% | | | | | | | | |
| National HealthCare Corp. | | | 4,000 | | | | 215,640 | |
| | | | | | | | | |
| Health Care Technology — 0.2% | | | | | | | | |
| Quality Systems, Inc. | | | 3,000 | | | | 63,180 | |
| | | | | | | | | |
Hussman Strategic Dividend Value Fund Schedule of Investments (continued) |
December 31, 2013 (Unaudited) |
COMMON STOCKS — 76.1% (continued) | | | | | | |
| Health Care — 10.7% (continued) | | | | | | |
| Pharmaceuticals — 6.4% | | | | | | |
| AbbVie, Inc. | | | 3,250 | | | $ | 171,632 | |
| AstraZeneca plc - ADR | | | 6,500 | | | | 385,905 | |
| Eli Lilly & Co. | | | 10,000 | | | | 510,000 | |
| Johnson & Johnson | | | 2,650 | | | | 242,714 | |
| Merck & Co., Inc. | | | 2,625 | | | | 131,381 | |
| Novartis AG - ADR | | | 7,200 | | | | 578,736 | |
| | | | | | | | 2,020,368 | |
| Industrials — 0.4% | | | | | | | | |
| Aerospace & Defense — 0.4% | | | | | | | | |
| Raytheon Co. | | | 1,400 | | | | 126,980 | |
| | | | | | | | | |
| Information Technology — 19.3% | | | | | | | | |
| Communications Equipment — 1.0% | | | | | | | | |
| Cisco Systems, Inc. | | | 13,300 | | | | 298,585 | |
| | | | | | | | | |
| Electronic Equipment, Instruments & Components — 0.6% | | | | | | | | |
| Corning, Inc. | | | 10,000 | | | | 178,200 | |
| | | | | | | | | |
| IT Services — 5.2% | | | | | | | | |
| CSG Systems International, Inc. | | | 15,000 | | | | 441,000 | |
| Leidos Holdings, Inc. | | | 7,500 | | | | 348,675 | |
| ManTech International Corp. - Class A | | | 14,000 | | | | 419,020 | |
| Western Union Co. (The) | | | 25,000 | | | | 431,250 | |
| | | | | | | | 1,639,945 | |
| Office Electronics — 1.4% | | | | | | | | |
| CANON, Inc. - ADR | | | 14,000 | | | | 448,000 | |
| | | | | | | | | |
| Semiconductors & Semiconductor Equipment — 5.8% | | | | | | | | |
| Analog Devices, Inc. | | | 2,000 | | | | 101,860 | |
| Intel Corp. | | | 22,000 | | | | 571,120 | |
| KLA-Tencor Corp. | | | 6,300 | | | | 406,098 | |
| Maxim Integrated Products, Inc. | | | 17,000 | | | | 474,470 | |
| Microchip Technology, Inc. | | | 6,000 | | | | 268,500 | |
| | | | | | | | 1,822,048 | |
| Software — 5.3% | | | | | | | | |
| CA, Inc. | | | 15,000 | | | | 504,750 | |
| ClickSoftware Technologies Ltd. | | | 17,500 | | | | 131,250 | |
| EPIQ Systems, Inc. | | | 30,000 | | | | 486,300 | |
| Microsoft Corp. | | | 15,000 | | | | 561,450 | |
| | | | | | | | 1,683,750 | |
Hussman Strategic Dividend Value Fund Schedule of Investments (continued) |
December 31, 2013 (Unaudited) |
COMMON STOCKS — 76.1% (continued) | | | | | | |
| Materials — 4.4% | | | | | | |
| Chemicals — 2.8% | | | | | | |
| BASF SE - ADR | | | 3,300 | | | $ | 355,707 | |
| Kronos Worldwide, Inc. | | | 7,500 | | | | 142,875 | |
| Potash Corp. of Saskatchewan, Inc. | | | 12,000 | | | | 395,520 | |
| | | | | | | | 894,102 | |
| Metals & Mining — 1.6% | | | | | | | | |
| AMCOL International Corp. | | | 7,500 | | | | 254,850 | |
| Newmont Mining Corp. | | | 10,000 | | | | 230,300 | |
| | | | | | | | 485,150 | |
| Utilities — 1.6% | | | | | | | | |
| Electric Utilities — 0.8% | | | | | | | | |
| Entergy Corp. | | | 4,100 | | | | 259,407 | |
| | | | | | | | | |
| Water Utilities — 0.8% | | | | | | | | |
| Consolidated Water Co. Ltd. | | | 17,000 | | | | 239,700 | |
| | | | | | | | | |
Total Common Stocks (Cost $21,435,459) | | | | | | $ | 23,963,187 | |
PUT OPTION CONTRACTS — 0.0% (a) | | | | | | |
| S&P 500 Index Option, 03/22/2014 at $1,280 (Cost $9,534) | | | 63 | | | $ | 5,670 | |
| | | | | | | | | |
Total Investments at Value — 76.1% (Cost $21,444,993) | | | | | | $ | 23,968,857 | |
Hussman Strategic Dividend Value Fund Schedule of Investments (continued) |
December 31, 2013 (Unaudited) |
MONEY MARKET FUNDS — 34.7% | | | | | | |
Federated U.S. Treasury Cash Reserves Fund - Institutional Shares, 0.00% (b) | | | 3,280,655 | | | $ | 3,280,655 | |
First American Treasury Obligations Fund - Class Y, 0.00% (b) | | | 7,654,860 | | | | 7,654,860 | |
Total Money Market Funds (Cost $10,935,515) | | | | | | $ | 10,935,515 | |
| | | | | | | | | |
| Total Investments and Money Market Funds at Value — 110.8% | | | | | | | | |
| (Cost $32,380,508) | | | | | | $ | 34,904,372 | |
| | | | | | | | | |
| Written Call Option Contracts — (11.2%) | | | | | | | (3,546,270 | ) |
| | | | | | | | | |
| Other Assets in Excess of Liabilities — 0.4% | | | | | | | 134,882 | |
| | | | | | | | | |
| Net Assets — 100.0% | | | | | | $ | 31,492,984 | |
| ADR - American Depositary Receipt. |
| (a) | Percentage rounds to less than 0.1%. |
| (b) | The rate shown is the 7-day effective yield as of December 31, 2013. |
| See accompanying notes to financial statements. |
Hussman Strategic Dividend Value Fund Schedule of Open Written Option Contracts |
December 31, 2013 (Unaudited) |
WRITTEN CALL OPTION CONTRACTS | | | | | | | | | |
| S&P 500 Index Option, | | | | | | | | | |
| 03/22/2014 at $1,280 | | | 63 | | | $ | 3,546,270 | | | $ | 3,194,316 | |
| See accompanying notes to financial statements. |
Hussman Investment Trust Statements of Assets and Liabilities |
December 31, 2013 (Unaudited) |
| | | Hussman Strategic Growth Fund | | | Hussman Strategic Total Return Fund | |
| ASSETS | | | | | | |
| Investments in securities: | | | | | | |
| At acquisition cost | | $ | 1,107,343,339 | | | $ | 665,290,454 | |
| At value (Note 1) | | $ | 1,299,403,465 | | | $ | 638,948,930 | |
| Investments in money market funds | | | 574,531,420 | | | | 67,829,650 | |
| Cash | | | 75,000 | | | | — | |
| Dividends and interest receivable | | | 1,202,224 | | | | 2,373,600 | |
| Receivable for capital shares sold | | | 1,110,754 | | | | 117,281 | |
| Other assets | | | 105,296 | | | | 55,421 | |
| Total Assets | | | 1,876,428,159 | | | | 709,324,882 | |
| | | | | | | | | |
| LIABILITIES | | | | | | | | |
| Dividends payable | | | 2,810,956 | | | | 109,819 | |
Written call options, at value (Notes 1 and 4)
(premiums received $559,608,153) | | | 594,119,500 | | | | — | |
| Payable for capital shares redeemed | | | 8,855,183 | | | | 6,651,512 | |
| Accrued investment advisory fees (Note 3) | | | 922,391 | | | | 246,596 | |
| Payable to administrator (Note 3) | | | 156,880 | | | | 80,690 | |
| Other accrued expenses | | | 197,025 | | | | 108,011 | |
| Total Liabilities | | | 607,061,935 | | | | 7,196,628 | |
| NET ASSETS | | $ | 1,269,366,224 | | | $ | 702,128,254 | |
| | | | | | | | | |
| Net assets consist of: | | | | | | | | |
| Paid-in capital | | $ | 3,060,350,538 | | | $ | 828,380,036 | |
| Accumulated undistributed net investment income | | | 149,877 | | | | 1,967,399 | |
Accumulated net realized losses from
security transactions and option contracts | | | (1,948,682,970 | ) | | | (101,877,657 | ) |
| Net unrealized appreciation (depreciation) on: | | | | | | | | |
| Investment securities | | | 190,506,875 | | | | (26,341,524 | ) |
| Option contracts | | | (32,958,096 | ) | | | — | |
| NET ASSETS | | $ | 1,269,366,224 | | | $ | 702,128,254 | |
| | | | | | | | | |
Shares of beneficial interest outstanding (unlimited number of shares
authorized, no par value) | | | 128,391,147 | | | | 63,966,404 | |
Net asset value, offering price and redemption price per share(a) (Note 1) | | $ | 9.89 | | | $ | 10.98 | |
| (a) | Redemption fee may apply to redemptions of shares held for 60 days or less. |
| See accompanying notes to financial statements. |
Hussman Investment Trust Statements of Assets and Liabilities (continued) |
December 31, 2013 (Unaudited) |
| | | Hussman Strategic International Fund | | | Hussman Strategic Dividend Value Fund | |
| ASSETS | | | | | | |
| Investments in securities: | | | | | | |
At acquisition cost | | $ | 55,921,001 | | | $ | 21,444,993 | |
At value (Note 1) | | $ | 66,959,668 | | | $ | 23,968,857 | |
Investments in money market funds | | | 38,001,332 | | | | 10,935,515 | |
Dividends receivable | | | 77,162 | | | | 46,699 | |
Reclaims receivable | | | 122,687 | | | | — | |
Receivable for capital shares sold | | | 85,860 | | | | 98,667 | |
Variation margin receivable (Notes 1 and 4) | | | 703,794 | | | | — | |
Margin deposits for futures contracts (Cost $7,051,711)
(Notes 1 and 4) | | | 7,093,821 | | | | — | |
Other assets | | | 63,745 | | | | 33,614 | |
Total Assets | | | 113,108,069 | | | | 35,083,352 | |
| LIABILITIES | | | | | | | | |
Foreign currency overdraft (Cost $263,226) | | | 262,657 | | | | — | |
Dividends payable | | | 104,929 | | | | 1,238 | |
Written call options, at value (Notes 1 and 4)
(premiums received $5,414,562 and $3,194,316, respectively) | | | 5,887,100 | | | | 3,546,270 | |
Payable for capital shares redeemed | | | 131,211 | | | | 10,827 | |
Variation margin payable (Notes 1 and 4) | | | 9,936 | | | | — | |
| Net unrealized depreciation on forward currency exchange contracts (Note 6) | | | 2 | | | | — | |
Accrued investment advisory fees (Note 3) | | | 75,450 | | | | 4,102 | |
Payable to administrator (Note 3) | | | 11,340 | | | | 6,690 | |
Other accrued expenses | | | 57,304 | | | | 21,241 | |
Total Liabilities | | | 6,539,929 | | | | 3,590,368 | |
NET ASSETS | | $ | 106,568,140 | | | $ | 31,492,984 | |
| Net assets consist of: | | | | | | | | |
Paid-in capital | | $ | 111,510,388 | | | $ | 29,823,100 | |
| Accumulated undistributed net investment income | | | 174,043 | | | | 80 | |
Accumulated net realized losses from security transactions
and option and futures contracts | | | (13,330,748 | ) | | | (502,106 | ) |
| Net unrealized appreciation (depreciation) on: | | | | | | | | |
Investment securities | | | 11,036,731 | | | | 2,527,728 | |
Option contracts | | | (470,602 | ) | | | (355,818 | ) |
Futures contracts | | | (2,397,955 | ) | | | — | |
| Translation of assets and liabilities in foreign currencies | | | 46,283 | | | | — | |
NET ASSETS | | $ | 106,568,140 | | | $ | 31,492,984 | |
Shares of beneficial interest outstanding (unlimited number of shares
authorized, no par value) | | | 10,967,610 | | | | 2,944,706 | |
Net asset value, offering price and redemption price per share (a) (Note 1) | | $ | 9.72 | | | $ | 10.69 | |
| (a) | Redemption fee may apply to redemptions of shares held for 60 days or less. |
See accompanying notes to financial statements. |
Hussman Investment Trust Statements of Operations |
For the Six Months Ended December 31, 2013 (Unaudited) |
| | | Hussman Strategic Growth Fund | | | Hussman Strategic Total Return Fund | |
| INVESTMENT INCOME | | | | | | |
| Dividends | | $ | 14,739,624 | | | $ | 1,207,245 | |
| Foreign withholding taxes on dividends | | | (18,585 | ) | | | (33,326 | ) |
| Interest | | | — | | | | 8,323,845 | |
| Total Income | | | 14,721,039 | | | | 9,497,764 | |
| | | | | | | | | |
| EXPENSES | | | | | | | | |
| Investment advisory fees (Note 3) | | | 7,978,653 | | | | 2,415,002 | |
Transfer agent, account maintenance and
shareholder services fees (Note 3) | | | 943,284 | | | | 451,796 | |
| Administration fees (Note 3) | | | 493,350 | | | | 292,227 | |
| Professional fees | | | 140,817 | | | | 46,699 | |
| Custodian and bank service fees | | | 111,345 | | | | 44,008 | |
| Postage and supplies | | | 91,819 | | | | 53,870 | |
| Fund accounting fees (Note 3) | | | 71,864 | | | | 51,823 | |
| Trustees’ fees and expenses (Note 3) | | | 41,392 | | | | 41,392 | |
| Printing of shareholder reports | | | 47,076 | | | | 28,943 | |
| Registration and filing fees | | | 32,514 | | | | 33,908 | |
| Insurance expense | | | 36,467 | | | | 21,258 | |
| Compliance service fees (Note 3) | | | 19,564 | | | | 11,693 | |
| Other expenses | | | 13,208 | | | | 9,962 | |
| Total Expenses | | | 10,021,353 | | | | 3,502,581 | |
| Less fee reductions by the Adviser (Note 3) | | | (535,630 | ) | | | (447,260 | ) |
| Net Expenses | | | 9,485,723 | | | | 3,055,321 | |
| | | | | | | | | |
| NET INVESTMENT INCOME | | | 5,235,316 | | | | 6,442,443 | |
| | | | | | | | | |
REALIZED AND UNREALIZED GAINS (LOSSES) ON INVESTMENTS
AND OPTION CONTRACTS (Note 4) | | | | | | | | |
| Net realized gains (losses) from: | | | | | | | | |
| Security transactions | | | 359,027,731 | | | | 5,692,150 | |
| Option contracts | | | (335,935,489 | ) | | | — | |
| Net change in unrealized appreciation (depreciation) on: | | | | | | | | |
| Investments | | | (49,870,810 | ) | | | (15,730,844 | ) |
| Option contracts | | | (63,356,651 | ) | | | — | |
| | | | | | | | | |
NET REALIZED AND UNREALIZED LOSSES ON
INVESTMENTS AND OPTION CONTRACTS | | | (90,135,219 | ) | | | (10,038,694 | ) |
| | | | | | | | | |
| NET DECREASE IN NET ASSETS RESULTING FROM OPERATIONS | | $ | (84,899,903 | ) | | $ | (3,596,251 | ) |
| See accompanying notes to financial statements. |
Hussman Investment Trust Statements of Operations (continued) |
For the Six Months Ended December 31, 2013 (Unaudited) |
| | | Hussman Strategic International Fund | | | Hussman Strategic Dividend Value Fund | |
| INVESTMENT INCOME | | | | | | |
Dividend income | | $ | 826,214 | | | $ | 307,122 | |
Foreign withholding taxes on dividends | | | (96,302 | ) | | | (1,697 | ) |
Total Income | | | 729,912 | | | | 305,425 | |
| | | | | | | | | |
| EXPENSES | | | | | | | | |
Investment advisory fees (Note 3) | | | 427,800 | | | | 156,689 | |
Professional fees | | | 53,579 | | | | 42,311 | |
Trustees' fees and expenses (Note 3) | | | 41,392 | | | | 41,392 | |
Administration fees (Note 3) | | | 31,491 | | | | 12,565 | |
Transfer agent, account maintenance and
shareholder services fees (Note 3) | | | 26,993 | | | | 14,165 | |
Fund accounting fees (Note 3) | | | 22,527 | | | | 16,743 | |
Registration and filing fees | | | 17,716 | | | | 16,835 | |
Custodian fees | | | 25,000 | | | | 4,033 | |
Postage and supplies | | | 9,582 | | | | 7,431 | |
Pricing fees | | | 15,212 | | | | 983 | |
Printing of shareholder reports | | | 8,716 | | | | 6,863 | |
Compliance service fees (Note 3) | | | 3,138 | | | | 2,595 | |
Insurance expense | | | 1,772 | | | | 742 | |
Other expenses | | | 10,406 | | | | 9,881 | |
Total Expenses | | | 695,324 | | | | 333,228 | |
Less fee reductions by the Adviser (Note 3) | | | — | | | | (115,605 | ) |
Net Expenses | | | 695,324 | | | | 217,623 | |
| | | | | | | | | |
NET INVESTMENT INCOME | | | 34,588 | | | | 87,802 | |
| | | | | | | | | |
REALIZED AND UNREALIZED GAINS (LOSSES) ON INVESTMENTS
AND OPTION AND FUTURES CONTRACTS (Note 4) | | | | | | | | |
| Net realized gains (losses) from: | | | | | | | | |
Security transactions | | | 3,595,084 | | | | 857,399 | |
Option contracts | | | (1,814,394 | ) | | | (1,081,248 | ) |
Futures contracts | | | (4,476,994 | ) | | | — | |
Foreign currency transactions | | | 139,673 | | | | — | |
| Net change in unrealized appreciation (depreciation) on: | | | | | | | | |
Investments | | | 6,948,962 | | | | 1,434,289 | |
Option contracts | | | (684,834 | ) | | | (409,980 | ) |
Futures contracts | | | (3,517,469 | ) | | | — | |
Foreign currency translation | | | 271,117 | | | | — | |
| | | | | | | | | |
NET REALIZED AND UNREALIZED GAINS ON INVESTMENTS
AND OPTION AND FUTURES CONTRACTS | | | 461,145 | | | | 800,460 | |
| | | | | | | | | |
| NET INCREASE IN NET ASSETS RESULTING FROM OPERATIONS | | $ | 495,733 | | | $ | 888,262 | |
| See accompanying notes to financial statements. |
Hussman Strategic Growth Fund Statements of Changes in Net Assets |
|
| | | Six Months Ended December 31, 2013 (Unaudited) | | | | |
| FROM OPERATIONS | | | | | | |
| Net investment income | | $ | 5,235,316 | | | $ | 35,796,702 | |
| Net realized gains (losses) from: | | | | | | | | |
| Security transactions | | | 359,027,731 | | | | 672,055,115 | |
| Option contracts | | | (335,935,489 | ) | | | (1,040,615,247 | ) |
| Net change in unrealized appreciation (depreciation) on: | | | | | | | | |
| Investments | | | (49,870,810 | ) | | | (197,974,220 | ) |
| Option contracts | | | (63,356,651 | ) | | | 207,399,843 | |
| Net decrease in net assets resulting from operations | | | (84,899,903 | ) | | | (323,337,807 | ) |
| | | | | | | | | |
| DISTRIBUTIONS TO SHAREHOLDERS | | | | | | | | |
| From net investment income | | | (14,172,416 | ) | | | (46,271,836 | ) |
| | | | | | | | | |
| FROM CAPITAL SHARE TRANSACTIONS | | | | | | | | |
| Proceeds from shares sold | | | 117,589,753 | | | | 630,539,623 | |
Net asset value of shares issued in reinvestment
of distributions to shareholders | | | 11,361,459 | | | | 30,810,496 | |
| Proceeds from redemption fees collected (Note 1) | | | 85,406 | | | | 291,248 | |
| Payments for shares redeemed | | | (799,521,334 | ) | | | (3,189,916,948 | ) |
| Net decrease in net assets from capital share transactions | | | (670,484,716 | ) | | | (2,528,275,581 | ) |
| | | | | | | | | |
| TOTAL DECREASE IN NET ASSETS | | | (769,557,035 | ) | | | (2,897,885,224 | ) |
| | | | | | | | | |
| NET ASSETS | | | | | | | | |
| Beginning of period | | | 2,038,923,259 | | | | 4,936,808,483 | |
| End of period | | $ | 1,269,366,224 | | | $ | 2,038,923,259 | |
| | | | | | | | | |
| ACCUMULATED UNDISTRIBUTED NET INVESTMENT INCOME | | $ | 149,877 | | | $ | 9,086,977 | |
| | | | | | | | | |
| CAPITAL SHARE ACTIVITY | | | | | | | | |
| Shares sold | | | 11,484,694 | | | | 57,939,435 | |
| Shares reinvested | | | 1,148,782 | | | | 2,876,797 | |
| Shares redeemed | | | (78,690,890 | ) | | | (296,176,122 | ) |
| Net decrease in shares outstanding | | | (66,057,414 | ) | | | (235,359,890 | ) |
| Shares outstanding at beginning of period | | | 194,448,561 | | | | 429,808,451 | |
| Shares outstanding at end of period | | | 128,391,147 | | | | 194,448,561 | |
| See accompanying notes to financial statements. |
Hussman Strategic Total Return Fund Statements of Changes in Net Assets |
|
| | | Six Months Ended December 31, 2013 (Unaudited) | | | | |
| FROM OPERATIONS | | | | | | |
| Net investment income | | $ | 6,442,443 | | | $ | 12,794,428 | |
| Net realized gains (losses) from security transactions | | | 5,692,150 | | | | (92,312,067 | ) |
| Net change in unrealized appreciation (depreciation) on investments | | | (15,730,844 | ) | | | (47,355,271 | ) |
| Net decrease in net assets resulting from operations | | | (3,596,251 | ) | | | (126,872,910 | ) |
| | | | | | | | | |
| DISTRIBUTIONS TO SHAREHOLDERS | | | | | | | | |
| From net investment income | | | (4,009,903 | ) | | | (12,116,495 | ) |
| From net realized gains | | | — | | | | (51,486,341 | ) |
| Decrease in net assets from distributions to shareholders | | | (4,009,903 | ) | | | (63,602,836 | ) |
| | | | | | | | | |
| FROM CAPITAL SHARE TRANSACTIONS | | | | | | | | |
| Proceeds from shares sold | | | 36,939,185 | | | | 303,553,582 | |
Net asset value of shares issued in reinvestment
of distributions to shareholders | | | 3,504,361 | | | | 55,698,799 | |
| Proceeds from redemption fees collected (Note 1) | | | 48,033 | | | | 104,623 | |
| Payments for shares redeemed | | | (529,981,637 | ) | | | (1,590,721,639 | ) |
| Net decrease in net assets from capital share transactions | | | (489,490,058 | ) | | | (1,231,364,635 | ) |
| | | | | | | | | |
| TOTAL DECREASE IN NET ASSETS | | | (497,096,212 | ) | | | (1,421,840,381 | ) |
| | | | | | | | | |
| NET ASSETS | | | | | | | | |
| Beginning of period | | | 1,199,224,466 | | | | 2,621,064,847 | |
| End of period | | $ | 702,128,254 | | | $ | 1,199,224,466 | |
| | | | | | | | | |
ACCUMULATED UNDISTRIBUTED (DISTRIBUTIONS
IN EXCESS OF) NET INVESTMENT INCOME | | $ | 1,967,399 | | | $ | (465,141 | ) |
| | | | | | | | | |
| CAPITAL SHARE ACTIVITY | | | | | | | | |
| Shares sold | | | 3,329,832 | | | | 25,070,900 | |
| Shares reinvested | | | 316,276 | | | | 4,620,192 | |
| Shares redeemed | | | (47,840,103 | ) | | | (133,330,888 | ) |
| Net decrease in shares outstanding | | | (44,193,995 | ) | | | (103,639,796 | ) |
| Shares outstanding at beginning of period | | | 108,160,399 | | | | 211,800,195 | |
| Shares outstanding at end of period | | | 63,966,404 | | | | 108,160,399 | |
| See accompanying notes to financial statements. |
Hussman Strategic International Fund Statements of Changes in Net Assets |
|
| | | Six Months Ended December 31, 2013 (Unaudited) | | | | |
| FROM OPERATIONS | | | | | | |
| Net investment income | | $ | 34,588 | | | $ | 616,531 | |
| Net realized gains (losses) from: | | | | | | | | |
| Security transactions | | | 3,595,084 | | | | 4,603,155 | |
| Option contracts | | | (1,814,394 | ) | | | (4,654,698 | ) |
| Futures contracts | | | (4,476,994 | ) | | | (8,797,151 | ) |
| Foreign currency transactions | | | 139,673 | | | | 350,785 | |
| Net change in unrealized appreciation (depreciation) on: | | | | | | | | |
| Investments | | | 6,948,962 | | | | 4,763,927 | |
| Option contracts | | | (684,834 | ) | | | 897,580 | |
| Futures contracts | | | (3,517,469 | ) | | | 3,011,063 | |
| Foreign currency translation | | | 271,117 | | | | (301,770 | ) |
| Net increase in net assets resulting from operations | | | 495,733 | | | | 489,422 | |
| | | | | | | | | |
| DISTRIBUTIONS TO SHAREHOLDERS | | | | | | | | |
| From net investment income | | | (747,075 | ) | | | — | |
| | | | | | | | | |
| FROM CAPITAL SHARE TRANSACTIONS | | | | | | | | |
| Proceeds from shares sold | | | 28,138,263 | | | | 24,157,041 | |
Net asset value of shares issued in reinvestment of
distributions to shareholders | | | 642,147 | | | | — | |
| Proceeds from redemption fees collected (Note 1) | | | 4,887 | | | | 1,170 | |
| Payments for shares redeemed | | | (10,265,791 | ) | | | (24,067,385 | ) |
| Net increase in net assets from capital share transactions | | | 18,519,506 | | | | 90,826 | |
| | | | | | | | | |
| TOTAL INCREASE IN NET ASSETS | | | 18,268,164 | | | | 580,248 | |
| | | | | | | | | |
| NET ASSETS | | | | | | | | |
| Beginning of period | | | 88,299,976 | | | | 87,719,728 | |
| End of period | | $ | 106,568,140 | | | $ | 88,299,976 | |
| | | | | | | | | |
| ACCUMULATED UNDISTRIBUTED NET INVESTMENT INCOME | | $ | 174,043 | | | $ | 746,857 | |
| | | | | | | | | |
| CAPITAL SHARE ACTIVITY | | | | | | | | |
| Shares sold | | | 2,878,122 | | | | 2,513,749 | |
| Shares reinvested | | | 66,064 | | | | — | |
| Shares redeemed | | | (1,045,215 | ) | | | (2,506,020 | ) |
| Net increase in shares outstanding | | | 1,898,971 | | | | 7,729 | |
| Shares outstanding at beginning of period | | | 9,068,639 | | | | 9,060,910 | |
| Shares outstanding at end of period | | | 10,967,610 | | | | 9,068,639 | |
| See accompanying notes to financial statements. |
Hussman Strategic Dividend Value Fund Statements of Changes in Net Assets |
|
| | | Six Months Ended December 31, 2013 (Unaudited) | | | | |
| FROM OPERATIONS | | | | | | |
| Net investment income | | $ | 87,802 | | | $ | 41,837 | |
| Net realized gains (losses) from: | | | | | | | | |
| Security transactions | | | 857,399 | | | | 475,226 | |
| Option contracts | | | (1,081,248 | ) | | | (798,023 | ) |
| Net change in unrealized appreciation (depreciation) on: | | | | | | | | |
| Investments | | | 1,434,289 | | | | 1,123,801 | |
| Option contracts | | | (409,980 | ) | | | 101,428 | |
| Net increase in net assets resulting from operations | | | 888,262 | | | | 944,269 | |
| | | | | | | | | |
| DISTRIBUTIONS TO SHAREHOLDERS | | | | | | | | |
| From net investment income | | | (87,680 | ) | | | (41,882 | ) |
| | | | | | | | | |
| FROM CAPITAL SHARE TRANSACTIONS | | | | | | | | |
| Proceeds from shares sold | | | 10,017,118 | | | | 29,441,449 | |
Net asset value of shares issued in reinvestment of
distributions to shareholders | | | 83,664 | | | | 40,147 | |
| Proceeds from redemption fees collected (Note 1) | | | 2,298 | | | | 2,548 | |
| Payments for shares redeemed | | | (11,944,309 | ) | | | (2,851,094 | ) |
| Net increase (decrease) in net assets from capital share transactions | | | (1,841,229 | ) | | | 26,633,050 | |
| | | | | | | | | |
| TOTAL INCREASE (DECREASE) IN NET ASSETS | | | (1,040,647 | ) | | | 27,535,437 | |
| | | | | | | | | |
| NET ASSETS | | | | | | | | |
| Beginning of period | | | 32,533,631 | | | | 4,998,194 | |
| End of period | | $ | 31,492,984 | | | $ | 32,533,631 | |
| | | | | | | | | |
ACCUMULATED UNDISTRIBUTED (DISTRIBUTIONS
IN EXCESS OF) NET INVESTMENT INCOME | | $ | 80 | | | $ | (42 | ) |
| | | | | | | | | |
| CAPITAL SHARE ACTIVITY | | | | | | | | |
| Shares sold | | | 950,050 | | | | 2,893,028 | |
| Shares reinvested | | | 7,865 | | | | 3,960 | |
| Shares redeemed | | | (1,131,240 | ) | | | (282,644 | ) |
| Net increase (decrease) in shares outstanding | | | (173,325 | ) | | | 2,614,344 | |
| Shares outstanding at beginning of period | | | 3,118,031 | | | | 503,687 | |
| Shares outstanding at end of period | | | 2,944,706 | | | | 3,118,031 | |
| See accompanying notes to financial statements. |
Hussman Strategic Growth Fund Financial Highlights |
Selected Per Share Data and Ratios for a Share Outstanding Throughout Each Period |
| | | Six Months Ended December 31, 2013 (Unaudited) | | | | | | | | | | | | | | | | |
| Net asset value at beginning of period | | $ | 10.49 | | | $ | 11.49 | | | $ | 12.28 | | | $ | 13.45 | | | $ | 12.99 | | | $ | 15.73 | |
| | | | | | | | | | | | | | | | | | | | | | | | | |
| Income (loss) from investment operations: | | | | | | | | | | | | | | | | | | | | | | | | |
| Net investment income | | | 0.07 | | | | 0.15 | | | | 0.08 | | | | 0.05 | | | | 0.00 | (a) | | | 0.03 | |
Net realized and unrealized gains
(losses) on investments and
option contracts | | | (0.56 | ) | | | (1.00 | ) | | | (0.81 | ) | | | (1.19 | ) | | | 0.48 | | | | (0.88 | ) |
| Total from investment operations | | | (0.49 | ) | | | (0.85 | ) | | | (0.73 | ) | | | (1.14 | ) | | | 0.48 | | | | (0.85 | ) |
| | | | | | | | | | | | | | | | | | | | | | | | | |
| Less distributions: | | | | | | | | | | | | | | | | | | | | | | | | |
Dividends from net
investment income | | | (0.11 | ) | | | (0.15 | ) | | | (0.06 | ) | | | (0.03 | ) | | | (0.02 | ) | | | (0.03 | ) |
| Distributions from net realized gains | | | — | | | | — | | | | — | | | | — | | | | — | | | | (1.87 | ) |
| Total distributions | | | (0.11 | ) | | | (0.15 | ) | | | (0.06 | ) | | | (0.03 | ) | | | (0.02 | ) | | | (1.90 | ) |
| | | | | | | | | | | | | | | | | | | | | | | | | |
| Proceeds from redemption fees collected (Note 1) | | | 0.00 | (a) | | | 0.00 | (a) | | | 0.00 | (a) | | | 0.00 | (a) | | | 0.00 | (a) | | | 0.01 | |
| | | | | | | | | | | | | | | | | | | | | | | | | |
| Net asset value at end of period | | $ | 9.89 | | | $ | 10.49 | | | $ | 11.49 | | | $ | 12.28 | | | $ | 13.45 | | | $ | 12.99 | |
| | | | | | | | | | | | | | | | | | | | | | | | | |
Total return (b) | | | (4.66% | )(c) | | | (7.41% | ) | | | (5.97% | ) | | | (8.49% | ) | | | 3.68% | | | | (4.35% | ) |
| | | | | | | | | | | | | | | | | | | | | | | | | |
| Net assets at end of period (000’s) | | $ | 1,269,366 | | | $ | 2,038,923 | | | $ | 4,936,808 | | | $ | 5,644,066 | | | $ | 6,185,342 | | | $ | 4,975,812 | |
| | | | | | | | | | | | | | | | | | | | | | | | | |
| Ratio of net expenses to average net assets | | 1.07% | (d)(e) | | | 1.08% | (e) | | | 1.05% | | | | 1.03% | | | | 1.05% | | | | 1.09% | |
| | | | | | | | | | | | | | | | | | | | | | | | | |
Ratio of net investment income to
average net assets | | | 0.59% | (d) | | | 1.08% | | | | 0.66% | | | | 0.39% | | | | 0.04% | | | | 0.28% | |
| | | | | | | | | | | | | | | | | | | | | | | | | |
| Portfolio turnover rate | | | 79% | (c) | | | 125% | | | | 72% | | | | 67% | | | | 111% | | | | 69% | |
| (a) | Amount rounds to less than $0.01 per share. |
| (b) | Total return is a measure of the change in value of an investment in the Fund over the period covered, which assumes any dividends or capital gains distributions are reinvested in shares of the Fund. Returns do not reflect the deduction of taxes a shareholder would pay on Fund distributions or the redemption of Fund shares. |
| (c) | Not annualized. |
| (d) | Annualized. |
| (e) | Absent investment advisory fee reductions by the Adviser, the ratios of expenses to average net assets would have been 1.13%(d) and 1.09% for the periods ended December 31, 2013 and June 30, 2013, respectively (Note 3). |
| See accompanying notes to financial statements. |
Hussman Strategic Total Return Fund Financial Highlights |
Selected Per Share Data and Ratios for a Share Outstanding Throughout Each Period |
| | | Six Months Ended December 31, 2013 (Unaudited) | | | | | | | | | | | | | | | | |
| Net asset value at beginning of period | | $ | 11.09 | | | $ | 12.38 | | | $ | 12.19 | | | $ | 12.41 | | | $ | 11.87 | | | $ | 11.99 | |
| | | | | | | | | | | | | | | | | | | | | | | | | |
| Income (loss) from investment operations: | | | | | | | | | | | | | | | | | | | | | | | | |
| Net investment income | | | 0.09 | | | | 0.10 | | | | 0.07 | | | | 0.07 | | | | 0.18 | | | | 0.05 | |
Net realized and unrealized gains
(losses) on investments and
foreign currencies | | | (0.15 | ) | | | (1.03 | ) | | | 0.43 | | | | 0.37 | | | | 0.69 | | | | 0.35 | |
| Total from investment operations | | | (0.06 | ) | | | (0.93 | ) | | | 0.50 | | | | 0.44 | | | | 0.87 | | | | 0.40 | |
| | | | | | | | | | | | | | | | | | | | | | | | | |
| Less distributions: | | | | | | | | | | | | | | | | | | | | | | | | |
Dividends from net
investment income | | | (0.05 | ) | | | (0.09 | ) | | | (0.07 | ) | | | (0.12 | ) | | | (0.16 | ) | | | (0.01 | ) |
| Distributions from net realized gains | | | — | | | | (0.27 | ) | | | (0.24 | ) | | | (0.54 | ) | | | (0.17 | ) | | | (0.53 | ) |
| Total distributions | | | (0.05 | ) | | | (0.36 | ) | | | (0.31 | ) | | | (0.66 | ) | | | (0.33 | ) | | | (0.54 | ) |
| | | | | | | | | | | | | | | | | | | | | | | | | |
| Proceeds from redemption fees collected (Note 1) | | | 0.00 | (a) | | | 0.00 | (a) | | | 0.00 | (a) | | | 0.00 | (a) | | | 0.00 | (a) | | | 0.02 | |
| | | | | | | | | | | | | | | | | | | | | | | | | |
| Net asset value at end of period | | $ | 10.98 | | | $ | 11.09 | | | $ | 12.38 | | | $ | 12.19 | | | $ | 12.41 | | | $ | 11.87 | |
| | | | | | | | | | | | | | | | | | | | | | | | | |
Total return (b) | | | (0.53% | )(c) | | | (7.71% | ) | | | 4.14% | | | | 3.53% | | | | 7.44% | | | | 3.94% | |
| | | | | | | | | | | | | | | | | | | | | | | | | |
| Net assets at end of period (000’s) | | $ | 702,128 | | | $ | 1,199,224 | | | $ | 2,621,065 | | | $ | 2,339,289 | | | $ | 1,884,985 | | | $ | 1,023,591 | |
| | | | | | | | | | | | | | | | | | | | | | | | | |
| Ratio of net expenses to average net assets | | 0.63% | (d)(e) | | | 0.64% | (e) | | | 0.63% | | | | 0.64% | | | | 0.67% | | | | 0.75% | |
| | | | | | | | | | | | | | | | | | | | | | | | | |
Ratio of net investment income to
average net assets | | | 1.33% | (d) | | | 0.62% | | | | 0.57% | | | | 0.61% | | | | 1.59% | | | | 0.26% | |
| | | | | | | | | | | | | | | | | | | | | | | | | |
| Portfolio turnover rate | | | 109% | (c) | | | 114% | | | | 78% | | | | 254% | | | | 69% | | | | 36% | |
| (a) | Amount rounds to less than $0.01 per share. |
| (b) | Total return is a measure of the change in value of an investment in the Fund over the period covered, which assumes any dividends or capital gains distributions are reinvested in shares of the Fund. Returns do not reflect the deduction of taxes a shareholder would pay on Fund distributions or the redemption of Fund shares. |
| (c) | Not annualized. |
| (d) | Annualized. |
| (e) | Absent investment advisory fee reductions by the Adviser, the ratios of expenses to average net assets would have been 0.72%(d) and 0.65% for the periods ended December 31, 2013 and June 30, 2013, respectively (Note 3). |
| See accompanying notes to financial statements. |
Hussman Strategic International Fund Financial Highlights |
Selected Per Share Data and Ratios for a Share Outstanding Throughout Each Period |
| | | Six Months Ended December 31, 2013 (Unaudited) | | | | | | | | | | | | Period Ended June 30, 2010(a) | |
| Net asset value at beginning of period | | $ | 9.74 | | | $ | 9.68 | | | $ | 10.54 | | | $ | 10.08 | | | $ | 10.00 | |
| | | | | | | | | | | | | | | | | | | | | |
| Income (loss) from investment operations: | | | | | | | | | | | | | | | | | | | | |
| Net investment income (loss) | | | (0.01 | ) | | | 0.07 | | | | 0.00 | (b) | | | 0.04 | | | | (0.03 | ) |
| Net realized and unrealized gains (losses) on investments and option and futures contracts | | | 0.06 | | | | (0.01 | ) | | | (0.65 | ) | | | 0.54 | | | | 0.11 | |
| Total from investment operations | | | 0.05 | | | | 0.06 | | | | (0.65 | ) | | | 0.58 | | | | 0.08 | |
| | | | | | | | | | | | | | | | | | | | | |
| Less distributions: | | | | | | | | | | | | | | | | | | | | |
| Dividends from net investment income | | | (0.07 | ) | | | — | | | | (0.05 | ) | | | — | | | | — | |
| Distributions from net realized gains | | | — | | | | — | | | | (0.16 | ) | | | (0.12 | ) | | | — | |
| Total distributions | | | (0.07 | ) | | | — | | | | (0.21 | ) | | | (0.12 | ) | | | — | |
| | | | | | | | | | | | | | | | | | | | | |
| Proceeds from redemption fees collected (Note 1) | | | 0.00 | (b) | | | 0.00 | (b) | | | 0.00 | (b) | | | 0.00 | (b) | | | — | |
| | | | | | | | | | | | | | | | | | | | | |
| Net asset value at end of period | | $ | 9.72 | | | $ | 9.74 | | | $ | 9.68 | | | $ | 10.54 | | | $ | 10.08 | |
| | | | | | | | | | | | | | | | | | | | | |
Total return (c) | | | 0.50% | (d) | | | 0.62% | | | | (6.14% | ) | | | 5.83% | | | | 0.80% | (d) |
| | | | | | | | | | | | | | | | | | | | | |
| Net assets at end of period (000's) | | $ | 106,568 | | | $ | 88,300 | | | $ | 87,720 | | | $ | 65,226 | | | $ | 8,802 | |
| | | | | | | | | | | | | | | | | | | | | |
| Ratio of net expenses to average net assets | | | 1.54% | (e) | | | 1.60% | | | | 1.93% | | | | 2.00% | (f) | | | 2.00% | (f) |
| | | | | | | | | | | | | | | | | | | | | |
Ratio of net investment income
(loss) to average net assets | | | 0.08% | (e) | | | 0.69% | | | | 0.24% | | | | 0.63% | | | | (0.67% | )(e) |
| | | | | | | | | | | | | | | | | | | | | |
| Portfolio turnover rate | | | 28% | (d) | | | 58% | | | | 51% | | | | 39% | | | | 13% | (d) |
| (a) | Represents the period from the commencement of operations (December 31, 2009) through June 30, 2010. |
| (b) | Amount rounds to less than $0.01 per share. |
| (c) | Total return is a measure of the change in value of an investment in the Fund over the period covered, which assumes any dividends or capital gains distributions are reinvested in shares of the Fund. Returns do not reflect the deduction of taxes a shareholder would pay on Fund distributions or the redemption of Fund shares. |
| (d) | Not annualized. |
| (e) | Annualized. |
| (f) | Absent investment advisory fee reductions and expense reimbursements by the Adviser, the ratios of expenses to average net assets would have been 2.14% and 5.00%(e) for the periods ended June 30, 2011 and 2010, respectively. |
| See accompanying notes to financial statements. |
Hussman Strategic Dividend Value Fund Financial Highlights |
Selected Per Share Data and Ratios for a Share Outstanding Throughout Each Period |
| | | Six Months Ended December 31, 2013 (Unaudited) | | | | | | Period Ended June 30, 2012(a) | |
| Net asset value at beginning of period | | $ | 10.43 | | | $ | 9.92 | | | $ | 10.00 | |
| | | | | | | | | | | | | |
| Income (loss) from investment operations: | | | | | | | | | | | | |
| Net investment income | | | 0.03 | | | | 0.03 | | | | 0.04 | |
| Net realized and unrealized gains (losses) on investments and option contracts | | | 0.26 | | | | 0.51 | | | | (0.08 | ) |
| Total from investment operations | | | 0.29 | | | | 0.54 | | | | (0.04 | ) |
| | | | | | | | | | | | | |
| Less distributions: | | | | | | | | | | | | |
| Dividends from net investment income | | | (0.03 | ) | | | (0.03 | ) | | | (0.04 | ) |
| | | | | | | | | | | | | |
| Proceeds from redemption fees collected (Note 1) | | | 0.00 | (b) | | | 0.00 | (b) | | | 0.00 | (b) |
| | | | | | | | | | | | | |
| Net asset value at end of period | | $ | 10.69 | | | $ | 10.43 | | | $ | 9.92 | |
| | | | | | | | | | | | | |
Total return (c) | | | 2.76% | (d) | | | 5.42% | | | | (0.41% | )(d) |
| | | | | | | | | | | | | |
| Net assets at end of period (000's) | | $ | 31,493 | | | $ | 32,534 | | | $ | 4,998 | |
| | | | | | | | | | | | | |
Ratio of net expenses to average net assets (f) | | | 1.25% | (e) | | | 1.25% | | | | 1.25% | (e) |
| | | | | | | | | | | | | |
| Ratio of net investment income to average net assets | | | 0.50% | (e) | | | 0.25% | | | | 1.01% | (e) |
| | | | | | | | | | | | | |
| Portfolio turnover rate | | | 26% | (d) | | | 57% | | | | 11% | (d) |
| (a) | Represents the period from the commencement of operations (February 6, 2012) through June 30, 2012. |
| (b) | Amount rounds to less than $0.01 per share. |
| (c) | Total return is a measure of the change in value of an investment in the Fund over the period covered, which assumes any dividends or capital gains distributions are reinvested in shares of the Fund. Returns do not reflect the deduction of taxes a shareholder would pay on Fund distributions or the redemption of Fund shares. |
| (d) | Not annualized. |
| (e) | Annualized. |
| (f) | Absent investment advisory fee reductions and expense reimbursements by the Adviser, the ratios of expenses to average net assets would have been 1.91%(e), 2.85% and 7.04%(e) for the periods ended December 31, 2013, June 30, 2013 and June 30, 2012, respectively (Note 3). |
| See accompanying notes to financial statements. |
Hussman Investment Trust Notes to Financial Statements |
December 31, 2013 (Unaudited) |
| 1. | ORGANIZATION AND SIGNIFICANT ACCOUNTING POLICIES |
Hussman Strategic Growth Fund, Hussman Strategic Total Return Fund, Hussman Strategic International Fund and Hussman Strategic Dividend Value Fund (each, a “Fund,” and collectively, the “Funds”) are diversified series of Hussman Investment Trust (the “Trust”), which is registered under the Investment Company Act of 1940 as an open-end management investment company. Each Fund is authorized to issue an unlimited number of shares. Hussman Strategic Growth Fund commenced operations on July 24, 2000. Hussman Strategic Total Return Fund commenced operations on September 12, 2002. Hussman Strategic International Fund commenced operations on December 31, 2009. Hussman Strategic Dividend Value Fund commenced operations on February 6, 2012.
Hussman Strategic Growth Fund’s investment objective is to provide long-term capital appreciation, with added emphasis on protection of capital during unfavorable market conditions.
Hussman Strategic Total Return Fund’s investment objective is to provide long-term total return from income and capital appreciation, with added emphasis on protection of capital during unfavorable market conditions.
Hussman Strategic International Fund’s investment objective is to provide long-term capital appreciation, with added emphasis on the protection of capital during unfavorable market conditions. The Fund invests primarily in equity securities of non-U.S. issuers.
Hussman Strategic Dividend Value Fund’s investment objective is to provide total return through a combination of dividend income and capital appreciation, with added emphasis on protection of capital during unfavorable market conditions.
Securities, Options and Futures Valuation — The Funds’ portfolio securities are valued at market value as of the close of regular trading on the New York Stock Exchange (“NYSE”) (normally, 4:00 p.m. Eastern time) on each business day the NYSE is open. Securities, other than options, listed on the NYSE or other exchanges are valued on the basis of their last sale prices on the exchanges on which they are primarily traded. However, if the last sale price on the NYSE is different than the last sale price on any other exchange, the NYSE price will be used. If there are no sales on that day, the securities are valued at the last bid price on the NYSE or other primary exchange for that day. Securities which are quoted by NASDAQ are valued at the NASDAQ Official Closing Price. If there are no sales on that day, the securities are valued at the last bid price as reported by NASDAQ. Securities traded in over-the-counter markets, other than NASDAQ quoted securities, are valued at the last
Hussman Investment Trust Notes to Financial Statements (continued) |
December 31, 2013 (Unaudited) |
sales price, or if there are no sales on that day, at the mean of the closing bid and ask prices. Securities traded on a foreign stock exchange may be valued based upon the closing price on the principal exchange where the security is traded; however, because the value of securities traded on foreign stock exchanges may be materially affected by events occurring before the Funds’ pricing time but after the close of the primary markets or exchanges on which such securities are traded, such securities will typically be priced at their fair value as determined by an independent pricing service approved by the Board of Trustees. As a result, the prices of securities used to calculate a Fund’s net asset value may differ from quoted or published prices for the same securities. Values of foreign securities are translated from the local currency into U.S. dollars using currency exchange rates supplied by an independent pricing quotation service.
Pursuant to procedures approved by the Board of Trustees, options traded on a national securities exchange are valued at prices between the closing bid and ask prices determined by Hussman Strategic Advisors, Inc. (the “Adviser”) to most closely reflect market value as of the time of computation of net asset value. As of December 31, 2013, all options held by Hussman Strategic Growth Fund, Hussman Strategic International Fund and Hussman Strategic Dividend Value Fund have been valued in this manner. Options not traded on a national securities exchange or board of trade, but for which over-the-counter market quotations are readily available, are valued at the mean of their closing bid and ask prices. Futures contracts and options thereon, which are traded on commodities exchanges, are valued at their last sale price as of the close of regular trading on the NYSE or, if not available, at the mean of the bid and ask prices.
Fixed income securities not traded or dealt in upon any securities exchange but for which over-the-counter market quotations are readily available generally are valued at the mean of their closing bid and ask prices. Fixed income securities may also be valued on the basis of prices provided by an independent pricing service. Debt securities with remaining maturities of 60 days or less are valued at amortized cost, absent unusual circumstances.
In the event that market quotations are not readily available or are determined by the Adviser to not be reflective of fair market value due to market events or developments, securities and other financial instruments are valued at fair value as determined by the Adviser in accordance with procedures adopted by the Board of Trustees. Such methods of fair valuation may include, but are not limited to: multiple of earnings, multiple of book value, discount from market of a similar freely traded security, purchase price of security, subsequent private transactions in the security or related securities, or a combination of these and other factors.
Hussman Investment Trust Notes to Financial Statements (continued) |
December 31, 2013 (Unaudited) |
Accounting principles generally accepted in the United States (“GAAP”) establish a single authoritative definition of fair value, set out a framework for measuring fair value and require additional disclosures about fair value measurements.
Various inputs are used in determining the value of each of the Funds’ investments. These inputs are summarized in the three broad levels listed below:
| | • | Level 1 – quoted unadjusted prices for identical instruments in active markets to which the Fund has access at the date of measurement. |
| | • | Level 2 – quoted prices for similar instruments in active markets; quoted prices for identical or similar instruments in markets that are not active; and model-derived valuations in which all significant inputs and significant value drivers are observable in active markets. Level 2 inputs are those in markets for which there are few transactions, the prices are not current, little public information exists or instances where prices vary substantially over time or among brokered market makers. |
| | • | Level 3 – model-derived valuations in which one or more significant inputs or significant value drivers are unobservable. Unobservable inputs are those inputs that reflect the Fund’s own assumptions that market participants would use to price the asset or liability based on the best available information. |
Option contracts purchased and written by Hussman Strategic Growth Fund, Hussman Strategic International Fund and Hussman Strategic Dividend Value Fund are classified as Level 2 since they are valued using “other significant observable inputs” at prices between the closing bid and ask prices determined by the Adviser to most closely reflect market value. U.S. Treasury obligations held by Hussman Strategic Total Return Fund are classified as Level 2 since values are based on prices provided by an independent pricing service that utilizes various “other significant observable inputs” including bid and ask quotations, prices of similar securities and interest rates, among other factors. Non-U.S. equity securities actively traded in foreign markets held by Hussman Strategic International Fund may be classified as Level 2 despite the availability of closing prices because such securities are typically valued at their fair value as determined by an independent pricing service. The Board of Trustees has authorized Hussman Strategic International Fund to retain an independent pricing service to determine the fair value of its foreign portfolio securities because the value of such securities may be materially affected by events occurring before Hussman Strategic International Fund’s pricing time but after the close of the primary markets or exchanges on which such foreign securities are traded. These intervening events might be country-specific (e.g., natural disaster, economic or political developments, interest
Hussman Investment Trust Notes to Financial Statements (continued) |
December 31, 2013 (Unaudited) |
rate change); issuer specific (e.g., earnings report, merger announcement); or U.S. markets-specific (such as a significant movement in the U.S. markets that is deemed to affect the value of foreign securities). The pricing service uses an automated system incorporating a model based on multiple parameters, including a security’s local closing price, relevant general and sector indices, currency fluctuations, trading in depositary receipts and futures, if applicable, and/or research valuations by its staff, in determining what it believes is the fair value of the securities. The frequency of use of these procedures will depend on market events and thus cannot be predicted and the procedures may be utilized to a significant extent. Determining the fair value of portfolio securities involves reliance on judgment and a security’s fair value may differ depending on the method used for determining value. There can be no assurance that Hussman Strategic International Fund could purchase or sell a portfolio security at the price used to calculate its net asset value. Because of the inherent uncertainty in fair valuations and the various factors considered in determining fair value, there can be significant deviations between a fair value at which a portfolio security is being carried and the price at which it is purchased or sold. Moreover, to the extent Hussman Strategic International Fund has significant holdings of foreign portfolio securities, fair valuation may be used more frequently than for other funds. The inputs or methodology used for valuing securities are not necessarily an indication of the risks associated with investing in those securities. The inputs used to measure the value of a particular security may fall into more than one level of the fair value hierarchy. In such cases, for disclosure purposes, the level in the fair value hierarchy within which the fair value measurement of that security is determined to fall in its entirety is the lowest level input that is significant to the fair value measurement.
Hussman Investment Trust Notes to Financial Statements (continued) |
December 31, 2013 (Unaudited) |
The following is a summary of the inputs used to value each Fund’s investments and other financial instruments as of December 31, 2013 by security type:
| Hussman Strategic Growth Fund |
| | | | | | | | | | | | | |
Investments in Securities and Money Market Funds: | | | | | | | | | | | | |
| Common Stocks | | $ | 1,282,245,965 | | | $ | — | | | $ | — | | | $ | 1,282,245,965 | |
| Call Option Contracts | | | — | | | | 3,700,000 | | | | — | | | | 3,700,000 | |
| Put Option Contracts | | | — | | | | 13,457,500 | | | | — | | | | 13,457,500 | |
| Money Market Funds | | | 574,531,420 | | | | — | | | | — | | | | 574,531,420 | |
| Total Investments in Securities and Money Market Funds | | $ | 1,856,777,385 | | | $ | 17,157,500 | | | $ | — | | | $ | 1,873,934,885 | |
| | | | | | | | | | | | | | | | | |
Other Financial Instruments: | | | | | | | | | | | | | | | | |
| Written Call Option Contracts | | $ | — | | | $ | (594,119,500 | ) | | $ | — | | | $ | (594,119,500 | ) |
| Total Other Financial Instruments | | $ | — | | | $ | (594,119,500 | ) | | $ | — | | | $ | (594,119,500 | ) |
| Hussman Strategic Total Return Fund |
| | | | | | | | | | | | | |
Investments in Securities and Money Market Funds: | | | | | | | | | | | | |
| Common Stocks | | $ | 64,889,581 | | | $ | — | | | $ | — | | | $ | 64,889,581 | |
| U.S. Treasury Obligations | | | — | | | | 561,212,799 | | | | — | | | | 561,212,799 | |
| Exchange-Traded Funds | | | 12,846,550 | | | | — | | | | — | | | | 12,846,550 | |
| Money Market Funds | | | 67,829,650 | | | | — | | | | — | | | | 67,829,650 | |
| Total Investments in Securities and Money Market Funds | | $ | 145,565,781 | | | $ | 561,212,799 | | | $ | — | | | $ | 706,778,580 | |
Hussman Investment Trust Notes to Financial Statements (continued) |
December 31, 2013 (Unaudited) |
| Hussman Strategic International Fund |
| | | | | | | | | | | | | |
Investments in Securities and Money Market Funds: | | | | | | | | | | | | |
| Common Stocks | | $ | 21,112,285 | | | $ | 37,071,264 | | | $ | — | | | $ | 58,183,549 | |
| Exchange-Traded Funds | | | 8,769,319 | | | | — | | | | — | | | | 8,769,319 | |
| Put Option Contracts | | | — | | | | 6,800 | | | | — | | | | 6,800 | |
| Money Market Funds | | | 38,001,332 | | | | — | | | | — | | | | 38,001,332 | |
| Total Investments in Securities and Money Market Funds | | $ | 67,882,936 | | | $ | 37,078,064 | | | $ | — | | | $ | 104,961,000 | |
| | | | | | | | | | | | | | | | | |
Other Financial Instruments: | | | | | | | | | | | | | | | | |
| Futures Contracts | | $ | (77,375 | ) | | $ | — | | | $ | — | | | $ | (77,375 | ) |
| Futures Contracts Sold Short | | | (2,320,580 | ) | | | — | | | | — | | | | (2,320,580 | ) |
| Written Call Option Contracts | | | — | | | | (5,887,100 | ) | | | — | | | | (5,887,100 | ) |
| Total Other Financial Instruments | | $ | (2,397,955 | ) | | $ | (5,887,100 | ) | | $ | — | | | $ | (8,285,055 | ) |
| Hussman Strategic Dividend Value Fund |
| | | | | | | | | | | | | |
Investments in Securities and Money Market Funds: | | | | | | | | | | | | |
| Common Stocks | | $ | 23,963,187 | | | $ | — | | | $ | — | | | $ | 23,963,187 | |
| Put Option Contracts | | | — | | | | 5,670 | | | | — | | | | 5,670 | |
| Money Market Funds | | | 10,935,515 | | | | — | | | | — | | | | 10,935,515 | |
| Total Investments in Securities and Money Market Funds | | $ | 34,898,702 | | | $ | 5,670 | | | $ | — | | | $ | 34,904,372 | |
| | | | | | | | | | | | | | | | | |
Other Financial Instruments: | | | | | | | | | | | | | | | | |
| Written Call Option Contracts | | $ | — | | | $ | (3,546,270 | ) | | $ | — | | | $ | (3,546,270 | ) |
| Total Other Financial Instruments | | $ | — | | | $ | (3,546,270 | ) | | $ | — | | | $ | (3,546,270 | ) |
Hussman Investment Trust Notes to Financial Statements (continued) |
December 31, 2013 (Unaudited) |
Each Fund’s Schedule of Investments identifies the specific securities (by type of security and industry type or geographical region) that comprise that Fund’s holdings within the Level 1 and Level 2 categories shown in the tables above. As of December 31, 2013, Hussman Strategic Growth Fund, Hussman Total Return Fund and Hussman Strategic Dividend Value Fund did not have any transfers in and out of any Level. Transfers that occurred between Levels 1 and 2 on December 31, 2013 for Hussman Strategic International Fund due to implementation of systematic fair value procedures are as follows:
| | | Transfers from Level 1 to Level 2 | | | Transfers from Level 2 to Level 1 | |
| Common Stocks | | $ | 1,228,634 | | | $ | 1,382,691 | |
In addition, the Funds did not have any assets or liabilities that were measured at fair value on a recurring basis using significant unobservable inputs (Level 3) as of December 31, 2013. It is the Funds’ policy to recognize transfers into and out of any Level at the end of the reporting period.
Futures Contracts and Option Transactions — Hussman Strategic Growth Fund, Hussman Strategic International Fund and Hussman Strategic Dividend Value Fund may purchase and write call and put options on broad-based stock indices and may also purchase and write call and put option contracts on individual securities. Each of the Funds may use financial futures contracts and related option contracts to hedge against changes in the market value of its portfolio securities. Hussman Strategic Total Return Fund and Hussman Strategic International Fund may also purchase foreign currency options to establish or modify the Funds’ exposure to foreign currencies, and Hussman Strategic Total Return Fund may purchase interest rate futures contracts to protect against a decline in the value of its portfolio. Hussman Strategic International Fund may enter into forward foreign currency contracts to hedge against the adverse impact of changes in foreign exchange rates on its investments and transactions in foreign securities.
Hussman Strategic Growth Fund, Hussman Strategic International Fund and Hussman Strategic Dividend Value Fund may each use futures and option contracts on stock indices for the purpose of seeking to reduce the market risk that would otherwise be associated with the securities in which it invests. For example, these Funds may sell a stock index futures contract to hedge the risk of a general market or market sector decline that might adversely affect prices of the Funds’ portfolio securities. To the extent there is a correlation between a Fund’s portfolio and a particular stock index, the sale of futures contracts on that index could reduce the Fund’s exposure to general market risk.
Hussman Investment Trust Notes to Financial Statements (continued) |
December 31, 2013 (Unaudited) |
When a Fund writes an index option, an amount equal to the net premium (the premium less the commission) received by the Fund is recorded as a liability in the Fund’s Statement of Assets and Liabilities and is subsequently marked-to market daily. If an index option written by the Fund expires unexercised on the stipulated expiration date or if the Fund enters into a closing purchase transaction, it will realize a gain (or a loss if the cost of a closing purchase transaction exceeds the net premium received when the option is sold) and the liability related to such option will be eliminated. If an index option written by the Fund is exercised, the Fund will be required to pay the difference between the closing index value and the exercise price of the option. In this event, the proceeds of the sale will be increased by the net premium originally received and the Fund will realize a gain or loss.
When a Fund purchases or sells a stock index futures contract, no price is paid to or received by the Fund upon the purchase or sale of the futures contract. Instead, the Fund is required to deposit in a segregated asset account an amount of cash or qualifying securities currently ranging from 2% to 11% of the contract amount. This is called the “initial margin deposit.” Subsequent payments, known as “variation margin,” are made or received by the Fund each day, depending on the daily fluctuations in the fair value of the underlying stock index. The Fund recognizes an unrealized gain or loss equal to the daily variation margin. If market conditions move unexpectedly, the Fund may not achieve the anticipated benefits of the futures contracts and may realize a loss. In addition to the possibility that there may be an imperfect correlation or no correlation at all between the movements in the stock index futures and the portion of the portfolio being hedged, the price of the stock index futures may not correlate perfectly with movements in the stock index due to certain market distortions.
Foreign Currency Translation — Amounts denominated in or expected to settle in foreign currencies are translated into U.S. dollars based on exchange rates on the following basis:
| | A. | The market values of investment securities and other assets and liabilities are translated as of the close of the New York Stock Exchange each day. |
| | B. | Purchases and sales of investment securities and income and expenses are translated at the rate of exchange prevailing as of 4:00 p.m. on the respective date of such transactions. |
Hussman Investment Trust Notes to Financial Statements (continued) |
December 31, 2013 (Unaudited) |
| | C. | The Funds do not isolate that portion of the results of operations caused by changes in foreign exchange rates on investments from those caused by changes in market prices of securities held. Such fluctuations are included with the net realized and unrealized gains or losses on investments. |
Reported net realized foreign exchange gains or losses arise from 1) purchases and sales of foreign currencies, 2) currency gains or losses realized between the trade and settlement dates on securities transactions and 3) the difference between the amounts of dividends, interest and foreign withholding taxes recorded on the Fund’s books and the U.S. dollar equivalent of the amounts actually received or paid. Reported net unrealized foreign exchange gains and losses arise from changes in the value of assets and liabilities that result from changes in exchange rates.
Share Valuation and Redemption Fees — The net asset value per share of each Fund is calculated as of the close of regular trading on the NYSE (normally 4:00 p.m., Eastern time) on each day that the NYSE is open for business. The net asset value per share of each Fund is calculated by dividing the total value of the Fund’s assets, less its liabilities, by the number of its shares outstanding. The offering price and redemption price per share of each Fund is equal to the net asset value per share. However, shares of each Fund are generally subject to a redemption fee of 1.5%, payable to the applicable Fund, if redeemed 60 days or less from the date of purchase. During the periods ended December 31, 2013 and June 30, 2013, proceeds from redemption fees, recorded in capital, totaled $85,406 and $291,248, respectively, for Hussman Strategic Growth Fund; $48,033 and $104,623, respectively, for Hussman Strategic Total Return Fund; $4,887 and $1,170, respectively, for Hussman Strategic International Fund; and $2,298 and $2,548, respectively, for Hussman Strategic Dividend Value Fund.
Investment Income — Interest income is accrued as earned. Dividend income is recorded on the ex-dividend date. Discounts and premiums on fixed income securities are amortized using the interest method.
Distributions to Shareholders — Dividends from net investment income, if any, are declared and paid annually to shareholders of Hussman Strategic Growth Fund and Hussman Strategic International Fund and are declared and paid quarterly to shareholders of Hussman Strategic Total Return Fund and Hussman Strategic Dividend Value Fund. Net realized short-term capital gains, if any, may be distributed throughout the year and net realized long-term capital gains, if any, are generally distributed annually. The amount of distributions from net investment income and net realized gains are determined in accordance with federal income tax regulations, which may differ from GAAP. These “book/tax” differences are either temporary or
Hussman Investment Trust Notes to Financial Statements (continued) |
December 31, 2013 (Unaudited) |
permanent in nature and are primarily due to timing differences in the recognition of capital gains or losses for option and futures transactions, losses deferred due to wash sales and treatment of foreign currency transactions.
The tax character of distributions paid during the periods ended December 31, 2013 and June 30, 2013 was as follows:
| | | | | | | |
| Hussman Strategic Growth Fund | 12/31/13 | | $ | 14,172,416 | | | $ | 14,172,416 | |
| | 06/30/13 | | $ | 46,271,836 | | | $ | 46,271,836 | |
| Hussman Strategic Total Return Fund | 12/31/13 | | $ | 4,009,903 | | | $ | 4,009,903 | |
| | 06/30/13 | | $ | 63,602,836 | | | $ | 63,602,836 | |
| Hussman Strategic International Fund | 12/31/13 | | $ | 747,075 | | | $ | 747,075 | |
| | 06/30/13 | | $ | — | | | $ | — | |
| Hussman Strategic Dividend Value Fund | 12/31/13 | | $ | 87,680 | | | $ | 87,680 | |
| | 06/30/13 | | $ | 41,882 | | | $ | 41,882 | |
Securities Transactions — Securities transactions are accounted for on trade date for financial reporting purposes. Gains and losses on securities sold are determined on a specific identification basis.
Common Expenses — Expenses of the Trust not attributable solely to one of the Funds are allocated among the Funds based on relative net assets of each Fund or the nature of the expense and the relative applicability to each Fund.
Accounting Estimates — The preparation of financial statements in conformity with GAAP requires management to make estimates and assumptions that affect the reported amounts of assets and liabilities and the disclosure of contingent assets and liabilities as of the date of the financial statements and the reported amounts of income and expenses during the reporting period. Actual results could differ from these estimates.
Federal Income Tax — The Funds intend to qualify each year as a “regulated investment company“ under Subchatper M of the Internal Revenue Code of 1986 (the "Code"). By so qualifying, the Funds will not be subject to federal income taxes to the extent that it distributes its net investment income and any realized capital gains in accordance with the Code. Accordingly, no provision for income taxes has been made.
Hussman Investment Trust Notes to Financial Statements (continued) |
December 31, 2013 (Unaudited) |
In order to avoid imposition of a federal excise tax applicable to regulated investment companies, it is each Fund’s intention to declare and pay as dividends in each calendar year at least 98% of its net investment income (earned during the calendar year) and 98.2% of its net realized capital gains (earned during the twelve months ended October 31) plus undistributed amounts from prior years.
The tax character of accumulated earnings (deficit) at December 31, 2013 was as follows:
| | | Hussman Strategic Growth Fund | | | Hussman Strategic Total Return Fund | | | Hussman Strategic International Fund | | | Hussman Strategic Dividend Value Fund | |
| Net unrealized appreciation (depreciation) on investments | | $ | 223,756,286 | | | $ | (33,247,165 | ) | | $ | 13,899,033 | | | $ | 2,856,762 | |
| Net unrealized depreciation on written options | | | (34,511,347 | ) | | | — | | | | (472,538 | ) | | | (351,954 | ) |
| Net unrealized depreciation on futures contracts | | | — | | | | — | | | | (2,397,955 | ) | | | — | |
Net unrealized appreciation of assets and liabilities in
foreign currencies | | | — | | | | — | | | | 46,283 | | | | — | |
| Accumulated undistributed ordinary income | | | 2,960,833 | | | | 2,071,843 | | | | 278,972 | | | | 1,318 | |
| Capital loss carryforwards | | | (1,936,353,909 | ) | | | (71,523,812 | ) | | | (9,947,129 | ) | | | (201,174 | ) |
| Other losses | | | (44,025,221 | ) | | | (23,442,829 | ) | | | (6,243,985 | ) | | | (633,830 | ) |
| Other temporary differences | | | (2,810,956 | ) | | | (109,819 | ) | | | (104,929 | ) | | | (1,238 | ) |
| Total accumulated earnings (deficit) | | $ | (1,790,984,314 | ) | | $ | (126,251,782 | ) | | $ | (4,942,248 | ) | | $ | 1,669,884 | |
The following information is based upon the federal income tax cost of investment securities as of December 31, 2013:
| | | Hussman Strategic Growth Fund | | | Hussman Strategic Total Return Fund | | | Hussman Strategic International Fund | | | Hussman Strategic Dividend Value Fund | |
| Cost of investments and money market funds | | $ | 1,683,136,695 | | | $ | 740,025,745 | | | $ | 93,930,524 | | | $ | 32,403,428 | |
| Gross unrealized appreciation | | $ | 200,240,784 | | | $ | 5,820,858 | | | $ | 11,993,878 | | | $ | 2,710,939 | |
| Gross unrealized depreciation | | | (9,442,594 | ) | | | (39,068,023 | ) | | | (963,402 | ) | | | (209,995 | ) |
| Net unrealized appreciation (depreciation) | | $ | 190,798,190 | | | $ | (33,247,165 | ) | | $ | 11,030,476 | | | $ | 2,500,944 | |
Hussman Investment Trust Notes to Financial Statements (continued) |
December 31, 2013 (Unaudited) |
The difference between the federal income tax cost of portfolio investments and their financial statement cost for the Funds is due to certain timing differences in the recognition of capital gains or losses under income tax regulations and GAAP. These “book/tax” differences are temporary in nature and are primarily due to option transactions, losses deferred due to wash sales, and adjustments to basis on publicly traded partnerships.
As of June 30, 2013, the Funds had the following capital loss carryforwards for federal income tax purposes:
| | | Hussman Strategic Growth Fund | | | Hussman Strategic Total Return Fund | | | Hussman Strategic International Fund | | | Hussman Strategic Dividend Value Fund | |
| Expires June 30, 2018 – short-term | | $ | 375,427,325 | | | $ | — | | | $ | — | | | $ | — | |
| Expires June 30, 2019 – short-term | | | 824,973,031 | | | | — | | | | — | | | | — | |
| No expiration – short-term | | | 566,255,322 | | | | 62,531,590 | | | | 9,052,615 | | | | — | |
| No expiration – long-term | | | 169,698,231 | | | | 8,992,222 | | | | 894,514 | | | | 201,174 | |
| | | $ | 1,936,353,909 | | | $ | 71,523,812 | | | $ | 9,947,129 | | | $ | 201,174 | |
These capital loss carryforwards may be utilized in the current and future years to offset net realized capital gains, if any, prior to distributing such gains to shareholders.
On December 22, 2010, the Regulated Investment Company Modernization Act of 2010 (the “Act”) was enacted, which changed various technical rules governing the tax treatment of regulated investment companies. The changes were generally effective for taxable years beginning after the date of enactment. One of the more prominent changes addressed capital loss carryforwards. Under the Act, each Fund is permitted to carry forward capital losses incurred in taxable years beginning after the date of enactment for an unlimited period. However, any losses incurred during those future taxable years will be required to be utilized prior to the losses incurred in pre-enactment taxable years, which carry an expiration date. As a result of this ordering rule, pre-enactment capital loss carryforwards may be more likely to expire unused. Additionally, post-enactment capital loss carryforwards retain their character as either short-term or long-term capital losses, rather than being considered all short-term as required under previous regulation.
Hussman Investment Trust Notes to Financial Statements (continued) |
December 31, 2013 (Unaudited) |
For the six months ended December 31, 2013, the following reclassification was made as a result of a permanent difference between the financial statement and income tax reporting:
| | | Hussman Strategic International Fund | |
| Accumulated undistributed net investment income | | $ | 139,673 | |
| Accumulated net realized losses from security transactions and option and futures contracts | | $ | (139,673 | ) |
Such reclassification, the result of permanent differences between financial statement and income tax reporting requirements, has no effect on the Fund’s total net assets or net asset value per share.
Each Fund recognizes the tax benefits or expenses of uncertain tax positions only when the position is “more likely than not” to be sustained assuming examination by tax authorities. Management has reviewed each Fund’s tax positions taken on federal income tax returns for the current and all open tax years (tax years ended June 30, 2010 through June 30, 2013) and has concluded that no provision for unrecognized tax benefits or expenses is required in these financial statements.
| 2. | INVESTMENT TRANSACTIONS |
During the six months ended December 31, 2013, cost of purchases and proceeds from sales and maturities of investment securities, other than short-term investments and U.S. government securities, amounted to $1,376,209,783 and $2,420,657,933, respectively, for Hussman Strategic Growth Fund; $153,353,179 and $232,531,037, respectively, for Hussman Strategic Total Return Fund; $18,019,803 and $24,607,010, respectively, for Hussman Strategic International Fund; and $12,415,189 and $5,061,918, respectively for Hussman Strategic Dividend Value Fund.
| 3. | TRANSACTIONS WITH AFFILIATES |
Under the terms of an Advisory Agreement between the Trust and the Adviser, Hussman Strategic Growth Fund pays the Adviser a fee, which is computed and accrued daily and paid monthly, at annual rates of 0.90% of the first $5 billion of its average daily net assets and 0.85% of such assets over $5 billion less any fee reductions. Under the terms of a separate Advisory Agreement between the Trust and the Adviser, Hussman Strategic Total Return Fund pays the Adviser a fee, which is computed and accrued daily
Hussman Investment Trust Notes to Financial Statements (continued) |
December 31, 2013 (Unaudited) |
and paid monthly, at annual rates of 0.50% of the first $1 billion of its average daily net assets; 0.45% of the next $1.5 billion of such assets; and 0.40% of such assets over $2.5 billion less any fee reductions. Under the terms of a separate Advisory Agreement between the Trust and the Adviser, Hussman Strategic International Fund pays a fee, which is computed and accrued daily and paid monthly, at annual rates of 0.95% of the first $2 billion of average daily net assets; 0.90% of the next $3 billion of such assets; and 0.85% of such assets over $5 billion. Under the terms of a separate Advisory Agreement between the Trust and the Adviser, Hussman Strategic Dividend Value Fund pays a fee, which is computed and accrued daily and paid monthly, at annual rates of 0.90% of the first $2 billion of average daily net assets; 0.85% of the next $3 billion of such assets; and 0.80% of such assets over $5 billion, less any fee reductions.
The Adviser has contractually agreed to reduce its advisory fees and/or to absorb operating expenses to the extent necessary so that ordinary operating expenses of Hussman Strategic Growth Fund, Hussman Strategic Total Return Fund and Hussman Strategic Dividend Value Fund do not exceed annually an amount equal to 1.07%, 0.63% and 1.25%, respectively, of average daily net assets. This Expense Limitation Agreement remains in effect until at least November 1, 2014 for Hussman Strategic Growth Fund and Hussman Strategic Total Return Fund and until at least February 1, 2015 for Hussman Strategic Dividend Value Fund. During the six months ended December 31, 2013, the Adviser reduced its advisory fees by $535,630, $447,260 and $115,605 for Hussman Strategic Growth Fund, Hussman Strategic Total Return Fund and Hussman Strategic Dividend Value Fund, respectively.
Any fee reductions or expense reimbursements by the Adviser are subject to repayment by the Funds provided that such repayment does not result in Hussman Strategic Growth Fund’s, Hussman Strategic Total Return Fund’s and Hussman Strategic Dividend Value Fund’s expenses exceeding the annual limitations of 1.07%, 0.63% and 1.25%, respectively, and provided further that the expenses which are the subject to the repayment were incurred within three years of such repayment. As of December 31, 2013, the amount of fee reductions and expense reimbursements available for recovery by the Adviser from Hussman Strategic Growth Fund, Hussman Strategic Total Return Fund and Hussman Strategic Dividend Value Fund is $896,995, $674,347 and $484,280, respectively. The Adviser may recoup a portion of these amounts no later than the dates as stated below:
| | | | | | | | | | |
| Hussman Strategic Growth Fund | | $ | — | | | $ | 361,365 | | | $ | 535,630 | |
| Hussman Strategic Total Return Fund | | $ | — | | | $ | 227,087 | | | $ | 447,260 | |
| Hussman Strategic Dividend Value Fund | | $ | 101,079 | | | $ | 267,596 | | | $ | 115,605 | |
Hussman Investment Trust Notes to Financial Statements (continued) |
December 31, 2013 (Unaudited) |
Certain officers of the Trust are also officers of the Adviser.
Ultimus provides fund administration, fund accounting, compliance and transfer agency services to the Funds. Pursuant to separate servicing agreements with Ultimus, the Funds pay Ultimus customary fees for its services. Certain officers of the Trust are also officers of Ultimus.
For shareholder accounts held through financial intermediaries, the Funds may, in some cases, compensate these intermediaries for providing certain account maintenance and shareholder services. During the six months ended December 31, 2013, Hussman Strategic Growth Fund, Hussman Strategic Total Return Fund, Hussman Strategic International Fund and Hussman Strategic Dividend Value Fund paid $474,226, $255,593, $17,993 and $5,165, respectively, to financial intermediaries for such services.
The Trust has entered into a Distribution Agreement with Ultimus Fund Distributors, LLC (the “Distributor”), pursuant to which the Distributor provides distribution services and serves as the principal underwriter to each Fund. The Distributor is a wholly-owned subsidiary of Ultimus. The Distributor’s fees are paid by the Adviser.
Trustees and officers affiliated with the Adviser or Ultimus are not compensated by the Trust for their services. During the period covered by this report, each Trustee who is not an affiliated person of the Adviser or Ultimus received from the Trust an annual retainer of $60,000, payable quarterly; a fee of $15,000 for attendance at each in-person meeting of the Board of Trustees (except that such fee is $20,000 with respect to the annual meeting of the Board) and a fee of $4,000 for attendance at each telephonic meeting of the Board of Trustees; a fee of $3,000 for attendance at each meeting of any committee of the Board; plus reimbursement of travel and other expenses incurred in attending meetings. Effective January 1, 2014, each Trustee who is not an affiliated person of the Adviser or Ultimus receives from the Trust an annual retainer of $60,000, payable quarterly, a fee of $10,000 for attendance at each in-person meeting of the Board of Trustees (except that such fee is $15,000 with respect to the annual meeting of the Board) and a fee of $4,000 for attendance at each telephone meeting of the Board of Trustees; a fee of $3,000
Hussman Investment Trust Notes to Financial Statements (continued) |
December 31, 2013 (Unaudited) |
for attendance at each meeting of any Committee of the Board; a fee of $1,500 for participation in each informal telephone monthly conference call of the Board; plus reimbursement of travel and other expenses incurred in attending meetings.
| 4. | DERIVATIVES TRANSACTIONS |
Transactions in option contracts written by Hussman Strategic Growth Fund, Hussman Strategic International Fund and Hussman Strategic Dividend Value Fund during the six months ended December 31, 2013 were as follows:
| Hussman Strategic Growth Fund |
| | | | | | | |
| Options outstanding at beginning of period | | | 12,800 | | | $ | 789,114,877 | |
| Options written | | | 47,000 | | | | 3,346,462,211 | |
| Options cancelled in a closing purchase transaction | | | (52,800 | ) | | | (3,575,968,935 | ) |
| Options outstanding at end of period | | | 7,000 | | | $ | 559,608,153 | |
| Hussman Strategic International Fund |
| | | | | | | |
| Options outstanding at beginning of period | | | 100 | | | $ | 4,709,866 | |
| Options written | | | 185 | | | | 10,654,428 | |
| Options cancelled in a closing purchase transaction | | | (200 | ) | | | (9,949,732 | ) |
| Options outstanding at end of period | | | 85 | | | $ | 5,414,562 | |
| Hussman Strategic Dividend Value Fund |
| | | | | | | |
| Options outstanding at beginning of period | | | 44 | | | $ | 1,473,941 | |
| Options written | | | 130 | | | | 5,782,796 | |
| Options cancelled in a closing purchase transaction | | | (111 | ) | | | (4,062,421 | ) |
| Options outstanding at end of period | | | 63 | | | $ | 3,194,316 | |
Hussman Investment Trust Notes to Financial Statements (continued) |
December 31, 2013 (Unaudited) |
The locations in the Statements of Assets and Liabilities of the derivative positions of Hussman Strategic Growth Fund, Hussman Strategic International Fund and Hussman Strategic Dividend Value Fund are as follows:
| Hussman Strategic Growth Fund |
| | | | Fair Value | | | Gross Notional Amount | |
Type of Derivative | Location | | Asset Derivatives | | | Liability Derivatives | | | Outstanding December 31, 2013 | |
| Index put options purchased | Investments in securities at value | | $ | 13,457,500 | | | $ | — | | | $ | 1,278,325,800 | |
| Index call options purchased | Investments in securities at value | | | 3,700,000 | | | | — | | | | 924,180,000 | |
| Index call options written | Written call options, at value | | | — | | | | (594,119,500 | ) | | | (1,278,325,800 | ) |
| Hussman Strategic International Fund |
| | | | Fair Value | | | Gross Notional Amount | |
Type of Derivative | Location | | Asset Derivatives | | | Liability Derivatives | | | Outstanding December 31, 2013 | |
| Index put options purchased | Investments in securities at value | | $ | 6,800 | | | $ | — | | | $ | 15,711,060 | |
| Index call options written | Written call options, at value | | | — | | | | (5,887,100 | ) | | | (15,711,060 | ) |
| Futures contracts purchased | Variation margin receivable | | | 647,126 | | | | — | | | | 12,005,250 | |
| Futures contracts sold short | Variation margin receivable | | | 56,668 | | | | — | | | | (50,984,038 | ) |
| Futures contracts sold short | Variation margin payable | | | — | | | | 9,936 | | | | (50,984,038 | ) |
Hussman Investment Trust Notes to Financial Statements (continued) |
December 31, 2013 (Unaudited) |
| Hussman Strategic Dividend Value Fund |
| | | | Fair Value | | | Gross Notional Amount | |
Type of Derivative | Location | | Asset Derivatives | | | Liability Derivatives | | | Outstanding December 31, 2013 | |
| Index put options purchased | Investments in securities at value | | $ | 5,670 | | | $ | — | | | $ | 11,644,668 | |
| Index call options written | Written call options, at value | | | — | | | | (3,546,270 | ) | | | (11,644,668 | ) |
The average monthly notional amount of put options purchased, call options purchased and call options written during the six months ended December 31, 2013 was $1,688,772,692, $720,853,333 and $1,688,772,692, respectively, for Hussman Strategic Growth Fund. The average monthly notional amount of put options purchased and call options written during the six months ended December 31, 2013 was $16,438,058 and $16,438,058, respectively, for Hussman Strategic International Fund. The average monthly notional amount of futures contracts purchased and sold short during the six months ended December 31, 2013 was $12,116,750 and $48,815,732, respectively, for Hussman Strategic International Fund. The average monthly notional amount of put options purchased and call options written during the six months ended December 31, 2013 was $9,801,271 and $9,801,271, respectively, for Hussman Strategic Dividend Value Fund.
Hussman Investment Trust Notes to Financial Statements (continued) |
December 31, 2013 (Unaudited) |
Transactions in derivative instruments for Hussman Strategic Growth Fund, Hussman Strategic International Fund and Hussman Strategic Dividend Value Fund during the six months ended December 31, 2013 are recorded in the following locations in the Statements of Operations:
| Hussman Strategic Growth Fund |
Type of Derivative | Location | | Realized Gains (Losses) | | Location | | Change in Unrealized Gains (Losses) | |
| Index put options purchased | Net realized gains (losses) from option contracts | | $ | (107,703,364 | ) | Net change in unrealized appreciation (depreciation) on option contracts | | $ | (3,529,749 | ) |
| Index call options purchased | Net realized gains (losses) from option contracts | | | (5,893,470 | ) | Net change in unrealized appreciation (depreciation) on option contracts | | | 1,219,323 | |
| Index call options written | Net realized gains (losses) from option contracts | | | (222,338,655 | ) | Net change in unrealized appreciation (depreciation) on option contracts | | | (61,046,225 | ) |
| Hussman Strategic International Fund |
| Type of Derivative | Location | | Realized Gains (Losses) | | Location | | Change in Unrealized Gains (Losses) | |
| Index put options purchased | Net realized gains (losses) from option contracts | | $ | (20,534 | ) | Net change in unrealized appreciation (depreciation) on option contracts | | $ | 5,570 | |
| Index call options written | Net realized gains (losses) from option contracts | | | (1,793,860 | ) | Net change in unrealized appreciation (depreciation) on option contracts | | | (690,404 | ) |
| Futures contracts purchased | Net realized gains (losses) from futures contracts | | | (136,572 | ) | Net change in unrealized appreciation (depreciation) on futures contracts | | | (388,045 | ) |
| Futures contracts sold short | Net realized gains (losses) from futures contracts | | | (4,340,422 | ) | Net change in unrealized appreciation (depreciation) on futures contracts | | | (3,129,424 | ) |
Hussman Investment Trust Notes to Financial Statements (continued) |
December 31, 2013 (Unaudited) |
| Hussman Strategic Dividend Value Fund |
| Type of Derivative | Location | | Realized Gains (Losses) | | Location | | Change in Unrealized Gains (Losses) | |
| Index put options purchased | Net realized gains (losses) from option contracts | | $ | (34,911 | ) | Net change in unrealized appreciation (depreciation) on option contracts | | $ | 479 | |
| Index call options written | Net realized gains (losses) from option contracts | | | (1,046,337 | ) | Net change in unrealized appreciation (depreciation) on option contracts | | | (410,459 | ) |
Hussman Strategic Total Return Fund had no transactions in derivative instruments during the six months ended December 31, 2013.
In January 2013, Accounting Standards Update 2013-01 (“ASU 2013-01”), “Clarifying the Scope of Disclosures about Offsetting Assets and Liabilities”, replaced Accounting Standards Update 2011-11 (“ASU 2011-11”), “Disclosures about Offsetting Assets and Liabilities”. ASU 2013-01 is effective for fiscal years beginning on or after January 1, 2013, and interim periods within those annual periods. ASU 2011-11 was intended to enhance disclosure requirements on the offsetting of financial assets and liabilities. ASU 2013-01 limits the scope of the new balance sheet offsetting disclosures to derivatives to the extent that they are (1) offset in the financial statements or (2) subject to an enforceable master netting arrangement or similar agreement.
Hussman Investment Trust Notes to Financial Statements (continued) |
December 31, 2013 (Unaudited) |
In the ordinary course of business, Hussman Strategic Growth Fund, Hussman Strategic International Fund and Hussman Strategic Dividend Value Fund entered into transactions subject to enforceable netting agreements or other similar arrangements (“netting agreements”). Generally, the right to offset in netting agreements allows the Funds to offset any exposure to a specific counterparty with any collateral received or delivered to that counterparty based on the terms of the agreements. Generally, the Funds manage their cash collateral securities and securities collateral on a counterparty basis. As of December 31, 2013, the offsetting of financial assets and derivatives assets as of December 31, 2013 is as follows:
| Hussman Strategic International Fund |
| | Gross Amounts of Recognized Liabilities | | | Gross Amounts Offset in Statements of Assets and Liabilities | | | Net Amounts of Assets Presented in Statements of Assets and Liabilities | | | | | | | |
Variation margin receivable - futures contracts | | $ | 703,794 | | | $ | — | | | $ | 703,794 | | | $ | — | | | $ | 703,794 | |
| Total subject to a master netting or similar arrangement | | $ | 703,794 | | | $ | — | | | $ | 703,794 | | | $ | — | | | $ | 703,794 | |
Hussman Investment Trust Notes to Financial Statements (continued) |
December 31, 2013 (Unaudited) |
Offsetting of financial liabilities and derivative liabilities as of December 31, 2013 is as follows:
| Hussman Strategic Growth Fund |
| | Gross Amounts of Recognized Liabilities | | | Gross Amounts Offset in Statements of Assets and Liabilities | | | Net Amounts of Assets Presented in Statements of Assets and Liabilities | | | | | | | |
| Written options at market value | | $ | 594,119,500 | | | $ | — | | | $ | 594,119,500 | | | $ | — | | | $ | 594,119,500 | |
| Total subject to a master netting or similar arrangement | | $ | 594,119,500 | | | $ | — | | | $ | 594,119,500 | | | $ | — | | | $ | 594,119,500 | |
| Hussman Strategic International Fund |
| | Gross Amounts of Recognized Liabilities | | | Gross Amounts Offset in Statements of Assets and Liabilities | | | Net Amounts of Assets Presented in Statements of Assets and Liabilities | | | | | | | |
| Written options at market value | | $ | 5,887,100 | | | $ | — | | | $ | 5,887,100 | | | $ | — | | | $ | 5,887,100 | |
Variation margin payable - futures contracts | | | 9,936 | | | | — | | | | 9,936 | | | | — | | | | 9,936 | |
| Unrealized depreciation on forward currency exchange contracts | | | 2 | | | | — | | | | 2 | | | | — | | | | 2 | |
| Total subject to a master netting or similar arrangement | | $ | 5,897,038 | | | $ | — | | | $ | 5,897,038 | | | $ | — | | | $ | 5,897,038 | |
Hussman Investment Trust Notes to Financial Statements (continued) |
December 31, 2013 (Unaudited) |
| Hussman Strategic Dividend Value Fund |
| | Gross Amounts of Recognized Liabilities | | | Gross Amounts Offset in Statements of Assets and Liabilities | | | Net Amounts of Assets Presented in Statements of Assets and Liabilities | | | | | | | |
| Written options at market value | | $ | 3,546,270 | | | $ | — | | | $ | 3,546,270 | | | $ | — | | | $ | 3,546,270 | |
| Total subject to a master netting or similar arrangement | | $ | 3,546,270 | | | $ | — | | | $ | 3,546,270 | | | $ | — | | | $ | 3,546,270 | |
| 5. | CERTAIN INVESTMENTS AND RISKS |
The securities in which the Funds invest, as well as the risks associated with these securities and with the investment programs of the Funds, are described in the Funds’ Prospectuses. Among these risks are those associated with investments in shares of money market mutual funds, concentration of investments within a particular business sector and, in the case of Hussman Strategic International Fund, investments in foreign securities.
Investments in Money Market Funds — In order to maintain sufficient liquidity to implement investment strategies, or for temporary defensive purposes, each Fund may invest a significant portion of its assets in shares of one or more money market mutual funds. As of December 31, 2013, Hussman Strategic Growth Fund, Hussman Strategic International Fund and Hussman Strategic Dividend Value Fund had 45.3%, 35.7% and 34.7%, respectively, of the value of their net assets invested in money market mutual funds registered under the Investment Company Act of 1940, including 31.6%, 35.7% and 24.3%, respectively, of the value of their net assets invested in shares of a single money market fund. An investment in a money market mutual fund is not insured or guaranteed by the Federal Deposit Insurance Corporation or any other governmental agency, entity or person. While investor losses in money market mutual funds have been rare, they are possible. In addition, the Funds will incur additional indirect expenses due to acquired fund fees and other costs to the extent they invest in shares of money market mutual funds.
Hussman Investment Trust Notes to Financial Statements (continued) |
December 31, 2013 (Unaudited) |
Sector Risk — If a Fund has significant investments in the securities of issuers in industries within a particular business sector, any development affecting that sector will have a greater impact on the value of the net assets of the Fund than would be the case if the Fund did not have significant investments in that sector. In addition, this may increase the risk of loss of an investment in the Fund and increase the volatility of the Fund’s net asset value per share. From time to time, circumstances may affect a particular sector and the companies within such sector. For instance, economic or market factors, regulation or deregulation, and technological or other developments may negatively impact all companies in a particular sector and therefore the value of the Funds’ portfolios will be adversely affected. As of December 31, 2013, Hussman Strategic Growth Fund had 26.0% and 27.6% of the value of its net assets invested in stocks within the Health Care and Information Technology sectors, respectively.
Foreign Investment Risk — Compared with investing in the United States, investing in foreign markets involves a greater degree and variety of risk. Investors in international or foreign markets may face delayed settlements, currency controls and adverse economic developments as well as higher overall transaction costs. In addition, fluctuations in the U.S. dollar’s value versus other currencies may erode or reverse gains from investments denominated in foreign currencies or increase losses. Foreign governments may expropriate assets, impose capital or currency controls, impose punitive taxes, impose limits on ownership or nationalize a company or industry. Any of these actions could have a severe effect on security prices and impair an investor’s ability to bring its capital or income back to the U.S. Exchange rate fluctuations also may impair an issuer’s ability to repay U.S. dollar denominated debt, thereby increasing credit risk of such debt. Finally, the value of foreign securities may be affected by incomplete, less frequent or inaccurate financial information about their issuers, social upheavals or political actions ranging from tax code changes to government collapse. Foreign companies may also receive less coverage than U.S. companies by market analysts and may be subject to different reporting standards or regulatory requirements than those applicable to U.S. companies.
| 6. | FORWARD FOREIGN CURRENCY EXCHANGE CONTRACTS |
Hussman Strategic International Fund is subject to foreign currency exchange rate risk in the normal course of pursuing its investment objective. Hussman Strategic International Fund may enter into contracts for the purchase or sale of a specific foreign currency at a fixed price on a future date as a hedge or cross-hedge against either specific transactions or portfolio positions. The purpose of Hussman Strategic International Fund’s foreign currency hedging transactions is to reduce risk that the U.S. dollar value of the Fund’s securities denominated in foreign currency will decline
Hussman Investment Trust Notes to Financial Statements (continued) |
December 31, 2013 (Unaudited) |
in value due to changes in foreign currency exchange rates. All foreign currency exchange contracts are “marked-to-market” daily at the applicable translation rates resulting in unrealized gains or losses. Realized and unrealized gains or losses from transactions in foreign currency exchange contracts will be included in the Fund’s Statement of Assets and Liabilities and Statement of Operations. Risks associated with these contracts include the potential inability of counterparties to meet the terms of their contracts and unanticipated movements in the value of a foreign currency relative to the U.S. dollar.
As of December 31, 2013, Hussman Strategic International Fund had forward currency exchange contracts outstanding as follows:
| | | | | | | | | | | | Net Unrealized Depreciation | |
| Contracts | | | | | | | | | | | | | |
| 1/2/2014 | | (11,008) USD | | 8,000 EUR | | $ | 11,008 | | | $ | 11,006 | | | $ | (2 | ) |
| | | | | | | | | | | | | | | | | |
| Total Contracts | | $ | 11,008 | | | $ | 11,006 | | | $ | (2 | ) |
EUR - Euro
USD - U.S. Dollar
Hussman Strategic Growth Fund has an unsecured bank line of credit in the amount of $10,000,000. Hussman Strategic Total Return Fund has an unsecured bank line of credit in the amount of $2,000,000. Borrowings under these arrangements bear interest at a rate determined by the lending bank at the time of borrowing. During the six months ended December 31, 2013, the Funds did not borrow under their respective lines of credit. Neither Hussman Strategic International Fund nor Hussman Strategic Dividend Value Fund currently has a bank line of credit.
| 8. | CONTINGENCIES AND COMMITMENTS |
The Trust’s officers and Trustees are entitled to indemnification from the Funds for certain liabilities to which they may become subject in connection with the performance of their duties to the Funds. Additionally, in the normal course of business, the Funds enter into contracts that contain a variety of representations and warranties and which may provide general indemnifications. The Funds’ maximum exposure under these arrangements is unknown, as this would involve potential claims for indemnification for losses that may or may not be incurred in the future. However, based on experience, the Trust believes the risk of loss to be remote.
Hussman Investment Trust Notes to Financial Statements (continued) |
December 31, 2013 (Unaudited) |
Several lawsuits have been filed relating to Hussman Strategic Growth Fund’s investment in Tribune Company common stock in connection with Tribune Company’s Chapter 11 bankruptcy. The lawsuits stem from a leveraged buyout by which Tribune Company converted to a privately-held company in 2007. The Trust, Hussman Strategic Growth Fund, and the Adviser were named as defendants and putative members of the proposed defendant class of shareholders in an adversary proceeding brought by The Official Committee of Unsecured Creditors of Tribune Company in the U.S. Bankruptcy Court for the District of Delaware in 2010. That action was subsequently transferred to the U.S. District Court for the Southern District of New York by order of the Judicial Panel on Multidistrict Litigation, and Marc S. Kirschner, the Litigation Trustee for the Tribune Litigation Trust, became successor plaintiff to the Creditors Committee on December 31, 2012, the effective date of Tribune Company’s plan of reorganization. The Trust and Hussman Strategic Growth Fund were also named as defendants in a lawsuit filed by the indenture trustees of certain noteholders of Tribune Company in the U.S. District Court for the Southern District of Ohio in 2011. Hussman Strategic Growth Fund and the Adviser were named as defendants in a similar action in the U.S. District Court for the District of Maryland in 2011. Both of those actions have been transferred to the U.S. District Court for the Southern District of New York for coordinated proceedings with many other similar lawsuits brought by individual creditors against former Tribune Company shareholders and the action currently prosecuted by the Tribune Litigation Trustee. The Trust, Hussman Strategic Growth Fund, and the Adviser may also be putative defendant class members in some of these actions. The plaintiffs in all these lawsuits seek to recover amounts paid to shareholders of Tribune Company in connection with the leveraged buyout, plus interest and attorneys’ fees and expenses.
An omnibus motion to dismiss the actions filed by the individual creditors (but not the action prosecuted by the Litigation Trustee for the Tribune Litigation Trust) was filed in November 2012. On September 23, 2013, the U.S. District Court Judge issued a decision and order dismissing those actions in full. The plaintiffs in those actions have appealed that decision to the U.S. Court of Appeals for the Second Circuit and certain shareholder defendants, including the Hussman entities, cross-appealed. The plaintiffs in those actions filed their opening appeal brief on December 20, 2013. The responding briefs, including argument on the cross appeal, are due February 28, 2014. Briefing is scheduled to be complete by April 25, 2014. Oral argument has not been set.
Hussman Investment Trust Notes to Financial Statements (continued) |
December 31, 2013 (Unaudited) |
On August 2, 2013, with the District Court’s permission, the Litigation Trustee filed an amended complaint that named Hussman Strategic Growth Fund as one of the class representatives for the putative class of shareholder defendants. The Court issued a revised scheduling order on November 20, 2013, but no briefing schedule has been set.
The lawsuits allege no misconduct by the Trust, Hussman Strategic Growth Fund, or the Adviser, and all the Hussman entities intend to defend themselves vigorously in the lawsuits. If the lawsuits were to be decided or settled in a manner adverse to Hussman Strategic Growth Fund, the payment of such judgments or settlements could adversely affect the Fund’s net asset value per share. The adverse impact to Hussman Strategic Growth Fund is not expected to exceed materially the value of the proceeds received by the Fund in connection with the leveraged buyout, which was $29,432,814 (which constitutes, as of December 31, 2013, approximately 2.3% of the Fund’s net assets), plus interest.
The Funds are required to recognize in their financial statements the effects of all subsequent events that provide additional evidence about conditions that existed as of the date of the Statements of Assets and Liabilities. For non-recognized subsequent events that must be disclosed to keep the financial statements from being misleading, the Funds are required to disclose the nature of the event as well as an estimate of its financial effect, or a statement that such an estimate cannot be made. Management has evaluated subsequent events through the date of issuance of these financial statements and has noted no such events.
Hussman Investment Trust About Your Funds’ Expenses (Unaudited) |
|
We believe it is important for you to understand the impact of costs on your investment. As a shareholder of the Funds, you incur two types of costs: (1) transaction costs, which may include redemption fees; and (2) ongoing costs, including management fees and other Fund expenses. The following examples are intended to help you understand your ongoing costs (in dollars) of investing in the Funds and to compare these costs with the ongoing costs of investing in other mutual funds. A mutual fund’s ongoing costs are expressed as a percentage of its average net assets. This figure is known as the expense ratio.
The examples below are based on an investment of $1,000 made at the beginning of the period shown and held for the entire period (July 1, 2013 - December 31, 2013).
The table on the following page illustrates each Fund’s ongoing costs in two ways:
Actual fund return – This section helps you to estimate the actual expenses that you paid over the period. The “Ending Account Value” shown is derived from each Fund’s actual return, and the third column shows the dollar amount of operating expenses that would have been paid by an investor who started the period with $1,000 invested in that Fund. You may use the information here, together with the amount of your investment, to estimate the expenses that you paid over the period.
To do so, simply divide your account value by $1,000 (for example, an $8,600 account value divided by $1,000 = 8.6), and then multiply the result by the number given for the applicable Fund under the heading “Expenses Paid During Period.”
Hypothetical 5% return – This section is intended to help you compare each Fund’s ongoing costs with those of other mutual funds. It assumes that each Fund had an annual return of 5% before expenses during the period shown. In this case, because the return used is not each Fund’s actual return, the results do not illustrate the actual expenses associated with your investment. However, the example is useful in making comparisons because the Securities and Exchange Commission (“SEC“) requires all mutual funds to provide an example of fund expenses based on a 5% annual return. You can assess each Fund’s ongoing costs by comparing this hypothetical example with the hypothetical examples that appear in shareholder reports of other mutual funds.
Note that expenses shown in the table are meant to highlight and help you compare ongoing costs only. The calculations assume no shares were bought or sold during the period. Your actual costs may have been higher or lower, depending on the amount of your investment and the timing of any purchases or redemptions.
Hussman Investment Trust About Your Funds’ Expenses (Unaudited) (continued) |
|
More information about each Fund’s expenses, including annual expense ratios, can be found elsewhere in this report. For additional information on operating expenses and other shareholder costs, please refer to each Fund’s prospectus.
| Hussman Strategic Growth Fund |
| Beginning Account Value July 1, 2013 | Ending Account Value December 31, 2013 | Expenses Paid During Period* |
| Based on Actual Fund Return | $1,000.00 | $953.40 | $5.27 |
Based on Hypothetical 5% Annual
Return (before expenses) | $1,000.00 | $1,019.81 | $5.45 |
| * | Expenses are equal to Hussman Strategic Growth Fund’s annualized expense ratio of 1.07% for the period, multiplied by the average account value over the period, multiplied by 184/365 (to reflect the one-half year period). |
| Hussman Strategic Total Return Fund |
| Beginning Account Value July 1, 2013 | Ending Account Value December 31, 2013 | Expenses Paid During Period* |
| Based on Actual Fund Return | $1,000.00 | $994.70 | $3.17 |
Based on Hypothetical 5% Annual
Return (before expenses) | $1,000.00 | $1,022.03 | $3.21 |
| * | Expenses are equal to Hussman Strategic Total Return Fund’s annualized expense ratio of 0.63% for the period, multiplied by the average account value over the period, multiplied by 184/365 (to reflect the one-half year period). |
| Hussman Strategic International Fund |
| Beginning Account Value July 1, 2013 | Ending Account Value December 31, 2013 | Expenses Paid During Period* |
| Based on Actual Fund Return | $1,000.00 | $1,005.00 | $7.78 |
Based on Hypothetical 5% Annual
Return (before expenses) | $1,000.00 | $1,017.44 | $7.83 |
| * | Expenses are equal to Hussman Strategic International Fund’s annualized expense ratio of 1.54% for the period, multiplied by the average account value over the period, multiplied by 184/365 (to reflect the one-half year period). |
Hussman Investment Trust About Your Funds’ Expenses (Unaudited) (continued) |
|
| Hussman Strategic Dividend Value Fund |
| Beginning Account Value July 1, 2013 | Ending Account Value December 31, 2013 | Expenses Paid During Period* |
| Based on Actual Fund Return | $1,000.00 | $1,027.60 | $6.39 |
Based on Hypothetical 5% Annual
Return (before expenses) | $1,000.00 | $1,018.90 | $6.36 |
| * | Expenses are equal to Hussman Strategic Dividend Value Fund’s annualized expense ratio of 1.25% for the period, multiplied by the average account value over the period, multiplied by 184/365 (to reflect the one-half year period). |
Hussman Investment Trust Other Information (Unaudited) |
|
A description of the policies and procedures the Funds use to determine how to vote proxies relating to portfolio securities is available without charge upon request by calling toll-free 1-800-HUSSMAN (1-800-487-7626), or on the SEC’s website at http://www.sec.gov. Information regarding how the Funds voted proxies relating to portfolio securities during the most recent 12-month period ended June 30 is also available without charge upon request by calling toll-free 1-800-HUSSMAN, or on the SEC’s website at http://www.sec.gov.
The Trust files a complete listing of portfolio holdings for each Fund with the SEC as of the end of the first and third quarters of each fiscal year on Form N-Q. The filings are available upon request, by calling 1-800-HUSSMAN (1-800-487-7626). You may also obtain copies of these filings on the SEC’s website at http://www.sec.gov. The Trust’s Forms N-Q may also be reviewed and copied at the SEC’s Public Reference Room in Washington, DC, and information on the operation of the Public Reference Room may be obtained by calling 1-800-SEC-0330.
THIS PAGE INTENTIONALLY LEFT BLANK.
THIS PAGE INTENTIONALLY LEFT BLANK.
INVESTMENT ADVISER
Hussman Strategic Advisors, Inc.
5136 Dorsey Hall Drive
Ellicott City, Maryland 21042
www.hussmanfunds.com
1-800-HUSSMAN (1-800-487-7626)
ADMINISTRATOR/TRANSFER AGENT
Ultimus Fund Solutions, LLC
225 Pictoria Drive, Suite 450
Cincinnati, Ohio 45246
CUSTODIANS
US Bank NA
425 Walnut Street
Cincinnati, Ohio 45202
The Northern Trust Company
50 South LaSalle Street
Chicago, Illinois 60675
INDEPENDENT REGISTERED
PUBLIC ACCOUNTING FIRM
Ernst & Young LLP
1900 Scripps Center
312 Walnut Street
Cincinnati, Ohio 45202
LEGAL COUNSEL
Schulte Roth & Zabel LLP
919 Third Avenue
New York, New York 10022
This Semi-Annual Report is authorized for
distribution only if accompanied or preceded
by a current Prospectus of the Funds.
Item 2. Code of Ethics.
Not required
Item 3. Audit Committee Financial Expert.
Not required
Item 4. Principal Accountant Fees and Services.
Not required
Item 5. Audit Committee of Listed Registrants.
Not applicable
Item 6. Schedule of Investments.
(a) Not applicable [schedule filed with Item 1]
(b) Not applicable
Item 7. Disclosure of Proxy Voting Policies and Procedures for Closed-End Management Investment Companies.
Item 8. Portfolio Managers of Closed-End Management Investment Companies
Item 9. Purchases of Equity Securities by Closed-End Management Investment Company and Affiliated Purchasers.
Item 10. Submission of Matters to a Vote of Security Holders.
The registrant has not adopted procedures by which shareholders may recommend nominees to the registrant’s board of trustees.
Item 11. Controls and Procedures.
(a) Based on their evaluation of the registrant’s disclosure controls and procedures (as defined in Rule 30a-3(c) under the Investment Company Act of 1940) as of a date within 90 days of the filing date of this report, the registrant’s principal executive officer and principal financial officer have concluded that such disclosure controls and procedures are reasonably designed and are operating effectively to ensure that material information relating to the registrant, including its consolidated subsidiaries, is made known to them by others within those entities, particularly during the period in which this report is being prepared, and that the information required in filings on Form N-CSR is recorded, processed, summarized, and reported on a timely basis.
(b) There were no changes in the registrant’s internal control over financial reporting (as defined in Rule 30a-3(d) under the Investment Company Act of 1940) that occurred during the second fiscal quarter of the period covered by this report that have materially affected, or are reasonably likely to materially affect, the registrant’s internal control over financial reporting.
Item 12. Exhibits.
File the exhibits listed below as part of this Form. Letter or number the exhibits in the sequence indicated.
(a)(1) Any code of ethics, or amendment thereto, that is the subject of the disclosure required by Item 2, to the extent that the registrant intends to satisfy the Item 2 requirements through filing of an exhibit: Not required
(a)(2) A separate certification for each principal executive officer and principal financial officer of the registrant as required by Rule 30a-2(a) under the Act (17 CFR 270.30a-2(a)): Attached hereto
(a)(3) Any written solicitation to purchase securities under Rule 23c-1 under the Act (17 CFR 270.23c-1) sent or given during the period covered by the report by or on behalf of the registrant to 10 or more persons: Not applicable
(b) Certifications required by Rule 30a-2(b) under the Act (17 CFR 270.30a-2(b)): Attached hereto
| Exhibit 99.CERT | Certifications required by Rule 30a-2(a) under the Act |
| Exhibit 99.906CERT | Certifications required by Rule 30a-2(b) under the Act |
SIGNATURES
Pursuant to the requirements of the Securities Exchange Act of 1934 and the Investment Company Act of 1940, the registrant has duly caused this report to be signed on its behalf by the undersigned, thereunto duly authorized.
(Registrant) Hussman Investment Trust
| By (Signature and Title)* | /s/ John P. Hussman | |
| | | John P. Hussman, President | |
| | | | |
| Date | February 25, 2014 | | |
Pursuant to the requirements of the Securities Exchange Act of 1934 and the Investment Company Act of 1940, this report has been signed below by the following persons on behalf of the registrant and in the capacities and on the dates indicated.
| By (Signature and Title)* | /s/ John P. Hussman | |
| | | John P. Hussman, President | |
| | | | |
| Date | February 25, 2014 | | |
| | | | |
| By (Signature and Title)* | /s/ Mark J. Seger | |
| | | Mark J. Seger, Treasurer | |
| | | | |
| Date | February 25, 2014 | | |
* Print the name and title of each signing officer under his or her signature.