Washington, D.C. 20549
John F. Splain
Form N-CSR is to be used by management investment companies to file reports with the Commission not later than 10 days after the transmission to stockholders of any report that is required to be transmitted to stockholders under Rule 30e-1 under the Investment Company Act of 1940 (17 CFR 270.30e-1). The Commission may use the information provided on Form N-CSR in its regulatory, disclosure review, inspection, and policymaking roles.
A registrant is required to disclose the information specified by Form N-CSR, and the Commission will make this information public. A registrant is not required to respond to the collection of information contained in Form N-CSR unless the Form displays a currently valid Office of Management and Budget ("OMB") control number. Please direct comments concerning the accuracy of the information collection burden estimate and any suggestions for reducing the burden to Secretary, Securities and Exchange Commission, 450 Fifth Street, NW, Washington, DC 20549-0609. The OMB has reviewed this collection of information under the clearance requirements of 44 U.S.C. § 3507.
HUSSMAN INVESTMENT TRUST
Hussman Strategic Growth Fund
Hussman Strategic Total Return Fund
Hussman Strategic International Fund
SEMI-ANNUAL REPORT
December 31, 2011
(Unaudited)
STRATEGIC GROWTH FUND
Comparison of the Change in Value of a $10,000 Investment in Hussman Strategic Growth Fund
versus the Standard & Poor’s 500 Index and the Russell 2000 Index(a)
Average Annual Total Returns For Periods Ended December 31, 2011 |
| | | | | | |
Hussman Strategic Growth Fund(b)(d) | 1.64% | 0.83% | (0.58)% | 4.44% | 6.52% |
| S&P 500 Index | 2.11% | 14.11% | (0.25)% | 2.92% | 0.55% |
| Russell 2000 Index | (4.18)% | 15.63% | 0.15% | 5.62% | 4.62% |
| (a) | Hussman Strategic Growth Fund invests in stocks listed on the New York, American, and NASDAQ exchanges, and does not specifically restrict its holdings to a particular market capitalization. The S&P 500 and Russell 2000 are indices of large and small capitalization stocks, respectively. “HSGFX equity investments and cash equivalents only (unhedged)” reflects the performance of the Fund’s stock investments and modest day-to-day cash balances, after fees and expenses, but excluding the impact of hedging transactions. The Fund’s unhedged equity investments do not represent a separately available portfolio, and their peformance is presented solely for purposes of comparison and performance attribution. |
| | |
| (b) | Returns do not reflect the deduction of taxes a shareholder would pay on Fund distributions or the redemption of Fund shares. |
| | |
| (c) | The Fund commenced operations on July 24, 2000. |
| | |
| (d) | The Fund’s annualized expense ratio was 1.04% during the six months ended December 31, 2011. The expense ratio as disclosed in the November 1, 2011 prospectus was 1.05% for the year ended June 30, 2011, including acquired fund fees. |

STRATEGIC TOTAL RETURN FUND
Comparison of the Change in Value of a $10,000 Investment in Hussman Strategic Total Return Fund
versus the Barclays Capital U.S. Aggregate Bond Index
Average Annual Total Returns For Periods Ended December 31, 2011 |
| | | | | |
Hussman Strategic Total Return Fund(a)(c) | 4.00% | 5.62% | 7.13% | 7.08% |
Barclays Capital U.S. Aggregate Bond Index(d) | 7.84% | 6.77% | 6.50% | 5.40% |
| (a) | Returns do not reflect the deduction of taxes a shareholder would pay on Fund distributions or the redemption of Fund shares. |
| | |
| (b) | The Fund commenced operations on September 12, 2002. |
| | |
| (c) | The Fund’s annualized expense ratio was 0.63% during the six months ended December 31, 2011. The expense ratio as disclosed in the November 1, 2011 prospectus was 0.72% for the year ended June 30, 2011, including acquired fund fees. |
| | |
| (d) | The Barclays Capital U.S. Aggregate Bond Index covers the U.S. investment grade fixed rate bond market, with index components for U.S. government, agency and corporate securities. The Fund does not invest solely in securities included in the Barclays Capital U.S. Aggregate Bond Index and may invest in other types of bonds, common stocks and etc. |
STRATEGIC INTERNATIONAL FUND
Comparison of the Change in Value of a $10,000 Investment in
Hussman Strategic International Fund versus the MSCI EAFE Index
Average Annual Total Returns For Periods Ended December 31, 2011 |
| | | |
Hussman Strategic International Fund(a)(c) | (3.93)% | 0.27% |
MSCI EAFE Index(d) | (12.14)% | (2.70)% |
| (a) | Returns do not reflect the deduction of taxes a shareholder would pay on Fund distributions or the redemption of Fund shares. |
| | |
| (b) | The Fund commenced operations on December 31, 2009. |
| | |
| (c) | The Fund’s annualized expense ratio was 2.00% during the six months ended December 31, 2011. The expense ratio as disclosed in the November 1, 2011 prospectus was 2.08% for the year ended June 30, 2011, including acquired fund fees. |
| | |
| (d) | The MSCI EAFE (Europe, Australasia, and Far East) Index is a free float weighted capitalization index that is designed to measure the equity market performance of developed markets, excluding the U.S. and Canada. As of December 31, 2011, the MSCI EAFE Index consisted of the following 22 developed market country indices: Australia, Austria, Belgium, Denmark, Finland, France, Germany, Greece, Hong Kong, Ireland, Israel, Italy, Japan, the Netherlands, New Zealand, Norway, Portugal, Singapore, Spain, Sweden, Switzerland and the United Kingdom. The Fund may not invest in all of the countries represented in the MSCI EAFE Index and may invest in securities that are not included in the MSCI EAFE Index. |
For the year ended December 31, 2011, Strategic Growth Fund achieved a total return of 1.64%, Strategic Total Return Fund achieved a total return of 4.00%, and Strategic International Fund lost -3.93%.
Strategic Growth Fund has achieved an average annual total return of 6.52% from its inception on July 24, 2000 through December 31, 2011, compared with an average annual return of 0.55% for the S&P 500 Index over the same period. An initial $10,000 investment in the Fund on July 24, 2000 would have grown to $20,601, compared with $10,649 for the same investment in the S&P 500 Index. The deepest loss experienced by the Fund since inception was -21.45%, compared with a maximum loss of -55.25% for the S&P 500 Index.
Strategic Total Return Fund has achieved an average annual total return of 7.08% from its inception on September 12, 2002 through December 31, 2011, compared with an average annual total return of 5.40% for the Barclays Capital U.S. Aggregate Bond Index for that period. An initial $10,000 investment in the Fund on September 12, 2002 would have grown to $18,902, compared with $16,310 for the same investment in the Barclays Capital U.S. Aggregate Bond Index. The deepest loss experienced by the Fund since inception was -11.52%, compared with a maximum loss of -5.08% for the Barclays Capital U.S. Aggregate Bond Index.
Strategic International Fund has achieved an average annual total return of 0.27% from its inception December 31, 2009 through December 31, 2011, compared with an average annual total return of -2.70% for the MSCI EAFE Index for that period. An initial $10,000 investment in the Fund on December 31, 2009 would have grown to $10,054, compared with $9,467 for the same investment in the MSCI EAFE Index. The deepest loss experienced by the Fund since inception was -7.92%, compared with a maximum loss of -26.93% for the MSCI EAFE Index.
Credit concerns remained a significant focus of the financial markets in 2011, with the modest 2.11% total return of the S&P 500 Index masking a great deal of volatility during the year. Meanwhile, the yield on 30-year U.S. Treasury securities plunged from 4.33% to 2.89% during the year, driven by strong “safe haven” demand for Treasury securities in the face of government debt strains affecting a number of European countries. As credit concerns mounted, the European Central Bank (ECB) introduced changes in the quality of collateral it would accept in return for 3-year loans. Notably, the list of acceptable collateral was revised to include new, unlisted
|
Letter to Shareholders (continued) |
debt issued by European banks - essentially allowing distressed banks to issue bonds to themselves and then pledge those bonds to the ECB as collateral for newly created Euros. While I believe that these actions are hostile to the long-term stability of the global financial system, they provided short-term relief for the distressed European banking system, and the global stock markets enjoyed a year-end advance from their mid-year lows.
Meanwhile, as leading economic measures broadly deteriorated, the retreat in credit concerns supported a burst of economic activity late in the year. This created a divergence between numerous historically reliable leading indicators, which remained unfavorable at the end of 2011, and widely followed coincident indicators (such as employment and various regional surveys), which enjoyed a rebound. It remains unclear whether the late-year increase in activity represented a temporary release of pent-up demand, or whether it reflects a more durable improvement in economic activity.
Over the past few quarters, Strategic Growth Fund has enjoyed muted volatility and positive returns during market declines, but also a moderately inverse relationship versus the S&P 500 Index during market advances. This behavior isn’t a general feature of our hedging approach, but rather the reflection of two factors that are currently in place. One is our significant “underweight” in financials, materials, cyclicals and other “risk on” sectors that we view as speculative, and where we find few candidates that satisfy the discounted cash flow criteria that we rely on in large part for stock selection. While our stock selection has significantly outperformed the S&P 500 Index over time, our continued avoidance of financials does introduce some inverse behavior in our hedged investment position during periods of “risk on” speculation.
The other related factor is that the past several quarters have been a constant cycle of “hot potato” between recession risk and what we identify as an “overvalued, overbought, overbullish” syndrome where market valuations, recent price trends, and investor sentiment are overextended at the same time. The result is that one or the other has generally kept us in a tightly hedged investment position. In our most defensive stance, we typically endure some decay in option value during market advances, because we raise the strike prices of our put options in order to defend against indiscriminate selling that often follows, as we saw during sharp market declines in 2010 and 2011. The overall result is that the Fund has typically enjoyed positive returns when the market plunges, but has experienced some erosion during speculative periods.
|
Letter to Shareholders (continued) |
During 2011, Strategic Growth Fund and Strategic International Fund remained largely hedged against the impact of market fluctuations. Strategic Total Return Fund generally held a conservative duration (a measure of interest-rate sensitivity and effective bond maturity) between 2-4 years during 2011, primarily in U.S. Treasury securities. The Fund also benefited from investments in precious metals and utility shares, which ranged from less than 2% of net assets early in the year, to slightly more than 20% of net assets by mid-year, followed by a gradual reduction in these holdings late in 2011.
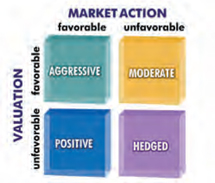
| Risk Management and Stress Testing |
One of the main approaches we use to estimate return and risk prospects is to group current market conditions among historical instances that are most similar. Each point in history is defined by various “features” based on a broad range of key factors, including valuations, measures of market action, investor sentiment, economic factors, and so forth. In order to make the analysis less dependent on any particular historical period (e.g., post-war data, bubble-era data, Depression-era data), or any single set of indicators, we extend this analysis to a very large number of randomly selected sub-samples across history.
This sort of analysis is an example of an “ensemble method” of modeling which has several benefits, the two most important being on measures of “accuracy” and “robustness.” It is not difficult to fit a model to past data, but those models often break down quickly in new data. So to evaluate accuracy, we estimate return and risk on data that the model has not “seen” previously, and find that the ensemble approach generally performs better than alternative methods. Equally important, ensembles tend to be robust to very large changes in the underlying economic environment, because randomizing over numerous sub-samples of history reduces the likelihood that the model is “over-fitted” to a particular set of economic conditions.
Though I wrote numerous commentaries anticipating much of what actually occurred during the credit crisis, I certainly did not anticipate what I still consider to be terrible policy mistakes - particularly the absolute unwillingness to restructure bad debt, in preference for kicking the can down the road with public funds. It was a far cry from how U.S. regulators had responded to the S&L crisis, and how other international banking crises had been successfully addressed. (For example, in the early 1990’s, the Swedish banking crisis was durably resolved by the government taking receivership of a large portion of the banking industry, wiping out existing shareholders, writing down bad assets, and then taking the banks public to recapitalize them under new owners.)
|
Letter to Shareholders (continued) |
In response to the 2008-2009 crisis, I believed that it was the responsibility of portfolio managers to stress-test each aspect of their investment approach, though I am still not convinced that much of Wall Street has stress-tested anything at all. For us, stress-testing meant taking our models to Depression-era data, because it was clear that events of the time were largely “out of sample” from the standpoint of post-war data. At the time, we were basing our estimates of market risk and return on data since about 1950, which I had expected was sufficient to capture “modern” market behavior. Prior to 2008, it seemed unlikely that the U.S. would face Depression-like credit strains again.
While our existing hedging approach performed well in Depression-era data overall, the occasional losses were far deeper than I was willing to risk for our shareholders. The result was what I called a “two-data sets” problem, which demanded that our hedging methods perform well, out-of-sample, and with tolerable risk, in data drawn from both post-war and Depression-era periods. We reached a satisfactory solution in late 2010 with the introduction of our ensemble approach. For the full period, we avoided a significant portion of the market’s 2007-2009 downturn, but in hindsight, the need to alter our hedging methods in response to the credit crisis led us to miss a rebound in 2009 that we should not have missed, had our present approach been already in hand.
As always, the hedging strategies used by the Hussman Funds are intended to be applied over a complete market cycle - generally several years, but in any event comprising a complete bull and bear market. Our approach to managing risk may result in lagging performance during the overvalued, overextended portions of a given cycle, but it has repeatedly demonstrated value over complete bull-bear market cycles, both adding returns and defending against severe market losses (exceeding 50% on two separate occasions in the last decade alone).
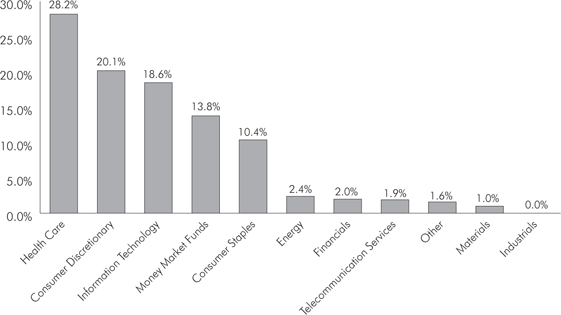
As of December 31, 2011, Strategic Growth Fund had net assets of $5,772,828,014, and held approximately 150 stocks in a wide variety of industries. The largest sector holdings as a percent of net assets were health care (33.5%), consumer discretionary (23.9%), information technology (22.0%), and consumer staples (12.4%). The smallest sector weights relative to the S&P 500 Index were in energy (2.8%), telecommunications (2.3%), financials (2.3%), materials (1.2%), and industrials (less than 0.1%). |
Letter to Shareholders (continued) |
The Fund’s holdings of individual stocks as of December 31, 2011 accounted for $5,792,612,946, or 100% of net assets. Against these stock positions, the Fund also held 37,000 option combinations (long put option/short call option) on the S&P 500 Index, 8,000 option combinations on the Russell 2000 Index and 2,000 option combinations on the Nasdaq 100 Index. Each option combination behaves as a short sale on the underlying index, with a notional value of $100 times the index value. On December 31, 2011, the S&P 500 Index closed at 1,257.60, while the Russell 2000 Index and the Nasdaq 100 Index closed at 740.92 and 2,277.83, respectively. The Fund’s total hedge therefore represented a short position of $5,701,422,000, thereby hedging 98.4% of the dollar value of the Fund’s long investment positions in individual stocks.
Though the performance of Strategic Growth Fund’s diversified portfolio cannot be attributed to any narrow group of stocks, the following holdings achieved gains in excess of $10 million during the semi-annual period ended December 31, 2011: Panera Bread, Apple, Synaptics, AutoZone, Dollar Tree Stores, Humana, Ross Stores, Starbucks, MasterCard, Cisco Systems, and Amazon.com. Holdings with losses in excess of $25 million during this same period were First Solar, Illumina, SunPower, BMC Software, and Life Technologies.
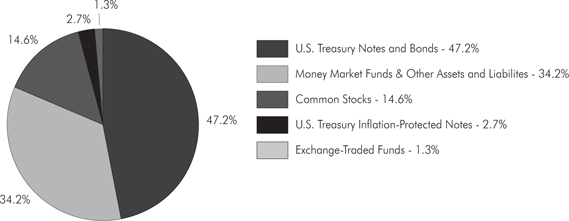
As of December 31, 2011, Strategic Total Return Fund had net assets of $2,728,550,834. Treasury notes, Treasury bonds, Treasury Inflation-Protected Securities (TIPS) and shares of money market funds represented 83.9% of the Fund’s net assets. Precious metals shares, utility and energy shares, and exchange-traded funds (ETFs) accounted for 13.2%, 1.4% and 1.3% of net assets, respectively. The Fund carried a duration of less than 4 years (meaning that a 1% change in interest rates would be expected to impact the Fund’s asset value by less than 4% on the basis of bond price fluctuations).
In Strategic Total Return Fund, during the semi-annual period ended December 31, 2011, portfolio gains in excess of $5 million were achieved in Newmont Mining, U.S. Treasury Note (1.75%, due 5/31/2016), U.S. Treasury Note (2.125%, due 8/15/2021), Randgold Resources-ADR, U.S. Treasury Bond (3.75%, due 8/15/2041), U.S. Treasury Note (2.25%, due 3/31/2016), U.S. Treasury Inflation-Protected Note (2.50%, due 1/15/2029), and U.S. Treasury Note (2.00%, due 4/30/2016). Holdings with losses in excess of $1 million during this same period were NuStar Energy, Freeport-McMoRan Copper & Gold, Harmony Gold Mining-ADR, Goldcorp, and Agnico-Eagle Mines.
|
Letter to Shareholders (continued) |
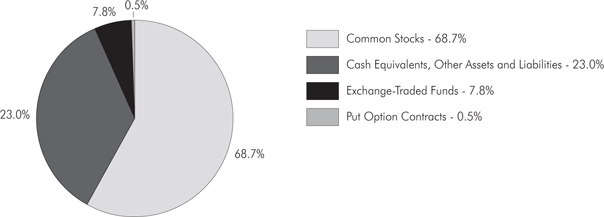
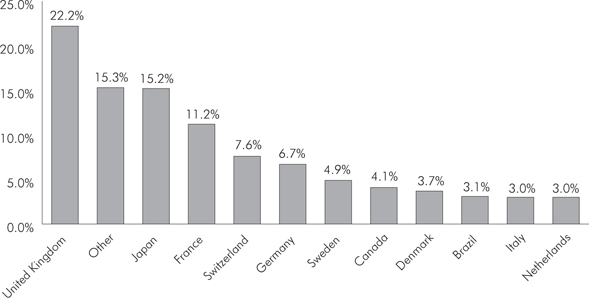
As of December 31, 2011, Strategic International Fund had net assets of $79,052,209 and held approximately 125 stocks in a wide variety of industries. The largest sectors as a percent of net assets were in health care (11.7%), consumer discretionary (11.2%), telecommunications (10.5%), consumer staples (9.4%), information technology (8.4%), and industrials (8.0%). The smallest sector weights were in utilities (5.5%), energy (3.0%), and materials (1.0%). Shares of exchange-traded funds and money market funds accounted for 7.8% and 13.6% of net assets, respectively. The total value of equities and ETF shares held by the Fund was $60,497,717.
In order to hedge the impact of general market fluctuations, as of December 31, 2011, Strategic International Fund held 185 option combinations (long put option/short call option) on the S&P 500 Index, and was short 750 futures on the Euro STOXX 50 Index and 150 futures on the FTSE 100 Index. The combined notional value of these hedges was $58,731,037, hedging 97.1% of the value of equity and ETF investments held by the Fund. When the Fund is in a hedged investment position, the primary driver of Fund returns is the difference in performance between the stocks owned by the Fund and the indices that are used to hedge.
While Strategic International Fund is widely diversified and its performance is affected by numerous investment positions, the hedging strategy of the Fund was primarily responsible for the reduced sensitivity of the Fund to market fluctuations from the Fund’s inception through December 31, 2011. Individual equity holdings having portfolio gains in excess of $75,000 during the semi-annual period ended December 31, 2011 included Bunzl, Royal Dutch Shell–ADR, William Morrison Supermarkets, and Next. Holdings with portfolio losses in excess of $200,000 during this same period included Norbert Dentressangle, Enel, H. Lundbeck, iShares MSCI Germany Index Fund, DeNA, Recordati, Telecom Argentina-ADR, and CENTROTEC Sustainable.
Supplementary information including quarterly returns and equity-only performance is available on the Hussman Funds website at www.hussmanfunds.com.
Recent quarters have been largely characterized by a fragile underlying global economy coupled with a persistently overvalued stock market (though to varying degrees). We have seen little during this period but the effect of a hot potato being repeatedly passed from speculative “overvalued, overbought, overbullish” market
|
Letter to Shareholders (continued) |
conditions fueled by massive central bank interventions, to renewed credit strains and emerging economic pressures that appear nearly the instant those interventions are even temporarily suspended. By turns, we’ve seen the repeated emergence of the same speculative conditions that have historically accompanied major and intermediate market peaks, followed by credit strains and economic pressures that reflect an unresolved overhang of global debt. The alternation is certainly not typical of market history. Nor is it typical of a complete market cycle or business cycle. As unsatisfactory as it may be, the market is presently in an extended game of “hot potato” which will be resolved by the market’s eventual departure from both environments.
The more extended period since 2000 has been generally characterized by unusually rich valuations, which is duly reflected in the annual average total return of 0.21%, including dividends, that the S&P 500 achieved from its 2000 peak through the end of 2011. That is not an accident, but instead approximates the total return that we projected for the S&P 500 more than a decade ago, based on our standard valuation methodology. Given this outcome, it should be clear that the generally defensive stance of Strategic Growth Fund during this period is no fixed aspect of investment strategy or personal temperament, but instead owes far more to the repeatedly and predictably disastrous overvaluation of the stock market since the late 1990’s.
Such a richly overvalued period is unique in U.S. stock market history, and as a direct result, 12-year periods of virtually zero returns are also rare. Only two periods come close. The stock market suffered negative returns in the 12 years after the 1929 peak, which started with the S&P 500 at about 22 times cyclically-adjusted earnings (the 10-year average of prior inflation-adjusted earnings). Stocks also achieved an average annual total return of just 3.7% in the 12 years between 1963 and 1975, owing to the unfortunate combination of a high starting valuation, with a starting price-earnings multiple of about 21, and a low ending valuation, with a multiple below 9. That depressed valuation in 1975 then set the groundwork for over two decades of excellent market returns.
As of February 2012, the S&P 500 is again at a multiple of over 22 times cyclically-adjusted earnings. Regardless of economic prospects, this is a strong headwind. As of February 2012, we estimate that the S&P 500 is likely to achieve an average annual total return of just 4.4% over the coming decade. However, this does not imply that strong investment opportunities will remain scarce for another decade. Projected long-term returns can rise quickly when the stock market declines significantly, which appears likely to occur within a far shorter period than a decade.
|
Letter to Shareholders (continued) |
Unfortunately, it is both dangerous to speculate, and utterly frustrating to remain defensive, in richly overvalued markets coupled with significant economic risks or strenuously overbought conditions. This is the environment we are presented with, and it is in no way typical of “standard” market conditions, despite its repetition in recent years.
Even so, it is notable that less than half of a bull market gain is typically retained by the end of the subsequent bear market. There is very little chance, in my view, that market gains from present levels will be retained by investors over the remainder of the current cycle. There appears equally little chance that investors who are willing to accept significant risk now will be prompted to reduce their risk later, until they encounter a market decline that is - by then - nearly impossible to act upon. The value of avoiding major losses is clear from the arithmetic of compounding: a 20% loss wipes out a 25% gain; a 30% loss wipes out a 43% gain; a 40% loss wipes out a 67% gain; and a 50% loss wipes out a 100% gain. Investors should not overlook the fact that the market has lost more than 50% of its value twice in the past decade, and remains overvalued on our measures (which correctly anticipated those losses).
We will certainly have periods where we appear remarkably out-of-step with the prevailing trend of the market, particularly in overvalued, overbought, overbullish periods of speculation. But defending against losses in these periods is essential to risk management, despite the tendency of bulls to declare victory at halftime. One of the reasons we so strongly discourage short-term investments in the Hussman Funds is that I hope - and also manage the Funds on the expectation - that shareholders will be with us through the completion of each bull-bear market cycle. For example, shareholders who initially invest in Strategic Growth Fund near major lows in the stock market are encouraged to set their investment horizon at least through the completion of the subsequent market cycle.
This period of overextended conditions and high recession uncertainty will end, and we will have opportunities to accept moderate or even significant amounts of market risk, with proportionately high expected returns. Whether the present gap between leading and coincident economic evidence closes in favor of recession or recovery, that gap will close. As investor sentiment and short-term price movement experience a normal ebb-and-flow, I expect that at least some opportunity to accept market risk will emerge even within the next few quarters. A major positive shift in our investment stance would most probably accompany a significant improvement in valuations, confirmed by improving market internals (a sequence that is characteristic |
Letter to Shareholders (continued) |
of early bull market advances). With the stock market characterized by an overvalued, overbought, overbullish syndrome of conditions, I do not believe that we are faced with such an opportunity here. This will change, and we will respond accordingly.
Always, I remain grateful for your trust.
Sincerely,
John P. Hussman, Ph.D.
Past performance is not predictive of future performance. Investment results and principal value will fluctuate so that shares of the Funds, when redeemed, may be worth more or less than their original cost. Current performance may be higher or lower than the performance data quoted.
Weekly updates regarding market conditions and investment strategy, as well as special reports, analysis, and performance data current to the most recent month end, are available at the Hussman Funds website www.hussmanfunds.com.
An investor should consider the investment objectives, risks, charges and expenses of the Funds carefully before investing. The Funds’ prospectuses contain this and other important information. To obtain a copy of the Hussman Funds’ prospectuses please visit our website at www.hussmanfunds.com or call 1-800-487-7626 and a copy will be sent to you free of charge. Please read the prospectus carefully before you invest. The Hussman Funds are distributed by Ultimus Fund Distributors, LLC.
The Letter to Shareholders seeks to describe some of the adviser’s current opinions and views of the financial markets. Although the adviser believes it has a reasonable basis for any opinions or views expressed, actual results may differ, sometimes significantly so, from those expected or expressed. The securities held by the Funds that are discussed in the Letter to Shareholders were held during the period covered by this Report. They do not comprise the entire investment portfolios of the Funds, may be sold at any time and may no longer be held by the Funds. The opinions of the Funds’ adviser with respect to those securities may change at any time.
Hussman Strategic Growth Fund Portfolio Information |
December 31, 2011 (Unaudited) |
| Sector Allocation (% of Total Investments and Money Market Funds) |
Hussman Strategic Total Return Fund Portfolio Information |
December 31, 2011 (Unaudited) |
| Asset Allocation (% of Net Assets) |
Hussman Strategic International Fund Portfolio Information |
December 31, 2011 (Unaudited) |
| Asset Allocation (% of Net Assets) |
| Country Allocation (% of Equity Holdings) |
Hussman Strategic Growth Fund Schedule of Investments |
December 31, 2011 (Unaudited) |
| | | | | | |
| Consumer Discretionary — 23.9% | | | | | | |
| Diversified Consumer Services — 0.9% | | | | | | |
DeVry, Inc. | | | 300,000 | | | $ | 11,538,000 | |
H&R Block, Inc. | | | 1,500,000 | | | | 24,495,000 | |
ITT Educational Services, Inc. (a) | | | 250,000 | | | | 14,222,500 | |
| | | | | | | | 50,255,500 | |
| Hotels, Restaurants & Leisure — 5.9% | | | | | | | | |
Cheesecake Factory, Inc. (The) (a) | | | 2,292,000 | | | | 67,270,200 | |
Jack in the Box, Inc. (a) | | | 1,200,000 | | | | 25,080,000 | |
Panera Bread Co. - Class A (a) | | | 1,228,000 | | | | 173,700,600 | |
PF Chang's China Bistro, Inc. | | | 500,000 | | | | 15,455,000 | |
Starbucks Corp. | | | 1,250,000 | | | | 57,512,500 | |
| | | | | | | | 339,018,300 | |
| Household Durables — 0.2% | | | | | | | | |
Whirlpool Corp. | | | 216,000 | | | | 10,249,200 | |
| | | | | | | | | |
| Internet & Catalog Retail — 0.7% | | | | | | | | |
Amazon.com, Inc. (a) | | | 250,000 | | | | 43,275,000 | |
| | | | | | | | | |
| Leisure Equipment & Products — 1.3% | | | | | | | | |
Mattel, Inc. | | | 2,700,000 | | | | 74,952,000 | |
| | | | | | | | | |
| Media — 2.0% | | | | | | | | |
Comcast Corp. - Class A | | | 1,050,000 | | | | 24,895,500 | |
DIRECTV - Class A (a) | | | 550,000 | | | | 23,518,000 | |
DISH Network Corp. - Class A | | | 1,500,000 | | | | 42,720,000 | |
McClatchy Co. (The) - Class A (a) | | | 143,000 | | | | 341,770 | |
McGraw-Hill Cos., Inc. (The) | | | 500,000 | | | | 22,485,000 | |
New York Times Co. (The) - Class A (a) | | | 200,000 | | | | 1,546,000 | |
| | | | | | | | 115,506,270 | |
| Multiline Retail — 1.7% | | | | | | | | |
Family Dollar Stores, Inc. | | | 693,000 | | | | 39,958,380 | |
Kohl's Corp. | | | 1,250,000 | | | | 61,687,500 | |
| | | | | | | | 101,645,880 | |
| Specialty Retail — 9.3% | | | | | | | | |
Aéropostale, Inc. (a) | | | 4,551,000 | | | | 69,402,750 | |
American Eagle Outfitters, Inc. | | | 1,000,000 | | | | 15,290,000 | |
AutoZone, Inc. (a) | | | 195,000 | | | | 63,369,150 | |
Bed Bath & Beyond, Inc. (a) | | | 1,500,000 | | | | 86,955,000 | |
Best Buy Co., Inc. | | | 2,250,000 | | | | 52,582,500 | |
Hussman Strategic Growth Fund Schedule of Investments (continued) |
December 31, 2011 (Unaudited) |
COMMON STOCKS — 100.4% (Continued) | | | | | | |
| Consumer Discretionary — 23.9% (Continued) | | | | | | |
| Specialty Retail — 9.3% (Continued) | | | | | | |
Buckle, Inc. (The) | | | 716,000 | | | $ | 29,262,920 | |
GameStop Corp. - Class A (a) | | | 1,112,000 | | | | 26,832,560 | |
Gap, Inc. (The) | | | 1,000,000 | | | | 18,550,000 | |
PetSmart, Inc. | | | 450,000 | | | | 23,080,500 | |
RadioShack Corp. | | | 1,000,000 | | | | 9,710,000 | |
Ross Stores, Inc. | | | 1,500,000 | | | | 71,295,000 | |
Staples, Inc. | | | 1,500,000 | | | | 20,835,000 | |
TJX Cos., Inc. (The) | | | 750,000 | | | | 48,412,500 | |
| | | | | | | | 535,577,880 | |
| Textiles, Apparel & Luxury Goods — 1.9% | | | | | | | | |
Coach, Inc. | | | 350,000 | | | | 21,364,000 | |
NIKE, Inc. - Class B | | | 300,000 | | | | 28,911,000 | |
Under Armour, Inc. - Class A (a) | | | 826,000 | | | | 59,298,540 | |
| | | | | | | | 109,573,540 | |
| Consumer Staples — 12.4% | | | | | | | | |
| Beverages — 3.3% | | | | | | | | |
Coca-Cola Co. (The) | | | 1,603,000 | | | | 112,161,910 | |
PepsiCo, Inc. | | | 1,177,000 | | | | 78,093,950 | |
| | | | | | | | 190,255,860 | |
| Food & Staples Retailing — 2.9% | | | | | | | | |
Kroger Co. (The) | | | 1,650,000 | | | | 39,963,000 | |
Sysco Corp. | | | 1,000,000 | | | | 29,330,000 | |
Walgreen Co. | | | 3,000,000 | | | | 99,180,000 | |
| | | | | | | | 168,473,000 | |
| Food Products — 1.4% | | | | | | | | |
Campbell Soup Co. | | | 1,055,000 | | | | 35,068,200 | |
ConAgra Foods, Inc. | | | 500,000 | | | | 13,200,000 | |
General Mills, Inc. | | | 400,000 | | | | 16,164,000 | |
Kellogg Co. | | | 250,000 | | | | 12,642,500 | |
| | | | | | | | 77,074,700 | |
| Household Products — 4.8% | | | | | | | | |
Clorox Co. (The) | | | 1,000,000 | | | | 66,560,000 | |
Colgate-Palmolive Co. | | | 1,000,000 | | | | 92,390,000 | |
Energizer Holdings, Inc. (a) | | | 250,000 | | | | 19,370,000 | |
Kimberly-Clark Corp. | | | 900,000 | | | | 66,204,000 | |
Procter & Gamble Co. (The) | | | 500,000 | | | | 33,355,000 | |
| | | | | | | | 277,879,000 | |
Hussman Strategic Growth Fund Schedule of Investments (continued) |
December 31, 2011 (Unaudited) |
COMMON STOCKS — 100.4% (Continued) | | | | | | |
| Energy — 2.8% | | | | | | |
| Oil, Gas & Consumable Fuels — 2.8% | | | | | | |
Chevron Corp. | | | 250,000 | | | $ | 26,600,000 | |
Exxon Mobil Corp. | | | 1,250,000 | | | | 105,950,000 | |
Marathon Oil Corp. | | | 1,000,000 | | | | 29,270,000 | |
| | | | | | | | 161,820,000 | |
| Financials — 2.3% | | | | | | | | |
| Consumer Finance — 0.4% | | | | | | | | |
World Acceptance Corp. (a) | | | 345,000 | | | | 25,357,500 | |
| | | | | | | | | |
| Insurance — 1.9% | | | | | | | | |
ACE Ltd. | | | 450,000 | | | | 31,554,000 | |
Aflac, Inc. | | | 500,000 | | | | 21,630,000 | |
Berkshire Hathaway, Inc. - Class B (a) | | | 375,000 | | | | 28,612,500 | |
Chubb Corp. (The) | | | 400,000 | | | | 27,688,000 | |
| | | | | | | | 109,484,500 | |
| Health Care — 33.5% | | | | | | | | |
| Biotechnology — 6.0% | | | | | | | | |
Amgen, Inc. | | | 1,500,000 | | | | 96,315,000 | |
Biogen Idec, Inc. (a) | | | 1,163,000 | | | | 127,988,150 | |
Cubist Pharmaceuticals, Inc. (a) | | | 458,000 | | | | 18,145,960 | |
Gilead Sciences, Inc. (a) | | | 1,000,000 | | | | 40,930,000 | |
PDL BioPharma, Inc. | | | 905,000 | | | | 5,611,000 | |
Vertex Pharmaceuticals, Inc. (a) | | | 1,800,000 | | | | 59,778,000 | |
| | | | | | | | 348,768,110 | |
| Health Care Equipment & Supplies — 7.1% | | | | | | | | |
Align Technology, Inc. (a) | | | 1,500,000 | | | | 35,587,500 | |
Baxter International, Inc. | | | 400,000 | | | | 19,792,000 | |
Becton, Dickinson and Co. | | | 450,000 | | | | 33,624,000 | |
C.R. Bard, Inc. | | | 340,000 | | | | 29,070,000 | |
Covidien plc | | | 500,000 | | | | 22,505,000 | |
Cyberonics, Inc. (a) | | | 997,000 | | | | 33,399,500 | |
IDEXX Laboratories, Inc. (a) | | | 46,000 | | | | 3,540,160 | |
Medtronic, Inc. | | | 1,250,000 | | | | 47,812,500 | |
ResMed, Inc. (a) | | | 477,000 | | | | 12,115,800 | |
St. Jude Medical, Inc. | | | 1,500,000 | | | | 51,450,000 | |
Stryker Corp. | | | 750,000 | | | | 37,282,500 | |
Varian Medical Systems, Inc. (a) | | | 1,250,000 | | | | 83,912,500 | |
| | | | | | | | 410,091,460 | |
| Health Care Providers & Services — 7.4% | | | | | | | | |
Aetna, Inc. | | | 750,000 | | | | 31,642,500 | |
Hussman Strategic Growth Fund Schedule of Investments (continued) |
December 31, 2011 (Unaudited) |
COMMON STOCKS — 100.4% (Continued) | | | | | | |
| Health Care — 33.5% (Continued) | | | | | | |
| Health Care Providers & Services — 7.4% (Continued) | | | | | | |
Amedisys, Inc. (a) | | | 146,000 | | | $ | 1,592,860 | |
Cardinal Health, Inc. | | | 250,000 | | | | 10,152,500 | |
CIGNA Corp. | | | 1,250,000 | | | | 52,500,000 | |
Humana, Inc. | | | 1,279,000 | | | | 112,053,190 | |
Laboratory Corp. of America Holdings (a) | | | 750,000 | | | | 64,477,500 | |
Patterson Cos., Inc. | | | 608,900 | | | | 17,974,728 | |
UnitedHealth Group, Inc. | | | 1,650,000 | | | | 83,622,000 | |
WellPoint, Inc. | | | 800,000 | | | | 53,000,000 | |
| | | | | | | | 427,015,278 | |
| Life Sciences Tools & Services — 3.2% | | | | | | | | |
Harvard Bioscience, Inc. (a) | | | 1,000,000 | | | | 3,870,000 | |
Illumina, Inc. (a) | | | 810,000 | | | | 24,688,800 | |
Life Technologies Corp. (a) | | | 1,953,000 | | | | 75,991,230 | |
Techne Corp. | | | 44,000 | | | | 3,003,440 | |
Waters Corp. (a) | | | 1,000,000 | | | | 74,050,000 | |
| | | | | | | | 181,603,470 | |
| Pharmaceuticals — 9.8% | | | | | | | | |
Abbott Laboratories | | | 750,000 | | | | 42,172,500 | |
AstraZeneca plc - ADR | | | 3,000,000 | | | | 138,870,000 | |
Bristol-Myers Squibb Co. | | | 1,000,000 | | | | 35,240,000 | |
Eli Lilly & Co. | | | 1,250,000 | | | | 51,950,000 | |
Endo Pharmaceuticals Holdings, Inc. (a) | | | 2,151,000 | | | | 74,274,030 | |
Forest Laboratories, Inc. (a) | | | 500,000 | | | | 15,130,000 | |
Impax Laboratories, Inc. (a) | | | 341,000 | | | | 6,877,970 | |
Johnson & Johnson | | | 1,250,000 | | | | 81,975,000 | |
Novartis AG - ADR | | | 650,000 | | | | 37,160,500 | |
Par Pharmaceutical Cos., Inc. (a) | | | 250,000 | | | | 8,182,500 | |
Pfizer, Inc. | | | 2,500,000 | | | | 54,100,000 | |
Shire plc - ADR | | | 183,000 | | | | 19,013,700 | |
| | | | | | | | 564,946,200 | |
| Industrials — 0.0% | | | | | | | | |
| Airlines — 0.0% | | | | | | | | |
Copa Holdings, S.A. - Class A | | | 1,000 | | | | 58,670 | |
| | | | | | | | | |
| Information Technology — 22.0% | | | | | | | | |
| Communications Equipment — 3.3% | | | | | | | | |
ADTRAN, Inc. | | | 1,000,000 | | | | 30,160,000 | |
Cisco Systems, Inc. | | | 4,500,000 | | | | 81,360,000 | |
InterDigital, Inc. | | | 608,000 | | | | 26,490,560 | |
Hussman Strategic Growth Fund Schedule of Investments (continued) |
December 31, 2011 (Unaudited) |
COMMON STOCKS — 100.4% (Continued) | | | | | | |
| Information Technology — 22.0% (Continued) | | | | | | |
| Communications Equipment — 3.3% (Continued) | | | | | | |
QUALCOMM, Inc. | | | 650,000 | | | $ | 35,555,000 | |
Research In Motion Ltd. (a) | | | 1,000,000 | | | | 14,500,000 | |
| | | | | | | | 188,065,560 | |
| Computers & Peripherals — 4.1% | | | | | | | | |
Dell, Inc. (a) | | | 5,000,000 | | | | 73,150,000 | |
Hewlett-Packard Co. | | | 500,000 | | | | 12,880,000 | |
NetApp, Inc. (a) | | | 500,000 | | | | 18,135,000 | |
QLogic Corp. (a) | | | 1,650,000 | | | | 24,750,000 | |
Synaptics, Inc. (a) | | | 3,135,000 | | | | 94,520,250 | |
Western Digital Corp. (a) | | | 516,000 | | | | 15,970,200 | |
| | | | | | | | 239,405,450 | |
| Electronic Equipment & Instruments — 0.0% | | | | | | | | |
FUJIFILM Holdings Corp. - ADR | | | 49,400 | | | | 1,149,044 | |
| | | | | | | | | |
| Internet Software & Services — 2.6% | | | | | | | | |
eBay, Inc. (a) | | | 3,000,000 | | | | 90,990,000 | |
j2 Global, Inc. | | | 572,000 | | | | 16,096,080 | |
Open Text Corp. (a) | | | 330,000 | | | | 16,876,200 | |
Sohu.com, Inc. (a) | | | 361,000 | | | | 18,050,000 | |
VistaPrint N.V. (a) | | | 277,500 | | | | 8,491,500 | |
| | | | | | | | 150,503,780 | |
| IT Services — 2.3% | | | | | | | | |
Accenture plc - Class A | | | 300,000 | | | | 15,969,000 | |
CACI International, Inc. - Class A (a) | | | 250,000 | | | | 13,980,000 | |
Cognizant Technology Solutions Corp. - Class A (a) | | | 250,000 | | | | 16,077,500 | |
MasterCard, Inc. - Class A | | | 150,000 | | | | 55,923,000 | |
Syntel, Inc. | | | 334,000 | | | | 15,621,180 | |
Western Union Co. (The) | | | 900,000 | | | | 16,434,000 | |
| | | | | | | | 134,004,680 | |
| Semiconductors & Semiconductor Equipment — 6.4% | | | | | | | | |
Altera Corp. | | | 952,000 | | | | 35,319,200 | |
Broadcom Corp. - Class A (a) | | | 1,250,000 | | | | 36,700,000 | |
First Solar, Inc. (a) | | | 567,000 | | | | 19,141,920 | |
Intel Corp. | | | 5,000,000 | | | | 121,250,000 | |
Microchip Technology, Inc. | | | 264,000 | | | | 9,670,320 | |
SunPower Corp. (a) | | | 2,700,000 | | | | 16,821,000 | |
Teradyne, Inc. (a) | | | 1,000,000 | | | | 13,630,000 | |
Texas Instruments, Inc. | | | 1,250,000 | | | | 36,387,500 | |
TriQuint Semiconductor, Inc. (a) | | | 1,319,000 | | | | 6,423,530 | |
Hussman Strategic Growth Fund Schedule of Investments (continued) |
December 31, 2011 (Unaudited) |
COMMON STOCKS — 100.4% (Continued) | | | | | | |
| Information Technology — 22.0% (Continued) | | | | | | |
| Semiconductors & Semiconductor Equipment — 6.4% (Continued) | | | | | | |
Xilinx, Inc. | | | 2,290,000 | | | $ | 73,417,400 | |
| | | | | | | | 368,760,870 | |
| Software — 3.3% | | | | | | | | |
Adobe Systems, Inc. (a) | | | 500,000 | | | | 14,135,000 | |
BMC Software, Inc. (a) | | | 1,354,000 | | | | 44,384,120 | |
Check Point Software Technologies Ltd. (a) | | | 309,000 | | | | 16,234,860 | |
Intuit, Inc. | | | 700,000 | | | | 36,813,000 | |
Microsoft Corp. | | | 2,000,000 | | | | 51,920,000 | |
Oracle Corp. | | | 1,000,000 | | | | 25,650,000 | |
| | | | | | | | 189,136,980 | |
| Materials — 1.2% | | | | | | | | |
| Chemicals — 0.1% | | | | | | | | |
BASF SE - ADR | | | 76,800 | | | | 5,355,264 | |
| | | | | | | | | |
| Metals & Mining — 1.1% | | | | | | | | |
Barrick Gold Corp. | | | 750,000 | | | | 33,937,500 | |
Newmont Mining Corp. | | | 500,000 | | | | 30,005,000 | |
| | | | | | | | 63,942,500 | |
| Telecommunication Services — 2.3% | | | | | | | | |
| Diversified Telecommunication Services — 1.6% | | | | | | | | |
AT&T, Inc. | | | 1,750,000 | | | | 52,920,000 | |
Verizon Communications, Inc. | | | 1,000,000 | | | | 40,120,000 | |
| | | | | | | | 93,040,000 | |
| Wireless Telecommunications Services — 0.7% | | | | | | | | |
China Mobile Ltd. - ADR | | | 750,000 | | | | 36,367,500 | |
| | | | | | | | | |
Total Common Stocks (Cost $5,431,973,411) | | | | | | $ | 5,792,612,946 | |
PUT OPTION CONTRACTS — 1.9% | | | | | | |
Nasdaq 100 Index Option, 03/17/2012 at $1,800 | | | 2,000 | | | $ | 2,126,000 | |
Russell 2000 Index Option, 03/17/2012 at $620 | | | 8,000 | | | | 9,144,000 | |
S&P 500 Index Option, 01/21/2012 at $1,260 | | | 20,000 | | | | 51,400,000 | |
S&P 500 Index Option, 02/18/2012 at $1,220 | | | 13,000 | | | | 37,362,000 | |
S&P 500 Index Option, 03/17/2012 at $1,160 | | | 4,000 | | | | 10,252,000 | |
Total Put Option Contracts (Cost $113,492,158) | | | | | | $ | 110,284,000 | |
| | | | | | | | | |
Total Investments at Value — 102.3% (Cost $5,545,465,569) | | | | | | $ | 5,902,896,946 | |
Hussman Strategic Growth Fund Schedule of Investments (continued) |
December 31, 2011 (Unaudited) |
MONEY MARKET FUNDS — 16.3% | | | | | | |
Federated U.S. Treasury Cash Reserve Fund - Institutional Shares, 0.00% (b) | | | 548,887,654 | | | $ | 548,887,654 | |
First American Treasury Obligations Fund - Class Y, 0.00% (b) | | | 394,458,053 | | | | 394,458,053 | |
Total Money Market Funds (Cost $943,345,707) | | | | | | $ | 943,345,707 | |
| | | | | | | | | |
Total Investments and Money Market Funds at Value — 118.6% (Cost $6,488,811,276) | | | | | | $ | 6,846,242,653 | |
| | | | | | | | | |
Written Call Options — (20.7%) | | | | | | | (1,197,242,000 | ) |
| | | | | | | | | |
Other Assets in Excess of Liabilities — 2.1% | | | | | | | 123,827,361 | |
| | | | | | | | | |
Net Assets — 100.0% | | | | | | $ | 5,772,828,014 | |
| ADR - American Depositary Receipt. |
| | |
| (a) | Non-income producing security. |
| | |
| (b) | Variable rate security. The rate shown is the 7-day effective yield as of December 31, 2011. |
| |
| See accompanying notes to financial statements. |
Hussman Strategic Growth Fund Schedule of Open Written Option Contracts |
December 31, 2011 (Unaudited) |
WRITTEN CALL OPTION CONTRACTS | | | | | | | | | |
| Nasdaq 100 Index Option, | | | | | | | | | |
03/17/2012 at $1,800 | | | 2,000 | | | $ | 96,712,000 | | | $ | 100,397,355 | |
| Russell 2000 Index Option, | | | | | | | | | | | | |
03/17/2012 at $620 | | | 8,000 | | | | 103,792,000 | | | | 101,989,420 | |
| S&P 500 Index Option, | | | | | | | | | | | | |
01/21/2012 at $950 | | | 13,000 | | | | 397,774,000 | | | | 380,882,808 | |
| S&P 500 Index Option, | | | | | | | | | | | | |
01/21/2012 at $980 | | | 20,000 | | | | 552,000,000 | | | | 527,973,550 | |
| S&P 500 Index Option, | | | | | | | | | | | | |
03/17/2012 at $1,160 | | | 4,000 | | | | 46,964,000 | | | | 46,559,710 | |
Total Written Option Contracts | | | | | | $ | 1,197,242,000 | | | $ | 1,157,802,843 | |
| See accompanying notes to financial statements. |
Hussman Strategic Total Return Fund Schedule of Investments |
December 31, 2011 (Unaudited) |
| | | | | | |
| Energy — 0.5% | | | | | | |
| Oil, Gas & Consumable Fuels — 0.5% | | | | | | |
NuStar Energy L.P. | | | 89,000 | | | $ | 5,042,740 | |
ONEOK Partners L.P. | | | 69,000 | | | | 3,984,060 | |
Williams Partners L.P. | | | 85,000 | | | | 5,099,150 | |
| | | | | | | | 14,125,950 | |
| Materials — 13.2% | | | | | | | | |
| Metals & Mining — 13.2% | | | | | | | | |
Agnico-Eagle Mines Ltd. | | | 500,000 | | | | 18,160,000 | |
AngloGold Ashanti Ltd. - ADR | | | 850,000 | | | | 36,082,500 | |
Barrick Gold Corp. | | | 1,500,000 | | | | 67,875,000 | |
| Compañía de Minas Buenaventura S.A. - ADR | | | 1,000,000 | | | | 38,340,000 | |
Goldcorp, Inc. | | | 1,095,000 | | | | 48,453,750 | |
Gold Fields Ltd. - ADR | | | 1,500,000 | | | | 22,875,000 | |
Harmony Gold Mining Co. Ltd. - ADR | | | 1,500,000 | | | | 17,460,000 | |
Newmont Mining Corp. | | | 1,100,000 | | | | 66,011,000 | |
Randgold Resources Ltd. - ADR | | | 450,000 | | | | 45,945,000 | |
Stillwater Mining Co. (a) | | | 10,000 | | | | 104,600 | |
| | | | | | | | 361,306,850 | |
| Utilities — 0.9% | | | | | | | | |
| Electric Utilities — 0.4% | | | | | | | | |
American Electric Power Co., Inc. | | | 1,000 | | | | 41,310 | |
Duke Energy Corp. | | | 1,000 | | | | 22,000 | |
Edison International | | | 1,000 | | | | 41,400 | |
Entergy Corp. | | | 14,000 | | | | 1,022,700 | |
Exelon Corp. | | | 1,000 | | | | 43,370 | |
FirstEnergy Corp. | | | 83,000 | | | | 3,676,900 | |
NextEra Energy, Inc. | | | 1,000 | | | | 60,880 | |
Pepco Holdings, Inc. | | | 55,000 | | | | 1,116,500 | |
Pinnacle West Capital Corp. | | | 23,000 | | | | 1,108,140 | |
PPL Corp. | | | 1,000 | | | | 29,420 | |
UniSource Energy Corp. | | | 56,000 | | | | 2,067,520 | |
| | | | | | | | 9,230,140 | |
| Multi-Utilities — 0.5% | | | | | | | | |
Ameren Corp. | | | 1,000 | | | | 33,130 | |
Dominion Resources, Inc. | | | 16,000 | | | | 849,280 | |
DTE Energy Co. | | | 67,000 | | | | 3,648,150 | |
Public Service Enterprise Group, Inc. | | | 250,000 | | | | 8,252,500 | |
SCANA Corp. | | | 37,000 | | | | 1,667,220 | |
| | | | | | | | 14,450,280 | |
| | | | | | | | | |
Total Common Stocks (Cost $411,409,788) | | | | | | $ | 399,113,220 | |
Hussman Strategic Total Return Fund Schedule of Investments (continued) |
December 31, 2011 (Unaudited) |
U.S. TREASURY OBLIGATIONS — 49.9% | | | | | | |
| U.S. Treasury Bonds — 4.3% | | | | | | |
3.75%, due 08/15/2041 | | $ | 100,000,000 | | | $ | 117,625,000 | |
| | | | | | | | | |
| U.S. Treasury Inflation-Protected Notes — 2.7% | | | | | | | | |
2.00%, due 04/15/2012 | | | 27,897,000 | | | | 28,036,485 | |
2.00%, due 07/15/2014 | | | 30,031,750 | | | | 32,375,638 | |
2.50%, due 01/15/2029 | | | 10,546,600 | | | | 14,093,717 | |
| | | | | | | | 74,505,840 | |
| U.S. Treasury Notes — 42.9% | | | | | | | | |
0.75%, due 06/15/2014 | | | 300,000,000 | | | | 303,304,800 | |
2.25%, due 03/31/2016 | | | 200,000,000 | | | | 213,359,400 | |
2.00%, due 04/30/2016 | | | 150,000,000 | | | | 158,414,100 | |
1.75%, due 05/31/2016 | | | 100,000,000 | | | | 104,586,000 | |
3.00%, due 08/31/2016 | | | 75,000,000 | | | | 82,623,075 | |
2.125%, due 08/15/2021 | | | 300,000,000 | | | | 307,734,300 | |
| | | | | | | | 1,170,021,675 | |
| | | | | | | | | |
Total U.S. Treasury Obligations (Cost $1,304,718,296) | | | | | | $ | 1,362,152,515 | |
EXCHANGE-TRADED FUNDS — 1.3% | | | | | | |
CurrencyShares British Pound Sterling Trust (a) (b) | | | 100,000 | | | $ | 15,413,000 | |
CurrencyShares Swiss Franc Trust (a) (b) | | | 100,000 | | | | 10,510,000 | |
| SPDR DB International Government Inflation-Protected Bond ETF | | | 160,000 | | | | 9,081,600 | |
Total Exchange-Traded Funds (Cost $33,328,100) | | | | | | $ | 35,004,600 | |
| | | | | | | | | |
Total Investments at Value — 65.8% (Cost $1,749,456,184) | | | | | | $ | 1,796,270,335 | |
Hussman Strategic Total Return Fund Schedule of Investments (continued) |
December 31, 2011 (Unaudited) |
MONEY MARKET FUNDS — 34.0% | | | | | | |
Federated U.S. Treasury Cash Reserve Fund - Institutional Shares, 0.00% (c) | | | 267,739,340 | | | $ | 267,739,340 | |
First American Treasury Obligations Fund - Class Y, 0.00% (c) | | | 658,189,031 | | | | 658,189,031 | |
Total Money Market Funds (Cost $925,928,371) | | | | | | $ | 925,928,371 | |
| | | | | | | | | |
Total Investments and Money Market Funds at Value — 99.8% (Cost $2,675,384,555) | | | | | | $ | 2,722,198,706 | |
| | | | | | | | | |
Other Assets in Excess of Liabilities — 0.2% | | | | | | | 6,352,128 | |
| | | | | | | | | |
| Net Assets — 100.0% | | | | | | $ | 2,728,550,834 | |
| ADR - American Depositary Receipt. |
| | |
| (a) | Non-income producing security. |
| | |
| (b) | For federal income tax purposes, structured as a grantor trust. |
| | |
| (c) | Variable rate security. The rate shown is the 7-day effective yield as of December 31, 2011. |
| |
| See accompanying notes to financial statements. |
Hussman Strategic International Fund Schedule of Investments |
December 31, 2011 (Unaudited) |
| | | | | | |
| Argentina — 0.6% | | | | | | |
Telecom Argentina S.A. - ADR | | | 28,000 | | | $ | 500,640 | |
| | | | | | | | | |
| Australia — 1.2% | | | | | | | | |
Cochlear Ltd. (a) | | | 3,000 | | | | 190,545 | |
Telstra Corp. Ltd. - ADR | | | 44,000 | | | | 750,200 | |
| | | | | | | | 940,745 | |
| Belgium — 0.5% | | | | | | | | |
Mobistar S.A. (a) | | | 8,000 | | | | 417,572 | |
| | | | | | | | | |
| Brazil — 2.4% | | | | | | | | |
Companhia de Saneamento Básico do Estado de São Paulo - ADR (b) | | | 12,000 | | | | 667,800 | |
Companhia Energética de Minas Gerais - ADR | | | 25,000 | | | | 444,750 | |
| Companhia Paranaense de Energia - COPEL - ADR | | | 7,500 | | | | 157,350 | |
Telefônica Brasil S.A. - ADR | | | 23,000 | | | | 628,590 | |
| | | | | | | | 1,898,490 | |
| Canada — 1.6% | | | | | | | | |
Alimentation Couche-Tard, Inc. - Class B (b) | | | 20,000 | | | | 622,362 | |
Tim Hortons, Inc. - ADR | | | 14,000 | | | | 677,880 | |
| | | | | | | | 1,300,242 | |
| Chile — 0.5% | | | | | | | | |
Embotelladora Andina S.A. - Class B - ADR | | | 200 | | | | 5,206 | |
Empresa Nacional de Electricidad S.A. - ADR | | | 6,000 | | | | 266,100 | |
Enersis S.A. - ADR | | | 8,000 | | | | 141,040 | |
| | | | | | | | 412,346 | |
| China — 2.0% | | | | | | | | |
3SBio, Inc. - ADR (b) | | | 22,000 | | | | 224,840 | |
China Petroleum and Chemical Corp. - ADR | | | 5,500 | | | | 577,775 | |
JA Solar Holdings Co. Ltd. - ADR (b) | | | 20,000 | | | | 26,800 | |
Mindray Medical International Ltd. - ADR | | | 5,000 | | | | 128,200 | |
NetEase.com, Inc. - ADR (b) | | | 8,000 | | | | 358,800 | |
Trina Solar Ltd. - ADR (b) | | | 7,500 | | | | 50,100 | |
Yue Yuen Industrial (Holdings) Ltd. - ADR | | | 12,000 | | | | 187,680 | |
| | | | | | | | 1,554,195 | |
| Denmark — 2.8% | | | | | | | | |
H. Lundbeck A/S (a) | | | 52,000 | | | | 975,120 | |
Novo Nordisk A/S - ADR | | | 5,000 | | | | 576,300 | |
William Demant Holding A/S (a) (b) | | | 8,000 | | | | 663,495 | |
| | | | | | | | 2,214,915 | |
Hussman Strategic International Fund Schedule of Investments (continued) |
December 31, 2011 (Unaudited) |
COMMON STOCKS — 68.7% (Continued) | | | | | | |
| France — 8.6% | | | | | | |
Alten (a) | | | 12,000 | | | $ | 281,530 | |
Casino Guichard-Perrachon S.A. (a) | | | 4,750 | | | | 399,374 | |
Cegid Group (a) | | | 10,000 | | | | 185,260 | |
Christian Dior S.A. (a) | | | 4,000 | | | | 472,089 | |
Danone S.A. (a) | | | 13,000 | | | | 815,674 | |
Dassault Systemes S.A. - ADR | | | 6,750 | | | | 542,767 | |
Iliad S.A. (a) | | | 5,500 | | | | 676,863 | |
Infotel S.A. | | | 3,900 | | | | 280,053 | |
L'Oréal S.A. (a) | | | 3,600 | | | | 374,890 | |
Metropole Television S.A. (a) | | | 17,500 | | | | 260,221 | |
Norbert Dentressangle S.A. (a) | | | 8,000 | | | | 558,243 | |
Sanofi-Aventis - ADR | | | 22,100 | | | | 807,534 | |
Somfy S.A. | | | 227 | | | | 44,622 | |
Total S.A. - ADR | | | 12,500 | | | | 638,875 | |
Zodiac Aerospace (a) | | | 5,000 | | | | 422,337 | |
| | | | | | | | 6,760,332 | |
| Germany — 3.6% | | | | | | | | |
Axel Springer AG (a) | | | 6,000 | | | | 257,444 | |
CENTROTEC Sustainable AG (a) | | | 22,500 | | | | 327,694 | |
Deutsche Telekom AG (a) | | | 60,000 | | | | 688,163 | |
SAP AG - ADR | | | 14,800 | | | | 783,660 | |
United Internet AG (a) | | | 45,000 | | | | 802,031 | |
| | | | | | | | 2,858,992 | |
| Hong Kong — 0.4% | | | | | | | | |
China Mobile Ltd. - ADR | | | 7,000 | | | | 339,430 | |
| | | | | | | | | |
| Italy — 2.3% | | | | | | | | |
Enel S.P.A. (a) | | | 125,000 | | | | 507,025 | |
Eni S.P.A. - ADR | | | 10,000 | | | | 412,700 | |
Luxottica Group S.P.A. (a) | | | 17,000 | | | | 475,295 | |
Recordati S.P.A. (a) | | | 60,000 | | | | 432,726 | |
| | | | | | | | 1,827,746 | |
| Japan — 11.6% | | | | | | | | |
ABC-MART, Inc. (a) | | | 13,000 | | | | 493,843 | |
AEON Co. Ltd. (a) | | | 40,000 | | | | 547,927 | |
Central Japan Railway Co. (a) | | | 35 | | | | 295,375 | |
DeNA Co. Ltd. (a) | | | 12,000 | | | | 359,477 | |
Don Quijote Co. Ltd. (a) | | | 20,000 | | | | 686,674 | |
KDDI Corp. (a) | | | 95 | | | | 610,119 | |
Komeri Co. Ltd. (a) | | | 20,000 | | | | 614,907 | |
Hussman Strategic International Fund Schedule of Investments (continued) |
December 31, 2011 (Unaudited) |
COMMON STOCKS — 68.7% (Continued) | | | | | | |
| Japan — 11.6% (Continued) | | | | | | |
K's Holdings Corp. (a) | | | 14,000 | | | $ | 553,966 | |
Mochida Pharmaceutical Co. Ltd. (a) | | | 50,000 | | | | 560,281 | |
NAFCO Co. Ltd (a) | | | 1,700 | | | | 29,082 | |
Nintendo Co. Ltd. - ADR | | | 12,500 | | | | 211,750 | |
Nippon Telegraph and Telephone Corp. - ADR | | | 20,000 | | | | 506,600 | |
Nitori Holdings Co. Ltd. (a) | | | 2,000 | | | | 187,535 | |
NTT DOCOMO, Inc. (a) | | | 275 | | | | 504,905 | |
Ryohin Keikaku Co. Ltd. (a) | | | 13,000 | | | | 634,782 | |
Sundrug Co. Ltd. (a) | | | 25,000 | | | | 755,655 | |
Takeda Pharmaceutical Co. Ltd. (a) | | | 10,500 | | | | 461,218 | |
United Arrows Ltd. (a) | | | 25,000 | | | | 481,953 | |
Yamada Denki Co. Ltd. (a) | | | 10,000 | | | | 681,192 | |
| | | | | | | | 9,177,241 | |
| Mexico — 1.1% | | | | | | | | |
| América Móvil S.A.B. de C.V. - Series A - ADR | | | 30,000 | | | | 674,400 | |
Gruma S.A.B. de C.V. - ADR (b) | | | 22,400 | | | | 168,224 | |
| | | | | | | | 842,624 | |
| Netherlands — 2.3% | | | | | | | | |
ASML Holding N.V. | | | 10,000 | | | | 417,900 | |
Royal Dutch Shell plc - Class A - ADR | | | 8,000 | | | | 584,720 | |
Unilever N.V. - ADR | | | 23,000 | | | | 790,510 | |
| | | | | | | | 1,793,130 | |
| New Zealand — 1.1% | | | | | | | | |
Chorus Ltd. - ADR (b) | | | 16,000 | | | | 191,520 | |
Telecom Corp. of New Zealand Ltd. - ADR | | | 80,000 | | | | 639,200 | |
| | | | | | | | 830,720 | |
| Norway — 0.8% | | | | | | | | |
Tomra Systems ASA (a) | | | 95,000 | | | | 635,090 | |
| | | | | | | | | |
| Philippines — 0.1% | | | | | | | | |
| Philippine Long Distance Telephone Co. - ADR | | | 2,000 | | | | 115,240 | |
| | | | | | | | | |
| Spain — 2.1% | | | | | | | | |
Abengoa S.A. (a) | | | 25,000 | | | | 528,003 | |
Industria de Diseño Textil S.A. (Inditex) (a) | | | 3,000 | | | | 244,872 | |
Red Electrica Corp. S.A. (a) | | | 20,000 | | | | 853,934 | |
| | | | | | | | 1,626,809 | |
| Sweden — 2.1% | | | | | | | | |
Alfa Laval AB (a) | | | 25,000 | | | | 472,098 | |
Axfood AB (a) | | | 13,000 | | | | 478,413 | |
Hussman Strategic International Fund Schedule of Investments (continued) |
December 31, 2011 (Unaudited) |
COMMON STOCKS — 68.7% (Continued) | | | | | | |
| Sweden — 2.1% (Continued) | | | | | | |
Hennes & Mauritz AB - B Shares (a) | | | 14,100 | | | $ | 452,291 | |
Securitas AB - Class B (a) | | | 25,000 | | | | 215,019 | |
Telefonaktiebolaget LM Ericsson - ADR | | | 6,000 | | | | 60,780 | |
| | | | | | | | 1,678,601 | |
| Switzerland — 4.2% | | | | | | | | |
Actelion Ltd. (a) | | | 9,000 | | | | 307,862 | |
Nestlé S.A. - ADR | | | 8,800 | | | | 507,848 | |
Novartis AG - ADR | | | 14,000 | | | | 800,380 | |
Roche Holding Ltd. - ADR | | | 15,000 | | | | 638,250 | |
SGS S.A. (a) | | | 250 | | | | 412,336 | |
Swisscom AG - ADR | | | 6,000 | | | | 227,520 | |
Synthes, Inc. (a) | | | 2,500 | | | | 418,449 | |
| | | | | | | | 3,312,645 | |
| Taiwan — 1.3% | | | | | | | | |
| Advanced Semiconductor Engineering, Inc. - ADR | | | 50,000 | | | | 217,000 | |
| Taiwan Semiconductor Manufacturing Co. Ltd. - ADR | | | 65,000 | | | | 839,150 | |
| | | | | | | | 1,056,150 | |
| United Kingdom — 15.5% | | | | | | | | |
AstraZeneca plc - ADR | | | 16,000 | | | | 740,640 | |
BHP Billiton plc - ADR | | | 13,000 | | | | 759,070 | |
BT Group plc - ADR | | | 10,000 | | | | 296,400 | |
Bunzl plc (a) | | | 60,000 | | | | 823,375 | |
Dairy Crest Group plc (a) | | | 90,000 | | | | 469,635 | |
Ensco plc - ADR | | | 2,500 | | | | 117,300 | |
Fidessa Group plc (a) | | | 24,000 | | | | 564,181 | |
GlaxoSmithKline plc - ADR | | | 16,500 | | | | 752,895 | |
Greggs plc (a) | | | 70,000 | | | | 550,186 | |
Interserve plc (a) | | | 64,000 | | | | 318,867 | |
Marks & Spencer Group plc (a) | | | 74,000 | | | | 357,441 | |
Mitie Group plc (a) | | | 225,000 | | | | 848,585 | |
N Brown Group plc (a) | | | 110,000 | | | | 397,071 | |
National Grid plc - ADR | | | 13,000 | | | | 630,240 | |
Next plc (a) | | | 15,000 | | | | 636,428 | |
PayPoint plc | | | 335 | | | | 2,872 | |
Reckitt Benckiser Group plc - ADR | | | 12,500 | | | | 123,000 | |
Sage Group plc (The) (a) | | | 150,000 | | | | 685,474 | |
Scottish and Southern Energy plc (a) | | | 35,000 | | | | 700,676 | |
Smith & Nephew plc - ADR | | | 12,500 | | | | 601,875 | |
Ted Baker plc (a) | | | 10,000 | | | | 101,247 | |
Hussman Strategic International Fund Schedule of Investments (continued) |
December 31, 2011 (Unaudited) |
COMMON STOCKS — 68.7% (Continued) | | | | | | |
| United Kingdom — 15.5% (Continued) | | | | | | |
Vodafone Group plc - ADR | | | 19,000 | | | $ | 532,570 | |
William Morrison Supermarkets plc (a) | | | 160,000 | | | | 809,360 | |
WS Atkins plc (a) | | | 45,000 | | | | 432,864 | |
| | | | | | | | 12,252,252 | |
| | | | | | | | | |
Total Common Stocks (Cost $56,077,441) | | | | | | $ | 54,346,147 | |
EXCHANGE-TRADED FUNDS — 7.8% | | | | | | |
iShares MSCI Canada Index Fund | | | 45,000 | | | $ | 1,197,000 | |
iShares MSCI Germany Index Fund | | | 63,500 | | | | 1,220,470 | |
iShares MSCI Sweden Index Fund | | | 50,000 | | | | 1,257,000 | |
iShares MSCI Switzerland Index Fund | | | 57,000 | | | | 1,289,340 | |
iShares MSCI United Kingdom Index Fund | | | 73,500 | | | | 1,187,760 | |
Total Exchange-Traded Funds (Cost $6,510,336) | | | | | | $ | 6,151,570 | |
PUT OPTION CONTRACTS — 0.5% | | | | | | |
S&P 500 Index Option, 03/17/2012 at $1,080 | | | 85 | | | $ | 113,390 | |
S&P 500 Index Option, 03/17/2012 at $1,170 | | | 100 | | | | 277,400 | |
Total Put Option Contracts (Cost $600,644) | | | | | | $ | 390,790 | |
| | | | | | | | | |
Total Investments at Value — 77.0% (Cost $63,188,421) | | | | | | $ | 60,888,507 | |
MONEY MARKET FUNDS — 13.6% | | | | | | |
Northern Institutional Treasury Portfolio, 0.01% (c) (Cost $10,753,205) | | | 10,753,205 | | | $ | 10,753,205 | |
| | | | | | | | | |
Total Investments and Money Market Funds at Value — 90.6% (Cost $73,941,626) | | | | | | $ | 71,641,712 | |
| | | | | | | | | |
Written Call Options — (3.4%) | | | | | | | (2,668,720 | ) |
| | | | | | | | | |
Other Assets in Excess of Liabilities — 12.8% | | | | | | | 10,079,217 | |
| | | | | | | | | |
Net Assets — 100.0% | | | | | | $ | 79,052,209 | |
| ADR - American Depositary Receipt. |
| | |
| (a) | Fair value priced (Note 1). Fair valued securities totaled $31,356,239 at December 31, 2011, representing 39.7% of net assets. |
| | |
| (b) | Non-income producing security. |
| | |
| (c) | Variable rate security. The rate shown is the 7-day effective yield as of December 31, 2011. |
| |
| See accompanying notes to financial statements. |
Hussman Strategic International Fund Schedule of Futures Contracts |
December 31, 2011 (Unaudited) |
| | | | | | Aggregate Market Value of Contracts | | | | |
Dollar Index Future | 3/16/2012 | | | 150 | | | $ | 12,096,000 | | | $ | 59,419 | |
| See accompanying notes to financial statements. |
Hussman Strategic International Fund Schedule of Open Written Option Contracts |
December 31, 2011 (Unaudited) |
WRITTEN CALL OPTION CONTRACTS | | | | | | | | | |
| S&P 500 Index Option, | | | | | | | | | |
03/17/2012 at $1,080 | | | 85 | | | $ | 1,573,520 | | | $ | 1,512,887 | |
| S&P 500 Index Option, | | | | | | | | | | | | |
03/17/2012 at $1,170 | | | 100 | | | | 1,095,200 | | | | 1,069,868 | |
Total Written Option Contracts | | | | | | $ | 2,668,720 | | | $ | 2,582,755 | |
| See accompanying notes to financial statements. |
Hussman Strategic International Fund Schedule of Futures Contracts Sold Short |
December 31, 2011 (Unaudited) |
FUTURES CONTRACTS SOLD SHORT | | | | | | Aggregate Market Value of Contracts | | | | |
Euro STOXX 50 Index Future | 3/16/2012 | | | 750 | | | $ | 22,400,518 | | | $ | (553,666 | ) |
FTSE 100 Index Future | 3/16/2012 | | | 150 | | | | 12,897,414 | | | | (175,330 | ) |
Total Futures Contracts Sold Short | | | | | | | $ | 35,297,932 | | | $ | (728,996 | ) |
| See accompanying notes to financial statements. |
Hussman Investment Trust Statements of Assets and Liabilities |
December 31, 2011 (Unaudited) |
| | | Hussman Strategic Growth Fund | | | Hussman Strategic Total Return Fund | |
| ASSETS | | | | | | |
| Investments in securities: | | | | | | |
At acquisition cost | | $ | 5,545,465,569 | | | $ | 1,749,456,184 | |
At value (Note 1) | | $ | 5,902,896,946 | | | $ | 1,796,270,335 | |
Investments in money market funds | | | 943,345,707 | | | | 925,928,371 | |
Cash | | | 500,000 | | | | — | |
Dividends and interest receivable | | | 4,388,996 | | | | 7,269,915 | |
Receivable for investment securities sold | | | 135,663,045 | | | | — | |
Receivable for capital shares sold | | | 8,466,484 | | | | 4,376,860 | |
Other assets | | | 161,741 | | | | 157,297 | |
Total Assets | | | 6,995,422,919 | | | | 2,734,002,778 | |
| | | | | | | | | |
| LIABILITIES | | | | | | | | |
Dividends payable | | | 10,067,778 | | | | 1,011,268 | |
Written call options, at value (Notes 1 and 4)
(premiums received $1,157,802,843) | | | 1,197,242,000 | | | | — | |
Payable for capital shares redeemed | | | 9,873,439 | | | | 2,844,677 | |
Accrued investment advisory fees (Note 3) | | | 4,444,314 | | | | 1,077,929 | |
Payable to administrator (Note 3) | | | 445,800 | | | | 204,200 | |
Other accrued expenses | | | 521,574 | | | | 313,870 | |
Total Liabilities | | | 1,222,594,905 | | | | 5,451,944 | |
| | | | | | | | | |
NET ASSETS | | $ | 5,772,828,014 | | | $ | 2,728,550,834 | |
| | | | | | | | | |
| Net assets consist of: | | | | | | | | |
Paid-in capital | | $ | 6,666,444,183 | | | $ | 2,673,536,481 | |
| Accumulated undistributed net investment income | | | 9,645 | | | | 211,924 | |
Accumulated net realized gains (losses) from security
transactions and option contracts | | | (1,211,618,034 | ) | | | 7,988,278 | |
| Net unrealized appreciation on investments and option contracts | | | 317,992,220 | | | | 46,814,151 | |
| | | | | | | | | |
NET ASSETS | | $ | 5,772,828,014 | | | $ | 2,728,550,834 | |
| | | | | | | | | |
Shares of beneficial interest outstanding
(unlimited number of shares authorized, no par value) | | | 464,570,576 | | | | 221,892,053 | |
| | | | | | | | | |
Net asset value, offering price and redemption
price per share(a) (Note 1) | | $ | 12.43 | | | $ | 12.30 | |
| (a) | Redemption fee may apply to redemptions of shares held for 60 days or less. |
| |
| See accompanying notes to financial statements. |
Hussman Investment Trust Statements of Assets and Liabilities (continued) |
December 31, 2011 (Unaudited) |
| | | Hussman Strategic International Fund | |
| ASSETS | | | |
| Investments in securities: | | | |
| At acquisition cost | | $ | 63,188,421 | |
| At value (Note 1) | | $ | 60,888,507 | |
| Investments in money market funds | | | 10,753,205 | |
| Dividends receivable | | | 157,166 | |
| Receivable for capital shares sold | | | 87,839 | |
| Variation margin receivable (Notes 1 and 4) | | | 4,139,134 | |
| Margin deposits for futures contracts (Notes 1 and 4) | | | 5,919,187 | |
| Other assets | | | 44,958 | |
| Total Assets | | | 81,989,996 | |
| | | | | |
| LIABILITIES | | | | |
| Dividends payable | | | 25,273 | |
| Written call options, at value (Notes 1 and 4) (premiums received $2,582,755) | | | 2,668,720 | |
| Payable for capital shares redeemed | | | 102,156 | |
| Accrued investment advisory fees (Note 3) | | | 77,104 | |
| Payable to administrator (Note 3) | | | 10,820 | |
| Other accrued expenses | | | 53,714 | |
| Total Liabilities | | | 2,937,787 | |
| | | | | |
| NET ASSETS | | $ | 79,052,209 | |
| | | | | |
| Net assets consist of: | | | | |
| Paid-in capital | | $ | 84,410,977 | |
| Accumulated net investment loss | | | (511,263 | ) |
| Accumulated net realized losses from security transactions and option and futures contracts | | | (1,746,409 | ) |
| Net unrealized depreciation on: | | | | |
| Investment securities | | | (2,090,060 | ) |
| Option contracts | | | (295,819 | ) |
| Futures contracts | | | (669,577 | ) |
| Translation of assets and liabilities in foreign currencies | | | (45,640 | ) |
| | | | | |
| NET ASSETS | | $ | 79,052,209 | |
| | | | | |
Shares of beneficial interest outstanding (unlimited number
of shares authorized, no par value) | | | 8,130,314 | |
| | | | | |
Net asset value, offering price and redemption price per share (a) (Note 1) | | $ | 9.72 | |
| (a) | Redemption fee may apply to redemptions of shares held for 60 days or less. |
| |
| See accompanying notes to financial statements. |
Hussman Investment Trust Statements of Operations |
For the Six Months Ended December 31, 2011 (Unaudited) |
| | | Hussman Strategic Growth Fund | | | Hussman Strategic Total Return Fund | |
| INVESTMENT INCOME | | | | | | |
Dividends | | $ | 46,856,347 | | | $ | 5,069,780 | |
Foreign withholding taxes on dividends | | | (93,704 | ) | | | (149,766 | ) |
Interest | | | — | | | | 10,445,478 | |
Total Income | | | 46,762,643 | | | | 15,365,492 | |
| | | | | | | | | |
| EXPENSES | | | | | | | | |
Investment advisory fees (Note 3) | | | 25,794,820 | | | | 6,084,312 | |
Transfer agent, account maintenance
and shareholder services fees (Note 3) | | | 2,203,760 | | | | 849,955 | |
Administration fees (Note 3) | | | 1,162,936 | | | | 685,320 | |
Custodian and bank service fees | | | 204,844 | | | | 86,582 | |
Fund accounting fees (Note 3) | | | 171,962 | | | | 92,756 | |
Registration and filing fees | | | 71,840 | | | | 142,885 | |
Postage and supplies | | | 130,704 | | | | 69,705 | |
Printing of shareholder reports | | | 71,600 | | | | 42,690 | |
Professional fees | | | 63,717 | | | | 37,411 | |
Trustees’ fees and expenses | | | 43,848 | | | | 43,848 | |
Compliance service fees (Note 3) | | | 45,474 | | | | 21,950 | |
Insurance expense | | | 40,530 | | | | 17,582 | |
Other expenses | | | 19,891 | | | | 16,114 | |
Total Expenses | | | 30,025,926 | | | | 8,191,110 | |
| | | | | | | | | |
NET INVESTMENT INCOME | | | 16,736,717 | | | | 7,174,382 | |
| | | | | | | | | |
REALIZED AND UNREALIZED GAINS (LOSSES) ON
INVESTMENTS AND OPTION CONTRACTS (Note 4) | | | | | | | | |
| Net realized gains from: | | | | | | | | |
Security transactions | | | 270,275,204 | | | | 31,169,444 | |
Option contracts | | | 141,702,077 | | | | — | |
| Net change in unrealized appreciation (depreciation) on: | | | | | | | | |
Investments | | | (472,579,655 | ) | | | 32,301,065 | |
Option contracts | | | 127,977,055 | | | | — | |
| | | | | | | | | |
NET REALIZED AND UNREALIZED GAINS
ON INVESTMENTS AND OPTION CONTRACTS | | | 67,374,681 | | | | 63,470,509 | |
| | | | | | | | | |
NET INCREASE IN NET ASSETS
RESULTING FROM OPERATIONS | | $ | 84,111,398 | | | $ | 70,644,891 | |
| See accompanying notes to financial statements. |
Hussman Investment Trust Statements of Operations (continued) |
For the Six Months Ended December 31, 2011 (Unaudited) |
| | | Hussman Strategic International Fund | |
| INVESTMENT INCOME | | | |
| Dividend income | | $ | 500,649 | |
| Foreign withholding taxes on dividends | | | (43,358 | ) |
| Total Income | | | 457,291 | |
| | | | | |
| EXPENSES | | | | |
| Investment advisory fees (Note 3) | | | 468,253 | (a) |
| Professional fees | | | 72,345 | |
| Registration and filing fees | | | 46,063 | |
| Trustees' fees and expenses | | | 43,848 | |
| Administration fees (Note 3) | | | 29,286 | |
| Custodian fees | | | 25,300 | |
| Transfer agent, account maintenance and shareholder services fees (Note 3) | | | 25,063 | |
| Fund accounting fees (Note 3) | | | 21,971 | |
| Printing of shareholder reports | | | 10,220 | |
| Postage and supplies | | | 4,304 | |
| Compliance service fees (Note 3) | | | 3,082 | |
| Insurance expense | | | 648 | |
| Other expenses | | | 30,621 | |
| Net Expenses | | | 781,004 | |
| | | | | |
| NET INVESTMENT LOSS | | | (323,713 | ) |
| | | | | |
REALIZED AND UNREALIZED GAINS (LOSSES) ON INVESTMENTS
AND OPTION AND FUTURES CONTRACTS (Note 4) | | | | |
| Net realized gains (losses) from: | | | | |
| Security transactions | | | (1,540,109 | ) |
| Option contracts | | | (679,997 | ) |
| Futures contracts | | | 2,637,804 | |
| Foreign currency transactions | | | (554,140 | ) |
| Net change in unrealized appreciation (depreciation) on: | | | | |
| Investments | | | (4,320,579 | ) |
| Option contracts | | | (45,609 | ) |
| Futures contracts | | | (125,721 | ) |
| Foreign currency translation | | | (126,728 | ) |
| | | | | |
NET REALIZED AND UNREALIZED LOSSES ON INVESTMENTS
AND OPTION AND FUTURES CONTRACTS | | | (4,755,079 | ) |
| | | | | |
| NET DECREASE IN NET ASSETS RESULTING FROM OPERATIONS | | $ | (5,078,792 | ) |
| (a) | Includes previously waived investment advisory fees of $77,975 recouped by the Adviser (Note 3). |
| |
| See accompanying notes to financial statements. |
Hussman Strategic Growth Fund Statements of Changes in Net Assets |
|
| | | Six Months Ended December 31, 2011 (Unaudited) | | | | |
| FROM OPERATIONS | | | | | | |
Net investment income | | $ | 16,736,717 | | | $ | 23,894,935 | |
| Net realized gains (losses) from: | | | | | | | | |
Security transactions | | | 270,275,204 | | | | 1,023,661,028 | |
Option contracts | | | 141,702,077 | | | | (2,038,117,631 | ) |
| Net change in unrealized appreciation (depreciation) on: | | | | | | | | |
Investments | | | (472,579,655 | ) | | | 789,181,664 | |
Option contracts | | | 127,977,055 | | | | (392,897,290 | ) |
| Net increase (decrease) in net assets resulting from operations | | | 84,111,398 | | | | (594,277,294 | ) |
| | | | | | | | | |
| DISTRIBUTIONS TO SHAREHOLDERS | | | | | | | | |
From net investment income | | | (28,671,281 | ) | | | (14,114,668 | ) |
| | | | | | | | | |
| FROM CAPITAL SHARE TRANSACTIONS | | | | | | | | |
Proceeds from shares sold | | | 1,089,558,467 | | | | 2,590,660,391 | |
Net asset value of shares issued in reinvestment
of distributions to shareholders | | | 18,603,504 | | | | 10,023,895 | |
| Proceeds from redemption fees collected (Note 1) | | | 306,748 | | | | 546,677 | |
Payments for shares redeemed | | | (1,035,146,928 | ) | | | (2,534,114,790 | ) |
| Net increase in net assets from capital share transactions | | | 73,321,791 | | | | 67,116,173 | |
| | | | | | | | | |
| TOTAL INCREASE (DECREASE) IN NET ASSETS | | | 128,761,908 | | | | (541,275,789 | ) |
| | | | | | | | | |
| NET ASSETS | | | | | | | | |
Beginning of period | | | 5,644,066,106 | | | | 6,185,341,895 | |
End of period | | $ | 5,772,828,014 | | | $ | 5,644,066,106 | |
| | | | | | | | | |
| ACCUMULATED UNDISTRIBUTED NET INVESTMENT INCOME | | $ | 9,645 | | | $ | 11,944,209 | |
| | | | | | | | | |
| CAPITAL SHARE ACTIVITY | | | | | | | | |
Shares sold | | | 85,815,404 | | | | 203,808,819 | |
Shares reinvested | | | 1,496,661 | | | | 815,614 | |
Shares redeemed | | | (82,385,843 | ) | | | (204,778,368 | ) |
Net increase (decrease) in shares outstanding | | | 4,926,222 | | | | (153,935 | ) |
Shares outstanding at beginning of period | | | 459,644,354 | | | | 459,798,289 | |
Shares outstanding at end of period | | | 464,570,576 | | | | 459,644,354 | |
See accompanying notes to financial statements.
Hussman Strategic Total Return Fund Statements of Changes in Net Assets |
|
| | | Six Months Ended December 31, 2011 (Unaudited) | | | | |
| FROM OPERATIONS | | | | | | |
Net investment income | | $ | 7,174,382 | | | $ | 14,156,089 | |
Net realized gains from security transactions | | | 31,169,444 | | | | 103,765,444 | |
Net change in unrealized appreciation
(depreciation) on investments | | | 32,301,065 | | | | (43,492,926 | ) |
| Net increase in net assets resulting from operations | | | 70,644,891 | | | | 74,428,607 | |
| | | | | | | | | |
| DISTRIBUTIONS TO SHAREHOLDERS | | | | | | | | |
From net investment income | | | (7,460,019 | ) | | | (22,867,054 | ) |
From net realized gains | | | (52,505,352 | ) | | | (102,020,396 | ) |
| Decrease in net assets from distributions to shareholders | | | (59,965,371 | ) | | | (124,887,450 | ) |
| | | | | | | | | |
| FROM CAPITAL SHARE TRANSACTIONS | | | | | | | �� | |
Proceeds from shares sold | | | 775,041,681 | | | | 1,314,006,299 | |
Net asset value of shares issued in reinvestment
of distributions to shareholders | | | 51,158,652 | | | | 107,590,729 | |
| Proceeds from redemption fees collected (Note 1) | | | 189,884 | | | | 318,293 | |
Payments for shares redeemed | | | (447,807,696 | ) | | | (917,152,925 | ) |
| Net increase in net assets from capital share transactions | | | 378,582,521 | | | | 504,762,396 | |
| | | | | | | | | |
TOTAL INCREASE IN NET ASSETS | | | 389,262,041 | | | | 454,303,553 | |
| | | | | | | | | |
| NET ASSETS | | | | | | | | |
Beginning of period | | | 2,339,288,793 | | | | 1,884,985,240 | |
End of period | | $ | 2,728,550,834 | | | $ | 2,339,288,793 | |
| | | | | | | | | |
| ACCUMULATED UNDISTRIBUTED NET INVESTMENT INCOME | | $ | 211,924 | | | $ | 605,424 | |
| | | | | | | | | |
| CAPITAL SHARE ACTIVITY | | | | | | | | |
Shares sold | | | 61,684,520 | | | | 105,936,628 | |
Shares reinvested | | | 4,122,347 | | | | 8,766,346 | |
Shares redeemed | | | (35,874,798 | ) | | | (74,680,643 | ) |
Net increase in shares outstanding | | | 29,932,069 | | | | 40,022,331 | |
Shares outstanding at beginning of period | | | 191,959,984 | | | | 151,937,653 | |
Shares outstanding at end of period | | | 221,892,053 | | | | 191,959,984 | |
| See accompanying notes to financial statements. |
Hussman Strategic International Fund Statements of Changes in Net Assets |
|
| | | Six Months Ended December 31, 2011 (Unaudited) | | | | |
| FROM OPERATIONS | | | | | | |
Net investment income (loss) | | $ | (323,713 | ) | | $ | 250,889 | |
| Net realized gains (losses) from: | | | | | | | | |
Security transactions | | | (1,540,109 | ) | | | 917,714 | |
Option contracts | | | (679,997 | ) | | | (908,388 | ) |
Futures contracts | | | 2,637,804 | | | | (270,219 | ) |
Foreign currency transactions | | | (554,140 | ) | | | 187,065 | |
| Net change in unrealized appreciation (depreciation) on: | | | | | | | | |
Investments | | | (4,320,579 | ) | | | 2,530,712 | |
Option contracts | | | (45,609 | ) | | | (386,308 | ) |
Futures contracts | | | (125,721 | ) | | | (602,079 | ) |
Foreign currency translation | | | (126,728 | ) | | | 81,569 | |
| Net increase (decrease) in net assets resulting from operations | | | (5,078,792 | ) | | | 1,800,955 | |
| | | | | | | | | |
| DISTRIBUTIONS TO SHAREHOLDERS | | | | | | | | |
From net investment income | | | (438,439 | ) | | | — | |
From net realized gains | | | (1,355,395 | ) | | | (386,352 | ) |
| Decrease in net assets from distributions to shareholders | | | (1,793,834 | ) | | | (386,352 | ) |
| | | | | | | | | |
| FROM CAPITAL SHARE TRANSACTIONS | | | | | | | | |
Proceeds from shares sold | | | 34,152,312 | | | | 58,482,638 | |
Net asset value of shares issued in reinvestment
of distributions to shareholders | | | 1,685,742 | | | | 362,653 | |
| Proceeds from redemption fees collected (Note 1) | | | 2,201 | | | | 2,996 | |
Payments for shares redeemed | | | (15,141,016 | ) | | | (3,838,932 | ) |
| Net increase in net assets from capital share transactions | | | 20,699,239 | | | | 55,009,355 | |
| | | | | | | | | |
TOTAL INCREASE IN NET ASSETS | | | 13,826,613 | | | | 56,423,958 | |
| | | | | | | | | |
| NET ASSETS | | | | | | | | |
Beginning of period | | | 65,225,596 | | | | 8,801,638 | |
End of period | | $ | 79,052,209 | | | $ | 65,225,596 | |
| | | | | | | | | |
ACCUMULATED UNDISTRIBUTED NET
INVESTMENT INCOME (LOSS) | | $ | (511,263 | ) | | $ | 250,889 | |
| | | | | | | | | |
| CAPITAL SHARE ACTIVITY | | | | | | | | |
Shares sold | | | 3,269,984 | | | | 5,650,037 | |
Shares reinvested | | | 169,006 | | | | 35,346 | |
Shares redeemed | | | (1,496,304 | ) | | | (371,106 | ) |
Net increase in shares outstanding | | | 1,942,686 | | | | 5,314,277 | |
Shares outstanding at beginning of period | | | 6,187,628 | | | | 873,351 | |
Shares outstanding at end of period | | | 8,130,314 | | | | 6,187,628 | |
| See accompanying notes to financial statements. |
Hussman Strategic Growth Fund Financial Highlights |
Selected Per Share Data and Ratios for a Share Outstanding Throughout Each Period |
| | | Six Months Ended December 31, 2011 (Unaudited) | | | | | | | | | | | | | | | | |
Net asset value at
beginning of period | | $ | 12.28 | | | $ | 13.45 | | | $ | 12.99 | | | $ | 15.73 | | | $ | 15.85 | | | $ | 16.13 | |
| | | | | | | | | | | | | | | | | | | | | | | | | |
Income (loss) from investment
operations: | | | | | | | | | | | | | | | | | | | | | | | | |
Net investment income | | | 0.04 | | | | 0.05 | | | | 0.00 | (a) | | | 0.03 | | | | 0.04 | | | | 0.14 | |
Net realized and unrealized gains
(losses) on investments and
option contracts | | | 0.17 | | | | (1.19 | ) | | | 0.48 | | | | (0.88 | ) | | | 0.55 | | | | 0.16 | |
Total from investment operations | | | 0.21 | | | | (1.14 | ) | | | 0.48 | | | | (0.85 | ) | | | 0.59 | | | | 0.30 | |
| | | | | | | | | | | | | | | | | | | | | | | | | |
| Less distributions: | | | | | | | | | | | | | | | | | | | | | | | | |
Dividends from net
investment income | | | (0.06 | ) | | | (0.03 | ) | | | (0.02 | ) | | | (0.03 | ) | | | (0.09 | ) | | | (0.13 | ) |
Distributions from net
realized gains | | | — | | | | — | | | | — | | | | (1.87 | ) | | | (0.63 | ) | | | (0.46 | ) |
Total distributions | | | (0.06 | ) | | | (0.03 | ) | | | (0.02 | ) | | | (1.90 | ) | | | (0.72 | ) | | | (0.59 | ) |
| | | | | | | | | | | | | | | | | | | | | | | | | |
Proceeds from redemption fees
collected (Note 1) | | | 0.00 | (a) | | | 0.00 | (a) | | | 0.00 | (a) | | | 0.01 | | | | 0.01 | | | | 0.01 | |
| | | | | | | | | | | | | | | | | | | | | | | | | |
Net asset value at end of period | | $ | 12.43 | | | $ | 12.28 | | | $ | 13.45 | | | $ | 12.99 | | | $ | 15.73 | | | $ | 15.85 | |
| | | | | | | | | | | | | | | | | | | | | | | | | |
Total return (b) | | | 1.73% | (c) | | | (8.49% | ) | | | 3.68% | | | | (4.35% | ) | | | 3.84% | | | | 1.98% | |
| | | | | | | | | | | | | | | | | | | | | | | | | |
Net assets at end of period (000’s) | | $ | 5,772,828 | | | $ | 5,644,066 | | | $ | 6,185,342 | | | $ | 4,975,812 | | | $ | 3,275,008 | | | $ | 2,718,324 | |
| | | | | | | | | | | | | | | | | | | | | | | | | |
Ratio of expenses to
average net assets | | | 1.04% | (d) | | | 1.03% | | | | 1.05% | | | | 1.09% | | | | 1.11% | | | | 1.11% | |
| | | | | | | | | | | | | | | | | | | | | | | | | |
Ratio of net investment income to
average net assets | | | 0.58% | (d) | | | 0.39% | | | | 0.04% | | | | 0.28% | | | | 0.28% | | | | 0.91% | |
| | | | | | | | | | | | | | | | | | | | | | | | | |
Portfolio turnover rate | | | 43% | (c) | | | 67% | | | | 111% | | | | 69% | | | | 150% | | | | 106% | |
| (a) | Amount rounds to less than $0.01 per share. |
| | |
| (b) | Total return is a measure of the change in value of an investment in the Fund over the period covered, which assumes any dividends or capital gains distributions are reinvested in shares of the Fund. Returns do not reflect the deduction of taxes a shareholder would pay on Fund distributions or the redemption of Fund shares. |
| | |
| (c) | Not annualized. |
| | |
| (d) | Annualized. |
| |
| See accompanying notes to financial statements. |
Hussman Strategic Total Return Fund Financial Highlights |
Selected Per Share Data and Ratios for a Share Outstanding Throughout Each Period |
| | | Six Months Ended December 31, 2011 (Unaudited) | | | | | | | | | | | | | | | | |
Net asset value at
beginning of period | | $ | 12.19 | | | $ | 12.41 | | | $ | 11.87 | | | $ | 11.99 | | | $ | 10.92 | | | $ | 11.30 | |
| | | | | | | | | | | | | | | | | | | | | | | | | |
| Income from investment operations: | | | | | | | | | | | | | | | | | | | | | | | | |
Net investment income | | | 0.03 | | | | 0.07 | | | | 0.18 | | | | 0.05 | | | | 0.24 | | | | 0.32 | |
Net realized and unrealized
gains on investments and
foreign currencies | | | 0.35 | | | | 0.37 | | | | 0.69 | | | | 0.35 | | | | 1.59 | | | | 0.06 | |
Total from investment operations | | | 0.38 | | | | 0.44 | | | | 0.87 | | | | 0.40 | | | | 1.83 | | | | 0.38 | |
| | | | | | | | | | | | | | | | | | | | | | | | | |
| Less distributions: | | | | | | | | | | | | | | | | | | | | | | | | |
Dividends from
net investment income | | | (0.03 | ) | | | (0.12 | ) | | | (0.16 | ) | | | (0.01 | ) | | | (0.23 | ) | | | (0.33 | ) |
Distributions from
net realized gains | | | (0.24 | ) | | | (0.54 | ) | | | (0.17 | ) | | | (0.53 | ) | | | (0.54 | ) | | | (0.43 | ) |
Total distributions | | | (0.27 | ) | | | (0.66 | ) | | | (0.33 | ) | | | (0.54 | ) | | | (0.77 | ) | | | (0.76 | ) |
| | | | | | | | | | | | | | | | | | | | | | | | | |
Proceeds from redemption fees
collected (Note 1) | | | 0.00 | (a) | | | 0.00 | (a) | | | 0.00 | (a) | | | 0.02 | | | | 0.01 | | | | 0.00 | (a) |
| | | | | | | | | | | | | | | | | | | | | | | | | |
Net asset value at end of period | | $ | 12.30 | | | $ | 12.19 | | | $ | 12.41 | | | $ | 11.87 | | | $ | 11.99 | | | $ | 10.92 | |
| | | | | | | | | | | | | | | | | | | | | | | | | |
Total return (b) | | | 3.16% | (c) | | | 3.53% | | | | 7.44% | | | | 3.94% | | | | 17.23% | | | | 3.46% | |
| | | | | | | | | | | | | | | | | | | | | | | | | |
Net assets at end of period (000’s) | | $ | 2,728,551 | | | $ | 2,339,289 | | | $ | 1,884,985 | | | $ | 1,023,591 | | | $ | 330,965 | | | $ | 174,480 | |
| | | | | | | | | | | | | | | | | | | | | | | | | |
Ratio of expenses to
average net assets | | | 0.63% | (d) | | | 0.64% | | | | 0.67% | | | | 0.75% | | | | 0.90% | | | | 0.90% | |
| | | | | | | | | | | | | | | | | | | | | | | | | |
Ratio of net investment income to
average net assets | | | 0.55% | (d) | | | 0.61% | | | | 1.59% | | | | 0.26% | | | | 2.05% | | | | 2.86% | |
| | | | | | | | | | | | | | | | | | | | | | | | | |
Portfolio turnover rate | | | 35% | (c) | | | 254% | | | | 69% | | | | 36% | | | | 212% | | | | 41% | |
| (a) | Amount rounds to less than $0.01 per share. |
| | |
| (b) | Total return is a measure of the change in value of an investment in the Fund over the period covered, which assumes any dividends or capital gains distributions are reinvested in shares of the Fund. Returns do not reflect the deduction of taxes a shareholder would pay on Fund distributions or the redemption of Fund shares. |
| | |
| (c) | Not annualized. |
| | |
| (d) | Annualized. |
| |
| See accompanying notes to financial statements. |
Hussman Strategic International Fund Financial Highlights |
Selected Per Share Data and Ratios for a Share Outstanding Throughout Each Period |
| | | Six Months Ended December 31, 2011 (Unaudited) | | | | | | Period Ended June 30, 2010(a) | |
Net asset value at beginning of period | | $ | 10.54 | | | $ | 10.08 | | | $ | 10.00 | |
| | | | | | | | | | | | | |
| Income (loss) from investment operations: | | | | | | | | | | | | |
Net investment income (loss) | | | (0.05 | ) | | | 0.04 | | | | (0.03 | ) |
Net realized and unrealized gains (losses) on investments
and option and futures contracts | | | (0.56 | ) | | | 0.54 | | | | 0.11 | |
Total from investment operations | | | (0.61 | ) | | | 0.58 | | | | 0.08 | |
| | | | | | | | | | | | | |
| Less distributions: | | | | | | | | | | | | |
Distributions from net investment income | | | (0.05 | ) | | | — | | | | — | |
Distributions from net realized gains | | | (0.16 | ) | | | (0.12 | ) | | | — | |
Total distributions | | | (0.21 | ) | | | (0.12 | ) | | | — | |
| | | | | | | | | | | | | |
| Proceeds from redemption fees collected (Note 1) | | | 0.00 | (b) | | | 0.00 | (b) | | | — | |
| | | | | | | | | | | | | |
Net asset value at end of period | | $ | 9.72 | | | $ | 10.54 | | | $ | 10.08 | |
| | | | | | | | | | | | | |
Total return (c) | | | (5.75% | )(d) | | | 5.83% | | | | 0.80% | (d) |
| | | | | | | | | | | | | |
Net assets at end of period (000's) | | $ | 79,052 | | | $ | 65,226 | | | $ | 8,802 | |
| | | | | | | | | | | | | |
Ratio of net expenses to average net assets (f) | | | 2.00% | (e) | | | 2.00% | | | | 2.00% | (e) |
| | | | | | | | | | | | | |
| Ratio of net investment income (loss) to average net assets | | | (0.86% | )(e) | | | 0.63% | | | | (0.67% | )(e) |
| | | | | | | | | | | | | |
Portfolio turnover rate | | | 22% | (d) | | | 39% | | | | 13% | (d) |
| (a) | Represents the period from the commencement of operations (December 31, 2009) through June 30, 2010. |
| | |
| (b) | Amount rounds to less than $0.01 per share. |
| | |
| (c) | Total return is a measure of the change in value of an investment in the Fund over the period covered, which assumes any dividends or capital gains distributions are reinvested in shares of the Fund. Returns do not reflect the deduction of taxes a shareholder would pay on Fund distributions or the redemption of Fund shares. |
| | |
| (d) | Not annualized. |
| | |
| (e) | Annualized. |
| | |
| (f) | Absent investment advisory fee reductions and expense reimbursements by the Adviser, the ratios of expenses to average net assets would have been 2.14% and 5.00%(e) for the periods ended June 30, 2011 and 2010, respectively (Note 3). |
| |
| See accompanying notes to financial statements. |
Hussman Investment Trust Notes to Financial Statements |
December 31, 2011 (Unaudited) |
| 1. | ORGANIZATION AND SIGNIFICANT ACCOUNTING POLICIES |
Hussman Strategic Growth Fund, Hussman Strategic Total Return Fund and Hussman Strategic International Fund (formerly Hussman Strategic International Equity Fund) (each, a “Fund”, and collectively, the “Funds”) are diversified series of Hussman Investment Trust (the “Trust”), which is registered under the Investment Company Act of 1940 as an open-end management investment company. Each Fund is authorized to issue an unlimited number of shares. Hussman Strategic Growth Fund commenced operations on July 24, 2000. Hussman Strategic Total Return Fund commenced operations on September 12, 2002. Hussman Strategic International Fund commenced operations on December 31, 2009.
Hussman Strategic Growth Fund’s investment objective is to provide long-term capital appreciation, with added emphasis on protection of capital during unfavorable market conditions.
Hussman Strategic Total Return Fund’s investment objective is to provide long-term total return from income and capital appreciation, with added emphasis on protection of capital during unfavorable market conditions.
Hussman Strategic International Fund’s investment objective is to provide long-term capital appreciation, with added emphasis on the protection of capital during unfavorable market conditions. The Fund invests primarily in equity securities of non-U.S. issuers.
Securities and Options Valuation — The Funds’ portfolio securities are valued at market value as of the close of regular trading on the New York Stock Exchange (“NYSE”) (normally, 4:00 Eastern time) on each business day the NYSE is open. Securities, other than options, listed on the NYSE or other exchanges are valued on the basis of their last sale prices on the exchanges on which they are primarily traded. However, if the last sale price on the NYSE is different than the last sale price on any other exchange, the NYSE price will be used. If there are no sales on that day, the securities are valued at the last bid price on the NYSE or other primary exchange for that day. Securities which are quoted by NASDAQ are valued at the NASDAQ Official Closing Price. If there are no sales on that day, the securities are valued at the last bid price as reported by NASDAQ. Securities traded in over-the-counter markets, other than NASDAQ quoted securities, are valued at the last sales price, or if there are no sales on that day, at the mean of the closing bid and asked prices. Securities traded on a foreign stock exchange may be valued based upon the closing price on the principal exchange where the security is traded; however, because the value of securities traded on foreign stock exchanges may be materially affected by events occurring before the Funds’ pricing time but after the close of the primary markets or
Hussman Investment Trust Notes to Financial Statements (continued) |
December 31, 2011 (Unaudited) |
exchanges on which such securities are traded, such securities will typically be priced at their fair value as determined by an independent pricing service approved by the Board of Trustees. As a result, the prices of securities used to calculate a Fund’s net asset value may differ from quoted or published prices for the same securities. Values of foreign securities are translated from the local currency into U.S. dollars using currency exchange rates supplied by an independent pricing quotation service.
Pursuant to procedures approved by the Board of Trustees, options traded on a national securities exchange are valued at prices between the closing bid and ask prices determined by Hussman Strategic Advisors, Inc. (the “Adviser”) to most closely reflect market value as of the time of computation of net asset value. As of December 31, 2011, all options held by Hussman Strategic Growth Fund and Hussman Strategic International Fund have been valued in this manner. Options not traded on a national securities exchange or board of trade, but for which over-the-counter market quotations are readily available, are valued at the mean of their closing bid and ask prices. Futures contracts and options thereon, which are traded on commodities exchanges, are valued at their last sale price as of the close of regular trading on the NYSE or, if not available, at the mean of the bid and ask prices.
Fixed income securities not traded or dealt in upon any securities exchange but for which over-the-counter market quotations are readily available generally are valued at the mean of their closing bid and asked prices. Fixed income securities may also be valued on the basis of prices provided by an independent pricing service. Debt securities with remaining maturities of 60 days or less are valued at amortized cost, absent unusual circumstances.
In the event that market quotations are not readily available or are determined by the Adviser to not be reflective of fair market value due to market events or developments, securities and options are valued at fair value as determined by the Adviser in accordance with procedures adopted by the Board of Trustees. Such methods of fair valuation may include, but are not limited to: multiple of earnings, multiple of book value, discount from market of a similar freely traded security, purchase price of security, subsequent private transactions in the security or related securities, or a combination of these and other factors.
Accounting principles generally accepted in the United States (“GAAP”) establish a single authoritative definition of fair value, set out a framework for measuring fair value and require additional disclosures about fair value measurements.
Various inputs are used in determining the value of each of the Funds’ investments. These inputs are summarized in the three broad levels listed below:
Hussman Investment Trust Notes to Financial Statements (continued) |
December 31, 2011 (Unaudited) |
• Level 1 – quoted prices in active markets for identical securities
• Level 2 – other significant observable inputs
• Level 3 – significant unobservable inputs
For example, option contracts purchased and written by Hussman Strategic Growth Fund and Hussman Strategic International Fund are classified as Level 2 since they are valued using “other significant observable inputs” at prices between the closing bid and ask prices determined by the Adviser to most closely reflect market value. U.S. Treasury obligations held by Hussman Strategic Total Return Fund are classified as Level 2 since values are based on prices provided by an independent pricing service that utilizes various “other significant observable inputs” including bid and ask quotations, prices of similar securities and interest rates, among other factors. Non-U.S. equity securities actively traded in foreign markets held by Hussman Strategic International Fund may be classified as Level 2 despite the availability of closing prices because the fair values of such securities are typically determined by an independent pricing service, as described in the preceding discussion of valuations of foreign securities. The inputs or methodology used for valuing securities are not necessarily an indication of the risks associated with investing in those securities. The inputs used to measure the value of a particular security may fall into more than one level of the fair value hierarchy. In such cases, for disclosure purposes, the level in the fair value hierarchy within which the fair value measurement of that security is determined to fall in its entirety is the lowest level input that is significant to the fair value measurement.
The following is a summary of the inputs used to value each Fund’s investments and other financial instruments as of December 31, 2011 by security type:
| Hussman Strategic Growth Fund |
| | | | | | | | | | | | | |
Investments in Securities and Money Market Funds: | | | | | | | | | | | | |
Common Stocks | | $ | 5,792,612,946 | | | $ | — | | | $ | — | | | $ | 5,792,612,946 | |
Put Option Contracts | | | — | | | | 110,284,000 | | | | — | | | | 110,284,000 | |
Money Market Funds | | | 943,345,707 | | | | — | | | | — | | | | 943,345,707 | |
| Total Investments in Securities and Money Market Funds | | $ | 6,735,958,653 | | | $ | 110,284,000 | | | $ | — | | | $ | 6,846,242,653 | |
| | | | | | | | | | | | | | | | | |
Other Financial Instruments: | | | | | | | | | | | | | | | | |
Written Call Option Contracts | | $ | — | | | $ | (1,197,242,000 | ) | | $ | — | | | $ | (1,197,242,000 | ) |
Total Other Financial Instruments | | $ | — | | | $ | (1,197,242,000 | ) | | $ | — | | | $ | (1,197,242,000 | ) |
Hussman Investment Trust Notes to Financial Statements (continued) |
December 31, 2011 (Unaudited) |
| Hussman Strategic Total Return Fund |
| | | | | | | | | | | | | |
Investments in Securities and Money Market Funds: | | | | | | | | | | | | |
Common Stocks | | $ | 399,113,220 | | | $ | — | | | $ | — | | | $ | 399,113,220 | |
U.S. Treasury Obligations | | | — | | | | 1,362,152,515 | | | | — | | | | 1,362,152,515 | |
Exchange-Traded Funds | | | 35,004,600 | | | | — | | | | — | | | | 35,004,600 | |
Money Market Funds | | | 925,928,371 | | | | — | | | | — | | | | 925,928,371 | |
| Total Investments in Securities and Money Market Funds | | $ | 1,360,046,191 | | | $ | 1,362,152,515 | | | $ | — | | | $ | 2,722,198,706 | |
| Hussman Strategic International Fund |
| | | | | | | | | | | | | |
Investments in Securities and Money Market Funds: | | | | | | | | | | | | |
Common Stocks | | $ | 22,989,908 | | | $ | 31,356,239 | | | $ | — | | | $ | 54,346,147 | |
Exchange-Traded Funds | | | 6,151,570 | | | | — | | | | — | | | | 6,151,570 | |
Put Option Contracts | | | — | | | | 390,790 | | | | — | | | | 390,790 | |
Futures Contracts | | | 12,096,000 | | | | — | | | | — | | | | 12,096,000 | |
Money Market Funds | | | 10,753,205 | | | | — | | | | — | | | | 10,753,205 | |
| Total Investments in Securities and Money Market Funds | | $ | 51,990,683 | | | $ | 31,747,029 | | | $ | — | | | $ | 83,737,712 | |
| | | | | | | | | | | | | | | | | |
Other Financial Instruments: | | | | | | | | | | | | | | | | |
Futures Contracts Sold Short | | $ | (35,297,932 | ) | | $ | — | | | $ | — | | | $ | (35,297,932 | ) |
Written Call Option Contracts | | | — | | | | (2,668,720 | ) | | | — | | | | (2,668,720 | ) |
Total Other Financial Instruments | | $ | (35,297,932 | ) | | $ | (2,668,720 | ) | | $ | — | | | $ | (37,966,652 | ) |
Each Fund’s Schedule of Investments identifies the specific securities (by type of security and industry type or geographical region) that comprise that Fund’s holdings within the Level 1 and Level 2 categories shown in the tables above. During the six months ended December 31, 2011, the Funds did not have any significant transfers in and out of any Level. In addition, the Funds did not have any assets or liabilities that were measured at fair value on a recurring basis using significant unobservable inputs (Level 3) as of or during the six months ended December 31, 2011. It is the Funds’ policy to recognize transfers into and out of any Level at the end of the reporting period.
Hussman Investment Trust Notes to Financial Statements (continued) |
December 31, 2011 (Unaudited) |
Futures Contracts and Option Transactions — Hussman Strategic Growth Fund and Hussman Strategic International Fund may purchase and write put and call options on broad-based stock indices and may also purchase and write call and put option contracts on individual securities. Each of the Funds may use financial futures contracts and related option contracts to hedge against changes in the market value of its portfolio securities. Hussman Strategic Total Return Fund and Hussman Strategic International Fund may also purchase foreign currency options to establish or modify the Funds’ exposure to foreign currencies, and Hussman Strategic Total Return Fund may purchase interest rate futures contracts to protect against a decline in the value of its portfolio. Hussman Strategic International Fund may enter into forward foreign currency contracts to hedge against the adverse impact of changes in foreign exchange rates on its investments and transactions in foreign securities.
Hussman Strategic Growth Fund and Hussman Strategic International Fund may each use futures and option contracts on stock indices for the purpose of seeking to reduce the market risk that would otherwise be associated with the securities in which it invests. For example, these Funds may sell a stock index futures contract to hedge the risk of a general market or market sector decline that might adversely affect prices of the Funds’ portfolio securities. To the extent there is a correlation between a Fund’s portfolio and a particular stock index, the sale of futures contracts on that index could reduce the Fund’s exposure to general market risk.
When a Fund writes an index option, an amount equal to the net premium (the premium less the commission) received by the Fund is recorded as a liability in the Fund’s Statement of Assets and Liabilities and is subsequently marked-to market daily. If an index option expires unexercised on the stipulated expiration date or if the Fund enters into a closing purchase transaction, it will realize a gain (or a loss if the cost of a closing purchase transaction exceeds the net premium received when the option is sold) and the liability related to such option will be eliminated. If an index option is exercised, the Fund will be required to pay the difference between the closing index value and the exercise price of the option. In this event, the proceeds of the sale will be increased by the net premium originally received and the Fund will realize a gain or loss.
When a Fund purchases or sells a stock index futures contract, no price is paid to or received by the Fund upon the purchase or sale of the futures contract. Instead, the Fund is required to deposit in a segregated asset account an amount of cash or qualifying securities currently ranging from 5% to 15% of the contract amount. This is called the “initial margin deposit.” Subsequent payments, known as “variation margin,” are made or received by the Fund each day, depending on the
Hussman Investment Trust Notes to Financial Statements (continued) |
December 31, 2011 (Unaudited) |
daily fluctuations in the fair value of the underlying stock index. The Fund recognizes an unrealized gain or loss equal to the daily variation margin. If market conditions move unexpectedly, the Fund may not achieve the anticipated benefits of the futures contracts and may realize a loss. In addition to the possibility that there may be an imperfect correlation or no correlation at all between the movements in the stock index futures and the portion of the portfolio being hedged, the price of the stock index futures may not correlate perfectly with movements in the stock index due to certain market distortions.
Repurchase Agreements — The Funds may enter into repurchase agreements with certain banks or non-bank dealers. The value of the underlying securities collateralizing these agreements is monitored on a daily basis to ensure that the value of the collateral during the term of the agreements equals or exceeds the repurchase price plus accrued interest. If the bank or dealer defaults, realization of the collateral by the Funds may be delayed or limited, and the Funds may suffer a loss if the value of the collateral declines.
Foreign Currency Translation — Amounts denominated in or expected to settle in foreign currencies are translated into U.S. dollars based on exchange rates on the following basis:
A. The market values of investment securities and other assets and liabilities are translated at the closing rate on the London Stock Exchange each day.
B. Purchases and sales of investment securities and income and expenses are translated at the rate of exchange prevailing on the respective date of such transactions.
C. The Funds do not isolate that portion of the results of operations caused by changes in foreign exchange rates on investments from those caused by changes in market prices of securities held. Such fluctuations are included with the net realized and unrealized gains or losses on investments.
Reported net realized foreign exchange gains or losses arise from 1) purchases and sales of foreign currencies, 2) currency gains or losses realized between the trade and settlement dates on securities transactions and 3) the difference between the amounts of dividends, interest and foreign withholding taxes recorded on the Fund’s books and the U.S. dollar equivalent of the amounts actually received or paid. Reported net unrealized foreign exchange gains and losses arise from changes in the value of assets and liabilities that result from changes in exchange rates.
Hussman Investment Trust Notes to Financial Statements (continued) |
December 31, 2011 (Unaudited) |
Share Valuation and Redemption Fees — The net asset value per share of each Fund is calculated as of the close of regular trading on the NYSE (normally 4:00 p.m., Eastern time) on each day that the NYSE is open for business. The net asset value per share of each Fund is calculated by dividing the total value of the Fund’s assets, less its liabilities, by the number of its shares outstanding. The offering price and redemption price per share of each Fund is equal to the net asset value per share. However, shares of each Fund are generally subject to a redemption fee of 1.5%, payable to the applicable Fund, if redeemed 60 days or less of the date of purchase. During the periods ended December 31, 2011 and June 30, 2011, proceeds from redemption fees totaled $306,748 and $546,677, respectively, for Hussman Strategic Growth Fund; $189,884 and $318,293, respectively, for Hussman Strategic Total Return Fund; and $2,201 and $2,996, respectively, for Hussman Strategic International Fund.
Investment Income — Interest income is accrued as earned. Dividend income is recorded on the ex-dividend date. Discounts and premiums on fixed income securities are amortized using the interest method.
Distributions to Shareholders — Dividends from net investment income, if any, are declared and paid annually to shareholders of Hussman Strategic Growth Fund and Hussman Strategic International Fund and are declared and paid quarterly to shareholders of Hussman Strategic Total Return Fund. Net realized short-term capital gains, if any, may be distributed throughout the year and net realized long-term capital gains, if any, are generally distributed annually. The amount of distributions from net investment income and net realized gains are determined in accordance with federal income tax regulations, which may differ from GAAP. These “book/tax” differences are either temporary or permanent in nature and are primarily due to timing differences in the recognition of capital gains or losses for option and futures transactions, losses deferred due to wash sales and treatment of foreign currency transactions.
The tax character of distributions paid during the periods ended December 31, 2011 and June 30, 2011 was as follows:
| | | | | | | | | | |
| Hussman Strategic Growth Fund | 12/31/11 | | $ | 28,671,281 | | | $ | — | | | $ | 28,671,281 | |
| | 6/30/11 | | $ | 14,114,668 | | | $ | — | | | $ | 14,114,668 | |
| Hussman Strategic Total Return Fund | 12/31/11 | | $ | 29,932,274 | | | $ | 30,033,097 | | | $ | 59,965,371 | |
| | 6/30/11 | | $ | 91,708,544 | | | $ | 33,178,906 | | | $ | 124,887,450 | |
| Hussman Strategic International Fund | 12/31/11 | | $ | 1,793,834 | | | $ | — | | | $ | 1,793,834 | |
| | 6/30/11 | | $ | 117,305 | | | $ | 269,047 | | | $ | 386,352 | |
Hussman Investment Trust Notes to Financial Statements (continued) |
December 31, 2011 (Unaudited) |
Securities Transactions — For financial statement purposes, securities transactions are accounted for on trade date. Gains and losses on securities sold are determined on a specific identification basis.
Common Expenses — Expenses of the Trust not attributable solely to one of the Funds are allocated among the Funds based on relative net assets of each Fund or the nature of the expense and the relative applicability to each Fund.
Accounting Estimates — The preparation of financial statements in conformity with GAAP requires management to make estimates and assumptions that affect the reported amounts of assets and liabilities and the disclosure of contingent assets and liabilities as of the date of the financial statements and the reported amounts of income and expenses during the reporting period. Actual results could differ from these estimates.
Federal Income Tax — It is each Fund’s policy to qualify as a regulated investment company under Subchapter M of the Internal Revenue Code. As provided therein, in any fiscal year in which a Fund so qualifies and distributes at least 90% of its taxable net income, the Fund (but not its shareholders) will be relieved of federal income tax on the income distributed. Accordingly, no provision for income taxes has been made.
In order to avoid imposition of a federal excise tax applicable to regulated investment companies, it is each Fund’s intention to declare and pay as dividends in each calendar year at least 98% of its net investment income (earned during the calendar year) and 98.2% of its net realized capital gains (earned during the twelve months ended October 31) plus undistributed amounts from prior years.
Hussman Investment Trust Notes to Financial Statements (continued) |
December 31, 2011 (Unaudited) |
The following information is computed on a tax basis for each item as of December 31, 2011:
| | | Hussman Strategic Growth Fund | | | Hussman Strategic Total Return Fund | | | Hussman Strategic International Fund | |
Cost of portfolio investments | | $ | 5,343,683,093 | | | $ | 2,675,870,576 | | | $ | 71,358,871 | |
Gross unrealized appreciation | | $ | 857,989,579 | | | $ | 78,645,128 | | | $ | 2,888,322 | |
Gross unrealized depreciation | | | (510,024,704 | ) | | | (32,316,998 | ) | | | (4,862,471 | ) |
Net unrealized appreciation (depreciation) | | $ | 347,964,875 | | | $ | 46,328,130 | | | $ | (1,974,149 | ) |
Net unrealized depreciation of assets and liabilities in foreign currencies | | | — | | | | — | | | | (45,640 | ) |
Net unrealized depreciation on futures contracts | | | — | | | | — | | | | (669,577 | ) |
Accumulated undistributed ordinary income (loss) | | | 10,077,423 | | | | 8,009,576 | | | | (853,066 | ) |
Capital loss carryforwards | | | (1,200,400,356 | ) | | | — | | | | (747,712 | ) |
Post-October losses | | | (588,750,546 | ) | | | — | | | | — | |
Other gains (losses) | | | 547,560,213 | | | | 1,687,915 | | | | (1,043,351 | ) |
Other temporary differences | | | (10,067,778 | ) | | | (1,011,268 | ) | | | (25,273 | ) |
Total accumulated earnings (deficit) | | $ | (893,616,169 | ) | | $ | 55,014,353 | | | $ | (5,358,768 | ) |
The difference between the federal income tax cost of portfolio investments and their financial statement cost for the Funds is due to certain timing differences in the recognition of capital gains or losses under income tax regulations and GAAP. These “book/tax” differences are temporary in nature and are primarily due to option transactions, losses deferred due to wash sales and differing treatments of realized and unrealized gains and losses on exchange-traded funds taxed as grantor trusts.
As of June 30, 2011, Hussman Strategic Growth Fund had capital loss carryforwards for federal income tax purposes of $1,200,400,356, of which $375,427,325 expire June 30, 2018 and $824,973,031 expire June 30, 2019. Additionally, Hussman Strategic Growth Fund had net realized capital losses of $588,750,546 during the period November 1, 2010 through June 30, 2011 (”post-October losses”), which are treated for federal income tax purposes as arising during the Fund’s tax year ending June 30, 2012. As of June 30, 2011, Hussman Strategic International Fund had capital loss carryforwards of $747,712, which expire June 30, 2019. These capital loss carryforwards and post-October losses may be utilized in the current and future years to offset net realized capital gains, if any, prior to distributing such gains to shareholders. Under the recently enacted Regulated Investment Company Modernization Act of 2010, the Funds are permitted to carry forward capital losses
Hussman Investment Trust Notes to Financial Statements (continued) |
December 31, 2011 (Unaudited) |
incurred in taxable years beginning after December 22, 2010 for an unlimited period. Capital losses incurred during post-enactment taxable years are required to be utilized prior to those losses incurred in pre-enactment taxable years. As a result of this ordering rule, pre-enactment capital loss carryforwards are more likely to expire unused. Also, post-enactment capital losses that are carried forward will retain their character as either short-term or long-term capital losses rather than being considered all short-term as under previous law.
For the six months ended December 31, 2011, Hussman Strategic Total Return Fund reclassified $107,863 of accumulated net realized losses from security transactions against undistributed net investment income on its Statement of Assets and Liabilities due to differing treatments of realized gains and losses on exchange-traded funds taxed as grantor trusts. Such reclassification, the result of permanent differences between financial statement and income tax reporting requirements, has no effect on the Fund’s total net assets or net asset value per share.
Each Fund recognizes the tax benefits or expenses of uncertain tax positions only when the position is “more likely than not” to be sustained assuming examination by tax authorities. Management has reviewed each Fund’s tax positions taken on federal income tax returns for all open tax years (tax years ended June 30, 2008 through June 30, 2011) and has concluded that no provision for unrecognized tax benefits or expenses is required in these financial statements.
| 2. | INVESTMENT TRANSACTIONS |
During the six months ended December 31, 2011, cost of purchases and proceeds from sales and maturities of investment securities, other than short-term investments and U.S. government securities, amounted to $2,774,974,737 and $2,482,337,178, respectively, for Hussman Strategic Growth Fund; $196,250,278 and $249,461,790, respectively, for Hussman Strategic Total Return Fund; and $36,194,401 and $11,904,638, respectively, for Hussman Strategic International Fund.
| 3. | TRANSACTIONS WITH AFFILIATES |
One of the Trustees and each of the officers of the Trust are affiliated with the Adviser or with Ultimus Fund Solutions, LLC (“Ultimus”), the Funds’ administrator, transfer agent and fund accounting agent.
Hussman Investment Trust Notes to Financial Statements (continued) |
December 31, 2011 (Unaudited) |
Under the terms of an Advisory Agreement between the Trust and the Adviser, Hussman Strategic Growth Fund pays the Adviser a fee, which is computed and accrued daily and paid monthly, at annual rates of 0.90% of the first $5 billion of its average daily net assets and 0.85% of such assets over $5 billion. Under the terms of a separate Advisory Agreement between the Trust and the Adviser, Hussman Strategic Total Return Fund pays the Adviser a fee, which is computed and accrued daily and paid monthly, at annual rates of 0.50% of the first $1 billion of its average daily net assets; 0.45% of the next $1.5 billion of such assets; and 0.40% of such assets over $2.5 billion. Under the terms of a separate Advisory Agreement between the Trust and the Adviser, Hussman Strategic International Fund pays a fee, which is computed and accrued daily and paid monthly, at annual rates of 1.00% of the first $1 billion of average daily net assets; 0.95% of the next $2 billion of such assets; and 0.90% of such assets over $3 billion, less any fee reductions.
With respect to Hussman Strategic International Fund, the Adviser has contractually agreed to reduce its advisory fees or to absorb the Fund’s operating expenses to the extent necessary so that the Fund’s ordinary operating expenses do not exceed an amount equal to 2.00% annually of its average daily net assets. This Expense Limitation Agreement remains in effect until at least December 31, 2012. Any fee reductions or expense reimbursements by the Adviser are subject to repayment by Hussman Strategic International Fund provided that such repayment does not result in the Fund’s expenses exceeding the 2.00% annual limitation and provided further that the expenses which are the subject of the repayment were incurred within three years of such repayment. During the six months ended December 31, 2011, the Adviser recouped $77,975 of previously waived fees from Hussman Strategic International Fund. As of December 31, 2011, the amount of fee reductions and expense reimbursements available for recovery by the Adviser is $89,859. The Advisor may recoup a portion of this amount no later than the dates as stated below:
Under the terms of an Administration Agreement between the Trust and Ultimus, Ultimus supplies executive, administrative and regulatory services to the Trust, supervises the preparation of tax returns, and coordinates the preparation of reports to shareholders and reports to and filings with the Securities and Exchange Commission
Hussman Investment Trust Notes to Financial Statements (continued) |
December 31, 2011 (Unaudited) |
(“SEC”) and state securities authorities. For these services, Ultimus receives a monthly fee from each Fund computed at annual rates of 0.075% of the Fund’s average daily net assets up to $500 million; 0.05% of the next $1.5 billion of such assets; 0.04% of the next $1 billion of such assets; 0.03% of the next $2 billion of such assets; and 0.025% of such assets in excess of $5 billion, subject to a per Fund minimum monthly fee of $2,000.
| Fund Accounting Agreement |
Under the terms of a Fund Accounting Agreement between the Trust and Ultimus, Ultimus calculates the daily net asset value per share and maintains the financial books and records of the Funds. For these services, Ultimus receives from each Fund a monthly base fee ($2,500 for Hussman Strategic Growth Fund and Hussman Strategic Total Return Fund and $3,000 for Hussman Strategic International Fund), plus an asset-based fee computed at annual rates of 0.01% of each Fund’s average daily net assets up to $500 million and 0.005% of such assets in excess of $500 million. In addition, the Funds reimburse Ultimus for certain out-of-pocket expenses incurred in obtaining valuations of the Funds’ portfolio securities.
| Transfer Agent and Shareholder Services Agreement |
Under the terms of a Transfer Agent and Shareholder Services Agreement between the Trust and Ultimus, Ultimus maintains the records of each shareholder’s account, answers shareholders’ inquiries concerning their accounts, processes purchases and redemptions of each Fund’s shares, acts as dividend and distribution disbursing agent, and performs other shareholder service functions. For these services, Ultimus receives from each Fund a fee, payable monthly, of $22 annually for each direct account and $12 annually for certain accounts established through financial intermediaries, subject to a per Fund minimum fee of $1,500 per month. For the six months ended December 31, 2011, such fees were $1,175,630, $339,202 and $9,532, for Hussman Strategic Growth Fund, Hussman Total Return Fund and Hussman Strategic International Fund, respectively. In addition, the Funds reimburse Ultimus for certain out-of-pocket expenses, including, but not limited to, postage and supplies.
For shareholder accounts held through financial intermediaries, the Funds may, in some cases, compensate these intermediaries for providing certain account maintenance and shareholder services. During the six months ended December 31, 2011, Hussman Strategic Growth Fund, Hussman Strategic Total Return Fund and Hussman Strategic International Fund paid $1,028,130, $510,753 and $15,531, respectively, to financial intermediaries for such services.
Hussman Investment Trust Notes to Financial Statements (continued) |
December 31, 2011 (Unaudited) |
| Compliance Consulting Agreement |
Under the terms of a Compliance Consulting Agreement between the Trust and Ultimus, Ultimus provides an individual to serve as the Trust’s Chief Compliance Officer and to administer the Trust’s compliance policies and procedures. For these services, the Trust pays Ultimus a base fee of $15,000 per annum, plus an asset-based fee computed at annual rates of .005% of the average value of the Trust’s aggregate daily net assets from $100 million to $500 million, .0025% of such assets from $500 million to $1 billion and .00125% of such assets in excess of $1 billion. Each Fund pays its proportionate share of such fee. In addition, the Trust reimburses Ultimus for reasonable out-of-pocket expenses, if any, incurred in connection with these services.
The Trust has entered into a Distribution Agreement with Ultimus Fund Distributors, LLC (the “Distributor”), pursuant to which the Distributor provides distribution services and serves as the principal underwriter to each Fund. The Distributor is a wholly-owned subsidiary of Ultimus. The Distributor’s fees are paid by the Adviser.
| 4. | DERIVATIVES TRANSACTIONS |
Transactions in option contracts written by Hussman Strategic Growth Fund and Hussman Strategic International Fund during the six months ended December 31, 2011 were as follows:
| Hussman Strategic Growth Fund |
| | | | | | | |
Options outstanding at beginning of period | | | 44,000 | | | $ | 1,028,071,820 | |
Options written | | | 246,500 | | | | 4,360,948,804 | |
| Options cancelled in a closing purchase transaction | | | (243,500 | ) | | | (4,231,217,781 | ) |
Options outstanding at end of period | | | 47,000 | | | $ | 1,157,802,843 | |
| Hussman Strategic International Fund |
| | | | | | | |
Options outstanding at beginning of period | | | 85 | | | $ | 1,796,362 | |
Options written | | | 520 | | | | 4,850,460 | |
| Options cancelled in a closing purchase transaction | | | (420 | ) | | | (4,064,067 | ) |
Options outstanding at end of period | | | 185 | | | $ | 2,582,755 | |
Hussman Investment Trust Notes to Financial Statements (continued) |
December 31, 2011 (Unaudited) |
The locations in the Statements of Assets and Liabilities of Hussman Strategic Growth Fund and Hussman Strategic International Funds’ derivative positions are as follows:
| Hussman Strategic Growth Fund |
| | | Fair Value | Gross Notional Amount Outstanding December 31, 2011 |
Type of Derivative | Location | Asset Derivatives | Liability Derivatives |
| Index put options purchased | Investments in securities at value | $110,284,000 | $— | $5,701,422,000 |
| Index call options written | Written call options, at value | — | (1,197,242,000) | (5,701,422,000) |
| Hussman Strategic International Fund |
| | | Fair Value | Gross Notional Amount Outstanding December 31, 2011 |
Type of Derivative | Location | Asset Derivatives | Liability Derivatives |
| Index put options purchased | Investments in securities at value | $390,790 | $— | $23,265,600 |
| Index call options written | Written call options, at value | — | (2,668,720) | (23,265,600) |
| Futures contracts purchased | Variation margin receivable | 744,184 | — | 12,026,700 |
| Futures contracts sold short | Variation margin receivable | 3,394,950 | — | (35,465,437) |
The average monthly notional amount of put options purchased and call options written during the six months ended December 31, 2011 was $5,682,395,000 and $5,682,395,000, respectively, for Hussman Strategic Growth Fund. The average monthly notional amount of put options purchased and call options written during the six months ended December 31, 2011 was $22,622,846 and $20,664,254, respectively, for Hussman Strategic International Fund. The average monthly notional amount of future contracts purchased and sold short during the six months ended December 31, 2011 was $5,868,200 and $29,377,751, respectively, for Hussman Strategic International Fund.
Hussman Investment Trust Notes to Financial Statements (continued) |
December 31, 2011 (Unaudited) |
Hussman Strategic Growth Fund’s and Hussman Strategic International Fund’s transactions in derivative instruments during the six months ended December 31, 2011 are recorded in the following locations in the Statements of Operations:
| Hussman Strategic Growth Fund |
Type of Derivative | Location | Realized Gains (Losses) | Location | Change in Unrealized Gains (Losses) |
| Index put options purchased | Net realized gains (losses) from option contracts | $(62,415,926) | Net change in unrealized appreciation (depreciation) on option contracts | $52,946,033 |
| Index call options purchased | Net realized gains (losses) from option contracts | (21,385,740) | Net change in unrealized appreciation (depreciation) on option contracts | — |
| Index call options written | Net realized gains (losses) from option contracts | 225,503,743 | Net change in unrealized appreciation (depreciation) on option contracts | 75,031,022 |
| Hussman Strategic International Fund |
Type of Derivative | Location | Realized Gains (Losses) | Location | Change in Unrealized Gains (Losses) |
| Index put options purchased | Net realized gains (losses) from option contracts | $(1,798,509) | Net change in unrealized appreciation (depreciation) on option contracts | $(187,897) |
| Index call options written | Net realized gains (losses) from option contracts | 1,118,512 | Net change in unrealized appreciation (depreciation) on option contracts | 142,288 |
| Futures contracts purchased | Net realized gains (losses) from futures contracts | 411,974 | Net change in unrealized appreciation (depreciation) on futures contracts | 59,419 |
| Futures contracts sold short | Net realized gains (losses) from futures contracts | 2,225,830 | Net change in unrealized appreciation (depreciation) on futures contracts | (185,140) |
Hussman Strategic Total Return Fund had no transactions in derivative instruments during the six months ended December 31, 2011.
Hussman Investment Trust Notes to Financial Statements (continued) |
December 31, 2011 (Unaudited) |
| 5. | OTHER INVESTMENTS AND STRATEGIES |
If a Fund has significant investments in the securities of issuers in industries within a particular market sector, any development generally affecting issuers within that sector will have a greater impact on the value of the net assets of the Fund than would be the case if the Fund did not have significant investments in that sector. This may increase the risk of loss of an investment in the Fund and increase the volatility of the Fund’s net asset value per share. As of December 31, 2011, Hussman Strategic Growth Fund had 33.5% of the value of its net assets invested in stocks within the Health Care sector. The value of companies in the Health Care sector may be significantly affected by technological obsolescence, changes in regulatory approval policies for drugs, medical devices or procedures and changes in governmental and private payment systems.
In order to maintain sufficient liquidity to implement investment strategies, or for temporary defensive purposes, each Fund may invest a significant portion of its assets in shares of one or more money market mutual funds. As of December 31, 2011, Hussman Strategic Total Return Fund had 34.0% of the value of its net assets invested in money market mutual funds registered under the Investment Company Act of 1940, including 24.1% of the value of its net assets invested in shares of a single money market fund. As of December 31, 2011, Hussman Strategic Growth Fund and Hussman Strategic International Fund had 16.3% and 13.6%, respectively, of the value of their net assets invested in money market mutual funds registered under the Investment Company Act of 1940. An investment in a money market mutual fund is not insured or guaranteed by the Federal Deposit Insurance Corporation or any other governmental agency, entity or person. While investor losses in money market mutual funds have been rare, they are possible. In addition, the Funds will incur additional indirect expenses due to acquired fund fees and other costs to the extent they invest in shares of money market mutual funds.
Foreign Investment Risk - Compared with investing in the United States, investing in foreign markets involves a greater degree and variety of risk. Investors in international or foreign markets may face delayed settlements, currency controls and adverse economic developments as well as higher overall transaction costs. In addition, fluctuations in the U.S. dollar’s value versus other currencies may erode or reverse gains from investments denominated in foreign currencies or widen losses. Foreign governments may expropriate assets, impose capital or currency controls, impose punitive taxes, impose limits on ownership or nationalize a company or industry. Any of these actions could have a severe effect on security prices and impair a Fund’s ability to bring its capital or income back to the U.S. Exchange rate
Hussman Investment Trust Notes to Financial Statements (continued) |
December 31, 2011 (Unaudited) |
fluctuations also may impair an issuer’s ability to repay U.S. dollar denominated debt, thereby increasing credit risk of such debt. Finally, the value of foreign securities may be affected by incomplete, less frequent or inaccurate financial information about their issuers, social upheavals or political actions ranging from tax code changes to government collapse. Foreign companies may also receive less coverage than U.S. companies by market analysts and financial reporting standards or regulatory requirements comparable to those applicable to U.S. companies.
| 6. | FORWARD FOREIGN CURRENCY EXCHANGE CONTRACTS |
Hussman Strategic International Fund is subject to foreign currency exchange rate risk in the normal course of pursuing its investment objective. Hussman Strategic International Fund may enter into contracts for the purchase or sale of a specific foreign currency at a fixed price on a future date as a hedge or cross-hedge against either specific transactions or portfolio positions. The purpose of Hussman Strategic International Fund’s foreign currency hedging transactions is to reduce risk that the U.S. dollar value of the Fund’s securities denominated in foreign currency will decline in value due to changes in foreign currency exchange rates. All foreign currency exchange contracts are “marked-to-market” daily at the applicable translation rates resulting in unrealized gains or losses. Realized and unrealized gains or losses will be included in the Fund’s Statement of Assets and Liabilities and Statement of Operations. Risks may arise upon entering into these contracts from the potential inability of counterparties to meet the terms of their contracts and from unanticipated movements in the value of a foreign currency relative to the U.S. dollar. As of December 31, 2011, Hussman Strategic International Fund did not have any forward foreign currency exchange contracts outstanding.
Hussman Strategic Growth Fund has an unsecured bank line of credit in the amount of $10,000,000. Hussman Strategic Total Return Fund has an unsecured bank line of credit in the amount of $2,000,000. Borrowings under these arrangements bear interest at a rate determined by the lending bank at the time of borrowing. During the six months ended December 31, 2011, the Funds did not borrow under their respective lines of credit. Hussman Strategic International Fund does not currently have a bank line of credit.
Hussman Investment Trust Notes to Financial Statements (continued) |
December 31, 2011 (Unaudited) |
| 8. | CONTINGENCIES AND COMMITMENTS |
The Trust’s officers and Trustees are entitled to indemnification from the Funds for certain liabilities to which they may become subject in connection with the performance of their duties to the Funds. Additionally, in the normal course of business, the Funds enter into contracts that contain a variety of representations and warranties and which may provide general indemnifications. The Funds’ maximum exposure under these arrangements is unknown, as this would involve potential claims for indemnification for losses that may or may not be incurred in the future. However, based on experience, the Trust believes the risk of loss to be remote.
| 9. | RECENT ACCOUNTING PRONOUNCEMENT |
In May 2011, the Financial Accounting Standards Board (“FASB”) issued ASU No. 2011-04 “Amendments to Achieve Common Fair Value Measurement and Disclosure Requirements” in GAAP and the International Financial Reporting Standards (“IFRSs”). ASU No. 2011-04 amends FASB ASC Topic 820, Fair Value Measurements and Disclosures, to establish common requirements for measuring fair value and for disclosing information about fair value measurements in accordance with GAAP and IFRSs. ASU No. 2011-04 is effective for fiscal years beginning after December 15, 2011 and for interim periods within those fiscal years. Management is currently evaluating the impact these amendments may have on the Funds’ financial statements.
Several lawsuits have been filed relating to Hussman Strategic Growth Fund’s investment in Tribune Company common stock in connection with Tribune Company’s Chapter 11 bankruptcy proceeding. The lawsuits stem from a leveraged buyout transaction by which Tribune Company converted to a privately-held company in 2007. On November 1, 2010, the Trust and Hussman Strategic Growth Fund were named as defendants and putative members of the proposed defendant class of shareholders in an adversary proceeding brought by The Official Committee of Unsecured Creditors of Tribune Company in the U.S. Bankruptcy Court for the District of Delaware. On June 2, 2011, the Trust was named as a defendant and a putative defendant class member in a lawsuit filed by the indenture trustees of certain noteholders of Tribune Company in the U.S. District Court for the Southern District of Ohio. The same indenture trustees have filed similar lawsuits in other jurisdictions
Hussman Investment Trust Notes to Financial Statements (continued) |
December 31, 2011 (Unaudited) |
against other former Tribune Company shareholders. The plaintiffs in all these lawsuits seek to recover amounts paid to shareholders of Tribune Company in connection with the leveraged buyout, plus interest and attorneys’ fees and expenses.
The lawsuits allege no misconduct by the Trust or Hussman Strategic Growth Fund, and the Trust and the Fund intend to defend themselves vigorously in the lawsuits. If the lawsuits were to be decided or settled in a manner adverse to the Fund, the payment of such judgments or settlements could adversely affect the Fund’s net asset value per share. The adverse impact to the Fund is not expected to exceed materially the value of the proceeds received by the Fund in connection with the leveraged buyout, which was $29,432,814 (which, as of December 31, 2011, constituted approximately 0.5% of the Fund’s net assets).
The Funds are required to recognize in their financial statements the effects of all subsequent events that provide additional evidence about conditions that existed as of the date of the Statements of Assets and Liabilities. For non-recognized subsequent events that must be disclosed to keep the financial statements from being misleading, the Funds are required to disclose the nature of the event as well as an estimate of its financial effect, or a statement that such an estimate cannot be made. Management has evaluated subsequent events through the date of issuance of these financial statements and has noted no such events.
Hussman Investment Trust About Your Fund’s Expenses (Unaudited) |
|
We believe it is important for you to understand the impact of costs on your investment. As a shareholder of the Funds, you incur two types of costs: (1) transaction costs, which may include redemption fees; and (2) ongoing costs, including management fees and other Fund expenses. The following examples are intended to help you understand your ongoing costs (in dollars) of investing in the Funds and to compare these costs with the ongoing costs of investing in other mutual funds. A mutual fund’s ongoing costs are expressed as a percentage of its average net assets. This figure is known as the expense ratio.
The examples below are based on an investment of $1,000 made at the beginning of the period shown and held for the entire period (July 1, 2011 – December 31, 2011).
The table on the following page illustrates each Fund’s ongoing costs in two ways:
Actual fund return – This section helps you to estimate the actual expenses that you paid over the period. The “Ending Account Value” shown is derived from each Fund’s actual return, and the third column shows the dollar amount of operating expenses that would have been paid by an investor who started the period with $1,000 invested in that Fund. You may use the information here, together with the amount of your investment, to estimate the expenses that you paid over the period.
To do so, simply divide your account value by $1,000 (for example, an $8,600 account value divided by $1,000 = 8.6), and then multiply the result by the number given for the applicable Fund under the heading “Expenses Paid During Period.”
Hypothetical 5% return – This section is intended to help you compare each Fund’s ongoing costs with those of other mutual funds. It assumes that each Fund had an annual return of 5% before expenses during the period shown. In this case, because the return used is not each Fund’s actual return, the results do not illustrate the actual expenses associated with your investment. However, the example is useful in making comparisons because the SEC requires all mutual funds to provide an example of fund expenses based on a 5% annual return. You can assess each Fund’s ongoing costs by comparing this hypothetical example with the hypothetical examples that appear in shareholder reports of other mutual funds.
Note that expenses shown in the table are meant to highlight and help you compare ongoing costs only. The calculations assume no shares were bought or sold during the period. Your actual costs may have been higher or lower, depending on the amount of your investment and the timing of any purchases or redemptions.
Hussman Investment Trust About Your Fund’s Expenses (Unaudited) (continued) |
|
More information about each Fund’s expenses, including annual expense ratios, can be found elsewhere in this report. For additional information on operating expenses and other shareholder costs, please refer to each Fund’s prospectus.
| Hussman Strategic Growth Fund |
| Beginning Account Value July 1, 2011 | Ending Account Value December 31, 2011 | Expenses Paid During Period* |
| Based on Actual Fund Return | $1,000.00 | $1,017.30 | $5.29 |
| Based on Hypothetical 5% Annual Return (before expenses) | $1,000.00 | $1,019.96 | $5.30 |
| * | Expenses are equal to Hussman Strategic Growth Fund’s annualized expense ratio of 1.04% for the period, multiplied by the average account value over the period, multiplied by 184/365 (to reflect the one-half year period). |
| Hussman Strategic Total Return Fund |
| Beginning Account Value July 1, 2011 | Ending Account Value December 31, 2011 | Expenses Paid During Period* |
| Based on Actual Fund Return | $1,000.00 | $1,031.60 | $3.23 |
| Based on Hypothetical 5% Annual Return (before expenses) | $1,000.00 | $1,022.03 | $3.21 |
| * | Expenses are equal to Hussman Strategic Total Return Fund’s annualized expense ratio of 0.63% for the period, multiplied by the average account value over the period, multiplied by 184/365 (to reflect the one-half year period). |
| Hussman Strategic International Fund |
| Beginning Account Value July 1, 2011 | Ending Account Value December 31, 2011 | Expenses Paid During Period* |
| Based on Actual Fund Return | $1,000.00 | $942.50 | $9.79 |
| Based on Hypothetical 5% Annual Return (before expenses) | $1,000.00 | $1,015.12 | $10.16 |
| * | Expenses are equal to Hussman Strategic International Fund’s annualized expense ratio of 2.00% for the period, multiplied by the average account value over the period, multiplied by 184/365 (to reflect the one-half year period). |
Hussman Investment Trust Other Information (Unaudited) |
|
A description of the policies and procedures the Funds use to determine how to vote proxies relating to portfolio securities is available without charge upon request by calling toll-free 1-800-HUSSMAN (1-800-487-7626), or on the SEC’s website at http://www.sec.gov. Information regarding how the Funds voted proxies relating to portfolio securities during the most recent 12-month period ended June 30 is also available without charge upon request by calling toll-free 1-800-HUSSMAN, or on the SEC’s website at http://www.sec.gov.
The Trust files a complete listing of portfolio holdings for each Fund with the SEC as of the end of the first and third quarters of each fiscal year on Form N-Q. The filings are available upon request, by calling 1-800-HUSSMAN (1-800-487-7626). You may also obtain copies of these filings on the SEC’s website at http://www.sec.gov. The Trust’s Forms N-Q may also be reviewed and copied at the SEC’s Public Reference Room in Washington, DC, and information on the operation of the Public Reference Room may be obtained by calling 1-800-SEC-0330.
THIS PAGE INTENTIONALLY LEFT BLANK
THIS PAGE INTENTIONALLY LEFT BLANK
INVESTMENT ADVISER
Hussman Strategic Advisors, Inc.
5136 Dorsey Hall Drive
Ellicott City, Maryland 21042
www.hussmanfunds.com
1-800-HUSSMAN (1-800-487-7626)
ADMINISTRATOR/TRANSFER AGENT
Ultimus Fund Solutions, LLC
225 Pictoria Drive, Suite 450
Cincinnati, Ohio 45246
CUSTODIANS
US Bank NA
425 Walnut Street
Cincinnati, Ohio 45202
The Northern Trust Company
50 South LaSalle Street
Chicago, Illinois 60675
INDEPENDENT REGISTERED
PUBLIC ACCOUNTING FIRM
Ernst & Young LLP
1900 Scripps Center
312 Walnut Street
Cincinnati, Ohio 45202
LEGAL COUNSEL
Schulte Roth & Zabel LLP
919 Third Avenue
New York, New York 10022
This Semi-Annual Report is authorized for
distribution only if accompanied or preceded
by a current Prospectus of the Funds.
The registrant has not adopted procedures by which shareholders may recommend nominees to the registrant’s board of trustees.
(a) Based on their evaluation of the registrant’s disclosure controls and procedures (as defined in Rule 30a-3(c) under the Investment Company Act of 1940) as of a date within 90 days of the filing date of this report, the registrant’s principal executive officer and principal financial officer have concluded that such disclosure controls and procedures are reasonably designed and are operating effectively to ensure that material information relating to the registrant, including its consolidated subsidiaries, is made known to them by others within those entities, particularly during the period in which this report is being prepared, and that the information required in filings on Form N-CSR is recorded, processed, summarized, and reported on a timely basis.
(b) There were no changes in the registrant’s internal control over financial reporting (as defined in Rule 30a-3(d) under the Investment Company Act of 1940) that occurred during the second fiscal quarter of the period covered by this report that have materially affected, or are reasonably likely to materially affect, the registrant’s internal control over financial reporting.
File the exhibits listed below as part of this Form. Letter or number the exhibits in the sequence indicated.
(a)(1) Any code of ethics, or amendment thereto, that is the subject of the disclosure required by Item 2, to the extent that the registrant intends to satisfy the Item 2 requirements through filing of an exhibit: Not required
(a)(2) A separate certification for each principal executive officer and principal financial officer of the registrant as required by Rule 30a-2(a) under the Act (17 CFR 270.30a-2(a)): Attached hereto
(a)(3) Any written solicitation to purchase securities under Rule 23c-1 under the Act (17 CFR 270.23c-1) sent or given during the period covered by the report by or on behalf of the registrant to 10 or more persons: Not applicable
(b) Certifications required by Rule 30a-2(b) under the Act (17 CFR 270.30a-2(b)): Attached hereto
Pursuant to the requirements of the Securities Exchange Act of 1934 and the Investment Company Act of 1940, the registrant has duly caused this report to be signed on its behalf by the undersigned, thereunto duly authorized.
Pursuant to the requirements of the Securities Exchange Act of 1934 and the Investment Company Act of 1940, this report has been signed below by the following persons on behalf of the registrant and in the capacities and on the dates indicated.