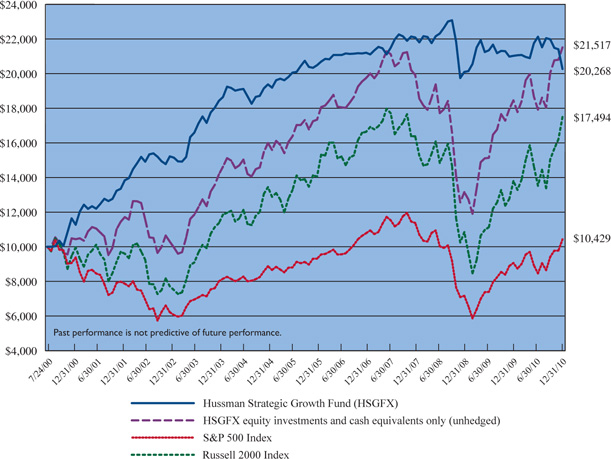
Comparison of the Change in Value of a $10,000 Investment in Hussman Strategic Growth Fund
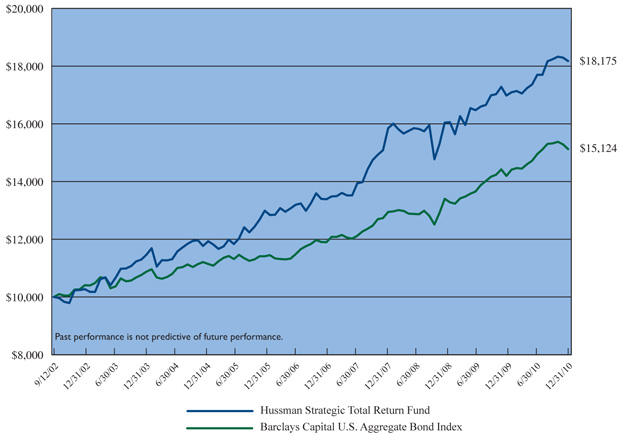
Comparison of the Change in Value of a $10,000 Investment in Hussman Strategic Total Return Fund
versus the Barclays Capital U.S. Aggregate Bond Index
For the year ended December 31, 2010, Hussman Strategic Growth Fund achieved a total return of -3.62%, compared with a total return of 15.06% for the Standard & Poor’s 500 Index. Meanwhile, Hussman Strategic Total Return Fund achieved a total return of 7.03%, compared with a gain of 6.54% for the Barclays Capital U.S. Aggregate Bond Index. While we successfully navigated bond market conditions in 2010, the stock market proved far more challenging in the final months of the year.
Strategic Growth Fund has achieved an average annual total return of 7.00% from its inception on July 24, 2000 through December 31, 2010, compared with an average annual return of 0.40% for the S&P 500 Index over the same period. An initial $10,000 investment in the Fund on July 24, 2000 would have grown to $20,268, compared with $10,429 for the same investment in the S&P 500 Index.
Strategic Total Return Fund has achieved an average annual total return of 7.46% from its inception on September 12, 2002 through December 31, 2010, compared with an average annual total return of 5.11% for the Barclays Capital U.S. Aggregate Bond Index. An initial $10,000 investment in the Fund on September 12, 2002 would have grown to $18,175, compared with $15,124 for the same investment in the Barclays Capital U.S. Aggregate Bond Index.
Since the inception of Strategic Growth Fund in 2000, the Fund has outperformed the S&P 500 Index by 6.60% (660 basis points) annually, on average. Since the inception of Strategic Total Return Fund in 2002, the Fund has outperformed the Barclays Capital U.S. Aggregate Bond Index by 2.35% (235 basis points) annually, on average.
As late as September 2010, Strategic Growth Fund had a 2010 year-to-date performance that was ahead of the S&P 500 Index. During the fourth quarter of 2010, the Federal Reserve embarked on an aggressive policy of “quantitative easing,” coupled with an Op-Ed article by Fed Chairman Ben Bernanke in the Washington Post, which all but endorsed speculation in stocks, on the theory that higher stock prices produce a “wealth effect” that increases economic output and earnings, which in turn justifies higher stock prices in a “virtuous circle.”
Despite extensive historical evidence against this proposition, Bernanke’s rhetoric and his repeated mention of the stock market provoked a surge in stocks associated with what Wall Street typically calls the “risk trade.” These included stocks in cyclical and commodity-related industries, small capitalization stocks, and companies with uneven revenue growth and unstable profit margins, which we typically characterize
|
Letter to Shareholders (continued) |
as “low quality.” At the same time, many conservative stocks fell out of favor. Ironically, the prices of Treasury bonds – the direct objects of the Fed’s purchases – also plunged. Though the individual stocks owned in Strategic Growth Fund actually slightly outperformed the S&P 500 Index for 2010 as a whole, a small portion of our hedge included the Nasdaq 100 and Russell 2000 Indices, and the late-year surge in those indices produced enough additional hedging losses to leave the Fund with a slightly negative return for 2010.
In pursuing the investment objective of Strategic Growth Fund, our goal is to outperform the S&P 500 Index over the complete market cycle (bull market peak to bull market peak, bear market trough to bear market trough), while having smaller periodic losses than a passive investment strategy. Consistent with this goal, and despite the most turbulent market environment since the Great Depression, Strategic Growth Fund remained ahead of the S&P 500 Index for the period from the 2007 market peak through December 31, 2010, and experienced substantially smaller interim losses during this period.
During the most recent market cycle, we continued to be very good at selecting stocks. For the three-year period ended December 31, 2010, the stocks held by Strategic Growth Fund appreciated by a cumulative 6.30%, versus an overall loss of -9.33% for the S&P 500 Index. In the interim, our stock selections experienced substantial losses during the 2008-2009 market plunge, albeit smaller than those experienced by the S&P 500 Index, but our hedging approach successfully reduced the impact of those losses. Still, taking the period since 2007 as a whole, we were not nearly as successful as we would have liked in achieving positive absolute returns from our ability to effectively identify stocks for investment.
Overall, this recent performance is a disappointment. Ultimately, successful investment requires positive absolute returns – losing less than the market is not enough. While hedging has helped us to largely avoid the impact of two spectacular market plunges during the past decade, the hedging component of our investment strategy has also been a source of periodic disappointment in recent years, and some explanation is in order.
Both day-to-day, and over the long-term, we pursue a straightforward investment discipline: find a set of daily actions that can be expected to produce results if they are followed consistently, and then follow them consistently. Having a well-tested investment discipline, evaluated by analyzing decades of historical data, is what gives us confidence in what we do. With regard to hedging, our approach is also fairly straightforward: accept market risk in proportion to the return that can be expected, on average, per unit of risk.
|
Letter to Shareholders (continued) |
Although we correctly foresaw the credit strains of 2008 and the likelihood of significant market losses, we did not foresee the speed and relentlessness of the decline, nor the policy responses of the Treasury and Federal Reserve, which I viewed as reckless and misguided. It quickly became clear that the behavior of the markets was “out of sample” from the standpoint of the post-1940 data that we had generally used as the basis for our hedging discipline. Indeed, on most measures, the market was acting in a way that was much more characteristic of other periods of credit crisis in the U.S. and internationally, including the Great Depression. We believed that it was a mistake to treat the downturn as a typical, run-of-the-mill post-war recession, but it was an enormous challenge to integrate the often contradictory implications of other crisis-related historical data in a satisfactory way.
Averaging the implications of post-war and post-credit crisis data proved to be inadequate, because the outcomes during comparable crises were so hostile, even if we gave them very little weight. For example, during the Depression era, by the time that the S&P 500 Index was priced to achieve 10-year expected returns of 10% annually (based on our standard valuation methodology), the stock market had already declined by half. But this was only the beginning – the market would continue to lose another two-thirds of its value before its final low. Even trend-following systems experienced false signals and deep losses. The threshold for accepting market risk during periods of credit crisis was typically much higher than in post-war data, requiring much more stringent valuation criteria. Even during lesser crises in the post-war period, stocks had typically established their lows at much cheaper valuations than existed at the 2009 trough. It was not enough to measure “risk” - the chance of rolling something other than 7, given that you know two six-sided dice are being thrown; we also needed to deal with “uncertainty” - the chance that the dice themselves might have actually eight, twelve, or twenty sides without our knowledge.
It was not until 2010 that we finally established an adequate and robust solution to these challenges, which we recently put into practice after extensive validation testing. I’ve described these methods at more length in my Weekly Market Comment on the Hussman Funds website. Briefly, rather than assuming that any single set of investment criteria is “best,” we evaluate scores of criteria over numerous historical data samples. If an observed set of market conditions would have resulted in strong average market returns regardless of which model or subset of data we examine, we conclude that significant exposure to market risk is warranted. In contrast, if a given set of conditions is associated with a wide range of possible outcomes depending on the subset of data we examine, we take a more cautious approach, even if the outcomes are positive on average. In this way, our exposure to market fluctuations can reflect the expected return, risk and uncertainty that has historically been associated with the investment
|
Letter to Shareholders (continued) |
conditions we observe at each point in time, without relying on any one particular view of the world. The implication for Strategic Growth Fund is that shareholders can expect a greater range of positive market exposures than we have accepted in past years, but also a tightly defensive stance in response to historically hostile market conditions.
It is tempting to believe that somehow Federal Reserve policy or other factors have changed the world in ways that make historical valuation relationships obsolete. I believe this is incorrect. These relationships have performed quite well over the past decade, and have correctly identified important valuation extremes. The challenges we faced as a result of having to consider Depression-era data had nothing to do with difficulties in valuing stocks. The basic fact remains that stocks are a claim on a long-term stream of cash flows that will be delivered to investors over time. Numerous factors can affect the day-to-day price that investors pay for stocks, but the historical record suggests that not even the wildest speculation materially changes the underlying stream of long-term cash flows they will deliver – it only changes the rate of return that investors can expect in the future, as the result of the price they pay.
The importance of careful investment valuation is easily ignored during periods of speculation, but as the great value investor Benjamin Graham wrote decades ago:
“Speculators often prosper through ignorance; it is a cliché that in a roaring bull market knowledge is superfluous and experience is a handicap. But the typical experience of the speculator is one of temporary profit and ultimate loss.”
In short, the hedging challenges we’ve faced in recent years resulted from a profound economic crisis that forced us to expand the range of historical data that we needed to contemplate. I have no faith that the underlying credit and solvency problems in the U.S. economy have been addressed, but changes in accounting rules coupled with large government deficits and extraordinary monetary interventions have successfully kicked the can down the road, allowing some amount of economic recovery. While I believe that the lessons from our research will be enormously useful during future periods of market turbulence, they unfortunately don’t give us a time machine to do anything differently in 2008 or 2009, nor would our investment decisions have been much different since about April 2010 than they have been in practice. Despite the challenges posed by the recent credit crisis, I remain convinced that the most reliable source of investment returns is to follow a consistent investment discipline that has stood the exhaustive test of history.
The table below presents the total returns for Strategic Growth Fund and S&P 500 Index since the inception of the Fund. In order to assist in attributing the effects of stock selection and hedging on the Fund, the table separately presents the returns of the stock positions and cash equivalents held by the Fund (after expenses), without the impact of hedging transactions.
|
Letter to Shareholders (continued) |
| | | |
| 2000* | 16.40% | 4.86% | -9.37% |
| 2001 | 14.67% | 9.13% | -11.89% |
| 2002 | 14.02% | -10.03% | -22.10% |
| 2003 | 21.08% | 37.68% | 28.68% |
| 2004 | 5.16% | 12.81% | 10.88% |
| 2005 | 5.71% | 8.43% | 4.91% |
| 2006 | 3.51% | 13.88% | 15.79% |
| 2007 | 4.16% | 0.89% | 5.49% |
| 2008 | -9.02% | -33.97% | -37.00% |
| 2009 | 4.63% | 38.12% | 26.46% |
| 2010 | -3.62% | 16.57% | 15.06% |
Since Inception (Average annual return) | 7.00% | 7.62% | 0.40% |
| * | July 24, 2000 – December 31, 2000, not annualized |
Given the weak total return of the S&P 500 Index since the inception of the Fund, and the general tendency of the Fund to hedge its exposure to market fluctuations during this generally unrewarding period, the performance of the stocks held by the Fund has been an essential source of overall investment performance. Since inception, the average annualized return of the stocks held by the Fund has been 7.62% after expenses. The primary effect of the Fund’s hedging has been to significantly reduce volatility and drawdown risk over time.
| Strategic Total Return Fund |
For the year ended December 31, 2010, Strategic Total Return Fund achieved a total return of 7.03%, compared with a total return of 6.54% for the Barclays Capital U.S. Aggregate Bond Index.
The Fund’s exposure to interest rate fluctuations was generally modest during 2010, typically less than 2 years. This means that a 100 basis point change in interest rates could be expected to impact the Fund’s value by less than 2%. While the Fund briefly increased its exposure to interest rate fluctuations to a duration of about 4 years in response to the spike in Treasury yields that followed the Federal Reserve’s policy of quantitative easing, we quickly cut the Fund’s duration back below 2 years
|
Letter to Shareholders (continued) |
on the nearly immediate upward pressure on commodity prices and global inflation measures that followed.
During 2010, Strategic Total Return Fund also held an allocation to precious metals shares generally ranging between 1% and 10% of assets. The Fund’s modest and variable exposure to precious metals shares has been an important contributor to its performance, but was also responsible for much of the Fund’s day-to-day volatility at times when the Fund was invested in this sector.
The table below presents the total returns for Strategic Total Return Fund since inception.
| | Barclays Capital U.S. Aggregate Bond Index |
| 2002* | 2.30% | 2.56% |
| 2003 | 9.80% | 4.10% |
| 2004 | 6.50% | 4.34% |
| 2005 | 6.00% | 2.43% |
| 2006 | 5.66% | 4.33% |
| 2007 | 12.61% | 6.97% |
| 2008 | 6.34% | 5.24% |
| 2009 | 5.84% | 5.93% |
| 2010 | 7.03% | 6.54% |
Since Inception (Average Annual Returns) | 7.46% | 5.11% |
| * | September 12, 2002 – December 31, 2002, not annualized |
| Portfolio Composition and Performance Drivers |
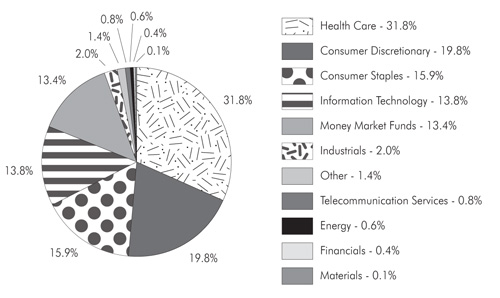
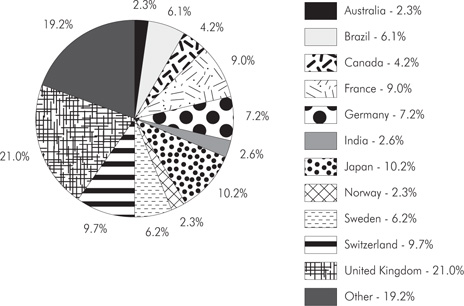
As of December 31, 2010, Strategic Growth Fund had net assets of $6,273,095,403, and held 120 stocks in a wide variety of industries. The largest sector holdings as a percent of net assets were health care (37.2%), consumer discretionary (23.2%), consumer staples (18.6%), and information technology (16.1%). The smallest industry weights relative to the S&P 500 Index were in industrials (2.4%), telecommunications (0.9%), energy (0.7%), financials (0.5%) and materials (0.1%).
The Fund’s holdings of individual stocks as of December 31, 2010 accounted for $6,256,722,934, or 99.7% of net assets. Against these stock positions, the Fund also held 39,000 option combinations (long put option, short call option) on the S&P
|
Letter to Shareholders (continued) |
500 Index, 8,000 option combinations on the Russell 2000 Index and 3,000 option combinations on the Nasdaq 100 Index. Each option combination behaves as a short sale on the underlying index, with a notional value of $100 times the index value. On December 31, 2010, the S&P 500 Index closed at 1,257.64, while the Russell 2000 Index and the Nasdaq 100 Index closed at 783.65 and 2,217.86, respectively. The Fund’s total hedge therefore represented a short position of $6,197,074,000, thereby hedging 99.0% of the dollar value of the Fund’s long investment positions in individual stocks.
Though the performance of Strategic Growth Fund’s diversified portfolio cannot be attributed to any narrow group of stocks, the following holdings achieved gains in excess of $35 million during the semi-annual period ended December 31, 2010: Amazon, Endo Pharmaceutical, Panera Bread, Joy Global, Network Appliances, Checkpoint Software, Bucyrus International, Walgreens, and Illumina. Holdings with losses in excess of $5 million during this same period were Cisco, Intuitive Surgical, and Aeropostale.
Strategic Growth Fund continues to be very manageable, with substantial flexibility to respond to changing market conditions, low market impact of trading, commission costs well below estimated industry averages, and continued reductions in the Fund’s expense ratio. The Fund’s positions in individual stocks generally represent less than a single day’s average trading volume in those securities. Even during the volatile and often low-volume trading of the past year, the Fund’s average market impact of trading (the difference between the last sale at the time of order placement and the actual price at which the Fund’s stock transactions are executed) has been a fraction of 1%, and the Fund’s average commission is currently 1.3 cents per share, compared with industry averages estimated to be several times that amount. Finally, the Fund’s expense ratio during its fiscal year ended June 30, 2010 was 1.05%, and has since declined further due to breakpoints in management fees and economies of scale in other Fund expenses. According to recent statistics, the average expense ratio among the limited group of mutual funds pursuing similar strategies and classified as “long-short” by Morningstar is 2.03%.
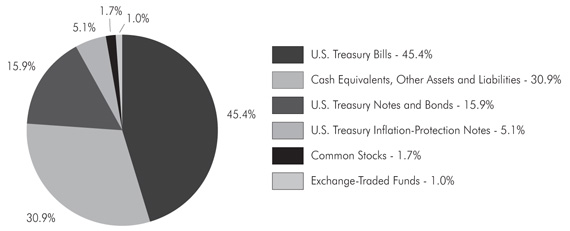
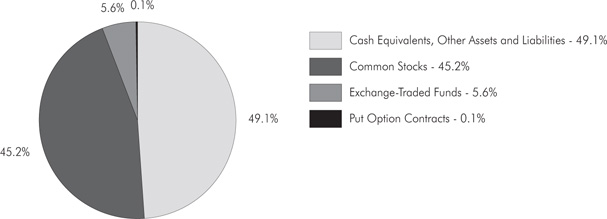
As of December 31, 2010, Strategic Total Return Fund had net assets of $2,426,035,797. Short-term Treasury bills accounted for 45.4% of the Fund’s net assets, with Treasury notes, Treasury bonds, Treasury Inflation Protected Securities (TIPS) and money market funds representing an additional 51.8% of the Fund’s net assets. Exchange-traded funds, precious metals shares and utility shares accounted for 1.0%, 1.4% and 0.3% of net assets, respectively. The Fund carried a duration of less than 2 years (meaning that a 1% change in interest rates would be expected to impact the Fund’s asset value by less than 2% on the basis of bond price fluctuations).
|
Letter to Shareholders (continued) |
In Strategic Total Return Fund, during the semi-annual period ended December 31, 2010, portfolio gains in excess of $5 million were achieved in U.S. Treasury Note (3.375%, due 11/15/2019), U.S. Treasury Note (3.625%, due 8/15/2019), Agnico-Eagle Mines, and Cia De Minas Buena - ADR . Holdings with losses in excess of $1 million during this same period were U.S. Treasury Bond (3.875%, due 8/15/2040), U.S. Treasury Note (4.25%, due 11/15/2040), U.S. Treasury Bond (4.25%, due 5/15/2039), and U.S. Treasury Note (2.625%, due 11/15/2020).
For the third time in a decade, the Federal Reserve has embarked on a policy that addresses structural economic problems by provoking speculation in asset prices. The first two attempts were ultimately followed by stock market declines greater than 50% each. As we enter 2011, the stock market remains in what we view as an already strenuously overvalued advance, which has driven our estimates for S&P 500 Index total returns to less than 3.2% annually over the coming decade. My expectation is that this attempt to create what the economist Ludwig von Mises called “illusory prosperity” will end no better than it has in the past. As von Mises wrote in 1931, before the worst portion of the Great Depression:
“Credit expansion cannot increase the supply of real goods. It merely brings about a rearrangement. It diverts capital investment away from the course prescribed by the state of economic wealth and market conditions. It causes production to pursue paths which it would not follow unless the economy were to acquire an increase in material goods. As a result, the upswing lacks a solid base. It is not a real prosperity. It is illusory prosperity. It did not develop from an increase in economic wealth [i.e. the accumulation of savings made available for productive investment]. Rather, it arose because the credit expansion created the illusion of such an increase. Sooner or later, it must become apparent that this economic situation is built on sand.”
None of this, however, implies that a severe market downturn should be expected over the near term. Though it is not possible to rule out a substantial decline in market valuations, our main reason for defensiveness as we enter 2011 is that the market environment is characterized by a syndrome of elevated valuations, overextended price trends, overbullish investor sentiment, and rising interest rates. This combination of conditions typically does not persist for more than a few months, but when the complete set has been observed, the stock market has often been vulnerable to abrupt losses that can erase weeks or months of gains in a few trading sessions.
|
Letter to Shareholders (continued) |
Over the past decade, I’ve typically written in our annual reports that our investment performance has been “as intended,” describing our record of outperforming the market with restrained risk as “neither extraordinary nor disappointing.” However, this characterization is not accurate for the period since the 2007 market peak. By nearly every measure, this recent period has been both extraordinary and disappointing for the economy, the stock market, and occasionally, for our own performance. Though we experienced far less volatility than the major stock market indices, we would have expected to also achieve positive absolute returns over this period, regardless of the overall decline in the stock market.
From the standpoint of the research we have recently implemented, I know where I could have done things differently, particularly in late 2008 and 2009. But given the exceptional uncertainties we faced at the time, I chose first to do no harm. The deepest pullback experienced by Strategic Growth Fund since its inception has been a 21.45% loss, versus a 55.25% loss in the S&P 500 Index. To appreciate the relative difference between the two, note that a 27.31% gain is required to recover a 21.45% loss, while a 123.46% gain is required to recover a 55.25% loss. This underscores the fact that risk management tends to be generous. Despite the possibility of missed returns, avoiding market risk during historically unfavorable market conditions need not be costly to long-term performance, provided that deep periodic losses are largely avoided.
We have emerged from this period with an expanded set of analytical tools that I expect to be useful regardless of future market conditions, and which I believe will extend our long-term record of outperforming the market over full market cycles with restrained volatility. Importantly, we also expect a beneficial impact on our analysis of bonds, precious metals, and other securities that we hold in Strategic Total Return Fund.
In recent quarters, the U.S. economy has enjoyed a sluggish recovery, with positive but weak employment growth, and strong corporate profits benefiting from government deficit spending coupled with labor substitution from the U.S. to China. Both for the labor market and for corporate profits, recent inflation pressure in China is an important development because it raises the “real” exchange rate for Chinese goods and labor services. While we would consider a substantial revaluation of the Chinese yuan to be favorable for U.S. employment prospects, it would also tend to reduce the record share of corporate profits-to-GDP that U.S. corporations temporarily enjoy. Careful attention to profit margins is as important as ever, and I remain concerned that analysts who value stocks based on a simplistic multiple of
|
Letter to Shareholders (continued) |
“forward operating earnings” are ignoring the strong historical tendency for elevated profit margins to retreat.
With regard to credit conditions in the U.S. economy, I disagree with the view that the extraordinary government interventions of recent years have corrected the underlying imbalances. In hindsight, the advance from the 2009 market low immediately followed a change in accounting rules by the FASB, which eliminated the need for financial companies to report their assets at market value, and instead allowed “substantial discretion” in the valuation of those assets. This effectively relieved banks of the regulatory burden of holding adequate capital. At the same time, the U.S. Federal Reserve purchased nearly $1.5 trillion of mortgage securities issued by Fannie Mae and Freddie Mac, both of which were insolvent and in conservatorship. I continue to believe that these purchases were not authorized under Section 14.1 of the Federal Reserve Act (which applies to open market purchases, but is restricted to bona-fide government agencies, Treasury debt and fully-guaranteed foreign government debt), nor under Section 13.3 (which applies to “discounting” of short-term obligations under the Act). Though the collective effect has been to obscure accounting transparency and to shift private sector losses to the public sector, none of this cures the insolvent debt. My impression is that by placing troubled debt out of sight, it has been possible for the investing public to focus on easy money and the temporarily high corporate profit margins that result from coupling mass layoffs with enormous government outlays. But I do not consider this situation to be permanent.
We already observe strong pressure in the U.S. and internationally to reduce fiscal deficits, while states, municipalities, and peripheral European countries that cannot print their own currencies are facing even more severe budget austerity. With the Federal Reserve already committed to expanding the U.S. monetary base to a record 16 cents of currency and reserves for every dollar of nominal GDP, monetary policy also appears to be approaching its unstable limits. It is quite true that by holding short-term interest rates near zero, bank profits can be enhanced by allowing them a cheap source of funding, but this is at the expense of individuals on fixed incomes who rely on interest from deposits, and accept lower yields in return for principal safety. It also risks creating a “zombie” banking system like that of Japan, where the primary activity of banks for nearly a decade was recapitalizing their balance sheets instead of making productive loans.
Meanwhile, the bailout of Fannie Mae and Freddie Mac has already cost more than five times the annual budget of the National Institutes of Health, which is the major source of funding for basic research in diseases such as cancer, Alzheimer’s, Parkinson’s, and autism. I strongly believe that by avoiding the continuing need to restructure mortgage debt, bank liabilities, and sovereign debt, the welfare of the
|
Letter to Shareholders (continued) |
general public has been pushed beneath that of bondholders who sought higher yields, knowingly accepted greater risk, financed bad loans, and now characterize any risk of loss on their part with words like “failure” and “meltdown.” Unfortunately, most of this debt is of short and intermediate maturity, requiring it to be repeatedly refinanced, and making it virtually impossible to inflate away because interest rates can be reset at each point of refunding. All of this may end without further turmoil, but I doubt it.
Nevertheless, it is important to emphasize that these are background considerations, and as we’ve seen over the past two years, intermediate-term risks do not persistently drive short-term market behavior. Our defensive stance as we enter 2011 is based on a syndrome of observable factors (elevated valuations, overextended price trends, overbullish sentiment, and rising interest rates) that has historically produced a negative return/risk profile, on average. As some of these conditions clear, we expect periodic opportunities to establish at least moderate exposure to market fluctuations, even against an economic backdrop that warrants continued concern.
The experience of the past decade emphasizes that speculators should not declare victory at halftime. Still, I expect that as we move forward, Strategic Growth Fund will exercise greater latitude in accepting moderate, if temporary, exposure to market fluctuations more frequently than we have in recent years, even if valuations do not normalize for some time.
With interest rates moving sharply higher from their recent lows, bond investors have increasingly recognized that the long bull market in bonds since the 1980’s may be behind us. With regard to our investment approach in Strategic Total Return, it is important to recognize that we tend to shift the Fund’s investment stance in response to shifts in market conditions a few times a year, on average. The strategy of Strategic Total Return has never relied much on the existence of a bull market in bonds (indeed, the Fund’s average bond market duration has rarely exceeded 4 years since the inception of the Fund, and has typically been limited to just 1-2 years). Since bond yields rarely advance in a straight line, I expect that we will continue to observe opportunities to shift the Fund’s investment positions a few times annually. Indeed, from an investment standpoint, higher average yields present much better periodic investment opportunities than low average yields do, again provided that yields are not rising in a straight line.
As always, we continue to focus on outperforming our investment benchmarks over the complete market cycle, with smaller periodic losses than a passive investment strategy. Despite the challenges of the recent market cycle, we are confident that adhering to a well-tested investment discipline is the best way to pursue strong absolute
|
Letter to Shareholders (continued) |
returns and long-term investment results. The ability to systematically vary the Funds’ investment exposure in response to changes in market conditions will be essential. I remain watchful of risk, and despite many continued concerns, I am excited about the opportunities ahead.
Sincerely,
John P. Hussman, Ph.D.
Past performance is not predictive of future performance. Investment results and principal value will fluctuate so that shares of the Funds, when redeemed, may be worth more or less than their original cost. Current performance may be higher or lower than the performance data quoted. Weekly updates regarding market conditions and investment strategy, as well as special reports, analysis, and performance data current to the most recent month end, are available at the Hussman Funds website www.hussmanfunds.com.
An investor should consider the investment objectives, risks, charges and expenses of the Funds carefully before investing. The Funds’ prospectuses contain this and other important information. To obtain a copy of the Hussman Funds’ prospectuses please visit our website at www.hussmanfunds.com or call 1-800-487-7626 and a copy will be sent to you free of charge. Please read the prospectus carefully before you invest. The Hussman Funds are distributed by Ultimus Fund Distributors, LLC.
The Letter to Shareholders seeks to describe some of the adviser’s current opinions and views of the financial markets. Although the adviser believes it has a reasonable basis for any opinions or views expressed, actual results may differ, sometimes significantly so, from those expected or expressed. The securities held by the Funds that are discussed in the Letter to Shareholders were held during the period covered by this Report. They do not comprise the entire investment portfolios of the Funds, may be sold at any time and may no longer be held by the Funds. The opinions of the Funds’ adviser with respect to those securities may change at any time.
Hussman Strategic Growth Fund Portfolio Information |
December 31, 2010 (Unaudited) |
| Sector Allocation (% of Total Investments and Money Market Funds) |
Hussman Strategic Total Return Fund Portfolio Information |
December 31, 2010 (Unaudited) |
| Asset Allocation (% of Net Assets) |
Hussman Strategic Growth Fund Schedule of Investments |
December 31, 2010 (Unaudited) |
| | | | | | |
| Consumer Discretionary — 23.2% | | | | | | |
| Hotels, Restaurants & Leisure — 5.8% | | | | | | |
Cheesecake Factory, Inc. (The) (a) | | | 2,292,000 | | | $ | 70,272,720 | |
Chipotle Mexican Grill, Inc. - Class A (a) | | | 250,000 | | | | 53,165,000 | |
McDonald's Corp. | | | 500,000 | | | | 38,380,000 | |
Panera Bread Co. - Class A (a) | | | 1,250,000 | | | | 126,512,500 | |
PF Chang's China Bistro, Inc. | | | 317,000 | | | | 15,361,820 | |
Royal Caribbean Cruises Ltd. (a) | | | 750,000 | | | | 35,250,000 | |
Starbucks Corp. | | | 750,000 | | | | 24,097,500 | |
| | | | | | | | 363,039,540 | |
| Internet & Catalog Retail — 0.3% | | | | | | | | |
Netflix, Inc. (a) | | | 100,000 | | | | 17,570,000 | |
| | | | | | | | | |
| Media — 1.9% | | | | | | | | |
ComCast Corp. - Class A | | | 1,050,000 | | | | 23,068,500 | |
Gannett Co., Inc. | | | 300,000 | | | | 4,527,000 | |
McClatchy Co. (The) - Class A (a) | | | 143,000 | | | | 667,810 | |
McGraw-Hill Cos., Inc. (The) | | | 2,500,000 | | | | 91,025,000 | |
| | | | | | | | 119,288,310 | |
| Multiline Retail — 3.7% | | | | | | | | |
Big Lots, Inc. (a) | | | 1,000,000 | | | | 30,460,000 | |
Dollar Tree, Inc. (a) | | | 910,000 | | | | 51,032,800 | |
Family Dollar Stores, Inc. | | | 750,000 | | | | 37,282,500 | |
Kohl's Corp. (a) | | | 1,000,000 | | | | 54,340,000 | |
Target Corp. | | | 1,000,000 | | | | 60,130,000 | |
| | | | | | | | 233,245,300 | |
| Specialty Retail — 9.6% | | | | | | | | |
Aéropostale, Inc. (a) | | | 5,250,000 | | | | 129,360,000 | |
American Eagle Outfitters, Inc. | | | 4,770,000 | | | | 69,785,100 | |
AutoZone, Inc. (a) | | | 100,000 | | | | 27,259,000 | |
Bed Bath & Beyond, Inc. (a) | | | 2,500,000 | | | | 122,875,000 | |
Best Buy Co., Inc. | | | 1,500,000 | | | | 51,435,000 | |
GameStop Corp. - Class A (a) | | | 800,000 | | | | 18,304,000 | |
Home Depot, Inc. (The) | | | 1,100,000 | | | | 38,566,000 | |
RadioShack Corp. | | | 1,000,000 | | | | 18,490,000 | |
Ross Stores, Inc. | | | 450,000 | | | | 28,462,500 | |
TJX Cos., Inc. (The) | | | 2,250,000 | | | | 99,877,500 | |
| | | | | | | | 604,414,100 | |
Hussman Strategic Growth Fund Schedule of Investments (continued) |
December 31, 2010 (Unaudited) |
COMMON STOCKS — 99.7% (continued) | | | | | | |
| Consumer Discretionary — 23.2% (continued) | | | | | | |
| Textiles, Apparel & Luxury Goods — 1.9% | | | | | | |
Coach, Inc. | | | 400,000 | | | $ | 22,124,000 | |
Deckers Outdoor Corp. (a) | | | 250,000 | | | | 19,935,000 | |
NIKE, Inc. - Class B | | | 600,000 | | | | 51,252,000 | |
Under Armour, Inc. - Class A (a) | | | 445,000 | | | | 24,403,800 | |
| | | | | | | | 117,714,800 | |
| Consumer Staples — 18.6% | | | | | | | | |
| Beverages — 2.6% | | | | | | | | |
Coca-Cola Co. (The) | | | 500,000 | | | | 32,885,000 | |
PepsiCo, Inc. | | | 2,000,000 | | | | 130,660,000 | |
| | | | | | | | 163,545,000 | |
| Food & Staples Retailing — 5.6% | | | | | | | | |
BJ's Wholesale Club, Inc. (a) | | | 2,335,000 | | | | 111,846,500 | |
CVS Caremark Corp. | | | 750,000 | | | | 26,077,500 | |
Sysco Corp. | | | 1,965,000 | | | | 57,771,000 | |
Walgreen Co. | | | 2,245,000 | | | | 87,465,200 | |
Whole Foods Market, Inc. (a) | | | 1,344,000 | | | | 67,992,960 | |
| | | | | | | | 351,153,160 | |
| Food Products — 4.6% | | | | | | | | |
Campbell Soup Co. | | | 1,055,000 | | | | 36,661,250 | |
Dean Foods Co. (a) | | | 1,155,000 | | | | 10,210,200 | |
General Mills, Inc. | | | 3,200,000 | | | | 113,888,000 | |
H.J. Heinz Co. | | | 600,000 | | | | 29,676,000 | |
J.M. Smucker Co. (The) | | | 250,000 | | | | 16,412,500 | |
Kellogg Co. | | | 1,250,000 | | | | 63,850,000 | |
Sara Lee Corp. | | | 1,000,000 | | | | 17,510,000 | |
| | | | | | | | 288,207,950 | |
| Household Products — 5.8% | | | | | | | | |
Clorox Co. (The) | | | 1,973,000 | | | | 124,851,440 | |
Colgate-Palmolive Co. | | | 1,750,000 | | | | 140,647,500 | |
Kimberly-Clark Corp. | | | 1,250,000 | | | | 78,800,000 | |
Procter & Gamble Co. (The) | | | 300,000 | | | | 19,299,000 | |
| | | | | | | | 363,597,940 | |
| Energy — 0.7% | | | | | | | | |
| Energy Equipment & Services — 0.7% | | | | | | | | |
Dresser-Rand Group, Inc. (a) | | | 650,000 | | | | 27,683,500 | |
Rowan Cos., Inc. (a) | | | 500,000 | | | | 17,455,000 | |
| | | | | | | | 45,138,500 | |
Hussman Strategic Growth Fund Schedule of Investments (continued) |
December 31, 2010 (Unaudited) |
COMMON STOCKS — 99.7% (continued) | | | | | | |
| Financials — 0.5% | | | | | | |
| Insurance — 0.5% | | | | | | |
Berkshire Hathaway, Inc. - Class B (a) | | | 375,000 | | | $ | 30,041,250 | |
| | | | | | | | | |
| Health Care — 37.2% | | | | | | | | |
| Biotechnology — 2.9% | | | | | | | | |
Amgen, Inc. (a) | | | 1,250,000 | | | | 68,625,000 | |
Biogen Idec, Inc. (a) | | | 1,500,000 | | | | 100,575,000 | |
Gilead Sciences, Inc. (a) | | | 400,000 | | | | 14,496,000 | |
| | | | | | | | 183,696,000 | |
| Health Care Equipment & Supplies — 7.5% | | | | | | | | |
Alcon, Inc. | | | 250,000 | | | | 40,850,000 | |
Align Technology, Inc. (a) | | | 1,337,000 | | | | 26,124,980 | |
ArthroCare Corp. (a) | | | 975,000 | | | | 30,283,500 | |
Becton, Dickinson and Co. | | | 484,000 | | | | 40,907,680 | |
C.R. Bard, Inc. | | | 760,000 | | | | 69,745,200 | |
IDEXX Laboratories, Inc. (a) | | | 386,000 | | | | 26,718,920 | |
Integra LifeSciences Holdings Corp. (a) | | | 1,001,000 | | | | 47,347,300 | |
Intuitive Surgical, Inc. (a) | | | 150,000 | | | | 38,662,500 | |
Medtronic, Inc. | | | 1,000,000 | | | | 37,090,000 | |
ResMed, Inc. (a) | | | 500,000 | | | | 17,320,000 | |
Stryker Corp. | | | 1,250,000 | | | | 67,125,000 | |
Varian Medical Systems, Inc. (a) | | | 273,000 | | | | 18,913,440 | |
Zimmer Holdings, Inc. (a) | | | 156,000 | | | | 8,374,080 | |
| | | | | | | | 469,462,600 | |
| Health Care Providers & Services — 8.2% | | | | | | | | |
Amedysis, Inc. (a) | | | 305,000 | | | | 10,217,500 | |
Humana, Inc. (a) | | | 3,000,000 | | | | 164,220,000 | |
Laboratory Corp. of America Holdings (a) | | | 685,000 | | | | 60,225,200 | |
LifePoint Hospitals, Inc. (a) | | | 327,000 | | | | 12,017,250 | |
Patterson Cos., Inc. | | | 1,000,000 | | | | 30,630,000 | |
Quest Diagnostics, Inc. | | | 608,000 | | | | 32,813,760 | |
UnitedHealth Group, Inc. | | | 2,500,000 | | | | 90,275,000 | |
WellPoint, Inc. (a) | | | 2,000,000 | | | | 113,720,000 | |
| | | | | | | | 514,118,710 | |
| Life Sciences Tools & Services — 6.1% | | | | | | | | |
Illumina, Inc. (a) | | | 1,534,000 | | | | 97,163,560 | |
Life Technologies Corp. (a) | | | 3,026,000 | | | | 167,943,000 | |
Pharmaceutical Product Development, Inc. | | | 720,000 | | | | 19,540,800 | |
Waters Corp. (a) | | | 1,240,000 | | | | 96,360,400 | |
| | | | | | | | 381,007,760 | |
Hussman Strategic Growth Fund Schedule of Investments (continued) |
December 31, 2010 (Unaudited) |
COMMON STOCKS — 99.7% (continued) | | | | | | |
| Health Care — 37.2% (continued) | | | | | | |
| Pharmaceuticals — 12.5% | | | | | | |
Abbott Laboratories | | | 1,500,000 | | | $ | 71,865,000 | |
AstraZeneca plc - ADR | | | 3,750,000 | | | | 173,212,500 | |
Bristol-Myers Squibb Co. | | | 3,500,000 | | | | 92,680,000 | |
Endo Pharmaceuticals Holdings, Inc. (a) | | | 2,555,000 | | | | 91,239,050 | |
Forest Laboratories, Inc. (a) | | | 150,000 | | | | 4,797,000 | |
Impax Laboratories, Inc. (a) | | | 282,000 | | | | 5,671,020 | |
Johnson & Johnson | | | 1,250,000 | | | | 77,312,500 | |
Merck & Co., Inc. | | | 2,500,000 | | | | 90,100,000 | |
Novartis AG - ADR | | | 635,000 | | | | 37,433,250 | |
Pfizer, Inc. | | | 5,000,000 | | | | 87,550,000 | |
Shire plc - ADR | | | 183,000 | | | | 13,245,540 | |
Valeant Pharmaceuticals International, Inc. | | | 1,500,000 | | | | 42,435,000 | |
| | | | | | | | 787,540,860 | |
| Industrials — 2.4% | | | | | | | | |
| Construction & Engineering — 0.1% | | | | | | | | |
KBR, Inc. | | | 197,000 | | | | 6,002,590 | |
| | | | | | | | | |
| Machinery — 2.3% | | | | | | | | |
Bucyrus International, Inc. | | | 642,000 | | | | 57,394,800 | |
Joy Global, Inc. | | | 800,000 | | | | 69,400,000 | |
Timken Co. | | | 350,000 | | | | 16,705,500 | |
| | | | | | | | 143,500,300 | |
| Information Technology — 16.1% | | | | | | | | |
| Communications Equipment — 1.4% | | | | | | | | |
Cisco Systems, Inc. (a) | | | 4,000,000 | | | | 80,920,000 | |
InterDigital, Inc. (a) | | | 132,000 | | | | 5,496,480 | |
| | | | | | | | 86,416,480 | |
| Computers & Peripherals — 4.8% | | | | | | | | |
Dell, Inc. (a) | | | 7,000,000 | | | | 94,850,000 | |
NetApp, Inc. (a) | | | 1,250,000 | | | | 68,700,000 | |
QLogic Corp. (a) | | | 2,559,000 | | | | 43,554,180 | |
Synaptics, Inc. (a) | | | 3,135,000 | | | | 92,106,300 | |
| | | | | | | | 299,210,480 | |
| Electronic Equipment & Instruments — 0.0% | | | | | | | | |
FUJIFILM Holdings Corp. - ADR | | | 49,400 | | | | 1,765,556 | |
Sanmina-SCI Corp. (a) | | | 12,000 | | | | 137,760 | |
| | | | | | | | 1,903,316 | |
Hussman Strategic Growth Fund Schedule of Investments (continued) |
December 31, 2010 (Unaudited) |
COMMON STOCKS — 99.7% (continued) | | | | | | |
| Information Technology — 16.1% (continued) | | | | | | |
| Internet Software & Services — 1.4% | | | | | | |
eBay, Inc. (a) | | | 2,000,000 | | | $ | 55,660,000 | |
VistaPrint N.V. (a) | | | 691,000 | | | | 31,786,000 | |
| | | | | | | | 87,446,000 | |
| IT Services — 2.1% | | | | | | | | |
Amdocs Ltd. (a) | | | 1,000,000 | | | | 27,470,000 | |
Cognizant Technology Solutions Corp. - Class A (a) | | | 500,000 | | | | 36,645,000 | |
Computer Sciences Corp. | | | 899,000 | | | | 44,590,400 | |
Sapient Corp. | | | 2,000,000 | | | | 24,200,000 | |
| | | | | | | | 132,905,400 | |
| Semiconductors & Semiconductor Equipment — 2.1% | | | | | | | | |
Altera Corp. | | | 1,000,000 | | | | 35,580,000 | |
SunPower Corp. - Class A (a) | | | 1,400,000 | | | | 17,962,000 | |
Xilinx, Inc. | | | 2,790,000 | | | | 80,854,200 | |
| | | | | | | | 134,396,200 | |
| Software — 4.3% | | | | | | | | |
Check Point Software Technologies Ltd. (a) | | | 1,500,000 | | | | 69,390,000 | |
FactSet Research Systems, Inc. | | | 160,000 | | | | 15,001,600 | |
Microsoft Corp. | | | 5,500,000 | | | | 153,560,000 | |
Oracle Corp. | | | 1,000,000 | | | | 31,300,000 | |
| | | | | | | | 269,251,600 | |
| Materials — 0.1% | | | | | | | | |
| Chemicals — 0.1% | | | | | | | | |
BASF SE - ADR | | | 76,800 | | | | 6,140,928 | |
| | | | | | | | | |
| Telecommunication Services — 0.9% | | | | | | | | |
| Diversified Telecommunication Services — 0.6% | | | | | | | | |
Verizon Communications, Inc. | | | 1,122,000 | | | | 40,145,160 | |
| | | | | | | | | |
| Wireless Telecommunication Services — 0.3% | | | | | | | | |
China Mobile Ltd. - ADR | | | 335,000 | | | | 16,622,700 | |
| | | | | | | | | |
Total Common Stocks (Cost $5,451,600,360) | | | | | | $ | 6,256,722,934 | |
Hussman Strategic Growth Fund Schedule of Investments (continued) |
December 31, 2010 (Unaudited) |
PUT OPTION CONTRACTS — 1.6% | | | | | | |
Nasdaq 100 Index Option, 01/22/2011 at $2,100 | | | 3,000 | | | $ | 2,505,000 | |
Russell 2000 Index Option, 02/19/2011 at $750 | | | 8,000 | | | | 13,168,000 | |
S&P 500 Index Option, 02/19/2011 at $1,230 | | | 39,000 | | | | 83,148,000 | |
Total Put Option Contracts (Cost $103,960,715) | | | | | | $ | 98,821,000 | |
| | | | | | | | | |
Total Investments at Value — 101.3% (Cost $5,555,561,075) | | | | | | $ | 6,355,543,934 | |
MONEY MARKET FUNDS — 15.7% | | | | | | |
Federated U.S. Treasury Cash Reserve Fund - Institutional Shares, 0.01% (b) | | | 337,129,386 | | | $ | 337,129,386 | |
First American Treasury Obligations Fund - Class Y, 0.00% (b) | | | 647,406,552 | | | | 647,406,552 | |
Total Money Market Funds (Cost $984,535,938) | | | | | | $ | 984,535,938 | |
| | | | | | | | | |
| Total Investments and Money Market Funds at Value — 117.0% | | | | | | | | |
(Cost $6,540,097,013) | | | | | | $ | 7,340,079,872 | |
| | | | | | | | | |
| Liabilities in Excess of Other Assets — (17.0%) | | | | | | | (1,066,984,469 | ) |
| | | | | | | | | |
Net Assets — 100.0% | | | | | | $ | 6,273,095,403 | |
| ADR - American Depositary Receipt. |
| |
| (a) | Non-income producing security. |
| | |
| (b) | Variable rate security. The rate shown is the 7-day effective yield as of December 31, 2010. |
| | |
| See accompanying notes to financial statements. |
Hussman Strategic Growth Fund Schedule of Open Written Option Contracts |
December 31, 2010 (Unaudited) |
WRITTEN CALL OPTION CONTRACTS | | | | | | | | | |
| Nasdaq 100 Index Option, | | | | | | | | | |
01/22/2011 at $1,800 | | | 3,000 | | | $ | 125,160,000 | | | $ | 116,396,060 | |
| Russell 2000 Index Option, | | | | | | | | | | | | |
01/22/2011 at $620 | | | 8,000 | | | | 130,800,000 | | | | 108,789,492 | |
| S&P 500 Index Option, | | | | | | | | | | | | |
01/22/2011 at $980 | | | 20,000 | | | | 553,980,000 | | | | 481,973,730 | |
| S&P 500 Index Option, | | | | | | | | | | | | |
01/22/2011 at $1,030 | | | 19,000 | | | | 431,262,000 | | | | 360,975,043 | |
Total Written Option Contracts | | | | | | $ | 1,241,202,000 | | | $ | 1,068,134,325 | |
| See accompanying notes to financial statements. |
Hussman Strategic Total Return Fund Schedule of Investments |
December 31, 2010 (Unaudited) |
| | | | | | |
| Materials — 1.4% | | | | | | |
| Metals & Mining — 1.4% | | | | | | |
Agnico-Eagle Mines Ltd. | | | 100,000 | | | $ | 7,670,000 | |
AngloGold Ashanti Ltd. - ADR | | | 100,000 | | | | 4,923,000 | |
Barrick Gold Corp. | | | 50,000 | | | | 2,659,000 | |
| Compania De Minas Buenaventura S.A. - ADR | | | 100,000 | | | | 4,896,000 | |
Goldcorp, Inc. | | | 100,000 | | | | 4,598,000 | |
Harmony Gold Mining Co. Ltd. - ADR | | | 264,000 | | | | 3,310,560 | |
Newmont Mining Corp. | | | 50,000 | | | | 3,071,500 | |
Randgold Resources Ltd. - ADR | | | 25,000 | | | | 2,058,250 | |
Stillwater Mining Co. (a) | | | 10,000 | | | | 213,500 | |
| | | | | | | | 33,399,810 | |
| Utilities — 0.3% | | | | | | | | |
| Electric Utilities — 0.2% | | | | | | | | |
Pepco Holdings, Inc. | | | 136,000 | | | | 2,482,000 | |
Pinnacle West Capital Corp. | | | 57,000 | | | | 2,362,650 | |
| | | | | | | | 4,844,650 | |
| Multi-Utilities — 0.1% | | | | | | | | |
Ameren Corp. | | | 43,000 | | | | 1,212,170 | |
DTE Energy Co. | | | 54,000 | | | | 2,447,280 | |
| | | | | | | | 3,659,450 | |
| | | | | | | | | |
Total Common Stocks (Cost $35,754,059) | | | | | | $ | 41,903,910 | |
U.S. TREASURY OBLIGATIONS — 66.4% | | | | | | |
U.S. Treasury Bills (b) - 45.4% | | | | | | |
0.19%, due 01/06/2011 | | $ | 500,000,000 | | | $ | 499,999,500 | |
0.16%, due 04/07/2011 | | | 500,000,000 | | | | 499,834,000 | |
0.15%, due 05/05/2011 | | | 100,000,000 | | | | 99,953,600 | |
| | | | | | | | 1,099,787,100 | |
| U.S. Treasury Bonds — 1.0% | | | | | | | | |
4.25%, due 05/15/2039 | | | 25,000,000 | | | | 24,632,825 | |
| | | | | | | | | |
| U.S. Treasury Inflation-Protected Notes — 5.1% | | | | | | | | |
2.00%, due 04/15/2012 | | | 26,944,250 | | | | 27,944,124 | |
| 2.00%, due 07/15/2014 | | | 29,006,000 | | | | 31,383,129 | |
| 2.375%, due 01/15/2027 | | | 16,267,350 | | | | 18,119,030 | |
| 2.50%, due 01/15/2029 | | | 40,745,600 | | | | 46,360,873 | |
| | | | | | | | 123,807,156 | |
Hussman Strategic Total Return Fund Schedule of Investments (continued) |
December 31, 2010 (Unaudited) |
U.S. TREASURY OBLIGATIONS — 66.4% (continued) | | | | | | |
| U.S. Treasury Notes — 14.9% | | | | | | |
3.00%, due 08/31/2016 | | $ | 75,000,000 | | | $ | 77,871,075 | |
2.625%, due 11/15/2020 | | | 300,000,000 | | | | 283,031,400 | |
| | | | | | | | 360,902,475 | |
| | | | | | | | | |
Total U.S. Treasury Obligations (Cost $1,598,715,220) | | | | | | $ | 1,609,129,556 | |
| | | | | | | |
EXCHANGE-TRADED FUNDS — 1.0% | | | | | | |
CurrencyShares British Pound Sterling Trust (a) (c) | | | 100,000 | | | $ | 15,577,000 | |
| SPDR DB International Government Inflation-Protected Bond ETF | | | 160,000 | | | | 9,297,600 | |
Total Exchange-Traded Funds (Cost $22,697,300) | | | | | | $ | 24,874,600 | |
| | | | | | | | | |
Total Investments at Value — 69.1% (Cost $1,657,166,579) | | | | | | $ | 1,675,908,066 | |
| | | | | | | |
MONEY MARKET FUNDS — 30.8% | | | | | | |
Federated U.S. Treasury Cash Reserve Fund - Institutional Shares, 0.01% (d) | | | 189,281,731 | | | $ | 189,281,731 | |
First American Treasury Obligations Fund - Class Y, 0.00% (d) | | | 558,469,354 | | | | 558,469,354 | |
Total Money Market Funds (Cost $747,751,085) | | | | | | $ | 747,751,085 | |
| | | | | | | | | |
| Total Investments and Money Market Funds at Value — 99.9% | | | | | | | | |
(Cost $2,404,917,664) | | | | | | $ | 2,423,659,151 | |
| | | | | | | | | |
Other Assets in Excess of Liabilities — 0.1% | | | | | | | 2,376,646 | |
| | | | | | | | | |
Net Assets — 100.0% | | | | | | $ | 2,426,035,797 | |
| ADR - American Depositary Receipt. |
| |
| (a) | Non-income producing security. |
| | |
| (b) | Rate shown is the annualized yield at time of purchase, not a coupon rate. |
| | |
| (c) | For federal income tax purposes, structured as a grantor trust. |
| | |
| (d) | Variable rate security. The rate shown is the 7-day effective yield as of December 31, 2010. |
| | |
| See accompanying notes to financial statements. |
Hussman Investment Trust Statements of Assets and Liabilities |
December 31, 2010 (Unaudited) |
| | | Hussman Strategic Growth Fund | | | Hussman Strategic Total Return Fund | |
| ASSETS | | | | | | |
| Investments in securities: | | | | | | |
At acquisition cost | | $ | 5,555,561,075 | | | $ | 1,657,166,579 | |
At value (Note 1) | | $ | 6,355,543,934 | | | $ | 1,675,908,066 | |
Investments in money market funds | | | 984,535,938 | | | | 747,751,085 | |
Cash | | | 500,000 | | | | — | |
Dividends and interest receivable | | | 4,308,441 | | | | 3,214,316 | |
Receivable for investment securities sold | | | 180,722,737 | | | | — | |
Receivable for capital shares sold | | | 8,484,345 | | | | 4,454,909 | |
Other assets | | | 323,456 | | | | 151,668 | |
Total Assets | | | 7,534,418,851 | | | | 2,431,480,044 | |
| | | | | | | | | |
| LIABILITIES | | | | | | | | |
Dividends payable | | | 4,090,773 | | | | 1,419,499 | |
Written call options, at value (Notes 1 and 4)
(premiums received $1,068,134,325) | | | 1,241,202,000 | | | | — | |
Payable for capital shares redeemed | | | 9,918,467 | | | | 2,584,713 | |
Accrued investment advisory fees (Note 3) | | | 4,903,156 | | | | 965,773 | |
Payable to administrator (Note 3) | | | 444,000 | | | | 179,200 | |
Payable to Trustees | | | 5,500 | | | | 5,500 | |
Other accrued expenses | | | 759,552 | | | | 289,562 | |
Total Liabilities | | | 1,261,323,448 | | | | 5,444,247 | |
| | | | | | | | | |
NET ASSETS | | $ | 6,273,095,403 | | | $ | 2,426,035,797 | |
| | | | | | | | | |
| Net assets consist of: | | | | | | | | |
Paid-in capital | | $ | 7,203,850,084 | | | $ | 2,393,418,483 | |
| Accumulated undistributed net investment income | | | 36,493 | | | | 109,870 | |
Accumulated net realized gains (losses) from security
transactions and option contracts | | | (1,557,706,358 | ) | | | 13,765,957 | |
| Net unrealized appreciation on investments and option contracts | | | 626,915,184 | | | | 18,741,487 | |
| | | | | | | | | |
NET ASSETS | | $ | 6,273,095,403 | | | $ | 2,426,035,797 | |
| | | | | | | | | |
Shares of beneficial interest outstanding (unlimited number
of shares authorized, no par value) | | | 510,253,786 | | | | 200,053,291 | |
| | | | | | | | | |
Net asset value, offering price and redemption
price per share(a) (Note 1) | | $ | 12.29 | | | $ | 12.13 | |
| (a) | Redemption price varies based on length of time shares are held. |
| | |
| See accompanying notes to financial statements. |
Hussman Investment Trust Statements of Operations |
For the Six Months Ended December 31, 2010 (Unaudited) |
| | | Hussman Strategic Growth Fund | | | Hussman Strategic Total Return Fund | |
| INVESTMENT INCOME | | | | | | |
Dividends | | $ | 46,032,157 | | | $ | 1,872,322 | |
Foreign withholding taxes on dividends | | | (284,263 | ) | | | (31,946 | ) |
Interest | | | — | | | | 11,427,551 | |
Total Income | | | 45,747,894 | | | | 13,267,927 | |
| | | | | | | | | |
| EXPENSES | | | | | | | | |
Investment advisory fees (Note 3) | | | 29,236,861 | | | | 5,320,905 | |
Transfer agent, account maintenance and
shareholder services fees (Note 3) | | | 2,066,170 | | | | 632,004 | |
Administration fees (Note 3) | | | 1,264,714 | | | | 614,738 | |
Registration and filing fees | | | 347,585 | | | | 188,847 | |
Custodian and bank service fees | | | 217,443 | | | | 82,197 | |
Fund accounting fees (Note 3) | | | 192,277 | | | | 84,078 | |
Postage and supplies | | | 158,767 | | | | 66,440 | |
Printing of shareholder reports | | | 85,480 | | | | 42,122 | |
Professional fees | | | 43,648 | | | | 32,752 | |
Compliance service fees (Note 3) | | | 51,113 | | | | 19,219 | |
Trustees’ fees and expenses | | | 33,053 | | | | 33,053 | |
Insurance expense | | | 44,525 | | | | 14,078 | |
Other expenses | | | 19,039 | | | | 18,461 | |
Total Expenses | | | 33,760,675 | | | | 7,148,894 | |
| | | | | | | | | |
NET INVESTMENT INCOME | | | 11,987,219 | | | | 6,119,033 | |
| | | | | | | | | |
REALIZED AND UNREALIZED GAINS (LOSSES) ON
INVESTMENTS AND OPTION CONTRACTS (Note 4) | | | | | | | | |
| Net realized gains (losses) from: | | | | | | | | |
Security transactions | | | 469,393,454 | | | | 88,315,078 | |
Option contracts | | | (1,417,961,100 | ) | | | — | |
| Net change in unrealized appreciation (depreciation) on: | | | | | | | | |
Investments | | | 761,085,048 | | | | (39,264,525 | ) |
Option contracts | | | (400,480,310 | ) | | | — | |
| | | | | | | | | |
NET REALIZED AND UNREALIZED GAINS (LOSSES)
ON INVESTMENTS AND OPTION CONTRACTS | | | (587,962,908 | ) | | | 49,050,553 | |
| | | | | | | | | |
NET INCREASE (DECREASE) IN NET ASSETS
RESULTING FROM OPERATIONS | | $ | (575,975,689 | ) | | $ | 55,169,586 | |
| See accompanying notes to financial statements. |
Hussman Strategic Growth Fund Statements of Changes in Net Assets |
|
| | | Six Months Ended December 31, 2010 (Unaudited) | | | | |
| FROM OPERATIONS | | | | | | |
Net investment income | | $ | 11,987,219 | | | $ | 2,164,645 | |
| Net realized gains (losses) from: | | | | | | | | |
Security transactions | | | 469,393,454 | | | | 1,022,837,564 | |
Option contracts | | | (1,417,961,100 | ) | | | (1,057,179,191 | ) |
| Net change in unrealized appreciation (depreciation) on: | | | | | | | | |
Investments | | | 761,085,048 | | | | (60,548,943 | ) |
Option contracts | | | (400,480,310 | ) | | | 302,121,068 | |
| Net increase (decrease) in net assets resulting from operations | | | (575,975,689 | ) | | | 209,395,143 | |
| | | | | | | | | |
| DISTRIBUTIONS TO SHAREHOLDERS | | | | | | | | |
From net investment income | | | (14,114,668 | ) | | | (7,151,672 | ) |
| | | | | | | | | |
| FROM CAPITAL SHARE TRANSACTIONS | | | | | | | | |
Proceeds from shares sold | | | 1,601,216,191 | | | | 3,031,392,017 | |
Net asset value of shares issued in reinvestment of
distributions to shareholders | | | 10,023,895 | | | | 5,351,985 | |
| Proceeds from redemption fees collected (Note 1) | | | 270,606 | | | | 474,913 | |
Payments for shares redeemed | | | (933,666,827 | ) | | | (2,029,932,592 | ) |
| Net increase in net assets from capital share transactions | | | 677,843,865 | | | | 1,007,286,323 | |
| | | | | | | | | |
TOTAL INCREASE IN NET ASSETS | | | 87,753,508 | | | | 1,209,529,794 | |
| | | | | | | | | |
| NET ASSETS | | | | | | | | |
Beginning of period | | | 6,185,341,895 | | | | 4,975,812,101 | |
End of period | | $ | 6,273,095,403 | | | $ | 6,185,341,895 | |
| | | | | | | | | |
ACCUMULATED UNDISTRIBUTED NET
INVESTMENT INCOME | | $ | 36,493 | | | $ | 2,163,942 | |
| | | | | | | | | |
| CAPITAL SHARE ACTIVITY | | | | | | | | |
Shares sold | | | 122,128,093 | | | | 233,800,402 | |
Shares reinvested | | | 815,614 | | | | 418,778 | |
Shares redeemed | | | (72,488,210 | ) | | | (157,582,321 | ) |
Net increase in shares outstanding | | | 50,455,497 | | | | 76,636,859 | |
Shares outstanding at beginning of period | | | 459,798,289 | | | | 383,161,430 | |
Shares outstanding at end of period | | | 510,253,786 | | | | 459,798,289 | |
| See accompanying notes to financial statements. |
Hussman Strategic Total Return Fund Statements of Changes in Net Assets |
|
| | | Six Months Ended December 31, 2010 (Unaudited) | | | | |
| FROM OPERATIONS | | | | | | |
Net investment income | | $ | 6,119,033 | | | $ | 22,353,210 | |
Net realized gains from security transactions | | | 88,315,078 | | | | 52,358,507 | |
Net change in unrealized appreciation (depreciation)
on investments | | | (39,264,525 | ) | | | 27,845,203 | |
| Net increase in net assets resulting from operations | | | 55,169,586 | | | | 102,556,920 | |
| | | | | | | | | |
| DISTRIBUTIONS TO SHAREHOLDERS | | | | | | | | |
From net investment income | | | (15,325,552 | ) | | | (19,991,520 | ) |
From net realized gains | | | (102,020,396 | ) | | | (18,352,276 | ) |
| Decrease in net assets from distributions to shareholders | | | (117,345,948 | ) | | | (38,343,796 | ) |
| | | | | | | | | |
| FROM CAPITAL SHARE TRANSACTIONS | | | | | | | | |
Proceeds from shares sold | | | 853,033,645 | | | | 1,259,791,954 | |
Net asset value of shares issued in reinvestment of
distributions to shareholders | | | 101,123,217 | | | | 33,519,756 | |
| Proceeds from redemption fees collected (Note 1) | | | 206,465 | | | | 244,066 | |
Payments for shares redeemed | | | (351,136,408 | ) | | | (496,374,834 | ) |
| Net increase in net assets from capital share transactions | | | 603,226,919 | | | | 797,180,942 | |
| | | | | | | | | |
TOTAL INCREASE IN NET ASSETS | | | 541,050,557 | | | | 861,394,066 | |
| | | | | | | | | |
| NET ASSETS | | | | | | | | |
Beginning of period | | | 1,884,985,240 | | | | 1,023,591,174 | |
End of period | | $ | 2,426,035,797 | | | $ | 1,884,985,240 | |
| | | | | | | | | |
ACCUMULATED UNDISTRIBUTED NET
INVESTMENT INCOME | | $ | 109,870 | | | $ | 3,367,648 | |
| | | | | | | | | |
| CAPITAL SHARE ACTIVITY | | | | | | | | |
Shares sold | | | 68,000,060 | | | | 104,030,315 | |
Shares reinvested | | | 8,235,210 | | | | 2,758,642 | |
Shares redeemed | | | (28,119,632 | ) | | | (41,070,483 | ) |
Net increase in shares outstanding | | | 48,115,638 | | | | 65,718,474 | |
Shares outstanding at beginning of period | | | 151,937,653 | | | | 86,219,179 | |
Shares outstanding at end of period | | | 200,053,291 | | | | 151,937,653 | |
| See accompanying notes to financial statements. |
Hussman Strategic Growth Fund Financial Highlights |
Selected Per Share Data and Ratios for a Share Outstanding Throughout Each Period |
| | | Six Months Ended December 31, 2010 (Unaudited) | | | | | | | | | | | | | | | | |
Net asset value at
beginning of period | | $ | 13.45 | | | $ | 12.99 | | | $ | 15.73 | | | $ | 15.85 | | | $ | 16.13 | | | $ | 15.90 | |
| | | | | | | | | | | | | | | | | | | | | | | | | |
Income (loss) from
investment operations: | | | | | | | | | | | | | | | | | | | | | | | | |
Net investment income | | | 0.02 | | | | 0.00 | (a) | | | 0.03 | | | | 0.04 | | | | 0.14 | | | | 0.08 | |
Net realized and unrealized
gains (losses) on investments and options | | | (1.15 | ) | | | 0.48 | | | | (0.88 | ) | | | 0.55 | | | | 0.16 | | | | 0.69 | |
Total from investment
operations | | | (1.13 | ) | | | 0.48 | | | | (0.85 | ) | | | 0.59 | | | | 0.30 | | | | 0.77 | |
| | | | | | | | | | | | | | | | | | | | | | | | | |
| Less distributions: | | | | | | | | | | | | | | | | | | | | | | | | |
Dividends from net
investment income | | | (0.03 | ) | | | (0.02 | ) | | | (0.03 | ) | | | (0.09 | ) | | | (0.13 | ) | | | (0.05 | ) |
Distributions from net
realized gains | | | — | | | | — | | | | (1.87 | ) | | | (0.63 | ) | | | (0.46 | ) | | | (0.50 | ) |
Total distributions | | | (0.03 | ) | | | (0.02 | ) | | | (1.90 | ) | | | (0.72 | ) | | | (0.59 | ) | | | (0.55 | ) |
| | | | | | | | | | | | | | | | | | | | | | | | | |
Proceeds from redemption
fees collected (Note 1) | | | 0.00 | (a) | | | 0.00 | (a) | | | 0.01 | | | | 0.01 | | | | 0.01 | | | | 0.01 | |
| | | | | | | | | | | | | | | | | | | | | | | | | |
Net asset value at end of period | | $ | 12.29 | | | $ | 13.45 | | | $ | 12.99 | | | $ | 15.73 | | | $ | 15.85 | | | $ | 16.13 | |
| | | | | | | | | | | | | | | | | | | | | | | | | |
Total return(b) | | | (8.42% | )(c) | | | 3.68% | | | | (4.35% | ) | | | 3.84% | | | | 1.98% | | | | 5.05% | |
| | | | | | | | | | | | | | | | | | | | | | | | | |
Net assets at end of period (000’s) | | $ | 6,273,095 | | | $ | 6,185,342 | | | $ | 4,975,812 | | | $ | 3,275,008 | | | $ | 2,718,324 | | | $ | 2,816,108 | |
| | | | | | | | | | | | | | | | | | | | | | | | | |
Ratio of expenses to
average net assets | | | 1.03% | (d) | | | 1.05% | | | | 1.09% | | | | 1.11% | | | | 1.11% | | | | 1.14% | |
| | | | | | | | | | | | | | | | | | | | | | | | | |
Ratio of net investment income to
average net assets | | | 0.36% | (d) | | | 0.04% | | | | 0.28% | | | | 0.28% | | | | 0.91% | | | | 0.63% | |
| | | | | | | | | | | | | | | | | | | | | | | | | |
Portfolio turnover rate | | | 25% | (c) | | | 111% | | | | 69% | | | | 150% | | | | 106% | | | | 63% | |
| (a) | Amount rounds to less than $0.01 per share. |
| | |
| (b) | Total return is a measure of the change in value of an investment in the Fund over the period covered, which assumes any dividends or capital gains distributions are reinvested in shares of the Fund. Returns do not reflect the deduction of taxes a shareholder would pay on Fund distributions or the redemption of Fund shares. |
| | |
| (c) | Not annualized. |
| | |
| (d) | Annualized. |
| | |
| See accompanying notes to financial statements. |
Hussman Strategic Total Return Fund Financial Highlights |
Selected Per Share Data and Ratios for a Share Outstanding Throughout Each Period |
| | | Six Months Ended December 31, 2010 (Unaudited) | | | | | | | | | | | | | | | | |
Net asset value at
beginning of period | | $ | 12.41 | | | $ | 11.87 | | | $ | 11.99 | | | $ | 10.92 | | | $ | 11.30 | | | $ | 10.94 | |
| | | | | | | | | | | | | | | | | | | | | | | | | |
| Income from investment operations: | | | | | | | | | | | | | | | | | | | | | | | | |
Net investment income | | | 0.03 | | | | 0.18 | | | | 0.05 | | | | 0.24 | | | | 0.32 | | | | 0.32 | |
Net realized and unrealized
gains on investments and foreign currencies | | | 0.31 | | | | 0.69 | | | | 0.35 | | | | 1.59 | | | | 0.06 | | | | 0.65 | |
Total from investment operations | | | 0.34 | | | | 0.87 | | | | 0.40 | | | | 1.83 | | | | 0.38 | | | | 0.97 | |
| | | | | | | | | | | | | | | | | | | | | | | | | |
| Less distributions: | | | | | | | | | | | | | | | | | | | | | | | | |
Dividends from net
investment income | | | (0.08 | ) | | | (0.16 | ) | | | (0.01 | ) | | | (0.23 | ) | | | (0.33 | ) | | | (0.31 | ) |
Distributions from net
realized gains | | | (0.54 | ) | | | (0.17 | ) | | | (0.53 | ) | | | (0.54 | ) | | | (0.43 | ) | | | (0.30 | ) |
Total distributions | | | (0.62 | ) | | | (0.33 | ) | | | (0.54 | ) | | | (0.77 | ) | | | (0.76 | ) | | | (0.61 | ) |
| | | | | | | | | | | | | | | | | | | | | | | | | |
Proceeds from redemption
fees collected (Note 1) | | | 0.00 | (a) | | | 0.00 | (a) | | | 0.02 | | | | 0.01 | | | | 0.00 | (a) | | | 0.00 | (a) |
| | | | | | | | | | | | | | | | | | | | | | | | | |
Net asset value at end of period | | $ | 12.13 | | | $ | 12.41 | | | $ | 11.87 | | | $ | 11.99 | | | $ | 10.92 | | | $ | 11.30 | |
| | | | | | | | | | | | | | | | | | | | | | | | | |
Total return(b) | | | 2.69% | (d) | | | 7.44% | | | | 3.94% | | | | 17.23% | | | | 3.46% | | | | 9.01% | |
| | | | | | | | | | | | | | | | | | | | | | | | | |
Net assets at end of period (000’s) | | $ | 2,426,036 | | | $ | 1,884,985 | | | $ | 1,023,591 | | | $ | 330,965 | | | $ | 174,480 | | | $ | 158,735 | |
| | | | | | | | | | | | | | | | | | | | | | | | | |
Ratio of net expenses
to average net assets | | | 0.63% | (e) | | | 0.67% | | | | 0.75% | | | | 0.90% | | | | 0.90% | | | | 0.90% | (c) |
| | | | | | | | | | | | | | | | | | | | | | | | | |
Ratio of net investment income
to average net assets | | | 0.54% | (e) | | | 1.59% | | | | 0.26% | | | | 2.05% | | | | 2.86% | | | | 2.94% | |
| | | | | | | | | | | | | | | | | | | | | | | | | |
Portfolio turnover rate | | | 118% | (d) | | | 69% | | | | 36% | | | | 212% | | | | 41% | | | | 55% | |
| (a) | Amount rounds to less than $0.01 per share. |
| | |
| (b) | Total return is a measure of the change in value of an investment in the Fund over the period covered, which assumes any dividends or capital gains distributions are reinvested in shares of the Fund. Returns do not reflect the deduction of taxes a shareholder would pay on Fund distributions or the redemption of Fund shares. |
| | |
| (c) | Absent investment advisory fee reductions by the Adviser, the ratio of expenses to average net assets would have been 0.92% for the year ended June 30, 2006. |
| | |
| (d) | Not annualized. |
| | |
| (e) | Annualized. |
| | |
| See accompanying notes to financial statements. |
Hussman Investment Trust Notes to Financial Statements |
December 31, 2010 (Unaudited) |
| 1. | ORGANIZATION AND SIGNIFICANT ACCOUNTING POLICIES |
Hussman Strategic Growth Fund and Hussman Strategic Total Return Fund (each, a “Fund”, and collectively, the “Funds”) are diversified series of Hussman Investment Trust (the “Trust”), which is registered under the Investment Company Act of 1940 as an open-end managment investment company. Each Fund is authorized to issue an unlimited number of shares. Hussman Strategic Growth Fund commenced operations on July 24, 2000. Hussman Strategic Total Return Fund commenced operations on September 12, 2002.
Hussman Strategic Growth Fund’s investment objective is to provide long-term capital appreciation, with added emphasis on protection of capital during unfavorable market conditions.
Hussman Strategic Total Return Fund’s investment objective is to provide long-term total return from income and capital appreciation, with added emphasis on protection of capital during unfavorable market conditions.
Securities and Options Valuation — The Funds’ portfolio securities are valued at market value as of the close of regular trading on the New York Stock Exchange (“NYSE”) (normally, 4:00 Eastern time) on each business day the NYSE is open. Securities, other than options, listed on the NYSE or other exchanges are valued on the basis of their last sale prices on the exchanges on which they are primarily traded. However, if the last sale price on the NYSE is different than the last sale price on any other exchange, the NYSE price will be used. If there are no sales on that day, the securities are valued at the last bid price on the NYSE or other primary exchange for that day. Securities traded on a foreign stock exchange are valued based upon the closing price on the principal exchange where the security is traded. Securities which are quoted by NASDAQ are valued at the NASDAQ Official Closing Price. If there are no sales on that day, the securities are valued at the last bid price as reported by NASDAQ. Securities traded in over-the-counter markets, other than NASDAQ quoted securities, are valued at the last sales price, or if there are no sales on that day, at the mean of the closing bid and asked prices. Values of foreign securities are translated from the local currency into U.S. dollars using currency exchange rates supplied by an independent pricing quotation service.
Pursuant to procedures approved by the Board of Trustees, options traded on a national securities exchange are valued at prices between the closing bid and ask prices determined by Hussman Econometrics Advisors, Inc. (the “Adviser”) to most closely reflect market value as of the time of computation of net asset value. As of December 31, 2010, all options held by Hussman Strategic Growth Fund have been valued in this manner. Options not traded on a national securities exchange or board
Hussman Investment Trust Notes to Financial Statements (continued) |
December 31, 2010 (Unaudited) |
of trade, but for which over-the-counter market quotations are readily available, are valued at the mean of their closing bid and ask prices. Futures contracts and options thereon, which are traded on commodities exchanges, are valued at their last sale price or, if not available, at the mean of the bid and ask prices as of the close of such commodities exchanges.
Fixed income securities not traded or dealt in upon any securities exchange but for which over-the-counter market quotations are readily available generally are valued at the mean of their closing bid and asked prices. Fixed income securities may also be valued on the basis of prices provided by an independent pricing service. The fair value of securities with remaining maturities of 60 days or less may be determined in good faith by the Board of Trustees to be represented by amortized cost value, absent unusual circumstances.
In the event that market quotations are not readily available or are determined by the Adviser to not be reflective of fair market value due to market events or developments, securities and options are valued at fair value as determined by the Adviser in accordance with procedures adopted by the Board of Trustees. Such methods of fair valuation may include, but are not limited to: multiple of earnings, multiple of book value, discount from market of a similar freely traded security, purchase price of security, subsequent private transactions in the security or related securities, or a combination of these and other factors.
Accounting principles generally accepted in the United States (“GAAP”) establish a single authoritative definition of fair value, set out a framework for measuring fair value and require additional disclosures about fair value measurements.
Various inputs are used in determining the value of each of the Fund’s investments. These inputs are summarized in the three broad levels listed below:
| | • | Level 1 – quoted prices in active markets for identical securities |
| | • | Level 2 – other significant observable inputs |
| | • | Level 3 – significant unobservable inputs |
For example, options contracts purchased and written by Hussman Strategic Growth Fund are classified as Level 2 since they are valued at prices between the closing bid and ask prices determined by the Adviser to most closely reflect market value. U.S. Treasury obligations held by Hussman Strategic Total Return Fund are classified as Level 2 since values are based on prices provided by an independent pricing service that utilizes various “other significant observable inputs” including bid and ask quotations, prices of similar securities and interest rates, among other factors. The inputs or methodology used for valuing securities are not necessarily an
Hussman Investment Trust Notes to Financial Statements (continued) |
December 31, 2010 (Unaudited) |
indication of the risks associated with investing in those securities. The inputs used to measure the value of a particular security may fall into more than one level of the fair value hierarchy. In such cases, for disclosure purposes, the level in the fair value hierarchy within which the fair value measurement of that security is determined to fall in its entirety is the lowest level input that is significant to the fair value measurement.
The following is a summary of the inputs used to value each Fund’s investments and other financial instruments as of December 31, 2010 by security type:
| Hussman Strategic Growth Fund |
| | | | | | | | | | | | | |
Investments in Securities and Money Market Funds: | | | | | | | | | | | | |
Common Stocks | | $ | 6,256,722,934 | | | $ | — | | | $ | — | | | $ | 6,256,722,934 | |
Put Option Contracts | | | — | | | | 98,821,000 | | | | — | | | | 98,821,000 | |
Money Market Funds | | | — | | | | 984,535,938 | | | | — | | | | 984,535,938 | |
Total Investments in Securities and Money Market Funds | | $ | 6,256,722,934 | | | $ | 1,083,356,938 | | | $ | — | | | $ | 7,340,079,872 | |
| | | | | | | | | | | | | | | | | |
Other Financial Instruments: | | | | | | | | | | | | | | | | |
Written Call Option Contracts | | $ | — | | | $ | (1,241,202,000 | ) | | $ | — | | | $ | (1,241,202,000 | ) |
Total Other Financial Instruments | | $ | — | | | $ | (1,241,202,000 | ) | | $ | — | | | $ | (1,241,202,000 | ) |
| Hussman Strategic Total Return Fund |
| | | | | | | | | | | | | |
Investments in Securities and Money Market Funds: | | | | | | | | | | | | |
Common Stocks | | $ | 41,903,910 | | | $ | — | | | $ | — | | | $ | 41,903,910 | |
U.S. Treasury Obligations | | | — | | | | 1,609,129,556 | | | | — | | | | 1,609,129,556 | |
Exchange-Traded Funds | | | 24,874,600 | | | | — | | | | — | | | | 24,874,600 | |
Money Market Funds | | | — | | | | 747,751,085 | | | | — | | | | 747,751,085 | |
Total Investments in Securities and Money Market Funds | | $ | 66,778,510 | | | $ | 2,356,880,641 | | | $ | — | | | $ | 2,423,659,151 | |
Each Fund’s Schedule of Investments identifies the specific securities (by type of security and industry type) that comprise that Funds holdings within the Level 1 and Level 2 categories shown in the tables above. During the six months ended December 31, 2010, the Funds did not have any significant transfers in and out of Level 1 or
Hussman Investment Trust Notes to Financial Statements (continued) |
December 31, 2010 (Unaudited) |
Level 2. In addition, the Funds did not have any assets or liabilities that were measured at fair value on a recurring basis using significant unobservable inputs (Level 3) as of or during the six months ended December 31, 2010.
Futures Contracts and Option Transactions — Hussman Strategic Growth Fund may purchase and write put and call options on broad-based stock indices. The Fund may also purchase and write call and put options on individual securities. Hussman Strategic Total Return Fund may use financial futures contracts and related options to hedge against changes in the market value of its portfolio securities. The Fund may also purchase a foreign currency option to establish or modify the Fund’s exposure to foreign currencies, or an interest rate futures contract to protect against a decline in the value of its portfolio.
Hussman Strategic Growth Fund may use futures and options contracts for the purpose of seeking to reduce the overall investment risk that would otherwise be associated with the securities in which it invests. For example, the Fund may sell a stock index futures contract to hedge the risk of a general market or market sector decline that might adversely affect prices of the Fund’s portfolio securities. To the extent there is a correlation between the Fund’s portfolio and a particular stock index, the sale of futures contracts on that index could reduce the Fund’s exposure to general market risk.
When a Fund writes an index option, an amount equal to the net premium (the premium less the commission) received by the Fund is recorded as a liability in the Fund’s Statement of Assets and Liabilities and is subsequently marked-to market daily. If an index option expires unexercised on the stipulated expiration date or if the Fund enters into a closing purchase transaction, it will realize a gain (or a loss if the cost of a closing purchase transaction exceeds the net premium received when the option is sold) and the liability related to such option will be eliminated. If an index option is exercised, the Fund will be required to pay the difference between the closing index value and the exercise price of the option. In this event, the proceeds of the sale will be increased by the net premium originally received and the Fund will realize a gain or loss.
Repurchase Agreements — The Funds may enter into repurchase agreements with certain banks or non-bank dealers. The value of the underlying securities collateralizing these agreements is monitored on a daily basis to ensure that the value of the collateral during the term of the agreements equals or exceeds the repurchase price plus accrued interest. If the bank or dealer defaults, realization of the collateral by the Funds may be delayed or limited, and the Funds may suffer a loss if the value of the collateral declines.
Hussman Investment Trust Notes to Financial Statements (continued) |
December 31, 2010 (Unaudited) |
Foreign Currency Translation — Amounts denominated in or expected to settle in foreign currencies are translated into U.S. dollars based on exchange rates on the following basis:
A. The market values of investment securities and other assets and liabilities are translated at the closing rate on the London Stock Exchange each day.
B. Purchases and sales of investment securities and income and expenses are translated at the rate of exchange prevailing on the respective date of such transactions.
C. The Funds do not isolate that portion of the results of operations caused by changes in foreign exchange rates on investments from those caused by changes in market prices of securities held. Such fluctuations are included with the net realized and unrealized gains or losses on investments.
Reported net realized foreign exchange gains or losses arise from 1) purchases and sales of foreign currencies, 2) currency gains or losses realized between the trade and settlement dates on securities transactions and 3) the difference between the amounts of dividends, interest and foreign withholding taxes recorded on the Fund’s books, and the U.S. dollar equivalent of the amounts actually received or paid. Reported net unrealized foreign exchange gains and losses arise from changes in the value of assets and liabilities that result from changes in exchange rates.
Share Valuation and Redemption Fees — The net asset value per share of each Fund is calculated as of the close of regular trading on the NYSE (normally 4:00 p.m., Eastern time) on each day that the NYSE is open for business. The net asset value per share of each Fund is calculated by dividing the total value of the Fund’s assets, less its liabilities, by the number of its shares outstanding. The offering price and redemption price per share of each Fund is equal to the net asset value per share. However, shares of each Fund are generally subject to a redemption fee of 1.5%, payable to the applicable Fund, if redeemed within sixty days of the date of purchase. During the periods ended December 31, 2010 and June 30, 2010, proceeds from redemption fees totaled $270,606 and $474,913, respectively, for Hussman Strategic Growth Fund and $206,465 and $244,066, respectively, for Hussman Strategic Total Return Fund.
Investment Income — Interest income is accrued as earned. Dividend income is recorded on the ex-dividend date. Discounts and premiums on fixed income securities are amortized using the interest method.
Hussman Investment Trust Notes to Financial Statements (continued) |
December 31, 2010 (Unaudited) |
Distributions to Shareholders — Dividends from net investment income, if any, are declared and paid annually to shareholders of Hussman Strategic Growth Fund and are declared and paid quarterly to shareholders of Hussman Strategic Total Return Fund. Net realized short-term capital gains, if any, may be distributed throughout the year and net realized long-term capital gains, if any, are generally distributed annually. The amount of distributions from net investment income and net realized gains are determined in accordance with federal income tax regulations, which may differ from GAAP. These “book/tax” differences are either temporary or permanent in nature and are primarily due to timing differences in the recognition of capital gains or losses for option transactions, losses deferred due to wash sales and treatment of foreign currency transactions.
The tax character of distributions paid during the periods ended December 31, 2010 and June 30, 2010 was as follows:
| | | | | | | | | | | |
| Hussman Strategic Growth Fund | 12/31/10 | | $ | 14,114,668 | | | $ | — | | | $ | 14,114,668 | |
| | 6/30/10 | | $ | 7,151,672 | | | $ | — | | | $ | 7,151,672 | |
| Hussman Strategic Total Return Fund | 12/31/10 | | $ | 84,167,042 | | | $ | 33,178,906 | | | $ | 117,345,948 | |
| | 6/30/10 | | $ | 34,722,623 | | | $ | 3,621,173 | | | $ | 38,343,796 | |
Securities Transactions — For financial statement purposes, securities transactions are accounted for on trade date. Gains and losses on securities sold are determined on a specific identification basis.
Common Expenses — Expenses of the Trust not attributable solely to one of the Funds are allocated between the Funds based on relative net assets of each Fund or the nature of the expense and the relative applicability to each Fund and the other series of the Trust.
Accounting Estimates — The preparation of financial statements in conformity with GAAP requires management to make estimates and assumptions that affect the reported amounts of assets and liabilities and the disclosure of contingent assets and liabilities as of the date of the financial statements and the reported amounts of income and expenses during the reporting period. Actual results could differ from these estimates.
Hussman Investment Trust Notes to Financial Statements (continued) |
December 31, 2010 (Unaudited) |
Federal Income Tax — It is each Fund’s policy to qualify as a regulated investment company under Subchapter M of the Internal Revenue Code. As provided therein, in any fiscal year in which a Fund so qualifies and distributes at least 90% of its taxable net income, the Fund (but not its shareholders) will be relieved of federal income tax on the income distributed. Accordingly, no provision for income taxes has been made.
In order to avoid imposition of a federal excise tax applicable to regulated investment companies, it is each Fund’s intention to declare and pay as dividends in each calendar year at least 98% of its net investment income (earned during the calendar year) and 98% of its net realized capital gains (earned during the twelve months ended October 31) plus undistributed amounts from prior years.
The following information is computed on a tax basis for each item as of December 31, 2010:
| | | Hussman Strategic Growth Fund | | | Hussman Strategic Total Return Fund | |
Cost of portfolio investments | | $ | 5,483,393,139 | | | $ | 2,404,801,647 | |
Gross unrealized appreciation | | $ | 950,626,378 | | | $ | 25,392,401 | |
Gross unrealized depreciation | | | (156,934,255 | ) | | | (6,420,046 | ) |
Net unrealized appreciation | | $ | 793,692,123 | | | $ | 18,972,355 | |
Accumulated undistributed ordinary income | | | 4,127,266 | | | | 1,298,501 | |
Capital loss carryforwards | | | (375,427,325 | ) | | | — | |
Other gains (losses) | | | (1,349,055,972 | ) | | | 13,765,957 | |
Other temporary differences | | | (4,090,773 | ) | | | (1,419,499 | ) |
Total accumulated earnings (deficit) | | $ | (930,754,681 | ) | | $ | 32,617,314 | |
The difference between the federal income tax cost of portfolio investments and their financial statement cost is due to certain timing differences in the recognition of capital gains or losses under income tax regulations and GAAP. These “book/tax” differences are temporary in nature and are primarily due to option transactions, losses deferred due to wash sales and differing treatments of realized and unrealized gains and losses on exchange-traded funds taxed as grantor trusts.
As of June 30, 2010, Hussman Strategic Growth Fund has capital loss carryforwards for federal income tax purposes of $375,427,325, which expire June 30, 2018. These capital loss carryforwards may be utilized in the current and future years to offset net realized capital gains prior to distributing such gains to shareholders.
Hussman Investment Trust Notes to Financial Statements (continued) |
December 31, 2010 (Unaudited) |
For the six months ended December 31, 2010, Hussman Strategic Total Return Fund reclassified $5,948,741 of accumulated net realized gains from security transactions against undistributed net investment income on its Statement of Assets and Liabilities due to differing treatments of realized gains and losses on exchange-traded funds taxed as grantor trusts. Such reclassification, the result of permanent differences between financial statement and income tax reporting requirements, has no effect on the Fund’s total net assets or net asset value per share.
Each Fund recognizes the tax benefits or expenses of uncertain tax positions only when the position is “more likely than not” to be sustained assuming examination by tax authorities. Management has reviewed each Fund’s tax positions taken on federal income tax returns for all open tax years (tax years ended June 30, 2006 through June 30, 2010) and has concluded that no provision for unrecognized tax benefits or expenses is required in these financial statements.
| 2. | INVESTMENT TRANSACTIONS |
During the six months ended December 31, 2010, cost of purchases and proceeds from sales and maturities of investment securities, other than short-term investments and U.S. government securities, amounted to $1,593,875,788 and $2,158,911,952, respectively, for Hussman Strategic Growth Fund and $236,302,008 and $438,865,255, respectively, for Hussman Strategic Total Return Fund.
| 3. | TRANSACTIONS WITH AFFILIATES |
One of the Trustees and certain officers of the Trust are affiliated with the Adviser or with Ultimus Fund Solutions, LLC (“Ultimus”), the Funds’ administrator, transfer agent and fund accounting agent.
Under the terms of an Advisory Agreement between the Trust and the Adviser, Hussman Strategic Growth Fund pays the Adviser a fee, which is computed and accrued daily and paid monthly, at annual rates of 0.90% of the first $5 billion of its average daily net assets and 0.85% of such assets over $5 billion. Under the terms of a separate Advisory Agreement between the Trust and the Adviser, Hussman Strategic Total Return Fund pays the Adviser a fee, which is computed and accrued daily and paid monthly, at annual rates of 0.50% of the first $1 billion of its average daily net assets and 0.45% of such assets in excess of $1 billion.
Hussman Investment Trust Notes to Financial Statements (continued) |
December 31, 2010 (Unaudited) |
Under the terms of an Administration Agreement, Ultimus supplies executive, administrative and regulatory services to the Trust, supervises the preparation of tax returns, and coordinates the preparation of reports to shareholders and reports to and filings with the Securities and Exchange Commission (“SEC”) and state securities authorities.
Under the terms of the Administration Agreement, Ultimus receives a monthly fee from each Fund computed at annual rates of 0.075% of the Fund’s average daily net assets up to $500 million; 0.05% of the next $1.5 billion of such assets; 0.04% of the next $1 billion of such assets; 0.03% of the next $2 billion of such assets; and 0.025% of such assets in excess of $5 billion, subject to a per Fund minimum monthly fee of $2,000.
| Fund Accounting Agreement |
Under the terms of a Fund Accounting Agreement between the Trust and Ultimus, Ultimus calculates the daily net asset value per share and maintains the financial books and records of the Funds. For these services, Ultimus receives from each Fund a monthly base fee of $2,500, plus an asset-based fee computed at annual rates of 0.01% of the Fund’s average daily net assets up to $500 million and 0.005% of such net assets in excess of $500 million. In addition, the Funds reimburse Ultimus for certain out-of-pocket expenses incurred in obtaining valuations of the Funds’ portfolio securities.
| Transfer Agent and Shareholder Services Agreement |
Under the terms of a Transfer Agent and Shareholder Services Agreement between the Trust and Ultimus, Ultimus maintains the records of each shareholder’s account, answers shareholders’ inquiries concerning their accounts, processes purchases and redemptions of each Fund’s shares, acts as dividend and distribution disbursing agent, and performs other shareholder service functions. For these services, Ultimus receives from each Fund a fee, payable monthly, of $22 annually for each direct account and $12 annually for certain accounts established through financial intermediaries, subject to a per Fund minimum fee of $1,500 per month. For the six months ended December 31, 2010, such fees were $1,080,268 and $277,354, for Hussman Strategic Growth Fund and Hussman Total Return Fund, respectively. In addition, the Funds reimburse Ultimus for certain out-of-pocket expenses, including, but not limited to, postage and supplies.
Hussman Investment Trust Notes to Financial Statements (continued) |
December 31, 2010 (Unaudited) |
For shareholder accounts held through financial intermediaries, the Funds may, in some cases, compensate these intermediaries for providing certain account maintenance and shareholder services. During the six months ended December 31, 2010, Hussman Strategic Growth Fund and Hussman Strategic Total Return Fund paid $985,902 and $354,650, respectively, to financial intermediaries for such services.
| Compliance Consulting Agreement |
Under the terms of a Compliance Consulting Agreement between the Trust and Ultimus, Ultimus provides an individual to serve as the Trust’s Chief Compliance Officer and to administer the Trust’s compliance policies and procedures. For these services, the Trust pays Ultimus a base fee of $15,000 per annum, plus an asset-based fee computed at annual rates of .005% of the average value of the Trust’s aggregate daily net assets from $100 million to $500 million, .0025% of such assets from $500 million to $1 billion and .00125% of such assets in excess of $1 billion. Each Fund pays its proportionate share of such fee along with the other series of the Trust. In addition, the Funds reimburse Ultimus for reasonable out-of-pocket expenses, if any, incurred in connection with these services.
The Trust has entered into a Distribution Agreement with Ultimus Fund Distributors, LLC (the “Distributor”), pursuant to which the Distributor provides distribution services and serves as the principal underwriter to each Fund. The Distributor is a wholly-owned subsidiary of Ultimus. The Distributor’s fees are paid by the Adviser.
| 4. | DERIVATIVES TRANSACTIONS |
Transactions in option contracts written by Hussman Strategic Growth Fund during the six months ended December 31, 2010 were as follows:
| | | | | | | |
Options outstanding at beginning of period | | | 55,000 | | | $ | 321,356,680 | |
Options written | | | 238,500 | | | | 3,641,942,783 | |
| Options cancelled in a closing purchase transaction | | | (243,500 | ) | | | (2,895,165,138 | ) |
Options outstanding at end of period | | | 50,000 | | | $ | 1,068,134,325 | |
Hussman Investment Trust Notes to Financial Statements (continued) |
December 31, 2010 (Unaudited) |
The locations in the Statements of Assets and Liabilities of Hussman Strategic Growth Fund’s derivative positions are as follows:
| | | | Value | | | Gross Notional Amount Outstanding | |
Type of Derivative | Location | | Asset Derivatives | | | Liability Derivatives | | | December 31, 2010 | |
| Index put options purchased | Investments in securities at value | | $ | 98,821,000 | | | $ | — | | | $ | 6,197,074,000 | |
| Index call options written | Written call options, at value | | | — | | | | (1,241,202,000 | ) | | | (6,197,074,000 | ) |
The average monthly notional amount of put options purchased, call options written and call options purchased during the six months ended December 31, 2010 was $6,398,219,167, $(6,398,219,167) and $367,200,000, respectively for Hussman Strategic Growth Fund.
Hussman Strategic Growth Fund’s transactions in derivative instruments during the six months ended December 31, 2010 are recorded in the following locations in the Statements of Operations:
| | | | | | | Change in Unrealized Gains (Losses) | |
| Index put options purchased | Net realized gains (losses) from option contracts | | $ | (695,885,321 | ) | Net change in unrealized appreciation (depreciation) on option contracts | | $ | (133,671,955 | ) |
| Index call options purchased | Net realized gains (losses) from option contracts | | | (26,808,464 | ) | Net change in unrealized appreciation (depreciation) on option contracts | | | — | |
| Index call options written | Net realized gains (losses) from option contracts | | | (695,267,315 | ) | Net change in unrealized appreciation (depreciation) on option contracts | | | (266,808,355 | ) |
Hussman Strategic Total Reutrn had no transactions in derivative instruments as of and for the six months ended December 31, 2010.
Hussman Investment Trust Notes to Financial Statements (continued) |
December 31, 2010 (Unaudited) |
Hussman Strategic Growth Fund has an unsecured bank line of credit in the amount of $10,000,000. Hussman Strategic Total Return Fund has an unsecured bank line of credit in the amount of $2,000,000. Borrowings under these arrangements bear interest at a rate determined by the lending bank at the time of borrowing. During the six months ended December 31, 2010, the Funds did not borrow under their respective lines of credit.
| 6. | CONTINGENCIES AND COMMITMENTS |
The Trust’s officers and Trustees are entitled to indemnification from the Funds for certain liabilities that may arise from their performance of their duties to the Funds. Additionally, in the normal course of business, the Funds enter into contracts that contain a variety of representations and warranties and which may provide general indemnifications. The Funds’ maximum exposure under these arrangements is unknown, as this would involve potential claims for indemnification for losses that may or may not be incurred in the future. However, based on experience, the Trust believes the risk of loss to be remote.
The Funds are required to recognize in the financial statements the effects of all subsequent events that provide additional evidence about conditions that existed as of the date of the Statement of Assets and Liabilities. For non-recognized subsequent events that must be disclosed to keep the financial statements from being misleading, the Funds are required to disclose the nature of the event as well as an estimate of its financial effect, or a statement that such an estimate cannot be made. Management has evaluated subsequent events through the issuance of these financial statements and has noted no such events.
Hussman Investment Trust About Your Fund’s Expenses (Unaudited) |
|
We believe it is important for you to understand the impact of costs on your investment. As a shareholder of the Funds, you incur two types of costs: (1) transaction costs, which may include redemption fees; and (2) ongoing costs, including management fees and other Fund expenses. The following examples are intended to help you understand your ongoing costs (in dollars) of investing in the Funds and to compare these costs with the ongoing costs of investing in other mutual funds. A mutual fund’s ongoing costs are expressed as a percentage of its average net assets. This figure is known as the expense ratio.
The examples below are based on an investment of $1,000 made at the beginning of the period shown and held for the entire period (July 1, 2010 – December 31, 2010).
The table on the following page illustrates each Fund’s costs in two ways:
Actual fund return – This section helps you to estimate the actual expenses that you paid over the period. The “Ending Account Value” shown is derived from each Fund’s actual return, and the third column shows the dollar amount of operating expenses that would have been paid by an investor who started the period with $1,000 invested in that Fund. You may use the information here, together with the amount of your investment, to estimate the expenses that you paid over the period.
To do so, simply divide your account value by $1,000 (for example, an $8,600 account value divided by $1,000 = 8.6), and then multiply the result by the number given for the applicable Fund under the heading “Expenses Paid During Period.”
Hypothetical 5% return – This section is intended to help you compare each Fund’s ongoing costs with those of other mutual funds. It assumes that each Fund had an annual return of 5% before expenses during the period shown. In this case, because the return used is not each Fund’s actual return, the results do not illustrate the actual expenses associated with your investment. However, the example is useful in making comparisons because the SEC requires all mutual funds to provide an example of fund expenses based on a 5% annual return. You can assess each Fund’s ongoing costs by comparing this hypothetical example with the hypothetical examples that appear in shareholder reports of other mutual funds.
Note that expenses shown in the table are meant to highlight and help you compare ongoing costs only. The calculations assume no shares were bought or sold during the period. Your actual costs may have been higher or lower, depending on the amount of your investment and the timing of any purchases or redemptions.
Hussman Investment Trust About Your Fund’s Expenses (Unaudited) (continued) |
|
More information about each Fund’s expenses, including annual expense ratios for the past five years, can be found elsewhere in this report. For additional information on operating expenses and other shareholder costs, please refer to each Fund’s prospectus.
| Hussman Strategic Growth Fund |
| Beginning Account Value July 1, 2010 | Ending Account Value December 31, 2010 | Expenses Paid During Period* |
| Based on Actual Fund Return | $1,000.00 | $915.80 | $4.97 |
| Based on Hypothetical 5% Annual Return (before expenses) | $1,000.00 | $1,020.01 | $5.24 |
| * | Expenses are equal to Hussman Strategic Growth Fund’s annualized expense ratio of 1.03% for the period, multiplied by the average account value over the period, multiplied by 184/365 (to reflect the one-half year period). |
| Hussman Strategic Total Return Fund |
| Beginning Account Value July 1, 2010 | Ending Account Value December 31, 2010 | Expenses Paid During Period* |
| Based on Actual Fund Return | $1,000.00 | $1,026.90 | $3.22 |
| Based on Hypothetical 5% Annual Return (before expenses) | $1,000.00 | $1,022.03 | $3.21 |
| * | Expenses are equal to Hussman Strategic Total Return Fund’s annualized expense ratio of 0.63% for the period, multiplied by the average account value over the period, multiplied by 184/365 (to reflect the one-half year period). |
Hussman Investment Trust Other Information (Unaudited) |
|
A description of the policies and procedures the Funds use to determine how to vote proxies relating to portfolio securities is available without charge upon request by calling toll-free 1-800-HUSSMAN (1-800-487-7626), or on the SEC’s website at http://www.sec.gov. Information regarding how the Funds voted proxies relating to portfolio securities during the most recent 12-month period ended June 30 is also available without charge upon request by calling toll-free 1-800-HUSSMAN, or on the SEC’s website at http://www.sec.gov.
The Trust files a complete listing of portfolio holdings for each Fund with the SEC as of the end of the first and third quarters of each fiscal year on Form N-Q. The filings are available upon request, by calling 1-800-HUSSMAN (1-800-487-7626). You may also obtain copies of these filings on the SEC’s website at http://www.sec.gov. The Trust’s Forms N-Q may also be reviewed and copied at the SEC’s Public Reference Room in Washington, DC, and information on the operation of the Public Reference Room may be obtained by calling 1-800-SEC-0330.
THIS PAGE INTENTIONALLY LEFT BLANK.
INVESTMENT ADVISER
Hussman Econometrics Advisors, Inc.
5136 Dorsey Hall Drive
Ellicott City, Maryland 21042
www.hussmanfunds.com
1-800-HUSSMAN (1-800-487-7626)
ADMINISTRATOR/TRANSFER AGENT
Ultimus Fund Solutions, LLC
225 Pictoria Drive, Suite 450
Cincinnati, Ohio 45246
CUSTODIAN
US Bank NA
425 Walnut Street
Cincinnati, Ohio 45202
INDEPENDENT REGISTERED
PUBLIC ACCOUNTING FIRM
Ernst & Young LLP
1900 Scripps Center
312 Walnut Street
Cincinnati, Ohio 45202
LEGAL COUNSEL
Schulte Roth & Zabel LLP
919 Third Avenue
New York, New York 10022
This Semi-Annual Report is authorized for
distribution only if accompanied or preceded
by a current Prospectus of the Funds.

HUSSMAN INVESTMENT TRUST
Hussman Strategic
International Equity Fund
SEMI-ANNUAL REPORT
December 31, 2010
(Unaudited)
STRATEGIC INTERNATIONAL EQUITY FUND
Comparison of the Change in Value of a $10,000 Investment in the
Hussman Strategic International Equity Fund versus the MSCI EAFE Index(a)
Average Annual Total Returns(b) For Periods Ended December 31, 2010 |
| | | | | |
Hussman Strategic International Equity Fund(d) | 4.65% | | 4.65% | |
| MSCI EAFE Index | 8.21% | | 8.21% | |
| (a) | The MSCI Europe, Australasia, and Far East Index (“MSCI EAFE Index”) covers the equity market performance of developed markets, excluding the U.S. and Canada. |
| | |
| (b) | The returns do not reflect the deduction of taxes a shareholder would pay on Fund distributions, if any, or the redemption of Fund shares. |
| | |
| (c) | Represents the period from the commencement of operations (December 31, 2009) through December 31, 2010. |
| | |
| (d) | The Fund’s expense ratio was 2.00% during the six months ended December 31, 2010. The expense ratio as disclosed in the November 1, 2010 prospectus was 2.04%. |
Hussman Strategic International Equity Fund |
| |
For the year ended December 31, 2010, Hussman Strategic International Equity Fund achieved a total return of 4.65%, compared with a total return of 8.21% in the MSCI EAFE Index during this same period.
The positive return for the EAFE Index followed a volatile year for international stock markets, especially in Europe where policy makers were forced to react to growing concerns of sovereign default, first in Greek bonds, and then in Irish debt. The EAFE Index declined by 19.45% during the year before recovering. For most of the year, hedging the Fund’s exposure to market fluctuations proved effective. The Fund’s maximum decline during the calendar year was 2.79%.
By late-September, the year-to-date return of the EAFE Index was still negative. During the final weeks of the year, international markets advanced on investor optimism that policy makers would add additional funds to the European Financial Stability Facility (EFSF) – the rescue vehicle created in May to bail out bondholders of peripheral European debt. Strategic International Equity Fund maintained its hedges against market fluctuations as measures of potential risk continued to rise, including wider spreads between the interest rates on peripheral European country debt and German Bunds, and a rise in the price of credit default swaps to insure this sovereign debt.
| Portfolio Composition and Performance Drivers |
As of December 31, 2010, Strategic International Equity Fund had net assets of $47,930,330 and held 75 stocks in a wide variety of industries. The largest sector holdings as a percent of net assets were in Health Care (8.7%), Consumer Discretionary (7.3%), Information Technology (7.1%), Consumer Staples (6.0%), Industrials (5.7%), and Telecommunication Services (5.3%). The smallest industry weights were in Utilities (2.8%), Energy (1.5%), Financials (0.5%) and Materials (0.3%). Exchange-traded funds (ETFs) accounted for 5.6% of net assets. The total value of equities and exchange-traded funds held by the Fund was $24,363,584.
In order to hedge the impact of general market fluctuations, as of December 31, 2010 the Fund held 75 option combinations (long put option / short call option) on the S&P 500 Index, and was short 300 futures on the Euro STOXX 50 Index and 25 futures on the FTSE 100 Index. The combined notional value of these hedges was $22,934,370, hedging 94.1% of the value of equity and ETF investments held by the Fund. When the Fund is in a hedged investment position, the primary driver of Fund returns is the difference in performance between the stocks owned by the Fund and the indices that are used to hedge.
Hussman Strategic International Equity Fund |
Letter to Shareholders (continued) |
Given what we viewed as an overextended advance in the international markets at the end of 2010, many candidates for new investment also appeared to have overextended price trends. Accordingly, nearly half of Fund assets were invested in short-term cash equivalents as of December 31, 2010. These balances were largely the result of recent shareholder investments in the Fund. Much of these cash holdings have subsequently been invested in individual stocks since the beginning of 2011, in response to day-to-day opportunities that we observe.
While the Fund is widely diversified and its performance is affected by numerous investment positions, hedging gains were primarily responsible for the reduced sensitivity of the Fund to market fluctuations from the Fund’s inception through December 31, 2010. Individual equity holdings having portfolio gains in excess of $75,000 during the semi-annual period ended December 31, 2010 included Fugro NV, iShares MSCI Sweden, Alfa Laval AB and Cia Saneamento Basico. Holdings with portfolio losses in excess of $25,000 included WS Atkins PLC, Icon PLC – ADR and Honeys Co. Ltd.
The recent credit crisis has emerged in stages; appearing first in real estate markets, then affecting local and national commercial banks, and most recently affecting governments that issued debt in order to offset losses in the banking system. During April and May 2010, while the EAFE Index declined by almost 20 percent from its peak, some peripheral European country stock markets experienced declines in excess of 30 percent. The volatility of international stock markets during 2010 may be representative of what investors may expect in these markets over the next few years.
Much of the enthusiasm in European stock markets late in the year appears to have been based on the hope that policy makers would increase the size of the $750 billion-euro ($1 trillion) European Financial Stability Facility (EFSF). Some analysts also speculated that restrictions may be lifted from the rescue fund, which could allow the EFSF to buy the debt of individual countries directly. Governments and central banks around the world have repeatedly addressed solvency issues by creating greater amounts of liquidity, and this has promoted speculation in the financial markets on the expectation of continued intervention. Given the focus of financial market participants on these policy interventions, the eventual transition from extremely easy monetary policy to more standard policies may provoke greater stock price volatility than has been typical in past economic recoveries.
Hussman Strategic International Equity Fund |
Letter to Shareholders (continued) |
Many of the efforts by the European Central Bank (ECB) and European governments have been focused on monetary policy, including direct bond purchases by the European Central Bank and the extension of loans to Ireland through the EFSF. Longer term, we believe that the success of efforts to promote economic growth and to preserve the Euro as a viable currency will require greater alignment of fiscal policies. Here the outlook is unclear, as European leaders have differing views on the future role and capabilities of the EFSF, debt limits, strategies to increase competitiveness, and sovereign tax policies.
Agreement on many of these issues will be important. Most of the balance sheets of the developed nations are expected to deteriorate over the next few years. Researchers at the Bank for International Settlements recently estimated that over the next decade, debt in relation to GDP will grow to 300% in Japan, 200% in Britain, and 150% in Belgium, France, Ireland, Greece, Italy, and the United States. These increases would represent ratios of debt-to-GDP that are 60% higher than current levels, on average.
Fixed income investors can be expected to be particularly sensitive to these issues, because much of the debt in troubled European countries is short-term in maturity and will need to be refinanced over the next few years. Interest rate levels will also be important in Europe, especially in peripheral countries. If interest rates are pressured higher, more countries will likely be forced to turn to the EFSF for loans, increasing the burden on the remaining countries supporting the rescue fund.
Agreement on structural issues such as fiscal policy and competitiveness will be important in helping to counter the natural headwinds that follow financial crises. As economists Carmen and Vincent Reinhart demonstrated in a recent paper entitled After the Fall, countries recovering from banking crises tend to grow more slowly, increase their debt loads, and experience stubbornly high levels of unemployment for up to a decade following the shock.
Based on the performance of more than two dozen of the world’s most developed countries, the broad pattern of economic recovery since the June 2009 recession trough is strongly consistent with historical experience. Using debt-to-GDP ratios as a proxy for the impact of the credit crisis, the 25 percent of countries with the lowest debt to GDP ratios have seen output grow by 4.8 percent since June 2009. The 25 percent most indebted countries in relation to GDP have increased output by just 2.5 percent. Many developed countries – especially those with high debt loads – still have not yet regained their peak levels of real output that were reached prior to the crisis.
Hussman Strategic International Equity Fund |
Letter to Shareholders (continued) |
Other economic measures also continue to track the typical “post-credit crisis” outcome described by the Reinhart’s. The unemployment rate in the least indebted countries has fallen by an average 0.5 percent since June 2009, while the countries with the highest debt loads in relation to GDP have seen their unemployment rates rise by an average of 0.5 percent. In general, inflation is rising more quickly in highly indebted countries, while home prices have improved at less than half the rate enjoyed by countries with healthier balance sheets.
We expect that these trends will continue to widen the dispersion in economic results experienced across the global economy, which is already leading to vastly different policy responses. Many emerging market countries are tightening monetary policy – including Taiwan, Brazil, India, and China – in response to rising inflation, particularly in the prices of food and other staples. In Brazil, food prices - which make up almost 25 percent of a typical Brazilian’s expenses – rose by 10.5 percent last year. Food prices in China rose by 9.6 percent.
Meanwhile, the US Federal Reserve continues to pursue its second round of asset purchases, promising to ultimately purchase $600 billion of Treasury securities. Of course, in a world that has become more connected over time, individual domestic policies create a feed-back loop between trading partners. The subdued growth rates and easy monetary policies of developed economies has already forced policy makers in faster growing economies to respond to price pressures and domestic demand growth more strongly than they might have otherwise.
As we enter 2011, we remain concerned about rich valuations, overextended price trends, and persistent credit strains in international markets. At the same time, we continue to identify many individual companies across the world that we believe to have both investment and diversification value. In our view, repeated credit strains, growth challenges, and dispersion between international financial markets are likely to remain part of the investment landscape in the coming years. We expect that our value-oriented investment discipline, coupled with the ability to vary our exposure to market fluctuations, will enable us to respond to the imbalances and opportunities ahead.
Sincerely,
John P. Hussman, Ph.D.
William J. Hester, M.Fin., CFA
Hussman Strategic International Equity Fund |
Letter to Shareholders (continued) |
Past performance is not predictive of future performance. Investment results and principal value will fluctuate so that shares, when redeemed, may be worth more or less than their original cost. Current performance may be higher or lower than the performance data quoted. Weekly updates regarding market conditions and investment strategy, as well as special reports, analysis, and performance data current to the most recent month end, are available at the Hussman Funds website www.hussmanfunds.com.
An investor should consider the investment objectives, risks, charges and expenses of the Fund carefully before investing. The Fund’s prospectus contains this and other important information. To obtain a copy of the Fund’s prospectus please visit our website at www.hussmanfunds.com or call 1-800-487-7626 and a copy will be sent to you free of charge. Please read the prospectus carefully before you invest. The Hussman Funds are distributed by Ultimus Fund Distributors, LLC.
The Letter to Shareholders seeks to describe some of the Adviser’s current opinions and views of the financial markets. Although the Adviser believes it has a reasonable basis for any opinions or views expressed, actual results may differ, sometimes significantly so, from those expected or expressed. The securities held by the Fund that are discussed in the Letter to Shareholders were held during the period covered by this Report. They do not comprise the entire investment portfolio of the Fund, may be sold at any time and may no longer be held by the Fund. The opinions of the Adviser with respect to those securities may change at any time.
Hussman Strategic International Equity Fund Portfolio Information |
December 31, 2010 (Unaudited) |
| Asset Allocation (% of Net Assets) |
| Country Allocation (% of Equity Holdings) (in clockwise order) |
Hussman Strategic International Equity Fund Schedule of Investments |
December 31, 2010 (Unaudited) |
| | | | | | |
| Argentina — 0.6% | | | | | | |
Telecom Argentina S.A. - ADR | | | 11,000 | | | $ | 273,790 | |
| | | | | | | | | |
| Australia — 1.2% | | | | | | | | |
Cochlear Ltd. (a) | | | 6,000 | | | | 493,493 | |
Telstra Corp. Ltd. - ADR | | | 5,000 | | | | 71,750 | |
| | | | | | | | 565,243 | |
| Belgium — 1.1% | | | | | | | | |
Mobistar S.A. (a) | | | 8,000 | | | | 519,367 | |
| | | | | | | | | |
| Brazil — 3.1% | | | | | | | | |
| Companhia de Saneamento Basico do Estado de Sao Paulo - ADR | | | 9,500 | | | | 502,360 | |
| Companhia Paranaense de Energia-Copel - ADR | | | 7,500 | | | | 188,775 | |
CPFL Energia S.A. - ADR | | | 6,000 | | | | 460,860 | |
Gol Linhas Aereas Inteligentes S.A. - ADR | | | 17,500 | | | | 269,150 | |
| Telecomunicações de São Paulo S.A. - TELESP - ADR | | | 3,000 | | | | 73,410 | |
| | | | | | | | 1,494,555 | |
| Canada — 1.0% | | | | | | | | |
Tim Hortons, Inc. - ADR | | | 11,500 | | | | 474,145 | |
| | | | | | | | | |
| Chile — 0.4% | | | | | | | | |
Embotelladora Andina S.A. - ADR | | | 200 | | | | 6,054 | |
Enersis S.A. - ADR | | | 8,000 | | | | 185,760 | |
| | | | | | | | 191,814 | |
| China — 1.2% | | | | | | | | |
JA Solar Holdings Co. Ltd. - ADR (b) | | | 20,000 | | | | 138,400 | |
Mindray Medical International Ltd. - ADR | | | 2,000 | | | | 52,800 | |
Trina Solar Ltd. - ADR (b) | | | 7,500 | | | | 175,650 | |
Yue Yuen Industrial (Holdings) Ltd. - ADR | | | 12,000 | | | | 213,840 | |
| | | | | | | | 580,690 | |
| France — 4.6% | | | | | | | | |
Alten (a) | | | 6,000 | | | | 197,339 | |
Casino Guichard-Perrachon S.A. (a) | | | 4,750 | | | | 463,713 | |
Dassault Systemes S.A. - ADR | | | 4,750 | | | | 363,470 | |
L'Oréal (a) | | | 3,600 | | | | 400,494 | |
Metropole Television S.A. (a) | | | 15,000 | | | | 363,560 | |
Sanofi-Aventis - ADR | | | 12,600 | | | | 406,098 | |
| | | | | | | | 2,194,674 | |
Hussman Strategic International Equity Fund Schedule of Investments (continued) |
December 31, 2010 (Unaudited) |
COMMON STOCKS — 45.2% (continued) | | | | | | |
| Germany — 2.5% | | | | | | |
BASF SE - ADR | | | 2,000 | | | $ | 159,920 | |
CENTROTEC Sustainable AG (b) | | | 20,000 | | | | 427,836 | |
Puma AG Rudolf Dassler Sport | | | 350 | | | | 116,051 | |
SAP AG - ADR | | | 10,300 | | | | 521,283 | |
| | | | | | | | 1,225,090 | |
| India — 1.3% | | | | | | | | |
Infosys Technologies Ltd. - ADR | | | 4,750 | | | | 361,380 | |
Wipro Ltd. - ADR | | | 17,500 | | | | 270,725 | |
| | | | | | | | 632,105 | |
| Israel — 0.4% | | | | | | | | |
Partner Communications Co. Ltd. - ADR | | | 10,000 | | | | 203,200 | |
| | | | | | | | | |
| Japan — 5.2% | | | | | | | | |
Central Japan Railway Co. (a) | | | 35 | | | | 292,454 | |
Honeys Co. Ltd. (a) | | | 40,000 | | | | 470,195 | |
Nintendo Co. Ltd. - ADR | | | 12,500 | | | | 454,125 | |
Nitori Holdings Co. Ltd. (a) | | | 2,000 | | | | 174,693 | |
Sundrug Co. Ltd (a) | | | 20,000 | | | | 581,468 | |
Takeda Pharmaceutical Co. Ltd. (a) | | | 10,500 | | | | 515,599 | |
| | | | | | | | 2,488,534 | |
| Korea — 0.9% | | | | | | | | |
LG Display Co. Ltd. - ADR | | | 24,000 | | | | 426,000 | |
| | | | | | | | | |
| Luxembourg — 0.5% | | | | | | | | |
Acergy S.A. - ADR | | | 10,000 | | | | 243,400 | |
| | | | | | | | | |
| Mexico — 0.5% | | | | | | | | |
| América Móvil S.A.B. de C.V. - Series A - ADR | | | 4,000 | | | | 227,920 | |
| | | | | | | | | |
| Netherlands — 1.1% | | | | | | | | |
Fugro N.V. (a) | | | 3,500 | | | | 288,321 | |
Unilever N.V. - ADR | | | 8,000 | | | | 251,200 | |
| | | | | | | | 539,521 | |
| Norway — 1.2% | | | | | | | | |
Tomra Systems ASA (a) | | | 85,000 | | | | 566,917 | |
| | | | | | | | | |
| Philippines — 0.2% | | | | | | | | |
| Philippine Long Distance Telephone Co. - ADR | | | 2,000 | | | | 116,540 | |
Hussman Strategic International Equity Fund Schedule of Investments (continued) |
December 31, 2010 (Unaudited) |
COMMON STOCKS — 45.2% (continued) | | | | | | |
| Portugal — 0.5% | | | | | | |
Portugal Telecom, SGPS, S.A. - ADR | | | 20,000 | | | $ | 229,200 | |
| | | | | | | | | |
| Russia — 0.1% | | | | | | | | |
Mobile TeleSystems - ADR | | | 3,500 | | | | 73,045 | |
| | | | | | | | | |
| Sweden — 2.0% | | | | | | | | |
Alfa Laval AB (a) | | | 13,600 | | | | 287,507 | |
Axfood AB | | | 3,000 | | | | 112,327 | |
Hennes & Mauritz AB (H&M) - B Shares (a) | | | 14,100 | | | | 470,206 | |
Telefonaktiebolaget LM Ericsson - ADR | | | 6,000 | | | | 69,180 | |
| | | | | | | | 939,220 | |
| Switzerland — 4.9% | | | | | | | | |
Geberit AG (a) | | | 1,300 | | | | 300,846 | |
Nestlé S.A. - ADR | | | 8,800 | | | | 517,616 | |
Novartis AG - ADR | | | 8,500 | | | | 501,075 | |
Sonova Holding AG (a) | | | 3,500 | | | | 451,559 | |
Swisscom AG - ADR | | | 6,000 | | | | 264,300 | |
Synthes, Inc. (a) | | | 2,500 | | | | 337,732 | |
| | | | | | | | 2,373,128 | |
| United Kingdom — 10.7% | | | | | | | | |
Amlin plc (a) | | | 37,500 | | | | 239,458 | |
AstraZeneca plc - ADR | | | 10,000 | | | | 461,900 | |
Carnival plc - ADR | | | 6,000 | | | | 278,220 | |
Fidessa Group plc (a) | | | 20,000 | | | | 481,154 | |
GlaxoSmithKline plc - ADR | | | 11,000 | | | | 431,420 | |
Greggs plc (a) | | | 55,000 | | | | 399,450 | |
Marks & Spencer Group plc (a) | | | 44,000 | | | | 253,785 | |
Next plc (a) | | | 15,000 | | | | 463,380 | |
Pearson plc - ADR | | | 14,500 | | | | 230,405 | |
Reckitt Benckiser Group plc - ADR | | | 12,500 | | | | 140,250 | |
Sage Group plc (The) (a) | | | 60,000 | | | | 256,347 | |
Shire plc - ADR | | | 3,000 | | | | 217,140 | |
Smith & Nephew plc - ADR | | | 6,000 | | | | 315,300 | |
Vodafone Group plc - ADR | | | 19,000 | | | | 502,170 | |
WS Atkins plc (a) | | | 40,000 | | | | 437,462 | |
| | | | | | | | 5,107,841 | |
| | | | | | | | | |
Total Common Stocks (Cost $20,507,037) | | | | | | $ | 21,685,939 | |
Hussman Strategic International Equity Fund Schedule of Investments (continued) |
December 31, 2010 (Unaudited) |
EXCHANGE-TRADED FUNDS — 5.6% | | | | | | |
iShares MSCI Canada Index Fund | | | 17,500 | | | $ | 542,500 | |
iShares MSCI Germany Index Fund | | | 22,000 | | | | 526,680 | |
iShares MSCI Hong Kong Index Fund | | | 27,500 | | | | 520,025 | |
iShares MSCI Singapore Index Fund | | | 38,000 | | | | 526,300 | |
iShares MSCI Sweden Index Fund | | | 18,000 | | | | 562,140 | |
Total Exchange-Traded Funds (Cost $2,583,640) | | | | | | $ | 2,677,645 | |
PUT OPTION CONTRACTS — 0.1% | | | | | | |
| S&P 500 Index Option, 3/19/2011 at $1,080 (Cost $79,098) | | | 75 | | | $ | 53,325 | |
| | | | | | | | | |
Total Investments at Value — 50.9% (Cost $23,169,775) | | | | | | $ | 24,416,909 | |
MONEY MARKET FUNDS — 45.6% | | | | | | |
Northern Institutional Treasury Portfolio, 0.04% (c) (Cost $21,852,687) | | | 21,852,687 | | | $ | 21,852,687 | |
| | | | | | | | | |
Total Investments and Money Market Funds at Value — 96.5% (Cost $45,022,462) | | | | | | $ | 46,269,596 | |
| | | | | | | | | |
Other Assets in Excess of Liabilities — 3.5% | | | | | | | 1,660,734 | |
| | | | | | | | | |
Net Assets — 100.0% | | | | | | $ | 47,930,330 | |
| ADR - American Depositary Receipt. |
| |
| (a) | Fair value priced (Note 1). Fair valued securities totaled $9,706,499 at December 31, 2010, representing 20.3% of net assets. |
| | |
| (b) | Non-income producing security. |
| | |
| (c) | Variable rate security. The rate shown is the 7-day effective yield as of December 31, 2010. |
| | |
| See accompanying notes to financial statements. |
Hussman Strategic International Equity Fund Schedule of Open Written Option Contracts |
December 31, 2010 (Unaudited) |
WRITTEN CALL OPTION CONTRACTS | | | | | | | | | |
| S&P 500 Index Option, | | | | | | | | | |
03/19/2011 at $1,080 | | | 75 | | | $ | 1,351,875 | | | $ | 1,210,801 | |
| See accompanying notes to financial statements. |
Hussman Strategic International Equity Fund Schedule of Futures Contracts Sold Short |
December 31, 2010 (Unaudited) |
FUTURES CONTRACTS SOLD SHORT | | | | | | Aggregate Market Value of Contracts | | | Unrealized Appreciation (Depreciation) | |
Euro STOXX 50 Index Future | 3/18/2011 | | | 300 | | | $ | 11,206,631 | | | $ | 222,093 | |
FTSE 100 Index Future | 3/18/2011 | | | 25 | | | | 2,297,466 | | | | (46,038 | ) |
Total Futures Contracts Sold Short | | | | | | | $ | 13,504,097 | | | $ | 176,055 | |
| See accompanying notes to financial statements. |
Hussman Strategic International Equity Fund Statement of Assets and Liabilities |
December 31, 2010 (Unaudited) |
| ASSETS | | | |
| Investments in securities: | | | |
| At acquisition cost | | $ | 23,169,775 | |
| At value (Note 1) | | $ | 24,416,909 | |
| Investments in money market funds | | | 21,852,687 | |
| Dividends receivable | | | 49,773 | |
| Receivable for capital shares sold | | | 735,166 | |
| Variation margin receivable (Note 1) (Note 4) | | | 344,157 | |
| Margin deposits for futures contracts (Note 1) | | | 1,946,118 | |
| Other assets | | | 46,425 | |
| Total Assets | | | 49,391,235 | |
| | | | | |
| LIABILITIES | | | | |
| Written call options, at value (Notes 1 and 4) (premiums received $1,210,801) | | | 1,351,875 | |
| Payable for capital shares redeemed | | | 30,914 | |
| Accrued investment advisory fees (Note 3) | | | 29,541 | |
| Payable to administrator (Note 3) | | | 7,775 | |
| Accrued Trustees' fees | | | 5,500 | |
| Other accrued expenses | | | 35,300 | |
| Total Liabilities | | | 1,460,905 | |
| | | | | |
| NET ASSETS | | $ | 47,930,330 | |
| | | | | |
| Net assets consist of: | | | | |
| Paid-in capital | | $ | 47,660,448 | |
| Accumulated net investment loss | | | (69,498 | ) |
Accumulated net realized losses from security transactions
and option and futures contracts | | | (952,979 | ) |
| Net unrealized appreciation (depreciation) on: | | | | |
| Investment securities | | | 1,272,907 | |
| Option contracts | | | (166,847 | ) |
| Futures contracts | | | 175,050 | |
| Translation of assets and liabilities in foreign currencies | | | 11,249 | |
| | | | | |
| NET ASSETS | | $ | 47,930,330 | |
| | | | | |
Shares of beneficial interest outstanding
(unlimited number of shares authorized, no par value) | | | 4,637,311 | |
| | | | | |
| Net asset value, offering price and redemption price per share (a) | | $ | 10.34 | |
| (a) | Redemption price varies based on length of time shares are held. |
| | |
| See accompanying notes to financial statements. |
Hussman Strategic International Equity Fund Statement of Operations |
For the Six Months Ended December 31, 2010 (Unaudited) |
| INVESTMENT INCOME | | | |
| Dividend income | | $ | 147,310 | |
| Foreign withholding taxes on dividends | | | (14,736 | ) |
| Total Income | | | 132,574 | |
| | | | | |
| EXPENSES | | | | |
| Investment advisory fees (Note 3) | | | 100,979 | |
| Trustees' fees and expenses | | | 33,053 | |
| Professional fees | | | 31,073 | |
| Custody fees | | | 28,400 | |
| Registration and filing fees | | | 23,902 | |
| Fund accounting fees (Note 3) | | | 18,985 | |
| Administration fees (Note 3) | | | 12,500 | |
| Transfer agent, account maintenance and shareholder services fees (Note 3) | | | 9,159 | |
| Printing of shareholder reports | | | 6,360 | |
| Compliance service fees (Note 3) | | | 2,662 | |
| Postage and supplies | | | 1,409 | |
| Insurance expense | | | 157 | |
| Other expenses | | | 10,373 | |
| Total Expenses | | | 279,012 | |
| Less fee reductions by the Adviser (Note 3) | | | (76,940 | ) |
| Net Expenses | | | 202,072 | |
| | | | | |
| NET INVESTMENT LOSS | | | (69,498 | ) |
| | | | | |
| REALIZED AND UNREALIZED GAINS (LOSSES) ON INVESTMENTS | | | | |
| Net realized gains (losses) from: | | | | |
| Security transactions | | | 94,210 | |
| Option contracts | | | (428,744 | ) |
| Futures contracts | | | (430,040 | ) |
| Foreign currency transactions | | | (7,430 | ) |
| Net change in unrealized appreciation (depreciation) on: | | | | |
| Investments | | | 1,573,100 | |
| Option contracts | | | (302,945 | ) |
| Futures contracts | | | 116,827 | |
| Foreign currency translation | | | 11,730 | |
| NET REALIZED AND UNREALIZED GAINS ON INVESTMENTS | | | 626,708 | |
| | | | | |
| NET INCREASE IN NET ASSETS RESULTING FROM OPERATIONS | | $ | 557,210 | |
| See accompanying notes to financial statements. |
Hussman Strategic International Equity Fund Statements of Changes in Net Assets |
|
| | | Six Months Ended December 31, 2010 (Unaudited) | | | Period Ended June 30, 2010(a) | |
| FROM OPERATIONS | | | | | | |
Net investment loss | | $ | (69,498 | ) | | $ | (24,775 | ) |
| Net realized gains (losses) from: | | | | | | | | |
Security transactions | | | 94,210 | | | | (61,952 | ) |
Option contracts | | | (428,744 | ) | | | 93,062 | |
Futures contracts | | | (430,040 | ) | | | 215,604 | |
Foreign currency transactions | | | (7,430 | ) | | | (16,562 | ) |
| Net change in unrealized appreciation (depreciation) on: | | | | | | | | |
Investments | | | 1,573,100 | | | | (300,193 | ) |
Option contracts | | | (302,945 | ) | | | 136,098 | |
Futures contracts | | | 116,827 | | | | 58,223 | |
Foreign currency translation | | | 11,730 | | | | (481 | ) |
| Net increase in net assets resulting from operations | | | 557,210 | | | | 99,024 | |
| | | | | | | | | |
| DISTRIBUTIONS TO SHAREHOLDERS | | | | | | | | |
From net realized gains | | | (386,352 | ) | | | — | |
| | | | | | | | | |
| FROM CAPITAL SHARE TRANSACTIONS | | | | | | | | |
Proceeds from shares sold | | | 39,129,480 | | | | 8,702,614 | |
Net asset value of shares issued in reinvestment of
distributions to shareholders | | | 362,653 | | | | — | |
| Proceeds from redemption fees collected (Note 1) | | | 883 | | | | — | |
Payments for shares redeemed | | | (535,182 | ) | | | — | |
| Net increase in net assets from capital share transactions | | | 38,957,834 | | | | 8,702,614 | |
| | | | | | | | | |
TOTAL INCREASE IN NET ASSETS | | | 39,128,692 | | | | 8,801,638 | |
| | | | | | | | | |
| NET ASSETS | | | | | | | | |
Beginning of period | | | 8,801,638 | | | | — | |
End of period | | $ | 47,930,330 | | | $ | 8,801,638 | |
| | | | | | | | | |
ACCUMULATED NET INVESTMENT LOSS | | $ | (69,498 | ) | | $ | — | |
| | | | | | | | | |
| CAPITAL SHARE ACTIVITY | | | | | | | | |
| Shares sold | | | 3,780,859 | | | | 873,351 | |
| Shares reinvested | | | 35,346 | | | | — | |
| Shares redeemed | | | (52,245 | ) | | | — | |
Net increase in shares outstanding | | | 3,763,960 | | | | 873,351 | |
Shares outstanding at beginning of period | | | 873,351 | | | | — | |
Shares outstanding at end of period | | | 4,637,311 | | | | 873,351 | |
| (a) | Represents the period from the commencement of operations (December 31, 2009) through June 30, 2010. |
| | |
| See accompanying notes to financial statements. |
Hussman Strategic International Equity Fund Financial Highlights |
Selected Per Share Data and Ratios for a Share Outstanding Throughout Each Period |
| | | Six Months Ended December 31, 2010 (Unaudited) | | | Period Ended June 30, 2010(a) | |
Net asset value at beginning of period | | $ | 10.08 | | | $ | 10.00 | |
| | | | | | | | | |
| Income (loss) from investment operations: | | | | | | | | |
Net investment loss | | | (0.02 | ) | | | (0.03 | ) |
Net realized and unrealized gains on investments
and option and futures contracts | | | 0.40 | | | | 0.11 | |
Total from investment operations | | | 0.38 | | | | 0.08 | |
| | | | | | | | | |
| Less distributions: | | | | | | | | |
From net realized gains | | | (0.12 | ) | | | — | |
| | | | | | | | | |
| Proceeds from redemption fees collected (Note 1) | | | 0.00 | (b) | | | — | |
| | | | | | | | | |
Net asset value at end of period | | $ | 10.34 | | | $ | 10.08 | |
| | | | | | | | | |
Total return (c) | | | 3.82% | (d) | | | 0.80% | (d) |
| | | | | | | | | |
Net assets at end of period (000's) | | $ | 47,930 | | | $ | 8,802 | |
| | | | | | | | | |
Ratio of total expenses to average net assets | | | 2.79% | (e) | | | 5.00% | (e) |
| | | | | | | | | |
Ratio of net expenses to average net assets (f) | | | 2.00% | (e) | | | 2.00% | (e) |
| | | | | | | | | |
Ratio of net investment loss to average net assets (f) | | | (0.72% | )(e) | | | (0.67% | )(e) |
| | | | | | | | | |
Portfolio turnover rate | | | 27% | (d) | | | 13% | (d) |
| (a) | Represents the period from the commencement of operations (December 31, 2009) through June 30, 2010. |
| | |
| (b) | Amount rounds to less than $0.01 per share. |
| | |
| (c) | Total return is a measure of the change in value of an investment in the Fund over the period covered, which assumes any dividends or capital gains distributions are reinvested in shares of the Fund. The returns shown do not reflect the deduction of taxes a shareholder would pay on Fund distributions or the redemption of Fund shares. |
| | |
| (d) | Not annualized. |
| | |
| (e) | Annualized. |
| | |
| (f) | Ratio was determined after advisory fee reductions and expense reimbursements (Note 3). |
| | |
| See accompanying notes to financial statements. |
Hussman Strategic International Equity Fund Notes to Financial Statements |
December 31, 2010 (Unaudited) |
| 1. | ORGANIZATION AND SIGNIFICANT ACCOUNTING POLICIES |
Hussman Strategic International Equity Fund (the “Fund”) is a diversified series of Hussman Investment Trust (the “Trust”), which is registered under the Investment Company Act of 1940 as an open-end management investment company. The Fund is authorized to issue an unlimited number of shares. The Fund commenced operations on December 31, 2009.
The Fund’s investment objective is to provide long-term capital appreciation, with added emphasis on the protection of capital during unfavorable market conditions. The Fund invests primarily in equity securities of non-U.S. issuers.
Securities and Options Valuation — The Fund’s portfolio securities are valued at market value as of the close of regular trading on the New York Stock Exchange (“NYSE”) (normally, 4:00 Eastern time) on each business day the NYSE is open. Securities traded on a foreign stock exchange may be valued based upon the closing price on the principal exchange where the security is traded; however, because the value of securities traded on foreign stock exchanges may be materially affected by events occurring before the Fund’s pricing time but after the close of the primary markets or exchanges on which such securities are traded, such securities will typically be priced at their fair value as determined by an independent pricing service approved by the Board of Trustees. As a result, the prices of securities used to calculate the Fund’s net asset value may differ from quoted or published prices for the same securities. Values of foreign securities are translated from the local currency into U.S. dollars using currency exchange rates supplied by an independent pricing quotation service. Securities, other than options, listed on the NYSE or other U.S. exchanges are valued on the basis of their last sale prices on the exchanges on which they are primarily traded. However, if the last sale price on the NYSE is different than the last sale price on any other exchange, the NYSE price will be used. If there are no sales on that day, the securities are valued at the last bid price on the NYSE or other primary exchange for that day. Securities which are quoted by NASDAQ are valued at the NASDAQ Official Closing Price; if there are no sales on that day, the securities are valued at the last bid price as reported by NASDAQ. Securities traded in over-the-counter markets, other than NASDAQ quoted securities, are valued at the last sales price, or if there are no sales on that day, at the mean of the closing bid and asked prices.
Hussman Strategic International Equity Fund Notes to Financial Statements (continued) |
December 31, 2010 (Unaudited) |
Pursuant to procedures approved by the Board of Trustees, options traded on a national securities exchange are valued at prices between the closing bid and ask prices determined by Hussman Econometrics Advisors, Inc. (the “Adviser”) to most closely reflect market value as of the time of computation of the net asset value. Options not traded on a national securities exchange or board of trade, but for which over-the-counter market quotations are readily available, are valued at the mean of their closing bid and ask prices. Futures contracts and options thereon, which are traded on commodities exchanges, are valued at their last sale price or, if not available, at the mean of the bid and ask prices as of the close of such commodities exchanges.
Fixed income securities not traded or dealt in upon any securities exchange but for which over-the-counter market quotations are readily available generally are valued at the mean of their closing bid and asked prices. Fixed income securities may also be valued on the basis of prices provided by an independent pricing service. The fair value of securities with remaining maturities of 60 days or less may be determined in good faith by the Board of Trustees to be represented by amortized cost value, absent unusual circumstances.
In the event that market quotations are not readily available or are determined by the Adviser to not be reflective of fair market value due to market events or developments, securities and options are valued at fair value as determined by the Adviser in accordance with procedures adopted by the Board of Trustees. Such methods of fair valuation may include, but are not limited to: multiple of earnings, multiple of book value, discount from market of a similar freely traded security, purchase price of security, subsequent private transactions in the security or related securities, or a combination of these and other factors.
Accounting principles generally accepted in the United States (“GAAP”) establish a single authoritative definition of fair value, set out a framework for measuring fair value and require additional disclosures about fair value measurements.
Various inputs are used in determining the value of the Fund’s investments. These inputs are summarized in the three broad levels listed below:
| | • | Level 1 – quoted prices in active markets for identical securities |
| | • | Level 2 – other significant observable inputs |
| | • | Level 3 – significant unobservable inputs |
Hussman Strategic International Equity Fund Notes to Financial Statements (continued) |
December 31, 2010 (Unaudited) |
For example, option contracts purchased and written by the Fund are classified as Level 2 since they are valued at prices between the closing bid and ask prices determined by the Adviser to most closely reflect market value. The inputs or methodology used for valuing securities are not necessarily an indication of the risks associated with investing in these securities. The inputs used to measure the value of a particular security may fall into more than one level of the fair value hierarchy. In such cases, for disclosure purposes, the level in the fair value hierarchy within which the fair value measurement of that security is determined to fall in its entirety is the lowest level input that is significant to the fair value measurement.
The following is a summary of the inputs used to value the Fund’s investments and other financial instruments as of December 31, 2010 by security type:
| | | | | | | | | | | | | |
Investments in Securities and Money Market Funds: | | | | | | | | | | | | |
Common Stocks | | $ | 11,979,440 | | | $ | 9,706,499 | | | $ | — | | | $ | 21,685,939 | |
Exchange-Traded Funds | | | 2,677,645 | | | | — | | | | — | | | | 2,677,645 | |
Put Option Contracts | | | — | | | | 53,325 | | | | — | | | | 53,325 | |
Money Market Funds | | | 21,852,687 | | | | — | | | | — | | | | 21,852,687 | |
Total Investments in Securities
and Money Market Funds | | $ | 36,509,772 | | | $ | 9,759,824 | | | $ | — | | | $ | 46,269,596 | |
| | | | | | | | | | | | | | | | | |
Other Financial Instruments: | | | | | | | | | | | | | | | | |
Futures Contracts Sold Short | | $ | (13,504,097 | ) | | $ | — | | | $ | — | | | $ | (13,504,097 | ) |
Written Call Option Contracts | | | — | | | | (1,351,875 | ) | | | — | | | | (1,351,875 | ) |
Total Other Financial Instruments | | $ | (13,504,097 | ) | | $ | (1,351,875 | ) | | $ | — | | | $ | (14,855,972 | ) |
Non-U.S. equity securities actively traded in foreign markets may be reflected in Level 2 despite the availability of closing prices, because the Fund evaluates and determines whether those closing prices reflect fair value at the close of the NYSE or require adjustment, as described in the preceding discussion of valuations of foreign securities.
The Fund’s Schedule of Investments identifies the specific securities (by type of security and geographical region) that comprise the Fund’s holdings within the Level 1 and Level 2 categories shown in the tables above. During the six months ended December 31, 2010, the Fund did not have any significant transfers in and out of Level 1 or Level 2. In addition, the Fund did not have any assets or liabilities that were measured at fair value on a recurring basis using significant unobservable inputs (Level 3) as of or during the six months ended December 31, 2010.
Hussman Strategic International Equity Fund Notes to Financial Statements (continued) |
December 31, 2010 (Unaudited) |
Futures and Options Transactions — The Fund may purchase and write put and call options on broad-based stock indices. The Fund may also purchase and write call and put options on individual securities. The Fund may use financial futures contracts and related options to hedge against changes in the market value of its portfolio securities. The Fund may also enter into forward foreign currency contracts to hedge against the adverse impact of changes in foreign exchange rates on its investments and transactions in foreign securities.
When the Fund writes an index option, an amount equal to the net premium (the premium less the commission) received by the Fund is recorded as a liability in the Fund’s Statement of Assets and Liabilities and is subsequently marked-to market daily. If an index option expires unexercised on the stipulated expiration date or if the Fund enters into a closing purchase transaction, it will realize a gain (or a loss if the cost of a closing purchase transaction exceeds the net premium received when the option is sold) and the liability related to such option will be eliminated. If an index option is exercised, the Fund will be required to pay the difference between the closing index value and the exercise price of the option. In this event, the proceeds of the sale will be increased by the net premium originally received and the Fund will realize a gain or loss.
When the Fund purchases or sells a stock index futures contract, no price is paid to or received by the Fund upon the purchase or sale of the futures contract. Instead, the Fund is required to deposit in a segregated asset account an amount of cash or qualifying securities currently ranging from 10% to 15% of the contract amount. This is called the “initial margin deposit.” Subsequent payments, known as “variation margin,” are made or received by the Fund each day, depending on the daily fluctuations in the fair value of the underlying stock index. The Fund recognizes a gain or loss equal to the daily variation margin. If market conditions move unexpectedly, the Fund may not achieve the anticipated benefits of the futures contracts and may realize a loss. In addition to the possibility that there may be an imperfect correlation or no correlation at all between the movements in the stock index future and the portion of the portfolio being hedged, the price of the stock index futures may not correlate perfectly with movements in the stock index due to certain market distortions.
Repurchase Agreements — The Fund may enter into repurchase agreements with certain banks or non-bank dealers. The value of the underlying securities collateralizing these agreements is monitored on a daily basis to ensure that the value of the collateral during the term of the agreements equals or exceeds the repurchase price plus accrued interest. If the bank or dealer defaults, realization of the collateral by the Fund may be delayed or limited, and the Fund may suffer a loss if the value of the collateral declines.
Hussman Strategic International Equity Fund Notes to Financial Statements (continued) |
December 31, 2010 (Unaudited) |
Foreign Currency Translation — Amounts denominated in or expected to settle in foreign currencies are translated into U.S. dollars based on exchange rates on the following basis:
A. The market values of investment securities and other assets and liabilities are translated at the closing spot rate on the London Stock Exchange each day.
B. Purchases and sales of investment securities and income and expenses are translated at the rate of exchange prevailing on the respective date of such transactions.
C. The Fund does not isolate that portion of the results of operations caused by changes in foreign exchange rates on investments from those caused by changes in market prices of securities held. Such fluctuations are included with the net realized and unrealized gains or losses on investments.
Reported net realized foreign exchange gains or losses arise from 1) purchases and sales of foreign currencies, 2) currency gains or losses realized between the trade and settlement dates on securities transactions, and 3) the difference between the amounts of dividends, interest and foreign withholding taxes recorded on the Fund’s books, and the U.S. dollar equivalent of the amounts actually received or paid. Reported net unrealized foreign exchange gains and losses arise from changes in the value of assets and liabilities that result from changes in exchange rates.
Share Valuation and Redemption Fees — The net asset value per share of the Fund is calculated as of the close of regular trading on the NYSE (normally 4:00 p.m., Eastern time) on each day that the NYSE is open for business. The net asset value per share of the Fund is calculated by dividing the total value of the Fund’s assets, less its liabilities, by the number of its shares outstanding. The offering price and redemption price per share of the Fund is equal to the net asset value per share. However, shares of the Fund are generally subject to a redemption fee of 1.5%, payable to the Fund, if redeemed within sixty days of the date of purchase. During the six months ended December 31, 2010, proceeds from redemption fees totaled $883. During the period ended June 30, 2010, no redemption fees were collected.
Investment Income — Interest income is accrued as earned. Dividend income is recorded on the ex-dividend date. Discounts and premiums on fixed income securities are amortized using the interest method.
Hussman Strategic International Equity Fund Notes to Financial Statements (continued) |
December 31, 2010 (Unaudited) |
Distributions to Shareholders — Distributions to shareholders arising from net investment income, if any, are declared and paid annually. Net realized short-term capital gains, if any, may be distributed throughout the year and net realized long-term capital gains, if any, are generally distributed annually. The amount of distributions from net investment income and net realized gains are determined in accordance with federal income tax regulations, which may differ from GAAP. These “book/tax” differences are either temporary or permanent in nature and are primarily due to timing differences in the recognition of capital gains or losses for option and futures transactions, losses deferred due to wash sales and treatment for foreign currency transactions.
The tax character of distributions paid during the periods ended December 31, 2010 and June 30, 2010 was as follows:
| | | | | | | | | |
| 12/31/10 | | $ | 117,274 | | | $ | 269,078 | | | $ | 386,352 | |
| 6/30/10 | | $ | — | | | $ | — | | | $ | — | |
Securities Transactions — For financial statement purposes, securities transactions are accounted for on trade date. Gains and losses on securities sold are determined on a specific identification basis.
Common Expenses — Expenses of the Trust not attributable solely to the Fund or solely to another series of the Trust are allocated among the Fund and other series of the Trust based on relative net assets or the nature of the expense and the relative applicability to the Fund and the other series of the Trust.
Accounting Estimates — The preparation of financial statements in conformity with GAAP requires management to make estimates and assumptions that affect the reported amounts of assets and liabilities and the disclosure of contingent assets and liabilities as of the date of the financial statements and the reported amounts of income and expenses during the reporting period. Actual results could differ from those estimates.
Federal Income Tax — It is the Fund’s policy to qualify as a regulated investment company under Subchapter M of the Internal Revenue Code. As provided therein, in any fiscal year in which the Fund so qualifies and distributes at least 90% of its taxable net income, the Fund (but not its shareholders) will be relieved of federal income tax on the income distributed. Accordingly, no provision for income taxes has been made.
Hussman Strategic International Equity Fund Notes to Financial Statements (continued) |
December 31, 2010 (Unaudited) |
In order to avoid imposition of a Federal excise tax applicable to regulated investment companies, it is also the Fund’s intention to declare and pay as dividends in each calendar year at least 98% of its net investment income (earned during the calendar year) and 98% of its net realized capital gains (earned during the twelve months ended October 31) plus undistributed amounts from prior years.
The following information is computed on a tax basis for each item as of December 31, 2010:
| Cost of portfolio investments and option contracts | | $ | 43,811,661 | |
| Gross unrealized appreciation | | $ | 1,708,127 | |
| Gross unrealized depreciation | | | (389,093 | ) |
| Net unrealized appreciation | | | 1,319,034 | |
| Net unrealized appreciation of assets and liabilities in foreign currencies | | | 11,249 | |
| Net unrealized appreciation on futures contracts | | | 175,050 | |
| Accumulated ordinary loss | | | (76,928 | ) |
| Other losses | | | (1,158,523 | ) |
| Total distributable earnings | | $ | 269,882 | |
The difference between the federal income tax cost of portfolio investments and its financial statement cost is due to certain timing differences in the recognition of capital gains or losses under income tax regulations and GAAP. These “book/tax” differences are temporary in nature and are primarily due to option transactions.
| 2. | INVESTMENT TRANSACTIONS |
During the six months ended December 31, 2010, cost of purchases and proceeds from sales and maturities of investment securities, other than short-term investments and U.S. government securities, amounted to $19,652,890 and $3,091,825, respectively.
| 3. | TRANSACTIONS WITH AFFILIATES |
One of the Trustees and certain officers of the Trust are affiliated with the Adviser or with Ultimus Fund Solutions, LLC (“Ultimus”), the Fund’s administrator, transfer agent and fund accounting agent.
Hussman Strategic International Equity Fund Notes to Financial Statements (continued) |
December 31, 2010 (Unaudited) |
Under the terms of an Advisory Agreement between the Trust and the Adviser, the Fund pays a fee, which is computed and accrued daily and paid monthly, at annual rates of 1.00% of the first $1 billion of average daily net assets; 0.95% of the next $2 billion of such assets; and 0.90% of such assets over $3 billion, less any fee reductions.
The Adviser has contractually agreed to reduce its advisory fees or to absorb the Fund’s operating expenses to the extent necessary so that the Fund’s ordinary operating expenses do not exceed an amount equal to 2.00% annually of its average daily net assets. This Expense Limitation Agreement remains in effect until at least December 31, 2012. During the six months ended December 31, 2010, the Adviser waived $76,940 of its advisory fees.
Any fee reductions or expense reimbursements by the Adviser, either before or after December 31, 2012, are subject to repayment by the Fund provided that such repayment does not result in the Fund’s expenses exceeding the 2.00% annual limitation and provided further that the expenses which are the subject of the repayment were incurred within three years of such repayment. As of December 31, 2010, the amount of fee reductions and expense reimbursements available for recovery by the Adviser is $188,438. The Advisor may recoup a portion of this amount no later than the dates as stated below:
Under the terms of an Administration Agreement, Ultimus supplies executive, administrative and regulatory services to the Trust, supervises the preparation of tax returns, and coordinates the preparation of reports to shareholders and reports to and filings with the Securities and Exchange Commission (“SEC”) and state securities authorities. Under the terms of the Administration Agreement, Ultimus receives a monthly fee from the Fund at annual rates of 0.075% of the Fund’s average daily net assets up to $500 million; 0.05% of the next $1.5 billion of such assets; 0.04% of the next $1 billion of such assets; 0.03% of the next $2 billion of such assets; and 0.025% of such assets in excess of $5 billion, subject to a minimum monthly fee of $2,000.
Hussman Strategic International Equity Fund Notes to Financial Statements (continued) |
December 31, 2010 (Unaudited) |
| Fund Accounting Agreement |
Under the terms of a Fund Accounting Agreement, Ultimus calculates the daily net asset value per share and maintains the financial books and records of the Fund. For these services, Ultimus receives a monthly base fee of $3,000, plus an asset-based fee computed at annual rates of 0.01% of the Fund’s average daily net assets up to $500 million and 0.005% of such assets in excess of $500 million. In addition, the Fund reimburses Ultimus for certain out-of-pocket expenses incurred in obtaining valuations of the Fund’s portfolio securities.
| Transfer Agent and Shareholder Services Agreement |
Under the terms of a Transfer Agent and Shareholder Services Agreement, Ultimus maintains the records of each shareholder’s account, answers shareholders’ inquiries concerning their accounts, processes purchases and redemptions of the Fund’s shares, acts as dividend and distribution disbursing agent and performs other shareholder service functions. For these services, Ultimus receives a fee from the Fund, payable monthly, of $22 annually for each direct account and $12 annually for certain accounts established through financial intermediaries, subject to a minimum monthly fee of $1,500. For the six months ended December 31, 2010, such fees were $9,000. In addition, the Fund reimburses Ultimus for certain out-of-pocket expenses, including, but not limited to, postage and supplies.
For shareholder accounts held through financial intermediaries, the Fund may, in some cases, compensate these intermediaries for providing certain account maintenance and shareholder services. During the six months ended December 31, 2010, the Fund paid $159 to financial intermediaries for such services.
| Compliance Consulting Agreement |
Under the terms of a Compliance Consulting Agreement between the Trust and Ultimus, Ultimus provides an individual to serve as the Trust’s Chief Compliance Officer and to administer the Trust’s compliance policies and procedures. For these services, the Trust pays Ultimus a base fee of $15,000 per annum, plus an asset-based fee computed at annual rates of .005% of the average value of the Trust’s aggregate daily net assets from $100 million to $500 million, .0025% of such assets from $500 million to $1 billion and .00125% of such assets in excess of $1 billion. The Fund pays its proportionate share of such fee along with the other series of the Trust. In addition, the Trust reimburses Ultimus for reasonable out-of-pocket expenses, if any, incurred in connection with these services.
Hussman Strategic International Equity Fund Notes to Financial Statements (continued) |
December 31, 2010 (Unaudited) |
The Trust has entered into a Distribution Agreement with Ultimus Fund Distributors, LLC (the “Distributor”), pursuant to which the Distributor provides distribution services and serves as the principal underwriter to the Fund. The Distributor is a wholly-owned subsidiary of Ultimus. The Distributor’s fees are paid by the Adviser.
| 4. | DERIVATIVES TRANSACTIONS |
Transactions in option contracts written by the Fund during the six months ended December 31, 2010 were as follows:
| | | | | | | |
Options outstanding at beginning of period | | | 20 | | | $ | 137,472 | |
Options written | | | 115 | | | | 1,532,748 | |
| Options cancelled in a closing purchase transaction | | | (60 | ) | | | (459,419 | ) |
Options outstanding at end of period | | | 75 | | | $ | 1,210,801 | |
The locations in the Statement of Assets and Liabilities of the Fund’s derivative positions are as follows:
| | | | | | | Gross Notional Amount Outstanding | |
| | | | | | | | | | |
| Index put options purchased | Investments in securities at value | | $ | 53,325 | | | $ | — | | | $ | 9,432,300 | |
| Index call options written | Written call options, at value | | | — | | | | (1,351,875 | ) | | | (9,432,300 | ) |
| Futures contracts sold short | Variation margin receivable | | | 344,157 | | | | — | | | | (13,502,070 | ) |
The average monthly notional amount of put options purchased and call options written during the six months ended December 31, 2010 was $4,245,300 and ($4,245,300), respectively. The average monthly notional amount of future contracts purchased and sold short during the six months ended December 31, 2010 was $1,584,610 and ($7,058,922), respectively.
Hussman Strategic International Equity Fund Notes to Financial Statements (continued) |
December 31, 2010 (Unaudited) |
The Fund’s transactions in derivative instruments during the six months ended December 31, 2010 are recorded in the following locations in the Statement of Operations:
| | | | | | | Change in Unrealized Gains (Losses) | |
| Index put options purchased | Net realized gains (losses) from option contracts | | $ | (228,085 | ) | Net change in unrealized appreciation (depreciation) on option contracts | | $ | (83,820 | ) |
| Index call options written | Net realized gains (losses) from option contracts | | | (200,659 | ) | Net change in unrealized appreciation (depreciation) on option contracts | | | (219,125 | ) |
| Futures contracts | Net realized gains (losses) from futures contracts | | | (430,040 | ) | Net change in unrealized appreciation (depreciation) on futures contracts | | | 116,827 | |
| 5. | CONTINGENCIES AND COMMITMENTS |
The Fund indemnifies the Trust’s officers and Trustees for certain liabilities that may arise from their performance of their duties to the Fund. Additionally, in the normal course of business, the Fund enters into contracts that contain a variety of representations and warranties and which provide general indemnifications. The Fund’s maximum exposure under these arrangements is unknown, as this would involve future claims that may be made against the Fund that have not yet occurred. However, based on experience, the Fund believes the risk of loss to be remote.
The Fund is required to recognize in the financial statements the effects of all subsequent events that provide additional evidence about conditions that existed as of the date of the Statement of Assets and Liabilities. For nonrecognized subsequent events that must be disclosed to keep the financial statements from being misleading, the Fund is required to disclose the nature of the event as well as an estimate of its financial effect, or a statement that such an estimate cannot be made. Management has evaluated subsequent events through the issuance of these financial statements and has noted no such events.
Hussman Strategic International Equity Fund About Your Fund’s Expenses (Unaudited) |
|
We believe it is important for you to understand the impact of costs on your investment. As a shareholder of the Fund, you incur two types of costs: (1) transactions costs, which may include redemption fees; and (2) ongoing costs, including management fees and other Fund expenses. The following examples are intended to help you understand your ongoing costs (in dollars) of investing in the Fund and to compare these costs with the ongoing costs of investing in other mutual funds. A mutual fund’s ongoing costs are expressed as a percentage of its average net assets. This figure is known as the expense ratio.
The expenses in the table below are based on an investment of $1,000 made at the beginning of the period shown and held for the entire period (July 1, 2010 – December 31, 2010).
The table below illustrates the Fund’s ongoing costs in two ways:
Actual fund return – This section helps you to estimate the actual expenses that you paid over the period. The “Ending Account Value” shown is derived from the Fund’s actual return, and the third column shows the dollar amount of operating expenses that would have been paid by an investor who started the period with $1,000 invested in the Fund. You may use the information here, together with the amount of your investment, to estimate the expenses that you paid over the period.
To do so, simply divide your account value by $1,000 (for example, an $8,600 account value divided by $1,000 = 8.6), and then multiply the result by the number given for the Fund under the heading “Expenses Paid During Period.”
Hypothetical 5% return – This section is intended to help you compare the Fund’s ongoing costs with those of other mutual funds. It assumes that the Fund had an annual return of 5% before expenses during the period shown. In this case, because the return used is not the Fund’s actual return, the results do not illustrate the actual expenses associated with your investment. However, the example is useful in making comparisons because the SEC requires all mutual funds to provide an example of fund expenses based on a 5% annual return. You can assess the Fund’s ongoing costs by comparing this hypothetical example with the hypothetical examples that appear in shareholder reports of other funds.
Note that expenses shown in the table are meant to highlight and help you compare ongoing costs only. The calculations assume no shares were bought or sold during the period. Your actual costs may have been higher or lower, depending on the amount of your investment and the timing of any purchases or redemptions.
Hussman Strategic International Equity Fund About Your Fund’s Expenses (Unaudited) (continued) |
|
More information about the Fund’s expenses, including annual expense ratios, can be found elsewhere in this report. For additional information on operating expenses and other shareholder costs, please refer to the Fund’s prospectus.
| Beginning Account Value July 1, 2010 | Ending Account Value December 31, 2010 | Expenses Paid During Period* |
| Based on Actual Fund Return | $1,000.00 | $1,038.20 | $10.27 |
| Based on Hypothetical 5% Annual Return (before expenses) | $1,000.00 | $1,015.12 | $10.16 |
| * | Expenses are equal to the Fund’s annualized expense ratio of 2.00% for the period, multiplied by the average account value over the period, multiplied by 184/365 (to reflect the one-half year period). |
Other Information (Unaudited) |
|
A description of the policies and procedures the Fund uses to determine how to vote proxies relating to portfolio securities is available without charge upon request by calling toll-free 1-800-HUSSMAN (1-800-487-7626), or on the SEC’s website at http://www.sec.gov. Information regarding how the Fund voted proxies relating to portfolio securities during the most recent 12-month period ended June 30 is also available without charge upon request by calling toll-free 1-800-HUSSMAN, or on the SEC’s website at http://www.sec.gov.
The Trust files a complete listing of portfolio holdings of the Fund with the SEC as of the end of the first and third quarters of each fiscal year on Form N-Q. These filings are available upon request, by calling 1-800-HUSSMAN (1-800-487-7626). You may also obtain copies of these filings on the SEC’s website at http://www.sec.gov. The Trust’s Forms N-Q may also be reviewed and copied at the SEC’s Public Reference Room in Washington, DC, and information on the operation of the Public Reference Room may be obtained by calling 1-800-SEC-0330.
INVESTMENT ADVISER
Hussman Econometrics Advisors, Inc.
5136 Dorsey Hall Drive
Ellicott City, Maryland 21042
www.hussmanfunds.com
1-800-HUSSMAN (1-800-487-7626)
ADMINISTRATOR/TRANSFER AGENT
Ultimus Fund Solutions, LLC
225 Pictoria Drive, Suite 450
Cincinnati, Ohio 45246
CUSTODIAN
US Bank NA
425 Walnut Street
Cincinnati, Ohio 45202
INDEPENDENT REGISTERED
PUBLIC ACCOUNTING FIRM
Ernst & Young LLP
1900 Scripps Center
312 Walnut Street
Cincinnati, Ohio 45202
LEGAL COUNSEL
Schulte Roth & Zabel LLP
919 Third Avenue
New York, New York 10022
This Semi-Annual Report is authorized for
distribution only if accompanied or preceded
by a current Prospectus of the Funds.
Not required
| Item 3. | Audit Committee Financial Expert. |
Not required
| Item 4. | Principal Accountant Fees and Services. |
Not required
| Item 5. | Audit Committee of Listed Registrants. |
Not applicable
| Item 6. | Schedule of Investments. |
| (a) | Not applicable [schedule filed with Item 1] |
| Item 7. | Disclosure of Proxy Voting Policies and Procedures for Closed-End Management Investment Companies. |
| Item 8. | Portfolio Managers of Closed-End Management Investment Companies |
| Item 9. | Purchases of Equity Securities by Closed-End Management Investment Company and Affiliated Purchasers. |
| Item 10. | Submission of Matters to a Vote of Security Holders. |
The registrant has not adopted procedures by which shareholders may recommend nominees to the registrant’s board of trustees.
| Item 11. | Controls and Procedures. |
(a) Based on their evaluation of the registrant’s disclosure controls and procedures (as defined in Rule 30a-3(c) under the Investment Company Act of 1940) as of a date within 90 days of the filing date of this report, the registrant’s principal executive officer and principal financial officer have concluded that such disclosure controls and procedures are reasonably designed and are operating effectively to ensure that material information relating to the registrant, including its consolidated subsidiaries, is made known to them by others within those entities, particularly during the period in which this report is being prepared, and that the information required in filings on Form N-CSR is recorded, processed, summarized, and reported on a timely basis.
(b) There were no changes in the registrant’s internal control over financial reporting (as defined in Rule 30a-3(d) under the Investment Company Act of 1940) that occurred during the second fiscal quarter of the period covered by this report that have materially affected, or are reasonably likely to materially affect, the registrant’s internal control over financial reporting.
File the exhibits listed below as part of this Form. Letter or number the exhibits in the sequence indicated.
(a)(1) Any code of ethics, or amendment thereto, that is the subject of the disclosure required by Item 2, to the extent that the registrant intends to satisfy the Item 2 requirements through filing of an exhibit: Not required
(a)(2) A separate certification for each principal executive officer and principal financial officer of the registrant as required by Rule 30a-2(a) under the Act (17 CFR 270.30a-2(a)): Attached hereto
(a)(3) Any written solicitation to purchase securities under Rule 23c-1 under the Act (17 CFR 270.23c-1) sent or given during the period covered by the report by or on behalf of the registrant to 10 or more persons: Not applicable
(b) Certifications required by Rule 30a-2(b) under the Act (17 CFR 270.30a-2(b)): Attached hereto
| Exhibit 99.CERT | Certifications required by Rule 30a-2(a) under the Act |
| Exhibit 99.906CERT | Certifications required by Rule 30a-2(b) under the Act |
SIGNATURES
Pursuant to the requirements of the Securities Exchange Act of 1934 and the Investment Company Act of 1940, the registrant has duly caused this report to be signed on its behalf by the undersigned, thereunto duly authorized.
(Registrant) Hussman Investment Trust
| By (Signature and Title)* | /s/ John P. Hussman | |
| | | John P. Hussman, President | |
| | | | |
| Date | February 28, 2011 | | |
Pursuant to the requirements of the Securities Exchange Act of 1934 and the Investment Company Act of 1940, this report has been signed below by the following persons on behalf of the registrant and in the capacities and on the dates indicated.
| By (Signature and Title)* | /s/ John P. Hussman | |
| | | John P. Hussman, President | |
| | | | |
| Date | February 28, 2011 | | |
| | | | |
| | | | |
| By (Signature and Title)* | /s/ Mark J. Seger | |
| | | Mark J. Seger, Treasurer | |
| | | | |
| Date | February 28, 2011 | | |
* Print the name and title of each signing officer under his or her signature.