UNITED STATES
SECURITIES AND EXCHANGE COMMISSION
Washington, D.C. 20549
FORM N-CSR
CERTIFIED SHAREHOLDER REPORT OF REGISTERED
MANAGEMENT INVESTMENT COMPANIES
Investment Company Act file number: 811-10045
CALVERT IMPACT FUND, INC.
(Exact name of registrant as specified in charter)
4550 Montgomery Avenue
Suite 1000N
Bethesda, Maryland 20814
(Address of Principal Executive Offices)
William M. Tartikoff, Esq.
4550 Montgomery Avenue
Suite 1000N
Bethesda, Maryland 20814
(Name and Address of Agent for Service)
Registrant's telephone number, including area code: (301) 951-4800
Date of fiscal year end: September 30
Date of reporting period: Six months ended March 31, 2014
Item 1. Report to Stockholders.
[Calvert Small Cap Fund Semi-Annual Report to Shareholders]
[Calvert Global Alternative Energy Fund and Calvert Global Water Fund Semi-Annual Report to Shareholders]
[Calvert Green Bond Fund Semi-Annual Report to Shareholders]
Choose Planet-friendly E-delivery!
Sign up now for on-line statements, prospectuses, and fund reports. In less than five minutes you can help reduce paper mail and lower fund costs.
Just go to www.calvert.com. If you already have an online account at Calvert, click on My Account, and select the documents you would like to receive via e-mail.
If you’re new to online account access, click on Login/Register to open an online account. Once you’re in, click on the E-delivery sign-up at the bottom of the Account Portfolio page and follow the quick, easy steps. Note: if your shares are not held directly at Calvert but through a brokerage firm, you must contact your broker for electronic delivery options available through their firm.

After a “risk-on” year in 2013, the first quarter of 2014 proved to be a more challenging environment for equities. Concerns about economic growth in emerging markets, geopolitical turmoil in the Ukraine, and somewhat softer macroeconomic data in the United States injected more risk aversion into the markets. At the same time, profit-taking and tempered expectations for a repeat performance of stellar 2013 returns likely drove down investor risk tolerance in the first quarter.
Despite investors taking a more cautious approach toward equities at the start of 2014, the exceptionally strong performance of the equity markets, particularly U.S. equities, in the fourth quarter of 2013 allowed all major global equity indices to finish the six-month reporting period in positive territory. For the six months ended March 31, 2014, the Standard and Poor’s (S&P) 500, Russell 1000, Russell 2000, MSCI EAFE, and MSCI Emerging Markets Indices returned 12.51%, 12.48%, 9.94%, 6.56%, and 1.49%, respectively.
From an investment-style perspective, small-cap stocks underperformed their large-cap counterparts, while value stocks outperformed growth stocks. The rotation from expensive growth stocks to more bargain-priced value stocks, if it continues, could suggest a more favorable outlook for higher-quality stocks. Looking at sector
A Look at the Environmental, Social, and Governance Analytical Framework
In recent years, U.S. consumers, investors, and companies themselves have become increasingly aware of how environmental, social, and governance (ESG) matters impact the corporate bottom line, the economy, and quality of life. At Calvert, we continue to look for ways to add value to many of our equity portfolios by integrating critical ESG factors into our research process on a company-by-company basis. We work extensively with our in-house sustainability research department to develop quantitative ESG methods and measures, compiled from multiple externally- and internally-generated data sources. We use these inputs in conjunction with fundamental research on company valuations and investment theses.
This integrated approach has yielded multiple opportunities to add value to the investment process, either by identifying long-term investment potential or by uncovering hidden risks. Calvert also continues to advocate for improved corporate policies in the areas of climate change, financial market reform, corporate governance, revenue transparency, and sustainability reporting, among others. Taken together, these efforts are helping to enhance the market’s focus on and understanding of relevant ESG issues.
4 www.calvert.com CALVERT SMALL CAP FUND SEMI-ANNUAL REPORT (UNAUDITED)
| CALVERT |
| SMALL CAP FUND |
| MARCH 31, 2014 |
| |
| | % OF TOTAL |
| ECONOMIC SECTORS | INVESTMENTS |
| Consumer Discretionary | 12.2% |
| Consumer Staples | 4.3% |
| Energy | 3.8% |
| Financials | 19.3% |
| Health Care | 9.4% |
| Industrials | 17.8% |
| Information Technology | 21.3% |
| Materials | 5.4% |
| Short-Term Investments | 4.7% |
| Telecommunication Services | 1.8% |
| Total | 100% |
performance, Health Care, Information Technology, and Materials were the top-performing sectors within the Russell 1000 Index, while the Telecommunications, Consumer Discretionary, and Consumer Staples sectors lagged.
U.S. Economic Recovery Moves Forward, Despite Fed Tapering Talk
Positive fourth-quarter results in the equity markets were driven by several factors, centering on continued U.S. economic recovery and growing investor confidence, thus creating an environment conducive to earnings expansion. These factors explain, in part, why U.S. equities shone so strongly compared with foreign developed and emerging markets. Extreme weather likely held back economic growth in much of the U.S. during the period, but markets found support as investors gained comfort in the view that weaker economic data was more a byproduct of inclement weather, rather than reflecting a broader economic slowdown.
| CALVERT |
| SMALL CAP FUND |
| MARCH 31, 2014 |
| |
| INVESTMENT PERFORMANCE | |
| (TOTAL RETURN AT NAV*) | |
| | 6 MONTHS | 12 MONTHS |
| | ENDED | ENDED |
| | 3/31/14 | 3/31/14 |
| Class A | 8.11% | 24.70% |
| Class B | 7.23% | 22.78% |
| Class C | 7.64% | 23.74% |
| Class I | 8.45% | 25.66% |
| Class Y** | 8.37% | 25.00% |
| |
| Russell 2000 | | |
| Index | 9.94% | 24.90% |
| |
| Lipper Small | | |
| Cap Core | | |
| Funds Average | 10.54% | 23.71% |
| |
| TEN LARGEST | | % OF NET |
| STOCK HOLDINGS | | ASSETS |
| DST Systems, Inc. | | 3.6% |
| Becton Dickinson & Co. | 3.6% |
| Unifirst Corp. | | 3.3% |
| Benchmark Electronics, Inc. | 3.1% |
| Kemper Corp. | | 3.1% |
| Casey's General Stores, Inc. | 2.9% |
| Matson, Inc. | | 2.9% |
| TeleTech Holdings, Inc. | 2.8% |
| Brown Shoe Co., Inc. | 2.8% |
| Deluxe Corp. | | 2.6% |
| Total | | 30.7% |
* Investment performance/return at NAV does not reflect the deduction of the Fund’s maximum 4.75% front-end sales charge or any deferred sales charges.
** Calvert Small Cap Fund first offered Class Y shares on October 18, 2013.
Performance prior to that date reflects the performance of Class A shares at net asset value (NAV). Actual Class Y share performance would have been different.
www.calvert.com CALVERT SMALL CAP FUND SEMI-ANNUAL REPORT (UNAUDITED) 5
The Fed’s decision to begin tapering its quantitative easing (QE) programs in January divided analysts on whether rising interest rates would dampen the economic recovery and create downward pressure on stocks, or whether they would instill confidence that the Fed is being responsible and attract more investors. On the whole, the resiliency and low volatility of interest rates in the wake of Fed tapering was a positive sign, indicating that—at least for a while—tapering need not produce the kind of jump in interest rates many analysts had feared.
Consumers Play a Key Role in Recovery
Although market analysts have focused largely on what is happening at the Federal Reserve, we believe an important driver of economic activity in the United States, and of Fed policy by extension, is the continued improvement in the health of the consumer balance sheet. This gives consumers better access to consumer loans and mortgages, supporting the continued recovery of the housing and automotive industries, among others. At the same time, initial jobless claims maintained their downward trend throughout the period. Continued improvements in the labor market should support consumer spending and the U.S. housing sector—keys to the success of the U.S. economic recovery.
An Anemic Europe and Sluggish China Worry Investors
A global backdrop of lower-than-target inflation persisted throughout the period, despite continued aggressive easing actions by the world’s largest central banks. There are several drivers contributing to low inflation we believe are likely to persist in the near-term. For example, anemic economic activity in Europe continued to highlight the threat of deflation, as inflation in the eurozone dipped below 1% during the period. While European Central Bank (ECB) President Mario Draghi indicated a willingness to intervene if further downside risks to price stability materialize, there appear to be few catalysts capable of driving an increase in demand-side inflation since the euro area’s economic recovery has remained tepid.
| CALVERT |
| SMALL CAP FUND |
| MARCH 31, 2014 |
| |
| AVERAGE ANNUAL TOTAL RETURNS |
| |
| CLASS A SHARES | (WITH MAX. LOAD) |
| One year | 18.79% |
| Five year | 20.08% |
| Since inception (10/1/2004) | 6.16% |
| |
| CLASS B SHARES | (WITH MAX. LOAD) |
| One year | 17.78% |
| Since inception (11/29/2010) | 13.84% |
| |
| CLASS C SHARES | (WITH MAX. LOAD) |
| One year | 22.74% |
| Five year | 20.17% |
| Since inception (4/1/2005) | 5.57% |
| |
| CLASS I SHARES | |
| One year | 25.66% |
| Five year | 22.17% |
| Since inception (4/29/2005) | 8.24% |
| |
| CLASS Y SHARES* | |
| One year | 25.00% |
| Five year | 21.32% |
| Since inception (10/1/2004) | 6.74% |
* Calvert Small Cap Fund first offered Class Y shares on October 18, 2013. Performance prior to that date reflects the performance of Class A shares at net asset value (NAV). Actual Class Y share performance would have been different.
6 www.calvert.com CALVERT SMALL CAP FUND SEMI-ANNUAL REPORT (UNAUDITED)
GROWTH OF $10,000
The graph below shows the value of a hypothetical $10,000 investment in the Fund over the past 10 fiscal year periods or since inception (for funds without 10-year records). The results shown are for Class A shares and reflect the deduction of the maximum front-end Class A sales charge of 4.75%, or deferred sales charge, as applicable and assume the reinvestment of dividends. The result is compared with benchmarks that include a broad based market index and a Lipper peer group average. Market indexes are unmanaged and their results do not reflect the effect of expenses or sales charges. The Lipper average reflects the deduction of the category’s average front-end sales charge. The value of an investment in a different share class would be different.
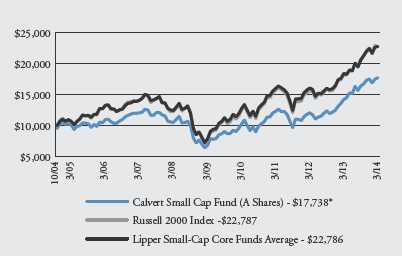
* The month-end date of 10/31/04 is used for comparison purposes only: actual fund inception is 10/1/04.
All performance data shown, including the graph above and the adjacent table, represents past performance, does not guarantee future results, assumes reinvestment of dividends and distributions and does not reflect the deduction of taxes that a shareholder would pay on the Fund’s distributions or the redemption of the Fund shares. All performance data reflects fee waivers and/or expense limitations, if any are in effect; in their absence performance would be lower. See Note B in Notes to Financial Statements. The investment return and principal value of an investment will fluctuate so that an investor’s shares, when redeemed, may be worth more or less than their original cost. Current performance may be lower or higher than the performance data quoted; for current performance data visit www.calvert.com. The gross expense ratio from the current prospectus for Class A shares is 1.78%. This number may differ from the expense ratio shown elsewhere in this report because it is based on a different time period and, if applicable, does not include fee or expense waivers. Performance data quoted already reflects the deduction of the Fund’s operating expenses.
www.calvert.com CALVERT SMALL CAP FUND SEMI-ANNUAL REPORT (UNAUDITED) 7
Worries about a hard landing in China returned to the forefront of investor concerns as the China HSBC Manufacturing PMI (Purchasing Managers’ Index) steadily declined throughout the period into contraction territory. Meanwhile, political upheaval in the Ukraine, which culminated with Russian forces occupying the Crimea region, injected further risk aversion into investor sentiment. The situation continued to negatively impact emerging-market stocks and currencies, which were already under pressure due to the prospect of slower GDP growth in emerging markets. We expect the Ukraine situation to be a continued source of headline market risk in the near-term, until a final diplomatic solution is reached.
Outlook
The contrast in economic conditions between the United States and both Europe and China (and other emerging markets) should continue to draw more investment to the U.S. in the near-term. Fed tapering will most likely add to this effect in equities as well as other asset classes. We expect the dollar to continue strengthening slowly, which may provide another reason for foreign investors to favor U.S. securities over those in their domestic markets. This also supports our outlook for continued low inflation in the near-term.
The recovery may still feel “sluggish” because the current 6.7% unemployment rate—while down from a recession peak of 10%—is still running higher than in previous expansions. From the perspective of equity investors, however, higher unemployment is likely keep downward pressure on wages, which, in turn, could help strengthen profit margins.
We think the Fed will be particularly careful not to derail economic expansion, especially as long as inflation remains low, and will do so by carefully telegraphing its position and plans as they evolve. Moreover, the signal that the Fed is serious about normalizing interest rates should improve investor confidence about the condition of the economy and reassure those who have been worried about the inflationary risk of an eternal quantitative easing. However, sharp changes in interest-rate expectations remain a risk factor, as they can drive mortgage rates higher, negatively impacting housing activity and weakening this major component of the U.S. economic recovery.
We also believe the U.S. economy can still compensate for a dampened global growth outlook. And we expect economic growth to reaccelerate in the second-half of the year on the heels of continued improvement in the housing and labor markets. In addition, as consumer activity picks up in the spring and summer, there is potential for some lost consumer activity to be recovered later in the year. Overall, we believe these conditions continue to provide a favorable underpinning for the equities markets.
Calvert Investment Management, Inc.
May 2014
8 www.calvert.com CALVERT SMALL CAP FUND SEMI-ANNUAL REPORT (UNAUDITED)

As always, Calvert continues to work hard to ensure you have a say in the responsible management of environmental, social, and governance (ESG) factors for the companies in which we invest. Below are highlights of our accomplishments during the reporting period.
Shareholder Advocacy
Calvert filed more than 26 shareholder proposals over the reporting period on a variety of issues, including board diversity, reduction of greenhouse gas emissions, disclosure of country-level sourcing and human rights risk assessment processes for apparel companies, and sustainability reporting.
After commitments from Pioneer Natural Resources Company and QEP Resources, Calvert has withdrawn one shareholder proposal and decided not to file a second one for the 2014 proxy season. The two companies agreed to improve disclosure and continue engagement regarding key challenges related to hydraulic fracturing, such as water use and emissions reduction. The resulting disclosures will help Calvert and the companies better understand how they are managing these important opportunities and risks.
Also, an effort led by Calvert Investments and other institutional investors drove the World Federation of Exchanges (WFE) to announce the launch of a Sustainability Working Group in March to develop a consensus on sustainability reporting. Such a standard would promote greater transparency and fairness in the capital markets, improve cost-efficiencies, promote timeliness and consistency for reporting companies, and equip investors to value companies more accurately and make more informed investment decisions.
During the period, Calvert filed proxy resolutions with all the U.S. publicly traded financial exchanges—CBOE, CME, IntercontinentalExchange Group/NYSE and NASDAQ OMX (NDAQ)—on this issue. However, all resolutions were withdrawn after leadership agreed to join the Working Group. We congratulate these WFE member exchanges for their leadership on investor information transparency.
Calvert was a part of the working group that developed the Shareholder Director Exchange Protocol (SDX) released in February. The protocol addresses the increasing levels of direct engagement between institutional investors, such as activist investors, and public company boards, which can significantly change the dynamic between public companies and investors. Engagement is typically between investors and management, but there is a growing interest on the part of investors and directors for more dialogue, especially when fundamental corporate governance or sustainability issues emerge. The protocol helps lay the basis for productive engagement while addressing common concerns each side may have.
www.calvert.com CALVERT SMALL CAP FUND SEMI-ANNUAL REPORT (UNAUDITED) 9
Community Investments
Many of our Funds participate in Calvert’s High Social Impact Investing program, through the CI notes administered through the Calvert Foundation. This community investment program may allocate a small percentage of Fund assets at below-market interest rates to investments that provide economic opportunity for struggling populations.
Through the CI notes’ WIN-WIN portfolio (Women Investing in Women), we recently invested in the Opportunity Fund, the leading microfinance provider in California, which provides microloans for small businesses, microsavings accounts, and community real estate financing. Its innovative repayment system allows clients like Chef Tina Ferguson-Riffe to grow her business with a $20,000 loan for new restaurant equipment and repay the loan based on daily credit/debit card sales, instead of large monthly payments.
In December, the CI notes program invested $1.2 million in One Acre Fund, a nonprofit that provides smallholder farmers in Kenya, Rwanda, and Burundi a bundle of services including seed, training, and access to markets. One Acre Fund expects to reach 251,000 farm families in 2014.
Special Equities
A modest but important portion of certain funds is allocated to small private companies developing products or services that address important sustainability or environmental issues facing our society.
One such recent investment, acquired just after the reporting period, was Africa Renewable Energy Fund, which supports small- to medium-scale independent power producers in sub-Saharan Africa with grid-connected, development-stage renewable energy projects, including small hydro, wind, geothermal, solar, biomass and waste gas technologies. Electricity outages continue to be a major problem in many of these countries. This investment will help to address that supply gap in a sustainable manner.
As of March 31, 2014, Calvert Social Investment Foundation (“Calvert Foundation” or “Foundation”) Community Investment Notes represented the following percentages of Fund net assets: Calvert Balanced Portfolio 0.7%, Calvert Equity Portfolio 0.4%, Calvert Bond Portfolio 0.4%, Calvert International Equity Fund 1.2%, Calvert Capital Accumulation Fund 0.4%, and Calvert Small Cap Fund 0.3%. The Calvert Foundation is a 501(c)(3) nonprofit organization. The Foundation’s Community Investment Note Program is not a mutual fund and should not be confused with any Calvert Investments-sponsored investment product.
As of March 31, 2014, the following companies represented the following percentages of Portfolio net assets: Pioneer Natural Resources Company .22% of Calvert Social Index Fund, 1.14% of Calvert Bond Portfolio and .29% of Calvert Balanced Portfolio; QEP Resources .04% of Calvert Social Index Fund, CBOE 0.04% of Calvert Social Index Fund, CME 0.19% of Calvert Social Index Fund, IntercontinentalExchange Group/NYSE 0.18% of Calvert Social Index Fund and 2.46% of Calvert Equity Portfolio, and NASDAQ OMX (NDAQ) 0.03% of Calvert Social Index Fund. Africa Renewable Energy Fund represented 0% of each of Calvert Equity Portfolio and Calvert International Equity Fund. Holdings are subject to change.
10 www.calvert.com CALVERT SMALL CAP FUND SEMI-ANNUAL REPORT (UNAUDITED)
SHAREHOLDER EXPENSE EXAMPLE
As a shareholder of the Fund, you incur two types of costs: (1) transaction costs, including sales charges and redemption fees; and (2) ongoing costs, including management fees; distribution (12b-1) fees; and other Fund expenses. This Example is intended to help you understand your ongoing costs (in dollars) of investing in the Fund and to compare these costs with the ongoing costs of investing in other mutual funds.
This Example is based on an investment of $1,000 invested at the beginning of the period and held for the entire period (October 1, 2013 to March 31, 2014).
Actual Expenses
The first line of the table below provides information about actual account values and actual expenses. You may use the information in this line, together with the amount you invested, to estimate the expenses that you paid over the period. Simply divide your account value by $1,000 (for example, an $8,600 account value divided by $1,000 = 8.6), then multiply the result by the number in the first line under the heading entitled “Expenses Paid During Period” to estimate the expenses you paid on your account during this period.
Hypothetical Example for Comparison Purposes
The second line of the table below provides information about hypothetical account values and hypothetical expenses based on the Fund’s actual expense ratio and an assumed rate of return of 5% per year before expenses, which is not the Fund’s actual return. The hypothetical account values and expenses may not be used to estimate the actual ending account balance or expenses you paid for the period. You may use this information to compare the ongoing costs of investing in the Fund and other funds. To do so, compare the 5% hypothetical example with the 5% hypothetical examples that appear in the shareholder reports of the other funds.
Please note that the expenses shown in the table are meant to highlight your ongoing costs only and do not reflect any transactional costs, such as sales charges (loads), or redemption fees. Therefore, the second line of the table is useful in comparing ongoing costs only, and will not help you determine the relative total costs of owning different funds. In addition, if these transactional costs were included, your costs would have been higher.
www.calvert.com CALVERT SMALL CAP FUND SEMI-ANNUAL REPORT (UNAUDITED) 11
| | BEGINNING | ENDING ACCOUNT | EXPENSES PAID |
| | ACCOUNT VALUE | VALUE | DURING PERIOD* |
| | 10/1/13 | 3/31/14 | 10/1/13 - 3/31/14 |
| CLASS A | | | |
| Actual | $1,000.00 | $1,081.11 | $8.15 |
| Hypothetical | $1,000.00 | $1,017.10 | $7.90 |
| (5% return per year before expenses) | | | |
| |
| CLASS B | | | |
| Actual | $1,000.00 | $1,072.29 | $16.48 |
| Hypothetical | $1,000.00 | $1,009.03 | $15.98 |
| (5% return per year before expenses) | | | |
| |
| CLASS C | | | |
| Actual | $1,000.00 | $1,076.43 | $12.24 |
| Hypothetical | $1,000.00 | $1,013.14 | $11.87 |
| (5% return per year before expenses) | | | |
| |
| CLASS I | | | |
| Actual | $1,000.00 | $1,084.50 | $4.78 |
| Hypothetical | $1,000.00 | $1,020.35 | $4.63 |
| (5% return per year before expenses) | | | |
| |
| CLASS Y | | | |
| Actual | $1,000.00 | $1,083.69 | $6.77 |
| Hypothetical | $1,000.00 | $1,018.44 | $6.56 |
| (5% return per year before expenses) | | | |
* Expenses are equal to the Fund’s annualized expense ratio of 1.57%, 3.19%, 2.36%, 0.92%, and 1.30% for Class A, Class B, Class C, and Class I, and Class Y, respectively, multiplied by the average account value over the period, multiplied by 182/365 (to reflect the one-half year period).
12 www.calvert.com CALVERT SMALL CAP FUND SEMI-ANNUAL REPORT (UNAUDITED)
| | |
| STATEMENT OF NET ASSETS |
| MARCH 31, 2014 |
| |
| EQUITY SECURITIES - 95.0% | SHARES | VALUE |
| Aerospace & Defense - 0.9% | | |
| Ducommun, Inc.* | 71,989 | $1,804,044 |
| |
| Airlines - 2.0% | | |
| Skywest, Inc. | 339,398 | 4,330,718 |
| |
| Auto Components - 0.4% | | |
| Gentex Corp. | 26,229 | 827,000 |
| |
| Automobiles - 0.2% | | |
| Toyota Motor Corp. (ADR) | 3,205 | 361,844 |
| |
| Banks - 6.2% | | |
| East West Bancorp, Inc | 86,193 | 3,146,044 |
| PrivateBancorp, Inc | 140,535 | 4,287,723 |
| SVB Financial Group* | 15,560 | 2,003,817 |
| Umpqua Holdings Corp. | 207,258 | 3,863,289 |
| | | 13,300,873 |
| |
| Biotechnology - 1.9% | | |
| PDL BioPharma, Inc | 490,325 | 4,074,601 |
| |
| Capital Markets - 0.5% | | |
| E*Trade Financial Corp.* | 46,603 | 1,072,801 |
| |
| Chemicals - 2.0% | | |
| Minerals Technologies, Inc. | 65,664 | 4,239,268 |
| |
| Commercial Services & Supplies - 5.9% | | |
| Deluxe Corp. | 105,250 | 5,522,467 |
| Unifirst Corp. | 64,604 | 7,102,564 |
| | | 12,625,031 |
| |
| Communications Equipment - 3.3% | | |
| Comtech Telecommunications Corp. | 67,251 | 2,142,617 |
| Harris Corp | 65,776 | 4,812,172 |
| | | 6,954,789 |
| |
| Consumer Finance - 2.1% | | |
| Nelnet, Inc | 107,664 | 4,403,458 |
| |
| Diversified Consumer Services - 1.3% | | |
| Grand Canyon Education, Inc.* | 57,005 | 2,662,134 |
| |
| Diversified Telecommunication Services - 1.1% | | |
| Atlantic Tele-Network, Inc. | 35,326 | 2,328,690 |
www.calvert.com CALVERT SMALL CAP FUND SEMI-ANNUAL REPORT (UNAUDITED) 13
| | |
| EQUITY SECURITIES - CONT’D | SHARES | VALUE |
| Electronic Equipment & Instruments - 8.9% | | |
| Anixter International, Inc | 5,513 | $559,680 |
| Arrow Electronics, Inc.* | 41,532 | 2,465,340 |
| Benchmark Electronics, Inc.* | 293,607 | 6,650,199 |
| PC Connection, Inc. | 14,526 | 295,168 |
| Plexus Corp.* | 97,277 | 3,897,889 |
| Sanmina Corp.* | 296,272 | 5,169,946 |
| | | 19,038,222 |
| |
| Energy Equipment & Services - 2.4% | | |
| Dresser-Rand Group, Inc.* | 23,206 | 1,355,462 |
| Exterran Holdings, Inc | 87,700 | 3,848,276 |
| | | 5,203,738 |
| |
| Food & Staples Retailing - 3.1% | | |
| Casey’s General Stores, Inc | 91,260 | 6,168,264 |
| Spartan Stores, Inc. | 17,144 | 397,912 |
| | | 6,566,176 |
| |
| Health Care Equipment & Supplies - 5.2% | | |
| Becton Dickinson & Co | 65,491 | 7,667,686 |
| Medtronic, Inc | 297 | 18,278 |
| Mindray Medical International Ltd. (ADR) | 108,526 | 3,511,901 |
| | | 11,197,865 |
| |
| Health Care Providers & Services - 2.2% | | |
| Ensign Group, Inc | 33,565 | 1,464,777 |
| Magellan Health Services, Inc.* | 54,393 | 3,228,224 |
| | | 4,693,001 |
| |
| Hotels, Restaurants & Leisure - 2.2% | | |
| Texas Roadhouse, Inc | 179,148 | 4,672,180 |
| |
| Household Durables - 1.1% | | |
| Panasonic Corp. (ADR) | 205,425 | 2,350,062 |
| |
| Insurance - 10.2% | | |
| American Financial Group, Inc | 51,618 | 2,978,875 |
| FBL Financial Group, Inc. | 49,902 | 2,161,754 |
| Fidelity National Financial, Inc | 16,911 | 531,682 |
| Kemper Corp. | 166,677 | 6,528,738 |
| PartnerRe Ltd | 12,026 | 1,244,691 |
| Platinum Underwriters Holdings Ltd | 80,668 | 4,848,147 |
| Symetra Financial Corp | 103,302 | 2,047,446 |
| The Navigators Group, Inc.* | 23,523 | 1,444,077 |
| | | 21,785,410 |
| |
| IT Services - 9.2% | | |
| CSG Systems International, Inc. | 13,082 | 340,655 |
| DST Systems, Inc | 82,216 | 7,793,255 |
| TeleTech Holdings, Inc.* | 245,341 | 6,013,308 |
| Unisys Corp.* | 176,820 | 5,385,937 |
| | | 19,533,155 |
14 www.calvert.com CALVERT SMALL CAP FUND SEMI-ANNUAL REPORT (UNAUDITED)
| | |
| EQUITY SECURITIES - CONT’D | SHARES | VALUE |
| Machinery - 2.8% | | |
| AGCO Corp | 4,543 | $250,592 |
| Barnes Group, Inc | 140,048 | 5,387,647 |
| LB Foster Co | 6,809 | 319,002 |
| Twin Disc, Inc | 3,376 | 88,924 |
| | | 6,046,165 |
| |
| Marine - 2.9% | | |
| Matson, Inc | 247,638 | 6,114,182 |
| |
| Media - 2.9% | | |
| McClatchy Co.* | 265,980 | 1,707,592 |
| Regal Entertainment Group | 190,043 | 3,550,003 |
| Time Warner Cable, Inc. | 6,878 | 943,524 |
| Time Warner, Inc. | 680 | 44,424 |
| | | 6,245,543 |
| |
| Metals & Mining - 2.6% | | |
| Olympic Steel, Inc. | 44,387 | 1,273,907 |
| Worthington Industries, Inc | 112,138 | 4,289,278 |
| | | 5,563,185 |
| |
| Oil, Gas & Consumable Fuels - 1.4% | | |
| EPL Oil & Gas, Inc.* | 53,334 | 2,058,692 |
| Knightsbridge Tankers Ltd | 71,681 | 971,278 |
| | | 3,029,970 |
| |
| Paper & Forest Products - 0.8% | | |
| PH Glatfelter Co | 63,528 | 1,729,232 |
| |
| Personal Products - 1.2% | | |
| USANA Health Sciences, Inc.* | 35,102 | 2,644,585 |
| |
| Pharmaceuticals - 0.0% | | |
| Roche Holding AG (ADR) | 706 | 26,630 |
| |
| Professional Services - 3.3% | | |
| ICF International, Inc.* | 71,601 | 2,850,436 |
| Insperity, Inc | 60,834 | 1,884,637 |
| Navigant Consulting, Inc.* | 127,180 | 2,373,179 |
| | | 7,108,252 |
| |
| Specialty Retail - 4.1% | | |
| ANN, Inc.* | 68,441 | 2,838,933 |
| Brown Shoe Co., Inc | 226,467 | 6,010,434 |
| | | 8,849,367 |
| |
| Wireless Telecommunication Services - 0.7% | | |
| Shenandoah Telecommunications Co. | 45,309 | 1,463,028 |
| |
| |
| Total Equity Securities (Cost $166,325,748) | | 202,845,199 |
www.calvert.com CALVERT SMALL CAP FUND SEMI-ANNUAL REPORT (UNAUDITED) 15
| | | |
| | | PRINCIPAL | |
| HIGH SOCIAL IMPACT INVESTMENTS - 0.3% | | AMOUNT | VALUE |
| Calvert Social Investment Foundation Notes, 0.50%, 7/1/14 (b)(i)(r) | $651,905 | $647,481 |
| |
| Total High Social Impact Investments (Cost $651,905) | | | 647,481 |
| |
| TIME DEPOSIT - 4.6% | | | |
| State Street Bank Time Deposit, 0.083%, 4/1/14 | | 9,958,354 | 9,958,354 |
| |
| Total Time Deposit (Cost $9,958,354) | | | 9,958,354 |
| |
| |
| TOTAL INVESTMENTS (Cost $176,936,007) - 99.9% | | 213,451,034 |
| Other assets and liabilities, net - 0.1% | | | 130,914 |
| NET ASSETS - 100% | | | $213,581,948 |
| |
| NET ASSETS CONSIST OF: | | | |
| Paid-in capital applicable to the following shares of common stock, | | |
| with 250,000,000 of $0.01 par value shares authorized: | | | |
| Class A: 6,052,661 shares outstanding | | | $112,784,761 |
| Class B: 50,776 shares outstanding | | | 317,883 |
| Class C: 678,745 shares outstanding | | | 12,119,793 |
| Class I: 2,150,273 shares outstanding | | | 46,466,569 |
| Class Y: 17,985 shares outstanding | | | 434,211 |
| Undistributed net investment income (loss) | | | (577,444) |
| Accumulated net realized gain (loss) | | | 5,521,148 |
| Net unrealized appreciation (depreciation) | | | 36,515,027 |
| |
| NET ASSETS | | | $213,581,948 |
| |
| |
| NET ASSET VALUE PER SHARE | | | |
| Class A (based on net assets of $143,648,878) | | | $23.73 |
| Class B (based on net assets of $1,158,932) | | | $22.82 |
| Class C (based on net assets of $14,867,200) | | | $21.90 |
| Class I (based on net assets of $53,479,113) | | | $24.87 |
| Class Y (based on net assets of $427,825) | | | $23.79 |
| |
| |
| RESTRICTED SECURITIES | ACQUISITION DATE | COST |
| Calvert Social Investment Foundation Notes, 0.50%, 7/1/14 | | 7/1/10 | $651,905 |
(b) This security was valued under the direction of the Board of Directors. See Note A.
(i) Restricted securities represent 0.3% of net assets.
(r) The coupon rate shown on floating or adjustable rate securities represents the rate at period end.
* Non-income producing security.
Abbreviations:
ADR: American Depositary Receipts
See notes to financial statements.
16 www.calvert.com CALVERT SMALL CAP FUND SEMI-ANNUAL REPORT (UNAUDITED)
| |
| STATEMENT OF OPERATIONS |
| SIX MONTHS ENDED MARCH 31, 2014 |
| |
| NET INVESTMENT INCOME | |
| Investment Income: | |
| Interest income | $6,766 |
| Dividend income (net of foreign taxes withheld of $116) | 1,314,782 |
| Total investment income | 1,321,548 |
| |
| Expenses: | |
| Investment advisory fee | 710,980 |
| Transfer agency fees and expenses | 207,922 |
| Administrative fees | 216,051 |
| Distribution Plan expenses: | |
| Class A | 171,263 |
| Class B | 6,115 |
| Class C | 71,374 |
| Directors’ fees and expenses | 7,936 |
| Custodian fees | 16,247 |
| Registration fees | 24,790 |
| Reports to shareholders | 33,692 |
| Professional fees | 14,771 |
| Accounting fees | 12,314 |
| Miscellaneous | 9,930 |
| Total expenses | 1,503,385 |
| Reimbursement from Advisor: | |
| Class B | (3,157) |
| Class I | (2,873) |
| Net expenses | 1,497,355 |
| |
| |
| NET INVESTMENT INCOME (LOSS) | (175,807) |
| |
| |
| REALIZED AND UNREALIZED | |
| GAIN (LOSS) ON INVESTMENTS | |
| Net realized gain (loss) | 22,577,183 |
| Change in unrealized appreciation (depreciation) | (6,504,104) |
| |
| NET REALIZED AND UNREALIZED | |
| GAIN (LOSS) ON INVESTMENTS | 16,073,079 |
| |
| INCREASE (DECREASE) IN NET ASSETS | |
| RESULTING FROM OPERATIONS | $15,897,272 |
See notes to financial statements.
www.calvert.com CALVERT SMALL CAP FUND SEMI-ANNUAL REPORT (UNAUDITED) 17
| | |
| STATEMENTS OF CHANGES IN NET ASSETS |
| |
| | SIX MONTHS ENDED | YEAR ENDED |
| | MARCH 31, | SEPTEMBER 30, |
| INCREASE (DECREASE) IN NET ASSETS | 2014 | 2013 |
| Operations: | | |
| Net investment income (loss) | ($175,807) | $59,127 |
| Net realized gain (loss) | 22,577,183 | 21,131,949 |
| Change in unrealized appreciation (depreciation) | (6,504,104) | 21,290,978 |
| |
| INCREASE (DECREASE) IN NET ASSETS | | |
| RESULTING FROM OPERATIONS | 15,897,272 | 42,482,054 |
| |
| Distributions to shareholders from: | | |
| Net investment income: | | |
| Class A shares | — | (1,239,153) |
| Class C shares | — | (21,918) |
| Class I shares | — | (484,645) |
| Net realized gain: | | |
| Class A shares | (14,647,076) | (2,586,265) |
| Class B shares | (138,533) | (38,354) |
| Class C shares | (1,638,395) | (288,508) |
| Class I shares | (5,147,885) | (707,515) |
| Class Y shares | (15,807) | — |
| Total distributions | (21,587,696) | (5,366,358) |
| |
| Capital share transactions: | | |
| Shares sold: | | |
| Class A shares | 18,166,349 | 24,588,981 |
| Class B shares | 47,074 | 13,124 |
| Class C shares | 1,347,429 | 2,375,780 |
| Class I shares | 6,271,803 | 18,224,871 |
| Class Y shares | 489,419 | — |
| Reinvestment of distributions: | | |
| Class A shares | 13,901,092 | 3,585,262 |
| Class B shares | 135,230 | 36,506 |
| Class C shares | 1,424,032 | 261,891 |
| Class I shares | 4,854,479 | 1,105,442 |
| Class Y shares | 15,806 | — |
| Redemption fees: | | |
| Class A shares | 691 | 376 |
| Shares redeemed: | | |
| Class A shares | (13,852,059) | (20,298,567) |
| Class B shares | (235,213) | (542,521) |
| Class C shares | (1,055,063) | (1,506,475) |
| Class I shares | (2,761,496) | (7,040,078) |
| Class Y shares | (71,014) | — |
| Total capital share transactions | 28,678,559 | 20,804,592 |
| |
| TOTAL INCREASE (DECREASE) IN NET ASSETS | 22,988,135 | 57,920,288 |
See notes to financial statements.
18 www.calvert.com CALVERT SMALL CAP FUND SEMI-ANNUAL REPORT (UNAUDITED)
| | |
| STATEMENTS OF CHANGES IN NET ASSETS |
| |
| INCREASE (DECREASE) IN NET ASSETS - CONT’D | | |
| | SIX MONTHS ENDED | YEAR ENDED |
| | MARCH
31, | SEPTEMBER
30, |
| NET ASSETS | 2014 | 2013 |
| Beginning of period | $190,593,813 | $132,673,525 |
| End of period (including undistributed net investment loss | | |
| and distributions in excess of net investment income | | |
| of $577,444 and $401,637, respectively) | $213,581,948 | $190,593,813 |
| |
| CAPITAL SHARE ACTIVITY | | |
| Shares sold: | | |
| Class A shares | 763,470 | 1,106,630 |
| Class B shares | 2,108 | 604 |
| Class C shares | 61,169 | 110,481 |
| Class I shares | 250,790 | 770,556 |
| Class Y shares | 20,138 | — |
| Reinvestment of distributions: | | |
| Class A shares | 611,593 | 193,984 |
| Class B shares | 6,155 | 2,027 |
| Class C shares | 67,714 | 15,188 |
| Class I shares | 204,227 | 57,733 |
| Class Y shares | 694 | — |
| Shares redeemed: | | |
| Class A shares | (586,180) | (952,854) |
| Class B shares | (10,287) | (26,539) |
| Class C shares | (47,521) | (76,223) |
| Class I shares | (112,175) | (323,345) |
| Class Y shares | (2,847) | — |
| Total capital share activity | 1,229,048 | 878,242 |
See notes to financial statements.
www.calvert.com CALVERT SMALL CAP FUND SEMI-ANNUAL REPORT (UNAUDITED) 19
NOTES TO FINANCIAL STATEMENTS
NOTE A — SIGNIFICANT ACCOUNTING POLICIES
General: Calvert Small Cap Fund (the “Fund”), a series of Calvert Impact Fund, Inc., is registered under the Investment Company Act of 1940 as a diversified, open-end management investment company. Calvert Impact Fund, Inc. is comprised of four separate series. The operations of each series are accounted for separately. The Fund offers five classes of shares - Classes A, B, C, I, and Y. Class A shares are sold with a maximum front-end sales charge of 4.75%. Class B shares are sold without a front-end sales charge and, with certain exceptions, will be charged a deferred sales charge at the time of redemption, depending on how long investors have owned the shares. Class B shares are no longer offered for purchase, except through reinvestment of dividends and/or distributions and through certain exchanges. Class C shares are sold without a front-end sales charge and, with certain exceptions, will be charged a deferred sales charge on shares sold within one year of purchase. Class B and Class C shares have higher levels of expenses than Class A shares. Class I shares require a minimum account balance of $1,000,000. The $1 million minimum initial investment is waived for retirement plans that trade through omnibus accounts and may be waived for certain other institutional accounts where it is believed to be in the best interest of the Fund and its shareholders. Class I shares have no front-end or deferred sales charge and have lower levels of expenses than Class A shares. Class Y shares are generally only available to wrap or similar fee-based programs offered by financial intermediaries, foundations, and endowments that have entered into an agreement with the Fund’s Distributor to offer Class Y shares. Class Y shares have no front-end or deferred sales charge and have lower levels of expenses than Class A shares. Each Class has different: (a) dividend rates, due to differences in Distribution Plan expenses and other class-specific expenses, (b) exchange privileges, and (c) class-specific voting rights.
Security Valuation: Net asset value per share is determined every business day as of the close of the regular session of the New York Stock Exchange (generally 4:00 p.m. Eastern time). The Fund uses independent pricing services approved by the Board of Directors (“the Board”) to value its investments wherever possible. Investments for which market quotations are not available or deemed not reliable are fair valued in good faith under the direction of the Board.
The Board has adopted Valuation Procedures (the “Procedures”) to determine the fair value of securities and other financial instruments for which market prices are not readily available or which may not be reliably priced. The Board has delegated the day-to-day responsibility for determining the fair value of assets of the Fund to Calvert Investment Management, Inc. (the “Advisor” or “Calvert”) and has provided these Procedures to govern Calvert in its valuation duties.
Calvert has chartered an internal Valuation Committee to oversee the implementation of these Procedures and to assist it in carrying out the valuation responsibilities that the Board has delegated.
The Valuation Committee meets on a regular basis to review illiquid securities and other investments which may not have readily available market prices. The Valuation Committee’s fair valuation determinations are subject to review, approval and ratification by the Board at its next regularly scheduled meeting covering the calendar quarter in which the fair valuation was determined.
20 www.calvert.com CALVERT SMALL CAP FUND SEMI-ANNUAL REPORT (UNAUDITED)
The Valuation Committee utilizes various methods to measure the fair value of the Fund’s investments. Generally Accepted Accounting Principles (GAAP) establishes a disclosure hierarchy that categorizes the inputs to valuation techniques used to value assets and liabilities at measurement date. These inputs are summarized in the three broad levels listed below:
Level 1 – quoted prices in active markets for identical securities
Level 2 – other significant observable inputs (including quoted prices for similar securities, interest rates, prepayment speeds, credit risk, etc.)
Level 3 – significant unobservable inputs (including the Fund’s own assumptions in determining the fair value of investments) The inputs or methodologies used for valuing securities are not necessarily an indication of the risk associated with investing in those securities.
Changes in valuation techniques may result in transfers in or out of an investment’s assigned level within the hierarchy during the period. There were no such transfers during the period. Valuation techniques used to value the Fund’s investments by major category are as follows: Equity securities, including restricted securities, for which market quotations are readily available, are valued at the last reported sale price or official closing price as reported by an independent pricing service on the primary market or exchange on which they are traded and are categorized as Level 1 in the hierarchy. In the event there were no sales during the day or closing prices are not available, securities are valued at the last quoted bid price or using the last available price and are categorized as Level 2 in the hierarchy. Foreign securities are valued based on quotations from the principal market in which such securities are normally traded. If events occur after the close of the principal market in which foreign securities are traded, and before the close of business of the Fund, that are expected to materially affect the value of those securities, then they are valued at their fair value taking these events into account. For restricted securities and private placements where observable inputs are limited, assumptions about market activity and risk are used and such securities are categorized as Level 3 in the hierarchy.
Debt securities, including restricted securities, are valued based on evaluated prices received from independent pricing services or from dealers who make markets in such securities and are generally categorized as Level 2 in the hierarchy. Short-term securities of sufficient credit quality with remaining maturities of sixty days or less for which quotations are not readily available are valued at amortized cost, which approximates fair value, and are categorized as Level 2 in the hierarchy.
When independent prices are unavailable or unreliable, debt securities may be valued utilizing pricing matrices which consider similar factors that would be used by independent pricing services. These are generally categorized as Level 2 in the hierarchy but may be Level 3 depending on the circumstances.
If a market value cannot be determined for a security using the methodologies described above, or if, in the good faith opinion of the Advisor, the market value does not constitute a readily available market quotation, or if a significant event has occurred that would
www.calvert.com CALVERT SMALL CAP FUND SEMI-ANNUAL REPORT (UNAUDITED) 21
materially affect the value of the security, the security will be fair valued as determined in good faith by the Valuation Committee.
The Valuation Committee considers a number of factors, including significant unobservable valuation inputs when arriving at fair value. It considers all significant facts that are reasonably available and relevant to the determination of fair value.
The Valuation Committee primarily employs a market-based approach which may use related or comparable assets or liabilities, recent transactions, market multiples, book values, and other relevant information for the investment to determine the fair value of the investment. When more appropriate, the fund may employ an income-based or cost approach. An income-based valuation approach discounts anticipated future cash flows of the investment to calculate a present amount (discounted). The measurement is based on the value indicated by current market expectations about those future amounts. Discounts may also be applied due to the nature or duration of any restrictions on the disposition of the investments. A cost based approach is based on the amount that currently would be required to replace the service capacity of an asset (current replacement cost). From the seller’s perspective, the price that would be received for the asset is determined based on the cost to a buyer to acquire or construct a substitute asset of comparable utility, adjusted for obsolescence.
The values assigned to fair value investments are based on available information and do not necessarily represent amounts that might ultimately be realized. Further, due to the inherent uncertainty of valuations of such investments, the fair values may differ significantly from the values that would have been used had an active market existed, and the differences could be material. The Valuation Committee employs various methods for calibrating these valuation approaches including a regular review of key inputs and assumptions, transactional back-testing or disposition analysis and reviews of any related market activity.
At March 31, 2014, securities valued at $647,481, or 0.3% of net assets, were fair valued in good faith under the direction of the Board.
The following is a summary of the inputs used to value the Fund’s net assets as of March 31, 2014:
| | | VALUATION INPUTS | |
| INVESTMENTS IN SECURITIES | LEVEL 1 | LEVEL 2 | LEVEL 3 | TOTAL |
| Equity securities* | $202,845,199 | — | — | $202,845,199 |
| Other debt obligations | — | $10,605,835 | — | 10,605,835 |
| TOTAL | $202,845,199 | $10,605,835 | — | $213,451,034 |
* For further breakdown of equity securities by industry, please refer to the Statement of Net Assets.
Restricted Securities: The Fund may invest in securities that are subject to legal or con tractual restrictions on resale. Generally, these securities may only be sold publicly upon registration under the Securities Act of 1933 or in transactions exempt from such registration. Information regarding restricted securities is included at the end of the Fund’s Statement of Net Assets.
22 www.calvert.com CALVERT SMALL CAP FUND SEMI-ANNUAL REPORT (UNAUDITED)
Security Transactions and Net Investment Income: Security transactions are accounted for on trade date. Realized gains and losses are recorded on an identified cost basis and may include proceeds from litigation. Dividend income is recorded on the ex-dividend date, or in the case of dividends on certain foreign securities, as soon as the Fund is informed of the ex-dividend date. Withholding taxes on foreign dividends have been provided for in accordance with the Fund’s understanding of the applicable country’s tax rules and rates. Distributions received on securities that represent a return of capital or capital gain are recorded as a reduction of cost of investments and/or as a realized gain. Interest income, which includes amortization of premium and accretion of discount on debt securities, is accrued as earned. Investment income and realized and unrealized gains and losses are allocated to separate classes of shares based upon the relative net assets of each class. Expenses arising in connection with a specific class are charged directly to that class. Expenses common to the classes are allocated to each class in proportion to their relative net assets.
Distributions to Shareholders: Distributions to shareholders are recorded by the Fund on ex-dividend date. Dividends from net investment income and distributions from net realized capital gains, if any, are paid at least annually. Distributions are determined in accordance with income tax regulations which may differ from generally accepted accounting principles; accordingly, periodic reclassifications are made within the Fund’s capital accounts to reflect income and gains available for distribution under income tax regulations.
Estimates: The preparation of financial statements in conformity with accounting principles generally accepted in the United States requires management to make estimates and assumptions that affect the reported amounts of assets and liabilities and disclosure of contingent assets and liabilities at the date of the financial statements and the reported amounts of income and expenses during the reporting period. Actual results could differ from those estimates.
Redemption Fees: The Fund charges a 2% redemption fee on redemptions, including exchanges, made within 30 days of purchase (within seven days for Class I shares). The redemption fee is accounted for as an addition to paid-in capital and is intended to discourage market-timers by ensuring that short-term trading costs are borne by the investors making the transactions and not the shareholders already in the Fund.
Federal Income Taxes: No provision for federal income or excise tax is required since the Fund intends to continue to qualify as a regulated investment company under the Internal Revenue Code and to distribute substantially all of its taxable earnings.
Management has analyzed the Fund’s tax positions taken for all open federal income tax years and has concluded that no provision for federal income tax is required in the Fund’s financial statements. A Fund’s federal tax return is subject to examination by the Internal Revenue Service for a period of three years.
NOTE B — RELATED PARTY TRANSACTIONS
Calvert Investment Management, Inc. (the “Advisor”) is wholly-owned by Calvert Investments, Inc., which is indirectly wholly-owned by Ameritas Mutual Holding Company. The Advisor provides investment advisory services and pays the salaries and fees of officers and Directors of the Fund who are employees of the Advisor or its affili-
www.calvert.com CALVERT SMALL CAP FUND SEMI-ANNUAL REPORT (UNAUDITED) 23
ates. For its services, the Advisor receives an annual fee, payable monthly, of .70% of the average daily net assets. Under the terms of the agreement, $125,931 was payable at period end. In addition, $10,014 was payable at period end for operating expenses paid by the Advisor during March 2014.
The Advisor has contractually agreed to limit net annual fund operating expenses through January 31, 2015. The contractual expense cap is 1.69%, 3.19%, 2.69%, .92%, and 1.42%. for Class A, B, C, I, and Y, respectively. For the purpose of these expense limits, operating expenses do not include interest expense, brokerage commissions, taxes, or extraordinary expenses. This expense limitation does not limit acquired fund fees and expenses, if any. At period end, $464 was recievable from the Advisor Calvert Investment Administrative Services, Inc., an affiliate of the Advisor, provides administrative services to the Fund for an annual fee, payable monthly, of .25% for Classes A, B, C, and Y shares and .10% for Class I shares based on the average daily net assets. Under the terms of the agreement, $38,206 was payable at period end.
Calvert Investment Distributors, Inc. (“CID”), an affiliate of the Advisor, is the distributor and principal underwriter for the Fund. Pursuant to Rule 12b-1 under the Investment Company Act of 1940, the Fund has adopted a Distribution Plan that permits the Fund to pay certain expenses associated with the distribution and servicing of its shares. The expenses paid may not exceed .35%, 1.00%, and 1.00% annually of average daily net assets of Class A, B, and C shares, respectively. The amount actually paid by the Fund is an annualized fee, payable monthly, of .25%, 1.00%, and 1.00% of average daily net assets of Class A, B, and C, respectively. Class I and Y shares do not have Distribution Plan expenses. Under the terms of the agreement, $43,840 was payable at period end.
CID received $22,524 as its portion of the commissions charged on sales of Class A shares for the six months ended March 31, 2014.
Calvert Investment Services, Inc. (“CIS”), an affiliate of the Advisor, acts as shareholder servicing agent for the Fund. For its services, CIS received a fee of $34,021 for the six months ended March 31, 2014. Under the terms of the agreement, $5,691 was payable at period end. Boston Financial Data Services, Inc. is the transfer and dividend disbursing agent.
The Fund invests in Community Investment Notes issued by the Calvert Social Investment Foundation (the “CSI Foundation”). The CSI Foundation is a 501(c)(3) nonprofit organization that receives in-kind support from Calvert and its subsidiaries. The Fund has received an exemptive order from the Securities and Exchange Commission permitting the Fund to make investments in these notes under certain conditions.
Each Director of the Fund who is not an employee of the Advisor or its affiliates receives an annual retainer of $48,000 plus a meeting fee of up to $3,000 for each Board meeting attended. Additional fees of $5,000 annually may be paid to the Board chair and Committee chairs ($10,000 for the Special Equities Committee chair) and $2,500 annually may be paid to Committee members, plus a Committee meeting fee of $500 for each Committee meeting attended. Directors’ fees are allocated to each of the funds served.
24 www.calvert.com CALVERT SMALL CAP FUND SEMI-ANNUAL REPORT (UNAUDITED)
NOTE C — INVESTMENT ACTIVITY AND TAX INFORMATION
During the period, the cost of purchases and proceeds from sales of investments, other than short-term securities, were $102,650,590 and $80,893,858, respectively.
The Fund intends to elect to defer ordinary losses of $401,637 incurred from January 1, 2013 through September 30, 2013 and treat them as arising in the fiscal year ending September 30, 2014.
As of March 31, 2014, the tax basis components of unrealized appreciation/(depreciation) and the federal tax cost were as follows:
| Unrealized appreciation | $39,049,391 |
| Unrealized (depreciation) | (2,568,522) |
| Net unrealized appreciation/(depreciation) | $36,480,869 |
| |
| Federal income tax cost of investments | $176,970,165 |
NOTE D — LINE OF CREDIT
A financing agreement is in place with the Calvert Funds and State Street Corporation (“SSC”). Under the agreement, SSC provides an unsecured line of credit facility, in the aggregate amount of $50 million ($25 million committed and $25 million uncommitted), accessible by the Funds for temporary or emergency purposes only. Borrowings under the committed facility bear interest at the higher of the London Interbank Offered Rate (LIBOR) or the overnight Federal Funds Rate plus 1.25% per annum. A commitment fee of .11% per annum is incurred on the unused portion of the committed facility, which is allocated to all participating funds. The Fund had no borrowings under the agreement during the six months ended March 31, 2014.
NOTE E — SUBSEQUENT EVENTS
In preparing the financial statements as of March 31, 2014, no subsequent events or transactions occurred that would have required recognition or disclosure in these financial statements.
www.calvert.com CALVERT SMALL CAP FUND SEMI-ANNUAL REPORT (UNAUDITED) 25
| | | |
| FINANCIAL HIGHLIGHTS |
| |
| | | PERIODS ENDED | |
| | MARCH 31, | SEPTEMBER 30, | SEPTEMBER 30, |
| CLASS A SHARES | 2014 (z) | 2013 (z) | 2012 (z) |
| Net asset value, beginning | $24.58 | $19.36 | $15.15 |
| Income from investment operations: | | | |
| Net investment income (loss) | (.03) | (.01) | .20 |
| Net realized and unrealized gain (loss) | 1.90 | 6.02 | 4.05 |
| Total from investment operations | 1.87 | 6.01 | 4.25 |
| Distributions from: | | | |
| Net investment income | — | (.25) | (.04) |
| Net realized gain | (2.72) | (.54) | — |
| Total distributions | (2.72) | (.79) | (.04) |
| Total increase (decrease) in net asset value | (.85) | 5.22 | 4.21 |
| Net asset value, ending | $23.73 | $24.58 | $19.36 |
| |
| Total return* | 8.11% | 32.42% | 28.12% |
| Ratios to average net assets:A | | | |
| Net investment income (loss) | (.27%) (a) | (.05%) | 1.13% |
| Total expenses | 1.57% (a) | 1.67% | 1.78% |
| Expenses before offsets | 1.57% (a) | 1.67% | 1.69% |
| Net expenses | 1.57% (a) | 1.67% | 1.69% |
| Portfolio turnover | 43% | 82% | 3% |
| Net assets, ending (in thousands) | $143,649 | $129,407 | $95,189 |
| |
| |
| | | YEARS ENDED | |
| | SEPTEMBER 30, | SEPTEMBER 30, | SEPTEMBER 30, |
| CLASS A SHARES | 2011 (z) | 2010 | 2009 |
| Net asset value, beginning | $15.55 | $14.14 | $15.61 |
| Income from investment operations: | | | |
| Net investment income (loss) | .02 | (.06) | (.02) |
| Net realized and unrealized gain (loss) | (.42) | 1.47 | (1.45) |
| Total from investment operations | (.40) | 1.41 | (1.47) |
| Distributions from: | | | |
| Net investment income | — | — | — |
| Net realized gain | — | — | — |
| Total distributions | — | — | — |
| Total increase (decrease) in net asset value | (.40) | 1.41 | (1.47) |
| Net asset value, ending | $15.15 | $15.55 | $14.14 |
| |
| Total return* | (2.56%) | 9.97% | (9.42%) |
| Ratios to average net assets:A | | | |
| Net investment income (loss) | .13% | (.35%) | (.18%) |
| Total expenses | 1.81% | 1.94% | 2.09% |
| Expenses before offsets | 1.69% | 1.69% | 1.70% |
| Net expenses | 1.69% | 1.69% | 1.69% |
| Portfolio turnover | 9% | 174% | 61% |
| Net assets, ending (in thousands) | $81,374 | $34,763 | $34,051 |
See notes to financial highlights.
26 www.calvert.com CALVERT SMALL CAP FUND SEMI-ANNUAL REPORT (UNAUDITED)
| | | |
| FINANCIAL HIGHLIGHTS |
| |
| | | PERIODS ENDED | |
| | MARCH 31, | SEPTEMBER 30, | SEPTEMBER 30, |
| CLASS B SHARES | 2014 (z) | 2013 (z) | 2012 (z) |
| Net asset value, beginning | $23.92 | $18.89 | $14.97 |
| Income from investment operations: | | | |
| Net investment income (loss) | (.22) | (.32) | (.05) |
| Net realized and unrealized gain (loss) | 1.84 | 5.89 | 3.97 |
| Total from investment operations | 1.62 | 5.57 | 3.92 |
| Distributions from: | | | |
| Net investment income | — | — | — |
| Net realized gain | (2.72) | (.54) | — |
| Total distributions | (2.72) | (.54) | — |
| Total increase (decrease) in net asset value | (1.10) | 5.03 | 3.92 |
| Net asset value, ending | $22.82 | $23.92 | $18.89 |
| |
| Total return* | 7.23% | 30.40% | 26.19% |
| Ratios to average net assets:A | | | |
| Net investment income (loss) | (1.90%) (a) | (1.53%) | (.31%) |
| Total expenses | 3.71% (a) | 3.64% | 3.50% |
| Expenses before offsets | 3.19% (a) | 3.19% | 3.19% |
| Net expenses | 3.19% (a) | 3.19% | 3.19% |
| Portfolio turnover | 43% | 82% | 3% |
| Net assets, ending (in thousands) | $1,159 | $1,263 | $1,449 |
| |
| |
| | | | PERIOD ENDED |
| | | | SEPTEMBER 30, |
| CLASS B SHARES | | | 2011 (z)# |
| Net asset value, beginning | | | $16.81 |
| Income from investment operations: | | | |
| Net investment income (loss) | | | (.21) |
| Net realized and unrealized gain (loss) | | | (1.63) |
| Total from investment operations | | | (1.84) |
| Distributions from: | | | |
| Net investment income | | | — |
| Net realized gain | | | — |
| Total distributions | | | — |
| Total increase (decrease) in net asset value | | | (1.84) |
| Net asset value, ending | | | $14.97 |
| |
| Total return* | | | (10.95%) |
| Ratios to average net assets: A | | | |
| Net investment income (loss) | | | (1.38%) (a) |
| Total expenses | | | 3.46% (a) |
| Expenses before offsets | | | 3.19% (a) |
| Net expenses | | | 3.19% (a) |
| Portfolio turnover | | | 9%** |
| Net assets, ending (in thousands) | | | $2,183 |
See notes to financial highlights.
www.calvert.com CALVERT SMALL CAP FUND SEMI-ANNUAL REPORT (UNAUDITED) 27
| | | |
| FINANCIAL HIGHLIGHTS |
| |
| | | PERIODS ENDED | |
| | MARCH 31, | SEPTEMBER 30, | SEPTEMBER 30, |
| CLASS C SHARES | 2014 (z) | 2013 (z) | 2012 (z) |
| Net asset value, beginning | $22.98 | $18.08 | $14.25 |
| Income from investment operations: | | | |
| Net investment income (loss) | (.12) | (.17) | .03 |
| Net realized and unrealized gain (loss) | 1.76 | 5.65 | 3.80 |
| Total from investment operations | 1.64 | 5.48 | 3.83 |
| Distributions from: | | | |
| Net investment income | — | (.04) | — |
| Net realized gain | (2.72) | (.54) | — |
| Total distributions | (2.72) | (.58) | — |
| Total increase (decrease) in net asset value | (1.08) | 4.90 | 3.83 |
| Net asset value, ending | $21.90 | $22.98 | $18.08 |
| |
| Total return* | 7.64% | 31.35% | 26.88% |
| Ratios to average net assets: A | | | |
| Net investment income (loss) | (1.07%) (a) | (.86%) | .19% |
| Total expenses | 2.36% (a) | 2.49% | 2.64% |
| Expenses before offsets | 2.36% (a) | 2.49% | 2.64% |
| Net expenses | 2.36% (a) | 2.49% | 2.64% |
| Portfolio turnover | 43% | 82% | 3% |
| Net assets, ending (in thousands) | $14,867 | $13,726 | $9,907 |
| |
| |
| | | YEARS ENDED | |
| | SEPTEMBER 30, | SEPTEMBER 30, | SEPTEMBER 30, |
| CLASS C SHARES | 2011 (z) | 2010 | 2009 |
| Net asset value, beginning | $14.77 | $13.55 | $15.08 |
| Income from investment operations: | | | |
| Net investment income (loss) | (.15) | (.15) | (.12) |
| Net realized and unrealized gain (loss) | (.37) | 1.37 | (1.41) |
| Total from investment operations | (.52) | 1.22 | (1.53) |
| Distributions from: | | | |
| Net investment income | — | — | — |
| Net realized gain | — | — | — |
| Total distributions | — | — | — |
| Total increase (decrease) in net asset value | (.52) | 1.22 | (1.53) |
| Net asset value, ending | $14.25 | $14.77 | $13.55 |
| |
| Total return* | (3.52%) | 9.00% | (10.15%) |
| Ratios to average net assets: A | | | |
| Net investment income (loss) | (.87%) | (1.28%) | (1.17%) |
| Total expenses | 2.74% | 3.17% | 3.64% |
| Expenses before offsets | 2.69% | 2.69% | 2.70% |
| Net expenses | 2.69% | 2.69% | 2.69% |
| Portfolio turnover | 9% | 174% | 61% |
| Net assets, ending (in thousands) | $8,618 | $2,583 | $1,889 |
See notes to financial highlights.
28 www.calvert.com CALVERT SMALL CAP FUND SEMI-ANNUAL REPORT (UNAUDITED)
| | | |
| FINANCIAL HIGHLIGHTS |
| |
| | | PERIODS ENDED | |
| | MARCH 31, | SEPTEMBER 30, | SEPTEMBER 30, |
| CLASS I SHARES | 2014 (z) | 2013 (z) | 2012 (z) |
| Net asset value, beginning | $25.56 | $20.06 | $15.80 |
| Income from investment operations: | | | |
| Net investment income | .05 | .16 | .35 |
| Net realized and unrealized gain (loss) | 1.98 | 6.24 | 4.21 |
| Total from investment operations | 2.03 | 6.40 | 4.56 |
| Distributions from: | | | |
| Net investment income | — | (.36) | (.30) |
| Net realized gain | (2.72) | (.54) | — |
| Total distributions | (2.72) | (.90) | (.30) |
| Total increase (decrease) in net asset value | (.69) | 5.50 | 4.26 |
| Net asset value, ending | $24.87 | $25.56 | $20.06 |
| |
| Total return* | 8.45% | 33.43% | 29.11% |
| Ratios to average net assets:A | | | |
| Net investment income | .38% (a) | .71% | 1.88% |
| Total expenses | .93% (a) | .98% | 1.03% |
| Expenses before offsets | .92% (a) | .92% | .92% |
| Net expenses | .92% (a) | .92% | .92% |
| Portfolio turnover | 43% | 82% | 3% |
| Net assets, ending (in thousands) | $53,479 | $46,198 | $26,129 |
| |
| |
| | | YEARS ENDED | |
| | SEPTEMBER 30, | SEPTEMBER 30, | SEPTEMBER 30, |
| CLASS I SHARES | 2011 (z) | 2010 | 2009 |
| Net asset value, beginning | $16.14 | $14.56 | $15.94 |
| Income from investment operations: | | | |
| Net investment income | .17 | .08 | .08 |
| Net realized and unrealized gain (loss) | (.45) | 1.50 | (1.46) |
| Total from investment operations | (.28) | 1.58 | (1.38) |
| Distributions from: | | | |
| Net investment income | (.06) | — | — |
| Net realized gain | — | — | — |
| Total distributions | (.06) | — | — |
| Total increase (decrease) in net asset value | (.34) | 1.58 | (1.38) |
| Net asset value, ending | $15.80 | $16.14 | $14.56 |
| |
| Total return* | (1.81%) | 10.85% | (8.66%) |
| Ratios to average net assets:A | | | |
| Net investment income | .90% | .44% | .60% |
| Total expenses | 1.08% | 1.16% | 1.16% |
| Expenses before offsets | .92% | .92% | .93% |
| Net expenses | .92% | .92% | .92% |
| Portfolio turnover | 9% | 174% | 61% |
| Net assets, ending (in thousands) | $17,895 | $12,001 | $12,428 |
See notes to financial highlights.
www.calvert.com CALVERT SMALL CAP FUND SEMI-ANNUAL REPORT (UNAUDITED) 29
| |
| FINANCIAL HIGHLIGHTS |
| |
| | PERIOD ENDED |
| | MARCH 31, |
| CLASS Y SHARES | 2014 (z)## |
| Net asset value, beginning | $25.36 |
| Income from investment operations: | |
| Net investment income | 0.02 |
| Net realized and unrealized gain (loss) | 1.13 |
| Total from investment operations | 1.15 |
| Distributions from: | |
| Net investment income | — |
| Net realized gain | (2.72) |
| Total distributions | (2.72) |
| Total increase (decrease) in net asset value | (1.57) |
| Net asset value, ending | $23.79 |
| |
| Total return* | 5.04% |
| Ratios to average net assets:A | |
| Net investment income | .23% (a) |
| Total expenses | 1.30% (a) |
| Expenses before offsets | 1.30% (a) |
| Net expenses | 1.30% (a) |
| Portfolio turnover | 43% |
| Net assets, ending (in thousands) | $428 |
A Total expenses do not reflect amounts reimbursed and/or waived by the Advisor or reductions from expense offset arrangements. Expenses before offsets reflect expenses after reimbursement and/or waiver by the Advisor but prior to reductions from expense offset arrangements. Net expenses are net of all reductions and represent the net expenses paid by the Fund.
* Total return is not annualized for periods of less than one year and does not reflect deduction of any front-end or deferred sales charge.
** Portfolio turnover is not annualized for periods of less than one year.
# From November 29, 2010 inception.
## From October 18, 2013 inception. (a) Annualized.
(z) Per share figures are calculated using the Average Shares Method.
See notes to financial statements.
30 www.calvert.com CALVERT SMALL CAP FUND SEMI-ANNUAL REPORT (UNAUDITED)
EXPLANATION OF FINANCIAL TABLES
SCHEDULE OF INVESTMENTS
The Schedule of Investments is a snapshot of all securities held in the fund at their market value, on the last day of the reporting period. Securities are listed by asset type (e.g., common stock, corporate bonds, U.S. government obligations) and may be further broken down into sub-groups and by industry classification.
STATEMENT OF ASSETS AND LIABILITIES
The Statement of Assets and Liabilities is often referred to as the fund’s balance sheet. It lists the value of what the fund owns, is due and owes on the last day of the reporting period. The fund’s assets include the market value of securities owned, cash, receivables for securities sold and shareholder subscriptions, and receivables for dividends and interest payments that have been earned, but not yet received. The fund’s liabilities include payables for securities purchased and shareholder redemptions, and expenses owed but not yet paid. The statement also reports the fund’s net asset value (NAV) per share on the last day of the reporting period. The NAV is calculated by dividing the fund’s net assets (assets minus liabilities) by the number of shares outstanding. This statement is accompanied by a Schedule of Investments. Alternatively, if certain conditions are met, a Statement of Net Assets may be presented in lieu of this statement and the Schedule of Investments.
STATEMENT OF NET ASSETS
The Statement of Net Assets provides a detailed list of the fund’s holdings, including each security’s market value on the last day of the reporting period. The Statement of Net Assets includes a Schedule of Investments. Other assets are added and other liabilities subtracted from the investments total to calculate the fund’s net assets. Finally, net assets are divided by the outstanding shares of the fund to arrive at its share price, or Net Asset Value (NAV) per share.
At the end of the Statement of Net Assets is a table displaying the composition of the fund’s net assets. Paid in Capital is the money invested by shareholders and represents the bulk of net assets. Undistributed Net Investment Income and Accumulated Net Realized Gains usually approximate the amounts the fund had available to distribute to shareholders as of the statement date. Accumulated Realized Losses will appear as negative balances. Unrealized Appreciation (Depreciation) is the difference between the market value of the fund’s investments and their cost, and reflects the gains (losses) that would be realized if the fund were to sell all of its investments at their statement-date values.
STATEMENT OF OPERATIONS
The Statement of Operations summarizes the fund’s investment income earned and expenses incurred in operating the fund. Investment income includes dividends earned from stocks and interest earned from interest-bearing securities in the fund. Expenses incurred in operating the fund include the advisory fee paid to the investment advisor, administrative services fees, distribution plan expenses (if applicable), transfer agent fees, shareholder servicing expenses, custodial, legal, and audit fees, and the printing and postage expenses related to shareholder reports. Expense offsets (fees paid indirectly) may also be shown. Credits earned from offset arrangements are used to reduce the fund’s expenses. This statement
www.calvert.com CALVERT SMALL CAP FUND SEMI-ANNUAL REPORT (UNAUDITED) 31
also shows net gains (losses) realized on the sale of investments and the increase or decrease in the unrealized appreciation (depreciation) on investments held during the period.
STATEMENT OF CHANGES IN NET ASSETS
The Statement of Changes in Net Assets shows how the fund’s total net assets changed during the two most recent reporting periods. Changes in the fund’s net assets are attributable to investment operations, distributions and capital share transactions.
The Operations section of the report summarizes information detailed in the Statement of Operations. The Distribution section shows the dividend and capital gain distributions made to shareholders. The amounts shown as distributions in this section may not match the net investment income and realized gains amounts shown in the Operations section because distributions are determined on a tax basis and certain investments or transactions may be treated differently for financial statement and tax purposes. The Capital Share Transactions section shows the amount shareholders invested in the fund, either by purchasing shares or by reinvesting distributions, and the amounts redeemed. The corresponding numbers of shares issued, reinvested and redeemed are shown at the end of the report.
FINANCIAL HIGHLIGHTS
The Financial Highlights table provides a per-share breakdown per class of the components that affect the fund’s net asset value for current and past reporting periods. The table provides total return, total distributions, expense ratios, portfolio turnover and net assets for the applicable period. Total return is a measure of a fund’s performance that encompasses all elements of return: dividends, capital gain distributions and changes in net asset value. Total return is the change in value of an investment over a given period, assuming reinvestment of any dividends and capital gain distributions, expressed as a percentage of the initial investment. Total distributions include distributions from net investment income and net realized gains. Long-term gains are earned on securities held in the fund more than one year. Short-term gains, on the sale of securities held less than one year, are treated as ordinary dividend income for tax purposes. The expense ratio is a fund’s cost of doing business, expressed as a percentage of net assets. These expenses directly reduce returns to shareholders. Portfolio turnover measures the trading activity in a fund’s investment portfolio – how often securities are bought and sold by a fund. Portfolio turnover is affected by market conditions, changes in the size of the fund, the nature of the fund’s investments and the investment style of the portfolio manager.
PROXY VOTING
The Proxy Voting Guidelines of the Calvert Funds that the Fund uses to determine how to vote proxies relating to portfolio securities are provided as an Appendix to the Fund’s Statement of Additional Information. The Statement of Additional Information can be obtained free of charge by calling the Fund at 1-800-368-2745, by visiting the Calvert website at www.calvert.com; or by visiting the SEC’s website at www.sec.gov.
Information regarding how the Fund voted proxies relating to portfolio securities during the most recent 12-month period ended June 30 is available on the Fund’s website at www.calvert.com and on the SEC’s website at www.sec.gov.
32 www.calvert.com CALVERT SMALL CAP FUND SEMI-ANNUAL REPORT (UNAUDITED)
AVAILABILITY OF QUARTERLY PORTFOLIO HOLDINGS
The Fund files its complete schedule of portfolio holdings with the SEC for the first and third quarters of each fiscal year on Form N-Q. The Fund’s Form N-Q is available on the SEC’s website at www.sec.gov. The Fund’s Form N-Q may be reviewed and copied at the SEC’s Public Reference Room in Washington, DC; information on the operation of the Public Reference Room may be obtained by calling 1-800-SEC-0330.
BASIS FOR BOARD’S APPROVAL OF INVESTMENT ADVISORY CONTRACT
At a meeting held on December 10, 2013, the Board of Directors, and by a separate vote, the disinterested Directors, approved the continuance of the Investment Advisory Agreement between Calvert Impact Fund, Inc. and the Advisor with respect to the Fund.
In evaluating the Investment Advisory Agreement, the Board considered, a variety of information relating to the Fund and the Advisor. The disinterested Directors reviewed a report prepared by the Advisor regarding various services provided to the Fund by the Advisor and its affiliates. Such report included, among other data, information regarding the Advisor’s personnel and the Advisor’s revenue and cost of providing services to the Fund, and a separate report prepared by an independent third party, which provided a statistical analysis comparing the Fund’s investment performance, expenses, and fees to comparable mutual funds.
The disinterested Directors were separately represented by independent legal counsel with respect to their consideration of the reapproval of the Investment Advisory Agreement. Prior to voting, the disinterested Directors reviewed the proposed continuance of the Investment Advisory Agreement with management and also met in private sessions with their counsel at which no representatives of management were present.
In the course of its deliberations regarding the Investment Advisory Agreement, the Board considered the following factors, among others: the nature, extent and quality of the services provided by the Advisor, including the personnel providing such services; the Advisor’s financial condition; the level and method of computing the Fund’s advisory fee; comparative performance, fee and expense information for the Fund; the profitability of the Calvert Family of Funds to the Advisor and its affiliates; the allocation of the Fund’s brokerage, including the Advisor’s process for monitoring “best execution”; the direct and indirect benefits, if any, derived by the Advisor and its affiliates from their relationship with the Fund; the effect of the Fund’s growth and size on the Fund’s performance and expenses; the affiliated distributor’s process for monitoring sales load breakpoints; the Advisor’s compliance programs and policies; the Advisor’s performance of substantially similar duties for other funds; and any possible conflicts of interest.
In considering the nature, extent and quality of the services provided by the Advisor under the Investment Advisory Agreement, the Board reviewed information provided by the Advisor relating to its operations and personnel, including, among other information, biographical information on the Advisor’s investment, supervisory and professional staff and descriptions of its organizational and management structure. The Board also took
www.calvert.com CALVERT SMALL CAP FUND SEMI-ANNUAL REPORT (UNAUDITED) 33
into account similar information provided periodically throughout the previous year by the Advisor as well as the Board’s familiarity with management through Board of Directors’ meetings, discussions and other reports. The Board considered the Advisor’s management style and its performance in employing its investment strategies as well as its current level of staffing and overall resources. The Board also noted that it reviewed on a quarterly basis information regarding the Advisor’s compliance with applicable policies and procedures, including those related to personal investing. The Advisor’s administrative capabilities, including its ability to supervise the other service providers for the Fund, were also considered. The Board also took into account the environmental, social, sustainability and governance research and analysis provided by the Advisor to the Fund. The Board observed that the scope of services provided by the Advisor generally had expanded over time as a result of regulatory, market and other changes. The Board took into consideration, among other factors, the effectiveness of the Fund’s and Advisor’s processes, policies and procedures and the Advisor’s personnel. The Board also took into account, among other items, periodic reports received from the Advisor over the past year concerning the Advisor’s ongoing review and enhancement of certain processes, policies and procedures of the Fund and the Advisor. The Board concluded that it was satisfied with the nature, extent and quality of services provided to the Fund by the Advisor under the Investment Advisory Agreement.
In considering the Fund’s performance, the Board noted that it reviewed on a quarterly basis detailed information about the Fund’s performance results, portfolio composition and investment strategies. In addition, the Board took into account overall financial market conditions. The Board also reviewed various comparative data provided to it in connection with its consideration of the renewal of the Investment Advisory Agreement, including, among other information, a comparison of the Fund’s total return with its Lipper index and with that of other mutual funds deemed to be in its peer group by an independent third party in its report. This comparison indicated that the Fund performed above the median of its peer group for the one- and three-year periods ended June 30, 2013. For the five-year period ended June 30, 2013, the Fund performed at the median of its peer group. The data also indicated that the Fund outperformed its Lipper index for the one-and three- year periods ended June 30, 2013 and underperformed its Lipper index for the five-year period ended June 30, 2013. Based upon its review, the Board concluded that the Fund’s performance was satisfactory relative to the performance of funds with similar investment objectives and to relevant indices.
In considering the Fund’s fees and expenses, the Board compared the Fund’s fees and total expense ratio with various comparative data for the funds in its peer group. Among other findings, the data indicated that the Fund’s advisory fee (after taking into account waivers and/or reimbursements) was below the median of its peer group and that total expenses (net of waivers and/or reimbursements) were above the median of its peer group. The Board noted that the allocation of advisory and administrative fees may vary among the Fund’s peer group. The Board noted the Advisor’s discussion of the Fund’s expenses and certain factors that affected the level of such expenses, including the cost of providing the environmental, social, sustainability and governance research and analysis provided by the Advisor. The Board also took into account the Advisor’s current undertaking to maintain expense limitations for the Fund and that the Advisor had reimbursed a portion of the Fund’s expenses. Based upon its review, the Board determined that the advisory fee was reasonable in view of the quality of services received by the Fund from the Advisor and the other factors considered.
34 www.calvert.com CALVERT SMALL CAP FUND SEMI-ANNUAL REPORT (UNAUDITED)
The Board reviewed the Advisor’s profitability on a fund-by-fund basis. In reviewing the overall profitability of the advisory fee to the Fund’s Advisor, the Board also considered the fact that affiliates of the Advisor provided shareholder servicing, administrative and distribution services to the Fund for which they received compensation. The information considered by the Board included Calvert’s operating profit margin information both before and after tax expenses with respect to the services that the Advisor and its affiliates provided to the Calvert Family of Funds complex. The Board reviewed the profitability of the Advisor’s relationship with the Fund in terms of the total amount of annual advisory fees it received with respect to the Fund and whether the Advisor had the financial wherewithal to continue to provide services to the Fund. The Board also noted that the Advisor had reimbursed a portion of the expenses of the Fund. The Board also noted the Advisor’s current undertaking to maintain expense limitations for the Fund. The Board also considered that the Advisor derived benefits to its reputation and other indirect benefits from its relationship with the Fund. Based upon its review, the Board concluded that the Advisor’s and its affiliates’ level of profitability from their relationship with the Fund was reasonable.
The Board considered the effect of the Fund’s current size and its potential growth on its performance and fees. The Board concluded that adding breakpoints to the advisory fee at specified asset levels would not be appropriate given the Fund’s current size. The Board noted that if the Fund’s assets increased over time, the Fund might realize other economies of scale if assets increased proportionally more than certain other expenses.
In reapproving the Investment Advisory Agreement, the Board, including the disinterested Directors, did not identify any single factor as controlling, and each Director may have attributed different weight to various factors.
CONCLUSIONS
The Board reached the following conclusions regarding the Investment Advisory Agreement, among others: (a) the Advisor has demonstrated that it possesses the capability and resources to perform the duties required of it under the Investment Advisory Agreement; (b) the Advisor maintains appropriate compliance programs; (c) the Fund’s performance is satisfactory relative to the performance of funds with similar investment objectives and to relevant indices; (d) the Advisor is likely to execute its investment strategies consistently over time; and (e) the Fund’s advisory fee is reasonable in view of the quality of services received by the Fund from the Advisor and the other factors considered. Based on its conclusions, the Board determined that reapproval of the Investment Advisory Agreement would be in the best interests of the Fund and its shareholders.
www.calvert.com CALVERT SMALL CAP FUND SEMI-ANNUAL REPORT (UNAUDITED) 35
This page intentionally left blank.
This page intentionally left blank.
This page intentionally left blank.
To Open an Account
800-368-2748
Service for Existing Account
Shareholders: 800-368-2745
Brokers: 800-368-2746
TDD for Hearing Impaired
800-541-1524
Registered Mail
Calvert Investments
c/o BFDS,
P.O. Box 219544
Kansas City, MO 64121-9544
Overnight Mail
Calvert Investments
c/o BFDS,
330 West 9th Street
Kansas City, MO 64105
Web Site
www.calvert.com
Principal Underwriter
Calvert Investment Distributors, Inc.
4550 Montgomery Avenue
Suite 1000 North
Bethesda, Maryland 20814
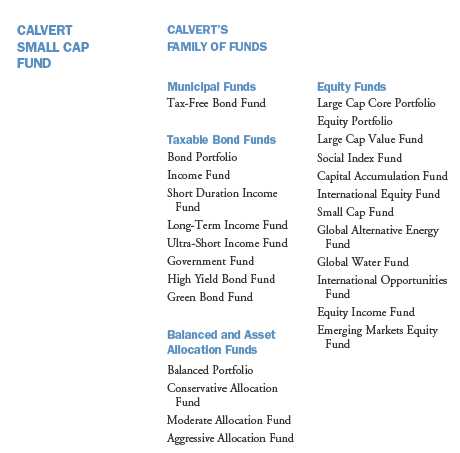
This report is intended to provide fund information to shareholders. It is not authorized for distribution to prospective investors unless preceded or accompanied by a prospectus.
Note: The information on our website is not incorporated by reference into this report; our website address is included as an inactive textual reference only.
Investors should carefully consider the investment objectives, risks, charges and expenses of the Calvert Funds. This and other important information is contained in the fund’s summary prospectus and prospectus, which can be obtained from your financial professional and should be read carefully before investing. You may also call Calvert at 800/368-2748 or visit www. calvert.com.
Choose Planet-friendly E-delivery!
Sign up now for on-line statements, prospectuses, and fund reports. In less than five minutes you can help reduce paper mail and lower fund costs.
Just go to www.calvert.com. If you already have an online account at Calvert, click on My Account, and select the documents you would like to receive via e-mail.
If you’re new to online account access, click on Login/Register to open an online account. Once you’re in, click on the E-delivery sign-up at the bottom of the Account Portfolio page and follow the quick, easy steps. Note: if your shares are not held directly at Calvert but through a brokerage firm, you must contact your broker for electronic delivery options available through their firm.
After a “risk-on” year in 2013, the first quarter of 2014 proved to be a more challenging environment for equities. Concerns about economic growth in emerging markets, geopolitical turmoil in the Ukraine, and somewhat softer macroeconomic data in the United States injected more risk aversion into the markets. At the same time, profit-taking and tempered expectations for a repeat performance of stellar 2013 returns likely drove down investor risk tolerance in the first quarter.
Despite investors taking a more cautious approach toward equities at the start of 2014, the exceptionally strong performance of the equity markets, particularly U.S. equities, in the fourth quarter of 2013 allowed all major global equity indices to finish the six-month reporting period in positive territory. For the six months ended March 31, 2014, the Standard and Poor’s (S&P) 500, Russell 1000, Russell 2000, MSCI EAFE, and MSCI Emerging Markets Indices returned 12.51%, 12.48%, 9.94%, 6.56%, and 1.49%, respectively.
From an investment-style perspective, small-cap stocks underperformed their large-cap counterparts, while value stocks outperformed growth stocks. The rotation from expensive growth stocks to more bargain-priced value stocks, if it continues, could suggest a more favorable outlook for higher-quality stocks. Looking at sector performance, Health Care, Information Technology, and Materials were the top-performing sectors within the Russell 1000 Index, while the Telecommunications, Consumer Discretionary, and Consumer Staples sectors lagged.
U.S. Economic Recovery Moves Forward, Despite Fed Tapering Talk
Positive fourth-quarter results in the equity markets were driven by several factors, centering on continued U.S. economic recovery and growing investor confidence, thus creating an environment conducive to earnings expansion. These factors explain, in part, why U.S. equities shone so strongly compared with foreign developed and emerging markets. Extreme weather likely held back economic growth in much of the U.S. during the period, but markets found support as investors gained comfort in the view that weaker economic data was more a by-product of inclement weather, rather than reflecting a broader economic slowdown.
The Fed’s decision to begin tapering its quantitative easing (QE) programs in January divided analysts on whether rising interest rates would dampen the economic recovery and create downward pressure on stocks, or whether they would instill confidence that the Fed is being responsible and attract more investors. On the whole, the resiliency and low volatility of interest rates in the wake of Fed tapering was a positive
4 www.calvert.com CALVERT SOLUTION STRATEGIES SEMI-ANNUAL REPORT (UNAUDITED)
| |
| CALVERT GLOBAL |
| ALTERNATIVE |
| ENERGY FUND |
| MARCH 31, 2014 |
| |
| | % OF TOTAL |
| ECONOMIC SECTORS | INVESTMENTS |
| Consumer Discretionary | 5.0% |
| Consumer Staples | 4.2% |
| Energy | 3.5% |
| Financials | 2.6% |
| Industrials | 27.4% |
| Information Technology | 18.6% |
| Materials | 5.0% |
| Mutual Funds | 1.9% |
| Short-Term Investments | 3.5% |
| Utilities | 28.3% |
| Total | 100% |
sign, indicating that—at least for a while—tapering need not produce the kind of jump in interest rates many analysts had feared.
Consumers Play a Key Role in Recovery
Although market analysts have focused largely on what is happening at the Federal Reserve, we believe an important driver of economic activity in the United States, and of Fed policy by extension, is the continued improvement in the health of the consumer balance sheet. This gives consumers better access to consumer loans and mortgages, supporting the continued recovery of the housing and automotive industries, among others. At the same time, initial jobless claims maintained their downward trend throughout the period. Continued improvements in the labor market should support consumer spending and the U.S. housing sector—keys to the success of the U.S. economic recovery.
An Anemic Europe and Sluggish China Worry Investors
A global backdrop of lower-than-target inflation persisted throughout the period, despite continued aggressive easing actions by the world’s largest central banks. There are several
| CALVERT GLOBAL |
| ALTERNATIVE |
| ENERGY FUND |
| MARCH 31, 2014 |
| |
| INVESTMENT PERFORMANCE | |
| (TOTAL RETURN AT NAV*) | |
| | 6 MONTHS | 12 MONTHS |
| | ENDED | ENDED |
| | 3/31/14 | 3/31/14 |
| Class A | 10.23% | 25.41% |
| Class C | 9.76% | 24.32% |
| Class I | 10.54% | 26.18% |
| Class Y | 10.45% | 25.87% |
| Ardour Global | | |
| Alternative | | |
| Energy Index | | |
| (Composite) | 16.69% | 59.59% |
| Lipper Global | | |
| Natural | | |
| Resources | | |
| Funds Average | 6.87% | 13.33% |
| |
| TEN LARGEST | | % OF NET |
| STOCK HOLDINGS | | ASSETS |
| Johnson Controls, Inc. | 5.0% |
| Eaton Corp. plc | | 5.0% |
| Cosan Ltd. | | 4.2% |
| Cree, Inc. | | 3.8% |
| Quanta Services, Inc. | | 3.1% |
| EDP Renovaveis SA | | 3.1% |
| Greencoat UK Wing plc | 3.0% |
| Capstone Infrastructire Corp. | 3.0% |
| Itron, Inc. | | 2.6% |
| Calgon Carbon Corp. | 2.6% |
| Total | | 35.4% |
* Investment performance/return at NAV does not reflect the deduction of the Fund’s maximum 4.75% front-end sales charge or any deferred sales charges.
www.calvert.com CALVERT SOLUTION STRATEGIES SEMI-ANNUAL REPORT (UNAUDITED) 5
drivers contributing to low inflation we believe are likely to persist in the near-term. For example, anemic economic activity in Europe continued to highlight the threat of deflation, as inflation in the eurozone dipped below 1% during the period. While European Central Bank (ECB) President Mario Draghi indicated a willingness to intervene if further downside risks to price stability materialize, there appear to be few catalysts capable of driving an increase in demand-side inflation since the euro area’s economic recovery has remained tepid.
Worries about a hard landing in China returned to the forefront of investor concerns as the China HSBC Manufacturing PMI (Purchasing Managers’ Index) steadily declined throughout the period into contraction territory. Meanwhile, political upheaval in the Ukraine, which culminated with Russian forces occupying the Crimea region, injected further risk aversion into investor sentiment. The situation continued to negatively impact emerging-market stocks and currencies, which were already under pressure due to the prospect of slower GDP growth in emerging markets. We expect the Ukraine situation to be a continued source of headline market risk in the near-term, until a final diplomatic solution is reached.
Outlook
The contrast in economic conditions between the United States and both Europe and China (and other emerging markets) should continue to draw more investment to the U.S. in the near-term. Fed tapering will most likely add to this effect in equities as well as other asset classes. We expect the dollar to continue strengthening slowly, which may provide another reason for foreign investors to favor U.S. securities over those in their domestic markets. This also supports our outlook for continued low inflation in the near-term.
The recovery may still feel “sluggish” because the current 6.7% unemployment rate—while down from a recession peak of 10%—is still running higher than in previous expansions. From the perspective of equity investors, however, higher unemployment is likely keep downward pressure on wages, which, in turn, could help strengthen profit margins.
| CALVERT GLOBAL |
| ALTERNATIVE |
| ENERGY FUND |
| MARCH 31, 2014 |
| |
| AVERAGE ANNUAL TOTAL RETURNS |
| |
| CLASS A SHARES | (WITH MAX. LOAD) |
| One year | 19.53% |
| Five year | 0.41% |
| Since inception (5/31/2007) | -9.67% |
| |
| CLASS C SHARES | (WITH MAX. LOAD) |
| One year | 23.32% |
| Five year | 0.41% |
| Since inception (7/31/2007) | -10.66% |
| |
| CLASS I SHARES | |
| One year | 26.18% |
| Five year | 1.92% |
| Since inception (5/31/2007) | -8.57% |
| |
| CLASS Y SHARES* | |
| One year | 25.87% |
| Five year | 1.59% |
| Since inception (5/31/2007) | -8.90% |
* Calvert Global Alternative Energy Fund first offered Class Y shares on July 29, 2011. Performance prior to that date reflects the performance of Class A shares at net asset value (NAV). Actual Class Y share performance would have been different.
6 www.calvert.com CALVERT SOLUTION STRATEGIES SEMI-ANNUAL REPORT (UNAUDITED)
GROWTH OF $10,000
The graph below shows the value of a hypothetical $10,000 investment in the Fund over the past 10 fiscal year periods or since inception (for funds without 10-year records). The results shown are for Classes A and I shares and reflect the deduction of the maximum front-end Class A sales charge of 4.75% and assume the reinvestment of dividends. The result is compared with benchmarks that include a broad based market index and a Lipper peer group average. Market indexes are unmanaged and their results do not reflect the effect of expenses or sales charges. The Lipper average reflects the deduction of the category’s average front-end sales charge. The value of an investment in a different share class would be different.
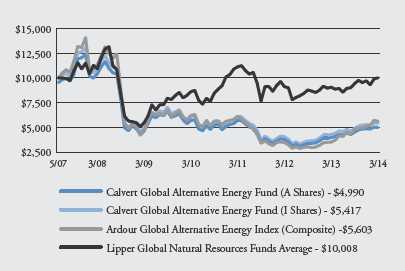
All performance data shown, including the graph above and the adjacent table, represents past performance, does not guarantee future results, assumes reinvestment of dividends and distributions and does not reflect the deduction of taxes that a shareholder would pay on the Fund’s distributions or the redemption of the Fund shares. All performance data reflects fee waivers and/or expense limitations, if any are in effect; in their absence performance would be lower. See Note B in Notes to Financial Statements. The investment return and principal value of an investment will fluctuate so that an investor’s shares, when redeemed, may be worth more or less than their original cost. Current performance may be lower or higher than the performance data quoted; for current performance data visit www.calvert.com. The gross expense ratio from the current prospectus for Class A shares is 2.40%. This number may differ from the expense ratio shown elsewhere in this report because it is based on a different time period and, if applicable, does not include fee or expense waivers. Performance data quoted already reflects the deduction of the Fund’s operating expenses.
www.calvert.com CALVERT SOLUTION STRATEGIES SEMI-ANNUAL REPORT (UNAUDITED) 7
We think the Fed will be particularly careful not to derail economic expansion, especially as long as inflation remains low, and will do so by carefully telegraphing its position and plans as they evolve. Moreover, the signal that the Fed is serious about normalizing interest rates should improve investor confidence about the condition of the economy and reassure those who have been worried about the inflationary risk of an eternal quantitative easing. However, sharp changes in interest-rate expectations remain a risk factor, as they can drive mortgage rates higher, negatively impacting housing activity and weakening this major component of the U.S. economic recovery.
We also believe the U.S. economy can still compensate for a dampened global growth outlook. And we expect economic growth to reaccelerate in the second-half of the year on the heels of continued improvement in the housing and labor markets. In addition, as consumer activity picks up in the spring and summer, there is potential for some lost consumer activity to be recovered later in the year. Overall, we believe these conditions continue to provide a favorable underpinning for the equities markets.
Calvert Investment Management, Inc.
May 2014
8 www.calvert.com CALVERT SOLUTION STRATEGIES SEMI-ANNUAL REPORT (UNAUDITED)
| CALVERT GLOBAL |
| WATER FUND |
| MARCH 31, 2014 |
| |
| | % OF TOTAL |
| ECONOMIC SECTORS | INVESTMENTS |
| Consumer Discretionary | 2.9% |
| Energy | 1.2% |
| Financials | 2.7% |
| Industrials | 48.3% |
| Information Technology | 4.6% |
| Materials | 5.9% |
| Short-Term Investments | 4.4% |
| Utilities | 30.0% |
| Total | 100% |
| CALVERT GLOBAL |
| WATER FUND |
| MARCH 31, 2014 |
| |
| INVESTMENT PERFORMANCE | |
| (TOTAL RETURN AT NAV*) | |
| | 6 MONTHS | 12 MONTHS |
| | ENDED | ENDED |
| | 3/31/14 | 3/31/14 |
| Class A | 13.62% | 22.46% |
| Class C | 13.19% | 21.47% |
| Class I** | 13.73% | 22.58% |
| Class Y | 13.83% | 22.84% |
| |
| S-Network | | |
| Global Water | | |
| Index | 12.13% | 24.32% |
| |
| Lipper Global | | |
| Natural | | |
| Resources | | |
| Funds Average | 6.87% | 13.33% |
| |
| TEN LARGEST | % OF NET |
| STOCK HOLDINGS | ASSETS |
| United Utilities Group plc | 5.8% |
| Cia de Saneamento Basico do | |
| Estado de Sao Paulo (ADR) | 5.4% |
| Sulzer AG | 5.3% |
| Ebara Corp. | 5.1% |
| HD Supply Holdings, Inc. | 4.9% |
| American Water Works Co., Inc. | 4.5% |
| Wolseley plc | 4.4% |
| Calgon Carbon Corp. | 4.4% |
| Suez Environnement SA | 4.0% |
| Danaher Corp. | 4.0% |
| Total | 47.8% |
* Investment performance/return at NAV does not reflect the deduction of the Fund’s maximum 4.75% front-end sales charge or any deferred sales charges.
** Calvert Global Water Fund first offered Class I shares on January 31, 2014 Performance prior to that date reflects the performance of Class A shares at net asset value (NAV). Actual Class I share performance would have been different.
www.calvert.com CALVERT SOLUTION STRATEGIES SEMI-ANNUAL REPORT (UNAUDITED) 9
| CALVERT GLOBAL |
| WATER FUND |
| MARCH 31, 2014 |
| |
| AVERAGE ANNUAL TOTAL RETURNS |
| |
| CLASS A SHARES | (WITH MAX. LOAD) |
| One year | 16.67% |
| Five year | 19.56% |
| Since inception (9/30/2008) | 10.15% |
| |
| CLASS C SHARES | (WITH MAX. LOAD) |
| One year | 20.47% |
| Five year | 19.57% |
| Since inception (9/30/2008) | 10.06% |
| |
| CLASS I SHARES* | |
| One year | 22.58% |
| Five year | 20.75% |
| Since inception (9/30/2008) | 11.15% |
| |
| CLASS Y SHARES | |
| One year | 22.84% |
| Five year | 21.05% |
| Since inception (9/30/2008) | 11.34% |
* Calvert Global Water Fund first offered Class I shares on January 31, 2014 Performance prior to that date reflects the performance of Class A shares at net asset value (NAV).
Actual Class I share performance would have been different.
10 www.calvert.com CALVERT SOLUTION STRATEGIES SEMI-ANNUAL REPORT (UNAUDITED)
GROWTH OF $10,000
The graph below shows the value of a hypothetical $10,000 investment in the Fund over the past 10 fiscal year periods or since inception (for funds without 10-year records). The results shown are for Classes A, C and Y shares and reflect the deduction of the maximum front-end Class A sales charge of 4.75%, or deferred sales charge, as applicable and assume the reinvestment of dividends. The result is compared with benchmarks that include a broad based market index and a Lipper peer group average. Market indexes are unmanaged and their results do not reflect the effect of expenses or sales charges. The Lipper average reflects the deduction of the category’s average front-end sales charge. The value of an investment in a different share class would be different.
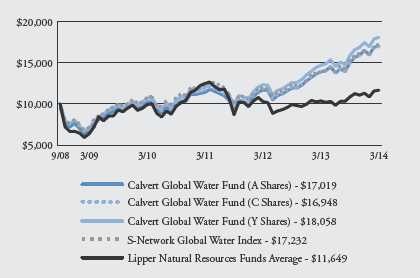
All performance data shown, including the graph above and the adjacent table, represents past performance, does not guarantee future results, assumes reinvestment of dividends and distributions and does not reflect the deduction of taxes that a shareholder would pay on the Fund’s distributions or the redemption of the Fund shares. All performance data reflects fee waivers and/or expense limitations, if any are in effect; in their absence performance would be lower. See Note B in Notes to Financial Statements. The investment return and principal value of an investment will fluctuate so that an investor’s shares, when redeemed, may be worth more or less than their original cost. Current performance may be lower or higher than the performance data quoted; for current performance data visit www.calvert.com. The gross expense ratio from the current prospectus for Class A shares is 1.99%. This number may differ from the expense ratio shown elsewhere in this report because it is based on a different time period and, if applicable, does not include fee or expense waivers. Performance data quoted already reflects the deduction of the Fund’s operating expenses.
www.calvert.com CALVERT SOLUTION STRATEGIES SEMI-ANNUAL REPORT (UNAUDITED) 11

As always, Calvert continues to work hard to ensure the companies in which we invest adhere to responsible environmental, social, and governance (ESG) practices and we seek to directly influence corporate behavior through dialogue and shareholder advocacy. Below are highlights of our accomplishments during the reporting period.
Shareholder Advocacy
Calvert filed more than 26 shareholder proposals over the reporting period on a variety of issues, including board diversity, reduction of greenhouse gas emissions, disclosure of country-level sourcing and human rights risk assessment processes for apparel companies, and sustainability reporting.
After commitments from Pioneer Natural Resources Company and QEP Resources, Calvert has withdrawn one shareholder proposal and decided not to file a second one for the 2014 proxy season. The two companies agreed to improve disclosure and continue engagement regarding key challenges related to hydraulic fracturing, such as water use and emissions reduction. The resulting disclosures will help Calvert and the companies better understand how they are managing these important opportunities and risks.
Water
Calvert remained an active leader in policy and advocacy campaigns on water issues, while promoting the CEO Water Mandate’s Disclosure Guidance document and encouraging select holdings to pilot its approach.
In November, the free Calvert Water Investing App for Apple and Android launched. It delivers news and facts about water-related issues, expert commentary and analysis, profiles of water-themed companies, and information about the Calvert Global Water Fund.
Calvert engaged with other CEO Water Mandate signatory companies such as Nestle and Coca-Cola on the human right to water. Discussions with Coca-Cola also addressed the materiality of water risk in emerging markets and community issues related to water use and quality.
Alternative Energy
Calvert returned to Capitol Hill with Ceres and U.S. Social Investment Forum last fall to express support for extending the benefits of master limited partnerships (MLPs) to renewable energy projects, the production tax credit, and climate change. Currently, MLPs help draw investment to oil and gas projects and Calvert believes removing barriers for solar, wind, and even energy-efficiency projects would provide an investment opportunity while helping to diversify our energy system and address climate change.
12 www.calvert.com CALVERT SOLUTION STRATEGIES SEMI-ANNUAL REPORT (UNAUDITED)
As of March 31, 2014, Pioneer Natural Resources Company, QEP Resources, Coco-Cola Co., and Nestle each represented 0% of net assets in Calvert Global Alternative Energy Fund and Calvert Global Water Fund. Holdings are subject to change.
www.calvert.com CALVERT SOLUTION STRATEGIES SEMI-ANNUAL REPORT (UNAUDITED) 13
SHAREHOLDER EXPENSE EXAMPLE
As a shareholder of the Fund, you incur two types of costs: (1) transaction costs, including sales charges and redemption fees; and (2) ongoing costs, including management fees; distribution (12b-1) fees; and other Fund expenses. This Example is intended to help you understand your ongoing costs (in dollars) of investing in the Fund and to compare these costs with the ongoing costs of investing in other mutual funds.
This Example is based on an investment of $1,000 invested at the beginning of the period and held for the entire period (October 1, 2013 to March 31, 2014).
Actual Expenses
The first line of the table below provides information about actual account values and actual expenses. You may use the information in this line, together with the amount you invested, to estimate the expenses that you paid over the period. Simply divide your account value by $1,000 (for example, an $8,600 account value divided by $1,000 = 8.6), then multiply the result by the number in the first line under the heading entitled “Expenses Paid During Period” to estimate the expenses you paid on your account during this period.
Hypothetical Example for Comparison Purposes
The second line of the table below provides information about hypothetical account values and hypothetical expenses based on the Fund’s actual expense ratio and an assumed rate of return of 5% per year before expenses, which is not the Fund’s actual return. The hypothetical account values and expenses may not be used to estimate the actual ending account balance or expenses you paid for the period. You may use this information to compare the ongoing costs of investing in the Fund and other funds. To do so, compare the 5% hypothetical example with the 5% hypothetical examples that appear in the shareholder reports of the other funds.
Please note that the expenses shown in the table are meant to highlight your ongoing costs only and do not reflect any transactional costs, such as sales charges (loads), or redemption fees. Therefore, the second line of the table is useful in comparing ongoing costs only, and will not help you determine the relative total costs of owning different funds. In addition, if these transactional costs were included, your costs would have been higher.
14 www.calvert.com CALVERT SOLUTION STRATEGIES SEMI-ANNUAL REPORT (UNAUDITED)
| | BEGINNING | ENDING ACCOUNT | EXPENSES PAID |
| | ACCOUNT VALUE | VALUE | DURING PERIOD* |
| GLOBAL ALTERNATIVE ENERGY | 10/1/13 | 3/31/14 | 10/1/13 - 3/31/14 |
| CLASS A | | | |
| Actual | $1,000.00 | $1,102.31 | $9.70 |
| Hypothetical | $1,000.00 | $1,015.71 | $9.30 |
| (5% return per year before expenses) | | | |
| |
| CLASS C | | | |
| Actual | $1,000.00 | $1,097.60 | $14.90 |
| Hypothetical | $1,000.00 | $1,010.72 | $14.29 |
| (5% return per year before expenses) | | | |
| |
| CLASS I | | | |
| Actual | $1,000.00 | $1,105.41 | $7.35 |
| Hypothetical | $1,000.00 | $1,017.95 | $7.04 |
| (5% return per year before expenses) | | | |
| |
| CLASS Y | | | |
| Actual | $1,000.00 | $1,104.46 | $8.39 |
| Hypothetical | $1,000.00 | $1,016.95 | $8.05 |
| (5% return per year before expenses) | | | |
* Expenses are equal to the Fund’s annualized expense ratio of 1.85%, 2.85%, 1.40%, and 1.60% for Class A, Class C, Class I, and Class Y, respectively, multiplied by the average account value over the period, multiplied by 182/365 (to reflect the one-half year period).
www.calvert.com CALVERT SOLUTION STRATEGIES SEMI-ANNUAL REPORT (UNAUDITED) 15
| | BEGINNING | ENDING ACCOUNT | EXPENSES PAID |
| | ACCOUNT VALUE | VALUE | DURING PERIOD* |
| GLOBAL WATER | 10/1/13 | 3/31/14 | 10/1/13 - 3/31/14 |
| CLASS A | | | |
| Actual | $1,000.00 | $1,136.22 | $9.46 |
| Hypothetical | $1,000.00 | $1,016.08 | $8.93 |
| (5% return per year before expenses) | | | |
| |
| CLASS C | | | |
| Actual | $1,000.00 | $1,131.93 | $13.17 |
| Hypothetical | $1,000.00 | $1,012.57 | $12.44 |
| (5% return per year before expenses) | | | |
| |
| CLASS I | | | |
| Actual | $1,000.00 | $1,137.34 | $6.73 |
| Hypothetical | $1,000.00 | $1,018.63 | $6.36 |
| (5% return per year before expenses) | | | |
| |
| CLASS Y | | | |
| Actual | $1,000.00 | $1,138.26 | $7.56 |
| Hypothetical | $1,000.00 | $1,017.86 | $7.13 |
| (5% return per year before expenses) | | | |
* Expenses are equal to the Fund’s annualized expense ratio of 1.78%, 2.48%, 1.26%, and 1.42% for Class A, Class C, Class I, and Class Y, respectively, multiplied by the average account value over the period, multiplied by 182/365 (to reflect the one-half year period).
16 www.calvert.com CALVERT SOLUTION STRATEGIES SEMI-ANNUAL REPORT (UNAUDITED)
| | |
| GLOBAL ALTERNATIVE ENERGY FUND |
| STATEMENT OF NET ASSETS |
| MARCH 31, 2014 |
| |
| EQUITY SECURITIES - 91.6% | SHARES | VALUE |
| Australia - 0.8% | | |
| Ceramic Fuel Cells Ltd.* | 28,531,883 | $489,380 |
| In gen Energy Ltd.* | 2,466,481 | 457,513 |
| | | 946,893 |
| |
| Brazil - 4.2% | | |
| Cosan Ltd. | 415,500 | 4,736,700 |
| |
| Canada - 5.6% | | |
| Brook eld Renewable Energy Partners LP | 65,696 | 1,917,273 |
| Capstone Infrastructure Corp | 908,891 | 3,305,357 |
| TransAlta Renewables, Inc | 98,604 | 1,025,824 |
| | | 6,248,454 |
| |
| China - 4.4% | | |
| China Longyuan Power Group Corp | 1,274,000 | 1,283,328 |
| China Suntien Green Energy Corp. Ltd. | 8,256,000 | 2,758,246 |
| Trina Solar Ltd. (ADR)* | 61,733 | 830,309 |
| | | 4,871,883 |
| |
| Denmark - 0.7% | | |
| Novozymes A/S, Series B | 17,741 | 781,139 |
| |
| France - 4.1% | | |
| Albioma | 96,619 | 2,597,660 |
| Cie de Saint-Gobain | 33,406 | 2,022,502 |
| | | 4,620,162 |
| |
| Germany - 7.6% | | |
| Capital Stage AG | 555,666 | 2,894,965 |
| CENTROTEC Sustainable AG | 40,368 | 1,047,559 |
| PNE Wind AG | 711,944 | 2,796,200 |
| PSI AG Gesellschaft Fuer Produkte und Systeme | | |
| der Informationstechnologie | 95,171 | 1,775,140 |
| | | 8,513,864 |
| |
| Hong Kong - 2.4% | | |
| GCL-Poly Energy Holdings Ltd.* | 7,297,000 | 2,634,041 |
| |
| Ireland - 5.0% | | |
| Eaton Corp. plc | 74,461 | 5,593,510 |
| |
| Italy - 3.1% | | |
| Enel Green Power SpA | 851,312 | 2,392,482 |
| Prysmian SpA | 41,962 | 1,047,113 |
| | | 3,439,595 |
www.calvert.com CALVERT SOLUTION STRATEGIES SEMI-ANNUAL REPORT (UNAUDITED) 17
| | |
| EQUITY SECURITIES - CONT’D | SHARES | VALUE |
| Japan - 0.7% | | |
| Kurita Water Industries Ltd | 37,600 | $816,293 |
| |
| Netherlands - 2.6% | | |
| Koninklijke Philips NV | 77,839 | 2,738,343 |
| |
| Spain - 4.7% | | |
| EDP Renovaveis SA | 511,324 | 3,408,161 |
| Iberdrola SA | 262,593 | 1,838,251 |
| | | 5,246,412 |
| |
| United Kingdom - 5.7% | | |
| Dialight plc | 69,302 | 1,050,041 |
| Johnson Matthey plc | 16,710 | 912,068 |
| National Grid plc | 96,738 | 1,328,776 |
| Renewables Infrastructure Group Ltd.: | | |
| Common | 1.476.923 | 2.505.539 |
| C Shares (b)* | 369,231 | 626,411 |
| | | 6,422,835 |
| |
| United States - 39.4% | | |
| Advanced Energy Industries, Inc.* | 108,738 | 2,664,081 |
| Ameresco, Inc.* | 358,928 | 2,713,496 |
| Calgon Carbon Corp.* | 133,090 | 2,905,355 |
| Covanta Holding Corp | 160,633 | 2,899,426 |
| Cree, Inc.* | 73,959 | 4,183,121 |
| FuelCell Energy, Inc.* | 363,044 | 900,349 |
| Itron, Inc.* | 82,634 | 2,936,812 |
| Johnson Controls, Inc. | 119,089 | 5,635,291 |
| MYR Group, Inc.* | 64,708 | 1,638,407 |
| NextEra Energy, Inc. | 29,221 | 2,794,112 |
| Owens Corning | 60,930 | 2,630,348 |
| Quanta Services, Inc.* | 94,508 | 3,487,345 |
| Regal-Beloit Corp | 35,414 | 2,574,952 |
| Rockwood Holdings, Inc | 12,844 | 955,594 |
| Solazyme, Inc.* | 95,823 | 1,112,505 |
| SunEdison, Inc.* | 150,628 | 2,837,832 |
| Veeco Instruments, Inc.* | 27,634 | 1,158,694 |
| | | 44,027,720 |
| |
| Virgin Islands, British - 0.6% | | |
| Wasion Group Holdings Ltd. | 978,000 | 696,622 |
| |
| |
| Total Equity Securities (Cost $93,959,979) | | 102,334,466 |
| |
| |
| CLOSED-END FUNDS - 4.9% | | |
| Foresight Solar Fund Ltd.* | 1,280,000 | 2,075,484 |
| Greencoat UK Wind plc | 1,925,335 | 3,370,474 |
| |
| Total Closed-End Funds (Cost $5,108,395) | | 5,445,958 |
18 www.calvert.com CALVERT SOLUTION STRATEGIES SEMI-ANNUAL REPORT (UNAUDITED)
| | | |
| | | PRINCIPAL | |
| TIME DEPOSIT - 3.5% | AMOUNT | VALUE |
| State Street Bank Time Deposit, 0.083%, 4/1/14 | $3,933,797 | $3,933,797 |
| |
| Total Time Deposit (Cost $3,933,797) | | 3,933,797 |
| |
| |
| TOTAL INVESTMENTS (Cost $103,002,171) - 100.0% | | 111,714,221 |
| Other assets and liabilities, net - 0.0% | | 21,338 |
| NET ASSETS - 100% | | $111,735,559 |
| |
| NET ASSETS CONSIST OF: | | |
| Paid-in capital applicable to the following shares of common stock, | | |
| with 250,000,000 shares of $0.01 par value shares authorized: | | |
| Class A: 11,687,031 shares outstanding | | $233,082,541 |
| Class C: 2,554,033 shares outstanding | | 50,647,335 |
| Class I: 75,567 shares outstanding | | 6,474,736 |
| Class Y: 382,186 shares outstanding | | 2,488,691 |
| Undistributed net investment income (loss) | | (433,682) |
| Accumulated net realized gain (loss) on investments and foreign | | |
| currency transactions | | (189,236,200) |
| Net unrealized appreciation (depreciation) on investments, foreign | | |
| currencies and assets and liabilities denominated in | | |
| foreign currencies | | 8,712,138 |
| |
| NET ASSETS | | $111,735,559 |
| |
| NET ASSET VALUE PER SHARE | | |
| Class A (based on net assets of $89,446,641) | | $7.65 |
| Class C (based on net assets of $18,672,742) | | $7.31 |
| Class I (based on net assets of $586,225) | | $7.76 |
| Class Y (based on net assets of $3,029,951) | | $7.93 |
(b) is security was valued under the direction of the Board of Directors. See Note A.
* Non-income producing security.
Abbreviations:
ADR: American Depositary Receipts
LP: Limited Partnership
plc: Public Limited Company
See notes to financial statements.
www.calvert.com CALVERT SOLUTION STRATEGIES SEMI-ANNUAL REPORT (UNAUDITED) 19
| | |
| GLOBAL WATER FUND |
| STATEMENT OF NET ASSETS |
| MARCH 31, 2014 |
| |
| EQUITY SECURITIES - 94.8% | SHARES | VALUE |
| Brazil - 5.4% | | |
| Cia de Saneamento Basico do Estado de Sao Paulo (ADR) | 2,638,189 | $24,429,630 |
| |
| Canada - 7.3% | | |
| Capstone Infrastructure Corp | 2,952,922 | 10,738,870 |
| EnerCare, Inc | 1,241,694 | 12,783,135 |
| GWR Global Water Resources Corp.* | 125,710 | 503,795 |
| Pure Technologies Ltd. | 1,466,890 | 8,864,506 |
| | | 32,890,306 |
| |
| Finland - 1.5% | | |
| Kemira OYJ | 461,702 | 6,737,702 |
| |
| France - 6.0% | | |
| Suez Environnement SA | 885,153 | 17,983,184 |
| Veolia Environnement SA | 445,728 | 8,839,515 |
| | | 26,822,699 |
| |
| Israel - 0.8% | | |
| Amiad Water Systems Ltd. | 791,040 | 3,693,034 |
| |
| Japan - 6.2% | | |
| Ebara Corp | 3,628,000 | 22,731,486 |
| Organo Corp | 1,099,270 | 5,135,115 |
| | | 27,866,601 |
| |
| Switzerland - 5.3% | | |
| Sulzer AG | 172,019 | 23,668,869 |
| |
| United Kingdom - 14.1% | | |
| Rotork plc | 69,872 | 3,092,625 |
| Severn Trent plc | 318,094 | 9,667,115 |
| Travis Perkins plc | 141,378 | 4,457,302 |
| United Utilities Group plc | 1,991,973 | 26,201,443 |
| Wolseley plc | 346,416 | 19,755,869 |
| | | 63,174,354 |
| |
| United States - 48.2% | | |
| A.O. Smith Corp | 141,729 | 6,522,369 |
| AECOM Technology Corp.* | 417,973 | 13,446,191 |
| Aegion Corp.* | 528,096 | 13,366,110 |
| American Water Works Co., Inc | 441,466 | 20,042,556 |
| Aqua America, Inc | 304,952 | 7,645,147 |
| Badger Meter, Inc | 49,900 | 2,749,490 |
| Calgon Carbon Corp.* | 903,610 | 19,725,806 |
| California Water Service Group | 186,504 | 4,464,906 |
| Danaher Corp. | 238,177 | 17,863,275 |
| Flowserve Corp. | 145,623 | 11,408,106 |
20 www.calvert.com CALVERT SOLUTION STRATEGIES SEMI-ANNUAL REPORT (UNAUDITED)
| | |
| EQUITY SECURITIES - CONT’D | SHARES | VALUE |
| United States - Cont’d | | |
| Franklin Electric Co., Inc. | 64,166 | $2,728,338 |
| HD Supply Holdings, Inc.* | 834,679 | 21,826,856 |
| Itron, Inc.* | 331,127 | 11,768,254 |
| Nuverra Environmental Solutions, Inc.* | 263,954 | 5,355,627 |
| Pentair Ltd. | 165,140 | 13,102,208 |
| Pico Holdings, Inc.* | 464,648 | 12,076,201 |
| Rexnord Corp.* | 417,436 | 12,097,295 |
| SJW Corp. | 105,660 | 3,123,310 |
| Tetra Tech, Inc.* | 437,235 | 12,937,784 |
| Xylem, Inc | 122,546 | 4,463,125 |
| | | 216,712,954 |
| |
| |
| Total Equity Securities (Cost $394,050,496) | | 425,996,149 |
| |
| | PRINCIPAL | |
| TIME DEPOSIT - 4.4% | AMOUNT | |
| State Street Bank Time Deposit, 0.083%, 4/1/14 | $19,631,900 | 19,631,900 |
| |
| Total Time Deposit (Cost $19,631,900) | | 19,631,900 |
| |
| |
| TOTAL INVESTMENTS (Cost $413,682,396) - 99.2% | | 445,628,049 |
| Other assets and liabilities, net - 0.8% | | 3,494,930 |
| NET ASSETS - 100% | | $449,122,979 |
| |
| |
| NET ASSETS CONSIST OF: | | |
| Paid-in capital applicable to the following shares of common stock, | | |
| with 250,000,000 shares of $0.01 par value shares authorized: | | |
| Class A: 15,417,250 shares outstanding | | $274,162,719 |
| Class C: 3,397,433 shares outstanding | | 59,015,706 |
| Class I: 105 shares outstanding | | 2,000 |
| Class Y: 3,525,971 shares outstanding | | 66,634,665 |
| Undistributed net investment income | | 58,559 |
| Accumulated net realized gain (loss) on investments and foreign | | |
| currency transactions | | 17,298,317 |
| Net unrealized appreciation (depreciation) on investments, foreign | | |
| currencies and assets and liabilities denominated in foreign currencies | | 31,951,013 |
| |
| NET ASSETS | | $449,122,979 |
| |
| |
| NET ASSET VALUE PER SHARE | | |
| Class A (based on net assets of $312,201,581) | | $20.25 |
| Class C (based on net assets of $65,008,493) | | $19.13 |
| Class I (based on net assets of $2,135) | | $20.27 |
| Class Y (based on net assets of $71,910,770) | | $20.39 |
See notes to financial statements.
www.calvert.com CALVERT SOLUTION STRATEGIES SEMI-ANNUAL REPORT (UNAUDITED) 21
* Non-income producing security.
Abbreviations:
ADR: American Depositary Receipts
plc: Public Limited Company
See notes to financial statements.
22 www.calvert.com CALVERT SOLUTION STRATEGIES SEMI-ANNUAL REPORT (UNAUDITED)
| | |
| STATEMENTS OF OPERATIONS |
| SIX MONTHS ENDED MARCH 31, 2014 |
| |
| | GLOBAL ALTERNATIVE | GLOBAL |
| NET INVESTMENT INCOME | ENERGY
FUND | WATER FUND |
| Investment Income: | | |
| Dividend income (net of foreign taxes withheld of | | |
| $35,887 and $267,209, respectively) | $632,503 | $3,169,841 |
| Interest income | 860 | 6,329 |
| Total investment income | 633,363 | 3,176,170 |
| Expenses: | | |
| Investment advisory fee | 504,363 | 1,507,308 |
| Transfer agency fees and expenses | 193,561 | 229,593 |
| Administrative fees | 185,255 | 578,933 |
| Distribution Plan expenses: | | |
| Class A | 106,740 | 298,931 |
| Class C | 89,132 | 234,788 |
| Directors’ fees and expenses | 4,600 | 6,347 |
| Custodian fees | 65,419 | 77,488 |
| Registration fees | 23,221 | 19,643 |
| Reports to shareholders | 56,239 | 35,109 |
| Professional fees | 12,769 | 13,801 |
| Accounting fees | 6,714 | 12,521 |
| Miscellaneous | 7,073 | 7,637 |
| Total expenses | 1,255,086 | 3,022,099 |
| Reimbursement from Advisor: | | |
| Class A | (159,683) | — |
| Class C | (17,105) | — |
| Class I | (5,355) | — |
| Class Y | (5,898) | — |
| Net expenses | 1,067,045 | 3,022,099 |
| |
| NET INVESTMENT INCOME (LOSS) | (433,682) | 154,071 |
| |
| REALIZED AND UNREALIZED GAIN (LOSS) | | |
| Net realized gain (loss) on: | | |
| Investments | 4,189,979 | 23,221,059 |
| Foreign currency transactions | (13,970) | 11,598 |
| | 4,176,009 | 23,232,657 |
| |
| Change in unrealized appreciation (depreciation) on: | | |
| Investments and foreign currencies | 6,334,894 | 18,338,206 |
| Assets and liabilities denominated in foreign currencies | (1,720) | 9,885 |
| | 6,333,174 | 18,348,091 |
| |
| NET REALIZED AND UNREALIZED GAIN (LOSS) | 10,509,183 | 41,580,748 |
| |
| INCREASE (DECREASE) IN NET ASSETS | | |
| RESULTING FROM OPERATIONS | $10,075,501 | $41,734,819 |
See notes to financial statements.
www.calvert.com CALVERT SOLUTION STRATEGIES SEMI-ANNUAL REPORT (UNAUDITED) 23
| | |
| GLOBAL ALTERNATIVE ENERGY FUND |
| STATEMENTS OF CHANGES IN NET ASSETS |
| |
| | SIX MONTHS ENDED | YEAR
ENDED |
| | MARCH 31, | SEPTEMBER 30, |
| INCREASE (DECREASE) IN NET ASSETS | 2014 | 2013 |
| Operations: | | |
| Net investment income (loss) | ($433,682) | ($298,315) |
| Net realized gain (loss) | 4,176,009 | 1,856,542 |
| Change in unrealized appreciation (depreciation) | 6,333,174 | 22,155,080 |
| |
| INCREASE (DECREASE) IN NET ASSETS | | |
| RESULTING FROM OPERATION | 10,075,501 | 23,713,307 |
| |
| Capital share transactions: | | |
| Shares sold: | | |
| Class A shares | 12,412,096 | 21,117,660 |
| Class C shares | 1,942,147 | 2,360,698 |
| Class I shares | 5,386 | 9,391 |
| Class Y shares | 1,132,767 | 896,652 |
| Redemption fees: | | |
| Class A shares | 1,052 | 394 |
| Class C shares | 209 | 28 |
| Class Y shares | 5 | 1 |
| Shares redeemed: | | |
| Class A shares | (10,438,884) | (18,476,965) |
| Class C shares | (1,598,982) | (3,427,511) |
| Class I shares | (40) | (409,125) |
| Class Y shares | (197,769) | (325,806) |
| Total capital share transactions | 3,257,987 | 1,745,417 |
| |
| |
| |
| TOTAL INCREASE (DECREASE) IN NET ASSETS | 13,333,488 | 25,458,724 |
| |
| NET ASSETS | | |
| Beginning of period | 98,402,071 | 72,943,347 |
| End of period (including distributions in excess of net | | |
| investment income and undistributed net investment | | |
| income of $433,682 and $0, respectively) | $111,735,559 | $98,402,071 |
See notes to financial statements.
24 www.calvert.com CALVERT SOLUTION STRATEGIES SEMI-ANNUAL REPORT (UNAUDITED)
| GLOBAL ALTERNATIVE ENERGY FUND |
| STATEMENTS OF CHANGES IN NET ASSETS |
| |
| | SIX MONTHS ENDED | YEAR ENDED |
| | MARCH 31, | SEPTEMBER 30, |
| CAPITAL SHARE ACTIVITY | 2014 | 2013 |
| Shares sold: | | |
| Class A shares | 1,666,291 | 3,364,849 |
| Class C shares | 271,915 | 388,901 |
| Class I shares | 717 | 1,524 |
| Class Y shares | 146,524 | 144,767 |
| Shares redeemed: | | |
| Class A shares | (1,409,428) | (3,123,974) |
| Class C shares | (224,716) | (599,574)) |
| Class I shares | (5) | (66,201) |
| Class Y shares | (25,892) | (51,713) |
| Total capital share activity | 425,406 | 58,579 |
See notes to financial statements.
www.calvert.com CALVERT SOLUTION STRATEGIES SEMI-ANNUAL REPORT (UNAUDITED) 25
| | |
| GLOBAL WATER FUND |
| STATEMENTS OF CHANGES IN NET ASSETS |
| |
| | SIX MONTHS ENDED | YEAR ENDED |
| | MARCH 31, | SEPTEMBER 30, |
| INCREASE (DECREASE) IN NET ASSETS | 2014 | 2013 |
| Operations: | | |
| Net investment income (loss) | $154,071 | ($429,990) |
| Net realized gain (loss) | 23,232,657 | 17,641,208 |
| Change in unrealized appreciation (depreciation) | 18,348,091 | 11,760,827 |
| |
| INCREASE (DECREASE) IN NET ASSETS | | |
| RESULTING FROM OPERATION | 41,734,819 | 28,972,045 |
| |
| Distributions to shareholders from: | | |
| Net investment income: | | |
| Class A shares | (68,577) | (31,852) |
| Class C shares | (14,539) | — |
| Class Y shares | (12,396) | (6,121) |
| Net realized gain: | | |
| Class A shares | (14,860,794) | (3,104,468) |
| Class C shares | (3,007,897) | (498,189) |
| Class Y shares | (2,403,907) | (238,844)) |
| Total distributions | (20,368,110) | (3,879,474) |
| |
| Capital share transactions: | | |
| Shares sold: | | |
| Class A shares | 121,756,094 | 118,000,210 |
| Class C shares | 31,387,992 | 20,087,503 |
| Class I shares | 2,000 | — |
| Class Y shares | 43,568,026 | 22,179,954 |
| Reinvestment of distributions: | | |
| Class A shares | 13,753,527 | 2,911,982 |
| Class C shares | 2,320,524 | 427,616 |
| Class Y shares | 1,859,211 | 219,499 |
| Redemption fees: | | |
| Class A shares | 9,035 | 2,134 |
| Class C shares | 527 | 263 |
| Class Y shares | 1,537 | 182 |
| Shares redeemed: | | |
| Class A shares | (16,976,080) | (18,585,101) |
| Class C shares | (2,162,911) | (1,333,877)) |
| Class Y shares | (2,806,495) | (2,190,110) |
| Total capital share transactions | 192,712,987 | 141,720,255 |
| |
| |
| TOTAL INCREASE (DECREASE) IN NET ASSETS | 214,079,696 | 166,812,826 |
See notes to financial statements.
26 www.calvert.com CALVERT SOLUTION STRATEGIES SEMI-ANNUAL REPORT (UNAUDITED)
| GLOBAL WATER FUND |
| STATEMENTS OF CHANGES IN NET ASSETS |
| |
| INCREASE (DECREASE) IN NET ASSETS - CONT’D | |
| | SIX MONTHS ENDED | YEAR ENDED |
| | MARCH 31, | SEPTEMBER 30, |
| NET ASSETS | 2014 | 2013 |
| Beginning of period | $235,043,283 | $68,230,457 |
| End of period (including undistributed net investment | | |
| income of $58,559 and $0, respectively) | $449,122,979 | $235,043,283 |
| |
| |
| CAPITAL SHARE ACTIVITY | | |
| Shares sold: | | |
| Class A shares | 6,221,298 | 6,704,040 |
| Class C shares | 1,692,178 | 1,184,342 |
| Class I shares | 105 | — |
| Class Y shares | 2,216,130 | 1,234,847 |
| Reinvestment of distributions: | | |
| Class A shares | 745,279 | 185,067 |
| Class C shares | 132,799 | 28,357 |
| Class Y shares | 100,149 | 13,900 |
| Shares redeemed: | | |
| Class A shares | (874,002) | (1,065,552) |
| Class C shares | (117,766) | (79,823) |
| Class Y shares | (144,051) | (125,302) |
| Total capital share activity | 9,972,119 | 8,079,876 |
See notes to financial statements.
www.calvert.com CALVERT SOLUTION STRATEGIES SEMI-ANNUAL REPORT (UNAUDITED) 27
NOTES TO FINANCIAL STATEMENTS
NOTE A — SIGNIFICANT ACCOUNTING POLICIES
General: Calvert Global Alternative Energy Fund and Calvert Global Water Fund (the “Funds,” each a “Fund”), each a series of Calvert Impact Fund, Inc., are registered under the Investment Company Act of 1940 as non-diversified, open-end management investment companies. Calvert Impact Fund, Inc. is comprised of four separate series. The operations of each series are accounted for separately. Global Alternative Energy Fund offers four classes of shares - Classes A, C, I, and Y. Global Water Fund offers four classes of shares - Classes A, C, I (which commenced operations on January 31, 2014), and Y. Class A shares are sold with a maximum front-end sales charge of 4.75%. Class C shares are sold without a front-end sales charge and, with certain exceptions, will be charged a deferred sales charge on shares sold within one year of purchase. Class C shares have higher levels of expenses than Class A shares. Class I shares require a minimum account balance of $1,000,000. The $1 million minimum initial investment is waived for retirement plans that trade through omnibus accounts and may be waived for certain other institutional accounts where it is believed to be in the best interest of the Fund and its shareholders. Class Y shares are generally only available to wrap or similar fee-based programs offered by financial intermediaries, foundations, and endowments that have entered into an agreement with the Fund’s Distributor to offer Class Y shares. Class I and Y shares have no front-end or deferred sales charge and have lower levels of expenses than Class A shares. Each class has different: (a) dividend rates, due to differences in Distribution Plan expenses and other class-specific expenses, (b) exchange privileges and (c) class-specific voting rights.
Security Valuation: Net asset value per share is determined every business day as of the close of the regular session of the New York Stock Exchange (generally 4:00 p.m. Eastern time). The Funds use independent pricing services approved by the Board of Directors (“the Board”) to value their investments wherever possible. Investments for which market quotations are not available or deemed not reliable are fair valued in good faith under the direction of the Board.
The Board has adopted Valuation Procedures (the “Procedures”) to determine the fair value of securities and other financial instruments for which market prices are not readily available or which may not be reliably priced. The Board has delegated the day-to-day responsibility for determining the fair value of assets of the Funds to Calvert Investment Management, Inc. (the “Advisor” or “Calvert”) and has provided these Procedures to govern Calvert in its valuation duties.
Calvert has chartered an internal Valuation Committee to oversee the implementation of these Procedures and to assist it in carrying out the valuation responsibilities that the Board has delegated.
The Valuation Committee meets on a regular basis to review illiquid securities and other investments which may not have readily available market prices. The Valuation Committee’s fair valuation determinations are subject to review, approval and ratification by the Board at its next regularly scheduled meeting covering the calendar quarter in which the fair valuation was determined.
28 www.calvert.com CALVERT SOLUTION STRATEGIES SEMI-ANNUAL REPORT (UNAUDITED)
The Valuation Committee utilizes various methods to measure the fair value of the Fund’s investments. Generally Accepted Accounting Principles (GAAP) establishes a disclosure hierarchy that categorizes the inputs to valuation techniques used to value assets and liabilities at measurement date. These inputs are summarized in the three broad levels listed below:
Level 1 – quoted prices in active markets for identical securities
Level 2 – other significant observable inputs (including quoted prices for similar securities, interest rates, prepayment speeds, credit risk, etc.)
Level 3 – significant unobservable inputs (including the Funds’ own assumptions in determining the fair value of investments) The inputs or methodologies used for valuing securities are not necessarily an indication of the risk associated with investing in those securities.
Changes in valuation techniques may result in transfers in or out of an investment’s assigned level within the hierarchy during the period. At March 31, 2014, $45,717,322 and $148,270,225 transferred out of Level 1 into Level 2 for Global Alternative Energy and Global Water, respectively. Valuation techniques used to value the Funds’ investments by major category are as follows: Equity securities, including restricted securities, for which market quotations are readily available, are valued at the last reported sale price or official closing price as reported by an independent pricing service on the primary market or exchange on which they are traded and are categorized as Level 1 in the hierarchy. In the event that there were no sales during the day or closing prices are not available, securities are valued at the last quoted bid price or using the last available price and are categorized as Level 2 in the hierarchy. Foreign securities are valued based on quotations from the principal market in which such securities are normally traded. If events occur after the close of the principal market in which foreign securities are traded, and before the close of business of the Funds, that are expected to materially affect the value of those securities, then they are valued at their fair value taking these events into account. The Funds have retained a third party fair value pricing service to quantitatively analyze the price movement of their holdings on foreign exchanges and to automatically fair value if the variation from the prior day’s closing price exceeds specified parameters. Such securities would be categorized as Level 2 in the hierarchy in these circumstances. Utilizing this technique may result in transfers between Level 1 and Level 2. For restricted securities and private placements where observable inputs are limited, assumptions about market activity and risk are used and such securities are categorized as Level 3 in the hierarchy.
Short-term securities of sufficient credit quality with remaining maturities of sixty days or less for which quotations are not readily available are valued at amortized cost, which approximates fair value, and are categorized as Level 2 in the hierarchy.
If a market value cannot be determined for a security using the methodologies described above, or if, in the good faith opinion of the Advisor, the market value does not constitute a readily available market quotation, or if a significant event has occurred that would materially affect the value of the security, the security will be fair valued as determined in good faith by the Valuation Committee.
www.calvert.com CALVERT SOLUTION STRATEGIES SEMI-ANNUAL REPORT (UNAUDITED) 29
The Valuation Committee considers a number of factors, including significant unobservable valuation inputs when arriving at fair value. It considers all significant facts that are reasonably available and relevant to the determination of fair value.
The Valuation Committee primarily employs a market-based approach which may use related or comparable assets or liabilities, recent transactions, market multiples, book values, and other relevant information for the investment to determine the fair value of the investment. When more appropriate, the fund may employ an income-based or cost approach. An income-based valuation approach discounts anticipated future cash flows of the investment to calculate a present amount (discounted). The measurement is based on the value indicated by current market expectations about those future amounts. Discounts may also be applied due to the nature or duration of any restrictions on the disposition of the investments. A cost based approach is based on the amount that currently would be required to replace the service capacity of an asset (current replacement cost). From the seller’s perspective, the price that would be received for the asset is determined based on the cost to a buyer to acquire or construct a substitute asset of comparable utility, adjusted for obsolescence.
The values assigned to fair value investments are based on available information and do not necessarily represent amounts that might ultimately be realized. Further, due to the inherent uncertainty of valuations of such investments, the fair values may differ significantly from the values that would have been used had an active market existed, and the differences could be material. The Valuation Committee employs various methods for calibrating these valuation approaches including a regular review of key inputs and assumptions, transactional back-testing or disposition analysis and reviews of any related market activity.
At March 31, 2014, securities valued at $626,411 and $0, or 0.6% and 0.0% of net assets were fair valued in good faith under the direction of the Board, for Global Alternative Energy and Global Water, respectively.
The following is a summary of the inputs used to value the Funds’ net assets as of March 31, 2014:
| GLOBAL ALTERNATIVE ENERGY | | VALUATION INPUTS | |
| INVESTMENTS IN SECURITIES | LEVEL 1 | LEVEL 2 | LEVEL 3 | TOTAL |
| Equity Securities* | $62,063,102 | $40,271,364** | — | $102,334,466 |
| Closed-End Funds | — | 5,445,958** | — | 5,445,958 |
| Other Debt Obligations | — | 3,933,797 | — | 3,933,797 |
| TOTAL | $62,063,102 | $49,651,119 | — | $111,714,221 |
| |
| GLOBAL WATER | | VALUATION INPUTS | |
| INVESTMENTS IN SECURITIES | LEVEL 1 | LEVEL 2 | LEVEL 3 | TOTAL |
| Equity Securities* | $277,725,924 | $148,270,225** | — | $425,996,149 |
| Other Debt Obligations | — | 19,631,900 | — | 19,631,900 |
| Total | $277,725,924 | $167,902,125 | — | $445,628,049 |
* For further breakdown of equity securities by country, please refer to the Statements of Net Assets.
** Includes certain securities trading primarily outside the U.S. whose value was adjusted as a result of significant market movements following the close of local trading. On March 31, 2014, price movements exceeded specified parameters and the third party fair value pricing service quantitatively fair valued the affected securities.
30 www.calvert.com CALVERT SOLUTION STRATEGIES SEMI-ANNUAL REPORT (UNAUDITED)
Security Transactions and Net Investment Income: Security transactions are accounted for on trade date. Realized gains and losses are recorded on an identified cost basis and may include proceeds from litigation. Dividend income is recorded on the ex-dividend date or, in the case of dividends on certain foreign securities, as soon as the Funds are informed of the ex-dividend date. Withholding taxes on foreign dividends have been provided for in accordance with the Funds’ understanding of the applicable country’s tax rules and rates. Distributions received on securities that represent a return of capital or capital gain are recorded as a reduction of cost of investments and/or as a realized gain. Interest income, which includes amortization of premium and accretion of discount on debt securities, is accrued as earned. Investment income and realized and unrealized gains and losses are allocated to separate classes of shares based upon the relative net assets of each class. Expenses arising in connection with a specific class are charged directly to that class. Expenses common to the classes are allocated to each class in proportion to their relative net assets.
Foreign Currency Transactions: The Funds’ accounting records are maintained in U.S. dollars. For valuation of assets and liabilities on each date of net asset value determination, foreign denominations are converted into U.S. dollars using the current exchange rate. Security transactions, income and expenses are translated at the prevailing rate of exchange on the date of the event. The effect of changes in foreign exchange rates on securities and foreign currencies is included in the net realized and unrealized gain or loss on securities and foreign currencies.
Distributions to Shareholders: Distributions to shareholders are recorded by the Funds on ex-dividend date. Dividends from net investment income and distributions from net realized capital gains, if any, are paid at least annually. Distributions are determined in accordance with income tax regulations which may differ from generally accepted accounting principles; accordingly, periodic reclassifications are made within the Funds’ capital accounts to reflect income and gains available for distribution under income tax regulations.
Estimates: The preparation of the financial statements in conformity with accounting principles generally accepted in the United States requires management to make estimates and assumptions that affect the reported amounts of assets and liabilities and disclosure of contingent assets and liabilities at the date of the financial statements and the reported amounts of income and expenses during the reported period. Actual results could differ from those estimates.
Redemption Fees: The Funds charge a 2% redemption fee on redemptions, including exchanges, made within 30 days of purchase in the same Fund (within seven days for Class I shares). The redemption fee is accounted for as an addition to paid-in capital and is intended to discourage market-timers by ensuring that short-term trading costs are borne by the investors making the transactions and not the shareholders already in the Fund.
Federal Income Taxes: No provision for federal income or excise tax is required since each Fund intends to continue to qualify as a regulated investment company under the Internal Revenue Code and to distribute substantially all of its taxable earnings.
www.calvert.com CALVERT SOLUTION STRATEGIES SEMI-ANNUAL REPORT (UNAUDITED) 31
Management has analyzed the Funds’ tax positions taken for all open federal income tax years and has concluded that no provision for federal income tax is required in the Funds’ financial statements. A Fund’s federal tax return is subject to examination by the Internal Revenue Service for a period of three years.
NOTE B — RELATED PARTY TRANSACTIONS
Calvert Investment Management, Inc. (the “Advisor”) is wholly-owned by Calvert Investments, Inc., which is indirectly wholly-owned by Ameritas Mutual Holding Company. The Advisor provides investment advisory services and pays the salaries and fees of officers and Directors of the Funds who are employees of the Advisor or its affiliates. For its services, the Advisor receives an annual fee, payable monthly, of .95% of the average daily net assets of Global Alternative Energy. For its services, the Advisor receives an annual fee, payable monthly, of .90% of the first $250 million of the average daily net assets of Global Water and .85% of all assets above $250 million. Prior to January 1, 2014, the Advisor received an annual fee of .95% of the total average daily net assets of Global Water. Under the terms of the agreement, $90,305 and $318,108 was payable at period end for Global Alternative Energy and Global Water, respectively. In addition, $7,685 and $34,676 was payable at period end for operating expenses paid by the Advisor during March 2014 for Global Alternative Energy and Global Water, respectively.
The Advisor has contractually agreed to limit net annual fund operating expenses for Classes A, C, Y and I through January 31, 2015. The contractual expense cap is 1.85% for Class A, 2.85% for Class C, 1.60% for Class Y of each Fund. The contractual expense cap is 1.40% and 1.29% for Class I in Global Alternative Energy and Global Water, respectively. For the purpose of this expense limit, operating expenses do not include interest expense, brokerage commissions, taxes, and extraordinary expenses. This expense limitation does not limit any acquired fund fees and expenses, if any. At period end, $13,552 was receivable from the Advisor for Global Alternative Energy.
Calvert Investment Administrative Services, Inc., an affiliate of the Advisor, provides administrative services to the Funds for an annual fee, payable monthly, of .35% for Classes A, C, and Y of each Fund and .15% for Class I shares in Global Alternative Energy and Global Water, based on their average daily net assets. Under the terms of the agreement, $33,170 and $125,972 was payable at period end for Global Alternative Energy and Global Water, respectively.
Calvert Investment Distributors, Inc. (“CID”), an affiliate of the Advisor, is the distributor and principal underwriter for the Funds. Pursuant to Rule 12b-1 under the Investment Company Act of 1940, each Fund has adopted a Distribution Plan that permits each Fund to pay certain expenses associated with the distribution and servicing of its shares. The expenses paid may not exceed .50% and 1.00% annually of average daily net assets of Class A and C, respectively. The amount actually paid by each Fund is an annualized fee, payable monthly, of .25% and 1.00% of the Funds’ average daily net assets of Class A and C, respectively. Class I and Class Y shares do not have Distribution Plan expenses. Under the terms of the agreement, $34,893 and $115,122 was payable at period end for Global Alternative Energy and Global Water, respectively.
CID received $27,458 and $262,903 as its portion of commissions charged on sales of Class A shares of Global Alternative Energy and Global Water, respectively, for the six months ended March 31, 2014.
32 www.calvert.com CALVERT SOLUTION STRATEGIES SEMI-ANNUAL REPORT (UNAUDITED)
Calvert Investment Services, Inc. (“CIS”), an affiliate of the Advisor, is the shareholder servicing agent for the Funds. For its services, CIS received a fee of $35,503 and $44,124 for the six months ended March 31, 2014 for Global Alternative Energy and Global Water, respectively. Under the terms of the agreement, $5,903 and $8,405 was payable at period end for Global Alternative Energy and Global Water, respectively. Boston Financial Data Services, Inc. is the transfer and dividend disbursing agent.
Each Director of the Funds who is not an employee of the Advisor or its affiliates receives an annual retainer of $48,000 plus a meeting fee of up to $3,000 for each Board meeting attended. Additional fees of up to $5,000 annually may be paid to the Board chair and Committee chairs ($10,000 for the Special Equities Committee chair) and $2,500 annually may be paid to Committee members, plus a Committee meeting fee of $500 for each Committee meeting attended. Directors’ fees are allocated to each of the funds served.
NOTE C — INVESTMENT ACTIVITY AND TAX INFORMATION
During the period, the cost of purchases and proceeds from sales of investments, other than short-term securities, were:
| | GLOBAL ALTERNATIVE | |
| | ENERGY | GLOBAL WATER |
| Purchases | $35,372,978 | $296,094,066 |
| Sales | 34,388,337 | 137,982,044 |
| CAPITAL LOSS CARRYFORWARDS | |
| | GLOBAL ALTERNATIVE |
| EXPIRATION DATE | ENERGY |
| 30-Sep-17 | ($21,115,915) |
| 30-Sep-18 | (56,693,584) |
| 30-Sep-19 | (43,799,530) |
| |
| NO EXPIRATION DATE | |
| Short-Term | ($1,406,142) |
| Long-Term | (67,055,125) |
Under the Regulated Investment Company Modernization Act of 2010, capital losses incurred in taxable years beginning after December 22, 2010 can be carried forward for an unlimited period. These losses are required to be utilized prior to the losses incurred in pre-enactment taxable years and will retain their character as either long-term or short-term. Losses incurred in pre-enactment taxable years can be utilized until expiration.
www.calvert.com CALVERT SOLUTION STRATEGIES SEMI-ANNUAL REPORT (UNAUDITED) 33
As of March 31, 2013, the tax basis components of unrealized appreciation/(depreciation) and the federal tax cost were as follows:
| | GLOBAL ALTERNATIVE | |
| | ENERGY | GLOBAL WATER |
| Unrealized Appreciation | $15,241,999 | $40,162,962 |
| Unrealized (Depreciation) | (7,964,910) | (11,225,645) |
| Net Unrealized Appreciation/(Depreciation) | $7,277,089 | $28,937,317 |
| |
| Federal Income Tax Cost of Investments | $104,437,132 | $416,690,732 |
NOTE D — LINE OF CREDIT
A financing agreement is in place with the Calvert Funds and State Street Corporation (“SSC”). Under the agreement, SSC provides an unsecured line of credit facility, in the aggregate amount of $50 million ($25 million committed and $25 million uncommitted), accessible by the Funds for temporary or emergency purposes only. Borrowings under the committed facility bear interest at the higher of the London Interbank Offered Rate (LIBOR) or the overnight Federal Funds Rate plus 1.25% per annum. A commitment fee of .11% per annum is incurred on the unused portion of the committed facility, which is allocated to all participating funds. Global Water had no borrowings under the agreement during the six months ended March 31, 2014. Global Alternative Energy had no loans outstanding pursuant to this line of credit at March 31, 2014. For the six months ended March 31, 2014, borrowings by Global Alternative Energy under the agreement were as follows:
| | | WEIGHTED | MAXIMUM | |
| | AVERAGE DAILY | AVERAGE | AMOUNT | MONTH OF MAXIMUM |
| | BALANCE | INTEREST RATE | BORROWED | AMOUNT BORROWED |
| Global Alternative Energy | $6,547 | 1.34% | $397,171 | February 2014 |
NOTE E — SUBSEQUENT EVENTS
In preparing the financial statements as of March 31, 2014, no subsequent events or transactions occurred that would have required recognition or disclosure in these financial statements.
34 www.calvert.com CALVERT SOLUTION STRATEGIES SEMI-ANNUAL REPORT (UNAUDITED)
| | | |
| GLOBAL ALTERNATIVE ENERGY FUND |
| FINANCIAL HIGHLIGHTS |
| |
| | | PERIODS ENDED | |
| | MARCH 31, | SEPTEMBER 30, | SEPTEMBER 30, |
| CLASS A SHARES | 2014 | 2013 | 2012 (z) |
| Net asset value, beginning | $6.94 | $5.16 | $5.48 |
| Income from investment operations: | | | |
| Net investment income (loss) | (.02) | (.01) | (.01) |
| Net realized and unrealized gain (loss) | .73 | 1.79 | (.17) |
| Total from investment operations | .71 | 1.78 | (.18) |
| Distributions from: | | | |
| Net investment income | — | — | (.14) |
| Net realized gain | — | — | — |
| Total distributions | — | — | (.14) |
| Total increase (decrease) in net asset value | .71 | 1.78 | (.32) |
| Net asset value, ending | $7.65 | $6.94 | $5.16 |
| |
| Total return* | 10.23% | 34.50% | (3.27%) |
| Ratios to average net assets:A | | | |
| Net investment income (loss) | (.66%) (a) | (.19%) | (.21%) |
| Total expenses | 2.22% (a) | 2.40% | 2.57% |
| Expenses before offsets | 1.85% (a) | 1.85% | 1.85% |
| Net expenses | 1.85% (a) | 1.85% | 1.85% |
| Portfolio turnover | 33% | 90% | 52% |
| Net assets, ending (in thousands) | $89,447 | $79,302 | $57,727 |
| |
| | | YEARS ENDED | |
| | SEPTEMBER 30, | SEPTEMBER 30, | SEPTEMBER 30, |
| CLASS A SHARES | 2011 (z) | 2010 | 2009 (z) |
| Net asset value, beginning | $8.22 | $10.45 | $12.35 |
| Income from investment operations: | | | |
| Net investment income (loss) | .10 | (.07) | (.02) |
| Net realized and unrealized gain (loss) | (2.84) | (2.16) | (1.88) |
| Total from investment operations | (2.74) | (2.23) | (1.90) |
| Distributions from: | | | |
| Net investment income | — | — | — |
| Net realized gain | — | — | — |
| Total distributions | — | — | — |
| Total increase (decrease) in net asset value | (2.74) | (2.23) | (1.90) |
| Net asset value, ending | $5.48 | $8.22 | $10.45 |
| |
| Total return* | (33.33%) | (21.34%) | (15.38%) |
| Ratios to average net assets: A | | | |
| Net investment income (loss) | 1.28% | (.69%) | (.25%) |
| Total expenses | 2.30% | 2.29% | 2.37% |
| Expenses before offsets | 1.85% | 1.85% | 1.85% |
| Net expenses | 1.85% | 1.85% | 1.85% |
| Portfolio turnover | 65% | 73% | 61% |
| Net assets, ending (in thousands) | $76,921 | $145,314 | $198,077 |
See notes to financial highlights.
www.calvert.com CALVERT SOLUTION STRATEGIES SEMI-ANNUAL REPORT (UNAUDITED) 35
| | | |
| GLOBAL ALTERNATIVE ENERGY FUND |
| FINANCIAL HIGHLIGHTS |
| |
| | | PERIODS ENDED | |
| | MARCH 31, | SEPTEMBER 30, | SEPTEMBER 30, |
| CLASS C SHARES | 2014 | 2013 | 2012 (z) |
| Net asset value, beginning | $6.66 | $5.00 | $5.28 |
| Income from investment operations: | | | |
| Net investment income (loss) | (.06) | (.07) | (.06) |
| Net realized and unrealized gain (loss) | .71 | 1.73 | (.17) |
| Total from investment operations | .65 | 1.66 | (.23) |
| Distributions from: | | | |
| Net investment income | — | — | (.05) |
| Net realized gain | — | — | — |
| Total distributions | — | — | (.05) |
| Total increase (decrease) in net asset value | .65 | 1.66 | (.28) |
| Net asset value, ending | $7.31 | $6.66 | $5.00 |
| |
| Total return* | 9.76% | 33.20% | (4.38%) |
| Ratios to average net assets:A | | | |
| Net investment income (loss) | (1.66%) (a) | (1.21%) | (1.22%) |
| Total expenses | 3.04% (a) | 3.20% | 3.37% |
| Expenses before offsets | 2.85% (a) | 2.85% | 2.85% |
| Net expenses | 2.85% (a) | 2.85% | 2.85% |
| Portfolio turnover | 33% | 90% | 52% |
| Net assets, ending (in thousands) | $18,673 | $16,697 | $13,595 |
| |
| | | YEARS ENDED | |
| | SEPTEMBER 30, | SEPTEMBER 30, | SEPTEMBER 30, |
| CLASS C SHARES | 2011 (z) | 2010 | 2009 (z) |
| Net asset value, beginning | $7.99 | $10.26 | $12.23 |
| Income from investment operations: | | | |
| Net investment income (loss) | .02 | (.15) | (.10) |
| Net realized and unrealized gain (loss) | (2.73) | (2.12) | (1.87) |
| Total from investment operations | (2.71) | (2.27) | (1.97) |
| Distributions from: | | | |
| Net investment income | — | — | — |
| Net realized gain | — | — | — |
| Total distributions | — | — | — |
| Total increase (decrease) in net asset value | (2.71) | (2.27) | (1.97) |
| Net asset value, ending | $5.28 | $7.99 | $10.26 |
| |
| Total return* | (33.92%) | (22.12%) | (16.11%) |
| Ratios to average net assets: A | | | |
| Net investment income (loss) | .28% | (1.68%) | (1.24%) |
| Total expenses | 3.10% | 3.10% | 3.20% |
| Expenses before offsets | 2.85% | 2.85% | 2.85% |
| Net expenses | 2.85% | 2.85% | 2.85% |
| Portfolio turnover | 65% | 73% | 61% |
| Net assets, ending (in thousands) | $18,300 | $33,191 | $42,224 |
See notes to financial highlights.
36 www.calvert.com CALVERT SOLUTION STRATEGIES SEMI-ANNUAL REPORT (UNAUDITED)
| | | |
| GLOBAL ALTERNATIVE ENERGY FUND |
| FINANCIAL HIGHLIGHTS |
| |
| | | PERIODS ENDED | |
| | MARCH 31, | SEPTEMBER 30, | SEPTEMBER 30, |
| CLASS I SHARES | 2014 | 2013 | 2012 (z) |
| Net asset value, beginning | $7.02 | $5.19 | $5.59 |
| Income from investment operations: | | | |
| Net investment income (loss) | (.01) | — | .02 |
| Net realized and unrealized gain (loss) | .75 | 1.83 | (.18) |
| Total from investment operations | .74 | 1.83 | (.16) |
| Distributions from: | | | |
| Net investment income | — | — | (.24) |
| Net realized gain | — | — | — |
| Total distributions | — | — | (.24) |
| Total increase (decrease) in net asset value | .74 | 1.83 | (.40) |
| Net asset value, ending | $7.76 | $7.02 | $5.19 |
| |
| Total return* | 10.54% | 35.26% | (2.77%) |
| Ratios to average net assets:A | | | |
| Net investment income (loss) | (.21%) (a) | .04% | .38% |
| Total expenses | 3.30% (a) | 3.19% | 1.77% |
| Expenses before offsets | 1.40% (a) | 1.40% | 1.40% |
| Net expenses | 1.40% (a) | 1.40% | 1.40% |
| Portfolio turnover | 33% | 90% | 52% |
| Net assets, ending (in thousands) | $586 | $525 | $725 |
| |
| | | YEARS ENDED | |
| | SEPTEMBER 30, | SEPTEMBER 30, | SEPTEMBER 30, |
| CLASS I SHARES | 2011 (z) | 2010 | 2009 (z) |
| Net asset value, beginning | $8.34 | $10.56 | $12.40 |
| Income from investment operations: | | | |
| Net investment income (loss) | .17 | (.02) | .02 |
| Net realized and unrealized gain (loss) | (2.92) | (2.20) | (1.86) |
| Total from investment operations | (2.75) | (2.22) | (1.84) |
| Distributions from: | | | |
| Net investment income | — | — | — |
| Net realized gain | — | — | — |
| Total distributions | — | — | — |
| Total increase (decrease) in net asset value | (2.75) | (2.22) | (1.84) |
| Net asset value, ending | $5.59 | $8.34 | $10.56 |
| |
| Total return* | (32.97%) | (21.02%) | (14.84%) |
| Ratios to average net assets: A | | | |
| Net investment income (loss) | 2.00% | (.25%) | .23% |
| Total expenses | 1.51% | 1.55% | 1.55% |
| Expenses before offsets | 1.40% | 1.40% | 1.40% |
| Net expenses | 1.40% | 1.40% | 1.40% |
| Portfolio turnover | 65% | 73% | 61% |
| Net assets, ending (in thousands) | $4,916 | $9,057 | $10,658 |
See notes to financial highlights.
www.calvert.com CALVERT SOLUTION STRATEGIES SEMI-ANNUAL REPORT (UNAUDITED) 37
| | | |
| GLOBAL ALTERNATIVE ENERGY FUND |
| FINANCIAL HIGHLIGHTS |
| |
| | | PERIODS ENDED | |
| | MARCH 31, | SEPTEMBER 30, | SEPTEMBER 30, |
| CLASS Y SHARES | 2014 | 2013 | 2012 (z) |
| Net asset value, beginning | $7.18 | $5.32 | $5.49 |
| Income from investment operations: | | | |
| Net investment income (loss) | (.01) | .01 | .05 |
| Net realized and unrealized gain (loss) | .76 | 1.85 | (.22) |
| Total from investment operations | .75 | 1.86 | (.17) |
| Distributions from: | | | |
| Net investment income | — | — | — |
| Net realized gain | — | — | — |
| Total distributions | — | | |
| Total increase (decrease) in net asset value | .75 | 1.86 | (.17) |
| Net asset value, ending | $7.93 | $7.18 | $5.32 |
| |
| Total return* | 10.45% | 34.96% | (3.10%) |
| Ratios to average net assets:A | | | |
| Net investment income (loss) | (.35%) (a) | .16% | .90% |
| Total expenses | 2.09% (a) | 2.50% | 6.75% |
| Expenses before offsets | 1.60% (a) | 1.60% | 1.60% |
| Net expenses | 1.60% (a) | 1.60% | 1.60% |
| Portfolio turnover | 33% | 90% | 52% |
| Net assets, ending (in thousands) | $3,030 | $1,877 | $897 |
| |
| | | | PERIOD ENDED |
| | | | SEPTEMBER 30, |
| CLASS Y SHARES | | | 2011 ^^ (z) |
| Net asset value, beginning | | | $7.70 |
| Income from investment operations: | | | |
| Net investment income (loss) | | | (.01) |
| Net realized and unrealized gain (loss) | | | (2.20) |
| Total from investment operations | | | (2.21) |
| Distributions from: | | | |
| Net investment income | | | — |
| Net realized gain | | | — |
| Total distributions | | | — |
| Total increase (decrease) in net asset value | | | (2.21) |
| Net asset value, ending | | | $5.49 |
| |
| Total return* | | | (28.70%) |
| Ratios to average net assets:A | | | |
| Net investment income (loss) | | | (.92%) (a) |
| Total expenses | | | 873.73% (a) |
| Expenses before offsets | | | 1.60% (a) |
| Net expenses | | | 1.60% (a) |
| Portfolio turnover | | | 65%*** |
| Net assets, ending (in thousands) | | | $9 |
See notes to financial highlights.
38 www.calvert.com CALVERT SOLUTION STRATEGIES SEMI-ANNUAL REPORT (UNAUDITED)
| | | |
| GLOBAL WATER FUND |
| FINANCIAL HIGHLIGHTS |
| |
| | | PERIODS ENDED | |
| | MARCH 31, | SEPTEMBER 30, | SEPTEMBER 30, |
| CLASS A SHARES | 2014 | 2013 (z) | 2012 (z) |
| Net asset value, beginning | $19.12 | $15.98 | $14.29 |
| Income from investment operations: | | | |
| Net investment income (loss) | .01 | (.04) | .02 |
| Net realized and unrealized gain (loss) | 2.47 | 3.99 | 3.29 |
| Total from investment operations | 2.48 | 3.95 | 3.31 |
| Distributions from: | | | |
| Net investment income | (.01) | (.01) | (.04) |
| Net realized gain | (1.34) | (.80) | (1.58) |
| Total distributions | (1.35) | (.81) | (1.62) |
| Total increase (decrease) in net asset value | 1.13 | 3.14 | 1.69 |
| Net asset value, ending | $20.25 | $19.12 | $15.98 |
| |
| Total return* | 13.62% | 25.81% | 25.16% |
| Ratios to average net assets: A | | | |
| Net investment income (loss) | .13% (a) | (.23%) | .16% |
| Total expenses | 1.78% (a) | 2.04% | 2.34% |
| Expenses before offsets | 1.78% (a) | 1.85% | 1.85% |
| Net expenses | 1.78% (a) | 1.85% | 1.85% |
| Portfolio turnover | 43% | 104% | 116% |
| Net assets, ending (in thousands) | $312,202 | $178,275 | $55,964 |
| |
| | | YEARS ENDED | |
| | SEPTEMBER 30, | SEPTEMBER 30, | SEPTEMBER 30, |
| CLASS A SHARES | 2011 (z) | 2010 (z) | 2009 (z) |
| Net asset value, beginning | $15.40 | $14.85 | $15.00 |
| Income from investment operations: | | | |
| Net investment income | .06 | .02 | .11 |
| Net realized and unrealized gain (loss) | (.69) | .79 | (.26) |
| Total from investment operations | (.63) | .81 | (.15) |
| Distributions from: | | | |
| Net investment income | (.02) | (.03) | — |
| Net realized gain | (.46) | (.23) | — |
| Total distributions | (.48) | (.26) | — |
| Total increase (decrease) in net asset value | (1.11) | .55 | (.15) |
| Net asset value, ending | $14.29 | $15.40 | $14.85 |
| |
| Total return* | (4.38%) | 5.50% | (1.00%) |
| Ratios to average net assets:A | | | |
| Net investment income | .36% | 16% | .87% |
| Total expenses | 2.32% | 2.69% | 5.78% |
| Expenses before offsets | 1.85% | 1.85% | 1.99% |
| Net expenses | 1.85% | 1.85% | 1.85% |
| Portfolio turnover | 125% | 61% | 58% |
| Net assets, ending (in thousands) | $39,535 | $35,401 | $9,365 |
See notes to financial highlights.
www.calvert.com CALVERT SOLUTION STRATEGIES SEMI-ANNUAL REPORT (UNAUDITED) 39
| | | |
| GLOBAL WATER FUND |
| FINANCIAL HIGHLIGHTS |
| |
| | | PERIODS ENDED | |
| | MARCH 31, | SEPTEMBER 30, | SEPTEMBER 30, |
| CLASS C SHARES | 2014 | 2013 (z) | 2012 (z) |
| Net asset value, beginning | $18.20 | $15.38 | $13.90 |
| Income from investment operations: | | | |
| Net investment income (loss) | (.04) | (.19) | (.12) |
| Net realized and unrealized gain (loss) | 2.32 | 3.81 | 3.18 |
| Total from investment operations | 2.28 | 3.62 | 3.06 |
| Distributions from: | | | |
| Net investment income | (.01) | — | — |
| Net realized gain | (1.34) | (.80) | (1.58) |
| Total distributions | (1.35) | (.80) | (1.58) |
| Total increase (decrease) in net asset value | .93 | 2.82 | 1.48 |
| Net asset value, ending | $19.13 | $18.20 | $15.38 |
| |
| Total return* | 13.19% | 24.63% | 23.90% |
| Ratios to average net assets: A | | | |
| Net investment income (loss) | (.54%) (a) | (1.16%) | (.81%) |
| Total expenses | 2.48% (a) | 2.79% | 3.20% |
| Expenses before offsets | 2.48% (a) | 2.79% | 2.85% |
| Net expenses | 2.48% (a) | 2.79% | 2.85% |
| Portfolio turnover | 43% | 104% | 116% |
| Net assets, ending (in thousands) | $65,008 | $30,759 | $8,574 |
| |
| | | YEARS ENDED | |
| | SEPTEMBER 30, | SEPTEMBER 30, | SEPTEMBER 30, |
| CLASS C SHARES | 2011 (z) | 2010 (z) | 2009 (z) |
| Net asset value, beginning | $15.12 | $14.70 | $15.00 |
| Income from investment operations: | | | |
| Net investment income (loss) | (.10) | (.13) | ** |
| Net realized and unrealized gain (loss) | (.66) | .79 | (.30) |
| Total from investment operations | (.76) | .66 | (.30) |
| Distributions from: | | | |
| Net investment income | — | (.01) | — |
| Net realized gain | (.46) | (.23) | — |
| Total distributions | (.46) | (.24) | — |
| Total increase (decrease) in net asset value | (1.22) | .42 | (.30) |
| Net asset value, ending | $13.90 | $15.12 | $14.70 |
| |
| Total return* | (5.33%) | 4.51% | (2.00%) |
| Ratios to average net assets: A | | | |
| Net investment income (loss) | (.60%) | (.90%) | .03% |
| Total expenses | 3.26% | 3.96% | 11.38% |
| Expenses before offsets | 2.85% | 2.85% | 2.99% |
| Net expenses | 2.85% | 2.85% | 2.85% |
| Portfolio turnover | 125% | 61% | 58% |
| Net assets, ending (in thousands) | $5,537 | $3,202 | $915 |
See notes to financial highlights.
40 www.calvert.com CALVERT SOLUTION STRATEGIES SEMI-ANNUAL REPORT (UNAUDITED)
| |
| GLOBAL WATER FUND |
| FINANCIAL HIGHLIGHTS |
| |
| | PERIOD ENDED |
| | MARCH 31, |
| CLASS I SHARES | 2014 ^ |
| Net asset value, beginning | $18.99 |
| Income from investment operations: | |
| Net investment income | .04 |
| Net realized and unrealized gain (loss) | 1.24 |
| Total from investment operations | 1.28 |
| Distributions from: | |
| Net investment income | — |
| Net realized gain | — |
| Total distributions | — |
| Total increase (decrease) in net asset value | 1.28 |
| Net asset value, ending | $20.27 |
| |
| Total return* | 6.74% |
| Ratios to average net assets: A | |
| Net investment income | 1.11% (a) |
| Total expenses | 1.26% (a) |
| Expenses before offsets | 1.26% (a) |
| Net expenses | 1.26% (a) |
| Portfolio turnover | 43%*** |
| Net assets, ending (in thousands) | $2 |
See notes to financial highlights.
www.calvert.com CALVERT SOLUTION STRATEGIES SEMI-ANNUAL REPORT (UNAUDITED) 41
| | | |
| GLOBAL WATER FUND |
| FINANCIAL HIGHLIGHTS |
| |
| | | PERIODS ENDED | |
| | MARCH 31, | SEPTEMBER 30, | SEPTEMBER 30, |
| CLASS Y SHARES | 2014 | 2013 (z) | 2012 (z) |
| Net asset value, beginning | $19.21 | $16.03 | $14.28 |
| Income from investment operations: | | | |
| Net investment income | .04 | .01 | .05 |
| Net realized and unrealized gain (loss) | 2.49 | 3.99 | 3.31 |
| Total from investment operations | 2.53 | 4.00 | 3.36 |
| Distributions from: | | | |
| Net investment income | (.01) | (.02) | (.03) |
| Net realized gain | (1.34) | (.80) | (1.58) |
| Total distributions | (1.35) | (.82) | (1.61) |
| Total increase (decrease) in net asset value | 1.18 | 3.18 | 1.75 |
| Net asset value, ending | $20.39 | $19.21 | $16.03 |
| |
| Total return* | 13.83% | 26.07% | 25.55% |
| Ratios to average net assets:A | | | |
| Net investment income | .56% (a) | .08% | .40% |
| Total expenses | 1.42% (a) | 1.66% | 2.12% |
| Expenses before offsets | 1.42% (a) | 1.60% | 1.60% |
| Net expenses | 1.42% (a) | 1.60% | 1.60% |
| Portfolio turnover | 43% | 104% | 116% |
| Net assets, ending (in thousands) | $71,911 | $26,009 | $3,692 |
| |
| | | YEARS ENDED | |
| | SEPTEMBER 30, | SEPTEMBER 30, | SEPTEMBER 30, |
| CLASS Y SHARES | 2011 (z) | 2010 (z) | 2009 (z) |
| Net asset value, beginning | $15.44 | $14.83 | $15.00 |
| Income from investment operations: | | | |
| Net investment income | .12 | .09 | .08 |
| Net realized and unrealized gain (loss) | (.71) | .77 | (.25) |
| Total from investment operations | (.59) | .86 | (.17) |
| Distributions from: | | | |
| Net investment income | (.11) | (.02) | — |
| Net realized gain | (.46) | (.23) | — |
| Total distributions | (.57) | (.25) | — |
| Total increase (decrease) in net asset value | (1.16) | .61 | (.17) |
| Net asset value, ending | $14.28 | $15.44 | $14.83 |
| |
| Total return* | (4.22%) | 5.84% | (1.13%) |
| Ratios to average net assets: A | | | |
| Net investment income | .76% | .61% | .60% |
| Total expenses | 2.56% | 8.03% | 145.92% |
| Expenses before offsets | 1.60% | 1.60% | 1.74% |
| Net expenses | 1.60% | 1.60% | 1.60% |
| Portfolio turnover | 125% | 61% | 58% |
| Net assets, ending (in thousands) | $2,934 | $345 | $31 |
See notes to financial highlights.
42 www.calvert.com CALVERT SOLUTION STRATEGIES SEMI-ANNUAL REPORT (UNAUDITED)
A Total expenses do not reflect amounts reimbursed and/or waived by the Advisor or reductions from expense offset arrangements. Expenses before offsets reflect expenses after reimbursement and/or waiver by the Advisor but prior to reductions from expense offset arrangements. Net expenses are net of all reductions and represent the net expenses paid by the Fund.
(a) Annualized.
(z) Per share figures are calculated using the Average Shares Method.
* Total return is not annualized for periods of less than one year and does not reflect deduction of any front-end or deferred sales charge.
** Less than $.01 per share.
*** Portfolio turnover is not annualized for periods of less than one year.
^ From January 31, 2014, inception
^^ From July 29, 2011 inception.
See notes to financial statements.
www.calvert.com CALVERT SOLUTION STRATEGIES SEMI-ANNUAL REPORT (UNAUDITED) 43
EXPLANATION OF FINANCIAL TABLES
SCHEDULE OF INVESTMENTS
The Schedule of Investments is a snapshot of all securities held in the fund at their market value, on the last day of the reporting period. Securities are listed by asset type (e.g., common stock, corporate bonds, U.S. government obligations), or, for International and Global funds, by country, and may be further broken down into sub-groups and by industry classification.
STATEMENT OF ASSETS AND LIABILITIES
The Statement of Assets and Liabilities is often referred to as the fund’s balance sheet. It lists the value of what the fund owns, is due and owes on the last day of the reporting period. The fund’s assets include the market value of securities owned, cash, receivables for securities sold and shareholder subscriptions, and receivables for dividends and interest payments that have been earned, but not yet received. The fund’s liabilities include payables for securities purchased and shareholder redemptions, and expenses owed but not yet paid. The statement also reports the fund’s net asset value (NAV) per share on the last day of the reporting period. The NAV is calculated by dividing the fund’s net assets (assets minus liabilities) by the number of shares outstanding. This statement is accompanied by a Schedule of Investments. Alternatively, if certain conditions are met, a Statement of Net Assets may be presented in lieu of this statement and the Schedule of Investments.
STATEMENT OF NET ASSETS
The Statement of Net Assets provides a detailed list of the fund’s holdings, including each security’s market value on the last day of the reporting period. The Statement of Net Assets includes a Schedule of Investments. Other assets are added and other liabilities subtracted from the investments total to calculate the fund’s net assets. Finally, net assets are divided by the outstanding shares of the fund to arrive at its share price, or Net Asset Value (NAV) per share.
At the end of the Statement of Net Assets is a table displaying the composition of the fund’s net assets. Paid in Capital is the money invested by shareholders and represents the bulk of net assets. Undistributed Net Investment Income and Accumulated Net Realized Gains usually approximate the amounts the fund had available to distribute to shareholders as of the statement date. Accumulated Realized Losses will appear as negative balances. Unrealized Appreciation (Depreciation) is the difference between the market value of the fund’s investments and their cost, and reflects the gains (losses) that would be realized if the fund were to sell all of its investments at their statement-date values.
STATEMENT OF OPERATIONS
The Statement of Operations summarizes the fund’s investment income earned and expenses incurred in operating the fund. Investment income includes dividends earned from stocks and interest earned from interest-bearing securities in the fund. Expenses incurred in operating the fund include the advisory fee paid to the investment advisor, administrative services fees, distribution plan expenses (if applicable), transfer agent fees, shareholder servicing expenses, custodial, legal, and audit fees, and the printing and postage expenses related to shareholder reports. Expense offsets (fees paid indirectly) may also be shown. Credits earned from offset arrangements are used to reduce the fund’s expenses.
44 www.calvert.com CALVERT SOLUTION STRATEGIES SEMI-ANNUAL REPORT (UNAUDITED)
This statement also shows net gains (losses) realized on the sale of investments and the increase or decrease in the unrealized appreciation (depreciation) on investments held during the period.
STATEMENT OF CHANGES IN NET ASSETS
The Statement of Changes in Net Assets shows how the fund’s total net assets changed during the two most recent reporting periods. Changes in the fund’s net assets are attributable to investment operations, distributions and capital share transactions.
The Operations section of the report summarizes information detailed in the Statement of Operations. The Distribution section shows the dividend and capital gain distributions made to shareholders. The amounts shown as distributions in this section may not match the net investment income and realized gains amounts shown in the Operations section because distributions are determined on a tax basis and certain investments or transactions may be treated differently for financial statement and tax purposes. The Capital Share Transactions section shows the amount shareholders invested in the fund, either by purchasing shares or by reinvesting distributions, and the amounts redeemed. The corresponding numbers of shares issued, reinvested and redeemed are shown at the end of the report.
FINANCIAL HIGHLIGHTS
The Financial Highlights table provides a per-share breakdown per class of the components that affect the fund’s net asset value for current and past reporting periods. The table provides total return, total distributions, expense ratios, portfolio turnover and net assets for the applicable period. Total return is a measure of a fund’s performance that encompasses all elements of return: dividends, capital gain distributions and changes in net asset value. Total return is the change in value of an investment over a given period, assuming reinvestment of any dividends and capital gain distributions, expressed as a percentage of the initial investment. Total distributions include distributions from net investment income and net realized gains. Long-term gains are earned on securities held in the fund more than one year. Short-term gains, on the sale of securities held less than one year, are treated as ordinary dividend income for tax purposes. The expense ratio is a fund’s cost of doing business, expressed as a percentage of net assets. These expenses directly reduce returns to shareholders. Portfolio turnover measures the trading activity in a fund’s investment portfolio – how often securities are bought and sold by a fund. Portfolio turnover is affected by market conditions, changes in the size of the fund, the nature of the fund’s investments and the investment style of the portfolio manager.
PROXY VOTING
The Proxy Voting Guidelines of the Calvert Funds that each Fund uses to determine how to vote proxies relating to portfolio securities are provided as an Appendix to the Fund’s Statement of Additional Information. The Statement of Additional Information can be obtained free of charge by calling the Fund at 1-800-368-2745, by visiting the Calvert website at www.calvert.com; or by visiting the SEC’s website at www.sec.gov.
Information regarding how the Fund voted proxies relating to portfolio securities during the most recent 12-month period ended June 30 is available on the Fund’s website at www.calvert.com and on the SEC’s website at www.sec.gov.
www.calvert.com CALVERT SOLUTION STRATEGIES SEMI-ANNUAL REPORT (UNAUDITED) 45
AVAILABILITY OF QUARTERLY PORTFOLIO HOLDINGS
Each Fund files its complete schedule of portfolio holdings with the SEC for the first and third quarters of each fiscal year on Form N-Q. The Fund’s Form N-Q is available on the SEC’s website at www.sec.gov. The Fund’s Form N-Q may be reviewed and copied at the SEC’s Public Reference Room in Washington, DC; information on the operation of the Public Reference Room may be obtained by calling 1-800-SEC-0330.
BASIS FOR BOARD’S APPROVAL OF INVESTMENT ADVISORY AND INVESTMENT SUBADVISORY CONTRACTS
At a meeting held on December 10, 2013, the Board of Directors, and by a separate vote, the disinterested Directors, approved the continuance of the Investment Advisory Agreement between Calvert Impact Fund, Inc. and the Advisor and the Investment Subadvisory Agreement between the Advisor and the Subadvisor with respect to each Fund.
In evaluating the Investment Advisory Agreement with respect to the Funds, the Board considered, on a Fund-by-Fund basis, a variety of information relating to the Funds and the Advisor. The disinterested Directors reviewed a report prepared by the Advisor regarding various services provided to the Funds by the Advisor and its affiliates. Such report included, among other data, information regarding the Advisor’s personnel and the Advisor’s revenue and cost of providing services to the Funds, and a separate report prepared by an independent third party, which provided a statistical analysis comparing each Fund’s investment performance, expenses, and fees to comparable mutual funds.
The disinterested Directors were separately represented by independent legal counsel with respect to their consideration of the reapproval of the Investment Advisory Agreement and Investment Subadvisory Agreement with respect to each Fund. Prior to voting, the disinterested Directors reviewed with respect to each Fund the proposed continuance of the Investment Advisory Agreement and Investment Subadvisory Agreement with management and also met in private sessions with their counsel at which no representatives of management were present.
In the course of its deliberations regarding the Investment Advisory Agreement with respect to the Funds, the Board considered, on a Fund-by-Fund basis, the following factors, among others: the nature, extent and quality of the services provided by the Advisor, including the personnel providing such services; the Advisor’s financial condition; the level and method of computing each Fund’s advisory fee; comparative performance, fee and expense information for each Fund; the profitability of the Calvert Family of Funds to the Advisor and its affiliates; the allocation of each Fund’s brokerage, including the Advisor’s process for monitoring “best execution”; the direct and indirect benefits, if any, derived by the Advisor and its affiliates from their relationship with each Fund; the effect of each Fund’s growth and size on the Fund’s performance and expenses; the affiliated distributor’s process for monitoring sales load breakpoints; the Advisor’s compliance programs and policies; the Advisor’s performance of substantially similar duties for other funds; and any possible conflicts of interest.
46 www.calvert.com CALVERT SOLUTION STRATEGIES SEMI-ANNUAL REPORT (UNAUDITED)
In considering the nature, extent and quality of the services provided to the Funds by the Advisor under the Investment Advisory Agreement, the Board reviewed information provided by the Advisor relating to its operations and personnel, including, among other information, biographical information on the Advisor’s supervisory and professional staff and descriptions of its organizational and management structure. The Board also took into account similar information provided periodically throughout the previous year by the Advisor as well as the Board’s familiarity with management through Board of Directors’ meetings, discussions and other reports. The Board also noted that it reviewed on a quarterly basis information regarding the Advisor’s compliance with applicable policies and procedures, including those related to personal investing. The Advisor’s administrative capabilities, including its ability to supervise the other service providers for each Fund, were also considered. The Board also took into account the environmental, social, sustainability and governance research and analysis provided by the Advisor to each Fund. The Board observed that the scope of services provided by the Advisor generally had expanded over time as a result of regulatory, market and other changes. The Board took into consideration, among other factors, the effectiveness of the Funds’ and Advisor’s processes, policies and procedures and the Advisor’s personnel. The Board also took into account, among other items, periodic reports received from the Advisor over the past year concerning the Advisor’s ongoing review and enhancement of certain processes, policies and procedures of the Funds and the Advisor. The Board discussed the Advisor’s effectiveness in monitoring the performance of the Subadvisor and its timeliness in responding to performance issues. The Board concluded that it was satisfied with the nature, extent and quality of services provided to each Fund by the Advisor under the Investment Advisory Agreement.
In considering each Fund’s performance, the Board noted that it reviewed on a quarterly basis detailed information about each Fund’s performance results, portfolio composition and investment strategies. In addition, the Board took into account overall financial market conditions. The Board also reviewed various comparative data provided to it in connection with its consideration of the renewal of the Investment Advisory Agreement with respect to each Fund, including, among other information, a comparison of each Fund’s total return with its Lipper index and with that of other mutual funds deemed to be in its peer universe by an independent third party in its report. This data, and the conclusions of the Board with respect to that data, included the following: Global Alternative Energy Fund. For the one-year period ended June 30, 2013, the Fund performed above the median of its peer universe. For the three- and five-year periods ended June 30, 2013, the Fund performed below the median of its peer group. The Fund outperformed its Lipper index for the one-year period ended June 30, 2013, and underperformed its Lipper index for the three- and five-year periods ended June 30, 2013. The Board took into account management’s discussion of the Fund’s performance and management’s continued monitoring of the Fund’s performance. The Board also considered management’s discussion of the limitations on the active benchmark against which the Fund’s performance was measured as well as the Fund’s performance against a custom active benchmark. Based upon its review, the Board concluded that appropriate action was being taken to address the Fund’s performance.
Global Water Fund. For the one- and three-year periods ended June 30, 2013, the Fund performed above the median of its peer universe. The Fund outperformed its Lipper
www.calvert.com CALVERT SOLUTION STRATEGIES SEMI-ANNUAL REPORT (UNAUDITED) 47
index for the one- and three-year periods ended June 30, 2013. Based upon its review, the Board concluded that the Fund’s performance was satisfactory relative to the performance of funds with similar investment objectives and to relevant indices.
In considering the Funds’ fees and expenses, the Board compared each Fund’s fees and total expense ratio with various comparative data for the funds in each Fund’s respective peer group or peer universe, as applicable. This data, and the considerations of the Board with respect to the Funds’ fees and expenses, included the following: Global Alternative Energy Fund. The Fund’s advisory fee (after taking into account waivers and/or reimbursements) was below the median of its peer group and that total expenses (net of waivers and/or reimbursements) were above the median of its peer group. The Board noted that the allocation of advisory and administrative fees may vary among the Fund’s peer group. The Board took into account the Advisor’s current undertaking to maintain expense limitations for the Fund and that the Advisor had reimbursed a portion of the Fund’s expenses. The Board noted the Advisor’s discussion of the Fund’s expenses and certain factors that affected the level of such expenses, including the cost of providing the environmental, social, sustainability and governance research and analysis provided by the Advisor. Based upon its review, the Board concluded that the advisory fee was reasonable in view of the quality of services received by the Fund from the Advisor and the other factors considered.
Global Water Fund. The Fund’s advisory fee (after taking into account waivers and/or reimbursements) was above the median of its peer group and that total expenses (net of waivers and/or reimbursements) were above the median of its peer universe. The Board noted that the allocation of advisory and administrative fees may vary among the Fund’s peer universe. The Board also noted that the Advisor had agreed to reduce the advisory fee it charged to the Fund and add a breakpoint to the advisory fee schedule. The Board also noted the Advisor’s discussion of the Fund’s expenses and certain factors that affected the level of such expenses, including the cost of providing the environmental, social, sustainability and governance research and analysis provided by the Advisor. The Board also took into account the Advisor’s current undertaking to maintain expense limitations for the Fund and that the Advisor had reimbursed a portion of the Fund’s expenses. Based upon its review, the Board determined that the advisory fee was reasonable in view of the quality of services received by the Fund from the Advisor and the other factors considered.
The Board reviewed the Advisor’s profitability on a Fund-by-Fund basis. In reviewing the overall profitability of the advisory fee to the Funds’ Advisor, the Board also considered the fact that affiliates of the Advisor provided shareholder servicing, administrative, and distribution services to the Funds for which they received compensation. The information considered by the Board included Calvert’s operating profit margin information both before and after tax expenses with respect to the services that the Advisor and its affiliates provided to the Calvert Family of Funds complex. The Board reviewed the profitability of the Advisor’s relationship with each Fund in terms of the total amount of annual advisory fees it received with respect to the Fund and whether the Advisor had the financial wherewithal to continue to provide services to the Fund. The Board noted that the Advisor had reimbursed a portion of each Fund’s expenses. The Board also noted the Advisor’s current undertaking to maintain expense limitations for the Funds and that the that the Advisor had agreed to reduce the advisory fee it charged to the Global Water
48 www.calvert.com CALVERT SOLUTION STRATEGIES SEMI-ANNUAL REPORT (UNAUDITED)
Fund and add a breakpoint to that Fund’s advisory fee schedule. The Board also considered that the Advisor derived benefits to its reputation and other indirect benefits from its relationship with the Funds. The Board also noted that the Advisor paid the subadvisory fee to the Subadvisor. Based upon its review, the Board concluded that the Advisor’s and its affiliates’ level of profitability from their relationship with the Funds was reasonable.
The Board considered the effect of each Fund’s current size and its potential growth on its performance and fees. The Board concluded that adding breakpoints to the advisory fee for the Global Alternative Energy Fund at specified asset levels would not be appropriate at this time given the Fund’s current size. The Board also took into account the addition of a breakpoint in the advisory fee schedule for Global Water Fund that would reduce the advisory fee rate on assets above a certain specified asset level as the Funds’ assets increased. The Board noted that if the Funds’ assets increased over time, the Funds might realize other economies of scale if assets increased proportionally more than certain other expenses.
In reapproving the Investment Advisory Agreement with respect to each Fund, the Board, including the disinterested Directors, did not identify any single factor as controlling, and each Director may have attributed different weight to various factors.
In evaluating the Investment Subadvisory Agreement with respect to each Fund, the disinterested Directors reviewed information provided by the Subadvisor relating to its operations, personnel, investment philosophy, strategies and techniques. Among other information, the Subadvisor provided biographical information on portfolio management and other professional staff, performance information for itself, and descriptions of its investment philosophies, strategies and techniques, organizational and management structures and brokerage policies and practices.
The Board reapproved the Investment Subadvisory Agreement between the Advisor and the Subadvisor with respect to each Fund based on a number of factors relating to the Subadvisor’s ability to perform under the Investment Subadvisory Agreement. In the course of its deliberations, the Board evaluated, among other factors: the nature, extent and the quality of the services provided by the Subadvisor; the Subadvisor’s management style and long-term performance record; each Fund’s performance record and the Subadvisor’s performance in employing its investment strategies; the Subadvisor’s current level of staffing and its overall resources; the qualifications and experience of the Subadvisor’s personnel; the Subadvisor’s financial condition with respect to its ability to perform the services required under the Investment Subadvisory Agreement; the Subadvisor’s risk management processes; the Subadvisor’s compliance systems, including those related to personal investing; and any disciplinary history. Based upon its review, the Board concluded that it was satisfied with the nature, extent and quality of services provided to each Fund by the Subadvisor under each Fund’s Investment Subadvisory Agreement.
As noted above, the Board considered, among other information, the Funds’ performance during the one-, three- and five-year periods ended June 30, 2013, as applicable, as compared to the Fund’s peer group or universe, as applicable, and noted that it reviewed on a quarterly basis detailed information about the Fund’s performance results, portfolio composition and investment strategies. The Board noted the Advisor’s expertise and resources in monitoring the performance, investment style and risk-adjusted performance of the Subadvisor.
www.calvert.com CALVERT SOLUTION STRATEGIES SEMI-ANNUAL REPORT (UNAUDITED) 49
In considering the cost of services provided by the Subadvisor to each Fund and the profitability to the Subadvisor of its relationship with each Fund, the Board noted that the subadvisory fee under the Investment Subadvisory Agreement was paid by the Advisor out of the advisory fee that the Advisor received under the Investment Advisory Agreement. The Board also relied on the ability of the Advisor to negotiate the Investment Subadvisory Agreement and the corresponding subadvisory fee with respect to each Fund at arm’s length. In addition, the Board took into account the fees the Subadvisor charged to its other clients and considered these fee comparisons in light of the differences in managing these other accounts. Based upon its review, the Board determined that the subadvisory fee for each Fund was reasonable in view of the quality of services received by the Fund from the Subadvisor and the other factors considered. For each of the above reasons, the cost of services provided by the Subadvisor to each Fund and the profitability to the Subadvisor of its relationship with each Fund were not material factors in the Board’s deliberations. For similar reasons, the Board did not consider the potential economies of scale in the Subadvisor’s management of the Funds to be a material factor in its consideration, although the Board noted that the subadvisory fee schedule for each Fund contained breakpoints that reduced the subadvisory fee rate on assets above specified levels.
In reapproving the Investment Subadvisory Agreement with respect to each Fund, the Board, including the disinterested Directors, did not identify any single factor as controlling, and each Director may have attributed different weights to various factors.
CONCLUSIONS
The Board reached the following conclusions regarding the Investment Advisory Agreement and the Investment Subadvisory Agreement with respect to each Fund, among others: (a) the Advisor has demonstrated that it possessed the capability and resources to perform the duties required of it under the Investment Advisory Agreement; (b) the Subadvisor is qualified to manage each Fund’s assets in accordance with each Fund’s investment objectives and policies; (c) the Advisor and Subadvisor maintain appropriate compliance programs; (d) the Subadvisor is likely to execute its investment strategies consistently over time; (e) appropriate action is being taken to address the performance of the Global Alternative Energy Fund, and the performance of the Global Water Fund is satisfactory relative to the performance of funds with similar investment objectives and to relevant indices; and (f) each Fund’s advisory and subadvisory fees are reasonable in view of the quality of services received by the Fund from the Advisor and Subadvisor, respectively, and the other factors considered. Based on its conclusions, the Board determined that reapproval of the Investment Advisory Agreement and the Investment Subadvisory Agreement with respect to each Fund would be in the best interests of the Funds and their respective shareholders.
50 www.calvert.com CALVERT SOLUTION STRATEGIES SEMI-ANNUAL REPORT (UNAUDITED)
To Open an Account
800-368-2748
Service for Existing Account
Shareholders: 800-368-2745
Brokers: 800-368-2746
TDD for Hearing Impaired
800-541-1524
Registered Mail
Calvert Investments
c/o BFDS,
P.O. Box 219544
Kansas City, MO 64121-9544
Overnight Mail
Calvert Investments
c/o BFDS,
330 West 9th Street
Kansas City, MO 64105
Web Site
www.calvert.com
Principal Underwriter
Calvert Investment Distributors, Inc.
4550 Montgomery Avenue
Suite 1000 North
Bethesda, Maryland 20814
is report is intended to provide fund information to shareholders. It is not authorized for distribution to prospective investors unless preceded or accompanied by a prospectus.
Note: e information on our website is not incorporated by reference into this report; our website address is included as an inactive textual reference only.
Investors should carefully consider the investment objectives, risks, charges and expenses of the Calvert Funds. is and other important information is contained in the fund’s summary prospectus and prospectus, which can be obtained from your nancial professional and should be read carefully before investing. You may also call Calvert at 800/368-2748 or visit www. calvert.com.
Choose Planet-friendly E-delivery!
Sign up now for on-line statements, prospectuses, and fund reports. In less than five minutes you can help reduce paper mail and lower fund costs.
Just go to www.calvert.com. If you already have an online account at Calvert, click on My Account, and select the documents you would like to receive via e-mail.
If you’re new to online account access, click on Login/Register to open an online account. Once you’re in, click on the E-delivery sign-up at the bottom of the Account Portfolio page and follow the quick, easy steps. Note: if your shares are not held directly at Calvert but through a brokerage firm, you must contact your broker for electronic delivery options available through their firm.

The U.S. economy has labored slowly and steadily to recover from the 2008 global financial crisis. Since the 2009 trough of the Great Recession, the growth rate has been sub-par, such that many still speak of the economy as being in recovery. That said, the United States has generally fared better than other major economies. For example, U.S. banks are in much better condition than most of their overseas counterparts.
But we’ve seen the same pattern every year since the crisis--just as economic momentum seems to gather force, events conspire to de-rail it. The eurozone crisis, which intensified in waves before appearing to peak in the summer of 2012. Political dysfunction in the United States, which led to self-imposed fiscal austerity and midnight-hour budget deals to avoid temporary defaults on Treasury financial obligations. All of these events raised uncertainty and kept a lid on investor and consumer confidence, creating a drag on U.S. economic output.
The pattern was finally broken in 2013. While the markets faced a heavy drag on U.S. growth from the “fiscal cliff,” hope increased in the markets—and at the Federal Reserve—as the year progressed that the U.S. economy would slowly but surely escape the drag and start growing at a sustainably moderate clip.
Six-Month Performance Solid Overall
This improved market sentiment resulted in strong performance by riskier asset classes such as U.S. equities, investment-grade corporate bonds, and high-yield bonds during the fourth quarter of 2013.
Integration of Environmental, Social, and Governance Factors in Credit Analysis
Our fixed-income portfolio managers seek to add alpha through an active management style that emphasizes duration management, yield-curve positioning, sector allocation, and security selection. Our team of credit analysts examines the financial condition of corporate bond issuers as well as the structure, terms, and covenants of specific bond issues.
From a fundamental research standpoint, the credit analysts collaborate closely with Calvert’s sustainability research department analysts to evaluate a bond issuer’s environmental, social, and governance (ESG) risk factors. We believe this robust, integrated approach helps us both mitigate risk and identify attractive sectors and securities within the fixed-income markets.
4 www.calvert.com CALVERT GREEN BOND FUND SEMI-ANNUAL REPORT (UNAUDITED)
| CALVERT GREEN |
| BOND FUND |
| MARCH 31, 2014 |
| |
| | % OF TOTAL |
| ECONOMIC SECTORS | INVESTMENTS |
| Corporate | 42.8% |
| Financial Institutions | 14.1% |
| Industrial | 28.7% |
| Government Related | 7.0% |
| Agency | 1.8% |
| Local Authority | 1.5% |
| Supranational | 3.7% |
| Securitized | 15.7% |
| Asset-Backed Securities | 4.6% |
| Mortgage-Backed Pass- | |
| Through | 11.1% |
| Short-Term Investments | 11.2% |
| Treasury | 23.3% |
| Total | 100% |
However, geopolitical and economic uncertainty pushed investors toward safer-haven bond markets in the first quarter of 2014. In fact, long-maturity U.S. Treasury bonds returned 7.10% during the first three months of 2014, far outpacing the 1.81% return for the S&P 500 Index.
Throughout the period, the unemployment rate fell from 7.2% to 6.7%. Total payrolls grew at a reasonable average monthly pace of 188,000, while labor force participation rate held steady at 63.2%—nearly the lowest since 1978. The Consumer Price Index, a proxy for the Fed’s benchmark inflation measure, increased at a modest 1.5% annual rate. After evaluating the economic data and financial market conditions, the Fed announced a gradual tapering of government bond purchases (quantitative easing) in December. Then in March, it dropped the unemployment and forecast inflation rate thresholds from its policy statement, returning to a more traditional, but less clear, set of economic indicators to guide policy deliberation.
While hopes for stronger economic growth were realized in the third quarter of 2013, when the U.S. economy expanded at an above-trend 4.1% annualized pace,1 it seems to have decelerated to under 2% in early 2014. This deceleration was expected—as is a spring rebound—as a notably cold and stormy winter for the eastern and mid-western
| CALVERT GREEN |
| BOND FUND |
| MARCH 31, 2014 |
| |
| INVESTMENT PERFORMANCE | |
| (TOTAL RETURN AT NAV*) | |
| | FROM |
| | INCEPTION |
| | 10/31/13
THROUGH |
| | 3/31/14 |
| Class A | 0.43% |
| Class I | 0.63% |
| Class Y | 0.59% |
| |
| Barclays U.S. | |
| Aggregate | |
| Bond Index | 0.89% |
| |
| Lipper | |
| BBB-Rated | |
| Corporate | |
| Debt Funds | |
| Average | 2.52% |
| |
| | 30 DAYS |
| | ENDED |
| SEC YIELD | 3/31/14 |
| Class A | 1.12% |
| Class I | 1.58% |
| Class Y | 1.43% |
* Investment performance/return of NAV does not reflect the deduction of the Fund’s maximum 3.75% front-end sales charge or any deferred sales charge.
www.calvert.com CALVERT GREEN BOND FUND SEMI-ANNUAL REPORT (UNAUDITED) 5
continental United States curbed economic activity and made it difficult to discern the underlying growth trend.
Flat Returns Belie Notable Shift in the Yield Curve
After falling in October, bond yields rose through the end of 2013. They declined again in January and February before stabilizing in March. As a result, the yield for the 10-year Treasury note ended only slightly higher than where it started. Since quantitative easing was already built into market expectations, attention shifted to when the Fed will start hiking its target interest rate. Current market expectations are for Fed rate hikes to begin in mid-2015.
| CALVERT GREEN |
| BOND FUND |
| MARCH 31, 2014 |
| |
| AVERAGE ANNUAL TOTAL RETURNS |
| |
| CLASS A SHARES | (WITH MAX. LOAD) |
| Since Inception (10/31/13) | -3.25% |
| | |
| CLASS I SHARES | |
| Since Inception (10/31/13) | 0.63% |
| | |
| CLASS Y SHARES | |
| Since Inception (10/31/13) | 0.59% |
While long-term interest rates were fairly stable over the reporting period, changing perceptions of the Fed policy path on interest-rate hikes began to re-shape the yield curve. During this re-shaping, yields in the three- to seven-year range rose approximately 0.30 percentage points.2 These so-called “short-intermediate” maturity bonds are the most sensitive to such a change in Fed policy expectations. But overall, U.S. investment- and below-investment grade corporate and municipal bonds outperformed Treasuries3 over the six-month period.
The 10-year Treasury note yield edged up to 2.73% over the period. Money market yields remained low, pinned down by the Fed’s near-zero interest rate policy, which is expected to persist well into 2015. However, the 30-year Treasury bond yield declined slightly.
Outlook
Looking ahead, we expect the economy to expand at a moderate pace. With U.S. budget and debt ceiling deals complete, there should be little fiscal policy turbulence during an election year. For 2014 as a whole, we think the inflation-adjusted GDP growth rate could reach the long-term average of about 3%. Assuming growth continues at a moderate pace, with below-target inflation and a still-soft labor market, we expect the Fed to finish quantitative easing by the end of October. After that, the Fed will slowly start to implement its three-part “exit strategy” that will include policy target rate hikes. We expect the first rate hike no earlier than the spring of 2015.
The fixed-income market will periodically challenge the Fed on the expected timing of rate hikes, witnessed mainly through fluctuating yields on bonds in the short-intermediate maturity range. In our view, long-term interest rates are likely to remain elevated compared to recent-year lows, yet will remain quite low by historical standards. With improving flows to bond funds, and interest rates remaining pinned near zero percent, we are cautiously optimistic on the bond market outlook for the balance of 2014.
Calvert Investment Management, Inc.
May 2014
6 www.calvert.com CALVERT GREEN BOND FUND SEMI-ANNUAL REPORT (UNAUDITED)
GROWTH OF $10,000
The graph below shows the value of a hypothetical $10,000 investment in the Fund over the past 10 fiscal year periods or since inception (for funds without 10 year records). The results shown are for Class A, I and Y shares and reflect the deduction of the maximum front-end Class A sales charge of 3.75%, as applicable, and assume the reinvestment of dividends. The result is compared with benchmarks that include a broad based market index and a Lipper peer group average. Market indexes are unmanaged and their results do not reflect the effect of expenses or sales charges. The Lipper average reflects the deduction of the category’s average front-end sales charge.
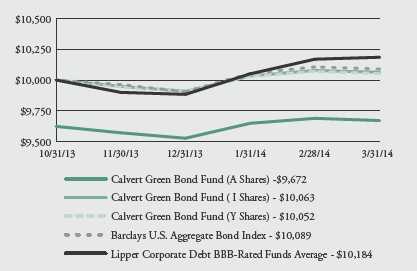
All performance data shown, including the graph above and the adjacent table, represents past performance, does not guarantee future results, assumes reinvestment of dividends and distributions and does not reflect the deduction of taxes that a shareholder would pay on the Fund’s distributions or the redemption of the Fund shares. All performance data reflects fee waivers and/or expense limitations, if any are in effect; in their absence performance would be lower. See Note B in Notes to Financial Statements. The investment return and principal value of an investment will fluctuate so that an investor’s shares, when redeemed, may be worth more or less than their original cost. Current performance may be lower or higher than the performance data quoted; for current performance data visit www.calvert.com. The gross expense ratio from the current prospectus for Class A shares is 1.59%. This number may differ from the expense ratio shown elsewhere in this report because it is based on a different time period and, if applicable, does not include fee or expense waivers. Performance data quoted already reflects the deduction of the Fund’s operating expenses.
www.calvert.com CALVERT GREEN BOND FUND SEMI-ANNUAL REPORT (UNAUDITED) 7
1. Data sources for economic data: Bureau of Labor Statistics and Bureau of Economic Analysis.
2. Data sources for yield and yield changes: Federal Reserve.
3. Per total returns for selected Barclays bond indices.
8 www.calvert.com CALVERT GREEN BOND FUND SEMI-ANNUAL REPORT (UNAUDITED)
SHAREHOLDER EXPENSE EXAMPLE
As a shareholder of the Fund, you incur two types of costs: (1) transaction costs, including sales charges (loads) and redemption fees and (2) ongoing costs, including management fees; distribution (12b-1) fees; and other Fund expenses. This Example is intended to help you understand your ongoing costs (in dollars) of investing in the Fund and to compare these costs with the ongoing costs of investing in other mutual funds.
This Example is based on an investment of $1,000 invested at the beginning of the period and held for the entire period (October 1, 2013 to March 31, 2014).
Actual Expenses
The first line of the table below provides information about actual account values and actual expenses. You may use the information in this line, together with the amount you invested, to estimate the expenses that you paid over the period. Simply divide your account value by $1,000 (for example, an $8,600 account value divided by $1,000 = 8.6), then multiply the result by the number in the first line under the heading entitled “Expenses Paid During Period” to estimate the expenses you paid on your account during this period.
Hypothetical Example for Comparison Purposes
The second line of the table below provides information about hypothetical account values and hypothetical expenses based on the Fund’s actual expense ratio and an assumed rate of return of 5% per year before expenses, which is not the Fund’s actual return. The hypothetical account values and expenses may not be used to estimate the actual ending account balance or expenses you paid for the period. You may use this information to compare the ongoing costs of investing in the Fund and other funds. To do so, compare the 5% hypothetical example with the 5% hypothetical examples that appear in the shareholder reports of the other funds.
Please note that the expenses shown in the table are meant to highlight your ongoing costs only and do not reflect any transactional costs, such as sales charges (loads) or redemption fees. Therefore, the second line of the table is useful in comparing ongoing costs only, and will not help you determine the relative total costs of owning different funds. In addition, if these transactional costs were included, your costs would have been higher.
www.calvert.com CALVERT GREEN BOND FUND SEMI-ANNUAL REPORT (UNAUDITED) 9
| | | |
| | BEGINNING | ENDING ACCOUNT | EXPENSES PAID |
| | ACCOUNT VALUE | VALUE | DURING PERIOD* |
| | 10/1/13 | 3/31/14 | 10/1/13 - 3/31/14 |
| CLASS A | | | |
| Actual | $1,000.00 | $1,004.93 | $4.40 |
| Hypothetical | $1,000.00 | $1,020.54 | $4.43 |
| (5% return per year before expenses) | | | |
| |
| CLASS I | | | |
| Actual | $1,000.00 | $1,006.31 | $2.50 |
| Hypothetical | $1,000.00 | $1,022.44 | $2.52 |
| (5% return per year before expenses) | | | |
| |
| CLASS Y | | | |
| Actual | $1,000.00 | $1,005.20 | $3.15 |
| Hypothetical | $1,000.00 | $1,021.79 | $3.18 |
| (5% return per year before expenses) | | | |
* Expenses are equal to the Fund’s annualized expense ratio of 0.88%, 0.50%, and 0.63% for Class A, Class I, and Class Y, respectively, multiplied by the average account value over the period, multiplied by 182/365 (to reflect the one-half year period).
10 www.calvert.com CALVERT GREEN BOND FUND SEMI-ANNUAL REPORT (UNAUDITED)
| | |
| SCHEDULE OF INVESTMENTS |
| MARCH 31, 2014 |
| |
| | PRINCIPAL | |
| ASSET-BACKED SECURITIES - 5.0% | AMOUNT | VALUE |
| Ford Credit Auto Lease Trust, 1.50%, 3/15/17 (e) | $100,000 | $100,624 |
| Ford Credit Floorplan Master Owner Trust, 1.82%, 1/15/18 | 150,000 | 151,065 |
| SolarCity LMC Series I LLC, 4.80%, 11/20/38 (e) | 326,683 | 323,525 |
| Toyota Auto Receivables Owner Trust, 1.18%, 6/17/19 | 300,000 | 299,495 |
| |
| Total Asset-Backed Securities (Cost $877,803) | | 874,709 |
| |
| CORPORATE BONDS - 51.2% | | |
| African Development Bank, 0.75%, 10/18/16 | 370,000 | 369,142 |
| American Express Credit Corp., 0.785%, 3/18/19 (r) | 350,000 | 350,849 |
| American Tower Corp., 3.40%, 2/15/19 | 200,000 | 204,947 |
| Anheuser-Busch InBev Worldwide, Inc., 2.50%, 7/15/22 | 250,000 | 236,047 |
| AT&T, Inc., 2.375%, 11/27/18 | 150,000 | 150,745 |
| Bank of America Corp.: | | |
| 1.35%, 11/21/16 | 200,000 | 200,309 |
| 4.125%, 1/22/24 | 100,000 | 101,127 |
| Burlington Northern Santa Fe LLC, 3.05%, 3/15/22 | 250,000 | 242,851 |
| Capital One Bank USA NA, 2.25%, 2/13/19 | 300,000 | 297,786 |
| Cisco Systems, Inc., 2.125%, 3/1/19 | 300,000 | 298,658 |
| Citigroup, Inc., 2.50%, 9/26/18 | 350,000 | 351,900 |
| Cummins, Inc., 3.65%, 10/1/23 | 100,000 | 101,381 |
| CVS Caremark Corp., 2.75%, 12/1/22 | 200,000 | 188,664 |
| Ford Motor Credit Co. LLC, 1.018%, 1/17/17 (r) | 300,000 | 301,655 |
| General Electric Co., 2.70%, 10/9/22 | 345,000 | 334,376 |
| Goldman Sachs Group, Inc., 2.375%, 1/22/18 | 250,000 | 251,661 |
| Hewlett-Packard Co., 3.75%, 12/1/20 | 250,000 | 253,951 |
| Home Depot, Inc., 2.70%, 4/1/23 | 100,000 | 95,180 |
| International Finance Corp., 0.625%, 11/15/16 | 200,000 | 198,863 |
| Johnson Controls, Inc., 5.00%, 3/30/20 | 250,000 | 277,501 |
| JPMorgan Chase & Co., 3.20%, 1/25/23 | 250,000 | 242,417 |
| Masco Corp., 5.95%, 3/15/22 | 226,000 | 245,210 |
| Methanex Corp., 5.25%, 3/1/22 | 125,000 | 135,350 |
| Mondelez International, Inc.: | | |
| 0.775%, 2/1/19 (r) | 150,000 | 149,010 |
| 2.25%, 2/1/19 | 200,000 | 198,171 |
| Morgan Stanley, 1.519%, 4/25/18 (r) | 350,000 | 356,823 |
| Nissan Motor Acceptance Corp.: | | |
| 0.935%, 9/26/16 (e)(r) | 250,000 | 251,411 |
| 2.35%, 3/4/19 (e) | 100,000 | 99,394 |
| North American Development Bank, 2.40%, 10/26/22 | 150,000 | 140,152 |
| Prudential Financial, Inc., 2.30%, 8/15/18 | 300,000 | 300,598 |
| SABMiller Holdings, Inc., 3.75%, 1/15/22 (e) | 300,000 | 306,613 |
| Telefonica Emisiones SAU: | | |
| 3.992%, 2/16/16 | 100,000 | 104,860 |
| 3.192%, 4/27/18 | 200,000 | 204,838 |
| Time Warner, Inc., 4.00%, 1/15/22 | 100,000 | 103,553 |
| United Airlines, Inc., 6.75%, 9/15/15 (e) | 260,000 | 265,200 |
www.calvert.com CALVERT GREEN BOND FUND SEMI-ANNUAL REPORT (UNAUDITED) 11
| | |
| | PRINCIPAL | |
| CORPORATE BONDS - CONT’D | AMOUNT | VALUE |
| Verizon Communications, Inc.: | | |
| 3.65%, 9/14/18 | $150,000 | $159,680 |
| 6.55%, 9/15/43 | 100,000 | 121,694 |
| Vornado Realty LP, 5.00%, 1/15/22 | 250,000 | 266,145 |
| Whirlpool Corp., 3.70%, 3/1/23 | 250,000 | 247,664 |
| Xerox Corp., 4.25%, 2/15/15 | 250,000 | 257,587 |
| |
| Total Corporate Bonds (Cost $8,956,726) | | 8,963,963 |
| |
| MUNICIPAL OBLIGATIONS - 1.6% | | |
| Metropolitan Water District of Southern California Revenue Bonds, | | |
| 6.947%, 7/1/40 | 250,000 | 284,588 |
| |
| Total Municipal Obligations (Cost $281,463) | | 284,588 |
| |
| SOVEREIGN GOVERNMENT BONDS - 2.0% | | |
| Export Development Canada, 0.875%, 1/30/17 | 150,000 | 149,776 |
| Kommunalbanken AS, 0.75%, 11/21/16 (e) | 200,000 | 197,662 |
| |
| Total Sovereign Government Bonds (Cost $349,477) | | 347,438 |
| |
| U.S. GOVERNMENT AGENCY | | |
| MORTGAGE-BACKED SECURITIES - 12.2% | | |
| Fannie Mae: | | |
| 3.11%, 7/1/23 | 148,565 | 149,302 |
| 3.00%, 5/15/29 | 400,000 | 409,750 |
| 3.50%, 5/15/29 | 290,000 | 303,276 |
| 3.50%, 5/15/44 | 745,000 | 746,863 |
| 4.00%, 5/15/44 | 515,000 | 533,427 |
| |
| Total U.S. Government Agency Mortgage-Backed Securities | | |
| (Cost $2,141,112) | | 2,142,618 |
| |
| U.S. TREASURY OBLIGATIONS - 25.6% | | |
| United States Treasury Bonds, 3.75%, 11/15/43 | 630,000 | 652,247 |
| United States Treasury Notes: | | |
| 0.75%, 3/15/17 | 365,000 | 363,631 |
| 1.625%, 3/31/19 | 2,205,000 | 2,192,941 |
| 2.75%, 2/15/24 | 1,275,000 | 1,277,790 |
| |
| Total U.S. Treasury Obligations (Cost $4,471,317) | | 4,486,609 |
| |
| TIME DEPOSIT - 12.4% | | |
| State Street Bank Time Deposit, 0.083%, 4/1/14 | 2,164,854 | 2,164,854 |
| |
| Total Time Deposit (Cost $2,164,854) | | 2,164,854 |
| |
| TOTAL INVESTMENTS (Cost $19,242,752) - 110.0% | | 19,264,779 |
| Other assets and liabilities, net - (10.0%) | | (1,749,528) |
| NET ASSETS - 100% | | $17,515,251 |
See notes to financial statements.12 www.calvert.com CALVERT GREEN BOND FUND SEMI-ANNUAL REPORT (UNAUDITED)
| | | | UNDERLYING | UNREALIZED |
| | NUMBER OF | EXPIRATION | FACE AMOUNT | APPRECIATION |
| FUTURES | CONTRACTS | DATE | AT VALUE | (DEPRECIATION) |
| Purchased: | | | | |
| 30 Year U.S. Treasury Bonds | 1 | 6/14 | $133,219 | $1,031 |
| |
| Sold: | | | | |
| 2 Year U.S. Treasury Notes | 1 | 6/14 | $219,563 | $92 |
| 5 Year U.S. Treasury Notes | 1 | 6/14 | 118,953 | 809 |
| 10 Year U.S. Treasury Notes | 17 | 6/14 | 2,099,500 | 15,385 |
| Total Sold | | | | $16,286 |
(e) Security is exempt from registration under Rule 144A of the Securities Act of 1933. These securities may be resold
in transactions exempt from registration, normally to qualified institutional buyers.
(r) The coupon rate shown on floating or adjustable rate securities represents the rate at period end.
Abbreviations:
LLC: Limited Liability Corporation
LP: Limited Partnership
See notes to financial statements.
www.calvert.com CALVERT GREEN BOND FUND SEMI-ANNUAL REPORT (UNAUDITED) 13
| |
| STATEMENT OF ASSETS AND LIABILITIES |
| MARCH 31, 2014 |
| |
| ASSETS | |
| Investments in securities, at value (Cost $19,242,752) - | |
| see accompanying schedule | $19,264,779 |
| Cash collateral at broker | 24,560 |
| Receivable for securities sold | 4,658,089 |
| Receivable for shares sold | 13,467 |
| Receivable from Calvert Investment Management, Inc. | 20,292 |
| Interest receivable | 65,292 |
| Receivable for futures variation margin | 594 |
| Other assets | 28,455 |
| Total assets | 24,075,528 |
| |
| LIABILITIES | |
| Payable for securities purchased | 6,555,473 |
| Payable for shares redeemed | 1,978 |
| Payable to Calvert Investment Administrative Services, Inc | 1,846 |
| Payable to Calvert Investment Services, Inc | 48 |
| Payable to Calvert Investment Distributors, Inc | 932 |
| Total liabilities | 6,560,277 |
| |
| NET ASSETS | $17,515,251 |
| |
| NET ASSETS CONSIST OF: | |
| Paid-in capital applicable to the following shares of common stock, | |
| with 250,000,000 of $0.01 par value shares authorized: | |
| Class A: 307,987 shares outstanding | $4,604,056 |
| Class I: 854,363 shares outstanding | 12,795,259 |
| Class Y: 4,602 shares outstanding | 69,179 |
| Undistributed net investment income | 271 |
| Accumulated net realized gain (loss) | 7,142 |
| Net unrealized appreciation (depreciation) | 39,344 |
| |
| NET ASSETS | $17,515,251 |
| |
| NET ASSET VALUE PER SHARE | |
| Class A (based on net assets of $4,624,126) | $15.01 |
| Class I (based on net assets of $12,822,023) | $15.01 |
| Class Y (based on net assets of $69,102) | $15.02 |
See notes to financial statements.
14 www.calvert.com CALVERT GREEN BOND FUND SEMI-ANNUAL REPORT (UNAUDITED)
| |
| STATEMENT OF OPERATIONS |
| FROM INCEPTION OCTOBER 31, 2013 |
| THROUGH MARCH 31, 2014 |
| |
| NET INVESTMENT INCOME | |
| Investment Income: | |
| Interest income | $105,543 |
| Total investment income | 105,543 |
| |
| Expenses: | |
| Investment advisory fee | 16,643 |
| Transfer agency fees and expenses | 4,949 |
| Distribution Plan expenses: | |
| Class A | 2,178 |
| Directors’ fees and expenses | 778 |
| Administrative fees | 6,425 |
| Accounting fees | 4,171 |
| Custodian fees | 7,381 |
| Registration fees | 20,289 |
| Reports to shareholders | 1,773 |
| Professional fees | 9,948 |
| Miscellaneous | 1,813 |
| Total expenses | 76,348 |
| Reimbursement from Advisor: | |
| Class A | (10,171) |
| Class I | (28,235) |
| Class Y | (7,296) |
| Net expenses | 30,646 |
| |
| NET INVESTMENT INCOME | 74,897 |
| |
| REALIZED AND UNREALIZED GAIN (LOSS) | |
| Net realized gain (loss) on: | |
| Investments | 5,988 |
| Futures | 1,154 |
| | 7,142 |
| |
| Change in unrealized appreciation (depreciation) on: | |
| Investments | 22,027 |
| Futures | 17,317 |
| | 39,344 |
| |
| NET REALIZED AND UNREALIZED GAIN (LOSS) | 46,486 |
| |
| INCREASE (DECREASE) IN NET ASSETS | |
| RESULTING FROM OPERATIONS | $121,383 |
See notes to financial statements.
www.calvert.com CALVERT GREEN BOND FUND SEMI-ANNUAL REPORT (UNAUDITED) 15
| |
| STATEMENT OF CHANGES IN NET ASSETS |
| |
| | FROM INCEPTION |
| | OCTOBER 31, 2013 |
| | THROUGH |
| | MARCH 31, |
| INCREASE (DECREASE) IN NET ASSETS | 2014 |
| Operations: | |
| Net investment income | $74,897 |
| Net realized gain (loss) | 7,142 |
| Change in unrealized appreciation (depreciation) | 39,344 |
| |
| INCREASE (DECREASE) IN NET ASSETS | |
| RESULTING FROM OPERATIONS | 121,383 |
| |
| Distributions to shareholders from: | |
| Net investment income: | |
| Class A shares | (9,532) |
| Class I shares | (65,010) |
| Class Y shares | (84) |
| Total distributions | (74,626) |
| |
| Capital share transactions: | |
| Shares sold: | |
| Class A shares | 4,626,198 |
| Class I shares | 12,788,491 |
| Class Y shares | 69,140 |
| Reinvestment of distributions: | |
| Class A shares | 5,979 |
| Class I shares | 6,768 |
| Class Y shares | 84 |
| Redemption fees: | |
| Class A shares | 118 |
| Shares redeemed: | |
| Class A shares | (28,239) |
| Class Y shares | (45) |
| Total capital share transactions | 17,468,494 |
| |
| TOTAL INCREASE (DECREASE) IN NET ASSETS | 17,515,251 |
| |
| NET ASSETS | |
| Beginning of period | — |
| End of period (including undistributed net investment | |
| income of $271) | $17,515,251 |
See notes to financial statements.
16 www.calvert.com CALVERT GREEN BOND FUND SEMI-ANNUAL REPORT (UNAUDITED)
| |
| STATEMENT OF CHANGES IN NET ASSETS |
| |
| | FROM INCEPTION |
| | OCTOBER 31, 2013 |
| | THROUGH |
| | MARCH 31, |
| CAPITAL SHARE ACTIVITY | 2014 |
| Shares sold: | |
| Class A shares | 309,469 |
| Class I shares | 853,913 |
| Class Y shares | 4,599 |
| Reinvestment of distributions: | |
| Class A shares | 398 |
| Class I shares | 450 |
| Class Y shares | 6 |
| Shares redeemed: | |
| Class A shares | (1,880) |
| Class Y shares | (3) |
| Total capital share activity | 1,166,952 |
See notes to financial statements.
www.calvert.com CALVERT GREEN BOND FUND SEMI-ANNUAL REPORT (UNAUDITED) 17
NOTES TO FINANCIAL STATEMENTS
NOTE A –– SIGNIFICANT ACCOUNTING POLICIES
General: Calvert Green Bond Fund (the “Fund”), a series of Calvert Impact Fund, Inc., is registered under the Investment Company Act of 1940 as a non-diversified, open-end management investment company. Calvert Impact Fund, Inc. is comprised of four separate series. The operations of each series are accounted for separately. The Fund, which commenced operations on October 31, 2013, offers three classes of shares - Classes A, I, and Y. Class A shares are sold with a maximum front-end sales charge of 3.75%. Class I shares require a minimum account balance of $1,000,000. The $1 million minimum initial investment is waived for retirement plans that trade through omnibus accounts and may be waived for certain other institutional accounts where it is believed to be in the best interest of the Fund and its shareholders. Class I shares have no front-end or deferred sales charge and have lower levels of expenses than Class A shares. Class Y shares are generally only available to wrap or similar fee-based programs offered by financial intermediaries, foundations, and endowments that have entered into an agreement with the Fund’s Distributor to offer Class Y shares. Class Y shares have no front-end or deferred sales charge and have lower levels of expenses than Class A shares. Each class has different: (a) dividend rates due to differences in Distribution Plan expenses and other class specific expenses, (b) exchange privileges and (c) class specific voting rights.
Security Valuation: Net asset value per share is determined every business day as of the close of the regular session of the New York Stock Exchange (generally 4:00 p.m. Eastern time). The Fund uses independent pricing services approved by the Board of Directors (“the Board”) to value its investments wherever possible. Investments for which market quotations are not available or deemed not reliable are fair valued in good faith under the direction of the Board.
The Board has adopted Valuation Procedures (the “Procedures”) to determine the fair value of securities and other financial instruments for which market prices are not readily available or which may not be reliably priced. The Board has delegated the day-to-day responsibility for determining the fair value of assets of the Fund to Calvert Investment Management, Inc. (the “Advisor” or “Calvert”) and has provided these Procedures to govern Calvert in its valuation duties.
Calvert has chartered an internal Valuation Committee to oversee the implementation of these Procedures and to assist it in carrying out the valuation responsibilities that the Board has delegated.
The Valuation Committee meets on a regular basis to review illiquid securities and other investments which may not have readily available market prices. The Valuation Committee’s fair valuation determinations are subject to review, approval and ratification by the Board at its next regularly scheduled meeting covering the calendar quarter in which the fair valuation was determined.
The Valuation Committee utilizes various methods to measure the fair value of the Fund’s investments. Generally Accepted Accounting Principles (GAAP) establishes a disclosure hierarchy that categorizes the inputs to valuation techniques used to value assets and liabilities at measurement date. These inputs are summarized in the three broad levels listed below:
18 www.calvert.com CALVERT GREEN BOND FUND SEMI-ANNUAL REPORT (UNAUDITED)
Level 1 – quoted prices in active markets for identical securities
Level 2 – other significant observable inputs (including quoted prices for similar securities, interest rates, prepayment speeds, credit risk, etc.)
Level 3 – significant unobservable inputs (including the Fund’s own assumptions in determining the fair value of investments) The inputs or methodologies used for valuing securities are not necessarily an indication of the risk associated with investing in those securities.
Changes in valuation techniques may result in transfers in or out of an investment’s assigned level within the hierarchy during the period. There were no such transfers during the period. Valuation techniques used to value the Fund’s investments by major category are as follows: Debt securities, including restricted securities, are valued based on evaluated prices received from independent pricing services or from dealers who make markets in such securities. For corporate bonds, sovereign government bonds, municipal securities, and U.S. government and government agency obligations, pricing services utilize matrix pricing which considers yield or price of bonds of comparable quality, coupon, maturity and type as well as dealer supplied prices and such securities are generally categorized as Level 2 in the hierarchy. For asset-backed securities and U.S. government agency mortgage-backed securities, pricing services utilize matrix pricing which considers prepayment speed assumptions, attributes of the collateral, yield or price of bonds of comparable quality, coupon, maturity and type as well as dealer supplied prices and, accordingly, such securities are generally categorized as Level 2 in the hierarchy. Short-term securities of sufficient credit quality with remaining maturities of sixty days or less for which quotations are not readily available are valued at amortized cost, which approximates fair value, and are categorized as Level 2 in the hierarchy.
When independent prices are unavailable or unreliable, debt securities may be valued utilizing pricing matrices which consider similar factors that would be used by independent pricing services. These are generally categorized as Level 2 in the hierarchy but may be Level 3 depending on the circumstances.
If a market value cannot be determined for a security using the methodologies described above, or if, in the good faith opinion of the Advisor, the market value does not constitute a readily available market quotation, or if a significant event has occurred that would materially affect the value of the security, the security will be fair valued as determined in good faith by the Valuation Committee.
The Valuation Committee considers a number of factors, including significant unobservable valuation inputs when arriving at fair value. It considers all significant facts that are reasonably available and relevant to the determination of fair value.
The Valuation Committee primarily employs a market-based approach which may use related or comparable assets or liabilities, recent transactions, market multiples, book values, and other relevant information for the investment to determine the fair value of the investment. When more appropriate, the fund may employ an income-based or cost approach. An income-based valuation approach discounts anticipated future cash flows of the investment to calculate a present amount (discounted). The measurement is based on
www.calvert.com CALVERT GREEN BOND FUND SEMI-ANNUAL REPORT (UNAUDITED) 19
the value indicated by current market expectations about those future amounts. Discounts may also be applied due to the nature or duration of any restrictions on the disposition of the investments. A cost based approach is based on the amount that currently would be required to replace the service capacity of an asset (current replacement cost). From the seller’s perspective, the price that would be received for the asset is determined based on the cost to a buyer to acquire or construct a substitute asset of comparable utility, adjusted for obsolescence.
The values assigned to fair value investments are based on available information and do not necessarily represent amounts that might ultimately be realized. Further, due to the inherent uncertainty of valuations of such investments, the fair values may differ significantly from the values that would have been used had an active market existed, and the differences could be material. The Valuation Committee employs various methods for calibrating these valuation approaches including a regular review of key inputs and assumptions, transactional back-testing or disposition analysis and reviews of any related market activity.
At March 31, 2014, no securities were fair valued in good faith under the direction of the Board.
The following is a summary of the inputs used to value the Fund’s net assets as of March 31, 2014:
| | | VALUATION INPUTS | |
| INVESTMENTS IN SECURITIES* | LEVEL 1 | LEVEL 2 | LEVEL 3 | TOTAL |
| Asset-backed securities | __ | $874,709 | __ | $874,709 |
| Corporate debt | — | 8,963,963 | — | 8,963,963 |
| Municipal obligations | — | 284,588 | — | 284,588 |
| U.S. government obligations | — | 6,629,227 | — | 6,629,227 |
| Other debt obligations | — | 2,512,292 | — | 2,512,292 |
| TOTAL | — | $19,264,779 | — | $19,264,779 |
| Other financial instruments** | $17,317 | — | — | $17,317 |
* For a complete listing of investments, please refer to the Schedule of Investments.
** Other financial instruments are derivative instruments not reflected in the Total Investments in the Schedule of Investments, such as futures, which are valued at the unrealized appreciation/depreciation on the instrument.
Futures Contracts: The Fund may purchase and sell futures contracts, but only when, in the judgment of the Advisor, such a position acts as a hedge. The Fund may not enter into futures contracts for the purpose of speculation or leverage. These futures contracts may include, but are not limited to, futures contracts based on U.S. Government obligations. The Fund is subject to interest rate risk in the normal course of pursuing its investment objectives and may use futures contracts to hedge against changes in interest rates. The Fund may enter into futures contracts agreeing to buy or sell a financial instrument for a set price at a future date. Initial margin deposits of either cash or securities as required by the broker are made upon entering into the contract. While the contract is open, daily variation margin payments are made to or received from the broker reflecting the daily change in market value of the contract and are recorded for financial reporting
20 www.calvert.com CALVERT GREEN BOND FUND SEMI-ANNUAL REPORT (UNAUDITED)
purposes as unrealized gains or losses by the Fund. When a futures contract is closed, a realized gain or loss is recorded equal to the difference between the opening and closing value of the contract. The risks associated with entering into futures contracts may include the possible illiquidity of the secondary market which would limit the Fund’s ability to close out a futures contract prior to the settlement date, an imperfect correlation between the value of the contracts and the underlying financial instruments, or that the counterparty will fail to perform its obligations under the contracts’ terms. Futures contracts are designed by boards of trade which are designated “contracts markets” by the Commodities Futures Trading Commission. Futures contracts trade on the contracts markets in a manner that is similar to the way a stock trades on a stock exchange and the boards of trade, through their clearing corporations, guarantee the futures contracts against default. As a result, there is minimal counterparty credit risk to the Fund. During the period, the Fund used U.S. Treasury Bond and Notes futures contracts to hedge against interest rate changes and to manage overall duration of the Fund. The Fund’s futures contracts at period end are presented in the Schedule of Investments.
During the period, the Fund invested in 2 year, 5 year, 10 year and 30 year U.S. Treasury Bond and Notes futures. The volume of outstanding contracts has varied throughout the period with a weighted average of 9 contracts and $564,654 weighted average notional value.
Short Sales: The Fund may use a hedging technique that involves short sales of U.S. Treasury securities for the purpose of managing the duration of the Fund. Any short sales are covered with an equivalent amount of high-quality, liquid securities.
Security Transactions and Net Investment Income: Security transactions are accounted for on trade date. Realized gains and losses are recorded on an identified cost basis and may include proceeds from litigation. Interest income, which includes amortization of premium and accretion of discount on debt securities, is accrued as earned. Debt obligations may be placed on non-accrual status and related interest income may be reduced by ceasing current accruals and writing off interest receivables when the collection of all or a portion of interest has become doubtful based on consistently applied procedures. (See the Schedule of Investments footnotes on page 13.) A debt obligation may be removed from non-accrual status when the issuer resumes interest payments or when collectability of interest is reasonably assured. Investment income and realized and unrealized gains and losses are allocated to separate classes of shares based upon the relative net assets of each class. Expenses arising in connection with a specific class are charged directly to that class. Expenses common to the classes are allocated to each class in proportion to their relative net assets.
Distributions to Shareholders: Distributions to shareholders are recorded by the Fund on ex-dividend date. Dividends from net investment income are paid monthly. Distributions from net realized capital gains, if any, are paid at least annually. Distributions are determined in accordance with income tax regulations which may differ from generally accepted accounting principles; accordingly, periodic reclassifications are made within the Fund’s capital accounts to reflect income and gains available for distribution under income tax regulations.
Estimates: The preparation of the financial statements in conformity with accounting principles generally accepted in the United States requires management to make estimates
www.calvert.com CALVERT GREEN BOND FUND SEMI-ANNUAL REPORT (UNAUDITED) 21
and assumptions that affect the reported amounts of assets and liabilities and disclosure of contingent assets and liabilities at the date of the financial statements and the reported amounts of income and expenses during the reported period. Actual results could differ from those estimates.
Redemption Fees: The Fund charges a 2% redemption fee on redemptions, including exchanges, made within 30 days of purchase (within seven days for Class I shares). The redemption fee is accounted for as an addition to paid-in capital. The fee is intended to discourage market-timers by ensuring that short-term trading costs are borne by the investors making the transactions and not the shareholders already in the Fund.
Federal Income Taxes: No provision for federal income or excise tax is required since the Fund intends to continue to qualify as a regulated investment company under the Internal Revenue Code and to distribute substantially all of its taxable earnings.
Management has analyzed the Fund’s tax positions taken for all open federal income tax years and has concluded that no provision for federal income tax is required in the Fund’s financial statements. A Fund’s federal tax return is subject to examination by the Internal Revenue Service for a period of three years.
NOTE B — RELATED PARTY TRANSACTIONS
Calvert Investment Management, Inc. (the “Advisor”) is wholly-owned by Calvert Investments, Inc., which is indirectly wholly-owned by Ameritas Mutual Holding Company. The Advisor provides investment advisory services and pays the salaries and fees of officers and Directors of the Fund who are employees of the Advisor or its affiliates. For its services, the Advisor receives an annual fee, payable monthly, of .30% of the Fund’s average daily net assets.
The Advisor has contractually agreed to limit net annual fund operating expenses through January 31, 2015 for Class A, I and Y. The contractual expense caps are .88%, .50%, and .63%, respectively. For the purpose of this expense limit, operating expenses do not include interest expense, brokerage commissions, taxes and extraordinary expenses. This expense limitation does not limit acquired fund fees and expenses, if any.
Calvert Investment Administrative Services, Inc., an affiliate of the Advisor, provides administrative services to the Fund for an annual fee, payable monthly, of .20% for Class A and Y shares and .10% for Class I shares based on their average daily net assets.
Calvert Investment Distributors, Inc. (“CID”), an affiliate of the Advisor, is the distributor and principal underwriter for the Fund. Pursuant to Rule 12b-1 under the Investment Company Act of 1940, the Fund has adopted a Distribution Plan that permits the Fund to pay certain expenses associated with the distribution and servicing of its shares. The expenses paid may not exceed .50% annually of the Fund’s average daily net assets of Class A. The amount actually paid by the Fund is an annualized fee, payable monthly, of .25% of the Fund’s average daily net assets of Class A. Class I and Y shares do not have Distribution Plan expenses.
CID received $1,977 as its portion of commissions charged on sales of the Fund’s Class A shares for the period from the inception of the Fund through March 31, 2014.
Calvert Investment Services, Inc. (“CIS”), an affiliate of the Advisor, is the shareholder servicing agent for the Fund. For its services, CIS received a fee of $157 for the period
22 www.calvert.com CALVERT GREEN BOND FUND SEMI-ANNUAL REPORT (UNAUDITED)
from the inception of the Fund through March 31, 2014. Boston Financial Data Services, Inc. is the transfer and dividend disbursing agent.
Each Director of the Fund who is not an employee of the Advisor or its affiliates receives an annual retainer of $48,000 plus a meeting fee of up to $3,000 for each Board meeting attended. Additional fees of $5,000 annually may be paid to the Board chair and Committee chairs ($10,000 for the Special Equities Committee chair) and $2,500 annually may be paid to Committee members, plus a Committee meeting fee of $500 for each Committee meeting attended. Directors’ fees are allocated to each of the funds served.
NOTE C — INVESTMENT ACTIVITY AND TAX INFORMATION
During the period, the cost of purchases and proceeds from sales of investments, other than short-term and U.S. government securities, were $14,120,326 and $3,647,482, respectively. U.S. government security purchases and sales were $39,887,874 and $33,281,638, respectively.
The Fund may purchase securities, typically short-term variable rate demand notes, from or sell to other funds managed by the Advisor. These interportfolio transactions are primarily used for cash management purposes and are made pursuant to Rule 17a-7 of the Investment Company Act of 1940. For the period from the inception of the Fund through March 31, 2014, there were no such transactions.
As of March 31, 2014, the tax basis components of unrealized appreciation/(depreciation) and the federal tax cost were as follows:
| Unrealized appreciation | $46,691 |
| Unrealized (depreciation) | (25,712) |
| Net unrealized appreciation/(depreciation) | $20,979 |
| |
| Federal income tax cost of investments | $19,243,800 |
NOTE D — SUBSEQUENT EVENTS
In preparing the financial statements as of March 31, 2014, no subsequent events or transactions occurred that would have required recognition or disclosure in these financial statements.
www.calvert.com CALVERT GREEN BOND FUND SEMI-ANNUAL REPORT (UNAUDITED) 23
| |
FINANCIAL HIGHLIGHTS |
| |
| | PERIOD ENDED |
| | MARCH 31, |
| CLASS A SHARES | 2014 (z) # |
| Net asset value, beginning | $15.00 |
| Income from investment operations: | |
| Net investment income | .06 |
| Net realized and unrealized gain (loss) | — |
| Total from investment operations | .06 |
| Distributions from: | |
| Net investment income | (.05) |
| Net realized gain | — |
| Total distributions | (.05) |
| Total increase (decrease) in net asset value | 0.01 |
| Net asset value, ending | $15.01 |
| |
| Total return* | .43% |
| Ratios to average net assets: A | |
| Net investment income | 1.10% (a) |
| Total expenses | 2.05% (a) |
| Expenses before offsets | .88% (a) |
| Net expenses | .88% (a) |
| Portfolio turnover | 298% |
| Net assets, ending (in thousands) | $4,624 |
See notes to financial highlights.
24 www.calvert.com CALVERT GREEN BOND FUND SEMI-ANNUAL REPORT (UNAUDITED)
| |
| FINANCIAL HIGHLIGHTS |
| |
| | PERIOD ENDED |
| | MARCH 31, |
| CLASS I SHARES | 2014 (z) # |
| Net asset value, beginning | $15.00 |
| Income from investment operations: | |
| Net investment income | .09 |
| Net realized and unrealized gain (loss) | — |
| Total from investment operations | .09 |
| Distributions from: | |
| Net investment income | (.08) |
| Net realized gain | — |
| Total distributions | (.08) |
| Total increase (decrease) in net asset value | 0.01 |
| Net asset value, ending | $15.01 |
| |
| Total return* | .63% |
| Ratios to average net assets: A | |
| Net investment income | 1.42% (a) |
| Total expenses | 1.12% (a) |
| Expenses before offsets | .50% (a) |
| Net expenses | .50% (a) |
| Portfolio turnover | 298% |
| Net assets, ending (in thousands) | $12,822 |
See notes to financial highlights.
www.calvert.com CALVERT GREEN BOND FUND SEMI-ANNUAL REPORT (UNAUDITED) 25
| |
FINANCIAL HIGHLIGHTS |
| |
| | PERIOD ENDED |
| | MARCH 31, |
| CLASS Y SHARES | 2014 (z) # |
| Net asset value, beginning | $15.00 |
| Income from investment operations: | |
| Net investment income | .08 |
| Net realized and unrealized gain (loss) | .01 |
| Total from investment operations | .09 |
| Distributions from: | |
| Net investment income | (.07) |
| Net realized gain | — |
| Total distributions | (.07) |
| Total increase (decrease) in net asset value | 0.02 |
| Net asset value, ending | $15.02 |
| |
| Total return* | .59% |
| Ratios to average net assets: A | |
| Net investment income | 1.43% (a) |
| Total expenses | 123.17% (a) |
| Expenses before offsets | .63% (a) |
| Net expenses | .63% (a) |
| Portfolio turnover | 298% |
| Net assets, ending (in thousands) | $69 |
A Total expenses do not reflect amounts reimbursed and/or waived by the Advisor or reductions from expense offset arrangements. Expenses before offsets reflect expenses after reimbursement and/or waiver by the Advisor but prior to reductions from expense offset arrangements. Net expenses are net of all reductions and represent the net expenses paid by the Fund.
* Total return is not annualized for periods of less than one year and does not reflect deduction of any front-end or deferred sales charge.
(a) Annualized.
(z) Per share figures are calculated using the Average Shares Method.
# From October 31, 2013 inception.
See notes to financial statements.
26 www.calvert.com CALVERT GREEN BOND FUND SEMI-ANNUAL REPORT (UNAUDITED)
EXPLANATION OF FINANCIAL TABLES
SCHEDULE OF INVESTMENTS
The Schedule of Investments is a snapshot of all securities held in the fund at their market value, on the last day of the reporting period. Securities are listed by asset type (e.g., common stock, corporate bonds, U.S. government obligations) and may be further broken down into sub-groups and by industry classification.
STATEMENT OF ASSETS AND LIABILITIES
The Statement of Assets and Liabilities is often referred to as the fund’s balance sheet. It lists the value of what the fund owns, is due and owes on the last day of the reporting period. The fund’s assets include the market value of securities owned, cash, receivables for securities sold and shareholder subscriptions, and receivables for dividends and interest payments that have been earned, but not yet received. The fund’s liabilities include payables for securities purchased and shareholder redemptions, and expenses owed but not yet paid. The statement also reports the fund’s net asset value (NAV) per share on the last day of the reporting period. The NAV is calculated by dividing the fund’s net assets (assets minus liabilities) by the number of shares outstanding. This statement is accompanied by a Schedule of Investments. Alternatively, if certain conditions are met, a Statement of Net Assets may be presented in lieu of this statement and the Schedule of Investments.
STATEMENT OF NET ASSETS
The Statement of Net Assets provides a detailed list of the fund’s holdings, including each security’s market value on the last day of the reporting period. The Statement of Net Assets includes a Schedule of Investments. Other assets are added and other liabilities subtracted from the investments total to calculate the fund’s net assets. Finally, net assets are divided by the outstanding shares of the fund to arrive at its share price, or Net Asset Value (NAV) per share.
At the end of the Statement of Net Assets is a table displaying the composition of the fund’s net assets. Paid in Capital is the money invested by shareholders and represents the bulk of net assets. Undistributed Net Investment Income and Accumulated Net Realized Gains usually approximate the amounts the fund had available to distribute to shareholders as of the statement date. Accumulated Realized Losses will appear as negative balances. Unrealized Appreciation (Depreciation) is the difference between the market value of the fund’s investments and their cost, and reflects the gains (losses) that would be realized if the fund were to sell all of its investments at their statement-date values.
STATEMENT OF OPERATIONS
The Statement of Operations summarizes the fund’s investment income earned and expenses incurred in operating the fund. Investment income includes dividends earned from stocks and interest earned from interest-bearing securities in the fund. Expenses incurred in operating the fund include the advisory fee paid to the investment advisor, administrative services fees, distribution plan expenses (if applicable), transfer agent fees, shareholder servicing expenses, custodial, legal, and audit fees, and the printing and postage expenses related to shareholder reports. Expense offsets (fees paid indirectly) may also be shown. Credits earned from offset arrangements are used to reduce the fund’s expenses. This statement also shows net gains (losses) realized on the sale of investments and the
www.calvert.com CALVERT GREEN BOND FUND SEMI-ANNUAL REPORT (UNAUDITED) 27
increase or decrease in the unrealized appreciation (depreciation) on investments held during the period.
STATEMENT OF CHANGES IN NET ASSETS
The Statement of Changes in Net Assets shows how the fund’s total net assets changed during the two most recent reporting periods. Changes in the fund’s net assets are attributable to investment operations, distributions and capital share transactions.
The Operations section of the report summarizes information detailed in the Statement of Operations. The Distribution section shows the dividend and capital gain distributions made to shareholders. The amounts shown as distributions in this section may not match the net investment income and realized gains amounts shown in the Operations section because distributions are determined on a tax basis and certain investments or transactions may be treated differently for financial statement and tax purposes. The Capital Share Transactions section shows the amount shareholders invested in the fund, either by purchasing shares or by reinvesting distributions, and the amounts redeemed. The corresponding numbers of shares issued, reinvested and redeemed are shown at the end of the report.
FINANCIAL HIGHLIGHTS
The Financial Highlights table provides a per-share breakdown per class of the components that affect the fund’s net asset value for current and past reporting periods. The table provides total return, total distributions, expense ratios, portfolio turnover and net assets for the applicable period. Total return is a measure of a fund’s performance that encompasses all elements of return: dividends, capital gain distributions and changes in net asset value. Total return is the change in value of an investment over a given period, assuming reinvestment of any dividends and capital gain distributions, expressed as a percentage of the initial investment. Total distributions include distributions from net investment income and net realized gains. Long-term gains are earned on securities held in the fund more than one year. Short-term gains, on the sale of securities held less than one year, are treated as ordinary dividend income for tax purposes. The expense ratio is a fund’s cost of doing business, expressed as a percentage of net assets. These expenses directly reduce returns to shareholders. Portfolio turnover measures the trading activity in a fund’s investment portfolio – how often securities are bought and sold by a fund. Portfolio turnover is affected by market conditions, changes in the size of the fund, the nature of the fund’s investments and the investment style of the portfolio manager.
PROXY VOTING
The Proxy Voting Guidelines of the Calvert Funds that the Fund uses to determine how to vote proxies relating to portfolio securities are provided as an Appendix to the Fund’s Statement of Additional Information. The Statement of Additional Information can be obtained free of charge by calling the Fund at 1-800-368-2745, by visiting the Calvert website at www.calvert.com; or by visiting the SEC’s website at www.sec.gov.
Information regarding how the Fund voted proxies relating to portfolio securities during the most recent 12-month period ended June 30 will be available on the Fund’s website at www.calvert.com and on the SEC’s website at www.sec.gov.
28 www.calvert.com CALVERT GREEN BOND FUND SEMI-ANNUAL REPORT (UNAUDITED)
AVAILABILITY OF QUARTERLY PORTFOLIO HOLDINGS
The Fund files its complete schedule of portfolio holdings with the SEC for the first and third quarters of each fiscal year on Form N-Q. The Fund’s Form N-Q is available on the SEC’s website at www.sec.gov. The Fund’s Form N-Q may be reviewed and copied at the SEC’s Public Reference Room in Washington, DC; information on the operation of the Public Reference Room may be obtained by calling 1-800-SEC-0330.
BASIS FOR BOARD’S APPROVAL OF INVESTMENT ADVISORY CONTRACT
At a meeting held on September 10, 2013, the Board of Directors (the “Board”), and by a separate vote, the disinterested Directors, voted to approve an amendment to the Investment Advisory Agreement (“Advisory Agreement”) between Calvert Impact Fund, Inc. and the Advisor, that would add the Fund to the Advisory Agreement.
In evaluating the Advisory Agreement, the Board considered a variety of information relating to the Fund and the Advisor. At meetings held on June 4, 2013 and September 10, 2013, the disinterested Directors reviewed materials provided by the Advisor regarding various services to be provided to the Fund by the Advisor and its affiliates.
The disinterested Directors were separately represented by independent legal counsel with respect to their consideration of the approval of the amendment to the Advisory Agreement. Prior to voting, the disinterested Directors reviewed the proposed approval of the amendment to the Advisory Agreement with management and also met in a private session with their counsel at which no representatives of management were present.
In the course of its deliberations regarding the Advisory Agreement, the Board considered the following factors, among others: the nature, extent and quality of the services to be provided by the Advisor, including the personnel who would be providing such services; the Advisor’s financial condition; the level and method of computing the Fund’s proposed advisory fee; comparative fee and expense information for the Fund and comparable performance for a similarly managed account; the anticipated profitability of the Calvert Family of Funds to the Advisor and its affiliates; the anticipated allocation of the Fund’s brokerage, including the Advisor’s process for monitoring “best execution”; the direct and indirect benefits, if any, to be derived by the Advisor and its affiliates from their relationship with the Fund; the effect of the Fund’s projected growth and size on the Fund’s performance and expenses; the affiliated distributor’s process for monitoring sales load breakpoints; the Advisor’s compliance programs and policies; the Advisor’s performance of substantially similar duties for other funds; and any possible conflicts of interest.
In considering the nature, extent and quality of the services to be provided to the Fund by the Advisor under the Advisory Agreement, the Board took into account information provided by the Advisor relating to its operations and personnel, including, among other information, biographical information on the Advisor’s investment, supervisory and professional staff and descriptions of its organizational and management structure.
The Board also took into account similar information provided periodically throughout the previous year by the Advisor, as well as the Board of Directors’ familiarity with man-
www.calvert.com CALVERT GREEN BOND FUND SEMI-ANNUAL REPORT (UNAUDITED) 29
agement through Board of Directors’ meetings, discussions and other reports. The Board also noted that it reviewed on a quarterly basis information regarding the Advisor’s compliance with applicable policies and procedures, including those related to personal investing. The Board considered the Advisor’s proposed management style and its performance in employing its investment strategies for a Calvert separate account offering, the Green Bond strategy, as well as its current level of staffing and overall resources. The Advisor’s administrative capabilities, including its ability to supervise the other service providers for the Fund, were also considered. The Board also took into account the environmental, social, sustainability and governance research and analysis to be provided by the Advisor to the Fund. The Board concluded that it was satisfied with the nature, extent and quality of services to be provided to the Fund by the Advisor under the Advisory Agreement.
In considering the management style and investment strategies that the Advisor proposed to use in managing the Fund, the Board of Directors took into consideration the performance of the Green Bond strategy currently offered in a separate account managed by the Advisor, that had similar investment strategies as those proposed for the Fund. The Board noted that the portfolio management team that currently managed the Green Bond separate account strategy was expected to manage the Fund as well. In addition, the Board took into consideration certain differences between how the Advisor managed the Green Bond separate account and how it proposed to manage the Fund, as well as the impact these differences were expected to have on the Fund’s performance. Based upon its review, the Board concluded that the Advisor is qualified to manage the Fund’s assets in accordance with the Fund’s investment objective and strategies and that the Advisor’s proposed investment strategies were appropriate for pursuing the Fund’s investment objective.
In considering the Fund’s proposed fees and estimated expenses, the Board compared the Fund’s proposed fees and estimated total expense ratio with those of comparable funds. The Board noted that the Fund’s proposed advisory fee and estimated total expenses for its Class A shares were within the range of advisory fees and total expenses paid by certain comparable funds as selected by the Advisor, described in the materials provided to the Board. The Board took into account that the Advisor had contractually agreed to limit the Fund’s net annual operating expenses for a specified period of time following the commencement of the Fund’s operations. The Board also noted management’s discussion of the Fund’s estimated expenses and certain factors that affected the level of such expenses, including the projected size of the Fund and the cost of the environmental, social, sustainability and governance research and analysis to be provided by the Advisor. Based upon its review, the Board concluded that the proposed advisory fee was reasonable in view of the quality of services to be received by the Fund from the Advisor and the other factors considered.
In reviewing the anticipated profitability of the advisory fee to the Fund’s Advisor, the Board considered the fact that affiliates of the Advisor would be providing shareholder servicing, administrative and distribution services to the Fund for which they would receive compensation. The Board also took into account whether the Advisor had the financial wherewithal to provide services to the Fund. The Board noted that the Advisor had contractually agreed to limit the Fund’s net annual operating expenses for a specified period of time following the commencement of the Fund’s operations. The Board also considered that the Advisor would likely derive benefits to its reputation and other
30 www.calvert.com CALVERT GREEN BOND FUND SEMI-ANNUAL REPORT (UNAUDITED)
indirect benefits from its relationship with the Fund. Based upon its review, the Board concluded that the Advisor’s and its affiliates’ anticipated level of profitability from their relationship with the Fund was reasonable.
The Board considered the effect of the Fund’s projected size and growth on its performance and expenses. The Board concluded that adding breakpoints to the advisory fee at specified asset levels would not be appropriate at this time. The Board also noted that if the Fund’s assets increased over time, the Fund might realize other economies of scale if assets increased proportionally more than certain other expenses.
In approving the amendment to the Advisory Agreement, the Board of Directors, including the disinterested Directors, did not identify any single factor as controlling, and each Director may have attributed different weight to various factors.
CONCLUSIONS
The Board reached the following conclusions regarding the amendment to the Advisory Agreement, among others: (a) the Advisor has demonstrated that it possesses the capability and resources to perform the duties required of it under the Advisory Agreement; (b) the Advisor is qualified to manage the Fund’s assets in accordance with the Fund’s investment objective and strategies; (c) the Advisor maintains appropriate compliance programs; (d) the Advisor’s proposed investment strategies are appropriate for pursuing the Fund’s investment objective; and (e) the Fund’s proposed advisory fee is reasonable in view of the quality of services to be received by the Fund from the Advisor and the other factors considered. Based on its conclusions, the Board determined that approval of the amendment to the Advisory Agreement would be in the best interests of the Fund and its shareholders.
www.calvert.com CALVERT GREEN BOND FUND SEMI-ANNUAL REPORT (UNAUDITED) 31
This page intentionally left blank.
32 www.calvert.com CALVERT GREEN BOND FUND SEMI-ANNUAL REPORT (UNAUDITED)
This page intentionally left blank.
www.calvert.com CALVERT GREEN BOND FUND SEMI-ANNUAL REPORT (UNAUDITED) 33
This page intentionally left blank.
To Open an Account
800-368-2748
Service for Existing Account
Shareholders: 800-368-2745
Brokers: 800-368-2746
TDD for Hearing Impaired
800-541-1524
Registered Mail
Calvert Investments
c/o BFDS,
P.O. Box 219544
Kansas City, MO 64121-9544
Overnight Mail
Calvert Investments
c/o BFDS,
330 West 9th Street
Kansas City, MO 64105
Web Site
www.calvert.com
Principal Underwriter
Calvert Investment Distributors, Inc.
4550 Montgomery Avenue
Suite 1000 North
Bethesda, Maryland 20814
This report is intended to provide fund information to shareholders. It is not authorized for distribution to prospective investors unless preceded or accompanied by a prospectus.
Note: The information on our website is not incorporated by reference into this report; our website address is included as an inactive textual reference only.
Investors should carefully consider the investment objectives, risks, charges and expenses of the Calvert Funds. This and other important information is contained in the fund’s summary prospectus and prospectus, which can be obtained from your financial professional and should be read carefully before investing. You may also call Calvert at 800/368-2748 or visit www. calvert.com.
Item 2. Code of Ethics.
Not applicable.
Item 3. Audit Committee Financial Expert.
Not applicable.
Item 4. Principal Accountant Fees and Services.
Not applicable.
Item 5. Audit Committee of Listed Registrants.
Not applicable.
Item 6. Schedule of Investments.
(a) This Schedule is included as part of the report to shareholders filed under Item 1 of this Form.
(b) Not applicable.
Item 7. Disclosure of Proxy Voting Policies and Procedures for Closed-End Management Investment Companies.
Not applicable.
Item 8. Portfolio Managers of Closed-End Management Investment Companies
Not applicable.
Item 9. Purchases of Equity Securities by Closed-End Management Investment Company and Affiliated Purchasers.
Not applicable.
Item 10. Submission of Matters to a Vote of Security Holders.
No material changes to the procedures by which shareholders may recommend nominees to the registrant’s Board of Directors since registrant last provided disclosure in response to this Item.
Item 11. Controls and Procedures.
(a) The principal executive and financial officers concluded that the registrant's disclosure controls and procedures (as defined in Rule 30a-3(c) under the 1940 Act) are effective, based on the evaluation of these controls and procedures required by Rule 30a-3(b) under the 1940 Act and Rules 13a-15(b) or 15d-15(b) under the Exchange Act, as of a date within 90 days of the filing date of this report.
(b) There was no change in the registrant's internal control over financial reporting (as defined in Rule 30a-3(d) under the 1940 Act) that occurred during the registrant's second fiscal quarter of the period covered by this report that has materially affected, or is reasonably likely to materially affect, the registrant's internal control over financial reporting.
Item 12. Exhibits.
(a)(1) Not applicable.
(a)(2) A separate certification for each principal executive officer and principal financial officer of the registrant as required by Rule 30a-2 under the Act (17 CFR 270.30a-2).
Attached hereto.
(a)(3) Not applicable.
(b) A certification for the registrant's Principal Executive Officer and Principal Financial Officer, as required by Rule 30a-2(b) under the Investment Company Act of 1940, is attached hereto. The certification furnished pursuant to this paragraph is not deemed to be "filed" for purposes of Section 18 of the Securities Exchange Act of 1934, or otherwise subject to the liability of that section. Such certification is not deemed to be incorporated by reference into any filing under the Securities Act of 1933 or the Securities Exchange Act of 1934, except to the extent that the registrant specifically incorporates it by reference.
Pursuant to the requirements of the Securities Exchange Act of 1934 and the Investment Act of 1940, the registrant has duly caused this report to be signed on its behalf by the undersigned, thereunto duly authorized.
CALVERT IMPACT FUND, INC.
By: /s/ Barbara J. Krumsiek
Barbara J. Krumsiek
President -- Principal Executive Officer
Date: May 29, 2014
Pursuant to the requirements of the Securities Exchange Act of 1934 and the Investment Act of 1940, this report has been signed below by the following persons on behalf of the registrant and in the capacities and on the dates indicated.
/s/ Barbara J. Krumsiek
Barbara J. Krumsiek
President -- Principal Executive Officer
Date: May 29, 2014
/s/ Ronald M. Wolfsheimer
Ronald M. Wolfsheimer
Treasurer -- Principal Financial Officer
Date: May 29, 2014