UNITED STATES
SECURITIES AND EXCHANGE COMMISSION
Washington, D.C. 20549
FORM N-CSR
CERTIFIED SHAREHOLDER REPORT OF REGISTERED
MANAGEMENT INVESTMENT COMPANIES
Investment Company Act file number: 811-10399
______________________________________________
HENDERSON GLOBAL FUNDS
______________________________________________________________________________
(Exact name of registrant as specified in charter)
737 NORTH MICHIGAN AVENUE, SUITE 1700
CHICAGO, ILLINOIS 60611
______________________________________________________________________________
(Address of principal executive offices)(Zip code)
| (Name and Address of Agent for Service) | Copy to: |
CHRISTOPHER GOLDEN 737 NORTH MICHIGAN AVENUE, SUITE 1700 CHICAGO, ILLINOIS 60611 | CATHY G. O’KELLY VEDDER PRICE P.C. 222 NORTH LASALLE STREET CHICAGO, ILLINOIS 60601 |
Registrant’s telephone number, including area code: (312) 397-1122
Date of fiscal year end: July 31
Date of reporting period: January 31, 2016
Item 1: Report to Shareholders.
| Letter to shareholders | 1 |
| Commentaries and Performance summaries | |
| All Asset Fund | 4 |
| Dividend & Income Builder Fund | 6 |
| Emerging Markets Fund | 8 |
| European Focus Fund | 10 |
| Global Equity Income Fund | 12 |
| Global Technology Fund | 14 |
| High Yield Opportunities Fund | 16 |
| International Long/Short Equity Fund | 18 |
| International Opportunities Fund | 20 |
| International Select Equity Fund | 22 |
| Strategic Income Fund | 24 |
| Unconstrained Bond Fund | 26 |
| US Growth Opportunities Fund | 28 |
| Portfolios of investments | 30 |
| Statements of assets and liabilities | 118 |
| Statements of operations | 126 |
| Statements of changes in net assets | 134 |
| Statements of changes – capital stock activity | 147 |
| Statement of cash flows | 164 |
| Financial highlights | 166 |
| Notes to financial statements | 186 |
| Other information | 201 |
| Trustees and officers | 206 |
International and emerging markets investing involves certain risks and increased volatility not associated with investing solely in the US. These risks include currency fluctuations, economic or financial instability, lack of timely or reliable financial information or unfavorable political or legal developments. The Funds may invest in securities issued by smaller companies which typically involve greater risk than investing in larger companies. Certain of the Funds are non-diversified and therefore the change in value of a single holding may have a more pronounced effect on a Fund's performance. Also, the Funds may invest in limited geographic areas and/or sectors which may result in greater market volatility. In addition, the Funds may invest in derivatives. Derivatives involve special risks different from, and potentially greater than, the risks associated with investing directly in securities and may result in greater losses. The Funds may be subject to frequent trading which may result in a turnover rate of 100% or more. Additional fund-specific risk is described in more detail in the Prospectus and Statement of Additional Information.
Investors should consider the investment objectives, risks, charges and expenses of a mutual fund carefully before investing. For a free Prospectus, which contains these items and other important information about the Funds, visit www.henderson.com. The Prospectus should be read carefully before investing.
Dear shareholder,
We are pleased to provide the semi-annual report for the Henderson Global Funds, which covers the six months ended January 31, 2016.
2015 was a year of heightened volatility and idiosyncratic market events. The policy-driven, high-return markets that have characterized the post-crisis era are evolving into more challenging conditions where economic and financial tensions play a prominent role. 2016 has begun with what could be understatedly described as a difficult start, with equity markets selling off sharply in one of the worst starts to a calendar year on record.
The epicenter of this market turmoil was the slowing Chinese economy, as authorities intervened with trading halts and liquidity injections; ultimately, the Shanghai Composite Index ended January down -22.7% for the month. The oil price has been the other key driver of markets, as NYMEX WTI Crude fell to a low of $27 per barrel in January, bringing other commodity prices lower with it. Weakening industrial spending stemming from the low oil price is being felt worldwide. As a result, investors in both developed and emerging equity markets are growing increasingly concerned about the path of global economic growth.
In Asia, it is important to remember that the drivers of developed economies like Australia, Singapore and Hong Kong are very different than China, India and Indonesia, for example. In many Asian economies, economic development is producing a rising middle class, which in turn should lead to sustainable consumption growth. Moreover, relative to other emerging market regions, Asia is a net importer of oil and commodities, hence most Asian economies are benefitting from the low oil price. This should also feed through to corporate profit margins. However, global investor flows and sentiment still have a significant, and potentially negative, impact on Asian markets.
Europe remains in a slow recovery characterized by low growth and muted inflationary pressures. The European Central Bank's monetary policy has been accommodative, maintaining negative interest rates. Additionally, low oil prices are positive for most European economies, as Europe is the world's largest net importer of oil. Nonetheless, there are still risks for European investors, including doubts around the potential impact of currency movements and challenging global economic conditions affecting the European region. However, as we mention in our "Case for Europe" whitepaper that immediately follows this letter, the European economy is more diverse and complex than just the stock markets, and opportunities abound for "bottom-up" stock selectors to find attractive investments amidst the turmoil.
At Henderson we believe that active management and good security selection remains the primary driver of long-term performance for our portfolios, and we remain focused on seeking out attractive global investment opportunities that can bring value to our clients' portfolios. Now, as much as ever, we believe the "Henderson Difference" is a key factor in helping to manage funds that are truly differentiated from the competition. We appreciate your trust in, and support of, our Funds, and we look forward to serving your financial needs in the years to come.
James G. O'Brien
President, Henderson Global Funds
Investors should consider the investment objectives, risks, charges and expenses of a mutual fund carefully before investing. For a free Prospectus, which contains this and other important information about the Funds, visit www.henderson.com. The Prospectus should be read carefully before investing.
1
Europe comprises liquid, well-regulated markets that offer exposure to all major sectors. The market's depth and breadth, with its regional variations and, at times, political uncertainty, provide investors with a wealth of opportunities across the market capitalization scale. Here we look at key market drivers for the region and explore the opportunities and risks they present.
Accommodative monetary policy
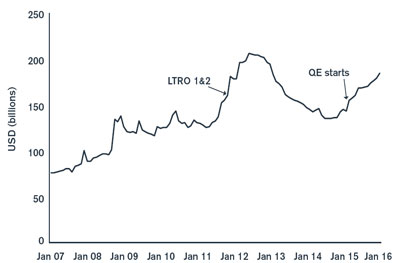
European Central Bank (ECB) President Mario Draghi remains committed to exploring extraordinary monetary policy measures, as evidenced by record low interest rates and the ongoing $65 billion per month asset purchase program (now extended until March 2017 'or beyond'). These are alongside other measures, such as the Longer-Term Refinancing Operations (LTROs) and Outright Monetary Transactions (OMT). The ECB has been concerned by the low rate of growth in the Eurozone and these stimulus measures support the case for a stronger regional recovery.
While questions remain about how effective these initiatives can be, the fact that the ECB is committed to decisive action to create inflationary pressures should help to steady nerves.
Chart 1 – ECB total assets
Source: Henderson Global Investors, as of 1/5/16. Note: Base year December 2007
Tailwind from low oil price
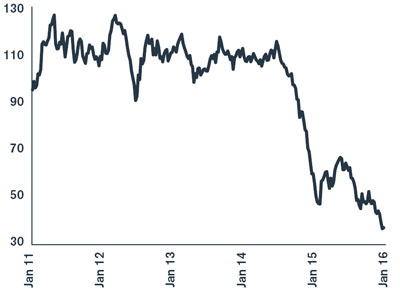
A sustained period of low oil prices would be a major positive for most European economies, putting more money into the pockets of consumers, while also helping to reduce the region's notoriously high industry energy costs – Europe is the world's largest net importer of oil and related products (approximately $406 billion in 2014). There are concerns, however, that lower oil prices could fuel a deflationary trend, while falling oil prices have also had a negative impact on oil producers and oil services companies based in Europe.
Chart 2 – Falling oil prices - good for businesses and consumers, but possibly deflationary
Source: Datastream, Brent crude oil price, US dollars per barrel, as of 1/8/16.
An improving economy
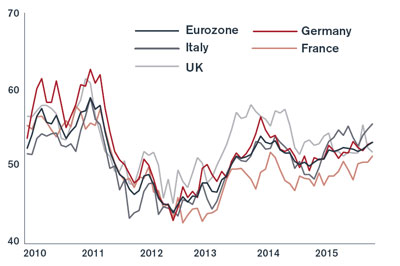
Europe remains in a slow and protracted recovery characterized by low growth and muted inflationary pressures. The region is no longer the weak link when it comes to the global economy, with Spain and Italy among the countries revising their expectations for growth upwards.
Purchasing managers' indices (PMIs), credit demand and wages data remain positive, while unemployment is falling. Nonetheless, there are pockets of uncertainty, with conditions in the global economy certainly more challenging than they were in recent years.
Chart 3 – Manufacturing PMIs still point to expansion
Source: Bloomberg, as of 1/4/16. A PMI above 50 suggests expansion in manufacturing activity, a leading indicator for the state of the broader economy.
2
Platform for earnings growth in Europe
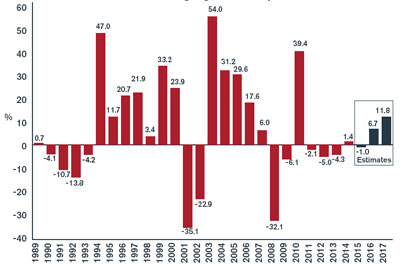
Performance within European markets over the past few years has been driven primarily by a re-rating in valuations from very low levels, rather than any improvement in corporate earnings. One of the challenges for 2016 is whether the step-up in corporate earnings growth justifies higher valuations. There have been previous false starts – the strength of the euro weighed on corporate earnings between 2012 and 2014, while Europe's earnings recovery in 2015 was threatened by China's slowdown and the bear market in commodities. The hope is that the ECB's quantitative easing (QE) stimulus package, combined with a weaker euro and lower energy costs, can provide the impetus to drive corporate earnings higher.
Chart 4 – Reasonable earnings growth expectations
Source: Henderson Global Investors, Goldman Sachs research, Citi group research, as of 12/31/15, including estimates for 2015, 2016 and 2017.
Europe - no longer cheap, but still offering value
European equities are no longer discounted relative to history. On a 12-month forward price-to-earnings basis the MSCI Europe Index is trading on a multiple of 15.5x earnings (as of 31 December 2015), compared to around 7.3x earnings in October 2008 and an historic average of 13.9x earnings. Nonetheless, European equities remain attractively priced relative to other regions and asset classes, particularly versus their US peers.
Sustained demand for quality stocks and alternative sources of income could well push price ratios higher, suggesting that the region still represents value on a selective basis. Many investors remain underweight the region, which should support future demand as reallocations are made. Any improvement in earnings growth in Europe should also be a catalyst for further gains.
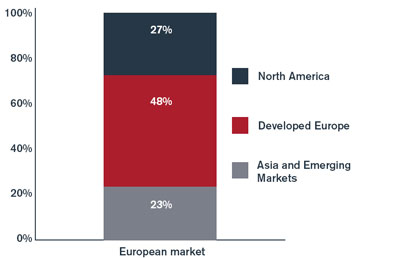
Well diversified market
The global reach of European companies is evident in the breadth of their sources of revenue (see chart 5), with many European-listed businesses deriving a significant proportion of their revenues from overseas. This allows European equity portfolios to be adjusted towards those firms with exposure to the regions with the most compelling opportunities – both domestic and global.
Many businesses in the region also benefit from reliable future revenues, through long-term supply contracts and service level agreements. Well managed companies with these resilient attributes can outperform in both rising and falling markets.
Chart 5 – European companies: diverse revenue sources
Source: Henderson Global Investors, as of 9/30/15. Note: Totals may not add up to 100 due to rounding.
Summary
Despite the gradually improving economic outlook, the outlook for European equities is not without its risks. It is important to remember that the economy is not purely the stock market. Good stock selection remains the primary driver of long-term performance in Europe, with significant divergence in prospects across countries and sectors.
Among the visible risks, doubts remain around the potential impact of currency movements, following the US Federal Reserve's decision to begin normalizing interest rates and the potential ramifications of slowing growth in China. The success, or otherwise, of the ECB's attempts to inject inflation back into the European economy will of course have an impact. There is also the risk of political contagion, with the rise in anti-austerity sentiment likely to influence the future balance of power across the region, as seen in the Spanish election in December 2015. However, the region offers strength in depth when it comes to well managed companies with good growth prospects and stock selection is likely to remain key through 2016.
3
All Asset Fund
The second half of 2015 was arguably the most significant phase of global monetary policy since the US Federal Reserve Bank (Fed) concluded its quantitative easing program. In the US, the target for the Federal Funds rate was increased to 0.5% marking the first increase in the base rate in over nine years. The rate rise was cushioned by the reiteration that the path to interest rate normalization would be shallow, and reassurance that the Fed would remain pragmatic. In Europe, the European Central Bank (ECB) announced a 0.10% cut in the deposit rate and broadened the remit and extended the duration of its quantitative easing program.
In emerging markets, macroeconomic instability prompted by falling commodity prices was compounded by a major Chinese stock market correction, the severity of which forced the government to intervene to restore price stability. The Chinese authorities' devaluation of the renminbi versus the dollar was cited as the main catalyst for the sell-off. The effects of falling commodity prices, particularly oil, furthered the woes of the emerging markets bloc with Latin America faring particularly poorly.
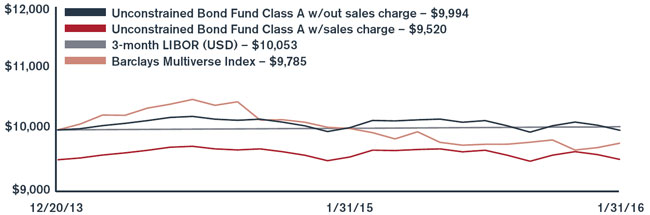
For the six month period ended January 31, 2016, the Fund returned -6.60% (Class A at NAV) versus the benchmark, 3-month LIBOR (USD), which posted a return of 0.14%. The Fund's international equity holdings were the main detractor from performance with the continued appreciation of the dollar
| Top 10 long-term holdings* |
| (at January 31, 2016) |
| | | As a percentage |
| Security | | of net assets |
| TIAA-CREF Asset Management | | | 5.4 | % |
| Core Property Fund LP | | | | |
| iShares MSCI EAFE Minimum Volatility | | | | |
| Index Fund | | | 4.7 | |
| Henderson Unconstrained Bond Fund | | | 4.4 | |
| iShares TIPS Bond ETF | | | 4.4 | |
| iShares iBoxx Investment Grade | | | | |
| Corporate Bond Fund | | | 3.9 | |
| ASG Global Alternatives Fund | | | 3.7 | |
| Gateway Fund | | | 3.1 | |
| Calamos Market Neutral Income Fund | | | 3.0 | |
| PowerShares Senior Loan Portfolio | | | 2.9 | |
| Henderson Global Equity Income Fund | | | 2.8 | |
accentuating negative performance in the underlying markets. In dollar terms, European equities fell 16% and Japanese equities fell 12% over the period. Investor positioning also contributed as both Europe and Japan were widely held by market participants looking to benefit from the influx of liquidity due to easy monetary policy.
Key changes to the portfolio over the period were largely driven by monetary policy. The ECB's policy-easing announcement and increasingly hawkish rhetoric from the Fed underlined our belief that we are entering a phase of monetary divergence. We reflected this view by further increasing the Fund's weight in the policy-supportive environments of Japan and Europe at the expense of the UK and US and further increased hedging to both the euro and yen.
As an extension of this theme, we switched the Fund's direct exposure to emerging markets into an indirect position through the FTSE 100 Index which has a high proportion of emerging market-dependent earnings. We also sold the Fund's holding in the Russell 2000 Value ETF as falling global liquidity levels reduced our appetite for holding smaller market capitalization equities. Elsewhere in the portfolio, we increased the Fund's allocation to US investment grade credit and global high yield bonds, which we believe are more attractive than nominal treasury bonds in the face of rising interest rates and very attractive credit spreads.
Notwithstanding the recent market volatility, we remain relatively constructive on the macro environment as a whole. It is easy to forget that 2015 saw the fastest growth in the developed markets in five years. The US recovery appears solid and we have confidence that the Chinese authorities can effectively balance their competing policy objectives, although further monetary easing may be required.
In Europe and Japan, accommodative policy looks set to support sustained currency weakness and promote earnings growth; although, at the margin, monetary policy appears to be losing its effectiveness. The key risks remain a financial accident stemming from the emerging markets weakness, oil, or a major geopolitical event affecting all risk assets.
* For further detail about these holdings, please refer to the section entitled "Portfolios of investments." Fund holdings are as of the date given, are subject to change at any time, and are not recommendations to buy or sell any security.
4
All Asset Fund
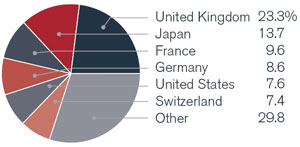
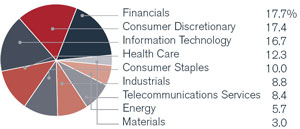
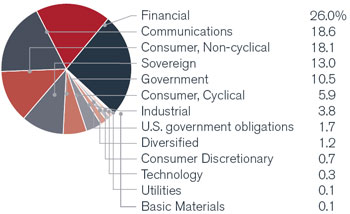
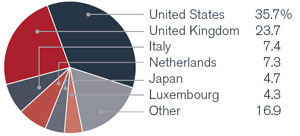
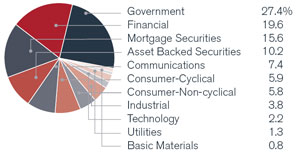
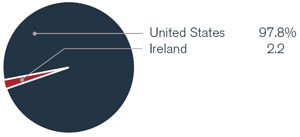
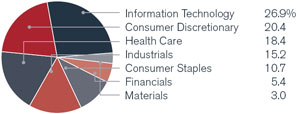
| Portfolio composition by country | Portfolio composition by sector |
| (as a % of long-term investments) | (as a % of long-term investments) |
| | |
| |
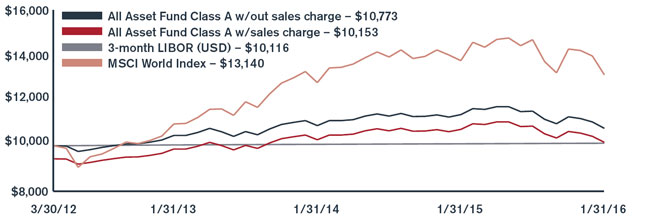
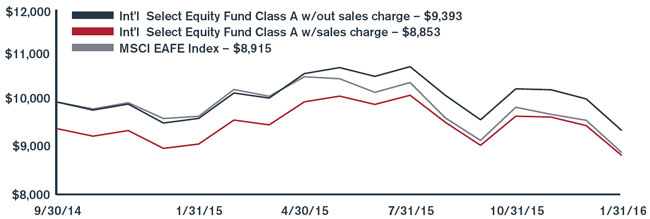
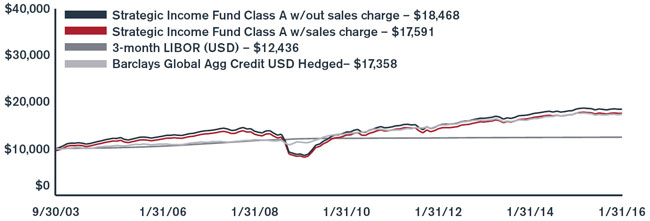
Investment comparison
Value of $10,000
| | | | | | | | | | | | | | | | | |
| Total returns as of January 31, 2016 | | | | | | | | | | | | | | | Since |
| | | | NASDAQ | | Six | | One | | Three | | inception |
| At NAV | | | symbol | | months | | year | | years* | | (3/30/2012)* |
| Class A | | | HGAAX | | | -6.60 | % | | -5.35 | % | | 0.99 | % | | 1.96 | % |
| Class C | | | HGACX | | | -6.92 | | | -6.02 | | | 0.22 | | | 1.20 | |
| Class I | | | HGAIX | | | -6.37 | | | -5.01 | | | 1.28 | | | 2.24 | |
| Class R6** | | | HGARX | | | -6.36 | | | -5.01 | | | 1.29 | | | 2.24 | |
| With sales charge | | | | | | | | | | | | | | | | |
| Class A | | | | | | -11.94 | % | | -10.83 | % | | -0.98 | % | | 0.40 | % |
| Class C | | | | | | -7.92 | | | -6.02 | | | 0.22 | | | 1.20 | |
| Index | | | | | | | | | | | | | | | | |
| 3-month LIBOR (USD) | | | | | | 0.14 | % | | 0.26 | % | | 0.26 | % | | 0.30 | % |
| MSCI World Index | | | | | | -10.58 | | | -4.55 | | | 6.21 | | | 7.51 | |
* Average annual return.
** Class R6 shares commenced operations on November 30, 2015. The performance for Class R6 shares for periods prior to November 30, 2015 is based on the performance of Class I shares. Performance for Class R6 shares would be similar because the shares are invested in the same portfolio of investments. Class R6 shares are not subject to a front-end sales charge or a distribution fee.
Performance data quoted represents past performance and is no guarantee of future results. Performance results with sales charges reflect the deduction of the maximum front-end sales charge or the deduction of the applicable contingent deferred sales charge ("CDSC"). Class A shares are subject to a maximum front-end sales charge of 5.75%. Class C shares are subject to a CDSC of up to 1% on certain redemptions made within 12 months of purchase. Performance presented at Net Asset Value (NAV), which does not include a sales charge, would be lower if this charge were reflected. NAV is the value of one share of the Fund excluding any sales charges. Performance quoted is based on the transacted NAV at each period end, which may differ from the US Generally Accepted Accounting Principles ("GAAP")-adjusted NAV and the total return presented in the Financial Highlights. Current performance may be lower or higher than the performance data quoted. Investment return and principal value will fluctuate so that an investor's shares, when redeemed, may be worth more or less than original cost. As stated in the current prospectus, the Fund's annual operating expense ratios (gross) for Class A, C, I and R6 shares are 1.41%, 2.18%, 1.13% and 1.10% (estimated), respectively. However, the Fund's adviser has contractually agreed to waive its management fee and, if necessary, to reimburse other operating expenses (excluding Acquired Fund Fees and Expenses from underlying investment companies) in order to limit total annual ordinary operating expenses, less distribution and service fees, to 0.60% of the Fund's average daily net assets, which is in effect until July 31, 2020. With respect to investments in affiliated underlying funds, the Fund's adviser has contractually agreed to reduce or waive the Fund's management fee to limit the combined management fees paid to the adviser for those assets to the greater of 1.00% or the affiliated underlying fund's management fee. Indirect net expenses associated with the Fund's investments in underlying investment companies are not subject to the contractual waiver. For the most recent month-end performance, please call 1.866.443.6337 or visit the Funds' website at www.henderson.com.
Performance results also reflect expense subsidies and waivers in effect during periods shown. Absent these waivers, results would have been less favorable. All results assume the reinvestment of dividends and capital gains.
The investment comparison graph above reflects the change in value of a $10,000 hypothetical investment since the Fund's inception, including reinvested dividends and distributions, compared to a broad based securities market index. The MSCI World Index is a free float-adjusted market capitalization weighted index that is designed to measure the equity market performance of developed markets. 3-Month LIBOR (London Interbank Offered Rate) (USD) is the interest rate participating banks offer to other banks for loans on the London market. The Fund is professionally managed while the Indices are unmanaged and not available for investment and do not include fees, expenses or other costs. Results in the table and graph do not reflect the deduction of taxes that a shareholder would pay on Fund distributions or the redemption of Fund shares.
5
Dividend & Income Builder Fund
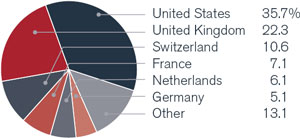
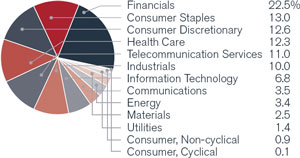
Global equities performed poorly over a volatile six month period. Investor concerns centered on the speed of global economic growth (and lack thereof), and in particular the speed at which the Chinese economy is slowing following disappointing manufacturing data and an unexpected currency devaluation. Commodity prices were also under pressure, as the oil price fell below $30/barrel due to supply growth. Given the debate around the strength of the global economy, cyclical sectors, such as materials and financials, were among the worst performers, while traditionally more defensive sectors, such as telecommunications, utilities and consumer staples, fared better.
For the six month period ended January 31, 2016, the Fund returned -6.89% (Class A at NAV) versus the benchmark, MSCI World Index, which posted a return of -10.58%. The Fund continued to meet its objectives for earning and distributing income over the period. Performance was led by stock selection in the Fund's underweight position in the US and overweight position in Europe. The fixed income allocation was also accretive over the period. The Fund further benefitted from its relatively defensive positioning, for example, an overweight position in the tobacco and telecommunications sectors. This was also reflected at the stock level where it tended to be the more defensive holdings such as Reynolds American, Orange and Imperial Tobacco that performed well, while more cyclical positions such as BHP Billiton and Royal Dutch Shell struggled. The
Top 10 long-term holdings*
(at January 31, 2016) | | | | |
| | | | As a percentage |
| Security/Issuer | | | of net assets |
| Microsoft Corp. | | | 2.9 | % |
| Imperial Tobacco Group plc | | | 2.5 | |
| Roche Holding AG | | | 2.5 | |
| Novartis AG | | | 2.4 | |
| Pfizer, Inc. | | | 2.2 | |
| RELX N.V. | | | 2.2 | |
| Verizon Communications, Inc. | | | 2.2 | |
| Reynolds American, Inc. | | | 2.2 | |
| Orange S.A. | | | 1.9 | |
| Nestle S.A. | | | 1.8 | |
outlier to this trend was the Fund's holding in the pharmaceutical company, Novartis. For a number of quarters, Novartis has had problems with a slowdown in growth and lower margins from its eye care division, Alcon. While the results were disappointing, they have taken measures to improve performance such as a reinvestment in research and development and putting in place a new head of the division.
In the equity allocation the Fund continued to seek companies with both above-average yield and dividend growth. The equity allocation remained over 80% of the Fund, reflecting the managers' current bias towards equities over bonds. While corporate earnings growth has remained mixed in recent years, dividend growth has proven more consistent. In comparison to other asset classes such as government or corporate bonds, it is our view that equities continue to have attractive valuations, especially given the prospects for ongoing dividend growth. In the fixed income allocation, we prefer credit over interest rate risk, continuing our strategy of investing in high quality names with attractive coupons.
Inflation has reached record lows in many developed economies, with government bond yields continuing to fall as investors "price in" monetary stimulus in Europe and delays to interest rate increases elsewhere. We believe equities, therefore, remain an attractive source of income for investors in many markets. Over the long term, dividends and dividend growth have provided a significant proportion of an investor's total equity return, and offer a compelling basis for valuing companies.
In an uncertain global growth environment, we are comfortable with the overweight positioning of the Fund in defensive sectors. Until we see evidence of improving top-line growth that can lead to operating leverage, we are likely to maintain this position. Within fixed income, credit markets now yield significantly more than a year ago. We now find markets much more interesting from a risk/reward perspective. As a result we have recently moderately increased the Fund's fixed income allocation to reflect relative value emerging here.
* For further detail about these holdings, please refer to the section entitled "Portfolios of investments." Fund holdings are as of the date given, are subject to change at any time, and are not recommendations to buy or sell any security.
6
Dividend & Income Builder Fund
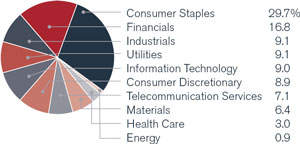
| Portfolio composition by country | Portfolio composition by sector |
| (as a % of long-term investments) | (as a % of long-term investments) |
| | |
| |
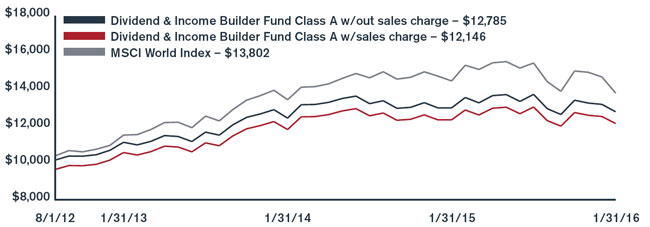
Investment comparison
Value of $10,000
| | | | | | | | | | | | | | | | | |
| Total returns as of January 31, 2016 | | | | | | | | | | | | | | | Since |
| | | | NASDAQ | | Six | | One | | Three | | inception |
| At NAV | | | symbol | | months | | year | | years* | | (8/1/2012)* |
| Class A | | | HDAVX | | | -6.89 | % | | -1.62 | % | | 4.74 | % | | 7.26 | % |
| Class C | | | HDCVX | | | -7.23 | | | -2.30 | | | 3.96 | | | 6.47 | |
| Class I | | | HDIVX | | | -6.71 | | | -1.33 | | | 4.98 | | | 7.51 | |
| Class R6** | | | HDRVX | | | -6.47 | | | -1.07 | | | 5.07 | | | 7.59 | |
| With sales charge | | | | | | | | | | | | | | | | |
| Class A | | | | | | -11.55 | % | | -6.53 | % | | 2.97 | % | | 5.69 | % |
| Class C | | | | | | -8.23 | | | -2.30 | | | 3.96 | | | 6.47 | |
| Index | | | | | | | | | | | | | | | | |
| MSCI World Index | | | | | | -10.58 | % | | -4.55 | % | | 6.21 | % | | 9.32 | % |
* Average annual return.
** Class R6 shares commenced operations on November 30, 2015. The performance for Class R6 shares for periods prior to November 30, 2015 is based on the performance of Class I shares. Performance for Class R6 shares would be similar because the shares are invested in the same portfolio of investments. Class R6 shares are not subject to a front-end sales charge or a distribution fee.
Performance data quoted represents past performance and is no guarantee of future results. Performance results with sales charges reflect the deduction of the maximum front-end sales charge or the deduction of the applicable contingent deferred sales charge ("CDSC"). Class A shares are subject to a maximum front-end sales charge of 5.00%. Class C shares are subject to a CDSC of up to 1% on certain redemptions made within 12 months of purchase. Performance presented at Net Asset Value (NAV), which does not include a sales charge, would be lower if this charge were reflected. NAV is the value of one share of the Fund excluding any sales charges. Performance quoted is based on the transacted NAV at each period end, which may differ from the US Generally Accepted Accounting Principles ("GAAP")-adjusted NAV and the total return presented in the Financial Highlights. Current performance may be lower or higher than the performance data quoted. Investment return and principal value will fluctuate so that an investor's shares, when redeemed, may be worth more or less than original cost. As stated in the current prospectus, the Fund's annual operating expense ratios (gross) for Class A, C, I and R6 shares are 1.47%, 2.24%, 1.25% and 1.19% (estimated), respectively. However, the Fund's adviser has contractually agreed to waive its management fee and, if necessary, to reimburse other operating expenses (excluding Acquired Fund Fees and Expenses from underlying investment companies) in order to limit total annual ordinary operating expenses, less distribution and service fees, to 1.05% of the Fund's average daily net assets, which is in effect until July 31, 2020. For the most recent month-end performance, please call 1.866.443.6337 or visit the Funds' website at www.henderson.com.
Performance results also reflect expense subsidies and waivers in effect during periods shown. Absent these waivers, results would have been less favorable. All results assume the reinvestment of dividends and capital gains.
The investment comparison graph above reflects the change in value of a $10,000 hypothetical investment since the Fund's inception, including reinvested dividends and distributions, compared to a broad based securities market index. The MSCI World Index is a free float-adjusted market capitalization weighted index that is designed to measure the equity market performance of developed markets. The Fund is professionally managed while the Index is unmanaged and not available for investment and does not include fees, expenses or other costs. Results in the table and graph do not reflect the deduction of taxes that a shareholder would pay on Fund distributions or the redemption of Fund shares.
7
Emerging Markets Fund
During the period, nervousness over the health of the Chinese economy continued to spread around the world. In what appeared a quite significant policy shift, the Chinese authorities allowed the yuan to move outside its normal band. Negative knock-on effects were felt in both commodity exporting countries and in the developed world, where many companies rely on a healthy Chinese market for their goods.
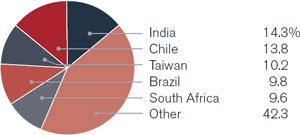
For the six month period ended January 31, 2016, the Fund returned -12.81% (Class A at NAV) versus the Fund's benchmark, the MSCI Emerging Markets Index, which returned -16.83%. While the Fund fell in value during the period, our strategy of owning quality companies trading at reasonable valuations meant it outperformed the index. Relative returns were helped by the Fund's limited exposure to China. This is based less on a macroeconomic view and more on, in our opinion, a lack of alignment between foreign minority shareholders and the Chinese government. Even when we analyze a healthy, state-owned company on a reasonable valuation, we worry it may be asked to do 'national service' which could include rescuing less healthy peers.
In Asia, recent short-term concerns regarding the Thai economy presented us with an opportunity to begin building a position in Mega Lifesciences, a consumer and healthcare product manufacturer. The company has a portfolio of popular branded products in Thailand, as well as a foothold in fast-growing
| Top 10 long-term holdings* |
| (at January 31, 2016) |
| | | | As a percentage |
| Security | | | of net assets |
| Grupo Herdez SAB de CV | | | 3.7 | % |
| Shoprite Holdings, Ltd. | | | 3.5 | |
| Inversiones Aguas Metropolitanas S.A. | | | 3.4 | |
| Unilever plc | | | 3.3 | |
| Bank Pekao S.A. | | | 3.2 | |
| Cia Cervecerias Unidas S.A., ADR | | | 3.2 | |
| Housing Development Finance Corp., Ltd. | | | 3.2 | |
| Uni-President Enterprises Corp. | | | 3.1 | |
| Mahle-Metal Leve S.A. | | | 3.0 | |
| Standard Bank Group, Ltd. | | | 3.0 | |
frontier Asian markets, including Myanmar, via its distribution business. We also added a new position in Fuyao Glass, a Chinese privately-owned glass manufacturer that has built up a globally competitive business serving well-known auto manufacturers in the US and China, trading at an attractive valuation. Fuyao's founder remains with the company as Chairman, but a significant part of his share of the company has been donated to a charitable foundation.
Over the period, the Fund took the opportunity to initiate positions in two high quality banking franchises, Commercial International Bank in Egypt and Komercni Banca in the Czech Republic. Both banks exemplify characteristics we believe can lead to attractive long term returns. These banks operate under private control as opposed to state control which is often the case for many emerging market banks. Over the long-term these relatively simple banks tend to compound returns and gain market share at the expense of the bureaucratic state-controlled competition. Another market where we find similar banks offering attractive investment opportunities is India. The Fund holds a sizeable position in HDFC, a leading privately owned Indian financial institution.
During the period, the Fund also exited a number of positions including Jeronimo Martins, the Portuguese and Polish discount retailer, after strong performance of the company's shares left the valuation looking stretched. Finally, the Fund sold its position in SABMiller. With increasingly attractive opportunities elsewhere, we exited our position as shares appeared to fully reflect Anheuser-Busch InBev's merger offer.
Following a sustained period of poor stock and currency market performance relative to much of the developed world, some quality emerging market companies have become considerably less popular than they once were. As "bottom-up" stock pickers, we relish this opportunity to comb less popular markets for quality companies trading at reasonable valuations.
* For further detail about these holdings, please refer to the section entitled "Portfolios of investments." Fund holdings are as of the date given, are subject to change at any time, and are not recommendations to buy or sell any security.
8
Emerging Markets Fund
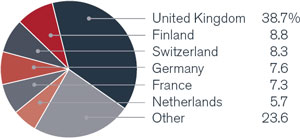
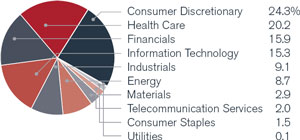
| Portfolio composition by country | Portfolio composition by sector |
| (as a % of long-term investments) | (as a % of long-term investments) |
| | |
| |
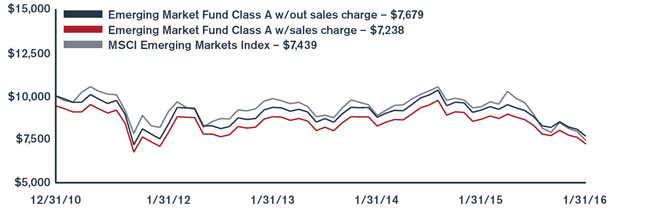
Investment comparison
Value of $10,000
| Total returns as of January 31, 2016 | | | | | | | | | | | | | | | Since |
| | | | NASDAQ | | Six | | One | | Three | | Five | | inception |
| At NAV | | | symbol | | months | | year | | years* | | years* | | (12/31/2010)* |
| Class A | | | HEMAX | | | -12.81 | % | | -16.41 | % | | -6.32 | % | | -4.82 | % | | -5.06 | % |
| Class C | | | HEMCX | | | -13.17 | | | -17.05 | | | -7.06 | | | -5.55 | | | -5.78 | |
| Class I | | | HEMIX | | | -12.70 | | | -16.20 | | | -6.12 | | | -4.61 | | | -4.84 | |
| Class R6** | | | HEMRX | | | -11.74 | | | -15.27 | | | -5.78 | | | -4.40 | | | -4.63 | |
| With sales charge | | | | | | | | | | | | | | | | | | | |
| Class A | | | | | | -17.78 | % | | -21.24 | % | | -8.16 | % | | -5.94 | % | | -6.16 | % |
| Class C | | | | | | -14.17 | | | -17.05 | | | -7.06 | | | -5.55 | | | -5.78 | |
| Index | | | | | | | | | | | | | | | | | | | |
| MSCI Emerging Markets Index | | | | | | -16.83 | % | | -20.62 | % | | -8.91 | % | | -5.23 | % | | -5.56 | % |
* Average annual return.
** Class R6 shares commenced operations on November 30, 2015. The performance for Class R6 shares for periods prior to November 30, 2015 is based on the performance of Class I shares. Performance for Class R6 shares would be similar because the shares are invested in the same portfolio of investments. Class R6 shares are not subject to a front-end sales charge or a distribution fee.
Performance data quoted represents past performance and is no guarantee of future results. Due to the Fund's relatively small asset base, performance may be impacted by portfolio turnover to a greater degree than it may be in the future. Performance results with sales charges reflect the deduction of the maximum front-end sales charge or the deduction of the applicable contingent deferred sales charge ("CDSC"). Class A shares are subject to a maximum front-end sales charge of 5.75%. Class C shares are subject to a CDSC of up to 1% on certain redemptions made within 12 months of purchase. Performance presented at Net Asset Value (NAV), which does not include a sales charge, would be lower if this charge were reflected. NAV is the value of one share of the Fund excluding any sales charges. Performance quoted is based on the transacted NAV at each period end, which may differ from the US Generally Accepted Accounting Principles ("GAAP")-adjusted NAV and the total return presented in the Financial Highlights. Current performance may be lower or higher than the performance data quoted. Investment return and principal value will fluctuate so that an investor's shares, when redeemed, may be worth more or less than original cost. As stated in the current prospectus, the Fund's annual operating expense ratios (gross) for Class A, C, I and R6 shares are 2.14%, 2.91%, 1.86% and 1.78% (estimated), respectively. However, the Fund's adviser has contractually agreed to waive its management fee and, if necessary, to reimburse other operating expenses (excluding Acquired Fund Fees and Expenses from underlying investment companies) in order to limit total annual ordinary operating expenses, less distribution and service fees, to 1.54% of the Fund's average daily net assets, which is in effect until July 31, 2020. For the most recent month-end performance, please call 1.866.443.6337 or visit the Funds' website at www.henderson.com.
Performance results also reflect expense subsidies and waivers in effect during periods shown. Absent these waivers, results would have been less favorable. All results assume the reinvestment of dividends and capital gains.
The investment comparison graph above reflects the change in value of a $10,000 hypothetical investment since the Fund's inception, including reinvested dividends and distributions, compared to a broad based securities market index. The MSCI Emerging Markets Index is a free float-adjusted market capitalization weighted index that is designed to measure the equity market performance of emerging markets. The Fund is professionally managed while the Index is unmanaged and not available for investment and does not include fees, expenses or other costs. Results in the table and graph do not reflect the deduction of taxes that a shareholder would pay on Fund distributions or the redemption of Fund shares.
9
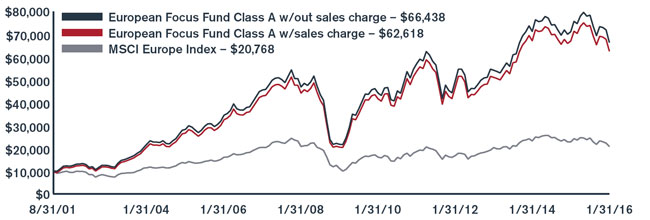
European Focus Fund
Market volatility which began in August dominated the third quarter of 2015, with European equities suffering in tandem with equities worldwide. Concerns over global implications of a slowing Chinese economy precipitated a global sell-off which extended to Europe. German equities, in particular, were hit quite hard due to their export relationship with China, while autos were a notable sufferer on an industry level due to the slowdown in the Chinese economy, as well as the Volkswagen emissions scandal.
Following the noted market volatility, there were growth expectation downgrades in Europe. The third quarter also saw a new bailout agreement between Greece and the European Union, and a snap election was called shortly afterwards with the incumbent Syriza party remaining as the largest party in the Greek parliament. European equities did produce a strong final quarter of the year with December recovering some steep losses incurred in the first half of the month. European Central Bank President Mario Draghi announced the extension of their quantitative easing program in December while also cutting the deposit rate to a historic low. This indicated to markets that the central bank is willing to take whatever policy action is necessary to support the burgeoning recovery. January proved to be a negative month for global risk assets, and European equity markets fell steeply as investors were gripped by nervousness. China fears, a further slump in oil, a broader slowdown in emerging markets and rising
| Top 10 long-term holdings* |
| (at January 31, 2016) |
| | | | As a percentage |
| Security | | | of net assets |
| Nokia Oyj | | | 8.6 | % |
| BG Group plc | | | 4.9 | |
| Teva Pharmaceutical Industries, Ltd., ADR | | | 4.0 | |
| Roche Holding AG | | | 3.9 | |
| AstraZeneca plc | | | 3.7 | |
| Poste Italiane SpA | | | 2.8 | |
| ASML Holding N.V. | | | 2.7 | |
| Barclays plc | | | 2.6 | |
| Dufry AG | | | 2.5 | |
| Renault S.A. | | | 2.5 | |
chatter of a US recession were some of the headlines that dominated January's trading.
For the six month period ended January 31, 2016, the Fund returned -15.17% (Class A at NAV) versus the Fund's benchmark, the MSCI Europe Index, which posted a return of -15.17%. Positive returns were driven from health care and IT exposure; Genmab, Alcatel-Lucent and Nokia were highlights. However, gains were negated by the overweight to consumer discretionary; Volkswagen, NH Hotel Group and Liberty Global were among the biggest drags. Barclays was the biggest detraction to overall Fund performance.
During the period the Fund took advantage of the adverse price movements in emerging markets-exposed companies, for example, British oil services provider Amec Foster Wheeler and asset manager Aberdeen Asset Management. AstraZeneca, the pharmaceuticals company, was also added as the Fund increased its health care exposure. Exposure to financials was increased towards the end of 2015 with the inclusion of Dutch bank ABN Amro after it was re-listed on the Amsterdam stock exchange.
The Fund initiated a hedge on the euro via a short forward currency contract in the third quarter in case of any adverse movements versus the US dollar; this was subsequently closed in January via an equal and offsetting long forward currency contract as we feel we have seen the best of a very strong US dollar.
We are facing a potentially more volatile period for equities globally but this will present more opportunities at the stock level. This is especially valid in equities that have sensitivity towards emerging markets. While economic expectations have been pared back for Europe, we remain confident in the European recovery and are constructive for 2016.
* For further detail about these holdings, please refer to the section entitled "Portfolios of investments." Fund holdings are as of the date given, are subject to change at any time, and are not recommendations to buy or sell any security.
10
European Focus Fund
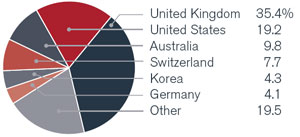
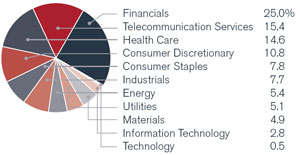
| Portfolio composition by country | Portfolio composition by sector |
| (as a % of long-term investments) | (as a % of long-term investments) |
| | |
| |
Investment comparison
Value of $10,000
| | | | | | | | | | | | | | | | | | | | | | | |
| Total returns as of January 31, 2016 | | | | | | | | | | | | | | | Since |
| | | | NASDAQ | | Six | | One | | Three | | Five | | Ten | | inception |
| At NAV | | | symbol | | months | | year | | years* | | years* | | years* | | (8/31/2001)* |
| Class A | | | HFEAX | | | -15.17 | % | | -6.54 | % | | 7.04 | % | | 3.11 | % | | 6.79 | % | | 14.03 | % |
| Class C | | | HFECX | | | -15.52 | | | -7.28 | | | 6.21 | | | 2.32 | | | 5.97 | | | 13.18 | |
| Class I** | | | HFEIX | | | -15.10 | | | -6.32 | | | 7.30 | | | 3.40 | | | 6.98 | | | 14.18 | |
| Class R6*** | | | HFERX | | | -15.08 | | | -6.30 | | | 7.31 | | | 3.40 | | | 6.98 | | | 14.18 | |
| With sales charge | | | | | | | | | | | | | | | | |
| Class A | | | | | | -20.05 | % | | -11.90 | % | | 4.95 | % | | 1.90 | % | | 6.16 | % | | 13.56 | % |
| Class C | | | | | | -16.52 | | | -7.28 | | | 6.21 | | | 2.32 | | | 5.97 | | | 13.18 | |
| Index | | | | | | | | | | | | | | | | | | | | | | |
| MSCI Europe Index | | | -15.17 | % | | -8.77 | % | | 0.79 | % | | 2.27 | % | | 2.61 | % | | 5.21 | % |
* Average annual return.
** Class I (formerly Class W) shares commenced operations on March 31, 2009. The performance for Class I shares for periods prior to March 31, 2009 is based on the performance of Class A shares. Performance for Class I shares would be similar because the shares are invested in the same portfolio of investments. Class I shares are not subject to a front-end sales charge or a distribution fee.
*** Class R6 shares commenced operations on November 30, 2015. The performance for Class R6 shares for periods prior to November 30, 2015 is based on the performance of Class I shares. Performance for Class R6 shares would be similar because the shares are invested in the same portfolio of investments. Class R6 shares are not subject to a front-end sales charge or a distribution fee.
Performance data quoted represents past performance and is no guarantee of future results. Performance results with sales charges reflect the deduction of the maximum front-end sales charge or the deduction of the applicable contingent deferred sales charge ("CDSC"). Class A shares are subject to a maximum front-end sales charge of 5.75%. Class C shares are subject to a CDSC of up to 1% on certain redemptions made within 12 months of purchase. Performance presented at Net Asset Value (NAV), which does not include a sales charge, would be lower if this charge were reflected. NAV is the value of one share of the Fund excluding any sales charges. Performance quoted is based on the transacted NAV at each period end, which may differ from the US Generally Accepted Accounting Principles ("GAAP")-adjusted NAV and the total return presented in the Financial Highlights. Current performance may be lower or higher than the performance data quoted. Investment return and principal value will fluctuate so that an investor's shares, when redeemed, may be worth more or less than original cost. As stated in the current prospectus, the Fund's annual operating expense ratios (gross) for Class A, C, I and R6 shares are 1.31%, 2.10%, 1.08% and 1.01% (estimated), respectively. As stated in the Statement of Additional Information (SAI), the Fund's adviser has contractually agreed to waive its management fee and, if necessary, to reimburse other operating expenses (excluding Acquired Fund Fees and Expenses from underlying investment companies) in order to limit total annual ordinary operating expenses, less distribution and service fees, to 1.75% of the Fund's average daily net assets, which is in effect until July 31, 2020. For the most recent month-end performance, please call 1.866.443.6337 or visit the Funds' website at www.henderson.com.
Performance results also reflect expense subsidies and waivers in effect during certain periods shown. Absent these waivers, results would have been less favorable for certain periods. All results assume the reinvestment of dividends and capital gains.
The investment comparison graph above reflects the change in value of a $10,000 hypothetical investment since the Fund's inception, including reinvested dividends and distributions, compared to a broad based securities market index. The MSCI Europe Index is a free float-adjusted market capitalization weighted index that is designed to measure the equity market performance of the developed markets in Europe. The Fund is professionally managed while the Index is unmanaged and not available for investment and does not include fees, expenses or other costs. Results in the table and graph do not reflect the deduction of taxes that a shareholder would pay on Fund distributions or the redemption of Fund shares.
11
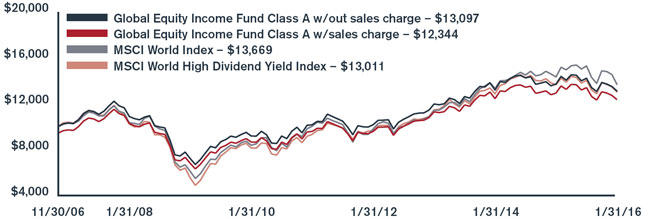
Global Equity Income Fund
The six months ended January 31, 2016 were a weak period for equity markets as resilient economic data from countries such as the US and UK were offset by concerns over the speed of global economic growth and the knock-on effects of a lower oil price. Investor concern was once again focused on China as disappointing economic data (such as manufacturing figures) reignited the debate about the speed at which their economy is slowing. The oil price was also making headline news as it fell to a low of $27/barrel, causing the energy sector to be among the worst performing sectors globally.
For the six month period ended January 31, 2016, the Fund returned -7.84% (Class A at NAV) versus the benchmark, MSCI World Index, which posted a return of -10.58%. The Fund continued to meet its objectives for earning and distributing income over the period. Positive relative performance was largely due to the Fund's defensive positioning in certain sectors. This was reflected at the stock level where the best performing stocks tended to be defensive, such as telecommunications companies Verizon and Orange as well as pharmaceutical company GlaxoSmithKline. One of the Fund's weakest performing sectors was in financials where stocks such as HSBC and Barclays performed poorly. As global growth expectations have declined, this has pushed out expectations of further interest rate
| Top 10 long-term holdings* |
| (at January 31, 2016) |
| | | | As a percentage |
| Security | | | of net assets |
| Novartis AG | | | 3.2 | % |
| Roche Holding AG | | | 2.9 | |
| HSBC Holdings plc | | | 2.8 | |
| British American Tobacco plc | | | 2.6 | |
| Royal Dutch Shell plc, A Shares | | | 2.3 | |
| BAE Systems plc | | | 2.2 | |
| Verizon Communications, Inc. | | | 2.2 | |
| GlaxoSmithKline plc | | | 2.1 | |
| BP plc | | | 2.1 | |
| DUET Group | | | 2.1 | |
increases in the US and an initial rate hike in countries such as the UK. If interest rates remain at current low levels this has an implication for banks' margin progression, and in turn, future earnings and dividend growth.
Investments continue to be focused on those companies capable of delivering earnings and free cash flow growth, subsequently leading to dividend growth. A good example of this would be the telecommunications sector where for several years these companies have been investing heavily in expanding fourth generation ('4G') coverage for customers, and this capital expenditure is beginning to roll over (boosting cash generation) at the same time data usage among customers is increasing.
Our work around dividends is showing that dividend growth is still reported in most markets around the world, but that growth should moderate this year compared to 2015. There is also a need to be quite selective with dividend investing in 2016 as there are, in our view, more dividends 'at risk' due to low commodity prices.
The Fund's strategy of seeking a high dividend yield naturally draws us to markets which are higher yielding, such as the UK and Europe. In Europe in particular, we are encouraged by the loose monetary conditions put in place by the European Central Bank and improving economic growth.
Looking to 2016, we expect global economic growth to continue at a moderate pace. In this environment, many companies are struggling to achieve the level of organic sales growth necessary to grow operating margins. For this reason we expect earnings growth in most areas to continue to be modest. Given this backdrop, the Fund is positioned defensively with a significant weighting in sectors such as telecommunications, utilities and pharmaceuticals.
* For further detail about these holdings, please refer to the section entitled "Portfolios of investments." Fund holdings are as of the date given, are subject to change at any time, and are not recommendations to buy or sell any security.
12
Global Equity Income Fund
| | |
| Portfolio composition by country | Portfolio composition by sector |
| (as a % of long-term investments) | (as a % of long-term investments) |
| | |
| |
Investment comparison
Value of $10,000
| | | | | | | | | | | | | | | | | | | | |
| Total returns as of January 31, 2016 | | | | | | | | | | | | Since |
| | | | NASDAQ | | Six | | One | | Three | | Five | | inception |
| At NAV | | | symbol | | months | | year | | years* | | years* | | (11/30/2006)* |
| Class A | | | HFQAX | | | -7.84 | % | | -4.44 | % | | 3.06 | % | | 5.22 | % | | 2.99 | % |
| Class C | | | HFQCX | | | -8.19 | | | -5.15 | | | 2.24 | | | 4.42 | | | 2.21 | |
| Class I** | | | HFQIX | | | -7.74 | | | -4.24 | | | 3.31 | | | 5.48 | | | 3.19 | |
| Class R6*** | | | HFQRX | | | -7.50 | | | -3.98 | | | 3.40 | | | 5.54 | | | 3.22 | |
| With sales charge | | | | | | | | | | | | | | | | | | | |
| Class A | | | | | | -13.15 | % | | -9.95 | % | | 1.05 | % | | 3.98 | % | | 2.32 | % |
| Class C | | | | | | -9.19 | | | -5.15 | | | 2.24 | | | 4.42 | | | 2.21 | |
| Index | | | | | | | | | | | | | | | | | | | |
| MSCI World Index | | | | | | -10.58 | % | | -4.55 | % | | 6.21 | % | | 6.39 | % | | 3.50 | % |
| MSCI World High Dividend Yield Index | | | | | | -7.22 | | | -4.62 | | | 4.33 | | | 6.91 | | | 2.93 | |
* Average annual return
** Class I (formerly Class W) shares commenced operations on March 31, 2009. The performance for Class I shares for periods prior to March 31, 2009 is based on the performance of Class A shares. Performance for Class I shares would be similar because the shares are invested in the same portfolio of investments. Class I shares are not subject to a front-end sales charge or a distribution fee.
*** Class R6 shares commenced operations on November 30, 2015. The performance for Class R6 shares for periods prior to November 30, 2015 is based on the performance of Class I shares. Performance for Class R6 shares would be similar because the shares are invested in the same portfolio of investments. Class R6 shares are not subject to a front-end sales charge or a distribution fee.
Performance data quoted represents past performance and is no guarantee of future results. Performance results with sales charges reflect the deduction of the maximum front-end sales charge or the deduction of the applicable contingent deferred sales charge ("CDSC"). Class A shares are subject to a maximum front-end sales charge of 5.75%. Class C shares are subject to a CDSC of up to 1% on certain redemptions made within 12 months of purchase. Performance presented at Net Asset Value (NAV), which does not include a sales charge, would be lower if this charge were reflected. NAV is the value of one share of the Fund excluding any sales charges. Performance quoted is based on the transacted NAV at each period end, which may differ from the US Generally Accepted Accounting Principles ("GAAP")-adjusted NAV and the total return presented in the Financial Highlights. Current performance may be lower or higher than the performance data quoted. Investment return and principal value will fluctuate so that an investor's shares, when redeemed, may be worth more or less than original cost. As stated in the current prospectus, the Fund's annual operating expense ratios (gross) for Class A, C, I and R6 shares are 1.19%, 1.96%, 0.96% and 0.89% (estimated), respectively. As stated in the Statement of Additional Information (SAI), the Fund's adviser has contractually agreed to waive its management fee and, if necessary, to reimburse other operating expenses (excluding Acquired Fund Fees and Expenses from underlying investment companies) in order to limit total annual ordinary operating expenses, less distribution and service fees, to 1.15% of the Fund's average daily net assets, which is in effect until July 31, 2020. For the most recent month-end performance, please call 1.866.443.6337 or visit the Funds' website at www.henderson.com.
Performance results also reflect expense subsidies and waivers in effect during certain periods shown. Absent these waivers during those periods, results would have been less favorable. All results assume the reinvestment of dividends and capital gains.
The investment comparison graph above reflects the change in value of a $10,000 hypothetical investment since the Fund's inception, including reinvested dividends and distributions, compared to a broad based securities market index. The MSCI World Index is a free float-adjusted market capitalization weighted index that is designed to measure the equity market performance of developed markets. The MSCI World High Dividend Yield Index aims to objectively reflect the high dividend yield opportunity set within the MSCI World Index. The Fund is professionally managed while the Indices are unmanaged and not available for investment and do not include fees, expenses or other costs. Results in the table and graph do not reflect the deduction of taxes that a shareholder would pay on Fund distributions or the redemption of Fund shares.
13
Global Technology Fund
It was a volatile period for the technology market which underperformed during the third quarter of 2015 as international equity sell-offs, which began in China, spread globally. The final quarter of the year saw international equity markets bounce back. Central banks dominated the news flow as the European Central Bank extended its quantitative easing program and the US Federal Reserve Bank hiked interest rates for the first time this cycle. Technology outperformed the broader market against this backdrop. The start of 2016 has seen heightened volatility and January was a negative month for global risk assets due to ongoing fears over China, a further slump in oil and a broader emerging markets slowdown. The volatility and fears of a macro slowdown led the technology index lower; however, over the period the MSCI World IT index outperformed the broader market.
For the six month period ended January 31, 2016, the Fund returned -7.38% (Class A at NAV) versus the benchmark, MSCI AC World IT Index, which posted a return of -5.22%. Stock specifics within semiconductors and semiconductor equipment sectors were the biggest detractor to performance, with NXP Semiconductors and SK Hynix among the biggest drags. The underweight in software was also detrimental. In particular, the Fund underperformed over the period as a result of not holding Microsoft, though a position has been taken in the company
Top 10 long-term holdings*
(at January 31, 2016) |
| | | | As a percentage |
| Security | | | of net assets |
| Facebook, Inc., Class A | | | 6.9 | % |
| Alphabet, Inc., Class C | | | 6.2 | |
| Apple, Inc. | | | 6.0 | |
| Alphabet, Inc., Class A | | | 4.8 | |
| Visa, Inc., A Shares | | | 4.0 | |
| Samsung Electronics Co., Ltd. | | | 3.7 | |
| Cisco Systems, Inc. | | | 3.3 | |
| Tencent Holdings, Ltd. | | | 3.1 | |
| Avago Technologies, Ltd. | | | 2.8 | |
| MasterCard, Inc., Class A | | | 2.8 | |
subsequent to period end. The main positive contributors came from within the exposure to internet software & services, and technology hardware storage & peripherals sectors. SanDisk, Alphabet and NetEase were leading positions.
Notable activity over the period included the sale of Oracle and switch into Adobe. We believe the former will face challenges against more nascent software offerings. Adobe is positioned well in its creative product offering and the transition to a subscription model makes it relatively attractive. We increased our holding in Facebook given its dominant position in internet advertising. A new position was initiated in Paypal post the pullback, given the company's exposure to the faster growth areas of our paperless payments theme, its strong platform and reasonable valuation. We sold Netflix as we believed that valuation had gotten excessive following a strong run. We reduced more macro-sensitive names such as Cisco, HP Enterprise and Ciena. We have been actively reducing our higher beta positions, increasing our cash position and trying to position the portfolio more defensively.
While further rounds of global quantitative easing are occurring, the uncertain economic environment continues to curtail capital spending, including technology expenditure. In addition, the strengthening dollar is proving an increasing headwind for US technology companies. However, longer term, we believe the technology sector is attractive as it continues to take share in the economy and valuations remain reasonable relative to the rest of the market, especially given its balance sheet strength.
* For further detail about these holdings, please refer to the section entitled "Portfolios of investments." Fund holdings are as of the date given, are subject to change at any time, and are not recommendations to buy or sell any security.
14
Global Technology Fund
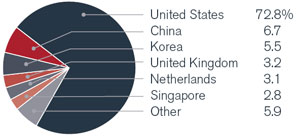
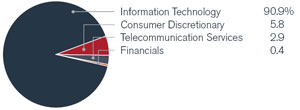
| Portfolio composition by country | Portfolio composition by sector |
| (as a % of long-term investments) | (as a % of long-term investments) |
| | |
| |
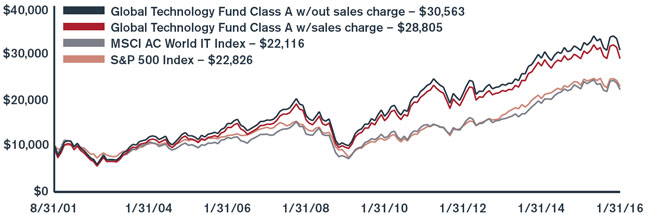
Investment comparison
Value of $10,000
| Total returns as of January 31, 2016 | | | | | | | | | | | | Since |
| | | | NASDAQ | | Six | | One | | Three | | Five | | Ten | | inception |
| At NAV | | | symbol | | months | | year | | years* | | years* | | years* | | (8/31/2001)* |
| Class A | | | HFGAX | | | -7.38 | % | | 0.33 | % | | 9.64 | % | | 6.59 | % | | 7.54 | % | | 8.06 | % |
| Class C | | | HFGCX | | | -7.78 | | | -0.53 | | | 8.78 | | | 5.76 | | | 6.72 | | | 7.25 | |
| Class I** | | | HFGIX | | | -7.28 | | | 0.49 | | | 9.89 | | | 6.86 | | | 7.73 | | | 8.19 | |
| Class R6*** | | | HFGRX | | | -7.03 | | | 0.75 | | | 9.99 | | | 6.92 | | | 7.76 | | | 8.21 | |
| With sales charge | | | | | | | | | | | | | | | | |
| Class A | | | | | | -12.69 | % | | -5.43 | % | | 7.49 | % | | 5.34 | % | | 6.91 | % | | 7.61 | % |
| Class C | | | | | | -8.78 | | | -0.53 | | | 8.78 | | | 5.76 | | | 6.72 | | | 7.25 | |
| Index | | | | | | | | | | | | | | | | | | | | | | |
| MSCI AC World IT Index | | | -5.22 | % | | -0.40 | % | | 12.08 | % | | 8.97 | % | | 6.53 | % | | 5.69 | % |
| S&P 500 | | | | | | -6.77 | | | -0.67 | | | 11.30 | | | 10.91 | | | 6.48 | | | 5.92 | |
* Average annual return.
** Class I (formerly Class W) shares commenced operations on March 31, 2009. The performance for Class I shares for the periods prior to March 31, 2009 is based on the performance of Class A shares. Performance for Class I shares would be similar because the shares are invested in the same portfolio of investments. Class I shares are not subject to a front-end sales charge or a distribution fee.
*** Class R6 shares commenced operations on November 30, 2015. The performance for Class R6 shares for periods prior to November 30, 2015 is based on the performance of Class I shares. Performance for Class R6 shares would be similar because the shares are invested in the same portfolio of investments. Class R6 shares are not subject to a front-end sales charge or a distribution fee.
Performance data quoted represents past performance and is no guarantee of future results. Performance results with sales charges reflect the deduction of the maximum front-end sales charge or the deduction of the applicable contingent deferred sales charge ("CDSC"). Class A shares are subject to a maximum front-end sales charge of 5.75%. Class C shares are subject to a CDSC of up to 1% on certain redemptions made within 12 months of purchase. Performance presented at Net Asset Value (NAV), which does not include a sales charge, would be lower if this charge were reflected. NAV is the value of one share of the Fund excluding any sales charges. Performance quoted is based on the transacted NAV at each period end, which may differ from the US Generally Accepted Accounting Principles ("GAAP")-adjusted NAV and the total return presented in the Financial Highlights. Current performance may be lower or higher than the performance data quoted. Investment return and principal value will fluctuate so that an investor's shares, when redeemed, may be worth more or less than original cost. As stated in the current prospectus, the Fund's annual operating expense ratios (gross) for Class A, C, I and R6 shares are 1.35%, 2.13%, 1.12% and 1.04% (estimated), respectively. As stated in the Statement of Additional Information (SAI), the Fund's adviser has contractually agreed to waive its management fee and, if necessary, to reimburse other operating expenses (excluding Acquired Fund Fees and Expenses from underlying investment companies) in order to limit total annual ordinary operating expenses, less distribution and service fees, to 1.75% of the Fund's average daily net assets, which is in effect until July 31, 2020. For the most recent month-end performance, please call 1.866.443.6337 or visit the Funds' website at www.henderson.com.
Performance results also reflect expense subsidies and waivers in effect during certain periods shown. Absent these waivers, results would have been less favorable for certain periods. All results assume the reinvestment of dividends and capital gains.
The investment comparison graph above reflects the change in value of a $10,000 hypothetical investment since the Fund's inception, including reinvested dividends and distributions, compared to a broad based securities market index and an industry focused index. The MSCI AC World IT Index is a free float adjusted market capitalization weighted index designed to measure the equity market performance of the Information Technology stocks within the MSCI AC World Index. The S&P 500 Index is a broad based measurement of changes in stock market conditions based on the average of 500 widely held common stocks. The Fund is professionally managed while the Indices are unmanaged and not available for investment and do not include fees, expenses or other costs. Results in the table and graph do not reflect the deduction of taxes that a shareholder would pay on Fund distributions or the redemption of Fund shares.
15
High Yield Opportunities Fund
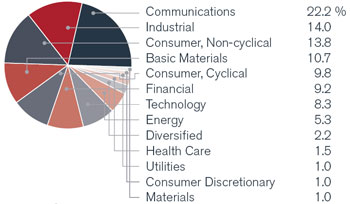
The US high yield market suffered steep declines over the period driven by unclear US Federal Reserve Bank expectations, languishing commodity prices, persistent retail outflows and emerging market growth concerns. For most of the period, higher quality rated bonds (double-B) outperformed lower quality rated bonds (triple-C) while both energy and metals/mining were the worst performing sectors. The energy sector now represents over 24% of the emerging market high yield market as compared to 10% for US high yield and only 6% for European high yield. By region, European high yield outperformed both US high yield and emerging market high yield.
Throughout 2015, retail fund flows were negative (-$13.4 billion) and new issuance was 18% below last year's rate. Over the same period, approximately 73% of all defaults and distressed debt exchanges ($48 billion) occurred in the energy and metals and mining (mostly coal) sectors; excluding these sectors, the trailing 12-month default rate was only 0.34%.
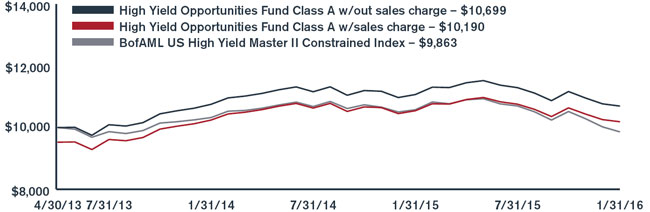
For the six month period ended January 31, 2016, the Fund returned -5.29% (Class A at NAV) versus the benchmark, BofAML US High Yield Master II Constrained Index, which returned -7.84%. Over the period, the Fund benefitted from maintaining a higher quality bias within the lower rating tiers. While an underweight allocation to double-B rated bonds was maintained, the Fund outperformed on strong
Top 10 long-term holdings*
(at January 31, 2016) |
| | | | As a percentage |
| Security/Issuer | | | of net assets |
| ILFC E-Capital Trust II | | | 2.9 | % |
| Post Holdings, Inc. | | | 2.1 | |
| Argos Merger Sub, Inc. | | | 2.0 | |
| Orbital ATK, Inc. | | | 1.9 | |
| Plastipak Holdings, Inc. | | | 1.9 | |
| RCN Telecom Services LLC | | | 1.9 | |
| CCO Holdings LLC | | | 1.8 | |
| First Data Corp. 2015 Term Loan | | | 1.8 | |
| Group 1 Automotive, Inc. | | | 1.8 | |
| MacDermid, Inc. | | | 1.7 | |
credit selection, an allocation to loans and an underweight stance in the energy sector. Though the Fund incurred some losses in the energy sector, it benefitted from a higher quality bias in this space. The Fund's best sector and contributors were in defensive industries like healthcare and media, while the worst detractors were almost exclusively in the energy and mining segments.
The portfolio is currently positioned firmly below the benchmark in terms of credit risk as measured by yield and spread, and in-line with weighted average credit ratings. Within the energy sector, we remain underweight versus the benchmark and have focused on higher quality exploration and product companies as well as midstream companies. We continue to remain underweight in the energy service sector. We remain cautious on the metals mining and steel sectors (on both an allocation and a credit quality basis).
We continue to view default risk in excess of consensus expectations (2-3%) and highly dependent on what happens in the energy space. We believe that $40/barrel oil for sustained periods will be troublesome for the default outlook in US high yield. We continue to be selective in the new issue calendar as we are witnessing declining credit quality in this market as measured by higher leverage, less robust covenants and smaller equity contributions in leveraged buyout deals. We are not seeing much value in the US leveraged loan market at the moment and have pared back our exposure from the 8% peak level that we reached in the first quarter of 2015 to 4% currently. We are monitoring opportunities in the investment grade rated commodity sector as well as the energy pipeline sector.
* For further detail about these holdings, please refer to the section entitled "Portfolios of investments." Fund holdings are as of the date given, are subject to change at any time, and are not recommendations to buy or sell any security.
16
High Yield Opportunities Fund
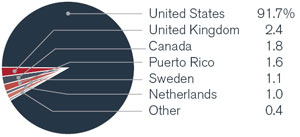
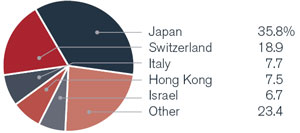
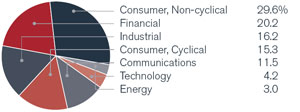
| Portfolio composition by country | Portfolio composition by sector |
| (as a % of long-term investments) | (as a % of long-term investments) |
| | |
| |
Investment comparison
Value of $10,000
| | | | | | | | | | | | | | |
| Total returns as of January 31, 2016 | | | | | | | | | | | | Since |
| | | | NASDAQ | | Six | | One | | inception |
| At NAV | | | symbol | | months | | year | | (4/30/2013)* |
| Class A | | | HYOAX | | | -5.29 | % | | -3.38 | % | | 2.48 | % |
| Class C | | | HYOCX | | | -5.60 | | | -4.18 | | | 1.71 | |
| Class I | | | HYOIX | | | -5.16 | | | -3.16 | | | 2.74 | |
| Class R6** | | | HYORX | | | -5.26 | | | -3.27 | | | 2.70 | |
| With sales charge | | | | | | | | | | | | | |
| Class A | | | | | | -9.76 | % | | -8.01 | % | | 0.68 | % |
| Class C | | | | | | -6.60 | | | -4.18 | | | 1.71 | |
| Index | | | | | | | | | | | | | |
| BofAML US High Yield Master II Constrained Index | | | | | | -7.84 | % | | -6.76 | % | | -0.43 | % |
* Average annual return.
** Class R6 shares commenced operations on November 30, 2015. The performance for Class R6 shares for periods prior to November 30, 2015 is based on the performance of Class I shares. Performance for Class R6 shares would be similar because the shares are invested in the same portfolio of investments. Class R6 shares are not subject to a front-end sales charge or a distribution fee.
Performance data quoted represents past performance and is no guarantee of future results. Due to the Fund's relatively small asset base, performance may be impacted by portfolio turnover to a greater degree than it may be in the future. Performance results with sales charges reflect the deduction of the maximum front-end sales charge or the deduction of the applicable contingent deferred sales charge ("CDSC"). Class A shares are subject to a maximum front-end sales charge of 4.75%. Class C shares are subject to a CDSC of up to 1% on certain redemptions made within 12 months of purchase. Performance presented at Net Asset Value (NAV), which does not include a sales charge, would be lower if this charge were reflected. NAV is the value of one share of the Fund excluding any sales charges. Performance quoted is based on the transacted NAV at each period end, which may differ from the US Generally Accepted Accounting Principles ("GAAP")-adjusted NAV and the total return presented in the Financial Highlights. Current performance may be lower or higher than the performance data quoted. Investment return and principal value will fluctuate so that an investor's shares, when redeemed, may be worth more or less than original cost. As stated in the current prospectus, the Fund's annual operating expense ratios (gross) for Class A, C, I and R6 shares are 1.39%, 2.01%, 1.16% and 1.16% (estimated), respectively. However, the Fund's adviser has contractually agreed to waive its management fee and, if necessary, to reimburse other operating expenses (excluding Acquired Fund Fees and Expenses from underlying investment companies) in order to limit total annual ordinary operating expenses, less distribution and service fees, to 0.85% of the Fund's average daily net assets, which is in effect until July 31, 2020. For the most recent month-end performance, please call 1.866.443.6337 or visit the Funds' website at www.henderson.com.
Performance results also reflect expense subsidies and waivers in effect during periods shown. Absent these waivers, results would have been less favorable. All results assume the reinvestment of dividends and capital gains.
The investment comparison graph above reflects the change in value of a $10,000 hypothetical investment since the Fund's inception, including reinvested dividends and distributions, compared to a broad based securities market index. The Bank of America Merrill Lynch U.S. High Yield Master II Constrained Index tracks the performance of below investment grade U.S. dollar-denominated corporate bonds publicly issued in the U.S. domestic market. The Fund is professionally managed while the Index is unmanaged and not available for investment and does not include fees, expenses or other costs. Results in the table and graph do not reflect the deduction of taxes that a shareholder would pay on Fund distributions or the redemption of Fund shares.
17
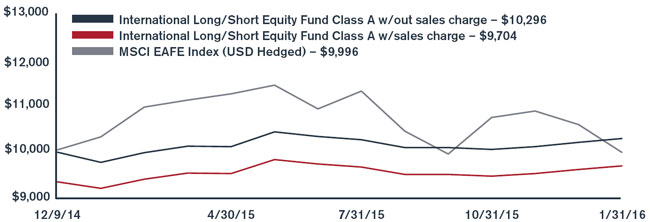
International Long/Short Equity Fund
The third quarter of 2015 saw international equity markets fall as concerns over slowing Chinese economic growth and the surprise decision to allow the yuan to move outside the fixed band against the dollar sounded the starting gun for a global sell-off. Asian markets reacted negatively to Chinese events, not welcoming the prospect of a more export-competitive China or the prospect of weakening demand from a huge market for consumption of many countries in the region's exports. European markets were weak and markets in Japan also declined as enthusiasm for Abenomics and quantitative easing waned after failing to jolt the economy back to life. International equity markets bounced back in the final quarter; central banks dominated the news flow as the European Central Bank extended its quantitative easing program while the US Federal Reserve Bank hiked interest rates for the first time this cycle. Japanese markets produced the best returns on the back of their gross domestic product growth revision from a recessionary number to an expansionary one. Asian markets were also positive following some well received policy action from China, including a rate cut. The start of 2016 saw a sharp sell-off with China once again the main area of concern where authorities intervened with trading halts and liquidity injections which further weakened the Chinese currency. A further slump in oil drove other commodity prices
Top 5 "Long" Holdings (including equity swaps)*
(at January 31, 2016) |
| | | | As a percentage |
| Security | | | of net assets |
| BG Group plc | | | 4.1 | % |
| Nokia Oyj | | | 3.6 | |
| Roche Holding AG | | | 3.5 | |
| Dufry AG | | | 3.3 | |
| Poste Italiane SpA | | | 3.3 | |
Top 5 "Short" Holdings (including equity swaps)*
(at January 31, 2016) |
| | | | As a percentage |
| Security | | | of net assets |
| Neste Oyj | | | (3.4 | )% |
| ICA Gruppen AB | | | (3.0 | ) |
| Kuehne & Nagel International AG | | | (2.9 | ) |
| SSE Plc | | | (2.8 | ) |
| Airbus Group NV | | | (2.7 | ) |
lower. Both developed and emerging equity markets were caught up in the sell-off as investors grew increasingly concerned about the path of global economic growth. The strengthening US dollar compounded this decline for local investors.
For the six month period ending January 31, 2016, the Fund returned 0.25% (Class A at NAV) versus the benchmark, MSCI EAFE Index (USD Hedged), which posted a return of -11.71%. Performance was driven by the short books of each of the geographic strategies, with the Europe and UK strategies having particularly strong periods. On a stock level, short positions in Fenner and Avanti Communications from the UK strategy and Woodford Patient Capital Trust and CHN Industrial from the Europe strategy were among the principal contributors. Key contributors from the Asia and Japan short books were Prada and Sumitomo Chemical. Leading contributors on the long book were Paysafe Group, Inmarsat, Asahi Kasei Corporation and Samsung from the UK, Europe, Japan and Asia strategies, respectively.
Notable activity over the period included the addition of long positions in pharmaceuticals companies AstraZeneca, from the Europe strategy, and Quantum Pharmaceuticals, from the UK strategy. Other positions initiated included insurer T&D Holdings, as the Japan strategy switched out of Tokio Marine, and oil company Inpex. The fourth quarter of 2015 saw the UK strategy exit short positions in Genus and Qinetiq while the Europe strategy closed out its short position in Thomas Cook. The Asia strategy closed out a short position in Prada and exited its long position in Dongfeng Motor Group. Telecommunications firm NTT Docomo was added to the Japan strategy long book.
There is likely to be more volatility given the Chinese economic slowdown; however, we remain broadly positive on the outlook for equities. Various European tailwinds and the political momentum behind the Japanese recovery are positive signs, and the backdrop of low inflation, low growth and low interest rates means equities offer attractive return opportunities. The heightened volatility means that stock selection remains key; however, there remain many investment opportunities from a "bottom-up" perspective.
* For further detail about these holdings, please refer to the section entitled "Portfolios of investments." Fund holdings are as of the date given, are subject to change at any time, and are not recommendations to buy or sell any security.
18
International Long/Short Equity Fund
| Portfolio composition by country | Portfolio composition by sector |
| (as a % of long-term investments) | (as a % of long-term investments) |
| | |
| |
Investment comparison
Value of $10,000
| | | | | | | | | | | | | | |
| Total returns as of January 31, 2016 | | | | | | | | | | | | Since |
| | | | NASDAQ | | Six | | One | | inception |
| At NAV | | | symbol | | months | | year | | (12/9/2014)* |
| Class A | | | HLNAX | | | 0.25 | % | | 5.28 | % | | 2.57 | % |
| Class C | | | HLNCX | | | -0.15 | | | 4.45 | | | 1.78 | |
| Class I | | | HLNIX | | | 0.47 | | | 5.61 | | | 2.85 | |
| Class R6** | | | HLNRX | | | 0.59 | | | 5.73 | | | 2.96 | |
| With sales charge | | | | | | | | | | | | | |
| Class A | | | | | | -5.54 | % | | -0.81 | % | | -2.58 | % |
| Class C | | | | | | -1.15 | | | 4.45 | | | 1.78 | |
| Index | | | | | | | | | | | | | |
| MSCI EAFE Index (USD Hedged) | | | | | | -11.71 | % | | -3.26 | % | | -0.67 | % |
* Average annual return.
** Class R6 shares commenced operations on November 30, 2015. The performance for Class R6 shares for periods prior to November 30, 2015 is based on the performance of Class I shares. Performance for Class R6 shares would be similar because the shares are invested in the same portfolio of investments. Class R6 shares are not subject to a front-end sales charge or a distribution fee.
Performance data quoted represents past performance and is no guarantee of future results. Due to the Fund's relatively small asset base, performance may be impacted by portfolio turnover to a greater degree than it may be in the future. Performance results with sales charges reflect the deduction of the maximum front-end sales charge or the deduction of the applicable contingent deferred sales charge ("CDSC"). Class A shares are subject to a maximum front-end sales charge of 5.75%. Class C shares are subject to a CDSC of up to 1% on certain redemptions made within 12 months of purchase. Performance presented at Net Asset Value (NAV), which does not include a sales charge, would be lower if this charge were reflected. NAV is the value of one share of the Fund excluding any sales charges. Performance quoted is based on the transacted NAV at each period end, which may differ from the US Generally Accepted Accounting Principles ("GAAP")-adjusted NAV and the total return presented in the Financial Highlights. Current performance may be lower or higher than the performance data quoted. Investment return and principal value will fluctuate so that an investor's shares, when redeemed, may be worth more or less than original cost. As stated in the current prospectus, the Fund's annual operating expense ratios (gross) for Class A, C, I and R6 shares excluding dividends and interest expenses on securities sold short are 7.97%, 8.71%, 7.68% and 7.67% (estimated), respectively. However, the Fund's adviser has agreed to contractually waive its management fee and, if necessary, reimburse other operating expenses (excluding Acquired Fund Fees and Expenses from underlying investment companies and dividends and interest expense on securities sold short) in order to limit total annual ordinary operating expenses, less distribution and service fees, to 1.50% of the Fund's average daily net assets, which is in effect until July 31, 2020. For the most recent month-end performance, please call 1.866.443.6337 or visit the Funds' website at www.henderson.com.
Performance results also reflect expense subsidies and waivers in effect during periods shown. Absent these waivers, results would have been less favorable. All results assume the reinvestment of dividends and capital gains.
The investment comparison graph above reflects the change in value of a $10,000 hypothetical investment since the Fund's inception, including reinvested dividends and distributions, compared to a broad based securities market index. The MSCI EAFE Index (USD Hedged) is a free float-adjusted market capitalization weighted index that is designed to measure the equity market performance of developed markets, excluding the US and Canada and excluding the effect of currency translations. The Fund may invest in emerging markets while the Index only consists of companies in developed markets. The Fund is professionally managed while the Index is unmanaged and not available for investment and does not include fees, expenses or other costs. Results in the table and graph do not reflect the deduction of taxes that a shareholder would pay on Fund distributions or the redemption of Fund shares.
19
International Opportunities Fund
Global equity market volatility was high throughout the period. During the third quarter of 2015, the heightened volatility, which began in China, spread globally. After the surprise devaluation of the yuan by the Chinese central bank and fears over slowing economic growth in China, Asia Pacific markets and emerging markets tumbled. European markets followed suit, particularly in Germany. International equity markets rebounded during the final quarter; central banks dominated the news flow as the European Central Bank extended its easing program while the US Federal Reserve Bank increased interest rates for the first time this cycle. Japanese markets produced the best returns over the quarter on the back of their gross domestic product growth revision from a recessionary number to an expansionary one. Asian markets were also positive following some well received policy action from China, including a rate cut. The period also saw a period of general US dollar strength and, in China, the removal of the reference rate by the People's Bank of China continued to see the currency fall. The start of 2016 saw a sharp sell-off with China once again the main area of concern where authorities intervened with trading halts and liquidity injections, further weakening the Chinese currency. A further slump in oil and other commodity prices raised fears of deflation. Both developed and emerging equity markets were caught up in the sell-off as investors grew increasingly concerned about the path of global economic growth. A strengthening US dollar compounded this decline for local investors.
Top 10 long-term holdings*
(at January 31, 2016) |
| | | | As a percentage |
| Security | | | of net assets |
| Nokia Oyj | | | 4.17 | % |
| BG Group plc | | | 3.08 | |
| Amadeus IT Holding S.A., A Shares | | | 2.80 | |
| Sodexo | | | 2.74 | |
| AstraZeneca plc | | | 2.74 | |
| Essilor International S.A. | | | 2.71 | |
| Standard Life plc | | | 2.64 | |
| Roche Holding AG | | | 2.62 | |
| Renault S. A. | | | 2.54 | |
| Deutsche Post AG | | | 2.53 | |
The Fund's sub-portfolio structure was altered during the period. In August, the Latin America sub-portfolio broadened to become an Emerging Markets sub-portfolio in order to strengthen the investment potential of the Fund.
For the six month period ending January 31, 2016, the Fund returned -12.10% (Class A at NAV) versus the Fund's benchmark, the MSCI EAFE Index, which posted a return of -14.50%. Only two of the sub-portfolios outperformed their respective indices over the period. The Europe 1 and Global Growth subportfolios outperformed with highlights being Ahold, Nokia, Alcatel-Lucent, Cognizant and Cardinal Health. Fund allocation was positive over the period. Allocation to the Europe 2 subportfolio was initially increased by 1.5%, funded with a transfer of 0.5% from Global Growth to lock in profits after a strong run and 1% from Asia Pacific in view of heightened regional uncertainty. The stance of the portfolio was shifted in January, with 1% taken from Europe 2 in favor of Global Growth and Emerging Markets which were both increased by 0.5%. During the period, the Fund placed a partial hedge on the euro via a short forward currency contract to protect against any adverse moves against the US dollar. This position was subsequently closed in January via an equal and offsetting long forward currency contract as we believe we have seen the best of a very strong dollar. A hedge position remains on the Japanese yen as a form of insurance against further depreciative moves from the Bank of Japan.
Despite a number of political and macroeconomic challenges, we remain broadly positive on the outlook for equities. We believe, in this low inflation, low growth and low interest rate environment, equities are offering attractive return opportunities. Various European tailwinds and the political momentum behind the Japanese recovery are further positive signs. There may be more volatility to come given the Chinese economic slowdown, currency moves and potential interest rate rises, although this will present us with further opportunities as stock selectors.
* For further detail about these holdings, please refer to the section entitled "Portfolios of investments." Fund holdings are as of the date given, are subject to change at any time, and are not recommendations to buy or sell any security.
20
International Opportunities Fund
| Portfolio composition by country | Portfolio composition by sector |
| (as a % of long-term investments) | (as a % of long-term investments) |
| | |
| |
Investment comparison
Value of $10,000
| Total returns as of January 31, 2016 | | | | | | | | | | | | Since |
| | | | NASDAQ | | Six | | One | | Three | | Five | | Ten | | inception |
| At NAV | | | symbol | | months | | year | | years* | | years* | | years* | | (8/31/2001)* |
| Class A | | | HFOAX | | | -12.10 | % | | -6.55 | % | | 4.92 | % | | 3.65 | % | | 3.81 | % | | 8.49 | % |
| Class C | | | HFOCX | | | -12.47 | | | -7.27 | | | 4.11 | | | 2.84 | | | 3.02 | | | 7.68 | |
| Class R** | | | HFORX | | | -12.23 | | | -6.80 | | | 4.61 | | | 3.32 | | | 3.53 | | | 8.20 | |
| Class I*** | | | HFOIX | | | -11.98 | | | -6.28 | | | 5.21 | | | 3.94 | | | 4.01 | | | 8.63 | |
| Class R6**** | | | HFOSX | | | -11.91 | | | -6.20 | | | 5.24 | | | 3.96 | | | 4.02 | | | 8.64 | |
| With sales charge | | | | | | | | | | | | | | | | | | | |
| Class A | | | | | | -17.15 | % | | -11.92 | % | | 2.86 | % | | 2.42 | % | | 3.20 | % | | 8.05 | % |
| Class C | | | | | | -13.47 | | | -7.27 | | | 4.11 | | | 2.84 | | | 3.02 | | | 7.68 | |
| Index | | | | | | | | | | | | | | | | | | | | | | |
| MSCI EAFE Index | | | -14.50 | % | | -8.04 | % | | 1.11 | % | | 2.04 | % | | 2.12 | % | | 5.04 | % |
* Average annual return.
** Class R shares commenced operations on September 30, 2005. The performance for Class R shares for periods prior to September 30, 2005 is based on the performance of Class A shares, adjusted for the higher expenses applicable to R shares. Performance for Class R shares would be similar because the shares are invested in the same portfolio of investments. Class R shares are not subject to a front-end sales charge but are subject to a distribution fee of 0.50%.
*** Class I (formerly Class W) shares commenced operations on March 31, 2009. The performance for Class I shares for periods prior to March 31, 2009 is based on the performance of Class A shares. Performance for Class I shares would be similar because the shares are invested in the same portfolio of investments. Class I shares are not subject to a front-end sales charge or a distribution fee.
**** Class R6 shares commenced operations on November 30, 2015. The performance for Class R6 shares for periods prior to November 30, 2015 is based on the performance of Class I shares. Performance for Class R6 shares would be similar because the shares are invested in the same portfolio of investments. Class R6 shares are not subject to a front-end sales charge or a distribution fee.
Performance data quoted represents past performance and is no guarantee of future results. Performance results with sales charges reflect the deduction of the maximum front-end sales charge or the deduction of the applicable contingent deferred sales charge ("CDSC"). Class A shares are subject to a maximum front-end sales charge of 5.75%. Class C shares are subject to a CDSC of up to 1% on certain redemptions made within 12 months of purchase. Class R shares have no front-end sales charge or CDSC. Performance presented at Net Asset Value (NAV), which does not include a sales charge, would be lower if this charge were reflected. NAV is the value of one share of the Fund excluding any sales charges. Performance quoted is based on the transacted NAV at each period end, which may differ from the US Generally Accepted Accounting Principles ("GAAP")-adjusted NAV and the total return presented in the Financial Highlights. Current performance may be lower or higher than the performance data quoted. Investment return and principal value will fluctuate so that an investor's shares, when redeemed, may be worth more or less than original cost. As stated in the current prospectus, the Fund's annual operating expense ratios (gross) for Class A, C, R, I and R6 shares are 1.37%, 2.14%, 1.64%, 1.11% and 1.03% (estimated), respectively. As stated in the Statement of Additional Information (SAI), the Fund's adviser has contractually agreed to waive its management fee and, if necessary, to reimburse other operating expenses (excluding Acquired Fund Fees and Expenses from underlying investment companies) in order to limit total annual ordinary operating expenses, less distribution and service fees, to 1.75% of the Fund's average daily net assets, which is in effect until July 31, 2020. For the most recent month-end performance, please call 1.866.443.6337 or visit the Funds' website at www.henderson.com.
Performance results also reflect expense subsidies and waivers in effect during certain periods shown. Absent these waivers, results would have been less favorable for certain periods. All results assume the reinvestment of dividends and capital gains.
The investment comparison graph above reflects the change in value of a $10,000 hypothetical investment since the Fund's inception, including reinvested dividends and distributions, compared to a broad based securities market index. The MSCI EAFE Index is a free float-adjusted market capitalization weighted index that is designed to measure the equity market performance of developed markets, excluding the US and Canada. The Fund may invest in emerging markets while the Index only consists of companies in developed markets. The Fund is professionally managed while the Index is unmanaged and not available for investment and does not include fees, expenses or other costs. Results in the table and graph do not reflect the deduction of taxes that a shareholder would pay on Fund distributions or the redemption of Fund shares.
21
International Select Equity Fund
The period was characterized by rising market volatility and sharp market corrections. The crunch point arrived in mid-August, when the People's Bank of China unexpectedly devalued the yuan, leading to heightened concerns about growth in the world's second largest economy. This dovetailed with the US Federal Reserve Bank keeping interest rates at record lows, which triggered a global market sell-off that erased most of the year's gain. October saw a partial reversal of this move as commodity and oil stocks rallied. October's sharp recovery, however, was dampened in November by continued concern over global economic growth, a lackluster third quarter earnings season and increased geopolitical risk. However, US economic data stabilized from its third quarter weakness and the Federal Reserve delivered a 0.25% rise in interest rates in December. Though equity markets rose leading into the announcement, they quickly retreated, unsure of the impact that a tightening US interest rate environment might have on the rest of the global economy. Further, concerns continued in light of the deflationary impact of the weak oil price and uncertain credit and emerging markets. Investor uncertainty came to a head in January as 2016 got off to what can only be described as a horrendous start, with equity markets selling off sharply in what was one of the worst starts to a calendar year on record.
| Top 10 long-term holdings* |
| (at January 31, 2016) |
| | As a percentage |
| Security | of net assets |
| Japan Tobacco, Inc. | 3.4 | % |
| Orange S.A. | 3.4 | |
| Cognizant Technology Solutions Corp., | | |
| Class A | 3.4 | |
| Nokia Oyj | 3.3 | |
| Total S.A. | 3.2 | |
| ASML Holding N.V. | 3.2 | |
| Vodafone Group plc | 3.2 | |
| WPP plc | 3.1 | |
| Tsuruha Holdings, Inc. | 3.1 | |
| ITV plc | 3.1 | |
For the six month period ended January 31, 2016, the Fund returned -12.79% (Class A at NAV) versus the benchmark, MSCI EAFE Index, which posted a return of -14.50%. Positions in technology, materials and energy contributed positively to excess relative return, as did the Fund's high cash position in these volatile and downward trending markets. This offset weakness in healthcare positions and the underweight towards the defensive, but in our view, expensive consumer staples sector. Within technology, positions in telecommunications equipment manufacturer Alcatel-Lucent benefitted from the takeover by Nokia, as did positive earnings from outsourcer Cognizant and semi-conductor chip manufacturer ASML. The position in French mobile operator Orange was the strongest performer after reporting better than expected results. Financials holdings were most impacted by the market uncertainty; UniCredit (Italy), Lloyds (UK) and SMFG (Japan) were the weakest stocks. This was somewhat offset by the Fund's underweight towards the financials sector.
At the end of the year, our outlook noted a cautious view on equity markets looking into 2016. Unfortunately, such caution appears warranted. The repercussions of a slowing Chinese economy and weakening industrial spending stemming from the low oil price are being felt worldwide. This is exacerbated by tightening credit conditions in the US and concerns that policy makers are running out of tools should the stimulus they have pumped into the global economy fail to spur growth.
There is a silver lining emerging to this cloudy environment, however, as two of the underlying causes of the current malaise, high oil prices and cheap credit, are beginning to reverse. Credit is beginning to be repriced in the US and there are signs that oil capacity might be taken off of the market in 2016/2017, with the first whiff of default and restructuring in the US shale landscape. We see this as a painful but positive long-term development. Therefore, despite some repricing of risk, we remain cautious on the near-term outlook for equities but are not outright bearish. Our focus in the year ahead will be, as ever, on identifying "bottom-up" stock specific mispricings because of change that can appreciate in value regardless of market gyrations.
* For further detail about these holdings, please refer to the section entitled "Portfolios of investments." Fund holdings are as of the date given, are subject to change at any time, and are not recommendations to buy or sell any security.
22
International Select Equity Fund
| Portfolio composition by country | Portfolio composition by sector |
| (as a % of long-term investments) | (as a % of long-term investments) |
| | |
| |
Investment comparison
Value of $10,000
| Total returns as of January 31, 2016 | | | | | | | | | | | | Since |
| | | | NASDAQ | | Six | | One | | inception |
| At NAV | | | symbol | | months | | year | | (9/30/2014)* |
| Class A | | | HSQAX | | | -12.79 | % | | -2.66 | % | | -4.57 | % |
| Class C | | | HSQCX | | | -13.13 | | | -3.48 | | | -5.31 | |
| Class I | | | HSQIX | | | -12.76 | | | -2.55 | | | -4.41 | |
| Class R6** | | | HSQRX | | | -12.53 | | | -2.30 | | | -4.23 | |
| With sales charge | | | | | | | | | | | | | |
| Class A | | | | | | -17.82 | % | | -8.27 | % | | -8.69 | % |
| Class C | | | | | | -14.13 | | | -3.48 | | | -5.31 | |
| Index | | | | | | | | | | | | | |
| MSCI EAFE Index | | | | | | -14.50 | % | | -8.04 | % | | -8.30 | % |
* Average annual return.
** Class R6 shares commenced operations on November 30, 2015. The performance for Class R6 shares for periods prior to November 30, 2015 is based on the performance of Class I shares. Performance for Class R6 shares would be similar because the shares are invested in the same portfolio of investments. Class R6 shares are not subject to a front-end sales charge or a distribution fee.
Performance data quoted represents past performance and is no guarantee of future results. Due to the Fund's relatively small asset base, performance may be impacted by portfolio turnover to a greater degree than it may be in the future. Performance results with sales charges reflect the deduction of the maximum front-end sales charge or the deduction of the applicable contingent deferred sales charge ("CDSC"). Class A shares are subject to a maximum front-end sales charge of 5.75%. Class C shares are subject to a CDSC of up to 1% on certain redemptions made within 12 months of purchase. Performance presented at Net Asset Value (NAV), which does not include a sales charge, would be lower if this charge were reflected. NAV is the value of one share of the Fund excluding any sales charges. Performance quoted is based on the transacted NAV at each period end, which may differ from the US Generally Accepted Accounting Principles ("GAAP")-adjusted NAV and the total return presented in the Financial Highlights. Current performance may be lower or higher than the performance data quoted. Investment return and principal value will fluctuate so that an investor's shares, when redeemed, may be worth more or less than original cost. As stated in the current prospectus, the Fund's annual operating expense ratios (gross) for Class A, C, I and R6 shares are 4.16%, 5.09%, 3.98% and 3.98% (estimated), respectively. However, the Fund's adviser has contractually agreed to waive its management fee and, if necessary, to reimburse other operating expenses (excluding Acquired Fund Fees and Expenses from underlying investment companies) in order to limit total annual ordinary operating expenses, less distribution and service fees, to 0.89% of the Fund's average daily net assets, which is in effect until July 31, 2020. For the most recent month-end performance, please call 1.866.443.6337 or visit the Funds' website at www.henderson.com.
Performance results also reflect expense subsidies and waivers in effect during periods shown. Absent these waivers, results would have been less favorable. All results assume the reinvestment of dividends and capital gains.
The investment comparison graph above reflects the change in value of a $10,000 hypothetical investment since the Fund's inception, including reinvested dividends and distributions, compared to a broad based securities market index. The MSCI EAFE Index is a free float-adjusted market capitalization weighted index that is designed to measure the equity market performance of developed markets, excluding the US and Canada. The Fund may invest in emerging markets while the Index only consists of companies in developed markets. The Fund is professionally managed while the Index is unmanaged and not available for investment and does not include fees, expenses or other costs. Results in the table and graph do not reflect the deduction of taxes that a shareholder would pay on Fund distributions or the redemption of Fund shares.
23
Strategic Income Fund
The backdrop for government bond markets remained constructive over the period driven by the twin forces of low global growth and inflation. The market shrugged off the first rate rise from the US Federal Reserve Bank in December, with long-dated government bond yields in the US falling following the announcement, reflecting wider concerns with the global economy which has become increasingly focused on China. Meanwhile in Europe, central bankers experimented with unconventional policy in the form of evermore negative interest rates. Corporate bond markets, by contrast, faced a much more hostile environment as the bear market trend of rising spread levels, which began in the US in June 2014, continued at an accelerated pace and began to spread to parts of the European corporate bond market.
For the six month period ended January 31, 2016, the Fund returned -0.25% (Class A at NAV) versus the benchmark, 3-month LIBOR (USD), which posted a return of 0.14%. Fund returns reflected the divergent performance of government and corporate bond markets. Positive returns were generated by holdings in government bonds and high quality investment grade bonds in defensive industries (e.g. tobacco and telecommunications). Holdings in loans and derivative positions also positively contributed in a very modest way to performance. The subordinated banking bonds generated positive returns for the Fund, despite poor performance in January as a result of general market turbulence. High yield
| | | | | |
Top 10 long-term holdings*
(at January 31, 2016) |
| | | | As a percentage |
| Security/Issuer | | | of net assets |
| United Kingdom Gilt | | | 11.4 | % |
| United States Treasury Note | | | 6.5 | |
| Bundesrepublik Deutschland | | | 4.3 | |
| Deutsche Telekom International | | | | |
| Finance B.V. | | | 2.3 | |
| Barclays Bank plc | | | 2.2 | |
| Lloyds Banking Group plc | | | 1.6 | |
| Philip Morris International, Inc. | | | 1.6 | |
| Orange S.A. | | | 1.6 | |
| BAT International Finance plc | | | 1.3 | |
| Imperial Tobacco Finance plc | | | 1.3 | |
corporate bonds contributed close to zero return over the period while investment grade financial bonds (a small allocation to longer dated insurance bonds) were the negative contributor to the Fund.
A number of macroeconomic trends continue to drive the construction of the Fund. The global backdrop remains one of low growth and low inflation with the recent pronounced slowdown across emerging markets only exacerbating these trends. This has made for a generally more defensive portfolio than we have historically run (e.g. an elevated cash balance and higher sovereign bond holdings). As a result, we remain constructive on core developed market government bond markets and view the recent rate hike from the Federal Reserve as a policy misstep given the substantial tightening in financial conditions that had already occurred in the US in the run up to this move. Our approach to corporate bonds in this environment is to focus on income return and to exercise caution in terms of the companies we lend money to, e.g. avoidance of commodity exposure entirely. We retain our holdings in legacy European banking bonds, which, although cyclical, are being phased out as Tier 1 capital under new regulations.
We have become incrementally more concerned about credit risk as time has gone on. This is evidenced by a significant pickup in distressed bonds in the US high yield market across a range of sectors, in contrast to the European market where the distressed ratio has been much more stable. In addition, the widening in US investment grade credit spreads is primarily a result of excessive supply of bonds being issued to fund mergers & acquisitions and share buybacks, which in itself is a reliable late cycle indicator, albeit again mainly an issue for the US market and not Europe. The result is attractive valuation opportunities emerging for the first time in a number of years for corporate bond investors but we will be patient about taking advantage of these opportunities given the underlying fundamental concerns in the global economy. To the extent we have been buying corporate bonds in the last six months it has been in the more defensive areas of the investment grade market reflecting this overriding caution.
* For further detail about these holdings, please refer to the section entitled "Portfolios of investments." Fund holdings are as of the date given, are subject to change at any time, and are not recommendations to buy or sell any security.
24
Strategic Income Fund
| Portfolio composition by country | Portfolio composition by sector |
| (as a % of long-term investments) | (as a % of long-term investments) |
| | |
| |
Investment comparison
Value of $10,000
| | | | | | | | | | | | | | | | | | | | | | | |
| Total returns as of January 31, 2016 | | | | | | | | | | | | | | | Since |
| | | | NASDAQ | | Six | | One | | Three | | Five | | Ten | | inception |
| At NAV | | | symbol | | months | | year | | years* | | years* | | years* | | (9/30/2003)* |
| Class A | | | HFAAX | | | -0.25 | % | | -0.06 | % | | 3.83 | % | | 4.70 | % | | 3.85 | % | | 5.10 | % |
| Class C | | | HFACX | | | -0.64 | | | -0.93 | | | 3.03 | | | 3.88 | | | 3.02 | | | 4.28 | |
| Class I** | | | HFAIX | | | -0.17 | | | 0.04 | | | 4.06 | | | 4.91 | | | 3.96 | | | 5.18 | |
| Class R6*** | | | HFARX | | | -0.16 | | | 0.05 | | | 4.07 | | | 4.91 | | | 3.96 | | | 5.18 | |
| With sales charge | | | | | | | | | | | | | | | | | | | | | | |
| Class A | | | | | | -4.96 | % | | -4.80 | % | | 2.17 | % | | 3.69 | % | | 3.35 | % | | 4.68 | % |
| Class C | | | | | | -1.64 | | | -0.93 | | | 3.03 | | | 3.88 | | | 3.02 | | | 4.28 | |
| Index | | | | | | | | | | | | | | | | | | | | | | |
| Barclays Global Agg Credit | | | | | | | | | | | | | | | | | | | |
| USD Hedged | | | | | | 0.23 | % | | -1.69 | % | | 2.75 | % | | 4.52 | % | | 4.71 | % | | 4.62 | % |
| 3-month LIBOR (USD) | | | 0.14 | | | 0.26 | | | 0.26 | | | 0.31 | | | 1.69 | | | 1.78 | |
* Average annual return.
** Class I shares commenced operations on April 29, 2011. The performance for Class I shares for periods prior to April 29, 2011 is based on the performance of Class A shares. Performance for Class I shares would be similar because the shares are invested in the same portfolio of investments. Class I shares are not subject to a front-end sales charge or a distribution fee.
*** Class R6 shares commenced operations on November 30, 2015. The performance for Class R6 shares for periods prior to November 30, 2015 is based on the performance of Class I shares. Performance for Class R6 shares would be similar because the shares are invested in the same portfolio of investments. Class R6 shares are not subject to a front-end sales charge or a distribution fee.
Performance data quoted represents past performance and is no guarantee of future results. Performance results with sales charges reflect the deduction of the maximum front-end sales charge or the deduction of the applicable contingent deferred sales charge ("CDSC"). Class A shares are subject to a maximum front-end sales charge of 4.75%. Class C shares are subject to a CDSC of up to 1% on certain redemptions made within 12 months of purchase. Performance presented at Net Asset Value (NAV), which does not include a sales charge, would be lower if this charge were reflected. NAV is the value of one share of the Fund excluding any sales charges. Performance quoted is based on the transacted NAV at each period end, which may differ from the US Generally Accepted Accounting Principles ("GAAP")-adjusted NAV and the total return presented in the Financial Highlights. Current performance may be lower or higher than the performance data quoted. Investment return and principal value will fluctuate so that an investor's shares, when redeemed, may be worth more or less than original cost. As stated in the current prospectus, the Fund's annual operating expense ratios (gross) for Class A, C, I and R6 shares are 1.17%, 1.94%, 0.94% and 0.86% (estimated), respectively. However, the Fund's adviser has contractually agreed to waive its management fee and, if necessary, to reimburse other operating expenses (excluding Acquired Fund Fees and Expenses from underlying investment companies) in order to limit total annual ordinary operating expenses, less distribution and service fees, to 0.85% of the Fund's average daily net assets, which will remain in effect until July 31, 2020. For the most recent month-end performance, please call 1.866.443.6337 or visit the Funds' website at www.henderson.com.
Performance results also reflect expense subsidies and waivers in effect during the periods shown. Absent these waivers, results would have been less favorable. All results assume the reinvestment of dividends and capital gains.
The investment comparison graph above reflects the change in value of a $10,000 hypothetical investment since the Fund's inception, including reinvested dividends and distributions, compared to a broad based securities market index. The Barclays Capital Global Aggregate Credit (USD) Hedged Index is a broad-based measure of the global investment-grade and high yield fixed-rate markets. 3-Month LIBOR (London Interbank Offered Rate) (USD) is the interest rate participating banks offer to other banks for loans on the London market. The Fund is professionally managed while the Indices are unmanaged and not available for investment and do not include fees, expenses or other costs. Results in the table and graphs do not reflect the deduction of taxes that a shareholder would pay on Fund distributions or the redemption of Fund shares.
25
Unconstrained Bond Fund
Over the period, concerns about global growth intensified and investor appetite for riskier asset classes waned. The economic effects of the slowdown in China and collapse in commodity prices were compounded by fears of a potential recession in the US and further tightening of financial conditions. Central bank policy continued to move in opposite directions with the US Federal Reserve Bank (Fed) raising interest rates by 0.25%, the first increase in a decade, while the European Central Bank (ECB) and Bank of Japan cut rates further into negative territory in an effort to boost inflation. European bond and credit markets outperformed their US counterparts, particularly in high yield. Emerging bond markets also struggled as slowing growth and falling commodity prices/disinflation continued to pressure their exchange rates. As a result, hard currency debt generally outperformed local currency bonds. US Treasuries and other developed market government bonds were amongst the best performers as demand for 'safe haven' assets grew and market expectations for rate hikes were pared back.
For the six month period ended January 31, 2016, the Fund returned -1.55% (Class A at NAV) versus the benchmark, 3-month LIBOR USD, which posted a return of 0.14%. The Fund's negative return over the period was led by holdings in corporate bonds and active interest rates strategies.
Performance of the Fund's high yield holdings were considerably better than the broader market due to the
| Top 10 long-term holdings* |
| (at January 31, 2016) |
| | | | As a percentage |
| Security/Issuer | | | of net assets |
| Italy Buoni Poliennali Del Tesoro | | | 6.7 | % |
| United States Treasury Inflation | | | | |
| Indexed Bonds | | | 6.2 | |
| Japan Treasury Discount Bill | | | 4.2 | |
| Spain Government Bond | | | 3.1 | |
| Paragon Mortgages plc | | | 2.0 | |
| Mexican Bonos | | | 1.8 | |
| New Zealand Government Bond | | | 1.7 | |
| Eurosail 2006-1 plc | | | 1.3 | |
| Barclays Dryrock Issuance Trust | | | 1.0 | |
| Discover Card Execution Note Trust | | | 1.0 | |
Fund's high weight to Europe, defensive positioning in emerging markets and active hedging of US high yield exposure through a position in the high yield credit derivative index.
Within investment grade, while total returns on the asset class were broadly flat over the period, the interest rate hedges held against investment grade corporate bonds detracted from Fund returns as corporate bond returns significantly lagged government equivalents. Towards the end of the period, we increased exposure to the subordinated bonds of European insurers; an area that suffered disproportionately in the recent sell off.
The allocation to Italian inflation-linked government bonds made a positive contribution as expectations grew of further supportive monetary policy action by the ECB. At the end of January, exposure to US 10-year Treasury inflation protected securities was also added. Long maturity inflation-linked securities are pricing an outcome that sits broadly in line with Fed estimates of long-term real interest rates, in contrast to fixed rate US Treasuries where today's yields are well below their estimates for long-term nominal rates. We believe this allocation should provide some offset to the Fund's credit holdings during periods of market weakness.
The Fund's interest rates strategy seeking to benefit from higher inflation expectations in the US, as well as the Fund's tactical positioning for higher government bond yields, were a drag on performance. This was offset in part by positive returns from currency strategies expecting the euro to outperform the British pound and the Australian dollar to outperform the New Zealand dollar. The Fund remains positioned for steeper yield curves but risk in the directional views outlined above has been reduced.
Economic data has been weaker of late in the US and Europe, but appears to be at odds with the sharp reaction of financial markets. We are cognizant that this period of market weakness could be self-reinforcing and feed through negatively to the real economy, but credit markets are already pricing in a significant slowdown. As a result, we are selectively adding exposure to credit opportunities and have increased the rates duration (interest rate sensitivity) of the Fund.
* For further detail about these holdings, please refer to the section entitled "Portfolios of investments." Fund holdings are as of the date given, are subject to change at any time, and are not recommendations to buy or sell any security.
26
Unconstrained Bond Fund
| Portfolio composition by country | Portfolio composition by sector |
| (as a % of long-term investments) | (as a % of long-term investments) |
| | |
| |
Investment comparison
Value of $10,000
| | | | | | | | | | | | | | |
| Total returns as of January 31, 2016 | | | | | | | | | | | | Since |
| | | | NASDAQ | | Six | | One | | inception |
| At NAV | | | symbol | | months | | year | | (12/20/2013)* |
| Class A | | | HUNAX | | | -1.55 | % | | -0.43 | % | | -0.03 | % |
| Class C | | | HUNCX | | | -1.89 | | | -1.23 | | | -0.78 | |
| Class I | | | HUNIX | | | -1.43 | | | -0.29 | | | 0.18 | |
| Class R6** | | | HUNRX | | | -1.43 | | | -0.29 | | | 0.18 | |
| With sales charge | | | | | | | | | | | | | |
| Class A | | | | | | -6.19 | % | | -5.15 | % | | -2.30 | % |
| Class C | | | | | | -2.89 | | | -1.23 | | | -0.78 | |
| Index | | | | | | | | | | | | | |
| 3-month LIBOR (USD) | | | | | | 0.14 | % | | 0.26 | % | | 0.25 | % |
| Barclays Multiverse Index | | | | | | 0.18 | | | -2.38 | | | -1.02 | |
* Average annual return
** Class R6 shares commenced operations on November 30, 2015. The performance for Class R6 shares for periods prior to November 30, 2015 is based on the performance of Class I shares. Performance for Class R6 shares would be similar because the shares are invested in the same portfolio of investments. Class R6 shares are not subject to a front-end sales charge or a distribution fee.
Performance data quoted represents past performance and is no guarantee of future results. Performance results with sales charges reflect the deduction of the maximum front-end sales charge or the deduction of the applicable contingent deferred sales charge ("CDSC"). Class A shares are subject to a maximum front-end sales charge of 4.75%. Class C shares are subject to a CDSC of up to 1% on certain redemptions made within 12 months of purchase. Performance presented at Net Asset Value (NAV), which does not include a sales charge, would be lower if this charge were reflected. NAV is the value of one share of the Fund excluding any sales charges. Performance quoted is based on the transacted NAV at each period end, which may differ from the US Generally Accepted Accounting Principles ("GAAP")-adjusted NAV and the total return presented in the Financial Highlights. Current performance may be lower or higher than the performance data quoted. Investment return and principal value will fluctuate so that an investor's shares, when redeemed, may be worth more or less than original cost. As stated in the current prospectus, the Fund's annual operating expense ratios (gross) for Class A, C, I and R6 shares are 2.05%, 2.80%, 1.79% and 1.79% (estimated), respectively. However, the Fund's adviser has contractually agreed to waive its management fee and, if necessary, to reimburse other operating expenses (excluding Acquired Fund Fees and Expenses from underlying investment companies) in order to limit total annual ordinary operating expenses, less distribution and service fees, to 0.90% of the Fund's average daily net assets, which is in effect until July 31, 2020. For the most recent month-end performance, please call 1.866.443.6337 or visit the Funds' website at www.henderson.com.
Performance results also reflect expense subsidies and waivers in effect during periods shown. Absent these waivers, results would have been less favorable. All results assume the reinvestment of dividends and capital gains.
The investment comparison graph above reflects the change in value of a $10,000 hypothetical investment since the Fund's inception, including reinvested dividends and distributions, compared to a broad based securities market index. The Barclays Multiverse Index is a broad-based measure of the global fixed-income bond market. The index captures investment grade and high yield securities in all eligible currencies. 3-Month LIBOR (London Interbank Offered Rate) (USD) is the interest rate participating banks offer to other banks for loans on the London market. The Fund is professionally managed while the Indices are unmanaged and not available for investment and do not include fees, expenses or other costs. Results in the table and graph do not reflect the deduction of taxes that a shareholder would pay on Fund distributions or the redemption of Fund shares.
27
US Growth Opportunities Fund
Over the period, US equity markets were weak as investors shifted out of equities into lower risk assets. Concerns over global equity markets grew as energy continued to deteriorate, with oil dipping below $30 per barrel and a lower than expected fourth quarter Gross Domestic Product number was announced. Leading the move down were small cap equities which fell -16.4% (as measured by the Russell 2000 Index) led by the downfall in health care and energy stocks.
The increase in fear and risk aversion led many equity investors to seek higher quality companies (rated B+ or higher by S&P) and allocate capital away from lower quality companies (rated B or lower). High quality companies typically exhibit fiscal prudence, stable earnings and organic growth. These characteristics of sustainable growth and fiscal conservatism demonstrated by high quality companies form the foundation for the Fund's investment philosophy. Over the period, high quality companies were rewarded with strong outperformance verses lower quality companies.
For the six month period ending January 31, 2016, the Fund returned -8.67% (Class A at NAV) versus the benchmark, Russell 3000 Growth Index, which posted a return of -8.17%. The underperformance was the result of an overweight to small and mid cap stocks as well as specific stock selection.
Stock selection in health care companies such as Cantel Medical and Hendry Schein were the greatest
Top 10 long-term holdings*
(at January 31, 2016) |
| | | | As a percentage |
| Security | | | of net assets |
| Fiserv, Inc. | | | 4.3 | % |
| Starbucks Corp. | | | 4.1 | |
| The TJX Companies, Inc. | | | 3.6 | |
| Adobe Systems, Inc. | | | 3.6 | |
| Costco Wholesale Corp. | | | 3.5 | |
| The JM Smucker Co. | | | 3.4 | |
| Cantel Medical Corp. | | | 3.4 | |
| Walgreens Boots Alliance, Inc. | | | 3.4 | |
| Tractor Supply Co. | | | 3.4 | |
| Cognizant Technology Solutions Corp, | | | | |
| Class A | | | 3.2 | |
contributors to performance. Cantel Medical delivered record sales and earnings primarily driven by further investments in new product development, sales and marketing programs, and the integration of recent acquisitions. Hendry Schien beat fourth quarter earnings estimates with the highest quarterly growth rate in eight years. The firm has continued its strategy of organic growth complemented by the aforementioned strategic acquisitions. The largest detractors over the period came from producer durables companies Middleby, Westinghouse Air Brake and Genesee & Wyoming. The under-performance in Middleby was in line with other machinery companies as investors question customers' appetite for large purchases given the perceived economic uncertainty. Underperformance in Genesee & Wyoming and Westinghouse Air Brake was related to the general slowdown in transportation names as a result of falling commodity prices.
The increase in global volatility and uncertainty has cast a dark shadow over the beginning of the year and investors have retreated into traditional safe havens. Looking out over the next few months, the chances of the Federal Reserve increasing interest rates diminished significantly and economic data has investors questioning if we are entering a US recession. While there are significant pockets of concern in the industrial and energy sectors, we believe the plunge in commodity prices is good for the US consumer. The question now is how this malaise in energy markets and a stronger US dollar will impact corporate spending and behaviors as signs of economic turmoil can become self-fulfilling. In any case, we expect the increase in volatility to continue for the duration of 2016 and we believe these types of markets are typically very good for active managers; many investors have historically paid closer attention to fundamentals and have rewarded higher quality companies based on fears of the unknown. We believe the Fund's team-based philosophy of finding high quality companies with conservative balance sheets and experienced management teams should ultimately be rewarded in such an environment.
* For further detail about these holdings, please refer to the section entitled "Portfolios of investments." Fund holdings are as of the date given, are subject to change at any time, and are not recommendations to buy or sell any security.
28
US Growth Opportunities Fund
| Portfolio composition by country | Portfolio composition by sector |
| (as a % of long-term investments) | (as a % of long-term investments) |
| | |
| |
Investment comparison
Value of $10,000
| | | | | | | | | | | | | | |
| Total returns as of January 31, 2016 | | | | | | | | | | | | Since |
| | | | NASDAQ | | Six | | One | | inception |
| At NAV | | | symbol | | months | | year | | (12/18/2014) * |
| Class A | | | HGRAX | | | -8.67 | % | | 3.34 | % | | 1.96 | % |
| Class C | | | HGRCX | | | -9.07 | | | 2.53 | | | 1.16 | |
| Class I | | | HGRIX | | | -8.56 | | | 3.64 | | | 2.22 | |
| Class R6** | | | HGRRX | | | -7.99 | | | 4.29 | | | 2.80 | |
| With sales charge | | | | | | | | | | | | | |
| Class A | | | | | | -13.90 | % | | -2.57 | % | | -3.28 | % |
| Class C | | | | | | -10.07 | | | 2.53 | | | 1.16 | |
| Index | | | | | | | | | | | | | |
| Russell 3000 Growth Index | | | | | | -8.17 | % | | 0.41 | % | | -1.10 | % |
* Average annual return
** Class R6 shares commenced operations on November 30, 2015. The performance for Class R6 shares for periods prior to November 30, 2015 is based on the performance of Class I shares. Performance for Class R6 shares would be similar because the shares are invested in the same portfolio of investments. Class R6 shares are not subject to a front-end sales charge or a distribution fee.
Performance data quoted represents past performance and is no guarantee of future results. Due to the Fund's relatively small asset base, performance may be impacted by portfolio turnover to a greater degree than it may be in the future. Performance results with sales charges reflect the deduction of the maximum front-end sales charge or the deduction of the applicable contingent deferred sales charge ("CDSC"). Class A shares are subject to a maximum front-end sales charge of 5.75%. Class C shares are subject to a CDSC of up to 1% on certain redemptions made within 12 months of purchase. Performance presented at Net Asset Value (NAV), which does not include a sales charge, would be lower if this charge were reflected. NAV is the value of one share of the Fund excluding any sales charges. Performance quoted is based on the transacted NAV at each period end, which may differ from the US Generally Accepted Accounting Principles ("GAAP")-adjusted NAV and the total return presented in the Financial Highlights. Current performance may be lower or higher than the performance data quoted. Investment return and principal value will fluctuate so that an investor's shares, when redeemed, may be worth more or less than original cost. As stated in the current prospectus, the Fund's annual operating expense ratios (gross) for Class A, C, I and R6 shares are 3.22%, 4.65%, 3.40% and 3.40% (estimated), respectively. However, the Fund's adviser has contractually agreed to waive its management fee and, if necessary, to reimburse other operating expenses (excluding Acquired Fund Fees and Expenses from underlying investment companies) in order to limit total annual ordinary operating expenses, less distribution and service fees, to 0.95% of the Fund's average daily net assets, which is in effect until July 31, 2020. For the most recent month-end performance, please call 1.866.443.6337 or visit the Funds' website at www.henderson.com.
Performance results also reflect expense subsidies and waivers in effect during periods shown. Absent these waivers, results would have been less favorable. All results assume the reinvestment of dividends and capital gains.
The investment comparison graph above reflects the change in value of a $10,000 hypothetical investment since the Fund's inception, including reinvested dividends and distributions, compared to a broad based securities market index. The Russell 3000 Growth Index comprises companies that display signs of above average growth. The Index is used to provide a gauge of the performance of growth stocks in the US. The Fund is professionally managed while the Index is unmanaged and not available for investment and does not include fees, expenses or other costs. Results in the table and graph do not reflect the deduction of taxes that a shareholder would pay on Fund distributions or the redemption of Fund shares.
29
| Portfolio of investments (unaudited) |
All Asset Fund
January 31, 2016
| | | | | Value | |
| Shares | | | | (note 2) | |
| | | | | | |
| Investment companies – 58.50% | | | |
| | | | | | |
| | | Alternatives – 5.67% | | | |
| 186,847 | | ASG Global Alternatives Fund | $ | 1,935,730 | |
| 115,162 | | Sprott Physical Gold Trust * | | 1,053,732 | |
| | | | | 2,989,462 | |
| | | Equity – 28.52% | | | |
| 128,478 | | Calamos Market Neutral | | | |
| | | Income Fund | | 1,593,131 | |
| 56,497 | | Gateway Fund | | 1,626,536 | |
| 32,947 | | Graphite Enterprise Trust plc | | 255,857 | |
| 21,471 | | HarbourVest Global Private | | | |
| | | Equity Ltd * | | 266,474 | |
| 207,354 | | Henderson Global Equity | | | |
| | | Income Fund (a) | | 1,468,069 | |
| 27,477 | | Henderson Global | | | |
| | | Technology Fund (a) * | | 603,674 | |
| 16,354 | | iShares High Dividend ETF | | 1,201,856 | |
| 39,144 | | iShares MSCI EAFE Minimum | | | |
| | | Volatility Index Fund | | 2,485,644 | |
| 34,902 | | iShares MSCI Emerging Markets | | | |
| | | Index Fund | | 1,067,303 | |
| 22,118 | | iShares MSCI Emerging Markets | | | |
| | | Minimum Volatility ETF | | 1,039,546 | |
| 15,600 | | iShares Russell 1000 Value ETF | | 1,445,964 | |
| 26,373 | | NB Private Equity Partners Ltd | | 268,345 | |
| 15,000 | | Pantheon International plc * | | 265,031 | |
| 114,838 | | PowerShares International | | | |
| | | Dividend Achievers Portfolio | | 1,456,146 | |
| | | | | 15,043,576 | |
| | | Fixed income – 24.31% | | | |
| 118,043 | | Henderson High Yield | | | |
| | | Opportunities Fund (a) | | 1,050,580 | |
| 136,052 | | Henderson Strategic Income | | | |
| | | Fund (a) | | 1,213,586 | |
| 257,145 | | Henderson Unconstrained Bond | | | |
| | | Fund (a) | | 2,304,015 | |
| 13,709 | | iShares Global High Yield Corporate | | | |
| | | Bond Fund | | 602,511 | |
| 10,757 | | iShares iBoxx $ High Yield Corporate | | | |
| | | Bond Fund | | 852,815 | |
| 18,118 | | iShares iBoxx Investment Grade | | | |
| | | Corporate Bond Fund | | 2,068,170 | |
| 20,641 | | iShares TIPS Bond ETF | | 2,299,407 | |
| 9,217 | | PIMCO Enhanced Short | | | |
| | | Maturity ETF | | 928,244 | |
| 67,780 | | PowerShares Senior Loan | | | |
| | | Portfolio | | 1,503,360 | |
| | | | | 12,822,688 | |
| | | Total investment companies | | | |
| | | (Cost $32,290,355) | | 30,855,726 | |
| | | | | Value | |
| Shares | | | | (note 2) | |
| | | | | | |
| Partnerships – 5.35% | | | | | |
| 5,167 | | TIAA-CREF Asset Management | | | |
| | | Core Property Fund LP (b) (c) | $ | 2,822,709 | |
| | | Total partnerships | | | |
| | | (Cost $2,554,353) | | 2,822,709 | |
| | | | | | |
| Short-term investment – 33.99% | | | |
| 17,927,660 | | Fidelity Institutional Treasury | | | |
| | | Portfolio (d) | | 17,927,660 | |
| | | Total short-term investment | | | |
| | | (Cost $17,927,660) | | 17,927,660 | |
| Total investments – 97.84% | | | |
| | | (Cost $52,772,368) | | 51,606,095 | |
| Financial Derivative Instruments(e) | | | |
(Cost or Premiums, net $0) – (0.96)% | | (505,794 | ) |
| Net other assets and liabilities – 3.12% | | 1,642,997 | |
| Total net assets – 100.00% | $ | 52,743,298 | |
| * | | Non-income producing security |
| (a) | | Affiliated holding, see notes to portfolio of investments for further information. |
| (b) | | The security has been deemed illiquid by the Adviser according to the policies and procedures adopted by the Board of Trustees. |
| (c) | | Fair valued at January 31, 2016 as determined in good faith using procedures approved by the Board of Trustees. |
| (d) | | This short-term investment has been segregated for open futures contracts and forward foreign currency contracts at January 31, 2016. |
| (e) | | Information with respect to financial derivative instruments is disclosed in the following tables. |
| ETF | | Exchange-traded fund |
See notes to financial statements
30
| Portfolio of investments (unaudited) |
All Asset Fund
January 31, 2016 (continued)
(e) FINANCIAL DERIVATIVE INSTRUMENTS
EXCHANGE-TRADED OR CENTRALLY-CLEARED FINANCIAL DERIVATIVE INSTRUMENTS
FUTURES CONTRACTS
| | | | | | | | | | | | | Unrealized |
| | | | | | | | | | Current | | | appreciation/ |
| | | | Number of | | | Expiration | | | notional | | | (depreciation) |
| | | | contracts | | | date | | | value | | | Asset | | | Liability | |
| E-mini S&P 500 Index (Long) | | | 8 | | | 3/18/16 | | $ | 772,040 | | $ | — | | $ | (20,920 | ) |
| EURO STOXX 50 Index (Long) | | | 114 | | | 3/18/16 | | | 3,739,466 | | | — | | | (231,797 | ) |
| FTSE 100 Index (Long) | | | 30 | | | 3/18/16 | | | 2,567,811 | | | 16,809 | | | — | |
| Nikkei 225 Index (Long) | | | 19 | | | 3/10/16 | | | 2,768,430 | | | — | | | (262,410 | ) |
| US Treasury 10 Year Note (Long) | | | 5 | | | 3/21/16 | | | 647,891 | | | 15,781 | | | — | |
| Total | | | | | | | | | | | $ | 32,590 | | $ | (515,127 | ) |
During the period ended January 31, 2016, average monthly notional value related to futures contracts was approximately $10.6 million or 20.0% of ending net assets.
FINANCIAL DERIVATIVE INSTRUMENTS: EXCHANGE-TRADED OR CENTRALLY-CLEARED SUMMARY
The following is a summary of the value of exchange-traded or centrally-cleared financial derivative instruments as of January 31, 2016:
| | | | Unrealized | | | | | | Unrealized | | | | |
| | | | Appreciation | | | | | | Depreciation | | | | |
| | | | Futures Contracts | | | Total | | | Futures Contracts | | | Total | |
| Total Exchange-Traded or Centrally Cleared | | $ | 32,590 | | $ | 32,590 | | $ | (515,127 | ) | $ | (515,127 | ) |
OVER-THE-COUNTER FINANCIAL DERIVATIVE INSTRUMENTS
FORWARD FOREIGN CURRENCY CONTRACTS
| | | | | | | | | | | | | | | | Unrealized | |
| | | | | | | | | | Local | | | Current | | | appreciation/ | |
| | | | | | | Value | | | amount | | | notional | | | (depreciation) | |
| | | | Counterparty | | | date | | | (000's | ) | | value | | | Asset | | | Liability | |
| British Pound (Long) | | | State Street Bank | | | | | | | | | | | | | | | | |
| | | | and Trust Company | | | 2/24/16 | | | 1,276 | | $ | 1,818,815 | | $ | — | | $ | (112,519 | ) |
| Euro (Long) | | | State Street Bank | | | | | | | | | | | | | | | | |
| | | | and Trust Company | | | 2/24/16 | | | 2,468 | | | 2,675,083 | | | 52,251 | | | — | |
| Japanese Yen (Long) | | | State Street Bank | | | | | | | | | | | | | | | | |
| | | | and Trust Company | | | 2/24/16 | | | 319,420 | | | 2,639,443 | | | 37,011 | | | — | |
| Total | | | | | | | | | | | | | | $ | 89,262 | | $ | (112,519 | ) |
During the period ended January 31, 2016, average monthly notional value related to forward foreign currency contracts was approximately $8.5 million or 16.1% of ending net assets.
See notes to financial statements
31
| Portfolio of investments (unaudited) |
All Asset Fund
January 31, 2016 (continued)
FINANCIAL DERIVATIVE INSTRUMENTS: OVER-THE-COUNTER SUMMARY
The following is a summary by counterparty of the value of over-the-counter financial derivative instruments and collateral (received)/pledged as of January 31, 2016.
| | | Financial Derivative Assets | | Financial Derivative Liabilities | | | | | | | | | | |
| | | | Unrealized | | | | | | Unrealized | | | | | | | | | | | | | |
| | | | Appreciation | | | | | | Depreciation | | | | | | | | | | | | | |
| | | | Forward | | | | | | Forward | | | | | | | | | | | | | |
| | | | Foreign | | | Total | | | Foreign | | | Total | | | Net Value | | | Collateral | | | | |
| | | | Currency | | | Over-the- | | | Currency | | | Over-the- | | | of OTC | | | (Received) / | | | Net | |
| | | | Contracts | | | Counter | | | Contracts | | | Counter | | | Derivatives | | | Pledged | | | Exposure(1) | |
| Amounts subject to a master netting or similar agreement: | | | | | | | | | | | | |
| | | $ | — | | $ | — | | $ | — | | $ | — | | $ | — | | $ | — | | $ | — | |
| | | $ | — | | $ | — | | $ | — | | $ | — | | $ | — | | $ | — | | $ | — | |
| Amounts NOT subject to a master netting or similar agreement: | | | | | | | | | | |
| State Street | | | | | | | | | | | | | | | | | | | | | |
| Bank and | | | | | | | | | | | | | | | | | | | | | |
Trust Company (2) | $ | 89,262 | | $ | 89,262 | | $ | (112,519 | ) | $ | (112,519 | ) | | | | | | | | | |
| | | $ | 89,262 | | $ | 89,262 | | $ | (112,519 | ) | $ | (112,519 | ) | | | | | | | | | |
| (1) | | Net Exposure represents the net receivable/(payable) that would be due from/to the counterparty in the event of default. Exposure from over-the-counter financial derivative instruments can only be netted across transactions governed under the same master agreement with the same legal entity. See Note 2, Significant Accounting Policies, "Derivative instruments," in the Notes to Financial Statements for more information regarding master netting arrangements. |
| (2) | | Forward foreign currency contracts with State Street Bank and Trust Company are not subject to a legally enforceable master netting arrangement or other similar agreements that provide a legally enforceable right of offset. |
| | | Cost or Premiums, Net | | | Asset | | | Liability | |
| TOTAL FINANCIAL DERIVATIVE INSTRUMENTS | | $ | — | | $ | 121,852 | | $ | (627,646 | ) |
Other information:
| Currency exposure of portfolio assets before | | |
| any currency hedging, if applicable. | | % of total |
| Excludes derivatives: | | investments |
| US Dollar | | 98 | % |
| British Pound | | 2 | |
| | | 100 | % |
See notes to financial statements
32
| Portfolio of investments (unaudited) |
All Asset Fund
January 31, 2016 (continued)
Fair Value Measurements
The following table summarizes the Fund's investments that are measured at fair value by level within the fair value hierarchy at January 31, 2016:
| | | | Quoted prices | | | Significant | | | | | | | |
| | | | in active | | | other | | | Significant | | | | |
| | | | markets for | | | observable | | | unobservable | | | | |
| | | | identical assets | | | inputs | | | inputs | | | | |
| Description | | | (level 1 | ) | | (level 2 | ) | | (level 3 | ) | | Total | |
| Assets | | | | | | | | | | | | | |
| Investment Companies | | $ | 30,855,726 | | $ | — | | $ | — | | $ | 30,855,726 | |
| Partnerships | | | — | | | — | | | 2,822,709 | | | 2,822,709 | |
| Short-Term Investment | | | 17,927,660 | | | — | | | — | | | 17,927,660 | |
| Total Investments | | $ | 48,783,386 | | $ | — | | $ | 2,822,709 | | $ | 51,606,095 | |
| | | | | | | | | | | | | | |
| Financial Derivative Instruments – Assets | | | | | | | | | | | | | |
| Exchange-traded or centrally-cleared | | $ | 32,590 | | $ | — | | $ | — | | $ | 32,590 | |
| Over-the-counter | | | — | | | 89,262 | | | — | | | 89,262 | |
| Total Financial Derivative Investments – Assets | | $ | 32,590 | | $ | 89,262 | | $ | — | | $ | 121,852 | |
| Liabilities | | | | | | | | | | | | | |
| | | | | | | | | | | | | | |
| Financial Derivative Instruments – Liabilities | | | | | | | | | | | | | |
| Exchange-traded or centrally-cleared | | $ | (515,127 | ) | $ | — | | $ | — | | $ | (515,127 | ) |
| Over-the-counter | | | — | | | (112,519 | ) | | — | | | (112,519 | ) |
| Total Financial Derivative Investments - Liabilities | | $ | (515,127 | ) | $ | (112,519 | ) | $ | — | | $ | (627,646 | ) |
During the period ended January 31, 2016, there were no transfers in or out of security levels.
See notes to financial statements
33
| Portfolio of investments (unaudited) |
All Asset Fund
January 31, 2016 (continued)
Following is a reconciliation of investments in which significant observable inputs (Level 3) were used in determining fair value:
| | | | Balance | | | | | | | | | Change in | | | | | | | | | | | | | | | Balance | |
| | | | as of | | | Accrued | | | | | | unrealized | | | | | | | | | Transfers | | | Transfers | | | as of | |
| | | | July 31, | | | discounts/ | | | Realized | | | appreciation | | | | | | | | | in to | | | out of | | | January 31, | |
| Investments in securities | | | 2015 | | | premiums | | | gain/(loss | ) | | (depreciation | ) | | Purchases | | | Sales | | | level 3 | | | level 3 | | | 2016 | |
| Investment Companies | | | | | | | | | | | | | | | | | | | | | | | | | | | | |
| TIAA-CREF Asset | | | | | | | | | | | | | | | | | | | | | | | | | | | | |
| Management Core | | | | | | | | | | | | | | | | | | | | | | | | | | | | |
| Property Fund LP | | $ | 2,684,523 | | $ | 0 | | $ | 0 | | $ | 118,182 | | $ | 20,004 | | $ | 0 | | $ | 0 | | $ | 0 | | $ | 2,822,709 | |
| Total | | $ | 2,684,523 | | $ | 0 | | $ | 0 | | $ | 118,182 | | $ | 20,004 | | $ | 0 | | $ | 0 | | $ | 0 | | $ | 2,822,709 | |
The total net change in unrealized appreciation (depreciation) attributable to level 3 investments held at January 31, 2016 was $118,182.
The Fund's Adviser has determined that TIAA-CREF Asset Management Core Property Fund LP ("CPF") is a Level 3 investment due to the lack of observable inputs that may be used in the determination of fair value. The CPF is a private Delaware limited partnership that provides monthly liquidity to its investors with 45 days written notice and invests its contributed capital in a TIAA-CREF Real Estate Investment Trust (REIT). The REIT is a limited partnership which in turn invests in a TIAA-CREF operating partnership. The investments of the operating partnership include a diversified portfolio of real property assets. As a result, the monthly valuations prepared by CPF and assignment of a net asset value per share are ultimately driven by changes in the valuation of the underlying real property assets in the operating partnership. All of the investments in real estate are appraised annually by an independent third party appraiser. The CPF's policy is to report all such investments, as well as related debt, at fair value under US Generally Accepted Accounting Principles based on the appraised value. The annual appraisals are conducted on a rolling basis such that approximately 25% of the portfolio receives an annual full appraisal each quarter. In addition, each appraisal is updated quarterly under the direction of an independent, third-party appraisal firm.
The significant unobservable inputs used by CPF in the fair value measurement and appraisal of the real property assets include: a) an extensive market study, including a thorough analysis of current market conditions and trends as they impact supply, demand and absorption of the relevant property type; b) thorough description of the site and improvements, including a site plan and renderings of the improvements if available; c) estimate of the value of the land; d) estimate of the value of the property using a cost approach; e) estimate of the market value of the property using a sales comparison approach; and f) estimate of the value of the property using a detailed income capitalization approach that includes several diagnostic inputs. Significant changes in any of those inputs in isolation would result in a significant change in the fair value measurement, and ultimately the value ascribed to All Asset Fund's limited partnership interests in CPF.
Due to the factors above, and consistent with a fair valuation policy approved by the Board of Trustees, the All Asset Fund values this investment monthly upon receipt of the limited partner statement and in-line with the capital balance allocated to its limited partnership interests, less the undistributed net income accrued within the capital balance. Separately, a daily income accrual is recognized by the Fund to account for the net income that is accrued and allocated to its limited partnership interests and distributed quarterly. The value assigned to the investment is revised monthly upon receipt of the limited partner statement. The value may be revised more frequently if, in the determination of the Adviser and/or the Board of Trustees, market or investment-specific developments warrant re-assessment.
See notes to financial statements
34
| Portfolio of investments (unaudited) |
All Asset Fund
January 31, 2016 (continued)
Fair Value of Financial Derivative Instruments
The following is a summary of the fair valuation of the Fund's financial derivative instruments categorized by risk exposure:
Fair Values of Financial Derivative Instruments on the Statement of Assets and Liabilities as of January 31, 2016
| | | Derivatives not accounted for as hedging instruments | |
| | | | Foreign | | | | | | | | | | | | | | | | |
| | | | Currency | | | Equity | | | Interest | | | Credit | | | Inflation | | | | |
| | | | Risk | | | Risk | | | Rate Risk | | | Risk | | | Risk | | | Total | |
| | | | | | | | | | | | | | | | | | | | |
| Financial Derivative Instruments – Assets | | | | | | | | | | | | | | | | | | | |
| Exchange-Traded or Centrally-Cleared | | | | | | | | | | | | | | | | | | | |
| Futures Contracts | | $ | — | | $ | 16,809 | | $ | 15,781 | | $ | — | | $ | — | | $ | 32,590 | |
| Over-the-Counter | | | | | | | | | | | | | | | | | | | |
| Forward Foreign Currency Contracts | | $ | 89,262 | | $ | — | | $ | — | | $ | — | | $ | — | | $ | 89,262 | |
| Total | | $ | 89,262 | | $ | 16,809 | | $ | 15,781 | | $ | — | | $ | — | | $ | 121,852 | |
| Financial Derivative Instruments – Liabilities | | | | | | | | | | | | | | | | | | | |
| Exchange-Traded or Centrally-Cleared | | | | | | | | | | | | | | | | | | | |
| Futures Contracts | | $ | — | | $ | (515,127 | ) | $ | — | | $ | — | | $ | — | | $ | (515,127 | ) |
| Over-the-Counter | | | | | | | | | | | | | | | | | | | |
| Forward Foreign Currency Contracts | | $ | (112,519 | ) | $ | — | | $ | — | | $ | — | | $ | — | | $ | (112,519 | ) |
| Total | | $ | (112,519 | ) | $ | (515,127 | ) | $ | — | | $ | — | | $ | — | | $ | (627,646 | ) |
| Net | | $ | (23,257 | ) | $ | (498,318 | ) | $ | 15,781 | | $ | — | | $ | — | | $ | (505,794 | ) |
Effect of Financial Derivative Instruments on the Statement of Operations for the Period Ended January 31, 2016
| | | Derivatives not accounted for as hedging instruments | |
| | | | Foreign | | | | | | | | | | | | | | | | |
| | | | Currency | | | Equity | | | Interest | | | Credit | | | Inflation | | | | |
| | | | Risk | | | Risk | | | Rate Risk | | | Risk | | | Risk | | | Total | |
| | | | | | | | | | | | | | | | | | | | |
| Net realized gain/(loss) from | | | | | | | | | | | | | | | | | | | |
| financial derivative instruments: | | | | | | | | | | | | | | | | | | | |
| Futures Contracts | | $ | — | | $ | (966,227 | ) | $ | 14,008 | | $ | — | | $ | — | | $ | (952,219 | ) |
| Forward Foreign Currency Contracts | | $ | (230,777 | ) | $ | — | | $ | — | | $ | — | | $ | — | | $ | (230,777 | ) |
| Total | | $ | (230,777 | ) | $ | (966,227 | ) | $ | 14,008 | | $ | — | | $ | — | | $ | (1,182,996 | ) |
| | | | | | | | | | | | | | | | | | | | |
| Net change in unrealized | | | | | | | | | | | | | | | | | | | |
| appreciation/(depreciation) | | | | | | | | | | | | | | | | | | | |
| of financial derivative instruments | | | | | | | | | | | | | | | | | | | |
| Futures Contracts | | $ | — | | $ | (599,136 | ) | $ | 8,266 | | $ | — | | $ | — | | $ | (590,870 | ) |
| Forward Foreign Currency Contracts | | $ | 176,709 | | $ | — | | $ | — | | $ | — | | $ | — | | $ | 176,709 | |
| Total | | $ | 176,709 | | $ | (599,136 | ) | $ | 8,266 | | $ | — | | $ | — | | $ | (414,161 | ) |
See notes to financial statements
35
| Portfolio of investments (unaudited) |
Dividend & Income Builder Fund
January 31, 2016
| | | | | Value | |
| Shares | | | | (note 2) | |
| | | | | | |
| Common stocks – 80.64% | | | |
| | | | | | |
| | | Australia – 1.09% | | | |
| 136,105 | | Suncorp Group, Ltd. | $ | 1,129,269 | |
| | | | | | |
| | | Canada – 1.15% | | | |
| 29,597 | | BCE, Inc. | | 1,192,204 | |
| | | | | | |
| | | France – 5.55% | | | |
| 24,874 | | Compagnie de Saint-Gobain | | 1,032,085 | |
| 16,441 | | Nexity S.A. | | 744,230 | |
| 109,382 | | Orange S.A. | | 1,959,253 | |
| 10,746 | | Sanofi | | 902,327 | |
| 32,547 | | SCOR SE | | 1,136,129 | |
| | | | | 5,774,024 | |
| | | | | | |
| | | Germany – 4.52% | | | |
| 10,053 | | Bayer AG | | 1,127,715 | |
| 12,929 | | Deutsche Boerse AG | | 1,099,146 | |
| 47,409 | | Deutsche Post AG | | 1,146,090 | |
| 76,525 | | Deutsche Telekom AG | | 1,328,433 | |
| | | | | 4,701,384 | |
| | | | | | |
| | | Hong Kong – 2.14% | | | |
| 116,000 | | Cheung Kong Property | | | |
| | | Holdings, Ltd. | | 627,953 | |
| 79,000 | | CK Hutchison Holdings, Ltd. | | 983,848 | |
| 63,500 | | Swire Pacific, Ltd., Class A | | 615,829 | |
| | | | | 2,227,630 | |
| | | | | | |
| | | Ireland – 0.43% | | | |
| 15,538 | | Seagate Technology plc | | 451,379 | |
| | | | | | |
| | | Israel – 1.37% | | | |
| 657,184 | | Bezeq The Israeli | | | |
| | | Telecommunication Corp, Ltd. | | 1,424,247 | |
| | | | | | |
| | | Italy – 1.02% | | | |
| 258,108 | | Enel SpA | | 1,056,148 | |
| | | | | | |
| | | Japan – 2.43% | | | |
| 199,000 | | Daiwa Securities Group, Inc. | | 1,258,024 | |
| 29,700 | | Nippon Telegraph and | | | |
| | | Telephone Corp. | | 1,263,454 | |
| | | | | 2,521,478 | |
| | | | | Value | |
| Shares | | | | (note 2) | |
| | | | | | |
| | | Luxembourg – 0.85% | | | |
| 10,991 | | RTL Group S.A. * | $ | 889,445 | |
| | | | | | |
| | | Netherlands – 4.30% | | | |
| 137,275 | | RELX N.V. | | 2,297,104 | |
| 28,265 | | Unilever N.V. | | 1,260,567 | |
| 26,905 | | Wolters Kluwer N.V. | | 915,899 | |
| | | | | 4,473,570 | |
| | | | | | |
| | | Portugal – 0.75% | | | |
| 107,705 | | NOS SGPS S.A. | | 782,601 | |
| | | | | | |
| | | Switzerland – 9.52% | | | |
| 12,537 | | Cembra Money Bank AG | | 754,545 | |
| 24,953 | | Nestle S.A. | | 1,837,949 | |
| 32,582 | | Novartis AG | | 2,527,277 | |
| 9,908 | | Roche Holding AG | | 2,577,673 | |
| 3,760 | | Syngenta AG | | 1,384,221 | |
| 3,654 | | Zurich Insurance Group AG | | 809,398 | |
| | | | | 9,891,063 | |
| | | | | | |
| | | Taiwan – 1.17% | | | |
| 54,345 | | Taiwan Semiconductor | | | |
| | | Manufacturing Co., Ltd., ADR | | 1,214,611 | |
| | | | | | |
| | | United Kingdom – 19.20% | | | |
| 25,688 | | AstraZeneca plc | | 1,643,349 | |
| 241,138 | | Barclays plc | | 644,026 | |
| 22,672 | | British American Tobacco plc | | 1,260,456 | |
| 112,201 | | Centrica plc | | 329,444 | |
| 56,678 | | Diageo plc | | 1,525,825 | |
| 403,292 | | GKN plc | | 1,607,049 | |
| 48,287 | | Imperial Tobacco Group plc | | 2,616,190 | |
| 393,663 | | ITV plc | | 1,503,237 | |
| 34,994 | | Nielsen Holdings plc | | 1,685,311 | |
| 51,714 | | Prudential plc | | 1,016,505 | |
| 14,174 | | Rio Tinto plc | | 348,617 | |
| 74,155 | | Royal Dutch Shell plc, A Shares | | 1,627,790 | |
| 190,488 | | Standard Life plc | | 994,307 | |
| 553,086 | | Vodafone Group plc | | 1,769,258 | |
| 63,500 | | WPP plc | | 1,382,064 | |
| | | | | 19,953,428 | |
See notes to financial statements
36
| Portfolio of investments (unaudited) |
Dividend & Income Builder Fund
January 31, 2016 (continued)
| | | | | Value | |
| Shares | | | | (note 2) | |
| | | | | | |
| | | United States – 25.15% | | | |
| 20,885 | | Chevron Corp. | $ | 1,805,926 | |
| 62,297 | | Cisco Systems, Inc. | | 1,482,046 | |
| 3,715 | | Cummins, Inc. | | 333,941 | |
| 6,079 | | Deere & Co. | | 468,144 | |
| 41,516 | | General Electric Co. | | 1,208,116 | |
| 11,777 | | Johnson & Johnson | | 1,229,990 | |
| 24,532 | | JPMorgan Chase & Co. | | 1,459,654 | |
| 19,169 | | Las Vegas Sands Corp. | | 864,522 | |
| 4,586 | | Lockheed Martin Corp. | | 967,646 | |
| 55,053 | | Microsoft Corp. | | 3,032,870 | |
| 76,357 | | Pfizer, Inc. | | 2,328,125 | |
| 15,190 | | Philip Morris International, Inc. | | 1,367,252 | |
| 13,888 | | QUALCOMM, Inc. | | 629,682 | |
| 33,676 | | Reynolds American, Inc. | | 1,682,116 | |
| 23,314 | | Six Flags Entertainment Corp. | | 1,171,995 | |
| | | | | Value | |
| Shares | | | | (note 2) | |
| | | | | | |
| | | United States (continued) | | | |
| 7,384 | | Stanley Black & Decker, Inc. | $ | 696,607 | |
| 32,305 | | Synchrony Financial * | | 918,108 | |
| 13,837 | | United Parcel Service, Inc., | | | |
| | | Class B | | 1,289,608 | |
| 1,149 | | Verizon Communications, Inc. | | 57,307 | |
| 31,399 | | Verizon Communications, Inc. | | 1,569,008 | |
| 31,437 | | Wells Fargo & Co. | | 1,579,080 | |
| | | | | 26,141,743 | |
| | | | | | |
| | | Total common stocks | | | |
| | | (Cost $86,014,903) | | 83,824,224 | |
| Face | | | | | | | | Value | |
| amount | | | Coupon | | | Maturity | | (note 2) | |
| | | | | | | | | | |
| Corporate bonds – 12.47% | | | | | | | |
| | | | | | | | | | | |
| | | | France – 0.65% | | | | | | | |
| USD | 600,000 | | BNP Paribas S.A. (a) (b) | 7.195 | % | | 6/25/37 | $ | 676,500 | |
| | | | | | | | | | | |
| | | | Germany – 0.48% | | | | | | | |
| USD | 500,000 | | Unitymedia Hessen GmbH & Co. KG (a) | 5.000 | % | | 1/15/25 | | 500,625 | |
| | | | | | | | | | | |
| | | | Netherlands – 0.68% | | | | | | | |
| USD | 500,000 | | Deutsche Telekom International Finance B.V. (a) | 4.875 | % | | 3/6/42 | | 517,911 | |
| USD | 200,000 | | Ziggo Bond Finance BV (a) | 5.875 | % | | 1/15/25 | | 184,250 | |
| | | | | | | | | | 702,161 | |
| | | | | | | | | | | |
| | | | Spain – 0.37% | | | | | | | |
| USD | 386,000 | | BBVA International Preferred SAU (b) | 5.919 | % | | 4/18/17 | | 387,448 | |
| | | | | | | | | | | |
| | | | Switzerland – 0.90% | | | | | | | |
| USD | 300,000 | | Credit Suisse Group AG (a) (b) | 7.500 | % | | 12/11/23 | | 308,674 | |
| USD | 600,000 | | UBS Group AG (b) | 7.000 | % | | 2/19/25 | | 624,750 | |
| | | | | | | | | | 933,424 | |
See notes to financial statements
37
| Portfolio of investments (unaudited) |
Dividend & Income Builder Fund
January 31, 2016 (continued)
| Face | | | | | | | | Value | |
| amount | | | Coupon | | | Maturity | | (note 2) | |
| | | | | | | | | | | |
| | | | United Kingdom – 2.58% | | | | | | | |
| USD | 370,000 | | Barclays Bank plc (b) | 6.860 | % | | 6/15/32 | $ | 423,650 | |
| USD | 500,000 | | Lloyds Banking Group plc (a) (b) | 6.657 | % | | 5/21/37 | | 559,375 | |
| USD | 100,000 | | Prudential plc (b) | 6.500 | % | | 3/23/16 | | 101,050 | |
| USD | 500,000 | | Royal Bank of Scotland Group plc | 6.100 | % | | 6/10/23 | | 533,345 | |
| USD | 550,000 | | Sky plc (a) | 3.750 | % | | 9/16/24 | | 547,847 | |
| USD | 500,000 | | Virgin Media Finance plc (a) | 6.375 | % | | 4/15/23 | | 514,375 | |
| | | | | | | | | | 2,679,642 | |
| | | | | | | | | | | |
| | | | United States – 6.81% | | | | | | | |
| USD | 600,000 | | Altria Group, Inc. | 4.250 | % | | 8/9/42 | | 557,915 | |
| USD | 108,000 | | Aramark Services, Inc. (a) | 5.125 | % | | 1/15/24 | | 111,780 | |
| USD | 550,000 | | AT&T, Inc. | 4.750 | % | | 5/15/46 | | 489,520 | |
| USD | 447,000 | | Ball Corp. | 5.000 | % | | 3/15/22 | | 464,880 | |
| USD | 127,000 | | Ball Corp. | 4.375 | % | | 12/15/20 | | 131,803 | |
| USD | 100,000 | | CCO Holdings LLC | 7.375 | % | | 6/1/20 | | 104,250 | |
| USD | 450,000 | | CCO Holdings LLC (a) | 5.875 | % | | 5/1/27 | | 444,375 | |
| USD | 100,000 | | Constellation Brands, Inc. | 4.250 | % | | 5/1/23 | | 102,625 | |
| USD | 550,000 | | Dresdner Funding Trust I (a) | 8.151 | % | | 6/30/31 | | 661,375 | |
| USD | 100,000 | | HBOS Capital Funding LP (b) | 6.850 | % | | 3/23/16 | | 101,107 | |
| USD | 250,000 | | Iron Mountain, Inc. | 6.000 | % | | 8/15/23 | | 260,937 | |
| USD | 600,000 | | Post Holdings, Inc. (a) | 6.750 | % | | 12/1/21 | | 629,160 | |
| USD | 600,000 | | Reynolds American, Inc. | 4.750 | % | | 11/1/42 | | 580,016 | |
| USD | 200,000 | | Sealed Air Corp. (a) | 5.250 | % | | 4/1/23 | | 203,500 | |
| USD | 200,000 | | Service Corp. International | 8.000 | % | | 11/15/21 | | 236,000 | |
| USD | 550,000 | | Sirius XM Radio, Inc. (a) | 6.000 | % | | 7/15/24 | | 577,500 | |
| USD | 550,000 | | Verizon Communications, Inc. | 6.550 | % | | 9/15/43 | | 644,315 | |
| USD | 500,000 | | Wachovia Capital Trust III (b) | 5.570 | % | | 2/29/16 | | 478,125 | |
| USD | 300,000 | | Walgreens Boots Alliance, Inc. | 3.800 | % | | 11/18/24 | | 295,869 | |
| | | | | | | | | | 7,075,052 | |
| | | | | | | | | | | |
| | | | Total corporate bonds | | | | | | | |
| | | | (Cost $12,987,409) | | | | | | 12,954,852 | |
See notes to financial statements
38
| Portfolio of investments (unaudited) |
Dividend & Income Builder Fund
January 31, 2016 (continued)
| | | | | Value | |
| Shares | | | | (note 2) | |
| | | | | | |
| REITs – 2.78% | | | | | |
| | | | | | |
| | | France – 0.70% | | | |
| 10,322 | | ICADE | $ | 733,643 | |
| | | | | | |
| | | Netherlands – 1.02% | | | |
| 24,149 | | Eurocommercial Properties N.V. | | 1,058,572 | |
| | | | | | |
| | | United States – 1.06% | | | |
| 39,915 | | Iron Mountain, Inc. | | 1,099,259 | |
| | | | | | |
| | | Total REITs | | | |
| | | (Cost $3,049,866) | | 2,891,474 | |
| | | | | | |
| | | Total long-term investments | | | |
| | | (Cost $102,052,178) | | 99,670,550 | |
| | | | | | |
| Partnerships – 0.76% | | | |
| | | | | | |
| | | United States – 0.76% | | | |
| 57,630 | | KKR & Co., L.P. | | 785,497 | |
| | | | | | |
| | | Total Partnerships | | | |
| | | (Cost $1,074,976) | | 785,497 | |
| | | | | | |
| Short-term investment – 1.10% | | | |
| 1,147,287 | | Fidelity Institutional | | | |
| | | Treasury Portfolio | | 1,147,287 | |
| | | | | | |
| | | Total short-term investment | | | |
| | | (Cost $1,147,287) | | 1,147,287 | |
| | | | | | |
| Total investments – 97.75% | | | |
| | | (Cost $104,274,441) | | 101,603,334 | |
| Financial Derivative Instruments(c) | | | |
(Cost or Premiums, net $0) – 0.18% | | 191,825 | |
| Net other assets and liabilities – 2.07% | | 2,144,983 | |
| Total net assets – 100.00% | $ | 103,940,142 | |
| * | | Non-income producing security |
| (a) | | Restricted security, purchased pursuant to Rule 144A under the Securities Act of 1933, as amended, and which is exempt from registration under that Act. At January 31, 2016, the restricted securities held by the Fund had an aggregate value of $6,437,247, which represented 6.2% of net assets. |
| (b) | | Maturity date is perpetual. Maturity date presented represents the next call date. |
| (c) | | Information with respect to financial derivative instruments is disclosed in the following tables. |
| ADR | | American Depositary Receipts |
| REIT | | Real Estate Investment Trust |
See notes to financial statements
39
| Portfolio of investments (unaudited) |
Dividend & Income Builder Fund
January 31, 2016 (continued)
(c) FINANCIAL DERIVATIVE INSTRUMENTS
OVER-THE-COUNTER FINANCIAL DERIVATIVE INSTRUMENTS
FORWARD FOREIGN CURRENCY CONTRACTS
| | | | | | | | | | | | | | | Unrealized | |
| | | | | | | | | | Local | | | Current | | appreciation/ | |
| | | | | | | Value | | | amount | | | notional | | (depreciation) | |
| | | | Counterparty | | | date | | | (000's | ) | | value | | | Asset | | | Liability | |
| British Pound (Short) | | | Morgan Stanley | | | | | | | | | | | | | | | | |
| | | | Capital Services LLC | | | 4/08/16 | | | 5,278 | | $ | 7,521,455 | | $ | 191,825 | | $ | — | |
During the period ended January 31, 2016, average monthly notional value related to forward foreign currency contracts was approximately $2.6 million or 2.5% of ending net assets.
FINANCIAL DERIVATIVE INSTRUMENTS: OVER-THE-COUNTER SUMMARY
The following is a summary by counterparty of the value of over-the-counter financial derivative instruments and collateral (received)/pledged as of January 31, 2016.
| | | Financial Derivative Assets | | Financial Derivative Liabilities | | | | | | | | | | |
| | | | Unrealized | | | | | | Unrealized | | | | | | | | | | | | | |
| | | | Appreciation | | | | | | Depreciation | | | | | | | | | | | | | |
| | | | Forward | | | | | | Forward | | | | | | | | | | | | | |
| | | | Foreign | | | Total | | | Foreign | | | Total | | | Net Value | | | Collateral | | | | |
| | | | Currency | | | Over-the- | | | Currency | | | Over-the- | �� | | of OTC | | | (Received) / | | | Net | |
| | | | Contracts | | | Counter | | | Contracts | | | Counter | | | Derivatives | | | Pledged | | | Exposure(1) | |
| Amounts subject to a master netting or similar agreement: | | | | | | | | | | | | | |
| Morgan Stanley | | | | | | | | | | | | | | | | | | | | | | |
| Capital Services LLC | | $ | 191,825 | | $ | 191,825 | | $ | — | | $ | — | | $ | 191,825 | | $ | — | | $ | 191,825 | |
| | | $ | 191,825 | | $ | 191,825 | | $ | — | | $ | — | | $ | 191,825 | | $ | — | | $ | 191,825 | |
| (1) | | Net Exposure represents the net receivable/(payable) that would be due from/to the counterparty in the event of default. Exposure from over-the-counter financial derivative instruments can only be netted across transactions governed under the same master agreement with the same master agreement with the same legal entity. See Note 2, Significant Accounting Policies, "Derivative instruments," in the Notes to Financial Statements for more information regarding master netting arrangements. |
| | | Cost or Premiums, Net | | | Asset | | | Liability | |
| TOTAL FINANCIAL DERIVATIVE INSTRUMENTS | | $ | — | | $ | 191,825 | | $ | — | |
Other information:
| Currency exposure of portfolio assets before | |
| any currency hedging, if applicable. | % of total |
| Excludes derivatives: | investments |
| US Dollar | 45 | % |
| Euro | 21 | |
| British Pound | 16 | |
| Swiss Franc | 10 | |
| Japanese Yen | 3 | |
| Hong Kong Dollar | 2 | |
| Israeli Shekel | 1 | |
| Canadian Dollar | 1 | |
| Australian Dollar | 1 | |
| | 100 | % |
See notes to financial statements
40
| Portfolio of investments (unaudited) |
Dividend & Income Builder Fund
January 31, 2016 (continued)
Other information:
| Industry concentration as | % of net |
| a percentage of net assets: | assets |
| | | |
| Pharmaceuticals | 11.87 | % |
| Integrated Telecommunication Services | 8.93 | |
| Tobacco | 7.76 | |
| Diversified Banks | 4.35 | |
| Integrated Oil & Gas | 3.30 | |
| Publishing | 3.09 | |
| Systems Software | 2.92 | |
| Air Freight & Logistics | 2.34 | |
| Broadcasting | 2.30 | |
| Industrial Conglomerates | 2.11 | |
| Communications Equipment | 2.03 | |
| Life & Health Insurance | 2.03 | |
| Packaged Foods & Meats | 1.77 | |
| Wireless Telecommunication Services | 1.70 | |
| Research & Consulting Services | 1.62 | |
| Consumer Finance | 1.61 | |
| Telephone-Integrated | 1.61 | |
| Distillers & Vintners | 1.57 | |
| Auto Parts & Equipment | 1.55 | |
| Other Diversified Financial Services | 1.40 | |
| Fertilizers & Agricultural Chemicals | 1.33 | |
| Advertising | 1.33 | |
| Cable & Satellite | 1.28 | |
| Personal Products | 1.21 | |
| Investment Banking & Brokerage | 1.21 | |
| Cable TV | 1.19 | |
| Semiconductors | 1.17 | |
| Leisure Facilities | 1.13 | |
| Reinsurance | 1.09 | |
| Property & Casualty Insurance | 1.09 | |
| Specialized REITs | 1.06 | |
| Specialized Finance | 1.06 | |
| Retail REITs | 1.02 | |
| Industry concentration as | % of net |
| a percentage of net assets: | assets |
| | | |
| Electric Utilities | 1.02 | % |
| Money Center Banks | 1.01 | |
| Building Products | 0.99 | |
| Aerospace & Defense | 0.93 | |
| Diversified Banking Institution | 0.90 | |
| Casinos & Gaming | 0.83 | |
| Multi-line Insurance | 0.78 | |
| Construction & Farm Machinery & Heavy Trucks | 0.77 | |
| Asset Management & Custody Banks | 0.76 | |
| Homebuilding | 0.72 | |
| Diversified REITs | 0.70 | |
| Industrial Machinery | 0.67 | |
| Food-Flour & Grain | 0.61 | |
| Real Estate Development | 0.60 | |
| Diversified Real Estate Activities | 0.59 | |
| Metal & Glass Containers | 0.57 | |
| Radio | 0.56 | |
| Super-Regional Banks-US | 0.46 | |
| Computers-Memory Devices | 0.43 | |
| Diversified Metals & Mining | 0.33 | |
| Multi-Utilities | 0.32 | |
| Drug Retail | 0.28 | |
| Diversified Support Services | 0.25 | |
| Funeral Services & Related Items | 0.23 | |
| Paper Packaging | 0.20 | |
| Food Catering | 0.11 | |
| Long-Term Investments | 96.65 | |
| Short-Term Investment | 1.10 | |
| Total Investments | 97.75 | |
| Financial Derivative Instruments | 0.18 | |
| Net Other Assets and Liabilities | 2.07 | |
| | 100.00% | |
See notes to financial statements
41
| Portfolio of investments (unaudited) |
Dividend & Income Builder Fund
January 31, 2016 (continued)
Fair Value Measurements
The following table summarizes the Fund's investments that are measured at fair value by level within the fair value hierarchy at January 31, 2016:
| | | | Quoted prices | | | Significant | | | | | | | |
| | | | in active | | | other | | | Significant | | | | |
| | | | markets for | | | observable | | | unobservable | | | | |
| | | | identical assets | | | inputs | | | inputs | | | | |
| Description | | | (level 1 | ) | | (level 2 | ) | | (level 3 | ) | | Total | |
| | | | | | | | | | | | | | |
| Assets | | | | | | | | | | | | | |
| Common Stocks | | | | | | | | | | | | | |
| Australia | | $ | — | | $ | 1,129,269 | | $ | — | | $ | 1,129,269 | |
| Canada | | | 1,192,204 | | | — | | | — | | | 1,192,204 | |
| France | | | — | | | 5,774,024 | | | — | | | 5,774,024 | |
| Germany | | | — | | | 4,701,384 | | | — | | | 4,701,384 | |
| Hong Kong | | | — | | | 2,227,630 | | | — | | | 2,227,630 | |
| Ireland | | | 451,379 | | | — | | | — | | | 451,379 | |
| Israel | | | — | | | 1,424,247 | | | — | | | 1,424,247 | |
| Italy | | | — | | | 1,056,148 | | | — | | | 1,056,148 | |
| Japan | | | — | | | 2,521,478 | | | — | | | 2,521,478 | |
| Luxembourg | | | — | | | 889,445 | | | — | | | 889,445 | |
| Netherlands | | | — | | | 4,473,570 | | | — | | | 4,473,570 | |
| Portugal | | | — | | | 782,601 | | | — | | | 782,601 | |
| Switzerland | | | — | | | 9,891,063 | | | — | | | 9,891,063 | |
| Taiwan | | | 1,214,611 | | | — | | | — | | | 1,214,611 | |
| United Kingdom | | | 1,685,311 | | | 18,268,117 | | | — | | | 19,953,428 | |
| United States | | | 26,084,436 | | | 57,307 | | | — | | | 26,141,743 | |
| Total Common Stocks | | | 30,627,941 | | | 53,196,283 | | | — | | | 83,824,224 | |
| | | | | | | | | | | | | | |
| Corporate Bonds | | | | | | | | | | | | | |
| France | | | — | | | 676,500 | | | — | | | 676,500 | |
| Germany | | | — | | | 500,625 | | | — | | | 500,625 | |
| Netherlands | | | — | | | 702,161 | | | — | | | 702,161 | |
| Spain | | | — | | | 387,448 | | | — | | | 387,448 | |
| Switzerland | | | — | | | 933,424 | | | — | | | 933,424 | |
| United Kingdom | | | — | | | 2,679,642 | | | — | | | 2,679,642 | |
| United States | | | — | | | 7,075,052 | | | — | | | 7,075,052 | |
| Total Corporate Bonds | | | — | | | 12,954,852 | | | — | | | 12,954,852 | |
| | | | | | | | | | | | | | |
| REITs | | | | | | | | | | | | | |
| France | | | — | | | 733,643 | | | — | | | 733,643 | |
| Netherlands | | | — | | | 1,058,572 | | | — | | | 1,058,572 | |
| United States | | | 1,099,259 | | | — | | | — | | | 1,099,259 | |
| Total REITs | | | 1,099,259 | | | 1,792,215 | | | — | | | 2,891,474 | |
| | | | | | | | | | | | | | |
| Partnerships | | | | | | | | | | | | | |
| United States | | | 785,497 | | | — | | | — | | | 785,497 | |
| Total Partnerships | | | 785,497 | | | — | | | — | | | 785,497 | |
| | | | | | | | | | | | | | |
| Short-term investment | | | 1,147,287 | | | — | | | — | | | 1,147,287 | |
| Total investments | | $ | 33,659,984 | | $ | 67,943,350 | | $ | — | | $ | 101,603,334 | |
See notes to financial statements
42
| Portfolio of investments (unaudited) |
Dividend & Income Builder Fund
January 31, 2016 (continued)
| | | | Quoted prices | | | Significant | | | | | | | |
| | | | in active | | | other | | | Significant | | | | |
| | | | markets for | | | observable | | | unobservable | | | | |
| | | | identical assets | | | inputs | | | inputs | | | | |
| Description | | | (level 1 | ) | | (level 2 | ) | | (level 3 | ) | | Total | |
| | | | | | | | | | | | | | |
| Financial Derivative Instruments – Assets | | | | | | | | | | | | | |
| Over-the-counter | | $ | — | | $ | 191,825 | | $ | — | | $ | 191,825 | |
| Total Financial Derivative Instruments - Assets | | $ | — | | $ | 191,825 | | $ | — | | $ | 191,825 | |
On July 31, 2015, all of the common stocks held by the Fund were valued at the last reported sale price or official closing price. However, on January 31, 2016, certain of the Fund's common stocks trading in foreign markets were fair valued in accordance with the fair value pricing procedures approved by the Board using the independent statistical fair value service as described in Note 2. Accordingly, using the end of the reporting period method for determining when transfers between levels are recognized, common stocks valued at $46,564,646 on January 31, 2016 were transferred from Level 1 to Level 2.
Fair Value of Financial Derivative Instruments
The following is a summary of the fair valuation of the Fund's financial derivative instruments categorized by risk exposure:
Fair Values of Financial Derivative Instruments on the Statement of Assets and Liabilities as of January 31, 2016
| | | Derivatives not accounted for as hedging instruments | |
| | | | Foreign | | | | | | | | | | | | | | | | |
| | | | Currency | | | Equity | | | Interest | | | Credit | | | Inflation | | | | |
| | | | Risk | | | Risk | | | Rate Risk | | | Risk | | | Risk | | | Total | |
| | | | | | | | | | | | | | | | | | | | |
| Financial Derivative Instruments – Assets | | | | | | | | | | | | | | | | | | | |
| Over-the-Counter | | | | | | | | | | | | | | | | | | | |
| Forward Foreign Currency Contracts | | $ | 191,825 | | $ | — | | $ | — | | $ | — | | $ | — | | $ | 191,825 | |
| Total | | $ | 191,825 | | $ | — | | $ | — | | $ | — | | $ | — | | $ | 191,825 | |
Effect of Financial Derivative Instruments on the Statement of Operations for the Period Ended January 31, 2016
| | | Derivatives not accounted for as hedging instruments | |
| | | | Foreign | | | | | | | | | | | | | | | | |
| | | | Currency | | | Equity | | | Interest | | | Credit | | | Inflation | | | | |
| | | | Risk | | | Risk | | | Rate Risk | | | Risk | | | Risk | | | Total | |
| | | | | | | | | | | | | | | | | | | | |
| Net realized gain/(loss) from | | | | | | | | | | | | | | | | | | | |
| financial derivative instruments: | | | | | | | | | | | | | | | | | | | |
| Forward Foreign Currency Contracts | | $ | 287,796 | | $ | — | | $ | — | | $ | — | | $ | — | | $ | 287,796 | |
| Total | | $ | 287,796 | | $ | — | | $ | — | | $ | — | | $ | — | | $ | 287,796 | |
| | | | | | | | | | | | | | | | | | | | |
| Net change in unrealized | | | | | | | | | | | | | | | | | | | |
| appreciation/(depreciation) | | | | | | | | | | | | | | | | | | | |
| of financial derivative instruments | | | | | | | | | | | | | | | | | | | |
| Forward Foreign Currency Contracts | | $ | 191,825 | | $ | — | | $ | — | | $ | — | | $ | — | | $ | 191,825 | |
| Total | | $ | 191,825 | | $ | — | | $ | — | | $ | — | | $ | — | | $ | 191,825 | |
See notes to financial statements
43
| Portfolio of investments (unaudited) |
Emerging Markets Fund
January 31, 2016
| | | | | Value | |
| Shares | | | | (note 2) | |
| | | | | | |
| Common stocks – 95.45% | | | |
| | | | | | |
| | | Australia – 1.96% | | | |
| 59,436 | | Newcrest Mining, Ltd. * | $ | 548,505 | |
| | | | | | |
| | | Brazil – 9.49% | | | |
| 16,132 | | Banco Bradesco S.A. * | | 79,010 | |
| 507,317 | | Duratex S.A. | | 672,229 | |
| 138,594 | | Mahle-Metal Leve S.A. | | 840,961 | |
| 68,268 | | Natura Cosmeticos S.A. | | 382,491 | |
| 34,919 | | Tractebel Energia S.A. | | 295,429 | |
| 98,814 | | WEG S.A. | | 381,935 | |
| | | | | 2,652,055 | |
| | | | | | |
| | | Chile – 13.40% | | | |
| 93,535 | | Antofagasta plc | | 511,388 | |
| 41,702 | | Cia Cervecerias Unidas | | | |
| | | S.A., ADR | | 900,346 | |
| 12,567,597 | | Cia Sud Americana | | | |
| | | de Vapores S.A. * | | 237,822 | |
| 60,388 | | Empresa Nacional de | | | |
| | | Telecomunicaciones S.A. | | 592,114 | |
| 697,164 | | Inversiones Aguas | | | |
| | | Metropolitanas S.A. | | 947,924 | |
| 310,516 | | Quinenco S.A. | | 552,783 | |
| | | | | 3,742,377 | |
| | | | | | |
| | | China – 7.46% | | | |
| 294,800 | | China Mengniu Dairy Co., Ltd. | | 414,403 | |
| 146,900 | | China Resources Beer | | | |
| | | Holdings Company, Ltd. | | 231,891 | |
| 104,000 | | China Resources Gas | | | |
| | | Group, Ltd. | | 261,696 | |
| 292,400 | | Fuyao Glass Industry Group | | | |
| | | Co., Ltd. (a) * | | 595,884 | |
| 169,300 | | Yue Yuen Industrial | | | |
| | | Holdings, Ltd. | | 580,211 | |
| | | | | 2,084,085 | |
| | | | | | |
| | | Czech Republic – 1.08% | | | |
| 1,434 | | Komercni banka AS | | 301,786 | |
| | | | | | |
| | | Egypt – 0.90% | | | |
| 65,237 | | Commercial International | | | |
| | | Bank Egypt SAE | | 251,163 | |
| | | | | Value | |
| Shares | | | | (note 2) | |
| | | | | | |
| | | India – 13.84% | | | |
| 118,390 | | City Union Bank, Ltd. | $ | 138,847 | |
| 4,530 | | Cognizant Technology | | | |
| | | Solutions Corp., Class A * | | 286,794 | |
| 6,875 | | Dr Reddy's Laboratories, Ltd. | | 312,661 | |
| 51,142 | | Housing Development | | | |
| | | Finance Corp., Ltd. | | 893,120 | |
| 335,955 | | Idea Cellular, Ltd. | | 515,111 | |
| 33,742 | | Infosys, Ltd. | | 583,368 | |
| 21,645 | | Mahindra & Mahindra, Ltd. | | 394,672 | |
| 455,417 | | Tata Power Co., Ltd. | | 405,869 | |
| 45,127 | | Tech Mahindra, Ltd. | | 335,206 | |
| | | | | 3,865,648 | |
| | | | | | |
| | | Indonesia – 1.17% | | | |
| 697,400 | | Hero Supermarket Tbk PT * | | 53,960 | |
| 1,015,800 | | XL Axiata Tbk PT * | | 272,135 | |
| | | | | 326,095 | |
| | | | | | |
| | | Kazakhstan – —% | | | |
| 955,965 | | International Petroleum, | | | |
| | | Ltd. (b) (c) * | | — | |
| | | | | | |
| | | Korea – 3.71% | | | |
| 11,669 | | LG Corp. * | | 724,643 | |
| 1,250 | | Samsung Fire & Marine | | | |
| | | Insurance Co., Ltd. | | 313,025 | |
| | | | | 1,037,668 | |
| | | | | | |
| | | Malaysia – 1.92% | | | |
| 396,812 | | Axiata Group Bhd | | 537,059 | |
| | | | | | |
| | | Mexico – 4.45% | | | |
| 330,749 | | Genomma Lab Internacional | | | |
| | | S.A.B de C.V., Class B * | | 223,019 | |
| 425,533 | | Grupo Herdez SAB de CV | | 1,020,092 | |
| | | | | 1,243,111 | |
| | | | | | |
| | | Nigeria – 3.44% | | | |
| 187,000 | | Guaranty Trust Bank plc | | 15,900 | |
| 101,885 | | Guaranty Trust Bank plc, GDR | | 368,824 | |
| 151,984 | | PZ Cussons plc | | 577,377 | |
| | | | | 962,101 | |
| | | | | | |
| | | Philippines – 1.98% | | | |
| 1,083,300 | | Manila Water Co., Inc. | | 553,774 | |
See notes to financial statements
44
| Portfolio of investments (unaudited) |
Emerging Markets Fund
January 31, 2016 (continued)
| | | | | Value | |
| Shares | | | | (note 2) | |
| | | | | | |
| | | Poland – 3.24% | | | |
| 26,928 | | Bank Pekao S.A. | $ | 905,956 | |
| | | | | | |
| | | South Africa – 9.33% | | | |
| 245,793 | | Grindrod, Ltd. | | 154,323 | |
| 105,199 | | Shoprite Holdings, Ltd. | | 971,839 | |
| 116,392 | | Standard Bank Group, Ltd. | | 826,023 | |
| 35,362 | | Tiger Brands, Ltd. | | 655,334 | |
| | | | | 2,607,519 | |
| | | | | | |
| | | Taiwan – 9.92% | | | |
| 34,000 | | Airtac International Group | | 162,601 | |
| 17,000 | | Asustek Computer, Inc. | | 138,018 | |
| 79,000 | | Chroma ATE, Inc. | | 157,460 | |
| 95,465 | | Delta Electronics, Inc. | | 405,587 | |
| 326,100 | | Standard Foods Corp. | | 780,536 | |
| 59,000 | | Taiwan Semiconductor | | | |
| | | Manufacturing Co., Ltd. | | 251,751 | |
| 521,280 | | Uni-President Enterprises Corp. | | 873,895 | |
| | | | | 2,769,848 | |
| | | | | | |
| | | Thailand – 3.06% | | | |
| 125,700 | | Delta Electronics Thailand pcl | | 281,590 | |
| 63,100 | | Kasikornbank pcl | | 301,518 | |
| 607,700 | | Mega Lifesciences pcl | | 270,710 | |
| | | | | 853,818 | |
| | | | | | |
| | | Turkey – 0.96% | | | |
| 68,973 | | Yazicilar Holding AS, Class A | | 267,346 | |
| | | | | | |
| | | United Kingdom – 4.14% | | | |
| 118,899 | | Cairn Energy plc * | | 242,639 | |
| 20,785 | | Unilever plc | | 914,785 | |
| | | | | 1,157,424 | |
| | | | | | |
| | | Total common stocks | | | |
| | | (Cost $30,373,085) | | 26,667,338 | |
| | | | | Value | |
| Shares | | | | (note 2) | |
| | | | | | |
| Preferred stock – 1.62% | | | |
| | | | | | |
| | | Brazil – 0.62% | | | |
| 38,162 | | Banco Bradesco S.A. | $ | 173,169 | |
| | | | | | |
| | | Chile – 1.00% | | | |
| 115,182 | | Embotelladora Andina S.A. | | 278,510 | |
| | | | | | |
| | | Total preferred stock | | | |
| | | (Cost $594,540) | | 451,679 | |
| | | | | | |
| Rights – —% | | | | | |
| | | | | | |
| | | Brazil – —% | | | |
| 1,217 | | Banco Bradesco S.A. (b) * | | 274 | |
| | | | | | |
| | | Total Rights | | | |
| | | (Cost $—) | | 274 | |
| | | | | | |
| | | Total long-term investments | | | |
| | | (Cost $30,967,625) | | 27,119,291 | |
| | | | | | |
| Total investments – 97.07% | | | |
| | | (Cost $30,967,625) | | 27,119,291 | |
| | | | | | |
| Net other assets and liabilities – 2.93% | | 818,195 | |
| | | | |
| Total net assets – 100.00% | $ | 27,937,486 | |
| * | | Non-income producing security |
| (a) | | Restricted security, purchased pursuant to Rule 144A under the Securities Act of 1933, as amended, and which is exempt from registration under that Act. At January 31, 2016, the restricted securities held by the Fund had an aggregate value of $595,884, which represented 2.1% of net assets. |
| (b) | | Fair valued at January 31, 2016 as determined in good faith using procedures approved by the Board of Trustees. |
| (c) | | The security has been deemed illiquid by the Adviser according to the policies and procedures adopted by the Board of Trustees. |
| ADR | | American Depositary Receipts |
| GDR | | Global Depositary Receipts |
See notes to financial statements
45
| Portfolio of investments (unaudited) |
Emerging Markets Fund
January 31, 2016 (continued)
Other information:
| Currency exposure of portfolio assets | |
| before any currency hedging, if applicable. | % of total |
| Excludes derivatives: | investments |
| | |
| Indian Rupee | 13 | % |
| Brazilian Real | 10 | |
| Taiwan Dollar | 10 | |
| Chilean Peso | 10 | |
| South African Rand | 10 | |
| British Pound | 8 | |
| Hong Kong Dollar | 8 | |
| US Dollar | 7 | |
| Mexican Peso | 5 | |
| South Korean Won | 4 | |
| Polish Zloty | 3 | |
| Thai Baht | 3 | |
| Philippine Peso | 2 | |
| Australian Dollar | 2 | |
| Malaysian Ringgit | 2 | |
| Indonesian Rupiah | 1 | |
| Czech Koruna | 1 | |
| Turkish Lira | 1 | |
| Nigerian Naira | 0 | * |
| | 100 | % |
* Less than 0.05% of total investments.
| Industry concentration as | % of net |
| a percentage of net assets: | assets |
| | | |
| Packaged Foods & Meats | 13.40 | % |
| Diversified Banks | 12.04 | |
| Wireless Telecommunication Services | 5.88 | |
| Industrial Conglomerates | 5.53 | |
| Water Utilities | 5.38 | |
| Household Products | 5.33 | |
| Auto Parts & Equipment | 5.14 | |
| Food Retail | 4.50 | |
| IT Consulting & Other Services | 4.32 | |
| Brewers | 3.22 | |
| Thrifts & Mortgage Finance | 3.20 | |
| Pharmaceuticals | 2.89 | |
| Electronic Components | 2.46 | |
| Forest Products | 2.40 | |
| Footwear | 2.08 | |
| Gold | 1.96 | |
| Industrial Machinery | 1.95 | |
| Diversified Metals & Mining | 1.83 | |
| Electric Utilities | 1.45 | |
| Automobile Manufacturers | 1.41 | |
| Marine | 1.40 | |
| Personal Products | 1.37 | |
| Property & Casualty Insurance | 1.12 | |
| Renewable Electricity | 1.06 | |
| Soft Drinks | 1.00 | |
| Integrated Telecommunication Services | 0.98 | |
| Gas Utilities | 0.94 | |
| Semiconductors | 0.90 | |
| Oil & Gas Exploration & Production | 0.87 | |
| Electronic Equipment & Instruments | 0.56 | |
| Computer Hardware | 0.50 | |
| Long-Term Investments | 97.07 | |
| Total Investments | 97.07 | |
| Net Other Assets and Liabilities | 2.93 | |
| | 100.00 | % |
See notes to financial statements
46
| Portfolio of investments (unaudited) |
Emerging Markets Fund
January 31, 2016 (continued)
Fair Value Measurements
The following table summarizes the Fund's investments that are measured at fair value by level within the fair value hierarchy at January 31, 2016:
| | | | Quoted prices | | | Significant | | | | | | | |
| | | | in active | | | other | | | Significant | | | | |
| | | | markets for | | | observable | | | unobservable | | | | |
| | | | identical assets | | | inputs | | | inputs | | | | |
| Description | | | (level 1 | ) | | (level 2 | ) | | (level 3 | ) | | Total | |
| | | | | | | | | | | | | | |
| Assets | | | | | | | | | | | | | |
| Common Stocks | | | | | | | | | | | | | |
| Australia | | $ | — | | $ | 548,505 | | $ | — | | $ | 548,505 | |
| Brazil | | | 2,652,055 | | | — | | | — | | | 2,652,055 | |
| Chile | | | 3,230,989 | | | 511,388 | | | — | | | 3,742,377 | |
| China | | | — | | | 2,084,085 | | | — | | | 2,084,085 | |
| Czech Republic | | | — | | | 301,786 | | | — | | | 301,786 | |
| Egypt | | | 251,163 | | | — | | | — | | | 251,163 | |
| India | | | 286,794 | | | 3,578,854 | | | — | | | 3,865,648 | |
| Indonesia | | | — | | | 326,095 | | | — | | | 326,095 | |
| Kazakhstan | | | — | | | — | | | — | * | | — | |
| Korea | | | — | | | 1,037,668 | | | — | | | 1,037,668 | |
| Malaysia | | | — | | | 537,059 | | | — | | | 537,059 | |
| Mexico | | | 1,243,111 | | | — | | | — | | | 1,243,111 | |
| Nigeria | | | 368,824 | | | 593,277 | | | — | | | 962,101 | |
| Philippines | | | — | | | 553,774 | | | — | | | 553,774 | |
| Poland | | | — | | | 905,956 | | | — | | | 905,956 | |
| South Africa | | | — | | | 2,607,519 | | | — | | | 2,607,519 | |
| Taiwan | | | — | | | 2,769,848 | | | — | | | 2,769,848 | |
| Thailand | | | — | | | 853,818 | | | — | | | 853,818 | |
| Turkey | | | — | | | 267,346 | | | — | | | 267,346 | |
| United Kingdom | | | — | | | 1,157,424 | | | — | | | 1,157,424 | |
| Total Common Stocks | | | 8,032,936 | | | 18,634,402 | | | — | | | 26,667,338 | |
| | | | | | | | | | | | | | |
| Preferred Stock | | | | | | | | | | | | | |
| Brazil | | | 173,169 | | | | | | | | | 173,169 | |
| Chile | | | 278,510 | | | — | | | — | | | 278,510 | |
| Total Preferred Stock | | | 451,679 | | | — | | | — | | | 451,679 | |
| | | | | | | | | | | | | | |
| Rights | | | | | | | | | | | | | |
| Brazil | | | — | | | 274 | | | — | | | 274 | |
| Total Investments | | $ | 8,484,615 | | $ | 18,634,676 | | $ | — | | $ | 27,119,291 | |
* Fund held a level 3 security that was fair valued at $0 at January 31, 2016.
On July 31, 2015, all of the common stocks held by the Fund were valued at the last reported sale price or official closing price. However, on January 31, 2016, certain of the Fund's common stocks trading in foreign markets were fair valued in accordance with the fair value pricing procedures approved by the Board using the independent statistical fair value service as described in Note 2. Accordingly, using the end of the reporting period method for determining when transfers between levels are recognized, common stocks valued at $16,062,013 on January 31, 2016 were transferred from Level 1 to Level 2.
See notes to financial statements
47
| Portfolio of investments (unaudited) |
Emerging Markets Fund
January 31, 2016 (continued)
Following is a reconciliation of investments in which significant observable inputs (Level 3) were used in determining fair value:
| | | | Balance | | | | | | | | | Change in | | | | | | | | | | | | | | | Balance | |
| | | | as of | | | Accrued | | | | | | unrealized | | | | | | | | | Transfers | | | Transfers | | | as of | |
| | | | July 31, | | | discounts/ | | | Realized | | | appreciation | | | | | | | | | in to | | | out of | | | January 31, | |
| Investments in Securities | | | 2015 | | | premiums | | | gain/(loss | ) | | (depreciation | ) | | Purchases | | | Sales | | | level 3 | | | level 3 | | | 2016 | |
| | | | | | | | | | | | | | | | | | | | | | | | | | | | | |
| Common Stock | | | | | | | | | | | | | | | | | | | | | | | | | | | | |
| International Petroleum, Ltd. | | $ | 0 | | $ | 0 | | $ | 0 | | $ | 0 | | $ | 0 | | $ | 0 | | $ | 0 | | $ | 0 | | $ | 0 | |
The total net change in unrealized appreciation (depreciation) attributable to level 3 investments held at January 31, 2016 was $0.
The Fund's Adviser has determined that International Petroleum, Ltd. is a Level 3 investment due to the lack of observable inputs that may be used in the determination of fair value. The fair valuation reflects that this early-stage exploration company has been suspended from trading since October 2013 due to significant doubt about its ability to sell its Russian-based assets and its failed merger with Range Resources, Ltd.
See notes to financial statements
48
| Portfolio of investments (unaudited) |
European Focus Fund
January 31, 2016
| | | | | Value | |
| Shares | | | | (note 2) | |
| | | | | | |
| Common stocks – 95.92% | | | |
| | | | | | |
| | | Australia – 0.03% | | | |
| 5,261,500 | | African Petroleum Corp., Ltd. * | $ | 1,013,601 | |
| | | | | | |
| | | Canada – 0.84% | | | |
| 5,000,000 | | Africa Energy Corp. (a) * | | 428,296 | |
| 5,752,083 | | Africa Energy Corp. (a) (d) * | | 295,631 | |
| 2,235,878 | | Africa Oil Corp. (b)* | | 3,096,298 | |
| 574,622 | | Africa Oil Corp. (d) * | | 795,750 | |
| 10,925,000 | | Africa Oil Corp. * | | 15,351,803 | |
| 3,964,200 | | First Quantum Minerals, Ltd.(b) | | 8,574,150 | |
| | | | | 28,541,928 | |
| | | | | | |
| | | Denmark – 3.51% | | | |
| 600,000 | | Genmab A/S * | | 75,139,021 | |
| 800,000 | | Novo Nordisk A/S | | 44,674,960 | |
| | | | | 119,813,981 | |
| | | | | | |
| | | Finland – 8.85% | | | |
| 20,350,000 | | Nokia Oyj * | | 147,148,309 | |
| 20,250,000 | | Nokia Oyj | | 145,239,448 | |
| 4,000,000 | | Outokumpu Oyj (b)* | | 9,802,772 | |
| | | | | 302,190,529 | |
| | | | | | |
| | | France – 7.33% | | | |
| 1,200,000 | | Accor S.A. | | 46,101,018 | |
| 999,875 | | Renault S.A. | | 84,718,302 | |
| 3,000,000 | | Rexel S.A. | | 35,573,034 | |
| 1,000,000 | | Sanofi | | 83,968,617 | |
| | | | | 250,360,971 | |
| | | | | | |
| | | Germany – 7.65% | | | |
| 250,000 | | Continental AG | | 52,208,223 | |
| 550,000 | | Fresenius SE & Co., KGaA | | 36,393,324 | |
| 1,200,000 | | KION Group AG * | | 59,209,653 | |
| 1,225,000 | | ProSiebenSat.1 Media SE | | 60,980,774 | |
| 3,100,000 | | TUI AG | | 52,635,849 | |
| | | | | 261,427,823 | |
| | | | | | |
| | | Greece – 0.72% | | | |
| 30,000,000 | | Eurobank Ergasias S.A. * | | 24,528,531 | |
| | | | | | |
| | | Ireland – 0.79% | | | |
| 80,000,000 | | Bank of Ireland * | | 26,512,607 | |
| 2,300,000 | | Providence Resources plc * | | 368,991 | |
| | | | | 26,881,598 | |
| | | | | Value | |
| Shares | | | | (note 2) | |
| | | | | | |
| | | Israel – 3.96% | | | |
| 2,200,000 | | Teva Pharmaceutical | | | |
| | | Industries, Ltd., ADR | $ | 135,256,000 | |
| | | | | | |
| | | Italy – 4.05% | | | |
| 12,000,000 | | Intesa Sanpaolo SpA | | 34,202,142 | |
| 12,750,000 | | Poste Italiane SpA (c) * | | 94,886,958 | |
| 2,400,000 | | Salini Impregilo SpA | | 9,330,396 | |
| | | | | 138,419,496 | |
| | | | | | |
| | | Netherlands – 5.75% | | | |
| 1,000,000 | | ASML Holding N.V. (b) | | 91,890,629 | |
| 2,250,000 | | Koninklijke Ahold N.V. | | 51,071,106 | |
| 1,450,000 | | Nostrum Oil & Gas plc (b) | | 5,725,040 | |
| 1,300,000 | | Sensata Technologies | | | |
| | | Holding N.V. * | | 47,710,000 | |
| | | | | 196,396,775 | |
| | | | | | |
| | | Nigeria – 0.05% | | | |
| 8,000,000 | | Lekoil, Ltd. * | | 1,798,189 | |
| | | | | | |
| | | Panama – 1.20% | | | |
| 850,000 | | Carnival Corp. | | 40,910,500 | |
| | | | | | |
| | | Russia – 0.12% | | | |
| 1,500,000 | | TCS Group Holding plc, | | | |
| | | GDR (a)(c) * | | 4,050,000 | |
| | | | | | |
| | | Spain – 2.39% | | | |
| 2,453,602 | | Atresmedia Corp de Medios | | | |
| | | de Comunicacion S.A. (b) | | 23,233,792 | |
| 14,000,000 | | NH Hotel Group S.A. * | | 58,463,977 | |
| | | | | 81,697,769 | |
| | | | | | |
| | | Sweden – 1.58% | | | |
| 3,750,000 | | Lundin Petroleum AB (b)* | | 53,909,054 | |
| | | | | | |
| | | Switzerland – 8.30% | | | |
| 786,627 | | Dufry AG (b)* | | 85,147,627 | |
| 700,000 | | LafargeHolcim, Ltd. * | | 29,904,084 | |
| 4,000,000 | | OC Oerlikon Corp. AG * | | 35,814,286 | |
| 510,000 | | Roche Holding AG | | 132,682,010 | |
| | | | | 283,548,007 | |
| | | | | | |
| | | United Kingdom – 38.80% | | | |
| 10,989,691 | | AA, Ltd. | | 46,420,986 | |
| 7,650,000 | | Aberdeen Asset | | | |
| | | Management plc | | 26,935,804 | |
| 5,000,000 | | ARM Holdings plc | | 71,781,124 | |
See notes to financial statements
49
| Portfolio of investments (unaudited) |
European Focus Fund
January 31, 2016 (continued)
| | | | | Value | |
| Shares | | | | (note 2) | |
| | | | | | |
| | | United Kingdom (continued) | | | |
| 8,100,000 | | Ashmore Group plc (b) | $ | 25,344,926 | |
| 2,000,000 | | AstraZeneca plc | | 127,946,860 | |
| 7,000,000 | | Aviva plc | | 48,342,883 | |
| 33,000,000 | | Barclays plc | | 88,135,642 | |
| 11,000,000 | | BG Group plc | | 166,750,539 | |
| 5,000,000 | | BHP Billiton plc | | 48,687,119 | |
| 4,000,000 | | Burberry Group plc | | 68,232,578 | |
| 3,000,000 | | Genel Energy plc (b)* | | 4,524,823 | |
| 2,800,000 | | IMI plc (b) | | 32,307,870 | |
| 12,250,000 | | Indivior plc | | 26,456,358 | |
| 4,750,000 | | Informa plc | | 43,246,453 | |
| 4,100,000 | | Inmarsat plc | | 64,579,066 | |
| 3,500,000 | | Just Eat plc * | | 18,736,234 | |
| 12,000,000 | | Kingfisher plc | | 56,161,167 | |
| 1,750,000 | | Liberty Global plc, Class A * | | 60,217,500 | |
| 161,992 | | LivaNova plc (b)* | | 9,068,312 | |
| 45,000,000 | | Lloyds Banking Group plc | | 42,210,824 | |
| 7,500,000 | | Merlin Entertainments plc (c) | | 44,407,131 | |
| 4,350,000 | | Mytrah Energy, Ltd. (a) * | | 2,742,468 | |
| 1,350,000 | | Phoenix Group Holdings | | 16,700,219 | |
| 1,536,645 | | Royal Dutch Shell plc, B Shares | | 33,303,273 | |
| 5,650,000 | | Royal Mail plc | | 37,163,440 | |
| 17,200,000 | | Saga plc | | 48,161,294 | |
| 9,276,000 | | Savannah Petroleum plc (a) (d) * | | 3,122,603 | |
| 5,600,000 | | William Hill plc | | 31,146,683 | |
| 7,267,502 | | Worldpay Group plc (c) * | | 32,542,007 | |
| | | | | 1,325,376,186 | |
| | | | | | |
| | | Total common stocks | | | |
| | | (Cost $3,629,632,870) | | 3,276,120,938 | |
| | | | | | |
| Preferred stock – 1.44% | | | | | |
| | | | | | |
| | | Italy – 1.44% | | | |
| 18,600,000 | | Intesa Sanpaolo SpA | | 49,247,721 | |
| | | | | | |
| | | Total preferred stock | | | |
| | | (Cost $52,704,948) | | 49,247,721 | |
| | | | | | |
| Warrants – —% | | | | | |
| | | | | | |
| | | Norway – —% | | | |
| 2,388,950 | | African Petroleum Corp., | | | |
| | | Ltd. (expires 3/16/17) (a)(d) * | | — | |
| | | | | | |
| | | Total Warrants | | | |
| | | (Cost $—) | | — | |
| | | | | | |
| | | Total long-term investments | | | |
| | | (Cost $3,682,337,818) | | 3,325,368,659 | |
| | | | | Value | |
| Shares | | | | (note 2) | |
| | | | | | |
| Short-term investment – 3.04% | | | |
| 103,874,842 | | Fidelity Institutional Treasury | | | |
| | | Portfolio (e) | $ | 103,874,842 | |
| | | | | | |
| | | Total short-term investment | | | |
| | | (Cost $103,874,842) | | 103,874,842 | |
| | | | | | |
| Other securities – 1.62% | | | |
| 55,198,044 | | State Street Navigator | | | |
| | | Securities Lending | | | |
| | | Prime Portfolio (f) | | 55,198,044 | |
| | | | | | |
| | | Total other securities | | | |
| | | (Cost $55,198,044) | | 55,198,044 | |
| | | | | | |
| Total investments – 102.02% | | | |
| | | (Cost $3,841,410,704) | | 3,484,441,545 | |
| | | | | | |
| Financial Derivative Instruments(g) | | | |
(Cost or Premiums, net $0) – (0.30)% | | (10,198,008) | |
| | | | | | |
| Net other assets and liabilities – (1.72)% | | (58,671,586) | |
| | | | | | |
| Total net assets – 100.00% | $ | 3,415,571,951 | |
| * | | Non-income producing security |
| (a) | | The security has been deemed illiquid by the Adviser according to the policies and procedures adopted by the Board of Trustees. |
| (b) | | All or a portion of this security is on loan on an overnight and continuous basis; see notes to financial statements for further information. |
| (c) | | Restricted security, purchased pursuant to Rule 144A under the Securities Act of 1933, as amended, and which is exempt from registration under that Act. At January 31, 2016, the restricted securities held by the Fund had an aggregate value of $175,886,096, which represented 5.2% of net assets. |
| (d) | | Fair valued at January 31, 2016 as determined in good faith using procedures approved by the Board of Trustees. |
| (e) | | This short-term investment has been segregated for delayed delivery purchases at January 31, 2016. |
| (f) | | Represents cash collateral received from securities lending transactions; see notes to financial statements for further information. |
| (g) | | Information with respect to financial derivative instruments is disclosed in the following tables. |
| ADR | | American Depositary Receipts |
| GDR | | Global Depositary Receipts |
See notes to financial statements
50
| Portfolio of investments (unaudited) |
European Focus Fund
January 31, 2016 (continued)
(g) FINANCIAL DERIVATIVE INSTRUMENTS
OVER-THE-COUNTER FINANCIAL DERIVATIVE INSTRUMENTS
FORWARD FOREIGN CURRENCY CONTRACTS
| | | | | | | | | | | | | | | | Unrealized | |
| | | | | | | | | | Local | | | Current | | | appreciation/ | |
| | | | | | | Value | | | amount | | | notional | | | (depreciation) | |
| | | | Counterparty | | | date | | | (000's | ) | | value | | | Asset | | | Liability | |
| Euro (Short) | | | Citibank, N.A. | | | 2/12/16 | | | 448,265 | | $ | 485,720,630 | | $ | — | | $ | (5,720,630 | ) |
| Euro (Long) | | | State Street Bank | | | | | | | | | | | | | | | | |
| | | | and Trust Company | | | 2/12/16 | | | 448,265 | | | 485,720,630 | | | — | | | (4,477,378 | ) |
| Total | | | | | | | | | | | | | | $ | — | | $ | (10,198,008 | ) |
During the period ended January 31, 2016, average monthly notional value related to forward foreign currency contracts was approximately $420.8 million or 12.3% of ending net assets.
FINANCIAL DERIVATIVE INSTRUMENTS: OVER-THE-COUNTER SUMMARY
The following is a summary by counterparty of the value of over-the-counter financial derivative instruments and collateral (received)/pledged as of January 31, 2016.
| | | | Unrealized | | | | | | Unrealized | | | | | | | | | | | | | |
| | | | Appreciation | | | | | | Depreciation | | | | | | | | | | | | | |
| | | | Forward | | | | | | Forward | | | | | | | | | | | | | |
| | | | Foreign | | | Total | | | Foreign | | | Total | | | Net Value | | | Collateral | | | | |
| | | | Currency | | | Over-the- | | | Currency | | | Over-the- | | | of OTC | | | (Received) / | | | Net | |
| | | | Contracts | | | Counter | | | Contracts | | | Counter | | | Derivatives | | | Pledged | | | Exposure(1) | |
| | | | | | | | | | | | | | | | | | | | | | | |
| Amounts subject to a master netting or similar agreement: | | | | | | | | | | | | | |
| Citibank, N.A. | | $ | — | | $ | — | | $ | (5,720,630 | ) | $ | (5,720,630 | ) | $ | (5,720,630 | ) | $ | — | | $ | (5,720,630 | ) |
| | | $ | — | | $ | — | | $ | (5,720,630 | ) | $ | (5,720,630 | ) | $ | (5,720,630 | ) | | — | | $ | (5,720,630 | ) |
| | | | | | | | | | | | | | | | | | | | | | | |
| Amounts NOT subject to a master netting or similar agreement: | | | | | | | | | | | | | |
| State Street Bank | | | | | | | | | | | | | | | | | | | | | | |
and Trust Company(2) | | $ | — | | $ | — | | $ | (4,477,378 | ) | $ | (4,477,378 | ) | | | | | | | | | |
| | | $ | — | | $ | — | | $ | (4,477,378 | ) | $ | (4,477,378 | ) | | | | | | | | | |
| Total Over- | | | | | | | | | | | | | | | | | | | | | | |
| the-Counter | | $ | — | | $ | — | | $ | (10,198,008 | ) | $ | (10,198,008 | ) | | | | | | | | | |
| (1) | | Net Exposure represents the net receivable/(payable) that would be due from/to the counterparty in the event of default. Exposure from over-the-counter financial derivative instruments can only be netted across transactions governed under the same master agreement with the same legal entity. See Note 2, Significant Accounting Policies, "Derivative instruments," in the Notes to Financial Statements for more information regarding master netting arrangements. |
| (2) | | Forward foreign currency contracts with State Street Bank and Trust Company are not subject to a legally enforceable master netting arrangement or other similar agreements that provide a legally enforceable right of offset. |
| | | Cost or Premiums, Net | | | Asset | | | Liability | |
| TOTAL FINANCIAL DERIVATIVE INSTRUMENTS | | $ | — | | $ | — | | $ | (10,198,008 | ) |
See notes to financial statements
51
| Portfolio of investments (unaudited) |
European Focus Fund
January 31, 2016 (continued)
Other information:
| Currency exposure of portfolio assets before | |
| any currency hedging, if applicable. | % of total |
| Excludes derivatives: | investments |
| | | |
| British Pound | 38 | % |
| Euro | 37 | |
| US Dollar | 12 | |
| Swiss Franc | 7 | |
| Danish Krone | 4 | |
| Swedish Krona | 2 | |
| Canadian Dollar | 0 | * |
| Norwegian Krone | 0 | * |
| | 100 | % |
* Less than 0.05% of total investments.
| Industry concentration as | % of net |
| a percentage of net assets: | assets |
| Pharmaceuticals | 16.13 | % |
| Communications Equipment | 8.56 | |
| Diversified Banks | 7.75 | |
| Integrated Oil & Gas | 5.86 | |
| Hotels, Resorts & Cruise Lines | 5.80 | |
| Life & Health Insurance | 3.27 | |
| Multi-line Insurance | 2.83 | |
| Semiconductor Equipment | 2.69 | |
| Oil & Gas Exploration & Production | 2.64 | |
| Specialty Stores | 2.49 | |
| Automobile Manufacturers | 2.48 | |
| Biotechnology | 2.20 | |
| Semiconductors | 2.10 | |
| Industrial Machinery | 2.00 | |
| Apparel, Accessories & Luxury Goods | 2.00 | |
| Alternative Carriers | 1.89 | |
| Broadcasting | 1.79 | |
| Cable & Satellite | 1.76 | |
| Material Handling Machinery Manufacturing | 1.73 | |
| Diversified Metals & Mining | 1.68 | |
| Home Improvement Retail | 1.64 | |
| Asset Management & Custody Banks | 1.53 | |
| Tires & Rubber | 1.53 | |
| Food Retail | 1.50 | |
| Electrical Components & Equipment | 1.39 | |
| Diversified Support Services | 1.36 | |
| Leisure Facilities | 1.30 | |
| Publishing | 1.27 | |
| Air Freight & Logistics | 1.09 | |
| Health Care Services | 1.07 | |
| Trading Companies & Distributors | 1.04 | |
| Data Processing & Outsourced Services | 0.95 | |
| Casinos & Gaming | 0.91 | |
| Construction Materials | 0.87 | |
| Broadcasting | 0.68 | |
| Internet Software & Services | 0.55 | |
| Steel | 0.29 | |
| Construction & Engineering | 0.27 | |
| Health Care Equipment | 0.27 | |
| Regional Banks | 0.12 | |
| Independent Power Producers & Energy Traders | 0.08 | |
| Long Term Investments | 97.36 | |
| Short Term | 3.04 | |
| Other securities | 1.62 | |
| Total Investments | 102.02 | |
| Financial Derivative Instruments | (0.30 | ) |
| Net Other Assets and Liabilities | (1.72 | ) |
| | 100.00 | % |
See notes to financial statements
52
| Portfolio of investments (unaudited) |
European Focus Fund
January 31, 2016 (continued)
Fair Value Measurements
The following table summarizes the Fund's investments that are measured at fair value by level within the fair value hierarchy at January 31, 2016:
| | | | Quoted prices | | | Significant | | | | | | | |
| | | | in active | | | other | | | Significant | | | | |
| | | | markets for | | | observable | | | unobservable | | | | |
| | | | identical assets | | | inputs | | | inputs | | | | |
| Description | | | (Level 1 | ) | | (Level 2 | ) | | (Level 3 | ) | | Total | |
| | | | | | | | | | | | | | |
| Assets | | | | | | | | | | | | | |
| | | | | | | | | | | | | | |
| Common Stocks | | | | | | | | | | | | | |
| Australia | | $ | — | | $ | 1,013,601 | | $ | — | | $ | 1,013,601 | |
| Canada | | | 12,098,744 | | | 16,443,184 | | | — | | | 28,541,928 | |
| Denmark | | | — | | | 119,813,981 | | | — | | | 119,813,981 | |
| Finland | | | — | | | 302,190,529 | | | — | | | 302,190,529 | |
| France | | | — | | | 250,360,971 | | | — | | | 250,360,971 | |
| Germany | | | — | | | 261,427,823 | | | — | | | 261,427,823 | |
| Greece | | | — | | | 24,528,531 | | | — | | | 24,528,531 | |
| Ireland | | | — | | | 26,881,598 | | | — | | | 26,881,598 | |
| Israel | | | 135,256,000 | | | — | | | — | | | 135,256,000 | |
| Italy | | | — | | | 138,419,496 | | | — | | | 138,419,496 | |
| Netherlands | | | 47,710,000 | | | 148,686,775 | | | — | | | 196,396,775 | |
| Nigeria | | | — | | | 1,798,189 | | | — | | | 1,798,189 | |
| Panama | | | 40,910,500 | | | — | | | — | | | 40,910,500 | |
| Russia | | | 4,050,000 | | | — | | | — | | | 4,050,000 | |
| Spain | | | — | | | 81,697,769 | | | — | | | 81,697,769 | |
| Sweden | | | — | | | 53,909,054 | | | — | | | 53,909,054 | |
| Switzerland | | | — | | | 283,548,007 | | | — | | | 283,548,007 | |
| United Kingdom | | | 102,589,085 | | | 1,222,787,101 | | | — | | | 1,325,376,186 | |
| Total common stocks | | | 342,614,329 | | | 2,933,506,609 | | | — | | | 3,276,120,938 | |
| | | | | | | | | | | | | | |
| Preferred stock | | | | | | | | | | | | | |
| Italy | | | — | | | 49,247,721 | | | — | | | 49,247,721 | |
| Total preferred stock | | | — | | | 49,247,721 | | | — | | | 49,247,721 | |
| | | | | | | | | | | | | | |
| Warrants | | | | | | | | | | | | | |
| Norway | | | — | | | — | * | | — | | | — | |
| Total Warrants | | | — | | | — | | | — | | | — | |
| | | | | | | | | | | | | | |
| Short-term investment | | | 103,874,842 | | | — | | | — | | | 103,874,842 | |
| Other Securities | | | 55,198,044 | | | — | | | — | | | 55,198,044 | |
| Total investments | | $ | 501,687,215 | | $ | 2,982,754,330 | | $ | — | | $ | 3,484,441,545 | |
See notes to financial statements
53
| Portfolio of investments (unaudited) |
European Focus Fund
January 31, 2016 (continued)
| | | | Quoted prices | | | Significant | | | | | | | |
| | | | in active | | | other | | | Significant | | | | |
| | | | markets for | | | observable | | | unobservable | | | | |
| | | | identical assets | | | inputs | | | inputs | | | | |
| Description | | | (Level 1 | ) | | (Level 2 | ) | | (Level 3 | ) | | Total | |
| | | | | | | | | | | | | | |
| Financial Derivative Instruments – Liabilities | | | | | | | | | | | | | |
| Over-the-counter | | | — | | $ | (10,198,008 | ) | | — | | $ | (10,198,008 | ) |
| Total Financial Derivative Instruments – Liabilities | | | — | | $ | (10,198,008 | ) | | — | | $ | (10,198,008 | ) |
* Fund held a Level 2 security that was fair valued at $0 at January 31, 2016.
On July 31, 2015, substantially all of the common and preferred stocks held by the Fund were valued at the last reported sale price or official closing price. However, on January 31, 2016, certain of the Fund's common and preferred stocks trading in foreign markets were fair valued in accordance with the fair value pricing procedures approved by the Board using the independent statistical fair value service as described in Note 2. Accordingly, using the end of the reporting period method for determining when transfers between levels are recognized, common stocks valued at $2,324,987,977 on January 31, 2016 were transferred from Level 1 to Level 2.
Fair Value of Financial Derivative Instruments
The following is a summary of the fair valuation of the Fund's financial derivative instruments categorized by risk exposure:
Fair Values of Financial Derivative Instruments on the Statement of Assets and Liabilities as of January 31, 2016
| | | Derivatives not accounted for as hedging instruments | |
| | | | Foreign | | | | | | | | | | | | | | | | |
| | | | Currency | | | Equity | | | Interest | | | Credit | | | Inflation | | | | |
| | | | Risk | | | Risk | | | Rate Risk | | | Risk | | | Risk | | | Total | |
| | | | | | | | | | | | | | | | | | | | |
| Financial Derivative Instruments – Liabilities | | | | | | | | | | | | | | | | | | | |
| Over-the-Counter | | | | | | | | | | | | | | | | | | | |
| Forward Foreign Currency Contracts | | $ | (10,198,008 | ) | $ | — | | $ | — | | $ | — | | $ | — | | $ | (10,198,008 | ) |
| Total | | $ | (10,198,008 | ) | $ | — | | $ | — | | $ | — | | $ | — | | $ | (10,198,008 | ) |
Effect of Financial Derivative Instruments on the Statement of Operations for the Period Ended January 31, 2016
| | | Derivatives not accounted for as hedging instruments | |
| | | | Foreign | | | | | | | | | | | | | | | | |
| | | | Currency | | | Equity | | | Interest | | | Credit | | | Inflation | | | | |
| | | | Risk | | | Risk | | | Rate Risk | | | Risk | | | Risk | | | Total | |
| | | | | | | | | | | | | | | | | | | | |
| Net realized gain/(loss) from | | | | | | | | | | | | | | | | | | | |
| financial derivative instruments: | | | | | | | | | | | | | | | | | | | |
| Forward Foreign Currency Contracts | | $ | 10,977,854 | | $ | — | | $ | — | | $ | — | | $ | — | | $ | 10,977,854 | |
| Total | | $ | 10,977,854 | | $ | — | | $ | — | | $ | — | | $ | — | | $ | 10,977,854 | |
| | | | | | | | | | | | | | | | | | | | |
| Net change in unrealized | | | | | | | | | | | | | | | | | | | |
| appreciation/(depreciation) | | | | | | | | | | | | | | | | | | | |
| of financial derivative instruments | | | | | | | | | | | | | | | | | | | |
| Forward Foreign Currency Contracts | | $ | (10,198,008 | ) | $ | — | | $ | — | | $ | — | | $ | — | | $ | (10,198,008 | ) |
| Total | | $ | (10,198,008 | ) | $ | — | | $ | — | | $ | — | | $ | — | | $ | (10,198,008 | ) |
See notes to financial statements
54
| Portfolio of investments (unaudited) |
Global Equity Income Fund
January 31, 2016
| | | | | Value | |
| Shares | | | | (note 2) | |
| | | | | | |
| Common stocks – 86.55% | | | |
| | | | | | |
| | | Australia – 8.14% | | | |
| 5,440,275 | | Amcor, Ltd. | $ | 51,602,506 | |
| 2,667,333 | | Australia & New Zealand | | | |
| | | Banking Group, Ltd. | | 46,199,006 | |
| 43,325,636 | | DUET Group | | 71,163,699 | |
| 2,591,610 | | Premier Investments, Ltd. | | 24,299,348 | |
| 3,767,719 | | Sonic Healthcare, Ltd. | | 49,344,493 | |
| 4,216,230 | | Suncorp Group, Ltd. | | 34,982,250 | |
| | | | | 277,591,302 | |
| | | | | | |
| | | Canada – 2.88% | | | |
| 741,931 | | Bank of Montreal | | 39,837,283 | |
| 840,996 | | BCE, Inc. | | 33,876,368 | |
| 833,849 | | Crescent Point Energy Corp. | | 9,243,826 | |
| 951,931 | | Inter Pipeline, Ltd. | | 15,424,965 | |
| | | | | 98,382,442 | |
| | | | | | |
| | | France – 2.47% | | | |
| 1,020,490 | | Lagardere SCA | | 29,202,806 | |
| 3,070,596 | | Orange S.A. | | 55,000,593 | |
| | | | | 84,203,399 | |
| | | | | | |
| | | Germany – 4.03% | | | |
| 1,961,458 | | Deutsche Telekom AG | | 34,049,862 | |
| 738,267 | | Siemens AG | | 70,673,344 | |
| 1,928,271 | | TUI AG | | 32,740,704 | |
| | | | | 137,463,910 | |
| | | | | | |
| | | Israel – 1.08% | | | |
| 17,072,461 | | Bezeq The Israeli | | | |
| | | Telecommunication Corp, Ltd. | | 36,999,378 | |
| | | | | | |
| | | Japan – 1.46% | | | |
| 7,849,000 | | Daiwa Securities Group, Inc. | | 49,619,268 | |
| | | | | | |
| | | Korea – 4.20% | | | |
| 1,183,341 | | KB Financial Group, Inc. | | 30,398,468 | |
| 829,044 | | Korea Electric Power Corp. * | | 36,515,505 | |
| 386,794 | | KT&G Corp. | | 33,446,153 | |
| 2,171,988 | | SK Telecom Co., Ltd., ADR | | 42,809,883 | |
| | | | | 143,170,009 | |
| | | | | | |
| | | Luxembourg – 1.02% | | | |
| 429,082 | | RTL Group S.A. | | 34,723,393 | |
| | | | | | |
| | | New Zealand – 2.78% | | | |
| 7,133,282 | | Fletcher Building, Ltd. | | 31,951,101 | |
| | | | | Value | |
| Shares | | | | (note 2) | |
| | | | | | |
| | | New Zealand (continued) | | | |
| 28,494,993 | | Spark New Zealand, Ltd. | $ | 62,899,782 | |
| | | | | 94,850,883 | |
| | | | | | |
| | | Norway – 1.27% | | | |
| 2,669,510 | | Telenor ASA | | 43,438,192 | |
| | | | | | |
| | | Singapore – 1.40% | | | |
| 19,237,900 | | Singapore | | | |
| | | Telecommunications, Ltd. | | 47,835,256 | |
| | | | | | |
| | | Spain – 0.70% | | | |
| 1,211,559 | | Gas Natural SDG S.A. | | 23,856,080 | |
| | | | | | |
| | | Switzerland – 7.62% | | | |
| 687,816 | | Nestle S.A. | | 50,662,071 | |
| 1,420,127 | | Novartis AG | | 110,154,529 | |
| 380,870 | | Roche Holding AG | | 99,087,445 | |
| | | | | 259,904,045 | |
| | | | | | |
| | | United Kingdom – 34.95% | | | |
| 7,536,154 | | Ashmore Group plc | | 23,580,650 | |
| 883,262 | | AstraZeneca plc | | 56,505,300 | |
| 10,156,505 | | BAE Systems plc | | 74,961,353 | |
| 12,318,365 | | Barclays plc | | 32,899,606 | |
| 652,007 | | Berkeley Group Holdings plc | | 32,965,594 | |
| 13,187,849 | | BP plc | | 71,455,166 | |
| 1,581,506 | | British American Tobacco plc | | 87,924,285 | |
| 12,091,981 | | Centrica plc | | 35,504,356 | |
| 2,047,422 | | Compass Group plc | | 35,293,903 | |
| 10,645,272 | | Connect Group plc (a) | | 22,166,294 | |
| 6,076,260 | | DS Smith plc | | 31,827,005 | |
| 1,490,769 | | Galliford Try plc | | 31,686,348 | |
| 3,504,254 | | GlaxoSmithKline plc | | 72,189,623 | |
| 13,466,800 | | HSBC Holdings plc | | 95,301,396 | |
| 674,623 | | Imperial Tobacco Group plc | | 36,551,077 | |
| 5,226,589 | | Investec plc | | 33,380,964 | |
| 631,796 | | Johnson Matthey plc | | 22,385,293 | |
| 1,938,867 | | Pearson plc | | 21,983,427 | |
| 2,890,925 | | Phoenix Group Holdings | | 35,762,281 | |
| 1,583,753 | | Prudential plc | | 31,130,704 | |
| 909,775 | | Rio Tinto plc | | 22,376,385 | |
| 3,535,116 | | Royal Dutch Shell plc, A Shares | | 77,599,998 | |
| 5,258,045 | | Royal Mail plc | | 34,585,317 | |
| 4,317,512 | | Sky plc | | 66,914,983 | |
| 2,851,137 | | Standard Life plc | | 14,882,334 | |
| 4,613,316 | | Tullett Prebon plc | | 22,112,744 | |
| 21,422,580 | | Vodafone Group plc | | 68,528,331 | |
| | | | | 1,192,454,717 | |
See notes to financial statements
55
| Portfolio of investments (unaudited) |
Global Equity Income Fund
January 31, 2016 (continued)
| | | | | Value | |
| Shares | | | | (note 2) | |
| | | | | | |
| | | United States – 12.55% | | | |
| 2,988,513 | | Ares Capital Corp. | $ | 41,540,331 | |
| 2,013,538 | | Cisco Systems, Inc. | | 47,902,069 | |
| 510,144 | | Johnson & Johnson | | 53,279,439 | |
| 183,082 | | Lockheed Martin Corp. | | 38,630,302 | |
| 778,679 | | Microsoft Corp. | | 42,897,426 | |
| 1,100,312 | | Pfizer, Inc. | | 33,548,513 | |
| 512,526 | | Philip Morris International, Inc. | | 46,132,465 | |
| 1,006,054 | | Six Flags Entertainment Corp. | | 50,574,335 | |
| 1,472,780 | | Verizon Communications, Inc. | | 73,594,817 | |
| | | | | 428,099,697 | |
| | | | | | |
| | | Total common stocks | | | |
| | | (Cost $3,164,082,046) | | 2,952,591,971 | |
| | | | | | |
| Partnerships – 0.60% | | | | | |
| | | | | | |
| | | United States – 0.60% | | | |
| 3,985,329 | | Och-Ziff Capital Management | | | |
| | | Group LLC, Class A | | 20,564,298 | |
| | | | | | |
| | | Total partnerships | | | |
| | | (Cost $49,963,875) | | 20,564,298 | |
| | | | | | |
| REITs – 7.67% | | | | | |
| | | | | | |
| | | Australia – 1.58% | | | |
| 17,366,752 | | Scentre Group | | 53,867,441 | |
| | | | | | |
| | | France – 1.28% | | | |
| 613,177 | | ICADE | | 43,581,963 | |
| | | | | | |
| | | Netherlands – 1.38% | | | |
| 1,074,796 | | Eurocommercial Properties N.V. | | 47,113,713 | |
| | | | | | |
| | | Singapore – 1.07% | | | |
| 22,414,783 | | Ascendas Real Estate | | | |
| | | Investment Trust | | 36,455,145 | |
| | | | | | |
| | | United States – 2.36% | | | |
| 1,721,864 | | Iron Mountain, Inc. | | 47,420,134 | |
| 423,242 | | The Macerich Co. | | 33,000,179 | |
| | | | | 80,420,313 | |
| | | | | | |
| | | Total REITs | | | |
| | | (Cost $277,963,103) | | 261,438,575 | |
| | | | | Value | |
| Shares | | | | (note 2) | |
| | | | | | |
| Investment companies – 0.51% | | | |
| | | | | | |
| | | Thailand – 0.51% | | | |
| 49,043,900 | | Digital Telecommunications | | | |
| | | Infrastructure Fund | $ | 17,432,515 | |
| | | | | | |
| | | Total investment companies | | | |
| | | (Cost $17,809,014) | | 17,432,515 | |
| | | | | | |
| | | Total long-term investments | | | |
| | | (Cost $3,509,818,038) | | 3,252,027,359 | |
| | | | | | |
| Short-term investment – 3.47% | | |
| 118,441,365 | | Fidelity Institutional Treasury | | | |
| | | Portfolio | | 118,441,365 | |
| | | | | | |
| | | Total short-term investment | | | |
| | | (Cost $118,441,365) | | 118,441,365 | |
| | | | | | |
| Total investments – 98.80% | | | |
| | | (Cost $3,628,259,403) | | 3,370,468,724 | |
| | | | | | |
| Financial Derivative Instruments(b) | | | |
(Cost or Premiums, net — $0) – 0.47% | | 15,936,658 | |
| | | | | | |
| Net other assets and liabilities – 0.73% | | 25,121,062 | |
| | | | | | |
| Total net assets – 100.00% | $ | 3,411,526,444 | |
| * | | Non-income producing security |
| (a) | | This security has been deemed illiquid in accordance to the policies and procedures adopted by the Board of Trustees. |
| (b) | | Information with respect to financial derivative instruments is disclosed in the following tables. |
| ADR | | American Depositary Receipts |
| REIT | | Real Estate Investment Trust |
See notes to financial statements
56
| Portfolio of investments (unaudited) |
Global Equity Income Fund
January 31, 2016 (continued)
(b) FINANCIAL DERIVATIVE INSTRUMENTS
OVER-THE-COUNTER FINANCIAL DERIVATIVE INSTRUMENTS
FORWARD FOREIGN CURRENCY CONTRACTS
| | | | | | | | | | | | | | | | Unrealized | |
| | | | | | | | | | Local | | | Current | | | appreciation/ | |
| | | | | | | Value | | | amount | | | notional | | | (depreciation) | |
| | | | Counterparty | | | date | | | (000's | ) | | value | | | Asset | | | Liability | |
| | | | | | | | | | | | | | | | | | | | |
| Australian Dollar (Short) | | | JP Morgan | | | | | | | | | | | | | | | | |
| | | | Chase Bank, N.A. | | | 4/08/16 | | | 121,000 | | $ | 85,371,550 | | $ | — | | $ | (250,112 | ) |
| Australian Dollar (Short) | | | Deutsche Bank AG | | | 4/08/16 | | | 58,500 | | | 41,274,675 | | | — | | | (98,748 | ) |
| Australian Dollar (Short) | | | Citibank, N.A. | | | 4/08/16 | | | 60,500 | | | 42,685,775 | | | — | | | (122,573 | ) |
| British Pound (Short) | | | UBS AG | | | 4/08/16 | | | 52,167 | | | 74,342,992 | | | 1,919,817 | | | — | |
| British Pound (Short) | | | JP Morgan | | | | | | | | | | | | | | | | |
| | | | Chase Bank, N.A. | | | 4/08/16 | | | 320,000 | | | 456,031,542 | | | 11,535,528 | | | — | |
| British Pound (Short) | | | Citibank, N.A. | | | 4/08/16 | | | 80,000 | | | 114,007,886 | | | 2,952,746 | | | — | |
| Total | | | | | | | | | | | | | | $ | 16,408,091 | | $ | (471,433 | ) |
During the period ended January 31, 2016, average monthly notional value related to forward foreign currency contracts was approximately $661.2 million or 19.4% of ending net assets.
FINANCIAL DERIVATIVE INSTRUMENTS: OVER-THE-COUNTER SUMMARY
The following is a summary by counterparty of the value of over-the-counter financial derivative instruments and collateral (received)/pledged as of January 31, 2016.
| | | Financial Derivative Assets | | Financial Derivative Liabilities | | | | | | | | | | |
| | | | Unrealized | | | | | | Unrealized | | | | | | | | | | | | | |
| | | | Appreciation | | | | | | Depreciation | | | | | | | | | | | | | |
| | | | Forward | | | | | | Forward | | | | | | | | | | | | | |
| | | | Foreign | | | Total | | | Foreign | | | Total | | | Net Value of | | | Collateral | | | | |
| | | | Currency | | | Over-the- | | | Currency | | | Over-the- | | | OTC | | | (Received) / | | | Net | |
| | | | Contracts | | | Counter | | | Contracts | | | Counter | | | Derivatives | | | Pledged | | | Exposure(1) | |
| | | | | | | | | | | | | | | | | | | | | | | |
| Amounts subject to a master netting or similar agreement: | | | | | | | | | | | | |
| Citibank, N.A. | | $ | 2,952,746 | | $ | 2,952,746 | | $ | (122,573 | ) | $ | (122,573 | ) | $ | 2,830,173 | | $ | — | | $ | 2,830,173 | |
| Deutsche Bank AG | | | — | | | — | | | (98,748 | ) | | (98,748 | ) | | (98,748 | ) | | — | | | (98,748 | ) |
| JP Morgan Chase | | | | | | | | | | | | | | | | | | | | | | |
| Bank, N.A. | | | 11,535,528 | | | 11,535,528 | | | (250,112 | ) | | (250,112 | ) | | 11,285,416 | | | — | | | 11,285,416 | |
| UBS AG | | | 1,919,817 | | | 1,919,817 | | | — | | | — | | | 1,919,817 | | | — | | | 1,919,817 | |
| | | $ | 16,408,091 | | $ | 16,408,091 | | $ | (471,433 | ) | $ | (471,433 | ) | $ | 15,936,658 | | $ | — | | $ | 15,936,658 | |
| (1) | | Net Exposure represents the net receivable/(payable) that would be due from/to the counterparty in the event of default. Exposure from over-the-counter financial derivative instruments can only be netted across transactions governed under the same master agreement with the same legal entity. See Note 2, Significant Accounting Policies, "Derivative instruments," in the Notes to Financial Statements for more information regarding master netting arrangements. |
| | | Cost or Premiums, Net | | | Asset | | | Liability | |
| TOTAL FINANCIAL DERIVATIVE INSTRUMENTS | | $ | — | | $ | 16,408,091 | | $ | (471,433 | ) |
See notes to financial statements
57
| Portfolio of investments (unaudited) |
Global Equity Income Fund
January 31, 2016 (continued)
Other information:
| Currency exposure of portfolio assets before | |
| any currency hedging, if applicable. | % of total |
| Excludes derivatives: | investments |
| British Pound | 31 | % |
| US Dollar | 20 | |
| Euro | 12 | |
| Australian Dollar | 12 | |
| Swiss Franc | 8 | |
| South Korean Won | 3 | |
| Canadian Dollar | 3 | |
| Hong Kong Dollar | 3 | |
| Singapore Dollar | 3 | |
| Japanese Yen | 1 | |
| Norweigan Krone | 1 | |
| New Israeli Sheqel | 1 | |
| New Zealand Dollar | 1 | |
| Thailand Bhat | 1 | |
| | 100 | % |
| Industry concentration as | % of net |
| a percentage of net assets: | assets |
| Pharmaceuticals | 12.45 | % |
| Integrated Telecommunication Services | 11.87 | |
| Diversified Banks | 7.17 | |
| Tobacco | 5.98 | |
| Integrated Oil & Gas | 4.37 | |
| Retail REITs | 3.93 | |
| Aerospace & Defense | 3.33 | |
| Wireless Telecommunication Services | 3.26 | |
| Multi-Utilities | 3.13 | |
| Asset Management & Custody Banks | 2.51 | |
| Paper Packaging | 2.45 | |
| Life & Health Insurance | 2.40 | |
| Investment Banking & Brokerage | 2.10 | |
| Industrial Conglomerates | 2.07 | |
| Cable & Satellite | 1.96 | |
| Publishing | 1.50 | |
| Packaged Foods & Meats | 1.48 | |
| Leisure Facilities | 1.48 | |
| Health Care Services | 1.45 | |
| Communications Equipment | 1.40 | |
| Specialized REITs | 1.39 | |
| Diversified REITs | 1.28 | |
| Systems Software | 1.26 | |
| Electric Utilities | 1.07 | |
| Industrial REIT's | 1.07 | |
| Restaurants | 1.03 | |
| Property & Casualty Insurance | 1.03 | |
| Broadcasting | 1.02 | |
| Air Freight & Logistics | 1.01 | |
| Diversified Capital Markets | 0.98 | |
| Homebuilding | 0.97 | |
| Hotels, Resorts & Cruise Lines | 0.96 | |
| Construction Materials | 0.94 | |
| Construction & Engineering | 0.93 | |
| Apparel Retail | 0.71 | |
| Gas Utilities | 0.70 | |
| Specialty Chemicals | 0.66 | |
| Diversified Metals & Mining | 0.66 | |
| Distributors | 0.65 | |
| Oil & Gas Storage & Transportation | 0.45 | |
| Oil & Gas Exploration & Production | 0.27 | |
| Long Term Investments | 95.33 | |
| Short Term Investment | 3.47 | |
| Total Investments | 98.80 | |
| Financial Derivative Instruments | 0.47 | |
| Net Other Assets and Liabilities | 0.73 | |
| | 100.00 | % |
See notes to financial statements
58
| Portfolio of investments (unaudited) |
Global Equity Income Fund
January 31, 2016 (continued)
Fair Value Measurements
The following table summarizes the Fund's investments that are measured at fair value by level within the fair value hierarchy at January 31, 2016:
| | | | Quoted prices | | | Significant | | | | | | | |
| | | | in active | | | other | | | Significant | | | | |
| | | | markets for | | | observable | | | unobservable | | | | |
| | | | identical assets | | | inputs | | | inputs | | | | |
| Description | | | (Level 1 | ) | | (Level 2 | ) | | (Level 3 | ) | | Total | |
| | | | | | | | | | | | | | |
| Assets | | | | | | | | | | | | | |
| Common Stocks | | | | | | | | | | | | | |
| Australia | | $ | — | | $ | 277,591,302 | | $ | — | | $ | 277,591,302 | |
| Canada | | | 98,382,442 | | | — | | | — | | | 98,382,442 | |
| France | | | — | | | 84,203,399 | | | — | | | 84,203,399 | |
| Germany | | | — | | | 137,463,910 | | | — | | | 137,463,910 | |
| Israel | | | — | | | 36,999,378 | | | — | | | 36,999,378 | |
| Japan | | | — | | | 49,619,268 | | | — | | | 49,619,268 | |
| Korea | | | 42,809,883 | | | 100,360,126 | | | — | | | 143,170,009 | |
| Luxembourg | | | — | | | 34,723,393 | | | — | | | 34,723,393 | |
| New Zealand | | | — | | | 94,850,883 | | | — | | | 94,850,883 | |
| Norway | | | — | | | 43,438,192 | | | — | | | 43,438,192 | |
| Singapore | | | — | | | 47,835,256 | | | — | | | 47,835,256 | |
| Spain | | | — | | | 23,856,080 | | | — | | | 23,856,080 | |
| Switzerland | | | — | | | 259,904,045 | | | — | | | 259,904,045 | |
| United Kingdom | | | — | | | 1,192,454,717 | | | — | | | 1,192,454,717 | |
| United States | | | 428,099,697 | | | — | | | — | | | 428,099,697 | |
| Total Common Stocks | | | 569,292,022 | | | 2,383,299,949 | | | — | | | 2,952,591,971 | |
| | | | | | | | | | | | | | |
| Partnerships | | | | | | | | | | | | | |
| United States | | | 20,564,298 | | | — | | | — | | | 20,564,298 | |
| Total partnerships | | | 20,564,298 | | | — | | | — | | | 20,564,298 | |
| | | | | | | | | | | | | | |
| REITs | | | | | | | | | | | | | |
| Australia | | | — | | | 53,867,441 | | | — | | | 53,867,441 | |
| France | | | — | | | 43,581,963 | | | — | | | 43,581,963 | |
| Netherlands | | | — | | | 47,113,713 | | | — | | | 47,113,713 | |
| Singapore | | | — | | | 36,455,145 | | | — | | | 36,455,145 | |
| United States | | | 80,420,313 | | | — | | | — | | | 80,420,313 | |
| Total REITs | | | 80,420,313 | | | 181,018,262 | | | — | | | 261,438,575 | |
| | | | | | | | | | | | | | |
| Investment companies | | | | | | | | | | | | | |
| Thailand | | | — | | | 17,432,515 | | | — | | | 17,432,515 | |
| Total investment companies | | | — | | | 17,432,515 | | | — | | | 17,432,515 | |
| Short-Term Investment | | | 118,441,365 | | | — | | | — | | | 118,441,365 | |
| Total Investments | | $ | 788,717,998 | | $ | 2,581,750,726 | | $ | — | | $ | 3,370,468,724 | |
| | | | | | | | | | | | | | |
| Financial Derivative Instruments – Assets | | | | | | | | | | | | | |
| Over-the-counter | | | — | | $ | 16,408,091 | | | — | | $ | 16,408,091 | |
| Total Financial Derivative Instruments – Assets | | | — | | $ | 16,408,091 | | | — | | $ | 16,408,091 | |
| | | | | | | | | | | | | | |
| Liabilities | | | | | | | | | | | | | |
| Financial Derivative Instruments – Liabilities | | | | | | | | | | | | | |
| Over-the-counter | | | — | | $ | (471,433 | ) | | — | | $ | (471,433 | ) |
| Total Financial Derivative Instruments – Liabilities | | | — | | $ | (471,433 | ) | | — | | $ | (471,433 | ) |
On July 31, 2015, all of the common stocks, partnerships, REITs and investment companies held by the Fund were valued at the last reported sale price or official closing price. However, on January 31, 2016, certain of the Fund's investments trading in foreign markets were fair valued in accordance with the fair value pricing procedures approved by the Board using the independent statistical fair value service as described in Note 2. Accordingly, using the end of the reporting period method for determining when transfers between levels are recognized, common stocks valued at $1,521,848,092 on January 31, 2016 were transferred from Level 1 to Level 2.
See notes to financial statements
59
| Portfolio of investments (unaudited) |
Global Equity Income Fund
January 31, 2016 (continued)
Fair Value of Financial Derivative Instruments
The following is a summary of the fair valuation of the Fund's financial derivative instruments categorized by risk exposure:
Fair Values of Financial Derivative Instruments on the Statement of Assets and Liabilities as of January 31, 2016
| | | Derivatives not accounted for as hedging instruments | |
| | | | Foreign | | | | | | | | | | | | | | | | |
| | | | Currency | | | Equity | | | Interest | | | Credit | | | Inflation | | | | |
| | | | Risk | | | Risk | | | Rate Risk | | | Risk | | | Risk | | | Total | |
| | | | | | | | | | | | | | | | | | | | |
| Financial Derivative Instruments – Assets | | | | | | | | | | | | | | | | | | | |
| Over-the-Counter | | | | | | | | | | | | | | | | | | | |
| Forward Foreign Currency Contracts | | $ | 16,408,091 | | $ | — | | $ | — | | $ | — | | $ | — | | $ | 16,408,091 | |
| Total | | $ | 16,408,091 | | $ | — | | $ | — | | $ | — | | $ | — | | $ | 16,408,091 | |
| | | | | | | | | | | | | | | | | | | | |
| Financial Derivative Instruments – Liabilities | | | | | | | | | | | | | | | | | | | |
| Over-the-Counter | | | | | | | | | | | | | | | | | | | |
| Forward Foreign Currency Contracts | | $ | (471,433 | ) | $ | — | | $ | — | | $ | — | | $ | — | | $ | (471,433 | ) |
| Total | | $ | (471,433 | ) | $ | — | | $ | — | | $ | — | | $ | — | | $ | (471,433 | ) |
| | | | | | | | | | | | | | | | | | | | |
| Net | | $ | 15,936,658 | | $ | — | | $ | — | | $ | — | | $ | — | | $ | 15,936,658 | |
Effect of Financial Derivative Instruments on the Statement of Operations for the Period Ended January 31, 2016
| | | Derivatives not accounted for as hedging instruments | |
| | | | Foreign | | | | | | | | | | | | | | | | |
| | | | Currency | | | Equity | | | Interest | | | Credit | | | Inflation | | | | |
| | | | Risk | | | Risk | | | Rate Risk | | | Risk | | | Risk | | | Total | |
| | | | | | | | | | | | | | | | | | | | |
| Net realized gain/(loss) from | | | | | | | | | | | | | | | | | | | |
| financial derivative instruments: | | | | | | | | | | | | | | | | | | | |
| Forward Foreign Currency Contracts | | $ | 45,095,511 | | $ | — | | $ | — | | $ | — | | $ | — | | $ | 45,095,511 | |
| Total | | $ | 45,095,511 | | $ | — | | $ | — | | $ | — | | $ | — | | $ | 45,095,511 | |
| | | Derivatives not accounted for as hedging instruments | |
| | | | Foreign | | | | | | | | | | | | | | | | |
| | | | Currency | | | Equity | | | Interest | | | Credit | | | Inflation | | | | |
| | | | Risk | | | Risk | | | Rate Risk | | | Risk | | | Risk | | | Total | |
| | | | | | | | | | | | | | | | | | | | |
| Net change in unrealized | | | | | | | | | | | | | | | | | | | |
| appreciation/(depreciation) | | | | | | | | | | | | | | | | | | | |
| of financial derivative instruments | | | | | | | | | | | | | | | | | | | |
| Forward Foreign Currency Contracts | | $ | 11,726,215 | | $ | — | | $ | — | | $ | — | | $ | — | | $ | 11,726,215 | |
| Total | | $ | 11,726,215 | | $ | — | | $ | — | | $ | — | | $ | — | | $ | 11,726,215 | |
See notes to financial statements
60
| Portfolio of investments (unaudited) |
Global Technology Fund
January 31, 2016
| | | | | Value | |
| Shares | | | | (note 2) | |
| | | | | | |
| Common stocks – 93.02% | | | |
| | | | | | |
| | | China – 6.64% | | | |
| 19,965 | | NetEase.com, Inc., ADR | $ | 3,117,335 | |
| 388,300 | | Tencent Holdings, Ltd. | | 7,335,793 | |
| 211,208 | | Vipshop Holdings, Ltd. ADR * | | 2,711,911 | |
| 47,055 | | YY, Inc., ADR * | | 2,734,366 | |
| | | | | 15,899,405 | |
| | | | | | |
| | | Finland – 1.38% | | | |
| 459,535 | | Nokia Oyj | | 3,295,931 | |
| | | | | | |
| | | France – 0.64% | | | |
| 86,189 | | Orange S.A. | | 1,543,819 | |
| | | | | | |
| | | Germany – 1.85% | | | |
| 206,983 | | Deutsche Telekom AG | | 3,593,114 | |
| 46,641 | | Siltronic AG * | | 849,683 | |
| | | | | 4,442,797 | |
| | | | | | |
| | | Ireland – 0.36% | | | |
| 7,470 | | Willis Towers Watson plc | | 855,091 | |
| | | | | | |
| | | Israel – 1.40% | | | |
| 42,457 | | Check Point Software | | | |
| | | Technologies, Ltd. (a) * | | 3,346,036 | |
| | | | | | |
| | | Japan – 0.24% | | | |
| 29,100 | | Alps Electric Co., Ltd. | | 574,710 | |
| | | | | | |
| | | Korea – 4.70% | | | |
| 7,528 | | Samsung Electronics Co., Ltd. | | 7,266,863 | |
| 108,582 | | SK Hynix, Inc. | | 2,511,140 | |
| 167,441 | | Wonik IPS Co., Ltd. * | | 1,482,813 | |
| | | | | 11,260,816 | |
| | | | | | |
| | | Netherlands – 3.09% | | | |
| 52,588 | | ASM International N.V. | | 2,103,075 | |
| 70,924 | | NXP Semiconductor N.V. * | | 5,303,697 | |
| | | | | 7,406,772 | |
| | | | | | |
| | | Singapore – 2.81% | | | |
| 50,335 | | Avago Technologies, Ltd. | | 6,730,293 | |
| | | | | Value | |
| Shares | | | | (note 2) | |
| | | | | | |
| | | United Kingdom – 3.11% | | | |
| 215,800 | | BT Group plc | $ | 1,501,035 | |
| 498,151 | | Just Eat plc * | | 2,666,707 | |
| 57,669 | | Rightmove plc | | 3,286,642 | |
| | | | | 7,454,384 | |
| | | | | | |
| | | United States – 66.80% | | | |
| 126,846 | | Activision Blizzard, Inc. | | 4,416,778 | |
| 51,616 | | Adobe Systems, Inc. * | | 4,600,534 | |
| 7,255 | | Alliance Data Systems Corp.* | | 1,449,476 | |
| 15,160 | | Alphabet, Inc. Class A * | | 11,542,066 | |
| 20,118 | | Alphabet, Inc. Class C * | | 14,946,668 | |
| 6,591 | | Amazon.com, Inc. * | | 3,868,917 | |
| 148,887 | | Apple, Inc. | | 14,492,661 | |
| 182,807 | | Applied Materials, Inc. | | 3,226,544 | |
| 49,388 | | Broadcom Corp., Class A | | 2,700,042 | |
| 97,828 | | CDW Corp. | | 3,761,487 | |
| 327,819 | | Cisco Systems, Inc. | | 7,798,814 | |
| 84,468 | | Cognizant Technology | | | |
| | | Solutions Corp., Class A * | | 5,347,669 | |
| 52,421 | | EPAM Systems, Inc. * | | 3,926,333 | |
| 18,858 | | F5 Networks, Inc. * | | 1,768,503 | |
| 146,984 | | Facebook, Inc., Class A * | | 16,493,075 | |
| 61,982 | | Fidelity National Information | | | |
| | | Services, Inc. | | 3,702,185 | |
| 18,662 | | FleetCor Technologies, Inc. * | | 2,292,440 | |
| 136,240 | | Juniper Networks, Inc. | | 3,215,264 | |
| 48,799 | | Lam Research Corp. | | 3,503,280 | |
| 13,532 | | LinkedIn Corp., Class A * | | 2,678,118 | |
| 74,093 | | MasterCard, Inc., Class A | | 6,596,500 | |
| 157,272 | | Mentor Graphics Corp. | | 2,733,387 | |
| 185,619 | | Micron Technology, Inc. * | | 2,047,378 | |
| 21,340 | | Palo Alto Networks, Inc. * | | 3,190,117 | |
| 77,816 | | PayPal Holdings, Inc. * | | 2,812,270 | |
| 43,218 | | Red Hat, Inc. * | | 3,027,421 | |
| 13,698 | | SanDisk Corp. | | 968,449 | |
| 29,507 | | ServiceNow, Inc. * | | 1,835,630 | |
| 2,949 | | The Priceline Group, Inc. * | | 3,140,596 | |
| 26,042 | | Universal Display Corp. * | | 1,278,662 | |
| 129,907 | | Visa, Inc., A Shares | | 9,676,772 | |
| 190,404 | | Web.com Group, Inc. * | | 3,585,307 | |
| 48,715 | | Western Digital Corp. | | 2,337,346 | |
| 14,813 | | WEX, Inc. * | | 1,075,572 | |
| | | | | 160,036,261 | |
| | | | | | |
| | | Total common stocks | | | |
| | | (Cost $171,337,345) | | 222,846,315 | |
See notes to financial statements
61
| Portfolio of investments (unaudited) |
Global Technology Fund
January 31, 2016 (continued)
| | | | | Value | |
| Shares | | | | (note 2) | |
| | | | | | |
| Preferred stock – 0.70% | | | |
| | | | | | |
| | | Korea – 0.70% | | | |
| 1,990 | | Samsung Electronics Co., Ltd. | $ | 1,664,680 | |
| | | | | | |
| | | Total preferred stock | | | |
| | | (Cost $2,058,613) | | 1,664,680 | |
| | | | | | |
| | | Total long-term investments | | | |
| | | (Cost $173,395,958) | | 224,510,995 | |
| | | | | | |
| Short-term investment – 5.04% | | | |
| 12,080,015 | | Fidelity Institutional | | | |
| | | Treasury Portfolio | | 12,080,015 | |
| | | | | | |
| | | Total short-term investment | | | |
| | | (Cost $12,080,015) | | 12,080,015 | |
| | | | | | |
| Other securities – 1.15% | | | |
| 2,766,576 | | State Street Navigator | | | |
| | | Securities Lending | | | |
| | | Prime Portfolio (b) | | 2,766,576 | |
| | | | | | |
| | | Total other securities | | | |
| | | (Cost $2,766,576) | | 2,766,576 | |
| | | | | | |
| Total investments – 99.91% | | | |
| | | (Cost $188,242,549) | | 239,357,586 | |
| Net other assets and liabilities – 0.09% | | 212,828 | |
| | | | | | |
| Total net assets – 100.00% | $ | 239,570,414 | |
| (a) | | All or a portion of this security is on loan on an overnight and continuous basis; see notes to financial statements for more information. |
| (b) | | Represents cash collateral received from securities lending transactions; see notes to financial statements for further information. |
| * | | Non-income producing security |
| ADR | | American Depositary Receipts |
Other information:
| Currency exposure of portfolio assets before | |
| any currency hedging, if applicable. | % of total |
| Excludes derivatives: | investments |
| US Dollar | 84 | % |
| South Korean Won | 5 | |
| Euro | 5 | |
| British Pound | 3 | |
| Hong Kong Dollar | 3 | |
| Japanese Yen | 0 | * |
| | 100 | % |
* Less than 0.05% of total investments.
| Industry concentration as | % of net |
| a percentage of net assets: | assets |
| | | |
| Internet | 33.61 | % |
| Semiconductors | 16.44 | |
| Computers | 12.44 | |
| Telecommunications | 10.08 | |
| Software | 10.04 | |
| Diversified Financial Services | 7.40 | |
| Commercial Services | 2.58 | |
| Electrical Components & Equipment | 0.53 | |
| Insurance | 0.36 | |
| Electronic | 0.24 | |
| Long Term Investments | 93.72 | |
| Short Term Investment | 5.04 | |
| Other securities | 1.15 | |
| Total Investments | 99.91 | |
| Net Other Assets and Liabilities | 0.09 | |
| Total Net Assets | 100.00 | % |
See notes to financial statements
62
| Portfolio of investments (unaudited) |
Global Technology Fund
January 31, 2016 (continued)
Fair Value Measurement
The following table summarizes the Fund's investments that are measured at fair value by level within the fair value hierarchy at January 31, 2016:
| | | | Quoted prices | | | Significant | | | | | | | |
| | | | in active | | | other | | | Significant | | | �� | |
| | | | markets for | | | observable | | | unobservable | | | | |
| | | | identical assets | | | inputs | | | inputs | | | | |
| Description | | | (level 1 | ) | | (level 2 | ) | | (level 3 | ) | | Total | |
| | | | | | | | | | | | | | |
| Assets | | | | | | | | | | | | | |
| | | | | | | | | | | | | | |
| Common stocks | | | | | | | | | | | | | |
| China | | $ | 8,563,612 | | $ | 7,335,793 | | $ | — | | $ | 15,899,405 | |
| Finland | | | — | | | 3,295,931 | | | — | | | 3,295,931 | |
| France | | | — | | | 1,543,819 | | | — | | | 1,543,819 | |
| Germany | | | — | | | 4,442,797 | | | — | | | 4,442,797 | |
| Ireland | | | 855,091 | | | — | | | — | | | 855,091 | |
| Israel | | | 3,346,036 | | | — | | | — | | | 3,346,036 | |
| Japan | | | — | | | 574,710 | | | — | | | 574,710 | |
| Korea | | | — | | | 11,260,816 | | | — | | | 11,260,816 | |
| Netherlands | | | 5,303,697 | | | 2,103,075 | | | — | | | 7,406,772 | |
| Singapore | | | 6,730,293 | | | — | | | — | | | 6,730,293 | |
| United Kingdom | | | — | | | 7,454,384 | | | — | | | 7,454,384 | |
| United States | | | 160,036,261 | | | — | | | — | | | 160,036,261 | |
| Total common stocks | | | 184,834,990 | | | 38,011,325 | | | — | | | 222,846,315 | |
| | | | | | | | | | | | | | |
| Preferred stock | | | | | | | | | | | | | |
| Korea | | | — | | | 1,664,680 | | | — | | | 1,664,680 | |
| Total preferred stock | | | — | | | — | | | — | | | 1,664,680 | |
| | | | | | | | | | | | | | |
| Short-term investment | | | 12,080,015 | | | — | | | — | | | 12,080,015 | |
| Other securities | | | 2,766,576 | | | — | | | — | | | 2,766,576 | |
| Total investments | | $ | 199,681,581 | | $ | 39,676,005 | | $ | — | | $ | 239,357,586 | |
On July 31, 2015, substantially all of the common and preferred stocks held by the Fund were valued at the last reported sale price or official closing price. However, on January 31, 2016, certain of the Fund's common and preferred stocks trading in foreign markets were fair valued in accordance with the fair value pricing procedures approved by the Board using the independent statistical fair value service as described in Note 2. Accordingly, using the end of the reporting period method for determining when transfers between levels are recognized, common and preferred stocks valued at $34,418,212 on January 31, 2016 were transferred from Level 1 to Level 2.
See notes to financial statements
63
| Portfolio of investments (unaudited) |
High Yield Opportunities Fund
January 31, 2016
| Face | | | | | | | | Value | |
| amount | | | Coupon | | | Maturity | | (note 2) | |
| | | | | | | | | | | |
| Bank Loans(a)(b) – 7.28% | | | | | | | |
| | | | | | | | | | | |
| | | | United States – 7.28% | | | | | | | |
| USD | 500,000 | | First Data Corp., Term Loan B (c) | 4.374% | | | 7/10/22 | $ | 491,500 | |
| USD | 472,973 | | Koppers, Inc., Term Loan A | 3.874% | | | 8/15/19 | | 444,595 | |
| USD | 498,750 | | MacDermid, Inc., Term Loan B | 5.500% | | | 6/7/20 | | 465,084 | |
| USD | 249,375 | | Party City Holdings, Inc., Term Loan B | 4.250% | | | 8/19/22 | | 242,361 | |
| USD | 320,000 | | XPO Logistics, Inc., Term Loan B | 5.500% | | | 10/30/21 | | 315,734 | |
| | | | | | | | | | 1,959,274 | |
| | | | | | | | | | | |
| | | | Total bank loans | | | | | | | |
| | | | (Cost $1,996,335) | | | | | | 1,959,274 | |
| | | | | | | | | | | |
| Corporate bonds – 84.85% | | | | | | | |
| | | | | | | | | | | |
| | | | Canada – 1.78% | | | | | | | |
| USD | 250,000 | | Garda World Security Corp. (d) | 7.250% | | | 11/15/21 | | 196,250 | |
| USD | 275,000 | | Masonite International Corp. (d) | 5.625% | | | 3/15/23 | | 283,250 | |
| | | | | | | | | | 479,500 | |
| | | | | | | | | | | |
| | | | Luxembourg – 0.38% | | | | | | | |
| USD | 125,000 | | ArcelorMittal | 7.250% | | | 2/25/22 | | 102,188 | |
| | | | | | | | | | | |
| | | | Netherlands – 1.05% | | | | | | | |
| USD | 275,000 | | Playa Resorts Holding B.V. (d) | 8.000% | | | 8/15/20 | | 281,188 | |
| | | | | | | | | | | |
| | | | Puerto Rico – 1.61% | | | | | | | |
| USD | 463,000 | | Popular, Inc. | 7.000% | | | 7/1/19 | | 432,905 | |
| | | | | | | | | | | |
| | | | Sweden – 1.12% | | | | | | | |
| USD | 325,000 | | Perstorp Holding AB (d) | 11.000% | | | 8/15/17 | | 302,250 | |
| | | | | | | | | | | |
| | | | United Kingdom – 2.40% | | | | | | | |
| USD | 335,000 | | Sensata Technologies UK Financing Co. plc (d) | 6.250% | | | 2/15/26 | | 342,537 | |
| USD | 315,000 | | International Game Technology plc (d) | 6.250% | | | 2/15/22 | | 304,762 | |
| | | | | | | | | | 647,299 | |
| | | | | | | | | | | |
| | | | United States – 76.51% | | | | | | | |
| USD | 265,000 | | Alere, Inc. (d)(e) | 6.375% | | | 7/1/23 | | 251,088 | |
| USD | 325,000 | | Antero Resources Corp. | 5.375% | | | 11/1/21 | | 277,062 | |
| USD | 535,000 | | Argos Merger Sub, Inc. (d) | 7.125% | | | 3/15/23 | | 540,350 | |
| USD | 250,000 | | Berry Plastics Corp. (d) | 6.000% | | | 10/15/22 | | 256,250 | |
| USD | 250,000 | | Blue Racer Midstream LLC (d) | 6.125% | | | 11/15/22 | | 188,125 | |
| USD | 250,000 | | BlueLine Rental Finance Corp. (d) | 7.000% | | | 2/1/19 | | 197,500 | |
| USD | 250,000 | | Building Materials Corp. of America (d) | 6.000% | | | 10/15/25 | | 256,250 | |
| USD | 450,000 | | Cable One, Inc. (d) | 5.750% | | | 6/15/22 | | 455,625 | |
| USD | 275,000 | | Calpine Corp. (e) | 5.750% | | | 1/15/25 | | 248,188 | |
| USD | 500,000 | | CCO Holdings LLC (d) | 5.875% | | | 5/1/27 | | 493,750 | |
See notes to financial statements
64
| Portfolio of investments (unaudited) |
High Yield Opportunities Fund
January 31, 2016 (continued)
| Face | | | | | | | | Value | |
| amount | | | Coupon | | | Maturity | | (note 2) | |
| | | | | | | | | | | |
| | | | United States (continued) | | | | | | | |
| USD | 355,000 | | Centene Escrow Corp.(c) | 6.125 | % | | 2/15/24 | $ | 365,650 | |
| USD | 275,000 | | Century Intermediate Holding Co. 2 (d) | 9.750 | % | | 2/15/19 | | 281,531 | |
| USD | 250,000 | | CenturyLink, Inc. | 5.800 | % | | 3/15/22 | | 232,188 | |
| USD | 270,000 | | Cequel Communications Holdings I LLC (d) | 7.750 | % | | 7/15/25 | | 248,400 | |
| USD | 510,000 | | CHS/Community Health Systems, Inc. | 6.875 | % | | 2/1/22 | | 464,100 | |
| USD | 250,000 | | CommScope Technologies Finance LLC (d) | 6.000 | % | | 6/15/25 | | 243,750 | |
| USD | 300,000 | | Dean Foods Co. (d) | 6.500 | % | | 3/15/23 | | 309,750 | |
| USD | 500,000 | | Digicel Group, Ltd. (d)(e)(f) | 8.250 | % | | 9/30/20 | | 406,937 | |
| USD | 250,000 | | DISH DBS Corp. | 5.875 | % | | 11/15/24 | | 223,438 | |
| USD | 275,000 | | E*TRADE Financial Corp. | 5.375 | % | | 11/15/22 | | 290,125 | |
| USD | 285,000 | | Eco Services Operations LLC (d) | 8.500 | % | | 11/1/22 | | 249,375 | |
| USD | 285,000 | | ESH Hospitality, Inc. (d) | 5.250 | % | | 5/1/25 | | 275,914 | |
| USD | 300,000 | | FelCor Lodging LP | 6.000 | % | | 6/1/25 | | 304,500 | |
| USD | 268,000 | | First Data Corp. (d) | 7.000 | % | | 12/1/23 | | 270,680 | |
| USD | 261,000 | | Frontier Communications Corp. (d) | 11.000 | % | | 9/15/25 | | 252,518 | |
| USD | 250,000 | | GCI, Inc. | 6.875 | % | | 4/15/25 | | 246,250 | |
| USD | 275,000 | | GCP Applied Technologies, Inc. (d) | 9.500 | % | | 2/1/23 | | 291,500 | |
| USD | 500,000 | | Group 1 Automotive, Inc. (d) | 5.250 | % | | 12/15/23 | | 472,500 | |
| USD | 260,000 | | HCA, Inc. | 5.875 | % | | 5/1/23 | | 272,350 | |
| USD | 250,000 | | Hot Topic, Inc. (d) | 9.250 | % | | 6/15/21 | | 225,000 | |
| USD | 265,000 | | HUB International, Ltd. (d) | 7.875 | % | | 10/1/21 | | 233,200 | |
| USD | 875,000 | | ILFC E-Capital Trust II (d)(f) | 4.740 | % | | 12/21/65 | | 791,875 | |
| USD | 300,000 | | Infor Software Parent LLC/Infor Software Parent, Inc. (d) | 7.125 | % | | 5/1/21 | | 214,875 | |
| USD | 250,000 | | j2 Global, Inc. | 8.000 | % | | 8/1/20 | | 263,750 | |
| USD | 275,000 | | KLX, Inc. (d) | 5.875 | % | | 12/1/22 | | 258,473 | |
| USD | 120,000 | | Lamar Media Corp. (d) | 5.750 | % | | 2/1/26 | | 123,900 | |
| USD | 250,000 | | MGM Resorts International | 6.000 | % | | 3/15/23 | | 249,844 | |
| USD | 275,000 | | Midas Intermediate Holdco II LLC (d) | 7.875 | % | | 10/1/22 | | 244,750 | |
| USD | 280,000 | | Midcontinent Communications & Midcontinent Finance Corp. (d) | 6.875 | % | | 8/15/23 | | 284,200 | |
| USD | 275,000 | | MPLX LP (d) | 4.875 | % | | 12/1/24 | | 214,994 | |
| USD | 275,000 | | Nexstar Broadcasting, Inc. (d) | 6.125 | % | | 2/15/22 | | 261,937 | |
| USD | 500,000 | | Orbital ATK, Inc. (d) | 5.500 | % | | 10/1/23 | | 510,000 | |
| USD | 250,000 | | Parsley Energy LLC (d) | 7.500 | % | | 2/15/22 | | 241,250 | |
| USD | 139,000 | | PBF Holding Co. LLC (d) | 7.000 | % | | 11/15/23 | | 127,359 | |
| USD | 250,000 | | Pinnacle Operating Corp. (d) | 9.000 | % | | 11/15/20 | | 234,375 | |
| USD | 525,000 | | Plastipak Holdings, Inc. (d) | 6.500 | % | | 10/1/21 | | 505,312 | |
| USD | 260,000 | | Platform Specialty Products Corp. (d) | 10.375 | % | | 5/1/21 | | 243,100 | |
| USD | 555,000 | | Post Holdings, Inc. (d) | 6.000 | % | | 12/15/22 | | 552,919 | |
| USD | 250,000 | | PQ Corp. (d) | 8.750 | % | | 11/1/18 | | 233,438 | |
| USD | 260,000 | | Qorvo, Inc. (d) | 6.750 | % | | 12/1/23 | | 257,400 | |
| USD | 250,000 | | Rackspace Hosting, Inc. (d) | 6.500 | % | | 1/15/24 | | 228,750 | |
| USD | 500,000 | | RCN Telecom Services LLC (d) | 8.500 | % | | 8/15/20 | | 504,375 | |
| USD | 250,000 | | Reynolds Group Issuer, Inc. | 8.250 | % | | 2/15/21 | | 234,375 | |
| USD | 270,000 | | RHP Hotel Properties LP | 5.000 | % | | 4/15/23 | | 270,337 | |
| USD | 375,000 | | Rite Aid Corp. | 6.750 | % | | 6/15/21 | | 397,500 | |
| USD | 250,000 | | Signode Industrial Group Lux S.A. (d) | 6.375 | % | | 5/1/22 | | 208,750 | |
| USD | 275,000 | | Sprint Corp. | 7.125 | % | | 6/15/24 | | 187,000 | |
| USD | 420,000 | | Steel Dynamics, Inc. | 5.125 | % | | 10/1/21 | | 393,750 | |
| USD | 275,000 | | Sunoco LP (d) | 6.375 | % | | 4/1/23 | | 255,063 | |
| USD | 200,000 | | T-Mobile USA, Inc. | 6.375 | % | | 3/1/25 | | 201,250 | |
See notes to financial statements
65
| Portfolio of investments (unaudited) |
High Yield Opportunities Fund
January 31, 2016 (continued)
| Face | | | | | | | | Value | |
| amount | | | Coupon | | | Maturity | | (note 2) | |
| | | | | | | | | | |
| | | | United States (continued) | | | | | | | |
| USD | 210,000 | | T-Mobile USA, Inc. | 6.500 | % | | 1/15/26 | $ | 211,050 | |
| USD | 385,000 | | Tenet Healthcare Corp. | 8.125 | % | | 4/1/22 | | 387,887 | |
| USD | 250,000 | | TMS International Corp. (d) | 7.625 | % | | 10/15/21 | | 194,375 | |
| USD | 375,000 | | TransDigm, Inc. | 6.000 | % | | 7/15/22 | | 369,375 | |
| USD | 25,000 | | TreeHouse Foods, Inc. (d) | 6.000 | % | | 2/15/24 | | 25,781 | |
| USD | 310,000 | | Tribune Media Co. (d) | 5.875 | % | | 7/15/22 | | 310,000 | |
| USD | 400,000 | | Univision Communications, Inc. (d) | 8.500 | % | | 5/15/21 | | 398,500 | |
| USD | 200,000 | | Vista Outdoor, Inc. (d) | 5.875 | % | | 10/1/23 | | 204,500 | |
| USD | 265,000 | | West Corp. (d) | 5.375 | % | | 7/15/22 | | 224,256 | |
| USD | 270,000 | | XPO Logistics, Inc. (d) | 6.500 | % | | 6/15/22 | | 242,662 | |
| | | | | | | | | | 20,587,131 | |
| | | | | | | | | | | |
| | | | Total corporate bonds | | | | | | | |
| | | | (Cost $24,072,323) | | | | | | 22,832,461 | |
| | | | | | | | | | | |
| | | | Total long-term investments | | | | | | | |
| | | | (Cost $26,068,658) | | | | | $ | 24,791,735 | |
| | | | | Value | |
| Shares | | | | (note 2) | |
| | | | | | |
| Short-term investment - 8.96% | | | |
| 2,409,945 | | Fidelity Institutional Treasury | | | |
| | | Portfolio (e) | | 2,409,945 | |
| | | | | | |
| | | Total short-term investment | | | |
| | | (Cost $2,409,945) | | 2,409,945 | |
| | | | | | |
| Total investments - 101.09% | | | |
| | | (Cost $28,478,603) | | 27,201,680 | |
| | | | | | |
| Financial Derivative Instruments (g) | | | |
(Cost or Premiums, net $28,891) – 0.08% | | 22,482 | |
| Net other assets and liabilities – (1.17)% | | (316,355 | ) |
| | | | | | |
| Total net assets – 100.00% | $ | 26,907,807 | |
| (a) | Bank loan interests are, at present, not readily marketable, not registered under the Securities Act of 1933, as amended, and may be subject to contractual and legal restrictions on sale. Bank loan interests in the Fund's portfolio generally have variable rates which adjust to a base, such as the London Inter-Bank Offered Rate ("LIBOR"), on set dates, typically every 30 days but not greater than one year; and/or have interest rates that float at a margin above a widely recognized base lending rate such as the Prime Rate of a designated U.S. bank. |
| (b) | Bank loan interests often require prepayments from excess cash flow or permit the borrower to repay at its election. The degree to which borrowers repay, whether as a contractual requirement or at their election, cannot be predicted with accuracy. As a result, the actual remaining maturity may be substantially less than the stated maturities shown. |
| (c) | Security is purchased on a delayed delivery basis. |
| (d) | Restricted security, purchased pursuant to Rule 144A under the Securities Act of 1933, as amended, and which is exempt from registration under that Act. At January 31, 2016, the restricted securities held by the Fund had an aggregate value of $16,207,399, which represented 60.2% of net assets. |
| (e) | This investment was segregated for open swap contracts and delayed delivery purchases at January 31, 2016. |
| (f) | Variable or Floating rate interest rate security. Includes fixed-to-floating rate corporate bond securities which currently pay a fixed coupon that will move to a floating rate coupon if the bond is not redeemed at the call date. Rate presented represents rate at January 31, 2016. |
| (g) | Information with respect to financial derivative instruments is disclosed in the following tables. |
See notes to financial statements
66
| Portfolio of investments (unaudited) |
High Yield Opportunities Fund
January 31, 2016 (continued)
(g) FINANCIAL DERIVATIVE INSTRUMENTS
OVER-THE-COUNTER FINANCIAL DERIVATIVE INSTRUMENTS
CREDIT DEFAULT SWAP CONTRACTS
| | | | | | | | | | | | | | | | | | | Upfront | | | | | | | | | | |
| | | | | | | Rates | | | | | | Implied | | | Notional | | | premiums | | | Unrealized | | | | | | | |
| | | | Reference | | | received/ | | | Termination | | | credit | | | amount | | | paid/ | | | appreciation/ | | Value | |
| Counterparty | | | entity | | | (paid | ) | | date | | | spread | | | (000s | ) | | (received | ) | | (depreciation | ) | | Asset | | | Liability | |
| | | | | | | | | | | | | | | | | | | | | | | | | | | | | |
| Protection sold: | | | | | | | | | | | | | | | | | | | | | | | | | | | | |
| JP Morgan Chase | | | | | | | | | | | | | | | | | | | | | | | | | | | | |
| Bank, N.A. | | | Delta Airlines, Inc. | | | 5.00 | % | | 12/20/20 | | | 2.98 | % | $ | 250 | | $ | 28,891 | | $ | (6,409 | ) | $ | 22,482 | | $ | — | |
| | | Cost or Premiums, net | | | Asset | | | Liability | |
| TOTAL SWAP CONTRACTS | | $ | 28,891 | | $ | 22,482 | | $ | — | |
During the period ended July 31, 2015, average notional value related to swap contracts, including both centrally-cleared and over-the-counter, was approximately $275,032 or 1.0% of ending net assets.
FINANCIAL DERIVATIVE INSTRUMENTS: OVER-THE-COUNTER SUMMARY
The following is a summary by counterparty of the value of over-the-counter financial derivative instruments and collateral (received)/pledged as of January 31, 2016.
| | | Financial Derivative Assets | | Financial Derivative Liabilities | | | | | | | | | | |
| | | | Value(1) | | | | | | Value(1) | | | | | | | | | | | | | |
| | �� | | | | | Total | | | | | | Total | | | Net Value | | | Collateral | | | | |
| | | | Swap | | | Over-the- | | | Swap | | | Over-the- | | | of OTC | | | (Received) / | | | Net | |
| | | | Contracts | | | Counter | | | Contracts | | | Counter | | | Derivatives | | | Pledged | | | Exposure(2) | |
| Amounts subject to a master netting or similar agreement: | | | | | | | | | | | | | |
| JP Morgan Chase | | | | | | | | | | | | | | | | | | | | | | |
| Bank, N.A. | | $ | 22,482 | | $ | 22,482 | | $ | — | | $ | — | | $ | 22,482 | | $ | — | | $ | 22,482 | |
| (1) | | Value on swap contracts is represented by "unrealized appreciation/(depreciation)" on interest rate swaps, and "value" on credit default swaps, which is inclusive of upfront premiums paid/(received). |
| (2) | | Net Exposure represents the net receivable/(payable) that would be due from/to the counterparty in the event of default. Exposure from over-the-counter financial derivative instruments can only be netted across transactions governed under the same master agreement with the same legal entity. See Note 2, Significant Accounting Policies, "Derivative instruments," in the Notes to Financial Statements for more information regarding master netting arrangements. |
| | | Cost or Premiums, net | | | Asset | | | Liability | |
| TOTAL FINANCIAL DERIVATIVE INSTRUMENTS | | $ | 28,891 | | $ | 22,482 | | $ | — | |
See notes to financial statements
67
| Portfolio of investments (unaudited) |
High Yield Opportunities Fund
January 31, 2016 (continued)
Other information:
| Currency exposure of portfolio assets before | |
| any currency hedging, if applicable. | % of total |
| Excludes derivatives: | investments |
| US Dollar | 100 | % |
| Industry concentration as | % of net |
| a percentage of net assets: | assets |
| | | |
| Cable TV | 8.21 | % |
| Aerospace/Defense-Equipment | 4.23 | |
| Medical-Hospitals | 4.18 | |
| Cellular Telecommunications | 3.74 | |
| Chemicals - Specialty | 3.50 | |
| Finance-Leasing Company | 2.94 | |
| Containers-Paper/Plastic | 2.83 | |
| Data Processing/Management | 2.83 | |
| Oil & Gas Exploration & Production | 2.62 | |
| Chemicals - Diversified | 2.58 | |
| Broadcast Services/Programs | 2.45 | |
| Electronic Components-Semiconductors | 2.23 | |
| Hotels & Motels | 2.18 | |
| Transport-Services | 2.07 | |
| Food-Flour & Grain | 2.05 | |
| Building & Construction Products - Miscellaneous | 2.04 | |
| REITS-Hotels | 2.03 | |
| Specified Purpose Acquisition | 2.01 | |
| Steel-Producers | 1.84 | |
| Telephone-Integrated | 1.80 | |
| Retail - Automobile | 1.76 | |
| Telecommunication Services | 1.75 | |
| Commercial Banks-Southern US | 1.61 | |
| Retail-Drug Store | 1.48 | |
| Oil & Gas Refining & Marketing | 1.42 | |
| Medical-HMO | 1.36 | |
| Food-Dairy Products | 1.15 | |
| Television | 1.15 | |
| Gambling (Non-Hotel) | 1.13 | |
| Chemicals - Other | 1.12 | |
| Finance - Investment Banking & Brokerage | 1.08 | |
| Building Products-Doors & Windows | 1.05 | |
| Consumer Products - Miscellaneous | 1.05 | |
| Computer Services | 0.98 | |
| Casino Hotels | 0.93 | |
| Diagnostic Kits | 0.93 | |
| Independent Power Producer | 0.92 | |
| Auto Repair Centers | 0.91 | |
| Telecommunication Equipment | 0.91 | |
| Specialty Stores | 0.90 | |
| Agricultural Operations | 0.87 | |
| Containers & Packaging | 0.87 | |
| Insurance Brokers | 0.87 | |
| Computer Software | 0.85 | |
| Retail - Apparel/Shoe | 0.84 | |
| Enterprise Software/Services | 0.80 | |
| Pipelines | 0.80 | |
| Steel-Specialty | 0.78 | |
| Retail-Sporting Goods | 0.76 | |
| Machinery-Construction & Mining | 0.73 | |
| Security Services | 0.73 | |
| Commercial Services | 0.72 | |
| Advertising Sales | 0.46 | |
| Food-Canned | 0.10 | |
| Long-Term Investments | 92.13 | |
| Short-Term Investment | 8.96 | |
| Total Investments | 101.09 | |
| Financial Derivative Instruments | 0.08 | |
| Net other assets and liabilities | (1.17 | ) |
| | 100.00 | % |
See notes to financial statements
68
| Portfolio of investments (unaudited) |
High Yield Opportunities Fund
January 31, 2016 (continued)
Fair Value Measurements
The following table summarizes the Fund's investments that are measured at fair value by level within the fair value hierarchy at January 31, 2016:
| | | | Quoted prices | | | Significant | | | | | | | |
| | | | in active | | | other | | | Significant | | | | |
| | | | markets for | | | observable | | | unobservable | | | | |
| | | | identical assets | | | inputs | | | inputs | | | | |
| Description | | | (level 1 | ) | | (level 2 | ) | | (level 3 | ) | | Total | |
| Assets | | | | | | | | | | | | | |
| | | | | | | | | | | | | | |
| Bank Loans | | | | | | | | | | | | | |
| United States | | $ | — | | $ | 1,959,274 | | $ | — | | $ | 1,959,274 | |
| Total Bank Loans | | | — | | | 1,959,274 | | | — | | | 1,959,274 | |
| | | | | | | | | | | | | | |
| Corporate Bonds | | | | | | | | | | | | | |
| Canada | | | — | | | 479,500 | | | — | | | 479,500 | |
| Luxembourg | | | — | | | 102,188 | | | — | | | 102,188 | |
| Netherlands | | | — | | | 281,188 | | | — | | | 281,188 | |
| Puerto Rico | | | — | | | 432,905 | | | — | | | 432,905 | |
| Sweden | | | — | | | 302,250 | | | — | | | 302,250 | |
| United Kingdom | | | — | | | 647,299 | | | — | | | 647,299 | |
| United States | | | — | | | 20,587,131 | | | — | | | 20,587,131 | |
| Total Corporate Bonds | | | — | | | 22,832,461 | | | — | | | 22,832,461 | |
| | | | | | | | | | | | | | |
| Short-term investment | | | 2,409,945 | | | — | | | — | | | 2,409,945 | |
| Total Investments | | $ | 2,409,945 | | $ | 24,791,735 | | $ | — | | $ | 27,201,680 | |
| | | | | | | | | | | | | | |
| Financial Derivative Instruments - Assets | | | | | | | | | | | | | |
| Over-the-counter | | | — | | | 22,482 | | | — | | | 22,482 | |
| Total Financial Derivative Instruments - Assets | | $ | — | | $ | 22,482 | | $ | — | | $ | 22,482 | |
During the period ended January 31, 2016, there were no transfers in or out of security levels.
See notes to financial statements
69
| Portfolio of investments (unaudited) |
High Yield Opportunities Fund
January 31, 2016 (continued)
Fair Value of Financial Derivative Instruments
The following is a summary of the fair valuation of the Fund's financial derivative instruments categorized by risk exposure:
Fair Values of Financial Derivative Instruments on the Statement of Assets and Liabilities as of January 31, 2016
| | | Derivatives not accounted for as hedging instruments | |
| | | | Foreign | | | | | | | | | | | | | | | | |
| | | | Currency | | | Equity | | | Interest | | | Credit | | | Inflation | | | | |
| | | | Risk | | | Risk | | | Rate Risk | | | Risk | | | Risk | | | Total | |
| | | | | | | | | | | | | | | | | | | | |
| Financial Derivative Instruments – Assets | | | | | | | | | | | | | |
| Over-the-Counter | | | | | | | | | | | | | | | | | | | |
| Swap Contracts | | $ | — | | $ | — | | $ | — | | $ | 22,482 | | $ | — | | $ | 22,482 | |
| Total | | $ | — | | $ | — | | $ | — | | $ | 22,482 | | $ | — | | $ | 22,482 | |
| | | | | | | | | | | | | | | | | | | | |
| Financial Derivative Instruments – Liabilities | | | | | | | | | | | | | |
| Over-the-Counter | | | | | | | | | | | | | | | | | | | |
| Swap Contracts | | $ | — | | $ | — | | $ | — | | $ | — | | $ | — | | $ | — | |
| Total | | $ | — | | $ | — | | $ | — | | $ | — | | $ | — | | $ | — | |
| Net | | $ | — | | $ | — | | $ | — | | $ | 22,482 | | $ | — | | $ | 22,482 | |
Effect of Financial Derivative Instruments on the Statement of Operations for the Period Ended January 31, 2016
| | | Derivatives not accounted for as hedging instruments | |
| | | | Foreign | | | | | | | | | | | | | | | | |
| | | | Currency | | | Equity | | | Interest | | | Credit | | | Inflation | | | | |
| | | | Risk | | | Risk | | | Rate Risk | | | Risk | | | Risk | | | Total | |
| | | | | | | | | | | | | | | | | | | | |
| Net realized gain/(loss) from | | | | | | | | | | | | | | | | | | | |
| financial derivative instruments: | | | | | | | | | | | | | | | | | | | |
| Swap Contracts | | $ | — | | $ | — | | $ | — | | $ | 11,528 | | $ | — | | $ | 11,528 | |
| Total | | $ | — | | $ | — | | $ | — | | $ | 11,528 | | $ | — | | $ | 11,528 | |
| | | Derivatives not accounted for as hedging instruments | |
| | | | Foreign | | | | | | | | | | | | | | | | |
| | | | Currency | | | Equity | | | Interest | | | Credit | | | Inflation | | | | |
| | | | Risk | | | Risk | | | Rate Risk | | | Risk | | | Risk | | | Total | |
| | | | | | | | | | | | | | | | | | | | |
| Net change in unrealized | | | | | | | | | | | | | | | | | | | |
| appreciation/(depreciation) | | | | | | | | | | | | | | | | | | | |
| of financial derivative instruments | | | | | | | | | | | | | | | | | | | |
| Swap Contracts | | $ | — | | $ | — | | $ | — | | $ | (6,838 | ) | $ | — | | $ | (6,838 | ) |
| Total | | $ | — | | $ | — | | $ | — | | $ | (6,838 | ) | $ | — | | $ | (6,838 | ) |
See notes to financial statements
70
| Portfolio of investments (unaudited) |
International Long/Short Equity Fund
January 31, 2016
| | | | | Value | |
| Shares | | | | (note 2) | |
| | | | | | |
| Common stocks – 42.24% | | | |
| | | | | | |
| | | Australia – 1.04% | | | |
| 1,810 | | CSL, Ltd. | $ | 134,765 | |
| | | | | | |
| | | China – 2.13% | | | |
| 810 | | Baidu, Inc., ADR (a) * | | 132,248 | |
| 7,600 | | Tencent Holdings, Ltd. (a) | | 143,580 | |
| | | | | 275,828 | |
| | | | | | |
| | | Finland – 1.47% | | | |
| 26,500 | | Nokia Oyj (a) | | 190,066 | |
| | | | | | |
| | | Hong Kong – 3.18% | | | |
| 25,400 | | AIA Group, Ltd. (a) | | 142,303 | |
| 24,500 | | Cheung Kong Property | | | |
| | | Holdings, Ltd. (a) | | 132,628 | |
| 11,000 | | CK Hutchison Holdings, Ltd. | | 136,991 | |
| | | | | 411,922 | |
| | | | | | |
| | | India – 1.45% | | | |
| 1,592 | | HDFC Bank, Ltd., ADR | | 96,045 | |
| 5,104 | | Infosys, Ltd., ADR | | 91,413 | |
| | | | | 187,458 | |
| | | | | | |
| | | Israel – 2.85% | | | |
| 6,000 | | Teva Pharmaceutical | | | |
| | | Industries, Ltd., ADR | | 368,880 | |
| | | | | | |
| | | Italy – 3.27% | | | |
| 57,000 | | Poste Italiane SpA (c) * | | 424,200 | |
| | | | | | |
| | | Japan – 15.11% | | | |
| 1,600 | | East Japan Railway Co. (a) | | 147,362 | |
| 1,000 | | Fanuc Corp. (a) | | 133,512 | |
| 27,000 | | Hitachi, Ltd. (a) | | 133,262 | |
| 18,200 | | Inpex Corp. (a) | | 161,062 | |
| 1,700 | | Kose Corp. | | 158,337 | |
| 7,000 | | NH Foods, Ltd. (a) | | 135,621 | |
| 7,400 | | NTT DoCoMo, Inc. (a) | | 165,078 | |
| 2,300 | | Secom Co., Ltd. (a) | | 160,435 | |
| 3,500 | | Seven & I Holdings Co., Ltd. (a) | | 155,638 | |
| 6,000 | | Sumitomo Realty & | | | |
| | | Development Co., Ltd. (a) | | 168,206 | |
| 12,400 | | T&D Holdings, Inc. (a) | | 141,904 | |
| 53,000 | | Taiheiyo Cement Corp. (a) | | 152,732 | |
| 2,400 | | Toyota Motor Corp. (a) | | 144,943 | |
| | | | | 1,958,092 | |
| | | | | Value | |
| Shares | | | | (note 2) | |
| | | | | | |
| | | Singapore – 0.96% | | | |
| 25,300 | | City Developments, Ltd. | $ | 124,492 | |
| | | | | | |
| | | Spain – 1.33% | | | |
| 23,000 | | Fomento de Construcciones | | | |
| | | y Contratas S.A. (a) * | | 172,721 | |
| | | | | | |
| | | Switzerland – 7.98% | | | |
| 3,986 | | Dufry AG * | | 431,461 | |
| 4,000 | | Gategroup Holding AG * | | 148,162 | |
| 1,750 | | Roche Holding AG (a) | | 455,281 | |
| | | | | 1,034,904 | |
| | | | | | |
| | | Taiwan – 1.09% | | | |
| 33,000 | | Taiwan Semiconductor | | | |
| | | Manufacturing Co., Ltd. | | 140,810 | |
| | | | | | |
| | | United Kingdom – 0.38% | | | |
| 5,406 | | Clinigen Group plc * | | 49,343 | |
| | | | | | |
| | | Total common stocks | | | |
| | | (Cost $5,495,241) | | 5,473,481 | |
| | | | | | |
| Warrants – —% | | | | | |
| | | | | | |
| | | Norway – —% | | | |
| 225,000 | | African Petroleum | | | |
| | | Corp., Ltd. (expires | | | |
| | | 3/16/17) (d) (e) * | | — | |
| | | | | | |
| | | Total Warrants | | | |
| | | (Cost $0) | | — | |
| | | | | | |
| | | Total long-term investments | | | |
| | | (Cost $5,495,241) | | 5,473,481 | |
| | | | | | |
| Short-term investment – 72.15% | | | |
| 9,349,762 | | Fidelity Institutional | | | |
| | | Treasury Portfolio | | 9,349,762 | |
| | | | | | |
| | | Total short-term investment | | | |
| | | (Cost $9,349,762) | | 9,349,762 | |
| | | | | | |
| Total investments – 114.39% (b) | | | |
| | | (Cost $14,845,003) | | 14,823,243 | |
| | | | | | |
| Securities sold short(f) | | | |
(Cost $(3,314,877)) – (25.49)% | | (3,303,270) | |
See notes to financial statements
71
| Portfolio of investments (unaudited) |
International Long/Short Equity Fund
January 31, 2016 (continued)
| | | Value | |
| | | (note 2) | |
| | | | |
| Financial Derivative Instruments(g) | | | |
(Cost or Premiums, net – $0) – 2.04% | $ | 265,420 | |
| Net other assets and liabilities – 9.06% | | 1,173,491 | |
| Total net assets – 100.00% | $ | 12,958,884 | |
| * | | Non-income producing security |
| (a) | | All or a portion of the security is pledged as collateral for securities sold sort. |
| (b) | | All or a portion of these securities and short-term investments were segregated for open futures contracts, securities sold short and swap contracts. |
| (c) | | Restricted security, purchased pursuant to Rule 144A under the Securities Act of 1933, as amended, and which is exempt from registration under that Act. At January 31, 2016, the restricted securities held by the Fund had an aggregate value of $424,200, which represented 3.3% of net assets. |
| (d) | | The security has been deemed illiquid by the Adviser according to the policies and procedures adopted by the Board of Trustees. |
| (e) | | Fair valued at January 31, 2016 as determined in good faith using procedures approved by the Board of Trustees. |
| (f) | | The portfolio of securities sold short is disclosed below. |
| (g) | | Information with respect to financial derivative instruments is disclosed in the following tables. |
| ADR | | American Depositary Receipts |
Securities Sold Short – (25.49)%
| | | | | Value | |
| Shares | | | | (note 2) | |
| | | | | | |
| | | China – (1.32)% | | | |
| (19,000) | | Byd Co., Ltd. * | $ | (87,363) | |
| (6,538) | | Vipshop Holdings, Ltd. ADR* | | (83,948) | |
| | | | | (171,311) | |
| | | | | | |
| | | Finland – (3.38)% | | | |
| (14,000) | | Neste Oyj | | (437,535) | |
| | | | | | |
| | | Germany – (2.26)% | | | |
| (20,000) | | Deutsche Lufthansa AG * | | (292,234) | |
| | | | | | |
| | | Hong Kong – (0.64)% | | | |
| (45,000) | | Hang Lung Properties, Ltd. | | (83,233) | |
| | | | | | |
| | | Japan – (5.73)% | | | |
| (2,200) | | Daikin Industries, Ltd. | | (148,613) | |
| (1,400) | | Daito Trust Construction Co., Ltd. | | (178,198) | |
| (40,000) | | Mitsui Chemicals, Inc. | | (174,437) | |
| (1,600) | | Nidec Corp. | | (109,039) | |
| (26,000) | | Sumitomo Chemical Co., Ltd. | | (131,714) | |
| | | | | (742,001) | |
| | | | | Value | |
| Shares | | | | (note 2) | |
| | | | | | |
| | | Netherlands – (2.32)% | | | |
| (48,000) | | CNH Industrial N.V. | $ | (300,635) | |
| | | | | | |
| | | Singapore – (1.41)% | | | |
| (8,900) | | DBS Group Holdings, Ltd. | | (88,651) | |
| (46,400) | | Wilmar International, Ltd. | | (94,076) | |
| | | | | (182,727) | |
| | | | | | |
| | | Sweden – (5.57)% | | | |
| (11,000) | | ICA Gruppen AB | | (389,170) | |
| (31,000) | | Meda AB | | (333,271) | |
| | | | | (722,441) | |
| | | | | | |
| | | Switzerland – (2.86)% | | | |
| (2,800) | | Kuehne & Nagel | | | |
| | | International AG | | (371,153) | |
| | | | | | |
| | | Total Securities Sold Short | | | |
| | | (Cost $(3,314,877)) | $ | (3,303,270) | |
See notes to financial statements
72
| Portfolio of investments (unaudited) |
International Long/Short Equity Fund
January 31, 2016 (continued)
(g) FINANCIAL DERIVATIVE INSTRUMENTS
EXCHANGE-TRADED OR CENTRALLY-CLEARED FINANCIAL DERIVATIVE INSTRUMENTS
FUTURES CONTRACTS
| | | | | | | | | | | | Unrealized | |
| | | | | | | | | | Current | | appreciation/ | |
| | | | Number of | | | Expiration | | | notional | | (depreciation) | |
| | | | contracts | | | date | | | value | | | Asset | | | Liability | |
| | | | | | | | | | | | | | | | | |
| ASX SPI 200 Index (Short) | | | (1 | ) | | 3/17/16 | | $ | 87,849 | | $ | — | | $ | (2,904 | ) |
| Hang Seng Index (Short) | | | (3 | ) | | 2/26/16 | | | 380,222 | | | — | | | (8,500 | ) |
| MSCI Taiwan Index (Short) | | | (3 | ) | | 2/25/16 | | | 88,650 | | | — | | | (3,010 | ) |
| SGX Nifty 50 Index (Short) | | | (8 | ) | | 2/25/16 | | | 120,816 | | | — | | | (1,507 | ) |
| TOPIX Index (Short) | | | (5 | ) | | 3/10/16 | | | 594,309 | | | — | | | (9,700 | ) |
| Total | | | | | | | | | | | $ | — | | $ | (25,621 | ) |
During the period ended January 31, 2016, average monthly notional value related to futures contracts was approximately $929,636 or 7.2% of ending net assets.
FINANCIAL DERIVATIVE INSTRUMENTS: EXCHANGE-TRADED OR CENTRALLY-CLEARED SUMMARY
The following is a summary of the value of exchange-traded or centrally-cleared financial derivative instruments as of January 31, 2016.
| | | | | | | | | | | | | | |
| | | | Futures Contracts | | | Total | | | Futures Contracts | | | Total | |
| Total Exchange-Traded or Centrally Cleared | | $ | — | | $ | — | | $ | (25,621 | ) | $ | (25,621 | ) |
OVER-THE-COUNTER FINANCIAL DERIVATIVE INSTRUMENTS
FORWARD FOREIGN CURRENCY CONTRACTS
| | | | | | | | | | | | | | | | Unrealized | |
| | | | | | | | | | Local | | | Current | | | appreciation/ | |
| | | | | | | Value | | | amount | | | notional | | | (depreciation) | |
| | | | Counterparty | | | date | | | (000's | ) | | value | | | Asset | | | Liability | |
| | | | | | | | | | | | | | | | | | | | |
| Australian Dollar (Short) | | | BNP Paribas Securities Services | | | 2/24/2016 | | | 207 | | $ | 146,442 | | $ | — | | $ | (3,932 | ) |
| British Pound (Short) | | | BNP Paribas Securities Services | | | 2/24/2016 | | | 158 | | | 225,904 | | | 841 | | | — | |
| Euro (Long) | | | BNP Paribas Securities Services | | | 2/24/2016 | | | 211 | | | 228,153 | | | 1,183 | | | — | |
| Hong Kong Dollar (Short) | | | BNP Paribas Securities Services | | | 2/24/2016 | | | 3,292 | | | 423,016 | | | — | | | (1,161 | ) |
| Japanese Yen (Short) | | | BNP Paribas Securities Services | | | 2/24/2016 | | | 143,613 | | | 1,186,710 | | | 34,108 | | | — | |
| Singapore Dollar (Long) | | | BNP Paribas Securities Services | | | 2/24/2016 | | | 77 | | | 54,408 | | | 573 | | | — | |
| Swedish Krona (Long) | | | BNP Paribas Securities Services | | | 2/24/2016 | | | 5,952 | | | 693,895 | | | — | | | (1,990 | ) |
| Swiss Franc (Short) | | | BNP Paribas Securities Services | | | 2/24/2016 | | | 648 | | | 633,763 | | | 14,255 | | | — | |
| South Korean Won (Long) | | | Citibank, N.A. | | | 3/23/2016 | | | 65,713 | | | 54,302 | | | 364 | | | — | |
| New Taiwan Dollar (Short) | | | JP Morgan Chase Bank, N.A. | | | 3/23/2016 | | | 3,776 | | | 112,664 | | | 681 | | | — | |
| South Korean Won (Short) | | | JP Morgan Chase Bank, N.A. | | | 3/23/2016 | | | 65,713 | | | 54,302 | | | 1,180 | | | — | |
| Total | | | | | | | | | | | | | | $ | 53,185 | | $ | (7,083 | ) |
During the period ended January 31, 2016, average monthly notional value related to forward foreign currency contracts was approximately $13.0 million or 100.32% of ending net assets.
See notes to financial statements
73
| Portfolio of investments (unaudited) |
International Long/Short Equity Fund
January 31, 2016 (continued)
EQUITY SWAPS
| | | | | | | | | | | | | | Unrealized | |
| | | | | | | | | | | | | | appreciation/ | |
| | | Pay/ | | Underlying | # of | | Financing | Termination | | Notional | | (depreciation) | |
| Counterparty | | Receive(1) | | Reference | Shares | | Rate | | Date | | amount | | | Asset | | | Liability | |
| | | | | | | | | | | | | | | | | | | |
| Credit Suisse Securities (Europe) Limited | | Receives | | Astrazeneca plc | 5,500 | | 1-month USD LIBOR plus a specified amount | | 6/13/2016 | | 351,683 | | $ | 19,061 | $ | | — | |
| Credit Suisse Securities (Europe) Limited | | Receives | | Balfour Beatty plc | 30,000 | | 1-month USD LIBOR plus a specified amount | | 6/13/2016 | | 107,167 | | | 4,699 | | | — | |
| Credit Suisse Securities (Europe) Limited | | Receives | | Barclays plc | 100,000 | | 1-month USD LIBOR plus a specified amount | | 6/13/2016 | | 265,031 | | | 10,000 | | | — | |
| Credit Suisse Securities (Europe) Limited | | Receives | | BG Group plc | 35,000 | | 1-month USD LIBOR plus a specified amount | | 6/13/2016 | | 525,895 | | | 11,654 | | | — | |
| Credit Suisse Securities (Europe) Limited | | Receives | | Clinigen Group plc | 7,594 | | 1-month USD LIBOR plus a specified amount | | 6/13/2016 | | 68,820 | | | 3,908 | | | — | |
| Credit Suisse Securities (Europe) Limited | | Receives | | E2V Technologies plc | 40,000 | | 1-month USD LIBOR plus a specified amount | | 6/13/2016 | | 120,831 | | | — | | | (11,033) | |
| Credit Suisse Securities (Europe) Limited | | Receives | | Grainger plc | 33,000 | | 1-month USD LIBOR plus a specified amount | | 6/13/2016 | | 108,432 | | | — | | | (667) | |
| Credit Suisse Securities (Europe) Limited | | Receives | | Inmarsat plc | 20,000 | | 1-month USD LIBOR plus a specified amount | | 6/13/2016 | | 313,478 | | | 36,631 | | | — | |
| Credit Suisse Securities (Europe) Limited | | Receives | | Interserve plc | 19,000 | | 1-month USD LIBOR plus a specified amount | | 6/13/2016 | | 126,269 | | | — | | | (15,270) | |
| Credit Suisse Securities (Europe) Limited | | Receives | | Kingfisher plc | 33,000 | | 1-month USD LIBOR plus a specified amount | | 6/13/2016 | | 153,338 | | | — | | | (12,461) | |
| Credit Suisse Securities (Europe) Limited | | Receives | | Laird plc | 20,000 | | 1-month USD LIBOR plus a specified amount | | 6/13/2016 | | 101,168 | | | 9,502 | | | — | |
| Credit Suisse Securities (Europe) Limited | | Receives | | NMC Health plc | 11,000 | | 1-month USD LIBOR plus a specified amount | | 6/13/2016 | | 151,880 | | | 27,088 | | | — | |
| Credit Suisse Securities (Europe) Limited | | Receives | | Nokia Oyj | 38,500 | | 1-month USD LIBOR plus a specified amount | | 7/10/2017 | | 275,267 | | | — | | | (2,336) | |
| Credit Suisse Securities (Europe) Limited | | Receives | | Optimal Payments plc | 14,000 | | 1-month USD LIBOR plus a specified amount | | 6/13/2016 | | 79,894 | | | 22,482 | | | — | |
| Credit Suisse Securities (Europe) Limited | | Receives | | Paragon Group Companies plc | 30,000 | | 1-month USD LIBOR plus a specified amount | | 6/13/2016 | | 134,909 | | | — | | | (14,098) | |
| Credit Suisse Securities (Europe) Limited | | Receives | | Playtech plc | 9,000 | | 1-month USD LIBOR plus a specified amount | | 6/13/2016 | | 98,553 | | | 8,565 | | | — | |
| Credit Suisse Securities (Europe) Limited | | Receives | | Quantum Pharmaceutical | 80,000 | | 1-month USD LIBOR plus a specified amount | | 6/13/2016 | | 84,924 | | | — | | | (25,593) | |
| Credit Suisse Securities (Europe) Limited | | Receives | | Renault SA | 3,600 | | 1-month USD LIBOR plus a specified amount | | 6/13/2016 | | 303,918 | | | 20,918 | | | — | |
| Credit Suisse Securities (Europe) Limited | | Receives | | Royal Dutch Shell plc B Shares | 7,603 | | 1-month USD LIBOR plus a specified amount | | 6/13/2016 | | 164,778 | | | 2,505 | | | — | |
| Credit Suisse Securities (Europe) Limited | | Receives | | Victrex plc | 5,000 | | 1-month USD LIBOR plus a specified amount | | 6/13/2016 | | 110,287 | | | — | | | (14,359) | |
| Credit Suisse Securities (Europe) Limited | | Pays | | Afren plc (a) (b) | (950,000) | | 1-month USD LIBOR less a specified amount | | 6/13/2016 | | (1,354) | | | 58,962 | | | — | |
| Credit Suisse Securities (Europe) Limited | | Pays | | Airbus Group NV | (5,500) | | 1-month USD LIBOR less a specified amount | | 6/13/2016 | | (344,500) | | | — | | | (11,054) | |
| Credit Suisse Securities (Europe) Limited | | Pays | | Allied Minds plc | (20,000) | | 1-month USD LIBOR less a specified amount | | 6/13/2016 | | (80,478) | | | 28,776 | | | — | |
| Credit Suisse Securities (Europe) Limited | | Pays | | AO World plc | (55,000) | | 1-month USD LIBOR less a specified amount | | 6/13/2016 | | (119,122) | | | 433 | | | — | |
| Credit Suisse Securities (Europe) Limited | | Pays | | Avanti Communications Group | (50,000) | | 1-month USD LIBOR less a specified amount | | 6/13/2016 | | (87,453) | | | 36,431 | | | — | |
| Credit Suisse Securities (Europe) Limited | | Pays | | Carillion plc | (32,000) | | 1-month USD LIBOR less a specified amount | | 6/13/2016 | | (125,528) | | | 16,860 | | | — | |
| Credit Suisse Securities (Europe) Limited | | Pays | | Fenner plc | (55,000) | | 1-month USD LIBOR less a specified amount | | 6/13/2016 | | (83,072) | | | 34,816 | | | — | |
| Credit Suisse Securities (Europe) Limited | | Pays | | Foxtons Group plc | (40,000) | | 1-month USD LIBOR less a specified amount | | 6/13/2016 | | (96,181) | | | 20,335 | | | — | |
| Credit Suisse Securities (Europe) Limited | | Pays | | Hargreaves Lansdown plc | (10,000) | | 1-month USD LIBOR less a specified amount | | 6/13/2016 | | (194,214) | | | — | | | (50,111) | |
| Credit Suisse Securities (Europe) Limited | | Pays | | Mitie Group plc | (30,000) | | 1-month USD LIBOR less a specified amount | | 6/13/2016 | | (120,803) | | | 698 | | | — | |
| Credit Suisse Securities (Europe) Limited | | Pays | | SSE plc | (17,500) | | 1-month USD LIBOR less a specified amount | | 6/13/2016 | | (361,568) | | | — | | | (12,505) | |
| Credit Suisse Securities (Europe) Limited | | Pays | | Telecom Plus plc | (8,500) | | 1-month USD LIBOR less a specified amount | | 6/13/2016 | | (122,328) | | | 437 | | | — | |
| Credit Suisse Securities (Europe) Limited | | Pays | | Woodford Patient Capital Trust | (180,000) | | 1-month USD LIBOR less a specified amount | | 6/13/2016 | | (226,602) | | | 39,665 | | | — | |
| | | | | | | | | | | | | | $ | 414,426 | | $ | (169,487) | |
| (1) | | Receive indicates the Fund receives payments for any positive return on the underlying reference. The Fund makes payments for any negative return on such underlying reference. Pay indicates the Fund receives payments for any negative return on the underlying reference. The Fund makes payments for any positive return on such underlying reference. |
| (a) | | The contract has been deemed illiquid by the Adviser according to policies and procedures adopted by the Board of Trustees. |
| (b) | | Fair valued at January 31, 2016 as determined in good faith using procedures approved by the Board of Trustees. |
See notes to financial statements
74
| Portfolio of investments (unaudited) |
International Long/Short Equity Fund
January 31, 2016 (continued)
FINANCIAL DERIVATIVE INSTRUMENTS: OVER-THE-COUNTER SUMMARY
The following is a summary by counterparty of the value of over-the-counter financial derivative instruments and collateral (received)/pledged as of January 31, 2016.
| | | | Unrealized | | | | | | | | | Unrealized | | | | | | | | | | | | | | | | |
| | | | Appreciation | | | Value(1) | | | | | | Depreciation | | | Value(1) | | | | | | | | | | | | | |
| | | | Forward | | | | | | | | | Forward | | | | | | | | | | | | | | | | |
| | | | Foreign | | | | | | Total | | | Foreign | | | | | | Total | | | Net Value | | | Collateral | | | | |
| | | | Currency | | | Swap | | | Over-the- | | | Currency | | | Swap | | | Over-the- | | | of OTC | | | (Received) / | | | Net | |
| | | | Contracts | | | Contracts | | | Counter | | | Contracts | | | Contracts | | | Counter | | | Derivatives | | | Pledged | | Exposure(2) | |
| | | | | | | | | | | | | | | | | | | | | | | | | | | | | |
| Amounts subject to a master netting or similar agreement: | | | | | | | | | | | | | | | | |
| BNP Paribas | | | | | | | | | | | | | | | | | | | | | | | | | | | | |
| Securities Services | | $ | 50,960 | | $ | — | | $ | 50,960 | | $ | (7,083 | ) | $ | — | | $ | (7,083 | ) | $ | 43,877 | | $ | — | | $ | 43,877 | |
| Citibank, N.A. | | | 364 | | | — | | | 364 | | | — | | | — | | | — | | | 364 | | | — | | | 364 | |
| Credit Suisse Securities | | | | | | | | | | | | | | | | | | | | | | | | | | | | |
| (Europe) Limited | | | — | | | 414,426 | | | 414,426 | | | — | | | (169,487 | ) | | (169,487 | ) | | 244,939 | | | 450,000 | | | 694,939 | |
| JP Morgan Chase | | | | | | | | | | | | | | | | | | | | | | | | | | | | |
| Bank, N.A. | | | 1,861 | | | — | | | 1,861 | | | — | | | — | | | — | | | 1,861 | | | — | | | 1,861 | |
| | | $ | 53,185 | | $ | 414,426 | | $ | 467,611 | | $ | (7,083 | ) | $ | (169,487 | ) | $ | (176,570 | ) | $ | 291,041 | | $ | 450,000 | | $ | 741,041 | |
| (1) | | Value on swap contracts is represented by "unrealized appreciation/(depreciation)" on interest rate swaps, and "value" on credit default swaps, which is inclusive of upfront premiums paid/(received). |
| (2) | | Net Exposure represents the net receivable/(payable) that would be due from/to the counterparty in the event of default. Exposure from over-the-counter financial derivative instruments can only be netted across transactions governed under the same master agreement with the same legal entity. See Note 2, Significant Accounting Policies, "Derivative instruments," in the Notes to Financial Statements for more information regarding master netting arrangements. |
| | | Cost or Premiums, net | | | Asset | | | Liability | |
| TOTAL FINANCIAL DERIVATIVE INSTRUMENTS | | $ | — | | $ | 467,611 | | $ | (202,191 | ) |
See notes to financial statements
75
| Portfolio of investments (unaudited) |
International Long/Short Equity Fund
January 31, 2016 (continued)
Other information:
| Currency exposure of portfolio assets before | |
| any currency hedging, if applicable. | % of net |
| Excludes derivatives: | investments |
| | | |
| Japanese Yen | 36 | % |
| Swiss Franc | 19 | |
| Euro | 14 | |
| US Dollar | 13 | |
| Hong Kong Dollar | 10 | |
| Taiwan Dollar | 3 | |
| Australian Dollar | 2 | |
| Singapore Dollar | 2 | |
| British Pound | 1 | |
| | 100 | % |
| Industry concentration as | % of net |
| a percentage of net assets: | assets |
| | | |
| Pharmaceuticals | 6.36 | % |
| Insurance | 5.47 | |
| Retail | 4.39 | |
| Telecommunications | 2.74 | |
| Real Estate | 2.32 | |
| Transportation | 2.28 | |
| Food | 2.25 | |
| Internet | 2.13 | |
| Engineering & Construction | 1.33 | |
| Oil & Gas | 1.24 | |
| Commercial Services | 1.24 | |
| Cosmetics/Personal Care | 1.22 | |
| Building Materials | 1.18 | |
| Auto Manufacturers | 1.12 | |
| Semiconductors | 1.09 | |
| Biotechnology | 1.04 | |
| Machinery - Diversified | 1.03 | |
| Machinery – Construction & Mining | 1.03 | |
| Lodging | 0.96 | |
| Banks | 0.74 | |
| Computers | 0.70 | |
| Healthcare - Products | 0.38 | |
| Long-Term Investments | 42.24 | |
| Short-Term Investment | 72.15 | |
| Securities Sold Short | | |
| Food | (3.73 | ) |
| Oil & Gas | (3.38 | ) |
| Transportation | (2.86 | ) |
| Pharmaceuticals | (2.57 | ) |
| Chemicals | (2.36 | ) |
| Machinery-Diversified | (2.32 | ) |
| Airlines | (2.26 | ) |
| Real Estate | (2.02 | ) |
| Building Materials | (1.15 | ) |
| Electrical Components &Equipment | (0.84 | ) |
| Banks | (0.68 | ) |
| Auto Manufacturers | (0.67 | ) |
| Internet | (0.65 | ) |
| Financial Derivative Instruments | 2.04 | |
| Net Other Assets and Liabilities | 9.06 | |
| | 100.00 | % |
See notes to financial statements
76
| Portfolio of investments (unaudited) |
International Long/Short Equity Fund
January 31, 2016 (continued)
Fair Value Measurements
The following table summarizes the Fund's investments that are measured at fair value by level within the fair value hierarchy at January 31, 2016:
| | | | Quoted prices | | | Significant | | | | | | | |
| | | | in active | | | other | | | Significant | | | | |
| | | | markets for | | | observable | | | unobservable | | | | |
| | | | identical assets | | | inputs | | | inputs | | | | |
| Description | | | (Level 1 | ) | | (Level 2 | ) | | (Level 3 | ) | | Total | |
| | | | | | | | | | | | | | |
| Assets | | | | | | | | | | | | | |
| Common Stocks | | | | | | | | | | | | | |
| Australia | | $ | — | | $ | 134,765 | | $ | — | | $ | 134,765 | |
| China | | | 132,248 | | | 143,580 | | | — | | | 275,828 | |
| Finland | | | — | | | 190,066 | | | — | | | 190,066 | |
| Hong Kong | | | — | | | 411,922 | | | — | | | 411,922 | |
| India | | | 187,458 | | | — | | | — | | | 187,458 | |
| Israel | | | 368,880 | | | — | | | — | | | 368,880 | |
| Italy | | | — | | | 424,200 | | | — | | | 424,200 | |
| Japan | | | — | | | 1,958,092 | | | — | | | 1,958,092 | |
| Singapore | | | — | | | 124,492 | | | — | | | 124,492 | |
| Spain | | | — | | | 172,721 | | | — | | | 172,721 | |
| Switzerland | | | — | | | 1,034,904 | | | — | | | 1,034,904 | |
| Taiwan | | | — | | | 140,810 | | | — | | | 140,810 | |
| United Kingdom | | | — | | | 49,343 | | | — | | | 49,343 | |
| Total Common Stocks | | | 688,586 | | | 4,784,895 | | | — | | | 5,473,481 | |
| Warrants | | | | | | | | | | | | | |
| Norway | | | — | | | — | * | | — | | | — | |
| Total Warrants | | | — | | | — | | | — | | | — | |
| Short-Term Investment | | | 9,349,762 | | | — | | | — | | | 9,349,762 | |
| Total Investments | | $ | 10,038,348 | | $ | 4,784,895 | | $ | — | | $ | 14,823,243 | |
| Liabilities | | | | | | | | | | | | | |
| Securities Sold Short | | | | | | | | | | | | | |
| China | | $ | (83,948 | ) | $ | (87,363 | ) | $ | — | | $ | (171,311 | ) |
| Finland | | | — | | | (437,535 | ) | | — | | | (437,535 | ) |
| Germany | | | — | | | (292,234 | ) | | — | | | (292,234 | ) |
| Hong Kong | | | — | | | (83,233 | ) | | — | | | (83,233 | ) |
| Japan | | | — | | | (742,001 | ) | | — | | | (742,001 | ) |
| Netherlands | | | — | | | (300,635 | ) | | — | | | (300,635 | ) |
| Singapore | | | — | | | (182,727 | ) | | — | | | (182,727 | ) |
| Sweden | | | — | | | (722,441 | ) | | — | | | (722,441 | ) |
| Switzerland | | | — | | | (371,153 | ) | | — | | | (371,153 | ) |
| Total Securities Sold Short | | | (83,948 | ) | | (3,219,322 | ) | | — | | | (3,303,270 | ) |
| Financial Derivative Instruments – Assets | | | | | | | | | | | | | |
| Over-the-counter | | $ | — | | $ | 408,649 | | $ | 58,962 | | $ | 467,611 | |
| Total Financial Derivative Instruments – Assets | | $ | — | | $ | 408,649 | | $ | 58,962 | | $ | 467,611 | |
| Financial Derivative Instruments – Liabilities | | | | | | | | | | | | | |
| Exchange-traded or centrally-cleared | | $ | (25,621 | ) | $ | — | | $ | — | | $ | (25,621 | ) |
| Over-the-counter | | | — | | | (176,570 | ) | | — | | | (176,570 | ) |
| Total Financial Derivative Instruments – Liabilities | | $ | (25,621 | ) | $ | (176,570 | ) | $ | — | | $ | (202,191 | ) |
* Fund held a level 2 security that was fair valued at $0 at January 31, 2016.
See notes to financial statements
77
| Portfolio of investments (unaudited) |
International Long/Short Equity Fund
January 31, 2016 (continued)
On July 31, 2015, substantially all of the common stocks held by the Fund (long and short) were valued at the last reported sale price or official closing price. However, on January 31, 2016, certain of the Fund's investments trading in foreign markets were fair valued in accordance with the fair value pricing procedures approved by the Board using the independent statistical fair value service as described in Note 2. Accordingly, using the end of the reporting period method for determining when transfers between levels are recognized, common stocks (long and short) valued at $1,014,569 net, on January 31, 2016 were transferred from Level 1 to Level 2.
On July 31, 2015, all of the equity swaps held by the Fund were valued based upon the last reported sale price or official closing price on the underlying equity, plus/minus accrued dividends. At January 31, 2016, the short equity swap on Afren plc was valued based upon a fair value price ascribed by the Adviser in accordance with fair value pricing procedures approved by the Board. Accordingly, using the end of the reporting period method for determining when transfers between levels are recognized, equity swaps valued at $58,962 on January 31, 2016 were transferred from Level 2 to Level 3.
Following is a reconciliation of investments in which significant unobservable inputs (Level 3) were used in determining fair value:
| | | | Balance | | | | | | | | | Change in | | | | | | | | | | | | | | | Balance | |
| | | | as of | | | Accrued | | | | | | unrealized | | | | | | | | | Transfers | | | Transfers | | | as of | |
| | | | July 31, | | | discounts/ | | | Realized | | | appreciation | | | | | | | | | in to | | | out of | | | January 31, | |
| Investments in Securities | | | 2015 | | | premiums | | | gain/(loss | ) | | (depreciation | ) | | Purchases | | | Sales | | | level 3 | | | level 3 | | | 2016 | |
| | | | | | | | | | | | | | | | | | | | | | | | | | | | | |
| Equity Swap | | | | | | | | | | | | | | | | | | | | | | | | | | | | |
| Afren plc | | $ | 39,622 | | $ | 0 | | $ | 0 | | $ | 19,340 | | $ | 0 | | $ | 0 | | $ | 58,962 | | $ | 0 | | $ | 58,962 | |
| | | $ | 39,622 | | $ | 0 | | $ | 0 | | $ | 19,340 | | $ | 0 | | $ | 0 | | $ | 58,962 | | $ | 0 | | $ | 58,962 | |
The total net change in unrealized appreciation (depreciation) attributable to Level 3 investments held at January 31, 2016 was $19,340.
The Fund's Adviser has determined that the short equity swaps on Afren plc is a Level 3 investment due to the lack of observable inputs that may be used in the determination of fair value. The fair valuation reflects that the underlying equity security has been delisted from the London Stock Exchange and is undergoing bankruptcy proceedings.
Fair Value of Financial Derivative Instruments
The following is a summary of the fair valuation of the Fund's financial derivative instruments categorized by risk exposure:
Fair Values of Financial Derivative Instruments on the Statement of Assets and Liabilities as of January 31, 2016
| | | Derivatives not accounted for as hedging instruments | |
| | | | Foreign | | | | | | | | | | | | | | | | |
| | | | Currency | | | Equity | | | Interest | | | Credit | | | Inflation | | | | |
| | | | Risk | | | Risk | | | Rate Risk | | | Risk | | | Risk | | | Total | |
| | | | | | | | | | | | | | | | | | | | |
| Financial Derivative Instruments – Assets | | | | | | | | | | | | | | | | | | | |
| Over-the-Counter | | | | | | | | | | | | | | | | | | | |
| Forward Foreign Currency Contracts | | $ | 53,185 | | $ | — | | $ | — | | $ | — | | $ | — | | $ | 53,185 | |
| Swap Contracts | | | — | | | 414,426 | | | — | | | — | | | — | | | 414,426 | |
| Total | | | 53,185 | | | 414,426 | | | — | | | — | | | — | | | 467,611 | |
| Financial Derivative Instruments – Liabilities | | | | | | | | | | | | | | | | | | | |
| Exchange-Traded | | | | | | | | | | | | | | | | | | | |
| Futures Contracts | | | — | | �� | (25,621 | ) | | — | | | — | | | — | | | (25,621 | ) |
| | | | — | | | (25,621 | ) | | — | | | — | | | — | | | (25,621 | ) |
| Over-the-Counter | | | | | | | | | | | | | | | | | | | |
| Forward Foreign Currency Contracts | | | (7,083 | ) | | — | | | — | | | — | | | — | | $ | (7,083 | ) |
| Swap Contracts | | | — | | | (169,487 | ) | | — | | | — | | | — | | | (169,487 | ) |
| Total | | | (7,083 | ) | | (195,108 | ) | | — | | | — | | | — | | | (202,191 | ) |
| Net | | | 46,102 | | | 219,318 | | | — | | | — | | | — | | $ | 265,420 | |
See notes to financial statements
78
| Portfolio of investments (unaudited) |
International Long/Short Equity Fund
January 31, 2016 (continued)
Effect of Financial Derivative Instruments on the Statement of Operations for the Period Ended January 31, 2016
| | | Derivatives not accounted for as hedging instruments | |
| | | | Foreign | | | | | | | | | | | | | | | | |
| | | | Currency | | | Equity | | | Interest | | | Credit | | | Inflation | | | | |
| | | | Risk | | | Risk | | | Rate Risk | | | Risk | | | Risk | | | Total | |
| | | | | | | | | | | | | | | | | | | | |
| Net realized gain/(loss) from | | | | | | | | | | | | | | | | | | | |
| financial derivative instruments | | | | | | | | | | | | | | | | | | | |
| Futures Contracts | | $ | — | | $ | (2,245 | ) | | — | | | — | | | — | | $ | (2,245 | ) |
| Forward Foreign Currency Contracts | | | 46,880 | | | — | | | — | | | — | | | — | | | 46,880 | |
| Swap Contracts | | | — | | | 86,019 | | | — | | | — | | | — | | | 86,019 | |
| | | $ | 46,880 | | $ | 83,774 | | | — | | | — | | | — | | $ | 130,654 | |
| Net change in unrealized | | | | | | | | | | | | | | | | | | | |
| appreciation/(depreciation) of | | | | | | | | | | | | | | | | | | | |
| financial derivative instruments | | | | | | | | | | | | | | | | | | | |
| Futures Contracts | | $ | — | | $ | (15,590 | ) | | — | | | — | | | — | | | (15,590 | ) |
| Forward Foreign Currency Contracts | | | 31,244 | | $ | — | | | — | | | — | | | — | | | 31,244 | |
| Swap Contracts | | | — | | $ | 94,980 | | | — | | | — | | | — | | | 94,980 | |
| | | $ | 31,244 | | $ | 79,390 | | | — | | | — | | | — | | $ | 110,634 | |
See notes to financial statements
79
| Portfolio of investments (unaudited) |
International Opportunities Fund
January 31, 2016
| | | | | Value | |
| Shares | | | | (note 2) | |
| | | | | | |
| Common stocks – 93.67% | | | |
| | | | | | |
| | | Australia – 0.79% | | | |
| 494,872 | | CSL, Ltd. | $ | 36,846,125 | |
| | | | | | |
| | | Brazil – 0.30% | | | |
| 1,639,870 | | Tractebel Energia S.A. | | 13,873,994 | |
| | | | | | |
| | | Chile – 0.66% | | | |
| 28,860,840 | | Aguas Andinas S.A., Class A | | 14,483,012 | |
| 1,536,936 | | Antofagasta plc (a) | | 8,402,951 | |
| 795,930 | | Empresa Nacional de | | | |
| | | Telecomunicaciones S.A. | | 7,804,220 | |
| | | | | 30,690,183 | |
| | | | | | |
| | | China – 1.83% | | | |
| 267,340 | | Baidu, Inc., ADR * | | 43,648,602 | |
| 2,231,000 | | Tencent Holdings, Ltd. | | 42,148,222 | |
| | | | | 85,796,824 | |
| | | | | | |
| | | Finland – 4.17% | | | |
| 12,100,000 | | Nokia Oyj * | | 87,493,589 | |
| 15,000,000 | | Nokia Oyj | | 107,584,777 | |
| | | | | 195,078,366 | |
| | | | | | |
| | | France – 11.28% | | | |
| 2,000,000 | | Accor S.A. | | 76,835,030 | |
| 1,020,000 | | Essilor International S.A. | | 126,744,348 | |
| 222,018 | | L'Oreal S.A. | | 38,322,474 | |
| 1,399,875 | | Renault S.A. | | 118,609,859 | |
| 3,300,000 | | Rexel S.A. | | 39,130,338 | |
| 1,294,369 | | Sodexo (a) | | 128,084,689 | |
| | | | | 527,726,738 | |
| | | | | | |
| | | Germany – 11.13% | | | |
| 535,812 | | Continental AG | | 111,895,170 | |
| 4,902,380 | | Deutsche Post AG | | 118,512,676 | |
| 1,716,348 | | Fresenius SE & Co., KGaA | | 113,570,199 | |
| 1,875,000 | | ProSiebenSat.1 Media SE | | 93,337,919 | |
| 1,050,000 | | SAP SE | | 83,304,539 | |
| | | | | 520,620,503 | |
| | | | | | |
| | | Hong Kong – 3.00% | | | |
| 7,536,800 | | AIA Group, Ltd. | | 42,224,653 | |
| 5,753,000 | | Cheung Kong Property | | | |
| | | Holdings, Ltd. | | 31,143,199 | |
| 2,522,500 | | China Mobile, Ltd. | | 27,605,643 | |
| 4,272,000 | | China Resources Beer | | | |
| | | Holdings Company, Ltd. | | 6,743,620 | |
| 2,602,500 | | CK Hutchison Holdings, Ltd. | | 32,410,950 | |
| | | | | 140,128,065 | |
| | | | | Value | |
| Shares | | | | (note 2) | |
| | | | | | |
| | | India – 2.67% | | | |
| 3,172,112 | | Housing Development | | | |
| | | Finance Corp., Ltd. | $ | 55,396,304 | |
| 1,630,000 | | Infosys, Ltd. | | 28,181,196 | |
| 955,273 | | Lupin, Ltd. | | 24,169,784 | |
| 490,219 | | Tata Consultancy | | | |
| | | Services, Ltd. | | 17,281,367 | |
| | | | | 125,028,651 | |
| | | | | | |
| | | Ireland – 0.53% | | | |
| 373,975 | | ICON plc * | | 24,708,528 | |
| | | | | | |
| | | Israel – 2.10% | | | |
| 1,600,000 | | Teva Pharmaceutical | | | |
| | | Industries, Ltd., ADR | | 98,368,000 | |
| | | | | | |
| | | Italy – 1.87% | | | |
| 11,750,000 | | Poste Italiane SpA * (b) | | 87,444,844 | |
| | | | | | |
| | | Japan – 18.58% | | | |
| 1,408,400 | | Denso Corp. (a) | | 61,126,488 | |
| 863,800 | | East Japan Railway Co. | | 79,556,877 | |
| 1,085,200 | | Electric Power | | | |
| | | Development Co., Ltd. | | 36,608,456 | |
| 361,900 | | Fanuc, Ltd. (a) | | 48,317,921 | |
| 11,761,000 | | Fujitsu, Ltd. | | 49,059,845 | |
| 14,707,000 | | Hitachi, Ltd. (a) | | 72,588,331 | |
| 3,045,500 | | Japan Post | | | |
| | | Holdings Co., Ltd. * | | 40,633,404 | |
| 15,428,000 | | Mitsubishi Heavy | | | |
| | | Industries, Ltd. (a) | | 60,831,003 | |
| 1,211,300 | | Nippon Telegraph & | | | |
| | | Telephone Corp. | | 51,529,355 | |
| 1,288,100 | | NTT Data Corp. | | 62,099,113 | |
| 2,152,700 | | Seven & I Holdings Co., Ltd. | | 95,726,211 | |
| 1,908,000 | | Sompo Japan Nipponkoa | | | |
| | | Holdings, Inc. | | 56,550,457 | |
| 3,649,700 | | Sumitomo Electric | | | |
| | | Industries, Ltd. | | 48,071,592 | |
| 1,706,000 | | Sumitomo Mitsui Financial | | | |
| | | Group, Inc. | | 57,292,084 | |
| 1,014,100 | | Takeda Pharmaceutical | | | |
| | | Co., Ltd. | | 49,039,280 | |
| | | | | 869,030,417 | |
| | | | | | |
| | | Korea – 1.24% | | | |
| 39,344 | | Samsung Electronics | | | |
| | | Co., Ltd. | | 37,979,207 | |
| 857,270 | | SK Hynix, Inc. | | 19,825,799 | |
| | | | | 57,805,006 | |
| | | | | | |
| | | Netherlands – 4.46% | | | |
| 9,029,194 | | ING Groep N.V. | | 104,225,962 | |
See notes to financial statements
80
| Portfolio of investments (unaudited) |
International Opportunities Fund
January 31, 2016 (continued)
| | | | | Value | |
| Shares | | | | (note 2) | |
| | | | | | |
| | | Netherlands (continued) | | | |
| 4,600,000 | | Koninklijke Ahold N.V. | $ | 104,412,039 | |
| | | | | 208,638,001 | |
| | | | | | |
| | | Philippines – 0.51% | | | |
| 1,680,000 | | Ayala Corp. | | 24,018,614 | |
| | | | | | |
| | | Poland – 0.20% | | | |
| 275,341 | | Bank Pekao S.A. | | 9,263,471 | |
| | | | | | |
| | | Russia – 0.02% | | | |
| 400,000 | | TCS Group Holdings plc, | | | |
| | | GDR (b)(c) * | | 1,080,000 | |
| | | | | | |
| | | Singapore – 0.55% | | | |
| 5,273,100 | | City Developments, Ltd. | | 25,947,028 | |
| | | | | | |
| | | South Africa – 0.62% | | | |
| 1,553,451 | | Shoprite Holdings, Ltd. | | 14,350,942 | |
| 2,088,837 | | Standard Bank Group, Ltd. | | 14,824,269 | |
| | | | | 29,175,211 | |
| | | | | | |
| | | Spain – 2.80% | | | |
| 3,190,374 | | Amadeus IT Holding S.A., | | | |
| | | A Shares (a) | | 131,007,867 | |
| | | | | | |
| | | Sweden – 1.29% | | | |
| 4,200,000 | | Lundin Petroleum AB (a)* | | 60,378,141 | |
| | | | | | |
| | | Switzerland – 4.88% | | | |
| 470,785 | | Roche Holding AG | | 122,479,804 | |
| 6,400,000 | | UBS Group AG | | 105,669,114 | |
| | | | | 228,148,918 | |
| | | | | | |
| | | Taiwan – 1.28% | | | |
| 2,262,900 | | Delta Electronics, Inc. | | 9,614,024 | |
| 2,241,860 | | Taiwan Semiconductor | | | |
| | | Manufacturing Co., Ltd., ADR | | 50,105,571 | |
| | | | | 59,719,595 | |
| | | | | | |
| | | United Kingdom – 13.59% | | | |
| 2,000,000 | | AstraZeneca plc | | 127,946,860 | |
| 38,500,000 | | Barclays plc | | 102,824,915 | |
| 9,500,000 | | BG Group plc | | 144,011,829 | |
| 270,996 | | Delphi Automotive plc | | 17,598,480 | |
| 19,000,000 | | Kingfisher plc | | 88,921,849 | |
| 1,417,461 | | Royal Dutch Shell plc, | | | |
| | | B Shares | | 30,720,232 | |
| 23,704,420 | | Standard Life plc | | 123,732,078 | |
| | | | | 635,756,243 | |
| | | | | Value | |
| Shares | | | | (note 2) | |
| | | | | | |
| | | United States – 3.32% | | | |
| 228,289 | | Apple, Inc. | $ | 22,221,651 | |
| 320,838 | | Cardinal Health, Inc. | | 26,106,588 | |
| 482,193 | | Cognizant Technology | | | |
| | | Solutions Corp., Class A * | | 30,527,639 | |
| 294,965 | | CVS Health Corp. | | 28,490,669 | |
| 290,592 | | MasterCard, Inc., Class A | | 25,871,406 | |
| 20,794 | | The Priceline Group, Inc. * | | 22,144,986 | |
| | | | | 155,362,939 | |
| | | | | | |
| | | Total common stocks | | | |
| | | (Cost $4,243,889,061) | | 4,381,642,272 | |
| | | | | | |
| | | Total long-term investments | | | |
| | | (Cost $4,243,889,061) | | 4,381,642,272 | |
| | | | | | |
| Short-term investment – 6.37% | | | |
| 298,121,603 | | Fidelity Institutional Treasury | | | |
| | | Portfolio (d) | | 298,121,603 | |
| | | | | | |
| | | Total short-term investment | | | |
| | | (Cost $298,121,603) | | 298,121,603 | |
| | | | | | |
| Other securities – 3.33% | | | |
| 155,521,617 | | State Street Navigator | | | |
| | | Securities Lending | | | |
| | | Prime Portfolio (e) | | 155,521,617 | |
| | | | | | |
| | | Total other securities | | | |
| | | (Cost $155,521,617) | | 155,521,617 | |
| | | | | | |
| Total investments – 103.37% | | | |
| | | (Cost $4,697,532,281) | | 4,835,285,492 | |
| | | | | | |
| Financial Derivative Instruments(f) | | | |
(Cost or Premiums, net $0) – (0.24)% | | (11,183,036) | |
| | | | �� | | |
| Net other assets and liabilities – (3.13)% | | (146,034,200) | |
| | | | | | |
| Total net assets – 100.00% | $ | 4,678,068,256 | |
| * | | Non-income producing security |
| (a) | | All or a portion of this security is on loan on an overnight and continuous basis; see notes to financial statements for further information. |
| (b) | | Restricted security, purchased pursuant to Rule 144A under the Securities Act of 1933, as amended, and which is exempt from registration under that Act. At January 31, 2016, the restricted securities held by the Fund had an aggregate value of $88,524,844, which represented 1.9% of net assets. |
| (c) | | The security has been deemed illiquid by the Adviser according to the policies and procedures adopted by the Board of Trustees. |
| (d) | | This short-term investment has been segregated for delayed delivery purchases at January 31, 2016. |
| (e) | | Represents cash collateral received from securities lending transactions; see notes to financial statements for further information. |
| (f) | | Information with respect to financial derivative instruments is disclosed in the following tables. |
| ADR | | American Depositary Receipts |
| GDR | | Global Depositary Receipts |
See notes to financial statements
81
| Portfolio of investments (unaudited) |
International Opportunities Fund
January 31, 2016 (continued)
(f) FINANCIAL DERIVATIVE INSTRUMENTS
OVER-THE-COUNTER FINANCIAL DERIVATIVE INSTRUMENTS
FORWARD FOREIGN CURRENCY CONTRACTS
| | | | | | | | | | | | | | | | Unrealized | |
| | | | | | | | | | Local | | | Current | | | appreciation/ | |
| | | | | | | Value | | | amount | | | notional | | | (depreciation) | |
| | | | Counterparty | | | date | | | (000's | ) | | value | | | Asset | | | Liability | |
| | | | | | | | | | | | | | | | | | | | |
| Euro (Short) | | | Citibank, N.A. | | | 2/12/16 | | | 350,207 | | $ | 379,469,242 | | $ | — | | $ | (4,469,242 | ) |
| Euro (Long) | | | State Street Bank | | | | | | | | | | | | | | | | |
| | | | and Trust Company | | | 2/12/16 | | | 350,207 | | | 379,469,242 | | | — | | | (3,497,952 | ) |
| Japanese Yen (Long) | | | Citibank, N.A. | | | 2/12/16 | | | 23,388,240 | | | 193,219,925 | | | 24,485 | | | — | |
| Japanese Yen (Short) | | | State Street Bank | | | | | | | | | | | | | | | | |
| | | | and Trust Company | | | 2/12/16 | | | 23,388,240 | | | 193,219,925 | | | — | | | (3,219,925 | ) |
| Japanese Yen (Short) | | | Citibank, N.A. | | | 4/28/16 | | | 12,081,900 | | | 100,020,401 | | | — | | | (20,402 | ) |
| Total | | | | | | | | | | | | | | $ | 24,485 | | $ | (11,207,521 | ) |
During the period ended January 31, 2016, average monthly notional value related to forward foreign currency contracts was approximately $614.0 million or 13.1% of ending net assets.
FINANCIAL DERIVATIVE INSTRUMENTS: OVER-THE-COUNTER SUMMARY
The following is a summary by counterparty of the value of over-the-counter financial derivative instruments and collateral (received)/pledged as of January 31, 2016.
| | | | Financial Derivative Assets | | Financial Derivative Liabilities | | | | | | | | | | |
| | | | Unrealized | | | | | | Unrealized | | | | | | | | | | | | | |
| | | | Appreciation | | | | | | Depreciation | | | | | | | | | | | | | |
| | | | Forward | | | | | | Forward | | | | | | Net Value of | | | | | | | |
| | | | Foreign | | | Total | | | Foreign | | | Total | | | Over-the- | | | Collateral | | | | |
| | | | Currency | | | Over-the- | | | Currency | | | Over-the- | | | Counter | | (Received) / | | | Net | |
| | | | Contracts | | | Counter | | | Contracts | | | Counter | | | Derivatives | | | Pledged | | Exposure(1) | |
| | | | | | | | | | | | | | | | | | | | | | | |
| Amounts subject to a master netting or similar arrangement: | | | | | | | | | | | | | | | | | | | | | | |
| Citibank, N.A. | | $ | 24,485 | | $ | 24,485 | | $ | (4,489,644 | ) | $ | (4,489,644 | ) | $ | (4,465,159 | ) | $ | — | | $ | (4,465,159 | ) |
| | | $ | 24,485 | | $ | 24,485 | | $ | (4,489,644 | ) | $ | (4,489,644 | ) | $ | (4,465,159 | ) | $ | — | | $ | (4,465,159 | ) |
| Amounts NOT subject to a master netting or similar arrangement: | | | | | | | | | | | | | | | | | | | | | | |
| State Street Bank and | | | | | | | | | | | | | | | | | | | | | | |
Trust Company(2) | | $ | — | | $ | — | | $ | (6,717,877 | ) | $ | (6,717,877 | ) | | | | | | | | | |
| | | $ | — | | $ | — | | $ | (6,717,877 | ) | $ | (6,717,877 | ) | | | | | | | | | |
| Total Over- | | | | | | | | | | | | | | | | | | | | | | |
| the-Counter | | $ | 24,485 | | $ | 24,485 | | $ | (11,207,521 | ) | $ | (11,207,521 | ) | | | | | | | | | |
| (1) | | Net Exposure represents the net receivable/(payable) that would be due from/to the counterparty in the event of default. Exposure from over-the-counter financial derivative instruments can only be netted across transactions governed under the same master agreement with the same legal entity. See Note 2, Significant Accounting Policies, "Derivative instruments," in the Notes to Financial Statements for more information regarding master netting arrangements. |
| (2) | | Forward foreign currency contracts with State Street Bank and Trust Company are not subject to a legally enforceable master netting arrangement or other similar agreements that provide a legally enforceable right of offset. |
| | | Cost or Premiums, net | | | Asset | | | Liability | |
| TOTAL FINANCIAL DERIVATIVE INSTRUMENTS | | $ | — | | $ | 24,485 | | $ | (11,207,521 | ) |
See notes to financial statements
82
| Portfolio of investments (unaudited) |
International Opportunities Fund
January 31, 2016 (continued)
Other information:
| Currency exposure of portfolio assets before | |
| any currency hedging, if applicable. | % of total |
| Excludes derivatives: | investments |
| | | |
| Euro | 36 | % |
| Japanese Yen | 18 | |
| US Dollar | 15 | |
| British Pound | 13 | |
| Swiss Franc | 5 | |
| Hong Kong Dollar | 4 | |
| Indian Rupee | 3 | |
| Swedish Krona | 1 | |
| South Korean Won | 1 | |
| Australian Dollar | 1 | |
| South African Rand | 1 | |
| Singapore Dollar | 1 | |
| Philippine Peso | 1 | |
| Chilean Peso | 0 | * |
| Brazilian Real | 0 | * |
| New Taiwan Dollar | 0 | * |
| Polish Zloty | 0 | * |
| | 100 | % |
*Less than 0.5% of total investments.
| Industry concentration as | % of net |
| a percentage of net assets: | assets |
| | | |
| Pharmaceuticals | 9.02 | % |
| Life & Health Insurance | 6.29 | |
| Diversified Banks | 6.17 | |
| Auto Parts & Equipment | 5.10 | |
| Food Retail | 4.73 | |
| Communications Equipment | 4.17 | |
| IT Consulting & Other Services | 4.00 | |
| Data Processing & Outsourced Services | 3.35 | |
| Integrated Oil & Gas | 3.74 | |
| Restaurants | 2.74 | |
| Health Care Supplies | 2.71 | |
| Automobile Manufacturers | 2.53 | |
| Air Freight & Logistics | 2.53 | |
| Health Care Equipment | 2.43 | |
| Industrial Machinery | 2.33 | |
| Diversified Capital Markets | 2.26 | |
| Broadcasting | 2.00 | |
| Home Improvement Retail | 1.90 | |
| Internet Software & Services | 1.83 | |
| Application Software | 1.78 | |
| Railroads | 1.70 | |
| Hotels, Resorts & Cruise Lines | 1.64 | |
| Electronic Equipment & Instruments | 1.55 | |
| Semiconductors | 1.49 | |
| Real Estate Development | 1.36 | |
| Oil & Gas Exploration & Production | 1.29 | |
| Technology Hardware, Storage & Peripherals | 1.29 | |
| Property & Casualty Insurance | 1.21 | |
| Thrifts & Mortgage Finance | 1.18 | |
| Integrated Telecommunication Services | 1.10 | |
| Trading Companies & Distributors | 0.84 | |
| Personal Products | 0.82 | |
| Biotechnology | 0.79 | |
| Independent Power Producers & Energy Traders | 0.78 | |
| Wireless Telecommunication Services | 0.76 | |
| Drug Retail | 0.61 | |
| Health Care Distributors | 0.56 | |
| Diversified Real Estate Activities | 0.55 | |
| Life Sciences Tools & Services | 0.53 | |
| Multi-Sector Holdings | 0.51 | |
| Internet Retail | 0.48 | |
| Water Utilities | 0.31 | |
| Renewable Electricity | 0.30 | |
| Electronic Components | 0.21 | |
| Diversified Metals & Mining | 0.18 | |
| Regional Banks | 0.02 | |
| Long Term Investments | 93.67 | |
| Short Term Investment | 6.37 | |
| Other securities | 3.33 | |
| Total Investments | 103.37 | |
| Financial Derivative Instruments | (0.24 | ) |
| Net Other Assets and Liabilities | (3.13 | ) |
| | 100.00 | % |
See notes to financial statements
83
| Portfolio of investments (unaudited) |
International Opportunities Fund
January 31, 2016 (continued)
Fair Value Measurement
The following table summarizes the Fund's investments that are measured at fair value by level within the fair value hierarchy at January 31, 2016:
| | | | Quoted prices | | | Significant | | | | | | | |
| | | | in active | | | other | | | Significant | | | | |
| | | | markets for | | | observable | | | unobservable | | | | |
| | | | identical assets | | | inputs | | | inputs | | | | |
| Description | | | (level 1 | ) | | (level 2 | ) | | (level 3 | ) | | Total | |
| | | | | | | | | | | | | | |
| Assets | | | | | | | | | | | | | |
| Common Stocks | | | | | | | | | | | | | |
| Australia | | $ | — | | $ | 36,846,125 | | $ | — | | $ | 36,846,125 | |
| Brazil | | | 13,873,994 | | | — | | | — | | | 13,873,994 | |
| Chile | | | 22,287,232 | | | 8,402,951 | | | — | | | 30,690,183 | |
| China | | | 43,648,602 | | | 42,148,222 | | | — | | | 85,796,824 | |
| Finland | | | — | | | 195,078,366 | | | — | | | 195,078,366 | |
| France | | | — | | | 527,726,738 | | | — | | | 527,726,738 | |
| Germany | | | — | | | 520,620,503 | | | — | | | 520,620,503 | |
| Hong Kong | | | — | | | 140,128,065 | | | — | | | 140,128,065 | |
| India | | | — | | | 125,028,651 | | | — | | | 125,028,651 | |
| Ireland | | | 24,708,528 | | | — | | | — | | | 24,708,528 | |
| Israel | | | 98,368,000 | | | — | | | — | | | 98,368,000 | |
| Italy | | | — | | | 87,444,844 | | | — | | | 87,444,844 | |
| Japan | | | — | | | 869,030,417 | | | — | | | 869,030,417 | |
| Korea | | | — | | | 57,805,006 | | | — | | | 57,805,006 | |
| Netherlands | | | — | | | 208,638,001 | | | — | | | 208,638,001 | |
| Philippines | | | — | | | 24,018,614 | | | — | | | 24,018,614 | |
| Poland | | | — | | | 9,263,471 | | | — | | | 9,263,471 | |
| Russia | | | 1,080,000 | | | — | | | — | | | 1,080,000 | |
| Singapore | | | — | | | 25,947,028 | | | — | | | 25,947,028 | |
| South Africa | | | — | | | 29,175,211 | | | — | | | 29,175,211 | |
| Spain | | | — | | | 131,007,867 | | | — | | | 131,007,867 | |
| Sweden | | | — | | | 60,378,141 | | | — | | | 60,378,141 | |
| Switzerland | | | — | | | 228,148,918 | | | — | | | 228,148,918 | |
| Taiwan | | | 50,105,571 | | | 9,614,024 | | | — | | | 59,719,595 | |
| United Kingdom | | | 48,318,712 | | | 587,437,531 | | | — | | | 635,756,243 | |
| United States | | | 155,362,939 | | | — | | | — | | | 155,362,939 | |
| Total Common Stocks | | | 457,753,578 | | | 3,923,888,694 | | | — | | | 4,381,642,272 | |
| Short-term investment | | | 298,121,603 | | | — | | | — | | | 298,121,603 | |
| Other securities | | | 155,521,617 | | | — | | | — | | | 155,521,617 | |
| Total Investments | | $ | 911,396,798 | | $ | 3,923,888,694 | | $ | — | | $ | 4,835,285,492 | |
| | | | | | | | | | | | | | |
| Financial Derivative Instruments – Assets | | | | | | | | | | | | | |
| Over-the-counter | | $ | — | | $ | 24,485 | | $ | — | | $ | 24,485 | |
| Total Financial Derivative Instruments – Assets | | $ | — | | $ | 24,485 | | $ | — | | $ | 24,485 | |
| | | | | | | | | | | | | | |
| Financial Derivative Instruments – Liabilities | | | | | | | | | | | | | |
| Over-the-counter | | $ | — | | $ | (11,207,521 | ) | $ | — | | $ | (11,207,521 | ) |
| Total Financial Derivative Instruments – Liabilities | | $ | — | | $ | (11,207,521 | ) | $ | — | | $ | (11,207,521 | ) |
On July 31, 2015, substantially all of the common and preferred stocks held by the Fund were valued at the last reported sale price or official closing price. However, on January 31, 2016, certain of the Fund's common stocks trading in foreign markets were fair valued in accordance with the fair value pricing procedures approved by the Board using the independent statistical fair value service as described in Note 2. Accordingly, using the end of the reporting period method for determining when transfers between levels are recognized, common stocks valued at $3,169,394,235 on January 31, 2016 were transferred from Level 1 to Level 2.
See notes to financial statements
84
| Portfolio of investments (unaudited) |
International Opportunities Fund
January 31, 2016 (continued)
Fair Value of Financial Derivative Instruments
The following is a summary of the fair valuation of the Fund's financial derivative instruments categorized by risk exposure:
Fair Values of Financial Derivative Instruments on the Statement of Assets and Liabilities as of January 31, 2016
| | | Derivatives not accounted for as hedging instruments | |
| | | | Foreign | | | | | | | | | | | | | | | | |
| | | | Currency | | | Equity | | | Interest | | | Credit | | | Inflation | | | | |
| | | | Risk | | | Risk | | | Rate Risk | | | Risk | | | Risk | | | Total | |
| | | | | | | | | | | | | | | | | | | | |
| Financial Derivative Instruments - Assets | | | | | | | | | | | | | | | | | | | |
| Over-the-Counter | | | | | | | | | | | | | | | | | | | |
| Forward Foreign Currency Contracts | | $ | 24,485 | | $ | — | | $ | — | | $ | — | | $ | — | | $ | 24,485 | |
| Total | | $ | 24,485 | | $ | — | | $ | — | | $ | — | | $ | — | | $ | 24,485 | |
| Financial Derivative Instruments - Liabilities | | | | | | | | | | | | | | | | | | | |
| Over-the-Counter | | | | | | | | | | | | | | | | | | | |
| Forward Foreign Currency Contracts | | $ | (11,207,521 | ) | $ | — | | $ | — | | $ | — | | $ | — | | $ | (11,207,521 | ) |
| Total | | $ | (11,207,521 | ) | $ | — | | $ | — | | $ | — | | $ | — | | $ | (11,207,521 | ) |
| Net | | $ | (11,183,036 | ) | $ | — | | $ | — | | $ | — | | $ | — | | $ | (11,183,036 | ) |
Effect of Financial Derivative Instruments on the Statement of Operations for the Period Ended January 31, 2016
| | | Derivatives not accounted for as hedging instruments | |
| | | | Foreign | | | | | | | | | | | | | | | | |
| | | | Currency | | | Equity | | | Interest | | | Credit | | | Inflation | | | | |
| | | | Risk | | | Risk | | | Rate Risk | | | Risk | | | Risk | | | Total | |
| | | | | | | | | | | | | | | | | | | | |
| Net realized gain/(loss) from | | | | | | | | | | | | | | | | | | | |
| financial derivative instruments: | | | | | | | | | | | | | | | | | | | |
| Forward Foreign Currency Contracts | | $ | 12,508,722 | | $ | — | | $ | — | | $ | — | | $ | — | | $ | 12,508,722 | |
| Total | | $ | 12,508,722 | | $ | — | | $ | — | | $ | — | | $ | — | | $ | 12,508,722 | |
| | | | Foreign | | | | | | | | | | | | | | | | |
| | | | Currency | | | Equity | | | Interest | | | Credit | | | Inflation | | | | |
| | | | Risk | | | Risk | | | Rate Risk | | | Risk | | | Risk | | | Total | |
| | | | | | | | | | | | | | | | | | | | |
| Net change in unrealized | | | | | | | | | | | | | | | | | | | |
| appreciation/(depreciation) | | | | | | | | | | | | | | | | | | | |
| of financial derivative instruments | | | | | | | | | | | | | | | | | | | |
| Forward Foreign Currency Contracts | | $ | (16,655,077 | ) | $ | — | | $ | — | | $ | — | | $ | — | | $ | (16,655,077 | ) |
| Total | | $ | (16,655,077 | ) | $ | — | | $ | — | | $ | — | | $ | — | | $ | (16,655,077 | ) |
See notes to financial statements
85
| Portfolio of investments (unaudited) |
International Select Equity Fund
January 31, 2016
| | | | | Value | |
| Shares | | | | (note 2) | |
| | | | | | |
| Common stocks – 95.74% | | | |
| | | | | | |
| | | Belgium – 2.99% | | | |
| 2,692 | | KBC Groep N.V. | $ | 154,338 | |
| | | | | | |
| | | Canada – 2.97% | | | |
| 6,067 | | Gildan Activewear, Inc. | | 153,137 | |
| | | | | | |
| | | Finland – 3.32% | | | |
| 23,667 | | Nokia Oyj * | | 171,133 | |
| | | | | | |
| | | France – 9.56% | | | |
| 514 | | Alcatel-Lucent S.A. * | | 2,034 | |
| 9,781 | | Orange S.A. | | 175,197 | |
| 12,550 | | Rexel S.A. | | 148,814 | |
| 3,750 | | Total S.A. | | 166,851 | |
| | | | | 492,896 | |
| | | | | | |
| | | Germany – 8.62% | | | |
| 1,375 | | Bayer AG | | 154,244 | |
| 1,584 | | Bayerische Motoren Werke AG | | 131,522 | |
| 2,000 | | SAP SE | | 158,675 | |
| | | | | 444,441 | |
| | | | | | |
| | | Hong Kong – 3.03% | | | |
| 27,901 | | AIA Group, Ltd. | | 156,314 | |
| | | | | | |
| | | Israel – 2.98% | | | |
| 2,502 | | Teva Pharmaceutical | | | |
| | | Industries, Ltd., ADR | | 153,823 | |
| | | | | | |
| | | Italy – 2.96% | | | |
| 11,715 | | Mediaset SpA | | 39,392 | |
| 29,082 | | UniCredit SpA | | 113,099 | |
| | | | | 152,491 | |
| | | | | | |
| | | Japan – 13.72% | | | |
| 3,922 | | FUJIFILM Holdings Corp. | | 151,408 | |
| 4,500 | | Japan Tobacco, Inc. | | 175,826 | |
| 3,216 | | NTT DoCoMo, Inc. | | 71,742 | |
| 4,400 | | Sumitomo Mitsui Financial | | | |
| | | Group, Inc. | | 147,764 | |
| 1,942 | | Tsuruha Holdings, Inc. | | 160,327 | |
| | | | | 707,067 | |
| | | | | | |
| | | Korea – 2.96% | | | |
| 4,750 | | Shinhan Financial Group | | | |
| | | Co., Ltd. * | | 152,510 | |
| | | | | Value | |
| Shares | | | | (note 2) | |
| | | | | | |
| | | Netherlands – 3.23% | | | |
| 1,810 | | ASML Holding N.V. | $ | 166,322 | |
| | | | | | |
| | | Portugal – 2.52% | | | |
| 14,925 | | CTT-Correios de Portugal S.A. | | 129,715 | |
| | | | | | |
| | | Spain – 2.82% | | | |
| 10,022 | | Grifols S.A., ADR | | 145,520 | |
| | | | | | |
| | | Switzerland – 7.42% | | | |
| 7,700 | | Coca-Cola HBC AG * | | 157,795 | |
| 680 | | Dufry AG * | | 73,606 | |
| 1,944 | | Novartis AG | | 150,789 | |
| | | | | 382,190 | |
| | | | | | |
| | | United Kingdom – 23.26% | | | |
| 7,650 | | BG Group plc | | 115,967 | |
| 2,850 | | Carnival plc | | 142,056 | |
| 28,596 | | DS Smith plc | | 149,784 | |
| 41,723 | | ITV plc | | 159,323 | |
| 156,615 | | Lloyds Banking Group plc | | 146,908 | |
| 70,558 | | Rentokil Initial plc | | 158,051 | |
| 51,925 | | Vodafone Group plc | | 166,102 | |
| 7,367 | | WPP plc | | 160,341 | |
| | | | | 1,198,532 | |
| | | | | | |
| | | United States – 3.38% | | | |
| 2,751 | | Cognizant Technology Solutions | | | |
| | | Corp., Class A * | | 174,166 | |
| | | | | | |
| | | Total common stocks | | | |
| | | (Cost $5,274,785) | | 4,934,595 | |
| | | | | | |
| | | Total long-term investments | | | |
| | | (Cost $5,274,785) | | 4,934,595 | |
| | | | | | |
| Short-term investment – 4.27% | | | |
| 220,116 | | Fidelity Institutional | | | |
| | | Treasury Portfolio | | 220,116 | |
| | | | | | |
| | | Total short-term investment | | | |
| | | (Cost $220,116) | | 220,116 | |
| | | | | | |
| Total investments – 100.01% | | | |
| | | (Cost $5,494,901) | | 5,154,711 | |
| Net other assets and liabilities – (0.01)% | | (727 | ) |
| Total net assets – 100.00% | $ | 5,153,984 | |
| * | | Non-income producing security |
| ADR | | American Depositary Receipts |
See notes to financial statements
86
| Portfolio of investments (unaudited) |
International Select Equity Fund
January 31, 2016 (continued)
Other information:
| Currency exposure of portfolio assets | |
| before any currency hedging, if applicable. | % of total |
| Excludes derivatives: | investments |
| | | |
| Euro | 33 | % |
| British Pound | 26 | |
| Japanese Yen | 14 | |
| US Dollar | 14 | |
| Swiss Franc | 4 | |
| Hong Kong Dollar | 3 | |
| Canadian Dollar | 3 | |
| Korean Won | 3 | |
| | 100 | % |
| Industry concentration as | % of net |
| a percentage of net assets: | assets |
| | | |
| Commercial Banks Non-US | 5.86 | % |
| Medical - Drugs | 5.75 | |
| Oil Comp-Integrated | 5.49 | |
| Unknown | 5.04 | |
| Cellular Telecommunications | 4.61 | |
| Television | 3.85 | |
| Tobacco | 3.41 | |
| Telephone-Integrated | 3.40 | |
| Computer Services | 3.38 | |
| Wireless Equipment | 3.32 | |
| Semiconductor Equipment | 3.23 | |
| Advertising Agencies | 3.11 | |
| Retail-Drug Store | 3.11 | |
| Enterprise Software/Services | 3.08 | |
| Diversified Operations/Commercial Services | 3.07 | |
| Beverages-Non-alcoholic | 3.06 | |
| Life/Health Insurance | 3.03 | |
| Chemicals - Diversified | 2.99 | |
| Medical-Generic Drugs | 2.98 | |
| Apparel Manufacturers | 2.97 | |
| Diversified Financial Services | 2.96 | |
| Photo Equipment & Supplies | 2.94 | |
| Paper & Related Products | 2.91 | |
| Electronic Parts Distribution | 2.89 | |
| Cruise Lines | 2.76 | |
| Auto-Cars/Light Trucks | 2.55 | |
| Commercial Services | 2.52 | |
| Retail-Miscellaneous/Diversified | 1.43 | |
| Telecommunication Equipment | 0.04 | |
| Long-Term Investments | 95.74 | |
| Short-Term Investment | 4.27 | |
| Total investments | 100.01 | |
| Net other assets and liabilities | (0.01 | ) |
| | 100.00 | % |
See notes to financial statements
87
| Portfolio of investments (unaudited) |
International Select Equity Fund
January 31, 2016 (continued)
Fair Value Measurement
The following table summarizes the Fund's investments that are measured at fair value by level within the fair value hierarchy at January 31, 2016:
| | | | Quoted prices | | | Significant | | | | | | | |
| | | | in active | | | other | | | Significant | | | | |
| | | | markets for | | | observable | | | unobservable | | | | |
| | | | identical assets | | | inputs | | | inputs | | | | |
| Description | | | (level 1 | ) | | (level 2 | ) | | (level 3 | ) | | Total | |
| | | | | | | | | | | | | | |
| Assets | | | | | | | | | | | | | |
| Common Stocks | | | | | | | | | | | | | |
| Belgium | | $ | — | | $ | 154,338 | | $ | — | | $ | 154,338 | |
| Canada | | | 153,137 | | | — | | | — | | | 153,137 | |
| Finland | | | — | | | 171,133 | | | — | | | 171,133 | |
| France | | | — | | | 492,896 | | | — | | | 492,896 | |
| Germany | | | — | | | 444,441 | | | — | | | 444,441 | |
| Hong Kong | | | — | | | 156,314 | | | — | | | 156,314 | |
| Israel | | | 153,823 | | | — | | | — | | | 153,823 | |
| Italy | | | — | | | 152,491 | | | — | | | 152,491 | |
| Japan | | | — | | | 707,067 | | | — | | | 707,067 | |
| Korea | | | — | | | 152,510 | | | — | | | 152,510 | |
| Netherlands | | | — | | | 166,322 | | | — | | | 166,322 | |
| Portugal | | | — | | | 129,715 | | | — | | | 129,715 | |
| Spain | | | 145,520 | | | — | | | — | | | 145,520 | |
| Switzerland | | | — | | | 382,190 | | | — | | | 382,190 | |
| United Kingdom | | | — | | | 1,198,532 | | | — | | | 1,198,532 | |
| United States | | | 174,166 | | | — | | | — | | | 174,166 | |
| Total Common Stocks | | | 626,646 | | | 4,307,949 | | | — | | | 4,934,595 | |
| | | | | | | | | | | | | | |
| Short-Term Investment | | | 220,116 | | | — | | | — | | | 220,116 | |
| Total Investments | | $ | 846,762 | | $ | 4,307,949 | | $ | — | | $ | 5,154,711 | |
On July 31, 2015, substantially all of the common stocks held by the Fund were valued at the last reported sale price or official closing price. However, on January 31, 2016, certain of the Fund's common stocks trading in foreign markets were fair valued in accordance with the fair value pricing procedures approved by the Board using the independent statistical fair value service as described in Note 2. Accordingly, using the end of the reporting period method for determining when transfers between levels are recognized, common stocks valued at $3,678,291 on January 31, 2016 were transferred from Level 1 to Level 2.
See notes to financial statements
88
| Portfolio of investments (unaudited) |
Strategic Income Fund
January 31, 2016
| Face | | | | | | | Value | |
| amount | | | Coupon | | Maturity | | (note 2) | |
| | | | | | | | | | |
| Bank Loans (a)(b) – 6.01% | | | | | | |
| | | | | | | | | | |
| | | | France – 1.27% | | | | | | |
| EUR | 1,995,238 | | Horizon Holdings III SASU, Term Loan B (c) | 5.000 | % | 7/24/22 | $ | 2,162,663 | |
| EUR | 1,900,000 | | Numericable - SFR SAS., Term Loan B (c) | 4.750 | % | 1/30/23 | | 2,023,167 | |
| | | | | | | | | 4,185,830 | |
| | | | | | | | | | |
| | | | Germany – 0.90% | | | | | | |
| EUR | 1,817,647 | | Kirk Beauty Zero GmbH, Term Loan B (c) | 6.000 | % | 6/26/22 | | 1,975,585 | |
| USD | 992,513 | | Siemens Audiology Solutions, Term Loan B | 4.250 | % | 1/17/22 | | 982,171 | |
| | | | | | | | | 2,957,756 | |
| | | | | | | | | | |
| | | | Ireland – 0.81% | | | | | | |
| EUR | 2,500,000 | | Eircom Finco Sarl, Term Loan B-3 (c) | 4.500 | % | 5/31/22 | | 2,678,623 | |
| | | | | | | | | | |
| | | | Luxembourg – 0.65% | | | | | | |
| EUR | 1,994,975 | | SIG Combibloc PurchaseCo Sarl, Term Loan B | 4.250 | % | 3/13/22 | | 2,158,455 | |
| | | | | | | | | | |
| | | | United Kingdom – 1.29% | | | | | | |
| GBP | 1,000,000 | | Cucina Acquisition (UK), Ltd., Second Lien Term Loan D (c) | 5.000 | % | 3/12/17 | | 1,419,998 | |
| GBP | 1,994,975 | | RAC Bidco, Ltd., First Lien Term Loan B (c) | 4.750 | % | 12/17/21 | | 2,846,191 | |
| | | | | | | | | 4,266,189 | |
| | | | | | | | | | |
| | | | United States – 1.09% | | | | | | |
| USD | 1,000,000 | | Delta 2 Lux Sarl, Term Loan B-3 | 4.750 | % | 7/30/21 | | 946,095 | |
| GBP | 840,000 | | Equinix, Inc., Term Loan B | 4.500 | % | 1/8/23 | | 1,194,671 | |
| USD | 1,485,000 | | Travelport Finance (Luxembourg) Sarl, Term Loan B | 6.000 | % | 9/2/21 | | 1,436,738 | |
| | | | | | | | | 3,577,504 | |
| | | | | | | | | | |
| | | | Total bank loans | | | | | | |
| | | | (Cost $20,442,318) | | | | | 19,824,357 | |
| | | | | | | | | | |
| Corporate bonds – 59.39% | | | | | | |
| | | | | | | | | | |
| | | | France – 4.92% | | | | | | |
| GBP | 727,000 | | AXA S.A. (d) | 6.686 | % | 7/6/26 | | 1,116,547 | |
| GBP | 969,000 | | AXA S.A. (e) | 5.625 | % | 1/16/54 | | 1,356,421 | |
| USD | 2,400,000 | | BNP Paribas S.A. (f) (d) | 7.195 | % | 6/25/37 | | 2,706,000 | |
| USD | 82,000 | | BNP Paribas S.A. (d) | 6.250 | % | 10/17/16 | | 83,845 | |
| USD | 384,000 | | BNP Paribas S.A. (d) | 6.500 | % | 3/6/16 | | 388,159 | |
| USD | 830,000 | | Credit Agricole S.A. (d) | 7.375 | % | 4/19/16 | | 841,982 | |
| EUR | 848,000 | | Oberthur Technologies Holding SAS | 9.250 | % | 4/30/20 | | 982,530 | |
| EUR | 2,182,000 | | Orange S.A. (d) | 4.250 | % | 2/7/20 | | 2,388,475 | |
| GBP | 1,212,000 | | Orange S.A. (d) | 5.750 | % | 4/1/23 | | 1,678,263 | |
| EUR | 1,000,000 | | Orange S.A. (d) | 5.000 | % | 10/1/26 | | 1,056,349 | |
| EUR | 3,024,000 | | Sodexo | 2.500 | % | 6/24/26 | | 3,625,599 | |
| | | | | | | | | 16,224,170 | |
See notes to financial statements
89
| Portfolio of investments (unaudited) |
Strategic Income Fund
January 31, 2016 (continued)
| Face | | | | | | | Value | |
| amount | | | Coupon | | Maturity | | (note 2) | |
| | | | | | | | | | |
| | | | Germany – 0.90% | | | | | | |
| EUR | 300,000 | | Trionista TopCo GmbH | 6.875 | % | 4/30/21 | $ | 341,311 | |
| EUR | 909,000 | | Unitymedia GmbH (f) | 3.750 | % | 1/15/27 | | 873,200 | |
| USD | 200,000 | | Unitymedia Hessen GmbH & Co. KG (f) | 5.000 | % | 1/15/25 | | 200,250 | |
| EUR | 200,000 | | Unitymedia Hessen GmbH & Co. KG (f) | 3.500 | % | 1/15/27 | | 205,015 | |
| EUR | 1,300,000 | | Unitymedia Hessen GmbH & Co. KG | 3.500 | % | 1/15/27 | | 1,332,595 | |
| | | | | | | | | 2,952,371 | |
| | | | | | | | | | |
| | | | Ireland – 2.07% | | | | | | |
| USD | 223,000 | | Ardagh Packaging Finance plc (f) | 6.000 | % | 6/30/21 | | 202,372 | |
| EUR | 1,030,000 | | Ardagh Packaging Finance plc | 9.250 | % | 10/15/20 | | 1,159,316 | |
| EUR | 1,931,000 | | Bank of Ireland (d) | 7.375 | % | 6/18/20 | | 2,127,603 | |
| GBP | 1,091,000 | | PGH Capital, Ltd. | 5.750 | % | 7/7/21 | | 1,649,403 | |
| GBP | 1,212,000 | | PGH Capital, Ltd. | 6.625 | % | 12/18/25 | | 1,688,164 | |
| | | | | | | | | 6,826,858 | |
| | | | | | | | | | |
| | | | Italy – 0.74% | | | | | | |
| GBP | 1,700,000 | | Assicurazioni Generali SpA (d) | 6.269 | % | 6/16/26 | | 2,270,630 | |
| GBP | 111,000 | | Enel SpA (e) | 6.625 | % | 9/15/76 | | 159,543 | |
| | | | | | | | | 2,430,173 | |
| | | | | | | | | | |
| | | | Luxembourg – 1.15% | | | | | | |
| EUR | 290,000 | | Auris Luxembourg II S.A. (f) | 8.000 | % | 1/15/23 | | 339,613 | |
| EUR | 605,000 | | Auris Luxembourg II S.A. | 8.000 | % | 1/15/23 | | 708,503 | |
| EUR | 2,200,000 | | Telenet Finance VI Luxembourg S.C.A. | 4.875 | % | 7/15/27 | | 2,279,887 | |
| USD | 480,000 | | Wind Acquisition Finance S.A. (f) | 7.375 | % | 4/23/21 | | 458,698 | |
| | | | | | | | | 3,786,701 | |
| | | | | | | | | | |
| | | | Netherlands – 3.22% | | | | | | |
| GBP | 750,000 | | Cooperatieve Rabobank UA (d) | 6.910 | % | 6/10/38 | | 1,281,505 | |
| EUR | 2,709,000 | | Deutsche Telekom International Finance B.V. | 3.250 | % | 1/17/28 | | 3,478,888 | |
| EUR | 3,250,000 | | Deutsche Telekom International Finance B.V. | 2.750 | % | 10/24/24 | | 4,011,445 | |
| USD | 400,000 | | ING Bank N.V. (e) | 4.125 | % | 11/21/23 | | 406,772 | |
| EUR | 200,000 | | Linde Finance B.V. (e) | 7.375 | % | 7/14/66 | | 222,835 | |
| EUR | 1,042,000 | | TMF Group Holding B.V. | 9.875 | % | 12/1/19 | | 1,214,813 | |
| | | | | | | | | 10,616,258 | |
| | | | | | | | | | |
| | | | Norway – 0.29% | | | | | | |
| EUR | 848,000 | | Lock A.S. | 7.000 | % | 8/15/21 | | 946,179 | |
| | | | | | | | | | |
| | | | Spain – 0.94% | | | | | | |
| USD | 3,097,000 | | BBVA International Preferred SAU (d) | 5.919 | % | 4/18/17 | | 3,108,614 | |
| | | | | | | | | | |
| | | | Switzerland – 0.69% | | | | | | |
| USD | 2,216,000 | | Credit Suisse Group AG (f) (d) | 7.500 | % | 12/11/23 | | 2,280,076 | |
| | | | | | | | | | |
| | | | United Kingdom – 27.45% | | | | | | |
| GBP | 1,988,000 | | AA Bond Co., Ltd. (f) | 5.500 | % | 7/31/22 | | 2,649,311 | |
| GBP | 205,000 | | Arqiva Broadcast Finance plc (f) | 9.500 | % | 3/31/20 | | 314,046 | |
See notes to financial statements
90
| Portfolio of investments (unaudited) |
Strategic Income Fund
January 31, 2016 (continued)
| Face | | | | | | | Value | |
| amount | | | Coupon | | Maturity | | (note 2) | |
| | | | | | | | | | |
| | | | United Kingdom (continued) | | | | | | |
| GBP | 1,610,000 | | Arqiva Broadcast Finance plc | 9.500 | % | 3/31/20 | $ | 2,466,408 | |
| GBP | 1,333,000 | | Aviva plc (e) | 6.875 | % | 5/20/58 | | 2,062,060 | |
| USD | 4,040,000 | | Barclays Bank plc (d) | 6.278 | % | 12/15/34 | | 4,506,414 | |
| GBP | 484,000 | | Barclays Bank plc (d) | 14.000 | % | 6/15/19 | | 876,892 | |
| USD | 1,632,000 | | Barclays Bank plc (d) | 6.860 | % | 6/15/32 | | 1,868,640 | |
| EUR | 2,500,000 | | BAT International Finance plc | 0.875 | % | 10/13/23 | | 2,613,782 | |
| GBP | 950,000 | | BAT International Finance plc | 6.000 | % | 6/29/22 | | 1,619,719 | |
| GBP | 1,454,000 | | Brakes Capital | 7.125 | % | 12/15/18 | | 2,133,616 | |
| GBP | 969,000 | | BUPA Finance plc | 5.000 | % | 4/25/23 | | 1,420,219 | |
| GBP | 969,000 | | BUPA Finance plc (d) | 6.125 | % | 9/16/20 | | 1,451,800 | |
| GBP | 1,259,000 | | Co-operative Group Holdings 2011, Ltd. | 6.875 | % | 7/8/20 | | 1,926,919 | |
| EUR | 3,000,000 | | Compass Group plc | 1.875 | % | 1/27/23 | | 3,436,416 | |
| GBP | 1,182,000 | | CPUK Finance, Ltd. (f) | 7.000 | % | 8/28/20 | | 1,713,284 | |
| GBP | 788,000 | | Daily Mail & General Trust | 5.750 | % | 12/7/18 | | 1,223,001 | |
| EUR | 1,060,000 | | Ephios Bondco plc (f) | 6.250 | % | 7/1/22 | | 1,179,130 | |
| EUR | 760,000 | | Ephios Bondco plc | 6.250 | % | 7/1/22 | | 845,414 | |
| GBP | 606,000 | | Galaxy Bidco, Ltd. | 6.375 | % | 11/15/20 | | 867,806 | |
| EUR | 2,250,000 | | GlaxoSmithKline Capital plc | 1.375 | % | 12/2/24 | | 2,509,803 | |
| GBP | 700,000 | | HBOS Capital Funding LP (d) | 6.461 | % | 11/30/18 | | 1,048,548 | |
| GBP | 909,000 | | HBOS Sterling Finance Jersey LP (d) | 7.881 | % | 12/9/31 | | 1,655,632 | |
| GBP | 2,212,000 | | Heathrow Funding, Ltd. | 6.000 | % | 3/20/20 | | 3,549,461 | |
| GBP | 2,275,000 | | HSBC Bank Capital Funding Sterling 1 LP (d) | 5.844 | % | 11/5/31 | | 3,476,665 | |
| EUR | 2,934,000 | | Imperial Tobacco Finance plc | 2.250 | % | 2/26/21 | | 3,348,349 | |
| GBP | 500,000 | | Imperial Tobacco Finance plc | 4.875 | % | 6/7/32 | | 778,063 | |
| USD | 372,000 | | International Game Technology plc (f) | 6.500 | % | 2/15/25 | | 334,800 | |
| GBP | 1,157,000 | | Iron Mountain Europe plc | 6.125 | % | 9/15/22 | | 1,679,437 | |
| GBP | 1,000,000 | | ITV plc | 6.125 | % | 1/5/17 | | 1,480,326 | |
| GBP | 727,000 | | Legal & General Group plc (e) | 5.500 | % | 6/27/64 | | 955,025 | |
| GBP | 600,000 | | Legal & General Group plc (d) | 6.385 | % | 5/2/17 | | 867,071 | |
| USD | 1,100,000 | | Lloyds Banking Group plc (d) | 7.500 | % | 6/27/24 | | 1,141,250 | |
| USD | 2,591,000 | | Lloyds Banking Group plc (f) (d) | 6.657 | % | 5/21/37 | | 2,898,681 | |
| USD | 1,333,000 | | Lloyds Banking Group plc (f) (d) | 6.267 | % | 11/14/16 | | 1,342,998 | |
| GBP | 768,000 | | Nationwide Building Society (d) | 6.875 | % | 6/20/19 | | 1,068,229 | |
| GBP | 727,000 | | Prudential plc (e) | 5.700 | % | 12/19/63 | | 994,134 | |
| USD | 969,000 | | Prudential plc (d) | 6.500 | % | 3/23/16 | | 979,175 | |
| EUR | 128,000 | | Rexam plc (e) | 6.750 | % | 6/29/67 | | 138,615 | |
| EUR | 606,000 | | Royal Bank of Scotland Group plc (d) | 5.500 | % | 3/31/16 | | 650,625 | |
| USD | 930,000 | | Royal Bank of Scotland Group plc (d) | 7.648 | % | 9/30/31 | | 1,153,200 | |
| USD | 2,100,000 | | Royal Bank of Scotland Group plc (d) | 7.640 | % | 9/30/17 | | 2,168,250 | |
| GBP | 500,000 | | RSA Insurance Group plc (e) | 5.125 | % | 10/10/45 | | 665,181 | |
| GBP | 1,212,000 | | Scottish Widows plc | 7.000 | % | 6/16/43 | | 1,890,186 | |
| EUR | 1,500,000 | | Sky plc | 1.875 | % | 11/24/23 | | 1,651,241 | |
| USD | 1,544,000 | | Sky plc (f) | 3.750 | % | 9/16/24 | | 1,537,955 | |
| GBP | 400,000 | | Standard Life plc (e) | 5.500 | % | 12/4/42 | | 593,064 | |
| GBP | 606,000 | | Standard Life plc (d) | 6.750 | % | 7/12/27 | | 940,232 | |
| GBP | 1,576,000 | | Tesco plc | 5.500 | % | 1/13/33 | | 2,011,722 | |
| GBP | 343,846 | | Tesco Property Finance 3 plc | 5.744 | % | 4/13/40 | | 418,453 | |
| GBP | 67,000 | | Thames Water Utilities Finance, Ltd. (e) | 5.375 | % | 7/21/25 | | 99,479 | |
| GBP | 48,000 | | Thomas Cook Group plc | 7.750 | % | 6/22/17 | | 71,131 | |
| GBP | 1,863,000 | | Virgin Media Finance plc | 7.000 | % | 4/15/23 | | 2,780,415 | |
| GBP | 2,152,000 | | Virgin Media Secured Finance plc | 6.250 | % | 3/28/29 | | 3,065,463 | |
| GBP | 606,000 | | William Hill plc | 7.125 | % | 11/11/16 | | 898,460 | |
| GBP | 1,000,000 | | WPP 2012 Ltd. | 6.000 | % | 4/4/17 | | 1,497,076 | |
See notes to financial statements
91
| Portfolio of investments (unaudited) |
Strategic Income Fund
January 31, 2016 (continued)
| Face | | | | | | | Value | |
| amount | | | Coupon | | Maturity | | (note 2) | |
| | | | | | | | | | |
| | | | United Kingdom (continued) | | | | | | |
| USD | 848,000 | | WPP Finance 2010 | 4.750% | | 11/21/21 | $ | 918,999 | |
| EUR | 1,703,000 | | WPP Finance 2013 | 3.000% | | 11/20/23 | | 2,062,484 | |
| | | | | | | | | 90,494,755 | |
| | | | | | | | | | |
| | | | United States – 17.03% | | | | | | |
| USD | 2,900,000 | | Altria Group, Inc. | 4.250% | | 8/9/42 | | 2,696,591 | |
| USD | 341,000 | | Aramark Services, Inc. (f) | 5.125% | | 1/15/24 | | 352,935 | |
| USD | 3,241,000 | | AT&T, Inc. | 4.750% | | 5/15/46 | | 2,884,607 | |
| USD | 771,000 | | Ball Corp. | 5.000% | | 3/15/22 | | 801,840 | |
| USD | 572,000 | | Ball Corp. | 4.375% | | 12/15/20 | | 593,630 | |
| EUR | 730,000 | | Ball Corp. | 4.375% | | 12/15/23 | | 812,062 | |
| USD | 2,150,000 | | CCO Holdings LLC | 7.375% | | 6/1/20 | | 2,241,375 | |
| USD | 836,000 | | CCO Holdings LLC (f) | 5.875% | | 5/1/27 | | 825,550 | |
| USD | 1,449,000 | | CCO Safari II LLC (f) | 6.484% | | 10/23/45 | | 1,462,590 | |
| USD | 2,426,000 | | CVS Health Corp. | 3.875% | | 7/20/25 | | 2,512,344 | |
| USD | 3,206,000 | | Dresdner Funding Trust I (f) | 8.151% | | 6/30/31 | | 3,855,215 | |
| USD | 137,000 | | HCA, Inc. | 5.000% | | 3/15/24 | | 139,055 | |
| USD | 515,000 | | HCA, Inc. | 6.500% | | 2/15/20 | | 569,075 | |
| USD | 2,000,000 | | Iron Mountain, Inc. | 6.000% | | 8/15/23 | | 2,087,500 | |
| USD | 745,000 | | JM Smucker Co. | 3.500% | | 3/15/25 | | 754,053 | |
| USD | 232,000 | | Levi Strauss & Co. | 5.000% | | 5/1/25 | | 227,360 | |
| USD | 2,240,000 | | McGraw Hill Financial, Inc. (c) | 4.000% | | 6/15/25 | | 2,264,374 | |
| EUR | 4,367,000 | | Philip Morris International, Inc. | 2.750% | | 3/19/25 | | 5,278,473 | |
| USD | 2,530,000 | | Post Holdings, Inc. (f) | 6.750% | | 12/1/21 | | 2,652,958 | |
| EUR | 1,422,000 | | Procter & Gamble Co. | 2.000% | | 8/16/22 | | 1,678,216 | |
| USD | 2,686,000 | | RBS Capital Trust II (d) | 6.425% | | 1/3/34 | | 2,914,310 | |
| USD | 1,365,000 | | Reynolds American, Inc. | 4.750% | | 11/1/42 | | 1,319,536 | |
| USD | 1,000,000 | | Reynolds American, Inc. | 6.150% | | 9/15/43 | | 1,141,809 | |
| USD | 1,400,000 | | Sealed Air Corp. (f) | 5.250% | | 4/1/23 | | 1,424,500 | |
| USD | 2,900,000 | | Service Corp. International | 5.375% | | 5/15/24 | | 3,081,250 | |
| USD | 650,000 | | Service Corp. International | 7.625% | | 10/1/18 | | 730,847 | |
| USD | 2,315,000 | | Sirius XM Radio, Inc. (f) | 5.375% | | 4/15/25 | | 2,332,363 | |
| USD | 1,300,000 | | Sirius XM Radio, Inc. (f) | 6.000% | | 7/15/24 | | 1,365,000 | |
| USD | 818,000 | | Verizon Communications, Inc. | 6.550% | | 9/15/43 | | 958,272 | |
| USD | 1,758,000 | | Verizon Communications, Inc. | 5.150% | | 9/15/23 | | 1,947,970 | |
| USD | 3,121,000 | | Wachovia Capital Trust III (d) | 5.570% | | 2/29/16 | | 2,984,456 | |
| USD | 980,000 | | Walgreens Boots Alliance, Inc. | 3.800% | | 11/18/24 | | 966,506 | |
| GBP | 215,000 | | Welltower, Inc. | 4.500% | | 12/1/34 | | 302,357 | |
| | | | | | | | | 56,158,979 | |
| | | | Total corporate bonds | | | | | | |
| | | | (Cost $206,274,671) | | | | | 195,825,134 | |
| | | | | | | | | | |
| Foreign government obligations – 15.78% | | | | | | |
| | | | | | | | | | |
| | | | Germany – 4.33% | | | | | | |
| EUR | 12,275,000 | | Bundesrepublik Deutschland | 1.000% | | 8/15/24 | | 14,285,265 | |
| | | | | | | | | | |
| | | | United Kingdom – 11.45% | | | | | | |
| GBP | 5,831,000 | | United Kingdom Gilt | 1.750% | | 7/22/19 | | 8,601,881 | |
| GBP | 10,000,000 | | United Kingdom Gilt | 2.000% | | 7/22/20 | | 14,935,823 | |
See notes to financial statements
92
| Portfolio of investments (unaudited) |
Strategic Income Fund
January 31, 2016 (continued)
| Face | | | | | | | Value | |
| amount | | | Coupon | | Maturity | | (note 2) | |
| | | | | | | | | | |
| | | | United Kingdom (continued) | | | | | | |
| GBP | 6,650,000 | | United Kingdom Gilt | 2.000% | | 9/7/25 | $ | 9,840,579 | |
| GBP | 2,300,000 | | United Kingdom Gilt | 4.250% | | 3/7/36 | | 4,352,347 | |
| | | | | | | | | 37,730,630 | |
| | | | Total foreign government obligations | | | | | | |
| | | | (Cost $52,534,593) | | | | | 52,015,895 | |
| | | | | | | |
| US government obligations – 6.50% | | | | | | |
| | | | | | | | | | |
| | | | United States – 6.50% | | | | | | |
| USD | 6,400,000 | | United States Treasury Note | 3.000% | | 11/15/45 | | 6,716,999 | |
| USD | 9,600,000 | | United States Treasury Note | 2.250% | | 11/15/25 | | 9,874,503 | |
| USD | 4,850,000 | | United States Treasury Note | 0.875% | | 1/31/18 | | 4,856,440 | |
| | | | | | | | | 21,447,942 | |
| | | | Total US government obligations | | | | | | |
| | | | (Cost $21,331,443) | | | | | 21,447,942 | |
| | | | | | | | | | |
| Shares | | | | | | | | |
| | | | | | | | | |
| Preferred stock – 0.66% | | | | | | |
| | | | | | | | | | |
| | | | United Kingdom – 0.48% | | | | | | |
| | 850,000 | | Nationwide Building Society (d) | | | | | 1,572,552 | |
| | | | | | | | | | |
| | | | United States – 0.18% | | | | | | |
| | 24,000 | | RBS Capital Funding Trust V (d) | | | | | 590,879 | |
| | | | Total preferred stock | | | | | | |
| | | | (Cost $2,242,753) | | | | | 2,163,431 | |
| | | | Total long-term investments | | | | | | |
| | | | (Cost $302,825,778) | | | | | 291,276,759 | |
| | | | | | | | | | |
| Short-term investment – 15.12% | | | | | | |
| 49,863,958 | | Fidelity Institutional Treasury Portfolio (g) | | | | | 49,863,958 | |
| | | | Total short-term investment | | | | | | |
| | | | (Cost $49,863,958) | | | | | 49,863,958 | |
| | | | | | | | | | |
| Total investments – 103.46% | | | | | | |
| | | | (Cost $352,689,736) | | | | | 341,140,717 | |
Financial Derivative Instruments(h) (Cost or Premiums, net — ($273,734)) | – 0.25% | | | | 839,292 | |
| Net other assets and liabilities – (3.71)% | | | | | (12,262,005 | ) |
| Total net assets – 100.00% | | | | $ | 329,718,004 | |
| (a) | | Bank loan interests are, at present, not readily marketable, not registered under the Securities Act of 1933, as amended, and may be subject to contractual and legal restrictions on sale. Bank loan interests in the Fund's portfolio generally have variable rates which adjust to a base, such as the London Inter-Bank Offered Rate ("LIBOR"), on set dates, typically every 30 days but not greater than one year; and/or have interest rates that float at a margin above a widely recognized base lending rate such as the Prime Rate of a designated U.S. bank. |
| (b) | | Bank loan interests often require prepayments from excess cash flow or permit the borrower to repay at its election. The degree to which borrowers repay, whether as a contractual requirement or at their election, cannot be predicted with accuracy. As a result, the actual remaining maturity may be substantially less than the stated maturities shown. |
| (c) | | Security is purchased on a delayed delivery basis. |
| (d) | | Maturity date is perpetual. Maturity date presented represents the next call date. |
See notes to financial statements
93
| Portfolio of investments (unaudited) |
Strategic Income Fund
January 31, 2016 (continued)
| (e) | | Variable or Floating rate interest rate security. Includes fixed-to-floating rate corporate bond securities which currently pay a fixed coupon that will move to a floating rate coupon if the bond is not redeemed at the call date. Rate presented represents rate at January 31, 2016. |
| (f) | | Restricted security, purchased pursuant to Rule 144A under the Securities Act of 1933, as amended, and which is exempt from registration under that Act. At January 31, 2016, the restricted securities held by the Fund had an aggregate value of $33,506,540, which represented 10.2% of net assets. |
| (g) | | This short-term investment has been segregated for open forward foreign currency contracts, delayed delivery purchases and swap contracts at January 31, 2016. |
| (h) | | Information with respect to financial derivative instruments is disclosed in the following tables. |
(h) FINANCIAL DERIVATIVE INSTRUMENTS
OVER-THE-COUNTER FINANCIAL DERIVATIVE INSTRUMENTS
FORWARD FOREIGN CURRENCY CONTRACTS
| | | | | | | | | | Local | | | Current | | | Unrealized | |
| | | | | | | Value | | | amount | | | notional | | | appreciation/(depreciation) | |
| | | | Counterparty | | | date | | | (000's | ) | | value | | | Asset | | | Liability | |
| | | | | | | | | | | | | | | | | | | | |
| British Pound (Short) | | | BNP Paribas | | | | | | | | | | | | | | | | |
| | | | Securities Services | | | 2/24/16 | | | 75,964 | | $ | 108,244,241 | | $ | 592,238 | | $ | — | |
| Euro (Short) | | | BNP Paribas | | | | | | | | | | | | | | | | |
| | | | Securities Services | | | 2/24/16 | | | 68,461 | | | 74,202,095 | | | 433,963 | | | — | |
| Total | | | | | | | | | | | | | | $ | 1,026,201 | | $ | — | |
During the period ended January 31, 2016, average monthly notional value related to forward foreign currency contracts was approximately $137.9 million or 41.8% of ending net assets.
CREDIT DEFAULT SWAP CONTRACTS
| | | | | | | | | | | | | | Upfront | | | | | | | | | | |
| | | | Rates | | | | Implied | | | Notional | | | premiums | | | Unrealized | | | | | | | |
| | | Reference | received/ | | Termination | | credit | | | amount | | | paid/ | | | appreciation/ | | Value | |
| Counterparty | | entity | (paid) | | date | | spread | | | (000s | ) | | (received | ) | | (depreciation | ) | | Asset | | | Liability | |
| | | | | | | | | | | | | | | | | | | | | | | | |
| Protection purchased: | | | | | | | | | | | | | | | | | | | | | | | |
| Barclays Bank plc | | Cox Communications | (1.00)% | | 12/20/2020 | | 0.57% | | $ | 1,000,000 | | $ | (2,401 | ) | $ | (18,106 | ) | $ | — | | $ | (20,507 | ) |
| Barclays Bank plc | | Deutsche Lufthansa | (1.00)% | | 12/20/2020 | | 1.38% | | | 1,083,300 | | | 6,070 | | | 13,637 | | | 19,707 | | | — | |
| Barclays Bank plc | | IBM | (1.00)% | | 12/20/2019 | | 0.48% | | | 180,000 | | | (4,893 | ) | | 1,338 | | | — | | | (3,555 | ) |
| Barclays Bank plc | | IBM | (1.00)% | | 12/20/2020 | | 0.66% | | | 725,000 | | | (18,177 | ) | | 6,490 | | | — | | | (11,687 | ) |
| Citibank, N.A. | | ITV plc | (5.00)% | | 12/20/2020 | | 1.09% | | | 541,650 | | | (104,562 | ) | | 2,341 | | | — | | | (102,221 | ) |
| Citibank, N.A. | | Vodafone GP | (1.00)% | | 12/20/2020 | | 1.21% | | | 184,161 | | | (482) | | | 2,356 | | | 1,874 | | | — | |
| Deutsche Bank AG | | IBM | (1.00)% | | 6/20/2019 | | 0.42% | | | 850,000 | | | (26,707 | ) | | 10,165 | | | — | | | (16,542 | ) |
| JPMorgan Chase Bank, N.A. | | Host Hotels | (1.00)% | | 12/20/2020 | | 1.60% | | | 1,250,000 | | | 20,186 | | | 14,741 | | | 34,927 | | | — | |
| JPMorgan Chase Bank, N.A. | | Host Hotels | (1.00)% | | 12/20/2020 | | 1.60% | | | 1,250,000 | | | 20,186 | | | 14,741 | | | 34,927 | | | — | |
| JPMorgan Chase Bank, N.A. | | IBM | (1.00)% | | 12/20/2020 | | 0.66% | | | 1,775,000 | | | (35,477 | ) | | 6,865 | | | — | | | (28,612 | ) |
| JPMorgan Chase Bank, N.A. | | McDonalds | (1.00)% | | 12/20/2020 | | 0.27% | | | 700,000 | | | (16,000 | ) | | (8,438 | ) | | — | | | (24,438 | ) |
| JPMorgan Chase Bank, N.A. | | Sunrise | | | | | | | | | | | | | | | | | | | | | |
| | | Communications | (5.00)% | | 12/20/2020 | | 1.84% | | | 433,320 | | | (75,626 | ) | | 11,050 | | | — | | | (64,576 | ) |
| JPMorgan Chase Bank, N.A. | | Vodafone GP | (1.00)% | | 12/20/2020 | | 1.21% | | | 866,640 | | | — | | | 8,818 | | | 8,818 | | | — | |
| JPMorgan Chase Bank, N.A. | | Wind Acquisition | | | | | | | | | | | | | | | | | | | | | |
| | | Finance | (5.00)% | | 12/20/2020 | | 4.20% | | | 541,650 | | | (34,214 | ) | | 15,087 | | | — | | | (19,127 | ) |
| Protection sold: | | | | | | | | | | | | | | | | | | | | | | | |
| JPMorgan Chase Bank, N.A. | | ConvaTec Healthcare | 5.00% | | 12/20/17 | | 1.01% | | | 54,165 | | | (1,637 | ) | | 5,740 | | | 4,103 | | | — | |
| Total | | | | | | | | | | | | $ | (273,734 | ) | $ | 86,825 | | $ | 104,356 | | $ | (291,265 | ) |
During the period ended January 31, 2016, average monthly notional value related to swap contracts, including both centrally-cleared and over-the-counter, was approximately $6.6 million or 2.0% of ending net assets.
See notes to financial statements
94
| Portfolio of investments (unaudited) |
Strategic Income Fund
January 31, 2016 (continued)
FINANCIAL DERIVATIVE INSTRUMENTS: OVER-THE-COUNTER SUMMARY
The following is a summary by counterparty of the value of over-the-counter financial derivative instruments and collateral (received)/pledged as of January 31, 2016.
| | | Financial Derivative Assets | | | | | Financial Derivative Liabilities | | | | | | | | | | | | | |
| | | Unrealized | | | | | | | | Unrealized | | | | | | | | | | | | | | | | |
| | | Appreciation | | | Value(1) | | | | | Depreciation | | | Value(1) | | | | | | | | | | | | | |
| | | | Forward | | | | | | | | | Forward | | | | | | | | | Net | | | | | | | |
| | | | Foreign | | | | | | Total | | | Foreign | | | | | | Total | | | Value | | | Collateral | | | | |
| | | | Currency | | | Swap | | | Over-the | | | Currency | | | Swap | | | Over-the | | | of OTC | | | (Received) / | | | Net | |
| | | | Contracts | | | Contracts | | | Counter | | | Contracts | | | Contracts | | | Counter | | | Derivatives | | | Pledged | | | Exposure(2) | |
| | | | | | | | | | | | | | | | | | | | | | | | | | | | | |
| Amounts subject to a master netting or similar arrangement: | | | | | | | | | | |
| Barclays Bank plc | | $ | — | | $ | 19,707 | | $ | 19,707 | | $ | — | | $ | (35,749 | ) | $ | (35,749 | ) | $ | (16,042 | ) | $ | — | | $ | (16,042 | ) |
| BNP Paribas | | | | | | | | | | | | | | | | | | | | | | | | | | | | |
| Securities Services | | | 1,026,201 | | | — | | | 1,026,201 | | | — | | | — | | | — | | | 1,026,201 | | | — | | | 1,026,201 | |
| Citibank, N.A. | | | — | | | 1,874 | | | 1,874 | | | — | | | (102,221 | ) | | (102,221 | ) | | (100,347 | ) | | — | | | (100,347 | ) |
| Deutsche Bank AG | | | — | | | — | | | — | | | — | | | (16,542 | ) | | (16,542 | ) | | (16,542 | ) | | — | | | (16,542 | ) |
| JPMorgan Chase | | | | | | | | | | | | | | | | | | | | | | | | | | | | |
| Bank, N.A. | | | — | | | 82,775 | | | 82,775 | | | — | | | (136,753 | ) | | (136,753 | ) | | (53,978 | ) | | — | | | (53,978 | ) |
| | | $ | 1,026,201 | | $ | 104,356 | | $ | 1,130,557 | | $ | — | | $ | (291,265 | ) | $ | (291,265 | ) | $ | 839,292 | | $ | — | | $ | 839,292 | |
| (1) | | Value on swap contracts is represented by "unrealized appreciation/(depreciation)" on interest rate swaps, and "value" on credit default swaps, which is inclusive of upfront premiums paid/(received). |
| (2) | | Net Exposure represents the net receivable/(payable) that would be due from/to the counterparty in the event of default. Exposure from over-the-counter financial derivative instruments can only be netted across transactions governed under the same master agreement with the same legal entity. See Note 2, Significant Accounting Policies, "Derivative instruments," in the Notes to Financial Statements for more information regarding master netting arrangements. |
| | | | Cost or Premiums, Net | | | Asset | | | Liability | |
| TOTAL FINANCIAL DERIVATIVE INSTRUMENTS | | $ | (273,734 | ) | $ | 1,130,557 | | $ | (291,265 | ) |
See notes to financial statements
95
| Portfolio of investments (unaudited) |
Strategic Income Fund
January 31, 2016 (continued)
Other information:
| Currency exposure of portfolio assets before | |
| any currency hedging, if applicable. | % of total |
| Excludes derivatives: | investments |
| US Dollar | 45 | % |
| British Pound | 32 | |
| Euro | 23 | |
| | 100 | % |
| Industry concentration as | % of net |
| a percentage of net assets: | assets |
| Sovereign | 20.81 | % |
| Telephone-Integrated | 6.43 | |
| Commercial Banks Non-US | 6.04 | |
| Tobacco | 5.70 | |
| Cable TV | 3.75 | |
| Life/Health Insurance | 3.59 | |
| Money Center Banks | 3.31 | |
| Diversified Banking Institution | 3.12 | |
| Food-Catering | 2.90 | |
| Telecommunication Services | 2.57 | |
| Multi-line Insurance | 2.54 | |
| Containers - Metal/Glass | 1.78 | |
| U.S. government obligations | 1.47 | |
| Funeral Services & Related Items | 1.16 | |
| Commercial Services | 1.14 | |
| Finance-Other Services | 1.12 | |
| Radio | 1.12 | |
| Airport Development & Maintenance | 1.08 | |
| Commercial Services-Finance | 1.06 | |
| Retail-Drug Store | 1.06 | |
| Diversified Operations | 1.02 | |
| Super-Regional Banks-US | 0.91 | |
| Advertising Services | 0.90 | |
| Medical-HMO | 0.87 | |
| Broadcast Services/Programs | 0.84 | |
| Auto Repair Centers | 0.80 | |
| Building Societies | 0.80 | |
| Food-Flour & Grain | 0.80 | |
| Medical - Drugs | 0.76 | |
| Medical Products | 0.62 | |
| Food-Retail | 0.61 | |
| Medical Labs & Testing Services | 0.61 | |
| Specialty Stores | 0.60 | |
| Resorts/Theme Parks | 0.52 | |
| Cosmetics & Toiletries | 0.51 | |
| Mortgage Banks | 0.50 | |
| Property/Casualty Insurance | 0.47 | |
| Consulting Services | 0.45 | |
| Television | 0.45 | |
| Containers-Paper/Plastic | 0.43 | |
| Food-Miscellaneous/Diversified | 0.43 | |
| Gambling (Non-Hotel) | 0.37 | |
| Publishing-Newspapers | 0.37 | |
| Specialized REITs | 0.36 | |
| Computer Data Security | 0.30 | |
| Auto Racing | 0.29 | |
| Food-Confectionery | 0.23 | |
| Medical-Hospitals | 0.21 | |
| Real Estate Operations/Development | 0.13 | |
| Electronic Measurement Instruments | 0.10 | |
| REITS-Health Care | 0.09 | |
| Apparel Manufacturers | 0.07 | |
| Industrial Gases | 0.07 | |
| Electric-Integrated | 0.05 | |
| Water | 0.03 | |
| Travel Services | 0.02 | |
| Long-Term Investments | 88.34 | |
| Short-Term Investment | 15.12 | |
| Total investments | 103.46 | |
| Financial Derivative Instruments | 0.25 | |
| Net other assets and liabilities | (3.71 | ) |
| | 100.00 | % |
See notes to financial statements
96
| Portfolio of investments (unaudited) |
Strategic Income Fund
January 31, 2016 (continued)
Fair Value Measurement
The following table summarizes the Fund's investments that are measured at fair value by level within the fair value hierarchy at January 31, 2016:
| | | | Quoted prices | | | Significant | | | | | | | |
| | | | in active | | | other | | | Significant | | | | |
| | | | markets for | | | observable | | | unobservable | | | | |
| | | | identical assets | | | inputs | | | inputs | | | | |
| Description | | | (level 1 | ) | | (level 2 | ) | | (level 3 | ) | | Total | |
| | | | | | | | | | | | | | |
| Assets | | | | | | | | | | | | | |
| Bank Loans | | | | | | | | | | | | | |
| France | | $ | — | | $ | 4,185,830 | | $ | — | | $ | 4,185,830 | |
| Germany | | | — | | | 2,957,756 | | | — | | | 2,957,756 | |
| Ireland | | | — | | | 2,678,623 | | | — | | | 2,678,623 | |
| Luxembourg | | | — | | | 2,158,455 | | | — | | | 2,158,455 | |
| United Kingdom | | | — | | | 4,266,189 | | | — | | | 4,266,189 | |
| United States | | | — | | | 3,577,504 | | | — | | | 3,577,504 | |
| Total Bank Loans | | | — | | | 19,824,357 | | | — | | | 19,824,357 | |
| | | | | | | | | | | | | | |
| Corporate Bonds | | | | | | | | | | | | | |
| France | | | — | | | 16,224,170 | | | — | | | 16,224,170 | |
| Germany | | | — | | | 2,952,371 | | | — | | | 2,952,371 | |
| Ireland | | | — | | | 6,826,858 | | | — | | | 6,826,858 | |
| Italy | | | — | | | 2,430,173 | | | — | | | 2,430,173 | |
| Luxembourg | | | — | | | 3,786,701 | | | — | | | 3,786,701 | |
| Netherlands | | | — | | | 10,616,258 | | | — | | | 10,616,258 | |
| Norway | | | — | | | 946,179 | | | — | | | 946,179 | |
| Spain | | | — | | | 3,108,614 | | | — | | | 3,108,614 | |
| Switzerland | | | — | | | 2,280,076 | | | — | | | 2,280,076 | |
| United Kingdom | | | — | | | 90,494,755 | | | — | | | 90,494,755 | |
| United States | | | — | | | 56,158,979 | | | — | | | 56,158,979 | |
| Total Corporate Bonds | | | — | | | 195,825,134 | | | — | | | 195,825,134 | |
| | | | | | | | | | | | | | |
| Foreign Government Obligations | | | | | | | | | | | | | |
| Germany | | | — | | | 14,285,265 | | | — | | | 14,285,265 | |
| United Kingdom | | | — | | | 37,730,630 | | | — | | | 37,730,630 | |
| Total Foreign Government Obligations | | | — | | | 52,015,895 | | | — | | | 52,015,895 | |
| | | | | | | | | | | | | | |
| US Government Obligations | | | | | | | | | | | | | |
| United States | | | — | | | 21,447,942 | | | — | | | 21,447,942 | |
| Total US Government Obligations | | | — | | | 21,447,942 | | | — | | | 21,447,942 | |
| | | | | | | | | | | | | | |
| Preferred Stock | | | | | | | | | | | | | |
| United Kingdom | | | — | | | 1,572,552 | | | — | | | 1,572,552 | |
| United States | | | 590,879 | | | — | | | — | | | 590,879 | |
| Total Preferred Stock | | | 590,879 | | | 1,572,552 | | | — | | | 2,163,431 | |
| | | | | | | | | | | | | | |
| Short-Term Investment | | | 49,863,958 | | | — | | | — | | | 49,863,958 | |
| Total Investments | | $ | 50,454,837 | | $ | 290,685,880 | | $ | — | | $ | 341,140,717 | |
See notes to financial statements
97
| Portfolio of investments (unaudited) |
Strategic Income Fund
January 31, 2016 (continued)
| | | | Quoted prices | | | Significant | | | | | | | |
| | | | in active | | | other | | | Significant | | | | |
| | | | markets for | | | observable | | | unobservable | | | | |
| | | | identical assets | | | inputs | | | inputs | | | | |
| Description | | | (level 1 | ) | | (level 2 | ) | | (level 3 | ) | | Total | |
| | | | | | | | | | | | | | |
| Financial Derivative Instruments - Assets | | | | | | | | | | | | | |
| Over-The-Counter | | $ | — | | $ | 1,130,557 | | $ | — | | $ | 1,130,557 | |
| Total Financial Derivative Instruments - Assets | | $ | — | | $ | 1,130,557 | | $ | — | | $ | 1,130,557 | |
| | | | | | | | | | | | | | |
| Liabilities | | | | | | | | | | | | | |
| Financial Derivative Instruments - Liabilities | | | | | | | | | | | | | |
| Over-The-Counter | | $ | — | | $ | (291,265 | ) | $ | — | | $ | (291,265 | ) |
| Total Financial Derivative Instruments - Liabilities | | $ | — | | $ | (291,265 | ) | $ | — | | $ | (291,265 | ) |
During the period ended January 31, 2016, there were no transfers in or out of security levels.
Fair Value of Financial Derivative Instruments
The following is a summary of the fair valuation of the Fund's financial derivative instruments categorized by risk exposure:
Fair Values of Financial Derivative Instruments on the Statement of Assets and Liabilities as of January 31, 2016
| | | Derivatives not accounted for as hedging instruments | |
| | | | Foreign | | | | | | | | | | | | | | | | |
| | | | Currency | | | Equity | | | Interest | | | Credit | | | Inflation | | | | |
| | | | Risk | | | Risk | | | Rate Risk | | | Risk | | | Risk | | | Total | |
| | | | | | | | | | | | | | | | | | | | |
| Financial Derivative Instruments – Assets | | | | | | | | | | | | | | | | | | | |
| Over-the-Counter | | | | | | | | | | | | | | | | | | | |
| Forward Foreign Currency Contracts | | $ | 1,026,201 | | $ | — | | $ | — | | $ | — | | $ | — | | $ | 1,026,201 | |
| Swap Contracts | | $ | — | | $ | — | | $ | — | | $ | 104,356 | | $ | — | | $ | 104,356 | |
| Total | | $ | 1,026,201 | | $ | — | | $ | — | | $ | 104,356 | | $ | — | | $ | 1,130,557 | |
| | | | | | | | | | | | | | | | | | | | |
| Financial Derivative Instruments – Liabilities | | | | | | | | | | | | | | | | | | | |
| Over-the-Counter | | | | | | | | | | | | | | | | | | | |
| Swap Contracts | | $ | — | | $ | — | | $ | — | | $ | (291,265 | ) | $ | — | | $ | (291,265 | ) |
| Total | | $ | — | | $ | — | | $ | — | | $ | (291,265 | ) | $ | — | | $ | (291,265 | ) |
| Net | | $ | 1,026,201 | | $ | — | | $ | — | | $ | (186,909 | ) | $ | — | | $ | 839,292 | |
See notes to financial statements
98
| Portfolio of investments (unaudited) |
Strategic Income Fund
January 31, 2016 (continued)
Effect of Financial Derivative Instruments on the Statement of Operations for the Period Ended January 31, 2016
| | | Derivatives not accounted for as hedging instruments | |
| | | | Foreign | | | | | | | | | | | | | | | | |
| | | | Currency | | | Equity | | | Interest | | | Credit | | | Inflation | | | | |
| | | | Risk | | | Risk | | | Rate Risk | | | Risk | | | Risk | | | Total | |
| | | | | | | | | | | | | | | | | | | | |
| Net realized gain/(loss) from | | | | | | | | | | | | | | | | | | | |
| financial derivative instruments: | | | | | | | | | | | | | | | | | | | |
| Futures Contracts | | $ | — | | $ | — | | $ | 59,908 | | $ | — | | $ | — | | $ | 59,908 | |
| Forward Foreign Currency Contracts | | $ | 7,703,244 | | $ | — | | $ | — | | $ | — | | $ | — | | $ | 7,703,244 | |
| Swap Contracts | | $ | — | | $ | — | | $ | — | | $ | 30,166 | | $ | — | | $ | 30,166 | |
| Total | | $ | 7,703,244 | | $ | — | | $ | 59,908 | | $ | 30,166 | | $ | — | | $ | 7,793,318 | |
| | | Derivatives not accounted for as hedging instruments | |
| | | | Foreign | | | | | | | | | | | | | | | | |
| | | | Currency | | | Equity | | | Interest | | | Credit | | | Inflation | | | | |
| | | | Risk | | | Risk | | | Rate Risk | | | Risk | | | Risk | | | Total | |
| | | | | | | | | | | | | | | | | | | | |
| Net change in unrealized | | | | | | | | | | | | | | | | | | | |
| appreciation/(depreciation) | | | | | | | | | | | | | | | | | | | |
| of financial derivative instruments | | | | | | | | | | | | | | | | | | | |
| Futures Contracts | | $ | — | | $ | — | | $ | (36,276 | ) | $ | — | | $ | — | | $ | (36,276 | ) |
| Forward Foreign Currency Contracts | | $ | 1,025,952 | | $ | — | | $ | — | | $ | — | | $ | — | | $ | 1,025,952 | |
| Swap Contracts | | $ | — | | $ | — | | $ | — | | $ | 67,005 | | $ | — | | $ | 67,005 | |
| Total | | $ | 1,025,952 | | $ | — | | $ | (36,276 | ) | $ | 67,005 | | $ | — | | $ | 1,056,681 | |
See notes to financial statements
99
| Portfolio of investments (unaudited) |
Unconstrained Bond Fund
January 31, 2016
| Face | | | | | | | Value | |
| amount | | | Coupon | | Maturity | | (note 2) | |
| | | | | | | | | | |
| Auto Loan Receivables – 1.05% | | | | | | |
| | | | | | | | | | |
| | | | Luxembourg – 1.05% | | | | | | |
| EUR | 166,269 | | Bavarian Sky S.A. (a) | 0.008 | % | 8/20/22 | $ | 179,984 | |
| EUR | 82,269 | | E-Carat S.A. (a) | 0.400 | % | 9/18/21 | | 89,346 | |
| | | | | | | | | 269,330 | |
| | | | | | | | | | |
| | | | Total Auto Loan Receivables | | | | | | |
| | | | (Cost $272,719) | | | | | 269,330 | |
| | | | | | | | | | |
| Corporate bonds – 40.41% | | | | | | |
| | | | | | | | | | |
| | | | Australia – 0.16% | | | | | | |
| USD | 40,000 | | Transurban Finance Co. Pty., Ltd. (b) (d) | 4.125 | % | 2/2/26 | | 40,166 | |
| | | | | | | | | | |
| | | | France – 4.45% | | | | | | |
| EUR | 160,000 | | AXA S.A. (a) | 5.125 | % | 7/4/43 | | 197,816 | |
| USD | 90,000 | | Banque PSA Finance S.A. | 5.750 | % | 4/4/21 | | 95,589 | |
| EUR | 100,000 | | BNP Paribas Cardif S.A. (c) | 4.032 | % | 11/25/25 | | 101,439 | |
| EUR | 100,000 | | Carmila SAS | 2.375 | % | 9/18/23 | | 109,153 | |
| EUR | 200,000 | | CNP Assurances (a) | 4.500 | % | 6/10/47 | | 203,674 | |
| EUR | 100,000 | | Dry Mix Solutions Investissements SAS (a) | 4.122 | % | 6/15/21 | | 105,498 | |
| EUR | 100,000 | | HomeVi SAS (b) | 6.875 | % | 8/15/21 | | 112,365 | |
| EUR | 100,000 | | Oberthur Technologies Holding SAS | 9.250 | % | 4/30/20 | | 115,865 | |
| EUR | 100,000 | | Solvay Finance S.A. (c) | 5.869 | % | 6/3/24 | | 103,502 | |
| | | | | | | | | 1,144,901 | |
| | | | | | | | | | |
| | | | Germany – 1.36% | | | | | | |
| EUR | 100,000 | | Heidelberger Druckmaschinen AG | 8.000 | % | 5/15/22 | | 106,288 | |
| EUR | 120,000 | | Kirk Beauty One GmbH | 8.750 | % | 7/15/23 | | 132,045 | |
| EUR | 100,000 | | Rapid Holding GmbH | 6.625 | % | 11/15/20 | | 111,282 | |
| | | | | | | | | 349,615 | |
| | | | | | | | | | |
| | | | Ireland – 0.45% | | | | | | |
| EUR | 100,000 | | Eircom Finance, Ltd. | 9.250 | % | 5/15/20 | | 114,921 | |
| | | | | | | | | | |
| | | | Italy – 0.83% | | | | | | |
| EUR | 200,000 | | Intesa Sanpaolo SpA (c) | 7.000 | % | 1/19/21 | | 214,452 | |
| | | | | | | | | | |
| | | | Japan – 0.66% | | | | | | |
| EUR | 170,000 | | SoftBank Group Corp. | 5.250 | % | 7/30/27 | | 168,968 | |
| | | | | | | | | | |
| | | | Jersey – 0.66% | | | | | | |
| GBP | 120,000 | | Aston Martin Capital, Ltd. | 9.250 | % | 7/15/18 | | 171,330 | |
| | | | | | | | | | |
| | | | Luxembourg – 2.88% | | | | | | |
| EUR | 100,000 | | Altice Luxembourg S.A. | 7.250 | % | 5/15/22 | | 102,778 | |
| EUR | 100,000 | | Cerberus Nightingale 1 SARL | 8.250 | % | 2/1/20 | | 110,226 | |
See notes to financial statements
100
| Portfolio of investments (unaudited) |
Unconstrained Bond Fund
January 31, 2016 (continued)
| Face | | | | | | | Value | |
| amount | | | Coupon | | Maturity | | (note 2) | |
| | | | | | | | | | |
| | | | Luxembourg (continued) | | | | | | |
| EUR | 100,000 | | Dufry Finance SCA (b) | 4.500 | % | 8/1/23 | $ | 111,309 | |
| EUR | 200,000 | | Grand City Properties S.A. (c) | 3.750 | % | 2/8/22 | | 197,537 | |
| EUR | 100,000 | | Pentair Finance S.A. | 2.450 | % | 9/17/19 | | 109,864 | |
| EUR | 100,000 | | Wind Acquisition Finance S.A. (a) (b) | 5.091 | % | 4/30/19 | | 108,388 | |
| | | | | | | | | 740,102 | |
| | | | | | | | | | |
| | | | Netherlands – 3.73% | | | | | | |
| EUR | 100,000 | | ASR Nederland N.V. (a) | 5.125 | % | 9/29/45 | | 107,864 | |
| EUR | 100,000 | | Grupo Antolin Dutch BV | 5.125 | % | 6/30/22 | | 111,580 | |
| EUR | 100,000 | | InterXion Holding N.V. | 6.000 | % | 7/15/20 | | 113,292 | |
| EUR | 100,000 | | JAB Holdings BV | 2.125 | % | 9/16/22 | | 108,374 | |
| EUR | 200,000 | | NN Group N.V. (c) | 4.500 | % | 1/15/26 | | 207,328 | |
| EUR | 200,000 | | Schaeffler Finance BV | 3.250 | % | 5/15/25 | | 203,931 | |
| EUR | 100,000 | | TMF Group Holding BV (a) | 5.262 | % | 12/1/18 | | 108,763 | |
| | | | | | | | | 961,132 | |
| | | | | | | | | | |
| | | | Portugal – 0.40% | | | | | | |
| EUR | 100,000 | | Energias de Portugal S.A. (a) | 5.375 | % | 9/16/75 | | 103,956 | |
| | | | | | | | | | |
| | | | United Kingdom – 13.35% | | | | | | |
| GBP | 130,000 | | AA Bond Co, Ltd. | 5.500 | % | 7/31/22 | | 173,245 | |
| GBP | 100,000 | | Admiral Group plc | 5.500 | % | 7/25/24 | | 142,758 | |
| GBP | 66 | | Annington Finance No 4 plc (a) (d) | 1.559 | % | 1/10/23 | | 94 | |
| USD | 80,000 | | AstraZeneca plc | 3.375 | % | 11/16/25 | | 80,541 | |
| EUR | 100,000 | | Atrium European Real Estate, Ltd. | 3.625 | % | 10/17/22 | | 112,013 | |
| GBP | 140,000 | | Aviva plc (a) | 6.875 | % | 5/20/58 | | 216,570 | |
| GBP | 155,000 | | Broadgate Financing plc (a) | 2.190 | % | 10/5/23 | | 214,786 | |
| GBP | 50,000 | | Co-Operative Bank plc | 5.125 | % | 9/20/17 | | 70,033 | |
| GBP | 100,000 | | CPUK Finance, Ltd. (b) | 7.000 | % | 8/28/20 | | 144,948 | |
| GBP | 100,000 | | Galaxy Bidco, Ltd. (a) (b) | 5.573 | % | 11/15/19 | | 142,476 | |
| GBP | 50,000 | | HBOS Capital Funding LP (c) | 6.461 | % | 11/30/18 | | 74,896 | |
| GBP | 50,000 | | HSBC Holdings plc | 7.000 | % | 4/7/38 | | 91,483 | |
| USD | 200,000 | | Imperial Tobacco Finance plc (b) | 3.750 | % | 7/21/22 | | 203,426 | |
| GBP | 100,000 | | Investec plc | 4.500 | % | 5/5/22 | | 140,446 | |
| EUR | 100,000 | | ITV plc | 2.125 | % | 9/21/22 | | 110,907 | |
| GBP | 140,000 | | Legal & General Group plc (a) | 5.375 | % | 10/27/45 | | 199,900 | |
| GBP | 100,000 | | Old Mutual plc | 8.000 | % | 6/3/21 | | 145,371 | |
| GBP | 100,000 | | Pension Insurance Corp., plc | 6.500 | % | 7/3/24 | | 133,666 | |
| GBP | 100,000 | | Pizzaexpress Financing 2 plc | 6.625 | % | 8/1/21 | | 147,422 | |
| GBP | 100,000 | | Prudential plc (a) | 5.000 | % | 7/20/55 | | 129,348 | |
| GBP | 50,000 | | RSA Insurance Group plc (a) | 9.375 | % | 5/20/39 | | 82,635 | |
| GBP | 100,000 | | Scottish Widows plc | 5.500 | % | 6/16/23 | | 146,605 | |
| GBP | 100,000 | | Standard Chartered plc | 5.125 | % | 6/6/34 | | 121,281 | |
| GBP | 100,000 | | Standard Life plc (a) | 5.500 | % | 12/4/42 | | 148,266 | |
| GBP | 70,000 | | Tesco plc | 6.000 | % | 12/14/29 | | 98,240 | |
| EUR | 50,000 | | The Royal Bank of Scotland plc (a) | 4.625 | % | 9/22/21 | | 54,417 | |
| EUR | 100,000 | | Vougeot Bidco plc (a) (b) | 5.106 | % | 7/15/20 | | 108,545 | |
| | | | | | | | | 3,434,318 | |
See notes to financial statements
101
| Portfolio of investments (unaudited) |
Unconstrained Bond Fund
January 31, 2016 (continued)
| Face | | | | | | | Value | |
| amount | | | Coupon | | Maturity | | (note 2) | |
| | | | | | | | | | |
| | | | United States – 11.48% | | | | | | |
| USD | 70,000 | | Amgen, Inc. | 3.625 | % | 5/22/24 | $ | 70,975 | |
| EUR | 100,000 | | Bank of America Corp. | 2.375 | % | 6/19/24 | | 113,848 | |
| EUR | 115,000 | | Berkshire Hathaway, Inc. | 1.125 | % | 3/16/27 | | 114,642 | |
| USD | 50,000 | | BlueLine Rental Finance Corp. (b) | 7.000 | % | 2/1/19 | | 39,500 | |
| USD | 36,000 | | Burlington Northern Santa Fe LLC | 4.150 | % | 4/1/45 | | 33,460 | |
| USD | 200,000 | | Calpine Corp. (e) | 5.750 | % | 1/15/25 | | 180,500 | |
| USD | 200,000 | | CCO Holdings LLC (b) | 5.875 | % | 5/1/27 | | 197,500 | |
| USD | 100,000 | | Centene Escrow Corp. (f) | 6.125 | % | 2/15/24 | | 103,000 | |
| USD | 100,000 | | CHS/Community Health Systems, Inc. | 6.875 | % | 2/1/22 | | 91,000 | |
| USD | 120,000 | | Citigroup, Inc. | 2.650 | % | 10/26/20 | | 119,926 | |
| USD | 60,000 | | ConAgra Foods, Inc. | 3.200 | % | 1/25/23 | | 58,350 | |
| USD | 200,000 | | Digicel Group, Ltd. (a) (b) (e) | 8.250 | % | 9/30/20 | | 162,775 | |
| USD | 70,000 | | DIRECTV Holdings LLC/DIRECTV Financing Co., Inc. | 6.000 | % | 8/15/40 | | 69,606 | |
| USD | 40,000 | | First Data Corp. (b) | 7.000 | % | 12/1/23 | | 40,400 | |
| USD | 125,000 | | Frontier Communications Corp. (b) | 11.000 | % | 9/15/25 | | 120,937 | |
| USD | 110,000 | | Hewlett-Packard Enterprise Co. (b) | 4.900 | % | 10/15/25 | | 104,897 | |
| USD | 100,000 | | ILFC E-Capital Trust I (a) (b) | 4.490 | % | 12/21/65 | | 90,000 | |
| EUR | 100,000 | | Jarden Corp. | 3.750 | % | 10/1/21 | | 113,442 | |
| USD | 75,000 | | KLX, Inc. (b) | 5.875 | % | 12/1/22 | | 70,492 | |
| USD | 130,000 | | Meccanica Holdings USA, Inc. (b) (d) | 6.250 | % | 1/15/40 | | 118,625 | |
| USD | 65,000 | | Medtronic, Inc. | 3.150 | % | 3/15/22 | | 67,192 | |
| USD | 85,000 | | Platform Specialty Products Corp. (b) | 10.375 | % | 5/1/21 | | 79,475 | |
| USD | 130,000 | | QUALCOMM, Inc. | 4.800 | % | 5/20/45 | | 115,984 | |
| USD | 200,000 | | RCN Telecom Services LLC (b) | 8.500 | % | 8/15/20 | | 201,750 | |
| USD | 125,000 | | T-Mobile USA, Inc. | 6.500 | % | 1/15/26 | | 125,625 | |
| USD | 40,000 | | The Priceline Group, Inc. | 3.650 | % | 3/15/25 | | 39,716 | |
| USD | 150,000 | | TransDigm, Inc. | 6.000 | % | 7/15/22 | | 147,750 | |
| USD | 22,000 | | Trinity Industries, Inc. | 4.550 | % | 10/1/24 | | 19,702 | |
| USD | 28,000 | | Verizon Communications, Inc. | 6.550 | % | 9/15/43 | | 32,802 | |
| USD | 27,000 | | Verizon Communications, Inc. | 5.012 | % | 8/21/54 | | 24,391 | |
| USD | 100,000 | | West Corp. (b) | 5.375 | % | 7/15/22 | | 84,625 | |
| | | | | | | | | 2,952,887 | |
| | | | | | | | | | |
| | | | Total corporate bonds | | | | | | |
| | | | (Cost $11,201,724) | | | | | 10,396,748 | |
| | | | | | | | | | |
| Commercial mortgage-backed securities – 5.65% | | | | | | |
| | | | | | | | | | |
| | | | Germany – 1.47% | | | | | | |
| EUR | 238,946 | | German Residential Funding plc (a) | 1.496 | % | 8/27/24 | | 261,439 | |
| EUR | 109,478 | | Juno Eclipse 2007-2, Ltd. (a) | 0.088 | % | 11/20/22 | | 116,496 | |
| | | | | | | | | 377,935 | |
| | | | | | | | | | |
| | | | United Kingdom – 2.35% | | | | | | |
| GBP | 71,000 | | Business Mortgage Finance 3 plc (a) | 4.223 | % | 11/15/38 | | 96,033 | |
| GBP | 112,609 | | Business Mortgage Finance 3 plc (a) | 1.973 | % | 11/15/38 | | 164,173 | |
| GBP | 49,386 | | DECO 12-UK 4 plc (a) | 0.779 | % | 1/27/20 | | 66,944 | |
| GBP | 50,000 | | Eddystone Finance plc (a) | 1.349 | % | 4/19/21 | | 68,599 | |
| GBP | 55,000 | | Eddystone Finance plc (a) | 1.749 | % | 4/19/21 | | 74,933 | |
| GBP | 94,219 | | Taurus CMBS UK 2014-1, Ltd. (a) | 1.979 | % | 5/1/22 | | 133,413 | |
| | | | | | | | | 604,095 | |
See notes to financial statements
102
| Portfolio of investments (unaudited) |
Unconstrained Bond Fund
January 31, 2016 (continued)
| Face | | | | | | | Value | |
| amount | | | Coupon | | Maturity | | (note 2) | |
| | | | | | | | | | |
| | | | United States – 1.83% | | | | | | |
| USD | 237,000 | | Invitation Homes 2015-SFR2 Trust (a) (b) | 2.426% | | 6/17/32 | $ | 227,008 | |
| USD | 100,000 | | Progress Residential 2014-SFR1 Trust (a) (b) | 2.676% | | 10/17/31 | | 97,341 | |
| USD | 149,760 | | Progress Residential Series 2014-SFR1 Trust (a) (b) | 1.526% | | 10/17/31 | | 147,789 | |
| | | | | | | | | 472,138 | |
| | | | | | | | | | |
| | | | Total commercial mortgage-backed securities | | | | | | |
| | | | (Cost $1,650,120) | | | | | 1,454,168 | |
| | | | | | | | | | |
| Credit Card Receivables – 3.23% | | | | | | |
| | | | | | | | | | |
| | | | United Kingdom – 0.73% | | | | | | |
| GBP | 133,000 | | Gracechurch Card Funding plc (a) | 1.011% | | 7/15/21 | | 188,701 | |
| | | | | | | | | | |
| | | | United States – 2.50% | | | | | | |
| USD | 270,000 | | Barclays Dryrock Issuance Trust (a) | 0.786% | | 12/16/19 | | 269,908 | |
| USD | 104,000 | | Capital One Multi-Asset Execution Trust (a) | 0.466% | | 7/15/20 | | 103,580 | |
| USD | 270,000 | | Discover Card Execution Note Trust (a) | 0.856% | | 7/15/21 | | 269,254 | |
| | | | | | | | | 642,742 | |
| | | | | | | | | | |
| | | | Total Credit Card Receivables | | | | | | |
| | | | (Cost $850,623) | | | | | 831,443 | |
| | | | | | | | | | |
| Collateralized loan obligations – 3.54% | | | | | | |
| | | | | | | | | | |
| | | | Ireland – 1.00% | | | | | | |
| EUR | 127,000 | | Bacchus Series 2006-2 plc (a) | 0.696% | | 8/17/22 | | 136,586 | |
| EUR | 12,734 | | Clavos Euro CDO Ltd. (a) | 1.357% | | 4/18/23 | | 13,802 | |
| EUR | 100,000 | | Harvest CLO XIV Designated Activity Co. (a) | 3.000% | | 11/18/29 | | 107,474 | |
| | | | | | | | | 257,862 | |
| | | | | | | | | | |
| | | | Luxembourg – 0.53% | | | | | | |
| EUR | 125,000 | | GSC European CDO I - R S.A. (a) | 1.322% | | 12/15/22 | | 132,681 | |
| EUR | 3,592 | | Harvest CLO II S.A. (a) | 0.631% | | 5/21/20 | | 3,886 | |
| | | | | | | | | 136,567 | |
| | | | | | | | | | |
| | | | Netherlands – 2.01% | | | | | | |
| EUR | 100,000 | | Babson Euro CLO 2015-1 BV (a) | 3.614% | | 10/25/29 | | 103,421 | |
| EUR | 100,000 | | Highlander Euro CDO II BV (a) | 0.519% | | 12/14/22 | | 99,576 | |
| EUR | 100,000 | | Jubilee BV (a) | 2.757% | | 7/12/28 | | 105,196 | |
| EUR | 100,000 | | Jubilee CDO VI BV (a) | 0.636% | | 9/20/22 | | 102,830 | |
| EUR | 100,000 | | Wood Street CLO II BV (a) | 0.630% | | 3/29/21 | | 104,410 | |
| | | | | | | | | 515,433 | |
| | | | | | | | | | |
| | | | Total collateralized loan obligations | | | | | | |
| | | | (Cost $959,333) | | | | | 909,862 | |
See notes to financial statements
103
| Portfolio of investments (unaudited) |
Unconstrained Bond Fund
January 31, 2016 (continued)
| Face | | | | | | | Value | |
| amount | | | Coupon | | Maturity | | (note 2) | |
| | | | | | | | | | |
| Residential mortgage-backed securities – 9.88% | | | | | | |
| | | | | | | | | | |
| | | | Australia – 0.37% | | | | | | |
| GBP | 68,549 | | Interstar Millennium Series 2004-4E Trust (a) | 0.933% | | 11/14/36 | $ | 94,243 | |
| | | | | | | | | | |
| | | | Netherlands – 1.71% | | | | | | |
| EUR | 200,000 | | Dolphin Master Issuer BV (a) | 0.719% | | 9/28/99 | | 219,850 | |
| EUR | 200,000 | | Storm 2015 - IV BV (a) | 1.158% | | 8/22/54 | | 220,146 | |
| | | | | | | | | 439,996 | |
| | | | | | | | | | |
| | | | United Kingdom – 7.80% | | | | | | |
| EUR | 109,008 | | Alba Series 2006-2 plc (a) | 0.032% | | 12/15/38 | | 106,980 | |
| GBP | 54,504 | | Alba Series 2006-2 plc (a) | 0.753% | | 12/15/38 | | 70,366 | |
| GBP | 119,000 | | Eurosail 2006-1 plc (a) | 0.843% | | 6/10/44 | | 147,140 | |
| EUR | 140,000 | | Eurosail 2006-1 plc (a) | 0.134% | | 6/10/44 | | 130,992 | |
| GBP | 50,000 | | Eurosail-UK 2007-2np plc (a) | 0.835% | | 3/13/45 | | 52,748 | |
| GBP | 159,969 | | Gosforth Funding 2012-1 plc (a) | 2.135% | | 12/19/47 | | 228,784 | |
| EUR | 178,971 | | Holmes Master Issuer plc (a) | 1.306% | | 10/15/54 | | 194,427 | |
| GBP | 136,591 | | Money Partners Securities 4 plc (a) | 0.963% | | 3/15/40 | | 182,624 | |
| EUR | 136,059 | | Paragon Mortgages No. 8 plc | 0.216% | | 4/16/35 | | 134,575 | |
| EUR | 234,687 | | Paragon Mortgages No. 9 plc (a) | 0.279% | | 5/15/41 | | 232,218 | |
| EUR | 149,508 | | Paragon Mortgages No.12 plc (a) | 0.159% | | 11/15/38 | | 146,497 | |
| GBP | 136,063 | | RMAC 2005-NS3 plc (a) | 0.945% | | 6/12/43 | | 177,963 | |
| GBP | 62,253 | | Southern Pacific Financing plc (a) | 1.043% | | 6/10/43 | | 69,696 | |
| GBP | 100,000 | | Warwick Finance Residential Mortgages number one plc (a) | 2.085% | | 9/21/49 | | 132,550 | |
| | | | | | | | | 2,007,560 | |
| | | | | | | | | | |
| | | | Total residential mortgage-backed securities | | | | | | |
| | | | (Cost $2,781,687) | | | | | 2,541,799 | |
| Principal | | | | | | | Value | |
| amount | | | Coupon | | Maturity | | (note 2) | |
| | | | | | | | | | |
| Sovereign debt obligations – 17.86% | | | | | | |
| EUR | 1,017,122 | | Italy Buoni Poliennali Del Tesoro (g) | 2.350% | | 9/15/19 | | 1,204,100 | |
| EUR | 463,000 | | Italy Buoni Poliennali Del Tesoro | 3.500% | | 11/1/17 | | 532,465 | |
| JPY | 130,000,000 | | Japan Treasury Discount Bill | —% | | 2/22/16 | | 1,073,790 | |
| MXN | 6,566,100 | | Mexican Bonos | 10.000% | | 12/5/24 | | 463,620 | |
| NZD | 434,000 | | New Zealand Government Bond (g) | 4.500% | | 2/15/16 | | 427,372 | |
| RON | 390,000 | | Romania Government Bond | 5.950% | | 6/11/21 | | 108,613 | |
| EUR | 718,000 | | Spain Government Bond | 0.500% | | 10/31/17 | | 784,771 | |
| | | | | | | | | | |
| | | | Total sovereign debt obligations | | | | | | |
| | | | (Cost $5,015,328) | | | | | 4,594,731 | |
See notes to financial statements
104
| Portfolio of investments (unaudited) |
Unconstrained Bond Fund
January 31, 2016 (continued)
| Face | | | | | | | Value | |
| amount | | | Coupon | | Maturity | | (note 2) | |
| | | | | | | | | | |
| US government obligations – 6.23% | | | | | | |
| | | | | | | | | | |
| | | | United States – 6.23% | | | | | | |
| USD | 845,169 | | United States Treasury Inflation Indexed Bonds (e) (g) | 0.625% | | 1/15/24 | $ | 853,191 | |
| USD | 769,174 | | United States Treasury Inflation Indexed Bonds (g) | 0.250% | | 1/15/25 | | 749,799 | |
| | | | | | | | | 1,602,990 | |
| | | | | | | | | | |
| | | | Total US government obligations | | | | | | |
| | | | (Cost $1,593,769) | | | | | 1,602,990 | |
| | | | | | | | | | |
| | | | Total long-term investments | | | | | | |
| | | | (Cost $24,325,303) | | | | | 22,601,071 | |
| | | | | | | | | | |
| | Shares | | | | | | | | |
| | | | | | | | | | |
| Short-term investment – 14.55% | | | | | | |
| | 3,743,698 | | Fidelity Institutional Treasury Portfolio (e) | | | | | 3,743,698 | |
| | | | | | | | | | |
| | | | Total short-term investment | | | | | | |
| | | | (Cost $3,743,698) | | | | | 3,743,698 | |
| Total investments(h) – 102.40% | | | | | | |
| | | | (Cost $28,069,001) | | | | | 26,344,769 | |
Financial Derivative Instruments (Cost or Premiums, net — $157,619)(i) – 1.70% | | | | | 437,375 | |
| Net other assets and liabilities – (4.10)% | | | | | (1,054,744 | ) |
| Total net assets – 100.00% | | | | $ | 25,727,400 | |
| (a) | | Variable or Floating rate interest rate security. Includes fixed-to-floating rate corporate bond securities which currently pay a fixed coupon that will move to a floating rate coupon if the bond is not redeemed at the call date. Rate presented represents rate at January 31, 2016. |
| (b) | | Restricted security, purchased pursuant to Rule 144A under the Securities Act of 1933, as amended, and which is exempt from registration under that Act. At January 31, 2016, the restricted securities held by the Fund had an aggregate value of $2,754,737, which represented 10.7% of net assets. |
| (c) | | Maturity date is perpetual. Maturity date presented represents the next call date. |
| (d) | | The security has been deemed illiquid by the Adviser according to the policies and procedures adopted by the Board of Trustees. |
| (e) | | This investment was segregated for open swap contracts and delayed delivery purchases at January 31, 2016. |
| (f) | | Security is purchased on a delayed delivery basis. |
| (g) | | Indexed security in which both the coupon and principal are adjusted in-line with movements in the inflation index in that sovereign market. |
| (h) | | All or a portion of these securities and short-term investments were segregated for open futures contracts, forward foreign currency contracts, options, delayed delivery purchases and swap contracts. |
| (i) | | Information with respect to financial derivative instruments is disclosed in the following tables. |
See notes to financial statements
105
| Portfolio of investments (unaudited) |
Unconstrained Bond Fund
January 31, 2016 (continued)
(i) FINANCIAL DERIVATIVE INSTRUMENTS
EXCHANGE-TRADED OR CENTRALLY-CLEARED FINANCIAL DERIVATIVE INSTRUMENTS
FUTURES CONTRACTS
| | | | | | | | | | Current | | | Unrealized | |
| | | | Number of | | | Expiration | | | notional | | | appreciation/(depreciation) | |
| | | | contracts | | | date | | | value | | | Asset | | | Liability | |
| | | | | | | | | | | | | | | | | |
| UK Long Gilt (Short) | | | (8 | ) | | 3/29/16 | | $ | 1,371,551 | | $ | — | | $ | (31,238 | ) |
| Total | | | | | | | | | | | $ | — | | $ | (31,238 | ) |
During the period ended January 31, 2016, average monthly notional value related to futures contracts was approximately $2.8 million or 10.8% of ending net assets.
SWAP CONTRACTS
Interest Rate Swap Contracts
| | | Notional | Fund | | | Annual | | | | Unrealized | |
| | | amounts | Pays/Receives | | | Fixed | | Termination | | appreciation/(depreciation) | |
| Exchange | | (000s) | Floating Rate | | Floating Rate Index | Rate | | Date | | Asset | | Liability | |
| | | | | | | | | | | | | | |
| LCH | $ | 3,876 | Receives | | 6-month GBP LIBOR | 2.230% | | 6/18/2020 | $ | — | $ | (64,605 | ) |
| LCH | | 3,790 | Pays | | 6-month GBP LIBOR | 1.560% | | 6/17/2018 | | 53,641 | | — | |
| LCH | | 990 | Receives | | 3-month USD LIBOR | 3.4270% | | 9/22/2026 | | — | | (137,149 | ) |
| LCH | | 1,840 | Pays | | 3-month USD LIBOR | 3.100% | | 9/22/2021 | | 145,518 | | — | |
| LCH | | 1,800 | Receives | | 3-month USD LIBOR | 3.6300% | | 10/6/2034 | | — | | (138,262 | ) |
| LCH | | 2,140 | Pays | | 3-month USD LIBOR | 3.4630% | | 10/6/2044 | | 114,489 | | — | |
| LCH | | 259 | Pays | | 3-month USD LIBOR | 3.1035% | | 5/14/2045 | | 8,095 | | — | |
| LCH | | 126 | Receives | | 3-month USD LIBOR | 3.250% | | 5/14/2035 | | — | | (5,827 | ) |
| LCH | | 2,060 | Pays | | 3-month USD LIBOR | 1.3750% | | 9/29/2018 | | 13,260 | | — | |
| LCH | | 2,150 | Receives | | 3-month USD LIBOR | 2.2250% | | 9/28/2020 | | — | | (24,061 | ) |
| LCH | | 590 | Receives | | 3-month USD LIBOR | 2.1925% | | 3/11/2026 | | — | | (20,035 | ) |
| LCH | | 310 | Receives | | 3-month USD LIBOR | 2.6160% | | 3/11/2046 | | — | | (22,677 | ) |
| LCH | | 1,681 | Receives | | 6-month GBP LIBOR | 2.4387% | | 9/1/2025 | | — | | (32,365 | ) |
| LCH | | 1,560 | Pays | | 6-month EURIBOR | 1.7980% | | 9/3/2025 | | 46,005 | | — | |
| LCH | | 2,026 | Pays | | 6-month EURIBOR | 0.1810% | | 12/1/2019 | | 4,922 | | — | |
| LCH | | 563 | Receives | | 6-month EURIBOR | 1.6250% | | 12/3/2045 | | — | | (9,005 | ) |
| Total | | | | | | | | | $ | 385,930 | $ | (453,986 | ) |
LCH London Clearing House
See notes to financial statements
106
| Portfolio of investments (unaudited) |
Unconstrained Bond Fund
January 31, 2016 (continued)
CREDIT DEFAULT SWAP CONTRACTS
| | | | | | | | | | | | | | | | | | | Upfront | | | | | | | | | | |
| | | | | | | Rates | | | | | | Implied | | | Notional | | | premiums | | | Unrealized | | | | | | | |
| | | | Reference | | | received/ | | | Termination | | | credit | | | amount | | | paid/ | | | appreciation/ | | | | | | Value | |
| Exchange | | | entity | | | (paid | ) | | date | | | spread | | | (000s | ) | | (received | ) | | (depreciation | ) | | Asset | | | Liability | |
| | | | | | | | | | | | | | | | | | | | | | | | | | | | | |
| Protection purchased: | | | | | | | | | | | | | | | | | | | | | | | | | |
| ICE | | | North America | | | | | | | | | | | | | | | | | | | | | | | | | |
| | | | High Yield CDS | | | | | | | | | | | | | | | | | | | | | | | | | |
| | | | Index, Series 24 | | | 5.00 | % | | 12/20/2020 | | | 5.04 | % | $ | 1,800 | | $ | (19,980 | ) | $ | 22,703 | | $ | 2,723 | | $ | — | |
| ICE | InterContinental Exchange |
During the period ended January 31, 2016, average monthly notional value related to swap contracts, including both centrally-cleared and over-the-counter, was approximately $41.7 million or 162.1% of ending net assets.
| | | | Cost or Premiums, net | | | Asset | | | Liability | |
| TOTAL CENTRALLY CLEARED SWAP CONTRACTS | | $ | (19,980 | ) | $ | 388,653 | | $ | (453,986 | ) |
The following is a summary of the value of exchange-traded or centrally-cleared financial derivative instruments as of January 31, 2016
| | | | Unrealized | | | | | | | | | | | | Unrealized | | | | | | | | | | |
| | | | Appreciation | | | Value | | | Value(1) | | | | | | Depreciation | | | Value | | | Value(1) | | | | |
| | | | Futures | | | Purchased | | | Swap | | | | | | Futures | | | Written | | | Swap | | | | |
| | | | Contracts | | | Options | | | Contracts | | | Total | | | Contracts | | | Options | | | Contracts | | | Total | |
| | | | | | | | | | | | | | | | | | | | | | | | | | |
| Total Exchange-Traded or | | | | | | | | | | | | | | | | | | | | | | | | | |
| Centrally Cleared | | $ | — | | $ | — | | $ | 388,653 | | $ | 388,653 | | $ | (31,238 | ) | $ | — | | $ | (453,986 | ) | $ | (485,224 | ) |
| (1) | | Value on swap contracts is represented by "unrealized appreciation/(depreciation)" on interest rate swaps, and "value" on credit default swaps, which is inclusive of upfront premiums paid/(received). |
See notes to financial statements
107
| Portfolio of investments (unaudited) |
Unconstrained Bond Fund
January 31, 2016 (continued)
OVER-THE-COUNTER FINANCIAL DERIVATIVE INSTRUMENTS
FORWARD FOREIGN CURRENCY CONTRACTS
| | | | | | | | | | Unrealized | |
| | | | | | Local | | Current | | appreciation/ | |
| | | | Value | | amount | | notional | | (depreciation) | |
| | Counterparty | | date | | (000's) | | value | | Asset | | Liability | |
| | | | | | | | | | | | | |
| Australian Dollar (Long) | Deutsche Bank AG | | 3/11/16 | | 732 | $ | 516,979 | $ | — | $ | (9,241) | |
| Australian Dollar (Long) | Citibank, N.A. | | 3/11/16 | | 17 | | 12,049 | | 163 | | — | |
| Australian Dollar (Short) | Morgan Stanley Capital Services LLC | | 3/11/16 | | 19 | | 13,635 | | — | | (324) | |
| British Pound (Long) | JP Morgan Chase Bank, N.A. | | 3/11/16 | | 802 | | 1,142,828 | | — | | (18,601) | |
| British Pound (Short) | Citibank, N.A. | | 3/11/16 | | 186 | | 264,087 | | 768 | | — | |
| British Pound (Short) | Deutsche Bank AG | | 3/11/16 | | 115 | | 163,105 | | 8,712 | | — | |
| British Pound (Short) | Morgan Stanley Capital Services LLC | | 3/11/16 | | 4,022 | | 5,731,785 | | 337,625 | | — | |
| Canadian Dollar (Long) | JP Morgan Chase Bank, N.A. | | 3/11/16 | | 22 | | 15,845 | | 537 | | — | |
| Canadian Dollar (Short) | Morgan Stanley Capital Services LLC | | 3/11/16 | | 23 | | 15,846 | | — | | (652) | |
| Euro (Long) | Deutsche Bank AG | | 3/11/16 | | 1,301 | | 1,411,145 | | 1,748 | | — | |
| Euro (Short) | Citibank, N.A. | | 3/11/16 | | 6,516 | | 7,066,045 | | 78,595 | | — | |
| Euro (Short) | JP Morgan Chase Bank, N.A. | | 3/11/16 | | 3,388 | | 3,674,044 | | 48,009 | | — | |
| Euro (Short) | Morgan Stanley Capital Services LLC | | 3/11/16 | | 898 | | 973,861 | | 10,505 | | — | |
| Indian Rupee (Long) | Morgan Stanley Capital Services LLC | | 3/11/16 | | 6,602 | | 96,671 | | — | | (710) | |
| Indian Rupee (Short) | Citibank, N.A. | | 3/11/16 | | 6,602 | | 96,671 | | 1,259 | | — | |
| Japanese Yen (Long) | Morgan Stanley Capital Services LLC | | 3/11/16 | | 32,777 | | 270,964 | | 1,234 | | — | |
| Japanese Yen (Short) | Morgan Stanley Capital Services LLC | | 2/22/16 | | 130,000 | | 1,074,180 | | — | | (14,633) | |
| Japanese Yen (Short) | Barclays Capital | | 3/11/16 | | 30,824 | | 254,819 | | — | | (999) | |
| Mexican Peso (Long) | Deutsche Bank AG | | 3/11/16 | | 2,305 | | 126,757 | | — | | (7,877) | |
| Mexican Peso (Short) | Citibank, N.A. | | 3/11/16 | | 4,824 | | 265,267 | | 4,733 | | — | |
| Mexican Peso (Short) | JP Morgan Chase Bank, N.A. | | 3/11/16 | | 31 | | 1,741 | | 610 | | — | |
| New Zealand Dollar (Short) | Morgan Stanley Capital Services LLC | | 3/11/16 | | 667 | | 430,793 | | 9,115 | | — | |
| New Zealand Dollar (Short) | Deutsche Bank AG | | 3/11/16 | | 780 | | 503,966 | | 22,254 | | — | |
| Romanian Leu (Short) | Citibank, N.A. | | 3/11/16 | | 467 | | 111,078 | | 2,398 | | — | |
| Swiss Franc (Long) | Barclays Capital | | 3/11/16 | | 260 | | 254,205 | | 386 | | — | |
| Swiss Franc (Short) | Morgan Stanley Capital Services LLC | | 3/11/16 | | 260 | | 253,891 | | 10,486 | | — | |
| Total | | | | | | | | $ | 539,137 | $ | (53,037) | |
During the period ended January 31, 2016, average monthly notional value related to forward foreign currency contracts was approximately $25.5 million or 99.1% of ending net assets.
See notes to financial statements
108
| Portfolio of investments (unaudited) |
Unconstrained Bond Fund
January 31, 2016 (continued)
PURCHASED OPTIONS
Currency Options
| | | | | | | | | | | | | | | | | | | Unrealized | | | | | | | |
| | | | | | | Notional/ | | | Put/ | | | Exercise | | | Expiration | | | appreciation/ | | | | | | | |
| Description | | | Counterparty | | | Contracts | | | Call | | | Rate | | | Date | | | (depreciation | ) | | Cost | | | Value | |
| | | | | | | | | | | | | | | | | | | | | | | | | | |
| British Pound vs. | | | Barclays Capital plc | | | 250,000 GBP | | | Put | | | 1.90 | | | 12/1/16 | | $ | 766 | | $ | 6,785 | | $ | 7,551 | |
| Canadian Dollar | | | | | | | | | | | | | | | | | | | | | | | | | |
| New Zealand Dollar | | | Citibank, N.A. | | | 950,000 NZD | | | Put | | | 0.625 | | | 2/12/16 | | | (14,199 | ) | | 15,201 | | | 1,002 | |
| vs. U.S. Dollar | | | | | | | | | | | | | | | | | | | | | | | | | |
| U.S. Dollar vs. Korean Won | | | JP Morgan | | | 1,440,000USD | | | Call | | | 1,250 | | | 12/19/16 | | | 10,680 | | | 42,386 | | | 53,066 | |
| | | | Chase Bank, N.A. | | | | | | | | | | | | | | | | | | | | | | |
| Total | | | | | | | | | | | | | | | | | $ | (2,753 | ) | $ | 64,372 | | $ | 61,619 | |
Interest Rate Swaptions
| | | | | | | | | | | | | | | | | | | Unrealized | | | | | | | |
| | | | | | | Notional/ | | | Put/ | | | Exercise | | | Expiration | | | appreciation/ | | | | | | | |
| Description | | | Counterparty | | | Contracts | | | Call | | | Rate | | | Date | | | (depreciation | ) | | Cost | | | Value | |
| | | | | | | | | | | | | | | | | | | | | | | | | | |
| OTC 10-Year Interest | | | | | | | | | | | | | | | | | | | | | | | | | |
| Rate Swap (Pay 4%, | | | Deutsche | | | | | | | | | | | | | | | | | | | | | | |
| Receive 3-month LIBOR) | | | Bank AG | | | 4,100,000 USD | | | Put | | | 4 | % | | 4/18/16 | | $ | (101,668 | ) | $ | 101,680 | | $ | 12 | |
| OTC 30-Year Interest | | | | | | | | | | | | | | | | | | | | | | | | | |
| Rate Swap (Pay 3%, | | | | | | | | | | | | | | | | | | | | | | | | | |
| Receive 6-month | | | | | | | | | | | | | | | | | | | | | | | | | |
| EURIBOR) | | | Citibank, N.A. | | | 1,000,000 EUR | | | Put | | | 3 | % | | 4/17/19 | | | (106,309 | ) | | 130,538 | | | 24,229 | |
| OTC 30-Year Interest | | | | | | | | | | | | | | | | | | | | | | | | | |
| Rate Swap (Pay 4%, | | | JP Morgan | | | | | | | | | | | | | | | | | | | | | | |
| Receive 3-month LIBOR) | | | Chase Bank, N.A. | | | 1,510,000 USD | | | Put | | | 4 | % | | 6/20/16 | | | (12,696 | ) | | 13,002 | | | 306 | |
| Total | | | | | | | | | | | | | | | | | $ | (220,673 | ) | $ | 245,220 | | $ | 24,547 | |
| | | | Cost | | | Value | |
| TOTAL OVER-THE-COUNTER PURCHASED OPTIONS | | $ | 309,592 | | $ | 86,166 | |
WRITTEN OPTIONS
Currency Options
| | | | | | | | | | | | | | | | | | | Unrealized | | | | | | | |
| | | | | | | Notional/ | | | Put/ | | | Exercise | | | Expiration | | | appreciation/ | | | Premiums | | | | |
| Description | | | Counterparty | | | Contracts | | | Call | | | Rate | | | Date | | | (depreciation | ) | | Received | | | Value | |
| | | | | | | | | | | | | | | | | | | | | | | | | | |
| British Pound vs. | | | | | | | | | | | | | | | | | | | | | | | | | |
| Canadian Dollar | | | Barclays Capital plc | | | (250,000) GBP | | | Put | | | 1.79 | | | 12/1/16 | | $ | (645 | ) | $ | (2,686 | ) | $ | (3,331 | ) |
| New Zealand Dollar vs. | | | | | | | | | | | | | | | | | | | | | | | | | |
| U.S. Dollar | | | Citibank, N.A. | | | (950,000) NZD | | | Put | | | 0.575 | | | 2/12/16 | | | 4,713 | | | (4,719 | ) | | (6 | ) |
| U.S. Dollar vs. | | | | | | | | | | | | | | | | | | | | | | | | | |
| Korean Won | | | Citibank, N.A. | | | (1,440,000) USD | | | Call | | | 1,350 | | | 12/19/16 | | | (6,349 | ) | | (21,492 | ) | | (27,841 | ) |
| Total | | | | | | | | | | | | | | | | | $ | (2,281 | ) | $ | (28,897 | ) | $ | (31,178 | ) |
See notes to financial statements
109
| Portfolio of investments (unaudited) |
Unconstrained Bond Fund
January 31, 2016 (continued)
Interest Rate Swaptions
| | | | | | | | | | | | | | | | | | | | | | | | | | |
| | | | | | | | | | | | | | | | | | | Unrealized | | | | | | | |
| | | | | | | Notional/ | | | Put/ | | | Exercise | | | Expiration | | | appreciation/ | | | Premiums | | | | |
| Description | | | Counterparty | | | Contracts | | | Call | | | Rate | | | Date | | | (depreciation | ) | | Received | | | Value | |
| | | | | | | | | | | | | | | | | | | | | | | | | | |
| OTC 10-Year Interest | | | | | | | | | | | | | | | | | | | | | | | | | |
| Rate Swap (Pay 3-month | | | Deutsche | | | | | | | | | | | | | | | | | | | | | | |
| LIBOR, Receive 5%) | | | Bank AG | | | (4,100,000) USD | | | Put | | | 5 | % | | 4/18/16 | | $ | 32,389 | | $ | (32,390 | ) | $ | (1 | ) |
| OTC 30-Year Interest | | | | | | | | | | | | | | | | | | | | | | | | | |
| Rate Swap (Pay 6-month | | | | | | | | | | | | | | | | | | | | | | | | | |
| EURIBOR, Receive 4%) | | | Citibank, N.A. | | | (1,000,000) EUR | | | Put | | | 4 | % | | 4/17/19 | | | 50,731 | | | (57,672 | ) | | (6,941 | ) |
| OTC 30-Year Interest | | | | | | | | | | | | | | | | | | | | | | | | | |
| Rate Swap (Pay 3-month | | | JP Morgan | | | | | | | | | | | | | | | | | | | | | | |
| EURIBOR, Receive 2.82%) | | | Chase Bank, N.A. | | | (1,120,000) EUR | | | Put | | | 2.82 | % | | 6/20/16 | | | 12,834 | | | (13,034 | ) | | (200 | ) |
| Total | | | | | | | | | | | | | | | | | $ | 95,954 | | $ | (103,096 | ) | $ | (7,142 | ) |
| | | | Premiums Received | | | Value | |
| TOTAL OVER-THE-COUNTER WRITTEN OPTIONS | | $ | (131,993 | ) | $ | (38,320 | ) |
FINANCIAL DERIVATIVE INSTRUMENTS: OVER-THE-COUNTER SUMMARY
The following is a summary by counterparty of the value of over-the-counter financial derivative instruments and collateral (received)/pledged as of January 31, 2016.
| | | | Unrealized | | | | | | | | | Unrealized | | | | | | | | | | | | | | | | |
| | | | Appreciation | | | Value | | | | | | Depreciation | | | Value | | | | | | | | | | | | | |
| | | | Forward | | | | | | | | | Forward | | | | | | | | | Net | | | | | | | |
| | | | Foreign | | | | | | Total | | | Foreign | | | | | | Total | | | Value | | | Collateral | | | | |
| | | | Currency | | | Purchased | | | Over-the | | | Currency | | | Written | | | Over-the | | | of OTC | | | (Received) / | | | Net | |
| | | | Contracts | | | Options | | | Counter | | | Contracts | | | Options | | | Counter | | | Derivatives | | | Pledged | | | Exposure(2) | |
| | | | | | | | | | | | | | | | | | | | | | | | | | | | | |
| Amounts subject to a master netting agreement: | | | | | | | | | | | | | | | | | | | |
| Barclays Capital plc | | $ | 386 | | $ | 7,551 | | $ | 7,937 | | $ | (999 | ) | $ | (3,331 | ) | $ | (4,330 | ) | $ | 3,607 | | | — | | $ | 3,607 | |
| Citibank, N.A. | | | 87,916 | | | 25,231 | | | 113,147 | | | — | | | (34,788 | ) | | (34,788 | ) | | 78,359 | | | — | | | 78,359 | |
| Deutsche Bank AG | | | 32,714 | | | 12 | | | 32,726 | | | (17,118 | ) | | (1 | ) | | (17,119 | ) | | 15,607 | | | — | | | 15,607 | |
| JP Morgan Chase Bank, N.A. | | | 49,156 | | | 53,372 | | | 102,528 | | | (18,601 | ) | | (200 | ) | | (18,801 | ) | | 83,727 | | | — | | | 83,727 | |
| Morgan Stanley Capital Services LLC | | | 368,965 | | | — | | | 368,965 | | | (16,319 | ) | | — | | | (16,319 | ) | | 352,646 | | | — | | | 352,646 | |
| | | $ | 539,137 | | $ | 86,166 | | $ | 625,303 | | $ | (53,037 | ) | $ | (38,320 | ) | $ | (91,357 | ) | $ | 533,946 | | $ | — | | $ | 533,946 | |
| (1) | | Value on swap contracts is represented by "unrealized appreciation/(depreciation)" on interest rate swaps, and "value" on credit default swaps, which is inclusive of upfront premiums paid/(received). |
| (2) | | Net Exposure represents the net receivable/(payable) that would be due from/to the counterparty in the event of default. Exposure from over-the-counter financial derivative instruments can only be netted across transactions governed under the same master agreement with the same legal entity. See Note 2, Significant Accounting Policies, "Derivative instruments," in the Notes to Financial Statements for more information regarding master netting arrangements. |
| | | Cost or Premiums, Net | | | Asset | | | Liability | |
| TOTAL FINANCIAL DERIVATIVE INSTRUMENTS | | $ | 157,619 | | $ | 1,013,956 | | $ | (576,581 | ) |
See notes to financial statements
110
| Portfolio of investments (unaudited) |
Unconstrained Bond Fund
January 31, 2016 (continued)
Other information:
| Industry concentration as | % of net |
| a percentage of net assets: | assets |
| | | |
| Sovereign | 24.09 | % |
| Whole Loan CMO Other | 6.60 | |
| Other ABS | 5.37 | |
| CMBS Other | 3.53 | |
| Life/Health Insurance | 3.50 | |
| Multi-line Insurance | 3.46 | |
| Credit Card Bullet | 2.50 | |
| Whole Loan CMO Mezzanine | 2.08 | |
| Real Estate Operations/Development | 2.03 | |
| Cable TV | 1.82 | |
| Diversified Banking Institution | 1.48 | |
| Property/Casualty Insurance | 1.43 | |
| Telephone-Integrated | 1.35 | |
| Commercial Banks Non-US | 1.31 | |
| Auto/Truck Parts & Equipment-Original | 1.23 | |
| WL Collat CMO Mezzanine | 1.21 | |
| Telecommunication Services | 1.20 | |
| Cellular Telecommunications | 1.12 | |
| Auto-Cars/Light Trucks | 1.04 | |
| Aerospace/Defense-Equipment | 0.85 | |
| Tobacco | 0.79 | |
| Credit Card Other | 0.73 | |
| Finance-Other Services | 0.70 | |
| Independent Power Producer | 0.70 | |
| Auto Repair Centers | 0.67 | |
| Investment Management & Advising Services | 0.57 | |
| Retail - Restaurants | 0.57 | |
| Resorts/Theme Parks | 0.56 | |
| Diversified Financial Services | 0.55 | |
| Retail-Perfume & Cosmetics | 0.51 | |
| Diversified Manufacturing Operations | 0.50 | |
| Aerospace/Defense | 0.46 | |
| Computer Data Security | 0.45 | |
| Reinsurance | 0.45 | |
| Semiconductor Components-Integrated Circuits | 0.45 | |
| Applications Software | 0.44 | |
| Athletic Equipment | 0.44 | |
| Real Estate Management/Services | 0.44 | |
| Retirement/Aged Care | 0.44 | |
| Medical Labs & Testing Services | 0.43 | |
| Power Conversion/Supply Equipment | 0.43 | |
| Retail-Misc/Diversified | 0.43 | |
| Television | 0.43 | |
| Commercial Services-Finance | 0.42 | |
| Investment Companies | 0.42 | |
| Theaters | 0.42 | |
| Building Products-Cement Aggregates | 0.41 | |
| Computer Services | 0.41 | |
| Machinery-Print Trade | 0.41 | |
| Cable/Satellite TV | 0.40 | |
| Chemicals - Diversified | 0.40 | |
| Electric-Integrated | 0.40 | |
| Medical-HMO | 0.40 | |
| Industry concentration as | % of net |
| a percentage of net assets: | assets |
| | | |
| Food-Retail | 0.38 | % |
| Automobile ABS Other | 0.35 | |
| Finance-Leasing Company | 0.35 | |
| Medical-Hospitals | 0.35 | |
| Chemicals - Specialty | 0.31 | |
| Medical - Drugs | 0.31 | |
| CMBS Subordinated | 0.29 | |
| Money Center Banks | 0.29 | |
| Medical-Biomedical/Gene | 0.28 | |
| Cooperative Banks | 0.27 | |
| Medical Instruments | 0.26 | |
| Food-Miscellaneous/Diversified | 0.23 | |
| Data Processing/Management | 0.16 | |
| Public Thoroughfares | 0.16 | |
| E-Commerce/Services | 0.15 | |
| Machinery-Construction & Mining | 0.15 | |
| Transport-Rail | 0.13 | |
| Long-Term Investments | 87.85 | |
| Short-Term Investment | 14.55 | |
| Total investments | 102.40 | |
| Financial Derivative Instruments | 1.70 | |
| Net other assets and liabilities | (4.10 | ) |
| | 100.00 | % |
Other information:
| Currency exposure of portfolio assets before | |
| any currency hedging, if applicable. | % of total |
| Excludes derivatives: | investments |
| | | |
| Euro | 38 | % |
| US Dollar | 36 | |
| British Pound | 18 | |
| Japanese Yen | 4 | |
| Mexican Peso | 2 | |
| New Zealand Dollar | 2 | |
| Romanian Leu | 0 | * |
| | 100 | % |
* Less than 0.5% of total investments.
See notes to financial statements
111
| Portfolio of investments (unaudited) |
Unconstrained Bond Fund
January 31, 2016 (continued)
Fair Value Measurements
The following table summarizes the Fund's investments that are measured at fair value by level within the fair value hierarchy at January 31, 2016:
| | | | Quoted Prices | | | Significant | | | | | | | |
| | | | in Active | | | Other | | | Significant | | | | |
| | | | Markets for | | | Observable | | | Unobservable | | | | |
| | | | Identical Assets | | | Inputs | | | Inputs | | | | |
| Description | | | (Level 1 | ) | | (Level 2 | ) | | (Level 3 | ) | | Total | |
| | | | | | | | | | | | | | |
| Assets | | | | | | | | | | | | | |
| Auto Loan Receivables | | | | | | | | | | | | | |
| Luxembourg | | $ | — | | $ | 269,330 | | $ | — | | $ | 269,330 | |
| Total Auto Loan Receivables | | | — | | | 269,330 | | | — | | | 269,330 | |
| | | | | | | | | | | | | | |
| Corporate Bonds | | | | | | | | | | | | | |
| Australia | | | — | | | 40,166 | | | — | | | 40,166 | |
| France | | | — | | | 1,144,901 | | | — | | | 1,144,901 | |
| Germany | | | — | | | 349,615 | | | — | | | 349,615 | |
| Ireland | | | — | | | 114,921 | | | — | | | 114,921 | |
| Italy | | | — | | | 214,452 | | | — | | | 214,452 | |
| Japan | | | — | | | 168,968 | | | — | | | 168,968 | |
| Jersey | | | — | | | 171,330 | | | — | | | 171,330 | |
| Luxembourg | | | — | | | 740,102 | | | — | | | 740,102 | |
| Netherlands | | | — | | | 961,132 | | | — | | | 961,132 | |
| Portugal | | | — | | | 103,956 | | | — | | | 103,956 | |
| United Kingdom | | | — | | | 3,434,318 | | | — | | | 3,434,318 | |
| United States | | | — | | | 2,952,887 | | | — | | | 2,952,887 | |
| Total Corporate Bonds | | | — | | | 10,396,748 | | | — | | | 10,396,748 | |
| | | | | | | | | | | | | | |
| Commercial Mortgage-backed Securities | | | | | | | | | | | | | |
| Germany | | | — | | | 377,935 | | | — | | | 377,935 | |
| United Kingdom | | | — | | | 604,095 | | | — | | | 604,095 | |
| United States | | | — | | | 472,138 | | | — | | | 472,138 | |
| Total Commercial Mortgage-backed Securities | | | — | | | 1,454,168 | | | — | | | 1,454,168 | |
| | | | | | | | | | | | | | |
| Credit Card Receivables | | | | | | | | | | | | | |
| United Kingdom | | | — | | | 188,701 | | | — | | | 188,701 | |
| United States | | | — | | | 642,742 | | | — | | | 642,742 | |
| Total Credit Card Receivables | | | — | | | 831,443 | | | — | | | 831,443 | |
| | | | | | | | | | | | | | |
| Collateralized Loan Obligations | | | | | | | | | | | | | |
| Ireland | | | — | | | 257,862 | | | — | | | 257,862 | |
| Luxembourg | | | — | | | 136,567 | | | — | | | 136,567 | |
| Netherlands | | | — | | | 515,433 | | | — | | | 515,433 | |
| Total Collateralized Loan Obligations | | | — | | | 909,862 | | | — | | | 909,862 | |
| | | | | | | | | | | | | | |
| Residential Mortgage-backed Securities | | | | | | | | | | | | | |
| Australia | | | — | | | 94,243 | | | — | | | 94,243 | |
| Netherlands | | | — | | | 439,996 | | | — | | | 439,996 | |
| United Kingdom | | | — | | | 2,007,560 | | | — | | | 2,007,560 | |
| Total Residential Mortgage-backed Securities | | | — | | | 2,541,799 | | | — | | | 2,541,799 | |
See notes to financial statements
112
| Portfolio of investments (unaudited) |
Unconstrained Bond Fund
January 31, 2016 (continued)
| | | | Quoted Prices | | | Significant | | | | | | | |
| | | | in Active | | | Other | | | Significant | | | | |
| | | | Markets for | | | Observable | | | Unobservable | | | | |
| | | | Identical Assets | | | Inputs | | | Inputs | | | | |
| Description | | | (Level 1 | ) | | (Level 2 | ) | | (Level 3 | ) | | Total | |
| | | | | | | | | | | | | | |
| Sovereign Debt Obligations | | $ | — | | $ | 4,594,731 | | $ | — | | $ | 4,594,731 | |
| Total Sovereign Debt Obligations | | | — | | | 4,594,731 | | | — | | | 4,594,731 | |
| | | | | | | | | | | | | | |
| US Government Obligations | | | | | | | | | | | | | |
| United States | | | — | | | 1,602,990 | | | — | | | 1,602,990 | |
| Total US Government Obligations | | | — | | | 1,602,990 | | | — | | | 1,602,990 | |
| | | | | | | | | | | | | | |
| Short-Term Investment | | | 3,743,698 | | | — | | | — | | | 3,743,698 | |
| Total Investments | | $ | 3,743,698 | | $ | 22,601,071 | | $ | — | | $ | 26,344,769 | |
| | | | | | | | | | | | | | |
| Financial Derivative Instruments - Assets | | | | | | | | | | | | | |
| Exchange-Traded or Centrally Cleared | | $ | — | | $ | 388,653 | | $ | — | | $ | 388,653 | |
| Over-The-Counter | | | — | | | 625,303 | | | — | | | 625,303 | |
| Total Financial Derivative Instruments - Assets | | $ | — | | $ | 1,013,956 | | $ | — | | $ | 1,013,956 | |
| | | | | | | | | | | | | | |
| Liabilities | | | | | | | | | | | | | |
| Financial Derivative Instruments - Liabilities | | | | | | | | | | | | | |
| Exchange-Traded or Centrally Cleared | | $ | (31,238 | ) | $ | (453,986 | ) | $ | — | | $ | (485,224 | ) |
| Over-The-Counter | | | — | | | (91,357 | ) | | — | | | (91,357 | ) |
| Total Financial Derivative Instruments - Liabilities | | $ | (31,238 | ) | $ | (545,343 | ) | $ | — | | $ | (576,581 | ) |
During the period ended January 31, 2016, there were no transfers in or out of security levels.
See notes to financial statements
113
| Portfolio of investments (unaudited) |
Unconstrained Bond Fund
January 31, 2016 (continued)
Fair Value of Financial Derivative Instruments
The following is a summary of the fair valuation of the Fund's financial derivative instruments categorized by risk exposure:
Fair Values of Financial Derivative Instruments on the Statement of Assets and Liabilities as of January 31, 2016
| | | Derivatives not accounted for as hedging instruments | |
| | | | Foreign | | | | | | | | | | | | | | | | |
| | | | Currency | | | Equity | | | Interest | | | Credit | | | Inflation | | | | |
| | | | Risk | | | Risk | | | Rate Risk | | | Risk | | | Risk | | | Total | |
| | | | | | | | | | | | | | | | | | | | |
| Financial Derivative Instruments - Assets | | | | | | | | | | | | | | | | | | | |
| Exchange-traded | | | | | | | | | | | | | | | | | | | |
| Swap Contracts | | $ | — | | $ | — | | $ | 385,930 | | $ | 2,723 | | $ | — | | $ | 388,653 | |
| Over-the-Counter | | | | | | | | | | | | | | | | | | | |
| Forward Foreign Currency Contracts | | $ | 539,137 | | $ | — | | $ | — | | $ | — | | $ | — | | $ | 539,137 | |
| Purchased Options | | $ | 61,619 | | $ | — | | $ | 24,547 | | $ | — | | $ | — | | $ | 86,166 | |
| Total | | $ | 600,756 | | $ | — | | $ | 410,477 | | $ | 2,723 | | $ | — | | $ | 1,013,956 | |
| | | | | | | | | | | | | | | | | | | | |
| Financial Derivative Instruments - Liabilities | | | | | | | | | | | | | | | | | | | |
| Exchange-traded | | | | | | | | | | | | | | | | | | | |
| Futures Contracts | | $ | — | | $ | — | | $ | (31,238 | ) | $ | — | | $ | — | | $ | (31.238 | ) |
| Swap Contracts | | $ | — | | $ | — | | $ | (453,986 | ) | $ | — | | $ | — | | $ | (453,986 | ) |
| Over-the-Counter | | | | | | | | | | | | | | | | | | | |
| Forward Foreign Currency Contracts | | $ | (53,037 | ) | $ | — | | $ | — | | $ | — | | $ | — | | $ | (53,037 | ) |
| Written Options | | $ | (31,178 | ) | $ | — | | $ | (7,142 | ) | $ | — | | $ | — | | $ | (38,320 | ) |
| Total | | $ | (84,215 | ) | $ | — | | $ | (492,366 | ) | $ | — | | $ | — | | $ | (576,581 | ) |
| Net | | $ | 516,541 | | $ | — | | $ | (81,899 | ) | $ | 2,723 | | $ | — | | $ | 437,375 | |
Effect of Financial Derivative Instruments on the Statement of Operations for the Period Ended January 31, 2016
| | | Derivatives not accounted for as hedging instruments | |
| | | | Foreign | | | | | | | | | | | | | | | | |
| | | | Currency | | | Equity | | | Interest | | | Credit | | | Inflation | | | | |
| | | | Risk | | | Risk | | | Rate Risk | | | Risk | | | Risk | | | Total | |
| | | | | | | | | | | | | | | | | | | | |
| Net realized gain/(loss) from | | | | | | | | | | | | | | | | | | | |
| financial derivative instruments: | | | | | | | | | | | | | | | | | | | |
| Futures Contracts | | $ | — | | $ | — | | $ | (106,187 | ) | $ | — | | $ | — | | $ | (106,187 | ) |
| Forward Foreign Currency Contracts | | $ | 468,230 | | $ | — | | $ | — | | $ | — | | $ | — | | $ | 468,230 | |
| Options | | $ | (763 | ) | $ | — | | $ | (110,374 | ) | $ | — | | $ | — | | $ | (111,137 | ) |
| Swap Contracts | | $ | — | | $ | — | | $ | 45,503 | | $ | 14,965 | | $ | 9,884 | | $ | 70,352 | |
| Total | | $ | 467,467 | | $ | — | | $ | (171,058 | ) | $ | 14,965 | | $ | 9,884 | | $ | 321,258 | |
| | | Derivatives not accounted for as hedging instruments | |
| | | | Foreign | | | | | | | | | | | | | | | | |
| | | | Currency | | | Equity | | | Interest | | | Credit | | | Inflation | | | | |
| | | | Risk | | | Risk | | | Rate Risk | | | Risk | | | Risk | | | Total | |
| | | | | | | | | | | | | | | | | | | | |
| Net change in unrealized | | | | | | | | | | | | | | | | | | | |
| appreciation/(depreciation) | | | | | | | | | | | | | | | | | | | |
| of financial derivative instruments | | | | | | | | | | | | | | | | | | | |
| Futures Contracts | | $ | — | | $ | — | | $ | 5,377 | | $ | — | | $ | — | | $ | 5,377 | |
| Forward Foreign Currency Contracts | | $ | 292,045 | | $ | — | | $ | — | | $ | — | | $ | — | | $ | 292,045 | |
| Options | | $ | (23,175 | ) | $ | — | | $ | 55,421 | | $ | — | | $ | — | | $ | 32,246 | |
| Swap Contracts | | $ | — | | $ | — | | $ | (108,194 | ) | $ | 8,488 | | $ | 10,129 | | $ | (89,577 | ) |
| Total | | $ | 268,870 | | $ | — | | $ | (47,396 | ) | $ | 8,488 | | $ | 10,129 | | $ | 240,091 | |
See notes to financial statements
114
| Portfolio of investments (unaudited) |
US Growth Opportunities Fund
January 31, 2016
| | | | | Value | |
| Shares | | | | (note 2) | |
| | | | | | |
| Common stocks – 95.87% | | | |
| | | | | | |
| | | Ireland – 2.23% | | | |
| 1,204 | | Perrigo Co. plc | $ | 174,074 | |
| | | | | | |
| | | United States – 93.64% | | | |
| 914 | | Acuity Brands, Inc. | | 185,021 | |
| 3,120 | | Adobe Systems, Inc. * | | 278,086 | |
| 3,410 | | Amphenol Corp., Class A | | 169,034 | |
| 5,156 | | Bank of the Ozarks, Inc. | | 228,617 | |
| 2,050 | | Bio-Techne Corp. | | 169,514 | |
| 891 | | C.R. Bard, Inc. | | 163,294 | |
| 4,487 | | Cantel Medical Corp. | | 266,393 | |
| 1,716 | | Celgene Corp. * | | 172,149 | |
| 3,299 | | Cerner Corp. * | | 191,375 | |
| 3,893 | | Cognizant Technology | | | |
| | | Solutions Corp., Class A * | | 246,466 | |
| 1,790 | | Costco Wholesale Corp. | | 270,505 | |
| 2,779 | | Danaher Corp. | | 240,800 | |
| 2,088 | | Ecolab, Inc. | | 225,233 | |
| 3,536 | | Fiserv, Inc. * | | 334,364 | |
| 1,575 | | Henry Schein, Inc. * | | 238,518 | |
| 2,466 | | Intuit, Inc. | | 235,528 | |
| 4,792 | | Microchip Technology, Inc. | | 214,730 | |
| 4,056 | | Raymond James | | | |
| | | Financial, Inc. | | 177,693 | |
| 2,523 | | Red Hat, Inc. * | | 176,736 | |
| 1,374 | | Snap-on, Inc. | | 221,983 | |
| 5,245 | | Starbucks Corp. | | 318,739 | |
| 2,088 | | The JM Smucker Co. | | 267,932 | |
| 2,318 | | The Middleby Corp. * | | 209,454 | |
| 3,982 | | The TJX Companies, Inc. | | 283,678 | |
| 1,998 | | The Walt Disney Co. | | 191,448 | |
| 2,979 | | Tractor Supply Co. | | 263,075 | |
| 1,020 | | Ultimate Software Group, Inc. * | | 179,143 | |
| 2,831 | | Under Armour, Inc., Class A * | | 241,852 | |
| 3,469 | | VF Corp. | | 217,159 | |
| 2,377 | | Visa, Inc., A Shares | | 177,063 | |
| 2,125 | | Wabtec Corp. | | 135,894 | |
| 3,321 | | Walgreens Boots Alliance, Inc. | | 264,750 | |
| 743 | | WW Grainger, Inc. | | 146,141 | |
| | | | | 7,302,367 | |
| | | | | | |
| | | Total common stocks | | | |
| | | (Cost $7,311,378) | | 7,476,441 | |
| | | | | | |
| | | Total long-term investments | | | |
| | | (Cost $7,311,378) | | 7,476,441 | |
| | | | | Value | |
| Shares | | | | (note 2) | |
| | | | | | |
| Short-term investment – 3.80% | | | |
| 296,539 | | Fidelity Institutional | | | |
| | | Treasury Portfolio | $ | 296,539 | |
| | | | | | |
| | | Total short-term investment | | | |
| | | (Cost $296,539) | | 296,539 | |
| | | | | | |
| | | Total investments – 99.67% | | | |
| | | (Cost $7,607,917) | | 7,772,980 | |
| Net other assets and liabilities – 0.33% | | 25,531 | |
| | | | | | |
| Total net assets – 100.00% | $ | 7,798,511 | |
| * | | Non-income producing security |
See notes to financial statements
115
| Portfolio of investments (unaudited) |
US Growth Opportunities Fund
January 31, 2016 (continued)
Other information:
| Industry concentration as | % of net |
| a percentage of net assets: | assets |
| | | |
| Medical Products | 6.47 | % |
| Apparel Manufacturers | 5.89 | |
| Applications Software | 5.29 | |
| Machinery-General Industrials | 4.43 | |
| Data Processing/Management | 4.29 | |
| Retail - Restaurants | 4.09 | |
| Retail-Major Department Store | 3.64 | |
| Electronic Forms | 3.57 | |
| Retail-Discount | 3.47 | |
| Food-Confectionery | 3.44 | |
| Retail-Drug Store | 3.39 | |
| Retail-Gardening Products | 3.37 | |
| Computer Services | 3.16 | |
| Diversified Manufacturing Operations | 3.09 | |
| Commercial Banks-Southern US | 2.93 | |
| Chemicals - Specialty | 2.89 | |
| Tools-Hand Held | 2.85 | |
| Electronic Components-Semiconductors | 2.75 | |
| Medical Information Systems | 2.45 | |
| Multimedia | 2.45 | |
| Lighting Products & Systems | 2.37 | |
| Enterprise Software/Services | 2.30 | |
| Finance - Investment Banking & Brokerage | 2.28 | |
| Commercial Services-Finance | 2.27 | |
| Medical-Generic Drugs | 2.23 | |
| Medical-Biomedical/Gene | 2.21 | |
| Electronic Connectors | 2.17 | |
| Medical Instruments | 2.17 | |
| Disposable Medical Products | 2.09 | |
| Distribution/Wholesale | 1.87 | |
| Long-Term Investments | 95.87 | |
| Short-Term Investment | 3.80 | |
| Total Investments | 99.67 | |
| Net other assets and liabilities | 0.33 | |
| | 100.00 | % |
| Currency exposure of portfolio assets before | |
| any currency hedging, if applicable. | % of total |
| Excludes derivatives: | investments |
| | | |
| US Dollar | 100 | % |
See notes to financial statements
116
| Portfolio of investments (unaudited) |
US Growth Opportunities Fund
January 31, 2016 (continued)
Fair Value Measurements
The following table summarizes the Fund's investments that are measured at fair value by level within the fair value hierarchy at January 31, 2016:
| | | | Quoted prices | | | Significant | | | | | | | |
| | | | in active | | | other | | | Significant | | | | |
| | | | markets for | | | observable | | | unobservable | | | | |
| | | | identical assets | | | inputs | | | inputs | | | | |
| Description | | | (level 1 | ) | | (level 2 | ) | | (level 3 | ) | | Total | |
| | | | | | | | | | | | | | |
| Assets | | | | | | | | | | | | | |
| Common Stocks | | | | | | | | | | | | | |
| Ireland | | $ | 174,074 | | $ | — | | $ | — | | $ | 174,074 | |
| United States | | | 7,302,367 | | | — | | | — | | | 7,302,367 | |
| Total Common Stocks | | | 7,476,441 | | | — | | | — | | | 7,476,441 | |
| | | | | | | | | | | | | | |
| Short-term investment | | | 296,539 | | | — | | | — | | | 296,539 | |
| Total Investments | | $ | 7,772,980 | | $ | — | | $ | — | | $ | 7,772,980 | |
During the period ended January 31, 2016, there were no transfers in or out of security levels.
See notes to financial statements
117
| Financial statements (unaudited) |
Statements of assets and liabilities
January 31, 2016
| | | | | | | Dividend | |
| | | | All | | | & Income | |
| | | | Asset | | | Builder | |
| | | | Fund | | | Fund | |
| Assets: | | | | | | | |
| Investments, at fair value | | | | | | | |
| Securities | | $ | 27,038,511 | | $ | 100,456,047 | |
| Affiliated companies | | | 6,639,924 | | | — | |
| Short term investment | | | 17,927,660 | | | 1,147,287 | |
| Other Securities (see note 2) | | | — | | | — | |
| Total investments | | | 51,606,095 | | | 101,603,334 | |
| Cash | | | — | | | — | |
| Foreign cash, at value | | | — | | | 24 | |
| Cash at broker for open futures contracts | | | 1,722,742 | | | — | |
| Dividends, interest and securities lending income receivable | | | 9,468 | | | 267,639 | |
| Receivable for investment securities sold | | | — | | | 349,269 | |
| Receivable for fund shares sold | | | 400 | | | 8,007,501 | |
| Financial Derivative Instruments | | | | | | | |
| Exchange-traded or centrally cleared | | | 32,590 | | | — | |
| Over-the-counter | | | 89,262 | | | 191,825 | |
| Prepaid expenses and other assets | | | 31,022 | | | 32,044 | |
| Total Assets | | | 53,491,579 | | | 110,451,636 | |
| | | | | | | | |
| Liabilities: | | | | | | | |
| Payable to custodian | | | — | | | 757,413 | |
| Payable for investment securities purchased | | | — | | | 3,580,972 | |
| Payable for collateral on securities loaned | | | — | | | — | |
| Payable for fund shares redeemed | | | 70,160 | | | 2,057,089 | |
| Financial Derivative Instruments | | | | | | | |
| Exchange-traded or centrally-cleared | | | 515,127 | | | — | |
| Over-the-counter | | | 112,519 | | | — | |
| Payable to investment adviser | | | 12,668 | | | 62,210 | |
| Payable for 12b-1 distribution and service fees | | | 8,550 | | | 28,887 | |
| Accrued expenses and other payables | | | 29,257 | | | 24,923 | |
| Total Liabilities | | | 748,281 | | | 6,511,494 | |
| Net assets | | $ | 52,743,298 | | $ | 103,940,142 | |
| | | | | | | | |
| Net assets consist of: | | | | | | | |
| Paid-in capital | | $ | 55,730,173 | | $ | 108,184,212 | |
| Accumulated undistributed net investment income (loss) | | | (245,145 | ) | | (170,286 | ) |
| Accumulated net realized gain (loss) on investments, financial derivative instruments, short sales and foreign currency transactions | | | (1,055,053 | ) | | (1,589,267 | ) |
| Net unrealized appreciation of investments, financial derivative instruments, short sales and foreign currencies | | | (1,686,677 | ) | | (2,484,517 | ) |
| | | $ | 52,743,298 | | $ | 103,940,142 | |
See notes to financial statements
118
| Financial statements (unaudited) |
Statements of assets and liabilities
January 31, 2016 (continued)
| | | | Emerging | | | European | | | Global Equity | | | Global | | | High Yield | |
| | | | Markets | | | Focus | | | Income | | | Technology | | | Opportunities | |
| | | | Fund | | | Fund | | | Fund | | | Fund | | | Fund | |
| | | | | | | | | | | | | | | | | |
| | | $ | 27,119,291 | | $ | 3,325,368,659 | | $ | 3,252,027,359 | | $ | 224,510,995 | | $ | 24,791,735 | |
| | | | — | | | — | | | — | | | — | | | — | |
| | | | — | | | 103,874,842 | | | 118,441,365 | | | 12,080,015 | | | 2,409,945 | |
| | | | — | | | 55,198,044 | | | — | | | 2,766,576 | | | — | |
| | | | 27,119,291 | | | 3,484,441,545 | | | 3,370,468,724 | | | 239,357,586 | | | 27,201,680 | |
| | | | 2,522 | | | 3,000,460 | | | — | | | — | | | — | |
| | | | 215,000 | | | 798 | | | 34 | | | 2 | | | — | |
| | | | — | | | — | | | — | | | — | | | — | |
| | | | 62,419 | | | 3,602,443 | | | 18,172,033 | | | 173,711 | | | 447,479 | |
| | | | 714,469 | | | 27,116,818 | | | 1,345,717 | | | 4,003,463 | | | 79,463 | |
| | | | 37,076 | | | 22,165,780 | | | 15,798,926 | | | 230,464 | | | 29,846 | |
| | | | | | | | | | | | | | | | | |
| | | | — | | | — | | | — | | | — | | | — | |
| | | | — | | | — | | | 16,408,091 | | | — | | | 22,482 | |
| | | | 41,913 | | | 104,202 | | | 102,034 | | | 51,286 | | | 21,557 | |
| | | | 28,192,690 | | | 3,540,432,046 | | | 3,422,295,559 | | | 243,816,512 | | | 27,802,507 | |
| | | | | | | | | | | | | | | | | |
| | | | — | | | — | | | — | | | — | | | — | |
| | | | 90,778 | | | 48,316,681 | | | — | | | 618,641 | | | 850,019 | |
| | | | — | | | 55,198,044 | | | — | | | 2,766,576 | | | — | |
| | | | 121,373 | | | 7,471,823 | | | 6,505,534 | | | 478,390 | | | 1,500 | |
| | | | | | | | | | | | | | | | | |
| | | | — | | | — | | | — | | | — | | | — | |
| | | | — | | | 10,198,008 | | | 471,433 | | | — | | | — | |
| | | | 12,235 | | | 2,553,906 | | | 1,953,791 | | | 185,449 | | | 6,688 | |
| | | | 3,675 | | | 460,055 | | | 992,443 | | | 77,196 | | | 1,133 | |
| | | | 27,143 | | | 661,578 | | | 837,292 | | | 119,846 | | | 35,360 | |
| | | | 255,204 | | | 124,860,095 | | | 10,769,115 | | | 4,246,098 | | | 894,700 | |
| | | $ | 27,937,486 | | $ | 3,415,571,951 | | $ | 3,411,526,444 | | $ | 239,570,414 | | $ | 26,907,807 | |
| | | | | | | | | | | | | | | | | |
| | | | | | | | | | | | | | | | | |
| | | $ | 35,249,321 | | $ | 3,907,982,839 | | $ | 3,893,502,143 | | $ | 185,614,307 | | $ | 29,821,970 | |
| | | | 33,142 | | | (8,678,350 | ) | | 11,024,444 | | | (969,455 | ) | | 33,843 | |
| | | | (3,496,692 | ) | | (116,311,749 | ) | | (250,366,420 | ) | | 3,814,723 | | | (1,664,674 | ) |
| | | | (3,848,285 | ) | | (367,420,789 | ) | | (242,633,723 | ) | | 51,110,839 | | | (1,283,332 | ) |
| | | $ | 27,937,486 | | $ | 3,415,571,951 | | $ | 3,411,526,444 | | $ | 239,570,414 | | $ | 26,907,807 | |
See notes to financial statements
119
| Financial statements (unaudited) |
Statements of assets and liabilities
January 31, 2016 (continued)
| | | | | | | Dividend | |
| | | | All | | | & Income | |
| | | | Asset | | | Builder | |
| | | | Fund | | | Fund | |
| | | | | | | | |
| Net assets: | | | | | | | |
| Class A Shares | | $ | 4,278,688 | | $ | 36,500,342 | |
| Class C Shares | | $ | 8,900,252 | | $ | 28,013,610 | |
| Class I Shares | | $ | 12,283,042 | | $ | 39,019,017 | |
| Class R6 Shares | | $ | 27,281,316 | | $ | 407,173 | |
| | | | | | | | |
| Shares outstanding: | | | | | | | |
| Class A Shares (unlimited number of shares authorized) | | | 449,112 | | | 3,181,164 | |
| Class C Shares (unlimited number of shares authorized) | | | 948,977 | | | 2,463,621 | |
| Class I Shares (unlimited number of shares authorized) | | | 1,293,190 | | | 3,401,092 | |
| Class R6 Shares (unlimited number of shares authorized) | | | 2,874,995 | | | 35,504 | |
| | | | | | | | |
| Class A shares: | | | | | | | |
| Net asset value and redemption price per share | | $ | 9.53 | | $ | 11.47 | |
| Maximum sales charge* | | | 5.75 | % | | 5.00 | % |
| Maximum offering price per share | | $ | 10.11 | | $ | 12.07 | |
| | | | | | | | |
| Class C shares: | | | | | | | |
| Net asset value and offering price per share | | $ | 9.38 | | $ | 11.37 | |
| | | | | | | | |
| Class I shares: | | | | | | | |
| Net asset value and offering price per share | | $ | 9.50 | | $ | 11.47 | |
| | | | | | | | |
| Class R6 shares: | | | | | | | |
| Net asset value and offering price per share | | $ | 9.49 | | $ | 11.47 | |
| | | | | | | | |
| Investments, at cost | | $ | 52,772,368 | | $ | 104,274,441 | |
| Cost or Premiums of Financial Derivative Instruments, net | | $ | — | | $ | — | |
| Foreign cash, at cost | | $ | — | | $ | 24 | |
| Value of securities on loan included in Securities at fair value | | $ | — | | $ | — | |
| * | On purchases of $50,000 or more, the sales charge may be reduced as outlined in the Prospectus. |
See notes to financial statements
120
| Financial statements (unaudited) |
Statements of assets and liabilities
January 31, 2016 (continued)
| | | | Emerging | | | European | | | Global Equity | | | Global | | | High Yield | |
| | | | Markets | | | Focus | | | Income | | | Technology | | | Opportunities | |
| | | | Fund | | | Fund | | | Fund | | | Fund | | | Fund | |
| | | | | | | | | | | | | | | | | |
| | | $ | 4,417,165 | | $ | 831,211,964 | | $ | 655,100,988 | | $ | 88,926,804 | | $ | 1,150,939 | |
| | | $ | 2,925,859 | | $ | 325,600,333 | | $ | 1,025,952,685 | | $ | 67,539,130 | | $ | 1,114,641 | |
| | | $ | 20,336,363 | | $ | 2,257,389,475 | | $ | 1,728,763,995 | | $ | 82,188,623 | | $ | 4,752,931 | |
| | | $ | 258,099 | | $ | 1,370,179 | | $ | 1,708,776 | | $ | 915,857 | | $ | 19,889,296 | |
| | | | | | | | | | | | | | | | | |
| | | | 590,900 | | | 26,743,888 | | | 92,660,657 | | | 4,142,935 | | | 128,787 | |
| | | | 403,518 | | | 11,165,287 | | | 146,070,089 | | | 3,624,840 | | | 125,082 | |
| | | | 2,714,021 | | | 72,690,710 | | | 244,074,663 | | | 3,742,525 | | | 534,066 | |
| | | | 34,462 | | | 44,126 | | | 241,281 | | | 41,691 | | | 2,234,884 | |
| | | | | | | | | | | | | | | | | |
| | | $ | 7.48 | | $ | 31.08 | | $ | 7.07 | | $ | 21.46 | | $ | 8.94 | |
| | | | 5.75 | % | | 5.75 | % | | 5.75 | % | | 5.75 | % | | 4.75 | % |
| | | $ | 7.94 | | $ | 32.98 | | $ | 7.50 | | $ | 22.77 | | $ | 9.39 | |
| | | | | | | | | | | | | | | | | |
| | | $ | 7.25 | | $ | 29.16 | | $ | 7.02 | | $ | 18.63 | | $ | 8.91 | |
| | | | | | | | | | | | | | | | | |
| | | $ | 7.49 | | $ | 31.05 | | $ | 7.08 | | $ | 21.96 | | $ | 8.90 | |
| | | | | | | | | | | | | | | | | |
| | | $ | 7.49 | | $ | 31.05 | | $ | 7.08 | | $ | 21.97 | | $ | 8.90 | |
| | | | | | | | | | | | | | | | | |
| | | $ | 30,967,625 | | $ | 3,841,410,704 | | $ | 3,628,259,403 | | $ | 188,242,549 | | $ | 28,478,603 | |
| | | $ | — | | $ | — | | $ | — | | $ | — | | $ | 28,891 | |
| | | $ | 214,174 | | $ | 798 | | $ | 34 | | $ | 2 | | $ | — | |
| | | $ | — | | $ | 52,671,585 | | $ | — | | $ | 2,777,501 | | $ | — | |
See notes to financial statements
121
| Financial statements (unaudited) |
Statements of assets and liabilities
January 31, 2016 (continued)
| | | | International | |
| | | | Long/Short | |
| | | | Equity | |
| | | | Fund | |
| | | | | |
| Assets: | | | | |
| Investments, at fair value | | | | |
| Securities | | $ | 5,473,481 | |
| Short term investment | | | 9,349,762 | |
| Other Securities (see note 2) | | | — | |
| Total investments | | | 14,823,243 | |
| Cash | | | 3,115 | |
| Foreign cash, at value | | | — | |
| Cash at broker for open futures contracts | | | 155,603 | |
| Cash at broker for open swap contracts | | | — | |
| Cash segregated as collateral on securities sold short | | | 552,128 | |
| Cash segregated as collateral on equity swap contracts | | | 450,000 | |
| Dividends, interest and securities lending income receivable | | | 3,225 | |
| Receivable for investment securities sold | | | 301,840 | |
| Receivable for fund shares sold | | | 25,590 | |
| Receivable from investment adviser | | | 8,885 | |
| Financial Derivative Instruments | | | | |
| Exchange-traded or centrally cleared | | | — | |
| Over-the-counter | | | 467,611 | |
| Prepaid expenses and other assets | | | 38,719 | |
| Total Assets | | | 16,829,959 | |
| | | | | |
| Liabilities: | | | | |
| Payable to custodian | | | — | |
| Payable for investment securities purchased | | | 316,748 | |
| Securities sold short, at value | | | 3,303,270 | |
| Payable for collateral on securities loaned | | | — | |
| Payable for fund shares redeemed | | | — | |
| Payable for short sale financing | | | 3,461 | |
| Financial Derivative Instruments | | | | |
| Exchange-traded or centrally-cleared | | | 25,621 | |
| Over-the-counter | | | 176,570 | |
| Payable for periodic payments on equity swap contracts | | | 6,037 | |
| Payable for interest rate swap agreements terminated | | | — | |
| Payable to investment adviser | | | — | |
| Payable for 12b-1 distribution and service fees | | | 138 | |
| Dividends payable for short sales | | | 843 | |
| Accrued expenses and other payables | | | 38,387 | |
| Total Liabilities | | | 3,871,075 | |
| Net assets | | $ | 12,958,884 | |
| | | | | |
| Net assets consist of: | | | | |
| Paid-in capital | | $ | 12,944,071 | |
| Accumulated undistributed net investment income (loss) | | | (320,331 | ) |
| Accumulated net realized gain (loss) on investments, financial derivative instruments, short sales and foreign currency transactions | | | 84,490 | |
| Net unrealized appreciation of investments, financial derivative instruments, short sales and foreign currencies | | | 250,654 | |
| | | $ | 12,958,884 | |
See notes to financial statements
122
| Financial statements (unaudited) |
Statements of assets and liabilities
January 31, 2016 (continued)
| | International | | | International | | | Strategic | | | Unconstrained | | | US Growth | |
| | Opportunities | | | Select Equity | | | Income | | | Bond | | | Opportunities | |
| | Fund | | | Fund | | | Fund | | | Fund | | | Fund | |
| | | | | | | | | | | | | | | |
| $ | 4,381,642,272 | | $ | 4,934,595 | | $ | 291,276,759 | | $ | 22,601,071 | | $ | 7,476,441 | |
| | 298,121,603 | | | 220,116 | | | 49,863,958 | | | 3,743,698 | | | 296,539 | |
| | 155,521,617 | | | — | | | — | | | — | | | — | |
| | 4,835,285,492 | | | 5,154,711 | | | 341,140,717 | | | 26,344,769 | | | 7,772,980 | |
| | — | | | — | | | — | | | 4,421 | | | 4,349 | |
| | 39,759 | | | — | | | 14,833 | | | 1,292 | | | — | |
| | — | | | — | | | — | | | 118,633 | | | — | |
| | — | | | — | | | 12,024 | | | 311,592 | | | — | |
| | — | | | — | | | — | | | — | | | — | |
| | — | | | — | | | — | | | — | | | — | |
| | 5,756,279 | | | 6,298 | | | 3,465,583 | | | 205,361 | | | 359 | |
| | 51,092,196 | | | — | | | 8,611,121 | | | 17,403 | | | — | |
| | 23,071,107 | | | 9,211 | | | 4,112,413 | | | — | | | — | |
| | — | | | 8,314 | | | — | | | 497 | | | 4,438 | |
| | | | | | | | | | | | | | | |
| | — | | | — | | | — | | | 388,653 | | | — | |
| | 24,485 | | | — | | | 1,130,557 | | | 625,303 | | | — | |
| | 198,324 | | | 32,192 | | | 43,430 | | | 37,051 | | | 36,037 | |
| | 4,915,467,642 | | | 5,210,726 | | | 358,530,678 | | | 28,054,975 | | | 7,818,163 | |
| | | | | | | | | | | | | | | |
| | — | | | — | | | — | | | — | | | — | |
| | 56,426,824 | | | — | | | 27,715,844 | | | 1,704,113 | | | — | |
| | — | | | — | | | — | | | — | | | — | |
| | 155,521,617 | | | — | | | — | | | — | | | — | |
| | 8,850,273 | | | 37,090 | | | 565,012 | | | — | | | — | |
| | — | | | — | | | — | | | — | | | — | |
| | | | | | | | | | | | | | | |
| | — | | | — | | | — | | | 485,224 | | | — | |
| | 11,207,520 | | | — | | | 291,265 | | | 91,357 | | | — | |
| | — | | | — | | | — | | | — | | | — | |
| | — | | | — | | | — | | | 6,349 | | | — | |
| | 3,505,047 | | | — | | | 146,138 | | | — | | | — | |
| | 755,804 | | | 149 | | | 42,791 | | | 1,089 | | | 574 | |
| | — | | | — | | | — | | | — | | | — | |
| | 1,132,301 | | | 19,503 | | | 51,624 | | | 39,443 | | | 19,078 | |
| | 237,399,386 | | | 56,742 | | | 28,812,674 | | | 2,327,575 | | | 19,652 | |
| $ | 4,678,068,256 | | $ | 5,153,984 | | $ | 329,718,004 | | $ | 25,727,400 | | $ | 7,798,511 | |
| | | | | | | | | | | | | | | |
| $ | 4,975,317,461 | | $ | 5,574,814 | | $ | 371,143,448 | | $ | 28,592,558 | | $ | 7,817,113 | |
| | (22,940,071) | | | 6,877 | | | (1,072,354 | ) | | (1,085,848 | ) | | (10,680 | ) |
| | (400,539,605) | | | (87,208 | ) | | (30,071,025 | ) | | (330,400 | ) | | (172,985 | ) |
| | 126,230,471 | | | (340,499 | ) | | (10,282,065 | ) | | (1,448,910 | ) | | 165,063 | |
| $ | 4,678,068,256 | | $ | 5,153,984 | | $ | 329,718,004 | | $ | 25,727,400 | | $ | 7,798,511 | |
See notes to financial statements
123
| Financial statements (unaudited) |
Statements of assets and liabilities
January 31, 2016 (continued)
| | | | International | |
| | | | Long/Short | |
| | | | Equity | |
| | | | Fund | |
| | | | | |
| Net assets: | | | | |
| Class A Shares | | $ | 292,512 | |
| Class C Shares | | $ | 104,190 | |
| Class I Shares | | $ | 7,672,533 | |
| Class R Shares | | $ | — | |
| Class R6 Shares | | $ | 4,889,649 | |
| | | | | |
| Shares outstanding: | | | | |
| Class A Shares (unlimited number of shares authorized) | | | 29,436 | |
| Class C Shares (unlimited number of shares authorized) | | | 10,517 | |
| Class I Shares (unlimited number of shares authorized) | | | 769,819 | |
| Class R Shares (unlimited number of shares authorized) | | | — | |
| Class R6 Shares (unlimited number of shares authorized) | | | 490,948 | |
| | | | | |
| Class A shares: | | | | |
| Net asset value and redemption price per share | | $ | 9.94 | |
| Maximum sales charge* | | | 5.75 | % |
| Maximum offering price per share | | $ | 10.55 | |
| | | | | |
| Class C shares: | | | | |
| Net asset value and offering price per share | | $ | 9.91 | |
| | | | | |
| Class I shares: | | | | |
| Net asset value and offering price per share | | $ | 9.97 | |
| | | | | |
| Class R shares: | | | | |
| Net asset value and offering price per share | | $ | — | |
| | | | | |
| Class R6 shares: | | | | |
| Net asset value and offering price per share | | $ | 9.96 | |
| | | | | |
| Investments, at cost | | $ | 14,845,003 | |
| Cost or Premiums of Financial Derivative Instruments, net | | $ | — | |
| Foreign cash, at cost | | $ | — | |
| Proceeds received on short sales | | $ | (3,314,877 | ) |
| Value of securities on loan included in Securities at fair value | | $ | — | |
| * | On purchases of $50,000 or more, the sales charge may be reduced as outlined in the Prospectus. |
See notes to financial statements
124
| Financial statements (unaudited) |
Statements of assets and liabilities
January 31, 2016 (continued)
| | | | International | | | International | | | Strategic | | | Unconstrained | | | US Growth | |
| | | | Opportunities | | | Select Equity | | | Income | | | Bond | | | Opportunities | |
| | | | Fund | | | Fund | | | Fund | | | Fund | | | Fund | |
| | | | | | | | | | | | | | | | | |
| | | $ | 1,487,697,447 | | $ | 238,456 | | $ | 45,847,677 | | $ | 938,377 | | $ | 2,241,953 | |
| | | $ | 508,502,833 | | $ | 112,903 | | $ | 40,967,019 | | $ | 1,050,375 | | $ | 121,199 | |
| | | $ | 2,664,525,368 | | $ | 221,891 | | $ | 241,559,081 | | $ | 977,877 | | $ | 156,140 | |
| | | $ | 16,674,135 | | $ | — | | $ | — | | $ | — | | $ | — | |
| | | $ | 668,473 | | $ | 4,580,734 | | $ | 1,344,227 | | $ | 22,760,771 | | $ | 5,279,219 | |
| | | | | | | | | | | | | | | | | |
| | | | 60,336,548 | | | 25,764 | | | 5,128,831 | | | 104,655 | | | 219,370 | |
| | | | 22,013,172 | | | 12,237 | | | 4,606,016 | | | 117,254 | | | 11,961 | |
| | | | 108,206,328 | | | 23,928 | | | 27,098,125 | | | 109,095 | | | 15,237 | |
| | | | 688,355 | | | — | | | — | | | — | | | — | |
| | | | 27,159 | | | 493,752 | | | 150,726 | | | 2,539,285 | | | 515,151 | |
| | | | | | | | | | | | | | | | | |
| | | $ | 24.66 | | $ | 9.26 | | $ | 8.94 | | $ | 8.97 | | $ | 10.22 | |
| | | | 5.75 | % | | 5.75 | % | | 4.75 | % | | 4.75 | % | | 5.75 | % |
| | | $ | 26.16 | | $ | 9.82 | | $ | 9.39 | | $ | 9.42 | | $ | 10.84 | |
| | | | | | | | | | | | | | | | | |
| | | $ | 23.10 | | $ | 9.23 | | $ | 8.90 | | $ | 8.96 | | $ | 10.13 | |
| | | | | | | | | | | | | | | | | |
| | | $ | 24.62 | | $ | 9.27 | | $ | 8.91 | | $ | 8.96 | | $ | 10.25 | |
| | | | | | | | | | | | | | | | | |
| | | $ | 24.22 | | $ | — | | $ | — | | $ | — | | $ | — | |
| | | | | | | | | | | | | | | | | |
| | | $ | 24.61 | | $ | 9.28 | | $ | 8.92 | | $ | 8.96 | | $ | 10.25 | |
| | | | | | | | | | | | | | | | | |
| | | $ | 4,697,532,281 | | $ | 5,494,901 | | $ | 352,689,736 | | $ | 28,069,001 | | $ | 7,607,917 | |
| | | $ | — | | $ | — | | $ | (273,734 | ) | $ | 157,619 | | $ | — | |
| | | $ | 39,563 | | $ | — | | $ | 14,834 | | $ | 821 | | $ | — | |
| | | $ | — | | $ | — | | $ | — | | $ | — | | $ | — | |
| | | $ | 149,678,663 | | $ | — | | $ | — | | $ | — | | $ | — | |
See notes to financial statements
125
| Financial statements (unaudited) |
Statements of operations
For the six months ended January 31, 2016
| | | | | | | Dividend | |
| | | | All | | | & Income | |
| | | | Asset | | | Builder | |
| | | | Fund | | | Fund | |
| Investment income: | | | | | | | |
| Dividends | | $ | 351,694 | | $ | 787,593 | |
| Dividends from affiliated companies | | | 76,314 | | | — | |
| Interest | | | 195 | | | 235,969 | |
| Securities lending income | | | — | | | — | |
| Foreign taxes withheld | | | — | | | (28,185 | ) |
| Total Investment Income | | | 428,203 | | | 995,377 | |
| | | | | | | | |
| Expenses: | | | | | | | |
| Investment advisory fees | | | 115,184 | | | 264,798 | |
| 12b-1 distribution and service fees: | | | | | | | |
| Class A Shares | | | 6,804 | | | 26,508 | |
| Class B Shares* | | | — | | | — | |
| Class C Shares | | | 49,832 | | | 88,690 | |
| Sub-accounting fees: | | | | | | | |
| Class A Shares | | | 2,329 | | | 3,202 | |
| Class B Shares* | | | — | | | — | |
| Class C Shares | | | 4,222 | | | 3,052 | |
| Class I Shares | | | 7,076 | | | 5,567 | |
| Transfer agent fees: | | | | | | | |
| Class A Shares | | | 486 | | | 1,576 | |
| Class B Shares* | | | — | | | — | |
| Class C Shares | | | 745 | | | 1,749 | |
| Class I Shares | | | 2,221 | | | 2,213 | |
| Class R6 Shares** | | | 649 | | | 7 | |
| Registration and filing fees | | | 20,209 | | | 21,990 | |
| Audit fees | | | 17,155 | | | 17,155 | |
| Administrative fees | | | 6,941 | | | 8,487 | |
| Custodian fees | | | 5,027 | | | 14,932 | |
| Printing and postage fees | | | 3,858 | | | 3,574 | |
| Legal fees | | | 1,787 | | | 1,271 | |
| Compliance officer fees | | | 1,003 | | | 776 | |
| Trustees' fees and expenses | | | 983 | | | 1,087 | |
| Accounting fees | | | 594 | | | 7,693 | |
| Miscellaneous fees | | | 3,758 | | | 9,558 | |
| Total Expenses | | | 250,863 | | | 483,885 | |
| Fees waived and/or expenses reimbursed by investment adviser | | | (20,918 | ) | | (6,048 | ) |
| Net Expenses | | | 229,945 | | | 477,837 | |
| Net investment income/(loss) | | $ | 198,258 | | $ | 517,540 | |
| * | Class terminated November 4, 2015. |
| ** | Class commenced operations November 30, 2015. |
See notes to financial statements
126
| Financial statements (unaudited) |
Statements of operations
For the six months ended January 31, 2016 (continued)
| | | | Emerging | | | European | | | Global Equity | | | Global | | | High Yield | |
| | | | Markets | | | Focus | | | Income | | | Technology | | | Opportunities | |
| | | | Fund | | | Fund | | | Fund | | | Fund | | | Fund | |
| | | | | | | | | | | | | | | | | |
| | | $ | 498,519 | | $ | 16,707,619 | | $ | 117,561,092 | | $ | 1,352,769 | | $ | 470 | |
| | | | — | | | — | | | — | | | — | | | — | |
| | | | — | | | — | | | — | | | — | | | 807,938 | |
| | | | — | | | 970,574 | | | — | | | 18,285 | | | — | |
| | | | (35,721 | ) | | (289,627 | ) | | (6,383,634 | ) | | (49,591 | ) | | — | |
| | | | 462,798 | | | 17,388,566 | | | 111,177,458 | | | 1,321,463 | | | 808,408 | |
| | | | | | | | | | | | | | | | | |
| | | | 127,523 | | | 15,684,672 | | | 12,117,309 | | | 1,187,613 | | | 84,837 | |
| | | | | | | | | | | | | | | | | |
| | | | 8,712 | | | 1,123,984 | | | 839,708 | | | 119,170 | | | 2,224 | |
| | | | — | | | 11,755 | | | — | | | 14,013 | | | — | |
| | | | 15,355 | | | 1,749,393 | | | 5,412,594 | | | 374,515 | | | 6,612 | |
| | | | | | | | | | | | | | | | | |
| | | | 3,009 | | | 240,846 | | | 183,309 | | | 35,157 | | | 842 | |
| | | | — | | | 3,117 | | | — | | | 2,543 | | | — | |
| | | | 1,994 | | | 145,460 | | | 377,524 | | | 36,858 | | | 55 | |
| | | | 6,598 | | | 756,685 | | | 624,587 | | | 36,847 | | | 265 | |
| | | | | | | | | | | | | | | | | |
| | | | 674 | | | 79,568 | | | 57,253 | | | 7,912 | | | 173 | |
| | | | — | | | 355 | | | — | | | 296 | | | — | |
| | | | 351 | | | 27,996 | | | 76,222 | | | 5,841 | | | 21 | |
| | | | 1,105 | | | 146,881 | | | 116,230 | | | 5,877 | | | 1,027 | |
| | | | 7 | | | 388 | | | 310 | | | 20 | | | 471 | |
| | | | 22,618 | | | 209,251 | | | 126,138 | | | 27,928 | | | 20,058 | |
| | | | 17,155 | | | 17,155 | | | 17,155 | | | 17,155 | | | 17,658 | |
| | | | 3,064 | | | 433,531 | | | 425,060 | | | 31,721 | | | 3,151 | |
| | | | 73,826 | | | 276,501 | | | 264,440 | | | 9,807 | | | 12,690 | |
| | | | 3,314 | | | 204,917 | | | 228,109 | | | 23,389 | | | 987 | |
| | | | 688 | | | 81,974 | | | 92,641 | | | 7,980 | | | 720 | |
| | | | 421 | | | 49,479 | | | 55,097 | | | 5,191 | | | 393 | |
| | | | 429 | | | 60,089 | | | 59,716 | | | 4,549 | | | 445 | |
| | | | 7,109 | | | 7,402 | | | 7,382 | | | 6,926 | | | 1,356 | |
| | | | 3,943 | | | 96,218 | | | 127,533 | | | 9,293 | | | 9,624 | |
| | | | 297,895 | | | 21,407,617 | | | 21,208,317 | | | 1,970,601 | | | 163,609 | |
| | | | (77,431 | ) | | — | | | — | | | — | | | (43,775 | ) |
| | | | 220,464 | | | 21,407,617 | | | 21,208,317 | | | 1,970,601 | | | 119,834 | |
| | | $ | 242,334 | | $ | (4,019,051 | ) | $ | 89,969,141 | | $ | (649,138 | ) | $ | 688,574 | |
See notes to financial statements
127
| Financial statements (unaudited) |
Statements of operations
For the six months ended January 31, 2016 (continued)
| | | | | | | Dividend | |
| | | | All | | | & Income | |
| | | | Asset | | | Builder | |
| | | | Fund | | | Fund | |
| | | | | | | | |
| Net realized and unrealized gain/(loss): | | | | | | | |
| Net realized gain/(loss) from: | | | | | | | |
| Investment transactions(a)(c) | | $ | (35,941 | ) | $ | (1,489,982 | ) |
| Distributions from investment companies(b) | | | 197,982 | | | — | |
| Financial derivative instruments | | | (1,182,996 | ) | | 287,796 | |
| Foreign currency transactions | | | (63,833 | ) | | (14,110 | ) |
| Net change in unrealized appreciation/(depreciation) of: | | | | | | | |
| Investments(d) | | | (2,577,775 | ) | | (4,499,919 | ) |
| Financial derivative instruments | | | (414,161 | ) | | 191,825 | |
| Translation of other assets and liabilities | | | 23,525 | | | (3,245 | ) |
| Net Realized and Unrealized Gain/(Loss) | | | (4,053,199 | ) | | (5,527,635 | ) |
| Net increase/(decrease) in net assets resulting from operations | | $ | (3,854,941 | ) | $ | (5,010,095 | ) |
| (a) | Affiliated companies accounted for $(27,001) of the net realized gain/(loss) from investment transactions. |
| (b) | Includes long-term capital gains distributions from affiliated companies of $181,221 for All Asset Fund. |
| (c) | Includes foreign capital gains tax paid of $(316) for Emerging Markets Fund. |
| (d) | Includes change in foreign capital gains tax accrued of $33,504 and $113,735 for Emerging Markets Fund and Global Equity Income Fund, respectively. |
See notes to financial statements
128
| Financial statements (unaudited) |
Statements of operations
For the six months ended January 31, 2016 (continued)
| | | | Emerging | | | European | | | Global Equity | | | Global | | | High Yield | |
| | | | Markets | | | Focus | | | Income | | | Technology | | | Opportunities | |
| | | | Fund | | | Fund | | | Fund | | | Fund | | | Fund | |
| | | | | | | | | | | | | | | | | |
| | | $ | (1,630,687 | ) | $ | (41,194,489 | ) | $ | (243,525,599 | ) | $ | 7,010,101 | | $ | (1,080,331 | ) |
| | | | — | | | — | | | — | | | — | | | — | |
| | | | — | | | 10,977,854 | | | 45,095,511 | | | — | | | 11,528 | |
| | | | (19,311 | ) | | (1,204,397 | ) | | (953,068 | ) | | (12,323 | ) | | — | |
| | | | | | | | | | | | | | | | | |
| | | | (2,492,922 | ) | | (542,603,423 | ) | | (192,732,262 | ) | | (26,744,583 | ) | | (989,475 | ) |
| | | | — | | | (10,198,008 | ) | | 11,726,215 | | | — | | | (6,838 | ) |
| | | | 948 | | | (247,751 | ) | | (564,309 | ) | | (2,527 | ) | | 65 | |
| | | | (4,141,972 | ) | | (584,470,214 | ) | | (380,953,512 | ) | | (19,749,332 | ) | | (2,065,051 | ) |
| | | $ | (3,899,638 | ) | $ | (588,489,265 | ) | $ | (290,984,371 | ) | $ | (20,398,470 | ) | $ | (1,376,477 | ) |
See notes to financial statements
129
| Financial statements (unaudited) |
Statements of operations
For the six months ended January 31, 2016 (continued)
| | | | International | |
| | | | Long/Short | |
| | | | Equity | |
| | | | Fund | |
| Investment income: | | | | |
| Dividends | | $ | 12,731 | |
| Interest | | | — | |
| Securities lending income | | | — | |
| Foreign taxes withheld | | | (1,995 | ) |
| Total Investment Income | | | 10,736 | |
| | | | | |
| Expenses: | | | | |
| Investment advisory fees | | | 39,521 | |
| 12b-1 distribution and service fees: | | | | |
| Class A Shares | | | 291 | |
| Class B Shares* | | | — | |
| Class C Shares | | | 517 | |
| Class R Shares | | | — | |
| Sub-accounting fees: | | | | |
| Class A Shares | | | 24 | |
| Class B Shares* | | | — | |
| Class C Shares | | | — | |
| Class I Shares | | | 425 | |
| Class R Shares | | | — | |
| Transfer agent fees: | | | | |
| Class A Shares | | | 50 | |
| Class B Shares* | | | — | |
| Class C Shares | | | 13 | |
| Class I Shares | | | 87 | |
| Class R Shares | | | — | |
| Class R6 Shares** | | | 120 | |
| Registration and filing fees | | | 10,026 | |
| Audit fees | | | 18,169 | |
| Administrative fees | | | 763 | |
| Custodian fees | | | 64,987 | |
| Printing and postage fees | | | 1,104 | |
| Legal fees | | | 234 | |
| Compliance officer fees | | | 96 | |
| Trustees' fees and expenses | | | 90 | |
| Accounting fees | | | 6,886 | |
| Deferred offering costs | | | 31,917 | |
| Miscellaneous fees | | | 3,101 | |
| Total Expenses before expenses on securities sold short | | | 178,421 | |
| Short sale financing fees | | | 14,316 | |
| Dividend expense on securities sold short | | | 5,224 | |
| Total Expenses after expenses on securities sold short | | | 197,961 | |
| Fees waived and/or expenses reimbursed by investment adviser | | | (130,018 | ) |
| Net Expenses | | | 67,943 | |
| Net investment income/(loss) | | $ | (57,207 | ) |
| * | Class terminated November 4, 2015 |
| ** | Class commenced operations November 30, 2015 |
See notes to financial statements
130
| Financial statements (unaudited) |
Statements of operations
For the six months ended January 31, 2016 (continued)
| | | | International | | | International | | | Strategic | | | Unconstrained | | | US Growth | |
| | | | Opportunities | | | Select Equity | | | Income | | | Bond | | | Opportunities | |
| | | | Fund | | | Fund | | | Fund | | | Fund | | | Fund | |
| | | | | | | | | | | | | | | | | |
| | | | | | | | | | | | | | | | | |
| | | $ | 31,660,269 | | $ | 35,067 | | $ | 57,317 | | $ | 505 | | $ | 30,524 | |
| | | | — | | | — | | | 4,639,704 | | | 240,518 | | | — | |
| | | | 55,062 | | | 1,022 | | | — | | | — | | | — | |
| | | | (1,733,332 | ) | | (3,884 | ) | | (3,742 | ) | | (935 | ) | | — | |
| | | | 29,981,999 | | | 32,205 | | | 4,693,279 | | | 240,088 | | | 30,524 | |
| | | | | | | | | | | | | | | | | |
| | | | | | | | | | | | | | | | | |
| | | | 20,552,056 | | | 17,758 | | | 655,424 | | | 86,837 | | | 28,773 | |
| | | | | | | | | | | | | | | | | |
| | | | 1,941,528 | | | 363 | | | 43,748 | | | 1,191 | | | 2,464 | |
| | | | 38,933 | | | — | | | 7,757 | | | — | | | — | |
| | | | 2,649,953 | | | 607 | | | 172,940 | | | 5,362 | | | 324 | |
| | | | 37,496 | | | — | | | — | | | — | | | — | |
| | | | | | | | | | | | | | | | | |
| | | | 748,074 | | | 74 | | | 9,239 | | | 7 | | | 727 | |
| | | | 8,326 | | | — | | | 1,104 | | | — | | | — | |
| | | | 288,179 | | | 6 | | | 11,991 | | | 21 | | | 4 | |
| | | | 808,854 | | | 11 | | | 44,662 | | | — | | | — | |
| | | | 6,778 | | | — | | | — | | | — | | | — | |
| | | | | | | | | | | | | | | | | |
| | | | 119,844 | | | 87 | | | 2,640 | | | 79 | | | 137 | |
| | | | 813 | | | — | | | 137 | | | — | | | — | |
| | | | 41,316 | | | 52 | | | 2,358 | | | 107 | | | 15 | |
| | | | 150,594 | | | 72 | | | 8,746 | | | 1,059 | | | 253 | |
| | | | 1,523 | | | — | | | — | | | — | | | — | |
| | | | 399 | | | 141 | | | 30 | | | 512 | | | 179 | |
| | | | 158,406 | | | 14,947 | | | 42,943 | | | 19,903 | | | 10,947 | |
| | | | 18,101 | | | 17,841 | | | 18,947 | | | 20,285 | | | 17,442 | |
| | | | 550,375 | | | 660 | | | 28,640 | | | 3,228 | | | 925 | |
| | | | 426,414 | | | 11,927 | | | 39,232 | | | 42,585 | | | 3,811 | |
| | | | 281,927 | | | 1,104 | | | 8,923 | | | 841 | | | 1,104 | |
| | | | 115,289 | | | 166 | | | 3,960 | | | 368 | | | 237 | |
| | | | 71,389 | | | 90 | | | 2,458 | | | 359 | | | 114 | |
| | | | 76,392 | | | 88 | | | 3,711 | | | 455 | | | 128 | |
| | | | 7,286 | | | 6,618 | | | 2,831 | | | 8,865 | | | 545 | |
| | | | — | | | 11,743 | | | — | | | — | | | 27,639 | |
| | | | 166,309 | | | 3,091 | | | 32,388 | | | 17,038 | | | 1,044 | |
| | | | 29,266,554 | | | 87,446 | | | 1,144,809 | | | 209,102 | | | 96,812 | |
| | | | — | | | — | | | — | | | — | | | — | |
| | | | — | | | — | | | — | | | — | | | — | |
| | | | 29,266,554 | | | 87,446 | | | 1,144,809 | | | 209,102 | | | 96,812 | |
| | | | — | | | (62,152 | ) | | (1,300 | ) | | (82,293 | ) | | (57,572 | ) |
| | | | 29,266,554 | | | 25,294 | | | 1,143,509 | | | 126,809 | | | 39,240 | |
| | | $ | 715,445 | | $ | 6,911 | | $ | 3,549,770 | | $ | 113,279 | | $ | (8,716 | ) |
See notes to financial statements
131
| Financial statements (unaudited) |
Statements of operations
For the six months ended January 31, 2016 (continued)
| | | | International | |
| | | | Long/Short | |
| | | | Equity | |
| | | | Fund | |
| | | | | |
| Net realized and unrealized gain/(loss): | | | | |
| Net realized gain/(loss) from: | | | | |
| Investment transactions | | $ | (337,618 | ) |
| Financial derivative instruments | | | 142,813 | |
| Short sales | | | 237,420 | |
| Foreign currency transactions | | | (3,639 | ) |
| Net change in unrealized appreciation/(depreciation) of: | | | | |
| Investments | | | 21,999 | |
| Financial derivative instruments | | | 110,634 | |
| Short sales | | | (14,047 | ) |
| Translation of other assets and liabilities | | | (4,856 | ) |
| Net Realized and Unrealized Gain/(Loss) | | | 152,706 | |
| Net increase/(decrease) in net assets resulting from operations | | $ | 95,499 | |
See notes to financial statements
132
| Financial statements (unaudited) |
Statements of operations
For the six months ended January 31, 2016 (continued)
| | International | | | International | | | Strategic | | | Unconstrained | | | US Growth | |
| | Opportunities | | | Select Equity | | | Income | | | Bond | | | Opportunities | |
| | Fund | | | Fund | | | Fund | | | Fund | | | Fund | |
| | | | | | | | | | | | | | | |
| | | | | | | | | | | | | | | |
| $ | (105,359,669 | ) | $ | (82,350 | ) | $ | (2,386,704 | ) | $ | (389,425 | ) | $ | (137,041 | ) |
| | 12,508,722 | | | — | | | 7,793,318 | | | 321,258 | | | — | |
| | — | | | — | | | — | | | — | | | — | |
| | (1,556,734 | ) | | (316 | ) | | (33,274 | ) | | (27,047 | ) | | — | |
| | | | | | | | | | | | | | | |
| | (479,216,496 | ) | | (665,552 | ) | | (10,142,829 | ) | | (642,482 | ) | | (558,943 | ) |
| | (16,655,077 | ) | | — | | | 1,056,681 | | | 240,091 | | | — | |
| | — | | | — | | | — | | | — | | | — | |
| | (424,515 | ) | | (306 | ) | | 142,629 | | | (5,556 | ) | | — | |
| | (590,703,769 | ) | | (748,524 | ) | | (3,570,179 | ) | | (503,161 | ) | | (695,984 | ) |
| $ | (589,988,324 | ) | $ | (741,613 | ) | $ | (20,409 | ) | $ | (389,882 | ) | $ | (704,700 | ) |
See notes to financial statements
133
| Financial statements (unaudited) |
Statements of changes in net assets
All Asset Fund
| | | | Six Months | | | | |
| | | | Ended | | | Year Ended | |
| | | January 31, 2016 | | | July 31, 2015 | |
| | | | | | | | |
| Net investment income | | $ | 198,258 | | $ | 613,801 | |
| Net realized gain/(loss) on investments, distributions from investment companies, financial derivative instruments and foreign currency transactions | | | (1,084,788 | ) | | 2,487,539 | |
| Net change in unrealized appreciation/(depreciation) of investments, financial derivative instruments and foreign currency translations | | | (2,968,411 | ) | | (1,848,724 | ) |
| Net increase/(decrease) in net assets resulting from operations | | | (3,854,941 | ) | | 1,252,616 | |
| | | | | | | | |
| Distributions to shareholders from net investment income: | | | | | | | |
| Class A Shares | | | (15,397 | ) | | (94,558 | ) |
| Class C Shares | | | — | | | (98,042 | ) |
| Class I Shares | | | (101,094 | ) | | (737,517 | ) |
| Class R6 Shares* | | | (230,208 | ) | | — | |
| Total distributions to shareholders from net investment income | | | (346,699 | ) | | (930,117 | ) |
| | | | | | | | |
| Distributions to shareholders from net realized gains: | | | | | | | |
| Class A Shares | | | (161,332 | ) | | (165,496 | ) |
| Class C Shares | | | (297,759 | ) | | (297,564 | ) |
| Class I Shares | | | (411,454 | ) | | (1,153,810 | ) |
| Class R6 Shares* | | | (860,579 | ) | | — | |
| Total distributions to shareholders from net realized gains | | | (1,731,124 | ) | | (1,616,870 | ) |
| | | | | | | | |
| Increase/(decrease) from Fund share transactions: | | | | | | | |
| Class A Shares | | | (1,568,674 | ) | | (2,406,158 | ) |
| Class C Shares | | | (917,009 | ) | | (46,472 | ) |
| Class I Shares | | | (29,819,060 | ) | | (1,589,999 | ) |
| Class R6 Shares* | | | 29,427,882 | | | — | |
| Net decrease from Fund share transactions: | | | (2,876,861 | ) | | (4,042,629 | ) |
| Net decrease in net assets | | | (8,809,625 | ) | | (5,337,000 | ) |
| | | | | | | | |
| Net assets: | | | | | | | |
| Beginning of period | | | 61,552,923 | | | 66,889,923 | |
| End of period | | $ | 52,743,298 | | $ | 61,552,923 | |
| Accumulated undistributed net investment loss | | $ | (245,145 | ) | $ | (96,704 | ) |
| * | Class commenced operations November 30, 2015. |
See notes to financial statements
134
| Financial statements (unaudited) |
Statements of changes in net assets
Dividend & Income Builder Fund
| | | | Six Months | | | | |
| | | | Ended | | | Year Ended | |
| | | January 31, 2016 | | | July 31, 2015 | |
| | | | | | | | |
| Net investment income | | $ | 517,540 | | $ | 1,108,356 | |
| Net realized loss on investments, financial derivative instruments and foreign currency transactions | | | (1,216,296 | ) | | (357,556 | ) |
| Net change in unrealized appreciation/(depreciation) of investments, financial derivative instruments and foreign currency translations | | | (4,311,339 | ) | | 1,058,577 | |
| Net increase/(decrease) in net assets resulting from operations | | | (5,010,095 | ) | | 1,809,377 | |
| | | | | | | | |
| Distributions to shareholders from net investment income: | | | | | | | |
| Class A Shares | | | (297,929 | ) | | (401,124 | ) |
| Class C Shares | | | (202,427 | ) | | (199,615 | ) |
| Class I Shares | | | (499,472 | ) | | (464,983 | ) |
| Class R6 Shares* | | | (2,186 | ) | | — | |
| Total distributions to shareholders from net investment income | | | (1,002,014 | ) | | (1,065,722 | ) |
| | | | | | | | |
| Distributions to shareholders from net realized gains: | | | | | | | |
| Class A Shares | | | — | | | (223,750 | ) |
| Class C Shares | | | — | | | (157,527 | ) |
| Class I Shares | | | — | | | (188,967 | ) |
| Total distributions to shareholders from net realized gains | | | — | | | (570,244 | ) |
| | | | | | | | |
| Increase from Fund share transactions: | | | | | | | |
| Class A Shares | | | 22,237,033 | | | 1,726,991 | |
| Class C Shares | | | 15,768,725 | | | 9,155,941 | |
| Class I Shares | | | 17,360,873 | | | 16,115,976 | |
| Class R6 Shares* | | | 424,453 | | | — | |
| Net increase from Fund share transactions: | | | 55,791,084 | | | 26,998,908 | |
| Net increase in net assets | | | 49,778,975 | | | 27,172,319 | |
| | | | | | | | |
| Net assets: | | | | | | | |
| Beginning of period | | | 54,161,167 | | | 26,988,848 | |
| End of period | | $ | 103,940,142 | | $ | 54,161,167 | |
| Accumulated undistributed net investment income/(loss) | | $ | (170,286 | ) | $ | 314,188 | |
| * | Class commenced operations November 30, 2015. |
See notes to financial statements
135
| Financial statements (unaudited) |
Statements of changes in net assets
Emerging Markets Fund
| | | | Six Months | | | | |
| | | | Ended | | | Year Ended | |
| | | January 31, 2016 | | | July 31, 2015 | |
| | | | | | | | |
| Net investment income | | $ | 242,334 | | $ | 51,492 | |
| Net realized gain/(loss) on investments and foreign currency transactions | | | (1,649,998 | ) | | 781,519 | |
| Net change in unrealized appreciation/(depreciation) of investments and foreign currency translations | | | (2,491,974 | ) | | (4,289,654 | ) |
| Net decrease in net assets resulting from operations | | | (3,899,638 | ) | | (3,456,643 | ) |
| | | | | | | | |
| Distributions to shareholders from net investment income: | | | | | | | |
| Class A Shares | | | (14,840 | ) | | — | |
| Class I Shares | | | (113,662 | ) | | (22,618 | ) |
| Class R6 Shares* | | | (1,528 | ) | | — | |
| Total distributions to shareholders from net investment income | | | (130,030 | ) | | (22,618 | ) |
| | | | | | | | |
| Increase/(decrease) from Fund share transactions: | | | | | | | |
| Class A Shares | | | (2,771,305 | ) | | 729,488 | |
| Class C Shares | | | 329,050 | | | (481,012 | ) |
| Class I Shares | | | 10,158,673 | | | (1,544,468 | ) |
| Class R6 Shares* | | | 277,376 | | | — | |
| Net increase/(decrease) from Fund share transactions: | | | 7,993,794 | | | (1,295,992 | ) |
| Net increase/(decrease) in net assets | | | 3,964,126 | | | (4,775,253 | ) |
| | | | | | | | |
| Net assets: | | | | | | | |
| Beginning of period | | | 23,973,360 | | | 28,748,613 | |
| End of period | | $ | 27,937,486 | | $ | 23,973,360 | |
| Accumulated undistributed net investment income/(loss) | | $ | 33,142 | | $ | (79,162 | ) |
| * | Class commenced operations November 30, 2015. |
See notes to financial statements
136
| Financial statements (unaudited) |
Statements of changes in net assets
European Focus Fund
| | | | Six Months | | | | |
| | | | Ended | | | Year Ended | |
| | | January 31, 2016 | | | July 31, 2015 | |
| | | | | | | | |
| Net investment income/(loss) | | $ | (4,019,051 | ) | $ | 26,659,649 | |
| Net realized loss on investments, financial derivative instruments and foreign currency transactions | | | (31,421,032 | ) | | (13,990,035 | ) |
| Net change in unrealized appreciation/(depreciation) of investments, financial derivative instruments and foreign currency translations | | | (553,049,182 | ) | | 128,267,219 | |
| Net increase/(decrease) in net assets resulting from operations | | | (588,489,265 | ) | | 140,936,833 | |
| | | | | | | | |
| Distributions to shareholders from net investment income: | | | | | | | |
| Class A Shares | | | (6,569,247 | ) | | (7,764,091 | ) |
| Class B Shares* | | | — | | | (5,811 | ) |
| Class C Shares | | | (456,492 | ) | | (3,266,638 | ) |
| Class I Shares | | | (21,619,784 | ) | | (25,811,654 | ) |
| Class R6 Shares** | | | (13,049 | ) | | — | |
| Total distributions to shareholders from net investment income | | | (28,658,572 | ) | | (36,848,194 | ) |
| | | | | | | | |
| Increase/(decrease) from Fund share transactions: | | | | | | | |
| Class A Shares | | | 79,524,817 | | | 127,843,914 | |
| Class B Shares* | | | (4,795,318 | ) | | (8,569,612 | ) |
| Class C Shares | | | 19,835,131 | | | 87,256,938 | |
| Class I Shares | | | 303,260,740 | | | 891,481,823 | |
| Class R6 Shares** | | | 1,516,984 | | | — | |
| Net increase from Fund share transactions: | | | 399,342,354 | | | 1,098,013,063 | |
| Net increase/(decrease) in net assets | | | (217,805,483 | ) | | 1,202,101,702 | |
| | | | | | | | |
| Net assets: | | | | | | | |
| Beginning of period | | | 3,633,377,434 | | | 2,431,275,732 | |
| End of period | | $ | 3,415,571,951 | | $ | 3,633,377,434 | |
| Accumulated undistributed net investment income/(loss) | | $ | (8,678,350 | ) | $ | 23,999,273 | |
| * | Class terminated November 4, 2015. |
| ** | Class commenced operations November 30, 2015. |
See notes to financial statements
137
| Financial statements (unaudited) |
Statements of changes in net assets
Global Equity Income Fund
| | | | Six Months | | | | |
| | | | Ended | | | Year Ended | |
| | | January 31, 2016 | | | July 31, 2015 | |
| | | | | | | | |
| Net investment income | | $ | 89,969,141 | | $ | 192,475,830 | |
| Net realized gain/(loss) on investments, financial derivative instruments and foreign currency transactions | | | (199,383,156 | ) | | 10,860,611 | |
| Net change in unrealized appreciation/(depreciation) of investments, financial derivative instruments and foreign currency translations | | | (181,570,356 | ) | | (224,041,245 | ) |
| Net decrease in net assets resulting from operations | | | (290,984,371 | ) | | (20,704,804 | ) |
| | | | | | | | |
| Distributions to shareholders from net investment income: | | | | | | | |
| Class A Shares | | | (16,144,731 | ) | | (39,536,986 | ) |
| Class C Shares | | | (22,772,749 | ) | | (54,265,095 | ) |
| Class I Shares | | | (44,503,150 | ) | | (100,478,175 | ) |
| Class R6 Shares* | | | (7,717 | ) | | — | |
| Total distributions to shareholders from net investment income | | | (83,428,347 | ) | | (194,280,256 | ) |
| | | | | | | | |
| Increase/(decrease) from Fund share transactions: | | | | | | | |
| Class A Shares | | | 22,892,624 | | | (55,180,085 | ) |
| Class C Shares | | | 3,199,870 | | | 246,969,235 | |
| Class I Shares | | | 52,405,531 | | | 604,508,415 | |
| Class R6 Shares* | | | 1,794,938 | | | — | |
| Net increase from Fund share transactions: | | | 80,292,963 | | | 796,297,565 | |
| Net increase/(decrease) in net assets | | | (294,119,755 | ) | | 581,312,505 | |
| | | | | | | | |
| Net assets: | | | | | | | |
| Beginning of period | | | 3,705,646,199 | | | 3,124,333,694 | |
| End of period | | $ | 3,411,526,444 | | $ | 3,705,646,199 | |
| Accumulated undistributed net investment income | | $ | 11,024,444 | | $ | 4,483,650 | |
| * | Class commenced operations November 30, 2015. |
See notes to financial statements
138
| Financial statements (unaudited) |
Statements of changes in net assets
Global Technology Fund
| | | | Six Months | | | | |
| | | | Ended | | | Year Ended | |
| | | January 31, 2016 | | | July 31, 2015 | |
| | | | | | | | |
| Net investment loss | | $ | (649,138 | ) | $ | (2,062,822 | ) |
| Net realized gain on investments and foreign currency transactions | | | 6,997,778 | | | 46,418,980 | |
| Net change in unrealized appreciation/(depreciation) of investments and foreign currency translations | | | (26,747,110 | ) | | (13,474,239 | ) |
| Net increase/(decrease) in net assets resulting from operations | | | (20,398,470 | ) | | 30,881,919 | |
| | | | | | | | |
| Distributions to shareholders from net realized gains: | | | | | | | |
| Class A Shares | | | (12,122,041 | ) | | (14,581,856 | ) |
| Class B Shares* | | | — | | | (1,117,177 | ) |
| Class C Shares | | | (10,437,961 | ) | | (10,977,712 | ) |
| Class I Shares | | | (10,850,890 | ) | | (15,573,789 | ) |
| Class R6 Shares** | | | (118,636 | ) | | — | |
| Total distributions to shareholders from net realized gains | | | (33,529,528 | ) | | (42,250,534 | ) |
| | | | | | | | |
| Increase/(decrease) from Fund share transactions: | | | | | | | |
| Class A Shares | | | 8,687,663 | | | (52,367,855 | ) |
| Class B Shares* | | | (6,324,806 | ) | | (1,836,313 | ) |
| Class C Shares | | | 4,243,590 | | | 350,215 | |
| Class I Shares | | | 3,966,479 | | | (15,718,293 | ) |
| Class R6 Shares** | | | 1,125,051 | | | — | |
| Net increase/(decrease) from Fund share transactions: | | | 11,697,977 | | | (69,572,246 | ) |
| Net decrease in net assets | | | (42,230,021 | ) | | (80,940,861 | ) |
| | | | | | | | |
| Net assets: | | | | | | | |
| Beginning of period | | | 281,800,435 | | | 362,741,296 | |
| End of period | | $ | 239,570,414 | | $ | 281,800,435 | |
| Accumulated undistributed net investment loss | | $ | (969,455 | ) | $ | (320,317 | ) |
| * | Class terminated November 4, 2015. |
| ** | Class commenced operations November 30, 2015. |
See notes to financial statements
139
| Financial statements (unaudited) |
Statements of changes in net assets
High Yield Opportunities Fund
| | | | Six Months | | | | |
| | | | Ended | | | Year Ended | |
| | | January 31, 2016 | | | July 31, 2015 | |
| | | | | | | | |
| Net investment income | | $ | 688,574 | | $ | 1,417,853 | |
| Net realized loss on investments and financial derivative instruments | | | (1,068,803 | ) | | (527,553 | ) |
| Net change in unrealized appreciation/(depreciation) of investments, financial derivative instruments and foreign currency translations | | | (996,248 | ) | | (492,014 | ) |
| Net increase/(decrease) in net assets resulting from operations | | | (1,376,477 | ) | | 398,286 | |
| | | | | | | | |
| Distributions to shareholders from net investment income: | | | | | | | |
| Class A Shares | | | (46,198 | ) | | (158,365 | ) |
| Class C Shares | | | (32,395 | ) | | (58,762 | ) |
| Class I Shares | | | (450,117 | ) | | (1,337,873 | ) |
| Class R6 Shares* | | | (196,291 | ) | | — | |
| Total distributions to shareholders from net investment income | | | (725,001 | ) | | (1,555,000 | ) |
| | | | | | | | |
| Distributions to shareholders from net realized gains: | | | | | | | |
| Class A Shares | | | — | | | (37,967 | ) |
| Class C Shares | | | — | | | (27,626 | ) |
| Class I Shares | | | — | | | (587,665 | ) |
| Total distributions to shareholders from net realized gains | | | — | | | (653,258 | ) |
| | | | | | | | |
| Increase/(decrease) from Fund share transactions: | | | | | | | |
| Class A Shares | | | (658,865 | ) | | (90,633 | ) |
| Class C Shares | | | (153,196 | ) | | 263,692 | |
| Class I Shares | | | (15,956,578 | ) | | 268,045 | |
| Class R6 Shares* | | | 20,567,186 | | | — | |
| Net increase from Fund share transactions: | | | 3,798,547 | | | 441,104 | |
| Net increase/(decrease) in net assets | | | 1,697,069 | | | (1,368,868 | ) |
| | | | | | | | |
| Net assets: | | | | | | | |
| Beginning of period | | | 25,210,738 | | | 26,579,606 | |
| End of period | | $ | 26,907,807 | | $ | 25,210,738 | |
| Accumulated undistributed net investment income | | $ | 33,843 | | $ | 70,270 | |
| * | Class commenced operations November 30, 2015. |
See notes to financial statements
140
| Financial statements (unaudited) |
Statements of changes in net assets
International Long/Short Equity Fund
| | | | Six Months | | | | |
| | | | Ended | | | Period Ended | |
| | | January 31, 2016 | | | July 31, 2015 | * |
| | | | | | | | |
| Net investment loss | | $ | (57,207 | ) | $ | (84,901 | ) |
| Net realized gain on investments, financial derivative instruments, short sales and foreign currency transactions | | | 38,976 | | | 74,106 | |
| Net change in unrealized appreciation/(depreciation) of investments, financial derivative instruments, short sales and foreign currency translations | | | 113,730 | | | 136,924 | |
| Net increase in net assets resulting from operations | | | 95,499 | | | 126,129 | |
| | | | | | | | |
| Distributions to shareholders from net investment income: | | | | | | | |
| Class A Shares | | | (7,080 | ) | | — | |
| Class C Shares | | | (2,841 | ) | | — | |
| Class I Shares | | | (19,072 | ) | | — | |
| Class R6 Shares** | | | (164,331 | ) | | — | |
| Total distributions to shareholders from net investment income | | | (193,324 | ) | | — | |
| | | | | | | | |
| Distributions to shareholders from net realized gains: | | | | | | | |
| Class A Shares | | | (676 | ) | | — | |
| Class C Shares | | | (333 | ) | | — | |
| Class I Shares | | | (3,476 | ) | | — | |
| Class R6 Shares** | | | (15,567 | ) | | — | |
| Total distributions to shareholders from net realized gains | | | (20,052 | ) | | — | |
| | | | | | | | |
| Increase from Fund share transactions: | | | | | | | |
| Class A Shares | | | 98,853 | | | 195,737 | |
| Class C Shares | | | 5,152 | | | 100,122 | |
| Class I Shares | | | 1,711,877 | | | 5,860,760 | |
| Class R6 Shares** | | | 4,978,131 | | | — | |
| Net increase from Fund share transactions: | | | 6,794,013 | | | 6,156,619 | |
| Net increase in net assets | | | 6,676,136 | | | 6,282,748 | |
| | | | | | | | |
| Net assets: | | | | | | | |
| Beginning of period | | | 6,282,748 | | | — | |
| End of period | | $ | 12,958,884 | | $ | 6,282,748 | |
| Accumulated undistributed net investment loss | | $ | (320,331 | ) | $ | (69,800 | ) |
| * | The International Long/Short Equity Fund commenced operations on December 9, 2014. |
| ** | Class commenced operations November 30, 2015. |
See notes to financial statements
141
| Financial statements (unaudited) |
Statements of changes in net assets
International Opportunities Fund
| | | | Six Months | | | | |
| | | | Ended | | | Year Ended | |
| | | January 31, 2016 | | | July 31, 2015 | |
| | | | | | | | |
| Net investment income | | $ | 715,445 | | $ | 47,096,272 | |
| Net realized gain/(loss) on investments, financial derivative instruments and foreign currency transactions | | | (94,407,681 | ) | | 186,668,325 | |
| Net change in unrealized appreciation/(depreciation) of investments, financial derivative instruments and foreign currency translations | | | (496,296,088 | ) | | 10,968,612 | |
| Net increase/(decrease) in net assets resulting from operations | | | (589,988,324 | ) | | 244,733,209 | |
| | | | | | | | |
| Distributions to shareholders from net investment income: | | | | | | | |
| Class A Shares | | | (20,869,230 | ) | | (13,739,334 | ) |
| Class C Shares | | | (4,349,701 | ) | | (1,759,814 | ) |
| Class I Shares | | | (44,704,034 | ) | | (23,673,060 | ) |
| Class R Shares | | | (210,746 | ) | | (79,695 | ) |
| Class R6 Shares* | | | (11,583 | ) | | — | |
| Total distributions to shareholders from net investment income | | | (70,145,294 | ) | | (39,251,903 | ) |
| | | | | | | | |
| Increase/(decrease) from Fund share transactions: | | | | | | | |
| Class A Shares | | | 85,906,191 | | | (447,677,648 | ) |
| Class B Shares** | | | (16,351,415 | ) | | (13,409,043 | ) |
| Class C Shares | | | 31,370,955 | | | 36,281,349 | |
| Class I Shares | | | 690,982,791 | | | 845,583,014 | |
| Class R Shares | | | 4,651,173 | | | 3,658,824 | |
| Class R6 Shares* | | | 737,607 | | | — | |
| Net increase from Fund share transactions: | | | 797,297,302 | | | 424,436,496 | |
| Net increase in net assets | | | 137,163,684 | | | 629,917,802 | |
| | | | | | | | |
| Net assets: | | | | | | | |
| Beginning of period | | | 4,540,904,572 | | | 3,910,986,770 | |
| End of period | | $ | 4,678,068,256 | | $ | 4,540,904,572 | |
| Accumulated undistributed net investment income/(loss) | | $ | (22,940,071 | ) | $ | 46,489,778 | |
| * | Class commenced operations November 30, 2015. |
| ** | Class terminated November 4, 2015. |
See notes to financial statements
142
| Financial statements (unaudited) |
Statements of changes in net assets
International Select Equity Fund
| | | | Six Months | | | | |
| | | | Ended | | | Period Ended | |
| | | January 31, 2016 | | | July 31, 2015 | * |
| | | | | | | | |
| Net investment income | | $ | 6,911 | | $ | 48,093 | |
| Net realized gain/(loss) on investments and foreign currency transactions | | | (82,666 | ) | | 29,513 | |
| Net change in unrealized appreciation/(depreciation) of investments and foreign currency translations | | | (665,858 | ) | | 325,359 | |
| Net increase/(decrease) in net assets resulting from operations | | | (741,613 | ) | | 402,965 | |
| | | | | | | | |
| Distributions to shareholders from net investment income: | | | | | | | |
| Class A Shares | | | (2,125 | ) | | — | |
| Class C Shares | | | (87 | ) | | — | |
| Class I Shares | | | (2,356 | ) | | — | |
| Class R6 Shares** | | | (43,034 | ) | | — | |
| Total distributions to shareholders from net investment income | | | (47,602 | ) | | — | |
| | | | | | | | |
| Distributions to shareholders from net realized gains: | | | | | | | |
| Class A Shares | | | (1,661 | ) | | — | |
| Class C Shares | | | (786 | ) | | — | |
| Class I Shares | | | (788 | ) | | — | |
| Class R6 Shares** | | | (31,668 | ) | | — | |
| Total distributions to shareholders from net realized gains | | | (34,903 | ) | | — | |
| | | | | | | | |
| Increase/(decrease) from Fund share transactions: | | | | | | | |
| Class A Shares | | | 6,797 | | | 257,531 | |
| Class C Shares | | | 10,392 | | | 111,850 | |
| Class I Shares | | | (4,735,167 | ) | | 4,838,337 | |
| Class R6 Shares** | | | 5,085,397 | | | — | |
| Net increase from Fund share transactions: | | | 367,419 | | | 5,207,718 | |
| Net increase/(decrease) in net assets | | | (456,699 | ) | | 5,610,683 | |
| | | | | | | | |
| Net assets: | | | | | | | |
| Beginning of period | | | 5,610,683 | | | — | |
| End of period | | $ | 5,153,984 | | $ | 5,610,683 | |
| Accumulated undistributed net investment income | | $ | 6,877 | | $ | 47,568 | |
| * | The International Select Equity Fund commenced operations on September 30, 2014. |
| ** | Class commenced operations November 30, 2015. |
See notes to financial statements
143
| Financial statements (unaudited) |
Statements of changes in net assets
Strategic Income Fund
| | | | | | | | |
| | | | Six Months | | | | |
| | | | Ended | | | Year Ended | |
| | | January 31, 2016 | | | July 31, 2015 | |
| | | | | | | | |
| Net investment income | | $ | 3,549,770 | | $ | 3,980,451 | |
| Net realized gain on investments, financial derivative instruments and foreign currency transactions | | | 5,373,340 | | | 303,507 | |
| Net change in unrealized appreciation/(depreciation) of investments, financial derivative instruments and foreign currency translations | | | (8,943,519 | ) | | (1,241,735 | ) |
| Net increase/(decrease) in net assets resulting from operations | | | (20,409 | ) | | 3,042,223 | |
| | | | | | | | |
| Distributions to shareholders from net investment income: | | | | | | | |
| Class A Shares | | | (505,006 | ) | | (814,505 | ) |
| Class B Shares* | | | (15,453 | ) | | (126,818 | ) |
| Class C Shares | | | (361,446 | ) | | (848,492 | ) |
| Class I Shares | | | (2,576,906 | ) | | (2,845,209 | ) |
| Class R6 Shares** | | | (6,105 | ) | | — | |
| Total distributions to shareholders from net investment income | | | (3,464,916 | ) | | (4,635,024 | ) |
| | | | | | | | |
| Increase/(decrease) from Fund share transactions: | | | | | | | |
| Class A Shares | | | 18,219,141 | | | 16,935,684 | |
| Class B Shares* | | | (3,111,688 | ) | | (1,100,439 | ) |
| Class C Shares | | | 11,490,238 | | | 12,458,298 | |
| Class I Shares | | | 137,330,894 | | | 89,428,317 | |
| Class R6 Shares** | | | 1,354,475 | | | — | |
| Net increase from Fund share transactions: | | | 165,283,060 | | | 117,721,860 | |
| Net increase in net assets | | | 161,797,735 | | | 116,129,059 | |
| | | | | | | | |
| Net assets: | | | | | | | |
| Beginning of period | | | 167,920,269 | | | 51,791,210 | |
| End of period | | $ | 329,718,004 | | $ | 167,920,269 | |
| Accumulated undistributed net investment loss | | $ | (1,072,354 | ) | $ | (1,157,208 | ) |
| * | Class terminated November 4, 2015. |
| ** | Class commenced operations November 30, 2015. |
See notes to financial statements
144
| Financial statements (unaudited) |
Statements of changes in net assets
Unconstrained Bond Fund
| | | | Six Months | | | | |
| | | | Ended | | | Period Ended | |
| | | January 31, 2016 | | | July 31, 2015 | |
| | | | | | | | |
| Net investment income | | $ | 113,279 | | $ | 352,563 | |
| Net realized gain/(loss) on investments, financial derivative instruments and foreign currency transactions | | | (95,214 | ) | | 1,004,418 | |
| Net change in unrealized appreciation/(depreciation) of investments, financial derivative instruments and foreign currency translations | | | (407,947 | ) | | (1,392,368 | ) |
| Net decrease in net assets resulting from operations | | | (389,882 | ) | | (35,387 | ) |
| | | | | | | | |
| Distributions to shareholders from net investment income: | | | | | | | |
| Class A Shares | | | (3,902 | ) | | (12,886 | ) |
| Class C Shares | | | (784 | ) | | (6,200 | ) |
| Class I Shares | | | (94,062 | ) | | (385,916 | ) |
| Class R6 Shares* | | | (37,251 | ) | | — | |
| Total distributions to shareholders from net investment income | | | (135,999 | ) | | (405,002 | ) |
| | | | | | | | |
| Distributions to shareholders from net realized gains: | | | | | | | |
| Class A Shares | | | (36,140 | ) | | (42,783 | ) |
| Class C Shares | | | (40,844 | ) | | (48,979 | ) |
| Class I Shares | | | (37,665 | ) | | (1,040,174 | ) |
| Class R6 Shares* | | | (900,782 | ) | | — | |
| Total distributions to shareholders from net realized gains | | | (1,015,431 | ) | | (1,131,936 | ) |
| | | | | | | | |
| Increase/(decrease) from Fund share transactions: | | | | | | | |
| Class A Shares | | | 35,523 | | | (117,696 | ) |
| Class C Shares | | | 30,856 | | | 142,884 | |
| Class I Shares | | | (23,703,839 | ) | | 170,411 | |
| Class R6 Shares* | | | 24,016,172 | | | — | |
| Net increase from Fund share transactions: | | | 378,712 | | | 195,599 | |
| Net decrease in net assets | | | (1,162,600 | ) | | (1,376,726 | ) |
| | | | | | | | |
| Net assets: | | | | | | | |
| Beginning of period | | | 26,890,000 | | | 28,266,726 | |
| End of period | | $ | 25,727,400 | | $ | 26,890,000 | |
| Accumulated undistributed net investment loss | | $ | (1,085,848 | ) | $ | (1,063,128 | ) |
| * | Class commenced operations November 30, 2015. |
See notes to financial statements
145
| Financial statements (unaudited) |
Statements of changes in net assets
US Growth Opportunities Fund
| | | | Six Months | | | | |
| | | | Ended | | | Period Ended | |
| | | January 31, 2016 | | | July 31, 2015 | * |
| | | | | | | | |
| Net investment loss | | $ | (8,716 | ) | $ | (2,089 | ) |
| Net realized loss on investments | | | (137,041 | ) | | (35,944 | ) |
| Net change in unrealized appreciation/(depreciation) of investments | | | (558,943 | ) | | 724,006 | |
| Net increase/(decrease) in net assets resulting from operations | | | (704,700 | ) | | 685,973 | |
| | | | | | | | |
| Increase/(decrease) from Fund share transactions: | | | | | | | |
| Class A Shares | | | 814,112 | | | 1,546,643 | |
| Class C Shares | | | 117,998 | | | 10,000 | |
| Class I Shares | | | (5,551,875 | ) | | 5,155,183 | |
| Class R6 Shares** | | | 5,725,177 | | | — | |
| Net increase from Fund share transactions: | | | 1,105,412 | | | 6,711,826 | |
| Net increase in net assets | | | 400,712 | | | 7,397,799 | |
| | | | | | | | |
| Net assets: | | | | | | | |
| Beginning of period | | | 7,397,799 | | | — | |
| End of period | | $ | 7,798,511 | | $ | 7,397,799 | |
| Accumulated undistributed net investment loss | | $ | (10,680 | ) | $ | (1,964 | ) |
| * | The US Growth Opportunities Fund commenced operations on December 18, 2014. |
| ** | Class commenced operations November 30, 2015. |
See notes to financial statements
146
| Financial statements (unaudited) |
Statements of changes – capital stock activity
All Asset Fund
| | | | Six Months | | | | |
| | | | Ended | | | Year Ended | |
| | | January 31, 2016 | | | July 31, 2015 | |
| | | | | | | | |
| Amount | | | | | | | |
| | | | | | | | |
| Class A shares: | | | | | | | |
| Sold | | $ | 789,246 | | $ | 2,554,231 | |
| Issued as reinvestment of dividends | | | 168,932 | | | 243,890 | |
| Redeemed | | | (2,526,852 | ) | | (5,204,279 | ) |
| Net decrease | | $ | (1,568,674 | ) | $ | (2,406,158 | ) |
| | | | | | | | |
| Class C shares: | | | | | | | |
| Sold | | $ | 1,527,857 | | $ | 4,904,804 | |
| Issued as reinvestment of dividends | | | 257,690 | | | 347,023 | |
| Redeemed | | | (2,702,556 | ) | | (5,298,299 | ) |
| Net decrease | | $ | (917,009 | ) | $ | (46,472 | ) |
| | | | | | | | |
| Class I shares: | | | | | | | |
| Sold | | $ | 1,917,279 | | $ | 7,046,213 | |
| Issued as reinvestment of dividends | | | 507,864 | | | 1,876,370 | |
| Redeemed | | | (32,244,203 | ) | | (10,512,582 | ) |
| Net decrease | | $ | (29,819,060 | ) | $ | (1,589,999 | ) |
| | | | | | | | |
| Class R6 shares:* | | | | | | | |
| Sold | | $ | 28,346,022 | | $ | — | |
| Issued as reinvestment of dividends | | | 1,090,787 | | | — | |
| Redeemed | | | (8,927 | ) | | — | |
| Net increase | | $ | 29,427,882 | | $ | — | |
| | | | | | | | |
| Shares | | | | | | | |
| | | | | | | | |
| Class A shares: | | | | | | | |
| Sold | | | 79,001 | | | 241,338 | |
| Issued as reinvestment of dividends | | | 17,076 | | | 23,272 | |
| Redeemed | | | (253,216 | ) | | (487,973 | ) |
| Net decrease | | | (157,139 | ) | | (223,363 | ) |
| | | | | | | | |
| Class C shares: | | | | | | | |
| Sold | | | 156,807 | | | 470,507 | |
| Issued as reinvestment of dividends | | | 26,511 | | | 33,502 | |
| Redeemed | | | (275,669 | ) | | (506,063 | ) |
| Net decrease | | | (92,351 | ) | | (2,054 | ) |
| | | | | | | | |
| Class I shares: | | | | | | | |
| Sold | | | 194,125 | | | 660,704 | |
| Issued as reinvestment of dividends | | | 51,382 | | | 179,159 | |
| Redeemed | | | (3,155,558 | ) | | (987,950 | ) |
| Net decrease | | | (2,910,051 | ) | | (148,087 | ) |
| | | | | | | | |
| Class R6 shares:* | | | | | | | |
| Sold | | | 2,765,471 | | | — | |
| Issued as reinvestment of dividends | | | 110,490 | | | — | |
| Redeemed | | | (966 | ) | | — | |
| Net increase | | | 2,874,995 | | | — | |
| * | Class commenced operations November 30, 2015. |
See notes to financial statements
147
| Financial statements (unaudited) |
Statements of changes – capital stock activity
Dividend & Income Builder Fund
| | | | Six Months | | | | |
| | | | Ended | | | Year Ended | |
| | | January 31, 2016 | | | July 31, 2015 | |
| | | | | | | | |
| Amount | | | | | | | |
| | | | | | | | |
| Class A shares: | | | | | | | |
| Sold | | $ | 26,280,658 | | $ | 8,893,558 | |
| Issued as reinvestment of dividends | | | 270,179 | | | 562,190 | |
| Redeemed | | | (4,313,804 | ) | | (7,728,757 | ) |
| Net increase | | $ | 22,237,033 | | $ | 1,726,991 | |
| | | | | | | | |
| Class C shares: | | | | | | | |
| Sold | | $ | 19,468,779 | | $ | 10,821,649 | |
| Issued as reinvestment of dividends | | | 169,885 | | | 302,228 | |
| Redeemed | | | (3,869,939 | ) | | (1,967,936 | ) |
| Net increase | | $ | 15,768,725 | | $ | 9,155,941 | |
| | | | | | | | |
| Class I shares: | | | | | | | |
| Sold | | $ | 27,831,317 | | $ | 20,292,092 | |
| Issued as reinvestment of dividends | | | 483,897 | | | 632,260 | |
| Redeemed | | | (10,954,341 | ) | | (4,808,376 | ) |
| Net increase | | $ | 17,360,873 | | $ | 16,115,976 | |
| | | | | | | | |
| Class R6 shares:* | | | | | | | |
| Sold | | $ | 427,505 | | $ | — | |
| Issued as reinvestment of dividends | | | 2,186 | | | — | |
| Redeemed | | | (5,238 | ) | | — | |
| Net increase | | $ | 424,453 | | $ | — | |
| | | | | | | | |
| Shares | | | | | | | |
| | | | | | | | |
| Class A shares: | | | | | | | |
| Sold | | | 2,252,054 | | | 724,925 | |
| Issued as reinvestment of dividends | | | 23,393 | | | 45,920 | |
| Redeemed | | | (371,342 | ) | | (631,636 | ) |
| Net increase | | | 1,904,105 | | | 139,209 | |
| | | | | | | | |
| Class C shares: | | | | | | | |
| Sold | | | 1,671,537 | | | 891,229 | |
| Issued as reinvestment of dividends | | | 14,839 | | | 24,863 | |
| Redeemed | | | (339,799 | ) | | (161,375 | ) |
| Net increase | | | 1,346,577 | | | 754,717 | |
| | | | | | | | |
| Class I shares: | | | | | | | |
| Sold | | | 2,365,066 | | | 1,643,065 | |
| Issued as reinvestment of dividends | | | 42,084 | | | 51,690 | |
| Redeemed | | | (955,503 | ) | | (394,096 | ) |
| Net increase | | | 1,451,647 | | | 1,300,659 | |
| | | | | | | | |
| Class R6 shares:* | | | | | | | |
| Sold | | | 35,799 | | | — | |
| Issued as reinvestment of dividends | | | 184 | | | — | |
| Redeemed | | | (479 | ) | | — | |
| Net increase | | | 35,504 | | | — | |
| * | Class commenced operations November 30, 2015. |
See notes to financial statements
148
| Financial statements (unaudited) |
Statements of changes – capital stock activity
Emerging Markets Fund
| | | | Six Months | | | | |
| | | | Ended | | | Year Ended | |
| | | January 31, 2016 | | | July 31, 2015 | |
| | | | | | | | |
| Amount | | | | | | | |
| | | | | | | | |
| Class A shares: | | | | | | | |
| Sold | | $ | 1,177,401 | | $ | 3,259,975 | |
| Issued as reinvestment of dividends | | | 14,627 | | | — | |
| Redeemed | | | (3,963,333 | ) | | (2,530,487 | ) |
| Net increase/(decrease) | | $ | (2,771,305 | ) | $ | 729,488 | |
| | | | | | | | |
| Class C shares: | | | | | | | |
| Sold | | $ | 1,054,066 | | $ | 404,342 | |
| Redeemed | | | (725,016 | ) | | (885,354 | ) |
| Net increase/(decrease) | | $ | 329,050 | | $ | (481,012 | ) |
| | | | | | | | |
| Class I shares: | | | | | | | |
| Sold | | $ | 16,148,235 | | $ | 6,847,431 | |
| Issued as reinvestment of dividends | | | 113,613 | | | 22,603 | |
| Redeemed | | | (6,103,175 | ) | | (8,414,502 | ) |
| Net increase/(decrease) | | $ | 10,158,673 | | $ | (1,544,468 | ) |
| | | | | | | | |
| Class R6 shares:* | | | | | | | |
| Sold | | $ | 276,470 | | $ | — | |
| Issued as reinvestment of dividends | | | 1,522 | | | — | |
| Redeemed | | | (616 | ) | | — | |
| Net increase | | $ | 277,376 | | $ | — | |
| | | | | | | | |
| Shares | | | | | | | |
| | | | | | | | |
| Class A shares: | | | | | | | |
| Sold | | | 147,523 | | | 351,593 | |
| Issued as reinvestment of dividends | | | 1,847 | | | — | |
| Redeemed | | | (520,553 | ) | | (270,545 | ) |
| Net increase/(decrease) | | | (371,183 | ) | | 81,048 | |
| | | | | | | | |
| Class C shares: | | | | | | | |
| Sold | | | 133,096 | | | 45,128 | |
| Redeemed | | | (94,763 | ) | | (99,689 | ) |
| Net increase/(decrease) | | | 38,333 | | | (54,561 | ) |
| | | | | | | | |
| Class I shares: | | | | | | | |
| Sold | | | 2,026,991 | | | 737,844 | |
| Issued as reinvestment of dividends | | | 14,327 | | | 2,537 | |
| Redeemed | | | (792,628 | ) | | (904,039 | ) |
| Net increase/(decrease) | | | 1,248,690 | | | (163,658 | ) |
| | | | | | | | |
| Class R6 shares:* | | | | | | | |
| Sold | | | 34,357 | | | — | |
| Issued as reinvestment of dividends | | | 192 | | | — | |
| Redeemed | | | (87 | ) | | — | |
| Net increase | | | 34,462 | | | — | |
| * | Class commenced operations November 30, 2015. |
See notes to financial statements
149
| Financial statements (unaudited) |
Statements of changes – capital stock activity
European Focus Fund
| | | | | | | | |
| | | | Six Months | | | | |
| | | | Ended | | | Year Ended | |
| | | January 31, 2016 | | | July 31, 2015 | |
| | | | | | | | |
| Amount | | | | | | | |
| | | | | | | | |
| Class A shares: | | | | | | | |
| Sold | | $ | 223,523,858 | | $ | 540,366,997 | |
| Issued as reinvestment of dividends | | | 6,122,302 | | | 7,076,371 | |
| Redeemed | | | (150,121,343 | ) | | (419,599,454 | ) |
| Net increase | | $ | 79,524,817 | | $ | 127,843,914 | |
| | | | | | | | |
| Class B shares:* | | | | | | | |
| Sold | | $ | — | | $ | 307,812 | |
| Issued as reinvestment of dividends | | | — | | | 5,174 | |
| Redeemed | | | (4,795,318 | ) | | (8,882,598 | ) |
| Net decrease | | $ | (4,795,318 | ) | $ | (8,569,612 | ) |
| | | | | | | | |
| Class C shares: | | | | | | | |
| Sold | | $ | 53,640,388 | | $ | 142,444,369 | |
| Issued as reinvestment of dividends | | | 363,049 | | | 2,448,975 | |
| Redeemed | | | (34,168,306 | ) | | (57,636,406 | ) |
| Net increase | | $ | 19,835,131 | | $ | 87,256,938 | |
| | | | | | | | |
| Class I shares: | | | | | | | |
| Sold | | $ | 768,084,168 | | $ | 1,520,198,059 | |
| Issued as reinvestment of dividends | | | 18,331,492 | | | 20,822,276 | |
| Redeemed | | | (483,154,920 | ) | | (649,538,512 | ) |
| Net increase | | $ | 303,260,740 | | $ | 891,481,823 | |
| | | | | | | | |
| Class R6 shares:** | | | | | | | |
| Sold | | $ | 1,513,919 | | $ | — | |
| Issued as reinvestment of dividends | | | 13,029 | | | — | |
| Redeemed | | | (9,964 | ) | | — | |
| Net increase | | $ | 1,516,984 | | $ | — | |
| * | Class terminated November 4, 2015. |
| ** | Class commenced operations November 30, 2015. |
See notes to financial statements
150
| Financial statements (unaudited) |
Statements of changes – capital stock activity
European Focus Fund (continued)
| | | | | | | | |
| | | | Six Months | | | | |
| | | | Ended | | | Year Ended | |
| | | January 31, 2016 | | | July 31, 2015 | |
| | | | | | | | |
| Shares | | | | | | | |
| | | | | | | | |
| Class A shares: | | | | | | | |
| Sold | | | 6,556,701 | | | 15,300,709 | |
| Issued as reinvestment of dividends | | | 179,803 | | | 212,440 | |
| Redeemed | | | (4,528,731 | ) | | (12,167,081 | ) |
| Net increase | | | 2,207,773 | | | 3,346,068 | |
| | | | | | | | |
| Class B shares:* | | | | | | | |
| Sold | | | — | | | 9,255 | |
| Issued as reinvestment of dividends | | | — | | | 163 | |
| Redeemed | | | (145,533 | ) | | (268,215 | ) |
| Net decrease | | | (145,533 | ) | | (258,797 | ) |
| | | | | | | | |
| Class C shares: | | | | | | | |
| Sold | | | 1,689,497 | | | 4,266,432 | |
| Issued as reinvestment of dividends | | | 11,356 | | | 78,142 | |
| Redeemed | | | (1,099,164 | ) | | (1,785,160 | ) |
| Net increase | | | 601,689 | | | 2,559,414 | |
| | | | | | | | |
| Class I shares: | | | | | | | |
| Sold | | | 22,758,194 | | | 42,855,950 | |
| Issued as reinvestment of dividends | | | 538,845 | | | 626,046 | |
| Redeemed | | | (14,495,842 | ) | | (19,060,749 | ) |
| Net increase | | | 8,801,197 | | | 24,421,247 | |
| | | | | | | | |
| Class R6 shares:** | | | | | | | |
| Sold | | | 44,074 | | | — | |
| Issued as reinvestment of dividends | | | 383 | | | — | |
| Redeemed | | | (331 | ) | | — | |
| Net increase | | | 44,126 | | | — | |
| * | Class terminated November 4, 2015. |
| ** | Class commenced operations November 30, 2015. |
See notes to financial statements
151
| Financial statements (unaudited) |
Statements of changes – capital stock activity
Global Equity Income Fund
| | | | | | | | |
| | | | Six Months | | | | |
| | | | Ended | | | Year Ended | |
| | | January 31, 2016 | | | July 31, 2015 | |
| | | | | | | | |
| Amount | | | | | | | |
| | | | | | | | |
| Class A shares: | | | | | | | |
| Sold | | $ | 139,566,344 | | $ | 291,894,829 | |
| Issued as reinvestment of dividends | | | 14,264,131 | | | 34,300,672 | |
| Redeemed | | | (130,937,851 | ) | | (381,375,586 | ) |
| Net increase/(decrease) | | $ | 22,892,624 | | $ | (55,180,085 | ) |
| | | | | | | | |
| Class C shares: | | | | | | | |
| Sold | | $ | 109,823,164 | | $ | 364,319,085 | |
| Issued as reinvestment of dividends | | | 18,684,471 | | | 43,154,113 | |
| Redeemed | | | (125,307,765 | ) | | (160,503,963 | ) |
| Net increase | | $ | 3,199,870 | | $ | 246,969,235 | |
| | | | | | | | |
| Class I shares: | | | | | | | |
| Sold | | $ | 449,161,286 | | $ | 1,000,905,791 | |
| Issued as reinvestment of dividends | | | 38,490,020 | | | 84,807,933 | |
| Redeemed | | | (435,245,775 | ) | | (481,205,309 | ) |
| Net increase | | $ | 52,405,531 | | $ | 604,508,415 | |
| | | | | | | | |
| Class R6 shares:* | | | | | | | |
| Sold | | $ | 1,787,461 | | $ | — | |
| Issued as reinvestment of dividends | | | 7,717 | | | — | |
| Redeemed | | | (240 | ) | | — | |
| Net increase | | $ | 1,794,938 | | $ | — | |
| | | | | | | | |
| Shares | | | | | | | |
| Class A shares: | | | | | | | |
| Sold | | | 19,103,759 | | | 36,327,979 | |
| Issued as reinvestment of dividends | | | 1,945,603 | | | 4,264,553 | |
| Redeemed | | | (17,856,617 | ) | | (47,295,093 | ) |
| Net increase/(decrease) | | | 3,192,745 | | | (6,702,561 | ) |
| | | | | | | | |
| Class C shares: | | | | | | | |
| Sold | | | 15,036,821 | | | 45,521,021 | |
| Issued as reinvestment of dividends | | | 2,563,263 | | | 5,394,540 | |
| Redeemed | | | (17,276,342 | ) | | (20,257,013 | ) |
| Net increase | | | 323,742 | | | 30,658,548 | |
| | | | | | | | |
| Class I shares: | | | | | | | |
| Sold | | | 61,493,165 | | | 124,121,908 | |
| Issued as reinvestment of dividends | | | 5,242,668 | | | 10,535,940 | |
| Redeemed | | | (59,616,681 | ) | | (60,505,550 | ) |
| Net increase | | | 7,119,152 | | | 74,152,298 | |
| | | | | | | | |
| Class R6 shares:* | | | | | | | |
| Sold | | | 240,266 | | | — | |
| Issued as reinvestment of dividends | | | 1,050 | | | — | |
| Redeemed | | | (35 | ) | | — | |
| Net increase | | | 241,281 | | | — | |
| * | Class commenced operations November 30, 2015. |
See notes to financial statements
152
| Financial statements (unaudited) |
Statements of changes – capital stock activity
Global Technology Fund
| | | | | | | | |
| | | | Six Months | | | | |
| | | | Ended | | | Year Ended | |
| | | January 31, 2016 | | | July 31, 2015 | |
| | | | | | | | |
| Amount | | | | | | | |
| | | | | | | | |
| Class A shares: | | | | | | | |
| Sold | | $ | 11,577,507 | | $ | 12,340,038 | |
| Issued as reinvestment of dividends | | | 10,939,084 | | | 13,535,620 | |
| Redeemed | | | (13,828,928 | ) | | (78,243,513 | ) |
| Net increase/(decrease) | | $ | 8,687,663 | | $ | (52,367,855 | ) |
| | | | | | | | |
| Class B shares:* | | | | | | | |
| Sold | | $ | — | | $ | 394,772 | |
| Issued as reinvestment of dividends | | | — | | | 820,432 | |
| Redeemed | | | (6,324,806 | ) | | (3,051,517 | ) |
| Net decrease | | $ | (6,324,806 | ) | $ | (1,836,313 | ) |
| | | | | | | | |
| Class C shares: | | | | | | | |
| Sold | | $ | 3,958,447 | | $ | 7,431,771 | |
| Issued as reinvestment of dividends | | | 8,316,446 | | | 8,551,931 | |
| Redeemed | | | (8,031,303 | ) | | (15,633,487 | ) |
| Net increase | | $ | 4,243,590 | | $ | 350,215 | |
| | | | | | | | |
| Class I shares: | | | | | | | |
| Sold | | $ | 12,396,524 | | $ | 38,203,596 | |
| Issued as reinvestment of dividends | | | 9,050,685 | | | 13,883,247 | |
| Redeemed | | | (17,480,730 | ) | | (67,805,136 | ) |
| Net increase/(decrease) | | $ | 3,966,479 | | $ | (15,718,293 | ) |
| | | | | | | | |
| Class R6 shares:** | | | | | | | |
| Sold | | $ | 1,011,372 | | $ | — | |
| Issued as reinvestment of dividends | | | 118,521 | | | — | |
| Redeemed | | | (4,842 | ) | | — | |
| Net increase | | $ | 1,125,051 | | $ | — | |
| * | Class terminated November 4, 2015. |
| ** | Class commenced operations November 30, 2015. |
See notes to financial statements
153
| Financial statements (unaudited) |
Statements of changes – capital stock activity
Global Technology Fund (continued)
| | | | | | | | |
| | | | Six Months | | | | |
| | | | Ended | | | Year Ended | |
| | | January 31, 2016 | | | July 31, 2015 | |
| | | | | | | | |
| Shares | | | | | | | |
| | | | | | | | |
| Class A shares: | | | | | | | |
| Sold | | | 456,403 | | | 472,340 | |
| Issued as reinvestment of dividends | | | 457,320 | | | 539,913 | |
| Redeemed | | | (569,803 | ) | | (2,985,655 | ) |
| Net increase/(decrease) | | | 343,920 | | | (1,973,402 | ) |
| | | | | | | | |
| Class B shares:* | | | | | | | |
| Sold | | | — | | | 17,110 | |
| Issued as reinvestment of dividends | | | — | | | 36,676 | |
| Redeemed | | | (268,813 | ) | | (132,870 | ) |
| Net decrease | | | (268,813 | ) | | (79,084 | ) |
| | | | | | | | |
| Class C shares: | | | | | | | |
| Sold | | | 188,897 | | | 321,748 | |
| Issued as reinvestment of dividends | | | 400,021 | | | 382,637 | |
| Redeemed | | | (379,667 | ) | | (669,297 | ) |
| Net increase | | | 209,251 | | | 35,088 | |
| | | | | | | | |
| Class I shares: | | | | | | | |
| Sold | | | 500,718 | | | 1,402,143 | |
| Issued as reinvestment of dividends | | | 369,869 | | | 544,014 | |
| Redeemed | | | (708,548 | ) | | (2,596,974 | ) |
| Net increase/(decrease) | | | 162,039 | | | (650,817 | ) |
| | | | | | | | |
| Class R6 shares:** | | | | | | | |
| Sold | | | 37,049 | | | — | |
| Issued as reinvestment of dividends | | | 4,843 | | | — | |
| Redeemed | | | (201 | ) | | — | |
| Net increase | | | 41,691 | | | — | |
| * | Class terminated November 4, 2015. |
| ** | Class commenced operations November 30, 2015. |
See notes to financial statements
154
| Financial statements (unaudited) |
Statements of changes – capital stock activity
High Yield Opportunities Fund
| | | | Six Months | | | | |
| | | | Ended | | | Year Ended | |
| | | January 31, 2016 | | | July 31, 2015 | |
| | | | | | | | |
| Amount | | | | | | | |
| | | | | | | | |
| Class A shares: | | | | | | | |
| Sold | | $ | 860,507 | | $ | 3,726,277 | |
| Issued as reinvestment of dividends | | | 27,679 | | | 109,641 | |
| Redeemed | | | (1,547,051 | ) | | (3,926,551 | ) |
| Net decrease | | $ | (658,865 | ) | $ | (90,633 | ) |
| | | | | | | | |
| Class C shares: | | | | | | | |
| Sold | | $ | 588,503 | | $ | 823,882 | |
| Issued as reinvestment of dividends | | | 24,187 | | | 17,113 | |
| Redeemed | | | (765,886 | ) | | (577,303 | ) |
| Net increase/(decrease) | | $ | (153,196 | ) | $ | 263,692 | |
| | | | | | | | |
| Class I shares: | | | | | | | |
| Sold | | $ | 3,691,991 | | $ | 1,713,990 | |
| Issued as reinvestment of dividends | | | 431,570 | | | 1,694,659 | |
| Redeemed | | | (20,080,139 | ) | | (3,140,604 | ) |
| Net increase/(decrease) | | $ | (15,956,578 | ) | $ | 268,045 | |
| | | | | | | | |
| Class R6 shares:* | | | | | | | |
| Sold | | $ | 22,362,538 | | $ | — | |
| Issued as reinvestment of dividends | | | 185,202 | | | — | |
| Redeemed | | | (1,980,554 | ) | | — | |
| Net increase | | $ | 20,567,186 | | $ | — | |
| | | | | | | | |
| Shares | | | | | | | |
| | | | | | | | |
| Class A shares: | | | | | | | |
| Sold | | | 91,838 | | | 379,791 | |
| Issued as reinvestment of dividends | | | 3,007 | | | 11,078 | |
| Redeemed | | | (167,992 | ) | | (395,901 | ) |
| Net decrease | | | (73,147 | ) | | (5,032 | ) |
| | | | | | | | |
| Class C shares: | | | | | | | |
| Sold | | | 64,320 | | | 82,672 | |
| Issued as reinvestment of dividends | | | 2,636 | | | 1,735 | |
| Redeemed | | | (83,862 | ) | | (57,651 | ) |
| Net increase/(decrease) | | | (16,906 | ) | | 26,756 | |
| | | | | | | | |
| Class I shares: | | | | | | | |
| Sold | | | 401,956 | | | 170,543 | |
| Issued as reinvestment of dividends | | | 46,582 | | | 171,348 | |
| Redeemed | | | (2,182,856 | ) | | (317,739 | ) |
| Net increase/(decrease) | | | (1,734,318 | ) | | 24,152 | |
| | | | | | | | |
| Class R6 shares:* | | | | | | | |
| Sold | | | 2,435,656 | | | — | |
| Issued as reinvestment of dividends | | | 20,788 | | | — | |
| Redeemed | | | (221,560 | ) | | — | |
| Net increase | | | 2,234,884 | | | — | |
| * | Class commenced operations November 30, 2015. |
See notes to financial statements
155
| Financial statements (unaudited) |
Statements of changes – capital stock activity
International Long/Short Equity Fund
| | | | Six Months | | | | |
| | | | Ended | | | Period Ended | |
| | | January 31, 2016 | | | July 31, 2015* | |
| | | | | | | | |
| Amount | | | | | | | |
| | | | | | | | |
| Class A shares: | | | | | | | |
| Sold | | $ | 250,971 | | $ | 195,737 | |
| Issued as reinvestment of dividends | | | 7,755 | | | — | |
| Redeemed | | | (159,873 | ) | | — | |
| Net increase | | $ | 98,853 | | $ | 195,737 | |
| | | | | | | | |
| Class C shares: | | | | | | | |
| Sold | | $ | 5,000 | | $ | 100,122 | |
| Issued as reinvestment of dividends | | | 152 | | | — | |
| Net increase | | $ | 5,152 | | $ | 100,122 | |
| | | | | | | | |
| Class I shares: | | | | | | | |
| Sold | | $ | 8,153,140 | | $ | 5,912,875 | |
| Issued as reinvestment of dividends | | | 22,548 | | | — | |
| Redeemed | | | (6,463,811 | ) | | (52,115 | ) |
| Net increase | | $ | 1,711,877 | | $ | 5,860,760 | |
| | | | | | | | |
| Class R6 shares:* | | | | | | | |
| Sold | | $ | 4,977,835 | | $ | — | |
| Issued as reinvestment of dividends | | | 296 | | | — | |
| Net increase | | $ | 4,978,131 | | $ | — | |
| | | | | | | | |
| Shares | | | | | | | |
| | | | | | | | |
| Class A shares: | | | | | | | |
| Sold | | | 25,093 | | | 19,335 | |
| Issued as reinvestment of dividends | | | 786 | | | — | |
| Redeemed | | | (15,778 | ) | | — | |
| Net increase | | | 10,101 | | | 19,335 | |
| | | | | | | | |
| Class C shares: | | | | | | | |
| Sold | | | 502 | | | 10,000 | |
| Issued as reinvestment of dividends | | | 15 | | | — | |
| Net increase | | | 517 | | | 10,000 | |
| | | | | | | | |
| Class I shares: | | | | | | | |
| Sold | | | 822,065 | | | 586,694 | |
| Issued as reinvestment of dividends | | | 2,274 | | | — | |
| Redeemed | | | (636,178 | ) | | (5,036 | ) |
| Net increase | | | 188,161 | | | 581,658 | |
| | | | | | | | |
| Class R6 shares:* | | | | | | | |
| Sold | | | 490,918 | | | — | |
| Issued as reinvestment of dividends | | | 30 | | | — | |
| Net increase | | | 490,948 | | | — | |
| * | The International Long/Short Equity Fund commenced operations on December 9, 2014. |
| ** | Class commenced operations November 30, 2015. |
See notes to financial statements
156
| Financial statements (unaudited) |
Statements of changes – capital stock activity
International Opportunities Fund
| | | | Six Months | | | | |
| | | | Ended | | | Year Ended | |
| | | January 31, 2016 | | | July 31, 2015 | |
| | | | | | | | |
| Amount | | | | | | | |
| | | | | | | | |
| Class A shares: | | | | | | | |
| Sold | | $ | 276,738,362 | | $ | 352,633,130 | |
| Issued as reinvestment of dividends | | | 19,476,476 | | | 12,951,301 | |
| Redeemed | | | (210,308,647 | ) | | (813,262,079 | ) |
| Net increase/(decrease) | | $ | 85,906,191 | | $ | (447,677,648 | ) |
| | | | | | | | |
| Class B shares:* | | | | | | | |
| Sold | | $ | 16,837 | | $ | 145,349 | |
| Redeemed | | | (16,368,252 | ) | | (13,554,392 | ) |
| Net decrease | | $ | (16,351,415 | ) | $ | (13,409,043 | ) |
| | | | | | | | |
| Class C shares: | | | | | | | |
| Sold | | $ | 64,900,379 | | $ | 103,376,810 | |
| Issued as reinvestment of dividends | | | 3,505,773 | | | 1,399,281 | |
| Redeemed | | | (37,035,197 | ) | | (68,494,742 | ) |
| Net increase | | $ | 31,370,955 | | $ | 36,281,349 | |
| | | | | | | | |
| Class I shares: | | | | | | | |
| Sold | | $ | 950,832,069 | | $ | 1,221,289,629 | |
| Issued as reinvestment of dividends | | | 37,491,564 | | | 19,889,540 | |
| Redeemed | | | (297,340,842 | ) | | (395,596,155 | ) |
| Net increase | | $ | 690,982,791 | | $ | 845,583,014 | |
| | | | | | | | |
| Class R shares: | | | | | | | |
| Sold | | $ | 7,200,250 | | $ | 7,724,510 | |
| Issued as reinvestment of dividends | | | 86,984 | | | 40,599 | |
| Redeemed | | | (2,636,061 | ) | | (4,106,285 | ) |
| Net Increase | | $ | 4,651,173 | | $ | 3,658,824 | |
| | | | | | | | |
| Class R6 shares:** | | | | | | | |
| Sold | | $ | 726,389 | | $ | — | |
| Issued as reinvestment of dividends | | | 11,583 | | | — | |
| Redeemed | | | (365 | ) | | — | |
| Net increase | | $ | 737,607 | | $ | — | |
| * | Class terminated November 4, 2015. |
| ** | Class commenced operations November 30, 2015. |
See notes to financial statements
157
| Financial statements (unaudited) |
Statements of changes – capital stock activity
International Opportunities Fund (continued)
| | | | Six Months | | | | |
| | | | Ended | | | Year Ended | |
| | | January 31, 2016 | | | July 31, 2015 | |
| | | | | | | | |
| Shares | | | | | | | |
| | | | | | | | |
| Class A shares: | | | | | | | |
| Sold | | | 10,560,481 | | | 12,604,025 | |
| Issued as reinvestment of dividends | | | 728,637 | | | 486,342 | |
| Redeemed | | | (8,037,434 | ) | | (29,770,021 | ) |
| Net increase/(decrease) | | | 3,251,684 | | | (16,679,654 | ) |
| | | | | | | | |
| Class B shares:* | | | | | | | |
| Sold | | | 635 | | | 5,779 | |
| Redeemed | | | (644,055 | ) | | (525,080 | ) |
| Net decrease | | | (643,420 | ) | | (519,301 | ) |
| | | | | | | | |
| Class C shares: | | | | | | | |
| Sold | | | 2,616,879 | | | 3,977,850 | |
| Issued as reinvestment of dividends | | | 139,895 | | | 55,904 | |
| Redeemed | | | (1,516,653 | ) | | (2,679,287 | ) |
| Net increase | | | 1,240,121 | | | 1,354,467 | |
| | | | | | | | |
| Class I shares: | | | | | | | |
| Sold | | | 36,136,184 | | | 44,389,992 | |
| Issued as reinvestment of dividends | | | 1,405,231 | | | 747,446 | |
| Redeemed | | | (11,346,734 | ) | | (14,498,697 | ) |
| Net increase | | | 26,194,681 | | | 30,638,741 | |
| | | | | | | | |
| Class R shares: | | | | | | | |
| Sold | | | 281,181 | | | 283,045 | |
| Issued as reinvestment of dividends | | | 3,312 | | | 1,548 | |
| Redeemed | | | (102,883 | ) | | (152,632 | ) |
| Net increase | | | 181,610 | | | 131,961 | |
| | | | | | | | |
| Class R6 shares:** | | | | | | | |
| Sold | | | 26,740 | | | — | |
| Issued as reinvestment of dividends | | | 434 | | | — | |
| Redeemed | | | (15 | ) | | — | |
| Net increase | | | 27,159 | | | — | |
| * | Class terminated November 4, 2015. |
| ** | Class commenced operations November 30, 2015. |
See notes to financial statements
158
Statements of changes – capital stock activity
International Select Equity Fund
| | | | Six Months | | | | |
| | | | Ended | | | Period Ended | |
| | | January 31, 2016 | | | July 31, 2015 | * |
| | | | | | | | |
| Amount | | | | | | | |
| | | | | | | | |
| Class A shares: | | | | | | | |
| Sold | | $ | 163,209 | | $ | 257,531 | |
| Issued as reinvestment of dividends | | | 3,785 | | | — | |
| Redeemed | | | (160,197 | ) | | — | |
| Net increase | | $ | 6,797 | | $ | 257,531 | |
| | | | | | | | |
| Class C shares: | | | | | | | |
| Sold | | $ | 12,602 | | $ | 111,850 | |
| Issued as reinvestment of dividends | | | 160 | | | — | |
| Redeemed | | | (2,370 | ) | | — | |
| Net increase | | $ | 10,392 | | $ | 111,850 | |
| | | | | | | | |
| Class I shares: | | | | | | | |
| Sold | | $ | 300,615 | | $ | 4,838,350 | |
| Issued as reinvestment of dividends | | | 2,785 | | | — | |
| Redeemed | | | (5,038,567 | ) | | (13 | ) |
| Net increase/(decrease) | | $ | (4,735,167 | ) | $ | 4,838,337 | |
| | | | | | | | |
| Class R6 shares:** | | | | | | | |
| Sold | | $ | 5,085,085 | | $ | — | |
| Issued as reinvestment of dividends | | | 325 | | | — | |
| Redeemed | | | (13 | ) | | — | |
| Net increase | | $ | 5,085,397 | | $ | — | |
| | | | | | | | |
| Shares | | | | | | | |
| | | | | | | | |
| Class A shares: | | | | | | | |
| Sold | | | 16,394 | | | 24,959 | |
| Issued as reinvestment of dividends | | | 374 | | | — | |
| Redeemed | | | (15,963 | ) | | — | |
| Net increase | | | 805 | | | 24,959 | |
| | | | | | | | |
| Class C shares: | | | | | | | |
| Sold | | | 1,257 | | | 11,217 | |
| Issued as reinvestment of dividends | | | 16 | | | — | |
| Redeemed | | | (253 | ) | | — | |
| Net increase | | | 1,020 | | | 11,217 | |
| | | | | | | | |
| Class I shares: | | | | | | | |
| Sold | | | 29,871 | | | 483,758 | |
| Issued as reinvestment of dividends | | | 276 | | | — | |
| Redeemed | | | (489,976 | ) | | (1 | ) |
| Net increase/(decrease) | | | (459,829 | ) | | 483,757 | |
| | | | | | | | |
| Class R6 shares:** | | | | | | | |
| Sold | | | 493,721 | | | — | |
| Issued as reinvestment of dividends | | | 32 | | | — | |
| Redeemed | | | (1 | ) | | — | |
| Net increase | | | 493,752 | | | — | |
| * | The International Select Equity Fund commenced operations on September 30, 2014. |
| ** | Class commenced operations on November 30, 2015. |
See notes to financial statements
159
| Financial statements (unaudited) |
Statements of changes – capital stock activity
Strategic Income Fund
| | | | | | | | |
| | | | Six Months | | | | |
| | | | Ended | | | Year Ended | |
| | | January 31, 2016 | | | July 31, 2015 | |
| | | | | | | | |
| Amount | | | | | | | |
| | | | | | | | |
| Class A shares: | | | | | | | |
| Sold | | $ | 28,499,266 | | $ | 29,141,354 | |
| Issued as reinvestment of dividends | | | 399,924 | | | 622,725 | |
| Redeemed | | | (10,680,049 | ) | | (12,828,395 | ) |
| Net increase | | $ | 18,219,141 | | $ | 16,935,684 | |
| | | | | | | | |
| Class B shares:* | | | | | | | |
| Sold | | $ | 1,294 | | $ | 446,301 | |
| Issued as reinvestment of dividends | | | 13,247 | | | 106,389 | |
| Redeemed | | | (3,126,229 | ) | | (1,653,129 | ) |
| Net decrease | | $ | (3,111,688 | ) | $ | (1,100,439 | ) |
| | | | | | | | |
| Class C shares: | | | | | | | |
| Sold | | $ | 14,643,188 | | $ | 19,887,755 | |
| Issued as reinvestment of dividends | | | 280,683 | | | 624,953 | |
| Redeemed | | | (3,433,633 | ) | | (8,054,410 | ) |
| Net increase | | $ | 11,490,238 | | $ | 12,458,298 | |
| | | | | | | | |
| Class I shares: | | | | | | | |
| Sold | | $ | 163,033,091 | | $ | 113,857,875 | |
| Issued as reinvestment of dividends | | | 1,878,126 | | | 2,103,066 | |
| Redeemed | | | (27,580,323 | ) | | (26,532,624 | ) |
| Net increase | | $ | 137,330,894 | | $ | 89,428,317 | |
| | | | | | | | |
| Class R6 shares:** | | | | | | | |
| Sold | | $ | 1,378,370 | | $ | — | |
| Issued as reinvestment of dividends | | | 6,105 | | | — | |
| Redeemed | | | (30,000 | ) | | — | |
| Net increase | | $ | 1,354,475 | | $ | — | |
| * | Class terminated November 4, 2015. |
| ** | Class commenced operations November 30, 2015. |
See notes to financial statements
160
| Financial statements (unaudited) |
Statements of changes – capital stock activity
Strategic Income Fund (continued)
| | | | Six Months | | | | |
| | | | Ended | | | Year Ended | |
| | | January 31, 2016 | | | July 31, 2015 | |
| | | | | | | | |
| Shares | | | | | | | |
| | | | | | | | |
| Class A shares: | | | | | | | |
| Sold | | | 3,170,548 | | | 3,178,806 | |
| Issued as reinvestment of dividends | | | 44,602 | | | 68,155 | |
| Redeemed | | | (1,188,841 | ) | | (1,406,207 | ) |
| Net increase | | | 2,026,309 | | | 1,840,754 | |
| | | | | | | | |
| Class B shares:* | | | | | | | |
| Sold | | | 143 | | | 48,700 | |
| Issued as reinvestment of dividends | | | 1,469 | | | 11,609 | |
| Redeemed | | | (346,145 | ) | | (180,331 | ) |
| Net decrease | | | (344,533 | ) | | (120,022 | ) |
| | | | | | | | |
| Class C shares: | | | | | | | |
| Sold | | | 1,637,721 | | | 2,184,718 | |
| Issued as reinvestment of dividends | | | 31,451 | | | 68,739 | |
| Redeemed | | | (383,980 | ) | | (884,577 | ) |
| Net increase | | | 1,285,192 | | | 1,368,880 | |
| | | | | | | | |
| Class I shares: | | | | | | | |
| Sold | | | 18,205,279 | | | 12,440,206 | |
| Issued as reinvestment of dividends | | | 210,167 | | | 230,755 | |
| Redeemed | | | (3,075,299 | ) | | (2,919,478 | ) |
| Net increase | | | 15,340,147 | | | 9,751,483 | |
| | | | | | | | |
| Class R6 shares:** | | | | | | | |
| Sold | | | 153,415 | | | — | |
| Issued as reinvestment of dividends | | | 686 | | | — | |
| Redeemed | | | (3,375 | ) | | — | |
| Net increase | | | 150,726 | | | — | |
| * | Class terminated November 4, 2015. |
| ** | Class commenced operations November 30, 2015. |
See notes to financial statements
161
| Financial statements (unaudited) |
Statements of changes – capital stock activity
Unconstrained Bond Fund
| | | | Six Months | | | | |
| | | | Ended | | | Period Ended | |
| | | January 31, 2016 | | | July 31, 2015 | |
| | | | | | | | |
| Amount | | | | | | | |
| | | | | | | | |
| Class A shares: | | | | | | | |
| Sold | | $ | 80 | | $ | 7,300 | |
| Issued as reinvestment of dividends | | | 35,708 | | | 1,647 | |
| Redeemed | | | (265 | ) | | (126,643 | ) |
| Net increase/(decrease) | | $ | 35,523 | | $ | (117,696 | ) |
| | | | | | | | |
| Class C shares: | | | | | | | |
| Sold | | $ | 4,421 | | $ | 227,508 | |
| Issued as reinvestment of dividends | | | 40,478 | | | 9,822 | |
| Redeemed | | | (14,043 | ) | | (94,446 | ) |
| Net increase | | $ | 30,856 | | $ | 142,884 | |
| | | | | | | | |
| Class I shares: | | | | | | | |
| Sold | | $ | 1,096 | | $ | 5,288 | |
| Issued as reinvestment of dividends | | | 48,335 | | | 165,124 | |
| Redeemed | | | (23,753,270 | ) | | — | |
| Net increase/(decrease) | | $ | (23,703,839 | ) | $ | 170,412 | |
| | | | | | | | |
| Class R6 shares:* | | | | | | | |
| Sold | | $ | 23,757,053 | | $ | — | |
| Issued as reinvestment of dividends | | | 894,852 | | | — | |
| Redeemed | | | (635,733 | ) | | — | |
| Net increase | | $ | 24,016,172 | | $ | — | |
| | | | | | | | |
| Shares | | | | | | | |
| Class A shares: | | | | | | | |
| Sold | | | 9 | | | 744 | |
| Issued as reinvestment of dividends | | | 3,928 | | | 171 | |
| Redeemed | | | (29 | ) | | (13,044 | ) |
| Net increase/(decrease) | | | 3,908 | | | (12,129 | ) |
| | | | | | | | |
| Class C shares: | | | | | | | |
| Sold | | | 494 | | | 22,771 | |
| Issued as reinvestment of dividends | | | 4,458 | | | 1,034 | |
| Redeemed | | | (1,551 | ) | | (9,952 | ) |
| Net increase | | | 3,401 | | | 13,853 | |
| | | | | | | | |
| Class I shares: | | | | | | | |
| Sold | | | 116 | | | 542 | |
| Issued as reinvestment of dividends | | | 5,281 | | | 17,315 | |
| Redeemed | | | (2,511,153 | ) | | — | |
| Net increase/(decrease) | | | (2,505,756 | ) | | 17,857 | |
| | | | | | | | |
| Class R6 shares:* | | | | | | | |
| Sold | | | 2,511,323 | | | — | |
| Issued as reinvestment of dividends | | | 98,556 | | | — | |
| Redeemed | | | (70,594 | ) | | — | |
| Net increase | | | 2,539,285 | | | — | |
| * | Class commenced operations November 30, 2015. |
See notes to financial statements
162
| Financial statements (unaudited) |
Statements of changes – capital stock activity
US Growth Opportunities Fund
| | | | | | | | |
| | | | Six Months | | | | |
| | | | Ended | | | Period Ended | |
| | | January 31, 2016 | | | July 31, 2015 | * |
| | | | | | | | |
| Shares | | | | | | | |
| | | | | | | | |
| Class A shares: | | | | | | | |
| Sold | | $ | 833,591 | | $ | 1,546,643 | |
| Redeemed | | | (19,479 | ) | | — | |
| Net increase | | $ | 814,112 | | $ | 1,546,643 | |
| | | | | | | | |
| Class C shares: | | | | | | | |
| Sold | | $ | 128,358 | | $ | 10,000 | |
| Redeemed | | | (10,360 | ) | | — | |
| Net increase | | $ | 117,998 | | $ | 10,000 | |
| | | | | | | | |
| Class I shares: | | | | | | | |
| Sold | | $ | 148,257 | | $ | 5,159,349 | |
| Redeemed | | | (5,700,132 | ) | | (4,166 | ) |
| Net increase/(decrease) | | $ | (5,551,875 | ) | $ | 5,155,183 | |
| | | | | | | | |
| Class R6 shares:** | | | | | | | |
| Sold | | $ | 5,735,309 | | $ | — | |
| Redeemed | | | (10,132 | ) | | — | |
| Net increase | | $ | 5,725,177 | | $ | — | |
| | | | | | | | |
| Shares | | | | | | | |
| | | | | | | | |
| Class A shares: | | | | | | | |
| Sold | | | 76,650 | | | 144,490 | |
| Redeemed | | | (1,770 | ) | | — | |
| Net increase | | | 74,880 | | | 144,490 | |
| | | | | | | | |
| Class C shares: | | | | | | | |
| Sold | | | 11,961 | | | 1,000 | |
| Redeemed | | | (1,000 | ) | | — | |
| Net increase | | | 10,961 | | | 1,000 | |
| | | | | | | | |
| Class I shares: | | | | | | | |
| Sold | | | 13,375 | | | 515,164 | |
| Redeemed | | | (512,921 | ) | | (381 | ) |
| Net increase/(decrease) | | | (499,546 | ) | | 514,783 | |
| | | | | | | | |
| Class R6 shares:** | | | | | | | |
| Sold | | | 516,277 | | | — | |
| Redeemed | | | (1,126 | ) | | — | |
| Net increase | | | 515,151 | | | — | |
| * | The US Growth Opportunities Fund commenced operations on December 18, 2014. |
| ** | Class commenced operations November 30, 2015. |
See notes to financial statements
163
Statement of Cash Flows
For the Period ended January 31, 2016
| | | | International | |
| | | | Long/Short Equity | |
| | | | Fund | |
| | | | | |
| Cash Flows from Operating Activities: | | | | |
| Net increase in net assets resulting from operations | | $ | 95,499 | |
| Adjustments to reconcile net increase in net assets resulting from operations to net cash provided by (used in) operating activities: | | | | |
| Purchases of investments in securities | | | (5,749,305 | ) |
| Payments to cover securities sold short | | | (2,160,135 | ) |
| Proceeds from disposition of investments in securities | | | 3,371,865 | |
| Proceeds from securities sold short | | | 4,462,067 | |
| Purchases of short term investments, net | | | (5,964,723 | ) |
| Net realized (gain) loss: | | | | |
| Investment transactions | | | 337,618 | |
| Short sales | | | (237,420 | ) |
| Net change in unrealized (gain) loss: | | | | |
| Investments | | | (21,999 | ) |
| Short sales | | | 14,047 | |
| Changes in assets and liabilities: | | | | |
| (Increase) decrease in assets: | | | | |
| Cash at broker for open futures contracts | | | (49,299 | ) |
| Cash segregated as collateral on open equity swap contracts | | | (220,000 | ) |
| Cash segregated as collateral on securities sold short | | | (552,128 | ) |
| Financial Derivative Instruments - Exchange-traded or centrally cleared | | | 142 | |
| Financial Derivative Instruments - Over-the-counter | | | (184,288 | ) |
| Receivable for investment securities sold | | | (145,031 | ) |
| Receivable from investment adviser | | | 18,677 | |
| Dividends and interest receivable | | | 2,300 | |
| Prepaid expenses and other assets | | | 1,750 | |
| Increase (decrease) in liabilities: | | | | |
| Payable for investment securities purchased | | | 316,748 | |
| Payable for short sale financing | | | 1,208 | |
| Payable for periodic payments on equity swap contracts | | | 1,950 | |
| Financial Derivative Instruments - Exchange-traded or centrally cleared | | | 15,448 | |
| Financial Derivative Instruments - Over-the-counter | | | 58,064 | |
| Dividends payable for short sales | | | 255 | |
| Payable for 12b-1 distribution and service fees | | | 12 | |
| Accrued expenses and other payables | | | 6,033 | |
| Net cash used in operating activities | | $ | (6,580,645 | ) |
| | | | | |
| Cash flows from Financing Activities: | | | | |
| Net proceeds from Fund share transactions | | | 6,794,013 | |
| Increase in receivable for Fund shares sold | | | (7,590 | ) |
| Fund distributions paid | | | (213,376 | ) |
| | | | | |
| Net cash received from financing activities | | | 6,573,047 | |
| | | | | |
| Net decrease in cash during the period | | $ | (7,598 | ) |
| | | | | |
| Cash and foreign currency, beginning of period: | | | 10,713 | |
| Cash and foreign currency, end of period: | | $ | 3,115 | |
See notes to financial statements
164
This page intentionally left blank.
165
| Financial highlights (unaudited) |
For a share outstanding throughout the periods indicated
| | | | | | | Income (loss) from investment operations: | | Less distributions: | |
| | | | | | | | | | | | | | | | Distributions | | Distributions | | | | |
| | | | Net asset | | | Net | | | Net | | | Total | | | from | | | from net | | | | |
| | | | value, | | | investment | | realized and | | | from | | | net | | | realized | | | | |
| | | | beginning | | | income | | | unrealized | | | investment | | | investment | | | capital | | | Total | |
| | | | of period | | | (loss)(b) | | | gain (loss) | | | operations | | | income | | | gains | | | distributions | |
| All Asset Fund | | | | | | | | | | | | | | | | | | | | | | |
| Class A | | | | | | | | | | | | | | | | | | | | | | |
| Period Ended 1/31/2016 | | $ | 10.55 | | | 0.04 | | | (0.77 | ) | | (0.73 | ) | | (0.03 | ) | | (0.26 | ) | | (0.29 | ) |
| Year Ended 7/31/2015 | | | 10.76 | | | 0.09 | | | 0.12 | | | 0.21 | | | (0.14 | ) | | (0.28 | ) | | (0.42 | ) |
| Year Ended 7/31/2014 | | | 10.52 | | | 0.10 | | | 0.56 | | | 0.66 | | | (0.11 | ) | | (0.31 | ) | | (0.42 | ) |
| Year Ended 7/31/2013 | | | 9.93 | | | 0.09 | | | 0.61 | | | 0.70 | | | (0.09 | ) | | (0.02 | ) | | (0.11 | ) |
| Period Ended 7/31/2012(a) | | | 10.00 | | | 0.01 | | | (0.08 | ) | | (0.07 | ) | | 0.00 | | | 0.00 | | | 0.00 | |
| Class C | | | | | | | | | | | | | | | | | | | | | | |
| Period Ended 1/31/2016 | | $ | 10.39 | | | 0.00 | | | (0.67 | ) | | (0.67 | ) | | (0.08 | ) | | (0.26 | ) | | (0.34 | ) |
| Year Ended 7/31/2015 | | | 10.63 | | | 0.02 | | | 0.10 | | | 0.12 | | | (0.08 | ) | | (0.28 | ) | | (0.36 | ) |
| Year Ended 7/31/2014 | | | 10.43 | | | 0.02 | | | 0.56 | | | 0.58 | | | (0.07 | ) | | (0.31 | ) | | (0.38 | ) |
| Year Ended 7/31/2013 | | | 9.91 | | | 0.02 | | | 0.59 | | | 0.61 | | | (0.07 | ) | | (0.02 | ) | | (0.09 | ) |
| Period Ended 7/31/2012(a) | | | 10.00 | | | (0.01 | ) | | (0.08 | ) | | (0.09 | ) | | 0.00 | | | 0.00 | | | 0.00 | |
| Class I | | | | | | | | | | | | | | | | | | | | | | |
| Period Ended 1/31/2016 | | $ | 10.55 | | | 0.02 | | | (0.73 | ) | | (0.71 | ) | | (0.08 | ) | | (0.26 | ) | | (0.34 | ) |
| Year Ended 7/31/2015 | | | 10.77 | | | 0.13 | | | 0.10 | | | 0.23 | | | (0.17 | ) | | (0.28 | ) | | (0.45 | ) |
| Year Ended 7/31/2014 | | | 10.54 | | | 0.13 | | | 0.56 | | | 0.69 | | | (0.15 | ) | | (0.31 | ) | | (0.46 | ) |
| Year Ended 7/31/2013 | | | 9.94 | | | 0.11 | | | 0.61 | | | 0.72 | | | (0.10 | ) | | (0.02 | ) | | (0.12 | ) |
| Period Ended 7/31/2012(a) | | | 10.00 | | | 0.02 | | | (0.08 | ) | | (0.06 | ) | | 0.00 | | | 0.00 | | | 0.00 | |
| Class R6 | | | | | | | | | | | | | | | | | | | | | | |
| Period Ended 1/31/2016(f) | | $ | 10.25 | | | 0.06 | | | (0.48 | ) | | (0.42 | ) | | (0.08 | ) | | (0.26 | ) | | (0.34 | ) |
| | | | | | | | | | | | | | | | | | | | | | | |
| Dividend & Income Builder Fund | | | | | | | | | | | | | | | | | | | | | | |
| Class A | | | | | | | | | | | | | | | | | | | | | | |
| Period Ended 1/31/2016 | | $ | 12.50 | | | 0.09 | | | (0.95 | ) | | (0.86 | ) | | (0.17 | ) | | 0.00 | | | (0.17 | ) |
| Year Ended 7/31/2015 | | | 12.57 | | | 0.35 | | | 0.11 | | | 0.46 | | | (0.33 | ) | | (0.20 | ) | | (0.53 | ) |
| Year Ended 7/31/2014 | | | 11.40 | | | 0.40 | | | 1.10 | | | 1.50 | | | (0.31 | ) | | (0.02 | ) | | (0.33 | ) |
| Period Ended 7/31/2013(a) | | | 10.00 | | | 0.33 | | | 1.33 | | | 1.66 | | | (0.26 | ) | | 0.00 | | | (0.26 | ) |
| Class C | | | | | | | | | | | | | | | | | | | | | | |
| Period Ended 1/31/2016 | | $ | 12.40 | | | 0.04 | | | (0.94 | ) | | (0.90 | ) | | (0.13 | ) | | 0.00 | | | (0.13 | ) |
| Year Ended 7/31/2015 | | | 12.49 | | | 0.26 | | | 0.10 | | | 0.36 | | | (0.25 | ) | | (0.20 | ) | | (0.45 | ) |
| Year Ended 7/31/2014 | | | 11.35 | | | 0.30 | | | 1.10 | | | 1.40 | | | (0.24 | ) | | (0.02 | ) | | (0.26 | ) |
| Period Ended 7/31/2013(a) | | | 10.00 | | | 0.25 | | | 1.33 | | | 1.58 | | | (0.23 | ) | | 0.00 | | | (0.23 | ) |
| Class I | | | | | | | | | | | | | | | | | | | | | | |
| Period Ended 1/31/2016 | | $ | 12.49 | | | 0.11 | | | (0.95 | ) | | (0.84 | ) | | (0.18 | ) | | 0.00 | | | (0.18 | ) |
| Year Ended 7/31/2015 | | | 12.57 | | | 0.39 | | | 0.09 | | | 0.48 | | | (0.36 | ) | | (0.20 | ) | | (0.56 | ) |
| Year Ended 7/31/2014 | | | 11.39 | | | 0.44 | | | 1.09 | | | 1.53 | | | (0.33 | ) | | (0.02 | ) | | (0.35 | ) |
| Period Ended 7/31/2013(a) | | | 10.00 | | | 0.46 | | | 1.22 | | | 1.68 | | | (0.29 | ) | | 0.00 | | | (0.29 | ) |
| Class R6 | | | | | | | | | | | | | | | | | | | | | | |
| Period Ended 1/31/2016(f) | | $ | 11.95 | | | 0.01 | | | (0.43 | ) | | (0.42 | ) | | (0.06 | ) | | 0.00 | | | (0.06 | ) |
| (a) | The All Asset Fund commenced operations on March 30, 2012 and the Dividend & Income Builder Fund commenced operations on August 1, 2012. |
| (b) | Per share data was calculated using average shares outstanding during the period. |
| (c) | Total returns are historical and assume changes in share price, reinvestment of all dividends and distributions and no sales charge. Had certain expenses not been waived/reimbursed during the periods shown, total returns would have been lower. Total returns for periods of less than one year are not annualized. |
| (d) | As the All Asset Fund invests in the shares of other investment companies, the calculation includes only those expenses charged directly to the Fund and does not include expenses charged by the underlying funds in which the Fund invests. |
| (e) | Not annualized for periods less than one year. |
| (f) | Class R6 commenced operations on November 30, 2015. |
See notes to financial statements
166
| Financial highlights (unaudited) |
| | | | | | | | | | | | Ratios to average net assets: | | | | |
| | | Net asset
value,
end of
period | | | Total
return(c) | | | Net assets,
end of period
(000) | | | Annualized
ratio of
operating
expenses to average
net assets(d) | | | Annualized ratio of net investment
income/(loss)
to average
net assets | | | Annualized
ratio of operating expenses
to average net assets without
waivers and/or expenses
reimbursed(d) | | | Portfolio turnover
rate(e) | |
| | | | | | | | | | | | | | | | | | | | | | |
| | | | | | | | | | | | | | | | | | | | | | |
| | $ | 9.53 | | | (6.50 | )% | $ | 4,279 | | | 0.85 | % | | 0.74 | % | | 0.96 | % | | 13 | % |
| | | 10.55 | | | 1.94 | | | 6,396 | | | 0.85 | | | 0.88 | | | 0.91 | | | 19 | |
| | | 10.76 | | | 6.44 | | | 8,929 | | | 0.85 | | | 0.94 | | | 0.93 | | | 52 | |
| | | 10.52 | | | 7.05 | | | 12,023 | | | 0.85 | | | 0.86 | | | 1.10 | | | 37 | |
| | | 9.93 | | | (0.70 | ) | | 5,740 | | | 0.85 | | | 0.43 | | | 2.13 | | | 7 | |
| | | | | | | | | | | | | | | | | | | | | | |
| | $ | 9.38 | | | (6.83 | )% | $ | 8,900 | | | 1.60 | % | | 0.03 | % | | 1.71 | % | | 13 | % |
| | | 10.39 | | | 1.14 | | | 10,824 | | | 1.60 | | | 0.18 | | | 1.68 | | | 19 | |
| | | 10.63 | | | 5.61 | | | 11,094 | | | 1.60 | | | 0.20 | | | 1.67 | | | 52 | |
| | | 10.43 | | | 6.18 | | | 9,357 | | | 1.60 | | | 0.20 | | | 1.80 | | | 37 | |
| | | 9.91 | | | (0.90 | ) | | 1,013 | | | 1.60 | | | (0.24 | ) | | 4.49 | | | 7 | |
| | | | | | | | | | | | | | | | | | | | | | |
| | $ | 9.50 | | | (6.37 | )% | $ | 12,283 | | | 0.60 | % | | 1.25 | % | | 0.66 | % | | 13 | % |
| | | 10.55 | | | 2.20 | | | 44,333 | | | 0.60 | | | 1.18 | | | 0.63 | | | 19 | |
| | | 10.77 | | | 6.72 | | | 46,867 | | | 0.60 | | | 1.22 | | | 0.62 | | | 52 | |
| | | 10.54 | | | 7.28 | | | 43,221 | | | 0.60 | | | 1.10 | | | 0.79 | | | 37 | |
| | | 9.94 | | | (0.60 | ) | | 28,875 | | | 0.60 | | | 0.52 | | | 1.41 | | | 7 | |
| | | | | | | | | | | | | | | | | | | | | | |
| | $ | 9.49 | | | (3.72% | ) | $ | 27,281 | | | 0.60 | % | | 3.84 | % | | 0.65 | % | | 13 | % |
| | | | | | | | | | | | | | | | | | | | | | |
| | | | | | | | | | | | | | | | | | | | | | |
| | | | | | | | | | | | | | | | | | | | | | |
| | $ | 11.47 | | | (6.89 | )% | $ | 36,500 | | | 1.27 | % | | 1.52 | % | | 1.29 | % | | 22 | % |
| | | 12.50 | | | 3.81 | | | 15,959 | | | 1.30 | | | 2.84 | | | 1.46 | | | 26 | |
| | | 12.57 | | | 13.26 | | | 14,308 | | | 1.30 | | | 3.20 | | | 1.94 | | | 78 | |
| | | 11.40 | | | 16.79 | | | 1,891 | | | 1.30 | | | 2.98 | | | 7.35 | | | 188 | |
| | | | | | | | | | | | | | | | | | | | | | |
| | $ | 11.37 | | | (7.23 | )% | $ | 28,014 | | | 2.03 | % | | 0.73 | % | | 2.05 | % | | 22 | % |
| | | 12.40 | | | 3.00 | | | 13,846 | | | 2.05 | | | 2.15 | | | 2.23 | | | 26 | |
| | | 12.49 | | | 12.45 | | | 4,525 | | | 2.05 | | | 2.38 | | | 2.68 | | | 78 | |
| | | 11.35 | | | 15.94 | | | 463 | | | 2.05 | | | 2.32 | | | 8.17 | | | 188 | |
| | | | | | | | | | | | | | | | | | | | | | |
| | $ | 11.47 | | | (6.71 | )% | $ | 39,019 | | | 1.03 | % | | 1.84 | % | | 1.05 | % | | 22 | % |
| | | 12.49 | | | 3.97 | | | 24,356 | | | 1.05 | | | 3.13 | | | 1.24 | | | 26 | |
| | | 12.57 | | | 13.56 | | | 8,156 | | | 1.05 | | | 3.50 | | | 1.66 | | | 78 | |
| | | 11.39 | | | 17.01 | | | 1,463 | | | 1.05 | | | 4.18 | | | 7.11 | | | 188 | |
| | | | | | | | | | | | | | | | | | | | | | |
| | $ | 11.47 | | | (3.52 | )% | $ | 407 | | | 0.96 | % | | 0.42 | % | | 0.96 | % | | 22 | % |
See notes to financial statements
167
| Financial highlights (unaudited) |
For a share outstanding throughout the periods indicated
| | | | | | Income (loss) from investment operations: | | Less distributions: | | |
| | | | | | | | | | | | | | | | Distributions | | | | | | | |
| | | | Net asset | | | Net | | | Net | | | Total | | | from | | | | | | Net asset | |
| | | | value, | | | investment | | realized and | | | from | | | net | | | | | | value, | |
| | | | beginning | | | income | | | unrealized | | | investment | | | investment | | | Total | | | end of | |
| | | | of period | | | (loss(b) | | | gain (loss) | | | operations | | | income | | | distributions | | | period | |
| Emerging Markets Fund | | | | | | | | | | | | | | | | | | | | | | |
| Class A | | | | | | | | | | | | | | | | | | | | | | |
| Period Ended 1/31/2016 | | $ | 8.60 | | | 0.09 | | | (1.19 | ) | | (1.10 | ) | | (0.02 | ) | | (0.02 | ) | $ | 7.48 | |
| Year Ended 7/31/2015 | | | 9.82 | | | 0.02 | | | (1.24 | ) | | (1.22 | ) | | 0.00 | | | 0.00 | | | 8.60 | |
| Year Ended 7/31/2014 | | | 8.49 | | | 0.02 | | | 1.31 | | | 1.33 | | | 0.00 | | | 0.00 | | | 9.82 | |
| Year Ended 7/31/2013 | | | 7.97 | | | 0.01 | | | 0.56 | | | 0.57 | | | (0.05 | ) | | (0.05 | ) | | 8.49 | |
| Year Ended 7/31/2012 | | | 9.74 | | | (0.02 | ) | | (1.62 | ) | | (1.64 | ) | | (0.13 | ) | | (0.13 | ) | | 7.97 | |
| Period Ended 7/31/2011(a) | | | 10.00 | | | 0.00* | | | (0.26 | ) | | (0.26 | ) | | 0.00 | | | 0.00 | | | 9.74 | |
| Class C | | | | | | | | | | | | | | | | | | | | | | |
| Period Ended 1/31/2016 | | $ | 8.35 | | | 0.05 | | | (1.15 | ) | | (1.10 | ) | | 0.00 | | | 0.00 | | $ | 7.25 | |
| Year Ended 7/31/2015 | | | 9.61 | | | (0.06 | ) | | (1.20 | ) | | (1.26 | ) | | 0.00 | | | 0.00 | | | 8.35 | |
| Year Ended 7/31/2014 | | | 8.37 | | | (0.04 | ) | | 1.28 | | | 1.24 | | | 0.00 | | | 0.00 | | | 9.61 | |
| Year Ended 7/31/2013 | | | 7.89 | | | (0.05 | ) | | 0.55 | | | 0.50 | | | (0.02 | ) | | (0.02 | ) | | 8.37 | |
| Year Ended 7/31/2012 | | | 9.70 | | | (0.09 | ) | | (1.60 | ) | | (1.69 | ) | | (0.12 | ) | | (0.12 | ) | | 7.89 | |
| Period Ended 7/31/2011(a) | | | 10.00 | | | (0.06 | ) | | (0.24 | ) | | (0.30 | ) | | 0.00 | | | 0.00 | | | 9.70 | |
| Class I | | | | | | | | | | | | | | | | | | | | | | |
| Period Ended 1/31/2016 | | $ | 8.63 | | | 0.08 | | | (1.17 | ) | | (1.09 | ) | | (0.05 | ) | | (0.05 | ) | $ | 7.49 | |
| Year Ended 7/31/2015 | | | 9.86 | | | 0.03 | | | (1.25 | ) | | (1.22 | ) | | (0.01 | ) | | (0.01 | ) | | 8.63 | |
| Year Ended 7/31/2014 | | | 8.49 | | | 0.05 | | | 1.32 | | | 1.37 | | | 0.00 | | | 0.00 | | | 9.86 | |
| Year Ended 7/31/2013 | | | 7.98 | | | 0.03 | | | 0.56 | | | 0.59 | | | (0.08 | ) | | (0.08 | ) | | 8.49 | |
| Year Ended 7/31/2012 | | | 9.75 | | | (0.00* | ) | | (1.62 | ) | | (1.62 | ) | | (0.15 | ) | | (0.15 | ) | | 7.98 | |
| Period Ended 7/31/2011(a) | | | 10.00 | | | (0.01 | ) | | (0.24 | ) | | (0.25 | ) | | 0.00 | | | 0.00 | | | 9.75 | |
| Class R6 | | | | | | | | | | | | | | | | | | | | | | |
| Period Ended 1/31/2016** | | $ | 8.06 | | | 0.01 | | | (0.53 | ) | | (0.52 | ) | | (0.05 | ) | | (0.05 | ) | $ | 7.49 | |
| (a) | The Emerging Markets Fund commenced operations on December 31, 2010. |
| (b) | Per share data was calculated using average shares outstanding during the period. |
| (c) | Total returns are historical and assume changes in share price, reinvestment of all dividends and distributions and no sales charge. Had certain expenses not been waived/reimbursed during the periods shown, total returns would have been lower. Total returns for periods of less than one year are not annualized. |
| (d) | Not annualized for periods less than one year. |
| (e) | Class R6 commenced operations on November 30, 2015. |
| * | Amount represents less than $0.01. |
See notes to financial statements
168
| Financial highlights (unaudited) |
| | | | | | | | Ratios to average net assets: | | | | |
| | | | | | | | | | | | | | | | | | | |
| | | | | | | | | Annualized | | | Annualized | | | Annualized ratio of operating expenses | | | | |
| | | | | | | | | ratio of | | | ratio of | | | to average net | | | | |
| | | | | | Net assets, | | | operating | | | net investment | | | assets without | | | | |
| | | | | | end of | | | expenses to | | | income/(loss) | | | waivers and/or | | | Portfolio | |
| | | Total | | | period | | | average | | | to average | | | expenses | | | turnover | |
| | | return(c) | | | (000) | | | net assets | | | net assets | | | reimbursed | | | rate(d) | |
| | | | | | | | | | | | | | | | | | | |
| | | | | | | | | | | | | | | | | | | |
| | | (12.81 | )% | $ | 4,417 | | | 1.79 | % | | 2.14 | % | | 2.39 | % | | 47 | % |
| | | (12.42 | ) | | 8,272 | | | 1.79 | | | 0.21 | | | 2.13 | | | 148 | |
| | | 15.67 | | | 8,656 | | | 1.79 | | | 0.26 | | | 1.97 | | | 97 | |
| | | 7.16 | | | 8,930 | | | 1.79 | | | 0.09 | | | 2.15 | | | 126 | |
| | | (16.70 | ) | | 7,011 | | | 1.79 | | | (0.25 | ) | | 2.51 | | | 110 | |
| | | (2.60 | ) | | 15,841 | | | 1.79 | | | 0.04 | | | 3.97 | | | 35 | |
| | | | | | | | | | | | | | | | | | | |
| | | (13.17 | )% | $ | 2,926 | | | 2.54 | % | | 1.17 | % | | 3.20 | % | | 47 | % |
| | | (13.11 | ) | | 3,049 | | | 2.54 | | | (0.62 | ) | | 2.90 | | | 148 | |
| | | 14.81 | | | 4,036 | | | 2.54 | | | (0.42 | ) | | 2.74 | | | 97 | |
| | | 6.33 | | | 3,169 | | | 2.54 | | | (0.60 | ) | | 2.87 | | | 126 | |
| | | (17.31 | ) | | 2,305 | | | 2.54 | | | (1.08 | ) | | 3.23 | | | 110 | |
| | | (3.00 | ) | | 1,384 | | | 2.54 | | | (1.06 | ) | | 4.72 | | | 35 | |
| | | | | | | | | | | | | | | | | | | |
| | | (12.70 | )% | $ | 20,336 | | | 1.54 | % | | 1.94 | % | | 2.14 | % | | 47 | % |
| | | (12.34 | ) | | 12,652 | | | 1.54 | | | 0.37 | | | 1.85 | | | 148 | |
| | | 16.14 | | | 16,057 | | | 1.54 | | | 0.56 | | | 1.66 | | | 97 | |
| | | 7.39 | | | 10,773 | | | 1.54 | | | 0.34 | | | 1.80 | | | 126 | |
| | | (16.49 | ) | | 7,724 | | | 1.54 | | | (0.06 | ) | | 2.16 | | | 110 | |
| | | (2.50 | ) | | 3,382 | | | 1.54 | | | (0.26 | ) | | 3.72 | | | 35 | |
| | | | | | | | | | | | | | | | | | | |
| | | (6.54 | )% | $ | 258 | | | 1.54 | % | | 0.57 | % | | 2.02 | % | | 47 | % |
See notes to financial statements
169
| Financial highlights (unaudited) |
For a share outstanding throughout the periods indicated
| | | | | | Income (loss) from investment operations: | | Less distributions: | | | |
| | | | | | | | | | | | | | | | Distributions | | | | | | | |
| | | | Net asset | | | Net | | | Net | | | Total | | | from | | | | | | Net asset | |
| | | | value, | | | investment | | realized and | | | from | | | net | | | | | | value, | |
| | | | beginning | | | income | | | unrealized | | | investment | | | investment | | | Total | | | end of | |
| | | | of period | | | (loss)(a) | | | gain (loss) | | | operations | | | income | | | distributions | | | period | |
| European Focus Fund | | | | | | | | | | | | | | | | | | | | | | |
| Class A | | | | | | | | | | | | | | | | | | | | | | |
| Period Ended 1/31/2016 | | $ | 36.91 | | | (0.05 | ) | | (5.54 | ) | | (5.59 | ) | | (0.24 | ) | | (0.24 | ) | $ | 31.08 | |
| Year Ended 7/31/2015 | | | 35.42 | | | 0.35 | | | 1.67 | | | 2.02 | | | (0.53 | ) | | (0.53 | ) | | 36.91 | |
| Year Ended 7/31/2014 | | | 29.23 | | | 0.66 | | | 5.60 | | | 6.26 | | | (0.07 | ) | | (0.07 | ) | | 35.42 | |
| Year Ended 7/31/2013 | | | 22.44 | | | 0.26 | | | 6.90 | | | 7.16 | | | (0.37 | ) | | (0.37 | ) | | 29.23 | |
| Year Ended 7/31/2012 | | | 29.07 | | | 0.30 | | | (5.71 | ) | | (5.41 | ) | | (1.22 | ) | | (1.22 | ) | | 22.44 | |
| Year Ended 7/31/2011 | | | 23.90 | | | 0.07 | | | 5.89 | | | 5.96 | | | (0.79 | ) | | (0.79 | ) | | 29.07 | |
| Class C | | | | | | | | | | | | | | | | | | | | | | |
| Period Ended 1/31/2016 | | $ | 34.57 | | | (0.17 | ) | | (5.20 | ) | | (5.37 | ) | | (0.04 | ) | | (0.04 | ) | $ | 29.16 | |
| Year Ended 7/31/2015 | | | 33.35 | | | 0.04 | | | 1.59 | | | 1.63 | | | (0.41 | ) | | (0.41 | ) | | 34.57 | |
| Year Ended 7/31/2014 | | | 27.67 | | | 0.32 | | | 5.36 | | | 5.68 | | | 0.00 | | | 0.00 | | | 33.35 | |
| Year Ended 7/31/2013 | | | 21.25 | | | 0.05 | | | 6.54 | | | 6.59 | | | (0.17 | ) | | (0.17 | ) | | 27.67 | |
| Year Ended 7/31/2012 | | | 27.50 | | | 0.10 | | | (5.37 | ) | | (5.27 | ) | | (0.98 | ) | | (0.98 | ) | | 21.25 | |
| Year Ended 7/31/2011 | | | 22.65 | | | (0.15 | ) | | 5.60 | | | 5.45 | | | (0.60 | ) | | (0.60 | ) | | 27.50 | |
| Class I | | | | | | | | | | | | | | | | | | | | | | |
| Period Ended 1/31/2016 | | $ | 36.90 | | | (0.01 | ) | | (5.54 | ) | | (5.55 | ) | | (0.30 | ) | | (0.30 | ) | $ | 31.05 | |
| Year Ended 7/31/2015 | | | 35.48 | | | 0.42 | | | 1.67 | | | 2.09 | | | (0.67 | ) | | (0.67 | ) | | 36.90 | |
| Year Ended 7/31/2014 | | | 29.25 | | | 0.74 | | | 5.61 | | | 6.35 | | | (0.12 | ) | | (0.12 | ) | | 35.48 | |
| Year Ended 7/31/2013 | | | 22.46 | | | 0.40 | | | 6.85 | | | 7.25 | | | (0.46 | ) | | (0.46 | ) | | 29.25 | |
| Year Ended 7/31/2012 | | | 29.10 | | | 0.39 | | | (5.73 | ) | | (5.34 | ) | | (1.30 | ) | | (1.30 | ) | | 22.46 | |
| Year Ended 7/31/2011 | | | 23.92 | | | 0.16 | | | 5.88 | | | 6.04 | | | (0.86 | ) | | (0.86 | ) | | 29.10 | |
| Class R6 | | | | | | | | | | | | | | | | | | | | | | |
| Period Ended 1/31/2016(e) | | $ | 34.37 | | | (0.03 | ) | | (2.99 | ) | | (3.02 | ) | | (0.30 | ) | | (0.30 | ) | $ | 31.05 | |
| (a) | Per share data was calculated using average shares outstanding during the period. |
| (b) | Total returns are historical and assume changes in share price, reinvestment of all dividends and distributions and no sales charge. Had certain expenses not been waived/reimbursed during the periods shown, total returns would have been lower. Total returns for periods of less than one year are not annualized. |
| (c) | The net investment income ratio would have been 0.00% lower had the Fund not received refunds of previously withheld tax, plus interest, based on reclaims filed with Finland for calendar years 2009-2013. Refer to Note 2, under the heading "Federal Income Taxes." |
| (d) | Not annualized for periods less than one year. |
| (e) | Class R6 commenced operations on November 30, 2015. |
See notes to financial statements
170
| Financial highlights (unaudited) |
| | | | | | | | | Ratios to average net assets: | | | | |
| | | | | | | | | | | | | | | Annualized ratio of | | | | |
| | | | | | | | | Annualized | | | Annualized | | | operating expenses | | | | |
| | | | | | | | | ratio of | | | ratio of | | | to average net | | | | |
| | | | | | Net assets, | | | operating | | | net investment | | | assets without | | | | |
| | | | | | end of | | | expenses to | | | income/(loss) | | | waivers and/or | | | Portfolio | |
| | | Total | | | period | | | average | | | to average | | | expenses | | | turnover | |
| | | return(b) | | | (000) | | | net assets | | | net assets | | | reimbursed | | | rate(d) | |
| | | | | | | | | | | | | | | | | | | |
| | | | | | | | | | | | | | | | | | | |
| | | (15.20 | )% | $ | 831,212 | | | 1.27 | % | | (0.30 | )% | | 1.27 | % | | 26 | % |
| | | 5.86 | | | 905,598 | | | 1.30 | | | 0.99 | (c) | | 1.30 | | | 75 | |
| | | 21.43 | | | 750,572 | | | 1.37 | | | 1.88 | | | 1.37 | | | 90 | |
| | | 32.13 | | | 317,547 | | | 1.50 | | | 1.01 | | | 1.50 | | | 115 | |
| | | (18.32 | ) | | 236,974 | | | 1.53 | | | 1.24 | | | 1.53 | | | 69 | |
| | | 25.08 | | | 332,755 | | | 1.54 | | | 0.25 | | | 1.54 | | | 67 | |
| | | | | | | | | | | | | | | | | | | |
| | | (15.54 | )% | $ | 325,600 | | | 2.05 | % | | (1.08 | )% | | 2.05 | % | | 26 | % |
| | | 5.02 | | | 365,135 | | | 2.09 | | | 0.12 | (c) | | 2.09 | | | 75 | |
| | | 20.53 | | | 266,900 | | | 2.14 | | | 0.98 | | | 2.14 | | | 90 | |
| | | 31.10 | | | 104,206 | | | 2.27 | | | 0.22 | | | 2.27 | | | 115 | |
| | | (18.94 | ) | | 88,015 | | | 2.32 | | | 0.45 | | | 2.32 | | | 69 | |
| | | 24.13 | | | 132,641 | | | 2.29 | | | (0.56 | ) | | 2.29 | | | 67 | |
| | | | | | | | | | | | | | | | | | | |
| | | (15.10 | )% | $ | 2,257,389 | | | 1.03 | % | | (0.06 | )% | | 1.03 | % | | 26 | % |
| | | 6.10 | | | 2,357,546 | | | 1.07 | | | 1.19 | (c) | | 1.07 | | | 75 | |
| | | 21.73 | | | 1,400,298 | | | 1.11 | | | 2.09 | | | 1.11 | | | 90 | |
| | | 32.54 | | | 266,517 | | | 1.20 | | | 1.55 | | | 1.20 | | | 115 | |
| | | (18.04 | ) | | 120,392 | | | 1.21 | | | 1.65 | | | 1.21 | | | 69 | |
| | | 25.40 | | | 129,452 | | | 1.29 | | | 0.57 | | | 1.29 | | | 67 | |
| | | | | | | | | | | | | | | | | | | |
| | | (8.86 | )% | $ | 1,370 | | | 1.11 | % | | (0.54 | )% | | 1.11 | % | | 26 | % |
See notes to financial statements
171
| Financial highlights (unaudited) |
For a share outstanding throughout the periods indicated
| | | | | | | Income (loss) from investment operations: | | | Less distributions: | | | | |
| | | | Net asset value, beginning of period | | | Net investment income (loss)(a) | | | Net realized and unrealized gain (loss) | | | Total from investment operations | | | Distributions from net investment income | | | Total distributions | | | Net asset value, end of period | |
| Global Equity Income Fund | | | | | | | | | | | | | | | | | | | | | | |
| Class A | | | | | | | | | | | | | | | | | | | | | | |
| Period Ended 1/31/2016 | | $ | 7.86 | | | 0.19 | | | (0.80 | ) | | (0.61 | ) | | (0.18 | ) | | (0.18 | ) | $ | 7.07 | |
| Year Ended 7/31/2015 | | | 8.36 | | | 0.48 | | | (0.50 | ) | | (0.02 | ) | | (0.48 | ) | | (0.48 | ) | | 7.86 | |
| Year Ended 7/31/2014 | | | 7.85 | | | 0.52 | | | 0.48 | | | 1.00 | | | (0.49 | ) | | (0.49 | ) | | 8.36 | |
| Year Ended 7/31/2013 | | | 7.06 | | | 0.50 | | | 0.78 | | | 1.28 | | | (0.49 | ) | | (0.49 | ) | | 7.85 | |
| Year Ended 7/31/2012 | | | 7.45 | | | 0.48 | | | (0.39 | ) | | 0.09 | | | (0.48 | ) | | (0.48 | ) | | 7.06 | |
| Year Ended 7/31/2011 | | | 6.99 | | | 0.46 | | | 0.51 | | | 0.97 | | | (0.51 | ) | | (0.51 | ) | | 7.45 | |
| Class C | | | | | | | | | | | | | | | | | | | | | | |
| Period Ended 1/31/2016 | | $ | 7.81 | | | 0.16 | | | (0.80 | ) | | (0.64 | ) | | (0.15 | ) | | (0.15 | ) | $ | 7.02 | |
| Year Ended 7/31/2015 | | | 8.32 | | | 0.42 | | | (0.51 | ) | | (0.09 | ) | | (0.42 | ) | | (0.42 | ) | | 7.81 | |
| Year Ended 7/31/2014 | | | 7.81 | | | 0.46 | | | 0.48 | | | 0.94 | | | (0.43 | ) | | (0.43 | ) | | 8.32 | |
| Year Ended 7/31/2013 | | | 7.03 | | | 0.44 | | | 0.77 | | | 1.21 | | | (0.43 | ) | | (0.43 | ) | | 7.81 | |
| Year Ended 7/31/2012 | | | 7.42 | | | 0.43 | | | (0.39 | ) | | 0.04 | | | (0.43 | ) | | (0.43 | ) | | 7.03 | |
| Year Ended 7/31/2011 | | | 6.96 | | | 0.40 | | | 0.52 | | | 0.92 | | | (0.46 | ) | | (0.46 | ) | | 7.42 | |
| Class I | | | | | | | | | | | | | | | | | | | | | | |
| Period Ended 1/31/2016 | | $ | 7.87 | | | 0.20 | | | (0.80 | ) | | (0.60 | ) | | (0.19 | ) | | (0.19 | ) | $ | 7.08 | |
| Year Ended 7/31/2015 | | | 8.37 | | | 0.51 | | | (0.51 | ) | | 0.00 | | | (0.50 | ) | | (0.50 | ) | | 7.87 | |
| Year Ended 7/31/2014 | | | 7.86 | | | 0.55 | | | 0.47 | | | 1.02 | | | (0.51 | ) | | (0.51 | ) | | 8.37 | |
| Year Ended 7/31/2013 | | | 7.07 | | | 0.53 | | | 0.77 | | | 1.30 | | | (0.51 | ) | | (0.51 | ) | | 7.86 | |
| Year Ended 7/31/2012 | | | 7.46 | | | 0.51 | | | (0.40 | ) | | 0.11 | | | (0.50 | ) | | (0.50 | ) | | 7.07 | |
| Year Ended 7/31/2011 | | | 6.99 | | | 0.48 | | | 0.52 | | | 1.00 | | | (0.53 | ) | | (0.53 | ) | | 7.46 | |
| Class R6 | | | | | | | | | | | | | | | | | | | | | | |
| Period Ended 1/31/2016(e) | | $ | 7.44 | | | 0.05 | | | (0.38 | ) | | (0.33 | ) | | (0.03 | ) | | (0.03 | ) | $ | 7.08 | |
| (a) | Per share data was calculated using average shares outstanding during the period. |
| (b) | Total returns are historical and assume changes in share price, reinvestment of all dividends and distributions and no sales charge. Had certain expenses not been waived/reimbursed during the periods shown, total returns would have been lower. Total returns for periods of less than one year are not annualized. |
| (c) | Not annualized for periods less than one year. |
| (d) | The net investment income ratio would have been 0.01% lower had the fund not received refunds of previously withheld tax ,plus interest, based on reclaims filed with Finland for calendar years 2009-2013. Refer to note 2, under the heading "Federal income taxes". |
| (e) | Class R6 commenced operations on November 30, 2015. |
See notes to financial statements
172
| Financial highlights (unaudited) |
| | | | | | | | Ratios to average net assets: | | | | |
| | | | | | | | Annualized ratio of | | | Annualized ratio of | | | Annualized ratio of operating expenses to average net | | | | |
| | | | | Net assets, | | | operating | | | net investment | | | assets without | | | | |
| | | | | end of | | | expenses to | | | income/(loss) | | | waivers and/or | | | Portfolio | |
| | Total | | | period | | | average | | | to average | | | expenses | | | turnover | |
| | return(b) | | | (000) | | | net assets | | | net assets | | | reimbursed | | | rate(c) | |
| | | | | | | | | | | | | | | | | | |
| | | | | | | | | | | | | | | | | | |
| | (7.84 | )% | $ | 655,101 | | | 1.09 | % | | 5.20 | % | | 1.09 | % | | 74 | % |
| | (0.21 | ) | | 702,841 | | | 1.09 | | | 5.99 | (d) | | 1.09 | | | 127 | |
| | 12.93 | | | 804,022 | | | 1.13 | | | 6.31 | | | 1.13 | | | 103 | |
| | 18.58 | | | 707,252 | | | 1.22 | | | 6.56 | | | 1.22 | | | 130 | |
| | 1.59 | | | 467,318 | | | 1.29 | | | 6.97 | | | 1.29 | | | 108 | |
| | 14.13 | | | 489,400 | | | 1.32 | | | 6.18 | | | 1.32 | | | 127 | |
| | | | | | | | | | | | | | | | | | |
| | (8.19 | )% | $ | 1,025,953 | | | 1.85 | % | | 4.44 | % | | 1.85 | % | | 74 | % |
| | (1.09 | ) | | 1,138,357 | | | 1.86 | | | 5.28 | (d) | | 1.86 | | | 127 | |
| | 12.18 | | | 957,099 | | | 1.88 | | | 5.59 | | | 1.88 | | | 103 | |
| | 17.65 | | | 587,376 | | | 1.98 | | | 5.85 | | | 1.98 | | | 130 | |
| | 0.82 | | | 363,751 | | | 2.05 | | | 6.21 | | | 2.05 | | | 108 | |
| | 13.35 | | | 363,455 | | | 2.07 | | | 5.36 | | | 2.07 | | | 127 | |
| | | | | | | | | | | | | | | | | | |
| | (7.74 | )% | $ | 1,728,764 | | | 0.85 | % | | 5.44 | % | | 0.85 | % | | 74 | % |
| | 0.02 | | | 1,864,448 | | | 0.86 | | | 6.32 | (d) | | 0.86 | | | 127 | |
| | 13.19 | | | 1,363,213 | | | 0.87 | | | 6.60 | | | 0.87 | | | 103 | |
| | 18.87 | | | 665,505 | | | 0.95 | | | 6.95 | | | 0.95 | | | 130 | |
| | 1.87 | | | 332,048 | | | 1.01 | | | 7.38 | | | 1.01 | | | 108 | |
| | 14.55 | | | 198,216 | | | 1.07 | | | 6.35 | | | 1.07 | | | 127 | |
| | | | | | | | | | | | | | | | | | |
| | (4.42 | )% | $ | 1,709 | | | 0.87 | % | | 4.05 | % | | 0.87 | % | | 74 | % |
See notes to financial statements
173
| Financial highlights (unaudited) |
For a share outstanding throughout the periods indicated
| | | | | | | Income (loss) from investment operations: | | | Less distributions: | | | | |
| | | | | | | | | | | | | | | | Distributions | | | | | | | |
| | | | Net asset | | | Net | | | Net | | | Total | | | from net | | | | | | Net asset | |
| | | | value, | | | investment | | | realized and | | | from | | | realized | | | | | | value, | |
| | | | beginning | | | income | | unrealized gain | | | investment | | | capital | | | Total | | | end of | |
| | | | of period | | | (loss)(a) | | | (loss) | | | operations | | | gains | | | distributions | | | period | |
| Global Technology Fund | | | | | | | | | | | | | | | | | | | | | | |
| Class A | | | | | | | | | | | | | | | | | | | | | | |
| Period Ended 1/31/2016 | | $ | 26.30 | | | (0.04 | ) | | (1.59 | ) | | (1.63 | ) | | (3.21 | ) | | (3.21 | ) | $ | 21.46 | |
| Year Ended 7/31/2015 | | | 26.97 | | | (0.14 | ) | | 2.86 | | | 2.72 | | | (3.39 | ) | | (3.39 | ) | | 26.30 | |
| Year Ended 7/31/2014 | | | 23.22 | | | (0.17 | ) | | 4.09 | | | 3.92 | | | (0.17 | ) | | (0.17 | ) | | 26.97 | |
| Year Ended 7/31/2013 | | | 19.69 | | | 0.06 | | | 3.47 | | | 3.53 | | | 0.00 | | | 0.00 | | | 23.22 | |
| Year Ended 7/31/2012 | | | 20.55 | | | (0.15 | ) | | (0.71 | ) | | (0.86 | ) | | 0.00 | | | 0.00 | | | 19.69 | |
| Year Ended 7/31/2011 | | | 16.10 | | | (0.08 | ) | | 4.53 | | | 4.45 | | | 0.00 | | | 0.00 | | | 20.55 | |
| Class C | | | | | | | | | | | | | | | | | | | | | | |
| Period Ended 1/31/2016 | | $ | 23.32 | | | (0.12 | ) | | (1.36 | ) | | (1.48 | ) | | (3.21 | ) | | (3.21 | ) | $ | 18.63 | |
| Year Ended 7/31/2015 | | | 24.46 | | | (0.30 | ) | | 2.55 | | | 2.25 | | | (3.39 | ) | | (3.39 | ) | | 23.32 | |
| Year Ended 7/31/2014 | | | 21.23 | | | (0.33 | ) | | 3.73 | | | 3.40 | | | (0.17 | ) | | (0.17 | ) | | 24.46 | |
| Year Ended 7/31/2013 | | | 18.15 | | | (0.09 | ) | | 3.17 | | | 3.08 | | | 0.00 | | | 0.00 | | | 21.23 | |
| Year Ended 7/31/2012 | | | 19.08 | | | (0.28 | ) | | (0.65 | ) | | (0.93 | ) | | 0.00 | | | 0.00 | | | 18.15 | |
| Year Ended 7/31/2011 | | | 15.06 | | | (0.22 | ) | | 4.24 | | | 4.02 | | | 0.00 | | | 0.00 | | | 19.08 | |
| Class I | | | | | | | | | | | | | | | | | | | | | | |
| Period Ended 1/31/2016 | | $ | 26.80 | | | (0.01 | ) | | (1.62 | ) | | (1.63 | ) | | (3.21 | ) | | (3.21 | ) | $ | 21.96 | |
| Year Ended 7/31/2015 | | | 27.37 | | | (0.08 | ) | | 2.90 | | | 2.82 | | | (3.39 | ) | | (3.39 | ) | | 26.80 | |
| Year Ended 7/31/2014 | | | 23.50 | | | (0.10 | ) | | 4.14 | | | 4.04 | | | (0.17 | ) | | (0.17 | ) | | 27.37 | |
| Year Ended 7/31/2013 | | | 19.88 | | | 0.11 | | | 3.51 | | | 3.62 | | | 0.00 | | | 0.00 | | | 23.50 | |
| Year Ended 7/31/2012 | | | 20.68 | | | (0.09 | ) | | (0.71 | ) | | (0.80 | ) | | 0.00 | | | 0.00 | | | 19.88 | |
| Year Ended 7/31/2011 | | | 16.16 | | | (0.02 | ) | | 4.54 | | | 4.52 | | | 0.00 | | | 0.00 | | | 20.68 | |
| Class R6 | | | | | | | | | | | | | | | | | | | | | | |
| Period Ended 1/31/2016(e) | | $ | 27.31 | | | 0.02 | | | (2.15 | ) | | (2.13 | ) | | (3.21 | ) | | (3.21 | ) | $ | 21.97 | |
| (a) | Per share data was calculated using average shares outstanding during the period. |
| (b) | Total returns are historical and assume changes in share price, reinvestment of all dividends and distributions and no sales charge. Had certain expenses not been waived/reimbursed during the periods shown, total returns would have been lower. Total returns for periods of less than one year are not annualized. |
| (c) | Not annualized for periods less than one year. |
| (d) | The net investment income ratio would have been 0.00% lower had the fund not received refunds of previously withheld tax ,plus interest, based on reclaims filed with Finland for calendar years 2009-2013. Refer to note 2, under the heading "Federal income taxes". |
| (e) | Class R6 commenced operations on November 30, 2015. |
See notes to financial statements
174
| Financial highlights (unaudited) |
| | | | | | | | Ratios to average net assets: | | | | |
| | | | | | | | | | | | | | Annualized ratio of | | | | |
| | | | | | | | Annualized | | | Annualized | | | operating expenses | | | | |
| | | | | | | | ratio of | | | ratio of | | | to average net | | | | |
| | | | | Net assets, | | | operating | | | net investment | | | assets without | | | | |
| | | | | end of | | | expenses to | | | income/(loss) | | | waivers and/or | | | Portfolio | |
| | Total | | | period | | | average | | | to average | | | expenses | | | turnover | |
| | return(b) | | | (000) | | | net assets | | | net assets | | | reimbursed | | | rate(c) | |
| | | | | | | | | | | | | | | | | | |
| | | | | | | | | | | | | | | | | | |
| | (7.45 | )% | $ | 88,927 | | | 1.35 | % | | (0.34 | )% | | 1.35 | % | | 18 | % |
| | 10.70 | | | 99,903 | | | 1.34 | | | (0.52 | )(d) | | 1.34 | | | 61 | |
| | 16.91 | | | 155,708 | | | 1.44 | | | (0.65 | ) | | 1.44 | | | 65 | |
| | 17.93 | | | 169,279 | | | 1.49 | | | 0.28 | | | 1.49 | | | 83 | |
| | (4.18 | ) | | 156,948 | | | 1.50 | | | (0.75 | ) | | 1.50 | | | 113 | |
| | 27.64 | | | 191,623 | | | 1.55 | | | (0.42 | ) | | 1.55 | | | 93 | |
| | | | | | | | | | | | | | | | | | |
| | (7.78 | )% | $ | 67,539 | | | 2.12 | % | | (1.12 | )% | | 2.12 | % | | 18 | % |
| | 9.79 | | | 79,667 | | | 2.12 | | | (1.29 | )(d) | | 2.12 | | | 61 | |
| | 16.04 | | | 82,699 | | | 2.21 | | | (1.42 | ) | | 2.21 | | | 65 | |
| | 16.97 | | | 71,401 | | | 2.26 | | | (0.49 | ) | | 2.26 | | | 83 | |
| | (4.87 | ) | | 69,286 | | | 2.29 | | | (1.54 | ) | | 2.29 | | | 113 | |
| | 26.69 | | | 79,228 | | | 2.30 | | | (1.17 | ) | | 2.30 | | | 93 | |
| | | | | | | | | | | | | | | | | | |
| | (7.31 | )% | $ | 82,189 | | | 1.10 | % | | (0.10 | )% | | 1.10 | % | | 18 | % |
| | 10.92 | | | 95,958 | | | 1.11 | | | (0.28 | )(d) | | 1.11 | | | 61 | |
| | 17.22 | | | 115,816 | | | 1.19 | | | (0.40 | ) | | 1.19 | | | 65 | |
| | 18.21 | | | 97,882 | | | 1.22 | | | 0.51 | | | 1.22 | | | 83 | |
| | (3.87 | ) | | 61,492 | | | 1.23 | | | (0.47 | ) | | 1.23 | | | 113 | |
| | 27.97 | | | 52,351 | | | 1.30 | | | (0.12 | ) | | 1.30 | | | 93 | |
| | | | | | | | | | | | | | | | | | |
| | (9.00 | )% | $ | 916 | | | 1.02 | % | | 0.53 | % | | 1.02 | % | | 18 | % |
See notes to financial statements
175
| Financial highlights (unaudited) |
For a share outstanding throughout the periods indicated
| | | | | | | Income (loss) from investment operations: | | | Less distributions: | | | | |
| | | | | | | | | | | | | | | | Distributions | | | Distributions | | | | |
| | | | Net asset | | | Net | | | Net | | | Total | | | from | | | from net | | | | |
| | | | value, | | | investment | | | realized and | | | from | | | net | | | realized | | | | |
| | | | beginning | | | income | | unrealized gain | | | investment | | | investment | | | capital | | | Total | |
| | | | of period | | | (loss)(c) | | | (loss) | | | operations | | | income | | | gains | | | distributions | |
| High Yield Opportunities Fund | | | | | | | | | | | | | | | | | | | | | | |
| Class A | | | | | | | | | | | | | | | | | | | | | | |
| Period Ended 1/31/2016 | | $ | 9.68 | | | 0.24 | | | (0.74 | ) | | (0.50 | ) | | (0.24 | ) | | 0.00 | | | (0.24 | ) |
| Year Ended 7/31/2015 | | | 10.38 | | | 0.51 | | | (0.39 | ) | | 0.12 | | | (0.56 | ) | | (0.26 | ) | | (0.82 | ) |
| Year Ended 7/31/2014 | | | 9.98 | | | 0.59 | | | 0.45 | | | 1.04 | | | (0.61 | ) | | (0.03 | ) | | (0.64 | ) |
| Period Ended 7/31/2013(a) | | | 10.00 | | | 0.15 | | | (0.06 | ) | | 0.09 | | | (0.11 | ) | | 0.00 | | | (0.11 | ) |
| Class C | | | | | | | | | | | | | | | | | | | | | | |
| Period Ended 1/31/2016 | | $ | 9.67 | | | 0.21 | | | (0.75 | ) | | (0.54 | ) | | (0.22 | ) | | 0.00 | | | (0.22 | ) |
| Year Ended 7/31/2015 | | | 10.38 | | | 0.42 | | | (0.38 | ) | | 0.04 | | | (0.49 | ) | | (0.26 | ) | | (0.75 | ) |
| Year Ended 7/31/2014 | | | 9.99 | | | 0.52 | | | 0.43 | | | 0.95 | | | (0.53 | ) | | (0.03 | ) | | (0.56 | ) |
| Period Ended 7/31/2013(a) | | | 10.00 | | | 0.13 | | | (0.05 | ) | | 0.08 | | | (0.09 | ) | | 0.00 | | | (0.09 | ) |
| Class I | | | | | | | | | | | | | | | | | | | | | | |
| Period Ended 1/31/2016 | | $ | 9.65 | | | 0.25 | | | (0.74 | ) | | (0.49 | ) | | (0.26 | ) | | 0.00 | | | (0.26 | ) |
| Year Ended 7/31/2015 | | | 10.35 | | | 0.54 | | | (0.39 | ) | | 0.15 | | | (0.59 | ) | | (0.26 | ) | | (0.85 | ) |
| Year Ended 7/31/2014 | | | 9.97 | | | 0.62 | | | 0.43 | | | 1.05 | | | (0.64 | ) | | (0.03 | ) | | (0.67 | ) |
| Period Ended 7/31/2013(a) | | | 10.00 | | | 0.16 | | | (0.06 | ) | | 0.10 | | | (0.13 | ) | | 0.00 | | | (0.13 | ) |
| Class R6 | | | | | | | | | | | | | | | | | | | | | | |
| Period Ended 1/31/2016(g) | | $ | 9.20 | | | 0.08 | | | (0.29 | ) | | (0.21 | ) | | (0.09 | ) | | 0.00 | | | (0.09 | ) |
| International Long/Short Equity Fund | | | | | | | | | | | | | | | | | | | | | | |
| Class A | | | | | | | | | | | | | | | | | | | | | | |
| Period Ended 1/31/2016 | | $ | 10.27 | | | (0.08 | ) | | 0.11 | | | 0.03 | | | (0.33 | ) | | (0.03 | ) | | (0.36 | ) |
| Period Ended 7/31/2015(b) | | | 10.00 | | | (0.12 | ) | | 0.39 | | | 0.27 | | | 0.00 | | | 0.00 | | | 0.00 | |
| Class C | | | | | | | | | | | | | | | | | | | | | | |
| Period Ended 1/31/2016 | | $ | 10.22 | | | (0.12 | ) | | 0.11 | | | (0.01 | ) | | (0.27 | ) | | (0.03 | ) | | (0.30 | ) |
| Period Ended 7/31/2015(b) | | | 10.00 | | | (0.17 | ) | | 0.39 | | | 0.22 | | | 0.00 | | | 0.00 | | | 0.00 | |
| Class I | | | | | | | | | | | | | | | | | | | | | | |
| Period Ended 1/31/2016 | | $ | 10.28 | | | (0.06 | ) | | 0.11 | | | 0.05 | | | (0.33 | ) | | (0.03 | ) | | (0.36 | ) |
| Period Ended 7/31/2015(b) | | | 10.00 | | | (0.10 | ) | | 0.38 | | | 0.28 | | | 0.00 | | | 0.00 | | | 0.00 | |
| Class R6 | | | | | | | | | | | | | | | | | | | | | | |
| Period Ended 1/31/2016(g) | | $ | 10.14 | | | (0.03 | ) | | 0.21 | | | 0.18 | | | (0.33 | ) | | (0.03 | ) | | (0.36 | ) |
| (a) | The High Yield Opportunities Fund commenced operations on April 30, 2013. |
| (b) | The International Long/Short Equity Fund commenced operations on December 9, 2014. |
| (c) | Per share data was calculated using average shares outstanding during the period. |
| (d) | Total returns are historical and assume changes in share price, reinvestment of all dividends and distributions and no sales charge. Had certain expenses not been waived/reimbursed during the periods shown, total returns would have been lower. Total returns for periods of less than one year are not annualized. |
| (e) | The International Long/Short Equity Fund's operating expenses, excluding 12b-1 fees and dividend expense and financing charges on securities sold short, are contractually limited to 1.50%. Additional columns have been shown to reflect the annualized gross and net expense ratios inclusive of investment expenses associated with short selling activities. |
| (f) | Not annualized for periods less than one year. Portfolio turnover for the International Long/Short Equity Fund includes the effect of short sales and purchases to close short positions. |
| (g) | Class R6 commenced operations on November 30, 2015. |
See notes to financial statements
176
| Financial highlights (unaudited) |
| | | | | | | | | | | Ratios to average net assets: | | | | |
| | | Net asset
value,
end of
period | | | Total
return(d) | | | Net
assets,
end of
period
(000) | | | Annualized
ratio of
operating
expenses to
average
net assets,
EXCLUDING
short sale
expenses(e) | | | Annualized
ratio of
operating
expenses to
average
net assets,
INCLUDING
short sale
expenses(e) | | | Annualized
ratio of
net
investment
income/
(loss)
to average
net assets | | | Annualized
ratio of
operating
expenses to
average net
assets without
waivers and/
or expenses
reimbursed,
EXCLUDING
short sale
expenses(e) | | | Annualized
ratio of
operating
expenses to
average net
assets without
waivers and/
or expenses
reimbursed,
INCLUDING
short sale
expenses(e) | | | Portfolio
turnover
rate(f) | |
| | | | | | | | | | | | | | | | | | | | | | | | | | | | |
| | | | | | | | | | | | | | | | | | | | | | | | | | | | |
| | $ | 8.94 | | | (5.18 | )% | $ | 1,151 | | | 1.10 | % | | 1.10 | % | | 5.15 | % | | 1.53 | % | | 1.53 | % | | 68 | % |
| | | 9.68 | | | 1.19 | | | 1,955 | | | 1.10 | | | 1.10 | | | 5.09 | | | 1.38 | | | 1.38 | | | 201 | |
| | | 10.38 | | | 10.62 | | | 2,148 | | | 1.10 | | | 1.10 | | | 5.66 | | | 1.68 | | | 1.68 | | | 340 | |
| | | 9.98 | | | 0.92 | | | 1,127 | | | 1.10 | | | 1.10 | | | 6.07 | | | 2.82 | | | 2.82 | | | 136 | |
| | | | | | | | | | | | | | | | | | | | | | | | | | | | |
| | $ | 8.91 | | | (5.60 | )% | $ | 1,115 | | | 1.85 | % | | 1.85 | % | | 4.39 | % | | 2.17 | % | | 2.17 | % | | 68 | % |
| | | 9.67 | | | 0.39 | | | 1,373 | | | 1.85 | | | 1.85 | | | 4.37 | | | 2.00 | | | 2.00 | | | 201 | |
| | | 10.38 | | | 9.67 | | | 1,196 | | | 1.85 | | | 1.85 | | | 5.01 | | | 2.45 | | | 2.45 | | | 340 | |
| | | 9.99 | | | 0.81 | | | 999 | | | 1.85 | | | 1.85 | | | 5.27 | | | 3.63 | | | 3.63 | | | 136 | |
| | | | | | | | | | | | | | | | | | | | | | | | | | | | |
| | $ | 8.90 | | | (5.16 | )% | $ | 4,753 | | | 0.84 | % | | 0.84 | % | | 5.38 | % | | 1.17 | % | | 1.17 | % | | 68 | % |
| | | 9.65 | | | 1.48 | | | 21,882 | | | 0.85 | | | 0.85 | | | 5.37 | | | 1.15 | | | 1.15 | | | 201 | |
| | | 10.35 | | | 10.76 | | | 23,235 | | | 0.85 | | | 0.85 | | | 6.02 | | | 1.38 | | | 1.38 | | | 340 | |
| | | 9.97 | | | 1.06 | | | 23,608 | | | 0.85 | | | 0.85 | | | 6.27 | | | 1.82 | | | 1.82 | | | 136 | |
| | | | | | | | | | | | | | | | | | | | | | | | | | | | |
| | $ | 8.90 | | | (2.31 | )% | $ | 19,889 | | | 0.85 | % | | 0.85 | % | | 5.15 | % | | 1.18 | % | | 1.18 | % | | 68 | % |
| | | | | | | | | | | | | | | | | | | | | | | | | | | | |
| | | | | | | | | | | | | | | | | | | | | | | | | | | | |
| | $ | 9.94 | | | 0.35 | % | $ | 293 | | | 1.75 | % | | 2.38 | % | | (1.58 | )% | | 6.14 | % | | 6.77 | % | | 167 | % |
| | | 10.27 | | | 2.70 | | | 199 | | | 1.75 | | | 4.00 | | | (1.84 | ) | | 7.86 | | | 10.12 | | | 285 | |
| | | | | | | | | | | | | | | | | | | | | | | | | | | | |
| | $ | 9.91 | | | (0.05 | )% | $ | 104 | | | 2.50 | % | | 3.14 | % | | (2.29 | )% | | 6.88 | % | | 7.52 | % | | 167 | % |
| | | 10.22 | | | 2.20 | | | 102 | | | 2.50 | | | 4.72 | | | (2.55 | ) | | 8.60 | | | 10.83 | | | 285 | |
| | | | | | | | | | | | | | | | | | | | | | | | | | | | |
| | $ | 9.97 | | | 0.57 | % | $ | 7,673 | | | 1.50 | % | | 2.04 | % | | (1.16 | )% | | 5.95 | % | | 6.49 | % | | 167 | % |
| | | 10.28 | | | 2.80 | | | 5,982 | | | 1.50 | | | 3.63 | | | (1.49 | ) | | 7.57 | | | 9.70 | | | 285 | |
| | | | | | | | | | | | | | | | | | | | | | | | | | | | |
| | $ | 9.96 | | | 1.88 | % | $ | 4,890 | | | 1.50 | % | | 2.30 | % | | (1.77 | )% | | 4.60 | % | | 5.40 | % | | 167 | % |
See notes to financial statements
177
| Financial highlights (unaudited) |
For a share outstanding throughout the periods indicated
| | | | | | | Income (loss) from investment operations: | | | Less distributions: | | | | |
| | | | | | | | | | | | | | | | Distributions | | | | | | | |
| | | | Net asset | | | Net | | | Net | | | Total | | | from | | | | | | Net asset | |
| | | | value, | | | investment | | | realized and | | | from | | | net | | | | | | value, | |
| | | | beginning | | | income | | unrealized gain | | | investment | | | investment | | | Total | | | end of | |
| | | | of period | | | (loss)(a) | | | (loss) | | | operations | | | income | | | distributions | | | period | |
| International Opportunities Fund | | | | | | | | | | | | | | | | | | | | | | |
| Class A | | | | | | | | | | | | | | | | | | | | | | |
| Period Ended 1/31/2016 | | $ | 28.44 | | | 0.00 | * | | (3.42 | ) | | (3.42 | ) | | (0.36 | ) | | (0.36 | ) | $ | 24.66 | |
| Year Ended 7/31/2015 | | | 26.99 | | | 0.28 | | | 1.41 | | | 1.69 | | | (0.24 | ) | | (0.24 | ) | | 28.44 | |
| Year Ended 7/31/2014 | | | 23.79 | | | 0.31 | | | 2.98 | | | 3.29 | | | (0.09 | ) | | (0.09 | ) | | 26.99 | |
| Year Ended 7/31/2013 | | | 19.22 | | | 0.14 | | | 4.58 | | | 4.72 | | | (0.15 | ) | | (0.15 | ) | | 23.79 | |
| Year Ended 7/31/2012 | | | 21.77 | | | 0.15 | | | (2.59 | ) | | (2.44 | ) | | (0.11 | ) | | (0.11 | ) | | 19.22 | |
| Year Ended 7/31/2011 | | | 19.10 | | | 0.13 | | | 2.68 | | | 2.81 | | | (0.14 | ) | | (0.14 | ) | | 21.77 | |
| Class C | | | | | | | | | | | | | | | | | | | | | | |
| Period Ended 1/31/2016 | | $ | 26.60 | | | (0.10 | ) | | (3.20 | ) | | (3.30 | ) | | (0.20 | ) | | (0.20 | ) | $ | 23.10 | |
| Year Ended 7/31/2015 | | | 25.31 | | | 0.09 | | | 1.29 | | | 1.38 | | | (0.09 | ) | | (0.09 | ) | | 26.60 | |
| Year Ended 7/31/2014 | | | 22.40 | | | 0.08 | | | 2.83 | | | 2.91 | | | 0.00 | | | 0.00 | | | 25.31 | |
| Year Ended 7/31/2013 | | | 18.12 | | | (0.04 | ) | | 4.32 | | | 4.28 | | | 0.00 | | | 0.00 | | | 22.40 | |
| Year Ended 7/31/2012 | | | 20.56 | | | (0.00 | )* | | (2.44 | ) | | (2.44 | ) | | 0.00 | | | 0.00 | | | 18.12 | |
| Year Ended 7/31/2011 | | | 18.06 | | | (0.03 | ) | | 2.53 | | | 2.50 | | | 0.00 | | | 0.00 | | | 20.56 | |
| Class I | | | | | | | | | | | | | | | | | | | | | | |
| Period Ended 1/31/2016 | | $ | 28.45 | | | 0.03 | | | (3.41 | ) | | (3.38 | ) | | (0.45 | ) | | (0.45 | ) | $ | 24.62 | |
| Year Ended 7/31/2015 | | | 27.04 | | | 0.40 | | | 1.36 | | | 1.76 | | | (0.35 | ) | | (0.35 | ) | | 28.45 | |
| Year Ended 7/31/2014 | | | 23.82 | | | 0.39 | | | 2.98 | | | 3.37 | | | (0.15 | ) | | (0.15 | ) | | 27.04 | |
| Year Ended 7/31/2013 | | | 19.25 | | | 0.22 | | | 4.57 | | | 4.79 | | | (0.22 | ) | | (0.22 | ) | | 23.82 | |
| Year Ended 7/31/2012 | | | 21.83 | | | 0.21 | | | (2.61 | ) | | (2.40 | ) | | (0.18 | ) | | (0.18 | ) | | 19.25 | |
| Year Ended 7/31/2011 | | | 19.16 | | | 0.19 | | | 2.67 | | | 2.86 | | | (0.19 | ) | | (0.19 | ) | | 21.83 | |
| Class R | | | | | | | | | | | | | | | | | | | | | | |
| Period Ended 1/31/2016 | | $ | 27.97 | | | (0.04 | ) | | (3.36 | ) | | (3.40 | ) | | (0.35 | ) | | (0.35 | ) | $ | 24.22 | |
| Year Ended 7/31/2015 | | | 26.59 | | | 0.24 | | | 1.35 | | | 1.59 | | | (0.21 | ) | | (0.21 | ) | | 27.97 | |
| Year Ended 7/31/2014 | | | 23.44 | | | 0.22 | | | 2.95 | | | 3.17 | | | (0.02 | ) | | (0.02 | ) | | 26.59 | |
| Year Ended 7/31/2013 | | | 18.93 | | | 0.07 | | | 4.51 | | | 4.58 | | | (0.07 | ) | | (0.07 | ) | | 23.44 | |
| Year Ended 7/31/2012 | | | 21.50 | | | 0.08 | | | (2.58 | ) | | (2.50 | ) | | (0.07 | ) | | (0.07 | ) | | 18.93 | |
| Year Ended 7/31/2011 | | | 18.88 | | | 0.09 | | | 2.64 | | | 2.73 | | | (0.11 | ) | | (0.11 | ) | | 21.50 | |
| Class R6 | | | | | | | | | | | | | | | | | | | | | | |
| Period Ended 1/31/2016(e) | | $ | 27.18 | | | (0.04 | ) | | (2.09 | ) | | (2.13 | ) | | (0.44 | ) | | (0.44 | ) | $ | 24.61 | |
| (a) | Per share data was calculated using average shares outstanding during the period. |
| (b) | Total returns are historical and assume changes in share price, reinvestment of all dividends and distributions and no sales charge. Had certain expenses not been waived/reimbursed during the periods shown, total returns would have been lower. |
| (c) | Not annualized for periods less than one year. |
| (d) | The net investment income ratio would have been 0.02% lower had the fund not received refunds of previously withheld tax ,plus interest, based on reclaims filed with Finland for calendar years 2009-2013. Refer to note 2, under the heading " Federal income taxes". |
| (e) | Class R6 commenced operations on November 30, 2015. |
| * | Amount represents less than $0.01. |
See notes to financial statements
178
| Financial highlights (unaudited) |
| | | | | | | | Ratios to average net assets: | | | | |
| | | Total
return(b) | | | Net assets,
end of
period
(000) | | | Annualized
ratio of operating
expenses to
average
net assets | | | Annualized
ratio of net investment
income/(loss)
to average
net assets | | | Annualized ratio of
operating expenses
to average net assets without
waivers and/or
expenses
reimbursed | | | Portfolio
turnover
rate(c) | |
| | | | | | | | | | | | | | | | | | | |
| | | | | | | | | | | | | | | | | | | |
| | | (12.13 | )% | $ | 1,487,697 | | | 1.34 | % | | 0.00 | %* | | 1.34 | % | | 20 | % |
| | | 6.33 | | | 1,623,379 | | | 1.36 | | | 1.03 | (d) | | 1.36 | | | 71 | |
| | | 13.84 | | | 1,991,001 | | | 1.40 | | | 1.18 | | | 1.40 | | | 74 | |
| | | 24.64 | | | 1,467,583 | | | 1.46 | | | 0.66 | | | 1.46 | | | 129 | |
| | | (11.17 | ) | | 1,263,648 | | | 1.47 | | | 0.78 | | | 1.47 | | | 45 | |
| | | 14.71 | | | 1,950,064 | | | 1.44 | | | 0.62 | | | 1.44 | | | 64 | |
| | | | | | | | | | | | | | | | | | | |
| | | (12.47 | )% | $ | 508,503 | | | 2.10 | % | | (0.77 | )% | | 2.10 | % | | 20 | % |
| | | 5.47 | | | 552,630 | | | 2.13 | | | 0.33 | (d) | | 2.13 | | | 71 | |
| | | 12.99 | | | 491,403 | | | 2.17 | | | 0.32 | | | 2.17 | | | 74 | |
| | | 23.62 | | | 424,538 | | | 2.26 | | | (0.18 | ) | | 2.26 | | | 129 | |
| | | (11.87 | ) | | 416,582 | | | 2.29 | | | (0.02 | ) | | 2.29 | | | 45 | |
| | | 13.84 | | | 639,252 | | | 2.19 | | | (0.15 | ) | | 2.19 | | | 64 | |
| | | | | | | | | | | | | | | | | | | |
| | | (12.02 | )% | $ | 2,664,525 | | | 1.06 | % | | 0.22 | % | | 1.06 | % | | 20 | % |
| | | 6.60 | | | 2,333,559 | | | 1.10 | | | 1.46 | (d) | | 1.10 | | | 71 | |
| | | 14.16 | | | 1,389,207 | | | 1.12 | | | 1.47 | | | 1.12 | | | 74 | |
| | | 25.00 | | | 872,974 | | | 1.16 | | | 1.04 | | | 1.16 | | | 129 | |
| | | (10.93 | ) | | 656,313 | | | 1.20 | | | 1.09 | | | 1.20 | | | 45 | |
| | | 14.96 | | | 797,316 | | | 1.19 | | | 0.87 | | | 1.19 | | | 64 | |
| | | | | | | | | | | | | | | | | | | |
| | | (12.27 | )% | $ | 16,674 | | | 1.59 | % | | (0.29 | )% | | 1.59 | % | | 20 | % |
| | | 6.05 | | | 14,173 | | | 1.63 | | | 0.89 | (d) | | 1.63 | | | 71 | |
| | | 13.54 | | | 9,966 | | | 1.68 | | | 0.85 | | | 1.68 | | | 74 | |
| | | 24.23 | | | 7,180 | | | 1.76 | | | 0.34 | | | 1.76 | | | 129 | |
| | | (11.60 | ) | | 6,454 | | | 1.94 | | | 0.42 | | | 1.94 | | | 45 | |
| | | 14.45 | | | 7,258 | | | 1.69 | | | 0.44 | | | 1.69 | | | 64 | |
| | | | | | | | | | | | | | | | | | | |
| | | (7.96 | )% | $ | 668 | | | 1.32 | % | | (1.00 | )% | | 1.32 | % | | 20 | % |
See notes to financial statements
179
| Financial highlights (unaudited) |
For a share outstanding throughout the periods indicated
| | | | | | Income (loss) from investment operations: | | Less distributions | |
| | | | | | | | | | | | | | | | | | | Distributions | | | | |
| | | | Net asset | | | Net | | | Net | | | Total | | | Dividends | | | from net | | | | |
| | | | value, | | | investment | | | realized and | | | from | | | from net | | | realized | | | | |
| | | | beginning | | | income | | | unrealized gain | | | investment | | | investment | | | capital | | | Total | |
| | | | of period | | | (loss)(b) | | | (loss) | | | operations | | | income | | | gains | | | distributions | |
| International Select Equity Fund | | | | | | | | | | | | | | | | | | | | | | |
| Class A | | | | | | | | | | | | | | | | | | | | | | |
| Period Ended 1/31/2016 | | $ | 10.77 | | | 0.00 | * | | (1.37 | ) | | (1.37 | ) | | (0.08 | ) | | (0.06 | ) | | (0.14 | ) |
| Period Ended 7/31/2015(a) | | | 10.00 | | | 0.10 | | | 0.67 | | | 0.77 | | | 0.00 | | | 0.00 | | | 0.00 | |
| Class C | | | | | | | | | | | | | | | | | | | | | | |
| Period Ended 1/31/2016 | | $ | 10.70 | | | 0.00 | * | | (1.40 | ) | | (1.40 | ) | | (0.01 | ) | | (0.06 | ) | | (0.07 | ) |
| Period Ended 7/31/2015(a) | | | 10.00 | | | 0.02 | | | 0.68 | | | 0.70 | | | 0.00 | | | 0.00 | | | 0.00 | |
| Class I | | | | | | | | | | | | | | | | | | | | | | |
| Period Ended 1/31/2016 | | $ | 10.79 | | | 0.00 | * | | (1.37 | ) | | (1.37 | ) | | (0.09 | ) | | (0.06 | ) | | (0.15 | ) |
| Period Ended 7/31/2015(a) | | | 10.00 | | | 0.10 | | | 0.69 | | | 0.79 | | | 0.00 | | | 0.00 | | | 0.00 | |
| Class R6 | | | | | | | | | | | | | | | | | | | | | | |
| Period Ended 1/31/2016(e) | | $ | 10.30 | | | 0.00 | * | | (0.87 | ) | | (0.87 | ) | | (0.09 | ) | | (0.06 | ) | | (0.15 | ) |
| (a) | The International Select Equity Fund commenced operations on September 30, 2014. |
| (b) | Per share data was calculated using average shares outstanding during the period. |
| (c) | Total returns are historical and assume changes in share price, reinvestment of all dividends and distributions and no sales charge. Had certain expenses not been waived/reimbursed during the periods shown, total returns would have been lower. Total returns for periods of less than one year are not annualized. |
| (d) | Not annualized for periods less than one year. |
| (e) | Class R6 commenced operations on November 30, 2015. |
| * | Amount represents less than $0.01. |
See notes to financial statements
180
| Financial highlights (unaudited) |
| | | | | | | | | | | Ratios to average net assets: | | | | |
| | | | | | | | | | | | | | | | | | Annualized ratio of | | | | |
| | | | | | | | | | | | Annualized | | | Annualized | | | operating expenses | | | | |
| | | | | | | | | | | | ratio of | | | ratio of | | | to average net | | | | |
| | | Net asset | | | | | | Net assets, | | | operating | | | net investment | | | assets without | | | | |
| | | value, | | | | | | end of | | | expenses to | | | income/(loss) | | | waivers and/or | | | Portfolio | |
| | | end of | | | Total | | | period | | | average | | | to average | | | expenses | | | turnover | |
| | | period | | | return(c) | | | (000) | | | net assets | | | net assets | | | reimbursed | | | rate(d) | |
| | | | | | | | | | | | | | | | | | | | | | |
| | | | | | | | | | | | | | | | | | | | | | |
| | $ | 9.26 | | | (12.79 | )% | $ | 238 | | | 1.14 | % | | 0.08 | % | | 3.50 | % | | 18 | % |
| | | 10.77 | | | 7.70 | | | 269 | | | 1.14 | | | 1.14 | | | 4.15 | | | 39 | |
| | | | | | | | | | | | | | | | | | | | | | |
| | $ | 9.23 | | | (13.13 | )% | $ | 113 | | | 1.89 | % | | (0.72 | )% | | 4.25 | % | | 18 | % |
| | | 10.70 | | | 7.00 | | | 120 | | | 1.89 | | | 0.21 | | | 5.08 | | | 39 | |
| | | | | | | | | | | | | | | | | | | | | | |
| | $ | 9.27 | | | (12.76 | )% | $ | 222 | | | 0.88 | % | | 0.43 | % | | 3.09 | % | | 18 | % |
| | | 10.79 | | | 7.90 | | | 5,222 | | | 0.89 | | | 1.14 | | | 3.97 | | | 39 | |
| | | | | | | | | | | | | | | | | | | | | | |
| | $ | 9.28 | | | (8.55 | )% | $ | 4,581 | | | 0.89 | % | | (0.03 | )% | | 3.25 | % | | 18 | % |
See notes to financial statements
181
| Financial highlights (unaudited) |
For a share outstanding throughout the periods indicated
| | | | | | Income (loss) from investment operations: | | | Less distributions: | |
| | | | Net asset | | | Net | | | Net | | | Total | | | Dividends | | | | |
| | | | value, | | | investment | | | realized and | | | from | | | from net | | | | |
| | | | beginning | | | income | | | unrealized gain | | | investment | | | investment | | | Return of | |
| | | | of period | | | (loss)(b) | | | (loss) | | | operations | | | income | | | capital | |
| Strategic Income Fund | | | | | | | | | | | | | | | | | | | |
| Class A | | | | | | | | | | | | | | | | | | | |
| Period Ended 1/31/2016 | | $ | 9.09 | | | 0.13 | | | (0.15 | ) | | (0.02 | ) | | (0.13 | ) | | 0.00 | |
| Year Ended 7/31/2015 | | | 9.13 | | | 0.32 | | | (0.01 | ) | | 0.33 | | | (0.37 | ) | | 0.00 | |
| Year Ended 7/31/2014 | | | 8.93 | | | 0.46 | | | 0.20 | | | 0.66 | | | (0.46 | ) | | 0.00 | |
| Period Ended 7/31/2013(a) | | | 9.12 | | | 0.23 | | | (0.19 | ) | | 0.04 | | | (0.23 | ) | | 0.00 | |
| Year Ended 12/31/2012 | | | 8.39 | | | 0.40 | | | 0.73 | | | 1.13 | | | (0.40 | ) | | 0.00 | |
| Year Ended 12/31/2011 | | | 8.82 | | | 0.44 | | | (0.43 | ) | | 0.01 | | | (0.37 | ) | | (0.07 | ) |
| Year Ended 12/31/2010 | | | 8.44 | | | 0.46 | | | 0.38 | | | 0.84 | | | (0.33 | ) | | (0.13 | ) |
| Class C | | | | | | | | | | | | | | | | | | | |
| Period Ended 1/31/2016 | | $ | 9.04 | | | 0.10 | | | (0.15 | ) | | (0.05 | ) | | (0.09 | ) | | 0.00 | |
| Year Ended 7/31/2015 | | | 9.09 | | | 0.26 | | | 0.00 | | | 0.26 | | | (0.31 | ) | | 0.00 | |
| Year Ended 7/31/2014 | | | 8.89 | | | 0.39 | | | 0.20 | | | 0.59 | | | (0.39 | ) | | 0.00 | |
| Period Ended 7/31/2013(a) | | | 9.08 | | | 0.19 | | | (0.20 | ) | | (0.01 | ) | | (0.18 | ) | | 0.00 | |
| Year Ended 12/31/2012 | | | 8.35 | | | 0.33 | | | 0.73 | | | 1.06 | | | (0.33 | ) | | 0.00 | |
| Year Ended 12/31/2011 | | | 8.79 | | | 0.37 | | | (0.43 | ) | | (0.06 | ) | | (0.32 | ) | | (0.06 | ) |
| Year Ended 12/31/2010 | | | 8.41 | | | 0.40 | | | 0.38 | | | 0.78 | | | (0.29 | ) | | (0.11 | ) |
| Class I | | | | | | | | | | | | | | | | | | | |
| Period Ended 1/31/2016 | | $ | 9.06 | | | 0.14 | | | (0.16 | ) | | (0.02 | ) | | (0.13 | ) | | 0.00 | |
| Year Ended 7/31/2015 | | | 9.11 | | | 0.34 | | | (0.01 | ) | | 0.35 | | | (0.40 | ) | | 0.00 | |
| Year Ended 7/31/2014 | | | 8.91 | | | 0.48 | | | 0.21 | | | 0.69 | | | (0.49 | ) | | 0.00 | |
| Period Ended 7/31/2013(a) | | | 9.10 | | | 0.24 | | | (0.19 | ) | | 0.05 | | | (0.24 | ) | | 0.00 | |
| Year Ended 12/31/2012 | | | 8.37 | | | 0.42 | | | 0.73 | | | 1.15 | | | (0.42 | ) | | 0.00 | |
| Period Ended 12/31/2011(c) | | | 9.06 | | | 0.29 | | | (0.66 | ) | | (0.37 | ) | | (0.27 | ) | | (0.05 | ) |
| Class R6 | | | | | | | | | | | | | | | | | | | |
| Period Ended 1/31/2016(g) | | $ | 8.99 | | | 0.04 | | | (0.07 | ) | | (0.03 | ) | | (0.04 | ) | | 0.00 | |
| (a) | Strategic Income Fund changed its fiscal year end from December 31 to July 31 effective July 31, 2013. |
| (b) | Per share data was calculated using average shares outstanding during the period. |
| (c) | Class I commenced operations on April 29, 2011. |
| (d) | Until July 1, 2010, the Fund imposed a redemption fee of 2.00% on Class A and C shares redeemed within 30 days of purchase. |
| (e) | Total returns are historical and assume changes in share price, reinvestment of all dividends and distributions and no sales charge. Had certain expenses not been waived/reimbursed during the periods shown, total returns would have been lower. Total returns for periods of less than one year are not annualized. |
| (f) | Not annualized for periods less than one year. |
| (g) | Class R6 commenced operations on November 30, 2015. |
| * | Amount represents less than $0.01. |
See notes to financial statements
182
| Financial highlights (unaudited) |
| | | | | | | | | | | | | | | Ratios to average net assets: | | | | |
| | | | | | | | | | | | | | | | Annualized | | | Annualized | | | Annualized ratio of operating expenses | | | | |
| | | | | | | | | | | | | | | | ratio of | | | ratio of | | | to average net | | | | |
| | | | | | | Net asset | | | | | | Net assets, | | | operating | | net investment | | | assets without | | | | |
| | | | | | | value, | | | | | | end of | | expenses to | | | income/(loss) | | | waivers and/or | | | Portfolio | |
| Total | | | Redemption | | | end of | | | Total | | | period | | | average | | | to average | | | expenses | | | turnover | |
| distributions | | | fees(d) | | | period | | | return(e) | | | (000) | | | net assets | | | net assets | | | reimbursed | | | rate(f) | |
| | | | | | | | | | | | | | | | | | | | | | | | | | |
| | | | | | | | | | | | | | | | | | | | | | | | | | |
| (0.13) | | | N/A | | $ | 8.94 | | | (0.25 | )% | $ | 45,848 | | | 1.02 | % | | 2.92 | % | | 1.02 | % | | 36 | % |
| (0.37) | | | N/A | | | 9.09 | | | 3.71 | | | 28,200 | | | 1.09 | | | 3.52 | | | 1.15 | | | 53 | |
| (0.46) | | | N/A | | | 9.13 | | | 7.56 | | | 11,522 | | | 1.10 | | | 5.02 | | | 1.36 | | | 84 | |
| (0.23) | | | N/A | | | 8.93 | | | 0.39 | | | 15,656 | | | 1.10 | | | 4.36 | | | 1.44 | | | 50 | |
| (0.40) | | | N/A | | | 9.12 | | | 13.75 | | | 17,596 | | | 1.10 | | | 4.51 | | | 1.34 | | | 47 | |
| (0.44) | | | N/A | | | 8.39 | | | 0.06 | | | 17,210 | | | 1.20 | | | 5.04 | | | 1.51 | | | 41 | |
| (0.46) | | | 0.00 | * | | 8.82 | | | 10.17 | | | 28,171 | | | 1.30 | | | 5.30 | | | 1.54 | | | 38 | |
| | | | | | | | | | | | | | | | | | | | | | | | | | |
| (0.09) | | | N/A | | $ | 8.90 | | | (0.53 | )% | $ | 40,967 | | | 1.79 | % | | 2.17 | % | | 1.79 | % | | 36 | % |
| (0.31) | | | N/A | | | 9.04 | | | 2.84 | | | 30,034 | | | 1.85 | | | 2.84 | | | 1.92 | | | 53 | |
| (0.39) | | | N/A | | | 9.09 | | | 6.78 | | | 17,744 | | | 1.85 | | | 4.27 | | | 2.12 | | | 84 | |
| (0.18) | | | N/A | | | 8.89 | | | (0.06 | ) | | 19,483 | | | 1.85 | | | 3.62 | | | 2.20 | | | 50 | |
| (0.33) | | | N/A | | | 9.08 | | | 12.95 | | | 22,328 | | | 1.85 | | | 3.77 | | | 2.11 | | | 47 | |
| (0.38) | | | N/A | | | 8.35 | | | (0.80 | ) | | 22,244 | | | 1.94 | | | 4.29 | | | 2.26 | | | 41 | |
| (0.40) | | | 0.00 | * | | 8.79 | | | 9.39 | | | 26,997 | | | 2.05 | | | 4.55 | | | 2.29 | | | 38 | |
| | | | | | | | | | | | | | | | | | | | | | | | | | |
| (0.13) | | | N/A | | $ | 8.91 | | | (0.17 | )% | $ | 241,559 | | | 0.77 | % | | 3.16 | % | | 0.77 | % | | 36 | % |
| (0.40) | | | N/A | | | 9.06 | | | 3.86 | | | 106,544 | | | 0.84 | | | 3.73 | | | 0.92 | | | 53 | |
| (0.49) | | | N/A | | | 9.11 | | | 7.88 | | | 18,271 | | | 0.85 | | | 5.29 | | | 1.08 | | | 84 | |
| (0.24) | | | N/A | | | 8.91 | | | 0.54 | | | 7,291 | | | 0.85 | | | 4.59 | | | 1.16 | | | 50 | |
| (0.42) | | | N/A | | | 9.10 | | | 14.06 | | | 3,903 | | | 0.85 | | | 4.79 | | | 1.07 | | | 47 | |
| (0.32) | | | N/A | | | 8.37 | | | (4.10 | ) | | 1,885 | | | 0.85 | | | 5.16 | | | 1.25 | | | 41 | |
| | | | | | | | | | | | | | | | | | | | | | | | | | |
| (0.04) | | | N/A | | $ | 8.92 | | | (0.31 | )% | $ | 1,344 | | | 0.70 | % | | 2.41 | % | | 0.70 | % | | 36 | % |
See notes to financial statements
183
| Financial highlights (unaudited) |
For a share outstanding throughout the periods indicated
| | | | | | Income (loss) from investment operations: | | | Less distributions: | |
| | | | | | | | | | | | | | | | Distributions | | | Distributions | | | | |
| | | | Net asset | | | Net | | | Net | | | Total | | | from | | | from net | | | | |
| | | | value, | | | investment | | | realized and | | | from | | | net | | | realized | | | | |
| | | | beginning | | | income | | | unrealized gain | | | investment | | | investment | | | capital | | | Total | |
| | | | of period | | | (loss)(c) | | | (loss) | | | operations | | | income | | | gains | | | distributions | |
| Unconstrained Bond Fund | | | | | | | | | | | | | | | | | | | | | | |
| Class A | | | | | | | | | | | | | | | | | | | | | | |
| Period Ended 1/31/2016 | | $ | 9.51 | | | 0.05 | | | (0.19 | ) | | (0.14 | ) | | (0.04 | ) | | (0.36 | ) | | (0.40 | ) |
| Year Ended 7/31/2015 | | | 10.06 | | | 0.11 | | | (0.14 | ) | | (0.03 | ) | | (0.12 | ) | | (0.40 | ) | | (0.52 | ) |
| Period Ended 7/31/2014(a) | | | 10.00 | | | 0.11 | | | 0.06 | | | 0.17 | | | (0.11 | ) | | 0.00 | | | (0.11 | ) |
| Class C | | | | | | | | | | | | | | | | | | | | | | |
| Period Ended 1/31/2016 | | $ | 9.50 | | | 0.01 | | | (0.18 | ) | | (0.17 | ) | | (0.01 | ) | | (0.36 | ) | | (0.37 | ) |
| Year Ended 7/31/2015 | | | 10.06 | | | 0.03 | | | (0.14 | ) | | (0.11 | ) | | (0.05 | ) | | (0.40 | ) | | (0.45 | ) |
| Period Ended 7/31/2014(a) | | | 10.00 | | | 0.06 | | | 0.07 | | | 0.13 | | | (0.07 | ) | | 0.00 | | | (0.07 | ) |
| Class I | | | | | | | | | | | | | | | | | | | | | | |
| Year Ended 1/31/2016 | | $ | 9.50 | | | 0.06 | | | (0.19 | ) | | (0.13 | ) | | (0.05 | ) | | (0.36 | ) | | (0.41 | ) |
| Year Ended 7/31/2015 | | | 10.06 | | | 0.13 | | | (0.14 | ) | | (0.01 | ) | | (0.15 | ) | | (0.40 | ) | | (0.55 | ) |
| Period Ended 7/31/2014(a) | | | 10.00 | | | 0.13 | | | 0.06 | | | 0.19 | | | (0.13 | ) | | 0.00 | | | (0.13 | ) |
| Class R6 | | | | | | | | | | | | | | | | | | | | | | |
| Period Ended 1/31/2016(f) | | $ | 9.46 | | | 0.00* | | | (0.13 | ) | | (0.13 | ) | | (0.01 | ) | | (0.36 | ) | | (0.37 | ) |
| US Growth Opportunities Fund | | | | | | | | | | | | | | | | | | | | | | |
| Class A | | | | | | | | | | | | | | | | | | | | | | |
| Period Ended 1/31/2016 | | $ | 11.19 | | | (0.02 | ) | | (0.95 | ) | | (0.97 | ) | | 0.00 | | | 0.00 | | | 0.00 | |
| Period Ended 7/31/2015(b) | | | 10.00 | | | (0.03 | ) | | 1.22 | | | 1.19 | | | 0.00 | | | 0.00 | | | 0.00 | |
| Class C | | | | | | | | | | | | | | | | | | | | | | |
| Period Ended 1/31/2016 | | $ | 11.14 | | | (0.07 | ) | | (0.94 | ) | | (1.01 | ) | | 0.00 | | | 0.00 | | | 0.00 | |
| Period Ended 7/31/2015(b) | | | 10.00 | | | (0.07 | ) | | 1.21 | | | 1.14 | | | 0.00 | | | 0.00 | | | 0.00 | |
| Class I | | | | | | | | | | | | | | | | | | | | | | |
| Period Ended 1/31/2016 | | $ | 11.21 | | | 0.00 | | | (0.96 | ) | | (0.96 | ) | | 0.00 | | | 0.00 | | | 0.00 | |
| Period Ended 7/31/2015(b) | | | 10.00 | | | 0.00 | | | 1.21 | | | 1.21 | | | 0.00 | | | 0.00 | | | 0.00 | |
| Class R6 | | | | | | | | | | | | | | | | | | | | | | |
| Period Ended 1/31/2016(f) | | $ | 11.11 | | | (0.01 | ) | | (0.85 | ) | | (0.86 | ) | | 0.00 | | | 0.00 | | | 0.00 | |
| (a) | The Unconstrained Bond Fund commenced operations on December 20, 2013. |
| (b) | The US Growth Opportunities Fund commenced operations on December 18, 2014. |
| (c) | Per share data was calculated using average shares outstanding during the period. |
| (d) | Total returns are historical and assume changes in share price, reinvestment of all dividends and distributions and no sales charge. Had certain expenses not been waived/reimbursed during the periods shown, total returns would have been lower. Total returns for periods of less than one year are not annualized. |
| (e) | Not annualized for periods less than one year. |
| (f) | Class R6 commenced operations on November 30, 2015. |
| * | Amount represents less than $0.01. |
See notes to financial statements
184
| Financial highlights (unaudited) |
| | | | | | | | | | | Ratios to average net assets: | | | |
| | | | | | | | | | | | | | | | | | Annualized ratio of | | | | |
| | | | | | | | | | | | Annualized | | | Annualized | | | operating expenses | | | | |
| | | | | | | | | | | | ratio of | | | ratio of | | | to average net | | | | |
| | | Net asset | | | | | | Net assets, | | | operating | | | net investment | | | assets without | | | | |
| | | value, | | | | | | end of | | | expenses to | | | income/(loss) | | | waivers and/or | | | Portfolio | |
| | | end of | | | Total | | | period | | | average | | | to average | | | expenses | | | turnover | |
| | | period | | | return(d) | | | (000) | | | net assets | | | net assets | | | reimbursed | | | rate(e) | |
| | | | | | | | | | | | | | | | | | | | | | |
| | | | | | | | | | | | | | | | | | | | | | |
| | $ | 8.97 | | | (1.55 | )% | $ | 938 | | | 1.15 | % | | 1.03 | % | | 1.77 | % | | 47 | % |
| | | 9.51 | | | (0.23 | ) | | 958 | | | 1.15 | | | 1.09 | | | 2.02 | | | 129 | |
| | | 10.06 | | | 1.75 | | | 1,136 | | | 1.15 | | | 1.80 | | | 2.33 | | | 97 | |
| | | | | | | | | | | | | | | | | | | | | | |
| | $ | 8.96 | | | (1.89 | )% | $ | 1,050 | | | 1.90 | % | | 0.27 | % | | 2.53 | % | | 47 | % |
| | | 9.50 | | | (1.04 | ) | | 1,082 | | | 1.90 | | | 0.33 | | | 2.77 | | | 129 | |
| | | 10.06 | | | 1.29 | | | 1,006 | | | 1.90 | | | 1.02 | | | 3.07 | | | 97 | |
| | | | | | | | | | | | | | | | | | | | | | |
| | $ | 8.96 | | | (1.43 | )% | $ | 978 | | | 0.89 | % | | 1.20 | % | | 1.47 | % | | 47 | % |
| | | 9.50 | | | (0.07 | ) | | 24,850 | | | 0.90 | | | 1.34 | | | 1.76 | | | 129 | |
| | | 10.06 | | | 1.91 | | | 26,125 | | | 0.90 | | | 2.04 | | | 2.07 | | | 97 | |
| | | | | | | | | | | | | | | | | | | | | | |
| | $ | 8.96 | | | (1.38 | )% | $ | 22,761 | | | 0.90 | % | | 0.30 | % | | 1.58 | % | | 47 | % |
| | | | | | | | | | | | | | | | | | | | | | |
| | | | | | | | | | | | | | | | | | | | | | |
| | | | | | | | | | | | | | | | | | | | | | |
| | $ | 10.22 | | | (8.67 | )% | $ | 2,242 | | | 1.20 | % | | (0.41 | )% | | 2.75 | % | | 5 | % |
| | | 11.19 | | | 11.90 | | | 1,617 | | | 1.20 | | | (0.46 | ) | | 3.21 | | | 12 | |
| | | | | | | | | | | | | | | | | | | | | | |
| | $ | 10.13 | | | (9.07 | )% | $ | 121 | | | 1.95 | % | | (1.32 | )% | | 3.43 | % | | 5 | % |
| | | 11.14 | | | 11.40 | | | 11 | | | 1.95 | | | (1.00 | ) | | 4.64 | | | 12 | |
| | | | | | | | | | | | | | | | | | | | | | |
| | $ | 10.25 | | | (8.56 | )% | $ | 156 | | | 0.94 | % | | (0.02 | )% | | 2.50 | % | | 5 | % |
| | | 11.21 | | | 12.10 | | | 5,770 | | | 0.95 | | | 0.01 | | | 3.39 | | | 12 | |
| | | | | | | | | | | | | | | | | | | | | | |
| | $ | 10.25 | | | (7.74 | )% | $ | 5,279 | | | 0.95 | % | | (0.42 | )% | | 2.26 | % | | 5 | % |
See notes to financial statements
185
| Notes to financial statements (unaudited) |
Note 1. Organization
Henderson Global Funds (the "Trust") was organized on May 11, 2001, as a Delaware statutory trust and is registered under the Investment Company Act of 1940, as amended (the "1940 Act"), as an open-end management investment company. The Trust has an unlimited number of authorized shares that are divided among thirteen series. The Henderson All Asset Fund, Henderson Dividend & Income Builder Fund, Henderson Emerging Markets Fund, Henderson European Focus Fund, Henderson Global Equity Income Fund, Henderson Global Technology Fund, Henderson High Yield Opportunities Fund, Henderson International Long/Short Equity Fund, Henderson International Opportunities Fund, Henderson International Select Equity Fund, Henderson Strategic Income Fund, Henderson Unconstrained Bond Fund and Henderson US Growth Opportunities Fund (collectively, the "Funds") are included in this report. Each is a separate series of the Trust and each is diversified except for the Henderson High Yield Opportunities Fund, Henderson International Long/Short Equity Fund, Henderson International Select Equity Fund, Henderson Unconstrained Bond Fund and Henderson US Growth Opportunities Fund, which are non-diversified.
Though it may invest directly in securities, the Henderson All Asset Fund is primarily a Fund-of-Funds ("FoF") that seeks to achieve its objective by investing in a portfolio of underlying funds ("underlying funds") which, in turn, may invest in a variety of US and foreign equity, fixed income, money market, derivative instruments and commodities products. The FoF does not invest in the underlying funds for the purpose of exercising management or control; however, investments by the FoF, within its principal investment strategies, may represent a significant portion of the underlying funds' net assets subject to 1940 Act limitations and any exemptive relief provided thereto. The FoF's "Portfolio of Investments" lists the underlying funds held as an investment of the FoF as of period end, but does not include the holdings of the underlying funds.
The Funds offer the following share classes:
| | Share Classes |
| Fund | A | C | I | R | R6 |
| All Asset | ✓ | ✓ | ✓ | n/a | ✓ |
| Dividend & | | | | | |
| Income Builder | ✓ | ✓ | ✓ | n/a | ✓ |
| Emerging Markets | ✓ | ✓ | ✓ | n/a | ✓ |
| European Focus | ✓ | ✓ | ✓ | n/a | ✓ |
| Global Equity Income | ✓ | ✓ | ✓ | n/a | ✓ |
| Global Technology | ✓ | ✓ | ✓ | n/a | ✓ |
| High Yield | | | | | |
| Opportunities | ✓ | ✓ | ✓ | n/a | ✓ |
| International Long/ | | | | | |
| Short Equity | ✓ | ✓ | ✓ | n/a | ✓ |
| International | | | | | |
| Opportunities | ✓ | ✓ | ✓ | ✓ | ✓ |
| International | | | | | |
| Select Equity | ✓ | ✓ | ✓ | n/a | ✓ |
| Strategic Income | ✓ | ✓ | ✓ | n/a | ✓ |
| Unconstrained Bond | ✓ | ✓ | ✓ | n/a | ✓ |
| US Growth | | | | | |
| Opportunities | ✓ | ✓ | ✓ | n/a | ✓ |
As of November 4, 2015, outstanding Class B shares of the European Focus Fund, Global Technology Fund, International Opportunities Fund and Strategic Income Fund were terminated. All outstanding Class B shares as of that date were converted into Class A shares within the same Fund.
Class A shares generally provide for a front-end sales charge. Class C shares provide for a contingent deferred sales charge. Class R, I and R6 shares are not subject to a front-end or contingent deferred sales charge.
Each class of shares has equal rights as to earnings and assets, except that each class may bear different distribution and shareholder service expenses. Each class of shares has exclusive voting rights with respect to matters that affect just that class. Income, expenses (other than expenses attributable to a specific class), and realized and unrealized gains and losses on investments are allocated to each class of shares based on its relative net assets.
Note 2. Significant accounting policies
The following is a summary of significant accounting policies followed by each Fund in preparation of its financial statements. These policies are in conformity with US generally accepted accounting principles ("US GAAP"), which includes the accounting and reporting guidelines under the Financial
186
| Notes to financial statements (unaudited) |
Accounting Standards Board's ("FASB") Accounting Standards Codification ("ASC") Topic 946, Financial Services – Investment Companies.
Security valuation
Securities, short sales and financial derivative instruments traded on a recognized exchange or market are generally valued at the last reported sale price or at the official closing price. Listed securities for which no sale was reported on that date and other securities traded in the over-the-counter ("OTC") market are valued at the mean between the last bid and asked price.
Debt securities, including short-term investments and/or those with an original or remaining maturity of 60 days or less, are valued at the market value provided by independent pricing services approved by the Board of Trustees of the Trust. If the pricing services are unable to provide valuations, the securities are valued at the mean between the last bid and asked price, or if no ask is available, then the last bid price obtained from one or more broker-dealers. Such pricing services may use various pricing techniques that take into account appropriate factors such as yield, quality, coupon rate, maturity, type of issue, trading characteristics and other data, as well as broker quotes.
Investments in investment companies are valued at its reported net asset value, which approximates fair market value.
Forward foreign currency contracts are valued daily at the applicable quoted forward rate.
OTC financial derivatives instruments between the Funds and their counterparties, including swap contracts and options (including swaptions) and centrally-cleared swap contracts listed or traded on a multi-lateral or trade facility platform, such as a registered exchange, are valued using independent values provided by independent pricing services when available. Otherwise, fair values are estimated on the basis of pricing models that incorporate current market measures for interest rates, currency exchange rates, equity prices and indices, credit spreads, corresponding market volatility levels and other market-based pricing factors.
If market quotations are not readily available, or if the investment adviser determines that a quotation of a security does not represent a fair value, then the security is valued at a fair value as determined in good faith using procedures approved by the Board of Trustees of the Trust. The Trustees of the Trust, or their designee, may also establish fair value using a wide variety of market data including yields or prices of investments of comparable quality, type of issue, coupon, maturity and rating, market quotes or indications of value from security dealers, evaluations of anticipated cash flows or collateral, general market conditions and other information and analysis, including the obligor's credit characteristics considered relevant.
For equity securities, the Trust has retained an independent statistical fair value pricing service to assist in the fair valuation process for securities principally traded in a foreign market in order to adjust for possible changes in value that may occur between the close of the foreign exchange and the time at which Fund shares are priced. If a security is valued at a "fair value," that value may be different from the last quoted market price for the security. As a result, it is possible that fair value prices will be used by the Funds.
Security transactions and investment income
Investment transactions are accounted for on a trade-date basis. Securities purchased or sold on a when-issued or delayed-delivery basis may be settled 15 days or more after the trade date. Interest income is recorded on an accrual basis. Dividend income, or expense on securities sold short, is recorded on the ex-dividend date. Bond premium is amortized and discount is accreted over the expected life of each applicable security. Paydown gains and losses on mortgage-related and other asset-backed securities are recorded as components of interest income on the Statements of Operations. Income or short-term capital gain distributions received from underlying funds are recorded as dividend income. Long-term capital gain distributions received from underlying funds are recorded as realized gains. Corporate actions involving foreign securities, including dividends, are recorded as soon as the information becomes available. Withholding taxes on foreign dividends are accrued in accordance with the applicable country's tax rules and rates subject to double taxation treaties with the United States, as applicable. Gains and losses realized on sales of securities are determined using the specific identification method by comparing the identified cost of the security lot sold with the net sales proceeds, which is the same basis used for federal income tax purposes.
Foreign currency translation
Investments in securities, financial derivative instruments and other assets and liabilities denominated in foreign currencies are translated into US dollar amounts at the date of valuation. Purchases and sales of investment securities and income and expense items denominated in foreign currencies are translated into US dollar amounts on the respective dates of such transactions.
The Funds do not separate the portion of the results of operations resulting from changes in foreign exchange rates on investments from the fluctuations arising from changes in market prices of securities held. Such fluctuations are included with the net realized and unrealized gain or loss from investments on the Statements of Operations.
187
| Notes to financial statements (unaudited) |
Reported net realized foreign exchange gains or losses arise from sales of foreign currencies, currency gains or losses realized between the trade date and settlement date on securities transactions, and the difference between the amounts of dividends, interest, and foreign withholding taxes recorded on the Funds' books and the US dollar equivalent of the amounts actually received or paid. Net unrealized foreign exchange gains and losses arise from changes in the fair values of assets and liabilities, other than investments in securities and financial derivative instruments, resulting from changes in exchange rates.
Forward foreign currency contracts
The Funds may enter into forward foreign currency contracts primarily to hedge against foreign currency exchange rate risks on its non-US dollar denominated investment securities. Alternatively, a Fund may enter into a forward foreign currency contract for the speculative purpose of gaining exposure to particular foreign currency markets. When entering into forward foreign currency contracts, a Fund agrees to receive or deliver a fixed quantity of foreign currency for an agreed-upon price on an agreed future date. Realized gains or losses on forward foreign currency contracts include net gains or losses on contracts that have matured. Forward foreign currency contracts are valued daily and the unrealized appreciation or depreciation is included in the Statements of Assets and Liabilities as a component of "Financial Derivative Instruments." These instruments involve market risk, credit risk or both kinds of risks, the extent of which may subject the Fund to loss in excess of the amount recognized on the Statements of Assets and Liabilities. These risks arise from the possible inability of counterparties to meet the terms of their contracts and from unfavorable currency fluctuations. When applicable, open forward foreign currency contracts at the end of the period are listed in each Fund's Portfolio of Investments.
Futures contracts
The Funds are subject to interest rate risk, equity risk and foreign currency risk in the normal course of pursuing their investment objectives. Accordingly, the Funds may invest in futures contracts to gain exposure to, or hedge against, changes in the value of interest rates, equity indices or foreign currencies. A futures contract represents a commitment for the future purchase or sale of an asset at a specified price and date. Upon entering into such contracts, a Fund is required to deposit cash with the broker as initial margin in an amount equal to a certain percentage of the contract amount. Subsequent payments, known as "variation margin," are made or received by the Fund, depending on fluctuations in the fair value of the underlying asset. Unrealized appreciation or depreciation, reflected as a component of "Financial Derivative Instruments" assets and/or liabilities on the Statements of Assets and Liabilities, is recognized but not considered realized until the contracts expire or are closed. Should market conditions move unexpectedly, the Funds may not achieve the anticipated benefits of the futures contracts and may realize a loss. The use of futures contracts involves the risk of imperfect correlation in movements in the price of futures contracts, interest rates, and/or the underlying hedged assets. With futures contracts, there is limited counterparty credit risk to the Funds as futures contracts are exchange-traded and the exchange's clearinghouse acts as counterparty to all exchange-traded futures transactions. When applicable, open futures contracts outstanding at the end of the period are listed in each Fund's Portfolio of Investments.
Short sales
The International Long/Short Equity Fund may engage in short selling (i.e., selling securities it does not own) as part of its normal investment activities. The Fund will enter into a short position on a security believed to be overvalued or poised to underperform in order to take advantage of a decline in its price. Securities sold short are recorded as a liability and marked-to-market daily. These positions are reflected as "Securities sold short, at value" on the Statement of Assets and Liabilities. There are substantial risks associated with selling short, including the risk that the Fund may have to cover its short position at a higher price than the short sale, resulting in a loss. The loss on a short sale is potentially unlimited as the value of a security sold short increases. The Fund is also subject to the risk that the third party to the short sale may fail to honor its contract terms, causing a loss to the Fund.
Short positions are collateralized by cash and/or securities held with the Fund's custodian. The collateral amount is adjusted daily based on the market value of the short positions. The cash collateral that is restricted from use is included on the Statement of Assets and Liabilities as "Cash segregated as collateral on securities sold short." The securities pledged as collateral that are restricted from use are included on the Portfolio of Investments. Dividends on short sales, in addition to short sale financing fees, are treated as an expense on the Statement of Operations. Liabilities for securities sold short are closed by purchasing the applicable securities for delivery to the Fund's custodian. Open short positions outstanding at the end of the period are listed in the Fund's Portfolio of Investments.
188
| Notes to financial statements (unaudited) |
Options
The Funds may purchase put and call options to create investment exposure consistent with their investment objectives or to hedge or limit the exposure of their portfolio holdings. Alternatively, certain Funds may write (sell) call and put options on securities and financial derivative instruments in order to gain exposure to, or protect against, changes in the markets. The Funds may use options on exchange-traded futures contracts, indices or securities to hedge an existing position or future investment, for speculative purposes, or to manage exposure to market movements. The Funds may also use foreign currency options. Purchasing foreign currency options gives the Fund the right, but not the obligation, to buy or sell the currency and will specify the amount of currency and a rate of exchange that may be exercised by a specified date. These options may be used as a short or long hedge against possible variations in foreign exchange rates or to gain exposure to foreign currencies. The Funds may also use interest rate swaptions in which the underlying instrument is an interest rate swap (discussed under the heading "Swap contracts"). Swaptions are agreements to enter into a pre-defined swap agreement by some specified date in the future. The writer of a swaption becomes the counterparty to the swap if the buyer exercises. The interest rate swaption agreement will specify whether the buyer of the swaption will be a fixed-rate receiver or a fixed-rate payer upon exercise. These types of options may be used to hedge against unfavorable fluctuations in interest rates.
Purchasing call options tends to increase the Fund's exposure to the underlying instrument, while purchasing put options tends to decrease the Fund's exposure to the underlying instrument. The Fund pays a premium when purchasing call options or put options. The option is subsequently valued daily and unrealized appreciation or depreciation is recorded; the asset is reflected as a component of "Financial Derivative Instruments" on the Statement of Assets and Liabilities. The Funds realize a gain or loss upon the expiration or closing of the option transaction. The primary risks of investing in purchased options include the risk of imperfect correlation between the option price and the value of the underlying instrument, and the possibility of an illiquid market for the option. There is limited counterparty risk with respect to exchange-traded purchased options as settlement is facilitated through a central clearinghouse. There is inherently more risk of counterparty non-performance for OTC purchased options, although the risk is generally limited to the premium paid. When applicable, options purchased by the Funds and outstanding at the end of the period are listed in each Fund's Portfolio of Investments.
Writing put options tends to increase the Fund's exposure to the underlying instrument. Writing call options tends to decrease the Fund's exposure to the underlying instrument. When a Fund writes a call or a put option, an amount equal to the premium received by the Fund is recognized as a liability. The amount of the liability is subsequently marked-to-market to reflect the current market value of the option written. These liabilities are reflected as a component of "Financial Derivative Instruments" on the Statement of Assets and Liabilities. If an option which the Fund has written either expires on its stipulated expiration date or the Fund enters into a closing purchase transaction, the Fund realizes a gain (or loss if the cost of a closing purchase transaction exceeds the premium received when the option was written) without regard to any unrealized gain or loss on the underlying security or derivative instrument, and the liability related to such option is extinguished. If a call option which the Fund has written is exercised, the Fund recognizes a realized gain or loss from the sale of the underlying security or derivative instrument and the proceeds from the sale are increased by the premium originally received. If a put option which the Fund has written is exercised, the amount of the premium originally received reduces the cost of the security or derivative instrument that the Fund purchases upon exercise of the option. Written options are subject to substantial risks. The Fund as a writer of an option has no control over whether the underlying instrument may be sold (call) or purchased (put) and, as a result, the Funds bear the market risk of an unfavorable change in the price of the derivative instrument, security/index or currency underlying the written option. Exercise of an option written by a Fund could result in a Fund selling or buying a derivative instrument, security or currency at a price different from current market value. Further, there is the risk the Fund may not be able to enter into a closing transaction because of an illiquid market. When applicable, open options and swaptions at the end of the period are listed in each Fund's Portfolio of Investments.
189
| Notes to financial statements (unaudited) |
The number of options/swaptions written and the premiums received, including both exchange-traded and OTC options, by the Unconstrained Bond Fund during the period ended January 31, 2016 were as follows:
| | | | Number of | | | Premiums | |
| | | | Contracts | | | Received | |
| Options outstanding, | | | | | | | |
| beginning of period | | | 14,440,000 | | $ | 128,008 | |
| Options written | | | | | | | |
| during period | | | 10,590,020 | | | 98,936 | |
| Options bought back | | | | | | | |
| during period | | | (7,320,000 | ) | | (61,061 | ) |
| Options expired | | | | | | | |
| during the period | | | (8,850,020 | ) | | (33,890 | ) |
| Options outstanding, | | | | | | | |
| end of period | | | 8,860,000 | | | 131,993 | |
Swap contracts
The Funds may enter into interest rate, credit default, inflation, equity, total return, currency and other swap contracts. Swap contracts are bilaterally negotiated agreements between the Funds and a counterparty to exchange or swap the returns (or the differential in rates of return) earned or realized on particular investments, instruments, indices or other measures for a defined series of cash flows at a predetermined rate at specified, future intervals. Swap contracts are privately negotiated in the OTC market ("OTC swaps"), or may be executed on a multi-lateral or other trade facility platform, such as a registered exchange ("centrally-cleared swaps"). The gross returns to be exchanged or "swapped" between parties are generally calculated with respect to a "notional amount" for a pre-determined period of time.
Certain Funds use credit default swaps to manage exposure to a given issuer or sector by either selling protection to increase exposure (i.e., leverage), or buying protection to reduce exposure. The "buyer" in a credit default swap is obligated to pay the "seller" a periodic stream of payments over the term of the contract provided that no event of default on an underlying reference obligation has occurred. If an event of default occurs, the seller must either pay the buyer the full notional value, or the "par value," of the reference obligation in exchange for the reference obligation or pay a net amount equal to the par value of the defaulted reference entity less its recovery value. In connection with these contracts, securities may be identified as collateral in accordance with the terms of the respective swap contracts to provide assets of value and recourse in the event of default or bankruptcy/insolvency. Recovery values are assumed by market makers considering either industry standard recovery rates or entity specific factors and considerations until a credit event occurs. If a credit event has occurred, the recovery value is typically determined by a facilitated auction whereby a minimum number of allowable broker bids, together with a specific valuation method, are used to calculate the settlement value. Implied credit spreads, represented in absolute terms, utilized in determining the market value of credit default swap contracts as of period end are disclosed in the Portfolios of Investments, as applicable. They serve as an indicator of the current status of the payment/performance risk and represent the likelihood or risk of default for the credit derivative. The implied credit spread of a particular referenced entity reflects the cost of buying/selling protection and may include upfront payments required to be made to enter into the contract. Wider credit spreads represent a deterioration of the referenced entity's credit soundness and a greater likelihood or risk of default or other credit event occurring as defined under the terms of the contract.
Certain Funds hold fixed-rate and/or floating-rate bonds. Accordingly, the Funds are subject to interest rate risk exposure in the normal course of pursuing its investment objectives as the value of these bonds may decrease if interest rates rise, or vice versa. To hedge against this risk and/or to generate income at prevailing market rates, the Funds may enter into interest rate swap contracts. Interest rate swap contracts involve the exchange by the Fund with another party for their respective commitment to pay or receive a fixed or variable interest rate on the notional amount.
The International Long/Short Equity Fund may enter into equity swaps for purposes of establishing long or short exposure to underlying individual securities. Equity swaps may be used in lieu of direct stock investment or short sale to enhance liquidity, synthetically enter markets with high barriers to entry or establish short positions in markets where short selling is disallowed. Equity swaps involve commitments where cash flows are exchanged based on a variable interest rate. At maturity, or upon reset or termination, a net cash flow is exchanged equivalent to the return, inclusive of dividends declared, on the underlying equity, less a financing rate.
Changes in market value, if any, are reflected as a component of net change in unrealized appreciation/(depreciation) of financial derivative instruments on the Statements of Operations. Swap payments received or made at the beginning of the measurement period represent premiums paid or received upon entering into the swap contract to compensate for differences between the stated terms of the swap contract and prevailing market conditions (credit spreads, currency exchange rates, interest rates, and other relevant factors). Upfront premiums received (paid) are initially recorded as liabilities (assets) and subsequently marked to market to reflect the current value of the swap. Upon termination or maturity of the swap, a liquidation payment received or made based on the current value is recorded as realized gain or loss on the Statements of
190
| Notes to financial statements (unaudited) |
Operations, net of any upfront premiums paid or received. Net periodic payments received or paid by the Funds are included as part of realized gains or losses on the Statements of Operations.
Entering into these contracts involves, to varying degrees, elements of counterparty, interest, credit and market risk in excess of the amounts recognized on the Statements of Assets and Liabilities. Such risks involve the potential inability of the counterparties to meet the terms of the contract (which is limited with respect to centrally-cleared swaps as described below), unanticipated changes in the value of the swap contract, the possibility that there will be no liquid market for the contract, and that there may be unfavorable changes in interest rates. The risk that a counterparty is unable to perform on its obligations in situations when the Funds are in an appreciated position is mitigated with respect to OTC swaps by having master netting arrangements between the Funds and their counterparties and, in certain scenarios dictated by the contracts, the posting of collateral by the counterparty to the Funds to cover the Funds' exposure to the counterparty. There is limited counterparty credit risk with respect to centrally-cleared swaps as the transaction is facilitated through a central clearinghouse, much like an exchange-traded futures contract. Upon entering into a centrally-cleared swap transaction, the Fund is required to deposit with its clearing broker an amount of cash or securities as an initial margin. Subsequent variation margin payments or receipts are made or received by the Fund, depending on fluctuations in the fair value of the reference entity. The magnitude of counterparty credit risk is different depending on the type of swap. Under a credit default swap, the Funds' maximum risk of loss as the protection buyer is limited to the market value, or the current unrealized appreciation/ depreciation on the contract plus/minus any upfront premiums paid/received. Alternatively, as the protection seller, the maximum risk of loss is equivalent to the notional or par value of the contract plus/minus any upfront premiums paid/received. At January 31, 2016, notional outstanding for credit protection sold, translated into US Dollar amounts, equated to $250,000 for the High Yield Opportunities Fund and $54,165 for the Strategic Income Fund. There are no sell protection credit default swaps as of January 31, 2016 in the Unconstrained Bond Fund. Alternatively, under an interest rate, inflation, or equity swap, as notional is not exchanged, the Funds' maximum risk of loss is limited to the unrealized loss on the contracts. When applicable, open swap contracts at the end of the period are listed in each Fund's Portfolio of Investments.
Derivative instruments
The FASB requires companies (including the Trust) to disclose information intended to enable financial statement users to understand how derivative instruments impact the Statements of Assets and Liabilities, as well as the effect of derivative instruments on the Statements of Operations during the reporting period, in the context of each entity's risk exposure. Accordingly, the tables included under the heading "Fair Value of Financial Derivative Instruments" in the Funds' Portfolios of Investments summarize each Fund's fair value of derivative instruments held as of January 31, 2016 and the related location on the accompanying Statements of Assets and Liabilities, as well as the amount of gains and losses on derivative instruments recognized in the Funds' earnings and the related location on the accompanying Statements of Operations, presented by primary underlying risk exposure. Supplementary information regarding gross and net values and the impact of any collateral posted for those transactions subject to master netting arrangements ("MNA") or similar agreements is presented in the Funds' Portfolios of Investments under the heading "Financial Derivative Instruments: Over-the-Counter Summary." Note that all OTC instruments (forward foreign currency contracts, OTC credit default, equity, inflation and interest rate swap contracts, swaptions and certain options) with Barclays Bank plc, BNP Paribas Securities Services, Citibank, N.A., Credit Suisse Securities (Europe) Limited, Credit Suisse International, Deutsche Bank AG, JPMorgan Chase Bank, N.A., Morgan Stanley Capital Services LLC and UBS AG are all subject to MNAs. The settlement of all futures contracts, exchange-traded options and centrally-cleared swap contracts (credit default and interest rate) is guaranteed by the clearinghouse or exchange the instrument is traded on and is not subject to arrangements with particular counterparties. For that reason, these types of investments are excluded from such disclosures.
Securities Lending
The European Focus Fund, Global Technology Fund, High Yield Opportunities Fund, International Opportunities Fund and International Select Equity Fund are enrolled in a securities lending program whereby the Funds may loan securities with a value of up to 331/3% of each Fund's total assets. The maturity associated with these securities is considered continuous. Securities loans are made to banks and broker-dealers via State Street Bank and Trust Company ("SSB") as lending agent pursuant to agreements requiring that loans be continuously secured by collateral at least equal at all times to the value of the securities on loan. The Funds receive cash or US government obligations as collateral against the loaned securities in an amount at least equal to 102% (for loans of US securities) or 105% (for loans of non-US securities) of the fair value of the loaned securities at the inception of each loan, and which is subsequently adjusted each day based on market value movements. Accordingly, the value of the collateral with respect to a loaned security may be temporarily more or less than the value of a security on a given day due to market
191
| Notes to financial statements (unaudited) |
fluctuations of securities values and as a result may appear to be over or under-collateralized. The required collateral to be received or returned is adjusted on the following business day. Under the securities lending arrangement, the collateral received is recorded by the lending Fund along with a related obligation to return the collateral. To the extent non-cash collateral received in the form of short-term US government obligations, brokers pay the lending Fund negotiated lenders' fees which are divided between the Fund and SSB and are recorded as security lending income. Cash collateral received is invested in the State Street Navigator Securities Lending Prime Portfolio, a 1940 Act-registered open-end mutual fund used exclusively for SSB securities lending clients, which management of the Funds has determined presents minimal credit risk. Securities on loan and investment of cash collateral in the State Street Navigator Securities Lending Prime Portfolio are reflected in each Fund's Portfolio of Investments, as applicable.
The risks in lending portfolio securities, as with other extensions of credit, consist of possible delay in recovery of the securities, or possible loss of rights in the collateral should the borrower fail financially. Consequently, loans are made only to borrowers which are deemed to be creditworthy by SSB and approved by management of the Funds. Further, the Funds have protections under the agreement with SSB in the event of borrower default. The borrower pays the Funds an amount equal to any dividends or interest received on securities lent, and the Funds retain all or a portion of the interest received on investment of the cash collateral or receives a fee from the borrower. The Funds may call such loans in order to, among other reasons, sell the securities involved.
The following table is a summary of each Fund's securities on loan and related cash and non-cash collateral received as of January 31, 2016:
| | | | Market | | | | | | Non- | | | | |
| | | | Value of | | | Cash | | | Cash | | | Total | |
| | | | Securities | | | Collateral | | | Collateral | | | Collateral | |
| Fund | | | on Loan | | | Received | | | Received | | | Received* | |
| European | | | | | | | | | | | | | |
| Focus | | | | | | | | | | | | | |
| Fund | | $ | 52,671,585 | | $ | 55,198,044 | | $ | — | | $ | 55,198,044 | |
| Global | | | | | | | | | | | | | |
| Technology | | | | | | | | | | | | | |
| Fund | | | 2,777,501 | | | 2,766,576 | | | — | | | 2,766,576 | |
| High Yield | | | | | | | | | | | | | |
| Opportunities | | | | | | | | | | | | | |
| Fund | | | — | | | — | | | — | | | — | |
| International | | | | | | | | | | | | | |
| Opportunities | | | | | | | | | | | | | |
| Fund | | | 149,678,663 | | | 155,521,617 | | | — | | | 155,521,617 | |
| International | | | | | | | | | | | | | |
| Select Equity | | | | | | | | | | | | | |
| Fund | | | — | | | — | | | — | | | — | |
| * | The "Total Collateral Received" as of period end may be less than the "Market Value of Securities on Loan" as the result of fluctuations in the value of the loaned securities. Additional required collateral as a result of changes in the value of loaned securities is received the following business day. |
Indemnifications
Under the Trust's organizational documents, its officers and trustees are indemnified against certain liabilities arising out of the performance of their duties to the Trust. In addition, in the normal course of business the Trust enters into contracts that provide general indemnifications to other parties. The Trust's maximum exposure under these arrangements is unknown as future claims may be made against the Trust that have not yet been asserted.
Use of estimates
The preparation of financial statements in conformity with US GAAP requires management to make estimates and assumptions that affect the reported amounts and disclosures in the financial statements. Actual results may differ from those estimates.
Expenses
Expenses are recorded on an accrual basis. Expenses of the Trust that are directly attributable to a specific Fund are charged to that Fund. Expenses attributable to a specific class of shares are charged to that class. Other expenses are allocated proportionately among each Fund within the Trust based on average daily net assets or on another reasonable basis.
192
| Notes to financial statements (unaudited) |
Deferred offering costs
Costs incurred in connection with the offering and initial registration of International Long/Short Equity, International Select Equity and US Growth Opportunities were deferred in conformity with US GAAP and amortized to expense on a straight-line basis over the first twelve months after commencement of operations. The deferred offering costs incurred by these Funds were fully amortized to expense as of September 30, 2015, December 9, 2015 and December 18, 2015, respectively.
Federal income taxes
The Trust's policy is that each Fund seeks to comply with the requirements of Subchapter M of the Internal Revenue Code of 1986, as amended ("Subchapter M"), that are applicable to regulated investment companies ("RICs") and to distribute substantially all its taxable income to shareholders. No federal income tax provision is required so long as each Fund operates in a manner that complies with the requirements of Subchapter M.
FASB ASC 740-10 "Income Taxes – Overall" sets forth a minimum threshold for financial statement recognition of the benefit of a tax position taken or expected to be taken in a tax return. Management of the Funds has concluded there are no significant uncertain tax positions that would require recognition in the financial statements. Management is also not aware of any tax positions for which it is reasonably possible that the total amount of unrecognized tax benefits will significantly change in the next twelve months. The Funds intend to file tax returns with the US Internal Revenue Service and various states. Generally, each of the tax years in the four-year period ended July 31, 2015 remains subject to examination by taxing authorities.
The Funds may be subject to taxes imposed by countries in which they invest. Such taxes are generally based on income and/or capital gains earned or repatriated. Taxes are accrued based on net investment income, net realized gains and net unrealized appreciation as such income and/or gains are earned. Taxes may also be based on transactions in foreign currency and are accrued based on the value of investments denominated in such currency. With respect to withholding taxes on certain foreign dividends and interest, the Funds file withholding tax reclaims in certain jurisdictions to recover a portion of amounts previously withheld. The Funds record a reclaim receivable based on, among other things, a jurisdiction's legal obligation to pay reclaims under double taxation agreements or treaties with the United States, as well as payment history and market convention.
In consideration of recent decisions rendered by European courts with respect to discriminatory taxation, and based on relative exposure, the European Focus Fund, Global Equity Income Fund, Global Technology Fund and International Opportunities Fund pursued additional reclaims related to prior years in certain jurisdictions in accordance with European Union law. However, the relevant tax authorities and the administrative courts within the various jurisdictions have been, to date, inconsistent in the approach, interpretation and rulings related to US RIC claimants. As a result, and consistent with US GAAP accrual requirements, these Funds have not recorded a corresponding receivable amount for these reclaim filings given the significant uncertainty in their ultimate recovery, with the exception of Finland. In June 2015 the Funds received payment, plus interest, of tax withheld in Finland from 2009-2013. The payments reduced fiscal year 2015 withholding tax, resulting in an increase in the net asset value of each Fund. Based on the merits of the reclaims and the low likelihood of appeal, management believes it is more likely than not that the Funds will retain the recovered amounts. Further, management's approach to offset current period withholding tax with these payments is consistent with the US Internal Revenue Service's Notice 2016-10.
As of January 31, 2016, the total amount of additional reclaims being pursued in France, Germany, Spain and Sweden with respect to withholdings amounts during the respective statute of limitations periods (generally 2009-2013) represent less than 0.35% with respect to the individual Fund net assets of European Focus, Global Equity Income and International Opportunities; however, the recovery of any or all of these amounts and timing of recovery, if any, is uncertain. Management is pursuing the reclaim of 2014 Finnish, French and Swedish amounts in each of the three above named Funds, and will continue to monitor developments in other jurisdictions to justify further filings.
To the extent that capital loss carryforwards incurred in current and prior years are used to offset any future capital gains realized during the carryover period as provided by US Federal income tax regulations, no capital gains tax liability will be incurred by the Funds for gains realized and not distributed. To the extent that capital gains are offset, such gains will not be distributed to the shareholders. Carryforwards not subject to expiration must be utilized prior to losses that carry an expiration; as a result, certain carryforwards may expire unused. Losses incurred that will be carried forward under the provisions of the regulations are as follows:
Dividend & Income Builder
| | | | Loss carryforward character | |
| Expiration | | | Short-term | | | Long-term | |
| Unlimited losses | | $ | 3,115 | | $ | — | |
193
| Notes to financial statements (unaudited) |
Emerging Markets
| | | | Loss carryforward character | |
| Expiration | | | Short-term | | | Long-term | |
| Unlimited losses | | $ | 1,804,491 | | $ | — | |
European Focus
| | | | Loss carryforward character | |
| Expiration | | | Short-term | | | Long-term | |
| 7/31/18 | | $ | 46,255,302 | | $ | — | |
High Yield Opportunities
| | | | Loss carryforward character | |
| Expiration | | | Short-term | | | Long-term | |
| Unlimited losses | | $ | 498,592 | | $ | 56,380 | |
International Opportunities
| | | | Loss carryforward character | |
| Expiration | | | Short-term | | | Long-term | |
| 7/31/18 | | $ | 298,194,218 | | $ | — | |
Strategic Income
| | | | Loss carryforward character | |
| Expiration | | | Short-term | | | Long-term | |
| 7/31/16 | | $ | 559,583 | | $ | — | |
| 7/31/17 | | | 34,174,962 | | | — | |
| 7/31/18 | | | 336,160 | | | — | |
| Total | | | 35,070,705 | | | — | |
US Growth Opportunities
| | | | Loss carryforward character | |
| Expiration | | | Short-term | | | Long-term | |
| Unlimited losses | | $ | 35,944 | | $ | — | |
Note that All Asset, Global Equity Income, Global Technology, International Long/Short Equity, International Select Equity and Unconstrained Bond do not have any capital loss carryforward to apply against future earnings.
During the year ended July 31, 2015 the Funds utilized the following capital loss carryforwards:
| | | | | |
| All Asset | | $ | — | |
| Dividend & Income Builder | | | — | |
| Emerging Markets | | | 782,742 | |
| European Focus | | | 11,482,117 | |
| Global Equity Income | | | 61,176,852 | |
| Global Technology | | | — | |
| High Yield Opportunities | | | — | |
| International Long/Short Equity | | | — | |
| International Opportunities | | | 176,074,558 | |
| International Select Equity | | | — | |
| Strategic Income | | | 1,593,726 | |
| Unconstrained Bond | | | — | |
| US Growth Opportunities | | | — | |
At July 31, 2015, the following Funds deferred post-October losses and/or late year ordinary losses, which will be recognized on the first day of the following year:
| | | | Ordinary | | | Capital | |
| | | | loss | | | loss | |
| | | | deferred | | | deferred | |
| All Asset | | $ | — | | $ | — | |
| Dividend & | | | | | | | |
| Income Builder | | | — | | | 344,431 | |
| Emerging Markets | | | 58,760 | | | — | |
| European Focus | | | — | | | 35,109,167 | |
| Global Equity Income | | | — | | | 47,394,203 | |
| Global Technology | | | 318,764 | | | — | |
| High Yield | | | | | | | |
| Opportunities | | | — | | | — | |
| International Long/ | | | | | | | |
| Short Equity | | | — | | | — | |
| International | | | | | | | |
| Opportunities | | | — | | | — | |
| International | | | | | | | |
| Select Equity | | | — | | | — | |
| Strategic Income | | | 962,675 | | | — | |
| Unconstrained Bond | | | 1,030,499 | | | — | |
| US Growth | | | | | | | |
| Opportunities | | | 1,963 | | | — | |
Distributions to shareholders
Distributions to shareholders are recorded on the ex-dividend date. Distributions from net investment income and net realized capital gains are determined in accordance with federal income tax regulations, which may differ from US GAAP. These book/tax differences are either temporary or permanent in
194
| Notes to financial statements (unaudited) |
nature. To the extent these differences are permanent, they are reclassified within the capital accounts based on their federal tax-basis treatment.
The tax character of distributions paid during the years ended July 31, 2015 and 2014 were as follows:
| Year ended | | | Ordinary | | | Capital | |
| July 31, 2015 | | | income | | | gains | |
| All Asset | | $ | 1,698,896 | | $ | 848,091 | |
| Dividend & | | | | | | | |
| Income Builder | | | 1,358,317 | | | 277,649 | |
| Emerging Markets | | | 22,618 | | | — | |
| European Focus | | | 36,848,194 | | | — | |
| Global Equity Income | | | 194,280,256 | | | — | |
| Global Technology | | | — | | | 42,250,534 | |
| High Yield | | | | | | | |
| Opportunities | | | 2,208,258 | | | — | |
| International Long/ | | | | | | | |
| Short Equity | | | — | | | — | |
| International | | | | | | | |
| Opportunities | | | 39,251,903 | | | — | |
| International | | | | | | | |
| Select Equity | | | — | | | — | |
| Strategic Income | | | 4,635,024 | | | — | |
| Unconstrained Bond | | | 958,626 | | | 578,312 | |
| US Growth | | | | | | | |
| Opportunities | | | — | | | — | |
| Year ended | | | Ordinary | | | Capital | |
| July 31, 2014 | | | income | | | gains | |
| All Asset | | $ | 2,546,811 | | $ | 532,924 | |
| Dividend & | | | | | | | |
| Income Builder | | | 488,048 | | | 9 | |
| Emerging Markets | | | — | | | — | |
| European Focus | | | 3,710,266 | | | — | |
| Global Equity Income | | | 156,362,094 | | | — | |
| Global Technology | | | — | | | 2,465,935 | |
| High Yield | | | | | | | |
| Opportunities | | | 1,725,650 | | | — | |
| International | | | | | | | |
| Opportunities | | | 12,686,584 | | | — | |
| Strategic Income | | | 2,015,022 | | | — | |
| Unconstrained Bond | | | 350,001 | | | — | |
As of July 31, 2015, the components of distributable earnings on a tax basis were as follows:
| | | | Undistributed | | | Undistributed | | | Undistributed | |
| | | | ordinary | | | capital gains/ | | | appreciation/ | |
| | | | income | | | (losses | ) | | (depreciation | ) |
| All Asset | | $ | 1,377,364 | | $ | 700,399 | | $ | 875,564 | |
| Dividend & | | | | | | | | | | |
| Income Builder | | | 422,448 | | | — | | | 1,693,376 | |
| Emerging Markets | | | — | | | — | | | (1,417,071 | ) |
| European Focus | | | 28,658,545 | | | — | | | 177,460,148 | |
| Global Equity | | | | | | | | | | |
| Income | | | 4,569,061 | | | — | | | (64,715,471 | ) |
| Global Technology | | | — | | | 31,479,250 | | | 76,725,042 | |
| High Yield | | | | | | | | | | |
| Opportunities | | | 75,405 | | | — | | | (328,413 | ) |
| International Long/ | | | | | | | | | | |
| Short Equity | | | 184,888 | | | 28,480 | | | (80,678 | ) |
| International | | | | | | | | | | |
| Opportunities | | | 70,143,876 | | | — | | | 590,959,397 | |
| International | | | | | | | | | | |
| Select Equity | | | 82,501 | | | — | | | 320,789 | |
| Strategic Income | | | — | | | — | | | (1,905,827 | ) |
| Unconstrained Bond | | | 160,809 | | | 928,592 | | | (1,362,741 | ) |
| US Growth | | | | | | | | | | |
| Opportunities | | | — | | | — | | | 724,006 | |
Ordinary income and net realized gains/losses may differ for book and tax basis reporting purposes due to post-October losses (which are not recognized for tax purposes until the first day of the following fiscal year), tax deferral on wash sales and PFIC transactions.
The US federal income tax basis of investments, including proceeds from securities sold short but excluding financial derivative instruments, is formally identified annually as part of the July 31 year-end audit and tax provision process. The US GAAP cost basis of investments as of January 31, 2016, which approximates the US federal income tax basis of investments, and the gross unrealized appreciation and depreciation, were as follows:
| | | | All | | | Dividend & | |
| | | | Asset | | | Income Builder | |
| Cost | | $ | 52,772,368 | | $ | 104,274,441 | |
| Gross unrealized | | | | | | | |
| appreciation | | | 777,434 | | | 3,270,824 | |
| Gross unrealized | | | | | | | |
| depreciation | | | (1,943,707 | ) | | (5,941,931 | ) |
| Net unrealized | | | | | | | |
| appreciation | | | | | | | |
| (depreciation) | | | (1,166,273 | ) | | (2,671,107 | ) |
195
| Notes to financial statements (unaudited) |
| | | | Emerging | | | European | |
| | | | Markets | | | Focus | |
| Cost | | $ | 30,967,625 | | $ | 3,841,410,704 | |
| Gross unrealized | | | | | | | |
| appreciation | | | 416,553 | | | 183,973,474 | |
| Gross unrealized | | | | | | | |
| depreciation | | | (4,264,887 | ) | | (540,942,633 | ) |
| Net unrealized | | | | | | | |
| appreciation | | | | | | | |
| (depreciation) | | | (3,848,334 | ) | | (356,969,159 | ) |
| | | | Global Equity | | | Global | |
| | | | Income | | | Technology | |
| Cost | | $ | 3,628,259,403 | | $ | 188,242,549 | |
| Gross unrealized | | | | | | | |
| appreciation | | | 116,245,383 | | | 65,469,286 | |
| Gross unrealized | | | | | | | |
| depreciation | | | (374,036,062 | ) | | (14,354,249 | ) |
| Net unrealized | | | | | | | |
| appreciation | | | | | | | |
| (depreciation) | | | (257,790,679 | ) | | 51,115,037 | |
| | | | | | | International | |
| | | | High Yield | | | Long/Short | |
| | | | Opportunities | | | Equity | |
| Cost | | $ | 28,478,603 | | $ | 11,530,126 | |
| Gross unrealized | | | | | | | |
| appreciation | | | 160,323 | | | 232,272 | |
| Gross unrealized | | | | | | | |
| depreciation | | | (1,437,246 | ) | | (242,425 | ) |
| Net unrealized | | | | | | | |
| appreciation | | | | | | | |
| (depreciation) | | | (1,276,923 | ) | | (10,153 | ) |
| | | | International | | | International | |
| | | | Opportunities | | | Select Equity | |
| Cost | | $ | 4,697,532,281 | | $ | 5,494,901 | |
| Gross unrealized | | | | | | | |
| appreciation | | | 494,975,286 | | | 221,181 | |
| Gross unrealized | | | | | | | |
| depreciation | | | (357,222,075 | ) | | (561,371 | ) |
| Net unrealized | | | | | | | |
| appreciation | | | | | | | |
| (depreciation) | | | 137,753,211 | | | (340,190 | ) |
| | | | Strategic | | | Unconstrained | |
| | | | Income | | | Bond | |
| Cost | | $ | 352,689,736 | | $ | 28,069,001 | |
| Gross unrealized | | | | | | | |
| appreciation | | | 1,277,863 | | | 49,154 | |
| Gross unrealized | | | | | | | |
| depreciation | | | (12,826,882 | ) | | (1,773,386 | ) |
| Net unrealized | | | | | | | |
| appreciation | | | | | | | |
| (depreciation) | | | (11,549,019 | ) | | (1,724,232 | ) |
| | | | US Growth | |
| | | | Opportunities | |
| Cost | | $ | 7,607,917 | |
| Gross unrealized | | | | |
| appreciation | | | 509,621 | |
| Gross unrealized | | | | |
| depreciation | | | (344,558 | ) |
| Net unrealized | | | | |
| appreciation | | | | |
| (depreciation) | | | 165,063 | |
Identified cost may differ for book and tax basis reporting purposes primarily due to tax deferral of losses on wash sales, PFIC transactions, different book and tax treatment on certain debt instruments and amortization of premiums.
Note 3. Fair value measurements
US GAAP defines fair market value as the price that a Fund would receive to sell an asset or pay to transfer a liability in an orderly transaction between market participants at the measurement date. Various inputs are used in determining the value of the Funds' investments. The Funds use a three-tier hierarchy of inputs to establish classification of fair value measurements for disclosure purposes. These inputs may be observable or unobservable. Observable inputs are inputs that reflect the assumptions market participants would use in pricing the asset or liability developed based on market data obtained from sources independent of the reporting entity. Unobservable inputs are inputs that reflect the reporting entity's own assumptions about the assumptions market participants would use in pricing the asset or liability developed based on the best information available under the circumstances. The inputs used for valuing securities are not necessarily an indication of the risk associated with investing in those securities. The three-tier hierarchy of inputs is summarized in the following three broad levels:
| • | Level 1 – quoted prices (unadjusted) in active markets for identical investments |
| | |
| • | Level 2 – other significant observable inputs (including quoted prices for similar investments, interest rates, prepayment speeds, credit risk, etc.) |
196
| Notes to financial statements (unaudited) |
| • | Level 3 – significant unobservable inputs based on the best information available in the circumstances to the extent observable inputs are not available (including the Fund's own assumptions in determining the fair value of investments) |
Tables included under the heading "Fair value measurements" summarizing each Fund's investments that are measured at fair value by level within the fair value hierarchy as of January 31, 2016 have been listed after each Fund's Portfolio of Investments.
Any transfers between levels are disclosed, effective at the end of the period, in each Fund's table with the reasons for the transfers disclosed in a note to the table, if applicable.
Note 4. Investment advisory fees and other transactions with affiliates
Pursuant to an Investment Advisory Agreement, Henderson Global Investors (North America) Inc. ("HGINA") acts as the Funds' investment adviser. HGINA is an indirect wholly-owned subsidiary of Henderson Group plc. HGINA supervises the investments of the Funds and earns a management fee for such services. HGINA earns a fee for its services based on each Fund's average daily net assets as set forth below.
| All Asset | | 0.40% | |
| Dividend & Income Builder | First $1 billion | 0.75% | |
| | Next $1 billion | 0.65% | |
| | Over $2 billion | 0.55% | |
| Emerging Markets | First $1 billion | 1.00% | |
| | Next $1 billion | 0.90% | |
| | Over $2 billion | 0.85% | |
| European Focus | First $500 million | 1.00% | |
| | Next $1 billion | 0.90% | |
| | Next $1 billion | 0.85% | |
| | Over $2.5 billion | 0.80% | |
| Global Equity Income | First $1 billion | 0.85% | |
| | Next $1 billion | 0.65% | |
| | Over $2 billion | 0.60% | |
| Global Technology | First $1 billion | 0.90% | |
| | Over $1 billion | 0.80% | |
| High Yield Opportunities | First $1 billion | 0.65% | |
| | Next $1 billion | 0.55% | |
| | Over $2 billion | 0.50% | |
| International Long/ | | | |
| Short Equity | | 1.25% | |
| International Opportunities | First $2 billion | 1.00% | |
| | Next $1 billion | 0.90% | |
| | Next $1 billion | 0.80% | |
| | Next $1 billion | 0.70% | |
| | Next $5 billion | 0.60% | |
| | Over $10 billion | 0.50% | |
| International Select Equity | | 0.65% | |
| Strategic Income* | First $1 billion | 0.55% | |
| | Next $500 million | 0.50% | |
| | Over $1.5 billion | 0.45% | |
| Unconstrained Bond | First $1 billion | 0.65% | |
| | Next $1 billion | 0.55% | |
| | Over $2 billion | 0.50% | |
| US Growth Opportunities | First $1 billion | 0.75% | |
| | Next $1 billion | 0.70% | |
| | Over $2 billion | 0.65% | |
| * | Based on average daily managed assets of the Fund. Managed assets mean the total assets of the Fund (including any assets attributable to any leverage that may be outstanding) minus the sum of accrued liabilities (other than debt representing financial leverage). Since the Fund pays HGINA based on the Fund's average daily managed assets, HGINA's fee will be higher if the Fund is leveraged. |
HGINA has engaged Henderson Investment Management Limited ("HIML") to act as the investment sub-adviser to the Funds, except for High Yield Opportunities and US Growth Opportunities. HGINA has engaged Geneva Capital Management ("Geneva") to act as the investment sub-adviser for US Growth Opportunities, while no sub-adviser has been appointed for High Yield Opportunities. Both HIML and Geneva are also indirect wholly owned subsidiaries of Henderson Group plc. Under separate Sub-Advisory Agreements, the sub-advisers provide research, advice and recommendations with respect to the purchase and sale of securities and make investment decisions regarding assets of the Funds subject to the oversight of the Board and the Adviser. No additional advisory fees are charged to the Funds for the services of the sub-advisers as these fees are paid from the fees earned by HGINA.
Pursuant to a separate contractual Expense Limitation Agreement, HGINA has agreed to waive or limit its investment advisory fee and, if necessary, to reimburse expenses of each Fund in order to limit total annual ordinary operating expenses, including distribution and service fees, but excluding any acquired fund fees and expenses as a result of investing in other funds, as a percentage of average daily net assets as follows:
197
| Notes to financial statements (unaudited) |
| | | | | | | | | | | | | | | | | |
| | | | Class | | | Class | | | Class | | | Class | | | Class | |
| | | | A | | | C | | | I | | | R | | | R6 | |
| All Asset* | | | 0.85 | % | | 1.60 | % | | 0.60 | % | | N/A | | | 0.60 | % |
| Dividend & | | | | | | | | | | | | | | | | |
| Income Builder | | | 1.30 | % | | 2.05 | % | | 1.05 | % | | N/A | | | 1.05 | % |
| Emerging | | | | | | | | | | | | | | | | |
| Markets | | | 1.79 | % | | 2.54 | % | | 1.54 | % | | N/A | | | 1.54 | % |
| European Focus | | | 2.00 | % | | 2.75 | % | | 1.75 | % | | N/A | | | 1.75 | % |
| Global Equity | | | | | | | | | | | | | | | | |
| Income | | | 1.40 | % | | 2.15 | % | | 1.15 | % | | N/A | | | 1.15 | % |
| Global | | | | | | | | | | | | | | | | |
| Technology | | | 2.00 | % | | 2.75 | % | | 1.75 | % | | N/A | | | 1.75 | % |
| High Yield | | | | | | | | | | | | | | | | |
| Opportunities | | | 1.10 | % | | 1.85 | % | | 0.85 | % | | N/A | | | 0.85 | % |
| International Long/ | | | | | | | | | | | | | | | | |
| Short Equity** | | | 1.75 | % | | 2.50 | % | | 1.50 | % | | N/A | | | 1.50 | % |
| International | | | | | | | | | | | | | | | | |
| Opportunities | | | 2.00 | % | | 2.75 | % | | 1.75 | % | | 2.25 | % | | 1.75 | % |
| International | | | | | | | | | | | | | | | | |
| Select Equity | | | 1.14 | % | | 1.89 | % | | 0.89 | % | | N/A | | | 0.89 | % |
| Strategic Income | | | 1.10 | % | | 1.85 | % | | 0.85 | % | | N/A | | | 0.85 | % |
| Unconstrained | | | | | | | | | | | | | | | | |
| Bond | | | 1.15 | % | | 1.90 | % | | 0.90 | % | | N/A | | | 0.90 | % |
| US Growth | | | | | | | | | | | | | | | | |
| Opportunities | | | 1.20 | % | | 1.95 | % | | 0.95 | % | | N/A | | | 0.95 | % |
| * | With respect to investments in affiliate underlying funds, HGINA has contractually agreed to reduce or waive the Fund's management fee to limit the combined management fees paid to the Adviser for those assets to the greater of 1.00% or the affiliate underlying fund's management fee. Any waiver calculated as a result of limiting these combined management fees is in addition to the general expense limitation highlighted in the table. Indirect net expenses associated with the Fund's investments in underlying investment companies are not subject to the contractual expense limitation. |
| ** | Dividends and interest expense on securities sold short are excluded from the expense limitation calculation. |
These agreements will remain in effect through July 31, 2020 unless otherwise extended or amended.
Shares of the Funds are often purchased through financial intermediaries who are agents of the Funds for the limited purpose of completing purchases and sales. These intermediaries may provide certain networking and sub-transfer agent services with respect to Fund shares held by that intermediary for its customers, and the intermediary may charge HGINA for those services. The Funds reimburse HGINA for such fees within limits specified by the Board of Trustees. The fees are incurred at the class level based on activity, asset levels and/or number of accounts and are included in "Sub-accounting fees" in the Statements of Operations.
At January 31, 2016, HGINA does not own shares in any of the Funds. HGI Group Limited, another indirect wholly-owned subsidiary of Henderson Group plc, owned shares in the following Funds. Significant ownership percentages in International Long/Short Equity, International Select Equity and Unconstrained Bond are the result of the initial investments necessary to facilitate commencement of operations and will be redeemed as external shareholders subscribe to the Funds.
| | | | | | | | | | | | | | | | | | | | |
| | | | | | | | | | | | | | | Total Value at | | | As a % of | |
| Fund | | | Class A | | | Class C | | | Class I | | | Class R6 | | | 1/31/16 | | | Net Assets | |
| HGI Group Limited | | | | | | | | | | | | | | | | | | | |
| International Long/Short Equity | | | — | | | 10,000 | | | — | | | 489,980 | | $ | 4,979,204 | | | 38.4 | % |
| International Select Equity | | | — | | | 10,000 | | | — | | | 489,971 | | $ | 4,639,230 | | | 90.0 | % |
| Unconstrained Bond | | | 103,896 | | | 103,900 | | | 109,095 | | | 2,280,602 | | $ | 23,274,575 | | | 90.5 | % |
An affiliated entity of a Fund may include any company in which the Fund owns 5% or more of its outstanding voting shares. Additionally, certain of the Funds held ownership in other Funds within the Trust. At January 31, 2016, the All Asset Fund held 0.04% of the Henderson Global Equity Income Fund, 0.25% of the Henderson Global Technology Fund, 3.90% of the Henderson High Yield Opportunities Fund, 0.37% of the Henderson Strategic Income Fund and 8.96% of the Henderson Unconstrained Bond Fund. Transactions in affiliates during the period ended January 31, 2016 were as follows:
198
| Notes to financial statements (unaudited) |
| | | | | | | | | | | | | Change in | | | | | | | | | | |
| | | | | | | | | | Proceeds | | | Unrealized | | | Realized | | | | | | | |
| | | | Value | | | Purchases | | | from | | | Appreciation/ | | | Gain/ | | | Value | | | Dividend | |
| Affiliate | | | 7/31/2015 | | | at Cost | | | Sales | | | (Depreciation | ) | | (Loss | ) | | 1/31/2016 | | | Income | |
| All Asset | | | | | | | | | | | | | | | | | | | | | | |
| Henderson Global | | | | | | | | | | | | | | | | | | | | | | |
| Equity Income Fund | | $ | 1,591,319 | | $ | 37,835 | | $ | — | | $ | (161,085 | ) | $ | — | | $ | 1,468,069 | | $ | 37,835 | |
| Henderson Global | | | | | | | | | | | | | | | | | | | | | | |
| Technology Fund | | | 1,486,901 | | | 77,970 | | | 771,552 | | | (239,347 | ) | | 49,702 | | | 603,674 | | | — | |
| Henderson High Yield | | | | | | | | | | | | | | | | | | | | | | |
| Opportunities Fund | | | — | | | 1,047,016 | | | — | | | 3,564 | | | — | | | 1,050,580 | | | 5,016 | |
| Henderson Strategic | | | | | | | | | | | | | | | | | | | | | | |
| Income Fund | | | 1,214,183 | | | 18,211 | | | — | | | (18,808 | ) | | — | | | 1,213,586 | | | 18,211 | |
| Henderson | | | | | | | | | | | | | | | | | | | | | | |
| Unconstrained | | | | | | | | | | | | | | | | | | | | | | |
| Bond Fund | | | 2,978,911 | | | 128,156 | | | 632,661 | | | (93,688 | ) | | (76,703 | ) | | 2,304,015 | | | 15,252 | |
| Total | | $ | 7,271,314 | | $ | 1,309,188 | | $ | 1,404,213 | | $ | (509,364 | ) | $ | (27,001 | ) | $ | 6,639,924 | | $ | 76,314 | |
The aggregate cost and value of affiliates at January 31, 2016 is $7,051,337 and $6,639,924, respectively. Investments in affiliates represented 12.59% of total net assets of the All Asset Fund as of January 31, 2016.
Note 5. Compensation of trustees and officers
Certain officers and trustees of the Trust are also officers of HGINA. None of the Trust's officers, other than the Chief Compliance Officer, are compensated by the Trust. The Trust makes no direct payments to trustees affiliated with HGINA. Fees paid to trustees are reflected as Trustees' fees and expenses in the Statements of Operations.
The Funds bear the full compensation paid to the Chief Compliance Officer. This compensation, together with other compliance-related costs, is reflected as "Compliance officer fees" in the Statements of Operations.
Note 6. Distribution plan
The Trust has adopted a distribution plan for Class A, Class C and Class R shares of the Funds in accordance with Rule 12b-1 under the 1940 Act (the "12b-1 Plan"). Under the 12b-1 Plan, the Funds pay the distributor an annual fee of 0.25% of the average daily net assets attributable to its Class A shares, an annual fee of 1.00% of the average daily net assets attributable to its Class C shares, and an annual fee of 0.50% of the average daily net assets attributable to its Class R shares. The 12b-1 Plan is used to induce or compensate financial intermediaries (including brokerage firms, depository institutions and other firms) to provide distribution services to the Funds and their shareholders.
Note 7. Investment transactions
Purchases and sales of investment securities, including proceeds from securities sold short but excluding short-term investments, financial derivatives instruments and US government securities, for the Funds for the period ended January 31, 2016, were as follows:
| | | | Purchases | | | Sales | |
| All Asset | | $ | 4,827,477 | | $ | 10,092,773 | |
| Dividend & | | | | | | | |
| Income Builder | | | 70,821,958 | | | 15,135,701 | |
| Emerging Markets | | | 19,620,391 | | | 11,398,244 | |
| European Focus | | | 1,306,389,772 | | | 904,564,490 | |
| Global Equity Income | | | 2,604,843,263 | | | 2,520,155,535 | |
| Global Technology | | | 45,023,250 | | | 79,237,110 | |
| High Yield Opportunities | | | 19,724,247 | | | 16,101,564 | |
| International Long/ | | | | | | | |
| Short Equity | | | 7,909,440 | | | 7,833,932 | |
| International | | | | | | | |
| Opportunities | | | 1,596,212,782 | | | 866,445,763 | |
| International | | | | | | | |
| Select Equity | | | 1,298,230 | | | 949,804 | |
| Strategic Income | | | 240,069,337 | | | 74,185,806 | |
| Unconstrained Bond | | | 12,088,710 | | | 10,011,435 | |
| US Growth Opportunities | | | 1,335,134 | | | 382,343 | |
Note 8. Significant concentrations
The Funds may invest a substantial percentage of their assets in securities of foreign issuers. These investments may involve certain considerations and risks not typically associated with investments in the United States as a result of, among other factors, the possibility of future political and economic developments and the level of governmental supervision and regulation of securities markets in the respective countries.
199
| Notes to financial statements (unaudited) |
Some countries in which the Funds invest may require government approval for repatriation of investment income, capital or the proceeds for sales of securities by foreign investors. In addition, if there is deterioration in a country's balance of payments or for other reasons, a country may impose temporary restrictions on foreign capital remittances abroad. In addition, changes in currency exchange rates will affect the value of investments denominated in a foreign currency, as well as investment income derived from those securities. These risks may be heightened in less developed countries, which are sometimes referred to as emerging markets. For example, political and economic structures in these countries may be changing rapidly, which can cause instability and greater risk of loss. These countries are also more likely to experience higher levels of inflation, deflation or currency devaluation, which could hurt their economies and securities markets. For these and other reasons, investments in emerging markets, particularly by the Emerging Markets Fund, are often considered speculative. Further, the Funds maintain many of their investments in issuers domiciled in the Eurozone. The private and public sectors' debt problems of a single Eurozone country may pose significant risks to the Eurozone as a whole. As a result, the Funds may be more susceptible to volatility generated by currency devaluations or other general uncertainties than more geographically diversified funds that do not concentrate in this region of the world.
The Funds may invest a high percentage of their net assets in specific sectors of the market in order to achieve a potentially greater investment return. As a result, the economic, political and regulatory developments in a particular sector of the market, positive or negative, have a greater impact on a Fund's net assets and will cause the value of its shares to fluctuate more than if the Fund did not concentrate its investments in a particular sector. In particular, the Global Technology Fund concentrates its investments in issuers within specific industries of the technology and telecommunications sectors. Valuations of companies in these sectors are typically subject to greater volatility than other sectors.
The Dividend & Income Builder Fund, High Yield Opportunities Fund, Strategic Income Fund and Unconstrained Bond Fund invest in a variety of income-producing debt instruments of corporate and sovereign issuers. Accordingly, each may be subject to the previously described foreign issuers risk, to varying degrees, in addition to the risk of default by the issuer. As a matter of their investment strategies, the High Yield Opportunities Fund, Strategic Income Fund and Unconstrained Bond Fund are also subject to higher concentrations of investments in lower quality high yield securities or asset-backed/structured securities. Investing in high yield, asset-backed or structured securities may involve greater risks and considerations not typically associated with investing in US Government bonds and other high quality fixed-income securities. High yield securities are non-investment grade securities, often referred to as "junk bonds." Economic downturns may disrupt the high yield market and impair the ability of issuers to repay principal and interest. Additionally, asset-backed securities are subject to the risk that underlying debt may be prepaid prior to maturity or refinanced causing further volatility in the value. A small change in interest rates would likely have a pronounced adverse impact on the value of such high yield and asset-backed obligations. Moreover, these securities may be less liquid as there is a less-established secondary market and the Funds may not be able to sell the asset timely.
Note 9. Borrowing arrangements
The Trust maintains a $100 million credit facility with State Street Bank and Trust Company to facilitate portfolio liquidity. Interest is charged to each Fund based on its borrowings at a rate per annum equal to the higher of the Federal Funds rate or 1 Month LIBOR plus 1.25%. In addition, a commitment fee of 0.20% per annum is accrued and apportioned among the Funds in the Trust based on relative average net assets. The commitment fee is included in "Miscellaneous fees" on the Statements of Operations. No amounts were borrowed by the Funds under this facility during the period ended January 31, 2016.
Note 10. Subsequent Events
Subsequent events occurring after the date of this report have been evaluated for potential impact, for purposes of recognition or disclosure in the financial statements, through the date the report was issued.
200
| Other information (unaudited) |
Proxy voting policies
The Funds have filed with the Securities and Exchange Commission their proxy voting records for the twelve months ended June 30, 2015 on Form N-PX, which must be filed each year by August 31. Form N-PX is available on the Securities and Exchange Commission's website at www.sec.gov. The Funds' proxy voting records and proxy voting policies and procedures are also available without charge, upon request, by calling 866.443.6337 or by visiting the Funds' website at www.henderson.com.
Portfolio holdings
A complete listing of each Fund's holdings is made available monthly at www.henderson.com. Further, the Funds' Portfolios of Investments are filed as of the end of the first and third quarter of the fiscal year on Form N-Q. The Henderson Global Funds' Forms N-Q are available at www.sec.gov or may be reviewed and copied at the Commission's Public Reference Room in Washington, DC. The quarterly Portfolios of Investments are also available without charge, upon request, by calling 866.443.6337.
Change in distribution schedule
Effective January 1, 2016, the Henderson Global Equity Income Fund intends to make distributions quarterly with its first quarterly distribution occurring in March 2016. The Fund paid its last monthly distribution on December 30, 2015.
Federal tax information
Certain tax information for the Funds is required to be provided to shareholders based on the Funds' income and distributions for the taxable year ending July 31. In February of each year, shareholders will receive Form 1099-DIV, which will include their share of foreign tax credit, qualified dividends and capital gains distributed during the calendar year. Shareholders are advised to check with their tax advisors for information on the treatment of these amounts on their individual income tax returns.
Statement Pursuant to Section 19(a) of the Investment Company Act of 1940
The exact source of aggregate fund distributions for each fiscal year can only be determined as of the end of each Fund's fiscal year, July 31. However, under Section 19(a) of the 1940 Act, the Funds are required to indicate the source of each distribution to shareholders at the time of payment if the distribution is made from any source other than accumulated undistributed net income. For purposes of this disclosure, the source of each distribution is based on US Generally Accepted Accounting Principles and will differ from federal income tax-based reporting provided to shareholders due to certain tax adjustments. Distributions paid in part from paid-in capital do not necessarily reflect a taxable return of capital. For federal income tax purposes, shareholders will receive a Form 1099-DIV for each calendar year that will tell you how to report these distributions.
Accordingly, the Funds are making the following disclosures pursuant to Section 19(a).
During the semi-annual period ended January 31, 2016, All Asset, Dividend & Income Builder, European Focus, International Long/Short Equity, International Opportunities and Unconstrained Bond paid the following income distributions in part from sources other than accumulated undistributed net income as measured at the time of payment.
| All Asset | | | | | | | | | | | | % from | | | % from | | | | |
| | | | | | | | | | | | | accumulated | | accumulated | | | % from | |
| | | | | | | | | | | | | undistributed | | | realized | | | paid-in | |
| Pay Date | | | Ex-Date | | | Class | | | Amount | | | net income | | | gains | | | capital | |
| 12/30/2015 | | | 12/29/2015 | | | A | | $ | 0.03431 | | | 89.3 | % | | 0.0 | % | | 10.7 | % |
| | | | | | | I | | $ | 0.07999 | % | | 89.3 | % | | 0.0 | % | | 10.7 | % |
| | | | | | | R6 | | $ | 0.08071 | % | | 89.3 | % | | 0.0 | % | | 10.7 | % |
| Dividend & Income Builder | | | | | | | | | | | | % from | | | % from | | | | |
| | | | | | | | | | | | | accumulated | | | accumulated | | | % from | |
| | | | | | | | | | | | | undistributed | | | realized | | | paid-in | |
| Pay Date | | | Ex-Date | | | Class | | | Amount | | | net income | | | gains | | | capital | |
| 12/30/2015 | | | 12/30/2015 | | | A | | $ | 0.056135 | | | 68.8 | % | | 0.0 | % | | 31.2 | % |
| | | | | | | C | | $ | 0.042003 | | | 68.8 | % | | 0.0 | % | | 31.2 | % |
| | | | | | | I | | $ | 0.061152 | | | 68.8 | % | | 0.0 | % | | 31.2 | % |
| | | | | | | R6 | | $ | 0.062193 | | | 68.8 | % | | 0.0 | % | | 31.2 | % |
201
| Other information (unaudited) |
| European Focus | | | | | | | | | | | | % from | | | % from | | | | |
| | | | | | | | | | | | | accumulated | | | accumulated | | | % from | |
| | | | | | | | | | | | | undistributed | | | realized | | | paid-in | |
| Pay Date | | | Ex-Date | | | Class | | | Amount | | | net income | | | gains | | | capital | |
| 12/30/2015 | | | 12/29/2015 | | | A | | $ | 0.24150 | | | 76.6 | % | | 0.0 | % | | 23.4 | % |
| | | | | | | C | | $ | 0.04060 | | | 76.6 | % | | 0.0 | % | | 23.4 | % |
| | | | | | | I | | $ | 0.30411 | | | 76.6 | % | | 0.0 | % | | 23.4 | % |
| | | | | | | R6 | | $ | 0.30174 | | | 76.6 | % | | 0.0 | % | | 23.4 | % |
| | | | | | | | | | | | | | | | | | | | |
International Long/ Short Equity | | | | | | | | | | | | % from accumulated | | | % from accumulated | | | % from | |
| | | | | | | | | | | | | undistributed | | | realized | | | paid-in | |
| Pay Date | | | Ex-Date | | | Class | | | Amount | | | net income | | | gains | | | capital | |
| 12/30/2015 | | | 12/29/2015 | | | A | | $ | 0.33101 | | | 0.0 | % | | 0.0 | % | | 100.0 | % |
| | | | | | | C | | $ | 0.27044 | | | 0.0 | % | | 0.0 | % | | 100.0 | % |
| | | | | | | I | | $ | 0.33318 | | | 0.0 | % | | 0.0 | % | | 100.0 | % |
| | | | | | | R6 | | $ | 0.33483 | | | 0.0 | % | | 0.0 | % | | 100.0 | % |
International Opportunities | | | | | | | | | | | | % from accumulated undistributed | | | % from accumulated realized | | | % from paid-in | |
| Pay Date | | | Ex-Date | | | Class | | | Amount | | | net income | | | gains | | | capital | |
| 12/30/2015 | | | 12/29/2015 | | | A | | $ | 0.35656 | | | 71.1 | % | | 0.0 | % | | 28.9 | % |
| | | | | | | C | | $ | 0.19948 | | | 71.1 | % | | 0.0 | % | | 28.9 | % |
| | | | | | | R | | $ | 0.34615 | | | 71.1 | % | | 0.0 | % | | 28.9 | % |
| | | | | | | I | | $ | 0.44513 | | | 71.1 | % | | 0.0 | % | | 28.9 | % |
| | | | | | | R6 | | $ | 0.44085 | | | 71.1 | % | | 0.0 | % | | 28.9 | % |
| Unconstrained Bond | | | | | | | | | | | | % from accumulated undistributed | | | % from accumulated realized | | | % from paid-in | |
| Pay Date | | | Ex-Date | | | Class | | | Amount | | | net income | | | gains | | | capital | |
| 9/29/2015 | | | 9/29/2015 | | | A | | $ | 0.004228 | | | 79.5 | % | | 0.0 | % | | 20.5 | % |
| | | | | | | I | | $ | 0.006337 | | | 79.5 | % | | 0.0 | % | | 20.5 | % |
| 10/29/2015 | | | 10/29/2015 | | | A | | $ | 0.007257 | | | 81.1 | % | | 0.0 | % | | 18.9 | % |
| | | | | | | C | | $ | 0.001459 | | | 81.1 | % | | 0.0 | % | | 18.9 | % |
| | | | | | | I | | $ | 0.009215 | | | 81.1 | % | | 0.0 | % | | 18.9 | % |
202
| Other information (unaudited) |
During the semi-annual period ended January 31, 2016, All Asset and Unconstrained Bond paid the following capital gain distributions in part from sources other than accumulated undistributed other taxable income and net realized gains as measured at the time of payment.
| All Asset | | | | | | | | | | | | % from accumulated undistributed | | | % from accumulated realized | | | % from paid-in | |
| Pay Date | | | Ex-Date | | | Class | | | Amount | | | net income | | | gains | | | capital | |
| 12/7/2015 | | | 12/4/2015 | | | A | | $ | 0.31120 | | | 0.0 | % | | 42.9 | % | | 57.1 | % |
| | | | | | | C | | $ | 0.31120 | | | 0.0 | % | | 42.9 | % | | 57.1 | % |
| | | | | | | I | | $ | 0.31120 | | | 0.0 | % | | 42.9 | % | | 57.1 | % |
| | | | | | | R6 | | $ | 0.31120 | | | 0.0 | % | | 42.9 | % | | 57.1 | % |
| Unconstrained Bond | | | | | | | | | | | | % from accumulated undistributed | | | % from accumulated realized | | | % from paid-in | |
| Pay Date | | | Ex-Date | | | Class | | | Amount | | | net income | | | gains | | | capital | |
| 12/7/2015 | | | 12/4/2015 | | | A | | $ | 0.35871 | | | 0.0 | % | | 48.1 | % | | 51.9 | % |
| | | | | | | C | | $ | 0.35871 | | | 0.0 | % | | 48.1 | % | | 51.9 | % |
| | | | | | | I | | $ | 0.35871 | | | 0.0 | % | | 48.1 | % | | 51.9 | % |
| | | | | | | R6 | | $ | 0.35871 | | | 0.0 | % | | 48.1 | % | | 51.9 | % |
Shareholder expense
As a shareholder of the Funds, you incur two types of costs: (1) transaction costs, including upfront or deferred sales charges (loads) on purchases and (2) ongoing operating costs, including management fees, distribution (12b-1) fees, shareholder services fees and other Fund operating expenses. The example in Table 1 and Table 2 is intended to help you understand your ongoing costs of investing in the Funds and to compare these costs with ongoing costs of investing in other mutual funds. It is based on an investment of $1,000 invested at the beginning of the period and held for the six months ended January 31, 2016.
Actual expenses
Table 1 provides information about actual account values and actual expenses. You may use the information in this line, together with the amount invested, to estimate the expenses that you incurred over the period. Simply divide your account value at the end of the period by $1,000 (for example, an $8,600 account value divided by $1,000 = 8.6), then multiply the result by the number under the heading entitled "Expenses Paid During the Period" to estimate the expenses attributable to your investment during this period.
Hypothetical example for comparison purposes
Table 2 provides information about hypothetical account values and hypothetical expenses based on the Funds' actual expense ratios and an assumed rate of return of 5% per year before expenses, which is not the Funds' actual return. Thus you should not use the hypothetical account values and expenses to estimate your actual ending account balance or the expense attributable to your investment during the period. Rather, these figures are provided to enable you to compare the ongoing costs of investing in the Funds and other funds. To do so, compare the 5% hypothetical examples with the 5% hypothetical examples that appear in the shareholder reports of other funds.
203
| Other information (unaudited) |
Expenses paid during the period include amounts reflected in the Funds' Statements of Operations (excluding the effect of short sale expenses for International Long/Short Equity Fund), net of reimbursements by the investment adviser. The annualized expense ratios used in the example are as follows:
| | | | Class | | | Class | | | Class | | | Class | | | Class | |
| | | | A | | | C | | | I | | | R | | | R6 | |
| All Asset | | | 0.85 | % | | 1.60 | % | | 0.60 | % | | N/A | | | 0.60 | % |
| Dividend & | | | | | | | | | | | | | | | | |
| Income | | | | | | | | | | | | | | | | |
| Builder | | | 1.27 | | | 2.03 | | | 1.03 | | | N/A | | | 0.96 | |
| Emerging | | | | | | | | | | | | | | | | |
| Markets | | | 1.79 | | | 2.54 | | | 1.54 | | | N/A | | | 1.54 | |
| European | | | | | | | | | | | | | | | | |
| Focus | | | 1.27 | | | 2.05 | | | 1.03 | | | N/A | | | 1.11 | |
| Global | | | | | | | | | | | | | | | | |
| Equity | | | | | | | | | | | | | | | | |
| Income | | | 1.09 | | | 1.85 | | | 0.85 | | | N/A | | | 0.87 | |
| Global | | | | | | | | | | | | | | | | |
| Technology | | | 1.35 | | | 2.12 | | | 1.10 | | | N/A | | | 1.02 | |
| High Yield | | | | | | | | | | | | | | | | |
| Opportunities | | | 1.10 | | | 1.85 | | | 0.84 | | | N/A | | | 0.85 | |
| International | | | | | | | | | | | | | | | | |
| Long/Short | | | | | | | | | | | | | | | | |
| Equity | | | 1.75 | | | 2.50 | | | 1.50 | | | N/A | | | 1.50 | |
| International | | | | | | | | | | | | | | | | |
| Opportunities | | | | | | | | | | | | | | | | |
| Fund | | | 1.34 | | | 2.10 | | | 1.06 | | | 1.59 | | | 1.32 | |
| International | | | | | | | | | | | | | | | | |
| Select Equity | | | 1.14 | | | 1.89 | | | 0.88 | | | N/A | | | 0.89 | |
| Strategic | | | | | | | | | | | | | | | | |
| Income | | | 1.02 | | | 1.79 | | | 0.77 | | | N/A | | | 0.70 | |
| Unconstrained | | | | | | | | | | | | | | | | |
| Bond | | | 1.15 | | | 1.90 | | | 0.89 | | | N/A | | | 0.90 | |
| US Growth | | | | | | | | | | | | | | | | |
| Opportunities | | | 1.20 | | | 1.95 | | | 0.94 | | | N/A | | | 0.95 | |
Note that the expenses do not reflect shareholder transaction costs such as front-end or deferred sales charges. These fees are described for each Fund and share class in the "Commentaries and Performance Summaries" section of this report beginning on page 4. Table 2 is useful in comparing ongoing costs only, and will not help you determine the relative total costs of owning different funds. In addition, if these transaction costs were included, your costs would have been higher.
Table 1
| | | | Beginning | | | Ending | | | Expenses | |
| | | | account | | | account | | | paid | |
| | | | value | | | value | | | during | |
| | | | August 1, | | | January 31, | | | the | |
| Actual | | | 2015 | | | 2016 | | | period* | |
| All Asset | | | | | | | | | | |
| Class A | | $ | 1,000.00 | | $ | 934.00 | | $ | 4.13 | |
| Class C | | | 1,000.00 | | | 930.80 | | | 7.77 | |
| Class I | | | 1,000.00 | | | 936.30 | | | 2.92 | |
| Class R6 | | | 1,000.00 | | | 962.80 | | | 2.96 | |
| Dividend & Income Builder | | | | | | | | | | |
| Class A | | $ | 1,000.00 | | | 931.10 | | | 6.16 | |
| Class C | | | 1,000.00 | | | 927.70 | | | 9.84 | |
| Class I | | | 1,000.00 | | | 932.90 | | | 5.00 | |
| Class R6 | | | 1,000.00 | | | 935.30 | | | 4.67 | |
| Emerging Markets | | | | | | | | | | |
| Class A | | $ | 1,000.00 | | | 871.90 | | | 8.42 | |
| Class C | | | 1,000.00 | | | 868.30 | | | 11.93 | |
| Class I | | | 1,000.00 | | | 873.00 | | | 7.25 | |
| Class R6 | | | 1,000.00 | | | 934.60 | | | 7.49 | |
| European Focus | | | | | | | | | | |
| Class A | | $ | 1,000.00 | | | 848.30 | | | 5.90 | |
| Class C | | | 1,000.00 | | | 844.80 | | | 9.51 | |
| Class I | | | 1,000.00 | | | 849.00 | | | 4.79 | |
| Class R6 | | | 1,000.00 | | | 849.20 | | | 5.16 | |
| Global Equity Income | | | | | | | | | | |
| Class A | | $ | 1,000.00 | | | 921.60 | | | 5.26 | |
| Class C | | | 1,000.00 | | | 918.10 | | | 8.92 | |
| Class I | | | 1,000.00 | | | 922.60 | | | 4.11 | |
| Class R6 | | | 1,000.00 | | | 955.80 | | | 4.28 | |
| Global Technology | | | | | | | | | | |
| Class A | | $ | 1,000.00 | | | 926.20 | | | 6.54 | |
| Class C | | | 1,000.00 | | | 922.20 | | | 10.24 | |
| Class I | | | 1,000.00 | | | 927.20 | | | 5.33 | |
| Class R6 | | | 1,000.00 | | | 910.00 | | | 4.90 | |
| High Yield Opportunity | | | | | | | | | | |
| Class A | | $ | 1,000.00 | | | 947.10 | | | 5.38 | |
| Class C | | | 1,000.00 | | | 944.00 | | | 9.04 | |
| Class I | | | 1,000.00 | | | 948.40 | | | 4.11 | |
| Class R6 | | | 1,000.00 | | | 976.90 | | | 4.22 | |
| International Long/Short Equity | | | | | | | | | | |
| Class A | | $ | 1,000.00 | | | 1,002.50 | | | 8.81 | |
| Class C | | | 1,000.00 | | | 998.50 | | | 12.56 | |
| Class I | | | 1,000.00 | | | 1,004.70 | | | 7.56 | |
| Class R6 | | | 1,000.00 | | | 1,018.80 | | | 7.61 | |
| International Opportunities | | | | | | | | | | |
| Class A | | $ | 1,000.00 | | | 879.00 | | | 6.33 | |
| Class C | | | 1,000.00 | | | 875.30 | | | 9.90 | |
| Class I | | | 1,000.00 | | | 880.20 | | | 5.01 | |
| Class R | | | 1,000.00 | | | 877.70 | | | 7.50 | |
| Class R6 | | | 1,000.00 | | | 880.90 | | | 6.19 | |
| International Select Equity | | | | | | | | | | |
| Class A | | $ | 1,000.00 | | | 872.10 | | | 5.36 | |
| Class C | | | 1,000.00 | | | 868.70 | | | 8.88 | |
| Class I | | | 1,000.00 | | | 872.40 | | | 4.14 | |
| Class R6 | | | 1,000.00 | | | 914.50 | | | 4.28 | |
| Strategic Income | | | | | | | | | | |
| Class A | | $ | 1,000.00 | | | 997.50 | | | 5.12 | |
| Class C | | | 1,000.00 | | | 993.60 | | | 8.97 | |
| Class I | | | 1,000.00 | | | 998.30 | | | 3.87 | |
| Class R6 | | | 1,000.00 | | | 998.40 | | | 3.52 | |
| Unconstrained Bond Fund | | | | | | | | | | |
| Class A | | $ | 1,000.00 | | | 984.50 | | | 5.74 | |
| Class C | | | 1,000.00 | | | 981.10 | | | 9.46 | |
| Class I | | | 1,000.00 | | | 985.70 | | | 4.44 | |
| Class R6 | | | 1,000.00 | | | 985.70 | | | 4.49 | |
| US Growth Opportunities | | | | | | | | | | |
| Class A | | $ | 1,000.00 | | | 913.30 | | | 5.77 | |
| Class C | | | 1,000.00 | | | 909.30 | | | 9.36 | |
| Class I | | | 1,000.00 | | | 914.40 | | | 4.52 | |
| Class R6 | | | 1,000.00 | | | 920.10 | | | 4.59 | |
204
| Other information (unaudited) |
Table 2
| Hypothetical | | | Beginning | | | Ending | | | Expenses | |
| (assuming a | | | account | | | account | | | paid | |
| 5% return | | | value | | | value | | | during | |
| before | | | August 1, | | | January 31, | | | the | |
| expenses) | | | 2015 | | | 2016 | | | period* | |
| All Asset | | | | | | | | | | |
| Class A | | $ | 1,000.00 | | $ | 1,020.86 | | $ | 4.32 | |
| Class C | | | 1,000.00 | | | 1,017.09 | | | 8.11 | |
| Class I | | | 1,000.00 | | | 1,022.12 | | | 3.05 | |
| Class R6 | | | 1,000.00 | | | 1,022.12 | | | 3.05 | |
| Dividend & Income Builder | | | | | | | | | | |
| Class A | | $ | 1,000.00 | | | 1,018.75 | | | 6.44 | |
| Class C | | | 1,000.00 | | | 1,014.93 | | | 10.28 | |
| Class I | | | 1,000.00 | | | 1,019.96 | | | 5.23 | |
| Class R6 | | | 1,000.00 | | | 1,020.31 | | | 4.88 | |
| Emerging Markets | | | | | | | | | | |
| Class A | | $ | 1,000.00 | | | 1,016.14 | | | 9.07 | |
| Class C | | | 1,000.00 | | | 1,012.37 | | | 12.85 | |
| Class I | | | 1,000.00 | | | 1,017.39 | | | 7.81 | |
| Class R6 | | | 1,000.00 | | | 1,022.52 | | | 2.64 | |
| European Focus | | | | | | | | | | |
| Class A | | $ | 1,000.00 | | | 1,018.75 | | | 6.44 | |
| Class C | | | 1,000.00 | | | 1,014.83 | | | 10.38 | |
| Class I | | | 1,000.00 | | | 1,019.96 | | | 5.23 | |
| Class R6 | | | 1,000.00 | | | 1,019.56 | | | 5.63 | |
| Global Equity Income | | | | | | | | | | |
| Class A | | $ | 1,000.00 | | | 1,019.66 | | | 5.53 | |
| Class C | | | 1,000.00 | | | 1,015.84 | | | 9.37 | |
| Class I | | | 1,000.00 | | | 1,020.86 | | | 4.32 | |
| Class R6 | | | 1,000.00 | | | 1,020.76 | | | 4.42 | |
| Global Technology | | | | | | | | | | |
| Class A | | $ | 1,000.00 | | | 1,018.35 | | | 6.85 | |
| Class C | | | 1,000.00 | | | 1,014.48 | | | 10.74 | |
| Class I | | | 1,000.00 | | | 1,019.61 | | | 5.58 | |
| Class R6 | | | 1,000.00 | | | 1,020.01 | | | 5.18 | |
| High Yield Opportunity | | | | | | | | | | |
| Class A | | $ | 1,000.00 | | | 1,019.61 | | | 5.58 | |
| Class C | | | 1,000.00 | | | 1,015.84 | | | 9.37 | |
| Class I | | | 1,000.00 | | | 1,020.91 | | | 4.27 | |
| Class R6 | | | 1,000.00 | | | 1,020.86 | | | 4.32 | |
| International Long/Short Equity | | | | | | | | | | |
| Class A | | $ | 1,000.00 | | | 1,016.34 | | | 8.87 | |
| Class C | | | 1,000.00 | | | 1,012.57 | | | 12.65 | |
| Class I | | | 1,000.00 | | | 1,017.60 | | | 7.61 | |
| Class R6 | | | 1,000.00 | | | 1,017.60 | | | 7.61 | |
| International Opportunities | | | | | | | | | | |
| Class A | | $ | 1,000.00 | | | 1,018.40 | | | 6.80 | |
| Class C | | | 1,000.00 | | | 1,014.58 | | | 10.63 | |
| Class I | | | 1,000.00 | | | 1,019.81 | | | 5.38 | |
| Class R | | | 1,000.00 | | | 1,017.14 | | | 8.06 | |
| Class R6 | | | 1,000.00 | | | 1,036.54 | | | 6.77 | |
| International Select Equity | | | | | | | | | | |
| Class A | | $ | 1,000.00 | | | 1,019.41 | | | 5.79 | |
| Class C | | | 1,000.00 | | | 1,015.64 | | | 9.58 | |
| Class I | | | 1,000.00 | | | 1,020.71 | | | 4.47 | |
| Class R6 | | | 1,000.00 | | | 1,020.66 | | | 4.52 | |
| Strategic Income | | | | | | | | | | |
| Class A | | $ | 1,000.00 | | | 1,020.01 | | | 5.18 | |
| Class C | | | 1,000.00 | | | 1,016.14 | | | 9.07 | |
| Class I | | | 1,000.00 | | | 1,021.27 | | | 3.91 | |
| Class R6 | | | 1,000.00 | | | 1,021.62 | | | 3.56 | |
| Unconstrained Bond Fund | | | | | | | | | | |
| Class A | | $ | 1,000.00 | | | 1,019.36 | | | 5.84 | |
| Class C | | | 1,000.00 | | | 1,015.59 | | | 9.63 | |
| Class I | | | 1,000.00 | | | 1,020.66 | | | 4.52 | |
| Class R6 | | | 1,000.00 | | | 1,023.63 | | | 4.57 | |
| US Growth Opportunities | | | | | | | | | | |
| Class A | | $ | 1,000.00 | | | 1,019.10 | | | 6.09 | |
| Class C | | | 1,000.00 | | | 1,015.33 | | | 9.88 | |
| Class I | | | 1,000.00 | | | 1,020.41 | | | 4.77 | |
| Class R6 | | | 1,000.00 | | | 1,020.36 | | | 4.82 | |
| * | Expenses are equal to the Funds' annualized net expense ratio multiplied by the average account value over the period multiplied by 184 days in the period, and divided by 365 (to reflect the one-half year period. The net expense ratio for Class R6 is based upon expenses over a period of 62 days. |
205
| Trustees and officers (unaudited) |
| | | | | | | | | | |
| | | | | Term of | | | | | |
Name, address1, | | Position(s) | | Office and | | | | Other | |
| month and | | with | | Time | | Principal Occupations | | Directorships | |
| year of birth | | the Trust2 | | Served3 | | During Past Five Years | | Held | |
| Independent Trustees | | | | | | | | | |
James W. Atkinson
August 1950 | | Trustee | | Since 2011; elected Chairman December 2015 | | Commercial Pilot, Atkinson Aviation LLC, since 2009 | | Formerly, Trustee, LaRabida Children's Hospital: formerly Trustee, Surgeons Diversified Investment Fund. | |
Barbara L. Lamb
September 1954 | | Trustee | | Since 2014 | | Managing Director, WH Trading LLC (proprietary trading company), since 2015; formerly, Managing Director, Cheiron Trading LLC (proprietary trading company). | | Formerly, Director, First Chicago Bancorp; formerly, Director, MAF Bancorp, Inc. | |
J. Marshall Peck
April 1952 | | Trustee | | Since 2014 | | President, Interpark Holdings, LLC (parking garage owner, developer and operator), since 2011; formerly, Chief Executive Officer, Interpark Holdings, LLC. | | Board Member and Finance Committee Chairman, Presbyterian Homes. | |
Diane L. Wallace
October 1958 | | Trustee | | Since 2015 | | Retired. | | Independent Trustee, State Farm Associates' Funds Trust, State Farm Mutual Fund Trust and State Farm Variable Product Trust (28 portfolios). | |
206
| Trustees and officers (unaudited) |
| | | | | Term of | | | | | |
Name, address1, | | Position(s) | | Office and | | | | Other | |
| month and | | with | | Time | | Principal Occupations | | Directorships | |
| year of birth | | the Trust2 | | Served3 | | During Past Five Years | | Held | |
| Interested Trustees and Officers of the Trust | | | | | |
James G. O'Brien4
May 1960 | | Trustee
and
President | | Since 2011 Since 2010 | | Managing Director, HGINA. | | None. | |
Charles Thompson II4
April 1970 | | Trustee
and
Vice President | | Since 2011 Since 2010 | | Director of Distribution (North America), since 2014; Director of US Retail, 2010-2014. | | None. | |
Kenneth A. Kalina
August 1959 | | Chief
Compliance
Officer | | Since 2005 | | Chief Compliance Officer, HGINA, until 2015. | | N/A | |
Alanna P. Nensel
July 1975 | | Vice President | | Since 2002 | | Director, Retail Marketing and Product Management, HGINA. | | N/A | |
David Latin
September 1981 | | Vice President | | Since 2012 | | Director of Product Development, HGINA. | | N/A | |
Christopher Golden
March 1977 | | Secretary | | Since 2015 | | Legal Counsel, HGINA. | | N/A | |
Troy M. Statczar
August 1971 | | Treasurer | | Since 2008 | | Head of US Fund Administration and Accounting, HGINA. | | N/A | |
Adam T. Reich
August 1983 | | Assistant Treasurer | | Since 2012 | | Manager of US Fund Administration and Accounting, HGINA, since August 2012; Manager, PricewaterhouseCoopers LLP 2006-2012. | | N/A | |
| 1. | Each person's address is 737 North Michigan Avenue, Suite 1700, Chicago, IL 60611. |
| 2. | Currently, all Trustees oversee all thirteen series of the Trust. |
| 3. | A Trustee may serve until his death, resignation, removal or until the end of the calendar year in which the Trustee reaches 75 years of age, subject to change by the Board. The officers of the Trust are elected annually by the Board. |
| 4. | This Trustee is an interested person of the Trust because of his employment relationship with Henderson Global Investors (North America) Inc., the investment adviser to the Fund. |
| | |
| | Unless otherwise noted, this information is as of January 31, 2016. The Statement of Additional Information for Henderson Global Funds includes additional information about the Trustees and is available without charge by calling 1.866.4HENDERSON (1.866.443.6337). |
207
| Trustees and officers (unaudited) |
| Trustees | Investment Adviser |
| James W. Atkinson, Chairman | Henderson Global Investors (North America) Inc. |
| Barbara L. Lamb | 737 North Michigan Avenue, Suite 1700 |
| J. Marshall Peck | Chicago, IL 60611 |
| Diane L. Wallace | |
| James G. O'Brien* | Transfer Agent |
| Charles Thompson II* | State Street Bank & Trust Company |
| | State Street Financial Center |
| Officers | One Lincoln Street |
| James G. O'Brien, President | Boston, MA 02111 |
| Charles Thompson II, Vice President | |
| Alanna P. Nensel, Vice President | Administrator and Custodian |
| David Latin, Vice President | State Street Bank & Trust Company |
| Christopher Golden, Secretary | State Street Financial Center |
| Kenneth A. Kalina, Chief Compliance Officer | One Lincoln Street |
| Troy M. Statczar, Treasurer | Boston, MA 02111 |
| Adam T. Reich, Assistant Treasurer | |
| | Auditors |
| | Ernst & Young LLP |
| | 155 North Wacker Drive |
| | Chicago, IL 60606 |
| | |
| | For more information |
| | Please call 1.866.4HENDERSON |
| | (1.866.443.6337) |
| | or visit our website: |
| | www.henderson.com |
| * | Trustee is an "interested person" of the Trust as defined in the1940 Act. |
The views expressed in this report and information about the Funds' portfolio holdings are for the period covered by this report and are subject to change hereafter. The views expressed in this report should not be constructed as a recommendation of any kind. The report may include forward-looking statements that involve risk and uncertainty, and there is no guarantee that any prediction will come to pass. There can be no assurance that a Fund will achieve its investment objectives. This report is submitted for the general information of the shareholders of the Funds. It is not authorized for distribution to prospective investors unless preceded or accompanied by an effective prospectus, which includes information regarding the Funds' risks, objectives, fees and expenses, experience of its management, and other information. Henderson Global Investors is the name under which various subsidiaries of Henderson Group plc, a UK limited company, provide investment products and services.
Foreside Fund Services, LLC, Distributor
208
This page intentionally left blank.
209
This page intentionally left blank.
210
This page intentionally left blank.
211
This page intentionally left blank.
212
This notice describes the privacy practices followed by Henderson Global Funds.
Your privacy is our top priority. Our policy is to respect the privacy of current and former shareholders and to protect personal information entrusted to us. We do not share any nonpublic personal information of shareholders or former shareholders with any nonaffiliated third parties, except as permitted by law or as authorized by our shareholders.
In the course of providing products and services to you, we collect nonpublic personal information about you from various sources such as account applications or agreements, other account forms, transactions in your account, and from information captured on our website, including any information captured through our use of "cookies." Such information may include your name, address, account or tax identification number, the types and amounts of investments, and bank account information. More detailed information about our Internet policy is available on our website, www.henderson.com.
In the normal course of serving shareholders, we may share information we collect with entities that help us process information or service your request, such as transfer agents, custodians, broker-dealers and marketing service firms, as well as with other financial institutions with whom we have joint marketing agreements. We may share information in connection with servicing accounts or to inform shareholders of products and services that we believe may be of interest to them. The organizations that receive shareholder information will use that information only for the services required and as allowed by applicable law or regulation, and are not permitted to share or use this information for any other purpose. Our affiliates do not use shareholder information that we receive to make marketing solicitations. We will disclose your personal information to government agencies, law enforcement officials, and others in the limited circumstances where we believe, in good faith, that such disclosure is required or permitted by law. For example, we will disclose your personal information in order to comply with a court order, to cooperate with government or industry regulators, or law enforcement authorities.
Access to customers' nonpublic personal information is restricted to employees who need to access that information. To guard shareholder's nonpublic personal information, we use industry standard physical, electronic, and procedural safeguards. A shareholder's right to privacy extends to all forms of contact with us, including telephone, written correspondence, and electronic media, such as the Internet.
For questions concerning this policy, please contact us by writing to: Alanna Nensel, Henderson Global Investors (North America) Inc., 737 North Michigan Avenue, Suite 1700, Chicago, Illinois 60611.