UNITED STATES
SECURITIES AND EXCHANGE COMMISSION
Washington, D.C. 20549
FORM N-CSR
CERTIFIED SHAREHOLDER REPORT OF REGISTERED
MANAGEMENT INVESTMENT COMPANIES
Investment Company Act file number: 811-10399
______________________________________________
HENDERSON GLOBAL FUNDS
______________________________________________________________________________
(Exact name of registrant as specified in charter)
737 NORTH MICHIGAN AVENUE, SUITE 1700
CHICAGO, ILLINOIS 60611
______________________________________________________________________________
(Address of principal executive offices)(Zip code)
| (Name and Address of Agent for Service) | Copy to: |
CHRISTOPHER K. YARBROUGH 737 NORTH MICHIGAN AVENUE, SUITE 1700 CHICAGO, ILLINOIS 60611 | CATHY G. O’KELLY VEDDER PRICE P.C. 222 NORTH LASALLE STREET CHICAGO, ILLINOIS 60601 |
Registrant’s telephone number, including area code: (312) 397-1122
Date of fiscal year end: July 31
Date of reporting period: January 31, 2014
Item 1: Report to Shareholders.
| Table of contents | |
| | |
| Letter to shareholders | 1 |
| Commentaries and Performance Summaries | |
| All Asset Fund | 2 |
| Dividend & Income Builder Fund | 4 |
| Emerging Markets Opportunities Fund | 6 |
| European Focus Fund | 8 |
| Global Equity Income Fund | 10 |
| Global Technology Fund | 12 |
| High Yield Opportunities Fund | 14 |
| International Opportunities Fund | 16 |
| Strategic Income Fund | 18 |
| Unconstrained Bond Fund | 20 |
| Portfolios of investments | 22 |
| Statements of assets and liabilities | 76 |
| Statements of operations | 82 |
| Statements of changes in net assets | 87 |
| Statements of changes – capital stock activity | 97 |
| Financial highlights | 108 |
| Notes to financial statements | 126 |
| Other information | 144 |
| Trustees and officers | 148 |
International investing involves certain risks and increased volatility not associated with investing solely in the US. These risks include currency fluctuations, economic or financial instability, lack of timely or reliable financial information or unfavorable political or legal developments. The Funds may invest in securities issued by smaller companies, which typically involves greater risk than investing in larger companies. Also, the Funds may invest in limited geographic areas and/or sectors which may result in greater market volatility. This risk is heightened in investments in emerging markets. In addition some of the Funds may invest in derivatives. Derivatives involve special risks different from, and potentially greater than, the risks associated with investing directly in securities and may result in greater losses.
The All Asset Fund invests in a smaller number of securities than the average mutual fund and the change in value of a single holding may have a more pronounced effect on the Fund’s net asset value and performance. The Fund may invest in derivatives and commodities. Investing in commodities entails additional risks including instability regarding control and jurisdiction of governments, international companies and other entities. Asset allocation strategies do not assure profit nor protect against loss. The Fund may be subject to frequent trading which may result in a turnover rate of 100% or more. The Fund is subject to investment company and pooled vehicles risk, allocation risk, leverage risk, interest rate risk and high yield securities risk. An investment in pooled vehicles, including closed-end funds, trusts, and exchange-traded funds (“ETFs”), may involve paying a premium at the time of purchase or receiving a discounted price at the time of sale. The Fund (and indirectly its shareholders) is responsible for a proportional share of the underlying investment company’s expenses, in addition to its own. Investments in high yield securities may offer more attractive returns than higher-rated securities, but the potentially higher yield is a function of the greater risk that a particular security may default.
The Dividend & Income Builder Fund invests in a smaller number of securities than the average mutual fund and the change in value of a single holding may have a more pronounced effect on the Fund’s net asset value and performance. The Fund may invest in illiquid securities and is subject to investment company and pooled vehicles risk, interest rate risk, credit/default risk and high yield securities risk. An investment in pooled vehicles, including closed-end funds, trusts, and ETFs, may involve paying a premium at the time of purchase or receiving a discounted price at the time of sale. The Fund (and indirectly its shareholders) is responsible for a proportional share of the underlying investment company’s expenses, in addition to its own. The Fund’s share price and yield will be affected by interest rate movements, with bond prices generally moving in the opposite direction from interest rates. During periods of rising interest rates, the value of a bond investment is at greater risk than during periods of stable or falling rates. The Fund may be subject to frequent trading which may result in a turnover rate of 100% or more. Credit risk refers to the bond issuer’s ability to make timely payments of principal and interest. Investments in high yield securities may offer more attractive returns than higher-rated securities, but the potentially higher yield is a function of the greater risk that a particular security may default.
The High Yield Opportunities Fund and Unconstrained Bond Fund may invest in illiquid securities and are subject to investment company risk, interest rate risk, credit/default risk and high yield securities risk. Credit risk refers to a bond issuers’ ability to make timely payments of principal and interest. Investments in high yield securities may increase the risk that a particular security may default. The Funds’ share price and yield will be affected by interest rate movements, as the value of bond investments as well as mortgage and asset backed securities are at greater risk during periods of rising interest rates than during periods of stable or falling rates. Also impact of prepayments on the value of asset backed securities may be difficult to predict. The Funds may be subject to frequent trading which may result in a turnover rate of 100% or more. The Funds may employ leverage and bank borrowings to increase the amount of the Funds’ investments, which may result in increased volatility of returns with the possibility of increased net income and capital gains as well as an exaggerated risk of loss. Unsecured bank loans may not provide the Funds with payment of principal, interest, and other amounts due. Loans or securities that are part of highly leveraged transactions involve a greater risk (including default and bankruptcy) than other investments. The Funds may invest in a smaller number of securities than the average mutual fund and the change in value of a single holding may have a more pronounced effect on the Funds’ net asset value and performance.
Technology companies may react similarly to certain market pressure and events. This may be significantly affected by short product cycles, aggressive pricing of products and services, competition from new market entrants, and obsolescence of existing technology. As a result, the Global Technology Fund’s returns may be considerably more volatile than a fund that does not invest in technology companies.
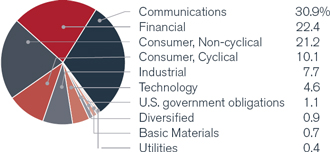
The Strategic Income Fund invests in high yield, lower rated (junk) bonds which involve a greater degree of risk than investment grade bonds in return for higher yield potential. As such, securities rated below investment grade generally entail greater credit, market, issuer and liquidity risk than investment grade securities. Moreover, the Fund is subject to interest rate risk which is the risk that debt securities in the Fund’s portfolio will decline in value because of increases in market interest rates. The Fund may borrow money which may affect the return to shareholders of the Fund, also known as leverage risk.
The views in this report were those of the Funds’ Portfolio Managers as of January 31, 2014, and may not reflect the views of the Portfolio Managers on the date this report is first published or anytime thereafter. These views are intended to assist shareholders of the Funds in understanding their investment in the Funds and do not constitute investment advice.
Dear shareholder,
We are pleased to provide the Semi-Annual report for the Henderson Global Funds, which covers the six months ended January 31, 2014.
The global economy ended 2013 on a strong note, with global purchasing managers’ indices (PMIs) signaling a steady acceleration in growth. Business activity increased in Europe for a fifth consecutive month in December, and Japanese inflation figures gave hope that Japan was finally exiting an extended deflationary period. PMI releases for Japan also pointed to the fastest manufacturing growth in more than seven years.
However, markets had a poor start to 2014 as concerns about Emerging Markets (EM) led investors to reduce their risk appetite and seek safe haven assets. January was a particularly bleak month for EM equities, which posted their fifth worst monthly performance since 1988. Developed Markets fared better but they were not immune to the sell-down. Asian equities suffered most from Chinese slowdown fears, but pockets of Europe outperformed as investors reappraised Spain, Portugal, Italy and Ireland as their borrowing costs fell in the bond markets.
In January, the US Federal Reserve decided to further reduce its monthly bond purchases by $10 billion to $65 billion, which caused volatility across EM equities, bonds and currencies, resulting in outflows from EM assets and the depreciation of their currencies. In China, manufacturing appeared to have contracted for the first time in six months – the HSBC/Markit manufacturing Purchasing Managers’ Index fell from 50.5 in December to 49.5 in January (a reading of below 50 indicates sector contraction).
Europe’s recovery remains fragile and deflation is still a risk, but there is scope for positive surprises from the region. The Eurozone Composite PMI rose to 52.9 in January, while the unemployment rate remained at 12% for a third month in December. The UK economy grew more strongly than expected in the last months of 2013, resulting in GDP expanding 1.9% over the year, its fastest pace since 2007.
Overall, despite January’s pullback, economic data globally has been improving and business and consumer sentiment indicators are also upbeat. Investors are adjusting to the pace of the withdrawal of US stimulus, and the return to fundamentals-based investing may be a choppy process. Further tapering activity may be very data-dependent, so markets could be volatile around important data releases that prove contrary to expectations. At Henderson, we believe that these conditions create many stock-specific opportunities for “bottom-up” investors to add value.
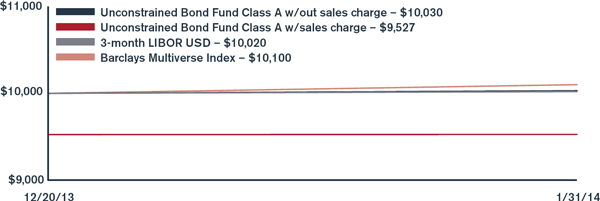
We are pleased to report that we launched the Henderson Unconstrained Bond Fund (HUNAX, HUNCX, HUNIX) on December 20, 2013. The Unconstrained Bond Fund is a core bond product that aims to provide a balance between investors’ need for yield and capital preservation. The Fund primarily invests in global fixed income securities and leverages opportunities from both rising and falling markets while actively managing risk exposure with the use of derivatives. The Fund’s unconstrained approach allows it to invest in opportunities across the entire bond universe.
We believe that this Fund is a key addition to the Henderson Global Funds family as we seek to provide you with further options to diversify your portfolios with funds that are truly differentiated from the competition. We appreciate your trust in and support of our Funds, and we look forward to serving your financial needs in the years to come.
James G. O’Brien
President, Henderson Global Funds
Investors should consider the investment objectives, risks, charges and expenses of a mutual fund carefully before investing. For a free Prospectus, which contains this and other important information about the Funds, visit www.henderson.com. The Prospectus should be read carefully before investing.
All Asset Fund
Risk assets rallied in the second half of 2013 as the market appeared to be more comfortable that the US economic recovery had become robust enough to withstand the removal of liquidity, and that policy is being correctly tempered to the strength of the available macroeconomic data. The US Federal Reserve’s (Fed) forward guidance continues to play a key role in managing expectations about a rise in interest rates, which the US central bank is keen to disassociate from the projected end of quantitative easing; it continues to modify its rhetoric saying that it will now likely hold interest rates at near zero beyond the US unemployment rate falling below its 6.5% threshold.
The measureable signs of recovery are not limited to the US; the world economy entered 2014 on an upswing as the impact of private sector deleveraging and fiscal drag recedes in the major countries and stimulus measures gain traction. G10 growth looks set to be the strongest since 2010 and the broadest as well, with all 10 economies predicted to expand. Despite this, inflation is expected to remain subdued, due to the unusually high levels of unemployment and spare capacity in the developed world.
However, risk assets had a poor start to 2014 as concerns about Emerging Markets led investors to
| Top 10 long-term holdings* |
| (at January 31, 2014) |
| | As a percentage |
| Security | of net assets |
| SPDR S&P 500 ETF Trust | 3.9 | % |
| PIMCO Total Return ETF | 3.8 | |
| PowerShares Senior Loan Portfolio | 3.4 | |
| Vanguard Dividend Appreciation ETF | 3.0 | |
| iShares iBoxx $ High Yield Corporate Bond Fund | 3.0 | |
| Henderson Global Technology Fund | 2.8 | |
| MSIF Multi-Asset Portfolio | 2.7 | |
| iShares MSCI EAFE Minimum Volatility Index Fund | 2.6 | |
| iShares iBoxx Investment Grade Corporate Bond Fund | 2.6 | |
| iShares High Dividend Equity Fund | 2.5 | |
reduce their risk appetite and seek safe haven assets. The Fed’s tapering caused significant volatility across Emerging Market equities, bonds and currencies, resulting in outflows from Emerging Market assets and the depreciation of their currencies.
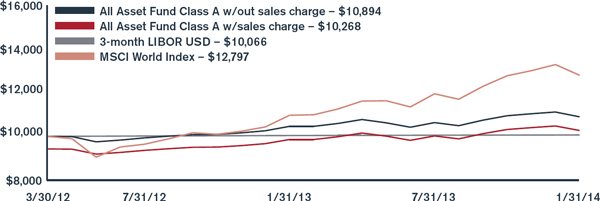
For the reporting period ended January 31, 2014, the Fund returned 2.48% (Class A at NAV) versus the benchmark, 3-month LIBOR USD, which posted a return of 0.14%. With positive economic data coming from the US and Japan, the Fund’s allocation to equities in these countries was very beneficial to performance. Allocations with corporate bond exposure also performed well and added value over the period, though sovereign debt continued to detract.
The Fund’s allocation is shifting from a defensively positioned portfolio to one that reflects our views of a slightly more optimistic macro environment. The Fund reduced its Emerging Market equity and debt exposure positions and invested the proceeds in high yielding equities as the former have been vulnerable to a withdrawal of liquidity. Elsewhere, the Fund has also switched some low beta equity for more cyclicality. The asset allocation of the Fund at the end of the period is overweight equities (preferring UK, Europe, US and Japan, cautious on Asia and Emerging Markets), fixed income underweight (high levels of cash, underweight duration but building a position in Emerging Markets debt), and a small allocation to gold.
The arrival of tapering and strengthened forward guidance has removed a significant portion of the uncertainty that hung over markets in 2013, but we remain in an environment transitioning from liquidity to growth. The continuation or expansion of tapering will be highly data-dependent, so markets will likely experience bouts of volatility around data releases that beat or miss expectations. We retain a cautious outlook on risk assets as markets adjust to an environment with lower liquidity. Given this outlook, we favor equities and are cautious on duration assets, preferring cash over bonds.
* For further detail about these holdings, please refer to the section entitled “Portfolios of Investments.” Fund holdings are as of the date given, are subject to change at any time, and are not recommendations to buy or sell any security.
All Asset Fund
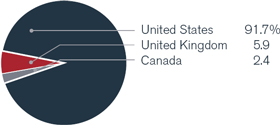
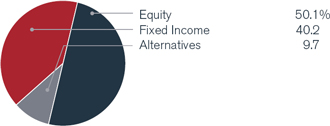
| Portfolio composition by country | | Portfolio composition by sector |
| (as a % of long-term investments) | | (as a % of long-term investments) |
| | | |
| | |
Investment comparison
Value of $10,000
| Total returns as of January 31, 2014 | | | | | | Since |
| | | NASDAQ | | Six | One | inception |
| At NAV | | symbol | | months | year | (3/30/2012)* |
| Class A | | HGAAX | | 2.48 | % | 4.17 | % | 4.76 | % |
| Class C | | HGACX | | 1.93 | | 3.22 | | 3.93 | |
| Class I | | HGAIX | | 2.65 | | 4.44 | | 5.03 | |
| With sales charge | | | | | | | | | |
| Class A | | | | -3.39 | % | -1.81 | % | 1.44 | % |
| Class C | | | | 0.93 | | 3.22 | | 3.93 | |
| Index | | | | | | | | | |
| 3-month LIBOR USD | | | | 0.14 | % | 0.28 | % | 0.36 | % |
| MSCI World Index | | | | 7.10 | | 16.70 | | 27.97 | |
* Average annual return.
Performance data quoted represents past performance and is no guarantee of future results. Performance results with sales charges reflect the deduction of the maximum front-end sales charge or the deduction of the applicable contingent deferred sales charge (“CDSC”). Class A shares are subject to a maximum front-end sales charge of 5.75%. Class C shares are subject to a CDSC of up to 1% on certain redemptions made within 12 months of purchase. Performance presented at Net Asset Value (NAV), which does not include a sales charge, would be lower if this charge were reflected. NAV is the value of one share of the Fund excluding any sales charges. Current performance may be lower or higher than the performance data quoted. Investment return and principal value will fluctuate so that an investor’s shares, when redeemed, may be worth more or less than original cost. As stated in the current prospectus, the Fund’s annual operating expense ratios (gross) for Class A, C and I shares are 1.55%, 2.25% and 1.24%, respectively. However, the Fund’s adviser has agreed to contractually waive a portion of its fees and/or reimburse other expenses such that total ordinary operating expenses, less distribution and service fees, do not exceed 0.85%, 1.60% and 0.60% for Class A, C and I shares, respectively, which is in effect until July 31, 2015. With respect to investments in affiliated underlying funds, the Fund’s adviser has contractually agreed to reduce or waive the Fund’s management fee to limit the combined management fees paid to the adviser for those assets to the greater of 1.00% or the affiliated underlying fund’s management fee. Indirect net expenses associated with the Fund’s investments in underlying investment companies are not subject to the contractual waiver. For the most recent month-end performance, please call 1.866.443.6337 or visit the Funds’ website at www.henderson.com.
Performance results also reflect expense subsidies and waivers in effect during periods shown. Absent these waivers, results would have been less favorable. All results assume the reinvestment of dividends and capital gains.
The investment comparison graph above reflects the change in value of a $10,000 hypothetical investment since the Fund’s inception, including reinvested dividends and distributions, compared to a broad based securities market index. The MSCI World Index is a free float-adjusted market capitalization weighted index that is designed to measure the equity market performance of developed markets. 3-Month LIBOR (London Interbank Offered Rate) USD is the interest rate participating banks offer to other banks for loans on the London market. The Fund is professionally managed while the Indices are unmanaged and not available for investment and do not include fees, expenses or other costs. Results in the table and graph do not reflect the deduction of taxes that a shareholder would pay on Fund distributions or the redemption of Fund shares.
Dividend & Income Builder Fund
For the majority of 2013 global equity markets performed well. It was another strong year for dividend investors, as global dividends grew 8% with countries such as the US growing dividends at double-digit rates. The US equity market was among the strongest performers globally, as economic data proved resilient such that the Federal Reserve (Fed) had the confidence in December to begin scaling back their $85 billion per month quantitative easing program. This caused US 10-year Treasury yields to breach 3% for the first time since 2011.
Global equity markets fell at the start of 2014. Emerging Markets such as China and Brazil were among the weakest performers globally, as the decision from the Fed to continue gradually withdrawing quantitative easing led to worries of foreign capital outflows, causing currency pressures. In bond markets, government bonds and investment grade bonds rallied strongly while high yield bonds posted positive but lower returns than these other asset classes.
For the reporting period ended January 31, 2014, the Fund returned 6.53% (Class A at NAV) versus the benchmark, MSCI World Index, which posted a return of 7.10%. The Fund also met its income objectives over the period. Performance relative to the benchmark was held back by an underweight
| Top 10 long-term holdings* |
| (at January 31, 2014) |
| | As a percentage |
| Security | of net assets |
| Vodafone Group plc | | | 2.9 | % |
| Novartis AG | | | 2.3 | |
| Roche Holding AG | | | 2.3 | |
| BNP Paribas S.A. | | | 2.2 | |
| Baxter International, Inc. | | | 2.1 | |
| Prudential plc | | | 2.1 | |
| British American Tobacco plc | | | 1.9 | |
| ENI SpA | | | 1.8 | |
| UBS AG | | | 1.8 | |
| Stanley Black & Decker, Inc. | | | 1.7 | |
allocation to the US and Japan as well as the Fund’s fixed income allocation, while equities strongly rallied. The Fund made gains in European holdings, particularly in the industrials and consumer discretionary sectors. Among the top equity performers during the period was information service provider Nielsen, which rose following the successful closure of their acquisition of Arbitron, as well as YouTube adopting their online rating service -both of which added to confidence in the sustainability of the business model. Also notable was telecommunications company Vodafone. Following the news in September that they would be selling their 45% Verizon Wireless stake, speculation increased that Vodafone could become a possible acquisition target.
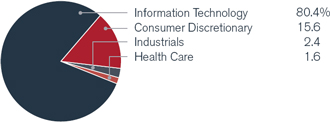
In the equity allocation, the Fund continues to seek companies with both above average yield and dividend growth. In the fixed income allocation, we prefer credit over interest rate risk. The equity allocation remained over 80% of the Fund, reflecting our current bias towards equities over bonds. While corporate earnings growth has remained mixed in recent years, dividend growth has proven more consistent. In comparison to other asset classes such as government or corporate bonds, we believe equity valuations continue to look positive, especially given the prospects for ongoing dividend growth.
As economic growth from areas such as the UK and US accelerate, reports from the corporate sectors are becoming increasingly confident in the outlook for sales and earnings growth, and this has been filtering down into dividend increases for shareholders. For example, Japanese bank Mizuho Financial Group recently announced an 8% dividend increase as a result of stronger than expected earnings growth. Despite significant dividend growth over recent years, global pay-out ratios remain below their long-term average, giving us confidence in the sustainability of dividend payments and the potential for continued dividend growth.
* For further detail about these holdings, please refer to the section entitled “Portfolios of Investments.” Fund holdings are as of the date given, are subject to change at any time, and are not recommendations to buy or sell any security.
Dividend & Income Builder Fund
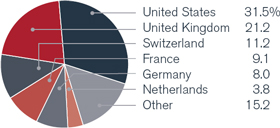
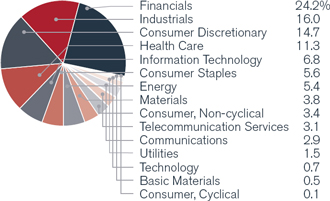
| Portfolio composition by country | | Portfolio composition by sector |
| (as a % of long-term investments) | | (as a % of long-term investments) |
| | | |
| | |
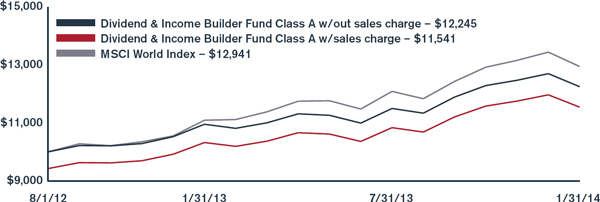
Investment comparison
Value of $10,000
| Total returns as of January 31, 2014 | | | | | | | | Since |
| | | NASDAQ | | Six | One | inception |
| At NAV | | symbol | | months | year | (8/1/2012) |
| Class A | | HDAVX | | 6.53 | % | 11.82 | % | 15.63 | % |
| Class C | | HDCVX | | 6.12 | | 10.99 | | 14.78 | |
| Class I | | HDIVX | | 6.67 | | 12.06 | | 15.88 | |
| With sales charge | | | | | | | | | |
| Class A | | | | 1.20 | % | 6.22 | % | 11.73 | % |
| Class C | | | | 5.12 | | 10.99 | | 14.78 | |
| Index | | | | | | | | | |
| MSCI World Index | | | | 7.10 | % | 16.70 | % | 20.92 | % |
Performance data quoted represents past performance and is no guarantee of future results. Performance results with sales charges reflect the deduction of the maximum front-end sales charge or the deduction of the applicable contingent deferred sales charge (“CDSC”). Class A shares are subject to a maximum front-end sales charge of 5.00%. Class C shares are subject to a CDSC of up to 1% on certain redemptions made within 12 months of purchase. Performance presented at Net Asset Value (NAV), which does not include a sales charge, would be lower if this charge were reflected. NAV is the value of one share of the Fund excluding any sales charges. Current performance may be lower or higher than the performance data quoted. Investment return and principal value will fluctuate so that an investor’s shares, when redeemed, may be worth more or less than original cost. As stated in the current prospectus, the Fund’s annual operating expense ratios (gross) for Class A, C and I shares are 7.40%, 8.22% and 7.16%, respectively. However, the Fund’s adviser has agreed to contractually waive a portion of its fees and/or reimburse other expenses such that total ordinary operating expenses, less distribution and service fees, do not exceed 1.30%, 2.05% and 1.05% for Class A, C and I shares, respectively, which is in effect until July 31, 2015. For the most recent month-end performance, please call 1.866.443.6337 or visit the Funds’ website at www.henderson.com.
Performance results also reflect expense subsidies and waivers in effect during periods shown. Absent these waivers, results would have been less favorable. All results assume the reinvestment of dividends and capital gains.
The investment comparison graph above reflects the change in value of a $10,000 hypothetical investment since the Fund’s inception, including reinvested dividends and distributions, compared to a broad based securities market index. The MSCI World Index is a free float-adjusted market capitalization weighted index that is designed to measure the equity market performance of developed markets. The Fund is professionally managed while the Index is unmanaged and not available for investment and does not include fees, expenses or other costs. Results in the table and graph do not reflect the deduction of taxes that a shareholder would pay on Fund distributions or the redemption of Fund shares.
Emerging Markets Opportunities Fund
Throughout 2013, developed market equities strongly outperformed the Emerging Markets. Investors have become increasingly cautious regarding the outlook for a number of Emerging Market economies due to a combination of ‘tapering’ of the US Federal Reserve’s (Fed) quantitative easing, political unrest and currency movements.
Latin America continued to struggle as weaker economic activity in China prompted a sell-off in hard commodities. In addition, US tapering led to further currency depreciation compounded by the devaluation of the Argentine Peso. An interest rate increase by Brazil’s central bank also contributed to poor equity performance. Mexico and Peru outperformed as investors sought markets with a more stable economic growth outlook.
Asia has been hit by renewed fears that the Chinese economy is slowing and concerns over financial vulnerability in other Emerging Markets (South Africa, Turkey, Brazil) will lead to contagion across the region. China was among the worst performing markets after domestic activity data, including the HSBC Flash Purchasing Managers’ Index, suggested economic momentum had eased towards the end of the year. Performance in Korea also remained lackluster as companies continued to suffer from a stronger Won and earnings downgrades, while India
| Top 10 long-term holdings* |
| (at January 31, 2014) |
| | As a percentage |
| Security | of net assets |
| ProSiebenSat.1 Media AG | | | 2.9 | % |
| Renault S.A. | | | 2.7 | |
| Investment AB Kinnevik, B Shares | | | 2.6 | |
| ASML Holding N.V. | | | 2.3 | |
| Novo Nordisk A/S | | | 2.2 | |
| Centrica plc | | | 2.2 | |
| Teva Pharmaceutical Industries, Ltd., ADR | | | 2.2 | |
| Nokia Oyj | | | 2.1 | |
| Fresenius SE & Co., KGaA | | | 2.1 | |
| British American Tobacco plc | | | 2.1 | |
was also weak after the central bank unexpectedly hiked policy rates.
For the reporting period ended January 31, 2014, the Fund returned 0.82% (Class A at NAV) versus the benchmark, MSCI Emerging Markets Index, which posted a return of -0.21%. The most positive relative performance has come from the EMEA (Europe, Middle East, and Africa) sub-portfolio which has benefitted from the diverse nature of its holdings.
The Fund has been defensively positioned for over a year, which has proven to be the correct stance. We have been very mindful of the risks and challenges faced by the Emerging Markets bloc, particularly in regards to US tapering and Chinese growth. Over the period, the Fund increased its allocation to EMEA, pulling away from Latin America and Asia. We believed our unique approach to stock selection in the EMEA region and focus on distinct situations would help the overall portfolio to be more immune to contagion than the other regional sleeves.
The gap between growth in the emerging economies and the developed world has been falling since 2009 and is expected to narrow further this year and next. At this stage, we do not see the catalyst for a reversal in these trends. Policymakers in these economies do not seem to have significant options for regenerating growth. The looming phase out of the Fed’s cheap money will likely continue to lead to capital outflow from Emerging Market countries and weigh on related assets. That said, some countries are better positioned than others to weather reduced monetary stimulus from the US. In particular, countries with sound fundamentals characterized by current account surpluses, significant foreign exchange reserves and healthy corporate leverage are likely to better withstand significant capital outflows. We continue to favor an active approach to investing in the Emerging Markets and seek to find opportunities that are less sensitive to the “herd mentality” and are valued on their own merits.
* For further detail about these holdings, please refer to the section entitled “Portfolios of Investments.” Fund holdings are as of the date given, are subject to change at any time, and are not recommendations to buy or sell any security.
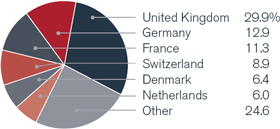
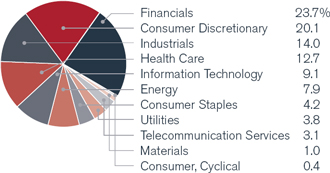
Emerging Markets Opportunities Fund
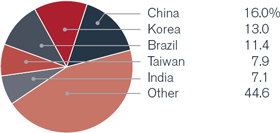
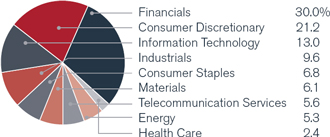
| Portfolio composition by country | | Portfolio composition by sector |
| (as a % of long-term investments) | | (as a % of long-term investments) |
| | | |
| | |
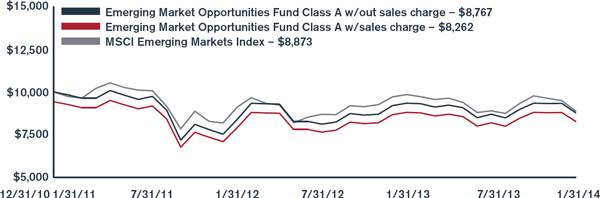
Investment comparison
Value of $10,000
| Total returns as of January 31, 2014 | | | | | | | | | | Since |
| | | NASDAQ | | Six | One | Three | inception |
| At NAV | | symbol | | months | year | years* | (12/31/2010)* |
| Class A | | HEMAX | | 0.82 | % | -6.14 | % | -3.74 | % | -4.17 | % |
| Class C | | HEMCX | | 0.36 | | -6.98 | | -4.51 | | -4.91 | |
| Class I | | HEMIX | | 0.94 | | -6.03 | | -3.56 | | -3.96 | |
| With sales charge | | | | | | | | | | | |
| Class A | | | | -4.99 | % | -11.57 | % | -5.63 | % | -5.99 | % |
| Class C | | | | -0.64 | | -6.98 | | -4.51 | | -4.91 | |
| Index | | | | | | | | | | | |
| MSCI Emerging Markets Index | | | | -0.21 | % | -9.85 | % | -3.03 | % | -3.80 | % |
* Average annual return.
Performance data quoted represents past performance and is no guarantee of future results. Due to the Fund’s relatively small asset base, performance may be impacted by IPOs to a greater degree than it may be in the future. IPO investments are not an integral component of the Fund’s investment process and may not be utilized to the same extent in the future. Performance results with sales charges reflect the deduction of the maximum front-end sales charge or the deduction of the applicable contingent deferred sales charge (“CDSC”). Class A shares are subject to a maximum front-end sales charge of 5.75%. Class C shares are subject to a CDSC of up to 1% on certain redemptions made within 12 months of purchase. Performance presented at Net Asset Value (NAV), which does not include a sales charge, would be lower if this charge were reflected. NAV is the value of one share of the Fund excluding any sales charges. Current performance may be lower or higher than the performance data quoted. Investment return and principal value will fluctuate so that an investor’s shares, when redeemed, may be worth more or less than original cost. As stated in the current prospectus, the Fund’s annual operating expense ratios (gross) for Class A, C and I shares are 2.16%, 2.88% and 1.81%, respectively. However, the Fund’s adviser has agreed to contractually waive a portion of its fees and/or reimburse other expenses such that total ordinary operating expenses, less distribution and service fees, do not exceed 1.79%, 2.54% and 1.54% for Class A, C and I shares, respectively, which is in effect until July 31, 2015. For the most recent month-end performance, please call 1.866.443.6337 or visit the Funds’ website at www.henderson.com.
Performance results also reflect expense subsidies and waivers in effect during periods shown. Absent these waivers, results would have been less favorable. All results assume the reinvestment of dividends and capital gains.
The investment comparison graph above reflects the change in value of a $10,000 hypothetical investment since the Fund’s inception, including reinvested dividends and distributions, compared to a broad based securities market index. The MSCI Emerging Markets Index is a free float-adjusted market capitalization weighted index that is designed to measure the equity market performance of emerging markets. The Fund is professionally managed while the Index is unmanaged and not available for investment and does not include fees, expenses or other costs. Results in the table and graph do not reflect the deduction of taxes that a shareholder would pay on Fund distributions or the redemption of Fund shares.
European Focus Fund
Improving global economic data underpinned the rally in equities over the majority of the period, with Europe (ex-UK) markets delivering the best returns, further boosted as investors continued to increase their weighting to the region. The European Central Bank (ECB) cut interest rates to 0.25% which was encouraging in light of the intent shown not to let deflation in European economies become established. Toward the end of the year the US Federal Reserve (Fed) decided to start ‘tapering’ the amount of open market bond purchases; in contrast to the initial market reaction in May, investors took the decision as good news choosing to focus on the Fed’s flexible rhetoric and the strength of the global economy rather than the withdrawal of liquidity. However, a number of developments shook market confidence in January and caused a notable swing in sentiment with a broad impact across asset classes and regions – primarily the impact of tapering on Emerging Markets. In addition, concerns over Europe slipping into a deflation trap grew.
For the reporting period ended January 31, 2014, the Fund returned 16.83% (class A at NAV) versus the benchmark, MSCI Europe Index, which posted a return of 9.83%. The overweight exposures to industrials, financials and consumer discretionary drove performance. The investment focus over the period was on increasing exposure to European focused companies which we believed were set to
| Top 10 long-term holdings* |
| (at January 31, 2014) |
| | As a percentage |
| Security | of net assets |
| Airports of Thailand pcl | | | 2.7 | % |
| SK Telecom Co., Ltd. | | | 2.6 | |
| Chinatrust Financial Holding Co., Ltd. | | | 2.6 | |
| Samsung Electronics Co., Ltd. | | | 2.6 | |
| SK Hynix, Inc. | | | 2.6 | |
| Taiwan Semiconductor Manufacturing Co., Ltd. | | | 2.5 | |
| Yuanta Financial Holding Co., Ltd. | | | 2.5 | |
| Brilliance China Automotive Holdings, Ltd. | | | 2.5 | |
| Hyundai Motor Co. | | | 2.5 | |
| SJM Holdings, Ltd. | | | 2.4 | |
benefit from European recovery. The increase in exposure to financials was the biggest shift in positioning and a significant contributor to performance. CaixaBank, Commerzbank, Direct Line, BBVA and HSBC were among the leading positions for the Fund. Highlights from the holdings in industrials and consumer discretionary included KION Group, forklift operator; AP Moller-Maersk, shipping conglomerate; Continental, auto parts manufacturer; RTL Group, multi-media and Accor, hotel chain.
Notable purchases included BBVA and HSBC as both had features not fully recognized by investors –namely a stabilizing Spain and sensitivity to steepening yield curves, respectively. Other additions to financials included Commerzbank, a recovery play and Erste Bank Group following a fund raise. Additions in other areas included semiconductor machinery manufacturer ASML Holding, mobile company Nokia, Spanish infrastructure company Tecnicas Reunidas and industrial inspection firm SGS. Market conditions and sector aversion created attractive entry points into resource plays including Lundin Mining Corp and Glencore Xstrata. Recent volatility in Emerging Markets has created selective opportunities in Turkey where the central bank has recently enacted policy action to ensure price stability and currency support. We made small investments in Halk Bankasi and the airline Turk Hava Yollari.
We suspect that the recent pullback is a healthy correction and on deflation, continental Europe is only just showing signs of better economic news. The ECB could develop further policies to stimulate demand and avert deflation if the need arises (they have been vocal in their recognition of the risks). We maintain our view that Europe is under-appreciated and there remains valuation upside, particularly versus the US, and we suspect positive earnings surprises as recovery takes hold. There will undoubtedly be some difficult phases but we believe the overall case remains a good one and offers upside for the portfolio.
* For further detail about these holdings, please refer to the section entitled “Portfolios of Investments.” Fund holdings are as of the date given, are subject to change at any time, and are not recommendations to buy or sell any security.
European Focus Fund
| Portfolio composition by country | | Portfolio composition by sector |
| (as a % of long-term investments) | | (as a % of long-term investments) |
| | | |
| | |
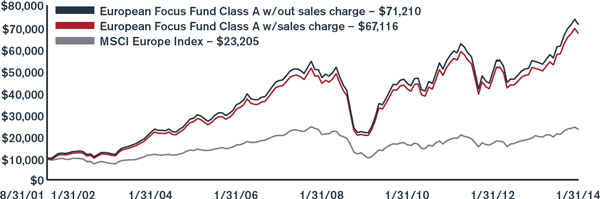
Investment comparison
Value of $10,000
| Total returns as of January 31, 2014 | | | | | | | | | | Since |
| | | NASDAQ | | Six | One | Three | Five | Ten | inception |
| At NAV | | symbol | | months | year | years* | years* | years* | (8/31/2001)* |
| Class A | | HFEAX | | 16.83 | % | 31.45 | % | 7.70 | % | 26.83 | % | 12.56 | % | 17.12 | % |
| Class B | | HFEBX | | 16.33 | | 30.38 | | 6.85 | | 25.85 | | 11.89 | | 16.57 | |
| Class C | | HFECX | | 16.37 | | 30.42 | | 6.88 | | 25.86 | | 11.72 | | 16.25 | |
| Class I** | | HFEIX | | 16.96 | | 31.78 | | 8.02 | | 27.17 | | 12.71 | | 17.25 | |
| With sales charge | | | | | | | | | | | | | | | |
| Class A | | | | 10.13 | % | 23.91 | % | 5.60 | % | 25.34 | % | 11.89 | % | 16.56 | % |
| Class B | | | | 11.33 | | 26.38 | | 5.96 | | 25.77 | | 11.89 | | 16.57 | |
| Class C | | | | 15.37 | | 30.42 | | 6.88 | | 25.86 | | 11.72 | | 16.25 | |
| Index | | | | | | | | | | | | | | | |
| MSCI Europe Index | | | | 9.83 | % | 14.39 | % | 7.72 | % | 15.86 | % | 7.34 | % | 7.01 | % |
* Average annual return.
** Class I (formerly Class W) shares commenced operations on March 31, 2009. The performance for Class I shares for the period prior to March 31, 2009 is based on the performance of Class A shares. Performance for Class I shares would be similar because the shares are invested in the same portfolio of securities and have the same portfolio management. Class I shares are not subject to a front-end sales charge or a distribution fee.
Performance data quoted represents past performance and is no guarantee of future results. Performance results with sales charges reflect the deduction of the maximum front-end sales charge or the deduction of the applicable contingent deferred sales charge (“CDSC”). Class A shares are subject to a maximum front-end sales charge of 5.75%. Class B shares are subject to a CDSC, which declines from 5% the 1st year to 0% at the beginning of the 7th year. Class C shares are subject to a CDSC of up to 1% on certain redemptions made within 12 months of purchase. Performance presented at Net Asset Value (NAV), which does not include a sales charge, would be lower if this charge were reflected. NAV is the value of one share of the Fund excluding any sales charges. Current performance may be lower or higher than the performance data quoted. Investment return and principal value will fluctuate so that an investor’s shares, when redeemed, may be worth more or less than original cost. As stated in the current prospectus, the Fund’s annual operating expense ratios (gross) for Class A, B, C and I shares are 1.51%, 2.33%, 2.28% and 1.21% respectively. As stated in the Statement of Additional Information (SAI), the Fund’s adviser has agreed to contractually waive a portion of its fees and/or reimburse other expenses such that total ordinary operating expenses, less distribution and service fees, do not exceed 2.00%, 2.75%, 2.75% and 1.75% for Class A, B, C and I shares, respectively, which is in effect until July 31, 2020. For the most recent month-end performance, please call 1.866.443.6337 or visit the Funds’ website at www.henderson.com.
Performance results also reflect expense subsidies and waivers in effect during certain periods shown. Absent these waivers, results would have been less favorable for certain periods. All results assume the reinvestment of dividends and capital gains.
The investment comparison graph above reflects the change in value of a $10,000 hypothetical investment since the Fund’s inception, including reinvested dividends and distributions, compared to a broad based securities market index. The MSCI Europe Index is a free float-adjusted market capitalization weighted index that is designed to measure the equity market performance of the developed markets in Europe. The Fund is professionally managed while the Index is unmanaged and not available for investment and does not include fees, expenses or other costs. Results in the table and graph do not reflect the deduction of taxes that a shareholder would pay on Fund distributions or the redemption of Fund shares.
Global Equity Income Fund
Global equity markets rose during the second half of 2013, led by the US as economic data proved resilient through a federal government shutdown and the decision by the Federal Reserve (Fed) in December to begin scaling back quantitative easing. Emerging Market equities underperformed, as the beginnings of monetary tightening from the US led to worries of foreign capital outflows and subsequent currency pressure. Investors became nervous in January and equities fell largely as a result of the potential domino effects of contagion from the Emerging Markets. Economic data in the developed markets however continued to strengthen, particularly in the UK and Japan.
For the reporting period ended January 31, 2014, the Fund returned 4.52% (Class A at NAV) versus the benchmark, MSCI World Index, which posted a return of 7.10%. The Fund continued to meet its high income objectives over the period. The Fund’s low weighting in lower yielding areas such as the US led to relative underperformance versus the broader market’s rally. One of the best performers at the stock level was telecommunications company Vodafone following news that they would be selling their 45% Verizon Wireless stake. Also amongst the top performers was Dow Chemical, which is taking steps to reduce its commodity chemicals exposure.
| Top 10 long-term holdings* |
| (at January 31, 2014) |
| | As a percentage |
| Security | of net assets |
| Vodafone Group plc | | | 3.3 | % |
| Novartis AG | | | 3.0 | |
| Royal Dutch Shell plc, A Shares | | | 2.5 | |
| National Grid plc | | | 2.4 | |
| British Sky Broadcasting Group plc | | | 2.1 | |
| Smiths Group plc | | | 2.1 | |
| Westfield Retail Trust | | | 2.1 | |
| Siemens AG | | | 2.0 | |
| Deutsche Post AG | | | 1.9 | |
| GlaxoSmithKline plc | | | 1.9 | |
We believe that over time this will increase the predictability of earnings and may result in a higher earnings multiple for the shares.
Toward the end of the period the Fund reduced its US weighting. While we believe the US will continue to perform well, we are finding more value in shares internationally. The Fund increased its weighting in Japan, where dividends are slowly rising and prospects for economic growth are improving. The Fund remained overweight Europe where we see a large valuation gap as a result of the difficulty the region has endured. Many high quality international companies listed in Europe have been trading at significant discounts. Forecasts for economic growth in Europe are stabilizing, and we think the valuation gap can continue to close.
The Fund has broad sector exposure but our favored area right now is financials, such as banks and insurers, where we are finding relatively attractive valuations and dividend yields. In banks, capital ratios have risen and prospects for earnings and dividend growth are improving. The Fund placed a small currency hedge on the Australian dollar. While we are positive on share prices and valuations in Australia we are less keen on the currency. The Fund also has a significant exposure to the pharmaceuticals sector where fundamentals and value still appeal.
As quantitative easing from the Fed is gradually withdrawn during 2014, there will likely be continued short-term volatility in equity markets. However, the reduction of monetary loosening as a result of economic recovery can be a positive for developed market equities as companies have greater potential for sales and earnings growth. In the context of strong corporate balance sheets and improving domestic economies in areas such as the US and UK, we remain comfortable with our positioning in the Fund.
* For further detail about these holdings, please refer to the section entitled “Portfolios of Investments.” Fund holdings are as of the date given, are subject to change at any time, and are not recommendations to buy or sell any security.
Global Equity Income Fund
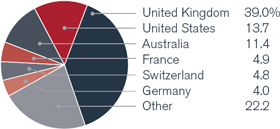
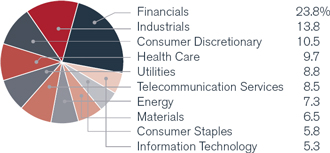
| Portfolio composition by country | | Portfolio composition by sector |
| (as a % of long-term investments) | | (as a % of long-term investments) |
| | | |
| | |
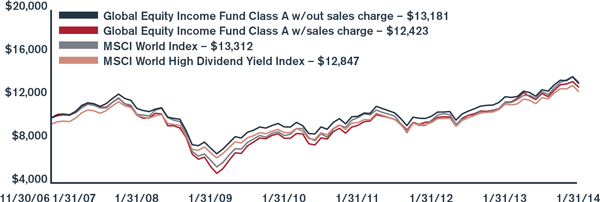
Investment comparison
Value of $10,000
| Total returns as of January 31, 2014 | | | | | | | | | | | | Since |
| | | NASDAQ | | Six | One | Three | Five | inception |
| At NAV | | symbol | | months | year | years* | years* | (11/30/2006)* |
| Class A | | HFQAX | | 4.52 | % | 10.18 | % | 9.09 | % | 12.84 | % | 3.93 | % |
| Class C | | HFQCX | | 4.16 | | 9.29 | | 8.28 | | 12.00 | | 3.15 | |
| Class I** | | HFQIX | | 4.65 | | 10.46 | | 9.37 | | 13.14 | | 4.12 | |
| With sales charge | | | | | | | | | | | | | |
| Class A | | | | -1.50 | % | 3.86 | % | 6.95 | % | 11.51 | % | 3.07 | % |
| Class C | | | | 3.16 | | 9.29 | | 8.28 | | 12.00 | | 3.15 | |
| Index | | | | | | | | | | | | | |
| MSCI World Index | | | | 7.10 | | 16.70 | % | 9.90 | % | 16.92 | % | 4.07 | % |
| MSCI World High Dividend Yield Index | | | | 4.76 | | 12.12 | | 11.29 | | 18.43 | | 3.55 | |
* Average annual return
** Class I (formerly Class W) shares commenced operations on March 31, 2009. The performance for Class I shares for the period prior to March 31, 2009 is based on the performance of Class A shares. Performance for Class I shares would be similar because the shares are invested in the same portfolio of securities and have the same portfolio management. Class I shares are not subject to a front-end sales charge or a distribution fee.
Performance data quoted represents past performance and is no guarantee of future results. Performance results with sales charges reflect the deduction of the maximum front-end sales charge or the deduction of the applicable contingent deferred sales charge (“CDSC”). Class A shares are subject to a maximum front-end sales charge of 5.75%. Class C shares are subject to a CDSC of up to 1% on certain redemptions made within 12 months of purchase. Performance presented at Net Asset Value (NAV), which does not include a sales charge, would be lower if this charge were reflected. NAV is the value of one share of the Fund excluding any sales charges. Current performance may be lower or higher than the performance data quoted. Investment return and principal value will fluctuate so that an investor’s shares, when redeemed, may be worth more or less than original cost. As stated in the current prospectus, the Fund’s annual operating expense ratios (gross) for Class A, C and I shares are 1.23%, 1.99% and 0.96%, respectively. As stated in the Statement of Additional Information (SAI), the Fund’s adviser has agreed to contractually waive a portion of its fees and/or reimburse other expenses such that total ordinary operating expenses, less distribution and service fees, do not exceed 1.40%, 2.15% and 1.15% for Class A, C and I shares, respectively, which is in effect until July 31, 2020. For the most recent month-end performance, please call 1.866.443.6337 or visit the Funds’ website at www.henderson.com.
Performance results also reflect expense subsidies and waivers in effect during certain periods shown. Absent these waivers during those periods, results would have been less favorable. All results assume the reinvestment of dividends and capital gains.
The investment comparison graph above reflects the change in value of a $10,000 hypothetical investment since the Fund’s inception, including reinvested dividends and distributions, compared to a broad based securities market index. The MSCI World Index is a free float-adjusted market capitalization weighted index that is designed to measure the equity market performance of developed markets. The MSCI World High Dividend Yield Index aims to objectively reflect the high dividend yield opportunity set within select MSCI World Index. The Fund is professionally managed while the Indices are unmanaged and not available for investment and do not include fees, expenses or other costs. Results in the table and graph do not reflect the deduction of taxes that a shareholder would pay on Fund distributions or the redemption of Fund shares.
Global Technology Fund
The reporting period was positive for the technology sector as improving economic data underpinned the rally in global equity markets. The Eurozone emerged from its longest ever recession, and economic news from China exceeded expectations; however, Emerging Markets underperformed given rising US yields and equity outflows. Much of the period was dominated by the prospect of the US Federal Reserve (Fed) tapering its quantitative easing program - the decision earlier in the reporting period to delay tapering triggered a rally in equities. However, renewed tapering concerns as well as volatility in Emerging Markets, which had a broad impact across asset classes and regions, caused a sharp pullback to global markets in January.
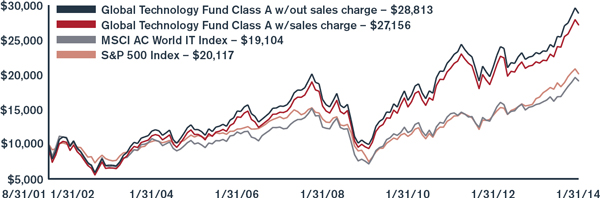
For the reporting period ended January 31, 2014, the Fund returned 12.96% (Class A at NAV) versus the benchmark, MSCI AC World IT Index, which posted a return of 13.50%. At the sector level, IT services and internet & catalog retail contributed most to the Fund’s performance; however gains were held back by our exposure to software as Citrix, Symantec, Nuance and Cadence Design all underperformed. Google was the largest detractor to performance on
| Top 10 long-term holdings* |
| (at January 31, 2014) |
| | As a percentage |
| Security | of net assets |
| QUALCOMM, Inc. | | | 3.2 | % |
| Apple, Inc. | | | 3.0 | |
| Google, Inc., Class A | | | 2.8 | |
| Western Digital Corp. | | | 2.8 | |
| Facebook, Inc., Class A | | | 2.2 | |
| FleetCor Technologies, Inc. | | | 2.2 | |
| Rightmove plc | | | 2.1 | |
| Pandora Media, Inc. | | | 2.1 | |
| Time Warner Cable, Inc. | | | 2.1 | |
| NetEase.com, Inc., ADR | | | 2.1 | |
a relative basis over the period. Pandora, an internet media company, was the leading performer for the Fund and Cognizant reported strong revenues driven by growth in its healthcare and continental European division. Priceline.com, the largest US online travel agent by market value, performed well after reporting strong quarterly sales and Western Digital, the data storage manufacturer, continued to benefit from less competition in the storage market.
A position in Baidu, a Chinese internet company, was re-established as we began to see evidence of an inflection in its mobile offering. Web.com was added to the portfolio; the web services company has a strong potential market opportunity emanating from increased online consumer spending and an increased shift of marketing spend to online and mobile. Cisco was trimmed on the back of Emerging Market concerns and Netapp was reduced as we became less confident in the stock due to the impact of cloud computing and competition from EMC.
Equity markets rallied strongly driven by better macroeconomic data and very strong inflows despite lackluster sales and overall earnings growth. At some stage, earnings will need to start surprising on the upside in order to sustain upward momentum. US and European demand does seem to be getting better while events in January highlight that Emerging Market economies continue to be the major risk in failing to keep the party going.
We believe our overall bias towards companies with strong barriers to entry should cushion the portfolio from macroeconomic volatility. Our valuation-aware process focuses on underappreciated areas of secular growth that offer strong returns over the long-term. The Fund remains biased to our preferred themes of E-Commerce, Online Advertising, Rational Commodities, Connectivity and Paperless Payment.
* For further detail about these holdings, please refer to the section entitled “Portfolios of Investments.” Fund holdings are as of the date given, are subject to change at any time, and are not recommendations to buy or sell any security.
Global Technology Fund
| Portfolio composition by country | | Portfolio composition by sector |
| (as a % of long-term investments) | | (as a % of long-term investments) |
| | | |
| | |
Investment comparison
Value of $10,000
| Total returns as of January 31, 2014 | | | | | | | | | | | | | | Since |
| | | NASDAQ | | Six | One | Three | Five | Ten | inception |
| At NAV | | symbol | | months | year | years* | years* | years* | (8/31/2001)* |
| Class A | | HFGAX | | 12.96 | % | 24.25 | % | 9.06 | % | 23.07 | % | 9.25 | % | 8.89 | % |
| Class B | | HFGBX | | 12.51 | | 23.24 | | 8.19 | | 22.11 | | 8.59 | | 8.41 | |
| Class C | | HFGCX | | 12.58 | | 23.32 | | 8.23 | | 22.15 | | 8.43 | | 8.10 | |
| Class I** | | HFGIX | | 13.11 | | 24.56 | | 9.37 | | 23.40 | | 9.40 | | 9.01 | |
| With sales charge | | | | | | | | | | | | | | | |
| Class A | | | | 6.45 | % | 17.10 | % | 6.94 | % | 21.61 | % | 8.60 | % | 8.38 | % |
| Class B | | | | 7.51 | | 19.24 | | 7.33 | | 22.02 | | 8.59 | | 8.41 | |
| Class C | | | | 11.58 | | 23.32 | | 8.23 | | 22.15 | | 8.43 | | 8.10 | |
| Index | | | | | | | | | | | | | | | |
| MSCI AC World IT Index | | | | 13.50 | % | 21.63 | % | 9.89 | % | 20.39 | % | 5.87 | % | 5.35 | % |
| S&P 500 | | | | 6.85 | | 21.52 | | 13.92 | | 19.18 | | 6.83 | | 5.79 | |
* Average annual return.
** Class I (formerly Class W) shares commenced operations on March 31, 2009. The performance for Class I shares for the period prior to March 31, 2009 is based on the performance of Class A shares. Performance for Class I shares would be similar because the shares are invested in the same portfolio of securities and have the same portfolio management. Class I shares are not subject to a front-end sales charge or a distribution fee.
Performance data quoted represents past performance and is no guarantee of future results. Performance results with sales charges reflect the deduction of the maximum front-end sales charge or the deduction of the applicable contingent deferred sales charge (“CDSC”). Class A shares are subject to a maximum front-end sales charge of 5.75%. Class B shares are subject to a CDSC which declines from 5% the 1st year to 0% at the beginning of the 7th year. Class C shares are subject to a CDSC of up to 1% on certain redemptions made within 12 months of purchase. Performance presented at Net Asset Value (NAV), which does not include a sales charge, would be lower if this charge were reflected. NAV is the value of one share of the Fund excluding any sales charges. Current performance may be lower or higher than the performance data quoted. Investment return and principal value will fluctuate so that an investor’s shares, when redeemed, may be worth more or less than original cost. As stated in the current prospectus, the Fund’s annual operating expense ratios (gross) for Class A, B, C and I shares are 1.50%, 2.32%, 2.27% and 1.23%, respectively. As stated in the Statement of Additional Information (SAI), the Fund’s adviser has agreed to contractually waive a portion of its fees and/or reimburse other expenses such that total ordinary operating expenses, less distribution and service fees, do not exceed 2.00%, 2.75%, 2.75% and 1.75% for Class A, B, C and I shares, respectively, which is in effect until July 31, 2020. For the most recent month-end performance, please call 1.866.443.6337 or visit the Funds’ website at www.henderson.com.
Performance results also reflect expense subsidies and waivers in effect during certain periods shown. Absent these waivers, results would have been less favorable for certain periods. All results assume the reinvestment of dividends and capital gains.
The investment comparison graph above reflects the change in value of a $10,000 hypothetical investment since the Fund’s inception, including reinvested dividends and distributions, compared to a broad based securities market index and an industry focused index. The MSCI AC World IT Index is a free float adjusted market capitalization weighted index designed to measure the equity market performance of the Information Technology stocks within the MSCI AC World Index. The S&P 500 Index is a broad based measurement of changes in stock market conditions based on the average of 500 widely held common stocks. The Fund is professionally managed while the Indices are unmanaged and not available for investment and do not include fees, expenses or other costs. Results in the table and graph do not reflect the deduction of taxes that a shareholder would pay on Fund distributions or the redemption of Fund shares.
High Yield Opportunities Fund
The high yield market posted a strong return over the period and outperformed most other segments of fixed income including leveraged loans, investment grade corporate bonds, US Treasuries and Emerging Markets corporate and sovereign bonds. Due to the sharp rally in risk assets prevalent throughout most of the period, save for the January pullback, high yield bonds underperformed equities as well as credit default swap indices. The prevailing environment for high yield bonds is favorable by many measures including valuation. New issuance was $33 billion following $25 billion in December and $25 billion in November. For the full year of 2013, new issuance of $398 billion broke the previous record set in 2012 of $368 billion.
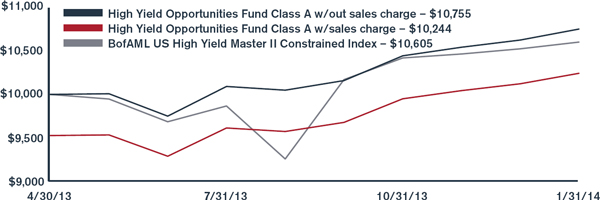
For the reporting period ended January 31, 2014, the Fund returned 6.57% (class A at NAV) versus the benchmark, Bank of America Merrill Lynch US
| Top 10 long-term holdings* |
| (at January 31, 2014) |
| | As a percentage |
| Security | of net assets |
| Ally Financial, Inc. | | | 3.6 | % |
| Orion Engineered Carbons Finance & Co. SCA | | | 2.1 | |
| Landry’s, Inc. | | | 2.0 | |
| Wok Acquisition Corp. | | | 2.0 | |
| Pittsburgh Glass Works LLC | | | 2.0 | |
| Intelsat Luxembourg S.A. | | | 2.0 | |
| Ancestry.com, Inc. | | | 1.9 | |
| Digicel Group, Ltd. | | | 1.9 | |
| Hockey Merger Sub 2, Inc. | | | 1.9 | |
| Artesyn Escrow, Inc. | | | 1.9 | |
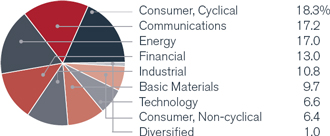
High Yield Master II Constrained Index, which posted a return of 4.65%. Credit selection drove the alpha and was boosted by positive sector allocation, low levels of cash and the absence of bank loans. The Fund’s positioning along the credit ratings curve aided relative performance due to the overweight position in triple-C and single-B rated bonds and underweight in double-B rated bonds. The best performers were Calumet (refining), Swift Energy (oil and gas), Ally Financial (banking), Garda World Security (services) and Pittsburgh Glassworks (auto parts). The worst performers were Claire’s Stores (retail), Advanced Micro Devices (technology) and Emerson (technology).
The only major change to the sector weightings in the Fund was a continued relative reduction in our exploration and production (energy) holdings due to relative valuation. We have maintained our overweight exposure to lower quality single-B and higher quality triple-C sectors which has been beneficial to performance versus the benchmark and peer group.
Credit fundamentals remain positive and most of the companies that we follow have taken advantage of the easy new issuance market to address any lingering liquidity concerns. As a result, we estimate that default rates will remain low, yet secondary market liquidity will remain challenging. Our main focus during 2014 will be scrutinizing new issues as we are starting to see a reversion to deteriorating credit trends in the new issue calendar as it relates to use of proceeds, covenants, leverage and valuation.
* For further detail about these holdings, please refer to the section entitled “Portfolios of Investments.” Fund holdings are as of the date given, are subject to change at any time, and are not recommendations to buy or sell any security.
High Yield Opportunities Fund
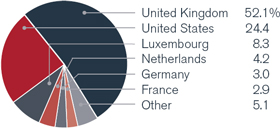
| Portfolio composition by country | | Portfolio composition by sector |
| (as a % of long-term investments) | | (as a % of long-term investments) |
| | | |
| | |
Investment comparison
Value of $10,000
| Total returns as of January 31, 2014 | | | | | | Since |
| | | NASDAQ | | Six | inception |
| At NAV | | symbol | | months | (4/30/2013) |
| Class A | | HYOAX | | 6.57 | % | 7.55 | % |
| Class C | | HYOCX | | 6.06 | | 6.92 | |
| Class I | | HYOIX | | 6.59 | | 7.72 | |
| With sales charge | | | | | | | |
| Class A | | | | 1.49 | % | 2.43 | % |
| Class C | | | | 5.06 | | 5.92 | |
| Index | | | | | | | |
| BofAML US High Yield Master II Constrained Index | | | | 4.65 | % | 3.25 | % |
Performance data quoted represents past performance and is no guarantee of future results. Due to the Fund’s relatively small asset base, performance may be impacted by portfolio turnover to a greater degree than it may be in the future. The Fund’s portfolio turnover rate may not be as high in the future. Performance results with sales charges reflect the deduction of the maximum front-end sales charge or the deduction of the applicable contingent deferred sales charge (“CDSC”). Class A shares are subject to a maximum front-end sales charge of 4.75%. Class C shares are subject to a CDSC of up to 1% on certain redemptions made within 12 months of purchase. Performance presented at Net Asset Value (NAV), which does not include a sales charge, would be lower if this charge were reflected. NAV is the value of one share of the Fund excluding any sales charges. Current performance may be lower or higher than the performance data quoted. Investment return and principal value will fluctuate so that an investor’s shares, when redeemed, may be worth more or less than original cost. As stated in the current prospectus, the Fund’s annual operating expense ratios (gross) for Class A, C and I shares are 2.83%, 3.64% and 1.83%, respectively. However, the Fund’s adviser has agreed to contractually waive a portion of its fees and/or reimburse other expenses such that total ordinary operating expenses, less distribution and service fees, do not exceed 1.10%, 1.85% and 0.85% for Class A, C and I shares, respectively, which is in effect until July 31, 2020. For the most recent month-end performance, please call 1.866.443.6337 or visit the Funds’ website at www.henderson.com.
Performance results also reflect expense subsidies and waivers in effect during periods shown. Absent these waivers, results would have been less favorable. All results assume the reinvestment of dividends and capital gains.
The investment comparison graph above reflects the change in value of a $10,000 hypothetical investment since the Fund’s inception, including reinvested dividends and distributions, compared to a broad based securities market index. The Bank of America Merrill Lynch U.S. High Yield Master II Constrained Index tracks the performance of below investment grade U.S. dollar-denominated corporate bonds publicly issued in the U.S. domestic market. The Fund is professionally managed while the Index is unmanaged and not available for investment and does not include fees, expenses or other costs. Results in the table and graph do not reflect the deduction of taxes that a shareholder would pay on Fund distributions or the redemption of Fund shares.
International Opportunities Fund
As a result of encouraging economic data, global equity markets rose for the majority of the reporting period. Investor confidence within Europe continued as investors increased their weighting to the region and the European Central Bank (ECB) cut interest rates to 0.25%. The two main reasons behind the ECB’s decision was the recent appreciation of the Euro and a significant decline in the inflation rate. In Japan, confidence grew that the policies brought in by Prime Minister Abe will lead to a sustained period of economic growth. Toward the end of the year, the Federal Reserve (Fed) decided to start tapering the amount of open market bond purchases; in contrast to the initial market reaction in May, investors took the decision as good news, choosing to focus on the Fed’s flexible rhetoric and the strength of the global economy rather than the withdrawal of liquidity. However, renewed tapering concerns coincided with a return of volatility in Emerging Markets (which had a broad impact across asset classes and regions) and caused a sharp pullback to global markets in January. Asia and Emerging Markets were the key areas affected by China and the Fed’s decision to taper.
For the reporting period ended January 31, 2014, the Fund returned 9.92% (class A at NAV) versus the MSCI EAFE Index, which posted a return of 7.60%, with only the Latin American sub-portfolio
| Top 10 long-term holdings* |
| (at January 31, 2014) |
| | As a percentage |
| Security | of net assets |
| Continental AG | | | 3.1 | % |
| Fresenius SE & Co., KGaA | | | 3.0 | |
| UBS AG | | | 2.9 | |
| Roche Holding AG | | | 2.7 | |
| Standard Life plc | | | 2.7 | |
| Koninklijke Philips N.V. | | | 2.7 | |
| Sodexo | | | 2.6 | |
| ASML Holding N.V. | | | 2.6 | |
| Amadeus IT Holding S.A., A Shares | | | 2.6 | |
| Deutsche Post AG | | | 2.6 | |
underperforming in the 6-month period in absolute terms. Returns from the Pan-European sub-portfolio drove performance as industrial and consumer discretionary stocks particularly benefitted from the recovery rally in Europe. International Consolidated Airlines Group, Continental, A.P. Moller-Maersk and Deutsche Post were among the leading performers for the Fund.
The Fund made a small allocation shift from the Pan-European sub-portfolio to the Japan sub-portfolio, which moved the Japan weight close to 20% of the Fund. Although this weighting is a bit light versus the index weighting of around 21%, we feel the huge political will and reform agenda in Japan makes the region the biggest area of potential during 2014 and we increased our allocation accordingly. Notable purchases in the Japan sub-portfolio included construction firm Sekisui house and automotive manufacturer Toyota Motors. Electronic payment solutions company Cielo was added to the Latin America sub-portfolio and the Pan-European sub-portfolio bought a stake in Richemont, the manufacturer and retailer of luxury goods.
Whether the current correction in equity markets proves to be just a pause before prices head higher, or the anticipated tapering in the US heralds more challenging times ahead for equities is unclear. However, stock prices retreated by a meaningful amount in January so the market correction is already well underway. Japan has an advantage in that the authorities’ efforts to rejuvenate activity are relatively young and are predominantly focused on reviving the domestic economy. Global economic data has been improving and business and consumer sentiment indicators are also upbeat. As such, while political and macroeconomic factors are continuing to drive markets and investor sentiment, there are many stock specific opportunities for “bottom-up” fund managers, such as ourselves, to add value.
* For further detail about these holdings, please refer to the section entitled “Portfolios of Investments.” Fund holdings are as of the date given, are subject to change at any time, and are not recommendations to buy or sell any security.
International Opportunities Fund
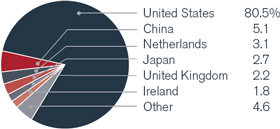
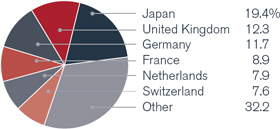
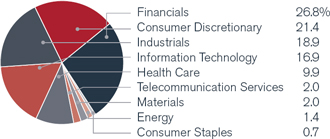
| Portfolio composition by country | | Portfolio composition by sector |
| (as a % of long-term investments) | | (as a % of long-term investments) |
| | | |
| | |
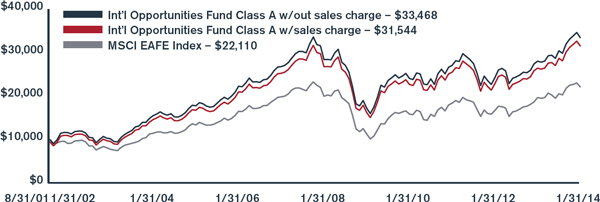
Investment comparison
Value of $10,000
| Total returns as of January 31, 2014 | | | | | | | | | Since |
| | | NASDAQ | | Six | One | Three | Five | Ten | inception |
| At NAV | | symbol | | months | year | years* | years* | years* | (8/31/2001)* |
| Class A | | HFOAX | | 9.92 | % | 19.35 | % | 7.32 | % | 14.21 | % | 8.00 | % | 10.21 | % |
| Class B | | HFOBX | | 9.46 | | 18.34 | | 6.45 | | 13.31 | | 7.36 | | 9.70 | |
| Class C | | HFOCX | | 9.51 | | 18.45 | | 6.50 | | 13.33 | | 7.18 | | 9.39 | |
| Class R** | | HFORX | | 9.78 | | 18.97 | | 6.96 | | 13.85 | | 7.71 | | 9.92 | |
| Class I*** | | HFOIX | | 10.06 | | 19.65 | | 7.62 | | 14.52 | | 8.15 | | 10.33 | |
| With sales charge | | | | | | | | | | | | | | | |
| Class A | | | | 3.60 | % | 12.47 | % | 5.22 | % | 12.87 | % | 7.36 | % | 9.69 | % |
| Class B | | | | 4.46 | | 14.34 | | 5.56 | | 13.19 | | 7.36 | | 9.70 | |
| Class C | | | | 8.51 | | 18.45 | | 6.50 | | 13.33 | | 7.18 | | 9.39 | |
| Index | | | | | | | | | | | | | | | |
| MSCI EAFE Index | | | | 7.60 | % | 12.39 | % | 6.35 | % | 14.36 | % | 6.80 | % | 6.59 | % |
* Average annual return.
** Class R shares commenced operations on September 30, 2005. The performance for Class R shares for the period prior to September 30, 2005 is based on the performance of Class A shares, adjusted for the higher expenses applicable to R shares. Class R shares are not subject to a front-end sales charge but are subject to a distribution fee of 0.50%.
*** Class I (formerly Class W) shares commenced operations on March 31, 2009. The performance for Class I shares for the period prior to March 31, 2009 is based on the performance of Class A shares. Performance for Class I shares would be similar because the shares are invested in the same portfolio of securities and have the same portfolio management. Class I shares are not subject to a front-end sales charge or a distribution fee.
Performance data quoted represents past performance and is no guarantee of future results. Performance results with sales charges reflect the deduction of the maximum front-end sales charge or the deduction of the applicable contingent deferred sales charge (“CDSC”). Class A shares are subject to a maximum front-end sales charge of 5.75%. Class B shares are subject to a CDSC, which declines from 5% the 1st year to 0% at the beginning of the 7th year. Class C shares are subject to a CDSC of up to 1% on certain redemptions made within 12 months of purchase. Class R shares have no front-end sales charge or CDSC. Performance presented at Net Asset Value (NAV), which does not include a sales charge, would be lower if this charge were reflected. NAV is the value of one share of the Fund excluding any sales charges. Current performance may be lower or higher than the performance data quoted. Investment return and principal value will fluctuate so that an investor’s shares, when redeemed, may be worth more or less than original cost. As stated in the current prospectus, the Fund’s annual operating expense ratios (gross) for Class A, B, C, R and I shares are 1.47%, 2.30%, 2.27%, 1.77% and 1.17% respectively. As stated in the Statement of Additional Information (SAI), the Fund’s adviser has agreed to contractually waive a portion of its fees and/or reimburse other expenses such that total ordinary operating expenses, less distribution and service fees, do not exceed 2.00%, 2.75%, 2.75%, 2.25% and 1.75% for Class A, B, C, R and I shares, respectively, which is in effect until July 31, 2020. For the most recent month-end performance, please call 1.866.443.6337 or visit the Funds’ website at www.henderson.com.
Performance results also reflect expense subsidies and waivers in effect during certain periods shown. Absent these waivers, results would have been less favorable for certain periods. All results assume the reinvestment of dividends and capital gains.
The investment comparison graph above reflects the change in value of a $10,000 hypothetical investment since the Fund’s inception, including reinvested dividends and distributions, compared to a broad based securities market index. The MSCI EAFE Index is a free float-adjusted market capitalization weighted index that is designed to measure the equity market performance of developed markets, excluding the US and Canada. The Fund may invest in emerging markets while the Index only consists of companies in developed markets. The Fund is professionally managed while the Index is unmanaged and not available for investment and does not include fees, expenses or other costs. Results in the table and graph do not reflect the deduction of taxes that a shareholder would pay on Fund distributions or the redemption of Fund shares.
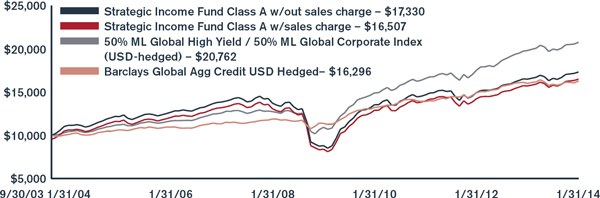
Strategic Income Fund
The reporting period was characterized by credit risk outperforming interest rate risk; high yield outperformed investment grade which in turn outperformed Treasuries. Two pivotal events happened in September: first, Larry Summers, a perceived monetary hawk, withdrew his candidacy for head of the US Federal Open Market Committee (FOMC); the market had sold off in anticipation as he was the front runner. Consequently, all risk assets, including sovereign bonds, rallied as the markets anticipated the more dovish Janet Yellen being appointed. Second, the outgoing Federal Reserve chairman, Ben Bernanke, performed an about-face on the summer tapering discussion which somewhat wrong-footed markets. The Fund was well-positioned for this result. The ‘no tapering’ decision was justified by the tightening in financial conditions in the US, which took place after the initial summer tapering talks. Markets rallied on this dovish turn of events; sovereign bonds however were weak into year-end as credit and equity markets rallied on.
January saw a significant reversal test for a lazy consensus view which had assumed that risk assets would continue rallying and government bonds would continue to sell-off. Despite the weakness in equities and Emerging Market assets, credit markets proved remarkably resilient reflecting a view that the news flow from Turkey and Argentina did not
| Top 10 long-term holdings* |
| (at January 31, 2014) |
| | As a percentage |
| Security | of net assets |
| AA Bond Co., Ltd. | | | 3.2 | % |
| Virgin Media Finance plc | | | 3.2 | |
| Daily Mail & General Trust | | | 2.9 | |
| Standard Chartered plc | | | 2.9 | |
| Telenet Finance Luxembourg SCA | | | 2.9 | |
| Levi Strauss & Co. | | | 2.8 | |
| Lloyds Banking Group plc | | | 2.7 | |
| BAA Funding, Ltd. | | | 2.7 | |
| Iron Mountain, Inc. | | | 2.5 | |
| William Hill plc | | | 2.3 | |
represent systemic risk, but rather were contained issues. This seems a fair assessment given that correlations even within the weakest Emerging Market countries were low.
For the reporting period ended January 31, 2014, the Fund returned 4.42% (Class A at NAV) versus the benchmark, 50% Merrill Lynch Global High Yield Index (USD hedged) / 50% Merrill Lynch Global Corporate Index (USD hedged), which posted a return of 0.97%.
Interest rate sensitivity (duration) was generally run at the low end, but the Fund managed to catch a late third quarter-end rally in sovereign bonds by using interest rate futures. Duration was extended as it appeared US economic data would continue to be moderate, even though investors seemed to be positioned short of the market. This position was then subsequently successfully closed. This worked well as sovereigns were weak late in the calendar year.
The largest bond deal ever came in 2013 from Verizon Telecom at $49 billion. This was a great opportunity and the participation benefitted the Fund. Further, generic credit risk was taken through the use of the highly liquid iTraxx Crossover Credit Derivative Index, which boosted returns in the final months of the year. This reflected a tactical decision to boost the credit beta (market sensitivity) of the Fund over this time period.
We continue to think that income will be the primary driver of returns going forward with little opportunity for capital appreciation opportunities in the bond market. With the expectation that defaults will remain at a historically low level, lower rated areas of the credit market continue to provide the most attractive potential returns in the fixed income universe. This has largely been the positioning of the Fund for a number of years now but there are, as yet, no signs that the animal spirits required to cause a significant deterioration in the quality of high yield bonds in issue have yet returned.
* For further detail about these holdings, please refer to the section entitled “Portfolios of Investments.” Fund holdings are as of the date given, are subject to change at any time, and are not recommendations to buy or sell any security.
Strategic Income Fund
| Portfolio composition by country | | Portfolio composition by sector |
| (as a % of long-term investments) | | (as a % of long-term investments) |
| | | |
| | |
Investment comparison
Value of $10,000
| Total returns as of January 31, 2014† | | | | | | | | | | |
| | | NASDAQ | | Six | One | Three | Five | Ten | inception |
| At NAV | | symbol | | months | year | years* | years* | years* | (9/30/2003)* |
| Class A | | HFAAX | | 4.42 | % | 5.05 | % | 5.69 | % | 14.47 | % | 4.50 | % | 5.46 | % |
| Class B | | HFABX | | 3.98 | | 4.20 | | 4.86 | | 13.64 | | 3.91 | | 4.87 | |
| Class C | | HFACX | | 4.03 | | 4.27 | | 4.87 | | 13.57 | | 3.67 | | 4.64 | |
| Class I** | | HFAIX | | 4.48 | | 5.25 | | 5.88 | | 14.60 | | 4.55 | | 5.52 | |
| With sales charge | | | | | | | | | | | | | | | |
| Class A | | | | -0.59 | % | 0.08 | % | 4.00 | % | 13.36 | % | 3.99 | % | 4.97 | % |
| Class B | | | | -1.02 | | 0.20 | | 3.94 | | 13.52 | | 3.91 | | 4.87 | |
| Class C | | | | 3.03 | | 4.27 | | 4.87 | | 13.57 | | 3.67 | | 4.64 | |
| Index | | | | | | | | | | | | | | | |
| 50% ML Global High Yield / 50% ML Global Corporate Index (USD hedged) | | | | 0.97 | % | 4.79 | % | 7.79 | % | 13.68 | % | 7.13 | % | 7.33 | % |
| Barclays Capital Global Aggregate Bond (ex US MBS) Index | | | | 2.12 | | -0.83 | | 0.94 | | 4.96 | | 4.49 | | 6.06 | |
| Barclays Global Agg Credit USD Hedged | | | | 2.44 | | 1.83 | | 5.41 | | 7.44 | | 4.91 | | 4.84 | |
* Average annual return.
** Class I shares commenced operations on April 29, 2011. The performance for Class I shares for the period prior to April 29, 2011 is based on the performance of Class A shares. Performance for Class I shares would be similar because the shares are invested in the same portfolio of securities and have the same portfolio management. Class I shares are not subject to a front-end sales charge or a distribution fee.
† The Strategic Income Fund changed its fiscal year end from December 31 to July 31 effective July 31, 2013.
Performance data quoted represents past performance and is no guarantee of future results. Performance results with sales charges reflect the deduction of the maximum front-end sales charge or the deduction of the applicable contingent deferred sales charge (“CDSC”). Class A shares are subject to a maximum front-end sales charge of 4.75%. Class B shares are subject to a CDSC, which declines from 5% the 1st year to 0% at the beginning of the 7th year. Class C shares are subject to a CDSC of up to 1% on certain redemptions made within 12 months of purchase. Performance presented at Net Asset Value (NAV), which does not include a sales charge, would be lower if this charge were reflected. NAV is the value of one share of the Fund excluding any sales charges. Current performance may be lower or higher than the performance data quoted. Investment return and principal value will fluctuate so that an investor’s shares, when redeemed, may be worth more or less than original cost. As stated in the current prospectus, the Fund’s annual operating expense ratios (gross) for Class A, B, C and I shares are 1.45%, 2.22%, 2.21% and 1.17%, respectively. However, the Fund’s adviser has agreed to contractually waive a portion of its fees and/or reimburse other expenses such that the total ordinary operating expenses, less distribution and service fees, do not exceed 1.10%, 1.85%, 1.85% and 0.85% for Class A, B, C and I shares, respectively, which will remain in effect until July 31, 2020. For the most recent month-end performance, please call 1.866.443.6337 or visit the Funds’ website at www.henderson.com.
Performance results also reflect expense subsidies and waivers in effect during the periods shown. Absent these waivers, results would have been less favorable. All results assume the reinvestment of dividends and capital gains.
The investment comparison graph above reflects the change in value of a $10,000 hypothetical investment since the Fund’s inception, including reinvested dividends and distributions, compared to a broad based securities market index. The Bank of America Merrill Lynch (“ML”) Global Corporate Index (USD-hedged) tracks the performance of developed market investment grade corporate debt publicly issued in the major US and Eurobond markets. The Bank of America Merrill Lynch (“ML”) Global High Yield Index tracks the performance of US dollar, Canadian Dollar, British sterling and euro denominated developed market below investment grade corporate debt publicly issued in the major US or Eurobond markets. The Barclays Capital Global Aggregate Bond (ex US MBS) Index is a broad-based measure of the global investment-grade fixed-rate debt markets, excluding US Mortgage Bonds. The Barclays Capital Global Aggregate Credit (USD hedged) Index is a broad-based measure of the global investment-grade and high yield fixed-rate markets. The Fund is professionally managed while the Indices are unmanaged and not available for investment and do not include fees, expenses or other costs. Results in the table and graphs do not reflect the deduction of taxes that a shareholder would pay on Fund distributions or the redemption of Fund shares.
Unconstrained Bond Fund
The Fund was successfully launched on December 20, 2013. During December, the Fund was invested to reach the target asset allocation. We remain constructive on credit markets and have allocated approximately 25% to high yield issuers, 20% to investment grade corporates and 12% to asset backed securities. We are more cautious on fixed interest government bonds although we have a meaningful allocation to inflation-linked bonds in the US and UK as well as short-dated Australian and long-dated Mexican government bond exposure. Emerging Market exposure has been focused on countries with strong fundamentals and in shorter maturity bonds from Russia and South Africa (currency hedged) where we do not expect the level of interest rate hikes priced in to be delivered as growth slows. We believe that duration (interest rate risk) will be a bigger headwind to market performance than credit defaults and the portfolio has been positioned accordingly with a low (but positive) duration.
For the reporting period (since inception) ended January 31, 2014, the Fund returned 0.20% (Class A at NAV) versus the benchmark, 3-month LIBOR USD, which posted a return of 0.03%. In January, with the exception of Emerging Market debt, total returns for fixed income were positive. However, asset allocation has not made a material
| Top 10 long-term holdings* |
| (at January 31, 2014) |
| | As a percentage |
| Security | of net assets |
| United States Treasury Note | | | 7.9 | % |
| United States Treasury Inflation Indexed Bonds | | | 6.5 | |
| United Kingdom Gilt Inflation Linked Bond | | | 6.2 | |
| Russian Federal Bond - OFZ | | | 4.2 | |
| Mexican Bonos | | | 3.3 | |
| South Africa Government Bond | | | 2.0 | |
| Grosvenor Place CLO II B.V. | | | 1.8 | |
| German Residential Funding plc | | | 1.4 | |
| Money Partners Securities 4 plc | | | 1.3 | |
| Silverstone Master Issuer plc | | | 1.3 | |
impact over the period as positive contributions from high yield as well as investment-grade corporates and inflation-linked government bonds were offset by holdings in Emerging Market sovereigns and interest rate hedges (used to reduce the interest rate sensitivity of the portfolio).
Derivatives were used for a number of purposes. Futures were primarily employed to manage Fund duration and forward currency contracts were used to hedge currency risk. By quantity, swaps were the largest category of derivative instruments applied to the portfolio and were used primarily to take active positions in interest rate markets. In this regard, the main positive contributor over the period was our positioning for a flatter yield curve in the US and a steeper yield curve in Europe. Options were also used to take active views on government bond and currency markets, including an expectation that the US dollar would appreciate versus the Australian Dollar and Swiss Franc.
Despite recent weak economic data (affected by poor weather), the US Federal Reserve seems willing to maintain the current pace of tapering unless there is a sustained downturn in the outlook for growth or inflation. This would mean US quantitative easing would be finished by the end of the year. As a result, the Fund continues to maintain a low interest rate sensitivity (duration), and focuses on credit markets for yield. Demand for credit remains strong (despite an uninspiring earnings season) and most of the companies that we follow have taken advantage of the new issuance market to address refinancing needs. While valuations are less compelling than before, default rates are expected to remain low and demand for yield should continue as short-term interest rates remain anchored. Emerging Markets will likely remain volatile and we continue to monitor investor flows closely. Our base case is that this is a period of re-pricing which will likely transition into a period of weaker growth in countries with fragile fundamentals and present opportunities in markets with less onerous external funding needs.
* For further detail about these holdings, please refer to the section entitled “Portfolios of Investments.” Fund holdings are as of the date given, are subject to change at any time, and are not recommendations to buy or sell any security.
Unconstrained Bond Fund
| Portfolio composition by country | | Portfolio composition by sector |
| (as a % of long-term investments) | | (as a % of long-term investments) |
| | | |
| | |
Investment comparison
Value of $10,000
| Total returns as of January 31, 2014 | | | | Since |
| | | NASDAQ | | inception |
| At NAV | | symbol | | (12/31/2013) |
| Class A | | HUNAX | | 0.20 | % |
| Class C | | HUNCX | | 0.12 | |
| Class I | | HUNIX | | 0.23 | |
| With sales charge | | | | | |
| Class A | | | | -4.57 | % |
| Class C | | | | -0.88 | |
| Index | | | | | |
| 3-month LIBOR USD | | | | 0.03 | % |
| Barclays Multiverse Index | | | | 1.00 | % |
Performance data quoted represents past performance and is no guarantee of future results. Performance results with sales charges reflect the deduction of the maximum front-end sales charge or the deduction of the applicable contingent deferred sales charge (“CDSC”). Class A shares are subject to a maximum front-end sales charge of 4.75%. Class C shares are subject to a CDSC of up to 1% on certain redemptions made within 12 months of purchase. Performance presented at Net Asset Value (NAV), which does not include a sales charge, would be lower if this charge were reflected. NAV is the value of one share of the Fund excluding any sales charges. Current performance may be lower or higher than the performance data quoted. Investment return and principal value will fluctuate so that an investor’s shares, when redeemed, may be worth more or less than original cost. As stated in the current prospectus, the Fund’s annual operating expense ratios (gross) for Class A, C and I shares are estimated to be 1.97%, 2.72% and 1.72%, respectively, for the Fund’s first full fiscal year. However, the Fund’s adviser has agreed to contractually waive a portion of its fees and/or reimburse other expenses such that total ordinary operating expenses, less distribution and services fees, do not exceed 1.15%, 1.90% and 0.90% for Class A, C and I shares, respectively, which is in effect until July 31, 2020. For the most recent month-end performance, please call 1.866.443.6337 or visit the Funds’ website at www.henderson.com.
Performance results also reflect expense subsidies and waivers in effect during periods shown. Absent these waivers, results would have been less favorable. All results assume the reinvestment of dividends and capital gains.
The investment comparison graph above reflects the change in value of a $10,000 hypothetical investment since the Fund’s inception, including reinvested dividends and distributions, compared to a broad based securities market index. The Barclays Multiverse Index is a broad-based measure of the global fixed-income bond market. The index captures investment grade and high yield securities in all eligible currencies. 3-Month LIBOR (London Interbank Offered Rate) USD is the interest rate participating banks offer to other banks for loans on the London market. The Fund is professionally managed while the Indices are unmanaged and not available for investment and do not include fees, expenses or other costs. Results in the table and graph do not reflect the deduction of taxes that a shareholder would pay on Fund distributions or the redemption of Fund shares.
| Portfolio of investments (unaudited) |
All Asset Fund
January 31, 2014
| | | | | | Value | |
| Shares | | | | | (note 2) | |
| | | | | | | |
| Investment companies - 56.15% | | | | |
| | | | | | | |
| | | Alternatives - 5.43% | | | | |
| 171,710 | | ASG Global Alternatives Fund | | $ | 1,899,107 | |
| 135,077 | | Franklin Templeton Hard | | | | |
| | | Currency Fund * | | | 1,226,497 | |
| 100,892 | | Sprott Physical Gold Trust * | | | 1,047,259 | |
| | | | | | 4,172,863 | |
| | | | | | | |
| | | Equity - 28.15% | | | | |
| 109,819 | | Calamos Market Neutral | | | | |
| | | Income Fund | | | 1,395,797 | |
| 49,116 | | Gateway Fund | | | 1,401,282 | |
| 136,534 | | Graphite Enterprise Trust plc | | | 1,264,765 | |
| 118,589 | | HarbourVest Global Private | | | | |
| | | Equity Ltd (a) * | | | 1,274,832 | |
| 183,631 | | Henderson Global Equity | | | | |
| | | Income Fund (b) | | | 1,470,881 | |
| 80,696 | | Henderson Global Technology | | | | |
| | | Fund (b) * | | | 2,131,191 | |
| 28,579 | | iShares High Dividend Equity | | | | |
| | | Fund | | | 1,931,083 | |
| 33,842 | | iShares MSCI EAFE Minimum | | | | |
| | | Volatility Index Fund | | | 2,011,568 | |
| 20,516 | | iShares MSCI Emerging | | | | |
| | | Markets Minimum Volatility ETF | | | 1,098,016 | |
| 100,059 | | PowerShares International | | | | |
| | | Dividend Achievers Portfolio | | | 1,750,032 | |
| 16,962 | | SPDR S&P 500 ETF Trust | | | 3,022,289 | |
| 32,032 | | Vanguard Dividend Appreciation | | | | |
| | | ETF | | | 2,289,327 | |
| 13,231 | | WisdomTree Emerging Markets | | | | |
| | | Equity Income Fund | | | 615,109 | |
| | | | | | 21,656,172 | |
| | | | | | | |
| | | Fixed income - 22.57% | | | | |
| 125,097 | | Henderson Strategic Income | | | | |
| | | Fund (b) | | | 1,132,127 | |
| 19,876 | | iShares Global High Yield | | | | |
| | | Corporate Bond Fund | | | 1,067,142 | |
| 24,441 | | iShares iBoxx $ High Yield | | | | |
| | | Corporate Bond Fund | | | 2,279,123 | |
| 17,140 | | iShares iBoxx Investment | | | | |
| | | Grade Corporate Bond Fund | | | 1,994,068 | |
| 176,416 | | MSIF Multi-Asset Portfolio | | | 2,090,532 | |
| 18,126 | | PIMCO Enhanced Short | | | | |
| | | Maturity ETF | | | 1,836,345 | |
| 113,816 | | PIMCO Income Fund | | | 1,409,038 | |
| 27,574 | | PIMCO Total Return ETF | | | 2,930,565 | |
| | | | | | Value | |
| Shares | | | | | (note 2) | |
| | | | | | | |
| | | Fixed income (continued) | | | | |
| 105,245 | | PowerShares Senior | | | | |
| | | Loan Portfolio | | $ | 2,621,653 | |
| | | | | | 17,360,593 | |
| | | | | | | |
| | | Total investment companies | | | | |
| | | (Cost $41,357,715) | | | 43,189,628 | |
| | | | | | | |
| Short-term investment - 42.61% | | | | |
| 32,779,083 | | Fidelity Institutional Treasury | | | | |
| | | Portfolio | | | 32,779,083 | |
| | | | | | | |
| | | Total short-term investment | | | | |
| | | (Cost $32,779,083) | | | 32,779,083 | |
| | | | | | | |
| Total investments - 98.76% (c) | | | | |
| | | (Cost $74,136,798) | | | 75,968,711 | |
| | | | | | | |
| Net other assets and liabilities – 1.24% | | | 951,102 | |
| | | | | | | |
| Total net assets – 100.00% | | $ | 76,919,813 | |
| * | | Non-income producing security |
| (a) | | The security has been deemed illiquid according to the policies and procedures adopted by the Board of Trustees. |
| (b) | | Affiliated holding, see notes to financial statements for further information. |
| (c) | | All or a portion of these securities and short-term investments were segregated as collateral for open futures contracts and forward foreign currency contracts. At January 31, 2014, the aggregate amount available to cover segregation requirements was $75,952,670. |
| ETF | | Exchange-traded fund |
See notes to financial statements
| Portfolio of investments (unaudited) |
All Asset Fund
January 31, 2014 (continued)
The Fund held the following open forward foreign currency contracts at January 31, 2014:
| | | | | | | | Local | | | Current | | | Unrealized | |
| | | | | Value | | | amount | | | notional | | | appreciation/ | |
| | | Counterparty | | date | | | (000’s | ) | | value | | | (depreciation | ) |
| Japanese Yen (Long) | | State Street Bank, London | | 2/20/14 | | | 220,231 | | $ | 2,155,695 | | $ | (30,435 | ) |
| Euro (Short) | | State Street Bank, London | | 2/20/14 | | | 840 | | | 1,132,912 | | | (1,506 | ) |
| British Pound (Short) | | State Street Bank, London | | 2/20/14 | | | 1,900 | | | 3,123,038 | | | (59,953 | ) |
| Total | | | | | | | | | | | | $ | (91,894 | ) |
During the six months ended January 31, 2014, average monthly notional value related to forward foreign currency contracts was $6.4 million or 8.3% of net assets.
The Fund held the following open futures contracts at January 31, 2014:
| | | | | | | | | | Current | | | Unrealized | |
| | | | Number of | | | Expiration | | | notional | | | appreciation/ | |
| | | | contracts | | | date | | | value | | | (depreciation | ) |
| EURO STOXX 50 Index (Long) | | | 96 | | | 3/21/14 | | $ | 3,907,560 | | $ | (40,406 | ) |
| FTSE 100 Index (Long) | | | 50 | | | 3/21/14 | | | 5,308,560 | | | 37,671 | |
| Nikkei 225 Index (Long) | | | 40 | | | 3/13/14 | | | 5,813,840 | | | (311,593 | ) |
| Russell 2000 Index Mini (Long) | | | 18 | | | 3/21/14 | | | 2,030,940 | | | 46,620 | |
| UK Long Gilt Bond (Long) | | | 4 | | | 3/27/14 | | | 725,880 | | | 8,941 | |
| US Treasury 10 Year Note (Long) | | | 23 | | | 3/20/14 | | | 2,892,250 | | | 4,914 | |
| Total | | | | | | | | | | | $ | (253,853 | ) |
During the six months ended January 31, 2014, average notional value related to futures contracts was $16.5 million or 21.4% of net assets.
The following table summarizes the Fund’s investments that are measured at fair value by level within the fair value hierarchy at January 31, 2014:
| | | Quoted prices | | Significant | | | | | |
| | | in active | | other | | Significant | | | |
| | | markets for | | observable | | unobservable | | | |
| | | identical assets | | inputs | | inputs | | | |
| Description | | (level 1 | ) | (level 2 | ) | (level 3 | ) | Total | |
| Assets | | | | | | | | | | | | | |
| Investment Companies | | $ | 43,189,628 | | $ | — | | $ | — | | $ | 43,189,628 | |
| Short-Term Investment | | | 32,779,083 | | | — | | | — | | | 32,779,083 | |
| Total Investments | | | 75,968,711 | | | — | | | — | | | 75,968,711 | |
| | | | | | | | | | | | | | |
| Financial Derivative Instruments* | | | | | | | | | | | | | |
| Futures Contracts | | | 98,146 | | | — | | | — | | | 98,146 | |
| Total Financial Derivative Instruments | | $ | 98,146 | | $ | — | | $ | — | | $ | 98,146 | |
| | | | | | | | | | | | | | |
| Liabilities | | | | | | | | | | | | | |
| | | | | | | | | | | | | | |
| Financial Derivative Instruments* | | | | | | | | | | | | | |
| Forward Foreign Currency Contracts | | | — | | | (91,894 | ) | | — | | | (91,894 | ) |
| Futures Contracts | | | (351,999 | ) | | — | | | — | | | (351,999 | ) |
| Total Financial Derivative Instruments | | $ | (351,999 | ) | $ | (91,894 | ) | $ | — | | $ | (443,893 | ) |
* These investments are recorded at the unrealized gain or loss on the investment.
During the six months ended January 31, 2014, there were no transfers in or out of security levels as a result of the fair value pricing procedures established by the Board.
See notes to financial statements
| Portfolio of investments (unaudited) |
Dividend & Income Builder Fund
January 31, 2014
| | | | | | Value | |
| Shares | | | | | (note 2) | |
| | | | | | | |
| Common stocks - 81.96% | | | | |
| | | | | | | |
| | | Australia - 1.13% | | | | |
| 49,763 | | Toll Holdings, Ltd. | | $ | 243,445 | |
| | | | | | | |
| | | Colombia - 0.68% | | | | |
| 3,308 | | Bancolombia S.A., ADR | | | 145,353 | |
| | | | | | | |
| | | France - 8.15% | | | | |
| 4,736 | | BNP Paribas S.A. | | | 366,959 | |
| 9,887 | | GDF Suez | | | 218,487 | |
| 4,800 | | Nexity S.A. | | | 191,882 | |
| 6,900 | | Rexel S.A. | | | 177,280 | |
| 2,508 | | Sanofi | | | 246,249 | |
| 4,679 | | Total S.A. | | | 267,189 | |
| 2,510 | | Valeo S.A. | | | 280,602 | |
| | | | | | 1,748,648 | |
| | | | | | | |
| | | Germany - 7.55% | | | | |
| 2,796 | | BASF SE | | | 299,905 | |
| 1,350 | | Bayer AG | | | 178,233 | |
| 2,496 | | Bayerische Motoren Werke AG | | | 272,069 | |
| 3,427 | | Deutsche Boerse AG | | | 263,869 | |
| 9,911 | | Deutsche Post AG | | | 343,130 | |
| 25,500 | | Infineon Technologies AG | | | 263,304 | |
| | | | | | 1,620,510 | |
| | | | | | | |
| | | Hong Kong - 2.99% | | | | |
| 78,000 | | Shanghai Industrial Holdings, | | | | |
| | | Ltd. | | | 259,705 | |
| 86,000 | | SJM Holdings, Ltd. | | | 268,065 | |
| 10,500 | | Swire Pacific, Ltd., Class A | | | 113,469 | |
| | | | | | 641,239 | |
| | | | | | | |
| | | Italy - 1.81% | | | | |
| 17,110 | | ENI SpA | | | 388,835 | |
| | | | | | | |
| | | Japan - 2.39% | | | | |
| 27,000 | | Daiwa Securities Group, Inc. | | | 256,338 | |
| 120,000 | | Mizuho Financial Group, Inc. | | | 257,218 | |
| | | | | | 513,556 | |
| | | | | | | |
| | | Luxembourg - 0.87% | | | | |
| 1,537 | | RTL Group S.A. | | | 187,395 | |
| | | | | | Value | |
| Shares | | | | | (note 2) | |
| | | | | | | |
| | | Netherlands - 3.59% | | | | |
| 8,236 | | Nielsen Holdings N.V. | | $ | 348,301 | |
| 13,173 | | Reed Elsevier N.V. | | | 271,648 | |
| 5,427 | | Wolters Kluwer N.V. | | | 149,901 | |
| | | | | | 769,850 | |
| | | | | | | |
| | | Norway - 1.11% | | | | |
| 10,044 | | Statoil ASA | | | 237,762 | |
| | | | | | | |
| | | Sweden - 1.76% | | | | |
| 9,411 | | Electrolux AB, Series B | | | 199,959 | |
| 13,262 | | Nordea Bank AB | | | 177,531 | |
| | | | | | 377,490 | |
| | | | | | | |
| | | Switzerland - 10.63% | | | | |
| 7,789 | | ABB, Ltd. * | | | 194,328 | |
| 4,000 | | Garmin, Ltd. | | | 180,200 | |
| 3,555 | | Nestle S.A. | | | 258,003 | |
| 6,318 | | Novartis AG | | | 500,339 | |
| 1,795 | | Roche Holding AG | | | 493,568 | |
| 19,136 | | UBS AG * | | | 379,702 | |
| 950 | | Zurich Insurance Group AG * | | | 275,889 | |
| | | | | | 2,282,029 | |
| | | | | | | |
| | | Taiwan - 0.64% | | | | |
| 8,110 | | Taiwan Semiconductor | | | | |
| | | Manufacturing Co., Ltd., ADR | | | 137,221 | |
| | | | | | | |
| | | United Kingdom - 16.96% | | | | |
| 27,862 | | Amlin plc | | | 191,545 | |
| 7,208 | | BHP Billiton plc | | | 212,753 | |
| 8,462 | | British American Tobacco plc | | | 405,635 | |
| 15,097 | | British Sky Broadcasting | | | | |
| | | Group plc | | | 217,405 | |
| 18,289 | | Centrica plc | | | 93,563 | |
| 15,883 | | Hiscox, Ltd. | | | 166,582 | |
| 26,441 | | HSBC Holdings plc | | | 272,534 | |
| 24,452 | | Investec plc | | | 157,571 | |
| 16,833 | | Prudential plc | | | 339,809 | |
| 4,719 | | Rio Tinto plc | | | 251,616 | |
| 50,070 | | Stagecoach Group plc | | | 299,444 | |
| 27,397 | | Standard Life Plc | | | 164,658 | |
| 164,282 | | Vodafone Group plc | | | 611,828 | |
| 12,173 | | WPP plc | | | 255,543 | |
| | | | | | 3,640,486 | |
See notes to financial statements
| Portfolio of investments (unaudited) |
Dividend & Income Builder Fund
January 31, 2014 (continued)
| | | | | | Value | |
| Shares | | | | | (note 2) | |
| | | | | | | |
| | | United States - 21.70% | | | | |
| 6,498 | | Baxter International, Inc. | | $ | 443,813 | |
| 10,833 | | Cisco Systems, Inc. | | | 237,351 | |
| 1,778 | | Cummins, Inc. | | | 225,771 | |
| 2,018 | | Deere & Co. | | | 173,467 | |
| 9,394 | | General Electric Co. | | | 236,071 | |
| 5,207 | | JPMorgan Chase & Co. | | | 288,260 | |
| 3,075 | | L Brands, Inc. | | | 161,007 | |
| 2,058 | | Lockheed Martin Corp. | | | 310,573 | |
| 7,265 | | Microsoft Corp. | | | 274,980 | |
| 2,616 | | National Oilwell Varco, Inc. | | | 196,226 | |
| 10,495 | | Pfizer, Inc. | | | 319,048 | |
| 3,941 | | PNC Financial Services | | | | |
| | | Group, Inc. | | | 314,807 | |
| 4,459 | | QUALCOMM, Inc. | | | 330,947 | |
| 1,916 | | Reynolds American, Inc. | | | 92,926 | |
| 7,333 | | Six Flags Entertainment Corp. | | | 263,181 | |
| 4,767 | | Stanley Black & Decker, Inc. | | | 368,966 | |
| 3,494 | | Texas Instruments, Inc. | | | 148,146 | |
| 4,763 | | Walgreen Co. | | | 273,158 | |
| | | | | | 4,658,698 | |
| | | | | | | |
| | | Total common stocks | | | | |
| | | (Cost $17,181,908) | | | 17,592,517 | |
| Face | | | | | | | | | Value | |
| amount | | | | Coupon | | Maturity | | | (note 2) | |
| | | | | | | | | | | | | |
| Corporate bonds – 11.51% | | | | | | | | |
| | | | | | | | | | | | | |
| | | | | France – 0.50% | | | | | | | | |
| USD | | 100,000 | | BNP Paribas S.A. (a) (b) | | 7.195% | | 6/25/37 | | $ | 106,750 | |
| | | | | | | | | | | | | |
| | | | | Luxembourg – 0.45% | | | | | | | | |
| USD | | 100,000 | | Intelsat Jackson Holdings S.A. (a) | | 5.500% | | 8/1/23 | | | 95,875 | |
| | | | | | | | | | | | | |
| | | | | United Kingdom – 3.20% | | | | | | | | |
| GBP | | 100,000 | | AA Bond Co., Ltd. | | 9.500% | | 7/31/19 | | | 182,021 | |
| USD | | 80,000 | | Barclays Bank plc (b) | | 6.860% | | 6/15/32 | | | 83,360 | |
| USD | | 100,000 | | Ineos Finance plc (a) | | 7.500% | | 5/1/20 | | | 109,750 | |
| USD | | 100,000 | | Prudential plc (b) | | 6.500% | | 3/23/14 | | | 100,750 | |
| USD | | 100,000 | | Royal Bank of Scotland Group plc | | 6.100% | | 6/10/23 | | | 102,553 | |
| USD | | 25,000 | | WPP Finance 2010 | | 4.750% | | 11/21/21 | | | 26,691 | |
| USD | | 83,000 | | WPP Finance 2010 | | 3.625% | | 9/7/22 | | | 81,877 | |
| | | | | | | | | | | | 687,002 | |
See notes to financial statements
| Portfolio of investments (unaudited) |
Dividend & Income Builder Fund
January 31, 2014 (continued)
| Face | | | | | | | | | Value | |
| amount | | | | Coupon | | Maturity | | | (note 2) | |
| | | | | | | | | | | | | |
| | | | | United States – 7.36% | | | | | | | | |
| USD | | 100,000 | | Avis Budget Car Rental LLC | | 5.500% | | 4/1/23 | | $ | 97,000 | |
| USD | | 49,000 | | BMC Software Finance, Inc. (a) | | 8.125% | | 7/15/21 | | | 50,838 | |
| USD | | 16,000 | | CenturyLink, Inc. | | 7.600% | | 9/15/39 | | | 14,360 | |
| USD | | 50,000 | | CHS/Community Health Systems, Inc. | | 8.000% | | 11/15/19 | | | 55,125 | |
| USD | | 50,000 | | CHS/Community Health Systems, Inc. | | 7.125% | | 7/15/20 | | | 53,312 | |
| USD | | 100,000 | | Constellation Brands, Inc. | | 4.250% | | 5/1/23 | | | 94,750 | |
| USD | | 62,000 | | First Data Corp. (a) | | 10.625% | | 6/15/21 | | | 67,890 | |
| USD | | 100,000 | | HBOS Capital Funding LP (b) | | 6.850% | | 3/23/14 | | | 100,012 | |
| USD | | 100,000 | | HCA, Inc. | | 8.000% | | 10/1/18 | | | 118,750 | |
| USD | | 25,000 | | Infor US, Inc. | | 9.375% | | 4/1/19 | | | 28,250 | |
| USD | | 75,000 | | Iron Mountain, Inc. | | 6.000% | | 8/15/23 | | | 77,531 | |
| USD | | 25,000 | | NIKE, Inc. | | 2.250% | | 5/1/23 | | | 23,264 | |
| USD | | 100,000 | | Regal Entertainment Group | | 5.750% | | 2/1/25 | | | 95,500 | |
| USD | | 100,000 | | Reynolds Group Issuer, Inc. | | 5.750% | | 10/15/20 | | | 102,750 | |
| USD | | 90,000 | | Service Corp. International | | 8.000% | | 11/15/21 | | | 103,725 | |
| USD | | 90,000 | | Sprint Communications, Inc. (a) | | 7.000% | | 3/1/20 | | | 101,925 | |
| USD | | 18,000 | | Sprint Corp. (a) | | 7.125% | | 6/15/24 | | | 18,135 | |
| USD | | 50,000 | | T-Mobile USA, Inc. | | 6.542% | | 4/28/20 | | | 53,125 | |
| USD | | 80,000 | | T-Mobile USA, Inc. | | 6.125% | | 1/15/22 | | | 82,000 | |
| USD | | 90,000 | | Tenet Healthcare Corp. | | 8.000% | | 8/1/20 | | | 98,550 | |
| USD | | 100,000 | | Verizon Communications, Inc. | | 6.550% | | 9/15/43 | | | 120,466 | |
| USD | | 25,000 | | Wal-Mart Stores, Inc. | | 4.000% | | 4/11/43 | | | 23,368 | |
| | | | | | | | | | | | 1,580,626 | |
| | | | | | | | | | | | | |
| | | | | Total corporate bonds | | | | | | | | |
| | | | | (Cost $2,431,229) | | | | | | | 2,470,253 | |
| | | | | | Value | |
| Shares | | | | | (note 2) | |
| | | | | | | |
| Investment companies - 0.81% | | | | |
| | | | | | | |
| Fixed income - 0.81% | | | | |
| 200 | | iShares Barclays Credit | | | | |
| | | Bond Fund | | $ | 21,744 | |
| 250 | | PIMCO 0-5 Year High-Yield | | | | |
| | | Corporate Bond Index Fund | | | 26,427 | |
| 235 | | PIMCO Investment Grade | | | | |
| | | Corporate Bond Index ETF | | | 23,660 | |
| 1,417 | | PowerShares Fundamental | | | | |
| | | High Yield Corporate Bond | | | | |
| | | Portfolio | | | 27,277 | |
| 1,690 | | PowerShares Senior Loan | | | | |
| | | Portfolio | | | 42,098 | |
| | | | | | Value | |
| Shares | | | | | (note 2) | |
| | | | | | | |
| | | Fixed income (continued) | | | | |
| 680 | | SPDR Blackstone/GSO | | | | |
| | | Senior Loan ETF | | $ | 34,150 | |
| | | | | | 175,356 | |
| | | Total investment companies | | | | |
| | | (Cost $175,542) | | | 175,356 | |
See notes to financial statements
| Portfolio of investments (unaudited) |
Dividend & Income Builder Fund
January 31, 2014 (continued)
| | | | | | Value | |
| Shares | | | | | (note 2) | |
| | | | | | | |
| REITs - 0.62% | | | | |
| | | | | | | |
| Mexico - 0.62% | | | | |
| 41,385 | | Fibra Uno Administracion | | | | |
| | | SA de C.V. | | $ | 133,556 | |
| | | Total REITs | | | | |
| | | (Cost $122,329) | | | 133,556 | |
| | | | | | | |
| | | Total long-term investments | | | | |
| | | (Cost $19,911,008) | | | 20,371,682 | |
| | | | | | | |
| Short-term investment - 2.91% | | | | |
| 624,162 | | Fidelity Institutional Treasury | | | | |
| | | Portfolio | | | 624,162 | |
| | | | | | | |
| | | Total short-term investment | | | | |
| | | (Cost $624,162) | | | 624,162 | |
| | | | | | | |
| Total investments - 97.81% | | | | |
| | | (Cost $20,535,170) | | | 20,995,844 | |
| | | | | | | |
| Net other assets and liabilities – 2.19% | | | 469,069 | |
| | | | | | | |
| Total net assets – 100.00% | | $ | 21,464,913 | |
| * | | Non-income producing security |
| (a) | | Restricted security, purchased pursuant to Rule 144A under the Securities Act of 1933, as amended, and which is exempt from registration under that Act. At January 31, 2014, the restricted securities held by the Fund had an aggregate value of $551,163, which represented 2.6% of net assets. |
| (b) | | Maturity date is perpetual. Maturity date presented represents the next call date. |
| ADR | | American Depositary Receipts |
| ETF | | Exchange-traded fund |
| REIT | | Real Estate Investment Trust |
See notes to financial statements
| Portfolio of investments (unaudited) |
Dividend & Income Builder Fund
January 31, 2014 (continued)
Other information:
| Industry concentration as | | | % of net |
| a percentage of net assets: | | | assets |
| | | | | |
| Pharmaceuticals | | | 8.09 | % |
| Diversified Banks | | | 7.51 | |
| Integrated Oil & Gas | | | 4.16 | |
| Wireless Telecommunication Services | | | 2.85 | |
| Life & Health Insurance | | | 2.82 | |
| Air Freight & Logistics | | | 2.73 | |
| Communications Equipment | | | 2.65 | |
| Semiconductors | | | 2.56 | |
| Diversified Capital Markets | | | 2.50 | |
| Tobacco | | | 2.32 | |
| Industrial Conglomerates | | | 2.31 | |
| Diversified Metals & Mining | | | 2.16 | |
| Health Care Equipment | | | 2.07 | |
| Publishing | | | 1.96 | |
| Construction & Farm Machinery & Heavy Trucks | | | 1.86 | |
| Industrial Machinery | | | 1.72 | |
| Property & Casualty Insurance | | | 1.67 | |
| Research & Consulting Services | | | 1.62 | |
| Regional Banks | | | 1.47 | |
| Multi-Utilities | | | 1.45 | |
| Aerospace & Defense | | | 1.45 | |
| Diversified Chemicals | | | 1.40 | |
| Trucking | | | 1.40 | |
| Other Diversified Financial Services | | | 1.34 | |
| Auto Parts & Equipment | | | 1.31 | |
| Multi-line Insurance | | | 1.29 | |
| Systems Software | | | 1.28 | |
| Drug Retail | | | 1.27 | |
| Automobile Manufacturers | | | 1.27 | |
| Casinos & Gaming | | | 1.25 | |
| Specialized Finance | | | 1.23 | |
| Leisure Facilities | | | 1.23 | |
| Packaged Foods & Meats | | | 1.20 | |
| Investment Banking & Brokerage | | | 1.19 | |
| Advertising | | | 1.19 | |
| Telephone - Integrated | | | 1.04 | |
| Cable & Satellite | | | 1.01 | |
| Medical - Hospitals | | | 0.96 | |
| Household Appliances | | | 0.93 | |
| Oil & Gas Equipment & Services | | | 0.91 | |
| Heavy Electrical Equipment | | | 0.91 | |
| Homebuilding | | | 0.89 | |
| Broadcasting | | | 0.87 | |
| Auto Repair Centers | | | 0.85 | |
| Consumer Electronics | | | 0.84 | |
| Trading Companies & Distributors | | | 0.83 | |
| Investment Companies | | | 0.82 | |
| Apparel Retail | | | 0.75 | |
| Cellular Telecommunications | | | 0.71 | |
| Diversified REITs | | | 0.62 | |
| Health Care Services | | | 0.55 | |
| Diversified Real Estate Activities | | | 0.53 | |
| Chemicals - Other | | | 0.51 | |
| Advertising Services | | | 0.51 | |
| Funeral Services & Related Items | | | 0.48 | |
| Consumer Products - Miscellaneous | | | 0.48 | |
| Rental Auto/Equipment | | | 0.45 | |
| Satellite Telecommunications | | | 0.45 | |
| Movies & Entertainment | | | 0.44 | |
| Distillers & Vintners | | | 0.44 | |
| Enterprise Software/Services | | | 0.37 | |
| Diversified Support Services | | | 0.36 | |
| Data Processing/Management | | | 0.32 | |
| Hypermarkets & Super Centers | | | 0.11 | |
| Athletic Footwear | | | 0.11 | |
| Integrated Telecommunication Services | | | 0.07 | |
| Long-Term Investments | | | 94.90 | |
| Short-Term Investment | | | 2.91 | |
| Total Investments | | | 97.81 | |
| Net Other Assets and Liabilities | | | 2.19 | |
| | | | 100.00 | % |
See notes to financial statements
| Portfolio of investments (unaudited) |
Dividend & Income Builder Fund
January 31, 2014 (continued)
The following table summarizes the Fund’s investments that are measured at fair value by level within the fair value hierarchy at January 31, 2014:
| | | Quoted prices | | Significant | | | | | |
| | | in active | | other | | Significant | | | |
| | | markets for | | observable | | unobservable | | | |
| | | identical assets | | inputs | | inputs | | | |
| Description | | (level 1 | ) | (level 2 | ) | (level 3 | ) | Total | |
| Assets | | | | | | | | | | | | | |
| | | | | | | | | | | | | | |
| Common Stocks | | | | | | | | | | | | | |
| Australia | | $ | 243,445 | | $ | — | | $ | — | | $ | 243,445 | |
| Colombia | | | 145,353 | | | — | | | — | | | 145,353 | |
| France | | | 1,748,648 | | | — | | | — | | | 1,748,648 | |
| Germany | | | 1,620,510 | | | — | | | — | | | 1,620,510 | |
| Hong Kong | | | 641,239 | | | — | | | — | | | 641,239 | |
| Italy | | | 388,835 | | | — | | | — | | | 388,835 | |
| Japan | | | 513,556 | | | — | | | — | | | 513,556 | |
| Luxembourg | | | 187,395 | | | — | | | — | | | 187,395 | |
| Netherlands | | | 769,850 | | | — | | | — | | | 769,850 | |
| Norway | | | 237,762 | | | — | | | — | | | 237,762 | |
| Sweden | | | 377,490 | | | — | | | — | | | 377,490 | |
| Switzerland | | | 2,282,029 | | | — | | | — | | | 2,282,029 | |
| Taiwan | | | 137,221 | | | — | | | — | | | 137,221 | |
| United Kingdom | | | 3,640,486 | | | — | | | — | | | 3,640,486 | |
| United States | | | 4,658,698 | | | — | | | — | | | 4,658,698 | |
| Total Common Stocks | | | 17,592,517 | | | — | | | — | | | 17,592,517 | |
| | | | | | | | | | | | | | |
| Corporate Bonds | | | | | | | | | | | | | |
| France | | | — | | | 106,750 | | | — | | | 106,750 | |
| Luxembourg | | | — | | | 95,875 | | | — | | | 95,875 | |
| United Kingdom | | | — | | | 687,002 | | | — | | | 687,002 | |
| United States | | | — | | | 1,580,626 | | | — | | | 1,580,626 | |
| Total Corporate Bonds | | | — | | | 2,470,253 | | | — | | | 2,470,253 | |
| | | | | | | | | | | | | | |
| Investment Companies | | | 175,356 | | | — | | | — | | | 175,356 | |
| REITs | | | | | | | | | | | | | |
| Mexico | | | 133,556 | | | — | | | — | | | 133,556 | |
| Total REITs | | | 133,556 | | | — | | | — | | | 133,556 | |
| | | | | | | | | | | | | | |
| Short-Term Investment | | | 624,162 | | | — | | | — | | | 624,162 | |
| Total Investments | | $ | 18,525,591 | | $ | 2,470,253 | | $ | — | | $ | 20,995,844 | |
During the six months ended January 31, 2014, there were no transfers in or out of security levels as a result of the fair value pricing procedures established by the Board.
See notes to financial statements
| Portfolio of investments (unaudited) |
Emerging Markets Opportunities Fund
January 31, 2014
| | | | | | Value | |
| Shares | | | | | (note 2) | |
| | | | | | | |
| Common stocks - 91.56% | | | | |
| | | | | | | |
| | | Australia - 0.17% | | | | |
| 446,325 | | Cape Lambert Resources, Ltd. * | | $ | 44,919 | |
| | | | | | | |
| | | Austria - 1.26% | | | | |
| 9,350 | | Erste Group Bank AG | | | 340,542 | |
| | | | | | | |
| | | Brazil - 7.75% | | | | |
| 106,199 | | BM&FBovespa S.A. | | | 422,024 | |
| 14,000 | | Cielo S.A. | | | 372,676 | |
| 12,436 | | Embraer S.A., ADR | | | 381,661 | |
| 22,100 | | Kroton Educacional S.A. | | | 337,739 | |
| 17,800 | | Linx S.A. | | | 323,435 | |
| 26,600 | | Via Varejo S.A. * | | | 254,619 | |
| | | | | | 2,092,154 | |
| | | | | | | |
| | | China - 18.09% | | | | |
| 142,000 | | Anhui Conch Cement Co., Ltd., | | | | |
| | | Class H | | | 550,529 | |
| 4,156 | | Baidu, Inc., ADR * | | | 650,414 | |
| 432,000 | | Brilliance China Automotive | | | | |
| | | Holdings, Ltd. | | | 666,602 | |
| 1,000,000 | | China Cinda Asset | | | | |
| | | Management Co., Ltd., Class H * | | | 650,455 | |
| 228,000 | | China Oilfield Services, Ltd., | | | | |
| | | Class H | | | 606,430 | |
| 65,000 | | Ping An Insurance Co. of China, | | | | |
| | | Ltd., Class H | | | 526,192 | |
| 216,600 | | Samsonite International S.A. | | | 599,822 | |
| 9,434 | | Yum! Brands, Inc. | | | 633,493 | |
| | | | | | 4,883,937 | |
| | | | | | | |
| | | Colombia - 1.10% | | | | |
| 25,300 | | Grupo Nutresa S.A. | | | 296,182 | |
| | | | | | | |
| | | Greece - 1.75% | | | | |
| 80,000 | | InternetQ plc * | | | 473,114 | |
| | | | | | | |
| | | Hong Kong - 2.42% | | | | |
| 210,000 | | SJM Holdings, Ltd. | | | 654,576 | |
| | | | | | | |
| | | India - 6.95% | | | | |
| 220,000 | | Dabur India Ltd. | | | 603,942 | |
| 22,766 | | Tata Motors, Ltd., ADR | | | 634,033 | |
| 150,000 | | Zee Entertainment Enterprises | | | | |
| | | Ltd. | | | 638,976 | |
| | | | | | 1,876,951 | |
| | | | | | Value | |
| Shares | | | | | (note 2) | |
| | | | | | | |
| | | Indonesia - 2.38% | | | | |
| 943,500 | | PT Bank Rakyat Indonesia Tbk | | $ | 643,295 | |
| | | | | | | |
| | | Kazakhstan - 1.63% | | | | |
| 955,965 | | International Petroleum, | | | | |
| | | Ltd. (a) (b) * | | | — | |
| 40,059 | | Nostrum Oil & Gas LP, GDR (a) | | | 440,248 | |
| | | | | | 440,248 | |
| | | | | | | |
| | | Korea - 10.07% | | | | |
| 3,032 | | Hyundai Motor Co. | | | 664,272 | |
| 2,819 | | Samsung Fire & Marine | | | | |
| | | Insurance Co., Ltd. | | | 653,162 | |
| 19,490 | | SK Hynix, Inc. * | | | 689,211 | |
| 3,526 | | SK Telecom Co., Ltd. | | | 713,205 | |
| | | | | | 2,719,850 | |
| | | | | | | |
| | | Liberia - 1.56% | | | | |
| 92,264 | | African Petroleum Corp., | | | | |
| | | Ltd. (a) * | | | 19,379 | |
| 2,216,086 | | Sable Mining Africa, Ltd. * | | | 400,732 | |
| | | | | | 420,111 | |
| | | | | | | |
| | | Luxembourg - 2.89% | | | | |
| 4,900 | | Millicom International | | | | |
| | | Cellular S.A. | | | 477,181 | |
| 6,800 | | Tenaris S.A., ADR | | | 302,464 | |
| | | | | | 779,645 | |
| | | | | | | |
| | | Malaysia - 1.80% | | | | |
| 168,400 | | Malayan Banking Bhd | | | 484,594 | |
| | | | | | | |
| | | Mexico - 4.46% | | | | |
| 4,739 | | Fomento Economico Mexicano, | | | | |
| | | S.A.B. de C.V., ADR | | | 427,647 | |
| 50,000 | | Grupo Aeroportuario del | | | | |
| | | Centro Norte, S.A.B. de C.V. * | | | 155,189 | |
| 193,000 | | Grupo Mexico S.A.B. de C.V., | | | | |
| | | Series B | | | 621,687 | |
| | | | | | 1,204,523 | |
| | | | | | | |
| | | Panama - 2.36% | | | | |
| 12,000 | | Banco Latinoamericano de | | | | |
| | | Comercio Exterior S.A., Class E | | | 304,800 | |
| 2,550 | | Copa Holdings S.A., Class A | | | 333,285 | |
| | | | | | 638,085 | |
See notes to financial statements
| Portfolio of investments (unaudited) |
Emerging Markets Opportunities Fund
January 31, 2014 (continued)
| | | | | | Value | |
| Shares | | | | | (note 2) | |
| | | | | | | |
| | | Peru - 1.22% | | | | |
| 2,500 | | Credicorp, Ltd. | | $ | 329,800 | |
| | | | | | | |
| | | Russia – 2.73% | | | | |
| 85,000 | | RusPetro plc (a) * | | | 33,536 | |
| 97,000 | | Sberbank of Russia | | | 265,780 | |
| 40,000 | | TCS Group Holding plc, GDR * | | | 436,000 | |
| | | | | | 735,316 | |
| | | | | | | |
| | | South Africa - 1.01% | | | | |
| 15,318 | | MTN Group, Ltd. | | | 272,254 | |
| | | | | | | |
| | | Taiwan - 7.66% | | | | |
| 1,070,500 | | Chinatrust Financial Holding | | | | |
| | | Co., Ltd. | | | 706,659 | |
| 198,000 | | Taiwan Semiconductor | | | | |
| | | Manufacturing Co., Ltd. | | | 686,195 | |
| 1,215,000 | | Yuanta Financial Holding | | | | |
| | | Co., Ltd. | | | 675,724 | |
| | | | | | 2,068,578 | |
| | | | | | | |
| | | Thailand - 5.00% | | | | |
| 132,800 | | AIA Group, Ltd. | | | 613,215 | |
| 141,700 | | Airports of Thailand pcl | | | 736,188 | |
| | | | | | 1,349,403 | |
| | | | | | | |
| | | Turkey - 2.02% | | | | |
| 100,000 | | Turk Hava Yollari | | | 298,151 | |
| 50,000 | | Turkiye Halk Bankasi AS | | | 246,616 | |
| | | | | | 544,767 | |
| | | | | | | |
| | | Ukraine - 1.67% | | | | |
| 39,082 | | Avangardco Investments | | | | |
| | | Public, Ltd. * | | | 451,397 | |
| | | | | | | |
| | | United Arab Emirates - 2.35% | | | | |
| 79,063 | | NMC Health plc | | | 634,391 | |
| | | | | | | |
| | | United Kingdom - 1.26% | | | | |
| 35,418 | | Inchcape plc | | | 340,608 | |
| | | | | | | |
| | | Total common stocks | | | | |
| | | (Cost $24,152,257) | | | 24,719,240 | |
| | | | | | Value | |
| Shares | | | | | (note 2) | |
| | | | | | | |
| Preferred stocks - 6.01% | | | | |
| | | | | | | |
| | | Brazil - 3.40% | | | | |
| 62,051 | | Alpargatas S.A.I.C. | | $ | 323,979 | |
| 47,350 | | Itau Unibanco Holding S.A. | | | 594,119 | |
| | | | | | 918,098 | |
| | | | | | | |
| | | Korea - 2.61% | | | | |
| 789 | | Samsung Electronics Co., Ltd. | | | 703,971 | |
| | | | | | | |
| | | Total preferred stocks | | | | |
| | | (Cost $1,769,210) | | | 1,622,069 | |
| | | | | | | |
| | | Total long-term investments | | | | |
| | | (Cost $25,921,467) | | | 26,341,309 | |
| | | | | | | |
| Short-term investment - 1.36% | | | | |
| 367,804 | | Fidelity Institutional Treasury | | | | |
| | | Portfolio | | | 367,804 | |
| | | | | | | |
| | | Total short-term investment | | | | |
| | | (Cost $367,804) | | | 367,804 | |
| | | | | | | |
| Total investments - 98.93% | | | | |
| | | (Cost $26,289,271) | | | 26,709,113 | |
| | | | | | | |
| Net other assets and liabilities – 1.07% | | | 289,480 | |
| | | | | | | |
| Total net assets – 100.00% | | $ | 26,998,593 | |
| * | | Non-income producing security |
| (a) | | The security has been deemed illiquid according to the policies and procedures adopted by the Board of Trustees. |
| (b) | | Fair valued at January 31, 2014 as determined in good faith using procedures approved by the Board of Trustees. |
| ADR | | American Depositary Receipts |
| GDR | | Global Depositary Receipts |
See notes to financial statements
| Portfolio of investments (unaudited) |
Emerging Markets Opportunities Fund
January 31, 2014 (continued)
Other information:
| Industry concentration as | | | % of net |
| a percentage of net assets: | | | assets |
| | | | | |
| Diversified Banks | | | 14.51 | % |
| Semiconductors | | | 7.70 | |
| Wireless Telecommunication Services | | | 5.42 | |
| Automobile Manufacturers | | | 4.93 | |
| Life & Health Insurance | | | 4.22 | |
| Diversified Metals & Mining | | | 3.79 | |
| Airport Services | | | 3.30 | |
| Packaged Foods & Meats | | | 2.77 | |
| Investment Banking & Brokerage | | | 2.50 | |
| Casinos & Gaming | | | 2.42 | |
| Property & Casualty Insurance | | | 2.42 | |
| Asset Management & Custody Banks | | | 2.41 | |
| Internet Software & Services | | | 2.41 | |
| Broadcasting | | | 2.37 | |
| Health Care Facilities | | | 2.35 | |
| Construction & Farm Machinery & Heavy Trucks | | | 2.35 | |
| Restaurants | | | 2.35 | |
| Airlines | | | 2.34 | |
| Oil & Gas Drilling | | | 2.25 | |
| Personal Products | | | 2.24 | |
| Apparel, Accessories & Luxury Goods | | | 2.22 | |
| Construction Materials | | | 2.04 | |
| Oil & Gas Exploration & Production | | | 1.83 | |
| Advertising | | | 1.75 | |
| Regional Banks | | | 1.61 | |
| Soft Drinks | | | 1.58 | |
| Specialized Finance | | | 1.56 | |
| Aerospace & Defense | | | 1.41 | |
| Data Processing & Outsourced Services | | | 1.38 | |
| Distributors | | | 1.26 | |
| Education Services | | | 1.25 | |
| Footwear | | | 1.20 | |
| Application Software | | | 1.20 | |
| Oil & Gas Equipment & Services | | | 1.12 | |
| Home Improvement Retail | | | 0.94 | |
| Steel | | | 0.17 | |
| Long-Term Investments | | | 97.57 | |
| Short-Term Investment | | | 1.36 | |
| Total Investments | | | 98.93 | |
| Net Other Assets and Liabilities | | | 1.07 | |
| | | | 100.00 | % |
See notes to financial statements
| Portfolio of investments (unaudited) |
Emerging Markets Opportunities Fund
January 31, 2014 (continued)
The following table summarizes the Fund’s investments that are measured at fair value by level within the fair value hierarchy at January 31, 2014:
| | | Quoted prices | | Significant | | | | | |
| | | in active | | other | | Significant | | | |
| | | markets for | | observable | | unobservable | | | |
| | | identical assets | | inputs | | inputs | | | |
| Description | | (level 1 | ) | (level 2 | ) | (level 3 | ) | Total | |
| Assets | | | | | | | | | | | | | |
| | | | | | | | | | | | | | |
| Common Stocks | | | | | | | | | | | | | |
| Australia | | $ | 44,919 | | $ | — | | $ | — | | $ | 44,919 | |
| Austria | | | 340,542 | | | — | | | — | | | 340,542 | |
| Brazil | | | 2,092,154 | | | — | | | — | | | 2,092,154 | |
| China | | | 4,883,937 | | | — | | | — | | | 4,883,937 | |
| Colombia | | | 296,182 | | | — | | | — | | | 296,182 | |
| Greece | | | 473,114 | | | — | | | — | | | 473,114 | |
| Hong Kong | | | 654,576 | | | — | | | — | | | 654,576 | |
| India | | | 1,876,951 | | | — | | | — | | | 1,876,951 | |
| Indonesia | | | 643,295 | | | — | | | — | | | 643,295 | |
| Kazakhstan | | | 440,248 | | | — | | | — | | | 440,248 | |
| Korea | | | 2,719,850 | | | — | | | — | | | 2,719,850 | |
| Liberia | | | 420,111 | | | — | | | — | | | 420,111 | |
| Luxembourg | | | 779,645 | | | — | | | — | | | 779,645 | |
| Malaysia | | | 484,594 | | | — | | | — | | | 484,594 | |
| Mexico | | | 1,204,523 | | | — | | | — | | | 1,204,523 | |
| Panama | | | 638,085 | | | — | | | — | | | 638,085 | |
| Peru | | | 329,800 | | | — | | | — | | | 329,800 | |
| Russia | | | 735,316 | | | — | | | — | | | 735,316 | |
| South Africa | | | 272,254 | | | — | | | — | | | 272,254 | |
| Taiwan | | | 2,068,578 | | | — | | | — | | | 2,068,578 | |
| Thailand | | | 1,349,403 | | | — | | | — | | | 1,349,403 | |
| Turkey | | | 544,767 | | | — | | | — | | | 544,767 | |
| Ukraine | | | 451,397 | | | — | | | — | | | 451,397 | |
| United Arab Emirates | | | 634,391 | | | — | | | — | | | 634,391 | |
| United Kingdom | | | 340,608 | | | — | | | — | | | 340,608 | |
| Total Common Stocks | | | 24,719,240 | | | — | | | — | | | 24,719,240 | |
| | | | | | | | | | | | | | |
| Preferred Stocks | | | | | | | | | | | | | |
| Brazil | | | 918,098 | | | — | | | — | | | 918,098 | |
| Korea | | | 703,971 | | | — | | | — | | | 703,971 | |
| Total Preferred Stocks | | | 1,622,069 | | | — | | | — | | | 1,622,069 | |
| | | | | | | | | | | | | | |
| Short-Term Investment | | | 367,804 | | | — | | | — | | | 367,804 | |
| Total | | $ | 26,709,113 | | $ | — | | $ | — | | $ | 26,709,113 | |
During the six months ended January 31, 2014, there was one transfer into Level 3 out of Level 2 as a result of the fair value pricing procedures established by the Board. Prior to October 18, 2013, the valuation of the Fund’s position in International Petroleum, Ltd. was based upon the proposed merger details with Range Resources, Ltd. Based upon evolving market information indicating the increased likelihood of a failed merger and inability of the company to sell their Russian-based assets to pay off its liabilities, on October 18, 2013 the Advisor approved pricing the security at a fair value of $0.
See notes to financial statements
| Portfolio of investments (unaudited) |
Emerging Markets Opportunities Fund
January 31, 2014 (continued)
Following is a reconciliation of investments in which significant unobservable inputs (Level 3) were used in determining fair value:
| | | Balance | | | | | | Change in | | | | | | | | | | Balance | |
| | | as of | | Accrued | | | | unrealized | | | | | | Transfers | | Transfers | | as of | |
| | | July 31, | | discounts/ | | Realized | | appreciation | | | | | | in to | | out of | | January 31, | |
| Investments in securities | | 2013 | | premiums | | gain/(loss) | | (depreciation) | | Purchases | | Sales | | level 3 | | level 3 | | 2014 | |
| | | | | | | | | | | | | | | | | | | | |
| Common Stock Kazakhstan International Petroleum, Ltd. | | $0 | | $0 | | $0 | | $0 | | $0 | | $0 | | $0 | | $0 | | $0 | |
| Total | | $0 | | $0 | | $0 | | $0 | | $0 | | $0 | | $0 | | $0 | | $0 | |
The total net change in unrealized appreciation (depreciation) attributable to Level 3 investments held at January 31, 2014 was $0. The Fund’s Advisor has determined that International Petroleum, Ltd. is a Level 3 investment due to the lack of observable inputs that may be used in the determination of fair value. The fair valuation reflects that the early-stage exploration company would be left with very few assets if the merger with Range Resources, Ltd. were to fall apart, an increased likelihood of a failed merger, and the lengthy period of time for the company to receive cash even if the sale of its Russian-based assets were successful.
See notes to financial statements
| Portfolio of investments (unaudited) |
European Focus Fund
January 31, 2014
| | | | | | Value | |
| Shares | | | | | (note 2) | |
| | | | | | | |
| Common stocks - 95.56% | | | | |
| | | | | | | |
| | | Australia - 0.07% | | | | |
| 5,531,067 | | African Petroleum Corp., | | | | |
| | | Ltd. (a) * | | $ | 1,161,723 | |
| | | | | | | |
| | | Austria - 1.15% | | | | |
| 540,000 | | Erste Group Bank AG | | | 19,667,680 | |
| | | | | | | |
| | | Canada - 2.39% | | | | |
| 2,235,878 | | Africa Oil Corp. * | | | 16,481,758 | |
| 574,622 | | Africa Oil Corp. (b) * | | | 4,235,822 | |
| 1,850,000 | | Africa Oil Corp. * | | | 13,497,878 | |
| 1,523,311 | | Lundin Mining Corp. * | | | 6,660,853 | |
| | | | | | 40,876,311 | |
| | | | | | | |
| | | Denmark - 6.07% | | | | |
| 1,650 | | AP Moeller-Maersk A/S, | | | | |
| | | Class B | | | 18,401,598 | |
| 970,000 | | Novo Nordisk A/S | | | 38,397,440 | |
| 480,000 | | Pandora A/S | | | 27,477,406 | |
| 600,000 | | Vestas Wind Systems A/S * | | | 19,738,269 | |
| | | | | | 104,014,713 | |
| | | | | | | |
| | | Finland - 3.38% | | | | |
| 5,300,000 | | Nokia Oyj * | | | 36,777,013 | |
| 2,500,000 | | Valmet Corp. * | | | 21,090,288 | |
| | | | | | 57,867,301 | |
| | | | | | | |
| | | France - 10.79% | | | | |
| 660,000 | | Accor S.A. | | | 31,497,663 | |
| 5,000,000 | | Alcatel-Lucent * | | | 20,210,262 | |
| 480,000 | | AXA S.A. | | | 12,623,828 | |
| 70,000 | | Christian Dior S.A. | | | 12,811,297 | |
| 275,000 | | Publicis Groupe | | | 24,397,300 | |
| 250,000 | | Remy Cointreau S.A. | | | 18,672,745 | |
| 525,000 | | Renault S.A. | | | 45,854,435 | |
| 1,185,000 | | Veolia Environnement S.A. | | | 18,635,116 | |
| | | | | | 184,702,646 | |
| | | | | | | |
| | | Germany - 12.36% | | | | |
| 1,400,000 | | Commerzbank AG * | | | 23,838,264 | |
| 145,000 | | Continental AG | | | 31,240,938 | |
| 1,325,000 | | Deutsche Lufthansa AG * | | | 31,567,829 | |
| 275,000 | | Deutsche Post AG | | | 9,520,807 | |
| 230,000 | | Fresenius SE & Co., KGaA | | | 35,874,733 | |
| 650,000 | | KION Group AG * | | | 29,762,427 | |
| 1,108,715 | | ProSiebenSat.1 Media AG | | | 49,779,316 | |
| | | | | | 211,584,314 | |
| | | | | | Value | |
| Shares | | | | | (note 2) | |
| | | | | | | |
| | | Ireland - 1.47% | | | | |
| 1,000,000 | | Glanbia plc | | $ | 14,538,981 | |
| 2,165,000 | | Petroceltic International plc * | | | 6,263,912 | |
| 1,180,952 | | Providence Resources plc * | | | 4,416,606 | |
| | | | | | 25,219,499 | |
| | | | | | | |
| | | Israel - 2.21% | | | | |
| 850,000 | | Teva Pharmaceutical Industries, | | | | |
| | | Ltd., ADR | | | 37,935,500 | |
| | | | | | | |
| | | Italy - 1.71% | | | | |
| 2,303,715 | | Moleskine SpA * | | | 5,285,040 | |
| 3,200,000 | | UniCredit SpA | | | 24,082,378 | |
| | | | | | 29,367,418 | |
| | | | | | | |
| | | Luxembourg - 1.00% | | | | |
| 140,000 | | RTL Group S.A. | | | 17,069,141 | |
| | | | | | | |
| | | Netherlands - 5.69% | | | | |
| 250,000 | | Airbus Group N.V. | | | 17,738,771 | |
| 414,902 | | Amtel Vredestein N.V., | | | | |
| | | GDR (a) (b) * | | | — | |
| 470,000 | | ASML Holding N.V. | | | 39,922,315 | |
| 150,000 | | Koninklijke DSM N.V. | | | 9,939,241 | |
| 8,000,000 | | Koninklijke KPN N.V. * | | | 29,919,550 | |
| | | | | | 97,519,877 | |
| | | | | | | |
| | | Russia - 1.05% | | | | |
| 4,169,668 | | RusPetro plc (a) * | | | 1,645,083 | |
| 1,500,000 | | TCS Group Holding plc, GDR * | | | 16,350,000 | |
| | | | | | 17,995,083 | |
| | | | | | | |
| | | Spain - 5.03% | | | | |
| 280,000 | | Amadeus IT Holding S.A., | | | | |
| | | A Shares | | | 11,085,501 | |
| 4,448,550 | | CaixaBank | | | 27,298,895 | |
| 6,400,000 | | Inmobiliaria Colonial S.A. * | | | 9,650,215 | |
| 3,650,000 | | International Consolidated | | | | |
| | | Airlines Group S.A. * | | | 25,002,959 | |
| 250,000 | | Tecnicas Reunidas S.A. | | | 13,159,936 | |
| | | | | | 86,197,506 | |
| | | | | | | |
| | | Sweden - 3.23% | | | | |
| 1,200,000 | | Fingerprint Cards AB, | | | | |
| | | B Shares * | | | 10,119,974 | |
| 1,150,000 | | Investment AB Kinnevik, | | | | |
| | | B Shares | | | 45,147,602 | |
| | | | | | 55,267,576 | |
See notes to financial statements
| Portfolio of investments (unaudited) |
European Focus Fund
January 31, 2014 (continued)
| | | | | | Value | |
| Shares | | | | | (note 2) | |
| | | | | | | |
| | | Switzerland - 8.54% | | | | |
| 350,000 | | Cie Financiere Richemont S.A. | | $ | 32,484,972 | |
| 875,000 | | Credit Suisse Group AG * | | | 26,443,501 | |
| 400,000 | | Novartis AG | | | 31,677,053 | |
| 120,000 | | Roche Holding AG | | | 32,996,195 | |
| 10,000 | | SGS S.A. | | | 22,643,798 | |
| | | | | | 146,245,519 | |
| | | | | | | |
| | | Turkey - 0.87% | | | | |
| 2,500,000 | | Turk Hava Yollari | | | 7,453,774 | |
| 1,500,000 | | Turkiye Halk Bankasi AS | | | 7,398,478 | |
| | | | | | 14,852,252 | |
| | | | | | | |
| | | United Kingdom - 28.55% | | | | |
| 110,795 | | Acquisition 1234 plc (a) (b) * | | | — | |
| 1,000,000 | | ARM Holdings plc | | | 15,370,453 | |
| 3,000,000 | | Ashmore Group plc | | | 16,047,739 | |
| 3,500,000 | | Aviva plc | | | 25,603,722 | |
| 6,000,000 | | Barclays plc | | | 26,877,743 | |
| 740,000 | | British American Tobacco plc | | | 35,472,703 | |
| 7,500,000 | | Centrica plc | | | 38,368,595 | |
| 1,450,000 | | CSR plc | | | 15,767,865 | |
| 8,000,000 | | Direct Line Insurance | | | | |
| | | Group plc | | | 34,824,350 | |
| 7,158,674 | | Essar Energy, Ltd. (a) * | | | 6,790,214 | |
| 500,000 | | Exillon Energy plc * | | | 1,175,388 | |
| 1,054,524 | | Genel Energy plc * | | | 17,040,606 | |
| 2,245,201 | | GKN plc | | | 14,553,151 | |
| 1,175,000 | | GlaxoSmithKline plc | | | 30,209,926 | |
| 3,400,000 | | HSBC Holdings plc | | | 35,044,632 | |
| 650,000 | | Inchcape plc | | | 6,250,925 | |
| 4,350,000 | | Mytrah Energy, Ltd. (a) * | | | 5,398,974 | |
| 1,716,557 | | Nostrum Oil & Gas LP, GDR (a) | | | 18,864,961 | |
| 1,325,000 | | Petrofac, Ltd. | | | 25,157,814 | |
| 1,650,000 | | Phoenix Group Holdings | | | 19,922,819 | |
| 850,000 | | Prudential plc | | | 17,159,014 | |
| 3,750,000 | | Serco Group plc | | | 26,945,554 | |
| 600,000 | | Tui Travel plc | | | 4,195,887 | |
| 5,500,000 | | Vodafone Group plc | | | 20,483,388 | |
| 5,750,000 | | William Hill plc | | | 31,419,835 | |
| | | | | | 488,946,258 | |
| | | | | | | |
| | | Total common stocks | | | | |
| | | (Cost $1,526,012,266) | | | 1,636,490,317 | |
| | | | | | | |
| | | Total long-term investments | | | | |
| | | (Cost $1,526,012,266) | | | 1,636,490,317 | |
| | | | | | Value | |
| Shares | | | | | (note 2) | |
| | | | | | | |
| Short-term investment - 3.66% | | | | |
| 62,655,648 | | Fidelity Institutional | | | | |
| | | Treasury Portfolio | | $ | 62,655,648 | |
| | | | | | | |
| | | Total short-term investment | | | | |
| | | (Cost $62,655,648) | | | 62,655,648 | |
| | | | | | | |
| Total investments - 99.22% | | | | |
| | | (Cost $1,588,667,914) | | | 1,699,145,965 | |
| | | | | | | |
| Net other assets and liabilities – 0.78% | | | 13,281,524 | |
| | | | | | | |
| Total net assets – 100.00% | | $ | 1,712,427,489 | |
| * | | Non-income producing security |
| (a) | | The security has been deemed illiquid according to the policies and procedures adopted by the Board of Trustees. |
| (b) | | Fair valued at January 31, 2014 as determined in good faith using procedures approved by the Board of Trustees. |
| ADR | | American Depositary Receipts |
| GDR | | Global Depositary Receipts |
See notes to financial statements
| Portfolio of investments (unaudited) |
European Focus Fund
January 31, 2014 (continued)
The Fund held the following open forward foreign currency contracts at January 31, 2014:
| | | | | | | | Local | | | Current | | | Unrealized | |
| | | | | Value | | | amount | | | notional | | | appreciation/ | |
| | | Counterparty | | date | | | (000’s | ) | | value | | | (depreciation | ) |
| Euro (Short) | | Deutsche Bank AG | | 2/14/14 | | | 96,414 | | $ | 130,034,043 | | $ | (34,043 | ) |
| Euro (Short) | | JPMorgan Chase Bank, N.A. | | 2/14/14 | | | 32,940 | | | 44,425,962 | | | 574,039 | |
| Euro (Short) | | Citibank, N.A. | | 2/14/14 | | | 54,895 | | | 74,036,929 | | | 963,071 | |
| Total | | | | | | | | | | | | $ | 1,503,067 | |
During the six months ended January 31, 2014, average monthly notional value related to forward foreign currency contracts was $132.5 million or 7.7% of net assets.
Other information:
| Industry concentration as | | | % of net |
| a percentage of net assets: | | | assets |
| | | | | |
| Pharmaceuticals | | | 10.00 | % |
| Diversified Banks | | | 9.59 | |
| Oil & Gas Exploration & Production | | | 5.35 | |
| Apparel, Accessories & Luxury Goods | | | 4.25 | |
| Broadcasting | | | 3.90 | |
| Airlines | | | 3.74 | |
| Multi-Utilities | | | 3.33 | |
| Communications Equipment | | | 3.33 | |
| Automobile Manufacturers | | | 2.68 | |
| Multi-Sector Holdings | | | 2.64 | |
| Semiconductor Equipment | | | 2.33 | |
| Oil & Gas Equipment & Services | | | 2.24 | |
| Multi-line Insurance | | | 2.23 | |
| Life & Health Insurance | | | 2.17 | |
| Health Care Services | | | 2.09 | |
| Hotels, Resorts & Cruise Lines | | | 2.08 | |
| Tobacco | | | 2.07 | |
| Property & Casualty Insurance | | | 2.03 | |
| Casinos & Gaming | | | 1.83 | |
| Tires & Rubber | | | 1.82 | |
| Semiconductors | | | 1.82 | |
| Integrated Telecommunication Services | | | 1.75 | |
| Material Handling Machinery Manufacturing | | | 1.74 | |
| Environmental & Facilities Services | | | 1.57 | |
| Diversified Capital Markets | | | 1.54 | |
| Advertising | | | 1.42 | |
| Research & Consulting Services | | | 1.32 | |
| Industrial Machinery | | | 1.23 | |
| Wireless Telecommunication Services | | | 1.20 | % |
| Heavy Electrical Equipment | | | 1.15 | |
| Distillers & Vintners | | | 1.09 | |
| Marine | | | 1.07 | |
| Aerospace & Defense | | | 1.04 | |
| Regional Banks | | | 0.95 | |
| Asset Management & Custody Banks | | | 0.94 | |
| Auto Parts & Equipment | | | 0.85 | |
| Packaged Foods & Meats | | | 0.85 | |
| Data Processing & Outsourced Services | | | 0.65 | |
| Electronic Equipment & Instruments | | | 0.59 | |
| Specialty Chemicals | | | 0.58 | |
| Diversified Real Estate Activities | | | 0.56 | |
| Air Freight & Logistics | | | 0.56 | |
| Diversified Metals & Mining | | | 0.39 | |
| Distributors | | | 0.37 | |
| Independent Power Producers & | | | | |
| Energy Traders | | | 0.32 | |
| Retail Office Supplies | | | 0.31 | |
| Financial Sponsor | | | — | |
| Long-Term Investments | | | 95.56 | |
| Short-Term Investment | | | 3.66 | |
| Total Investments | | | 99.22 | |
| Net Other Assets and Liabilities | | | 0.78 | |
| | | | 100.00 | % |
See notes to financial statements
| Portfolio of investments (unaudited) |
European Focus Fund
January 31, 2014 (continued)
The following table summarizes the Fund’s investments that are measured at fair value by level within the fair value hierarchy at January 31, 2014:
| | | Quoted prices | | Significant | | | | | |
| | | in active | | other | | Significant | | | |
| | | markets for | | observable | | unobservable | | | |
| | | identical assets | | inputs | | inputs | | | |
| Description | | (level 1 | ) | (level 2 | ) | (level 3 | ) | Total | |
| Assets | | | | | | | | | | | | | |
| | | | | | | | | | | | | | |
| Common Stocks | | | | | | | | | | | | | |
| Australia | | $ | 1,161,723 | | $ | — | | $ | — | | $ | 1,161,723 | |
| Austria | | | 19,667,680 | | | — | | | — | | | 19,667,680 | |
| Canada | | | 36,640,489 | | | 4,235,822 | | | — | | | 40,876,311 | |
| Denmark | | | 104,014,713 | | | — | | | — | | | 104,014,713 | |
| Finland | | | 57,867,301 | | | — | | | — | | | 57,867,301 | |
| France | | | 184,702,646 | | | — | | | — | | | 184,702,646 | |
| Germany | | | 211,584,314 | | | — | | | — | | | 211,584,314 | |
| Ireland | | | 25,219,499 | | | — | | | — | | | 25,219,499 | |
| Israel | | | 37,935,500 | | | — | | | — | | | 37,935,500 | |
| Italy | | | 29,367,418 | | | — | | | — | | | 29,367,418 | |
| Luxembourg | | | 17,069,141 | | | — | | | — | | | 17,069,141 | |
| Netherlands | | | 97,519,877 | | | — | | | — | | | 97,519,877 | |
| Russia | | | 17,995,083 | | | — | | | — | | | 17,995,083 | |
| Spain | | | 86,197,506 | | | — | | | — | | | 86,197,506 | |
| Sweden | | | 55,267,576 | | | — | | | — | | | 55,267,576 | |
| Switzerland | | | 146,245,519 | | | — | | | — | | | 146,245,519 | |
| Turkey | | | 14,852,252 | | | — | | | — | | | 14,852,252 | |
| United Kingdom | | | 488,946,258 | | | — | | | — | | | 488,946,258 | |
| Total Common Stocks | | | 1,632,254,495 | | | 4,235,822 | | | — | | | 1,636,490,317 | |
| | | | | | | | | | | | | | |
| Short-Term Investment | | | 62,655,648 | | | — | | | — | | | 62,655,648 | |
| Total Investments | | $ | 1,694,910,143 | | $ | 4,235,822 | | $ | — | | $ | 1,699,145,965 | |
| | | | | | | | | | | | | | |
| Financial Derivative Instruments* | | | | | | | | | | | | | |
| Forward Foreign Currency Contracts | | | — | | | 1,537,110 | | | — | | | 1,537,110 | |
| Total Financial Derivative Instruments | | $ | — | | $ | 1,537,110 | | $ | — | | $ | 1,537,110 | |
| | | | | | | | | | | | | | |
| Liabilities | | | | | | | | | | | | | |
| | | | | | | | | | | | | | |
| Financial Derivative Instruments* | | | | | | | | | | | | | |
| Forward Foreign Currency Contracts | | | — | | | (34,043 | ) | | — | | | (34,043 | ) |
| Total Financial Derivative Instruments | | $ | — | | $ | (34,043 | ) | $ | — | | $ | (34,043 | ) |
* These investments are recorded at the unrealized gain or loss on the investment.
During the six months ended January 31, 2014, there were no transfers in or out of security levels as a result of the fair value pricing procedures established by the Board.
See notes to financial statements
| Portfolio of investments (unaudited) |
European Focus Fund
January 31, 2014 (continued)
Following is a reconciliation of investments in which significant unobservable inputs (Level 3) were used in determining fair value:
| | | Balance | | | | | | Change in | | | | | | | | | | Balance | |
| | | as of | | Accrued | | | | unrealized | | | | | | Transfers | | Transfers | | as of | |
| | | July 31, | | discounts/ | | Realized | | appreciation | | | | | | in to | | out of | | January 31, | |
| Investments in securities | | 2013 | | premiums | | gain/(loss) | | (depreciation) | | Purchases | | Sales | | level 3 | | level 3 | | 2014 | |
| | | | | | | | | | | | | | | | | | | | |
| Common Stock Netherlands Amtel Vredestein N.V., GDR | | $0 | | $0 | | $0 | | $0 | | $0 | | $0 | | $0 | | $0 | | $0 | |
| United Kingdom Acquisition 1234 plc | | 0 | | 0 | | 0 | | 0 | | 0 | | 0 | | 0 | | 0 | | 0 | |
| Total | | $0 | | $0 | | $0 | | $0 | | $0 | | $0 | | $0 | | $0 | | $0 | |
The total net change in unrealized appreciation (depreciation) in the Statements of Operations attributable to Level 3 investments held at January 31, 2014 was $0.
The Fund’s Advisor has determined that Amstel Vredstein N.V., GDR is a Level 3 investment due to the lack of observable inputs that may be used in the determination of fair value. Management has also concluded there is no value for the investment primarily on the basis that the company is bankrupt, has no current operations, and has delisted from the exchange.
The Fund’s Advisor has determined that Acquisition 1234 plc (formerly W&G Investments plc (“W&G”)) is a Level 3 investment as it was established for the sole purpose of evaluating and potentially acquiring certain branch assets of the Royal Bank of Scotland Group PLC (“RBS”). On September 27, 2013, W&G notified the market that the final proposed takeover terms had been rejected by RBS and as a result, the remaining cash in W&G was to be returned to investors. For a period of time, the Advisor utilized a fair value that was indicative of the prospective return and timeline for that capital disbursement. On January 30, 2014, a cash disbursement from the company was received by the Fund in the amount at which it was fair valued. Subsequent to the cash receipt, the Advisor fair valued the security with no value given the prospects of future payment were questionable based on the information available.
See notes to financial statements
| Portfolio of investments (unaudited) |
Global Equity Income Fund
January 31, 2014
| | | | | | Value | |
| Shares | | | | | (note 2) | |
| | | | | | | |
| Common stocks - 91.96% | | | | |
| | | | | | | |
| | | Australia - 8.98% | | | | |
| 2,820,159 | | Amcor, Ltd. | | $ | 26,432,952 | |
| 1,529,544 | | Australia & New Zealand | | | | |
| | | Banking Group, Ltd. | | | 40,331,437 | |
| 15,843,665 | | DUET Group | | | 28,979,076 | |
| 8,500,000 | | Myer Holdings, Ltd. | | | 18,820,105 | |
| 1,384,857 | | National Australia Bank, Ltd. | | | 40,297,599 | |
| 11,416,358 | | Orora, Ltd. * | | | 12,788,516 | |
| 1,685,519 | | Premier Investments, Ltd. | | | 11,254,878 | |
| 8,029,325 | | Telstra Corp., Ltd. | | | 36,118,088 | |
| 4,187,147 | | Toll Holdings, Ltd. | | | 20,483,898 | |
| | | | | | 235,506,549 | |
| | | | | | | |
| | | Brazil - 1.94% | | | | |
| 1,833,819 | | CCR S.A. | | | 11,808,784 | |
| 2,875,824 | | Vale S.A., ADR | | | 39,111,206 | |
| | | | | | 50,919,990 | |
| | | | | | | |
| | | Canada - 1.17% | | | | |
| 331,508 | | Bank of Montreal | | | 20,258,078 | |
| 300,271 | | Crescent Point Energy Corp. | | | 10,385,130 | |
| | | | | | 30,643,208 | |
| | | | | | | |
| | | China - 0.64% | | | | |
| 12,905,500 | | Sinopec Engineering Group | | | | |
| | | Co Ltd., Class H | | | 16,689,150 | |
| | | | | | | |
| | | Cyprus - 0.72% | | | | |
| 2,855,160 | | ProSafe SE | | | 18,979,972 | |
| | | | | | | |
| | | Denmark - 0.79% | | | | |
| 2,200,000 | | TDC A/S | | | 20,678,187 | |
| | | | | | | |
| | | France - 4.79% | | | | |
| 343,291 | | Eutelsat Communications S.A. | | | 10,424,364 | |
| 1,946,496 | | GDF Suez | | | 43,014,528 | |
| 155,500 | | Neopost S.A. | | | 13,191,563 | |
| 255,100 | | Sodexo | | | 25,146,852 | |
| 595,092 | | Total S.A. | | | 33,982,096 | |
| | | | | | 125,759,403 | |
| | | | | | | |
| | | Germany - 3.91% | | | | |
| 1,450,000 | | Deutsche Post AG | | | 50,200,619 | |
| 413,299 | | Siemens AG | | | 52,374,823 | |
| | | | | | 102,575,442 | |
| | | | | | Value | |
| Shares | | | | | (note 2) | |
| | | | | | | |
| | | Hong Kong - 3.06% | | | | |
| 6,736,000 | | NWS Holdings, Ltd. | | $ | 9,769,360 | |
| 9,894,000 | | Shanghai Industrial | | | | |
| | | Holdings, Ltd. | | | 32,942,618 | |
| 7,972,000 | | SJM Holdings, Ltd. | | | 24,848,966 | |
| 1,173,500 | | Swire Pacific, Ltd., Class A | | | 12,681,503 | |
| | | | | | 80,242,447 | |
| | | | | | | |
| | | Italy - 1.56% | | | | |
| 1,801,611 | | ENI SpA | | | 40,942,667 | |
| | | | | | | |
| | | Japan - 2.41% | | | | |
| 11,818,100 | | Mizuho Financial Group, Inc. | | | 25,331,936 | |
| 694,300 | | Nippon Telegraph and | | | | |
| | | Telephone Corp. | | | 37,789,980 | |
| | | | | | 63,121,916 | |
| | | | | | | |
| | | Korea - 1.12% | | | | |
| 340,000 | | KT&G Corp. | | | 24,046,340 | |
| 241,949 | | SK Telecom Co., Ltd., ADR | | | 5,308,361 | |
| | | | | | 29,354,701 | |
| | | | | | | |
| | | Luxembourg - 1.01% | | | | |
| 826,860 | | SES | | | 26,558,147 | |
| | | | | | | |
| | | Malaysia - 0.91% | | | | |
| 8,254,800 | | Malayan Banking Bhd | | | 23,754,288 | |
| | | | | | | |
| | | New Zealand - 1.24% | | | | |
| 17,094,261 | | Telecom Corp. of New | | | | |
| | | Zealand, Ltd. | | | 32,463,300 | |
| | | | | | | |
| | | Norway - 0.62% | | | | |
| 456,016 | | Seadrill, Ltd. | | | 16,352,054 | |
| | | | | | | |
| | | Spain - 1.68% | | | | |
| 1,775,525 | | Gas Natural SDG S.A. | | | 43,953,795 | |
| | | | | | | |
| | | Sweden - 1.89% | | | | |
| 1,857,000 | | Nordea Bank AB | | | 24,858,641 | |
| 946,362 | | Swedbank AB, A Shares | | | 24,744,606 | |
| | | | | | 49,603,247 | |
| | | | | | | |
| | | Switzerland - 4.67% | | | | |
| 996,836 | | Novartis AG | | | 78,942,067 | |
| 97,497 | | Roche Holding AG | | | 26,808,583 | |
| 57,523 | | Zurich Insurance Group AG * | | | 16,705,240 | |
| | | | | | 122,455,890 | |
See notes to financial statements
| Portfolio of investments (unaudited) |
Global Equity Income Fund
January 31, 2014 (continued)
| | | | | | Value | |
| Shares | | | | | (note 2) | |
| | | | | | | |
| | | Thailand - 0.27% | | | | |
| 8,251,600 | | Charoen Pokphand Foods pcl | | $ | 7,124,223 | |
| | | | | | | |
| | | United Kingdom - 36.61% | | | | |
| 2,142,859 | | Aberdeen Asset | | | | |
| | | Management plc | | | 13,766,489 | |
| 3,912,485 | | Amlin plc | | | 26,897,490 | |
| 5,962,971 | | BAE Systems plc | | | 42,062,614 | |
| 2,850,000 | | Beazley plc | | | 11,970,459 | |
| 1,551,572 | | BHP Billiton plc | | | 45,796,510 | |
| 931,305 | | British American Tobacco plc | | | 44,643,116 | |
| 3,883,374 | | British Sky Broadcasting | | | | |
| | | Group plc | | | 55,922,730 | |
| 1,404,500 | | Catlin Group, Ltd. | | | 12,179,214 | |
| 1,648,700 | | Compass Group plc | | | 24,677,243 | |
| 1,193,819 | | Dairy Crest Group plc | | | 10,185,466 | |
| 1,262,295 | | De La Rue plc | | | 16,206,414 | |
| 6,276,349 | | Electrocomponents plc | | | 27,403,763 | |
| 533,935 | | Galliford Try plc | | | 10,295,832 | |
| 1,933,931 | | GlaxoSmithKline plc | | | 49,722,478 | |
| 201,217 | | Greene King plc | | | 2,836,441 | |
| 3,447,200 | | HSBC Holdings plc | | | 35,920,359 | |
| 1,417,039 | | ICAP plc | | | 9,003,396 | |
| 710,679 | | Imperial Tobacco Group plc | | | 25,970,959 | |
| 3,458,384 | | Investec plc | | | 22,286,113 | |
| 1,390,832 | | Lancashire Holdings, Ltd. | | | 17,239,357 | |
| 4,781,737 | | National Grid plc | | | 62,020,853 | |
| 2,590,925 | | Phoenix Group Holdings | | | 31,283,957 | |
| 1,872,028 | | Royal Dutch Shell plc, | | | | |
| | | A Shares | | | 64,660,211 | |
| 2,349,568 | | Smiths Group plc | | | 55,542,056 | |
| 7,101,402 | | Smiths News plc | | | 24,807,219 | |
| 2,235,144 | | SSE plc | | | 48,023,758 | |
| 1,627,147 | | Tate & Lyle plc | | | 20,262,101 | |
| 3,965,259 | | The Sage Group plc | | | 26,614,970 | |
| 6,617,938 | | Tullett Prebon plc | | | 36,119,009 | |
| 23,077,197 | | Vodafone Group plc | | | 85,945,307 | |
| | | | | | 960,265,884 | |
| | | | | | | |
| | | United States - 11.97% | | | | |
| 1,123,722 | | Ares Capital Corp. | | | 19,901,117 | |
| 1,076,418 | | Cisco Systems, Inc. | | | 23,584,318 | |
| 320,000 | | Kohl’s Corp. | | | 16,201,600 | |
| 853,773 | | Merck & Co., Inc. | | | 45,224,356 | |
| 1,119,203 | | Microsoft Corp. | | | 42,361,833 | |
| 1,575,277 | | Pfizer, Inc. | | | 47,888,421 | |
| 351,698 | | Reynolds American, Inc. | | | 17,057,353 | |
| 748,015 | | Six Flags Entertainment Corp. | | | 26,846,258 | |
| 913,553 | | The Dow Chemical Co. | | | 41,575,797 | |
| 350,746 | | United Parcel Service, Inc., | | | | |
| | | Class B | | | 33,401,542 | |
| | | | | | 314,042,595 | |
| | | | | | | |
| | | Total common stocks | | | | |
| | | (Cost $2,312,727,968) | | | 2,411,987,055 | |
| | | | | | Value | |
| Shares | | | | | (note 2) | |
| | | | | | | |
| Partnerships - 1.41% | | | | |
| | | | | | | |
| | | United States - 1.41% | | | | |
| 2,641,966 | | Och-Ziff Capital Management | | | | |
| | | Group LLC, Class A | | $ | 36,934,685 | |
| | | | | | | |
| | | Total partnerships | | | | |
| | | (Cost $33,680,442) | | | 36,934,685 | |
| | | | | | | |
| REITs - 3.99% | | | | |
| | | | | | | |
| | | Australia - 2.09% | | | | |
| 20,762,103 | | Westfield Retail Trust | | | 54,873,275 | |
| | | | | | | |
| | | Netherlands - 0.59% | | | | |
| 378,480 | | Eurocommercial Properties N.V. | | | 15,568,902 | |
| | | | | | | |
| | | United Kingdom - 1.31% | | | | |
| 6,204,537 | | Segro plc | | | 34,382,953 | |
| | | | | | | |
| | | Total REITs | | | | |
| | | (Cost $97,623,588) | | | 104,825,130 | |
| | | | | | | |
| | | Total long-term investments | | | | |
| | | (Cost $2,444,031,998) | | | 2,553,746,870 | |
| | | | | | | |
| Total investments - 97.36% | | | | |
| | | (Cost $2,444,031,998) | | | 2,553,746,870 | |
| | | | | | | |
| Net other assets and liabilities – 2.64% | | | 69,164,386 | |
| | | | | | | |
| Total net assets – 100.00% | | $ | 2,622,911,256 | |
| * | | Non-income producing security |
| ADR | | American Depositary Receipts |
| REIT | | Real Estate Investment Trust |
See notes to financial statements
| Portfolio of investments (unaudited) |
Global Equity Income Fund
January 31, 2014 (continued)
The Fund held the following open forward foreign currency contracts at January 31, 2014:
| | | | | | | | Local | | | Current | | | Unrealized | |
| | | | | Value | | | amount | | | notional | | | appreciation/ | |
| | | Counterparty | | date | | | (000’s | ) | | value | | | (depreciation | ) |
Australian Dollar (Short) | | State Street Bank, London | | 4/9/14 | | | 240,000 | | $ | 209,135,461 | | $ | 505,740 | |
During the six months ended January 31, 2014, average monthly notional value related to forward foreign currency contracts was $223 million or 8.5% of net assets.
Other information:
| Industry concentration as | | | % of net |
| a percentage of net assets: | | | assets |
| | | | | |
| Pharmaceuticals | | | 9.48 | % |
| Diversified Banks | | | 8.98 | |
| Industrial Conglomerates | | | 5.74 | |
| Integrated Oil & Gas | | | 5.32 | |
| Multi-Utilities | | | 5.11 | |
| Integrated Telecommunication Services | | | 4.84 | |
| Tobacco | | | 4.26 | |
| Air Freight & Logistics | | | 3.97 | |
| Cable & Satellite | | | 3.54 | |
| Wireless Telecommunication Services | | | 3.48 | |
| Asset Management & Custody Banks | | | 2.69 | |
| Retail REITs | | | 2.69 | |
| Restaurants | | | 2.01 | |
| Property & Casualty Insurance | | | 1.95 | |
| Electric Utilities | | | 1.83 | |
| Diversified Metals & Mining | | | 1.75 | |
| Investment Banking & Brokerage | | | 1.72 | |
| Gas Utilities | | | 1.68 | |
| Systems Software | | | 1.61 | |
| Aerospace & Defense | | | 1.60 | |
| Diversified Chemicals | | | 1.58 | |
| Paper Packaging | | | 1.50 | |
| Steel | | | 1.49 | |
| Packaged Foods & Meats | | | 1.43 | |
| Department Stores | | | 1.34 | |
| Industrial REIT’s | | | 1.31 | |
| Life & Health Insurance | | | 1.19 | |
| Technology Distributors | | | 1.04 | |
| Construction & Engineering | | | 1.03 | |
| Leisure Facilities | | | 1.02 | |
| Application Software | | | 1.01 | |
| Casinos & Gaming | | | 0.95 | |
| Distributors | | | 0.95 | |
| Communications Equipment | | | 0.90 | |
| Diversified Capital Markets | | | 0.85 | |
| Oil & Gas Equipment & Services | | | 0.72 | |
| Reinsurance | | | 0.66 | |
| Multi-line Insurance | | | 0.64 | |
| Oil & Gas Drilling | | | 0.62 | |
| Commercial Printing | | | 0.62 | |
| Office Electronics | | | 0.50 | |
| Diversified Real Estate Activities | | | 0.48 | |
| Highways & Railtracks | | | 0.45 | |
| Apparel Retail | | | 0.43 | |
| Oil & Gas Exploration & Production | | | 0.40 | |
| Long-Term Investments | | | 97.36 | |
| Total Investments | | | 97.36 | |
| Net Other Assets and Liabilities | | | 2.64 | |
| | | | 100.00 | % |
See notes to financial statements
| Portfolio of investments (unaudited) |
Global Equity Income Fund
January 31, 2014 (continued)
The following table summarizes the Fund’s investments that are measured at fair value by level within the fair value hierarchy at January 31, 2014:
| | | Quoted prices | | Significant | | | | | |
| | | in active | | other | | Significant | | | |
| | | markets for | | observable | | unobservable | | | |
| | | identical assets | | inputs | | inputs | | | |
| Description | | (level 1 | ) | (level 2 | ) | (level 3 | ) | Total | |
| Assets | | | | | | | | | | | | | |
| | | | | | | | | | | | | | |
| Common Stocks | | | | | | | | | | | | | |
| Australia | | $ | 235,506,549 | | $ | — | | $ | — | | $ | 235,506,549 | |
| Brazil | | | 50,919,990 | | | — | | | — | | | 50,919,990 | |
| Canada | | | 30,643,208 | | | — | | | — | | | 30,643,208 | |
| China | | | 16,689,150 | | | — | | | — | | | 16,689,150 | |
| Cyprus | | | 18,979,972 | | | — | | | — | | | 18,979,972 | |
| Denmark | | | 20,678,187 | | | — | | | — | | | 20,678,187 | |
| France | | | 125,759,403 | | | — | | | — | | | 125,759,403 | |
| Germany | | | 102,575,442 | | | — | | | — | | | 102,575,442 | |
| Hong Kong | | | 80,242,447 | | | — | | | — | | | 80,242,447 | |
| Italy | | | 40,942,667 | | | — | | | — | | | 40,942,667 | |
| Japan | | | 63,121,916 | | | — | | | — | | | 63,121,916 | |
| Korea | | | 29,354,701 | | | — | | | — | | | 29,354,701 | |
| Luxembourg | | | 26,558,147 | | | — | | | — | | | 26,558,147 | |
| Malaysia | | | 23,754,288 | | | — | | | — | | | 23,754,288 | |
| New Zealand | | | 32,463,300 | | | — | | | — | | | 32,463,300 | |
| Norway | | | 16,352,054 | | | — | | | — | | | 16,352,054 | |
| Spain | | | 43,953,795 | | | — | | | — | | | 43,953,795 | |
| Sweden | | | 49,603,247 | | | — | | | — | | | 49,603,247 | |
| Switzerland | | | 122,455,890 | | | — | | | — | | | 122,455,890 | |
| Thailand | | | 7,124,223 | | | — | | | — | | | 7,124,223 | |
| United Kingdom | | | 960,265,884 | | | — | | | — | | | 960,265,884 | |
| United States | | | 314,042,595 | | | — | | | — | | | 314,042,595 | |
| Total Common Stocks | | | 2,411,987,055 | | | — | | | — | | | 2,411,987,055 | |
| | | | | | | | | | | | | | |
| Partnerships | | | | | | | | | | | | | |
| United States | | | 36,934,685 | | | — | | | — | | | 36,934,685 | |
| Total Partnerships | | | 36,934,685 | | | — | | | — | | | 36,934,685 | |
| | | | | | | | | | | | | | |
| REITs | | | | | | | | | | | | | |
| Australia | | | 54,873,275 | | | — | | | — | | | 54,873,275 | |
| Netherlands | | | 15,568,902 | | | — | | | — | | | 15,568,902 | |
| United Kingdom | | | 34,382,953 | | | — | | | — | | | 34,382,953 | |
| Total REITs | | | 104,825,130 | | | — | | | — | | | 104,825,130 | |
| | | | | | | | | | | | | | |
| Total Investments | | $ | 2,553,746,870 | | $ | — | | $ | — | | $ | 2,553,746,870 | |
| | | | | | | | | | | | | | |
| Financial Derivative Instruments* | | | | | | | | | | | | | |
| Forward Foreign Currency Contracts | | | — | | | 505,740 | | | — | | | 505,740 | |
| Total Financial Derivative Instruments | | $ | — | | $ | 505,740 | | $ | — | | $ | 505,740 | |
* These investments are recorded at the unrealized gain or loss on the investment.
During the six months ended January 31, 2014, there were no transfers in or out of security levels as a result of the fair value pricing procedures established by the Board.
See notes to financial statements
| Portfolio of investments (unaudited) |
Global Technology Fund
January 31, 2014
| | | | | | Value | |
| Shares | | | | | (note 2) | |
| | | | | | | |
| Common stocks - 96.28% | | | | |
| | | | | | | |
| | | China - 4.87% | | | | |
| 43,132 | | 51job, Inc., ADR * | | $ | 3,149,067 | |
| 47,993 | | Baidu, Inc., ADR * | | | 7,510,905 | |
| 103,807 | | NetEase.com, Inc., ADR * | | | 7,782,411 | |
| | | | | | 18,442,383 | |
| | | | | | | |
| | | Ireland - 1.75% | | | | |
| 83,000 | | Accenture plc, Class A | | | 6,630,040 | |
| | | | | | | |
| | | Japan - 2.57% | | | | |
| 19,100 | | Nuflare Technology, Inc. | | | 2,018,988 | |
| 466,800 | | Rakuten, Inc. | | | 7,693,953 | |
| | | | | | 9,712,941 | |
| | | | | | | |
| | | Korea - 1.38% | | | | |
| 4,368 | | Samsung Electronics Co., Ltd. | | | 5,223,562 | |
| | | | | | | |
| | | Netherlands - 2.97% | | | | |
| 64,544 | | ASML Holding N.V. | | | 5,482,438 | |
| 156,305 | | Yandex N.V., Class A * | | | 5,744,209 | |
| | | | | | 11,226,647 | |
| | | | | | | |
| | | Russia - 1.67% | | | | |
| 169,526 | | Mail.ru Group, Ltd., GDR | | | 6,318,234 | |
| | | | | | | |
| | | Taiwan - 1.53% | | | | |
| 341,260 | | Taiwan Semiconductor | | | | |
| | | Manufacturing Co., Ltd., ADR | | | 5,774,119 | |
| | | | | | | |
| | | United Kingdom - 2.08% | | | | |
| 189,635 | | Rightmove plc | | | 7,893,275 | |
| | | | | | | |
| | | United States - 77.46% | | | | |
| 107,292 | | ACI Worldwide, Inc. * | | | 6,502,968 | |
| 18,021 | | Amazon.com, Inc. * | | | 6,463,952 | |
| 22,686 | | Apple, Inc. | | | 11,356,612 | |
| 343,146 | | Applied Materials, Inc. | | | 5,771,716 | |
| 109,767 | | Arrow Electronics, Inc. * | | | 5,639,828 | |
| | | | | | Value | |
| Shares | | | | | (note 2) | |
| | | | | | | |
| | | United States (continued) | | | | |
| 379,126 | | Cadence Design Systems, | | | | |
| | | Inc. * | | $ | 5,353,259 | |
| 279,309 | | Cisco Systems, Inc. | | | 6,119,660 | |
| 72,093 | | Cognizant Technology Solutions | | | | |
| | | Corp., Class A * | | | 6,987,253 | |
| 140,111 | | Comcast Corp., Class A | | | 7,629,044 | |
| 115,408 | | eBay, Inc. * | | | 6,139,706 | |
| 232,258 | | EMC Corp. | | | 5,629,934 | |
| 32,325 | | Equinix, Inc. * | | | 5,986,590 | |
| 69,486 | | F5 Networks, Inc. * | | | 7,435,002 | |
| 134,899 | | Facebook, Inc., Class A * | | | 8,440,630 | |
| 256,372 | | Finisar Corp. * | | | 6,078,580 | |
| 133,516 | | Fiserv, Inc. * | | | 7,483,572 | |
| 77,081 | | FleetCor Technologies, Inc. * | | | 8,195,252 | |
| 70,895 | | Gilead Sciences, Inc. * | | | 5,717,682 | |
| 9,011 | | Google, Inc., Class A * | | | 10,641,721 | |
| 202,244 | | Hewlett-Packard Co. | | | 5,865,076 | |
| 180,914 | | HomeAway, Inc. * | | | 7,392,146 | |
| 225,839 | | Juniper Networks, Inc. * | | | 6,009,576 | |
| 85,240 | | MasterCard, Inc., Class A | | | 6,450,963 | |
| 316,166 | | Micron Technology, Inc. * | | | 7,284,465 | |
| 141,076 | | NetApp, Inc. | | | 5,973,158 | |
| 184,700 | | Oracle Corp. | | | 6,815,430 | |
| 217,643 | | Pandora Media, Inc. * | | | 7,850,383 | |
| 5,631 | | Priceline.com, Inc. * | | | 6,446,876 | |
| 67,439 | | Qihoo 360 Technology Co., | | | | |
| | | Ltd., ADR * | | | 6,816,734 | |
| 165,519 | | QUALCOMM, Inc. | | | 12,284,820 | |
| 96,604 | | SanDisk Corp. | | | 6,718,808 | |
| 237,222 | | Symantec Corp. | | | 5,078,923 | |
| 163,752 | | Synopsys, Inc. * | | | 6,527,155 | |
| 140,600 | | Texas Instruments, Inc. | | | 5,961,440 | |
| 58,403 | | Time Warner Cable, Inc. | | | 7,783,368 | |
| 48,196 | | Towers Watson & Co., Class A | | | 5,635,076 | |
| 72,787 | | TripAdvisor, Inc. * | | | 5,618,428 | |
| 32,912 | | Visa, Inc., A Shares | | | 7,090,232 | |
| 207,617 | | Web.com Group, Inc. * | | | 7,017,455 | |
| 122,063 | | Western Digital Corp. | | | 10,518,169 | |
| 76,592 | | WEX, Inc. * | | | 6,308,117 | |
| 172,038 | | Yahoo!, Inc. * | | | 6,196,809 | |
| | | | | | 293,216,568 | |
| | | | | | | |
| | | Total common stocks | | | | |
| | | (Cost $257,444,131) | | | 364,437,769 | |
| | | | | | | |
| | | Total long-term investments | | | | |
| | | (Cost $257,444,131) | | | 364,437,769 | |
See notes to financial statements
| Portfolio of investments (unaudited) |
Global Technology Fund
January 31, 2014 (continued)
| | | | | | Value | |
| Shares | | | | | (note 2) | |
| | | | | | | |
| Short-term investment - 4.00% | | | | |
| 15,155,539 | | Fidelity Institutional | | | | |
| | | Treasury Portfolio | | $ | 15,155,539 | |
| | | | | | | |
| | | Total short-term investment | | | | |
| | | (Cost $15,155,539) | | | 15,155,539 | |
| | | | | | | |
| Total investments - 100.28% | | | | |
| | | (Cost $272,599,670) | | | 379,593,308 | |
| | | | | | | |
| Net other assets and liabilities – (0.28)% | | | (1,062,216 | ) |
| | | | | | | |
| Total net assets – 100.00% | | $ | 378,531,092 | |
| * | | Non-income producing security |
| ADR | | American Depositary Receipts |
| GDR | | Global Depositary Receipts |
Other information:
| Industry concentration as | | | % of net |
| a percentage of net assets: | | | assets |
| | | | | |
| Internet Software & Services | | | 22.84 | % |
| Communications Equipment | | | 10.02 | |
| Data Processing & Outsourced Services | | | 9.39 | |
| Internet Retail | | | 8.88 | |
| Computer Storage & Peripherals | | | 7.62 | |
| Semiconductors | | | 6.40 | |
| Application Software | | | 4.86 | |
| Computer Hardware | | | 4.55 | |
| Cable & Satellite | | | 4.07 | |
| IT Consulting & Other Services | | | 3.60 | |
| Semiconductor Equipment | | | 3.51 | |
| Systems Software | | | 3.14 | |
| Human Resource & Employment Services | | | 2.32 | |
| Publishing | | | 2.08 | |
| Biotechnology | | | 1.51 | |
| Technology Distributors | | | 1.49 | |
| Long-Term Investments | | | 96.28 | |
| Short-Term Investment | | | 4.00 | |
| Total Investments | | | 100.28 | |
| Net Other Assets and Liabilities | | | (0.28 | ) |
| | | | 100.00 | % |
See notes to financial statements
| Portfolio of investments (unaudited) |
Global Technology Fund
January 31, 2014 (continued)
The following table summarizes the Fund’s investments that are measured at fair value by level within the fair value hierarchy at January 31, 2014:
| | | Quoted prices | | Significant | | | | | |
| | | in active | | other | | Significant | | | |
| | | markets for | | observable | | unobservable | | | |
| | | identical assets | | inputs | | inputs | | | |
| Description | | (level 1 | ) | (level 2 | ) | (level 3 | ) | Total | |
| Assets | | | | | | | | | | | | | |
| | | | | | | | | | | | | | |
| Common Stocks | | | | | | | | | | | | | |
| China | | $ | 18,442,383 | | $ | — | | $ | — | | $ | 18,442,383 | |
| Ireland | | | 6,630,040 | | | — | | | — | | | 6,630,040 | |
| Japan | | | 9,712,941 | | | — | | | — | | | 9,712,941 | |
| Korea | | | 5,223,562 | | | — | | | — | | | 5,223,562 | |
| Netherlands | | | 11,226,647 | | | — | | | — | | | 11,226,647 | |
| Russia | | | 6,318,234 | | | — | | | — | | | 6,318,234 | |
| Taiwan | | | 5,774,119 | | | — | | | — | | | 5,774,119 | |
| United Kingdom | | | 7,893,275 | | | — | | | — | | | 7,893,275 | |
| United States | | | 293,216,568 | | | — | | | — | | | 293,216,568 | |
| Total Common Stocks | | | 364,437,769 | | | — | | | — | | | 364,437,769 | |
| | | | | | | | | | | | | | |
| Short-Term Investment | | | 15,155,539 | | | — | | | — | | | 15,155,539 | |
| Total Investments | | $ | 379,593,308 | | $ | — | | $ | — | | $ | 379,593,308 | |
During the six months ended January 31, 2014, there were no transfers in or out of security levels as a result of the fair value pricing procedures established by the Board.
See notes to financial statements
| Portfolio of investments (unaudited) |
High Yield Opportunities Fund
January 31, 2014
| Face | | | | | | | | | Value | |
| amount | | | | Coupon | | Maturity | | | (note 2) | |
| | | | | | | | | | | | | |
| Corporate bonds – 88.42% | | | | | | | | |
| | | | | | | | | | | | | |
| | | | | Austria – 1.03% | | | | | | | | |
| USD | | 275,000 | | Sappi Papier Holding GmbH (a) | | 6.625% | | 4/15/21 | | $ | 277,750 | |
| | | | | | | | | | | | | |
| | | | | Canada – 2.81% | | | | | | | | |
| USD | | 500,000 | | Garda World Security Corp. (a) | | 7.250% | | 11/15/21 | | | 515,625 | |
| USD | | 250,000 | | New Gold, Inc. (a) | | 6.250% | | 11/15/22 | | | 241,250 | |
| | | | | | | | | | | | 756,875 | |
| | | | | | | | | | | | | |
| | | | | Ireland – 1.01% | | | | | | | | |
| USD | | 250,000 | | Nara Cable Funding, Ltd. (a) | | 8.875% | | 12/1/18 | | | 272,500 | |
| | | | | | | | | | | | | |
| | | | | Luxembourg – 6.21% | | | | | | | | |
| USD | | 278,585 | | ARD Finance S.A. (a) | | 11.125% | | 6/1/18 | | | 298,782 | |
| USD | | 500,000 | | Intelsat Luxembourg S.A. (a) | | 7.750% | | 6/1/21 | | | 538,125 | |
| USD | | 539,000 | | Orion Engineered Carbons Finance & Co. SCA (a) | | 9.250% | | 8/1/19 | | | 561,908 | |
| USD | | 250,000 | | Wind Acquisition Finance S.A. (a) | | 6.500% | | 4/30/20 | | | 273,750 | |
| | | | | | | | | | | | 1,672,565 | |
| | | | | | | | | | | | | |
| | | | | Netherlands – 1.03% | | | | | | | | |
| USD | | 275,000 | | VTR Finance BV (a) | | 6.875% | | 1/15/24 | | | 276,006 | |
| | | | | | | | | | | | | |
| | | | | Norway – 1.93% | | | | | | | | |
| USD | | 515,000 | | Seadrill, Ltd. (a) | | 6.125% | | 9/15/20 | | | 520,150 | |
| | | | | | | | | | | | | |
| | | | | Sweden – 1.00% | | | | | | | | |
| USD | | 250,000 | | Perstorp Holding AB (a) | | 8.750% | | 5/15/17 | | | 268,125 | |
| | | | | | | | | | | | | |
| | | | | United Kingdom – 1.91% | | | | | | | | |
| USD | | 500,000 | | Tullow Oil plc (a) | | 6.000% | | 11/1/20 | | | 513,750 | |
| | | | | | | | | | | | | |
| | | | | United States – 71.49% | | | | | | | | |
| USD | | 275,000 | | Advanced Micro Devices, Inc. | | 7.750% | | 8/1/20 | | | 275,000 | |
| USD | | 500,000 | | Ancestry.com, Inc. (a) | | 9.625% | | 10/15/18 | | | 523,750 | |
| USD | | 500,000 | | Artesyn Escrow, Inc. (a) | | 9.750% | | 10/15/20 | | | 521,250 | |
| USD | | 250,000 | | Blackboard, Inc. (a) | | 7.750% | | 11/15/19 | | | 255,625 | |
| USD | | 275,000 | | BlueLine Rental Finance Corp. (a) | | 7.000% | | 2/1/19 | | | 284,969 | |
| USD | | 325,000 | | BMC Software Finance, Inc. (a) | | 8.125% | | 7/15/21 | | | 337,187 | |
| USD | | 250,000 | | Caesars Entertainment Resort Properties LLC (a) | | 8.000% | | 10/1/20 | | | 260,625 | |
| USD | | 335,000 | | Calumet Specialty Products Partners LP | | 7.625% | | 1/15/22 | | | 355,519 | |
| USD | | 275,000 | | Chassix Holdings, Inc. (a) | | 10.000% | | 12/15/18 | | | 279,125 | |
| USD | | 225,000 | | Chassix, Inc. (a) | | 9.250% | | 8/1/18 | | | 241,313 | |
| USD | | 250,000 | | Chesapeake Energy Corp. | | 5.750% | | 3/15/23 | | | 261,562 | |
| USD | | 200,000 | | CIT Group, Inc. | | 5.375% | | 5/15/20 | | | 212,750 | |
| USD | | 250,000 | | Clear Channel Communications, Inc. | | 9.000% | | 3/1/21 | | | 253,750 | |
See notes to financial statements
| Portfolio of investments (unaudited) |
High Yield Opportunities Fund
January 31, 2014 (continued)
| Face | | | | | | | | | Value | |
| amount | | | | Coupon | | Maturity | | | (note 2) | |
| | | | | | | | | | | | | |
| | | | | United States (continued) | | | | | | | | |
| USD | | 250,000 | | Clear Channel Worldwide Holdings, Inc., Series B | | 7.625% | | 3/15/20 | | $ | 265,000 | |
| USD | | 500,000 | | Coeur Mining, Inc. | | 7.875% | | 2/1/21 | | | 513,750 | |
| USD | | 250,000 | | Consolidated Container Co. LLC (a) | | 10.125% | | 7/15/20 | | | 266,250 | |
| USD | | 250,000 | | CPG Merger Sub LLC (a) | | 8.000% | | 10/1/21 | | | 265,625 | |
| USD | | 250,000 | | Crestview DS Merger Sub II, Inc. (a) | | 10.000% | | 9/1/21 | | | 273,750 | |
| USD | | 500,000 | | Digicel Group, Ltd. (a) | | 8.250% | | 9/30/20 | | | 522,500 | |
| USD | | 250,000 | | DISH DBS Corp. | | 6.750% | | 6/1/21 | | | 267,500 | |
| USD | | 500,000 | | Energy XXI Gulf Coast, Inc. (a) | | 7.500% | | 12/15/21 | | | 521,250 | |
| USD | | 500,000 | | Foresight Energy LLC (a) | | 7.875% | | 8/15/21 | | | 515,625 | |
| USD | | 250,000 | | Gardner Denver, Inc. (a) | | 6.875% | | 8/15/21 | | | 251,875 | |
| USD | | 250,000 | | HD Supply, Inc. | | 7.500% | | 7/15/20 | | | 268,125 | |
| USD | | 500,000 | | Headwaters, Inc. (a) | | 7.250% | | 1/15/19 | | | 515,000 | |
| USD | | 500,000 | | Hockey Merger Sub 2, Inc. (a) | | 7.875% | | 10/1/21 | | | 522,500 | |
| USD | | 250,000 | | Hot Topic, Inc. (a) | | 9.250% | | 6/15/21 | | | 266,250 | |
| USD | | 250,000 | | ILFC E-Capital Trust II (a) | | 6.250% | | 12/21/65 | | | 236,250 | |
| USD | | 200,000 | | j2 Global, Inc. | | 8.000% | | 8/1/20 | | | 216,000 | |
| USD | | 250,000 | | Jefferies LoanCore LLC (a) | | 6.875% | | 6/1/20 | | | 251,250 | |
| USD | | 500,000 | | Landry’s, Inc. (a) | | 9.375% | | 5/1/20 | | | 546,250 | |
| USD | | 250,000 | | Momentive Performance Materials, Inc. | | 8.875% | | 10/15/20 | | | 268,125 | |
| USD | | 500,000 | | MPH Intermediate Holding Co. (a) | | 8.375% | | 8/1/18 | | | 516,875 | |
| USD | | 250,000 | | Murray Energy Corp. (a) | | 8.625% | | 6/15/21 | | | 263,125 | |
| USD | | 282,000 | | NCR Escrow Corp. (a) | | 6.375% | | 12/15/23 | | | 294,690 | |
| USD | | 250,000 | | Nuance Communications, Inc. (a) | | 5.375% | | 8/15/20 | | | 245,625 | |
| USD | | 250,000 | | Onex USI Acquisition Corp. (a) | | 7.750% | | 1/15/21 | | | 257,812 | |
| USD | | 280,000 | | Parker Drilling Co. (a) | | 6.750% | | 7/15/22 | | | 286,650 | |
| USD | | 500,000 | | PC Nextco Holdings LLC (a) | | 8.750% | | 8/15/19 | | | 517,500 | |
| USD | | 250,000 | | Pinnacle Operating Corp. (a) | | 9.000% | | 11/15/20 | | | 270,000 | |
| USD | | 500,000 | | Pittsburgh Glass Works LLC (a) | | 8.000% | | 11/15/18 | | | 542,500 | |
| USD | | 500,000 | | Plastipak Holdings, Inc. (a) | | 6.500% | | 10/1/21 | | | 515,000 | |
| USD | | 250,000 | | PQ Corp. (a) | | 8.750% | | 5/1/18 | | | 273,125 | |
| USD | | 250,000 | | Quiksilver, Inc. | | 10.000% | | 8/1/20 | | | 283,125 | |
| USD | | 250,000 | | RCN Telecom Services LLC (a) | | 8.500% | | 8/15/20 | | | 254,375 | |
| USD | | 250,000 | | Reynolds Group Issuer, Inc. | | 8.250% | | 2/15/21 | | | 266,875 | |
| USD | | 250,000 | | Rite Aid Corp. | | 6.750% | | 6/15/21 | | | 265,000 | |
| USD | | 450,000 | | Sanchez Energy Corp. (a) | | 7.750% | | 6/15/21 | | | 466,875 | |
| USD | | 300,000 | | Sirius XM Holdings, Inc. (a) | | 4.250% | | 5/15/20 | | | 280,875 | |
| USD | | 250,000 | | Snoqualmie Entertainment Authority (a) | | 9.125% | | 2/1/15 | | | 250,000 | |
| USD | | 250,000 | | Sophia Holding Finance LP (a) | | 9.625% | | 12/1/18 | | | 260,000 | |
| USD | | 250,000 | | Sprint Corp. (a) | | 7.125% | | 6/15/24 | | | 251,875 | |
| USD | | 500,000 | | Swift Energy Co. | | 7.875% | | 3/1/22 | | | 512,500 | |
| USD | | 250,000 | | Titan International, Inc. (a) | | 6.875% | | 10/1/20 | | | 265,000 | |
| USD | | 250,000 | | TMS International Corp. (a) | | 7.625% | | 10/15/21 | | | 267,500 | |
| USD | | 250,000 | | Univision Communications, Inc. (a) | | 8.500% | | 5/15/21 | | | 275,625 | |
| USD | | 500,000 | | Wok Acquisition Corp. (a) | | 10.250% | | 6/30/20 | | | 545,625 | |
| | | | | | | | | | | | 19,243,452 | |
| | | | | | | | | | | | | |
| | | | | Total corporate bonds | | | | | | | | |
| | | | | (Cost $23,274,454) | | | | | | | 23,801,173 | |
See notes to financial statements
| Portfolio of investments (unaudited) |
High Yield Opportunities Fund
January 31, 2014 (continued)
| | | | | | Value | |
| Shares | | | | | (note 2) | |
| | | | | | | |
| Preferred stock – 3.61% | | | | |
| | | | | | | |
| | | United States - 3.61% | | | | |
| 1,000 | | Ally Financial, Inc. 7%, | | | | |
| | | 3/03/14 (a) (b) | | $ | 972,844 | |
| | | | | | | |
| | | Total preferred stock | | | | |
| | | (Cost $973,125) | | | 972,844 | |
| | | | | | | |
| | | Total long-term investments | | | | |
| | | (Cost $24,247,579) | | | 24,774,017 | |
| | | | | | | |
| Short-term investment - 6.01% | | | | |
| 1,617,464 | | Fidelity Institutional | | | | |
| | | Treasury Portfolio | | | 1,617,464 | |
| | | | | | | |
| | | Total short-term investment | | | | |
| | | (Cost $1,617,464) | | | 1,617,464 | |
| | | | | | | |
| Total investments - 98.04% (c) | | | | |
| | | (Cost $25,865,043) | | | 26,391,481 | |
| | | | | | | |
| Net other assets and liabilities – 1.96% | | | 526,864 | |
| | | | | | | |
| Total net assets – 100.00% | | $ | 26,918,345 | |
| (a) | | Restricted security, purchased pursuant to Rule 144A under the Securities Act of 1933, as amended, and which is exempt from registration under that Act. At January 31, 2014, the restricted securities held by the Fund had an aggregate value of $20,289,436, which represented 75.4% of net assets. |
| (b) | | Maturity date is perpetual. Maturity date presented represents the next call date. |
| (c) | | All or a portion of these securities and short-term investments were segregated as collateral for open delayed-delivery purchases of the Fund. At January 31, 2014, the aggregate amount available to cover segregation requirements was $25,696,481. |
See notes to financial statements
| Portfolio of investments (unaudited) |
High Yield Opportunities Fund
January 31, 2014 (continued)
Other information:
| Industry concentration as | | | % of net |
| a percentage of net assets: | | | assets |
| | | | | |
| Oil & Gas Exploration & Production | | | 8.46 | % |
| Auto/Truck Parts & Equipment - Original | | | 4.93 | |
| Retail - Restaurants | | | 4.06 | |
| Diversified Banking Institution | | | 3.61 | |
| Chemicals - Diversified | | | 3.08 | |
| Oil & Gas Drilling | | | 3.00 | |
| Broadcast Services/Programs | | | 2.95 | |
| Cable TV | | | 2.95 | |
| Containers - Paper/Plastic | | | 2.90 | |
| Insurance Brokers | | | 2.90 | |
| Coal | | | 2.89 | |
| Cellular Telecommunications | | | 2.88 | |
| Satellite Telecommunications | | | 2.00 | |
| E-Commerce/Services | | | 1.95 | |
| Power Conversion/Supply Equipment | | | 1.94 | |
| Retail - Leisure Products | | | 1.92 | |
| Security Services | | | 1.92 | |
| Special Purpose Entity | | | 1.92 | |
| Building Products - Cement Aggregates | | | 1.91 | |
| Precious Metals | | | 1.91 | |
| Oil & Gas Refining & Marketing | | | 1.32 | |
| Enterprise Software/Services | | | 1.25 | |
| Containers - Metal/Glass | | | 1.11 | |
| Computers - Integrated Systems | | | 1.09 | |
| Machinery - Construction & Mining | | | 1.06 | |
| Apparel Manufacturers | | | 1.05 | |
| Radio | | | 1.04 | |
| Paper & Related Products | | | 1.03 | |
| Beverages - Non-alcoholic | | | 1.02 | |
| Electronic Components - Semiconductors | | | 1.02 | |
| Telecommunication Services | | | 1.02 | |
| Television | | | 1.02 | |
| Chemicals - Specialty | | | 1.01 | |
| Agricultural Operations | | | 1.00 | |
| Chemicals - Other | | | 1.00 | |
| Distribution/Wholesale | | | 1.00 | |
| Building & Construction Products - Miscellaneous | | | 0.99 | |
| Commercial Services | | | 0.99 | |
| Consumer Products - Miscellaneous | | | 0.99 | |
| Retail - Apparel/Shoe | | | 0.99 | |
| Retail - Drug Store | | | 0.98 | |
| Casino Hotels | | | 0.97 | |
| Commercial Banks Non-US | | | 0.97 | |
| Educational Software | | | 0.95 | |
| Specified Purpose Acquisition | | | 0.94 | |
| Casino Services | | | 0.93 | |
| Finance - Commercial | | | 0.93 | |
| Applications Software | | | 0.91 | |
| Gold Mining | | | 0.90 | |
| Finance - Leasing Company | | | 0.88 | |
| Computer Services | | | 0.80 | |
| Commercial Banks - Eastern US | | | 0.79 | |
| Long-Term Investments | | | 92.03 | |
| Short-Term Investment | | | 6.01 | |
| Total Investments | | | 98.04 | |
| Net Other Assets and Liabilities | | | 1.96 | |
| | | | 100.00 | % |
See notes to financial statements
| Portfolio of investments (unaudited) |
High Yield Opportunities Fund
January 31, 2014 (continued)
The following table summarizes the Fund’s investments that are measured at fair value by level within the fair value hierarchy at January 31, 2014:
| | | Quoted prices | | Significant | | | | | |
| | | in active | | other | | Significant | | | |
| | | markets for | | observable | | unobservable | | | |
| | | identical assets | | inputs | | inputs | | | |
| Description | | (level 1 | ) | (level 2 | ) | (level 3 | ) | Total | |
| Assets | | | | | | | | | | | | | |
| | | | | | | | | | | | | | |
| Corporate Bonds | | | | | | | | | | | | | |
| Austria | | $ | — | | $ | 277,750 | | $ | — | | $ | 277,750 | |
| Canada | | | — | | | 756,875 | | | — | | | 756,875 | |
| Ireland | | | — | | | 272,500 | | | — | | | 272,500 | |
| Luxembourg | | | — | | | 1,672,565 | | | — | | | 1,672,565 | |
| Netherlands | | | — | | | 276,006 | | | — | | | 276,006 | |
| Norway | | | — | | | 520,150 | | | — | | | 520,150 | |
| Sweden | | | — | | | 268,125 | | | — | | | 268,125 | |
| United Kingdom | | | — | | | 513,750 | | | — | | | 513,750 | |
| United States | | | — | | | 19,243,452 | | | — | | | 19,243,452 | |
| Total Corporate Bonds | | | — | | | 23,801,173 | | | — | | | 23,801,173 | |
| | | | | | | | | | | | | | |
| Preferred Stock | | | | | | | | | | | | | |
| United States | | | — | | | 972,844 | | | — | | | 972,844 | |
| Total Preferred Stock | | | — | | | 972,844 | | | — | | | 972,844 | |
| | | | | | | | | | | | | | |
| Short-Term Investment | | | 1,617,464 | | | — | | | — | | | 1,617,464 | |
| Total | | $ | 1,617,464 | | $ | 24,774,017 | | $ | — | | $ | 26,391,481 | |
During the six months ended January 31, 2014, there were no transfers in or out of security levels as a result of the fair value pricing procedures established by the Board.
See notes to financial statements
| Portfolio of investments (unaudited) |
International Opportunities Fund
January 31, 2014
| | | | | | Value | |
| Shares | | | | | (note 2) | |
| | | | | | | |
| Common stocks - 93.90% | | | | |
| | | | | | | |
| | | Australia - 1.41% | | | | |
| 5,412,166 | | African Petroleum Corp., | | | | |
| | | Ltd. (a) * | | $ | 1,136,750 | |
| 4,400,000 | | Fortescue Metals Group, Ltd. | | | 20,524,022 | |
| 1,004,593 | | National Australia Bank, Ltd. | | | 29,232,395 | |
| | | | | | 50,893,167 | |
| | | | | | | |
| | | Austria - 1.42% | | | | |
| 1,400,000 | | Erste Group Bank AG | | | 50,990,283 | |
| | | | | | | |
| | | Brazil - 0.85% | | | | |
| 2,280,000 | | BM&FBOVESPA S.A. | | | 9,060,479 | |
| 371,000 | | Cielo S.A. | | | 9,875,910 | |
| 245,000 | | Embraer S.A., ADR | | | 7,519,050 | |
| 416,300 | | Via Varejo S.A. * | | | 3,984,887 | |
| | | | | | 30,440,326 | |
| | | | | | | |
| | | China - 3.09% | | | | |
| 220,594 | | Baidu, Inc., ADR * | | | 34,522,961 | |
| 34,842,000 | | China Construction Bank | | | | |
| | | Corp., Class H | | | 24,188,977 | |
| 24,292,500 | | China Galaxy Securities Co., | | | | |
| | | Ltd., Class H * | | | 17,553,379 | |
| 8,628,000 | | China Oilfield Services, Ltd., | | | | |
| | | Class H | | | 22,948,582 | |
| 1,500,000 | | Ping An Insurance (Group) | | | | |
| | | Co. of China, Ltd., Class H | | | 12,142,894 | |
| | | | | | 111,356,793 | |
| | | | | | | |
| | | Denmark - 1.55% | | | | |
| 5,000 | | AP Moeller-Maersk A/S, | | | | |
| | | Class B | | | 55,762,418 | |
| | | | | | | |
| | | Finland - 1.77% | | | | |
| 9,200,000 | | Nokia Oyj * | | | 63,839,343 | |
| | | | | | | |
| | | France - 8.45% | | | | |
| 1,750,000 | | Accor S.A. | | | 83,516,531 | |
| 1,650,000 | | AXA S.A. | | | 43,394,407 | |
| 945,000 | | Renault S.A. | | | 82,537,983 | |
| 964,486 | | Sodexo | | | 95,075,604 | |
| | | | | | 304,524,525 | |
| | | | | | | |
| | | Germany - 11.09% | | | | |
| 521,519 | | Continental AG | | | 112,363,745 | |
| 2,699,918 | | Deutsche Post AG | | | 93,474,176 | |
| 684,367 | | Fresenius SE & Co., KGaA | | | 106,745,579 | |
| 1,940,826 | | ProSiebenSat.1 Media AG | | | 87,139,607 | |
| | | | | | 399,723,107 | |
| | | | | | Value | |
| Shares | | | | | (note 2) | |
| | | | | | | |
| | | Hong Kong - 3.35% | | | | |
| 8,309,600 | | AIA Group, Ltd. | | $ | 38,370,277 | |
| 3,616,000 | | Cheung Kong Holdings, Ltd. | | | 53,654,551 | |
| 9,235,000 | | SJM Holdings, Ltd. | | | 28,785,775 | |
| | | | | | 120,810,603 | |
| | | | | | | |
| | | India - 0.83% | | | | |
| 1,075,143 | | Tata Motors, Ltd., ADR | | | 29,942,733 | |
| | | | | | | |
| | | Indonesia - 0.68% | | | | |
| 35,935,500 | | PT Bank Rakyat Indonesia Tbk | | | 24,501,477 | |
| | | | | | | |
| | | Japan - 18.41% | | | | |
| 10,008,000 | | Ebara Corp. | | | 65,041,715 | |
| 343,700 | | Fanuc, Ltd. | | | 56,414,300 | |
| 11,889,000 | | Hitachi, Ltd. | | | 92,160,987 | |
| 905,900 | | JSR Corp. | | | 16,394,334 | |
| 1,213,000 | | Kirin Holdings Co., Ltd. | | | 16,692,552 | |
| 1,247,400 | | Mitsui & Co., Ltd. | | | 16,909,553 | |
| 43,013,700 | | Mizuho Financial Group, Inc. | | | 92,199,279 | |
| 2,405,400 | | NKSJ Holdings, Inc. | | | 63,825,383 | |
| 9,311,000 | | Obayashi Corp. | | | 55,681,912 | |
| 1,674,100 | | Sekisui House, Ltd. | | | 23,496,715 | |
| 1,374,700 | | Sumitomo Mitsui Financial | | | | |
| | | Group, Inc. | | | 64,907,045 | |
| 920,500 | | Takeda Pharmaceutical | | | | |
| | | Co., Ltd. | | | 43,182,505 | |
| 1,675,600 | | Tokyu Fudosan Holdings Corp. | | | 14,546,904 | |
| 3,160,000 | | Toray Industries, Inc. | | | 20,938,827 | |
| 361,900 | | Toyota Motor Corp. | | | 20,976,527 | |
| | | | | | 663,368,538 | |
| | | | | | | |
| | | Korea - 0.83% | | | | |
| 136,507 | | Hyundai Motor Co. | | | 29,906,938 | |
| | | | | | | |
| | | Mexico - 0.58% | | | | |
| 82,000 | | Fomento Economico Mexicano, | | | | |
| | | S.A.B. de C.V., ADR | | | 7,399,680 | |
| 550,000 | | Grupo Aeroportuario del | | | | |
| | | Centro Norte, S.A.B. de C.V. * | | | 1,707,081 | |
| 3,700,000 | | Grupo Mexico S.A.B. de C.V., | | | | |
| | | Series B | | | 11,918,349 | |
| | | | | | 21,025,110 | |
| | | | | | | |
| | | Netherlands - 7.54% | | | | |
| 585,000 | | Airbus Group N.V. | | | 41,508,723 | |
| 1,114,101 | | ASML Holding N.V. | | | 94,632,960 | |
| 10,500,000 | | Koninklijke KPN N.V. * | | | 39,269,409 | |
| 2,759,000 | | Koninklijke Philips N.V. | | | 96,152,241 | |
| | | | | | 271,563,333 | |
See notes to financial statements
| Portfolio of investments (unaudited) |
International Opportunities Fund
January 31, 2014 (continued)
| | | | | | Value | |
| Shares | | | | | (note 2) | |
| | | | | | | |
| | | Panama - 0.17% | | | | |
| 47,200 | | Copa Holdings S.A., Class A | | $ | 6,169,040 | |
| | | | | | | |
| | | Russia - 0.34% | | | | |
| 16,000,000 | | RusPetro plc (a) * | | | 6,312,571 | |
| 550,000 | | TCS Group Holdings plc, GDR * | | | 5,995,000 | |
| | | | | | 12,307,571 | |
| | | | | | | |
| | | Singapore - 1.18% | | | | |
| 3,295,000 | | DBS Group Holdings, Ltd. | | | 42,505,306 | |
| | | | | | | |
| | | Spain - 4.29% | | | | |
| 2,365,000 | | Amadeus IT Holding S.A., | | | | |
| | | A Shares | | | 93,632,891 | |
| 8,900,000 | | International Consolidated | | | | |
| | | Airlines Group S.A. * | | | 60,966,119 | |
| | | | | | 154,599,010 | |
| | | | | | | |
| | | Switzerland - 7.21% | | | | |
| 625,000 | | Cie Financiere Richemont S.A. | | | 58,008,879 | |
| 354,929 | | Roche Holding AG | | | 97,594,220 | |
| 5,250,000 | | UBS AG * | | | 104,171,952 | |
| | | | | | 259,775,051 | |
| | | | | | | |
| | | Taiwan - 1.13% | | | | |
| 2,412,771 | | Taiwan Semiconductor | | | | |
| | | Manufacturing Co., Ltd., ADR | | | 40,824,085 | |
| | | | | | | |
| | | United Kingdom - 11.72% | | | | |
| 11,500,000 | | Barclays plc | | | 51,515,675 | |
| 5,534,536 | | Capita Group plc | | | 89,480,958 | |
| 17,852,977 | | Essar Energy, Ltd. (a) * | | | 16,934,076 | |
| 2,700,000 | | GlaxoSmithKline plc | | | 69,418,553 | |
| 6,500,000 | | HSBC Holdings plc | | | 66,997,090 | |
| 16,150,000 | | Standard Life plc | | | 97,063,011 | |
| 8,300,000 | | Vodafone Group plc | | | 30,911,295 | |
| | | | | | 422,320,658 | |
| | | | | | | |
| | | United States - 6.01% | | | | |
| 67,611 | | Amazon.com, Inc. * | | | 24,251,390 | |
| 305,914 | | AmerisourceBergen Corp. | | | 20,563,539 | |
| 867,962 | | Cisco Systems, Inc. | | | 19,017,047 | |
| 268,807 | | Cognizant Technology | | | | |
| | | Solutions Corp., Class A * | | | 26,052,774 | |
| 483,543 | | Comcast Corp., Class A | | | 26,328,916 | |
| 23,314 | | Google, Inc., Class A * | | | 27,533,135 | |
| | | | | | Value | |
| Shares | | | | | (note 2) | |
| | | | | | | |
| | | United States- 6.01% | | | | |
| 315,520 | | MasterCard, Inc., Class A | | $ | 23,878,554 | |
| 23,266 | | Priceline.com, Inc. * | | | 26,637,011 | |
| 299,755 | | QUALCOMM, Inc. | | | 22,247,816 | |
| | | | | | 216,510,182 | |
| | | Total common stocks | | | | |
| | | (Cost $2,821,232,222) | | $ | 3,383,659,597 | |
| | | | | | | |
| Preferred stocks - 1.10% | | | | |
| | | | | | | |
| | | Brazil - 0.29% | | | | |
| 846,500 | | Itau Unibanco Holding S.A. | | | 10,621,369 | |
| | | | | | | |
| | | Korea - 0.81% | | | | |
| 32,767 | | Samsung Electronics Co., Ltd. | | | 29,235,750 | |
| | | | | | | |
| | | Total preferred stocks | | | | |
| | | (Cost $40,116,089) | | | 39,857,119 | |
| | | | | | | |
| | | Total long-term investments | | | | |
| | | (Cost $2,861,348,311) | | | 3,423,516,716 | |
| | | | | | | |
| Short-term investment - 4.74% | | | | |
| 170,864,320 | | Fidelity Institutional | | | | |
| | | Treasury Portfolio | | | 170,864,320 | |
| | | | | | | |
| | | Total short-term investment | | | | |
| | | (Cost $170,864,320) | | | 170,864,320 | |
| | | | | | | |
| Total investments - 99.74% | | | | |
| | | (Cost $3,032,212,631) | | | 3,594,381,036 | |
| | | | | | | |
| Net other assets and liabilities – 0.26% | | | 9,198,810 | |
| | | | | | | |
| Total net assets – 100.00% | | $ | 3,603,579,846 | |
| * | | Non-income producing security |
| (a) | | The security has been deemed illiquid according to the policies and procedures adopted by the Board of Trustees. |
| ADR | | American Depositary Receipts |
| GDR | | Global Depositary Receipts |
See notes to financial statements
| Portfolio of investments (unaudited) |
International Opportunities Fund
January 31, 2014 (continued)
The Fund held the following open forward foreign currency contracts at January 31, 2014:
| | | | | | | | Local | | | Current | | | Unrealized | |
| | | | | Value | | | amount | | | notional | | | appreciation/ | |
| | | Counterparty | | date | | | (000’s | ) | | value | | | (depreciation | ) |
| Euro (Short) | | State Street Bank, London | | 2/14/14 | | | 96,442 | | $ | 130,071,665 | | $ | (71,665 | ) |
| Euro (Short) | | State Street Bank, London | | 2/14/14 | | | 74,186 | | | 100,055,127 | | | (55,127 | ) |
| Euro (Short) | | State Street Bank, London | | 2/14/14 | | | 74,186 | | | 100,055,127 | | | (55,127 | ) |
| Japanese Yen (Short) | | Citibank, N.A. | | 2/21/14 | | | 13,986,448 | | | 136,904,418 | | | 3,095,582 | |
| Japanese Yen (Short) | | Citibank, N.A. | | 2/21/14 | | | 13,986,448 | | | 136,904,418 | | | 3,095,582 | |
| Japanese Yen (Short) | | Deutsche Bank AG | | 2/21/14 | | | 6,265,644 | | | 61,330,393 | | | (1,330,393 | ) |
| Total | | | | | | | | | | | | $ | 4,678,852 | |
During the six months ended January 31, 2014, average monthly notional value related to forward foreign currency contracts was $667.8 million or 18.5% of net assets.
Other information:
| Industry concentration as | | | % of net |
| a percentage of net assets: | | | assets |
| | | | | |
| Diversified Banks | | | 12.70 | % |
| Pharmaceuticals | | | 5.83 | |
| Life & Health Insurance | | | 4.10 | |
| Automobile Manufacturers | | | 3.70 | |
| Data Processing & Outsourced Services | | | 3.53 | |
| Industrial Machinery | | | 3.37 | |
| Auto Parts & Equipment | | | 3.12 | |
| Health Care Equipment | | | 2.96 | |
| Communications Equipment | | | 2.92 | |
| Diversified Capital Markets | | | 2.89 | |
| Industrial Conglomerates | | | 2.67 | |
| Restaurants | | | 2.64 | |
| Semiconductor Equipment | | | 2.63 | |
| Air Freight & Logistics | | | 2.59 | |
| Electronic Equipment & Instruments | | | 2.56 | |
| Human Resource & Employment Services | | | 2.48 | |
| Broadcasting | | | 2.42 | |
| Hotels, Resorts & Cruise Lines | | | 2.32 | |
| Semiconductors | | | 1.94 | |
| Airlines | | | 1.86 | |
| Property & Casualty Insurance | | | 1.77 | |
| Internet Software & Services | | | 1.72 | |
| Apparel, Accessories & Luxury Goods | | | 1.61 | |
| Marine | | | 1.55 | |
| Construction & Engineering | | | 1.55 | |
| Real Estate Development | | | 1.49 | |
| Internet Retail | | | 1.41 | |
| Aerospace & Defense | | | 1.36 | |
| Multi-line Insurance | | | 1.20 | |
| Integrated Telecommunication Services | | | 1.09 | |
| Wireless Telecommunication Services | | | 0.86 | |
| Construction & Farm Machinery & Heavy Trucks | | | 0.83 | |
| Casinos & Gaming | | | 0.80 | |
| Cable & Satellite | | | 0.73 | |
| IT Consulting & Other Services | | | 0.72 | |
| Oil & Gas Exploration & Production | | | 0.68 | |
| Homebuilding | | | 0.65 | |
| Oil & Gas Drilling | | | 0.64 | |
| Commodity Chemicals | | | 0.58 | |
| Health Care Distributors | | | 0.57 | |
| Steel | | | 0.57 | |
| Investment Banking & Brokerage | | | 0.49 | |
| Trading Companies & Distributors | | | 0.47 | |
| Brewers | | | 0.46 | |
| Specialty Chemicals | | | 0.45 | |
| Diversified Real Estate Activities | | | 0.40 | |
| Diversified Metals & Mining | | | 0.33 | |
| Specialized Finance | | | 0.25 | |
| Soft Drinks | | | 0.21 | |
| Regional Banks | | | 0.17 | |
| Home Improvement Retail | | | 0.11 | |
| Airport Services | | | 0.05 | |
| Long-Term Investments | | | 95.00 | |
| Short-Term Investment | | | 4.74 | |
| Total Investments | | | 99.74 | |
| Net Other Assets and Liabilities | | | 0.26 | |
| | | | 100.00 | % |
See notes to financial statements
| Portfolio of investments (unaudited) |
International Opportunities Fund
January 31, 2014 (continued)
The following table summarizes the Fund’s investments that are measured at fair value by level within the fair value hierarchy at January 31, 2014:
| | | | | | | | | | | | | |
| | | Quoted prices | | | Significant | | | | | | | |
| | | in active | | | other | | | Significant | | | | |
| | | markets for | | | observable | | | unobservable | | | | |
| | identical assets | | | inputs | | | inputs | | | | |
| Description | | (level 1 | ) | | (level 2 | ) | | (level 3 | ) | | Total | |
| Assets | | | | | | | | | | | | |
| Common Stocks | | | | | | | | | | | | |
| Australia | | $ | 50,893,167 | | | $ | — | | | $ | — | | | $ | 50,893,167 | |
| Austria | | | 50,990,283 | | | | — | | | | — | | | | 50,990,283 | |
| Brazil | | | 30,440,326 | | | | — | | | | — | | | | 30,440,326 | |
| China | | | 111,356,793 | | | | — | | | | — | | | | 111,356,793 | |
| Denmark | | | 55,762,418 | | | | — | | | | — | | | | 55,762,418 | |
| Finland | | | 63,839,343 | | | | — | | | | — | | | | 63,839,343 | |
| France | | | 304,524,525 | | | | — | | | | — | | | | 304,524,525 | |
| Germany | | | 399,723,107 | | | | — | | | | — | | | | 399,723,107 | |
| Hong Kong | | | 120,810,603 | | | | — | | | | — | | | | 120,810,603 | |
| India | | | 29,942,733 | | | | — | | | | — | | | | 29,942,733 | |
| Indonesia | | | 24,501,477 | | | | — | | | | — | | | | 24,501,477 | |
| Japan | | | 663,368,538 | | | | — | | | | — | | | | 663,368,538 | |
| Korea | | | 29,906,938 | | | | — | | | | — | | | | 29,906,938 | |
| Mexico | | | 21,025,110 | | | | — | | | | — | | | | 21,025,110 | |
| Netherlands | | | 271,563,333 | | | | — | | | | — | | | | 271,563,333 | |
| Panama | | | 6,169,040 | | | | — | | | | — | | | | 6,169,040 | |
| Russia | | | 12,307,571 | | | | — | | | | — | | | | 12,307,571 | |
| Singapore | | | 42,505,306 | | | | — | | | | — | | | | 42,505,306 | |
| Spain | | | 154,599,010 | | | | — | | | | — | | | | 154,599,010 | |
| Switzerland | | | 259,775,051 | | | | — | | | | — | | | | 259,775,051 | |
| Taiwan | | | 40,824,085 | | | | — | | | | — | | | | 40,824,085 | |
| United Kingdom | | | 422,320,658 | | | | — | | | | — | | | | 422,320,658 | |
| United States | | | 216,510,182 | | | | — | | | | — | | | | 216,510,182 | |
| Total Common Stocks | | | 3,383,659,597 | | | | — | | | | — | | | | 3,383,659,597 | |
| | | | | | | | | | | | | | | | | |
| Preferred Stocks | | | | | | | | | | | | | | | | |
| Brazil | | | 10,621,369 | | | | — | | | | — | | | | 10,621,369 | |
| Korea | | | 29,235,750 | | | | — | | | | — | | | | 29,235,750 | |
| Total Preferred Stocks | | | 39,857,119 | | | | — | | | | — | | | | 39,857,119 | |
| | | | | | | | | | | | | | | | | |
| Short-Term Investment | | | 170,864,320 | | | | — | | | | — | | | | 170,864,320 | |
| Total Investments | | $ | 3,594,381,036 | | | $ | — | | | $ | — | | | $ | 3,594,381,036 | |
| | | | | | | | | | | | | | | | | |
| Financial Derivative Instruments* | | | | | | | | | | | | | | | | |
| Forward Foreign Currency Contracts | | | — | | | | 6,191,164 | | | | — | | | | 6,191,164 | |
| Total Financial Derivative Instruments | | $ | — | | | $ | 6,191,164 | | | $ | — | | | $ | 6,191,164 | |
| | | | | | | | | | | | | | | | | |
| Liabilities | | | | | | | | | | | | | | | | |
| Financial Derivative Instruments* | | | | | | | | | | | | | | | | |
| Forward Foreign Currency Contracts | | | — | | | | (1,512,312 | ) | | | — | | | | (1,512,312 | ) |
| Total Financial Derivative Instruments | | $ | — | | | $ | (1,512,312 | ) | | $ | — | | | $ | (1,512,312 | ) |
* These investments are recorded at the unrealized gain or loss on the investment.
During the six months ended January 31, 2014, there were no transfers in or out of security levels as a result of the fair value pricing procedures established by the Board.
See notes to financial statements
| Portfolio of investments (unaudited) |
Strategic Income Fund
January 31, 2014
| Face | | | | | | | | | Value | |
| amount | | | | Coupon | | Maturity | | | (note 2) | |
| | | | | | | | | |
| Corporate bonds – 92.51% | | | | | | | | |
| | | | | | | | | |
| | | | France – 2.67% | | | | | | | | |
| USD | 600,000 | | BNP Paribas S.A. (a) (b) | | 7.195% | | 6/25/37 | | $ | 640,500 | |
| EUR | 145,000 | | Europcar Groupe S.A. | | 9.375% | | 4/15/18 | | | 206,458 | |
| EUR | 150,000 | | SMCP SAS | | 8.875% | | 6/15/20 | | | 216,673 | |
| | | | | | | | | | | 1,063,631 | |
| | | | | | | | | | | | |
| | | | Germany – 2.80% | | | | | | | | |
| EUR | 400,000 | | Kabel Deutschland Vertrieb und Service GmbH | | 6.500% | | 6/29/18 | | | 569,815 | |
| USD | 500,000 | | Unitymedia Hessen GmbH & Co. KG (a) | | 7.500% | | 3/15/19 | | | 548,125 | |
| | | | | | | | | | | 1,117,940 | |
| | | | | | | | | | | | |
| | | | Ireland – 2.14% | | | | | | | | |
| EUR | 440,000 | | Ardagh Glass Finance plc | | 8.750% | | 2/1/20 | | | 633,532 | |
| EUR | 150,000 | | Ardagh Packaging Finance plc | | 9.250% | | 10/15/20 | | | 221,362 | |
| | | | | | | | | | | 854,894 | |
| | | | | | | | | | | | |
| | | | Italy – 0.78% | | | | | | | | |
| GBP | 200,000 | | Assicurazioni Generali SpA (b) | | 6.269% | | 6/16/26 | | | 309,053 | |
| | | | | | | | | | | | |
| | | | Jamaica – 1.86% | | | | | | | | |
| USD | 710,000 | | Digicel, Ltd. (a) | | 8.250% | | 9/1/17 | | | 739,820 | |
| | | | | | | | | | | | |
| | | | Luxembourg – 7.74% | | | | | | | | |
| USD | 465,000 | | Dufry Finance SCA (a) | | 5.500% | | 10/15/20 | | | 478,950 | |
| EUR | 150,000 | | Geo Travel Finance SCA | | 10.375% | | 5/1/19 | | | 219,289 | |
| USD | 157,000 | | Intelsat Jackson Holdings S.A. (a) | | 5.500% | | 8/1/23 | | | 150,524 | |
| EUR | 130,000 | | Numericable Finance & Co. SCA | | 12.375% | | 2/15/19 | | | 213,991 | |
| EUR | 300,000 | | Ontex IV S.A. | | 9.000% | | 4/15/19 | | | 432,933 | |
| EUR | 800,000 | | Telenet Finance Luxembourg SCA | | 6.375% | | 11/15/20 | | | 1,165,276 | |
| EUR | 298,000 | | Wind Acquisition Finance S.A. | | 11.750% | | 7/15/17 | | | 425,022 | |
| | | | | | | | | | | 3,085,985 | |
| | | | | | | | | | | | |
| | | | Netherlands – 3.95% | | | | | | | | |
| EUR | 150,000 | | Linde Finance B.V. | | 7.375% | | 7/14/66 | | | 228,048 | |
| EUR | 100,000 | | TMF Group Holding B.V. | | 9.875% | | 12/1/19 | | | 149,646 | |
| EUR | 93,000 | | UPC Holding B.V. | | 8.375% | | 8/15/20 | | | 138,182 | |
| USD | 150,000 | | UPCB Finance III, Ltd. (a) | | 6.625% | | 7/1/20 | | | 159,750 | |
| EUR | 625,000 | | Ziggo Bond Co. B.V. (a) | | 8.000% | | 5/15/18 | | | 897,728 | |
| | | | | | | | | | | 1,573,354 | |
| | | | | | | | | | | | |
| | | | United Kingdom – 48.72% | | | | | | | | |
| GBP | 700,000 | | AA Bond Co., Ltd. | | 9.500% | | 7/31/19 | | | 1,274,145 | |
| GBP | 205,000 | | Arqiva Broadcast Finance plc (a) | | 9.500% | | 3/31/20 | | | 376,597 | |
See notes to financial statements
| Portfolio of investments (unaudited) |
Strategic Income Fund
January 31, 2014 (continued)
| Face | | | | | | | | | Value | |
| amount | | | | Coupon | | Maturity | | | (note 2) | |
| | | | | | | | | | | | |
| | | | United Kingdom (continued) | | | | | | | | |
| GBP | 200,000 | | Arqiva Broadcast Finance plc | | 9.500% | | 3/31/20 | | $ | 367,411 | |
| EUR | 700,000 | | BAA Funding, Ltd. | | 4.600% | | 2/15/18 | | | 1,060,563 | |
| GBP | 200,000 | | Bakkavor Finance 2 plc | | 8.250% | | 2/15/18 | | | 352,452 | |
| GBP | 250,000 | | Barclays Bank plc | | 10.000% | | 5/21/21 | | | 541,377 | |
| USD | 235,000 | | Barclays Bank plc (b) | | 6.860% | | 6/15/32 | | | 244,870 | |
| GBP | 150,000 | | BAT International Finance plc | | 6.000% | | 6/29/22 | | | 293,432 | |
| USD | 490,000 | | British Sky Broadcasting Group plc (a) | | 3.125% | | 11/26/22 | | | 467,403 | |
| GBP | 650,000 | | Daily Mail & General Trust | | 5.750% | | 12/7/18 | | | 1,172,592 | |
| GBP | 400,000 | | F&C Finance plc | | 9.000% | | 12/20/16 | | | 752,371 | |
| GBP | 200,000 | | Gala Electric Casinos plc | | 11.500% | | 6/1/19 | | | 352,616 | |
| GBP | 400,000 | | Gala Group Finance plc | | 8.875% | | 9/1/18 | | | 701,945 | |
| EUR | 320,000 | | Global Switch Holdings, Ltd. | | 5.500% | | 4/18/18 | | | 496,565 | |
| GBP | 150,000 | | Hastings Insurance Group Finance plc | | 8.000% | | 10/21/20 | | | 255,215 | |
| USD | 200,000 | | Imperial Tobacco Finance plc (a) | | 3.500% | | 2/11/23 | | | 191,284 | |
| GBP | 501,000 | | ITV plc | | 5.375% | | 10/19/15 | | | 876,287 | |
| GBP | 500,000 | | Legal & General Group plc (b) | | 6.385% | | 5/2/17 | | | 875,376 | |
| USD | 1,100,000 | | Lloyds Banking Group plc (a) (b) | | 6.267% | | 11/14/16 | | | 1,078,000 | |
| USD | 200,000 | | Pearson Funding Five plc (a) | | 3.250% | | 5/8/23 | | | 186,359 | |
| USD | 400,000 | | Prudential plc (b) | | 6.500% | | 3/23/14 | | | 403,000 | |
| EUR | 510,000 | | Rexam plc | | 6.750% | | 6/29/67 | | | 732,546 | |
| USD | 400,000 | | Royal Bank of Scotland Group plc (b) | | 7.640% | | 9/30/17 | | | 396,000 | |
| USD | 1,100,000 | | Standard Chartered plc (b) | | 6.409% | | 1/1/00 | | | 1,172,187 | |
| GBP | 50,000 | | Tesco plc | | 5.500% | | 12/13/19 | | | 92,620 | |
| GBP | 89,000 | | Tesco plc | | 6.125% | | 2/24/22 | | | 168,164 | |
| GBP | 50,000 | | Tesco plc | | 5.000% | | 3/24/23 | | | 87,027 | |
| GBP | 67,000 | | Thames Water Utilities Finance, Ltd. | | 5.375% | | 7/21/25 | | | 119,567 | |
| GBP | 300,000 | | Thomas Cook Group plc | | 7.750% | | 6/22/17 | | | 537,555 | |
| GBP | 450,000 | | Towergate Finance plc | | 8.500% | | 2/15/18 | | | 784,140 | |
| GBP | 710,000 | | Virgin Media Finance plc | | 8.875% | | 10/15/19 | | | 1,272,213 | |
| GBP | 500,000 | | William Hill plc | | 7.125% | | 11/11/16 | | | 925,104 | |
| GBP | 100,000 | | WPP 2012 Ltd. | | 6.000% | | 4/4/17 | | | 183,888 | |
| USD | 595,000 | | WPP Finance 2010 | | 4.750% | | 11/21/21 | | | 635,245 | |
| | | | | | | | | | | 19,426,116 | |
| | | | | | | | | | | | |
| | | | United States – 21.85% | | | | | | | | |
| USD | 526,000 | | Avis Budget Car Rental LLC | | 5.500% | | 4/1/23 | | | 510,220 | |
| USD | 86,000 | | BMC Software Finance, Inc. (a) | | 8.125% | | 7/15/21 | | | 89,225 | |
| USD | 200,000 | | CenturyLink, Inc. | | 5.800% | | 3/15/22 | | | 198,000 | |
| USD | 347,000 | | CenturyLink, Inc. | | 7.600% | | 9/15/39 | | | 311,432 | |
| USD | 66,000 | | CHS/Community Health Systems, Inc. (a) | | 6.875% | | 2/1/22 | | | 67,774 | |
| USD | 600,000 | | CHS/Community Health Systems, Inc. | | 7.125% | | 7/15/20 | | | 639,750 | |
| USD | 125,000 | | First Data Corp. (a) | | 10.625% | | 6/15/21 | | | 136,875 | |
| USD | 75,000 | | First Data Corp. (a) | | 11.250% | | 1/15/21 | | | 83,062 | |
| USD | 600,000 | | HCA Holdings, Inc. | | 7.750% | | 5/15/21 | | | 660,000 | |
| EUR | 600,000 | | Infor (US), Inc. | | 10.000% | | 4/1/19 | | | 922,510 | |
| USD | 950,000 | | Iron Mountain, Inc. | | 6.000% | | 8/15/23 | | | 982,062 | |
| EUR | 2,500,000 | | Lehman Brothers UK Capital Funding IV LP (b) (c) (d) (e) | | 5.750% | | 4/25/14 | | | — | |
| EUR | 775,000 | | Levi Strauss & Co. | | 7.750% | | 5/15/18 | | | 1,106,410 | |
| USD | 140,000 | | Regal Entertainment Group | | 9.125% | | 8/15/18 | | | 151,900 | |
| USD | 160,000 | | Regal Entertainment Group | | 5.750% | | 2/1/25 | | | 152,800 | |
See notes to financial statements
| Portfolio of investments (unaudited) |
Strategic Income Fund
January 31, 2014 (continued)
| Face | | | | | | | | | Value | |
| amount | | | | Coupon | | Maturity | | | (note 2) | |
| | | | | | | | | | | | |
| | | | United States (continued) | | | | | | | | |
| USD | 205,000 | | Regal Entertainment Group | | 5.750% | | 6/15/23 | | $ | 202,950 | |
| USD | 250,000 | | Reynolds Group Issuer, Inc. | | 5.750% | | 10/15/20 | | | 256,875 | |
| USD | 540,000 | | Service Corp. International | | 7.625% | | 10/1/18 | | | 625,050 | |
| USD | 140,000 | | Sprint Corp. (a) | | 7.875% | | 9/15/23 | | | 149,800 | |
| USD | 210,000 | | Sprint Corp. (a) | | 7.125% | | 6/15/24 | | | 211,575 | |
| USD | 38,000 | | T-Mobile USA, Inc. | | 6.633% | | 4/28/21 | | | 40,138 | |
| USD | 460,000 | | T-Mobile USA, Inc. | | 6.125% | | 1/15/22 | | | 471,500 | |
| USD | 60,000 | | Tenet Healthcare Corp. (a) | | 6.000% | | 10/1/20 | | | 63,263 | |
| USD | 125,000 | | Tenet Healthcare Corp. | | 8.000% | | 8/1/20 | | | 136,875 | |
| USD | 496,000 | | Tenet Healthcare Corp. | | 8.125% | | 4/1/22 | | | 542,500 | |
| | | | | | | | | | | 8,712,546 | |
| | | | Total corporate bonds | | | | | | | | |
| | | | (Cost $36,710,033) | | | | | | | 36,883,339 | |
| | | | | | | | | | | | |
| US government obligations – 0.99% | | | | | | | | |
| | | | | | | | | | | | |
| | | | United States - 0.99% | | | | | | | | |
| USD | 400,000 | | United States Treasury Note (f) | | 0.875% | | 1/31/18 | | | 395,609 | |
| | | | Total US government obligations | | | | | | | | |
| | | | (Cost $395,726) | | | | | | | 395,609 | |
| | | | Total long-term investments | | | | | | | | |
| | | | (Cost $37,105,759) | | | | | | | 37,278,948 | |
| | | | | | | | | | | | |
| Shares | | | | | | | | | | |
| | | | | | | | | |
| Short-term investment - 4.13% | | | | | | | | |
| | 1,643,925 | | Fidelity Institutional Treasury Portfolio | | | | | | | 1,643,925 | |
| | | | Total short-term investment | | | | | | | | |
| | | | (Cost $1,643,925) | | | | | | | 1,643,925 | |
| | | | | | | | | | | | |
| Total investments - 97.63% (g) | | | | | | | | |
| | | | (Cost $38,749,684) | | | | | | | 38,922,873 | |
| Net other assets and liabilities – 2.37% | | | | | | | 946,329 | |
| Total net assets – 100.00% | | | | | | $ | 39,869,202 | |
| (a) | | Restricted security, purchased pursuant to Rule 144A under the Securities Act of 1933, as amended, and which is exempt from registration under that Act. At January 31, 2014, the restricted securities held by the Fund had an aggregate value of $6,716,614, which represented 16.8% of net assets. |
| (b) | | Maturity date is perpetual. Maturity date presented represents the next call date. |
| (c) | | Security is in default. |
| (d) | | Fair valued at January 31, 2014 as determined in good faith using procedures approved by the Board of Trustees. |
| (e) | | The security has been deemed illiquid according to the policies and procedures adopted by the Board of Trustees. |
| (f) | | A portion of this security is held at the broker as collateral for swap contracts. |
| (g) | | All or a portion of these securities and short-term investments were segregated as collateral for open futures contracts and swap contracts. At January 31, 2014, the aggregate amount available to cover segregation requirements was $38,922,873. |
See notes to financial statements
| Portfolio of investments (unaudited) |
Strategic Income Fund
January 31, 2014 (continued)
The Fund held the following open forward foreign currency contracts at January 31, 2014:
| | | | | | | | | | | | | | | | | |
| | | | | | | | | | Local | | | Current | | | Unrealized | |
| | | | | | | | | | | | | | | | appreciation/ | |
| | | | Counterparty | | | date | | | (000’s | ) | | value | | | (depreciation | ) |
| Euro (Short) | | | Deutsche Bank AG | | | 2/21/14 | | | 8,952 | | $ | 12,074,177 | | $ | 47,371 | |
| British Pound (Short) | | | Citibank, N.A. | | | 2/21/14 | | | 8,048 | | | 13,228,559 | | | 17,905 | |
| Total | | | | | | | | | | | | | | $ | 65,276 | |
During the six months ended January 31, 2014, average monthly notional value related to forward foreign currency contracts was $29.1 million or 73.0% of net assets.
The Fund held the following open futures contracts at January 31, 2014:
| | | | | | | | | | | | | | |
| | | | | | | | | | Current | | | Unrealized | |
| | | | Number of | | | Expiration | | | notional | | | appreciation/ | |
| | | | contracts | | | date | | | value | | | (depreciation | ) |
| UK Long Gilt Bond (Long) | | | 15 | | | 3/27/14 | | $ | 2,722,050 | | $ | 29,956 | |
| US Treasury 10 Year Note (Long) | | | 45 | | | 3/20/14 | | | 5,658,750 | | | 37,187 | |
| Total | | | | | | | | | | | $ | 67,143 | |
During the six months ended January 31, 2014, average notional value related to futures contracts was $2.1 million or 5.3% of net assets.
The Fund held the following over-the-counter credit default swap contracts at January 31, 2014:
| | | | | | | | | | | | | | | | | | | | | | | | |
| | | | | | | | | | | | | | | | | | | | Upfront | | | | |
| | | | | Rates | | | | | | Implied | | | Notional | | | | | | premiums | | | Unrealized | |
| | | Reference | | received/ | | | Termination | | | credit | | | amount | | | Market | | | paid/ | | | appreciation/ | |
| Counterparty | | entity | | (paid | ) | | date | | | spread | | | (000s | ) | | value | | | (received | ) | | (depreciation | ) |
| Protection purchased: | | | | | | | | | | | | | | | | | | | | | | | |
| Deutsche Bank AG | | International Business | | | | | | | | | | | | | | | | | | | | | |
| | | Machine Corp. | | (1.00 | )% | | 12/20/18 | | | 0.35 | % | | USD 850 | | $ | (26,545 | ) | $ | (26,279 | ) | $ | (266 | ) |
| Barclays Bank plc | | Hewlett Packard Co. | | (1.00 | )% | | 3/20/19 | | | 1.14 | % | | USD 150 | | | 1,026 | | | 2,175 | | | (1,149 | ) |
| Protection sold: | | | | | | | | | | | | | | | | | | | | | | | |
| Citibank, N.A. | | Sunrise Communications | | 5.00 | % | | 3/20/19 | | | 2.89 | % | | EUR 300 | | | 40,022 | | | 39,888 | | | 134 | |
| J.P. Morgan Chase | | | | | | | | | | | | | | | | | | | | | | | |
| Bank, N.A. | | ConvaTec Healthcare | | 5.00 | % | | 12/20/17 | | | 2.74 | % | | EUR 50 | | | 5,604 | | | (1,637 | ) | | 7,241 | |
| Barclays Bank plc | | Schaeffler Finance B.V. | | 5.00 | % | | 12/20/18 | | | 2.14 | % | | EUR 350 | | | 61,875 | | | 55,055 | | | 6,820 | |
| Barclays Bank plc | | ConvaTec Healthcare | | 5.00 | % | | 12/20/18 | | | 3.47 | % | | EUR 350 | | | 31,946 | | | 2,368 | | | 29,578 | |
| Citibank, N.A. | | Cerved Group SPA | | 5.00 | % | | 12/20/18 | | | 4.46 | % | | EUR 100 | | | 3,211 | | | (3,066 | ) | | 6,277 | |
| Total | | | | | | | | | | | | | | | $ | 117,139 | | $ | 68,504 | | $ | 48,635 | |
During the six months ended January 31, 2014, average notional value related to swap contracts was $4.6 million or 11.5% of net assets.
See notes to financial statements
| Portfolio of investments (unaudited) |
Strategic Income Fund
January 31, 2014 (continued)
Other information:
| | | | | |
| Industry concentration as | | | % of net |
| a percentage of net assets: | | | assets |
| | | | | |
| Commercial Banks Non-US | | | 7.62 | % |
| Telecommunication Services | | | 6.59 | |
| Cable TV | | | 6.23 | |
| Medical - Hospitals | | | 5.29 | |
| Telephone - Integrated | | | 4.47 | |
| Containers - Metal/Glass | | | 3.98 | |
| Apparel Manufacturers | | | 3.32 | |
| Life/Health Insurance | | | 3.21 | |
| Auto Repair Centers | | | 3.20 | |
| Publishing - Newspapers | | | 2.94 | |
| Airport Development & Maintenance | | | 2.66 | |
| Diversified Banking Institution | | | 2.60 | |
| Enterprise Software/Services | | | 2.54 | |
| Commercial Services | | | 2.46 | |
| Gambling (Non-Hotel) | | | 2.32 | |
| Finance - Other Services | | | 2.30 | |
| Television | | | 2.20 | |
| Cellular Telecommunications | | | 2.19 | |
| Insurance Brokers | | | 1.97 | |
| Investment Management & Advising Services | | | 1.89 | |
| Broadcast Services/Programs | | | 1.87 | |
| Rental Auto/Equipment | | | 1.80 | |
| Advertising Services | | | 1.59 | |
| Funeral Services & Related Items | | | 1.57 | |
| Multi-line Insurance | | | 1.41 | |
| Travel Services | | | 1.35 | |
| Theaters | | | 1.27 | |
| Computer Data Security | | | 1.25 | |
| Tobacco | | | 1.22 | |
| Retail - Miscellaneous/Diversified | | | 1.20 | |
| Feminine Health Care Products | | | 1.09 | |
| U.S. Government Obligations | | | 0.99 | |
| Diversified Operations | | | 0.88 | |
| Food - Wholesale/Distribution | | | 0.88 | |
| Food - Retail | | | 0.87 | |
| Consumer Products - Miscellaneous | | | 0.64 | |
| Industrial Gases | | | 0.57 | |
| Data Processing/Management | | | 0.55 | |
| Transport - Services | | | 0.55 | |
| Multimedia | | | 0.47 | |
| Consulting Services | | | 0.46 | |
| Satellite Telecommunications | | | 0.38 | |
| Commercial Services - Finance | | | 0.37 | |
| Water | | | 0.30 | |
| Finance - Investment Banking & Brokerage | | | 0.00 | |
| Long-Term Investments | | | 93.51 | |
| Short-Term Investment | | | 4.12 | |
| Total Investments | | | 97.63 | |
| Net Other Assets and Liabilities | | | 2.37 | |
| | | | 100.00 | % |
See notes to financial statements
| Portfolio of investments (unaudited) |
Strategic Income Fund
January 31, 2014 (continued)
The following table summarizes the Fund’s investments that are measured at fair value by level within the fair value hierarchy at January 31, 2014:
| | | | | | | | | | | | | |
| | | Quoted prices | | | Significant | | | | | | | |
| | | in active | | | other | | | Significant | | | | |
| | | markets for | | | observable | | | unobservable | | | | |
| | | identical assets | | | inputs | | | inputs | | | | |
| Description | | (level 1 | ) | | (level 2 | ) | | (level 3 | ) | | Total | |
| Assets | | | | | | | | | | | | |
| | | | | | | | | | | | | |
| Corporate Bonds | | | | | | | | | | | | |
| France | | $ | — | | | $ | 1,063,631 | | | $ | — | | | $ | 1,063,631 | |
| Germany | | | — | | | | 1,117,940 | | | | — | | | | 1,117,940 | |
| Ireland | | | — | | | | 854,894 | | | | — | | | | 854,894 | |
| Italy | | | — | | | | 309,053 | | | | — | | | | 309,053 | |
| Jamaica | | | — | | | | 739,820 | | | | — | | | | 739,820 | |
| Luxembourg | | | — | | | | 3,085,985 | | | | — | | | | 3,085,985 | |
| Netherlands | | | — | | | | 1,573,354 | | | | — | | | | 1,573,354 | |
| United Kingdom | | | — | | | | 19,426,116 | | | | — | | | | 19,426,116 | |
| United States | | | — | | | | 8,712,546 | | | | — | | | | 8,712,546 | |
| Total Corporate Bonds | | | — | | | | 36,883,339 | | | | — | | | | 36,883,339 | |
| | | | | | | | | | | | | | | | | |
| US Government Obligations | | | | | | | | | | | | | | | | |
| United States | | | — | | | | 395,609 | | | | — | | | | 395,609 | |
| Total US Government Obligations | | | — | | | | 395,609 | | | | — | | | | 395,609 | |
| Short-Term Investment | | | 1,643,925 | | | | — | | | | — | | | | 1,643,925 | |
| Total Investments | | $ | 1,643,925 | | | $ | 37,278,948 | | | $ | — | | | $ | 38,922,873 | |
| | | | | | | | | | | | | | | | | |
| Financial Derivative Instruments* | | | | | | | | | | | | | | | | |
| Forward Foreign Currency Contracts | | | — | | | | 65,276 | | | | — | | | | 65,276 | |
| Futures Contracts | | | 67,143 | | | | — | | | | — | | | | 67,143 | |
| Over-The-Counter Credit Default Swap Contracts | | | — | | | | 50,050 | | | | — | | | | 50,050 | |
| Total Financial Derivative Instruments | | $ | 67,143 | | | $ | 115,326 | | | $ | — | | | $ | 182,469 | |
| | | | | | | | | | | | | | | | | |
| Liabilities | | | | | | | | | | | | | | | | |
| Financial Derivative Instruments* | | | | | | | | | | | | | | | | |
| Over-The-Counter Credit Default Swap Contracts | | | — | | | | (1,415 | ) | | | — | | | | (1,415 | ) |
| Total Financial Derivative Instruments | | $ | — | | | $ | (1,415 | ) | | $ | — | | | $ | (1,415 | ) |
* These investments are recorded at the unrealized gain or loss on the investment.
During the six months ended January 31, 2014, there were no transfers in or out of security levels as a result of the fair value pricing procedures established by the Board.
See notes to financial statements
| Portfolio of investments (unaudited) |
Strategic Income Fund
January 31, 2014 (continued)
Following is a reconciliation of investments in which significant unobservable inputs (Level 3) were used in determining fair value:
| | | | | | | | | | | | | | | | | | | | | | | | | | | | | |
| | | | Balance | | | | | | | | | Change in | | | | | | | | | | | | | | | Balance | |
| | | | as of | | | Accrued | | | | | | unrealized | | | | | | | | | Transfers | | | Transfers | | | as of | |
| | | | July 31, | | | discounts/ | | | Realized | | | appreciation | | | | | | | | | in to | | | out of | | | January 31, | |
| Investments in securities | | | 2013 | | | premiums | | | gain/(loss | ) | | (depreciation | ) | | Purchases | | | Sales | | | level 3 | | | level 3 | | | 2014 | |
Corporate Bonds United States Lehman Brothers UK Capital Funding IV LP | | $ | 0 | | $ | 0 | | $ | 0 | | $ | 0 | | $ | 0 | | $ | 0 | | $ | 0 | | $ | 0 | | $ | 0 | |
| Total | | $ | 0 | | $ | 0 | | $ | 0 | | $ | 0 | | $ | 0 | | $ | 0 | | $ | 0 | | $ | 0 | | $ | 0 | |
The total net change in unrealized depreciation included in the Statements of Operations attributable to Level 3 investments held at January 31, 2014 was $0.
The Fund’s Adviser has determined that Lehman Brothers UK Capital Funding IV LP is a Level 3 investment due to the lack of observable inputs that may be used in the determination of fair value. Management has also concluded there is no value for the investment on the basis that the company has filed for bankruptcy, the position is currently in default and is highly subordinated.
See notes to financial statements
| Portfolio of investments (unaudited) |
Unconstrained Bond Fund
January 31, 2014
| Face | | | | | | | | | Value | |
| amount | | | | Coupon | | Maturity | | | (note 2) | |
| | | | | | | | | |
| Corporate bonds – 42.74% | | | | | | | | |
| | | | | | | | | | | | |
| | | | Australia – 1.57% | | | | | | | | |
| USD | 200,000 | | Origin Energy Finance, Ltd. (a) | | 3.500% | | 10/9/18 | | $ | 203,875 | |
| EUR | 50,000 | | Santos Finance, Ltd. | | 8.250% | | 9/22/70 | | | 76,061 | |
| USD | 100,000 | | Westpac Banking Corp. | | 4.875% | | 11/19/19 | | | 112,369 | |
| | | | | | | | | | | 392,305 | |
| | | | | | | | | | | | |
| | | | Belgium – 0.61% | | | | | | | | |
| EUR | 100,000 | | Barry Callebaut Services N.V. | | 5.625% | | 6/15/21 | | | 152,947 | |
| | | | | | | | | | | | |
| | | | Brazil – 0.26% | | | | | | | | |
| USD | 60,000 | | Vale Overseas, Ltd. | | 5.625% | | 9/15/19 | | | 65,542 | |
| | | | | | | | | | | | |
| | | | Canada – 0.77% | | | | | | | | |
| USD | 200,000 | | New Gold, Inc. (a) | | 6.250% | | 11/15/22 | | | 193,000 | |
| | | | | | | | | | | | |
| | | | Denmark – 0.34% | | | | | | | | |
| EUR | 50,000 | | DONG Energy A/S | | 6.500% | | 5/7/19 | | | 83,928 | |
| | | | | | | | | | | | |
| | | | Finland – 0.56% | | | | | | | | |
| EUR | 100,000 | | Citycon OYJ | | 3.750% | | 6/24/20 | | | 140,062 | |
| | | | | | | | | | | | |
| | | | France – 3.03% | | | | | | | | |
| EUR | 75,000 | | BNP Paribas S.A. | | 2.250% | | 1/13/21 | | | 101,734 | |
| EUR | 100,000 | | Cegedim S.A. | | 6.750% | | 4/1/20 | | | 142,119 | |
| EUR | 100,000 | | CMA CGM S.A. | | 8.875% | | 4/15/19 | | | 133,521 | |
| EUR | 100,000 | | Oberthur Technologies Holding SAS | | 9.250% | | 4/30/20 | | | 146,132 | |
| GBP | 50,000 | | Societe Generale S.A. (b) | | 8.875% | | 6/16/18 | | | 91,236 | |
| EUR | 100,000 | | Wendel S.A. | | 4.875% | | 5/26/16 | | | 143,299 | |
| | | | | | | | | | | 758,041 | |
| | | | | | | | | | | | |
| | | | Germany – 0.22% | | | | | | | | |
| EUR | 40,000 | | Bayer AG | | 1.875% | | 1/25/21 | | | 54,265 | |
| | | | | | | | | | | | |
| | | | Hong Kong – 0.52% | | | | | | | | |
| EUR | 100,000 | | Hutchison Whampoa Europe Finance 13, Ltd. (b) | | 3.750% | | 5/10/18 | | | 130,729 | |
| | | | | | | | | | | | |
| | | | Ireland – 1.74% | | | | | | | | |
| EUR | 100,000 | | Ardagh Packaging Finance plc | | 9.250% | | 10/15/20 | | | 147,575 | |
| EUR | 100,000 | | Baggot Securities, Ltd. (b) | | 10.240% | | 12/29/49 | | | 144,223 | |
| EUR | 100,000 | | Eircom Finance, Ltd. | | 9.250% | | 5/15/20 | | | 144,311 | |
| | | | | | | | | | | 436,109 | |
See notes to financial statements
| Portfolio of investments (unaudited) |
Unconstrained Bond Fund
January 31, 2014 (continued)
| Face | | | | | | | | | Value | |
| amount | | | | Coupon | | Maturity | | | (note 2) | |
| | | | | | | | | | | | |
| | | | Italy – 0.81% | | | | | | | | |
| EUR | 150,000 | | Intesa Sanpaolo SpA | | 3.500% | | 1/17/22 | | $ | 202,177 | |
| | | | | | | | | | | | |
| | | | Luxembourg – 3.27% | | | | | | | | |
| GBP | 100,000 | | Cabot Financial Luxembourg S.A. | | 8.375% | | 8/1/20 | | | 180,753 | |
| USD | 200,000 | | Intelsat Luxembourg S.A. (a) | | 7.750% | | 6/1/21 | | | 215,250 | |
| EUR | 100,000 | | Matterhorn Mobile S.A. (a) (c) | | 5.468% | | 5/15/19 | | | 137,573 | |
| EUR | 100,000 | | Telenet Finance Luxembourg SCA | | 6.375% | | 11/15/20 | | | 145,659 | |
| EUR | 100,000 | | Wind Acquisition Finance S.A. (a) (c) | | 5.551% | | 4/30/19 | | | 138,242 | |
| | | | | | | | | | | 817,477 | |
| | | | | | | | | | | | |
| | | | Mexico – 0.60% | | | | | | | | |
| EUR | 100,000 | | America Movil SAB de C.V. | | 4.125% | | 10/25/19 | | | 150,426 | |
| | | | | | | | | | | | |
| | | | Netherlands – 1.50% | | | | | | | | |
| GBP | 100,000 | | Koninklijke KPN N.V. | | 6.875% | | 3/14/73 | | | 169,322 | |
| EUR | 100,000 | | Stork Technical Services Holdings B.V. | | 11.000% | | 8/15/17 | | | 135,612 | |
| EUR | 50,000 | | Ziggo Finance B.V. | | 6.125% | | 11/15/17 | | | 69,761 | |
| | | | | | | | | | | 374,695 | |
| | | | | | | | | | | | |
| | | | United Kingdom – 13.34% | | | | | | | | |
| EUR | 100,000 | | Anglo American Capital plc | | 2.875% | | 11/20/20 | | | 135,443 | |
| GBP | 100,000 | | Arqiva Financing plc | | 4.040% | | 6/30/20 | | | 166,436 | |
| EUR | 100,000 | | Atrium European Real Estate, Ltd. | | 4.000% | | 4/20/20 | | | 137,638 | |
| GBP | 100,000 | | Bond Mission Critical Services plc (a) (c) | | 6.269% | | 5/1/19 | | | 162,746 | |
| GBP | 50,000 | | Centrica plc | | 6.375% | | 3/10/22 | | | 98,508 | |
| GBP | 50,000 | | Firstgroup plc | | 8.125% | | 9/19/18 | | | 98,234 | |
| GBP | 100,000 | | Galaxy Bidco, Ltd. (a) (c) | | 5.525% | | 11/15/19 | | | 165,623 | |
| GBP | 100,000 | | Hastings Insurance Group Finance plc (a) (c) | | 6.578% | | 10/21/19 | | | 165,623 | |
| GBP | 50,000 | | HBOS Capital Funding LP (b) | | 6.461% | | 11/30/18 | | | 85,914 | |
| GBP | 50,000 | | HSBC Holdings plc | | 7.000% | | 4/7/38 | | | 104,498 | |
| GBP | 50,000 | | Imperial Tobacco Finance plc | | 7.750% | | 6/24/19 | | | 100,485 | |
| EUR | 100,000 | | Nationwide Building Society | | 4.125% | | 3/20/23 | | | 140,140 | |
| GBP | 100,000 | | Odeon & UCI Finco plc | | 9.000% | | 8/1/18 | | | 163,979 | |
| GBP | 100,000 | | Old Mutual plc | | 8.000% | | 6/3/21 | | | 176,597 | |
| EUR | 50,000 | | Royal Bank of Scotland plc | | 4.625% | | 9/22/21 | | | 68,438 | |
| GBP | 50,000 | | RSA Insurance Group plc | | 9.375% | | 5/20/39 | | | 99,866 | |
| GBP | 50,000 | | Southern Gas Networks plc (c) | | 0.810% | | 10/21/15 | | | 80,962 | |
| GBP | 100,000 | | Standard Life plc | | 5.500% | | 12/4/42 | | | 172,872 | |
| GBP | 50,000 | | Tesco plc | | 6.125% | | 2/24/22 | | | 94,474 | |
| EUR | 100,000 | | Thomas Cook Finance plc | | 7.750% | | 6/15/20 | | | 146,487 | |
| GBP | 100,000 | | Towergate Finance plc (a) (c) | | 6.021% | | 2/15/18 | | | 166,363 | |
| USD | 132,000 | | Tullow Oil plc (a) | | 6.000% | | 11/1/20 | | | 135,630 | |
| GBP | 100,000 | | Virgin Media Secured Finance plc | | 7.000% | | 1/15/18 | | | 170,801 | |
| EUR | 100,000 | | Vougeot Bidco plc (a) (c) | | 5.532% | | 7/15/20 | | | 137,837 | |
| GBP | 100,000 | | William Hill plc | | 4.250% | | 6/5/20 | | | 162,335 | |
| | | | | | | | | | | 3,337,929 | |
See notes to financial statements
| Portfolio of investments (unaudited) |
Unconstrained Bond Fund
January 31, 2014 (continued)
| Face | | | | | | | | | Value | |
| amount | | | | Coupon | | Maturity | | | (note 2) | |
| | | | | | | | | | | | |
| | | | United States – 13.60% | | | | | | | | |
| USD | 200,000 | | Advanced Micro Devices, Inc. | | 7.750% | | 8/1/20 | | $ | 200,000 | |
| GBP | 50,000 | | AT&T, Inc. | | 7.000% | | 4/30/40 | | | 107,661 | |
| GBP | 50,000 | | Bank of America Corp. | | 7.750% | | 4/30/18 | | | 99,591 | |
| USD | 100,000 | | Caesars Entertainment Resort Properties LLC (a) | | 8.000% | | 10/1/20 | | | 104,250 | |
| USD | 200,000 | | Calumet Specialty Products Partners LP | | 7.625% | | 1/15/22 | | | 212,250 | |
| USD | 200,000 | | Chesapeake Energy Corp. | | 5.750% | | 3/15/23 | | | 209,250 | |
| USD | 100,000 | | Citigroup, Inc. | | 1.750% | | 5/1/18 | | | 98,500 | |
| USD | 200,000 | | Clear Channel Worldwide Holdings, Inc., Series B | | 7.625% | | 3/15/20 | | | 212,000 | |
| USD | 200,000 | | Digicel Group, Ltd. (a) | | 8.250% | | 9/30/20 | | | 209,000 | |
| USD | 200,000 | | Gardner Denver, Inc. (a) | | 6.875% | | 8/15/21 | | | 201,500 | |
| GBP | 50,000 | | Goldman Sachs Group, Inc. | | 6.125% | | 5/14/17 | | | 91,282 | |
| GBP | 100,000 | | Health Care REIT, Inc. | | 4.800% | | 11/20/28 | | | 166,797 | |
| USD | 100,000 | | Hockey Merger Sub 2, Inc. (a) | | 7.875% | | 10/1/21 | | | 104,500 | |
| USD | 200,000 | | Hot Topic, Inc. (a) | | 9.250% | | 6/15/21 | | | 213,000 | |
| USD | 200,000 | | Landry’s, Inc. (a) | | 9.375% | | 5/1/20 | | | 218,500 | |
| USD | 50,000 | | Philip Morris International, Inc. | | 5.650% | | 5/16/18 | | | 57,981 | |
| USD | 200,000 | | Pittsburgh Glass Works LLC (a) | | 8.000% | | 11/15/18 | | | 217,000 | |
| USD | 200,000 | | RCN Telecom Services LLC (a) | | 8.500% | | 8/15/20 | | | 203,500 | |
| USD | 200,000 | | Reynolds Group Issuer, Inc. | | 8.250% | | 2/15/21 | | | 213,500 | |
| USD | 200,000 | | Sprint Corp. (a) | | 7.125% | | 6/15/24 | | | 201,500 | |
| USD | 50,000 | | Verizon Communications, Inc. | | 6.550% | | 9/15/43 | | | 60,233 | |
| | | | | | | | | | | 3,401,795 | |
| | | | | | | | | | | | |
| | | | Total corporate bonds | | | | | | | | |
| | | | (Cost $10,666,927) | | | | | | | 10,691,427 | |
| | | | | | | | | | | | |
| Commercial mortgage-backed securities – 3.41% | | | | | | | | |
| | | | | | | | | | | | |
| | | | Germany – 2.69% | | | | | | | | |
| EUR | 256,811 | | German Residential Funding plc (c) | | 1.827% | | 8/27/24 | | | 351,989 | |
| EUR | 242,672 | | Juno Eclipse 2007-2, Ltd. (c) | | 0.398% | | 11/20/22 | | | 321,564 | |
| | | | | | | | | | | 673,553 | |
| | | | | | | | | | | | |
| | | | United Kingdom – 0.72% | | | | | | | | |
| GBP | 25,313 | | Business Mortgage Finance 2 plc (c) | | 2.324% | | 2/15/37 | | | 42,117 | |
| GBP | 86,000 | | Business Mortgage Finance 3 plc (c) | | 1.924% | | 11/15/38 | | | 138,526 | |
| | | | | | | | | | | 180,643 | |
| | | | | | | | | | | | |
| | | | Total Commercial mortgage-backed securities | | | | | | | | |
| | | | (Cost $857,213) | | | | | | | 854,196 | |
See notes to financial statements
| Portfolio of investments (unaudited) |
Unconstrained Bond Fund
January 31, 2014 (continued)
| Face | | | | | | | | | Value | |
| amount | | | | Coupon | | Maturity | | | (note 2) | |
| | | | | | | | | |
| Residential mortgage-backed securities – 4.89% | | | | | | | | |
| | | | | | | | | | | | |
| | | | Australia – 0.98% | | | | | | | | |
| EUR | 188,061 | | Interstar Millennium Series 2004-1E Trust (c) | | 0.687% | | 5/7/36 | | $ | 245,350 | |
| | | | | | | | | | | | |
| | | | United Kingdom – 3.91% | | | | | | | | |
| USD | 320,955 | | Granite Master Issuer plc (c) | | 0.237% | | 12/20/54 | | | 317,329 | |
| GBP | 205,691 | | Money Partners Securities 4 plc (c) | | 0.715% | | 3/15/40 | | | 332,703 | |
| USD | 325,000 | | Silverstone Master Issuer plc (a) (c) | | 1.786% | | 1/21/55 | | | 327,575 | |
| | | | | | | | | | | 977,607 | |
| | | | | | | | | | | | |
| | | | Total residential mortgage-backed securities | | | | | | | | |
| | | | (Cost $1,223,579) | | | | | | | 1,222,957 | |
| | | | | | | | | | | | |
| Collateralized loan obligations – 4.44% | | | | | | | | |
| | | | | | | | | | | | |
| | | | United Kingdom – 4.44% | | | | | | | | |
| EUR | 250,000 | | Dalradian European Clo III BV (c) | | 0.891% | | 4/11/23 | | | 302,594 | |
| EUR | 332,477 | | Grosvenor Place CLO II B.V. (c) | | 0.552% | | 3/28/23 | | | 444,353 | |
| EUR | 100,000 | | Highlander Euro CDO II BV (c) | | 0.944% | | 12/14/22 | | | 119,981 | |
| EUR | 185,077 | | Lambda Finance B.V. (c) | | 0.848% | | 9/20/31 | | | 243,232 | |
| | | | | | | | | | | 1,110,160 | |
| | | | | | | | | | | | |
| | | | Total collateralized loan obligations | | | | | | | | |
| | | | (Cost $1,112,935) | | | | | | | 1,110,160 | |
| | | | | | | | | | | | |
| Preferred stocks – 0.39% | | | | | | | | |
| | | | | | | | | | | | |
| | | | United States - 0.39% | | | | | | | | |
| | 100 | | Ally Financial, Inc. 7%, 3/03/14 (a) (b) | | | | | | | 97,284 | |
| | | | | | | | | | | | |
| | | | Total preferred stocks | | | | | | | | |
| | | | (Cost $96,500) | | | | | | $ | 97,284 | |
See notes to financial statements
| Portfolio of investments (unaudited) |
Unconstrained Bond Fund
January 31, 2014 (continued)
| | | | | | | | | | | Value | |
| Principal | | | | Coupon | | Maturity | | | (note 2) | |
| | | | | | | | | |
| Sovereign debt obligations – 18.73% | | | | | | | | |
| AUD | 161,000 | | Australia Government Bond | | 4.000% | | 8/20/15 | | $ | 251,664 | |
| CAD | 73,417 | | Canadian Government Bond | | 1.500% | | 12/1/44 | | | 74,788 | |
| CZK | 3,700,000 | | Czech Republic Government Bond | | 1.500% | | 10/29/19 | | | 182,026 | |
| EUR | 179,913 | | France Government Bond OAT | | 0.100% | | 7/25/21 | | | 240,814 | |
| MXN | 8,790,400 | | Mexican Bonos | | 10.000% | | 12/5/24 | | | 826,325 | |
| RUB | 11,000,000 | | Russian Federal Bond - OFZ | | 6.400% | | 5/27/20 | | | 289,466 | |
| RUB | 27,386,000 | | Russian Federal Bond - OFZ | | 7.500% | | 2/27/19 | | | 772,056 | |
| ZAR | 5,780,000 | | South Africa Government Bond | | 7.250% | | 1/15/20 | | | 489,821 | |
| GBP | 607,307 | | United Kingdom Inflation Linked Gilt (d) | | 0.125% | | 3/22/24 | | | 1,030,349 | |
| GBP | 95,000 | | United Kingdom Inflation Linked Gilt (d) | | 2.500% | | 7/26/16 | | | 529,364 | |
| | | | | | | | | | | | |
| | | | Total sovereign debt obligations | | | | | | | | |
| | | | (Cost $4,800,240) | | | | | | | 4,686,673 | |
| | | | | | | | | | | | |
| US government obligations – 14.42% | | | | | | | | |
| | | | | | | | | | | | |
| | | | United States - 14.42% | | | | | | | | |
| USD | 26,820 | | United States Treasury Inflation Indexed Bonds (d) | | 0.750% | | 2/15/42 | | | 23,149 | |
| USD | 1,358,333 | | United States Treasury Inflation Indexed Bonds (d) | | 0.125% | | 1/15/22 | | | 1,341,248 | |
| USD | 218,212 | | United States Treasury Inflation Indexed Bonds (d) | | 2.500% | | 1/15/29 | | | 265,911 | |
| USD | 1,973,000 | | United States Treasury Note | | 0.375% | | 6/15/15 | | | 1,978,086 | |
| | | | | | | | | | | 3,608,394 | |
| | | | | | | | | | | | |
| | | | Total US government obligations | | | | | | | | |
| | | | (Cost $3,563,300) | | | | | | | 3,608,394 | |
See notes to financial statements
| Portfolio of investments (unaudited) |
Unconstrained Bond Fund
January 31, 2014 (continued)
| | | | | | | Exercise | | | | | Value | |
| Contracts | | Underlying | Counterparty | | | Price | | Expiration | | | (note 2) | |
| | | | | | | | | | | |
| Options purchased – 0.31% | | | | | | | | | | |
| | | | | | | | | | | | | |
| | | Exchange-traded call option – 0.11% | | | | | | | | | | |
| 13 | | 30 Year United States Treasury Note Future | N/A | | $ | 132 | | 2/21/14 | | $ | 25,797 | |
| | | | | | | | | | | | | |
| | | Exchange-traded put option – 0.03% | | | | | | | | | | |
| 26 | | German Euro Bund Future | N/A | | | 139 EUR | | 3/21/14 | | $ | 8,065 | |
| | | | | | | | | | | | | |
| | | Foreign exchange over-the-counter call option – 0.01% | | | | | | | | | | |
| 380,000 CHF | | U.S. Dollar vs. Swiss Franc | Citibank, N.A. | | | 0.9752 | | 9/1/14 | | $ | 2,923 | |
| | | | | | | | | | | | | |
| | | Foreign exchange over-the-counter put options – 0.16% | | | | | | | | | | |
| 730,000 AUD | | Australian Dollar vs. U.S. Dollar | Citibank, N.A. | | | 0.85 | | 7/31/14 | | $ | 14,527 | |
| 530,000 EUR | | Euro vs. U.S. Dollar | Citibank, N.A. | | | 1.30 | | 1/19/15 | | $ | 12,710 | |
| 530,000 EUR | | Euro vs. U.S. Dollar | Barclays Bank plc | | | 1.30 | | 1/19/15 | | $ | 12,710 | |
| | | | | | | | | | | $ | 39,947 | |
| | | | | | | | | | | | | |
| | | Total options purchased | | | | | | | | | | |
| | | (Cost $58,460) | | | | | | | | | 76,732 | |
| | | | | | | | | | | | | |
| | | Total long-term investments | | | | | | | | | | |
| | | (Cost $22,379,154) | | | | | | | | | 22,347,823 | |
| | | | | | Value | |
| Shares | | | | | (note 2) | |
| | | | | |
| Short-term investment - 7.49% | | | | |
| 1,873,067 | | Fidelity Institutional Treasury Portfolio | | $ | 1,873,067 | |
| | | | | | | |
| | | Total short-term investment | | | | |
| | | (Cost $1,873,067) | | | 1,873,067 | |
| | | | | | | |
| Total investments - 96.82% (e) | | | | |
| | | (Cost $24,252,221) | | | 24,220,890 | |
| Net other assets and liabilities – 3.18% | | | 796,451 | |
| Total net assets – 100.00% | | $ | 25,017,341 | |
| (a) | | Restricted security, purchased pursuant to Rule 144A under the Securities Act of 1933, as amended, and which is exempt from registration under that Act. At January 31, 2014, the restricted securities held by the Fund had an aggregate value of $3,919,371, which represented 15.7% of net assets. |
| (b) | | Maturity date is perpetual. Maturity date presented represents the next call date. |
| (c) | | Variable or Floating rate interest rate security. Rate presented represents rate at January 31, 2014. |
| (d) | | Indexed security in which both the coupon and principal are adjusted in-line with movements in the inflation index in that sovereign market. |
| (e) | | All or a portion of these securities and short-term investments, excluding purchased options, were segregated as collateral for open futures contracts, forward foreign currency contracts and swap contracts. At January 31, 2014, the aggregate amount available to cover segregation requirements was $24,142,063. |
| REIT | | Real Estate Investment Trust |
See notes to financial statements
| Portfolio of investments (unaudited) |
Unconstrained Bond Fund
January 31, 2014 (continued)
The Fund held the following open forward foreign currency contracts at January 31, 2014:
| | | | | | | | | | | | | |
| | | | | | Local | | | Current | | | Unrealized | |
| | | | Value | | amount | | | notional | | | appreciation/ | |
| | Counterparty | | date | | | (000’s | ) | | value | | | (depreciation | ) |
| Australian Dollar (Short) | Deutsche Bank AG | | 3/20/14 | | | 362 | | | $ | 315,505 | | | $ | 5,053 | |
| British Pound (Short) | JPMorgan | | | | | | | | | | | | | | |
| | Chase Bank, N.A. | | 3/20/14 | | | 945 | | | | 1,552,973 | | | | (6,025 | ) |
| British Pound (Short) | Deutsche Bank AG | | 3/20/14 | | | 2,547 | | | | 4,724,281 | | | | (15,671 | ) |
| Canadian Dollar (Short) | Deutsche Bank AG | | 3/20/14 | | | 83 | | | | 73,999 | | | | 3,407 | |
| Columbian Peso (Long) | JPMorgan | | | | | | | | | | | | | | |
| | Chase Bank, N.A. | | 3/20/14 | | | 398,602 | | | | 197,119 | | | | (7,881 | ) |
| Czech Koruna (Short) | Deutsche Bank AG | | 3/20/14 | | | 3,715 | | | | 182,025 | | | | 2,836 | |
| Euro (Short) | Deutsche Bank AG | | 3/20/14 | | | 5,104 | | | | 6,884,261 | | | | 88,945 | |
| Euro (Long) | Deutsche Bank AG | | 3/20/14 | | | 16 | | | | 21,018 | | | | (295 | ) |
| Japanese Yen (Short) | JPMorgan | | | | | | | | | | | | | | |
| | Chase Bank, N.A. | | 3/20/14 | | | 78,303 | | | | 766,563 | | | | (16,563 | ) |
| Mexican Peso (Short) | JPMorgan | | | | | | | | | | | | | | |
| | Chase Bank, N.A. | | 3/20/14 | | | 7,210 | | | | 537,235 | | | | 15,195 | |
| Mexican Peso (Short) | Deutsche Bank AG | | 3/20/14 | | | 4,214 | | | | 314,016 | | | | (4,016 | ) |
| Mexican Peso (Long) | Deutsche Bank AG | | 3/20/14 | | | 4,469 | | | | 332,997 | | | | 1,750 | |
| Polish Zloty (Long) | Deutsche Bank AG | | 3/20/14 | | | 314 | | | | 99,483 | | | | (3,017 | ) |
| Russian Ruble (Short) | JPMorgan | | | | | | | | | | | | | | |
| | Chase Bank, N.A. | | 3/20/14 | | | 21,524 | | | | 606,258 | | | | 31,470 | |
| Russian Ruble (Short) | Deutsche Bank AG | | 3/20/14 | | | 17,646 | | | | 497,027 | | | | 32,162 | |
| Singapore Dollar (Long) | Deutsche Bank AG | | 3/20/14 | | | 130 | | | | 101,725 | | | | (775 | ) |
| South African Rand (Short) | Deutsche Bank AG | | 3/20/14 | | | 5,707 | | | | 510,163 | | | | 12,869 | |
| South African Rand (Long) | Deutsche Bank AG | | 3/20/14 | | | 180 | | | | 16,082 | | | | 83 | |
| South Korean Won (Short) | Deutsche Bank AG | | 3/20/14 | | | 110,643 | | | | 101,925 | | | | 1,075 | |
| South Korean Won (Long) | JPMorgan | | | | | | | | | | | | | | |
| | Chase Bank, N.A. | | 3/20/14 | | | 326,461 | | | | 300,738 | | | | (4,262 | ) |
| Total | | | | | | | | | | | | | $ | 136,340 | |
During the period ended January 31, 2014, average monthly notional value related to forward foreign currency contracts was $14.6 million or 58.4% of net assets
See notes to financial statements
| Portfolio of investments (unaudited) |
Unconstrained Bond Fund
January 31, 2014 (continued)
The Fund held the following written option contracts at January 31, 2014:
| | | | | | | | | | | | | | | | | | | | |
| | | | | | | | | | | | | | | | | | | Unrealized | |
| Exchange-traded call | | | Strike | | | Expiration | | | | | | Premium | | | Market | | | appreciation/ | |
| options written | | | index | | | date | | | Contracts | | | received | | | Value | | | (depreciation) | |
| 30 Year United States Treasury | | | | | | | | | | | | | | | | | | | |
| Note Future | | $ | 135 USD | | | 2/21/14 | | | 19 | | $ | (3,525 | ) | $ | (7,719 | ) | $ | (4,194 | ) |
| | | | | | | | | | | | | | | | | | | | |
| | | | | | | | | | | | | | | | | | | Unrealized | |
| Exchange-traded put | | | Strike | | | Expiration | | | | | | Premium | | | Market | | | appreciation/ | |
| options written | | | index | | | date | | | Contracts | | | received | | | Value | | | (depreciation) | |
| German Euro Bund Future | | | 137 EUR | | | 3/21/14 | | | 26 | | $ | (4,222 | ) | $ | (2,454 | ) | $ | 1,768 | |
| Foreign exchange | | | | | | | | | | | | | | | | | Unrealized | |
| over-the-counter | | | | Strike | | Expiration | | | | | Premium | | | Market | | | appreciation/ | |
| put options written | Counterparty | | | index | | date | | Contracts | | | received | | | Value | | | (depreciation) | |
| Euro vs. U.S. Dollar | Citibank, N.A. | | $ | 1.20 USD | | 1/19/15 | | 530,000 EUR | | $ | (3,167 | ) | $ | (3,998 | ) | $ | (832 | ) |
| Euro vs. U.S. Dollar | Barclays Bank plc | | | 1.20 USD | | 1/19/15 | | 530,000 EUR | | | (3,165 | ) | | (3,998 | ) | | (831 | ) |
| Total | | | | | | | | | | $ | (6,332 | ) | $ | (7,996 | ) | $ | (1,663 | ) |
The Fund held the following open futures contracts at January 31, 2014:
| | | | | | | | | | | | | | |
| | | | | | | | | | Current | | | Unrealized | |
| | | | Number of | | | Expiration | | | notional | | | appreciation/ | |
| | | | contracts | | | date | | | value | | | (depreciation | ) |
| Australian 3 Year Bond (Long) | | | 28 | | | 3/17/14 | | $ | 2,670,124 | | $ | 13,305 | |
| Euro Bund (Long) | | | 8 | | | 3/06/14 | | | 1,552,407 | | | 43,828 | |
| Japan 10 Year Bond (Short) | | | (1 | ) | | 3/11/14 | | | 1,416,659 | | | (4,363 | ) |
| UK Long Gilt Bond (Short) | | | (10 | ) | | 3/27/14 | | | 1,814,700 | | | (58,232 | ) |
| US Treasury 10 Year Note (Short) | | | (13 | ) | | 3/20/14 | | | 1,634,750 | | | (27,461 | ) |
| Total | | | | | | | | | | | $ | (32,923 | ) |
During the period ended January 31, 2014, average monthly notional value related to futures contracts was $6.8 million or 27.2% of net assets.
The Fund held the following centrally cleared interest rate swap contracts at January 31, 2014:
| | | | | | | | | | | | | | | | | | | | | |
| | | | Notional | | | Portfolio | | | | | | Annual | | | | | | Net Unrealized | |
| | | | amount | | | Pays/Receives | | | | | | Fixed | | | Termination | | | appreciation/ | |
| Exchange | | | (000s) | | | Floating rate | | | Floating Rate Index | | | Rate | | | Date | | | (depreciation | ) |
| CME Group | | | EUR | 1,300 | | | Receives | | | 6-month EUR EURIBOR | | | 2.925 | | | 12/27/43 | | $ | (15,730 | ) |
| CME Group | | | EUR | 5,800 | | | Pays | | | 6-month EUR EURIBOR | | | 1.131 | | | 1/8/17 | | | 21,718 | |
| CME Group | | | EUR | 1,302 | | | Receives | | | 6-month EUR EURIBOR | | | 2.0402 | | | 2/15/23 | | | (39,881 | ) |
| CME Group | | | GBP | 900 | | | Receives | | | 6-month GBP LIBOR | | | 3.347 | | | 12/20/63 | | | (9,554 | ) |
| LCH.Clearnet | | | USD | 840 | | | Receives | | | 3-month USD LIBOR | | | 4.232 | | | 1/27/47 | | | (18,623 | ) |
| LCH.Clearnet | | | USD | 1,750 | | | Pays | | | 3-month USD LIBOR | | | 4.133 | | | 1/27/27 | | | 22,788 | |
| LCH.Clearnet | | | USD | 5,700 | | | Receives | | | 3-month USD LIBOR | | | 0.46 | | | 2/4/16 | | | 0 | |
| LCH.Clearnet | | | USD | 2,200 | | | Pays | | | 3-month USD LIBOR | | | 1.611 | | | 2/4/19 | | | 0 | |
| Total | | | | | | | | | | | | | | | | | | $ | (39,282 | ) |
CME Chicago Mercantile Exchange
LCH London Clearing House
See notes to financial statements
| Portfolio of investments (unaudited) |
Unconstrained Bond Fund
January 31, 2014 (continued)
The Fund held the following over-the-counter interest rate and inflation swap contracts at January 31, 2014:
| | | Notional | | Portfolio | | | | Annual | | | | Net Unrealized | |
| | | amount | | Pays/Receives | | | | Fixed | | Termination | | appreciation/ | |
| Counterparty | | (000s) | | Floating rate | | Floating Rate Index | | Rate | | Date | | (depreciation) | |
| Deutsche Bank AG | | CAD | 8,500 | | Pays | | 3-month CAD CDOR | | | 1.26 | | 1/31/16 | | $ | — | |
| Deutsche Bank AG | | CAD | 3,500 | | Receives | | 3-month CAD CDOR | | | 1.9275 | | 1/31/19 | | | — | |
| Barclays Bank plc | | CHF | 1,870 | | Pays | | 6-month CHF LIBOR | | | 2.5625 | | 12/24/23 | | | 34,352 | |
| Barclays Bank plc | | CHF | 4,480 | | Receives | | 6-month CHF LIBOR | | | 0.805 | | 12/24/17 | | | (30,947 | ) |
| Deutsche Bank AG | | GBP | 610 | | Receives | | UK Retail Price Index | | | 3.365 | | 12/20/23 | | | (10,959 | ) |
| Total | | | | | | | | | | | | | | $ | (7,554 | ) |
The Fund held the following over-the-counter credit default swap contracts at January 31, 2014:
| | | | | | | | | | | | | | | | | Upfront | | | | |
| | | | Rates | | | | Implied | | | Notional | | | | | | premiums | | | Unrealized | |
| | Reference | | received/ | | Termination | | credit | | | amount | | | Market | | | paid/ | | | appreciation/ | |
| Counterparty | entity | | (paid | ) | date | | spread | | | | (000s | ) | | value | | | (received | ) | | (depreciation) | |
| Protection sold: | | | | | | | | | | | | | | | | | | | | | |
| Citibank, N.A. | Wendel | | | 5.00 | % | 3/20/19 | | | 2.32 | % | | EUR100 | | | | 17,288 | | | | 19,404 | | | | (2,116 | ) |
| Citibank, N.A. | Stena Aktiebolag | | | 5.00 | % | 3/20/19 | | | 4.12 | % | | EUR 50 | | | | 2,681 | | | | 3,278 | | | | (597 | ) |
| Total | | | | | | | | | | | | | | | | $ | 19,969 | | | $ | 22,682 | | | $ | (2,713 | ) |
During the period ended January 31, 2014, average notional value related to swap contracts was $35.3 million or 141.3% of net assets.
See notes to financial statements
| Portfolio of investments (unaudited) |
Unconstrained Bond Fund
January 31, 2014 (continued)
Other information:
| | | | | |
| Industry concentration as | | | % of net |
| a percentage of net assets: | | | assets |
| | | | | |
| Sovereign | | | 33.16 | % |
| Other ABS | | | 5.16 | |
| WL Collat CMO Other | | | 4.89 | |
| Cellular Telecommunications | | | 2.79 | |
| CMBS Other | | | 2.69 | |
| Telecommunication Services | | | 2.67 | |
| Diversified Banking Institution | | | 2.61 | |
| Diversified Operations | | | 1.75 | |
| Oil & Gas Exploration & Production | | | 1.68 | |
| Finance - Other Services | | | 1.39 | |
| Telephone - Integrated | | | 1.35 | |
| Commercial Banks Non-US | | | 1.26 | |
| Electric - Integrated | | | 1.15 | |
| Consulting Services | | | 1.11 | |
| Real Estate Management/Services | | | 1.11 | |
| Insurance Brokers | | | 1.08 | |
| Property/Casualty Insurance | | | 1.06 | |
| Transport - Services | | | 1.04 | |
| Auto/Truck Parts & Equipment - Original | | | 0.87 | |
| Retail - Restaurants | | | 0.87 | |
| Satellite Telecommunications | | | 0.86 | |
| Broadcast Services/Programs | | | 0.85 | |
| Consumer Products - Miscellaneous | | | 0.85 | |
| Oil & Gas Refining & Marketing | | | 0.85 | |
| Retail - Apparel/Shoe | | | 0.85 | |
| Cable TV | | | 0.81 | |
| Specified Purpose Acquisition | | | 0.81 | |
| Electronic Components - Semiconductors | | | 0.80 | |
| Gold Mining | | | 0.77 | |
| Gas - Distribution | | | 0.72 | |
| Investment Management & Advising Services | | | 0.71 | |
| Life/Health Insurance | | | 0.69 | |
| REITs - Health Care | | | 0.67 | |
| Multi-line Insurance | | | 0.66 | |
| Gambling (Non-Hotel) | | | 0.65 | |
| Tobacco | | | 0.63 | |
| Food - Confectionery | | | 0.61 | |
| Containers - Metal/Glass | | | 0.59 | |
| Travel Services | | | 0.59 | |
| Computer Data Security | | | 0.58 | |
| Diversified Financial Services | | | 0.58 | |
| Building Societies | | | 0.56 | |
| Theaters | | | 0.55 | |
| Diversified Minerals | | | 0.54 | |
| Transport - Marine | | | 0.53 | |
| Casino Hotels | | | 0.42 | |
| Finance - Investment Banking & Brokerage | | | 0.40 | |
| Food - Retail | | | 0.38 | |
| Money Center Banks | | | 0.34 | |
| Options Purchased | | | 0.31 | |
| Metal - Iron | | | 0.26 | |
| Medical - Drugs | | | 0.22 | |
| Long-Term Investments | | | 89.33 | |
| Short-Term Investment | | | 7.49 | |
| Total Investments | | | 96.82 | |
| Net Other Assets and Liabilities | | | 3.18 | |
| | | | 100.00 | % |
See notes to financial statements
| Portfolio of investments (unaudited) |
Unconstrained Bond Fund
January 31, 2014 (continued)
The following table summarizes the Fund’s investments that are measured at fair value by level within the fair value hierarchy at January 31, 2014:
| | | | | | | | | | | | | |
| | | Quoted prices | | | Significant | | | | | | | |
| | | in active | | | other | | | Significant | | | | |
| | | markets for | | | observable | | | unobservable | | | | |
| | | identical assets | | | inputs | | | inputs | | | | |
| Description | | (level 1 | ) | | (level 2 | ) | | (level 3 | ) | | Total | |
| Assets | | | | | | | | | | | | |
| | | | | | | | | | | | | |
| Corporate Bonds | | | | | | | | | | | | |
| Australia | | $ | — | | | $ | 392,305 | | | $ | — | | | $ | 392,305 | |
| Belgium | | | — | | | | 152,947 | | | | — | | | | 152,947 | |
| Brazil | | | — | | | | 65,542 | | | | — | | | | 65,542 | |
| Canada | | | — | | | | 193,000 | | | | — | | | | 193,000 | |
| Denmark | | | — | | | | 83,928 | | | | — | | | | 83,928 | |
| Finland | | | — | | | | 140,062 | | | | — | | | | 140,062 | |
| France | | | — | | | | 758,041 | | | | — | | | | 758,041 | |
| Germany | | | — | | | | 54,265 | | | | — | | | | 54,265 | |
| Hong Kong | | | — | | | | 130,729 | | | | — | | | | 130,729 | |
| Ireland | | | — | | | | 436,109 | | | | — | | | | 436,109 | |
| Italy | | | — | | | | 202,177 | | | | — | | | | 202,177 | |
| Luxembourg | | | — | | | | 817,477 | | | | — | | | | 817,477 | |
| Mexico | | | — | | | | 150,426 | | | | — | | | | 150,426 | |
| Netherlands | | | — | | | | 374,695 | | | | — | | | | 374,695 | |
| United Kingdom | | | — | | | | 3,337,929 | | | | — | | | | 3,337,929 | |
| United States | | | — | | | | 3,401,795 | | | | — | | | | 3,401,795 | |
| Total Corporate Bonds | | | — | | | | 10,691,427 | | | | — | | | | 10,691,427 | |
| | | | | | | | | | | | | | | | | |
| Commercial Mortgage-Backed Securities | | | | | | | | | | | | | | | | |
| Germany | | | — | | | | 673,553 | | | | — | | | | 673,553 | |
| United Kingdom | | | — | | | | 180,643 | | | | — | | | | 180,643 | |
| Total Commercial Mortgage-Backed Securities | | | — | | | | 854,196 | | | | — | | | | 854,196 | |
| | | | | | | | | | | | | | | | | |
| Residential Mortgage-Backed Securities | | | | | | | | | | | | | | | | |
| Australia | | | — | | | | 245,350 | | | | — | | | | 245,350 | |
| United Kingdom | | | — | | | | 977,607 | | | | — | | | | 977,607 | |
| Total Residential Mortgage-Backed Securities | | | — | | | | 1,222,957 | | | | — | | | | 1,222,957 | |
| | | | | | | | | | | | | | | | | |
| Collateralized Loan Obligations | | | | | | | | | | | | | | | | |
| United Kingdom | | | — | | | | 1,110,160 | | | | — | | | | 1,110,160 | |
| Total Collateralized Loan Obligations | | | — | | | | 1,110,160 | | | | — | | | | 1,110,160 | |
| | | | | | | | | | | | | | | | | |
| Preferred Stocks | | | | | | | | | | | | | | | | |
| United States | | | — | | | | 97,284 | | | | — | | | | 97,284 | |
| Total Preferred Stocks | | | — | | | | 97,284 | | | | — | | | | 97,284 | |
| | | | | | | | | | | | | | | | | |
| Sovereign Debt Obligations | | | — | | | | 4,686,673 | | | | — | | | | 4,686,673 | |
| | | | | | | | | | | | | | | | | |
| US Government Obligations | | | | | | | | | | | | | | | | |
| United States | | | — | | | | 3,608,394 | | | | — | | | | 3,608,394 | |
| Total US Government Obligations | | | — | | | | 3,608,394 | | | | — | | | | 3,608,394 | |
See notes to financial statements
| Portfolio of investments (unaudited) |
Unconstrained Bond Fund
January 31, 2014 (continued)
| | | | | | | | | | | | | |
| | | Quoted prices | | | Significant | | | | | | | |
| | | in active | | | other | | | Significant | | | | |
| | | markets for | | | observable | | | unobservable | | | | |
| | | identical assets | | | inputs | | | inputs | | | | |
| Description | | (level 1 | ) | | (level 2 | ) | | (level 3 | ) | | Total | |
| Options Purchased | | | | | | | | | | | | |
| Exchange-Traded Call Option | | $ | 25,797 | | | $ | — | | | $ | — | | | $ | 25,797 | |
| Exchange-Traded Put Option | | | 8,065 | | | | — | | | | — | | | | 8,065 | |
| Foreign Exchange Over-The-Counter Call Option | | | | | | | 2,923 | | | | — | | | | 2,923 | |
| Foreign Exchange Over-The-Counter Put Options | | | | | | | 39,947 | | | | — | | | | 39,947 | |
| Total Options Purchased | | | 33,862 | | | | 42,870 | | | | — | | | | 76,732 | |
| | | | | | | | | | | | | | | | | |
| Short-Term Investment | | | 1,873,067 | | | | — | | | | — | | | | 1,873,067 | |
| Total Investments | | | 1,906,929 | | | | 22,313,961 | | | | — | | | | 24,220,890 | |
| | | | | | | | | | | | | | | | | |
| Financial Derivative Instruments* | | | | | | | | | | | | | | | | |
| Forward Foreign Currency Contracts | | | — | | | | 194,845 | | | | — | | | | 194,845 | |
| Exchange-Traded Put Options Written | | | 1,768 | | | | — | | | | — | | | | 1,768 | |
| Futures Contracts | | | 57,133 | | | | — | | | | — | | | | 57,133 | |
| Centrally Cleared Interest Rate Swap Contracts | | | — | | | | 44,506 | | | | — | | | | 44,506 | |
| Over-The-Counter Interest Rate and Inflation Swap Contracts | | | — | | | | 34,352 | | | | — | | | | 34,352 | |
| Total Financial Derivative Instruments | | $ | 58,901 | | | $ | 273,703 | | | $ | — | | | $ | 332,604 | |
| | | | | | | | | | | | | | | | | |
| Liabilities | | | | | | | | | | | | | | | | |
| Financial Derivative Instruments* | | | | | | | | | | | | | | | | |
| Forward Foreign Currency Contracts | | | — | | | | (58,505 | ) | | | — | | | | (58,505 | ) |
| Exchange-Traded Call Options Written | | | (4,194 | ) | | | — | | | | — | | | | (4,194 | ) |
| Foreign Exchange Over-The-Counter Put Options Written | | | — | | | | (1,663 | ) | | | — | | | | (1,663 | ) |
| Futures Contracts | | | (90,056 | ) | | | — | | | | — | | | | (90,056 | ) |
| Centrally Cleared Interest Rate Swap Contracts | | | — | | | | (83,788 | ) | | | — | | | | (83,788 | ) |
| Over-The-Counter Interest Rate and Inflation Swap Contracts | | | — | | | | (41,906 | ) | | | — | | | | (41,906 | ) |
| Over-The-Counter Credit Default Swap Contracts | | | — | | | | (2,713 | ) | | | — | | | | (2,713 | ) |
| Total Financial Derivative Instruments | | $ | (94,250 | ) | | $ | (188,575 | ) | | $ | — | | | $ | (282,825 | ) |
* These investments are recorded at the unrealized gain or loss on the investment.
During the period ended January 31, 2014, there were no transfers in or out of security levels as a result of the fair value pricing procedures established by the Board.
See notes to financial statements
This page intentionally left blank.
| Financial statements (unaudited) |
Statements of assets and liabilities
January 31, 2014
| | | | | | | | | | | |
| | | | | | | Dividend | | | Emerging | |
| | | | All | | | & Income | | | Markets | |
| | | | Asset | | | Builder | | | Opportunities | |
| | | | Fund | | | Fund | | | Fund | |
| | | | | | | | | | | |
| Assets: | | | | | | | | | | |
| Investments, at fair value | | | | | | | | | | |
| Securities | | $ | 38,455,429 | | $ | 20,371,682 | | $ | 26,341,309 | |
| Affiliated companies, at fair value | | | 4,734,199 | | | — | | | — | |
| Short term investment, at fair value | | | 32,779,083 | | | 624,162 | | | 367,804 | |
| Total investments | | | 75,968,711 | | | 20,995,844 | | | 26,709,113 | |
| Cash | | | — | | | 19,005 | | | — | |
| Foreign cash, at value | | | — | | | 63 | | | 1 | |
| Cash at broker for open futures contracts | | | 1,491,287 | | | — | | | — | |
| Dividends and interest receivable | | | 13,639 | | | 61,666 | | | 31,369 | |
| Receivable for investment securities sold | | | — | | | 56 | | | 416,640 | |
| Receivable for fund shares sold | | | 185,712 | | | 686,600 | | | 272,759 | |
| Unrealized appreciation on open futures contracts | | | 98,146 | | | — | | | — | |
| Unrealized appreciation on forward foreign currency contracts | | | — | | | — | | | — | |
| Prepaid expenses and other assets | | | 11,374 | | | 19,587 | | | 26,868 | |
| Total Assets | | | 77,768,869 | | | 21,782,821 | | | 27,456,750 | |
| | | | | | | | | | | |
| Liabilities: | | | | | | | | | | |
| Payable for investment securities purchased | | | 9,986 | | | 211,533 | | | 105,937 | |
| Payable for fund shares redeemed | | | 125,321 | | | 88,632 | | | 147,690 | |
| Foreign cash overdraft, at value | | | 201,411 | | | — | | | — | |
| Payable to custodian | | | — | | | — | | | 126,227 | |
| Unrealized depreciation on open futures contracts | | | 351,999 | | | — | | | — | |
| Unrealized depreciation on forward foreign currency contracts | | | 91,894 | | | — | | | — | |
| Payable to investment adviser | | | 25,067 | | | 770 | | | 22,403 | |
| Payable for 12b-1 distribution and service fees | | | 11,110 | | | 5,240 | | | 5,417 | |
| Accrued expenses and other payables | | | 32,268 | | | 11,733 | | | 50,483 | |
| Total Liabilities | | | 849,056 | | | 317,908 | | | 458,157 | |
| Net assets | | $ | 76,919,813 | | $ | 21,464,913 | | $ | 26,998,593 | |
| | | | | | | | | | | |
| Net assets consist of: | | | | | | | | | | |
| Paid-in capital | | $ | 75,634,440 | | $ | 20,855,881 | | $ | 30,738,119 | |
| Accumulated undistributed net investment income (loss) | | | (505,029 | ) | | 34,335 | | | (137,993 | ) |
| Accumulated net realized gain (loss) on investments, futures, options contracts, swaps and foreign currency transactions | | | 299,763 | | | 113,537 | | | (4,020,236 | ) |
| Net unrealized appreciation of investments, futures options contracts, swaps and foreign currencies | | | 1,490,639 | | | 461,160 | | | 418,703 | |
| | | $ | 76,919,813 | | $ | 21,464,913 | | $ | 26,998,593 | |
See notes to financial statements
| Financial statements (unaudited) |
Statements of assets and liabilities
January 31, 2014 (continued)
| | | | | | | | | | | | | | | | | |
| | | | European | | | Global Equity | | | Global | | | High Yield | | | International | |
| | | | Focus | | | Income | | | Technology | | | Opportunities | | | Opportunities | |
| | | | Fund | | | Fund | | | Fund | | | Fund | | | Fund | |
| | | | | | | | | | | | | | | | | |
| | | $ | 1,636,490,317 | | $ | 2,553,746,870 | | $ | 364,437,769 | | $ | 24,774,017 | | $ | 3,423,516,716 | |
| | | | — | | | — | | | — | | | — | | | — | |
| | | | 62,655,648 | | | — | | | 15,155,539 | | | 1,617,464 | | | 170,864,320 | |
| | | | 1,699,145,965 | | | 2,553,746,870 | | | 379,593,308 | | | 26,391,481 | | | 3,594,381,036 | |
| | | | — | | | — | | | — | | | — | | | — | |
| | | | 204,676 | | | 17,795,537 | | | 7 | | | — | | | 755,960 | |
| | | | — | | | — | | | — | | | — | | | — | |
| | | | 695,505 | | | 12,407,410 | | | 192,142 | | | 530,881 | | | 5,339,476 | |
| | | | 30,946,140 | | | 82,998,439 | | | 4,338,722 | | | 702,650 | | | 16,093,156 | |
| | | | 28,843,792 | | | 16,270,872 | | | 1,456,235 | | | — | | | 17,462,172 | |
| | | | — | | | — | | | — | | | — | | | — | |
| | | | 1,537,110 | | | 505,740 | | | — | | | — | | | 6,191,164 | |
| | | | 113,639 | | | 96,769 | | | 36,687 | | | 25,098 | | | 112,658 | |
| | | | 1,761,486,827 | | | 2,683,821,637 | | | 385,617,101 | | | 27,650,110 | | | 3,640,335,622 | |
| | | | | | | | | | | | | | | | | |
| | | | 42,614,719 | | | 47,621,922 | | | 5,692,737 | | | 695,000 | | | 26,893,544 | |
| | | | 4,457,591 | | | 3,693,342 | | | 834,814 | | | — | | | 3,623,534 | |
| | | | — | | | — | | | — | | | — | | | — | |
| | | | — | | | 6,550,616 | | | — | | | — | | | — | |
| | | | — | | | — | | | — | | | — | | | — | |
| | | | 34,043 | | | — | | | — | | | — | | | 1,512,312 | |
| | | | 1,292,149 | | | 1,600,682 | | | 326,188 | | | 4,513 | | | 2,880,066 | |
| | | | 323,985 | | | 867,885 | | | 118,613 | | | 1,132 | | | 851,352 | |
| | | | 336,851 | | | 575,934 | | | 113,657 | | | 31,120 | | | 994,968 | |
| | | | 49,059,338 | | | 60,910,381 | | | 7,086,009 | | | 731,765 | | | 36,755,776 | |
| | | $ | 1,712,427,489 | | $ | 2,622,911,256 | | $ | 378,531,092 | | $ | 26,918,345 | | $ | 3,603,579,846 | |
| | | | | | | | | | | | | | | | | |
| | | | | | | | | | | | | | | | | |
| | | $ | 1,747,121,013 | | $ | 2,631,022,767 | | $ | 273,434,916 | | $ | 26,278,658 | | $ | 3,576,694,804 | |
| | | | (4,687,952 | ) | | (4,170,254 | ) | | (2,259,415 | ) | | 11,229 | | | (7,148,932 | ) |
| | | | (141,942,942 | ) | | (113,572,321 | ) | | 362,987 | | | 102,020 | | | (532,811,342 | ) |
| | | | 111,937,370 | | | 109,631,064 | | | 106,992,604 | | | 526,438 | | | 566,845,316 | |
| | | $ | 1,712,427,489 | | $ | 2,622,911,256 | | $ | 378,531,092 | | $ | 26,918,345 | | $ | 3,603,579,846 | |
See notes to financial statements
| Financial statements (unaudited) |
Statements of assets and liabilities
January 31, 2014 (continued)
| | | | | | | | | | | |
| | | | | | | Dividend | | | Emerging | |
| | | | All | | | & Income | | | Markets | |
| | | | Asset | | | Builder | | | Opportunities | |
| | | | Fund | | | Fund | | | Fund | |
| | | | | | | | | | | |
| Net assets: | | | | | | | | | | |
| Class A Shares | | $ | 10,248,369 | | $ | 14,607,755 | | $ | 9,350,642 | |
| Class B Shares | | | N/A | | | N/A | | | N/A | |
| Class C Shares | | $ | 10,312,958 | | $ | 2,625,736 | | $ | 3,494,978 | |
| Class I Shares | | $ | 56,358,486 | | $ | 4,231,422 | | $ | 14,152,973 | |
| Class R Shares | | | N/A | | | N/A | | | N/A | |
| | | | | | | | | | | |
| Shares outstanding: | | | | | | | | | | |
| Class A Shares (unlimited number of shares authorized) | | | 989,075 | | | 1,220,448 | | | 1,092,863 | |
| Class B Shares (unlimited number of shares authorized) | | | N/A | | | N/A | | | N/A | |
| Class C Shares (unlimited number of shares authorized) | | | 1,003,717 | | | 220,681 | | | 415,828 | |
| Class I Shares (unlimited number of shares authorized) | | | 5,441,791 | | | 353,611 | | | 1,650,567 | |
| Class R Shares (unlimited number of shares authorized) | | | N/A | | | N/A | | | N/A | |
| | | | | | | | | | | |
| Class A shares: | | | | | | | | | | |
| Net asset value and redemption price per share | | $ | 10.36 | | $ | 11.97 | | $ | 8.56 | |
| Maximum sales charge* | | | 5.75 | % | | 5.00 | % | | 5.75 | % |
| Maximum offering price per share | | $ | 10.99 | | $ | 12.60 | | $ | 9.08 | |
| | | | | | | | | | | |
| Class B shares: | | | | | | | | | | |
| Net asset value and offering price per share | | | N/A | | | N/A | | | N/A | |
| | | | | | | | | | | |
| Class C shares: | | | | | | | | | | |
| Net asset value and offering price per share | | $ | 10.27 | | $ | 11.90 | | $ | 8.40 | |
| | | | | | | | | | | |
| Class I shares: | | | | | | | | | | |
| Net asset value and offering price per share | | $ | 10.36 | | $ | 11.97 | | $ | 8.57 | |
| | | | | | | | | | | |
| Class R shares: | | | | | | | | | | |
| Net asset value and offering price per share | | | N/A | | | N/A | | | N/A | |
| Investments, at cost | | $ | 74,136,798 | | $ | 20,535,170 | | $ | 26,289,271 | |
| Foreign cash, at cost | | $ | (206,113 | ) | $ | 63 | | $ | 1 | |
* On purchases of $50,000 or more, the sales charge may be reduced as outlined in the Prospectus.
See notes to financial statements
| Financial statements (unaudited) |
Statements of assets and liabilities
January 31, 2014 (continued)
| | | | | | | | | | | | | | | | | |
| | | | European | | | Global Equity | | | Global | | | High Yield | | | International | |
| | | | Focus | | | Income | | | Technology | | | Opportunities | | | Opportunities | |
| | | | Fund | | | Fund | | | Fund | | | Fund | | | Fund | |
| | | | | | | | | | | | | | | | | |
| | | | | | | | | | | | | | | | | |
| | | $ | 719,110,964 | | $ | 862,374,711 | | $ | 180,183,523 | | $ | 1,222,285 | | $ | 1,937,207,987 | |
| | | $ | 16,696,275 | | | N/A | | $ | 9,185,663 | | | N/A | | $ | 36,372,352 | |
| | | $ | 197,913,603 | | $ | 797,458,924 | | $ | 81,869,520 | | $ | 1,044,372 | | $ | 471,738,897 | |
| | | $ | 778,706,647 | | $ | 963,077,621 | | $ | 107,292,386 | | $ | 24,651,688 | | $ | 1,149,714,045 | |
| | | | N/A | | | N/A | | | N/A | | | N/A | | | 8,546,565 | |
| | | | | | | | | | | | | | | | | |
| | | | | | | | | | | | | | | | | |
| | | | 21,101,262 | | | 107,782,995 | | | 6,913,548 | | | 119,071 | | | 74,327,713 | |
| | | | 517,460 | | | N/A | | | 386,764 | | | N/A | | | 1,483,425 | |
| | | | 6,145,664 | | | 100,174,928 | | | 3,450,723 | | | 101,713 | | | 19,233,792 | |
| | | | 22,841,741 | | | 120,194,279 | | | 4,062,230 | | | 2,407,792 | | | 44,094,039 | |
| | | | N/A | | | N/A | | | N/A | | | N/A | | | 332,399 | |
| | | | | | | | | | | | | | | | | |
| | | | | | | | | | | | | | | | | |
| | | $ | 34.08 | | $ | 8.00 | | $ | 26.06 | | $ | 10.27 | | $ | 26.06 | |
| | | | 5.75 | % | | 5.75 | % | | 5.75 | % | | 4.75 | % | | 5.75 | % |
| | | $ | 36.16 | | $ | 8.49 | | $ | 27.65 | | $ | 10.78 | | $ | 27.65 | |
| | | | | | | | | | | | | | | | | |
| | | | | | | | | | | | | | | | | |
| | | $ | 32.27 | | | N/A | | $ | 23.75 | | | N/A | | $ | 24.52 | |
| | | | | | | | | | | | | | | | | |
| | | | | | | | | | | | | | | | | |
| | | $ | 32.20 | | $ | 7.96 | | $ | 23.73 | | $ | 10.27 | | $ | 24.53 | |
| | | | | | | | | | | | | | | | | |
| | | | | | | | | | | | | | | | | |
| | | $ | 34.09 | | $ | 8.01 | | $ | 26.41 | | $ | 10.24 | | $ | 26.07 | |
| | | | | | | | | | | | | | | | | |
| | | | | | | | | | | | | | | | | |
| | | | N/A | | | N/A | | | N/A | | | N/A | | $ | 25.71 | |
| | | $ | 1,588,667,914 | | $ | 2,444,031,998 | | $ | 272,599,670 | | $ | 25,865,043 | | $ | 3,032,212,631 | |
| | | $ | 205,622 | | $ | 18,344,794 | | $ | 7 | | $ | — | | $ | 755,512 | |
See notes to financial statements
| Financial statements (unaudited) |
Statements of assets and liabilities
January 31, 2014 (continued)
| | | | | | | | |
| | | | Strategic | | | | |
| | | | Income | | | Unconstrained | |
| | | | Fund | | | Bond Fund | |
| | | | | | | | |
| Assets: | | | | | | | |
| Investments, at fair value | | | | | | | |
| Securities | | $ | 37,278,948 | | $ | 22,347,823 | |
| Short term investment, at fair value | | | 1,643,925 | | | 1,873,067 | |
| Total investments | | | 38,922,873 | | | 24,220,890 | |
| Cash | | | 1,705 | | | — | |
| Foreign cash, at value | | | — | | | 850,739 | |
| Cash at broker for open futures contracts | | | 184,630 | | | 47,997 | |
| Cash at broker for open swap contracts | | | 5,304 | | | 250,790 | |
| Receivable for variation margin on open swap contracts | | | — | | | 35,093 | |
| Dividends and interest receivable | | | 830,193 | | | 289,205 | |
| Receivable for investment securities sold | | | — | | | 836,753 | |
| Receivable for fund shares sold | | | 63,062 | | | — | |
| Receivable from investment adviser | | | — | | | 270 | |
| Foreign cash at broker for open futures contracts | | | — | | | 574 | |
| Unrealized appreciation on open futures contracts | | | 67,143 | | | 57,133 | |
| Unrealized appreciation on forward foreign currency contracts | | | 65,276 | | | 194,845 | |
| Unrealized appreciation on open swap contracts | | | 50,050 | | | 78,858 | |
| Credit default swap contracts premiums paid | | | 99,486 | | | 22,682 | |
| Prepaid expenses and other assets | | | 21,252 | | | 84,096 | |
| Total Assets | | | 40,310,974 | | | 26,969,925 | |
| | | | | | | | |
| Liabilities: | | | | | | | |
| Payable for investment securities purchased | | | 227,121 | | | 1,626,745 | |
| Payable for fund shares redeemed | | | 86,562 | | | — | |
| Foreign cash overdraft, at value | | | 16,521 | | | — | |
| Credit default swap contracts premiums received | | | 30,982 | | | — | |
| Unrealized depreciation on open futures contracts | | | — | | | 90,056 | |
| Options written, at value (premium received $14,080) | | | — | | | 18,169 | |
| Payable for interest rate swap agreements terminated | | | — | | | 20,324 | |
| Unrealized depreciation on open swap contracts | | | 1,415 | | | 128,407 | |
| Unrealized depreciation on forward foreign currency contracts | | | — | | | 58,505 | |
| Payable to investment adviser | | | 5,231 | | | — | |
| Payable for 12b-1 distribution and service fees | | | 21,496 | | | 1,064 | |
| Accrued expenses and other payables | | | 52,444 | | | 9,314 | |
| Total Liabilities | | | 441,772 | | | 1,952,584 | |
| Net assets | | $ | 39,869,202 | | $ | 25,017,341 | |
| | | | | | | | |
| Net assets consist of: | | | | | | | |
| Paid-in capital | | $ | 76,575,085 | | $ | 25,001,877 | |
| Accumulated undistributed net investment income | | | 13,247 | | | 22,330 | |
| Accumulated net realized loss on investments, futures, options contracts, swaps and foreign currency transactions | | | (37,077,630 | ) | | (19,583 | ) |
| Net unrealized appreciation of investments, futures, options contracts, swaps and foreign currencies | | | 358,500 | | | 12,717 | |
| | | $ | 39,869,202 | | $ | 25,017,341 | |
See notes to financial statements
| Financial statements (unaudited) |
Statements of assets and liabilities
January 31, 2014 (continued)
| | | | | | | | |
| | | | Strategic | | | | |
| | | | Income | | | Unconstrained | |
| | | | Fund | | | Bond Fund | |
| | | | | | | | |
| Net assets: | | | | | | | |
| Class A Shares | | $ | 10,981,766 | | $ | 1,000,612 | |
| Class B Shares | | $ | 5,030,029 | | | N/A | |
| Class C Shares | | $ | 17,163,476 | | $ | 1,000,571 | |
| Class I Shares | | $ | 6,693,931 | | $ | 23,016,158 | |
| | | | | | | | |
| Shares outstanding: | | | | | | | |
| Class A Shares (unlimited number of shares authorized) | | | 1,209,751 | | | 100,000 | |
| Class B Shares (unlimited number of shares authorized) | | | 552,689 | | | N/A | |
| Class C Shares (unlimited number of shares authorized) | | | 1,899,126 | | | 100,000 | |
| Class I Shares (unlimited number of shares authorized) | | | 739,308 | | | 2,300,187 | |
| | | | | | | | |
| Class A shares: | | | | | | | |
| Net asset value and redemption price per share | | $ | 9.08 | | $ | 10.01 | |
| Maximum sales charge* | | | 4.75 | % | | 4.75 | % |
| Maximum offering price per share | | $ | 9.53 | | $ | 10.51 | |
| | | | | | | | |
| Class B shares: | | | | | | | |
| Net asset value and offering price per share | | $ | 9.10 | | | N/A | |
| | | | | | | | |
| Class C shares: | | | | | | | |
| Net asset value and offering price per share | | $ | 9.04 | | $ | 10.01 | |
| | | | | | | | |
| Class I shares: | | | | | | | |
| Net asset value and offering price per share | | $ | 9.05 | | $ | 10.01 | |
| Investments, at cost | | $ | 38,749,684 | | $ | 24,252,221 | |
| Foreign cash, at cost | | $ | (15,715 | ) | $ | 854,217 | |
* On purchases of $50,000 or more, the sales charge may be reduced as outlined in the Prospectus.
See notes to financial statements
| Financial statements (unaudited) |
Statements of operations
For the six months ended January 31, 2014
| | | | | | | | | | | |
| | | | | | | | | | Emerging | |
| | | | All | | | & Income | | | Markets | |
| | | | Asset | | | Builder | | | Opportunities | |
| | | | Fund | | | Fund | | | Fund | |
| | | | | | | | | | | |
| Investment income: | | | | | | | | | | |
| Dividends | | $ | 615,280 | | $ | 108,270 | | $ | 157,870 | |
| Dividends from affiliated companies | | | 63,819 | | | — | | | — | |
| Interest | | | 4,714 | | | 48,482 | | | — | |
| Foreign taxes withheld | | | — | | | (4,299 | ) | | (18,186 | ) |
| Total Investment Income | | | 683,813 | | | 152,453 | | | 139,684 | |
| | | | | | | | | | | |
| Expenses: | | | | | | | | | | |
| Investment advisory fees | | | 143,992 | | | 50,513 | | | 134,426 | |
| 12b-1 distribution and service fees: | | | | | | | | | | |
| Class A Shares | | | 12,973 | | | 11,430 | | | 13,011 | |
| Class B Shares | | | — | | | — | | | — | |
| Class C Shares | | | 50,934 | | | 8,352 | | | 17,438 | |
| Class R Shares | | | — | | | — | | | — | |
| Sub-accounting fees: | | | | | | | | | | |
| Class A Shares | | | 4,692 | | | 1,081 | | | 5,382 | |
| Class B Shares | | | — | | | — | | | — | |
| Class C Shares | | | 3,772 | | | 396 | | | 1,909 | |
| Class I Shares | | | 5,612 | | | 607 | | | 2,346 | |
| Class R Shares | | | — | | | — | | | — | |
| Transfer agent fees: | | | | | | | | | | |
| Class A Shares | | | 1,099 | | | 365 | | | 1,056 | |
| Class B Shares | | | — | | | — | | | — | |
| Class C Shares | | | 918 | | | 168 | | | 477 | |
| Class I Shares | | | 5,027 | | | 506 | | | 1,228 | |
| Class R Shares | | | — | | | — | | | — | |
| Registration and filing fees | | | 21,886 | | | 20,021 | | | 19,546 | |
| Audit fees | | | 17,597 | | | 17,597 | | | 17,597 | |
| Administrative fees | | | 8,999 | | | 1,684 | | | 3,361 | |
| Custodian fees | | | 3,832 | | | 16,522 | | | 21,872 | |
| Printing and postage fees | | | 3,359 | | | — | | | 2,018 | |
| Legal fees | | | 2,738 | | | — | | | 557 | |
| Trustees’ fees and expenses | | | 1,913 | | | 61 | | | 704 | |
| Accounting fees | | | 1,364 | | | 7,485 | | | 7,205 | |
| Compliance officer fees | | | 1,108 | | | 113 | | | 373 | |
| Deferred offering costs | | | — | | | 166 | | | — | |
| Miscellaneous fees | | | 3,754 | | | 7,295 | | | 10,496 | |
| Total Expenses | | | 295,569 | | | 144,362 | | | 261,002 | |
| Fees waived and/or expenses reimbursed by investment adviser | | | (16,268 | ) | | (53,862 | ) | | (23,537 | ) |
| Net Expenses | | | 279,301 | | | 90,500 | | | 237,465 | |
| Net investment income/(loss) | | | 404,512 | | | 61,953 | | | (97,781 | ) |
See notes to financial statements
| Financial statements (unaudited) |
Statements of operations
For the six months ended January 31, 2014 (continued)
| | | | | | | | | | | | | | | | | |
| | | | European | | | Global Equity | | | Global | | | High Yield | | | International | |
| | | | Focus | | | Income | | | Technology | | | Opportunities | | | Opportunities | |
| | | | Fund | | | Fund | | | Fund | | | Fund | | | Fund | |
| | | | | | | | | | | | | | | | | |
| | | | | | | | | | | | | | | | | |
| | | $ | 5,069,506 | | $ | 72,951,812 | | $ | 1,438,504 | | $ | 31,272 | | $ | 17,155,591 | |
| | | | — | | | — | | | — | | | — | | | — | |
| | | | — | | | 742 | | | — | | | 919,048 | | | — | |
| | | | (197,399 | ) | | (5,187,581 | ) | | (21,447 | ) | | — | | | (1,077,819 | ) |
| | | | 4,872,107 | | | 67,764,973 | | | 1,417,057 | | | 950,320 | | | 16,077,772 | |
| | | | | | | | | | | | | | | | | |
| | | | | | | | | | | | | | | | | |
| | | | 5,600,858 | | | 8,600,772 | | | 1,847,800 | | | 85,766 | | | 15,563,884 | |
| | | | | | | | | | | | | | | | | |
| | | | 621,013 | | | 1,018,749 | | | 220,926 | | | 1,435 | | | 2,140,518 | |
| | | | 85,210 | | | — | | | 47,965 | | | — | | | 196,939 | |
| | | | 743,591 | | | 3,551,424 | | | 390,255 | | | 5,118 | | | 2,296,227 | |
| | | | — | | | — | | | — | | | — | | | 19,803 | |
| | | | | | | | | | | | | | | | | |
| | | | 181,561 | | | 269,950 | | | 67,160 | | | 920 | | | 734,900 | |
| | | | 12,144 | | | — | | | 6,831 | | | — | | | 32,200 | |
| | | | 67,438 | | | 251,325 | | | 38,272 | | | 920 | | | 282,288 | |
| | | | 161,323 | | | 230,175 | | | 38,364 | | | 920 | | | 353,200 | |
| | | | — | | | — | | | — | | | — | | | 5,114 | |
| | | | | | | | | | | | | | | | | |
| | | | 43,983 | | | 73,776 | | | 18,869 | | | — | | | 154,172 | |
| | | | 2,403 | | | — | | | 1,100 | | | — | | | 4,973 | |
| | | | 13,623 | | | 58,086 | | | 8,027 | | | — | | | 47,913 | |
| | | | 30,530 | | | 64,827 | | | 9,092 | | | 1,889 | | | 79,706 | |
| | | | — | | | — | | | — | | | — | | | 1,078 | |
| | | | 136,609 | | | 123,110 | | | 30,317 | | | 8,213 | | | 111,490 | |
| | | | 17,597 | | | 17,597 | | | 17,597 | | | 17,584 | | | 18,605 | |
| | | | 148,748 | | | 295,364 | | | 46,195 | | | 3,299 | | | 405,868 | |
| | | | 90,847 | | | 151,885 | | | 12,868 | | | 3,900 | | | 253,483 | |
| | | | 60,791 | | | 122,735 | | | 23,449 | | | 979 | | | 193,742 | |
| | | | 23,289 | | | 54,361 | | | 8,225 | | | 2,072 | | | 65,394 | |
| | | | 27,172 | | | 67,809 | | | 9,752 | | | 440 | | | 83,629 | |
| | | | 7,181 | | | 7,406 | | | 6,871 | | | 2,095 | | | 7,125 | |
| | | | 15,184 | | | 33,985 | | | 5,313 | | | 121 | | | 47,945 | |
| | | | — | | | — | | | — | | | 37,779 | | | — | |
| | | | 36,906 | | | 83,321 | | | 24,831 | | | 17,516 | | | 117,594 | |
| | | | 8,128,001 | | | 15,076,657 | | | 2,880,079 | | | 190,966 | | | 23,217,790 | |
| | | | — | | | — | | | — | | | (72,257 | ) | | — | |
| | | | 8,128,001 | | | 15,076,657 | | | 2,880,079 | | | 118,709 | | | 23,217,790 | |
| | | | (3,255,894 | ) | | 52,688,316 | | | (1,463,022 | ) | | 831,611 | | | (7,140,018 | ) |
See notes to financial statements
| Financial statements (unaudited) |
Statements of operations
For the six months ended January 31, 2014 (continued)
| | | | | | | | | | | |
| | | | | | | | | | Emerging | |
| | | | All | | | & Income | | | Markets | |
| | | | Asset | | | Builder | | | Opportunities | |
| | | | Fund | | | Fund | | | Fund | |
| | | | | | | | | | | |
| Net realized and unrealized gain/(loss): | | | | | | | | | | |
| Net realized gain/(loss) from: | | | | | | | | | | |
| Investment transactions | | | (123,534 | ) | | 118,566 | | | (789,497 | ) |
| Distributions from investment companies(b) | | | 114,096 | | | 496 | | | — | |
| Futures contracts | | | 1,378,523 | | | — | | | — | |
| Swap contracts | | | — | | | — | | | — | |
| Foreign currency transactions | | | (153,256 | ) | | (5,073 | ) | | (33,057 | ) |
| Net change in unrealized appreciation/(depreciation) of: | | | | | | | | | | |
| Investments | | | 898,950 | | | 329,983(a | ) | | 829,496 | |
| Futures contracts | | | (686,545 | ) | | — | | | — | |
| Swap contracts | | | — | | | — | | | — | |
| Translation of other assets and liabilities | | | (150,168 | ) | | 2,121 | | | (1,219 | ) |
| Net Realized and Unrealized Gain | | | 1,278,066 | | | 446,093 | | | 5,723 | |
| Net increase/(decrease) in net assets resulting from operations | | $ | 1,682,578 | | $ | 508,046 | | $ | (92,058 | ) |
| (a) | Includes foreign capital gains tax of $1,436 and $241,589 for Dividend & Income Builder Fund and International Opportunities Fund, respectively. |
| (b) | Includes long-term capital gains distributions from affiliated companies of $13,497 for All Asset Fund. |
See notes to financial statements
| Financial statements (unaudited) |
Statements of operations
For the six months ended January 31, 2014 (continued)
| | | | | | | | | | | | | | | | | |
| | | | European | | | Global Equity | | | Global | | | High Yield | | | International | |
| | | | Focus | | | Income | | | Technology | | | Opportunities | | | Opportunities | |
| | | | Fund | | | Fund | | | Fund | | | Fund | | | Fund | |
| | | | | | | | | | | | | | | | | |
| | | | | | | | | | | | | | | | | |
| | | | | | | | | | | | | | | | | |
| | | | 110,637,549 | | | 72,242,637 | | | 14,914,380 | | | 122,420 | | | 197,342,354 | |
| | | | — | | | — | | | — | | | — | | | — | |
| | | | — | | | — | | | — | | | — | | | — | |
| | | | — | | | — | | | — | | | 10,271 | | | — | |
| | | | (3,214,711 | ) | | (20,296,814 | ) | | (164,636 | ) | | (736 | ) | | (9,610,411 | ) |
| | | | | | | | | | | | | | | | | |
| | | | 36,925,643 | | | (23,557,891 | ) | | 30,459,398 | | | 716,426 | | | 86,819,581(a | ) |
| | | | — | | | — | | | — | | | — | | | — | |
| | | | — | | | — | | | — | | | (6,586 | ) | | — | |
| | | | 2,897,536 | | | 4,097,758 | | | 39,846 | | | (311 | ) | | 15,779,217 | |
| | | | 147,246,017 | | | 32,485,690 | | | 45,248,988 | | | 841,484 | | | 290,330,741 | |
| | | $ | 143,990,123 | | $ | 85,174,006 | | $ | 43,785,966 | | $ | 1,673,095 | | $ | 283,190,723 | |
See notes to financial statements
| Financial statements (unaudited) |
Statements of operations
For the six months ended January 31, 2014 (continued)
| | | | | | | | |
| | | | Strategic | | | | |
| | | | Income | | | Unconstrained | |
| | | | Fund | | | Bond Fund | * |
| | | | | | | | |
| Investment income: | | | | | | | |
| Dividends | | $ | 6,915 | | $ | 1,872 | |
| Interest | | | 1,392,951 | | | 77,846 | |
| Total Investment Income | | | 1,399,866 | | | 79,718 | |
| | | | | | | | |
| Expenses: | | | | | | | |
| Investment advisory fees | | | 124,030 | | | 18,739 | |
| 12b-1 distribution and service fees: | | | | | | | |
| Class A Shares | | | 17,862 | | | 288 | |
| Class B Shares | | | 27,892 | | | — | |
| Class C Shares | | | 91,345 | | | 1,153 | |
| Sub-accounting fees: | | | | | | | |
| Class A Shares | | | 5,152 | | | — | |
| Class B Shares | | | 3,956 | | | — | |
| Class C Shares | | | 9,292 | | | — | |
| Class I Shares | | | 897 | | | — | |
| Transfer agent fees: | | | | | | | |
| Class A Shares | | | 2,000 | | | 21 | |
| Class B Shares | | | 623 | | | — | |
| Class C Shares | | | 2,136 | | | 21 | |
| Class I Shares | | | 709 | | | 378 | |
| Registration and filing fees | | | 32,226 | | | 1,050 | |
| Printing and postage fees | | | 9,045 | | | 294 | |
| Audit fees | | | 21,280 | | | 6,366 | |
| Administrative fees | | | 5,638 | | | 721 | |
| Accounting fees | | | 4,938 | | | — | |
| Legal fees | | | 1,475 | | | 210 | |
| Trustees’ fees and expenses | | | 1,171 | | | 126 | |
| Compliance officer fees | | | 460 | | | 544 | |
| Custodian fees | | | 11,118 | | | 2,730 | |
| Deferred offering costs | | | — | | | 11,017 | |
| Organization expense | | | — | | | 26,635 | |
| Miscellaneous fees | | | 28,170 | | | 2,771 | |
| Total Expenses | | | 401,415 | | | 73,064 | |
| Fees waived and/or expenses reimbursed by investment adviser | | | (72,633 | ) | | (45,677 | ) |
| Net Expenses | | | 328,782 | | | 27,387 | |
| Net investment income | | | 1,071,084 | | | 52,331 | |
| | | | | | | | |
| Net realized and unrealized gain/(loss): | | | | | | | |
| Net realized gain/(loss) from: | | | | | | | |
| Investment transactions | | | 575,966 | | | (51,029 | ) |
| Futures contracts | | | 119,635 | | | 27,205 | |
| Swap contracts | | | 64,586 | | | 10,143 | |
| Foreign currency transactions | | | (1,800,650 | ) | | (5,902 | ) |
| Net change in unrealized appreciation/(depreciation) of: | | | | | | | |
| Investments | | | 1,229,451 | | | (31,331 | ) |
| Futures contracts | | | 94,154 | | | (32,923 | ) |
| Written options contracts | | | — | | | (4,089 | ) |
| Swap contracts | | | 63,987 | | | (49,549 | ) |
| Translation of other assets and liabilities | | | 404,480 | | | 130,609 | |
| Net Realized and Unrealized Gain/(Loss) | | | 751,609 | | | (6,866 | ) |
| Net increase in net assets resulting from operations | | $ | 1,822,693 | | $ | 45,465 | |
| * | Fund commenced operations on December 20, 2013. |
See notes to financial statements
| Financial statements (unaudited) |
Statements of changes in net assets
All Asset Fund
| | | | | | | | |
| | | | Six Months | | | | |
| | | | Ended | | | Year Ended | |
| | | | January 31, 2014 | | | July 31, 2013 | |
| | | | | | | | |
| Net investment income | | $ | 404,512 | | $ | 493,573 | |
| Net realized gain on investments, distributions from investment companies, futures contracts and foreign currency transactions | | | 1,215,829 | | | 1,210,276 | |
| Net change in unrealized appreciation/(depreciation) of investments, futures contracts and foreign currency translations | | | 62,237 | | | 1,530,487 | |
| Net increase in net assets resulting from operations | | | 1,682,578 | | | 3,234,336 | |
| | | | | | | | |
| Distributions to shareholders from net investment income: | | | | | | | |
| Class A Shares | | | (110,882 | ) | | (94,424 | ) |
| Class C Shares | | | (65,035 | ) | | (30,321 | ) |
| Class I Shares | | | (804,147 | ) | | (342,009 | ) |
| Total distributions to shareholders from net investment income | | | (980,064 | ) | | (466,754 | ) |
| | | | | | | | |
| Distributions to shareholders from net realized gains: | | | | | | | |
| Class A Shares | | | (296,403 | ) | | (16,634 | ) |
| Class C Shares | | | (295,843 | ) | | (6,285 | ) |
| Class I Shares | | | (1,507,425 | ) | | (52,932 | ) |
| Total distributions to shareholders from net realized gains | | | (2,099,671 | ) | | (75,851 | ) |
| | | | | | | | |
| Increase/(decrease) from Fund share transactions: | | | | | | | |
| Class A Shares | | | (1,591,424 | ) | | 5,709,941 | |
| Class C Shares | | | 1,106,427 | | | 8,148,340 | |
| Class I Shares | | | 14,201,149 | | | 12,422,210 | |
| Net increase from Fund share transactions: | | | 13,716,152 | | | 26,280,491 | |
| Net increase in net assets | | | 12,318,995 | | | 28,972,222 | |
| | | | | | | | |
| Net assets: | | | | | | | |
| Beginning of period | | | 64,600,818 | | | 35,628,596 | |
| End of period | | $ | 76,919,813 | | $ | 64,600,818 | |
| Accumulated undistributed net investment income/(loss) | | $ | (505,029 | ) | $ | 70,5235 | |
See notes to financial statements
| Financial statements (unaudited) |
Statements of changes in net assets
Dividend & Income Builder Fund
| | | | | | | | |
| | | | Six Months | | | | |
| | | | Ended | | | Period ended | |
| | | | January 31, 2014 | | | July 31, 2013 | * |
| | | | | | | | |
| Net investment income | | $ | 61,953 | | $ | 94,429 | |
| Net realized gain on investments, distributions from investment companies, swap contracts and foreign currency transactions | | | 113,989 | | | 40,716 | |
| Net change in unrealized appreciation/(depreciation) of investments and foreign currency translations | | | 332,104 | | | 129,056 | |
| Net increase in net assets resulting from operations | | | 508,046 | | | 264,201 | |
| | | | | | | | |
| Distributions to shareholders from net investment income: | | | | | | | |
| Class A Shares | | | (85,708 | ) | | (10,916 | ) |
| Class C Shares | | | (14,552 | ) | | (3,446 | ) |
| Class I Shares | | | (32,069 | ) | | (40,177 | ) |
| Total distributions to shareholders from net investment income | | | (132,329 | ) | | (54,539 | ) |
| | | | | | | | |
| Distributions to shareholders from net realized gains: | | | | | | | |
| Class A Shares | | | (26,820 | ) | | — | |
| Class C Shares | | | (4,620 | ) | | — | |
| Class I Shares | | | (6,478 | ) | | — | |
| Total distributions to shareholders from net realized gains | | | (37,918 | ) | | — | |
| | | | | | | | |
| Increase from Fund share transactions: | | | | | | | |
| Class A Shares | | | 12,465,101 | | | 1,865,786 | |
| Class C Shares | | | 2,133,594 | | | 450,282 | |
| Class I Shares | | | 2,710,445 | | | 1,292,244 | |
| Net increase from Fund share transactions: | | | 17,309,140 | | | 3,608,312 | |
| Net increase in net assets | | | 17,646,939 | | | 3,817,974 | |
| | | | | | | | |
| Net assets: | | | | | | | |
| Beginning of period | | | 3,817,974 | | | — | |
| End of period | | $ | 21,464,913 | | $ | 3,817,974 | |
| Accumulated undistributed net investment income | | $ | 34,335 | | $ | 104,711 | |
* Fund commenced operations on August 1, 2012.
See notes to financial statements
| Financial statements (unaudited) |
Statements of changes in net assets
Emerging Markets Opportunities Fund
| | | | | | | | |
| | | | Six Months | | | | |
| | | | Ended | | | Year Ended | |
| | | | January 31, 2014 | | | July 31, 2013 | |
| | | | | | | | |
| Net investment income/(loss) | | $ | (97,781 | ) | $ | 30,429 | |
| Net realized gain/(loss) on investments and foreign currency transactions | | | (822,554 | ) | | 252,081 | |
| Net change in unrealized appreciation/(depreciation) of investments and foreign currency translations | | | 828,277 | | | 398,440 | |
| Net increase/(decrease) in net assets resulting from operations | | | (92,058 | ) | | 680,950 | |
| | | | | | | | |
| Distributions to shareholders from net investment income: | | | | | | | |
| Class A Shares | | | — | | | (50,326 | ) |
| Class C Shares | | | — | | | (6,619 | ) |
| Class I Shares | | | — | | | (106,840 | ) |
| Total distributions to shareholders from net investment income | | | — | | | (163,785 | ) |
| | | | | | | | |
| Increase from Fund share transactions: | | | | | | | |
| Class A Shares | | | 355,018 | | | 1,592,717 | |
| Class C Shares | | | 324,850 | | | 805,110 | |
| Class I Shares | | | 3,539,597 | | | 2,915,230 | |
| Net increase from Fund share transactions: | | | 4,219,465 | | | 5,313,057 | |
| Net increase in net assets | | | 4,127,407 | | | 5,830,222 | |
| | | | | | | | |
| Net assets: | | | | | | | |
| Beginning of period | | | 22,871,186 | | | 17,040,964 | |
| End of period | | $ | 26,998,593 | | $ | 22,871,186 | |
| Accumulated undistributed net investment loss | | $ | (137,993 | ) | $ | (40,212 | ) |
See notes to financial statements
| Financial statements (unaudited) |
Statements of changes in net assets
European Focus Fund
| | | | | | | | |
| | | | Six Months | | | | |
| | | | Ended | | | Year Ended | |
| | | | January 31, 2014 | | | July 31, 2013 | |
| | | | | | | | |
| Net investment income/(loss) | | $ | (3,255,894 | ) | $ | 5,800,412 | |
| Net realized gain on investments and foreign currency transactions | | | 107,422,838 | | | 39,921,596 | |
| Net change in unrealized appreciation/(depreciation) of investments, options contracts and foreign currency translations | | | 39,823,179 | | | 110,647,521 | |
| Net increase in net assets resulting from operations | | | 143,990,123 | | | 156,369,529 | |
| | | | | | | | |
| Distributions to shareholders from net investment income: | | | | | | | |
| Class A Shares | | | (1,300,114 | ) | | (3,862,742 | ) |
| Class B Shares | | | — | | | (77,089 | ) |
| Class C Shares | | | — | | | (655,390 | ) |
| Class I Shares | | | (2,410,152 | ) | | (2,990,865 | ) |
| Total distributions to shareholders from net investment income | | | (3,710,266 | ) | | (7,586,086 | ) |
| | | | | | | | |
| Increase/(decrease) from Fund share transactions: | | | | | | | |
| Class A Shares | | | 342,070,440 | | | 10,265,885 | |
| Class B Shares | | | (2,867,809 | ) | | (7,619,811 | ) |
| Class C Shares | | | 75,039,334 | | | (8,815,524 | ) |
| Class I Shares | | | 452,612,012 | | | 97,569,948 | |
| Net increase from Fund share transactions: | | | 866,853,977 | | | 91,400,498 | |
| Net increase in net assets | | | 1,007,133,834 | | | 240,183,941 | |
| | | | | | | | |
| Net assets: | | | | | | | |
| Beginning of period | | | 705,293,655 | | | 465,109,714 | |
| End of period | | $ | 1,712,427,489 | | $ | 705,293,655 | |
| Accumulated undistributed net investment income/(loss) | | $ | (4,687,952 | ) | $ | 2,278,208 | |
See notes to financial statements
| Financial statements (unaudited) |
Statements of changes in net assets
Global Equity Income Fund
| | | | | | | | |
| | | | Six Months | | | | |
| | | | Ended | | | Year Ended | |
| | | | January 31, 2014 | | | July 31, 2013 | |
| | | | | | | | |
| Net investment income | | $ | 52,688,316 | | $ | 97,478,765 | |
| Net realized gain on investments and foreign currency transactions | | | 51,945,823 | | | 72,318,489 | |
| Net change in unrealized appreciation/(depreciation) of investments and foreign currency translations | | | (19,460,133 | ) | | 74,768,920 | |
| Net increase in net assets resulting from operations | | | 85,174,006 | | | 244,566,174 | |
| | | | | | | | |
| Distributions to shareholders from net investment income: | | | | | | | |
| Class A Shares | | | (20,514,632 | ) | | (37,792,159 | ) |
| Class C Shares | | | (15,402,441 | ) | | (26,916,004 | ) |
| Class I Shares | | | (22,306,998 | ) | | (33,218,170 | ) |
| Total distributions to shareholders from net investment income | | | (58,224,071 | ) | | (97,926,333 | ) |
| | | | | | | | |
| Increase from Fund share transactions: | | | | | | | |
| Class A Shares | | | 143,970,180 | | | 182,850,123 | |
| Class C Shares | | | 202,325,801 | | | 179,088,816 | |
| Class I Shares | | | 289,531,317 | | | 288,439,474 | |
| Net increase from Fund share transactions: | | | 635,827,298 | | | 650,378,413 | |
| Net increase in net assets | | | 662,777,233 | | | 797,018,254 | |
| | | | | | | | |
| Net assets: | | | | | | | |
| Beginning of period | | | 1,960,134,023 | | | 1,163,115,769 | |
| End of period | | $ | 2,622,911,256 | | $ | 1,960,134,023 | |
| Accumulated undistributed net investment income/(loss) | | $ | (4,170,254 | ) | $ | 1,365,501 | |
See notes to financial statements
| Financial statements (unaudited) |
Statements of changes in net assets
Global Technology Fund
| | | | | | | | |
| | | | Six Months | | | | |
| | | | Ended | | | Year Ended | |
| | | | January 31, 2014 | | | July 31, 2013 | |
| | | | | | | | |
| Net investment income/(loss) | | $ | (1,463,022 | ) | $ | 498,814 | |
| Net realized gain on investments and foreign currency transactions | | | 14,749,744 | | | 16,723,973 | |
| Net change in unrealized appreciation/(depreciation) of investments and foreign currency translations | | | 30,499,244 | | | 35,136,486 | |
| Net increase in net assets resulting from operations | | | 43,785,966 | | | 52,359,273 | |
| | | | | | | | |
| Distributions to shareholders from net realized gains: | | | | | | | |
| Class A Shares | | | (1,157,738 | ) | | — | |
| Class B Shares | | | (68,522 | ) | | — | |
| Class C Shares | | | (575,039 | ) | | — | |
| Class I Shares | | | (664,636 | ) | | — | |
| Total distributions to shareholders from net realized gains | | | (2,465,935 | ) | | — | |
| | | | | | | | |
| Increase/(decrease) from Fund share transactions: | | | | | | | |
| Class A Shares | | | (8,899,612 | ) | | (14,144,029 | ) |
| Class B Shares | | | (1,121,120 | ) | | (1,971,719 | ) |
| Class C Shares | | | 2,111,927 | | | (8,905,587 | ) |
| Class I Shares | | | (2,691,381 | ) | | 22,996,125 | |
| Net decrease from Fund share transactions: | | | (10,600,186 | ) | | (2,025,210 | ) |
| Net increase in net assets | | | 30,719,845 | | | 50,334,063 | |
| | | | | | | | |
| Net assets: | | | | | | | |
| Beginning of period | | | 347,811,247 | | | 297,477,184 | |
| End of period | | $ | 378,531,092 | | $ | 347,811,247 | |
| Accumulated undistributed net investment loss | | $ | (2,259,415 | ) | $ | (796,393 | ) |
See notes to financial statements
| Financial statements (unaudited) |
Statements of changes in net assets
High Yield Opportunities Fund
| | | | | | | | |
| | | | Six Months | | | | |
| | | | Ended | | | Period ended | |
| | | | January 31, 2014 | | | July 31, 2013 | * |
| | | | | | | | |
| Net investment income | | $ | 831,611 | | $ | 363,231 | |
| Net realized gain on investments, swap contracts and foreign currency transactions | | | 131,955 | | | 73,215 | |
| Net change in unrealized appreciation/(depreciation) of investments, swap contracts and foreign currency translations | | | 709,529 | | | (183,091 | ) |
| Net increase in net assets resulting from operations | | | 1,673,095 | | | 253,355 | |
| | | | | | | | |
| Distributions to shareholders from net investment income: | | | | | | | |
| Class A Shares | | | (37,422 | ) | | (12,054 | ) |
| Class C Shares | | | (29,260 | ) | | (9,024 | ) |
| Class I Shares | | | (833,316 | ) | | (318,923 | ) |
| Total distributions to shareholders from net investment income | | | (899,998 | ) | | (340,001 | ) |
| | | | | | | | |
| Distributions to shareholders from net realized gains: | | | | | | | |
| Class A Shares | | | (2,814 | ) | | — | |
| Class C Shares | | | (2,548 | ) | | — | |
| Class I Shares | | | (60,291 | ) | | — | |
| Total distributions to shareholders from net realized gains | | | (65,653 | ) | | — | |
| | | | | | | | |
| Increase from Fund share transactions: | | | | | | | |
| Class A Shares | | | 64,314 | | | 1,127,699 | |
| Class C Shares | | | 17,635 | | | 1,000,000 | |
| Class I Shares | | | 395,355 | | | 23,692,544 | |
| Net increase from Fund share transactions: | | | 477,304 | | | 25,820,243 | |
| Net increase in net assets | | | 1,184,748 | | | 25,733,597 | |
| | | | | | | | |
| Net assets: | | | | | | | |
| Beginning of period | | | 25,733,597 | | | — | |
| End of period | | $ | 26,918,345 | | $ | 25,733,597 | |
| Accumulated undistributed net investment income | | $ | 11,229 | | $ | 79,616 | |
* Fund commenced operations on April 30, 2013.
See notes to financial statements
| Financial statements (unaudited) |
Statements of changes in net assets
International Opportunities Fund
| | | | | | | | |
| | | | Six Months | | | | |
| | | | Ended | | | Year Ended | |
| | | | January 31, 2014 | | | July 31, 2013 | |
| | | | | | | | |
| Net investment income/(loss) | | $ | (7,140,018 | ) | $ | 15,633,977 | |
| Net realized gain on investments, options contracts and foreign currency transactions | | | 187,731,943 | | | 161,674,798 | |
| Net change in unrealized appreciation/(depreciation) of investments, options contracts and foreign currency translations | | | 102,598,798 | | | 381,496,211 | |
| Net increase in net assets resulting from operations | | | 283,190,723 | | | 558,804,986 | |
| | | | | | | | |
| Distributions to shareholders from net investment income: | | | | | | | |
| Class A Shares | | | (6,338,907 | ) | | (9,051,310 | ) |
| Class I Shares | | | (6,339,779 | ) | | (7,133,469 | ) |
| Class R Shares | | | (7,898 | ) | | (21,816 | ) |
| Total distributions to shareholders from net investment income | | | (12,686,584 | ) | | (16,206,595 | ) |
| | | | | | | | |
| Increase/(decrease) from Fund share transactions: | | | | | | | |
| Class A Shares | | | 327,862,088 | | | (81,695,905 | ) |
| Class B Shares | | | (7,247,986 | ) | | (18,077,030 | ) |
| Class C Shares | | | 7,117,828 | | | (79,871,934 | ) |
| Class I Shares | | | 192,377,343 | | | 58,283,653 | |
| Class R Shares | | | 669,416 | | | (708,500 | ) |
| Net increase/(decrease) from Fund share transactions: | | | 520,778,689 | | | (122,069,716 | ) |
| Net increase in net assets | | | 791,282,828 | | | 420,528,675 | |
| | | | | | | | |
| Net assets: | | | | | | | |
| Beginning of period | | | 2,812,297,018 | | | 2,391,768,343 | |
| End of period | | $ | 3,603,579,846 | | $ | 2,812,297,018 | |
| Accumulated undistributed net investment income/(loss) | | $ | (7,148,932 | ) | $ | 12,677,670 | |
See notes to financial statements
| Financial statements (unaudited) |
Statements of changes in net assets
Strategic Income Fund
| | | | | | | | | | | |
| | | | Six Months | | | | | | Year Ended | |
| | | | Ended | | | Period ended | | | December 31, | |
| | | | January 31, 2014 | | | July 31, 2013 | * | | 2012 | |
| | | | | | | | | | | |
| Net investment income | | $ | 1,071,084 | | $ | 1,244,794 | | $ | 1,982,556 | |
| Net realized gain/(loss) on investments, futures contracts, options contracts, swap contracts and foreign currency transactions | | | (1,040,463 | ) | | 1,486,191 | | | (399,915 | ) |
| Net change in unrealized appreciation/(depreciation) of investments, futures contracts, swap contracts and foreign currency translations | | | 1,792,072 | | | (2,653,818 | ) | | 4,489,643 | |
| Net increase in net assets resulting from operations | | | 1,822,693 | | | 77,167 | | | 6,072,284 | |
| | | | | | | | | | | |
| Distributions to shareholders from net investment income: | | | | | | | | | | |
| Class A Shares | | | (364,008 | ) | | (465,226 | ) | | (727,166 | ) |
| Class B Shares | | | (121,705 | ) | | (134,459 | ) | | (276,825 | ) |
| Class C Shares | | | (406,785 | ) | | (428,408 | ) | | (842,201 | ) |
| Class I Shares | | | (192,525 | ) | | (177,910 | ) | | (148,305 | ) |
| Total distributions to shareholders from net investment income | | | (1,085,023 | ) | | (1,206,003 | ) | | (1,994,497 | ) |
| | | | | | | | | | | |
| Increase/(decrease) from Fund share transactions: | | | | | | | | | | |
| Class A Shares | | | (4,911,614 | ) | | (1,525,748 | ) | | (963,804 | ) |
| Class B Shares | | | (1,259,827 | ) | | (627,272 | ) | | (1,070,745 | ) |
| Class C Shares | | | (2,617,438 | ) | | (2,413,031 | ) | | (1,784,747 | ) |
| Class I Shares | | | (707,173 | ) | | 3,531,507 | | | 1,781,274 | |
| Net decrease from Fund share transactions: | | | (9,496,052 | ) | | (1,034,544 | ) | | (2,038,022 | ) |
| Net increase/(decrease) in net assets | | | (8,758,382 | ) | | (2,163,380 | ) | | 2,039,765 | |
| | | | | | | | | | | |
| Net assets: | | | | | | | | | | |
| Beginning of period | | | 48,627,584 | | | 50,790,964 | | | 48,751,199 | |
| End of period | | $ | 39,869,202 | | $ | 48,627,584 | | $ | 50,790,964 | |
| Accumulated undistributed net investment income/(loss) | | $ | 13,247 | | $ | 27,186 | | $ | (31,774 | ) |
* The Strategic Income Fund changed its fiscal year end from December 31 to July 31 effective July 31, 2013.
See notes to financial statements
| Financial statements (unaudited) |
Statements of changes in net assets
Unconstrained Bond Fund
| | | | | |
| | | | Period Ended | |
| | | | January 31, 2014 | * |
| | | | | |
| Net investment income | | $ | 52,331 | |
| Net realized loss on investments, futures contracts, options written, swap contracts and foreign currency transactions | | | (19,583 | ) |
| Net change in unrealized appreciation/(depreciation) of investments, futures contracts, options written, swap contracts and foreign currency translations | | | 12,717 | |
| Net increase in net assets resulting from operations | | | 45,465 | |
| | | | | |
| Distributions to shareholders from net investment income: | | | | |
| Class A Shares | | | (976 | ) |
| Class C Shares | | | (153 | ) |
| Class I Shares | | | (28,872 | ) |
| Total distributions to shareholders from net investment income | | | (30,001 | ) |
| | | | | |
| Increase from Fund share transactions: | | | | |
| Class A Shares | | | 1,000,000 | |
| Class C Shares | | | 1,000,000 | |
| Class I Shares | | | 23,001,877 | |
| Net increase from Fund share transactions: | | | 25,001,877 | |
| Net increase in net assets | | | 25,017,341 | |
| | | | | |
| Net assets: | | | | |
| Beginning of period | | | — | |
| End of period | | $ | 25,017,341 | |
| Accumulated undistributed net investment income | | $ | 22,330 | |
* Fund commenced operations on December 20, 2013.
See notes to financial statements
| Financial statements (unaudited) |
Statements of changes – capital stock activity
All Asset Fund
| | | | | | | | |
| | | | Six Months | | | | |
| | | | Ended | | | Year Ended | |
| | | | January 31, 2014 | | | July 31, 2013 | |
| | | | | | | | |
| Amount | | | | | | | |
| | | | | | | | |
| Class A shares: | | | | | | | |
| Sold | | $ | 3,380,310 | | $ | 8,842,297 | |
| Issued as reinvestment of dividends | | | 393,801 | | | 106,782 | |
| Redeemed | | | (5,365,535 | ) | | (3,239,138 | ) |
| Net increase/(decrease) | | $ | (1,591,424 | ) | $ | 5,709,941 | |
| | | | | | | | |
| Class C shares: | | | | | | | |
| Sold | | $ | 3,094,826 | | $ | 8,715,037 | |
| Issued as reinvestment of dividends | | | 354,883 | | | 35,786 | |
| Redeemed | | | (2,343,282 | ) | | (602,483 | ) |
| Net increase | | $ | 1,106,427 | | $ | 8,148,340 | |
| | | | | | | | |
| Class I shares: | | | | | | | |
| Sold | | $ | 15,605,979 | | $ | 17,659,642 | |
| Issued as reinvestment of dividends | | | 2,273,522 | | | 393,440 | |
| Redeemed | | | (3,678,352 | ) | | (5,630,872 | ) |
| Net increase | | $ | 14,201,149 | | $ | 12,422,210 | |
| | | | | | | | |
| Shares | | | | | | | |
| | | | | | | | |
| Class A shares: | | | | | | | |
| Sold | | | 315,248 | | | 867,856 | |
| Issued as reinvestment of dividends | | | 37,508 | | | 10,507 | |
| Redeemed | | | (506,755 | ) | | (313,476 | ) |
| Net increase/(decrease) | | | (153,999 | ) | | 564,887 | |
| | | | | | | | |
| Class C shares: | | | | | | | |
| Sold | | | 294,887 | | | 849,679 | |
| Issued as reinvestment of dividends | | | 34,190 | | | 3,536 | |
| Redeemed | | | (222,063 | ) | | (58,798 | ) |
| Net increase | | | 107,014 | | | 794,417 | |
| | | | | | | | |
| Class I shares: | | | | | | | |
| Sold | | | 1,473,610 | | | 1,697,899 | |
| Issued as reinvestment of dividends | | | 216,107 | | | 38,671 | |
| Redeemed | | | (347,444 | ) | | (542,417 | ) |
| Net increase | | | 1,342,273 | | | 1,194,153 | |
See notes to financial statements
| Financial statements (unaudited) |
Statements of changes – capital stock activity
Dividend & Income Builder Fund
| | | | | | | | |
| | | | Six Months | | | | |
| | | | Ended | | | Period ended | |
| | | | January 31, 2014 | | | July 31, 2013 | * |
| | | | | | | | |
| Amount | | | | | | | |
| | | | | | | | |
| Class A shares: | | | | | | | |
| Sold | | $ | 13,317,928 | | $ | 1,973,672 | |
| Issued as reinvestment of dividends | | | 99,942 | | | 8,795 | |
| Redeemed | | | (952,769 | ) | | (116,681 | ) |
| Net increase | | $ | 12,465,101 | | $ | 1,865,786 | |
| | | | | | | | |
| Class C shares: | | | | | | | |
| Sold | | $ | 2,158,303 | | $ | 450,951 | |
| Issued as reinvestment of dividends | | | 13,614 | | | 3,197 | |
| Redeemed | | | (38,323 | ) | | (3,866 | ) |
| Net increase | | $ | 2,133,594 | | $ | 450,282 | |
| | | | | | | | |
| Class I shares: | | | | | | | |
| Sold | | $ | 3,045,228 | | $ | 6,556,447 | |
| Issued as reinvestment of dividends | | | 37,157 | | | 40,178 | |
| Redeemed | | | (371,940 | ) | | (5,304,381 | ) |
| Net increase | | $ | 2,710,445 | | $ | 1,292,244 | |
| | | | | | | | |
| Shares | | | | | | | |
| | | | | | | | |
| Class A shares: | | | | | | | |
| Sold | | | 1,124,793 | | | 175,582 | |
| Issued as reinvestment of dividends | | | 8,227 | | | 807 | |
| Redeemed | | | (78,468 | ) | | (10,493 | ) |
| Net increase | | | 1,054,552 | | | 165,896 | |
| | | | | | | | |
| Class C shares: | | | | | | | |
| Sold | | | 181,892 | | | 40,883 | |
| Issued as reinvestment of dividends | | | 1,140 | | | 296 | |
| Redeemed | | | (3,174 | ) | | (356 | ) |
| Net increase | | | 179,858 | | | 40,823 | |
| | | | | | | | |
| Class I shares: | | | | | | | |
| Sold | | | 252,497 | | | 597,065 | |
| Issued as reinvestment of dividends | | | 3,083 | | | 3,715 | |
| Redeemed | | | (30,458 | ) | | (472,291 | ) |
| Net increase | | | 225,122 | | | 128,489 | |
* Fund commenced operations on August 1, 2012.
See notes to financial statements
| Financial statements (unaudited) |
Statements of changes – capital stock activity
Emerging Markets Opportunities Fund
| | | | | | | | |
| | | | Six Months | | | | |
| | | | Ended | | | Year Ended | |
| | | | January 31, 2014 | | | July 31, 2013 | |
| | | | | | | | |
| Amount | | | | | | | |
| | | | | | | | |
| Class A shares: | | | | | | | |
| Sold | | $ | 4,624,582 | | $ | 4,365,417 | |
| Issued as reinvestment of dividends | | | — | | | 49,943 | |
| Redeemed | | | (4,269,564 | ) | | (2,822,643 | ) |
| Net increase | | $ | 355,018 | | $ | 1,592,717 | |
| | | | | | | | |
| Class C shares: | | | | | | | |
| Sold | | $ | 594,540 | | $ | 1,550,330 | |
| Issued as reinvestment of dividends | | | — | | | 6,388 | |
| Redeemed | | | (269,690 | ) | | (751,608 | ) |
| Net increase | | $ | 324,850 | | $ | 805,110 | |
| | | | | | | | |
| Class I shares: | | | | | | | |
| Sold | | $ | 7,095,709 | | $ | 13,296,073 | |
| Issued as reinvestment of dividends | | | — | | | 104,690 | |
| Redeemed | | | (3,556,112 | ) | | (10,485,533 | ) |
| Net increase | | $ | 3,539,597 | | $ | 2,915,230 | |
| | | | | | | | |
| Shares | | | | | | | |
| | | | | | | | |
| Class A shares: | | | | | | | |
| Sold | | | 522,587 | | | 493,674 | |
| Issued as reinvestment of dividends | | | — | | | 5,675 | |
| Redeemed | | | (481,934 | ) | | (326,718 | ) |
| Net increase | | | 40,653 | | | 172,631 | |
| | | | | | | | |
| Class C shares: | | | | | | | |
| Sold | | | 68,314 | | | 176,697 | |
| Issued as reinvestment of dividends | | | — | | | 733 | |
| Redeemed | | | (31,103 | ) | | (90,932 | ) |
| Net increase | | | 37,211 | | | 86,498 | |
| | | | | | | | |
| Class I shares: | | | | | | | |
| Sold | | | 790,382 | | | 1,507,812 | |
| Issued as reinvestment of dividends | | | — | | | 11,910 | |
| Redeemed | | | (408,028 | ) | | (1,218,900 | ) |
| Net increase | | | 382,354 | | | 300,822 | |
See notes to financial statements
| Financial statements (unaudited) |
Statements of changes – capital stock activity
European Focus Fund
| | | | | | | | |
| | | | Six Months | | | | |
| | | | Ended | | | Year Ended | |
| | | | January 31, 2014 | | | July 31, 2013 | |
| | | | | | | | |
| Amount | | | | | | | |
| | | | | | | | |
| Class A shares: | | | | | | | |
| Sold | | $ | 406,483,006 | | $ | 96,937,012 | |
| Issued as reinvestment of dividends | | | 1,220,839 | | | 3,495,075 | |
| Redeemed | | | (65,633,405 | ) | | (90,166,202 | ) |
| Net increase | | $ | 342,070,440 | | $ | 10,265,885 | |
| | | | | | | | |
| Class B shares: | | | | | | | |
| Sold | | $ | 194,744 | | $ | 218,831 | |
| Issued as reinvestment of dividends | | | — | | | 62,554 | |
| Redeemed | | | (3,062,553 | ) | | (7,901,196 | ) |
| Net decrease | | $ | (2,867,809 | ) | $ | (7,619,811 | ) |
| | | | | | | | |
| Class C shares: | | | | | | | |
| Sold | | $ | 84,707,371 | | $ | 16,722,655 | |
| Issued as reinvestment of dividends | | | — | | | 495,819 | |
| Redeemed | | | (9,668,037 | ) | | (26,033,998 | ) |
| Net increase/(decrease) | | $ | 75,039,334 | | $ | (8,815,524 | ) |
| | | | | | | | |
| Class I shares: | | | | | | | |
| Sold | | $ | 497,763,522 | | $ | 159,421,762 | |
| Issued as reinvestment of dividends | | | 1,901,500 | | | 2,060,013 | |
| Redeemed | | | (47,053,010 | ) | | (63,911,827 | ) |
| Net increase | | $ | 452,612,012 | | $ | 97,569,948 | |
| | | | | | | | |
| Shares | | | | | | | |
| | | | | | | | |
| Class A shares: | | | | | | | |
| Sold | | | 12,204,902 | | | 3,696,041 | |
| Issued as reinvestment of dividends | | | 34,801 | | | 135,521 | |
| Redeemed | | | (2,001,127 | ) | | (3,526,993 | ) |
| Net increase | | | 10,238,576 | | | 304,569 | |
| | | | | | | | |
| Class B shares: | | | | | | | |
| Sold | | | 6,298 | | | 8,714 | |
| Issued as reinvestment of dividends | | | — | | | 2,544 | |
| Redeemed | | | (102,575 | ) | | (325,906 | ) |
| Net decrease | | | (96,277 | ) | | (314,648 | ) |
| | | | | | | | |
| Class C shares: | | | | | | | |
| Sold | | | 2,693,473 | | | 679,593 | |
| Issued as reinvestment of dividends | | | — | | | 20,213 | |
| Redeemed | | | (313,303 | ) | | (1,075,455 | ) |
| Net increase/(decrease) | | | 2,380,170 | | | (375,649 | ) |
| | | | | | | | |
| Class I shares: | | | | | | | |
| Sold | | | 15,083,335 | | | 6,118,514 | |
| Issued as reinvestment of dividends | | | 54,205 | | | 79,969 | |
| Redeemed | | | (1,408,816 | ) | | (2,445,172 | ) |
| Net increase | | | 13,728,724 | | | 3,753,311 | |
See notes to financial statements
| Financial statements (unaudited) |
Statements of changes – capital stock activity
Global Equity Income Fund
| | | | | | | | |
| | | | Six Months | | | | |
| | | | Ended | | | Year Ended | |
| | | | January 31, 2014 | | | July 31, 2013 | |
| | | | | | | | |
| Amount | | | | | | | |
| | | | | | | | |
| Class A shares: | | | | | | | |
| Sold | | $ | 212,492,277 | | $ | 317,859,258 | |
| Issued as reinvestment of dividends | | | 18,229,701 | | | 32,882,277 | |
| Redeemed | | | (86,751,798 | ) | | (167,891,412 | ) |
| Net increase | | $ | 143,970,180 | | $ | 182,850,123 | |
| | | | | | | | |
| Class C shares: | | | | | | | |
| Sold | | $ | 226,036,736 | | $ | 225,888,510 | |
| Issued as reinvestment of dividends | | | 11,903,589 | | | 20,134,401 | |
| Redeemed | | | (35,614,524 | ) | | (66,934,095 | ) |
| Net increase | | $ | 202,325,801 | | $ | 179,088,816 | |
| | | | | | | | |
| Class I shares: | | | | | | | |
| Sold | | $ | 349,285,265 | | $ | 385,822,562 | |
| Issued as reinvestment of dividends | | | 17,314,550 | | | 25,582,449 | |
| Redeemed | | | (77,068,498 | ) | | (122,965,537 | ) |
| Net increase | | $ | 289,531,317 | | $ | 288,439,474 | |
| | | | | | | | |
| Shares | | | | | | | |
| | | | | | | | |
| Class A shares: | | | | | | | |
| Sold | | | 26,142,644 | | | 41,847,410 | |
| Issued as reinvestment of dividends | | | 2,248,336 | | | 4,334,126 | |
| Redeemed | | | (10,713,933 | ) | | (22,263,151 | ) |
| Net increase | | | 17,677,047 | | | 23,918,385 | |
| | | | | | | | |
| Class C shares: | | | | | | | |
| Sold | | | 27,906,906 | | | 29,728,241 | |
| Issued as reinvestment of dividends | | | 1,475,512 | | | 2,664,089 | |
| Redeemed | | | (4,401,993 | ) | | (8,940,948 | ) |
| Net increase | | | 24,980,425 | | | 23,451,382 | |
| | | | | | | | |
| Class I shares: | | | | | | | |
| Sold | | | 42,852,589 | | | 50,592,034 | |
| Issued as reinvestment of dividends | | | 2,131,472 | | | 3,358,207 | |
| Redeemed | | | (9,460,295 | ) | | (16,248,320 | ) |
| Net increase | | | 35,523,766 | | | 37,701,921 | |
See notes to financial statements
| Financial statements (unaudited) |
Statements of changes – capital stock activity
Global Technology Fund
| | | | | | | | |
| | | | Six Months | | | | |
| | | | Ended | | | Year Ended | |
| | | | January 31, 2014 | | | July 31, 2013 | |
| | | | | | | | |
| Amount | | | | | | | |
| | | | | | | | |
| Class A shares: | | | | | | | |
| Sold | | $ | 16,397,944 | | $ | 49,582,683 | |
| Issued as reinvestment of dividends | | | 1,100,055 | | | — | |
| Redeemed | | | (26,397,611 | ) | | (63,726,712 | ) |
| Net decrease | | $ | (8,899,612 | ) | $ | (14,144,029 | ) |
| | | | | | | | |
| Class B shares: | | | | | | | |
| Sold | | $ | 16,853 | | $ | 64,881 | |
| Issued as reinvestment of dividends | | | 52,166 | | | — | |
| Redeemed | | | (1,190,139 | ) | | (2,036,600 | ) |
| Net decrease | | $ | (1,121,120 | ) | $ | (1,971,719 | ) |
| | | | | | | | |
| Class C shares: | | | | | | | |
| Sold | | $ | 8,171,869 | | $ | 8,588,077 | |
| Issued as reinvestment of dividends | | | 447,275 | | | — | |
| Redeemed | | | (6,507,217 | ) | | (17,493,664 | ) |
| Net increase/(decrease) | | $ | 2,111,927 | | $ | (8,905,587 | ) |
| | | | | | | | |
| Class I shares: | | | | | | | |
| Sold | | $ | 15,555,703 | | $ | 53,780,464 | |
| Issued as reinvestment of dividends | | | 580,136 | | | — | |
| Redeemed | | | (18,827,220 | ) | | (30,784,339 | ) |
| Net increase/(decrease) | | $ | (2,691,381 | ) | $ | 22,996,125 | |
| | | | | | | | |
| Shares | | | | | | | |
| | | | | | | | |
| Class A shares: | | | | | | | |
| Sold | | | 648,986 | | | 2,336,620 | |
| Issued as reinvestment of dividends | | | 42,654 | | | — | |
| Redeemed | | | (1,069,672 | ) | | (3,014,804 | ) |
| Net decrease | | | (378,032 | ) | | (678,184 | ) |
| | | | | | | | |
| Class B shares: | | | | | | | |
| Sold | | | 716 | | | 3,345 | |
| Issued as reinvestment of dividends | | | 2,217 | | | — | |
| Redeemed | | | (51,302 | ) | | (104,592 | ) |
| Net decrease | | | (48,369 | ) | | (101,247 | ) |
| | | | | | | | |
| Class C shares: | | | | | | | |
| Sold | | | 357,112 | | | 443,570 | |
| Issued as reinvestment of dividends | | | 19,033 | | | — | |
| Redeemed | | | (288,721 | ) | | (898,304 | ) |
| Net increase/(decrease) | | | 87,424 | | | (454,734 | ) |
| | | | | | | | |
| Class I shares: | | | | | | | |
| Sold | | | 608,561 | | | 2,512,271 | |
| Issued as reinvestment of dividends | | | 22,211 | | | — | |
| Redeemed | | | (734,619 | ) | | (1,440,006 | ) |
| Net increase/(decrease) | | | (103,847 | ) | | 1,072,265 | |
See notes to financial statements
| Financial statements (unaudited) |
Statements of changes – capital stock activity
High Yield Opportunities Fund
| | | | | | | | |
| | | | Six Months | | | | |
| | | | Ended | | | Period ended | |
| | | | January 31, 2014 | | | July 31, 2013 | * |
| | | | | | | | |
| Amount | | | | | | | |
| | | | | | | | |
| Class A shares: | | | | | | | |
| Sold | | $ | 117,442 | | $ | 1,127,415 | |
| Issued as reinvestment of dividends | | | 3,215 | | | 398 | |
| Redeemed | | | (56,343 | ) | | (114 | ) |
| Net increase | | $ | 64,314 | | $ | 1,127,699 | |
| | | | | | | | |
| Class C shares: | | | | | | | |
| Sold | | $ | 17,597 | | $ | 1,000,000 | |
| Issued as reinvestment of dividends | | | 210 | | | — | |
| Redeemed | | | (172 | ) | | — | |
| Net increase | | $ | 17,635 | | $ | 1,000,000 | |
| | | | | | | | |
| Class I shares: | | | | | | | |
| Sold | | $ | 35,468 | | $ | 23,778,693 | |
| Issued as reinvestment of dividends | | | 467,695 | | | 68,766 | |
| Redeemed | | | (107,808 | ) | | (154,915 | ) |
| Net increase | | $ | 395,355 | | $ | 23,692,544 | |
| | | | | | | | |
| Shares | | | | | | | |
| | | | | | | | |
| Class A shares: | | | | | | | |
| Sold | | | 11,384 | | | 112,878 | |
| Issued as reinvestment of dividends | | | 317 | | | 40 | |
| Redeemed | | | (5,537 | ) | | (11 | ) |
| Net increase | | | 6,164 | | | 112,907 | |
| | | | | | | | |
| Class C shares: | | | | | | | |
| Sold | | | 1,710 | | | 100,000 | |
| Issued as reinvestment of dividends | | | 20 | | | — | |
| Redeemed | | | (17 | ) | | — | |
| Net increase | | | 1,713 | | | 100,000 | |
| | | | | | | | |
| Class I shares: | | | | | | | |
| Sold | | | 3,367 | | | 2,377,698 | |
| Issued as reinvestment of dividends | | | 45,968 | | | 6,893 | |
| Redeemed | | | (10,517 | ) | | (15,617 | ) |
| Net increase | | | 38,818 | | | 2,368,974 | |
* Fund commenced operations on April 30, 2013.
See notes to financial statements
| Financial statements (unaudited) |
Statements of changes – capital stock activity
International Opportunities Fund
| | | | | | | | |
| | | | Six Months | | | | |
| | | | Ended | | | Year Ended | |
| | | | January 31, 2014 | | | July 31, 2013 | |
| | | | | | | | |
| Amount | | | | | | | |
| | | | | | | | |
| Class A shares: | | | | | | | |
| Sold | | $ | 466,008,223 | | $ | 275,251,042 | |
| Issued as reinvestment of dividends | | | 6,045,720 | | | 8,147,699 | |
| Redeemed | | | (144,191,855 | ) | | (365,094,646 | ) |
| Net increase/(decrease) | | $ | 327,862,088 | | $ | (81,695,905 | ) |
| | | | | | | | |
| Class B shares: | | | | | | | |
| Sold | | $ | 97,516 | | $ | 112,237 | |
| Redeemed | | | (7,345,502 | ) | | (18,189,267 | ) |
| Net decrease | | $ | (7,247,986 | ) | $ | (18,077,030 | ) |
| | | | | | | | |
| Class C shares: | | | | | | | |
| Sold | | $ | 37,020,393 | | $ | 23,024,033 | |
| Redeemed | | | (29,902,565 | ) | | (102,895,967 | ) |
| Net increase/(decrease) | | $ | 7,117,828 | | $ | (79,871,934 | ) |
| | | | | | | | |
| Class I shares: | | | | | | | |
| Sold | | $ | 285,916,446 | | $ | 291,900,748 | |
| Issued as reinvestment of dividends | | | 4,711,845 | | | 4,735,254 | |
| Redeemed | | | (98,250,948 | ) | | (238,352,349 | ) |
| Net increase | | $ | 192,377,343 | | $ | 58,283,653 | |
| | | | | | | | |
| Class R shares: | | | | | | | |
| Sold | | $ | 2,034,700 | | $ | 2,328,347 | |
| Issued as reinvestment of dividends | | | 3,956 | | | 9,883 | |
| Redeemed | | | (1,369,240 | ) | | (3,046,730 | ) |
| Net increase/(decrease) | | $ | 669,416 | | $ | (708,500 | ) |
See notes to financial statements
| Financial statements (unaudited) |
Statements of changes – capital stock activity
International Opportunities Fund (continued)
| | | | | | | | |
| | | | Six Months | | | | |
| | | | Ended | | | Year Ended | |
| | | | January 31, 2014 | | | July 31, 2013 | |
| | | | | | | | |
| Shares | | | | | | | |
| | | | | | | | |
| Class A shares: | | | | | | | |
| Sold | | | 18,119,551 | | | 12,653,875 | |
| Issued as reinvestment of dividends | | | 224,999 | | | 384,688 | |
| Redeemed | | | (5,711,674 | ) | | (17,074,906 | ) |
| Net increase/(decrease) | | | 12,632,876 | | | (4,036,343 | ) |
| | | | | | | | |
| Class B shares: | | | | | | | |
| Sold | | | 4,144 | | | 5,284 | |
| Redeemed | | | (307,687 | ) | | (908,898 | ) |
| Net decrease | | | (303,543 | ) | | (903,614 | ) |
| | | | | | | | |
| Class C shares: | | | | | | | |
| Sold | | | 1,529,099 | | | 1,130,119 | |
| Redeemed | | | (1,249,289 | ) | | (5,165,111 | ) |
| Net increase/(decrease) | | | 279,810 | | | (4,034,992 | ) |
| | | | | | | | |
| Class I shares: | | | | | | | |
| Sold | | | 11,092,263 | | | 13,635,625 | |
| Issued as reinvestment of dividends | | | 175,292 | | | 223,678 | |
| Redeemed | | | (3,825,645 | ) | | (11,296,233 | ) |
| Net increase | | | 7,441,910 | | | 2,563,070 | |
| | | | | | | | |
| Class R shares: | | | | | | | |
| Sold | | | 80,241 | | | 108,856 | |
| Issued as reinvestment of dividends | | | 149 | | | 472 | |
| Redeemed | | | (54,232 | ) | | (143,934 | ) |
| Net increase/(decrease) | | | 26,158 | | | (34,606 | ) |
See notes to financial statements
| Financial statements (unaudited) |
Statements of changes – capital stock activity
Strategic Income Fund
| | | | | | | | | | | |
| | | | Six Months | | | | | | Year Ended | |
| | | | Ended | | | Period ended | | | December 31, | |
| | | | January 31, 2014 | | | July 31, 2013* | | | 2012 | |
| | | | | | | | | | | |
| Amount | | | | | | | | | | |
| | | | | | | | | | | |
| Class A shares: | | | | | | | | | | |
| Sold | | $ | 2,489,277 | | $ | 4,311,487 | | $ | 5,603,423 | |
| Issued as reinvestment of dividends | | | 247,152 | | | 295,530 | | | 532,079 | |
| Redeemed | | | (7,648,043 | ) | | (6,132,765 | ) | | (7,099,306 | ) |
| Net decrease | | $ | (4,911,614 | ) | $ | (1,525,748 | ) | $ | (963,804 | ) |
| | | | | | | | | | | |
| Class B shares: | | | | | | | | | | |
| Sold | | $ | 57,278 | | $ | 159,430 | | $ | 622,043 | |
| Issued as reinvestment of dividends | | | 93,331 | | | 94,785 | | | 156,511 | |
| Redeemed | | | (1,410,436 | ) | | (881,487 | ) | | (1,849,299 | ) |
| Net decrease | | $ | (1,259,827 | ) | $ | (627,272 | ) | $ | (1,070,745 | ) |
| | | | | | | | | | | |
| Class C shares: | | | | | | | | | | |
| Sold | | $ | 727,870 | | $ | 1,068,241 | | $ | 4,068,174 | |
| Issued as reinvestment of dividends | | | 281,650 | | | 291,254 | | | 551,924 | |
| Redeemed | | | (3,626,958 | ) | | (3,772,526 | ) | | (6,404,845 | ) |
| Net decrease | | $ | (2,617,438 | ) | $ | (2,413,031 | ) | $ | (1,784,747 | ) |
| | | | | | | | | | | |
| Class I shares: | | | | | | | | | | |
| Sold | | $ | 1,148,673 | | $ | 7,892,375 | | $ | 2,570,614 | |
| Issued as reinvestment of dividends | | | 156,427 | | | 171,183 | | | 148,178 | |
| Redeemed | | | (2,012,273 | ) | | (4,532,051 | ) | | (937,518 | ) |
| Net increase/(decrease) | | $ | (707,173 | ) | $ | 3,531,507 | | $ | 1,781,274 | |
| | | | | | | | | | | |
| Shares | | | | | | | | | | |
| | | | | | | | | | | |
| Class A shares: | | | | | | | | | | |
| Sold | | | 275,347 | | | 472,304 | | | 627,594 | |
| Issued as reinvestment of dividends | | | 27,480 | | | 32,650 | | | 60,353 | |
| Redeemed | | | (846,967 | ) | | (681,183 | ) | | (809,621 | ) |
| Net decrease | | | (544,140 | ) | | (176,229 | ) | | (121,674 | ) |
| | | | | | | | | | | |
| Class B shares: | | | | | | | | | | |
| Sold | | | 6,326 | | | 17,408 | | | 71,281 | |
| Issued as reinvestment of dividends | | | 10,350 | | | 10,460 | | | 17,734 | |
| Redeemed | | | (156,735 | ) | | (97,398 | ) | | (208,985 | ) |
| Net decrease | | | (140,059 | ) | | (69,530 | ) | | (119,970 | ) |
| | | | | | | | | | | |
| Class C shares: | | | | | | | | | | |
| Sold | | | 81,323 | | | 118,108 | | | 464,519 | |
| Issued as reinvestment of dividends | | | 31,431 | | | 32,330 | | | 62,861 | |
| Redeemed | | | (405,672 | ) | | (418,191 | ) | | (730,681 | ) |
| Net decrease | | | (292,918 | ) | | (267,753 | ) | | (203,301 | ) |
| | | | | | | | | | | |
| Class I shares: | | | | | | | | | | |
| Sold | | | 127,559 | | | 874,064 | | | 292,845 | |
| Issued as reinvestment of dividends | | | 17,429 | | | 18,926 | | | 16,777 | |
| Redeemed | | | (224,121 | ) | | (503,470 | ) | | (105,887 | ) |
| Net increase/(decrease) | | | (79,133 | ) | | 389,520 | | | 203,735 | |
* The Strategic Income Fund changed its fiscal year end from December 31 to July 31 effective July 31, 2013.
See notes to financial statements
| Financial statements (unaudited) |
Statements of changes – capital stock activity
Unconstrained Bond Fund
| | | | | |
| | | | Period Ended | |
| | | | January 31, 2014 | * |
| | | | | |
| Amount | | | | |
| | | | | |
| Class A shares: | | | | |
| Sold | | $ | 1,000,000 | |
| Net increase | | $ | 1,000,000 | |
| | | | | |
| Class C shares: | | | | |
| Sold | | $ | 1,000,000 | |
| Net increase | | $ | 1,000,000 | |
| | | | | |
| Class I shares: | | | | |
| Sold | | $ | 23,001,877 | |
| Net increase | | $ | 23,001,877 | |
| | | | | |
| Shares | | | | |
| | | | | |
| Class A shares: | | | | |
| Sold | | | 100,000 | |
| Net increase | | | 100,000 | |
| | | | | |
| Class C shares: | | | | |
| Sold | | | 100,000 | |
| Net increase | | | 100,000 | |
| | | | | |
| Class I shares: | | | | |
| Sold | | | 2,300,187 | |
| Net increase | | | 2,300,187 | |
* Fund commenced operations on December 20, 2013.
See notes to financial statements
| Financial highlights (unaudited) |
For a share outstanding throughout the periods indicated
| | | | | | | | | | | | | | | | | | | | | | |
| | | | | | Income (loss) from investment operations: | | Less distributions |
| | | Net asset value, beginning of period | | Net investment income (loss)(b) | | Net realized and unrealized gain (loss) on investments | | Total from investment operations | | Dividends from net investment income | | Distributions from net realized capital gains | | Total distributions |
| | | | | | | | | | | | | | | | | | | | | | |
| All Asset Fund | | | | | | | | | | | | | | | | | | | | | |
| Class A | | | | | | | | | | | | | | | | | | | | | |
| Period Ended 1/31/2014 | $ | 10.52 | | | 0.05 | | | 0.21 | | | 0.26 | | | (0.11 | ) | | (0.31 | ) | | (0.42 | ) |
| Year Ended 7/31/2013 | | 9.93 | | | 0.09 | | | 0.61 | | | 0.70 | | | (0.09 | ) | | (0.02 | ) | | (0.11 | ) |
| Period Ended 7/31/2012(a) | | 10.00 | | | 0.01 | | | (0.08 | ) | | (0.07 | ) | | 0.00 | | | 0.00 | | | 0.00 | |
| | | | | | | | | | | | | | | | | | | | | | |
| Class C | | | | | | | | | | | | | | | | | | | | | |
| Period Ended 1/31/2014 | $ | 10.43 | | | 0.01 | | | 0.21 | | | 0.22 | | | (0.07 | ) | | (0.31 | ) | | (0.38 | ) |
| Year Ended 7/31/2013 | | 9.91 | | | 0.02 | | | 0.59 | | | 0.61 | | | (0.07 | ) | | (0.02 | ) | | (0.09 | ) |
| Period Ended 7/31/2012(a) | | 10.00 | | | (0.01 | ) | | (0.08 | ) | | (0.09 | ) | | 0.00 | | | 0.00 | | | 0.00 | |
| | | | | | | | | | | | | | | | | | | | | | |
| Class I | | | | | | | | | | | | | | | | | | | | | |
| Period Ended 1/31/2014 | $ | 10.54 | | | 0.07 | | | 0.21 | | | 0.28 | | | (0.15 | ) | | (0.31 | ) | | (0.46 | ) |
| Year Ended 7/31/2013 | | 9.94 | | | 0.11 | | | 0.61 | | | 0.72 | | | (0.10 | ) | | (0.02 | ) | | (0.12 | ) |
| Period Ended 7/31/2012(a) | | 10.00 | | | 0.02 | | | (0.08 | ) | | (0.06 | ) | | 0.00 | | | 0.00 | | | 0.00 | |
| | | | | | | | | | | | | | | | | | | | | | |
| Dividend & Income Builder Fund | | | | | | | | | | | | | | | | | | | | | |
| Class A | | | | | | | | | | | | | | | | | | | | | |
| Period Ended 1/31/2014 | $ | 11.40 | | | 0.06 | | | 0.68 | | | 0.74 | | | (0.15 | ) | | (0.02 | ) | | (0.17 | ) |
| Year Ended 7/31/2013(a) | | 10.00 | | | 0.33 | | | 1.33 | | | 1.66 | | | (0.26 | ) | | 0.00 | | | (0.26 | ) |
| | | | | | | | | | | | | | | | | | | | | | |
| Class C | | | | | | | | | | | | | | | | | | | | | |
| Period Ended 1/31/2014 | $ | 11.35 | | | 0.02 | | | 0.67 | | | 0.69 | | | (0.12 | ) | | (0.02 | ) | | (0.14 | ) |
| Year Ended 7/31/2013(a) | | 10.00 | | | 0.25 | | | 1.33 | | | 1.58 | | | (0.23 | ) | | 0.00 | | | (0.23 | ) |
| | | | | | | | | | | | | | | | | | | | | | |
| Class I | | | | | | | | | | | | | | | | | | | | | |
| Period Ended 1/31/2014 | $ | 11.39 | | | 0.08 | | | 0.68 | | | 0.76 | | | (0.16 | ) | | (0.02 | ) | | (0.18 | ) |
| Year Ended 7/31/2013(a) | | 10.00 | | | 0.46 | | | 1.22 | | | 1.68 | | | (0.29 | ) | | 0.00 | | | (0.29 | ) |
| (a) | The All Asset Fund commenced operations on March 30, 2012 and the Dividend & Income Builder Fund commenced operations on August 1, 2012. |
| (b) | Per share data was calculated using average shares outstanding during the period. |
| (c) | Total returns are historical and assume changes in share price, reinvestment of all dividends and distributions and no sales charge. Had certain expenses not been reduced during the periods shown, total returns would have been lower. Total returns for periods of less than one year are not annualized. |
| (d) | As the Henderson All Asset Fund and Henderson Dividend & Income Builder Fund invest in the shares of other investment companies, the calculation includes only those expenses charged directly to the Fund and does not include expenses charged to the underlying funds in which the Fund invests. |
| (e) | Not annualized for periods less than one year. |
See notes to financial statements
| Financial highlights (unaudited) |
| | | | | | | | | | | | Ratios to average net assets: | | | |
| | | Net asset value, end of period | | Total return(c) | | Net assets, end of period (000) | | Annualized ratio of operating expenses to average net assets(d) | | Annualized ratio of net investment income/(loss) to average net assets | | Annualized ratio of operating expenses to average net assets without waivers and/or expenses reimbursed(d) | | Portfolio turnover rate(e) |
| | | | | | | | | | | | | | | | | | | | | | |
| | | | | | | | | | | | | | | | | | | | | | |
| | $ | 10.36 | | | 2.48 | % | $ | 10,248 | | | 0.85 | % | | 0.99 | % | | 0.95 | % | | 25 | % |
| | | 10.52 | | | 7.05 | | | 12,023 | | | 0.85 | | | 0.86 | | | 1.10 | | | 37 | |
| | | 9.93 | | | (0.70 | ) | | 5,740 | | | 0.85 | | | 0.43 | | | 2.13 | | | 7 | |
| | | | | | | | | | | | | | | | | | | | | | |
| | $ | 10.27 | | | 1.93 | % | $ | 10,313 | | | 1.60 | % | | 0.28 | % | | 1.68 | % | | 25 | % |
| | | 10.43 | | | 6.18 | | | 9,357 | | | 1.60 | | | 0.20 | | | 1.80 | | | 37 | |
| | | 9.91 | | | (0.90 | ) | | 1,013 | | | 1.60 | | | (0.24 | ) | | 4.49 | | | 7 | |
| | | | | | | | | | | | | | | | | | | | | | |
| | $ | 10.36 | | | 2.65 | % | $ | 56,358 | | | 0.60 | % | | 1.32 | % | | 0.63 | % | | 25 | % |
| | | 10.54 | | | 7.28 | | | 43,221 | | | 0.60 | | | 1.10 | | | 0.79 | | | 37 | |
| | | 9.94 | | | (0.60 | ) | | 28,875 | | | 0.60 | | | 0.52 | | | 1.41 | | | 7 | |
| | | | | | | | | | | | | | | | | | | | | | |
| | | | | | | | | | | | | | | | | | | | | | |
| | $ | 11.97 | | | 6.53 | % | $ | 14,608 | | | 1.30 | % | | 0.91 | % | | 2.09 | % | | 23 | % |
| | | 11.40 | | | 16.79 | | | 1,891 | | | 1.30 | | | 2.98 | | | 7.35 | | | 188 | |
| | | | | | | | | | | | | | | | | | | | | | |
| | $ | 11.90 | | | 6.12 | % | $ | 2,626 | | | 2.05 | % | | 0.25 | % | | 2.87 | % | | 23 | % |
| | | 11.35 | | | 15.94 | | | 463 | | | 2.05 | | | 2.32 | | | 8.17 | | | 188 | |
| | | | | | | | | | | | | | | | | | | | | | |
| | $ | 11.97 | | | 6.67 | % | $ | 4,231 | | | 1.05 | % | | 1.37 | % | | 1.89 | % | | 23 | % |
| | | 11.39 | | | 17.01 | | | 1,463 | | | 1.05 | | | 4.18 | | | 7.11 | | | 188 | |
See notes to financial statements
| Financial highlights (unaudited) |
For a share outstanding throughout the periods indicated
| | | | | | Income (loss) from investment operations: | | Less distributions |
| | | Net asset value, beginning of period | | Net investment income (loss)(b) | | Net realized and unrealized gain (loss) on investments | | Total from investment operations | | Dividends from net investment income | | Distributions from net realized capital gains | | Total distributions |
| | | | | | | | | | | | | | | | | | | | | | |
| Emerging Markets Opportunities Fund | | | | | | | | | | | | | | | | | | | | | |
| Class A | | | | | | | | | | | | | | | | | | | | | |
| Period Ended 1/31/2014 | $ | 8.49 | | | (0.03 | ) | | 0.10 | | | 0.07 | | | 0.00 | | | 0.00 | | | 0.00 | |
| Year Ended 7/31/2013 | | 7.97 | | | 0.01 | | | 0.56 | | | 0.57 | | | (0.05 | ) | | 0.00 | | | (0.05 | ) |
| Year Ended 7/31/2012 | | 9.74 | | | (0.02 | ) | | (1.62 | ) | | (1.64 | ) | | (0.13 | ) | | 0.00 | | | (0.13 | ) |
| Period Ended 7/31/2011(a) | | 10.00 | | | 0.00 | * | | (0.26 | ) | | (0.26 | ) | | 0.00 | | | 0.00 | | | 0.00 | |
| | | | | | | | | | | | | | | | | | | | | | |
| Class C | | | | | | | | | | | | | | | | | | | | | |
| Period Ended 1/31/2014 | $ | 8.37 | | | (0.07 | ) | | 0.10 | | | 0.03 | | | 0.00 | | | 0.00 | | | 0.00 | |
| Year Ended 7/31/2013 | | 7.89 | | | (0.05 | ) | | 0.55 | | | 0.50 | | | (0.02 | ) | | 0.00 | | | (0.02 | ) |
| Year Ended 7/31/2012 | | 9.70 | | | (0.09 | ) | | (1.60 | ) | | (1.69 | ) | | (0.12 | ) | | 0.00 | | | (0.12 | ) |
| Period Ended 7/31/2011(a) | | 10.00 | | | (0.06 | ) | | (0.24 | ) | | (0.30 | ) | | 0.00 | | | 0.00 | | | 0.00 | |
| | | | | | | | | | | | | | | | | | | | | | |
| Class I | | | | | | | | | | | | | | | | | | | | | |
| Period Ended 1/31/2014 | $ | 8.49 | | | (0.02 | ) | | 0.10 | | | 0.08 | | | 0.00 | | | 0.00 | | | 0.00 | |
| Year Ended 7/31/2013 | | 7.98 | | | 0.03 | | | 0.56 | | | 0.59 | | | (0.08 | ) | | 0.00 | | | (0.08 | ) |
| Year Ended 7/31/2012 | | 9.75 | | | (0.00 | )* | | (1.62 | ) | | (1.62 | ) | | (0.15 | ) | | 0.00 | | | (0.15 | ) |
| Period Ended 7/31/2011(a) | | 10.00 | | | (0.01 | ) | | (0.24 | ) | | (0.25 | ) | | 0.00 | | | 0.00 | | | 0.00 | |
| (a) | The Emerging Markets Opportunities Fund commenced operations on December 31, 2010. |
| (b) | Per share data was calculated using average shares outstanding during the period. |
| (c) | Total returns are historical and assume changes in share price, reinvestment of all dividends and distributions and no sales charge. Had certain expenses not been reduced during the periods shown, total returns would have been lower. Total returns for periods of less than one year are not annualized. |
| (d) | Not annualized for periods less than one year. |
| * | Amount represents less than $0.01. |
See notes to financial statements
| Financial highlights (unaudited) |
| | | | | | | | | | | | Ratios to average net assets: | | | |
| | | Net asset value, end of period | | Total return(c) | | Net assets, end of period (000) | | Annualized ratio of operating expenses to average net assets(d) | | Annualized ratio of net investment income/(loss) to average net assets | | Annualized ratio of operating expenses to average net assets without waivers and/or expenses reimbursed(d) | | Portfolio turnover rate(d) |
| | | | | | | | | | | | | | | |
| | | | | | | | | | | | | | | |
| | $ | 8.56 | | | 0.82 | % | $ | 9,351 | | | 1.79 | % | | (0.76 | )% | | 2.00 | % | | 45 | % |
| | | 8.49 | | | 7.16 | | | 8,930 | | | 1.79 | | | 0.09 | | | 2.15 | | | 126 | |
| | | 7.97 | | | (16.70 | ) | | 7,011 | | | 1.79 | | | (0.25 | ) | | 2.51 | | | 110 | |
| | | 9.74 | | | (2.60 | ) | | 15,841 | | | 1.79 | | | 0.04 | | | 3.97 | | | 35 | |
| | | | | | | | | | | | | | | | | | | | | | |
| | $ | 8.40 | | | 0.36 | % | $ | 3,495 | | | 2.54 | % | | (1.49 | )% | | 2.76 | % | | 45 | % |
| | | 8.37 | | | 6.33 | | | 3,169 | | | 2.54 | | | (0.60 | ) | | 2.87 | | | 126 | |
| | | 7.89 | | | (17.31 | ) | | 2,305 | | | 2.54 | | | (1.08 | ) | | 3.23 | | | 110 | |
| | | 9.70 | | | (3.00 | ) | | 1,384 | | | 2.54 | | | (1.06 | ) | | 4.72 | | | 35 | |
| | | | | | | | | | | | | | | | | | | | | | |
| | $ | 8.57 | | | 0.94 | % | $ | 14,153 | | | 1.54 | % | | (0.50 | )% | | 1.68 | % | | 45 | % |
| | | 8.49 | | | 7.39 | | | 10,773 | | | 1.54 | | | 0.34 | | | 1.80 | | | 126 | |
| | | 7.98 | | | (16.49 | ) | | 7,724 | | | 1.54 | | | (0.06 | ) | | 2.16 | | | 110 | |
| | | 9.75 | | | (2.50 | ) | | 3,382 | | | 1.54 | | | (0.26 | ) | | 3.72 | | | 35 | |
See notes to financial statements
| Financial highlights (unaudited) |
For a share outstanding throughout the periods indicated
| | | | | | | | | | | | | | | | | | | | | | |
| | | | | | Income (loss) from investment operations: | | Less distributions |
| | | Net asset value, beginning of period | | Net investment income (loss)(b) | | Net realized and unrealized gain (loss) on investments | | Total from investment operations | | Dividends from net investment income | | Distributions from net realized capital gains | | Total distributions |
| | | | | | | | | | | | | | | | | | | | | | |
| European Focus Fund | | | | | | | | | | | | | | | | | | | | | |
| Class A | | | | | | | | | | | | | | | | | | | | | |
| Period Ended 1/31/2014 | $ | 29.23 | | | (0.09 | ) | | 5.01 | | | 4.92 | | | (0.07 | ) | | 0.00 | | | (0.07 | ) |
| Year Ended 7/31/2013 | | 22.44 | | | 0.26 | | | 6.90 | | | 7.16 | | | (0.37 | ) | | 0.00 | | | (0.37 | ) |
| Year Ended 7/31/2012 | | 29.07 | | | 0.30 | | | (5.71 | ) | | (5.41 | ) | | (1.22 | ) | | 0.00 | | | (1.22 | ) |
| Year Ended 7/31/2011 | | 23.90 | | | 0.07 | | | 5.89 | | | 5.96 | | | (0.79 | ) | | 0.00 | | | (0.79 | ) |
| Year Ended 7/31/2010 | | 20.32 | | | (0.03 | ) | | 4.31 | | | 4.28 | | | (0.70 | ) | | 0.00 | | | (0.70 | ) |
| Year Ended 7/31/2009 | | 28.57 | | | 0.26 | | | (6.20 | ) | | (5.94 | ) | | (0.60 | ) | | (1.71 | ) | | (2.31 | ) |
| | | | | | | | | | | | | | | | | | | | | | |
| Class B | | | | | | | | | | | | | | | | | | | | | |
| Period Ended 1/31/2014 | $ | 27.74 | | | (0.21 | ) | | 4.74 | | | 4.53 | | | 0.00 | | | 0.00 | | | 0.00 | |
| Year Ended 7/31/2013 | | 21.25 | | | 0.01 | | | 6.58 | | | 6.59 | | | (0.10 | ) | | 0.00 | | | (0.10 | ) |
| Year Ended 7/31/2012 | | 27.51 | | | 0.09 | | | (5.37 | ) | | (5.28 | ) | | (0.98 | ) | | 0.00 | | | (0.98 | ) |
| Year Ended 7/31/2011 | | 22.65 | | | (0.16 | ) | | 5.62 | | | 5.46 | | | (0.60 | ) | | 0.00 | | | (0.60 | ) |
| Year Ended 7/31/2010 | | 19.33 | | | (0.20 | ) | | 4.09 | | | 3.89 | | | (0.57 | ) | | 0.00 | | | (0.57 | ) |
| Year Ended 7/31/2009 | | 27.17 | | | 0.10 | | | (5.83 | ) | | (5.73 | ) | | (0.40 | ) | | (1.71 | ) | | (2.11 | ) |
| | | | | | | | | | | | | | | | | | | | | | |
| Class C | | | | | | | | | | | | | | | | | | | | | |
| Period Ended 1/31/2014 | $ | 27.67 | | | (0.21 | ) | | 4.74 | | | 4.53 | | | 0.00 | | | 0.00 | | | 0.00 | |
| Year Ended 7/31/2013 | | 21.25 | | | 0.05 | | | 6.54 | | | 6.59 | | | (0.17 | ) | | 0.00 | | | (0.17 | ) |
| Year Ended 7/31/2012 | | 27.50 | | | 0.10 | | | (5.37 | ) | | (5.27 | ) | | (0.98 | ) | | 0.00 | | | (0.98 | ) |
| Year Ended 7/31/2011 | | 22.65 | | | (0.15 | ) | | 5.60 | | | 5.45 | | | (0.60 | ) | | 0.00 | | | (0.60 | ) |
| Year Ended 7/31/2010 | | 19.33 | | | (0.20 | ) | | 4.09 | | | 3.89 | | | (0.57 | ) | | 0.00 | | | (0.57 | ) |
| Year Ended 7/31/2009 | | 27.17 | | | 0.12 | | | (5.85 | ) | | (5.73 | ) | | (0.40 | ) | | (1.71 | ) | | (2.11 | ) |
| | | | | | | | | | | | | | | | | | | | | | |
| Class I | | | | | | | | | | | | | | | | | | | | | |
| Period Ended 1/31/2014 | $ | 29.25 | | | (0.05 | ) | | 5.01 | | | 4.96 | | | (0.12 | ) | | 0.00 | | | (0.12 | ) |
| Year Ended 7/31/2013 | | 22.46 | | | 0.40 | | | 6.85 | | | 7.25 | | | (0.46 | ) | | 0.00 | | | (0.46 | ) |
| Year Ended 7/31/2012 | | 29.10 | | | 0.39 | | | (5.73 | ) | | (5.34 | ) | | (1.30 | ) | | 0.00 | | | (1.30 | ) |
| Year Ended 7/31/2011 | | 23.92 | | | 0.16 | | | 5.88 | | | 6.04 | | | (0.86 | ) | | 0.00 | | | (0.86 | ) |
| Year Ended 7/31/2010 | | 20.34 | | | 0.04 | | | 4.30 | | | 4.34 | | | (0.76 | ) | | 0.00 | | | (0.76 | ) |
| Period Ended 7/31/2009(a) | | 13.35 | | | 0.05 | | | 6.94 | | | 6.99 | | | 0.00 | | | 0.00 | | | 0.00 | |
| (a) | The European Focus Fund Class W commenced operations on March 31, 2009. Class W shares were converted to Class I shares on January 18, 2011. |
| (b) | Per share data was calculated using average shares outstanding during the period. |
| (c) | Total returns are historical and assume changes in share price, reinvestment of all dividends and distributions and no sales charge. Had certain expenses not been reduced during the periods shown, total returns would have been lower. Total returns for periods of less than one year are not annualized. |
| (d) | Not annualized for periods less than one year. |
| * | Amount represents less than $0.01. |
See notes to financial statements
| Financial highlights (unaudited) |
| | | | | | | | | | | | | | Ratios to average net assets: | | | |
| | Redemption fees | | Net asset value, end of period | | Total return(c) | | Net assets, end of period (000) | | Annualized ratio of operating expenses to average net assets | | Annualized ratio of net investment income/(loss) to average net assets | | Annualized ratio of operating expenses to average net assets without waivers and/or expenses reimbursed | | Portfolio turnover rate(d) |
| | | | | | | | | | | | | | | | |
| | | | | | | | | | | | | | | | |
| | N/A | | $ | 34.08 | | | 16.83 | % | $ | 719,111 | | | 1.38 | % | | (0.56 | )% | | 1.38 | % | | 64 | % |
| | N/A | | | 29.23 | | | 32.13 | | | 317,547 | | | 1.50 | | | 1.01 | | | 1.50 | | | 115 | |
| | N/A | | | 22.44 | | | (18.32 | ) | | 236,974 | | | 1.53 | | | 1.24 | | | 1.53 | | | 69 | |
| | N/A | | | 29.07 | | | 25.08 | | | 332,755 | | | 1.54 | | | 0.25 | | | 1.54 | | | 67 | |
| | 0.00 | * | | 23.90 | | | 20.97 | | | 253,421 | | | 1.61 | | | (0.14 | ) | | 1.61 | | | 86 | |
| | 0.00 | * | | 20.32 | | | (14.12 | ) | | 299,183 | | | 1.72 | | | 1.52 | | | 1.72 | | | 51 | |
| | | | | | | | | | | | | | | | | | | | | | | | |
| | N/A | | $ | 32.27 | | | 16.33 | % | $ | 16,696 | | | 2.21 | % | | (1.32 | )% | | 2.21 | % | | 64 | % |
| | N/A | | | 27.74 | | | 31.05 | | | 17,023 | | | 2.32 | | | 0.03 | | | 2.32 | | | 115 | |
| | N/A | | | 21.25 | | | (18.97 | ) | | 19,728 | | | 2.36 | | | 0.38 | | | 2.36 | | | 69 | |
| | N/A | | | 27.51 | | | 24.18 | | | 34,561 | | | 2.29 | | | (0.58 | ) | | 2.29 | | | 67 | |
| | 0.00 | * | | 22.65 | | | 20.07 | | | 31,989 | | | 2.36 | | | (0.88 | ) | | 2.36 | | | 86 | |
| | 0.00 | * | | 19.33 | | | (14.75 | ) | | 31,555 | | | 2.47 | | | 0.64 | | | 2.47 | | | 51 | |
| | | | | | | | | | | | | | | | | | | | | | | | |
| | N/A | | $ | 32.20 | | | 16.37 | % | $ | 197,914 | | | 2.15 | % | | (1.31 | )% | | 2.15 | % | | 64 | % |
| | N/A | | | 27.67 | | | 31.10 | | | 104,206 | | | 2.27 | | | 0.22 | | | 2.27 | | | 115 | |
| | N/A | | | 21.25 | | | (18.94 | ) | | 88,015 | | | 2.32 | | | 0.45 | | | 2.32 | | | 69 | |
| | N/A | | | 27.50 | | | 24.13 | | | 132,641 | | | 2.29 | | | (0.56 | ) | | 2.29 | | | 67 | |
| | 0.00 | * | | 22.65 | | | 20.07 | | | 115,197 | | | 2.36 | | | (0.88 | ) | | 2.36 | | | 86 | |
| | 0.00 | * | | 19.33 | | | (14.75 | ) | | 114,401 | | | 2.47 | | | 0.72 | | | 2.47 | | | 51 | |
| | | | | | | | | | | | | | | | | | | | | | | | |
| | N/A | | $ | 34.09 | | | 16.96 | % | $ | 778,707 | | | 1.11 | % | | (0.30 | )% | | 1.11 | % | | 64 | % |
| | N/A | | | 29.25 | | | 32.54 | | | 266,517 | | | 1.20 | | | 1.55 | | | 1.20 | | | 115 | |
| | N/A | | | 22.46 | | | (18.04 | ) | | 120,392 | | | 1.21 | | | 1.65 | | | 1.21 | | | 69 | |
| | N/A | | | 29.10 | | | 25.40 | | | 129,452 | | | 1.29 | | | 0.57 | | | 1.29 | | | 67 | |
| | 0.00 | * | | 23.92 | | | 21.30 | | | 73,412 | | | 1.36 | | | 0.19 | | | 1.36 | | | 86 | |
| | 0.00 | * | | 20.34 | | | 52.36 | | | 8,954 | | | 1.60 | | | 0.78 | | | 1.60 | | | 51 | |
See notes to financial statements
| Financial highlights (unaudited) |
For a share outstanding throughout the periods indicated
| | | | | | Income (loss) from investment operations: | | Less distributions |
| | | Net asset value, beginning of period | | Net investment income (loss)(b) | | Net realized and unrealized gain (loss) on investments | | Total from investment operations | | Dividends from net investment income | | Total distributions | | Redemption fees |
| | | | | | | | | | | | | | | | | | | | | | |
| Global Equity Income Fund | | | | | | | | | | | | | | | | | | | | | |
| Class A | | | | | | | | | | | | | | | | | | | | | |
| Period Ended 1/31/2014 | $ | 7.85 | | | 0.19 | | | 0.17 | | | 0.36 | | | (0.21 | ) | | (0.21 | ) | | 0.00 | |
| Year Ended 7/31/2013 | | 7.06 | | | 0.50 | | | 0.78 | | | 1.28 | | | (0.49 | ) | | (0.49 | ) | | 0.00 | |
| Year Ended 7/31/2012 | | 7.45 | | | 0.48 | | | (0.39 | ) | | 0.09 | | | (0.48 | ) | | (0.48 | ) | | 0.00 | |
| Year Ended 7/31/2011 | | 6.99 | | | 0.46 | | | 0.51 | | | 0.97 | | | (0.51 | ) | | (0.51 | ) | | 0.00 | |
| Year Ended 7/31/2010 | | 7.11 | | | 0.57 | | | (0.17 | ) | | 0.40 | | | (0.52 | ) | | (0.52 | ) | | 0.00 | * |
| Year Ended 7/31/2009 | | 8.85 | | | 0.58 | | | (1.77 | ) | | (1.19 | ) | | (0.55 | ) | | (0.55 | ) | | 0.00 | * |
| | | | | | | | | | | | | | | | | | | | | | |
| Class C | | | | | | | | | | | | | | | | | | | | | |
| Period Ended 1/31/2014 | $ | 7.81 | | | 0.16 | | | 0.17 | | | 0.33 | | | (0.18 | ) | | (0.18 | ) | | 0.00 | |
| Year Ended 7/31/2013 | | 7.03 | | | 0.44 | | | 0.77 | | | 1.21 | | | (0.43 | ) | | (0.43 | ) | | 0.00 | |
| Year Ended 7/31/2012 | | 7.42 | | | 0.43 | | | (0.39 | ) | | 0.04 | | | (0.43 | ) | | (0.43 | ) | | 0.00 | |
| Year Ended 7/31/2011 | | 6.96 | | | 0.40 | | | 0.52 | | | 0.92 | | | (0.46 | ) | | (0.46 | ) | | 0.00 | |
| Year Ended 7/31/2010 | | 7.08 | | | 0.52 | | | (0.17 | ) | | 0.35 | | | (0.47 | ) | | (0.47 | ) | | 0.00 | * |
| Year Ended 7/31/2009 | | 8.82 | | | 0.51 | | | (1.76 | ) | | (1.25 | ) | | (0.49 | ) | | (0.49 | ) | | 0.00 | * |
| | | | | | | | | | | | | | | | | | | | | | |
| Class I | | | | | | | | | | | | | | | | | | | | | |
| Period Ended 1/31/2014 | $ | 7.86 | | | 0.20 | | | 0.17 | | | 0.37 | | | (0.22 | ) | | (0.22 | ) | | 0.00 | |
| Year Ended 7/31/2013 | | 7.07 | | | 0.53 | | | 0.77 | | | 1.30 | | | (0.51 | ) | | (0.51 | ) | | 0.00 | |
| Year Ended 7/31/2012 | | 7.46 | | | 0.51 | | | (0.40 | ) | | 0.11 | | | (0.50 | ) | | (0.50 | ) | | 0.00 | |
| Year Ended 7/31/2011 | | 6.99 | | | 0.48 | | | 0.52 | | | 1.00 | | | (0.53 | ) | | (0.53 | ) | | 0.00 | |
| Year Ended 7/31/2010 | | 7.12 | | | 0.62 | | | (0.21 | ) | | 0.41 | | | (0.54 | ) | | (0.54 | ) | | 0.00 | |
| Period Ended 7/31/2009(a) | | 6.08 | | | 0.32 | | | 1.00 | | | 1.32 | | | (0.28 | ) | | (0.28 | ) | | 0.00 | |
| (a) | The Global Equity Income Fund Class W commenced operations on March 31, 2009. Class W shares converted to Class I shares on January 18, 2011. |
| (b) | Per share data was calculated using average shares outstanding during the period. |
| (c) | Total returns are historical and assume changes in share price, reinvestment of all dividends and distributions and no sales charge. Had certain expenses not been reduced during the periods shown, total returns would have been lower. Total returns for periods of less than one year are not annualized. |
| (d) | Not annualized for periods less than one year. |
| * | Amount represents less than $0.01. |
See notes to financial statements
| Financial highlights (unaudited) |
| | | | | | | | | | | | | | | Ratios to average net assets: | | | |
| | | Redemption fees | | Net asset value, end of period | | Total return(c) | | Net assets, end of period (000) | | Annualized ratio of operating expenses to average net assets | | Annualized ratio of net investment income/(loss) to average net assets | | Annualized ratio of operating expenses to average net assets without waivers and/or expenses reimbursed | | Portfolio turnover rate(d) |
| | | | | | | | | | | | | | | | | |
| | | | | | | | | | | | | | | | | |
| | | N/A | | $ | 8.00 | | | 4.52 | % | $ | 862,375 | | | 1.14 | % | | 4.61 | % | | 1.14 | % | | 45 | % |
| | | N/A | | | 7.85 | | | 18.58 | | | 707,252 | | | 1.22 | | | 6.56 | | | 1.22 | | | 130 | |
| | | N/A | | | 7.06 | | | 1.59 | | | 467,318 | | | 1.29 | | | 6.97 | | | 1.29 | | | 108 | |
| | | N/A | | | 7.45 | | | 14.13 | | | 489,400 | | | 1.32 | | | 6.18 | | | 1.32 | | | 127 | |
| | | 0.00 | * | | 6.99 | | | 5.76 | | | 351,445 | | | 1.36 | | | 7.89 | | | 1.37 | | | 174 | |
| | | 0.00 | * | | 7.11 | | | (12.93 | ) | | 186,248 | | | 1.40 | | | 8.45 | | | 1.50 | | | 155 | |
| | | | | | | | | | | | | | | | | | | | | | | | | |
| | | N/A | | $ | 7.96 | | | 4.16 | % | $ | 797,459 | | | 1.90 | % | | 3.84 | % | | 1.90 | % | | 45 | % |
| | | N/A | | | 7.81 | | | 17.65 | | | 587,376 | | | 1.98 | | | 5.85 | | | 1.98 | | | 130 | |
| | | N/A | | | 7.03 | | | 0.82 | | | 363,751 | | | 2.05 | | | 6.21 | | | 2.05 | | | 108 | |
| | | N/A | | | 7.42 | | | 13.35 | | | 363,455 | | | 2.07 | | | 5.36 | | | 2.07 | | | 127 | |
| | | 0.00 | * | | 6.96 | | | 5.01 | | | 274,571 | | | 2.11 | | | 7.17 | | | 2.12 | | | 174 | |
| | | 0.00 | * | | 7.08 | | | (13.64 | ) | | 131,990 | | | 2.15 | | | 7.40 | | | 2.25 | | | 155 | |
| | | | | | | | | | | | | | | | | | | | | | | | | |
| | | N/A | | $ | 8.01 | | | 4.65 | % | $ | 963,078 | | | 0.88 | % | | 4.84 | % | | 0.88 | % | | 45 | % |
| | | N/A | | | 7.86 | | | 18.87 | | | 665,505 | | | 0.95 | | | 6.95 | | | 0.95 | | | 130 | |
| | | N/A | | | 7.07 | | | 1.87 | | | 332,048 | | | 1.01 | | | 7.38 | | | 1.01 | | | 108 | |
| | | N/A | | | 7.46 | | | 14.55 | | | 198,216 | | | 1.07 | | | 6.35 | | | 1.07 | | | 127 | |
| | | 0.00 | * | | 6.99 | | | 5.87 | | | 92,146 | | | 1.11 | | | 8.60 | | | 1.12 | | | 174 | |
| | | 0.00 | * | | 7.12 | | | 22.03 | | | 9,119 | | | 1.15 | | | 13.83 | | | 1.32 | | | 155 | |
See notes to financial statements
| Financial highlights (unaudited) |
For a share outstanding throughout the periods indicated
| | | | | | Income (loss) from investment operations: | | Less distributions |
| | | Net asset value, beginning of period | | Net investment income (loss)(b) | | Net realized and unrealized gain (loss) on investments | | Total from investment operations | | Dividends from net investment income | | Distributions from net realized capital gains | | Total distributions |
| | | | | | | | | | | | | | | | | | | | | | |
| Global Technology Fund | | | | | | | | | | | | | | | | | | | | | |
| Class A | | | | | | | | | | | | | | | | | | | | | |
| Period Ended 1/31/2014 | $ | 23.22 | | | (0.09 | ) | | 3.10 | | | 3.01 | | | 0.00 | | | (0.17 | ) | | (0.17 | ) |
| Year Ended 7/31/2013 | | 19.69 | | | 0.06 | | | 3.47 | | | 3.53 | | | 0.00 | | | 0.00 | | | 0.00 | |
| Year Ended 7/31/2012 | | 20.55 | | | (0.15 | ) | | (0.71 | ) | | (0.86 | ) | | 0.00 | | | 0.00 | | | 0.00 | |
| Year Ended 7/31/2011 | | 16.10 | | | (0.08 | ) | | 4.53 | | | 4.45 | | | 0.00 | | | 0.00 | | | 0.00 | |
| Year Ended 7/31/2010 | | 13.32 | | | (0.17 | ) | | 2.95 | | | 2.78 | | | 0.00 | | | 0.00 | | | 0.00 | |
| Year Ended 7/31/2009 | | 13.88 | | | (0.09 | ) | | (0.47 | ) | | (0.56 | ) | | 0.00 | | | 0.00 | | | 0.00 | |
| | | | | | | | | | | | | | | | | | | | | | |
| Class B | | | | | | | | | | | | | | | | | | | | | |
| Period Ended 1/31/2014 | $ | 21.26 | | | (0.17 | ) | | 2.83 | | | 2.66 | | | 0.00 | | | (0.17 | ) | | (0.17 | ) |
| Year Ended 7/31/2013 | | 18.18 | | | (0.10 | ) | | 3.18 | | | 3.08 | | | 0.00 | | | 0.00 | | | 0.00 | |
| Year Ended 7/31/2012 | | 19.13 | | | (0.29 | ) | | (0.66 | ) | | (0.95 | ) | | 0.00 | | | 0.00 | | | 0.00 | |
| Year Ended 7/31/2011 | | 15.10 | | | (0.22 | ) | | 4.25 | | | 4.03 | | | 0.00 | | | 0.00 | | | 0.00 | |
| Year Ended 7/31/2010 | | 12.59 | | | (0.27 | ) | | 2.78 | | | 2.51 | | | 0.00 | | | 0.00 | | | 0.00 | |
| Year Ended 7/31/2009 | | 13.22 | | | (0.17 | ) | | (0.46 | ) | | (0.63 | ) | | 0.00 | | | 0.00 | | | 0.00 | |
| | | | | | | | | | | | | | | | | | | | | | |
| Class C | | | | | | | | | | | | | | | | | | | | | |
| Period Ended 1/31/2014 | $ | 21.23 | | | (0.17 | ) | | 2.84 | | | 2.67 | | | 0.00 | | | (0.17 | ) | | (0.17 | ) |
| Year Ended 7/31/2013 | | 18.15 | | | (0.09 | ) | | 3.17 | | | 3.08 | | | 0.00 | | | 0.00 | | | 0.00 | |
| Year Ended 7/31/2012 | | 19.08 | | | (0.28 | ) | | (0.65 | ) | | (0.93 | ) | | 0.00 | | | 0.00 | | | 0.00 | |
| Year Ended 7/31/2011 | | 15.06 | | | (0.22 | ) | | 4.24 | | | 4.02 | | | 0.00 | | | 0.00 | | | 0.00 | |
| Year Ended 7/31/2010 | | 12.56 | | | (0.27 | ) | | 2.77 | | | 2.50 | | | 0.00 | | | 0.00 | | | 0.00 | |
| Year Ended 7/31/2009 | | 13.19 | | | (0.17 | ) | | (0.46 | ) | | (0.63 | ) | | 0.00 | | | 0.00 | | | 0.00 | |
| | | | | | | | | | | | | | | | | | | | | | |
| Class I | | | | | | | | | | | | | | | | | | | | | |
| Period Ended 1/31/2014 | $ | 23.50 | | | (0.05 | ) | | 3.13 | | | 3.08 | | | 0.00 | | | (0.17 | ) | | (0.17 | ) |
| Year Ended 7/31/2013 | | 19.88 | | | 0.11 | | | 3.51 | | | 3.62 | | | 0.00 | | | 0.00 | | | 0.00 | |
| Year Ended 7/31/2012 | | 20.68 | | | (0.09 | ) | | (0.71 | ) | | (0.80 | ) | | 0.00 | | | 0.00 | | | 0.00 | |
| Year Ended 7/31/2011 | | 16.16 | | | (0.02 | ) | | 4.54 | | | 4.52 | | | 0.00 | | | 0.00 | | | 0.00 | |
| Year Ended 7/31/2010 | | 13.34 | | | (0.13 | ) | | 2.95 | | | 2.82 | | | 0.00 | | | 0.00 | | | 0.00 | |
| Period Ended 7/31/2009(a) | | 9.94 | | | (0.03 | ) | | 3.43 | | | 3.40 | | | 0.00 | | | 0.00 | | | 0.00 | |
| (a) | The Global Technology Fund Class W commenced operations on March 31, 2009. Class W shares converted to Class I shares on January 18, 2011. |
| (b) | Per share data was calculated using average shares outstanding during the period. |
| (c) | Total returns are historical and assume changes in share price, reinvestment of all dividends and distributions and no sales charge. Had certain expenses not been reduced during the periods shown, total returns would have been lower. Total returns for periods of less than one year are not annualized. |
| (d) | Not annualized for periods less than one year. |
See notes to financial statements
| Financial highlights (unaudited) |
| | | | | | | | | | | | | | | Ratios to average net assets: |
| | | Redemption fees | | Net asset value, end of period | | Total return(c) | | Net assets, end of period (000) | | Annualized ratio of operating expenses to average net assets | | Annualized ratio of net investment income/(loss) to average net assets | | Annualized ratio of operating expenses to average net assets without waivers and/or expenses reimbursed | | Portfolio turnover rate(d) |
| | | | | | | | | | | | | | | | | |
| | | | | | | | | | | | | | | | | |
| | | N/A | | $ | 26.06 | | | 12.96 | % | $ | 180,184 | | | 1.45 | % | | (0.68 | )% | | 1.45 | % | | 31 | % |
| | | N/A | | | 23.22 | | | 17.93 | | | 169,279 | | | 1.49 | | | 0.28 | | | 1.49 | | | 83 | |
| | | N/A | | | 19.69 | | | (4.18 | ) | | 156,948 | | | 1.50 | | | (0.75 | ) | | 1.50 | | | 113 | |
| | | N/A | | | 20.55 | | | 27.64 | | | 191,623 | | | 1.55 | | | (0.42 | ) | | 1.55 | | | 93 | |
| | | 0.00 | * | | 16.10 | | | 20.87 | | | 116,903 | | | 1.64 | | | (1.07 | ) | | 1.64 | | | 76 | |
| | | 0.00 | * | | 13.32 | | | (4.03 | ) | | 71,472 | | | 1.81 | | | (0.83 | ) | | 1.81 | | | 160 | |
| | | | | | | | | | | | | | | | | | | | | | | | | |
| | | N/A | | $ | 23.75 | | | 12.51 | % | $ | 9,186 | | | 2.27 | % | | (1.50 | )% | | 2.27 | % | | 31 | % |
| | | N/A | | | 21.26 | | | 16.94 | | | 9,249 | | | 2.31 | | | (0.52 | ) | | 2.31 | | | 83 | |
| | | N/A | | | 18.18 | | | (4.97 | ) | | 9,751 | | | 2.36 | | | (1.62 | ) | | 2.36 | | | 113 | |
| | | N/A | | | 19.13 | | | 26.69 | | | 11,821 | | | 2.30 | | | (1.19 | ) | | 2.30 | | | 93 | |
| | | 0.00 | * | | 15.10 | | | 19.94 | | | 9,283 | | | 2.39 | | | (1.82 | ) | | 2.39 | | | 76 | |
| | | 0.00 | * | | 12.59 | | | (4.77 | ) | | 5,994 | | | 2.56 | | | (1.65 | ) | | 2.56 | | | 160 | |
| | | | | | | | | | | | | | | | | | | | | | | | | |
| | | N/A | | $ | 23.73 | | | 12.58 | % | $ | 81,870 | | | 2.22 | % | | (1.45 | )% | | 2.22 | % | | 31 | % |
| | | N/A | | | 21.23 | | | 16.97 | | | 71,401 | | | 2.26 | | | (0.49 | ) | | 2.26 | | | 83 | |
| | | N/A | | | 18.15 | | | (4.87 | ) | | 69,286 | | | 2.29 | | | (1.54 | ) | | 2.29 | | | 113 | |
| | | N/A | | | 19.08 | | | 26.69 | | | 79,228 | | | 2.30 | | | (1.17 | ) | | 2.30 | | | 93 | |
| | | 0.00 | * | | 15.06 | | | 19.90 | | | 53,793 | | | 2.39 | | | (1.82 | ) | | 2.39 | | | 76 | |
| | | 0.00 | * | | 12.56 | | | (4.78 | ) | | 39,330 | | | 2.56 | | | (1.61 | ) | | 2.56 | | | 160 | |
| | | | | | | | | | | | | | | | | | | | | | | | | |
| | | N/A | | $ | 26.41 | | | 13.11 | % | $ | 107,292 | | | 1.19 | % | | (0.42 | )% | | 1.19 | % | | 31 | % |
| | | N/A | | | 23.50 | | | 18.21 | | | 97,882 | | | 1.22 | | | 0.51 | | | 1.22 | | | 83 | |
| | | N/A | | | 19.88 | | | (3.87 | ) | | 61,492 | | | 1.23 | | | (0.47 | ) | | 1.23 | | | 113 | |
| | | N/A | | | 20.68 | | | 27.97 | | | 52,351 | | | 1.30 | | | (0.12 | ) | | 1.30 | | | 93 | |
| | | 0.00 | * | | 16.16 | | | 21.14 | | | 18,810 | | | 1.39 | | | (0.82 | ) | | 1.39 | | | 76 | |
| | | 0.00 | * | | 13.34 | | | 34.21 | | | 2,914 | | | 1.71 | | | (0.74 | ) | | 1.71 | | | 160 | |
See notes to financial statements
| Financial highlights (unaudited) |
For a share outstanding throughout the periods indicated
| | | | | | Income (loss) from investment operations: | | Less distributions |
| | | Net asset value, beginning of period | | Net investment income (loss)(b) | | Net realized and unrealized gain (loss) on investments | | Total from investment operations | | Dividends from net investment income | | Distributions from net realized capital gains | | Total distributions |
| | | | | | | | | | | | | | | | | | | | | | |
| High Yield Opportunities Fund | | | | | | | | | | | | | | | | | | | | | |
| Class A | | | | | | | | | | | | | | | | | | | | | |
| Period Ended 1/31/2014 | $ | 9.98 | | | 0.31 | | | 0.34 | | | 0.65 | | | (0.33 | ) | | (0.03 | ) | | (0.36 | ) |
| Period Ended 7/31/2013(a) | | 10.00 | | | 0.15 | | | (0.06 | ) | | 0.09 | | | (0.11 | ) | | 0.00 | | | (0.11 | ) |
| | | | | | | | | | | | | | | | | | | | | | |
| Class C | | | | | | | | | | | | | | | | | | | | | |
| Period Ended 1/31/2014 | $ | 9.99 | | | 0.27 | | | 0.33 | | | 0.60 | | | (0.29 | ) | | (0.03 | ) | | (0.32 | ) |
| Period Ended 7/31/2013(a) | | 10.00 | | | 0.13 | | | (0.05 | ) | | 0.08 | | | (0.09 | ) | | 0.00 | | | (0.09 | ) |
| | | | | | | | | | | | | | | | | | | | | | |
| Class I | | | | | | | | | | | | | | | | | | | | | |
| Period Ended 1/31/2014 | $ | 9.97 | | | 0.32 | | | 0.33 | | | 0.65 | | | (0.35 | ) | | (0.03 | ) | | (0.38 | ) |
| Period Ended 7/31/2013(a) | | 10.00 | | | 0.16 | | | (0.06 | ) | | 0.10 | | | (0.13 | ) | | 0.00 | | | (0.13 | ) |
| (a) | The High Yield Opportunities Fund commenced operations on April 30, 2013. |
| (b) | Per share data was calculated using average shares outstanding during the period. |
| (c) | Total returns are historical and assume changes in share price, reinvestment of all dividends and distributions and no sales charge. Had certain expenses not been reduced during the periods shown, total returns would have been lower. Total returns for periods of less than one year are not annualized. |
| (d) | Not annualized for periods less than one year. |
See notes to financial statements
| Financial highlights (unaudited) |
| | | | | | | | | | | | Ratios to average net assets: | | | |
| | | Net asset value, end of period | | Total return(c) | | Net assets, end of period (000) | | Annualized ratio of operating expenses to average net assets | | Annualized ratio of net investment income/(loss) to average net assets | | Annualized ratio of operating expenses to average net assets without waivers and/or expenses reimbursed | | Portfolio turnover rate(d) |
| | | | | | | | | | | | | | | |
| | | | | | | | | | | | | | | |
| | $ | 10.27 | | | 6.57 | % | $ | 1,222 | | | 1.10 | % | | 6.11 | % | | 1.77 | % | | 182 | % |
| | | 9.98 | | | 0.92 | | | 1,127 | | | 1.10 | | | 6.07 | | | 2.82 | | | 136 | |
| | | | | | | | | | | | | | | | | | | | | | |
| | $ | 10.27 | | | 6.06 | % | $ | 1,044 | | | 1.85 | % | | 5.35 | % | | 2.54 | % | | 182 | % |
| | | 9.99 | | | 0.81 | | | 999 | | | 1.85 | | | 5.27 | | | 3.63 | | | 136 | |
| | | | | | | | | | | | | | | | | | | | | | |
| | $ | 10.24 | | | 6.59 | % | $ | 24,652 | | | 0.85 | % | | 6.35 | % | | 1.39 | % | | 182 | % |
| | | 9.97 | | | 1.06 | | | 23,608 | | | 0.85 | | | 6.27 | | | 1.82 | | | 136 | |
See notes to financial statements
| Financial highlights (unaudited) |
For a share outstanding throughout the periods indicated
| | | | | | Income (loss) from investment operations: | | Less distributions |
| | | Net asset value, beginning of period | | Net investment income (loss)(b) | | Net realized and unrealized gain (loss) on investments | | Total from investment operations | | Dividends from net investment income | | Distributions from net realized capital gains | | Total distributions |
| | | | | | | | | | | | | | | | | | | | | | |
| International Opportunities Fund | | | | | | | | | | | | | | | | | | | | | |
| Class A | | | | | | | | | | | | | | | | | | | | | |
| Period Ended 1/31/2014 | $ | 23.79 | | | (0.05 | ) | | 2.41 | | | 2.36 | | | (0.09 | ) | | 0.00 | | | (0.09 | ) |
| Year Ended 7/31/2013 | | 19.22 | | | 0.14 | | | 4.58 | | | 4.72 | | | (0.15 | ) | | 0.00 | | | (0.15 | ) |
| Year Ended 7/31/2012 | | 21.77 | | | 0.15 | | | (2.59 | ) | | (2.44 | ) | | (0.11 | ) | | 0.00 | | | (0.11 | ) |
| Year Ended 7/31/2011 | | 19.10 | | | 0.13 | | | 2.68 | | | 2.81 | | | (0.14 | ) | | 0.00 | | | (0.14 | ) |
| Year Ended 7/31/2010 | | 18.87 | | | 0.16 | | | 0.14 | | | 0.30 | | | (0.07 | ) | | 0.00 | | | (0.07 | ) |
| Year Ended 7/31/2009 | | 22.11 | | | 0.25 | | | (3.20 | ) | | (2.95 | ) | | (0.20 | ) | | (0.09 | ) | | (0.29 | ) |
| | | | | | | | | | | | | | | | | | | | | | |
| Class B | | | | | | | | | | | | | | | | | | | | | |
| Period Ended 1/31/2014 | $ | 22.40 | | | (0.15 | ) | | 2.27 | | | 2.12 | | | 0.00 | | | 0.00 | | | 0.00 | |
| Year Ended 7/31/2013 | | 18.13 | | | (0.06 | ) | | 4.33 | | | 4.27 | | | 0.00 | | | 0.00 | | | 0.00 | |
| Year Ended 7/31/2012 | | 20.58 | | | (0.01 | ) | | (2.44 | ) | | (2.45 | ) | | 0.00 | | | 0.00 | | | 0.00 | |
| Year Ended 7/31/2011 | | 18.07 | | | (0.03 | ) | | 2.54 | | | 2.51 | | | 0.00 | | | 0.00 | | | 0.00 | |
| Year Ended 7/31/2010 | | 17.92 | | | 0.01 | | | 0.14 | | | 0.15 | | | (0.00 | )* | | 0.00 | | | (0.00 | )* |
| Year Ended 7/31/2009 | | 21.00 | | | 0.12 | | | (3.02 | ) | | (2.90 | ) | | (0.09 | ) | | (0.09 | ) | | (0.18 | ) |
| | | | | | | | | | | | | | | | | | | | | | |
| Class C | | | | | | | | | | | | | | | | | | | | | |
| Period Ended 1/31/2014 | $ | 22.40 | | | (0.14 | ) | | 2.27 | | | 2.13 | | | 0.00 | | | 0.00 | | | 0.00 | |
| Year Ended 7/31/2013 | | 18.12 | | | (0.04 | ) | | 4.32 | | | 4.28 | | | 0.00 | | | 0.00 | | | 0.00 | |
| Year Ended 7/31/2012 | | 20.56 | | | (0.00 | )* | | (2.44 | ) | | (2.44 | ) | | 0.00 | | | 0.00 | | | 0.00 | |
| Year Ended 7/31/2011 | | 18.06 | | | (0.03 | ) | | 2.53 | | | 2.50 | | | 0.00 | | | 0.00 | | | 0.00 | |
| Year Ended 7/31/2010 | | 17.91 | | | 0.01 | | | 0.14 | | | 0.15 | | | (0.00 | )* | | 0.00 | | | (0.00 | )* |
| Year Ended 7/31/2009 | | 20.99 | | | 0.12 | | | (3.02 | ) | | (2.90 | ) | | (0.09 | ) | | (0.09 | ) | | (0.18 | ) |
| | | | | | | | | | | | | | | | | | | | | | |
| Class I | | | | | | | | | | | | | | | | | | | | | |
| Period Ended 1/31/2014 | $ | 23.82 | | | (0.02 | ) | | 2.29 | | | 2.27 | | | (0.02 | ) | | 0.00 | | | (0.02 | ) |
| Year Ended 7/31/2013 | | 19.25 | | | 0.22 | | | 4.57 | | | 4.79 | | | (0.22 | ) | | 0.00 | | | (0.22 | ) |
| Year Ended 7/31/2012 | | 21.83 | | | 0.21 | | | (2.61 | ) | | (2.40 | ) | | (0.18 | ) | | 0.00 | | | (0.18 | ) |
| Year Ended 7/31/2011 | | 19.16 | | | 0.19 | | | 2.67 | | | 2.86 | | | (0.19 | ) | | 0.00 | | | (0.19 | ) |
| Year Ended 7/31/2010 | | 18.89 | | | 0.22 | | | 0.15 | | | 0.37 | | | (0.10 | ) | | 0.00 | | | (0.10 | ) |
| Period Ended 7/31/2009(a) | | 13.96 | | | 0.11 | | | 4.82 | | | 4.93 | | | 0.00 | | | 0.00 | | | 0.00 | |
| | | | | | | | | | | | | | | | | | | | | | |
| Class R | | | | | | | | | | | | | | | | | | | | | |
| Period Ended 1/31/2014 | $ | 23.44 | | | (0.09 | ) | | 2.51 | | | 2.42 | | | (0.15 | ) | | 0.00 | | | (0.15 | ) |
| Year Ended 7/31/2013 | | 18.93 | | | 0.07 | | | 4.51 | | | 4.58 | | | (0.07 | ) | | 0.00 | | | (0.07 | ) |
| Year Ended 7/31/2012 | | 21.50 | | | 0.08 | | | (2.58 | ) | | (2.50 | ) | | (0.07 | ) | | 0.00 | | | (0.07 | ) |
| Year Ended 7/31/2011 | | 18.88 | | | 0.09 | | | 2.64 | | | 2.73 | | | (0.11 | ) | | 0.00 | | | (0.11 | ) |
| Year Ended 7/31/2010 | | 18.70 | | | 0.14 | | | 0.12 | | | 0.26 | | | (0.08 | ) | | 0.00 | | | (0.08 | ) |
| Year Ended 7/31/2009 | | 21.94 | | | 0.19 | | | (3.16 | ) | | (2.97 | ) | | (0.18 | ) | | (0.09 | ) | | (0.27 | ) |
| (a) | The International Opportunities Fund Class W commenced operations on March 31, 2009. Class W shares were converted to Class I shares on January 18, 2011. |
| (b) | Per share data was calculated using average shares outstanding during the period. |
| (c) | Total returns are historical and assume changes in share price, reinvestment of all dividends and distributions and no sales charge. Had certain expenses not been reduced during the periods shown, total returns would have been lower. Total returns for periods of less than one year are not annualized. |
| (d) | Not annualized for periods less than one year. |
| * | Amount represents less than $0.01. |
See notes to financial statements
| Financial highlights (unaudited) |
| | | | | | | | | | | | | | | Ratios to average net assets: | |
| | | Redemption fees | | Net asset value, end of period | | Total return(c) | | Net assets, end of period (000) | | Annualized ratio of operating expenses to average net assets | | Annualized ratio of net investment income/(loss) to average net assets | | Annualized ratio of operating expenses to average net assets without waivers and/or expenses reimbursed | | Portfolio turnover rate(d) |
| | | | | | | | | | | | | | | | | |
| | | | | | | | | | | | | | | | | |
| | | N/A | | $ | 26.06 | | | 9.92 | % | $ | 1,937,208 | | | 1.39 | % | | (0.40 | )% | | 1.39 | % | | 38 | % |
| | | N/A | | | 23.79 | | | 24.64 | | | 1,467,583 | | | 1.46 | | | 0.66 | | | 1.46 | | | 129 | |
| | | N/A | | | 19.22 | | | (11.17 | ) | | 1,263,648 | | | 1.47 | | | 0.78 | | | 1.47 | | | 45 | |
| | | N/A | | | 21.77 | | | 14.71 | | | 1,950,064 | | | 1.44 | | | 0.62 | | | 1.44 | | | 64 | |
| | | 0.00 | * | | 19.10 | | | 1.59 | | | 2,097,217 | | | 1.48 | | | 0.81 | | | 1.48 | | | 52 | |
| | | 0.00 | * | | 18.87 | | | (12.86 | ) | | 2,036,371 | | | 1.61 | | | 1.52 | | | 1.61 | | | 66 | |
| | | | | | | | | | | | | | | | | | | | | | | | | |
| | | N/A | | $ | 24.52 | | | 9.46 | % | $ | 36,372 | | | 2.23 | % | | (1.23 | )% | | 2.23 | % | | 38 | % |
| | | N/A | | | 22.40 | | | 23.55 | | | 40,023 | | | 2.29 | | | (0.30 | ) | | 2.29 | | | 129 | |
| | | N/A | | | 18.13 | | | (11.90 | ) | | 48,771 | | | 2.32 | | | (0.07 | ) | | 2.32 | | | 45 | |
| | | N/A | | | 20.58 | | | 13.89 | | | 79,091 | | | 2.19 | | | (0.14 | ) | | 2.19 | | | 64 | |
| | | 0.00 | * | | 18.07 | | | 0.84 | | | 84,619 | | | 2.23 | | | 0.03 | | | 2.23 | | | 52 | |
| | | 0.00 | * | | 17.92 | | | (13.55 | ) | | 91,697 | | | 2.36 | | | 0.77 | | | 2.36 | | | 66 | |
| | | | | | | | | | | | | | | | | | | | | | | | | |
| | | N/A | | $ | 24.53 | | | 9.51 | % | $ | 471,739 | | | 2.18 | % | | (1.19 | )% | | 2.18 | % | | 38 | % |
| | | N/A | | | 22.40 | | | 23.62 | | | 424,538 | | | 2.26 | | | (0.18 | ) | | 2.26 | | | 129 | |
| | | N/A | | | 18.12 | | | (11.87 | ) | | 416,582 | | | 2.29 | | | (0.02 | ) | | 2.29 | | | 45 | |
| | | N/A | | | 20.56 | | | 13.84 | | | 639,252 | | | 2.19 | | | (0.15 | ) | | 2.19 | | | 64 | |
| | | 0.00 | * | | 18.06 | | | 0.84 | | | 706,332 | | | 2.23 | | | 0.04 | | | 2.23 | | | 52 | |
| | | 0.00 | * | | 17.91 | | | (13.55 | ) | | 713,020 | | | 2.36 | | | 0.78 | | | 2.36 | | | 66 | |
| | | | | | | | | | | | | | | | | | | | | | | | | |
| | | N/A | | $ | 26.07 | | | 10.06 | % | $ | 1,149,714 | | | 1.12 | % | | (0.14 | )% | | 1.12 | % | | 38 | % |
| | | N/A | | | 23.82 | | | 25.00 | | | 872,974 | | | 1.16 | | | 1.04 | | | 1.16 | | | 129 | |
| | | N/A | | | 19.25 | | | (10.93 | ) | | 656,313 | | | 1.20 | | | 1.09 | | | 1.20 | | | 45 | |
| | | N/A | | | 21.83 | | | 14.96 | | | 797,316 | | | 1.19 | | | 0.87 | | | 1.19 | | | 64 | |
| | | 0.00 | * | | 19.16 | | | 1.92 | | | 555,653 | | | 1.23 | | | 1.12 | | | 1.23 | | | 52 | |
| | | 0.00 | * | | 18.89 | | | 35.32 | | | 86,447 | | | 1.43 | | | 1.98 | | | 1.43 | | | 66 | |
| | | | | | | | | | | | | | | | | | | | | | | | | |
| | | N/A | | $ | 25.71 | | | 9.78 | % | $ | 8,547 | | | 1.69 | % | | (0.71 | )% | | 1.69 | % | | 38 | % |
| | | N/A | | | 23.44 | | | 24.23 | | | 7,180 | | | 1.76 | | | 0.34 | | | 1.76 | | | 129 | |
| | | N/A | | | 18.93 | | | (11.60 | ) | | 6,454 | | | 1.94 | | | 0.42 | | | 1.94 | | | 45 | |
| | | N/A | | | 21.50 | | | 14.45 | | | 7,258 | | | 1.69 | | | 0.44 | | | 1.69 | | | 64 | |
| | | 0.00 | * | | 18.88 | | | 1.35 | | | 7,288 | | | 1.73 | | | 0.73 | | | 1.73 | | | 52 | |
| | | 0.00 | * | | 18.70 | | | (13.10 | ) | | 3,093 | | | 1.86 | | | 1.18 | | | 1.86 | | | 66 | |
See notes to financial statements
| Financial highlights (unaudited) |
For a share outstanding throughout the periods indicated
| | | | | | Income (loss) from investment operations: | | Less distributions |
| | | Net asset value, beginning of period | | Net investment income (loss)(d) | | Net realized and unrealized gain (loss) on investments | | Total from investment operations | | Dividends from net investment income | | Distributions from net realized capital gains | | Return of capital |
| | | | | | | | | | | | | | | | | | | | | | |
| Strategic Income Fund | | | | | | | | | | | | | | | | | | | | | |
| Class A | | | | | | | | | | | | | | | | | | | | | |
| Period Ended 1/31/2014 | $ | 8.93 | | | 0.23 | | | 0.16 | | | 0.39 | | | (0.24 | ) | | 0.00 | | | 0.00 | |
| Period Ended 7/31/2013(a) | | 9.12 | | | 0.23 | | | (0.19 | ) | | 0.04 | | | (0.23 | ) | | 0.00 | | | 0.00 | |
| Year Ended 12/31/2012 | | 8.39 | | | 0.40 | | | 0.73 | | | 1.13 | | | (0.40 | ) | | 0.00 | | | 0.00 | |
| Year Ended 12/31/2011 | | 8.82 | | | 0.44 | | | (0.43 | ) | | 0.01 | | | (0.37 | ) | | 0.00 | | | (0.07 | ) |
| Year Ended 12/31/2010 | | 8.44 | | | 0.46 | | | 0.38 | | | 0.84 | | | (0.33 | ) | | 0.00 | | | (0.13 | ) |
| Period ended 12/31/2009(b) | | 7.60 | | | 0.21 | | | 0.83 | | | 1.04 | | | 0.00 | | | 0.00 | | | (0.20 | ) |
| Year Ended 7/31/2009 | | 9.45 | | | 0.63 | | | (1.78 | ) | | (1.15 | ) | | (0.70 | ) | | 0.00 | | | 0.00 | |
| Year Ended 7/31/2008 | | 10.87 | | | 0.71 | | | (1.37 | ) | | (0.66 | ) | | (0.76 | ) | | 0.00 | | | 0.00 | |
| | | | | | | | | | | | | | | | | | | | | | |
| Class B | | | | | | | | | | | | | | | | | | | | | |
| Period Ended 1/31/2014 | $ | 8.95 | | | 0.20 | | | 0.15 | | | 0.35 | | | (0.20 | ) | | 0.00 | | | 0.00 | |
| Period Ended 7/31/2013(a) | | 9.14 | | | 0.19 | | | (0.20 | ) | | (0.01 | ) | | (0.18 | ) | | 0.00 | | | 0.00 | |
| Year Ended 12/31/2012 | | 8.40 | | | 0.33 | | | 0.74 | | | 1.07 | | | (0.33 | ) | | 0.00 | | | 0.00 | |
| Year Ended 12/31/2011 | | 8.83 | | | 0.38 | | | (0.43 | ) | | (0.05 | ) | | (0.32 | ) | | 0.00 | | | (0.06 | ) |
| Year Ended 12/31/2010 | | 8.46 | | | 0.40 | | | 0.37 | | | 0.77 | | | (0.29 | ) | | 0.00 | | | (0.11 | ) |
| Period ended 12/31/2009(b) | | 7.61 | | | 0.19 | | | 0.84 | | | 1.03 | | | 0.00 | | | 0.00 | | | (0.18 | ) |
| Year Ended 7/31/2009 | | 9.44 | | | 0.56 | | | (1.75 | ) | | (1.19 | ) | | (0.64 | ) | | 0.00 | | | 0.00 | |
| Year Ended 7/31/2008 | | 10.84 | | | 0.64 | | | (1.36 | ) | | (0.72 | ) | | (0.68 | ) | | 0.00 | | | 0.00 | |
| | | | | | | | | | | | | | | | | | | | | | |
| Class C | | | | | | | | | | | | | | | | | | | | | |
| Period Ended 1/31/2014 | $ | 8.89 | | | 0.20 | | | 0.15 | | | 0.35 | | | (0.20 | ) | | 0.00 | | | 0.00 | |
| Period Ended 7/31/2013(a) | | 9.08 | | | 0.19 | | | (0.20 | ) | | (0.01 | ) | | (0.18 | ) | | 0.00 | | | 0.00 | |
| Year Ended 12/31/2012 | | 8.35 | | | 0.33 | | | 0.73 | | | 1.06 | | | (0.33 | ) | | 0.00 | | | 0.00 | |
| Year Ended 12/31/2011 | | 8.79 | | | 0.37 | | | (0.43 | ) | | (0.06 | ) | | (0.32 | ) | | 0.00 | | | (0.06 | ) |
| Year Ended 12/31/2010 | | 8.41 | | | 0.40 | | | 0.38 | | | 0.78 | | | (0.29 | ) | | 0.00 | | | (0.11 | ) |
| Period ended 12/31/2009(b) | | 7.59 | | | 0.19 | | | 0.81 | | | 1.00 | | | 0.00 | | | 0.00 | | | (0.18 | ) |
| Year Ended 7/31/2009 | | 9.45 | | | 0.57 | | | (1.79 | ) | | (1.22 | ) | | (0.64 | ) | | 0.00 | | | 0.00 | |
| Year Ended 7/31/2008 | | 10.86 | | | 0.64 | | | (1.37 | ) | | (0.73 | ) | | (0.68 | ) | | 0.00 | | | 0.00 | |
| | | | | | | | | | | | | | | | | | | | | | |
| Class I | | | | | | | | | | | | | | | | | | | | | |
| Period Ended 1/31/2014 | $ | 8.91 | | | 0.24 | | | 0.15 | | | 0.39 | | | (0.25 | ) | | 0.00 | | | 0.00 | |
| Period Ended 7/31/2013(a) | | 9.10 | | | 0.24 | | | (0.19 | ) | | 0.05 | | | (0.24 | ) | | 0.00 | | | 0.00 | |
| Year Ended 12/31/2012 | | 8.37 | | | 0.42 | | | 0.73 | | | 1.15 | | | (0.42 | ) | | 0.00 | | | 0.00 | |
| Period Ended 12/31/2011(c) | | 9.06 | | | 0.29 | | | (0.66 | ) | | (0.37 | ) | | (0.27 | ) | | 0.00 | | | (0.05 | ) |
| (a) | Strategic Income Fund changed its fiscal year end from December 31 to July 31 effective July 31, 2013. |
| (b) | Strategic Income Fund changed its fiscal year end from July 31 to December 31 effective December 31, 2009. |
| (c) | Class I commenced operations on April 29, 2011. |
| (d) | Per share data was calculated using average shares outstanding during the period. |
| (e) | Total returns are historical and assume changes in share price, reinvestment of all dividends and distributions and no sales charge. Had certain expenses not been reduced during the periods shown, total returns would have been lower. Total returns for periods of less than one year are not annualized. |
| (f) | Not annualized for periods less than one year. |
| * | Amount represents less than $0.01. |
See notes to financial statements
| Financial highlights (unaudited) |
| | | | | | | | | | | | | | | | Ratios to average net assets: | |
| | | Total distributions | | Redemption fees | | Net asset value, end of period | | Total return(e) | | Net assets, end of period (000) | | Annualized ratio of operating expenses to average net assets(d) | | Annualized ratio of net investment income/(loss) to average net assets | | Annualized ratio of operating expenses to average net assets without waivers and/or expenses reimbursed | | Portfolio turnover rate(f) |
| | | | | | | | | | | | | | | | | | | |
| | | | | | | | | | | | | | | | | | | |
| | | | | | | | | | | | | | | | | | | |
| | | (0.24 | ) | | N/A | | $ | 9.08 | | | 4.42 | % | $ | 10,982 | | | 1.10 | % | | 5.10 | % | | 1.41 | % | | 32 | % |
| | | (0.23 | ) | | N/A | | | 8.93 | | | 0.39 | | | 15,656 | | | 1.10 | | | 4.36 | | | 1.44 | | | 50 | |
| | | (0.40 | ) | | N/A | | | 9.12 | | | 13.75 | | | 17,596 | | | 1.10 | | | 4.51 | | | 1.34 | | | 47 | |
| | | (0.44 | ) | | N/A | | | 8.39 | | | 0.06 | | | 17,210 | | | 1.20 | | | 5.04 | | | 1.51 | | | 41 | |
| | | (0.46 | ) | | 0.00 | * | | 8.82 | | | 10.17 | | | 28,171 | | | 1.30 | | | 5.30 | | | 1.54 | | | 38 | |
| | | (0.20 | ) | | 0.00 | * | | 8.44 | | | 13.82 | | | 35,656 | | | 1.30 | | | 6.19 | | | 1.63 | | | 11 | |
| | | (0.70 | ) | | 0.00 | * | | 7.60 | | | (10.71 | ) | | 28,905 | | | 1.30 | | | 8.69 | | | 1.62 | | | 53 | |
| | | (0.76 | ) | | 0.00 | * | | 9.45 | | | (6.47 | ) | | 64,687 | | | 1.30 | | | 6.87 | | | 1.45 | | | 41 | |
| | | | | | | | | | | | | | | | | | | | | | | | | | | | |
| | | (0.20 | ) | | 0.00 | | $ | 9.10 | | | 3.98 | % | $ | 5,030 | | | 1.85 | % | | 4.35 | % | | 2.23 | % | | 32 | % |
| | | (0.18 | ) | | 0.00 | | | 8.95 | | | (0.07 | ) | | 6,198 | | | 1.85 | | | 3.62 | | | 2.21 | | | 50 | |
| | | (0.33 | ) | | 0.00 | | | 9.14 | | | 12.97 | | | 6,963 | | | 1.85 | | | 3.77 | | | 2.12 | | | 47 | |
| | | (0.38 | ) | | 0.00 | | | 8.40 | | | (0.69 | ) | | 7,412 | | | 1.94 | | | 4.29 | | | 2.27 | | | 41 | |
| | | (0.40 | ) | | 0.00 | * | | 8.83 | | | 9.21 | | | 8,537 | | | 2.05 | | | 4.55 | | | 2.29 | | | 38 | |
| | | (0.18 | ) | | 0.00 | * | | 8.46 | | | 13.59 | | | 7,824 | | | 2.05 | | | 5.44 | | | 2.38 | | | 11 | |
| | | (0.64 | ) | | 0.00 | * | | 7.61 | | | (11.23 | ) | | 6,325 | | | 2.05 | | | 8.02 | | | 2.37 | | | 53 | |
| | | (0.68 | ) | | 0.00 | * | | 9.44 | | | (7.00 | ) | | 5,789 | | | 2.05 | | | 6.13 | | | 2.20 | | | 41 | |
| | | | | | | | | | | | | | | | | | | | | | | | | | | | |
| | | (0.20 | ) | | 0.00 | | $ | 9.04 | | | 4.03 | % | $ | 17,163 | | | 1.85 | % | | 4.36 | % | | 2.19 | % | | 32 | % |
| | | (0.18 | ) | | 0.00 | | | 8.89 | | | (0.06 | ) | | 19,483 | | | 1.85 | | | 3.62 | | | 2.20 | | | 50 | |
| | | (0.33 | ) | | 0.00 | | | 9.08 | | | 12.95 | | | 22,328 | | | 1.85 | | | 3.77 | | | 2.11 | | | 47 | |
| | | (0.38 | ) | | 0.00 | | | 8.35 | | | (0.80 | ) | | 22,244 | | | 1.94 | | | 4.29 | | | 2.26 | | | 41 | |
| | | (0.40 | ) | | 0.00 | * | | 8.79 | | | 9.39 | | | 26,997 | | | 2.05 | | | 4.55 | | | 2.29 | | | 38 | |
| | | (0.18 | ) | | 0.00 | * | | 8.41 | | | 13.22 | | | 30,152 | | | 2.05 | | | 5.45 | | | 2.38 | | | 11 | |
| | | (0.64 | ) | | 0.00 | * | | 7.59 | | | (11.55 | ) | | 28,513 | | | 2.05 | | | 7.96 | | | 2.37 | | | 53 | |
| | | (0.68 | ) | | 0.00 | * | | 9.45 | | | (7.09 | ) | | 62,906 | | | 2.05 | | | 6.17 | | | 2.20 | | | 41 | |
| | | | | | | | | | | | | | | | | | | | | | | | | | | | |
| | | (0.25 | ) | | 0.00 | | $ | 9.05 | | | 4.48 | % | $ | 6,694 | | | 0.85 | % | | 5.37 | % | | 1.11 | % | | 32 | % |
| | | (0.24 | ) | | 0.00 | | | 8.91 | | | 0.54 | | | 7,291 | | | 0.85 | | | 4.59 | | | 1.16 | | | 50 | |
| | | (0.42 | ) | | 0.00 | | | 9.10 | | | 14.06 | | | 3,903 | | | 0.85 | | | 4.79 | | | 1.07 | | | 47 | |
| | | (0.32 | ) | | 0.00 | | | 8.37 | | | (4.10 | ) | | 1,885 | | | 0.85 | | | 5.16 | | | 1.25 | | | 41 | |
See notes to financial statements
| Financial highlights (unaudited) |
For a share outstanding throughout the periods indicated
| | | | | | Income (loss) from investment operations: | | Less distributions |
| | | Net asset value, beginning of period | | Net investment income (loss)(b) | | Net realized and unrealized gain (loss) on investments | | Total from investment operations | | Dividends from net investment income | | Distributions from net realized capital gains | | Total distributions |
| | | | | | | | | | | | | | | | | | | | | | |
| Unconstrained Bond Fund | | | | | | | | | | | | | | | | | | | | | |
| Class A | | | | | | | | | | | | | | | | | | | | | |
| Period Ended 1/31/2014(a) | $ | 10.00 | | | 0.02 | | | (0.00 | )* | | 0.02 | | | (0.01 | ) | | 0.00 | | | (0.01 | ) |
| | | | | | | | | | | | | | | | | | | | | | |
| Class C | | | | | | | | | | | | | | | | | | | | | |
| Period Ended 1/31/2014(a) | $ | 10.00 | | | 0.01 | | | (0.00 | )* | | 0.01 | | | (0.00 | )* | | 0.00 | | | (0.00 | )* |
| | | | | | | | | | | | | | | | | | | | | | |
| Class I | | | | | | | | | | | | | | | | | | | | | |
| Period Ended 1/31/2014(a) | $ | 10.00 | | | 0.02 | | | (0.00 | )* | | 0.02 | | | (0.01 | ) | | 0.00 | | | (0.01 | ) |
| (a) | The Unconstrained Bond Fund commenced operations on December 20, 2013. |
| (b) | Per share data was calculated using average shares outstanding during the period. |
| (c) | Total returns are historical and assume changes in share price, reinvestment of all dividends and distributions and no sales charge. Had certain expenses not been reduced during the periods shown, total returns would have been lower. Total returns for periods of less than one year are not annualized. |
| (d) | Not annualized for periods less than one year. |
| * | Amount represents less than $0.01. |
See notes to financial statements
| Financial highlights (unaudited) |
| | | | | | | | | | | | Ratios to average net assets: | |
| | | Net asset value, end of period | | Total return(c) | | Net assets, end of period (000) | | Annualized ratio of operating expenses to average net assets | | Annualized ratio of net investment income/(loss) to average net assets | | Annualized ratio of operating expenses to average net assets without waivers and/or expenses reimbursed | | Portfolio turnover rate(d) |
| | | | | | | | | | | | | | | |
| | | | | | | | | | | | | | | |
| | $ | 10.01 | | | 0.20 | % | $ | 1,001 | | | 1.15 | % | | 1.61 | % | | 2.74 | % | | 15 | % |
| | | | | | | | | | | | | | | | | | | | | | |
| | $ | 10.01 | | | 0.12 | % | $ | 1,001 | | | 1.90 | % | | 0.86 | % | | 3.49 | % | | 15 | % |
| | | | | | | | | | | | | | | | | | | | | | |
| | $ | 10.01 | | | 0.23 | % | $ | 23,016 | | | 0.90 | % | | 1.87 | % | | 2.48 | % | | 15 | % |
See notes to financial statements
| Notes to financial statements (unaudited) |
Note 1. Organization
Henderson Global Funds (the “Trust”) was organized on May 11, 2001, as a Delaware statutory trust and is registered under the Investment Company Act of 1940, as amended (the “1940 Act”), as an open-end management investment company. The Trust has an unlimited number of authorized shares that are divided among ten series. The Henderson All Asset Fund, Henderson Dividend & Income Builder Fund, Henderson Emerging Markets Opportunities Fund, Henderson European Focus Fund, Henderson Global Equity Income Fund, Henderson Global Technology Fund, Henderson High Yield Opportunities Fund, Henderson International Opportunities Fund, Henderson Strategic Income Fund and Henderson Unconstrained Bond Fund (collectively, the “Funds”) are included in this report. Each is a separate series of the Trust and each is diversified except for the Henderson All Asset Fund, Henderson Dividend & Income Builder Fund, Henderson High Yield Opportunities Fund and Henderson Unconstrained Bond Fund. The Henderson Unconstrained Bond Fund commenced operations on December 20, 2013.
The Henderson All Asset Fund is a Fund-of-Funds (“FoF”) that seeks to achieve its objective by investing in a portfolio of underlying funds (“underlying funds”) which, in turn, may invest in a variety of US and foreign equity, fixed income, money market and derivative instruments. The FoF does not invest in the underlying funds for the purpose of exercising management or control; however, investments by the FoF, within its principal investment strategies, may represent a significant portion of the underlying funds’ net assets. The FoFs’ “Portfolio of Investments” lists the underlying funds held as an investment of the FoF as of period end, but does not include the holdings of the underlying funds.
The Funds offer the following share classes:
| | Share Classes |
| Fund | A | B | C | I | R |
| All Asset | ü | n/a | | | n/a |
| Dividend & | | | | | |
| Income Builder | | n/a | | | n/a |
| Emerging Markets | | | | | |
| Opportunities | | n/a | | | n/a |
| European Focus | | | | | n/a |
| Global Equity Income | | n/a | | | n/a |
| Global Technology | | | | | n/a |
| High Yield | | | | | |
| Opportunities | | n/a | | | n/a |
| International | | | | | |
| Opportunities | | | | | |
| Strategic Income | | | | | n/a |
| Unconstrained Bond | | n/a | | | n/a |
Class A shares generally provide for a front-end sales charge. Class B and C shares provide for a contingent deferred sales charge. Class R and I shares are not subject to a front-end or contingent deferred sales charge.
Each class of shares has equal rights as to earnings and assets except that each class may bear different distribution and shareholder service expenses. Each class of shares has exclusive voting rights with respect to matters that affect just that class. Income, expenses (other than expenses attributable to a specific class), and realized and unrealized gains and losses on investments are allocated to each class of shares based on its relative net assets. Class B shares automatically convert to Class A shares at the end of the month following the eighth anniversary of issuance. The Funds do not accept new or additional investments in Class B shares of the Funds with the limited exception that current Class B shareholders may continue to have their dividends automatically reinvested in Class B shares of the Funds. As described in the prospectus, Class B shares of a particular Fund may continue to be exchanged with Class B shares of other Henderson Global Funds.
Note 2. Significant accounting policies
The following is a summary of significant accounting policies followed by each Fund in preparation of its financial statements. These policies are in conformity with US generally accepted accounting principles (“GAAP”). The preparation of financial statements in accordance with GAAP requires management to make estimates and assumptions that affect the reported amounts. The actual results could differ from those estimates.
Security valuation
Securities and derivatives traded on a recognized exchange or market are generally valued at the last reported sale price or at the official closing price. Listed securities for which no sale was reported on that date and other securities traded in the over-the-counter (“OTC”) market are valued at the mean between the last bid and asked price.
Debt securities are valued at the market value provided by independent pricing services approved by the Board of Trustees of the Trust. If the pricing services are unable to provide valuations, the securities are valued at the mean between the last bid and asked price, or if no ask is available, then the last bid price obtained from one or more broker-dealers. Such pricing services may use various pricing techniques that take into account appropriate factors such as yield, quality, coupon rate, maturity, type of issue, trading characteristics and other data, as well as broker quotes.
| Notes to financial statements (unaudited) |
Short-term investments purchased with an original or remaining maturity of 60 days or less at the time of purchase are valued at amortized cost, which approximates fair market value. Investments in investment companies are valued at its reported net asset value, which approximates fair market value.
Forward foreign currency contracts are valued daily at the applicable forward rate.
OTC financial derivatives instruments between the Funds and their counterparties, including swap contracts and option contracts are valued using independent values provided by independent pricing services when available, otherwise, fair values are estimated on the basis of pricing models that incorporate current market measures for interest rates, currency exchange rates, equity prices and indices, credit spreads, corresponding market volatility levels and other market-based pricing factors. Centrally cleared swaps listed or traded on a multilateral or trade facility platform, such as a registered exchange, are valued at the daily settlement price determined by the respective exchange. For centrally cleared credit default swaps the clearing facility requires its members to provide actionable levels across complete term structures. These levels along with external third party prices are used to produce daily settlement prices. Centrally cleared interest rate swaps are valued using a pricing model that references the underlying rates including the overnight index swap rate and London Interbank Offered Rate (“LIBOR”) forward rate to produce the daily settlement price.
If market quotations are not readily available, or if the investment adviser determines that a quotation of a security does not represent a fair value, then the security is valued at a fair value as determined in good faith using procedures approved by the Board of Trustees of the Trust. The Trustees of the Trust, or their designee, may establish fair value using a wide variety of market data including yields or prices of investments of comparable quality, type of issue, coupon, maturity and rating, market quotes or indications of value from security dealers, evaluations of anticipated cash flows or collateral, general market conditions and other information and analysis, including the obligor’s credit characteristics considered relevant.
For equity securities, the Trust has retained an independent statistical fair value pricing service to assist in the fair valuation process for securities principally traded in a foreign market in order to adjust for possible changes in value that may occur between the close of the foreign exchange and the time at which Fund shares are priced. If a security is valued at a “fair value,” that value may be different from the last quoted market price for the security. As a result, it is possible that fair value prices will be used by the Funds.
Security transactions and investment income
Investment transactions are accounted for on a trade-date basis. Securities purchased or sold on a when-issued or delayed-delivery basis may be settled 15 days or more after the trade date. Interest income is recorded on an accrual basis. Dividend income is recorded on the ex-dividend date. Bond premium is amortized and discount is accreted over the expected life of each applicable security. Paydown gains and losses on mortgage-related and other asset-backed securities are recorded as components of interest income on the Statements of Operations. Income or short-term capital gain distributions received from underlying funds are recorded as dividend income. Long-term capital gain distributions received from underlying funds are recorded as realized gains. Corporate actions involving foreign securities, including dividends, are recorded as soon as the information becomes available. Withholding taxes on foreign dividends are accrued in accordance with the applicable country’s tax rules and rates. Gains and losses realized on sales of securities are determined using the specific identification method by comparing the identified cost of the security lot sold with the net sales proceeds, which is the same basis used for federal income tax purposes.
Foreign currency translation
Investments in securities and other assets and liabilities denominated in foreign currencies are translated into US dollar amounts at the date of valuation. Purchases and sales of investment securities and income and expense items denominated in foreign currencies are translated into US dollar amounts on the respective dates of such transactions.
The Funds do not separate the portion of the results of operations resulting from changes in foreign exchange rates on investments from the fluctuations arising from changes in market prices of securities held. Such fluctuations are included with the net realized and unrealized gain or loss from investments on the Statements of Operations.
Reported net realized foreign exchange gains or losses arise from sales of foreign currencies, currency gains or losses realized between the trade date and settlement date on securities transactions, and the difference between the amounts of dividends, interest, and foreign withholding taxes recorded on the Funds’ books and the US dollar equivalent of the amounts actually received or paid. Net unrealized foreign exchange gains and losses arise from changes in the fair values of assets and liabilities, other than investments in securities at fiscal period end, resulting from changes in exchange rates.
| Notes to financial statements (unaudited) |
Forward foreign currency contracts
The Funds may enter into forward foreign currency contracts primarily to hedge against foreign currency exchange rate risks on its non-US dollar denominated investment securities. Alternatively, a Fund may enter into a forward foreign currency contract for speculative purposes of gaining exposure to particular foreign currency markets. When entering into forward foreign currency contracts, a Fund agrees to receive or deliver a fixed quantity of foreign currency for an agreed-upon price on an agreed future date. Realized gains or losses on forward foreign currency contracts include net gains or losses on contracts that have matured. Forward foreign currency contracts are valued daily and the unrealized appreciation or depreciation is included in the Statements of Assets and Liabilities. These instruments involve market risk, credit risk or both kinds of risks, the extent of which may subject the Fund to loss in excess of the amount recognized as unrealized appreciation or depreciation in the Statements of Assets and Liabilities. These risks arise from the possible inability of counterparties to meet the terms of their contracts and from unfavorable currency fluctuations. When applicable, open forward foreign currency contracts at the end of the period are listed in each Fund’s Portfolio of Investments.
Futures contracts
The Funds are subject to interest rate risk, equity risk and foreign currency risk in the normal course of pursuing their investment objectives. Accordingly, the Funds may invest in futures contracts to gain exposure to, or hedge against, changes in the value of interest rates or foreign currencies and to gain exposure to equity indices. A futures contract represents a commitment for the future purchase or sale of an asset at a specified price and date. Upon entering into such contracts, a Fund is required to deposit with the broker, either in cash or securities, an initial margin in an amount equal to a certain percentage of the contract amount. Subsequent payments, known as “variation margin,” are made or received by the Fund, depending on the fluctuations in the fair value of the underlying asset. The Funds realize a gain or loss upon the expiration or closing of the futures contracts. Should market conditions move unexpectedly, the Funds may not achieve the anticipated benefits of the futures contracts and may realize a loss. The use of futures contracts involves the risk of imperfect correlation in movements in the price of futures contracts, interest rates, and/or the underlying hedged assets. With futures contracts, there is limited counterparty credit risk to the Funds as futures contracts are exchange-traded and the exchange’s clearinghouse acts as counterparty to all exchange-traded futures transactions. When applicable, open futures contracts outstanding at the end of the period are listed in each Fund’s Portfolio of Investments.
Options contracts
The Funds may purchase put and call options to create investment exposure consistent with their investment objectives or to hedge or limit the exposure of their portfolio holdings. Alternatively, certain Funds may write (sell) call and put options on securities and financial derivative instruments in order to gain exposure to, or protect against, changes in the markets. The Funds may use options on exchange-traded futures contracts, indices or securities to hedge an existing position or future investment, for speculative purposes, or to manage exposure to market movements. The Funds may also use foreign currency options. Purchasing foreign currency options gives the Fund the right, but not the obligation to buy or sell the currency and will specify the amount of currency and a rate of exchange that may be exercised by a specified date. These options may be used as a short or long hedge against possible variations in foreign exchange rates or to gain exposure to foreign currencies.
Purchasing call options tends to increase the Fund’s exposure to the underlying instrument, while purchasing put options tends to decrease the Fund’s exposure to the underlying instrument. The Fund pays a premium when purchasing call options or put options which is included on the Fund’s Statement of Assets and Liabilities as an investment. The option is subsequently valued daily and unrealized appreciation or depreciation is recorded. The Funds realize a gain or loss upon the expiration or closing of the option transaction. The primary risks of investing in purchased options include the risk of imperfect correlation between the option price and the value of the underlying instrument, and the possibility of an illiquid market for the option. Purchased options are generally exchange traded with limited counterparty risk as settlement is facilitated through a central clearinghouse. Accordingly, the risk is generally limited to the premium paid. When applicable, option contracts purchased by the Funds and contracts outstanding at the end of the period are listed in each Fund’s Portfolio of Investments.
Writing put options tends to increase the Fund’s exposure to the underlying instrument. Writing call options tends to decrease the Fund’s exposure to the underlying instrument. When a Fund writes a call or a put option, an amount equal to the premium received by the Fund is recognized as a liability. The amount of the liability is subsequently marked-to-market to reflect the current market value of the option written. These liabilities are reflected as “Options written, at value” on the Statement of Assets and Liabilities. If an option which the Fund has written either expires on its stipulated expiration date or the Fund enters into a closing purchase transaction, the Fund realizes a gain (or loss if the cost of a closing purchase transaction exceeds the premium received when the option was written) without regard to any unrealized gain or loss on the underlying security or derivative instrument, and the liability related to such option is extinguished. If a call option which the Fund has written is
| Notes to financial statements (unaudited) |
exercised, the Fund recognizes a realized gain or loss from the sale of the underlying security or derivative instrument and the proceeds from the sale are increased by the premium originally received. If a put option which the Fund has written is exercised, the amount of the premium originally received reduces the cost of the security or derivative instrument that the Fund purchases upon exercise of the option. Written options are subject to substantial risks. The Fund as a writer of an option has no control over whether the underlying instrument may be sold (call) or purchased (put) and, as a result, the Funds bear the market risk of an unfavorable change in the price of the derivative instrument, security or currency underlying the written option. Exercise of an option written by a Fund could result in a Fund selling or buying a derivative instrument, security or currency at a price different from current market value. Further, there is the risk the Fund may not be able to enter into a closing transaction because of an illiquid market.
The number of options contracts written and the premiums received by the Unconstrained Bond Fund during the period ended January 31, 2014 were as follows:
| | | | | | | | |
| | | | Number of | | | Premiums | |
| | | | Contracts | | | Received | |
| Options outstanding, beginning of period | | | — | | $ | — | |
| Options written during period | | | 1,060,045 | | | 14,080 | |
| Options closed during period | | | — | | | — | |
| Options outstanding, end of period | | | 1,060,045 | | | 14,080 | |
Swap contracts
The Funds may enter into interest rate, total return, credit default, inflation, currency and other swap contracts. Swap contracts are bilaterally negotiated agreements between the Funds and a counterparty to exchange or swap the returns (or the differential in rates of return) earned or realized on particular investments, instruments, indices or other measures for a defined series of cash flows at a predetermined rate at specified, future intervals. Swap contracts are privately negotiated in the OTC market (“OTC swaps”), or may be executed on a multi-lateral or other trade facility platform, such as a registered exchange (“centrally cleared swaps”). The gross returns to be exchanged or “swapped” between parties are generally calculated with respect to a “notional amount” for a pre-determined period of time.
Certain Funds use credit default swaps to manage exposure to a given issuer or sector by either selling protection to increase exposure (i.e., leverage), or buying protection to reduce exposure. The “buyer” in a credit default swap is obligated to pay the “seller” a periodic stream of payments over the term of the contract provided that no event of default on an underlying reference obligation has occurred. If an event of default occurs, the seller must pay the buyer the full notional value, or the “par value,” of the reference obligation in exchange for the reference obligation. In connection with these contracts, securities may be identified as collateral in accordance with the terms of the respective swap contracts to provide assets of value and recourse in the event of default or bankruptcy/insolvency. Recovery values are assumed by market makers considering either industry standard recovery rates or entity specific factors and considerations until a credit event occurs. If a credit event has occurred, the recovery value is typically determined by a facilitated auction whereby a minimum number of allowable broker bids, together with a specific valuation method, are used to calculate the settlement value. Implied credit spreads, represented in absolute terms, utilized in determining the market value of credit default swap contracts as of period end are disclosed in the Portfolios of Investments, as applicable. They serve as an indicator of the current status of the payment/performance risk and represent the likelihood or risk of default for the credit derivative. The implied credit spread of a particular referenced entity reflects the cost of buying/selling protection and may include upfront payments required to be made to enter into the contract. Wider credit spreads represent a deterioration of the referenced entity’s credit soundness and a greater likelihood or risk of default or other credit event occurring as defined under the terms of the contract.
Certain Funds hold fixed-rate and/or floating-rate bonds. Accordingly, the Funds are subject to interest rate risk exposure in the normal course of pursuing its investment objectives as the value of these bonds may decrease if interest rates rise, or vice versa. To hedge against this risk and/or to generate income at prevailing market rates, the Funds may enter into interest rate swap contracts. Interest rate swap contracts involve the exchange by the Fund with another party for their respective commitment to pay or receive a fixed or variable interest rate on the notional amount.
Changes in market value, if any, are reflected as a component of net change in unrealized appreciation/(depreciation) on the Statements of Operations. Daily changes in the valuation of centrally cleared swaps are recorded as a receivable or payable for the change in value (“variation margin”) on the Statements of Assets and Liabilities. OTC swap payments received or made at the beginning of the measurement period are reflected as such on the Statements of Assets and Liabilities and represent premiums paid or received upon entering into the swap contract to compensate for differences between the stated terms of the swap contract and prevailing market conditions (credit spreads, currency exchange rates, interest rates, and other relevant factors). These upfront premiums are recorded as realized gains
| Notes to financial statements (unaudited) |
or losses on the Statements of Operations upon termination or maturity of the swap. A liquidation payment received or made at the termination of the swap is recorded as realized gain or loss on the Statements of Operations. Net periodic payments received or paid by the Funds are included as part of realized gains or losses on the Statements of Operations.
Entering into these contracts involves, to varying degrees, elements of counterparty, interest, credit and market risk in excess of the amounts recognized on the Statements of Assets and Liabilities. Such risks involve the potential inability of the counterparties to meet the terms of their contract (which is limited with respect to centrally cleared swaps as described below), unanticipated changes in the value of the swap contract, the possibility that there will be no liquid market for the contract, and that there may be unfavorable changes in interest rates. The risk that a counterparty is unable to perform on its obligations in situations when the Funds are in an appreciated position is mitigated with respect to OTC swaps by having master netting arrangements between the Funds and their counterparties and, in certain scenarios dictated by the contracts, the posting of collateral by the counterparty to the Funds to cover the Funds’ exposure to the counterparty. There is limited counterparty credit risk with respect to centrally cleared swaps as the transaction is facilitated through a central clearinghouse, much like an exchange-traded futures contract. Upon entering into a centrally cleared swap transaction, the Fund is required to deposit with its clearing broker an amount of cash or securities as an initial margin. Subsequent variation margin payments or receipts are made or received by the Fund, depending on the fluctuations in the fair value of the reference entity. The magnitude of counterparty credit risk is different depending on the type of swap. Under a credit default swap, the Funds’ maximum risk of loss as the protection buyer is limited to the market value, or the current unrealized appreciation/depreciation on the contract plus/minus any upfront premiums paid/received. Alternatively, as the protection seller, the maximum risk of loss is equivalent to the notional or par value of the contract plus/minus any upfront premiums paid/received. At January 31, 2014, notional outstanding for credit protection sold, translated into US Dollar amounts, equated to $1,551,004 for the Strategic Income Fund and $202,305 for the Unconstrained Bond Fund. Alternatively, under an interest rate swap, as notional is not exchanged, the Funds’ maximum risk of loss is limited to the market value as described above.
When applicable, open swap contracts at the end of the period are listed in each Fund’s Portfolio of Investments.
Derivative instruments
The Financial Accounting Standards Board (“FASB”) requires companies (including the Trust) to disclose information intended to enable financial statement users to understand how derivative instruments impact the Statements of Assets and Liabilities as well as the effect of derivative instruments on the Statements of Operations during the reporting period, in the context of each entity’s risk exposure. Further, in January 2013, the FASB issued Accounting Standard Update (“ASU”) 2013-01 Clarifying the Scope of Disclosures about Offsetting Assets and Liabilities. The update clarifies the scope of ASU 2011-11 which requires enhanced disclosures around financial instruments and derivative instruments that are either offset in accordance with US GAAP or are subject to an enforceable master netting arrangement (“MNA”) or similar agreement. The updates mandate that entities disclose both gross and net information about such financial instruments and transactions eligible for offset on the Statements of Assets and Liabilities, in addition to required disclosure of collateral received and posted in connection with MNAs or similar agreements. Adoption of the updates has no effect on the Funds’ net assets. Accordingly, the following tables summarize each Fund’s fair value of derivative instruments held at January 31, 2014 and the related location on the accompanying Statements of Assets and Liabilities, presented by primary underlying risk exposure, in addition to supplementary information regarding gross and net values and the impact of any collateral posted for those transactions subject to MNAs. Note that all OTC instruments (forward foreign currency contracts, certain credit default swap and interest rate swap contracts and certain options contracts) with Barclays Bank plc, Citibank, N.A., Deutsche Bank AG and JPMorgan Chase Bank, N.A., are all subject to MNAs.
All Asset:
| | | Location on Statement | | | Fair | |
| | | of Assets and Liabilities | | | value | |
| Assets | | | | | | |
| Equity risk | | Unrealized appreciation on open futures contracts | | $ | 84,291 | |
| Interest rate risk | | Unrealized appreciation on open futures contracts | | $ | 13,855 | |
| Liabilities | | | | | | |
| Equity risk | | Unrealized depreciation on open futures contracts | | $ | 351,999 | |
| Foreign currency risk | | Unrealized depreciation on forward foreign currency contracts | | $ | 91,894 | |
| Notes to financial statements (unaudited) |
European Focus:
| | | Location on Statement | | | Fair | |
| | | of Assets and Liabilities | | | value | |
| Assets | | | | | | |
| Foreign currency risk | | Unrealized appreciation on forward foreign currency contracts | | $ | 1,537,110 | |
| Liabilities | | | | | | |
| Foreign currency risk | | Unrealized depreciation on forward foreign currency contracts | | $ | 34,043 | |
Global Equity Income:
| | | Location on Statement | | | Fair | |
| | | of Assets and Liabilities | | | value | |
| Assets | | | | | | |
| Foreign currency risk | | Unrealized appreciation on forward foreign currency contracts | | $ | 505,740 | |
International Opportunities:
| | | Location on Statement | | | Fair | |
| | | of Assets and Liabilities | | | value | |
| Assets | | | | | | |
| Foreign currency risk | | Unrealized appreciation on forward foreign currency contracts | | $ | 6,191,164 | |
| Liabilities | | | | | | |
| Foreign currency risk | | Unrealized depreciation on forward foreign currency contracts | | $ | 1,512,312 | |
Strategic Income:
| | | Location on Statement | | | Fair | |
| | | of Assets and Liabilities | | | value | |
| Assets | | | | | | |
| Interest rate risk | | Unrealized appreciation on open futures contracts | | $ | 67,143 | |
| Foreign currency risk | | Unrealized appreciation on forward foreign currency contracts | | $ | 65,276 | |
| Credit risk | | Unrealized appreciation on open swap contracts | | $ | 50,050 | |
| Credit risk | | Credit default swap contracts premiums paid | | $ | 99,486 | |
| | | Location on Statement | | | Fair | |
| | | of Assets and Liabilities | | | value | |
| Liabilities | | | | | | |
| Credit risk | | Unrealized depreciation on open swap contracts | | $ | 1,415 | |
| Credit risk | | Credit default swap contracts premiums received | | $ | 30,982 | |
Unconstrained Bond:
| | | Location on Statement | | | Fair | |
| | | of Assets and Liabilities | | | value | |
| Assets | | | | | | |
| Interest rate risk | | Unrealized appreciation on open futures contracts | | $ | 57,133 | |
| Foreign currency risk | | Unrealized appreciation on forward foreign currency contracts | | $ | 194,845 | |
| Credit risk | | Credit default swap contracts premiums paid | | $ | 22,682 | |
| Foreign currency risk | | Investments, at fair value (for purchased options) | | $ | 42,870 | |
| Interest rate risk | | Investments, at fair value (for purchased options) | | $ | 33,862 | |
| Interest rate risk | | Unrealized appreciation on open swap contracts | | $ | 78,858 | |
| Liabilities | | | | | | |
| Interest rate risk | | Unrealized depreciation on open futures contracts | | $ | 90,056 | |
| Foreign currency risk | | Unrealized depreciation on forward foreign currency contracts | | $ | 58,505 | |
| Credit risk | | Unrealized depreciation on open swap contracts | | $ | 2,713 | |
| Interest rate risk | | Unrealized depreciation on swap contracts | | $ | 114,735 | |
| Inflation risk | | Unrealized depreciation on swap contracts | | $ | 10,959 | |
| Interest rate risk | | Options written, at value | | $ | 10,173 | |
| Foreign currency risk | | Options written, at value | | $ | 7,996 | |
| Notes to financial statements (unaudited) |
All Asset Fund
| Gross Amounts not Offset in the Statement of Assets & Liabilities |
| | | | | | | | | | | | | | |
| | | | Gross Amounts of Assets | | | | | | | | | Net Amount | |
| | | | Presented in Statement | | | Financial | | | Collateral | | | (not less | |
| Counterparty | | | of Assets & Liabilities (a) | | | Instrument | | | Received | | | than 0) | |
| Amounts not subject to a master netting or similar arrangement: |
| | | | — | | | — | | | — | | | — | |
| Total | | | — | | | — | | | — | | | — | |
| | | | | | | | | | | | | | |
| | | | Gross Amounts of Liabilities | | | | | | | | | Net Amount | |
| | | | Presented in Statement | | | Financial | | | Collateral | | | (not less | |
| Counterparty | | | of Assets & Liabilities (a) | | | Instrument | | | Received | | | than 0) | |
| Amounts not subject to a master netting or similar arrangement: |
| State Street Bank, London* | | | 91,894 | | | — | | | — | | | 91,894 | |
| Total | | | 91,894 | | | — | | | — | | | 91,894 | |
| (a) | Absent an event of default or early termination, OTC derivative assets and liabilities are presented gross and not offset in the Statement of Assets & Liabilities. All futures contracts are exchange traded for which their settlement is guaranteed by the clearinghouse and not subject to arrangements with particular counterparties. |
| * | Forward currency contracts with State Street Bank, London are not subject to a legally enforceable MNA or other similar agreements that provide legally enforceable right of offset. |
European Focus
| | | | | | | | | | | | | | |
| Gross Amounts not Offset in the Statement of Assets & Liabilities |
| | | | | | | | | | | | | | |
| | | | Gross Amounts of Assets | | | | | | | | | Net Amount | |
| | | | Presented in Statement | | | Financial | | | Collateral | | | (not less | |
| Counterparty | | | of Assets & Liabilities (a) | | | Instrument | | | Received | | | than 0) | |
| Amounts subject to a master netting or similar arrangement: |
| JPMorgan Chase Bank, N.A. | | | 574,039 | | | — | | | — | | | 574,039 | |
| Citibank, N.A. | | | 963,071 | | | — | | | — | | | 963,071 | |
| Total | | | 1,537,110 | | | — | | | — | | | 1,537,110 | |
| | | | | | | | | | | | | | |
| | | | Gross Amounts of Liabilities | | | | | | | | | Net Amount | |
| | | | Presented in Statement | | | Financial | | | Collateral | | | (not less | |
| Counterparty | | | of Assets & Liabilities (a) | | | Instrument | | | Received | | | than 0) | |
| Amounts subject to a master netting or similar arrangement: |
| Deutsche Bank AG | | | 34,043 | | | — | | | — | | | 34,043 | |
| Total | | | 34,043 | | | — | | | — | | | 34,043 | |
| (a) | Absent an event of default or early termination, OTC derivative assets and liabilities are presented gross and not offset in the Statement of Assets & Liabilities. |
| Notes to financial statements (unaudited) |
Global Equity Income
| | | | | | | | | | | | | | |
| Gross Amounts not Offset in the Statement of Assets & Liabilities |
| | | | | | | | | | | | | | |
| | | | Gross Amounts of Assets | | | | | | | | | Net Amount | |
| | | | Presented in Statement | | | Financial | | | Collateral | | | (not less | |
| Counterparty | | | of Assets & Liabilities (a) | | | Instrument | | | Received | | | than 0) | |
| Amounts not subject to a master netting or similar arrangement: |
| State Street Bank, London* | | | 505,740 | | | — | | | — | | | 505,740 | |
| Total | | | 505,740 | | | — | | | — | | | 505,740 | |
| | | | | | | | | | | | | | |
| | | | Gross Amounts of Liabilities | | | | | | | | | Net Amount | |
| | | | Presented in Statement | | | Financial | | | Collateral | | | (not less | |
| Counterparty | | | of Assets & Liabilities (a) | | | Instrument | | | Received | | | than 0) | |
| Amounts not subject to a master netting or similar arrangement: |
| | | | — | | | — | | | — | | | — | |
| Total | | | — | | | — | | | — | | | — | |
| (a) | Absent an event of default or early termination, OTC derivative assets and liabilities are presented gross and not offset in the Statement of Assets & Liabilities. |
| * | Forward currency contracts with State Street Bank, London are not subject to a legally enforceable MNA or other similar agreements that provide legally enforceable right of offset. |
International Opportunities
| | | | | | | | | | | | | | |
| Gross Amounts not Offset in the Statement of Assets & Liabilities |
| | | | | | | | | | | | | | |
| | | | Gross Amounts of Assets | | | | | | | | | Net Amount | |
| | | | Presented in Statement | | | Financial | | | Collateral | | | (not less | |
| Counterparty | | | of Assets & Liabilities (a) | | | Instrument | | | Received | | | than 0) | |
| Amounts subject to a master netting or similar arrangement: |
| Citibank, N.A. | | | 6,191,164 | | | — | | | — | | | 6,191,164 | |
| Total | | | 6,191,164 | | | — | | | — | | | 6,191,164 | |
| | | | | | | | | | | | | | |
| | | | Gross Amounts of Liabilities | | | | | | | | | Net Amount | |
| | | | Presented in Statement | | | Financial | | | Collateral | | | (not less | |
| Counterparty | | | of Assets & Liabilities (a) | | | Instrument | | | Received | | | than 0) | |
| Amounts subject to a master netting or similar arrangement: |
| Deutsche Bank AG | | | 1,330,393 | | | — | | | — | | | 1,330,393 | |
| Total | | | 1,330,393 | | | — | | | — | | | 1,330,393 | |
| Amounts not subject to a master netting or similar arrangement: |
| State Street Bank, London* | | | 181,919 | | | — | | | — | | | 181,919 | |
| Total | | | 181,919 | | | — | | | — | | | 181,919 | |
| (a) | Absent an event of default or early termination, OTC derivative assets and liabilities are presented gross and not offset in the Statement of Assets & Liabilities. |
| * | Forward currency contracts with State Street Bank, London are not subject to a legally enforceable MNA or other similar agreements that provide legally enforceable right of offset. |
| Notes to financial statements (unaudited) |
Strategic Income
| | | | | | | | | | | | | | |
| Gross Amounts not Offset in the Statement of Assets & Liabilities |
| | | | | | | | | | | | | | |
| | | | Gross Amounts of Assets | | | | | | | | | Net Amount | |
| | | | Presented in Statement | | | Financial | | | Collateral | | | (not less | |
| Counterparty | | | of Assets & Liabilities (a) | | | Instrument | | | Received | | | than 0) | |
| Amounts subject to a master netting or similar arrangement: |
| Barclays Bank plc | | | 36,398 | | | (1,149 | ) | | — | | | 35,249 | |
| Citibank, N.A. | | | 24,316 | | | — | | | — | | | 24,316 | |
| Deutsche Bank AG | | | 47,371 | | | (266 | ) | | — | | | 47,105 | |
| JPMorgan Chase Bank, N.A. | | | 7,241 | | | — | | | — | | | 7,241 | |
| Total | | | 115,326 | | | (1,415 | ) | | — | | | 113,911 | |
| | | | | | | | | | | | | | |
| | | | Gross Amounts of Assets | | | | | | | | | Net Amount | |
| | | | Presented in Statement | | | Financial | | | Collateral | | | (not less | |
| Counterparty | | | of Assets & Liabilities (a) | | | Instrument | | | Received | | | than 0) | |
| Amounts subject to a master netting or similar arrangement: |
| Barclays Bank plc | | | 1,149 | | | (1,149 | ) | | — | | | — | |
| Deutsche Bank AG | | | 266 | | | (266 | ) | | — | | | — | |
| Total | | | 1,415 | | | (1,415 | ) | | — | | | — | |
| Amounts not subject to a master netting or similar arrangement: |
| – | | | — | | | — | | | — | | | — | |
| Total | | | — | | | — | | | — | | | — | |
| (a) | Absent an event of default or early termination, OTC derivative assets and liabilities are presented gross and not offset in the Statement of Assets & Liabilities. All futures contracts are exchange traded for which their settlement is guaranteed by the clearinghouse and not subject to arrangements with particular counterparties. |
Unconstrained Bond
| | | | | | | | | | | | | | |
| Gross Amounts not Offset in the Statement of Assets & Liabilities |
| | | | | | | | | | | | | | |
| | | | Gross Amounts of Assets | | | | | | | | | Net Amount | |
| | | | Presented in Statement | | | Financial | | | Collateral | | | (not less | |
| Counterparty | | | of Assets & Liabilities (a) | | | Instrument | | | Received | | | than 0) | |
| Amounts subject to a master netting or similar arrangement: |
| Barclays Bank plc | | | 47,062 | | | (31,778 | ) | | — | | | 15,284 | |
| Citibank, N.A. | | | 30,160 | | | (3,545 | ) | | — | | | 26,615 | |
| Deutsche Bank AG | | | 148,180 | | | (34,733 | ) | | — | | | 113,447 | |
| JPMorgan Chase Bank, N.A. | | | 46,665 | | | (34,731 | ) | | — | | | 11,934 | |
| Total | | | 272,067 | | | (104,787 | ) | | — | | | 167,280 | |
| | | | | | | | | | | | | | |
| | | | Gross Amounts of Liabilities | | | | | | | | | Net Amount | |
| | | | Presented in Statement | | | Financial | | | Collateral | | | (not less | |
| Counterparty | | | of Assets & Liabilities (a) | | | Instrument | | | Received | | | than 0) | |
| Amounts subject to a master netting or similar arrangement: |
| Barclays Bank plc | | | 31,778 | | | (31,778 | ) | | — | | | — | |
| Citibank, N.A. | | | 3,545 | | | (3,545 | ) | | — | | | — | |
| Deutsche Bank AG | | | 34,733 | | | (34,733 | ) | | — | | | — | |
| JPMorgan Chase Bank, N.A. | | | 34,731 | | | (34,731 | ) | | — | | | — | |
| Total | | | 104,787 | | | (104,787 | ) | | — | | | — | |
| (a) | Absent an event of default or early termination, OTC derivative assets and liabilities are presented gross and not offset in the Statement of Assets & Liabilities. All futures contracts and those options contracts that are explicitly identified as exchange-traded are traded on a registered exchange for which their settlement is guaranteed by the clearinghouse and not subject to arrangements with particular counterparties. The same facts and circumstances apply to centrally cleared swap contracts and for that reason they are also excluded from the above disclosure. |
| Notes to financial statements (unaudited) |
Additionally, the amount of gains and losses on derivative instruments recognized in the Funds’ earnings during the period and the related location on the accompanying Statements of Operations is summarized in the following table by primary risk exposure:
All Asset:
| | | Location on Statement | | | |
| | | of Operations | | | |
| Realized gain/(loss) | | | |
| Equity risk | | Net realized gain/(loss) from futures contracts | $ | 1,332,005 | |
| Interest Rate Risk | | Net realized gain/(loss) from futures contracts | $ | 46,518 | |
| Foreign currency risk | | Net realized gain/(loss) from foreign currency transactions | $ | (172,660 | ) |
| Change in unrealized appreciation/(depreciation) | | | |
| Equity risk | | Net change in unrealized appreciation/(depreciation) of futures contracts | $ | (700,400 | ) |
| Interest Rate Risk | | Net change in unrealized appreciation/(depreciation) of futures contracts | $ | 13,855 | |
| Foreign currency risk | | Net change in unrealized appreciation/(depreciation) of translation of other assets and liabilities | $ | (151,258 | ) |
European Focus:
| | | Location on Statement | | | |
| | | of Operations | | | |
| Realized gain/(loss) | | | |
| Foreign currency risk | | Net realized gain/(loss) from foreign currency transactions | $ | (2,511,588 | ) |
| Change in unrealized appreciation/(depreciation) | | | |
| Foreign currency risk | | Net change in unrealized appreciation/(depreciation) of translation of other assets and liabilities | $ | 2,907,457 | |
Global Equity Income:
| | | Location on Statement | | | |
| | | of Operations | | | |
| Realized gain/(loss) | | | | | |
| Foreign currency risk | | Net realized gain/(loss) from foreign currency transactions | $ | (20,789,460 | ) |
| Change in unrealized appreciation/(depreciation) | | | |
| Foreign currency risk | | Net change in unrealized appreciation/(depreciation) of translation of other assets and liabilities | $ | 4,552,074 | |
High Yield Opportunities:
| | | Location on Statement | | | |
| | | of Operations | | | |
| Realized gain/(loss) | | | | | |
| Credit risk | | Net realized gain (loss) from swap contracts | $ | 10,271 | |
| Change in unrealized appreciation/(depreciation) | | | |
| Credit risk | | Net change in unrealized appreciation/(depreciation) of credit default swap contracts | $ | (6,586 | ) |
International Opportunities:
| | | Location on Statement | | | |
| | | of Operations | | | |
| Realized gain/(loss) | | | | | |
| Foreign currency risk | | Net realized gain/(loss) from foreign currency transactions | $ | (8,374,830 | ) |
| Change in unrealized appreciation/(depreciation) | | | |
| Foreign currency risk | | Net change in unrealized appreciation/(depreciation) of translation of other assets and liabilities | $ | 14,819,572 | |
| Notes to financial statements (unaudited) |
Strategic Income:
| | | Location on Statement | | | |
| | | of Operations | | | |
| Realized gain/(loss) | | | | | |
| Interest rate risk | | Net realized gain/(loss) from futures contracts | $ | 119,635 | |
| Credit risk | | Net realized gain (loss) from swap contracts | $ | 64,586 | |
| Foreign currency risk | | Net realized gain/(loss) from foreign currency transactions | $ | (1,814,002 | ) |
| Change in unrealized appreciation/(depreciation) | | | |
| Interest rate risk | | Net change in unrealized appreciation/(depreciation) of futures contracts | $ | 94,154 | |
| Credit risk | | Net change in unrealized appreciation/(depreciation) of swap contracts | $ | 63,987 | |
| Foreign currency risk | | Net change in unrealized appreciation/(depreciation) of translation of other assets and liabilities | $ | 401,554 | |
Unconstrained Bond:
| | | Location on Statement | | | |
| | | of Operations | | | |
| Realized gain/(loss) | | | | | |
| Interest rate risk | | Net realized gain/(loss) from futures contracts | $ | 27,205 | |
| Interest rate risk | | Net realized gain (loss) from investment transactions (for purchased options) | $ | 3,027 | |
| Credit risk | | Net realized gain (loss) from swap contracts | $ | (1,242 | ) |
| Interest rate risk | | Net realized gain (loss) from swap contracts | $ | 11,385 | |
| Change in unrealized appreciation/(depreciation) | | | |
| Interest rate risk | | Net change in unrealized appreciation/(depreciation) of futures contracts | $ | (32,923 | ) |
| Interest rate risk | | Net change in unrealized appreciation/(depreciation) of investments (for purchased options) | $ | 12,241 | |
| Foreign currency risk | | Net change in unrealized appreciation/(depreciation) of investments (for purchased options) | $ | 6,032 | |
| | | Location on Statement | | | |
| | | of Operations | | | |
| Change in unrealized appreciation/(depreciation) (cont.) | | | |
| Interest rate risk | | Net change in unrealized appreciation/(depreciation) of written options contracts | $ | (2,426 | ) |
| Foreign currency risk | | Net change in unrealized appreciation/(depreciation) of written options contracts | $ | (1,663 | ) |
| Credit risk | | Net change in unrealized appreciation/(depreciation) of swap contracts | $ | (2,713 | ) |
| Inflation risk | | Net change in unrealized appreciation/(depreciation) of swap contracts | $ | (10,959 | ) |
| Interest rate risk | | Net change in unrealized appreciation/(depreciation) of swap contracts | $ | (35,877 | ) |
| Foreign currency risk | | Net change in unrealized appreciation/(depreciation) of translation of other assets and liabilities | $ | 136,340 | |
Indemnifications
Under the Trust’s organizational documents, its officers and trustees are indemnified against certain liabilities arising out of the performance of their duties to the Trust. In addition, in the normal course of business, the Trust enters into contracts that provide general indemnifications to other parties. The Trust’s maximum exposure under these arrangements is unknown as future claims may be made against the Trust that have not yet been asserted.
Use of estimates
The preparation of financial statements in conformity with US GAAP requires management to make estimates and assumptions that affect the reported amounts and disclosures in the financial statements. Actual results may differ from those estimates.
Expenses
Expenses are recorded on an accrual basis. Expenses of the Trust that are directly attributable to a specific Fund are charged to that Fund. Expenses attributable to a specific class of shares are charged to that class. Other expenses are allocated proportionately among each Fund within the Trust based on average daily net assets or on another reasonable basis.
| Notes to financial statements (unaudited) |
Deferred offering costs
Costs incurred in connection with the offering and initial registration of High Yield Opportunities and Unconstrained Bond have been deferred in conformity with US GAAP and are being amortized to expense on a straight-line basis over the first twelve months after commencement of operations.
Federal income taxes
The Trust’s policy is that each Fund seeks to comply with the requirements of Subchapter M of the Internal Revenue Code of 1986, as amended (“Subchapter M”), that are applicable to regulated investment companies and to distribute substantially all its taxable income to shareholders. No federal income tax provision is required so long as each Fund operates in a manner that complies with the requirements of Subchapter M. Management has concluded that there are no significant uncertain tax positions that would require recognition in the financial statements. Management of the Funds is also not aware of any tax positions for which it is reasonably possible that the total amount of unrecognized tax benefits will significantly change in the next twelve months. The Funds intend to file tax returns with the US Internal Revenue Service and various states. Generally, the tax authorities can examine all tax returns filed for the last three years.
On December 22, 2010, the Regulated Investment Company Modernization Act of 2010 (the “Act”) was enacted, which changed various technical rules governing the tax treatment of regulated investment companies. One of the more prominent changes addresses capital loss carryforwards. Under the Act, each Fund will be permitted to carry forward capital losses incurred in taxable years beginning after the date of enactment for an unlimited period. However, any losses incurred during those future taxable years will be required to be utilized prior to the losses incurred in pre-enactment taxable years, which carry an expiration date. As a result of this ordering rule, pre-enactment capital loss carryforwards may be more likely to expire unused. Additionally, post-enactment capital loss carryforwards will retain their character as either short-term or long-term capital losses rather than being considered all short-term as permitted under previous regulation.
Finally, the Act contains several provisions aimed at preserving the character of distributions made by a fiscal year registered investment company (“RIC”) during the portion of its taxable year ending after October 31 or December 31, reducing the circumstances under which a RIC might be required to file amended Forms 1099 to restate previously reported distributions. Except for the simplification provisions related to RIC qualification, the Act is effective for taxable years beginning after December 22, 2010. The provisions related to RIC qualification are effective for taxable years for which the extended due date of the tax return is after December 22, 2010.
Losses incurred that will be carried forward under the provisions of the Act are as follows:
Emerging Markets Opportunities
| | | | | | | | |
| | | | Loss carryforward character | |
| Expiration | | | Short-term | | | Long-term | |
| Unlimited losses | | $ | 2,860,357 | | $ | 67,296 | |
European Focus
| | | | | | | | |
| | | | Loss carryforward character | |
| Expiration | | | Short-term | | | Long-term | |
| Unlimited losses | | $ | — | | $ | — | |
| 7/31/18 | | | 248,276,050 | | | — | |
Global Equity Income
| | | | | | | | |
| | | | Loss carryforward character | |
| Expiration | | | Short-term | | | Long-term | |
| Unlimited losses | | $ | 11,842,447 | | $ | — | |
| 7/31/16 | | | 506,123 | | | — | |
| 7/31/17 | | | 40,759,829 | | | — | |
| 7/31/18 | | | 75,631,427 | | | — | |
| 7/31/19 | | | 38,549,435 | | | — | |
Global Technology
| | | | | | | | |
| | | | Loss carryforward character | |
| Expiration | | | Short-term | | | Long-term | |
| Unlimited losses | | $ | — | | $ | — | |
| 7/31/17 | | | 2,312,696 | | | — | |
| 7/31/18 | | | 8,744,622 | | | — | |
International Opportunities
| | | | | | | | |
| | | | Loss carryforward character | |
| Expiration | | | Short-term | | | Long-term | |
| Unlimited losses | | $ | — | | $ | — | |
| 7/31/17 | | | 40,548,387 | | | — | |
| 7/31/18 | | | 688,182,842 | | | — | |
| Notes to financial statements (unaudited) |
Strategic Income
| | | | | | | | |
| | | | Loss carryforward character | |
| Expiration | | | Short-term | | | Long-term | |
| Unlimited losses | | $ | 58,763 | | $ | — | |
| 7/31/14 | | | 207,447 | | | — | |
| 7/31/15 | | | 477,632 | | | — | |
| 7/31/16 | | | 1,001,344 | | | — | |
| 7/31/17 | | | 34,174,962 | | | — | |
| 7/31/18 | | | 336,160 | | | — | |
Note that All Asset, Dividend & Income Builder and High Yield Opportunities do not have any capital loss carryforwards to apply against future earnings. Unconstrained Bond commenced operations on December 20, 2013 and thus does not have any capital loss carryforwards.
During the year ended July 31, 2013 the Funds utilized the following capital loss carryforwards:
| | | | |
| All Asset | $ | 86,853 | |
| Dividend & Income Builder | | — | |
| Emerging Markets Opportunities | | — | |
| European Focus | | 9,379,330 | |
| Global Equity Income | | — | |
| Global Technology | | 12,315,494 | |
| High Yield Opportunities | | — | |
| International Opportunities | | 75,269,012 | |
| Strategic Income * | | 971,714 | |
| * | For seven months ended July 31, 2013. During the seven months ended July 31, 2013, Strategic Income Fund had $341,836 of capital loss carryforward expire. During the year ended December 31, 2012, the Strategic Income Fund utilized no capital loss carryforwards. |
At July 31, 2013, the following Funds deferred post-October losses and/or late year ordinary losses, which will be recognized on the first day of the following year:
| | | | | | | | |
| | | | Ordinary | | | Capital | |
| | | | loss | | | loss | |
| | | | deferred | | | deferred | |
| All Asset | | $ | — | | $ | — | |
| Dividend & Income | | | | | | | |
| Builder | | | — | | | — | |
| Emerging Markets | | | | | | | |
| Opportunities | | | — | | | 131,190 | |
| European Focus | | | — | | | 2,484,450 | |
| Global Equity Income | | | — | | | — | |
| Global Technology | | | 794,719 | | | — | |
| High Yield | | | | | | | |
| Opportunities | | | — | | | — | |
| International Opportunities | | | — | | | — | |
| Strategic Income | | | — | | | — | |
Distributions to shareholders
Distributions to shareholders are recorded on the ex-dividend date. Distributions from net investment income and net realized capital gains are determined in accordance with federal income tax regulations, which may differ from US GAAP. These book/tax differences are either temporary or permanent in nature. To the extent these differences are permanent, they are reclassified within the capital accounts based on their federal tax-basis treatment.
The tax character of distributions paid during the six months ended January 31, 2014 and the year ended July 31, 2013 were as follows:
| | | | | | | | |
| Six months ended | | | Ordinary | | | Capital | |
| January 31, 2014 | | | income | | | gains | |
| All Asset | | $ | 980,064 | | $ | 2,099,671 | |
| Dividend & Income Builder | | | 132,329 | | | 37,918 | |
| Emerging Markets Opportunities | | | — | | | — | |
| European Focus | | | 3,710,266 | | | — | |
| Global Equity Income | | | 58,224,071 | | | — | |
| Global Technology | | | — | | | 2,465,935 | |
| High Yield Opportunities | | | 899,998 | | | 65,653 | |
| International Opportunities | | | 12,686,584 | | | — | |
| Strategic Income | | | 1,085,023 | | | — | |
| Unconstrained Bond | | | 30,001 | | | — | |
| Year ended | | | Ordinary | | | Capital | |
| July 31, 2013 | | | income | | | gains | |
| All Asset | | $ | 542,605 | | $ | — | |
| Dividend & Income Builder | | | 54,539 | | | — | |
| Emerging Markets Opportunities | | | 163,785 | | | — | |
| European Focus | | | 7,586,086 | | | — | |
| Global Equity Income | | | 97,926,333 | | | — | |
| Global Technology | | | — | | | — | |
| High Yield Opportunities | | | 340,001 | | | — | |
| International Opportunities | | | 16,206,595 | | | — | |
| Strategic Income * | | | 1,206,003 | | | — | |
| * | For seven months ended July 31, 2013. For the year ended December 31, 2012, the tax character of distributions paid by Strategic Income in the amount of $1,994,497 were comprised entirely of ordinary income. |
| Notes to financial statements (unaudited) |
As of July 31, 2013, the components of distributable earnings on a tax basis were as follows:
| | | | | | | | | | | |
| | | | Undistributed | | | Undistributed | | | Undistributed | |
| | | | ordinary | | | capital gains/ | | | appreciation | |
| | | | income | | | (losses | ) | | (depreciation | ) |
| All Asset | | $ | 1,442,738 | | $ | 392,324 | | $ | 856,013 | |
| Dividend &Income Builder | | | 143,672 | | | — | | | 127,694 | |
| Emerging Markets Opportunities | | | — | | | — | | | (586,430 | ) |
| European Focus | | | 3,871,366 | | | — | | | 71,921,219 | |
| Global Equity Income | | | 1,493,762 | | | — | | | 130,747,777 | |
| Global Technology | | | — | | | — | | | 75,629,856 | |
| High Yield Opportunities | | | 157,661 | | | — | | | (220,096 | ) |
| International Opportunities | | | 12,685,873 | | | — | | | 472,443,119 | |
| Strategic Income | | | 107,200 | | | — | | | (1,293,693 | ) |
Ordinary income and net realized gains/losses may differ for book and tax basis reporting purposes due to post-October losses (which are not recognized for tax purposes until the first day of the following fiscal year), tax deferral on wash sales and PFIC transactions.
Note 3. Fair value measurements
US GAAP defines fair market value as the price that a Fund would receive to sell an asset or pay to transfer a liability in an orderly transaction between market participants at the measurement date. Various inputs are used in determining the value of the Funds’ investments. The Funds use a three-tier hierarchy of inputs to establish classification of fair value measurements for disclosure purposes. These inputs may be observable or unobservable. Observable inputs are inputs that reflect the assumptions market participants would use in pricing the asset or liability developed based on market data obtained from sources independent of the reporting entity. Unobservable inputs are inputs that reflect the reporting entity’s own assumptions about the assumptions market participants would use in pricing the asset or liability developed based on the best information available under the circumstances. The inputs used for valuing securities are not necessarily an indication of the risk associated with investing in those securities. The three-tier hierarchy of inputs is summarized in the following three broad levels:
| • | Level 1 – quoted prices (unadjusted) in active markets for identical investments |
| | |
| • | Level 2 – other significant observable inputs (including quoted prices for similar investments, interest rates, prepayment speeds, credit risk, etc.) |
| | |
| • | Level 3 – significant unobservable inputs based on the best information available in the circumstances to the extent observable inputs are not available (including the Fund’s own assumptions in determining the fair value of investments) |
Tables summarizing each Fund’s investments that are measured at fair value by level within the fair value hierarchy at January 31, 2014 have been listed after each Fund’s Portfolio of Investments.
Any transfers between levels are disclosed, effective at the end of the period, in each Fund’s table with the reasons for the transfers disclosed in a note to the table, if applicable.
Note 4. Investment advisory fees and other transactions with affiliates
Pursuant to an Investment Advisory Agreement, Henderson Global Investors (North America) Inc. (“HGINA”) acts as the Funds’ investment adviser. HGINA is an indirect wholly-owned subsidiary of Henderson Group plc. HGINA supervises the investments of the Funds and earns a management fee for such services. HGINA earns a fee for its services based on each Fund’s average daily net assets as set forth below.
| All Asset | | | | | | 0.40% | |
| Dividend & Income Builder | | | First $1 billion | | | 0.75% | |
| | | | Next $1 billion | | | 0.65% | |
| | | | Over $2 billion | | | 0.55% | |
| Emerging Markets | | | First $1 billion | | | 1.00% | |
| Opportunities | | | Next $1 billion | | | 0.90% | |
| | | | Over $2 billion | | | 0.85% | |
| European Focus | | | First $500 million | | | 1.00% | |
| | | | Next $1 billion | | | 0.90% | |
| | | | Over $1.5 billion | | | 0.85% | |
| Global Equity Income | | | First $1 billion | | | 0.85% | |
| | | | Next $1 billion | | | 0.65% | |
| | | | Over $2 billion | | | 0.60% | |
| Global Technology | | | First $500 million | | | 1.00% | |
| | | | Next $500 million | | | 0.95% | |
| | | | Over $1 billion | | | 0.90% | |
| High Yield Opportunities | | | First $1 billion | | | 0.65% | |
| | | | Next $1 billion | | | 0.55% | |
| | | | Over $2 billion | | | 0.50% | |
| International Opportunities | | | First $1 billion | | | 1.10% | |
| | | | Next $1 billion | | | 0.95% | |
| | | | Over $2 billion | | | 0.85% | |
| Notes to financial statements (unaudited) |
| Strategic Income* | | | First $1 billion | | | 0.55% | |
| | | | Next $500 million | | | 0.50% | |
| | | | Over $1.5 billion | | | 0.45% | |
| Unconstrained Bond | | | First $1 billion | | | 0.65% | |
| | | | Next $1 billion | | | 0.55% | |
| | | | Over $2 billion | | | 0.50% | |
| * | Based on average daily managed assets of the Fund. Managed assets mean the total assets of the Fund (including any assets attributable to any leverage that may be outstanding) minus the sum of accrued liabilities (other than debt representing financial leverage). Since the Fund pays HGINA based on the Fund’s average daily managed assets, HGINA’s fee will be higher if the Fund is leveraged. |
HGINA has engaged Henderson Investment Management Limited (“HIML”), also an indirect wholly-owned subsidiary of Henderson Group plc, to act as the investment sub-adviser to the Funds, except for Strategic Income and High Yield Opportunities. Under a separate Sub-Advisory Agreement, the sub-adviser provides research, advice and recommendations with respect to the purchase and sale of securities and makes investment decisions regarding assets of the Funds subject to the oversight of the Board and the Adviser. No additional advisory fees are charged to the Funds for the services of the sub-adviser as these fees are paid from the fees earned by HGINA.
Pursuant to a separate contractual Expense Limitation Agreement, HGINA has agreed to waive or limit its investment advisory fee and, if necessary, to reimburse expenses of each Fund in order to limit total annual ordinary operating expenses, including distribution and service fees, as a percentage of average daily net assets as follows:
| | | | | | | | | | | | | | | | | |
| | | | Class | | | Class | | | Class | | | Class | | | Class | |
| | | | A | | | B | | | C | | | I | | | R | |
| All Asset* | | | 0.85 | % | | N/A | | | 1.60 | % | | 0.60 | % | | N/A | |
| Dividend &Income Builder | | | 1.30 | % | | N/A | | | 2.05 | % | | 1.05 | % | | N/A | |
| Emerging Markets Opportunities | | | 1.79 | % | | N/A | | | 2.54 | % | | 1.54 | % | | N/A | |
| European Focus | | | 2.00 | % | | 2.75 | % | | 2.75 | % | | 1.75 | % | | N/A | |
| Global Equity Income | | | 1.40 | % | | N/A | | | 2.15 | % | | 1.15 | % | | N/A | |
| Global Technology | | | 2.00 | % | | 2.75 | % | | 2.75 | % | | 1.75 | % | | N/A | |
| High Yield Opportunities | | | 1.10 | % | | N/A | | | 1.85 | % | | 0.85 | % | | N/A | |
| International Opportunities | | | 2.00 | % | | 2.75 | % | | 2.75 | % | | 1.75 | % | | 2.25 | % |
| Strategic Income | | | 1.10 | % | | 1.85 | % | | 1.85 | % | | 0.85 | % | | N/A | |
| Unconstrained Bond | | | 1.15 | % | | N/A | | | 1.90 | % | | 0.90 | % | | N/A | |
| * | With respect to investments in affiliated underlying funds, HGINA has contractually agreed to reduce or waive the Fund’s management fee to limit the combined management fees paid to the adviser for those assets to the greater of 1.00% or the affiliated underlying fund’s management fee. Any waiver calculated as a result of limiting these combined management fees is in addition to the general expense limitation highlighted in the table. Indirect net expenses associated with the Fund’s investments in underlying investment companies are not subject to the contractual expense limitation. |
These agreements will remain in effect through July 31, 2020, except the agreement for All Asset, Dividend & Income Builder and Emerging Markets Opportunities, which are effective through July 31, 2015. Shares of the Funds are often purchased through financial intermediaries who are agents of the Funds for the limited purpose of completing purchases and sales. These intermediaries may provide certain networking and sub-transfer agent services with respect to Fund shares held by that intermediary for its customers, and the intermediary may charge HGINA for those services. The Funds reimburse HGINA for such fees within limits specified by the Board of Trustees. The fees are incurred at the class level based on activity, asset levels and/or number of accounts and are included in Sub-accounting fees in the Statements of Operations.
At January 31, 2014, HGINA owned the following number of shares in the following Funds:
| | | | | |
| | | | Shares | |
| All Asset Class A | | | 473 | |
| All Asset Class C | | | 470 | |
| All Asset Class I | | | 106 | |
| Dividend & Income Builder Class A | | | 2,598 | |
| Dividend & Income Builder Class C | | | 2,585 | |
| Dividend & Income Builder Class I | | | 20,855 | |
| High Yield Opportunities Class A | | | 100,000 | |
| High Yield Opportunities Class C | | | 100,000 | |
| High Yield Opportunities Class I | | | 573,913 | |
| Strategic Income Class I | | | 1,270 | |
HGI (Investments) Limited is an indirect wholly-owned subsidiary of Henderson Group plc. At January 31, 2014, HGI (Investments) Limited owned the following number of shares in the following Funds:
| | | | | |
| | | | Shares | |
| Unconstrained Bond Class A | | | 100,000 | |
| Unconstrained Bond Class C | | | 100,000 | |
| Unconstrained Bond Class I | | | 2,300,000 | |
| Notes to financial statements (unaudited) |
An affiliated entity of a Fund may include any company in which the Fund owns five percent or more of its outstanding voting shares. Additionally, certain of the Funds held ownership in other Funds within the Trust. At January 31, 2014, the All Asset Fund held 0.1% of the Henderson Global Equity Income Fund, 0.6% of the Henderson Global Technology Fund and 2.8% of the Henderson Strategic Income Fund. Transactions in affiliates during the period ended January 31, 2014 were as follows:
| | | | | | | | | | | | | | | | | | | | | | | |
| | | | | | | | | | | | | Change in | | | | | | | | | | |
| | | | | | | | | | Proceeds | | | Unrealized | | | Realized | | | | | | | |
| | | | Value | | | Purchases | | | from | | | Appreciation | | | Gain/ | | | Value | | | Dividend | |
| Affiliate | | | 7/31/2013 | | | at Cost | | | Sales | | | (Depreciation) | | | (Loss) | | | 1/31/2014 | | | Income | |
| All Asset | | | | | | | | | | | | | | | | | | | | | | |
| Henderson Global Equity Income Fund | | $ | — | | $ | 1,453,489 | | $ | — | | $ | 17,392 | | $ | — | | $ | 1,470,881 | | $ | 39,046 | |
| Henderson Global Technology Fund | | | 1,031,701 | | | 889,927 | | | — | | | 209,563 | | | — | | | 2,131,191 | | | — | |
| Henderson Strategic Income Fund | | | 730,359 | | | 389,305 | | | — | | | 12,463 | | | — | | | 1,132,127 | | | 24,773 | |
The aggregate cost and value of affiliates at January 31, 2014 is $4,399,567 and $4,734,199, respectively. Investments in affiliates represented 6.15% of total net assets of the All Asset Fund as of January 31, 2014.
Note 5. Compensation of trustees and officers
Certain officers and trustees of the Trust are also officers of HGINA. None of the Trust’s officers, other than the Chief Compliance Officer, are compensated by the Trust. The Trust makes no direct payments to trustees affiliated with HGINA. Fees paid to trustees are reflected as Trustees’ fees and expenses in the Statements of Operations.
The Funds bear a portion of the compensation paid to the Chief Compliance Officer who performs services directly related to the Trust. This compensation is reflected as Compliance officer fees in the Statements of Operations.
Note 6. Distribution plan
The Trust has adopted a distribution plan for Class A, Class B, Class C and Class R shares of the Funds in accordance with Rule 12b-1 under the 1940 Act (the “12b-1 Plan”). Under the 12b-1 Plan, the Funds pay the distributor an annual fee of 0.25% of the average daily net assets attributable to its Class A shares, an annual fee of 1.00% of the average daily net assets attributable to its Class B and C shares, and an annual fee of 0.50% of the average daily net assets attributable to its Class R shares. The 12b-1 Plan is used to induce or compensate financial intermediaries (including brokerage firms, depository institutions and other firms) to provide distribution services to the Funds and their shareholders.
Note 7. Investment transactions
Purchases and sales of investment securities, excluding short-term investments and U.S. government securities, for the Funds for the six months ended January 31, 2014, were as follows:
| | | | | | | | |
| | | | Purchases | | | Sales | |
| All Asset | | $ | 12,748,244 | | $ | 10,921,496 | |
| Dividend & Income Builder | | | 19,353,197 | | | 2,928,189 | |
| Emerging Markets Opportunities | | | 15,435,815 | | | 11,443,920 | |
| European Focus | | | 1,547,945,526 | | | 731,526,547 | |
| Global Equity Income | | | 1,655,735,993 | | | 1,020,981,077 | |
| Global Technology | | | 107,892,257 | | | 129,098,334 | |
| High Yield Opportunities | | | 44,960,609 | | | 45,386,381 | |
| International Opportunities | | | 1,569,540,921 | | | 1,167,562,703 | |
| Strategic Income | | | 13,475,362 | | | 22,430,840 | |
| Unconstrained Bond | | | 25,429,692 | | | 3,043,917 | |
The US federal income tax basis of investments excluding foreign currency and forward currency contracts at January 31, 2014, and the gross unrealized appreciation and depreciation, were as follows:
| | | | | | | | |
| | | | All | | | Dividend & | |
| | | | Asset | | | Income Builder | |
| Cost | | $ | 74,136,798 | | $ | 20,535,170 | |
| Gross unrealized appreciation | | | 2,259,080 | | | 843,760 | |
| Gross unrealized depreciation | | | (427,167 | ) | | (383,086 | ) |
| Net unrealized appreciation (depreciation) | | | 1,831,913 | | | 460,674 | |
| Notes to financial statements (unaudited) |
| | | | Emerging Markets | | | European | |
| | | | Opportunities | | | Focus | |
| Cost | | $ | 26,289,271 | | $ | 1,588,667,914 | |
| Gross unrealized appreciation | | | 2,376,047 | | | 209,796,403 | |
| Gross unrealized depreciation | | | (1,956,205 | ) | | (99,318,352 | ) |
| Net unrealized appreciation (depreciation) | | | 419,842 | | | 110,478,051 | |
| | | | | | | | |
| | | | Global Equity | | | Global | |
| | | | Income | | | Technology | |
| Cost | | $ | 2,444,031,998 | | $ | 272,599,670 | |
| Gross unrealized appreciation | | | 192,148,661 | | | 109,444,424 | |
| Gross unrealized depreciation | | | (82,433,789 | ) | | (2,450,786 | ) |
| Net unrealized appreciation (depreciation) | | | 109,714,872 | | | 106,993,638 | |
| | | | | | | | |
| | | | High Yield | | | International | |
| | | | Opportunities | | | Opportunities | |
| Cost | | $ | 25,865,043 | | $ | 3,032,212,631 | |
| Gross unrealized appreciation | | | 632,674 | | | 704,235,044 | |
| Gross unrealized depreciation | | | (106,236 | ) | | (142,066,639 | ) |
| Net unrealized appreciation (depreciation) | | | 526,438 | | | 562,168,405 | |
| | | | | | | | |
| | | | Strategic | | | Unconstrained | |
| | | | Income | | | Bond | |
| Cost | | $ | 38,749,684 | | $ | 24,252,221 | |
| Gross unrealized appreciation | | | 3,314,276 | | | 176,639 | |
| Gross unrealized depreciation | | | (3,141,087 | ) | | (207,970 | ) |
| Net unrealized appreciation/depreciation | | | 173,189 | | | (31,331 | ) |
Identified cost may differ for book and tax basis reporting purposes primarily due to tax deferral of losses on wash sales, PFIC transactions, different book and tax treatment on certain debt instruments and amortization of premiums reflected as of January 31, 2014.
Note 8. Significant concentrations
The Funds may invest a substantial percentage of their assets in securities of foreign issuers. These investments may involve certain considerations and risks not typically associated with investments in the United States as a result of, among other factors, the possibility of future political and economic developments and the level of governmental supervision and regulation of securities markets in the respective countries. Some countries in which the Funds invest may require government approval for repatriation of investment income, capital or the proceeds of sales of securities by foreign investors. In addition, if there is deterioration in a country’s balance of payments or for other reasons, a country may impose temporary restrictions on foreign capital remittances abroad. In addition, changes in currency exchange rates will affect the value of investments denominated in a foreign currency, as well as investment income derived from those securities. These risks may be heightened in less developed countries, which are sometimes referred to as emerging markets. For example, political and economic structures in these countries may be changing rapidly, which can cause instability and greater risk of loss. These countries are also more likely to experience higher levels of inflation, deflation or currency devaluation, which could hurt their economies and securities markets. For these and other reasons, investments in emerging markets, particularly in Emerging Markets Opportunities Fund, are often considered speculative. Further, the Funds maintain many of their investments in issuers domiciled in the Eurozone. The private and public sectors’ debt problems of a single Eurozone country may pose significant risks to the Eurozone as a whole. As a result, the Funds may be more susceptible to volatility generated by currency devaluations or other general uncertainties than more geographically diversified funds that do not concentrate in this region of the world.
The Funds may invest a high percentage of their net assets in specific sectors of the market in order to achieve a potentially greater investment return. As a result, the economic, political and regulatory developments in a particular sector of the market, positive or negative, may have a greater impact on a Fund’s net assets and will cause the value of its shares to fluctuate more than if the Fund did not concentrate its investments in a particular sector. In particular, Global Technology concentrates its investments in issuers within specific industries of the technology and telecommunications sectors. Valuations of companies in these sectors are typically subject to greater volatility than other sectors.
The Dividend & Income Builder Fund, High Yield Opportunities Fund, Strategic Income Fund and Unconstrained Bond Fund invest in a variety of income-producing debt instruments of corporate and sovereign issuers. Accordingly, each may be subject to the previously described foreign issuers risk, to varying degrees, in addition to the risk of default by the issuer. As a matter of their investment strategies, the High Yield Opportunities Fund and Unconstrained Bond Fund are also subject to higher concentrations of investments in lower quality
| Notes to financial statements (unaudited) |
high yield securities or asset-backed/structured securities. Investing in high yield, asset-backed or structured securities may involve greater risks and considerations not typically associated with investing in US Government bonds and other high quality fixed-income securities. High yield securities are non-investment grade securities, often referred to as “junk bonds.” Economic downturns may disrupt the high yield market and impair the ability of issuers to repay principal and interest. Additionally, asset-backed securities are subject to the risk that underlying debt may be prepaid prior to maturity or refinanced causing further volatility in the value. A small change in interest rates would likely have a pronounced adverse impact on the value of such high yield and asset-backed obligations. Moreover, these securities may be less liquid as there is a less-established secondary market and the Funds may not be able to sell the asset timely.
Note 9. Borrowing arrangements
The Trust maintains a $100 million credit facility to facilitate portfolio liquidity. Interest is charged to each Fund based on its borrowings at a rate per annum equal to the Federal Funds rate plus 1.25%. In addition, a commitment fee of 0.10% per annum is accrued and apportioned among the Funds in the Trust. The commitment fee is included in Miscellaneous fees on the Statements of Operations. No amounts were borrowed by the Funds under this facility during the six months ended January 31, 2014.
Note 10. Recently issued accounting pronouncements
In June 2013, the FASB issued ASU 2013-08, “Financial Services – Investment Companies (Topic 946): Amendments to the Scope, Measurement, and Disclosure Requirements,” which sets forth a new approach for determining whether a public or private company is an Investment Company and sets certain measurement and disclosure requirements for an Investment Company. The amendments are effective for fiscal years beginning on or after December 15, 2013. An entity regulated under the 1940 Act would automatically qualify as an Investment Company for accounting purposes under Topic 946 and thus the Funds’ management believes the release will have no impact to the Funds.
| Other information (unaudited) |
Proxy voting policies
The Funds have filed with the Securities and Exchange Commission their proxy voting records for the twelve months ended June 30, 2013 on Form N-PX, which must be filed each year by August 31. Form N-PX is available on the Securities and Exchange Commission’s website at www.sec.gov. The Funds’ proxy voting records and proxy voting policies and procedures are also available without charge, upon request, by calling 866.443.6337 or by visiting the Funds’ website at www.henderson.com.
Quarterly portfolio of investments
A Portfolio of Investments is filed as of the end of the first and third quarter of each fiscal year on Form N-Q. The Funds have filed with the Securities and Exchange Commission the Form N-Q and it is available on the Securities and Exchange Commission’s website at www.sec.gov. Additionally, the Portfolios of Investments may be reviewed and copied at the Commission’s Public Reference Room in Washington, DC. Information on the operation of the Public Reference Room may be obtained by calling 1.800.SEC.0330. The quarterly Portfolios of Investments are also available without charge, upon request, by calling 866.443.6337 or by visiting the Funds’ website at www.henderson.com.
Federal tax information
Certain tax information for the Funds is required to be provided to shareholders based on the Funds’ income and distributions for the taxable year ending July 31, 2013. In February 2014, shareholders will receive Form 1099-DIV, which includes their share of foreign tax credit, qualified dividends and capital gains distributed during the calendar year 2013. Shareholders are advised to check with their tax advisors for information on the treatment of these amounts on their individual income tax returns.
Statement Pursuant to Section 19(a) of the Investment Company Act of 1940
The exact source of aggregate fund distributions for each fiscal year can only be determined as of the end of each Fund’s fiscal year, July 31. However, under Section 19(a) of the Investment Company Act of 1940, the Funds are required to indicate the source of each distribution to shareholders at the time of payment if the distribution is made from any source other than accumulated undistributed net income. For purposes of this disclosure, the source of each distribution is based on US Generally Accepted Accounting Principles (“GAAP”) and will differ from federal income tax-based reporting provided to shareholders due to certain tax adjustments. For federal income tax purposes, the Funds will send you a Form 1099-DIV for each calendar year that will tell you how to report these distributions.
The Funds are making the following disclosures pursuant to Section 19(a).
During the period ended January 31, 2014, All Asset, European Focus, Global Equity Income, International Opportunities, Unconstrained Bond and World Select paid the following distributions, which were paid in part from sources other than accumulated undistributed net income as measured at the time of payment:
All Asset
| | | | | | | | | | | | | | | | | |
| | | | | | | | | | | % from | | | | | | |
| | | | | | | | | | | accumulated | | | % from | | % from | |
| | | | | | | | | | | undistributed | | | accumulated | | paid-in | |
| Pay Date | | | Ex-Date | | | Amount | | | | net income | | | realized gains | | capital | |
| 12/30/2013 | | | 12/27/2013 | | | Class A: | $0.11466 | | | 62.3% | | | 0.0% | | 37.7% | |
| | | | | | | Class C: | $0.06502 | | | 62.3% | | | 0.0% | | 37.7% | |
| | | | | | | Class I: | $0.15360 | | | 62.3% | | | 0.0% | | 37.7% | |
European Focus
| | | | | | | | | | | % from | | | | | | |
| | | | | | | | | | | accumulated | | | % from | | % from | |
| | | | | | | | | | | undistributed | | | accumulated | | paid-in | |
| Pay Date | | | Ex-Date | | | Amount | | | | net income | | | realized gains | | capital | |
| 12/30/2013 | | | 12/27/2013 | | | Class A: | $0.07263 | | | 12.1% | | | 0.0% | | 87.9% | |
| | | | | | | Class I: | $0.12336 | | | 12.1% | | | 0.0% | | 87.9% | |
| Other information (unaudited) |
Global Equity
| | | | | | | | | | | % from | | | | | | | |
| | | | | | | | | | | accumulated | | | % from | | | % from | |
| | | | | | | | | | | undistributed | | | accumulated | | | paid-in | |
| Pay Date | | | Ex-Date | | | Amount | | | | net income | | | realized gains | | | capital | |
| 12/30/2013 | | | 12/30/2013 | | | Class A: | $0.038000 | | | 62.5% | | | 0.0% | | | 37.5% | |
| | | | | | | Class C: | $0.032646 | | | 62.5% | | | 0.0% | | | 37.5% | |
| | | | | | | Class I: | $0.039924 | | | 62.5% | | | 0.0% | | | 37.5% | |
International Opportunities
| | | | | | | | | | % from | | | | | | | |
| | | | | | | | | | accumulated | | | % from | | | % from | |
| | | | | | | | | | undistributed | | | accumulated | | | paid-in | |
| Pay Date | | | Ex-Date | | Amount | | | | net income | | | realized gains | | | capital | |
| 12/30/2013 | | | 12/27/2013 | | Class A: | $0.09182 | | | 44.4% | | | 0.0% | | | 55.6% | |
| | | | | | Class R: | $0.02411 | | | 44.4% | | | 0.0% | | | 55.6% | |
| | | | | | Class I: | $0.15090 | | | 44.4% | | | 0.0% | | | 55.6% | |
Unconstrained Bond
| | | | | | | | | | | % from | | | | | | | |
| | | | | | | | | | | accumulated | | | % from | | | % from | |
| | | | | | | | | | | undistributed | | | accumulated | | | paid-in | |
| Pay Date | | | Ex-Date | | | Amount | | | | net income | | | realized gains | | | capital | |
| 1/30/2014 | | | 1/30/2014 | | | Class A: | $0.009763 | | | 73.6% | | | 0.0% | | | 26.4% | |
| | | | | | | Class R: | $0.001531 | | | 73.6% | | | 0.0% | | | 26.4% | |
| | | | | | | Class I: | $0.012552 | | | 73.6% | | | 0.0% | | | 26.4% | |
World Select*
| | | | | | | | | | | % from | | | | | | | |
| | | | | | | | | | | accumulated | | | % from | | | % from | |
| | | | | | | | | | | undistributed | | | accumulated | | | paid-in | |
| Pay Date | | | Ex-Date | | | Amount | | | | net income | | | realized gains | | | capital | |
| 8/27/2013 | | | 8/27/2013 | | | Class A: | $0.003871 | | | 62.8% | | | 0.0% | | | 37.2% | |
| | | | | | | Class I: | $0.041491 | | | 62.8% | | | 0.0% | | | 37.2% | |
*The Henderson World Select Fund terminated and liquidated on 8/30/2013.
| Other information (unaudited) |
Shareholder expense
As a shareholder of the Funds, you incur two types of costs: (1) transaction costs, including sales charges (loads) on purchase payments and redemption fees and (2) ongoing costs, including management fees, distribution (12b-1) fees, shareholder services fees and other Fund expenses. The example in Table 1 and Table 2 is intended to help you understand your ongoing costs of investing in the Funds and to compare these costs with ongoing costs of investing in other mutual funds. It is based on an investment of $1,000 invested at the beginning of the period and held for the six months ended January 31, 2014.
Actual expenses
Table 1 provides information about actual account values and actual expenses. You may use the information in this line, together with the amount invested, to estimate the expenses that you incurred over the period. Simply divide your account value at the end of the period by $1,000 (for example, an $8,600 account value divided by $1,000 = 8.6), then multiply the result by the number under the heading entitled “Expenses Paid During the Period” to estimate the expenses attributable to your investment during this period.
Hypothetical example for comparison purposes
Table 2 provides information about hypothetical account values and hypothetical expenses based on the Funds’ actual expense ratios and an assumed rate of return of 5% per year before expenses, which is not the Funds’ actual return. Thus you should not use the hypothetical account values and expenses to estimate your actual ending account balance or the expense attributable to your investment during the period. Rather, these figures are provided to enable you to compare the ongoing costs of investing in the Funds and other funds. To do so, compare the 5% hypothetical examples with the 5% hypothetical examples that appear in the shareholder reports of other funds.
Expenses paid during the period include amounts reflected in the Funds’ Statements of Operations net of reimbursements by the investment adviser. The annualized expense ratios used in the example are as follows:
| | | | | | | | | | | | | | | | | |
| | | | Class | | | Class | | | Class | | | Class | | | Class | |
| | | | A | | | B | | | C | | | I | | | R | |
| All Asset | | | 0.85 | % | | N/A | | | 1.60 | % | | 0.60 | % | | N/A | |
| Dividend &Income Builder | | | 1.30 | % | | N/A | | | 2.05 | % | | 1.05 | % | | N/A | |
| Emerging Markets Opportunities | | | 1.79 | % | | N/A | | | 2.54 | % | | 1.54 | % | | N/A | |
| European Focus | | | 1.38 | % | | 2.21 | % | | 2.15 | % | | 1.11 | % | | N/A | |
| Global Equity Income | | | 1.14 | % | | N/A | | | 1.90 | % | | 0.88 | % | | N/A | |
| Global Technology | | | 1.45 | % | | 2.27 | % | | 2.22 | % | | 1.19 | % | | N/A | |
| High Yield Opportunities | | | 1.10 | % | | N/A | | | 1.85 | % | | 0.85 | % | | N/A | |
| International Opportunities | | | 1.39 | % | | 2.23 | % | | 2.18 | % | | 1.69 | % | | 1.12 | % |
| Strategic Income | | | 1.10 | % | | 1.85 | % | | 1.85 | % | | 0.85 | % | | N/A | |
| Unconstrained Bond | | | 1.15 | % | | N/A | | | 1.90 | % | | 0.90 | % | | N/A | |
Please note that the expenses do not reflect shareowner transaction costs such as front end sales charges and redemption fees. These fees are described for each Fund and share class in the “Commentaries and Performance Summaries” section of this report beginning on page 2. Table 2 is useful in comparing ongoing costs only, and will not help you determine the relative total costs of owning different funds. In addition, if these transaction costs were included, your costs would have been higher.
| Other information (unaudited) |
| | | | | | | | | | | |
| Table 1 | | | | | | | | | | |
| | | | | | | | | | | |
| | | | Beginning | | | Ending | | | Expenses | |
| | | | account | | | account | | | paid | |
| | | | value | | | value | | | during | |
| | | | August 1, | | | January 31, | | | the | |
| Actual | | | 2013 | | | 2014 | | | period* | |
| All Asset | | | | | | | | | | |
| Class A | | $ | 1,000.00 | | $ | 1,024.80 | | $ | 4.34 | |
| Class C | | | 1,000.00 | | | 1,019.30 | | | 8.14 | |
| Class I | | | 1,000.00 | | | 1,026.50 | | | 3.06 | |
| Dividend & Income Builder | | | | | | | | | | |
| Class A | | $ | 1,000.00 | | $ | 1,065.30 | | $ | 6.77 | |
| Class C | | | 1,000.00 | | | 1,061.20 | | | 10.65 | |
| Class I | | | 1,000.00 | | | 1,066.70 | | | 5.47 | |
| Emerging Market Opportunities | | | | | | | | | | |
| Class A | | $ | 1,000.00 | | $ | 1,008.20 | | $ | 9.06 | |
| Class C | | | 1,000.00 | | | 1,003.60 | | | 12.83 | |
| Class I | | | 1,000.00 | | | 1,009.40 | | | 7.80 | |
| European Focus | | | | | | | | | | |
| Class A | | $ | 1,000.00 | | $ | 1,168.30 | | $ | 7.54 | |
| Class B | | | 1,000.00 | | | 1,163.30 | | | 12.05 | |
| Class C | | | 1,000.00 | | | 1,163.70 | | | 11.73 | |
| Class I | | | 1,000.00 | | | 1,169.60 | | | 6.07 | |
| Global Equity Income | | | | | | | | | | |
| Class A | | $ | 1,000.00 | | $ | 1,045.20 | | $ | 5.88 | |
| Class C | | | 1,000.00 | | | 1,041.60 | | | 9.78 | |
| Class I | | | 1,000.00 | | | 1,046.50 | | | 4.54 | |
| Global Technology | | | | | | | | | | |
| Class A | | $ | 1,000.00 | | $ | 1,129.60 | | $ | 7.78 | |
| Class B | | | 1,000.00 | | | 1,125.10 | | | 12.16 | |
| Class C | | | 1,000.00 | | | 1,125.80 | | | 11.90 | |
| Class I | | | 1,000.00 | | | 1,131.10 | | | 6.39 | |
| High Yield Opportunities | | | | | | | | | | |
| Class A | | $ | 1,000.00 | | $ | 1,065.70 | | $ | 5.73 | |
| Class C | | | 1,000.00 | | | 1,060.60 | | | 9.61 | |
| Class I | | | 1,000.00 | | | 1,065.90 | | | 4.43 | |
| International Opportunities | | | | | | | | | | |
| Class A | | $ | 1,000.00 | | $ | 1,099.20 | | $ | 7.35 | |
| Class B | | | 1,000.00 | | | 1,094.60 | | | 11.77 | |
| Class C | | | 1,000.00 | | | 1,095.10 | | | 11.51 | |
| Class I | | | 1,000.00 | | | 1,097.80 | | | 8.94 | |
| Class R | | | 1,000.00 | | | 1,100.60 | | | 5.93 | |
| Strategic Income | | | | | | | | | | |
| Class A | | $ | 1,000.00 | | $ | 1,044.20 | | $ | 5.67 | |
| Class B | | | 1,000.00 | | | 1,039.80 | | | 9.51 | |
| Class C | | | 1,000.00 | | | 1,040.30 | | | 9.51 | |
| Class I | | | 1,000.00 | | | 1,044.80 | | | 4.38 | |
| Unconstrained Bond** | | | | | | | | | | |
| Class A | | $ | 1,000.00 | | $ | 1,002.00 | | $ | 1.36 | |
| Class C | | | 1,000.00 | | | 1,001.20 | | | 2.19 | |
| Class I | | | 1,000.00 | | | 1,002.30 | | | 1.04 | |
| Table 2 | | | | | | | | | | |
| | | | | | | | | | | |
| Hypothetical | | | Beginning | | | Ending | | | Expenses | |
| (assuming a | | | account | | | account | | | paid | |
| 5% return | | | value | | | value | | | during | |
| before | | | August 1, | | | January 31, | | | the | |
| expenses) | | | 2013 | | | 2014 | | | period* | |
| All Asset | | | | | | | | | | |
| Class A | | $ | 1,000.00 | | $ | 1,020.92 | | $ | 4.33 | |
| Class C | | | 1,000.00 | | | 1,017.14 | | | 8.13 | |
| Class I | | | 1,000.00 | | | 1,022.18 | | | 3.06 | |
| Dividend & Income Builder | | | | | | | | | | |
| Class A | | $ | 1,000.00 | | $ | 1,018.65 | | $ | 6.61 | |
| Class C | | | 1,000.00 | | | 1,014.87 | | | 10.41 | |
| Class I | | | 1,000.00 | | | 1,019.91 | | | 5.35 | |
| Emerging Market Opportunities | | | | | | | | | | |
| Class A | | $ | 1,000.00 | | $ | 1,016.18 | | $ | 9.10 | |
| Class C | | | 1,000.00 | | | 1,012.40 | | | 12.88 | |
| Class I | | | 1,000.00 | | | 1,017.44 | | | 7.83 | |
| European Focus | | | | | | | | | | |
| Class A | | $ | 1,000.00 | | $ | 1,08.25 | | $ | 7.02 | |
| Class B | | | 1,000.00 | | | 1,014.06 | | | 11.22 | |
| Class C | | | 1,000.00 | | | 1,014.37 | | | 10.92 | |
| Class I | | | 1,000.00 | | | 1,019.61 | | | 5.65 | |
| Global Equity Income | | | | | | | | | | |
| Class A | | $ | 1,000.00 | | $ | 1,019.46 | | $ | 5.80 | |
| Class C | | | 1,000.00 | | | 1,015.63 | | | 9.65 | |
| Class I | | | 1,000.00 | | | 1,020.77 | | | 4.48 | |
| Global Technology | | | | | | | | | | |
| Class A | | $ | 1,000.00 | | $ | 1,017.90 | | $ | 7.37 | |
| Class B | | | 1,000.00 | | | 1,013.76 | | | 11.52 | |
| Class C | | | 1,000.00 | | | 1,014.01 | | | 11.27 | |
| Class I | | | 1,000.00 | | | 1,019.21 | | | 6.06 | |
| High Yield Opportunities | | | | | | | | | | |
| Class A | | $ | 1,000.00 | | $ | 1,019.66 | | $ | 5.60 | |
| Class C | | | 1,000.00 | | | 1,015.88 | | | 9.40 | |
| Class I | | | 1,000.00 | | | 1,020.92 | | | 4.33 | |
| International Opportunities | | | | | | | | | | |
| Class A | | $ | 1,000.00 | | $ | 1,018.20 | | $ | 7.07 | |
| Class B | | | 1,000.00 | | | 1,013.96 | | | 11.32 | |
| Class C | | | 1,000.00 | | | 1,014.22 | | | 11.07 | |
| Class I | | | 1,000.00 | | | 1,016.69 | | | 8.59 | |
| Class R | | | 1,000.00 | | | 1,019.56 | | | 5.70 | |
| Strategic Income | | | | | | | | | | |
| Class A | | $ | 1,000.00 | | $ | 1,019.66 | | $ | 5.60 | |
| Class B | | | 1,000.00 | | | 1,015.88 | | | 9.40 | |
| Class C | | | 1,000.00 | | | 1,015.88 | | | 9.40 | |
| Class I | | | 1,000.00 | | | 1,020.92 | | | 4.33 | |
| Unconstrained Bond** | | | | | | | | | | |
| Class A | | $ | 1,000.00 | | $ | 1,019.26 | | $ | 6.01 | |
| Class C | | | 1,000.00 | | | 1,015.63 | | | 9.65 | |
| Class I | | | 1,000.00 | | | 1,020.67 | | | 4.58 | |
| * | Expenses are equal to the Funds’ annualized net expense ratio multiplied by the average account value over the period multiplied by 184 days in the period, and divided by 365 (to reflect the one-half year period). |
| ** | Expenses are equal to the Funds’ annualized net expense ratio multiplied by the average account value over the period multiplied by 42 days in the period, and divided by 365 (to reflect the one-half year period). |
Trustees and officers (unaudited)
| | |
| Trustees | Investment Adviser |
| C. Gary Gerst, Chairman | Henderson Global Investors (North America) Inc. |
| James W. Atkinson | 737 North Michigan Avenue, Suite 1700 |
| Roland C. Baker | Chicago, IL 60611 |
| Faris F. Chesley | |
| Richard W. Durkes | Transfer Agent |
| James G. O’Brien* | State Street Bank & Trust Company |
| Charles Thompson II* | State Street Financial Center |
| | One Lincoln Street |
| Officers | Boston, MA 02111 |
| James G. O’Brien, President | |
| Charles Thompson II, Vice President | Auditors |
| Alanna P. Nensel, Vice President | Ernst & Young LLP |
| David Latin, Vice President | 155 North Wacker Drive |
| Scott E. Volk, Vice President | Chicago, IL 60606 |
| Christopher K. Yarbrough, Secretary | |
| Kenneth A. Kalina, Chief Compliance Officer | For more information |
| Troy M. Statczar, Treasurer | Please call 1.866.4HENDERSON |
| Adam T. Reich, Assistant Treasurer | (1.866.443.6337) |
| | or visit our website: |
| | www.henderson.com |
| * | Trustee is an “interested person” of the Trust as defined in the Investment Company Act of 1940, as amended. |
The views expressed in this report and information about the Funds’ portfolio holdings are for the period covered by this report and are subject to change hereafter. This report is submitted for the general information of the shareholders of the Funds. It is not authorized for distribution to prospective investors unless preceded or accompanied by an effective prospectus, which includes information regarding the Funds’ risks, objectives, fees and expenses, experience of its management, and other information. Henderson Global Investors is the name under which various subsidiaries of Henderson Group plc, a UK limited company, provide investment products and services.
Foreside Fund Services, LLC, Distributor
This notice describes the privacy practices followed by Henderson Global Funds.
Your privacy is our top priority. Our policy is to respect the privacy of current and former shareholders and to protect personal information entrusted to us. We do not share any nonpublic personal information of shareholders or former shareholders with any nonaffiliated third parties, except as permitted by law or as authorized by our shareholders.
In the course of providing products and services to you, we collect nonpublic personal information about you from various sources such as account applications or agreements, other account forms, transactions in your account, and from information captured on our website, including any information captured through our use of “cookies.” Such information may include your name, address, account or tax identification number, the types and amounts of investments, and bank account information. More detailed information about our Internet policy is available on our website, www.henderson.com.
In the normal course of serving shareholders, we may share information we collect with entities that help us process information or service your request, such as transfer agents, custodians, broker-dealers and marketing service firms, as well as with other financial institutions with whom we have joint marketing agreements. We may share information in connection with servicing accounts or to inform shareholders of products and services that we believe may be of interest to them. The organizations that receive shareholder information will use that information only for the services required and as allowed by applicable law or regulation, and are not permitted to share or use this information for any other purpose. Our affiliates do not use shareholder information that we receive to make marketing solicitations. We will disclose your personal information to government agencies, law enforcement officials, and others in the limited circumstances where we believe, in good faith, that such disclosure is required or permitted by law. For example, we will disclose your personal information in order to comply with a court order, to cooperate with government or industry regulators, or law enforcement authorities.
Access to customers’ nonpublic personal information is restricted to employees who need to access that information. To guard shareholder’s nonpublic personal information, we use industry standard physical, electronic, and procedural safeguards. A shareholder’s right to privacy extends to all forms of contact with us, including telephone, written correspondence, and electronic media, such as the Internet.
For questions concerning this policy, please contact us by writing to: Alanna Nensel, Henderson Global Investors (North America) Inc., 737 North Michigan Avenue, Suite 1700, Chicago, Illinois 60611.

Item 2. Code of Ethics.
Not required.
Item 3. Audit Committee Financial Expert.
Not required.
Item 4. Principal Accountant Fees and Services.
Not required.
Item 5. Audit Committee of Listed Registrants.
Not applicable.
Item 6. Investments.
| (a) | Schedule of Investments is included as a part of the report to shareholders filed under Item 1 of this Form N-CSR. |
Item 7. Disclosure of Proxy Voting Policies and Procedures for Closed-End Management Investment Companies.
Not applicable.
Item 8. Portfolio Managers of Closed-End Management Investment Companies.
Not applicable.
Item 9. Purchases of Equity Securities by Closed-End Management Investment Company and Affiliated Purchasers.
Not applicable.
Item 10. Submission of Matters to a Vote of Security Holders.
There have been no material changes to the procedures by which the shareholders may recommend nominees to the registrant’s board of trustees, where those changes were implemented after the registrant last provided disclosure in response to this Item.
Item 11. Controls and Procedures.
| (a) | The registrant’s principal executive officer and principal financial officer have evaluated the registrant’s disclosure controls and procedures within 90 days of this filing and have concluded that the registrant’s disclosure controls and procedures were effective, as of that date, in ensuring that information required to be disclosed by the registrant in this Form N-CSR was recorded, processed, summarized and reported timely. |
| (b) | There were no changes in the registrant’s internal controls over financial reporting (as defined in Rule 30a-3(d) under the Investment Company Act of 1940) that occurred during the registrant’s second fiscal quarter of the period covered by this report that has materially affected, or is reasonably likely to materially affect, the registrant’s internal controls over financial reporting. |
Item 12. Exhibits.
| (a)(2) | The certifications required by Rule 30a-2(a) under the 1940 Act (17 CFR 270.30a-2(a)) are attached hereto. |
| (b) | The certifications required by Rule 30a-2(b) under the 1940 Act (17 CFR 270.30a-2(b)) and Section 906 of the Sarbanes-Oxley Act of 2002 are attached hereto. |
SIGNATURES
Pursuant to the requirements of the Securities Exchange Act of 1934 and the Investment Company Act of 1940, the registrant has duly caused this report to be signed on its behalf by the undersigned, thereunto duly authorized.
HENDERSON GLOBAL FUNDS
By: /s/ James G. O’Brien
James G. O’Brien
President (principal executive officer) of Henderson Global Funds
Date: April 3, 2014
Pursuant to the requirements of the Securities Exchange Act of 1934 and the Investment Company Act of 1940, this report has been signed below by the following persons on behalf of the registrant and in the capacities and on the dates indicated.
By: /s/ James G. O’Brien
James G. O’Brien
President (principal executive officer) of Henderson Global Funds
Date: April 3, 2014
By: /s/ Troy Statczar
Troy Statczar
Treasurer (principal financial officer) of Henderson Global Funds
Date: April 3, 2014