Washington, D.C. 20549
Item 1: Report to Shareholders.
| Letter to shareholders | 1 |
| Commentaries and Performance summaries | |
| All Asset Fund | 4 |
| Dividend & Income Builder Fund | 6 |
| Emerging Markets Fund | 8 |
| European Focus Fund | 10 |
| Global Equity Income Fund | 12 |
| Global Technology Fund | 14 |
| High Yield Opportunities Fund | 16 |
| International Long/Short Equity Fund | 18 |
| International Opportunities Fund | 20 |
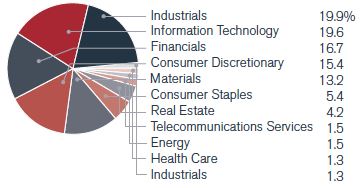
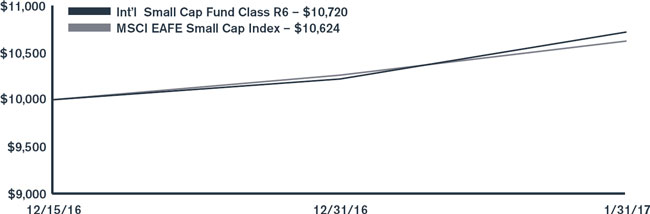
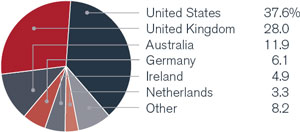
| International Small Cap Fund | 22 |
| Strategic Income Fund | 24 |
| US Growth Opportunities Fund | 26 |
| Portfolios of investments | 28 |
| Statements of assets and liabilities | 102 |
| Statements of operations | 110 |
| Statements of changes in net assets | 118 |
| Statements of changes – capital stock activity | 130 |
| Statement of cash flows | 152 |
| Financial highlights | 154 |
| Notes to financial statements | 178 |
| Other information | 194 |
| Trustees and officers | 201 |
International and emerging markets investing involves certain risks and increased volatility not associated with investing solely in the US. These risks include currency fluctuations, economic or financial instability, lack of timely or reliable financial information or unfavorable political or legal developments. The Funds may invest in securities issued by smaller companies which typically involve greater risk than investing in larger companies. Certain of the Funds are non-diversified and therefore the change in value of a single holding may have a more pronounced effect on a Fund's performance. Also, the Funds may invest in limited geographic areas and/or sectors which may result in greater market volatility. In addition, the Funds may invest in derivatives. Derivatives involve special risks different from, and potentially greater than, the risks associated with investing directly in securities and may result in greater losses. The Funds may be subject to frequent trading which may result in a turnover rate of 100% or more. Additional fund-specific risk is described in more detail in the Prospectus and Statement of Additional Information.
Investors should consider the investment objectives, risks, charges and expenses of a mutual fund carefully before investing. For a free Prospectus, which contains these items and other important information about the Funds, visit www.henderson.com. The Prospectus should be read carefully before investing.
Dear shareholder,
We are pleased to provide the semi-annual report for the Henderson Global Funds, which covers the six months ended January 31, 2017.
The past six months have been dominated by geo-political uncertainty and a fundamental shift in global monetary policy. The US posted strong returns in 2016 with almost half of the year's performance coming after the election of Donald Trump, as investors bet that the President's commitment to swift tax cuts, larger infrastructure spending and tough renegotiations of trade deals would translate into stronger economic growth and topline revenue for businesses.
In Europe and the United Kingdom, political uncertainty has also caught the attention of investors. The UK has now begun to implement its 'Brexit' strategy by sending the Article 50 legislation, a part of European Union law that sets out the process to withdraw from the EU, to the British Parliament for approval. Outside of the UK, there are tight presidential races in France and Germany to be decided in the second half of 2017, where candidates have different views on globalism and the role of the EU. In the face of this uncertainty, Europe and the UK continue to post better than expected economic growth and improving fundamentals: higher wage growth, lower unemployment, and double digit earnings growth forecasted for 2017.
Emerging markets had a strong start to 2016 but struggled in the final months of the year, with the MSCI Emerging Markets Index falling 4% after the US elections and emerging markets funds (including ETFs) shedding $3.5 billion in the final two months of the year, reversing the trend of consecutive five months of inflows. The main reasons for the pullback: a stronger US Dollar, a rising US interest rate environment and the uncertainty of trade negotiations under the Trump administration.
Global fixed income continued its rally as interest rates remained low in much of the developed world. By the end of 2016, there was roughly $35.6 trillion in outstanding government debt globally, and of that amount, over 70% was yielding 1% or less. However, a shift has begun from monetary stimulus to better fiscal policy, and as such central banks have begun to slow their quantitative easing programs: the Bank of Japan announced in September that they will stop expanding their balance sheet; the European Central Bank announced a reduction to €60 billion in purchases through end of 2017; and the US Fed implemented their second interest rate hike in a decade. This fundamental shift will have a profound impact on bond markets in 2017, highlighting the need for high performing active managers.
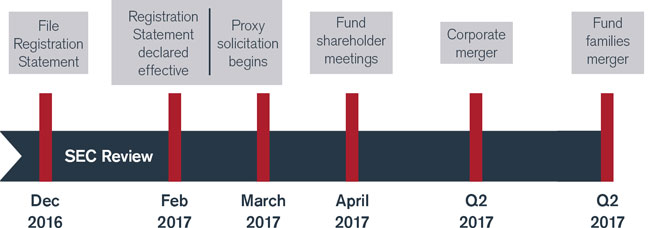
Also during the period, on October 3, 2016, Henderson Global Investors announced its intention to merge with Janus Capital Group. The merger, slated for the second quarter of 2017, will create a truly global active management firm with $320B in assets under management (as of 9/30/16). The new firm will offer a broader range of investment options and the combined resources of Henderson and Janus. Please see the following pages for more information on the effect of the Plan of Reorganization for the Henderson Global Funds which has been approved by its Board. Subject to satisfaction of closing conditions, including approval by shareholders of the participating Funds, included is an anticipated timeline for the integration. We hope this information gives you a sense of what to expect in the coming months as we approach the anticipated merger close date.
As always, we appreciate your trust in and support of our Funds, and we look forward to serving your financial needs in the years to come.
James G. O'Brien
President, Henderson Global Funds
Investors should consider the investment objectives, risks, charges and expenses of a mutual fund carefully before investing. For a free Prospectus, which contains this and other important information about the Funds, visit www.henderson.com. The Prospectus should be read carefully before investing.
1
| Proposed reorganization of Henderson Funds |
Please see the tables below for the effect of the Plan of Reorganization for the Henderson Global Funds.
Existing Funds proposed to be offered in Janus Henderson Fund family
(The portfolio managers currently managing each of the following Henderson Funds are anticipated to serve as the portfolio managers of the corresponding Janus Henderson Fund, subject to the same investment objectives, principal investment strategies and risks as the corresponding Henderson Fund.)
| Henderson Fund name | Janus Henderson Fund name | | Inception
date |
| Henderson All Asset Fund | Janus Henderson All Asset Fund | | 3/30/12 |
| Henderson Dividend & Income Builder Fund | Janus Henderson Dividend & Income Builder Fund | | 8/01/12 |
| Henderson Emerging Markets Fund | Janus Henderson Emerging Markets Fund | | 12/31/10 |
| Henderson European Focus Fund | Janus Henderson European Focus Fund | | 8/31/01 |
| Henderson Global Equity Income Fund | Janus Henderson Global Equity Income Fund | | 11/30/06 |
| Henderson International Opportunities Fund | Janus Henderson International Opportunities Fund | | 8/31/01 |
| Henderson International Long/Short Equity Fund | Janus Henderson International Long/Short Equity Fund | | 12/9/14 |
| Henderson International Small Cap Fund* | Janus Henderson International Small Cap Fund | | 12/15/16 |
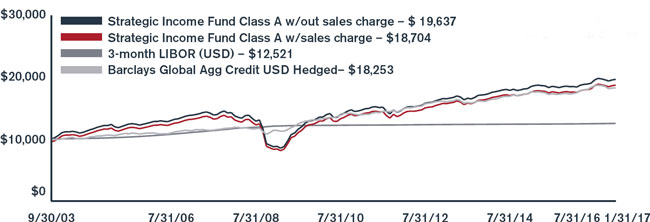
| Henderson Strategic Income Fund | Janus Henderson Strategic Income Fund | | 9/30/03 |
| Henderson US Growth Opportunities Fund | Janus Henderson US Growth Opportunities Fund | | 12/18/14 |
*Not available for public investment until merger completion in 2017
Proposed Fund merger into an existing Janus Fund, to be renamed
(The following Henderson Fund will merge into an existing Janus Fund and will be managed by the Janus Fund's current portfolio managers and according to the Janus Fund's existing investment process.
| Henderson Fund name | | Merged Fund name |
| Henderson Global Technology Fund | | Janus Henderson Global Technology Fund
(currently named Janus Global Technology Fund) |
The Henderson High Yield Opportunities Fund will not be transitioned to the Janus Henderson platform. Please see Note 10. Subsequent Events in the Notes to financial statements. At this time, the Fund's current portfolio manager continues to manage the Fund under its normal investment policies.
2
| Anticipated integration timetable |
Note: Dates are subject to approvals and may be subject to change
The foregoing is for informational purposes only and is not intended to, and shall not, constitute an offer to purchase or sell shares of any of the Funds in connection with the proposed Fund reorganizations, nor is it a solicitation of a proxy from any shareholder of the participating Henderson Global Funds.3 The solicitation of proxies will only be made by a final, effective registration statement on Form N-14, including a definitive proxy statement/prospectus.3 The proxy materials include important information about the proposed Fund reorganizations that shareholders of the participating Henderson Global Funds should carefully consider.
3
All Asset Fund
The latter-half of 2016 saw the start of a regime change in the global economy and financial markets. This was most clearly encapsulated by the recovery of inflation, after an 18-month period in which deflation and secular stagnation were overarching themes. The resulting moves in markets, which were accentuated by the US election, were characterized by a material shift from deflationary assets such as government bonds and gold towards more reflationary areas such as value and small cap equity styles, high yield and commodities. The focal point for the market rotation was the US, where investors interpreted the possibility of a major fiscal expansion in a late-cycle economy as highly inflationary. The period was characterized by a strong dollar and weak treasury market as a result.
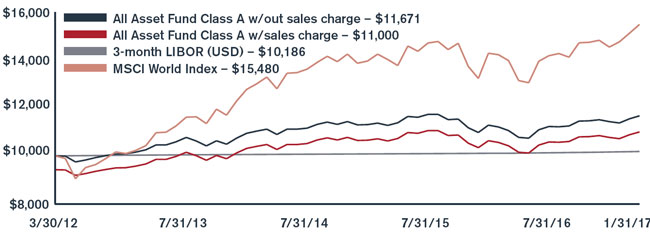
For the six-month reporting period ended January 31, 2017, the Fund returned 1.91% (Class A at NAV) versus the benchmark, 3-month LIBOR (USD), which posted a return of 0.40%. The Fund's equity allocations were the largest contributors to performance, with US equities contributing the most. Elsewhere, the Fund's diversifying assets also added value with allocations to investment grade and high yield credit generating positive returns despite the
| Top 10 long-term holdings* | |
| (at January 31, 2017) | |
| | As a percentage |
| Security | of net assets |
| PIMCO Enhanced Short Maturity ETF | 5.2 | % |
| iShares TIPS Bond ETF | 4.5 | |
| iShares iBoxx Investment Grade | 4.0 | |
| Corporate Bond Fund | | |
| PowerShares Senior Loan Portfolio | 4.0 | |
| ASG Global Alternatives Fund, Class Y | 3.8 | |
| Henderson Emerging Markets Fund, | 3.8 | |
| Class R6 | | |
| Henderson High Yield Opportunities | 3.5 | |
| Fund, Class R6 | | |
| Henderson Global Equity Income Fund, | 3.2 | |
| Class R6 | | |
| AQR Equity Market Neutral Fund, Class R6 | 3.0 | |
| AQR Managed Futures Strategy Fund, | 2.9 | |
| Class R6 | | |
broader sell-off in sovereign bonds. The Fund's hedging assets were the worst performing area of the portfolio with defensive positions in US treasuries and gold suffering from the highly positive investor sentiment over the period.
Over the period, we made a number of portfolio changes in the run-up to, and immediate aftermath of, the US presidential election. Prior to the election, we reduced our emerging markets exposure through the sale of the iShares MSCI Emerging Markets ETF to reduce the sensitivity to a potential election shock while also taking profits on the position that had generated strong returns in the preceding six months.
Post-election, we entered two tactical trades, a position in the SPDR US Regional Banks ETF and the iShares Russell 2000 Value ETF. Both trades took advantage of the cyclical rotation that took place as investors priced in expansionary fiscal policy in the US. Both positions were highly successful, so much so that we exited the banks position in early-January and trimmed back our holding in the Russell 2000 Value ETF.
Looking forward, we continue to believe that we are entering a more supportive macro backdrop than we have seen in recent years. Growth and inflation across the global economy are normalizing and macro momentum is broadening. The challenge is that concurrent to this pick-up in economic growth, central banks are beginning to withdraw policy support and political shocks appear to be more frequent. Therefore, the potential for periods of market satisfaction to be disturbed by political shocks is high. With this in mind, we have balanced an increase in our allocation to risk assets with a renewed position in nominal treasuries. We prefer equities to bonds but are a long way from 'all-in'. A significant improvement in corporate earnings and a period of relative calm in the political sphere would likely be sufficient to draw us further in this direction.
* For further detail about these holdings, please refer to the section entitled "Portfolios of investments." Fund holdings are as of the date given, are subject to change at any time, and are not recommendations to buy or sell any security.
4
All Asset Fund
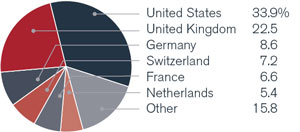
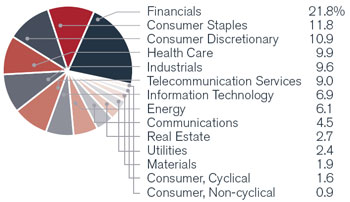
| Portfolio composition by country | | Portfolio composition by sector |
(as a % of long-term investments)
| | (as a % of long-term investments)
|
| | |
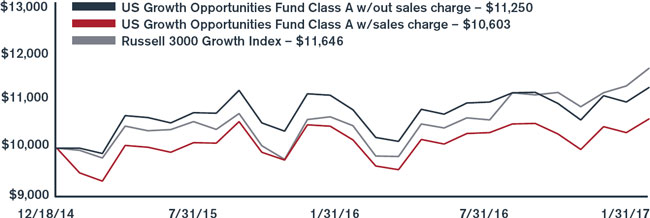
Investment comparison
Value of $10,000
| Total returns as of January 31, 2017 | | | | | | | | | | Since |
| | NASDAQ | | | Six | | One | | Three | | inception |
| At NAV | symbol | | | months | | year | | years* | | (3/30/2012)* |
| Class A | HGAAX | | | 1.91 | % | | 8.34 | % | | 2.32 | % | | 3.24 | % |
| Class C | HGACX | | | 1.51 | | | 7.46 | | | 1.58 | | | 2.47 | |
| Class I | HGAIX | | | 2.10 | | | 8.54 | | | 2.59 | | | 3.51 | |
| Class R6** | HGARX | | | 2.13 | | | 8.59 | | | 2.58 | | | 3.50 | |
| With sales charge | | | | | | | | | | | | | | |
| Class A | | | | -3.97 | % | | 2.12 | % | | 0.33 | % | | 1.99 | % |
| Class C | | | | 0.51 | | | 7.46 | | | 1.58 | | | 2.47 | |
| Index | | | | | | | | | | | | | | |
| 3-month LIBOR (USD) | | | | 0.40 | % | | 0.69 | % | | 0.39 | % | | 0.38 | % |
| MSCI World Index | | | | 5.20 | | | 17.81 | | | 6.55 | | | 9.56 | |
* Average annual return.
** Class R6 shares commenced operations on November 30, 2015. The performance for Class R6 shares for periods prior to November 30, 2015 is based on the performance of Class I shares. Performance for Class R6 shares would be similar because the shares are invested in the same portfolio of investments, and like Class I shares, Class R6 shares are not subject to a front-end sales charge or a distribution fee.
Performance data quoted represents past performance and is no guarantee of future results. Performance results with sales charges reflect the deduction of the maximum front-end sales charge or the deduction of the applicable contingent deferred sales charge ("CDSC"). Class A shares are subject to a maximum front-end sales charge of 5.75%. Class C shares are subject to a CDSC of up to 1% on certain redemptions made within 12 months of purchase. Performance presented at Net Asset Value (NAV), which does not include a sales charge, would be lower if this charge were reflected. NAV is the value of one share of the Fund excluding any sales charges. Performance quoted is based on the transacted NAV at each period end, which may differ from the US Generally Accepted Accounting Principles ("GAAP")-adjusted NAV and the total return presented in the Financial Highlights. Current performance may be lower or higher than the performance data quoted. Investment return and principal value will fluctuate so that an investor's shares, when redeemed, may be worth more or less than original cost. As stated in the current prospectus, the Fund's annual operating expense ratios (gross) for Class A, C, I and R6 shares are 1.40%, 2.16%, 1.13% and 1.09%, respectively. However, the Fund's adviser has contractually agreed to waive its management fee and, if necessary, to reimburse other operating expenses (excluding Acquired Fund Fees and Expenses from underlying investment companies) in order to limit total annual ordinary operating expenses, less distribution and service fees, to 0.60% of the Fund's average daily net assets, which is in effect until July 31, 2020. With respect to investments in affiliated underlying funds, the Fund's adviser has contractually agreed to reduce or waive the Fund's management fee to limit the combined management fees paid to the adviser for those assets to the greater of 1.00% or the affiliated underlying fund's management fee. Indirect net expenses associated with the Fund's investments in underlying investment companies are not subject to the contractual waiver. For the most recent month-end performance, please call 1.866.443.6337 or visit the Funds' website at www.henderson.com.
Performance results also reflect expense subsidies and waivers in effect during periods shown. Absent these waivers, results would have been less favorable. All results assume the reinvestment of dividends and capital gains.
The investment comparison graph above reflects the change in value of a $10,000 hypothetical investment since the Fund's inception, including reinvested dividends and distributions, compared to a broad based securities market index. The MSCI World Index is a free float-adjusted market capitalization weighted index that is designed to measure the equity market performance of developed markets. 3-Month LIBOR (London Interbank Offered Rate) (USD) is the interest rate participating banks offer to other banks for loans on the London market. The Fund is professionally managed while the Indices are unmanaged and not available for investment and do not include fees, expenses or other costs. Results in the table and graph do not reflect the deduction of taxes that a shareholder would pay on Fund distributions or the redemption of Fund shares.
5
Dividend & Income Builder Fund
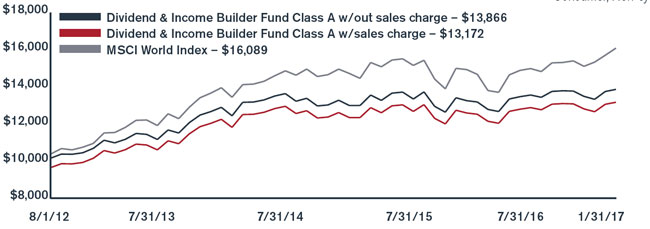
Global equity markets rose during the six-month reporting period ended January 31, 2017. Within this period, the US market outperformed following the Republican victory in the US presidential election on the expectation of corporate tax reform and higher infrastructure spending. Other notable moves during the period included higher oil prices following an agreement from OPEC to curb production and higher US government bond yields following the election. Higher bond yields were driven by the expectation that expansionary fiscal policy could cause inflationary pressures to rise.
At the sector level, continued strength in economic data (such as US manufacturing production), meant cyclical sectors such as consumer discretionary and information technology performed well, while defensive sectors such as utilities and healthcare lagged.
For the six-month reporting period ended January 31, 2017, the Fund returned 0.80% (Class A at NAV) versus the benchmark MSCI World Index, which posted a return of 5.20%. The Fund continued to meet its income objectives over the period and is on track for annual dividend growth. Part of the reason for the underperformance was due to sector allocation, in particular, the overweight position in high dividend yield sectors such as telecommunications and consumer staples. The fixed income allocation was also a relative detractor over the period. At the individual stock level, the largest contributor to performance was Microsoft as it continues to successfully transition towards a subscription-based model for its software (such as Office 365).
| Top 10 long-term holdings* | |
| (at January 31, 2017) | |
| | As a percentage |
| Security/Issuer | of net assets |
| Microsoft Corp. | 2.9 | % |
| Pfizer, Inc. | 2.4 | |
| Nestle S.A. | 2.3 | |
| Imperial Brands plc | 2.2 | |
| Novartis AG | 2.0 | |
| Chevron Corp. | 2.0 | |
| RELX N.V. | 2.0 | |
| Roche Holding AG | 1.9 | |
| Siemens AG | 1.8 | |
| Orange S.A. | 1.8 | |
Where we have fundamental concerns regarding a currency or have a material overweight position relative to the benchmark, we often choose to hedge a portion of the currency risk. For example, over the referendum regarding EU membership in the UK, we hedged a material portion of our Sterling exposure. This was a positive contributor to performance and we have reduced our hedge following the subsequent fall.
Within the equity allocation, the Fund continues to seek companies with both above-average yield and dividend growth. The equity allocation remained over 80% of the Fund, reflecting the managers' current bias towards equities over bonds. While corporate earnings growth has remained mixed in recent years, dividend growth has proven more consistent. In comparison to other asset classes, such as government or corporate bonds, it is our view that equities continue to be a good value, especially given the prospects for ongoing dividend growth. Within the fixed income allocation, the managers prefer credit risk over interest-rate risk; continuing their strategy of investing in high quality companies with attractive coupons.
If corporate tax reforms and greater infrastructure spending in the US drive higher economic growth, US and global equities should benefit. Higher economic growth should allow for greater sales and earnings growth for companies; ultimately driving dividend growth for shareholders. We continue to believe this outlook favors our existing strategy of identifying companies that pay an attractive and sustainable dividend and that have the capacity to grow over the medium- to long-term.
Within the fixed income allocation, we are beginning to see value in corporate bond markets which have repriced with the recent move in interest rates. Whilst the shift to fiscal stimulus under President Trump and divergent monetary policy in the US versus other major developed markets provide fundamental support for higher yields, in the short term it looks increasingly stretched in our eyes and opportunities are presenting themselves. In general, we remain relatively untroubled by default concerns within the portfolio.
* For further detail about these holdings, please refer to the section entitled "Portfolios of investments." Fund holdings are as of the date given, are subject to change at any time, and are not recommendations to buy or sell any security.
6
Dividend & Income Builder Fund
| Portfolio composition by country | | Portfolio composition by sector |
(as a % of long-term investments)
| | (as a % of long-term investments)
|
| | | |
| | |
Investment comparison
Value of $10,000
| Total returns as of January 31, 2017 | | | | | | | | | | | | Since |
| | | | NASDAQ | | | Six | | One | | Three | | inception |
| At NAV | | | symbol | | | months | | year | | years* | | (8/1/2012)* |
| Class A | | | HDAVX | | | 0.80 | % | | 8.45 | % | | 3.68 | % | | 7.53 | % |
| Class C | | | HDCVX | | | 0.37 | | | 7.57 | | | 2.88 | | | 6.71 | |
| Class I | | | HDIVX | | | 0.94 | | | 8.71 | | | 3.93 | | | 7.77 | |
| Class R6** | | | HDRVX | | | 0.94 | | | 8.64 | | | 3.90 | | | 7.76 | |
| With sales charge | | | | | | | | | | | | | | | | |
| Class A | | | | | | -4.24 | % | | 3.06 | % | | 1.92 | % | | 6.30 | % |
| Class C | | | | | | -0.63 | | | 7.57 | | | 2.88 | | | 6.71 | |
| Index | | | | | | | | | | | | | | | | |
| MSCI World Index | | | | | | 5.20 | % | | 17.81 | % | | 6.55 | % | | 11.14 | % |
* Average annual return.
** Class R6 shares commenced operations on November 30, 2015. The performance for Class R6 shares for periods prior to November 30, 2015 is based on the performance of Class I shares. Performance for Class R6 shares would be similar because the shares are invested in the same portfolio of investments, and like Class I shares, Class R6 shares are not subject to a front-end sales charge or a distribution fee.
Performance data quoted represents past performance and is no guarantee of future results. Performance results with sales charges reflect the deduction of the maximum front-end sales charge or the deduction of the applicable contingent deferred sales charge ("CDSC"). Class A shares are subject to a maximum front-end sales charge of 5.00%. Class C shares are subject to a CDSC of up to 1% on certain redemptions made within 12 months of purchase. Performance presented at Net Asset Value (NAV), which does not include a sales charge, would be lower if this charge were reflected. NAV is the value of one share of the Fund excluding any sales charges. Performance quoted is based on the transacted NAV at each period end, which may differ from the US Generally Accepted Accounting Principles ("GAAP")-adjusted NAV and the total return presented in the Financial Highlights. Current performance may be lower or higher than the performance data quoted. Investment return and principal value will fluctuate so that an investor's shares, when redeemed, may be worth more or less than original cost. As stated in the current prospectus, the Fund's annual operating expense ratios (gross) for Class A, C, I and R6 shares are 1.28%, 2.05%, 1.05% and 1.10%, respectively. However, the Fund's adviser has contractually agreed to waive its management fee and, if necessary, to reimburse other operating expenses (excluding Acquired Fund Fees and Expenses from underlying investment companies) in order to limit total annual ordinary operating expenses, less distribution and service fees, to 1.05% of the Fund's average daily net assets, which is in effect until July 31, 2020. For the most recent month-end performance, please call 1.866.443.6337 or visit the Funds' website at www.henderson.com.
Performance results also reflect expense subsidies and waivers in effect during periods shown. Absent these waivers, results would have been less favorable. All results assume the reinvestment of dividends and capital gains.
The investment comparison graph above reflects the change in value of a $10,000 hypothetical investment since the Fund's inception, including reinvested dividends and distributions, compared to a broad based securities market index. The MSCI World Index is a free float-adjusted market capitalization weighted index that is designed to measure the equity market performance of developed markets. The Fund is professionally managed while the Index is unmanaged and not available for investment and does not include fees, expenses or other costs. Results in the table and graph do not reflect the deduction of taxes that a shareholder would pay on Fund distributions or the redemption of Fund shares.
7
Emerging Markets Fund
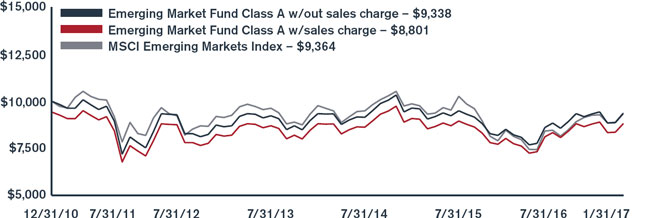
Following a prolonged period of poor returns for the asset class, appetite for emerging market risk stabilized over the course of 2016. For the six-month reporting period ended January 31, 2017, the Fund returned -0.04% (Class A at NAV), lagging the Fund's benchmark, the MSCI Emerging Markets Index, which returned 5.08%.
Over the period, our search for risk-aware exposure to the demographic opportunity offered by some emerging markets resulted in a due diligence review of family-controlled Heineken Holding N.V. The holding company, where the majority of the family's financial interests lie, trades at a discount to the more liquid Heineken N.V. In line with our investment philosophy, we are comfortable sacrificing liquidity for greater alignment with controlling shareholders. Heineken, which has been family-controlled for more than 140 years, has become a truly global brand. We have come to know the company via investments in its listed subsidiary, Nigerian Breweries, and Latin American partner, Quinenco. Heineken's volume mix is changing in favor of faster-growing developing markets where price points have scope to increase. We believe these factors underpin the investment case for longer-term investors, leading the Fund to accumulate a significant position during the period.
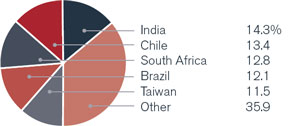
The portfolio continues to have a bias towards companies listed in markets that bore the brunt of commodity price declines such as Brazil, Chile and
| | |
| Top 10 long-term holdings* | |
| (at January 31, 2017) | |
| | As a percentage |
| Security | of net assets |
| Tiger Brands, Ltd. | 3.4 | % |
| Uni-President Enterprises Corp. | 3.3 | |
| Standard Bank Group, Ltd. | 3.2 | |
| Newcrest Mining, Ltd. | 3.0 | |
| Cia Cervecerias Unidas S.A., ADR | 2.9 | |
| Housing Development Finance Corp., Ltd. | 2.9 | |
| Duratex S.A. | 2.8 | |
| Standard Foods Corp. | 2.7 | |
| Mahle-Metal Leve S.A. | 2.5 | |
| Quinenco S.A. | 2.5 | |
South Africa. The resulting economic shock resulted in weaker currencies, more attractive valuations and the tantalizing possibility of improving national governance. During the period, we initiated positions in African Oxygen, which sells industrial gasses across Africa, and Nampak, Africa's leading packaging company. Both businesses face short-term headwinds that have resulted in attractive valuations for long-term investors to invest in the secular growth of African markets.
Despite a small decline in the valuation of some good quality companies towards the end of 2016, many of Asia's best domestic businesses remain too expensive for our taste. With that said, the correction did provide us with an opportunity to purchase a stake in LG Household & Healthcare, an extremely well-run and leading consumer business in Korea, at what appears to be a reasonable valuation. We have been investors in the parent company LG Corporation for some time and are comfortable with the governance at the LG group thanks to its transparent corporate structure.
Less positively, some emerging markets that have come to be seen as relatively stable may not be insulated from the populist wave sweeping the developed world. During 2016, the Polish government adopted a more interventionist stance and left-wing politicians in Chile recently proposed changes to the regulation of water utilities. Both of these developments negatively affected the strategy over the period. In the absence of an improvement in broad-based economic growth this type of populist risk to investment returns is likely to increase.
Our strict valuation discipline and focus on only the highest-quality companies aims to provide downside protection over and above seeking exposure to the long-term opportunity of rising living standards in some parts of the developing world. We will not sacrifice quality for the benefit of short-term momentum. In line with our more cautious view, the strategy's cash level increased over the course of the reporting period.
* For further detail about these holdings, please refer to the section entitled "Portfolios of investments." Fund holdings are as of the date given, are subject to change at any time, and are not recommendations to buy or sell any security.
8
Emerging Markets Fund
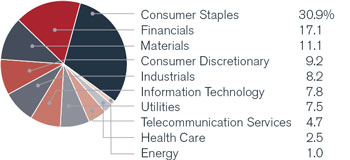
| Portfolio composition by country | | Portfolio composition by sector |
(as a % of long-term investments)
| | (as a % of long-term investments)
|
| | | |
| | |
Investment comparison
Value of $10,000
| Total returns as of January 31, 2017 | | | | | | | | | | | Since |
| | | | NASDAQ | | | Six | | One | | Three | | Five | | inception |
| At NAV | | | symbol | | | months | | year | | years* | | years* | | (12/31/2010)* |
| Class A | | | HEMAX | | | -0.04 | % | | 21.61 | % | | 2.13 | % | | 2.17 | % | | -1.12 | % |
| Class C | | | HEMCX | | | -0.39 | | | 20.77 | | | 1.39 | | | 1.42 | | | -1.86 | |
| Class I | | | HEMIX | | | 0.11 | | | 22.03 | | | 2.42 | | | 2.44 | | | -0.87 | |
| Class R6** | | | HEMRX | | | 0.13 | | | 22.05 | | | 2.42 | | | 2.44 | | | -0.87 | |
| With sales charge | | | | | | | | | | | | | | | | | | | |
| Class A | | | | | | -5.84 | % | | 14.56 | % | | 0.14 | % | | 0.97 | % | | -2.08 | % |
| Class C | | | | | | -1.39 | | | 20.77 | | | 1.39 | | | 1.42 | | | -1.86 | |
| Index | | | | | | | | | | | | | | | | | | | |
| MSCI Emerging Markets Index | | | | | | 5.08 | % | | 25.88 | % | | 1.81 | % | | 0.55 | % | | -0.99 | % |
* Average annual return.
** Class R6 shares commenced operations on November 30, 2015. The performance for Class R6 shares for periods prior to November 30, 2015 is based on the performance of Class I shares. Performance for Class R6 shares would be similar because the shares are invested in the same portfolio of investments, and like Class I shares, Class R6 shares are not subject to a front-end sales charge or a distribution fee.
Performance data quoted represents past performance and is no guarantee of future results. Due to the Fund's relatively small asset base, performance may be impacted by portfolio turnover to a greater degree than it may be in the future. Performance results with sales charges reflect the deduction of the maximum front-end sales charge or the deduction of the applicable contingent deferred sales charge ("CDSC"). Class A shares are subject to a maximum front-end sales charge of 5.75%. Class C shares are subject to a CDSC of up to 1% on certain redemptions made within 12 months of purchase. Performance presented at Net Asset Value (NAV), which does not include a sales charge, would be lower if this charge were reflected. NAV is the value of one share of the Fund excluding any sales charges. Performance quoted is based on the transacted NAV at each period end, which may differ from the US Generally Accepted Accounting Principles ("GAAP")-adjusted NAV and the total return presented in the Financial Highlights. Current performance may be lower or higher than the performance data quoted. Investment return and principal value will fluctuate so that an investor's shares, when redeemed, may be worth more or less than original cost. As stated in the current prospectus, the Fund's annual operating expense ratios (gross) for Class A, C, I and R6 shares are 2.37%, 3.17%, 2.10% and 2.18%, respectively. However, the Fund's adviser has contractually agreed to waive its management fee and, if necessary, to reimburse other operating expenses (excluding Acquired Fund Fees and Expenses from underlying investment companies) in order to limit total annual ordinary operating expenses, less distribution and service fees, to 1.20% of the Fund's average daily net assets, which is in effect until July 31, 2020. For the most recent month-end performance, please call 1.866.443.6337 or visit the Funds' website at www.henderson.com.
Performance results also reflect expense subsidies and waivers in effect during periods shown. Absent these waivers, results would have been less favorable. All results assume the reinvestment of dividends and capital gains.
The investment comparison graph above reflects the change in value of a $10,000 hypothetical investment since the Fund's inception, including reinvested dividends and distributions, compared to a broad based securities market index. The MSCI Emerging Markets Index is a free float-adjusted market capitalization weighted index that is designed to measure the equity market performance of emerging markets. The Fund is professionally managed while the Index is unmanaged and not available for investment and does not include fees, expenses or other costs. Results in the table and graph do not reflect the deduction of taxes that a shareholder would pay on Fund distributions or the redemption of Fund shares.
9
European Focus Fund
European equities posted a slight gain in dollar terms over the six-month reporting period ended January 31, 2017, which was dominated by the lead up to and aftermath of the US Presidential election. After declining leading into November, developed markets rallied globally upon the election of Donald Trump driven by upgrades to global growth expectations and hopes for reflation given Trump's planned fiscal spending. While Europe rallied alongside the US in local currency terms, US dollar strength weighed on returns until its depreciation in January. The 'Trump Rally' also helped push through the rotation in market leadership from growth/defensive stocks to value/cyclical stocks in Europe which was a big phenomenon in European equity markets after several years of growth/defensives outperformance. This caused unloved areas of the market like banks and the broad consumer discretionary sector to perform strong while predictable and high yielding areas such as consumer staples and utilities sold off. We believe that the improving macroeconomic backdrop in Europe, increased optimism for earnings growth and signs of the return of inflation should help the effects of the rotation to persist for a while longer and this should suit the valuation sensitive, opportunistic style of the Fund.
For the six-month reporting period ended January 31, 2017, the Fund returned -3.26% (Class A at NAV) versus a return of 2.94% by the Fund's benchmark, MSCI Europe Index. The Fund's exposure to
| Top 10 long-term holdings* | |
| (at January 31, 2017) | |
| | As a percentage |
| Security | of net assets |
| Teva Pharmaceutical Industries, Ltd., ADR | 7.8 | % |
| Bayer AG | 4.7 | |
| Renault S.A. | 4.5 | |
| Nokia Oyj | 4.2 | |
| Continental AG | 4.0 | |
| Dufry AG | 4.0 | |
| BT Group plc | 4.0 | |
| Shire plc | 3.7 | |
| TUI AG | 3.2 | |
| Saga plc | 3.0 | |
pharmaceutical companies proved to be detractive with holdings such as Teva Pharmaceutical, Roche and Shire among the weaker performers. There was also underperformance from telecom-related holdings; Inmarsat, BT Group and Nokia. Travel-related exposure was a positive with TUI, Carnival and Norwegian Cruise Lines all performing well while financials holdings Barclays, Aviva and Intesa Sanpaolo also contributed positively to performance.
During the period, the Fund took a position in Koç Holding, a Turkish conglomerate that owns several businesses with leading competitive positions in Turkey in areas such as autos, energy, finance and white goods. A position was added in British telecommunications company BT Group; telecoms was the worst performing sector in Europe in 2016 but this provided the opportunity to add a fairly steady company which is making inroads in UK TV subscriptions given their strong sports offering. Other positions added included clothing retailer Hennes & Mauritz, telecoms equipment firm Ericsson and British retailer Marks & Spencer.
The Fund exited its position in Genmab, the Danish biotech company, taking profits on a long-term holding. The takeover of UK chip designer, ARM Holdings, by Japan's SoftBank allowed the Fund to exit at a large profit. Aberdeen Asset Management was also sold after the tailwinds for the share price provided by stronger investor appetite for emerging markets took a turn for the worse upon President Trump's election. Other sales included telecoms group Liberty Global, Finnish steel company Outokumpu and Italian postal and financial services provider Poste Italiane.
Expectations for European equity performance in 2017 are low despite a solid macro backdrop and increasing optimism on earnings growth. We believe that the political risks to Europe are now well understood and, to a degree, priced in. Therefore, our stance is more cautiously optimistic for European equities in 2017 but we are also conscious of the impact currencies may have on returns for US investors.
* For further detail about these holdings, please refer to the section entitled "Portfolios of investments." Fund holdings are as of the date given, are subject to change at any time, and are not recommendations to buy or sell any security.
10
European Focus Fund
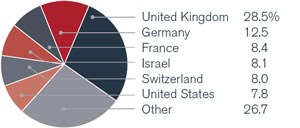
| Portfolio composition by country | | Portfolio composition by sector |
(as a % of long-term investments)
| | (as a % of long-term investments)
|
| | | |
| | |
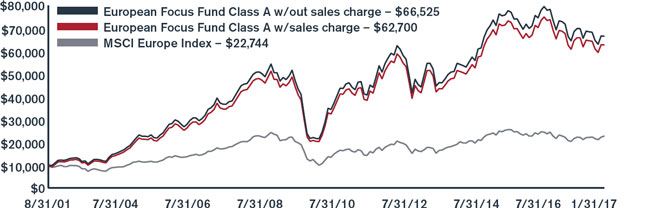
Investment comparison
Value of $10,000
| Total returns as of January 31, 2017 | | | | | | | | | | | | | Since |
| | | | NASDAQ | | | Six | | One | | Three | | Five | | Ten | | inception |
| At NAV | | | symbol | | | months | | year | | years* | | years* | | years* | | (8/31/2001)* |
| Class A | | | HFEAX | | | -3.26 | % | | 0.13 | % | | -2.24 | % | | 6.13 | % | | 3.86 | % | | 13.07 | % |
| Class C | | | HFECX | | | -3.64 | | | -0.66 | | | -3.00 | | | 5.30 | | | 3.07 | | | 12.23 | |
| Class I** | | | HFEIX | | | -3.13 | | | 0.39 | | | -2.00 | | | 6.42 | | | 4.08 | | | 13.23 | |
| Class R6*** | | | HFERX | | | -3.15 | | | 0.38 | | | -2.01 | | | 6.41 | | | 4.08 | | | 13.23 | |
| With sales charge | | | | | | | | | | | | | | | | | | | | | | |
| Class A | | | | | | -8.82 | % | | -5.64 | % | | -4.15 | % | | 4.88 | % | | 3.25 | % | | 12.64 | % |
| Class C | | | | | | -4.64 | | | -0.66 | | | -3.00 | | | 5.30 | | | 3.07 | | | 12.23 | |
| Index | | | | | | | | | | | | | | | | | | | | | | |
| MSCI Europe Index | | | | | | 2.94 | % | | 9.52 | % | | -0.67 | % | | 6.33 | % | | 1.11 | % | | 5.48 | % |
* Average annual return.
** Class I (formerly Class W) shares commenced operations on March 31, 2009. The performance for Class I shares for periods prior to March 31, 2009 is based on the performance of Class A shares. Performance for Class I shares would be similar because the shares are invested in the same portfolio of investments. Class I shares are not subject to a front-end sales charge or a distribution fee.
*** Class R6 shares commenced operations on November 30, 2015. The performance for Class R6 shares for periods prior to November 30, 2015 is based on the performance of Class I shares. Performance for Class R6 shares would be similar because the shares are invested in the same portfolio of investments, and like Class I shares, Class R6 shares are not subject to a front-end sales charge or a distribution fee.
Performance data quoted represents past performance and is no guarantee of future results. Performance results with sales charges reflect the deduction of the maximum front-end sales charge or the deduction of the applicable contingent deferred sales charge ("CDSC"). Class A shares are subject to a maximum front-end sales charge of 5.75%. Class C shares are subject to a CDSC of up to 1% on certain redemptions made within 12 months of purchase. Performance presented at Net Asset Value (NAV), which does not include a sales charge, would be lower if this charge were reflected. NAV is the value of one share of the Fund excluding any sales charges. Performance quoted is based on the transacted NAV at each period end, which may differ from the US Generally Accepted Accounting Principles ("GAAP")-adjusted NAV and the total return presented in the Financial Highlights. Current performance may be lower or higher than the performance data quoted. Investment return and principal value will fluctuate so that an investor's shares, when redeemed, may be worth more or less than original cost. As stated in the current prospectus, the Fund's annual operating expense ratios (gross) for Class A, C, I and R6 shares are 1.29%, 2.08%, 1.05% and 1.06%, respectively. As stated in the Statement of Additional Information (SAI), the Fund's adviser has contractually agreed to waive its management fee and, if necessary, to reimburse other operating expenses (excluding Acquired Fund Fees and Expenses from underlying investment companies) in order to limit total annual ordinary operating expenses, less distribution and service fees, to 1.75% of the Fund's average daily net assets, which is in effect until July 31, 2020. For the most recent month-end performance, please call 1.866.443.6337 or visit the Funds' website at www.henderson.com.
Performance results also reflect expense subsidies and waivers in effect during certain periods shown. Absent these waivers, results would have been less favorable for certain periods. All results assume the reinvestment of dividends and capital gains.
The investment comparison graph above reflects the change in value of a $10,000 hypothetical investment since the Fund's inception, including reinvested dividends and distributions, compared to a broad based securities market index. The MSCI Europe Index is a free float-adjusted market capitalization weighted index that is designed to measure the equity market performance of the developed markets in Europe. The Fund is professionally managed while the Index is unmanaged and not available for investment and does not include fees, expenses or other costs. Results in the table and graph do not reflect the deduction of taxes that a shareholder would pay on Fund distributions or the redemption of Fund shares.
11
Global Equity Income Fund
Global equity markets rose during the six-month reporting period ended January, 31, 2017, as global economic data as a whole (such as unemployment rates and industrial production) surpassed expectations. However, geographic performance was widely dispersed. The US outperformed following the Republican victory in the presidential election on the expectation of future corporate tax reform and higher infrastructure spending. This also caused the US dollar to rise relative to other global currencies such as the Euro and the Japanese yen.
At the sector level, energy was among the best performers following an agreement by OPEC to curb oil production and a subsequent rise in the oil price to over $55/barrel. Financials also performed well following an interest rate hike from the Federal Reserve in December based on the expectation that in a rising rate environment their margins can begin to improve, leading to earnings upgrades. In contrast, a rise in bond yields meant that more defensive sectors (such as consumer staples and healthcare) underperformed.
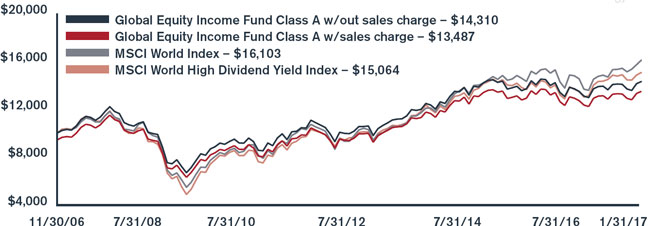
For the reporting period ended January 31, 2017, the Fund returned 1.76% (Class A at NAV) versus the benchmark MSCI World Index which posted a return of 5.20%. The Fund continued to meet its high income objectives over the period. Relative performance was largely a result of country allocation, in particular the underweight position in
| Top 10 long-term holdings* | |
| (at January 31, 2017) | |
| | As a percentage |
| Security | of net assets |
| Royal Dutch Shell plc, A Shares | 3.3 | % |
| Siemens AG | 3.1 | |
| BP plc | 3.0 | |
| Novartis AG | 2.9 | |
| British American Tobacco plc | 2.6 | |
| Sumitomo Mitsui Financial Group, Inc. | 2.5 | |
| Nordea Bank AB | 2.1 | |
| Singapore Telecommunications, Ltd. | 2.1 | |
| Vodafone Group plc | 2.0 | |
| Roche Holding AG | 1.9 | |
the US market as a result of its low dividend yield. By sector, the Fund's overweight in defensive sectors such as telecommunications and utilities detracted from relative performance. The Fund did, however, benefit from good stock selection in sectors such as health care, consumer staples and industrials.
Where we hold material overweight positions in a country relative to the benchmark or have fundamental concerns regarding a currency we often choose to hedge some of the currency risk. Over the referendum regarding EU membership in the UK we hedged a material portion of our Sterling exposure. This was a positive contributor to performance and following the subsequent fall we have reduced our hedge. We continue to hold a small hedge on the Australian dollar, which is a high dividend yield market so the Fund tends to hold a structural overweight position.
The Fund's strategy of seeking a high dividend yield naturally draws us to markets which are higher yielding, such as the UK and Europe. In Europe we are encouraged by the loose monetary conditions put in place by the European Central Bank and improving economic growth. We also find valuations more attractive relative to US peers.
If the US enters a period of higher economic growth driven by higher infrastructure spending and corporate tax reform, this should be positive for US and global equities. Muted global economic growth in recent years has led to low sales growth and a lack of operating leverage for companies. If we enter a period of higher economic growth, this should allow companies to grow sales and earnings (and therefore dividends) at a faster pace. We will continue with our existing strategy of identifying companies that pay an attractive and sustainable dividend that have capacity to grow over the medium- to long-term.
* For further detail about these holdings, please refer to the section entitled "Portfolios of investments." Fund holdings are as of the date given, are subject to change at any time, and are not recommendations to buy or sell any security.
12
Global Equity Income Fund
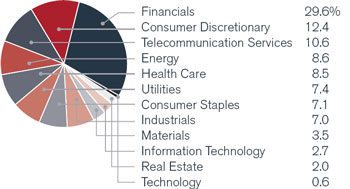
| Portfolio composition by country | | Portfolio composition by sector |
| (as a % of long-term investments) | | (as a % of long-term investments)
|
| | | |
| | |
Investment comparison
Value of $10,000
| Total returns as of January 31, 2017 | | | | | | | | | | | | | Since |
| | | | NASDAQ | | | Six | | One | | Three | | Five | | Ten | | inception |
| At NAV | | | symbol | | | months | | year | | years* | | years* | | years | | (11/30/2006)* |
| Class A | | | HFQAX | | | 1.76 | % | | 9.26 | % | | 2.78 | % | | 7.09 | % | | 3.34 | % | | 3.59 | % |
| Class C | | | HFQCX | | | 1.39 | | | 8.49 | | | 1.99 | | | 6.29 | | | 2.56 | | | 2.81 | |
| Class I** | | | HFQIX | | | 2.04 | | | 9.68 | | | 3.06 | | | 7.38 | | | 3.57 | | | 3.81 | |
| Class R6*** | | | HFQRX | | | 2.06 | | | 9.74 | | | 3.08 | | | 7.39 | | | 3.57 | | | 3.81 | |
| With sales charge | | | | | | | | | | | | | | | | | | | | | | |
| Class A | | | | | | -4.03 | % | | 3.00 | % | | 0.76 | % | | 5.83 | % | | 2.73 | % | | 2.99 | % |
| Class C | | | | | | 0.39 | | | 8.49 | | | 1.99 | | | 6.29 | | | 2.56 | | | 2.81 | |
| Index | | | | | | | | | | | | | | | | | | | | | | |
| MSCI World Index | | | | | | 5.20 | % | | 17.81 | % | | 6.55 | % | | 10.48 | % | | 4.54 | % | | 4.83 | % |
| MSCI World High Dividend Yield Index | | | | | | 1.52 | | | 15.78 | | | 5.45 | | | 9.32 | | | 3.80 | | | 4.12 | |
* Average annual return
** Class I (formerly Class W) shares commenced operations on March 31, 2009. The performance for Class I shares for periods prior to March 31, 2009 is based on the performance of Class A shares. Performance for Class I shares would be similar because the shares are invested in the same portfolio of investments. Class I shares are not subject to a front-end sales charge or a distribution fee.
*** Class R6 shares commenced operations on November 30, 2015. The performance for Class R6 shares for periods prior to November 30, 2015 is based on the performance of Class I shares. Performance for Class R6 shares would be similar because the shares are invested in the same portfolio of investments, and like Class I shares, Class R6 shares are not subject to a front-end sales charge or a distribution fee.
Performance data quoted represents past performance and is no guarantee of future results. Performance results with sales charges reflect the deduction of the maximum front-end sales charge or the deduction of the applicable contingent deferred sales charge ("CDSC"). Class A shares are subject to a maximum front-end sales charge of 5.75%. Class C shares are subject to a CDSC of up to 1% on certain redemptions made within 12 months of purchase. Performance presented at Net Asset Value (NAV), which does not include a sales charge, would be lower if this charge were reflected. NAV is the value of one share of the Fund excluding any sales charges. Performance quoted is based on the transacted NAV at each period end, which may differ from the US Generally Accepted Accounting Principles ("GAAP")-adjusted NAV and the total return presented in the Financial Highlights. Current performance may be lower or higher than the performance data quoted. Investment return and principal value will fluctuate so that an investor's shares, when redeemed, may be worth more or less than original cost. As stated in the current prospectus, the Fund's annual operating expense ratios (gross) for Class A, C, I and R6 shares are 1.17%, 1.93%, 0.92% and 0.87%, respectively. As stated in the Statement of Additional Information (SAI), the Fund's adviser has contractually agreed to waive its management fee and, if necessary, to reimburse other operating expenses (excluding Acquired Fund Fees and Expenses from underlying investment companies) in order to limit total annual ordinary operating expenses, less distribution and service fees, to 1.15% of the Fund's average daily net assets, which is in effect until July 31, 2020. For the most recent month-end performance, please call 1.866.443.6337 or visit the Funds' website at www.henderson.com.
Performance results also reflect expense subsidies and waivers in effect during certain periods shown. Absent these waivers during those periods, results would have been less favorable. All results assume the reinvestment of dividends and capital gains.
The investment comparison graph above reflects the change in value of a $10,000 hypothetical investment since the Fund's inception, including reinvested dividends and distributions, compared to a broad based securities market index. The MSCI World Index is a free float-adjusted market capitalization weighted index that is designed to measure the equity market performance of developed markets. The MSCI World High Dividend Yield Index aims to objectively reflect the high dividend yield opportunity set within the MSCI World Index. The Fund is professionally managed while the Indices are unmanaged and not available for investment and do not include fees, expenses or other costs. Results in the table and graph do not reflect the deduction of taxes that a shareholder would pay on Fund distributions or the redemption of Fund shares.
13
Global Technology Fund
It was a strong period for technology equities as they outperformed global equities. Buoyed by optimism for global growth and reflation, global equities rallied strongly after the election of Donald Trump as US President.
For the six-month reporting period ended January 31, 2017, the Fund returned 9.85% (Class A at NAV) versus the benchmark, MSCI AC World Information Technology Index, which posted a return of 9.96%. Specific detractors included Nokia, the Finnish telecoms equipment company; the industry faced challenges in 2016 as carriers reigned in spending. However, Nokia boasts a management with a good track record in capital allocation and in operational efficiency that trades on a very attractive valuation. Nokia's results later in January demonstrated this. Cognizant also underperformed. The IT services company is a user of visas that allows offshore workers to work in countries where they are not citizens. Rhetoric surrounding visa restriction and its potential impact from the new US administration weighed on the name. Other detractors included Vipshop, the Chinese online discount retailer, IT services company, EPAM, and the fund's cash position (in light of market strength).
Micron performed well. Having operated in a very fragmented memory industry that has now consolidated to three players (including Samsung), coupled with a slowing Moore's Law (reduction in
| Top 10 long-term holdings* | |
| (at January 31, 2017) | |
| | As a percentage |
| Security | of net assets |
| Apple, Inc. | 7.6 | % |
| Facebook, Inc., Class A | 7.2 | |
| Alphabet, Inc., Class A | 5.6 | |
| Samsung Electronics Co., Ltd. | 4.7 | |
| Alphabet, Inc., Class C | 4.3 | |
| Visa, Inc., A Shares | 3.9 | |
| Microsoft Corp. | 3.7 | |
| Tencent Holdings, Ltd. | 3.6 | |
| Cisco Systems, Inc. | 3.5 | |
| Broadcom, Ltd. | 3.4 | |
pace of computer power advancement), we believe Micron should benefit from more restrained supply leading to better pricing and margins. Cavium and Broadcom contributed to performance. Both Cavium and Broadcom are exposed to growth areas in semiconductors like networking, datacenter and cloud infrastructure. NXP Semiconductors also performed well. The company agreed to a $110 bid from Broadcom with the deal due to be completed by the end of 2017. Other positive performers included Samsung and Western Digital.
Notable activity over the period included the initiation of a position in Xilinx, a fabless semiconductor design company. The company has a strong franchise in wireless chips alongside some interesting and underappreciated opportunities in artificial intelligence and autonomous driving. A position was also added in Texas Instruments. Texas Instruments has a very strong franchise in analog semiconductors and a strong track record in capital allocation. Texas Instruments is also likely a beneficiary of US tax reform. Qualcomm was sold, as was Paypal.
The long-term drivers of technology remain intact as it continues to take share versus the old economy, driven by demographics and innovation. The relative valuation of the sector is attractive, especially given the balance sheet strength. We continue to focus bottom-up on powerful secular themes and growth at a reasonable price.
* For further detail about these holdings, please refer to the section entitled "Portfolios of investments." Fund holdings are as of the date given, are subject to change at any time, and are not recommendations to buy or sell any security.
14
Global Technology Fund
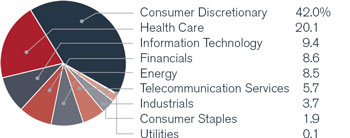
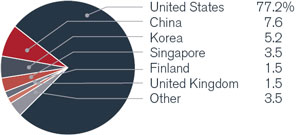
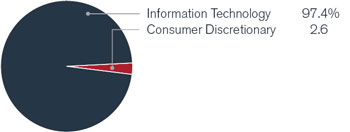
| Portfolio composition by country | | Portfolio composition by sector |
(as a % of long-term investments)
| | (as a % of long-term investments)
|
| | | |
| | |
Investment comparison
Value of $10,000
| Total returns as of January 31, 2017 | | | | | | | | | | | | | Since |
| | | | NASDAQ | | | Six | | One | | Three | | Five | | Ten | | inception |
| At NAV | | | symbol | | | months | | year | | years* | | years* | | years* | | (8/31/2001)* |
| Class A | | | HFGAX | | | 9.85 | % | | 21.00 | % | | 8.68 | % | | 11.82 | % | | 9.09 | % | | 8.85 | % |
| Class C | | | HFGCX | | | 9.43 | | | 20.12 | | | 7.83 | | | 10.95 | | | 8.26 | | | 8.04 | |
| Class I** | | | HFGIX | | | 10.04 | | | 21.36 | | | 8.94 | | | 12.11 | | | 9.32 | | | 9.00 | |
| Class R6*** | | | HFGRX | | | 9.99 | | | 21.30 | | | 8.94 | | | 12.11 | | | 9.32 | | | 9.00 | |
| With sales charge | | | | | | | | | | | | | | | | | | | | | | |
| Class A | | | | | | 3.55 | % | | 14.05 | % | | 6.55 | % | | 10.50 | % | | 8.45 | % | | 8.43 | % |
| Class C | | | | | | 8.43 | | | 20.12 | | | 7.83 | | | 10.95 | | | 8.26 | | | 8.04 | |
| Index | | | | | | | | | | | | | | | | | | | | | | |
| MSCI AC World IT Index | | | | | | 9.96 | % | | 26.06 | % | | 13.43 | % | | 14.24 | % | | 8.39 | % | | 6.90 | % |
| S&P 500 | | | | | | 5.96 | | | 20.04 | | | 10.85 | | | 14.09 | | | 6.99 | | | 6.78 | |
* Average annual return.
** Class I (formerly Class W) shares commenced operations on March 31, 2009. The performance for Class I shares for the periods prior to March 31, 2009 is based on the performance of Class A shares. Performance for Class I shares would be similar because the shares are invested in the same portfolio of investments. Class I shares are not subject to a front-end sales charge or a distribution fee.
*** Class R6 shares commenced operations on November 30, 2015. The performance for Class R6 shares for periods prior to November 30, 2015 is based on the performance of Class I shares. Performance for Class R6 shares would be similar because the shares are invested in the same portfolio of investments, and like Class I shares, Class R6 shares are not subject to a front-end sales charge or a distribution fee.
Performance data quoted represents past performance and is no guarantee of future results. Performance results with sales charges reflect the deduction of the maximum front-end sales charge or the deduction of the applicable contingent deferred sales charge ("CDSC"). Class A shares are subject to a maximum front-end sales charge of 5.75%. Class C shares are subject to a CDSC of up to 1% on certain redemptions made within 12 months of purchase. Performance presented at Net Asset Value (NAV), which does not include a sales charge, would be lower if this charge were reflected. NAV is the value of one share of the Fund excluding any sales charges. Performance quoted is based on the transacted NAV at each period end, which may differ from the US Generally Accepted Accounting Principles ("GAAP")-adjusted NAV and the total return presented in the Financial Highlights. Current performance may be lower or higher than the performance data quoted. Investment return and principal value will fluctuate so that an investor's shares, when redeemed, may be worth more or less than original cost. As stated in the current prospectus, the Fund's annual operating expense ratios (gross) for Class A, C, I and R6 shares are 1.35%, 2.12%, 1.11% and 1.10%, respectively. As stated in the Statement of Additional Information (SAI), the Fund's adviser has contractually agreed to waive its management fee and, if necessary, to reimburse other operating expenses (excluding Acquired Fund Fees and Expenses from underlying investment companies) in order to limit total annual ordinary operating expenses, less distribution and service fees, to 1.75% of the Fund's average daily net assets, which is in effect until July 31, 2020. For the most recent month-end performance, please call 1.866.443.6337 or visit the Funds' website at www.henderson.com.
Performance results also reflect expense subsidies and waivers in effect during certain periods shown. Absent these waivers, results would have been less favorable for certain periods. All results assume the reinvestment of dividends and capital gains.
The investment comparison graph above reflects the change in value of a $10,000 hypothetical investment since the Fund's inception, including reinvested dividends and distributions, compared to a broad based securities market index and an industry focused index. The MSCI AC World IT Index is a free float adjusted market capitalization weighted index designed to measure the equity market performance of the Information Technology stocks within the MSCI AC World Index. The S&P 500 Index is a broad based measurement of changes in stock market conditions based on the average of 500 widely held common stocks. The Fund is professionally managed while the Indices are unmanaged and not available for investment and do not include fees, expenses or other costs. Results in the table and graph do not reflect the deduction of taxes that a shareholder would pay on Fund distributions or the redemption of Fund shares.
15
High Yield Opportunities Fund
The US high yield market performed well over the six-month period led by a recovery in oil prices and commodity sub-sectors. The high yield market yield spreads have tightened as the asset class performed admirably since the election in early November given the steep increase in rates. The sharp increase in LIBOR rates has created a strong technical demand for loans; however, over 70% of leveraged loans tracked by JPM are now trading over par.
For most of the period, higher quality rated bonds (double-B) outperformed lower quality rated bonds (triple-C). The energy sector now represents over 26% of the emerging markets high yield segment as compared to 15% for US high yield and only 6% for European high yield.
The 12 month default rate is 3.6% (4.3% including distressed debt exchanges), but only 0.80% excluding energy and metals and mining. Not only have the commodity sectors had a big impact on the headline default rate, but they have also created an historical skew to recovery rates. Last twelve month recovery rates for high yield debt has been only 27% as compared to historical averages of 40-45%. During January, there were 38 credit rating upgrades ($65 billion) versus 45 credit rating downgrades ($63 billion) in the high yield market.
For the six-month reporting period ended January 31, 2017, the Fund returned 7.44% (Class A at NAV) versus the benchmark BofAML US High Yield
| Top 10 long-term holdings* | |
| (at January 31, 2017) | |
| | As a percentage |
| Security/Issuer | of net assets |
| Intelsat Jackson Holdings S.A. | 2.7 | % |
| Nuance Communications, Inc. | 2.6 | |
| CCO Holdings LLC | 2.5 | |
| SFR Group S.A. | 2.2 | |
| Frontier Communications Corp. | 2.1 | |
| PetSmart, Inc. | 1.8 | |
| Sprint Corp. | 1.7 | |
| Murray Energy Corp. 2015 Term Loan B | 1.7 | |
| NRG Energy, Inc. | 1.6 | |
| Valeant Pharmaceuticals International, Inc. | 1.5 | |
Constrained Index return of 6.23%. The portfolio benefited from positioning in the higher quality part of the triple-C space and an increase in weighting to the energy and mining sectors. We believe that the peer group is relatively underweight to energy as well given the deficit (shrinking) between the peer group average return and the benchmark return over the reporting period.
The Fund is currently positioned in line with the benchmark as far as credit risk (as measured by yield), spread, and weighted average credit rating. Within the energy sector, we decreased the underweight position since the second quarter of 2016 and have focused on higher quality Exploration & Production companies as well as midstream companies. We continue to be selective in the new issue market. We have made a conscious effort to add risk to the portfolio over the last nine months but have found it difficult given the challenging secondary market liquidity and the higher quality bias of the new issue calendar.
Our energy outlook has improved given the fact that oil has moved from $25 to $53 per barrel; furthermore, most of the defaults and distressed exchanges that we expected to occur in the energy sector have taken place. We will look to keep the portfolio slightly above the benchmark as far as yield and spread and rely on credit selection as the main driver of alpha over the next few months and quarters. Low global government bond yields continue to drive strong demand for high yield bonds and leveraged loans on both the retail and institutional side. We expect this trend to continue. We are less excited about leveraged loans as valuations are stretched. We expect the prospects for trade tariffs, changes in tax deductibility of interest and potentially lower corporate tax rates in the US to have a muted impact on US HY issuers when compared to US investment grade issuers.
* For further detail about these holdings, please refer to the section entitled "Portfolios of investments." Fund holdings are as of the date given, are subject to change at any time, and are not recommendations to buy or sell any security.
16
High Yield Opportunities Fund
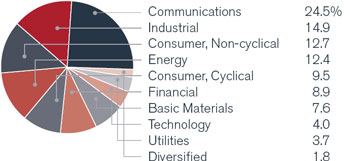
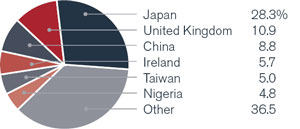
| Portfolio composition by country | | Portfolio composition by sector |
(as a % of long-term investments)
| | (as a % of long-term investments)
|
| | | |
| | |
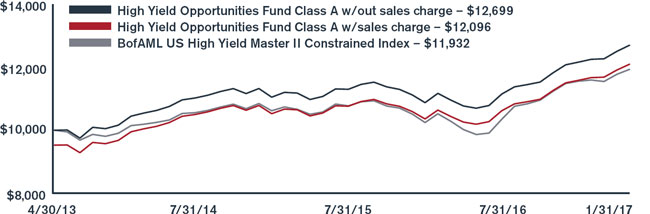
Investment comparison
Value of $10,000
| Total returns as of January 31, 2017 | | | | | | | | | | | | Since |
| | | | NASDAQ | | | Six | | One | | Three | | inception |
| At NAV | | | symbol | | | months | | year | | year* | | (4/30/2013)* |
| Class A | | | HYOAX | | | 7.44 | % | | 18.70 | % | | 5.69 | % | | 6.56 | % |
| Class C | | | HYOCX | | | 7.08 | | | 17.83 | | | 4.91 | | | 5.77 | |
| Class I | | | HYOIX | | | 7.61 | | | 18.87 | | | 5.93 | | | 6.80 | |
| Class R6** | | | HYORX | | | 7.64 | | | 18.96 | | | 5.96 | | | 6.82 | |
| With sales charge | | | | | | | | | | | | | | | | |
| Class A | | | | | | 2.33 | % | | 13.00 | % | | 4.00 | % | | 5.19 | % |
| Class C | | | | | | 6.08 | | | 17.83 | | | 4.91 | | | 5.77 | |
| Index | | | | | | | | | | | | | | | | |
| BofAML US High Yield Master II Constrained Index | | | | | | 6.23 | % | | 20.98 | % | | 4.94 | % | | 4.86 | % |
* Average annual return.
** Class R6 shares commenced operations on November 30, 2015. The performance for Class R6 shares for periods prior to November 30, 2015 is based on the performance of Class I shares. Performance for Class R6 shares would be similar because the shares are invested in the same portfolio of investments, and like Class I shares, Class R6 shares are not subject to a front-end sales charge or a distribution fee.
Performance data quoted represents past performance and is no guarantee of future results. Due to the Fund's relatively small asset base, performance may be impacted by portfolio turnover to a greater degree than it may be in the future. Performance results with sales charges reflect the deduction of the maximum front-end sales charge or the deduction of the applicable contingent deferred sales charge ("CDSC"). Class A shares are subject to a maximum front-end sales charge of 4.75%. Class C shares are subject to a CDSC of up to 1% on certain redemptions made within 12 months of purchase. Performance presented at Net Asset Value (NAV), which does not include a sales charge, would be lower if this charge were reflected. NAV is the value of one share of the Fund excluding any sales charges. Performance quoted is based on the transacted NAV at each period end, which may differ from the US Generally Accepted Accounting Principles ("GAAP")-adjusted NAV and the total return presented in the Financial Highlights. Current performance may be lower or higher than the performance data quoted. Investment return and principal value will fluctuate so that an investor's shares, when redeemed, may be worth more or less than original cost. As stated in the current prospectus, the Fund's annual operating expense ratios (gross) for Class A, C, I and R6 shares are 1.25%, 2.06%, 1.05% and 0.99%, respectively. However, the Fund's adviser has contractually agreed to waive its management fee and, if necessary, to reimburse other operating expenses (excluding Acquired Fund Fees and Expenses from underlying investment companies) in order to limit total annual ordinary operating expenses, less distribution and service fees, to 0.68% of the Fund's average daily net assets, which is in effect until July 31, 2020. For the most recent month-end performance, please call 1.866.443.6337 or visit the Funds' website at www.henderson.com.
Performance results also reflect expense subsidies and waivers in effect during periods shown. Absent these waivers, results would have been less favorable. All results assume the reinvestment of dividends and capital gains.
The investment comparison graph above reflects the change in value of a $10,000 hypothetical investment since the Fund's inception, including reinvested dividends and distributions, compared to a broad based securities market index. The Bank of America Merrill Lynch U.S. High Yield Master II Constrained Index tracks the performance of below investment grade U.S. dollar-denominated corporate bonds publicly issued in the U.S. domestic market. The Fund is professionally managed while the Index is unmanaged and not available for investment and does not include fees, expenses or other costs. Results in the table and graph do not reflect the deduction of taxes that a shareholder would pay on Fund distributions or the redemption of Fund shares.
17
International Long/Short Equity Fund
International equities rallied over the period with developed markets buoyed by hopes for reflation and growth upgrades as a result of Donald Trump's election as President of the United States. After performing strongly in the first three quarters of 2016, Asian (ex-Japan) and emerging markets equities sold off quite strongly in November with the new President striking a protectionist tone, however both recovered ground in January. A major theme in the markets was the rotation from deflationary to reflationary assets and this caused a sharp shift from growth and defensives equity market leadership to value and cyclicals; a big change given the significant period, especially in Europe, defensives and growth had outperformed value and cyclicals.
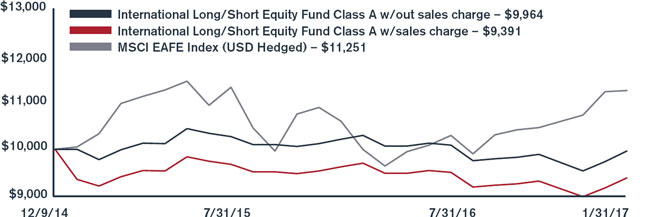
For the six-month reporting period ended January 31, 2017, the Fund returned 1.69% (class A at NAV) versus the benchmark, MSCI EAFE USD Hedged Index, which posted a return of 9.15%. The Fund ran with an average net exposure to the market of around 20% over the period, this underexposure to the rising market saw the Fund underperform relative to the benchmark; however, the Fund did post a positive absolute return.
| | |
| Top 5 "Long" Holdings (including equity swaps)* | |
| (at January 31, 2017) | |
| | As a percentage |
| Security | of net assets |
| Providence Resources plc | 2.8 | % |
| Lekoil, Ltd. | 2.4 | |
| BNN Technology plc | 2.1 | |
| Samsung Electronics Co., Ltd. | 2.1 | |
| Teva Pharmaceutical Industries, Ltd., ADR | 2.0 | |
| Top 5 "Short" Holdings (including equity swaps)* | |
| (at January 31, 2017) | |
| | As a percentage |
| Security | of net assets |
| ICA Gruppen AB | (2.2) | % |
| ANA Holdings, Inc. | (2.0) | |
| Kuehne & Nagel International AG | (1.9) | |
| Mitie Group plc | (1.7) | |
| Komatsu, Ltd. | (1.7) | |
The Fund's long books contributed positively to performance, in particular the UK and Europe strategies' long books performed well. The Fund's long exposure to energy was a positive with Providence Resources, Lekoil and African Petroleum all contributing to performance as oil companies continue to recover. Long technology exposure was another positive with positions in e2v technologies, Samsung and Largan Precision all performing well. Detractors from the long books included Teva Pharmaceutical, due to the invalidation of some of its drug copaxone's patents, BNN Technology and BT Group which reported a deeper than expected write down on its Italian business. In aggregate, the Fund's short books detracted from performance.
Fund activity included the purchase of a long position in German pharma and agribusiness company, Bayer, by the Europe strategy. The Europe strategy also added long positions in Swedish engineering firm, Alfa Laval and exited long positions in Aberdeen Asset Management and Finnish cranes company, Konecranes. The Japan strategy closed out its long positions in financial holdings, Mitsubishi UFJ and Tokio Marine and also exited its position in manufacturer, Murata. Also sold over the period were Catcher Technology, the Taiwanese die-casting firm by the Asia strategy, and e2v Technologies, a semiconductor firm by the UK strategy. The Japan strategy added a long position in Mitsubishi Motors and exited long positions in bank, Mitsubishi UFJ, and insurer, Tokio Marine.
Developed market equities finished 2016 strongly on a wave of optimism. Our sense, however, is that some of the optimism may have gone slightly too far in the case of the US. International has its challenges but we believe that with the relatively solid macro backdrop in Europe, Japan continuing to look intriguing, and depressed valuations in emerging markets, International could be a good place to be for investors in 2017.
* For further detail about these holdings, please refer to the section entitled "Portfolios of investments." Fund holdings are as of the date given, are subject to change at any time, and are not recommendations to buy or sell any security.
18
International Long/Short Equity Fund
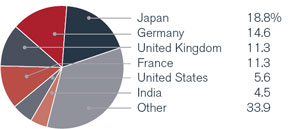
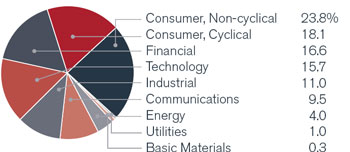
| Portfolio composition by country | | Portfolio composition by sector |
| (as a % of long-term investments) | | (as a % of long-term investments)
|
| | | |
| | |
Investment comparison
Value of $10,000
| Total returns as of January 31, 2017 | | | | | | | | | | Since |
| | | | NASDAQ | | | Six | | One | | inception |
| At NAV | | | symbol | | | months | | year | | (12/9/2014)* |
| Class A | | | HLNAX | | | 1.69 | % | | -3.22 | % | | -0.17 | % |
| Class C | | | HLNCX | | | 1.62 | | | -3.71 | | | -0.82 | |
| Class I | | | HLNIX | | | 2.10 | | | -2.72 | | | 0.22 | |
| Class R6** | | | HLNRX | | | 2.12 | | | -2.81 | | | 0.19 | |
| With sales charge | | | | | | | | | | | | | |
| Class A | | | | | | -4.19 | % | | -8.82 | % | | -2.88 | % |
| Class C | | | | | | 0.62 | | | -3.71 | | | -0.82 | |
| Index | | | | | | | | | | | | | |
| MSCI EAFE Index (USD Hedged) | | | | | | 9.15 | % | | 13.38 | % | | 5.64 | % |
* Average annual return.
** Class R6 shares commenced operations on November 30, 2015. The performance for Class R6 shares for periods prior to November 30, 2015 is based on the performance of Class I shares. Performance for Class R6 shares would be similar because the shares are invested in the same portfolio of investments, and like Class I shares, Class R6 shares are not subject to a front-end sales charge or a distribution fee.
Performance data quoted represents past performance and is no guarantee of future results. Due to the Fund's relatively small asset base, performance may be impacted by portfolio turnover to a greater degree than it may be in the future. Performance results with sales charges reflect the deduction of the maximum front-end sales charge or the deduction of the applicable contingent deferred sales charge ("CDSC"). Class A shares are subject to a maximum front-end sales charge of 5.75%. Class C shares are subject to a CDSC of up to 1% on certain redemptions made within 12 months of purchase. Performance presented at Net Asset Value (NAV), which does not include a sales charge, would be lower if this charge were reflected. NAV is the value of one share of the Fund excluding any sales charges. Performance quoted is based on the transacted NAV at each period end, which may differ from the US Generally Accepted Accounting Principles ("GAAP")-adjusted NAV and the total return presented in the Financial Highlights. Current performance may be lower or higher than the performance data quoted. Investment return and principal value will fluctuate so that an investor's shares, when redeemed, may be worth more or less than original cost. As stated in the current prospectus, the Fund's annual operating expense ratios (gross) for Class A, C, I and R6 shares excluding dividends and interest expenses on securities sold short are 4.12%, 5.99%, 4.70% and 4.39%, respectively. However, the Fund's adviser has agreed to contractually waive its management fee and, if necessary, reimburse other operating expenses (excluding Acquired Fund Fees and Expenses from underlying investment companies and dividends and interest expense on securities sold short) in order to limit total annual ordinary operating expenses, less distribution and service fees, to 1.50% of the Fund's average daily net assets, which is in effect until July 31, 2020. For the most recent month-end performance, please call 1.866.443.6337 or visit the Funds' website at www.henderson.com.
Performance results also reflect expense subsidies and waivers in effect during periods shown. Absent these waivers, results would have been less favorable. All results assume the reinvestment of dividends and capital gains.
The investment comparison graph above reflects the change in value of a $10,000 hypothetical investment since the Fund's inception, including reinvested dividends and distributions, compared to a broad based securities market index. The MSCI EAFE Index (USD Hedged) is a free float-adjusted market capitalization weighted index that is designed to measure the equity market performance of developed markets, excluding the US and Canada and excluding the effect of currency translations. The Fund may invest in emerging markets while the Index only consists of companies in developed markets. The Fund is professionally managed while the Index is unmanaged and not available for investment and does not include fees, expenses or other costs. Results in the table and graph do not reflect the deduction of taxes that a shareholder would pay on Fund distributions or the redemption of Fund shares.
19
International Opportunities Fund
International equities rallied over the period with developed markets buoyed by hopes for reflation and growth upgrades as a result of Donald Trump's election as President of the United States. After performing strongly in the first three calendar quarters of 2016, Asian (ex-Japan) and emerging markets equities sold off quite strongly with the new President striking a protectionist tone.
For the six-month reporting period ended January 31, 2017, the Fund returned 0.07% versus the MSCI EAFE Index's return of 3.60%. The Fund struggled in the second half of 2016 with sector favorability rotation in Europe following the Brexit decision and the reaction to Trump's election as President saw the previously outperforming EuropeGrowth, Emerging Markets and Asia-Pacific sub-portfolios erase their gains. Stock specific issues prevented the more cyclically positioned Pan Europe sub-portfolio from taking full advantage of the rotation while macro headwinds made Japan a difficult place for the active investor.
Exposure to pharmaceutical names such as Teva, Lupin and Roche was detractive to performance as political rhetoric weighed on share prices in the space as product pricing concerns grow. The Fund's exposure to outsourcers also detracted with the outlook for the industry deteriorating; the Fund had positions in Capita and Sodexo. Financials exposure was broadly positive with banks' share prices boosted by rising bond yields; British bank Barclays
| Top 10 long-term holdings* | |
| (at January 31, 2017) | |
| | As a percentage |
| Security | of net assets |
| Renault S.A. | 3.1 | % |
| Continental AG | 3.1 | |
| Fresenius SE & Co., KGaA | 2.9 | |
| Deutsche Post AG | 2.9 | |
| SAP SE | 2.8 | |
| Amadeus IT Group S.A. | 2.7 | |
| Roche Holding AG | 2.5 | |
| Teva Pharmaceutical Industries, Ltd., ADR | 2.4 | |
| Bayer AG | 2.4 | |
| Housing Development Finance Corp., Ltd. | 2.3 | |
was the Fund's best performer over the period while the Fund's holdings in Spanish and Japanese banks, BBVA and Sumitomo Mitsui Financial Group, also contributed to performance. The Fund's energy holdings also contributed positively with Lundin Petroleum performing especially well.
During the period, the Pan Europe sub-portfolio added a position in German pharmaceuticals and agriculture firm, Bayer, taking advantage of share price weakness with some questioning whether their proposed acquisition of Monsanto will receive regulatory approval. The Europe Growth sub-portfolio added some banks exposure by taking a position in Credit Agricole while also taking a position in consumer goods company, Reckitt Benckiser. Sales included Baidu, the Chinese internet company, by the Asia-Pacific sub-portfolio and Delphi Automotive, the components company, by the Global Growth sub-portfolio.
We adjusted the flow allocation of the Fund in January; the idea being to even out the flows in and out of the Fund for the sub-portfolios, rather than as a result of a macro view. The Emerging Markets sub-portfolio was increased by 1%, the Global Growth sub-portfolio by 1.5% and the Japan sub-portfolio by 1%. The Europe Growth sub-portfolio was reduced by 3% and the Asia-Pacific sub-portfolio by 0.5%. We also closed the hedge on the yen as we view the strength of the US dollar as in its latter stages given how crowded the long dollar trade has become. The hedge against sterling remains as we are cognizant of the risks relating to sterling's sensitivity to news-flow regarding Brexit.
Developed market equities finished 2016 strongly on a wave of optimism. Our sense, however, is that some of the optimism may have gone too far in the case of the US. International has its challenges but we believe that with the relatively solid macro backdrop in Europe, Japan continuing to look intriguing, and depressed valuations in emerging markets, International could be a good place to be for investors in 2017.
* For further detail about these holdings, please refer to the section entitled "Portfolios of investments." Fund holdings are as of the date given, are subject to change at any time, and are not recommendations to buy or sell any security.
20
International Opportunities Fund
| Portfolio composition by country | | Portfolio composition by sector |
| (as a % of long-term investments) | | (as a % of long-term investments)
|
| | | |
| | |
Investment comparison
Value of $10,000
| Total returns as of January 31, 2017 | | | | | | | | | | | | Since |
| | | | NASDAQ | | | Six | | One | | Three | | Five | | Ten | | inception |
| At NAV | | | symbol | | | months | | year | | years* | | years* | | years* | | (8/31/2001)* |
| Class A | | | HFOAX | | | 0.07 | % | | 5.71 | % | | 0.76 | % | | 7.15 | % | | 2.48 | % | | 8.31 | % |
| Class C | | | HFOCX | | | -0.28 | | | 4.95 | | | -0.01 | | | 6.32 | | | 1.70 | | | 7.50 | |
| Class I** | | | HFOIX | | | 0.25 | | | 6.03 | | | 1.05 | | | 7.46 | | | 2.71 | | | 8.46 | |
| Class R*** | | | HFORX | | | 0.10 | | | 5.38 | | | 0.47 | | | 6.81 | | | 2.19 | | | 8.02 | |
| Class R6**** | | | HFOSX | | | 0.19 | | | 6.05 | | | 1.02 | | | 7.44 | | | 2.70 | | | 8.46 | |
| Class IF***** | | | HFITX | | | 0.24 | | | 6.01 | | | 0.85 | | | 7.21 | | | 2.51 | | | 8.33 | |
| With sales charge | | | | | | | | | | | | | | | | | | | | | | |
| Class A | | | | | | -5.69 | % | | -0.35 | % | | -1.21 | % | | 5.89 | % | | 1.87 | % | | 7.89 | % |
| Class C | | | | | | -1.28 | | | 4.95 | | | -0.01 | | | 6.32 | | | 1.70 | | | 7.50 | |
| Index | | | | | | | | | | | | | | | | | | | | | | |
| MSCI EAFE Index | | | | | | 3.60 | % | | 12.59 | % | | 1.17 | % | | 6.52 | % | | 1.44 | % | | 5.51 | % |
* Average annual return.
** Class I (formerly Class W) shares commenced operations on March 31, 2009. The performance for Class I shares for periods prior to March 31, 2009 is based on the performance of Class A shares. Performance for Class I shares would be similar because the shares are invested in the same portfolio of investments. Class I shares are not subject to a front-end sales charge or a distribution fee.
*** Class R shares commenced operations on September 30, 2005. The performance for Class R shares for periods prior to September 30, 2005 is based on the performance of Class A shares, adjusted for the higher expenses applicable to R shares. Performance for Class R shares would be similar because the shares are invested in the same portfolio of investments. Class R shares are not subject to a front-end sales charge but are subject to a distribution fee of 0.50%.
**** Class R6 shares commenced operations on November 30, 2015. The performance for Class R6 shares for periods prior to November 30, 2015 is based on the performance of Class I shares. Performance for Class R6 shares would be similar because the shares are invested in the same portfolio of investments, and like Class I shares, Class R6 shares are not subject to a front-end sales charge or a distribution fee.
***** Class IF shares commenced operations on March 31, 2016. The performance for Class IF shares for periods prior to March 31, 2016 is based on the performance of Class A shares. Performance for Class IF shares would be similar because the shares are invested in the same portfolio of investments. Class IF shares are not subject to a front-end sales charge but are subject to a distribution fee of 0.05%.
Performance data quoted represents past performance and is no guarantee of future results. Performance results with sales charges reflect the deduction of the maximum front-end sales charge or the deduction of the applicable contingent deferred sales charge ("CDSC"). Class A shares are subject to a maximum front-end sales charge of 5.75%. Class C shares are subject to a CDSC of up to 1% on certain redemptions made within 12 months of purchase. Class R shares have no front-end sales charge or CDSC. Performance presented at Net Asset Value (NAV), which does not include a sales charge, would be lower if this charge were reflected. NAV is the value of one share of the Fund excluding any sales charges. Performance quoted is based on the transacted NAV at each period end, which may differ from the US Generally Accepted Accounting Principles ("GAAP")-adjusted NAV and the total return presented in the Financial Highlights. Current performance may be lower or higher than the performance data quoted. Investment return and principal value will fluctuate so that an investor's shares, when redeemed, may be worth more or less than original cost. As stated in the current prospectus, the Fund's annual operating expense ratios (gross) for Class A, C, R, I, R6 and IF shares are 1.36%, 2.12%, 1.68%, 1.07%, 1.09%, and 1.05%, respectively. As stated in the Statement of Additional Information (SAI), the Fund's adviser has contractually agreed to waive its management fee and, if necessary, to reimburse other operating expenses (excluding Acquired Fund Fees and Expenses from underlying investment companies) in order to limit total annual ordinary operating expenses, less distribution and service fees, to 1.75% of the Fund's average daily net assets, which is in effect until July 31, 2020. For the most recent month-end performance, please call 1.866.443.6337 or visit the Funds' website at www.henderson.com.
Performance results also reflect expense subsidies and waivers in effect during certain periods shown. Absent these waivers, results would have been less favorable for certain periods. All results assume the reinvestment of dividends and capital gains.
The investment comparison graph above reflects the change in value of a $10,000 hypothetical investment since the Fund's inception, including reinvested dividends and distributions, compared to a broad based securities market index. The MSCI EAFE Index is a free float-adjusted market capitalization weighted index that is designed to measure the equity market performance of developed markets, excluding the US and Canada. The Fund may invest in emerging markets while the Index only consists of companies in developed markets. The Fund is professionally managed while the Index is unmanaged and not available for investment and does not include fees, expenses or other costs. Results in the table and graph do not reflect the deduction of taxes that a shareholder would pay on Fund distributions or the redemption of Fund shares.
21
International Small Cap Fund
The Fund successfully launched in mid-December 2016 covering the European, Asian and Japanese small cap markets. We have introduced seventy one holdings to the portfolio offering good diversification by geography, sector and individual holdings. Our value biased stock picking has caused us to have a bias toward Europe at the expense of Asia and Japan at January 31, 2017. The Fund is also overweight the technology, financial and materials sectors, again this is predominantly driven by our bottom up stock selection.
Although it is early days for the Fund, it has been encouraging to post both positive absolute and relative returns. The Fund returned 7.20% versus the MSCI EAFE Small Cap Index which returned 6.24% over the period from inception, December 15, 2016, to January 31, 2017. The Fund's biggest contributors to performance included Granges, a Swedish Aluminium manufacturer, Lenzing, an innovative textile manufacturer using pulp raw materials, Fujimi, a Japanese silicon wafer materials manufacturer, Logitech, which manufactures computer mice and smart home devices, DFDS, a passenger and freight shipping company in Northern Europe, and Moneysupermaket.com, a finance and travel comparison website. The variety contained within our top contributors serves to highlight the attractive niches offered in the international small cap space.
| Top 10 long-term holdings* | |
| (at January 31, 2017) | |
| | As a percentage |
| Security | of net assets |
| Granges AB | 1.7 | % |
| Lenzing AG | 1.7 | |
| Dfds A/S | 1.6 | |
| Logitech International S.A. | 1.5 | |
| Scandic Hotels Group AB | 1.5 | |
| Moneysupermarket.com Group plc | 1.5 | |
| Fujimi, Inc. | 1.5 | |
| Cie Plastic Omnium S.A. | 1.5 | |
| ASM International N.V. | 1.5 | |
| en-japan, Inc. | 1.5 | |
January 2017 will be best remembered for the official inauguration of President Trump, and with it the first clues of what to expect from his presidency ahead. He has already pulled out of the Trans-Pacific Partnership (TPP), confirmed his intention to build 'the wall' on the Mexican border and has temporarily banned nationals from seven majority Muslim countries entering the US. This saw the 'reflation trade' that has been underway since the election give back some ground towards the end of the reporting period. Aside from the political pantomime, economic data continued to surprise positively, which we believe could offer a good environment for earnings growth for smaller international companies.
The political calendar remains heavy in 2017, with investors now looking to the French election as the next potential flash point. While it seems unlikely Le Pen will be elected President, the recent drop in popularity of the leading favorite, François Fillon, demonstrates how quickly things can change. Otherwise, we believe the macroeconomic backdrop is providing a good environment for the value-biased stock picker.
* For further detail about these holdings, please refer to the section entitled "Portfolios of investments." Fund holdings are as of the date given, are subject to change at any time, and are not recommendations to buy or sell any security.
22
International Small Cap Fund
| Portfolio composition by country | | Portfolio composition by sector |
(as a % of long-term investments)
| | (as a % of long-term investments) |
| | | |
| | |
Investment comparison
Value of $10,000
| Total returns as of January 31, 2017 | | | | | | Since |
| | | | NASDAQ | | | inception |
| At NAV | | | symbol | | | (12/15/16) |
| Class R6 | | | HSQRX | | | 7.20 | % |
| Index | | | | | | | |
| MSCI EAFE Small Cap Index | | | | | | 6.24 | % |
Performance data quoted represents past performance and is no guarantee of future results. Due to the Fund's relatively small asset base, performance may be impacted by portfolio turnover to a greater degree than it may be in the future. NAV is the value of one share of the Fund. Performance quoted is based on the transacted NAV at each period end, which may differ from the US Generally Accepted Accounting Principles ("GAAP")-adjusted NAV and the total return presented in the Financial Highlights. Current performance may be lower or higher than the performance data quoted. Investment return and principal value will fluctuate so that an investor's shares, when redeemed, may be worth more or less than original cost.
As stated in the current prospectus, the Fund's annual operating expense ratio (gross) for class R6 shares is estimated to be 4.64% for the first fiscal year. However, the Fund's adviser has contractually agreed to waive its management fee and, if necessary, to reimburse other operating expenses (excluding Acquired Fund Fees and Expenses from underlying investment companies) in order to limit total annual ordinary operating expenses, less distribution and service fees, to 1.24% of the Fund's average daily net assets, which is in effect until July 31, 2020. For the most recent month-end performance, please call 1.866.443.6337 or visit the Funds' website at www.henderson.com.
Performance results also reflect expense subsidies and waivers in effect during periods shown. Absent these waivers, results would have been less favorable. All results assume the reinvestment of dividends and capital gains.
The investment comparison graph above reflects the change in value of a $10,000 hypothetical investment since the Fund's inception, including reinvested dividends and distributions, compared to a broad based securities market index. The MSCI EAFE Small Cap Index is a free float-adjusted market capitalization weighted index that is designed to measure the equity market performance of small cap representation across developed markets, excluding the US and Canada. The Fund may invest in emerging markets while the Index only consists of companies in developed markets. The Fund is professionally managed while the Index is unmanaged and not available for investment and does not include fees, expenses or other costs. Results in the table and graph do not reflect the deduction of taxes that a shareholder would pay on Fund distributions or the redemption of Fund shares.
23
Strategic Income Fund
The primary event at the end of the reporting period was again political with the unexpected election of Donald Trump as President of the United States. This caused a material shift in expectations for fiscal stimulus at a time when the pick-up in global economic data which had begun in the late summer was strengthening. This proved fertile ground for a US reflation trade in financial markets; specifically a stronger US dollar and higher US bond yields. Credit markets performed well in this environment with a significant tightening in credit spreads over the most recent calendar quarter. It should be noted that the US bond market suffered disproportionately in the bond sell-off with German bunds and Japanese government bonds relatively immune from the drawdown. The Trump victory has served to exacerbate a trend which was already underway in terms of the divergence in developed market bond yields.
For the six-month reporting period ended January 31, 2017, the Fund returned 0.56% (Class A at NAV) versus the benchmark 90-Day LIBOR (USD) return of 0.40%.
The gyrations in bond markets provided ample asset allocation opportunity. The Fund built a significant position in four-year and under Australian government bonds. This is the one economy which appears to have slowed rapidly in the second half of 2016 when most other economies were accelerating. In addition, there is a longer-term positive story for bondholders relating to the overheated and now slowing housing market and
| Top 10 long-term holdings* | |
| (at January 31, 2017) | |
| | As a percentage |
| Security/Issuer | of net assets |
| Australia Government Bond | 11.5 | % |
| iShares US Preferred Stock ETF | 2.9 | |
| Prudential plc | 1.8 | |
| Virgin Media Secured Finance plc | 1.7 | |
| Wachovia Capital Trust III | 1.6 | |
| Tesco plc | 1.6 | |
| UBS Group A.G. | 1.6 | |
| Equinix, Inc. Term Loan B | 1.5 | |
| Berry Plastics Group, Inc. Term Loan D | 1.5 | |
| ConvaTec Healthcare D Sarl, Term Loan B | 1.5 | |
over-indebted consumer combined with disappointing and below target inflation measures. We reduced rates sensitive investment grade bonds and increased high yield. We also added to US bank preferred stocks following their sell off in line with the rates market. We actively traded interest rate futures during the period in order to cheaply and quickly adjust the duration position of the portfolio. This contributed significantly to performance.
Our approach to corporate bonds in the current environment is to focus on income return and to exercise caution in terms of the companies we lend money to e.g. avoidance of commodity exposure entirely. In addition, we retain our holdings in legacy European banking bonds, which although cyclical, are being phased out as Tier 1 capital under new regulations.
We expect the first calendar quarter of 2017 to be associated with rising headline inflation measures as a result of a 12 month commodity price rally. Based on leading indicators that we follow the growth data could well also peak by early spring 2017. This is a challenging backdrop for bond markets and it will be very important to watch how Central Banks respond or don't respond to this cyclical impulse - any unexpected hawkishness (e.g. a rate rise from the Federal Reserve in March) is perhaps the greatest threat now given how yields have sold off and priced in much of the cyclical uptick already. The broader credit cycle remains relatively mundane - no signs of a change to the low default rate regime in Europe and rapidly falling defaults in US high yield to come as the commodity defaults of 2016 fall out of the 12 month numbers. Going forward the key risk to credit markets in 2017 is the election calendar in Europe and the risk of an anti-establishment breakthrough in this region of the world. We remain concerned about all the long-term structural factors inhibiting global growth. With this in mind we continue our sensible income strategy. We continue to be very choosey in our stock selection given the relative maturity of the elongated credit cycle. Collating reliable coupons for our investors will be the main driver of returns going forward.
* For further detail about these holdings, please refer to the section entitled "Portfolios of investments." Fund holdings are as of the date given, are subject to change at any time, and are not recommendations to buy or sell any security.
24
Strategic Income Fund
| Portfolio composition by country | | Portfolio composition by sector |
(as a % of long-term investments)
| | (as a % of long-term investments) |
| | | |
| | |
Investment comparison
Value of $10,000
| Total returns as of January 31, 2017 | | | | | | | | | | | | | Since |
| | | | NASDAQ | | | Six | | One | | Three | | Five | | Ten | | inception |
| At NAV | | | symbol | | | months | | year | | years* | | years* | | years* | | (9/30/2003)* |
| Class A | | | HFAAX | | | 0.56 | % | | 6.33 | % | | 4.25 | % | | 5.61 | % | | 3.55 | % | | 5.19 | % |
| Class C | | | HFACX | | | 0.18 | | | 5.56 | | | 3.45 | | | 4.79 | | | 2.72 | | | 4.37 | |
| Class I** | | | HFAIX | | | 0.69 | | | 6.61 | | | 4.51 | | | 5.84 | | | 3.68 | | | 5.29 | |
| Class R6*** | | | HFARX | | | 0.72 | | | 6.67 | | | 4.57 | | | 5.87 | | | 3.70 | | | 5.30 | |
| With sales charge | | | | | | | | | | | | | | | | | | | | | | |
| Class A | | | | | | -4.26 | % | | 1.23 | % | | 2.58 | % | | 4.58 | % | | 3.04 | % | | 4.80 | % |
| Class C | | | | | | -0.82 | | | 5.56 | | | 3.45 | | | 4.79 | | | 2.72 | | | 4.37 | |
| Index | | | | | | | | | | | | | | | | | | | | | | |
| 3-month LIBOR (USD) | | | | | | 0.40 | % | | 0.69 | % | | 0.39 | % | | 0.39 | % | | 1.24 | % | | 1.70 | % |
| Barclays Global Agg Credit | | | | | | | | | | | | | | | | | | | | | | |
| USD Hedged | | | | | | -1.87 | | | 5.16 | | | 3.85 | | | 4.12 | | | 4.88 | | | 4.66 | |
* Average annual return.
** Class I shares commenced operations on April 29, 2011. The performance for Class I shares for periods prior to April 29, 2011 is based on the performance of Class A shares. Performance for Class I shares would be similar because the shares are invested in the same portfolio of investments. Class I shares are not subject to a front-end sales charge or a distribution fee.
*** Class R6 shares commenced operations on November 30, 2015. The performance for Class R6 shares for periods prior to November 30, 2015 is based on the performance of Class I shares. Performance for Class R6 shares would be similar because the shares are invested in the same portfolio of investments, and like Class I shares, Class R6 shares are not subject to a front-end sales charge or a distribution fee.
Performance data quoted represents past performance and is no guarantee of future results. Performance results with sales charges reflect the deduction of the maximum front-end sales charge or the deduction of the applicable contingent deferred sales charge ("CDSC"). Class A shares are subject to a maximum front-end sales charge of 4.75%. Class C shares are subject to a CDSC of up to 1% on certain redemptions made within 12 months of purchase. Performance presented at Net Asset Value (NAV), which does not include a sales charge, would be lower if this charge were reflected. NAV is the value of one share of the Fund excluding any sales charges. Performance quoted is based on the transacted NAV at each period end, which may differ from the US Generally Accepted Accounting Principles ("GAAP")-adjusted NAV and the total return presented in the Financial Highlights. Current performance may be lower or higher than the performance data quoted. Investment return and principal value will fluctuate so that an investor's shares, when redeemed, may be worth more or less than original cost. As stated in the current prospectus, the Fund's annual operating expense ratios (gross) for Class A, C, I and R6 shares are 1.06%, 1.82%, 0.81% and 0.75%, respectively. However, the Fund's adviser has contractually agreed to waive its management fee and, if necessary, to reimburse other operating expenses (excluding Acquired Fund Fees and Expenses from underlying investment companies) in order to limit total annual ordinary operating expenses, less distribution and service fees, to 0.85% of the Fund's average daily net assets, which will remain in effect until July 31, 2020. For the most recent month-end performance, please call 1.866.443.6337 or visit the Funds' website at www.henderson.com.
Performance results also reflect expense subsidies and waivers in effect during the periods shown. Absent these waivers, results would have been less favorable. All results assume the reinvestment of dividends and capital gains.
The investment comparison graph above reflects the change in value of a $10,000 hypothetical investment since the Fund's inception, including reinvested dividends and distributions, compared to a broad based securities market index. The Barclays Capital Global Aggregate Credit (USD) Hedged Index is a broad-based measure of the global investment-grade and high yield fixed-rate markets. 3-Month LIBOR (London Interbank Offered Rate) (USD) is the interest rate participating banks offer to other banks for loans on the London market. The Fund is professionally managed while the Indices are unmanaged and not available for investment and do not include fees, expenses or other costs. Results in the table and graphs do not reflect the deduction of taxes that a shareholder would pay on Fund distributions or the redemption of Fund shares.
25
US Growth Opportunities Fund
Over the six-month reporting period ended January 31, 2017, US equity markets were strong with the S&P 500 up nearly 6% and small cap equities (Russell 2000 Index) up over 11%. This resilient performance came after the US Presidential election as Donald Trump unexpectedly won; his pro-business and pro-growth policies expected to be good for the US economy and markets. Small cap US companies should have an advantage; historically they profit from a stronger US economy as their revenues are typically more skewed towards US customers and they would disproportionally benefit from a reduction in the corporate tax rate due to their higher marginal rates.
From a quality perspective the period was very heavily skewed towards low quality companies (rated B or lower by S&P), which returned 9.31% for the period versus 3.75% for high quality companies (rated B+ or higher). Additionally, factor attribution indicated a bias for companies that trade on a low price to earnings ratio (P/E) and those with high betas.
For the six-month reporting period ended January 31, 2017, the Fund returned 0.99% (Class A at NAV) versus the benchmark, Russell 3000 Growth Index, which posted a return of 4.54%. The underperformance was the result of the outperformance of low quality stocks as well as specific stock selection.
Stock selection within the consumer discretionary and technology sectors led underperformance. Within consumer discretionary, Tractor Supply Co., Under
| Top 10 long-term holdings* | |
| (at January 31, 2017) | |
| | As a percentage |
| Security | of net assets |
| Bank of the Ozarks, Inc. | 4.0 | % |
| Fiserv, Inc. | 3.9 | |
| Adobe Systems, Inc. | 3.6 | |
| Raymond James Financial, Inc. | 3.6 | |
| The TJX Companies, Inc. | 3.5 | |
| Costco Wholesale Corp. | 3.4 | |
| Intuit, Inc. | 3.4 | |
| Starbucks Corp. | 3.4 | |
| Visa, Inc., A Shares | 3.4 | |
| Microchip Technology, Inc. | 3.2 | |
Armour and VF Corp. weighed on performance. The weakness in consumer discretionary can partially be explained by a frail retail sector and shifting consumer spending habits. Within technology, the Fund's position in Tyler Technologies detracted from performance as the company's stock price declined due to a slowdown in organic growth. Additionally, not holding positions in Microsoft, Facebook and Apple detracted from performance as all three companies are significant portions of the sector and performed well during the period. Contributing to performance was stock selection within financial services, specifically an overweight position to banks and diversified financial services.
Given what we know today, the incoming administration's policies appear to be pro-growth and pro-business, however, we are short on a concrete proposal, which is driving uncertainty. Tax policy will certainly be in play as republicans look to reform the corporate tax code and some legislators will attempt to repeal and replace aspects of the Affordable Care Act. We expect a large infrastructure package to be announced, yet the lack of "shovel ready" projects and lag time related to these types of investments means there won't be a meaningful impact to the US economy in the short-term. Immigration reform will also be near the top of the President's agenda, but we fear his hardline policies may hinder US growth. If Mr. Trump is able to push through his agenda of tax reform, regulatory reform, and infrastructure spending we would expect markets to react favorably, which would be especially positive for small and midcap companies who are domestically focused and profitable. We expect market volatility to continue as details of his plans emerge and this should be beneficial to high quality equities. As always, we will continue to adhere to our high quality philosophy and the nature of our companies, specifically companies with high degrees of recurring revenue, earnings visibility and high organic growth rates. We believe these are exactly the types of companies investors should have exposure to in the current environment.
* For further detail about these holdings, please refer to the section entitled "Portfolios of investments." Fund holdings are as of the date given, are subject to change at any time, and are not recommendations to buy or sell any security.
26
US Growth Opportunities Fund
| Portfolio composition by country | | Portfolio composition by sector |
(as a % of long-term investments)
| | (as a % of long-term investments)
|
| | | |
| | |
Investment comparison
Value of $10,000
| Total returns as of January 31, 2017 | | | | | | | | | | Since |
| | | | NASDAQ | | | Six | | One | | inception |
| At NAV | | | symbol | | | months | | year | | (12/18/2014)* |
| Class A | | | HGRAX | | | 0.99 | % | | 10.08 | % | | 5.70 | % |
| Class C | | | HGRCX | | | 0.54 | | | 9.28 | | | 4.90 | |
| Class I | | | HGRIX | | | 1.07 | | | 10.34 | | | 5.97 | |
| Class R6** | | | HGRRX | | | 1.07 | | | 10.34 | | | 5.97 | |
| With sales charge | | | | | | | | | | | | | |
| Class A | | | | | | -4.82 | % | | 3.78 | % | | 2.80 | % |
| Class C | | | | | | -0.46 | | | 9.28 | | | 4.90 | |
| Index | | | | | | | | | | | | | |
| Russell 3000 Growth Index | | | | | | 4.54 | % | | 17.91 | % | | 7.44 | % |
* Average annual return
** Class R6 shares commenced operations on November 30, 2015. The performance for Class R6 shares for periods prior to November 30, 2015 is based on the performance of Class I shares. Performance for Class R6 shares would be similar because the shares are invested in the same portfolio of investments, and like Class I shares, Class R6 shares are not subject to a front-end sales charge or a distribution fee.
Performance data quoted represents past performance and is no guarantee of future results. Due to the Fund's relatively small asset base, performance may be impacted by portfolio turnover to a greater degree than it may be in the future. Performance results with sales charges reflect the deduction of the maximum front-end sales charge or the deduction of the applicable contingent deferred sales charge ("CDSC"). Class A shares are subject to a maximum front-end sales charge of 5.75%. Class C shares are subject to a CDSC of up to 1% on certain redemptions made within 12 months of purchase. Performance presented at Net Asset Value (NAV), which does not include a sales charge, would be lower if this charge were reflected. NAV is the value of one share of the Fund excluding any sales charges. Performance quoted is based on the transacted NAV at each period end, which may differ from the US Generally Accepted Accounting Principles ("GAAP")-adjusted NAV and the total return presented in the Financial Highlights. Current performance may be lower or higher than the performance data quoted. Investment return and principal value will fluctuate so that an investor's shares, when redeemed, may be worth more or less than original cost. As stated in the current prospectus, the Fund's annual operating expense ratios (gross) for Class A, C, I and R6 shares are 2.23%, 3.05%, 1.58% and 2.01%, respectively. However, the Fund's adviser has contractually agreed to waive its management fee and, if necessary, to reimburse other operating expenses (excluding Acquired Fund Fees and Expenses from underlying investment companies) in order to limit total annual ordinary operating expenses, less distribution and service fees, to 0.95% of the Fund's average daily net assets, which is in effect until July 31, 2020. For the most recent month-end performance, please call 1.866.443.6337 or visit the Funds' website at www.henderson.com.
Performance results also reflect expense subsidies and waivers in effect during periods shown. Absent these waivers, results would have been less favorable. All results assume the reinvestment of dividends and capital gains.
The investment comparison graph above reflects the change in value of a $10,000 hypothetical investment since the Fund's inception, including reinvested dividends and distributions, compared to a broad based securities market index. The Russell 3000 Growth Index comprises companies that display signs of above average growth. The Index is used to provide a gauge of the performance of growth stocks in the US. The Fund is professionally managed while the Index is unmanaged and not available for investment and does not include fees, expenses or other costs. Results in the table and graph do not reflect the deduction of taxes that a shareholder would pay on Fund distributions or the redemption of Fund shares.
27
| Portfolio of investments (unaudited) |
All Asset Fund
January 31, 2017
| | | | | | Value | |
| Shares | | | | | (note 2) | |
| | | | | | | |
| Investment companies – 58.45% | | | | |
| | | | | | | |
| | | Alternatives – 12.31% | | | | |
| 129,500 | | AQR Equity Market Neutral | | | | |
| | | Fund, Class R6 | | $ | 1,541,054 | |
| 158,342 | | AQR Managed Futures Strategy | | | | |
| | | Fund, Class R6 | | | 1,486,832 | |
| 186,847 | | ASG Global Alternatives Fund, | | | | |
| | | Class Y * | | | 1,922,651 | |
| 129,644 | | Sprott Physical Gold Trust * | | | 1,289,958 | |
| | | | | | 6,240,495 | |
| | | | | | | |
| | | Equity – 20.41% | | | | |
| 17,689 | | HarbourVest Global Private | | | | |
| | | Equity Ltd * | | | 265,920 | |
| 210,214 | | Henderson Emerging Markets | | | | |
| | | Fund, Class R6 (a) | | | 1,904,535 | |
| 222,825 | | Henderson Global Equity | | | | |
| | | Income Fund, Class R6 (a) | | | 1,611,023 | |
| 32,947 | | ICG Enterprise Trust plc | | | 289,509 | |
| 16,285 | | iShares Edge MSCI Minimum | | | | |
| | | Volatility EAFE ETF | | | 1,028,724 | |
| 25,919 | | iShares Edge MSCI Minimum | | | | |
| | | Volatility Emerging | | | | |
| | | Markets ETF | | | 1,314,871 | |
| 14,560 | | iShares Edge MSCI USA | | | | |
| | | Quality Factor ETF | | | 1,017,744 | |
| 10,438 | | iShares Russell 2000 | | | | |
| | | Value ETF | | | 1,230,953 | |
| 23,039 | | NB Private Equity Partners Ltd | | | 285,108 | |
| 9,861 | | Pantheon International plc * | | | 214,485 | |
| 80,324 | | PowerShares International | | | | |
| | | Dividend Achievers Portfolio | | | 1,189,599 | |
| | | | | | 10,352,471 | |
| | | | | | | |
| | | Fixed income – 25.73% | | | | |
| 180,473 | | Henderson High Yield | | | | |
| | | Opportunities Fund, | | | | |
| | | Class R6 (a) | | | 1,799,314 | |
| 139,946 | | Henderson Strategic Income | | | | |
| | | Fund, Class R6 (a) | | | 1,294,503 | |
| 17,329 | | iShares iBoxx Investment | | | | |
| | | Grade Corporate Bond Fund | | | 2,033,558 | |
| 9,184 | | iShares JP Morgan USD | | | | |
| | | Emerging Markets Bond Fund | | | 1,029,802 | |
| 19,770 | | iShares TIPS Bond ETF | | | 2,257,339 | |
| 25,843 | | PIMCO Enhanced Short | | | | |
| | | Maturity ETF | | | 2,623,581 | |
| 86,321 | | PowerShares Senior Loan | | | | |
| | | Portfolio | | | 2,011,279 | |
| | | | | | 13,049,376 | |
| | | Total investment companies | | | | |
| | | (Cost $29,407,670) | | | 29,642,342 | |
| | | | | | Value | |
| Shares | | | | | (note 2) | |
| | | | | | | |
| Partnerships – 2.78% | | | | |
| 2,482 | | U.S. Cities Fund LP (b) (c) | | $ | 1,412,183 | |
| | | Total partnerships | | | | |
| | | (Cost $1,227,144) | | | 1,412,183 | |
| | | Total long term investments | | | | |
| | | (Cost $30,634,814) | | | 31,054,525 | |
| | | | | | | |
| Short-term investment – 37.36% | | | | |
| 18,944,741 | | Fidelity Investments Money | | | | |
| | | Market Treasury Portfolio (d) | | | 18,944,741 | |
| | | Total short-term investment | | | | |
| | | (Cost $18,944,741) | | | 18,944,741 | |
| | | | | | | |
| Total investments – 98.59% | | | | |
| | | (Cost $49,579,555) | | | 49,999,266 | |
| | | | | | | |
| Financial Derivative Instruments (e) | | | | |
| (Cost or Premiums, net $0) – 0.75% | | | 383,190 | |
| Net other assets and liabilities – 0.66% | | | 330,315 | |
| Total net assets – 100.00% | | $ | 50,712,771 | |
| * | | Non-income producing security |
| (a) | | Affiliated holding, see note 4 to financial statements for further information. |
| (b) | | The security has been deemed illiquid according to the policies and procedures adopted by the Board of Trustees. |
| (c) | | Fair valued at January 31, 2017 as determined in good faith using procedures approved by the Board of Trustees. |
| (d) | | This short-term investment has been segregated for open futures contracts and forward foreign currency contracts at January 31, 2017. |
| (e) | | Information with respect to financial derivative instruments is disclosed in the following tables. |
| ETF | | Exchange-traded fund |
See notes to financial statements
28
| Portfolio of investments (unaudited) |
All Asset Fund
January 31, 2017 (continued)
(e) FINANCIAL DERIVATIVE INSTRUMENTS
EXCHANGE-TRADED OR CENTRALLY-CLEARED FINANCIAL DERIVATIVE INSTRUMENTS
FUTURES CONTRACTS
| | | | | | | | | | | | | Unrealized | |
| | | | | | | | | | Current | | | appreciation/ | |
| | | | Number of | | | Expiration | | | notional | | | (depreciation) | |
| | | | contracts | | | date | | | value | | | Asset | | | Liability | |
| EURO STOXX 50 Index (Long) | | | 89 | | | 3/17/17 | | $ | 3,107,081 | | $ | 38,224 | | $ | — | |
| FTSE 100 Index (Long) | | | 41 | | | 3/17/17 | | | 3,633,926 | | | 93,697 | | | — | |
| Nikkei 225 Index (Long) | | | 6 | | | 3/9/17 | | | 1,008,591 | | | 34,090 | | | — | |
| TOPIX Index (Long) | | | 19 | | | 3/9/17 | | | 2,552,741 | | | 60,043 | | | — | |
| US Treasury 10 Year Note (Long) | | | 29 | | | 3/22/17 | | | 3,609,594 | | | 11,703 | | | — | |
| Total | | | | | | | | | | | $ | 237,757 | | $ | — | |
During the period ended January 31, 2017, average monthly notional value related to futures contracts was approximately $10.6 million or 21.0% of net assets.
FINANCIAL DERIVATIVE INSTRUMENTS: EXCHANGE-TRADED OR CENTRALLY-CLEARED SUMMARY
The following is a summary of the value of exchange-traded or centrally-cleared financial derivative instruments as of January 31, 2017:
| | | Unrealized | | | | | Unrealized | | | | |
| | | Appreciation | | | | | Depreciation | | | | |
| | | Futures Contracts | | Total | | Futures Contracts | | Total | |
| Total Exchange-Traded or Centrally Cleared | | $ | 237,757 | | $ | 237,757 | | $ | — | | $ | — | |
OVER-THE-COUNTER FINANCIAL DERIVATIVE INSTRUMENTS
FORWARD FOREIGN CURRENCY CONTRACTS
| | | | | | | | | | | | | | | | Unrealized | |
| | | | | | | | | | Local | | | Current | | | appreciation/ | |
| | | | | | | Value | | | amount | | | notional | | | (depreciation) | |
| | | | Counterparty | | | date | | | (000's | ) | | value | | | Asset | | | Liability | |
| British Pound (Long) | | | BNP Paribas | | | | | | | | | | | | | | | | |
| | | | Securities Services | | | 2/22/17 | | | 2,455 | | $ | 3,089,853 | | $ | 95,424 | | $ | — | |
| Euro (Long) | | | BNP Paribas | | | | | | | | | | | | | | | | |
| | | | Securities Services | | | 2/22/17 | | | 1,397 | | | 1,508,773 | | | 21,584 | | | — | |
| Japanese Yen (Long) | | | BNP Paribas | | | | | | | | | | | | | | | | |
| | | | Securities Services | | | 2/22/17 | | | 409,160 | | | 3,625,660 | | | 28,425 | | | — | |
| Total | | | | | | | | | | | | | | $ | 145,433 | | $ | — | |
During the period ended January 31, 2017, average monthly notional value related to forward foreign currency contracts was approximately $5.3 million or 10.4% of net assets.
See notes to financial statements
29
| Portfolio of investments (unaudited) |
All Asset Fund
January 31, 2017 (continued)
FINANCIAL DERIVATIVE INSTRUMENTS: OVER-THE-COUNTER SUMMARY
The following is a summary by counterparty of the value of over-the-counter financial derivative instruments and collateral (received)/pledged as of January 31, 2017:
| | | | Financial Derivative Assets | | | Financial Derivative Liabilities | | | | | | | | | | |
| | | | Unrealized | | | | | | Unrealized | | | | | | | | | | | | | |
| | | | Appreciation | | | | | | Depreciation | | | | | | | | | | | | | |
| | | | Forward | | | | | | Forward | | | | | | | | | | | | | |
| | | | Foreign | | | Total | | | Foreign | | | Total | | | Net Value | | | Collateral | | | | |
| | | | Currency | | | Over-the- | | | Currency | | | Over-the- | | | of OTC | | | (Received) / | | | Net | |
| | | | Contracts | | | Counter | | | Contracts | | | Counter | | | Derivatives | | | Pledged | | | Exposure(1) | |
| Amounts subject to a master netting agreement: | | | | | | | | | | | | | | | | |
| BNP Paribas | | | | | | | | | | | | | | | | | | | | | | |
| Securities Services | | $ | 145,433 | | $ | 145,433 | | $ | — | | $ | — | | $ | 145,433 | | $ | — | | $ | 145,433 | |
| | | $ | 145,433 | | $ | 145,433 | | $ | — | | $ | — | | $ | 145,433 | | $ | — | | $ | 145,433 | |
(1) | | Net Exposure represents the net receivable/(payable) that would be due from/to the counterparty in the event of default. Exposure from over-the-counter financial derivative instruments can only be netted across transactions governed under the same master agreement with the same legal entity. See Note 2, Significant Accounting Policies, "Derivative instruments," in the Notes to Financial Statements for more information regarding master netting arrangements. |
| | Cost or Premiums, Net | | Asset | | Liability | |
| TOTAL FINANCIAL DERIVATIVE INSTRUMENTS | | $ | — | | | $ | 383,190 | | $ | — | |
Other information:
| Currency exposure of portfolio assets before | | | |
| any currency hedging, if applicable. | | | % of total |
| Excludes derivatives: | | | investments |
| US Dollar | | | 98 | % |
| British Pound | | | 2 | |
| | | | 100 | % |
See notes to financial statements
30
| Portfolio of investments (unaudited) |
All Asset Fund
January 31, 2017 (continued)
Fair Value Measurement
The following table summarizes the Fund's investments that are measured at fair value by level within the fair value hierarchy at January 31, 2017:
| | | Quoted prices | | Significant | | | | | | | |
| | | in active | | other | | Significant | | | | |
| | | markets for | | observable | | unobservable | | | | |
| | | identical assets | | inputs | | inputs | | | | |
| Description | | (level 1 | ) | (level 2 | ) | (level 3 | ) | | Total | |
| | | | | | | | | | | | | | |
| Assets | | | | | | | | | | | | | |
| Investment companies | | $ | 29,642,342 | | $ | — | | $ | — | | $ | 29,642,342 | |
| Partnerships | | | — | | | — | | | 1,412,183 | | | 1,412,183 | |
| Short-term investment | | | 18,944,741 | | | — | | | — | | | 18,944,741 | |
| Total Investments | | $ | 48,587,083 | | $ | — | | $ | 1,412,183 | | $ | 49,999,266 | |
| | | | | | | | | | | | | | |
| Financial Derivative Instruments – Assets | | | | | | | | | | | | | |
| Exchange-traded or centrally-cleared | | $ | 237,757 | | $ | — | | $ | — | | $ | 237,757 | |
| Over-the-counter | | | — | | | 145,433 | | | — | | | 145,433 | |
| Total Financial Derivative Instruments – Assets | | $ | 237,757 | | $ | 145,433 | | $ | — | | $ | 383,190 | |
During the period ended January 31, 2017, there were no transfers in or out of security levels.
Following is a reconciliation of investments in which significant unobservable inputs (Level 3) were used in determining fair value:
| | | | Balance | | | | | | | | Change in | | | | | | | | | | | | | | | Balance | |
| | | | as of | | | Accrued | | | | | unrealized | | | | | | | | Transfers | | Transfers | | | as of | |
| | | | July 31, | | | discounts/ | | | Realized | | appreciation | | | | | | | | | in to | | | out of | | January 31, | |
| Investments in securities | | | 2016 | | | premiums | | gain/(loss | ) | (depreciation | ) | | Purchases | | | Sales | | | level 3 | | | level 3 | | | 2017 | |
| Partnerships | | | | | | | | | | | | | | | | | | | | | | | | | | | | |
| U.S. Cities Fund LP | | $ | 2,020,258 | | $ | 0 | | $ | 75,876 | | $ | (42,901 | ) | $ | 0 | | $ | (641,050 | ) | $ | 0 | | $ | 0 | | $ | 1,412,183 | |
| | | $ | 2,020,258 | | $ | 0 | | $ | 75,876 | | $ | (42,901 | ) | $ | 0 | | $ | (641,050 | ) | $ | 0 | | $ | 0 | | $ | 1,412,183 | |
The total net change in unrealized appreciation/(depreciation) attributable to level 3 investments held at January 31,2017 was $(42,901).
The Fund's Advisor has determined that U.S. Cities Fund LP ("CF") (formerly "TIAA-CREF Asset Management Core Property Fund LP") is a Level 3 investment due to the lack of observable inputs that may be used in the determination of fair value. The CF is a private Delaware limited partnership that provides monthly liquidity to its investors with 45 days written notice and invests its contributed capital in a TIAA-CREF Real Estate Investment Trust (REIT). The REIT is a limited partnership which in turn invests in a TIAA-CREF operating partnership. The investments of the operating partnership include real property assets. As a result, the monthly valuations prepared by the CF and assignment of a net asset value per share are ultimately driven by changes in the valuation of the underlying real property assets in the operating partnership. All of the investments in real estate are appraised annually by an independent third-party appraiser. The CF's policy is to report all such investments, as well as related debt at fair value under US Generally Accepted Accounting Principles based on the appraised value. The annual appraisals are conducted on a rolling basis such that approximately 25% of the portfolio receives an annual full appraisal each quarter. In addition, each appraisal is updated quarterly under the direction of an independent, third-party appraisal firm.
The significant unobservable inputs used in the fair value measurement and appraisal of the real property assets include: a) an extensive market study, including a thorough analysis of current market conditions and trends as they impact supply, demand and absorption of the relevant property type; b) thorough description of the site and improvements, including a site plan and renderings of the improvements if available; c) estimate of the value of the land; d) estimate of the value of the property using a cost approach; e) estimate of the market value of the property using a sales comparison approach; and f) estimate of the value of the property using a detailed income capitalization approach that includes several diagnostic inputs. Significant changes in any of those inputs in isolation would result in a significant change in the fair value measurement, and ultimately the value ascribed to All Asset Fund's limited partnership interests in CF.
Due to the factors above, and consistent with a fair valuation policy approved by the Board of Trustees, the All Asset Fund values this investment monthly upon receipt of the limited partner statement and in-line with the capital balance allocated to its limited partnership interests, less the undistributed net income accrued within the capital balance. Separately, a daily income accrual is recognized by the Fund to account for the net income that is accrued and allocated to its limited partnership interests and distributed quarterly. The value assigned to the investment is revised monthly upon receipt of the limited partner statement. The value may be revised more frequently if, in the determination of the Advisor and/or the Board of Trustees, market or investment-specific developments warrant re-assessment.
See notes to financial statements
31
| Portfolio of investments (unaudited) |
All Asset Fund
January 31, 2017 (continued)
Fair Value of Financial Derivative Instruments
The following is a summary of the fair valuation of the Fund's financial derivative instruments categorized by risk exposure:
Fair Values of Financial Derivative Instruments on the Statement of Assets and Liabilities as of January 31, 2017
| | | | Derivatives not accounted for as hedging instruments |
| | | | Foreign | | | | | | | | | | | | | | | | |
| | | | Currency | | | Equity | | | Interest | | | Credit | | | Inflation | | | | |
| | | | Risk | | | Risk | | | Rate Risk | | | Risk | | | Risk | | | Total | |
| | | | | | | | | | | | | | | | | | | | |
| Financial Derivative Instruments – Assets | | | | | | | | | | | | | | | | | | | |
| Exchange-traded | | | | | | | | | | | | | | | | | | | |
| Futures Contracts | | $ | — | | $ | 226,054 | | $ | 11,703 | | $ | — | | $ | — | | $ | 237,757 | |
| Over-the-Counter | | | | | | | | | | | | | | | | | | | |
| Forward Foreign Currency Contracts | | $ | 145,433 | | $ | — | | $ | — | | $ | — | | $ | — | | $ | 145,433 | |
| Total | | $ | 145,433 | | $ | 226,054 | | $ | 11,703 | | $ | — | | $ | — | | $ | 383,190 | |
Effect of Financial Derivative Instruments on the Statement of Operations for the Period Ended January 31, 2017
| | | | Derivatives not accounted for as hedging instruments |
| | | | Foreign | | | | | | | | | | | | | | | | |
| | | | Currency | | | Equity | | | Interest | | | Credit | | | Inflation | | | | |
| | | | Risk | | | Risk | | | Rate Risk | | | Risk | | | Risk | | | Total | |
| | | | | | | | | | | | | | | | | | | | |
| Net realized gain/(loss) from | | | | | | | | | | | | | | | | | | | |
| financial derivative instruments: | | | | | | | | | | | | | | | | | | | |
| Futures Contracts | | $ | — | | $ | 1,096,029 | | $ | (75,443 | ) | $ | — | | $ | — | | $ | 1,020,586 | |
| Forward Foreign Currency Contracts | | $ | (227,788 | ) | $ | — | | $ | — | | $ | — | | $ | — | | $ | (227,788 | ) |
| Total | | $ | (227,788 | ) | $ | 1,096,029 | | $ | (75,443 | ) | $ | — | | $ | — | | $ | 792,798 | |
| | | | Derivatives not accounted for as hedging instruments |
| | | | Foreign | | | | | | | | | | | | | | | | |
| | | | Currency | | | Equity | | | Interest | | | Credit | | | Inflation | | | | |
| | | | Risk | | | Risk | | | Rate Risk | | | Risk | | | Risk | | | Total | |
| | | | | | | | | | | | | | | | | | | | |
| Net change in unrealized | | | | | | | | | | | | | | | | | | | |
| appreciation/(depreciation) | | | | | | | | | | | | | | | | | | | |
| of financial derivative instruments | | | | | | | | | | | | | | | | | | | |
| Futures Contracts | | $ | — | | $ | (273,269 | ) | $ | (6,781 | ) | $ | — | | $ | — | | $ | (280,050 | ) |
| Forward Foreign Currency Contracts | | $ | 74,153 | | $ | — | | $ | — | | $ | — | | $ | — | | $ | 74,153 | |
| Total | | $ | 74,153 | | $ | (273,269 | ) | $ | (6,781 | ) | $ | — | | $ | — | | $ | (205,897 | ) |
See notes to financial statements
32
| Portfolio of investments (unaudited) |
Dividend & Income Builder Fund
January 31, 2017
| | | | | | Value | |
| Shares | | | | | (note 2) | |
| | | | | | | |
| Common stocks – 79.92% | | | | |
| | | | | | | |
| | | Australia – 0.90% | | | | |
| 313,234 | | AMP, Ltd. | | $ | 1,187,784 | |
| | | | | | | |
| | | France – 5.72% | | | | |
| 45,746 | | AXA S.A. | | | 1,121,977 | |
| 311,087 | | Natixis S.A. | | | 1,841,964 | |
| 17,328 | | Nexity S.A. * | | | 850,355 | |
| 150,909 | | Orange S.A. | | | 2,333,632 | |
| 27,235 | | Total S.A. | | | 1,371,812 | |
| | | | | | 7,519,740 | |
| | | | | | | |
| | | Germany – 8.15% | | | | |
| 17,942 | | Bayer AG | | | 1,981,386 | |
| 15,100 | | Daimler AG | | | 1,130,436 | |
| 13,626 | | Deutsche Boerse AG * | | | 1,253,818 | |
| 61,523 | | Deutsche Post AG | | | 2,055,847 | |
| 107,892 | | Deutsche Telekom AG | | | 1,882,145 | |
| 19,144 | | Siemens AG | | | 2,402,416 | |
| | | | | | 10,706,048 | |
| | | | | | | |
| | | Hong Kong – 1.11% | | | | |
| 121,500 | | CK Hutchison Holdings, Ltd. | | | 1,463,374 | |
| | | | | | | |
| | | Israel – 0.92% | | | | |
| 692,024 | | Bezeq The Israeli | | | | |
| | | Telecommunication Corp, Ltd. | | | 1,207,974 | |
| | | | | | | |
| | | Italy – 1.45% | | | | |
| 456,503 | | Enel SpA | | | 1,904,159 | |
| | | | | | | |
| | | Japan – 4.39% | | | | |
| 43,300 | | Japan Tobacco, Inc. | | | 1,395,908 | |
| 34,500 | | Nippon Telegraph and | | | | |
| | | Telephone Corp. | | | 1,521,349 | |
| 118,800 | | Panasonic Corp. | | | 1,239,977 | |
| 27,700 | | Toyota Motor Corp. | | | 1,615,241 | |
| | | | | | 5,772,475 | |
| | | | | | | |
| | | Netherlands – 4.39% | | | | |
| 133,652 | | ING Groep N.V. | | | 1,911,674 | |
| 157,662 | | RELX N.V. | | | 2,659,314 | |
| 29,790 | | Unilever N.V. | | | 1,202,560 | |
| | | | | | 5,773,548 | |
| | | | | | | |
| | | Norway – 0.94% | | | | |
| 77,925 | | Telenor ASA | | | 1,233,868 | |
| | | | | | Value | |
| Shares | | | | | (note 2) | |
| | | | | | | |
| | | Portugal – 0.98% | | | | |
| 229,607 | | NOS SGPS S.A. | | $ | 1,291,106 | |
| | | | | | | |
| | | Sweden – 1.85% | | | | |
| 100,999 | | Nordea Bank AB | | | 1,220,472 | |
| 47,626 | | Swedbank AB, A Shares | | | 1,203,840 | |
| | | | | | 2,424,312 | |
| | | | | | | |
| | | Switzerland – 7.11% | | | | |
| 15,956 | | Cembra Money Bank AG * | | | 1,202,082 | |
| 41,209 | | Nestle S.A. | | | 3,010,874 | |
| 36,394 | | Novartis AG | | | 2,664,590 | |
| 10,442 | | Roche Holding AG | | | 2,458,679 | |
| | | | | | 9,336,225 | |
| | | | | | | |
| | | Taiwan – 1.35% | | | | |
| 57,277 | | Taiwan Semiconductor | | | | |
| | | Manufacturing Co., Ltd., ADR | | | 1,770,432 | |
| | | | | | | |
| | | United Kingdom – 19.00% | | | | |
| 27,074 | | AstraZeneca plc | | | 1,428,438 | |
| 161,209 | | BAE Systems plc | | | 1,180,301 | |
| 297,765 | | BP plc | | | 1,771,240 | |
| 20,142 | | British American Tobacco plc | | | 1,241,466 | |
| 34,517 | | Coca-Cola European | | | | |
| | | Partners plc | | | 1,191,872 | |
| 59,736 | | Diageo plc | | | 1,655,883 | |
| 425,054 | | GKN plc | | | 1,836,220 | |
| 61,253 | | Imperial Brands plc | | | 2,830,661 | |
| 524,359 | | ITV plc | | | 1,340,395 | |
| 106,448 | | National Grid plc | | | 1,242,297 | |
| 46,247 | | Nielsen Holdings plc | | | 1,891,965 | |
| 93,531 | | Prudential plc | | | 1,802,581 | |
| 78,156 | | Royal Dutch Shell plc, A Shares | | | 2,112,609 | |
| 418,524 | | Standard Life plc | | | 1,820,120 | |
| 659,584 | | Vodafone Group plc | | | 1,612,631 | |
| | | | | | 24,958,679 | |
| | | | | | | |
| | | United States – 21.66% | | | | |
| 23,922 | | Chevron Corp. | | | 2,663,715 | |
| 69,296 | | Cisco Systems, Inc. | | | 2,128,773 | |
| 43,756 | | General Electric Co. | | | 1,299,553 | |
| 31,860 | | General Motors Co. | | | 1,166,395 | |
| 10,373 | | Johnson & Johnson | | | 1,174,742 | |
| 23,359 | | JPMorgan Chase & Co. | | | 1,976,872 | |
| 20,203 | | Las Vegas Sands Corp. | | | 1,062,274 | |
| 58,023 | | Microsoft Corp. | | | 3,751,187 | |
| 99,439 | | Pfizer, Inc. | | | 3,155,200 | |
| 16,009 | | Philip Morris International, Inc. | | | 1,538,945 | |
| 14,138 | | Six Flags Entertainment Corp. | | | 842,342 | |
See notes to financial statements
33
| Portfolio of investments (unaudited) |
Dividend & Income Builder Fund
January 31, 2017 (continued)
| | | | | | Value | |
| Shares | | | | | (note 2) | |
| | | | | | | |
| | | United States (continued) | | | | |
| 42,859 | | Synchrony Financial | | $ | 1,535,209 | |
| 30,392 | | The Coca-Cola Co. | | | 1,263,396 | |
| 14,583 | | United Parcel Service, Inc., | | | | |
| | | Class B | | | 1,591,443 | |
| 26,921 | | Verizon Communications, Inc. | | | 1,319,398 | |
| 35,446 | | Wells Fargo & Co. | | | 1,996,673 | |
| | | | | | 28,466,117 | |
| | | | | | | |
| | | Total common stocks | | | | |
| | | (Cost $103,024,342) | | | 105,015,841 | |
| | Face | | | | | | | | Value | |
| | amount | | | Coupon | | Maturity | | | (note 2) | |
| | | | | | | | | | | |
| Corporate bonds – 13.92% | | | | | | | |
| | | | | | | | | | | |
| | | | Germany – 0.39% | | | | | | | |
| USD | 500,000 | | Unitymedia Hessen GmbH & Co. KG (a) | 5.000% | | 1/15/25 | | $ | 510,000 | |
| | | | | | | | | | | |
| | | | Ireland – 0.46% | | | | | | | |
| USD | 600,000 | | Ardagh Packaging Finance plc/Ardagh MP Holding USA, Inc. (a) | 4.625% | | 5/15/23 | | | 607,875 | |
| | | | | | | | | | | |
| | | | Netherlands – 0.21% | | | | | | | |
| USD | 250,000 | | Deutsche Telekom International Finance B.V. (a) | 4.875% | | 3/6/42 | | | 268,396 | |
| | | | | | | | | | | |
| | | | Spain – 0.27% | | | | | | | |
| USD | 366,000 | | BBVA International Preferred SAU (b) | 5.919% | | 4/18/17 | | | 359,870 | |
| | | | | | | | | | | |
| | | | United Kingdom – 3.32% | | | | | | | |
| USD | 1,000,000 | | Barclays Bank plc (b) | 6.278% | | 12/15/34 | | | 1,058,750 | |
| USD | 1,000,000 | | International Game Technology plc (a) | 6.250% | | 2/15/22 | | | 1,070,620 | |
| USD | 546,000 | | Lloyds Banking Group plc (a) (b) | 6.657% | | 5/21/37 | | | 596,505 | |
| USD | 100,000 | | Prudential plc (b) | 6.500% | | 3/23/17 | | | 101,750 | |
| USD | 500,000 | | Royal Bank of Scotland Group plc | 6.100% | | 6/10/23 | | | 529,300 | |
| USD | 1,000,000 | | Virgin Media Secured Finance plc (a) | 5.250% | | 1/15/26 | | | 1,007,120 | |
| | | | | | | | | | 4,364,045 | |
See notes to financial statements
34
| Portfolio of investments (unaudited) |
Dividend & Income Builder Fund
January 31, 2017 (continued)
| | Face | | | | | | | | Value | |
| | amount | | | Coupon | | Maturity | | | (note 2) | |
| | | | | | | | | | | |
| | | | United States – 9.27% | | | | | | | |
| USD | 1,000,000 | | Altice US Finance I Corp. (a) | 5.500% | | 5/15/26 | | $ | 1,027,500 | |
| USD | 715,000 | | Aramark Services, Inc. | 5.125% | | 1/15/24 | | | 744,787 | |
| USD | 291,000 | | Aramark Services, Inc. (a) | 4.750% | | 6/1/26 | | | 290,563 | |
| USD | 500,000 | | Ball Corp. | 5.250% | | 7/1/25 | | | 527,500 | |
| USD | 147,000 | | Ball Corp. | 4.000% | | 11/15/23 | | | 146,449 | |
| USD | 574,000 | | Berry Plastics Corp. | 5.125% | | 7/15/23 | | | 590,187 | |
| USD | 1,000,000 | | CCO Holdings LLC (a) | 5.875% | | 5/1/27 | | | 1,063,440 | |
| USD | 1,000,000 | | Crown Americas LLC | 4.500% | | 1/15/23 | | | 1,026,250 | |
| USD | 600,000 | | CSC Holdings LLC (a) | 6.625% | | 10/15/25 | | | 656,250 | |
| USD | 810,000 | | Diamond 1 Finance Corp. (a) | 8.100% | | 7/15/36 | | | 980,765 | |
| USD | 600,000 | | Equinix, Inc. | 5.375% | | 4/1/23 | | | 630,798 | |
| USD | 100,000 | | HBOS Capital Funding LP (b) | 6.850% | | 3/23/17 | | | 101,900 | |
| USD | 250,000 | | HCA, Inc. | 5.250% | | 6/15/26 | | | 261,250 | |
| USD | 200,000 | | Sealed Air Corp. (a) | 5.250% | | 4/1/23 | | | 209,500 | |
| USD | 200,000 | | Service Corp. International | 8.000% | | 11/15/21 | | | 234,500 | |
| USD | 700,000 | | Service Corp. International | 5.375% | | 5/15/24 | | | 736,750 | |
| USD | 1,000,000 | | Sirius XM Radio, Inc. (a) | 6.000% | | 7/15/24 | | | 1,066,880 | |
| USD | 600,000 | | T-Mobile USA, Inc. | 6.000% | | 3/1/23 | | | 636,000 | |
| USD | 210,000 | | Verizon Communications, Inc. | 6.550% | | 9/15/43 | | | 259,912 | |
| USD | 1,000,000 | | Wachovia Capital Trust III (b) | 5.570% | | 3/1/17 | | | 988,750 | |
| | | | | | | | | | 12,179,931 | |
| | | | | | | | | | | |
| | | | Total corporate bonds | | | | | | | |
| | | | (Cost $18,015,876) | | | | | | 18,290,117 | |
See notes to financial statements
35
| Portfolio of investments (unaudited) |
Dividend & Income Builder Fund
January 31, 2017 (continued)
| | | | | | Value | |
| Shares | | | | | (note 2) | |
| | | | | | | |
| Preferred stock – 0.99% | | | | |
| | | | | | | |
| | | Korea – 0.99% | | | | |
| 964 | | Samsung Electronics Co., Ltd. | | $ | 1,303,196 | |
| | | | | | | |
| | | Total preferred stock | | | | |
| | | (Cost $1,148,309) | | | 1,303,196 | |
| | | | | | | |
| REITs – 3.13% | | | | |
| | | | | | | |
| | | France – 0.85% | | | | |
| 15,856 | | ICADE | | | 1,121,476 | |
| | | | | | | |
| | | Netherlands – 0.72% | | | | |
| 25,452 | | Eurocommercial Properties N.V. | | | 943,232 | |
| | | | | | | |
| | | United States – 1.56% | | | | |
| 12,786 | | Crown Castle International | | | | |
| | | Corp. | | | 1,122,994 | |
| 25,742 | | Iron Mountain, Inc. | | | 921,564 | |
| | | | | | 2,044,558 | |
| | | | | | | |
| | | Total REITs | | | | |
| | | (Cost $4,195,759) | | | 4,109,266 | |
| | | | | | Value | |
| Shares | | | | | (note 2) | |
| | | | | | | |
| Partnerships – 1.11% | | | | |
| | | | | | | |
| | | United States – 1.11% | | | | |
| 47,739 | | The Blackstone Group L.P. | | $ | 1,462,245 | |
| | | | | | | |
| | | Total partnerships | | | | |
| | | (Cost $1,228,534) | | | 1,462,245 | |
| | | | | | | |
| | | Total long-term investments | | | | |
| | | (Cost $127,612,820) | | | 130,180,665 | |
| | | | | | | |
| Short-term investment – 0.39% | | | | |
| 514,000 | | Fidelity Investments Money | | | | |
| | | Market Treasury Portfolio | | | 514,000 | |
| | | | | | | |
| | | Total short-term investment | | | | |
| | | (Cost $514,000) | | | 514,000 | |
| | | | | | | |
| Total investments – 99.46% | | | | |
| | | (Cost $128,126,820) | | | 130,694,665 | |
| | | | | | | |
| Financial Derivative Instruments (c) | | | | |
(Cost or Premiums, net $0) – (0.24)% | | | (310,663 | ) |
| Net other assets and liabilities – 0.78% | | | 1,019,502 | |
| Total net assets – 100.00% | | $ | 131,403,504 | |
| * | | Non-income producing security |
| (a) | | Restricted security, purchased pursuant to Rule 144A under the Securities Act of 1933, as amended, and which is exempt from registration under that Act. At January 31, 2017, the restricted securities held by the Fund had an aggregate value of $9,355,414, which represented 7.1% of net assets. |
| (b) | | Maturity date is perpetual. Maturity date presented represents the next call date. |
| (c) | | Information with respect to financial derivative instruments is disclosed in the following tables. |
| | | |
| ADR | | American Depositary Receipt |
| REIT | | Real Estate Investment Trust |
See notes to financial statements
36
| Portfolio of investments (unaudited) |
Dividend & Income Builder Fund
January 31, 2017 (continued)
(c) FINANCIAL DERIVATIVE INSTRUMENTS
OVER-THE-COUNTER FINANCIAL DERIVATIVE INSTRUMENTS
FORWARD FOREIGN CURRENCY CONTRACTS
| | | | | | | | | | | | | | | | Unrealized | |
| | | | | | | | | | Local | | | Current | | | appreciation/ | |
| | | | | | | Value | | | amount | | | notional | | | (depreciation) | |
| | | | Counterparty | | | date | | | (000's | ) | | value | | | Asset | | | Liability | |
| British Pound (Short) | | | BNP Paribas | | | | | | | | | | | | | | | | |
| | | | Securities Services | | | 2/22/17 | | | 5,278 | | $ | 6,641,785 | | $ | — | | $ | (202,768 | ) |
| Euro (Short) | | | BNP Paribas | | | | | | | | | | | | | | | | |
| | | | Securities Services | | | 2/22/17 | | | 7,099 | | | 7,669,210 | | | — | | | (107,895 | ) |
| Total | | | | | | | | | | | | | | $ | — | | $ | (310,663 | ) |
During the period ended January 31, 2017, average monthly notional value related to forward foreign currency contracts was approximately $12.1 million or 9.2% of net assets.
FINANCIAL DERIVATIVE INSTRUMENTS: OVER-THE-COUNTER SUMMARY
The following is a summary by counterparty of the value of over-the-counter financial derivative instruments and collateral (received)/pledged as of January 31, 2017:
| | | | Financial Derivative Assets | | | Financial Derivative Liabilities | | | | | | | | | | |
| | | | Unrealized | | | | | | Unrealized | | | | | | | | | | | | | |
| | | | Appreciation | | | | | | Depreciation | | | | | | | | | | | | | |
| | | | Forward | | | | | | Forward | | | | | | | | | | | | | |
| | | | Foreign | | | Total | | | Foreign | | | Total | | | Net Value | | | Collateral | | | | |
| | | | Currency | | | Over-the- | | | Currency | | | Over-the- | | | of OTC | | | (Received)/ | | | Net | |
| | | | Contracts | | | Counter | | | Contracts | | | Counter | | | Derivatives | | | Pledged | | | Exposure(1) | |
| Amounts subject to a master netting agreement: | | | | | | | | | | | | | | | | |
| BNP Paribas | | | | | | | | | | | | | | | | | | | | | | |
| Securities Services | | $ | — | | $ | — | | $ | (310,663 | ) | $ | (310,663 | ) | $ | (310,663 | ) | $ | — | | $ | (310,663 | ) |
| | | $ | — | | $ | — | | $ | (310,663 | ) | $ | (310,663 | ) | $ | (310,663 | ) | $ | — | | $ | (310,663 | ) |
(1) | | Net Exposure represents the net receivable/(payable) that would be due from/to the counterparty in the event of default. Exposure from over-the-counter financial derivative instruments can only be netted across transactions governed under the same master agreement with the same legal entity. See Note 2, Significant Accounting Policies, "Derivative instruments," in the Notes to Financial Statements for more information regarding master netting arrangements. |
| | Cost or Premiums, Net | | Asset | | Liability | |
| TOTAL FINANCIAL DERIVATIVE INSTRUMENTS | | $ | — | | | $ | — | | $ | (310,663 | ) |
Other information:
| Currency exposure of portfolio assets before | |
| any currency hedging, if applicable. | % of total |
| Excludes derivatives: | investments |
| US Dollar | 43 | % |
| Euro | 24 | |
| British Pound | 15 | |
| Swiss Franc | 7 | |
| Japanese Yen | 4 | |
| Swedish Krona | 2 | |
| Hong Kong Dollar | 1 | |
| Korean Won | 1 | |
| Currency exposure of portfolio assets before | | |
| any currency hedging, if applicable. | % of total |
| Excludes derivatives: | investments |
| Norwegian Krone | 1 | % |
| Israeli Shekel | 1 | |
| Australian Dollar | 1 | |
| | 100 | % |
See notes to financial statements
37
| Portfolio of investments (unaudited) |
Dividend & Income Builder Fund
January 31, 2017 (continued)
| Industry concentration as | % of net |
| a percentage of net assets: | assets |
| | | |
| Pharmaceuticals | 9.79 | % |
| Diversified Banks | 7.96 | |
| Integrated Telecommunication Services | 7.23 | |
| Integrated Oil & Gas | 6.03 | |
| Tobacco | 5.33 | |
| Industrial Conglomerates | 3.93 | |
| Automobile Manufacturers | 2.98 | |
| Systems Software | 2.85 | |
| Life & Health Insurance | 2.83 | |
| Air Freight & Logistics | 2.78 | |
| Other Diversified Financial Services | 2.41 | |
| Packaged Foods & Meats | 2.29 | |
| Consumer Finance | 2.08 | |
| Specialized REITs | 2.04 | |
| Publishing | 2.02 | |
| Cable TV | 1.98 | |
| Soft Drinks | 1.87 | |
| Metal & Glass Containers | 1.74 | |
| Wireless Telecommunication Services | 1.71 | |
| Communications Equipment | 1.62 | |
| Cable & Satellite | 1.48 | |
| Electric Utilities | 1.45 | |
| Research & Consulting Services | 1.44 | |
| Auto Parts & Equipment | 1.40 | |
| Semiconductors | 1.35 | |
| Distillers & Vintners | 1.26 | |
| Asset Management & Custody Banks | 1.11 | |
| Broadcasting | 1.02 | |
| Technology Hardware, Storage & Peripherals | 0.99 | |
| Industry concentration as | % of net |
| a percentage of net assets: | assets |
| | | |
| Financial Exchanges & Data | 0.95 | % |
| Multi-Utilities | 0.95 | |
| Consumer Electronics | 0.94 | |
| Personal Products | 0.92 | |
| Aerospace & Defense | 0.90 | |
| Multi-line Insurance | 0.85 | |
| Diversified REITs | 0.85 | |
| Gambling (Non-Hotel) | 0.82 | |
| Radio | 0.81 | |
| Casinos & Gaming | 0.81 | |
| Food-Catering | 0.79 | |
| Telecommunication Services | 0.77 | |
| Super-Regional Banks-US | 0.75 | |
| Specialized Finance | 0.75 | |
| Funeral Services & Related Items | 0.74 | |
| Retail REITs | 0.72 | |
| Real Estate Development | 0.65 | |
| Leisure Facilities | 0.64 | |
| Containers - Metal/Glass | 0.46 | |
| Telephone-Integrated | 0.40 | |
| Money Center Banks | 0.27 | |
| Medical-Hospitals | 0.20 | |
| Paper Packaging | 0.16 | |
| Total Long-Term Investments | 99.07 | |
| Short-Term Investment | 0.39 | |
| Total Investments | 99.46 | |
| Financial Derivative Instruments | (0.24 | ) |
| Net Other Assets and Liabilities | 0.78 | |
| | 100.00 | % |
See notes to financial statements
38
| Portfolio of investments (unaudited) |
Dividend & Income Builder Fund
January 31, 2017 (continued)
Fair Value Measurement
The following table summarizes the Fund's investments that are measured at fair value by level within the fair value hierarchy at January 31, 2017:
| | | | Quoted prices | | | Significant | | | | | | | |
| | | | in active | | | other | | | Significant | | | | |
| | | | markets for | | | observable | | | unobservable | | | | |
| | | | identical assets | | | inputs | | | inputs | | | | |
| Description | | | (level 1 | ) | | (level 2 | ) | | (level 3 | ) | | Total | |
| | | | | | | | | | | | | | |
| Assets | | | | | | | | | | | | | |
| | | | | | | | | | | | | | |
| Common stocks | | | | | | | | | | | | | |
| Australia | | $ | 1,187,784 | | $ | — | | $ | — | | $ | 1,187,784 | |
| France | | | 7,519,740 | | | — | | | — | | | 7,519,740 | |
| Germany | | | 10,706,048 | | | — | | | — | | | 10,706,048 | |
| Hong Kong | | | 1,463,374 | | | — | | | — | | | 1,463,374 | |
| Israel | | | 1,207,974 | | | — | | | — | | | 1,207,974 | |
| Italy | | | 1,904,159 | | | — | | | — | | | 1,904,159 | |
| Japan | | | 5,772,475 | | | — | | | — | | | 5,772,475 | |
| Netherlands | | | 5,773,548 | | | — | | | — | | | 5,773,548 | |
| Norway | | | 1,233,868 | | | — | | | — | | | 1,233,868 | |
| Portugal | | | 1,291,106 | | | — | | | — | | | 1,291,106 | |
| Sweden | | | 2,424,312 | | | — | | | — | | | 2,424,312 | |
| Switzerland | | | 9,336,225 | | | — | | | — | | | 9,336,225 | |
| Taiwan | | | 1,770,432 | | | — | | | — | | | 1,770,432 | |
| United Kingdom | | | 24,958,679 | | | — | | | — | | | 24,958,679 | |
| United States | | | 28,466,117 | | | — | | | — | | | 28,466,117 | |
| Total Common stocks | | | 105,015,841 | | | — | | | — | | | 105,015,841 | |
| | | | | | | | | | | | | | |
| Corporate bonds | | | | | | | | | | | | | |
| Germany | | | — | | | 510,000 | | | — | | | 510,000 | |
| Ireland | | | — | | | 607,875 | | | — | | | 607,875 | |
| Netherlands | | | — | | | 268,396 | | | — | | | 268,396 | |
| Spain | | | — | | | 359,870 | | | — | | | 359,870 | |
| United Kingdom | | | — | | | 4,364,045 | | | — | | | 4,364,045 | |
| United States | | | — | | | 12,179,931 | | | — | | | 12,179,931 | |
| Total Corporate bonds | | | — | | | 18,290,117 | | | — | | | 18,290,117 | |
| | | | | | | | | | | | | | |
| Preferred stock | | | | | | | | | | | | | |
| Korea | | | 1,303,196 | | | — | | | — | | | 1,303,196 | |
| Total Preferred stock | | | 1,303,196 | | | — | | | — | | | 1,303,196 | |
| | | | | | | | | | | | | | |
| REITs | | | | | | | | | | | | | |
| France | | | 1,121,476 | | | — | | | — | | | 1,121,476 | |
| Netherlands | | | 943,232 | | | — | | | — | | | 943,232 | |
| United States | | | 2,044,558 | | | — | | | — | | | 2,044,558 | |
| Total REITs | | | 4,109,266 | | | — | | | — | | | 4,109,266 | |
| | | | | | | | | | | | | | |
| Partnerships | | | | | | | | | | | | | |
| United States | | | 1,462,245 | | | — | | | — | | | 1,462,245 | |
| Total Partnerships | | | 1,462,245 | | | — | | | — | | | 1,462,245 | |
| Short-term investment | | | 514,000 | | | — | | | — | | | 514,000 | |
| Total Short-term investment | | | 514,000 | | | — | | | — | | | 514,000 | |
| Total Investments | | $ | 112,404,548 | | $ | 18,290,117 | | $ | — | | $ | 130,694,665 | |
See notes to financial statements
39
| Portfolio of investments (unaudited) |
Dividend & Income Builder Fund
January 31, 2017 (continued)
Fair Value Measurements (continued)
| | | | Quoted prices | | | Significant | | | | | | | |
| | | | in active | | | other | | | Significant | | | | |
| | | | markets for | | | observable | | | unobservable | | | | |
| | | | identical assets | | | inputs | | | inputs | | | | |
| Description | | | (level 1 | ) | | (level 2 | ) | | (level 3 | ) | | Total | |
| | | | | | | | | | | | | | |
| Liabilities | | | | | | | | | | | | | |
| | | | | | | | | | | | | | |
| Financial Derivative Instruments – Liabilities | | | | | | | | | | | | | |
| Over-the-counter | | $ | — | | $ | (310,663 | ) | $ | — | | $ | (310,663 | ) |
| Total Financial Derivative Instruments – Liabilities | | $ | — | | $ | (310,663 | ) | $ | — | | $ | (310,663 | ) |
During the period ended January 31, 2017, there were no transfers in or out of security levels.
Fair Value of Financial Derivative Instruments
The following is a summary of the fair valuation of the Fund's financial derivative instruments categorized by risk exposure:
Fair Values of Financial Derivative Instruments on the Statement of Assets and Liabilities as of January 31, 2017
| | | | Derivatives not accounted for as hedging instruments |
| | | | Foreign | | | | | | | | | | | | | | | | |
| | | | Currency | | | Equity | | | Interest | | | Credit | | | Inflation | | | | |
| | | | Risk | | | Risk | | | Rate Risk | | | Risk | | | Risk | | | Total | |
| | | | | | | | | | | | | | | | | | | | |
| Financial Derivative Instruments – Liabilities | | | | | | | | | | | | | | | | | | | |
| Over-the-Counter | | | | | | | | | | | | | | | | | | | |
| Forward Foreign Currency Contracts | | $ | (310,663 | ) | $ | — | | $ | — | | $ | — | | $ | — | | $ | (310,663 | ) |
| Total | | $ | (310,663 | ) | $ | — | | $ | — | | $ | — | | $ | — | | $ | (310,663 | ) |
Effect of Financial Derivative Instruments on the Statement of Operations for the Period Ended January 31, 2017
| | | | Derivatives not accounted for as hedging instruments |
| | | | Foreign | | | | | | | | | | | | | | | | |
| | | | Currency | | | Equity | | | Interest | | | Credit | | | Inflation | | | | |
| | | | Risk | | | Risk | | | Rate Risk | | | Risk | | | Risk | | | Total | |
| | | | | | | | | | | | | | | | | | | | |
| Net realized gain/(loss) from | | | | | | | | | | | | | | | | | | | |
| financial derivative instruments: | | | | | | | | | | | | | | | | | | | |
| Forward Foreign Currency Contracts | | $ | 894,315 | | $ | — | | $ | — | | $ | — | | $ | — | | $ | 894,315 | |
| Total | | $ | 894,315 | | $ | — | | $ | — | | $ | — | | $ | — | | $ | 894,315 | |
| | | | | | | | | | | | | | | | | | | | |
| Net change in unrealized | | | | | | | | | | | | | | | | | | | |
| appreciation/(depreciation) | | | | | | | | | | | | | | | | | | | |
| of financial derivative instruments | | | | | | | | | | | | | | | | | | | |
| Forward Foreign Currency Contracts | | $ | (184,280 | ) | $ | — | | $ | — | | $ | — | | $ | — | | $ | (184,280 | ) |
| Total | | $ | (184,280 | ) | $ | — | | $ | — | | $ | — | | $ | — | | $ | (184,280 | ) |
See notes to financial statements
40
| Portfolio of investments (unaudited) |
Emerging Markets Fund
January 31, 2017
| | | | | | Value | |
| Shares | | | | | (note 2) | |
| | | | | | | |
| Common stocks – 93.17% | | | | |
| | | | | | | |
| | | Australia – 3.05% | | | | |
| 145,989 | | Newcrest Mining, Ltd. | | $ | 2,383,760 | |
| | | | | | | |
| | | Brazil – 11.44% | | | | |
| 181,867 | | Banco Bradesco S.A. | | | 1,854,973 | |
| 910,394 | | Duratex S.A. * | | | 2,178,405 | |
| 68,205 | | Engie Brasil Energia S.A. | | | 774,885 | |
| 285,886 | | Mahle-Metal Leve S.A. | | | 1,929,737 | |
| 96,760 | | Natura Cosmeticos S.A. | | | 775,959 | |
| 282,734 | | WEG S.A. | | | 1,427,532 | |
| | | | | | 8,941,491 | |
| | | | | | | |
| | | Chile – 11.50% | | | | |
| 84,209 | | Antofagasta plc | | | 884,556 | |
| 102,015 | | Cia Cervecerias Unidas | | | | |
| | | S.A., ADR | | | 2,304,519 | |
| 23,956,771 | | Cia Sud Americana de | | | | |
| | | Vapores S.A. * | | | 718,435 | |
| 116,133 | | Empresa Nacional de | | | | |
| | | Telecomunicaciones S.A. * | | | 1,256,455 | |
| 1,319,048 | | Inversiones Aguas | | | | |
| | | Metropolitanas S.A. | | | 1,899,535 | |
| 700,560 | | Quinenco S.A. (a) | | | 1,922,672 | |
| | | | | | 8,986,172 | |
| | | | | | | |
| | | China – 7.42% | | | | |
| 316,800 | | China Mengniu Dairy Co., Ltd. | | | 591,773 | |
| 286,000 | | China Resources Gas | | | | |
| | | Group, Ltd. | | | 906,068 | |
| 627,600 | | Fuyao Glass Industry Group | | | | |
| | | Co., Ltd. (b) | | | 1,854,825 | |
| 420,500 | | Stella International | | | | |
| | | Holdings, Ltd. | | | 640,108 | |
| 1,767,000 | | Uni-President China | | | | |
| | | Holdings, Ltd. | | | 1,350,046 | |
| 125,300 | | Yue Yuen Industrial | | | | |
| | | Holdings, Ltd. | | | 459,075 | |
| | | | | | 5,801,895 | |
| | | | | | | |
| | | Czech Republic – 1.20% | | | | |
| 26,403 | | Komercni banka AS | | | 933,509 | |
| | | | | | | |
| | | Egypt – 0.91% | | | | |
| 179,570 | | Commercial International Bank | | | | |
| | | Egypt SAE, GDR | | | 713,791 | |
| | | | | | Value | |
| Shares | | | | | (note 2) | |
| | | | | | | |
| | | India – 13.46% | | | | |
| 8,964 | | Aditya Birla Nuvo, Ltd. | | $ | 179,227 | |
| 263,785 | | City Union Bank, Ltd. | | | 575,237 | |
| 15,430 | | Cognizant Technology | | | | |
| | | Solutions Corp., Class A * | | | 811,464 | |
| 13,787 | | Dr Reddy's Laboratories, Ltd. | | | 612,485 | |
| 57,170 | | Grasim Industries, Ltd. | | | 766,817 | |
| 111,510 | | Housing Development | | | | |
| | | Finance Corp., Ltd. | | | 2,243,513 | |
| 849,400 | | Idea Cellular, Ltd. | | | 1,379,046 | |
| 590,611 | | IDFC Bank, Ltd. | | | 522,318 | |
| 260,544 | | IDFC, Ltd. * | | | 211,216 | |
| 77,805 | | Infosys, Ltd. | | | 1,065,841 | |
| 21,932 | | Mahindra & Mahindra, Ltd. | | | 401,707 | |
| 1,007,640 | | Tata Power Co., Ltd. | | | 1,182,226 | |
| 55,586 | | Tech Mahindra, Ltd. | | | 371,966 | |
| 3,688 | | UltraTech Cement, Ltd. | | | 200,314 | |
| | | | | | 10,523,377 | |
| | | | | | | |
| | | Indonesia – 1.14% | | | | |
| 697,400 | | Hero Supermarket Tbk PT (a) * | | | 69,335 | |
| 3,778,775 | | XL Axiata Tbk PT * | | | 823,534 | |
| | | | | | 892,869 | |
| | | | | | | |
| | | Kazakhstan – —% | | | | |
| 955,965 | | International Petroleum, | | | | |
| | | Ltd. (a) (c) * | | | — | |
| | | | | | | |
| | | Korea – 3.60% | | | | |
| 23,911 | | LG Corp. | | | 1,218,080 | |
| 1,315 | | LG Household & Health | | | | |
| | | Care, Ltd. | | | 994,652 | |
| 2,602 | | Samsung Fire & Marine | | | | |
| | | Insurance Co., Ltd. | | | 602,305 | |
| | | | | | 2,815,037 | |
| | | | | | | |
| | | Mexico – 2.64% | | | | |
| 415,981 | | Genomma Lab Internacional | | | | |
| | | S.A.B de C.V., Class B * | | | 433,266 | |
| 915,354 | | Grupo Herdez SAB de CV | | | 1,626,291 | |
| | | | | | 2,059,557 | |
| | | | | | | |
| | | Netherlands – 1.95% | | | | |
| 21,733 | | Heineken Holding N.V. | | | 1,524,481 | |
| | | | | | | |
| | | Nigeria – 3.18% | | | | |
| 512,000 | | Guaranty Trust Bank plc | | | 39,720 | |
| 252,627 | | Guaranty Trust Bank plc, GDR | | | 884,194 | |
| 408,542 | | PZ Cussons plc | | | 1,564,964 | |
| | | | | | 2,488,878 | |
See notes to financial statements
41
| Portfolio of investments (unaudited) |
Emerging Markets Fund
January 31, 2017 (continued)
| | | | | | Value | |
| Shares | | | | | (note 2) | |
| | | | | | | |
| | | Philippines – 0.98% | | | | |
| 1,260,200 | | Manila Water Co., Inc. | | $ | 763,489 | |
| | | | | | | |
| | | Poland – 1.19% | | | | |
| 27,560 | | Bank Pekao S.A. | | | 931,123 | |
| | | | | | | |
| | | South Africa – 12.11% | | | | |
| 623,896 | | African Oxygen, Ltd. (a) | | | 879,705 | |
| 288,849 | | Grindrod, Ltd. | | | 303,318 | |
| 668,885 | | Nampak, Ltd. * | | | 928,249 | |
| 32,865 | | Pioneer Foods Group, Ltd. | | | 404,599 | |
| 134,610 | | Shoprite Holdings, Ltd. | | | 1,788,140 | |
| 232,546 | | Standard Bank Group, Ltd. | | | 2,483,712 | |
| 88,951 | | Tiger Brands, Ltd. | | | 2,677,508 | |
| | | | | | 9,465,231 | |
| | | | | | | |
| | | Taiwan – 10.83% | | | | |
| 63,000 | | Asustek Computer, Inc. | | | 551,957 | |
| 178,000 | | Chroma ATE, Inc. | | | 466,234 | |
| 216,465 | | Delta Electronics, Inc. | | | 1,215,791 | |
| 293,000 | | Merida Industry Co., Ltd. | | | 1,535,240 | |
| 872,001 | | Standard Foods Corp. | | | 2,144,183 | |
| 1,492,280 | | Uni-President Enterprises Corp. | | | 2,553,293 | |
| | | | | | 8,466,698 | |
| | | | | | | |
| | | Thailand – 3.43% | | | | |
| 524,800 | | Delta Electronics Thailand pcl | | | 1,278,092 | |
| 116,900 | | Kasikornbank pcl | | | 622,515 | |
| 968,400 | | Mega Lifesciences pcl | | | 776,975 | |
| | | | | | 2,677,582 | |
| | | | | | | |
| | | Turkey – 0.31% | | | | |
| 61,261 | | Yazicilar Holding AS, Class A | | | 241,430 | |
| | | | | | | |
| | | United Kingdom – 2.83% | | | | |
| 246,788 | | Cairn Energy plc * | | | 704,121 | |
| 37,134 | | Unilever plc | | | 1,507,712 | |
| | | | | | 2,211,833 | |
| | | | | | | |
| | | Total common stocks | | | | |
| | | (Cost $68,828,949) | | | 72,822,203 | |
| | | | | | Value | |
| Shares | | | | | (note 2) | |
| | | | | | | |
| Preferred stock – 1.15% | | | | |
| | | | | | | |
| | | Chile – 1.15% | | | | |
| 255,530 | | Embotelladora Andina S.A. | | $ | 902,152 | |
| | | | | | | |
| | | Total preferred stock | | | | |
| | | (Cost $793,094) | | | 902,152 | |
| | | | | | | |
| | | Total long-term investments | | | | |
| | | (Cost $69,622,043) | | | 73,724,355 | |
| | | | | | | |
| Short-term investment – 5.87% | | | | |
| 4,588,507 | | Fidelity Investments Money | | | | |
| | | Market Treasury Portfolio | | | 4,588,507 | |
| | | | | | | |
| | | Total short-term investment | | | | |
| | | (Cost $4,588,507) | | | 4,588,507 | |
| | | | | | | |
| Total investments – 100.19% | | | | |
| | | (Cost $74,210,550) | | | 78,312,862 | |
| Net other assets and liabilities – (0.19)% | | | (148,498 | ) |
| Total net assets – 100.00% | | $ | 78,164,364 | |
| * | | Non-income producing security |
| (a) | | The security has been deemed illiquid by the Advisor according to the policies and procedures adopted by the Board of Trustees. |
| (b) | | Restricted security, purchased pursuant to Rule 144A under the Securities Act of 1933, as amended, and which is exempt from registration under that Act. At January 31, 2017, the restricted securities held by the Fund had an aggregate value of $1,854,825, which represented 2.4% of net assets. |
| (c) | | Fair valued at January 31, 2017 as determined in good faith using procedures approved by the Board of Trustees. |
| ADR | | American Depositary Receipt |
| GDR | | Global Depositary Receipts |
See notes to financial statements
42
| Portfolio of investments (unaudited) |
Emerging Markets Fund
January 31, 2017 (continued)
Other information:
| Currency exposure of portfolio assets | | |
| before any currency hedging, if applicable. | % of total |
| Excludes derivatives: | investments |
| Indian Rupee | 12 | % |
| South African Rand | 12 | |
| US Dollar | 12 | |
| Brazilian Real | 11 | |
| Taiwan Dollar | 11 | |
| Chilean Peso | 9 | |
| Hong Kong Dollar | 7 | |
| British Pound | 6 | |
| Korean Won | 4 | |
| Thai Baht | 4 | |
| Australian Dollar | 3 | |
| Mexican Peso | 3 | |
| Euro | 2 | |
| Czech Koruna | 1 | |
| Polish Zloty | 1 | |
| Indonesian Rupiah | 1 | |
| Philippine Peso | 1 | |
| Turkish Lira | 0 | * |
| Nigerian Naira | 0 | * |
| | 100 | % |
| * Less than 0.5% of total investments. | | |
| Industry concentration as | % of net |
| a percentage of net assets: | assets |
| Packaged Foods & Meats | 14.52 | % |
| Diversified Banks | 12.23 | |
| Brewers | 4.90 | |
| Auto Parts & Equipment | 4.84 | |
| Industrial Conglomerates | 4.56 | |
| Household Products | 3.93 | |
| Water Utilities | 3.41 | |
| Wireless Telecommunication Services | 3.37 | |
| Electronic Components | 3.19 | |
| Gold | 3.05 | |
| IT Consulting & Other Services | 2.88 | |
| Thrifts & Mortgage Finance | 2.87 | |
| Forest Products | 2.79 | |
| Food Retail | 2.38 | |
| Pharmaceuticals | 2.33 | |
| Personal Products | 2.26 | |
| Leisure Products | 1.96 | |
| Industrial Machinery | 1.83 | |
| Electric Utilities | 1.51 | |
| Footwear | 1.41 | |
| Marine | 1.31 | |
| Construction Materials | 1.24 | |
| Metal & Glass Containers | 1.19 | |
| Gas Utilities | 1.16 | |
| Soft Drinks | 1.15 | |
| Diversified Metals & Mining | 1.13 | |
| Industrial Gases | 1.12 | |
| Integrated Telecommunication Services | 1.05 | |
| Renewable Electricity | 0.99 | |
| Oil & Gas Exploration & Production | 0.90 | |
| Property & Casualty Insurance | 0.77 | |
| Computer Hardware | 0.71 | |
| Electronic Equipment & Instruments | 0.60 | |
| Automobile Manufacturers | 0.51 | |
| Specialized Finance | 0.27 | |
| Total Long-Term Investments | 94.32 | |
| Short-Term Investment | 5.87 | |
| Total Investments | 100.19 | |
| Net Other Assets and Liabilities | (0.19 | ) |
| | 100.00 | % |
See notes to financial statements
43
| Portfolio of investments (unaudited) |
Emerging Markets Fund
January 31, 2017 (continued)
Fair Value Measurement
The following table summarizes the Fund's investments that are measured at fair value by level within the fair value hierarchy at January 31, 2017:
| | | Quoted prices | | Significant | | | | | | | |
| | | in active | | other | | Significant | | | | |
| | | markets for | | observable | | unobservable | | | | |
| | | identical assets | | inputs | | inputs | | | | |
| Description | | (level 1 | ) | (level 2 | ) | (level 3 | ) | | Total | |
| | | | | | | | | | | | | | |
| Assets | | | | | | | | | | | | | |
| | | | | | | | | | | | | | |
| Common stocks | | | | | | | | | | | | | |
| Australia | | $ | 2,383,760 | | $ | — | | $ | — | | $ | 2,383,760 | |
| Brazil | | | 8,941,491 | | | — | | | — | | | 8,941,491 | |
| Chile | | | 8,986,172 | | | — | | | — | | | 8,986,172 | |
| China | | | 5,801,895 | | | — | | | — | | | 5,801,895 | |
| Czech Republic | | | 933,509 | | | — | | | — | | | 933,509 | |
| Egypt | | | 713,791 | | | — | | | — | | | 713,791 | |
| India | | | 10,523,377 | | | — | | | — | | | 10,523,377 | |
| Indonesia | | | 892,869 | | | — | | | — | | | 892,869 | |
| Kazakhstan | | | — | | | — | | | —* | | | — | |
| Korea | | | 2,815,037 | | | — | | | — | | | 2,815,037 | |
| Mexico | | | 2,059,557 | | | — | | | — | | | 2,059,557 | |
| Netherlands | | | 1,524,481 | | | — | | | — | | | 1,524,481 | |
| Nigeria | | | 2,488,878 | | | — | | | — | | | 2,488,878 | |
| Philippines | | | 763,489 | | | — | | | — | | | 763,489 | |
| Poland | | | 931,123 | | | — | | | — | | | 931,123 | |
| South Africa | | | 9,465,231 | | | — | | | — | | | 9,465,231 | |
| Taiwan | | | 8,466,698 | | | — | | | — | | | 8,466,698 | |
| Thailand | | | 2,677,582 | | | — | | | — | | | 2,677,582 | |
| Turkey | | | 241,430 | | | — | | | — | | | 241,430 | |
| United Kingdom | | | 2,211,833 | | | — | | | — | | | 2,211,833 | |
| Total Common stocks | | | 72,822,203 | | | — | | | — | | | 72,822,203 | |
| | | | | | | | | | | | | | |
| Preferred stock | | | | | | | | | | | | | |
| Chile | | | 902,152 | | | — | | | — | | | 902,152 | |
| Total Preferred stock | | | 902,152 | | | — | | | — | | | 902,152 | |
| Short-term investment | | | 4,588,507 | | | — | | | — | | | 4,588,507 | |
| Total Short-term investment | | | 4,588,507 | | | — | | | — | | | 4,588,507 | |
| Total Investments | | $ | 78,312,862 | | $ | — | | $ | — | | $ | 78,312,862 | |
* Fund held a level 3 security that was fair valued at $0 at January 31, 2017.
During the period ended January 31, 2017, there were no transfers in or out of security levels.
See notes to financial statements
44
| Portfolio of investments (unaudited) |
Emerging Markets Fund
January 31, 2017 (continued)
Following is a reconciliation of investments in which significant unobservable inputs (Level 3) were used in determining fair value:
| | | | | | | | | | | | | | | | | | | | | | | | | | | | | |
| | | Balance | | | | | | | | Change in | | | | | | | | | | | | | | Balance | |
| | | as of | | Accrued | | | | | unrealized | | | | | | | | Transfers | | Transfers | | as of | |
| | | July 31, | | discounts/ | | Realized | | appreciation | | | | | | | | in to | | out of | | January 31, | |
| Investments in Securities | | 2016 | | premiums | | gain/(loss) | | (depreciation) | | Purchases | | Sales | | level 3 | | level 3 | | 2017 | |
| | | | | | | | | | | | | | | | | | | | | | | | | | | | | |
| Common Stock | | | | | | | | | | | | | | | | | | | | | | | | | | | | |
| International Petroleum, Ltd. | | $ | 0 | | $ | 0 | | $ | 0 | | $ | 0 | | $ | 0 | | $ | 0 | | $ | 0 | | $ | 0 | | $ | 0 | |
The total net change in unrealized appreciation (depreciation) attributable to level 3 investments held at January 31, 2017 was $0.
The Fund's Advisor has determined that International Petroleum, Ltd. is a Level 3 investment due to the lack of observable inputs that may be used in the determination of fair value. The fair valuation reflects that the early-stage exploration company has been suspended from trading since October 2013 due to significant doubt about its ability to sell its Russian-based assets and failed merger with Range Resources, Ltd.
See notes to financial statements
45
| Portfolio of investments (unaudited) |
European Focus Fund
January 31, 2017
| | | | | | Value | |
| Shares | | | | | (note 2) | |
| | | | | | | |
| | | Common stocks – 94.77% | | | | |
| | | | | | | |
| | | Australia – 0.11% | | | | |
| 5,200,000 | | African Petroleum Corp., | | | | |
| | | Ltd. (a) * | | $ | 2,074,187 | |
| | | | | | | |
| | | Canada – 1.70% | | | | |
| 13,752,083 | | Africa Energy Corp. (b) * | | | 2,959,142 | |
| 2,235,878 | | Africa Oil Corp. (a) * | | | 4,553,373 | |
| 574,622 | | Africa Oil Corp. (c) * | | | 1,170,220 | |
| 10,925,000 | | Africa Oil Corp. (a) * | | | 22,157,000 | |
| | | | | | 30,839,735 | |
| | | | | | | |
| | | Finland – 4.21% | | | | |
| 17,000,000 | | Nokia Oyj | | | 76,158,708 | |
| | | | | | | |
| | | France – 7.98% | | | | |
| 950,000 | | Accor S.A. | | | 38,462,307 | |
| 900,000 | | Carrefour S.A. | | | 22,010,460 | |
| 900,000 | | Renault S.A. | | | 81,007,821 | |
| 153,614 | | Vivendi S.A. | | | 2,809,097 | |
| | | | | | 144,289,685 | |
| | | | | | | |
| | | Germany – 11.95% | | | | |
| 775,000 | | Bayer AG | | | 85,585,440 | |
| 370,000 | | Continental AG | | | 72,174,274 | |
| 4,000,000 | | TUI AG (a) | | | 58,471,808 | |
| | | | | | 216,231,522 | |
| | | | | | | |
| | | Ireland – 0.29% | | | | |
| 24,300,000 | | Providence Resources plc (a) * | | | 5,235,007 | |
| | | | | | | |
| | | Israel – 7.76% | | | | |
| 4,200,000 | | Teva Pharmaceutical Industries, | | | | |
| | | Ltd., ADR | | | 140,406,000 | |
| | | | | | | |
| | | Italy – 1.04% | | | | |
| 8,000,000 | | Intesa Sanpaolo SpA | | | 18,740,116 | |
| | | | | | | |
| | | Netherlands – 3.59% | | | | |
| 400,000 | | ASML Holding N.V. | | | 48,534,309 | |
| 500,000 | | Koninklijke Ahold Delhaize N.V. | | | 10,630,374 | |
| 975,000 | | Nostrum Oil & Gas plc (a) * | | | 5,783,180 | |
| | | | | | 64,947,863 | |
| | | | | | | |
| | | Nigeria – 0.16% | | | | |
| 8,280,000 | | Lekoil, Ltd. (a) * | | | 2,942,586 | |
| | | | | | Value | |
| Shares | | | | | (note 2) | |
| | | | | | | |
| | | Panama – 2.14% | | | | |
| 700,000 | | Carnival Corp. (a) | | $ | 38,766,000 | |
| | | | | | | |
| | | Spain – 5.57% | | | | |
| 10,460,000 | | NH Hotel Group S.A. * | | | 46,182,511 | |
| 3,370,000 | | Parques Reunidos Servicios | | | | |
| | | Centrales SAU (b) (d) * | | | 54,568,713 | |
| | | | | | 100,751,224 | |
| | | | | | | |
| | | Sweden – 5.27% | | | | |
| 900,000 | | Hennes & Mauritz AB, | | | | |
| | | B Shares | | | 25,722,811 | |
| 2,300,000 | | Lundin Petroleum AB * | | | 49,591,293 | |
| 3,400,000 | | Telefonaktiebolaget LM | | | | |
| | | Ericsson, B Shares | | | 20,076,368 | |
| | | | | | 95,390,472 | |
| | | | | | | |
| | | Switzerland – 7.59% | | | | |
| 505,000 | | Dufry AG * | | | 71,803,850 | |
| 1,000,000 | | OC Oerlikon Corp. AG (a) * | | | 11,318,276 | |
| 230,000 | | Roche Holding AG | | | 54,155,930 | |
| | | | | | 137,278,056 | |
| | | | | | | |
| | | Turkey – 0.79% | | | | |
| 3,569,236 | | KOC Holding AS | | | 14,369,080 | |
| | | | | | | |
| | | United Kingdom – 27.17% | | | | |
| 1,800,000 | | Ashmore Group plc | | | 7,019,636 | |
| 3,800,000 | | Aviva plc | | | 22,797,715 | |
| 12,000,000 | | Barclays plc | | | 33,128,154 | |
| 10,125,000 | | BNN Technology plc (a) (b) * | | | 15,603,123 | |
| 18,750,000 | | BT Group plc | | | 71,670,579 | |
| 5,100,000 | | Diversified Gas & Oil plc (c) * | | | 4,170,268 | |
| 5,000,000 | | Informa plc | | | 41,010,777 | |
| 3,500,000 | | Inmarsat plc | | | 26,770,225 | |
| 2,500,000 | | Just Eat plc * | | | 16,967,266 | |
| 6,850,000 | | Kingfisher plc | | | 28,971,346 | |
| 7,000,000 | | Marks & Spencer Group plc | | | 29,544,114 | |
| 8,500,000 | | Merlin Entertainments plc (d) | | | 51,016,275 | |
| 4,350,000 | | Mytrah Energy, Ltd. (a) (b) * | | | 2,093,153 | |
| 1,500,000 | | Royal Dutch Shell plc, B Shares | | | 42,202,732 | |
| 7,500,000 | | Royal Mail plc | | | 38,834,438 | |
| 23,700,000 | | Saga plc | | | 55,097,350 | |
| 12,515,000 | | Savannah Petroleum plc (b) * | | | 4,624,759 | |
| | | | | | 491,521,910 | |
See notes to financial statements
46
| Portfolio of investments (unaudited) |
European Focus Fund
January 31, 2017 (continued)
| | | | | | Value | |
| Shares | | | | | (note 2) | |
| | | | | | | |
| | | United States – 7.45% | | | | |
| 370,000 | | Autoliv, Inc. (a) | | $ | 42,794,200 | |
| 550,000 | | Norwegian Cruise Line | | | | |
| | | Holdings, Ltd. (a) * | | | 25,850,000 | |
| 1,200,000 | | Shire plc | | | 66,112,896 | |
| | | | | | 134,757,096 | |
| | | | | | | |
| | | Total common stocks | | | | |
| | | (Cost $1,866,031,426) | | | 1,714,699,247 | |
| | | | | | | |
| Preferred stock – 0.67% | | | | |
| | | | | | | |
| | | Italy – 0.67% | | | | |
| 5,500,000 | | Intesa Sanpaolo SpA | | $ | 12,111,987 | |
| | | | | | | |
| | | Total preferred stock | | | | |
| | | (Cost $14,647,122) | | | 12,111,987 | |
| | | | | | | |
| Warrants – —% | | | | |
| | | | | | | |
| | | Norway – —% | | | | |
| 2,388,950 | | African Petroleum Corp., Ltd. | | | | |
| | | (expires 3/16/17) (b) (c) * | | | — | |
| | | | | | | |
| | | Total Warrants | | | | |
| | | (Cost $—) | | | — | |
| | | | | | | |
| | | Total long-term investments | | | | |
| | | (Cost $1,880,678,548) | | | 1,726,811,234 | |
| | | | | | | |
| Short-term investment – 2.93% | | | | |
| 53,062,027 | | Fidelity Investments Money | | | | |
| | | Market Treasury Portfolio | | | 53,062,027 | |
| | | | | | | |
| | | Total short-term investment | | | | |
| | | (Cost $53,062,027) | | | 53,062,027 | |
| | | | | | Value | |
| Shares | | | | | (note 2) | |
| | | | | | | |
| Other securities – 1.76% | | | | |
| 31,774,590 | | State Street Navigator | | | | |
| | | Securities Lending | | | | |
| | | Government Portfolio (e) | | $ | 31,774,590 | |
| | | | | | | |
| | | Total other securities | | | | |
| | | (Cost $31,774,590) | | | 31,774,590 | |
| | | | | | | |
| Total investments – 100.13% | | | | |
| | | (Cost $1,965,515,165) | | | 1,811,647,851 | |
| Financial Derivative Instruments (f) | | | | |
(Cost or Premiums, net $0) – (0.41)% | | | (7,428,774 | ) |
| Net other assets and liabilities – 0.28% | | | 5,126,775 | |
| Total net assets – 100.00% | | $ | 1,809,345,852 | |
| * | | Non-income producing security |
| (a) | | All or a portion of this security is on loan on an overnight and continuous basis; see notes to financial statements for further information. |
| (b) | | The security has been deemed illiquid by the Advisor according to the policies and procedures adopted by the Board of Trustees. |
| (c) | | Fair valued at January 31, 2017 as determined in good faith using procedures approved by the Board of Trustees. |
| (d) | | Restricted security, purchased pursuant to Rule 144A under the Securities Act of 1933, as amended, and which is exempt from registration under that Act. At January 31, 2017, the restricted securities held by the Fund had an aggregate value of $105,584,988, which represented 5.8% of net assets. |
| (e) | | Represents cash collateral received from securities lending transactions; see notes to financial statements for further information. |
| (f) | | Information with respect to financial derivative instruments is disclosed in the following tables. |
| ADR | | American Depositary Receipt |
See notes to financial statements
47
| Portfolio of investments (unaudited) |
European Focus Fund
January 31, 2017 (continued)
(f) FINANCIAL DERIVATIVE INSTRUMENTS
OVER-THE-COUNTER FINANCIAL DERIVATIVE INSTRUMENTS
FORWARD FOREIGN CURRENCY CONTRACTS
| | | | | | | | | | | | | | | | Unrealized | |
| | | | | | | | | | Local | | | Current | | | appreciation/ | |
| | | | | | | Value | | | amount | | | notional | | | (depreciation) | |
| | | | Counterparty | | | date | | | (000's | ) | | value | | | Asset | | | Liability | |
| British Pound (Short) | | | JP Morgan | | | 2/10/17 | | | 204,609 | | $ | 257,428,774 | | $ | — | | $ | (7,428,774 | ) |
| | | | Chase Bank, N.A. | | | | | | | | | | | | | | | | |
| Total | | | | | | | | | | | | | | $ | — | | $ | (7,428,774 | ) |
During the period ended January 31, 2017, average monthly notional value related to forward foreign currency contracts was approximately $230.6 million or 12.7% of net assets.
FINANCIAL DERIVATIVE INSTRUMENTS: OVER-THE-COUNTER SUMMARY
The following is a summary by counterparty of the value of over-the-counter financial derivative instruments and collateral (received)/pledged as of January 31, 2017:
| | | | Financial Derivative Assets | | | Financial Derivative Liabilities | | | | | | | | | | |
| | | | Unrealized | | | | | | Unrealized | | | | | | | | | | | | | |
| | | | Appreciation | | | | | | Depreciation | | | | | | | | | | | | | |
| | | | Forward | | | | | | Forward | | | | | | | | | | | | | |
| | | | Foreign | | | Total | | | Foreign | | | Total | | | Net Value | | | Collateral | | | | |
| | | | Currency | | | Over-the- | | | Currency | | | Over-the- | | | of OTC | | | (Received)/ | | | Net | |
| | | | Contracts | | | Counter | | | Contracts | | | Counter | | | Derivatives | | | Pledged | | | Exposure(1) | |
| Amounts subject to a master netting agreement: | | | | | | | | | | | | | |
| JP Morgan | | | | | | | | | | | | | | | | | | | | | | |
| Chase Bank, N.A. | | $ | — | | $ | — | | $ | (7,428,774 | ) | $ | (7,428,774 | ) | $ | (7,428,774 | ) | $ | — | | $ | (7,428,774 | ) |
| | | $ | — | | $ | — | | $ | (7,428,774 | ) | $ | (7,428,774 | ) | $ | (7,428,774 | ) | $ | — | | $ | (7,428,774 | ) |
(1) | | Net Exposure represents the net receivable/(payable) that would be due from/to the counterparty in the event of default. Exposure from over-the-counter financial derivative instruments can only be netted across transactions governed under the same master agreement with the same legal entity. See Note 2, Significant Accounting Policies, "Derivative instruments," in the Notes to Financial Statements for more information regarding master netting arrangements. |
| | Cost or Premiums, Net | | Asset | | Liability | |
| TOTAL FINANCIAL DERIVATIVE INSTRUMENTS | | $ | — | | | $ | — | | $ | (7,428,774 | ) |
See notes to financial statements
48
| Portfolio of investments (unaudited) |
European Focus Fund
January 31, 2017 (continued)
Other information:
| Currency exposure of portfolio assets before | | |
| any currency hedging, if applicable. | % of total |
| Excludes derivatives: | investments |
| British Pound | 35 | % |
| Euro | 31 | |
| US Dollar | 18 | |
| Swiss Franc | 8 | |
| Swedish Krona | 7 | |
| Turkish Lira | 1 | |
| Canadian Dollar | 0 | * |
| Norwegian Krone | 0 | * |
| | 100 | % |
* Less than 0.5% of total investments. | | |
| Industry concentration as | % of net |
| a percentage of net assets: | assets |
| Pharmaceuticals | 15.48 | % |
| Hotels, Resorts & Cruise Lines | 11.48 | |
| Leisure Facilities | 5.84 | |
| Oil & Gas Exploration & Production | 5.82 | |
| Communications Equipment | 5.32 | |
| Automobile Manufacturers | 4.48 | |
| Multi-line Insurance | 4.30 | |
| Tires & Rubber | 3.99 | |
| Specialty Stores | 3.97 | |
| Integrated Telecommunication Services | 3.96 | |
| Biotechnology | 3.65 | |
| Diversified Banks | 3.54 | |
| Semiconductor Equipment | 2.68 | |
| Auto Parts & Equipment | 2.36 | |
| Integrated Oil & Gas | 2.33 | |
| Publishing | 2.27 | |
| Air Freight & Logistics | 2.15 | |
| Department Stores | 1.63 | |
| Home Improvement Retail | 1.60 | |
| Alternative Carriers | 1.48 | |
| Apparel Retail | 1.42 | |
| Hypermarkets & Super Centers | 1.22 | |
| Internet Software & Services | 0.94 | |
| Casinos & Gaming | 0.86 | |
| Industrial Conglomerates | 0.79 | |
| Industrial Machinery | 0.63 | |
| Food Retail | 0.59 | |
| Asset Management & Custody Banks | 0.39 | |
| Movies & Entertainment | 0.15 | |
| Independent Power Producers & Energy Traders | 0.12 | |
| Total Long-Term Investments | 95.44 | |
| Short-Term Investment | 2.93 | |
| Other Securities | 1.76 | |
| Total Investments | 100.13 | |
| Financial Derivative Instruments | (0.41 | ) |
| Net Other Assets and Liabilities | 0.28 | |
| | 100.00 | % |
See notes to financial statements
49
| Portfolio of investments (unaudited) |
European Focus Fund
January 31, 2017 (continued)
Fair Value Measurement
The following table summarizes the Fund's investments that are measured at fair value by level within the fair value hierarchy at January 31, 2017:
| | | Quoted prices | | Significant | | | | | | | |
| | | in active | | other | | Significant | | | | |
| | | markets for | | observable | | unobservable | | | | |
| | | identical assets | | inputs | | inputs | | | | |
| Description | | (Level 1 | ) | (Level 2 | ) | (Level 3 | ) | | Total | |
| | | | | | | | | | | | | | |
| Assets | | | | | | | | | | | | | |
| | | | | | | | | | | | | | |
| Common stocks | | | | | | | | | | | | | |
| Australia | | $ | 2,074,187 | | $ | — | | $ | — | | $ | 2,074,187 | |
| Canada | | | 29,669,515 | | | 1,170,220 | | | — | | | 30,839,735 | |
| Finland | | | 76,158,708 | | | — | | | — | | | 76,158,708 | |
| France | | | 144,289,685 | | | — | | | — | | | 144,289,685 | |
| Germany | | | 216,231,522 | | | — | | | — | | | 216,231,522 | |
| Ireland | | | 5,235,007 | | | — | | | — | | | 5,235,007 | |
| Israel | | | 140,406,000 | | | — | | | — | | | 140,406,000 | |
| Italy | | | 18,740,116 | | | — | | | — | | | 18,740,116 | |
| Netherlands | | | 64,947,863 | | | — | | | — | | | 64,947,863 | |
| Nigeria | | | 2,942,586 | | | — | | | — | | | 2,942,586 | |
| Panama | | | 38,766,000 | | | — | | | — | | | 38,766,000 | |
| Spain | | | 100,751,224 | | | — | | | — | | | 100,751,224 | |
| Sweden | | | 95,390,472 | | | — | | | — | | | 95,390,472 | |
| Switzerland | | | 137,278,056 | | | — | | | — | | | 137,278,056 | |
| Turkey | | | 14,369,080 | | | — | | | — | | | 14,369,080 | |
| United Kingdom | | | 487,351,642 | | | — | | | 4,170,268 | | | 491,521,910 | |
| United States | | | 134,757,096 | | | — | | | — | | | 134,757,096 | |
| Total Common stocks | | | 1,709,358,759 | | | 1,170,220 | | | 4,170,268 | | | 1,714,699,247 | |
| | | | | | | | | | | | | | |
| Preferred stock | | | | | | | | | | | | | |
| Italy | | | 12,111,987 | | | — | | | — | | | 12,111,987 | |
| Total Preferred stock | | | 12,111,987 | | | — | | | — | | | 12,111,987 | |
| | | | | | | | | | | | | | |
| Warrants | | | | | | | | | | | | | |
| Norway | | | — | | | — | * | | — | | | — | |
| Total Warrants | | | — | | | — | | | — | | | — | |
| Short-term investment | | | 53,062,027 | | | — | | | — | | | 53,062,027 | |
| Other securities | | | 31,774,590 | | | — | | | — | | | 31,774,590 | |
| Total Investments | | $ | 1,806,307,363 | | $ | 1,170,220 | | $ | 4,170,268 | | $ | 1,811,647,851 | |
See notes to financial statements
50
| Portfolio of investments (unaudited) |
European Focus Fund
January 31, 2017 (continued)
Fair Value Measurement (continued)
| | | Quoted prices | | Significant | | | | | | | |
| | | in active | | other | | Significant | | | | |
| | | markets for | | observable | | unobservable | | | | |
| | | identical assets | | inputs | | inputs | | | | |
| Description | | (Level 1 | ) | (Level 2 | ) | (Level 3 | ) | | Total | |
| | | | | | | | | | | |
| Liabilities | | | | | | | | | | | | | |
| | | | | | | | | | | | | | |
| Financial Derivative Instruments – Liabilities | | | | | | | | | | | | | |
| Over-the-counter | | $ | — | | $ | (7,428,774 | ) | $ | — | | $ | (7,428,774 | ) |
| Total Financial Derivative Instruments – Liabilities | | $ | — | | $ | (7,428,774 | ) | $ | — | | $ | (7,428,774 | ) |
*Fund held a level 2 security that was fair valued at $0 at January 31, 2017.
During the period ended January 31, 2017, there were no transfers in or out of security levels.
Following is a reconciliation of investments in which significant unobservable inputs (Level 3) were used in determining fair value:
| | | Balance | | | | | | | | Change in | | | | | | | | | | | | | | Balance | |
| | | as of | | Accrued | | | | | unrealized | | | | | | | | Transfers | | Transfers | | as of | |
| | | July 31, | | discounts / | | Realized | | appreciation / | | | | | | | | in to | | out of | | January 31, | |
| Investment | | 2016 | | premiums | | gain / (loss | ) | (depreciation | ) | Purchases | | Sales | | level 3 | | level 3 | | 2017 | |
| Common Stock | | | | | | | | | | | | | | | | | | | | | | | | | | | | |
| Diversified Gas & Oil plc | | $ | 0 | | $ | 0 | | $ | 0 | | $ | 31,820 | | $ | 4,138,448 | | $ | 0 | | $ | 0 | | $ | 0 | | $ | 4,170,268 | |
| | | $ | 0 | | $ | 0 | | $ | 0 | | $ | 31,820 | | $ | 4,138,448 | | $ | 0 | | $ | 0 | | $ | 0 | | $ | 4,170,268 | |
The total net change in unrealized appreciation (depreciation) attributable to Level 3 investments held at January 31, 2017 was $31,820.
The Fund's Advisor has determined that Diversified Gas & Oil plc is a Level 3 investment due to the lack of observable inputs that may be used in the determination of fair value. The fair valuation reflects that this equity security was purchased in advance of its initial public offering on the London Stock Exchange's Alternative Investment Market ("AIM") and had not begun trading at January 31, 2017. The fair valuation reflects the lack of observable price transparency and the change in unrealized appreciation is purely due to foreign currency translation.
Fair Value of Financial Derivative Instruments
The following is a summary of the fair valuation of the Fund's financial derivative instruments categorized by risk exposure:
Fair Values of Financial Derivative Instruments on the Statement of Assets and Liabilities as of January 31, 2017
| | | | | | | | | | | | | | | | | | | | |
| | | | Derivatives not accounted for as hedging instruments |
| | | | Foreign | | | | | | | | | | | | | | | | |
| | | | Currency | | | Equity | | | Interest | | | Credit | | | Inflation | | | | |
| | | | Risk | | | Risk | | | Rate Risk | | | Risk | | | Risk | | | Total | |
| | | | | | | | | | | | | | | | | | | | |
| Financial Derivative Instruments – Liabilities | | | | | | | | | | | | | | | | | | | |
| Over-the-Counter | | | | | | | | | | | | | | | | | | | |
| Forward Foreign Currency Contracts | | $ | (7,428,774 | ) | $ | — | | $ | — | | $ | — | | $ | — | | $ | (7,428,774 | ) |
| Total | | $ | (7,428,774 | ) | $ | — | | $ | — | | $ | — | | $ | — | | $ | (7,428,774 | ) |
See notes to financial statements
51
| Portfolio of investments (unaudited) |
European Focus Fund
January 31, 2017 (continued)
Effect of Financial Derivative Instruments on the Statement of Operations for the Period Ended January 31, 2017
| | | | Derivatives not accounted for as hedging instruments |
| | | | Foreign | | | | | | | | | | | | | | | | |
| | | | Currency | | | Equity | | | Interest | | | Credit | | | Inflation | | | | |
| | | | Risk | | | Risk | | | Rate Risk | | | Risk | | | Risk | | | Total | |
| | | | | | | | | | | | | | | | | | | | |
| Net realized gain/(loss) from | | | | | | | | | | | | | | | | | | | |
| financial derivative instruments: | | | | | | | | | | | | | | | | | | | |
| Forward Foreign Currency Contracts | | $ | 15,587,770 | | $ | — | | $ | — | | $ | — | | $ | — | | $ | 15,587,770 | |
| Total | | $ | 15,587,770 | | $ | — | | $ | — | | $ | — | | | — | | $ | 15,587,770 | |
| | | | Derivatives not accounted for as hedging instruments |
| | | | Foreign | | | | | | | | | | | | | | | | |
| | | | Currency | | | Equity | | | Interest | | | Credit | | | Inflation | | | | |
| | | | Risk | | | Risk | | | Rate Risk | | | Risk | | | Risk | | | Total | |
| | | | | | | | | | | | | | | | | | | | |
| Net change in unrealized | | | | | | | | | | | | | | | | | | | |
| appreciation/(depreciation) | | | | | | | | | | | | | | | | | | | |
| of financial derivative instruments | | | | | | | | | | | | | | | | | | | |
| Forward Foreign Currency Contracts | | $ | (4,232,645 | ) | $ | — | | $ | — | | $ | — | | $ | — | | $ | (4,232,645 | ) |
| Total | | $ | (4,232,645 | ) | $ | — | | $ | — | | $ | — | | $ | — | | $ | (4,232,645 | ) |
See notes to financial statements
52
| Portfolio of investments (unaudited) |
Global Equity Income Fund
January 31, 2017
| | | | | | Value | |
| Shares | | | | | (note 2) | |
| | | | | | | |
| Common stocks – 89.87% | | | | |
| | | | | | | |
| | | Australia – 5.22% | | | | |
| 3,414,412 | | Amcor, Ltd. | | $ | 37,029,719 | |
| 18,346,909 | | AMP, Ltd. | | | 69,571,500 | |
| 1,036,100 | | Commonwealth Bank of | | | | |
| | | Australia | | | 64,166,671 | |
| 4,879,927 | | Crown Resorts, Ltd. | | | 42,190,690 | |
| | | | | | 212,958,580 | |
| | | | | | | |
| | | Canada – 2.00% | | | | |
| 741,931 | | Bank of Montreal | | | 56,121,628 | |
| 1,168,252 | | Inter Pipeline, Ltd. | | | 25,335,694 | |
| | | | | | 81,457,322 | |
| | | | | | | |
| | | Denmark – 0.04% | | | | |
| 74,280 | | Tryg A/S | | | 1,418,000 | |
| | | | | | | |
| | | France – 3.95% | | | | |
| 315,522 | | Lagardere SCA | | | 7,905,464 | |
| 7,415,282 | | Natixis S.A. | | | 43,906,301 | |
| 2,847,699 | | Orange S.A. | | | 44,036,345 | |
| 1,295,357 | | Total S.A. | | | 65,246,431 | |
| | | | | | 161,094,541 | |
| | | | | | | |
| | | Germany – 6.90% | | | | |
| 808,947 | | Daimler AG | | | 60,560,449 | |
| 913,616 | | Deutsche Post AG | | | 30,529,314 | |
| 992,807 | | Siemens AG | | | 124,589,184 | |
| 4,487,838 | | TUI AG | | | 65,603,000 | |
| | | | | | 281,281,947 | |
| | | | | | | |
| | | Israel – 0.92% | | | | |
| 21,581,561 | | Bezeq The Israeli | | | | |
| | | Telecommunication Corp, Ltd. | | | 37,672,049 | |
| | | | | | | |
| | | Italy – 1.77% | | | | |
| 17,312,801 | | Enel SpA | | | 72,214,932 | |
| | | | | | | |
| | | Japan – 7.98% | | | | |
| 7,849,000 | | Daiwa Securities Group, Inc. | | | 50,294,496 | |
| 1,517,300 | | Japan Tobacco, Inc. | | | 48,914,817 | |
| 2,565,000 | | Sumitomo Mitsui Financial | | | | |
| | | Group, Inc. | | | 101,114,295 | |
| 1,569,800 | | Tokio Marine Holdings, Inc. | | | 65,775,607 | |
| 1,015,300 | | Toyota Motor Corp. | | | 59,204,102 | |
| | | | | | 325,303,317 | |
| | | | | | Value | |
| Shares | | | | | (note 2) | |
| | | | | | | |
| | | Korea – 2.06% | | | | |
| 544,935 | | KT&G Corp. | | $ | 47,126,725 | |
| 191,442 | | SK Telecom Co., Ltd. | | | 36,736,568 | |
| | | | | | 83,863,293 | |
| | | | | | | |
| | | Netherlands – 1.51% | | | | |
| 4,310,820 | | ING Groep N.V. | | | 61,659,261 | |
| | | | | | | |
| | | New Zealand – 2.11% | | | | |
| 3,929,414 | | Fletcher Building, Ltd. | | | 30,271,614 | |
| 21,442,062 | | Spark New Zealand, Ltd. * | | | 55,777,510 | |
| | | | | | 86,049,124 | |
| | | | | | | |
| | | Norway – 1.53% | | | | |
| 3,932,316 | | Telenor ASA | | | 62,264,471 | |
| | | | | | | |
| | | Singapore – 2.07% | | | | |
| 30,706,700 | | Singapore | | | | |
| | | Telecommunications, Ltd. | | | 84,318,962 | |
| | | | | | | |
| | | Spain – 2.68% | | | | |
| 3,085,052 | | Gas Natural SDG S.A. | | | 59,346,176 | |
| 2,794,910 | | Red Electrica Corp. S.A. | | | 49,872,740 | |
| | | | | | 109,218,916 | |
| | | | | | | |
| | | Sweden – 4.26% | | | | |
| 7,169,195 | | Nordea Bank AB | | | 86,632,588 | |
| 2,200,993 | | SKF AB, B Shares | | | 44,286,080 | |
| 1,697,043 | | Swedbank AB, A Shares | | | 42,896,069 | |
| | | | | | 173,814,737 | |
| | | | | | | |
| | | Switzerland – 4.80% | | | | |
| 1,591,379 | | Novartis AG | | | 116,512,969 | |
| 337,014 | | Roche Holding AG | | | 79,353,506 | |
| | | | | | 195,866,475 | |
| | | | | | | |
| | | United Kingdom – 32.40% | | | | |
| 719,651 | | AstraZeneca plc | | | 37,969,140 | |
| 5,231,290 | | BAE Systems plc | | | 38,301,182 | |
| 20,327,448 | | BP plc | | | 120,916,802 | |
| 1,724,986 | | British American Tobacco plc | | | 106,320,678 | |
| 6,412,672 | | BT Group plc | | | 24,511,995 | |
| 10,645,272 | | Connect Group plc (a) | | | 18,480,608 | |
| 1,449,918 | | Diageo plc | | | 40,191,748 | |
| 11,373,992 | | Direct Line Insurance Group plc | | | 50,795,083 | |
| 6,076,260 | | DS Smith plc | | | 33,862,614 | |
| 1,490,769 | | Galliford Try plc | | | 25,298,962 | |
See notes to financial statements
53
| Portfolio of investments (unaudited) |
Global Equity Income Fund
January 31, 2017 (continued)
| | | | | | Value | |
| Shares | | | | | (note 2) | |
| | | | | | | |
| | | United Kingdom (continued) | | | | |
| 2,105,840 | | GlaxoSmithKline plc | | $ | 40,478,939 | |
| 692,989 | | Go-Ahead Group plc | | | 19,554,018 | |
| 5,011,409 | | Intermediate Capital Group plc | | | 43,657,617 | |
| 3,585,293 | | Investec plc | | | 25,325,313 | |
| 19,961,959 | | ITV plc | | | 51,027,849 | |
| 4,146,042 | | National Grid plc | | | 48,386,215 | |
| 1,520,677 | | Persimmon plc | | | 36,901,975 | |
| 4,410,672 | | Phoenix Group Holdings | | | 41,753,383 | |
| 3,460,353 | | Prudential plc | | | 66,689,824 | |
| 878,758 | | Rio Tinto plc | | | 38,592,200 | |
| 4,953,228 | | Royal Dutch Shell plc, A Shares | | | 133,889,091 | |
| 3,566,399 | | SSE plc | | | 66,804,394 | |
| 14,260,876 | | Standard Life plc | | | 62,019,175 | |
| 1,907,995 | | The Berkeley Group | | | | |
| | | Holdings plc | | | 67,207,179 | |
| 33,643,107 | | Vodafone Group plc | | | 82,254,761 | |
| | | | | | 1,321,190,745 | |
| | | | | | | |
| | | United States – 7.67% | | | | |
| 2,988,513 | | Ares Capital Corp. | | | 50,505,870 | |
| 2,013,538 | | Cisco Systems, Inc. | | | 61,855,887 | |
| 1,106,726 | | General Motors Co. | | | 40,517,239 | |
| 762,935 | | Las Vegas Sands Corp. | | | 40,115,122 | |
| 2,162,997 | | Pfizer, Inc. | | | 68,631,895 | |
| 424,926 | | Philip Morris International, Inc. | | | 40,848,136 | |
| 170,467 | | Six Flags Entertainment Corp. | | | 10,156,424 | |
| | | | | | 312,630,573 | |
| | | | | | | |
| | | Total common stocks | | | | |
| | | (Cost $3,680,950,760) | | | 3,664,277,245 | |
| | | | | | | |
| Preferred stock – 1.12% | | | | |
| | | | | | | |
| | | Korea – 1.12% | | | | |
| 33,825 | | Samsung Electronics Co., Ltd. | | | 45,726,766 | |
| | | | | | | |
| | | Total preferred stock | | | | |
| | | Cost $40,176,793) | | | 45,726,766 | |
| | | | | | | |
| REITs – 7.06% | | | | |
| | | | | | | |
| | | Australia – 1.15% | | | | |
| 14,025,391 | | Scentre Group | | | 46,802,183 | |
| | | | | | | |
| | | France – 2.55% | | | | |
| 613,177 | | ICADE | | | 43,369,289 | |
| 262,854 | | Unibail-Rodamco SE | | | 60,424,739 | |
| | | | | | 103,794,028 | |
| | | | | | Value | |
| Shares | | | | | (note 2) | |
| | | | | | | |
| | | Netherlands – 1.07% | | | | |
| 1,173,369 | | Eurocommercial | | | | |
| | | Properties N.V. | | $ | 43,484,148 | |
| | | | | | | |
| | | Singapore – 1.48% | | | | |
| 34,610,483 | | Ascendas Real Estate | | | | |
| | | Investment Trust | | | 60,412,096 | |
| | | | | | | |
| | | United States – 0.81% | | | | |
| 927,916 | | Iron Mountain, Inc. | | | 33,219,393 | |
| | | | | | | |
| | | Total REITs | | | | |
| | | (Cost $300,780,237) | | | 287,711,848 | |
| | | | | | | |
| Investment companies – 0.58% | | | | |
| | | Thailand – 0.58% | | | | |
| 57,859,600 | | Digital Telecommunications | | | | |
| | | Infrastructure Fund | | | 23,827,441 | |
| | | | | | | |
| | | Total investment companies | | | | |
| | | (Cost $21,594,216) | | | 23,827,441 | |
| | | | | | | |
| | | Total long-term investments | | | | |
| | | (Cost $4,043,502,006) | | | 4,021,543,300 | |
| | | | | | | |
| Short-term investment – 2.30% | | | | |
| 93,669,513 | | Fidelity Investments Money | | | | |
| | | Market Treasury Portfolio | | | 93,669,513 | |
| | | | | | | |
| | | Total short-term investment | | | | |
| | | (Cost $93,669,513) | | | 93,669,513 | |
| | | | | | | |
| Total investments – 100.93% | | | | |
| | | (Cost $4,137,171,519) | | | 4,115,212,813 | |
| | | | | | | |
| Financial Derivative Instruments (b) | | | | |
(Cost or Premiums, net $0) – (0.36)% | | | (14,597,668 | ) |
| Net other assets and liabilities – (0.57)% | | | (23,385,801 | ) |
| Total net assets – 100.00% | | $ | 4,077,229,344 | |
| * | | Non-income producing security |
| (a) | | The security has been deemed illiquid by the Advisor according to the policies and procedures adopted by the Board of Trustees. |
| (b) | | Information with respect to financial derivative instruments is disclosed in the following tables. |
| REIT | | Real Estate Investment Trust |
See notes to financial statements
54
| Portfolio of investments (unaudited) |
Global Equity Income Fund
January 31, 2017 (continued)
(b) FINANCIAL DERIVATIVE INSTRUMENTS
OVER-THE-COUNTER FINANCIAL DERIVATIVE INSTRUMENTS
FORWARD FOREIGN CURRENCY CONTRACTS
| | | | | | | | | | | | | | | | Unrealized | |
| | | | | | | | | | Local | | | Current | | | appreciation/ | |
| | | | | | | Value | | | amount | | | notional | | | (depreciation) | |
| | | | Counterparty | | | date | | | (000's | ) | | value | | | Asset | | | Liability | |
| Australian Dollar (Short) | | | BNP Paribas | | | 2/22/17 | | | 240,000 | | $ | 181,928,387 | | $ | — | | $ | (2,265,273 | ) |
| | | | Securities Services | | | | | | | | | | | | | | | | |
| British Pound (Short) | | | BNP Paribas | | | 2/22/17 | | | 321,000 | | | 403,954,875 | | | — | | | (12,332,395 | ) |
| | | | Securities Services | | | | | | | | | | | | | | | | |
| Total | | | | | | | | | | | | | | $ | — | | $ | (14,597,668 | ) |
During the period ended January 31, 2017, average monthly notional value related to forward foreign currency contracts was approximately $933.7 million or 22.9% of net assets.
FINANCIAL DERIVATIVE INSTRUMENTS: OVER-THE-COUNTER SUMMARY
The following is a summary by counterparty of the value of over-the-counter financial derivative instruments and collateral (received)/pledged as of January 31, 2017:
| | | | Financial Derivative Assets | | | Financial Derivative Liabilities | | | | | | | | | | |
| | | | Unrealized | | | | | | Unrealized | | | | | | | | | | | | | |
| | | | Appreciation | | | | | | Depreciation | | | | | | | | | | | | | |
| | | | Forward | | | | | | Forward | | | | | | | | | | | | | |
| | | | Foreign | | | Total | | | Foreign | | | Total | | | Net Value | | | Collateral | | | | |
| | | | Currency | | | Over-the- | | | Currency | | | Over-the- | | | of OTC | | | (Received)/ | | | Net | |
| | | | Contracts | | | Counter | | | Contracts | | | Counter | | | Derivatives | | | Pledged | | | Exposure(1) | |
| Amounts subject to a master netting agreement: | | | | | | | | | | | | | | | | |
| BNP Paribas | | $ | — | | $ | — | | $ | (14,597,668 | ) | $ | (14,597,668 | ) | $ | (14,597,668 | ) | $ | — | | $ | (14,597,668 | ) |
| Securities Services | | | | | | | | | | | | | | | | | | | | | | |
| | | $ | — | | $ | — | | $ | (14,597,668 | ) | $ | (14,597,668 | ) | $ | (14,597,668 | ) | $ | — | | $ | (14,597,668 | ) |
(1) | | Net Exposure represents the net receivable/(payable) that would be due from/to the counterparty in the event of default. Exposure from over-the-counter financial derivative instruments can only be netted across transactions governed under the same master agreement with the same legal entity. See Note 2, Significant Accounting Policies, "Derivative instruments," in the Notes to Financial Statements for more information regarding master netting arrangements. |
| | Cost or Premiums, Net | | Asset | | Liability | |
| TOTAL FINANCIAL DERIVATIVE INSTRUMENTS | | $ | — | | | $ | — | | $ | (14,597,668 | ) |
See notes to financial statements
55
| Portfolio of investments (unaudited) |
Global Equity Income Fund
January 31, 2017 (continued)
Other information:
| Currency exposure of portfolio assets before | | |
| any currency hedging, if applicable. | % of total |
| Excludes derivatives: | investments |
| British Pound | 30 | % |
| Euro | 22 | |
| US Dollar | 11 | |
| Japanese Yen | 8 | |
| Australian Dollar | 8 | |
| Swiss Franc | 5 | |
| Swedish Krona | 4 | |
| Singapore Dollar | 3 | |
| Korean Won | 3 | |
| Canadian Dollar | 2 | |
| Norwegian Krone | 1 | |
| Israeli Shekel | 1 | |
| New Zealand Dollar | 1 | |
| Thai Baht | 1 | |
| Danish Krone | 0 | * |
| | 100 | % |
| * Less than 0.5% of total investments. | | |
| Industry concentration as | % of net |
| a percentage of net assets: | assets |
| Diversified Banks | 11.20 | % |
| Pharmaceuticals | 8.41 | |
| Integrated Oil & Gas | 7.85 | |
| Integrated Telecommunication Services | 7.57 | |
| Tobacco | 5.96 | |
| Electric Utilities | 4.63 | |
| Life & Health Insurance | 4.18 | |
| Automobile Manufacturers | 3.93 | |
| Retail REITs | 3.70 | |
| Industrial Conglomerates | 3.06 | |
| Wireless Telecommunication Services | 2.92 | |
| Asset Management & Custody Banks | 2.89 | |
| Property & Casualty Insurance | 2.89 | |
| Homebuilding | 2.55 | |
| Casinos & Gaming | 2.02 | |
| Paper Packaging | 1.74 | |
| Other Diversified Financial Services | 1.71 | |
| Hotels, Resorts & Cruise Lines | 1.61 | |
| Communications Equipment | 1.52 | |
| Industrial REITs | 1.48 | |
| Gas Utilities | 1.46 | |
| Broadcasting | 1.25 | |
| Investment Banking & Brokerage | 1.23 | |
| Industry concentration as | % of net |
| a percentage of net assets (continued): | assets |
| Multi-Utilities | 1.19 | % |
| Technology Hardware, Storage & Peripherals | 1.12 | |
| Industrial Machinery | 1.09 | |
| Diversified REITs | 1.06 | |
| Distillers & Vintners | 0.99 | |
| Diversified Metals & Mining | 0.95 | |
| Aerospace & Defense | 0.94 | |
| Specialized REITs | 0.81 | |
| Air Freight & Logistics | 0.75 | |
| Construction Materials | 0.74 | |
| Oil & Gas Storage & Transportation | 0.62 | |
| Diversified Capital Markets | 0.62 | |
| Construction & Engineering | 0.62 | |
| Railroads | 0.48 | |
| Distributors | 0.45 | |
| Leisure Facilities | 0.25 | |
| Publishing | 0.19 | |
| Total Long-Term Investments | 98.63 | |
| Short-Term Investment | 2.30 | |
| Total Investments | 100.93 | |
| Financial Derivative Instruments | (0.36 | ) |
| Net Other Assets and Liabilities | (0.57 | ) |
| | 100.00 | % |
See notes to financial statements
56
| Portfolio of investments (unaudited) |
Global Equity Income Fund
January 31, 2017 (continued)
Fair Value Measurement
The following table summarizes the Fund's investments that are measured at fair value by level within the fair value hierarchy at January 31, 2017:
| | | Quoted prices | | Significant | | | | | | | |
| | | in active | | other | | Significant | | | | |
| | | markets for | | observable | | unobservable | | | | |
| | | identical assets | | inputs | | inputs | | | | |
| Description | | (Level 1 | ) | (Level 2 | ) | (Level 3 | ) | | Total | |
| | | | | | | | | | | |
| Assets | | | | | | | | | | | | | |
| | | | | | | | | | | | | | |
| Common stocks | | | | | | | | | | | | | |
| Australia | | $ | 212,958,580 | | $ | — | | $ | — | | $ | 212,958,580 | |
| Canada | | | 81,457,322 | | | — | | | — | | | 81,457,322 | |
| Denmark | | | 1,418,000 | | | — | | | — | | | 1,418,000 | |
| France | | | 161,094,541 | | | — | | | — | | | 161,094,541 | |
| Germany | | | 281,281,947 | | | — | | | — | | | 281,281,947 | |
| Israel | | | 37,672,049 | | | — | | | — | | | 37,672,049 | |
| Italy | | | 72,214,932 | | | — | | | — | | | 72,214,932 | |
| Japan | | | 325,303,317 | | | — | | | — | | | 325,303,317 | |
| Korea | | | 83,863,293 | | | — | | | — | | | 83,863,293 | |
| Netherlands | | | 61,659,261 | | | — | | | — | | | 61,659,261 | |
| New Zealand | | | 86,049,124 | | | — | | | — | | | 86,049,124 | |
| Norway | | | 62,264,471 | | | — | | | — | | | 62,264,471 | |
| Singapore | | | 84,318,962 | | | — | | | — | | | 84,318,962 | |
| Spain | | | 109,218,916 | | | — | | | — | | | 109,218,916 | |
| Sweden | | | 173,814,737 | | | — | | | — | | | 173,814,737 | |
| Switzerland | | | 195,866,475 | | | — | | | — | | | 195,866,475 | |
| United Kingdom | | | 1,321,190,745 | | | — | | | — | | | 1,321,190,745 | |
| United States | | | 312,630,573 | | | — | | | — | | | 312,630,573 | |
| Total Common stocks | | | 3,664,277,245 | | | — | | | — | | | 3,664,277,245 | |
| | | | | | | | | | | | | | |
| Preferred stock | | | | | | | | | | | | | |
| Korea | | | 45,726,766 | | | — | | | — | | | 45,726,766 | |
| Total Preferred stock | | | 45,726,766 | | | — | | | — | | | 45,726,766 | |
| | | | | | | | | | | | | | |
| REITs | | | | | | | | | | | | | |
| Australia | | | 46,802,183 | | | — | | | — | | | 46,802,183 | |
| France | | | 103,794,028 | | | — | | | — | | | 103,794,028 | |
| Netherlands | | | 43,484,148 | | | — | | | — | | | 43,484,148 | |
| Singapore | | | 60,412,096 | | | — | | | — | | | 60,412,096 | |
| United States | | | 33,219,393 | | | — | | | — | | | 33,219,393 | |
| Total REITs | | | 287,711,848 | | | — | | | — | | | 287,711,848 | |
| | | | | | | | | | | | | | |
| Investment companies | | | | | | | | | | | | | |
| Thailand | | | 23,827,441 | | | — | | | — | | | 23,827,441 | |
| Total Investment companies | | | 23,827,441 | | | — | | | — | | | 23,827,441 | |
| Short-term investment | | | 93,669,513 | | | — | | | — | | | 93,669,513 | |
| Total Short-term investment | | | 93,669,513 | | | — | | | — | | | 93,669,513 | |
| Total Investments | | $ | 4,115,212,813 | | $ | — | | $ | — | | $ | 4,115,212,813 | |
See notes to financial statements
57
| Portfolio of investments (unaudited) |
Global Equity Income Fund
January 31, 2017 (continued)
Fair Value Measurement (continued)
| | | Quoted prices | | Significant | | | | | | | |
| | | in active | | other | | Significant | | | | |
| | | markets for | | observable | | unobservable | | | | |
| | | identical assets | | inputs | | inputs | | | | |
| Description | | (Level 1 | ) | (Level 2 | ) | (Level 3 | ) | | Total | |
| | | | | | | | | | | | | | |
| Liabilities | | | | | | | | | | | | | |
| | | | | | | | | | | | | | |
| Financial Derivative Instruments – Liabilities | | | | | | | | | | | | | |
| Over-the-Counter | | $ | — | | $ | (14,597,668 | ) | $ | — | | $ | (14,597,668 | ) |
| Total Financial Derivative Instruments – Liabilities | | $ | — | | $ | (14,597,668 | ) | $ | — | | $ | (14,597,668 | ) |
During the period ended January 31, 2017, there were no transfers in or out of security levels.
Fair Value of Financial Derivative Instruments
The following is a summary of the fair valuation of the Fund's financial derivative instruments categorized by risk exposure:
Fair Values of Financial Derivative Instruments on the Statement of Assets and Liabilities as of January 31, 2017
| | | | Derivatives not accounted for as hedging instruments |
| | | | Foreign | | | | | | | | | | | | | | | | |
| | | | Currency | | | Equity | | | Interest | | | Credit | | | Inflation | | | | |
| | | | Risk | | | Risk | | | Rate Risk | | | Risk | | | Risk | | | Total | |
| | | | | | | | | | | | | | | | | | | | |
| Financial Derivative Instruments – Liabilities | | | | | | | | | | | | | | | | | | | |
| Over-the-Counter | | | | | | | | | | | | | | | | | | | |
| Forward Foreign Currency Contracts | | $ | (14,597,668 | ) | $ | — | | $ | — | | $ | — | | $ | — | | $ | (14,597,668 | ) |
| Total | | $ | (14,597,668 | ) | $ | — | | $ | — | | $ | — | | $ | — | | $ | (14,597,668 | ) |
Effect of Financial Derivative Instruments on the Statement of Operations for the Period Ended January 31, 2017
| | | | Derivatives not accounted for as hedging instruments |
| | | | Foreign | | | | | | | | | | | | | | | | |
| | | | Currency | | | Equity | | | Interest | | | Credit | | | Inflation | | | | |
| | | | Risk | | | Risk | | | Rate Risk | | | Risk | | | Risk | | | Total | |
| | | | | | | | | | | | | | | | | | | | |
| Net realized gain/(loss) from | | | | | | | | | | | | | | | | | | | |
| financial derivative instruments: | | | | | | | | | | | | | | | | | | | |
| Forward Foreign Currency Contracts | | $ | 30,006,001 | | $ | — | | $ | — | | $ | — | | $ | — | | $ | 30,006,001 | |
| Total | | $ | 30,006,001 | | $ | — | | $ | — | | $ | — | | | — | | $ | 30,006,001 | |
| | | | Derivatives not accounted for as hedging instruments |
| | | | Foreign | | | | | | | | | | | | | | | | |
| | | | Currency | | | Equity | | | Interest | | | Credit | | | Inflation | | | | |
| | | | Risk | | | Risk | | | Rate Risk | | | Risk | | | Risk | | | Total | |
| | | | | | | | | | | | | | | | | | | | |
| Net change in unrealized | | | | | | | | | | | | | | | | | | | |
| appreciation/(depreciation) | | | | | | | | | | | | | | | | | | | |
| of financial derivative instruments | | | | | | | | | | | | | | | | | | | |
| Forward Foreign Currency Contracts | | $ | 195,784 | | $ | — | | $ | — | | $ | — | | $ | — | | $ | 195,784 | |
| Total | | $ | 195,784 | | $ | — | | $ | — | | $ | — | | $ | — | | $ | 195,784 | |
See notes to financial statements
58
| Portfolio of investments (unaudited) |
Global Technology Fund
January 31, 2017
| | | | | | Value | |
| Shares | | | | | (note 2) | |
| | | | | | | |
| Common stocks – 98.61% | | | | |
| | | | | | | |
| | | China – 7.49% | | | | |
| 67,133 | | Alibaba Group Holding, | | | | |
| | | Ltd., ADR * | | $ | 6,801,244 | |
| 276,400 | | Tencent Holdings, Ltd. | | | 7,281,465 | |
| 103,130 | | Vipshop Holdings, Ltd., ADR * | | | 1,167,432 | |
| | | | | | 15,250,141 | |
| | | | | | | |
| | | Finland – 1.50% | | | | |
| 679,693 | | Nokia Oyj | | | 3,044,973 | |
| | | | | | | |
| | | France – 0.98% | | | | |
| 44,456 | | Criteo S.A., ADR * | | | 2,003,632 | |
| | | | | | | |
| | | Israel – 0.71% | | | | |
| 14,656 | | Check Point Software | | | | |
| | | Technologies, Ltd. (a) * | | | 1,447,573 | |
| | | | | | | |
| | | Japan – 0.50% | | | | |
| 14,200 | | TDK Corp. | | | 1,022,460 | |
| | | | | | | |
| | | Korea – 4.92% | | | | |
| 5,383 | | Samsung Electronics Co., Ltd. | | | 9,139,195 | |
| 42,881 | | WONIK IPS Co., Ltd. * | | | 878,210 | |
| | | | | | 10,017,405 | |
| | | | | | | |
| | | Netherlands – 1.30% | | | | |
| 31,764 | | ASM International N.V. | | | 1,563,589 | |
| 47,256 | | Yandex N.V., Class A * | | | 1,093,504 | |
| | | | | | 2,657,093 | |
| | | | | | | |
| | | Singapore – 3.42% | | | | |
| 34,928 | | Broadcom, Ltd. | | | 6,968,136 | |
| | | | | | | |
| | | United Kingdom – 1.46% | | | | |
| 363,108 | | Auto Trader Group plc (b) | | | 1,827,158 | |
| 317,904 | | Worldpay Group plc (b) | | | 1,143,380 | |
| | | | | | 2,970,538 | |
| | | | | | | |
| | | United States – 76.33% | | | | |
| 56,792 | | Activision Blizzard, Inc. (a) | | | 2,283,606 | |
| 43,485 | | Adobe Systems, Inc. * | | | 4,930,329 | |
| 13,794 | | Alphabet, Inc., Class A * | | | 11,313,701 | |
| 10,977 | | Alphabet, Inc., Class C * | | | 8,746,364 | |
| 2,576 | | Amazon.com, Inc. * | | | 2,121,284 | |
| 128,331 | | Apple, Inc. | | | 15,572,967 | |
| | | | | | Value | |
| Shares | | | | | (note 2) | |
| | | | | | | |
| | | United States (continued) | | | | |
| 101,650 | | Applied Materials, Inc. | | $ | 3,481,513 | |
| 39,238 | | Cavium, Inc. (a) * | | | 2,597,948 | |
| 50,584 | | CDW Corp. | | | 2,605,582 | |
| 232,638 | | Cisco Systems, Inc. | | | 7,146,639 | |
| 48,239 | | Cognizant Technology | | | | |
| | | Solutions Corp., Class A * | | | 2,536,889 | |
| 14,221 | | Dolby Laboratories, Inc., | | | | |
| | | Class A | | | 681,328 | |
| 104,437 | | eBay, Inc. * | | | 3,324,230 | |
| 40,075 | | Electronic Arts, Inc. (a) * | | | 3,343,457 | |
| 28,505 | | EPAM Systems, Inc. * | | | 1,834,582 | |
| 112,018 | | Facebook, Inc., Class A * | | | 14,598,186 | |
| 40,977 | | Fidelity National Information | | | | |
| | | Services, Inc. | | | 3,254,393 | |
| 18,275 | | FleetCor Technologies, Inc. (a) * | | | 2,695,380 | |
| 191,314 | | HP, Inc. | | | 2,879,276 | |
| 14,576 | | IAC/InterActiveCorp. * | | | 1,002,975 | |
| 164,528 | | Intel Corp. | | | 6,057,921 | |
| 55,772 | | MasterCard, Inc., Class A (a) | | | 5,930,237 | |
| 194,583 | | Micron Technology, Inc. * | | | 4,691,396 | |
| 116,298 | | Microsoft Corp. | | | 7,518,666 | |
| 14,636 | | Palo Alto Networks, Inc. (a) * | | | 2,159,688 | |
| 21,460 | | PTC, Inc. * | | | 1,128,152 | |
| 38,789 | | Red Hat, Inc. (a) * | | | 2,943,309 | |
| 49,211 | | salesforce.com, Inc. * | | | 3,892,590 | |
| 36,985 | | ServiceNow, Inc. (a) * | | | 3,351,581 | |
| 56,473 | | Texas Instruments, Inc. | | | 4,265,970 | |
| 1,273 | | The Priceline Group, Inc. (a) * | | | 2,005,140 | |
| 17,890 | | Universal Display Corp. * | | | 1,180,740 | |
| 96,728 | | Visa, Inc., A Shares | | | 8,000,373 | |
| 41,121 | | Western Digital Corp. (a) | | | 3,278,577 | |
| 36,508 | | Xilinx, Inc. (a) | | | 2,124,767 | |
| | | | | | 155,479,736 | |
| | | | | | | |
| | | Total common stocks | | | | |
| | | (Cost $124,779,822) | | | 200,861,687 | |
| | | | | | | |
| Preferred stock – 0.25% | | | | |
| | | | | | | |
| | | Korea – 0.25% | | | | |
| 373 | | Samsung Electronics Co., Ltd. | | | 504,245 | |
| | | | | | | |
| | | Total preferred stock | | | | |
| | | (Cost $385,861) | | | 504,245 | |
| | | | | | | |
| | | Total long-term investments | | | | |
| | | (Cost $125,165,683) | | | 201,365,932 | |
See notes to financial statements
59
| Portfolio of investments (unaudited) |
Global Technology Fund
January 31, 2017 (continued)
| | | | | | Value | |
| Shares | | | | | (note 2) | |
| | | | | | | |
| Short-term investment – 0.46% | | | | |
| 937,822 | | Fidelity Investments Money | | | | |
| | | Market Treasury Portfolio | | $ | 937,822 | |
| | | | | | | |
| | | Total short-term investment | | | | |
| | | (Cost $937,822) | | | 937,822 | |
| | | | | | | |
| Total investments – 99.32% | | | | |
| (Cost $126,103,505) | | | 202,303,754 | |
| Net other assets and liabilities – 0.68% | | | 1,379,738 | |
| | | | | |
| Total net assets – 100.00% | | $ | 203,683,492 | |
| * | | Non-income producing security |
| (a) | | All or a portion of this security is on loan on an overnight and continuous basis; see notes to financial statements for further information. |
| (b) | | Restricted security, purchased pursuant to Rule 144A under the Securities Act of 1933, as amended, and which is exempt from registration under that Act. At January 31, 2017, the restricted securities held by the Fund had an aggregate value of $2,970,538, which represented 1.5% of net assets. |
| ADR | | American Depositary Receipt |
Other information:
| Currency exposure of portfolio assets before | | |
| any currency hedging, if applicable. | % of total |
| Excludes derivatives: | investments |
| US Dollar | 87 | % |
| Korean Won | 5 | |
| Hong Kong Dollar | 4 | |
| Euro | 2 | |
| British Pound | 1 | |
| Japanese Yen | 1 | |
| | 100 | % |
| Industry concentration as | % of net |
| a percentage of net assets: | assets |
| Internet Software & Services | 28.47 | % |
| Semiconductors & Semiconductor Equipment | 16.02 | |
| Technology Hardware, Storage & Peripherals | 15.40 | |
| Software | 15.14 | |
| IT Services | 12.47 | |
| Communications Equipment | 6.06 | |
| Electronic Equipment, Instruments & Components | 2.70 | |
| Internet & Direct Marketing Retail | 2.60 | |
| Total Long-Term Investments | 98.86 | |
| Short-Term Investment | 0.46 | |
| Total Investments | 99.32 | |
| Net Other Assets and Liabilities | 0.68 | |
| | 100.00 | % |
See notes to financial statements
60
| Portfolio of investments (unaudited) |
Global Technology Fund
January 31, 2017 (continued)
Fair Value Measurement
The following table summarizes the Fund's investments that are measured at fair value by level within the fair value hierarchy at January 31, 2017:
| | | | Quoted prices | | | Significant | | | | | | | |
| | | | in active | | | other | | | Significant | | | | |
| | | | markets for | | | observable | | | unobservable | | | | |
| | | | identical assets | | | inputs | | | inputs | | | | |
| Description | | | (level 1 | ) | | (level 2 | ) | | (level 3 | ) | | Total | |
| Assets | | | | | | | | | | | | | |
| | | | | | | | | | | | | | |
| Common stocks | | | | | | | | | | | | | |
| China | | $ | 15,250,141 | | $ | — | | $ | — | | $ | 15,250,141 | |
| Finland | | | 3,044,973 | | | — | | | — | | | 3,044,973 | |
| France | | | 2,003,632 | | | — | | | — | | | 2,003,632 | |
| Israel | | | 1,447,573 | | | — | | | — | | | 1,447,573 | |
| Japan | | | 1,022,460 | | | — | | | — | | | 1,022,460 | |
| Korea | | | 10,017,405 | | | — | | | — | | | 10,017,405 | |
| Netherlands | | | 2,657,093 | | | — | | | — | | | 2,657,093 | |
| Singapore | | | 6,968,136 | | | — | | | — | | | 6,968,136 | |
| United Kingdom | | | 2,970,538 | | | — | | | — | | | 2,970,538 | |
| United States | | | 155,479,736 | | | — | | | — | | | 155,479,736 | |
| Total Common stocks | | | 200,861,687 | | | — | | | — | | | 200,861,687 | |
| | | | | | | | | | | | | | |
| Preferred stock | | | | | | | | | | | | | |
| Korea | | | 504,245 | | | — | | | — | | | 504,245 | |
| Total Preferred stock | | | 504,245 | | | — | | | — | | | 504,245 | |
| Short-term investment | | | 937,822 | | | — | | | — | | | 937,822 | |
| Total Short-term investment | | | 937,822 | | | — | | | — | | | 937,822 | |
| Total Investments | | $ | 202,303,754 | | $ | — | | $ | — | | $ | 202,303,754 | |
During the period ended January 31, 2017, there were no transfers in or out of security levels.
See notes to financial statements
61
| Portfolio of investments (unaudited) |
High Yield Opportunities Fund
January 31, 2017
| Face | | | | | | | | | | | | Value | |
| amount | | | | | | Coupon | | | Maturity | | | (note 2 | ) |
| | | | | | | | | | | | | | |
| Bank Loans(a) (b) – 3.05% | | | | | | | | | | |
| | | | | | | | | | | | | | |
| | | | United States – 3.05% | | | | | | | | | | |
| 500,000 | | | Chesapeake Energy Corp. Term Loan | | | 8.500% | | | 8/23/21 | | $ | 548,540 | |
| 997,373 | | | Murray Energy Corp. 2015 Term Loan B | | | 7.000% | | | 4/16/20 | | | 950,516 | |
| 248,750 | | | Zekelman Industries, Inc. Term Loan B | | | 6.000% | | | 6/14/21 | | | 250,823 | |
| | | | | | | | | | | | | 1,749,879 | |
| | | | | | | | | | | | | | |
| | | | Total bank loans | | | | | | | | | | |
| | | | (Cost $1,674,219) | | | | | | | | | 1,749,879 | |
| | | | | | | | | | | | | | |
| Corporate bonds – 89.96% | | | | | | | | | | |
| | | | | | | | | | | | | | |
| | | | Canada – 5.63% | | | | | | | | | | |
| 500,000 | | | First Quantum Minerals, Ltd. (c) | | | 7.250% | | | 5/15/22 | | | 512,500 | |
| 250,000 | | | Garda World Security Corp. (c) | | | 7.250% | | | 11/15/21 | | | 240,625 | |
| 200,000 | | | HudBay Minerals, Inc. (c) | | | 7.250% | | | 1/15/23 | | | 212,500 | |
| 450,000 | | | Precision Drilling Corp. (c) | | | 7.750% | | | 12/15/23 | | | 488,250 | |
| 400,000 | | | Teck Resources, Ltd. | | | 3.750% | | | 2/1/23 | | | 390,000 | |
| 500,000 | | | Tervita Escrow Corp. (c) | | | 7.625% | | | 12/1/21 | | | 520,000 | |
| 875,000 | | | Valeant Pharmaceuticals International, Inc. (c) | | | 6.750% | | | 8/15/18 | | | 867,344 | |
| | | | | | | | | | | | | 3,231,219 | |
| | | | | | | | | | | | | | |
| | | | France – 2.24% | | | | | | | | | | |
| 1,250,000 | | | SFR Group S.A. (c) | | | 7.375% | | | 5/1/26 | | | 1,287,500 | |
| | | | | | | | | | | | | | |
| | | | Luxembourg – 3.88% | | | | | | | | | | |
| 650,000 | | | ARD Finance S.A. (c) | | | 7.125% | | | 9/15/23 | | | 663,000 | |
| 1,500,000 | | | Intelsat Jackson Holdings S.A. (c) | | | 8.000% | | | 2/15/24 | | | 1,560,000 | |
| | | | | | | | | | | | | 2,223,000 | |
| | | | | | | | | | | | | | |
| | | | Netherlands – 1.72% | | | | | | | | | | |
| 275,000 | | | Playa Resorts Holding B.V. (c) | | | 8.000% | | | 8/15/20 | | | 290,812 | |
| 700,000 | | | Ziggo Bond Finance B.V. (c) | | | 6.000% | | | 1/15/27 | | | 696,220 | |
| | | | | | | | | | | | | 987,032 | |
| | | | | | | | | | | | | | |
| | | | Switzerland – 1.12% | | | | | | | | | | |
| 600,000 | | | Transocean, Inc. (c) | | | 9.000% | | | 7/15/23 | | | 641,625 | |
| | | | | | | | | | | | | | |
| | | | United Kingdom – 1.79% | | | | | | | | | | |
| 500,000 | | | Inmarsat Finance plc (c) | | | 6.500% | | | 10/1/24 | | | 514,690 | |
| 550,000 | | | Tullow Oil plc (c) | | | 6.250% | | | 4/15/22 | | | 511,500 | |
| | | | | | | | | | | | | 1,026,190 | |
See notes to financial statements
62
| Portfolio of investments (unaudited) |
High Yield Opportunities Fund
January 31, 2017 (continued)
| Face | | | | | | | | | | Value | |
| amount | | | | Coupon | | | Maturity | | | (note 2 | ) |
| | | United States – 73.58% | | | | | | | | | |
| 265,000 | | Alere, Inc. (c) | | 6.375% | | | 7/1/23 | | $ | 269,472 | |
| 500,000 | | AmeriGas Partners LP | | 5.500% | | | 5/20/25 | | | 514,375 | |
| 500,000 | | Avon International Operations, Inc. (c) | | 7.875% | | | 8/15/22 | | | 533,275 | |
| 500,000 | | BlueLine Rental Finance Corp. (c) | | 7.000% | | | 2/1/19 | | | 496,250 | |
| 435,000 | | BMC East LLC (c) | | 5.500% | | | 10/1/24 | | | 445,745 | |
| 285,000 | | Builders FirstSource, Inc. (c) | | 5.625% | | | 9/1/24 | | | 293,906 | |
| 640,000 | | BWAY Holding Co. (c) | | 9.125% | | | 8/15/21 | | | 691,200 | |
| 400,000 | | Caesars Entertainment Resort Properties LLC | | 11.000% | | | 10/1/21 | | | 436,500 | |
| 775,000 | | Calpine Corp. | | 5.750% | | | 1/15/25 | | | 761,437 | |
| 750,000 | | CBS Radio, Inc. (c) | | 7.250% | | | 11/1/24 | | | 783,277 | |
| 375,000 | | CCO Holdings LLC (c) | | 5.875% | | | 5/1/27 | | | 398,790 | |
| 1,000,000 | | CCO Holdings LLC (c) | | 5.500% | | | 5/1/26 | | | 1,050,000 | |
| 275,000 | | Century Intermediate Holding Co. 2 (c) | | 9.750% | | | 2/15/19 | | | 279,125 | |
| 525,000 | | CenturyLink, Inc. | | 7.500% | | | 4/1/24 | | | 557,156 | |
| 470,000 | | Cequel Communications Holdings I LLC (c) | | 7.750% | | | 7/15/25 | | | 522,288 | |
| 500,000 | | CHS/Community Health Systems, Inc. | | 5.125% | | | 8/1/21 | | | 472,500 | |
| 500,000 | | Cloud Crane LLC (c) | | 10.125% | | | 8/1/24 | | | 551,250 | |
| 215,000 | | CPG Merger Sub LLC (c) | | 8.000% | | | 10/1/21 | | | 225,750 | |
| 200,000 | | CVR Partners LP (c) | | 9.250% | | | 6/15/23 | | | 213,750 | |
| 600,000 | | Denbury Resources, Inc. | | 4.625% | | | 7/15/23 | | | 482,250 | |
| 500,000 | | Digicel Group, Ltd. (c) | | 8.250% | | | 9/30/20 | | | 445,625 | |
| 650,000 | | DISH DBS Corp. | | 7.750% | | | 7/1/26 | | | 729,222 | |
| 500,000 | | Eagle Materials, Inc. | | 4.500% | | | 8/1/26 | | | 500,155 | |
| 500,000 | | EMI Music Publishing Group North America Holdings, Inc. (c) | | 7.625% | | | 6/15/24 | | | 548,750 | |
| 300,000 | | Endeavor Energy Resources LP (c) | | 8.125% | | | 9/15/23 | | | 327,000 | |
| 450,000 | | Energy Transfer Equity LP | | 5.875% | | | 1/15/24 | | | 482,625 | |
| 440,000 | | Enviva Partners LP (c) | | 8.500% | | | 11/1/21 | | | 473,000 | |
| 410,000 | | ESH Hospitality, Inc. (c) | | 5.250% | | | 5/1/25 | | | 412,563 | |
| 500,000 | | Flex Acquisition Co., Inc. (c) | | 6.875% | | | 1/15/25 | | | 509,250 | |
| 230,000 | | Fresh Market, Inc. (c) | | 9.750% | | | 5/1/23 | | | 205,275 | |
| 500,000 | | Frontier Communications Corp. | | 8.500% | | | 4/15/20 | | | 534,675 | |
| 675,000 | | Frontier Communications Corp. | | 11.000% | | | 9/15/25 | | | 685,125 | |
| 675,000 | | GCI, Inc. | | 6.875% | | | 4/15/25 | | | 705,375 | |
| 525,000 | | Gray Television, Inc. (c) | | 5.875% | | | 7/15/26 | | | 523,031 | |
| 500,000 | | Halcon Resources Corp. (c) | | 12.000% | | | 2/15/22 | | | 567,500 | |
| 500,000 | | Hecla Mining Co. | | 6.875% | | | 5/1/21 | | | 520,000 | |
| 400,000 | | Herc Rentals, Inc. (c) | | 7.500% | | | 6/1/22 | | | 434,000 | |
| 500,000 | | Hexion, Inc. | | 10.000% | | | 4/15/20 | | | 508,750 | |
| 625,000 | | Horizon Pharma, Inc. | | 6.625% | | | 5/1/23 | | | 604,687 | |
| 540,000 | | Hot Topic, Inc. (c) | | 9.250% | | | 6/15/21 | | | 569,700 | |
| 265,000 | | HUB International, Ltd. (c) | | 7.875% | | | 10/1/21 | | | 278,250 | |
| 500,000 | | Hughes Satellite Systems Corp. (c) | | 6.625% | | | 8/1/26 | | | 517,500 | |
| 250,000 | | j2 Cloud Services, Inc. | | 8.000% | | | 8/1/20 | | | 260,781 | |
| 500,000 | | Jack Ohio Finance LLC (c) | | 6.750% | | | 11/15/21 | | | 512,500 | |
| 550,000 | | Kindred Healthcare, Inc. | | 8.750% | | | 1/15/23 | | | 502,563 | |
| 275,000 | | KLX, Inc. (c) | | 5.875% | | | 12/1/22 | | | 289,094 | |
| 400,000 | | Kraton Polymers LLC (c) | | 10.500% | | | 4/15/23 | | | 457,000 | |
| 500,000 | | Landry's, Inc. (c) | | 6.750% | | | 10/15/24 | | | 516,250 | |
| 475,000 | | Meritor, Inc. | | 6.250% | | | 2/15/24 | | | 479,845 | |
| 350,000 | | Midas Intermediate Holdco II LLC (c) | | 7.875% | | | 10/1/22 | | | 361,375 | |
| 530,000 | | Midcontinent Communications & Midcontinent | | | | | | | | | |
| | | Finance Corp. (c) | | 6.875% | | | 8/15/23 | | | 571,737 | |
See notes to financial statements
63
| Portfolio of investments (unaudited) |
High Yield Opportunities Fund
January 31, 2017 (continued)
| Face | | | | | | | | | Value | |
| amount | | | | Coupon | | Maturity | | | (note 2) | |
| | | United States (continued) | | | | | | | | |
| 500,000 | | Momentive Performance Materials, Inc. | | 3.880% | | 10/24/21 | | $ | 488,750 | |
| 400,000 | | MPH Acquisition Holdings LLC (c) | | 7.125% | | 6/1/24 | | | 425,500 | |
| 500,000 | | MPM Escrow LLC (d) (e) | | 8.875% | | 10/15/20 | | | — | |
| 892,000 | | NRG Energy, Inc. (c) | | 6.625% | | 1/15/27 | | | 889,770 | |
| 1,500,000 | | Nuance Communications, Inc. (c) | | 5.625% | | 12/15/26 | | | 1,501,875 | |
| 500,000 | | Parsley Energy LLC (c) | | 5.375% | | 1/15/25 | | | 515,000 | |
| 550,000 | | Penn National Gaming, Inc. (c) | | 5.625% | | 1/15/27 | | | 552,074 | |
| 1,050,000 | | PetSmart, Inc. (c) | | 7.125% | | 3/15/23 | | | 1,034,250 | |
| 460,000 | | Platform Specialty Products Corp. (c) | | 10.375% | | 5/1/21 | | | 511,750 | |
| 545,000 | | Prime Security Services Borrower LLC (c) | | 9.250% | | 5/15/23 | | | 592,006 | |
| 550,000 | | Radiate Holdco LLC (c) (f) | | 6.625% | | 2/15/25 | | | 550,000 | |
| 500,000 | | Reynolds Group Issuer, Inc. (c) | | 7.000% | | 7/15/24 | | | 533,688 | |
| 500,000 | | Rivers Pittsburgh Borrower LP (c) | | 6.125% | | 8/15/21 | | | 515,000 | |
| 685,000 | | Select Medical Corp. | | 6.375% | | 6/1/21 | | | 681,575 | |
| 575,000 | | Signode Industrial Group Lux S.A. (c) | | 6.375% | | 5/1/22 | | | 586,500 | |
| 500,000 | | Silversea Cruise Finance, Ltd. (c) | | 7.250% | | 2/1/25 | | | 516,355 | |
| 550,000 | | SM Energy Co. | | 6.750% | | 9/15/26 | | | 574,750 | |
| 925,000 | | Sprint Corp. | | 7.125% | | 6/15/24 | | | 968,937 | |
| 400,000 | | Summit Materials LLC (c) | | 8.500% | | 4/15/22 | | | 446,000 | |
| 600,000 | | Sunoco LP (c) | | 6.250% | | 4/15/21 | | | 616,686 | |
| 500,000 | | T-Mobile USA, Inc. | | 6.500% | | 1/15/26 | | | 550,625 | |
| 550,000 | | Tenet Healthcare Corp. | | 8.125% | | 4/1/22 | | | 558,250 | |
| 750,000 | | Terex Corp. (c) (f) | | 5.625% | | 2/1/25 | | | 766,912 | |
| 305,000 | | The Nature's Bounty Co. (c) | | 7.625% | | 5/15/21 | | | 320,250 | |
| 500,000 | | TransDigm, Inc. (c) | | 6.375% | | 6/15/26 | | | 495,000 | |
| 456,000 | | Western Digital Corp. (c) | | 10.500% | | 4/1/24 | | | 538,080 | |
| 550,000 | | William Lyon Homes, Inc. (c) | | 5.875% | | 1/31/25 | | | 547,938 | |
| 415,000 | | XPO Logistics, Inc. (c) | | 6.125% | | 9/1/23 | | | 430,044 | |
| 435,000 | | Zekelman Industries, Inc. (c) | | 9.875% | | 6/15/23 | | | 492,638 | |
| | | | | | | | | | 42,211,702 | |
| | | Total corporate bonds | | | | | | | | |
| | | (Cost $49,828,122) | | | | | | | 51,608,268 | |
| | | Total long-term investments | | | | | | | | |
| | | (Cost $51,502,341) | | | | | | | 53,358,147 | |
| | | | | | | Value | |
| Shares | | | | | | (note 2) | |
| | | | | |
| Short-term investment – 7.76% | | | | |
| 4,454,097 | | | Fidelity Investments Money | | | | |
| | | | Market Treasury Portfolio (g) | | | 4,454,097 | |
| | | | Total short-term investment | | | | |
| | | | (Cost $4,454,097) | | | 4,454,097 | |
| Total investments – 100.77% | | | | |
| (Cost $55,956,438) | | | 57,812,244 | |
| Net other assets and liabilities – (0.77)% | | | (443,725 | ) |
| Total net assets – 100.00% | | $ | 57,368,519 | |
| (a) | | Bank loan interests are, at present, not readily marketable, not registered under the Securities Act of 1933, as amended (the "1933 Act"), and may be subject to contractual and legal restrictions on sale. Bank loan interests in the Fund's portfolio generally have variable rates which adjust to a base, such as the London Inter-Bank Offered Rate ("LIBOR"), on set dates, typically every 30 days but not greater than one year; and/or have interest rates that float at a margin above a widely recognized base lending rate such as the Prime Rate of a designated U.S. bank. |
| (b) | | Bank loan interests often require prepayments from excess cash flow or permit the borrower to repay at its election. The degree to which borrowers repay, whether as a contractual requirement or at their election, cannot be predicted with accuracy. As a result, the actual remaining maturity may be substantially less than the stated maturities shown. |
See notes to financial statements
64
| Portfolio of investments (unaudited) |
High Yield Opportunities Fund
January 31, 2017 (continued)
| (c) | | Restricted security, purchased pursuant to Rule 144A under the Securities Act of 1933, as amended, and which is exempt from registration under that Act. At January 31, 2017, the restricted securities held by the Fund had an aggregate value of $37,657,360, which represented 65.6% of net assets. |
| (d) | | The security has been deemed illiquid by the Advisor according to the policies and procedures adopted by the Board of Trustees. |
| (e) | | Fair valued at January 31, 2017 as determined in good faith using procedures approved by the Trustees of the Trust. |
| (f) | | Security or a portion thereof is purchased on a delayed delivery basis. |
| (g) | | This short-term investment was segregated for delayed delivery purchases at January 31, 2017. |
Other information:
| Currency exposure of portfolio assets before | | |
| any currency hedging, if applicable. | % of total |
| Excludes derivatives: | investments |
| US Dollar | 100 | % |
| | 100 | % |
| Industry concentration as | % of net |
| a percentage of net assets: | assets |
| Oil & Gas Exploration & Production | 6.15 | % |
| Cable/Satellite TV | 4.73 | |
| Satellite Telecommunications | 4.52 | |
| Cable TV | 4.43 | |
| Cellular Telecommunications | 3.42 | |
| Telephone-Integrated | 3.10 | |
| Medical-Hospitals | 2.98 | |
| Independent Power Producer | 2.88 | |
| Applications Software | 2.62 | |
| Medical – Drugs | 2.57 | |
| Building & Construction Products – Miscellaneous | 2.46 | |
| Containers – Metal/Glass | 2.36 | |
| Machinery-Construction & Mining | 2.20 | |
| Oil & Gas Drilling | 1.97 | |
| Containers-Paper/Plastic | 1.82 | |
| Specified Purpose Acquisition | 1.80 | |
| Chemicals – Diversified | 1.74 | |
| Chemicals – Specialty | 1.69 | |
| Coal | 1.66 | |
| Casino Hotels | 1.65 | |
| Security Services | 1.45 | |
| Aerospace/Defense-Equipment | 1.37 | |
| Radio | 1.36 | |
| Telecommunication Services | 1.23 | |
| Oil & Gas Refining & Marketing | 1.07 | |
| Steel-Specialty | 1.02 | |
| Retail – Apparel/Shoe | 0.99 | |
| Machinery-Material Handling | 0.96 | |
| Music | 0.96 | |
| Networking Products | 0.96 | |
| Racetracks | 0.96 | |
| Building-Residential/Commercial | 0.95 | |
| Computers-Memory Devices | 0.94 | |
| Cosmetics & Toiletries | 0.93 | |
| Hazardous Waste Disposal | 0.91 | |
| Silver Mining | 0.91 | |
| Industry concentration as | % of net |
| a percentage of net assets: | assets |
| Television | 0.91 | % |
| Casino Services | 0.90 | |
| Cruise Lines | 0.90 | |
| Gas-Distribution | 0.90 | |
| Retail – Restaurants | 0.90 | |
| Metal-Copper | 0.89 | |
| Medical-Nursing Homes | 0.88 | |
| Building Products-Cement Aggregates | 0.87 | |
| Metal Processors & Fabrication | 0.86 | |
| Auto/Truck Parts & Equipment-Original | 0.84 | |
| Pipelines | 0.84 | |
| Energy-Alternate Sources | 0.82 | |
| Rental Auto/Equipment | 0.76 | |
| Transport-Truck | 0.75 | |
| Medical-HMO | 0.74 | |
| REITS-Hotels | 0.72 | |
| Diversified Minerals | 0.68 | |
| Auto Repair Centers | 0.63 | |
| Vitamins & Nutrition Products | 0.56 | |
| Hotels & Motels | 0.51 | |
| Consumer Products – Miscellaneous | 0.49 | |
| Insurance Brokers | 0.48 | |
| Diagnostic Kits | 0.47 | |
| Computer Services | 0.45 | |
| Fabricated Metal & Hardware | 0.44 | |
| Agricultural Chemicals | 0.37 | |
| Metal-Diversified | 0.37 | |
| Food-Retail | 0.36 | |
| Long-Term Investments | 93.01 | |
| Short-Term Investment | 7.76 | |
| Total investments | 100.77 | |
| Net other assets and liabilities | (0.77 | ) |
| | 100.00 | % |
See notes to financial statements
65
| Portfolio of investments (unaudited) |
High Yield Opportunities Fund
January 31, 2017 (continued)
Fair Value Measurements
The following table summarizes the Fund's investments that are measured at fair value by level within the fair value hierarchy at January 31, 2017:
| | | Quoted prices | | Significant | | | | | |
| | | in active | | other | | Significant | | | | |
| | | markets for | | observable | | unobservable | | | | |
| | | identical assets | | inputs | | inputs | | | |
| Description | | (level 1 | ) | (level 2 | ) | (level 3 | ) | Total | |
| Assets | | | | | | | | | | | | | |
| | | | | | | | | | | | | | |
| Bank loans | | | | | | | | | | | | | |
| United States | | $ | — | | $ | 1,749,879 | | $ | — | | $ | 1,749,879 | |
| Total Bank loans | | | — | | | 1,749,879 | | | — | | | 1,749,879 | |
| | | | | | | | | | | | | | |
| Corporate bonds | | | | | | | | | | | | | |
| Canada | | | — | | | 3,231,219 | | | — | | | 3,231,219 | |
| France | | | — | | | 1,287,500 | | | — | | | 1,287,500 | |
| Luxembourg | | | — | | | 2,223,000 | | | — | | | 2,223,000 | |
| Netherlands | | | — | | | 987,032 | | | — | | | 987,032 | |
| Switzerland | | | — | | | 641,625 | | | — | | | 641,625 | |
| United Kingdom | | | — | | | 1,026,190 | | | — | | | 1,026,190 | |
| United States | | | — | | | 42,211,702 | | | —* | | | 42,211,702 | |
| Total Corporate bonds | | | — | | | 51,608,268 | | | — | | | 51,608,268 | |
| Short-term investment | | | 4,454,097 | | | — | | | — | | | 4,454,097 | |
| Total Short-term investment | | | 4,454,097 | | | — | | | — | | | 4,454,097 | |
| Total Investments | | $ | 4,454,097 | | $ | 53,358,147 | | $ | — | | $ | 57,812,244 | |
| * | Fund held a level 3 security that was fair valued at $0 at January 31, 2017. |
During the period ended January 31, 2017, there were no transfers in or out of security levels.
Following is a reconciliation of investments in which significant observable inputs (Level 3) were used in determining fair value:
| | | | | | | | | | | | | | | | | | | | | | | | | | | | | |
| | | | | | | | | | | | | Change in | | | | | | | | | | | | | | | Balance | |
| | | | Balance as | | | Accrued | | | | | | unrealized | | | | | | | | | | | | | | | as of | |
| Investments in | | | of July 31, | | | discounts/ | | | Realized | | | appreciation | | | | | | | | | Transfers in | | Transfers out | | January 31, | |
| Securities | | | 2016 | | | premiums | | | gain/(loss | ) | | (depreciation | ) | | Purchases | | | Sales | | | to level 3 | | | of level 3 | | | 2017 | |
| Corporate Bond | | | | | | | | | | | | | | | | | | | | | | | | | | | | |
| MPM Escrow LLC | | $ | 0 | | $ | 0 | | $ | 0 | | $ | 0 | | $ | 0 | | $ | 0 | | $ | 0 | | $ | 0 | | $ | 0 | |
The total net change in unrealized appreciation (depreciation) attributable to level 3 investments held at January 31, 2017 was $0.
The Fund's Advisor has determined that MPM Escrow LLC is a Level 3 investment due to the lack of observable inputs in its valuation. In 2014, Momentive Performance Materials, Inc. defaulted on a debt obligation which was restructured into a new debt offering, which the Fund has purchased (Momentive Performance Materials, Inc. 3.88% 10/24/21). Attached to the purchase, the Fund received MPM Escrow LLC, which is the vehicle through which any recovery of the defaulted debt would take place. At January 31, 2017, this escrow stub was fair valued at $0 as it is unlikely to ever have value in the marketplace.
See notes to financial statements
66
| Portfolio of investments (unaudited) |
High Yield Opportunities Fund
January 31, 2017 (continued)
Effect of Financial Derivative Instruments on the Statement of Operations for the Period Ended January 31, 2017
| | | | Derivatives not accounted for as hedging instruments |
| | | | Foreign | | | | | | | | | | | | | | | | |
| | | | Currency | | | Equity | | | Interest | | | Credit | | | Inflation | | | | |
| | | | Risk | | | Risk | | | Rate Risk | | | Risk | | | Risk | | | Total | |
| Net realized gain/(loss) from | | | | | | | | | | | | | | | | | | | |
| financial derivative instruments: | | | | | | | | | | | | | | | | | | | |
| Swap Contracts | | $ | — | | $ | — | | $ | — | | $ | (5,532 | ) | $ | — | | $ | (5,532 | ) |
| Total | | $ | — | | $ | — | | $ | — | | $ | (5,532 | ) | $ | — | | $ | (5,532 | ) |
| | | | Derivatives not accounted for as hedging instruments |
| | | | Foreign | | | | | | | | | | | | | | | | |
| | | | Currency | | | Equity | | | Interest | | | Credit | | | Inflation | | | | |
| | | | Risk | | | Risk | | | Rate Risk | | | Risk | | | Risk | | | Total | |
| Net change in unrealized | | | | | | | | | | | | | | | | | | | |
| appreciation/(depreciation) | | | | | | | | | | | | | | | | | | | |
| of financial derivative instruments | | | | | | | | | | | | | | | | | | | |
| Swap Contracts | | $ | — | | $ | — | | $ | — | | $ | 6,671 | | $ | — | | $ | 6,671 | |
| Total | | $ | — | | $ | — | | $ | — | | $ | 6,671 | | $ | — | | $ | 6,671 | |
See notes to financial statements
67
| Portfolio of investments (unaudited) |
International Long/Short Equity Fund
January 31, 2017
| | | | | Value | |
| Shares | | | | (note 2) | |
| | | | | | |
| Common stocks – 45.87% | | | |
| | | | | | |
| | | Australia – 2.29% | | | |
| 345,000 | | African Petroleum Corp., Ltd. * | $ | 137,614 | |
| 2,332 | | CSL, Ltd. | | 198,613 | |
| | | | | 336,227 | |
| | | | | | |
| | | Canada – 0.87% | | | |
| 266,616 | | SDX Energy, Inc. * | | 127,872 | |
| | | | | | |
| | | China – 4.30% | | | |
| 1,905 | | Alibaba Group Holding, | | | |
| | | Ltd., ADR * | | 192,996 | |
| 69,900 | | Samsonite International S.A. | | 219,537 | |
| 8,400 | | Tencent Holdings, Ltd. (a) | | 219,860 | |
| | | | | 632,393 | |
| | | | | | |
| | | Finland – 0.30% | | | |
| 10,000 | | Nokia Oyj | | 44,799 | |
| | | | | | |
| | | Germany – 1.50% | | | |
| 2,000 | | Bayer AG (a) | | 220,866 | |
| | | | | | |
| | | Hong Kong – 1.31% | | | |
| 31,000 | | AIA Group, Ltd. (a) | | 192,075 | |
| | | | | | |
| | | India – 2.18% | | | |
| 2,794 | | HDFC Bank, Ltd., ADR | | 192,590 | |
| 9,306 | | Infosys, Ltd., ADR | | 128,144 | |
| | | | | 320,734 | |
| | | | | | |
| | | Ireland – 2.78% | | | |
| 1,900,000 | | Providence Resources plc * | | 409,322 | |
| | | | | | |
| | | Israel – 2.05% | | | |
| 9,000 | | Teva Pharmaceutical | | | |
| | | Industries, Ltd., ADR | | 300,870 | |
| | | | | | |
| | | Japan – 12.82% | | | |
| 27,000 | | Fujitsu, Ltd. (a) | | 157,490 | |
| 28,000 | | Hitachi, Ltd. (a) | | 160,595 | |
| 14,900 | | Inpex Corp. (a) | | 146,545 | |
| 11,900 | | Japan Post Holdings Co., Ltd. (a) | | 149,659 | |
| 1,900 | | Kose Corp. (a) | | 161,545 | |
| 26,600 | | Mitsubishi Motors Corp. (a) | | 144,414 | |
| 126,000 | | Nippon Yusen KK (a) | | 267,824 | |
| 4,000 | | Seven & I Holdings Co., Ltd. (a) | | 159,738 | |
| | | | | Value | |
| Shares | | | | (note 2) | |
| | | | | | |
| | | Japan – (continued) | | | |
| 7,400 | | Sohgo Security Services | | | |
| | | Co., Ltd (a) | $ | 278,213 | |
| 19,000 | | Sumitomo Metal Mining | | | |
| | | Co., Ltd. (a) | | 257,798 | |
| | | | | 1,883,821 | |
| | | | | | |
| | | Nigeria – 2.37% | | | |
| 980,000 | | Lekoil, Ltd. * | | 348,277 | |
| | | | | | |
| | | Singapore – 1.31% | | | |
| 29,400 | | City Developments, Ltd. | | 192,544 | |
| | | | | | |
| | | Spain – 1.27% | | | |
| 40,000 | | Telepizza Group S.A. * (b) | | 186,408 | |
| | | | | | |
| | | Switzerland – 1.93% | | | |
| 2,000 | | Dufry AG * | | 284,372 | |
| | | | | | |
| | | Taiwan – 2.45% | | | |
| 1,000 | | Largan Precision Co., Ltd. | | 143,437 | |
| 36,000 | | Taiwan Semiconductor | | | |
| | | Manufacturing Co., Ltd. | | 216,253 | |
| | | | | 359,690 | |
| | | | | | |
| | | United Kingdom – 5.34% | | | |
| 200,000 | | BNN Technology plc (c) * | | 308,210 | |
| 169,000 | | Diversified Gas & Oil plc * | | 138,191 | |
| 90,000 | | Saga plc | | 209,231 | |
| 350,000 | | Savannah Petroleum plc (c) * | | 129,338 | |
| | | | | 784,970 | |
| | | | | | |
| | | United States – 0.80% | | | |
| 2,500 | | Norwegian Cruise Line | | | |
| | | Holdings, Ltd. * (a) | | 117,500 | |
| | | | | | |
| | | Total common stocks | | | |
| | | (Cost $6,172,343) | | 6,742,740 | |
| | | | | | |
| Preferred stock – 2.08% | | | |
| | | | | | |
| | | Korea – 2.08% | | | |
| 226 | | Samsung Electronics Co., Ltd. | | 305,521 | |
| | | | | | |
| | | Total preferred stock | | | |
| | | (Cost $240,181) | | 305,521 | |
See notes to financial statements
68
| Portfolio of investments (unaudited) |
International Long/Short Equity Fund
January 31, 2017 (continued)
| | | | | Value | |
| Shares | | | | (note 2) | |
| | | | | | |
| REITs – 1.08% | | | |
| | | Japan – 1.08% | | | |
| 337 | | Invincible Investment Corp. | $ | 159,382 | |
| | | | | | |
| | | Total REITs | | | |
| | | (Cost $172,048) | | 159,382 | |
| | | | | | |
| Warrants – —% | | | |
| | | | | | |
| | | Norway – —% | | | |
| 225,000 | | African Petroleum Corp., | | | |
| | | Ltd. (expires 3/16/17) (c) (d) * | | — | |
| | | | | | |
| | | Total Warrants | | | |
| | | (Cost $—) | | — | |
| | | Total long-term investments | | | |
| | | (Cost $6,584,572) | | 7,207,643 | |
| Short-term investment – 56.64% | | | |
| 8,326,758 | | Fidelity Investments Money | | | |
| | | Market Treasury Portfolio | | 8,326,758 | |
| | | Total short-term investment | | | |
| | | (Cost $8,326,758) | | 8,326,758 | |
| Total investments (e) – 105.67% | | | |
| (Cost $14,911,330) | | 15,534,401 | |
Securities Sold Short – (35.96)%
| | | | | Value | |
| Shares | | | | (note 2) | |
| | | | | | |
| | | Australia – (0.89)% | | | |
| (4,300) | | Wesfarmers, Ltd. | $ | (131,293 | ) |
| | | Austria – (1.19)% | | | |
| (5,000) | | OMV AG | | (174,690 | ) |
| | | Cayman Islands – (0.87)% | | | |
| (320,000) | | Sa Sa International | | | |
| | | Holdings, Ltd. | | (127,558 | ) |
| | | | Value | |
| Shares | | | (note 2) | |
| | | | |
| Securities sold short(f) | | | |
(Cost $(5,079,151)) – (35.96)% | $ | (5,286,355 | ) |
| | | | |
| Financial Derivative Instruments (g) | | | |
(Cost or Premiums, net $0) – 0.12% | | 17,962 | |
| Net other assets and liabilities – 30.17% | | 4,434,471 | |
| Total net assets – 100.00% | $ | 14,700,479 | |
| * | | Non-income producing security |
| (a) | | All or a portion of the security is pledged as collateral for securities sold short. At January 31, 2017, the value of securities pledged was $2,692,727. An additional $3,273,947 in cash has been segregated for collateral on securities sold short. |
| (b) | | Restricted security, purchased pursuant to Rule 144A under the Securities Act of 1933, as amended, and which is exempt from registration under that Act. At January 31, 2017, the restricted securities held by the Fund had an aggregate value of $186,408, which represented 1.3% of net assets. |
| (c) | | The security has been deemed illiquid by the Advisor according to the policies and procedures adopted by the Board of Trustees. |
| (d) | | Fair valued at January 31, 2017 as determined in good faith using procedures approved by the Board of Trustees. |
| (e) | | All or a portion of these securities and short-term investments were segregated for open futures contracts, securities sold short and swap contracts at January 31, 2017. |
| (f) | | The portfolio of securities sold short is disclosed below. |
| (g) | | Information with respect to financial derivative instruments is disclosed in the following tables. |
| ADR | | American Depositary Receipt |
| REIT | | Real Estate Investment Trust |
| | | | | Value | |
| Shares | | | | (note 2) | |
| | | | | | |
| | | China – (2.26)% | | | |
| (151,000) | | China Minsheng Banking | | | |
| | | Corp., Ltd. | $ | (166,359 | ) |
| (288,000) | | China Southern Airlines | | | |
| | | Co., Ltd. | | (166,231 | ) |
| | | | | (332,590 | ) |
| | | Finland – (3.86)% | | | |
| (6,000) | | Neste Oyj | | (208,948 | ) |
| (7,000) | | UPM-Kymmene Oyj | | (158,686 | ) |
| (4,000) | | Wartsila Oyj Abp | | (200,571 | ) |
| | | | | (568,205 | ) |
See notes to financial statements
69
| Portfolio of investments (unaudited) |
International Long/Short Equity Fund
January 31, 2017 (continued)
| | | | | Value | |
| Shares | | | | (note 2) | |
| | | Germany – (3.93)% | | | |
| (1,000) | | Adidas AG | $ | (157,229 | ) |
| (2,500) | | Covestro AG | | (187,536 | ) |
| (1,500) | | Volkswagen AG | | (233,010 | ) |
| | | | | (577,775 | ) |
| | | | | | |
| | | Hong Kong – (0.94)% | | | |
| (27,000) | | MTR Corp., Ltd. | | (137,490 | ) |
| | | | | | |
| | | Italy – (0.91)% | | | |
| (2,500) | | Luxottica Group SpA | | (134,101 | ) |
| | | | | | |
| | | Japan – (11.55)% | | | |
| (100,000) | | ANA Holdings, Inc. | | (297,139 | ) |
| (4,000) | | Asahi Intecc Co., Ltd. | | (162,962 | ) |
| (10,400) | | Komatsu, Ltd. | | (248,141 | ) |
| (3,100) | | Nitto Denko Corp. | | (245,534 | ) |
| (25,200) | | Nomura Holdings, Inc. | | (157,012 | ) |
| (6,000) | | Shiseido Co., Ltd. | | (167,815 | ) |
| (80,000) | | Toshiba Corp. | | (171,677 | ) |
| (11,000) | | Unicharm Corp. | | (247,454 | ) |
| | | | | (1,697,734 | ) |
| | | | | Value | |
| Shares | | | | (note 2) | |
| | | Singapore – (1.83)% | | | |
| (28,300) | | BOC Aviation, Ltd. | $ | (142,500 | ) |
| (9,400) | | DBS Group Holdings, Ltd. | | (126,525 | ) |
| | | | | (269,025 | ) |
| | | | | | |
| | | Spain – (1.35)% | | | |
| (6,000) | | Industria de Diseno Textil S.A. | | (197,775 | ) |
| | | | | | |
| | | Sweden – (4.53)% | | | |
| (7,000) | | Boliden AB | | (204,148 | ) |
| (10,000) | | ICA Gruppen AB | | (326,622 | ) |
| (10,000) | | Sandvik AB | | (134,902 | ) |
| | | | | (665,672 | ) |
| | | Switzerland – (1.85)% | | | |
| (2,000) | | Kuehne & Nagel | | | |
| | | International AG | | (272,447 | ) |
| | | Total Securities Sold Short | | | |
| | | (Cost $(5,079,151)) | $ | (5,286,355 | ) |
(g) FINANCIAL DERIVATIVE INSTRUMENTS
EXCHANGE-TRADED OR CENTRALLY-CLEARED FINANCIAL DERIVATIVE INSTRUMENTS
FUTURES CONTRACTS
| | | | | | | | | | | | | |
| | | | | | | | | | | | Unrealized | |
| | | | | | | | | Current | | appreciation/ | |
| | | Number of | | Expiration | | notional | | (depreciation) | |
| | | | contracts | | | date | | | value | | | Asset | | | Liability | |
| SGX Nifty 50 Index (Short) | | | (12 | ) | | 2/23/17 | | $ | 205,824 | | $ | — | | $ | (4,840 | ) |
| Total | | | | | | | | | | | $ | — | | $ | (4,840 | ) |
During the period ended January 31, 2017, average monthly notional value related to futures contracts was approximately $0.3 million or 2.0% of net assets.
FINANCIAL DERIVATIVE INSTRUMENTS: EXCHANGE-TRADED OR CENTRALLY-CLEARED SUMMARY
The following is a summary of the value of exchange-traded or centrally-cleared financial derivative instruments as of January 31, 2017:
| | | | | | |
| | | | | | | | | | | | |
| | | Futures Contracts | | | Total | | Futures Contracts | | | Total | |
| Total Exchange-Traded or Centrally Cleared | | $ | — | | $ | — | | $ | (4,840 | ) | $ | (4,840 | ) |
See notes to financial statements
70
| Portfolio of investments (unaudited) |
International Long/Short Equity Fund
January 31, 2017 (continued)
OVER-THE-COUNTER FINANCIAL DERIVATIVE INSTRUMENTS
FORWARD FOREIGN CURRENCY CONTRACTS
| | | | | | | | | | | | | | | Unrealized | |
| | | | | | | | | | Local | | | Current | | appreciation/ | |
| | | | | | | Value | | | amount | | | notional | | (depreciation) | |
| | | | Counterparty | | | date | | | (000's | ) | | value | | | Asset | | | Liability | |
| Australian Dollar (Short) | | | BNP Paribas Securities Services | | | 2/22/17 | | | 84 | | $ | 63,999 | | $ | — | | $ | (654 | ) |
| British Pound (Short) | | | BNP Paribas Securities Services | | | 2/22/17 | | | 1,242 | | | 1,563,279 | | | — | | | (46,324 | ) |
| Euro (Long) | | | BNP Paribas Securities Services | | | 2/22/17 | | | 1,115 | | | 1,204,526 | | | 13,949 | | | — | |
| Hong Kong Dollar (Long) | | | BNP Paribas Securities Services | | | 2/22/17 | | | 818 | | | 105,414 | | | — | | | (87 | ) |
| Japanese Yen (Short) | | | BNP Paribas Securities Services | | | 2/22/17 | | | 40,437 | | | 358,315 | | | — | | | (6,963 | ) |
| New Taiwan Dollar (Short) | | | UBS AG | | | 3/29/17 | | | 10,178 | | | 327,429 | | | — | | | (5,949 | ) |
| Norwegian Krone (Short) | | | BNP Paribas Securities Services | | | 2/22/17 | | | 1,112 | | | 134,882 | | | — | | | (3,715 | ) |
| Singapore Dollar (Short) | | | BNP Paribas Securities Services | | | 2/22/17 | | | 91 | | | 64,357 | | | — | | | (862 | ) |
| South Korean Won (Short) | | | Citibank, N.A. | | | 3/29/17 | | | 323,807 | | | 281,248 | | | — | | | (4,094 | ) |
| South Korean Won (Short) | | | UBS AG | | | 3/29/17 | | | 21,140 | | | 18,362 | | | — | | | (401 | ) |
| Swedish Krona (Long) | | | BNP Paribas Securities Services | | | 2/22/17 | | | 5,738 | | | 656,535 | | | 9,246 | | | — | |
| Swiss Franc (Short) | | | BNP Paribas Securities Services | | | 2/22/17 | | | 12 | | | 12,590 | | | — | | | (182 | ) |
| Total | | | | | | | | | | | | | | $ | 23,195 | | $ | (69,231 | ) |
During the period ended January 31, 2017, average monthly notional value related to forward foreign currency contracts was approximately $5.4 million or 36.8% of net assets.
EQUITY SWAPS
| | | | | | | | | | | | | | Unrealized | |
| | | | | | | | | | | | | | appreciation/ | |
| | | Pay/ | | Underlying | | # of | | Financing | | Termination | | Notional | (depreciation) | |
| Counterparty | | Receive(1) | | Reference | | Shares | | Rate | | Date | | amount | | Asset | | Liability | |
| Credit Suisse Securities (Europe) Limited | | Receives | | Balfour Beatty plc | | 65,000 | | 1-month USD LIBOR plus 0.20% | | 01/08/2018 | $ | 211,375 | $ | — | $ | (6,913 | ) |
| Credit Suisse Securities (Europe) Limited | | Receives | | Barclays plc | | 45,000 | | 1-month USD LIBOR plus 0.20% | | 07/09/2018 | | 124,231 | | — | | (7,416 | ) |
| Credit Suisse Securities (Europe) Limited | | Receives | | Bellway plc | | 7,000 | | 1-month USD LIBOR plus 0.20% | | 01/08/2018 | | 218,741 | | — | | (2,378 | ) |
| Credit Suisse Securities (Europe) Limited | | Receives | | BT Group plc | | 60,000 | | 1-month USD LIBOR plus 0.20% | | 07/09/2018 | | 229,346 | | — | | (39,360 | ) |
| Credit Suisse Securities (Europe) Limited | | Receives | | Clinigen Group plc | | 25,000 | | 1-month USD LIBOR plus 0.20% | | 01/08/2018 | | 247,826 | | 157 | | — | |
| Credit Suisse Securities (Europe) Limited | | Receives | | Interserve plc | | 35,000 | | 1-month USD LIBOR plus 0.20% | | 01/08/2018 | | 142,547 | | — | | (12,769) | |
| Credit Suisse Securities (Europe) Limited | | Receives | | Marks + Spencer Group plc | | 50,000 | | 1-month USD LIBOR plus 0.20% | | 07/09/2018 | | 211,029 | | 7,234 | | — | |
| Credit Suisse Securities (Europe) Limited | | Receives | | NMC Health plc | | 13,000 | | 1-month USD LIBOR plus 0.20% | | 01/08/2018 | | 266,734 | | — | | (1,472 | ) |
| Credit Suisse Securities (Europe) Limited | | Receives | | Paysafe Group plc | | 35,000 | | 1-month USD LIBOR plus 0.20% | | 01/08/2018 | | 168,150 | | 4,359 | | — | |
| Credit Suisse Securities (Europe) Limited | | Receives | | Paragon Group Companies plc | | 50,000 | | 1-month USD LIBOR plus 0.20% | | 01/08/2018 | | 253,990 | | 1,510 | | — | |
| Credit Suisse Securities (Europe) Limited | | Receives | | Playtech plc | | 16,000 | | 1-month USD LIBOR plus 0.20% | | 01/08/2018 | | 166,861 | | 302 | | — | |
| Credit Suisse Securities (Europe) Limited | | Receives | | Renault S.A. | | 2,600 | | 1-month USD LIBOR plus 0.20% | | 07/09/2018 | | 234,023 | | — | | (7,662) | |
| Credit Suisse Securities (Europe) Limited | | Receives | | Royal Mail Plc | | 40,000 | | 1-month USD LIBOR plus 0.20% | | 07/09/2018 | | 207,117 | | — | | (1,200) | |
| Credit Suisse Securities (Europe) Limited | | Receives | | St. Modwen Properties plc | | 55,000 | | 1-month USD LIBOR plus 0.20% | | 01/08/2018 | | 220,508 | | 2,491 | | — | |
| Credit Suisse Securities (Europe) Limited | | Receives | | Taylor Wimpey plc | | 100,000 | | 1-month USD LIBOR plus 0.20% | | 07/09/2018 | | 210,212 | | — | | (2,893 | ) |
| Credit Suisse Securities (Europe) Limited | | Receives | | Victrex plc | | 10,000 | | 1-month USD LIBOR plus 0.20% | | 01/08/2018 | | 239,020 | | — | | (6,667 | ) |
| Credit Suisse Securities (Europe) Limited | | Pays | | Afren plc(a)(b) | | (950,000) | | 1-month USD LIBOR less 0.30% | | 01/08/2018 | | (1,195 | ) | 52,055 | | — | |
| Credit Suisse Securities (Europe) Limited | | Pays | | Airbus Group N.V. | | (3,000) | | 1-month USD LIBOR less 0.35% | | 07/09/2018 | | (203,248 | ) | 5,959 | | — | |
| Credit Suisse Securities (Europe) Limited | | Pays | | Allied Minds plc | | (38,000) | | 1-month USD LIBOR less 0.91% | | 01/08/2018 | | (190,308 | ) | 32,937 | | — | |
| Credit Suisse Securities (Europe) Limited | | Pays | | AO World plc | | (80,000) | | 1-month USD LIBOR less 1.75% | | 01/08/2018 | | (160,923 | ) | 20,631 | | — | |
| Credit Suisse Securities (Europe) Limited | | Pays | | Avanti Communications Group | | (161,486) | | 1-month USD LIBOR less 12.00% | | 01/08/2018 | | (40,376 | ) | 2,285 | | — | |
| Credit Suisse Securities (Europe) Limited | | Pays | | Carillion plc | | (85,000) | | 1-month USD LIBOR less 0.44% | | 01/08/2018 | | (230,434 | ) | 18,053 | | — | |
See notes to financial statements
71
| Portfolio of investments (unaudited) |
International Long/Short Equity Fund
January 31, 2017 (continued)
EQUITY SWAPS (continued)
| | | | | | | | | | | | | | | | Unrealized | |
| | | | | | | | | | | | | | | | appreciation/ | |
| | | Pay/ | | Underlying | | # of | | Financing | | Termination | | Notional | | | (depreciation) | |
| Counterparty | | Receive(1) | | Reference | | Shares | | Rate | | Date | | amount | | | Asset | | Liability | |
| Credit Suisse Securities (Europe) Limited | | Pays | | Foxtons Group plc | | (95,000 | ) | 1-month USD LIBOR less 0.30% | | 01/08/2018 | $ | (115,925 | ) | $ | 4,780 | $ | — | |
| Credit Suisse Securities (Europe) Limited | | Pays | | Hotel Chocolat Group, Ltd. | | (40,000 | ) | 1-month USD LIBOR less 7.00% | | 01/08/2018 | | (129,322 | ) | | 256 | | — | |
| Credit Suisse Securities (Europe) Limited | | Pays | | Majestic Wine Plc | | (40,000 | ) | 1-month USD LIBOR less 5.50% | | 01/08/2018 | | (176,749 | ) | | — | | (18,493 | ) |
| Credit Suisse Securities (Europe) Limited | | Pays | | Mediatek, Inc. | | (17,000 | ) | 1-month USD LIBOR less 1.00% | | 03/22/2018 | | (115,788 | ) | | 178 | | — | |
| Credit Suisse Securities (Europe) Limited | | Pays | | Meggitt plc | | (40,000 | ) | 1-month USD LIBOR less 0.30% | | 07/09/2018 | | (210,287 | ) | | 16,354 | | — | |
| Credit Suisse Securities (Europe) Limited | | Pays | | Mitie Group plc | | (100,000 | ) | 1-month USD LIBOR less 0.60% | | 01/08/2018 | | (252,480) | | | 13,344 | | — | |
| Credit Suisse Securities (Europe) Limited | | Pays | | Sig plc | | (100,000 | ) | 1-month USD LIBOR less 0.30% | | 01/08/2018 | | (129,322 | ) | | — | | (1,006 | ) |
| Credit Suisse Securities (Europe) Limited | | Pays | | Telit Communications plc | | (50,000 | ) | 1-month USD LIBOR less 8.00% | | 01/08/2018 | | (180,051 | ) | | — | | (5,818 | ) |
| Total | | | | | | | | | | | | | | $ | 182,885 | $ | (114,047 | ) |
| (1) | Receive indicates the Fund receives payments for any positive return on the underlying reference. The Fund makes payments for any negative return on such underlying reference. Pay indicates the Fund receives payments for any negative return on the underlying reference. The Fund makes payments for any positive return on such underlying reference. |
| (a) | The contract has been deemed illiquid by the Advisor according to policies and procedures adopted by the Board of Trustees. |
| (b) | Fair valued at January 31, 2017 as determined in good faith using procedures approved by the Board of Trustees. |
During the period ended January 31, 2017, average monthly notional value related to equity swap contracts was approximately $5.4 million or 37.1% of net assets.
FINANCIAL DERIVATIVE INSTRUMENTS: OVER-THE-COUNTER SUMMARY
The following is a summary by counterparty of the value of over-the-counter financial derivative instruments and collateral (received)/pledged as of January 31, 2017:
| | | | Financial Derivative Assets | | | Financial Derivative Liabilities | | | | | | | | | | |
| | | | Unrealized | | | | | | | | | Unrealized | | | | | | | | | | | | | | | | |
| | | | Appreciation | | | Value(1) | | | | | | Depreciation | | | Value(1) | | | | | | | | | | | | | |
| | | | Forward | | | | | | Total | | | Forward | | | | | | Total | | | Net | | | | | | | |
| | | | Foreign | | | | | | Over- | | | Foreign | | | | | | Over- | | | Value | | | Collateral | | | | |
| | | | Currency | | | Swap | | | the- | | | Currency | | | Swap | | | the- | | | of OTC | | | (Received) | | | Net | |
| | | | Contracts | | | Contracts | | | Counter | | | Contracts | | | Contracts | | | Counter | | | Derivatives | | | /Pledged | | Exposure(2) | |
| Amounts subject to a master netting agreement: | | | | | | | | | | | | | | | | | |
| BNP Paribas | | | | | | | | | | | | | | | | | | | | | | | | | | | | |
| Securities | | | | | | | | | | | | | | | | | | | | | | | | | | | | |
| Services | | $ | 23,195 | | $ | — | | $ | 23,195 | | $ | (58,787 | ) | $ | — | | $ | (58,787 | ) | $ | (35,592 | ) | $ | — | | $ | (35,592 | ) |
| Citibank, N.A. | | | — | | | — | | | — | | | (4,094 | ) | | — | | | (4,094 | ) | | (4,094 | ) | | — | | | (4,094 | ) |
| Credit Suisse | | | | | | | | | | | | | | | | | | | | | | | | | | | | |
| Securities | | | | | | | | | | | | | | | | | | | | | | | | | | | | |
| (Europe) Limited — | | | — | | | 182,885 | | | 182,885 | | | — | | | (114,047 | ) | | (114,047 | ) | | 68,838 | | | 560,000 | | | 628,838 | |
| UBS AG | | | — | | | — | | | — | | | (6,350 | ) | | — | | | (6,350 | ) | | (6,350 | ) | | — | | | (6,350 | ) |
| | | $ | 23,195 | | $ | 182,885 | | $ | 206,080 | | $ | (69,231 | ) | $ | (114,047 | ) | $ | (183,278 | ) | $ | 22,802 | | $ | 560,000 | | $ | 582,802 | |
(1) | Value on swap contracts is represented by "unrealized appreciation/(depreciation)" on interest rate swaps. |
(2) | Net Exposure represents the net receivable/(payable) that would be due from/to the counterparty in the event of default. Exposure from over-the-counter financial derivative instruments can only be netted across transactions governed under the same master agreement with the same legal entity. See Note 2, Significant Accounting Policies, "Derivative instruments," in the Notes to Financial Statements for more information regarding master netting arrangements. |
| | | | Cost or Premiums, net | | | Asset | | | Liability | |
| TOTAL FINANCIAL DERIVATIVE INSTRUMENTS | | $ | — | | $ | 206,080 | | $ | (188,118 | ) |
See notes to financial statements
72
| Portfolio of investments (unaudited) |
International Long/Short Equity Fund
January 31, 2017 (continued)
Other information:
| Industry concentration as | % of net |
| a percentage of net assets: | assets |
| Oil & Gas Exploration & Production | 9.78 | % |
| Retail-Misc/Diversified | 3.02 | |
| Life/Health Insurance | 2.33 | |
| Gambling (Non-Hotel) | 2.10 | |
| Electronic Components-Semiconductors | 2.08 | |
| Medical-Generic Drugs | 2.05 | |
| Security Services | 1.89 | |
| Transport-Marine | 1.82 | |
| Diversified Minerals | 1.75 | |
| Chemicals – Diversified | 1.50 | |
| Internet Application Software | 1.50 | |
| Consumer Products – Miscellaneous | 1.49 | |
| Semiconductor Components-Integrated Circuits | 1.47 | |
| Property/Casualty Insurance | 1.42 | |
| Medical-Biomedical/Gene | 1.35 | |
| Commercial Banks Non-US | 1.31 | |
| E-Commerce/Products | 1.31 | |
| Hotels & Motels | 1.31 | |
| Retail – Restaurants | 1.27 | |
| Cosmetics & Toiletries | 1.10 | |
| Electric Products-Miscellaneous | 1.09 | |
| REITS-Apartments | 1.08 | |
| Computers-Integrated Systems | 1.07 | |
| Auto-Cars/Light Trucks | 0.98 | |
| Photo Equipment & Supplies | 0.98 | |
| Computer Services | 0.87 | |
| Cruise Lines | 0.80 | |
| Wireless Equipment | 0.31 | |
| Long-Term Investments | 49.03 | |
| Short-Term Investment | 56.64 | |
| Industry concentration as | % of net |
| a percentage of net assets: | assets |
| Securities Sold Short | | |
| Retail-Perfume & Cosmetics | (0.87 | )% |
| Optical Supplies | (0.91 | ) |
| Machinery Tools & Related Products | (0.92 | ) |
| Transport-Rail | (0.94 | ) |
| Finance-Leasing Company | (0.97 | ) |
| Finance – Investment Banking & Brokerage | (1.07 | ) |
| Athletic Footwear | (1.07 | ) |
| Paper & Related Products | (1.08 | ) |
| Medical Products | (1.11 | ) |
| Oil Comp-Integrated | (1.19 | ) |
| Retail – Apparel/Shoe | (1.35 | ) |
| Metal-Diversified | (1.39 | ) |
| Oil & Gas Refining & Marketing | (1.42 | ) |
| Auto-Cars/Light Trucks | (1.58 | ) |
| Machinery-Construction & Mining | (1.69 | ) |
| Transport-Services | (1.85 | ) |
| Commercial Banks Non-US | (1.99 | ) |
| Diversified Manufacturing Operations | (2.53 | ) |
| Cosmetics & Toiletries | (2.82 | ) |
| Chemicals – Diversified | (2.95 | ) |
| Food-Retail | (3.11 | ) |
| Airlines | (3.15 | ) |
| Financial Derivative Instruments | 0.12 | |
| Net other assets and liabilities | 30.17 | |
| | 100.00 | % |
| Currency exposure of long portfolio assets | | |
| before any currency hedging, if applicable. | % of net |
| Excludes derivatives: | investments |
| US Dollar | 60 | % |
| Japanese Yen | 13 | |
| British Pound | 11 | |
| Hong Kong Dollar | 4 | |
| Euro | 3 | |
| Taiwan Dollar | 2 | |
| Korean Won | 2 | |
| Swiss Franc | 2 | |
| Australian Dollar | 1 | |
| Singapore Dollar | 1 | |
| Norwegian Krone | 1 | |
| | 100 | % |
See notes to financial statements
73
| Portfolio of investments (unaudited) |
International Long/Short Equity Fund
January 31, 2017 (continued)
Fair Value Measurement
The following table summarizes the Fund's investments that are measured at fair value by level within the fair value hierarchy at January 31, 2017:
| | | Quoted prices | | Significant | | | | | |
| | | in active | | other | | Significant | | | |
| | | markets for | | observable | | unobservable | | | |
| | | identical assets | | inputs | | inputs | | | | |
| Description | | | (Level 1 | ) | | (Level 2 | ) | | (Level 3 | ) | | Total | |
| Assets | | | | | | | | | | | | | |
| Common stocks | | | | | | | | | | | | | |
| Australia | | $ | 336,227 | | $ | — | | $ | — | | $ | 336,227 | |
| Canada | | | 127,872 | | | — | | | — | | | 127,872 | |
| China | | | 632,393 | | | — | | | — | | | 632,393 | |
| Finland | | | 44,799 | | | — | | | — | | | 44,799 | |
| Germany | | | 220,866 | | | — | | | — | | | 220,866 | |
| Hong Kong | | | 192,075 | | | — | | | — | | | 192,075 | |
| India | | | 320,734 | | | — | | | — | | | 320,734 | |
| Ireland | | | 409,322 | | | — | | | — | | | 409,322 | |
| Israel | | | 300,870 | | | — | | | — | | | 300,870 | |
| Japan | | | 1,883,821 | | | — | | | — | | | 1,883,821 | |
| Nigeria | | | 348,277 | | | — | | | — | | | 348,277 | |
| Singapore | | | 192,544 | | | — | | | — | | | 192,544 | |
| Spain | | | 186,408 | | | — | | | — | | | 186,408 | |
| Switzerland | | | 284,372 | | | — | | | — | | | 284,372 | |
| Taiwan | | | 359,690 | | | — | | | — | | | 359,690 | |
| United Kingdom | | | 784,970 | | | — | | | — | | | 784,970 | |
| United States | | | 117,500 | | | — | | | — | | | 117,500 | |
| Total Common stocks | | | 6,742,740 | | | — | | | — | | | 6,742,740 | |
| Preferred stock | | | | | | | | | | | | | |
| Korea | | | 305,521 | | | — | | | — | | | 305,521 | |
| Total Preferred stock | | | 305,521 | | | — | | | — | | | 305,521 | |
| REITs | | | | | | | | | | | | | |
| Japan | | | 159,382 | | | — | | | — | | | 159,382 | |
| Total REITs | | | 159,382 | | | — | | | — | | | 159,382 | |
| Warrants | | | | | | | | | | | | | |
| Norway | | | — | | | — | * | | — | | | — | |
| Total Warrants | | | — | | | — | * | | — | | | — | |
| Short-term investment | | | 8,326,758 | | | — | | | — | | | 8,326,758 | |
| Total Short-term investment | | | 8,326,758 | | | — | | | — | | | 8,326,758 | |
| Total Investments | | $ | 15,534,401 | | $ | — | | $ | — | | $ | 15,534,401 | |
| Liabilities | | | | | | | | | | | | | |
| Securities Sold Short | | | | | | | | | | | | | |
| Australia | | $ | (131,293 | ) | $ | — | | $ | — | | $ | (131,293 | ) |
| Austria | | | (174,690 | ) | | — | | | — | | | (174,690 | ) |
| Cayman Islands | | | (127,558 | ) | | — | | | — | | | (127,558 | ) |
| China | | | (332,590 | ) | | — | | | — | | | (332,590 | ) |
| Finland | | | (568,205 | ) | | — | | | — | | | (568,205 | ) |
| Germany | | | (577,775 | ) | | — | | | — | | | (577,775 | ) |
See notes to financial statements
74
| Portfolio of investments (unaudited) |
International Long/Short Equity Fund
January 31, 2017 (continued)
Fair Value Measurements (continued)
| | | | Quoted prices | | | Significant | | | | | | | |
| | | | in active | | | other | | | Significant | | | | |
| | | | markets for | | | observable | | | unobservable | | | | |
| | | | identical assets | | | inputs | | | inputs | | | | |
| Description | | | (Level 1 | ) | | (Level 2 | ) | | (Level 3 | ) | | Total | |
| Securities Sold Short (continued) | | | | | | | | | | | | | |
| Hong Kong | | $ | (137,490 | ) | $ | — | | $ | — | | $ | (137,490 | ) |
| Italy | | | (134,101 | ) | | — | | | — | | | (134,101 | ) |
| Japan | | | (1,697,734 | ) | | — | | | — | | | (1,697,734 | ) |
| Singapore | | | (269,025 | ) | | — | | | — | | | (269,025 | ) |
| Spain | | | (197,775 | ) | | — | | | — | | | (197,775 | ) |
| Sweden | | | (665,672 | ) | | — | | | — | | | (665,672 | ) |
| Switzerland | | | (272,447 | ) | | — | | | — | | | (272,447 | ) |
| Total Securities Sold Short | | | (5,286,355 | ) | | — | | | — | | | (5,286,355 | ) |
| Financial Derivative Instruments – Assets | | | | | | | | | | | | | |
| Over-the-counter | | $ | — | | $ | 154,025 | | $ | 52,055 | | $ | 206,080 | |
| Total Financial Derivative Instruments – Assets | | $ | — | | $ | 154,025 | | $ | 52,055 | | $ | 206,080 | |
| Liabilities | | | | | | | | | | | | | |
| Financial Derivative Instruments – Liabilities | | | | | | | | | | | | | |
| Exchange-traded or centrally-cleared | | $ | (4,840 | ) | $ | — | | $ | — | | $ | (4,840 | ) |
| Over-the-counter | | | — | | | (183,278 | ) | | — | | | (183,278 | ) |
| Total Financial Derivative Instruments – Liabilities | | $ | (4,840 | ) | $ | (183,278 | ) | $ | — | | $ | (188,118 | ) |
*Fund held a level 2 security that was fair valued at $0 at January 31, 2017.
During the period ended January 31, 2017, there were no transfers in or out of security levels.
Following is a reconciliation of investments in which significant unobservable inputs (Level 3) were used in determining fair value:
| | | | | | | | | | | | | Change in | | | | | | | | | | | | | | | Balance | |
| | | | Balance as | | | Accrued | | | | | | unrealized | | | | | | | | | | | | | | | as pf | |
| | | | of July 31, | | | discounts/ | | | Realized | | | appreciation/ | | | | | | | | Transfers in | | Transfers out | | January 31, | |
| Investment | | | 2016 | | | premiums | | | gain/(loss | ) | | (depreciation | ) | | Purchases | | | Sales | | | to level 3 | | | of level 3 | | | 2017 | |
| Equity Swap | | | | | | | | | | | | | | | | | | | | | | | | | | | | |
| Afren PLC | | $ | 54,764 | | $ | 0 | | $ | 0 | | $ | (2,709 | ) | $ | 0 | | $ | 0 | | $ | 0 | | $ | 0 | | $ | 52,055 | |
| | | $ | 54,764 | | $ | 0 | | $ | 0 | | $ | (2,709 | ) | $ | 0 | | $ | 0 | | $ | 0 | | $ | 0 | | $ | 52,055 | |
The Fund's Advisor has determined that the short equity swap on the underlying referenced security Afren plc ("Afren") is a Level 3 investment due to the lack of observable inputs that may be used in the determination of fair value. In accordance with the pricing procedures approved by the Board of Trustees, equity swap contracts are valued using the last traded exchange price on the underlying equity security. Afren was an international oil exploration and production company that traded on the London Stock Exchange. In July 2015, Afren's stock was suspended from trading at a last traded price of 0.01785 GBP as the result of management's announcement that it was unable to accurately assess its financial position due to reduced production levels and inability to raise capital. Subsequently, in August 2015, the stock was formally delisted from the exchange as the company was taken into bankruptcy proceedings. As the Fund's position is "short," it benefitted from the ultimate decline in the company's value and eventual delisting. Accordingly, pending the company's liquidation and given the likelihood that the sale of the company's assets will not be sufficient to cover its outstanding debt, the fair valuation of the security underlying the equity swap reflects only inconsequential final costs associated with the termination of the contract but which is otherwise deemed worthless.
See notes to financial statements
75
| Portfolio of investments (unaudited) |
International Long/Short Equity Fund
January 31, 2017 (continued)
Fair Value of Financial Derivative Instruments
The following is a summary of the fair valuation of the Fund's financial derivative instruments categorized by risk exposure:
Fair Values of Financial Derivative Instruments on the Statement of Assets and Liabilities as of January 31, 2017
| | | | | | Derivatives not accounted for as hedging instruments | | | | |
| | | | Foreign | | | | | | | | | | | | | | | | |
| | | | Currency | | | Equity | | | Interest | | | Credit | | | Inflation | | | | |
| | | | Risk | | | Risk | | | Rate Risk | | | Risk | | | Risk | | | Total | |
| Financial Derivative Instruments – Assets | | | | | | | | | | | | |
| Over-the-Counter | | | | | | | | | | | | | | | | | | | |
| Forward Foreign Currency Contracts | | $ | 23,195 | | $ | — | | $ | — | | $ | — | | $ | — | | $ | 23,195 | |
| Swap Contracts | | | — | | | 182,885 | | | — | | | — | | | — | | | 182,885 | |
| Total | | | 23,195 | | | 182,885 | | | — | | | — | | | — | | | 206,080 | |
| Financial Derivative Instruments – Liabilities | | | | | | | | | | | | |
| Exchange-traded | | | | | | | | | | | | | | | | | | | |
| Futures Contracts | | | — | | | (4,840 | ) | | — | | | — | | | — | | | (4,840 | ) |
| | | | — | | | (4,840 | ) | | — | | | — | | | — | | | (4,840 | ) |
| Over-the-Counter | | | | | | | | | | | | | | | | | | | |
| Forward Foreign Currency Contracts | | | (69,231 | ) | | — | | | — | | | — | | | — | | | (69,231 | ) |
| Swap Contracts | | | — | | | (114,047 | ) | | — | | | — | | | — | | | (114,047 | ) |
| Total | | | (69,231 | ) | | (118,887 | ) | | — | | | — | | | — | | | (188,118 | ) |
| Net | | $ | (46,036 | ) | $ | 63,998 | | | — | | | — | | | — | | $ | 17,962 | |
Effect of Financial Derivative Instruments on the Statement of Operations for the Period Ended January 31, 2017
| | | | | | Derivatives not accounted for as hedging instruments | | | | |
| | | | Foreign | | | | | | | | | | | | | | | | |
| | | | Currency | | | Equity | | | Interest | | | Credit | | | Inflation | | | | |
| | | | Risk | | | Risk | | | Rate Risk | | | Risk | | | Risk | | | Total | |
| Net realized gain/(loss) from | | | | | | | | | | | | | | | |
| financial derivative instruments: | | | | | | | | | | | | | | | |
| Futures Contracts | | $ | — | | $ | (9,731 | ) | $ | — | | $ | — | | $ | — | | $ | (9,731 | ) |
| Forward Foreign Currency Contracts | | | 71,571 | | | — | | | — | | | — | | | — | | | 71,571 | |
| Swap Contracts | | | — | | | 905,505 | | | — | | | — | | | — | | | 905,505 | |
| Total | | $ | 71,571 | | $ | 895,774 | | $ | — | | $ | — | | $ | — | | $ | 967,345 | |
| | | | | | Derivatives not accounted for as hedging instruments | | | | |
| | | | Foreign | | | | | | | | | | | | | | | | |
| | | | Currency | | | Equity | | | Interest | | | Credit | | | Inflation | | | | |
| | | | Risk | | | Risk | | | Rate Risk | | | Risk | | | Risk | | | Total | |
| Net change in unrealized | | | | | | | | | | | | | | | | | | | |
| appreciation/(depreciation) of | | | | | | | | | | | | | | | |
| financial derivative instruments | | | | | | | | | | | | | | | |
| Futures Contracts | | $ | — | | $ | 7,392 | | $ | — | | $ | — | | $ | — | | $ | 7,392 | |
| Forward Foreign Currency Contracts | | | (10,815 | ) | | — | | | — | | | — | | | — | | | (10,815 | ) |
| Swap Contracts | | | — | | | (716,218 | ) | | — | | | — | | | — | | | (716,218 | ) |
| Total | | $ | (10,815 | ) | $ | (708,826 | ) | $ | — | | $ | — | | $ | — | | $ | (719,641 | ) |
See notes to financial statements
76
| Portfolio of investments (unaudited) |
International Opportunities Fund
January 31, 2017
| | | | | Value | |
| Shares | | | | (note 2) | |
| | | | | | |
| Common stocks – 95.88% | | | |
| | | | | | |
| | | Australia – 1.20% | | | |
| 612,369 | | CSL, Ltd. | $ | 52,154,455 | |
| | | | | | |
| | | Brazil – 0.42% | | | |
| 1,610,178 | | Engie Brasil Energia S.A. | | 18,293,412 | |
| | | | | | |
| | | Chile – 0.82% | | | |
| 47,102,567 | | Aguas Andinas S.A., Class A | | 25,573,337 | |
| 983,328 | | Antofagasta plc | | 10,329,166 | |
| | | | | 35,902,503 | |
| | | | | | |
| | | China – 2.40% | | | |
| 325,000 | | Alibaba Group Holding, | | | |
| | | Ltd., ADR * | | 32,925,750 | |
| 2,743,800 | | Tencent Holdings, Ltd. | | 71,815,776 | |
| | | | | 104,741,526 | |
| | | | | | |
| | | Finland – 1.44% | | | |
| 14,000,000 | | Nokia Oyj | | 62,718,936 | |
| | | | | | |
| | | France – 10.92% | | | |
| 1,800,000 | | Accor S.A. | | 72,875,949 | |
| 3,719,439 | | Credit Agricole S.A. | | 49,245,612 | |
| 472,701 | | Essilor International S.A. | | 55,314,419 | |
| 1,250,000 | | Publicis Groupe S.A. | | 85,766,256 | |
| 1,500,000 | | Renault S.A. | | 135,013,035 | |
| 636,891 | | Sodexo (a) | | 70,368,049 | |
| 384,035 | | Vivendi S.A. | | 7,022,743 | |
| | | | | 475,606,063 | |
| | | | | | |
| | | Germany – 14.08% | | | |
| 950,000 | | Bayer AG | | 104,911,184 | |
| 687,647 | | Continental AG | | 134,136,279 | |
| 3,752,380 | | Deutsche Post AG | | 125,389,211 | |
| 1,596,348 | | Fresenius SE & Co., KGaA | | 125,677,154 | |
| 1,347,625 | | SAP SE | | 123,116,412 | |
| | | | | 613,230,240 | |
| | | | | | |
| | | Hong Kong – 1.38% | | | |
| 9,734,200 | | AIA Group, Ltd. | | 60,312,867 | |
| | | | | | |
| | | India – 4.32% | | | |
| 4,923,963 | | Housing Development | | | |
| | | Finance Corp., Ltd. | | 99,067,131 | |
| 2,198,000 | | Infosys, Ltd. | | 30,110,122 | |
| | | | | Value | |
| Shares | | | | (note 2) | |
| | | India – (continued) | | | |
| 1,328,273 | | Lupin, Ltd. | $ | 28,818,894 | |
| 921,408 | | Tata Consultancy | | | |
| | | Services, Ltd. | | 30,312,958 | |
| | | | | 188,309,105 | |
| | | | | | |
| | | Ireland – 0.83% | | | |
| 429,463 | | ICON plc * | | 36,100,660 | |
| | | | | | |
| | | Israel – 2.42% | | | |
| 3,150,000 | | Teva Pharmaceutical | | | |
| | | Industries, Ltd., ADR | | 105,304,500 | |
| | | | | | |
| | | Japan – 18.18% | | | |
| 1,167,100 | | Denso Corp. (a) | | 50,659,438 | |
| 888,700 | | East Japan Railway Co. | | 80,519,006 | |
| 311,700 | | Fanuc Corp. (a) | | 61,188,827 | |
| 10,628,000 | | Fujitsu, Ltd. | | 61,992,745 | |
| 13,099,000 | | Hitachi, Ltd. | | 75,129,859 | |
| 3,169,700 | | Inpex Corp. | | 31,174,846 | |
| 3,210,800 | | Japan Post Holdings | | | |
| | | Co., Ltd. | | 40,380,267 | |
| 13,381,000 | | Mitsubishi Heavy | | | |
| | | Industries, Ltd. | | 60,309,901 | |
| 1,240,000 | | Mitsui Fudosan Co., Ltd. | | 28,734,922 | |
| 1,424,100 | | NTT Data Corp. | | 71,892,392 | |
| 1,739,600 | | Seven & I Holdings Co., Ltd. | | 69,469,989 | |
| 2,788,000 | | Sumitomo Electric | | | |
| | | Industries, Ltd. | | 40,680,453 | |
| 1,034,700 | | Sumitomo Mitsui Financial | | | |
| | | Group, Inc. | | 40,788,679 | |
| 921,600 | | Takeda Pharmaceutical | | | |
| | | Co., Ltd. (a) | | 38,558,484 | |
| 962,700 | | Tokio Marine Holdings, Inc. | | 40,337,735 | |
| | | | | 791,817,543 | |
| | | | | | |
| | | Korea – 1.43% | | | |
| 21,977 | | Samsung Electronics | | | |
| | | Co., Ltd. | | 37,312,298 | |
| 542,273 | | SK Hynix, Inc. | | 25,058,136 | |
| | | | | 62,370,434 | |
| | | | | | |
| | | Netherlands – 1.32% | | | |
| 2,700,000 | | Koninklijke Ahold | | | |
| | | Delhaize N.V. | | 57,404,019 | |
| | | | | | |
| | | Panama – 1.91% | | | |
| 1,500,000 | | Carnival Corp. | | 83,070,000 | |
| | | | | | |
| | | Philippines – 0.72% | | | |
| 1,950,140 | | Ayala Corp. | | 31,349,583 | |
See notes to financial statements
77
| Portfolio of investments (unaudited) |
International Opportunities Fund
January 31, 2017 (continued)
| | | | | Value | |
| Shares | | | | (note 2) | |
| | | | | | |
| | | Poland – 0.30% | | | |
| 391,872 | | Bank Pekao S.A. | $ | 13,239,514 | |
| | | | | | |
| | | Singapore – 0.85% | | | |
| 5,628,200 | | City Developments, Ltd. | | 36,859,748 | |
| | | | | | |
| | | South Africa – 1.31% | | | |
| 1,829,315 | | Shoprite Holdings, Ltd. | | 24,300,363 | |
| 3,055,365 | | Standard Bank Group, Ltd. | | 32,632,885 | |
| | | | | 56,933,248 | |
| | | | | | |
| | | Spain – 2.73% | | | |
| 2,579,310 | | Amadeus IT Group S.A. (a) | | 119,017,662 | |
| | | | | | |
| | | Sweden – 3.52% | | | |
| 2,500,000 | | Hennes & Mauritz AB, | | | |
| | | B Shares | | 71,452,252 | |
| 3,800,000 | | Lundin Petroleum AB * | | 81,933,441 | |
| | | | | 153,385,693 | |
| | | | | | |
| | | Switzerland – 2.94% | | | |
| 455,785 | | Roche Holding AG | | 107,319,392 | |
| 1,285,605 | | UBS Group AG | | 20,747,928 | |
| | | | | 128,067,320 | |
| | | | | | |
| | | Taiwan – 4.04% | | | |
| 4,832,900 | | Delta Electronics, Inc. | | 26,827,174 | |
| 220,000 | | Largan Precision Co., Ltd. | | 31,556,181 | |
| 2,717,000 | | Taiwan Semiconductor | | | |
| | | Manufacturing Co., Ltd. | | 16,321,105 | |
| 1,556,038 | | Taiwan Semiconductor | | | |
| | | Manufacturing Co., Ltd., ADR | | 48,097,135 | |
| 31,058,000 | | Uni-President | | | |
| | | Enterprises Corp. | | 53,068,601 | |
| | | | | 175,870,196 | |
| | | | | | |
| | | United Kingdom – 10.95% | | | |
| 19,250,000 | | BT Group plc | | 73,581,794 | |
| 670,000 | | Reckitt Benckiser Group plc | | 57,348,163 | |
| 21,500,000 | | Barclays plc | | 59,354,609 | |
| 16,300,000 | | Kingfisher plc | | 68,939,117 | |
| 2,000,000 | | Royal Dutch Shell plc, | | | |
| | | B Shares | | 56,270,309 | |
| 27,400,000 | | Saga plc | | 63,699,046 | |
| 22,586,126 | | Standard Life plc | | 98,224,884 | |
| | | | | 477,417,922 | |
| | | | | Value | |
| Shares | | | | (note 2) | |
| | | | | | |
| | | United States – 5.45% | | | |
| 39,558 | | Alphabet, Inc., Class C * | $ | 31,519,419 | |
| 276,510 | | American Express Co. (a) | | 21,119,834 | |
| 286,409 | | Apple, Inc. | | 34,755,732 | |
| 452,466 | | Cardinal Health, Inc. (a) | | 33,916,852 | |
| 585,263 | | Cognizant Technology | | | |
| | | Solutions Corp., Class A * | | 30,778,981 | |
| 319,300 | | MasterCard, Inc., Class A | | 33,951,169 | |
| 20,887 | | The Priceline Group, Inc. (a) * | | 32,899,740 | |
| 222,124 | | Visa, Inc., A Shares | | 18,371,876 | |
| | | | | 237,313,603 | |
| | | Total common stocks | | | |
| | | (Cost $3,665,642,358) | | 4,176,790,752 | |
| Preferred stock – 0.75% | | | | |
| | | Korea – 0.75% | | | | |
| 24,164 | | Samsung Electronics | | | | |
| | | Co., Ltd. | | | 32,666,418 | |
| | | | | | | |
| | | Total preferred stock | | | | |
| | | (Cost $27,931,842) | | | 32,666,418 | |
| | | | | | | |
| | | Total long-term investments | | | | |
| | | (Cost $3,693,574,200) | | | 4,209,457,170 | |
| | | | | |
| Short-term investment – 3.34% | | | | |
| 145,503,490 | | Fidelity Investments Money | | | | |
| | | Market Treasury Portfolio | | | 145,503,490 | |
| | | Total short-term investment | | | | |
| | | (Cost $145,503,490) | | | 145,503,490 | |
| | | | | |
| Other securities – 1.88% | | | | |
| | | United States – 1.88% | | | | |
| 82,045,262 | | State Street Navigator | | | | |
| | | Securities Lending | | | | |
| | | Government Portfolio (b) | | | 82,045,262 | |
| | | | | | | |
| | | Total other securities | | | | |
| | | (Cost $82,045,262) | | | 82,045,262 | |
| | | | | |
| Total investments – 101.85% | | | | |
| | | (Cost $3,921,122,952) | | | 4,437,005,922 | |
| | | | | | | |
| Financial Derivative Instruments (c) | | | | |
(Cost or Premiums, net $0) – (0.20)% | | | (8,913,085 | ) |
| Net other assets and liabilities – (1.65)% | | | (71,883,621 | ) |
| Total net assets – 100.00% | | $ | 4,356,209,216 | |
See notes to financial statements
78
| Portfolio of investments (unaudited) |
International Opportunities Fund
January 31, 2017 (continued)
| * | | Non-income producing security |
| (a) | | All or a portion of this security is on loan on an overnight and continuous basis; see notes to financial statements for further information. |
| (b) | | Represents cash collateral received from securities lending transactions; see notes to financial statements for further information. |
| (c) | | Information with respect to financial derivative instruments is disclosed in the following tables. |
| ADR | | American Depositary Receipt |
(c) FINANCIAL DERIVATIVE INSTRUMENTS
OVER-THE-COUNTER FINANCIAL DERIVATIVE INSTRUMENTS
FORWARD FOREIGN CURRENCY CONTRACTS
| | | | | | | | | | | | | | | Unrealized | |
| | | | | | | | | | Local | | | Current | | appreciation/ | |
| | | | | | | Value | | | amount | | | notional | | (depreciation) | |
| | | | Counterparty | | | date | | | (000's | ) | | value | | | Asset | | | Liability | |
| British Pound (Short) | JP Morgan Chase Bank, N.A. | | | 2/10/17 | | | 245,529 | | $ | 308,913,085 | | $ | — | | $ | (8,913,085 | ) |
| Total | | | | | | | | | | | | | | $ | — | | $ | (8,913,085 | ) |
During the period ended January 31, 2017, average monthly notional value related to forward foreign currency contracts was approximately $347.2 million or 8.0% of net assets.
FINANCIAL DERIVATIVE INSTRUMENTS: OVER-THE-COUNTER SUMMARY
The following is a summary by counterparty of the value of over-the-counter financial derivative instruments and collateral (received)/pledged as of January 31, 2017:
| | | Financial Derivative Assets | | Financial Derivative Liabilities | | | | | | | | | | |
| | | Unrealized | | | | | Unrealized | | | | | | | | | | | | | |
| | | Appreciation | | | | | Depreciation | | | | | | | | | | | | | |
| | | | Forward | | | | | | Forward | | | | | | | | | | | | | |
| | | | Foreign | | | Total | | | Foreign | | | Total | | | Net Value of | | Collateral | | | | |
| | | | Currency | | | Over-the- | | | Currency | | | Over-the- | | | OTC | | (Received) / | | | Net | |
| | | | Contracts | | | Counter | | | Contracts | | | Counter | | | Derivatives | | | Pledged | | | Exposure(1) | |
| Amounts subject to a master netting agreement: | | | | | | | | | | | | | | | |
| | | | | | | | | | | | | | | | | | | | | | | |
| JP Morgan Chase Bank, N.A. | | $ | — | | $ | — | | $ | (8,913,085 | ) | $ | (8,913,085 | ) | $ | (8,913,085 | ) | $ | — | | $ | (8,913,085 | ) |
| | | $ | — | | $ | — | | $ | (8,913,085 | ) | $ | (8,913,085 | ) | $ | (8,913,085 | ) | $ | — | | $ | (8,913,085 | ) |
(1) | | Net Exposure represents the net receivable/(payable) that would be due from/to the counterparty in the event of default. Exposure from over-the-counter financial derivative instruments can only be netted across transactions governed under the same master agreement with the same legal entity. See Note 2, Significant Accounting Policies, "Derivative instruments," in the Notes to Financial Statements for more information regarding master netting arrangements. |
| | | | Cost or Premiums, net | | | | Asset | | | Liability | |
| TOTAL FINANCIAL DERIVATIVE INSTRUMENTS | | $ | — | | | $ | — | | $ | (8,913,085 | ) |
See notes to financial statements
79
| Portfolio of investments (unaudited) |
International Opportunities Fund
January 31, 2017 (continued)
Other information:
| Currency exposure of portfolio assets before | | |
| any currency hedging, if applicable. | % of total |
| Excludes derivatives: | investments |
| Euro | 30 | % |
| Japanese Yen | 18 | |
| US Dollar | 17 | |
| British Pound | 11 | |
| Indian Rupee | 4 | |
| Swedish Krona | 4 | |
| Hong Kong Dollar | 3 | |
| Swiss Franc | 3 | |
| Taiwan Dollar | 3 | |
| Korean Won | 2 | |
| South African Rand | 1 | |
| Australian Dollar | 1 | |
| Singapore Dollar | 1 | |
| Philippine Peso | 1 | |
| Chilean Peso | 1 | |
| Brazilian Real | 0 | * |
| Polish Zloty | 0 | * |
| | 100 | % |
| * | Less than 0.5% of total investments. |
| Industry concentration as | % of net |
| a percentage of net assets: | assets |
| Pharmaceuticals | 8.84 | % |
| Auto Parts & Equipment | 5.18 | |
| IT Consulting & Other Services | 5.17 | |
| Life & Health Insurance | 4.57 | |
| Diversified Banks | 4.48 | |
| Data Processing & Outsourced Services | 3.93 | |
| Hotels, Resorts & Cruise Lines | 3.58 | |
| Food Retail | 3.47 | |
| Internet Software & Services | 3.13 | |
| Automobile Manufacturers | 3.10 | |
| Health Care Equipment | 2.88 | |
| Air Freight & Logistics | 2.88 | |
| Application Software | 2.83 | |
| Industrial Machinery | 2.79 | |
| Oil & Gas Exploration & Production | 2.60 | |
| Technology Hardware, Storage & Peripherals | 2.40 | |
| Thrifts & Mortgage Finance | 2.27 | |
| Semiconductors | 2.05 | |
| Advertising | 1.97 | |
| Railroads | 1.85 | |
| Electronic Equipment & Instruments | 1.72 | |
| Integrated Telecommunication Services | 1.69 | |
| Apparel Retail | 1.64 | |
| Restaurants | 1.61 | |
| Home Improvement Retail | 1.58 | |
| Diversified Real Estate Activities | 1.50 | |
| Multi-line Insurance | 1.46 | |
| Communications Equipment | 1.44 | |
| Electronic Components | 1.34 | |
| Household Products | 1.32 | |
| Integrated Oil & Gas | 1.29 | |
| Health Care Supplies | 1.27 | |
| Packaged Foods & Meats | 1.22 | |
| Biotechnology | 1.20 | |
| Property & Casualty Insurance | 0.93 | |
| Life Sciences Tools & Services | 0.83 | |
| Health Care Distributors | 0.78 | |
| Internet Retail | 0.75 | |
| Multi-Sector Holdings | 0.72 | |
| Water Utilities | 0.59 | |
| Consumer Finance | 0.48 | |
| Diversified Capital Markets | 0.48 | |
| Renewable Electricity | 0.42 | |
| Diversified Metals & Mining | 0.24 | |
| Movies & Entertainment | 0.16 | |
| Total Long-Term Investments | 96.63 | |
| Short-Term Investment | 3.34 | |
| Other Securities | 1.88 | |
| Total Investments | 101.85 | |
| Financial Derivative Instruments | (0.20 | ) |
| Net Other Assets and Liabilities | (1.65 | ) |
| | 100.00 | % |
See notes to financial statements
80
| Portfolio of investments (unaudited) |
International Opportunities Fund
January 31, 2017 (continued)
Fair Value Measurement
The following table summarizes the Fund's investments that are measured at fair value by level within the fair value hierarchy at January 31, 2017:
| | | | | | | | | | | | | | |
| | | | Quoted prices | | | Significant | | | | | | | |
| | | | in active | | | other | | | Significant | | | | |
| | | | markets for | | | observable | | | unobservable | | | | |
| | | | identical assets | | | inputs | | | inputs | | | | |
| Description | | | (level 1 | ) | | (level 2 | ) | | (level 3 | ) | | Total | |
| Assets | | | | | | | | | | | | | |
| Common stocks | | | | | | | | | | | | | |
| Australia | | $ | 52,154,455 | | $ | — | | $ | — | | $ | 52,154,455 | |
| Brazil | | | 18,293,412 | | | — | | | — | | | 18,293,412 | |
| Chile | | | 35,902,503 | | | — | | | — | | | 35,902,503 | |
| China | | | 104,741,526 | | | — | | | — | | | 104,741,526 | |
| Finland | | | 62,718,936 | | | — | | | — | | | 62,718,936 | |
| France | | | 475,606,063 | | | — | | | — | | | 475,606,063 | |
| Germany | | | 613,230,240 | | | — | | | — | | | 613,230,240 | |
| Hong Kong | | | 60,312,867 | | | — | | | — | | | 60,312,867 | |
| India | | | 188,309,105 | | | — | | | — | | | 188,309,105 | |
| Ireland | | | 36,100,660 | | | — | | | — | | | 36,100,660 | |
| Israel | | | 105,304,500 | | | — | | | — | | | 105,304,500 | |
| Japan | | | 791,817,543 | | | — | | | — | | | 791,817,543 | |
| Korea | | | 62,370,434 | | | — | | | — | | | 62,370,434 | |
| Netherlands | | | 57,404,019 | | | — | | | — | | | 57,404,019 | |
| Panama | | | 83,070,000 | | | — | | | — | | | 83,070,000 | |
| Philippines | | | 31,349,583 | | | — | | | — | | | 31,349,583 | |
| Poland | | | 13,239,514 | | | — | | | — | | | 13,239,514 | |
| Singapore | | | 36,859,748 | | | — | | | — | | | 36,859,748 | |
| South Africa | | | 56,933,248 | | | — | | | — | | | 56,933,248 | |
| Spain | | | 119,017,662 | | | — | | | — | | | 119,017,662 | |
| Sweden | | | 153,385,693 | | | — | | | — | | | 153,385,693 | |
| Switzerland | | | 128,067,320 | | | — | | | — | | | 128,067,320 | |
| Taiwan | | | 175,870,196 | | | — | | | — | | | 175,870,196 | |
| United Kingdom | | | 477,417,922 | | | — | | | — | | | 477,417,922 | |
| United States | | | 237,313,603 | | | — | | | — | | | 237,313,603 | |
| Total Common stocks | | | 4,176,790,752 | | | — | | | — | | | 4,176,790,752 | |
| | | | | | | | | | | | | | |
| Preferred stock | | | | | | | | | | | | | |
| Korea | | | 32,666,418 | | | — | | | — | | | 32,666,418 | |
| Total Preferred stock | | | 32,666,418 | | | — | | | — | | | 32,666,418 | |
| Short-term investment | | | 145,503,490 | | | — | | | — | | | 145,503,490 | |
| Other securities | | | 82,045,262 | | | — | | | — | | | 82,045,262 | |
| Total Investments | | $ | 4,437,005,922 | | $ | — | | $ | — | | $ | 4,437,005,922 | |
| Liabilities | | | | | | | | | | | | | |
| Financial Derivative Instruments – Liabilities | | | | | | | | | | | | | |
| Over-the-counter | | $ | — | | $ | (8,913,085 | ) | $ | — | | $ | (8,913,085 | ) |
| Total Financial Derivative Instruments – Liabilities | | $ | — | | $ | (8,913,085 | ) | $ | — | | $ | (8,913,085 | ) |
During the period ended January 31, 2017, there were no transfers in or out of security levels.
See notes to financial statements
81
| Portfolio of investments (unaudited) |
International Opportunities Fund
January 31, 2017 (continued)
Fair Value of Financial Derivative Instruments
The following is a summary of the fair valuation of the Fund's financial derivative instruments categorized by risk exposure:
Fair Values of Financial Derivative Instruments on the Statement of Assets and Liabilities as of January 31, 2017
| | | Derivatives not accounted for as hedging instruments | |
| | | | Foreign | | | | | | | | | | | | | | | | |
| | | | Currency | | | Equity | | | Interest | | | Credit | | | Inflation | | | | |
| | | | Risk | | | Risk | | | Rate Risk | | | Risk | | | Risk | | | Total | |
| Financial Derivative Instruments – Liabilities | | | | | | | | | | | | | | | | | | | |
| Over-the-Counter | | | | | | | | | | | | | | | | | | | |
| Forward Foreign Currency Contracts | | $ | (8,913,085 | ) | $ | — | | $ | — | | $ | — | | $ | — | | $ | (8,913,085 | ) |
| Total | | $ | (8,913,085 | ) | $ | — | | $ | — | | $ | — | | $ | — | | $ | (8,913,085 | ) |
Effect of Financial Derivative Instruments on the Statement of Operations for the Period Ended January 31, 2017
| | | Derivatives not accounted for as hedging instruments | |
| | | | Foreign | | | | | | | | | | | | | | | | |
| | | | Currency | | | Equity | | | Interest | | | Credit | | | Inflation | | | | |
| | | | Risk | | | Risk | | | Rate Risk | | | Risk | | | Risk | | | Total | |
| Net realized gain/(loss) from financial derivative instruments: | | | | | | | | | | | | | | | | | | | |
| Forward Foreign Currency Contracts | | $ | 34,567,382 | | $ | — | | $ | — | | $ | — | | $ | — | | $ | 34,567,382 | |
| Total | | $ | 34,567,382 | | $ | — | | $ | — | | $ | — | | $ | — | | $ | 34,567,382 | |
| | | Derivatives not accounted for as hedging instruments | |
| | | | Foreign | | | | | | | | | | | | | | | | |
| | | | Currency | | | Equity | | | Interest | | | Credit | | | Inflation | | | | |
| | | | Risk | | | Risk | | | Rate Risk | | | Risk | | | Risk | | | Total | |
| Net change in unrealized appreciation/(depreciation) of financial derivative instruments | | | | | | | | | | | | | | | | | | | |
| Forward Foreign Currency Contracts | | $ | (357,077 | ) | $ | — | | $ | — | | $ | — | | $ | — | | $ | (357,077 | ) |
| Total | | $ | (357,077 | ) | $ | — | | $ | — | | $ | — | | $ | — | | $ | (357,077 | ) |
See notes to financial statements
82
| Portfolio of investments (unaudited) |
International Small Cap Fund
January 31, 2017
| | | | | Value | |
| Shares | | | | (note 2) | |
| | | | | | |
| Common stocks – 98.07% | | | |
| | | | |
| | | Australia - 6.60% | | | |
| 3,435 | | JB Hi-Fi, Ltd. | $ | 72,031 | |
| 42,229 | | Metcash, Ltd. * | | 67,576 | |
| 7,585 | | Mineral Resources, Ltd. | | 70,698 | |
| 14,603 | | Pact Group Holdings, Ltd. | | 72,319 | |
| 40,149 | | Spark Infrastructure Group | | 71,251 | |
| | | | | 353,875 | |
| | | | | | |
| | | Austria – 1.65% | | | |
| 619 | | Lenzing AG | | 88,438 | |
| | | | | | |
| | | Belgium – 1.35% | | | |
| 1,678 | | Bekaert S.A. | | 72,637 | |
| | | | | | |
| | | Denmark – 4.35% | | | |
| 9,254 | | Alm Brand A/S | | 72,544 | |
| 1,772 | | DFDS A/S | | 86,588 | |
| 415 | | Rockwool International A/S | | 73,982 | |
| | | | | 233,114 | |
| | | | | | |
| | | France – 5.76% | | | |
| 2,367 | | Cie Plastic Omnium S.A. | | 80,233 | |
| 1,868 | | Gaztransport Et Technigaz S.A. | | 77,020 | |
| 1,516 | | Nexity S.A. * | | 74,396 | |
| 720 | | Teleperformance | | 77,032 | |
| | | | | 308,681 | |
| | | | | | |
| | | Germany – 6.63% | | | |
| 1,844 | | Aareal Bank AG | | 71,164 | |
| 1,133 | | AURELIUS Equity | | | |
| | | Opportunities SE & Co., KGaA | | 71,366 | |
| 2,117 | | Deutsche Beteiligungs AG | | 76,066 | |
| 1,282 | | Nemetschek SE | | 65,432 | |
| 1,392 | | STADA Arzneimittel AG | | 71,369 | |
| | | | | 355,397 | |
| | | | | | |
| | | Hong Kong – 5.45% | | | |
| 214,000 | | Guotai Junan International | | | |
| | | Holdings, Ltd. | | 70,608 | |
| 26,000 | | Luk Fook Holdings | | | |
| | | International, Ltd. | | 76,570 | |
| 101,600 | | Man Wah Holdings, Ltd. | | 65,212 | |
| 88,000 | | Xinyi Glass Holdings, Ltd. * | | 79,506 | |
| | | | | 291,896 | |
| | | | | Value | |
| Shares | | | | (note 2) | |
| | | | | | |
| | | Japan – 23.74% | | | |
| 4,000 | | Amano Corp. | $ | 76,627 | |
| 3,900 | | Asahi Holdings, Inc. | | 77,406 | |
| 2,500 | | Ci:z Holdings Co., Ltd. | | 72,071 | |
| 4,400 | | En-Japan, Inc. | | 79,536 | |
| 3,700 | | Fujimi, Inc. | | 81,268 | |
| 3,400 | | Fuso Chemical Co., Ltd. | | 75,281 | |
| 3,500 | | Gurunavi, Inc. | | 77,185 | |
| 11,000 | | Hanwa Co., Ltd. | | 75,113 | |
| 3,100 | | Heiwa Corp. | | 74,789 | |
| 2,700 | | ITOCHU Techno-Solutions | | | |
| | | Corp. | | 72,575 | |
| 4,200 | | Koei Tecmo Holdings Co., Ltd. | | 71,271 | |
| 3,100 | | Kotobuki Spirits Co., Ltd. | | 74,981 | |
| 15,000 | | KYB Corp. | | 73,200 | |
| 31,100 | | Nippon Light Metal Holdings | | | |
| | | Co., Ltd. | | 76,022 | |
| 14,000 | | Penta-Ocean Construction | | | |
| | | Co., Ltd. | | 68,444 | |
| 2,200 | | TechnoPro Holdings, Inc. | | 75,892 | |
| 4,700 | | Toshiba Plant Systems & | | | |
| | | Services Corp. | | 70,806 | |
| | | | | 1,272,467 | |
| | | | | | |
| | | Malta – 1.34% | | | |
| 8,537 | | Kindred Group plc | | 72,076 | |
| | | | | | |
| | | Netherlands – 2.93% | | | |
| 1,620 | | ASM International N.V. | | 79,745 | |
| 2,142 | | BE Semiconductor | | | |
| | | Industries N.V. | | 77,276 | |
| | | | | 157,021 | |
| | | | | | |
| | | Norway – 5.69% | | | |
| 3,369 | | Norway Royal Salmon ASA | | 75,157 | |
| 11,198 | | SpareBank 1 Nord Norge | | 73,653 | |
| 9,248 | | SpareBank 1 SMN | | 77,365 | |
| 12,931 | | Storebrand ASA * | | 78,780 | |
| | | | | 304,955 | |
| | | | | | |
| | | Singapore – 1.38% | | | |
| 10,200 | | Venture Corp., Ltd. | | 73,749 | |
| | | | | | |
| | | Spain – 2.90% | | | |
| 3,284 | | Cia de Distribucion Integral | | | |
| | | Logista Holdings S.A. | | 79,339 | |
| 3,633 | | Gamesa Corp. Tecnologica S.A. | | 76,201 | |
| | | | | 155,540 | |
See notes to financial statements
83
| Portfolio of investments (unaudited) |
International Small Cap Fund
January 31, 2017 (continued)
| | | | | Value | |
| Shares | | | | (note 2) | |
| | | | | | |
| | | Sweden – 11.67% | | | |
| 7,566 | | Com Hem Holding AB | $ | 79,188 | |
| 8,178 | | Granges AB | | 90,689 | |
| 7,577 | | Hemfosa Fastigheter AB | | 70,035 | |
| 2,203 | | Intrum Justitia AB | | 74,196 | |
| 6,493 | | Mycronic AB | | 74,045 | |
| 13,311 | | Nordax Group AB (a) | | 76,849 | |
| 9,599 | | Peab AB | | 78,628 | |
| 9,201 | | Scandic Hotels Group | | | |
| | | AB * (a) | | 81,785 | |
| | | | | 625,415 | |
| | | | | | |
| | | Switzerland – 4.37% | | | |
| 958 | | Cembra Money Bank AG * | | 72,173 | |
| 1,064 | | Implenia AG | | 79,460 | |
| 2,901 | | Logitech International S.A. | | 82,819 | |
| | | | | 234,452 | |
| | | | | | |
| | | United Kingdom – 12.26% | | | |
| 19,164 | | Ashmore Group plc | | 74,736 | |
| 11,752 | | Electrocomponents plc | | 71,673 | |
| 9,674 | | GVC Holdings plc | | 73,749 | |
| 2,505 | | Micro Focus International plc | | 67,595 | |
| 19,687 | | Moneysupermarket.com | | | |
| | | Group plc | | 81,605 | |
| 15,740 | | National Express Group plc | | 66,986 | |
| 2,498 | | Spectris plc | | 75,954 | |
| 12,724 | | TP ICAP plc | | 74,384 | |
| 7,923 | | UBM plc | | 70,218 | |
| | | | | 656,900 | |
| | | | | | |
| | | Total common stocks | | | |
| | | (Cost $4,889,521) | | 5,256,613 | |
| REITs – 1.43% | | | | | |
| | | | | | |
| | | Singapore – 1.43% | | | |
| 70,500 | | Mapletree Commercial Trust | | 76,535 | |
| | | | | | |
| | | Total REITs | | | |
| | | (Cost $69,075) | | 76,535 | |
| | | | | | |
| | | Total long-term investments | | | |
| | | (Cost $4,958,596) | | 5,333,148 | |
| | | | | Value | |
| Shares | | | | (note 2) | |
| | | | | | |
| | | Short-term investment – 0.23% | | | |
| 12,152 | | Fidelity Investments Money | | | |
| | | Market Treasury Portfolio | $ | 12,152 | |
| | | | | | |
| | | Total short-term investment | | | |
| | | (Cost $12,152) | | 12,152 | |
| | | | | | |
| | | Total investments – 99.73% | | | |
| | | (Cost $4,970,748) | | 5,345,300 | |
| Net other assets and liabilities – 0.27% | | 14,568 | |
| Total net assets – 100.00% | $ | 5,359,868 | |
| * | | Non-income producing security |
| (a) | | Restricted security, purchased pursuant to Rule 144A under the Securities Act of 1933, as amended, and which is exempt from registration under that Act. At January 31, 2017, the restricted securities held by the Fund had an aggregate value of $158,634, which represented 3.0% of net assets. |
| REIT | | Real Estate Investment Trust |
84
| Portfolio of investments (unaudited) |
International Small Cap Fund
January 31, 2017 (continued)
Other information:
| | |
| Currency exposure of portfolio assets | |
| before any currency hedging, if applicable. | % of total |
| Excludes derivatives: | investments |
| Japanese Yen | 24 | % |
| Euro | 21 | |
| Swedish Krona | 13 | |
| British Pound | 12 | |
| Australian Dollar | 7 | |
| Norwegian Krone | 6 | |
| Hong Kong Dollar | 6 | |
| Swiss Franc | 4 | |
| Danish Krone | 4 | |
| Singapore Dollar | 3 | |
| US Dollar | 0 | * |
| | 100 | % |
* Less than 0.5% of total investments.
| Industry concentration as | % of net |
| a percentage of net assets: | assets |
| Construction & Engineering | 5.55 | % |
| Auto Parts & Equipment | 4.35 | |
| Electronic Equipment & Instruments | 4.23 | |
| Asset Management & Custody Banks | 4.14 | |
| Aluminum | 3.11 | |
| Internet Software & Services | 2.96 | |
| Semiconductor Equipment | 2.93 | |
| Specialty Chemicals | 2.92 | |
| Human Resource & Employment Services | 2.90 | |
| Regional Banks | 2.82 | |
| Packaged Foods & Meats | 2.80 | |
| Casinos & Gaming | 2.72 | |
| Investment Banking & Brokerage | 2.70 | |
| Application Software | 2.48 | |
| Commodity Chemicals | 1.65 | |
| Marine | 1.62 | |
| Technology Hardware, Storage & Peripherals | 1.54 | |
| Hotels, Resorts & Cruise Lines | 1.53 | |
| Air Freight & Logistics | 1.48 | |
| Alternative Carriers | 1.48 | |
| Industry concentration as | % of net |
| a percentage of net assets: | assets |
| Life & Health Insurance | 1.47 | % |
| Precious Metals & Minerals | 1.44 | |
| Research & Consulting Services | 1.44 | |
| Oil & Gas Storage & Transportation | 1.44 | |
| Diversified Banks | 1.43 | |
| Specialty Stores | 1.43 | |
| Retail REITs | 1.43 | |
| Heavy Electrical Equipment | 1.42 | |
| Trading Companies & Distributors | 1.40 | |
| Leisure Products | 1.40 | |
| Real Estate Development | 1.39 | |
| Diversified Support Services | 1.38 | |
| Building Products | 1.38 | |
| Electronic Manufacturing Services | 1.38 | |
| Steel | 1.35 | |
| IT Consulting & Other Services | 1.35 | |
| Property & Casualty Insurance | 1.35 | |
| Metal & Glass Containers | 1.35 | |
| Consumer Finance | 1.35 | |
| Personal Products | 1.34 | |
| Computer & Electronics Retail | 1.34 | |
| Technology Distributors | 1.34 | |
| Pharmaceuticals | 1.33 | |
| Home Entertainment Software | 1.33 | |
| Electric Utilities | 1.33 | |
| Thrifts & Mortgage Finance | 1.33 | |
| Diversified Metals & Mining | 1.32 | |
| Advertising | 1.31 | |
| Real Estate Operating Companies | 1.31 | |
| Food Distributors | 1.26 | |
| Trucking | 1.25 | |
| Home Furnishings | 1.22 | |
| Total Long-Term Investments | 99.50 | |
| Short-Term Investment | 0.23 | |
| Total Investments | 99.73 | |
| Net Other Assets and Liabilities | 0.27 | |
| | 100.00 | % |
See notes to financial statements
85
| Portfolio of investments (unaudited) |
International Small Cap Fund
January 31, 2017 (continued)
Fair Value Measurement
The following table summarizes the Fund's investments that are measured at fair value by level within the fair value hierarchy at January 31, 2017:
| | | | | | | | | | | | | | |
| | | | Quoted prices | | | Significant | | | | | | | |
| | | | in active | | | other | | | Significant | | | | |
| | | | markets for | | | observable | | | unobservable | | | | |
| | | | identical assets | | | inputs | | | inputs | | | | |
| Description | | | (level 1 | ) | | (level 2 | ) | | (level 3 | ) | | Total | |
| | | | | | | | | | | | | | |
| Assets | | | | | | | | | | | | | |
| Common stocks | | | | | | | | | | | | | |
| Australia | | $ | 353,875 | | $ | — | | $ | — | | $ | 353,875 | |
| Austria | | | 88,438 | | | — | | | — | | | 88,438 | |
| Belgium | | | 72,637 | | | — | | | — | | | 72,637 | |
| Denmark | | | 233,114 | | | — | | | — | | | 233,114 | |
| France | | | 308,681 | | | — | | | — | | | 308,681 | |
| Germany | | | 355,397 | | | — | | | — | | | 355,397 | |
| Hong Kong | | | 291,896 | | | — | | | — | | | 291,896 | |
| Japan | | | 1,272,467 | | | — | | | — | | | 1,272,467 | |
| Malta | | | 72,076 | | | — | | | — | | | 72,076 | |
| Netherlands | | | 157,021 | | | — | | | — | | | 157,021 | |
| Norway | | | 304,955 | | | — | | | — | | | 304,955 | |
| Singapore | | | 73,749 | | | — | | | — | | | 73,749 | |
| Spain | | | 155,540 | | | — | | | — | | | 155,540 | |
| Sweden | | | 625,415 | | | — | | | — | | | 625,415 | |
| Switzerland | | | 234,452 | | | — | | | — | | | 234,452 | |
| United Kingdom | | | 656,900 | | | — | | | — | | | 656,900 | |
| Total Common stocks | | | 5,256,613 | | | — | | | — | | | 5,256,613 | |
| | | | | | | | | | | | | | |
| REITs | | | | | | | | | | | | | |
| Singapore | | | 76,535 | | | — | | | — | | | 76,535 | |
| Total REITs | | | 76,535 | | | — | | | — | | | 76,535 | |
| Short-term Investment | | | 12,152 | | | — | | | — | | | 12,152 | |
| Total Short-term investment | | | 12,152 | | | — | | | — | | | 12,152 | |
| Total Investments | | $ | 5,345,300 | | $ | — | | $ | — | | $ | 5,345,300 | |
During the period ended January 31, 2017, there were no transfers in or out of security levels.
See notes to financial statements
86
| Portfolio of investments (unaudited) |
Strategic Income Fund
January 31, 2017
Face
amount | | | Coupon | | Maturity | | Value
(note 2) | |
| | | | | | | | | |
| Bank Loans(a) (b) – 20.06% | | | | | | |
| | | | | | | | | | |
| | | | France – 1.28% | | | | | | |
| EUR | 2,408,000 | | Numericable Group S.A. Term Loan B10 | 3.750% | | 1/14/25 | $ | 2,630,512 | |
| EUR | 990,354 | | Oberthur Technologies S.A. Term Loan B1 | 3.750% | | 12/14/23 | | 1,085,508 | |
| EUR | 1,597,646 | | Oberthur Technologies S.A. Term Loan B1 (c) | 3.750% | | 12/14/23 | | 1,751,149 | |
| | | | | | | | | 5,467,169 | |
| | | | | | | | | | |
| | | | Germany – 2.60% | | | | | | |
| EUR | 485,259 | | Kirk Beauty One Gmbh, Term Loan B10 | 4.750% | | 8/13/22 | | 533,135 | |
| EUR | 377,561 | | Kirk Beauty One Gmbh, Term Loan B11 | 4.750% | | 8/13/22 | | 414,812 | |
| EUR | 83,903 | | Kirk Beauty One Gmbh, Term Loan B12 | 4.750% | | 8/13/22 | | 92,180 | |
| EUR | 318,422 | | Kirk Beauty One Gmbh, Term Loan B13 | 4.750% | | 8/13/22 | | 349,838 | |
| EUR | 213,561 | | Kirk Beauty One Gmbh, Term Loan B14 | 4.750% | | 8/13/22 | | 234,631 | |
| EUR | 4,550,564 | | Kirk Beauty One Gmbh, Term Loan B8 (c) | 4.750% | | 8/13/22 | | 4,999,527 | |
| EUR | 197,377 | | Kirk Beauty One Gmbh, Term Loan B9 | 4.750% | | 8/13/22 | | 216,850 | |
| USD | 982,538 | | Siemens Audiology Solutions, Term Loan B | 3.750% | | 1/15/22 | | 991,754 | |
| EUR | 3,000,000 | | Trionista Holdco Gmbh, Term Loan B1A3 (c) | 3.000% | | 4/30/20 | | 3,272,682 | |
| | | | | | | | | 11,105,409 | |
| | | | | | | | | | |
| | | | Ireland – 0.94% | | | | | | |
| EUR | 3,664,442 | | eircom Finco Sarl, Eur Term Loan B5 | 4.000% | | 5/31/22 | | 4,032,348 | |
| | | | | | | | | | |
| | | | Netherlands – 1.97% | | | | | | |
| EUR | 3,552,697 | | Charger Opco B.V. Term Loan B3 (c) | 3.000% | | 7/2/22 | | 3,907,044 | |
| EUR | 4,115,053 | | TMF Group Holding B.V. Eur Term Loan B1 (c) | 4.000% | | 9/30/23 | | 4,524,735 | |
| | | | | | | | | 8,431,779 | |
| | | | | | | | | | |
| | | | Switzerland – 0.84% | | | | | | |
| EUR | 3,280,000 | | Unilabs Diagnostics AB, Term Loan B | 4.250% | | 10/11/21 | | 3,610,370 | |
| | | | | | | | | | |
| | | | United States – 12.43% | | | | | | |
| USD | 6,471,860 | | Berry Plastics Group, Inc. Term Loan D | 3.500% | | 2/8/20 | | 6,486,680 | |
| USD | 6,400,000 | | ConvaTec Healthcare D Sarl, Term Loan B | 3.250% | | 10/31/23 | | 6,464,032 | |
| USD | 3,979,194 | | DaVita Healthcare Partners, Inc. Term Loan B | 3.500% | | 6/24/21 | | 4,035,400 | |
| USD | 4,300,000 | | Delta 2 Lux Sarl, Term Loan B-3 | 4.750% | | 7/30/21 | | 4,329,863 | |
| USD | 2,711,500 | | Diebold, Inc.Term Loan B | 5.250% | | 11/6/23 | | 2,756,118 | |
| GBP | 833,700 | | Equinix, Inc. Term Loan | 3.750% | | 1/8/23 | | 1,065,512 | |
| EUR | 6,000,000 | | Equinix, Inc. Term Loan B | 3.250% | | 12/9/23 | | 6,600,483 | |
| USD | 4,488,693 | | HCA, Inc. Term Loan B6 | 3.250% | | 3/17/23 | | 4,540,740 | |
| USD | 4,568,635 | | Kloeckner Pentaplast of America, Inc. Term Loan C | 4.250% | | 4/28/20 | | 4,616,035 | |
| USD | 1,952,408 | | Kloeckner Pentaplast of America, Inc. Term Loan C | 4.250% | | 4/28/20 | | 1,972,664 | |
| USD | 3,964,719 | | Las Vegas Sands LLC Term Loan B | 2.250% | | 12/19/20 | | 3,988,012 | |
| USD | 1,994,937 | | Spectrum Brands, Inc. Term Loan B | 3.500% | | 6/23/22 | | 2,022,896 | |
| USD | 4,233,682 | | Travelport Finance (Luxembourg) Sarl, Term Loan B | 5.000% | | 9/2/21 | | 4,277,776 | |
| | | | | | | | | 53,156,211 | |
| | | | Total bank loans | | | | | | |
| | | | (Cost $85,433,448) | | | | | 85,803,286 | |
See notes to financial statements
87
| Portfolio of investments (unaudited) |
Strategic Income Fund
January 31, 2017 (continued)
| Face | | | | | | | Value | |
| amount | | | Coupon | | Maturity | | (note 2) | |
| | | | | | | | | |
| Corporate bonds – 62.11% | | | | | | |
| | | | | | | | | | |
| | | | Denmark – 0.39% | | | | | | |
| EUR | 1,500,000 | | ISS Global A/S | 1.125% | | 1/7/21 | $ | 1,656,638 | |
| | | | | | | | | | |
| | | | France – 1.87% | | | | | | |
| USD | 82,000 | | BNP Paribas S.A. (d) | 6.250% | | 10/17/17 | | 83,822 | |
| USD | 4,084,000 | | BNP Paribas S.A. (d) | 6.500% | | 3/6/17 | | 4,150,365 | |
| USD | 2,130,000 | | Credit Agricole S.A. (d) | 7.375% | | 4/19/17 | | 2,170,106 | |
| GBP | 1,212,000 | | Orange S.A. (d) | 5.750% | | 4/1/23 | | 1,610,647 | |
| | | | | | | | | 8,014,940 | |
| | | | | | | | | | |
| | | | Germany – 3.34% | | | | | | |
| EUR | 1,500,000 | | Trionista TopCo GmbH | 6.875% | | 4/30/21 | | 1,707,062 | |
| EUR | 909,000 | | Unitymedia GmbH (e) | 3.750% | | 1/15/27 | | 935,882 | |
| USD | 200,000 | | Unitymedia Hessen GmbH & Co. KG (e) | 5.000% | | 1/15/25 | | 204,000 | |
| EUR | 200,000 | | Unitymedia Hessen GmbH & Co. KG (e) | 3.500% | | 1/15/27 | | 214,507 | |
| EUR | 5,200,000 | | Unitymedia Hessen GmbH & Co. KG | 3.500% | | 1/15/27 | | 5,577,192 | |
| EUR | 5,000,000 | | WEPA Hygieneprodukte GmbH (e) | 3.750% | | 5/15/24 | | 5,655,499 | |
| | | | | | | | | 14,294,142 | |
| | | | | | | | | | |
| | | | Ireland – 3.84% | | | | | | |
| USD | 3,500,000 | | Aquarius & Investments plc for Swiss Reinsurance Co., Ltd. (d) | 8.250% | | 9/1/18 | | 3,745,000 | |
| USD | 223,000 | | Ardagh Packaging Finance plc (e) | 6.000% | | 6/30/21 | | 230,526 | |
| EUR | 3,350,000 | | Ardagh Packaging Finance plc (e) | 6.750% | | 5/15/24 | | 3,950,599 | |
| USD | 860,000 | | Ardagh Packaging Finance plc (e) | 6.000% | | 2/15/25 | | 867,525 | |
| EUR | 2,700,000 | | eircom Finance DAC (e) | 4.500% | | 5/31/22 | | 3,048,502 | |
| GBP | 2,091,000 | | PGH Capital plc | 5.750% | | 7/7/21 | | 2,938,632 | |
| GBP | 1,212,000 | | PGH Capital plc | 6.625% | | 12/18/25 | | 1,623,559 | |
| | | | | | | | | 16,404,343 | |
| | | | | | | | | | |
| | | | Luxembourg – 1.09% | | | | | | |
| EUR | 290,000 | | Auris Luxembourg II S.A. (e) | 8.000% | | 1/15/23 | | 342,341 | |
| EUR | 605,000 | | Auris Luxembourg II S.A. | 8.000% | | 1/15/23 | | 714,195 | |
| EUR | 3,200,000 | | Telenet Finance VI Luxembourg S.C.A. | 4.875% | | 7/15/27 | | 3,625,824 | |
| | | | | | | | | 4,682,360 | |
| | | | | | | | | | |
| | | | Netherlands – 1.27% | | | | | | |
| GBP | 1,250,000 | | Cooperatieve Rabobank UA (d) | 6.910% | | 6/10/38 | | 1,949,144 | |
| USD | 370,000 | | Deutsche Telekom International Finance B.V. (e) | 4.875% | | 3/6/42 | | 397,226 | |
| EUR | 700,000 | | InterXion Holding N.V. (e) | 6.000% | | 7/15/20 | | 794,373 | |
| EUR | 2,000,000 | | TenneT Holding B.V. | 1.750% | | 6/4/27 | | 2,279,021 | |
| | | | | | | | | 5,419,764 | |
| | | | | | | | | | |
| | | | Spain – 0.86% | | | | | | |
| USD | 3,747,000 | | BBVA International Preferred SAU (d) | 5.919% | | 4/18/17 | | 3,684,238 | |
| | | | | | | | | | |
| | | | Switzerland – 1.56% | | | | | | |
| USD | 6,300,000 | | UBS Group A.G. (d) | 7.000% | | 2/19/25 | | 6,657,809 | |
See notes to financial statements
88
| Portfolio of investments (unaudited) |
Strategic Income Fund
January 31, 2017 (continued)
| Face | | | | | | | Value | |
| amount | | | Coupon | | Maturity | | (note 2) | |
| | | | | | | | | |
| | | | United Kingdom – 26.89% | | | | | | |
| GBP | 205,000 | | Arqiva Broadcast Finance plc (e) | 9.500% | | 3/31/20 | $ | 274,911 | |
| GBP | 2,260,000 | | Arqiva Broadcast Finance plc | 9.500% | | 3/31/20 | | 3,030,722 | |
| GBP | 1,333,000 | | Aviva plc (f) | 6.875% | | 5/20/58 | | 1,982,804 | |
| GBP | 1,300,000 | | Aviva plc (d) | 6.875% | | 11/21/19 | | 1,748,219 | |
| USD | 4,040,000 | | Barclays Bank plc (d) | 6.278% | | 12/15/34 | | 4,277,350 | |
| GBP | 700,000 | | Barclays Bank plc (d) | 14.000% | | 6/15/19 | | 1,084,217 | |
| USD | 3,300,000 | | Barclays plc (d) | 7.875% | | 3/15/22 | | 3,395,205 | |
| EUR | 2,500,000 | | BAT International Finance plc | 0.875% | | 10/13/23 | | 2,666,453 | |
| USD | 2,000,000 | | BAT International Finance plc (e) | 3.950% | | 6/15/25 | | 2,044,722 | |
| GBP | 950,000 | | BAT International Finance plc | 6.000% | | 6/29/22 | | 1,450,045 | |
| GBP | 1,869,000 | | BUPA Finance plc (d) | 6.125% | | 9/16/20 | | 2,578,543 | |
| GBP | 2,509,000 | | Co-operative Group Holdings 2011, Ltd. (f) | 6.875% | | 7/8/20 | | 3,586,684 | |
| GBP | 1,182,000 | | CPUK Finance, Ltd. (e) | 7.000% | | 8/28/20 | | 1,579,969 | |
| GBP | 788,000 | | Daily Mail & General Trust | 5.750% | | 12/7/18 | | 1,066,737 | |
| GBP | 406,000 | | Galaxy Bidco, Ltd. | 6.375% | | 11/15/20 | | 527,260 | |
| GBP | 1,909,000 | | HBOS Sterling Finance Jersey LP (d) | 7.881% | | 12/9/31 | | 3,173,009 | |
| GBP | 300,000 | | Heathrow Funding, Ltd. | 7.125% | | 2/14/24 | | 485,320 | |
| GBP | 2,212,000 | | Heathrow Funding, Ltd. | 6.000% | | 3/20/20 | | 3,160,935 | |
| GBP | 3,275,000 | | HSBC Bank Capital Funding Sterling 1 LP (d) | 5.844% | | 11/5/31 | | 4,717,975 | |
| GBP | 1,650,000 | | HSBC Bank plc | 5.375% | | 8/22/33 | | 2,460,048 | |
| EUR | 2,934,000 | | Imperial Brands Finance plc | 2.250% | | 2/26/21 | | 3,379,392 | |
| GBP | 1,750,000 | | Imperial Brands Finance plc | 4.875% | | 6/7/32 | | 2,644,797 | |
| USD | 1,962,000 | | International Game Technology plc (e) | 6.500% | | 2/15/25 | | 2,128,770 | |
| USD | 3,400,000 | | International Game Technology plc (e) | 6.250% | | 2/15/22 | | 3,640,108 | |
| GBP | 2,607,000 | | Iron Mountain Europe plc | 6.125% | | 9/15/22 | | 3,505,405 | |
| GBP | 1,300,000 | | Legal & General Group plc (d) | 5.875% | | 4/1/19 | | 1,705,926 | |
| GBP | 600,000 | | Legal & General Group plc (d) | 6.385% | | 5/2/17 | | 757,381 | |
| USD | 2,020,000 | | Lloyds Banking Group plc (d) (e) | 6.657% | | 5/21/37 | | 2,206,850 | |
| USD | 2,250,000 | | Nationwide Building Society (e) | 4.000% | | 9/14/26 | | 2,146,086 | |
| GBP | 2,515,000 | | NGG Finance plc (f) | 5.625% | | 6/18/73 | | 3,467,062 | |
| USD | 5,469,000 | | Prudential plc (d) | 6.500% | | 3/23/17 | | 5,564,707 | |
| USD | 2,000,000 | | Prudential plc (d) | 7.750% | | 3/23/17 | | 2,058,790 | |
| GBP | 4,100,000 | | RAC Bond Co. plc | 4.565% | | 5/6/23 | | 5,563,148 | |
| USD | 1,430,000 | | Royal Bank of Scotland Group plc (d) | 7.648% | | 9/30/31 | | 1,659,872 | |
| GBP | 612,000 | | Scottish Widows, Ltd. | 7.000% | | 6/16/43 | | 872,866 | |
| EUR | 1,500,000 | | Sky plc | 1.875% | | 11/24/23 | | 1,684,235 | |
| USD | 736,000 | | Sky plc (e) | 3.750% | | 9/16/24 | | 736,168 | |
| GBP | 400,000 | | Standard Life plc (f) | 5.500% | | 12/4/42 | | 533,719 | |
| GBP | 1,400,000 | | Standard Life plc (d) | 6.546% | | 1/6/20 | | 1,872,582 | |
| GBP | 606,000 | | Standard Life plc (d) | 6.750% | | 7/12/27 | | 860,035 | |
| EUR | 1,060,000 | | Synlab Bondco plc (e) | 6.250% | | 7/1/22 | | 1,250,630 | |
| EUR | 760,000 | | Synlab Bondco plc | 6.250% | | 7/1/22 | | 896,678 | |
| GBP | 1,576,000 | | Tesco plc | 5.500% | | 1/13/33 | | 2,076,436 | |
| GBP | 3,200,000 | | Tesco plc | 6.125% | | 2/24/22 | | 4,601,560 | |
| GBP | 342,450 | | Tesco Property Finance 3 plc | 5.744% | | 4/13/40 | | 433,692 | |
| GBP | 67,000 | | Thames Water Utilities Finance, Ltd. (f) | 5.375% | | 7/21/25 | | 85,820 | |
| GBP | 3,152,000 | | Virgin Media Secured Finance plc | 6.250% | | 3/28/29 | | 4,220,772 | |
| USD | 2,900,000 | | Virgin Media Secured Finance plc (e) | 5.250% | | 1/15/26 | | 2,920,648 | |
| EUR | 2,500,000 | | Worldpay Finance plc | 3.750% | | 11/15/22 | | 2,876,732 | |
| GBP | 1,000,000 | | WPP 2012 Ltd. | 6.000% | | 4/4/17 | | 1,268,865 | |
| EUR | 1,703,000 | | WPP Finance 2013 | 3.000% | | 11/20/23 | | 2,093,762 | |
| | | | | | | | | 115,004,622 | |
See notes to financial statements
89
| Portfolio of investments (unaudited) |
Strategic Income Fund
January 31, 2017 (continued)
| Face | | | | | | | Value | |
| amount | | | Coupon | | Maturity | | (note 2) | |
| | | | | | | | | | |
| | | | United States – 21.00% | | | | | | |
| USD | 4,300,000 | | Altice US Finance I Corp. (e) | 5.500% | | 5/15/26 | $ | 4,418,250 | |
| USD | 1,500,000 | | Altria Group, Inc. | 2.625% | | 9/16/26 | | 1,412,024 | |
| USD | 1,915,000 | | Anheuser-Busch InBev Finance, Inc. | 4.900% | | 2/1/46 | | 2,057,330 | |
| USD | 681,000 | | Aramark Services, Inc. | 5.125% | | 1/15/24 | | 709,370 | |
| USD | 2,419,000 | | Aramark Services, Inc. (e) | 4.750% | | 6/1/26 | | 2,415,372 | |
| USD | 2,220,000 | | Ball Corp | 5.250% | | 7/1/25 | | 2,342,100 | |
| USD | 648,000 | | Ball Corp | 4.000% | | 11/15/23 | | 645,570 | |
| EUR | 730,000 | | Ball Corp. | 4.375% | | 12/15/23 | | 883,781 | |
| USD | 1,700,000 | | Bank of America Corp. (d) | 8.000% | | 1/30/18 | | 1,759,968 | |
| USD | 2,086,000 | | Berry Plastics Corp. | 5.125% | | 7/15/23 | | 2,144,825 | |
| EUR | 1,000,000 | | Catalent Pharma Solutions Inc (e) | 4.750% | | 12/15/24 | | 1,135,086 | |
| USD | 836,000 | | CCO Holdings LLC (e) | 5.875% | | 5/1/27 | | 889,036 | |
| USD | 1,086,000 | | Charter Communications Operating LLC | 6.484% | | 10/23/45 | | 1,238,774 | |
| USD | 2,080,000 | | Charter Communications Operating LLC | 4.908% | | 7/23/25 | | 2,190,841 | |
| USD | 1,940,000 | | Citigroup, Inc. (d) | 5.350% | | 5/15/23 | | 1,896,350 | |
| USD | 2,688,000 | | Cott Beverages, Inc. | 5.375% | | 7/1/22 | | 2,762,592 | |
| USD | 2,235,000 | | Crown Americas LLC (e) | 4.250% | | 9/30/26 | | 2,140,013 | |
| USD | 2,722,000 | | Diamond 1 Finance Corp. (e) | 8.100% | | 7/15/36 | | 3,295,855 | |
| USD | 1,563,000 | | Dresdner Funding Trust I (e) | 8.151% | | 6/30/31 | | 1,813,080 | |
| USD | 2,200,000 | | Equinix, Inc. | 5.375% | | 4/1/23 | | 2,312,926 | |
| USD | 900,000 | | First Data Corp. (e) | 5.375% | | 8/15/23 | | 929,250 | |
| USD | 935,000 | | First Data Corp. (e) | 5.000% | | 1/15/24 | | 950,783 | |
| USD | 2,220,000 | | First Data Corp. (e) | 5.750% | | 1/15/24 | | 2,297,700 | |
| USD | 2,500,000 | | Fresenius Medical Care US Finance II Inc. (e) | 4.750% | | 10/15/24 | | 2,543,750 | |
| USD | 67,000 | | HCA, Inc. | 5.000% | | 3/15/24 | | 69,931 | |
| USD | 2,000,000 | | Iron Mountain, Inc. | 6.000% | | 8/15/23 | | 2,130,000 | |
| USD | 1,750,000 | | JPMorgan Chase & Co. (d) | 6.750% | | 2/1/24 | | 1,917,405 | |
| EUR | 1,200,000 | | Kellogg Co. | 1.250% | | 3/10/25 | | 1,283,483 | |
| USD | 250,000 | | Microsoft Corp. | 4.450% | | 11/3/45 | | 258,788 | |
| USD | 1,325,000 | | Microsoft Corp. | 3.450% | | 8/8/36 | | 1,234,163 | |
| USD | 1,720,000 | | Molson Coors Brewing Co. | 3.000% | | 7/15/26 | | 1,621,212 | |
| USD | 576,000 | | Molson Coors Brewing Co. | 4.200% | | 7/15/46 | | 536,735 | |
| USD | 2,686,000 | | RBS Capital Trust II (d) | 6.425% | | 1/3/34 | | 2,726,290 | |
| EUR | 2,000,000 | | RELX Capital, Inc. | 1.300% | | 5/12/25 | | 2,174,246 | |
| USD | 1,000,000 | | Reynolds American, Inc. | 6.150% | | 9/15/43 | | 1,193,567 | |
| USD | 2,240,000 | | Reynolds Group Issuer, Inc. (e) | 7.000% | | 7/15/24 | | 2,390,920 | |
| USD | 2,830,000 | | S&P Global, Inc. | 4.000% | | 6/15/25 | | 2,918,177 | |
| USD | 1,850,000 | | Sealed Air Corp. (e) | 5.250% | | 4/1/23 | | 1,937,875 | |
| USD | 567,000 | | Sealed Air Corp. (e) | 5.125% | | 12/1/24 | | 590,389 | |
| USD | 2,900,000 | | Service Corp. International | 5.375% | | 5/15/24 | | 3,052,250 | |
| USD | 650,000 | | Service Corp. International | 7.625% | | 10/1/18 | | 705,250 | |
| USD | 2,315,000 | | Sirius XM Radio, Inc. (e) | 5.375% | | 4/15/25 | | 2,361,300 | |
| USD | 1,300,000 | | Sirius XM Radio, Inc. (e) | 6.000% | | 7/15/24 | | 1,386,944 | |
| EUR | 700,000 | | Spectrum Brands, Inc. (e) | 4.000% | | 10/1/26 | | 782,369 | |
| USD | 2,100,000 | | T-Mobile USA , Inc. | 6.000% | | 3/1/23 | | 2,226,000 | |
| USD | 318,000 | | Verizon Communications, Inc. | 6.550% | | 9/15/43 | | 393,581 | |
| USD | 6,821,000 | | Wachovia Capital Trust III (d) | 5.570% | | 3/3/17 | | 6,744,264 | |
| USD | 970,000 | | Walgreens Boots Alliance, Inc. | 3.800% | | 11/18/24 | | 982,536 | |
| USD | 520,000 | | Walgreens Boots Alliance, Inc. | 3.450% | | 6/1/26 | | 507,971 | |
| EUR | 2,300,000 | | Walgreens Boots Alliance, Inc. | 2.125% | | 11/20/26 | | 2,525,299 | |
| | | | | | | | | 89,835,571 | |
| | | | Total corporate bonds | | | | | | |
| | | | (Cost $274,522,633) | | | | | 265,654,427 | |
See notes to financial statements
90
| Portfolio of investments (unaudited) |
Strategic Income Fund
January 31, 2017 (continued)
| | Face | | | | | | | Value | |
| | amount | | | Coupon | | Maturity | | (note 2) | |
| | | | | | | | | | |
| Foreign government obligations – 11.50% | | | | | | |
| | | | | | | | | | |
| | | | Australia – 11.50% | | | | | | |
| AUD | 10,600,000 | | Australia Government Bond | 3.250% | | 10/21/18 | $ | 8,243,315 | |
| AUD | 17,900,000 | | Australia Government Bond | 2.750% | | 10/21/19 | | 13,899,204 | |
| AUD | 36,000,000 | | Australia Government Bond (g) | 1.750% | | 11/21/20 | | 27,049,916 | |
| | | | | | | | | 49,192,435 | |
| | | | Total Foreign government obligations | | | | | | |
| | | | (Cost $49,067,092) | | | | | 49,192,435 | |
| | | | | Value | |
| Shares | | | | (note 2) | |
| | | | | | |
| Investment companies – 2.92% | | | |
| | | | | | |
| | | United States – 2.92% | | | |
| 327,983 | | iShares US Preferred Stock ETF | | 12,496,152 | |
| | | Total investment companies | | | |
| | | (Cost $12,366,349) | | 12,496,152 | |
| | | | | | |
| Preferred stock – 0.47% | | | |
| | | United Kingdom – 0.34% | | | |
| 850,000 | | Nationwide Building Society (d) | | 1,441,031 | |
| | | | | | |
| | | United States – 0.13% | | | |
| 21,258 | | Citigroup Capital XIII (f) | | 548,881 | |
| | | Total preferred stock | | | |
| | | (Cost $2,218,697) | | 1,989,912 | |
| | | Total long-term investments | | | |
| | | (Cost $423,608,219) | | 415,136,212 | |
| | | | | | |
| Short-term investment – 5.06% | | | |
| 21,654,897 | | Fidelity Investments Money Market Treasury Portfolio (g) | | 21,654,897 | |
| | | Total short-term investment | | | |
| | | (Cost $21,654,897) | | 21,654,897 | |
| | | | | | |
| Total investments – 102.12% | | | |
| | | (Cost $445,263,116) | | 436,791,109 | |
| Financial Derivative Instruments (h) | | | |
| | | (Cost or Premiums, net $36,267) – (0.98)% | $ | (4,190,403 | ) |
| Net other assets and liabilities – (1.14)% | | (4,883,396 | ) |
| Total net assets – 100.00% | $ | 427,717,310 | |
| (a) | | Bank loan interests are, at present, not readily marketable, not registered under the Securities Act of 1933, as amended (the "1933 Act"), and may be subject to contractual and legal restrictions on sale. Bank loan interests in the Fund's portfolio generally have variable rates which adjust to a base, such as the London Inter-Bank Offered Rate ("LIBOR"), on set dates, typically every 30 days but not greater than one year; and/or have interest rates that float at a margin above a widely recognized base lending rate such as the Prime Rate of a designated U.S. bank. |
| (b) | | Bank loan interests often require prepayments from excess cash flow or permit the borrower to repay at its election. The degree to which borrowers repay, whether as a contractual requirement or at their election, cannot be predicted with accuracy. As a result, the actual remaining maturity may be substantially less than the stated maturities shown. |
| (c) | | Security or a portion thereof is purchased on a delayed delivery basis. |
| (d) | | Maturity date is perpetual. Maturity date presented represents the next call date. |
| (e) | | Restricted security, purchased pursuant to Rule 144A under the Securities Act of 1933, as amended, and which is exempt from registration under that Act. At January 31, 2017, the restricted securities held by the Fund had an aggregate value of $67,847,814, which represented 15.9% of net assets. |
See notes to financial statements
91
| Portfolio of investments (unaudited) |
Strategic Income Fund
January 31, 2017 (continued)
| (f) | | Variable or Floating rate interest rate security. Includes fixed-to-floating rate corporate bond securities which currently pay a fixed coupon that will move to a floating rate coupon if the bond is not redeemed at the call date. Rate presented represents rate at January 31, 2017. |
| (g) | | All or a portion of these securities and short-term investments were segregated for open futures contracts, open forward foreign currency contracts, delayed delivery purchases and swap contracts at January 31, 2017. |
| (h) | | Information with respect to financial derivative instruments is disclosed in the following tables. |
| ETF | | Exchange-traded fund |
(h) FINANCIAL DERIVATIVE INSTRUMENTS
EXCHANGE-TRADED OR CENTRALLY-CLEARED FINANCIAL DERIVATIVE INSTRUMENTS
FUTURES CONTRACTS
| | | | | | | | | | Current | | | Unrealized | |
| | | | Number of | | | Expiration | | | notional | | | appreciation/(depreciation) | |
| | | | contracts | | | date | | | value | | | Asset | | | Liability | |
| UK Long Gilt Bond (Long) | | | 166 | | | 3/29/17 | | $ | 25,867,510 | | $ | — | | $ | (49,507 | ) |
| Total | | | | | | | | | | | $ | — | | $ | (49,507 | ) |
During the period ended January 31, 2017, average monthly notional value related to futures contracts was approximately $16.9 million or 3.9% of net assets.
FINANCIAL DERIVATIVE INSTRUMENTS: EXCHANGE-TRADED OR CENTRALLY-CLEARED SUMMARY
The following is a summary of the value of exchange-traded or centrally-cleared financial derivative instruments as of January 31, 2017:
| | | | Unrealized | | | | | | Unrealized | | | | |
| | | | Appreciation | | | | | | Depreciation | | | | |
| | | | Futures | | | | | | Futures | | | | |
| | | | Contracts | | | Total | | | Contracts | | | Total | |
| Total Exchange-Traded or | | | | | | | | | | | | | |
| Centrally Cleared | | $ | — | | $ | — | | $ | (49,507 | ) | $ | (49,507 | ) |
OVER-THE-COUNTER FINANCIAL DERIVATIVE INSTRUMENTS
FORWARD FOREIGN CURRENCY CONTRACTS
| | | | | | Local | | | Current | | | Unrealized | |
| | | | Value | | amount | | | notional | | | appreciation/(depreciation) | |
| | | Counterparty | date | | (000's) | | | value | | | Asset | | | Liability | |
| Australian Dollar (Short) | | BNP Paribas | | | | | | | | | | | | | |
| | | Securities Services | 2/22/17 | | 65,304 | | $ | 49,502,663 | | $ | — | | $ | (575,908 | ) |
| British Pound (Short) | | BNP Paribas | | | | | | | | | | | | | |
| | | Securities Services | 2/22/17 | | 63,691 | | | 80,149,885 | | | — | | | (2,402,357 | ) |
| Euro (Short) | | BNP Paribas | | | | | | | | | | | | | |
| | | Securities Services | 2/22/17 | | 75,502 | | | 81,563,597 | | | — | | | (1,095,556 | ) |
| Total | | | | | | | | | | $ | — | | $ | (4,073,821 | ) |
During the period ended January 31, 2017, average monthly notional value related to forward foreign currency contracts was approximately $253.23million or 59.2% of net assets.
See notes to financial statements
92
| Portfolio of investments (unaudited) |
Strategic Income Fund
January 31, 2017 (continued)
Credit Default Swap Contracts
| | | | | | | | | | | | | | | | Upfront | | | | | | | | | | |
| | | | | Rates | | | | | Implied | | | Notional | | | premiums | | | Unrealized | | | | | | | |
| | | Reference | | received/ | | | Termination | | credit | | | amount | | | paid/ | | | appreciation/ | | | Value | |
| Counterparty | | entity | | (paid | ) | | date | | spread | | | (000s) | | | (received | ) | | (depreciation) | | | Asset | | | Liability | |
| | | | | | | | | | | | | | | | | | | | | | | | | | |
| Protection purchased: | | | | | | | | | | | | | | | | | | | | | | | | | |
| JP Morgan Chase Bank, N.A. | | Deutsche Lufthansa | | (1.00 | )% | | 12/20/21 | | 1.32% | | | $2,159 | | $ | 62,500 | | $ | (29,090) | | $ | 33,410 | | $ | — | |
| JP Morgan Chase Bank, N.A. | | Host Hotels | | (1.00 | )% | | 12/20/20 | | 0.65% | | | 2,500 | | | 40,372 | | | (73,440) | | | — | | | (33,068 | ) |
| Barclays Bank plc | | McKesson | | (1.00 | )% | | 12/20/21 | | 0.56% | | | 3,200 | | | (75,671 | ) | | 10,102 | | | — | | | (65,569 | ) |
| Barclays Bank plc | | Renault | | (1.00 | )% | | 12/20/21 | | 0.97% | | | 3,238 | | | 10,704 | | | (14,914) | | | — | | | (4,210 | ) |
| | | | | | | | | | | | | | | | | | | | | | | | | | |
| Protection sold: | | | | | | | | | | | | | | | | | | | | | | | | | |
| JPMorgan Chase Bank, N.A. | | ConvaTec Healthcare | | 5.00 | % | | 12/20/17 | | 0.12% | | | 54 | | | (1,638 | ) | $ | 4,000 | | $ | 2,362 | | $ | — | |
| Total | | | | | | | | | | | | | | $ | 36,267 | | $ | (103,342 | ) | $ | 35,772 | | $ | (102,847 | ) |
During the period ended January 31, 2017, average monthly notional value related to swap contracts, including both centrally-cleared and over-the-counter, was approximately $16.2 million or 3.8% of net assets.
FINANCIAL DERIVATIVE INSTRUMENTS: OVER-THE-COUNTER SUMMARY
The following is a summary by counterparty of the value of over-the-counter financial derivative instruments and collateral (received)/pledged as of January 31, 2017:
| | | Financial Derivative Assets | | Financial Derivative Liabilities | | | | | | | |
| | | Unrealized
Appreciation | | Value(1) | | | | Unrealized
Depreciation | | Value(1) | | | | | | | | | |
| | | Forward
Foreign
Currency
Contracts | | Swap
Contracts | | Total
Over-the
Counter | | Forward
Foreign
Currency
Contracts | | Swap
Contracts | | Total
Over-the
Counter | | Net
Value
of OTC
Derivatives | | Collateral
(Received) /
Pledged | | Net
Exposure(2) | |
| | | | | | | | | | | | | | | | | | | | | | | | | | | | | |
| Amounts subject to a master netting agreement: | | | | | | | | | | | | | | | | | | | | | | |
| Barclays Bank plc | | $ | — | | $ | — | | $ | — | | $ | — | | $ | (69,779 | ) | $ | (69,779 | ) | $ | (69,779 | ) | $ | — | | $ | (69,779 | ) |
| BNP Paribas | | | | | | | | | | | | | | | | | | | | | | | | | | | | |
| Securities Services | | | — | | | — | | | — | | | (4,073,821 | ) | | — | | | (4,073,821 | ) | | (4,073,821 | ) | | — | | | (4,073,821 | ) |
| JPMorgan Chase Bank, N.A. | | | — | | | 35,772 | | | 35,772 | | | — | | | (33,068 | ) | | (33,068 | ) | | 2,704 | | | — | | | 2,704 | |
| | | $ | — | | $ | 35,772 | | $ | 35,772 | | $ | (4,073,821 | ) | $ | (102,847 | ) | $ | (4,176,668 | ) | $ | (4,140,896 | ) | $ | — | | $ | (4,140,896 | ) |
| (1) | | Value on swap contracts is represented by "unrealized appreciation/(depreciation)" on interest rate swaps, and "value" on credit default swaps, which is inclusive of upfront premiums paid/(received). |
| (2) | | Net Exposure represents the net receivable/(payable) that would be due from/to the counterparty in the event of default. Exposure from over-the-counter financial derivative instruments can only be netted across transactions governed under the same master agreement with the same legal entity. See Note 2, Significant Accounting Policies, "Derivative instruments," in the Notes to Financial Statements for more information regarding master netting arrangements. |
| | Cost or Premiums, Net | | Asset | | | Liability | |
| TOTAL FINANCIAL DERIVATIVE INSTRUMENTS | | $ | 36,267 | | $ | 35,772 | | $ | (4,226,175 | ) |
See notes to financial statements
93
| Portfolio of investments (unaudited) |
Strategic Income Fund
January 31, 2017 (continued)
Other information:
| | |
| Industry concentration as | % of net |
| a percentage of net assets: | assets |
| Sovereign | 11.50 | % |
| Diversified Banking Institution | 6.35 | |
| Cable TV | 5.53 | |
| Life/Health Insurance | 5.06 | |
| Commercial Banks Non-US | 3.90 | |
| Containers-Paper/Plastic | 3.69 | |
| Telecommunication Services | 3.49 | |
| Tobacco | 3.46 | |
| Commercial Services | 3.01 | |
| Income Equity | 2.92 | |
| Containers - Metal/Glass | 2.09 | |
| Medical-Hospitals | 2.02 | |
| Medical Products | 1.99 | |
| Money Center Banks | 1.92 | |
| Diversified Operations | 1.84 | |
| Specialized REITs | 1.79 | |
| Specialty Stores | 1.60 | |
| Super-Regional Banks-US | 1.58 | |
| Food-Retail | 1.56 | |
| Containers & Packaging | 1.52 | |
| Gambling (Non-Hotel) | 1.35 | |
| Medical Labs & Testing Services | 1.35 | |
| Electric-Transmission | 1.34 | |
| Paper & Related Products | 1.32 | |
| Commercial Services-Finance | 1.06 | |
| Auto Racing | 1.01 | |
| Brewery | 0.99 | |
| Data Processing/Management | 0.98 | |
| Retail-Drug Store | 0.94 | |
| Casinos & Gaming | 0.93 | |
| Beverages | 0.91 | |
| Funeral Services & Related Items | 0.88 | |
| Radio | 0.88 | |
| Reinsurance | 0.88 | |
| Airport Development & Maintenance | 0.85 | |
| Building Societies | 0.84 | |
| Broadcast Services/Programs | 0.77 | |
| Specialized Finance | 0.77 | |
| Power Conversion/Supply Equipment | 0.76 | |
| Mortgage Banks | 0.74 | |
| Food-Catering | 0.73 | |
| Finance-Other Services | 0.67 | |
| Computer Data Security | 0.66 | |
| Consumer Products - Miscellaneous | 0.66 | |
| Beverages-Non-alcoholic | 0.65 | |
| Transaction Mgt Systems | 0.64 | |
| Medical-HMO | 0.60 | |
| Dialysis Centers | 0.59 | |
| Telephone-Integrated | 0.56 | |
| REITS-Diversified | 0.54 | |
| Cellular Telecommunications | 0.52 | |
| Publishing-Books | 0.51 | |
| Industry concentration as | % of net |
| a percentage of net assets: | assets |
| Advertising Services | 0.49 | % |
| Electronic Measurement Instruments | 0.40 | |
| Resorts/Theme Parks | 0.37 | |
| Applications Software | 0.35 | |
| Consulting Services | 0.30 | |
| Food-Miscellaneous/Diversified | 0.30 | |
| Drug Delivery Systems | 0.27 | |
| Publishing-Newspapers | 0.25 | |
| Multi-line Insurance | 0.20 | |
| Computer Software | 0.19 | |
| Property/Casualty Insurance | 0.12 | |
| Real Estate Operations/Development | 0.10 | |
| Water | 0.02 | |
| Total Long-Term Investments | 97.06 | |
| Short-Term Investment | 5.06 | |
| Total Investments | 102.12 | |
| Financial Derivative Instruments | (0.98 | ) |
| Net Other Assets and Liabilities | (1.14 | ) |
| | 100.00 | % |
| Currency exposure of portfolio assets before | |
| any currency hedging, if applicable. | % of total |
| Excludes derivatives: | investments |
| US Dollar | 50 | % |
| Euro | 21 | |
| British Pound | 18 | |
| Australian Dollar | 11 | |
| | 100 | % |
See notes to financial statements
94
| Portfolio of investments (unaudited) |
Strategic Income Fund
January 31, 2017 (continued)
Fair Value Measurement
The following table summarizes the Fund's investments that are measured at fair value by level within the fair value hierarchy at January 31, 2017:
| | | | | | | | | | | | | | |
| | | | Quoted prices | | | Significant | | | | | | | |
| | | | in active | | | other | | | Significant | | | | |
| | | | markets for | | | observable | | | unobservable | | | | |
| | | | identical assets | | | inputs | | | inputs | | | | |
| Description | | | (level 1 | ) | | (level 2 | ) | | (level 3 | ) | | Total | |
| Assets | | | | | | | | | | | | | |
| Bank loans | | | | | | | | | | | | | |
| France | | $ | — | | $ | 5,467,169 | | $ | — | | $ | 5,467,169 | |
| Germany | | | — | | | 11,105,409 | | | — | | | 11,105,409 | |
| Ireland | | | — | | | 4,032,348 | | | — | | | 4,032,348 | |
| Netherlands | | | — | | | 8,431,779 | | | — | | | 8,431,779 | |
| Switzerland | | | — | | | 3,610,370 | | | — | | | 3,610,370 | |
| United States | | | — | | | 53,156,211 | | | — | | | 53,156,211 | |
| Total Bank loans | | | — | | | 85,803,286 | | | — | | | 85,803,286 | |
| | | | | | | | | | | | | | |
| Corporate bonds | | | | | | | | | | | | | |
| Denmark | | | — | | | 1,656,638 | | | — | | | 1,656,638 | |
| France | | | — | | | 8,014,940 | | | — | | | 8,014,940 | |
| Germany | | | — | | | 14,294,142 | | | — | | | 14,294,142 | |
| Ireland | | | — | | | 16,404,343 | | | — | | | 16,404,343 | |
| Luxembourg | | | — | | | 4,682,360 | | | — | | | 4,682,360 | |
| Netherlands | | | — | | | 5,419,764 | | | — | | | 5,419,764 | |
| Spain | | | — | | | 3,684,238 | | | — | | | 3,684,238 | |
| Switzerland | | | — | | | 6,657,809 | | | — | | | 6,657,809 | |
| United Kingdom | | | — | | | 115,004,622 | | | — | | | 115,004,622 | |
| United States | | | — | | | 89,835,571 | | | — | | | 89,835,571 | |
| Total Corporate bonds | | | — | | | 265,654,427 | | | — | | | 265,654,427 | |
| | | | | | | | | | | | | | |
| Foreign government obligations | | | | | | | | | | | | | |
| Australia | | | — | | | 49,192,435 | | | — | | | 49,192,435 | |
| Total Foreign government obligations | | | — | | | 49,192,435 | | | — | | | 49,192,435 | |
| | | | | | | | | | | | | | |
| Investment companies | | | | | | | | | | | | | |
| United States | | | 12,496,152 | | | — | | | — | | | 12,496,152 | |
| Total Investment companies | | | 12,496,152 | | | — | | | — | | | 12,496,152 | |
| | | | | | | | | | | | | | |
| Preferred stock | | | | | | | | | | | | | |
| United Kingdom | | | — | | | 1,441,031 | | | — | | | 1,441,031 | |
| United States | | | 548,881 | | | — | | | — | | | 548,881 | |
| Total Preferred stock | | | 548,881 | | | 1,441,031 | | | — | | | 1,989,912 | |
| | | | | | | | | | | | | | |
| Short-term investment | | | 21,654,897 | | | — | | | — | | | 21,654,897 | |
| Total Short-term investment | | | 21,654,897 | | | — | | | — | | | 21,654,897 | |
| Total Investments | | $ | 34,699,930 | | $ | 402,091,179 | | $ | — | | $ | 436,791,109 | |
See notes to financial statements
95
| Portfolio of investments (unaudited) |
Strategic Income Fund
January 31, 2017 (continued)
| | | | | | | | | | | | | | |
| | | | Quoted prices | | | Significant | | | | | | | |
| | | | in active | | | other | | | Significant | | | | |
| | | | markets for | | | observable | | | unobservable | | | | |
| | | | identical assets | | | inputs | | | inputs | | | | |
| Description | | | (level 1 | ) | | (level 2 | ) | | (level 3 | ) | | Total | |
| | | | | | | | | | | | | | |
| Financial Derivative Instruments – Assets | | | | | | | | | | | | | |
| Over-the-counter | | $ | — | | $ | 35,772 | | $ | — | | $ | 35,772 | |
| Total Financial Derivative Instruments – Assets | | $ | — | | $ | 35,772 | | $ | — | | $ | 35,772 | |
| | | | | | | | | | | | | | |
| Liabilities | | | | | | | | | | | | | |
| Financial Derivative Instruments – Liabilities | | | | | | | | | | | | | |
| Exchange-traded or centrally-cleared | | $ | (49,507 | ) | $ | — | | $ | — | | $ | (49,507 | ) |
| Over-the-counter | | | — | | | (4,176,668 | ) | | — | | | (4,176,668 | ) |
| Total Financial Derivative Instruments – Liabilities | | $ | (49,507 | ) | $ | (4,176,668 | ) | $ | — | | $ | (4,226,175 | ) |
During the period ended January 31, 2017, there were no transfers in or out of security levels.
Fair Value of Financial Derivative Instruments
The following is a summary of the fair valuation of the Fund's financial derivative instruments categorized by risk exposure:
Fair Values of Financial Derivative Instruments on the Statement of Assets and Liabilities as of January 31, 2017
| | | | Derivatives not accounted for as hedging instruments | |
| | | | Foreign | | | | | | | | | | | | | | | | |
| | | | Currency | | | Equity | | | Interest | | | Credit | | | Inflation | | | | |
| | | | Risk | | | Risk | | | Rate Risk | | | Risk | | | Risk | | | Total | |
| Financial Derivative Instruments – Assets | | | | | | | | | | | | | | | | | | | |
| Over-the-Counter | | | | | | | | | | | | | | | | | | | |
| Swap Contracts | | $ | — | | $ | — | | $ | — | | $ | 35,772 | | $ | — | | $ | 35,772 | |
| Total | | $ | — | | $ | — | | $ | — | | $ | 35,772 | | $ | — | | $ | 35,772 | |
| | | | | | | | | | | | | | | | | | | | |
| Financial Derivative Instruments – Liabilities | | | | | | | | | | | | | | | | | | | |
| Exchange-traded | | | | | | | | | | | | | | | | | | | |
| Futures Contracts | | $ | — | | $ | — | | $ | — | | $ | — | | $ | (49,507 | ) | $ | (49,507 | ) |
| | | $ | — | | $ | — | | $ | — | | $ | — | | $ | (49,507 | ) | $ | (49,507 | ) |
| Over-the-Counter | | | | | | | | | | | | | | | | | | | |
| Forward Foreign Currency Contracts | | $ | (4,073,821 | ) | $ | — | | $ | — | | $ | — | | $ | — | | $ | (4,073,821 | ) |
| Swap Contracts | | | — | | | — | | | — | | | (102,847 | ) | | — | | | (102,847 | ) |
| Total | | $ | (4,073,821 | ) | $ | — | | $ | — | | $ | (102,847 | ) | $ | — | | $ | (4,176,668 | ) |
| Net | | $ | (4,073,821 | ) | $ | — | | $ | — | | $ | (67,075 | ) | $ | (49,507 | ) | $ | (4,190,403 | ) |
See notes to financial statements
96
| Portfolio of investments (unaudited) |
Strategic Income Fund
January 31, 2017 (continued)
Effect of Financial Derivative Instruments on the Statement of Operations for the Period Ended January 31, 2017
| | | | Derivatives not accounted for as hedging instruments | |
| | | | Foreign | | | | | | | | | | | | | | | | |
| | | | Currency | | | Equity | | | Interest | | | Credit | | | Inflation | | | | |
| | | | Risk | | | Risk | | | Rate Risk | | | Risk | | | Risk | | | Total | |
| | | | | | | | | | | | | | | | | | | | |
Net realized gain/(loss) from
financial derivative instruments: | | | | | | | | | | | | | | | | | | | |
| Futures Contracts | | $ | — | | $ | — | | $ | 614,774 | | $ | — | | $ | 568,028 | | $ | 1,182,802 | |
| Forward Foreign Currency Contracts | | $ | 13,368,031 | | $ | — | | $ | — | | $ | — | | $ | — | | $ | 13,368,031 | |
| Swap Contracts | | $ | — | | $ | — | | $ | — | | $ | (152,882 | ) | $ | — | | $ | (152,882 | ) |
| Total | | $ | 13,368,031 | | $ | — | | $ | 614,774 | | $ | (152,882 | ) | $ | 568,028 | | $ | 14,397,951 | |
| | | | Derivatives not accounted for as hedging instruments | |
| | | | Foreign | | | | | | | | | | | | | | | | |
| | | | Currency | | | Equity | | | Interest | | | Credit | | | Inflation | | | | |
| | | | Risk | | | Risk | | | Rate Risk | | | Risk | | | Risk | | | Total | |
| | | | | | | | | | | | | | | | | | | | |
| Net change in unrealized appreciation/(depreciation) of financial derivative instruments | | | | | | | | | | | | | | | | | | | |
| Futures Contracts | | $ | — | | $ | — | | $ | (276,057 | ) | $ | — | | $ | — | | $ | (276,057 | ) |
| Forward Foreign Currency Contracts | | $ | (2,225,767 | ) | $ | — | | $ | — | | $ | — | | $ | — | | $ | (2,225,767 | ) |
| Swap Contracts | | $ | — | | $ | — | | $ | — | | $ | 35,706 | | $ | — | | $ | 35,706 | |
| Total | | $ | (2,225,767 | ) | $ | — | | $ | (276,057 | ) | $ | 35,706 | | $ | — | | $ | (2,466,118 | ) |
See notes to financial statements
97
| Portfolio of investments (unaudited) |
US Growth Opportunities Fund
January 31, 2017
| | | | | | |
| | | | | Value | |
| Shares | | | | (note 2) | |
| | | | | | |
| Common stocks – 96.48% | | | |
| | | | | | |
| | | United States – 96.48% | | | |
| 923 | | Acuity Brands, Inc. | $ | 191,273 | |
| 2,730 | | Adobe Systems, Inc. * | | 309,527 | |
| 207 | | Alphabet, Inc., Class A * | | 169,779 | |
| 3,443 | | Amphenol Corp., Class A | | 232,368 | |
| 6,248 | | Bank of the Ozarks, Inc. | | 342,828 | |
| 2,070 | | Bio-Techne Corp. | | 210,623 | |
| 900 | | C.R. Bard, Inc. | | 213,597 | |
| 2,948 | | Cantel Medical Corp. | | 228,205 | |
| 1,733 | | Celgene Corp. * | | 201,288 | |
| 908 | | CoStar Group, Inc. * | | 183,507 | |
| 1,808 | | Costco Wholesale Corp. | | 296,422 | |
| 2,805 | | Danaher Corp. | | 235,396 | |
| 2,108 | | Ecolab, Inc. | | 253,234 | |
| 3,143 | | Fiserv, Inc. * | | 337,652 | |
| 2,895 | | Fortive Corp. | | 160,122 | |
| 1,590 | | Henry Schein, Inc. * | | 254,177 | |
| 1,725 | | IDEX Corp. | | 155,526 | |
| 2,490 | | Intuit, Inc. | | 295,264 | |
| 2,985 | | Manhattan Associates, Inc. * | | 153,011 | |
| 4,133 | | Microchip Technology, Inc. | | 278,358 | |
| 593 | | Panera Bread Co., Class A * | | 123,973 | |
| 4,095 | | Raymond James Financial, Inc. | | 306,838 | |
| 2,550 | | Red Hat, Inc. * | | 193,494 | |
| 2,190 | | salesforce.com, Inc. * | | 173,229 | |
| 1,388 | | Snap-on, Inc. | | 251,964 | |
| 5,295 | | Starbucks Corp. | | 292,390 | |
| 1,830 | | The JM Smucker Co. | | 248,605 | |
| 1,965 | | The Middleby Corp. * | | 263,664 | |
| 4,020 | | The TJX Companies, Inc. | | 301,178 | |
| 2,460 | | The Walt Disney Co. | | 272,199 | |
| 1,838 | | Tractor Supply Co. | | 135,405 | |
| 1,095 | | Tyler Technologies, Inc. * | | 159,892 | |
| 795 | | Ultimate Software Group, Inc. * | | 153,960 | |
| 3,503 | | VF Corp. | | 180,334 | |
| 3,498 | | Visa, Inc., A Shares | | 289,320 | |
| 3,353 | | Walgreens Boots Alliance, Inc. | | 274,745 | |
| | | | | 8,323,347 | |
| | | | | | |
| | | Total common stocks | | | |
| | | (Cost $7,122,954) | | 8,323,347 | |
| | | | | | |
| | | Total long-term investments | | | |
| | | (Cost $7,122,954) | | 8,323,347 | |
| | | | | Value | |
| Shares | | | | (note 2) | |
| | | | | | |
| Short-term investment – 3.19% | | | |
| 275,294 | | Fidelity Investments Money | | | |
| | | Market Treasury Portfolio | $ | 275,294 | |
| | | | | | |
| | | Total short-term investment | | | |
| | | (Cost $275,294) | | 275,294 | |
| | | | | | |
| Total investments – 99.67% | | | |
| | | (Cost $7,398,248) | | 8,598,641 | |
| Net other assets and liabilities – 0.33% | | 28,871 | |
| Total net assets – 100.00% | $ | 8,627,512 | |
| * | | Non-income producing security |
See notes to financial statements
98
| Portfolio of investments (unaudited) |
US Growth Opportunities Fund
January 31, 2017 (continued)
Other information:
| | |
| Industry concentration as | % of net |
| a percentage of net assets: | assets |
| Applications Software | 7.67 | % |
| Medical Products | 5.59 | |
| Enterprise Software/Services | 5.41 | |
| Machinery-General Industrials | 4.86 | |
| Retail - Restaurants | 4.83 | |
| Commercial Banks-Southern US | 3.97 | |
| Data Processing/Management | 3.91 | |
| Electronic Forms | 3.59 | |
| Finance - Investment Banking & Brokerage | 3.56 | |
| Retail-Major Department Store | 3.49 | |
| Retail-Discount | 3.44 | |
| Commercial Services-Finance | 3.35 | |
| Electronic Components-Semiconductors | 3.23 | |
| Retail-Drug Store | 3.18 | |
| Multimedia | 3.15 | |
| Chemicals - Specialty | 2.94 | |
| Tools-Hand Held | 2.92 | |
| Food-Confectionery | 2.88 | |
| Diversified Manufacturing Operations | 2.73 | |
| Electronic Connectors | 2.69 | |
| Disposable Medical Products | 2.48 | |
| Medical Instruments | 2.44 | |
| Medical-Biomedical/Gene | 2.33 | |
| Lighting Products & Systems | 2.22 | |
| Commercial Services | 2.13 | |
| Apparel Manufacturers | 2.09 | |
| Web Portals/ISP | 1.97 | |
| Electronic Measurement Instruments | 1.86 | |
| Retail-Gardening Products | 1.57 | |
| Total Long-Term Investments | 96.48 | |
| Short-Term Investment | 3.19 | |
| Total Investments | 99.67 | |
| Net Other Assets and Liabilities | 0.33 | |
| | 100.00 | % |
| Currency exposure of portfolio assets before | |
| any currency hedging, if applicable. | % of total |
| Excludes derivatives: | investments |
| US Dollar | 100 | % |
| | 100 | % |
See notes to financial statements
99
| Portfolio of investments (unaudited) |
US Growth Opportunities Fund
January 31, 2017 (continued)
Fair Value Measurement
The following table summarizes the Fund's investments that are measured at fair value by level within the fair value hierarchy at January 31, 2017:
| | | | | | | | | | | | | | |
| | | | Quoted prices | | | Significant | | | | | | | |
| | | | in active | | | other | | | Significant | | | | |
| | | | markets for | | | observable | | | unobservable | | | | |
| | | | identical assets | | | inputs | | | inputs | | | | |
| Description | | | (level 1 | ) | | (level 2 | ) | | (level 3 | ) | | Total | |
| Assets | | | | | | | | | | | | | |
| Common stocks | | | | | | | | | | | | | |
| United States | | $ | 8,323,347 | | $ | — | | $ | — | | $ | 8,323,347 | |
| Total Common stocks | | | 8,323,347 | | | — | | | — | | | 8,323,347 | |
| Short-term investment | | | 275,294 | | | — | | | — | | | 275,294 | |
| Total Short-term investment | | | 275,294 | | | — | | | — | | | 275,294 | |
| Total Investments | | $ | 8,598,641 | | $ | — | | $ | — | | $ | 8,598,641 | |
During the period ended January 31, 2017, there were no transfers in or out of security levels.
See notes to financial statements
100
This page intentionally left blank.
101
| Financial statements (unaudited) |
Statements of assets and liabilities
January 31, 2017
| | | | | | | Dividend | |
| | | | All | | | & Income | |
| | | | Asset | | | Builder | |
| | | | Fund | | | Fund | |
| Assets: | | | | | | | |
| Investments, at fair value | | | | | | | |
| Securities | | $ | 24,445,150 | | $ | 130,180,665 | |
| Affiliated companies | | | 6,609,375 | | | — | |
| Short term investment | | | 18,944,741 | | | 514,000 | |
| Other Securities (see note 2) | | | — | | | — | |
| Total investments | | | 49,999,266 | | | 130,694,665 | |
| Cash | | | — | | | 512 | |
| Foreign cash, at value | | | 18,394 | | | — | |
| Cash at broker for open futures contracts | | | 450,752 | | | — | |
| Dividends, interest, and securities lending income receivable | | | 10,167 | | | 383,025 | |
| Receivable for investment securities sold | | | — | | | 1,385,549 | |
| Receivable for fund shares sold | | | 24,566 | | | 233,607 | |
| Financial Derivative Instruments | | | | | | | |
| Exchange-traded or centrally-cleared | | | 237,757 | | | — | |
| Over-the-counter | | | 145,433 | | | — | |
| Prepaid expenses and other assets | | | 29,214 | | | 40,125 | |
| Total Assets | | | 50,915,549 | | | 132,737,483 | |
| Liabilities: | | | | | | | |
| Foreign cash overdraft, at value | | | — | | | 20 | |
| Payable for investment securities purchased | | | — | | | — | |
| Payable for collateral on securities loaned | | | — | | | — | |
| Payable for fund shares redeemed | | | 155,831 | | | 846,785 | |
| Financial Derivative Instruments | | | | | | | |
| Exchange-traded or centrally-cleared | | | — | | | — | |
| Over-the-counter | | | — | | | 310,663 | |
| Payable to investment advisor | | | 11,966 | | | 87,282 | |
| Payable for 12b-1 distribution and service fees | | | 9,299 | | | 37,520 | |
| Accrued expenses and other payables | | | 25,682 | | | 51,709 | |
| Total Liabilities | | | 202,778 | | | 1,333,979 | |
| Net assets | | $ | 50,712,771 | | $ | 131,403,504 | |
| Net assets consist of: | | | | | | | |
| Paid-in capital | | $ | 49,826,953 | | $ | 129,532,379 | |
| Accumulated undistributed net investment income (loss) | | | (1,635 | ) | | (178,423 | ) |
| Accumulated net realized gain on investments, financial derivative instruments, short sales and foreign currency transactions | | | 83,703 | | | (206,517 | ) |
| Net unrealized appreciation of investments, financial derivative instruments, short sales and foreign currencies | | | 803,750 | | | 2,256,065 | |
| | | $ | 50,712,771 | | $ | 131,403,504 | |
See notes to financial statements
102
| Financial statements (unaudited) |
Statements of assets and liabilities
January 31, 2017 (continued)
| | Emerging | | | European | | | Global Equity | | | Global | | | High Yield | |
| | Markets | | | Focus | | | Income | | | Technology | | | Opportunities | |
| | Fund | | | Fund | | | Fund | | | Fund | | | Fund | |
| | | | | | | | | | | | | | | |
| $ | 73,724,355 | | $ | 1,726,811,234 | | $ | 4,021,543,300 | | $ | 201,365,932 | | $ | 53,358,147 | |
| | — | | | — | | | — | | | — | | | — | |
| | 4,588,507 | | | 53,062,027 | | | 93,669,513 | | | 937,822 | | | 4,454,097 | |
| | — | | | 31,774,590 | | | — | | | — | | | — | |
| | 78,312,862 | | | 1,811,647,851 | | | 4,115,212,813 | | | 202,303,754 | | | 57,812,244 | |
| | — | | | — | | | — | | | — | | | 751,042 | |
| | 255,107 | | | 2,677,478 | | | — | | | 13 | | | — | |
| | — | | | — | | | — | | | — | | | — | |
| | 104,489 | | | 3,488,594 | | | 21,027,466 | | | 154,854 | | | 954,076 | |
| | 134,148 | | | 43,581,929 | | | 77,390,385 | | | 2,732,619 | | | 250,625 | |
| | 442,976 | | | 24,015,432 | | | 26,122,776 | | | 148,601 | | | 614,905 | |
| | | | | | | | | | | | | | | |
| | — | | | — | | | — | | | — | | | — | |
| | — | | | — | | | — | | | — | | | — | |
| | 55,312 | | | 93,855 | | | 204,644 | | | 41,131 | | | 20,405 | |
| | 79,304,894 | | | 1,885,505,139 | | | 4,239,958,084 | | | 205,380,972 | | | 60,403,297 | |
| | | | | | | | | | | | | | | |
| | — | | | — | | | 264 | | | — | | | — | |
| | 862,236 | | | 19,458,796 | | | 128,997,126 | | | 898,221 | | | 2,971,162 | |
| | — | | | 31,774,590 | | | — | | | — | | | — | |
| | 69,189 | | | 14,761,783 | | | 14,354,308 | | | 484,485 | | | 12,004 | |
| | | | | | | | | | | | | | | |
| | — | | | — | | | — | | | — | | | — | |
| | — | | | 7,428,774 | | | 14,597,668 | | | — | | | — | |
| | 37,138 | | | 1,485,949 | | | 2,364,647 | | | 157,428 | | | 15,953 | |
| | 7,547 | | | 257,494 | | | 1,000,768 | | | 65,085 | | | 4,824 | |
| | 164,420 | | | 991,901 | | | 1,413,959 | | | 92,261 | | | 30,385 | |
| | 1,140,530 | | | 76,159,287 | | | 162,728,740 | | | 1,697,480 | | | 3,034,778 | |
| $ | 78,164,364 | | $ | 1,809,345,852 | | $ | 4,077,229,344 | | $ | 203,683,492 | | $ | 57,368,519 | |
| | | | | | | | | | | | | | | |
| $ | 79,588,595 | | $ | 2,363,074,352 | | $ | 4,496,226,548 | | $ | 124,281,460 | | $ | 56,023,951 | |
| | (330,319 | ) | | (412,461 | ) | | (25,311,075 | ) | | (1,230,174 | ) | | 23,857 | |
| | | | | | | | | | | | | | | |
| | (5,082,344 | ) | | (389,834,962 | ) | | (356,927,124 | ) | | 4,427,607 | | | (535,095 | ) |
| | | | | | | | | | | | | | | |
| | 3,988,432 | | | (163,481,077 | ) | | (36,759,005 | ) | | 76,204,599 | | | 1,855,806 | |
| $ | 78,164,364 | | $ | 1,809,345,852 | | $ | 4,077,229,344 | | $ | 203,683,492 | | $ | 57,368,519 | |
See notes to financial statements
103
| Financial statements (unaudited) |
Statements of assets and liabilities
January 31, 2017 (continued)
| | | | | | | Dividend | |
| | | | All | | | & Income | |
| | | | Asset | | | Builder | |
| | | | Fund | | | Fund | |
| Net assets: | | | | | | | |
| Class A Shares | | $ | 3,849,676 | | $ | 26,947,936 | |
| Class C Shares | | $ | 9,286,818 | | $ | 35,580,204 | |
| Class I Shares | | $ | 7,992,763 | | $ | 68,610,014 | |
| Class R6 Shares | | $ | 29,583,514 | | $ | 265,350 | |
| Shares outstanding: | | | | | | | |
| Class A Shares (unlimited number of shares authorized) | | | 374,677 | | | 2,230,555 | |
| Class C Shares (unlimited number of shares authorized) | | | 921,245 | | | 2,974,147 | |
| Class I Shares (unlimited number of shares authorized) | | | 780,574 | | | 5,680,372 | |
| Class R6 Shares (unlimited number of shares authorized) | | | 2,895,620 | | | 21,954 | |
| Class A shares: | | | | | | | |
| Net asset value and redemption price per share | | $ | 10.27 | | $ | 12.08 | |
| Maximum sales charge* | | | 5.75% | | | 5.00% | |
| Maximum offering price per share | | $ | 10.90 | | $ | 12.72 | |
| Class C shares: | | | | | | | |
| Net asset value and offering price per share | | $ | 10.08 | | $ | 11.96 | |
| Class I shares: | | | | | | | |
| Net asset value and offering price per share | | $ | 10.24 | | $ | 12.08 | |
| Class R6 shares: | | | | | | | |
| Net asset value and offering price per share | | $ | 10.22 | | $ | 12.09 | |
| | | | | | | | |
| Investments, at cost | | $ | 49,579,555 | | $ | 128,126,820 | |
| Cost or Premiums of Financial Derivative Instruments, net | | $ | — | | $ | — | |
| Foreign cash, at cost | | $ | 17,472 | | $ | (20 | ) |
| * | On purchases of $50,000 or more, the sales charge may be reduced as outlined in the Prospectus. |
See notes to financial statements
104
| Financial statements (unaudited) |
Statements of assets and liabilities
January 31, 2017 (continued)
| | Emerging | | | European | | | Global Equity | | | Global | | | High Yield | |
| | Markets | | | Focus | | | Income | | | Technology | | | Opportunities | |
| | Fund | | | Fund | | | Fund | | | Fund | | | Fund | |
| | | | | | | | | | | | | | | |
| $ | 13,422,172 | | $ | 340,959,950 | | $ | 768,509,735 | | $ | 81,098,442 | | $ | 11,359,119 | |
| $ | 5,804,291 | | $ | 203,571,610 | | $ | 984,684,869 | | $ | 56,963,173 | | $ | 3,112,414 | |
| $ | 56,657,047 | | $ | 1,263,721,044 | | $ | 2,321,620,568 | | $ | 65,337,140 | | $ | 19,966,221 | |
| $ | 2,280,854 | | $ | 1,093,248 | | $ | 2,414,172 | | $ | 284,737 | | $ | 22,930,765 | |
| | | | | | | | | | | | | | | |
| | 1,486,204 | | | 11,243,176 | | | 106,554,898 | | | 3,349,427 | | | 1,134,359 | |
| | 663,931 | | | 7,155,718 | | | 137,461,637 | | | 2,763,595 | | | 311,679 | |
| | 6,252,109 | | | 41,834,955 | | | 321,243,938 | | | 2,626,571 | | | 2,001,661 | |
| | 251,772 | | | 36,208 | | | 334,071 | | | 11,446 | | | 2,300,466 | |
| | | | | | | | | | | | | | | |
| $ | 9.03 | | $ | 30.33 | | $ | 7.21 | | $ | 24.21 | | $ | 10.01 | |
| | 5.75% | | | 5.75 | % | | 5.75 | % | | 5.75 | % | | 4.75 | % |
| $ | 9.58 | | $ | 32.18 | | $ | 7.65 | | $ | 25.69 | | $ | 10.51 | |
| | | | | | | | | | | | | | | |
| $ | 8.74 | | $ | 28.45 | | $ | 7.16 | | $ | 20.61 | | $ | 9.99 | |
| | | | | | | | | | | | | | | |
| $ | 9.06 | | $ | 30.21 | | $ | 7.23 | | $ | 24.88 | | $ | 9.97 | |
| | | | | | | | | | | | | | | |
| $ | 9.06 | | $ | 30.19 | | $ | 7.23 | | $ | 24.88 | | $ | 9.97 | |
| | | | | | | | | | | | | | | |
| $ | 74,210,550 | | $ | 1,965,515,165 | | $ | 4,137,171,519 | | $ | 126,103,505 | | $ | 55,956,438 | |
| $ | — | | $ | — | | $ | — | | $ | — | | $ | — | |
| $ | 255,095 | | $ | 4,698,183 | | $ | (267 | ) | $ | 13 | | $ | — | |
See notes to financial statements
105
| Financial statements (unaudited) |
Statements of assets and liabilities
January 31, 2017 (continued)
| | | International | |
| | | Long/Short | |
| | | Equity | |
| | | Fund | |
| Assets: | | | | |
| Investments, at fair value | | | | |
| Securities | | $ | 7,207,643 | |
| Affiliated companies | | | — | |
| Short term investment | | | 8,326,758 | |
| Other Securities (see note 2) | | | — | |
| Total investments | | | 15,534,401 | |
| Cash | | | 13,453 | |
| Foreign cash, at value | | | 1,945 | |
| Cash at broker for open futures contracts | | | 27,172 | |
| Cash segregated as collateral on securities sold short | | | 3,273,947 | |
| Cash segregated as collateral on equity swap contracts | | | 560,000 | |
| Dividends, interest, and securities lending income receivable | | | 17,637 | |
| Receivable for investment securities sold | | | 836,273 | |
| Receivable for fund shares sold | | | 20,000 | |
| Receivable from investment advisor | | | 3,869 | |
| Financial Derivative Instruments | | | | |
| Exchange-traded or centrally-cleared | | | — | |
| Over-the-counter | | | 206,080 | |
| Prepaid expenses and other assets | | | 39,158 | |
| Total Assets | | | 20,533,935 | |
| Liabilities: | | | | |
| Foreign cash overdraft, at value | | | — | |
| Payable for investment securities purchased | | | 274,521 | |
| Securities sold short, at value | | | 5,286,355 | |
| Payable for collateral on securities loaned | | | — | |
| Payable for fund shares redeemed | | | 29,571 | |
| Payable for short sale financing | | | 4,862 | |
| Due to broker for open swap contracts | | | — | |
| Financial Derivative Instruments | | | | |
| Exchange-traded or centrally-cleared | | | 4,840 | |
| Over-the-counter | | | 183,278 | |
| Payable for periodic payments on equity swap contracts | | | 7,217 | |
| Payable to investment advisor | | | — | |
| Payable for 12b-1 distribution and service fees | | | 426 | |
| Dividends payable for short sales | | | 630 | |
| Accrued expenses and other payables | | | 41,756 | |
| Total Liabilities | | | 5,833,456 | |
| Net assets | | $ | 14,700,479 | |
| Net assets consist of: | | | | |
| Paid-in capital | | $ | 16,123,886 | |
| Accumulated undistributed net investment income (loss) | | | (961,317 | ) |
| Accumulated net realized gain on investments, financial derivative instruments, short sales and foreign currency transactions | | | (897,007 | ) |
| Net unrealized appreciation of investments, financial derivative instruments, short sales and foreign currencies | | | 434,917 | |
| | | $ | 14,700,479 | |
See notes to financial statements
106
| Financial statements (unaudited) |
Statements of assets and liabilities
January 31, 2017 (continued)
| | International | | | International | | | Strategic | | | US Growth | |
| | Opportunities | | | Small Cap | | | Income | | | Opportunities | |
| | Fund | | | Fund | | | Fund | | | Fund | |
| | | | | | | | | | | | |
| $ | 4,209,457,170 | | $ | 5,333,148 | | $ | 415,136,212 | | $ | 8,323,347 | |
| | — | | | — | | | — | | | — | |
| | 145,503,490 | | | 12,152 | | | 21,654,897 | | | 275,294 | |
| | 82,045,262 | | | — | | | — | | | — | |
| | 4,437,005,922 | | | 5,345,300 | | | 436,791,109 | | | 8,598,641 | |
| | — | | | 741 | | | 35,792 | | | 11,821 | |
| | 14,588,461 | | | — | | | 145,386 | | | — | |
| | — | | | — | | | 353,820 | | | — | |
| | — | | | — | | | — | | | — | |
| | — | | | — | | | — | | | — | |
| | 5,809,250 | | | 2,405 | | | 4,596,328 | | | 447 | |
| | 55,069,394 | | | — | | | 10,619,226 | | | — | |
| | 17,981,688 | | | — | | | 1,755,217 | | | — | |
| | — | | | 2,546 | | | — | | | 2,269 | |
| | | | | | | | | | | | |
| | — | | | — | | | — | | | — | |
| | — | | | — | | | 35,772 | | | — | |
| | 206,005 | | | 10,519 | | | 45,470 | | | 33,848 | |
| | 4,530,660,720 | | | 5,361,511 | | | 454,378,120 | | | 8,647,026 | |
| | | | | | | | | | | | |
| | — | | | — | | | — | | | — | |
| | 64,919,150 | | | — | | | 19,265,151 | | | — | |
| | — | | | — | | | — | | | — | |
| | 82,045,262 | | | — | | | — | | | — | |
| | 13,143,616 | | | — | | | 2,381,464 | | | — | |
| | — | | | — | | | — | | | — | |
| | — | | | — | | | 368,742 | | | — | |
| | | | | | | | | | | | |
| | — | | | — | | | 49,507 | | | — | |
| | 8,913,085 | | | — | | | 4,176,668 | | | — | |
| | — | | | — | | | — | | | — | |
| | 3,413,381 | | | — | | | 205,697 | | | — | |
| | 551,180 | | | — | | | 53,142 | | | 726 | |
| | — | | | — | | | — | | | — | |
| | 1,465,830 | | | 1,643 | | | 160,439 | | | 18,788 | |
| | 174,451,504 | | | 1,643 | | | 26,660,810 | | | 19,514 | |
| $ | 4,356,209,216 | | $ | 5,359,868 | | $ | 427,717,310 | | $ | 8,627,512 | |
| | | | | | | | | | | | |
| $ | 4,464,094,918 | | $ | 5,000,000 | | $ | 454,303,753 | | $ | 7,823,951 | |
| | (32,412,614 | ) | | (2,484 | ) | | (1,673,558 | ) | | (21,251 | ) |
| | | | | | | | | | | | |
| | (582,308,866 | ) | | (12,252 | ) | | (12,087,572 | ) | | (375,581 | ) |
| | | | | | | | | | | | |
| | 506,835,778 | | | 374,604 | | | (12,825,313 | ) | | 1,200,393 | |
| $ | 4,356,209,216 | | $ | 5,359,868 | | $ | 427,717,310 | | $ | 8,627,512 | |
See notes to financial statements
107
| Financial statements (unaudited) |
Statements of assets and liabilities
January 31, 2017 (continued)
| | | International | |
| | | Long/Short | |
| | | Equity | |
| | | Fund | |
| Net assets: | | | | |
| Class A Shares | | $ | 1,079,576 | |
| Class C Shares | | $ | 229,940 | |
| Class I Shares | | $ | 8,725,633 | |
| Class R Shares | | $ | — | |
| Class R6 Shares | | $ | 4,665,330 | |
| Class IF Shares | | $ | — | |
| Shares outstanding: | | | | |
| Class A Shares (unlimited number of shares authorized) | | | 112,361 | |
| Class C Shares (unlimited number of shares authorized) | | | 24,582 | |
| Class I Shares (unlimited number of shares authorized) | | | 922,126 | |
| Class R Shares (unlimited number of shares authorized) | | | — | |
| Class R6 Shares (unlimited number of shares authorized) | | | 493,487 | |
| Class IF Shares (unlimited number of shares authorized) | | | — | |
| Class A shares: | | | | |
| Net asset value and redemption price per share | | $ | 9.61 | |
| Maximum sales charge* | | | 5.75 | % |
| Maximum offering price per share | | $ | 10.20 | |
| Class C shares: | | | | |
| Net asset value and offering price per share | | $ | 9.35 | |
| Class I shares: | | | | |
| Net asset value and offering price per share | | $ | 9.46 | |
| Class R shares: | | | | |
| Net asset value and offering price per share | | $ | — | |
| Class R6 shares: | | | | |
| Net asset value and offering price per share | | $ | 9.45 | |
| Class IF shares: | | | | |
| Net asset value and offering price per share | | $ | — | |
| | | | | |
| Investments, at cost | | $ | 14,911,330 | |
| Cost or Premiums of Financial Derivative Instruments, net | | $ | — | |
| Foreign cash, at cost | | $ | 1,929 | |
| Proceeds received on short sales | | $ | (5,079,151 | ) |
| * | On purchases of $50,000 or more, the sales charge may be reduced as outlined in the Prospectus. |
See notes to financial statements
108
| Financial statements (unaudited) |
Statements of assets and liabilities
January 31, 2017 (continued)
| | International | | | International | | | Strategic | | | US Growth | |
| | Opportunities | | | Small Cap | | | Income | | | Opportunities | |
| | Fund | | | Fund | | | Fund | | | Fund | |
| | | | | | | | | | | | |
| $ | 645,754,867 | | $ | — | | $ | 60,468,748 | | $ | 2,509,695 | |
| $ | 445,060,579 | | $ | — | | $ | 45,047,287 | | $ | 196,442 | |
| $ | 2,734,242,869 | | $ | — | | $ | 320,806,870 | | $ | 183,414 | |
| $ | 21,220,345 | | $ | — | | $ | — | | $ | — | |
| $ | 388,311 | | $ | 5,359,868 | | $ | 1,394,405 | | $ | 5,737,961 | |
| $ | 509,542,245 | | $ | — | | $ | — | | $ | — | |
| | | | | | | | | | | | |
| | 25,153,980 | | | — | | | 6,522,076 | | | 223,071 | |
| | 18,524,270 | | | — | | | 4,884,037 | | | 17,741 | |
| | 106,784,638 | | | — | | | 34,702,862 | | | 16,215 | |
| | 844,205 | | | — | | | — | | | — | |
| | 15,167 | | | 500,000 | | | 150,762 | | | 507,222 | |
| | 19,818,065 | | | — | | | — | | | — | |
| | | | | | | | | | | | |
| $ | 25.67 | | $ | — | | $ | 9.27 | | $ | 11.25 | |
| | 5.75 | % | | | | | 4.75 | % | | 5.75 | % |
| $ | 27.24 | | $ | — | | $ | 9.73 | | $ | 11.94 | |
| | | | | | | | | | | | |
| $ | 24.03 | | $ | — | | $ | 9.22 | | $ | 11.07 | |
| | | | | | | | | | | | |
| $ | 25.61 | | $ | — | | $ | 9.24 | | $ | 11.31 | |
| | | | | | | | | | | | |
| $ | 25.14 | | $ | — | | $ | — | | $ | — | |
| | | | | | | | | | | | |
| $ | 25.60 | | $ | 10.72 | | $ | 9.25 | | $ | 11.31 | |
| | | | | | | | | | | | |
| $ | 25.71 | | $ | — | | $ | — | | $ | — | |
| | | | | | | | | | | | |
| $ | 3,921,122,952 | | $ | 4,970,748 | | $ | 445,263,116 | | $ | 7,398,248 | |
| $ | — | | $ | — | | $ | 36,267 | | $ | — | |
| $ | 14,512,066 | | $ | — | | $ | 147,119 | | $ | — | |
| $ | — | | $ | — | | $ | — | | $ | — | |
See notes to financial statements
109
| Financial statements (unaudited) |
Statements of operations
For the six months ended January 31, 2017
| | | | | | | Dividend | |
| | | | All | | | & Income | |
| | | | Asset | | | Builder | |
| | | | Fund | | | Fund | |
| Investment income: | | | | | | | |
| Dividends | | $ | 302,679 | | $ | 1,515,486 | |
| Dividends from affiliated companies | | | 146,334 | | | — | |
| Interest | | | — | | | 441,623 | |
| Securities lending income | | | — | | | — | |
| Foreign taxes withheld | | | — | | | (93,664 | ) |
| Total Investment Income | | | 449,013 | | | 1,863,445 | |
| Expenses: | | | | | | | |
| Investment advisory fees | | | 103,559 | | | 478,024 | |
| 12b-1 distribution and service fees: | | | | | | | |
| Class A Shares | | | 4,891 | | | 41,395 | |
| Class C Shares | | | 48,141 | | | 168,844 | |
| Sub-accounting fees: | | | | | | | |
| Class A Shares | | | 995 | | | 6,771 | |
| Class C Shares | | | 3,289 | | | 9,016 | |
| Class I Shares | | | 5,126 | | | 13,041 | |
| Transfer agent fees: | | | | | | | |
| Class A Shares | | | 341 | | | 3,221 | |
| Class C Shares | | | 667 | | | 3,341 | |
| Class I Shares | | | 717 | | | 4,680 | |
| Class R6 Shares | | | 1,883 | | | 289 | |
| Registration and filing fees | | | 30,383 | | | 33,045 | |
| Audit fees | | | 17,791 | | | 17,791 | |
| Custodian fees | | | 9,055 | | | 15,120 | |
| Administrative fees | | | 6,264 | | | 15,428 | |
| Printing and postage fees | | | 2,121 | | | 5,013 | |
| Legal fees | | | 1,217 | | | 2,427 | |
| Compliance officer fees | | | 1,042 | | | 2,062 | |
| Trustees' fees and expenses | | | 984 | | | 2,347 | |
| Accounting fees | | | 683 | | | 7,681 | |
| Miscellaneous fees | | | 5,825 | | | 9,338 | |
| Total Expenses | | | 244,974 | | | 838,874 | |
| Fees waived and/or expenses reimbursed by investment advisor | | | (35,312 | ) | | (85 | ) |
| Net Expenses | | | 209,662 | | | 838,789 | |
| Net investment income/(loss) | | $ | 239,351 | | $ | 1,024,656 | |
See notes to financial statements
110
| Financial statements (unaudited) |
Statements of operations
For the six months ended January 31, 2017 (continued)
| | | | Emerging | | | European | | | Global Equity | | | Global | | | High Yield | |
| | | | Markets | | | Focus | | | Income | | | Technology | | | Opportunities | |
| | | | Fund | | | Fund | | | Fund | | | Fund | | | Fund | |
| | | | | | | | | | | | | | | | | |
| | | $ | 620,301 | | $ | 14,693,620 | | $ | 112,052,980 | | $ | 957,668 | | $ | 3,607 | |
| | | | — | | | — | | | — | | | — | | | — | |
| | | | — | | | — | | | 4,256 | | | — | | | 1,605,391 | |
| | | | — | | | 107,716 | | | — | | | 12,857 | | | — | |
| | | | (89,611 | ) | | (423,300 | ) | | (7,071,237 | ) | | (31,185 | ) | | — | |
| | | | 530,690 | | | 14,378,036 | | | 104,985,999 | | | 939,340 | | | 1,608,998 | |
| | | | | | | | | | | | | | | | | |
| | | | | | | | | | | | | | | | | |
| | | | 334,820 | | | 10,367,081 | | | 13,720,563 | | | 949,894 | | | 117,121 | |
| | | | | | | | | | | | | | | | | |
| | | | 12,778 | | | 564,066 | | | 942,952 | | | 101,682 | | | 11,176 | |
| | | | 27,413 | | | 1,229,656 | | | 5,162,410 | | | 301,256 | | | 13,197 | |
| | | | | | | | | | | | | | | | | |
| | | | 2,758 | | | 180,570 | | | 281,776 | | | 26,447 | | | 2,941 | |
| | | | 2,157 | | | 145,442 | | | 388,241 | | | 27,499 | | | 708 | |
| | | | 12,584 | | | 715,425 | | | 760,227 | | | 28,471 | | | 3,483 | |
| | | | | | | | | | | | | | | | | |
| | | | 728 | | | 50,665 | | | 63,247 | | | 6,645 | | | 682 | |
| | | | 500 | | | 23,023 | | | 74,866 | | | 4,985 | | | 21 | |
| | | | 2,845 | | | 120,686 | | | 151,201 | | | 4,554 | | | 777 | |
| | | | 308 | | | 645 | | | 316 | | | 220 | | | 1,563 | |
| | | | 35,210 | | | 71,431 | | | 103,679 | | | 31,196 | | | 27,082 | |
| | | | 17,791 | | | 17,791 | | | 17,791 | | | 17,791 | | | 18,306 | |
| | | | 98,150 | | | 238,869 | | | 300,896 | | | 12,355 | | | 11,452 | |
| | | | 8,109 | | | 277,183 | | | 492,304 | | | 25,533 | | | 5,671 | |
| | | | 2,462 | | | 169,830 | | | 187,691 | | | 13,798 | | | 1,370 | |
| | | | 895 | | | 74,674 | | | 87,614 | | | 5,185 | | | 785 | |
| | | | 1,088 | | | 43,513 | | | 72,661 | | | 4,822 | | | 764 | |
| | | | 1,133 | | | 48,699 | | | 76,673 | | | 4,071 | | | 807 | |
| | | | 7,292 | | | 7,160 | | | 7,460 | | | 6,878 | | | 1,763 | |
| | | | 5,635 | | | 110,630 | | | 136,045 | | | 10,737 | | | 10,217 | |
| | | | 574,656 | | | 14,457,039 | | | 23,028,613 | | | 1,584,019 | | | 229,886 | |
| | | | (63,118 | ) | | — | | | — | | | — | | | (46,229 | ) |
| | | | 511,538 | | | 14,457,039 | | | 23,028,613 | | | 1,584,019 | | | 183,657 | |
| | | $ | 19,152 | | $ | (79,003 | ) | $ | 81,957,386 | | $ | (644,679 | ) | $ | 1,425,341 | |
See notes to financial statements
111
| Financial statements (unaudited) |
Statements of operations
For the six months ended January 31, 2017 (continued)
| | | | | | | Dividend | |
| | | | All | | | & Income | |
| | | | Asset | | | Builder | |
| | | | Fund | | | Fund | |
| Net realized and unrealized gain/(loss): | | | | | | | |
| Net realized gain/(loss) from: | | | | | | | |
| Investment transactions(a)(b) | | $ | 751,827 | | $ | 1,164,130 | |
| Distributions from investment companies | | | 127 | | | — | |
| Financial derivative instruments | | | 792,798 | | | 894,315 | |
| Short sales | | | — | | | — | |
| Foreign currency transactions | | | (28,881 | ) | | (29,446 | ) |
| Net change in unrealized appreciation/(depreciation) of: | | | | | | | |
| Investments(b)(c) | | | (558,386 | ) | | (1,530,315 | ) |
| Financial derivative instruments | | | (205,897 | ) | | (184,280 | ) |
| Translation of other assets and liabilities | | | (4,318 | ) | | 9,313 | |
| Net Realized and Unrealized Gain/(Loss) | | | 747,270 | | | 323,717 | |
| Net increase/(decrease) in net assets resulting from operations | | $ | 986,621 | | $ | 1,348,373 | |
| (a) | Affiliated companies accounted for $(213,478) of the net realized gain/(loss) from investment transactions. |
| (b) | Includes foreign capital gains tax paid of $(10,514) for Emerging Markets Fund. |
| (c) | Includes change in foreign capital gains tax accrued of $(89,949) and $187,665 for Emerging Markets Fund and Global Equity Income Fund, |
| | respectively. |
See notes to financial statements
112
| Financial statements (unaudited) |
Statements of operations
For the six months ended January 31, 2017 (continued)
| | | | Emerging | | | European | | | Global Equity | | | Global | | | High Yield | |
| | | | Markets | | | Focus | | | Income | | | Technology | | | Opportunities | |
| | | | Fund | | | Fund | | | Fund | | | Fund | | | Fund | |
| | | | | | | | | | | | | | | | | |
| | | $ | 323,276 | | $ | (122,833,865 | ) | $ | 5,116,312 | | $ | 12,553,305 | | $ | 888,940 | |
| | | | — | | | — | | | — | | | — | | | — | |
| | | | — | | | 15,587,770 | | | 30,006,001 | | | — | | | (5,532 | ) |
| | | | — | | | — | | | — | | | — | | | — | |
| | | | (12,393 | ) | | 1,076,282 | | | (3,823,828 | ) | | (17,650 | ) | | — | |
| | | | | | | | | | | | | | | | | |
| | | | (191,715 | ) | | 16,436,265 | | | (45,347,942 | ) | | 7,464,205 | | | 1,081,771 | |
| | | | — | | | (4,232,645 | ) | | 195,784 | | | — | | | 6,671 | |
| | | | 2,653 | | | (2,017,565 | ) | | 1,012,262 | | | 4,125 | | | — | |
| | | | 121,821 | | | (95,983,758 | ) | | (12,841,411 | ) | | 20,003,985 | | | 1,971,850 | |
| | | $ | 140,973 | | $ | (96,062,761 | ) | $ | 69,115,975 | | $ | 19,359,306 | | $ | 3,397,191 | |
See notes to financial statements
113
| Financial statements (unaudited) |
Statements of operations
For the six months ended January 31, 2017 (continued)
| | | International | |
| | | Long/Short | |
| | | Equity | |
| | | Fund | |
| Investment income: | | | | |
| Dividends | | $ | 58,783 | |
| Dividends from affiliated companies | | | — | |
| Interest | | | — | |
| Securities lending income | | | — | |
| Foreign taxes withheld | | | (5,388 | ) |
| Total Investment Income | | | 53,395 | |
| Expenses: | | | | |
| Investment advisory fees | | | 105,046 | |
| 12b-1 distribution and service fees: | | | | |
| Class A Shares | | | 2,300 | |
| Class C Shares | | | 1,148 | |
| Class R Shares | | | — | |
| Class IF Shares | | | — | |
| Sub-accounting fees: | | | | |
| Class A Shares | | | 896 | |
| Class C Shares | | | 20 | |
| Class I Shares | | | 4,353 | |
| Class R Shares | | | — | |
| Transfer agent fees: | | | | |
| Class A Shares | | | 2,753 | |
| Class C Shares | | | 37 | |
| Class I Shares | | | 697 | |
| Class R Shares | | | — | |
| Class R6 Shares | | | 351 | |
| Class IF Shares | | | — | |
| Registration and filing fees | | | 28,640 | |
| Audit fees | | | 18,271 | |
| Custodian fees | | | 72,933 | |
| Administrative fees | | | 2,033 | |
| Printing and postage fees | | | 636 | |
| Legal fees | | | 512 | |
| Compliance officer fees | | | 289 | |
| Trustees' fees and expenses | | | 374 | |
| Accounting fees | | | 7,116 | |
| Organization expense | | | — | |
| Deferred offering costs | | | — | |
| Miscellaneous fees | | | 4,853 | |
| Total Expenses before expenses on securities sold short | | | 253,258 | |
| Dividend expense on securities sold short | | | 27,239 | |
| Short sale financing fees | | | 31,991 | |
| Total Expenses after expenses on securities sold short | | | 312,488 | |
| Fees waived and/or expenses reimbursed by investment advisor | | | (125,707 | ) |
| Net Expenses | | | 186,781 | |
| Net investment income/(loss) | | $ | (133,386 | ) |
| * | Fund commenced operations on December 15, 2016. |
See notes to financial statements
114
| Financial statements (unaudited) |
Statements of operations
For the six months ended January 31, 2017 (continued)
| | | | | | | | | | | | | | |
| | | | International | | | International | | | Strategic | | | US Growth | |
| | | | Opportunities | | | Small Cap | | | Income | | | Opportunities | |
| | | | Fund | | | Fund* | | | Fund | | | Fund | |
| | | | | | | | | | | | | | |
| | | $ | 31,999,964 | | $ | 5,985 | | $ | 108,427 | | $ | 37,374 | |
| | | | — | | | — | | | — | | | — | |
| | | | — | | | — | | | 8,297,566 | | | — | |
| | | | 193,854 | | | — | | | — | | | — | |
| | | | (2,399,721 | ) | | (226 | ) | | — | | | — | |
| | | | 29,794,097 | | | 5,759 | | | 8,405,993 | | | 37,374 | |
| | | | | | | | | | | | | | |
| | | | 20,865,125 | | | 6,581 | | | 1,228,888 | | | 33,124 | |
| | | | 915,590 | | | — | | | 80,233 | | | 3,426 | |
| | | | 2,387,174 | | | — | | | 246,516 | | | 952 | |
| | | | 51,882 | | | — | | | — | | | — | |
| | | | 139,571 | | | — | | | — | | | — | |
| | | | 300,555 | | | — | | | 22,753 | | | 1,184 | |
| | | | 281,960 | | | — | | | 18,699 | | | 38 | |
| | | | 1,060,558 | | | — | | | 114,000 | | | — | |
| | | | 20,124 | | | — | | | — | | | — | |
| | | | 73,989 | | | — | | | 6,075 | | | 300 | |
| | | | 38,013 | | | — | | | 3,752 | | | 40 | |
| | | | 194,141 | | | — | | | 26,260 | | | 24 | |
| | | | 1,977 | | | — | | | — | | | — | |
| | | | 371 | | | 193 | | | 220 | | | 573 | |
| | | | 9,760 | | | — | | | — | | | — | |
| | | | 131,312 | | | — | | | 44,897 | | | 26,477 | |
| | | | 18,095 | | | 6,092 | | | 19,663 | | | 17,762 | |
| | | | 569,688 | | | 1,288 | | | 57,749 | | | 2,629 | |
| | | | 564,190 | | | 163 | | | 54,057 | | | 1,069 | |
| | | | 247,957 | | | 64 | | | 18,830 | | | 34 | |
| | | | 110,079 | | | 52 | | | 8,821 | | | 192 | |
| | | | 87,736 | | | 26 | | | 7,147 | | | 149 | |
| | | | 90,054 | | | 23 | | | 8,306 | | | 172 | |
| | | | 7,344 | | | 1,107 | | | 4,480 | | | 576 | |
| | | | — | | | 12,436 | | | — | | | — | |
| | | | — | | | 2,785 | | | — | | | — | |
| | | | 163,742 | | | 537 | | | 37,751 | | | 1,728 | |
| | | | 28,330,987 | | | 31,347 | | | 2,009,097 | | | 90,449 | |
| | | | — | | | — | | | — | | | — | |
| | | | — | | | — | | | — | | | — | |
| | | | 28,330,987 | | | 31,347 | | | 2,009,097 | | | 90,449 | |
| | | | — | | | (23,104 | ) | | — | | | (44,113 | ) |
| | | | 28,330,987 | | | 8,243 | | | 2,009,097 | | | 46,336 | |
| | | $ | 1,463,110 | | $ | (2,484 | ) | $ | 6,396,896 | | $ | (8,962 | ) |
See notes to financial statements
115
| Financial statements (unaudited) |
Statements of operations
For the six months ended January 31, 2017 (continued)
| | | International | |
| | | Long/Short | |
| | | Equity | |
| | | Fund | |
| Net realized and unrealized gain/(loss): | | | | |
| Net realized gain/(loss) from: | | | | |
| Investment transactions | | $ | 106,202 | |
| Distributions from investment companies | | | — | |
| Financial derivative instruments | | | 967,345 | |
| Short sales | | | (879,208 | ) |
| Foreign currency transactions | | | (14,917 | ) |
| Net change in unrealized appreciation/(depreciation) of: | | | | |
| Investments(a) | | | 220,624 | |
| Financial derivative instruments | | | (719,641 | ) |
| Short sales | | | 619,902 | |
| Translation of other assets and liabilities | | | 2,215 | |
| Net Realized and Unrealized Gain/(Loss) | | | 302,522 | |
| Net increase/(decrease) in net assets resulting from operations | | $ | 169,136 | |
| (a) | Includes change in foreign capital gains tax accrued of $1,345,462 for International Opportunities Fund. |
| * | Fund commenced operations on December 15, 2016. |
See notes to financial statements
116
| Financial statements (unaudited) |
Statements of operations
For the six months ended January 31, 2017 (continued)
| | | International | | International | | Strategic | | US Growth | |
| | | Opportunities | | Small Cap | | Income | | Opportunities | |
| | | Fund | | Fund | * | Fund | | Fund | |
| | | | | | | | | | | | | | |
| | | $ | (55,199,072 | ) | $ | — | | $ | (6,050,619 | ) | $ | (213,850 | ) |
| | | | — | | | — | | | — | | | — | |
| | | | 34,567,382 | | | — | | | 14,397,951 | | | — | |
| | | | — | | | — | | | — | | | — | |
| | | | (4,571,671 | ) | | (12,252 | ) | | (159,375 | ) | | — | |
| | | | | | | | | | | | | | |
| | | | 20,849,444 | | | 374,552 | | | (9,848,789 | ) | | 308,964 | |
| | | | (357,077 | ) | | — | | | (2,466,118 | ) | | — | |
| | | | — | | | — | | | — | | | — | |
| | | | (53,934 | ) | | 52 | | | 210,006 | | | — | |
| | | | (4,764,928 | ) | | 362,352 | | | (3,916,944 | ) | | 95,114 | |
| | | $ | (3,301,818 | ) | $ | 359,868 | | $ | 2,479,952 | | $ | 86,152 | |
See notes to financial statements
117
| Financial statements (unaudited) |
Statements of changes in net assets
All Asset Fund
| | | Six Months | | | |
| | | Ended | | Year Ended | |
| | | January 31, 2017 | | July 31, 2016 | |
| Net investment income/(loss) | | $ | 239,351 | | $ | 467,923 | |
| Net realized gain/(loss) from investments, financial derivative instruments and foreign currency transactions | | | 1,515,871 | | | (1,417,530 | ) |
| Net change in unrealized appreciation/(depreciation) of investments,financial derivative instruments and foreign currency translations | | | (768,601 | ) | | 290,617 | |
| Net increase/(decrease) in net assets resulting from operations | | | 986,621 | | | (658,990 | ) |
| Distributions to shareholders from net investment income: | | | | | | | |
| Class A Shares | | | (16,308 | ) | | (15,397 | ) |
| Class C Shares | | | — | | | (98,042 | ) |
| Class I Shares | | | (52,539 | ) | | (101,094 | ) |
| Class R6 Shares* | | | (241,032 | ) | | (230,208 | ) |
| Total distributions to shareholders from net investment income | | | (309,879 | ) | | (346,699 | ) |
| Distributions to shareholders from net realized gains: | | | | | | | |
| Class A Shares | | | — | | | (161,332 | ) |
| Class C Shares | | | — | | | (297,759 | ) |
| Class I Shares | | | — | | | (411,454 | ) |
| Class R6 Shares* | | | — | | | (860,579 | ) |
| Total distributions to shareholders from net realized gains | | | — | | | (1,731,124 | ) |
| Net increase/(decrease) from Fund share transactions: | | | | | | | |
| Class A Shares | | | (219,294 | ) | | (2,065,085 | ) |
| Class C Shares | | | (119,029 | ) | | (1,096,409 | ) |
| Class I Shares | | | (2,861,313 | ) | | (32,054,787 | ) |
| Class R6 Shares* | | | 207,343 | | | 29,428,493 | |
| Net increase/(decrease) from Fund share transactions: | | | (2,992,293 | ) | | (5,787,788 | ) |
| Net decrease in net assets | | | (2,315,551 | ) | | (8,524,601 | ) |
| | | | | | | | |
| Net assets: | | | | | | | |
| Beginning of period | | | 53,028,322 | | | 61,552,923 | |
| End of period | | $ | 50,712,771 | | $ | 53,028,322 | |
| Accumulated undistributed net investment income/(loss) | | $ | (1,635 | ) | $ | 68,893 | |
| * | Class commenced operations November 30, 2015. |
See notes to financial statements
118
| Financial statements (unaudited) |
Statements of changes in net assets
Dividend & Income Builder Fund
| | | Six Months | | | |
| | | Ended | | Year Ended | |
| | | January 31, 2017 | | July 31, 2016 | |
| Net investment income/(loss) | | $ | 1,024,656 | | $ | 2,864,282 | |
| Net realized gain/(loss) from investments, financial derivative instruments and foreign currency transactions | | | 2,028,999 | | | (1,888,832 | ) |
| Net change in unrealized appreciation/(depreciation) of investments,financial derivative instruments and foreign currency translations | | | (1,705,282 | ) | | 2,134,525 | |
| Net increase/(decrease) in net assets resulting from operations | | | 1,348,373 | | | 3,109,975 | |
| | | | | | | | |
| Distributions to shareholders from net investment income: | | | | | | | |
| Class A Shares | | | (469,189 | ) | | (868,814 | ) |
| Class C Shares | | | (373,631 | ) | | (547,913 | ) |
| Class I Shares | | | (961,114 | ) | | (1,120,978 | ) |
| Class R6 Shares* | | | (5,597 | ) | | (8,044 | ) |
| Total distributions to shareholders from net investment income | | | (1,809,531 | ) | | (2,545,749 | ) |
| | | | | | | | |
| Net increase/(decrease) from Fund share transactions: | | | | | | | |
| Class A Shares | | | (13,678,865 | ) | | 24,280,254 | |
| Class C Shares | | | 2,406,928 | | | 19,255,636 | |
| Class I Shares | | | 22,216,077 | | | 22,396,737 | |
| Class R6 Shares* | | | (132,410 | ) | | 394,912 | |
| Net increase/(decrease) from Fund share transactions: | | | 10,811,730 | | | 66,327,539 | |
| Net increase/(decrease) in net assets | | | 10,350,572 | | | 66,891,765 | |
| | | | | | | | |
| Net assets: | | | | | | | |
| Beginning of period | | | 121,052,932 | | | 54,161,167 | |
| End of period | | $ | 131,403,504 | | $ | 121,052,932 | |
| Accumulated undistributed net investment income/(loss) | | $ | (178,423 | ) | $ | 606,452 | |
| * | Class commenced operations November 30, 2015. |
See notes to financial statements
119
| Financial statements (unaudited) |
Statements of changes in net assets
Emerging Markets Fund
| | | | Six Months | | | | |
| | | | Ended | | | Year Ended | |
| | | January 31, 2017 | | | July 31, 2016 | |
| Net investment income/(loss) | | $ | 19,152 | | $ | 442,831 | |
| Net realized gain/(loss) from investments, financial derivative instruments and foreign currency transactions | | | 310,883 | | | (3,549,865 | ) |
| Net change in unrealized appreciation/(depreciation) of investments, financial derivative instruments and foreign currency translations | | | (189,062 | ) | | 5,533,805 | |
| Net increase/(decrease) in net assets resulting from operations | | | 140,973 | | | 2,426,771 | |
| | | | | | | | |
| Distributions to shareholders from net investment income: | | | | | | | |
| Class A Shares | | | (84,478 | ) | | (14,840 | ) |
| Class C Shares | | | (10,078 | ) | | — | |
| Class I Shares | | | (467,218 | ) | | (113,662 | ) |
| Class R6 Shares* | | | (18,614 | ) | | (1,528 | ) |
| Total distributions to shareholders from net investment income | | | (580,388 | ) | | (130,030 | ) |
| | | | | | | | |
| Net increase/(decrease) from Fund share transactions: | | | | | | | |
| Class A Shares | | | 7,004,443 | | | (1,657,413 | ) |
| Class C Shares | | | 2,313,926 | | | 388,634 | |
| Class I Shares | | | 20,119,648 | | | 21,914,202 | |
| Class R6 Shares* | | | 1,969,651 | | | 280,587 | |
| Net increase/(decrease) from Fund share transactions: | | | 31,407,668 | | | 20,926,010 | |
| Net increase/(decrease) in net assets | | | 30,968,253 | | | 23,222,751 | |
| | | | | | | | |
| Net assets: | | | | | | | |
| Beginning of period | | | 47,196,111 | | | 23,973,360 | |
| End of period | | $ | 78,164,364 | | $ | 47,196,111 | |
| Accumulated undistributed net investment income/(loss) | | $ | (330,319 | ) | $ | 230,917 | |
| * | Class commenced operations November 30, 2015. |
See notes to financial statements
120
| Financial statements (unaudited) |
Statements of changes in net assets
European Focus Fund
| | | Six Months | | | |
| | | Ended | | Year Ended | |
| | | January 31, 2017 | | July 31, 2016 | |
| Net investment income/(loss) | | $ | (79,003 | ) | $ | 55,061,279 | |
| Net realized gain/(loss) from investments, financial derivative instruments and foreign currency transactions | | | (106,169,813 | ) | | (194,161,310 | ) |
| Net change in unrealized appreciation/(depreciation) of investments, financial derivative instruments and foreign currency translations | | | 10,186,055 | | | (359,295,525 | ) |
| Net decrease in net assets resulting from operations | | | (96,062,761 | ) | | (498,395,556 | ) |
| | | | | | | | |
| Distributions to shareholders from net investment income: | | | | | | | |
| Class A Shares | | | (9,900,205 | ) | | (6,569,247 | ) |
| Class C Shares | | | (3,893,328 | ) | | (456,492 | ) |
| Class I Shares | | | (41,518,851 | ) | | (21,619,784 | ) |
| Class R6 Shares** | | | (40,779 | ) | | (13,049 | ) |
| Total distributions to shareholders from net investment income | | | (55,353,163 | ) | | (28,658,572 | ) |
| | | | | | | | |
| Net increase/(decrease) from Fund share transactions: | | | | | | | |
| Class A Shares | | | (191,998,847 | ) | | (214,278,626 | ) |
| Class B Shares* | | | — | | | (4,795,318 | ) |
| Class C Shares | | | (69,320,013 | ) | | (27,165,240 | ) |
| Class I Shares | | | (501,253,661 | ) | | (138,019,201 | ) |
| Class R6 Shares** | | | (240,014 | ) | | 1,509,390 | |
| Net decrease from Fund share transactions: | | | (762,812,535 | ) | | (382,748,995 | ) |
| Net decrease in net assets | | | (914,228,459 | ) | | (909,803,123 | ) |
| | | | | | | | |
| Net assets: | | | | | | | |
| Beginning of period | | | 2,723,574,311 | | | 3,633,377,434 | |
| End of period | | $ | 1,809,345,852 | | $ | 2,723,574,311 | |
| Accumulated undistributed net investment income/(loss) | | $ | (412,461 | ) | $ | 55,019,705 | |
| * | Class terminated November 4, 2015. |
| ** | Class commenced operations November 30, 2015. |
See notes to financial statements
121
| Financial statements (unaudited) |
Statements of changes in net assets
Global Equity Income Fund
| | | | Six Months | | | | |
| | | | Ended | | | Year Ended | |
| | | | January 31, 2017 | | | July 31, 2016 | |
| Net investment income/(loss) | | $ | 81,957,386 | | $ | 232,382,159 | |
| Net realized gain/(loss) from investments, financial derivative instruments and foreign currency transactions | | | 31,298,485 | | | (338,375,418 | ) |
| Net change in unrealized appreciation/(depreciation) of investments, financial derivative instruments and foreign currency translations | | | (44,139,896 | ) | | 68,444,258 | |
| Net increase/(decrease) in net assets resulting from operations | | | 69,115,975 | | | (37,549,001 | ) |
| | | | | | | | |
| Distributions to shareholders from net investment income: | | | | | | | |
| Class A Shares | | | (21,209,493 | ) | | (46,285,877 | ) |
| Class C Shares | | | (25,364,943 | ) | | (59,681,818 | ) |
| Class I Shares | | | (67,655,744 | ) | | (122,675,979 | ) |
| Class R6 Shares* | | | (59,856 | ) | | (77,455 | ) |
| Total distributions to shareholders from net investment income | | | (114,290,036 | ) | | (228,721,129 | ) |
| | | | | | | | |
| Net increase/(decrease) from Fund share transactions: | | | | | | | |
| Class A Shares | | | 20,287,080 | | | 103,907,258 | |
| Class C Shares | | | (77,373,477 | ) | | 19,709,933 | |
| Class I Shares | | | 167,985,710 | | | 446,057,936 | |
| Class R6 Shares* | | | 600,615 | | | 1,852,281 | |
| Net increase/(decrease) from Fund share transactions: | | | 111,499,928 | | | 571,527,408 | |
| Net increase/(decrease) in net assets | | | 66,325,867 | | | 305,257,278 | |
| | | | | | | | |
| Net assets: | | | | | | | |
| Beginning of period | | | 4,010,903,477 | | | 3,705,646,199 | |
| End of period | | $ | 4,077,229,344 | | $ | 4,010,903,477 | |
| Accumulated undistributed net investment income/(loss) | | $ | (25,311,075 | ) | $ | 7,021,575 | |
| * | Class commenced operations November 30, 2015. |
See notes to financial statements
122
| Financial statements (unaudited) |
Statements of changes in net assets
Global Technology Fund
| | | | Six Months | | | | |
| | | | Ended | | | Year Ended | |
| | | | January 31, 2017 | | | July 31, 2016 | |
| Net investment loss | | $ | (644,679 | ) | $ | (1,138,206 | ) |
| Net realized gain/(loss) from investments, financial derivative instruments and foreign currency transactions | | | 12,535,655 | | | 9,489,270 | |
| Net change in unrealized appreciation/(depreciation) of investments, financial derivative instruments and foreign currency translations | | | 7,468,330 | | | (9,121,680 | ) |
| Net increase/(decrease) in net assets resulting from operations | | | 19,359,306 | | | (770,616 | ) |
| | | | | | | | |
| Distributions to shareholders from net realized gains: | | | | | | | |
| Class A Shares | | | (5,445,059 | ) | | (12,122,041 | ) |
| Class C Shares | | | (4,557,679 | ) | | (10,437,961 | ) |
| Class I Shares | | | (4,466,632 | ) | | (10,850,890 | ) |
| Class R6 Shares** | | | (17,870 | ) | | (118,636 | ) |
| Total distributions to shareholders from net realized gains | | | (14,487,240 | ) | | (33,529,528 | ) |
| | | | | | | | |
| Net increase/(decrease) from Fund share transactions: | | | | | | | |
| Class A Shares | | | (1,896,372 | ) | | (6,998,455 | ) |
| Class B Shares* | | | — | | | (6,324,806 | ) |
| Class C Shares | | | (5,116,469 | ) | | (7,370,520 | ) |
| Class I Shares | | | (6,372,838 | ) | | (15,072,169 | ) |
| Class R6 Shares** | | | (56,766 | ) | | 519,530 | |
| Net decrease from Fund share transactions: | | | (13,442,445 | ) | | (35,246,420 | ) |
| Net decrease in net assets | | | (8,570,379 | ) | | (69,546,564 | ) |
| | | | | | | | |
| Net assets: | | | | | | | |
| Beginning of period | | | 212,253,871 | | | 281,800,435 | |
| End of period | | $ | 203,683,492 | | $ | 212,253,871 | |
| Accumulated undistributed net investment loss | | $ | (1,230,174 | ) | $ | (585,495 | ) |
| * | Class terminated November 4, 2015. |
| ** | Class commenced operations November 30, 2015. |
See notes to financial statements
123
| Financial statements (unaudited) |
Statements of changes in net assets
High Yield Opportunities Fund
| | | | Six Months | | | | |
| | | | Ended | | | Year Ended | |
| | | | January 31, 2017 | | | July 31, 2016 | |
| Net investment income/(loss) | | $ | 1,425,341 | | $ | 1,616,808 | |
| Net realized gain/(loss) from investments, financial derivative instruments and foreign currency transactions | | | 883,408 | | | (776,195 | ) |
| Net change in unrealized appreciation/(depreciation) of investments, financial derivative instruments and foreign currency translations | | | 1,088,442 | | | 1,054,448 | |
| Net increase/(decrease) in net assets resulting from operations | | | 3,397,191 | | | 1,895,061 | |
| | | | | | | | |
| Distributions to shareholders from net investment income: | | | | | | | |
| Class A Shares | | | (270,033 | ) | | (164,493 | ) |
| Class C Shares | | | (71,146 | ) | | (68,258 | ) |
| Class I Shares | | | (402,980 | ) | | (645,242 | ) |
| Class R6 Shares* | | | (720,843 | ) | | (792,004 | ) |
| Total distributions to shareholders from net investment income | | | (1,465,002 | ) | | (1,669,997 | ) |
| | | | | | | | |
| Net increase/(decrease) from Fund share transactions: | | | | | | | |
| Class A Shares | | | 3,040,087 | | | 5,894,219 | |
| Class C Shares | | | 946,005 | | | 685,019 | |
| Class I Shares | | | 10,462,420 | | | (12,178,370 | ) |
| Class R6 Shares* | | | (397,520 | ) | | 21,548,668 | |
| Net increase/(decrease) from Fund share transactions: | | | 14,050,992 | | | 15,949,536 | |
| Net increase/(decrease) in net assets | | | 15,983,181 | | | 16,174,600 | |
| | | | | | | | |
| Net assets: | | | | | | | |
| Beginning of period | | | 41,385,338 | | | 25,210,738 | |
| End of period | | $ | 57,368,519 | | $ | 41,385,338 | |
| Accumulated undistributed net investment income/(loss) | | $ | 23,857 | | $ | 63,518 | |
| * | Class commenced operations November 30, 2015. |
See notes to financial statements
124
| Financial statements (unaudited) |
Statements of changes in net assets
International Long/Short Equity Fund
| | | | Six Months | | | | |
| | | | Ended | | | Year Ended | |
| | | | January 31, 2017 | | | July 31, 2016 | |
| Net investment income/(loss) | | $ | (133,386 | ) | $ | (342,498 | ) |
| Net realized gain/(loss) from investments, financial derivative instruments and foreign currency transactions | | | 179,422 | | | (1,006,327 | ) |
| Net change in unrealized appreciation/(depreciation) of investments, financial derivative instruments,securities sold short and foreign currency translations | | | 123,100 | | | 174,893 | |
| Net increase/(decrease) in net assets resulting from operations | | | 169,136 | | | (1,173,932 | ) |
| | | | | | | | |
| Distributions to shareholders from net investment income: | | | | | | | |
| Class A Shares | | | — | | | (7,080 | ) |
| Class C Shares | | | (4,283 | ) | | (2,841 | ) |
| Class I Shares | | | (223,699 | ) | | (19,072 | ) |
| Class R6 Shares* | | | (110,041 | ) | | (164,331 | ) |
| Total distributions to shareholders from net investment income | | | (338,023 | ) | | (193,324 | ) |
| | | | | | | | |
| Distributions to shareholders from net realized gains: | | | | | | | |
| Class A Shares | | | — | | | (676 | ) |
| Class C Shares | | | — | | | (333 | ) |
| Class I Shares | | | — | | | (3,476 | ) |
| Class R6 Shares* | | | — | | | (15,567 | ) |
| Total distributions to shareholders from net realized gains | | | — | | | (20,052 | ) |
| Net increase/(decrease) from Fund share transactions: | | | | | | | |
| Class A Shares | | | (16,865,467 | ) | | 18,451,807 | |
| Class C Shares | | | (2,297 | ) | | 136,714 | |
| Class I Shares | | | (1,515,543 | ) | | 4,765,039 | |
| Class R6 Shares* | | | (1,497 | ) | | 5,005,170 | |
| Net increase/(decrease) from Fund share transactions: | | | (18,384,804 | ) | | 28,358,730 | |
| Net increase/(decrease) in net assets | | | (18,553,691 | ) | | 26,971,422 | |
| | | | | | | | |
| Net assets: | | | | | | | |
| Beginning of period | | | 33,254,170 | | | 6,282,748 | |
| End of period | | $ | 14,700,479 | | $ | 33,254,170 | |
| Accumulated undistributed net investment income/(loss) | | $ | (961,317 | ) | $ | (489,908 | ) |
| * Class commenced operations November 30, 2015. | | | | | | | |
See notes to financial statements
125
| Financial statements (unaudited) |
Statements of changes in net assets
International Opportunities Fund
| | | | Six Months | | | | |
| | | | Ended | | | Year Ended | |
| | | January 31, 2017 | | | July 31, 2016 | |
| Net investment income/(loss) | | $ | 1,463,110 | | $ | 65,394,365 | |
| Net realized gain/(loss) from investments, financial derivative instruments and foreign currency transactions | | | (25,203,361 | ) | | (250,791,330 | ) |
| Net change in unrealized appreciation/(depreciation) of investments, financial derivative instruments and foreign currency translations | | | 20,438,433 | | | (136,129,214 | ) |
| Net increase/(decrease) in net assets resulting from operations | | | (3,301,818 | ) | | (321,526,179 | ) |
| | | | | | | | |
| Distributions to shareholders from net investment income: | | | | | | | |
| Class A Shares | | | (9,980,360 | ) | | (20,869,230 | ) |
| Class C Shares | | | (3,938,552 | ) | | (4,349,701 | ) |
| Class I Shares | | | (52,961,746 | ) | | (44,704,034 | ) |
| Class R Shares | | | (311,863 | ) | | (210,746 | ) |
| Class R6 Shares** | | | (12,169 | ) | | (11,583 | ) |
| Class IF Shares*** | | | (8,593,150 | ) | | — | |
| Total distributions to shareholders from net investment income | | | (75,797,840 | ) | | (70,145,294 | ) |
| | | | | | | | |
| Net increase/(decrease) from Fund share transactions: | | | | | | | |
| Class A Shares | | | (127,585,857 | ) | | (683,968,887 | ) |
| Class B Shares* | | | — | | | (16,351,415 | ) |
| Class C Shares | | | (53,057,821 | ) | | 1,545,359 | |
| Class I Shares | | | (179,606,549 | ) | | 829,351,127 | |
| Class R Shares | | | 1,502,504 | | | 6,967,314 | |
| Class R6 Shares** | | | (312,630 | ) | | 743,244 | |
| Class IF Shares*** | | | (81,520,846 | ) | | 588,370,232 | |
| Net increase/(decrease) from Fund share transactions: | | | (440,581,199 | ) | | 726,656,974 | |
| Net increase/(decrease) in net assets | | | (519,680,857 | ) | | 334,985,501 | |
| | | | | | | | |
| Net assets: | | | | | | | |
| Beginning of period | | | 4,875,890,073 | | | 4,540,904,572 | |
| End of period | | $ | 4,356,209,216 | | $ | 4,875,890,073 | |
| Accumulated undistributed net investment income/(loss) | | $ | (32,412,614 | ) | $ | 41,922,116 | |
| * | Class terminated November 4, 2015. |
| ** | Class commenced operations November 30, 2015. |
| *** | Class commenced operations on March 31, 2016. |
See notes to financial statements
126
| Financial statements (unaudited) |
Statements of changes in net assets
International Small Cap Fund
| | | | Six Months | |
| | | | Ended | |
| | | | January 31, 2017 | * |
| Net investment loss | | $ | (2,484 | ) |
| Net realized gain/(loss) from investments, financial derivative instruments and foreign currency transactions | | | (12,252 | ) |
| Net change in unrealized appreciation/(depreciation) of investments, financial derivative instruments and foreign currency translations | | | 374,604 | |
| Net increase/(decrease) in net assets resulting from operations | | | 359,868 | |
| | | | | |
| Net increase/(decrease) from Fund share transactions: | | | | |
| Class R6 Shares | | | 5,000,000 | |
| Net increase/(decrease) from Fund share transactions: | | | 5,000,000 | |
| Net increase/(decrease) in net assets | | | 5,359,868 | |
| | | | | |
| Net assets: | | | | |
| Beginning of period | | | — | |
| End of period | | $ | 5,359,868 | |
| Accumulated undistributed net investment loss | | $ | (2,484 | ) |
| * | Fund commenced operations on December 15, 2016. |
See notes to financial statements
127
| Financial statements (unaudited) |
Statements of changes in net assets
Strategic Income Fund
| | | | Six Months | | | | |
| | | | Ended | | | Year Ended | |
| | | January 31, 2017 | | | July 31, 2016 | |
| Net investment income/(loss) | | $ | 6,396,896 | | $ | 8,848,387 | |
| Net realized gain/(loss) from investments, financial derivative instruments and foreign currency transactions | | | 8,187,957 | | | 13,805,694 | |
| Net change in unrealized appreciation/(depreciation) of investments,financial derivative instruments and foreign currency translations | | | (12,104,901 | ) | | 618,134 | |
| Net increase/(decrease) in net assets resulting from operations | | | 2,479,952 | | | 23,272,215 | |
| | | | | | | | |
| Distributions to shareholders from net investment income: | | | | | | | |
| Class A Shares | | | (828,460 | ) | | (1,238,725 | ) |
| Class B Shares* | | | — | | | (15,453 | ) |
| Class C Shares | | | (448,632 | ) | | (751,605 | ) |
| Class I Shares | | | (4,746,583 | ) | | (6,468,399 | ) |
| Class R6 Shares** | | | (21,433 | ) | | (25,685 | ) |
| Total distributions to shareholders from net investment income | | | (6,045,108 | ) | | (8,499,867 | ) |
| | | | | | | | |
| Net increase/(decrease) from Fund share transactions: | | | | | | | |
| Class A Shares | | | (5,938,734 | ) | | 36,420,698 | |
| Class B Shares* | | | — | | | (3,111,688 | ) |
| Class C Shares | | | (5,117,790 | ) | | 18,933,455 | |
| Class I Shares | | | 78,393 | | | 205,975,225 | |
| Class R6 Shares** | | | (122,698 | ) | | 1,472,988 | |
| Net increase/(decrease) from Fund share transactions: | | | (11,100,829 | ) | | 259,690,678 | |
| Net increase/(decrease) in net assets | | | (14,665,985 | ) | | 274,463,026 | |
| | | | | | | | |
| Net assets: | | | | | | | |
| Beginning of period | | | 442,383,295 | | | 167,920,269 | |
| End of period | | $ | 427,717,310 | | $ | 442,383,295 | |
| Accumulated undistributed net investment income/(loss) | | $ | (1,673,558 | ) | $ | (2,025,346 | ) |
| * | Class terminated November 4, 2015. |
| ** | Class commenced operations November 30, 2015. |
See notes to financial statements
128
| Financial statements (unaudited) |
Statements of changes in net assets
US Growth Opportunities Fund
| | | | Six Months | | | | |
| | | | Ended | | | Year Ended | |
| | | January 31, 2017 | | | July 31, 2016 | |
| Net investment income/(loss) | | $ | (8,962 | ) | $ | (16,323 | ) |
| Net realized gain/(loss) from investments, financial derivative instruments and foreign currency transactions | | | (213,850 | ) | | (128,780 | ) |
| Net change in unrealized appreciation/(depreciation) of investments, financial derivative instruments and foreign currency translations | | | 308,964 | | | 167,423 | |
| Net increase/(decrease) in net assets resulting from operations | | | 86,152 | | | 22,320 | |
| | | | | | | | |
| Net increase/(decrease) from Fund share transactions: | | | | | | | |
| Class A Shares | | | (259,578 | ) | | 1,105,303 | |
| Class C Shares | | | 19,169 | | | 161,978 | |
| Class I Shares | | | 579 | | | (5,542,046 | ) |
| Class R6 Shares* | | | (103,175 | ) | | 5,739,011 | |
| Net increase/(decrease) from Fund share transactions: | | | (343,005 | ) | | 1,464,246 | |
| Net increase/(decrease) in net assets | | | (256,853 | ) | | 1,486,566 | |
| | | | | | | | |
| Net assets: | | | | | | | |
| Beginning of period | | | 8,884,365 | | | 7,397,799 | |
| End of period | | $ | 8,627,512 | | $ | 8,884,365 | |
| Accumulated undistributed net investment income/(loss) | | $ | (21,251 | ) | $ | (12,289 | ) |
| * | Class commenced operations November 30, 2015. |
See notes to financial statements
129
| Financial statements (unaudited) |
Statements of changes – capital stock activity
All Asset Fund
| | | | Six Months | | | | |
| | | | Ended | | | Year Ended | |
| | | January 31, 2017 | | | July 31, 2016 | |
| | | | | | | | |
| Amount | | | | | | | |
| | | | | | | | |
| Class A shares: | | | | | | | |
| Sold | | $ | 337,892 | | $ | 2,389,247 | |
| Issued as reinvestment of dividends | | | 9,385 | | | 168,932 | |
| Redeemed | | | (566,571 | ) | | (4,623,264 | ) |
| Net decrease | | $ | (219,294 | ) | $ | (2,065,085 | ) |
| | | | | | | | |
| Class C shares: | | | | | | | |
| Sold | | $ | 2,282,876 | | $ | 3,171,463 | |
| Issued as reinvestment of dividends | | | — | | | 257,689 | |
| Redeemed | | | (2,401,905 | ) | | (4,525,561 | ) |
| Net decrease | | $ | (119,029 | ) | $ | (1,096,409 | ) |
| | | | | | | | |
| Class I shares: | | | | | | | |
| Sold | | $ | 1,606,667 | | $ | 2,652,602 | |
| Issued as reinvestment of dividends | | | 51,538 | | | 507,864 | |
| Redeemed | | | (4,519,518 | ) | | (35,215,253 | ) |
| Net decrease | | $ | (2,861,313 | ) | $ | (32,054,787 | ) |
| | | | | | | | |
| Class R6 shares:* | | | | | | | |
| Sold | | $ | 44,249 | | $ | 28,346,633 | |
| Issued as reinvestment of dividends | | | 240,992 | | | 1,090,787 | |
| Redeemed | | | (77,898 | ) | | (8,927 | ) |
| Net increase | | $ | 207,343 | | $ | 29,428,493 | |
| * | Class commenced operations November 30, 2015. |
See notes to financial statements
130
| Financial statements (unaudited) |
Statements of changes – capital stock activity
All Asset Fund (continued)
| | | | Six Months | | | | |
| | | | Ended | | | Year Ended | |
| | | | January 31, 2017 | | | July 31, 2016 | |
| | | | | | | | |
| Shares | | | | | | | |
| | | | | | | | |
| Class A shares: | | | | | | | |
| Sold | | | 33,460 | | | 242,349 | |
| Issued as reinvestment of dividends | | | 926 | | | 17,076 | |
| Redeemed | | | (55,939 | ) | | (469,446 | ) |
| Net decrease | | | (21,553 | ) | | (210,021 | ) |
| | | | | | | | |
| Class C shares: | | | | | | | |
| Sold | | | 230,464 | | | 328,077 | |
| Issued as reinvestment of dividends | | | — | | | 26,511 | |
| Redeemed | | | (240,786 | ) | | (464,349 | ) |
| Net decrease | | | (10,322 | ) | | (109,761 | ) |
| | | | | | | | |
| Class I shares: | | | | | | | |
| Sold | | | 158,308 | | | 270,034 | |
| Issued as reinvestment of dividends | | | 5,108 | | | 51,382 | |
| Redeemed | | | (446,801 | ) | | (3,460,698 | ) |
| Net decrease | | | (283,385 | ) | | (3,139,282 | ) |
| | | | | | | | |
| Class R6 shares:* | | | | | | | |
| Sold | | | 4,415 | | | 2,765,534 | |
| Issued as reinvestment of dividends | | | 23,932 | | | 110,490 | |
| Redeemed | | | (7,785 | ) | | (966 | ) |
| Net increase | | | 20,562 | | | 2,875,058 | |
| * | Class commenced operations November 30, 2015. |
See notes to financial statements
131
| Financial statements (unaudited) |
Statements of changes – capital stock activity
Dividend & Income Builder Fund
| | | | Six Months | | | | |
| | | | Ended | | | Year Ended | |
| | | | January 31, 2017 | | | July 31, 2016 | |
| | | | | | | | |
| Amount | | | | | | | |
| | | | | | | | |
| Class A shares: | | | | | | | |
| Sold | | $ | 7,568,603 | | $ | 32,547,025 | |
| Issued as reinvestment of dividends | | | 420,456 | | | 802,945 | |
| Redeemed | | | (21,667,924 | ) | | (9,069,716 | ) |
| Net increase/(decrease) | | $ | (13,678,865 | ) | $ | 24,280,254 | |
| | | | | | | | |
| Class C shares: | | | | | | | |
| Sold | | $ | 8,836,619 | | $ | 27,918,336 | |
| Issued as reinvestment of dividends | | | 337,470 | | | 482,691 | |
| Redeemed | | | (6,767,161 | ) | | (9,145,391 | ) |
| Net increase | | $ | 2,406,928 | | $ | 19,255,636 | |
| | | | | | | | |
| Class I shares: | | | | | | | |
| Sold | | $ | 38,532,503 | | $ | 47,186,699 | |
| Issued as reinvestment of dividends | | | 897,464 | | | 1,071,929 | |
| Redeemed | | | (17,213,890 | ) | | (25,861,891 | ) |
| Net increase | | $ | 22,216,077 | | $ | 22,396,737 | |
| | | | | | | | |
| Class R6 shares:* | | | | | | | |
| Sold | | $ | 40,525 | | $ | 447,689 | |
| Issued as reinvestment of dividends | | | 5,597 | | | 8,044 | |
| Redeemed | | | (178,532 | ) | | (60,821 | ) |
| Net increase/(decrease) | | $ | (132,410 | ) | $ | 394,912 | |
| * | Class commenced operations November 30, 2015. |
See notes to financial statements
132
| Financial statements (unaudited) |
Statements of changes – capital stock activity
Dividend & Income Builder Fund (continued)
| | | | Six Months | | | | |
| | | | Ended | | | Year Ended | |
| | | | January 31, 2017 | | | July 31, 2016 | |
| | | | | | | | |
| Shares | | | | | | | |
| | | | | | | | |
| Class A shares: | | | | | | | |
| Sold | | | 633,861 | | | 2,785,583 | |
| Issued as reinvestment of dividends | | | 35,005 | | | 70,083 | |
| Redeemed | | | (1,798,260 | ) | | (772,776 | ) |
| Net increase/(decrease) | | | (1,129,394 | ) | | 2,082,890 | |
| | | | | | | | |
| Class C shares: | | | | | | | |
| Sold | | | 749,778 | | | 2,400,976 | |
| Issued as reinvestment of dividends | | | 28,340 | | | 42,557 | |
| Redeemed | | | (569,588 | ) | | (794,960 | ) |
| Net increase | | | 208,530 | | | 1,648,573 | |
| | | | | | | | |
| Class I shares: | | | | | | | |
| Sold | | | 3,225,850 | | | 3,995,617 | |
| Issued as reinvestment of dividends | | | 74,777 | | | 93,605 | |
| Redeemed | | | (1,439,746 | ) | | (2,219,176 | ) |
| Net increase | | | 1,860,881 | | | 1,870,046 | |
| | | | | | | | |
| Class R6 shares:* | | | | | | | |
| Sold | | | 3,369 | | | 37,520 | |
| Issued as reinvestment of dividends | | | 466 | | | 696 | |
| Redeemed | | | (14,993 | ) | | (5,104 | ) |
| Net increase/(decrease) | | | (11,158 | ) | | 33,112 | |
| * | Class commenced operations November 30, 2015. |
See notes to financial statements
133
| Financial statements (unaudited) |
Statements of changes – capital stock activity
Emerging Markets Fund
| | | | | | | | |
| | | | Six Months | | | | |
| | | | Ended | | | Year Ended | |
| | | | January 31, 2017 | | | July 31, 2016 | |
| | | | | | | | |
| Amount | | | | | | | |
| | | | | | | | |
| Class A shares: | | | | | | | |
| Sold | | $ | 9,626,520 | | $ | 2,908,545 | |
| Issued as reinvestment of dividends | | | 83,492 | | | 14,627 | |
| Redeemed | | | (2,705,569 | ) | | (4,580,585 | ) |
| Net increase/(decrease) | | $ | 7,004,443 | | $ | (1,657,413 | ) |
| | | | | | | | |
| Class C shares: | | | | | | | |
| Sold | | $ | 3,419,943 | | $ | 1,713,106 | |
| Issued as reinvestment of dividends | | | 9,982 | | | — | |
| Redeemed | | | (1,115,999 | ) | | (1,324,472 | ) |
| Net increase | | $ | 2,313,926 | | $ | 388,634 | |
| | | | | | | | |
| Class I shares: | | | | | | | |
| Sold | | $ | 27,404,071 | | $ | 41,225,273 | |
| Issued as reinvestment of dividends | | | 466,847 | | | 113,613 | |
| Redeemed | | | (7,751,270 | ) | | (19,424,684 | ) |
| Net increase | | $ | 20,119,648 | | $ | 21,914,202 | |
| | | | | | | | |
| Class R6 shares:* | | | | | | | |
| Sold | | $ | 1,965,945 | | $ | 283,500 | |
| Issued as reinvestment of dividends | | | 18,584 | | | 1,522 | |
| Redeemed | | | (14,878 | ) | | (4,435 | ) |
| Net increase | | $ | 1,969,651 | | $ | 280,587 | |
| * | Class commenced operations November 30, 2015. |
See notes to financial statements
134
| Financial statements (unaudited) |
Statements of changes – capital stock activity
Emerging Markets Fund (continued)
| | | | Six Months | | | | |
| | | | Ended | | | Year Ended | |
| | | | January 31, 2017 | | | July 31, 2016 | |
| | | | | | | | |
| Shares | | | | | | | |
| | | | | | | | |
| Class A shares: | | | | | | | |
| Sold | | | 1,065,569 | | | 347,785 | |
| Issued as reinvestment of dividends | | | 9,893 | | | 1,847 | |
| Redeemed | | | (304,780 | ) | | (596,193 | ) |
| Net increase/(decrease) | | | 770,682 | | | (246,561 | ) |
| | | | | | | | |
| Class C shares: | | | | | | | |
| Sold | | | 391,127 | | | 212,291 | |
| Issued as reinvestment of dividends | | | 1,220 | | | — | |
| Redeemed | | | (132,511 | ) | | (173,381 | ) |
| Net increase | | | 259,836 | | | 38,910 | |
| | | | | | | | |
| Class I shares: | | | | | | | |
| Sold | | | 3,056,478 | | | 4,969,448 | |
| Issued as reinvestment of dividends | | | 55,118 | | | 14,327 | |
| Redeemed | | | (891,590 | ) | | (2,417,003 | ) |
| Net increase | | | 2,220,006 | | | 2,566,772 | |
| | | | | | | | |
| Class R6 shares:* | | | | | | | |
| Sold | | | 216,361 | | | 35,207 | |
| Issued as reinvestment of dividends | | | 2,194 | | | 192 | |
| Redeemed | | | (1,637 | ) | | (545 | ) |
| Net increase | | | 216,918 | | | 34,854 | |
| * | Class commenced operations November 30, 2015. |
See notes to financial statements
135
| Financial statements (unaudited) |
Statements of changes – capital stock activity
European Focus Fund
| | | | | | | | |
| | | | Six Months | | | | |
| | | | Ended | | | Year Ended | |
| | | | January 31, 2017 | | | July 31, 2016 | |
| | | | | | | | |
| Amount | | | | | | | |
| | | | | | | | |
| Class A shares: | | | | | | | |
| Sold | | $ | 28,608,535 | | $ | 301,826,065 | |
| Issued as reinvestment of dividends | | | 8,911,143 | | | 6,122,302 | |
| Redeemed | | | (229,518,525 | ) | | (522,226,993 | ) |
| Net decrease | | $ | (191,998,847 | ) | $ | (214,278,626 | ) |
| | | | | | | | |
| Class B shares:* | | | | | | | |
| Sold | | $ | — | | $ | 186 | |
| Redeemed | | | — | | | (4,795,504 | ) |
| Net decrease | | $ | — | | $ | (4,795,318 | ) |
| | | | | | | | |
| Class C shares: | | | | | | | |
| Sold | | $ | 7,898,784 | | $ | 68,249,134 | |
| Issued as reinvestment of dividends | | | 3,118,276 | | | 363,049 | |
| Redeemed | | | (80,337,073 | ) | | (95,777,423 | ) |
| Net decrease | | $ | (69,320,013 | ) | $ | (27,165,240 | ) |
| | | | | | | | |
| Class I shares: | | | | | | | |
| Sold | | $ | 305,494,625 | | $ | 1,279,799,507 | |
| Issued as reinvestment of dividends | | | 35,797,951 | | | 18,331,492 | |
| Redeemed | | | (842,546,237 | ) | | (1,436,150,200 | ) |
| Net decrease | | $ | (501,253,661 | ) | $ | (138,019,201 | ) |
| | | | | | | | |
| Class R6 shares:** | | | | | | | |
| Sold | | $ | 132,991 | | $ | 1,531,816 | |
| Issued as reinvestment of dividends | | | 40,620 | | | 13,029 | |
| Redeemed | | | (413,625 | ) | | (35,455 | ) |
| Net increase/(decrease) | | $ | (240,014 | ) | $ | 1,509,390 | |
| * | Class terminated November 4, 2015. |
| ** | Class commenced operations November 30, 2015. |
See notes to financial statements
136
| Financial statements (unaudited) |
Statements of changes – capital stock activity
European Focus Fund (continued)
| | | | | | | | |
| | | | Six Months | | | | |
| | | | Ended | | | Year Ended | |
| | | | January 31, 2017 | | | July 31, 2016 | |
| | | | | | | | |
| Shares | | | | | | | |
| | | | | | | | |
| Class A shares: | | | | | | | |
| Sold | | | 923,494 | | | 9,054,474 | |
| Issued as reinvestment of dividends | | | 295,364 | | | 179,803 | |
| Redeemed | | | (7,398,555 | ) | | (16,347,519 | ) |
| Net decrease | | | (6,179,697 | ) | | (7,113,242 | ) |
| | | | | | | | |
| Class B shares:* | | | | | | | |
| Redeemed | | | — | | | (145,533 | ) |
| Net decrease | | | — | | | (145,533 | ) |
| | | | | | | | |
| Class C shares: | | | | | | | |
| Sold | | | 275,468 | | | 2,195,418 | |
| Issued as reinvestment of dividends | | | 110,070 | | | 11,356 | |
| Redeemed | | | (2,787,807 | ) | | (3,212,385 | ) |
| Net decrease | | | (2,402,269 | ) | | (1,005,611 | ) |
| | | | | | | | |
| Class I shares: | | | | | | | |
| Sold | | | 9,851,952 | | | 39,106,723 | |
| Issued as reinvestment of dividends | | | 1,191,676 | | | 538,845 | |
| Redeemed | | | (27,451,510 | ) | | (45,292,244 | ) |
| Net decrease | | | (16,407,882 | ) | | (5,646,676 | ) |
| | | | | | | | |
| Class R6 shares:** | | | | | | | |
| Sold | | | 4,371 | | | 44,648 | |
| Issued as reinvestment of dividends | | | 1,352 | | | 383 | |
| Redeemed | | | (13,412 | ) | | (1,134 | ) |
| Net increase/(decrease) | | | (7,689 | ) | | 43,897 | |
| * | Class terminated November 4, 2015. |
| ** | Class commenced operations November 30, 2015. |
See notes to financial statements
137
| Financial statements (unaudited) |
Statements of changes – capital stock activity
Global Equity Income Fund
| | | | | | | | |
| | | | Six Months | | | | |
| | | | Ended | | | Year Ended | |
| | | | January 31, 2017 | | | July 31, 2016 | |
| | | | | | | | |
| Amount | | | | | | | |
| | | | | | | | |
| Class A shares: | | | | | | | |
| Sold | | $ | 192,431,569 | | $ | 394,225,119 | |
| Issued as reinvestment of dividends | | | 18,373,264 | | | 41,172,929 | |
| Redeemed | | | (190,517,753 | ) | | (331,490,790 | ) |
| Net increase | | $ | 20,287,080 | | $ | 103,907,258 | |
| | | | | | | | |
| Class C shares: | | | | | | | |
| Sold | | $ | 86,883,153 | | $ | 220,041,077 | |
| Issued as reinvestment of dividends | | | 21,036,803 | | | 49,241,654 | |
| Redeemed | | | (185,293,433 | ) | | (249,572,798 | ) |
| Net increase/(decrease) | | $ | (77,373,477 | ) | $ | 19,709,933 | |
| | | | | | | | |
| Class I shares: | | | | | | | |
| Sold | | $ | 582,119,237 | | $ | 1,079,850,876 | |
| Issued as reinvestment of dividends | | | 60,012,742 | | | 107,395,820 | |
| Redeemed | | | (474,146,269 | ) | | (741,188,760 | ) |
| Net increase | | $ | 167,985,710 | | $ | 446,057,936 | |
| | | | | | | | |
| Class R6 shares:* | | | | | | | |
| Sold | | $ | 595,152 | | $ | 1,792,803 | |
| Issued as reinvestment of dividends | | | 59,856 | | | 77,455 | |
| Redeemed | | | (54,393 | ) | | (17,977 | ) |
| Net increase | | $ | 600,615 | | $ | 1,852,281 | |
| * | Class commenced operations November 30, 2015. |
See notes to financial statements
138
| Financial statements (unaudited) |
Statements of changes – capital stock activity
Global Equity Income Fund (continued)
| | | | | | | | |
| | | | Six Months | | | | |
| | | | Ended | | | Year Ended | |
| | | | January 31, 2017 | | | July 31, 2016 | |
| | | | | | | | |
| Shares | | | | | | | |
| | | | | | | | |
| Class A shares: | | | | | | | |
| Sold | | | 27,063,768 | | | 54,630,754 | |
| Issued as reinvestment of dividends | | | 2,579,756 | | | 5,924,027 | |
| Redeemed | | | (26,796,113 | ) | | (46,315,206 | ) |
| Net increase | | | 2,847,411 | | | 14,239,575 | |
| | | | | | | | |
| Class C shares: | | | | | | | |
| Sold | | | 12,201,709 | | | 30,472,273 | |
| Issued as reinvestment of dividends | | | 2,973,974 | | | 7,110,034 | |
| Redeemed | | | (26,207,958 | ) | | (34,834,742 | ) |
| Net increase/(decrease) | | | (11,032,275 | ) | | 2,747,565 | |
| | | | | | | | |
| Class I shares: | | | | | | | |
| Sold | | | 81,031,875 | | | 148,700,648 | |
| Issued as reinvestment of dividends | | | 8,414,906 | | | 15,422,364 | |
| Redeemed | | | (66,581,005 | ) | | (102,700,361 | ) |
| Net increase | | | 22,865,776 | | | 61,422,651 | |
| | | | | | | | |
| Class R6 shares:* | | | | | | | |
| Sold | | | 83,497 | | | 241,013 | |
| Issued as reinvestment of dividends | | | 8,398 | | | 11,328 | |
| Redeemed | | | (7,693 | ) | | (2,472 | ) |
| Net increase | | | 84,202 | | | 249,869 | |
| * | Class commenced operations November 30, 2015. |
See notes to financial statements
139
| Financial statements (unaudited) |
Statements of changes – capital stock activity
Global Technology Fund
| | | | | | | | |
| | | | Six Months | | | | |
| | | | Ended | | | Year Ended | |
| | | | January 31, 2017 | | | July 31, 2016 | |
| | | | | | | | |
| Amount | | | | | | | |
| | | | | | | | |
| Class A shares: | | | | | | | |
| Sold | | $ | 3,857,229 | | $ | 13,432,218 | |
| Issued as reinvestment of dividends | | | 4,979,483 | | | 10,939,084 | |
| Redeemed | | | (10,733,084 | ) | | (31,369,757 | ) |
| Net decrease | | $ | (1,896,372 | ) | $ | (6,998,455 | ) |
| | | | | | | | |
| Class B shares:* | | | | | | | |
| Redeemed | | | — | | | (6,324,806 | ) |
| Net decrease | | $ | — | | $ | (6,324,806 | ) |
| | | | | | | | |
| Class C shares: | | | | | | | |
| Sold | | $ | 1,966,456 | | $ | 4,563,811 | |
| Issued as reinvestment of dividends | | | 3,604,525 | | | 8,316,446 | |
| Redeemed | | | (10,687,450 | ) | | (20,250,777 | ) |
| Net decrease | | $ | (5,116,469 | ) | $ | (7,370,520 | ) |
| | | | | | | | |
| Class I shares: | | | | | | | |
| Sold | | $ | 5,293,429 | | $ | 20,737,364 | |
| Issued as reinvestment of dividends | | | 3,594,357 | | | 9,050,685 | |
| Redeemed | | | (15,260,624 | ) | | (44,860,218 | ) |
| Net decrease | | $ | (6,372,838 | ) | $ | (15,072,169 | ) |
| | | | | | | | |
| Class R6 shares:** | | | | | | | |
| Sold | | $ | 5,172 | | $ | 1,017,292 | |
| Issued as reinvestment of dividends | | | 17,810 | | | 118,521 | |
| Redeemed | | | (79,748 | ) | | (616,283 | ) |
| Net increase/(decrease) | | $ | (56,766 | ) | $ | 519,530 | |
| * | Class terminated November 4, 2015. |
| ** | Class commenced operations November 30, 2015. |
See notes to financial statements
140
| Financial statements (unaudited) |
Statements of changes – capital stock activity
Global Technology Fund (continued)
| | | | | | | | |
| | | | Six Months | | | | |
| | | | Ended | | | Year Ended | |
| | | | January 31, 2017 | | | July 31, 2016 | |
| | | | | | | | |
| Shares | | | | | | | |
| | | | | | | | |
| Class A shares: | | | | | | | |
| Sold | | | 159,793 | | | 540,807 | |
| Issued as reinvestment of dividends | | | 216,499 | | | 457,320 | |
| Redeemed | | | (445,336 | ) | | (1,378,671 | ) |
| Net decrease | | | (69,044 | ) | | (380,544 | ) |
| | | | | | | | |
| Class B shares:* | | | | | | | |
| Redeemed | | | — | | | (268,813 | ) |
| Net decrease | | | — | | | (268,813 | ) |
| | | | | | | | |
| Class C shares: | | | | | | | |
| Sold | | | 97,969 | | | 220,670 | |
| Issued as reinvestment of dividends | | | 183,904 | | | 400,021 | |
| Redeemed | | | (517,858 | ) | | (1,036,700 | ) |
| Net decrease | | | (235,985 | ) | | (416,009 | ) |
| | | | | | | | |
| Class I shares: | | | | | | | |
| Sold | | | 215,290 | | | 875,166 | |
| Issued as reinvestment of dividends | | | 152,174 | | | 369,868 | |
| Redeemed | | | (619,587 | ) | | (1,946,826 | ) |
| Net decrease | | | (252,123 | ) | | (701,792 | ) |
| | | | | | | | |
| Class R6 shares:** | | | | | | | |
| Sold | | | 208 | | | 37,312 | |
| Issued as reinvestment of dividends | | | 754 | | | 4,844 | |
| Redeemed | | | (3,189 | ) | | (28,483 | ) |
| Net increase/(decrease) | | | (2,227 | ) | | 13,673 | |
| * | Class terminated November 4, 2015. |
| ** | Class commenced operations November 30, 2015. |
See notes to financial statements
141
| Financial statements (unaudited) |
Statements of changes – capital stock activity
High Yield Opportunities Fund
| | | | Six Months | | | | |
| | | | Ended | | | Year Ended | |
| | | | January 31, 2017 | | | July 31, 2016 | |
| | | | | | | | |
| Amount | | | | | | | |
| | | | | | | | |
| Class A shares: | | | | | | | |
| Sold | | $ | 3,569,293 | | $ | 7,510,025 | |
| Issued as reinvestment of dividends | | | 260,896 | | | 141,624 | |
| Redeemed | | | (790,102 | ) | | (1,757,430 | ) |
| Net increase | | $ | 3,040,087 | | $ | 5,894,219 | |
| | | | | | | | |
| Class C shares: | | | | | | | |
| Sold | | $ | 1,298,884 | | $ | 1,554,754 | |
| Issued as reinvestment of dividends | | | 65,632 | | | 59,458 | |
| Redeemed | | | (418,511 | ) | | (929,193 | ) |
| Net increase | | $ | 946,005 | | $ | 685,019 | |
| | | | | | | | |
| Class I shares: | | | | | | | |
| Sold | | $ | 13,451,164 | | $ | 9,190,209 | |
| Issued as reinvestment of dividends | | | 380,643 | | | 624,072 | |
| Redeemed | | | (3,369,387 | ) | | (21,992,651 | ) |
| Net increase/(decrease) | | $ | 10,462,420 | | $ | (12,178,370 | ) |
| | | | | | | | |
| Class R6 shares:* | | | | | | | |
| Sold | | $ | 3,862 | | $ | 22,866,396 | |
| Issued as reinvestment of dividends | | | 716,667 | | | 770,089 | |
| Redeemed | | | (1,118,049 | ) | | (2,087,817 | ) |
| Net increase/(decrease) | | $ | (397,520 | ) | $ | 21,548,668 | |
| * | Class commenced operations November 30, 2015. |
See notes to financial statements
142
| Financial statements (unaudited) |
Statements of changes – capital stock activity
High Yield Opportunities Fund (continued)
| | | | | | | | |
| | | | Six Months | | | | |
| | | | Ended | | | Year Ended | |
| | | | January 31, 2017 | | | July 31, 2016 | |
| | | | | | | | |
| Shares | | | | | | | |
| | | | | | | | |
| Class A shares: | | | | | | | |
| Sold | | | 360,525 | | | 801,668 | |
| Issued as reinvestment of dividends | | | 26,536 | | | 15,138 | |
| Redeemed | | | (80,793 | ) | | (190,649 | ) |
| Net increase | | | 306,268 | | | 626,157 | |
| | | | | | | | |
| Class C shares: | | | | | | | |
| Sold | | | 132,337 | | | 168,125 | |
| Issued as reinvestment of dividends | | | 6,694 | | | 6,433 | |
| Redeemed | | | (42,452 | ) | | (101,446 | ) |
| Net increase | | | 96,579 | | | 73,112 | |
| | | | | | | | |
| Class I shares: | | | | | | | |
| Sold | | | 1,366,479 | | | 995,745 | |
| Issued as reinvestment of dividends | | | 38,796 | | | 67,342 | |
| Redeemed | | | (344,906 | ) | | (2,390,179 | ) |
| Net increase/(decrease) | | | 1,060,369 | | | (1,327,092 | ) |
| | | | | | | | |
| Class R6 shares:* | | | | | | | |
| Sold | | | 396 | | | 2,489,207 | |
| Issued as reinvestment of dividends | | | 73,261 | | | 84,094 | |
| Redeemed | | | (113,254 | ) | | (233,238 | ) |
| Net increase/(decrease) | | | (39,597 | ) | | 2,340,063 | |
| * | Class commenced operations November 30, 2015. |
See notes to financial statements
143
| Financial statements (unaudited) |
Statements of changes – capital stock activity
International Long/Short Equity Fund
| | | | | | | | |
| | | | Six Months | | | | |
| | | | Ended | | | Year Ended | |
| | | | January 31, 2017 | | | July 31, 2016 | |
| | | | | | | | |
| Amount | | | | | | | |
| | | | | | | | |
| Class A shares: | | | | | | | |
| Sold | | $ | 15,926,649 | | $ | 21,931,915 | |
| Issued as reinvestment of dividends | | | — | | | 7,755 | |
| Redeemed | | | (32,792,116 | ) | | (3,487,863 | ) |
| Net increase/(decrease) | | $ | (16,865,467 | ) | $ | 18,451,807 | |
| | | | | | | | |
| Class C shares: | | | | | | | |
| Sold | | $ | — | | $ | 136,562 | |
| Issued as reinvestment of dividends | | | 2,588 | | | 152 | |
| Redeemed | | | (4,885 | ) | | — | |
| Net increase/(decrease) | | $ | (2,297 | ) | $ | 136,714 | |
| | | | | | | | |
| Class I shares: | | | | | | | |
| Sold | | $ | 697,179 | | $ | 11,259,960 | |
| Issued as reinvestment of dividends | | | 205,493 | | | 22,548 | |
| Redeemed | | | (2,418,215 | ) | | (6,517,469 | ) |
| Net increase/(decrease) | | $ | (1,515,543 | ) | $ | 4,765,039 | |
| | | | | | | | |
| Class R6 shares:* | | | | | | | |
| Sold | | $ | 2,904 | | $ | 5,004,874 | |
| Issued as reinvestment of dividends | | | 763 | | | 296 | |
| Redeemed | | | (5,164 | ) | | — | |
| Net increase/(decrease) | | $ | (1,497 | ) | $ | 5,005,170 | |
| * | Class commenced operations November 30, 2015. |
See notes to financial statements
144
| Financial statements (unaudited) |
Statements of changes – capital stock activity
International Long/Short Equity Fund (continued)
| | | | Six Months | | | | |
| | | | Ended | | | Year Ended | |
| | | | January 31, 2017 | | | July 31, 2016 | |
| | | | | | | | |
| Shares | | | | | | | |
| | | | | | | | |
| Class A shares: | | | | | | | |
| Sold | | | 1,703,544 | | | 2,254,481 | |
| Issued as reinvestment of dividends | | | — | | | 786 | |
| Redeemed | | | (3,501,241 | ) | | (364,544 | ) |
| Net increase/(decrease) | | | (1,797,697 | ) | | 1,890,723 | |
| | | | | | | | |
| Class C shares: | | | | | | | |
| Sold | | | — | | | 14,806 | |
| Issued as reinvestment of dividends | | | 279 | | | 15 | |
| Redeemed | | | (517 | ) | | — | |
| Net increase/(decrease) | | | (238 | ) | | 14,821 | |
| | | | | | | | |
| Class I shares: | | | | | | | |
| Sold | | | 74,022 | | | 1,143,147 | |
| Issued as reinvestment of dividends | | | 22,483 | | | 2,274 | |
| Redeemed | | | (259,761 | ) | | (641,697 | ) |
| Net increase/(decrease) | | | (163,256 | ) | | 503,724 | |
| | | | | | | | |
| Class R6 shares:* | | | | | | | |
| Sold | | | 164 | | | 493,775 | |
| Issued as reinvestment of dividends | | | 84 | | | 30 | |
| Redeemed | | | (566 | ) | | — | |
| Net increase/(decrease) | | | (318 | ) | | 493,805 | |
| * | Class commenced operations November 30, 2015. |
See notes to financial statements
145
| Financial statements (unaudited) |
Statements of changes – capital stock activity
International Opportunities Fund
| | | | Six Months | | | | |
| | | | Ended | | | Year Ended | |
| | | January 31, 2017 | | | July 31, 2016 | |
| | | | | | | | |
| Amount | | | | | | | |
| | | | | | | | |
| Class A shares: | | | | | | | |
| Sold | | $ | 73,663,527 | | $ | 374,521,319 | |
| Issued as reinvestment of dividends | | | 8,624,883 | | | 19,476,476 | |
| Redeemed | | | (209,874,267 | ) | | (1,077,966,682 | ) |
| Net decrease | | $ | (127,585,857 | ) | $ | (683,968,887 | ) |
| | | | | | | | |
| Class B shares:* | | | | | | | |
| Sold | | $ | — | | $ | 16,837 | |
| Redeemed | | | — | | | (16,368,252 | ) |
| Net decrease | | $ | — | | $ | (16,351,415 | ) |
| | | | | | | | |
| Class C shares: | | | | | | | |
| Sold | | $ | 23,555,409 | | $ | 88,932,601 | |
| Issued as reinvestment of dividends | | | 3,226,754 | | | 3,505,773 | |
| Redeemed | | | (79,839,984 | ) | | (90,893,015 | ) |
| Net increase/(decrease) | | $ | (53,057,821 | ) | $ | 1,545,359 | |
| | | | | | | | |
| Class I shares: | | | | | | | |
| Sold | | $ | 427,366,460 | | $ | 1,605,372,241 | |
| Issued as reinvestment of dividends | | | 45,833,170 | | | 37,491,564 | |
| Redeemed | | | (652,806,179 | ) | | (813,512,678 | ) |
| Net increase/(decrease) | | $ | (179,606,549 | ) | $ | 829,351,127 | |
| | | | | | | | |
| Class R Shares: | | | | | | | |
| Sold | | $ | 4,548,485 | | $ | 13,083,736 | |
| Issued as reinvestment of dividends | | | 88,057 | | | 86,984 | |
| Redeemed | | | (3,134,038 | ) | | (6,203,406 | ) |
| Net Increase | | $ | 1,502,504 | | $ | 6,967,314 | |
| | | | | | | | |
| Class R6 shares:** | | | | | | | |
| Sold | | $ | 6,823 | | $ | 734,407 | |
| Issued as reinvestment of dividends | | | 12,169 | | | 11,583 | |
| Redeemed | | | (331,622 | ) | | (2,746 | ) |
| Net increase/(decrease) | | $ | (312,630 | ) | $ | 743,244 | |
| | | | | | | | |
| Class IF shares:*** | | | | | | | |
| Sold | | $ | — | | $ | 652,904,907 | |
| Issued as reinvestment of dividends | | | 8,594,598 | | | — | |
| Redeemed | | | (90,115,444 | ) | | (64,534,675 | ) |
| Net increase/(decrease) | | $ | (81,520,846 | ) | $ | 588,370,232 | |
| * | Class terminated November 4, 2015. |
| ** | Class commenced operations November 30, 2015. |
| *** | Class commenced operations on March 31, 2016. |
See notes to financial statements
146
| Financial statements (unaudited) |
Statements of changes – capital stock activity
International Opportunities Fund (continued)
| | | | | | | | |
| | | | Six Months | | | | |
| | | | Ended | | | Year Ended | |
| | | | January 31, 2017 | | | July 31, 2016 | |
| | | | | | | | |
| Shares | | | | | | | |
| | | | | | | | |
| Class A shares: | | | | | | | |
| Sold | | | 2,868,938 | | | 14,537,408 | |
| Issued as reinvestment of dividends | | | 343,347 | | | 728,637 | |
| Redeemed | | | (8,192,987 | ) | | (42,216,227 | ) |
| Net decrease | | | (4,980,702 | ) | | (26,950,182 | ) |
| | | | | | | | |
| Class B shares:* | | | | | | | |
| Sold | | | — | | | 635 | |
| Redeemed | | | — | | | (644,055 | ) |
| Net decrease | | | — | | | (643,420 | ) |
| | | | | | | | |
| Class C shares: | | | | | | | |
| Sold | | | 986,234 | | | 3,655,206 | |
| Issued as reinvestment of dividends | | | 137,134 | | | 139,895 | |
| Redeemed | | | (3,334,981 | ) | | (3,832,269 | ) |
| Net decrease | | | (2,211,613 | ) | | (37,168 | ) |
| | | | | | | | |
| Class I shares: | | | | | | | |
| Sold | | | 16,650,723 | | | 62,565,571 | |
| Issued as reinvestment of dividends | | | 1,829,667 | | | 1,405,231 | |
| Redeemed | | | (25,558,799 | ) | | (32,119,402 | ) |
| Net increase/(decrease) | | | (7,078,409 | ) | | 31,851,400 | |
| | | | | | | | |
| Class R Shares | | | | | | | |
| Sold | | | 180,572 | | | 524,369 | |
| Issued as reinvestment of dividends | | | 3,578 | | | 3,313 | |
| Redeemed | | | (125,011 | ) | | (249,361 | ) |
| Net increase | | | 59,139 | | | 278,321 | |
| | | | | | | | |
| Class R6 shares:** | | | | | | | |
| Sold | | | 263 | | | 27,065 | |
| Issued as reinvestment of dividends | | | 486 | | | 434 | |
| Redeemed | | | (12,974 | ) | | (107 | ) |
| Net increase/(decrease) | | | (12,225 | ) | | 27,392 | |
| | | | | | | | |
| Class IF shares:*** | | | | | | | |
| Sold | | | — | | | 25,547,838 | |
| Issued as reinvestment of dividends | | | 341,676 | | | — | |
| Redeemed | | | (3,498,610 | ) | | (2,572,839 | ) |
| Net increase/(decrease) | | | (3,156,934 | ) | | 22,974,999 | |
| * | Class terminated November 4, 2015. |
| ** | Class commenced operations November 30, 2015. |
| *** | Class commenced operations on March 31, 2016. |
See notes to financial statements
147
| Financial statements (unaudited) |
Statements of changes – capital stock activity
International Small Cap Fund
| | | | Six Months | |
| | | | Ended | |
| | | | January 31, 2017 | * |
| | | | | |
| Amount | | | | |
| | | | | |
| Class R6 shares: | | | | |
| Sold | | $ | 5,000,000 | |
| Net increase | | $ | 5,000,000 | |
| | | | | |
| Shares | | | | |
| | | | | |
| Class R6 shares: | | | | |
| Sold | | | 500,000 | |
| Net increase | | | 500,000 | |
| * | Fund commenced operations on December 15, 2016. |
See notes to financial statements
148
| Financial statements (unaudited) |
Statements of changes – capital stock activity
Strategic Income Fund
| | | | | | | | |
| | | | Six Months | | | | |
| | | | Ended | | | Year Ended | |
| | | | January 31, 2017 | | | July 31, 2016 | |
| | | | | | | | |
| Amount | | | | | | | |
| | | | | | | | |
| Class A shares: | | | | | | | |
| Sold | | $ | 8,972,963 | | $ | 56,939,970 | |
| Issued as reinvestment of dividends | | | 733,791 | | | 1,047,220 | |
| Redeemed | | | (15,645,488 | ) | | (21,566,492 | ) |
| Net increase/(decrease) | | $ | (5,938,734 | ) | $ | 36,420,698 | |
| | | | | | | | |
| Class B shares:* | | | | | | | |
| Sold | | $ | — | | $ | 1,294 | |
| Issued as reinvestment of dividends | | | — | | | 13,247 | |
| Redeemed | | | — | | | (3,126,229 | ) |
| Net decrease | | $ | — | | $ | (3,111,688 | ) |
| | | | | | | | |
| Class C shares: | | | | | | | |
| Sold | | $ | 8,739,285 | | $ | 29,842,445 | |
| Issued as reinvestment of dividends | | | 375,498 | | | 598,489 | |
| Redeemed | | | (14,232,573 | ) | | (11,507,479 | ) |
| Net increase/(decrease) | | $ | (5,117,790 | ) | $ | 18,933,455 | |
| | | | | | | | |
| Class I shares: | | | | | | | |
| Sold | | $ | 67,585,436 | | $ | 283,167,551 | |
| Issued as reinvestment of dividends | | | 3,728,852 | | | 4,888,280 | |
| Redeemed | | | (71,235,895 | ) | | (82,080,606 | ) |
| Net increase | | $ | 78,393 | | $ | 205,975,225 | |
| | | | | | | | |
| Class R6 shares:** | | | | | | | |
| Sold | | $ | 5,109 | | $ | 1,477,303 | |
| Issued as reinvestment of dividends | | | 21,433 | | | 25,685 | |
| Redeemed | | | (149,240 | ) | | (30,000 | ) |
| Net increase/(decrease) | | $ | (122,698 | ) | $ | 1,472,988 | |
| * | Class terminated November 4, 2015. |
| ** | Class commenced operations November 30, 2015. |
See notes to financial statements
149
| Financial statements (unaudited) |
Statements of changes – capital stock activity
Strategic Income Fund (continued)
| | | | | | | | |
| | | | Six Months | | | | |
| | | | Ended | | | Year Ended | |
| | | | January 31, 2017 | | | July 31, 2016 | |
| | | | | | | | |
| Shares | | | | | | | |
| | | | | | | | |
| Class A shares: | | | | | | | |
| Sold | | | 964,836 | | | 6,326,553 | |
| Issued as reinvestment of dividends | | | 78,865 | | | 116,026 | |
| Redeemed | | | (1,679,960 | ) | | (2,386,765 | ) |
| Net increase/(decrease) | | | (636,259 | ) | | 4,055,814 | |
| | | | | | | | |
| Class B shares:* | | | | | | | |
| Sold | | | — | | | 144 | |
| Issued as reinvestment of dividends | | | — | | | 1,469 | |
| Redeemed | | | — | | | (346,146 | ) |
| Net decrease | | | — | | | (344,533 | ) |
| | | | | | | | |
| Class C shares: | | | | | | | |
| Sold | | | 945,668 | | | 3,328,628 | |
| Issued as reinvestment of dividends | | | 40,580 | | | 66,695 | |
| Redeemed | | | (1,540,138 | ) | | (1,278,220 | ) |
| Net increase/(decrease) | | | (553,890 | ) | | 2,117,103 | |
| | | | | | | | |
| Class I shares: | | | | | | | |
| Sold | | | 7,263,479 | | | 31,542,533 | |
| Issued as reinvestment of dividends | | | 401,887 | | | 543,286 | |
| Redeemed | | | (7,691,828 | ) | | (9,114,474 | ) |
| Net increase/(decrease) | | | (26,462 | ) | | 22,971,345 | |
| | | | | | | | |
| Class R6 shares:** | | | | | | | |
| Sold | | | 552 | | | 164,489 | |
| Issued as reinvestment of dividends | | | 2,308 | | | 2,852 | |
| Redeemed | | | (16,064 | ) | | (3,375 | ) |
| Net increase/(decrease) | | | (13,204 | ) | | 163,966 | |
| * | Class terminated November 4, 2015. |
| ** | Class commenced operations November 30, 2015. |
See notes to financial statements
150
| Financial statements (unaudited) |
Statements of changes – capital stock activity
US Growth Opportunities Fund
| | | | | | | | |
| | | | Six Months | | | | |
| | | | Ended | | | Year Ended | |
| | | | January 31, 2017 | | | July 31, 2016 | |
| | | | | | | | |
| Amount | | | | | | | |
| | | | | | | | |
| Class A shares: | | | | | | | |
| Sold | | $ | 169,877 | | $ | 1,174,521 | |
| Redeemed | | | (429,455 | ) | | (69,218 | ) |
| Net increase/(decrease) | | $ | (259,578 | ) | $ | 1,105,303 | |
| | | | | | | | |
| Class C shares: | | | | | | | |
| Sold | | $ | 66,756 | | $ | 172,338 | |
| Redeemed | | | (47,587 | ) | | (10,360 | ) |
| Net increase | | $ | 19,169 | | $ | 161,978 | |
| | | | | | | | |
| Class I shares: | | | | | | | |
| Sold | | $ | 28,771 | | $ | 166,256 | |
| Redeemed | | | (28,192 | ) | | (5,708,302 | ) |
| Net increase/(decrease) | | $ | 579 | | $ | (5,542,046 | ) |
| | | | | | | | |
| Class R6 shares:* | | | | | | | |
| Sold | | $ | 16,304 | | $ | 5,754,182 | |
| Redeemed | | | (119,479 | ) | | (15,171 | ) |
| Net increase/(decrease) | | $ | (103,175 | ) | $ | 5,739,011 | |
| | | | | | | | |
| Shares | | | | | | | |
| | | | | | | | |
| Class A shares: | | | | | | | |
| Sold | | | 15,179 | | | 108,669 | |
| Redeemed | | | (38,990 | ) | | (6,277 | ) |
| Net increase/(decrease) | | | (23,811 | ) | | 102,392 | |
| | | | | | | | |
| Class C shares: | | | | | | | |
| Sold | | | 6,045 | | | 16,029 | |
| Redeemed | | | (4,334 | ) | | (1,000 | ) |
| Net increase | | | 1,711 | | | 15,029 | |
| | | | | | | | |
| Class I shares: | | | | | | | |
| Sold | | | 2,676 | | | 15,054 | |
| Redeemed | | | (2,556 | ) | | (513,742 | ) |
| Net increase/(decrease) | | | 120 | | | (498,688 | ) |
| | | | | | | | |
| Class R6 shares:* | | | | | | | |
| Sold | | | 1,469 | | | 517,889 | |
| Redeemed | | | (10,698 | ) | | (1,438 | ) |
| Net increase/(decrease) | | | (9,229 | ) | | 516,451 | |
| * | Class commenced operations November 30, 2015. |
See notes to financial statements
151
| Financial statements (unaudited) |
Statement of Cash Flows
For the Period ended January 31, 2017
| | | | |
| | | International | |
| | | Long/Short Equity | |
| | | Fund | |
| Cash Flows from Operating Activities: | | | | |
| Net increase in net assets resulting from operations | | $ | 169,136 | |
| Adjustments to reconcile net decrease in net assets resulting from operations to net cash provided by (used for) operating activities: | | | | |
| Purchases of investments in securities | | | (5,280,354 | ) |
| Payments to cover securities sold short | | | (9,091,096 | ) |
| Proceeds from disposition of investments in securities | | | 12,058,969 | |
| Proceeds from securities sold short | | | 3,984,336 | |
| Purchases of short term investments, net | | | 14,553,610 | |
| Net realized (gain) loss: | | | | |
| Investment transactions | | | (106,202 | ) |
| Short sales | | | 879,208 | |
| Net change in unrealized appreciation/(depreciation) of: | | | | |
| Investments | | | (220,624 | ) |
| Short sales | | | (619,902 | ) |
| Changes in assets and liabilities: | | | | |
| (Increase) decrease in assets: | | | | |
| Cash at broker for open futures contracts | | | 12,308 | |
| Cash segregated as collateral on equity swaps | | | 320,000 | |
| Cash segregated as collateral on securities sold short | | | 2,866,629 | |
| Financial Derivative Instruments - Exchange-traded or centrally cleared | | | — | |
| Financial Derivative Instruments - Over-the-counter | | | 994,893 | |
| Receivable for investment securities sold | | | (490,222 | ) |
| Receivable from investment advisor | | | (25,904 | ) |
| Dividend and interest receivable | | | 903 | |
| Prepaid expenses and other assets | | | (16,113 | ) |
| Increase (decrease) in liabilities: | | | | |
| Payable for investment securities purchased | | | (1,377,463 | ) |
| Payable for short sale financing | | | (9,073 | ) |
| Payable for periodic payments for equity swap contracts | | | 400 | |
| Financial Derivative Instruments - Exchange-traded or centrally cleared | | | (7,392 | ) |
| Financial Derivative Instruments - Over-the-counter | | | (267,862 | ) |
| Payable for dividends on short sales | | | (491 | ) |
| Payable for 12b-1 distribution and service fees | | | (3,908 | ) |
| Accrued expenses and other payables | | | (7,547 | ) |
| Net cash used in operating activities | | $ | 18,316,241 | |
| Cash flows from Financing Activities: | | | | |
| Fund shares sold | | | 16,626,732 | |
| Fund shares redeemed | | | (35,220,380 | ) |
| Fund distributions paid and not reinvested* | | | (129,179 | ) |
| Decrease in receivable for Fund shares sold | | | 29,571 | |
| Increase in payable for Fund shares redeemed | | | 10,400 | |
| Net cash received from financing activities | | | (18,682,856 | ) |
| Net decrease in cash during the period | | $ | (366,615 | ) |
| Cash and foreign currency, beginning of period: | | | 382,013 | |
| Cash and foreign currency, end of period: | | $ | 15,398 | |
| * Non-cash reinvestment of Fund distributions | | $ | 208,844 | |
See notes to financial statements
152
This page intentionally left blank.
153
| Financial highlights (unaudited) |
For a share outstanding throughout the periods indicated
| | | | | | Income (loss) from investment operations: | | | Less distributions | |
| | | | | | | | | | | Dividends | | Distributions | | | |
| | | Net asset | | Net | | Net | | Total | | from | | from net | | | |
| | | value, | | investment | | realized and | | from | | net | | realized | | | |
| | | beginning | | income | | unrealized | | investment | | investment | | capital | | Total | |
| | | of period | | (loss)(b) | | gain (loss)(g) | | operations | | income | | gains | | distributions | |
| All Asset Fund | | | | | | | | | | | | | | | | | | | | | | |
| Class A | | | | | | | | | | | | | | | | | | | | | | |
| Period Ended 1/31/2017 | | $ | 10.12 | | | 0.05 | | | 0.14 | | | 0.19 | | | (0.04 | ) | | 0.00 | | | (0.04 | ) |
| Year Ended 7/31/2016(h) | | | 10.55 | | | 0.08 | | | (0.17 | ) | | (0.09 | ) | | (0.03 | ) | | (0.31 | ) | | (0.34 | ) |
| Year Ended 7/31/2015 | | | 10.76 | | | 0.09 | | | 0.12 | | | 0.21 | | | (0.14 | ) | | (0.28 | ) | | (0.42 | ) |
| Year Ended 7/31/2014 | | | 10.52 | | | 0.10 | | | 0.56 | | | 0.66 | | | (0.11 | ) | | (0.31 | ) | | (0.42 | ) |
| Year Ended 7/31/2013 | | | 9.93 | | | 0.09 | | | 0.61 | | | 0.70 | | | (0.09 | ) | | (0.02 | ) | | (0.11 | ) |
| Period Ended 7/31/2012(a) | | | 10.00 | | | 0.01 | | | (0.08 | ) | | (0.07 | ) | | 0.00 | | | 0.00 | | | 0.00 | |
| Class C | | | | | | | | | | | | | | | | | | | | | | |
| Period Ended 1/31/2017 | | $ | 9.93 | | | 0.01 | | | 0.14 | | | 0.15 | | | 0.00 | | | 0.00 | | | 0.00 | |
| Year Ended 7/31/2016(h) | | | 10.39 | | | 0.01 | | | (0.16 | ) | | (0.15 | ) | | 0.00 | | | (0.31 | ) | | (0.31 | ) |
| Year Ended 7/31/2015 | | | 10.63 | | | 0.02 | | | 0.10 | | | 0.12 | | | (0.08 | ) | | (0.28 | ) | | (0.36 | ) |
| Year Ended 7/31/2014 | | | 10.43 | | | 0.02 | | | 0.56 | | | 0.58 | | | (0.07 | ) | | (0.31 | ) | | (0.38 | ) |
| Year Ended 7/31/2013 | | | 9.91 | | | 0.02 | | | 0.59 | | | 0.61 | | | (0.07 | ) | | (0.02 | ) | | (0.09 | ) |
| Period Ended 7/31/2012(a) | | | 10.00 | | | (0.01 | ) | | (0.08 | ) | | (0.09 | ) | | 0.00 | | | 0.00 | | | 0.00 | |
| Class I | | | | | | | | | | | | | | | | | | | | | | |
| Period Ended 1/31/2017 | | $ | 10.10 | | | 0.06 | | | 0.15 | | | 0.21 | | | (0.07 | ) | | 0.00 | | | (0.07 | ) |
| Year Ended 7/31/2016(h) | | | 10.55 | | | 0.07 | | | (0.13 | ) | | (0.06 | ) | | (0.08 | ) | | (0.31 | ) | | (0.39 | ) |
| Year Ended 7/31/2015 | | | 10.77 | | | 0.13 | | | 0.10 | | | 0.23 | | | (0.17 | ) | | (0.28 | ) | | (0.45 | ) |
| Year Ended 7/31/2014 | | | 10.54 | | | 0.13 | | | 0.56 | | | 0.69 | | | (0.15 | ) | | (0.31 | ) | | (0.46 | ) |
| Year Ended 7/31/2013 | | | 9.94 | | | 0.11 | | | 0.61 | | | 0.72 | | | (0.10 | ) | | (0.02 | ) | | (0.12 | ) |
| Period Ended 7/31/2012(a) | | | 10.00 | | | 0.02 | | | (0.08 | ) | | (0.06 | ) | | 0.00 | | | 0.00 | | | 0.00 | |
| Class R6 | | | | | | | | | | | | | | | | | | | | | | |
| Period Ended 1/31/2017 | | $ | 10.09 | | | 0.06 | | | 0.15 | | | 0.21 | | | (0.08 | ) | | 0.00 | | | (0.08 | ) |
| Period Ended 7/31/2016(f)(h) | | | 10.25 | | | 0.12 | | | 0.11 | | | 0.23 | | | (0.08 | ) | | (0.31 | ) | | (0.39 | ) |
| (a) | The All Asset Fund commenced operations on March 30, 2012. |
| (b) | Per share data was calculated using average shares outstanding during the period. |
| (c) | Total returns are historical and assume changes in share price, reinvestment of all dividends and distributions and no sales charge. Had certain expenses not been waived/reimbursed during the periods shown, total returns would have been lower. Total returns for periods of less than one year are not annualized. |
| (d) | As the All Asset Fund invest in the shares of other investment companies, the calculation includes only those expenses charged directly to the Fund and does not include expenses charged to the underlying funds in which the Fund invests. |
| (e) | Not annualized for periods less than one year. |
| (f) | Class R6 commenced operations on November 30, 2015. |
| (g) | The amount shown for a share outstanding throughout the period may not be in accordance with the aggregate net realized and unrealized gain (loss) because of the timing of sales and repurchases of Fund shares in relation to fluctuating market value of the investments in the Fund. |
| (h) | The Funds' custodian, SSB, identified that clients were over-billed for certain "out-of-pocket" (OOP) costs during an 18-year period from 1998 until early November 2015. The amount of the difference in what was and what should have been charged, plus interest, was paid back to clients during the period ended 7/31/2016 as a reimbursement. The amount of the reimbursement was immaterial on a per share basis and would not have impacted the total return of the Fund. The "Annualized ratio of net investment income/(loss) to average net assets" and "Annualized ratio of operating expenses to average net assets" would be unchanged as the change to current period custodian fees was offset against current period expense waivers/reimbursements with no impact to net expenses or net investment income. The "Annualized ratio of operating expenses to average net assets without waivers and/or expenses reimbursed" would have been 0.01% higher had the custodian not reimbursed the Fund. |
See notes to financial statements
154
| Financial highlights (unaudited) |
| | | | | | | | | | | | Ratios to average net assets: | | | | |
| | | | | | | | | | | | | | | | | | Annualized ratio of | | | | |
| | | | | | | | | | | | | Annualized | | | Annualized | | operating expenses | | | | |
| | | | | | | | | | | | | ratio of | | | ratio of | | to average net | | | | |
| | | | Net asset | | | | | | Net assets, | | | operating | | net investment | | assets without | | | | |
| | | | value, | | | | | | end of | | | expenses to | | income/(loss) | | waivers and/or | | Portfolio | |
| | | | end of | | | Total | | | period | | | average | | to average | | expenses | | turnover | |
| | | | period | | | return(c) | | | (000) | | | net assets(d) | | net assets | | reimbursed(d) | | rate(e) | |
| | | | | | | | | | | | | | | | | | | | | | | |
| | | $ | 10.27 | | | 1.91 | % | $ | 3,850 | | | 0.85 | % | | 0.88 | % | | 1.01 | % | | 35 | % |
| | | | 10.12 | | | (0.71 | ) | | 4,011 | | | 0.85 | | | 0.84 | | | 0.95 | | | 44 | |
| | | | 10.55 | | | 1.94 | | | 6,396 | | | 0.85 | | | 0.88 | | | 0.91 | | | 19 | |
| | | | 10.76 | | | 6.44 | | | 8,929 | | | 0.85 | | | 0.94 | | | 0.93 | | | 52 | |
| | | | 10.52 | | | 7.05 | | | 12,023 | | | 0.85 | | | 0.86 | | | 1.10 | | | 37 | |
| | | | 9.93 | | | (0.70 | ) | | 5,740 | | | 0.85 | | | 0.43 | | | 2.13 | | | 7 | |
| | | | | | | | | | | | | | | | | | | | | | | |
| | | $ | 10.08 | | | 1.51 | % | $ | 9,287 | | | 1.60 | % | | 0.15 | % | | 1.77 | % | | 35 | % |
| | | | 9.93 | | | (1.37 | ) | | 9,247 | | | 1.60 | | | 0.09 | | | 1.71 | | | 44 | |
| | | | 10.39 | | | 1.14 | | | 10,824 | | | 1.60 | | | 0.18 | | | 1.68 | | | 19 | |
| | | | 10.63 | | | 5.61 | | | 11,094 | | | 1.60 | | | 0.20 | | | 1.67 | | | 52 | |
| | | | 10.43 | | | 6.18 | | | 9,357 | | | 1.60 | | | 0.20 | | | 1.80 | | | 37 | |
| | | | 9.41 | | | (0.90 | ) | | 1,013 | | | 1.60 | | | (0.24 | ) | | 4.49 | | | 7 | |
| | | | | | | | | | | | | | | | | | | | | | | |
| | | $ | 10.24 | | | 2.10 | % | $ | 7,993 | | | 0.60 | % | | 1.09 | % | | 0.82 | % | | 35 | % |
| | | | 10.10 | | | (0.45 | ) | | 10,750 | | | 0.60 | | | 0.69 | | | 0.68 | | | 44 | |
| | | | 10.55 | | | 2.20 | | | 44,333 | | | 0.60 | | | 1.18 | | | 0.63 | | | 19 | |
| | | | 10.77 | | | 6.72 | | | 46,867 | | | 0.60 | | | 1.22 | | | 0.62 | | | 52 | |
| | | | 10.54 | | | 7.28 | | | 43,221 | | | 0.60 | | | 1.10 | | | 0.79 | | | 37 | |
| | | | 9.94 | | | (0.60 | ) | | 28,875 | | | 0.60 | | | 0.52 | | | 1.41 | | | 7 | |
| | | | | | | | | | | | | | | | | | | | | | | |
| | | $ | 10.22 | | | 2.13 | % | $ | 29,584 | | | 0.60 | % | | 1.14 | % | | 0.70 | % | | 35 | % |
| | | | 10.09 | | | 2.37 | | | 29,020 | | | 0.60 | | | 1.88 | | | 0.64 | | | 44 | |
See notes to financial statements
155
| Financial highlights (unaudited) |
For a share outstanding throughout the periods indicated
| | | | | | Income (loss) from investment operations: | | Less distributions | |
| | | | | | | | | | | | | | | | Dividends | | Distributions | | | | |
| | | | Net asset | | | Net | | | Net | | | Total | | | from | | | from net | | | | |
| | | | value, | | | investment | | | realized and | | | from | | | net | | | realized | | | | |
| | | | beginning | | | income | | | unrealized | | | investment | | | investment | | | capital | | | Total | |
| | | | of period | | | (loss)(b) | | | gain (loss)(f) | | | operations | | | income | | | gains | | distributions | |
| Dividend & Income Builder Fund | | | | | | | | | | | | | | | | | | | |
| Class A | | | | | | | | | | | | | | | | | | | | | | |
| Period Ended 1/31/2017 | | $ | 12.16 | | | 0.11 | | | (0.01 | ) | | 0.10 | | | (0.18 | ) | | 0.00 | | | (0.18 | ) |
| Year Ended 7/31/2016(g) | | | 12.50 | | | 0.40 | | | (0.40 | ) | | 0.00 | | | (0.34 | ) | | 0.00 | | | (0.34 | ) |
| Year Ended 7/31/2015 | | | 12.57 | | | 0.35 | | | 0.11 | | | 0.46 | | | (0.33 | ) | | (0.20 | ) | | (0.53 | ) |
| Year Ended 7/31/2014 | | | 11.40 | | | 0.40 | | | 1.10 | | | 1.50 | | | (0.31 | ) | | (0.02 | ) | | (0.33 | ) |
| Period Ended 7/31/2013(a) | | | 10.00 | | | 0.33 | | | 1.33 | | | 1.66 | | | (0.26 | ) | | 0.00 | | | (0.26 | ) |
| Class C | | | | | | | | | | | | | | | | | | | | | | |
| Period Ended 1/31/2017 | | $ | 12.05 | | | 0.06 | | | (0.02 | ) | | 0.04 | | | (0.13 | ) | | 0.00 | | | (0.13 | ) |
| Year Ended 7/31/2016(g) | | | 12.40 | | | 0.30 | | | (0.39 | ) | | (0.09 | ) | | (0.26 | ) | | 0.00 | | | (0.26 | ) |
| Year Ended 7/31/2015 | | | 12.49 | | | 0.26 | | | 0.10 | | | 0.36 | | | (0.25 | ) | | (0.20 | ) | | (0.45 | ) |
| Year Ended 7/31/2014 | | | 11.35 | | | 0.30 | | | 1.10 | | | 1.40 | | | (0.24 | ) | | (0.02 | ) | | (0.26 | ) |
| Period Ended 7/31/2013(a) | | | 10.00 | | | 0.25 | | | 1.33 | | | 1.58 | | | (0.23 | ) | | 0.00 | | | (0.23 | ) |
| Class I | | | | | | | | | | | | | | | | | | | | | | |
| Period Ended 1/31/2017 | | $ | 12.16 | | | 0.11 | | | 0.00 | | | 0.11 | | | (0.19 | ) | | 0.00 | | | (0.19 | ) |
| Year Ended 7/31/2016 (g) | | | 12.49 | | | 0.40 | | | (0.37 | ) | | 0.03 | | | (0.36 | ) | | 0.00 | | | (0.36 | ) |
| Year Ended 7/31/2015 | | | 12.57 | | | 0.39 | | | 0.09 | | | 0.48 | | | (0.36 | ) | | (0.20 | ) | | (0.56 | ) |
| Year Ended 7/31/2014 | | | 11.39 | | | 0.44 | | | 1.09 | | | 1.53 | | | (0.33 | ) | | (0.02 | ) | | (0.35 | ) |
| Period Ended 7/31/2013 (a) | | | 10.00 | | | 0.46 | | | 1.22 | | | 1.68 | | | (0.29 | ) | | 0.00 | | | (0.29 | ) |
| Class R6 | | | | | | | | | | | | | | | | | | | | | | |
| Period Ended 1/31/2017 | | $ | 12.17 | | | 0.12 | | | (0.02 | ) | | 0.10 | | | (0.18 | ) | | 0.00 | | | (0.18 | ) |
| Period Ended 7/31/2016(e)(g) | | | 11.95 | | | 0.28 | | | 0.17 | | | 0.45 | | | (0.23 | ) | | 0.00 | | | (0.23 | ) |
| (a) | The Dividend & Income Builder Fund commenced operations on August 1, 2012. |
| (b) | Per share data was calculated using average shares outstanding during the period. |
| (c) | Total returns are historical and assume changes in share price, reinvestment of all dividends and distributions and no sales charge. Had certain expenses not been waived/reimbursed during the periods shown, total returns would have been lower. Total returns for periods of less than one year are not annualized. |
| (d) | Not annualized for periods less than one year. |
| (e) | Class R6 commenced operations on November 30, 2015. |
| (f) | The amount shown for a share outstanding throughout the period may not be in accordance with the aggregate net realized and unrealized gain (loss) because of the timing of sales and repurchases of Fund shares in relation to fluctuating market value of the investments in the Fund. |
| (g) | The Funds' custodian, SSB, identified that clients were over-billed for certain "out-of-pocket" (OOP) costs during an 18-year period from 1998 until early November 2015. The amount of the difference in what was and what should have been charged, plus interest, was paid back to clients during the period ended 7/31/2016 as a reimbursement. The amount of the reimbursement was immaterial on a per share basis and would not have impacted the total return of the Fund. The "Annualized ratio of net investment income/(loss) to average net assets" would have been 0.01% lower had the custodian not reimbursed the Fund. The "Annualized ratio of operating expenses to average net assets" and "Annualized ratio of operating expenses to average net assets without waivers and/or expenses reimbursed" would have been 0.01% and 0.02% higher, respectively. |
See notes to financial statements
156
| Financial highlights (unaudited) |
| | | | | | | | | | | | Ratios to average net assets: | | | | |
| | | | | | | | | | | | | | | | | | Annualized ratio of | | | | |
| | | | | | | | | | | | | Annualized | | | Annualized | | operating expenses | | | | |
| | | | | | | | | | | | | ratio of | | | ratio of | | to average net | | | | |
| | | | Net asset | | | | | | Net assets, | | | operating | | net investment | | assets without | | | | |
| | | | value, | | | | | | end of | | | expenses to | | income/(loss) | | waivers and/or | | | Portfolio | |
| | | | end of | | | Total | | | period | | | average | | | to average | | | expenses | | | turnover | |
| | | | period | | | return(c) | | | (000) | | | net assets | | | net assets | | | reimbursed | | | rate(d) | |
| | | | | | | | | | | | | | | | | | | | | | | |
| | | $ | 12.08 | | | 0.80 | % | $ | 26,948 | | | 1.23 | % | | 1.79 | % | | 1.23 | % | | 24 | % |
| | | | 12.16 | | | 0.19 | | | 40,869 | | | 1.27 | | | 3.37 | | | 1.27 | | | 39 | |
| | | | 12.50 | | | 3.81 | | | 15,959 | | | 1.30 | | | 2.84 | | | 1.46 | | | 26 | |
| | | | 12.57 | | | 13.26 | | | 14,308 | | | 1.30 | | | 3.20 | | | 1.94 | | | 78 | |
| | | | 11.40 | | | 16.79 | | | 1,891 | | | 1.30 | | | 2.98 | | | 7.35 | | | 188 | |
| | | | | | | | | | | | | | | | | | | | | | | |
| | | $ | 11.96 | | | 0.37 | % | $ | 35,580 | | | 2.00 | % | | 0.93 | % | | 2.00 | % | | 24 | % |
| | | | 12.05 | | | (0.58 | ) | | 33,327 | | | 2.03 | | | 2.55 | | | 2.04 | | | 39 | |
| | | | 12.40 | | | 3.00 | | | 13,846 | | | 2.05 | | | 2.15 | | | 2.23 | | | 26 | |
| | | | 12.49 | | | 12.45 | | | 4,525 | | | 2.05 | | | 2.38 | | | 2.68 | | | 78 | |
| | | | 11.35 | | | 15.94 | | | 463 | | | 2.05 | | | 2.32 | | | 8.17 | | | 188 | |
| | | | | | | | | | | | | | | | | | | | | | | |
| | | $ | 12.08 | | | 0.94 | % | $ | 68,610 | | | 0.98 | % | | 1.88 | % | | 0.98 | % | | 24 | % |
| | | | 12.16 | | | 0.48 | | | 46,454 | | | 1.04 | | | 3.37 | | | 1.04 | | | 39 | |
| | | | 12.49 | | | 3.97 | | | 24,356 | | | 1.05 | | | 3.13 | | | 1.24 | | | 26 | |
| | | | 12.57 | | | 13.56 | | | 8,156 | | | 1.05 | | | 3.50 | | | 1.66 | | | 78 | |
| | | | 11.39 | | | 17.01 | | | 1,463 | | | 1.05 | | | 4.18 | | | 7.11 | | | 188 | |
| | | | | | | | | | | | | | | | | | | | | | | |
| | | $ | 12.09 | | | 0.86 | % | $ | 265 | | | 1.05 | % | | 2.03 | % | | 1.10 | % | | 24 | % |
| | | | 12.17 | | | 3.93 | | | 403 | | | 1.03 | | | 3.51 | | | 1.09 | | | 39 | |
See notes to financial statements
157
| Financial highlights (unaudited) |
For a share outstanding throughout the periods indicated
| | | | | | Income (loss) from investment operations: | | Less distributions | |
| | | | | | | | | | | | | | | | Dividends | | | | | | | |
| | | | Net asset | | | Net | | | Net | | | Total | | | from | | | | | | Net asset | |
| | | | value, | | | investment | | | realized and | | | from | | | net | | | | | | value, | |
| | | | beginning | | | income | | | unrealized | | | investment | | | investment | | | Total | | | end of | |
| | | | of period | | | (loss)(a) | | gain (loss)(e) | | | operations | | | income | | distributions | | | period | |
| Emerging Markets Fund | | | | | | | | | | | | | | | | | | | | | | |
| Class A | | | | | | | | | | | | | | | | | | | | | | |
| Period Ended 1/31/2017 | | $ | 9.10 | | | (0.01 | ) | | 0.00 | * | | (0.01 | ) | | (0.06 | ) | | (0.06 | ) | $ | 9.03 | |
| Year Ended 7/31/2016 (f) | | | 8.60 | | | 0.13 | | | 0.39 | | | 0.52 | | | (0.02 | ) | | (0.02 | ) | | 9.10 | |
| Year Ended 7/31/2015 | | | 9.82 | | | 0.02 | | | (1.24 | ) | | (1.22 | ) | | 0.00 | | | 0.00 | | | 8.60 | |
| Year Ended 7/31/2014 | | | 8.49 | | | 0.02 | | | 1.31 | | | 1.33 | | | 0.00 | | | 0.00 | | | 9.82 | |
| Year Ended 7/31/2013 | | | 7.97 | | | 0.01 | | | 0.56 | | | 0.57 | | | (0.05 | ) | | (0.05 | ) | | 8.49 | |
| Year Ended 7/31/2012 | | | 9.74 | | | (0.02 | ) | | (1.62 | ) | | (1.64 | ) | | (0.13 | ) | | (0.13 | ) | | 7.97 | |
| Class C | | | | | | | | | | | | | | | | | | | | | | |
| Period Ended 1/31/2017 | | $ | 8.79 | | | (0.04 | ) | | 0.00 | * | | (0.04 | ) | | (0.01 | ) | | (0.01 | ) | $ | 8.74 | |
| Year Ended 7/31/2016 (f) | | | 8.35 | | | 0.06 | | | 0.38 | | | 0.44 | | | 0.00 | | | 0.00 | | | 8.79 | |
| Year Ended 7/31/2015 | | | 9.61 | | | (0.06 | ) | | (1.20 | ) | | (1.26 | ) | | 0.00 | | | 0.00 | | | 8.35 | |
| Year Ended 7/31/2014 | | | 8.37 | | | (0.04 | ) | | 1.28 | | | 1.24 | | | 0.00 | | | 0.00 | | | 9.61 | |
| Year Ended 7/31/2013 | | | 7.89 | | | (0.05 | ) | | 0.55 | | | 0.50 | | | (0.02 | ) | | (0.02 | ) | | 8.37 | |
| Year Ended 7/31/2012 | | | 9.70 | | | (0.09 | ) | | (1.60 | ) | | (1.69 | ) | | (0.12 | ) | | (0.12 | ) | | 7.89 | |
| Class I | | | | | | | | | | | | | | | | | | | | | | |
| Period Ended 1/31/2017 | | $ | 9.13 | | | 0.01 | | | (0.01 | ) | | 0.00 | | | (0.07 | ) | | (0.07 | ) | $ | 9.06 | |
| Year Ended 7/31/2016 (f) | | | 8.63 | | | 0.13 | | | 0.42 | | | 0.55 | | | (0.05 | ) | | (0.05 | ) | | 9.13 | |
| Year Ended 7/31/2015 | | | 9.86 | | | 0.03 | | | (1.25 | ) | | (1.22 | ) | | (0.01 | ) | | (0.01 | ) | | 8.63 | |
| Year Ended 7/31/2014 | | | 8.49 | | | 0.05 | | | 1.32 | | | 1.37 | | | 0.00 | | | 0.00 | | | 9.86 | |
| Year Ended 7/31/2013 | | | 7.98 | | | 0.03 | | | 0.56 | | | 0.59 | | | (0.08 | ) | | (0.08 | ) | | 8.49 | |
| Year Ended 7/31/2012 | | | 9.75 | | | (0.00 | )* | | (1.62 | ) | | (1.62 | ) | | (0.15 | ) | | (0.15 | ) | | 7.98 | |
| Class R6 | | | | | | | | | | | | | | | | | | | | | | |
| Period Ended 1/31/2017 | | $ | 9.13 | | | 0.01 | | | 0.00 | | | 0.01 | | | (0.08 | ) | | (0.08 | ) | $ | 9.06 | |
| Period Ended 7/31/2016(d)(f) | | | 8.06 | | | 0.06 | | | 1.06 | | | 1.12 | | | (0.05 | ) | | (0.05 | ) | | 9.13 | |
| (a) | Per share data was calculated using average shares outstanding during the period. |
| (b) | Total returns are historical and assume changes in share price, reinvestment of all dividends and distributions and no sales charge. Had certain expenses not been waived/reimbursed during the periods shown, total returns would have been lower. Total returns for periods of less than one year are not annualized. |
| (c) | Not annualized for periods less than one year. |
| (d) | Class R6 commenced operations on November 30, 2015. |
| (e) | The amount shown for a share outstanding throughout the period may not be in accordance with the aggregate net realized and unrealized gain (loss) because of the timing of sales and repurchases of Fund shares in relation to fluctuating market value of the investments in the Fund. |
| (f) | The Funds' custodian, SSB, identified that clients were over-billed for certain "out-of-pocket" (OOP) costs during an 18-year period from 1998 until early November 2015. The amount of the difference in what was and what should have been charged, plus interest, was paid back to clients during the period ended 7/31/2016 as a reimbursement. The amount of the reimbursement was immaterial on a per share basis and would not have impacted the total return of the Fund. The "Annualized ratio of net investment income/(loss) to average net assets" and "Annualized ratio of operating expenses to average net assets" would be unchanged as the change to custodian fees was offset against current period expense waivers/reimbursements with no impact to net expenses or net investment income. The "Annualized ratio of operating expenses to average net assets without waivers and/or expenses reimbursed" would have been 0.07% higher had the custodian not reimbursed the Fund. |
| * | Amount represents less than $0.01. |
See notes to financial statements
158
| Financial highlights (unaudited) |
| | | | | | | | | Ratios to average net assets: | | | | |
| | | | | | | | | | | | | | | | Annualized ratio of | | | | |
| | | | | | | | | | Annualized | | | Annualized | | operating expenses | | | | |
| | | | | | | | | | ratio of | | | ratio of | | to average net | | | | |
| | | | | | | Net assets, | | | operating | | | net investment | | assets without | | | | |
| | | | | | | end of | | | expenses to | | income/(loss) | | waivers and/or | | | Portfolio | |
| | | | Total | | | period | | | average | | | to average | | | expenses | | | turnover | |
| | | | return(b) | | | (000) | | | net assets | | | net assets | | | reimbursed | | | rate(c) | |
| | | | | | | | | | | | | | | | | | | | |
| | | | (0.04 | )% | $ | 13,422 | | | 1.65 | % | | (0.16 | )% | | 1.85 | % | | 14 | % |
| | | | 6.07 | | | 6,510 | | | 1.79 | | | 1.64 | | | 2.36 | | | 86 | |
| | | | (12.42 | ) | | 8,272 | | | 1.79 | | | 0.21 | | | 2.13 | | | 148 | |
| | | | 15.67 | | | 8,656 | | | 1.79 | | | 0.26 | | | 1.97 | | | 97 | |
| | | | 7.16 | | | 8,930 | | | 1.79 | | | 0.09 | | | 2.15 | | | 126 | |
| | | | (16.70 | ) | | 7,011 | | | 1.79 | | | (0.25 | ) | | 2.51 | | | 110 | |
| | | | | | | | | | | | | | | | | | | | |
| | | | (0.39 | )% | $ | 5,804 | | | 2.42 | % | | (0.88 | )% | | 2.63 | % | | 14 | % |
| | | | 5.27 | | | 3,553 | | | 2.54 | | | 0.70 | | | 3.16 | | | 86 | |
| | | | (13.11 | ) | | 3,049 | | | 2.54 | | | (0.62 | ) | | 2.90 | | | 148 | |
| | | | 14.81 | | | 4,036 | | | 2.54 | | | (0.42 | ) | | 2.74 | | | 97 | |
| | | | 6.33 | | | 3,169 | | | 2.54 | | | (0.60 | ) | | 2.87 | | | 126 | |
| | | | (17.31 | ) | | 2,305 | | | 2.54 | | | (1.08 | ) | | 3.23 | | | 110 | |
| | | | | | | | | | | | | | | | | | | | |
| | | | 0.11 | % | $ | 56,657 | | | 1.41 | % | | 0.20 | % | | 1.59 | % | | 14 | % |
| | | | 6.41 | | | 36,815 | | | 1.54 | | | 1.52 | | | 2.09 | | | 86 | |
| | | | (12.34 | ) | | 12,652 | | | 1.54 | | | 0.37 | | | 1.85 | | | 148 | |
| | | | 16.14 | | | 16,057 | | | 1.54 | | | 0.56 | | | 1.66 | | | 97 | |
| | | | 7.39 | | | 10,773 | | | 1.54 | | | 0.34 | | | 1.80 | | | 126 | |
| | | | (16.49 | ) | | 7,724 | | | 1.54 | | | (0.06 | ) | | 2.16 | | | 110 | |
| | | | | | | | | | | | | | | | | | | | |
| | | | 0.13 | % | $ | 2,281 | | | 1.41 | % | | 0.28 | % | | 1.57 | % | | 14 | % |
| | | | 13.92 | | | 318 | | | 1.54 | | | 1.07 | | | 2.17 | | | 86 | |
See notes to financial statements
159
| Financial highlights (unaudited) |
For a share outstanding throughout the periods indicated
| | | | | | Income (loss) from investment operations: | | Less distributions | | | | |
| | | | | | | | | | | | | | | | Dividends | | | | | | | |
| | | | Net asset | | | Net | | | Net | | | Total | | | from | | | | | | Net asset | |
| | | | value, | | | investment | | | realized and | | | from | | | net | | | | | | value, | |
| | | | beginning | | | income | | | unrealized | | | investment | | | investment | | | Total | | | end of | |
| | | | of period | | | (loss)(a) | | | gain (loss)(f) | | | operations | | | income | | distributions | | | period | |
| European Focus Fund | | | | | | | | | | | | | | | | | | | | | | |
| Class A | | | | | | | | | | | | | | | | | | | | | | |
| Period Ended 1/31/2017 | | $ | 32.17 | | | (0.01 | ) | | (1.04 | ) | | (1.05 | ) | | (0.79 | ) | | (0.79 | ) | $ | 30.33 | |
| Year Ended 7/31/2016(g) | | | 36.91 | | | 0.44 | | | (4.94 | ) | | (4.50 | ) | | (0.24 | ) | | (0.24 | ) | | 32.17 | |
| Year Ended 7/31/2015 | | | 35.42 | | | 0.35 | | | 1.67 | | | 2.02 | | | (0.53 | ) | | (0.53 | ) | | 36.91 | |
| Year Ended 7/31/2014 | | | 29.23 | | | 0.66 | | | 5.60 | | | 6.26 | | | (0.07 | ) | | (0.07 | ) | | 35.42 | |
| Year Ended 7/31/2013 | | | 22.44 | | | 0.26 | | | 6.90 | | | 7.16 | | | (0.37 | ) | | (0.37 | ) | | 29.23 | |
| Class C | | | | | | | | | | | | | | | | | | | | | | |
| Period Ended 1/31/2017 | | $ | 30.06 | | | (0.13 | ) | | (0.97 | ) | | (1.10 | ) | | (0.51 | ) | | (0.51 | ) | $ | 28.45 | |
| Year Ended 7/31/2016(g) | | | 34.57 | | | 0.22 | | | (4.69 | ) | | (4.47 | ) | | (0.04 | ) | | (0.04 | ) | | 30.06 | |
| Year Ended 7/31/2015 | | | 33.35 | | | 0.04 | | | 1.59 | | | 1.63 | | | (0.41 | ) | | (0.41 | ) | | 34.57 | |
| Year Ended 7/31/2014 | | | 27.67 | | | 0.32 | | | 5.36 | | | 5.68 | | | 0.00 | | | 0.00 | | | 33.35 | |
| Year Ended 7/31/2013 | | | 21.25 | | | 0.05 | | | 6.54 | | | 6.59 | | | (0.17 | ) | | (0.17 | ) | | 27.67 | |
| Class I | | | | | | | | | | | | | | | | | | | | | | |
| Period Ended 1/31/2017 | | $ | 32.18 | | | 0.02 | | | (1.03 | ) | | (1.01 | ) | | (0.96 | ) | | (0.96 | ) | $ | 30.21 | |
| Year Ended 7/31/2016(g) | | | 36.90 | | | 0.60 | | | (5.02 | ) | | (4.42 | ) | | (0.30 | ) | | (0.30 | ) | | 32.18 | |
| Year Ended 7/31/2015 | | | 35.48 | | | 0.42 | | | 1.67 | | | 2.09 | | | (0.67 | ) | | (0.67 | ) | | 36.90 | |
| Year Ended 7/31/2014 | | | 29.25 | | | 0.74 | | | 5.61 | | | 6.35 | | | (0.12 | ) | | (0.12 | ) | | 35.48 | |
| Year Ended 7/31/2013 | | | 22.46 | | | 0.40 | | | 6.85 | | | 7.25 | | | (0.46 | ) | | (0.46 | ) | | 29.25 | |
| Class R6 | | | | | | | | | | | | | | | | | | | | | | |
| Period Ended 1/31/2017 | | $ | 32.18 | | | 0.02 | | | (1.04 | ) | | (1.02 | ) | | (0.97 | ) | | (0.97 | ) | $ | 30.19 | |
| Period Ended 7/31/2016(d)(g) | | | 34.37 | | | 0.57 | | | (2.46 | ) | | (1.89 | ) | | (0.30 | ) | | (0.30 | ) | | 32.18 | |
| (a) | Per share data was calculated using average shares outstanding during the period. |
| (b) | Total returns are historical and assume changes in share price, reinvestment of all dividends and distributions and no sales charge. Had certain expenses not been waived/reimbursed during the periods shown, total returns would have been lower. Total returns for periods of less than one year are not annualized. |
| (c) | Not annualized for periods less than one year. |
| (d) | Class R6 commenced operations on November 30, 2015. |
| (e) | The net investment income ratio would have been 0.00% lower had the Fund not received refunds of previously withheld tax, plus interest, based on reclaims filed with Finland for calendar years 2009-2013. Refer to note 2, under the heading "Federal income taxes." |
| (f) | The amount shown for a share outstanding throughout the period may not be in accordance with the aggregate net realized and unrealized gain (loss) because of the timing of sales and repurchases of Fund shares in relation to fluctuating market value of the investments in the Fund. |
| (g) | The Funds' custodian, SSB, identified that clients were over-billed for certain "out-of-pocket" (OOP) costs during an 18-year period from 1998 until early November 2015. The amount of the difference in what was and what should have been charged, plus interest, was paid back to clients during the period ended 7/31/2016 as a reimbursement. The amount of the reimbursement was immaterial on a per share basis and would not have impacted the total return of the Fund. The "Annualized ratio of net investment income/(loss) to average net assets" would have been 0.00% lower had the custodian not reimbursed the Fund. The "Annualized ratio of operating expenses to average net assets" and "Annualized ratio of operating expenses to average net assets without waivers and/or expenses reimbursed" would have been 0.00% higher. |
See notes to financial statements
160
| Financial highlights (unaudited) |
| | | | | | | | | Ratios to average net assets: | | | | |
| | | | | | | | | | | | | | | | Annualized ratio of | | | | |
| | | | | | | | | | Annualized | | | Annualized | | | operating expenses | | | | |
| | | | | | | | | | ratio of | | | ratio of | | | to average net | | | | |
| | | | | | | Net assets, | | | operating | | | net investment | | | assets without | | | | |
| | | | | | | end of | | expenses to | | income/(loss) | | | waivers and/or | | | Portfolio | |
| | | | Total | | | period | | | average | | | to average | | | expenses | | | turnover | |
| | | | return(b) | | | (000) | | | net assets | | | net assets | | | reimbursed | | | rate(c) | |
| | | | | | | | | | | | | | | | | | | | |
| | | | (3.26 | )% | $ | 340,960 | | | 1.35 | % | | (0.09 | )% | | 1.35 | % | | 21 | % |
| | | | (12.22 | ) | | 560,452 | | | 1.28 | | | 1.35 | | | 1.28 | | | 62 | |
| | | | 5.86 | | | 905,598 | | | 1.30 | | | 0.99 | (e) | | 1.30 | | | 75 | |
| | | | 21.43 | | | 750,572 | | | 1.37 | | | 1.88 | | | 1.37 | | | 90 | |
| | | | 32.13 | | | 317,547 | | | 1.50 | | | 1.01 | | | 1.50 | | | 115 | |
| | | | | | | | | | | | | | | | | | | | |
| | | | (3.64 | )% | $ | 203,572 | | | 2.13 | % | | (0.89 | )% | | 2.13 | % | | 21 | % |
| | | | (12.94 | ) | | 287,339 | | | 2.07 | | | 0.71 | | | 2.07 | | | 62 | |
| | | | 5.02 | | | 365,135 | | | 2.09 | | | 0.12 | (e) | | 2.09 | | | 75 | |
| | | | 20.53 | | | 266,900 | | | 2.14 | | | 0.98 | | | 2.14 | | | 90 | |
| | | | 31.10 | | | 104,206 | | | 2.27 | | | 0.22 | | | 2.27 | | | 115 | |
| | | | | | | | | | | | | | | | | | | | |
| | | | (3.13 | )% | $ | 1,263,721 | | | 1.10 | % | | 0.15 | % | | 1.10 | % | | 21 | % |
| | | | (12.01 | ) | | 1,874,371 | | | 1.04 | | | 1.83 | | | 1.04 | | | 62 | |
| | | | 6.10 | | | 2,357,546 | | | 1.07 | | | 1.19 | (e) | | 1.07 | | | 75 | |
| | | | 21.73 | | | 1,400,298 | | | 1.11 | | | 2.09 | | | 1.11 | | | 90 | |
| | | | 32.54 | | | 266,517 | | | 1.20 | | | 1.55 | | | 1.20 | | | 115 | |
| | | | | | | | | | | | | | | | | | | | |
| | | | (3.15 | )% | $ | 1,093 | | | 1.09 | % | | 0.14 | % | | 1.09 | % | | 21 | % |
| | | | (5.54 | ) | | 1,413 | | | 1.05 | | | 2.68 | | | 1.05 | | | 62 | |
See notes to financial statements
161
| Financial highlights (unaudited) |
For a share outstanding throughout the periods indicated
| | | | | | Income (loss) from investment operations: | | Less distributions: | | | | |
| | | | | | | | | | | | | | | | Dividends | | | | | | | |
| | | | Net asset | | | Net | | | Net | | | Total | | | from | | | | | | Net asset | |
| | | | value, | | | investment | | | realized and | | | from | | | net | | | | | | value, | |
| | | | beginning | | | income | | | unrealized | | | investment | | | investment | | | Total | | | end of | |
| | | | of period | | | (loss)(a) | | | gain (loss)(f) | | | operations | | | income | | distributions | | | period | |
| Global Equity Income Fund | | | | | | | | | | | | | | | | | | | | | | |
| Class A | | | | | | | | | | | | | | | | | | | | | | |
| Period Ended 1/31/2017 | | $ | 7.29 | | | 0.15 | | | (0.03 | ) | | 0.12 | | | (0.20 | ) | | (0.20 | ) | $ | 7.21 | |
| Year Ended 7/31/2016(g) | | | 7.86 | | | 0.48 | | | (0.59 | ) | | (0.11 | ) | | (0.46 | ) | | (0.46 | ) | | 7.29 | |
| Year Ended 7/31/2015 | | | 8.36 | | | 0.48 | | | (0.50 | ) | | (0.02 | ) | | (0.48 | ) | | (0.48 | ) | | 7.86 | |
| Year Ended 7/31/2014 | | | 7.85 | | | 0.52 | | | 0.48 | | | 1.00 | | | (0.49 | ) | | (0.49 | ) | | 8.36 | |
| Year Ended 7/31/2013 | | | 7.06 | | | 0.50 | | | 0.78 | | | 1.28 | | | (0.49 | ) | | (0.49 | ) | | 7.85 | |
| Year Ended 7/31/2012 | | | 7.45 | | | 0.48 | | | (0.39 | ) | | 0.09 | | | (0.48 | ) | | (0.48 | ) | | 7.06 | |
| Class C | | | | | | | | | | | | | | | | | | | | | | |
| Period Ended 1/31/2017 | | $ | 7.24 | | | 0.12 | | | (0.02 | ) | | 0.10 | | | (0.18 | ) | | (0.18 | ) | $ | 7.16 | |
| Year Ended 7/31/2016(g) | | | 7.81 | | | 0.41 | | | (0.58 | ) | | (0.17 | ) | | (0.40 | ) | | (0.40 | ) | | 7.24 | |
| Year Ended 7/31/2015 | | | 8.32 | | | 0.42 | | | (0.51 | ) | | (0.09 | ) | | (0.42 | ) | | (0.42 | ) | | 7.81 | |
| Year Ended 7/31/2014 | | | 7.81 | | | 0.46 | | | 0.48 | | | 0.94 | | | (0.43 | ) | | (0.43 | ) | | 8.32 | |
| Year Ended 7/31/2013 | | | 7.03 | | | 0.44 | | | 0.77 | | | 1.21 | | | (0.43 | ) | | (0.43 | ) | | 7.81 | |
| Year Ended 7/31/2012 | | | 7.42 | | | 0.43 | | | (0.39 | ) | | 0.04 | | | (0.43 | ) | | (0.43 | ) | | 7.03 | |
| Class I | | | | | | | | | | | | | | | | | | | | | | |
| Period Ended 1/31/2017 | | $ | 7.30 | | | 0.16 | | | (0.02 | ) | | 0.14 | | | (0.21 | ) | | (0.21 | ) | $ | 7.23 | |
| Year Ended 7/31/2016(g) | | | 7.87 | | | 0.49 | | | (0.59 | ) | | (0.10 | ) | | (0.47 | ) | | (0.47 | ) | | 7.30 | |
| Year Ended 7/31/2015 | | | 8.37 | | | 0.51 | | | (0.51 | ) | | 0.00 | | | (0.50 | ) | | (0.50 | ) | | 7.87 | |
| Year Ended 7/31/2014 | | | 7.86 | | | 0.55 | | | 0.47 | | | 1.02 | | | (0.51 | ) | | (0.51 | ) | | 8.37 | |
| Year Ended 7/31/2013 | | | 7.07 | | | 0.53 | | | 0.77 | | | 1.30 | | | (0.51 | ) | | (0.51 | ) | | 7.86 | |
| Year Ended 7/31/2012 | | | 7.46 | | | 0.51 | | | (0.40 | ) | | 0.11 | | | (0.50 | ) | | (0.50 | ) | | 7.07 | |
| Class R6 | | | | | | | | | | | | | | | | | | | | | | |
| Period Ended 1/31/2017 | | $ | 7.30 | | | 0.15 | | | 0.00 | | | 0.15 | | | (0.22 | ) | | (0.22 | ) | $ | 7.23 | |
| Period Ended 7/31/2016(e)(g) | | | 7.44 | | | 0.34 | | | (0.16 | ) | | 0.18 | | | (0.32 | ) | | (0.32 | ) | | 7.30 | |
| (a) | Per share data was calculated using average shares outstanding during the period. |
| (b) | Total returns are historical and assume changes in share price, reinvestment of all dividends and distributions and no sales charge. Had certain expenses not been waived/reimbursed during the periods shown, total returns would have been lower. Total returns for periods of less than one year are not annualized. |
| (c) | Not annualized for periods less than one year. |
| (d) | The net investment income ratio would have been 0.01% lower had the fund not received refunds of previously withheld tax, plus interest, based on reclaims filed with Finland for calendar years 2009-2013. Refer to note 2, under the heading "Federal income taxes". |
| (e) | Class R6 commenced operations on November 30, 2015. |
| (f) | The amount shown for a share outstanding throughout the period may not be in accordance with the aggregate net realized and unrealized gain (loss) because of the timing of sales and repurchases of Fund shares in relation to fluctuating market value of the investments in the Fund. |
| (g) | The Funds' custodian, SSB, identified that clients were over-billed for certain "out-of-pocket" (OOP) costs during an 18-year period from 1998 until early November 2015. The amount of the difference in what was and what should have been charged, plus interest, was paid back to clients during the period ended 7/31/2016 as a reimbursement. The amount of the reimbursement was immaterial on a per share basis and would not have impacted the total return of the Fund. The "Annualized ratio of net investment income/(loss) to average net assets" would have been 0.00% lower had the custodian not reimbursed the Fund. The "Annualized ratio of operating expenses to average net assets" and "Annualized ratio of operating expenses to average net assets without waivers and/or expenses reimbursed" would have been 0.00% higher. |
See notes to financial statements
162
| Financial highlights (unaudited) |
| | | | | | | | | Ratios to average net assets: | | | | |
| | | | | | | | | | | | | | | | Annualized ratio of | | | | |
| | | | | | | | | | Annualized | | | Annualized | | | operating expenses | | | | |
| | | | | | | | | | ratio of | | | ratio of | | | to average net | | | | |
| | | | | | | Net assets, | | | operating | | | net investment | | | assets without | | | | |
| | | | | | | end of | | | expenses to | | | income/(loss) | | waivers and/or | | | Portfolio | |
| | | | Total | | | period | | | average | | | to average | | | expenses | | | turnover | |
| | | | return(b) | | | (000) | | | net assets | | | net assets | | | reimbursed | | | rate(c) | |
| | | | | | | | | | | | | | | | | | | | |
| | | | 1.76 | % | $ | 768,510 | | | 1.09 | % | | 4.07 | % | | 1.09 | % | | 55 | % |
| | | | (1.05 | ) | | 755,674 | | | 1.09 | | | 6.60 | | | 1.09 | | | 145 | |
| | | | (0.21 | ) | | 702,841 | | | 1.09 | | | 5.99 | (d) | | 1.09 | | | 127 | |
| | | | 12.93 | | | 804,022 | | | 1.13 | | | 6.31 | | | 1.13 | | | 103 | |
| | | | 18.58 | | | 707,252 | | | 1.22 | | | 6.56 | | | 1.22 | | | 130 | |
| | | | 1.59 | | | 467,318 | | | 1.29 | | | 6.97 | | | 1.29 | | | 108 | |
| | | | | | | | | | | | | | | | | | | | |
| | | | 1.39 | % | $ | 984,685 | | | 1.84 | % | | 3.40 | % | | 1.84 | % | | 55 | % |
| | | | (1.76 | ) | | 1,074,860 | | | 1.85 | | | 5.70 | | | 1.85 | | | 145 | |
| | | | (1.09 | ) | | 1,138,357 | | | 1.86 | | | 5.28 | (d) | | 1.86 | | | 127 | |
| | | | 12.18 | | | 957,099 | | | 1.88 | | | 5.59 | | | 1.88 | | | 103 | |
| | | | 17.65 | | | 587,376 | | | 1.98 | | | 5.85 | | | 1.98 | | | 130 | |
| | | | 0.82 | | | 363,751 | | | 2.05 | | | 6.21 | | | 2.05 | | | 108 | |
| | | | | | | | | | | | | | | | | | | | |
| | | | 2.04 | % | $ | 2,321,621 | | | 0.83 | % | | 4.30 | % | | 0.83 | % | | 55 | % |
| | | | (0.83 | ) | | 2,178,545 | | | 0.84 | | | 6.75 | | | 0.84 | | | 145 | |
| | | | 0.02 | | | 1,864,448 | | | 0.86 | | | 6.32 | (d) | | 0.86 | | | 127 | |
| | | | 13.19 | | | 1,363,213 | | | 0.87 | | | 6.60 | | | 0.87 | | | 103 | |
| | | | 18.87 | | | 665,505 | | | 0.95 | | | 6.95 | | | 0.95 | | | 130 | |
| | | | 1.87 | | | 332,048 | | | 1.01 | | | 7.38 | | | 1.01 | | | 108 | |
| | | | | | | | | | | | | | | | | | | | |
| | | | 2.06 | % | $ | 2,414 | | | 0.78 | % | | 4.13 | % | | 0.78 | % | | 55 | % |
| | | | 2.77 | % | | 1,824 | | | 0.79 | | | 4.71 | | | 0.79 | | | 145 | |
See notes to financial statements
163
| Financial highlights (unaudited) |
For a share outstanding throughout the periods indicated
| | | | | | Income (loss) from investment operations: | | Less distributions: | | | | |
| | | | | | | | | | | | | | | | Dividends | | | | | | | |
| | | | Net asset | | | Net | | | Net | | | Total | | | from | | | | | | Net asset | |
| | | | value, | | | investment | | | realized and | | | from | | | net realized | | | | | | value, | |
| | | | beginning | | | income | | | unrealized | | | investment | | | capital | | | Total | | | end of | |
| | | | of period | | | (loss)(a) | | | gain (loss)(f) | | | operations | | | gains | | distributions | | | period | |
| Global Technology Fund | | | | | | | | | | | | | | | | | | | | | | |
| Class A | | | | | | | | | | | | | | | | | | | | | | |
| Period Ended 1/31/2017 | | $ | 23.65 | | | (0.06 | ) | | 2.30 | | | 2.24 | | | (1.68 | ) | | (1.68 | ) | $ | 24.21 | |
| Year Ended 7/31/2016(g) | | | 26.30 | | | (0.08 | ) | | 0.64 | | | 0.56 | | | (3.21 | ) | | (3.21 | ) | | 23.65 | |
| Year Ended 7/31/2015 | | | 26.97 | | | (0.14 | ) | | 2.86 | | | 2.72 | | | (3.39 | ) | | (3.39 | ) | | 26.30 | |
| Year Ended 7/31/2014 | | | 23.22 | | | (0.17 | ) | | 4.09 | | | 3.92 | | | (0.17 | ) | | (0.17 | ) | | 26.97 | |
| Year Ended 7/31/2013 | | | 19.69 | | | 0.06 | | | 3.47 | | | 3.53 | | | 0.00 | | | 0.00 | | | 23.22 | |
| Year Ended 7/31/2012 | | | 20.55 | | | (0.15 | ) | | (0.71 | ) | | (0.86 | ) | | 0.00 | | | 0.00 | | | 19.69 | |
| Class C | | | | | | | | | | | | | | | | | | | | | | |
| Period Ended 1/31/2017 | | $ | 20.45 | | | (0.13 | ) | | 1.97 | | | 1.84 | | | (1.68 | ) | | (1.68 | ) | $ | 20.61 | |
| Year Ended 7/31/2016(g) | | | 23.32 | | | (0.23 | ) | | 0.57 | | | 0.34 | | | (3.21 | ) | | (3.21 | ) | | 20.45 | |
| Year Ended 7/31/2015 | | | 24.46 | | | (0.30 | ) | | 2.55 | | | 2.25 | | | (3.39 | ) | | (3.39 | ) | | 23.32 | |
| Year Ended 7/31/2014 | | | 21.23 | | | (0.33 | ) | | 3.73 | | | 3.40 | | | (0.17 | ) | | (0.17 | ) | | 24.46 | |
| Year Ended 7/31/2013 | | | 18.15 | | | (0.09 | ) | | 3.17 | | | 3.08 | | | 0.00 | | | 0.00 | | | 21.23 | |
| Year Ended 7/31/2012 | | | 19.08 | | | (0.28 | ) | | (0.65 | ) | | (0.93 | ) | | 0.00 | | | 0.00 | | | 18.15 | |
| Class I | | | | | | | | | | | | | | | | | | | | | | |
| Period Ended 1/31/2017 | | $ | 24.22 | | | (0.03 | ) | | 2.37 | | | 2.34 | | | (1.68 | ) | | (1.68 | ) | $ | 24.88 | |
| Year Ended 7/31/2016(g) | | | 26.80 | | | (0.02 | ) | | 0.65 | | | 0.63 | | | (3.21 | ) | | (3.21 | ) | | 24.22 | |
| Year Ended 7/31/2015 | | | 27.37 | | | (0.08 | ) | | 2.90 | | | 2.82 | | | (3.39 | ) | | (3.39 | ) | | 26.80 | |
| Year Ended 7/31/2014 | | | 23.50 | | | (0.10 | ) | | 4.14 | | | 4.04 | | | (0.17 | ) | | (0.17 | ) | | 27.37 | |
| Year Ended 7/31/2013 | | | 19.88 | | | 0.11 | | | 3.51 | | | 3.62 | | | 0.00 | | | 0.00 | | | 23.50 | |
| Year Ended 7/31/2012 | | | 20.68 | | | (0.09 | ) | | (0.71 | ) | | (0.80 | ) | | 0.00 | | | 0.00 | | | 19.88 | |
| Class R6 | | | | | | | | | | | | | | | | | | | | | | |
| Period Ended 1/31/2017 | | $ | 24.23 | | | (0.03 | ) | | 2.36 | | | 2.33 | | | (1.68 | ) | | (1.68 | ) | $ | 24.88 | |
| Period Ended 7/31/2016(d)(g) | | | 27.31 | | | 0.03 | | | 0.10 | | | 0.13 | | | (3.21 | ) | | (3.21 | ) | | 24.23 | |
| (a) | Per share data was calculated using average shares outstanding during the period. |
| (b) | Total returns are historical and assume changes in share price, reinvestment of all dividends and distributions and no sales charge. Had certain expenses not been waived/reimbursed during the periods shown, total returns would have been lower. Total returns for periods of less than one year are not annualized. |
| (c) | Not annualized for periods less than one year. |
| (d) | Class R6 commenced operations on November 30, 2015. |
| (e) | The net investment income ratio would have been 0.00% lower had the fund not received refunds of previously withheld tax, plus interest, based on reclaims filed with Finland for calendar years 2009-2013. Refer to note 2, under the heading "Federal income taxes". |
| (f) | The amount shown for a share outstanding throughout the period may not be in accordance with the aggregate net realized and unrealized gain (loss) because of the timing of sales and repurchases of Fund shares in relation to fluctuating market value of the investments in the Fund. |
| (g) | The Funds' custodian, SSB, identified that clients were over-billed for certain "out-of-pocket" (OOP) costs during an 18-year period from 1998 until early November 2015. The amount of the difference in what was and what should have been charged, plus interest, was paid back to clients during the period ended 7/31/2016 as a reimbursement. The amount of the reimbursement was immaterial on a per share basis and would not have impacted the total return of the Fund. The "Annualized ratio of net investment income/(loss) to average net assets" would have been 0.01% lower had the custodian not reimbursed the Fund. The "Annualized ratio of operating expenses to average net assets" and "Annualized ratio of operating expenses to average net assets without waivers and/or expenses reimbursed" would have been 0.01% higher. |
See notes to financial statements
164
| Financial highlights (unaudited) |
| | | | | | | | | Ratios to average net assets: | | | | |
| | | | | | | | | | | | | | | | Annualized ratio of | | | | |
| | | | | | | | | | Annualized | | | Annualized | | | operating expenses | | | | |
| | | | | | | | | | ratio of | | | ratio of | | | to average net | | | | |
| | | | | | | Net assets, | | | operating | | | net investment | | | assets without | | | | |
| | | | | | | end of | | | expenses to | | income/(loss) | | | waivers and/or | | | Portfolio | |
| | | | Total | | | period | | | average | | | to average | | | expenses | | | turnover | |
| | | | return(b) | | | (000) | | | net assets | | | net assets | | | reimbursed | | | rate(c) | |
| | | | | | | | | | | | | | | | | | | | |
| | | | 9.85 | % | $ | 81,098 | | | 1.36 | % | | (0.47 | )% | | 1.36 | % | | 19 | % |
| | | | 1.99 | | | 80,845 | | | 1.34 | | | (0.33 | ) | | 1.34 | | | 40 | |
| | | | 10.70 | | | 99,903 | | | 1.34 | | | (0.52 | )(e) | | 1.34 | | | 61 | |
| | | | 16.91 | | | 155,708 | | | 1.44 | | | (0.65 | ) | | 1.44 | | | 65 | |
| | | | 17.93 | | | 169,279 | | | 1.49 | | | 0.28 | | | 1.49 | | | 83 | |
| | | | (4.18 | ) | | 156,948 | | | 1.50 | | | (0.75 | ) | | 1.50 | | | 113 | |
| | | | | | | | | | | | | | | | | | | | |
| | | | 9.43 | % | $ | 56,963 | | | 2.13 | % | | (1.24 | )% | | 2.13 | % | | 19 | % |
| | | | 1.23 | | | 61,342 | | | 2.11 | | | (1.11 | ) | | 2.11 | | | 40 | |
| | | | 9.79 | | | 79,667 | | | 2.12 | | | (1.29 | )(e) | | 2.12 | | | 61 | |
| | | | 16.04 | | | 82,699 | | | 2.21 | | | (1.42 | ) | | 2.21 | | | 65 | |
| | | | 16.97 | | | 71,401 | | | 2.26 | | | (0.49 | ) | | 2.26 | | | 83 | |
| | | | (4.87 | ) | | 69,286 | | | 2.29 | | | (1.54 | ) | | 2.29 | | | 113 | |
| | | | | | | | | | | | | | | | | | | | |
| | | | 10.04 | % | $ | 65,337 | | | 1.12 | % | | (0.23 | )% | | 1.12 | % | | 19 | % |
| | | | 2.23 | | | 69,735 | | | 1.10 | | | (0.09 | ) | | 1.10 | | | 40 | |
| | | | 10.92 | | | 95,958 | | | 1.11 | | | (0.28 | )(e) | | 1.11 | | | 61 | |
| | | | 17.22 | | | 115,816 | | | 1.19 | | | (0.40 | ) | | 1.19 | | | 65 | |
| | | | 18.21 | | | 97,882 | | | 1.22 | | | 0.51 | | | 1.22 | | | 83 | |
| | | | (3.87 | ) | | 61,492 | | | 1.23 | | | (0.47 | ) | | 1.23 | | | 113 | |
| | | | | | | | | | | | | | | | | | | | |
| | | | 9.99 | % | $ | 285 | | | 1.16 | % | | (0.28 | )% | | 1.16 | % | | 19 | % |
| | | | 0.36 | | | 331 | | | 1.09 | | | 0.17 | | | 1.09 | | | 40 | |
See notes to financial statements
165
| Financial highlights (unaudited) |
For a share outstanding throughout the periods indicated
| | | | | | Income (loss) from investment operations: | | Less distributions: | | | | |
| | | | | | | | | | | | | | | | | | Distributions | | | | |
| | | | Net asset | | | Net | | | Net | | | Total | | | Dividends | | | from net | | | | |
| | | | value, | | | investment | | | realized and | | | from | | | from net | | | realized | | | | |
| | | | beginning | | | income | | | unrealized | | | investment | | | investment | | | capital | | | Total | |
| | | | of period | | | (loss)(b) | | | gain (loss)(f) | | | operations | | | income | | | gains | | distributions | |
| High Yield Opportunities Fund | | | | | | | | | | | | | | | | | | | | | | |
| Class A | | | | | | | | | | | | | | | | | | | | | | |
| Period Ended 1/31/2017 | | $ | 9.60 | | | 0.29 | | | 0.42 | | | 0.71 | | | (0.30 | ) | | 0.00 | | | (0.30 | ) |
| Year Ended 7/31/2016(g) | | | 9.68 | | | 0.52 | | | (0.10 | ) | | 0.42 | | | (0.50 | ) | | 0.00 | | | (0.50 | ) |
| Year Ended 7/31/2015 | | | 10.38 | | | 0.51 | | | (0.39 | ) | | 0.12 | | | (0.56 | ) | | (0.26 | ) | | (0.82 | ) |
| Year Ended 7/31/2014 | | | 9.98 | | | 0.59 | | | 0.45 | | | 1.04 | | | (0.61 | ) | | (0.03 | ) | | (0.64 | ) |
| Period Ended 7/31/2013(a) | | | 10.00 | | | 0.15 | | | (0.06 | ) | | 0.09 | | | (0.11 | ) | | 0.00 | | | (0.11 | ) |
| Class C | | | | | | | | | | | | | | | | | | | | | | |
| Period Ended 1/31/2017 | | $ | 9.58 | | | 0.26 | | | 0.41 | | | 0.67 | | | (0.26 | ) | | 0.00 | | | (0.26 | ) |
| Year Ended 7/31/2016(g) | | | 9.67 | | | 0.40 | | | (0.05 | ) | | 0.35 | | | (0.44 | ) | | 0.00 | | | (0.44 | ) |
| Year Ended 7/31/2015 | | | 10.38 | | | 0.42 | | | (0.38 | ) | | 0.04 | | | (0.49 | ) | | (0.26 | ) | | (0.75 | ) |
| Year Ended 7/31/2014 | | | 9.99 | | | 0.52 | | | 0.43 | | | 0.95 | | | (0.53 | ) | | (0.03 | ) | | (0.56 | ) |
| Period Ended 7/31/2013(a) | | | 10.00 | | | 0.13 | | | (0.05 | ) | | 0.08 | | | (0.09 | ) | | 0.00 | | | (0.09 | ) |
| Class I | | | | | | | | | | | | | | | | | | | | | | |
| Period Ended 1/31/2017 | | $ | 9.56 | | | 0.30 | | | 0.42 | | | 0.72 | | | (0.31 | ) | | 0.00 | | | (0.31 | ) |
| Year Ended 7/31/2016(g) | | | 9.65 | | | 0.51 | | | (0.08 | ) | | 0.43 | | | (0.52 | ) | | 0.00 | | | (0.52 | ) |
| Year Ended 7/31/2015 | | | 10.35 | | | 0.54 | | | (0.39 | ) | | 0.15 | | | (0.59 | ) | | (0.26 | ) | | (0.85 | ) |
| Year Ended 7/31/2014 | | | 9.97 | | | 0.62 | | | 0.43 | | | 1.05 | | | (0.64 | ) | | (0.03 | ) | | (0.67 | ) |
| Period Ended 7/31/2013(a) | | | 10.00 | | | 0.16 | | | (0.06 | ) | | 0.10 | | | (0.13 | ) | | 0.00 | | | (0.13 | ) |
| Class R6 | | | | | | | | | | | | | | | | | | | | | | |
| Period Ended 1/31/2017 | | $ | 9.56 | | | 0.30 | | | 0.42 | | | 0.72 | | | (0.31 | ) | | 0.00 | | | (0.31 | ) |
| Period Ended 7/31/2016(e)(g) | | | 9.20 | | | 0.34 | | | 0.37 | | | 0.71 | | | (0.35 | ) | | 0.00 | | | (0.35 | ) |
| (a) | The High Yield Opportunities Fund commenced operations on April 30, 2013. |
| (b) | Per share data was calculated using average shares outstanding during the period. |
| (c) | Total returns are historical and assume changes in share price, reinvestment of all dividends and distributions and no sales charge. Had certain expenses not been waived/reimbursed during the periods shown, total returns would have been lower. Total returns for periods of less than one year are not annualized. |
| (d) | Not annualized for periods less than one year. |
| (e) | Class R6 commenced operations on November 30, 2015. |
| (f) | The amount shown for a share outstanding throughout the period may not be in accordance with the aggregate net realized and unrealized gain (loss) because of the timing of sales and repurchases of Fund shares in relation to fluctuating market value of the investments in the Fund. |
| (g) | The Funds' custodian, SSB, identified that clients were over-billed for certain "out-of-pocket" (OOP) costs during an 18-year period from 1998 until early November 2015. The amount of the difference in what was and what should have been charged, plus interest, was paid back to clients during the period ended 7/31/2016 as a reimbursement. The amount of the reimbursement was immaterial on a per share basis and would not have impacted the total return of the Fund. The "Annualized ratio of net investment income/(loss) to average net assets" and "Annualized ratio of operating expenses to average net assets" would be unchanged as the change to current period custodian fees was offset against current period expense waivers/reimbursements with no impact to net expenses or net investment income. The "Annualized ratio of operating expenses to average net assets without waivers and/or expenses reimbursed" would have been 0.02% higher had the custodian not reimbursed the Fund. |
See notes to financial statements
166
| Financial highlights (unaudited) |
| | | | | | | | | | | | Ratios to average net assets: | | | | |
| | | | | | | | | | | | | | | | | | | Annualized ratio of | | | | |
| | | | | | | | | | | | | Annualized | | | Annualized | | | operating expenses | | | | |
| | | | | | | | | | | | | ratio of | | | ratio of | | | to average net | | | | |
| | | | Net asset | | | | | | Net assets, | | | operating | | | net investment | | | assets without | | | | |
| | | | value, | | | | | | end of | | | expenses to | | income/(loss) | | | waivers and/or | | | Portfolio | |
| | | | end of | | | Total | | | period | | | average | | | to average | | | expenses | | | turnover | |
| | | | period | | | return(c) | | | (000) | | | net assets | | | net assets | | | reimbursed | | | rate(d) | |
| | | | | | | | | | | | | | | | | | | | | | | |
| | | $ | 10.01 | | | 7.44 | % | $ | 11,359 | | | 0.93 | % | | 5.94 | % | | 1.17 | % | | 88 | % |
| | | | 9.60 | | | 4.63 | | | 7,950 | | | 1.00 | | | 5.49 | | | 1.30 | | | 174 | |
| | | | 9.68 | | | 1.19 | | | 1,955 | | | 1.10 | | | 5.09 | | | 1.38 | | | 201 | |
| | | | 10.38 | | | 10.62 | | | 2,148 | | | 1.10 | | | 5.66 | | | 1.68 | | | 340 | |
| | | | 9.98 | | | 0.92 | | | 1,127 | | | 1.10 | | | 6.07 | | | 2.82 | | | 136 | |
| | | | | | | | | | | | | | | | | | | | | | | |
| | | $ | 9.99 | | | 7.08 | % | $ | 3,112 | | | 1.68 | % | | 5.19 | % | | 1.89 | % | | 88 | % |
| | | | 9.58 | | | 3.88 | | | 2,060 | | | 1.78 | | | 4.60 | | | 2.14 | | | 174 | |
| | | | 9.67 | | | 0.39 | | | 1,373 | | | 1.85 | | | 4.37 | | | 2.00 | | | 201 | |
| | | | 10.38 | | | 9.67 | | | 1,196 | | | 1.85 | | | 5.01 | | | 2.45 | | | 340 | |
| | | | 9.99 | | | 0.81 | | | 999 | | | 1.85 | | | 5.27 | | | 3.63 | | | 136 | |
| | | | | | | | | | | | | | | | | | | | | | | |
| | | $ | 9.97 | | | 7.61 | % | $ | 19,966 | | | 0.68 | % | | 6.19 | % | | 0.90 | % | | 88 | % |
| | | | 9.56 | | | 4.76 | | | 9,003 | | | 0.81 | | | 5.50 | | | 1.15 | | | 174 | |
| | | | 9.65 | | | 1.48 | | | 21,882 | | | 0.85 | | | 5.37 | | | 1.15 | | | 201 | |
| | | | 10.35 | | | 10.76 | | | 23,235 | | | 0.85 | | | 6.02 | | | 1.38 | | | 340 | |
| | | | 9.97 | | | 1.06 | | | 23,608 | | | 0.85 | | | 6.27 | | | 1.82 | | | 136 | |
| | | | | | | | | | | | | | | | | | | | | | | |
| | | $ | 9.97 | | | 7.64 | % | $ | 22,931 | | | 0.68 | % | | 6.19 | % | | 0.85 | % | | 88 | % |
| | | | 9.56 | | | 7.96 | | | 22,372 | | | 0.76 | | | 5.60 | | | 1.05 | | | 174 | |
See notes to financial statements
167
| Financial highlights (unaudited) |
For a share outstanding throughout the periods indicated
| | | | | | Income (loss) from investment operations: | | Less distributions: | | | | |
| | | | | | | | | | | | | | | | Dividends | | | Distributions | | | | |
| | | | Net asset | | | Net | | | Net | | | Total | | | from | | | from net | | | | |
| | | | value, | | | investment | | | realized and | | | from | | | net | | | realized | | | | |
| | | | beginning | | | income | | unrealized gain | | | investment | | | investment | | | capital | | | Total | |
| | | | of period | | | (loss)(b) | | | (loss)(h) | | | operations | | | income | | | gains | | distributions | |
| International Long/Short Equity Fund | | | | | | | | | | | | | | | | | | | |
| Class A | | | | | | | | | | | | | | | | | | | | | | |
| Period Ended 1/31/2017 | | $ | 9.45 | | | (0.07 | ) | | 0.23 | | | 0.16 | | | 0.00 | | | 0.00 | | | 0.00 | |
| Year Ended 7/31/2016(g) | | | 10.27 | | | (0.14 | ) | | (0.32 | ) | | (0.46 | ) | | (0.33 | ) | | (0.03 | ) | | (0.36 | ) |
| Period Ended 7/31/2015(a) | | | 10.00 | | | (0.12 | ) | | 0.39 | | | 0.27 | | | 0.00 | | | 0.00 | | | 0.00 | |
| Class C | | | | | | | | | | | | | | | | | | | | | | |
| Period Ended 1/31/2017 | | $ | 9.38 | | | (0.09 | ) | | 0.24 | | | 0.15 | | | (0.18 | ) | | 0.00 | | | (0.18 | ) |
| Year Ended 7/31/2016(g) | | | 10.22 | | | (0.22 | ) | | (0.32 | ) | | (0.54 | ) | | (0.27 | ) | | (0.03 | ) | | (0.30 | ) |
| Period Ended 7/31/2015(a) | | | 10.00 | | | (0.17 | ) | | 0.39 | | | 0.22 | | | 0.00 | | | 0.00 | | | 0.00 | |
| Class I | | | | | | | | | | | | | | | | | | | | | | |
| Period Ended 1/31/2017 | | $ | 9.49 | | | (0.04 | ) | | 0.23 | | | 0.19 | | | (0.22 | ) | | 0.00 | | | (0.22 | ) |
| Year Ended 7/31/2016(g) | | | 10.28 | | | (0.12 | ) | | (0.31 | ) | | (0.43 | ) | | (0.33 | ) | | (0.03 | ) | | (0.36 | ) |
| Period Ended 7/31/2015(a) | | | 10.00 | | | (0.10 | ) | | 0.38 | | | 0.28 | | | 0.00 | | | 0.00 | | | 0.00 | |
| Class R6 | | | | | | | | | | | | | | | | | | | | | | |
| Period Ended 1/31/2017 | | $ | 9.48 | | | (0.04 | ) | | 0.23 | | | 0.19 | | | (0.22 | ) | | 0.00 | | | (0.22 | ) |
| Period Ended 7/31/2016(f)(g) | | | 10.14 | | | (0.09 | ) | | (0.21 | ) | | (0.30 | ) | | (0.33 | ) | | (0.03 | ) | | (0.36 | ) |
| (a) | The International Long/Short Equity Fund commenced operations on December 9, 2014. |
| (b) | Per share data was calculated using average shares outstanding during the period. |
| (c) | Total returns are historical and assume changes in share price, reinvestment of all dividends and distributions and no sales charge. Had certain expenses not been waived/reimbursed during the periods shown, total returns would have been lower. Total returns for periods of less than one year are not annualized. |
| (d) | The International Long/Short Equity Fund's operating expenses, excluding 12b-1 fees and dividend expense and financing charges on securities sold short, are contractually limited to 1.50%. Inclusive of investment expenses associated with short selling activities for the period ended 1/31/2017, the "Annualized ratio of operating expenses to average net assets" for Classes A, C, I and R6 was 2.16%, 3.21%, 2.22% and 2.21%, respectively. The "Annualized ratio of operating expenses to average net assets without waivers and/or expenses reimbursed" for Classes A, C, I and R6 was 3.51%, 4.70%, 3.76% and 3.67%, respectively. |
| (e) | Not annualized for periods less than one year. |
| (f) | Class R6 commenced operations on November 30, 2015. |
| (g) | The Funds' custodian, SSB, identified that clients were over-billed for certain "out-of-pocket" (OOP) costs during an 18-year period from 1998 until early November 2015. The amount of the difference in what was and what should have been charged, plus interest, was paid back to clients during the period ended 7/31/2016 as a reimbursement. The amount of the reimbursement was immaterial on a per share basis and would not have impacted the total return of the Fund. The "Annualized ratio of net investment income/(loss) to average net assets" and "Annualized ratio of operating expenses to average net assets" would be unchanged as the change to current period custodian fees was offset against current period expense waivers/reimbursements with no impact to net expenses or net investment income. The "Annualized ratio of operating expenses to average net assets without waivers and/or expenses reimbursed" would have been 0.04% higher had the custodian not reimbursed the Fund. |
| (h) | The amount shown for a share outstanding throughout the period may not be in accordance with the aggregate net realized and unrealized gain (loss) because of the timing of sales and repurchases of Fund shares in relation to fluctuating market value of the investments in the Fund. |
See notes to financial statements
168
| Financial highlights (unaudited) |
| | | | | | | | | | | | Ratios to average net assets: | | | | |
| | | | | | | | | | | | | | | | | | | Annualized ratio of | | | | |
| | | | | | | | | | | | | Annualized | | | Annualized | | | operating expenses | | | | |
| | | | | | | | | | | | | ratio of | | | ratio of | | | to average net | | | | |
| | | | Net asset | | | | | | Net assets, | | | operating | | | net investment | | | assets without | | | | |
| | | | value, | | | | | | end of | | | expenses to | | | income/(loss) | | | waivers and/or | | | Portfolio | |
| | | | end of | | | Total | | | period | | | average | | | to average | | | expenses | | | turnover | |
| | | | period | | | return(c) | | | (000) | | | net assets(d) | | | net assets | | reimbursed(d) | | | rate(e) | |
| | | | | | | | | | | | | | | | | | | | | | | |
| | | $ | 9.61 | | | 1.69 | % | $ | 1,080 | | | 1.62 | % | | (1.18 | )% | | 2.97 | % | | 111 | % |
| | | | 9.45 | | | (4.59 | ) | | 18,046 | | | 1.75 | | | (1.47 | ) | | 2.44 | | | 274 | |
| | | | 10.27 | | | 2.70 | | | 199 | | | 1.75 | | | (1.84 | ) | | 7.86 | | | 285 | |
| | | | | | | | | | | | | | | | | | | | | | | |
| | | $ | 9.35 | | | 1.62 | % | $ | 230 | | | 2.49 | % | | (1.83 | )% | | 3.98 | % | | 111 | % |
| | | | 9.38 | | | (5.39 | ) | | 233 | | | 2.50 | | | (2.28 | ) | | 4.80 | | | 274 | |
| | | | 10.22 | | | 2.20 | | | 102 | | | 2.50 | | | (2.55 | ) | | 8.60 | | | 285 | |
| | | | | | | | | | | | | | | | | | | | | | | |
| | | $ | 9.46 | | | 2.10 | % | $ | 8,726 | | | 1.49 | % | | (0.83 | )% | | 3.03 | % | | 111 | % |
| | | | 9.49 | | | (4.27 | ) | | 10,295 | | | 1.50 | | | (1.20 | ) | | 3.44 | | | 274 | |
| | | | 10.28 | | | 2.80 | | | 5,982 | | | 1.50 | | | (1.49 | ) | | 7.57 | | | 285 | |
| | | | | | | | | | | | | | | | | | | | | | | |
| | | $ | 9.45 | | | 2.12 | % | $ | 4,665 | | | 1.49 | % | | (0.83 | )% | | 2.95 | % | | 111 | % |
| | | | 9.48 | | | (3.03 | ) | | 4,681 | | | 1.50 | | | (1.39 | ) | | 2.74 | | | 274 | |
See notes to financial statements
169
| Financial highlights (unaudited) |
For a share outstanding throughout the periods indicated
| | | | | | Income (loss) from investment operations: | | Less distributions: | | | | |
| | | | | | | | | | | | | | | | | | | | | | | |
| | | | Net asset | | | Net | | | Net | | | Total | | | Dividends | | | | | | Net asset | |
| | | | value, | | | investment | | | realized and | | | from | | | from net | | | | | | value, | |
| | | | beginning | | | income | | | unrealized | | | investment | | | investment | | | Total | | | end of | |
| | | | of period | | | (loss)(a) | | gain (loss)(g) | | | operations | | | income | | distributions | | | period | |
| International Opportunities Fund | | | | | | | | | | | | | | | | | | | |
| Class A | | | | | | | | | | | | | | | | | | | | | | |
| Period Ended 1/31/2017 | | $ | 26.05 | | | (0.01 | ) | | 0.02 | | | 0.01 | | | (0.39 | ) | | (0.39 | ) | $ | 25.67 | |
| Year Ended 7/31/2016(h) | | | 28.44 | | | 0.25 | | | (2.28 | ) | | (2.03 | ) | | (0.36 | ) | | (0.36 | ) | | 26.05 | |
| Year Ended 7/31/2015 | | | 26.99 | | | 0.28 | | | 1.41 | | | 1.69 | | | (0.24 | ) | | (0.24 | ) | | 28.44 | |
| Year Ended 7/31/2014 | | | 23.79 | | | 0.31 | | | 2.98 | | | 3.29 | | | (0.09 | ) | | (0.09 | ) | | 26.99 | |
| Year Ended 7/31/2013 | | | 19.22 | | | 0.14 | | | 4.58 | | | 4.72 | | | (0.15 | ) | | (0.15 | ) | | 23.79 | |
| Year Ended 7/31/2012 | | | 21.77 | | | 0.15 | | | (2.59 | ) | | (2.44 | ) | | (0.11 | ) | | (0.11 | ) | | 19.22 | |
| Class C | | | | | | | | | | | | | | | | | | | | | | |
| Period Ended 1/31/2017 | | $ | 24.31 | | | (0.10 | ) | | 0.03 | | | (0.07 | ) | | (0.21 | ) | | (0.21 | ) | $ | 24.03 | |
| Year Ended 7/31/2016(h) | | | 26.60 | | | 0.12 | | | (2.21 | ) | | (2.09 | ) | | (0.20 | ) | | (0.20 | ) | | 24.31 | |
| Year Ended 7/31/2015 | | | 25.31 | | | 0.09 | | | 1.29 | | | 1.38 | | | (0.09 | ) | | (0.09 | ) | | 26.60 | |
| Year Ended 7/31/2014 | | | 22.40 | | | 0.08 | | | 2.83 | | | 2.91 | | | 0.00 | | | 0.00 | | | 25.31 | |
| Year Ended 7/31/2013 | | | 18.12 | | | (0.04 | ) | | 4.32 | | | 4.28 | | | 0.00 | | | 0.00 | | | 22.40 | |
| Year Ended 7/31/2012 | | | 20.56 | | | (0.00 | )* | | (2.44 | ) | | (2.44 | ) | | 0.00 | | | 0.00 | | | 18.12 | |
| Class I | | | | | | | | | | | | | | | | | | | | | | |
| Period Ended 1/31/2017 | | $ | 26.06 | | | 0.03 | | | 0.01 | | | 0.04 | | | (0.49 | ) | | (0.49 | ) | $ | 25.61 | |
| Year Ended 7/31/2016(h) | | | 28.45 | | | 0.42 | | | (2.36 | ) | | (1.94 | ) | | (0.45 | ) | | (0.45 | ) | | 26.06 | |
| Year Ended 7/31/2015 | | | 27.04 | | | 0.40 | | | 1.36 | | | 1.76 | | | (0.35 | ) | | (0.35 | ) | | 28.45 | |
| Year Ended 7/31/2014 | | | 23.82 | | | 0.39 | | | 2.98 | | | 3.37 | | | (0.15 | ) | | (0.15 | ) | | 27.04 | |
| Year Ended 7/31/2013 | | | 19.25 | | | 0.22 | | | 4.57 | | | 4.79 | | | (0.22 | ) | | (0.22 | ) | | 23.82 | |
| Year Ended 7/31/2012 | | | 21.83 | | | 0.21 | | | (2.61 | ) | | (2.40 | ) | | (0.18 | ) | | (0.18 | ) | | 19.25 | |
| Class R | | | | | | | | | | | | | | | | | | | | | | |
| Period Ended 1/31/2017 | | $ | 25.55 | | | (0.06 | ) | | 0.03 | | | (0.03 | ) | | (0.38 | ) | | (0.38 | ) | $ | 25.14 | |
| Year Ended 7/31/2016(h) | | | 27.97 | | | 0.28 | | | (2.35 | ) | | (2.07 | ) | | (0.35 | ) | | (0.35 | ) | | 25.55 | |
| Year Ended 7/31/2015 | | | 26.59 | | | 0.24 | | | 1.35 | | | 1.59 | | | (0.21 | ) | | (0.21 | ) | | 27.97 | |
| Year Ended 7/31/2014 | | | 23.44 | | | 0.22 | | | 2.95 | | | 3.17 | | | (0.02 | ) | | (0.02 | ) | | 26.59 | |
| Year Ended 7/31/2013 | | | 18.93 | | | 0.07 | | | 4.51 | | | 4.58 | | | (0.07 | ) | | (0.07 | ) | | 23.44 | |
| Year Ended 7/31/2012 | | | 21.50 | | | 0.08 | | | (2.58 | ) | | (2.50 | ) | | (0.07 | ) | | (0.07 | ) | | 18.93 | |
| Class R6 | | | | | | | | | | | | | | | | | | | | | | |
| Period Ended 1/31/2017 | | $ | 26.05 | | | 0.03 | | | 0.01 | | | 0.04 | | | (0.49 | ) | | (0.49 | ) | $ | 25.60 | |
| Period Ended 7/31/2016(e)(h) | | | 27.18 | | | 0.33 | | | (1.02 | ) | | (0.69 | ) | | (0.44 | ) | | (0.44 | ) | | 26.05 | |
| Class IF | | | | | | | | | | | | | | | | | | | | | | |
| Period Ended 1/31/2017 | | $ | 26.08 | | | 0.03 | | | 0.02 | | | 0.05 | | | (0.42 | ) | | (0.42 | ) | $ | 25.71 | |
| Year Ended 7/31/2016(f)(h) | | | 25.26 | | | 0.33 | | | 0.49 | | | 0.82 | | | 0.00 | | | 0.00 | | | 26.08 | |
| (a) | Per share data was calculated using average shares outstanding during the period. |
| (b) | Total returns are historical and assume changes in share price, reinvestment of all dividends and distributions and no sales charge. Had certain expenses not been waived/reimbursed during the periods shown, total returns would have been lower. Total returns for periods of less than one year are not annualized. |
| (c) | Not annualized for periods less than one year. |
| (d) | The net investment income ratio would have been 0.02% lower had the fund not received refunds of previously withheld tax, plus interest, based on reclaims filed with Finland for calendar years 2009-2013. Refer to note 2, under the heading "Federal income taxes". |
| (e) | Class R6 commenced operations on November 30, 2015. |
| (f) | Class IF commenced operations on March 31, 2016. |
See notes to financial statements
170
| Financial highlights (unaudited) |
| | | | | | | | | Ratios to average net assets: | | | | |
| | | | | | | | | | | | | | | | Annualized ratio of | | | | |
| | | | | | | | | | Annualized | | | Annualized | | | operating expenses | | | | |
| | | | | | | | | | ratio of | | | ratio of | | | to average net | | | | |
| | | | | | | Net assets, | | | operating | | | net investment | | | assets without | | | | |
| | | | | | | end of | | | expenses to | | income/(loss) | | | waivers and/or | | | Portfolio | |
| | | | Total | | | period | | | average | | | to average | | | expenses | | | turnover | |
| | | | return(b) | | | (000) | | | net assets | | | net assets | | | reimbursed | | | rate(c) | |
| | | | | | | | | | | | | | | | | | | | |
| | | | 0.07 | % | $ | 645,755 | | | 1.33 | % | | (0.04 | )% | | 1.33 | % | | 19 | % |
| | | | (7.18 | ) | | 784,966 | | | 1.35 | | | 0.99 | | | 1.35 | | | 45 | |
| | | | 6.33 | | | 1,623,379 | | | 1.36 | | | 1.03 | (d) | | 1.36 | | | 71 | |
| | | | 13.84 | | | 1,991,001 | | | 1.40 | | | 1.18 | | | 1.40 | | | 74 | |
| | | | 24.64 | | | 1,467,583 | | | 1.46 | | | 0.66 | | | 1.46 | | | 129 | |
| | | | (11.17 | ) | | 1,263,648 | | | 1.47 | | | 0.78 | | | 1.47 | | | 45 | |
| | | | | | | | | | | | | | | | | | | | |
| | | | (0.28 | )% | $ | 445,061 | | | 2.11 | % | | (0.84 | )% | | 2.11 | % | | 19 | % |
| | | | (7.88 | ) | | 504,192 | | | 2.11 | | | 0.50 | | | 2.11 | | | 45 | |
| | | | 5.47 | | | 552,630 | | | 2.13 | | | 0.33 | (d) | | 2.13 | | | 71 | |
| | | | 12.99 | | | 491,403 | | | 2.17 | | | 0.32 | | | 2.17 | | | 74 | |
| | | | 23.62 | | | 424,538 | | | 2.26 | | | (0.18 | ) | | 2.26 | | | 129 | |
| | | | (11.87 | ) | | 416,582 | | | 2.29 | | | (0.02 | ) | | 2.29 | | | 45 | |
| | | | | | | | | | | | | | | | | | | | |
| | | | 0.21 | % | $ | 2,734,243 | | | 1.07 | % | | 0.21 | % | | 1.07 | % | | 19 | % |
| | | | (6.87 | ) | | 2,966,703 | | | 1.06 | | | 1.65 | | | 1.06 | | | 45 | |
| | | | 6.60 | | | 2,333,559 | | | 1.10 | | | 1.46 | (d) | | 1.10 | | | 71 | |
| | | | 14.16 | | | 1,389,207 | | | 1.12 | | | 1.47 | | | 1.12 | | | 74 | |
| | | | 25.00 | | | 872,974 | | | 1.16 | | | 1.04 | | | 1.16 | | | 129 | |
| | | | (10.93 | ) | | 656,313 | | | 1.20 | | | 1.09 | | | 1.20 | | | 45 | |
| | | | | | | | | | | | | | | | | | | | |
| | | | (0.10 | )% | $ | 21,220 | | | 1.69 | % | | (0.45 | )% | | 1.69 | % | | 19 | % |
| | | | (7.45 | ) | | 20,056 | | | 1.67 | | | 1.12 | | | 1.67 | | | 45 | |
| | | | 6.05 | | | 14,173 | | | 1.63 | | | 0.89 | (d) | | 1.63 | | | 71 | |
| | | | 13.54 | | | 9,966 | | | 1.68 | | | 0.85 | | | 1.68 | | | 74 | |
| | | | 24.23 | | | 7,180 | | | 1.76 | | | 0.34 | | | 1.76 | | | 129 | |
| | | | (11.60 | ) | | 6,454 | | | 1.94 | | | 0.42 | | | 1.94 | | | 45 | |
| | | | | | | | | | | | | | | | | | | | |
| | | | 0.19 | % | $ | 388 | | | 1.09 | % | | 0.21 | % | | 1.09 | % | | 19 | % |
| | | | (2.57 | ) | | 714 | | | 1.08 | | | 1.96 | | | 1.08 | | | 45 | |
| | | | | | | | | | | | | | | | | | | | |
| | | | 0.24 | % | $ | 509,542 | | | 1.03 | % | | 0.25 | % | | 1.03 | % | | 19 | % |
| | | | 3.25 | | | 599,260 | | | 1.04 | | | 3.96 | | | 1.04 | | | 45 | |
| (g) | The amount shown for a share outstanding throughout the period may not be in accordance with the aggregate net realized and unrealized gain (loss) because of the timing of sales and repurchases of Fund shares in relation to fluctuating market value of the investments in the Fund. |
| (h) | The Funds' custodian, SSB, identified that clients were over-billed for certain "out-of-pocket" (OOP) costs during an 18-year period from 1998 until early November 2015. The amount of the difference in what was and what should have been charged, plus interest, was paid back to clients during the period ended 7/31/2016 as a reimbursement. The amount of the reimbursement was immaterial on a per share basis and would not have impacted the total return of the Fund. The "Annualized ratio of net investment income/(loss) to average net assets" would have been 0.00% lower had the custodian not reimbursed the Fund. The "Annualized ratio of operating expenses to average net assets" and "Annualized ratio of operating expenses to average net assets without waivers and/or expenses reimbursed" would have been 0.00% higher. |
| * | Amount represents less than $0.01. |
See notes to financial statements
171
| Financial highlights (unaudited) |
For a share outstanding throughout the periods indicated
| | | | | | Income (loss) from investment operations: | |
| | | | | | | | | | | | | | |
| | | | Net asset | | | Net | | | Net | | | Total | |
| | | | value, | | | investment | | | realized and | | | from | |
| | | | beginning | | | income | | | unrealized | | | investment | |
| | | | of period | | | (loss)(a) | | gain (loss)(d) | | | operations | |
| International Small Cap Fund | | | | | | | | | | | | | |
| | | | | | | | | | | | | | |
| Class R6 | | | | | | | | | | | | | |
| Period Ended 1/31/2017(e) | | $ | 10.00 | | | (0.01 | ) | | 0.73 | | | 0.72 | |
| (a) | Per share data was calculated using average shares outstanding during the period. |
| (b) | Total returns are historical and assume changes in share price, reinvestment of all dividends and distributions and no sales charge. Had certain expenses not been waived/reimbursed during the periods shown, total returns would have been lower. Total returns for periods of less than one year are not annualized. |
| (c) | Not annualized for periods less than one year. |
| (d) | The amount shown for a share outstanding throughout the period may not be in accordance with the aggregate net realized and unrealized gain (loss) because of the timing of sales and repurchases of Fund shares in relation to fluctuating market value of the investments in the Fund. |
| (e) | The International Small Cap Fund commenced operations on December 15, 2016. |
See notes to financial statements
172
| Financial highlights (unaudited) |
| | | Less distributions: | | Ratios to average net assets: | | | | |
| | | | | | | | | | | | | | | | | | | Annualized ratio of | | | | |
| | | | | | | | | | | | | Annualized | | | Annualized | | | operating expenses | | | | |
| | | | | | | | | | | | | ratio of | | | ratio of | | | to average net | | | | |
| | | | Net asset | | | | | | Net assets, | | | operating | | | net investment | | | assets without | | | | |
| | | | value, | | | | | | end of | | | expenses to | | income/(loss) | | waivers and/or | | | Portfolio | |
| | | | end of | | | Total | | | period | | | average | | | to average | | | expenses | | | turnover | |
| | | | period | | | return(b) | | | (000) | | | net assets | | | net assets | | | reimbursed | | | rate(c) | |
| | | | | | | | | | | | | | | | | | | | | | | |
| | | | | | | | | | | | | | | | | | | | | | | |
| | | $ | 10.72 | | | 7.20 | % | $ | 5,360 | | | 1.24 | % | | (0.37 | )% | | 4.72 | % | | 0 | % |
See notes to financial statements
173
| Financial highlights (unaudited) |
For a share outstanding throughout the periods indicated
| | | | | | Income (loss) from investment operations: | | Less distributions: | |
| | | | | | | | | | Net | | | | | | | | | | | | | |
| | | | | | | | | | realized | | | | | | | | | | | | | |
| | | | Net asset | | | Net | | | and | | | Total | | | Dividends | | | | | | | |
| | | | value, | | | investment | | | unrealized | | | from | | | from net | | | Return | | | | |
| | | | beginning | | | income | | | gain | | | investment | | | investment | | | of | | | Total | |
| | | | of period | | | (loss)(a) | | | (loss)(g) | | | operations | | | income | | | capital(i) | | distributions | |
| Strategic Income Fund | | | | | | | | | | | | | | | | | | | | | | |
| Class A | | | | | | | | | | | | | | | | | | | | | | |
| Period Ended 1/31/2017 | | $ | 9.34 | | | 0.13 | | | (0.08 | ) | | 0.05 | | | (0.12 | ) | | 0.00 | | | (0.12 | ) |
| Year Ended 7/31/2016(h) | | | 9.09 | | | 0.25 | | | 0.24 | | | 0.49 | | | (0.24 | ) | | 0.00 | | | (0.24 | ) |
| Year Ended 7/31/2015 | | | 9.13 | | | 0.32 | | | 0.01 | | | 0.33 | | | (0.37 | ) | | 0.00 | | | (0.37 | ) |
| Year Ended 7/31/2014 | | | 8.93 | | | 0.46 | | | 0.20 | | | 0.66 | | | (0.46 | ) | | 0.00 | | | (0.46 | ) |
| Period Ended 7/31/2013(b) | | | 9.12 | | | 0.23 | | | (0.19 | ) | | 0.04 | | | (0.23 | ) | | 0.00 | | | (0.23 | ) |
| Year Ended 12/31/2012 | | | 8.39 | | | 0.40 | | | 0.73 | | | 1.13 | | | (0.40 | ) | | 0.00 | | | (0.40 | ) |
| Year Ended 12/31/2011 | | | 8.82 | | | 0.44 | | | (0.43 | ) | | 0.01 | | | (0.37 | ) | | (0.07 | ) | | (0.44 | ) |
| Class C | | | | | | | | | | | | | | | | | | | | | | |
| Period Ended 1/31/2017 | | $ | 9.29 | | | 0.09 | | | (0.07 | ) | | 0.02 | | | (0.09 | ) | | 0.00 | | | (0.09 | ) |
| Year Ended 7/31/2016(h) | | | 9.04 | | | 0.18 | | | 0.24 | | | 0.42 | | | (0.17 | ) | | 0.00 | | | (0.17 | ) |
| Year Ended 7/31/2015 | | | 9.09 | | | 0.26 | | | 0.00 | * | | 0.26 | | | (0.31 | ) | | 0.00 | | | (0.31 | ) |
| Year Ended 7/31/2014 | | | 8.89 | | | 0.39 | | | 0.20 | | | 0.59 | | | (0.39 | ) | | 0.00 | | | (0.39 | ) |
| Period Ended 7/31/2013(b) | | | 9.08 | | | 0.19 | | | (0.20 | ) | | (0.01 | ) | | (0.18 | ) | | 0.00 | | | (0.18 | ) |
| Year Ended 12/31/2012 | | | 8.35 | | | 0.33 | | | 0.73 | | | 1.06 | | | (0.33 | ) | | 0.00 | | | (0.33 | ) |
| Year Ended 12/31/2011 | | | 8.79 | | | 0.37 | | | (0.43 | ) | | (0.06 | ) | | (0.32 | ) | | (0.06 | ) | | (0.38 | ) |
| Class I | | | | | | | | | | | | | | | | | | | | | | |
| Period Ended 1/31/2017 | | $ | 9.31 | | | 0.14 | | | (0.08 | ) | | 0.06 | | | (0.13 | ) | | 0.00 | | | (0.13 | ) |
| Year Ended 7/31/2016(h) | | | 9.06 | | | 0.27 | | | 0.23 | | | 0.50 | | | (0.25 | ) | | 0.00 | | | (0.25 | ) |
| Year Ended 7/31/2015 | | | 9.11 | | | 0.34 | | | 0.01 | | | 0.35 | | | (0.40 | ) | | 0.00 | | | (0.40 | ) |
| Year Ended 7/31/2014 | | | 8.91 | | | 0.48 | | | 0.21 | | | 0.69 | | | (0.49 | ) | | 0.00 | | | (0.49 | ) |
| Year Ended 7/31/2013(b) | | | 9.10 | | | 0.24 | | | (0.19 | ) | | 0.05 | | | (0.24 | ) | | 0.00 | | | (0.24 | ) |
| Year Ended 12/31/2012 | | | 8.37 | | | 0.42 | | | 0.73 | | | 1.15 | | | (0.42 | ) | | 0.00 | | | (0.42 | ) |
| Period Ended 12/31/2011(c) | | | 9.06 | | | 0.29 | | | (0.66 | ) | | (0.37 | ) | | (0.27 | ) | | (0.05 | ) | | (0.32 | ) |
| Class R6 | | | | | | | | | | | | | | | | | | | | | | |
| Period Ended 1/31/2017 | | $ | 9.32 | | | 0.14 | | | (0.07 | ) | | 0.07 | | | (0.14 | ) | | 0.00 | | | (0.14 | ) |
| Period Ended 7/31/2016(f)(h) | | | 8.99 | | | 0.17 | | | 0.32 | | | 0.49 | | | (0.16 | ) | | 0.00 | | | (0.16 | ) |
| (a) | Per share data was calculated using average shares outstanding during the period. |
| (b) | Strategic Income Fund changed its fiscal year end from December 31 to July 31 effective July 31, 2013. |
| (c) | Class I commenced operations on April 29, 2011. |
| (d) | Total returns are historical and assume changes in share price, reinvestment of all dividends and distributions and no sales charge. Had certain expenses not been waived/reimbursed during the periods shown, total returns would have been lower. Total returns for periods of less than one year are not annualized. |
| (e) | Not annualized for periods less than one year. |
| (f) | Class R6 commenced operations on November 30, 2015. |
| (g) | The amount shown for a share outstanding throughout the period may not be in accordance with the aggregate net realized and unrealized gain (loss) because of the timing of sales and repurchases of Fund shares in relation to fluctuating market value of the investments in the Fund. |
| (h) | The Funds' custodian, SSB, identified that clients were over-billed for certain "out-of-pocket" (OOP) costs during an 18-year period from 1998 until early November 2015. The amount of the difference in what was and what should have been charged, plus interest, was paid back to clients during the period ended 7/31/2016 as a reimbursement. The amount of the reimbursement was immaterial on a per share basis and would not have impacted the total return of the Fund. The "Annualized ratio of net investment income/(loss) to average net assets" would have been 0.01% lower had the custodian not reimbursed the Fund. The "Annualized ratio of operating expenses to average net assets" and "Annualized ratio of operating expenses to average net assets without waivers and/or expenses reimbursed" would have been 0.01% higher. |
| (i) | Determined in accordance with federal income tax regulations; refer to note 2, under the heading "Federal income taxes." |
| * | Amount represents less than $0.01. |
See notes to financial statements
174
| Financial highlights (unaudited) |
| | | | | | | | | | | | Ratios to average net assets: | | | | |
| | | | | | | | | | | | | | | | | | | Annualized ratio of | | | | |
| | | | | | | | | | | | | Annualized | | | Annualized | | | operating expenses | | | | |
| | | | | | | | | | | | | ratio of | | | ratio of | | | to average net | | | | |
| | | | Net asset | | | | | | Net assets, | | | operating | | | net investment | | | assets without | | | | |
| | | | value, | | | | | | end of | | | expenses to | | income/(loss) | | | waivers and/or | | | Portfolio | |
| | | | end of | | | Total | | | period | | | average | | | to average | | | expenses | | | turnover | |
| | | | period | | | return(d) | | | (000) | | | net assets | | | net assets | | | reimbursed | | | rate(e) | |
| | | | | | | | | | | | | | | | | | | | | | | |
| | | $ | 9.27 | | | 0.56 | % | $ | 60,469 | | | 1.01 | % | | 2.75 | % | | 1.01 | % | | 54 | % |
| | | | 9.34 | | | 5.46 | | | 66,863 | | | 1.04 | | | 2.72 | | | 1.04 | | | 110 | |
| | | | 9.09 | | | 3.71 | | | 28,200 | | | 1.09 | | | 3.52 | | | 1.15 | | | 54 | |
| | | | 9.13 | | | 7.56 | | | 11,522 | | | 1.10 | | | 5.02 | | | 1.36 | | | 84 | |
| | | | 8.93 | | | 0.39 | | | 15,656 | | | 1.10 | | | 4.36 | | | 1.44 | | | 50 | |
| | | | 9.12 | | | 13.75 | | | 17,596 | | | 1.10 | | | 4.51 | | | 1.34 | | | 47 | |
| | | | 8.39 | | | 0.06 | | | 17,210 | | | 1.20 | | | 5.04 | | | 1.51 | | | 41 | |
| | | | | | | | | | | | | | | | | | | | | | | |
| | | $ | 9.22 | | | 0.18 | % | $ | 45,047 | | | 1.76 | % | | 2.00 | % | | 1.76 | % | | 54 | % |
| | | | 9.29 | | | 4.70 | | | 50,531 | | | 1.80 | | | 1.98 | | | 1.80 | | | 110 | |
| | | | 9.04 | | | 2.84 | | | 30,034 | | | 1.85 | | | 2.84 | | | 1.92 | | | 54 | |
| | | | 9.09 | | | 6.78 | | | 17,744 | | | 1.85 | | | 4.27 | | | 2.12 | | | 84 | |
| | | | 8.89 | | | (0.06 | ) | | 19,483 | | | 1.85 | | | 3.62 | | | 2.20 | | | 50 | |
| | | | 9.08 | | | 12.95 | | | 22,328 | | | 1.85 | | | 3.77 | | | 2.11 | | | 47 | |
| | | | 8.35 | | | (0.80 | ) | | 22,244 | | | 1.94 | | | 4.29 | | | 2.26 | | | 41 | |
| | | | | | | | | | | | | | | | | | | | | | | |
| | | $ | 9.24 | | | 0.69 | % | $ | 320,807 | | | 0.75 | % | | 3.01 | % | | 0.75 | % | | 54 | % |
| | | | 9.31 | | | 5.70 | | | 323,462 | | | 0.79 | | | 2.96 | | | 0.79 | | | 110 | |
| | | | 9.06 | | | 3.86 | | | 106,544 | | | 0.84 | | | 3.73 | | | 0.92 | | | 54 | |
| | | | 9.11 | | | 7.88 | | | 18,271 | | | 0.85 | | | 5.29 | | | 1.08 | | | 84 | |
| | | | 8.91 | | | 0.54 | | | 7,291 | | | 0.85 | | | 4.59 | | | 1.16 | | | 50 | |
| | | | 9.10 | | | 14.06 | | | 3,903 | | | 0.85 | | | 4.79 | | | 1.07 | | | 47 | |
| | | | 8.37 | | | (4.10 | ) | | 1,885 | | | 0.85 | | | 5.16 | | | 1.25 | | | 41 | |
| | | | | | | | | | | | | | | | | | | | | | | |
| | | $ | 9.25 | | | 0.72 | % | $ | 1,394 | | | 0.70 | % | | 3.06 | % | | 0.70 | % | | 54 | % |
| | | | 9.32 | | | 5.57 | | | 1,528 | | | 0.73 | | | 2.77 | | | 0.73 | | | 110 | |
See notes to financial statements
175
| Financial highlights (unaudited) |
For a share outstanding throughout the periods indicated
| | | | | | Income (loss) from investment operations: | | | | | | | | | | |
| | | | | | | | | | | | | | | | | | | | | | | |
| | | | Net asset | | | Net | | | Net | | | Total | | | Net asset | | | | | | Net assets, | |
| | | | value, | | | investment | | | realized and | | | from | | | value, | | | | | | end of | |
| | | | beginning | | | income | | | unrealized | | | investment | | | end of | | | Total | | | period | |
| | | | of period | | | (loss)(b) | | | gain (loss)(f) | | | operations | | | period | | | return(c) | | | (000) | |
| US Growth Opportunities Fund | | | | | | | | | | | | | | | | | | | | | | |
| Class A | | | | | | | | | | | | | | | | | | | | | | |
| Period Ended 1/31/2017 | | $ | 11.14 | | | (0.02 | ) | | 0.13 | | | 0.11 | | $ | 11.25 | | | 0.99 | % | $ | 2,510 | |
| Year Ended 7/31/2016(g) | | | 11.19 | | | (0.04 | ) | | (0.01 | ) | | (0.05 | ) | | 11.14 | | | (0.45 | ) | | 2,750 | |
| Period Ended 7/31/2015(a) | | | 10.00 | | | (0.03 | ) | | 1.22 | | | 1.19 | | | 11.19 | | | 11.90 | | | 1,617 | |
| Class C | | | | | | | | | | | | | | | | | | | | | | |
| Period Ended 1/31/2017 | | $ | 11.01 | | | (0.06 | ) | | 0.12 | | | 0.06 | | $ | 11.07 | | | 0.54 | % | $ | 196 | |
| Year Ended 7/31/2016(g) | | | 11.14 | | | (0.13 | ) | | 0.00 | | | (0.13 | ) | | 11.01 | | | (1.17 | ) | | 176 | |
| Period Ended 7/31/2015(a) | | | 10.00 | | | (0.07 | ) | | 1.21 | | | 1.14 | | | 11.14 | | | 11.40 | | | 11 | |
| Class I | | | | | | | | | | | | | | | | | | | | | | |
| Period Ended 1/31/2017 | | $ | 11.19 | | | (0.01 | ) | | 0.13 | | | 0.12 | | $ | 11.31 | | | 1.07 | % | $ | 183 | |
| Year Ended 7/31/2016(g) | | | 11.21 | | | (0.00 | )* | | (0.02 | ) | | (0.02 | ) | | 11.19 | | | (0.18 | ) | | 180 | |
| Period Ended 7/31/2015(a) | | | 10.00 | | | 0.00 | | | 1.21 | | | 1.21 | | | 11.21 | | | 12.10 | | | 5,770 | |
| Class R6 | | | | | | | | | | | | | | | | | | | | | | |
| Period Ended 1/31/2017 | | $ | 11.19 | | | (0.01 | ) | | 0.13 | | | 0.12 | | $ | 11.31 | | | 1.07 | % | $ | 5,738 | |
| Period Ended 7/31/2016(e)(g) | | | 11.11 | | | (0.01 | ) | | 0.09 | | | 0.08 | | | 11.19 | | | 0.72 | | | 5,778 | |
| (a) | The US Growth Opportunities Fund commenced operations on December 18, 2014. |
| (b) | Per share data was calculated using average shares outstanding during the period. |
| (c) | Total returns are historical and assume changes in share price, reinvestment of all dividends and distributions and no sales charge. Had certain expenses not been waived/reimbursed during the periods shown, total returns would have been lower. Total returns for periods of less than one year are not annualized. |
| (d) | Not annualized for periods less than one year. |
| (e) | Class R6 commenced operations on November 30, 2015. |
| (f) | The amount shown for a share outstanding throughout the period may not be in accordance with the aggregate net realized and unrealized gain (loss) because of the timing of sales and repurchases of Fund shares in relation to fluctuating market value of the investments in the Fund. |
| (g) | The Funds' custodian, SSB, identified that clients were over-billed for certain "out-of-pocket" (OOP) costs during an 18-year period from 1998 until early November 2015. The amount of the difference in what was and what should have been charged, plus interest, was paid back to clients during the period ended 7/31/2016 as a reimbursement. The amount of the reimbursement was immaterial on a per share basis and would not have impacted the total return of the Fund. The "Annualized ratio of net investment income/(loss) to average net assets" and "Annualized ratio of operating expenses to average net assets" would be unchanged as the change to current period custodian fees was offset against current period expense waivers/reimbursements with no impact to net expenses or net investment income. The "Annualized ratio of operating expenses to average net assets without waivers and/or expenses reimbursed" would have been 0.01% higher had the custodian not reimbursed the Fund. |
| * | Amount represents less than $0.01. |
See notes to financial statements
176
| Financial highlights (unaudited) |
| | | Ratios to average net assets: | | | | |
| | | | | | | | | | Annualized ratio of | | | | |
| | | | Annualized | | | Annualized | | | operating expenses | | | | |
| | | | ratio of | | | ratio of | | | to average net | | | | |
| | | | operating | | | net investment | | | assets without | | | | |
| | | | expenses to | | | income/(loss) | | | waivers and/or | | | Portfolio | |
| | | | average | | | to average | | | expenses | | | turnover | |
| | | | net assets | | | net assets | | | reimbursed | | | rate(d) | |
| | | | | | | | | | | | | | |
| | | | 1.20 | % | | (0.35 | )% | | 2.26 | % | | 15 | % |
| | | | 1.20 | | | (0.38 | ) | | 2.53 | | | 8 | |
| | | | 1.20 | | | (0.46 | ) | | 3.21 | | | 12 | |
| | | | | | | | | | | | | | |
| | | | 1.95 | % | | (1.13 | )% | | 2.99 | % | | 15 | % |
| | | | 1.95 | | | (1.19 | ) | | 3.20 | | | 8 | |
| | | | 1.95 | | | (1.00 | ) | | 4.64 | | | 12 | |
| | | | | | | | | | | | | | |
| | | | 0.95 | % | | (0.10 | )% | | 1.93 | % | | 15 | % |
| | | | 0.94 | | | (0.02 | ) | | 2.47 | | | 8 | |
| | | | 0.95 | | | 0.01 | | | 3.39 | | | 12 | |
| | | | | | | | | | | | | | |
| | | | 0.95 | % | | (0.10 | )% | | 1.92 | % | | 15 | % |
| | | | 0.95 | | | (0.17 | ) | | 2.06 | | | 8 | |
See notes to financial statements
177
| Notes to financial statements (unaudited) |
Note 1. Organization
Henderson Global Funds (the "Trust") was organized on May 11, 2001, as a Delaware statutory trust and is registered under the Investment Company Act of 1940, as amended (the "1940 Act"), as an open-end management investment company. The Trust has an unlimited number of authorized shares that are divided among twelve series. The Henderson All Asset Fund ("All Asset"), Henderson Dividend & Income Builder Fund ("Dividend & Income Builder"), Henderson Emerging Markets Fund ("Emerging Markets"), Henderson European Focus Fund ("European Focus"), Henderson Global Equity Income Fund ("Global Equity Income"), Henderson Global Technology Fund ("Global Technology"), Henderson High Yield Opportunities Fund ("High Yield Opportunities"), Henderson International Long/Short Equity Fund ("International Long/Short Equity"), Henderson International Opportunities Fund ("International Opportunities"), Henderson International Small Cap Fund ("International Small Cap"), Henderson Strategic Income Fund ("Strategic Income"), and Henderson US Growth Opportunities Fund ("US Growth Opportunities") (collectively, the "Funds" or the "Henderson Funds") are included in this report. Each is a separate series of the Trust and each is diversified except for High Yield Opportunities, International Long/Short Equity, US Growth Opportunities and International Small Cap, which are non-diversified.
Though it may invest directly in securities, All Asset is primarily a Fund-of-Funds ("FoF") that seeks to achieve its objective by investing in a portfolio of underlying funds ("underlying funds") which, in turn, may invest in a variety of US and foreign equity, fixed income, money market, derivative instruments and commodities products. The FoF does not invest in the underlying funds for the purpose of exercising management or control; however, investments by the FoF, within its principal investment strategies, may represent a significant portion of the underlying funds' net assets subject to 1940 Act limitations and any exemptive relief provided thereto. The FoF's "Portfolio of Investments" lists the underlying funds held as an investment of the FoF as of period end, but does not include the holdings of the underlying funds.
The Funds offer the following share classes:
| | | | Share Classes | |
| Fund | | | A | | | C | | | I | | | R | | | R6 | | | IF | |
| All Asset | | | ✓ | | | ✓ | | | ✓ | | | n/a | | | ✓ | | | n/a | |
| Dividend & Income Builder | | | ✓ | | | ✓ | | | ✓ | | | n/a | | | ✓ | | | n/a | |
| Emerging Markets | | | ✓ | | | ✓ | | | ✓ | | | n/a | | | ✓ | | | n/a | |
| European Focus | | | ✓ | | | ✓ | | | ✓ | | | n/a | | | ✓ | | | n/a | |
| Global Equity Income | | | ✓ | | | ✓ | | | ✓ | | | n/a | | | ✓ | | | n/a | |
| Global Technology | | | ✓ | | | ✓ | | | ✓ | | | n/a | | | ✓ | | | n/a | |
| High Yield Opportunities | | | ✓ | | | ✓ | | | ✓ | | | n/a | | | ✓ | | | n/a | |
| International Long/Short Equity | | | ✓ | | | ✓ | | | ✓ | | | n/a | | | ✓ | | | n/a | |
| International Opportunities | | | ✓ | | | ✓ | | | ✓ | | | ✓ | | | ✓ | | | ✓ | |
| International Small Cap | | | n/a | | | n/a | | | n/a | | | n/a | | | ✓ | | | n/a | |
| Strategic Income | | | ✓ | | | ✓ | | | ✓ | | | n/a | | | ✓ | | | n/a | |
| US Growth Opportunities | | | ✓ | | | ✓ | | | ✓ | | | n/a | | | ✓ | | | n/a | |
Class A shares generally provide for a front-end sales charge. Class C shares provide for a contingent deferred sales charge. Class R, I, R6 and IF shares are not subject to a front-end or contingent deferred sales charge.
Each class of shares has equal rights as to earnings and assets, except that each class may bear different distribution and shareholder service expenses. Each class of shares has exclusive voting rights with respect to matters that affect just that class. Income, expenses (other than expenses attributable to a specific class), and realized and unrealized gains and losses on investments are allocated to each class of shares based on its relative net assets.
On October 3, 2016, Henderson Group plc, the indirect parent of Henderson Global Investors (North America) Inc., the investment advisor to the Henderson Funds ("HGINA" or the "Advisor"), and indirect parent to the sub-advisors of certain Henderson Funds, and Janus Capital Group Inc. announced that their respective Boards of Directors had agreed to an all-stock merger of equals (the "Parent Company Transaction"). As a part of their business combination, the parties agreed to seek to reorganize certain of the Henderson Funds into the Janus Investment Fund (the "Janus Trust"). In connection with this, on December 9, 2016, the Board of Trustees of the Trust (the "Henderson Funds Board") approved proposed reorganizations to integrate certain of the Henderson Funds with series of the Janus Trust, which are to be advised by the combined
178
| Notes to financial statements (unaudited) |
Henderson-Janus organization or its subsidiaries or affiliates upon completion of the Parent Company Transaction (the "Henderson-Janus Fund Reorganizations").
The Henderson-Janus Fund Reorganizations approved by the Henderson Funds Board include the transition of All Asset, Dividend & Income Builder, Emerging Markets, European Focus, Global Equity Income, International Long/Short Equity, International Opportunities, International Small Cap, Strategic Income and US Growth Opportunities to the Janus mutual fund platform by transferring the assets and liabilities of each Fund to a newly formed series of Janus Trust with the same investment objective(s), principal investment strategies and risks, pursuant to an Agreement and Plan of Reorganization.
In addition to the foregoing, the Henderson Funds Board approved the transition of the Henderson Global Technology Fund to the Janus mutual fund platform by transferring the assets and liabilities of the Henderson Global Technology Fund to the Janus Global Technology Fund, an existing series of the Janus Trust that has a substantially similar investment objective and principal investment strategies as the Henderson Global Technology Fund, pursuant to an Agreement and Plan of Reorganization.
Each of the Henderson-Janus Fund Reorganizations is conditioned on the closing of the Parent Company Transaction. In addition, before any of the Henderson-Janus Fund Reorganizations can occur, the applicable Agreement and Plan of Reorganization would need to be approved by the shareholders of the participating Henderson Fund.
Note 2. Significant accounting policies
The following is a summary of significant accounting policies followed by each Fund in preparation of its financial statements. These policies are in conformity with US generally accepted accounting principles ("US GAAP"), which includes the accounting and reporting guidelines under the Financial Accounting Standards Board's ("FASB") Accounting Standards Codification ("ASC") Topic 946, Financial Services – Investment Companies.
Security valuation
All securities and other investments are recorded at their estimated fair values, as described in Note 3.
Security transactions and investment income
Investment transactions are accounted for on a trade-date basis. Securities purchased or sold on a when-issued or delayed-delivery basis may be settled 15 days or more after the trade date. Interest income is recorded on an accrual basis. Dividend income, or dividend expense on securities sold short, is recorded on the ex-dividend date. Bond premium is amortized and discount is accreted over the expected life of each applicable security. Paydown gains and losses on mortgage-related and other asset-backed securities are recorded as components of interest income on the Statements of Operations. Income or short-term capital gain distributions received from underlying funds are recorded as dividend income. Long-term capital gain distributions received from underlying funds are recorded as realized gains. Corporate actions involving foreign securities, including dividends, are recorded as soon as the information becomes available. Withholding taxes on foreign dividends are accrued in accordance with the applicable country's tax rules and rates subject to double taxation treaties with the United States, as applicable. Gains and losses realized on sales of securities are determined using the specific identification method by comparing the identified cost of the security lot sold with the net sales proceeds, which is the same basis used for federal income tax purposes.
Foreign currency translation
Investments in securities, including securities sold short, financial derivative instruments and other assets and liabilities denominated in foreign currencies are translated into US dollar amounts at the date of valuation. Purchases and sales of investment securities and income and expense items denominated in foreign currencies are translated into US dollar amounts on the respective dates of such transactions.
The Funds do not separate the portion of the results of operations resulting from changes in foreign exchange rates on investments from the fluctuations arising from changes in market prices of securities held. Such fluctuations are included with the net realized and unrealized gain or loss from investments on the Statements of Operations.
Reported net realized foreign exchange gains or losses arise from sales of foreign currencies, currency gains or losses realized between the trade date and settlement date on securities transactions, and the difference between the amounts of dividends, interest, and foreign withholding taxes recorded on the Funds' books and the US dollar equivalent of the amounts actually received or paid. Net unrealized foreign exchange gains and losses arise from changes in the fair values of assets and liabilities, other than investments in securities and financial derivative instruments, resulting from changes in exchange rates.
Forward foreign currency contracts
The Funds may enter into forward foreign currency contracts primarily to hedge against foreign currency exchange rate risks on its non-US dollar denominated investment securities. Alternatively, a Fund may enter into a forward foreign currency contract for the speculative purpose of gaining exposure to particular foreign currency markets. When entering into forward foreign currency contracts, a Fund agrees to receive or deliver a
179
| Notes to financial statements (unaudited) |
fixed quantity of foreign currency for an agreed-upon price on an agreed future date. Realized gains or losses on forward foreign currency contracts include net gains or losses on contracts that have matured. Forward foreign currency contracts are valued daily and the unrealized appreciation or depreciation is included in the Statements of Assets and Liabilities as a component of "Financial Derivative Instruments." These instruments involve market risk, credit risk or both kinds of risks, the extent of which may subject the Fund to loss in excess of the amount recognized on the Statements of Assets and Liabilities. These risks arise from the possible inability of counterparties to meet the terms of their contracts and from unfavorable currency fluctuations. When applicable, open forward foreign currency contracts at the end of the period are listed in each Fund's Portfolio of Investments.
Futures contracts
The Funds are subject to interest rate risk, equity risk and foreign currency risk in the normal course of pursuing their investment objectives. Accordingly, the Funds may invest in futures contracts to gain exposure to, or hedge against, changes in the value of interest rates, equity indices or foreign currencies. A futures contract represents a commitment for the future purchase or sale of an asset at a specified price and date. Upon entering into such contracts, a Fund is required to deposit cash with the broker as initial margin in an amount equal to a certain percentage of the contract amount. Subsequent payments, known as "variation margin," are made or received by the Fund, depending on fluctuations in the fair value of the underlying asset. Unrealized appreciation or depreciation, reflected as a component of "Financial Derivative Instruments" assets and/or liabilities on the Statements of Assets and Liabilities, is recognized but not considered realized until the contracts expire or are closed. Should market conditions move unexpectedly, the Funds may not achieve the anticipated benefits of the futures contracts and may realize a loss. The use of futures contracts involves the risk of imperfect correlation in movements in the price of futures contracts, interest rates, and/or the underlying hedged assets. With futures contracts, there is limited counterparty credit risk to the Funds as futures contracts are exchange-traded and the exchange's clearinghouse acts as counterparty to all exchange-traded futures transactions. When applicable, open futures contracts outstanding at the end of the period are listed in each Fund's Portfolio of Investments.
Securities sold short
International Long/Short Equity may engage in short selling (i.e., selling securities it does not own) as part of its normal investment activities. The Fund will enter into a short position on a security believed to be overvalued or poised to underperform in order to take advantage of a decline in its price. The Fund has an agreement with its custodian in order to execute its short sales strategy. To complete the short sale, the Fund must borrow the security to make delivery to the buyer. Securities sold short are recorded as a liability and marked-to-market daily. These positions are reflected as "Securities sold short, at value" on the Statement of Assets and Liabilities. The Fund is required to pay the lender any dividends or interest, which accrues during the period of the loan. The Fund is then obligated to replace the security borrowed by purchasing it at market price at the time of replacement and delivering it to the custodian to extinguish the liability. The price of the security at replacement may differ from the price at which the security was sold. The Fund will incur a loss if the price of the security increases between the dates of the short sale and when the Fund replaces the borrowed security. This loss may be unlimited. The Fund will realize a gain if the security declines in price between those dates. The amount of any gain will be decreased, and the amount of any loss increased, by the amount of any premium, dividends or interest the Fund may be required to pay in connection with a short sale.
The proceeds of a short sale may be reinvested in additional security positions. Because the Fund may invest the proceeds of a short sale, the effect of short selling is similar to the effect of leverage. The Fund is required to segregate cash and/or securities with its custodian, so that the amount segregated is at least equal to the current value of the securities sold short. At January 31, 2017, the Fund had pledged securities valued at $2,692,727 and segregated $3,273,947 in cash collateral held at the custodian for securities sold short in the amount of $5,286,355. The collateral amount required to be pledged/segregated is adjusted daily based on the market value of the short positions. The securities pledged as collateral that are restricted from use are included on the Portfolio of Investments. Dividends declared on securities sold short, in addition to short sale financing fees, are treated as an expense on the Statement of Operations.
There are substantial risks associated with selling short, including the risk that a loss on a short sale is potentially unlimited as the value of a security sold short increases. The Fund is also subject to the risk that the third party to the short sale may fail to honor its contract terms, causing a loss to the Fund. Open short positions outstanding at the end of the period are listed in the Fund's Portfolio of Investments.
Options
The Funds may purchase put and call options to create investment exposure consistent with their investment objectives or to hedge or limit the exposure of their portfolio holdings. Alternatively, certain Funds may write (sell) call and put options on securities and financial derivative instruments in order to gain
180
| Notes to financial statements (unaudited) |
exposure to, or protect against, changes in the markets. The Funds may use options on exchange-traded futures contracts, indices or securities to hedge an existing position or future investment, for speculative purposes, or to manage exposure to market movements. The Funds may also use foreign currency options. Purchasing foreign currency options gives the Fund the right, but not the obligation, to buy or sell the currency and will specify the amount of currency and a rate of exchange that may be exercised by a specified date. These options may be used as a short or long hedge against possible variations in foreign exchange rates or to gain exposure to foreign currencies. The Funds may also use interest rate swaptions in which the underlying instrument is an interest rate swap (discussed below under the heading "Swap contracts"). Swaptions are agreements to enter into a pre-defined swap agreement by some specified date in the future. The writer of a swaption becomes the counterparty to the swap if the buyer exercises. The interest rate swaption agreement will specify whether the buyer of the swaption will be a fixed-rate receiver or a fixed-rate payer upon exercise. These types of options may be used to hedge against unfavorable fluctuations in interest rates.
Purchasing call options tends to increase the Fund's exposure to the underlying instrument, while purchasing put options tends to decrease the Fund's exposure to the underlying instrument. The Fund pays a premium when purchasing call options or put options. The option is subsequently valued daily and unrealized appreciation or depreciation is recorded; the asset is reflected as a component of "Financial Derivative Instruments" on the Statement of Assets and Liabilities. The Funds realize a gain or loss upon the expiration or closing of the option transaction. The primary risks of investing in purchased options include the risk of imperfect correlation between the option price and the value of the underlying instrument, and the possibility of an illiquid market for the option. There is limited counterparty risk with respect to exchange-traded purchased options as settlement is facilitated through a central clearinghouse. There is inherently more risk of counterparty non-performance for OTC purchased options, although the risk is generally limited to the premium paid. When applicable, options purchased by the Funds and outstanding at the end of the period are listed in each Fund's Portfolio of Investments.
Writing put options tends to increase the Fund's exposure to the underlying instrument. Writing call options tends to decrease the Fund's exposure to the underlying instrument. When a Fund writes a call or a put option, an amount equal to the premium received by the Fund is recognized as a liability. The amount of the liability is subsequently marked-to-market to reflect the current market value of the option written. These liabilities are reflected as a component of "Financial Derivative Instruments" on the Statement of Assets and Liabilities. If an option which the Fund has written either expires on its stipulated expiration date or the Fund enters into a closing purchase transaction, the Fund realizes a gain (or loss if the cost of a closing purchase transaction exceeds the premium received when the option was written) without regard to any unrealized gain or loss on the underlying security or derivative instrument, and the liability related to such option is extinguished. If a call option which the Fund has written is exercised, the Fund recognizes a realized gain or loss from the sale of the underlying security or derivative instrument and the proceeds from the sale are increased by the premium originally received. If a put option which the Fund has written is exercised, the amount of the premium originally received reduces the cost of the security or derivative instrument that the Fund purchases upon exercise of the option. Written options are subject to substantial risks. The Fund as a writer of an option has no control over whether the underlying instrument may be sold (call) or purchased (put) and, as a result, the Funds bear the market risk of an unfavorable change in the price of the derivative instrument, security/index or currency underlying the written option. Exercise of an option written by a Fund could result in a Fund selling or buying the underlying referenced entity at a price different from current market value. Further, there is the risk the Fund may not be able to enter into a closing transaction because of an illiquid market. When applicable, open options and swaptions at the end of the period are listed in each Fund's Portfolio of Investments.
The Funds may enter into interest rate, credit default, inflation, equity, total return, currency and other swap contracts. Swap contracts are bilaterally negotiated agreements between the Funds and a counterparty to exchange or swap the returns (or the differential in rates of return) earned or realized on particular investments, instruments, indices or other measures for a defined series of cash flows at a predetermined rate at specified, future intervals. Swap contracts are privately negotiated in the OTC market ("OTC swaps"), or may be executed on a multi-lateral or other trade facility platform, such as a registered exchange ("centrally-cleared swaps"). The gross returns to be exchanged or "swapped" between parties are generally calculated with respect to a "notional amount" for a pre-determined period of time.
Certain Funds use credit default swaps to manage exposure to a given issuer or sector by either selling protection to increase exposure (i.e., leverage), or buying protection to reduce exposure. The "buyer" in a credit default swap is obligated to pay the "seller" a periodic stream of payments over the term of the contract provided that no event of default on an underlying reference obligation has occurred. If an event of default occurs, the seller must either pay the buyer the full notional value or the "par value" of the reference obligation in exchange for the reference obligation, or pay a net amount equal to the par value
181
| Notes to financial statements (unaudited) |
of the defaulted reference entity less its recovery value. In connection with these contracts, securities may be identified as collateral in accordance with the terms of the respective swap contracts to provide assets of value and recourse in the event of default or bankruptcy/insolvency. Recovery values are assumed by market makers considering either industry standard recovery rates or entity specific factors and considerations until a credit event occurs. If a credit event has occurred, the recovery value is typically determined by a facilitated auction whereby a minimum number of allowable broker bids, together with a specific valuation method, are used to calculate the settlement value. Implied credit spreads, represented in absolute terms, utilized in determining the market value of credit default swap contracts as of period end are disclosed in the Portfolios of Investments, as applicable. They serve as an indicator of the current status of the payment/performance risk and represent the likelihood or risk of default for the credit derivative. The implied credit spread of a particular referenced entity reflects the cost of buying/selling protection and may include upfront payments required to be made to enter into the contract. Wider credit spreads represent a deterioration of the referenced entity's credit soundness and a greater likelihood or risk of default or other credit event occurring as defined under the terms of the contract.
Certain Funds hold fixed-rate and/or floating-rate bonds. Accordingly, the Funds are subject to interest rate risk exposure in the normal course of pursuing their investment objectives as the value of these bonds may decrease if interest rates rise, or vice versa. To hedge against this risk and/or to generate income at prevailing market rates, the Funds may enter into interest rate swap contracts. Interest rate swap contracts involve the exchange by the Fund with another party for their respective commitment to pay or receive a fixed or variable interest rate on the notional amount.
International Long/Short Equity may enter into equity swaps for purposes of establishing long or short exposure to underlying individual securities. Equity swaps may be used in lieu of direct stock investment or short sale to enhance liquidity, synthetically enter markets with high barriers to entry or establish short positions in markets where short selling is disallowed. Equity swaps involve commitments where cash flows are exchanged based on a variable interest rate. At maturity, or upon reset or termination, a net cash flow is exchanged equivalent to the return, inclusive of dividends declared, on the underlying equity, less a financing rate.
Changes in market value, if any, are reflected as a component of net change in unrealized appreciation/ (depreciation) on the Statements of Operations. Swap payments received or made at the beginning of the measurement period represent premiums paid or received upon entering into the swap contract to compensate for differences between the stated terms of the swap contract and prevailing market conditions (credit spreads, currency exchange rates, interest rates, and other relevant factors). Upfront premiums received (paid) are initially recorded as liabilities (assets) and subsequently marked to market to reflect the current value of the swap. Upon termination or maturity of the swap, a liquidation payment received or made at the termination of the swap is recorded as realized gain or loss on the Statements of Operations, net of any upfront premiums paid or received. Net periodic payments received or paid by the Funds are included as part of realized gains or losses on the Statements of Operations.
Entering into these contracts involves, to varying degrees, elements of counterparty, interest, credit and market risk in excess of the amounts recognized on the Statements of Assets and Liabilities. Such risks involve the potential inability of the counterparties to meet the terms of the contract (which is limited with respect to centrally-cleared swaps as described below), unanticipated changes in the value of the swap contract, the possibility that there will be no liquid market for the contract, and that there may be unfavorable changes in interest rates. The risk that a counterparty is unable to perform on its obligations in situations when the Funds are in an appreciated position is mitigated with respect to OTC swaps by having master netting arrangements ("MNA") between the Funds and their counterparties and, in certain scenarios dictated by the contracts, the posting of collateral by the counterparty to the Funds to cover the Funds' exposure to the counterparty. There is limited counterparty credit risk with respect to centrally-cleared swaps as the transaction is facilitated through a central clearinghouse, much like an exchange-traded futures contract. Upon entering into a centrally-cleared swap transaction, the Fund is required to deposit with its clearing broker an amount of cash or securities as an initial margin. Subsequent variation margin payments or receipts are made or received by the Fund, depending on fluctuations in the fair value of the reference entity. The magnitude of counterparty credit risk is different depending on the type of swap. Under a credit default swap, the Funds' maximum risk of loss as the protection buyer is limited to the market value, or the current unrealized appreciation/ depreciation on the contract plus/minus any upfront premiums paid/received. Alternatively, as the protection seller, the maximum risk of loss is equivalent to the notional or par value of the contract plus/minus any upfront premiums paid/received. At January 31, 2017, notional outstanding for credit protection sold, translated into US Dollar amounts, equated to $53,975 for Strategic Income. Alternatively, under an interest rate, inflation, or equity swap, as notional is not exchanged, the Funds' maximum risk of loss is limited to the unrealized loss on the contracts. When applicable, open swap contracts at the end of the period are listed in each Fund's Portfolio of Investments.
182
| Notes to financial statements (unaudited) |
Derivative instruments
The FASB requires companies (including the Trust) to disclose information intended to enable financial statement users to understand how derivative instruments impact the Statements of Assets and Liabilities, as well as the effect of derivative instruments on the Statements of Operations during the reporting period, in the context of each entity's risk exposure. Accordingly, the tables included under the heading "Fair Value of Financial Derivative Instruments" in the Funds' Portfolios of Investments summarize each Fund's fair value of derivative instruments held as of January 31, 2017 and the related location on the accompanying Statements of Assets and Liabilities, as well as the amount of gains and losses on derivative instruments recognized in the Funds' earnings and the related location on the accompanying Statements of Operations, presented by primary underlying risk exposure. Supplementary information regarding gross and net values and the impact of any collateral posted for those transactions subject to MNA or similar agreements is presented in the Funds' Portfolios of Investments under the heading "Financial Derivative Instruments: Over-the-Counter Summary." Note that all OTC instruments (forward foreign currency contracts, OTC credit default, equity, inflation and interest rate swap contracts, swaptions and certain options) with Barclays Bank plc, BNP Paribas Securities Services, Citibank, N.A., Credit Suisse Securities (Europe) International, Credit Suisse International, Deutsche Bank AG, JPMorgan Chase Bank, N.A., Morgan Stanley Capital Services LLC and UBS AG are all subject to MNAs. The settlement of all futures contracts, exchange-traded options and centrally-cleared swap contracts (credit default and interest rate) is guaranteed by the clearinghouse or exchange the instrument is traded on and is not subject to arrangements with particular counterparties. For that reason, these types of investments are excluded from such disclosures.
Securities lending
European Focus, Global Technology, High Yield Opportunities, and International Opportunities are enrolled in a securities lending program whereby the Funds may loan securities with a value of up to 331/3% of each Fund's total assets. The maturity associated with these securities is considered continuous. Securities loans are made to banks and broker-dealers via State Street Bank and Trust Company ("SSB") as lending agent pursuant to agreements requiring that loans be continuously secured by collateral at least equal at all times to the value of the securities on loan. The Funds receive cash or short-term US government obligations as collateral against the loaned securities in an amount at least equal to 102% (for loans of US securities) or 105% (for loans of non-US securities) of the fair value of the loaned securities at the inception of each loan, and which is subsequently adjusted each day based on market value movements. Accordingly, the value of the collateral with respect to a loaned security may be temporarily more or less than the value of a security on a given day due to market fluctuations of securities values and as a result may appear to be over or under-collateralized. The required collateral to be received or returned is adjusted on the following business day. Under the securities lending arrangement, the collateral received is recorded by the lending Fund along with a related obligation to return the collateral. To the extent non-cash collateral is received in the form of short-term US government obligations, brokers pay the lending Fund negotiated lenders' fees which are divided between the Fund and SSB and are recorded as security lending income. Cash collateral received is invested in the State Street Navigator Securities Lending Government Portfolio, a 1940 Act-registered open-end mutual fund used exclusively for SSB securities lending clients, which management of the Funds has determined presents minimal credit risk. Securities on loan and investment of cash collateral in the State Street Navigator Securities Lending Government Portfolio are reflected in each Fund's Portfolio of Investments, as applicable.
The risks in lending portfolio securities, as with other extensions of credit, consist of possible delay in recovery of the securities, or possible loss of rights in the collateral should the borrower fail financially. Consequently, loans are made only to borrowers which are deemed to be creditworthy by SSB and approved by management of the Funds. Further, the Funds have protection under the agreement with SSB in the event of borrower default. The borrower pays the Funds an amount equal to any dividends or interest received on securities lent, and the Funds retain all or a portion of the interest received on investment of the cash collateral or receives a fee from the borrower. The Funds may call such loans in order to, among other reasons, sell the securities involved.
183
| Notes to financial statements (unaudited) |
The following table is a summary of each Fund's securities on loan and related cash and non-cash collateral received as of January 31, 2017:
| | | | Market | | | | | | Non- | | | | |
| | | | Value of | | | Cash | | | Cash | | | Total | |
| | | | Securities | | | Collateral | | | Collateral | | | Collateral | |
| Fund | | | on Loan | | | Received | | | Received | | | Received* | |
| European Focus | | $ | 66,172,224 | | $ | 31,774,590 | | $ | 35,311,568 | | $ | 67,086,158 | |
| Global Technology | | | 21,780,429 | | | — | | | 22,355,238 | | | 22,355,238 | |
| High Yield Opportunities | | | — | | | — | | | — | | | — | |
| International Opportunities | | | 237,234,860 | | | 82,045,262 | | | 165,753,509 | | | 247,798,771 | |
| * | The total " Collateral Received" as of period end may be less than the "Market Value of Securities on Loan" as the result of fluctuations in the value of the loaned securities. Additional required collateral as a result of changes in the value of loaned securities is received the following business day. |
Indemnifications
Under the Trust's organizational documents, its officers and trustees are indemnified against certain liabilities arising out of the performance of their duties to the Trust. In addition, in the normal course of business the Trust enters into contracts that provide general indemnifications to other parties. The Trust's maximum exposure under these arrangements is unknown as future claims may be made against the Trust that have not yet been asserted.
Use of estimates
The preparation of financial statements in conformity with US GAAP requires management to make estimates and assumptions that affect the reported amounts and disclosures in the financial statements. Actual results may differ from those estimates.
Expenses
Expenses are recorded on an accrual basis. Expenses of the Trust that are directly attributable to a specific Fund are charged to that Fund. Expenses attributable to a specific class of shares are charged to that class. Other expenses are allocated proportionately among each Fund within the Trust based on average daily net assets or on another reasonable basis.
Deferred offering costs
Costs incurred in connection with the offering and initial registration of International Small Cap were deferred in conformity with US GAAP and amortized to expense on a straight-line basis over the first twelve months after commencement of operations. The deferred offering costs incurred by this Fund will be fully amortized to expense as of December 15, 2017.
Federal income taxes
The Trust's policy is that each Fund seeks to comply with the requirements of Subchapter M of the Internal Revenue Code of 1986, as amended ("Subchapter M"), that are applicable to regulated investment companies ("RICs") and to distribute substantially all its taxable income to shareholders. No federal income tax provision is required so long as each Fund operates in a manner that complies with the requirements of Subchapter M.
FASB ASC 740-10 "Income Taxes – Overall" sets forth a minimum threshold for financial statement recognition of the benefit of a tax position taken or expected to be taken in a tax return. Management of the Funds has concluded there are no significant uncertain tax positions that would require recognition in the financial statements. Management is also not aware of any tax positions for which it is reasonably possible that the total amount of unrecognized tax benefits will significantly change in the next twelve months. The Funds intend to file tax returns with the US Internal Revenue Service and various states. Generally, each of the tax years in the four-year period ended July 31, 2016 remains subject to examination by taxing authorities.
The Funds may be subject to taxes imposed by countries in which they invest. Such taxes are generally based on income and/or capital gains earned or repatriated. Taxes are accrued based on net investment income, net realized gains and net unrealized appreciation as such income and/or gains are earned. Taxes may also be based on transactions in foreign currency and are accrued based on the value of investments denominated in such currency. With respect to withholding taxes on certain foreign dividends and interest, the Funds file withholding tax reclaims in certain jurisdictions to recover a portion of amounts previously withheld. The Funds record a reclaim receivable based on, among other things, a jurisdiction's legal obligation to pay reclaims under double taxation agreements or treaties with the United States, as well as payment history and market convention.
184
| Notes to financial statements (unaudited) |
In consideration of recent decisions rendered by European courts with respect to discriminatory taxation, and based on relative exposure in relation to the cost of filing, European Focus, Global Equity Income, Global Technology and International Opportunities pursued additional reclaims related to prior years in certain jurisdictions in accordance with European Union law. However, the relevant tax authorities and the administrative courts within the various jurisdictions have been, to date, inconsistent in the approach, interpretation and rulings related to US RIC claimants. As a result, and consistent with US GAAP accrual requirements, these Funds have not recorded a corresponding receivable amount for these reclaim filings given the significant uncertainty in their ultimate recovery, with the exception of reclaims from Finland. In June 2015 the Funds received payment, plus interest, of tax withheld in Finland from 2009-2013. The payments reduced fiscal year 2015 withholding tax, resulting in an increase in the net asset value of each Fund. Based on the merits of the reclaims and the low likelihood of appeal, management believes it is more likely than not that the Funds will retain the recovered amounts. Further, management's approach to offset withholding tax with these payments in the period in which the payments are received is consistent with the US Internal Revenue Service's Notice 2016-10.
As of January 31, 2017, the total amount of additional reclaims that have been or are expected to be filed in France, Germany, Spain and Sweden with respect to withholdings amounts during the respective statute of limitations periods (generally 2009-2016) represent less than 0.65% of the net assets of European Focus, Global Equity Income and International Opportunities; however, the recovery of any or all of these amounts and timing of recovery, if any, is uncertain. With respect to the three above named Funds, Management has filed and received relief at source (i.e. 0% withholding) in Finland for calendar year 2017. Management will continue to monitor developments in other jurisdictions to justify further filings.
To the extent that capital loss carryforwards incurred in current and prior years are used to offset any future capital gains realized during the carryover period as provided by US Federal income tax regulations, no capital gains tax liability will be incurred by the Funds for gains realized and not distributed. To the extent that capital gains are offset, such gains will not be distributed to the shareholders. Carryforwards not subject to expiration must be utilized prior to losses that carry an expiration; as a result, certain carryforwards may expire unused. Losses incurred that will be carried forward under the provisions of the regulations are as follows (as measured at July 31, 2016):
All Asset
| | | | Loss carryforward character | |
| Expiration | | | Short-term | | | Long-term | |
| Unlimited Losses | | $ | 902,514 | | $ | — | |
Dividend & Income Builder
| | | | Loss carryforward character | |
| Expiration | | | Short-term | | | Long-term | |
| Unlimited Losses | | $ | 969,052 | | $ | 1,349,143 | |
Emerging Markets
| | | | Loss carryforward character | |
| Expiration | | | Short-term | | | Long-term | |
| Unlimited Losses | | $ | 2,325,263 | | $ | — | |
European Focus
| | | | Loss carryforward character | |
| Expiration | | | Short-term | | | Long-term | |
| 7/31/18 | | $ | 46,255,302 | | $ | — | |
| Unlimited Losses | | | 178,594,541 | | | 48,058,347 | |
| Total | | $ | 224,849,843 | | $ | 48,058,347 | |
Global Equity Income
| | | | Loss carryforward character | |
| Expiration | | | Short-term | | | Long-term | |
| Unlimited Losses | | $ | 315,590,526 | | $ | 82,501,676 | |
High Yield Opportunities
| | | | Loss carryforward character | |
| Expiration | | | Short-term | | | Long-term | |
| Unlimited Losses | | $ | 1,004,638 | | $ | 378,437 | |
International Long/Short Equity
| | | | Loss carryforward character | |
| Expiration | | | Short-term | | | Long-term | |
| Unlimited Losses | | $ | 846,391 | | $ | 170,710 | |
185
| Notes to financial statements (unaudited) |
International Opportunities
| | | | Loss carryforward character | |
| Expiration | | | Short-term | | | Long-term | |
| 7/31/18 | | $ | 298,194,218 | | $ | — | |
| Unlimited Losses | | | 149,176,858 | | | 105,155,437 | |
| Total | | $ | 447,371,076 | | $ | 105,155,437 | |
Strategic Income
| | | | Loss carryforward character | |
| Expiration | | | Short-term | | | Long-term | |
| 7/31/17 | | $ | 20,554,688 | | $ | — | |
| 7/31/18 | | $ | 336,160 | | $ | — | |
| Total | | $ | 20,890,848 | | $ | — | |
US Growth Opportunities
| | | | Loss carryforward character | |
| Expiration | | | Short-term | | | Long-term | |
| Unlimited Losses | | $ | 91,777 | | $ | 72,438 | |
Note that Global Technology does not have any capital loss carryforward to apply against future earnings. International Small Cap commenced operations on December 15, 2016 and thus does not have any capital loss carryforward.
During the year ended July 31, 2016 the Funds utilized the following capital loss carryforwards:
| All Asset | | $ | — | |
| Dividend & Income Builder | | | — | |
| Emerging Markets | | | — | |
| European Focus | | | — | |
| Global Equity Income | | | — | |
| Global Technology | | | — | |
| High Yield Opportunities | | | — | |
| International Long/Short Equity | | | — | |
| International Opportunities | | | — | |
| Strategic Income | | | 14,179,857 | |
| US Growth Opportunities | | | — | |
At July 31, 2016, the following Funds deferred post-October losses and/or late year ordinary losses, which will be recognized on the first day of the following year:
| | | | Ordinary | | | Capital | |
| | | | loss | | | loss | |
| | | | deferred | | | deferred | |
| All Asset | | $ | — | | $ | — | |
| Dividend & Income Builder | | | — | | | — | |
| Emerging Markets | | | — | | | — | |
| European Focus | | | — | | | — | |
| Global Equity Income | | | — | | | — | |
| Global Technology | | | 584,144 | | | — | |
| High Yield Opportunities | | | — | | | — | |
| International Long/Short Equity | | | — | | | — | |
| International Opportunities | | | — | | | — | |
| Strategic Income | | | 1,928,889 | | | — | |
| US Growth Opportunities | | | 12,232 | | | — | |
Distributions to shareholders
Distributions to shareholders are recorded on the ex-dividend date. Distributions from net investment income and net realized capital gains are determined in accordance with federal income tax regulations, which may differ from US GAAP. A tax basis return of capital, if any, is reflected on the Statements of Changes in Net Assets and have been recorded to Paid-in Capital. Book/tax differences are either temporary or permanent in nature. To the extent these differences are permanent they are reclassified within the capital accounts based on their federal tax-basis treatment.
186
| Notes to financial statements (unaudited) |
The tax character of distributions paid during the years ended July 31, 2016 and July 31, 2015 were as follows:
| Year ended | | | Ordinary | | | Return of | | | Capital | |
| July 31, 2016 | | | income | | | capital | | | gains | |
| All Asset | | $ | 1,377,424 | | $ | 700,399 | | $ | — | |
| Dividend & Income Builder | | | 2,545,749 | | | — | | | — | |
| Emerging Markets | | | 130,030 | | | — | | | — | |
| European Focus | | | 28,658,572 | | | — | | | — | |
| Global Equity Income | | | 228,721,129 | | | — | | | — | |
| Global Technology | | | — | | | 33,529,528 | | | — | |
| High Yield Opportunities | | | 1,669,997 | | | — | | | — | |
| International Long/Short Equity | | | 193,326 | | | 20,050 | | | — | |
| International Opportunities | | | 70,145,294 | | | — | | | — | |
| Strategic Income | | | 8,499,867 | | | — | | | — | |
| US Growth Opportunities | | | — | | | — | | | — | |
| Year ended | | | Ordinary | | | Capital | |
| July 31, 2015 | | | income | | | gains | |
| All Asset | | $ | 1,698,896 | | $ | 848,091 | |
| Dividend & Income Builder | | | 1,358,317 | | | 277,649 | |
| Emerging Markets | | | 22,618 | | | — | |
| European Focus | | | 36,848,194 | | | — | |
| Global Equity Income | | | 194,280,256 | | | — | |
| Global Technology | | | — | | | 42,250,534 | |
| High Yield Opportunities | | | 2,208,258 | | | — | |
| International Long/Short Equity | | | — | | | — | |
| International Opportunities | | | 39,251,903 | | | — | |
| Strategic Income | | | 4,635,024 | | | — | |
| US Growth Opportunities | | | — | | | — | |
As of July 31, 2016, the components of distributable earnings on a tax basis were as follows:
| | | | Undistributed | | | Undistributed | | | Undistributed | |
| | | | ordinary | | | capital gains/ | | | appreciation/ | |
| | | | income | | | (losses | ) | | (depreciation | ) |
| All Asset | | $ | 309,840 | | $ | — | | $ | 808,622 | |
| Dividend & Income Builder | | | 663,954 | | | — | | | 3,987,263 | |
| Emerging Markets | | | 469,570 | | | — | | | 872,709 | |
| European Focus | | | 55,352,906 | | | — | | | (184,738,125 | ) |
| Global Equity Income | | | 35,622,145 | | | — | | | (11,324,984 | ) |
| Global Technology | | | — | | | 7,095,833 | | | 68,019,628 | |
| High Yield Opportunities | | | 61,326 | | | — | | | 738,606 | |
| International Long/Short Equity | | | 338,018 | | | — | | | (575,211 | ) |
| International Opportunities | | | 75,796,215 | | | — | | | 447,974,205 | |
| Strategic Income | | | — | | | — | | | (198,615 | ) |
| US Growth Opportunities | | | — | | | — | | | 893,913 | |
Ordinary income and net realized gains/losses may differ for book and tax basis reporting purposes due to the treatment of outstanding unrealized appreciation/(depreciation) on derivatives, REIT basis adjustments, premium amortization accruals, tax deferral on wash sales and PFIC transactions.
The US federal income tax basis of investments, including proceeds from securities sold short but excluding financial derivative instruments, is formally identified annually as part of the July 31 year-end audit and tax provision process. The US GAAP cost basis of investments as of January 31, 2017, which approximates the US federal income tax basis of investments, and the gross unrealized appreciation and depreciation, were as follows:
187
| Notes to financial statements (unaudited) |
| | | | All Asset | | | Dividend & Income Builder | |
| Cost | | $ | 49,579,555 | | $ | 128,126,820 | |
| Gross unrealized appreciation | | | 1,047,207 | | | 8,064,829 | |
| Gross unrealized depreciation | | | (627,496 | ) | | (5,496,984 | ) |
| Net unrealized appreciation (depreciation) | | | 419,711 | | | 2,567,845 | |
| | | | Emerging | | | European | |
| | | | Markets | | | Focus | |
| Cost | | $ | 74,210,550 | | $ | 1,965,515,165 | |
| Gross unrealized appreciation | | | 6,862,006 | | | 140,667,045 | |
| Gross unrealized depreciation | | | (2,759,694 | ) | | (294,534,359 | ) |
| Net unrealized appreciation (depreciation) | | | 4,102,312 | | | (153,867,314 | ) |
| | | | Global Equity | | | Global | |
| | | | Income | | | Technology | |
| Cost | | $ | 4,137,171,519 | | $ | 126,103,505 | |
| Gross unrealized appreciation | | | 198,743,495 | | | 79,004,995 | |
| Gross unrealized depreciation | | | (220,702,201 | ) | | (2,804,746 | ) |
| Net unrealized appreciation (depreciation) | | | (21,958,706 | ) | | 76,200,249 | |
| | | | | | | International | |
| | | | High Yield | | | Long/Short | |
| | | | Opportunities | | | Equity | |
| Cost | | $ | 55,956,438 | | $ | 9,832,179 | |
| Gross unrealized appreciation | | | 2,101,599 | | | 1,100,810 | |
| Gross unrealized depreciation | | | (245,793 | ) | | (684,943 | ) |
| Net unrealized appreciation (depreciation) | | | 1,855,806 | | | 415,867 | |
| | | | International | | | International | |
| | | | Opportunities | | | Small Cap | |
| Cost | | $ | 3,921,122,952 | | $ | 4,970,748 | |
| Gross unrealized appreciation | | | 736,363,638 | | | 393,523 | |
| Gross unrealized depreciation | | | (220,480,668 | ) | | (18,971 | ) |
| Net unrealized appreciation (depreciation) | | | 515,882,970 | | | 374,552 | |
| | | | Strategic Income | | | US Growth Opportunities | |
| Cost | | $ | 445,263,116 | | $ | 7,398,249 | |
| Gross unrealized appreciation | | | 4,955,701 | | | 1,308,585 | |
| Gross unrealized depreciation | | | (13,427,708 | ) | | (108,192 | ) |
| Net unrealized appreciation (depreciation) | | | (8,472,007 | ) | | 1,200,393 | |
Identified cost may differ for book and tax basis reporting purposes primarily due to tax deferral of losses on wash sales, PFIC transactions, different book and tax treatment on certain debt instruments and amortization of premiums reflected as January 31, 2017.
Note 3. Fair value measurements
US GAAP defines fair market value as the price that a Fund would receive to sell an asset or pay to transfer a liability in an orderly transaction between market participants at the measurement date. Various inputs are used in determining the value of the Funds' investments. The Funds use a three-tier hierarchy of inputs to establish classification of fair value measurements for disclosure purposes. These inputs may be observable or unobservable. Observable inputs are inputs that reflect the assumptions market participants would use in pricing the asset or liability developed based on market data obtained from sources independent of the reporting entity. Unobservable inputs are inputs that reflect the reporting entity's own assumptions about the assumptions market participants would use in pricing the asset or liability developed based on the best information available under the circumstances. The inputs used for valuing securities are not necessarily an indication of the risk associated with investing in those securities. The three-tier hierarchy of inputs is summarized in the following three broad levels:
| • | | Level 1 – quoted prices (unadjusted) in active markets for identical investments |
| • | | Level 2 – other significant observable inputs (including quoted prices for similar investments, interest rates, prepayment speeds, credit risk, etc.) |
188
| Notes to financial statements (unaudited) |
| • | | Level 3 –significant unobservable inputs based on the best information available in the circumstances to the extent observable inputs are not available (including the Fund's own assumptions in determining the fair value of investments) |
Tables included under the heading "Fair value measurements" summarizing each Fund's investments that are measured at fair value by level within the fair value hierarchy as of January 31, 2017 have been listed after each Fund's Portfolio of Investments.
Any transfers between levels are disclosed, effective at the end of the period, in each Fund's table with the reasons for the transfers disclosed in a note to the table, if applicable.
Valuation Techniques
The following inputs and techniques may be used by the Funds to evaluate how to classify each major category of assets and liabilities into the appropriate fair value hierarchy in accordance with GAAP.
Securities, securities sold short and financial derivative instruments traded on a recognized exchange or market are generally valued at the last reported sale price or at the official closing price and are therefore classified as Level 1.
Listed securities for which no sale was reported on that date and other securities traded in the over-the-counter ("OTC") market are valued at the mean between the last bid and asked price and are therefore classified as Level 2. In addition, for equity securities, the Trust has retained an independent statistical fair value pricing service to assist in the fair valuation process for securities principally traded in a foreign market in order to adjust for possible changes in value that may occur between the close of the foreign exchange and the time at which Fund shares are priced. If a security is valued at a "fair value," that value may be different from the last quoted market price for the security. As a result, it is possible that fair value prices will be used by the Funds. Securities using these valuation adjustments are categorized as Level 2.
Debt securities, including short-term investments and/or those with an original or remaining maturity of 60 days or less, are valued at the market value provided by independent pricing services approved by the Henderson Funds Board. If the pricing services are unable to provide valuations, the securities are valued at the mean between the last bid and asked price, or if no ask is available, then the last bid price obtained from one or more broker-dealers. Such pricing services may use various pricing techniques that take into account appropriate factors such as yield, quality, coupon rate, maturity, type of issue, trading characteristics and other data, as well as broker quotes. These investments are categorized as Level 2.
Investments in investment companies are valued at the reported net asset value, which approximates fair market value and are categorized as Level 1.
Forward foreign currency contracts are valued daily at the applicable quoted forward rate supplied by an independent pricing service and are categorized as Level 2.
OTC financial derivatives instruments between the Funds and their counterparties, including swap contracts and options (including swaptions) and centrally-cleared swap contracts listed or traded on a multi-lateral or trade facility platform, such as a registered exchange, are valued using independent values provided by independent pricing services when available. Otherwise, fair values are estimated on the basis of pricing models that incorporate current market measures for interest rates, currency exchange rates, equity prices and indices, credit spreads, corresponding market volatility levels and other market-based pricing factors. Certain OTC derivatives, such as generic forwards, swaps and options, have inputs which can generally be corroborated by market data and are therefore classified within Level 2. Those OTC derivatives that have less liquidity or for which inputs are unobservable are classified within Level 3.
If market quotations are not readily available, or if the investment advisor determines that a quotation of a security does not represent a fair value, then the security is valued at a fair value as determined in good faith using procedures approved by the Henderson Funds Board and are therefore classified within Level 3.The Henderson Funds Board, or their designee, may also establish fair value using a wide variety of market data including yields or prices of investments of comparable quality, type of issue, coupon, maturity and rating, market quotes or indications of value from security dealers, evaluations of anticipated cash flows or collateral, general market conditions and other information and analysis, including the obligor's credit characteristics considered relevant. Assumptions used by the Funds due to the lack of observable inputs may significantly impact the fair value of the investment.
Note 4. Investment advisory fees and other transactions with affiliates
Pursuant to an Investment Advisory Agreement, HGINA acts as the Funds' investment advisor. HGINA is an indirect wholly-owned subsidiary of Henderson Group plc. HGINA supervises the investments of the Funds and earns an investment advisory fee for such services. HGINA earns a fee for its services based on each Fund's average daily net assets as set forth below.
| All Asset | | | | | 0.40 | % |
| Dividend & Income Builder | | | First $1 billion | | 0.75 | % |
| | | | Next $1 billion | | 0.65 | % |
| | | | Over $2 billion | | 0.55 | % |
189
| Notes to financial statements (unaudited) |
| Emerging Markets | | | First $1 billion | | 1.00 | % |
| | | | Next $1 billion | | 0.90 | % |
| | | | Over $2 billion | | 0.85 | % |
| European Focus | | | First $500 million | | 1.00 | % |
| | | | Next $1 billion | | 0.90 | % |
| | | | Next $1 billion | | 0.85 | % |
| | | | Over $2.5 billion | | 0.80 | % |
| Global Equity Income | | | First $1 billion | | 0.85 | % |
| | | | Next $1 billion | | 0.65 | % |
| | | | Over $2 billion | | 0.60 | % |
| Global Technology | | | First $1 billion | | 0.90 | % |
| | | | Over $1 billion | | 0.80 | % |
| High Yield Opportunities | | | | | 0.50 | % |
| International Long/Short Equity | | | | | 1.25 | % |
| International Opportunities | | | First $2 billion | | 1.00 | % |
| | | | Next $1 billion | | 0.90 | % |
| | | | Next $1 billion | | 0.80 | % |
| | | | Next $1 billion | | 0.70 | % |
| | | | Next $5 billion | | 0.60 | % |
| | | | Over $10 billion | | 0.50 | % |
| International Small Cap | | | First $500 million | | 0.99 | % |
| | | | Next $500 million | | 0.89 | % |
| | | | Over $1 billion | | 0.84 | % |
| Strategic Income* | | | First $1 billion | | 0.55 | % |
| | | | Next $500 million | | 0.50 | % |
| | | | Over $1.5 billion | | 0.45 | % |
| US Growth Opportunities | | | First $1 billion | | 0.75 | % |
| | | | Next $1 billion | | 0.70 | % |
| | | | Over $2 billion | | 0.65 | % |
| * | | Based on average daily managed assets of the Fund. Managed assets mean the total assets of the Fund (including any assets attributable to any leverage that may be outstanding) minus the sum of accrued liabilities (other than debt representing financial leverage). Since the Fund pays HGINA based on the Fund's average daily managed assets, HGINA's fee will be higher if the Fund is leveraged. |
HGINA has engaged Henderson Investment Management Limited ("HIML") to act as the investment sub-advisor to the Funds, except for High Yield Opportunities and US Growth Opportunities. HGINA has engaged Henderson Geneva Capital Management ("Geneva") to act as the investment sub-adviser for US Growth Opportunities, while no sub-advisor has been appointed for High Yield Opportunities. Both HIML and Geneva are also indirect wholly owned subsidiaries of Henderson Group plc. Under separate Sub-Advisory Agreements, the sub-advisers provide research, advice and recommendations with respect to the purchase and sale of securities and make investment decisions regarding assets of the Funds subject to the oversight of the Henderson Funds Board and the Advisor. No additional advisory fees are charged to the Funds for the services of the sub-advisers as these fees are paid from the fees earned by HGINA.
Pursuant to a separate contractual Expense Limitation Agreement, HGINA has agreed to waive or limit its investment advisory fee and, if necessary, to reimburse expenses of each Fund in order to limit total annual ordinary operating expenses, including distribution and service fees, but excluding any acquired fund fees and expenses as a result of investing in other funds, as a percentage of average daily net assets as follows:
| | | | Class | | | Class | | | Class | | | Class | | | Class | | | Class | |
| | | | A | | | C | | | I | | | R | | | R6 | | | IF | |
| All Asset* | | | 0.85 | % | | 1.60 | % | | 0.60 | % | | N/A | | | 0.60 | % | | N/A | |
| Dividend & Income Builder | | | 1.30 | % | | 2.05 | % | | 1.05 | % | | N/A | | | 1.05 | % | | N/A | |
| Emerging Markets** | | | 1.45 | % | | 2.20 | % | | 1.20 | % | | N/A | | | 1.20 | % | | N/A | |
| European Focus | | | 2.00 | % | | 2.75 | % | | 1.75 | % | | N/A | | | 1.75 | % | | N/A | |
| Global Equity Income | | | 1.40 | % | | 2.15 | % | | 1.15 | % | | N/A | | | 1.15 | % | | N/A | |
| Global Technology | | | 2.00 | % | | 2.75 | % | | 1.75 | % | | N/A | | | 1.75 | % | | N/A | |
| High Yield Opportunities | | | 0.93 | % | | 1.68 | % | | 0.68 | % | | N/A | | | 0.68 | % | | N/A | |
| International Long/Short Equity*** | | | 1.75 | % | | 2.50 | % | | 1.50 | % | | N/A | | | 1.50 | % | | N/A | |
| International Opportunities | | | 2.00 | % | | 2.75 | % | | 1.75 | % | | 2.25% | | | 1.75 | % | | 1.80% | |
| International Small Cap | | | 1.49 | % | | 2.24 | % | | 1.24 | % | | N/A | | | 1.24 | % | | N/A | |
| Strategic Income | | | 1.10 | % | | 1.85 | % | | 0.85 | % | | N/A | | | 0.85 | % | | N/A | |
| US Growth Opportunities | | | 1.20 | % | | 1.95 | % | | 0.95 | % | | N/A | | | 0.95 | % | | N/A | |
| * | | With respect to investments in affiliate underlying funds, HGINA has contractually agreed to reduce or waive the Fund's management fee to limit the combined management fees paid to the Advisor for those assets to the greater of 1.00% or the affiliate underlying fund's management fee. Any waiver calculated as a result of limiting these combined management fees is in addition to the general expense limitation highlighted in the table. Indirect net expenses associated with the Fund's investments in underlying investment companies are not subject to the contractual expense limitation. |
| ** | | Prior to November 30, 2016, the expense limitation as a percentage of average daily net assets, inclusive of distribution and service fees, was 1.79%, 2.54%, 1.54% and 1.54% for Class A, Class C, Class I and Class R6, respectively. |
| *** | | Dividends and interest expense on securities sold short are excluded from the expense limitation calculation. |
190
| Notes to financial statements (unaudited) |
These agreements will remain in effect through July 31, 2020, unless otherwise extended or amended.
Shares of the Funds are often purchased through financial intermediaries who are agents of the Funds for the limited purpose of completing purchases and sales. These intermediaries may provide certain networking and sub-transfer agent services with respect to Fund shares held by that intermediary for its customers, and the intermediary may charge HGINA for those services. The Funds reimburse HGINA for such fees within limits specified by the Henderson Funds Board. The fees are incurred at the class level based on activity, asset levels and/or number of accounts and are included in "Sub-accounting fees" in the Statements of Operations.
At January 31, 2017, HGINA does not own shares in any of the Funds. HGI Group Limited, another indirect wholly-owned subsidiary of Henderson Group plc, owned shares in the following Funds. Significant ownership percentages in International Long/Short Equity and International Small Cap are the result of the initial investments necessary to facilitate commencement of operations and will be redeemed as external shareholders subscribe to the Funds.
| | | | | | | | | | | | | | | | Total Value at | | | As a % of | |
| Fund | | | Class A | | | Class C | | | Class I | | | Class R6 | | January 31, 2017 | | | Net Assets | |
| HGI Group Limited | | | | | | | | | | | | | | | | | | | |
| International Long/Short Equity | | | — | | | 10,000 | | | — | | | 489,980 | | $ | 4,723,814 | | | 32.1 | % |
| International Small Cap | | | — | | | — | | | — | | | 500,000 | | $ | 5,359,868 | | | 100.0 | % |
An affiliated entity of a Fund may include any company in which the Fund owns 5% or more of its outstanding voting shares. Additionally, certain of the Funds held ownership in other Funds within the Trust. At January 31, 2017, All Asset held 2.24% of Emerging Markets, 0.04% of Global Equity Income, 3.14% of High Yield Opportunities and 0.30% of Strategic Income. Transactions in affiliates during the period ended January 31, 2017 were as follows:
| Affiliate | | Value
7/31/2016 | | Purchases
at Cost | | Proceeds
from
Sales | | Change in Unrealized Appreciation/ (Depreciation) | | Realized
Gain/
(Loss) | | Value
1/31/2017 | | Dividend
Income | |
| All Asset | | | | | | | | | | | | | | | | | | | | | | |
| Henderson Emerging Markets Fund | | $ | — | | $ | 1,912,259 | | $ | — | | $ | (7,724 | ) | $ | — | | $ | 1,904,535 | | $ | 15,925 | |
| Henderson Global Equity Income Fund | | | 1,578,473 | | | 47,038 | | | — | | | (14,488 | ) | | — | | | 1,611,023 | | | 47,038 | |
| Henderson High Yield Opportunities Fund | | | 1,671,584 | | | 54,990 | | | — | | | 72,740 | | | — | | | 1,799,314 | | | 54,990 | |
| Henderson Strategic Income Fund | | | 1,285,225 | | | 18,993 | | | — | | | (9,715 | ) | | — | | | 1,294,503 | | | 18,993 | |
| Henderson Unconstrained Bond Fund | | | 2,374,991 | | | 9,388 | | | (2,377,012 | ) | | 206,111 | | | (213,478 | ) | | — | | | 9,388 | |
| Total | | $ | 6,910,273 | | $ | 2,042,668 | | $ | (2,377,012 | ) | $ | 246,924 | | $ | (213,478 | ) | $ | 6,609,375 | | $ | 146,334 | |
191
| Notes to financial statements (unaudited) |
The aggregate cost and value of affiliates at January 31, 2017 is $6,538,654 and $6,609,375, respectively. Investments in affiliates represented 13.08% of the total net assets of All Asset as of January 31, 2017.
Note 5. Compensation of trustees and officers
Certain officers and trustees of the Trust are also officers of HGINA. None of the Trust's officers, other than the Chief Compliance Officer, are compensated by the Trust. The Trust makes no direct payments to trustees affiliated with HGINA. Fees paid to trustees are reflected as Trustees' fees and expenses in the Statements of Operations.
The Funds bear the full compensation paid to the Chief Compliance Officer. This compensation, together with other compliance-related costs, is reflected as "Compliance officer fees" in the Statements of Operations.
Note 6. Distribution plan
The Trust has adopted a distribution plan for Class A, Class C, Class R and Class IF shares of the Funds in accordance with Rule 12b-1 under the 1940 Act (the "12 b-1 Plan"). Under the 12b-1 Plan, the Funds pay the distributor an annual fee of 0.25% of the average daily net assets attributable to its Class A shares, an annual fee of 1.00% of the average daily net assets attributable to its Class C shares, an annual fee of 0.50% of the average daily net assets attributable to its Class R shares and an annual fee of 0.05% of the average daily net assets attributable to its Class IF shares. The 12b-1 Plan is used to induce or compensate financial intermediaries (including brokerage firms, depository institutions and other firms) to provide distribution services to the Funds and their shareholders.
Note 7. Investment transactions
Purchases and sales of investment securities, including proceeds from securities sold short but excluding short-term investments, financial derivatives instruments and US government securities, for the period ended January 31, 2017, were as follows:
| | | | Purchases | | | Sales | |
| All Asset | | $ | 11,815,467 | | $ | 14,136,713 | |
| Dividend & Income Builder | | | 45,305,467 | | | 29,277,100 | |
| Emerging Markets | | | 38,332,476 | | | 8,564,439 | |
| European Focus | | | 462,970,082 | | | 1,352,468,941 | |
| Global Equity Income | | | 2,392,490,442 | | | 2,177,833,712 | |
| Global Technology | | | 37,786,540 | | | 60,920,376 | |
| High Yield Opportunities | | | 51,616,097 | | | 39,014,443 | |
| International Long/Short Equity | | | 14,371,450 | | | 16,043,305 | |
| International Opportunities | | | 851,763,273 | | | 1,335,206,580 | |
| International Small Cap | | | 4,958,596 | | | — | |
| Strategic Income | | | 237,083,706 | | | 220,169,526 | |
| US Growth Opportunities | | | 1,233,040 | | | 1,677,557 | |
Note 8. Significant concentrations
The Funds may invest a substantial percentage of their assets in securities of foreign issuers. These investments may involve certain considerations and risks not typically associated with investments in the United States as a result of, among other factors, the possibility of future political and economic developments and the level of governmental supervision and regulation of securities markets in the respective countries. Some countries in which the Funds invest may require government approval for repatriation of investment income, capital or the proceeds for sales of securities by foreign investors. In addition, if there is deterioration in a country's balance of payments or for other reasons, a country may impose temporary restrictions on foreign capital remittances abroad. In addition, changes in currency exchange rates will affect the value of investments denominated in a foreign currency, as well as investment income derived from those securities. These risks may be heightened in less developed countries, which are sometimes referred to as emerging markets. For example, political and economic structures in these countries may be changing rapidly, which can cause instability and greater risk of loss. These countries are also more likely to experience higher levels of inflation, deflation or currency devaluation, which could hurt their economies and securities markets. For these and other reasons, investments in emerging markets, particularly by the Emerging Markets Fund, are often considered speculative.
Certain of the Funds have significant investments in issuers domiciled in the Eurozone. The private and public sectors' debt problems of a single Eurozone country may pose significant risks to the Eurozone as a whole. As a result, the Funds may be more susceptible to volatility generated by currency devaluations
192
| Notes to financial statements (unaudited) |
or other general uncertainties than more geographically diversified funds that do not concentrate in this region of the world. Further, on June 23, 2016, the United Kingdom voted via referendum to leave the European Union ("EU"), which led to significant market volatility around the world, as well as political, economic, and legal uncertainty. It is expected that the United Kingdom's exit from the EU (known as "Brexit") will take place within two years after the United Kingdom formally notifies the European Council of its intention to withdraw. However, there is still considerable uncertainty relating to the potential consequences and precise timeframe for the exit, how the negotiations for the withdrawal and new trade agreements will be conducted, and whether the United Kingdom's exit will increase the likelihood of other countries also departing the EU. During this period of uncertainty, the negative impact on not only the United Kingdom and European economies, but the broader global economy, could be significant, potentially resulting in increased volatility and illiquidity and lower economic growth for companies that rely significantly on the United Kingdom and/or Europe for their business activities and revenues. Any further exits from the EU, or the possibility of such exits, would likely cause additional market disruption globally and introduce new legal and regulatory uncertainties.
The Funds may invest a high percentage of their net assets in specific sectors of the market in order to achieve a potentially greater investment return. As a result, the economic, political and regulatory developments in a particular sector of the market, positive or negative, have a greater impact on a Fund's net assets and will cause the value of its shares to fluctuate more than if the Fund did not concentrate its investments in a particular sector. In particular, Global Technology concentrates its investments in issuers within specific industries of the technology and telecommunications sectors. Valuations of companies in these sectors are typically subject to greater volatility than other sectors.
Dividend & Income Builder, High Yield Opportunities and Strategic Income invest in a variety of income-producing debt instruments of corporate and sovereign issuers. Accordingly, each may be subject to the previously described foreign issuers risk, to varying degrees, in addition to the risk of default by the issuer. As a matter of their investment strategies, High Yield Opportunities and Strategic Income are also subject to higher concentrations of investments in lower quality high yield securities or asset-backed/structured securities. Investing in high yield, asset-backed or structured securities may involve greater risks and considerations not typically associated with investing in US Government bonds and other high quality fixed-income securities. High yield securities are non-investment grade securities, often referred to as "junk bonds." Economic downturns may disrupt the high yield market and impair the ability of issuers to repay principal and interest. Additionally, asset-backed securities are subject to the risk that underlying debt may be prepaid prior to maturity or refinanced causing further volatility in the value. A small change in interest rates would likely have a pronounced adverse impact on the value of such high yield and asset-backed obligations. Moreover, these securities may be less liquid as there is a less-established secondary market and the Funds may not be able to sell the asset timely.
Note 9. Borrowing arrangements
The Trust maintains a $100 million credit facility with State Street Bank and Trust Company ("SSB") to facilitate portfolio liquidity. Interest is charged to each Fund based on its borrowings at a rate per annum equal to the higher of the Federal Funds rate or 1 Month LIBOR plus 1.25%. In addition, a commitment fee of 0.25% per annum is accrued and apportioned among the Funds in the Trust based on relative average net assets. The commitment fee is included in "Miscellaneous fees" on the Statements of Operations. No amounts were borrowed by the Funds under this facility during the period ended January 31, 2017.
Note 10. Subsequent Events
Subsequent events occurring after the date of this report have been evaluated for potential impact, for purposes of recognition or disclosure in the financial statements, through the date the report was issued.
In February 2017, registration statements on Form N-14 were filed and declared effective with respect to the Henderson-Janus Fund Reorganizations (described in Note 1. Organization) and the proxy solicitation process commenced. In addition, on February 24, 2017, the Henderson Funds Board approved the reorganization of Henderson High Yield Opportunities Fund ("High Yield") with and into T. Rowe Price U.S. High Yield Fund, a newly-organized fund in the T. Rowe Price family of funds (the "High Yield Fund Reorganization"), pursuant to an Agreement and Plan of Reorganization (the "High Yield Plan"). The High Yield Fund Reorganization is subject to approval by High Yield's shareholders of the High Yield Plan. The registration statement on Form N-14 with respect to the High Yield Fund Reorganization has yet to be declared effective.
193
| Other information (unaudited) |
Proxy voting policies
The Funds have filed with the Securities and Exchange Commission their proxy voting records for the twelve months ended June 30, 2016 on Form N-PX, which must be filed each year by August 31. Form N-PX is available on the Securities and Exchange Commission's website at www.sec.gov. The Funds' proxy voting records and proxy voting policies and procedures are also available without charge, upon request, by calling 866.443.6337 or by visiting the Funds' website at www.henderson.com.
Portfolio holdings
A complete listing of each Fund's holdings is made available monthly at www.henderson.com. Further, the Funds' Portfolios of Investments are filed as of the end of the first and third quarter of the fiscal year on Form N-Q. The Henderson Global Funds' Forms N-Q are available at www.sec.gov or may be reviewed and copied at the Commission's Public Reference Room in Washington, DC. The quarterly Portfolios of Investments are also available without charge, upon request, by calling 866.443.6337.
Approval of Investment Advisory and Sub-Advisory Agreements
During the most recent fiscal half year, Henderson Global Funds (the "Trust") launched one new series: the Henderson International Small Cap Fund (the "New Fund"). Henderson Global Investors (North America) Inc. ("HGINA" or the "Advisor"), an indirect, wholly-owned subsidiary of Henderson Group plc ("Henderson Group"), serves as investment advisor to each of the other series of the Trust (each, a "Fund" and collectively, the "Funds") pursuant to an investment advisory agreement between the Trust, with respect to the Funds, and HGINA (the "Investment Advisory Agreement"). (Henderson Group, HGINA, Henderson Investment Management Limited ("HIML" or the "Sub-Advisor"), Henderson Global Investors ("HGI") and their affiliates may be referred to herein collectively as "Henderson.") The Investment Advisory Agreement was approved with respect to the New Fund as described below.
Under the supervision of the Board of Trustees of the Trust (the "Board," with the members of the Board referred to individually as the "Trustees"), HGINA is responsible for managing the investment and reinvestment of the assets of each Fund in accordance with its applicable investment objectives, policies and restrictions, or overseeing the provision of such services by a Fund's sub-advisor. In this connection, HGINA and HIML have entered into an investment sub-advisory agreement (the "Sub-Advisory Agreement"), pursuant to which HIML acts as investment sub-advisor and provides research, analysis, advice and recommendations with respect to the purchase and sale of securities and makes investment commitments regarding the assets of each Fund (with the exception of Henderson High Yield Opportunities Fund and Henderson US Growth Opportunities Fund).
The 1940 Act provides, in substance, that an investment advisory agreement between a fund and its investment advisor may be entered into only if it is approved by the fund's board of trustees, including by a vote of a majority of the trustees who are not "interested person[s]," as defined by the 1940 Act, of the fund, cast in person at a meeting called for the purpose of considering such approval. During the most recent fiscal half year, at a special meeting of the Board held in person on December 5, 2016 (the "December Meeting"), the Trustees who are not "interested person[s]" of the Trust (collectively, the "Independent Trustees") approved the Investment Advisory Agreement and the Sub-Advisory Agreement (together, the "Advisory Agreements") with respect to the New Fund. HGINA and HIML will provide the same services each firm currently provides to the Funds to the New Fund, under the Investment Advisory Agreement and Sub-Advisory Agreement, respectively.
In connection with their consideration of the Advisory Agreements for the New Fund, the Trustees received and reviewed information provided by Henderson and discussed with representatives of management the proposed operations of the New Fund and the nature and quality of advisory and other services proposed to be provided by the Advisor and the Sub-Advisor to the New Fund. The Trustees also received and reviewed a memorandum from counsel to the Independent Trustees regarding the Trustees' responsibilities in evaluating the Advisory Agreements. Throughout their consideration of the Advisory Agreements, the Independent Trustees were advised by their independent legal counsel. The Independent Trustees met with management to consider the Advisory Agreements, and also met separately in executive session with their counsel.
Based on their evaluation of the information provided by the Advisor and the Sub-Advisor and other information, the Trustees determined that the overall arrangements between the New Fund and the Advisor were fair and reasonable in light of the nature and quality of the services proposed to be provided by the Advisor and the Sub-Advisors, the fees proposed to be charged for those services, and other matters that the Trustees considered relevant in the exercise of their business judgment. The Trustees, including all of the Independent Trustees, unanimously approved the Investment Advisory Agreement and the Sub-Advisory Agreement for the New Fund through August 31, 2018, subject to earlier termination as provided in each agreement.
In approving the Advisory Agreements with respect to the New Fund, the Trustees reviewed and analyzed various factors that they determined were relevant, including the factors described
194
| Other information (unaudited) |
below, none of which by itself was considered dispositive. Furthermore, in their deliberations, the Independent Trustees did not identify any single factor that was paramount or determinative and each Independent Trustee may have weighed information differently. However, the material factors and conclusions that formed the basis for the Trustees' determination to approve the agreements are discussed separately below.
Nature, Extent and Quality of Services to be Provided
The Trustees reviewed the nature, extent and quality of the services proposed to be provided by the Advisor and Sub-Advisor to the New Fund, taking into account the investment objective and strategy of the New Fund. In addition, the Trustees reviewed the resources and key personnel of the Advisor and Sub-Advisor, especially the personnel who would provide investment management services to the New Fund. In this connection, the Trustees took into account the presentation from the New Fund's portfolio management team at the Board's September 20-22, 2016 meeting (the "September Meeting"), including information concerning the New Fund's investment process and the composition of the portfolio management team, among other things. The Trustees also considered other services to be provided to the New Fund by the Advisor and Sub-Advisor, such as managing the execution of portfolio transactions and the selection of broker-dealers for those transactions, monitoring adherence to the New Fund's investment restrictions, providing support services for the Trustees and Trustee committees and overseeing the activities of other service providers, including monitoring compliance with various policies and procedures of the New Fund and with applicable securities laws and regulations. In connection with the Board's evaluation of the overall package of services to be provided by Henderson, the Board took into account the nature and quality of services provided by the organization in the past, including the firm's management capabilities demonstrated with respect to the other Funds. In this connection, the Board took into account information provided in connection with its 2016 contract review process ("2016 Contract Review"), including with respect to Henderson's resources and ability to carry out its responsibilities under the Advisory Agreements.
Based on the information received, discussed and evaluated at the September Meeting and the December Meeting, as well as other considerations, including the Trustees' knowledge of Henderson's performance through Board meetings, discussions and reports during the year with respect to the Funds, the Trustees concluded that the nature, extent and quality of the services to be provided by the Advisor and Sub-Advisor to the New Fund were expected to be appropriate and consistent with the terms of the Advisory Agreements, that the quality of those services were expected to be consistent with norms in the industry and that the New Fund would benefit from the provision of those services. They also concluded that the Advisor and Sub-Advisor had sufficient personnel, with the appropriate education and experience, to serve the New Fund effectively and, in connection with the 2016 Contract Review, had demonstrated their continuing ability to attract and retain well-qualified personnel.
Investment Performance
With respect to investment performance, the Board noted that the New Fund has no operating history. The Board considered that the New Fund's investment objective is to seek long-term capital appreciation. The Board also took into account management's presentation at the September Meeting, including information concerning the New Fund's benchmark, anticipated number of holdings, weightings, market cap range and Morningstar and Lipper categories, as well as the New Fund's investment and screening process and risk controls. In addition, the Board considered the information provided by Henderson concerning the performance of an existing SICAV (a foreign variable capital investment fund) that employs a strategy that is similar in certain respects to the New Fund's strategy. In addition to the foregoing, the Board considered Henderson's overall performance record in managing the Funds, as well as the portfolio managers' expertise, and determined that the Advisor's and Sub-Advisor's performance was expected to be acceptable.
Comparative Fees and Expenses
The Trustees examined information on the proposed fees and expenses of the New Fund in comparison to information for other comparable funds as provided by Broadridge Financial Solutions, Inc. ("Broadridge"), an independent, third-party research provider, in a report that was included among the materials provided to the Board for the September Meeting. The Trustees noted that Broadridge was engaged in connection with the 2016 Contract Review to prepare a detailed advisory contract review report designed to help the Trustees fulfill their advisory contract review responsibilities and, in this regard, the Trustees are familiar with the presentation of expense and management fee data in Broadridge reports. For purposes of their review of the reasonableness of the New Fund's proposed advisory fee, the Trustees considered the expense rankings and quintile tables, contractual management fee at common asset levels and at various asset levels, expense ratios and other information contained within the report from Broadridge. In connection with their evaluation of the Broadridge report data, the Independent Trustees took into account management's suggestion that the Board should focus on the smaller peer group for expenses comparisons (rather than the larger comparative universe of funds), noting that such view is
195
| Other information (unaudited) |
consistent with management's recommendation for purposes of the 2016 Contract Review. The Trustees also noted that the peer group consists of seven funds: the New Fund (with respect to Class A shares), one other international small/mid-cap value fund and five international small/mid-cap core funds, as classified by Thomson Reuters Lipper, with only retail front-end load funds considered for inclusion in the group. Taking into account the foregoing, the Trustees observed that, relative to the New Fund's peer group as identified by Broadridge, the New Fund's total expense ratio ranks in the second quintile (below the peer group median) and its contractual management fee ranks in the third quintile (equal to the peer group median). In considering the New Fund's fees and expenses, the Trustees also considered a memorandum provided by management setting forth Henderson's view as to the appropriateness of the proposed fees. In addition, the Trustees noted that the proposed advisory fee includes breakpoints that reduce the fee rate as the New Fund's assets increase. The Board also considered that the Advisor has proposed an expense limitation agreement with respect to the New Fund to remain in effect until July 31, 2020, under which the Advisor agrees to waive its management fee and, if necessary, to reimburse other operating expenses in order to limit total annual ordinary operating expenses, less distribution and services fees (among other things), to 1.24% of the Fund's average daily net assets.
The Trustees also considered their review of the fee rate paid by the Advisor to the Sub-Advisor in connection with the 2016 Contract Review and their conclusion that the fees paid by the Advisor to the Sub-Advisor were reasonable in relation to the nature, extent and quality of the services provided, among other things.
Costs of Services to be Provided and Profits to be Realized by Henderson and its Affiliates from their Relationships with the New Fund
In considering the reasonableness of the proposed investment management fee, the Trustees also considered the costs of advisory services to be provided and estimated level of profitability. In this regard, the Trustees noted that the New Fund is newly organized and has no assets, and that they would have the opportunity in the future to periodically reexamine this matter. The Trustees also noted their conclusion in connection with the 2016 Contract Review that the Advisor's profitability level with respect to each of the other Henderson Funds in relation to the services rendered was not unreasonable.
Other Benefits to the Advisor
The Trustees also considered benefits expected to be derived by the Advisor and the Sub-Advisor from their relationship with the New Fund, including the potential use of commissions paid on portfolio brokerage transactions of the New Fund to obtain research products and services benefiting the New Fund, other Funds and/or other clients. In this connection, the Trustees noted their conclusion in the 2016 Contract Review that the use by the Advisor and Sub-Advisor of commissions paid by the Funds to obtain research products and services was consistent with regulatory requirements and likely benefits the Funds.
Economies of Scale
The Trustees considered the potential of the Advisor to experience economies of scale as the assets of the New Fund increases. They noted that by virtue of the expense limitation that the Advisor had agreed to, the Advisor would be subsidizing the New Fund during its start-up phase until it reached adequate scale. In addition, the Trustees took into account the proposed advisory fee breakpoints offered by the Advisor that would reduce the advisory fee rate as the New Fund's assets increase. The Trustees also noted that they would have the opportunity in the future to re-examine whether the New Fund had achieved economies of scale and the appropriateness of the advisory fee payable by the New Fund to the Advisor. The Trustees concluded that the proposed advisory fee rate reflected an appropriate level of sharing of any economies of scale between the Advisor and the New Fund.
Overall Conclusions
Based on the foregoing, the Trustees determined at the December Meeting that the proposed advisory fee for the New Fund is fair and reasonable in light of the extent and anticipated quality of the services expected to be provided and other benefits to be received and that the approval of each of the Advisory Agreements is in the best interest of the New Fund. In reaching this conclusion, the Independent Trustees did not identify any single factor that was paramount or determinative and each Independent Trustee may have weighed information differently. At the December Meeting, the Board, including all of the Independent Trustees, unanimously approved each of the Advisory Agreements with respect to the New Fund for an initial term through August 31, 2018.
196
| Other information (unaudited) |
Federal tax information
Certain tax information for the Funds is required to be provided to shareholders based on the Funds' income and distributions for the taxable year ending July 31. In February of each year, shareholders will receive Form 1099-DIV, which will include their share of foreign tax credit, qualified dividends and capital gains distributed during the calendar year. Shareholders are advised to check with their tax advisors for information on the treatment of these amounts on their individual income tax returns.
Statement Pursuant to Section 19(a) of the Investment Company Act of 1940
The exact source of aggregate fund distributions for each fiscal year can only be determined as of the end of each Fund's fiscal year, July 31. However, under Section 19(a) of the 1940 Act, the Funds are required to indicate the source of each distribution to shareholders at the time of payment if the distribution is made from any source other than accumulated undistributed net income. For purposes of this disclosure, the source of each distribution is based on US Generally Accepted Accounting Principles and will differ from federal income tax-based reporting provided to shareholders due to certain tax adjustments. Distributions paid in part from paid-in capital do not necessarily reflect a taxable return of capital. For federal income tax purposes, shareholders will receive a Form 1099-DIV for each calendar year that will tell you how to report these distributions.
Accordingly, the Funds are making the following disclosures pursuant to Section 19(a).
During the semi-annual period ended January 31, 2017, Dividend & Income Builder, Emerging Markets, Global Equity Income, International Long/Short Equity and International Opportunities paid the following income distributions in part from sources other than accumulated undistributed net income as measured at the time of payment.
| Dividend & Income Builder | | | | | | | | | | | | % from | | | % from | | | | |
| Pay Date | | | Ex-Date | | | Class | | | Amount | | | accumulated undistributed net income | | | accumulated
realized
gains | | | % from
paid-in
capital | |
| 9/27/16 | | | 9/27/16 | | | A | | $ | 0.116761 | | | 97.7 | % | | 0.0 | % | | 2.3 | % |
| | | | | | | C | | $ | 0.094304 | | | 97.7 | % | | 0.0 | % | | 2.3 | % |
| | | | | | | I | | $ | 0.125636 | | | 97.7 | % | | 0.0 | % | | 2.3 | % |
| | | | | | | R6 | | $ | 0.125425 | | | 97.7 | % | | 0.0 | % | | 2.3 | % |
| | | | | | | | | | | | | | | | | | | | |
| 12/27/16 | | | 12/27/16 | | | A | | $ | 0.058380 | | | 64.6 | % | | 0.0 | % | | 35.4 | % |
| | | | | | | C | | $ | 0.039231 | | | 64.6 | % | | 0.0 | % | | 35.4 | % |
| | | | | | | I | | $ | 0.066431 | | | 64.6 | % | | 0.0 | % | | 35.4 | % |
| | | | | | | R6 | | $ | 0.057040 | | | 64.6 | % | | 0.0 | % | | 35.4 | % |
| Emerging Markets | | | | | | | | | | | | % from | | | % from | | | | |
| Pay Date | | | Ex-Date | | | Class | | | Amount | | | accumulated undistributed net income | | | accumulated
realized
gains | | | % from
paid-in
capital | |
| 12/22/16 | | | 12/21/16 | | | A | | $ | 0.06182 | | | 38.8 | % | | 0.0 | % | | 61.2 | % |
| | | | | | | C | | $ | 0.01460 | | | 38.8 | % | | 0.0 | % | | 61.2 | % |
| | | | | | | I | | $ | 0.07462 | | | 38.8 | % | | 0.0 | % | | 61.2 | % |
| | | | | | | R6 | | $ | 0.07644 | | | 38.8 | % | | 0.0 | % | | 61.2 | % |
197
| Other information (unaudited) |
| Global Equity Income | | | | | | | | | | | | % from | | | % from | | | | |
| Pay Date | | | Ex-Date | | | Class | | | Amount | | | accumulated undistributed net income | | | accumulated
realized
gains | | | % from
paid-in
capital | |
| 9/27/16 | | | 9/27/16 | | | A | | $ | 0.108000 | | | 99.3 | % | | 0.0 | % | | 0.7 | % |
| | | | | | | C | | $ | 0.094620 | | | 99.3 | % | | 0.0 | % | | 0.7 | % |
| | | | | | | I | | $ | 0.113173 | | | 99.3 | % | | 0.0 | % | | 0.7 | % |
| | | | | | | R6 | | $ | 0.114046 | | | 99.3 | % | | 0.0 | % | | 0.7 | % |
| | | | | | | | | | | | | | | | | | | | |
| 12/27/16 | | | 12/27/16 | | | A | | $ | 0.096360 | | | 38.2 | % | | 0.0 | % | | 61.8 | % |
| | | | | | | C | | $ | 0.082604 | | | 38.2 | % | | 0.0 | % | | 61.8 | % |
| | | | | | | I | | $ | 0.100931 | | | 38.2 | % | | 0.0 | % | | 61.8 | % |
| | | | | | | R6 | | $ | 0.101869 | | | 38.2 | % | | 0.0 | % | | 61.8 | % |
| International Long/Short Equity | | | | | | | | | | | | % from | | | % from | | | | |
| Pay Date | | | Ex-Date | | | Class | | | Amount | | | accumulated undistributed net income | | | accumulated
realized
gains | | | % from
paid-in
capital | |
| 12/22/16 | | | 12/21/16 | | | A | | $ | — | | | N/A | | | N/A | | | N/A | |
| | | | | | | C | | $ | 0.17624 | | | 0.0 | % | | 0.0 | % | | 100.0 | % |
| | | | | | | I | | $ | 0.22108 | | | 0.0 | % | | 0.0 | % | | 100.0 | % |
| | | | | | | R6 | | $ | 0.22277 | | | 0.0 | % | | 0.0 | % | | 100.0 | % |
| International Opportunities | | | | | | | | | | | | % from | | | % from | | | | |
| Pay Date | | | Ex-Date | | | Class | | | Amount | | | accumulated undistributed net income | | | accumulated
realized
gains | | | % from
paid-in
capital | |
| 12/22/16 | | | 12/21/16 | | | A | | $ | 0.38865 | | | 60.1 | % | | 0.0 | % | | 39.9 | % |
| | | | | | | C | | $ | 0.20816 | | | 60.1 | % | | 0.0 | % | | 39.9 | % |
| | | | | | | R | | $ | 0.37575 | | | 60.1 | % | | 0.0 | % | | 39.9 | % |
| | | | | | | I | | $ | 0.49443 | | | 60.1 | % | | 0.0 | % | | 39.9 | % |
| | | | | | | R6 | | $ | 0.48889 | | | 60.1 | % | | 0.0 | % | | 39.9 | % |
| | | | | | | IF | | $ | 0.42280 | | | 60.1 | % | | 0.0 | % | | 39.9 | % |
198
| Other information (unaudited) |
Shareholder expense
As a shareholder of the Funds, you incur two types of costs: (1) transaction costs, including upfront or deferred sales charges (loads) on purchases and (2) ongoing operating costs, including management fees, distribution (12b-1) fees, shareholder services fees and other Fund operating expenses. The example in Table 1 and Table 2 is intended to help you understand your ongoing costs of investing in the Funds and to compare these costs with ongoing costs of investing in other mutual funds. It is based on an investment of $1,000 invested at the beginning of the period and held for the six months ended January 31, 2017.
Actual expenses
Table 1 provides information about actual account values and actual expenses. You may use the information in this line, together with the amount invested, to estimate the expenses that you incurred over the period. Simply divide your account value at the end of the period by $1,000 (for example, an $8,600 account value divided by $1,000 = 8.6), then multiply the result by the number under the heading entitled "Expenses Paid During the Period" to estimate the expenses attributable to your investment during this period.
Hypothetical example for comparison purposes
Table 2 provides information about hypothetical account values and hypothetical expenses based on the Funds' actual expense ratios and an assumed rate of return of 5% per year before expenses, which is not the Funds' actual return. Thus you should not use the hypothetical account values and expenses to estimate your actual ending account balance or the expense attributable to your investment during the period. Rather, these figures are provided to enable you to compare the ongoing costs of investing in the Funds and other funds. To do so, compare the 5% hypothetical examples with the 5% hypothetical examples that appear in the shareholder reports of other funds.
Expenses paid during the period include amounts reflected in the Funds' Statements of Operations (excluding the effect of short sale expenses for International Long/Short), net of reimbursements by the investment advisor. The annualized expense ratios used in the example are as follows:
| | | | Class | | | Class | | | Class | | | Class | | | Class | | | Class | |
| | | | A | | | C | | | I | | | R | | | R6 | | | IF | |
| All Asset | | | 0.85 | % | | 1.60 | % | | 0.60 | % | | N/A | | | 0.60 | % | | N/A | |
| Dividend & Income Builder | | | 1.23 | % | | 2.00 | % | | 0.98 | % | | N/A | | | 1.05 | % | | N/A | |
| Emerging Markets | | | 1.65 | % | | 2.42 | % | | 1.41 | % | | N/A | | | 1.41 | % | | N/A | |
| European Focus | | | 1.35 | % | | 2.13 | % | | 1.10 | % | | N/A | | | 1.09 | % | | N/A | |
| Global Equity Income | | | 1.09 | % | | 1.84 | % | | 0.83 | % | | N/A | | | 0.78 | % | | N/A | |
| Global Technology | | | 1.36 | % | | 2.13 | % | | 1.12 | % | | N/A | | | 1.16 | % | | N/A | |
| High Yield Opportunities | | | 0.93 | % | | 1.68 | % | | 0.68 | % | | N/A | | | 0.68 | % | | N/A | |
| International Long/Short Equity | | | 1.62 | % | | 2.49 | % | | 1.49 | % | | N/A | | | 1.49 | % | | N/A | |
| International Opportunities Fund | | | 1.33 | % | | 2.11 | % | | 1.07 | % | | 1.69% | | | 1.09 | % | | 1.03% | |
| International Small Cap | | | N/A | | | N/A | | | N/A | | | N/A | | | 1.24 | % | | N/A | |
| Strategic Income | | | 1.01 | % | | 1.76 | % | | 0.75 | % | | N/A | | | 0.70 | % | | N/A | |
| US Growth Opportunities | | | 1.20 | % | | 1.95 | % | | 0.95 | % | | N/A | | | 0.95 | % | | N/A | |
Note that the expenses do not reflect shareholder transaction costs such as front-end or deferred sales charges. These fees are described for each Fund and share class in the "Commentaries and Performance Summaries" section of this report beginning on page 4. Table 2 is useful in comparing ongoing costs only, and will not help you determine the relative total costs of owning different funds. In addition, if these transaction costs were included, your costs would have been higher.
199
| Other information (unaudited) |
Table 1
| | | | Beginning | | | Ending | | | Expenses | |
| | | | account | | | account | | | paid | |
| | | | value | | | value | | | during | |
| | | | August 1, | | | January 31, | | | the | |
| Actual | | | 2016 | | | 2017 | | | period* | |
| All Asset Class A | | $ | 1,000.00 | | | 1,019.10 | | | 4.33 | |
| Class C | | | 1,000.00 | | | 1,015.10 | | | 8.13 | |
| Class I | | | 1,000.00 | | | 1,021.00 | | | 3.06 | |
| Class R6 | | | 1,000.00 | | | 1,021.30 | | | 3.06 | |
| Dividend & Income Builder |
| Class A | | $ | 1,000.00 | | | 1,008.00 | | | 6.23 | |
| Class C | | | 1,000.00 | | | 1,003.70 | | | 10.10 | |
| Class I | | | 1,000.00 | | | 1,009.40 | | | 4.96 | |
| Class R6 | | | 1,000.00 | | | 1,008.60 | | | 5.32 | |
| Emerging Markets |
| Class A | | $ | 1,000.00 | | | 999.60 | | | 8.32 | |
| Class C | | | 1,000.00 | | | 996.10 | | | 12.18 | |
| Class I | | | 1,000.00 | | | 1,001.10 | | | 7.11 | |
| Class R6 | | | 1,000.00 | | | 1,001.30 | | | 7.11 | |
| European Focus |
| Class A | | $ | 1,000.00 | | | 967.40 | | | 6.69 | |
| Class C | | | 1,000.00 | | | 963.60 | | | 10.54 | |
| Class I | | | 1,000.00 | | | 968.70 | | | 5.46 | |
| Class R6 | | | 1,000.00 | | | 968.50 | | | 5.41 | |
| Global Equity Income |
| Class A | | $ | 1,000.00 | | | 1,017.60 | | | 5.54 | |
| Class C | | | 1,000.00 | | | 1,013.90 | | | 9.34 | |
| Class I | | | 1,000.00 | | | 1,020.40 | | | 4.23 | |
| Class R6 | | | 1,000.00 | | | 1,020.60 | | | 3.97 | |
| Global Technology |
| Class A | | $ | 1,000.00 | | | 1,098.50 | | | 7.19 | |
| Class C | | | 1,000.00 | | | 1,094.30 | | | 11.24 | |
| Class I | | | 1,000.00 | | | 1,100.40 | | | 5.93 | |
| Class R6 | | | 1,000.00 | | | 1,099.90 | | | 6.14 | |
| High Yield Opportunities |
| Class A | | $ | 1,000.00 | | | 1,074.40 | | | 4.86 | |
| Class C | | | 1,000.00 | | | 1,070.80 | | | 8.77 | |
| Class I | | | 1,000.00 | | | 1,076.10 | | | 3.56 | |
| Class R6 | | | 1,000.00 | | | 1,076.40 | | | 3.56 | |
| International Long/Short Equity | | | | | | | | | | |
| Class A | | $ | 1,000.00 | | | 1,016.90 | | | 8.24 | |
| Class C | | | 1,000.00 | | | 1,016.20 | | | 12.65 | |
| Class I | | | 1,000.00 | | | 1,021.00 | | | 7.59 | |
| Class R6 | | | 1,000.00 | | | 1,021.20 | | | 7.59 | |
| International Opportunities | | | | | | | | | | |
| Class A | | $ | 1,000.00 | | | 1,000.70 | | | 6.71 | |
| Class C | | | 1,000.00 | | | 997.20 | | | 10.62 | |
| Class I | | | 1,000.00 | | | 1,002.10 | | | 5.40 | |
| Class R | | | 1,000.00 | | | 999.00 | | | 8.52 | |
| Class R6 | | | 1,000.00 | | | 1,001.90 | | | 5.50 | |
| Class IF | | | 1,000.00 | | | 1,002.40 | | | 5.20 | |
| International Small Cap Class R6 | | $ | 1,000.00 | | | 1,072.00 | | | 6.48 | |
| Strategic Income | | | | | | | | | | |
| Class A | | $ | 1,000.00 | | | 1,005.60 | | | 5.11 | |
| Class C | | | 1,000.00 | | | 1,001.80 | | | 8.88 | |
| Class I | | | 1,000.00 | | | 1,006.90 | | | 3.79 | |
| Class R6 | | | 1,000.00 | | | 1,007.20 | | | 3.54 | |
| US Growth Opportunities |
| Class A | | $ | 1,000.00 | | | 1,009.90 | | | 6.08 | |
| Class C | | | 1,000.00 | | | 1,005.40 | | | 9.86 | |
| Class I | | | 1,000.00 | | | 1,010.70 | | | 4.81 | |
| Class R6 | | | 1,000.00 | | | 1,010.70 | | | 4.81 | |
Table 2
| | | | | | | | | | | |
| Hypothetical | | | Beginning | | | Ending | | | Expenses | |
| (assuming a | | | account | | | account | | | paid | |
| 5% return | | | value | | | value | | | during | |
| before | | | August 1, | | | January 31, | | | the | |
| expenses) | | | 2016 | | | 2017 | | | period* | |
| All Asset |
| Class A | | $ | 1,000.00 | | | 1,020.93 | | | 4.33 | |
| Class C | | | 1,000.00 | | | 1,017.16 | | | 8.13 | |
| Class I | | | 1,000.00 | | | 1,022.19 | | | 3.06 | |
| Class R6 | | | 1,000.00 | | | 1,022.19 | | | 3.06 | |
| Dividend & Income Builder |
| Class A | | $ | 1,000.00 | | | 1,019.02 | | | 6.26 | |
| Class C | | | 1,000.00 | | | 1,015.15 | | | 10.16 | |
| Class I | | | 1,000.00 | | | 1,020.28 | | | 4.99 | |
| Class R6 | | | 1,000.00 | | | 1,019.93 | | | 5.35 | |
| Emerging Markets |
| Class A | | $ | 1,000.00 | | | 1,016.91 | | | 8.39 | |
| Class C | | | 1,000.00 | | | 1,013.04 | | | 12.28 | |
| Class I | | | 1,000.00 | | | 1,018.12 | | | 7.17 | |
| Class R6 | | | 1,000.00 | | | 1,018.42 | | | 6.87 | |
| European Focus |
| Class A | | $ | 1,000.00 | | | 1,018.42 | | | 6.87 | |
| Class C | | | 1,000.00 | | | 1,014.50 | | | 10.82 | |
| Class I | | | 1,000.00 | | | 1,019.67 | | | 5.60 | |
| Class R6 | | | 1,000.00 | | | 1,019.73 | | | 5.55 | |
| Global Equity Income |
| Class A | | $ | 1,000.00 | | | 1,019.73 | | | 5.55 | |
| Class C | | | 1,000.00 | | | 1,015.95 | | | 9.35 | |
| Class I | | | 1,000.00 | | | 1,021.03 | | | 4.23 | |
| Class R6 | | | 1,000.00 | | | 1,021.28 | | | 3.97 | |
| Global Technology |
| Class A | | $ | 1,000.00 | | | 1,018.37 | | | 6.92 | |
| Class C | | | 1,000.00 | | | 1,014.50 | | | 10.82 | |
| Class I | | | 1,000.00 | | | 1,019.57 | | | 5.70 | |
| Class R6 | | | 1,000.00 | | | 1,019.37 | | | 5.90 | |
| High Yield Opportunities |
| Class A | | $ | 1,000.00 | | | 1,020.53 | | | 4.74 | |
| Class C | | | 1,000.00 | | | 1,016.76 | | | 8.54 | |
| Class I | | | 1,000.00 | | | 1,021.79 | | | 3.47 | |
| Class R6 | | | 1,000.00 | | | 1,021.79 | | | 3.47 | |
| International Long/Short Equity | | | | | | | | | | |
| Class A | | | $1,000.00 | | | 1,017.06 | | | 8.24 | |
| Class C | | | 1,000.00 | | | 1,012.69 | | | 12.63 | |
| Class I | | | 1,000.00 | | | 1,017.71 | | | 7.58 | |
| Class R6 | | | 1,000.00 | | | 1,017.71 | | | 7.58 | |
| International Opportunities |
| Class A | | $ | 1,000.00 | | | 1,018.52 | | | 6.77 | |
| Class C | | | 1,000.00 | | | 1,014.60 | | | 10.71 | |
| Class I | | | 1,000.00 | | | 1,019.83 | | | 5.45 | |
| Class R | | | 1,000.00 | | | 1,016.71 | | | 8.59 | |
| Class R6 | | | 1,000.00 | | | 1,019.73 | | | 5.55 | |
| Class IF | | | 1,000.00 | | | 1,020.03 | | | 5.24 | |
| International Small Cap | | | | | | | | | | |
| Class R6 | | $ | 1,000.00 | | | 1,018.97 | | | 6.31 | |
| Strategic Income | | | | | | | | | | |
| Class A | | $ | 1,000.00 | | | 1,020.13 | | | 5.14 | |
| Class C | | | 1,000.00 | | | 1,016.36 | | | 8.94 | |
| Class I | | | 1,000.00 | | | 1,021.43 | | | 3.82 | |
| Class R6 | | | 1,000.00 | | | 1,021.69 | | | 3.57 | |
| US Growth Opportunities | | | | | | | | | | |
| Class A | | $ | 1,000.00 | | | 1,019.17 | | | 6.11 | |
| Class C | | | 1,000.00 | | | 1,015.40 | | | 9.91 | |
| Class I | | | 1,000.00 | | | 1,020.43 | | | 4.84 | |
| Class R6 | | | 1,000.00 | | | 1,020.43 | | | 4.84 | |
| * | | Expenses are equal to the Funds' annualized net expense ratio multiplied by the average account value over the period multiplied by 184 days in the period, and divided by 365 (to reflect the one-half year period). |
200
| Trustees and officers (unaudited) |
| | | | | Term of | | | | |
Name, address1, | | Position(s) | | Office and | | | | Other |
| month and | | with | | Time | | Principal Occupations | | Directorships |
| year of birth | | the Trust2 | | Served3 | | During Past Five Years | | Held |
| Independent Trustees | | | | | | | | |
James W. Atkinson
August 1950 | | Chairman and Trustee | | Trustee since 2011; elected Chairman December 2015 | | Commercial Pilot, Atkinson Aviation LLC, since 2009. | | Formerly, Trustee,
LaRabida Children's Hospital: formerly Trustee, Surgeons Diversified Investment Fund. |
Barbara L. Lamb
September 1954 | | Trustee | | Since 2014 | | Managing Director, WH Trading LLC (proprietary trading company), since 2015; formerly, Managing Director, Cheiron Trading LLC (proprietary trading company). | | Formerly, Director, First Chicago Bancorp; formerly Director, MAF Bancorp, Inc. |
J. Marshall Peck
April 1952 | | Trustee | | Since 2014 | | President, Interpark Holdings, LLC (parking garage owner, developer and operator), since 2011; formerly, Chief Executive Officer, Interpark Holdings, LLC. | | Board Member and Finance Committee Chairman, Presbyterian Homes. |
Diane L. Wallace
October 1958 | | Trustee | | Since 2015 | | Retired. | | Independent Trustee, State Farm Associates' Funds Trust, State Farm Mutual Fund Trust and State Farm Variable Product Trust (28 portfolios). |
201
| Trustees and officers (unaudited) |
| | | | | Term of | | | | |
Name, address1, | | Position(s) | | Office and | | | | Other |
| month and | | with | | Time | | Principal Occupations | | Directorships |
| year of birth | | the Trust2 | | Served3 | | During Past Five Years | | Held |
| Interested Trustees and Officers of the Trust |
James G. O'Brien4
May 1960 | | Trustee and President | | Since 2011
Since 2010 | | Managing Director, HGINA. | | None. |
Charles Thompson II4
April 1970 | | Trustee and Vice President | | Since 2011
Since 2010 | | Director of Distribution (North America),
since 2014; Director of US Retail, 2010-2014. | | None. |
Kenneth A. Kalina
August 1959 | | Chief Compliance Officer | | Since 2005 | | Chief Compliance Officer, HGINA, until 2015. | | N/A |
Alanna P. Nensel
July 1975 | | Vice President | | Since 2002 | | Director of US Marketing, HGINA. | | N/A |
David Latin
September 1981 | | Vice President | | Since 2012 | | Director of Product Development, HGINA. | | N/A |
Christopher Golden
March 1977 | | Secretary | | Since 2015 | | Legal Counsel, HGINA. | | N/A |
Suzanne Cullinane
March 1970 | | Vice President and Assistant Secretary | | Since 2016 | | Head of US Operations, since 2016; previously, Head of US Transfer Agent & Intermediary Operations, HGINA. | | N/A |
Troy M. Statczar
August 1971 | | Treasurer | | Since 2008 | | Director of US Operations, since 2016; previously, Head of US Fund Administration and Accounting, HGINA. | | N/A |
Jonathan G. Szafran
November 1989 | | Assistant Treasurer | | Since February 2017 | | Manager of US Fund Administration, since 2017; previously, Senior Analyst of US Fund Administration, HGINA, since March 2014; Senior Associate of Fund Administration, Cortland Capital Market Services, LLC 2013-2014; Experienced Associate, PricewaterhouseCoopers LLP 2012-2013. | | N/A |
| 1. | | Each person's address is 737 North Michigan Avenue, Suite 1700, Chicago, IL 60611. |
| 2. | | Currently, all Trustees oversee all twelve series of the Trust. |
| 3. | | A Trustee may serve until his death, resignation, removal or until the end of the calendar year in which the Trustee reaches 75 years of age, subject to change by the Board. The officers of the Trust are elected annually by the Board. |
| 4. | | This Trustee is an interested person of the Trust because of his employment relationship with Henderson Global Investors (North America) Inc., the investment advisor to the Fund. |
| | | |
| | | Unless otherwise noted, this information is as of January 31, 2017. The Statement of Additional Information for Henderson Global Funds includes additional information about the Trustees and is available without charge by calling 1.866.4HENDERSON (1.866.443.6337). |
202
| Trustees and officers (unaudited) |
Trustees
James W. Atkinson, Chairman
Barbara L. Lamb
J. Marshall Peck
Diane L. Wallace
James G. O'Brien*
Charles Thompson II* Officers
James G. O'Brien, President
Charles Thompson II, Vice President
Alanna P. Nensel, Vice President David Latin, Vice President
Christopher Golden, Secretary
Suzanne Cullinane, Vice President & Assistant Secretary
Kenneth A. Kalina, Chief Compliance Officer
Troy M. Statczar, Treasurer
Jonathan G. Szafran, Assistant Treasurer | Investment Advisor Henderson Global Investors (North America) Inc.
737 North Michigan Avenue, Suite 1700
Chicago, IL 60611 Transfer Agent State Street Bank and Trust Company
2000 Crown Colony Drive
Quincy, MA 02169 Administrator and Custodian State Street Bank & Trust Company
State Street Financial Center
One Lincoln Street
Boston, MA 02111 Independent Public Registered Accounting Firm Ernst & Young LLP
155 North Wacker Drive
Chicago, IL 60606 For more information
Please call 1.866.4HENDERSON
(1.866.443.6337)
or visit our website:
www.henderson.com |
| |
| |
| |
| |
| |
| * | Trustee is an "interested person" of the Trust as defined in the1940 Act. |
The views expressed in this report and information about the Funds' portfolio holdings are for the period covered by this report and are subject to change hereafter. The views expressed in this report should not be constructed as a recommendation of any kind. The report may include forward-looking statements that involve risk and uncertainty, and there is no guarantee that any prediction will come to pass. There can be no assurance that a Fund will achieve its investment objectives. This report is submitted for the general information of the shareholders of the Funds. It is not authorized for distribution to prospective investors unless preceded or accompanied by an effective prospectus, which includes information regarding the Funds' risks, objectives, fees and expenses, experience of its management, and other information. Henderson Global Investors is the name under which various subsidiaries of Henderson Group plc, a UK limited company, provide investment products and services.
Foreside Fund Services, LLC, Distributor
203
This page intentionally left blank.
204
This notice describes the privacy practices followed by Henderson Global Funds.
Your privacy is our top priority. Our policy is to respect the privacy of current and former shareholders and to protect personal information entrusted to us. We do not share any nonpublic personal information of shareholders or former shareholders with any nonaffiliated third parties, except as permitted by law or as authorized by our shareholders.
In the course of providing products and services to you, we collect nonpublic personal information about you from various sources such as account applications or agreements, other account forms, transactions in your account, and from information captured on our website, including any information captured through our use of "cookies." Such information may include your name, address, account or tax identification number, the types and amounts of investments, and bank account information. More detailed information about our Internet policy is available on our website, www.henderson.com.
In the normal course of serving shareholders, we may share information we collect with entities that help us process information or service your request, such as transfer agents, custodians, broker-dealers and marketing service firms, as well as with other financial institutions with whom we have joint marketing agreements. We may share information in connection with servicing accounts or to inform shareholders of products and services that we believe may be of interest to them. The organizations that receive shareholder information will use that information only for the services required and as allowed by applicable law or regulation, and are not permitted to share or use this information for any other purpose. Our affiliates do not use shareholder information that we receive to make marketing solicitations. We will disclose your personal information to government agencies, law enforcement officials, and others in the limited circumstances where we believe, in good faith, that such disclosure is required or permitted by law. For example, we will disclose your personal information in order to comply with a court order, to cooperate with government or industry regulators, or law enforcement authorities.
Access to customers' nonpublic personal information is restricted to employees who need to access that information. To guard shareholder's nonpublic personal information, we use industry standard physical, electronic, and procedural safeguards. A shareholder's right to privacy extends to all forms of contact with us, including telephone, written correspondence, and electronic media, such as the Internet.
For questions concerning this policy, please contact us by writing to: Alanna Nensel, Henderson Global Investors (North America) Inc., 737 North Michigan Avenue, Suite 1700, Chicago, Illinois 60611.