UNITED STATES
SECURITIES AND EXCHANGE COMMISSION
Washington, D.C. 20549
SECURITIES AND EXCHANGE COMMISSION
Washington, D.C. 20549
FORM N-CSR
CERTIFIED SHAREHOLDER REPORT OF REGISTERED
MANAGEMENT INVESTMENT COMPANIES
Investment Company Act file number 811-10401
Trust for Professional Managers
(Exact name of registrant as specified in charter)
(Exact name of registrant as specified in charter)
615 East Michigan Street
Milwaukee, WI 53202
(Address of principal executive offices) (Zip code)
(Address of principal executive offices) (Zip code)
Adam W. Smith
U.S. Bancorp Fund Services, LLC
615 East Michigan Street
Milwaukee, WI 53202
(Name and address of agent for service)
(Name and address of agent for service)
(414) 765-6115
Registrant's telephone number, including area code
Date of fiscal year end: September 30, 2019
Date of reporting period: March 31, 2019
Item 1. Reports to Stockholders.
March 31, 2019
CrossingBridge Low Duration High Yield Fund
Institutional Class
(CBLDX)
CrossingBridge Long/Short Credit Fund
Institutional Class
(CCLIX)
Investment Adviser
CrossingBridge Advisors, LLC
427 Bedford Road
Suite 230
Pleasantville, New York 10570
Phone: 1-888-898-2780
IMPORTANT NOTE: Beginning on January 1, 2021, paper copies of the CrossingBridge Low Duration High Yield Fund and CrossingBridge Long/Short Credit Fund, (“the Funds”), shareholder reports will no longer be sent by mail, unless you specifically request paper copies of the shareholder reports from your financial intermediary, such as a broker-dealer or bank. Instead, the shareholder reports will be made available on a website, and you will be notified by mail each time a report is posted and provided with a website link to access the report.
You may elect to receive all future Funds’ shareholder reports in paper, free of charge. If you already elected to receive shareholder reports electronically, you will not be affected by this change and you need not take any action. Please contact your financial intermediary to inform them that you wish to continue receiving paper copies of Funds’ shareholder reports and for details about whether your election to receive reports in paper will apply to all funds held with your financial intermediary.
Table of Contents
| LETTERS TO SHAREHOLDERS | 3 | |
| EXPENSE EXAMPLE | 7 | |
| INVESTMENT HIGHLIGHTS | 9 | |
| SCHEDULES OF INVESTMENTS | 13 | |
| SCHEDULE OF SECURITIES SOLD SHORT | 22 | |
| STATEMENTS OF ASSETS AND LIABILITIES | 24 | |
| STATEMENTS OF OPERATIONS | 25 | |
| STATEMENTS OF CHANGES IN NET ASSETS | 27 | |
| FINANCIAL HIGHLIGHTS | 31 | |
| NOTES TO FINANCIAL STATEMENTS | 35 | |
| ADDITIONAL INFORMATION | 47 |
Management’s Discussion of Fund Performance and Analysis
CrossingBridge Low Duration High Yield Fund
(Unaudited)
Dear Shareholder,
The Semi-Annual Report for the CrossingBridge Low Duration High Yield Fund (“CBLDX” or the “Fund”) covers the six-month period from October 1, 2018 through March 31, 2019. For the six-months ended March 31, 2019, the Fund gained 1.17% on its Institutional Class shares while the ICE BofAML 0-3 Year U.S. High Yield Excluding Financials Index gained 1.43%, the ICE BofAML 1-3 Year U.S. Corporate Bond Index gained 2.67% and the ICE BofAML 0-3 Year U.S. Treasury Index gained 1.98%.
Investment results for the six month period ranged from -0.19% in December 2018 to 0.73% in January 2019. The median monthly return for the period was 0.15% with a standard deviation of 0.35%. The Fund realized positive contributions from interest income, realized capital gains and unrealized capital gains. For the six-month fiscal period ended March 31, 2019, the estimated total return was composed as follows: 107% interest income and -7% net capital gains/(losses) of which 98% of the net capital gains/(losses) were realized and 2% remain unrealized.
After a volatile 4Q18, followed by an even stronger recovery in 1Q19, the Fund continues to strive for an attractive yield while maintaining a very short average effective maturity. As of March 31, 2019, CBLDX’s estimated effective maturity was just over six months, of which just under 60% of the Fund’s investments had an effective maturity of 90 days or less. Under more normal interest rate and credit spread expectations, CBLDX would target a 0.75 – 1.50 duration.
The Fund purchases below investment grade debt as part of its core strategy. Deemed speculative in nature by credit ratings because of elevated balance sheet leverage, the asset class has a greater potential for defaults and credit losses than government and investment grade debt. However, we believe our “bottom-up” research approach significantly mitigates this risk.
Opinions expressed are subject to change at any time, are not guaranteed and should not be considered investment advice.
Past performance does not guarantee future results.
Diversification does not assure a profit nor protect against risk in a declining market.
Fund holdings and sector allocation are subject to change at any time and should not be considered a recommendation to buy or sell any security. Please see the Schedule of Investments for complete fund holdings.
*Definitions: The ICE BofAML 0-3 Year U.S. Treasury Index tracks the performance of U.S. dollar denominated sovereign debt publicly issued by the U.S. government in its domestic market with maturities less than three years. The ICE BofAML 1-3 Year U.S. Corporate Bond Index is a subset of the ICE BofAML U.S. Corporate Bond Index including all securities with a remaining term to final maturity less than three years. The ICE BofAML U.S. Corporate Bond Index tracks the performance of U.S. dollar denominated investment grade corporate debt publicly issued in the U.S. domestic market. The ICE BofAML 0-3 Year U.S. High Yield Excluding Financials Index tracks the performance of short maturity U.S. dollar denominated below investment grade rating (based on an average of Moody’s, S&P, and Fitch), at least 18 months to final maturity at the time of issuance, at
3
least one month but less than three years remaining term to final maturity as of the rebalancing date, a fixed coupon schedule and minimum amount outstanding of $250 million. Standard Deviation is a statistical measure that is used to quantify the amount of variation or dispersion of a set of data values. Duration is the weighted average of the present value of the cash flows and is used as a measure of a bond price’s response to changes in yield. Rising interest rates mean falling bond prices, while declining interest rates mean rising bond prices. Effective Maturity is the weighted average of the portfolio’s yield to worst date/work out date. Credit Spread is the difference in yield between a U.S. Treasury bond and another debt security with the same maturity but of lesser quality.
It is not possible to invest directly in an index.
Mutual fund investing involves risk. Principal loss is possible. Investments in foreign securities involve greater volatility and political, economic and currency risks and differences in accounting methods. Investments in debt securities typically decrease in value when interest rates rise. This risk is usually greater for longer-term debt securities. Investment in lower-rated and non-rated securities presents a greater risk of loss to principal and interest than higher-rated securities. The fund may make short sales of securities, which involves the risk that losses may exceed the original amount invested. The fund may invest in exchange-traded funds (“ETFs”) and exchange-traded notes (“ETNs”), which are subject to additional risks that do not apply to conventional mutual funds, including the risks that the market price of an ETF’s and ETN’s shares may trade at a discount to its net asset value (“NAV”), an active secondary trading market may not develop or be maintained, or trading may be halted by the exchange in which they trade, which may impact the Fund’s ability to sell its shares. The value of ETNs may be influenced by the level of supply and demand for the ETN, volatility and lack of liquidity. The Fund may invest in derivative securities, which derive their performance from the performance of an underlying asset, index, interest rate or currency exchange rate. Derivatives can be volatile and involve various types and degrees of risks, and, depending upon the characteristics of a particular derivative, suddenly can become illiquid. Investments in asset-backed, mortgage-backed, and collateralized mortgage-backed securities include additional risks that investors should be aware of such as credit risk, prepayment risk, possible illiquidity and default, as well as increased susceptibility to adverse economic developments.
Must be preceded or accompanied by a prospectus.
Distributor: Quasar Distributors, LLC.
4
Management’s Discussion of Fund Performance and Analysis
CrossingBridge Long/Short Credit Fund
(Unaudited)
Dear Shareholder,
The Semi-Annual Report for the CrossingBridge Long/Short Credit Fund’s (“CCLIX” or the “Fund”) covers the six-month period from October 1, 2018 through March 31, 2019. For the six-month period ended March 31, 2019, the Fund lost -0.04% while the ICE BofAML U.S. High Yield Master II Index gained 2.39%, and the Bloomberg Barclays U.S. Aggregate Total Return Bond Index returned 4.63%.
Monthly investment results for the fiscal year fluctuated across the six months, ranging from -0.57% in March 2019 to 1.26% in January 2019. The median monthly return for the period was -0.11% with a standard deviation of 0.67%. The bulk of the returns were generated by net interest carry as our long book underwent moderate declines from interest rate pressures and one significant credit error. On March 31st, the net exposure of the Fund was 33.7%. For the six-month period ended March 31, 2019, the net exposure ranged from 33.7% to 62.6%, averaging 52.6% for the period. For the six-month fiscal period ended March 31, 2019, the estimated gross total return was composed as follows: 1.9% net interest income and 1.3% net capital losses (inclusive of both realized and unrealized gains and losses). The long book accounted for about 80% of capital losses while the short bond book was flat and short equity accounted for about 20% of the capital losses.
With an economic recovery already the second longest on record, coupled with trade tensions and weakness in certain sectors of the economy, the Fund is slowly increasing its short exposure while maintaining a long book with duration under 2 years. We are cognizant that the late 2018 Fed signaling of a respite from its tightening regime ignited a powerful rally in equity and credit markets, but we believe fundamentals are weakening and the markets have run too far too fast.
The Fund seeks to capitalize on opportunities across all phases of the credit cycle, providing investors with consistent returns that are uncorrelated to major indices. The Fund employs a dynamic long/short investment approach that tactically shifts net exposure depending on the point in the credit cycle and opportunities in the market. The Fund has a broad capital structure focus, but primarily invests in U.S. Corporate High Yield debt instruments.
Opinions expressed are subject to change at any time, are not guaranteed and should not be considered investment advice.
Past performance does not guarantee future results.
Diversification does not assure a profit nor protect against risk in a declining market.
Fund holdings and sector allocation are subject to change at any time and should not be considered a recommendation to buy or sell any security. Please see the Schedule of Investments for complete fund holdings.
Definitions: The ICE BofAML U.S. High Yield Master II Index tracks the performance of U.S. dollar denominated below investment grade corporate debt publicly issued in the U.S. domestic market. The Bloomberg Barclays U.S. Aggregate Total Return Bond Index is a broad base index that is often used to represent investment grade bonds being traded in the United States. The Index is a market capitalization-weighted index, meaning the securities in the index are weighted according to the market size of each bond type. Most U.S. traded investment grade bonds are represented.
5
Municipal bonds and Treasury inflation-protected securities are excluded, due to tax treatment issues. The Index includes Treasury securities, Government agency bonds, Mortgage-backed bonds, Corporate bonds, and a small amount of foreign bonds traded in the U.S. Standard Deviation is a statistical measure that is used to quantify the amount of variation or dispersion of a set of data values. Duration is the weighted average of the present value of the cash flows and is used as a measure of a bond price’s response to changes in yield. Rising interest rates mean falling bond prices, while declining interest rates mean rising bond prices. Net Interest Carry is calculated by subtracting gross short interest income from gross long interest income and dividing by net assets. Net Exposure is calculated by subtracting gross short positions from the gross long positions and dividing by net assets. The gross long positions exclude cash and cash equivalents.
It is not possible to invest directly in an index.
Mutual fund investing involves risk. Principal loss is possible. Investments in debt securities typically decrease in value when interest rates rise. This risk is usually greater for longer-term debt securities. Investment in lower-rated and non-rated securities presents a greater risk of loss to principal and interest than higher-rated securities. The Fund may make short sales of securities, which involves the risk that losses may exceed the original amount invested. The Fund may invest in exchange-traded funds (ETFs) and exchange-traded notes (ETNs), which are subject to additional risks that do not apply to conventional mutual funds, including the risks that the market price of an ETF’s and ETN’s shares may trade at a discount to its net asset value (“NAV”), an active secondary trading market may not develop or be maintained, or trading may be halted by the exchange in which they trade, which may impact the Fund’s ability to sell its shares. The value of ETNs may be influenced by the level of supply and demand for the ETN, volatility and lack of liquidity. The Fund may invest in smaller and medium sized companies, which involve additional risks such as limited liquidity and greater volatility. Investments in foreign securities involve greater volatility and political, economic and currency risks and differences in accounting methods. The Fund may invest in derivative securities, which derive their performance from the performance of an underlying asset, index, interest rate or currency exchange rate. Derivatives can be volatile and involve various types and degrees of risks, and, depending upon the characteristics of a particular derivative, suddenly can become illiquid. Investments in asset-backed, mortgage-backed, and collateralized mortgage-backed securities include additional risks that investors should be aware of such as credit risk, prepayment risk, possible illiquidity and default, as well as increased susceptibility to adverse economic developments. The Fund is non-diversified meaning it may concentrate its assets in fewer individual holdings than a diversified fund. Credit ratings are subject to change. The credit quality of investments in the portfolio does not apply to the stability or safety of the Fund or its shares. As the term implies, credit rating informs investors of a bond’s credit worthiness, or risk of default. An investment grade rating is not a guarantee that a bond will not default. Absolute return strategies are not intended to outperform stocks and bonds during strong market rallies.
Must be preceded or accompanied by a prospectus.
Distributor: Quasar Distributors, LLC.
6
CROSSINGBRIDGE FUNDS
Expense Example
(Unaudited)
As a shareholder of each Fund, you incur two types of costs: (1) transaction costs, and (2) ongoing costs, including management fees, shareholder servicing fees and other Fund expenses. This Example is intended to help you understand your ongoing costs (in dollars) of investing in each Fund, and to compare these costs with the ongoing costs of investing in other mutual funds. The Example is based on an investment of $1,000 invested at the beginning of the period and held for the entire period (10/1/18 – 3/31/19).
Actual Expenses
The first lines of the following tables provide information about actual account values and actual expenses. You will be assessed fees for outgoing wire transfers, returned checks and stop payment orders at prevailing rates charged by U.S. Bank Global Fund Services, the Funds’ transfer agent. If you request that a redemption be made by wire transfer, currently a $15.00 fee is charged by each Fund’s transfer agent. IRA accounts will be charged a $15.00 annual maintenance fee. To the extent each Fund invests in shares of exchange-traded funds or other investment companies as part of their investment strategies, you will indirectly bear your proportionate share of any fees and expenses charged by the underlying funds in which each Fund invests in addition to the expenses of each Fund. Actual expenses of the underlying funds are expected to vary among the various underlying funds. These expenses are not included in the example. The example includes, but is not limited to, management fees, fund administration and accounting, custody and transfer agent fees. You may use the information in these line, together with the amount you invested, to estimate the expenses that you paid over the period. Simply divide your account value by $1,000 (for example, an $8,600 account value divided by $1,000 = 8.6), then multiply the result by the number in the first line under the heading entitled “Expenses Paid During Period” to estimate the expenses you paid on your account during this period.
Hypothetical Example for Comparison Purposes
The second lines of the following tables provide information about hypothetical account values and hypothetical expenses based on each Fund’s actual expense ratio and an assumed rate of return of 5% per year before expenses, which is not each Fund’s actual return. The hypothetical account values and expenses may not be used to estimate the actual ending account balance or expenses you paid for the period. You may use this information to compare the ongoing costs of investing in each Fund and other funds. To do so, compare this 5% hypothetical example with the 5% hypothetical examples that appear in the shareholder reports of other funds. Please note that the expenses shown in the table are meant to highlight your ongoing costs only and do not reflect any transactional costs, such as sales charges (loads), redemption fees or exchange fees. Therefore, the second lines of the tables are useful in comparing ongoing costs only, and will not help you determine the relative total costs of owning different funds. In addition, if these transactional costs were included, your costs would have been higher.
7
CROSSINGBRIDGE FUNDS
Expense Example (Continued)
(Unaudited)
CrossingBridge Low Duration High Yield Fund
| Institutional Class | |||
| Beginning | Ending | Expenses Paid | |
| Account Value | Account Value | During Period | |
10/1/18 | 3/31/19 | 10/1/18 – 3/31/19* | |
| Actual | $1,000.00 | $1,011.70 | $5.02 |
| Hypothetical (5% return | |||
| before expenses) | $1,000.00 | $1,019.95 | $5.04 |
| * | Expenses are equal to the Fund’s annualized expense ratio of 1.00%, multiplied by the average account value over the period, multiplied by 182/365 (to reflect the one-half year period). |
CrossingBridge Long/Short Credit Fund
| Institutional Class | |||
| Beginning | Ending | Expenses Paid | |
| Account Value | Account Value | During Period | |
10/1/18 | 3/31/19 | 10/1/18 – 3/31/19* | |
| Actual | $1,000.00 | $ 999.60 | $12.21 |
| Hypothetical (5% return | |||
| before expenses) | $1,000.00 | $1,012.72 | $12.29 |
| * | Expenses are equal to the Fund’s annualized expense ratio of 2.45%, multiplied by the average account value over the period, multiplied by 182/365 (to reflect the one-half year period). |
8
CROSSINGBRIDGE LOW DURATION HIGH YIELD FUND
Investment Highlights
(Unaudited)
The Fund seeks high current income and capital appreciation consistent with the preservation of capital using a low duration mandate. The allocation of portfolio holdings as of March 31, 2019 is as follows:
Allocation of Portfolio Holdings
(% of Net Assets)

Average Annual Returns as of March 31, 2019
| One | Since Inception | |
Year | (1/31/18) | |
| Institutional Class Shares | 2.74% | 2.69% |
| ICE BofAML 0-3 Year U.S. High Yield | ||
| Excluding Financials Index | 5.19% | 4.39% |
| ICE BofAML 0-3 Year U.S. Treasury Index | 2.59% | 2.38% |
| ICE BofAML 1-3 Year U.S. Corporate Bond Index | 3.89% | 3.16% |
Performance data quoted represents past performance and does not guarantee future results. The investment return and principal value of an investment will fluctuate so that an investor’s shares, when redeemed, may be worth more or less than their original cost. Current performance of the Fund may be lower or higher than the performance quoted. Performance data current to the most recent month-end may be obtained by calling 1-888-898-2780.
Investment performance reflects fee waivers in effect. In the absence of such waivers, total returns would be reduced.
9
CROSSINGBRIDGE LOW DURATION HIGH YIELD FUND
Investment Highlights (Continued)
(Unaudited)
The returns shown assume reinvestment of Fund distributions and do not reflect the deduction of taxes that a shareholder would pay on Fund distributions or the redemption of Fund shares. The following graph illustrates performance of a hypothetical investment made in the Fund and a broad-based securities index on the Fund’s inception date. The graph does not reflect any future performance. ICE BofAML 0-3 Year U.S. High Yield Excluding Financials Index is a subset of ICE BofAML 0-3 Year U.S. High Yield Index excluding sector level 2 Financial issuers. ICE BofAML 0-3 Year U.S. Treasury Index tracks the performance of U.S. dollar denominated sovereign debt publicly issued by the U.S. government in its domestic market with maturities less than three years. Qualifying securities must have at least 18 months to maturity at point of issuance, at least one month and less than three years remaining term to final maturity, a fixed coupon schedule and minimum amount outstanding of $1 billion. ICE BofAML 1-3 Year U.S. Corporate Bond Index is a subset of ICE BofAML U.S. Corporate Bond Index including all securities with a remaining term to final maturity less than 3 years. It is not possible to invest directly in an index.
| Growth of $250,000 Investment |
 |
* Inception Date
10
CROSSINGBRIDGE LONG/SHORT CREDIT FUND
Investment Highlights
(Unaudited)
The Fund seeks absolute total returns over a complete market cycle. The Adviser believes that the Fund’s investment objective of seeking absolute total returns over a complete market cycle, typically three to five years, can be achieved primarily through a portfolio of long and short investments in credit-related instruments. The allocation of portfolio holdings as of March 31, 2019 is as follows:
Allocation of Portfolio Holdings
(% of Net Assets)

Average Annual Returns as of March 31, 2019
| One | Three | Since Inception | |
Year | Year | (2/27/15) | |
| Institutional Class Shares | 0.87% | 2.48% | 1.75% |
| Bloomberg Barclays U.S. Aggregate | |||
| Total Return Bond Index | 4.48% | 2.03% | 2.08% |
Performance data quoted represents past performance and does not guarantee future results. The investment return and principal value of an investment will fluctuate so that an investor’s shares, when redeemed, may be worth more or less than their original cost. Current performance of the Fund may be lower or higher than the performance quoted. Performance data current to the most recent month-end may be obtained by calling 1-888-898-2780.
Investment performance reflects fee waivers in effect. In the absence of such waivers, total returns would be reduced.
11
CROSSINGBRIDGE LONG/SHORT CREDIT FUND
Investment Highlights (Continued)
(Unaudited)
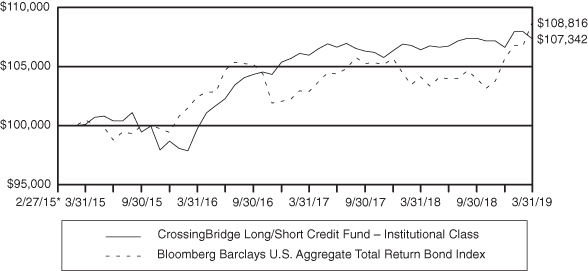
The returns shown assume reinvestment of Fund distributions and do not reflect the deduction of taxes that a shareholder would pay on Fund distributions or the redemption of Fund shares. The following graph illustrates performance of a hypothetical investment made in the Fund and a broad-based securities index on the Fund’s inception date. The graph does not reflect any future performance.
The Bloomberg Barclays U.S. Aggregate Total Return Bond Index is a broad-based index that is often used to represent investment grade bonds being traded in the United States. The Bloomberg Barclays U.S. Aggregate Total Return Bond Index is a market capitalization-weighted index, meaning the securities in the index are weighted according to the market size of each bond type. Most U.S. traded investment grade bonds are represented. Municipal bonds and Treasury Inflation-Protected Securities are excluded, due to tax treatment issues. The Bloomberg Barclays U.S. Aggregate Total Return Bond Index includes Treasury securities, Government agency bonds, mortgage-backed bonds, corporate bonds, and a small amount of foreign bonds traded in the United States.
| Growth of $100,000 Investment |
 |
* Inception Date
12
CROSSINGBRIDGE LOW DURATION HIGH YIELD FUND
| Schedule of Investments |
March 31, 2019 (Unaudited)
| Principal | ||||||||
| Amount | Value | |||||||
| BANK LOANS – 15.54% | ||||||||
| Administrative and Support and Waste Management | ||||||||
| and Remediation Services – 0.18% | ||||||||
| Monitronics International, Inc. | ||||||||
| 8.101% (3 Month LIBOR + 5.500%), 09/30/2022 (a) | $ | 163,740 | $ | 137,717 | ||||
| Arts, Entertainment, and Recreation – 0.32% | ||||||||
| Town Sports International LLC | ||||||||
| 5.999% (1 Month LIBOR + 3.500%), 11/15/2020 (a) | 247,000 | 241,134 | ||||||
| Information – 8.79% | ||||||||
| First Data Corp. | ||||||||
| 4.486% (1 Month LIBOR + 2.000%), 07/10/2022 (a) | 1,335,117 | 1,333,321 | ||||||
| Infor US, Inc. | ||||||||
| 5.249% (1 Month LIBOR + 2.750%), 02/01/2022 (a) | 1,099,000 | 1,095,824 | ||||||
| Internap Corp. | ||||||||
| 8.240% (1 Month LIBOR + 5.750%), 04/06/2022 (a) | 93,807 | 90,992 | ||||||
| LSC Communications, Inc. | ||||||||
| 7.999% (1 Month LIBOR + 5.500%), 09/30/2022 (a) | 694,778 | 693,044 | ||||||
| Tribune Media Co. | ||||||||
| 5.499% (1 Month LIBOR + 3.000%), 01/27/2024 (a) | 1,000,000 | 1,000,625 | ||||||
| Windstream Services LLC | ||||||||
| 6.499% (3 Month LIBOR + 4.000%), 03/30/2021 (a)(b) | 613,000 | 616,160 | ||||||
| 4.999% (3 Month LIBOR + 2.500%), 02/26/2021 (a) | 1,772,000 | 1,773,107 | ||||||
| 6,603,073 | ||||||||
| Manufacturing – 2.60% | ||||||||
| Berry Global, Inc. | ||||||||
| 4.243% (1 Month LIBOR + 1.750%), 02/08/2020 (a) | 1,954,300 | 1,950,900 | ||||||
| Mining, Quarrying, and Oil and Gas Extraction – 0.15% | ||||||||
| Crestwood Holdings LLC | ||||||||
| 10.000% (1 Month LIBOR + 7.500%), 03/05/2023 (a) | 115,087 | 113,360 | ||||||
| Professional, Scientific, and Technical Services – 1.16% | ||||||||
| Eastman Kodak Co. | ||||||||
| 8.749% (1 Month LIBOR + 6.250%), 09/03/2019 (a) | 895,000 | 871,135 | ||||||
| Real Estate and Rental and Leasing – 2.34% | ||||||||
| Uniti Group LP | ||||||||
| 7.499% (1 Month LIBOR + 5.000%), 10/24/2022 (a) | 1,800,000 | 1,762,497 | ||||||
| TOTAL BANK LOANS (Cost $11,708,237) | 11,679,816 | |||||||
The accompanying notes are an integral part of these financial statements.
13
CROSSINGBRIDGE LOW DURATION HIGH YIELD FUND
| Schedule of Investments (Continued) |
March 31, 2019 (Unaudited)
| Principal | ||||||||
| Amount | Value | |||||||
| COMMERCIAL PAPER – 7.06% | ||||||||
| Manufacturing – 3.86% | ||||||||
| Ablemarle Corp. | ||||||||
| 2.832%, 04/01/2019 (c) | $ | 1,638,000 | $ | 1,637,613 | ||||
| Ford Motor Credit Co. LLC | ||||||||
| 3.507%, 04/03/2019 (c) | 1,264,000 | 1,263,468 | ||||||
| Transportation and Warehousing – 3.20% | ||||||||
| Royal Caribbean Ltd. | ||||||||
| 3.094%, 04/01/2019 (c) | 2,405,000 | 2,404,474 | ||||||
| TOTAL COMMERCIAL PAPER (Cost $5,306,762) | 5,305,555 | |||||||
| CONVERTIBLE BONDS – 10.54% | ||||||||
| Information – 2.73% | ||||||||
| Twitter, Inc. | ||||||||
| 0.250%, 09/15/2019 | 2,082,000 | 2,052,651 | ||||||
| Manufacturing – 6.49% | ||||||||
| Arconic, Inc. | ||||||||
| 1.625%, 10/15/2019 | 1,769,000 | 1,750,885 | ||||||
| Electronics For Imaging, Inc. | ||||||||
| 0.750%, 09/01/2019 | 495,000 | 489,000 | ||||||
| Navistar International Corp. | ||||||||
| 4.750%, 04/15/2019 | 2,630,000 | 2,636,573 | ||||||
| 4,876,458 | ||||||||
| Professional, Scientific, and Technical Services – 0.79% | ||||||||
| Macquarie Infrastructure Corp. | ||||||||
| 2.875%, 07/15/2019 | 592,000 | 592,099 | ||||||
| Transportation and Warehousing – 0.53% | ||||||||
| Ship Finance International Ltd. | ||||||||
| 5.750%, 10/15/2021 (f) | 398,000 | 397,072 | ||||||
| TOTAL CONVERTIBLE BONDS (Cost $7,913,419) | 7,918,280 | |||||||
| CORPORATE BONDS – 51.40% | ||||||||
| Accommodation and Food Services – 2.33% | ||||||||
| Carrols Restaurant Group, Inc. | ||||||||
| 8.000%, 05/01/2022 | 1,710,000 | 1,751,467 | ||||||
| Administrative and Support and Waste Management | ||||||||
| and Remediation Services – 1.54% | ||||||||
| Clean Harbors, Inc. | ||||||||
| 5.125%, 06/01/2021 | 1,149,000 | 1,154,745 | ||||||
The accompanying notes are an integral part of these financial statements.
14
CROSSINGBRIDGE LOW DURATION HIGH YIELD FUND
| Schedule of Investments (Continued) |
March 31, 2019 (Unaudited)
| Principal | ||||||||
| Amount | Value | |||||||
| CORPORATE BONDS – 51.40% (CONTINUED) | ||||||||
| Arts, Entertainment and Recreation – 0.50% | ||||||||
| Rivers Pittsburgh Borrower LP | ||||||||
| 6.125%, 08/15/2021 (g) | $ | 377,000 | $ | 377,943 | ||||
| Construction – 1.51% | ||||||||
| Lennar Corp. | ||||||||
| 4.500%, 06/15/2019 | 811,000 | 811,507 | ||||||
| 4.500%, 11/15/2019 | 321,000 | 322,204 | ||||||
| 1,133,711 | ||||||||
| Finance and Insurance – 1.90% | ||||||||
| Icahn Enterprises LP | ||||||||
| 6.000%, 08/01/2020 | 1,414,000 | 1,429,200 | ||||||
| Information – 15.81% | ||||||||
| CCO Holdings LLC | ||||||||
| 5.250%, 03/15/2021 | 1,098,000 | 1,103,496 | ||||||
| CDK Global, Inc. | ||||||||
| 3.800%, 10/15/2019 | 98,000 | 98,245 | ||||||
| CenturyLink, Inc. | ||||||||
| 6.150%, 09/15/2019 | 685,000 | 692,706 | ||||||
| Cogent Communications Finance, Inc. | ||||||||
| 5.625%, 04/15/2021 (g) | 855,000 | 867,825 | ||||||
| HC2 Holdings, Inc. | ||||||||
| 11.500%, 12/01/2021 (g) | 837,000 | 732,375 | ||||||
| Inmarsat Finance PLC | ||||||||
| 4.875%, 05/15/2022 (f)(g) | 886,000 | 903,897 | ||||||
| Lee Enterprises, Inc. | ||||||||
| 9.500%, 03/15/2022 (g) | 868,000 | 890,785 | ||||||
| Level 3 Financing, Inc. | ||||||||
| 6.125%, 01/15/2021 | 1,891,000 | 1,910,288 | ||||||
| Mediacom Broadband Corp. | ||||||||
| 5.500%, 04/15/2021 | 1,339,000 | 1,345,092 | ||||||
| Sprint Capital Corp. | ||||||||
| 6.900%, 05/01/2019 | 1,749,000 | 1,757,745 | ||||||
| TEGNA, Inc. | ||||||||
| 5.125%, 10/15/2019 | 537,000 | 539,014 | ||||||
| Time Warner Cable LLC | 1,039,000 | |||||||
| 8.250%, 04/01/2019 | 1,039,000 | |||||||
The accompanying notes are an integral part of these financial statements.
15
CROSSINGBRIDGE LOW DURATION HIGH YIELD FUND
| Schedule of Investments (Continued) |
March 31, 2019 (Unaudited)
| Principal | ||||||||
| Amount | Value | |||||||
| CORPORATE BONDS – 51.40% (CONTINUED) | ||||||||
| Manufacturing – 16.90% | ||||||||
| Briggs & Stratton Corp. | ||||||||
| 6.875%, 12/15/2020 | $ | 389,000 | $ | 404,560 | ||||
| Dell, Inc. | ||||||||
| 5.875%, 06/15/2019 | 1,587,000 | 1,596,522 | ||||||
| EMC Corp. | ||||||||
| 5.875%, 06/15/2021 (g) | 937,000 | 954,930 | ||||||
| European Lingerie Group AB | ||||||||
| 7.750% (3 Month EURIBOR + 7.750%), 02/22/2021 (a)(f) | 200,000 | 209,684 | ||||||
| Greif, Inc. | ||||||||
| 7.750%, 08/01/2019 | 1,895,000 | 1,928,162 | ||||||
| INVISTA Finance LLC | ||||||||
| 4.250%, 10/15/2019 (g) | 1,046,000 | 1,055,583 | ||||||
| Momentive Performance Materials, Inc. | ||||||||
| 3.880%, 10/24/2021 | 1,150,000 | 1,243,438 | ||||||
| Nokia OYJ | ||||||||
| 5.375%, 05/15/2019 (f) | 450,000 | 452,588 | ||||||
| Reynolds Group Issuer, Inc. | ||||||||
| 5.750%, 10/15/2020 | 381,828 | 382,783 | ||||||
| Sanmina Corp. | ||||||||
| 4.375%, 06/01/2019 (g) | 1,310,000 | 1,313,275 | ||||||
| Spectrum Brands, Inc. | ||||||||
| 6.625%, 11/15/2022 | 567,000 | 581,459 | ||||||
| Teva Pharmaceutical Finance IV LLC | ||||||||
| 2.250%, 03/18/2020 | 253,000 | 249,042 | ||||||
| Teva Pharmaceutical Finance Netherlands III BV | ||||||||
| 1.700%, 07/19/2019 (f) | 1,687,000 | 1,683,422 | ||||||
| Welbilt, Inc. | ||||||||
| 9.500%, 02/15/2024 | 595,000 | 644,087 | ||||||
| 12,699,535 | ||||||||
| Mining, Quarrying and Oil and Gas Extraction – 0.17% | ||||||||
| Largo Resources Ltd. | ||||||||
| 9.250%, 06/01/2021 (f)(g) | 121,000 | 127,504 | ||||||
| Professional, Scientific, and Technical Services – 2.47% | ||||||||
| Nielsen Finance LLC | ||||||||
| 4.500%, 10/01/2020 | 1,856,000 | 1,858,320 | ||||||
| Retail Trade – 5.43% | ||||||||
| GameStop Corp. | ||||||||
| 5.500%, 10/01/2019 (g) | 1,818,000 | 1,824,817 | ||||||
The accompanying notes are an integral part of these financial statements.
16
CROSSINGBRIDGE LOW DURATION HIGH YIELD FUND
| Schedule of Investments (Continued) |
March 31, 2019 (Unaudited)
| Principal | ||||||||
| Amount | Value | |||||||
| CORPORATE BONDS – 51.40% (CONTINUED) | ||||||||
| Retail Trade – 5.43% (Continued) | ||||||||
| Michaels Stores, Inc. | ||||||||
| 5.875%, 12/15/2020 (g) | $ | 1,806,000 | $ | 1,810,515 | ||||
| QVC, Inc. | ||||||||
| 3.125%, 04/01/2019 | 447,000 | 447,000 | ||||||
| 4,082,332 | ||||||||
| Transportation and Warehousing – 2.28% | ||||||||
| Borealis Finance LLC | ||||||||
| 7.500%, 11/16/2022 (g)(f) | 125,000 | 120,825 | ||||||
| Dynagas Finance, Inc. | ||||||||
| 6.250%, 10/30/2019 (f) | 355,000 | 339,025 | ||||||
| Stolt-Nielsen Ltd. | ||||||||
| 6.375%, 09/21/2022 (b)(f) | 200,000 | 193,000 | ||||||
| Virgin Australia Holdings Ltd. | ||||||||
| 8.500%, 11/15/2019 (f)(g) | 1,033,000 | 1,057,534 | ||||||
| 1,710,384 | ||||||||
| Utilities – 0.56% | ||||||||
| Pacific Gas & Electric Co. | ||||||||
| 3.500%, 10/01/2020 (b) | 450,000 | 416,250 | ||||||
| TOTAL CORPORATE BONDS (Cost $38,597,395) | 38,621,859 | |||||||
| Shares | ||||||||
| SPECIAL PURPOSE ACQUISITION VEHICLES – 7.91% | ||||||||
| Big Rock Partners Acquisition Corp. (d) | 18,902 | 195,636 | ||||||
| CM Seven Star Acquisition Corp. (d)(e) | 23,282 | 240,503 | ||||||
| GigCapital, Inc. (d) | 19,316 | 197,023 | ||||||
| Pensare Acquisition Corp. (d) | 70,799 | 727,106 | ||||||
| Pure Acquisition Corp. (d) | 18,111 | 182,016 | ||||||
| Saban Capital Acquisition Corp. (d) | 54,386 | 559,088 | ||||||
| Sentinel Energy Services, Inc. (d) | 139,888 | 1,410,071 | ||||||
| Social Capital Hedosophia Holdings Corp. (d) | 18,286 | 186,334 | ||||||
| Twelve Seas Investment Co. (d) | 142,300 | 1,426,557 | ||||||
| Vantage Energy Acquisition Corp. (d) | 80,183 | 819,470 | ||||||
| TOTAL SPECIAL PURPOSE ACQUISITION VEHICLES | ||||||||
| (Cost $5,902,521) | 5,943,804 | |||||||
The accompanying notes are an integral part of these financial statements.
17
CROSSINGBRIDGE LOW DURATION HIGH YIELD FUND
| Schedule of Investments (Continued) |
March 31, 2019 (Unaudited)
| Shares | Value | |||||||
| MONEY MARKET FUNDS – 10.36% | ||||||||
| First American Government Obligations Fund – | ||||||||
| Class X, 2.332% (h) | 3,890,735 | $ | 3,890,735 | |||||
| First American Treasury Obligations Fund – Class X, 2.333% (h) | 3,890,736 | 3,890,736 | ||||||
| TOTAL MONEY MARKET FUNDS (Cost $7,781,471) | 7,781,471 | |||||||
| Total Investments (Cost $77,209,805) – 102.81% | 77,250,785 | |||||||
| Liabilities in Excess of Other Assets – (2.81)% | (2,108,473 | ) | ||||||
| Total Net Assets – 100.00% | $ | 75,142,312 | ||||||
Percentages are stated as a percent of net assets.
| (a) | Variable rate security; the rate shown represents the rate at March 31, 2019. |
| (b) | Represents a security in default. |
| (c) | Zero coupon bond; the effective yield is listed. |
| (d) | Non-income producing security. |
| (e) | Represents an illiquid security. |
| (f) | Foreign issued security. |
| (g) | Securities issued pursuant to Rule 144A under the Securities Act of 1933 and Regulation S under the Securities Act of 1933. |
| (h) | Seven day yield as of March 31, 2019. |
Definitions:
EURIBOR – Euro-Interbank Offer Rate is a reference rate expressing the average interest rate at which eurozone banks offer unsecured loans on the interbank market.
LIBOR – London Interbank Offer Rate is a benchmark rate at which banks offer to lend funds to one another in the international interbank market for short-term loans.
The accompanying notes are an integral part of these financial statements.
18
CROSSINGBRIDGE LONG/SHORT CREDIT FUND
| Schedule of Investments |
March 31, 2019 (Unaudited)
| Principal | ||||||||
| Amount | Value | |||||||
| BANK LOANS – 2.62% | ||||||||
| Professional, Scientific, and Technical Services – 1.83% | ||||||||
| Eastman Kodak Co. | ||||||||
| 8.749%, 09/03/2019 (a) | $ | 1,481,000 | $ | 1,441,509 | ||||
| Retail Trade – 0.79% | ||||||||
| BI-LO LLC | ||||||||
| 10.607%, 05/31/2024 (a) | 643,175 | 624,523 | ||||||
| TOTAL BANK LOANS (Cost $2,093,868) | 2,066,032 | |||||||
| COMMERCIAL PAPER – 20.28% | ||||||||
| Manufacturing – 20.28% | ||||||||
| Ford Motor Credit Co. LLC | ||||||||
| 3.410%, 04/22/2019 (b) | 5,000,000 | 4,989,754 | ||||||
| Sherwin-Williams Co. | ||||||||
| 2.990%, 04/29/2019 (b) | 5,000,000 | 4,989,421 | ||||||
| The Campbell Soup Co. | ||||||||
| 3.131%, 04/15/2019 (b) | 6,000,000 | 5,992,424 | ||||||
| TOTAL COMMERCIAL PAPER (Cost $15,972,027) | 15,971,599 | |||||||
| CONVERTIBLE BONDS – 1.84% | ||||||||
| Information – 1.84% | ||||||||
| HC2 Holdings, Inc. | ||||||||
| 7.500%, 06/01/2022 (c) | 1,768,000 | 1,447,233 | ||||||
| TOTAL CONVERTIBLE BONDS (Cost $1,768,000) | 1,447,233 | |||||||
| CORPORATE BONDS – 43.15% | ||||||||
| Information – 19.19% | ||||||||
| CSC Holdings LLC | ||||||||
| 5.125%, 12/15/2021 (c) | 2,000,000 | 2,007,500 | ||||||
| Frontier Communications Corp. | ||||||||
| 8.000%, 04/01/2027 (c) | 400,000 | 414,000 | ||||||
| Lee Enterprises, Inc. | ||||||||
| 9.500%, 03/15/2022 (c) | 3,037,000 | 3,116,721 | ||||||
| Salem Media Group, Inc. | ||||||||
| 6.750%, 06/01/2024 (c) | 193,000 | 175,630 | ||||||
The accompanying notes are an integral part of these financial statements.
19
CROSSINGBRIDGE LONG/SHORT CREDIT FUND
| Schedule of Investments (Continued) |
March 31, 2019 (Unaudited)
| Principal | ||||||||
| Amount | Value | |||||||
| CORPORATE BONDS – 43.15% (CONTINUED) | ||||||||
| Information – 19.19% (Continued) | ||||||||
| Sirius XM Radio, Inc. | ||||||||
| 3.875%, 08/01/2022 (c) | $ | 2,500,000 | $ | 2,493,750 | ||||
| 6.000%, 07/15/2024 (c) | 1,000,000 | 1,040,000 | ||||||
| Sprint Capital Corp. | ||||||||
| 6.900%, 05/01/2019 | 3,500,000 | 3,517,500 | ||||||
| Sprint Corp. | ||||||||
| 7.250%, 09/15/2021 | 2,230,000 | 2,347,075 | ||||||
| 15,112,176 | ||||||||
| Manufacturing – 18.69% | ||||||||
| FXI Holdings, Inc. | ||||||||
| 7.875%, 11/01/2024 (c) | 1,000,000 | 932,500 | ||||||
| INVISTA Finance LLC | ||||||||
| 4.250%, 10/15/2019 (c) | 3,000,000 | 3,027,484 | ||||||
| Mueller Industries, Inc. | ||||||||
| 6.000%, 03/01/2027 | 2,000,000 | 1,970,000 | ||||||
| Reynolds Group Issuer, Inc. | ||||||||
| 5.750%, 10/15/2020 | 3,785,335 | 3,794,798 | ||||||
| Teva Pharmaceutical Finance LLC | ||||||||
| 1.700%, 07/19/2019 (d) | 5,000,000 | 4,989,396 | ||||||
| 14,714,178 | ||||||||
| Professional, Scientific, and Technical Services – 5.27% | ||||||||
| Nielsen Finance LLC | ||||||||
| 4.500%, 10/01/2020 | 3,180,000 | 3,183,975 | ||||||
| The Nielsen Co. Luxembourg SARL | ||||||||
| 5.000%, 02/01/2025 (c)(d) | 1,000,000 | 966,250 | ||||||
| 4,150,225 | ||||||||
| TOTAL CORPORATE BONDS (Cost $33,883,086) | 33,976,579 | |||||||
The accompanying notes are an integral part of these financial statements.
20
CROSSINGBRIDGE LONG/SHORT CREDIT FUND
| Schedule of Investments (Continued) |
March 31, 2019 (Unaudited)
| Shares | Value | |||||||
| MONEY MARKET FUNDS – 21.38% | ||||||||
| Fidelity Institutional Money Market Funds – | ||||||||
| Government Portfolio – Institutional Class, 2.300% (e)(f) | 9,700,000 | $ | 9,700,000 | |||||
| First American Government Obligations Fund – | ||||||||
| Class X, 2.332% (e)(f) | 3,565,633 | 3,565,633 | ||||||
| First American Treasury Obligations Fund – Class X, 2.333% (e)(f) | 3,565,632 | 3,565,632 | ||||||
| TOTAL MONEY MARKET FUNDS (Cost $16,831,265) | 16,831,265 | |||||||
| Total Investments (Cost $70,548,246) – 89.27% | 70,292,708 | |||||||
| Other Assets in Excess of Liabilities – 10.73% | 8,447,820 | |||||||
| Total Net Assets – 100.00% | $ | 78,740,528 | ||||||
Percentages are stated as a percent of net assets.
| (a) | Variable rate security; the rate shown represents the rate at March 31, 2019. |
| (b) | Zero coupon bond. The effective yield is listed. |
| (c) | Securities issued pursuant to Rule 144A under the Securities Act of 1933 and Regulation S under the Securities Act of 1933. |
| (d) | Foreign issued security. |
| (e) | All or a portion of this security is pledged as collateral for securities sold short. |
| (f) | Seven day yield as of March 31, 2019. |
The accompanying notes are an integral part of these financial statements.
21
CROSSINGBRIDGE LONG/SHORT CREDIT FUND
| Schedule of Securities Sold Short |
March 31, 2019 (Unaudited)
| Shares | Value | |||||||
| SECURITIES SOLD SHORT – (17.46)% | ||||||||
| COMMON STOCKS – (0.05)% | ||||||||
| Information – (0.05)% | ||||||||
| HC2 Holdings, Inc. | (16,494 | ) | $ | (40,410 | ) | |||
| TOTAL COMMON STOCKS (Proceeds $54,617) | (40,410 | ) | ||||||
| Principal | ||||||||
| Amount | ||||||||
| CORPORATE BONDS – (14.18)% | ||||||||
| Health Care and Social Assistance – (4.16)% | ||||||||
| DaVita, Inc. | ||||||||
| 5.125%, 07/15/2024 | $ | (2,400,000 | ) | (2,376,000 | ) | |||
| Quorum Health Corp. | ||||||||
| 11.625%, 04/15/2023 | (1,000,000 | ) | (900,000 | ) | ||||
| (3,276,000 | ) | |||||||
| Information – (2.59)% | ||||||||
| CSC Holdings LLC | ||||||||
| 5.250%, 06/01/2024 | (2,000,000 | ) | (2,035,000 | ) | ||||
| Manufacturing – (4.98)% | ||||||||
| Advanced Micro Devices, Inc. | ||||||||
| 7.500%, 08/15/2022 | (1,000,000 | ) | (1,118,750 | ) | ||||
| Post Holdings, Inc. | ||||||||
| 5.500%, 03/01/2025 (a) | (993,000 | ) | (1,007,895 | ) | ||||
| 5.750%, 03/01/2027 (a) | (1,780,000 | ) | (1,795,575 | ) | ||||
| (3,922,220 | ) | |||||||
| Other Services (except Public Administration) – (1.15)% | ||||||||
| Weight Watchers International, Inc. | ||||||||
| 8.625%, 12/01/2025 (a) | (1,000,000 | ) | (902,500 | ) | ||||
| Retail Trades – (1.30)% | ||||||||
| L Brands, Inc. | ||||||||
| 5.625%, 10/15/2023 | (1,000,000 | ) | (1,026,250 | ) | ||||
| TOTAL CORPORATE BONDS (Proceeds $11,420,007) | (11,161,970 | ) | ||||||
The accompanying notes are an integral part of these financial statements.
22
CROSSINGBRIDGE LONG/SHORT CREDIT FUND
| Schedule of Securities Sold Short (Continued) |
March 31, 2019 (Unaudited)
| Shares | Value | |||||||
| EXCHANGE-TRADED FUNDS – (3.23)% | ||||||||
| Finance and Insurance – (3.23)% | ||||||||
| SPDR S&P 500 ETF Trust | (9,000 | ) | $ | (2,542,320 | ) | |||
| TOTAL EXCHANGE-TRADED FUNDS (Proceeds $2,498,840) | (2,542,320 | ) | ||||||
| TOTAL SECURITIES SOLD SHORT (Proceeds $13,973,464) | $ | (13,744,700 | ) | |||||
Percentages are stated as a percent of net assets.
| (a) | Securities issued pursuant to Rule 144A under the Securities Act of 1933 and Regulation S under the Securities Act of 1933. |
The accompanying notes are an integral part of these financial statements.
23
CROSSINGBRIDGE FUNDS
| Statements of Assets and Liabilities (Unaudited) |
March 31, 2019
| CrossingBridge | CrossingBridge | |||||||
| Low Duration | Long/Short | |||||||
| High Yield Fund | Credit Fund | |||||||
| ASSETS | ||||||||
| Investments, at value (cost $77,209,805 and $70,548,246) | $ | 77,250,785 | $ | 70,292,708 | ||||
| Cash | 4,422,209 | 8,278,940 | ||||||
| Receivables: | ||||||||
| Fund shares sold | 162,475 | 167,047 | ||||||
| Dividends and interest | 851,694 | 582,746 | ||||||
| Deposits for securities sold short (Note 2) | — | 12,810,638 | ||||||
| Receivable for investment securities sold | 280,767 | 1,040,770 | ||||||
| Other assets | 24,859 | 10,275 | ||||||
| TOTAL ASSETS | 82,992,789 | 93,183,124 | ||||||
| LIABILITIES | ||||||||
| Short securities, at value | ||||||||
| (premiums received $— and $13,973,464) | — | 13,744,700 | ||||||
| Payables: | ||||||||
| Investments purchased | 7,638,309 | — | ||||||
| To Adviser | 39,558 | 69,775 | ||||||
| To affiliates | 26,857 | 24,056 | ||||||
| Interest on short positions | — | 191,922 | ||||||
| Fund shares redeemed | 8,808 | 326,572 | ||||||
| Shareholder service fees | 27,209 | 37,942 | ||||||
| Distributions to shareholders | 77,114 | — | ||||||
| Dividends on short positions | — | 18,497 | ||||||
| Accrued expenses and other liabilities | 32,622 | 29,132 | ||||||
| TOTAL LIABILITIES | 7,850,477 | 14,442,596 | ||||||
| NET ASSETS | $ | 75,142,312 | $ | 78,740,528 | ||||
| Net assets consist of: | ||||||||
| Paid-in capital | $ | 75,220,912 | $ | 82,438,523 | ||||
| Accumulated deficit | (78,600 | ) | (3,697,995 | ) | ||||
| NET ASSETS | $ | 75,142,312 | $ | 78,740,528 | ||||
| INSTITUTIONAL CLASS | ||||||||
| Shares of beneficial interest outstanding (unlimited | ||||||||
| number of shares authorized, $0.001 par value) | 7,498,572 | 8,225,283 | ||||||
| Net asset value, offering, and redemption price per share | $ | 10.02 | $ | 9.57 | ||||
The accompanying notes are an integral part of these financial statements.
24
CROSSINGBRIDGE FUNDS
| Statements of Operations (Unaudited) |
For the Six Months Ended March 31, 2019
| CrossingBridge | CrossingBridge | |||||||
| Low Duration | Long/Short | |||||||
| High Yield Fund | Credit Fund | |||||||
| INVESTMENT INCOME | ||||||||
| Interest income | $ | 1,239,621 | $ | 1,912,281 | ||||
| TOTAL INVESTMENT INCOME | 1,239,621 | 1,912,281 | ||||||
| EXPENSES | ||||||||
| Management fees | 202,687 | 532,718 | ||||||
| Administration and accounting fees | 35,233 | 27,424 | ||||||
| Shareholder servicing fees – Institutional Class | 31,182 | 42,617 | ||||||
| Federal and state registration fees | 18,034 | 25,983 | ||||||
| Legal fees | 14,820 | 16,027 | ||||||
| Transfer agent fees and expenses | 13,983 | 22,032 | ||||||
| Audit and tax fees | 11,059 | 10,642 | ||||||
| Pricing fees | 6,528 | 2,398 | ||||||
| Custody fees | 5,533 | 1,309 | ||||||
| Chief Compliance Officer fees | 3,787 | 4,275 | ||||||
| Trustees’ fees | 3,406 | 3,406 | ||||||
| Reports to shareholders | 2,632 | 9,670 | ||||||
| Broker expense | — | 278,932 | ||||||
| Interest expense | — | 172,452 | ||||||
| Dividend expense | — | 18,497 | ||||||
| Other expenses | 6,794 | 2,201 | ||||||
| TOTAL EXPENSES | 355,678 | 1,170,583 | ||||||
| Less waivers and reimbursement by Adviser (Note 4) | (43,849 | ) | (125,367 | ) | ||||
| NET EXPENSES | 311,829 | 1,045,216 | ||||||
| NET INVESTMENT INCOME | 927,792 | 867,065 | ||||||
| REALIZED AND UNREALIZED GAIN (LOSS) | ||||||||
| ON INVESTMENTS | ||||||||
| Net realized gain/(loss) on: | ||||||||
| Investments | (68,325 | ) | (597,393 | ) | ||||
| Foreign currency translation | (12,109 | ) | — | |||||
| Securities sold short | — | (64,969 | ) | |||||
| (80,434 | ) | (662,362 | ) | |||||
| Net change in unrealized appreciation/(depreciation) on: | ||||||||
| Investments | (14,832 | ) | (190,786 | ) | ||||
| Foreign currency translation | 225 | — | ||||||
| Securities sold short | — | (52,748 | ) | |||||
| (14,607 | ) | (243,534 | ) | |||||
| NET REALIZED AND UNREALIZED | ||||||||
| LOSS ON INVESTMENTS | (95,041 | ) | (905,896 | ) | ||||
| NET INCREASE/(DECREASE) IN NET ASSETS | ||||||||
| FROM OPERATIONS | 832,751 | (38,831 | ) | |||||
The accompanying notes are an integral part of these financial statements.
25
(This Page Intentionally Left Blank.)
26
CROSSINGBRIDGE LOW DURATION HIGH YIELD FUND
| Statements of Changes in Net Assets |
| For the Six | For Fiscal | |||||||
| Months Ended | Period through | |||||||
| March 31, 2019 | September 30, | |||||||
| (Unaudited) | 2018(1) | |||||||
| FROM OPERATIONS | ||||||||
| Net investment income | $ | 927,792 | $ | 361,442 | ||||
| Net realized gain/(loss) on: | ||||||||
| Investments | (68,325 | ) | 19,071 | |||||
| Foreign currency translation | (12,109 | ) | — | |||||
| Net change in unrealized | ||||||||
| appreciation/(depreciation) on: | ||||||||
| Investments | (14,832 | ) | 55,812 | |||||
| Foreign currency translation | 225 | (16 | ) | |||||
| Net increase in net assets from operations | 832,751 | 436,309 | ||||||
| FROM DISTRIBUTIONS | ||||||||
| Net dividends and distributions – | ||||||||
| Institutional Class | (1,000,708 | ) | (346,952 | ) | ||||
| Net decrease in net assets resulting | ||||||||
| from distributions paid | (1,000,708 | ) | (346,952 | ) | ||||
| FROM CAPITAL SHARE TRANSACTIONS | ||||||||
| Proceeds from sales of shares – Institutional Class | 36,111,318 | 52,856,029 | ||||||
| Net asset value of shares issued to shareholders | ||||||||
| in payment of distributions declared – | ||||||||
| Institutional Class | 574,139 | 186,182 | ||||||
| Payments for shares redeemed – | ||||||||
| Institutional Class | (7,202,568 | ) | (7,304,188 | ) | ||||
| Net increase in net assets from | ||||||||
| capital share transactions | 29,482,889 | 45,738,023 | ||||||
| TOTAL INCREASE IN NET ASSETS | 29,314,932 | 45,827,380 | ||||||
| NET ASSETS: | ||||||||
| Beginning of Period | 45,827,380 | — | ||||||
| End of Period | $ | 75,142,312 | $ | 45,827,380 | ||||
(1) | The Fund commenced on February 1, 2018. |
The accompanying notes are an integral part of these financial statements.
27
CROSSINGBRIDGE LONG/SHORT CREDIT FUND
| Statements of Changes in Net Assets |
| FROM OPERATIONS | |
| Net investment income | |
| Net realized gain/(loss) on: | |
| Investments | |
| Securities sold short | |
| Net change in unrealized appreciation/(depreciation) on: | |
| Investments | |
| Securities sold short | |
| Net increase/(decrease) in net assets from operations | |
| FROM DISTRIBUTIONS | |
| Net dividends and distributions – Institutional Class | |
| Net dividends and distributions – Class A | |
| Net decrease in net assets resulting from distributions paid | |
| FROM CAPITAL SHARE TRANSACTIONS | |
| Proceeds from sales of shares – Institutional Class | |
| Proceeds from shares sold – Class A | |
| Net asset value of shares issued to shareholders in payment of distributions declared – | |
| Institutional Class | |
| Net asset value of shares issued to shareholders in payment of distributions declared – | |
| Class A | |
| Payments for shares redeemed – Institutional Class | |
| Payments for shares redeemed – Class A | |
| Net asset value of shares converted into Institutional Class from Class A (Note 1) | |
| Net asset value of shares converted from Class A to Institutional Class (Note 1) | |
| Net decrease in net assets from capital share transactions | |
| TOTAL INCREASE/(DECREASE) IN NET ASSETS | |
| NET ASSETS: | |
| Beginning of Period | |
| End of Period |
(1) | The CrossingBridge Long/Short Credit Fund changed its fiscal year end from February 28th to September 30th. This period represents activity from March 1, 2018 through September 30, 2018. |
(2) | Prior period amounts. |
(3) | Includes net investment income distributions of $2,959,357 and $40,253 for the Institutional Class and Class A, respectively. |
(4) | End of year net assets include accumulated undistributed net investment income of $320,828. |
The accompanying notes are an integral part of these financial statements.
28
CROSSINGBRIDGE LONG/SHORT CREDIT FUND
| Statements of Changes in Net Assets (Continued) |
| For the Six Months Ended | For Fiscal Period | ||||||||||
| March 31, 2019 | through | Year Ended | |||||||||
| (Unaudited) | September 30, 2018(1)(2) | February 28, 2018(2) | |||||||||
| $ | 867,065 | $ | 1,196,580 | $ | 2,884,621 | ||||||
| (597,393 | ) | (1,561,485 | ) | (1,366,460 | ) | ||||||
| (64,969 | ) | (27,790 | ) | 8,125 | |||||||
| (190,786 | ) | 991,316 | (1,362,424 | ) | |||||||
| (52,748 | ) | (10,696 | ) | 293,775 | |||||||
| (38,831 | ) | 587,925 | 457,637 | ||||||||
| (925,594 | ) | (1,426,836 | ) | (2,959,357 | ) | ||||||
| — | (3,604 | ) | (40,253 | ) | |||||||
| (925,594 | ) | (1,430,440 | ) | (2,999,610 | )(3) | ||||||
| 12,616,310 | 16,148,263 | 74,313,314 | |||||||||
| — | 20,618 | 184,730 | |||||||||
| 153,859 | 248,302 | 752,068 | |||||||||
| — | 3,383 | 37,709 | |||||||||
| (25,534,441 | ) | (31,428,581 | ) | (42,524,896 | ) | ||||||
| — | (37,034 | ) | (282,548 | ) | |||||||
| — | 1,120,598 | — | |||||||||
| — | (1,120,598 | ) | — | ||||||||
| (12,764,272 | ) | (15,045,049 | ) | 32,480,377 | |||||||
| (13,728,697 | ) | (15,887,564 | ) | 29,938,404 | |||||||
| 92,469,225 | 108,356,789 | 78,418,385 | |||||||||
| $ | 78,740,528 | $ | 92,469,225 | $ | 108,356,789 | (4) | |||||
The accompanying notes are an integral part of these financial statements.
29
(This Page Intentionally Left Blank.)
30
CROSSINGBRIDGE LOW DURATION HIGH YIELD FUND
| Financial Highlights |
Per Share Data for a Share Outstanding Throughout Each Period
Institutional Class
| Six Months Ended | Period Ended | |||||||
| March 31, 2019 | September 30, | |||||||
| (Unaudited) | 2018(1) | |||||||
| Net Asset Value, Beginning of Period | $ | 10.06 | $ | 10.00 | ||||
| Income from investment operations: | ||||||||
Net investment income(2) | 0.15 | 0.17 | ||||||
| Net realized and unrealized gain (loss) | ||||||||
on investments(3) | (0.03 | ) | 0.02 | |||||
| Total from investment operations | 0.12 | 0.19 | ||||||
| Less distributions paid: | ||||||||
| From net investment income | (0.16 | ) | (0.13 | ) | ||||
| From net realized gains | (0.00 | )(7) | — | |||||
| Total distributions paid | (0.16 | ) | (0.13 | ) | ||||
| Net Asset Value, End of Period | $ | 10.02 | $ | 10.06 | ||||
Total return(4) | 1.17 | % | 1.95 | % | ||||
| Supplemental Data and Ratios: | ||||||||
| Net assets, end of period (000’s) | $ | 75,142 | $ | 45,827 | ||||
| Ratio of expenses to average net assets: | ||||||||
Before waivers and reimbursements of expenses(5) | 1.14 | % | 1.90 | % | ||||
After waivers and reimbursements of expenses(5) | 1.00 | % | 1.00 | % | ||||
| Ratio of net investment income to average net assets: | ||||||||
Before waivers and reimbursements of expenses(5) | 2.84 | % | 1.64 | % | ||||
After waivers and reimbursements of expenses(5) | 2.98 | % | 2.54 | % | ||||
Portfolio turnover rate(6) | 106.51 | % | 76.70 | % | ||||
(1) | The Fund became effective on January 8, 2018 and commenced investment operations on February 1, 2018. |
(2) | Per share net investment income was calculated using average shares outstanding. |
(3) | Realized gain (loss) per share in the caption are balancing amounts necessary to reconcile the change in net asset value per share for the period and may not reconcile with the aggregate gains and losses in the Statement of Operations. |
(4) | Total return represents the rate that the investor would have earned or lost on an investment in the Fund, assuming reinvestment of dividends. Total return for a period of less than one year is not annualized. |
(5) | Annualized for periods less than one year. |
(6) | Portfolio turnover rate is not annualized. Short-term securities with maturities less than or equal to 365 days are excluded from the portfolio turnover rate calculation. |
(7) | Less than $0.005 per share. |
The accompanying notes are an integral part of these financial statements.
31
CROSSINGBRIDGE LONG/SHORT CREDIT FUND
| Financial Highlights |
Institutional Class
| Six Months Ended | ||||
| March 31, 2019 | ||||
| (Unaudited) | ||||
| Net Asset Value, Beginning of Period | $ | 9.68 | ||
| Income from investment operations: | ||||
Net investment income(3) | 0.10 | |||
Net realized and unrealized gain (loss) on investments(4) | (0.10 | ) | ||
| Total from investment operations | 0.00 | |||
| Less distributions paid: | ||||
| From net investment income | (0.11 | ) | ||
| From net realized gain on investments | — | |||
| Total distributions paid | (0.11 | ) | ||
| Net Asset Value, End of Period | $ | 9.57 | ||
Total return(5) | -0.04 | % | ||
| Supplemental Data and Ratios: | ||||
| Net assets, end of period (000’s) | $ | 78,741 | ||
| Ratio of expenses to average net assets: | ||||
Before waivers and reimbursements of expenses(6)(7) | 2.75 | % | ||
After waivers and reimbursements of expenses(6)(8) | 2.45 | % | ||
| Ratio of net investment income (loss) to average net assets: | ||||
Before waivers and reimbursements of expenses(6)(12) | 1.74 | % | ||
After waivers and reimbursements of expenses(6)(12) | 2.04 | % | ||
Portfolio turnover rate(13) | 33.62 | % | ||
The accompanying notes are an integral part of these financial statements.
32
CROSSINGBRIDGE LONG/SHORT CREDIT FUND
| Financial Highlights (Continued) |
Per Share Data for a Share Outstanding Throughout Each Period
| Period from | |||||||||||||||
| March 1, 2018 to | Year Ended | Year Ended | Year Ended | ||||||||||||
September 30, 2018(2) | February 28, 2018 | February 28, 2017 | February 29, 2016(1) | ||||||||||||
| $ | 9.77 | $ | 9.99 | $ | 9.54 | $ | 10.00 | ||||||||
| 0.12 | 0.26 | 0.39 | 0.34 | ||||||||||||
| (0.07 | ) | (0.20 | ) | 0.41 | (0.55 | ) | |||||||||
| 0.05 | 0.06 | 0.80 | (0.21 | ) | |||||||||||
| (0.14 | ) | (0.28 | ) | (0.33 | ) | (0.22 | ) | ||||||||
| — | — | (0.02 | ) | (0.03 | ) | ||||||||||
| (0.14 | ) | (0.28 | ) | (0.35 | ) | (0.25 | ) | ||||||||
| $ | 9.68 | $ | 9.77 | $ | 9.99 | $ | 9.54 | ||||||||
| 0.56 | % | 0.64 | % | 8.42 | % | -2.13 | % | ||||||||
| $ | 92,469 | $ | 107,218 | $ | 77,183 | $ | 7,005 | ||||||||
| 2.47 | % | 2.18 | % | 2.34 | % | 5.94 | % | ||||||||
| 2.13 | %(11) | 1.88 | %(10) | 1.52 | % | 2.00 | %(9) | ||||||||
| 1.78 | % | 2.39 | % | 3.06 | % | (0.47 | )% | ||||||||
| 2.12 | % | 2.69 | % | 3.88 | % | 3.47 | % | ||||||||
| 48.00 | % | 116.13 | % | 87.15 | % | 93.12 | % | ||||||||
The accompanying notes are an integral part of these financial statements.
33
CROSSINGBRIDGE LONG/SHORT CREDIT FUND
| Financial Highlights (Continued) |
(1) | The Fund commenced investment operations on March 1, 2015. | ||
(2) | The CrossingBridge Long/Short Credit Fund changed its fiscal year end from February 28th to September 30th. This period represents activity from March 1, 2018 through September 30, 2018. | ||
(3) | Per share net investment income was calculated using average shares outstanding. | ||
(4) | Realized gain (loss) per share in the caption are balancing amounts necessary to reconcile the change in net asset value per share for the period and may not reconcile with the aggregate gains and losses in the Statement of Operations. | ||
(5) | Total return represents the rate that the investor would have earned or lost on an investment in the Fund, assuming reinvestment of dividends. Total return for a period of less than one year is not annualized. | ||
(6) | Annualized for periods less than one year. | ||
(7) | The before waivers and reimbursements of expenses excluding dividends, amortization and interest expense on short positions are 1.65%, 1.73%, 1.75%, 2.27%, and 5.84% for the six months ended March 31, 2019, the fiscal period ended September 30, 2018, and the years ended February 28, 2018, February 28, 2017, and February 29, 2016, respectively. | ||
(8) | The after waivers and reimbursements of expenses excluding dividends, amortization and interest expense on short positions are 1.35%, 1.39%, 1.45%, 1.45%, and 1.90% for the six months ended March 31, 2019, fiscal period ended September 30, 2018, and the years ended February 28, 2018, February 28, 2017, and February 29, 2016, respectively. | ||
(9) | Effective January 28, 2016, the expense cap was decreased from 1.95% to 1.45%. | ||
(10) | Effective June 28, 2017, the expense cap was revised from 1.45% to 1.35%, excluding shareholder servicing fees of 0.10%. | ||
(11) | Effective May 7, 2018, the expense cap was decreased from 1.35% to 1.25%, excluding shareholder servicing fees of 0.10%. | ||
(12) | The net investment income (loss) ratios include dividends, amortization and interest expense on short positions. | ||
(13) | Portfolio turnover rate is calculated on the basis of the Fund as a whole without distinguishing between the classes of shares issued. Portfolio turnover rate is not annualized and excludes securities sold short. Short-term securities with maturities less than or equal to 365 days are also excluded from the portfolio turnover rate calculation. |
The accompanying notes are an integral part of these financial statements.
34
CROSSINGBRIDGE FUNDS
Notes to Financial Statements
March 31, 2019 (Unaudited)
| (1) | Organization |
| Trust for Professional Managers (the “Trust”) was organized as a Delaware statutory trust under a Declaration of Trust dated May 29, 2001. The Trust is registered under the Investment Company Act of 1940, as amended (the “1940 Act”), as an open-end management investment company. The CrossingBridge Long/Short Credit Fund, formerly the Collins Long/Short Credit Fund, represents a distinct non-diversified series with its own investment objective and policies within the Trust. The CrossingBridge Low Duration High Yield Fund represents a distinct diversified series with its own investment objective and policies within the Trust. The investment objective of the CrossingBridge Long/Short Credit Fund is absolute total returns over a complete market cycle. The investment objective of the CrossingBridge Low Duration High Yield Fund is high current income and capital appreciation consistent with the preservation of capital. The CrossingBridge Long/Short Credit Fund’s inception date was February 27, 2015 and it commenced investment operations on March 1, 2015. Outstanding Class A shares were converted to Institutional Class shares effective at the close of business on May 31, 2018. During the July 18, 2018 meeting of the Board of Trustees (the “Board”), the Board approved a change in fiscal year end for the CrossingBridge Long/Short Credit Fund from February 28th to September 30th. The CrossingBridge Low Duration High Yield Fund’s inception date was January 31, 2018 and it commenced investment operations on February 1, 2018. Costs incurred by CrossingBridge Low Duration High Yield Fund in connection with the organization, registration and the initial public offering of shares were paid by CrossingBridge Advisors, LLC (“the Adviser”), the Fund’s investment adviser. The Trust may issue an unlimited number of shares of beneficial interest at $0.001 par value. The assets of each Fund are segregated, and a shareholder’s interest is limited to the Fund in which shares are held. The CrossingBridge Low Duration High Yield Fund and the CrossingBridge Long/Short Credit Fund (each a “Fund”, together the “Funds”) are both investment companies and accordingly follow the investment company accounting and reporting guidance of the Financial Accounting Standards Board (FASB) Accounting Standard Codification Topic 946 “Financial Services – Investment Companies.” | |
| (2) | Significant Accounting Policies |
| The following is a summary of significant accounting policies consistently followed by each Fund in the preparation of the financial statements. These policies are in conformity with generally accepted accounting principles in the United States of America (“GAAP”). | |
(a) Investment Valuation | |
| Each security owned by each Fund that is listed on a securities exchange is valued at its last sale price on that exchange on the date as of which assets are valued. Swap agreements, such as credit default swaps, interest rate swaps and currency swaps, are priced by an approved independent pricing service (“Pricing Service”). Forward currency contracts are valued at the mean between the bid and asked prices by an approved Pricing Service. Commodities futures contracts and options thereon traded on a commodities exchange or board of trade are valued at the last sale price at the close of trading. Rights and warrants are valued at the last sale price at the close of the exchange on which the security is primarily traded. Bank loans are valued at |
35
CROSSINGBRIDGE FUNDS
Notes to Financial Statements (Continued)
March 31, 2019 (Unaudited)
| prices supplied by a Pricing Service, if available, and otherwise will be valued at the most recent bid quotations or evaluated prices, as applicable, based on quotations or prices obtained from one or more broker-dealers known to follow the issue. | |
| If the security is listed on more than one exchange, each Fund will use the price of the exchange that the Fund generally considers to be the principal exchange on which the security is traded. Portfolio securities listed on the NASDAQ Stock Market, Inc. (“NASDAQ”) will be valued at the NASDAQ Official Closing Price, which may not necessarily represent the last sale price. If there has been no sale on such exchange or on NASDAQ on such day, the security is valued at the mean between the most recent bid and asked prices on such day or the security shall be valued at the latest sales price on the “composite market” for the day such security is being valued. The composite market is defined as a consolidation of the trade information provided by national securities and foreign exchanges and over-the-counter markets as published by a Pricing Service. | |
| If market quotations are not readily available, a security or other asset will be valued at its fair value as determined under fair value pricing procedures approved by the Board of Trustees. These fair value pricing procedures will also be used to price a security when corporate events, events in the securities market and/or world events cause the Adviser to believe that a security’s last sale price may not reflect its actual fair market value. The intended effect of using fair value pricing procedures is to ensure that each Fund is accurately priced. The Board of Trustees will regularly evaluate whether the Funds’ fair value pricing procedures continue to be appropriate in light of the specific circumstances of each Fund and the quality of prices obtained through the application of such procedures by the Trust’s valuation committee. | |
| Foreign securities will be priced in their local currencies as of the close of their primary exchange or market or as of the time each Fund calculates its NAV, whichever is earlier. Foreign securities, currencies and other assets denominated in foreign currencies are then translated into U.S. dollars at the exchange rate of such currencies against the U.S. dollar, as provided by an approved pricing service or reporting agency. All assets denominated in foreign currencies will be converted into U.S. dollars using the applicable currency exchange rates as of the close of the New York Stock Exchange (“NYSE”), generally 4:00 p.m. Eastern Time. | |
| Debt securities, including corporate bonds, bank loans, commercial paper, and short-term debt instruments having a maturity of 60 days or less, are valued at the mean in accordance with prices supplied by an approved Pricing Service. Pricing Services may use various valuation methodologies such as the mean between the bid and the asked prices, matrix pricing and other analytical pricing models as well as market transactions and dealer quotations. If a price is not available from a Pricing Service, the most recent quotation obtained from one or more broker-dealers known to follow the issue will be obtained. Quotations will be valued at the mean between the bid and the offer. Any discount or premium is accreted or amortized using constant yield method over the life of the security. | |
| Money market funds, demand notes and repurchase agreements are valued at cost. If cost does not represent current market value the securities will be priced at fair value. | |
| Redeemable securities issued by open-end, registered investment companies are valued at the NAVs of such companies for purchase and/or redemption orders placed |
36
CROSSINGBRIDGE FUNDS
Notes to Financial Statements (Continued)
March 31, 2019 (Unaudited)
| on that day. All exchange-traded funds are valued at the last reported sale price on the exchange on which the security is principally traded. | |
| FASB Accounting Standards Codification, “Fair Value Measurements and Disclosures” Topic 820 (“ASC 820”), establishes an authoritative definition of fair value and sets out a hierarchy for measuring fair value. ASC 820 requires an entity to evaluate certain factors to determine whether there has been a significant decrease in volume and level of activity for the security such that recent transactions and quoted prices may not be determinative of fair value and further analysis and adjustment may be necessary to estimate fair value. ASC 820 also requires enhanced disclosure regarding the inputs and valuation techniques used to measure fair value in those instances as well as expanded disclosure of valuation levels for major security types. These inputs are summarized in the three broad levels listed below: |
| Level 1 – | Quoted prices in active markets for identical securities. | |
| Level 2 – | Other significant observable inputs (including quoted prices for similar securities, interest rates, prepayment speeds, credit risk, etc.). | |
| Level 3 – | Significant unobservable inputs (including the Funds’ own assumptions in determining the fair value of investments). |
| The inputs or methodology used for valuing securities are not necessarily an indication of the risk associated with investing in those securities. The following is a summary of the inputs used to value each Fund’s investments carried at fair value as of March 31, 2019: |
| CrossingBridge Low Duration High Yield Fund | |||||||||||||||||
| Level 1 | Level 2 | Level 3 | Total | ||||||||||||||
| Assets: | |||||||||||||||||
Bank Loans(1) | $ | — | $ | 11,679,816 | $ | — | $ | 11,679,816 | |||||||||
| Special Purpose | |||||||||||||||||
| Acquisition Vehicles | 3,899,092 | 2,044,712 | — | 5,943,804 | |||||||||||||
Convertible Bonds(1) | — | 7,918,280 | — | 7,918,280 | |||||||||||||
Corporate Bonds(1) | — | 38,621,859 | — | 38,621,859 | |||||||||||||
Commercial Paper(1) | — | 5,305,555 | — | 5,305,555 | |||||||||||||
| Short-Term Investments | 7,781,471 | — | — | 7,781,471 | |||||||||||||
| Total Assets | $ | 11,680,563 | $ | 65,570,222 | $ | — | $ | 77,250,785 | |||||||||
| (1) See the Schedule of Investments for industry classifications. | |||||||||||||||||
37
CROSSINGBRIDGE FUNDS
Notes to Financial Statements (Continued)
March 31, 2019 (Unaudited)
| CrossingBridge Long/Short Credit Fund | |||||||||||||||||
| Level 1 | Level 2 | Level 3 | Total | ||||||||||||||
| Assets: | |||||||||||||||||
Bank Loans(1) | $ | — | $ | 2,066,032 | $ | — | $ | 2,066,032 | |||||||||
Corporate Bonds(1) | — | 33,976,579 | — | 33,976,579 | |||||||||||||
Convertible Bonds(1) | — | 1,447,233 | — | 1,447,233 | |||||||||||||
Commercial Paper(1) | — | 15,971,599 | — | 15,971,599 | |||||||||||||
| Short-Term Investments | 16,831,265 | — | — | 16,831,265 | |||||||||||||
| Total Assets | $ | 16,831,265 | $ | 53,461,443 | $ | — | $ | 70,292,708 | |||||||||
| Liabilities: | |||||||||||||||||
| Securities Sold Short | |||||||||||||||||
Common Stock(1) | $ | (40,410 | ) | $ | — | $ | — | $ | (40,410 | ) | |||||||
Corporate Bonds(1) | — | (11,161,970 | ) | — | (11,161,970 | ) | |||||||||||
Exchange-Traded Funds(1) | (2,542,320 | ) | — | — | (2,542,320 | ) | |||||||||||
| Total Liabilities | $ | (2,582,730 | ) | $ | (11,161,970 | ) | $ | — | $ | (13,744,700 | ) | ||||||
| (1) See the Schedule of Investments for industry classifications. | |||||||||||||||||
| The Funds did not hold any Level 3 securities during the six months ended March 31, 2019. | |
| The Funds did not invest in derivative securities or engage in hedging activities during the fiscal period ended March 31, 2019. | |
(b) Foreign Securities and Currency Transactions | |
| Investment securities and other assets and liabilities denominated in foreign currencies are translated into U.S. dollar amounts at the date of valuation. Purchases and sales of investment securities and income and expense items denominated in foreign currencies are translated into U.S. dollar amounts on the respective dates of such transactions. | |
| The Funds do not isolate the portion of the results of operations from changes in foreign exchange rates on investments from the fluctuations arising from changes in market prices of securities held. Realized foreign exchange gains or losses arising from sales of portfolio securities and sales and maturities of short-term securities are reported within realized gain (loss) on investments. Net unrealized foreign exchange gains and losses arising from changes in the values of investments in securities from fluctuations in exchange rates are reported within unrealized gain (loss) on investments. | |
| Investments in foreign securities entail certain risks. There may be a possibility of nationalization or expropriation of assets, confiscatory taxation, political or financial instability, and diplomatic developments that could affect the value of the Funds’ investments in certain foreign countries. Since foreign securities normally are denominated and traded in foreign currencies, the value of the Funds’ assets may be affected favorably or unfavorably by currency exchange rates, currency exchange control regulations, foreign withholding taxes, and restrictions or prohibitions on the repatriation of foreign currencies. There may be less information publicly available about a foreign issuer than about a U.S. issuer, and foreign issuers are not generally |
38
CROSSINGBRIDGE FUNDS
Notes to Financial Statements (Continued)
March 31, 2019 (Unaudited)
| subject to accounting, auditing, and financial reporting standards and practices comparable to those in the United States. The securities of some foreign issuers are less liquid and at times more volatile than securities of comparable U.S. issuers. | |
(c) Short Positions | |
| The Funds may sell a security it does not own in anticipation of a decline in the fair value of that security. When the Funds sell a security short, they must borrow the security sold short and deliver it to the broker-dealer through which it made the short sale. A gain, limited to the price at which each Fund sold the security short, or a loss, unlimited in size, will be recognized upon the termination of a short sale. For financial statement purposes, an amount equal to the settlement amount is included in the Statements of Assets and Liabilities as a liability. The amount of the liability is subsequently marked-to-market to reflect the current value of the short positions. Subsequent fluctuations in the market prices of the securities sold, but not yet purchased, may require purchasing the securities at prices which could differ from the amount reflected in the Statements of Assets and Liabilities. Each Fund is liable for any dividends or interest payable on securities while those securities are in a short position. Such dividend amounts are recorded on the ex-dividend date as a dividend expense. As collateral for its short positions, each Fund is required under the 1940 Act to maintain segregated assets consisting of cash, cash equivalents or liquid securities. The segregated assets are valued consistent with Note 2a above. The amount of segregated assets is required to be adjusted daily to reflect changes in the fair value of the securities sold short. At March 31, 2019, the CrossingBridge Long/Short Credit Fund had deposits at brokers of $12,810,638 which served as collateral for securities sold short. A money market fund held in a segregated account was also pledged as collateral for securities sold short. The CrossingBridge Long/Short Credit Fund’s deposits at brokers for securities sold short are with Interactive Brokers. | |
(d) Federal Income Taxes | |
| The Funds intend to comply with the requirements of Subchapter M of the Internal Revenue Code of 1986, as amended, necessary to qualify as regulated investment companies and to make the requisite distributions of income and capital gains to their shareholders sufficient to relieve them from all or substantially all federal income taxes. Therefore, no federal income tax provision has been provided. | |
| During the July 18, 2018 meeting of the Board of Trustees, the Board approved a change in fiscal year end for the CrossingBridge Long/Short Credit Fund from February 28th to September 30th. | |
| As of and during the fiscal period ended September 30, 2018, the Funds did not have liabilities for any unrecognized tax benefits. The Funds recognize interest and penalties, if any, related to unrecognized tax benefits as income tax expense in the Statements of Operations. During the fiscal period ended September 30, 2018, the Funds did not incur any interest or penalties. |
39
CROSSINGBRIDGE FUNDS
Notes to Financial Statements (Continued)
March 31, 2019 (Unaudited)
(e) Distributions to Shareholders | |
| In general, the Funds will distribute any net investment income and any net realized long- or short-term capital gains at least annually. The Funds may make additional distributions if deemed to be desirable during the year. Distributions from net realized gains for book purposes may include short-term capital gains. All short-term capital gains are included in ordinary income for tax purposes. Distributions to shareholders are recorded on the ex-dividend date. The Funds may also pay a special distribution at the end of the calendar year to comply with federal tax requirements. | |
| Treatment of income and capital gain distributions for federal income tax purposes may differ from GAAP, primarily due to timing differences in the recognition of income and gains and losses by the Funds. To the extent that these differences are attributable to permanent book and tax accounting differences, they are reclassified in the components of net assets. | |
(f) Use of Estimates | |
| The preparation of financial statements in conformity with GAAP requires management to make estimates and assumptions that affect the reported amounts of assets and liabilities and disclosure of contingent assets and liabilities at the date of the financial statements and the reported amounts of revenues and expenses during the reporting period. Actual results could differ from those estimates. | |
(g) Share Valuation | |
| The NAV per share of each Fund is calculated by dividing the sum of the value of the securities held by each Fund, plus cash or other assets, minus all liabilities (including estimated accrued expenses) by the total number of shares outstanding for each Fund, rounded to the nearest cent. Each Fund’s shares will not be priced on the days on which the NYSE is closed for trading. | |
(h) Allocation of Income, Expenses and Gains/Losses | |
| Income, expenses (other than those deemed attributable to a specific share class), and gains and losses of the Funds are allocated daily to each class of shares based upon the ratio of net assets represented by each class as a percentage of the net assets of the Funds. Expenses deemed directly attributable to a class of shares are recorded by the specific class. Most Funds’ expenses are allocated by class based on relative net assets. Shareholder servicing fees are expensed up to 0.10% of average daily net assets of each Fund’s Institutional Class shares. Expenses associated with a specific fund in the Trust are charged to that fund. Common Trust expenses are typically allocated evenly between the funds of the Trust, or by other equitable means. | |
(i) Other | |
| Investment transactions are recorded on the trade date. The Funds determine the gain or loss from investment transactions using the specific identification method for the best tax relief order by comparing the original cost of the security lot sold with the net sale proceeds. Dividend income and expense are recognized on the ex-dividend date and interest income and expense are recognized on an accrual basis. Withholding taxes on |
40
CROSSINGBRIDGE FUNDS
Notes to Financial Statements (Continued)
March 31, 2019 (Unaudited)
| foreign dividends and interest, net of any reclaims, have been provided for in accordance with each Fund’s understanding of the applicable country’s tax rules and rates. Any discount or premium on securities purchased are accreted or amortized over the expected life of the respective securities using the constant yield method. | |
(j) Loan Participation | |
| When purchasing participation interests in a loan, the Funds generally have no right to enforce compliance with the terms of the loan agreement with the borrower. As a result, the Funds may be subject to the credit risk of both the borrower and the lender that is selling the loan agreement. The Funds may enter into unfunded loan commitments, which are contractual obligations for future funding. Unfunded loan commitments represent a future obligation in full, even though a percentage of the notional loan amounts may not be utilized by the borrower. When investing in a loan participation agreement, the Funds have the right to receive payments of principal, interest and any fees to which they are entitled only from the lender selling the loan agreement and only upon receipt of payments by the lender from the borrower. The Funds may receive a commitment fee based on the undrawn portion of the underlying line of credit portion of a floating rate loan. In certain circumstances, the Funds may receive a penalty fee upon the prepayment of a floating rate loan by a borrower. Fees earned are recorded as a component of interest income or interest expense, respectively, on the Statements of Operations. | |
| (3) | Federal Tax Matters |
| The tax character of distributions paid during the year ended February 28, 2018, and for fiscal period ended September 30, 2018, were as follows: |
| CrossingBridge | CrossingBridge | CrossingBridge | ||
| Low Duration | Long/Short | Long/Short | ||
High Yield Fund(1) | Credit Fund | Credit Fund | ||
September 30, 2018 | September 30, 2018 | February 28, 2018 | ||
| Ordinary Income | $346,952 | $1,430,440 | $2,999,610 |
| (1) The Fund commenced operations on February 1, 2018. | |
| The Funds designated as long-term capital gain dividend, pursuant to Internal Revenue Code Section 852(b)(3), the amount necessary to reduce the earnings and profits of the Funds related to net capital gain to zero for the tax year ended September 30, 2018. |
41
CROSSINGBRIDGE FUNDS
Notes to Financial Statements (Continued)
March 31, 2019 (Unaudited)
| As of September 30, 2018, the components of accumulated earnings on a tax basis were as follows: |
| CrossingBridge | CrossingBridge | ||||||||
| Low Duration | Long/Short | ||||||||
| High Yield Fund | Credit Fund | ||||||||
| Cost basis of investments | |||||||||
| for federal income tax purposes | $ | 47,337,367 | $ | 81,872,113 | |||||
| Gross tax unrealized appreciation | 96,411 | 619,889 | |||||||
| Gross tax unrealized depreciation | (40,615 | ) | (454,379 | ) | |||||
| Total net tax unrealized | |||||||||
| appreciation on investments | $ | 55,796 | $ | 165,510 | |||||
| Undistributed ordinary income | 81,536 | 86,968 | |||||||
| Undistributed long-term capital gain | — | — | |||||||
| Total distributable earnings | $ | 81,536 | $ | 86,968 | |||||
| Other accumulated losses | (47,975 | ) | (2,986,048 | ) | |||||
| Total accumulated earnings/(losses) | $ | (89,357 | ) | $ | (2,733,570 | ) | |||
| At September 30, 2018, the CrossingBridge Long/Short Credit Fund had current year short-term and long-term capital losses of $1,265,395 and $1,720,653, remaining which will be carried forward indefinitely to offset future realized gains. To the extent the Fund realizes future net capital gains, taxable distributions to its shareholders will be first offset by any unused capital loss carryovers from the fiscal period ended September 30, 2018. | |
| GAAP requires that certain components of net assets relating to permanent differences be reclassified between financial and tax reporting. These reclassifications have no effect on net assets or net asset value per share. For the fiscal period ended September 30, 2018, the following reclassifications were made for permanent tax differences on the Statements of Assets and Liabilities: |
| Total Distributable | Paid-In | ||
Earnings/(Loss) | Capital | ||
| CrossingBridge Low Duration High Yield Fund | — | — | |
| CrossingBridge Long/Short Credit Fund | — | — |
| (4) | Investment Adviser |
| The Trust has an Investment Advisory Agreement (the “Agreement”) with the Adviser to furnish investment advisory services to each Fund. Under the terms of the Agreement, the Trust, on behalf of the CrossingBridge Long/Short Credit Fund and CrossingBridge Low Duration High Yield Fund, compensates the Adviser for its investment advisory services at the annual rate of 1.25% and 0.65%, respectively, of each Fund’s average daily net assets. | |
| The Adviser has contractually agreed to waive its management fee and/or reimburse each Fund’s other expenses at least through the expiration dates listed below to the extent necessary to ensure that each Fund’s total operating expenses (exclusive of front-end or contingent deferred sales loads, distribution fees, shareholder servicing plan |
42
CROSSINGBRIDGE FUNDS
Notes to Financial Statements (Continued)
March 31, 2019 (Unaudited)
| fees, taxes, leverage (i.e., any expense incurred in connection with borrowings made by each Fund), interest, brokerage commissions, expenses incurred in connection with any merger or reorganization, dividends or interest expenses on short positions, acquired fund fees and expenses and extraordinary items), (the “Expense Limitation Cap”) do not exceed each Fund’s average daily net assets as follows: |
| Expense | |||
Limitation Cap | Expiration Date | ||
| CrossingBridge Low Duration High Yield Fund | 0.90% | January 8, 2021 | |
| CrossingBridge Long/Short Credit Fund | 1.25%(1) | May 7, 2020 | |
| (1) The Expense Cap was previously 1.35% from February 1, 2018 through May 7, 2018. | |||
| Any such waiver or reimbursement is subject to later adjustment to allow the Adviser to recoup amounts waived or reimbursed within three years from the date such amount was waived or reimbursed, subject to the operating expense limitation agreement, if such reimbursement will not cause each Fund’s expense ratio, after recoupment has been taken into account, to exceed the lesser of: (1) the Expense Limitation Cap in place at the time of the waiver and/or expense payment; or (2) the Expense Limitation Cap in place at the time of the recoupment. The following table shows the remaining waiver or reimbursed expenses for each Fund subject to potential recovery expiring: |
| CrossingBridge | CrossingBridge | ||||||||
| Low Duration | Long/Short | ||||||||
High Yield Fund | Credit Fund | ||||||||
| February 29, 2020 | $ | — | $ | 288,328 | |||||
| February 28, 2021 | $ | — | $ | 325,317 | (2) | ||||
| September 30, 2021 | $ | 127,970 | $ | 190,706 | |||||
| March 31, 2022 | $ | 43,849 | $ | 125,367 | |||||
| (2) | $27,431 is eligible for recoupment with CrossingBridge. $297,886 is eligible for recoupment with CrossingBridge, previously acquired from Collins Capital, the Long/Short Fund’s previous Adviser. |
| (5) | Distribution and Shareholder Servicing Plans |
| The Trust has adopted a plan pursuant to Rule 12b-1 under the 1940 Act (the “12b-1 Plan”), on behalf of each Fund, which authorizes each Fund to pay Quasar Distributors, LLC (the “Distributor”) a distribution fee of 0.25% of each Fund’s average daily net assets of the CrossingBridge Long/Short Credit Fund’s Class A shares, and 0.25% on the CrossingBridge Low Duration High Yield Fund’s Investor Class shares for services to prospective Fund shareholders and distribution of Fund shares. The following table details the fees incurred pursuant to the 12b-1 Plan during the six months ended March 31, 2019, as well as the fees owed as of March 31, 2019: |
Fees Owed | Fees Incurred | ||
| CrossingBridge Low Duration High Yield Fund | $0 | $0 | |
| CrossingBridge Long/Short Credit Fund | $0 | $0 |
| The Trust adopted a shareholder servicing plan (the “Shareholder Servicing Plan”) on behalf of each Fund which currently authorizes each Fund to pay up to 0.10% of each Fund’s average daily net assets attributable to Institutional Class shares, Class A shares and Investor Class Shares, as applicable, to other financial institutions for |
43
CROSSINGBRIDGE FUNDS
Notes to Financial Statements (Continued)
March 31, 2019 (Unaudited)
| shareholder servicing (however, the fee may be increased to 0.15% of the Low Duration High Yield Fund’s average daily net assets at any time). The following table details the fees incurred for Institutional Class shares for each Fund pursuant to the Shareholder Serving Plan during the six months ended March 31, 2019, as well as the fees owed as of March 31, 2019. |
Shareholder Servicing | Fees Owed | Fees Incurred | |
| CrossingBridge Low Duration High Yield Fund | $27,209 | $31,182 | |
| CrossingBridge Long/Short Credit Fund | $37,942 | $42,617 |
| (6) | Related Party Transactions |
| U.S. Bank Fund Services, LLC, doing business as U.S. Bank Global Fund Services (“Fund Services” or “ Administrator”), acts as each Fund’s administrator under an Administration Agreement. The Administrator prepares various federal and state regulatory filings, reports and returns for each Fund; prepares reports and materials to be supplied to the Trustees; monitors the activities of each Funds’ custodian, transfer agent and accountants; coordinates the preparation and payment of the Funds’ expenses and reviews the Funds’ expense accruals. Fund Services also serves as the transfer agent to each Fund and provides pricing services to each Fund. U.S. Bank, N.A. (“US Bank”), an affiliate of Fund Services, serves as each Fund’s custodian. Fees incurred for the six months ended March 31, 2019, and owed as of March 31, 2019, are as follows: |
Fund Administration | Fees Owed | Fees Incurred | |
| CrossingBridge Low Duration High Yield Fund | $14,977 | $35,233 | |
| CrossingBridge Long/Short Credit Fund | $ 7,267 | $27,424 | |
Pricing | Fees Owed | Fees Incurred | |
| CrossingBridge Low Duration High Yield Fund | $2,652 | $6,528 | |
| CrossingBridge Long/Short Credit Fund | $1,359 | $2,398 | |
Transfer Agency | Fees Owed | Fees Incurred | |
| CrossingBridge Low Duration High Yield Fund | $ 5,980 | $13,983 | |
| CrossingBridge Long/Short Credit Fund | $13,657 | $22,032 | |
Custody | Fees Owed | Fees Incurred | |
| CrossingBridge Low Duration High Yield Fund | $2,081 | $5,533 | |
| CrossingBridge Long/Short Credit Fund | $ 108 | $1,309 |
| The Distributor acts as each Fund’s principal underwriter in a continuous public offering of each Fund’s shares. The Distributor is an affiliate of Fund Services and US Bank. Certain officers of each Fund are also employees of Fund Services. A Trustee of the Trust is affiliated with Fund Services and US Bank. This same Trustee is an interested person of the Distributor. | |
| The Trust’s Chief Compliance Officer is also an employee of Fund Services. Each Fund’s allocation of the Trust’s Chief Compliance Officer fee incurred for the six months ended March 31, 2019, and owed as of March 31, 2019, is as follows: |
Chief Compliance Officer | Fees Owed | Fees Incurred | |
| CrossingBridge Low Duration High Yield Fund | $1,167 | $3,787 | |
| CrossingBridge Long/Short Credit Fund | $1,665 | $4,275 | |
| Each Fund also has a line of credit with US Bank (See footnote 10). | |||
44
CROSSINGBRIDGE FUNDS
Notes to Financial Statements (Continued)
March 31, 2019 (Unaudited)
| (7) | Capital Share Transactions |
| Transactions in shares of each Fund were as follows: |
| CrossingBridge Low Duration High Yield Fund | |||||||||||||
| Six Months | Fiscal | ||||||||||||
| Ended | Period Ended | ||||||||||||
| March 31, | September 30, | ||||||||||||
| Institutional Class | 2019 | 2018(1) | |||||||||||
| Shares sold | 3,606,498 | 5,265,832 | |||||||||||
| Shares reinvested | 57,422 | 18,537 | |||||||||||
| Shares redeemed | (720,072 | ) | (729,645 | ) | |||||||||
| Net Increase | 2,943,848 | 4,554,724 | |||||||||||
| (1) The Fund commenced operations on February 1, 2018. | |||||||||||||
CrossingBridge Long/Short Credit Fund(2) | |||||||||||||
| Six Months | Fiscal | ||||||||||||
| Ended | Period Ended | Year Ended | |||||||||||
| March 31, | September 30, | February 28, | |||||||||||
| Institutional Class | 2019 | 2018 | 2018 | ||||||||||
| Shares sold | 1,312,647 | 1,661,730 | 7,511,984 | ||||||||||
| Shares reinvested | 16,049 | 25,619 | 76,607 | ||||||||||
| Shares redeemed | (2,653,271 | ) | (3,231,884 | ) | (4,333,171 | ) | |||||||
| Shares converted from Class A | — | 115,312 | (3) | — | |||||||||
| Net Increase/(Decrease) | (1,324,575 | ) | (1,429,223 | ) | 3,255,420 | ||||||||
| Fiscal | ||||||||||
| Period Ended | Year Ended | |||||||||
| September 30, | February 28, | |||||||||
| Class A | 2018 | 2018 | ||||||||
| Shares sold | 2,137 | 18,855 | ||||||||
| Shares reinvested | 351 | 3,867 | ||||||||
| Shares redeemed | (3,835 | ) | (28,927 | ) | ||||||
| Shares converted to Institutional Class | (116,301 | )(3) | — | |||||||
| Net Decrease | (117,648 | ) | (6,205 | ) | ||||||
| (2) The Fund changed its fiscal year end to September 30, 2018. | ||||||||||
| (3) The Class A shares were converted to Institutional Class shares effective as of the close of business on May 31, 2018. | ||||||||||
| (8) | Investment Transactions |
| The aggregate purchases and sales of securities, excluding short-term investments and securities sold short for the CrossingBridge Low Duration High Yield Fund and CrossingBridge Long/Short Credit Fund for the six months ended March 31, 2019, were as follows: |
Purchases | Sales | ||
| CrossingBridge Low Duration High Yield Fund | $48,775,988 | $35,710,047 | |
| CrossingBridge Long/Short Credit Fund | $13,599,005 | $34,007,701 | |
| There were no purchases or sales of U.S. government securities for either Fund. | |||
45
CROSSINGBRIDGE FUNDS
Notes to Financial Statements (Continued)
March 31, 2019 (Unaudited)
| (9) | Beneficial Ownership |
| The beneficial ownership, either directly or indirectly, of more than 25% of the voting securities of a fund creates a presumption of control of each fund, under Section 2(a)(9) of the 1940 Act. At March 31, 2019, each entity held the following: |
| Charles | National | |||
| Band | Schwab & | Financial | ||
& Co. | Co., Inc. | Services LLC | ||
| CrossingBridge Low Duration High Yield Fund | 0.00% | 0.00% | 30.13% | |
| CrossingBridge Long/Short Credit Fund | 64.92% | 39.88% | 25.02% |
| (10) | Line of Credit |
| For the current fiscal period, the CrossingBridge Long/Short Credit Fund had a line of credit in the amount of the lesser of $12,000,000, or 33.33% of the fair value of unencumbered assets. Effective August 10, 2018, the CrossingBridge Low Duration High Yield Fund had a line of credit in the amount of the lesser of $5,000,000 or 33.33% of the fair value of unencumbered assets. The line of credit for both Funds mature on August 9, 2019. These unsecured lines of credit are intended to provide short-term financing, if necessary, subject to certain restrictions, in connection with shareholder redemptions. The credit facility is with the Funds’ custodian, US Bank. Interest will be accrued at the prime rate (5.50% as of December 20, 2018). During the fiscal period ended September 30, 2018, the Funds did not utilize the line of credit. | |
| (11) | Subsequent Event |
| On April 29, 2019, the CrossingBridge Low Duration High Yield Fund declared and paid a distribution of $175,239 to the Institutional Class shareholders of record on April 26, 2019. | |
| On May 30, 2019, the CrossingBridge Low Duration High Yield Fund declared and paid a distribution of $223,274 to the Institutional Class shareholders of record on May 29, 2019. | |
| (12) | Regulatory Updates |
| In March 2017, the Financial Accounting Standards Board (FASB) issued Accounting Standards Update (ASU) No. 2017-08, Receivables—Nonrefundable Fees and Other Costs (Subtopic 310-20): Premium Amortization on Purchased Callable Debt Securities. The amendments in the ASU shorten the amortization period for certain callable debt securities, held at a premium, to be amortized to the earliest call date. The ASU does not require an accounting change for securities held at a discount; which continues to be amortized to maturity. The ASU is effective for fiscal years and interim periods within those fiscal years beginning after December 15, 2018. Management is currently evaluating the impact, if any, of applying this provision. |
46
CROSSINGBRIDGE FUNDS
Additional Information
(Unaudited)
Tax Information
For the fiscal period ended September 30, 2018, 0.00% of each Fund’s taxable ordinary income distributions were designated as short-term capital gain distributions under the Internal Revenue Code Section 871(k).
Indemnifications
Under the Trust’s organizational documents, its Officers and Trustees are indemnified against certain liabilities arising out of the performance of their duties to the Funds. In addition, in the normal course of business, each Fund enters into contracts that provide general indemnifications to other parties. Each Fund’s maximum exposure under these arrangements is unknown as this would involve future claims that may be made against the Funds that have not yet occurred. However, the Funds have not had prior claims or losses pursuant to these contracts and expects the risk of loss to be remote.
Information about Trustees
The business and affairs of the Trust are managed under the direction of the Board of Trustees. Information pertaining to the Trustees of the Trust is set forth below. The Statement of Additional Information includes additional information about the Trustees and is available, without charge, upon request by calling 1-888-898-2780.
| Other | |||||
| Directorships | |||||
| Number of | Held by | ||||
| Term of | Portfolios | Principal | Trustee | ||
| Name, | Position(s) | Office and | in the Trust | Occupation(s) | During |
| Address and | Held with | Length of | Overseen | During the Past | the Past |
Year of Birth | the Trust | Time Served | by Trustee | Five Years | Five Years |
| Independent Trustees | |||||
| Michael D. Akers, Ph.D. | Trustee | Indefinite | 28 | Professor, | Independent |
| 615 E. Michigan St. | Term; Since | Department | Trustee, USA | ||
| Milwaukee, WI 53202 | August 22, | of Accounting, | MUTUALS | ||
| Year of Birth: 1955 | 2001 | Marquette | (an open-end | ||
| University (2004– | investment | ||||
| present); Chair, | company with | ||||
| Department of | three portfolios). | ||||
| Accounting, | |||||
| Marquette | |||||
| University | |||||
| (2004–2017). | |||||
| Gary A. Drska | Trustee | Indefinite | 28 | Pilot, | Independent |
| 615 E. Michigan St. | Term; Since | Frontier/Midwest | Trustee, USA | ||
| Milwaukee, WI 53202 | August 22, | Airlines, Inc. | MUTUALS | ||
| Year of Birth: 1956 | 2001 | (airline company) | (an open-end | ||
| (1986–present). | investment | ||||
| company with | |||||
| three portfolios). |
47
CROSSINGBRIDGE FUNDS
Additional Information (Continued)
(Unaudited)
| Other | |||||
| Directorships | |||||
| Number of | Held by | ||||
| Term of | Portfolios | Principal | Trustee | ||
| Name, | Position(s) | Office and | in the Trust | Occupation(s) | During |
| Address and | Held with | Length of | Overseen | During the Past | the Past |
Year of Birth | the Trust | Time Served | by Trustee | Five Years | Five Years |
| Jonas B. Siegel | Trustee | Indefinite | 28 | Retired (2011– | Independent |
| 615 E. Michigan St. | Term; Since | present); | Trustee, | ||
| Milwaukee, WI 53202 | October 23, | Managing | Gottex Trust | ||
| Year of Birth: 1943 | 2009 | Director, Chief | (an open-end | ||
| Administrative | investment | ||||
| Officer (“CAO”) | company) | ||||
| and Chief | (2010–2016); | ||||
| Compliance | Independent | ||||
| Officer (“CCO”), | Manager, | ||||
| Granite Capital | Ramius IDF | ||||
| International | fund complex | ||||
| Group, L.P. | (two closed-end | ||||
| (an investment | investment | ||||
| management | companies) | ||||
| firm) (1994– | (2010–2015); | ||||
| 2011). | Independent | ||||
| Trustee, Gottex | |||||
| Multi-Asset | |||||
| Endowment | |||||
| fund complex | |||||
| (three closed- | |||||
| end investment | |||||
| companies) | |||||
| (2010–2015); | |||||
| Independent | |||||
| Trustee, Gottex | |||||
| Multi- | |||||
| Alternatives | |||||
| fund complex | |||||
| (three closed- | |||||
| end investment | |||||
| companies) | |||||
| (2010–2015). |
48
CROSSINGBRIDGE FUNDS
Additional Information (Continued)
(Unaudited)
| Other | |||||
| Directorships | |||||
| Number of | Held by | ||||
| Term of | Portfolios | Principal | Trustee | ||
| Name, | Position(s) | Office and | in the Trust | Occupation(s) | During |
| Address and | Held with | Length of | Overseen | During the Past | the Past |
Year of Birth | the Trust | Time Served | by Trustee | Five Years | Five Years |
| Interested Trustee and Officers | |||||
| Joseph C. Neuberger* | Chairperson | Indefinite | 28 | President | Trustee, Buffalo |
| 615 E. Michigan St. | and | Term; Since | (2017–present), | Funds (an | |
| Milwaukee, WI 53202 | Trustee | August 22, | Chief | open-end | |
| Year of Birth: 1962 | 2001 | Operating | investment | ||
| Officer | company) | ||||
| (2016–present), | (2003–2017); | ||||
| Executive Vice | Trustee, USA | ||||
| President | MUTUALS | ||||
| (1994–2017), | (an open-end | ||||
| U.S. Bancorp | investment | ||||
| Fund Services, | company) | ||||
| LLC. | (2001–2018). | ||||
| John P. Buckel | President | Indefinite | N/A | Vice President, | N/A |
| 615 E. Michigan St. | and | Term; Since | U.S. Bancorp | ||
| Milwaukee, WI 53202 | Principal | January 24, | Fund Services, | ||
| Year of Birth: 1957 | Executive | 2013 | LLC (2004– | ||
| Officer | present). | ||||
| Jennifer A. Lima | Vice | Indefinite | N/A | Vice President, | N/A |
| 615 E. Michigan St. | President, | Term; Since | U.S. Bancorp | ||
| Milwaukee, WI 53202 | Treasurer | January 24, | Fund Services, | ||
| Year of Birth: 1974 | and | 2013 | LLC (2002– | ||
| Principal | present). | ||||
| Financial | |||||
| and | |||||
| Accounting | |||||
| Officer |
49
CROSSINGBRIDGE FUNDS
Additional Information (Continued)
(Unaudited)
| Other | |||||
| Directorships | |||||
| Number of | Held by | ||||
| Term of | Portfolios | Principal | Trustee | ||
| Name, | Position(s) | Office and | in the Trust | Occupation(s) | During |
| Address and | Held with | Length of | Overseen | During the Past | the Past |
Year of Birth | the Trust | Time Served | by Trustee | Five Years | Five Years |
| Elizabeth B. Scalf | Chief | Indefinite | N/A | Senior Vice | N/A |
| 615 E. Michigan St. | Compliance | Term; Since | President, U.S. | ||
| Milwaukee, WI 53202 | Officer, | July 1, | Bancorp Fund | ||
| Year of Birth: 1985 | Vice | 2017 | Services, LLC | ||
| President | (February 2017– | ||||
| and Anti- | present); Vice | ||||
| Money | President and | ||||
| Laundering | Assistant CCO, | ||||
| Officer | Heartland Advisors, | ||||
| Inc. (December | |||||
| 2016–January | |||||
| 2017); Vice | |||||
| President and CCO, | |||||
| Heartland Group, | |||||
| Inc. (May 2016– | |||||
| November 2016); | |||||
| Vice President, | |||||
| CCO and Senior | |||||
| Legal Counsel | |||||
| (May 2016– | |||||
| November 2016), | |||||
| Assistant CCO | |||||
| and Senior Legal | |||||
| Counsel (January | |||||
| 2016–April 2016), | |||||
| Heartland | |||||
| Advisors, Inc. | |||||
| Adam W. Smith | Secretary | Indefinite | N/A | Vice President, | N/A |
| 615 E. Michigan St. | Term; Since | U.S. Bancorp | |||
| Milwaukee, WI 53202 | May 29, | Fund Services, | |||
| Year of Birth: 1981 | 2015 | LLC (2012– | |||
| present). | |||||
| Kelly A. Burns | Assistant | Indefinite | N/A | Assistant Vice | N/A |
| 615 E. Michigan St. | Treasurer | Term; Since | President, U.S. | ||
| Milwaukee, WI 53202 | April 23, | Bancorp Fund | |||
| Year of Birth: 1987 | 2015 | Services, LLC | |||
| (2011–present). |
50
CROSSINGBRIDGE FUNDS
Additional Information (Continued)
(Unaudited)
| Other | |||||
| Directorships | |||||
| Number of | Held by | ||||
| Term of | Portfolios | Principal | Trustee | ||
| Name, | Position(s) | Office and | in the Trust | Occupation(s) | During |
| Address and | Held with | Length of | Overseen | During the Past | the Past |
Year of Birth | the Trust | Time Served | by Trustee | Five Years | Five Years |
| Melissa Aguinaga | Assistant | Indefinite | N/A | Assistant Vice | N/A |
| 615 E. Michigan St. | Treasurer | Term; Since | President, U.S. | ||
| Milwaukee, WI 53202 | July 1, | Bancorp Fund | |||
| Year of Birth: 1987 | 2015 | Services, LLC | |||
| (2010–present). | |||||
| Laura Carroll | Assistant | Indefinite | N/A | Assistant Vice | N/A |
| 615 E. Michigan St. | Treasurer | Term; Since | President, U.S. | ||
| Milwaukee, WI 53202 | August 20, | Bancorp Fund | |||
| Year of Birth: 1985 | 2018 | Services, LLC | |||
| (2007–present). |
| * | Mr. Neuberger is an “interested person” of the Trust as defined by the 1940 Act by virtue of the fact that he is a board member and an interested person of Quasar Distributors, LLC (the “Distributor”), the Funds’ principal underwriter. |
51
(This Page Intentionally Left Blank.)
A NOTE ON FORWARD LOOKING STATEMENTS (Unaudited)
Except for historical information contained in this report for each Fund, the matters discussed in this report may constitute forward-looking statements made pursuant to the safe-harbor provisions of the Private Securities Litigation Reform Act of 1995. These include any adviser or portfolio manager predictions, assessments, analyses or outlooks for individual securities, industries, market sectors and/or markets. These statements involve risks and uncertainties. In addition to the general risks described for each Fund in the current Prospectus, other factors bearing on this report include the accuracy of the adviser’s or portfolio managers’ forecasts and predictions, and the appropriateness of the investment programs designed by the adviser or portfolio managers to implement their strategies efficiently and effectively. Any one or more of these factors, as well as other risks affecting the securities markets and investment instruments generally, could cause the actual results of each Fund to differ materially as compared to benchmarks associated with each Fund.
ADDITIONAL INFORMATION (Unaudited)
Each Fund has adopted proxy voting policies and procedures that delegate to the Adviser the authority to vote proxies. A description of each Fund’s proxy voting policies and procedures is available without charge, upon request, by calling each Fund toll free at 1-888-898-2780. A description of these policies and procedures is also included in each Fund’s Statement of Additional Information, which is available on the SEC’s website at http://www.sec.gov.
Each Fund’s proxy voting record for the most recent 12-month period ended June 30 is available without charge, upon request, by calling, toll free, 1-888-898-2780, or by accessing the SEC’s website at http://www.sec.gov.
Each Fund files its complete schedule of portfolio holdings with the SEC four times each fiscal year at quarter-ends. Each Fund files the schedule of portfolio holdings with the SEC on Form N-CSR (second and fourth quarters) and on Form N-Q (first and third quarters). Shareholders may view the Funds’ Forms N-CSR and N-Q on the SEC’s website at www.sec.gov.
HOUSEHOLDING (Unaudited)
In an effort to decrease costs, each Fund intends to reduce the number of duplicate prospectuses and annual and semi-annual reports you receive by sending only one copy of each to those addresses shared by two or more accounts and to shareholders the Fund reasonably believes are from the same family or household. Once implemented, if you would like to discontinue householding for your accounts, please call toll-free at 1-888-898-2780 to request individual copies of these documents. Once a Fund receives notice to stop householding, the Fund will begin sending individual copies 30 days after receiving your request. This policy does not apply to account statements.
CROSSINGBRIDGE FUNDS
| Investment Adviser | CrossingBridge Advisors, LLC |
| 427 Bedford Road | |
| Suite 230 | |
| Pleasantville, New York 10570 | |
| Legal Counsel | Godfrey & Kahn, S.C. |
| 833 East Michigan Street, Suite 1800 | |
| Milwaukee, Wisconsin 53202 | |
| Independent Registered Public | Cohen & Company, Ltd. |
| Accounting Firm | 1350 Euclid Avenue |
| Suite 800 | |
| Cleveland, Ohio 44115 | |
| Transfer Agent, Fund Accountant and | U.S. Bancorp Fund Services, LLC |
| Fund Administrator | 615 East Michigan Street |
| Milwaukee, Wisconsin 53202 | |
| Custodian | U.S. Bank, N.A. |
| Custody Operations | |
| 1555 North River Center Drive | |
| Milwaukee, Wisconsin 53212 | |
| Distributor | Quasar Distributors, LLC |
| 777 East Wisconsin Avenue | |
| Milwaukee, Wisconsin 53202 |
This report is intended for shareholders of each Fund and may not be used as sales literature unless preceded or accompanied by a current prospectus.
Item 2. Code of Ethics.
Not applicable for semi-annual reports.
Item 3. Audit Committee Financial Expert.
Not applicable for semi-annual reports.
Item 4. Principal Accountant Fees and Services.
Not applicable for semi-annual reports.
Item 5. Audit Committee of Listed Registrants.
Not applicable to registrants who are not listed issuers (as defined in Rule 10A-3 under the Securities Exchange Act of 1934).
Item 6. Investments.
(a) | Schedule of Investments is included as part of the report to shareholders filed under Item 1 of this Form. |
(b) | Not Applicable. |
Item 7. Disclosure of Proxy Voting Policies and Procedures for Closed-End Management Investment Companies.
Not applicable to open-end investment companies.
Item 8. Portfolio Managers of Closed-End Management Investment Companies.
Not applicable to open-end investment companies.
Item 9. Purchases of Equity Securities by Closed‑End Management Investment Company and Affiliated Purchasers.
Not applicable to open-end investment companies.
Item 10. Submission of Matters to a Vote of Security Holders.
There have been no material changes to the procedures by which shareholders may recommend nominees to the registrant’s board of trustees.
Item 11. Controls and Procedures.
| (a) | The Registrant’s President and Treasurer have reviewed the Registrant's disclosure controls and procedures (as defined in Rule 30a-3(c) under the Investment Company Act of 1940 (the “Act”)) as of a date within 90 days of the filing of this report, as required by Rule 30a-3(b) under the Act and Rules 13a-15(b) or 15d‑15(b) under the Securities Exchange Act of 1934. Based on their review, such officers have concluded that the disclosure controls and procedures are effective in ensuring that information required to be disclosed in this report is appropriately recorded, processed, summarized and reported and made known to them by others within the Registrant and by the Registrant’s service provider. |
| (b) | There were no changes in the Registrant's internal control over financial reporting (as defined in Rule 30a-3(d) under the Act) that occurred during the last fiscal half-year covered by this report that has materially affected, or is reasonably likely to materially affect, the Registrant's internal control over financial reporting. |
Item 12. Disclosure of Securities Lending Activities for Closed-End Management Investment Companies
Not applicable to open-end investment companies.
Item 13. Exhibits.
| (a) | (1) Any code of ethics or amendment thereto, that is the subject of the disclosure required by Item 2, to the extent that the registrant intends to satisfy Item 2 requirements through filing an exhibit. Not applicable. |
(2) A separate certification for each principal executive and principal financial officer pursuant to Section 302 of the Sarbanes-Oxley Act of 2002. Filed herewith.
(3) Any written solicitation to purchase securities under Rule 23c‑1 under the Act sent or given during the period covered by the report by or on behalf of the registrant to 10 or more persons. Not applicable to open-end investment companies.
(4) Change in the registrant’s independent public accountant. There was no change in the registrant’s independent public accountant for the period covered by this report.
| (b) | Certifications pursuant to Section 906 of the Sarbanes‑Oxley Act of 2002. Furnished herewith. |
SIGNATURES
Pursuant to the requirements of the Securities Exchange Act of 1934 and the Investment Company Act of 1940, the registrant has duly caused this report to be signed on its behalf by the undersigned, thereunto duly authorized.
(Registrant) Trust for Professional Managers
By (Signature and Title)* /s/ John Buckel
John Buckel, President
Date June 4, 2019
Pursuant to the requirements of the Securities Exchange Act of 1934 and the Investment Company Act of 1940, this report has been signed below by the following persons on behalf of the registrant and in the capacities and on the dates indicated.
By (Signature and Title)* /s/ John Buckel
John Buckel, President
Date June 4, 2019
By (Signature and Title)* /s/ Jennifer Lima
Jennifer Lima, Treasurer
Date June 4, 2019
* Print the name and title of each signing officer under his or her signature.