UNITED STATES
SECURITIES AND EXCHANGE COMMISSION
Washington, D.C. 20549
SECURITIES AND EXCHANGE COMMISSION
Washington, D.C. 20549
FORM N-CSR
CERTIFIED SHAREHOLDER REPORT OF REGISTERED
MANAGEMENT INVESTMENT COMPANIES
Investment Company Act file number 811-10401
Trust for Professional Managers
(Exact name of registrant as specified in charter)
(Exact name of registrant as specified in charter)
615 East Michigan Street
Milwaukee, WI 53202
(Address of principal executive offices) (Zip code)
(Address of principal executive offices) (Zip code)
Jay Fitton
U.S. Bancorp Fund Services, LLC
615 East Michigan Street
Milwaukee, WI 53202
(Name and address of agent for service)
(Name and address of agent for service)
(513) 629-8104
Registrant's telephone number, including area code
Date of fiscal year end: November 30, 2019
Date of reporting period: May 31, 2019
Item 1. Reports to Stockholders.
Semi-Annual Report
May 31, 2019
Investment Advisor
Gerstein Fisher
565 Fifth Avenue, 27th Floor
New York, New York 10017
Phone: 800-473-1155
www.GersteinFisherFunds.com
Gerstein Fisher is a division of People’s United Advisors, Inc.
Beginning on January 1, 2021, as permitted by regulations adopted by the U.S. Securities and Exchange Commission, paper copies of the Funds’ annual and semi-annual shareholder reports will no longer be sent by mail, unless you specifically request paper copies of the reports from the Funds or from your financial intermediary (such as a broker-dealer or bank). Instead, the reports will be made available on a website, and you will be notified by mail each time a report is posted and provided with a website link to access the report.
If you already elected to receive shareholder reports electronically, you will not be affected by this change and you need not take any action. You may elect to receive shareholder reports and other communications from the Funds electronically by contacting your financial intermediary or, if you are a direct investor, by calling the Funds at 1-800-473-1155.
You may elect to receive all future reports in paper free of charge. If you invest through a financial intermediary, you can contact your financial intermediary to request that you continue to receive paper copies of your shareholder reports; if you invest directly with the Funds, you can call the Funds at 1-800-473-1155. Your election to receive reports in paper form will apply to all funds held in your account with your financial intermediary or, if you invest directly, to all Gerstein Fisher Funds you hold.
Table of Contents
| LETTER TO SHAREHOLDERS | 3 |
| EXPENSE EXAMPLES | 7 |
| INVESTMENT HIGHLIGHTS | 9 |
| SCHEDULES OF INVESTMENTS | 15 |
| STATEMENTS OF ASSETS AND LIABILITIES | 44 |
| STATEMENTS OF OPERATIONS | 46 |
| STATEMENTS OF CHANGES IN NET ASSETS | 48 |
| FINANCIAL HIGHLIGHTS | 52 |
| NOTES TO FINANCIAL STATEMENTS | 58 |
| NOTICE OF PRIVACY POLICY & PRACTICES | 74 |
| ADDITIONAL INFORMATION | 75 |
Dear Fellow Shareholders,
The beginning of 2019 saw the markets recover from one of the worst downturns since the Global Financial Crisis in 2008-2009. After one of the most volatile periods of the last decade for U.S. markets in the fourth quarter of 2018 and January of 2019, stocks have generally returned to a more stable or positive state.
Gerstein Fisher is focused on building and managing well-diversified, research-driven portfolios with the goal of offering investors systematic strategies across multiple asset classes. We will continue to push forward our research and processes to ensure that the Multi-Factor® portfolios Gerstein Fisher offers continue to provide a disciplined and well-reasoned approach to quantitative investing.
As always, it remains our privilege to recognize the trust that you have placed in Gerstein Fisher as we manage our funds and strategies. It is a responsibility we take seriously, and we look forward to continuing to earn this trust in the years to come.
We pride ourselves, through our Multi-Factor® strategies, on our commitment to offering a quantitative alternative to managing investments, and in doing everything we can to serve the best interest of our investors.
Sincerely,

Gregg S. Fisher, CFA
Founder, Portfolio Manager and Head of Research
3
Review of Fund Performance
Gerstein Fisher Multi-Factor® Growth Equity Fund (GFMGX)
The six months ended May 31, 2019 were broadly positive for U.S. equities and for U.S. large-cap growth equities. The Gerstein Fisher Multi-Factor® Growth Equity Fund (the “Fund”) returned -2.41% for this period, compared to the Russell 1000® Growth Total Return Index, which returned 3.91% for the same six months.
As a result of the Fund’s diversified investment approach, with approximately 240 holdings and no individual holding constituted more than 5% of the total portfolio, performance was determined principally by the returns of U.S. Large Cap Growth equities, and our targeted factor exposures, rather than the behavior of a limited number of stocks. The Fund’s performance relative to the Russell 1000® Growth Total Return Index was due largely to the returns of the risk factors that are components of our Multi-Factor® strategy. Performance attribution during the six month period ended May 31, 2019 reveals that the Fund’s tilt to higher-profitability securities, smaller market cap securities, and more value-oriented securities all negatively impacted performance. Higher price momentum securities (calculated over a 2-12 month trailing period) contributed moderately positively to returns for the same period.
Since its inception in December 2009, the Fund has performed in line with our expectations. It is designed to be an all-cap U.S. growth equity portfolio with additional exposures to targeted, systematic risk factors that include profitability, value, and momentum, while seeking to avoid non-systematic risks such as industry or company overexposures. Because our process is based on a scientifically grounded approach, we believe that over time the Gerstein Fisher Multi-Factor® Growth Equity Fund should continue to be well positioned to deliver a positive investment experience in the U.S. growth equity space, as well as to provide exposure to often overlooked factors within the domestic growth universe.
Gerstein Fisher Multi-Factor® International Growth Equity Fund (GFIGX)
Developed-market equities were positive in the six months ended May 31, 2019. The Gerstein Fisher Multi-Factor® International Growth Equity Fund (the “Fund”) returned 4.33% for this period, compared to the MSCI EAFE Growth Index, which returned 5.88% during the same six months.
The Fund maintains a diversified exposure to over 250 securities and approximately 25 countries, and no individual holding constituted more than 5% of the total portfolio. Additionally, any single country’s exposure within the portfolio is limited to a maximum of approximately 15% of the Fund, providing a high degree of country-level diversification. The Fund’s performance relative to the MSCI EAFE Growth Index was due largely to targeted exposures to certain risk factors that are components of our Multi-Factor® strategy. Performance attribution during the six month period ended May 31, 2019 reveals that the Fund’s tilt to stocks with smaller market capitalization, higher-profitability securities, and lower-valuation securities all negatively impacted performance when compared to the benchmark. The Fund’s exposure to stocks with higher momentum had a positive impact on returns.
Since its inception in January 2012, the Fund has performed in line with our expectations. It is designed to be a large-cap, developed-market growth equity portfolio with additional exposures to targeted, systematic risk factors that include profitability, value, and momentum, while seeking to avoid non-systematic risks such as industry or company overexposures. Because our process is based on a scientifically grounded approach, we believe that the Gerstein Fisher Multi-Factor® International Growth Equity Fund should be well positioned to deliver a positive investment experience in the international-developed
4
growth equity space, as well as provide exposure to often overlooked factors within the international growth equity universe.
Gerstein Fisher Multi-Factor® Global Real Estate Securities Fund (GFMRX)
Global real estate as an asset class saw very positive returns in the six months ended May 31, 2019. The Gerstein Fisher Multi-Factor® Global Real Estate Securities Fund (the “Fund”) returned 7.66% for that period, while the FTSE EPRA/NAREIT Developed Index Net Total Return was up 6.48% for the same six months.
The Fund maintains a diversified exposure to over 200 securities and approximately 25 countries, and no individual holding constituted more than 5% of the total portfolio. The real estate exposure in the Fund is global in nature, with approximately 50% exposure to non-U.S. real estate securities. The Fund’s performance relative to the FTSE EPRA/NAREIT Developed Index Net Total Return was due in large part to higher exposure to certain risk factors targeted by our Multi-Factor® strategy. Performance attribution during the six month period ended May 31, 2019 reveals that the Fund’s tilt to real estate securities with high price momentum and contributed positively to returns, while smaller capitalization securities produced lower returns.
Since its inception in April 2013, the Fund has performed in line with our expectations. It is designed to be a global real estate portfolio with additional exposures to targeted, systematic risk factors that include size, value, and avoiding securities with a high degree of leverage, while seeking to avoid non-systematic risks such as company or single-security overexposures. Because our process is based on a scientifically grounded approach, we believe that the Gerstein Fisher Multi-Factor® Global Real Estate Securities Fund should be well positioned to deliver a positive investment experience in the global real estate space, as well as to provide exposure to often overlooked factors within that investable universe.
Opinions expressed are subject to change at any time, are not guaranteed and should not be considered investment advice.
Past performance does not guarantee future results.
Mutual fund investing involves risk. Principal loss is possible.
This strategy and mutual fund investing involves risk. Principal loss is possible. Investments in foreign securities involve greater volatility and political, economic and currency risks as well as differences in accounting methods. These risks are greater for emerging markets. Small- and medium-capitalization companies tend to have limited liquidity and greater price volatility than large-capitalization companies. Growth stocks typically are relatively more expensive than value stocks; however, value stocks have a lower expected growth rate in earnings and sales. Options on securities may be subject to greater fluctuations in value than an investment in the underlying securities. The investment in options is not suitable for all investors. The risks of investments in derivatives include imperfect correlation between the value of these instruments and the underlying assets; risks of default by the other party to the derivative transactions; risks that the transactions may result in losses that partially or completely offset gains in portfolio positions; and risks that the derivative transactions may not be liquid. The Funds may engage in short sales of securities, which involves the risk that losses may exceed the original amount invested. A real estate investment trust’s (“REIT”) share price may decline because of adverse developments affecting the real estate industry, including changes in interest rates. The returns from REITs may trail returns from the overall market. Additionally, there is always a risk that a REIT will fail to qualify for favorable tax treatment. Unlike mutual funds, exchange-traded funds (“ETFs”) do not necessarily trade at the net asset values of their underlying securities, which means an ETF could potentially trade above or below the value of the underlying portfolios.
5
Additionally, because ETFs trade like stocks on exchanges, they are subject to trading and commission costs, unlike open-end investment companies.
Diversification does not assure a profit or protect against a loss in a declining market.
Index Definitions:
Russell 1000® Growth Total Return Index: The Russell 1000® Growth Index measures the performance of the broad growth segment of the U.S. equity universe. It includes those Russell 1000 companies with higher price-to-book ratios and higher forecasted growth values. The Russell 1000® Growth Index is constructed to provide a comprehensive, unbiased, and stable barometer of the broad growth market. The Index is completely reconstituted annually to ensure new and growing equities are included and that the represented companies continue to reflect growth characteristics.
MSCI EAFE Growth Index: The MSCI EAFE Growth Index (Europe, Australasia, Far East) is a free float-adjusted market capitalization index that is designed to measure the equity market performance of developed markets, excluding the U.S. & Canada, focusing on companies with higher price-to-book ratios and higher forecasted growth values. The index consists of the following 21 developed market country indexes: Australia, Austria, Belgium, Denmark, Finland, France, Germany, Hong Kong, Ireland, Israel, Italy, Japan, the Netherlands, New Zealand, Norway, Portugal, Singapore, Spain, Sweden, Switzerland, and the United Kingdom.
FTSE EPRA/NAREIT Developed Index Net Total Return: The Index is a global market capitalization weighted index composed of listed real estate securities from developed market countries in North America, Europe, and Asia.
An investment cannot be made directly in an index.
Must be preceded or accompanied by a prospectus.
The Gerstein Fisher Funds are distributed by Quasar Distributors, LLC.
6
Gerstein Fisher Funds
Expense Examples
(Unaudited)
As a shareholder of the Funds, you incur two types of costs: (1) transaction costs, including redemption fees, and (2) ongoing costs, including management fees and other Fund expenses. These Examples are intended to help you understand your ongoing costs (in dollars) of investing in the Funds, and to compare these costs with the ongoing costs of investing in other mutual funds. The Examples are based on an investment of $1,000 invested at the beginning of the period and held for the entire period (12/1/18–5/31/19).
Actual Expenses
The first lines of the following tables provide information about actual account values and actual expenses. Although the Funds charge no sales load, you will be assessed fees for outgoing wire transfers, returned checks and stop payment orders at prevailing rates charged by U.S. Bancorp Fund Services, LLC, the Funds’ transfer agent. If you request that a redemption be made by wire transfer, currently a $15.00 fee is charged by the Funds’ transfer agent. You will be charged a redemption fee equal to 1.00% of the net amount of the redemption if you redeem your shares of a Fund within sixty days of purchase. Individual retirement accounts (“IRAs”) will be charged a $15.00 annual maintenance fee. To the extent a Fund invests in shares of exchange-traded funds or other investment companies as part of their investment strategies, you will indirectly bear your proportionate share of any fees and expenses charged by the underlying funds in which the Fund invests in addition to the expenses of the Fund. Actual expenses of the underlying funds are expected to vary among the various underlying funds. These expenses are not included in the Examples. The Examples include, but are not limited to, management fees, fund administration fees and accounting, custody and transfer agent fees. You may use the information in this line, together with the amount you invested, to estimate the expenses that you paid over the period. Simply divide your account value by $1,000 (for example, an $8,600 account value divided by $1,000 = 8.6), then multiply the result by the number in the first line under the heading titled “Expenses Paid During Period” to estimate the expenses you paid on your account during this period.
Hypothetical Examples for Comparison Purposes
The second lines of the following tables provide information about hypothetical account values and hypothetical expenses based on the Funds’ actual expense ratios and an assumed rate of return of 5% per year before expenses, which is not the Funds’ actual return. The hypothetical account values and expenses may not be used to estimate the actual ending account balance or expenses you paid for the period. You may use this information to compare the ongoing costs of investing in the Funds and other funds. To do so, compare the 5% hypothetical examples with the 5% hypothetical examples that appear in the shareholder reports of other funds. Please note that the expenses shown in the table are meant to highlight your ongoing costs only and do not reflect any transactional costs, such as sales charges (loads), redemption fees or exchange fees. Therefore, the second line of the table is useful in comparing ongoing costs only, and will not help you determine the relative total costs of owning different funds. In addition, if these transactional costs were included, your costs would have been higher.
7
Gerstein Fisher Funds
Expense Examples (Continued)
(Unaudited)
Gerstein Fisher Multi-Factor® Growth Equity Fund
| Expenses Paid | |||
| Beginning | Ending | During Period | |
| Account Value | Account Value | December 1, 2018 - | |
December 1, 2018 | May 31, 2019 | May 31, 2019* | |
| Actual | $1,000.00 | $ 975.90 | $4.88 |
| Hypothetical (5% return | |||
| before expenses) | $1,000.00 | $1,020.00 | $4.99 |
| * | Expenses are equal to the Fund’s annualized expense ratio of 0.99%, multiplied by the average account value over the period, multiplied by 182/365 (to reflect the one-half year period). |
Gerstein Fisher Multi-Factor® International Growth Equity Fund
| Expenses Paid | |||
| Beginning | Ending | During Period | |
| Account Value | Account Value | December 1, 2018 - | |
December 1, 2018 | May 31, 2019 | May 31, 2019* | |
| Actual | $1,000.00 | $1,043.30 | $5.65 |
| Hypothetical (5% return | |||
| before expenses) | $1,000.00 | $1,019.40 | $5.59 |
| * | Expenses are equal to the Fund’s annualized expense ratio of 1.11%, multiplied by the average account value over the period, multiplied by 182/365 (to reflect the one-half year period). |
Gerstein Fisher Multi-Factor® Global Real Estate Securities Fund
| Expenses Paid | |||
| Beginning | Ending | During Period | |
| Account Value | Account Value | December 1, 2018 - | |
December 1, 2018 | May 31, 2019 | May 31, 2019* | |
| Actual | $1,000.00 | $1,076.60 | $4.87 |
| Hypothetical (5% return | |||
| before expenses) | $1,000.00 | $1,020.24 | $4.73 |
| * | Expenses are equal to the Fund’s annualized expense ratio of 0.94%, multiplied by the average account value over the period, multiplied by 182/365 (to reflect the one-half year period). |
8
Gerstein Fisher Multi-Factor® Growth Equity Fund
Investment Highlights
(Unaudited)
Under normal market conditions, at least 80% of the Fund’s net assets (plus any borrowings for investment purposes) will be invested in equity securities. The Fund seeks to invest primarily in common stocks of domestic companies of any size. Equity securities may also include preferred stocks, ETFs that invest in equities, individual stock options and options on indices. At any one time, the combined value of options may be up to 5% of the Fund’s net assets. The Fund may invest up to 20% of its net assets in the securities of foreign issuers that are publicly traded in the United States or on foreign exchanges. Additionally, the Fund may sell shares of securities short for hedging purposes.
Allocation of Portfolio Holdings as of May 31, 2019
(% of Investments)
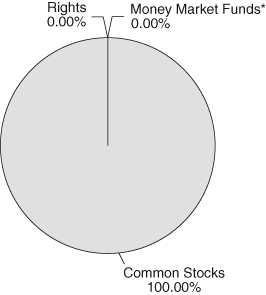
* Excludes securities lending collateral.
Average Annual Total Returns as of May 31, 2019
| Gerstein Fisher | Russell 1000® | |
Multi-Factor® | Growth Total | |
Growth Equity | Return Index | |
| One Year | -5.13% | 5.39% |
| Three Year | 10.79% | 15.33% |
| Five Year | 8.54% | 12.33% |
Since Inception (1/15/10)(1) | 11.98% | 13.93% |
(1) | While the Fund commenced operations on December 31, 2009, the Fund began investing consistent with its investment objective on January 15, 2010. |
Continued
9
Gerstein Fisher Multi-Factor® Growth Equity Fund
Investment Highlights (Continued)
(Unaudited)
Performance data quoted represents past performance and does not guarantee future results. The investment return and principal value of an investment will fluctuate so that an investor’s shares, when redeemed, may be worth more or less than their original cost. Current performance of the Fund may be lower or higher than the performance quoted. Performance data current to the most recent month-end may be obtained by calling 800-473-1155. The Fund imposes a 1.00% redemption fee of the net amount of the redemption on shares held for 60 days or less. Performance quoted does not reflect the redemption fee. If reflected, total returns would be reduced.
Short-term performance, in particular, is not a good indication of the Fund’s future performance, and an investment should not be made based solely on historical returns.
Investment performance reflects fee waivers in effect. In the absence of such waivers, total return would be reduced.
The returns shown assume reinvestment of Fund distributions and do not reflect the deduction of taxes that a shareholder would pay on Fund distributions or the redemption of Fund shares. The following chart illustrates performance of a hypothetical investment made in the Fund and a broad-based securities index on the Fund’s inception date. The graph does not reflect any future performance.
The Russell 1000® Growth Total Return Index measures the performance of the broad growth segment of the U.S. equity universe. It includes those Russell 1000 companies with higher price-to-book ratios and higher forecasted growth values. The Russell 1000® Growth Total Return Index is constructed to provide a comprehensive, unbiased, and stable barometer of the broad growth market. The Index is completely reconstituted annually to ensure new and growing equities are included and that the represented companies continue to reflect growth characteristics.
One cannot invest directly in an index.
Growth of $10,000 Investment
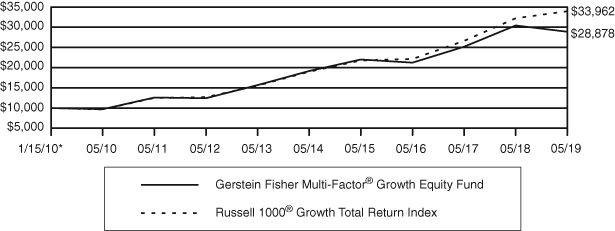
| * | While the Fund commenced operations on December 31, 2009, the Fund began investing consistent with its investment objective on January 15, 2010. |
10
Gerstein Fisher Multi-Factor® International Growth Equity Fund
Investment Highlights
(Unaudited)
Under normal market conditions, at least 80% of the Fund’s net assets (plus any borrowings for investment purposes) will be invested in equity securities. The Fund seeks to invest primarily in common stocks of international companies of any size, including foreign securities and securities of U.S. companies. The Fund may invest in foreign securities, which may include securities of companies in emerging markets or less developed countries. Equity securities include common stocks, preferred stocks, ETFs that invest in equities, individual stock options and options on stock indices.
Allocation of Portfolio Holdings as of May 31, 2019
(% of Investments)
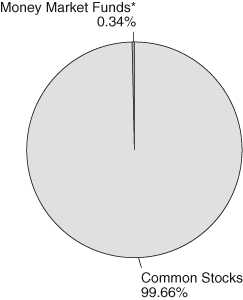
* Excludes securities lending collateral.
Average Annual Total Returns as of May 31, 2019
| Gerstein Fisher | ||
Multi-Factor® | ||
| International | MSCI EAFE | |
Growth Equity | Growth Index | |
| One Year | -9.10% | -3.27% |
| Three Year | 5.02% | 6.77% |
| Five Year | 1.84% | 3.23% |
| Since Inception (1/27/12) | 7.16% | 6.86% |
Performance data quoted represents past performance and does not guarantee future results. The investment return and principal value of an investment will fluctuate so that an investor’s shares, when redeemed, may be worth more or less than their original cost.
Continued
11
Gerstein Fisher Multi-Factor® International Growth Equity Fund
Investment Highlights (Continued)
(Unaudited)
Current performance of the Fund may be lower or higher than the performance quoted. Performance data current to the most recent month end may be obtained by calling 800-473-1155. The Fund imposes a 1.00% redemption fee of the net amount of the redemption on shares held for 60 days or less. Performance quoted does not reflect the redemption fee. If reflected, total returns would be reduced.
Short-term performance, in particular, is not a good indication of the Fund’s future performance, and an investment should not be made based solely on historical returns.
Investment performance reflects fee waivers in effect. In the absence of such waivers, total return would be reduced.
The returns shown assume reinvestment of Fund distributions and do not reflect the deduction of taxes that a shareholder would pay on Fund distributions or the redemption of Fund shares. The following chart illustrates performance of a hypothetical investment made in the Fund and a broad-based securities index on the Fund’s inception date. The graph does not reflect any future performance.
The MSCI EAFE Growth Index consists of the growth portion (growth being a measure of price relative to book/value/cash flow) of the MSCI EAFE Index. One cannot invest directly in an index.
Growth of $10,000 Investment
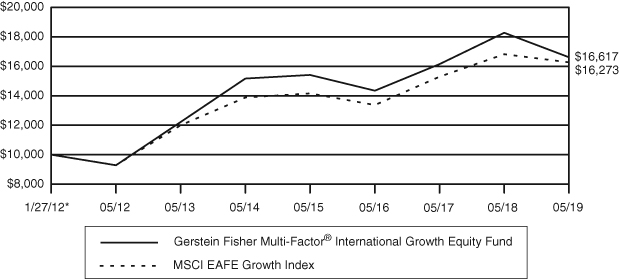
* Inception Date
12
Gerstein Fisher Multi-Factor® Global Real Estate Securities Fund
Investment Highlights
(Unaudited)
Under normal market conditions, at least 80% of the Fund’s net assets (plus any borrowings for investment purposes) will be invested in income-producing common stocks and other real estate securities, including REITs. The Fund may invest in equity securities (such as common, convertible and preferred stock) of real estate-related companies of any market capitalization. Equity securities may also include ETFs that invest in real estate-related equities, individual stock options and options on indices.
Allocation of Portfolio Holdings as of May 31, 2019
(% of Investments)
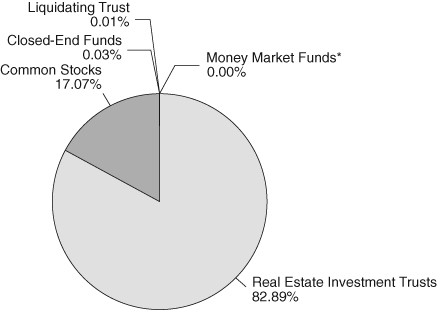
* Excludes securities lending collateral.
Average Annual Total Returns as of May 31, 2019
| Gerstein Fisher | FTSE EPRA/ | |
Multi-Factor® | NAREIT | |
| Global Real | Developed Index | |
Estate Securities | Net Total Return | |
| One Year | 7.06% | 7.53% |
| Three Year | 5.40% | 5.16% |
| Five Year | 6.47% | 4.79% |
| Since Inception (4/30/13) | 5.33% | 4.01% |
Performance data quoted represents past performance and does not guarantee future results. The investment return and principal value of an investment will fluctuate so that an investor’s shares, when redeemed, may be worth more or less than their original cost. Current performance of the Fund may be lower or higher than the performance quoted.
Continued
13
Gerstein Fisher Multi-Factor® Global Real Estate Securities Fund
Investment Highlights (Continued)
(Unaudited)
Performance data current to the most recent month-end may be obtained by calling 800-473-1155. The Fund imposes a 1.00% redemption fee of the net amount of the redemption on shares held for 60 days or less. Performance quoted does not reflect the redemption fee. If reflected, total returns would be reduced.
Short-term performance, in particular, is not a good indication of the Fund’s future performance, and an investment should not be made based solely on historical returns.
Investment performance reflects fee waivers in effect. In the absence of such waivers, total return would be reduced.
The returns shown assume reinvestment of Fund distributions and do not reflect the deduction of taxes that a shareholder would pay on Fund distributions or the redemption of Fund shares. The following chart illustrates performance of a hypothetical investment made in the Fund and a broad-based securities index on the Fund’s inception date. The graph does not reflect any future performance.
FTSE EPRA/NAREIT Developed Index Net Total Return is a global market capitalization weighted index composed of listed real estate securities from developed market countries in North America, Europe, and Asia. By making the index constituents free-float adjusted, liquidity, size and revenue screened, the series is suitable for use as the basis for investment products, such as derivatives and ETFs. The index reflects the reinvestment of dividends and the application of the relevant withholding tax rates. One cannot invest directly in an index.
Growth of $10,000 Investment
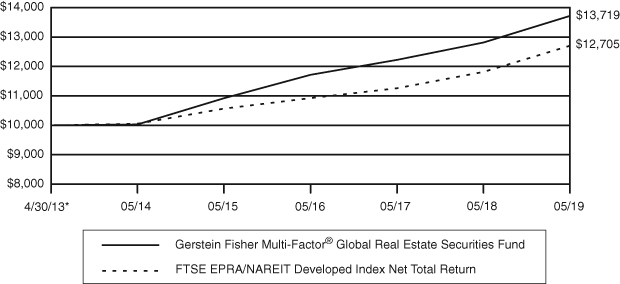
* Inception Date
14
Gerstein Fisher Multi-Factor® Growth Equity Fund
| Schedule of Investments |
May 31, 2019 (Unaudited)
| Shares | Value | |||||||
| COMMON STOCKS – 100.08% | ||||||||
| Administrative and Support Services – 4.00% | ||||||||
| AECOM (a) | 700 | $ | 22,330 | |||||
| Booking Holdings, Inc. (a) | 48 | 79,499 | ||||||
| Kforce, Inc. | 7,123 | 247,524 | ||||||
| MasterCard, Inc. | 38,857 | 9,772,147 | ||||||
| PayPal Holdings, Inc. (a) | 3,190 | 350,103 | ||||||
| Perspecta, Inc. | 524 | 11,376 | ||||||
| Robert Half International, Inc. | 446 | 23,932 | ||||||
| 10,506,911 | ||||||||
| Air Transportation – 2.93% | ||||||||
| American Airlines Group, Inc. | 293 | 7,978 | ||||||
| Delta Air Lines, Inc. | 41,349 | 2,129,473 | ||||||
| Mesa Air Group, Inc. (a) | 18,816 | 171,602 | ||||||
| Southwest Airlines Co. | 82,478 | 3,925,953 | ||||||
| United Continental Holdings, Inc. (a) | 18,841 | 1,463,004 | ||||||
| 7,698,010 | ||||||||
| Ambulatory Health Care Services – 3.78% | ||||||||
| Amedisys, Inc. (a) | 73,670 | 8,273,878 | ||||||
| Chemed Corp. | 208 | 68,211 | ||||||
| Genomic Health, Inc. (a) | 14,729 | 769,590 | ||||||
| Novocure Ltd. (a)(b) | 15,388 | 817,411 | ||||||
| Tivity Health, Inc. (a) | 79 | 1,446 | ||||||
| 9,930,536 | ||||||||
| Apparel Manufacturing – 1.00% | ||||||||
| Capri Holdings Ltd. (a)(b) | 236 | 7,665 | ||||||
| Columbia Sportswear Co. | 2,293 | 215,037 | ||||||
| Lululemon Athletica, Inc. (a) | 2,449 | 405,530 | ||||||
| VF Corp. | 13,000 | 1,064,440 | ||||||
| Zumiez, Inc. (a) | 47,501 | 939,570 | ||||||
| 2,632,242 | ||||||||
| Automobiles & Components – 0.00% | ||||||||
| Garrett Motion, Inc. (a) | 49 | 754 | ||||||
| Beverage and Tobacco Product Manufacturing – 2.97% | ||||||||
| Altria Group, Inc. | 680 | 33,361 | ||||||
| Boston Beer Co., Inc. (a) | 848 | 266,526 | ||||||
| Coca-Cola Consolidated, Inc. | 129 | 38,959 | ||||||
| Keurig Dr Pepper, Inc. | 137,787 | 3,884,216 | ||||||
| National Beverage Corp. (a) | 122 | 5,508 | ||||||
| NMI Holdings, Inc. (a) | 24,537 | 668,879 | ||||||
| PepsiCo, Inc. | 22,578 | 2,889,984 | ||||||
| 7,787,433 | ||||||||
The accompanying notes are an integral part of these financial statements.
15
Gerstein Fisher Multi-Factor® Growth Equity Fund
| Schedule of Investments (Continued) |
May 31, 2019 (Unaudited)
| Shares | Value | |||||||
| Broadcasting (except Internet) – 1.14% | ||||||||
| CBS Corp. | 559 | $ | 26,989 | |||||
| Comcast Corp. | 12,847 | 526,727 | ||||||
| Discovery Communications, Inc. – Class A (a) | 23,775 | 648,107 | ||||||
| Discovery Communications, Inc. – Class C (a) | 14,742 | 377,985 | ||||||
| Fox Corp. | 1,302 | 45,192 | ||||||
| Walt Disney Co. | 10,307 | 1,360,936 | ||||||
| 2,985,936 | ||||||||
| Building Material and Garden Equipment and Supplies Dealers – 3.49% | ||||||||
| Fastenal Co. | 728 | 22,270 | ||||||
| Home Depot, Inc. | 42,020 | 7,977,497 | ||||||
| Lowe’s Cos, Inc. | 12,472 | 1,163,388 | ||||||
| 9,163,155 | ||||||||
| Chemical Manufacturing – 5.97% | ||||||||
| Abbott Laboratories | 149 | 11,343 | ||||||
| AbbVie, Inc. | 31,369 | 2,406,316 | ||||||
| Allergan PLC (b) | 80 | 9,753 | ||||||
| Celgene Corp. (a) | 116 | 10,880 | ||||||
| Chemours Co. | 286 | 6,032 | ||||||
| Eli Lilly & Co. | 8,874 | 1,028,852 | ||||||
| Horizon Therapeutics PLC (a)(b) | 78,581 | 1,872,585 | ||||||
| Innophos Holdings, Inc. | 493 | 13,109 | ||||||
| Innoviva, Inc. (a) | 237,533 | 3,247,076 | ||||||
| Johnson & Johnson | 20,281 | 2,659,853 | ||||||
| LyondellBasell Industries NV (b) | 15,131 | 1,123,477 | ||||||
| Medifast, Inc. | 1,851 | 238,686 | ||||||
| Merck & Co, Inc. | 11,522 | 912,658 | ||||||
| Myriad Genetics, Inc. (a) | 337 | 8,347 | ||||||
| SIGA Technologies, Inc. (a) | 88,527 | 472,734 | ||||||
| Supernus Pharmaceuticals, Inc. (a) | 549 | 16,486 | ||||||
| Trex Co., Inc. (a) | 5,552 | 332,121 | ||||||
| Trinseo SA (b) | 3,000 | 110,520 | ||||||
| USANA Health Sciences, Inc. (a) | 238 | 16,846 | ||||||
| Vertex Pharmaceuticals, Inc. (a) | 6,985 | 1,160,767 | ||||||
| 15,658,441 | ||||||||
| Clothing and Clothing Accessories Stores – 1.49% | ||||||||
| American Eagle Outfitters, Inc. | 9,342 | 162,551 | ||||||
| Gap, Inc. | 1,059 | 19,782 | ||||||
| Ross Stores, Inc. | 15,963 | 1,484,399 | ||||||
| TJX Companies, Inc. | 38,144 | 1,918,262 | ||||||
| Urban Outfitters, Inc. (a) | 14,927 | 335,410 | ||||||
| 3,920,404 | ||||||||
The accompanying notes are an integral part of these financial statements.
16
Gerstein Fisher Multi-Factor® Growth Equity Fund
| Schedule of Investments (Continued) |
May 31, 2019 (Unaudited)
| Shares | Value | |||||||
| Computer and Electronic Product Manufacturing – 13.59% | ||||||||
| Alphabet, Inc. (a) | 5,772 | $ | 6,370,913 | |||||
| Apple, Inc. | 75,665 | 13,246,672 | ||||||
| Broadcom, Inc. | 83 | 20,886 | ||||||
| Ciena Corp. (a) | 971 | 33,927 | ||||||
| Cirrus Logic, Inc. (a) | 243 | 9,081 | ||||||
| Dell Technologies, Inc. (a) | 4,751 | 282,922 | ||||||
| Harris Corp. | 6,496 | 1,215,986 | ||||||
| Harvard Bioscience, Inc. (a) | 6,087 | 13,817 | ||||||
| Intel Corp. | 62,048 | 2,732,594 | ||||||
| Lam Research Corp. | 7,500 | 1,309,575 | ||||||
| Medtronic PLC (b) | 113 | 10,461 | ||||||
| Micron Technology, Inc. (a) | 211,262 | 6,889,254 | ||||||
| ON Semiconductor Corp. (a) | 65,000 | 1,154,400 | ||||||
| QUALCOMM, Inc. | 190 | 12,696 | ||||||
| Roper Technologies, Inc. | 213 | 73,255 | ||||||
| Rubicon Technology, Inc. (a) | 610 | 4,929 | ||||||
| SMART Global Holdings, Inc. (a)(b) | 13,146 | 223,876 | ||||||
| Teradyne, Inc. | 310 | 13,063 | ||||||
| Thermo Fisher Scientific, Inc. | 112 | 29,902 | ||||||
| Turtle Beach Corp. (a)(c) | 51,848 | 431,375 | ||||||
| Western Digital Corp. | 244 | 9,082 | ||||||
| Zebra Technologies Corp. (a) | 9,145 | 1,567,819 | ||||||
| 35,656,485 | ||||||||
| Construction of Buildings – 0.03% | ||||||||
| KB Home | 1,575 | 39,580 | ||||||
| TRI Pointe Group, Inc. (a) | 3,361 | 41,340 | ||||||
| 80,920 | ||||||||
| Consumer Durables & Apparel – 0.02% | ||||||||
| Kontoor Brands, Inc. (a) | 1,857 | 54,414 | ||||||
| Credit Intermediation and Related Activities – 2.88% | ||||||||
| Altisource Portfolio Solutions SA (a)(b)(c) | 11,971 | 240,976 | ||||||
| Amalgamated Bank | 1,448 | 23,892 | ||||||
| Capital One Financial Corp. | 22,404 | 1,923,831 | ||||||
| OneMain Holdings, Inc. | 33,240 | 992,879 | ||||||
| Regional Management Corp. (a) | 2,511 | 61,946 | ||||||
| Santander Consumer USA Holdings, Inc. | 157,753 | 3,532,090 | ||||||
| USA Technologies, Inc. (a) | 3,367 | 22,593 | ||||||
| Wells Fargo & Co. | 16,844 | 747,368 | ||||||
| 7,545,575 | ||||||||
| Data Processing, Hosting and Related Services – 2.32% | ||||||||
| Limelight Networks, Inc. (a) | 3,360 | 10,349 | ||||||
| Match Group, Inc. (a) | 519 | 35,629 | ||||||
The accompanying notes are an integral part of these financial statements.
17
Gerstein Fisher Multi-Factor® Growth Equity Fund
| Schedule of Investments (Continued) |
May 31, 2019 (Unaudited)
| Shares | Value | |||||||
| Data Processing, Hosting and Related Services – 2.32% (Continued) | ||||||||
| Visa, Inc. | 37,492 | $ | 6,048,584 | |||||
| 6,094,562 | ||||||||
| Educational Services – 0.00% | ||||||||
| ITT Educational Services, Inc. (a) | 3,750 | 4 | ||||||
| Electrical Equipment, Appliance, and Component Manufacturing – 0.01% | ||||||||
| AO Smith Corp. | 414 | 16,767 | ||||||
| Resideo Technologies, Inc. (a) | 81 | 1,594 | ||||||
| 18,361 | ||||||||
| Electronics and Appliance Stores – 0.24% | ||||||||
| Aaron’s, Inc. | 9,884 | 526,422 | ||||||
| Best Buy Co., Inc. | 1,500 | 94,005 | ||||||
| 620,427 | ||||||||
| Fabricated Metal Product Manufacturing – 0.00% | ||||||||
| General Finance Corp. (a) | 1,408 | 10,743 | ||||||
| Food Services and Drinking Places – 0.60% | ||||||||
| Chipotle Mexican Grill, Inc. (a) | 100 | 65,997 | ||||||
| Darden Restaurants, Inc. | 10,620 | 1,235,318 | ||||||
| Domino’s Pizza, Inc. | 96 | 26,832 | ||||||
| McDonald’s Corp. | 151 | 29,939 | ||||||
| Wendy’s Co. | 10,000 | 183,900 | ||||||
| Yum! Brands, Inc. | 234 | 23,950 | ||||||
| 1,565,936 | ||||||||
| Furniture and Home Furnishings Stores – 0.40% | ||||||||
| RH (a) | 12,402 | 1,056,030 | ||||||
| Furniture and Related Product Manufacturing – 0.28% | ||||||||
| Herman Miller, Inc. | 7,630 | 270,789 | ||||||
| Kimball International, Inc. | 10,491 | 161,981 | ||||||
| Sleep Number Corp. (a) | 8,688 | 302,429 | ||||||
| 735,199 | ||||||||
| Gasoline Stations – 0.14% | ||||||||
| Delek US Holdings, Inc. | 11,813 | 361,596 | ||||||
| General Merchandise Stores – 4.26% | ||||||||
| Burlington Stores, Inc. (a) | 30,000 | 4,697,400 | ||||||
| Dollar General Corp. | 26,783 | 3,408,940 | ||||||
| Tractor Supply Co. | 304 | 30,637 | ||||||
| WalMart, Inc. | 30,000 | 3,043,200 | ||||||
| 11,180,177 | ||||||||
The accompanying notes are an integral part of these financial statements.
18
Gerstein Fisher Multi-Factor® Growth Equity Fund
| Schedule of Investments (Continued) |
May 31, 2019 (Unaudited)
| Shares | Value | |||||||
| Health and Personal Care Stores – 0.13% | ||||||||
| Ulta Beauty, Inc. (a) | 1,000 | $ | 333,380 | |||||
| Heavy and Civil Engineering Construction – 0.00% | ||||||||
| Century Communities, Inc. (a) | 478 | 12,763 | ||||||
| Insurance Carriers and Related Activities – 6.37% | ||||||||
| American International Group, Inc. | 490 | 25,024 | ||||||
| Anthem, Inc. | 29,812 | 8,287,140 | ||||||
| Berkshire Hathaway, Inc. (a) | 5,771 | 1,139,311 | ||||||
| Essent Group Ltd. (a)(b) | 5,544 | 260,291 | ||||||
| Everest Re Group Ltd. (b) | 100 | 24,766 | ||||||
| Humana, Inc. | 38 | 9,305 | ||||||
| Lincoln National Corp. | 23,256 | 1,382,569 | ||||||
| Molina Healthcare, Inc. (a) | 22,163 | 3,152,908 | ||||||
| Prudential Financial, Inc. | 7,525 | 695,159 | ||||||
| Travelers Companies, Inc. | 72 | 10,481 | ||||||
| Voya Financial, Inc. | 33,992 | 1,731,213 | ||||||
| 16,718,167 | ||||||||
| Leather and Allied Product Manufacturing – 1.15% | ||||||||
| Crocs, Inc. (a) | 67,639 | 1,306,786 | ||||||
| Deckers Outdoor Corp. (a) | 182 | 27,682 | ||||||
| NIKE, Inc. | 21,592 | 1,665,607 | ||||||
| Tapestry, Inc. | 208 | 5,940 | ||||||
| 3,006,015 | ||||||||
| Machinery Manufacturing – 0.38% | ||||||||
| Applied Materials, Inc. | 280 | 10,833 | ||||||
| Caterpillar, Inc. | 1,008 | 120,769 | ||||||
| Cummins, Inc. | 4,156 | 626,559 | ||||||
| Deere & Co. | 261 | 36,584 | ||||||
| Ingersoll-Rand PLC (b) | 1,641 | 194,196 | ||||||
| 988,941 | ||||||||
| Management of Companies and Enterprises – 0.01% | ||||||||
| EchoStar Corp. (a) | 470 | 20,107 | ||||||
| Merchant Wholesalers, Durable Goods – 1.58% | ||||||||
| 3M Co. | 6,653 | 1,062,817 | ||||||
| Arrow Electronics, Inc. (a) | 17,635 | 1,105,009 | ||||||
| Honeywell International, Inc. | 491 | 80,676 | ||||||
| Paycom Software, Inc. (a) | 9,000 | 1,908,900 | ||||||
| 4,157,402 | ||||||||
The accompanying notes are an integral part of these financial statements.
19
Gerstein Fisher Multi-Factor® Growth Equity Fund
| Schedule of Investments (Continued) |
May 31, 2019 (Unaudited)
| Shares | Value | |||||||
| Merchant Wholesalers, Nondurable Goods – 0.67% | ||||||||
| Freshpet, Inc. (a) | 9,463 | $ | 439,745 | |||||
| Herbalife Nutrition Ltd. (a)(b) | 30,701 | 1,282,688 | ||||||
| Sysco Corp. | 439 | 30,212 | ||||||
| US Foods Holding Corp. (a) | 430 | 14,861 | ||||||
| 1,767,506 | ||||||||
| Miscellaneous Manufacturing – 0.87% | ||||||||
| ABIOMED, Inc. (a) | 30 | 7,858 | ||||||
| Brady Corp. | 201 | 9,306 | ||||||
| Estee Lauder Companies, Inc. | 3,000 | 483,090 | ||||||
| Intuitive Surgical, Inc. (a) | 55 | 25,567 | ||||||
| YETI Holdings, Inc. (a) | 72,970 | 1,745,442 | ||||||
| 2,271,263 | ||||||||
| Motion Picture and Sound Recording Industries – 2.37% | ||||||||
| Netflix, Inc. (a) | 9,360 | 3,213,101 | ||||||
| World Wrestling Entertainment, Inc. | 41,463 | 3,016,018 | ||||||
| 6,229,119 | ||||||||
| Motor Vehicle and Parts Dealers – 0.00% | ||||||||
| Lithia Motors, Inc. | 115 | 13,127 | ||||||
| Nonstore Retailers – 4.24% | ||||||||
| Amazon.com, Inc. (a) | 6,054 | 10,746,274 | ||||||
| Natural Health Trends Corp. | 1,673 | 17,031 | ||||||
| Systemax, Inc. | 16,729 | 344,450 | ||||||
| WW Grainger, Inc. | 90 | 23,552 | ||||||
| 11,131,307 | ||||||||
| Oil and Gas Extraction – 1.16% | ||||||||
| Evolution Petroleum Corp. | 40,540 | 247,699 | ||||||
| Renewable Energy Group, Inc. (a) | 178,748 | 2,795,619 | ||||||
| 3,043,318 | ||||||||
| Other Information Services – 3.77% | ||||||||
| Chegg, Inc. (a) | 71,560 | 2,680,638 | ||||||
| Facebook, Inc. (a) | 24,916 | 4,421,843 | ||||||
| QuinStreet, Inc. (a) | 130,686 | 2,003,416 | ||||||
| Travelzoo (a) | 798 | 13,574 | ||||||
| Twitter, Inc. (a) | 17,121 | 623,889 | ||||||
| VeriSign, Inc. (a) | 750 | 146,235 | ||||||
| Yelp, Inc. (a) | 276 | 8,481 | ||||||
| 9,898,076 | ||||||||
| Paper Manufacturing – 0.76% | ||||||||
| Veritiv Corp. (a) | 113 | 1,996 | ||||||
| Verso Corp. (a) | 115,468 | 1,988,359 | ||||||
| 1,990,355 | ||||||||
The accompanying notes are an integral part of these financial statements.
20
Gerstein Fisher Multi-Factor® Growth Equity Fund
| Schedule of Investments (Continued) |
May 31, 2019 (Unaudited)
| Shares | Value | |||||||
| Primary Metal Manufacturing – 0.05% | ||||||||
| Global Brass & Copper Holdings, Inc. | 350 | $ | 15,270 | |||||
| Olympic Steel, Inc. | 9,542 | 118,130 | ||||||
| 133,400 | ||||||||
| Professional, Scientific, and Technical Services – 6.50% | ||||||||
| Amgen, Inc. | 3,682 | 613,789 | ||||||
| Arrowhead Pharmaceuticals, Inc. (a) | 4,374 | 103,708 | ||||||
| Cadence Design Systems, Inc. (a) | 4,307 | 273,796 | ||||||
| eBay, Inc. | 370 | 13,294 | ||||||
| Hackett Group, Inc. | 2,561 | 41,206 | ||||||
| Insperity, Inc. | 29,758 | 3,389,436 | ||||||
| Itron, Inc. (a) | 363 | 20,564 | ||||||
| LivePerson, Inc. (a) | 22,491 | 625,925 | ||||||
| Okta, Inc. (a) | 8,323 | 942,330 | ||||||
| salesforce.com, Inc. (a) | 12,556 | 1,901,104 | ||||||
| SecureWorks Corp. (a)(c) | 20,416 | 298,278 | ||||||
| Trade Desk, Inc. (a) | 224 | 44,533 | ||||||
| VMware, Inc. (a) | 49,650 | 8,787,057 | ||||||
| 17,055,020 | ||||||||
| Publishing Industries (except Internet) – 11.99% | ||||||||
| Adobe, Inc. (a) | 11,597 | 3,141,627 | ||||||
| DXC Technology Co. | 445 | 21,155 | ||||||
| eGain Corp. (a) | 21,500 | 169,420 | ||||||
| EPAM Systems, Inc. (a) | 1,225 | 211,423 | ||||||
| ePlus, Inc. (a) | 4,572 | 323,058 | ||||||
| Fair Isaac Corp. (a) | 1,000 | 295,900 | ||||||
| InterActiveCorp (a) | 22,322 | 4,929,814 | ||||||
| Intuit, Inc. | 25,000 | 6,121,250 | ||||||
| Microsoft Corp. | 115,806 | 14,322,886 | ||||||
| News Corp. | 852 | 9,704 | ||||||
| Oracle Corp. | 20,000 | 1,012,000 | ||||||
| Red Hat, Inc. (a) | 123 | 22,669 | ||||||
| Synopsys, Inc. (a) | 1,000 | 116,440 | ||||||
| Twilio, Inc. (a) | 1,279 | 168,815 | ||||||
| Workday, Inc. (a) | 160 | 32,659 | ||||||
| Workiva, Inc. (a) | 10,000 | 556,400 | ||||||
| 31,455,220 | ||||||||
| Rail Transportation – 0.02% | ||||||||
| CSX Corp. | 321 | 23,905 | ||||||
| Union Pacific Corp. | 173 | 28,853 | ||||||
| 52,758 | ||||||||
| Rental and Leasing Services – 1.27% | ||||||||
| Air Lease Corp. | 16,515 | 594,540 | ||||||
| Aircastle Ltd. (b) | 22,939 | 445,475 | ||||||
The accompanying notes are an integral part of these financial statements.
21
Gerstein Fisher Multi-Factor® Growth Equity Fund
| Schedule of Investments (Continued) |
May 31, 2019 (Unaudited)
| Shares | Value | |||||||
| Rental and Leasing Services – 1.27% (Continued) | ||||||||
| CAI International, Inc. (a) | 41,913 | $ | 943,881 | |||||
| Triton International Ltd. (b) | 12,826 | 379,008 | ||||||
| United Rentals, Inc. (a) | 8,718 | 959,852 | ||||||
| 3,322,756 | ||||||||
| Securities, Commodity Contracts, and Other | ||||||||
| Financial Investments and Related Activities – 1.07% | ||||||||
| CME Group, Inc. | 145 | 27,857 | ||||||
| MSCI, Inc. | 678 | 149,167 | ||||||
| S&P Global, Inc. | 5,994 | 1,281,997 | ||||||
| Yum China Holdings, Inc. | 33,790 | 1,351,938 | ||||||
| 2,810,959 | ||||||||
| Specialty Trade Contractors – 0.72% | ||||||||
| Armstrong Flooring, Inc. (a) | 2,076 | 21,881 | ||||||
| Comfort Systems USA, Inc. | 763 | 35,998 | ||||||
| Quanta Services, Inc. | 52,756 | 1,833,799 | ||||||
| 1,891,678 | ||||||||
| Support Activities for Mining – 0.00% | ||||||||
| Antero Resources Corp. (a) | 924 | 6,071 | ||||||
| Support Activities for Transportation – 0.01% | ||||||||
| Willis Lease Finance Corp. (a) | 300 | 14,940 | ||||||
| Telecommunications – 0.83% | ||||||||
| ARC Group Worldwide, Inc. (a) | 1,500 | 728 | ||||||
| AT&T, Inc. | 8,113 | 248,096 | ||||||
| T-Mobile US, Inc. (a) | 6,578 | 483,088 | ||||||
| Ubiquiti Networks, Inc. (c) | 11,853 | 1,426,034 | ||||||
| Vonage Holdings Corp. (a) | 1,644 | 19,465 | ||||||
| 2,177,411 | ||||||||
| Transportation Equipment Manufacturing – 2.62% | ||||||||
| Allison Transmission Holdings, Inc. | 552 | 22,847 | ||||||
| Boeing Co. | 16,291 | 5,565,169 | ||||||
| Commercial Vehicle Group, Inc. (a) | 20,815 | 129,261 | ||||||
| Lawson Products, Inc. (a) | 3,160 | 115,909 | ||||||
| Lear Corp. | 7,500 | 892,725 | ||||||
| Marine Products Corp. | 7,973 | 110,346 | ||||||
| Meritor, Inc. (a) | 2,416 | 48,707 | ||||||
| 6,884,964 | ||||||||
| Total Common Stocks (Cost $174,014,069) | 262,650,274 | |||||||
The accompanying notes are an integral part of these financial statements.
22
Gerstein Fisher Multi-Factor® Growth Equity Fund
| Schedule of Investments (Continued) |
May 31, 2019 (Unaudited)
| Shares | Value | |||||||
| RIGHTS – 0.00% | ||||||||
| Newstar Financial, Inc. CVR (a)(d)(e) | 4,036 | $ | 2,341 | |||||
| Total Rights (Cost $0) | 2,341 | |||||||
| INVESTMENTS PURCHASED WITH PROCEEDS | ||||||||
| FROM SECURITIES LENDING – 0.57% | ||||||||
| Money Market Fund – 0.57% | ||||||||
| First American Government Obligations Fund, Class Y, 2.000% (f) | 1,489,918 | 1,489,918 | ||||||
| Total Investments Purchased with Proceeds | ||||||||
| from Securities Lending (Cost 1,489,918) | 1,489,918 | |||||||
| SHORT-TERM INVESTMENTS – 0.00% | ||||||||
| Money Market Fund – 0.00% | ||||||||
| First American Treasury Obligations Fund, Class X, 2.297% (f) | 681 | 681 | ||||||
| Total Short-Term Investments (Cost $681) | 681 | |||||||
| Total Investments (Cost $175,504,668) – 100.65% | 264,143,214 | |||||||
| Liabilities in Excess of Other Assets – (0.65)% | (1,693,875 | ) | ||||||
| TOTAL NET ASSETS – 100.00% | $ | 262,449,339 | ||||||
Percentages are stated as a percent of net assets.
| (a) | Non-income producing security. |
| (b) | Foreign issued security. |
| (c) | All or a portion of this security is out on loan as of May 31, 2019. Total value of securities out on loan is $1,393,836. |
| (d) | Illiquid security. The total market value of this security was $2,341, representing 0.00% of net assets. |
| (e) | Fair valued security. Value determined using significant unobservable inputs. |
| (f) | Seven day yield as of May 31, 2019. |
| Abbreviations: | |
| Ltd. | Limited is a term indicating a company is incorporated and shareholder have limited liability. |
| NV | Naamloze Vennootschap is a Dutch term for publicly traded companies. |
| PLC | Public Limited Company is a publicly traded company which signifies that shareholders have limited liability. |
| SA | An abbreviation used by many countries to signify a stock company whereby shareholders have limited liability. |
The accompanying notes are an integral part of these financial statements.
23
Gerstein Fisher Multi-Factor® International Growth Equity Fund
| Schedule of Investments |
May 31, 2019 (Unaudited)
| Shares | Value | |||||||
| COMMON STOCKS – 98.98% | ||||||||
| Australia – 10.36% | ||||||||
| BHP Billiton Ltd. | 327,628 | $ | 8,513,404 | |||||
| BlueScope Steel Ltd. | 113,865 | 829,964 | ||||||
| Caltex Australia Ltd. | 1,202 | 21,962 | ||||||
| CIMIC Group Ltd. | 27,868 | 872,609 | ||||||
| Coca-Cola Amatil Ltd. | 154,205 | 1,017,430 | ||||||
| Cochlear Ltd. | 162 | 22,395 | ||||||
| Coles Group Ltd. (a) | 608 | 5,232 | ||||||
| CSL Ltd. | 77 | 10,940 | ||||||
| Insurance Australia Group Ltd. | 117,465 | 621,461 | ||||||
| Macquarie Group Ltd. | 264 | 21,965 | ||||||
| Medibank Private Ltd. | 923,732 | 2,113,846 | ||||||
| Qantas Airways Ltd. | 153,654 | 590,827 | ||||||
| QBE Insurance Group Ltd. | 2,590 | 20,891 | ||||||
| Rio Tinto Ltd. | 87,852 | 6,097,276 | ||||||
| Santos Ltd. | 4,571 | 21,257 | ||||||
| Sonic Healthcare Ltd. | 1,211 | 21,921 | ||||||
| South32 Ltd. | 435,897 | 999,763 | ||||||
| Washington H Soul Pattinson & Co. Ltd. | 41,302 | 636,231 | ||||||
| Wesfarmers Ltd. | 608 | 15,586 | ||||||
| Woolworths Group Ltd. | 7,887 | 171,108 | ||||||
| 22,626,068 | ||||||||
| Austria – 0.23% | ||||||||
| ANDRITZ AG | 594 | 21,360 | ||||||
| Verbund AG | 9,600 | 479,940 | ||||||
| 501,300 | ||||||||
| Belgium – 3.64% | ||||||||
| Colruyt SA | 82,841 | 6,168,106 | ||||||
| UCB SA | 23,264 | 1,778,536 | ||||||
| 7,946,642 | ||||||||
| Bermuda – 1.82% | ||||||||
| Jardine Strategic Holdings Ltd. | 43,265 | 1,619,317 | ||||||
| NWS Holdings Ltd. | 1,197,863 | 2,360,380 | ||||||
| 3,979,697 | ||||||||
| Cayman Islands – 0.54% | ||||||||
| WH Group Ltd. (b) | 1,304,314 | 1,174,056 | ||||||
| Denmark – 3.99% | ||||||||
| Coloplast A/S | 16,733 | 1,777,711 | ||||||
| H Lundbeck A/S | 38,826 | 1,557,685 | ||||||
| Novo Nordisk A/S | 113,660 | 5,348,651 | ||||||
The accompanying notes are an integral part of these financial statements.
24
Gerstein Fisher Multi-Factor® International Growth Equity Fund
| Schedule of Investments (Continued) |
May 31, 2019 (Unaudited)
| Shares | Value | |||||||
| Denmark – 3.99% (Continued) | ||||||||
| Vestas Wind System A/S | 185 | $ | 15,061 | |||||
| Demant A/S (a) | 340 | 11,355 | ||||||
| 8,710,463 | ||||||||
| Finland – 1.43% | ||||||||
| Elisa OYJ | 237 | 10,569 | ||||||
| Metso OYJ | 757 | 24,425 | ||||||
| Neste OYJ | 87,345 | 2,948,665 | ||||||
| Orion OYJ | 3,742 | 122,394 | ||||||
| Stora Enso OYJ | 2,458 | 25,948 | ||||||
| 3,132,001 | ||||||||
| France – 10.28% | ||||||||
| Aeroports de Paris | 55 | 9,418 | ||||||
| Alstom SA | 156,133 | 7,125,486 | ||||||
| Arkema SA | 111 | 9,308 | ||||||
| Atos SE | 6,067 | 461,481 | ||||||
| Bouygues SA | 14,753 | 515,769 | ||||||
| Dassault Systemes SE | 8,374 | 1,242,500 | ||||||
| Edenred | 14,389 | 656,414 | ||||||
| Eiffage SA | 3,500 | 334,588 | ||||||
| Eurazeo SA | 9,556 | 668,665 | ||||||
| Hermes International | 1,348 | 895,698 | ||||||
| Ingenico Group SA | 270 | 21,542 | ||||||
| Ipsen SA | 86 | 10,274 | ||||||
| Kering SA | 1,433 | 745,877 | ||||||
| Legrand SA | 1,384 | 93,039 | ||||||
| L’Oreal SA | 3,638 | 976,009 | ||||||
| LVMH Moet Hennessy Louis Vuitton SE | 5,928 | 2,236,908 | ||||||
| Pernod Ricard SA | 2,332 | 411,152 | ||||||
| Peugeot SA | 90,096 | 2,010,961 | ||||||
| Remy Cointreau SA | 5,147 | 707,250 | ||||||
| Rexel SA | 58,174 | 627,805 | ||||||
| Safran SA | 3,830 | 502,517 | ||||||
| Sartorius Stedim Biotech | 2,277 | 315,464 | ||||||
| SCOR SE | 29,216 | 1,201,978 | ||||||
| Societe BIC SA | 5,722 | 447,750 | ||||||
| Sodexo SA | 193 | 22,208 | ||||||
| Thales SA | 200 | 22,017 | ||||||
| Ubisoft Entertainment SA (a) | 227 | 18,550 | ||||||
| Veolia Environnement SA | 984 | 22,775 | ||||||
| Worldline SA (a)(b) | 2,426 | 145,564 | ||||||
| 22,458,967 | ||||||||
The accompanying notes are an integral part of these financial statements.
25
Gerstein Fisher Multi-Factor® International Growth Equity Fund
| Schedule of Investments (Continued) |
May 31, 2019 (Unaudited)
| Shares | Value | |||||||
| Germany – 8.56% | ||||||||
| Adidas AG | 10,126 | $ | 2,890,766 | |||||
| Beiersdorf AG | 190 | 21,863 | ||||||
| Commerzbank AG | 68,274 | 478,457 | ||||||
| Continental AG | 136 | 18,496 | ||||||
| Daimler AG | 564 | 29,231 | ||||||
| Deutsche Boerse AG | 938 | 129,097 | ||||||
| Deutsche Lufthansa AG | 71,132 | 1,348,794 | ||||||
| Deutsche Post AG | 26,669 | 784,620 | ||||||
| E.ON SE | 50,000 | 522,775 | ||||||
| Fresenius Medical Care AG & Co. KGaA | 1,091 | 79,503 | ||||||
| Henkel AG & Co. KGaA | 4,143 | 358,905 | ||||||
| HUGO BOSS AG | 13,395 | 777,109 | ||||||
| Infineon Technologies AG | 9,849 | 175,412 | ||||||
| Kabel Deutschland Holding AG | 7,275 | 870,065 | ||||||
| MTU Aero Engines AG | 5,806 | 1,252,518 | ||||||
| Porsche Automobil Holding SE – Preference Shares | 12,051 | 747,784 | ||||||
| Puma SE | 5,232 | 3,042,302 | ||||||
| RWE AG | 80,223 | 2,007,048 | ||||||
| SAP SE | 20,000 | 2,463,736 | ||||||
| Siemens AG | 2,400 | 271,562 | ||||||
| Wirecard AG | 2,764 | 431,969 | ||||||
| 18,702,012 | ||||||||
| Hong Kong – 2.24% | ||||||||
| AIA Group Ltd. | 164,754 | 1,547,734 | ||||||
| HKT Trust & HKT Ltd. | 489,275 | 771,401 | ||||||
| SJM Holdings Ltd. | 1,261,087 | 1,398,010 | ||||||
| Swire Pacific Ltd. | 15,000 | 177,488 | ||||||
| Techtronic Industries Co. Ltd. | 157,215 | 1,003,607 | ||||||
| 4,898,240 | ||||||||
| Ireland – 0.74% | ||||||||
| Kerry Group PLC | 2,339 | 270,139 | ||||||
| Kingspan Group PLC | 25,703 | 1,339,808 | ||||||
| 1,609,947 | ||||||||
| Israel – 0.89% | ||||||||
| Bank Leumi Le-Israel BM | 4,909 | 32,892 | ||||||
| Check Point Software Technologies Ltd. (a) | 1,558 | 171,816 | ||||||
| Israel Chemicals Ltd. | 83,061 | 416,110 | ||||||
| Mizrahi Tefahot Bank Ltd. (a) | 56,633 | 1,238,680 | ||||||
| Nice Ltd. (a) | 179 | 24,993 | ||||||
| Taro Pharmaceutical Industries Ltd. (a) | 707 | 65,737 | ||||||
| 1,950,228 | ||||||||
The accompanying notes are an integral part of these financial statements.
26
Gerstein Fisher Multi-Factor® International Growth Equity Fund
| Schedule of Investments (Continued) |
May 31, 2019 (Unaudited)
| Shares | Value | |||||||
| Italy – 0.63% | ||||||||
| Leonardo SpA | 67,579 | $ | 747,615 | |||||
| Moncler SpA | 16,518 | 606,894 | ||||||
| Rizzoli Corriere Della Sera Mediagroup SpA | 14,241 | 14,063 | ||||||
| Saipem SpA (a) | 131 | 558 | ||||||
| 1,369,130 | ||||||||
| Japan – 14.63% | ||||||||
| Alfresa Holdings Corp. | 104,941 | 2,624,119 | ||||||
| Astellas Pharma, Inc. | 1,586 | 21,254 | ||||||
| Bandai Namco Holdings, Inc. | 10,000 | 489,590 | ||||||
| Calbee, Inc. | 341 | 9,670 | ||||||
| Daifuku Co Ltd. | 3,398 | 169,032 | ||||||
| Daiichi Sankyo Co Ltd. | 38,192 | 1,842,199 | ||||||
| FUJIFILM Holdings Corp. | 2,360 | 112,454 | ||||||
| Fujitsu Ltd. | 23,922 | 1,612,695 | ||||||
| Hitachi Chemical Co. Ltd. | 819 | 21,750 | ||||||
| Hitachi Construction Machinery Co. Ltd. | 761 | 17,570 | ||||||
| Hitachi High-Technologies Corp. | 6,000 | 253,008 | ||||||
| Hitachi Ltd. | 30,296 | 1,020,155 | ||||||
| Hoya Corp. | 7,488 | 518,311 | ||||||
| ITOCHU Corp. | 110,730 | 2,032,820 | ||||||
| Kakaku.com, Inc. | 44,182 | 891,014 | ||||||
| Kaneka Corp. | 500 | 17,156 | ||||||
| Keio Corp. | 313 | 20,841 | ||||||
| Keisei Electric Railway Co. Ltd. | 593 | 22,107 | ||||||
| Kikkoman Corp. | 22,607 | 934,528 | ||||||
| Kose Corp. | 12,518 | 1,967,906 | ||||||
| Marui Group Co Ltd. | 25,000 | 519,862 | ||||||
| Mitsui Chemicals, Inc. | 394 | 8,597 | ||||||
| MonotaRO Co Ltd. | 6,395 | 135,073 | ||||||
| Nabtesco Corp. | 577 | 14,371 | ||||||
| Nagoya Railroad Co. Ltd. | 707 | 19,464 | ||||||
| Nexon Co. Ltd. (a) | 1,342 | 19,905 | ||||||
| NGK Insulators Ltd. | 6,093 | 82,284 | ||||||
| NGK Spark Plug Co. Ltd. | 931 | 16,250 | ||||||
| Nisshin Seifun Group, Inc. | 30,000 | 696,668 | ||||||
| NSK Ltd. | 2,274 | 18,145 | ||||||
| Omron Corp. | 11,015 | 518,382 | ||||||
| Pan Pacific International Holdings Corp. | 2,944 | 181,564 | ||||||
| Pola Orbis Holdings, Inc. | 23,695 | 649,841 | ||||||
| Rakuten, Inc. | 67,955 | 702,623 | ||||||
| Ryohin Keikaku Co. Ltd. | 68 | 12,265 | ||||||
| SBI Holdings, Inc. | 8,349 | 191,585 | ||||||
| SG Holdings Co Ltd. | 43,801 | 1,182,953 | ||||||
| Shimizu Corp. | 11,544 | 93,738 | ||||||
The accompanying notes are an integral part of these financial statements.
27
Gerstein Fisher Multi-Factor® International Growth Equity Fund
| Schedule of Investments (Continued) |
May 31, 2019 (Unaudited)
| Shares | Value | |||||||
| Japan – 14.63% (Continued) | ||||||||
| Shionogi & Co. Ltd. | 6,447 | $ | 351,525 | |||||
| Shiseido Co. Ltd. | 37,576 | 2,695,880 | ||||||
| Showa Denko KK | 39,284 | 1,065,326 | ||||||
| SMC Corp/Japan | 66 | 21,513 | ||||||
| SoftBank Group Corp. | 12,116 | 1,124,153 | ||||||
| Subaru Corp. | 38 | 878 | ||||||
| Sumitomo Dainippon Pharma Co. Ltd. | 143,323 | 2,928,496 | ||||||
| Suzuken Co. Ltd. | 43,551 | 2,678,216 | ||||||
| Toho Co. Ltd. | 513 | 21,986 | ||||||
| Toho Gas Co Ltd. | 553 | 21,543 | ||||||
| Unicharm Corp. | 15,955 | 475,945 | ||||||
| Yamaha Corp. | 919 | 41,126 | ||||||
| Yamazaki Baking Co. Ltd. | 1,392 | 20,852 | ||||||
| Yokogawa Electric Corp. | 42,853 | 827,408 | ||||||
| ZOZO, Inc. | 1,013 | 17,316 | ||||||
| 31,953,912 | ||||||||
| Jersey – 0.31% | ||||||||
| Experian PLC | 4,542 | 136,875 | ||||||
| Ferguson PLC | 5,524 | 357,037 | ||||||
| Glencore PLC | 58,027 | 185,668 | ||||||
| 679,580 | ||||||||
| Luxembourg – 0.00% | ||||||||
| Tenaris SA | 636 | 7,448 | ||||||
| Netherlands – 8.59% | ||||||||
| Airbus SE | 3,828 | 490,114 | ||||||
| ASML Holding NV | 8,000 | 1,506,043 | ||||||
| Ferrari NV | 72 | 10,236 | ||||||
| Fiat Chrysler Automobiles NV | 31,810 | 405,105 | ||||||
| Heineken Holding NV | 16,716 | 1,653,934 | ||||||
| Heineken NV | 287 | 30,125 | ||||||
| ING Groep NV | 180 | 1,944 | ||||||
| Koninklijke DSM NV | 4,688 | 525,921 | ||||||
| Koninklijke KPN NV | 844,730 | 2,578,920 | ||||||
| Koninklijke Philips NV | 46,015 | 1,823,572 | ||||||
| Koninklijke Vopak NV | 19,115 | 782,985 | ||||||
| NN Group NV (c) | 74,158 | 2,815,113 | ||||||
| Randstad NV (a) | 1,208 | 62,185 | ||||||
| STMicroelectronics NV | 818 | 12,369 | ||||||
| Unilever NV | 25,005 | 1,505,146 | ||||||
| Wolters Kluwer NV | 65,278 | 4,554,022 | ||||||
| 18,757,734 | ||||||||
The accompanying notes are an integral part of these financial statements.
28
Gerstein Fisher Multi-Factor® International Growth Equity Fund
| Schedule of Investments (Continued) |
May 31, 2019 (Unaudited)
| Shares | Value | |||||||
| New Zealand – 0.41% | ||||||||
| a2 Milk Co. Ltd. (a) | 82,400 | $ | 849,036 | |||||
| Mercury NZ Ltd. | 10,033 | 25,247 | ||||||
| Spark New Zealand Ltd. | 8,874 | 22,114 | ||||||
| 896,397 | ||||||||
| Norway – 0.95% | ||||||||
| Equinor ASA | 21,276 | 406,411 | ||||||
| Marine Harvest ASA | 26,016 | 603,713 | ||||||
| Norsk Hydro ASA | 31,302 | 109,413 | ||||||
| Orkla ASA | 109,452 | 947,843 | ||||||
| 2,067,380 | ||||||||
| Portugal – 0.01% | ||||||||
| Galp Energia SGPS SA | 1,378 | 20,700 | ||||||
| Singapore – 1.47% | ||||||||
| ComfortDelGro Corp. Ltd. | 528,170 | 946,472 | ||||||
| Fraser & Neave Ltd. | 14,289 | 17,976 | ||||||
| Genting Singapore Ltd. | 28,527 | 18,043 | ||||||
| Sembcorp Industries Ltd. | 337,143 | 590,900 | ||||||
| United Overseas Bank Ltd. | 23,900 | 409,415 | ||||||
| Wilmar International Ltd. | 511,058 | 1,223,774 | ||||||
| 3,206,580 | ||||||||
| Spain – 1.47% | ||||||||
| Aena SME SA (b) | 2,076 | 381,208 | ||||||
| Amadeus IT Group SA (a) | 15,921 | 1,214,455 | ||||||
| CaixaBank SA | 156,566 | 481,005 | ||||||
| Ferrovial SA | 8,751 | 208,584 | ||||||
| Industria de Diseno Textil SA | 367 | 9,801 | ||||||
| Red Electrica Corp. SA | 43,045 | 912,357 | ||||||
| 3,207,410 | ||||||||
| Sweden – 4.83% | ||||||||
| Atlas Copco AB – Class A | 556 | 14,922 | ||||||
| Atlas Copco AB – Class B | 623 | 15,059 | ||||||
| Boliden AB | 46,738 | 1,063,515 | ||||||
| Epiroc AB – Class A | 556 | 5,171 | ||||||
| Epiroc AB – Class B | 623 | 5,632 | ||||||
| Essity AB | 5,840 | 171,349 | ||||||
| Holmen AB | 606 | 11,752 | ||||||
| Industrivarden AB | 517 | 10,429 | ||||||
| Investor AB | 41,904 | 1,809,784 | ||||||
| Kinnevik AB | 835 | 21,267 | ||||||
| Lundin Petroleum AB | 37,711 | 1,023,088 | ||||||
| Sandvik AB | 31,528 | 486,688 | ||||||
The accompanying notes are an integral part of these financial statements.
29
Gerstein Fisher Multi-Factor® International Growth Equity Fund
| Schedule of Investments (Continued) |
May 31, 2019 (Unaudited)
| Shares | Value | |||||||
| Sweden – 4.83% (Continued) | ||||||||
| Swedish Match AB | 102,895 | $ | 4,644,658 | |||||
| Telefonaktiebolaget LM Ericsson | 130,941 | 1,259,874 | ||||||
| 10,543,188 | ||||||||
| Switzerland – 10.35% | ||||||||
| Adecco Group AG | 26,696 | 1,441,057 | ||||||
| Alcon, Inc. (a) | 16,422 | 955,059 | ||||||
| Cie Financiere Richemont SA | 296 | 21,774 | ||||||
| Coca-Cola HBC AG (a) | 4,221 | 151,951 | ||||||
| Credit Suisse Group AG (a) | 18,424 | 208,466 | ||||||
| Kuehne + Nagel International AG | 5,000 | 665,029 | ||||||
| Nestle SA | 39,128 | 3,881,449 | ||||||
| Novartis AG | 82,111 | 7,056,452 | ||||||
| Roche Holding AG | 21,277 | 5,588,449 | ||||||
| SGS SA | 369 | 930,705 | ||||||
| Sika AG | 600 | 88,964 | ||||||
| Sonova Holding AG | 267 | 59,452 | ||||||
| Swatch Group AG | 281 | 13,576 | ||||||
| Temenos AG (a) | 8,444 | 1,469,134 | ||||||
| UBS Group AG (a) | 3,540 | 40,738 | ||||||
| Vifor Pharma AG | 159 | 21,997 | ||||||
| 22,594,252 | ||||||||
| United Kingdom – 10.59% | ||||||||
| 3i Group PLC | 227,186 | 3,015,912 | ||||||
| Anglo American PLC | 42,959 | 1,027,737 | ||||||
| Ashtead Group PLC | 353 | 8,287 | ||||||
| AstraZeneca PLC | 1,797 | 132,426 | ||||||
| Auto Trader Group PLC (b) | 317,889 | 2,403,205 | ||||||
| Berkeley Group Holdings PLC | 45,540 | 2,013,146 | ||||||
| BP PLC | 75,000 | 508,184 | ||||||
| Burberry Group PLC | 72,780 | 1,557,775 | ||||||
| Carnival PLC | 114,435 | 5,699,110 | ||||||
| Croda International PLC | 339 | 21,694 | ||||||
| Hargreaves Lansdown PLC | 1,004 | 28,655 | ||||||
| InterContinental Hotels Group PLC | 180 | 11,595 | ||||||
| ITV PLC | 11,855 | 16,052 | ||||||
| Kingfisher PLC | 2,816 | 7,593 | ||||||
| London Stock Exchange Group PLC | 178 | 11,885 | ||||||
| Next PLC | 35,402 | 2,580,652 | ||||||
| Pearson PLC | 60,345 | 600,654 | ||||||
| Persimmon PLC | 26,733 | 664,992 | ||||||
| RELX PLC – London Stock Exchange | 951 | 22,126 | ||||||
| Rio Tinto PLC | 1,017 | 58,318 | ||||||
| Sage Group PLC | 64,982 | 612,658 | ||||||
The accompanying notes are an integral part of these financial statements.
30
Gerstein Fisher Multi-Factor® International Growth Equity Fund
| Schedule of Investments (Continued) |
May 31, 2019 (Unaudited)
| Shares | Value | |||||||
| United Kingdom – 10.59% (Continued) | ||||||||
| Smith & Nephew PLC | 8,263 | $ | 173,596 | |||||
| Smiths Group PLC | 496 | 9,012 | ||||||
| Tate & Lyle PLC | 5,289 | 48,278 | ||||||
| Unilever PLC | 30,951 | 1,888,197 | ||||||
| 23,121,739 | ||||||||
| United States – 0.02% | ||||||||
| Ball Corp. | 540 | 33,240 | ||||||
| Total Common Stocks (Cost $196,164,001) | 216,148,311 | |||||||
| INVESTMENTS PURCHASED WITH PROCEEDS | ||||||||
| FROM SECURITIES LENDING – 1.42% | ||||||||
| Money Market Fund – 1.42% | ||||||||
| First American Government Obligations Fund, Class Y, 2.000% (d) | 3,101,826 | 3,101,826 | ||||||
| Total Investments Purchased with Proceeds | ||||||||
| from Securities Lending (Cost 3,101,826) | 3,101,826 | |||||||
The accompanying notes are an integral part of these financial statements.
31
Gerstein Fisher Multi-Factor® International Growth Equity Fund
| Schedule of Investments (Continued) |
May 31, 2019 (Unaudited)
| Shares | Value | |||||||
| SHORT-TERM INVESTMENTS – 0.34% | ||||||||
| Money Market Fund – 0.34% | ||||||||
| First American Treasury Obligations Fund, Class X, 2.297% (d) | 737,888 | $ | 737,888 | |||||
| Total Short-Term Investments (Cost $737,888) | 737,888 | |||||||
| Total Investments (Cost $200,003,715) – 100.74% | 219,988,025 | |||||||
| Liabilities in Excess of Other Assets – (0.74)% | (1,615,293 | ) | ||||||
| TOTAL NET ASSETS – 100.00% | $ | 218,372,732 | ||||||
Percentages are stated as a percent of net assets.
| (a) | Non-income producing security. |
| (b) | Securities issued pursuant to Rule 144A under the Securities Act of 1933. Such securities are deemed to be liquid and the aggregate value, $4,104,033, represents 1.18% of net assets. |
| (c) | All or a portion of this security is out on loan as of May 31, 2019. Total value of securities out on loan is $2,783,215. |
| (d) | Seven day yield as of May 31, 2019. |
| Abbreviations: | |
| A/S | Aktieselskap is the Danish term for a stock company, which signifies that shareholders have limited liability. |
| AB | Aktiebolag is the Swedish term for stock company. |
| AG | Aktiengesellschaft is a German term that refers to a corporation that is limited by shares, i.e. owned by shareholders. |
| ASA | Allmennaksjeselskap is a Norwegian term which signifies that the company is listed in the stock-exchange. |
| BM | An abbreviation that refers to a limited liability company. |
| KGaA | Kommanditgesellschaft auf Aktien is a German term that refers to a Limited Partnership that has shares. |
| Ltd. | Limited is a term indicating a company is incorporated and shareholders have limited liability. |
| NV | Naamloze Vennootschap is a Dutch term for publicly traded companies. |
| OYJ | Julkinen osakeyhtiö is the Finnish term for publicly-traded companies. |
| PLC | Public Limited Company is a publicly traded company which signifies that shareholders have limited liability. |
| SA | An abbreviation used by many countries to signify a stock company whereby shareholders have limited liability. |
| SE | Societas Europaea is a term for a European Public Limited Liability Company. |
| SGPS | Sociedade gestora de participacoes socialis is a Portugese term for a holding enterprise. |
| SpA | Società per Azioni is the Italian term for a limited share company. |
The accompanying notes are an integral part of these financial statements.
32
Gerstein Fisher Multi-Factor® Global Real Estate Securities Fund
| Schedule of Investments |
May 31, 2019 (Unaudited)
| Shares | Value | |||||||
| COMMON STOCKS – 17.08% | ||||||||
| Australia – 0.00% | ||||||||
| OneMarket Ltd. (a) | 3,750 | $ | 2,068 | |||||
| Bermuda – 0.66% | ||||||||
| Hongkong Land Holdings Ltd. | 131,973 | 861,142 | ||||||
| Sinolink Worldwide Holdings Ltd. (a) | 1,250,000 | 94,158 | ||||||
| 955,300 | ||||||||
| Brazil – 0.31% | ||||||||
| BR Malls Participacoes SA | 51,271 | 168,293 | ||||||
| Construtora Tenda SA | 39,630 | 203,909 | ||||||
| Direcional Engenharia SA | 27,778 | 70,437 | ||||||
| 442,639 | ||||||||
| Canada – 0.15% | ||||||||
| Brookfield Property Partners LP | 11,933 | 220,808 | ||||||
| Cayman Islands – 0.19% | ||||||||
| Aoyuan Healthy Life Group Co. Ltd. (a) | 4,888 | 2,481 | ||||||
| Powerlong Real Estate Holdings Ltd. | 595,061 | 270,002 | ||||||
| 272,483 | ||||||||
| China – 0.10% | ||||||||
| Yuzhou Properties Co. Ltd. | 325,480 | 148,305 | ||||||
| Germany – 1.62% | ||||||||
| Deutsche Wohnen SE | 12,775 | 603,071 | ||||||
| DIC Asset AG | 9,867 | 103,246 | ||||||
| TAG Immobilien AG | 23,056 | 541,105 | ||||||
| TLG Immobilien AG | 16,263 | 476,918 | ||||||
| Vonovia SE | 11,678 | 611,862 | ||||||
| 2,336,202 | ||||||||
| Hong Kong – 5.91% | ||||||||
| China Aoyuan Group Ltd. | 415,543 | 449,481 | ||||||
| China Resources Land Ltd. | 282,000 | 1,147,169 | ||||||
| Gemdale Properties & Investment Corp Ltd. | 6,650,633 | 798,150 | ||||||
| Henderson Land Development Co. Ltd. | 2,213 | 11,436 | ||||||
| HKC Holdings Ltd. | 26,889 | 18,390 | ||||||
| Hopson Development Holdings Ltd. | 256,232 | 256,175 | ||||||
| Hysan Development Co. Ltd. | 153,514 | 799,520 | ||||||
| Kerry Properties Ltd. | 181,270 | 689,018 | ||||||
| Liu Chong Hing Investment Ltd. | 13,337 | 20,328 | ||||||
| Longfor Group Holdings Ltd. | 112,216 | 413,381 | ||||||
| New World Development Co. Ltd. | 269,855 | 398,963 | ||||||
| Poly Property Group Co. Ltd. | 204,152 | 70,225 | ||||||
The accompanying notes are an integral part of these financial statements.
33
Gerstein Fisher Multi-Factor® Global Real Estate Securities Fund
| Schedule of Investments (Continued) |
May 31, 2019 (Unaudited)
| Shares | Value | |||||||
| Hong Kong – 5.91% (Continued) | ||||||||
| Road King Infrastructure Ltd. | 176,807 | $ | 358,592 | |||||
| Shanghai Industrial Urban Development Group Ltd. | 326,585 | 60,414 | ||||||
| Shui On Land Ltd. | 866,903 | 196,541 | ||||||
| Sino Land Co. Ltd. | 591,923 | 947,223 | ||||||
| Swire Properties Ltd. | 113,902 | 469,736 | ||||||
| Times China Holdings Ltd. | 343,307 | 568,600 | ||||||
| Wheelock & Co. Ltd. | 129,609 | 855,587 | ||||||
| 8,528,929 | ||||||||
| Indonesia – 0.07% | ||||||||
| Bumi Serpong Damai Tbk PT (a) | 384,000 | 36,458 | ||||||
| Ciputra Development Tbk PT | 387,000 | 26,573 | ||||||
| Pakuwon Jati Tbk PT | 900,000 | 44,422 | ||||||
| 107,453 | ||||||||
| Israel – 0.08% | ||||||||
| Azrieli Group Ltd. | 1,866 | 111,405 | ||||||
| Japan – 1.07% | ||||||||
| Aeon Mall Co. Ltd. | 857 | 12,575 | ||||||
| Heiwa Real Estate Co. Ltd. | 5,239 | 101,121 | ||||||
| Leopalace21 Corp. | 4,404 | 12,874 | ||||||
| Mitsui Fudosan Co. Ltd. | 815 | 19,691 | ||||||
| Nomura Real Estate Holdings, Inc. | 10,000 | 204,886 | ||||||
| Sumitomo Realty & Development Co. Ltd. | 31,960 | 1,175,175 | ||||||
| Tokyo Tatemono Co. Ltd. | 2,402 | 24,963 | ||||||
| 1,551,285 | ||||||||
| Jersey – 0.03% | ||||||||
| Atrium European Real Estate Ltd. | 10,533 | 38,891 | ||||||
| Luxembourg – 1.68% | ||||||||
| ADO Properties SA (b) | 9,434 | 508,085 | ||||||
| Aroundtown SA | 182,895 | 1,551,766 | ||||||
| Grand City Properties SA | 14,018 | 359,744 | ||||||
| 2,419,595 | ||||||||
| Malaysia – 0.05% | ||||||||
| IOI Properties Group Bhd | 159,442 | 51,024 | ||||||
| UOA Development Bhd | 32,200 | 17,981 | ||||||
| 69,005 | ||||||||
| Mexico – 0.10% | ||||||||
| Corp Inmobiliaria Vesta SAB de CV | 101,225 | 143,842 | ||||||
| Netherlands – 0.07% | ||||||||
| Eurocommercial Properties NV | 3,788 | 98,939 | ||||||
The accompanying notes are an integral part of these financial statements.
34
Gerstein Fisher Multi-Factor® Global Real Estate Securities Fund
| Schedule of Investments (Continued) |
May 31, 2019 (Unaudited)
| Shares | Value | |||||||
| New Zealand – 0.20% | ||||||||
| Argosy Property Ltd. | 110,786 | $ | 95,669 | |||||
| Kiwi Property Group Ltd. | 103,269 | 106,405 | ||||||
| Precinct Properties New Zealand Ltd. | 89,355 | 94,563 | ||||||
| 296,637 | ||||||||
| Norway – 0.06% | ||||||||
| Entra ASA (b) | 6,138 | 91,532 | ||||||
| Philippines – 0.69% | ||||||||
| Ayala Land, Inc. | 75,000 | 71,346 | ||||||
| Megaworld Corp. | 1,000,000 | 113,112 | ||||||
| Robinsons Land Corp. | 296,391 | 147,738 | ||||||
| SM Prime Holdings, Inc. | 860,876 | 658,223 | ||||||
| 990,419 | ||||||||
| Singapore – 1.08% | ||||||||
| City Developments Ltd. | 7,827 | 46,941 | ||||||
| United Industrial Corp. Ltd. | 194,476 | 421,953 | ||||||
| UOL Group Ltd. | 138,912 | 684,255 | ||||||
| Wing Tai Holdings Ltd. | 235,663 | 348,008 | ||||||
| Yanlord Land Group Ltd. | 72,611 | 62,957 | ||||||
| 1,564,114 | ||||||||
| Sweden – 1.47% | ||||||||
| Castellum AB | 10,217 | 193,856 | ||||||
| Fabege AB | 53,650 | 804,867 | ||||||
| Hembla AB (a) | 4,274 | 77,222 | ||||||
| Hemfosa Fastigheter AB | 52,006 | 479,585 | ||||||
| Klovern AB | 106,640 | 160,168 | ||||||
| Kungsleden AB | 37,031 | 286,501 | ||||||
| Nyfosa AB (a) | 18,134 | 114,695 | ||||||
| 2,116,894 | ||||||||
| Switzerland – 0.52% | ||||||||
| Allreal Holding AG | 887 | 144,898 | ||||||
| PSP Swiss Property AG | 3,760 | 421,313 | ||||||
| Swiss Prime Site AG (a) | 2,244 | 182,934 | ||||||
| 749,145 | ||||||||
| Thailand – 0.29% | ||||||||
| Central Pattana PLC | 55,664 | 125,188 | ||||||
| Central Pattana PLC-NVDR | 130,689 | 293,918 | ||||||
| 419,106 | ||||||||
| United Kingdom – 0.42% | ||||||||
| Capital & Counties Properties PLC | 8,006 | 22,006 | ||||||
| Daejan Holdings PLC | 8,322 | 578,662 | ||||||
| 600,668 | ||||||||
The accompanying notes are an integral part of these financial statements.
35
Gerstein Fisher Multi-Factor® Global Real Estate Securities Fund
| Schedule of Investments (Continued) |
May 31, 2019 (Unaudited)
| Shares | Value | |||||||
| United States – 0.26% | ||||||||
| CBRE Group, Inc. (a) | 541 | $ | 24,723 | |||||
| Forestar Group, Inc. (a) | 6,557 | 117,436 | ||||||
| FRP Holdings, Inc. (a) | 915 | 42,566 | ||||||
| Jones Lang LaSalle, Inc. | 116 | 14,436 | ||||||
| Kennedy-Wilson Holdings, Inc. | 745 | 15,310 | ||||||
| Marcus & Millichap, Inc. (a) | 1,465 | 44,741 | ||||||
| RMR Group, Inc. | 2,413 | 116,355 | ||||||
| 375,567 | ||||||||
| Total Common Stocks (Cost $23,281,427) | 24,651,231 | |||||||
| REAL ESTATE INVESTMENT TRUSTS – 82.91% | ||||||||
| Australia – 6.33% | ||||||||
| Abacus Property Group | 982 | 2,606 | ||||||
| Astro Japan Property Group (a)(c)(d)(f) | 107,959 | 3,745 | ||||||
| BWP Trust | 369,933 | 923,234 | ||||||
| Charter Hall Education Trust | 10,135 | 25,451 | ||||||
| Charter Hall Retail REIT | 79,372 | 243,154 | ||||||
| Cromwell Property Group | 317,286 | 254,206 | ||||||
| Dexus | 191,841 | 1,716,869 | ||||||
| GDI Property Group | 100,000 | 91,773 | ||||||
| Goodman Group | 96,191 | 894,868 | ||||||
| GPT Group | 302,236 | 1,209,198 | ||||||
| Mirvac Group | 462,961 | 975,608 | ||||||
| Scentre Group | 246,005 | 649,334 | ||||||
| Unibail-Rodamco-Westfield – CDI | 1 | 7 | ||||||
| Vicinity Centres | 1,193,554 | 2,139,379 | ||||||
| 9,129,432 | ||||||||
| Belgium – 0.78% | ||||||||
| Aedifica SA | 505 | 46,514 | ||||||
| Befimmo SA | 2,586 | 144,695 | ||||||
| Cofinimmo SA | 2,010 | 253,739 | ||||||
| Montea CVA | 1,887 | 164,219 | ||||||
| Warehouses De Pauw CVA | 3,310 | 514,732 | ||||||
| 1,123,899 | ||||||||
| Canada – 3.74% | ||||||||
| Artis Real Estate Investment Trust | 4,019 | 35,028 | ||||||
| Canadian Apartment Properties REIT | 20,493 | 742,629 | ||||||
| Dream Global Real Estate Investment Trust | 24,409 | 244,162 | ||||||
| Dream Office Real Estate Investment Trust | 8,524 | 148,520 | ||||||
| Granite Real Estate Investment Trust | 45,674 | 2,041,408 | ||||||
| H&R Real Estate Investment Trust | 14,434 | 243,486 | ||||||
| InterRent Real Estate Investment Trust | 86,016 | 900,508 | ||||||
| Morguard Real Estate Investment Trust | 37,272 | 329,811 | ||||||
The accompanying notes are an integral part of these financial statements.
36
Gerstein Fisher Multi-Factor® Global Real Estate Securities Fund
| Schedule of Investments (Continued) |
May 31, 2019 (Unaudited)
| Shares | Value | |||||||
| Canada – 3.74% (Continued) | ||||||||
| RioCan Real Estate Investment Trust | 19,256 | $ | 371,557 | |||||
| SmartCentres Real Estate Investment Trust | 13,688 | 330,756 | ||||||
| WPT Industrial Real Estate Investment Trust | 1,100 | 14,982 | ||||||
| 5,402,847 | ||||||||
| France – 1.36% | ||||||||
| Covivio | 2,503 | 262,665 | ||||||
| Gecina SA | 8,888 | 1,270,948 | ||||||
| Societe de la Tour Eiffel | 10,381 | 430,256 | ||||||
| 1,963,869 | ||||||||
| Guernsey – 0.30% | ||||||||
| Picton Property Income Ltd. | 50,000 | 60,458 | ||||||
| UK Commercial Property REIT Ltd. | 327,205 | 378,095 | ||||||
| 438,553 | ||||||||
| Hong Kong – 4.07% | ||||||||
| Champion REIT | 2,157,076 | 1,755,858 | ||||||
| Hui Xian Real Estate Investment Trust | 347,122 | 163,471 | ||||||
| Link REIT | 331,043 | 3,961,255 | ||||||
| 5,880,584 | ||||||||
| Ireland – 0.29% | ||||||||
| Green REIT PLC | 147,164 | 285,042 | ||||||
| Irish Residential Properties REIT PLC | 73,680 | 131,205 | ||||||
| 416,247 | ||||||||
| Italy – 0.03% | ||||||||
| Immobiliare Grande Distribuzione SIIQ SpA | 6,260 | 43,009 | ||||||
| Japan – 5.66% | ||||||||
| Advance Residence Investment Corp. | 5 | 14,472 | ||||||
| Comforia Residential REIT, Inc. | 32 | 87,778 | ||||||
| Daiwa Office Investment Corp. | 122 | 845,317 | ||||||
| Frontier Real Estate Investment Corp. | 11 | 46,495 | ||||||
| Fukuoka REIT Corp. | 9 | 14,533 | ||||||
| Global One Real Estate Investment Corp. | 379 | 457,059 | ||||||
| GLP J-Reit | 13 | 14,484 | ||||||
| Hankyu Hanshin REIT, Inc. | 85 | 115,792 | ||||||
| Heiwa Real Estate REIT, Inc. | 80 | 91,072 | ||||||
| Hulic Reit, Inc. | 336 | 557,049 | ||||||
| Japan Excellent, Inc. | 54 | 80,241 | ||||||
| Japan Hotel REIT Investment Corp. | 922 | 747,225 | ||||||
| Japan Logistics Fund, Inc. | 14 | 31,242 | ||||||
| Japan Rental Housing Investments, Inc. | 93 | 74,033 | ||||||
| Japan Retail Fund Investment Corp. | 54 | 108,777 | ||||||
| Kenedix Office Investment Corp. | 240 | 1,653,110 | ||||||
The accompanying notes are an integral part of these financial statements.
37
Gerstein Fisher Multi-Factor® Global Real Estate Securities Fund
| Schedule of Investments (Continued) |
May 31, 2019 (Unaudited)
| Shares | Value | |||||||
| Japan – 5.66% (Continued) | ||||||||
| Marimo Regional Revitalization REIT, Inc. (e) | 120 | $ | 129,750 | |||||
| MCUBS MidCity Investment Corp. | 570 | 548,143 | ||||||
| Mori Trust Sogo Reit, Inc. | 145 | 230,494 | ||||||
| Nippon Accommodations Fund, Inc. | 66 | 348,322 | ||||||
| Nomura Real Estate Master Fund, Inc. | 391 | 607,396 | ||||||
| Ooedo Onsen Reit Investment Corp. | 120 | 94,703 | ||||||
| Orix JREIT, Inc. | 181 | 324,825 | ||||||
| Premier Investment Corp. | 480 | 611,479 | ||||||
| Tokyu REIT, Inc. | 200 | 326,576 | ||||||
| United Urban Investment Corp. | 9 | 14,858 | ||||||
| 8,175,225 | ||||||||
| Malaysia – 0.09% | ||||||||
| IGB Real Estate Investment Trust | 108,000 | 48,245 | ||||||
| KLCCP Stapled Group | 25,200 | 46,310 | ||||||
| Sunway Real Estate Investment Trust | 64,000 | 28,407 | ||||||
| 122,962 | ||||||||
| Mexico – 0.22% | ||||||||
| Concentradora Fibra Danhos SA de CV | 21,000 | 25,855 | ||||||
| Fibra Uno Administracion SA de CV | 100,000 | 127,916 | ||||||
| Macquarie Mexico Real Estate Management SA de CV (a)(b) | 80,366 | 84,062 | ||||||
| PLA Administradora Industrial S de RL de CV | 30,000 | 45,906 | ||||||
| Prologis Property Mexico SA de CV | 18,000 | 35,102 | ||||||
| 318,841 | ||||||||
| Netherlands – 0.38% | ||||||||
| NSI NV | 4,471 | 181,311 | ||||||
| Vastned Retail NV | 10,386 | 340,957 | ||||||
| Wereldhave NV | 831 | 20,275 | ||||||
| 542,543 | ||||||||
| New Zealand – 0.11% | ||||||||
| Goodman Property Trust | 134,956 | 163,775 | ||||||
| Singapore – 1.95% | ||||||||
| CapitaLand Commercial Trust | 36,384 | 51,194 | ||||||
| Fortune Real Estate Investment Trust | 1,315,802 | 1,731,993 | ||||||
| Mapletree Commercial Trust | 108,937 | 151,750 | ||||||
| Mapletree Industrial Trust | 102,229 | 156,961 | ||||||
| Mapletree Logistics Trust | 392,751 | 418,182 | ||||||
| Mapletree North Asia Commercial Trust | 158,163 | 152,027 | ||||||
| Starhill Global REIT | 171,918 | 91,963 | ||||||
| Suntec Real Estate Investment Trust | 44,263 | 58,737 | ||||||
| 2,812,807 | ||||||||
The accompanying notes are an integral part of these financial statements.
38
Gerstein Fisher Multi-Factor® Global Real Estate Securities Fund
| Schedule of Investments (Continued) |
May 31, 2019 (Unaudited)
| Shares | Value | |||||||
| South Africa – 0.61% | ||||||||
| Arrowhead Properties Ltd. | 79,358 | $ | 20,074 | |||||
| Fortress REIT Ltd. – Class A | 79,360 | 107,992 | ||||||
| Fortress REIT Ltd. – Class B | 68,360 | 55,584 | ||||||
| Growthpoint Properties Ltd. | 48,281 | 80,030 | ||||||
| Hyprop Investments Ltd. | 30,746 | 149,295 | ||||||
| Redefine Properties Ltd. | 34,217 | 21,298 | ||||||
| SA Corporate Real Estate Ltd. | 1,056,595 | 211,809 | ||||||
| Vukile Property Fund Ltd. | 167,036 | 237,374 | ||||||
| 883,456 | ||||||||
| Spain – 0.48% | ||||||||
| Lar Espana Real Estate Socimi SA | 8,340 | 63,717 | ||||||
| Merlin Properties Socimi SA | 47,468 | 631,398 | ||||||
| 695,115 | ||||||||
| United Kingdom – 3.87% | ||||||||
| Assura PLC | 219,035 | 177,503 | ||||||
| Big Yellow Group PLC | 31,923 | 410,655 | ||||||
| British Land Co. PLC | 147,510 | 995,287 | ||||||
| Derwent London PLC | 10,133 | 411,725 | ||||||
| Hansteen Holdings PLC | 179,858 | 213,879 | ||||||
| Land Securities Group PLC | 1,686 | 17,637 | ||||||
| Primary Health Properties PLC | 18,871 | 32,624 | ||||||
| Schroder Real Estate Investment Trust Ltd. | 33,987 | 24,621 | ||||||
| Segro PLC | 96,824 | 852,376 | ||||||
| Shaftesbury PLC | 1,209 | 12,580 | ||||||
| Target Healthcare REIT Ltd. | 16,666 | 24,526 | ||||||
| Tritax Big Box REIT PLC | 429,697 | 804,172 | ||||||
| UNITE Group PLC | 65,148 | 781,722 | ||||||
| Workspace Group PLC | 73,358 | 818,600 | ||||||
| 5,577,907 | ||||||||
| United States – 52.64% | ||||||||
| Agree Realty Corp. | 47,467 | 3,177,916 | ||||||
| Alexander & Baldwin, Inc. | 1,400 | 32,298 | ||||||
| American Assets Trust, Inc. | 11,815 | 536,283 | ||||||
| American Campus Communities, Inc. | 12,011 | 556,349 | ||||||
| American Homes 4 Rent | 2,874 | 70,154 | ||||||
| American Tower Corp. | 728 | 151,985 | ||||||
| Americold Realty Trust | 96,015 | 3,005,269 | ||||||
| Apartment Investment & Management Co. | 25,099 | 1,253,695 | ||||||
| Apple Hospitality REIT, Inc. | 1,815 | 28,024 | ||||||
| AvalonBay Communities, Inc. | 17,084 | 3,468,223 | ||||||
| Braemar Hotels & Resorts, Inc. | �� | 332 | 3,466 | |||||
| Brandywine Realty Trust | 2,500 | 37,775 | ||||||
| Brookfield Property REIT, Inc. | 753 | 13,885 | ||||||
The accompanying notes are an integral part of these financial statements.
39
Gerstein Fisher Multi-Factor® Global Real Estate Securities Fund
| Schedule of Investments (Continued) |
May 31, 2019 (Unaudited)
| Shares | Value | |||||||
| United States – 52.64% (Continued) | ||||||||
| Camden Property Trust | 27,055 | $ | 2,796,405 | |||||
| CareTrust REIT, Inc. | 92,500 | 2,248,675 | ||||||
| Chatham Lodging Trust | 819 | 15,594 | ||||||
| Chesapeake Lodging Trust | 16,337 | 470,015 | ||||||
| Columbia Property Trust, Inc. | 35,571 | 760,508 | ||||||
| Community Healthcare Trust, Inc. | 8,400 | 328,692 | ||||||
| CubeSmart | 26,694 | 900,122 | ||||||
| DiamondRock Hospitality Co. | 30,225 | 299,530 | ||||||
| Douglas Emmett, Inc. | 378 | 15,230 | ||||||
| Duke Realty Corp. | 7,821 | 235,334 | ||||||
| EastGroup Properties, Inc. | 3,186 | 353,646 | ||||||
| EPR Properties | 17,597 | 1,374,326 | ||||||
| Equity Commonwealth | 94,678 | 3,083,662 | ||||||
| Equity LifeStyle Properties, Inc. | 1,919 | 233,466 | ||||||
| Equity Residential | 22,395 | 1,714,785 | ||||||
| Extra Space Storage, Inc. | 172 | 18,432 | ||||||
| Federal Realty Investment Trust | 223 | 29,153 | ||||||
| First Industrial Realty Trust, Inc. | 9,846 | 341,755 | ||||||
| Four Corners Property Trust, Inc. | 60,000 | 1,725,600 | ||||||
| Gaming & Leisure Properties, Inc. | 416 | 16,428 | ||||||
| Getty Realty Corp. | 100,489 | 3,111,139 | ||||||
| HCP, Inc. | 20,391 | 646,599 | ||||||
| Hersha Hospitality Trust | 8,419 | 143,544 | ||||||
| Host Hotels & Resorts, Inc. | 99,829 | 1,807,903 | ||||||
| Independence Realty Trust, Inc. | 1,576 | 17,304 | ||||||
| Investors Real Estate Trust | 2,981 | 172,570 | ||||||
| Invitation Homes, Inc. | 635 | 16,275 | ||||||
| JBG SMITH Properties | 30,588 | 1,207,920 | ||||||
| Kilroy Realty Corp. | 16,867 | 1,243,267 | ||||||
| Liberty Property Trust | 27,098 | 1,286,342 | ||||||
| Life Storage, Inc. | 17,697 | 1,703,867 | ||||||
| LTC Properties, Inc. | 21,342 | 955,054 | ||||||
| Mack-Cali Realty Corp. | 13,152 | 298,813 | ||||||
| Medical Properties Trust, Inc. | 148,929 | 2,647,958 | ||||||
| Mid-America Apartment Communities, Inc. | 12,985 | 1,482,627 | ||||||
| National Health Investors, Inc. | 24,504 | 1,924,789 | ||||||
| National Retail Properties, Inc. | 1,500 | 80,295 | ||||||
| National Storage Affiliates Trust | 586 | 17,457 | ||||||
| Omega Healthcare Investors, Inc. | 13,011 | 463,452 | ||||||
| Paramount Group, Inc. | 52,000 | 741,000 | ||||||
| Park Hotels & Resorts, Inc. | 55,952 | 1,545,394 | ||||||
| Piedmont Office Realty Trust, Inc. | 146,570 | 2,979,768 | ||||||
| Prologis, Inc. | 30,894 | 2,275,961 | ||||||
| PS Business Parks, Inc. | 14,536 | 2,339,133 | ||||||
The accompanying notes are an integral part of these financial statements.
40
Gerstein Fisher Multi-Factor® Global Real Estate Securities Fund
| Schedule of Investments (Continued) |
May 31, 2019 (Unaudited)
| Shares | Value | |||||||
| United States – 52.64% (Continued) | ||||||||
| Public Storage | 6,637 | $ | 1,578,810 | |||||
| Realty Income Corp. | 247 | 17,310 | ||||||
| Regency Centers Corp. | 200 | 13,192 | ||||||
| Retail Properties of America, Inc. | 105,152 | 1,250,257 | ||||||
| Retail Value, Inc. | 4,776 | 152,450 | ||||||
| Rexford Industrial Realty, Inc. | 42,991 | 1,625,060 | ||||||
| RPT Realty | 1,262 | 15,359 | ||||||
| Ryman Hospitality Properties, Inc. | 5,387 | 430,691 | ||||||
| SBA Communications Corp. (a) | 153 | 33,111 | ||||||
| Simon Property Group, Inc. | 13,894 | 2,252,078 | ||||||
| SL Green Realty Corp. | 8,933 | 768,238 | ||||||
| Spirit MTA REIT | 586 | 4,120 | ||||||
| Spirit Realty Capital, Inc. | 7,493 | 319,651 | ||||||
| STAG Industrial, Inc. | 539 | 15,728 | ||||||
| STORE Capital Corp. | 11,181 | 382,614 | ||||||
| Sun Communities, Inc. | 4,009 | 506,216 | ||||||
| Sunstone Hotel Investors, Inc. | 43,739 | 586,977 | ||||||
| Terreno Realty Corp. | 31,426 | 1,436,482 | ||||||
| Tier REIT, Inc. | 58,756 | 1,581,712 | ||||||
| UDR, Inc. | 14,766 | 661,221 | ||||||
| Universal Health Realty Income Trust | 782 | 64,101 | ||||||
| Urstadt Biddle Properties, Inc. | 23,059 | 504,531 | ||||||
| Ventas, Inc. | 258 | 16,589 | ||||||
| VEREIT, Inc. | 1,904 | 16,908 | ||||||
| VICI Properties, Inc. | 62,408 | 1,384,209 | ||||||
| Washington Prime Group, Inc. | 2,929 | 12,009 | ||||||
| Weingarten Realty Investors | 1,731 | 48,814 | ||||||
| Welltower, Inc. | 216 | 17,544 | ||||||
| WP Carey, Inc. | 20,930 | 1,737,399 | ||||||
| Xenia Hotels & Resorts, Inc. | 6,100 | 127,551 | ||||||
| 75,966,043 | ||||||||
| Total Real Estate Investment Trusts (Cost $102,224,934) | 119,657,114 | |||||||
| CLOSED-END FUNDS – 0.03% | ||||||||
| Guernsey – 0.03% | ||||||||
| F&C Commercial Property Trust Ltd. | 27,740 | 42,505 | ||||||
| Total Closed-End Funds (Cost $56,864) | 42,505 | |||||||
The accompanying notes are an integral part of these financial statements.
41
Gerstein Fisher Multi-Factor® Global Real Estate Securities Fund
| Schedule of Investments (Continued) |
May 31, 2019 (Unaudited)
| Shares | Value | |||||||
| INVESTMENTS PURCHASED WITH PROCEEDS | ||||||||
| FROM SECURITIES LENDING – 0.09% | ||||||||
| Money Market Fund – 0.09% | ||||||||
| First American Government Obligations Fund, Class Y, 2.000% (g) | 131,334 | $ | 131,334 | |||||
| Total Investments Purchased with Proceeds | ||||||||
| from Securities Lending (Cost 131,334) | 131,334 | |||||||
| LIQUIDATING TRUSTS – 0.01% | ||||||||
| United States – 0.01% | ||||||||
| Winthrop Realty Trust (a)(c) | 9,590 | 11,604 | ||||||
| Total Liquidating Trusts (Cost $21,535) | 11,604 | |||||||
| SHORT-TERM INVESTMENTS – 0.00% | ||||||||
| Money Market Fund – 0.00% | ||||||||
| First American Treasury Obligations Fund, Class X, 2.297% (g) | 81 | 81 | ||||||
| Total Short-Term Investments (Cost $81) | 81 | |||||||
| Total Investments (Cost $125,716,175) – 100.12% | 144,493,869 | |||||||
| Liabilities in Excess of Other Assets – (0.12)% | (172,240 | ) | ||||||
| TOTAL NET ASSETS – 100.00% | $ | 144,321,629 | ||||||
Percentages are stated as a percent of net assets.
| (a) | Non-income producing security. |
| (b) | Securities issued pursuant to Rule 144A under the Securities Act of 1933. Such securities are deemed to be liquid and the aggregate value, $683,679, represents 0.47% of net assets. |
| (c) | Illiquid security. The total market value of these securities was $15,349, representing 0.01% of net assets. |
| (d) | Fair valued security. Value determined using significant unobservable inputs. |
| (e) | All or a portion of this security is out on loan as of May 31, 2019. Total value of securities out on loan is $127,482. |
| (f) | Restricted security as to resale. As of the report date, the Fund held a restricted security with a current value of $3,745, acquired January 14, 2014 with an original cost of $0, which was 0.00% of its net assets. |
| (g) | Seven day yield as of May 31, 2019. |
| Abbreviations: | |
| AB | Aktiebolag is the Swedish term for stock company. |
| AG | Aktiengesellschaft is a German term that refers to a corporation that is limited by shares, i.e. owned by shareholders. |
| ASA | Allmennaksjeselskap is a Norwegian term which signifies that the company is listed in the stock-exchange. |
| CDI | CHESS Depositary Interests are a way of allowing securities of foreign companies to be traded on the Australian Stock Exchange. CDIs afford shareholders all of the same direct economic benefits as ordinary shares, such as the right to dividends and to participate in rights offers. |
The accompanying notes are an integral part of these financial statements.
42
Gerstein Fisher Multi-Factor® Global Real Estate Securities Fund
| Schedule of Investments (Continued) |
| CVA | Commanditaire Vennootschap op Aandelen is a Belgium term for limited partnership with shares. |
| LP | Limited Partnership. |
| Ltd. | Limited is a term indicating a company is incorporated and shareholders have limited liability. |
| NV | Naamloze Vennootschap is a Dutch term for publicly traded companies. |
| PLC | Public Limited Company is a publicly traded company which signifies that shareholders have limited liability. |
| SA | An abbreviation used by many countries to signify a stock company whereby shareholders have limited liability. |
| SA de CV | Sociedad Anonima de Capital Variable is a Spanish term for an SA with variable capital. |
| S de RL de CV | Sociedad De Responsabilidad Limitada De Capital Variable is a nonnegotiable stock limited liability corporation of two or more persons whose liabilities for acts of the corporation are limited to their capital contribution. |
| SE | Societas Europaea is a term for a European Public Limited Liability Company. |
| SIIQ | An Italian term for listed Real Estate Investment Company. |
| SpA | Società per Azioni is the Italian term for a limited share company. |
| Tbk PT | Perseroan Terbatas is an Indonesian term that refers to a Limited Liability Company. Tbk is added if the shares become publicly listed on the stock exchange. |
The accompanying notes are an integral part of these financial statements.
43
Gerstein Fisher Funds
| Statements of Assets and Liabilities |
Assets
Investments, at value (cost $175,504,668, $200,003,715 and $125,716,175, respectively)(1)
Foreign currencies (cost $0, $883,537 and $595,049, respectively)
Receivables:
Dividends and interest
Dividend tax reclaim
Investments sold
Fund shares sold
Securities lending (Note 9)
Other assets
Total Assets
Liabilities
Loans payable
Payable for investments purchased
Payable for collateral on securities loaned
Payable to the Advisor
Payable to affiliates
Payable for Fund shares redeemed
Accrued expenses and other liabilities
Total Liabilities
Net Assets
Net Assets Consist Of:
Paid-in capital
Total distributable earnings
Net Assets
(1) | Includes loaned securities with a value of |
| Shares of beneficial interest outstanding | |
| (unlimited number of shares authorized, $0.001 par value) | |
Net asset value, redemption price and offering price per share(2) | |
(2) | If applicable, redemption price per share may be reduced by a 1.00% redemption fee of the net amount of the redemption on shares redeemed within 60 days of purchase. |
The accompanying notes are an integral part of these financial statements.
44
May 31, 2019 (Unaudited)
| Gerstein Fisher | Gerstein Fisher | ||||||||||
| Gerstein Fisher | Multi-Factor® | Multi-Factor® | |||||||||
Multi-Factor® | International | Global Real Estate | |||||||||
| Growth Equity Fund | Growth Equity Fund | Securities Fund | |||||||||
| $ | 264,143,214 | $ | 219,988,025 | $ | 144,493,869 | ||||||
| — | 892,321 | 590,905 | |||||||||
| 243,066 | 529,238 | 319,144 | |||||||||
| 12 | 874,778 | 169,052 | |||||||||
| 589,713 | 2,312,223 | 3,530,286 | |||||||||
| 190,763 | 174,129 | 43,066 | |||||||||
| 3,155 | 2,626 | 437 | |||||||||
| 13,214 | 15,196 | 17,074 | |||||||||
| 265,183,137 | 224,788,536 | 149,163,833 | |||||||||
| 359,000 | — | 3,109,000 | |||||||||
| 294,505 | 3,027,782 | 1,371,884 | |||||||||
| 1,489,918 | 3,101,826 | 131,334 | |||||||||
| 186,796 | 161,071 | 78,137 | |||||||||
| 47,527 | 51,520 | 41,774 | |||||||||
| 330,416 | 55,635 | 89,096 | |||||||||
| 25,636 | 17,970 | 20,979 | |||||||||
| 2,733,798 | 6,415,804 | 4,842,204 | |||||||||
| $ | 262,449,339 | $ | 218,372,732 | $ | 144,321,629 | ||||||
| $ | 146,065,912 | $ | 193,040,992 | $ | 126,513,391 | ||||||
| 116,383,427 | 25,331,740 | 17,808,238 | |||||||||
| $ | 262,449,339 | $ | 218,372,732 | $ | 144,321,629 | ||||||
| $ | 1,393,836 | $ | 2,783,215 | $ | 127,482 | ||||||
| 12,869,776 | 15,280,859 | 12,462,010 | |||||||||
| $ | 20.39 | $ | 14.29 | $ | 11.58 | ||||||
The accompanying notes are an integral part of these financial statements.
45
Gerstein Fisher Funds
| Statements of Operations |
Investment Income
Dividend income(1)
Interest income
Securities lending income
Total investment income
Expenses
Management fees
Administration and accounting fees
Transfer agent fees and expenses
Federal and state registration fees
Audit and tax fees
Legal fees
Reports to shareholders
Chief Compliance Officer fees and expenses
Custody fees
Trustees’ fees and related expenses
Other expenses
Total expenses before recoupment or waivers
Less (waivers) or recoupment by Adviser (Note 4)
Net expenses
Net Investment Income
Realized and Unrealized Gain (Loss) on Investments
Net realized gain from investments
Change in net unrealized appreciation (depreciation) on:
Investments
Foreign currency translation
Net Realized and Unrealized Gain (Loss) on Investments
Net Increase (Decrease) in Net Assets from Operations
(1) | Net of foreign taxes withheld of $0, $361,994 and $136,823, respectively. |
The accompanying notes are an integral part of these financial statements.
46
For the Six Months Ended May 31, 2019 (Unaudited)
| Gerstein Fisher | Gerstein Fisher | ||||||||||
| Gerstein Fisher | Multi-Factor® | Multi-Factor® | |||||||||
Multi-Factor® | International | Global Real Estate | |||||||||
| Growth Equity Fund | Growth Equity Fund | Securities Fund | |||||||||
| $ | 2,359,875 | $ | 3,727,951 | $ | 2,861,350 | ||||||
| 5,648 | 8,261 | 912 | |||||||||
| 51,315 | 3,057 | 1,634 | |||||||||
| 2,416,838 | 3,739,269 | 2,863,896 | |||||||||
| 1,160,757 | 911,030 | 479,892 | |||||||||
| 95,604 | 98,240 | 73,680 | |||||||||
| 89,928 | 60,618 | 47,314 | |||||||||
| 11,372 | 10,434 | 10,176 | |||||||||
| 9,734 | 10,738 | 10,538 | |||||||||
| 8,570 | 8,024 | 7,100 | |||||||||
| 7,368 | 7,138 | 5,952 | |||||||||
| 5,208 | 5,208 | 5,208 | |||||||||
| 4,708 | 43,268 | 28,054 | |||||||||
| 4,186 | 4,186 | 4,186 | |||||||||
| 9,870 | 14,974 | 19,570 | |||||||||
| 1,407,305 | 1,173,858 | 691,670 | |||||||||
| (50,482 | ) | 15,724 | — | ||||||||
| 1,356,823 | 1,189,582 | 691,670 | |||||||||
| 1,060,015 | 2,549,687 | 2,172,226 | |||||||||
| 28,405,329 | 4,751,609 | 1,602,088 | |||||||||
| (35,901,235 | ) | 1,238,330 | 6,928,808 | ||||||||
| — | 3,810 | (3,904 | ) | ||||||||
| (7,495,906 | ) | 5,993,749 | 8,526,992 | ||||||||
| $ | (6,435,891 | ) | $ | 8,543,436 | $ | 10,699,218 | |||||
The accompanying notes are an integral part of these financial statements.
47
Gerstein Fisher Multi-Factor® Growth Equity Fund
| Statements of Changes in Net Assets |
| Six Months | ||||||||
| Ended | Year Ended | |||||||
| May 31, 2019 | November 30, | |||||||
| (Unaudited) | 2018 | |||||||
| From Operations | ||||||||
| Net investment income | $ | 1,060,015 | $ | 218,075 | ||||
| Net realized gain from investments | 28,405,329 | 18,038,665 | ||||||
| Net change in unrealized depreciation on investments | (35,901,235 | ) | (1,108,871 | ) | ||||
| Net increase (decrease) in net assets from operations | (6,435,891 | ) | 17,147,869 | |||||
| From Distributions | ||||||||
| Net dividends and distributions | (19,608,899 | ) | (8,625,737 | ) | ||||
| Net decrease in net assets resulting | ||||||||
| from dividends and distributions paid | (19,608,899 | ) | (8,625,737 | ) | ||||
| From Capital Share Transactions | ||||||||
| Proceeds from shares sold | 22,045,854 | 37,509,548 | ||||||
| Net asset value of shares issued | ||||||||
| to distributions declared | 19,478,237 | 8,522,142 | ||||||
| Cost for shares redeemed* | (29,423,642 | ) | (85,259,762 | ) | ||||
| Net increase (decrease) in net assets from | ||||||||
| capital share transactions | 12,100,449 | (39,228,072 | ) | |||||
| Total Decrease in Net Assets | (13,944,341 | ) | (30,705,940 | ) | ||||
| Net Assets | ||||||||
| Beginning of period | 276,393,680 | 307,099,620 | ||||||
| End of period | $ | 262,449,339 | $ | 276,393,680 | ||||
| * Net of redemption fees of | $ | 910 | $ | 5,912 | ||||
The accompanying notes are an integral part of these financial statements.
48
Gerstein Fisher Multi-Factor® International Growth Equity Fund
| Statements of Changes in Net Assets |
| Six Months | ||||||||
| Ended | Year Ended | |||||||
| May 31, 2019 | November 30, | |||||||
| (Unaudited) | 2018 | |||||||
| From Operations | ||||||||
| Net investment income | $ | 2,549,687 | $ | 2,869,420 | ||||
| Net realized gain from investments | 4,751,609 | 2,406,932 | ||||||
| Net change in unrealized appreciation | ||||||||
| (depreciation) on investments | 1,242,140 | (33,109,956 | ) | |||||
| Net increase (decrease) in net assets from operations | 8,543,436 | (27,833,604 | ) | |||||
| From Distributions | ||||||||
| Net dividends and distributions | (3,490,210 | ) | (3,672,334 | ) | ||||
| Net decrease in net assets resulting | ||||||||
| from dividends and distributions paid | (3,490,210 | ) | (3,672,334 | ) | ||||
| From Capital Share Transactions | ||||||||
| Proceeds from shares sold | 26,677,025 | 47,907,405 | ||||||
| Net asset value of shares issued | ||||||||
| to distributions declared | 2,466,695 | 2,692,715 | ||||||
| Cost for shares redeemed* | (29,069,563 | ) | (45,585,106 | ) | ||||
| Net increase in net assets from | ||||||||
| capital share transactions | 74,157 | 5,015,014 | ||||||
| Total Increase (Decrease) in Net Assets | 5,127,383 | (26,490,924 | ) | |||||
| Net Assets | ||||||||
| Beginning of period | 213,245,349 | 239,736,273 | ||||||
| End of period | $ | 218,372,732 | $ | 213,245,349 | ||||
| * Net of redemption fees of | $ | 945 | $ | 1,304 | ||||
The accompanying notes are an integral part of these financial statements.
49
Gerstein Fisher Multi-Factor® Global Real Estate Securities Fund
| Statements of Changes in Net Assets |
| Six Months | ||||||||
| Ended | Year Ended | |||||||
| May 31, 2019 | November 30, | |||||||
| (Unaudited) | 2018 | |||||||
| From Operations | ||||||||
| Net investment income | $ | 2,172,226 | $ | 3,747,778 | ||||
| Net realized gain (loss) from investments | 1,602,088 | (176,594 | ) | |||||
| Net change in unrealized appreciation | ||||||||
| (depreciation) on investments | 6,924,904 | (3,131,785 | ) | |||||
| Net increase in net assets from operations | 10,699,218 | 439,399 | ||||||
| From Distributions | ||||||||
| Net dividends and distributions | (1,501,206 | ) | (5,640,614 | ) | ||||
| Net decrease in net assets resulting from | ||||||||
| dividends and distributions paid | (1,501,206 | ) | (5,640,614 | ) | ||||
| From Capital Share Transactions | ||||||||
| Proceeds from shares sold | 6,627,790 | 33,613,283 | ||||||
| Net asset value of shares issued | ||||||||
| to distributions declared | 1,247,654 | 4,874,695 | ||||||
| Cost for shares redeemed* | (21,116,938 | ) | (20,358,257 | ) | ||||
| Net increase (decrease) in net assets from | ||||||||
| capital share transactions | (13,241,494 | ) | 18,129,721 | |||||
| Total Increase (Decrease) in Net Assets | (4,043,482 | ) | 12,928,506 | |||||
| Net Assets | ||||||||
| Beginning of period | 148,365,111 | 135,436,605 | ||||||
| End of period | $ | 144,321,629 | $ | 148,365,111 | ||||
| * Net of redemption fees of | $ | 74 | $ | 1,198 | ||||
The accompanying notes are an integral part of these financial statements.
50
(This Page Intentionally Left Blank.)
51
Gerstein Fisher Multi-Factor® Growth Equity Fund
| Financial Highlights |
| Six Months | ||||
| Ended | ||||
| May 31, 2019 | ||||
| (Unaudited) | ||||
| Net Asset Value, Beginning of Year/Period | $ | 22.67 | ||
| Income from investment operations: | ||||
Net investment income(1) | 0.08 | |||
| Net realized and unrealized gain (loss) on investments | (0.75 | ) | ||
| Total from investment operations | (0.67 | ) | ||
| Less distributions paid: | ||||
| From net investment income | (0.13 | ) | ||
| From net realized gain on investments | (1.48 | ) | ||
| Total distributions paid | (1.61 | ) | ||
Paid-in capital from redemption fees (Note 2)(2) | 0.00 | |||
| Net Asset Value, End of Year/Period | $ | 20.39 | ||
Total Return(3) | -2.41 | % | ||
| Supplemental Data and Ratios: | ||||
| Net assets at end of year/period (000’s) | $ | 262,449 | ||
| Ratio of expenses to average net assets: | ||||
Before waiver, expense reimbursement and recoupments(4) | 1.03 | % | ||
After waiver, expense reimbursement and recoupments(4) | 0.99 | % | ||
| Ratio of net investment income to average net assets: | ||||
Before waiver, expense reimbursement and recoupments(4) | 0.74 | % | ||
After waiver, expense reimbursement and recoupments(4) | 0.78 | % | ||
Portfolio turnover rate(3) | 31.64 | % | ||
(1) | Per share net investment income has been calculated using the daily average share method. |
(2) | Rounds to less than 0.5 cent per share. |
(3) | Not annualized for periods less than one year. |
(4) | Annualized for periods less than one year. |
(5) | The ratio of expenses to average net assets include interest expenses. The annualized before waiver, expense reimbursement and recoupments excluding interest was 1.00%. The annualized after waiver, expense reimbursement and recoupments excluding interest was 0.99%. |
The accompanying notes are an integral part of these financial statements.
52
Per Share Data for a Share Outstanding Throughout Each Year/Period
| Year Ended November 30, | ||||||||||||||||||
| 2018 | 2017 | 2016 | 2015 | 2014 | ||||||||||||||
| $ | 22.04 | $ | 18.07 | $ | 17.84 | $ | 18.77 | $ | 17.19 | |||||||||
| 0.02 | 0.07 | 0.11 | 0.11 | 0.07 | ||||||||||||||
| 1.23 | 4.22 | 0.54 | 0.44 | 2.46 | ||||||||||||||
| 1.25 | 4.29 | 0.65 | 0.55 | 2.53 | ||||||||||||||
| (0.08 | ) | (0.10 | ) | (0.11 | ) | (0.07 | ) | (0.11 | ) | |||||||||
| (0.54 | ) | (0.22 | ) | (0.31 | ) | (1.41 | ) | (0.84 | ) | |||||||||
| (0.62 | ) | (0.32 | ) | (0.42 | ) | (1.48 | ) | (0.95 | ) | |||||||||
| 0.00 | 0.00 | 0.00 | 0.00 | 0.00 | ||||||||||||||
| $ | 22.67 | $ | 22.04 | $ | 18.07 | $ | 17.84 | $ | 18.77 | |||||||||
| 5.81 | % | 24.13 | % | 3.78 | % | 3.43 | % | 15.50 | % | |||||||||
| $ | 276,394 | $ | 307,100 | $ | 260,610 | $ | 239,939 | $ | 223,818 | |||||||||
| 1.02 | %(5) | 1.02 | % | 1.06 | % | 1.05 | % | 1.03 | % | |||||||||
| 1.00 | %(5) | 0.99 | % | 0.99 | % | 1.00 | % | 1.03 | % | |||||||||
| 0.05 | % | 0.32 | % | 0.57 | % | 0.59 | % | 0.40 | % | |||||||||
| 0.07 | % | 0.35 | % | 0.64 | % | 0.64 | % | 0.40 | % | |||||||||
| 11.86 | % | 20.81 | % | 22.06 | % | 40.10 | % | 58.82 | % | |||||||||
The accompanying notes are an integral part of these financial statements.
53
Gerstein Fisher Multi-Factor® International Growth Equity Fund
| Financial Highlights |
| Six Months | ||||
| Ended | ||||
| May 31, 2019 | ||||
| (Unaudited) | ||||
| Net Asset Value, Beginning of Year/Period | $ | 13.95 | ||
| Income from investment operations: | ||||
Net investment income(1) | 0.17 | |||
| Net realized and unrealized gain (loss) on investments | 0.41 | |||
| Total from investment operations | 0.58 | |||
| Less distributions paid: | ||||
| From net investment income | (0.15 | ) | ||
| From net realized gain on investments | (0.09 | ) | ||
| Total distributions paid | (0.24 | ) | ||
Paid-in capital from redemption fees (Note 2)(2) | 0.00 | |||
| Net Asset Value, End of Year/Period | $ | 14.29 | ||
Total Return(3) | 4.33 | % | ||
| Supplemental Data and Ratios: | ||||
| Net assets at end of year/period (000’s) | $ | 218,373 | ||
| Ratio of expenses to average net assets: | ||||
Before waiver, expense reimbursement and recoupments(4) | 1.10 | %(5) | ||
After waiver, expense reimbursement and recoupments(4) | 1.11 | %(5) | ||
| Ratio of net investment income to average net assets: | ||||
Before waiver, expense reimbursement and recoupments(4) | 2.39 | % | ||
After waiver, expense reimbursement and recoupments(4) | 2.38 | % | ||
Portfolio turnover rate(3) | 36.16 | % | ||
(1) | Per share net investment income has been calculated using the daily average share method. |
(2) | Rounds to less than 0.5 cent per share. |
(3) | Not annualized for periods less than one year. |
(4) | Annualized for periods less than one year. |
(5) | The ratio of expenses to average net assets include interest expenses. The annualized before waiver, expense reimbursement and recoupments excluding interest was 1.09%. The annualized after waiver, expense reimbursement and recoupments excluding interest was 1.10%. |
(6) | The ratio of expenses to average net assets include interest expenses. The annualized before waiver, expense reimbursement and recoupments excluding interest was 1.05%. The annualized after waiver, expense reimbursement and recoupments excluding interest was 1.10%. |
(7) | The ratio of expenses to average net assets include interest expenses. The annualized before waiver, expense reimbursement and recoupments excluding interest was 1.18%. The annualized after waiver, expense reimbursement and recoupments excluding interest was 1.12%. |
(8) | The ratio of expenses to average net assets include interest expenses. The annualized before and after waiver, expense reimbursement and recoupments excluding interest was 1.18%. |
The accompanying notes are an integral part of these financial statements.
54
Per Share Data for a Share Outstanding Throughout Each Year/Period
| Year Ended November 30, | ||||||||||||||||||
| 2018 | 2017 | 2016 | 2015 | 2014 | ||||||||||||||
| $ | 16.01 | $ | 12.06 | $ | 13.16 | $ | 14.03 | $ | 13.93 | |||||||||
| 0.19 | 0.17 | 0.18 | 0.14 | 0.21 | ||||||||||||||
| (2.01 | ) | 3.91 | (1.12 | ) | (0.20 | ) | 0.14 | |||||||||||
| (1.82 | ) | 4.08 | (0.94 | ) | (0.06 | ) | 0.35 | |||||||||||
| (0.24 | ) | (0.13 | ) | (0.16 | ) | (0.28 | ) | (0.24 | ) | |||||||||
| — | — | — | (0.53 | ) | (0.01 | ) | ||||||||||||
| (0.24 | ) | (0.13 | ) | (0.16 | ) | (0.81 | ) | (0.25 | ) | |||||||||
| 0.00 | 0.00 | 0.00 | 0.00 | 0.00 | ||||||||||||||
| $ | 13.95 | $ | 16.01 | $ | 12.06 | $ | 13.16 | $ | 14.03 | |||||||||
| -11.55 | % | 34.16 | % | -7.24 | % | -0.20 | % | 2.56 | % | |||||||||
| $ | 213,245 | $ | 239,736 | $ | 134,150 | $ | 139,209 | $ | 120,714 | |||||||||
| 1.06 | %(6) | 1.12 | % | 1.19 | %(7) | 1.19 | %(8) | 1.18 | % | |||||||||
| 1.11 | %(6) | 1.10 | % | 1.13 | %(7) | 1.19 | %(8) | 1.18 | % | |||||||||
| 1.26 | % | 1.14 | % | 1.38 | % | 1.03 | % | 1.50 | % | |||||||||
| 1.21 | % | 1.16 | % | 1.44 | % | 1.03 | % | 1.50 | % | |||||||||
| 26.38 | % | 16.29 | % | 36.19 | % | 29.84 | % | 50.99 | % | |||||||||
The accompanying notes are an integral part of these financial statements.
55
Gerstein Fisher Multi-Factor® Global Real Estate Securities Fund
| Financial Highlights |
| Six Months | ||||
| Ended | ||||
| May 31, 2019 | ||||
| (Unaudited) | ||||
| Net Asset Value, Beginning of Year/Period | $ | 10.88 | ||
| Income from investment operations: | ||||
Net investment income(1) | 0.16 | |||
| Net realized and unrealized gain (loss) on investments | 0.65 | |||
| Total from investment operations | 0.81 | |||
| Less distributions paid: | ||||
| From net investment income | (0.11 | ) | ||
| From net realized gain on investments | — | |||
| Total distributions paid | (0.11 | ) | ||
Paid-in capital from redemption fees (Note 2)(2) | 0.00 | |||
| Net Asset Value, End of Year/Period | $ | 11.58 | ||
Total Return(3) | 7.66 | % | ||
| Supplemental Data and Ratios: | ||||
| Net assets at end of year/period (000’s) | $ | 144,322 | ||
| Ratio of expenses to average net assets: | ||||
Before waiver, expense reimbursement and recoupments(4) | 0.94 | %(5) | ||
After waiver, expense reimbursement and recoupments(4) | 0.94 | %(5) | ||
| Ratio of net investment income to average net assets: | ||||
Before waiver, expense reimbursement and recoupments(4) | 2.94 | % | ||
After waiver, expense reimbursement and recoupments(4) | 2.94 | % | ||
Portfolio turnover rate(3) | 16.54 | % | ||
(1) | Per share net investment income has been calculated using the daily average share method. |
(2) | Rounds to less than 0.5 cent per share. |
(3) | Not annualized for periods less than one year. |
(4) | Annualized for periods less than one year. |
(5) | The ratio of expenses to average net assets include interest expenses. The annualized before and after waiver, expense reimbursement and recoupments excluding interest was 0.92%. |
The accompanying notes are an integral part of these financial statements.
56
Per Share Data for a Share Outstanding Throughout Each Year/Period
| Year Ended November 30, | ||||||||||||||||||
| 2018 | 2017 | 2016 | 2015 | 2014 | ||||||||||||||
| $ | 11.30 | $ | 10.35 | $ | 10.24 | $ | 10.51 | $ | 9.04 | |||||||||
| 0.28 | 0.22 | 0.25 | 0.19 | 0.20 | ||||||||||||||
| (0.26 | ) | 1.11 | 0.11 | (0.03 | ) | 1.42 | ||||||||||||
| 0.02 | 1.33 | 0.36 | 0.16 | 1.62 | ||||||||||||||
| (0.41 | ) | (0.30 | ) | (0.25 | ) | (0.43 | ) | (0.15 | ) | |||||||||
| (0.03 | ) | (0.08 | ) | — | — | — | ||||||||||||
| (0.44 | ) | (0.38 | ) | (0.25 | ) | (0.43 | ) | (0.15 | ) | |||||||||
| 0.00 | 0.00 | 0.00 | 0.00 | 0.00 | ||||||||||||||
| $ | 10.88 | $ | 11.30 | $ | 10.35 | $ | 10.24 | $ | 10.51 | |||||||||
| 0.19 | % | 13.16 | % | 3.43 | % | 1.65 | % | 18.37 | % | |||||||||
| $ | 148,365 | $ | 135,437 | $ | 100,545 | $ | 90,549 | $ | 77,825 | |||||||||
| 0.90 | % | 0.96 | % | 1.01 | % | 1.03 | % | 1.20 | % | |||||||||
| 0.92 | % | 1.00 | % | 1.00 | % | 1.00 | % | 1.00 | % | |||||||||
| 2.63 | % | 2.06 | % | 2.32 | % | 1.78 | % | 1.91 | % | |||||||||
| 2.61 | % | 2.02 | % | 2.33 | % | 1.81 | % | 2.11 | % | |||||||||
| 17.28 | % | 7.24 | % | 20.09 | % | 8.52 | % | 80.22 | % | |||||||||
The accompanying notes are an integral part of these financial statements.
57
Gerstein Fisher Funds
Notes to Financial Statements
May 31, 2019 (Unaudited)
| (1) | Organization |
Trust for Professional Managers (the “Trust”) was organized as a Delaware statutory trust under a Declaration of Trust dated May 29, 2001. The Trust is registered under the Investment Company Act of 1940, as amended (the “1940 Act”), as an open-end management investment company. The Gerstein Fisher Funds (the “Funds”) are comprised of the Gerstein Fisher Multi-Factor® Growth Equity Fund, the Gerstein Fisher Multi-Factor® International Growth Equity Fund and the Gerstein Fisher Multi-Factor® Global Real Estate Securities Fund, and each Fund represents a distinct, diversified series with its own investment objectives and policies within the Trust. The investment objective of the Gerstein Fisher Multi-Factor® Growth Equity Fund and the Gerstein Fisher Multi-Factor® International Growth Equity Fund is long-term capital appreciation. The investment objective of the Gerstein Fisher Multi-Factor® Global Real Estate Securities Fund is total return (a combination of long-term capital appreciation and current income). The Trust may issue an unlimited number of shares of beneficial interest at $0.001 par value. The Gerstein Fisher Multi-Factor® Growth Equity Fund commenced operations on December 31, 2009 and began investing consistent with its investment objective on January 15, 2010. The Gerstein Fisher Multi-Factor® International Growth Equity Fund commenced operations on January 27, 2012. The Gerstein Fisher Multi-Factor® Global Real Estate Securities Fund commenced operations on April 30, 2013. On July 21, 2016, Gerstein, Fisher & Associates, Inc. entered into a definitive agreement to be acquired by People’s Securities, Inc., a subsidiary of People’s United Bank, N.A. The transaction closed on November 2, 2016. At such time, Gerstein, Fisher & Associates, Inc. became a division of People’s Securities, Inc. and began operating as People’s Securities, Inc. doing business as Gerstein Fisher. On April 1, 2018, in connection with an internal corporate restructuring, People’s Securities, Inc. transferred the advisory agreement for the Funds to its affiliate, People’s United Advisors, Inc., a subsidiary of People’s United Bank, N.A. People’s United Advisors, Inc., doing business as Gerstein Fisher or Gerstein Fisher Asset Management (the “Advisor”), is the Funds’ investment advisor. Costs incurred by the Funds in connection with the organization, registration and initial public offering of shares were paid by the Advisor’s predecessor entity. The Funds are investment companies and accordingly follow the investment company accounting and reporting guidance of the Financial Accounting Standards Board (“FASB”) Accounting Standard Codification Topic 946 “Financial Services—Investment Companies”. | |
| (2) | Significant Accounting Policies |
| The following is a summary of significant accounting policies consistently followed by the Funds in the preparation of the financial statements. These policies are in conformity with accounting principles generally accepted in the United States of America (“GAAP”). | |
(a) Investment Valuation | |
| Each security owned by the Funds that is listed on a securities exchange, except those listed on the NASDAQ Stock Market LLC (“NASDAQ”), is valued at its last sale price on that exchange on the date as of which assets are valued. If the security is listed on more than one exchange, the Funds will use the price of the exchange that the Funds generally consider to be the principal exchange on which the stock is traded. |
58
Gerstein Fisher Funds
Notes to Financial Statements (Continued)
May 31, 2019 (Unaudited)
| Portfolio securities listed on NASDAQ will be valued at the NASDAQ Official Closing Price, which may not necessarily represent the last sale price. If there has been no sale on such exchange or on NASDAQ on such day, the security is valued at the mean between the most recent quoted bid and ask prices at the close of the exchange on such day, or at the latest sale price on the Composite Market (defined as the consolidation of the trade information provided by national securities and foreign exchanges and over-the-counter markets as published by an approved independent pricing service (“Pricing Service”)) for the day such security is being valued. | |
| Debt securities, including short-term debt instruments having a maturity of 60 days or less, are valued at the mean in accordance with prices provided by a Pricing Service. Pricing Services may use various valuation methodologies such as the mean between the bid and the asked prices, matrix pricing and other analytical pricing models as well as market transactions and dealer quotations. If a price is not available from a Pricing Service, the most recent quotation obtained from one or more broker-dealers known to follow the issue will be obtained. Quotations will be valued at the mean between the bid and the offer. Any discount or premium is accreted or amortized using the constant yield method until maturity. | |
| Rights and warrants are valued at the last sale price at the close of the exchange on which the security is primarily traded. | |
| Redeemable securities issued by open-end, registered investment companies are valued at the net asset value (“NAV”) of such companies for purchase and/or redemption orders placed on that day. If, on a particular day, a share of an investment company is not listed on NASDAQ, such security’s fair value will be determined as described below. All ETFs are valued at the last reported sales price on the exchange on which the security is principally traded. | |
| Money market mutual funds, demand notes and repurchase agreements are valued at cost. If cost does not represent current market value the securities will be priced at fair value. | |
| Foreign securities will be priced in their local currencies as of the close of their primary exchange or market or as of the time a Fund calculates its NAV, whichever is earlier. Foreign securities, currencies and other assets denominated in foreign currencies are then translated into U.S. dollars at the exchange rate of such currencies against the U.S. dollar, as provided by an approved pricing service or reporting agency. All assets denominated in foreign currencies will be converted into U.S. dollars using the applicable currency exchange rates as of the close of the New York Stock Exchange (“NYSE”), generally 4:00 p.m. Eastern Time. | |
| For foreign securities traded on foreign exchanges, the Trust has selected Interactive Data’s Fair Value Information Services (“FVIS”) to provide pricing data with respect to foreign security holdings held by the Funds. The use of this third-party pricing service is designed to capture events occurring after a foreign exchange closes that may affect the value of certain holdings of the Funds’ securities traded on those foreign exchanges. The Funds utilize a confidence interval when determining the use of the FVIS provided prices. The confidence interval is a measure of the historical |
59
Gerstein Fisher Funds
Notes to Financial Statements (Continued)
May 31, 2019 (Unaudited)
| relationship that each foreign exchange traded security has to movements in various indices and the price of the security’s corresponding American Depositary Receipt, if one exists. FVIS provides the confidence interval for each security for which it provides a price. If the FVIS provided price falls within the confidence interval the Funds will value the particular security at that price. If the FVIS provided price does not fall within the confidence interval the particular security will be valued at the preceding closing price on its respective foreign exchange, or if there were no transactions on such day, at the mean between the bid and asked prices. These securities would generally be categorized as Level 2 in the FASB Accounting Standards Codification (“ASC”) Topic 820 hierarchy. The Advisor anticipates that the Funds’ portfolio holdings will be fair valued only if market quotations for those holdings are considered unreliable. | |
| If market quotations are not readily available, any security or other asset will be valued at its fair value as determined under procedures approved by the Trust’s Board of Trustees. These fair value procedures will also be used to price a security when corporate events, events in the securities market and/or world events cause the Advisor to believe that a security’s last sale price may not reflect its actual value. The intended effect of using fair value pricing procedures is to ensure that the Funds are accurately priced. The Board of Trustees will regularly evaluate whether the Funds’ fair value pricing procedures continue to be appropriate in light of the specific circumstances of the Funds and the quality of prices obtained through the application of such procedures by the Trust’s valuation committee. | |
| When fair value pricing is employed, the prices of securities used by a Fund to calculate its NAV may differ from quoted or published prices for the same securities. Due to the subjective and variable nature of fair value pricing, it is possible that the fair value determined for a particular security may be materially different from the price of the security quoted or published by others or the value when trading resumes or realized upon sale. | |
| The Funds have adopted Statement of Financial Accounting Standards, “Fair Value Measurements and Disclosures” (“Fair Value Measurements”) and FASB Staff Position “Determining Fair Value when the Volume and Level of Activity for the Asset or Liability Have Significantly Decreased and Identified Transactions that are not Orderly” (“Determining Fair Value”). Determining Fair Value clarifies Fair Value Measurements and requires an entity to evaluate certain factors to determine whether there has been a significant decrease in volume and level of activity for the security such that recent transactions and quoted prices may not be determinative of fair value and further analysis and adjustment may be necessary to estimate fair value. Determining Fair Value also requires enhanced disclosure regarding the inputs and valuation techniques used to measure fair value in those instances as well as expanded disclosure of valuation levels for major security types. Fair Value Measurements requires the Funds to classify their securities based on valuation method. These inputs are summarized in the three broad levels listed below: |
| Level 1— | Quoted prices in active markets for identical securities. | |
| Level 2— | Other significant observable inputs (including quoted prices for similar securities, interest rates, prepayment speeds, credit risk, etc.). |
60
Gerstein Fisher Funds
Notes to Financial Statements (Continued)
May 31, 2019 (Unaudited)
| Level 3— | Significant unobservable inputs (including the Funds’ own assumptions in determining the fair value of investments). |
| The inputs or methodology used for valuing securities are not necessarily an indication of the risk associated with investing in those securities. The following is a summary of the inputs used to value the Funds’ investments carried at fair value as of May 31, 2019: |
Gerstein Fisher Multi-Factor® Growth Equity Fund | |||||||||||||||||
| Level 1 | Level 2 | Level 3^ | Total | ||||||||||||||
| Assets: | |||||||||||||||||
| Common Stocks* | $ | 262,650,270 | $ | 4 | $ | — | $ | 262,650,274 | |||||||||
| Rights | — | — | 2,341 | 2,341 | |||||||||||||
| Short-Term Investments | 681 | — | — | 681 | |||||||||||||
| Investments Purchased with | |||||||||||||||||
| Proceeds from Securities Lending | 1,489,918 | — | — | 1,489,918 | |||||||||||||
| Total Investments in Securities | $ | 264,140,869 | $ | 4 | $ | 2,341 | $ | 264,143,214 | |||||||||
| * | For further information regarding security characteristics, please see the Schedules of Investments. | |
| ^ | The Fund measures Level 3 activity as of the end of each financial reporting period. |
| Level 3 Reconciliation Disclosure | |
| The following is a reconciliation of Level 3 assets for which significant unobservable inputs were used to determine fair value: |
Description | Rights | ||||
| Balance as of 11/30/2018 | $ | 2,341 | |||
| Acquisitions | — | ||||
| Dispositions | — | ||||
| Realized Gain (Loss) | — | ||||
| Change in unrealized appreciation (depreciation) | — | ||||
| Transfers into level 3 | — | ||||
| Balance as of 5/31/2019 | $ | 2,341 | |||
| Change in unrealized appreciation (depreciation) during the | |||||
| period for Level 3 Investments held at 5/31/2019 | $ | — | |||
| The following table represents additional information about valuation methodologies and inputs used for investments that are measured at fair value and categorized within Level 3 as of May 31, 2019: |
| Range/Weighted | |||||
| Fair Value | Valuation | Unobservable | Average | ||
Description | May 31, 2019 | Methodologies | Input | Unobservable Input+ | |
| Rights | $2,341 | Last traded price | Market | $0.58 | |
| and company- | Assessment | ||||
| specific | |||||
| information |
+ Table presents information for one security, which has been valued at $0.58 throughout the period. |
61
Gerstein Fisher Funds
Notes to Financial Statements (Continued)
May 31, 2019 (Unaudited)
Gerstein Fisher Multi-Factor® International Growth Equity Fund | |||||||||||||||||
| Level 1 | Level 2 | Level 3 | Total | ||||||||||||||
| Assets: | |||||||||||||||||
| Common Stocks* | $ | 7,086,151 | $ | 209,062,160 | $ | — | $ | 216,148,311 | |||||||||
| Short-Term Investments | 737,888 | — | — | 737,888 | |||||||||||||
| Investments Purchased | |||||||||||||||||
| with Proceeds from | |||||||||||||||||
| Securities Lending | 3,101,826 | — | — | 3,101,826 | |||||||||||||
| Total Investments | |||||||||||||||||
| in Securities | $ | 10,925,865 | $ | 209,062,160 | $ | — | $ | 219,988,025 | |||||||||
| * | For further information regarding security characteristics, please see the Schedules of Investments. |
| The Fund did not hold any Level 3 securities during the period. |
Gerstein Fisher Multi-Factor® Global Real Estate Securities Fund | |||||||||||||||||
| Level 1 | Level 2 | Level 3^ | Total | ||||||||||||||
| Assets: | |||||||||||||||||
| Common Stocks* | $ | 3,014,746 | $ | 21,636,485 | $ | — | $ | 24,651,231 | |||||||||
| Real Estate | |||||||||||||||||
| Investment Trusts* | 86,085,135 | 33,568,234 | 3,745 | 119,657,114 | |||||||||||||
| Closed-End Funds | 42,505 | — | — | 42,505 | |||||||||||||
| Liquidating Trusts | — | — | 11,604 | 11,604 | |||||||||||||
| Short-Term Investments | 81 | — | — | 81 | |||||||||||||
| Investments Purchased | |||||||||||||||||
| with Proceeds from | |||||||||||||||||
| Securities Lending | 131,334 | — | — | 131,334 | |||||||||||||
| Total Investments | |||||||||||||||||
| in Securities | $ | 89,273,801 | $ | 55,204,719 | $ | 15,349 | $ | 144,493,869 | |||||||||
| * | For further information regarding security characteristics, please see the Schedules of Investments. | |
| ^ | The Fund measures Level 3 activity as of the end of each financial reporting period. |
| Level 3 Reconciliation Disclosure | |
| The following is a reconciliation of Level 3 assets for which significant unobservable inputs were used to determine fair value: |
| Real Estate | |||||||||
Description | Investment Trusts | Liquidating Trusts | |||||||
| Balance as of 11/30/2018 | $ | 3,945 | $ | — | |||||
| Acquisitions | — | — | |||||||
| Dispositions | — | — | |||||||
| Realized Gain (Loss) | — | — | |||||||
| Change in unrealized | |||||||||
| appreciation (depreciation) | (200 | ) | — | ||||||
| Transfers into level 3 | — | 11,604 | |||||||
| Balance as of 5/31/2019 | $ | 3,745 | $ | 11,604 | |||||
| Change in unrealized appreciation | |||||||||
| (depreciation) during the period for | |||||||||
| Level 3 Investments held at 5/31/2019 | $ | (200 | ) | $ | — | ||||
62
Gerstein Fisher Funds
Notes to Financial Statements (Continued)
May 31, 2019 (Unaudited)
| Range/Weighted | |||||
| Fair Value | Valuation | Unobservable | Average | ||
Description | May 31, 2019 | Methodologies | Input | Unobservable Input | |
| Real Estate | $3,745 | Last traded price | Liquidation | $0.04(1) | |
| Investment Trusts | and company- | Value | |||
| specific | |||||
| information | |||||
| Liquidating Trusts | $11,604 | Last traded price | Liquidation | $1.21(2) | |
| and company- | Value | ||||
| specific | |||||
| information |
(1) | Value presents information for one security, which has been valued at 0.05 Australian dollars throughout the period. | |
(2) | Value presents information for one security, which has been valued at $1.21 throughout the period. |
| The Funds did not hold derivative instruments during the six months ended May 31, 2019. | |
(b) Foreign Securities and Currency | |
| Investment securities and other assets and liabilities denominated in foreign currencies are translated into U.S. dollar amounts on the date of valuation. Purchases and sales of investment securities and income and expense items denominated in foreign currencies are translated into U.S. dollar amounts on the respective dates of such transactions. | |
| The Funds do not isolate the portion of the results of operations from changes in foreign exchange rates on investments from those resulting from the changes in market prices of securities held. Reported net realized foreign exchange gains or losses arise from sales of portfolio securities, sales and maturities of short-term securities, sales of foreign currencies, currency gains or losses realized between trade and settlement dates on securities transactions, and the difference between the amounts of dividends, interest and foreign withholding taxes recorded on the Funds’ books, and the U.S. dollar equivalent of the amounts actually received or paid. Net unrealized foreign exchange gains and losses arise from changes in the values of assets and liabilities, including investments in securities at fiscal period end, resulting from changes in the exchange rate. | |
| Investments in foreign securities entail certain risks. Individual foreign economies of certain countries may differ favorably or unfavorably from the U.S. economy in such respects as growth of gross national product, rate of inflation, capital reinvestment, resource self-sufficiency, diversification and balance of payments position. The internal politics of certain foreign countries may not be as stable as those of the United States. Since foreign securities normally are denominated and traded in foreign currencies, the value of a Fund’s assets may be affected favorably or unfavorably by currency exchange rates, currency exchange control regulations, foreign withholding taxes, and restrictions or prohibitions on the repatriation of foreign currencies. There may be less information publicly available about a foreign issuer than about a U.S. issuer, and foreign issuers are not generally subject to accounting, |
63
Gerstein Fisher Funds
Notes to Financial Statements (Continued)
May 31, 2019 (Unaudited)
| auditing, and financial reporting standards and practices comparable to those in the United States. The securities of some foreign issuers are less liquid and at times more volatile than securities of comparable U.S. issuers. | |
(c) Security Loans | |
| When the Funds loan securities held in their portfolios, the Funds receive compensation in the form of fees, or retain a portion of the interest on the investment of any cash received as collateral. The loans are secured by collateral at least equal to: (i) 105% of the market value of the loaned securities that are foreign securities, or 102% of the market value of any other loaned securities, at the time the securities are loaned; and (ii) 100% of the market value of the loaned securities at all times. Gain or loss in the value of securities loaned that may occur during the term of the loan will be for the account of the Funds. The Funds have the right under the lending agreement to recover the securities from the borrower on demand. | |
(d) Federal Income Taxes | |
| The Funds comply with the requirements of Subchapter M of the Internal Revenue Code of 1986, as amended, necessary to qualify as a regulated investment company and make the requisite distributions of income and capital gains to its shareholders sufficient to relieve it from all or substantially all federal income taxes. Therefore, no federal income tax provision has been provided. | |
(e) Distributions to Shareholders | |
| The Funds will distribute net investment income and net capital gains at least annually. Distributions from net realized gains for book purposes may include short-term capital gains. All short-term capital gains are included in ordinary income for tax purposes. Distributions to shareholders are recorded on the ex-dividend date. The Funds may also pay a special distribution at the end of the calendar year to comply with federal tax requirements. | |
| The amounts of dividends from net investment income and distributions from net realized gains are determined in accordance with federal income tax regulations, which may differ from GAAP. These differences are either temporary or permanent in nature. To the extent these differences are permanent in nature, such amounts are reclassified within the composition of net assets based on their federal tax-basis treatment. | |
(f) Use of Estimates | |
| The preparation of financial statements in conformity with GAAP requires management to make estimates and assumptions that affect the reported amounts of assets and liabilities and disclosure of contingent assets and liabilities at the date of the financial statements and the reported amounts of revenues and expenses during the reporting period. Actual results could differ from those estimates. | |
(g) Share Valuation | |
| The NAV per share of each Fund is calculated by dividing the sum of the value of the securities held by each Fund, plus cash or other assets, minus all liabilities (including |
64
Gerstein Fisher Funds
Notes to Financial Statements (Continued)
May 31, 2019 (Unaudited)
| estimated accrued expenses) by the total number of shares outstanding for each Fund, rounded to the nearest cent. The Funds’ shares will not be priced on the days on which the New York Stock Exchange is closed for trading. The offering and redemption price per share for each Fund is equal to each Fund’s NAV per share. The Funds charge a 1.00% redemption fee on the net amount of the redemption on shares held for 60 days or less. These fees are deducted from the redemption proceeds otherwise payable to the shareholder. The Funds will retain the fee charged as an increase in paid-in capital and such fees become part of each Fund’s daily NAV calculation. | |
(h) Expenses | |
| Expenses associated with a specific fund in the Trust are charged to that fund. Common expenses are typically allocated evenly between the funds of the Trust, or by other equitable means. | |
(i) Other | |
| Investment transactions are recorded on the trade date. Realized gains and losses are evaluated on the basis of identified cost. Dividend income is recognized on the ex-dividend date and interest income is recognized on an accrual basis. Distributions received from the Funds’ investments in domestic REITs are comprised of ordinary income, capital gains and return of capital, as applicable. For financial statement purposes, the Funds use estimates to characterize these distributions received as return of capital, capital gains or ordinary income. Such estimates are based on historical information available from each REIT and other industry sources. These estimates may subsequently be revised based on information received for the security after its tax reporting periods are concluded, as the actual character of these distributions is not known until after the fiscal year end of the Funds. Changes to estimates will be recorded in the period they are known. The distributions received from REIT securities that have been classified as income and capital gains are included in dividend income and net realized gain on investments, respectively, on the Statements of Operations. The distributions received that are classified as return of capital reduced the cost of investments on the Statements of Assets and Liabilities. | |
| Withholding taxes on foreign dividends, net of any reclaims, have been provided for in accordance with the Funds’ understanding of the applicable country’s tax rules and rates. | |
| (3) | Federal Tax Matters |
| The tax character of distributions paid during the years ended November 30, 2018 and November 30, 2017 were as follows: |
| Ordinary | Long-Term | ||
Income | Capital Gains | ||
Gerstein Fisher Multi-Factor® | |||
| Growth Equity Fund | |||
| Year Ended November 30, 2018 | $1,090,856 | $7,534,881 | |
| Year Ended November 30, 2017 | $1,480,248 | $3,191,563 |
65
Gerstein Fisher Funds
Notes to Financial Statements (Continued)
May 31, 2019 (Unaudited)
| Ordinary | Long-Term | ||
Income | Capital Gains | ||
Gerstein Fisher Multi-Factor® | |||
| International Growth Equity Fund | |||
| Year Ended November 30, 2018 | $3,672,334 | $ — | |
| Year Ended November 30, 2017 | $1,430,467 | $ — | |
| Ordinary | Long-Term | ||
Income | Capital Gains | ||
Gerstein Fisher Multi-Factor® | |||
| Global Real Estate Securities Fund | |||
| Year Ended November 30, 2018 | $5,329,605 | $311,009 | |
| Year Ended November 30, 2017 | $2,912,688 | $966,049 |
| As of November 30, 2018, the components of accumulated earnings (losses) on a tax basis were as follows: |
| Gerstein Fisher | Gerstein Fisher | ||||||||||||
| Gerstein Fisher | Multi-Factor® | Multi-Factor® | |||||||||||
Multi-Factor® | International | Global Real | |||||||||||
| Growth Equity | Growth Equity | Estate Securities | |||||||||||
| Fund | Fund | Fund | |||||||||||
| Cost basis of investments for | |||||||||||||
| federal income tax purposes | $ | 152,604,471 | $ | 193,760,243 | $ | 139,414,134 | |||||||
| Gross tax unrealized appreciation | 128,172,333 | 33,885,516 | 18,990,581 | ||||||||||
| Gross tax unrealized depreciation | (3,831,937 | ) | (17,069,514 | ) | (10,271,189 | ) | |||||||
| Net tax unrealized appreciation | 124,340,396 | 16,816,002 | 8,719,392 | ||||||||||
| Undistributed ordinary income | 57,049 | 2,185,111 | 307,014 | ||||||||||
| Undistributed long-term capital gain | 18,030,772 | 1,296,127 | — | ||||||||||
| Total distributable earnings | 18,087,821 | 3,481,238 | 307,014 | ||||||||||
| Other accumulated gain/(loss) | — | (18,726 | ) | (416,180 | ) | ||||||||
| Total accumulated gains | $ | 142,428,217 | $ | 20,278,514 | $ | 8,610,226 | |||||||
| The basis of investments for tax and financial reporting purposes differs principally due to the deferral of losses on wash sales, mark-to-market of passive foreign investment company (“PFIC”) adjustments, and Partnership Basis Adjustments. | |
| At November 30, 2018, the Funds had the following capital losses remaining, which will be carried forward indefinitely to offset future realized capital gains. To the extent the Funds realize future net capital gains, taxable distributions to its shareholders will be first offset by any unused capital loss carryovers from the year ended November 30, 2018. |
Short-Term | Long-Term | ||
Gerstein Fisher Multi-Factor® | |||
| Global Real Estate Securities Fund | $12,846 | $400,803 |
The Gerstein Fisher Multi-Factor® International Growth Equity Fund utilized $1,267,130 of short-term capital loss carryover in the fiscal year 2018. |
66
Gerstein Fisher Funds
Notes to Financial Statements (Continued)
May 31, 2019 (Unaudited)
| Additionally, GAAP requires that certain components of net assets relating to permanent differences be reclassified between financial and tax reporting. These reclassifications have no effect on net assets or net asset value per share. For the year ended November 30, 2018, the following table shows the reclassifications made: |
| Gerstein Fisher | Gerstein Fisher | ||||||||||||
| Gerstein Fisher | Multi-Factor® | Multi-Factor® | |||||||||||
Multi-Factor® | International | Global Real | |||||||||||
| Growth Equity | Growth Equity | Estate Securities | |||||||||||
| Fund | Fund | Fund | |||||||||||
| Total distributable earnings | $ | — | $ | — | $ | — | |||||||
| Paid-in capital | $ | — | $ | — | $ | — | |||||||
| The Funds had no material uncertain tax positions and have not recorded a liability for unrecognized tax benefits as of November 30, 2018. Also, the Funds had recognized no interest and penalties related to uncertain tax benefits in fiscal year 2018. At November 30, 2018, the fiscal tax years 2015 through 2018 remain open to examination for the Funds in the Funds’ major tax jurisdictions. | |
| (4) | Investment Advisor |
The Trust, on behalf of the Funds, has an Investment Advisory Agreement (the “Agreement”) with the Advisor to furnish investment advisory services to the Funds. Under the terms of the Agreement, the Gerstein Fisher Multi-Factor® Growth Equity Fund, the Gerstein Fisher Multi-Factor® International Growth Equity Fund and the Gerstein Fisher Multi-Factor® Global Real Estate Securities Fund compensate the Advisor for its management services at the annual rate of 0.85%, 0.85% and 0.65%, respectively, of each Fund’s average daily net assets. | |
| The Advisor has contractually agreed to waive its management fee and/or reimburse each Fund’s other expenses at least through the expiration dates listed below, at the discretion of the Advisor and the Board of Trustees, to the extent necessary to ensure that the Fund’s operating expenses (exclusive of front-end or contingent deferred loads, Rule 12b-1 plan fees, shareholder servicing plan fees, taxes, leverage (i.e., any expenses incurred in connection with borrowings made by the Fund), interest (including interest incurred in connection with bank and custody overdrafts), brokerage commissions and other transactional expenses, expenses incurred in connection with any merger or reorganization, dividends or interest on short positions, acquired fund fees and expenses or extraordinary expenses such as litigation) do not exceed the expense limitation caps listed below of each Fund’s average daily net assets. |
| Expense | |||
Limitation Cap | Expiration Date | ||
Gerstein Fisher Multi-Factor® | |||
| Growth Equity Fund | 0.99% | March 30, 2020 | |
Gerstein Fisher Multi-Factor® | |||
| International Growth Equity Fund | 1.10% | March 30, 2020 | |
Gerstein Fisher Multi-Factor® | |||
| Global Real Estate Securities Fund | 1.00% | March 30, 2020 |
67
Gerstein Fisher Funds
Notes to Financial Statements (Continued)
May 31, 2019 (Unaudited)
| Any such waiver or reimbursement is subject to later adjustment to allow the Advisor to recoup amounts waived or reimbursed to the extent actual fees and expenses for a fiscal period do not exceed the lesser of: (1) the Expense Limitation Cap in place at the time of the waiver or reimbursement; or (2) the Expense Limitation Cap in place at the time of the recoupment; provided, however, that the Advisor shall only be entitled to recoup such amounts over the following three year period from the date of the waiver or reimbursement. | |
| The following table shows the remaining waived or reimbursed expenses subject to potential recovery expiring during the fiscal period ending: |
| Gerstein Fisher | Gerstein Fisher | ||||||||||||
| Gerstein Fisher | Multi-Factor® | Multi-Factor® | |||||||||||
Multi-Factor® | International | Global Real | |||||||||||
| Growth Equity | Growth Equity | Estate Securities | |||||||||||
| Fund | Fund | Fund | |||||||||||
| November 30, 2019 | $ | 95,111 | $ | — | $ | — | |||||||
| November 30, 2020 | $ | 96,324 | $ | 7,714 | $ | — | |||||||
| November 30, 2021 | $ | 60,048 | $ | — | $ | — | |||||||
| May 31, 2022 | $ | 50,482 | $ | — | $ | — | |||||||
| (5) | Related Party Transactions |
| U.S. Bancorp Fund Services, LLC, doing business as U.S. Bank Global Fund Services (“Fund Services” or the “Administrator”), acts as the Funds’ Administrator under an Administration Agreement. The Administrator prepares various federal and state regulatory filings, reports and returns for the Funds; prepares reports and materials to be supplied to the Trustees; monitors the activities of the Funds’ custodian, transfer agent and accountants; coordinates the preparation and payment of the Funds’ expenses; and reviews the Funds’ expense accruals. Fund Services also serves as the fund accountant and transfer agent to the Funds. U.S. Bank National Association (“US Bank”), an affiliate of Fund Services, serves as each Fund’s custodian. Fees and expenses incurred for the six months ended May 31, 2019, and owed as of May 31, 2019, are as follows: |
Administration and Accounting | Incurred | Owed | |
Gerstein Fisher Multi-Factor® Growth Equity Fund | $95,604 | $34,986 | |
Gerstein Fisher Multi-Factor® International | |||
| Growth Equity Fund | $98,240 | $35,072 | |
Gerstein Fisher Multi-Factor® Global | |||
| Real Estate Securities Fund | $73,680 | $24,265 | |
Transfer Agency | Incurred(1) | Owed | |
Gerstein Fisher Multi-Factor® Growth Equity Fund | $28,658 | $9,769 | |
Gerstein Fisher Multi-Factor® International | |||
| Growth Equity Fund | $22,596 | $7,927 | |
Gerstein Fisher Multi-Factor® Global | |||
| Real Estate Securities Fund | $15,564 | $5,339 |
(1) | These amounts do not include sub-transfer agency fees, therefore they do not agree to the amount on the Statements of Operations. |
68
Gerstein Fisher Funds
Notes to Financial Statements (Continued)
May 31, 2019 (Unaudited)
Custody | Incurred | Owed | |
Gerstein Fisher Multi-Factor® Growth Equity Fund | $ 4,708 | $ 1,108 | |
Gerstein Fisher Multi-Factor® International | |||
| Growth Equity Fund | $43,268 | $ 6,852 | |
Gerstein Fisher Multi-Factor® Global | |||
| Real Estate Securities Fund | $28,054 | $10,504 |
| The Funds each have a line of credit with US Bank (see Note 8). | |
| The Funds have entered into a securities lending agreement with US Bank (see Note 9). | |
| Quasar Distributors, LLC (the “Distributor”) acts as the Funds’ principal underwriter in a continuous public offering of the Funds’ shares. The Distributor is an affiliate of Fund Services and US Bank. | |
| Certain officers of the Funds are also employees of Fund Services. A Trustee of the Trust is affiliated with Fund Services and US Bank. This same Trustee is a board member and an interested person of the Distributor. | |
| The Trust’s Chief Compliance Officer is also an employee of Fund Services. Each Fund’s allocation of the Trust’s Chief Compliance Officer fee incurred for the six months ended May 31, 2019, and owed as of May 31, 2019, are as follows: |
Incurred | Owed | ||
Gerstein Fisher Multi-Factor® Growth Equity Fund | $5,208 | $1,664 | |
Gerstein Fisher Multi-Factor® International | |||
| Growth Equity Fund | $5,208 | $1,669 | |
Gerstein Fisher Multi-Factor® Global | |||
| Real Estate Securities Fund | $5,208 | $1,666 |
| (6) | Capital Share Transactions |
| Transactions in shares of the Funds were as follows: | |
Gerstein Fisher Multi-Factor® Growth Equity Fund |
| Six Months Ended | Year Ended | ||||||||
| May 31, 2019 | November 30, 2018 | ||||||||
| Shares sold | 1,062,152 | 1,618,287 | |||||||
| Shares reinvested | 1,030,595 | 393,269 | |||||||
| Shares redeemed | (1,417,612 | ) | (3,750,455 | ) | |||||
| Net increase (decrease) | 675,135 | (1,738,899 | ) | ||||||
Gerstein Fisher Multi-Factor® International Growth Equity Fund |
| Six Months Ended | Year Ended | ||||||||
| May 31, 2019 | November 30, 2018 | ||||||||
| Shares sold | 1,917,119 | 3,050,075 | |||||||
| Shares reinvested | 189,746 | 168,822 | |||||||
| Shares redeemed | (2,115,276 | ) | (2,905,433 | ) | |||||
| Net increase (decrease) | (8,411 | ) | 313,464 | ||||||
69
Gerstein Fisher Funds
Notes to Financial Statements (Continued)
May 31, 2019 (Unaudited)
Gerstein Fisher Multi-Factor® Global Real Estate Securities Fund |
| Six Months Ended | Year Ended | ||||||||
| May 31, 2019 | November 30, 2018 | ||||||||
| Shares sold | 589,302 | 3,082,385 | |||||||
| Shares reinvested | 117,511 | 440,561 | |||||||
| Shares redeemed | (1,884,361 | ) | (1,871,196 | ) | |||||
| Net increase (decrease) | (1,177,548 | ) | 1,651,750 | ||||||
| (7) | Investment Transactions |
| The aggregate securities transactions, excluding short-term investments, for the Funds for the six months ended May 31, 2019, are listed below. The Funds did not have any purchases or sales of long-term U.S. Government securities. |
Purchases | Sales | ||
Gerstein Fisher Multi-Factor® | |||
| Growth Equity Fund | $86,694,373 | $90,745,222 | |
Gerstein Fisher Multi-Factor® | |||
| International Growth Equity Fund | $76,861,478 | $77,225,762 | |
Gerstein Fisher Multi-Factor® | |||
| Global Real Estate Securities Fund | $24,365,650 | $35,387,670 |
| (8) | Line of Credit |
At May 31, 2019, the Gerstein Fisher Multi-Factor® Growth Equity Fund, Gerstein Fisher Multi-Factor® International Growth Equity Fund and Gerstein Fisher Multi-Factor® Global Real Estate Securities Fund each had lines of credit in the amount of the lesser of 33.33% of the fair value of unencumbered assets of the Fund or $10,000,000, $10,000,000 and $4,000,000, respectively, which all mature August 9, 2019. These unsecured lines of credit are intended to provide short-term financing, if necessary, subject to certain restrictions, in connection with shareholder redemptions. The credit facility is with the Funds’ custodian, US Bank. Interest was accrued at the prime rate of 5.25% from December 1, 2018 through December 19, 2018 and 5.50% thereafter. As of May 31, 2019, the Gerstein Fisher Multi-Factor® Growth Equity Fund had an outstanding balance on its line of credit of $359,000 and the Gerstein Fisher Multi-Factor® Global Real Estate Securities Fund had an outstanding balance on its line of credit of $3,109,000. There was no outstanding balance on the line of credit for the Gerstein Fisher Multi-Factor® International Growth Equity Fund as of May 31, 2019. The following table provides information regarding usage of the line of credit for the six months ended May 31, 2019. |
70
Gerstein Fisher Funds
Notes to Financial Statements (Continued)
May 31, 2019 (Unaudited)
| Average | Maximum | Date of | ||||
| Days | Amount of | Interest | Amount of | Maximum | ||
Utilized | Borrowing | Expense* | Borrowing | Borrowing | ||
| Gerstein Fisher | ||||||
Multi-Factor® Growth | ||||||
| Equity Fund | 66 | $ 677,061 | $ 6,814 | $2,581,000 | 1/2/2019 | |
| Gerstein Fisher | ||||||
Multi-Factor® | ||||||
| International Growth | ||||||
| Equity Fund | 63 | $1,258,841 | $11,833 | $4,452,000 | 1/2/2019 | |
| Gerstein Fisher | ||||||
Multi-Factor® Global Real | ||||||
| Estate Securities Fund | 126 | $1,058,238 | $20,366 | $3,453,000 | 1/2/2019 |
| * | Interest expense is included with “Other expenses” on the Statements of Operations. |
| (9) | Securities Lending |
| Following terms of a securities lending agreement with the Funds’ custodian, U.S. Bank, each Fund may lend securities from its portfolio to brokers, dealers and financial institutions in order to increase the return on its portfolio, primarily through the receipt of borrowing fees and earnings on invested collateral. Any such loan must be continuously secured by collateral in cash or cash equivalents maintained on a current basis in an amount at least equal to the market value of the securities loaned by a Fund. During the time securities are on loan, the borrower will pay the applicable Fund any accrued income on those securities, and the Fund may invest the cash collateral and earn income or receive an agreed-upon fee from a borrower that has delivered cash-equivalent collateral. In determining whether or not to lend a security to a particular broker, dealer or financial institution, the Advisor considers all relevant facts and circumstances, including the size, creditworthiness and reputation of the broker, dealer or financial institution. | |
| Securities lending involves the risk of a default or insolvency of the borrower. In either of these cases, a Fund could experience delays in recovering securities or collateral or could lose all or part of the value of the loaned securities. A Fund also could lose money in the event of a decline in the value of the collateral provided for loaned securities. Additionally, the loaned portfolio securities may not be available to a Fund on a timely basis and that Fund may therefore lose the opportunity to sell the securities at a desirable price. Any decline in the value of a security that occurs while the security is out on loan would continue to be borne by the applicable Fund. |
71
Gerstein Fisher Funds
Notes to Financial Statements (Continued)
May 31, 2019 (Unaudited)
| As of May 31, 2019, the market value of the securities on loan and value of collateral received for securities lending were as follows: |
| Loaned Securities | Value of | % of | ||
Market Value | Cash Collateral | Net Assets | ||
Gerstein Fisher Multi-Factor® | ||||
| Growth Equity Fund | $1,393,836 | $1,489,918 | 0.53% | |
Gerstein Fisher Multi-Factor® | ||||
| International Growth Equity Fund | $2,783,215 | $3,101,826 | 1.27% | |
Gerstein Fisher Multi-Factor® Global | ||||
| Real Estate Securities Fund | $ 127,482 | $ 131,334 | 0.09% |
| The Funds receive cash as collateral in return for securities lent as part of the securities lending program. The collateral is invested in the First American Government Obligations Fund – Class Y (a money market fund subject to Rule 2a-7 under the 1940 Act). The Schedule of Investments for the Funds include the particular cash collateral holding as of May 31, 2019. The remaining contractual maturity of all securities lending transactions is overnight and continuous. | |
| The Funds are not subject to a master netting agreement with respect to securities lending; therefore no additional disclosures are required. | |
| The fee and interest income earned by the Funds on investments of cash collateral received from borrowers for the securities loaned to them are reflected in the Funds’ Statements of Operations. | |
| (10) | Beneficial Ownership |
| The beneficial ownership, either directly or indirectly, of more than 25% of the voting securities of a fund creates a presumption of control of the fund, under Section 2(a)(9) of the 1940 Act. At May 31, 2019, Pershing, LLC, for the benefit of others, held the following percentage of each Fund’s outstanding shares: |
| Gerstein Fisher | Gerstein Fisher | |
| Gerstein Fisher | Multi-Factor® | Multi-Factor® |
Multi-Factor® | International | Global Real |
| Growth Equity | Growth Equity | Estate Securities |
Fund | Fund | Fund |
| 46.55% | 36.73% | 41.04% |
| (11) | Recent Accounting Pronouncements |
In August 2018, FASB issued ASU 2018-13, Fair Value Measurement (Topic 820): Disclosure Framework—Changes to the Disclosure Requirements for Fair Value Measurement (“ASU 2018-13”). The primary focus of ASU 2018-13 is to improve the effectiveness of the disclosure requirements for fair value measurements. The changes affect all companies that are required to include fair value measurement disclosures. In general, the amendments in ASU 2018-13 are effective for all entities for fiscal years and interim periods within those fiscal years, beginning after |
72
Gerstein Fisher Funds
Notes to Financial Statements (Continued)
May 31, 2019 (Unaudited)
| December 15, 2019. An entity is permitted to early adopt the removed or modified disclosures upon the issuance of ASU 2018-13 and may delay adoption of the additional disclosures, which are required for public companies only, until their effective date. Management has chosen to early adopt the eliminated or modified disclosures for the period ended May 31, 2019. | |
| (12) | Subsequent Event |
On June 17, 2019, the Gerstein Fisher Multi-Factor® Global Real Estate Securities Fund declared and paid a distribution from ordinary income of $1,068,892 to the shareholders of record on June 14, 2019. |
73
Gerstein Fisher Funds
Notice of Privacy Policy & Practices
We collect non-public personal information about you from the following sources:
• information we receive about you on applications or other forms;
• information you give us orally; and
• information about your transactions with us or others.
We do not disclose any non-public personal information about our shareholders or former shareholders without the shareholder’s authorization, except as permitted by law or in response to inquiries from governmental authorities. We may share information with affiliated parties and unaffiliated third parties with whom we have contracts for servicing the Funds. We will provide unaffiliated third parties with only the information necessary to carry out their assigned responsibility. All shareholder records will be disposed of in accordance with applicable law. We maintain physical, electronic and procedural safeguards to protect your non-public personal information and require third parties to treat your non-public personal information with the same high degree of confidentiality.
In the event that you hold shares of the Funds through a financial intermediary, including, but not limited to, a broker-dealer, bank or trust company, the privacy policy of your financial intermediary would govern how your non-public personal information would be shared with unaffiliated third parties.
74
Gerstein Fisher Funds
Additional Information
(Unaudited)
Tax Information
The Funds designated the following percentages of ordinary dividends declared during the fiscal year ended November 30, 2018 as dividends qualifying for the dividends received deduction available to corporate shareholders:
Gerstein Fisher Multi-Factor® Growth Equity Fund | 100.00% |
Gerstein Fisher Multi-Factor® International Growth Equity Fund | 0.00% |
Gerstein Fisher Multi-Factor® Global Real Estate Securities Fund | 6.74% |
The Funds designated the following percentages of ordinary dividends declared from net investment income during the fiscal year ended November 30, 2018, as qualified income under the Jobs and Growth Tax Relief Act of 2003:
Gerstein Fisher Multi-Factor® Growth Equity Fund | 100.00% |
Gerstein Fisher Multi-Factor® International Growth Equity Fund | 95.56% |
Gerstein Fisher Multi-Factor® Global Real Estate Securities Fund | 50.99% |
The Gerstein Fisher Multi-Factor® International Growth Equity Fund has elected to pass through to its shareholders the foreign taxes paid for the year ended November 30, 2018 as follows:
| Foreign | |||
| Foreign | Foreign | Paid Taxes | |
Dividend Income | Taxes Paid | per share | |
Gerstein Fisher Multi-Factor® | |||
| International Growth Equity Fund | $6,040,377 | $591,117 | $0.0387 |
The Funds designated as long-term capital gain dividend, pursuant to Internal Revenue Code Section 852(b)(3) for the tax year ended November 30, 2018. The amounts designated as long-term capital gains were as follows:
| Gerstein Fisher | Gerstein Fisher | |
| Gerstein Fisher | Multi-Factor® | Multi-Factor® |
Multi-Factor® | International | Global Real |
| Growth Equity | Growth Equity | Estate Securities |
Fund | Fund | Fund |
| $7,534,881 | $— | $311,009 |
Ordinary Income Dividend and Foreign Tax Credit
The Gerstein Fisher Multi-Factor® International Growth Equity Fund has made an election under Section 853 of the Internal Revenue Code to provide to its shareholders the benefit of foreign tax credits in the per share amount designated below. Therefore, shareholders who must file a U.S. Federal Income tax return will be entitled to a foreign tax credit or itemized deduction in an amount equal to $0.0326 per share for each share owned on November 30, 2018, in computing their tax liability. It is generally more advantageous to claim a credit than a deduction.
75
Gerstein Fisher Funds
Additional Information (Continued)
(Unaudited)
Indemnifications
Under the Trust’s organizational documents, its officers and Trustees are indemnified against certain liabilities arising out of the performance of their duties to the Funds. In addition, in the normal course of business, the Funds enter into contracts that provide general indemnifications to other parties. The Funds’ maximum exposure under these arrangements is unknown as this would involve future claims that may be made against the Funds that have not yet occurred. However, the Funds have not had prior claims or losses pursuant to these contracts and expects the risk of loss to be remote.
Information about Trustees
The business and affairs of the Trust are managed under the direction of the Board of Trustees. Information pertaining to the Trustees of the Trust is set forth below. The Statement of Additional Information includes additional information about the Trustees and is available, without charge, upon request by calling 800-473-1155.
| Other | |||||
| Directorships | |||||
| Term of | Number of | Principal | Held by | ||
| Office and | Portfolios | Occupation(s) | Trustee | ||
| Position(s) | Length | in Trust | During the | During the | |
| Name, Address | Held with | of Time | Overseen | Past Five | Past Five |
and Year of Birth | the Trust | Served | by Trustee | Years | Years |
| Independent Trustees | |||||
| Michael D. Akers, Ph.D. | Trustee | Indefinite | 28 | Professor Emeritus, | Independent |
| 615 E. Michigan St. | Term; Since | Department of | Trustee, USA | ||
| Milwaukee, WI 53202 | August 22, | Accounting (June | MUTUALS | ||
| Year of Birth: 1955 | 2001 | 2019–present), | (an open-end | ||
| Professor, | investment | ||||
| Department | company with | ||||
| of Accounting | two portfolios). | ||||
| (2004–May 2019), | |||||
| Chair, Department | |||||
| of Accounting | |||||
| (2004–2017), | |||||
| Marquette University. | |||||
| Gary A. Drska | Trustee | Indefinite | 28 | Pilot, | Independent |
| 615 E. Michigan St. | Term; Since | Frontier/Midwest | Trustee, USA | ||
| Milwaukee, WI 53202 | August 22, | Airlines, Inc. | MUTUALS | ||
| Year of Birth: 1956 | 2001 | (airline company) | (an open-end | ||
| (1986–present). | investment | ||||
| company with | |||||
| two portfolios). |
76
Gerstein Fisher Funds
Additional Information (Continued)
(Unaudited)
| Other | |||||
| Directorships | |||||
| Term of | Number of | Principal | Held by | ||
| Office and | Portfolios | Occupation(s) | Trustee | ||
| Position(s) | Length | in Trust | During the | During the | |
| Name, Address | Held with | of Time | Overseen | Past Five | Past Five |
and Year of Birth | the Trust | Served | by Trustee | Years | Years |
| Jonas B. Siegel | Trustee | Indefinite | 28 | Retired | Independent |
| 615 E. Michigan St. | Term; Since | (2011–present); | Trustee, | ||
| Milwaukee, WI 53202 | October 23, | Managing Director, | Gottex Trust | ||
| Year of Birth: 1943 | 2009 | Chief Administrative | (an open-end | ||
| Officer (“CAO”) and | investment | ||||
| Chief Compliance | company | ||||
| Officer (“CCO”), | (2010–2016); | ||||
| Granite Capital | Independent | ||||
| International Group, | Manager, | ||||
| L.P. (an investment | Ramius IDF | ||||
| management firm) | fund complex | ||||
| (1994–2011). | (two closed- | ||||
| end investment | |||||
| companies) | |||||
| (2010–2015); | |||||
| Independent | |||||
| Trustee, Gottex | |||||
| Multi-Asset | |||||
| Endowment | |||||
| fund complex | |||||
| (three closed- | |||||
| end investment | |||||
| companies) | |||||
| (2010–2015); | |||||
| Independent | |||||
| Trustee, | |||||
| Gottex Multi- | |||||
| Alternatives | |||||
| fund complex | |||||
| (three closed- | |||||
| end investment | |||||
| companies) | |||||
| (2010–2015). |
77
Gerstein Fisher Funds
Additional Information (Continued)
(Unaudited)
| Other | |||||
| Directorships | |||||
| Term of | Number of | Principal | Held by | ||
| Office and | Portfolios | Occupation(s) | Trustee | ||
| Position(s) | Length | in Trust | During the | During the | |
| Name, Address | Held with | of Time | Overseen | Past Five | Past Five |
and Year of Birth | the Trust | Served | by Trustee | Years | Years |
| Interested Trustee and Officers | |||||
| Joseph C. Neuberger* | Chairperson | Indefinite | 28 | President | Trustee, Buffalo |
| 615 E. Michigan St. | and | Term; Since | (2017–present), | Funds (an | |
| Milwaukee, WI 53202 | Trustee | August 22, | Chief Operating | open-end | |
| Year of Birth: 1962 | 2001 | Officer (2016– | investment | ||
| present), Executive | company) | ||||
| Vice President | (2003–2017); | ||||
| (1994–2017), | Trustee, USA | ||||
| U.S. Bancorp Fund | MUTUALS | ||||
| Services, LLC. | (an open-end | ||||
| investment | |||||
| company) | |||||
| (2001–2018). | |||||
| John P. Buckel | President | Indefinite | N/A | Vice President, | N/A |
| 615 E. Michigan St. | and | Term; Since | U.S. Bancorp Fund | ||
| Milwaukee, WI 53202 | Principal | January 24, | Services, LLC | ||
| Year of Birth: 1957 | Executive | 2013 | (2004–present). | ||
| Officer | |||||
| Jennifer A. Lima | Vice | Indefinite | N/A | Vice President, | N/A |
| 615 E. Michigan St. | President, | Term; Since | U.S. Bancorp Fund | ||
| Milwaukee, WI 53202 | Treasurer | January 24, | Services, LLC | ||
| Year of Birth: 1974 | and | 2013 | (2002–present). | ||
| Principal | |||||
| Financial | |||||
| and | |||||
| Accounting | |||||
| Officer | |||||
78
Gerstein Fisher Funds
Additional Information (Continued)
(Unaudited)
| Other | |||||
| Directorships | |||||
| Term of | Number of | Principal | Held by | ||
| Office and | Portfolios | Occupation(s) | Trustee | ||
| Position(s) | Length | in Trust | During the | During the | |
| Name, Address | Held with | of Time | Overseen | Past Five | Past Five |
and Year of Birth | the Trust | Served | by Trustee | Years | Years |
| Elizabeth B. Scalf | Chief | Indefinite | N/A | Senior Vice | N/A |
| 615 E. Michigan St. | Compliance | Term; Since | President, | ||
| Milwaukee, WI 53202 | Officer, | July 1, | U.S. Bancorp Fund | ||
| Year of Birth: 1985 | Vice | 2017 | Services, | ||
| President | LLC (February | ||||
| and | 2017–present); | ||||
| Anti-Money | Vice President and | ||||
| Laundering | Assistant CCO, | ||||
| Officer | Heartland Advisors, | ||||
| Inc. (December 2016– | |||||
| January 2017); | |||||
| Vice President and | |||||
| CCO, Heartland | |||||
| Group, Inc. (May | |||||
| 2016–November | |||||
| 2016); Vice | |||||
| President, CCO and | |||||
| Senior Legal Counsel | |||||
| (May 2016–November | |||||
| 2016), Assistant CCO | |||||
| and Senior Legal | |||||
| Counsel (January | |||||
| 2016–April 2016), | |||||
| Senior Legal and | |||||
| Compliance Counsel | |||||
| (2013–2015), | |||||
| Heartland Advisors, Inc. | |||||
| Adam W. Smith | Secretary | Indefinite | N/A | Vice President, | N/A |
| 615 E. Michigan St. | Term; Since | U.S. Bancorp Fund | |||
| Milwaukee, WI 53202 | May 29, 2015 | Services, LLC | |||
| Year of Birth: 1981 | (2012–present). | ||||
| Kelly A. Burns | Assistant | Indefinite | N/A | Assistant Vice | N/A |
| 615 E. Michigan St. | Treasurer | Term; Since | President, U.S. | ||
| Milwaukee, WI 53202 | April 23, | Bancorp Fund | |||
| Year of Birth: 1987 | 2015 | Services, LLC | |||
| (2011–present). |
79
Gerstein Fisher Funds
Additional Information (Continued)
(Unaudited)
| Other | |||||
| Directorships | |||||
| Term of | Number of | Principal | Held by | ||
| Office and | Portfolios | Occupation(s) | Trustee | ||
| Position(s) | Length | in Trust | During the | During the | |
| Name, Address | Held with | of Time | Overseen | Past Five | Past Five |
and Year of Birth | the Trust | Served | by Trustee | Years | Years |
| Melissa Aguinaga | Assistant | Indefinite | N/A | Assistant Vice | N/A |
| 615 E. Michigan St. | Treasurer | Term; Since | President, U.S. | ||
| Milwaukee, WI 53202 | July 1, | Bancorp Fund | |||
| Year of Birth: 1987 | 2015 | Services, LLC | |||
| (2010–present). | |||||
| Laura A. Carroll | Assistant | Indefinite | N/A | Assistant Vice | N/A |
| 615 E. Michigan St. | Treasurer | Term; Since | President, U.S. | ||
| Milwaukee, WI 53202 | August 20, | Bancorp Fund | |||
| Year of Birth: 1985 | 2018 | Services, LLC | |||
| (2007–present). |
| * | Mr. Neuberger is an “interested person” of the Trust as defined by the 1940 Act by virtue of the fact that he is a board member and an interested person of Quasar Distributors, LLC (the “Distributor”), the Funds’ principal underwriter. |
80
A NOTE ON FORWARD LOOKING STATEMENTS
Except for historical information contained in this report for the Funds, the matters discussed in this report may constitute forward-looking statements made pursuant to the safe-harbor provisions of the Private Securities Litigation Reform Act of 1995. These include any advisor or portfolio manager predictions, assessments, analyses or outlooks for individual securities, industries, market sectors and/or markets. These statements involve risks and uncertainties. In addition to the general risks described for the Funds in the current Prospectus, other factors bearing on this report include the accuracy of the advisor’s or portfolio manager’s forecasts and predictions, and the appropriateness of the investment programs designed by the advisor or portfolio manager to implement their strategies efficiently and effectively. Any one or more of these factors, as well as other risks affecting the securities markets and investment instruments generally, could cause the actual results of the Funds to differ materially as compared to benchmarks associated with the Funds.
ADDITIONAL INFORMATION
The Funds have adopted proxy voting policies and procedures that delegate to the Advisor the authority to vote proxies. A description of the Funds’ proxy voting policies and procedures is available without charge, upon request, by calling the Funds toll free at 1-800-473-1155. A description of these policies and procedures is also included in the Funds’ Statement of Additional Information, which is available on the SEC’s website at http://www.sec.gov.
The Funds’ proxy voting records for the most recent 12-month period ended June 30, are available without charge, either upon request by calling the Funds toll free at 1-800-473-1155 or by accessing the SEC’s website at http://www.sec.gov.
The Funds file their complete schedules of portfolio holdings with the SEC for the first and third quarters of each fiscal year on Form N-Q. Shareholders may view the Funds’ Forms N-Q on the SEC’s website at http://www.sec.gov.
HOUSEHOLDING (Unaudited)
In an effort to decrease costs, the Funds intend to reduce the number of duplicate prospectuses and annual and semi-annual reports you receive by sending only one copy of each to those addresses shared by two or more accounts and to shareholders the Funds reasonably believe are from the same family or household. Once implemented, if you would like to discontinue householding for your accounts, please call the Funds toll-free at 800-473-1155 to request individual copies of these documents. Once the Funds receive notice to stop householding, the Funds will begin sending individual copies 30 days after receiving your request. This policy does not apply to account statements.
81
(This Page Intentionally Left Blank.)
GERSTEIN FISHER FUNDS
| Investment Advisor | Gerstein Fisher |
565 Fifth Avenue, 27th Floor | |
| New York, New York 10017 | |
| Gerstein Fisher is a division | |
| of People’s United Advisors, Inc. | |
| Legal Counsel | Godfrey & Kahn, S.C. |
| 833 East Michigan Street | |
| Suite 1800 | |
| Milwaukee, Wisconsin 53202 | |
| Independent Registered Public | Cohen & Company, Ltd. |
| Accounting Firm | 1350 Euclid Avenue |
| Suite 800 | |
| Cleveland, Ohio 44115 | |
| Transfer Agent, Fund Accountant and | U.S. Bancorp Fund Services, LLC |
| Fund Administrator | 615 East Michigan Street |
| Milwaukee, Wisconsin 53202 | |
| Custodian | U.S. Bank National Association |
| Custody Operations | |
| 1555 North River Center Drive | |
| Suite 302 | |
| Milwaukee, Wisconsin 53212 | |
| Distributor | Quasar Distributors, LLC |
| 777 East Wisconsin Avenue | |
| 6th Floor | |
| Milwaukee, Wisconsin 53202 |
This report is intended for shareholders of the Funds and may not be used as sales literature unless preceded or accompanied by a current prospectus.
Item 2. Code of Ethics.
Not applicable for semi-annual reports.
Item 3. Audit Committee Financial Expert.
Not applicable for semi-annual reports.
Item 4. Principal Accountant Fees and Services.
Not applicable for semi-annual reports.
Item 5. Audit Committee of Listed Registrants.
Not applicable to registrants who are not listed issuers (as defined in Rule 10A-3 under the Securities Exchange Act of 1934).
Item 6. Investments.
(a) | Schedule of Investments is included as part of the report to shareholders filed under Item 1 of this Form. |
(b) Not Applicable.
Item 7. Disclosure of Proxy Voting Policies and Procedures for Closed-End Management Investment Companies.
Not applicable to open-end investment companies.
Item 8. Portfolio Managers of Closed-End Management Investment Companies.
Not applicable to open-end investment companies.
Item 9. Purchases of Equity Securities by Closed‑End Management Investment Company and Affiliated Purchasers.
Not applicable to open-end investment companies.
Item 10. Submission of Matters to a Vote of Security Holders.
There have been no material changes to the procedures by which shareholders may recommend nominees to the registrant’s board of trustees.
Item 11. Controls and Procedures.
(a) | The Registrant’s President and Treasurer have reviewed the Registrant's disclosure controls and procedures (as defined in Rule 30a-3(c) under the Investment Company Act of 1940 (the “Act”)) as of a date within 90 days of the filing of this report, as required by Rule 30a-3(b) under the Act and Rules 13a-15(b) or 15d‑15(b) under the Securities Exchange Act of 1934. Based on their review, such officers have concluded that the disclosure controls and procedures are effective in ensuring that information required to be disclosed in this report is appropriately recorded, processed, summarized and reported and made known to them by others within the Registrant and by the Registrant’s service provider. |
(b) | There were no changes in the Registrant's internal control over financial reporting (as defined in Rule 30a-3(d) under the Act) that occurred during the last fiscal half-year covered by this report that has materially affected, or is reasonably likely to materially affect, the Registrant's internal control over financial reporting. |
Item 12. Disclosure of Securities Lending Activities for Closed-End Management Investment Companies
Not applicable to open-end investment companies.
Item 13. Exhibits.
| (a) | (1) Any code of ethics or amendment thereto, that is the subject of the disclosure required by Item 2, to the extent that the registrant intends to satisfy Item 2 requirements through filing an exhibit. Incorporated by reference to the Registrant’s Form N-CSR filed on February 5, 2014. |
(2) A separate certification for each principal executive and principal financial officer pursuant to Section 302 of the Sarbanes-Oxley Act of 2002. Filed herewith.
(3) Any written solicitation to purchase securities under Rule 23c‑1 under the Act sent or given during the period covered by the report by or on behalf of the registrant to 10 or more persons. Not applicable to open-end investment companies.
(4) Change in the registrant’s independent public accountant. There was no change in the registrant’s independent public accountant for the period covered by this report.
| (b) | Certifications pursuant to Section 906 of the Sarbanes‑Oxley Act of 2002. Furnished herewith. |
SIGNATURES
Pursuant to the requirements of the Securities Exchange Act of 1934 and the Investment Company Act of 1940, the registrant has duly caused this report to be signed on its behalf by the undersigned, thereunto duly authorized.
(Registrant) Trust for Professional Managers
By (Signature and Title)* /s/John Buckel
John Buckel, President
Date July 31, 2019
Pursuant to the requirements of the Securities Exchange Act of 1934 and the Investment Company Act of 1940, this report has been signed below by the following persons on behalf of the registrant and in the capacities and on the dates indicated.
By (Signature and Title)* /s/John Buckel
John Buckel, President
Date July 31, 2019
By (Signature and Title)* /s/Jennifer Lima
Jennifer Lima, Treasurer
Date July 31, 2019
* Print the name and title of each signing officer under his or her signature.