UNITED STATES
SECURITIES AND EXCHANGE COMMISSION
Washington, D.C. 20549
SECURITIES AND EXCHANGE COMMISSION
Washington, D.C. 20549
FORM N-CSR
CERTIFIED SHAREHOLDER REPORT OF REGISTERED
MANAGEMENT INVESTMENT COMPANIES
Investment Company Act file number: 811-10401
Trust for Professional Managers
(Exact name of registrant as specified in charter)
(Exact name of registrant as specified in charter)
615 East Michigan Street
Milwaukee, WI 53202
(Address of principal executive offices) (Zip code)
(Address of principal executive offices) (Zip code)
Jay S. Fitton
U.S. Bancorp Fund Services, LLC
615 East Michigan Street
Milwaukee, WI 53202
(Name and address of agent for service)
(Name and address of agent for service)
(513) 629-8104
Registrant's telephone number, including area code
Date of fiscal year end: November 30, 2019
Date of reporting period: May 31, 2019
Item 1. Reports to Stockholders.
Semi-Annual Report
Convergence Long/Short Equity Fund
(formerly the Convergence Core Plus Fund)
Convergence Opportunities Fund
Convergence Market Neutral Fund
May 31, 2019
Investment Adviser
Convergence Investment Partners, LLC
3801 PGA Boulevard
Suite 1001
Palm Beach Gardens, Florida 33410
Phone: 877-677-9414
Table of Contents
| LETTER TO SHAREHOLDERS | 3 | ||
| EXPENSE EXAMPLES | 9 | ||
| CONVERGENCE LONG/SHORT EQUITY FUND | |||
| SCHEDULE OF INVESTMENTS | 18 | ||
| SCHEDULE OF SECURITIES SOLD SHORT | 25 | ||
CONVERGENCE OPPORTUNITIES FUND | |||
| SCHEDULE OF INVESTMENTS | 33 | ||
| SCHEDULE OF SECURITIES SOLD SHORT | 40 | ||
| CONVERGENCE MARKET NEUTRAL FUND | |||
| SCHEDULE OF INVESTMENTS | 47 | ||
| SCHEDULE OF SECURITIES SOLD SHORT | 54 | ||
| STATEMENTS OF ASSETS AND LIABILITIES | 62 | ||
| STATEMENTS OF OPERATIONS | 63 | ||
| STATEMENTS OF CHANGES IN NET ASSETS | |||
| CONVERGENCE LONG/SHORT EQUITY FUND | 64 | ||
| CONVERGENCE OPPORTUNITIES FUND | 65 | ||
| CONVERGENCE MARKET NEUTRAL FUND | 66 | ||
| STATEMENTS OF CASH FLOWS | 68 | ||
| FINANCIAL HIGHLIGHTS | |||
| CONVERGENCE LONG/SHORT EQUITY FUND | 70 | ||
| CONVERGENCE OPPORTUNITIES FUND | 72 | ||
| CONVERGENCE MARKET NEUTRAL FUND | 74 | ||
| NOTES TO FINANCIAL STATEMENTS | 76 | ||
| NOTICE OF PRIVACY POLICY & PRACTICES | 89 | ||
| ADDITIONAL INFORMATION | 90 |
Convergence Investment Partners
2019 Semi-Annual Shareholder Report
Convergence Long/Short Equity Fund (MARNX)
Convergence Opportunities Fund (CIPOX)
Convergence Market Neutral Fund (CPMNX)
Shareholder Letter (Unaudited)
Dear Shareholder:
We are pleased to provide to you the semi-annual report of the Convergence Long/Short Equity Fund, the Convergence Opportunities Fund and the Convergence Market Neutral Fund for the six-month period ended May 31, 2019. We have been managing our U.S. larger cap Convergence Long/Short Equity Fund, incepted December 29, 2009, for over nine years. Additionally, we have now managed our smaller cap focused Convergence Opportunities Fund for over five years. Finally, our youngest fund, the Convergence Market Neutral Fund, has just passed its three-year anniversary at the end of January 2019. All our funds employ the Convergence systematic long/short investment approach which seeks to benefit from fundamentally strong companies outperforming their weak fundamental counterparts. Over the long term, our funds strive for strong total returns with the potential for downside risk mitigation through an active short. We manage all our mutual funds with the philosophy that over the long term, strong “fundamentals” outperform weak “fundamentals.” Moreover, our funds all utilize the Convergence proprietary stock ranking process which analyzes the domestic investment universe and helps to identify, quantify and rank strong and weak fundamentals.
Our long-term investors know that we utilize numerous factors grouped into factor composites, like Traditional Value and Accelerating Sales. We monitor the performance of these composites to learn what the market is rewarding or punishing. Over the six months ended May 31, 2019, we see that much of the positive spread or differentiation in stocks has been a combination of strong price momentum, historical earnings and cash flow growth, and capital discipline. Conversely, there was negative contribution from fundamental tilts to valuation, lower risk companies, and financial statement quality (accruals). This demonstrates the benefit of the fundamental factor diversification that we employ at Convergence. While it is unlikely for all fundamental tilts to generate a positive spread in short time periods, we believe these fundamental spreads, based on sound economic principles, can help produce real wealth for investors over time as they provide complimentary attributes. We remain steadfast to our philosophy that strong fundamentals win in the long run.
Digging a bit deeper into the performance over the past six months, all of the funds underperformed their benchmarks. Since Christmas Eve 2018 through mid- to late-April 2019, many of the usual heuristics that rational market participants employ in stock selection have been out of favor: valuation, quality and leverage, for example. This environment of inverted fundamentals is always challenging for investors like Convergence who focus on fundamentally strong companies for investment. All three of our funds had negative long-short spread over the trailing 6-month periods. Over the trailing 6 months, for all of the funds, the longs and shorts both contributed negatively to the long-short spread.
Our research shows that historically periods of “fundamental inversion” do occur and tend to be short lived, typically 2-4 months. As we neared the end of April, we began to see increasing evidence that this period of fundamental inversion was coming to an end. Looking back over Convergence Investment Partners’ 15 years, our research shows that when the
3
fundamental rubber band gets stretched too far, it tends to snap back meaningfully. We saw a strong close to May for all three funds and look forward to the coming 6 to 12 months.
At Convergence, we never expect our funds to outperform in every time period. We do, however, firmly believe that investment decisions based on a sound and logical philosophy paired with a long-term approach can deliver superior results. Buying reasonably valued stocks with strong earnings and sales growth, while shorting unprofitable stocks with wild valuations, seems like a recipe for success to us at Convergence.
Convergence Long/Short Equity Fund Performance
The objective of the Convergence Long/Short Equity Fund is to seek long-term capital growth. The Fund seeks to realize its investment objective by establishing long and short positions in equity securities of larger cap domestic companies primarily with medium and large market capitalizations. The Fund will hold long (purchase) securities that Convergence believes will outperform the market, and it will sell short securities expected to underperform the market. The Fund intends to maintain a net long exposure (the market value of long positions minus the market value of short positions) of approximately 50% to 100% of the Fund’s total assets. Under normal market conditions, the Fund’s long positions may range from approximately 90% to 150% of the Fund’s total assets and its short positions may range from approximately 20% to 70% of the Fund’s total assets. In making investment decisions for the Fund, Convergence utilizes a bottom-up approach that focuses on the individual strengths of the underlying companies and the relative and absolute attractiveness of the companies within each industry group.
In the six-month period ended May 31, 2019, the Convergence Long/Short Equity Fund returned -6.03%, versus the Russell 3000® Total Return Index at 0.60%. The Convergence Long/Short Equity Fund has advanced cumulatively 190.08% net of fees from December 29, 2009 (its inception) through May 31, 2019, versus the Russell 3000® Total Return Index at 195.10%.
Average Annual Total Returns (net of fees)
| Annualized | ||||||
| One | Three | Five | Since | |||
Through May 31, 2019 | Month | YTD | Year | Year | Year | Inception |
| Convergence Long/Short Equity | ||||||
| Institutional Class (MARNX) | -4.93% | 1.43% | -4.69% | 10.07% | 6.58% | 11.97% |
Russell 3000® Total Return | -6.47% | 10.92% | 2.50% | 11.55% | 9.25% | 12.17% |
| Annualized | ||||||
| One | Three | Five | Since | |||
Through March 31, 2019 | Quarter | YTD | Year | Year | Year | Inception |
| Convergence Long/Short Equity | ||||||
| Institutional Class (MARNX) | 3.78% | 3.78% | 2.06% | 10.43% | 8.07% | 12.48% |
Russell 3000® Total Return | 14.04% | 14.04% | 8.77% | 13.48% | 10.36% | 12.75% |
| Institutional Class inception = 12/29/2009 | ||||||
Performance data quoted represents past performance and does not guarantee future results. The investment return and principal value of an investment will fluctuate so that an investor’s shares, when redeemed, may be worth more or less than their original cost. Current performance of the Fund may be lower or higher than the performance quoted. Performance data current to the most recent month-end may be obtained by calling 1-877-677-9414.
Gross Expense Ratio on the Fund applicable to investors is 2.20%, the Expense Ratio net of dividends on short positions is 1.27%. Pursuant to an operating expense limitation agreement between the Adviser and the Fund, the Adviser has agreed to contractually waive its
4
management fees and/or reimburse Fund expenses to ensure that total annual fund operating expenses (exclusive of front-end or contingent deferred loads, Rule 12b-1 plan fees, shareholder servicing plan fees, taxes, leverage (i.e., any expenses incurred in connection with borrowings made by the Fund), interest (including interest incurred in connection with bank and custody overdrafts), brokerage commissions and other transactional expenses, expenses incurred in connection with any merger or reorganization, dividends or interest on short positions, acquired fund fees and expenses or extraordinary expenses such as litigation (collectively, “Excluded Expenses”) do not exceed 1.50% of the average net assets for the Institutional Class of the Fund through at least November 1, 2020.
Periods less than 12 months are not annualized.
Convergence Opportunities Fund Performance
The objective of the Convergence Opportunities Fund is to seek long-term capital growth. The Fund seeks to realize its investment objective by establishing long and short positions in equity securities of domestic companies primarily with small and medium market capitalizations. The Fund will hold long (purchase) securities that Convergence believes will outperform the market, and it will sell short securities expected to underperform the market. The Fund intends to maintain a net long exposure (the market value of long positions minus the market value of short positions) of approximately 50% to 100% of the Fund’s total assets. Under normal market conditions, the Fund’s long positions may range from approximately 90% to 150% of the Fund’s total assets and its short positions may range from approximately 20% to 70% of the Fund’s total assets. In making investment decisions for the Fund, Convergence utilizes a bottom-up approach that focuses on the individual strengths of the underlying companies and the relative and absolute attractiveness of the companies within each industry group.
In the six-month period ended May 31, 2019, the Convergence Opportunities Fund returned -9.79%, versus the Russell 2000® Total Return Index at -3.72%. From inception November 29, 2013, through May 31, 2019, the Convergence Opportunities Fund was up 18.34% cumulatively net of fees, while the Russell 2000® Total Return Index was up 38.25% cumulatively over the same period.
Average Annual Total Returns (net of fees)
| Annualized | ||||||
| One | One | Three | Five | Since | ||
Through May 31, 2019 | Month | YTD | Year | Year | Year | Inception |
| Convergence Opportunities | ||||||
| Institutional Class (CIPOX) | -6.45% | 1.28% | -13.40% | 3.95% | 3.05% | 3.11% |
Russell 2000® Total Return | -7.78% | 9.26% | -9.04% | 9.75% | 6.71% | 6.06% |
| Annualized | ||||||
| One | Three | Five | Since | |||
Through March 31, 2019 | Quarter | YTD | Year | Year | Year | Inception |
| Convergence Opportunities | ||||||
| Institutional Class (CIPOX) | 6.78% | 6.78% | -7.85% | 5.40% | 4.35% | 4.24% |
Russell 2000® Total Return | 14.58% | 14.58% | 2.05% | 12.92% | 7.05% | 7.21% |
| Institutional Class inception = 11/29/2013 | ||||||
Performance data quoted represents past performance and does not guarantee future results. The investment return and principal value of an investment will fluctuate so that an investor’s shares, when redeemed, may be worth more or less
5
than their original cost. Current performance of the Fund may be lower or higher than the performance quoted. Performance data current to the most recent month-end may be obtained by calling 1-877-677-9414.
Gross Expense Ratio on the Fund applicable to investors is 2.73%, the Net Expense Ratio is 2.71%*, and the Net Expense Ratio excluding dividends and interest expenses and short positions is 1.50%. Pursuant to an operating expense limitation agreement between the Adviser and the Fund, the Adviser has agreed to contractually waive its management fees and/or reimburse Fund expenses to ensure that total annual fund operating expenses (exclusive of Excluded Expenses) do not exceed 1.50% of the average net assets for the Institutional Class of the Fund through at least November 1, 2020.
*The Net Expense Ratio is applicable to investors.
Periods less than 12 months are not annualized.
Convergence Market Neutral Fund Performance
The Convergence Market Neutral Fund’s objective is to seek positive absolute returns. The Market Neutral Fund is intended to produce returns uncorrelated to the stock market, aiding diversification while striving to improve risk adjusted returns. The Fund seeks to achieve its investment objective by establishing long and short positions in equity securities of domestic companies that are deemed to be attractive (and likely to increase in price), or unattractive (and likely to decrease in price). The Fund is designed to be “market neutral,” targeting a portfolio designed to generate positive absolute returns with low correlation to the U.S. equity market over a normal business cycle. The Fund focuses primarily on companies with medium and large market capitalizations. Convergence constructs the portfolio as an actively managed equity strategy that adapts to ever changing market dynamics through a market cycle. The Fund intends to maintain a net long exposure (the market value of long positions minus the market value of short positions) of approximately 0% to 30% of the Fund’s total assets. Under normal market conditions, the Fund’s long positions may range from approximately 70% to 125% of the Fund’s total assets and its short positions may range from approximately 60% to 100% of the Fund’s total assets. In making investment decisions for the Fund, Convergence utilizes a bottom-up approach that focuses on the individual strengths of the underlying companies and the relative and absolute attractiveness (and unattractiveness) of the companies within each industry group.
In the six-month period ended May 31, 2019, the Convergence Market Neutral Fund returned -6.81%, versus the ICE BofA Merrill Lynch 3-Month U.S. Treasury Bill Index at 1.20% and the S&P 500 Total Return Index at 0.74%. The Convergence Market Neutral Fund was up cumulatively 5.22% net of fees from its January 29, 2016, inception through May 31, 2019, while the ICE BofA Merrill Lynch 3-Month U.S. Treasury Bill Index was up cumulatively 4.13% over the same period.
Average Annual Total Returns (net of fees)
| Annualized | |||||
| One | One | Three | Since | ||
Through May 31, 2019 | Month | YTD | Year | Year | Inception |
| Convergence Market Neutral | |||||
| Institutional Class (CPMNX) | -0.38% | -6.49% | -5.97% | 3.10% | 1.54% |
| ICE BofA Merrill Lynch | |||||
| 3-Month U.S. Treasury Bill | 0.23% | 1.02% | 2.26% | 1.32% | 1.22% |
| S&P 500 TR | -6.35% | 10.74% | 3.78% | 11.72% | 13.36% |
6
| Annualized | |||||
| One | Three | Since | |||
Through March 31, 2019 | Quarter | YTD | Year | Year | Inception |
| Convergence Market Neutral | |||||
| Institutional Class (CPMNX) | -5.51% | -5.51% | -3.35% | 2.17% | 1.95% |
| ICE BofA Merrill Lynch | |||||
| 3-Month U.S. Treasury Bill | 0.60% | 0.60% | 2.12% | 1.19% | 1.15% |
| S&P 500 TR | 13.65% | 13.65% | 9.50% | 13.51% | 15.05% |
| Fund inception = 1/29/2016 | |||||
Performance data quoted represents past performance and does not guarantee future results. The investment return and principal value of an investment will fluctuate so that an investor’s shares, when redeemed, may be worth more or less than their original cost. Current performance of the Fund may be lower or higher than the performance quoted. Performance data current to the most recent month-end may be obtained by calling 1-877-677-9414.
Gross Expense Ratio on the Fund is 2.63%, the Net Expense Ratio is 2.70%* and the Net Expense Ratio excluding dividends and interest expenses on short positions is 1.50%. Pursuant to an operating expense limitation agreement between the Adviser and the Fund, the Adviser has contractually agreed to waive its management fees and/or reimburse Fund expenses to ensure that total annual fund operating expenses (exclusive of Excluded Expenses) for the Fund does not exceed 1.50% of the average net assets for the Institutional Class of the Fund through at least November 1, 2020.
*The Net Expense Ratio is applicable to investors.
Periods less than 12 months are not annualized.
The Convergence fundamental stock picking methodology is geared toward long holdings with strong cash flow, earnings, profits and other desirable financial characteristics. And we strive to achieve these favorable portfolio statistics while never overpaying in terms of valuation. Our research has shown that, over time, companies with these ingredients have rewarded investors, as the portfolio statistics are signs of healthy and growing companies with competitively strong business models. The Convergence process separately seeks to identify companies with weak or declining fundamentals, and our research has shown this to be effective in sourcing alpha from shorting.
In closing, as we always say, stay fundamental.
Thank you for your support.
| David J. Abitz, CFA | Justin Neuberg, CFA |
| President & Chief Investment Officer | Co-Portfolio Manager |
| Convergence Investment Partners, LLC | Convergence Investment Partners, LLC |
7
Disclosures
Past performance is not indicative of future results.
This commentary is for informational purposes only and should not be viewed as a recommendation to buy or sell any security. Investors should seek financial advice regarding the appropriateness of investing in any securities or investment strategies discussed in this documentation and should understand that statements regarding future prospects may not be realized. Investors should note that income from such securities may fluctuate and that each security’s price or value may rise or fall. Accordingly, investors may receive back less than originally invested. There is no guarantee that the views expressed will come to pass.
Mutual fund investing involves risk. Principal loss is possible. Investments in small, micro and medium capitalization companies involve additional risks such as limited liquidity and greater volatility than larger capitalization companies. The Funds regularly make short sales of securities, which involves unlimited risk including the possibility that losses may exceed the original amount invested. However, a mutual fund investor’s risk is limited to one’s amount of investment in a mutual fund.
Must be preceded or accompanied by a prospectus.
Diversification does not assure a profit nor protect against loss in a declining market.
The Funds are distributed by Quasar Distributors, LLC.
Alpha – The excess return of an investment relative to the return of a benchmark index is the investment’s alpha.
Correlation – A statistical measure that quantifies the degree to which two securities move in relation to each other. Correlations are used in advanced portfolio management and have a value that must fall between -1 and 1.
Long Short Spread – The long-short spread is the return of the portfolio’s holdings in the long minus the return of the portfolio’s short holdings. It provides insight into the efficacy of returns of the portfolio’s long versus short holdings.
The Russell 2000 Total Return Index measures the performance of the small-cap segment of the U.S. equity universe. The Russell 2000 Total Return Index is a subset of the Russell 3000 Total Return Index. The Russell 3000 Total Return Index measures the performance of the largest 3000 U.S. companies representing approximately 98% of the investable U.S. equity market. The ICE BofA Merrill Lynch 3-Month U.S. Treasury Bill Index is an unmanaged market index of U.S. Treasury securities maturing in 90 days that assumes reinvestment of all income. The S&P 500 Total Return Index is an American stock market index based on the market capitalizations of 500 large companies having common stock listed on the NYSE or NASDAQ and assumes that any cash distributions, such as dividends, are reinvested back into the index. You cannot invest directly in an index. The volatility of an index may be materially different from that of the strategy due to varying degrees of diversification and other factors. Index returns do not reflect the deduction of any fees.
8
CONVERGENCE FUNDS
Expense Examples
(Unaudited)
As a shareholder of the Funds, you incur two types of costs: (1) transaction costs, and (2) ongoing costs, including management fees and other fund expenses. These Examples are intended to help you understand your ongoing costs (in dollars) of investing in the Funds, and to compare these costs with the ongoing costs of investing in other mutual funds. The Examples are based on an investment of $1,000 invested at the beginning of the period and held for the entire period (12/1/18 – 5/31/19).
Actual Expenses
The first lines of the following tables provide information about actual account values and actual expenses. In addition, you will be assessed fees for outgoing wire transfers, returned checks and stop payment orders at prevailing rates charged by U.S. Bancorp Fund Services, LLC, the Funds’ transfer agent. If you request that a redemption be made by wire transfer, currently a $15.00 fee is charged by the Funds’ transfer agent. IRA accounts will be charged a $15.00 annual maintenance fee. To the extent the Funds invest in shares of exchange-traded funds or other investment companies as part of its investment strategy, you will indirectly bear your proportionate share of any fees and expenses charged by the underlying funds in which the Funds invest in addition to the expenses of the Funds. Actual expenses of the underlying funds are expected to vary among the various underlying funds. These expenses are not included in the example. The example includes, but is not limited to, management fees, fund administration and accounting, custody and transfer agent fees. You may use the information in these lines, together with the amount you invested, to estimate the expenses that you paid over the period. Simply divide your account value by $1,000 (for example, an $8,600 account value divided by $1,000 = 8.6), then multiply the result by the number in the first line under the heading titled “Expenses Paid During Period” to estimate the expenses you paid on your account during this period.
Hypothetical Example for Comparison Purposes
The second lines of the following tables provide information about hypothetical account values and hypothetical expenses based on the Funds’ actual expense ratios and an assumed rate of return of 5% per year before expenses, which is not the Funds’ actual return. The hypothetical account values and expenses may not be used to estimate the actual ending account balance or expenses you paid for the period. You may use this information to compare the ongoing costs of investing in the Funds and other funds. To do so, compare this 5% hypothetical example with the 5% hypothetical examples that appear in the shareholder reports of other funds. Please note that the expenses shown in the table are meant to highlight your ongoing costs only and do not reflect any transactional costs, such as sales charges (loads), redemption fees or exchange fees. Therefore, the second lines of the tables are useful in comparing ongoing costs only, and will not help you determine the relative total costs of owning different funds.
9
CONVERGENCE FUNDS
Expense Examples (Continued)
(Unaudited)
| Convergence Long/Short Equity Fund – | |||
| Institutional Class | |||
| Beginning | Ending | Expenses Paid | |
| Account Value | Account Value | During Period | |
12/1/18 | 5/31/19 | 12/1/18 – 5/31/19* | |
| Actual** | $1,000.00 | $ 939.70 | $10.45 |
| Hypothetical (5% return | |||
| before expenses)*** | $1,000.00 | $1,014.16 | $10.85 |
| * | Expenses are equal to the Fund’s annualized expense ratio of 2.16%, multiplied by the average account value over the period, multiplied by 182/365 (to reflect the one-half year period). Excluding dividends on short positions, interest and broker expenses, the Fund’s annualized expense ratio would be 1.29%. | |
| ** | Excluding dividends on short positions, interest and broker expenses, your actual cost of investing in the Fund would be $6.24. | |
| *** | Excluding dividends on short positions, interest and broker expenses, your hypothetical cost of investing in the Fund would be $6.49. |
| Convergence Opportunities Fund – | |||
| Institutional Class | |||
| Beginning | Ending | Expenses Paid | |
| Account Value | Account Value | During Period | |
12/1/18 | 5/31/19 | 12/1/18 – 5/31/19* | |
| Actual** | $1,000.00 | $ 902.10 | $13.28 |
| Hypothetical (5% return | |||
| before expenses)*** | $1,000.00 | $1,010.97 | $14.04 |
| * | Expenses are equal to the Fund’s annualized expense ratio of 2.80%, multiplied by the average account value over the period, multiplied by 182/365 (to reflect the one-half year period). Excluding dividends on short positions, interest and broker expenses, the Fund’s annualized expense ratio would be 1.50%. | |
| ** | Excluding dividends on short positions, interest and broker expenses, your actual cost of investing in the Fund would be $7.11. | |
| *** | Excluding dividends on short positions, interest and broker expenses, your hypothetical cost of investing in the Fund would be $7.54. |
10
CONVERGENCE FUNDS
Expense Examples (Continued)
(Unaudited)
| Convergence Market Neutral Fund – | |||
| Institutional Class | |||
| Beginning | Ending | Expenses Paid | |
| Account Value | Account Value | During Period | |
12/1/18 | 5/31/19 | 12/1/18 – 5/31/19* | |
| Actual** | $1,000.00 | $ 931.90 | $13.53 |
| Hypothetical (5% return | |||
| before expenses)*** | $1,000.00 | $1,010.92 | $14.09 |
| * | Expenses are equal to the Fund’s annualized expense ratio of 2.81%, multiplied by the average account value over the period, multiplied by 182/365 (to reflect the one-half year period). Excluding dividends on short positions, interest and broker expenses, the Fund’s annualized expense ratio would be 1.50%. | |
| ** | Excluding dividends on short positions, interest and broker expenses, your actual cost of investing in the Fund would be $7.22. | |
| *** | Excluding dividends on short positions, interest and broker expenses, your hypothetical cost of investing in the Fund would be $7.54. |
11
CONVERGENCE LONG/SHORT EQUITY FUND
Investment Highlights
(Unaudited)
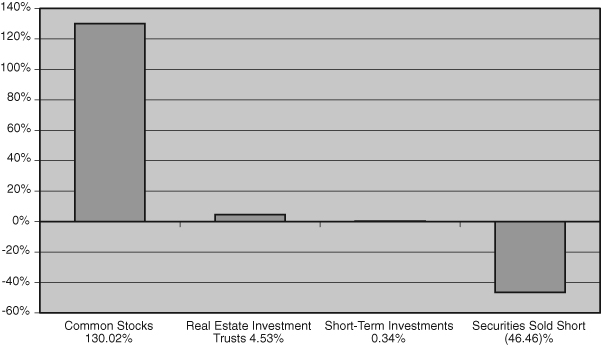
The Fund’s investment objective is to seek long-term capital growth. The Fund seeks to achieve this objective by investing, under normal market conditions, at least 80% of its net assets (plus any borrowings for investment proposes) in long and short positions in equity securities of domestic companies. The Fund focuses primarily on companies with medium and large market capitalizations, although the Fund may establish long and short positions in companies of any market capitalization. The Fund generally considers companies with medium and large market capitalizations to be those that comprise the upper half of the Russell 3000® Total Return Index. The Fund will hold long (purchase) securities that the Adviser believes will outperform the market, and will sell short securities expected to underperform the market.
Allocation of Portfolio Holdings
(as a percentage of net assets)
Continued
12
CONVERGENCE LONG/SHORT EQUITY FUND
Investment Highlights (Continued)
(Unaudited)
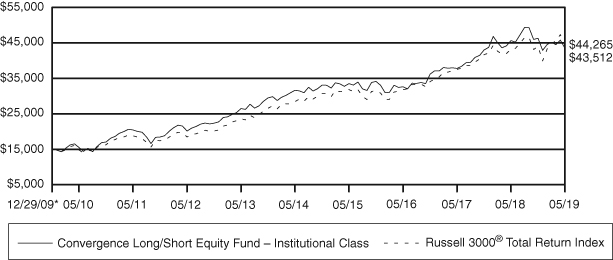
Average Annual Total Returns as of May 31, 2019
Russell 3000® | ||
| Institutional | Total Return | |
Class Shares | Index | |
| One Year | -4.69% | 2.50% |
| Three Year | 10.07% | 11.55% |
| Five Year | 6.58% | 9.25% |
| Since Inception (12/29/09) | 11.97% | 12.17% |
Performance data quoted represents past performance and does not guarantee future results. The investment return and principal value of an investment will fluctuate so that an investor’s shares, when redeemed, may be worth more or less than their original cost. Current performance of the Fund may be lower or higher than the performance quoted. Performance data current to the most recent month- end may be obtained by calling 877-677-9414.
Investment performance reflects fee waivers in effect. In the absence of such waivers, total returns would be reduced.
The returns shown assume reinvestment of Fund distributions and do not reflect the deduction of taxes that a shareholder would pay on Fund distributions or the redemption of Fund shares. The following graph illustrates performance of a hypothetical investment made in the Fund and a broad-based securities index on the Fund’s inception date for Institutional Class shares. The graph does not reflect any future performance.
The Russell 3000® Total Return Index measures the performance of the largest 3,000 U.S. companies representing approximately 98% of the investable U.S. equity market.
One cannot invest directly in an index.
| Growth of $15,000 Investment |
 |
| * | Inception Date |
13
CONVERGENCE OPPORTUNITIES FUND
Investment Highlights
(Unaudited)
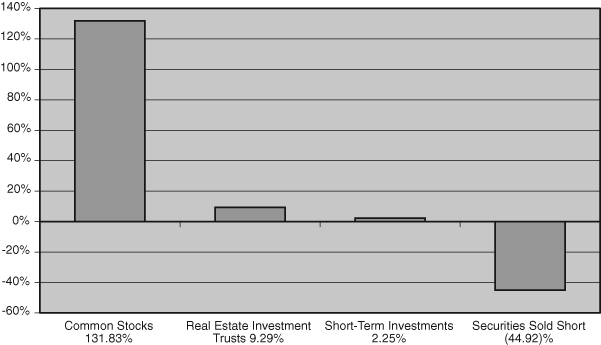
The Fund’s investment objective is to seek long-term capital growth. The Fund seeks to achieve this objective by establishing long and short positions in equity securities of domestic companies. The Fund focuses primarily on companies with small to medium market capitalizations, although the Fund may establish long and short positions in companies of any market capitalization. The Fund generally considers companies with small and medium market capitalizations to be those companies that comprise the lower 2,500 stocks by market capitalization of the Russell 3000® Total Return Index. The Fund will hold long (purchase) securities that the Adviser believes will outperform the market, and will sell short securities expected to underperform the market.
Allocation of Portfolio Holdings
(as a percentage of net assets)
Continued
14
CONVERGENCE OPPORTUNITIES FUND
Investment Highlights (Continued)
(Unaudited)
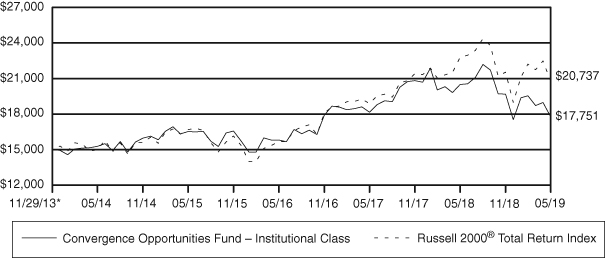
Average Annual Total Returns as of May 31, 2019
Russell 2000® | ||
| Institutional | Total Return | |
Class Shares | Index | |
| One Year | -13.40% | -9.04% |
| Three Year | 3.95% | 9.75% |
| Five Year | 3.05% | 6.71% |
| Since Inception (11/29/13) | 3.11% | 6.06% |
Performance data quoted represents past performance and does not guarantee future results. The investment return and principal value of an investment will fluctuate so that an investor’s shares, when redeemed, may be worth more or less than their original cost. Current performance of the Fund may be lower or higher than the performance quoted. Performance data current to the most recent month- end may be obtained by calling 877-677-9414.
Investment performance reflects fee waivers in effect. In the absence of such waivers, total returns would be reduced.
The returns shown assume reinvestment of Fund distributions and do not reflect the deduction of taxes that a shareholder would pay on Fund distributions or the redemption of Fund shares. The following graph illustrates performance of a hypothetical investment made in the Fund and a broad-based securities index on the Fund’s inception date for Institutional Class shares. The graph does not reflect any future performance.
The Russell 2000® Total Return Index measures the performance of the small-cap segment of the U.S. equity universe. The Russell 2000® Total Return Index is a subset of the Russell 3000® Total Return Index.
One cannot invest directly in an index.
| Growth of $15,000 Investment |
 |
| * | Inception Date |
15
CONVERGENCE MARKET NEUTRAL FUND
Investment Highlights
(Unaudited)
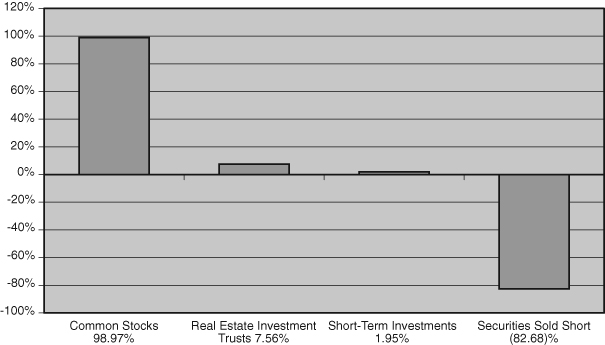
The Fund’s investment objective is to seek positive absolute returns. The Fund seeks to achieve its investment objective by establishing long and short positions in equity securities of domestic companies that are deemed to be attractive (and likely to increase in price), or unattractive (and likely to decrease in price). The Fund is designed to be “market neutral,” targeting a portfolio designed to generate positive absolute returns with low correlation to the U.S. equity market over a normal business cycle. The Fund focuses primarily on companies with medium and large market capitalizations, although the Fund may establish long and short positions in companies of any market capitalization. The Fund will hold long (purchase) securities that the Adviser believes will outperform the market, and will sell short securities it expects to underperform the market.
Allocation of Portfolio Holdings
(as a percentage of net assets)
Continued
16
CONVERGENCE MARKET NEUTRAL FUND
Investment Highlights (Continued)
(Unaudited)
Average Annual Returns as of May 31, 2019
| ICE BofA | ||
| Merrill Lynch | ||
| 3-Month | ||
| Institutional | U.S. Treasury | |
Class Shares | Bill Index | |
| One Year | -5.97% | 2.26% |
| Three Year | 3.10% | 1.32% |
| Since Inception (1/29/16) | 1.54% | 1.22% |
Performance data quoted represents past performance and does not guarantee future results. The investment return and principal value of an investment will fluctuate so that an investor’s shares, when redeemed, may be worth more or less than their original cost. Current performance of the Fund may be lower or higher than the performance quoted. Performance data current to the most recent month- end may be obtained by calling 877-677-9414.
Investment performance reflects fee waivers in effect. In the absence of such waivers, total returns would be reduced.
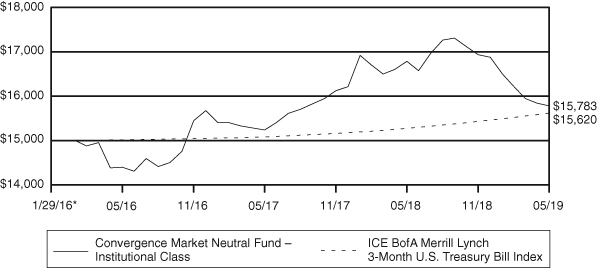
The returns shown assume reinvestment of Fund distributions and do not reflect the deduction of taxes that a shareholder would pay on Fund distributions or the redemption of Fund shares. The following graph illustrates performance of a hypothetical investment made in the Fund and a broad-based securities index on the Fund’s inception date for Institutional Class shares. The graph does not reflect any future performance.
The ICE BofA Merrill Lynch 3-Month U.S. Treasury Bill Index is an unmanaged market index of U.S. Treasury securities maturing in 90 days that assumes reinvestment of all income.
One cannot invest directly in an index.
| Growth of $15,000 Investment |
 |
| * | Inception Date |
17
CONVERGENCE LONG/SHORT EQUITY FUND
| Schedule of Investments |
May 31, 2019 (Unaudited)
| Shares | Value | |||||||
| COMMON STOCKS* 130.02% | ||||||||
| Administrative and Support Services 2.36% | ||||||||
| ABM Industries, Inc. | 9,750 | $ | 353,438 | |||||
| ManpowerGroup, Inc. | 4,339 | 371,071 | ||||||
| PayPal Holdings, Inc. (a) | 13,656 | 1,498,746 | ||||||
| 2,223,255 | ||||||||
| Air Transportation 0.88% | ||||||||
| United Continental Holdings, Inc. (a) | 10,692 | 830,234 | ||||||
| Ambulatory Health Care Services 0.86% | ||||||||
| Medpace Holdings, Inc. (a)(b) | 15,054 | 812,615 | ||||||
| Amusement, Gambling, and Recreation Industries 1.28% | ||||||||
| Planet Fitness, Inc. – Class A (a) | 7,985 | 610,613 | ||||||
| SeaWorld Entertainment, Inc. (a) | 18,509 | 592,288 | ||||||
| 1,202,901 | ||||||||
| Apparel Manufacturing 0.46% | ||||||||
| Lululemon Athletica, Inc. (a) | 2,598 | 430,203 | ||||||
| Beverage and Tobacco Product Manufacturing 2.29% | ||||||||
| Coca-Cola Co. | 20,612 | 1,012,668 | ||||||
| Coca-Cola Consolidated, Inc. | 3,780 | 1,141,597 | ||||||
| 2,154,265 | ||||||||
| Broadcasting (except Internet) 4.58% | ||||||||
| AMC Networks, Inc. – Class A (a) | 21,830 | 1,151,969 | ||||||
| Comcast Corp. – Class A | 33,054 | 1,355,214 | ||||||
| Sinclair Broadcast Group, Inc. – Class A | 33,656 | 1,806,654 | ||||||
| 4,313,837 | ||||||||
| Building Material and Garden Equipment and Supplies Dealers 1.77% | ||||||||
| Home Depot, Inc. | 8,755 | 1,662,137 | ||||||
| Chemical Manufacturing 6.18% | ||||||||
| AbbVie, Inc. | 22,696 | 1,741,010 | ||||||
| Celanese Corp. – Class A | 5,818 | 552,303 | ||||||
| Celgene Corp. (a) | 9,135 | 856,772 | ||||||
| Colgate-Palmolive Co. | 11,133 | 775,079 | ||||||
| Merck & Co., Inc. | 17,440 | 1,381,422 | ||||||
| PPG Industries, Inc. | 4,885 | 511,215 | ||||||
| 5,817,801 | ||||||||
The accompanying notes are an integral part of these financial statements.
18
CONVERGENCE LONG/SHORT EQUITY FUND
| Schedule of Investments (Continued) |
May 31, 2019 (Unaudited)
| Shares | Value | |||||||
| Computer and Electronic Product Manufacturing 16.14% | ||||||||
| Alphabet, Inc. – Class A (a) | 1,110 | $ | 1,228,215 | |||||
| Alphabet, Inc. – Class C (a) | 2,176 | 2,401,499 | ||||||
| Apple, Inc. | 17,741 | 3,105,917 | ||||||
| Broadcom, Inc. | 4,385 | 1,103,441 | ||||||
| Cisco Systems, Inc. | 18,563 | 965,833 | ||||||
| Danaher Corp. | 7,369 | 972,782 | ||||||
| Garmin Ltd. (c) | 5,940 | 454,291 | ||||||
| Mettler-Toledo International, Inc. (a) | 1,010 | 730,321 | ||||||
| QUALCOMM, Inc. | 16,940 | 1,131,931 | ||||||
| Tech Data Corp. (a) | 9,718 | 880,937 | ||||||
| Teradyne, Inc. | 26,540 | 1,118,395 | ||||||
| Xilinx, Inc. | 10,842 | 1,109,245 | ||||||
| 15,202,807 | ||||||||
| Credit Intermediation and Related Activities 11.01% | ||||||||
| Ameriprise Financial, Inc. | 8,194 | 1,132,657 | ||||||
| Bank of America Corp. | 79,116 | 2,104,485 | ||||||
| Capital One Financial Corp. | 11,181 | 960,112 | ||||||
| Citigroup, Inc. | 28,508 | 1,771,772 | ||||||
| Citizens Financial Group, Inc. | 6,775 | 220,730 | ||||||
| Discover Financial Services | 15,447 | 1,151,574 | ||||||
| Fifth Third Bancorp | 14,709 | 389,789 | ||||||
| KeyCorp | 16,637 | 265,693 | ||||||
| Popular, Inc. (c) | 5,255 | 274,364 | ||||||
| Regions Financial Corp. | 18,200 | 251,706 | ||||||
| Wells Fargo & Co. | 36,132 | 1,603,177 | ||||||
| Zions Bancorporation | 5,763 | 248,212 | ||||||
| 10,374,271 | ||||||||
| Data Processing, Hosting and Related Services 0.98% | ||||||||
| Hewlett Packard Enterprise Co. | 67,366 | 924,262 | ||||||
| Fabricated Metal Product Manufacturing 0.93% | ||||||||
| Ball Corp. | 8,750 | 537,163 | ||||||
| Timken Co. | 7,760 | 341,518 | ||||||
| 878,681 | ||||||||
| Food and Beverage Stores 2.19% | ||||||||
| Core-Mark Holding Company, Inc. | 38,416 | 1,416,782 | ||||||
| Kroger Co. | 28,278 | 645,021 | ||||||
| 2,061,803 | ||||||||
The accompanying notes are an integral part of these financial statements.
19
CONVERGENCE LONG/SHORT EQUITY FUND
| Schedule of Investments (Continued) |
May 31, 2019 (Unaudited)
| Shares | Value | |||||||
| Food Manufacturing 2.49% | ||||||||
| Hershey Co. | 9,040 | $ | 1,192,918 | |||||
| Mondelez International, Inc. – Class A | 22,646 | 1,151,549 | ||||||
| 2,344,467 | ||||||||
| Food Services and Drinking Places 1.23% | ||||||||
| Starbucks Corp. | 9,932 | 755,427 | ||||||
| Yum! Brands, Inc. | 3,973 | 406,637 | ||||||
| 1,162,064 | ||||||||
| Funds, Trusts, and Other Financial Vehicles 0.99% | ||||||||
| HealthEquity, Inc. (a) | 14,229 | 930,007 | ||||||
| General Merchandise Stores 1.29% | ||||||||
| Wal-Mart, Inc. | 11,966 | 1,213,831 | ||||||
| Health and Personal Care Stores 2.63% | ||||||||
| McKesson Corp. | 8,153 | 995,807 | ||||||
| Ulta Beauty, Inc. (a) | 4,476 | 1,492,210 | ||||||
| 2,488,017 | ||||||||
| Heavy and Civil Engineering Construction 0.45% | ||||||||
| MasTec, Inc. (a) | 9,097 | 422,919 | ||||||
| Insurance Carriers and Related Activities 3.93% | ||||||||
| Allstate Corp. | 7,363 | 703,239 | ||||||
| MetLife, Inc. | 14,795 | 683,677 | ||||||
| MGIC Investment Corp. (a) | 20,310 | 275,201 | ||||||
| Principal Financial Group, Inc. | 12,910 | 665,769 | ||||||
| Progressive Corp. | 8,764 | 694,810 | ||||||
| Prudential Financial, Inc. | 7,271 | 671,695 | ||||||
| 3,694,391 | ||||||||
| Leather and Allied Product Manufacturing 0.73% | ||||||||
| Deckers Outdoor Corp. (a) | 1,881 | 286,100 | ||||||
| Nike, Inc. – Class B | 5,260 | 405,757 | ||||||
| 691,857 | ||||||||
| Machinery Manufacturing 2.29% | ||||||||
| AGCO Corp. | 7,554 | 502,794 | ||||||
| Belden, Inc. | 14,312 | 732,774 | ||||||
| Cummins, Inc. | 3,843 | 579,371 | ||||||
| John Bean Technologies Corp. | 3,330 | 341,492 | ||||||
| 2,156,431 | ||||||||
The accompanying notes are an integral part of these financial statements.
20
CONVERGENCE LONG/SHORT EQUITY FUND
| Schedule of Investments (Continued) |
May 31, 2019 (Unaudited)
| Shares | Value | |||||||
| Management of Companies and Enterprises 0.84% | ||||||||
| AES Corp. | 49,935 | $ | 788,973 | |||||
| Merchant Wholesalers, Durable Goods 1.88% | ||||||||
| Builders FirstSource, Inc. (a) | 24,876 | 350,254 | ||||||
| Henry Schein, Inc. (a) | 14,533 | 936,797 | ||||||
| WESCO International, Inc. (a) | 10,488 | 491,153 | ||||||
| 1,778,204 | ||||||||
| Merchant Wholesalers, Nondurable Goods 3.54% | ||||||||
| AmerisourceBergen Corp. | 13,599 | 1,058,818 | ||||||
| Cardinal Health, Inc. | 22,059 | 928,022 | ||||||
| Procter & Gamble Co. | 13,013 | 1,339,168 | ||||||
| 3,326,008 | ||||||||
| Mining (except Oil and Gas) 0.53% | ||||||||
| Worthington Industries, Inc. | 14,742 | 503,292 | ||||||
| Motor Vehicle and Parts Dealers 0.94% | ||||||||
| AutoZone, Inc. (a) | 858 | 881,260 | ||||||
| Nonmetallic Mineral Product Manufacturing 0.51% | ||||||||
| Owens-Illinois, Inc. | 29,981 | 479,696 | ||||||
| Nonstore Retailers 2.83% | ||||||||
| Amazon.com, Inc. (a) | 842 | 1,494,609 | ||||||
| World Fuel Services Corp. | 40,150 | 1,169,971 | ||||||
| 2,664,580 | ||||||||
| Nursing and Residential Care Facilities 1.02% | ||||||||
| Omnicell, Inc. (a) | 12,033 | 956,022 | ||||||
| Oil and Gas Extraction 1.12% | ||||||||
| Phillips 66 | 13,014 | 1,051,531 | ||||||
| Petroleum and Coal Products Manufacturing 3.80% | ||||||||
| Chevron Corp. | 13,648 | 1,553,825 | ||||||
| CVR Energy, Inc. (b) | 23,845 | 1,012,697 | ||||||
| Valero Energy Corp. | 14,397 | 1,013,549 | ||||||
| 3,580,071 | ||||||||
The accompanying notes are an integral part of these financial statements.
21
CONVERGENCE LONG/SHORT EQUITY FUND
| Schedule of Investments (Continued) |
May 31, 2019 (Unaudited)
| Shares | Value | |||||||
| Plastics and Rubber Products Manufacturing 0.96% | ||||||||
| Berry Global Group, Inc. (a) | 11,950 | $ | 561,889 | |||||
| Carlisle Companies, Inc. | 2,569 | 342,473 | ||||||
| 904,362 | ||||||||
| Professional, Scientific, and Technical Services 13.90% | ||||||||
| Amgen, Inc. | 10,201 | 1,700,507 | ||||||
| Arrowhead Pharmaceuticals, Inc. (a) | 29,570 | 701,105 | ||||||
| Biogen, Inc. (a) | 5,781 | 1,267,715 | ||||||
| Cadence Design Systems, Inc. (a) | 22,527 | 1,432,041 | ||||||
| eBay, Inc. | 23,836 | 856,427 | ||||||
| Insperity, Inc. | 3,207 | 365,277 | ||||||
| International Business Machines Corp. | 10,267 | 1,303,806 | ||||||
| Omnicom Group, Inc. | 21,217 | 1,641,347 | ||||||
| PRA Health Sciences, Inc. (a) | 8,363 | 725,323 | ||||||
| Tetra Tech, Inc. | 5,380 | 363,258 | ||||||
| Verint Systems, Inc. (a) | 24,818 | 1,408,422 | ||||||
| VMware, Inc. – Class A (a)(b) | 7,460 | 1,320,271 | ||||||
| 13,085,499 | ||||||||
| Publishing Industries (except Internet) 10.25% | ||||||||
| Citrix Systems, Inc. | 15,161 | 1,426,953 | ||||||
| Fortinet, Inc. (a) | 18,931 | 1,372,119 | ||||||
| Intuit, Inc. | 5,909 | 1,446,819 | ||||||
| Microsoft Corp. | 11,922 | 1,474,513 | ||||||
| Nuance Communications, Inc. (a) | 82,920 | 1,423,736 | ||||||
| Oracle Corp. | 27,972 | 1,415,383 | ||||||
| Veeva Systems, Inc. – Class A (a) | 7,064 | 1,089,905 | ||||||
| 9,649,428 | ||||||||
| Rail Transportation 0.89% | ||||||||
| Union Pacific Corp. | 5,052 | 842,572 | ||||||
| Real Estate 0.94% | ||||||||
| CBRE Group, Inc. – Class A (a) | 10,247 | 468,288 | ||||||
| Jones Lang LaSalle, Inc. | 3,300 | 410,685 | ||||||
| 878,973 | ||||||||
| Rental and Leasing Services 2.06% | ||||||||
| Navient Corp. | 68,025 | 887,046 | ||||||
| Synchrony Financial | 31,469 | 1,058,302 | ||||||
| 1,945,348 | ||||||||
The accompanying notes are an integral part of these financial statements.
22
CONVERGENCE LONG/SHORT EQUITY FUND
| Schedule of Investments (Continued) |
May 31, 2019 (Unaudited)
| Shares | Value | |||||||
| Securities, Commodity Contracts, and Other Financial | ||||||||
| Investments and Related Activities 1.49% | ||||||||
| Allegion PLC (c) | 3,520 | $ | 341,616 | |||||
| Stifel Financial Corp. | 19,762 | 1,059,836 | ||||||
| 1,401,452 | ||||||||
| Specialty Trade Contractors 0.36% | ||||||||
| EMCOR Group, Inc. | 4,235 | 341,172 | ||||||
| Support Activities for Mining 0.55% | ||||||||
| Compass Minerals International, Inc. | 10,198 | 520,200 | ||||||
| Telecommunications 2.48% | ||||||||
| Verizon Communications, Inc. | 43,017 | 2,337,974 | ||||||
| Transportation Equipment Manufacturing 6.02% | ||||||||
| Boeing Co. | 5,626 | 1,921,898 | ||||||
| Ford Motor Co. | 45,000 | 428,400 | ||||||
| General Motors Co. | 13,994 | 466,560 | ||||||
| Lockheed Martin Corp. | 5,909 | 2,000,433 | ||||||
| Oshkosh Corp. | 7,099 | 505,378 | ||||||
| Spirit AeroSystems Holdings, Inc. – Class A | 4,200 | 340,368 | ||||||
| 5,663,037 | ||||||||
| Truck Transportation 0.84% | ||||||||
| Landstar System, Inc. | 8,187 | 787,999 | ||||||
| Utilities 3.62% | ||||||||
| Black Hills Corp. | 11,624 | 885,748 | ||||||
| Exelon Corp. | 17,484 | 840,631 | ||||||
| NRG Energy, Inc. | 23,365 | 795,345 | ||||||
| Southwest Gas Holdings, Inc. | 10,454 | 890,054 | ||||||
| 3,411,778 | ||||||||
| Water Transportation 0.71% | ||||||||
| Norwegian Cruise Line Holdings Ltd. (a)(c) | 12,207 | 667,845 | ||||||
| TOTAL COMMON STOCKS (Cost $112,692,912) | 122,440,332 | |||||||
The accompanying notes are an integral part of these financial statements.
23
CONVERGENCE LONG/SHORT EQUITY FUND
| Schedule of Investments (Continued) |
May 31, 2019 (Unaudited)
| Shares | Value | |||||||
| REAL ESTATE INVESTMENT TRUSTS* 4.53% | ||||||||
| Apartment Investment & Management Co. – Class A | 8,478 | $ | 423,476 | |||||
| AvalonBay Communities, Inc. | 2,386 | 484,381 | ||||||
| Brandywine Realty Trust | 31,624 | 477,839 | ||||||
| Host Hotels & Resorts, Inc. | 28,917 | 523,687 | ||||||
| Kimco Realty Corp. | 27,486 | 478,257 | ||||||
| Mack-Cali Realty Corp. | 19,846 | 450,901 | ||||||
| Medical Properties Trust, Inc. | 26,869 | 477,731 | ||||||
| PS Business Parks, Inc. | 2,988 | 480,829 | ||||||
| Xenia Hotels & Resorts, Inc. | 22,432 | 469,053 | ||||||
| TOTAL REAL ESTATE INVESTMENT TRUSTS (Cost $4,173,492) | 4,266,154 | |||||||
| SHORT-TERM INVESTMENTS 0.34% | ||||||||
| Fidelity Investments Money Market Funds – | ||||||||
| Government Portfolio – Class I, 2.270% (b)(d) | 322,251 | 322,251 | ||||||
| TOTAL SHORT-TERM INVESTMENTS (Cost $322,251) | 322,251 | |||||||
| Total Investments (Cost $117,188,655) 134.89% | 127,028,737 | |||||||
| Liabilities in Excess of Other Assets (34.89)% | (32,859,127 | ) | ||||||
| TOTAL NET ASSETS 100.00% | $ | 94,169,610 | ||||||
Percentages are stated as a percent of net assets.
| * | Unless otherwise noted, all or a portion of these securities, totaling $123,455,811, is pledged as collateral for securities sold short. |
| (a) | Non-income producing security. |
| (b) | This security is not pledged as collateral for securities sold short. |
| (c) | Foreign issued security. |
| (d) | Seven day yield as of May 31, 2019. |
Abbreviations:
| Ltd. | Limited Liability Company. |
| PLC | Public Limited Company. |
The accompanying notes are an integral part of these financial statements.
24
CONVERGENCE LONG/SHORT EQUITY FUND
| Schedule of Securities Sold Short |
May 31, 2019 (Unaudited)
| Shares | Value | |||||||
| SECURITIES SOLD SHORT (46.46)% | ||||||||
| COMMON STOCKS (42.99)% | ||||||||
| Accommodation (0.18)% | ||||||||
| MGM Resorts International | (6,980 | ) | $ | (173,244 | ) | |||
| Administrative and Support Services (0.91)% | ||||||||
| Perspecta, Inc. | (17,893 | ) | (388,457 | ) | ||||
| ServiceMaster Global Holdings, Inc. | (3,521 | ) | (190,134 | ) | ||||
| Teladoc Health, Inc. | (4,771 | ) | (277,291 | ) | ||||
| (855,882 | ) | |||||||
| Air Transportation (0.45)% | ||||||||
| Alaska Air Group, Inc. | (3,913 | ) | (227,736 | ) | ||||
| Spirit Airlines, Inc. | (4,308 | ) | (198,513 | ) | ||||
| (426,249 | ) | |||||||
| Amusement, Gambling, and Recreation Industries (0.19)% | ||||||||
| Six Flags Entertainment Corp. | (3,530 | ) | (174,241 | ) | ||||
| Beverage and Tobacco Product Manufacturing (0.32)% | ||||||||
| National Beverage Corp. | (6,735 | ) | (304,085 | ) | ||||
| Broadcasting (except Internet) (0.47)% | ||||||||
| Cable One, Inc. | (400 | ) | (446,820 | ) | ||||
| Chemical Manufacturing (3.83)% | ||||||||
| ACADIA Pharmaceuticals, Inc. | (8,202 | ) | (196,766 | ) | ||||
| Aerie Pharmaceuticals, Inc. | (4,065 | ) | (148,047 | ) | ||||
| Albemarle Corp. | (2,095 | ) | (132,614 | ) | ||||
| Alnylam Pharmaceuticals, Inc. | (6,907 | ) | (466,362 | ) | ||||
| Bluebird Bio, Inc. | (3,714 | ) | (445,383 | ) | ||||
| Clovis Oncology, Inc. | (6,193 | ) | (91,533 | ) | ||||
| DowDuPont, Inc. | (5,190 | ) | (158,399 | ) | ||||
| Heron Therapeutics, Inc. | (7,171 | ) | (122,122 | ) | ||||
| Immunomedics, Inc. | (10,107 | ) | (132,098 | ) | ||||
| Medicines Co. | (4,885 | ) | (174,150 | ) | ||||
| MyoKardia, Inc. | (3,050 | ) | (142,069 | ) | ||||
| Nektar Therapeutics | (11,290 | ) | (353,603 | ) | ||||
| Puma Biotechnology, Inc. | (7,422 | ) | (109,771 | ) | ||||
| REGENXBIO, Inc. | (2,796 | ) | (120,284 | ) | ||||
| Rogers Corp. | (2,550 | ) | (351,874 | ) | ||||
| Tronox Holdings PLC – Class A (a) | (14,391 | ) | (133,405 | ) | ||||
The accompanying notes are an integral part of these financial statements.
25
CONVERGENCE LONG/SHORT EQUITY FUND
| Schedule of Securities Sold Short (Continued) |
May 31, 2019 (Unaudited)
| Shares | Value | |||||||
| Chemical Manufacturing (3.83)% (Continued) | ||||||||
| Ultragenyx Pharmaceutical, Inc. | (3,991 | ) | $ | (219,226 | ) | |||
| Zogenix, Inc. | (2,800 | ) | (105,532 | ) | ||||
| (3,603,238 | ) | |||||||
| Clothing and Clothing Accessories Stores (0.37)% | ||||||||
| Tiffany & Co. | (3,949 | ) | (351,895 | ) | ||||
| Computer and Electronic Product Manufacturing (4.19)% | ||||||||
| Advanced Micro Devices, Inc. | (13,800 | ) | (378,257 | ) | ||||
| Avanos Medical, Inc. | (7,333 | ) | (276,308 | ) | ||||
| Cubic Corp. | (3,234 | ) | (182,462 | ) | ||||
| Guidewire Software, Inc. | (3,709 | ) | (372,828 | ) | ||||
| Lumentum Holdings, Inc. | (9,398 | ) | (380,337 | ) | ||||
| MACOM Technology Solutions Holdings, Inc. | (11,140 | ) | (157,631 | ) | ||||
| Marvell Technology Group Ltd. (a) | (14,492 | ) | (323,172 | ) | ||||
| Microchip Technology, Inc. | (4,536 | ) | (363,016 | ) | ||||
| NVIDIA Corp. | (2,245 | ) | (304,108 | ) | ||||
| Plantronics, Inc. | (9,016 | ) | (370,287 | ) | ||||
| Pure Storage, Inc. – Class A | (16,140 | ) | (255,980 | ) | ||||
| Square, Inc. – Class A | (6,210 | ) | (384,710 | ) | ||||
| Zynga, Inc. – Class A | (31,502 | ) | (198,148 | ) | ||||
| (3,947,244 | ) | |||||||
| Construction of Buildings (0.43)% | ||||||||
| Dycom Industries, Inc. | (3,499 | ) | (182,543 | ) | ||||
| KB Home | (4,490 | ) | (112,834 | ) | ||||
| Lennar Corp. – Class A | (2,328 | ) | (115,608 | ) | ||||
| (410,985 | ) | |||||||
| Credit Intermediation and Related Activities (2.30)% | ||||||||
| Atlantic Union Bankshares Corp. | (6,321 | ) | (204,168 | ) | ||||
| BOK Financial Corp. | (6,250 | ) | (468,313 | ) | ||||
| Cadence BanCorp | (12,509 | ) | (231,417 | ) | ||||
| CenterState Bank Corp. | (12,229 | ) | (267,692 | ) | ||||
| CVB Financial Corp. | (10,640 | ) | (218,652 | ) | ||||
| Flagstar Bancorp, Inc. | (5,545 | ) | (174,557 | ) | ||||
| Independent Bank Group, Inc. | (3,259 | ) | (168,295 | ) | ||||
| PennyMac Financial Services, Inc. | (4,601 | ) | (97,587 | ) | ||||
| Synovus Financial Corp. | (4,709 | ) | (150,500 | ) | ||||
| WSFS Financial Corp. | (4,670 | ) | (185,352 | ) | ||||
| (2,166,533 | ) | |||||||
The accompanying notes are an integral part of these financial statements.
26
CONVERGENCE LONG/SHORT EQUITY FUND
| Schedule of Securities Sold Short (Continued) |
May 31, 2019 (Unaudited)
| Shares | Value | |||||||
| Data Processing, Hosting and Related Services (0.54)% | ||||||||
| Ceridian HCM Holding, Inc. | (7,850 | ) | $ | (386,063 | ) | |||
| Upwork, Inc. | (8,250 | ) | (123,585 | ) | ||||
| (509,648 | ) | |||||||
| Educational Services (0.19)% | ||||||||
| Grand Canyon Education, Inc. | (1,490 | ) | (178,591 | ) | ||||
| Electrical Equipment, Appliance, and | ||||||||
| Component Manufacturing (0.78)% | ||||||||
| Altra Industrial Motion Corp. | (5,283 | ) | �� | (165,728 | ) | |||
| Axon Enterprise, Inc. | (3,528 | ) | (235,600 | ) | ||||
| Energizer Holdings, Inc. | (8,240 | ) | (337,181 | ) | ||||
| (738,509 | ) | |||||||
| Fabricated Metal Product Manufacturing (0.17)% | ||||||||
| McDermott International, Inc. (a) | (26,096 | ) | (157,620 | ) | ||||
| Food and Beverage Stores (0.49)% | ||||||||
| GrubHub, Inc. | (7,021 | ) | (457,418 | ) | ||||
| Food Manufacturing (0.98)% | ||||||||
| Conagra Brands, Inc. | (11,968 | ) | (320,383 | ) | ||||
| Hain Celestial Group, Inc. | (14,416 | ) | (293,942 | ) | ||||
| Kraft Heinz Co. | (11,251 | ) | (311,090 | ) | ||||
| (925,415 | ) | |||||||
| Food Services and Drinking Places (0.33)% | ||||||||
| Casey’s General Stores, Inc. | (2,399 | ) | (309,663 | ) | ||||
| Furniture and Home Furnishings Stores (0.44)% | ||||||||
| Floor & Decor Holdings, Inc. – Class A | (11,766 | ) | (417,928 | ) | ||||
| General Merchandise Stores (0.28)% | ||||||||
| PriceSmart, Inc. | (5,416 | ) | (263,218 | ) | ||||
| Heavy and Civil Engineering Construction (0.25)% | ||||||||
| Granite Construction, Inc. | (5,780 | ) | (232,298 | ) | ||||
| Insurance Carriers and Related Activities (2.02)% | ||||||||
| American International Group, Inc. | (4,475 | ) | (228,538 | ) | ||||
| Brighthouse Financial, Inc. | (5,249 | ) | (186,287 | ) | ||||
| Centene Corp. | (5,712 | ) | (329,867 | ) | ||||
| Everest Re Group Ltd. (a) | (845 | ) | (209,273 | ) | ||||
The accompanying notes are an integral part of these financial statements.
27
CONVERGENCE LONG/SHORT EQUITY FUND
| Schedule of Securities Sold Short (Continued) |
May 31, 2019 (Unaudited)
| Shares | Value | |||||||
| Insurance Carriers and Related Activities (2.02)% (Continued) | ||||||||
| Humana, Inc. | (1,200 | ) | $ | (293,832 | ) | |||
| Loews Corp. | (4,050 | ) | (208,008 | ) | ||||
| Markel Corp. | (218 | ) | (230,834 | ) | ||||
| White Mountains Insurance Group Ltd. (a) | (221 | ) | (216,492 | ) | ||||
| (1,903,131 | ) | |||||||
| Machinery Manufacturing (0.58)% | ||||||||
| Evoqua Water Technologies Corp. | (13,293 | ) | (156,459 | ) | ||||
| II-VI, Inc. | (12,340 | ) | (387,846 | ) | ||||
| (544,305 | ) | |||||||
| Management of Companies and Enterprises (0.42)% | ||||||||
| Ameris Bancorp | (5,208 | ) | (183,790 | ) | ||||
| Renasant Corp. | (6,230 | ) | (210,574 | ) | ||||
| (394,364 | ) | |||||||
| Merchant Wholesalers, Durable Goods (1.93)% | ||||||||
| Adient PLC (a) | (7,634 | ) | (131,763 | ) | ||||
| GCP Applied Technologies, Inc. | (6,185 | ) | (161,800 | ) | ||||
| Mohawk Industries, Inc. | (1,000 | ) | (135,550 | ) | ||||
| Spectrum Brands Holdings, Inc. | (6,441 | ) | (339,247 | ) | ||||
| Sunrun, Inc. | (16,129 | ) | (252,580 | ) | ||||
| Trinity Industries, Inc. | (11,148 | ) | (214,933 | ) | ||||
| Varonis Systems, Inc. | (6,820 | ) | (426,523 | ) | ||||
| Westrock Co. | (4,800 | ) | (156,480 | ) | ||||
| (1,818,876 | ) | |||||||
| Merchant Wholesalers, Nondurable Goods (0.54)% | ||||||||
| Aimmune Therapeutics, Inc. | (6,475 | ) | (126,716 | ) | ||||
| Atara Biotherapeutics, Inc. | (2,458 | ) | (54,592 | ) | ||||
| Freshpet, Inc. | (7,078 | ) | (328,915 | ) | ||||
| (510,223 | ) | |||||||
| Miscellaneous Manufacturing (2.32)% | ||||||||
| Cantel Medical Corp. | (4,578 | ) | (314,692 | ) | ||||
| Haemonetics Corp. | (3,008 | ) | (291,746 | ) | ||||
| ICU Medical, Inc. | (1,262 | ) | (268,554 | ) | ||||
| Insulet Corp. | (2,730 | ) | (299,727 | ) | ||||
| Mattel, Inc. | (10,997 | ) | (108,320 | ) | ||||
| Mirati Therapeutics, Inc. | (2,380 | ) | (161,340 | ) | ||||
| National Vision Holdings, Inc. | (16,203 | ) | (441,207 | ) | ||||
| Nevro Corp. | (5,133 | ) | (303,412 | ) | ||||
| (2,188,998 | ) | |||||||
The accompanying notes are an integral part of these financial statements.
28
CONVERGENCE LONG/SHORT EQUITY FUND
| Schedule of Securities Sold Short (Continued) |
May 31, 2019 (Unaudited)
| Shares | Value | |||||||
| Miscellaneous Store Retailers (0.09)% | ||||||||
| Stamps.com, Inc. | (2,630 | ) | $ | (88,210 | ) | |||
| Motion Picture and Sound Recording Industries (0.68)% | ||||||||
| Lions Gate Entertainment Corp. – Class B (a) | (10,665 | ) | (146,750 | ) | ||||
| Take-Two Interactive Software, Inc. | (4,598 | ) | (497,274 | ) | ||||
(644,024 | ) | |||||||
| Motor Vehicle and Parts Dealers (0.91)% | ||||||||
| Cargurus, Inc. | (11,092 | ) | (378,903 | ) | ||||
| Carvana Co. | (8,187 | ) | (473,864 | ) | ||||
(852,767 | ) | |||||||
| Oil and Gas Extraction (1.33)% | ||||||||
| Callon Petroleum Co. | (16,456 | ) | (102,850 | ) | ||||
| Concho Resources, Inc. | (2,754 | ) | (269,920 | ) | ||||
| Diamondback Energy, Inc. | (2,714 | ) | (266,135 | ) | ||||
| Jagged Peak Energy, Inc. | (34,199 | ) | (283,852 | ) | ||||
| Matador Resources Co. | (19,564 | ) | (321,631 | ) | ||||
(1,244,388 | ) | |||||||
| Other Information Services (0.64)% | ||||||||
| Zillow Group, Inc. – Class A | (4,067 | ) | (172,156 | ) | ||||
| Zillow Group, Inc. – Class C | (9,810 | ) | (422,026 | ) | ||||
(594,182 | ) | |||||||
| Performing Arts, Spectator Sports, and Related Industries (0.29)% | ||||||||
| Electronic Arts, Inc. | (1,088 | ) | (101,271 | ) | ||||
| International Game Technology PLC (a) | (13,229 | ) | (171,977 | ) | ||||
(273,248 | ) | |||||||
| Pipeline Transportation (0.20)% | ||||||||
| South Jersey Industries, Inc. | (5,965 | ) | (188,196 | ) | ||||
| Plastics and Rubber Products Manufacturing (0.12)% | ||||||||
| Newell Brands, Inc. | (8,377 | ) | (112,419 | ) | ||||
| Primary Metal Manufacturing (0.30)% | ||||||||
| Commercial Metals Co. | (10,181 | ) | (135,916 | ) | ||||
| United States Steel Corp. | (12,560 | ) | (148,459 | ) | ||||
(284,375 | ) | |||||||
The accompanying notes are an integral part of these financial statements.
29
CONVERGENCE LONG/SHORT EQUITY FUND
| Schedule of Securities Sold Short (Continued) |
May 31, 2019 (Unaudited)
| Shares | Value | |||||||
| Printing and Related Support Activities (0.33)% | ||||||||
| Centennial Resource Development, Inc. – Class A | (38,960 | ) | $ | (307,784 | ) | |||
| Professional, Scientific, and Technical Services (3.22)% | ||||||||
| 2U, Inc. | (10,305 | ) | (391,487 | ) | ||||
| ADT, Inc. | (20,320 | ) | (118,872 | ) | ||||
| Allakos, Inc. | (2,850 | ) | (111,720 | ) | ||||
| AnaptysBio, Inc. | (2,013 | ) | (146,567 | ) | ||||
| Aspen Technology, Inc. | (3,730 | ) | (423,764 | ) | ||||
| BrightView Holdings, Inc. | (7,460 | ) | (124,657 | ) | ||||
| Cimpress NV (a) | (1,410 | ) | (123,375 | ) | ||||
| Cloudera, Inc. | (41,723 | ) | (382,600 | ) | ||||
| Diebold Nixdorf, Inc. | (18,337 | ) | (155,865 | ) | ||||
| Nutanix, Inc. – Class A | (11,000 | ) | (308,770 | ) | ||||
| Pluralsight, Inc. – Class A | (11,830 | ) | (376,904 | ) | ||||
| SYNNEX Corp. | (4,278 | ) | (370,945 | ) | ||||
(3,035,526 | ) | |||||||
| Publishing Industries (except Internet) (2.77)% | ||||||||
| Activision Blizzard, Inc. | (14,263 | ) | (618,587 | ) | ||||
| Blackbaud, Inc. | (5,190 | ) | (399,215 | ) | ||||
| FireEye, Inc. | (26,510 | ) | (386,781 | ) | ||||
| LogMeIn, Inc. | (4,975 | ) | (357,354 | ) | ||||
| Shutterfly, Inc. | (9,190 | ) | (436,341 | ) | ||||
| SS&C Technologies Holdings, Inc. | (7,260 | ) | (404,019 | ) | ||||
(2,602,297 | ) | |||||||
| Real Estate (0.15)% | ||||||||
| Howard Hughes Corp. | (1,411 | ) | (145,107 | ) | ||||
| Rental and Leasing Services (0.40)% | ||||||||
| Air Lease Corp. – Class A | (5,312 | ) | (191,232 | ) | ||||
| Aircastle Ltd. (a) | (9,833 | ) | (190,957 | ) | ||||
(382,189 | ) | |||||||
| Securities, Commodity Contracts, and Other Financial | ||||||||
| Investments and Related Activities (0.80)% | ||||||||
| Aramark | (5,410 | ) | (188,214 | ) | ||||
| CBOE Global Markets, Inc. | (2,657 | ) | (288,391 | ) | ||||
| Goldman Sachs Group, Inc. | (831 | ) | (151,649 | ) | ||||
| Moelis & Co. – Class A | (3,885 | ) | (123,465 | ) | ||||
(751,719 | ) | |||||||
The accompanying notes are an integral part of these financial statements.
30
CONVERGENCE LONG/SHORT EQUITY FUND
| Schedule of Securities Sold Short (Continued) |
May 31, 2019 (Unaudited)
| Shares | Value | |||||||
| Support Activities for Mining (0.16)% | ||||||||
| Cleveland-Cliffs, Inc. | (17,830 | ) | $ | (155,121 | ) | |||
| Telecommunications (1.31)% | ||||||||
| GCI Liberty, Inc. – Class A | (7,183 | ) | (417,260 | ) | ||||
| Vonage Holdings Corp. | (35,157 | ) | (416,259 | ) | ||||
| Zayo Group Holdings, Inc. | (12,188 | ) | (398,548 | ) | ||||
(1,232,067 | ) | |||||||
| Transportation Equipment Manufacturing (1.25)% | ||||||||
| Aerovironment, Inc. | (2,992 | ) | (193,732 | ) | ||||
| Kratos Defense & Security Solutions, Inc. | (7,750 | ) | (170,888 | ) | ||||
| RBC Bearings, Inc. | (1,180 | ) | (167,914 | ) | ||||
| REV Group, Inc. | (16,036 | ) | (177,679 | ) | ||||
| Sun Hydraulics Corp. | (3,339 | ) | (139,403 | ) | ||||
| Tesla, Inc. | (690 | ) | (127,760 | ) | ||||
| Wabtec Corp. | (3,108 | ) | (193,877 | ) | ||||
(1,171,253 | ) | |||||||
| Truck Transportation (0.21)% | ||||||||
| Knight-Swift Transportation Holdings, Inc. – Class A | (7,127 | ) | (196,990 | ) | ||||
| Utilities (1.40)% | ||||||||
| American Water Works Co., Inc. | (2,180 | ) | (246,384 | ) | ||||
| Aqua America, Inc. | (6,537 | ) | (258,472 | ) | ||||
| Atmos Energy Corp. | (2,731 | ) | (278,016 | ) | ||||
| Sempra Energy | (2,119 | ) | (278,542 | ) | ||||
| SJW Group | (4,150 | ) | (255,765 | ) | ||||
(1,317,179 | ) | |||||||
| Water Transportation (0.53)% | ||||||||
| Golar LNG Ltd. (a) | (15,021 | ) | (273,232 | ) | ||||
| Kirby Corp. | (2,919 | ) | (225,872 | ) | ||||
(499,104 | ) | |||||||
| TOTAL COMMON STOCKS (Proceeds $47,658,359) | (40,488,766 | ) | ||||||
The accompanying notes are an integral part of these financial statements.
31
CONVERGENCE LONG/SHORT EQUITY FUND
| Schedule of Securities Sold Short (Continued) |
May 31, 2019 (Unaudited)
| Shares | Value | |||||||
| REAL ESTATE INVESTMENT TRUSTS (3.47)% | ||||||||
| Acadia Realty Trust | (5,189 | ) | $ | (141,919 | ) | |||
| Annaly Capital Management, Inc. | (34,977 | ) | (308,147 | ) | ||||
| Colony Credit Real Estate, Inc. | (19,319 | ) | (293,842 | ) | ||||
| CyrusOne, Inc. | (2,801 | ) | (165,371 | ) | ||||
| Healthcare Trust of America, Inc. – Class A | (4,920 | ) | (141,647 | ) | ||||
| Hudson Pacific Properties, Inc. | (3,951 | ) | (132,003 | ) | ||||
| Macerich Co. | (3,041 | ) | (110,480 | ) | ||||
| National Health Investors, Inc. | (1,524 | ) | (119,710 | ) | ||||
| New Residential Investment Corp. | (16,513 | ) | (251,823 | ) | ||||
| Outfront Media, Inc. | (5,884 | ) | (145,041 | ) | ||||
| Pebblebrook Hotel Trust | (4,683 | ) | (130,328 | ) | ||||
| PennyMac Mortgage Investment Trust | (13,350 | ) | (277,680 | ) | ||||
| PotlatchDeltic Corp. | (3,553 | ) | (119,558 | ) | ||||
| Redwood Trust, Inc. | (17,620 | ) | (280,687 | ) | ||||
| Two Harbors Investment Corp. | (22,554 | ) | (275,610 | ) | ||||
| Urban Edge Properties | (5,615 | ) | (96,859 | ) | ||||
| Vornado Realty Trust | (1,503 | ) | (99,544 | ) | ||||
| WP Carey, Inc. | (2,086 | ) | (173,158 | ) | ||||
| TOTAL REAL ESTATE INVESTMENT TRUSTS | ||||||||
| (Proceeds $3,364,890) | (3,263,407 | ) | ||||||
| Total Securities Sold Short (Proceeds $51,023,249) | $ | (43,752,173 | ) | |||||
| (a) | Foreign issued security. |
| Abbreviations: | |
| Ltd. | Limited Liability Company. |
| NV | Naamloze Vennootschap is a Dutch term for publicly traded companies. |
| PLC | Public Limited Company. |
The accompanying notes are an integral part of these financial statements.
32
CONVERGENCE OPPORTUNITIES FUND
| Schedule of Investments |
May 31, 2019 (Unaudited)
| Shares | Value | |||||||
| COMMON STOCKS* 131.83% | ||||||||
| Administrative and Support Services 4.47% | ||||||||
| Cardtronics PLC – Class A (a)(c) | 7,854 | $ | 237,191 | |||||
| Kforce, Inc. | 5,841 | 202,974 | ||||||
| ManpowerGroup, Inc. | 1,453 | 124,261 | ||||||
| Piper Jaffray Companies | 2,025 | 143,411 | ||||||
707,837 | ||||||||
| Ambulatory Health Care Services 3.71% | ||||||||
| Amedisys, Inc. (a) | 1,925 | 216,197 | ||||||
| Genomic Health, Inc. (a) | 3,570 | 186,532 | ||||||
| Medpace Holdings, Inc. (a)(b) | 3,451 | 186,285 | ||||||
589,014 | ||||||||
| Beverage and Tobacco Product Manufacturing 1.55% | ||||||||
| Coca-Cola Consolidated, Inc. | 492 | 148,589 | ||||||
| MGP Ingredients, Inc. | 1,601 | 96,396 | ||||||
244,985 | ||||||||
| Broadcasting (except Internet) 2.76% | ||||||||
| AMC Networks, Inc. – Class A (a) | 2,534 | 133,719 | ||||||
| Nexstar Media Group, Inc. – Class A | 1,256 | 125,788 | ||||||
| Sinclair Broadcast Group, Inc. – Class A | 3,325 | 178,487 | ||||||
437,994 | ||||||||
| Building Material and Garden Equipment | ||||||||
| and Supplies Dealers 1.07% | ||||||||
| BMC Stock Holdings, Inc. (a) | 8,464 | 169,534 | ||||||
| Chemical Manufacturing 11.96% | ||||||||
| ANI Pharmaceuticals, Inc. (a) | 2,000 | 139,320 | ||||||
| Arena Pharmaceuticals, Inc. (a) | 3,818 | 202,392 | ||||||
| Cardiovascular Systems, Inc. (a) | 4,874 | 189,842 | ||||||
| Eagle Pharmaceuticals, Inc. (a) | 3,877 | 196,990 | ||||||
| Horizon Therapeutics PLC (a)(c) | 8,146 | 194,119 | ||||||
| Innoviva, Inc. (a) | 15,193 | 207,689 | ||||||
| Mallinckrodt PLC (a)(c) | 13,838 | 120,252 | ||||||
| Medifast, Inc. | 820 | 105,739 | ||||||
| Myers Industries, Inc. | 6,832 | 115,597 | ||||||
| NewMarket Corp. | 333 | 128,871 | ||||||
| Pacira BioSciences, Inc. (a) | 4,010 | 174,475 | ||||||
| Veracyte, Inc. (a) | 5,223 | 118,353 | ||||||
1,893,639 | ||||||||
The accompanying notes are an integral part of these financial statements.
33
CONVERGENCE OPPORTUNITIES FUND
| Schedule of Investments (Continued) |
May 31, 2019 (Unaudited)
| Shares | Value | |||||||
| Clothing and Clothing Accessories Stores 1.12% | ||||||||
| American Eagle Outfitters, Inc. | 10,195 | $ | 177,393 | |||||
| Computer and Electronic Product Manufacturing 8.45% | ||||||||
| Cirrus Logic, Inc. (a) | 5,178 | 193,502 | ||||||
| Jabil, Inc. | 8,513 | 209,335 | ||||||
| Lattice Semiconductor Corp. (a) | 15,487 | 198,234 | ||||||
| Natus Medical, Inc. (a) | 8,255 | 205,550 | ||||||
| Stratasys Ltd. (a)(c) | 6,626 | 145,176 | ||||||
| Tech Data Corp. (a) | 2,168 | 196,529 | ||||||
| Xperi Corp. | 8,946 | 187,955 | ||||||
1,336,281 | ||||||||
| Credit Intermediation and Related Activities 13.54% | ||||||||
| Everi Holdings, Inc. (a) | 17,305 | 192,778 | ||||||
| First BanCorp (c) | 15,588 | 155,256 | ||||||
| Hancock Whitney Corp. | 5,115 | 194,268 | ||||||
| IBERIABANK Corp. | 2,924 | 209,066 | ||||||
| OneMain Holdings, Inc. | 3,125 | 93,344 | ||||||
| Pinnacle Financial Partners, Inc. | 4,341 | 229,856 | ||||||
| Popular, Inc. (c) | 4,668 | 243,716 | ||||||
| Preferred Bank | 1,629 | 71,301 | ||||||
| Regions Financial Corp. | 11,872 | 164,190 | ||||||
| Signature Bank | 1,500 | 171,825 | ||||||
| Western Alliance Bancorp (a) | 4,665 | 191,965 | ||||||
| Zions Bancorporation | 5,277 | 227,280 | ||||||
2,144,845 | ||||||||
| Educational Services 2.41% | ||||||||
| Career Education Corp. (a) | 10,251 | 192,412 | ||||||
| K12, Inc. (a) | 6,206 | 189,717 | ||||||
382,129 | ||||||||
| Fabricated Metal Product Manufacturing 1.13% | ||||||||
| Timken Co. | 4,084 | 179,737 | ||||||
| Food and Beverage Stores 1.15% | ||||||||
| Core-Mark Holding Company, Inc. | 4,941 | 182,224 | ||||||
| Food Manufacturing 0.73% | ||||||||
| Flowers Foods, Inc. | 5,179 | 115,854 | ||||||
The accompanying notes are an integral part of these financial statements.
34
CONVERGENCE OPPORTUNITIES FUND
| Schedule of Investments (Continued) |
May 31, 2019 (Unaudited)
| Shares | Value | |||||||
| Food Services and Drinking Places 1.79% | ||||||||
| Brinker International, Inc. | 2,967 | $ | 111,470 | |||||
| Dave & Buster’s Entertainment, Inc. | 3,470 | 172,598 | ||||||
284,068 | ||||||||
| Funds, Trusts, and Other Financial Vehicles 1.26% | ||||||||
| HealthEquity, Inc. (a) | 3,046 | 199,087 | ||||||
| Furniture and Related Product Manufacturing 2.91% | ||||||||
| Ethan Allen Interiors, Inc. | 6,251 | 132,646 | ||||||
| Sleep Number Corp. (a) | 5,556 | 193,404 | ||||||
| Tempur Sealy International, Inc. (a) | 2,112 | 134,767 | ||||||
460,817 | ||||||||
| Gasoline Stations 0.65% | ||||||||
| Delek U.S. Holdings, Inc. | 3,363 | 102,941 | ||||||
| Heavy and Civil Engineering Construction 3.65% | ||||||||
| Great Lakes Dredge & Dock Corp. (a) | 15,730 | 167,367 | ||||||
| KBR, Inc. | 11,065 | 245,864 | ||||||
| MasTec, Inc. (a) | 3,532 | 164,203 | ||||||
577,434 | ||||||||
| Insurance Carriers and Related Activities 8.27% | ||||||||
| Argo Group International Holdings Ltd. (c) | 2,918 | 205,690 | ||||||
| CorVel Corp. (a) | 2,986 | 220,904 | ||||||
| Essent Group Ltd. (a)(c) | 4,856 | 227,989 | ||||||
| MGIC Investment Corp. (a) | 15,719 | 212,992 | ||||||
| Primerica, Inc. | 1,719 | 197,444 | ||||||
| Radian Group, Inc. | 10,941 | 245,626 | ||||||
1,310,645 | ||||||||
| Leather and Allied Product Manufacturing 0.86% | ||||||||
| Deckers Outdoor Corp. (a) | 898 | 136,586 | ||||||
| Machinery Manufacturing 3.17% | ||||||||
| AGCO Corp. | 2,383 | 158,612 | ||||||
| Belden, Inc. | 3,563 | 182,426 | ||||||
| John Bean Technologies Corp. | 1,575 | 161,516 | ||||||
502,554 | ||||||||
| Merchant Wholesalers, Durable Goods 3.51% | ||||||||
| Builders FirstSource, Inc. (a) | 12,282 | 172,931 | ||||||
| Gentherm, Inc. (a) | 2,755 | 102,982 | ||||||
The accompanying notes are an integral part of these financial statements.
35
CONVERGENCE OPPORTUNITIES FUND
| Schedule of Investments (Continued) |
May 31, 2019 (Unaudited)
| Shares | Value | |||||||
| Merchant Wholesalers, Durable Goods 3.51% (Continued) | ||||||||
| Warrior Met Coal, Inc. (b) | 5,062 | $ | 130,650 | |||||
| WESCO International, Inc. (a) | 3,192 | 149,481 | ||||||
556,044 | ||||||||
| Merchant Wholesalers, Nondurable Goods 0.92% | ||||||||
| Performance Food Group Co. (a) | 3,688 | 145,123 | ||||||
| Mining (except Oil and Gas) 1.48% | ||||||||
| Arch Coal, Inc. – Class A | 1,209 | 106,573 | ||||||
| Worthington Industries, Inc. | 3,761 | 128,401 | ||||||
234,974 | ||||||||
| Miscellaneous Manufacturing 0.76% | ||||||||
| YETI Holdings, Inc. (a) | 5,015 | 119,959 | ||||||
| Miscellaneous Store Retailers 1.26% | ||||||||
| 1-800-Flowers.com, Inc. – Class A (a) | 10,955 | 200,038 | ||||||
| Motor Vehicle and Parts Dealers 1.21% | ||||||||
| Lithia Motors, Inc. – Class A | 1,680 | 191,772 | ||||||
| Nonmetallic Mineral Product Manufacturing 0.81% | ||||||||
| US Concrete, Inc. (a) | 2,771 | 129,045 | ||||||
| Nonstore Retailers 1.58% | ||||||||
| Insight Enterprises, Inc. (a) | 2,672 | 137,555 | ||||||
| World Fuel Services Corp. | 3,857 | 112,393 | ||||||
249,948 | ||||||||
| Nursing and Residential Care Facilities 1.44% | ||||||||
| Omnicell, Inc. (a) | 2,864 | 227,545 | ||||||
| Oil and Gas Extraction 1.35% | ||||||||
| Berry Petroleum Corp. | 10,006 | 107,565 | ||||||
| Par Pacific Holdings, Inc. (a) | 5,380 | 105,448 | ||||||
213,013 | ||||||||
| Primary Metal Manufacturing 2.89% | ||||||||
| Encore Wire Corp. | 3,521 | 175,733 | ||||||
| Global Brass & Copper Holdings, Inc. | 2,856 | 124,607 | ||||||
| Quanex Building Products Corp. | 10,149 | 157,411 | ||||||
457,751 | ||||||||
The accompanying notes are an integral part of these financial statements.
36
CONVERGENCE OPPORTUNITIES FUND
| Schedule of Investments (Continued) |
May 31, 2019 (Unaudited)
| Shares | Value | |||||||
| Professional, Scientific, and Technical Services 12.30% | ||||||||
| Arrowhead Pharmaceuticals, Inc. (a) | 7,821 | $ | 185,435 | |||||
| Echo Global Logistics, Inc. (a) | 5,686 | 111,844 | ||||||
| Heidrick & Struggles International, Inc. | 6,476 | 196,611 | ||||||
| Insperity, Inc. | 1,741 | 198,300 | ||||||
| MAXIMUS, Inc. | 3,388 | 241,395 | ||||||
| NextGen Healthcare, Inc. (a) | 10,910 | 210,018 | ||||||
| Tetra Tech, Inc. | 3,221 | 217,482 | ||||||
| TTEC Holdings, Inc. | 6,613 | 262,404 | ||||||
| Verint Systems, Inc. (a) | 4,200 | 238,350 | ||||||
| Voyager Therapeutics, Inc. (a) | 3,950 | 86,150 | ||||||
1,947,989 | ||||||||
| Publishing Industries (except Internet) 5.32% | ||||||||
| Manhattan Associates, Inc. (a) | 3,637 | 238,114 | ||||||
| Nuance Communications, Inc. (a) | 13,776 | 236,534 | ||||||
| TEGNA, Inc. | 8,453 | 127,978 | ||||||
| Workiva, Inc. (a) | 4,298 | 239,141 | ||||||
841,767 | ||||||||
| Real Estate 1.80% | ||||||||
| Realogy Holdings Corp. | 16,890 | 119,750 | ||||||
| RMR Group, Inc. – Class A | 3,437 | 165,733 | ||||||
285,483 | ||||||||
| Rental and Leasing Services 2.01% | ||||||||
| Avis Budget Group, Inc. (a) | 2,128 | 60,350 | ||||||
| Enova International, Inc. (a) | 4,378 | 93,470 | ||||||
| Navient Corp. | 12,610 | 164,434 | ||||||
318,254 | ||||||||
| Securities, Commodity Contracts, and Other Financial | ||||||||
| Investments and Related Activities 3.83% | ||||||||
| BrightSphere Investment Group PLC (c) | 8,292 | 89,056 | ||||||
| CommScope Holding Company, Inc. (a) | 6,004 | 96,965 | ||||||
| National General Holdings Corp. | 9,155 | 208,002 | ||||||
| Stifel Financial Corp. | 2,968 | 159,174 | ||||||
| TriState Capital Holdings, Inc. (a) | 2,625 | 53,996 | ||||||
607,193 | ||||||||
| Support Activities for Mining 0.73% | ||||||||
| Patterson-UTI Energy, Inc. | 10,880 | 115,654 | ||||||
The accompanying notes are an integral part of these financial statements.
37
CONVERGENCE OPPORTUNITIES FUND
| Schedule of Investments (Continued) |
May 31, 2019 (Unaudited)
| Shares | Value | |||||||
| Telecommunications 1.00% | ||||||||
| Telephone & Data Systems, Inc. (b) | 2,663 | $ | 76,721 | |||||
| United States Cellular Corp. (a) | 1,881 | 81,918 | ||||||
158,639 | ||||||||
| Transportation Equipment Manufacturing 2.38% | ||||||||
| Brunswick Corp. | 3,170 | 131,492 | ||||||
| Fox Factory Holding Corp. (a) | 1,367 | 91,616 | ||||||
| Oshkosh Corp. | 2,169 | 154,411 | ||||||
377,519 | ||||||||
| Truck Transportation 0.71% | ||||||||
| Landstar System, Inc. | 1,160 | 111,650 | ||||||
| Utilities 5.62% | ||||||||
| Black Hills Corp. | 3,925 | 299,085 | ||||||
| Hawaiian Electric Industries, Inc. | 7,119 | 295,723 | ||||||
| NorthWestern Corp. | 4,168 | 295,678 | ||||||
890,486 | ||||||||
| Water Transportation 0.46% | ||||||||
| Frontline Ltd. (a)(c) | 9,310 | 72,990 | ||||||
| Wood Product Manufacturing 1.85% | ||||||||
| American Woodmark Corp. (a) | 2,150 | 155,854 | ||||||
| Louisiana-Pacific Corp. | 6,039 | 137,810 | ||||||
293,664 | ||||||||
| TOTAL COMMON STOCKS (Cost $20,407,995) | 20,882,098 | |||||||
| REAL ESTATE INVESTMENT TRUSTS* 9.29% | ||||||||
| Brandywine Realty Trust | 12,914 | 195,131 | ||||||
| Empire State Realty Trust, Inc. – Class A | 11,228 | 172,462 | ||||||
| Mack-Cali Realty Corp. | 8,264 | 187,758 | ||||||
| Piedmont Office Realty Trust, Inc. – Class A | 8,745 | 177,786 | ||||||
| PS Business Parks, Inc. | 1,227 | 197,448 | ||||||
| STAG Industrial, Inc. | 5,761 | 168,106 | ||||||
| Sunstone Hotel Investors, Inc. | 13,852 | 185,894 | ||||||
| Xenia Hotels & Resorts, Inc. | 8,968 | 187,521 | ||||||
| TOTAL REAL ESTATE INVESTMENT TRUSTS (Cost $1,445,404) | 1,472,106 | |||||||
The accompanying notes are an integral part of these financial statements.
38
CONVERGENCE OPPORTUNITIES FUND
| Schedule of Investments (Continued) |
May 31, 2019 (Unaudited)
| Shares | Value | |||||||
| SHORT-TERM INVESTMENTS 2.25% | ||||||||
| Fidelity Investments Money Market Funds – | ||||||||
| Government Portfolio – Class I, 2.270% (b)(d) | 356,765 | $ | 356,765 | |||||
| TOTAL SHORT-TERM INVESTMENTS (Cost $356,765) | 356,765 | |||||||
| Total Investments (Cost $22,210,164) 143.37% | 22,710,969 | |||||||
| Liabilities in Excess of Other Assets (43.37)% | (6,870,128 | ) | ||||||
| TOTAL NET ASSETS 100.00% | $ | 15,840,841 | ||||||
Percentages are stated as a percent of net assets.
| * | Unless otherwise noted, all or a portion of these securities, totaling $21,960,548, is pledged as collateral for securities sold short. |
| (a) | Non-income producing security. |
| (b) | This security is not pledged as collateral for securities sold short. |
| (c) | Foreign issued security. |
| (d) | Seven day yield as of May 31, 2019. |
| Abbreviations: | |
| Ltd. | Limited Liability Company. |
| PLC | Public Limited Company. |
The accompanying notes are an integral part of these financial statements.
39
CONVERGENCE OPPORTUNITIES FUND
| Schedule of Securities Sold Short |
May 31, 2019 (Unaudited)
| Shares | Value | |||||||
| SECURITIES SOLD SHORT (44.92)% | ||||||||
| COMMON STOCKS (40.27)% | ||||||||
| Accommodation (0.34)% | ||||||||
| Penn National Gaming, Inc. | (2,830 | ) | $ | (53,346 | ) | |||
| Administrative and Support Services (1.10)% | ||||||||
| Perspecta, Inc. | (2,860 | ) | (62,091 | ) | ||||
| Teladoc Health, Inc. | (875 | ) | (50,855 | ) | ||||
| WageWorks, Inc. | (1,237 | ) | (61,812 | ) | ||||
(174,758 | ) | |||||||
| Air Transportation (0.43)% | ||||||||
| Allegiant Travel Co. | (271 | ) | (37,970 | ) | ||||
| Spirit Airlines, Inc. | (661 | ) | (30,459 | ) | ||||
(68,429 | ) | |||||||
| Amusement, Gambling, and Recreation Industries (0.73)% | ||||||||
| SeaWorld Entertainment, Inc. | (1,805 | ) | (57,760 | ) | ||||
| Six Flags Entertainment Corp. | (1,183 | ) | (58,393 | ) | ||||
(116,153 | ) | |||||||
| Beverage and Tobacco Product Manufacturing (0.26)% | ||||||||
| National Beverage Corp. | (900 | ) | (40,635 | ) | ||||
| Broadcasting (except Internet) (0.17)% | ||||||||
| Entercom Communications Corp. – Class A | (4,730 | ) | (27,387 | ) | ||||
| Chemical Manufacturing (3.18)% | ||||||||
| Aclaris Therapeutics, Inc. | (4,143 | ) | (19,389 | ) | ||||
| Aerie Pharmaceuticals, Inc. | (876 | ) | (31,904 | ) | ||||
| Alder Biopharmaceuticals, Inc. | (2,123 | ) | (22,971 | ) | ||||
| ArQule, Inc. | (4,825 | ) | (34,691 | ) | ||||
| Assembly Biosciences, Inc. | (1,321 | ) | (18,547 | ) | ||||
| Deciphera Pharmaceuticals, Inc. | (1,278 | ) | (29,164 | ) | ||||
| Dermira, Inc. | (2,184 | ) | (20,399 | ) | ||||
| Dynavax Technologies Corp. | (3,689 | ) | (17,781 | ) | ||||
| Flexion Therapeutics, Inc. | (1,466 | ) | (16,170 | ) | ||||
| G1 Therapeutics, Inc. | (1,053 | ) | (22,071 | ) | ||||
| Homology Medicines, Inc. | (1,435 | ) | (29,044 | ) | ||||
| Immunomedics, Inc. | (2,151 | ) | (28,114 | ) | ||||
| La Jolla Pharmaceutical Co. | (2,309 | ) | (12,446 | ) | ||||
| REGENXBIO, Inc. | (657 | ) | (28,264 | ) | ||||
| Revance Therapeutics, Inc. | (2,368 | ) | (25,503 | ) | ||||
The accompanying notes are an integral part of these financial statements.
40
CONVERGENCE OPPORTUNITIES FUND
| Schedule of Securities Sold Short (Continued) |
May 31, 2019 (Unaudited)
| Shares | Value | |||||||
| Chemical Manufacturing (3.18)% (Continued) | ||||||||
| Rubius Therapeutics, Inc. | (1,840 | ) | $ | (26,606 | ) | |||
| SIGA Technologies, Inc. | (3,652 | ) | (19,502 | ) | ||||
| Surmodics, Inc. | (1,266 | ) | (51,349 | ) | ||||
| Tronox Holdings PLC – Class A (a) | (3,019 | ) | (27,986 | ) | ||||
| Zogenix, Inc. | (551 | ) | (20,767 | ) | ||||
(502,668 | ) | |||||||
| Computer and Electronic Product Manufacturing (4.28)% | ||||||||
| Advanced Energy Industries, Inc. | (911 | ) | (45,705 | ) | ||||
| Avaya Holdings Corp. | (5,530 | ) | (69,568 | ) | ||||
| AxoGen, Inc. | (2,464 | ) | (51,572 | ) | ||||
| Casa Systems, Inc. | (8,294 | ) | (46,612 | ) | ||||
| Cubic Corp. | (1,026 | ) | (57,887 | ) | ||||
| Infinera Corp. | (12,916 | ) | (40,169 | ) | ||||
| LivaNova PLC (a) | (751 | ) | (53,997 | ) | ||||
| MACOM Technology Solutions Holdings, Inc. | (3,152 | ) | (44,601 | ) | ||||
| Materion Corp. | (601 | ) | (36,330 | ) | ||||
| nLight, Inc. | (2,368 | ) | (44,258 | ) | ||||
| PAR Technology Corp. | (1,612 | ) | (45,313 | ) | ||||
| Pure Storage, Inc. – Class A | (2,828 | ) | (44,852 | ) | ||||
| Rambus, Inc. | (3,998 | ) | (45,417 | ) | ||||
| ViewRay, Inc. | (6,056 | ) | (50,870 | ) | ||||
(677,151 | ) | |||||||
| Construction of Buildings (0.21)% | ||||||||
| TRI Pointe Group, Inc. | (2,670 | ) | (32,841 | ) | ||||
| Credit Intermediation and Related Activities (4.32)% | ||||||||
| Atlantic Union Bankshares Corp. | (1,846 | ) | (59,625 | ) | ||||
| Cadence BanCorp | (2,433 | ) | (45,011 | ) | ||||
| CenterState Bank Corp. | (2,520 | ) | (55,163 | ) | ||||
| CVB Financial Corp. | (2,551 | ) | (52,423 | ) | ||||
| Flagstar Bancorp, Inc. | (1,700 | ) | (53,516 | ) | ||||
| Independent Bank Group, Inc. | (916 | ) | (47,302 | ) | ||||
| Live Oak Bancshares, Inc. | (3,466 | ) | (53,827 | ) | ||||
| Merchants Bancorp | (2,968 | ) | (54,018 | ) | ||||
| Meta Financial Group, Inc. | (2,326 | ) | (60,870 | ) | ||||
| Synovus Financial Corp. | (1,208 | ) | (38,608 | ) | ||||
| Texas Capital Bancshares, Inc. | (1,005 | ) | (57,586 | ) | ||||
| Veritex Holdings, Inc. | (1,858 | ) | (47,249 | ) | ||||
| WSFS Financial Corp. | (1,430 | ) | (56,757 | ) | ||||
(681,955 | ) | |||||||
The accompanying notes are an integral part of these financial statements.
41
CONVERGENCE OPPORTUNITIES FUND
| Schedule of Securities Sold Short (Continued) |
May 31, 2019 (Unaudited)
| Shares | Value | |||||||
| Data Processing, Hosting and Related Services (0.82)% | ||||||||
| Upwork, Inc. | (4,319 | ) | $ | (64,699 | ) | |||
| Zix Corp. | (7,260 | ) | (65,049 | ) | ||||
(129,748 | ) | |||||||
| Electrical Equipment, Appliance, and | ||||||||
| Component Manufacturing (0.59)% | ||||||||
| Altra Industrial Motion Corp. | (1,280 | ) | (40,154 | ) | ||||
| Axon Enterprise, Inc. | (554 | ) | (36,996 | ) | ||||
| Energizer Holdings, Inc. | (410 | ) | (16,777 | ) | ||||
(93,927 | ) | |||||||
| Fabricated Metal Product Manufacturing (0.96)% | ||||||||
| Cornerstone Building Brands, Inc. | (8,810 | ) | (38,676 | ) | ||||
| McDermott International, Inc. (a) | (4,410 | ) | (26,636 | ) | ||||
| NN, Inc. | (7,363 | ) | (57,063 | ) | ||||
| Vista Outdoor, Inc. | (3,915 | ) | (30,028 | ) | ||||
(152,403 | ) | |||||||
| Food Manufacturing (0.49)% | ||||||||
| Hain Celestial Group, Inc. | (1,986 | ) | (40,495 | ) | ||||
| Lancaster Colony Corp. | (258 | ) | (37,108 | ) | ||||
(77,603 | ) | |||||||
| Furniture and Home Furnishings Stores (0.83)% | ||||||||
| At Home Group, Inc. | (2,479 | ) | (47,225 | ) | ||||
| Floor & Decor Holdings, Inc. – Class A | (1,427 | ) | (50,687 | ) | ||||
| Lovesac Co. | (960 | ) | (34,608 | ) | ||||
(132,520 | ) | |||||||
| Furniture and Related Product Manufacturing (0.18)% | ||||||||
| Cactus, Inc. – Class A | (898 | ) | (29,230 | ) | ||||
| Health and Personal Care Stores (0.16)% | ||||||||
| Rite Aid Corp. | (3,235 | ) | (24,780 | ) | ||||
| Insurance Carriers and Related Activities (0.99)% | ||||||||
| eHealth, Inc. | �� | (735 | ) | (51,862 | ) | |||
| MBIA, Inc. | (6,680 | ) | (59,252 | ) | ||||
| Third Point Reinsurance Ltd. (a) | (4,575 | ) | (46,482 | ) | ||||
(157,596 | ) | |||||||
The accompanying notes are an integral part of these financial statements.
42
CONVERGENCE OPPORTUNITIES FUND
| Schedule of Securities Sold Short (Continued) |
May 31, 2019 (Unaudited)
| Shares | Value | |||||||
| Leather and Allied Product Manufacturing (0.22)% | ||||||||
| Wolverine World Wide, Inc. | (1,265 | ) | $ | (35,344 | ) | |||
| Machinery Manufacturing (0.53)% | ||||||||
| TPI Composites, Inc. | (1,950 | ) | (40,658 | ) | ||||
| Welbilt, Inc. | (2,750 | ) | (42,433 | ) | ||||
(83,091 | ) | |||||||
| Management of Companies and Enterprises (1.65)% | ||||||||
| Allegiance Bancshares, Inc. | (1,655 | ) | (53,721 | ) | ||||
| Ambac Financial Group, Inc. | (3,196 | ) | (48,579 | ) | ||||
| Ameris Bancorp | (1,350 | ) | (47,642 | ) | ||||
| NV5 Global, Inc. | (730 | ) | (56,758 | ) | ||||
| Renasant Corp. | (1,625 | ) | (54,925 | ) | ||||
(261,625 | ) | |||||||
| Merchant Wholesalers, Durable Goods (1.78)% | ||||||||
| Adient PLC (a) | (2,083 | ) | (35,953 | ) | ||||
| Spectrum Brands Holdings, Inc. | (352 | ) | (18,540 | ) | ||||
| Sunrun, Inc. | (2,769 | ) | (43,363 | ) | ||||
| TrueCar, Inc. | (6,142 | ) | (40,045 | ) | ||||
| Varonis Systems, Inc. | (977 | ) | (61,102 | ) | ||||
| Veeco Instruments, Inc. | (3,601 | ) | (41,375 | ) | ||||
| Vivint Solar, Inc. | (6,452 | ) | (42,067 | ) | ||||
(282,445 | ) | |||||||
| Merchant Wholesalers, Nondurable Goods (0.80)% | ||||||||
| Adamas Pharmaceuticals, Inc. | (2,837 | ) | (13,334 | ) | ||||
| Aimmune Therapeutics, Inc. | (1,471 | ) | (28,788 | ) | ||||
| Andersons, Inc. | (878 | ) | (23,855 | ) | ||||
| Atara Biotherapeutics, Inc. | (1,035 | ) | (22,987 | ) | ||||
| Livent Corp. | (6,000 | ) | (37,920 | ) | ||||
(126,884 | ) | |||||||
| Mining (except Oil and Gas) (0.18)% | ||||||||
| US Silica Holdings, Inc. | (2,750 | ) | (28,545 | ) | ||||
| Miscellaneous Manufacturing (1.51)% | ||||||||
| Acushnet Holdings Corp. | (1,485 | ) | (34,882 | ) | ||||
| Haemonetics Corp. | (514 | ) | (49,853 | ) | ||||
| ICU Medical, Inc. | (237 | ) | (50,434 | ) | ||||
| Mattel, Inc. | (3,490 | ) | (34,377 | ) | ||||
| Mirati Therapeutics, Inc. | (279 | ) | (18,913 | ) | ||||
The accompanying notes are an integral part of these financial statements.
43
CONVERGENCE OPPORTUNITIES FUND
| Schedule of Securities Sold Short (Continued) |
May 31, 2019 (Unaudited)
| Shares | Value | |||||||
| Miscellaneous Manufacturing (1.51)% (Continued) | ||||||||
| National Vision Holdings, Inc. | (1,840 | ) | $ | (50,103 | ) | |||
(238,562 | ) | |||||||
| Miscellaneous Store Retailers (0.29)% | ||||||||
| Party City Holdco, Inc. | (5,845 | ) | (46,176 | ) | ||||
| Motor Vehicle and Parts Dealers (0.35)% | ||||||||
| Carvana Co. | (957 | ) | (55,391 | ) | ||||
| Nursing and Residential Care Facilities (0.40)% | ||||||||
| Acadia Healthcare Company, Inc. | (1,991 | ) | (64,150 | ) | ||||
| Oil and Gas Extraction (0.72)% | ||||||||
| Jagged Peak Energy, Inc. | (2,726 | ) | (22,626 | ) | ||||
| Pattern Energy Group, Inc. – Class A | (3,320 | ) | (70,417 | ) | ||||
| Tellurian, Inc. | (2,745 | ) | (21,109 | ) | ||||
(114,152 | ) | |||||||
| Other Information Services (0.46)% | ||||||||
| TechTarget, Inc. | (1,395 | ) | (26,366 | ) | ||||
| Zillow Group, Inc. – Class A | (1,116 | ) | (47,240 | ) | ||||
(73,606 | ) | |||||||
| Paper Manufacturing (0.23)% | ||||||||
| Graphic Packaging Holding Co. | (2,824 | ) | (36,712 | ) | ||||
| Performing Arts, Spectator Sports, and Related Industries (0.34)% | ||||||||
| International Game Technology PLC (a) | (4,115 | ) | (53,495 | ) | ||||
| Primary Metal Manufacturing (0.47)% | ||||||||
| Carpenter Technology Corp. | (937 | ) | (38,005 | ) | ||||
| Commercial Metals Co. | (2,772 | ) | (37,006 | ) | ||||
(75,011 | ) | |||||||
| Professional, Scientific, and Technical Services (5.37)% | ||||||||
| ADT, Inc. | (10,045 | ) | (58,763 | ) | ||||
| Altair Engineering, Inc. – Class A | (1,830 | ) | (69,741 | ) | ||||
| AnaptysBio, Inc. | (433 | ) | (31,527 | ) | ||||
| Apellis Pharmaceuticals, Inc. | (1,023 | ) | (20,552 | ) | ||||
| B. Riley Financial, Inc. | (1,728 | ) | (34,266 | ) | ||||
| Carbon Black, Inc. | (4,508 | ) | (67,845 | ) | ||||
| Carbonite, Inc. | (2,855 | ) | (67,578 | ) | ||||
| Cardlytics, Inc. | (1,575 | ) | (36,146 | ) | ||||
The accompanying notes are an integral part of these financial statements.
44
CONVERGENCE OPPORTUNITIES FUND
| Schedule of Securities Sold Short (Continued) |
May 31, 2019 (Unaudited)
| Shares | Value | |||||||
| Professional, Scientific, and Technical Services (5.37)% (Continued) | ||||||||
| Cimpress NV (a) | (707 | ) | $ | (61,863 | ) | |||
| Cloudera, Inc. | (7,903 | ) | (72,471 | ) | ||||
| Cymabay Therapeutics, Inc. | (1,669 | ) | (20,162 | ) | ||||
| Diebold Nixdorf, Inc. | (5,064 | ) | (43,044 | ) | ||||
| GlycoMimetics, Inc. | (2,689 | ) | (31,837 | ) | ||||
| Nutanix, Inc. – Class A | (2,217 | ) | (62,231 | ) | ||||
| Quotient Technology, Inc. | (4,859 | ) | (51,360 | ) | ||||
| Ribbon Communications, Inc. | (11,664 | ) | (49,805 | ) | ||||
| Sotheby’s | (1,543 | ) | (52,015 | ) | ||||
| WaVe Life Sciences Ltd. (a) | (856 | ) | (19,628 | ) | ||||
(850,834 | ) | |||||||
| Publishing Industries (except Internet) (0.26)% | ||||||||
| Evolent Health, Inc. – Class A | (3,797 | ) | (40,400 | ) | ||||
| Rental and Leasing Services (0.31)% | ||||||||
| Textainer Group Holdings Ltd. (a) | (5,230 | ) | (48,430 | ) | ||||
| Securities, Commodity Contracts, and Other Financial | ||||||||
| Investments and Related Activities (0.53)% | ||||||||
| PJT Partners, Inc. – Class A | (848 | ) | (31,291 | ) | ||||
| WillScot Corp. | (3,835 | ) | (52,080 | ) | ||||
(83,371 | ) | |||||||
| Support Activities for Mining (0.54)% | ||||||||
| Century Aluminum Co. | (5,880 | ) | (32,869 | ) | ||||
| KLX Energy Services Holdings, Inc. | (1,350 | ) | (26,595 | ) | ||||
| Nine Energy Service, Inc. | (1,570 | ) | (26,533 | ) | ||||
(85,997 | ) | |||||||
| Telecommunications (0.62)% | ||||||||
| Argan, Inc. | (1,070 | ) | (49,145 | ) | ||||
| Cincinnati Bell, Inc. | (4,007 | ) | (25,645 | ) | ||||
| Intelsat SA (a) | (1,326 | ) | (23,934 | ) | ||||
(98,724 | ) | |||||||
| Textile Product Mills (0.34)% | ||||||||
| Interface, Inc. | (3,720 | ) | (53,828 | ) | ||||
| Transportation Equipment Manufacturing (0.57)% | ||||||||
| Sun Hydraulics Corp. | (1,346 | ) | (56,195 | ) | ||||
| Tenneco, Inc. – Class A | (3,373 | ) | (33,528 | ) | ||||
(89,723 | ) | |||||||
The accompanying notes are an integral part of these financial statements.
45
CONVERGENCE OPPORTUNITIES FUND
| Schedule of Securities Sold Short (Continued) |
May 31, 2019 (Unaudited)
| Shares | Value | |||||||
| Truck Transportation (0.18)% | ||||||||
| Knight-Swift Transportation Holdings, Inc. – Class A | (1,052 | ) | $ | (29,077 | ) | |||
| Utilities (1.34)% | ||||||||
| California Water Service Group | (1,445 | ) | (71,123 | ) | ||||
| Chesapeake Utilities Corp. | (780 | ) | (70,808 | ) | ||||
| Middlesex Water Co. | (1,199 | ) | (70,933 | ) | ||||
(212,864 | ) | |||||||
| Water Transportation (0.24)% | ||||||||
| Golar LNG Ltd. (a) | (2,053 | ) | (37,344 | ) | ||||
| TOTAL COMMON STOCKS (Proceeds $7,776,515) | (6,378,911 | ) | ||||||
| REAL ESTATE INVESTMENT TRUSTS (4.65)% | ||||||||
| Acadia Realty Trust | (1,714 | ) | (46,878 | ) | ||||
| ARMOUR Residential REIT, Inc. | (1,899 | ) | (33,043 | ) | ||||
| Brookfield Property REIT, Inc. – Class A | (2,359 | ) | (43,500 | ) | ||||
| Colony Credit Real Estate, Inc. | (2,281 | ) | (34,694 | ) | ||||
| CoreSite Realty Corp. | (394 | ) | (45,988 | ) | ||||
| Front Yard Residential Corp. | (4,102 | ) | (46,927 | ) | ||||
| Global Net Lease, Inc. | (2,698 | ) | (49,669 | ) | ||||
| Hannon Armstrong Sustainable Infrastructure Capital, Inc. | (1,755 | ) | (45,472 | ) | ||||
| Hudson Pacific Properties, Inc. | (1,407 | ) | (47,008 | ) | ||||
| National Health Investors, Inc. | (646 | ) | (50,743 | ) | ||||
| New York Mortgage Trust, Inc. | (5,795 | ) | (35,002 | ) | ||||
| Pebblebrook Hotel Trust | (1,897 | ) | (52,793 | ) | ||||
| PotlatchDeltic Corp. | (1,324 | ) | (44,553 | ) | ||||
| Redwood Trust, Inc. | (2,201 | ) | (35,062 | ) | ||||
| Tier REIT, Inc. | (1,707 | ) | (45,952 | ) | ||||
| Two Harbors Investment Corp. | (2,653 | ) | (32,420 | ) | ||||
| Urban Edge Properties | (2,684 | ) | (46,299 | ) | ||||
| TOTAL REAL ESTATE INVESTMENT TRUSTS | ||||||||
| (Proceeds $757,595) | (736,003 | ) | ||||||
| Total Securities Sold Short (Proceeds $8,534,110) | $ | (7,114,914 | ) | |||||
| (a) | Foreign issued security. |
| Abbreviations: | |
| Ltd. | Limited Liability Company. |
| NV | Naamloze Vennootschap is a Dutch term for publicly traded companies. |
| PLC | Public Limited Company. |
| SA | Generally designates a type of corporation in various countries, mostly those employing a civil law legal system. |
The accompanying notes are an integral part of these financial statements.
46
CONVERGENCE MARKET NEUTRAL FUND
| Schedule of Investments |
May 31, 2019 (Unaudited)
| Shares | Value | |||||||
| COMMON STOCKS* 98.97% | ||||||||
| Administrative and Support Services 2.24% | ||||||||
| ABM Industries, Inc. | 11,870 | $ | 430,288 | |||||
| ManpowerGroup, Inc. | 5,027 | 429,909 | ||||||
| PayPal Holdings, Inc. (a) | 4,793 | 526,031 | ||||||
1,386,228 | ||||||||
| Air Transportation 0.80% | ||||||||
| United Continental Holdings, Inc. (a) | 6,360 | 493,854 | ||||||
| Ambulatory Health Care Services 0.85% | ||||||||
| Medpace Holdings, Inc. (a)(b) | 9,748 | 526,197 | ||||||
| Amusement, Gambling, and Recreation Industries 1.69% | ||||||||
| Planet Fitness, Inc. – Class A (a) | 6,796 | 519,690 | ||||||
| SeaWorld Entertainment, Inc. (a) | 16,311 | 521,952 | ||||||
1,041,642 | ||||||||
| Apparel Manufacturing 0.84% | ||||||||
| Lululemon Athletica, Inc. (a) | 3,130 | 518,297 | ||||||
| Beverage and Tobacco Product Manufacturing 1.29% | ||||||||
| Coca-Cola Co. | 8,880 | 436,274 | ||||||
| Coca-Cola Consolidated, Inc. | 1,203 | 363,318 | ||||||
799,592 | ||||||||
| Broadcasting (except Internet) 1.89% | ||||||||
| AMC Networks, Inc. – Class A (a) | 7,728 | 407,807 | ||||||
| Comcast Corp. – Class A | 9,055 | 371,255 | ||||||
| Sinclair Broadcast Group, Inc. – Class A | 7,230 | 388,106 | ||||||
1,167,168 | ||||||||
| Building Material and Garden Equipment and Supplies Dealers 0.65% | ||||||||
| Home Depot, Inc. | 2,114 | 401,343 | ||||||
| Chemical Manufacturing 4.33% | ||||||||
| AbbVie, Inc. | 5,984 | 459,033 | ||||||
| Celanese Corp. – Class A | 5,218 | 495,345 | ||||||
| Celgene Corp. (a) | 4,991 | 468,106 | ||||||
| Colgate-Palmolive Co. | 4,375 | 304,588 | ||||||
| Merck & Co., Inc. | 6,549 | 518,746 | ||||||
| PPG Industries, Inc. | 4,151 | 434,402 | ||||||
2,680,220 | ||||||||
The accompanying notes are an integral part of these financial statements.
47
CONVERGENCE MARKET NEUTRAL FUND
| Schedule of Investments (Continued) |
May 31, 2019 (Unaudited)
| Shares | Value | �� | ||||||
| Computer and Electronic Product Manufacturing 8.73% | ||||||||
| Alphabet, Inc. – Class A (a) | 355 | $ | 392,808 | |||||
| Alphabet, Inc. – Class C (a) | 365 | 402,825 | ||||||
| Apple, Inc. | 2,921 | 511,379 | ||||||
| Broadcom, Inc. | 1,529 | 384,758 | ||||||
| Cisco Systems, Inc. | 9,899 | 515,045 | ||||||
| Danaher Corp. | 3,660 | 483,157 | ||||||
| Garmin Ltd. (c) | 6,346 | 485,341 | ||||||
| Mettler-Toledo International, Inc. (a) | 670 | 484,470 | ||||||
| QUALCOMM, Inc. | 6,530 | 436,335 | ||||||
| Tech Data Corp. (a) | 5,517 | 500,115 | ||||||
| Teradyne, Inc. | 9,361 | 394,473 | ||||||
| Xilinx, Inc. | 3,908 | 399,827 | ||||||
5,390,533 | ||||||||
| Credit Intermediation and Related Activities 9.51% | ||||||||
| Ameriprise Financial, Inc. | 3,825 | 528,730 | ||||||
| Bank of America Corp. | 16,844 | 448,050 | ||||||
| Capital One Financial Corp. | 5,908 | 507,320 | ||||||
| Citigroup, Inc. | 7,601 | 472,402 | ||||||
| Citizens Financial Group, Inc. | 14,900 | 485,442 | ||||||
| Discover Financial Services | 6,337 | 472,423 | ||||||
| Fifth Third Bancorp | 16,345 | 433,143 | ||||||
| KeyCorp | 32,966 | 526,467 | ||||||
| Popular, Inc. (c) | 9,824 | 512,911 | ||||||
| Regions Financial Corp. | 35,510 | 491,103 | ||||||
| Wells Fargo & Co. | 10,669 | 473,384 | ||||||
| Zions Bancorporation | 12,177 | 524,463 | ||||||
5,875,838 | ||||||||
| Data Processing, Hosting and Related Services 0.82% | ||||||||
| Hewlett Packard Enterprise Co. | 36,996 | 507,585 | ||||||
| Fabricated Metal Product Manufacturing 1.57% | ||||||||
| Ball Corp. | 8,477 | 520,403 | ||||||
| Timken Co. | 10,260 | 451,543 | ||||||
971,946 | ||||||||
| Food and Beverage Stores 1.02% | ||||||||
| Core-Mark Holding Company, Inc. | 11,113 | 409,847 | ||||||
| Kroger Co. | 9,539 | 217,585 | ||||||
627,432 | ||||||||
The accompanying notes are an integral part of these financial statements.
48
CONVERGENCE MARKET NEUTRAL FUND
| Schedule of Investments (Continued) |
May 31, 2019 (Unaudited)
| Shares | Value | |||||||
| Food Manufacturing 1.44% | ||||||||
| Hershey Co. | 3,497 | $ | 461,464 | |||||
| Mondelez International, Inc. – Class A | 8,488 | 431,615 | ||||||
893,079 | ||||||||
| Food Services and Drinking Places 1.63% | ||||||||
| Starbucks Corp. | 7,076 | 538,201 | ||||||
| Yum! Brands, Inc. | 4,598 | 470,605 | ||||||
1,008,806 | ||||||||
| Funds, Trusts, and Other Financial Vehicles 0.72% | ||||||||
| HealthEquity, Inc. (a) | 6,834 | 446,670 | ||||||
| General Merchandise Stores 0.75% | ||||||||
| Wal-Mart, Inc. | 4,556 | 462,161 | ||||||
| Health and Personal Care Stores 1.52% | ||||||||
| McKesson Corp. | 3,678 | 449,231 | ||||||
| Ulta Beauty, Inc. (a) | 1,489 | 496,403 | ||||||
945,634 | ||||||||
| Heavy and Civil Engineering Construction 0.74% | ||||||||
| MasTec, Inc. (a) | 9,711 | 451,464 | ||||||
| Insurance Carriers and Related Activities 4.84% | ||||||||
| Allstate Corp. | 5,210 | 497,607 | ||||||
| MetLife, Inc. | 10,805 | 499,299 | ||||||
| MGIC Investment Corp. (a) | 39,277 | 532,203 | ||||||
| Principal Financial Group, Inc. | 9,047 | 466,554 | ||||||
| Progressive Corp. | 6,793 | 538,549 | ||||||
| Prudential Financial, Inc. | 4,947 | 457,004 | ||||||
2,991,216 | ||||||||
| Leather and Allied Product Manufacturing 1.58% | ||||||||
| Deckers Outdoor Corp. (a) | 3,458 | 525,962 | ||||||
| Nike, Inc. – Class B | 5,855 | 451,655 | ||||||
977,617 | ||||||||
| Machinery Manufacturing 2.95% | ||||||||
| AGCO Corp. | 6,908 | 459,796 | ||||||
| Belden, Inc. | 9,990 | 511,488 | ||||||
| Cummins, Inc. | 3,003 | 452,732 | ||||||
| John Bean Technologies Corp. | 3,918 | 401,791 | ||||||
1,825,807 | ||||||||
The accompanying notes are an integral part of these financial statements.
49
CONVERGENCE MARKET NEUTRAL FUND
| Schedule of Investments (Continued) |
May 31, 2019 (Unaudited)
| Shares | Value | |||||||
| Management of Companies and Enterprises 0.89% | ||||||||
| AES Corp. | 34,905 | $ | 551,499 | |||||
| Merchant Wholesalers, Durable Goods 2.26% | ||||||||
| Builders FirstSource, Inc. (a) | 31,010 | 436,621 | ||||||
| Henry Schein, Inc. (a) | 7,440 | 479,582 | ||||||
| WESCO International, Inc. (a) | 10,204 | 477,853 | ||||||
1,394,056 | ||||||||
| Merchant Wholesalers, Nondurable Goods 2.01% | ||||||||
| AmerisourceBergen Corp. | 5,855 | 455,871 | ||||||
| Cardinal Health, Inc. | 10,331 | 434,625 | ||||||
| Procter & Gamble Co. | 3,391 | 348,968 | ||||||
1,239,464 | ||||||||
| Mining (except Oil and Gas) 0.75% | ||||||||
| Worthington Industries, Inc. | 13,528 | 461,846 | ||||||
| Motor Vehicle and Parts Dealers 0.64% | ||||||||
| AutoZone, Inc. (a) | 385 | 395,437 | ||||||
| Nonmetallic Mineral Product Manufacturing 0.70% | ||||||||
| Owens-Illinois, Inc. | 27,047 | 432,752 | ||||||
| Nonstore Retailers 1.49% | ||||||||
| Amazon.com, Inc. (a) | 229 | 406,491 | ||||||
| World Fuel Services Corp. | 17,693 | 515,574 | ||||||
922,065 | ||||||||
| Nursing and Residential Care Facilities 0.76% | ||||||||
| Omnicell, Inc. (a) | 5,889 | 467,881 | ||||||
| Oil and Gas Extraction 0.76% | ||||||||
| Phillips 66 | 5,805 | 469,044 | ||||||
| Petroleum and Coal Products Manufacturing 2.50% | ||||||||
| Chevron Corp. | 4,373 | 497,866 | ||||||
| CVR Energy, Inc. (b) | 12,365 | 525,142 | ||||||
| Valero Energy Corp. | 7,430 | 523,072 | ||||||
1,546,080 | ||||||||
The accompanying notes are an integral part of these financial statements.
50
CONVERGENCE MARKET NEUTRAL FUND
| Schedule of Investments (Continued) |
May 31, 2019 (Unaudited)
| Shares | Value | |||||||
| Plastics and Rubber Products Manufacturing 1.51% | ||||||||
| Berry Global Group, Inc. (a) | 9,097 | $ | 427,741 | |||||
| Carlisle Companies, Inc. | 3,784 | 504,445 | ||||||
932,186 | ||||||||
| Professional, Scientific, and Technical Services 9.33% | ||||||||
| Amgen, Inc. | 3,230 | 538,440 | ||||||
| Arrowhead Pharmaceuticals, Inc. (a) | 19,736 | 467,941 | ||||||
| Biogen, Inc. (a) | 1,921 | 421,256 | ||||||
| Cadence Design Systems, Inc. (a) | 8,440 | 536,531 | ||||||
| eBay, Inc. | 11,050 | 397,027 | ||||||
| Insperity, Inc. | 3,577 | 407,420 | ||||||
| International Business Machines Corp. | 4,195 | 532,723 | ||||||
| Omnicom Group, Inc. | 6,143 | 475,222 | ||||||
| PRA Health Sciences, Inc. (a) | 5,560 | 482,219 | ||||||
| Tetra Tech, Inc. | 6,512 | 439,690 | ||||||
| Verint Systems, Inc. (a) | 9,527 | 540,658 | ||||||
| VMware, Inc. – Class A (a)(b) | 2,985 | 528,285 | ||||||
5,767,412 | ||||||||
| Publishing Industries (except Internet) 5.90% | ||||||||
| Citrix Systems, Inc. | 5,688 | 535,355 | ||||||
| Fortinet, Inc. (a) | 7,146 | 517,942 | ||||||
| Intuit, Inc. | 2,011 | 492,393 | ||||||
| Microsoft Corp. | 4,029 | 498,307 | ||||||
| Nuance Communications, Inc. (a) | 33,231 | 570,575 | ||||||
| Oracle Corp. | 10,858 | 549,415 | ||||||
| Veeva Systems, Inc. – Class A (a) | 3,140 | 484,471 | ||||||
3,648,458 | ||||||||
| Rail Transportation 0.78% | ||||||||
| Union Pacific Corp. | 2,907 | 484,829 | ||||||
| Real Estate 1.61% | ||||||||
| CBRE Group, Inc. – Class A (a) | 10,742 | 490,909 | ||||||
| Jones Lang LaSalle, Inc. | 4,096 | 509,747 | ||||||
1,000,656 | ||||||||
| Rental and Leasing Services 1.68% | ||||||||
| Navient Corp. | 39,430 | 514,167 | ||||||
| Synchrony Financial | 15,463 | 520,021 | ||||||
1,034,188 | ||||||||
The accompanying notes are an integral part of these financial statements.
51
CONVERGENCE MARKET NEUTRAL FUND
| Schedule of Investments (Continued) |
May 31, 2019 (Unaudited)
| Shares | Value | |||||||
| Securities, Commodity Contracts, and Other Financial | ||||||||
| Investments and Related Activities 1.46% | ||||||||
| Allegion PLC (c) | 4,091 | $ | 397,032 | |||||
| Stifel Financial Corp. | 9,463 | 507,501 | ||||||
904,533 | ||||||||
| Specialty Trade Contractors 0.72% | ||||||||
| EMCOR Group, Inc. | 5,560 | 447,914 | ||||||
| Support Activities for Mining 0.73% | ||||||||
| Compass Minerals International, Inc. | 8,875 | 452,714 | ||||||
| Telecommunications 0.95% | ||||||||
| Verizon Communications, Inc. | 10,802 | 587,089 | ||||||
| Transportation Equipment Manufacturing 4.01% | ||||||||
| Boeing Co. | 1,383 | 472,446 | ||||||
| Ford Motor Co. | 34,326 | 326,784 | ||||||
| General Motors Co. | 11,200 | 373,408 | ||||||
| Lockheed Martin Corp. | 1,320 | 446,873 | ||||||
| Oshkosh Corp. | 6,118 | 435,540 | ||||||
| Spirit AeroSystems Holdings, Inc. – Class A | 5,225 | 423,434 | ||||||
2,478,485 | ||||||||
| Truck Transportation 0.81% | ||||||||
| Landstar System, Inc. | 5,208 | 501,270 | ||||||
| Utilities 3.42% | ||||||||
| Black Hills Corp. | 8,409 | 640,767 | ||||||
| Exelon Corp. | 11,453 | 550,660 | ||||||
| NRG Energy, Inc. | 11,335 | 385,843 | ||||||
| Southwest Gas Holdings, Inc. | 6,280 | 534,679 | ||||||
2,111,949 | ||||||||
| Water Transportation 0.90% | ||||||||
| Norwegian Cruise Line Holdings Ltd. (a)(c) | 10,153 | 555,471 | ||||||
| TOTAL COMMON STOCKS (Cost $59,858,055) | 61,177,607 | |||||||
The accompanying notes are an integral part of these financial statements.
52
CONVERGENCE MARKET NEUTRAL FUND
| Schedule of Investments (Continued) |
May 31, 2019 (Unaudited)
| Shares | Value | |||||||
| REAL ESTATE INVESTMENT TRUSTS* 7.56% | ||||||||
| Apartment Investment & Management Co. – Class A | 10,300 | $ | 514,485 | |||||
| AvalonBay Communities, Inc. | 2,767 | 561,730 | ||||||
| Brandywine Realty Trust | 36,222 | 547,314 | ||||||
| Host Hotels & Resorts, Inc. | 26,801 | 485,366 | ||||||
| Kimco Realty Corp. | 29,320 | 510,168 | ||||||
| Mack-Cali Realty Corp. | 24,317 | 552,482 | ||||||
| Medical Properties Trust, Inc. | 28,949 | 514,713 | ||||||
| PS Business Parks, Inc. | 2,990 | 481,151 | ||||||
| Xenia Hotels & Resorts, Inc. | 24,098 | 503,889 | ||||||
| TOTAL REAL ESTATE INVESTMENT TRUSTS (Cost $4,521,729) | 4,671,298 | |||||||
| SHORT-TERM INVESTMENTS 1.95% | ||||||||
| Fidelity Investments Money Market Funds – | ||||||||
| Government Portfolio – Class I, 2.270% (b)(d) | 1,202,714 | 1,202,714 | ||||||
| TOTAL SHORT-TERM INVESTMENTS (Cost $1,202,714) | 1,202,714 | |||||||
| Total Investments (Cost $65,582,498) 108.48% | 67,051,619 | |||||||
| Liabilities in Excess of Other Assets (8.48)% | (5,241,496 | ) | ||||||
| TOTAL NET ASSETS 100.00% | $ | 61,810,123 | ||||||
Percentages are stated as a percent of net assets.
| * | Unless otherwise noted, all or a portion of these securities, totaling $62,605,352, is pledged as collateral for securities sold short. |
| (a) | Non-income producing security. |
| (b) | This security is not pledged as collateral for securities sold short. |
| (c) | Foreign issued security. |
| (d) | Seven day yield as of May 31, 2019. |
| Abbreviations: | |
| Ltd. | Limited Liability Company. |
| PLC | Public Limited Company. |
The accompanying notes are an integral part of these financial statements.
53
CONVERGENCE MARKET NEUTRAL FUND
| Schedule of Securities Sold Short |
May 31, 2019 (Unaudited)
| Shares | Value | |||||||
| SECURITIES SOLD SHORT (82.68)% | ||||||||
| COMMON STOCKS (73.63)% | ||||||||
| Accommodation (0.53)% | ||||||||
| MGM Resorts International | (13,230 | ) | $ | (328,369 | ) | |||
| Administrative and Support Services (1.62)% | ||||||||
| Perspecta, Inc. | (16,294 | ) | (353,743 | ) | ||||
| ServiceMaster Global Holdings, Inc. | (6,465 | ) | (349,110 | ) | ||||
| Teladoc Health, Inc. | (5,118 | ) | (297,458 | ) | ||||
(1,000,311 | ) | |||||||
| Air Transportation (0.47)% | ||||||||
| Spirit Airlines, Inc. | (6,270 | ) | (288,922 | ) | ||||
| Amusement, Gambling, and Recreation Industries (0.50)% | ||||||||
| Six Flags Entertainment Corp. | (6,231 | ) | (307,562 | ) | ||||
| Beverage and Tobacco Product Manufacturing (0.45)% | ||||||||
| National Beverage Corp. | (6,210 | ) | (280,382 | ) | ||||
| Broadcasting (except Internet) (0.31)% | ||||||||
| Cable One, Inc. | (170 | ) | (189,899 | ) | ||||
| Chemical Manufacturing (5.48)% | ||||||||
| ACADIA Pharmaceuticals, Inc. | (3,614 | ) | (86,700 | ) | ||||
| Aerie Pharmaceuticals, Inc. | (5,426 | ) | (197,615 | ) | ||||
| Albemarle Corp. | (5,933 | ) | (375,559 | ) | ||||
| Alnylam Pharmaceuticals, Inc. | (2,367 | ) | (159,820 | ) | ||||
| Bluebird Bio, Inc. | (1,372 | ) | (164,530 | ) | ||||
| Clovis Oncology, Inc. | (8,827 | ) | (130,463 | ) | ||||
| DowDuPont, Inc. | (10,430 | ) | (318,324 | ) | ||||
| Heron Therapeutics, Inc. | (10,310 | ) | (175,579 | ) | ||||
| Immunomedics, Inc. | (12,902 | ) | (168,629 | ) | ||||
| Medicines Co. | (5,441 | ) | (193,972 | ) | ||||
| MyoKardia, Inc. | (3,770 | ) | (175,607 | ) | ||||
| Nektar Therapeutics | (6,681 | ) | (209,248 | ) | ||||
| Puma Biotechnology, Inc. | (6,302 | ) | (93,207 | ) | ||||
| REGENXBIO, Inc. | (3,972 | ) | (170,875 | ) | ||||
| Sarepta Therapeutics, Inc. | (1,487 | ) | (169,295 | ) | ||||
| Tronox Holdings PLC – Class A (a) | (26,611 | ) | (246,684 | ) | ||||
| Ultragenyx Pharmaceutical, Inc. | (3,140 | ) | (172,480 | ) | ||||
| Zogenix, Inc. | (4,800 | ) | (180,912 | ) | ||||
(3,389,499 | ) | |||||||
The accompanying notes are an integral part of these financial statements.
54
CONVERGENCE MARKET NEUTRAL FUND
| Schedule of Securities Sold Short (Continued) |
May 31, 2019 (Unaudited)
| Shares | Value | |||||||
| Clothing and Clothing Accessories Stores (0.47)% | ||||||||
| Tiffany & Co. | (3,289 | ) | $ | (293,083 | ) | |||
| Computer and Electronic Product Manufacturing (6.25)% | ||||||||
| Advanced Micro Devices, Inc. | (9,144 | ) | (250,637 | ) | ||||
| Avanos Medical, Inc. | (8,075 | ) | (304,266 | ) | ||||
| Cubic Corp. | (5,453 | ) | (307,658 | ) | ||||
| First Solar, Inc. | (4,535 | ) | (263,211 | ) | ||||
| Guidewire Software, Inc. | (3,373 | ) | (339,054 | ) | ||||
| Lumentum Holdings, Inc. | (6,154 | ) | (249,052 | ) | ||||
| Marvell Technology Group Ltd. (a) | (14,232 | ) | (317,374 | ) | ||||
| Microchip Technology, Inc. | (3,330 | ) | (266,500 | ) | ||||
| NVIDIA Corp. | (2,067 | ) | (279,996 | ) | ||||
| Plantronics, Inc. | (6,812 | ) | (279,769 | ) | ||||
| Pure Storage, Inc. – Class A | (15,195 | ) | (240,993 | ) | ||||
| Square, Inc. – Class A | (5,210 | ) | (322,759 | ) | ||||
| Western Digital Corp. | (6,819 | ) | (253,803 | ) | ||||
| Zynga, Inc. – Class A | (29,860 | ) | (187,819 | ) | ||||
(3,862,891 | ) | |||||||
| Construction of Buildings (1.51)% | ||||||||
| Dycom Industries, Inc. | (5,870 | ) | (306,238 | ) | ||||
| KB Home | (12,470 | ) | (313,371 | ) | ||||
| Lennar Corp. – Class A | (6,340 | ) | (314,844 | ) | ||||
(934,453 | ) | |||||||
| Credit Intermediation and Related Activities (5.12)% | ||||||||
| Atlantic Union Bankshares Corp. | (9,535 | ) | (307,981 | ) | ||||
| BOK Financial Corp. | (4,230 | ) | (316,954 | ) | ||||
| Cadence BanCorp | (15,665 | ) | (289,803 | ) | ||||
| CenterState Bank Corp. | (14,346 | ) | (314,034 | ) | ||||
| CVB Financial Corp. | (15,040 | ) | (309,072 | ) | ||||
| Flagstar Bancorp, Inc. | (10,849 | ) | (341,526 | ) | ||||
| Independent Bank Group, Inc. | (6,531 | ) | (337,261 | ) | ||||
| PennyMac Financial Services, Inc. | (14,950 | ) | (317,090 | ) | ||||
| Synovus Financial Corp. | (9,764 | ) | (312,057 | ) | ||||
| WSFS Financial Corp. | (8,090 | ) | (321,092 | ) | ||||
(3,166,870 | ) | |||||||
| Data Processing, Hosting and Related Services (1.07)% | ||||||||
| Ceridian HCM Holding, Inc. | (6,560 | ) | (322,621 | ) | ||||
| Upwork, Inc. | (22,480 | ) | (336,750 | ) | ||||
(659,371 | ) | |||||||
The accompanying notes are an integral part of these financial statements.
55
CONVERGENCE MARKET NEUTRAL FUND
| Schedule of Securities Sold Short (Continued) |
May 31, 2019 (Unaudited)
| Shares | Value | |||||||
| Educational Services (0.54)% | ||||||||
| Grand Canyon Education, Inc. | (2,810 | ) | $ | (336,807 | ) | |||
| Electrical Equipment, Appliance, and | ||||||||
| Component Manufacturing (1.44)% | ||||||||
| Altra Industrial Motion Corp. | (9,616 | ) | (301,654 | ) | ||||
| Axon Enterprise, Inc. | (5,076 | ) | (338,975 | ) | ||||
| Energizer Holdings, Inc. | (6,141 | ) | (251,290 | ) | ||||
(891,919 | ) | |||||||
| Fabricated Metal Product Manufacturing (0.38)% | ||||||||
| McDermott International, Inc. (a) | (38,400 | ) | (231,936 | ) | ||||
| Food and Beverage Stores (0.53)% | ||||||||
| GrubHub, Inc. | (5,044 | ) | (328,617 | ) | ||||
| Food Manufacturing (1.23)% | ||||||||
| Conagra Brands, Inc. | (9,677 | ) | (259,053 | ) | ||||
| Hain Celestial Group, Inc. | (12,367 | ) | (252,163 | ) | ||||
| Kraft Heinz Co. | (9,023 | ) | (249,486 | ) | ||||
(760,702 | ) | |||||||
| Food Services and Drinking Places (0.33)% | ||||||||
| Casey’s General Stores, Inc. | (1,587 | ) | (204,850 | ) | ||||
| Furniture and Home Furnishings Stores (0.88)% | ||||||||
| At Home Group, Inc. | (14,036 | ) | (267,386 | ) | ||||
| Floor & Decor Holdings, Inc. – Class A | (7,685 | ) | (272,970 | ) | ||||
(540,356 | ) | |||||||
| General Merchandise Stores (0.27)% | ||||||||
| PriceSmart, Inc. | (3,475 | ) | (168,885 | ) | ||||
| Heavy and Civil Engineering Construction (0.50)% | ||||||||
| Granite Construction, Inc. | (7,677 | ) | (308,539 | ) | ||||
| Insurance Carriers and Related Activities (4.23)% | ||||||||
| American International Group, Inc. | (6,427 | ) | (328,227 | ) | ||||
| Brighthouse Financial, Inc. | (8,395 | ) | (297,939 | ) | ||||
| Centene Corp. | (5,658 | ) | (326,750 | ) | ||||
| Everest Re Group Ltd. (a) | (1,329 | ) | (329,139 | ) | ||||
| Humana, Inc. | (1,350 | ) | (330,560 | ) | ||||
| Loews Corp. | (6,310 | ) | (324,082 | ) | ||||
The accompanying notes are an integral part of these financial statements.
56
CONVERGENCE MARKET NEUTRAL FUND
| Schedule of Securities Sold Short (Continued) |
May 31, 2019 (Unaudited)
| Shares | Value | |||||||
| Insurance Carriers and Related Activities (4.23)% (Continued) | ||||||||
| Markel Corp. | (310 | ) | $ | (328,250 | ) | |||
| White Mountains Insurance Group Ltd. (a) | (360 | ) | (352,655 | ) | ||||
(2,617,602 | ) | |||||||
| Machinery Manufacturing (0.92)% | ||||||||
| Evoqua Water Technologies Corp. | (24,296 | ) | (285,964 | ) | ||||
| II-VI, Inc. | (9,070 | ) | (285,070 | ) | ||||
(571,034 | ) | |||||||
| Management of Companies and Enterprises (1.06)% | ||||||||
| Ameris Bancorp | (9,578 | ) | (338,008 | ) | ||||
| Renasant Corp. | (9,390 | ) | (317,382 | ) | ||||
(655,390 | ) | |||||||
| Merchant Wholesalers, Durable Goods (4.37)% | ||||||||
| Adient PLC (a) | (14,520 | ) | (250,615 | ) | ||||
| GCP Applied Technologies, Inc. | (12,047 | ) | (315,149 | ) | ||||
| Mohawk Industries, Inc. | (2,310 | ) | (313,121 | ) | ||||
| New Relic, Inc. | (3,185 | ) | (319,520 | ) | ||||
| Spectrum Brands Holdings, Inc. | (5,023 | ) | (264,561 | ) | ||||
| Sunrun, Inc. | (19,026 | ) | (297,947 | ) | ||||
| Trinity Industries, Inc. | (15,804 | ) | (304,702 | ) | ||||
| Varonis Systems, Inc. | (5,078 | ) | (317,578 | ) | ||||
| Westrock Co. | (9,800 | ) | (319,480 | ) | ||||
(2,702,673 | ) | |||||||
| Merchant Wholesalers, Nondurable Goods (0.97)% | ||||||||
| Aimmune Therapeutics, Inc. | (9,791 | ) | (191,610 | ) | ||||
| Atara Biotherapeutics, Inc. | (5,597 | ) | (124,309 | ) | ||||
| Freshpet, Inc. | (6,120 | ) | (284,396 | ) | ||||
(600,315 | ) | |||||||
| Miscellaneous Manufacturing (3.78)% | ||||||||
| Cantel Medical Corp. | (4,718 | ) | (324,315 | ) | ||||
| Haemonetics Corp. | (3,184 | ) | (308,816 | ) | ||||
| ICU Medical, Inc. | (1,538 | ) | (327,286 | ) | ||||
| Insulet Corp. | (2,986 | ) | (327,834 | ) | ||||
| Mattel, Inc. | (26,588 | ) | (261,892 | ) | ||||
| Mirati Therapeutics, Inc. | (2,560 | ) | (173,542 | ) | ||||
| National Vision Holdings, Inc. | (9,910 | ) | (269,849 | ) | ||||
| Nevro Corp. | (5,821 | ) | (344,080 | ) | ||||
(2,337,614 | ) | |||||||
The accompanying notes are an integral part of these financial statements.
57
CONVERGENCE MARKET NEUTRAL FUND
| Schedule of Securities Sold Short (Continued) |
May 31, 2019 (Unaudited)
| Shares | Value | |||||||
| Motion Picture and Sound Recording Industries (0.64)% | ||||||||
| Lions Gate Entertainment Corp. – Class B (a) | (14,330 | ) | $ | (197,181 | ) | |||
| Take-Two Interactive Software, Inc. | (1,862 | ) | (201,375 | ) | ||||
(398,556 | ) | |||||||
| Motor Vehicle and Parts Dealers (0.74)% | ||||||||
| Cargurus, Inc. | (5,288 | ) | (180,638 | ) | ||||
| Carvana Co. | (4,710 | ) | (272,615 | ) | ||||
(453,253 | ) | |||||||
| Oil and Gas Extraction (1.98)% | ||||||||
| Callon Petroleum Co. | (38,521 | ) | (240,756 | ) | ||||
| Concho Resources, Inc. | (2,442 | ) | (239,340 | ) | ||||
| Diamondback Energy, Inc. | (2,869 | ) | (281,334 | ) | ||||
| Jagged Peak Energy, Inc. | (27,335 | ) | (226,881 | ) | ||||
| Matador Resources Co. | (14,188 | ) | (233,251 | ) | ||||
(1,221,562 | ) | |||||||
| Other Information Services (0.65)% | ||||||||
| Facebook, Inc. – Class A | (972 | ) | (172,501 | ) | ||||
| Zillow Group, Inc. – Class A | (5,377 | ) | (227,608 | ) | ||||
(400,109 | ) | |||||||
| Paper Manufacturing (0.11)% | ||||||||
| Graphic Packaging Holding Co. | (5,251 | ) | (68,263 | ) | ||||
| Performing Arts, Spectator Sports, and Related Industries (0.81)% | ||||||||
| Electronic Arts, Inc. | (2,030 | ) | (188,952 | ) | ||||
| International Game Technology PLC (a) | (24,261 | ) | (315,394 | ) | ||||
(504,346 | ) | |||||||
| Pipeline Transportation (1.47)% | ||||||||
| New Jersey Resources Corp. | (6,755 | ) | (320,525 | ) | ||||
| South Jersey Industries, Inc. | (11,197 | ) | (353,264 | ) | ||||
| Targa Resources Corp. | (6,020 | ) | (231,529 | ) | ||||
(905,318 | ) | |||||||
| Plastics and Rubber Products Manufacturing (0.45)% | ||||||||
| Newell Brands, Inc. | (20,870 | ) | (280,075 | ) | ||||
| Primary Metal Manufacturing (0.96)% | ||||||||
| Commercial Metals Co. | (21,048 | ) | (280,991 | ) | ||||
| United States Steel Corp. | (26,620 | ) | (314,648 | ) | ||||
(595,639 | ) | |||||||
The accompanying notes are an integral part of these financial statements.
58
CONVERGENCE MARKET NEUTRAL FUND
| Schedule of Securities Sold Short (Continued) |
May 31, 2019 (Unaudited)
| Shares | Value | |||||||
| Printing and Related Support Activities (0.37)% | ||||||||
| Centennial Resource Development, Inc. – Class A | (29,055 | ) | $ | (229,535 | ) | |||
| Professional, Scientific, and Technical Services (5.69)% | ||||||||
| 2U, Inc. | (8,672 | ) | (329,449 | ) | ||||
| ADT, Inc. | (55,240 | ) | (323,154 | ) | ||||
| Allakos, Inc. | (4,500 | ) | (176,400 | ) | ||||
| AnaptysBio, Inc. | (2,916 | ) | (212,314 | ) | ||||
| Aspen Technology, Inc. | (2,892 | ) | (328,560 | ) | ||||
| BrightView Holdings, Inc. | (20,699 | ) | (345,880 | ) | ||||
| Cimpress NV (a) | (3,979 | ) | (348,163 | ) | ||||
| Cloudera, Inc. | (33,884 | ) | (310,716 | ) | ||||
| Diebold Nixdorf, Inc. | (32,120 | ) | (273,020 | ) | ||||
| Nutanix, Inc. – Class A | (9,256 | ) | (259,816 | ) | ||||
| Pluralsight, Inc. – Class A | (10,520 | ) | (335,167 | ) | ||||
| SYNNEX Corp. | (3,159 | ) | (273,917 | ) | ||||
(3,516,556 | ) | |||||||
| Publishing Industries (except Internet) (2.22)% | ||||||||
| Activision Blizzard, Inc. | (4,129 | ) | (179,075 | ) | ||||
| FireEye, Inc. | (21,980 | ) | (320,688 | ) | ||||
| LogMeIn, Inc. | (4,038 | ) | (290,050 | ) | ||||
| Shutterfly, Inc. | (5,630 | ) | (267,312 | ) | ||||
| SS&C Technologies Holdings, Inc. | (5,673 | ) | (315,702 | ) | ||||
(1,372,827 | ) | |||||||
| Real Estate (0.55)% | ||||||||
| Howard Hughes Corp. | (3,281 | ) | (337,418 | ) | ||||
| Rental and Leasing Services (0.97)% | ||||||||
| Air Lease Corp. – Class A | (8,370 | ) | (301,320 | ) | ||||
| Aircastle Ltd. (a) | (15,380 | ) | (298,680 | ) | ||||
(600,000 | ) | |||||||
| Securities, Commodity Contracts, and Other Financial | ||||||||
| Investments and Related Activities (1.95)% | ||||||||
| Aramark | (9,610 | ) | (334,332 | ) | ||||
| CBOE Global Markets, Inc. | (3,115 | ) | (338,102 | ) | ||||
| Goldman Sachs Group, Inc. | (1,440 | ) | (262,786 | ) | ||||
| Moelis & Co. – Class A | (8,290 | ) | (263,456 | ) | ||||
(1,198,676 | ) | |||||||
| Support Activities for Mining (0.52)% | ||||||||
| Cleveland-Cliffs, Inc. | (36,900 | ) | (321,030 | ) | ||||
The accompanying notes are an integral part of these financial statements.
59
CONVERGENCE MARKET NEUTRAL FUND
| Schedule of Securities Sold Short (Continued) |
May 31, 2019 (Unaudited)
| Shares | Value | |||||||
| Telecommunications (0.96)% | ||||||||
| GCI Liberty, Inc. – Class A | (3,105 | ) | $ | (180,369 | ) | |||
| Vonage Holdings Corp. | (17,693 | ) | (209,485 | ) | ||||
| Zayo Group Holdings, Inc. | (6,222 | ) | (203,460 | ) | ||||
(593,314 | ) | |||||||
| Transportation Equipment Manufacturing (3.35)% | ||||||||
| Aerovironment, Inc. | (4,630 | ) | (299,793 | ) | ||||
| Kratos Defense & Security Solutions, Inc. | (13,752 | ) | (303,231 | ) | ||||
| RBC Bearings, Inc. | (2,486 | ) | (353,757 | ) | ||||
| REV Group, Inc. | (27,749 | ) | (307,459 | ) | ||||
| Sun Hydraulics Corp. | (6,914 | ) | (288,660 | ) | ||||
| Tesla, Inc. | (1,135 | ) | (210,157 | ) | ||||
| Wabtec Corp. | (4,830 | ) | (301,295 | ) | ||||
(2,064,352 | ) | |||||||
| Truck Transportation (0.84)% | ||||||||
| Knight-Swift Transportation Holdings, Inc. – Class A | (9,453 | ) | (261,281 | ) | ||||
| Saia, Inc. | (4,423 | ) | (260,957 | ) | ||||
(522,238 | ) | |||||||
| Utilities (2.33)% | ||||||||
| American Water Works Co., Inc. | (3,050 | ) | (344,711 | ) | ||||
| Aqua America, Inc. | (8,780 | ) | (347,161 | ) | ||||
| Atmos Energy Corp. | (3,704 | ) | (377,068 | ) | ||||
| NiSource, Inc. | (13,285 | ) | (369,987 | ) | ||||
(1,438,927 | ) | |||||||
| Water Transportation (0.86)% | ||||||||
| Golar LNG Ltd. (a) | (12,730 | ) | (231,559 | ) | ||||
| Kirby Corp. | (3,897 | ) | (301,550 | ) | ||||
(533,109 | ) | |||||||
| TOTAL COMMON STOCKS (Proceeds $50,932,627) | (45,513,954 | ) | ||||||
The accompanying notes are an integral part of these financial statements.
60
CONVERGENCE MARKET NEUTRAL FUND
| Schedule of Securities Sold Short (Continued) |
May 31, 2019 (Unaudited)
| Shares | Value | |||||||
| REAL ESTATE INVESTMENT TRUSTS (9.05)% | ||||||||
| Acadia Realty Trust | (12,727 | ) | $ | (348,084 | ) | |||
| Annaly Capital Management, Inc. | (34,389 | ) | (302,967 | ) | ||||
| Colony Credit Real Estate, Inc. | (16,444 | ) | (250,113 | ) | ||||
| CyrusOne, Inc. | (5,541 | ) | (327,141 | ) | ||||
| Healthcare Trust of America, Inc. – Class A | (11,780 | ) | (339,146 | ) | ||||
| Hudson Pacific Properties, Inc. | (9,588 | ) | (320,335 | ) | ||||
| Macerich Co. | (8,482 | ) | (308,151 | ) | ||||
| National Health Investors, Inc. | (4,141 | ) | (325,276 | ) | ||||
| New Residential Investment Corp. | (15,829 | ) | (241,392 | ) | ||||
| Outfront Media, Inc. | (13,266 | ) | (327,007 | ) | ||||
| Pebblebrook Hotel Trust | (10,161 | ) | (282,781 | ) | ||||
| PennyMac Mortgage Investment Trust | (12,890 | ) | (268,112 | ) | ||||
| PotlatchDeltic Corp. | (9,502 | ) | (319,742 | ) | ||||
| Redwood Trust, Inc. | (16,880 | ) | (268,898 | ) | ||||
| Two Harbors Investment Corp. | (21,750 | ) | (265,785 | ) | ||||
| Urban Edge Properties | (21,822 | ) | (376,430 | ) | ||||
| Vornado Realty Trust | (5,238 | ) | (346,913 | ) | ||||
| WP Carey, Inc. | (4,510 | ) | (374,374 | ) | ||||
| TOTAL REAL ESTATE INVESTMENT TRUSTS | ||||||||
| (Proceeds $5,757,444) | (5,592,647 | ) | ||||||
| Total Securities Sold Short (Proceeds $56,690,071) | $ | (51,106,601 | ) | |||||
| (a) | Foreign issued security. |
| Abbreviations: | |
| Ltd. | Limited Liability Company. |
| NV | Naamloze Vennootschap is a Dutch term for publicly traded companies. |
| PLC | Public Limited Company. |
The accompanying notes are an integral part of these financial statements.
61
CONVERGENCE FUNDS
| Statements of Assets and Liabilities |
May 31, 2019 (Unaudited)
| Long/Short | Opportunities | Market | ||||||||||
| Equity Fund | Fund | Neutral Fund | ||||||||||
| Assets | ||||||||||||
Investments, at value (cost $117,188,655, | ||||||||||||
$22,210,164 and $65,582,498, respectively) | $ | 127,028,737 | $ | 22,710,969 | $ | 67,051,619 | ||||||
Receivable for investments sold | 31,880,947 | — | 28,714,263 | |||||||||
Deposit for short sales at broker | 10,083,698 | 262,095 | 44,830,858 | |||||||||
Dividends and interest receivable | 291,827 | 26,143 | 151,597 | |||||||||
Receivable for Fund shares sold | 4,300 | — | 141,623 | |||||||||
Cash | 2,689 | 777 | — | |||||||||
Receivable from Broker | — | — | 28,932 | |||||||||
Other assets | 11,805 | 10,716 | 14,356 | |||||||||
| Total Assets | 169,304,003 | 23,010,700 | 140,933,248 | |||||||||
| Liabilities | ||||||||||||
Securities sold short, at value | ||||||||||||
(proceeds $51,023,249, $8,534,110 | ||||||||||||
and $56,690,071, respectively) | 43,752,173 | 7,114,914 | 51,106,601 | |||||||||
Payable for investments purchased | 31,196,262 | — | 27,866,534 | |||||||||
Dividends payable on short positions | 44,833 | 4,931 | 53,853 | |||||||||
Payable to broker for interest expense | 7,260 | 3,943 | — | |||||||||
Payable to Adviser | 83,404 | 12,232 | 60,969 | |||||||||
Payable to affiliates | 33,489 | 19,816 | 23,978 | |||||||||
Accrued expenses and other liabilities | 16,972 | 14,023 | 11,190 | |||||||||
| Total Liabilities | 75,134,393 | 7,169,859 | 79,123,125 | |||||||||
| Net Assets | $ | 94,169,610 | $ | 15,840,841 | $ | 61,810,123 | ||||||
| Net Assets Consist Of: | ||||||||||||
Paid-in capital | 65,490,593 | 9,098,497 | 64,176,910 | |||||||||
Total distributable earnings | 28,679,017 | 6,742,344 | (2,366,787 | ) | ||||||||
| Net Assets | $ | 94,169,610 | $ | 15,840,841 | $ | 61,810,123 | ||||||
| Institutional Class Shares | ||||||||||||
Net Assets | $ | 94,169,610 | $ | 15,840,841 | $ | 61,810,123 | ||||||
Shares of beneficial interest outstanding | ||||||||||||
(unlimited number of shares authorized, | ||||||||||||
$0.001 par value) | 5,311,179 | 1,538,311 | 5,878,036 | |||||||||
Net asset value, redemption price | ||||||||||||
and offering price per share | $ | 17.73 | $ | 10.30 | $ | 10.52 | ||||||
The accompanying notes are an integral part of these financial statements.
62
CONVERGENCE FUNDS
| Statements of Operations |
For the Six Months Ended May 31, 2019 (Unaudited)
| Long/Short | Opportunities | Market | ||||||||||
| Equity Fund | Fund | Neutral Fund | ||||||||||
| Investment Income | ||||||||||||
Dividend income(1) | $ | 1,774,670 | $ | 280,812 | $ | 1,047,103 | ||||||
Interest income | 3,614 | 3,537 | 451,151 | |||||||||
Securities lending income | — | 64 | — | |||||||||
| Total Investment Income | 1,778,284 | 284,413 | 1,498,254 | |||||||||
| Expenses | ||||||||||||
Management fees | 503,503 | 118,956 | 376,432 | |||||||||
Dividends on short positions | 292,901 | 87,196 | 492,910 | |||||||||
Interest and broker expenses | 144,839 | 67,231 | — | |||||||||
Administration fees | 61,297 | 16,875 | 46,401 | |||||||||
Transfer agent fees and expenses | 22,662 | 10,875 | 14,990 | |||||||||
Federal and state registration fees | 10,650 | 9,928 | 13,426 | |||||||||
Audit and tax fees | 9,822 | 9,822 | 9,822 | |||||||||
Custody fees | 9,755 | 6,470 | 8,702 | |||||||||
Legal fees | 9,509 | 6,549 | 6,090 | |||||||||
Chief Compliance Officer fees | 5,909 | 5,909 | 5,909 | |||||||||
Reports to shareholders | 5,017 | 1,993 | 2,087 | |||||||||
Fund accounting fees | 4,999 | 4,817 | 5,005 | |||||||||
Trustees’ fees | 4,101 | 4,101 | 4,101 | |||||||||
Other expenses | 3,864 | 3,354 | 5,311 | |||||||||
| Total Expenses | 1,088,828 | 354,076 | 991,186 | |||||||||
| Expense (waiver) recoupment | ||||||||||||
| by Adviser (Note 4) | — | (20,865 | ) | 67,218 | ||||||||
| Net Expenses | 1,088,828 | 333,211 | 1,058,404 | |||||||||
| Net Investment Income (Loss) | 689,456 | (48,798 | ) | 439,850 | ||||||||
| Realized and Unrealized | ||||||||||||
| Gain (Loss) on Investments | ||||||||||||
Net realized gain (loss) from: | ||||||||||||
| Investments | 8,732,782 | 2,544,401 | (153,715 | ) | ||||||||
| Short transactions | 2,675,713 | 2,758,399 | (4,172,488 | ) | ||||||||
Change in net unrealized | ||||||||||||
appreciation (depreciation) on: | ||||||||||||
| Investments | (15,717,602 | ) | (6,176,803 | ) | (2,392,696 | ) | ||||||
| Short transactions | (3,173,515 | ) | (2,083,136 | ) | 734,504 | |||||||
| Realized and Unrealized | ||||||||||||
| Loss on Investments | (7,482,622 | ) | (2,957,139 | ) | (5,984,395 | ) | ||||||
| Net Decrease in Net | ||||||||||||
| Assets from Operations | $ | (6,793,166 | ) | $ | (3,005,937 | ) | $ | (5,544,545 | ) | |||
(1) | Net of $606 in dividend withholding tax for the Opportunities Fund. |
The accompanying notes are an integral part of these financial statements.
63
CONVERGENCE LONG/SHORT EQUITY FUND
| Statements of Changes in Net Assets |
| Six Months Ended | Year Ended | |||||||
| May 31, 2019 | November 30, | |||||||
| (Unaudited) | 2018 | |||||||
| From Operations | ||||||||
| Net investment income | $ | 689,456 | $ | 39,778 | ||||
| Net realized gain (loss) from: | ||||||||
| Investments | 8,732,782 | 15,476,063 | ||||||
| Short transactions | 2,675,713 | (9,606,014 | ) | |||||
| Change in net unrealized | ||||||||
| appreciation (depreciation) on: | ||||||||
| Investments | (15,717,602 | ) | (7,017,239 | ) | ||||
| Short transactions | (3,173,515 | ) | 10,537,785 | |||||
Net increase (decrease) in | ||||||||
net assets from operations | (6,793,166 | ) | 9,430,373 | |||||
| From Distributions | ||||||||
| Net dividends and distributions | (4,715,158 | ) | (16,352,802 | ) | ||||
Net decrease in net assets resulting | ||||||||
from distributions paid | (4,715,158 | ) | (16,352,802 | ) | ||||
| From Capital Share Transactions | ||||||||
| Proceeds from shares sold – Institutional Class | 5,557,547 | 8,504,815 | ||||||
| Net asset value of shares issued in | ||||||||
| reinvestment of distributions to shareholders – | ||||||||
| Institutional Class | 3,301,834 | 12,291,992 | ||||||
| Payments for shares redeemed – | ||||||||
| Institutional Class | (16,042,741 | ) | (29,578,358 | ) | ||||
Net decrease in net assets from | ||||||||
capital share transactions | (7,183,360 | ) | (8,781,551 | ) | ||||
| Total Decrease In Net Assets | (18,691,684 | ) | (15,703,980 | ) | ||||
| Net Assets | ||||||||
| Beginning of period | 112,861,294 | 128,565,274 | ||||||
| End of period | $ | 94,169,610 | $ | 112,861,294 | ||||
The accompanying notes are an integral part of these financial statements.
64
CONVERGENCE OPPORTUNITIES FUND
| Statements of Changes in Net Assets |
| Six Months Ended | Year Ended | |||||||
| May 31, 2019 | November 30, | |||||||
| (Unaudited) | 2018 | |||||||
| From Operations | ||||||||
| Net investment loss | $ | (48,798 | ) | $ | (457,822 | ) | ||
| Net realized gain (loss) from: | ||||||||
| Investments | 2,544,401 | 7,826,820 | ||||||
| Short transactions | 2,758,399 | (5,436,778 | ) | |||||
| Change in net unrealized | ||||||||
| appreciation (depreciation) on: | ||||||||
| Investments | (6,176,803 | ) | (8,051,073 | ) | ||||
| Short transactions | (2,083,136 | ) | 4,024,434 | |||||
Net decrease in net assets from operations | (3,005,937 | ) | (2,094,419 | ) | ||||
| From Distributions | ||||||||
| Net dividends and distributions | (249,132 | ) | (7,815,655 | ) | ||||
Net decrease in net assets resulting | ||||||||
from distributions paid | (249,132 | ) | (7,815,655 | ) | ||||
| From Capital Share Transactions | ||||||||
| Proceeds from shares sold – Institutional Class | 406,436 | 1,321,094 | ||||||
| Net asset value of shares issued in | ||||||||
| reinvestment of distributions to shareholders – | ||||||||
| Institutional Class | 195,259 | 6,789,789 | ||||||
| Payments for shares redeemed – | ||||||||
| Institutional Class | (16,159,888 | ) | (32,435,091 | ) | ||||
Net decrease in net assets from | ||||||||
capital share transactions | (15,558,193 | ) | (24,324,208 | ) | ||||
| Total Decrease In Net Assets | (18,813,262 | ) | (34,234,282 | ) | ||||
| Net Assets | ||||||||
| Beginning of period | 34,654,103 | 68,888,385 | ||||||
| End of period | $ | 15,840,841 | $ | 34,654,103 | ||||
The accompanying notes are an integral part of these financial statements.
65
CONVERGENCE MARKET NEUTRAL FUND
| Statements of Changes in Net Assets |
| Six Months Ended | Year Ended | |||||||
| May 31, 2019 | November 30, | |||||||
| (Unaudited) | 2018 | |||||||
| From Operations | ||||||||
| Net investment gain (loss) | $ | 439,850 | $ | (16,121 | ) | |||
| Net realized loss from: | ||||||||
| Investments | (153,715 | ) | (975,840 | ) | ||||
| Short transactions | (4,172,488 | ) | (3,414,707 | ) | ||||
| Change in net unrealized | ||||||||
| appreciation (depreciation) on: | ||||||||
| Investments | (2,392,696 | ) | 741,915 | |||||
| Short transactions | 734,504 | 5,185,930 | ||||||
Net increase (decrease) in | ||||||||
net assets from operations | (5,544,545 | ) | 1,521,177 | |||||
| From Distributions | ||||||||
| Net dividends and distributions | (13,122 | ) | — | |||||
Net decrease in net assets | ||||||||
resulting from distributions paid | (13,122 | ) | — | |||||
| From Capital Share Transactions | ||||||||
| Proceeds from shares sold – Institutional Class | 20,573,390 | 62,278,983 | ||||||
| Net asset value of shares issued in | ||||||||
| reinvestment of distributions to shareholders – | ||||||||
| Institutional Class | 10,484 | — | ||||||
| Payments for shares redeemed – | ||||||||
| Institutional Class | (34,333,773 | ) | (5,306,765 | ) | ||||
Net increase (decrease) in net assets | ||||||||
from capital share transactions | (13,749,899 | ) | 56,972,218 | |||||
| Total Increase (Decrease) In Net Assets | (19,307,566 | ) | 58,493,395 | |||||
| Net Assets | ||||||||
| Beginning of period | 81,117,689 | 22,624,294 | ||||||
| End of period | $ | 61,810,123 | $ | 81,117,689 | ||||
The accompanying notes are an integral part of these financial statements.
66
(This Page Intentionally Left Blank.)
67
CONVERGENCE FUNDS
| Statements of Cash Flows |
For the Period Ended May 31, 2019 (Unaudited)
| Long/Short | Opportunities | Market | ||||||||||
| Equity Fund | Fund | Neutral Fund | ||||||||||
| CASH FLOWS FROM OPERATING ACTIVITIES: | ||||||||||||
| Net decrease in net assets | ||||||||||||
| resulting from operations | $ | (6,793,166 | ) | $ | (3,005,937 | ) | $ | (5,544,545 | ) | |||
| Adjustments to reconcile net increase in | ||||||||||||
| net assets from operations to net | ||||||||||||
| cash provided in operating activities: | ||||||||||||
| Purchases of investments | (161,765,254 | ) | (48,501,568 | ) | (109,937,081 | ) | ||||||
| Purchases of short-term investments, net | (226,715 | ) | 732,980 | (377,729 | ) | |||||||
| Proceeds from sales of | ||||||||||||
| long-term investments | 183,441,309 | 71,936,013 | 130,662,143 | |||||||||
| Return of capital distributions received | ||||||||||||
| from underlying investments | 153,155 | 2,443 | 227,787 | |||||||||
| (Increase) Decrease in dividends and | ||||||||||||
| interest receivable | (40,652 | ) | 15,268 | 22,703 | ||||||||
| Decrease in deposits at broker | ||||||||||||
| for short sales | 1,486,374 | 46,222 | 16,200,594 | |||||||||
| Increase in receivable for investment | ||||||||||||
| securities sold | (31,880,947 | ) | — | (2,103,420 | ) | |||||||
| Decrease in receivable for | ||||||||||||
| securities lending | 15 | 449 | — | |||||||||
| Decrease in receivable from broker | — | — | 2,942 | |||||||||
| (Increase) Decrease in other assets | 1,468 | 5,371 | (6,137 | ) | ||||||||
| Proceeds from securities sold short | 64,898,771 | 14,738,604 | 86,285,344 | |||||||||
| Purchases to cover securities sold short | (76,028,539 | ) | (23,080,075 | ) | (107,280,526 | ) | ||||||
| Increase (Decrease) in payable for | ||||||||||||
| investment securities purchased | 31,196,262 | — | (368,971 | ) | ||||||||
| Increase (Decrease) in dividends | ||||||||||||
| payable on short positions | 3,100 | (9,635 | ) | (27,115 | ) | |||||||
| Decrease in payable to broker | ||||||||||||
| for interest expense | (2,760 | ) | (2,444 | ) | — | |||||||
| Decrease in payable to Adviser | (9,307 | ) | (16,885 | ) | (12,369 | ) | ||||||
| Decrease in accrued expenses and | ||||||||||||
| other liabilities | (13,573 | ) | (13,769 | ) | (22,356 | ) | ||||||
| Unrealized depreciation on investments | 15,717,602 | 6,176,803 | 2,392,696 | |||||||||
| Unrealized depreciation (appreciation) | ||||||||||||
| on short transactions | 3,173,515 | 2,083,136 | (734,504 | ) | ||||||||
| Net realized (gain) loss on investments | (8,732,782 | ) | (2,544,401 | ) | 153,715 | |||||||
| Net realized (gain) loss on short transactions | (2,675,713 | ) | (2,758,399 | ) | 4,172,488 | |||||||
| Net cash provided in operating activities | 11,902,163 | 15,804,176 | 13,705,659 | |||||||||
The accompanying notes are an integral part of these financial statements.
68
CONVERGENCE FUNDS
| Statements of Cash Flows (Continued) |
For the Period Ended May 31, 2019 (Unaudited)
| Long/Short | Opportunities | Market | ||||||||||
| Equity Fund | Fund | Neutral Fund | ||||||||||
| CASH FLOWS FROM FINANCING ACTIVITIES: | ||||||||||||
| Proceeds from shares sold | $ | 5,556,674 | $ | 407,305 | $ | 20,632,914 | ||||||
| Payment on shares redeemed | (16,051,091 | ) | (16,159,888 | ) | (34,338,773 | ) | ||||||
| Cash distributions paid to shareholders | (1,413,324 | ) | (53,873 | ) | (2,638 | ) | ||||||
| Net cash used by financing activities | (11,907,741 | ) | (15,806,456 | ) | (13,708,497 | ) | ||||||
Net change in cash | $ | (5,578 | ) | $ | (2,280 | ) | $ | (2,838 | ) | |||
| CASH: | ||||||||||||
| Beginning Balance | 8,267 | 3,057 | 2,838 | |||||||||
| Ending Balance | $ | 2,689 | $ | 777 | $ | — | ||||||
| SUPPLEMENTAL DISCLOSURES: | ||||||||||||
| Cash paid for interest | 147,599 | 69,675 | — | |||||||||
| Non-cash financing activities – | ||||||||||||
| distributions reinvested | 3,301,834 | 195,259 | 10,484 | |||||||||
| Non-cash financing activities – | ||||||||||||
| increase (decrease) in receivable | ||||||||||||
| for Fund shares sold | 873 | (869 | ) | (59,524 | ) | |||||||
| Non-cash financing activities – | ||||||||||||
| decrease in payable for | ||||||||||||
| Fund shares redeemed | 8,350 | — | 5,000 | |||||||||
The accompanying notes are an integral part of these financial statements.
69
CONVERGENCE LONG/SHORT EQUITY FUND
| Financial Highlights – Institutional Class |
| Six Months Ended | ||||
| May 31, 2019 | ||||
| (Unaudited) | ||||
| Net Asset Value, Beginning of Period | $ | 19.83 | ||
| Income (loss) from investment operations: | ||||
Net investment income(1) | 0.12 | |||
| Net realized and unrealized gain (loss) on investments | (1.36 | ) | ||
Total from investment operations | (1.24 | ) | ||
| Less distributions paid: | ||||
| From net investment income | (0.07 | ) | ||
| From net realized gains | (0.79 | ) | ||
Total distributions paid | (0.86 | ) | ||
| Net Asset Value, End of Period | $ | 17.73 | ||
Total Return(2)(5) | -6.03 | % | ||
| Supplemental Data and Ratios: | ||||
Net assets at end of period (000’s) | $ | 94,170 | ||
Ratio of expenses to average net assets: | ||||
Before waiver and expense reimbursement(3)(4) | 2.16 | % | ||
After waiver and expense reimbursement(3)(4) | 2.16 | % | ||
Ratio of net investment income to average net assets: | ||||
Before waiver and expense reimbursement(4) | 1.37 | % | ||
After waiver and expense reimbursement(4) | 1.37 | % | ||
Portfolio turnover rate(5) | 115.63 | % | ||
(1) | Per share net investment income was calculated using the daily average shares outstanding method. |
(2) | Total return in the table represents the rate that the investor would have earned or lost on an investment in the Fund, assuming reinvestment of dividends. |
(3) | The ratio of expenses to average net assets includes dividends on short positions, interest and broker expenses. The annualized before waiver and expense reimbursement and after waiver and expense reimbursement ratios excluding dividends on short positions, interest and broker expenses were 1.29% and 1.29%, 1.27% and 1.27%, 1.28% and 1.28%, 1.31% and 1.31%, 1.26% and 1.26%, 1.24% and 1.24% for the periods ended May 31, 2019, November 30, 2018, November 30, 2017, November 30, 2016, November 30, 2015, and November 30, 2014, respectively. |
(4) | Annualized for periods less than one year. |
(5) | Not annualized for periods less than one year. |
The accompanying notes are an integral part of these financial statements.
70
Per Share Data for a Share Outstanding Throughout Each Period
| Year Ended November 30, | ||||||||||||||||||
| 2018 | 2017 | 2016 | 2015 | 2014 | ||||||||||||||
$ | 21.03 | $ | 18.47 | $ | 18.63 | $ | 18.11 | $ | 17.65 | |||||||||
0.01 | 0.04 | 0.11 | 0.04 | 0.02 | ||||||||||||||
1.47 | 3.32 | 0.93 | 0.53 | 2.02 | ||||||||||||||
1.48 | 3.36 | 1.04 | 0.57 | 2.04 | ||||||||||||||
(0.04 | ) | (0.18 | ) | (0.07 | ) | (0.05 | ) | (0.09 | ) | |||||||||
(2.64 | ) | (0.62 | ) | (1.13 | ) | — | (1.49 | ) | ||||||||||
(2.68 | ) | (0.80 | ) | (1.20 | ) | (0.05 | ) | (1.58 | ) | |||||||||
$ | 19.83 | $ | 21.03 | $ | 18.47 | $ | 18.63 | $ | 18.11 | |||||||||
7.69 | % | 18.81 | % | 6.04 | % | 3.15 | % | 12.18 | % | |||||||||
$ | 112,861 | $ | 128,565 | $ | 125,815 | $ | 225,867 | $ | 316,621 | |||||||||
2.20 | % | 2.11 | % | 2.21 | % | 2.24 | % | 2.24 | % | |||||||||
2.20 | % | 2.11 | % | 2.21 | % | 2.24 | % | 2.24 | % | |||||||||
0.03 | % | 0.20 | % | 0.65 | % | 0.24 | % | 0.15 | % | |||||||||
0.03 | % | 0.20 | % | 0.65 | % | 0.24 | % | 0.15 | % | |||||||||
193.55 | % | 214.61 | % | 260.81 | % | 251.00 | % | 267.84 | % | |||||||||
The accompanying notes are an integral part of these financial statements.
71
CONVERGENCE OPPORTUNITIES FUND
| Financial Highlights – Institutional Class |
| Six Months Ended | ||||
| May 31, 2019 | ||||
| (Unaudited) | ||||
| Net Asset Value, Beginning of Period | $ | 11.52 | ||
| Income (loss) from investment operations: | ||||
Net investment income (loss)(2) | (0.02 | ) | ||
| Net realized and unrealized gain (loss) on investments | (1.11 | ) | ||
Total from investment operations | (1.13 | ) | ||
| Less distributions paid: | ||||
| From net investment income | — | |||
| From net realized gains | (0.09 | ) | ||
Total distributions paid | (0.09 | ) | ||
| Net Asset Value, End of Period | $ | 10.30 | ||
Total Return(4)(5) | -9.79 | % | ||
| Supplemental Data and Ratios: | ||||
Net assets at end of period (000’s) | $ | 15,841 | ||
Ratio of expenses to average net assets: | ||||
Before waiver and expense reimbursement(6)(7) | 2.98 | % | ||
After waiver and expense reimbursement(6)(7) | 2.80 | % | ||
Ratio of net investment income (loss) to average net assets: | ||||
Before waiver and expense reimbursement(7) | (0.59 | )% | ||
After waiver and expense reimbursement(7) | (0.41 | )% | ||
Portfolio turnover rate(5) | 142.53 | % | ||
(1) | The Fund commenced operations on November 29, 2013. |
(2) | Per share net investment income (loss) was calculated using average shares outstanding. |
(3) | Amount is less than 0.5 cent per share. |
(4) | Total return in the table represents the rate that the investor would have earned or lost on an investment in the Fund, assuming reinvestment of dividends. |
(5) | Not annualized for periods less than one year. |
(6) | The ratio of expenses to average net assets includes dividends on short positions, interest and broker expenses. The annualized before waiver and expense reimbursement and after waiver and expense reimbursement ratios excluding dividends on short positions, interest and broker expenses were 1.68% and 1.50%, 1.43% and 1.41%, 1.34% and 1.34%, 1.36% and 1.36%, 1.34% and 1.34%, and 1.50% and 1.50% for the periods ended May 31, 2019, November 30, 2018, November 30, 2017, November 30, 2016, November 30, 2015 and November 30, 2014, respectively. |
(7) | Annualized for periods less than one year. |
The accompanying notes are an integral part of these financial statements.
72
Per Share Data for a Share Outstanding Throughout Each Period
| Year Ended November 30, | ||||||||||||||||||
| 2018 | 2017 | 2016 | 2015 | 2014(1) | ||||||||||||||
$ | 13.74 | $ | 11.82 | $ | 11.04 | $ | 10.63 | $ | 10.00 | |||||||||
(0.11 | ) | (0.08 | ) | 0.01 | (0.11 | ) | (0.10 | ) | ||||||||||
(0.55 | ) | 2.00 | 0.87 | 0.52 | 0.73 | |||||||||||||
(0.66 | ) | 1.92 | 0.88 | 0.41 | 0.63 | |||||||||||||
— | — | — | — | (0.00 | )(3) | |||||||||||||
(1.56 | ) | — | (0.10 | ) | — | 0.00 | ||||||||||||
(1.56 | ) | — | (0.10 | ) | — | — | ||||||||||||
$ | 11.52 | $ | 13.74 | $ | 11.82 | $ | 11.04 | $ | 10.63 | |||||||||
-5.48 | % | 16.24 | % | 8.11 | % | 3.76 | % | 6.34 | % | |||||||||
$ | 34,654 | $ | 68,888 | $ | 77,990 | $ | 85,536 | $ | 69,026 | |||||||||
2.64 | % | 2.35 | % | 2.57 | % | 2.63 | % | 2.69 | % | |||||||||
2.62 | % | 2.35 | % | 2.57 | % | 2.63 | % | 2.69 | % | |||||||||
(0.91 | )% | (0.63 | )% | 0.12 | % | (0.99 | )% | (1.02 | )% | |||||||||
(0.89 | )% | (0.63 | )% | 0.12 | % | (0.99 | )% | (1.02 | )% | |||||||||
252.88 | % | 262.18 | % | 316.15 | % | 319.97 | % | 281.92 | % | |||||||||
The accompanying notes are an integral part of these financial statements.
73
CONVERGENCE MARKET NEUTRAL FUND
| Financial Highlights – Institutional Class |
| Six Months Ended | ||||
| May 31, 2019 | ||||
| (Unaudited) | ||||
| Net Asset Value, Beginning of Period | $ | 11.29 | ||
| Income (loss) from investment operations: | ||||
Net investment income (loss)(2) | 0.06 | |||
| Net realized and unrealized gain (loss) on investments | (0.83 | ) | ||
Total from investment operations | (0.77 | ) | ||
| Less distributions paid: | ||||
| From net investment income | (0.00 | )(7) | ||
| From net realized gains | — | |||
Total distributions paid | — | |||
| Net Asset Value, End of Period | $ | 10.52 | ||
Total Return(3)(4) | -6.81 | % | ||
| Supplemental Data and Ratios: | ||||
Net assets at end of period (000’s) | $ | 61,810 | ||
Ratio of expenses to average net assets: | ||||
Before waiver, expense reimbursement and recoupment(5)(6) | 2.63 | % | ||
After waiver, expense reimbursement and recoupment(5)(6) | 2.81 | % | ||
Ratio of net investment income (loss) to average net assets: | ||||
Before waiver, expense reimbursement and recoupment(6) | 1.35 | % | ||
After waiver, expense reimbursement and recoupment(6) | 1.17 | % | ||
Portfolio turnover rate(4) | 131.93 | % | ||
(1) | The Fund commenced operations on January 29, 2016. |
(2) | Per share net investment income (loss) was calculated using average shares outstanding. |
(3) | Total return in the table represents the rate that the investor would have earned or lost on an investment in the Fund, assuming reinvestment of dividends. |
(4) | Not annualized for periods less than one year. |
(5) | The ratio of expenses to average net assets includes dividends on short positions, interest and broker expenses. The annualized before waiver, expense reimbursement and recoupment and after waiver, expense reimbursement and recoupment ratios excluding dividends on short positions, interest and broker expenses were 1.32% and 1.50%, 1.43% and 1.50%, 1.91% and 1.50%, 2.51% and 1.50% for the periods ended May 31, 2019, November 30, 2018, November 30, 2017 and November 30, 2016, respectively. |
(6) | Annualized for periods less than one year. |
(7) | Amount is less than 0.5 cent per share. |
The accompanying notes are an integral part of these financial statements.
74
Per Share Data for a Share Outstanding Throughout Each Period
| Period Ended | ||||||||||
| Year Ended November 30, | November 30, | |||||||||
| 2018 | 2017 | 2016(1) | ||||||||
$ | 10.74 | $ | 10.30 | $ | 10.00 | |||||
(0.00 | )(7) | (0.06 | ) | (0.07 | ) | |||||
0.55 | 0.50 | 0.37 | ||||||||
0.55 | 0.44 | 0.30 | ||||||||
— | — | — | ||||||||
— | — | — | ||||||||
— | — | — | ||||||||
$ | 11.29 | $ | 10.74 | $ | 10.30 | |||||
5.02 | % | 4.37 | % | 3.00 | % | |||||
$ | 81,118 | $ | 22,624 | $ | 16,872 | |||||
2.63 | % | 2.88 | % | 4.27 | % | |||||
2.70 | % | 2.47 | % | 3.26 | % | |||||
0.04 | % | (0.96 | )% | (1.92 | )% | |||||
(0.03 | ) | (0.55 | )% | (0.91 | )% | |||||
220.15 | % | 262.19 | % | 218.04 | % | |||||
The accompanying notes are an integral part of these financial statements.
75
CONVERGENCE FUNDS
Notes to Financial Statements
May 31, 2019 (Unaudited)
| (1) | Organization |
| Trust for Professional Managers (the “Trust”) was organized as a Delaware statutory trust under a Declaration of Trust dated May 29, 2001. The Trust is registered under the Investment Company Act of 1940, as amended (the “1940 Act”), as an open-end management investment company. The Convergence Long/Short Equity Fund (formerly known as the Convergence Core Plus Fund), Convergence Opportunities Fund and Convergence Market Neutral Fund (each, a “Fund” and together the “Funds”) represent distinct diversified series with their own investment objectives and policies within the Trust. The investment objective of the Convergence Long/Short Equity Fund and Convergence Opportunities Fund is long-term capital growth. The investment objective of the Convergence Market Neutral Fund is positive absolute returns. The Trust may issue an unlimited number of shares of beneficial interest at $0.001 par value. The assets of the Funds are segregated, and a shareholder’s interest is limited to the Fund in which shares are held. The Convergence Long/Short Equity Fund became effective on December 29, 2009 and commenced operations on December 29, 2009 and January 31, 2013 for the Institutional Class and Investment Class shares, respectively. Effective February 27, 2017 the Convergence Long/Short Equity Fund ceased offering its Investment Class shares and the remaining Investment Class shares converted to Institutional Class shares on March 27, 2017. Effective January 25, 2018 the Convergence Long/Short Equity Fund’s Investment Class shares were permanently closed. The Convergence Opportunities Fund became effective on November 29, 2013 and commenced operations on November 29, 2013 for the Institutional Class shares. The Convergence Market Neutral Fund became effective on January 29, 2016 and commenced operations on January 29, 2016 for the Institutional Class shares. Each class of shares has identical rights and privileges except with respect to the distribution fees, and voting rights on matters affecting a single class of shares. Costs incurred by the Funds in connection with the organization, registration and the initial public offering of shares were paid by Convergence Investment Partners, LLC (the “Adviser”), the Funds’ investment adviser. | |
| The Funds are investment companies and accordingly follow the investment company accounting and reporting guidance of the Financial Accounting Standards Board (“FASB”) Accounting Standard Codification Topic 946 “Financial Services–Investment Companies.” | |
| (2) | Significant Accounting Policies |
| The following is a summary of significant accounting policies consistently followed by the Funds in the preparation of the financial statements. These policies are in conformity with generally accepted accounting principles in the United States of America (“GAAP”). |
| (a) | Investment Valuation |
| Each security owned by the Funds, including long and short positions of common stock and real estate investment trusts, that is listed on a securities exchange, except those listed on the NASDAQ Stock Market LLC (“NASDAQ”), is valued at its last sale price on that exchange on the date as of which assets are valued. When the security is listed on more than one exchange, the Funds will use the price of the exchange that the Funds generally consider to be the principal exchange on which the stock is traded. |
76
CONVERGENCE FUNDS
Notes to Financial Statements (Continued)
May 31, 2019 (Unaudited)
| Fund securities listed on NASDAQ will be valued at the NASDAQ Official Closing Price, which may not necessarily represent the last sale price. If there has been no sale on such exchange or on NASDAQ on such day, the security shall be valued at, (i) the mean between the most recent quoted bid and asked prices at the close of the exchange on such day or (ii) the last sales price on the Composite Market for the day such security is being valued. “Composite Market” means a consolidation of the trade information provided by national securities and foreign exchanges and over-the-counter markets, as published by an approved independent pricing service (“Pricing Service”). | |
| Debt securities, including short-term debt instruments having a maturity of 60 days or less, are valued at the mean in accordance with prices supplied by a Pricing Service. Pricing Services may use various valuation methodologies such as the mean between the bid and the asked prices, matrix pricing and other analytical pricing models as well as market transactions and dealer quotations. If a price is not available from a Pricing Service, the most recent quotation obtained from one or more broker-dealers known to follow the issue will be obtained. Quotations will be valued at the mean between the bid and the offer. In the absence of available quotations, the securities will be priced at fair value, as described below. Any discount or premium is accreted or amortized using the constant yield method until maturity. | |
| Redeemable securities issued by open-end, registered investment companies are valued at the net asset value (“NAV”) of such companies for purchase and/or redemption orders placed on that day. If, on a particular day, a share of an investment company is not listed on NASDAQ, such security’s fair value will be determined as described below. Money market mutual funds are valued at cost. If cost does not represent current market value the securities will be priced at fair value. | |
| When market quotations are not readily available, any security or other asset is valued at its fair value as determined under procedures approved by the Trust’s Board of Trustees. These fair value procedures will also be used to price a security when corporate events, events in the securities market or world events cause the Adviser to believe that a security’s last sale price may not reflect its actual fair market value. The intended effect of using fair value pricing procedures is to ensure that the Funds are accurately priced. | |
| FASB Accounting Standards Codification, “Fair Value Measurements and Disclosures” Topic 820 (“ASC 820”), establishes an authoritative definition of fair value and sets out a hierarchy for measuring fair value. ASC 820 requires an entity to evaluate certain factors to determine whether there has been a significant decrease in volume and level of activity for the security such that recent transactions and quoted prices may not be determinative of fair value and further analysis and adjustment may be necessary to estimate fair value. ASC 820 also requires enhanced disclosures regarding the inputs and valuation techniques used to measure fair value in those instances as well as expanded disclosure of valuation levels for each class of investments. These inputs are summarized in the three broad levels listed below: |
| Level 1— | Quoted prices in active markets for identical securities. | |
| Level 2— | Other significant observable inputs (including quoted prices for similar securities, interest rates, prepayment speeds, credit risk, etc.). |
77
CONVERGENCE FUNDS
Notes to Financial Statements (Continued)
May 31, 2019 (Unaudited)
| Level 3— | Significant unobservable inputs (including a Fund’s own assumptions in determining the fair value of investments). |
| The inputs or methodology used for valuing securities are not necessarily an indication of the risk associated with investing in those securities. The following is a summary of the inputs used to value the Funds’ investments carried at fair value as of May 31, 2019: |
| Convergence Long/Short Equity Fund | |||||||||||||||||
| Level 1 | Level 2 | Level 3 | Total | ||||||||||||||
Assets(1): | |||||||||||||||||
| Common Stock | $ | 122,440,332 | $ | — | $ | — | $ | 122,440,332 | |||||||||
| Real Estate | |||||||||||||||||
| Investment Trusts | 4,266,154 | — | — | 4,266,154 | |||||||||||||
| Short-Term Investments | 322,251 | — | — | 322,251 | |||||||||||||
| Total Assets | $ | 127,028,737 | $ | — | $ | — | $ | 127,028,737 | |||||||||
| Liabilities: | |||||||||||||||||
| Securities Sold Short | |||||||||||||||||
| Common Stocks | $ | (40,488,766 | ) | $ | — | $ | — | $ | (40,488,766 | ) | |||||||
| Real Estate | |||||||||||||||||
| Investment Trusts | (3,263,407 | ) | — | — | (3,263,407 | ) | |||||||||||
| Total Securities Sold Short | $ | (43,752,173 | ) | $ | — | $ | — | $ | (43,752,173 | ) | |||||||
| Total Liabilities | $ | (43,752,173 | ) | $ | — | $ | — | $ | (43,752,173 | ) | |||||||
| Convergence Opportunities Fund | |||||||||||||||||
| Level 1 | Level 2 | Level 3 | Total | ||||||||||||||
Assets(1): | |||||||||||||||||
| Common Stock | $ | 20,882,098 | $ | — | $ | — | $ | 20,882,098 | |||||||||
| Real Estate | |||||||||||||||||
| Investment Trusts | 1,472,106 | — | — | 1,472,106 | |||||||||||||
| Short-Term Investments | 356,765 | — | — | 356,765 | |||||||||||||
| Total Equity | 22,710,969 | — | — | 22,710,969 | |||||||||||||
| Total Assets | $ | 22,710,969 | $ | — | $ | — | $ | 22,710,969 | |||||||||
| Liabilities: | |||||||||||||||||
| Securities Sold Short | |||||||||||||||||
| Common Stocks | $ | (6,378,911 | ) | $ | — | $ | — | $ | (6,378,911 | ) | |||||||
| Real Estate | |||||||||||||||||
| Investment Trusts | (736,003 | ) | — | — | (736,003 | ) | |||||||||||
| Total Securities Sold Short | $ | (7,114,914 | ) | $ | — | $ | — | $ | (7,114,914 | ) | |||||||
| Total Liabilities | $ | (7,114,914 | ) | $ | — | $ | — | $ | (7,114,914 | ) | |||||||
78
CONVERGENCE FUNDS
Notes to Financial Statements (Continued)
May 31, 2019 (Unaudited)
| Convergence Market Neutral Fund | |||||||||||||||||
| Level 1 | Level 2 | Level 3 | Total | ||||||||||||||
Assets(1): | |||||||||||||||||
| Common Stock | $ | 61,177,607 | $ | — | $ | — | $ | 61,177,607 | |||||||||
| Real Estate | |||||||||||||||||
| Investment Trusts | 4,671,298 | — | — | 4,671,298 | |||||||||||||
| Short-Term Investments | 1,202,714 | — | — | 1,202,714 | |||||||||||||
| Total Assets | $ | 67,051,619 | $ | — | $ | — | $ | 67,051,619 | |||||||||
| Liabilities: | |||||||||||||||||
| Securities Sold Short | |||||||||||||||||
| Common Stocks | $ | (45,513,954 | ) | $ | — | $ | — | $ | (45,513,954 | ) | |||||||
| Real Estate | |||||||||||||||||
| Investment Trusts | (5,592,647 | ) | — | — | (5,592,647 | ) | |||||||||||
| Total Securities Sold Short | $ | (51,106,601 | ) | $ | — | $ | — | $ | (51,106,601 | ) | |||||||
| Total Liabilities | $ | (51,106,601 | ) | $ | — | $ | — | $ | (51,106,601 | ) | |||||||
(1) See the Schedule of Investments for industry classifications. | |||||||||||||||||
| The Funds measure Level 3 activity as of the end of the period. For the period ended May 31, 2019, the Funds did not have any significant unobservable inputs (Level 3 securities) used in determining fair value. Therefore, a reconciliation of assets in which significant unobservable inputs (Level 3) were used in determining fair value is not applicable. | |
| The Funds did not invest in derivative securities or engage in hedging activities during the period ended May 31, 2019. |
| (b) | Short Positions |
| The Funds may sell a security they do not own in anticipation of a decline in the fair value of that security. When a fund sells a security short, it must borrow the security sold short and deliver it to the broker-dealer through which it made the short sale. A gain, limited to the price at which a fund sold the security short, or a loss, unlimited in size, will be recognized upon the termination of a short sale. For financial statement purposes, an amount equal to the settlement amount is included in the Statements of Assets and Liabilities as a liability. The amount of the liability is subsequently marked-to-market to reflect the current value of the short positions. Subsequent fluctuations in the market prices of the securities sold, but not yet purchased, may require purchasing the securities at prices which could differ from the amount reflected in the Statements of Assets and Liabilities. The Funds are liable for any dividends or interest payable on securities while those securities are in a short position. Such amounts are recorded on the ex-dividend date as a dividend expense, and interest expense is accrued daily. As collateral for its short positions, the Funds are required under the 1940 Act to maintain segregated assets consisting of cash, cash equivalents or liquid securities. The segregated assets are valued consistent with Note 2a above. The amount of segregated assets is required to be adjusted daily to the extent additional collateral is |
79
CONVERGENCE FUNDS
Notes to Financial Statements (Continued)
May 31, 2019 (Unaudited)
| required based on the change in fair value of the securities sold short. The Funds’ securities sold short and deposits for short sales are held with one major securities broker-dealer. The Funds do not require this broker-dealer to maintain collateral in support of the receivable for proceeds on securities sold short. |
| (c) | Security Loans |
| When the Funds loan securities held in their portfolios, the Funds receive compensation in the form of fees, or retain a portion of the interest on the investment of any cash received as collateral. The Funds also continue to receive dividends on the securities loaned. The loans are secured by collateral at least equal to: (i) 105% of the market value of the loaned securities that are foreign securities, or 102% of the market value of any other loaned securities, at the time the securities are loaned; and (ii) 100% of the market value of the loaned securities at all times. Gain or loss in the value of securities loaned that may occur during the term of the loan will be for the account of the Funds. The Funds have the right under the lending agreement to recover the securities from the borrower on demand. |
| (d) | Federal Income Taxes |
| The Funds comply with the requirements of Subchapter M of the Internal Revenue Code, as amended, necessary to qualify as a regulated investment company and make the requisite distributions of income and capital gains to their shareholders sufficient to relieve them from all or substantially all federal income taxes. Therefore, no federal income tax provision has been provided. | |
| As of and during the year ended November 30, 2018, the Funds did not have a liability for any unrecognized tax benefits. The Funds recognize interest and penalties, if any, related to unrecognized tax benefits as income tax expense in the Statements of Operations. During the year ended November 30, 2018, the Funds did not incur any interest or penalties. |
| (e) | Distributions to Shareholders |
| The Funds will distribute any net investment income and any net capital gains at least annually. Distributions from net realized gains for book purposes may include short-term capital gains. All short-term capital gains are included in ordinary income for tax purposes. Distributions to shareholders are recorded on the ex-dividend date. The Funds may also pay a special distribution at the end of the calendar year to comply with federal tax requirements. |
| (f) | Use of Estimates |
| The preparation of financial statements in conformity with GAAP requires management to make estimates and assumptions that affect the reported amounts of assets and liabilities and disclosure of contingent assets and liabilities at the date of the financial statements and the reported amounts of revenues and expenses during the reporting period. Actual results could differ from those estimates. |
80
CONVERGENCE FUNDS
Notes to Financial Statements (Continued)
May 31, 2019 (Unaudited)
| (g) | Share Valuation |
| The NAV per share of each Fund is calculated by dividing the sum of the fair value of the securities held by the Fund, plus cash or other assets, minus all liabilities (including estimated accrued expenses) by the total number of shares outstanding for the Fund, rounded to the nearest cent. The Funds’ shares will not be priced on the days on which the New York Stock Exchange is closed for trading. The Funds do not charge a redemption fee, and therefore the offering and redemption price per share are equal to a Fund’s NAV per share. |
| (h) | Allocation of Income, Expenses and Gains/Losses |
| Expenses associated with a specific fund in the Trust are charged to that Fund. Common Trust expenses are typically allocated evenly between the funds of the Trust, or by other equitable means. |
| (i) | Other |
| Investment transactions are recorded on the trade date. The Funds determine the gain or loss from investment transactions on the identified cost basis by comparing original cost of the security lot sold with the net sale proceeds. Dividend income and expense is recognized on the ex-dividend date and interest income and expense is recognized on an accrual basis. Dividend income from real estate investment trusts (“REITs”) is recognized on the ex-date and included in dividend income. The calendar year-end classification of distributions received from REITs during the fiscal year are reported subsequent to year end; accordingly, the Funds estimate the character of REIT distributions based on the most recent information available and adjust for actual classifications in the calendar year the information is reported. |
| (3) | Federal Tax Matters |
| The tax character of distributions paid during the fiscal years ended November 30, 2018 and November 30, 2017 was as follows: |
| Convergence Long/Short Equity Fund | |||||||||
| November 30, 2018 | November 30, 2017 | ||||||||
| Ordinary Income | $ | 8,734,021 | $ | 5,240,678 | |||||
| Long-Term Capital Gain | $ | 7,618,781 | $ | 334,878 | |||||
| Convergence Opportunities Fund | |||||||||
| November 30, 2018 | November 30, 2017 | ||||||||
| Ordinary Income | $ | 6,131,381 | $ | — | |||||
| Long-Term Capital Gain | $ | 1,684,274 | $ | — | |||||
| The Convergence Long/Short Equity Fund and Convergence Opportunities Fund designated as short-term and long-term capital gain dividend, pursuant to Internal Revenue Code Section 852(b)(3), the amount necessary to reduce the earnings and profits of the Fund related to net capital gain to zero for the tax year ended November 30, 2018. The Convergence Long/Short Equity Fund and Convergence Opportunities Fund utilized earnings and profits distributed to shareholders on |
81
CONVERGENCE FUNDS
Notes to Financial Statements (Continued)
May 31, 2019 (Unaudited)
| redemption of shares as part of the dividend paid deduction. The amounts designated as gain for the fiscal years ended November 30, 2018 and 2017 were as follows: |
| Convergence Long/Short Equity Fund | |||
November 30, 2018 | November 30, 2017 | ||
| Long-term | $1,433,047 | $4,521,695 | |
| Convergence Opportunities Fund | |||
November 30, 2018 | November 30, 2017 | ||
| Long-term | $1,967,067 | $2,808,716 |
| As of November 30, 2018, the components of accumulated earnings on a tax basis were as follows: |
| Convergence | Convergence | Convergence | |||||||||||
| Long/Short | Opportunities | Market | |||||||||||
| Equity Fund | Fund | Neutral Fund | |||||||||||
| Cost basis of investments for | |||||||||||||
federal income tax purposes(1) | $ | 130,236,189 | $ | 43,887,217 | $ | 86,389,263 | |||||||
| Gross tax unrealized appreciation | $ | 37,523,719 | $ | 10,964,312 | $ | 13,246,759 | |||||||
| Gross tax unrealized depreciation | (1,718,111 | ) | (838,328 | ) | (4,623,791 | ) | |||||||
| Net tax unrealized appreciation | 35,805,608 | 10,125,984 | 8,622,968 | ||||||||||
| Undistributed ordinary income | 82,703 | — | — | ||||||||||
| Undistributed long-term capital gain | 4,323,976 | 249,106 | — | ||||||||||
| Total distributable earnings | 4,406,679 | 249,106 | — | ||||||||||
| Other accumulated losses | (24,946 | ) | (377,677 | ) | (5,432,088 | ) | |||||||
| Total accumulated gains | $ | 40,187,341 | $ | 9,997,413 | $ | 3,190,880 | |||||||
(1) Excludes securities sold short. | |||||||||||||
| The tax basis of distributable earnings for tax and financial reporting purposes differs principally due to the deferral of losses on wash sales, transfers in-kind, and unsettled short losses for the Funds. | |
| At November 30, 2018, the Convergence Market Neutral Fund had the following capital losses remaining, which will be carried forward indefinitely to offset future realized capital gains. To the extent the Convergence Market Neutral Fund realizes future net capital gains, taxable distributions to its shareholders will be first offset by any unused capital loss carryovers from the year ended November 30, 2018. |
| Short-Term | |||||
| Convergence Market Neutral Fund | $ | 4,225,804 | |||
| At November 30, 2018 the following Funds deferred, on a tax basis, late year losses of: |
| Convergence Opportunities Fund | $ | 308,772 | |||
| Convergence Market Neutral Fund | $ | 73,190 |
82
CONVERGENCE FUNDS
Notes to Financial Statements (Continued)
May 31, 2019 (Unaudited)
| Income and capital gains distributions may differ from GAAP, primarily due to timing differences in the recognition of income, gains and losses and equalization by the Funds. To the extent that these differences are attributable to permanent book and tax accounting differences, the components of net assets have been adjusted. | |
| Additionally, GAAP requires that certain components of net assets relating to permanent differences be reclassified between financial and tax reporting. These reclassifications have no effect on net assets or NAV per share. For the year ended November 30, 2018, the following table shows the reclassifications made: |
| Convergence | Convergence | Convergence | |||||||||||
| Long/Short | Opportunities | Market | |||||||||||
| Equity Fund | Fund | Neutral Fund | |||||||||||
| Paid-in capital | $ | 1,442,237 | $ | 1,963,211 | $ | 89,706 | |||||||
| Total distributable earnings | $ | (1,442,237 | ) | $ | (1,963,211 | ) | $ | (89,706 | ) | ||||
| (4) | Investment Adviser |
| The Trust has an Investment Advisory Agreement (the “Agreement”) with the Adviser to furnish investment advisory services to the Funds. Under the terms of the Agreement, each Fund compensates the Adviser for its management services at the annual rate of 1.00% of the Fund’s average daily net assets. | |
| The Adviser has contractually agreed to waive its management fee and/or reimburse each Fund’s other expenses at least through the expiration dates listed below, at the discretion of the Adviser and the Board of Trustees, to the extent necessary to ensure that the Fund’s operating expenses (exclusive of front-end or contingent deferred loads, Rule 12b-1 plan fees, shareholder servicing plan fees, taxes, leverage (i.e., any expenses incurred in connection with borrowings made by the Fund), interest (including interest incurred in connection with bank and custody overdrafts), brokerage commissions and other transactional expenses, expenses incurred in connection with any merger or reorganization, dividends or interest on short positions, acquired fund fees and expenses or extraordinary expenses such as litigation) do not exceed the expense limitation caps listed below of each Fund’s average daily net assets. |
Expiration Date | Expense Limitation Cap | ||
| Convergence Long/Short Equity Fund | |||
| Institutional Class | November 1, 2020 | 1.50% | |
| Convergence Opportunities Fund | |||
| Institutional Class | November 1, 2020 | 1.50% | |
| Convergence Market Neutral Fund | |||
| Institutional Class | November 1, 2020 | 1.50% |
| Any such waiver or reimbursement is subject to later adjustment to allow the Adviser to recoup amounts waived or reimbursed to the extent actual fees and expenses for a fiscal period do not exceed the lesser of: (1) the Expense Limitation Cap in place at the time of the waiver or reimbursement; or (2) the Expense Limitation Cap in place at the time of the recoupment; provided, however, that the Adviser shall only be entitled to recoup such amounts over the following three year period from the date of the waiver or |
83
CONVERGENCE FUNDS
Notes to Financial Statements (Continued)
May 31, 2019 (Unaudited)
| reimbursement. During the period ended May 31, 2019, expenses of $67,218 previously waived by the Adviser were recouped by the Adviser for the Market Neutral Fund. As of the date of this report, there were no prior waivers or reimbursements subject to recoupment from the Convergence Long/Short Equity Fund. | |
| The following table shows the remaining waived or reimbursed expenses subject to potential recovery expiring during the fiscal period ending: |
| Convergence | Convergence | |||||||||
| Opportunities Fund | Market Neutral Fund | |||||||||
| November 30, 2019 | $ | — | $ | 8,095 | ||||||
| November 30, 2020 | — | 85,383 | ||||||||
| November 30, 2021 | 9,161 | — | ||||||||
| May 31, 2022 | 20,865 | — | ||||||||
| (5) | Related Party Transactions |
| U.S. Bancorp Fund Services, LLC, doing business as U.S. Bank Global Fund Services (“Fund Services” or the “Administrator”), acts as the Funds’ administrator under an Administration Agreement. The Administrator prepares various federal and state regulatory filings, reports and returns for the Funds; prepares reports and materials to be supplied to the Trustees; monitors the activities of the Funds’ custodian, transfer agent and accountants; coordinates the preparation and payment of the Funds’ expenses and reviews the Funds’ expense accruals. Fees incurred for the period ended May 31, 2019, and owed as of May 31, 2019 are as follows: |
| Incurred | Owed | ||||||||
Convergence Long/Short Equity Fund | $ | 61,297 | $ | 19,166 | |||||
Convergence Opportunities Fund | $ | 16,875 | $ | 9,826 | |||||
Convergence Market Neutral Fund | $ | 46,401 | $ | 14,425 | |||||
| Fund Services also serves as the fund accountant and transfer agent to the Funds. U.S. Bank National Association (“US Bank”), an affiliate of Fund Services, serves as each Fund’s custodian. Fees incurred for the period ended May 31, 2019, and owed as of May 31, 2019 are as follows: |
Fund Accounting | Incurred | Owed | |||||||
Convergence Long/Short Equity Fund | $ | 4,999 | $ | 1,731 | |||||
Convergence Opportunities Fund | $ | 4,817 | $ | 1,703 | |||||
Convergence Market Neutral Fund | $ | 5,005 | $ | 1,666 | |||||
Transfer Agency | Incurred | Owed | |||||||
Convergence Long/Short Equity Fund | $ | 22,662 | $ | 7,160 | |||||
Convergence Opportunities Fund | $ | 10,875 | $ | 4,347 | |||||
Convergence Market Neutral Fund | $ | 14,990 | $ | 3,588 | |||||
Custody | Incurred | Owed | |||||||
Convergence Long/Short Equity Fund | $ | 9,755 | $ | 3,383 | |||||
Convergence Opportunities Fund | $ | 6,470 | $ | 1,886 | |||||
Convergence Market Neutral Fund | $ | 8,702 | $ | 2,245 | |||||
The Funds each have a line of credit with US Bank (see Note 9). |
84
CONVERGENCE FUNDS
Notes to Financial Statements (Continued)
May 31, 2019 (Unaudited)
| The Funds have entered into a securities lending agreement with US Bank (see Note 10). | |
| The Distributor acts as the Funds’ principal underwriter in a continuous public offering of the Funds’ shares. The Distributor is an affiliate of Fund Services and US Bank. | |
| Certain officers of the Funds are also employees of Fund Services. A Trustee of the Trust is affiliated with Fund Services and US Bank. This same Trustee is a board member and an interested person of the Distributor. | |
| The Trust’s Chief Compliance Officer is also an employee of Fund Services. Each Funds’ allocation of the Trust’s Chief Compliance Officer fee incurred for the period ended May 31, 2019, and owed as of May 31, 2019, are as follows: |
| Incurred | Owed | ||||||||
Convergence Long/Short Equity Fund | $ | 5,909 | $ | 2,049 | |||||
Convergence Opportunities Fund | $ | 5,909 | $ | 2,054 | |||||
Convergence Market Neutral Fund | $ | 5,909 | $ | 2,054 | |||||
| (6) | Capital Share Transactions |
| Transactions in shares of the Funds were as follows: |
| Convergence Long/Short Equity Fund – Institutional Class | |||||||||
| Six Months Ended | Year Ended | ||||||||
| May 31, 2019 | November 30, 2018 | ||||||||
| Shares sold | 307,209 | 425,449 | |||||||
| Shares reinvested | 195,029 | 652,095 | |||||||
| Shares redeemed | (881,512 | ) | (1,499,644 | ) | |||||
| Net decrease | (379,274 | ) | (422,100 | ) | |||||
| Convergence Opportunities Fund – Institutional Class | |||||||||
| Six Months Ended | Year Ended | ||||||||
| May 31, 2019 | November 30, 2018 | ||||||||
| Shares sold | 37,540 | 106,952 | |||||||
| Shares reinvested | 19,924 | 554,269 | |||||||
| Shares redeemed | (1,527,767 | ) | (2,664,958 | ) | |||||
| Net decrease | (1,470,303 | ) | (2,003,737 | ) | |||||
| Convergence Market Neutral Fund – Institutional Class | |||||||||
| Six Months Ended | Year Ended | ||||||||
| May 31, 2019 | November 30, 2018 | ||||||||
| Shares sold | 1,888,864 | 5,553,532 | |||||||
| Shares reinvested | 936 | — | |||||||
| Shares redeemed | (3,197,524 | ) | (473,346 | ) | |||||
| Net increase (decrease) | (1,307,724 | ) | 5,080,186 | ||||||
85
CONVERGENCE FUNDS
Notes to Financial Statements (Continued)
May 31, 2019 (Unaudited)
| (7) | Investment Transactions |
| The aggregate purchases and sales of securities, excluding short-term investments and securities sold short, for the Funds for the period ended May 31, 2019 are summarized below. There were no purchases or sales of U.S. government securities for the Funds. |
| Convergence | Convergence | Convergence | |||||||||||
| Long/Short Equity Fund | Opportunities Fund | Market Neutral Fund | |||||||||||
Purchases | $ | 161,765,254 | $ | 48,501,568 | $ | 109,937,081 | |||||||
Sales | $ | 183,441,309 | $ | 71,936,013 | $ | 130,662,143 | |||||||
| (8) | Beneficial Ownership |
| The beneficial ownership, either directly or indirectly, of more than 25% of the voting securities of a fund creates a presumption of control of the fund, under Section 2(a)(9) of the 1940 Act. At May 31, 2019, National Financial Services, LLC, for the benefit of others, held the following percentage of each Fund’s outstanding shares: |
| Convergence | Convergence | Convergence | |
Long/Short Equity Fund | Opportunities Fund | Market Neutral Fund | |
| 54.68% | 86.38% | 65.80% |
| (9) | Line of Credit |
| The Convergence Long/Short Equity Fund, Convergence Opportunities Fund, and Convergence Market Neutral Fund each have a line of credit in the amount of the lessor of $13,000,000, $5,000,000 and $5,000,000, respectively, or 33.33% of the fair value of unencumbered assets of the Convergence Long/Short Equity Fund, Convergence Opportunities Fund, and Convergence Market Neutral Fund, which all mature on August 9, 2019. These unsecured lines of credit are intended to provide short-term financing, if necessary and subject to certain restrictions, in connection with shareholder redemptions. The credit facility is with the Funds’ custodian, US Bank. Interest was accrued at the prime rate of 5.25% from December 1, 2018 through December 19, 2018 and 5.50% thereafter. There were no outstanding balances on the lines of credit for the Funds as of May 31, 2019. The following table provides information regarding usage of the lines of credit for the period ended May 31, 2019. |
| Average | Maximum | Date of | ||||||||||||||||
| Days | Amount of | Interest | Amount of | Maximum | ||||||||||||||
| Utilized | Borrowing | Expense* | Borrowing | Borrowing | ||||||||||||||
Convergence | ||||||||||||||||||
Long/Short Equity Fund | 10 | $ | 601,100 | $ | 918 | $ | 2,190,000 | 12/24/2018 | ||||||||||
Convergence | ||||||||||||||||||
Opportunities Fund | 21 | $ | 61,571 | $ | 196 | $ | 270,000 | 12/26/2018 | ||||||||||
Convergence | ||||||||||||||||||
Market Neutral Fund | 19 | $ | 268,316 | $ | 779 | $ | 512,000 | 2/28/2019 | ||||||||||
* Interest expense is included within other expenses on the Statements of Operations. |
86
CONVERGENCE FUNDS
Notes to Financial Statements (Continued)
May 31, 2019 (Unaudited)
| (10) | Securities Lending |
| Following terms of a securities lending agreement with the Funds’ custodian, US Bank, a Fund may lend securities from its portfolio to brokers, dealers and financial institutions in order to increase the return on its portfolio, primarily through the receipt of borrowing fees and earnings on invested collateral. Any such loan must be continuously secured by collateral in cash or cash equivalents maintained on a current basis in an amount at least equal to the market value of the securities loaned by a Fund. During the time securities are on loan, the borrower will pay the applicable Fund any accrued income on those securities, and the Fund may invest the cash collateral and earn income or receive an agreed-upon fee from a borrower that has delivered cash-equivalent collateral. In determining whether or not to lend a security to a particular broker, dealer or financial institution, the Adviser considers all relevant facts and circumstances, including the size, creditworthiness and reputation of the broker, dealer or financial institution. | |
| Securities lending involves the risk of a default or insolvency of the borrower. In either of these cases, a Fund could experience delays in recovering securities or collateral or could lose all or part of the value of the loaned securities. A Fund also could lose money in the event of a decline in the value of the collateral provided for loaned securities. Additionally, the loaned portfolio securities may not be available to a Fund on a timely basis and that Fund may therefore lose the opportunity to sell the securities at a desirable price. Any decline in the value of a security that occurs while the security is out on loan would continue to be borne by the applicable Fund. | |
| As of May 31, 2019, the Funds did not have any securities out on loan. | |
| The Funds receive cash as collateral in return for securities lent as part of the securities lending program. The collateral is invested in the First American Government Obligations Fund – Class Y (a money market fund subject to Rule 2a-7 under the 1940 Act). The remaining contractual maturity of all securities lending transactions is overnight and continuous. | |
| The Funds are not subject to a master netting agreement with respect to securities lending; therefore no additional disclosures are required. | |
| The fee and interest income earned by the Funds on investments of cash collateral received from borrowers for the securities loaned to them are reflected in the Funds’ Statements of Operations. | |
| (11) | Recent Accounting Pronouncements |
In August 2018, FASB issued ASU 2018-13, Fair Value Measurement (Topic 820): Disclosure Framework—Changes to the Disclosure Requirements for Fair Value Measurement (“ASU 2018-13”). The primary focus of ASU 2018-13 is to improve the effectiveness of the disclosure requirements for fair value measurements. The changes affect all companies that are required to include fair value measurement disclosures. In general, the amendments in ASU 2018-13 are effective for all entities for fiscal years and interim periods within those fiscal years, beginning after |
87
CONVERGENCE FUNDS
Notes to Financial Statements (Continued)
May 31, 2019 (Unaudited)
| December 15, 2019. An entity is permitted to early adopt the removed or modified disclosures upon the issuance of ASU 2018-13 and may delay adoption of the additional disclosures, which are required for public companies only, until their effective date. Management has chosen to early adopt the eliminated or modified disclosures for the period ended May 31, 2019. | |
| (12) | Subsequent Event |
| On February 22, 2019, the Board of Trustees of the Trust, based upon the recommendation of the Adviser, approved a change to the name of the Convergence Core Plus Fund to the Convergence Long/Short Equity Fund, which became effective on June 18, 2019. Also effective June 18, 2019, and in connection with the name change, the Fund incorporated into its principal investment strategies a policy of investing at least 80% of its net assets (plus any borrowings for investment purposes) in long and short positions in equity securities of domestic companies. The addition of this investment policy did not affect the management of the Fund’s portfolio, and there were no changes to the Fund’s investment objective. |
88
CONVERGENCE FUNDS
Notice of Privacy Policy & Practices
(Unaudited)
We collect non-public personal information about you from the following sources:
| • | information we receive about you on applications or other forms; |
| • | information you give us orally; and |
| • | information about your transactions with us or others. |
We do not disclose any non-public personal information about our shareholders or former shareholders without the shareholder’s authorization, except as permitted by law or in response to inquiries from governmental authorities. We may share information with affiliated parties and unaffiliated third parties with whom we have contracts for servicing the Funds. We will provide unaffiliated third parties with only the information necessary to carry out their assigned responsibility. All shareholder records will be disposed of in accordance with applicable law. We maintain physical, electronic and procedural safeguards to protect your non-public personal information and require third parties to treat your non-public personal information with the same high degree of confidentiality.
In the event that you hold shares of the Funds through a financial intermediary, including, but not limited to, a broker-dealer, bank or trust company, the privacy policy of your financial intermediary would govern how your non-public personal information would be shared with unaffiliated third parties.
89
CONVERGENCE FUNDS
Additional Information
(Unaudited)
Tax Information
For the year ended November 30, 2018, the Convergence Long/Short Equity Fund, the Convergence Opportunities Fund and the Convergence Market Neutral Fund designated 27.17%, 11.17% and 0.00%, respectively, of its ordinary income distribution as qualified dividend income under the Jobs and Growth Tax Relief Reconciliation Act of 2003.
For the year ended November 30, 2018, 27.18%, 11.49% and 0.00% of dividends paid from net ordinary income for the Convergence Long/Short Equity Fund, the Convergence Opportunities Fund and the Convergence Market Neutral Fund, respectively, qualified for the dividends received deduction available to corporate shareholders.
For the fiscal year ended November 30, 2018, taxable ordinary income distributions are designated as short-term capital gain distributions under Internal Revenue Code Section 871(k)(2)(c) for the Funds as follows:
| Convergence Long/Short Equity Fund | 97.78 | % | |||
| Convergence Opportunities Fund | 100.00 | % | |||
| Convergence Market Neutral Fund | 0.00 | % |
Indemnifications
Under the Trust’s organizational documents, its officers and Trustees are indemnified against certain liabilities arising out of the performance of their duties to the Funds. In addition, in the normal course of business, the Funds enter into contracts that provide general indemnifications to other parties. The Funds’ maximum exposure under these arrangements is unknown as this would involve future claims that may be made against the Funds that have not yet occurred. However, the Funds have not had prior claims or losses pursuant to these contracts and expect the risk of loss to be remote.
90
CONVERGENCE FUNDS
Additional Information (Continued)
(Unaudited)
Information about Trustees
The business and affairs of the Trust are managed under the direction of the Board of Trustees. Information pertaining to the Trustees of the Trust is set forth below. The Statement of Additional Information includes additional information about the Trustees and is available, without charge, upon request by calling 877-677-9414.
| Other | |||||
| Directorships | |||||
| Term of | Number of | Principal | Held by | ||
| Office and | Portfolios | Occupation(s) | Trustee | ||
| Position(s) | Length | in Trust | During the | During the | |
| Name, Address | Held with | of Time | Overseen | Past Five | Past Five |
and Year of Birth | the Trust | Served | by Trustee | Years | Years |
| Independent Trustees | |||||
Michael D. Akers, Ph.D. | Trustee | Indefinite | 28 | Professor Emeritus, | Independent |
615 E. Michigan St. | Term; Since | Department | Trustee, USA | ||
Milwaukee, WI 53202 | August 22, | of Accounting, | MUTUALS | ||
Year of Birth: 1955 | 2001 | (June 2019– | (an open-end | ||
present), Professor, | investment | ||||
Department | company with | ||||
of Accounting, | two | ||||
(2004–May 2019), | portfolios). | ||||
Chair, Department | |||||
of Accounting | |||||
(2004–2017), | |||||
Marquette University. | |||||
Gary A. Drska | Trustee | Indefinite | 28 | Pilot, | Independent |
615 E. Michigan St. | Term; Since | Frontier/Midwest | Trustee, USA | ||
Milwaukee, WI 53202 | August 22, | Airlines, Inc. | MUTUALS | ||
Year of Birth: 1956 | 2001 | (airline company) | (an open-end | ||
(1986–present). | investment | ||||
company with | |||||
two | |||||
portfolios). | |||||
91
CONVERGENCE FUNDS
Additional Information (Continued)
(Unaudited)
| Other | |||||
| Directorships | |||||
| Term of | Number of | Principal | Held by | ||
| Office and | Portfolios | Occupation(s) | Trustee | ||
| Position(s) | Length | in Trust | During the | During the | |
| Name, Address | Held with | of Time | Overseen | Past Five | Past Five |
and Year of Birth | the Trust | Served | by Trustee | Years | Years |
Jonas B. Siegel | Trustee | Indefinite | 28 | Retired | Independent |
615 E. Michigan St. | Term; Since | (2011–present); | Trustee, | ||
Milwaukee, WI 53202 | October 23, | Managing Director, | Gottex Trust | ||
Year of Birth: 1943 | 2009 | Chief Administrative | (an open-end | ||
Officer (“CAO”) and | investment | ||||
Chief Compliance | company) | ||||
Officer (“CCO”), | (2010–2016); | ||||
Granite Capital | Independent | ||||
International Group, | Manager, | ||||
L.P. (an investment | Ramius IDF | ||||
management firm) | fund complex | ||||
(1994–2011). | (two closed- | ||||
end investment | |||||
companies) | |||||
(2010–2015); | |||||
Independent | |||||
Trustee, Gottex | |||||
Multi-Asset | |||||
Endowment | |||||
fund complex | |||||
(three closed- | |||||
end investment | |||||
companies) | |||||
(2010–2015); | |||||
Independent | |||||
Trustee, | |||||
Gottex Multi- | |||||
Alternatives | |||||
fund complex | |||||
(three closed- | |||||
end investment | |||||
companies) | |||||
(2010–2015). |
92
CONVERGENCE FUNDS
Additional Information (Continued)
(Unaudited)
| Other | |||||
| Directorships | |||||
| Term of | Number of | Principal | Held by | ||
| Office and | Portfolios | Occupation(s) | Trustee | ||
| Position(s) | Length | in Trust | During the | During the | |
| Name, Address | Held with | of Time | Overseen | Past Five | Past Five |
and Year of Birth | the Trust | Served | by Trustee | Years | Years |
| Interested Trustee and Officers | |||||
Joseph C. Neuberger* | Chairperson | Indefinite | 28 | President | Trustee, Buffalo |
615 E. Michigan St. | and | Term; Since | (2017–present), | Funds (an | |
Milwaukee, WI 53202 | Trustee | August 22, | Chief Operating | open-end | |
Year of Birth: 1962 | 2001 | Officer (2016– | investment | ||
present), Executive | company) | ||||
Vice President | (2003–2017); | ||||
(1994–2017), U.S. | Trustee, USA | ||||
Bancorp Fund | MUTUALS | ||||
Services, LLC. | (an open-end | ||||
investment | |||||
company) | |||||
(2001–2018). | |||||
John P. Buckel | President | Indefinite | N/A | Vice President, | N/A |
615 E. Michigan St. | and | Term; Since | U.S. Bancorp Fund | ||
Milwaukee, WI 53202 | Principal | January 24, | Services, LLC | ||
Year of Birth: 1957 | Executive | 2013 | (2004–present). | ||
Officer | |||||
Jennifer A. Lima | Vice | Indefinite | N/A | Vice President, | N/A |
615 E. Michigan St. | President, | Term; Since | U.S. Bancorp Fund | ||
Milwaukee, WI 53202 | Treasurer | January 24, | Services, LLC | ||
Year of Birth: 1974 | and | 2013 | (2002–present). | ||
Principal | |||||
Financial | |||||
and | |||||
Accounting | |||||
Officer |
93
CONVERGENCE FUNDS
Additional Information (Continued)
(Unaudited)
| Other | |||||
| Directorships | |||||
| Term of | Number of | Principal | Held by | ||
| Office and | Portfolios | Occupation(s) | Trustee | ||
| Position(s) | Length | in Trust | During the | During the | |
| Name, Address | Held with | of Time | Overseen | Past Five | Past Five |
and Year of Birth | the Trust | Served | by Trustee | Years | Years |
Elizabeth B. Scalf | Chief | Indefinite | N/A | Senior Vice | N/A |
615 E. Michigan St. | Compliance | Term; Since | President, | ||
Milwaukee, WI 53202 | Officer, | July 1, | U.S. Bancorp Fund | ||
Year of Birth: 1985 | Vice | 2017 | Services, | ||
President | LLC (February | ||||
and | 2017–present); | ||||
Anti-Money | Vice President and | ||||
Laundering | Assistant CCO, | ||||
Officer | Heartland Advisors, | ||||
Inc. (December 2016– | |||||
January 2017); | |||||
Vice President and | |||||
CCO, Heartland | |||||
Group, Inc. (May | |||||
2016–November | |||||
2016); Vice | |||||
President, CCO and | |||||
Senior Legal Counsel | |||||
(May 2016–November | |||||
2016), Assistant CCO | |||||
and Senior Legal | |||||
Counsel (January | |||||
2016–April 2016), | |||||
Senior Legal and | |||||
Compliance Counsel | |||||
(2013–2015), | |||||
Heartland Advisors, Inc. | |||||
Adam W. Smith | Secretary | Indefinite | N/A | Vice President, | N/A |
615 E. Michigan St. | Term; Since | U.S. Bancorp | |||
Milwaukee, WI 53202 | May 29, 2015 | Fund Services, | |||
Year of Birth: 1981 | LLC (2012–present). | ||||
Kelly A. Burns | Assistant | Indefinite | N/A | Assistant Vice | N/A |
615 E. Michigan St. | Treasurer | Term; Since | President, U.S. | ||
Milwaukee, WI 53202 | April 23, | Bancorp Fund | |||
Year of Birth: 1987 | 2015 | Services, LLC | |||
(2011–present). |
94
CONVERGENCE FUNDS
Additional Information (Continued)
(Unaudited)
| Other | |||||
| Directorships | |||||
| Term of | Number of | Principal | Held by | ||
| Office and | Portfolios | Occupation(s) | Trustee | ||
| Position(s) | Length | in Trust | During the | During the | |
| Name, Address | Held with | of Time | Overseen | Past Five | Past Five |
and Year of Birth | the Trust | Served | by Trustee | Years | Years |
Melissa Aguinaga | Assistant | Indefinite | N/A | Assistant Vice | N/A |
615 E. Michigan St. | Treasurer | Term; Since | President, U.S. | ||
Milwaukee, WI 53202 | July 1, | Bancorp Fund | |||
Year of Birth: 1987 | 2015 | Services, LLC | |||
(2010–present). | |||||
Laura A. Carroll | Assistant | Indefinite | N/A | Assistant Vice | N/A |
615 E. Michigan St. | Treasurer | Term; Since | President, U.S. | ||
Milwaukee, WI 53202 | August 20, | Bancorp Fund | |||
Year of Birth: 1985 | 2018 | Services, LLC | |||
(2007–present). |
| * | Mr. Neuberger is an “interested person” of the Trust as defined by the 1940 Act by virtue of the fact that he is a board member and an interested person of Quasar Distributors, LLC (the “Distributor”), the Funds’ principal underwriter. |
95
A NOTE ON FORWARD LOOKING STATEMENTS (Unaudited)
Except for historical information contained in this report for the Funds, the matters discussed in this report may constitute forward-looking statements made pursuant to the safe-harbor provisions of the Private Securities Litigation Reform Act of 1995. These include any adviser or portfolio manager predictions, assessments, analyses or outlooks for individual securities, industries, market sectors and/or markets. These statements involve risks and uncertainties. In addition to the general risks described for the Funds in the current Prospectus, other factors bearing on this report include the accuracy of the Adviser’s or portfolio managers’ forecasts and predictions, and the appropriateness of the investment programs designed by the Adviser or portfolio managers to implement their strategies efficiently and effectively. Any one or more of these factors, as well as other risks affecting the securities markets and investment instruments generally, could cause the actual results of the Funds to differ materially as compared to benchmarks associated with the Funds.
ADDITIONAL INFORMATION (Unaudited)
The Funds have adopted proxy voting policies and procedures that delegate to the Adviser the authority to vote proxies. A description of the Funds’ proxy voting policies and procedures is available without charge, upon request, by calling the Funds toll free at 1-877-677-9414. A description of these policies and procedures is also included in the Funds’ Statement of Additional Information, which is available on the SEC’s website at http://www.sec.gov.
The Funds’ proxy voting record for the most recent 12-month period ended June 30 is available without charge, upon request, by calling, toll free, 1-877-677-9414, or by accessing the SEC’s website at http://www.sec.gov.
The Funds file their complete schedules of portfolio holdings with the SEC for the first and third quarters of each fiscal year on Form N-Q. Shareholders may view the Funds’ Forms N-Q on the SEC’s website at www.sec.gov.
HOUSEHOLDING (Unaudited)
In an effort to decrease costs, the Funds intend to reduce the number of duplicate prospectuses and annual and semi-annual reports you receive by sending only one copy of each to those addresses shared by two or more accounts and to shareholders the Funds reasonably believe are from the same family or household. Once implemented, if you would like to discontinue householding for your accounts, please call the Funds toll-free at 1-877-677-9414 to request individual copies of these documents. Once the Funds receive notice to stop householding, the Funds will begin sending individual copies 30 days after receiving your request. This policy does not apply to account statements.
(This Page Intentionally Left Blank.)
CONVERGENCE FUNDS
| Investment Adviser | Convergence Investment Partners, LLC |
| 3801 PGA Boulevard | |
| Suite 1001 | |
| Palm Beach Gardens, Florida 33410 | |
| Legal Counsel | Godfrey & Kahn, S.C. |
| 833 East Michigan Street | |
| Suite 1800 | |
| Milwaukee, Wisconsin 53202 | |
| Independent Registered Public | Cohen & Company, Ltd. |
| Accounting Firm | 1350 Euclid Avenue |
| Suite 800 | |
| Cleveland, Ohio 44115 | |
| Transfer Agent, Fund Accountant and | U.S. Bancorp Fund Services, LLC |
| Fund Administrator | 615 East Michigan Street |
| Milwaukee, Wisconsin 53202 | |
| Custodian | U.S. Bank National Association |
| Custody Operations | |
| 1555 North River Center Drive | |
| Milwaukee, Wisconsin 53212 | |
| Distributor | Quasar Distributors, LLC |
| 777 East Wisconsin Avenue | |
| Milwaukee, Wisconsin 53202 | |
This report is intended for shareholders of the Funds and may not be used as sales literature unless preceded or accompanied by a current prospectus.
MN-SEMI
Item 2. Code of Ethics.
Not applicable for semi-annual reports.
Item 3. Audit Committee Financial Expert.
Not applicable for semi-annual reports.
Item 4. Principal Accountant Fees and Services.
Not applicable for semi-annual reports.
Item 5. Audit Committee of Listed Registrants.
Not applicable to registrants who are not listed issuers (as defined in Rule 10A-3 under the Securities Exchange Act of 1934).
Item 6. Investments.
Schedule of Investments is included as part of the report to shareholders filed under Item 1 of this Form.
Item 7. Disclosure of Proxy Voting Policies and Procedures for Closed-End Management Investment Companies.
Not applicable to open-end investment companies.
Item 8. Portfolio Managers of Closed-End Management Investment Companies.
Not applicable to open-end investment companies.
Item 9. Purchases of Equity Securities by Closed‑End Management Investment Company and Affiliated Purchasers.
Not applicable to open-end investment companies.
Item 10. Submission of Matters to a Vote of Security Holders.
There have been no material changes to the procedures by which shareholders may recommend nominees to the registrant’s board of trustees.
Item 11. Controls and Procedures.
(a) | The Registrant’s President and Treasurer have reviewed the Registrant's disclosure controls and procedures (as defined in Rule 30a-3(c) under the Investment Company Act of 1940 (the “Act”)) as of a date within 90 days of the filing of this report, as required by Rule 30a-3(b) under the Act and Rules 13a-15(b) or 15d‑15(b) under the Securities Exchange Act of 1934. Based on their review, such officers have concluded that the disclosure controls and procedures are effective in ensuring that information required to be disclosed in this report is appropriately recorded, processed, summarized and reported and made known to them by others within the Registrant and by the Registrant’s service provider. |
(b) | There were no changes in the Registrant's internal control over financial reporting (as defined in Rule 30a-3(d) under the Act) that occurred during the last fiscal half-year of the period covered by this report that has materially affected, or is reasonably likely to materially affect, the Registrant's internal control over financial reporting. |
Item 12. Disclosure of Securities Lending Activities for Closed-End Management Investment Companies
Not applicable to open-end investment companies.
Item 13. Exhibits.
| (a) | (1) Any code of ethics or amendment thereto, that is the subject of the disclosure required by Item 2, to the extent that the registrant intends to satisfy Item 2 requirements through filing an exhibit. Not Applicable. |
(2) A separate certification for each principal executive and principal financial officer pursuant to Section 302 of the Sarbanes-Oxley Act of 2002. Filed herewith.
(3) Any written solicitation to purchase securities under Rule 23c‑1 under the Act sent or given during the period covered by the report by or on behalf of the registrant to 10 or more persons. Not applicable to open-end investment companies.
(4) Change in the registrant’s independent public accountant. There was no change in the registrant’s independent public accountant for the period covered by this report.
| (b) | Certifications pursuant to Section 906 of the Sarbanes‑Oxley Act of 2002. Furnished herewith. |
SIGNATURES
Pursuant to the requirements of the Securities Exchange Act of 1934 and the Investment Company Act of 1940, the registrant has duly caused this report to be signed on its behalf by the undersigned, thereunto duly authorized.
(Registrant) Trust for Professional Managers
By (Signature and Title)* /s/John Buckel
John Buckel, President
Date July 31, 2019
Pursuant to the requirements of the Securities Exchange Act of 1934 and the Investment Company Act of 1940, this report has been signed below by the following persons on behalf of the registrant and in the capacities and on the dates indicated.
By (Signature and Title)* /s/John Buckel
John Buckel, President
Date July 31, 2019
By (Signature and Title)* /s/Jennifer Lima
Jennifer Lima, Treasurer
Date July 31, 2019
* Print the name and title of each signing officer under his or her signature.