UNITED STATES
SECURITIES AND EXCHANGE COMMISSION
Washington, D.C. 20549
SECURITIES AND EXCHANGE COMMISSION
Washington, D.C. 20549
FORM N-CSR
CERTIFIED SHAREHOLDER REPORT OF REGISTERED
MANAGEMENT INVESTMENT COMPANIES
Investment Company Act file number: 811-10401
Trust for Professional Managers
(Exact name of registrant as specified in charter)
(Exact name of registrant as specified in charter)
615 East Michigan Street
Milwaukee, WI 53202
(Address of principal executive offices) (Zip code)
(Address of principal executive offices) (Zip code)
Jay S. Fitton
U.S. Bancorp Fund Services, LLC
615 East Michigan Street
Milwaukee, WI 53202
(Name and address of agent for service)
(Name and address of agent for service)
(513) 629-8104
Registrant's telephone number, including area code
Date of fiscal year end: November 30, 2019
Date of reporting period: May 31, 2019
Item 1. Reports to Stockholders.
Rockefeller Equity Allocation Fund
Rockefeller Core Taxable Bond Fund
Rockefeller Intermediate Tax Exempt
National Bond Fund
Rockefeller Intermediate Tax Exempt
New York Bond Fund
Semi-Annual Report
May 31, 2019
Investment Adviser
Rockefeller & Co. LLC
45 Rockefeller Plaza, 5th Floor
New York, New York 10111
Beginning on January 1, 2021, as permitted by regulations adopted by the U.S. Securities and Exchange Commission, paper copies of the shareholder reports for the Rockefeller Equity Allocation Fund, Rockefeller Core Taxable Bond Fund, Rockefeller Intermediate Tax Exempt National Bond Fund and Rockefeller Intermediate Tax Exempt New York Bond Fund (each a “Fund,” and collectively, the “Funds”) will no longer be sent by mail, unless you specifically request paper copies of the reports from the Funds or from your financial intermediary (such as a broker-dealer or bank). Instead, the reports will be made available on a website, and you will be notified by mail each time a report is posted and provided with a website link to access the report.
If you already elected to receive shareholder reports electronically, you will not be affected by this change and you need not take any action. You may elect to receive shareholder reports and other communications from the Funds electronically by contacting your financial intermediary or, if you are a direct investor, by calling the Funds at 1-855-369-6209, sending an e-mail request to inquires@rockefellerfunds.com, or by enrolling at http://www.rockefellerfunds.com.
You may elect to receive all future reports in paper free of charge. To request that you continue to receive paper copies of your shareholder reports, you can contact your financial intermediary or, if you invest directly with the Funds, you can call the Funds at 1-855-369-3209 or send an e-mail request to inquires@rockefellerfunds.com. Your election to receive reports in paper form will apply to all funds held in your account with your financial intermediary or, if you invest directly, to all Rockefeller Funds you hold.
Table of Contents
| LETTER TO SHAREHOLDERS | 3 | ||
| EXPENSE EXAMPLES | 7 | ||
| INVESTMENT HIGHLIGHTS | 9 | ||
| SCHEDULES OF INVESTMENTS | 19 | ||
| STATEMENTS OF ASSETS AND LIABILITIES | 40 | ||
| STATEMENTS OF OPERATIONS | 42 | ||
| STATEMENTS OF CHANGES IN NET ASSETS | 44 | ||
| FINANCIAL HIGHLIGHTS | 48 | ||
| NOTES TO FINANCIAL STATEMENTS | 56 | ||
| NOTICE OF PRIVACY POLICY & PRACTICES | 67 | ||
| ADDITIONAL INFORMATION | 68 |
Dear Shareholder:
Over the past six months, the Federal Reserve (“Fed”) has shifted to a highly dovish stance, which helped to ease financial conditions and could potentially extend the expansion cycle. Chinese policymakers have also continued to provide stimulus in an attempt to reflate their economy. While the first quarter of 2019 got off to a good start with regards to economic growth (coupled with equities experiencing one of its strongest quarters in recent memory), a slowdown later in the year is expected given the strong growth the U.S. economy experienced in 2018 due to a highly stimulative tax cut.
While economic growth continues to be strong in the U.S., foreign markets appear skittish due to the escalation in protectionist trade measures, which may have attributed to a slowdown in economic growth in China and Europe. At the end of May 2019, President Donald Trump made an unprecedented move of threatening tariffs on Mexican imports unless Mexico manages to stem the flow of north-bound migrants.
These developments sparked risk-off reactions, with equities, emerging markets in particular, declining and sovereign bonds rallying. The bond market priced in a near certain Fed funds rate cut by year end, with the 3-month/10-year U.S. Treasury yield curve inverting further. Rockefeller continues to closely monitor signals from around the globe to assess the macro environment and to look for attractive investment opportunities.
Global Economy
Growth in 2019 has so far been uneven in the global markets. In the U.S., the unemployment rate continues to be low and growth strong. However, a slowdown is expected later in the year due to a number of factors. Much of the strong economic growth was driven by the 2018 tax cuts and more recently an inventory build-up and net exports. The impacts of these catalysts are likely to slow later in the year. In addition, consumer spending and capital expenditures have been on the softer side.
Elsewhere, Manufacturing Purchasing Managers’ Indices (“Manufacturing PMI”) in Japan, China, and Germany all dipped below 50 during the six month period – a signal that the manufacturing economy in those regions is declining. Emerging market economic growth has been mixed, with those countries closely tied to China experiencing a slowdown. However, those countries with a current account deficit could receive an economic boost given the increasingly dovish tone from central banks across the globe.
Federal Reserve Policy and the Bond Market:
Growth held up better than expected in the first quarter, with the economy expanding at a 3.1% annualized pace. Fears about deteriorating growth, however, were not fully unfounded. Although the big picture for the U.S. economy is not fundamentally different, the global economy seems to be experiencing a synchronized slowdown, which has prompted central bank policymakers to directionally turn decidedly more dovish. Earlier this month, Fed Chair Jerome Powell seemed to open the door for a potential rate cut should economic conditions warrant an adjustment in policy. Up until now, the Fed has seemed opposed to the notion of rate cuts, dismissing the recent weakness in growth and inflation for one reason or another. Domestic economic data has been mixed, but Rockefeller believes data has been strong enough on balance to keep the Fed on hold in the near-term. However, it is now increasingly likely that the Federal Open Market Committee (FOMC) has concluded hiking rates this cycle. While Powell’s comments have opened the door to rate cuts, they leave little doubt that his policy approach remains reactive and data dependent. It may require more data weakness or tighter financial conditions to trigger the
3
Fed to cut rates; however, the landscape has clearly changed over the past several weeks and we believe the direction of the next Fed move is likely down, not up.
The 10-Year U.S. Treasury precipitously declined through the period and traded in an 86 basis point (bps) range finishing May at the lows, yielding 2.13%. Investors will continue to track and debate the economic landscape while monitoring the direction of Fed policy.
Rockefeller Equity Allocation Fund:
For the six months ended May 31, 2019, the Institutional Class shares of the Rockefeller Equity Allocation Fund returned -1.49% (net), while the MSCI All-Country World Index (Net Dividends) had a return of 1.40%. Weak relative returns in the Financials sector was the leading contributor to the Fund’s underperformance during the period. On the upside, strong returns in Communication Services had the greatest positive impact on relative performance. The Fund is invested in a blend of value and growth securities on a global basis, as well as preferred stocks.
Rockefeller Core Taxable Bond Fund:
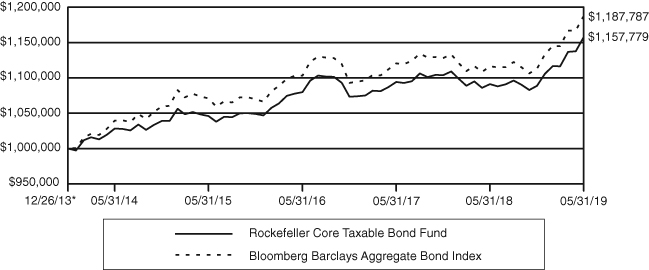
For the six months ended May 31, 2019, the Institutional Class shares of the Rockefeller Core Taxable Bond Fund had a return of 6.34% (net), underperforming the Bloomberg Barclays Aggregate Bond Index benchmark, which returned 6.72%. Detracting from relative performance was the Fund’s sector allocations. An overweight to corporate bonds detracted as spreads compressed over the period. Meanwhile, the Fund’s longer relative duration contributed positively as yields declined across the curve.
Rockefeller Intermediate Tax Exempt National Bond Fund:
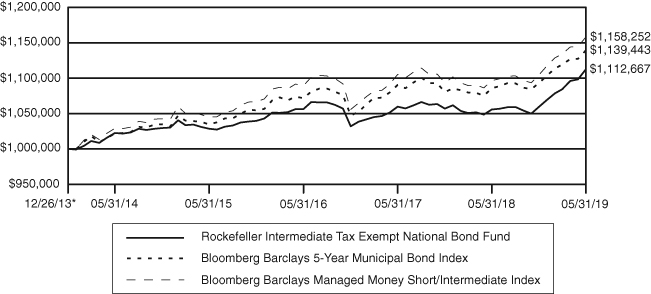
For the six months ended May 31, 2019, the Institutional Class shares of the Rockefeller Intermediate Tax Exempt National Bond Fund had a return of +5.02% (net), while the Bloomberg Barclays Managed Money Short/Intermediate (1 – 10 Years) Index returned +4.85% and the Bloomberg Barclays 5-Year Municipal Bond Index returned +4.24%. Favorable positioning of the Fund toward a “flattening” of the yield curve, or a decrease in the extra yield available between short and long maturities, boosted relative returns as the yield curve flattened considerably.
Rockefeller Intermediate Tax Exempt New York Bond Fund:
For the six months ended May 31, 2019, the Institutional Class shares of the Rockefeller Intermediate Tax Exempt New York Bond Fund had a return of +5.00% (net), while the Bloomberg Barclays Managed Money Short/Intermediate (1 – 10 Years) Index returned +4.85% and the Bloomberg Barclays 5-Year Municipal Bond Index returned +4.24%. Favorable positioning of the Fund toward a “flattening” of the yield curve, or a decrease in the extra yield available between short and long maturities, boosted relative returns as the yield curve flattened considerably.
Looking Forward
Rockefeller believes that the sharp recovery has brought U.S. equities into fair value market territory. Non-U.S. equities still appear slightly undervalued if China can indeed manage to reflate its economy by late 2019. Market expectation for the first half of 2019 has come down materially, but remains somewhat elevated for the back half.
4
Fears of a global slowdown have caused interest rates across the world to come down, with yields on German 10 year bunds ending the period at -20 bps. This has created distortions in the market, with investors overlooking cyclical value and paying up for safe havens such as companies in the Staples and Utilities sectors, who have had a tough time generating earnings growth. Rockefeller continues to see opportunity in some of these cyclical stocks across the globe.
Sincerely,
 |  |
| David P. Harris, CFA | Jimmy C. Chang, CFA |
| Chief Investment Officer | Chief Investment Strategist |
| Rockefeller & Co. LLC | Rockefeller & Co. LLC |
Opinions expressed are those of Rockefeller & Co. LLC and are subject to change, are not guaranteed and should not be considered investment advice.
Must be preceded or accompanied by a current prospectus.
Past performance is no guarantee of future results.
Mutual fund investing involves risk. Principal loss is possible. The Funds are susceptible to adverse economic, political, tax, or regulatory changes which may magnify other risks. Income from tax-exempt funds may become subject to state and local taxes and a portion of income may be subject to the federal alternative minimum tax for certain investors. Investments in debt securities typically decrease in value when interest rates rise. This risk is usually greater for longer-term debt securities. Investment by the Funds in lower-rated and non-rated securities presents a greater risk of loss to principal and interest than higher-rated securities. Investing in the municipal securities market is volatile and can be significantly affected by adverse tax, legislative or political changes and the financial condition of the issuers of municipal securities. Investments in asset-backed and mortgage-backed securities include additional risks that investors should be aware of such as credit risk, prepayment risk, possible illiquidity and default, as well as increased susceptibility to adverse economic development. The Funds may invest in restricted securities or “private placement” transactions. Private placement securities are not registered under the Securities Act of 1933, as amended, and are subject to restrictions on resale. As such they are often both difficult to sell and to value. The Funds may invest in exchange traded funds (“ETFs”) which are subject to additional risks, including the risks that the market price of an ETF’s shares may trade at a discount to its net asset value (“NAV”), an active secondary trading market may not develop or be maintained, or trading may be halted by the exchange on which they trade, which may impact a Fund’s ability to sell its shares. The Rockefeller Intermediate Tax Exempt New York Bond Fund is non-diversified, meaning it concentrates its assets in fewer individual holdings than a diversified fund, specifically in the State of New York issues. The Rockefeller Equity Allocation Fund is subject to small- and medium-capitalization company risks, which tend to have limited liquidity and greater price volatility than large-capitalization companies. The Rockefeller Equity Allocation Fund also invests in foreign securities which involve greater volatility and political, economic and currency risks and differences in accounting methods. These risks are greater in emerging markets. Investing in commodities may subject the Fund to greater risks and volatility as commodity prices may be influenced by a variety of factors including unfavorable weather, environmental factors, and changes in government
5
regulations. Master limited partnerships (“MLPs”) in which the Rockefeller Equity Allocation Fund may invest are subject to certain risks inherent in the structure of MLPs, including complex tax structure risks, the limited ability for election or removal of management, limited voting rights, potential dependence on parent companies or sponsors for revenues to satisfy obligations, and potential conflicts of interest between partners, members and affiliates. Earnings growth is not representative of the Fund’s future performance.
Manufacturing Purchasing Managers’ Indices are indicators of business activity in the manufacturing sectors. They are survey-based measures that ask respondents about changes in their perception of certain key business variables from the prior month. A figure above 50 denotes an expansion in business activity. A figure below 50 denotes a contraction in business activity.
The Bloomberg Barclays Aggregate Bond Index is an unmanaged index which is widely regarded as a standard for measuring U.S. investment grade bond market performance.
The Bloomberg Barclays Managed Money Short/Intermediate (1 – 10 Years) Index has replaced the Bloomberg Barclays 5-Year Municipal Bond Index as the primary benchmark for the Rockefeller Intermediate Tax Exempt National Bond Fund and the Rockefeller Intermediate Tax Exempt New York Bond Fund. Rockefeller & Co. LLC believes that the new index is a better representation of each Fund’s investment style, strategies and portfolio holdings than the prior benchmark. The Bloomberg Barclays Managed Money Short/Intermediate (1 – 10 Years) Index is the 1-10 year component of the Barclays Managed Money Index, which is a rules-based, market-value-weighted index engineered for the tax-exempt municipal bond market. The Bloomberg Barclays 5-Year Municipal Bond Index is an index of long-term, fixed rate, investment-grade, tax-exempt bonds representative of the municipal bond market. The index is the 5-year (4-6) component of the Bloomberg Barclays Municipal Bond Index.
The MSCI All Country World Index (Net Dividends) (“MSCI ACWI”) is a free float-adjusted market capitalization weighted index that measures the equity performance of global developed and emerging markets. The MSCI ACWI total return indices reinvest dividends after the deduction of withholding taxes, using (for international indices) a tax rate applicable to non-resident institutional investors who do not benefit from double taxation treaties.
One cannot invest directly in an index.
Basis point (bp) is a unit equal to 1/100th of 1% and is used to denote the change in a financial instrument. For example, 25 basis points is equal to 0.25%.
Duration is a commonly used measure of the potential volatility of the price of a debt security, or the aggregate market value of a portfolio of debt securities, prior to maturity. Securities with a longer duration generally have more volatile prices than securities of comparable quality with a shorter duration.
Yield Curve is a line that plots the interest rates, at a set point in time, of bonds having equal credit quality, but differing maturity dates. The most frequently reported yield curve compares the three-month, two-year, five-year and 30-year U.S. Treasury debt. The curve is used to predict changes in economic output and growth.
Fund holdings and sector allocations are subject to change and are not recommendations to buy or sell any security. See schedule of investments for holdings.
The Rockefeller Funds are distributed by Quasar Distributors, LLC.
6
Rockefeller Funds
Expense Examples
(Unaudited)
As a shareholder of the Funds, you incur two types of costs: (1) transaction costs, and (2) ongoing costs, including management fees, distribution and service (12b-1) fees and other Fund expenses. These Examples are intended to help you understand your ongoing costs (in dollars) of investing in the Funds, and to compare these costs with the ongoing costs of investing in other mutual funds. The Examples are based on an investment of $1,000 invested at the beginning of the period and held for the entire period (12/1/18 – 5/31/19).
Actual Expenses
The first line of each of the following tables provides information about actual account values and actual expenses. Although the Funds charge no sales load, you will be assessed fees for outgoing wire transfers, returned checks and stop payment orders at prevailing rates charged by U.S. Bancorp Fund Services, LLC, the Funds’ transfer agent. If you request that a redemption be made by wire transfer, currently a $15.00 fee is charged by the Funds’ transfer agent. Individual Retirement Accounts will be charged a $15.00 annual maintenance fee. To the extent the Funds invest in shares of exchange-traded funds or other investment companies as part of their investment strategies, you will indirectly bear your proportionate share of any fees and expenses charged by the underlying funds in which the Funds invest in addition to the expenses of the Funds. Actual expenses of the underlying funds are expected to vary among the various underlying funds. These expenses are not included in the Examples. The Examples include, but are not limited to, management fees, fund administration fees and accounting, custody and transfer agent fees. You may use the information in this line, together with the amount you invested, to estimate the expenses that you paid over the period. Simply divide your account value by $1,000 (for example, an $8,600 account value divided by $1,000 = 8.6), then multiply the result by the number in the first line under the heading entitled “Expenses Paid During Period” to estimate the expenses you paid on your account during this period.
Hypothetical Example for Comparison Purposes
The second line of each of the following tables provides information about hypothetical account values and hypothetical expenses based on the Funds’ actual expense ratios and an assumed rate of return of 5% per year before expenses, which is not the Funds’ actual return. The hypothetical account values and expenses may not be used to estimate the actual ending account balance or expenses you paid for the period. You may use this information to compare the ongoing costs of investing in the Funds and other funds. To do so, compare this 5% hypothetical example with the 5% hypothetical examples that appear in the shareholder reports of other funds. Please note that the expenses shown in the tables are meant to highlight your ongoing costs only and do not reflect any transactional costs, such as sales charges (loads), redemption fees or exchange fees. Therefore, the second line of the table is useful in comparing ongoing costs only, and will not help you determine the relative total costs of owning different funds. In addition, if these transactional costs were included, your costs would have been higher.
7
Rockefeller Funds
Expense Examples (Continued)
(Unaudited)
Rockefeller Equity Allocation Fund
| Beginning | Ending | Expenses Paid | |
| Account Value | Account Value | During Period | |
12/1/18 | 5/31/19 | 12/1/18 – 5/31/19* | |
| Actual | $1,000.00 | $ 985.10 | $5.69 |
| Hypothetical (5% return | |||
| before expenses) | $1,000.00 | $1,019.20 | $5.79 |
| * | Expenses are equal to the Fund’s annualized expense ratio of 1.15%, multiplied by the average account value over the period, multiplied by 182/365 (to reflect the one-half year period). |
Rockefeller Core Taxable Bond Fund
| Beginning | Ending | Expenses Paid | |
| Account Value | Account Value | During Period | |
12/1/18 | 5/31/19 | 12/1/18 – 5/31/19* | |
| Actual | $1,000.00 | $1,063.40 | $3.40 |
| Hypothetical (5% return | |||
| before expenses) | $1,000.00 | $1,021.64 | $3.33 |
| * | Expenses are equal to the Fund’s annualized expense ratio of 0.66%, multiplied by the average account value over the period, multiplied by 182/365 (to reflect the one-half year period). |
Rockefeller Intermediate Tax Exempt National Bond Fund
| Beginning | Ending | Expenses Paid | |
| Account Value | Account Value | During Period | |
12/1/18 | 5/31/19 | 12/1/18 – 5/31/19* | |
| Actual | $1,000.00 | $1,050.20 | $3.22 |
| Hypothetical (5% return | |||
| before expenses) | $1,000.00 | $1,021.79 | $3.18 |
| * | Expenses are equal to the Fund’s annualized expense ratio of 0.63%, multiplied by the average account value over the period, multiplied by 182/365 (to reflect the one-half year period). |
Rockefeller Intermediate Tax Exempt New York Bond Fund
| Beginning | Ending | Expenses Paid | |
| Account Value | Account Value | During Period | |
12/1/18 | 5/31/19 | 12/1/18 – 5/31/19* | |
| Actual | $1,000.00 | $1,050.00 | $3.78 |
| Hypothetical (5% return | |||
| before expenses) | $1,000.00 | $1,021.24 | $3.73 |
| * | Expenses are equal to the Fund’s annualized expense ratio of 0.74%, multiplied by the average account value over the period, multiplied by 182/365 (to reflect the one-half year period). |
8
Rockefeller Equity Allocation Fund
Investment Highlights
(Unaudited)
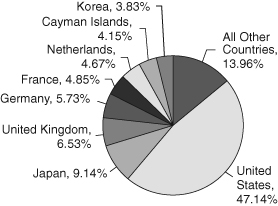
The Fund seeks to achieve its investment objective of long-term total return from capital appreciation and income by investing its assets globally in a range of equity asset classes and, to a lesser extent, in fixed-income securities, real estate and commodity linked equities (such as real estate investment trusts and master limited partnerships), and currencies. Rockefeller & Co. LLC (the “Adviser”) will allocate the Fund’s assets across asset classes taking into consideration both the Adviser’s longer-term strategic outlook as well as tactical views as to potential near-term opportunities. The Adviser considers a number of factors when making allocation decisions, including relative attractiveness among equity market capitalizations and geographic regions, inflation risks and factors that influence commodity prices.
Allocation of Portfolio Holdings as of May 31, 2019*
(% of Investments)
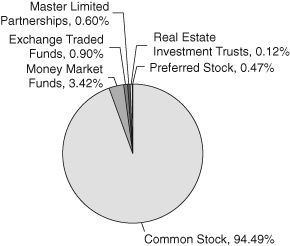 |  |
* For additional details on allocation of portfolio holdings by industry, please see the Schedule of Investments.
Average Annual Returns as of May 31, 2019
| Rockefeller | MSCI All Country | |
| Equity Allocation | World Index | |
Fund | (Net Dividends) | |
| 1 Year | -2.73% | -1.29% |
| 3 Year | 7.74% | 9.07% |
| Since Inception (2/4/15) | 5.25% | 5.92% |
Performance data quoted represents past performance and does not guarantee future results. The investment return and principal value of an investment will fluctuate so that an investor’s shares, when redeemed, may be worth more or less than their original cost. Current performance of the Fund may be lower or higher than the performance quoted. Performance data current to the most recent month-end may be obtained by calling 855-369-6209.
Continued
9
Rockefeller Equity Allocation Fund
Investment Highlights (Continued)
(Unaudited)
Short-term performance, in particular, is not a good indication of the Fund’s future performance, and an investment should not be made based solely on historical returns.
Investment performance reflects fee waivers in effect. In the absence of such waivers, total return would be reduced.
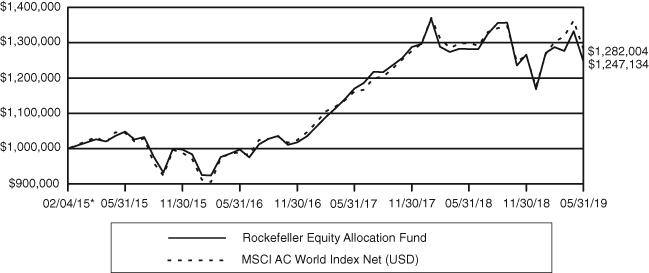
The returns shown assume reinvestment of Fund distributions and do not reflect the deduction of taxes that a shareholder would pay on Fund distributions or the redemption of Fund shares. The following chart illustrates performance of a hypothetical investment made in the Fund and a broad-based securities index on the Fund’s inception date. The graph does not reflect any future performance.
The MSCI All Country World Index (Net Dividends) (“MSCI ACWI”) is a free float-adjusted market capitalization weighted index that measures the equity performance of global developed and emerging markets. The MSCI ACWI total return indices reinvest dividends after the deduction of withholding taxes, using (for international indices) a tax rate applicable to non-resident institutional investors who do not benefit from double taxation treaties.
| Growth of $1,000,000 Investment |
 |
| * | Inception Date |
10
Rockefeller Core Taxable Bond Fund
Investment Highlights
(Unaudited)
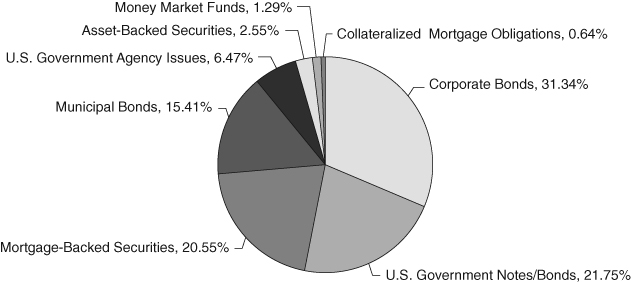
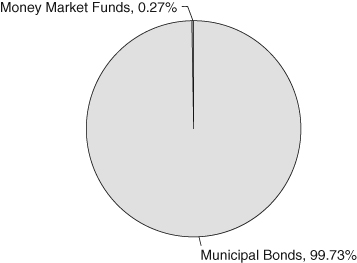
The Fund seeks to achieve its investment objective to generate current income consistent with the preservation of capital by investing under normal market conditions at least 80% of its net assets (plus any borrowings for investment purposes) in taxable fixed-income securities. “Fixed-income securities” include corporate, government and municipal bonds, asset-backed and mortgage-backed securities, other investment companies and ETFs that will invest in fixed-income securities, and other fixed-income instruments. The Fund invests primarily in investment grade fixed-income securities. Investment grade securities are fixed-income securities rated in the top four ratings categories by independent rating organizations such as Standard & Poor’s Ratings Group (“S&P”) and Moody’s Investors Service, Inc. (“Moody’s”) or another nationally recognized statistical rating organization (“NRSRO”), or deemed by the Adviser to be of comparable quality. The Adviser anticipates the Fund’s weighted average duration will be more than three years but less than ten years.
Allocation of Portfolio Holdings as of May 31, 2019
(% of Investments)
Average Annual Returns as of May 31, 2019
| Bloomberg | ||
| Rockefeller | Barclays | |
| Core Taxable | Aggregate | |
Bond Fund | Bond Index | |
| 1 Year | 6.11% | 6.40% |
| 5 Year | 2.40% | 2.70% |
| Since Inception (12/26/13) | 2.74% | 3.22% |
Performance data quoted represents past performance and does not guarantee future results. The investment return and principal value of an investment will fluctuate so that an investor’s shares, when redeemed, may be worth more or less than their original cost. Current performance of the Fund may be lower or higher than the performance quoted. Performance data current to the most recent month-end may be obtained by calling 855-369-6209.
Continued
11
Rockefeller Core Taxable Bond Fund
Investment Highlights (Continued)
(Unaudited)
Short-term performance, in particular, is not a good indication of the Fund’s future performance, and an investment should not be made based solely on historical returns.
Investment performance reflects fee waivers in effect. In the absence of such waivers, total return would be reduced.
The returns shown assume reinvestment of Fund distributions and do not reflect the deduction of taxes that a shareholder would pay on Fund distributions or the redemption of Fund shares. The following chart illustrates performance of a hypothetical investment made in the Fund and a broad-based securities index on the Fund’s inception date. The graph does not reflect any future performance.
The Bloomberg Barclays Aggregate Bond Index is an unmanaged index which is widely regarded as a standard for measuring U.S. investment grade bond market performance. An index is unmanaged and cannot be invested in directly.
| Growth of $1,000,000 Investment |
 |
| * | Inception Date |
12
Rockefeller Intermediate Tax Exempt National Bond Fund
Investment Highlights
(Unaudited)
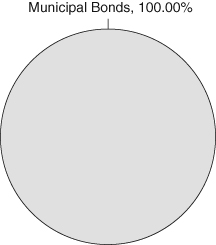
The Fund seeks to achieve its investment objective to generate current income that is exempt from federal personal income tax consistent with the preservation of capital by investing under normal market conditions at least 80% of its net assets (plus any borrowings for investment purposes) in municipal bonds and other fixed-income securities that generate income exempt from regular federal income tax, including the federal alternative minimum tax (“AMT”). The Fund may invest in all types of municipal bonds, including, but not limited to, general obligation bonds and industrial development bonds. The Fund may also invest in asset-backed and mortgage-backed securities, other investment companies, ETFs and the obligations of other issuers that pay interest that is exempt from regular federal income taxes. While the Fund will invest primarily in tax exempt securities, it is possible that up to 20% of the Fund’s total assets may be invested in fixed-income securities that generate income that is not exempt from regular federal income tax, including the federal AMT. The Fund invests primarily in investment grade municipal bonds and other types of fixed-income securities. Investment grade securities are fixed-income securities rated in the top four ratings categories by independent rating organizations such as S&P and Moody’s or another NRSRO, or, if unrated, deemed by the Adviser to be of comparable quality. While the Fund may invest in securities of any duration, the Adviser anticipates the weighted average duration of the Fund’s portfolio will be more than three years but less than ten years.
Allocation of Portfolio Holdings as of May 31, 2019
(% of Investments)
Continued
13
Rockefeller Intermediate Tax Exempt National Bond Fund
Investment Highlights (Continued)
(Unaudited)
Average Annual Returns as of May 31, 2019
| Rockefeller | Bloomberg | Bloomberg | |
| Intermediate Tax | Barclays Managed | Barclays 5-Year | |
| Exempt National | Money Short/ | Municipal | |
Bond Fund | Intermediate Index | Bond Index | |
| 1 Year | 5.39% | 5.62% | 4.94% |
| 5 Year | 1.70% | 2.39% | 2.20% |
| Since Inception (12/26/13) | 1.99% | 2.74% | 2.43% |
Performance data quoted represents past performance and does not guarantee future results. The investment return and principal value of an investment will fluctuate so that an investor’s shares, when redeemed, may be worth more or less than their original cost. Current performance of the Fund may be lower or higher than the performance quoted. Performance data current to the most recent month end may be obtained by calling 855-369-6209.
Short-term performance, in particular, is not a good indication of the Fund’s future performance, and an investment should not be made based solely on historical returns.
Investment performance reflects fee waivers in effect. In the absence of such waivers, total return would be reduced.
The returns shown assume reinvestment of Fund distributions and do not reflect the deduction of taxes that a shareholder would pay on Fund distributions or the redemption of Fund shares. The following chart illustrates performance of a hypothetical investment made in the Fund and a broad-based securities index on the Fund’s inception date. The graph does not reflect any future performance.
The Bloomberg Barclays Managed Money Short‐Intermediate Index has replaced the Bloomberg Barclays 5 Year Municipal Bond Index as the Fund’s primary benchmark. The Advisor believes that the new index is a better representation of the Fund’s investment style, strategies and portfolio holdings than the prior benchmark.
The Bloomberg Barclays Managed Money Short/Intermediate (1 – 10 Years) Index is the 1-10 year component of the Barclays Managed Money Index, which is a rules-based, market-value-weighted index engineered for the tax-exempt municipal bond market.
The Bloomberg Barclays 5-Year Municipal Bond Index is an index of long-term, fixed-rate, investment-grade, tax-exempt bonds representative of the municipal bond market. The index is the 5-Year (4-6) component of the Barclays Municipal Bond Index. An index is unmanaged and cannot be invested in directly.
Continued
14
Rockefeller Intermediate Tax Exempt National Bond Fund
Investment Highlights (Continued)
(Unaudited)
| Growth of $1,000,000 Investment |
 |
| * | Inception Date |
15
Rockefeller Intermediate Tax Exempt New York Bond Fund
Investment Highlights
(Unaudited)
The Fund seeks to achieve its investment objective to generate current income that is exempt from federal, New York State and New York City personal income tax consistent with the preservation of capital by investing under normal market conditions at least 80% of its net assets (plus any borrowings for investment purposes) in municipal bonds and other fixed-income securities that generate income exempt from regular federal, New York State and New York City personal income tax, including the federal AMT. The Fund may invest in all types of municipal bonds, including, but not limited to, general obligation bonds, industrial development bonds, and other obligations issued by the State of New York, its subdivisions, authorities, instrumentalities and corporations. The Fund may also invest in asset-backed and mortgage-backed securities, other investment companies, ETFs and the obligations of other issuers that pay interest that is exempt from regular federal and New York State and New York City personal income tax. While the Fund will invest primarily in tax exempt securities, it is possible that up to 20% of the Fund’s total assets may be invested in securities that generate income that is not exempt from regular federal income tax, New York State and New York City personal income tax, including the federal AMT. The Fund invests primarily in investment grade fixed-income securities rated in the top four ratings categories by independent rating organizations such as S&P and Moody’s or another NRSRO, or deemed by the Adviser to be of comparable quality. While the Fund may invest in securities of any duration, the Adviser anticipates the weighted average duration of the Fund’s portfolio will be more than three years but less than ten years. The Fund is non-diversified.
Allocation of Portfolio Holdings as of May 31, 2019
(% of Investments)
Continued
16
Rockefeller Intermediate Tax Exempt New York Bond Fund
Investment Highlights (Continued)
(Unaudited)
Average Annual Returns as of May 31, 2019
| Rockefeller | Bloomberg | Bloomberg | |
| Intermediate Tax | Barclays Managed | Barclays 5-Year | |
| Exempt New York | Money Short/ | Municipal | |
Bond Fund | Intermediate Index | Bond Index | |
| 1 Year | 5.19% | 5.62% | 4.94% |
| 5 Year | 1.62% | 2.39% | 2.20% |
| Since Inception (12/26/13) | 1.79% | 2.74% | 2.43% |
Performance data quoted represents past performance and does not guarantee future results. The investment return and principal value of an investment will fluctuate so that an investor’s shares, when redeemed, may be worth more or less than their original cost. Current performance of the Fund may be lower or higher than the performance quoted. Performance data current to the most recent month-end may be obtained by calling 855-369-6209.
Short-term performance, in particular, is not a good indication of the Fund’s future performance, and an investment should not be made based solely on historical returns.
Investment performance reflects fee waivers in effect. In the absence of such waivers, total return would be reduced.
The returns shown assume reinvestment of Fund distributions and do not reflect the deduction of taxes that a shareholder would pay on Fund distributions or the redemption of Fund shares. The following chart illustrates performance of a hypothetical investment made in the Fund and a broad-based securities index on the Fund’s inception date. The graph does not reflect any future performance.
The Bloomberg Barclays Managed Money Short‐Intermediate Index has replaced the Bloomberg Barclays 5 Year Municipal Bond Index as the Fund’s primary benchmark. The Advisor believes that the new index is a better representation of the Fund’s investment style, strategies and portfolio holdings than the prior benchmark.
The Bloomberg Barclays 5-Year Municipal Bond Index is an index of long-term, fixed-rate, investment-grade, tax-exempt bonds representative of the municipal bond market. The index is the 5-Year (4-6) component of the Barclays Municipal Bond Index. An index is unmanaged and cannot be invested in directly.
The Bloomberg Barclays Managed Money Short/Intermediate (1 – 10 Years) Index is the 1-10 year component of the Barclays Managed Money Index, which is a rules-based, market-value-weighted index engineered for the tax-exempt municipal bond market.
Continued
17
Rockefeller Intermediate Tax Exempt New York Bond Fund
Investment Highlights (Continued)
(Unaudited)
| Growth of $1,000,000 Investment |
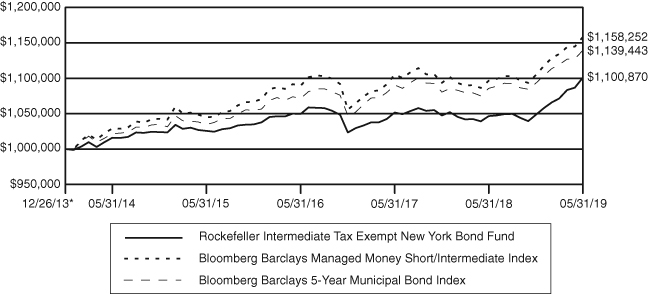 |
| * | Inception Date |
18
Rockefeller Equity Allocation Fund
| Schedule of Investments |
May 31, 2019 (Unaudited)
| Shares | Value | |||||||
| Common Stocks – 94.12% | ||||||||
| Aerospace & Defense – 3.59% | ||||||||
| Airbus SE (a) | 16,298 | $ | 2,086,695 | |||||
| Safran SA (a) | 13,004 | 1,706,197 | ||||||
| Triumph Group, Inc. | 3,217 | 62,378 | ||||||
| 3,855,270 | ||||||||
| Airlines – 2.96% | ||||||||
| Southwest Airlines Co. | 46,066 | 2,192,742 | ||||||
| United Continental Holdings, Inc. (b) | 11,108 | 862,536 | ||||||
| Wizz Air Holdings PLC (a)(b)(c) | 3,275 | 129,641 | ||||||
| 3,184,919 | ||||||||
| Auto Components – 1.22% | ||||||||
| Continental AG (a) | 7,922 | 1,077,408 | ||||||
| Gentherm, Inc. (b) | 3,927 | 146,791 | ||||||
| Standard Motor Products, Inc. | 2,207 | 93,533 | ||||||
| 1,317,732 | ||||||||
| Banks – 13.89% | ||||||||
| ABN AMRO Group NV (a)(c) | 50,994 | 1,077,351 | ||||||
| Bank Rakyat Indonesia Persero Tbk PT (a) | 4,272,300 | 1,231,034 | ||||||
| Comerica, Inc. | 18,759 | 1,290,994 | ||||||
| HDFC Bank Ltd. – ADR | 1,296 | 160,911 | ||||||
| ICICI Bank Ltd. – ADR | 105,343 | 1,264,116 | ||||||
| ING Group NV (a) | 172,607 | 1,864,389 | ||||||
| JPMorgan Chase & Co. | 14,630 | 1,550,195 | ||||||
| KB Financial Group, Inc. (a) | 25,754 | 947,421 | ||||||
| Lloyds Banking Group PLC (a) | 2,865,525 | 2,071,219 | ||||||
| Swedbank AB (a) | 104,572 | 1,499,772 | ||||||
| The Siam Commercial Bank PLC (a) | 15,100 | 61,924 | ||||||
| Wells Fargo & Co. | 43,708 | 1,939,324 | ||||||
| 14,958,650 | ||||||||
| Beverages – 0.60% | ||||||||
| Treasury Wine Estates Ltd. (a) | 62,457 | 648,954 | ||||||
| Biotechnology – 2.44% | ||||||||
| Alnylam Pharmaceuticals, Inc. (b) | 6,058 | 409,036 | ||||||
| BeiGene Ltd. – ADR (b) | 4,891 | 576,796 | ||||||
| Biogen, Inc. (b) | 3,021 | 662,475 | ||||||
| Galapagos NV (a)(b) | 962 | 109,435 | ||||||
| Neurocrine Biosciences, Inc. (b) | 4,541 | 384,986 | ||||||
| Regeneron Pharmaceuticals, Inc. (b) | 1,614 | 486,976 | ||||||
| 2,629,704 | ||||||||
The accompanying notes are an integral part of these financial statements.
19
Rockefeller Equity Allocation Fund
| Schedule of Investments (Continued) |
May 31, 2019 (Unaudited)
| Shares | Value | |||||||
| Building Products – 1.24% | ||||||||
| AAON, Inc. | 4,088 | $ | 185,554 | |||||
| Cie de Saint-Gobain (a) | 27,326 | 985,627 | ||||||
| Simpson Manufacturing Co., Inc. | 2,756 | 167,675 | ||||||
| 1,338,856 | ||||||||
| Commercial Services & Supplies – 0.35% | ||||||||
| Healthcare Services Group, Inc. | 5,758 | 182,010 | ||||||
| Stericycle, Inc. (b) | 1,399 | 64,886 | ||||||
| Tetra Tech, Inc. | 1,925 | 129,976 | ||||||
| 376,872 | ||||||||
| Construction & Engineering – 0.19% | ||||||||
| Kinden Corp. (a) | 13,400 | 205,739 | ||||||
| Construction Materials – 2.39% | ||||||||
| Cemex SAB de CV – ADR (b) | 186,644 | 768,973 | ||||||
| China Resources Cement Holdings Ltd. (a) | 99,000 | 85,841 | ||||||
| HeidelbergCement AG (a) | 23,083 | 1,712,572 | ||||||
| 2,567,386 | ||||||||
| Consumer Finance – 1.42% | ||||||||
| FirstCash, Inc. | 2,624 | 248,545 | ||||||
| SLM Corp. | 12,412 | 118,038 | ||||||
| Synchrony Financial | 34,436 | 1,158,083 | ||||||
| 1,524,666 | ||||||||
| Diversified Financial Services – 0.28% | ||||||||
| FactSet Research Systems, Inc. | 1,080 | 300,456 | ||||||
| Diversified Telecommunication Services – 0.49% | ||||||||
| KT Corp. – ADR (b) | 22,162 | 266,830 | ||||||
| KT Corp. (a) | 6,034 | 141,857 | ||||||
| ORBCOMM, Inc. (b) | 17,516 | 117,007 | ||||||
| 525,694 | ||||||||
| Electric Utilities – 1.49% | ||||||||
| Korea Electric Power Corp. (a)(b) | 18,158 | 396,801 | ||||||
| The Kansai Electric Power Co., Inc. (a) | 102,700 | 1,196,325 | ||||||
| 1,593,126 | ||||||||
| Electrical Equipment – 1.09% | ||||||||
| Mitsubishi Electric Corp. (a) | 94,000 | 1,167,488 | ||||||
| Electronic Equipment, Instruments & Components – 3.21% | ||||||||
| Badger Meter, Inc. | 2,967 | 156,658 | ||||||
| IPG Photonics Corp. (b) | 1,168 | 146,199 | ||||||
The accompanying notes are an integral part of these financial statements.
20
Rockefeller Equity Allocation Fund
| Schedule of Investments (Continued) |
May 31, 2019 (Unaudited)
| Shares | Value | |||||||
| Electronic Equipment, Instruments & Components – 3.21% (Continued) | ||||||||
| Kyocera Corp. (a) | 28,100 | $ | 1,705,320 | |||||
| Littelfuse, Inc. | 1,199 | 195,689 | ||||||
| Samsung SDI Co. Ltd. (a) | 605 | 110,865 | ||||||
| TE Connectivity Ltd. (a) | 10,684 | 899,913 | ||||||
| Trimble, Inc. (b) | 6,009 | 239,759 | ||||||
3,454,403 | ||||||||
| Energy Equipment & Services – 0.10% | ||||||||
| Newpark Resources, Inc. (b) | 14,634 | 102,292 | ||||||
| Food & Staples Retailing – 1.22% | ||||||||
| CVS Health Corp. | 24,941 | 1,306,160 | ||||||
| Food Products – 0.73% | ||||||||
| LAMB WESTON HLDGS, Inc. | 13,299 | 787,966 | ||||||
| Gas Utilities – 0.24% | ||||||||
| Rubis SCA (a) | 5,258 | 262,803 | ||||||
| Health Care Equipment & Supplies – 4.70% | ||||||||
| ABIOMED, Inc. (b) | 726 | 190,154 | ||||||
| Alcon, Inc. (a)(b) | 1,039 | 60,425 | ||||||
| Alcon AG (a)(b) | 4,315 | 251,047 | ||||||
| Becton Dickinson & Co. | 4,847 | 1,131,484 | ||||||
| DexCom, Inc. (b) | 4,300 | 521,590 | ||||||
| Edwards Lifesciences Corp. (b) | 821 | 140,145 | ||||||
| Inogen, Inc. (b) | 1,323 | 85,294 | ||||||
| Insulet Corp. (b) | 2,766 | 303,679 | ||||||
| Integer Holdings Corp. (b) | 2,731 | 191,443 | ||||||
| Masimo Corp. (b) | 2,095 | 273,900 | ||||||
| Medtronic PLC (a) | 16,363 | 1,514,886 | ||||||
| Merit Medical Systems, Inc. (b) | 4,452 | 229,857 | ||||||
| Nuvectra Corp. (b) | 1,786 | 6,769 | ||||||
| ResMed, Inc. | 1,402 | 159,996 | ||||||
5,060,669 | ||||||||
| Health Care Providers & Services – 0.62% | ||||||||
| Chemed Corp. | 652 | 213,817 | ||||||
| Covetrus, Inc. (b) | 18,289 | 451,007 | ||||||
664,824 | ||||||||
| Health Care Technology – 2.13% | ||||||||
| Cerner Corp. (b) | 22,078 | 1,544,799 | ||||||
| Medidata Solutions, Inc. (b) | 2,563 | 233,617 | ||||||
The accompanying notes are an integral part of these financial statements.
21
Rockefeller Equity Allocation Fund
| Schedule of Investments (Continued) |
May 31, 2019 (Unaudited)
| Shares | Value | |||||||
| Health Care Technology – 2.13% (Continued) | ||||||||
| Omnicell, Inc. (b) | 3,823 | $ | 303,737 | |||||
| Vocera Communications, Inc. (b) | 6,343 | 205,259 | ||||||
2,287,412 | ||||||||
| Hotels, Restaurants & Leisure – 4.40% | ||||||||
| Compass Group PLC (a) | 77,548 | 1,754,524 | ||||||
| Norwegian Cruise Line Holdings Ltd. (a)(b) | 6,432 | 351,895 | ||||||
| Royal Caribbean Cruises Ltd. (a) | 21,513 | 2,619,422 | ||||||
4,725,841 | ||||||||
| Household Durables – 1.86% | ||||||||
| Sony Corp. (a) | 41,700 | 1,998,420 | ||||||
| Household Products – 0.28% | ||||||||
| Reckitt Benckiser Group PLC (a) | 3,726 | 299,066 | ||||||
| Insurance – 2.72% | ||||||||
| Prudential PLC (a) | 60,497 | 1,205,776 | ||||||
| Reinsurance Group of America, Inc. | 11,492 | 1,701,506 | ||||||
| Samsung Fire & Marine Insurance Co. Ltd. (a) | 68 | 15,474 | ||||||
2,922,756 | ||||||||
| Internet & Catalog Retail – 2.49% | ||||||||
| Amazon.com, Inc. (b) | 1,511 | 2,682,131 | ||||||
| Internet & Direct Marketing Retail – 0.07% | ||||||||
| ASOS Plc (a)(b) | 1,834 | 79,523 | ||||||
| Internet Software & Services – 8.38% | ||||||||
| Alibaba Group Holding, Ltd. – ADR (b) | 1,044 | 155,827 | ||||||
| Alphabet, Inc. – Class C (b) | 2,800 | 3,090,163 | ||||||
| Baidu, Inc. – ADR (b) | 972 | 106,920 | ||||||
| Facebook, Inc. – Class A (b) | 17,562 | 3,116,729 | ||||||
| NIC, Inc. | 6,392 | 102,016 | ||||||
| Tencent Holdings Ltd. (a) | 58,500 | 2,439,313 | ||||||
9,010,968 | ||||||||
| IT Services – 1.90% | ||||||||
| Visa, Inc. – Class A | 12,651 | 2,040,986 | ||||||
| Life Sciences Tools & Services – 0.71% | ||||||||
| Illumina, Inc. (b) | 2,498 | 766,661 | ||||||
The accompanying notes are an integral part of these financial statements.
22
Rockefeller Equity Allocation Fund
| Schedule of Investments (Continued) |
May 31, 2019 (Unaudited)
| Shares | Value | |||||||
| Machinery – 1.77% | ||||||||
| Amada Holdings Co. Ltd. (a) | 95,500 | $ | 979,292 | |||||
| Epiroc AB (a) | 12,555 | 116,762 | ||||||
| KION Group AG (a) | 14,944 | 812,786 | ||||||
1,908,840 | ||||||||
| Media – 2.59% | ||||||||
| Comcast Corp. | 67,740 | 2,777,340 | ||||||
| Metals & Mining – 0.16% | ||||||||
| Grupo Mexico SAB de CV (a) | 69,800 | 173,799 | ||||||
| Oil, Gas & Consumable Fuels – 5.47% | ||||||||
| BP PLC – ADR | 39,543 | 1,610,191 | ||||||
| EOG Resources, Inc. | 11,910 | 975,191 | ||||||
| Kinder Morgan, Inc. | 52,051 | 1,038,417 | ||||||
| TOTAL SA (a) | 43,731 | 2,267,362 | ||||||
5,891,161 | ||||||||
| Pharmaceuticals – 2.20% | ||||||||
| Hanmi Pharm Co. Ltd. (a) | 198 | 67,902 | ||||||
| Novartis AG (a) | 5,196 | 446,534 | ||||||
| Novartis AG – ADR | 21,576 | 1,847,768 | ||||||
2,362,204 | ||||||||
| Professional Services – 0.10% | ||||||||
| Mistras Group, Inc. (b) | 7,665 | 105,930 | ||||||
| Real Estate Management & Development – 2.39% | ||||||||
| Vonovia SE (a) | 49,003 | 2,567,484 | ||||||
| Semiconductors & Semiconductor Equipment – 2.17% | ||||||||
| Samsung Electronics Co. Ltd. (a) | 54,110 | 1,926,415 | ||||||
| Taiwan Semiconductor Manufacturing Co Ltd. – ADR | 10,746 | 412,109 | ||||||
2,338,524 | ||||||||
| Software – 2.43% | ||||||||
| Everbridge, Inc. (b) | 1,333 | 104,827 | ||||||
| Microsoft Corp. | 17,672 | 2,185,673 | ||||||
| PROS Holdings, Inc. (b) | 5,741 | 325,515 | ||||||
2,616,015 | ||||||||
| Specialty Retail – 1.71% | ||||||||
| Foot Locker, Inc. | 14,341 | 564,318 | ||||||
| Ross Stores, Inc. | 13,725 | 1,276,288 | ||||||
1,840,606 | ||||||||
The accompanying notes are an integral part of these financial statements.
23
Rockefeller Equity Allocation Fund
| Schedule of Investments (Continued) |
May 31, 2019 (Unaudited)
| Shares | Value | |||||||
| Technology Hardware, Storage & Peripherals – 0.07% | ||||||||
| Stratasys Ltd. (a)(b) | 3,596 | $ | 78,788 | |||||
| Textiles, Apparel & Luxury Goods – 1.16% | ||||||||
| Carter’s, Inc. | 1,863 | 156,697 | ||||||
| Shenzhou International Group Holdings Ltd. (a) | 92,600 | 1,095,612 | ||||||
1,252,309 | ||||||||
| Wireless Telecommunication Services – 2.50% | ||||||||
| China Mobile Ltd. – ADR | 2,529 | 110,821 | ||||||
| KDDI Corp. (a) | 100,700 | 2,579,224 | ||||||
2,690,045 | ||||||||
| Total Common Stocks (Cost $88,848,598) | 101,251,438 | |||||||
| Exchange-Traded Funds – 0.90% | ||||||||
| iShares Core MSCI EAFE ETF | 8,121 | 482,306 | ||||||
| iShares Core S&P 500 ETF | 1,740 | 482,502 | ||||||
| Total Exchange-Traded Funds (Cost $989,042) | 964,808 | |||||||
| Master Limited Partnerships – 0.59% | ||||||||
| Plains GP Holdings LP | 28,407 | 639,726 | ||||||
| Total Master Limited Partnerships (Cost $558,972) | 639,726 | |||||||
| Preferred Stocks – 0.47% | ||||||||
| Banks – 0.24% | ||||||||
| Itau Unibanco Holding SA | ||||||||
| 6.56% (a)(d) | 28,725 | 255,653 | ||||||
| Insurance – 0.17% | ||||||||
| Samsung Fire & Marine Insurance Co. Ltd. | ||||||||
| 6.01% (a)(d) | 1,147 | 182,759 | ||||||
| Semiconductors & Semiconductor Equipment – 0.06% | ||||||||
| Samsung Electronics Co Ltd. | ||||||||
| 2.78% (a)(d) | 2,213 | 64,485 | ||||||
| Total Preferred Stocks (Cost $486,045) | 502,897 | |||||||
| Real Estate Investment Trusts – 0.12% | ||||||||
| Iron Mountain, Inc. | 4,151 | 127,228 | ||||||
| Total Real Estate Investment Trusts (Cost $124,774) | 127,228 | |||||||
The accompanying notes are an integral part of these financial statements.
24
Rockefeller Equity Allocation Fund
| Schedule of Investments (Continued) |
May 31, 2019 (Unaudited)
| Shares | Value | |||||||
| Money Market Funds – 3.41% | ||||||||
| Morgan Stanley Institutional Liquidity Funds – | ||||||||
| Treasury Portfolio – Institutional Class, 2.259% (e) | 3,670,859 | $ | 3,670,859 | |||||
| Total Money Market Funds (Cost $3,670,859) | 3,670,859 | |||||||
| Total Investments (Cost $94,678,290) – 99.61% | 107,156,956 | |||||||
| Other Assets in Excess of Liabilities – 0.39% | 423,345 | |||||||
| Total Net Assets – 100.00% | $ | 107,580,301 | ||||||
Percentages are stated as a percent of net assets.
| ADR | American Depository Receipt. |
| (a) | Foreign issued security. |
| (b) | Non-income producing security. |
| (c) | Securities issued pursuant to Rule 144A under the Securities Act of 1933 and Regulation S under the Securities Act of 1933. |
| (d) | Dividend yield; the rate shown represents the rate at May 31, 2019. |
| (e) | The rate shown represents the seven day yield as of May 31, 2019. |
The Global Industry Classification Standard (GICS®) was developed by and/or is the exclusive property of MSCI, Inc. (“MSCI”) and Standard & Poor’s Financial Services LLC (“S&P”). GICS is a service mark of MSCI and S&P and has been licensed for use by U.S. Bancorp Fund Services, LLC.
The accompanying notes are an integral part of these financial statements.
25
Rockefeller Core Taxable Bond Fund
| Schedule of Investments |
May 31, 2019 (Unaudited)
| Principal | ||||||||
| Amount | Value | |||||||
| Asset-Backed Securities – 2.56% | ||||||||
| Ford Credit Floorplan Master Owner Trust A | ||||||||
| A-1, 2.070%, 05/15/2022 | $ | 1,475,000 | $ | 1,470,500 | ||||
| Hyundai Auto Receivables Trust 2019-A | ||||||||
| 2019-A, 2.670%, 12/15/2021 | 430,000 | 431,678 | ||||||
| Total Asset-Backed Securities (Cost $1,891,080) | 1,902,178 | |||||||
| Collateralized Mortgage Obligations – 0.65% | ||||||||
| Government National Mortgage Association | ||||||||
| 2010-157, 2.841% | ||||||||
| (1 Month LIBOR USD + 0.400%), 01/20/2040 (a) | 479,485 | 479,897 | ||||||
| Total Collateralized Mortgage Obligations (Cost $480,270) | 479,897 | |||||||
| Corporate Bonds – 31.42% | ||||||||
| Commercial Banking – 3.08% | ||||||||
| BB&T Corp. | ||||||||
| 3.750%, 12/06/2023 | 2,191,000 | 2,286,871 | ||||||
| Diversified Banks – 10.80% | ||||||||
| Bank of America Corp. | ||||||||
| 3.458% (3 Month LIBOR USD + 0.970%), 03/15/2025 (a) | 2,132,000 | 2,170,458 | ||||||
| Citigroup, Inc. | ||||||||
| 3.887% (3 Month LIBOR USD + 1.563%), 01/10/2028 (a) | 2,050,000 | 2,110,000 | ||||||
| JPMorgan Chase & Co. | ||||||||
| 3.782% (3 Month LIBOR USD + 1.337%), 02/01/2028 (a) | 1,743,000 | 1,799,280 | ||||||
| Wells Fargo Bank N.A. | ||||||||
| 3.625%, 10/22/2021 | 1,907,000 | 1,950,387 | ||||||
8,030,125 | ||||||||
| Food Retail – 2.48% | ||||||||
| The Kroger Co. | ||||||||
| 7.500%, 04/01/2031 | 1,411,000 | 1,843,399 | ||||||
| Health Care Services – 2.44% | ||||||||
| CVS Health Corp. | ||||||||
| 3.700%, 03/09/2023 | 1,777,000 | 1,815,233 | ||||||
| Home Improvement Retail – 2.51% | ||||||||
| The Home Depot, Inc. | ||||||||
| 5.875%, 12/16/2036 | 1,443,000 | 1,866,133 | ||||||
| Homebuilding – 1.96% | ||||||||
| NVR, Inc. | ||||||||
| 3.950%, 09/15/2022 | 1,405,000 | 1,455,958 | ||||||
The accompanying notes are an integral part of these financial statements.
26
Rockefeller Core Taxable Bond Fund
| Schedule of Investments (Continued) |
May 31, 2019 (Unaudited)
| Principal | ||||||||
| Amount | Value | |||||||
| Integrated Telecommunication Services – 2.52% | ||||||||
| Verizon Communications, Inc. | ||||||||
| 5.250%, 03/16/2037 | $ | 1,629,000 | $ | 1,872,949 | ||||
| Investment Banking & Brokerage – 5.63% | ||||||||
| Morgan Stanley | ||||||||
| 6.375%, 07/24/2042 | 1,637,000 | 2,184,296 | ||||||
| The Goldman Sachs Group, Inc. | ||||||||
| 4.223% (3 Month LIBOR USD + 1.301%), 05/01/2029 (a) | 1,921,000 | 1,997,858 | ||||||
4,182,154 | ||||||||
| Total Corporate Bonds (Cost $22,666,268) | 23,352,822 | |||||||
| Mortgage-Backed Securities – 20.60% | ||||||||
| Fannie Mae Pool | ||||||||
| 2.500%, 07/01/2023 | 213,073 | 213,880 | ||||||
| 3.000%, 04/01/2032 | 1,318,112 | 1,337,878 | ||||||
| 3.500%, 05/01/2039 | 712,443 | 732,148 | ||||||
| 3.000%, 05/01/2043 | 2,604,567 | 2,628,691 | ||||||
| 4.000%, 10/01/2048 | 2,544,065 | 2,675,517 | ||||||
| 4.000%, 12/01/2048 | 1,501,905 | 1,555,822 | ||||||
| Freddie Mac Gold Pool | ||||||||
| 2.500%, 10/01/2032 | 1,088,272 | 1,090,515 | ||||||
| 3.500%, 01/01/2048 | 3,047,723 | 3,124,169 | ||||||
| 4.500%, 06/01/2048 | 1,857,800 | 1,950,567 | ||||||
| Total Mortgage-Backed Securities (Cost $15,021,512) | 15,309,187 | |||||||
| Municipal Bonds – 15.45% | ||||||||
| California – 4.86% | ||||||||
| Contra Costa Community College District | ||||||||
| 6.504%, 08/01/2034 | 750,000 | 998,107 | ||||||
| Los Angeles Department of Water & Power System Revenue | ||||||||
| 5.516%, 07/01/2027 | 380,000 | 457,786 | ||||||
| Metropolitan Water District of Southern California | ||||||||
| 6.538%, 07/01/2039 | 1,000,000 | 1,003,110 | ||||||
| San Diego County Regional Airport Authority | ||||||||
| 6.628%, 07/01/2040 | 1,105,000 | 1,153,554 | ||||||
3,612,557 | ||||||||
| New York – 0.72% | ||||||||
| Nassau County Interim Finance Authority | ||||||||
| 1.976%, 11/15/2019 | 150,000 | 149,748 | ||||||
The accompanying notes are an integral part of these financial statements.
27
Rockefeller Core Taxable Bond Fund
| Schedule of Investments (Continued) |
May 31, 2019 (Unaudited)
| Principal | ||||||||
| Amount | Value | |||||||
| New York – 0.72% (Continued) | ||||||||
| New York City Transitional Finance Authority | ||||||||
| Future Tax Secured Revenue | ||||||||
| 2.540%, 08/01/2023 | $ | 150,000 | $ | 151,821 | ||||
| 5.932%, 11/01/2036 | 225,000 | 235,643 | ||||||
537,212 | ||||||||
| North Carolina – 2.49% | ||||||||
| University of North Carolina at Chapel Hill | ||||||||
| 3.327%, 12/01/2036 | 1,755,000 | 1,848,770 | ||||||
| Ohio – 0.74% | ||||||||
| Ohio Housing Finance Agency | ||||||||
| 2.650%, 11/01/2041 | 543,000 | 545,856 | ||||||
| Texas – 4.84% | ||||||||
| Permanent University Fund – Texas A&M University System | ||||||||
| 3.660%, 07/01/2047 | 3,500,000 | 3,595,200 | ||||||
| Washington – 1.80% | ||||||||
| University of Washington | ||||||||
| 3.704%, 12/01/2044 | 1,315,000 | 1,340,800 | ||||||
| Total Municipal Bonds (Cost $11,274,053) | 11,480,395 | |||||||
| U.S. Government Agency Issues – 6.49% | ||||||||
| Ginnie Mae II Pool | ||||||||
| 3.000%, 08/20/2045 | 1,418,073 | 1,441,591 | ||||||
| 3.500%, 03/20/2047 | 1,984,286 | 2,043,420 | ||||||
| 4.000%, 12/20/2047 | 1,290,985 | 1,338,878 | ||||||
| Total U.S. Government Agency Issues (Cost $4,732,793) | 4,823,889 | |||||||
| U.S. Government Notes/Bonds – 21.81% | ||||||||
| United States Treasury Note/Bond | ||||||||
| 2.875%, 11/15/2021 | 2,973,000 | 3,040,357 | ||||||
| 1.625%, 08/31/2022 | 1,801,000 | 1,785,452 | ||||||
| 2.875%, 09/30/2023 | 1,374,000 | 1,427,565 | ||||||
| 2.625%, 03/31/2025 | 4,531,000 | 4,690,381 | ||||||
| 2.750%, 02/15/2028 | 2,081,000 | 2,186,310 | ||||||
| 2.500%, 02/15/2045 | 3,123,000 | 3,080,547 | ||||||
| Total U.S. Government Notes/Bonds (Cost $15,415,147) | 16,210,612 | |||||||
The accompanying notes are an integral part of these financial statements.
28
Rockefeller Core Taxable Bond Fund
| Schedule of Investments (Continued) |
May 31, 2019 (Unaudited)
| Shares | Value | |||||||
| Money Market Funds – 1.29% | ||||||||
| Morgan Stanley Institutional Liquidity Funds – | ||||||||
| Treasury Portfolio – Institutional Class, 2.259% (b) | 958,679 | $ | 958,679 | |||||
| Total Money Market Funds (Cost $958,679) | 958,679 | |||||||
| Total Investments (Cost $72,439,802) – 100.27% | 74,517,659 | |||||||
| Liabilities in Excess of Other Assets – (0.27)% | (198,781 | ) | ||||||
| Total Net Assets – 100.00% | $ | 74,318,878 | ||||||
Percentages are stated as a percent of net assets.
| (a) | Variable rate security; the rate shown represents the rate at May 31, 2019. |
| (b) | The rate shown represents the seven day yield as of May 31, 2019. |
The Global Industry Classification Standard (GICS®) was developed by and/or is the exclusive property of MSCI, Inc. (“MSCI”) and Standard & Poor’s Financial Services LLC (“S&P”). GICS is a service mark of MSCI and S&P and has been licensed for use by U.S. Bancorp Fund Services, LLC.
The accompanying notes are an integral part of these financial statements.
29
Rockefeller Intermediate Tax Exempt National Bond Fund
| Schedule of Investments |
May 31, 2019 (Unaudited)
| Principal | ||||||||
| Amount | Value | |||||||
| Municipal Bonds – 98.64% | ||||||||
| Alaska – 0.70% | ||||||||
| State of Alaska | ||||||||
| 5.000%, 04/01/2022 | $ | 695,000 | $ | 714,161 | ||||
| Arizona – 0.76% | ||||||||
| Salt River Project Agricultural Improvement & Power District | ||||||||
| 5.000%, 01/01/2032 | 625,000 | 777,306 | ||||||
| Connecticut – 2.48% | ||||||||
| Connecticut Housing Finance Authority | ||||||||
| 2.850%, 11/15/2026 | 465,000 | 481,703 | ||||||
| Connecticut State Health & Educational | ||||||||
| Facilities Authority – Yale University | ||||||||
| 2.050%, 07/01/2035 (a) | 1,025,000 | 1,037,484 | ||||||
| Connecticut State Health & Educational | ||||||||
| Facility Authority – Yale University | ||||||||
| 2.000%, 07/01/2042 (a) | 1,000,000 | 1,013,040 | ||||||
2,532,227 | ||||||||
| Florida – 2.93% | ||||||||
| Florida Housing Finance Corp. | ||||||||
| 2.250%, 01/01/2026 | 485,000 | 494,050 | ||||||
| 3.200%, 07/01/2030 | 815,000 | 841,512 | ||||||
| Florida’s Turnpike Enterprise | ||||||||
| 4.000%, 07/01/2033 | 1,500,000 | 1,652,760 | ||||||
2,988,322 | ||||||||
| Illinois – 5.07% | ||||||||
| Chicago O’Hare International Airport | ||||||||
| 5.000%, 01/01/2036 | 2,000,000 | 2,362,980 | ||||||
| Illinois Finance Authority – Ascension Health Credit Group | ||||||||
| 4.000%, 02/15/2033 | 2,550,000 | 2,813,645 | ||||||
5,176,625 | ||||||||
| Iowa – 0.76% | ||||||||
| Iowa State University of Science & Technology – | ||||||||
| Iowa State University of Science | ||||||||
| 3.000%, 07/01/2025 | 720,000 | 777,110 | ||||||
| Kansas – 1.43% | ||||||||
| State of Kansas Department of Transportation | ||||||||
| 5.000%, 09/01/2030 | 1,180,000 | 1,462,221 | ||||||
The accompanying notes are an integral part of these financial statements.
30
Rockefeller Intermediate Tax Exempt National Bond Fund
| Schedule of Investments (Continued) |
May 31, 2019 (Unaudited)
| Principal | ||||||||
| Amount | Value | |||||||
| Kentucky – 2.11% | ||||||||
| Kentucky Rural Water Finance Corp. | ||||||||
| 2.250%, 03/01/2020 | $ | 2,150,000 | $ | 2,152,688 | ||||
| Maryland – 1.21% | ||||||||
| City of Baltimore, MD – Baltimore, MD Wastewater Utility | ||||||||
| 5.000%, 07/01/2027 | 1,000,000 | 1,239,850 | ||||||
| Massachusetts – 3.75% | ||||||||
| Massachusetts Development Finance Agency – | ||||||||
| Dana-Farber Cancer Obligation | ||||||||
| 5.000%, 12/01/2032 | 430,000 | 516,834 | ||||||
| Massachusetts Development Finance Agency – | ||||||||
| Partners HealthCare System | ||||||||
| 5.000%, 07/01/2030 | 2,660,000 | 3,311,301 | ||||||
3,828,135 | ||||||||
| Minnesota – 2.21% | ||||||||
| City of Rochester, MN | ||||||||
| 4.500%, 11/15/2038 (a) | 1,000,000 | 1,071,210 | ||||||
| Minneapolis-St. Paul Metropolitan Airports Commission | ||||||||
| 5.000%, 01/01/2030 | 1,040,000 | 1,185,257 | ||||||
2,256,467 | ||||||||
| Nebraska – 1.53% | ||||||||
| Nebraska Investment Finance Authority | ||||||||
| 2.900%, 09/01/2026 | 505,000 | 526,185 | ||||||
| 3.350%, 09/01/2028 | 1,000,000 | 1,035,860 | ||||||
1,562,045 | ||||||||
| Nevada – 6.58% | ||||||||
| Clark County Water Reclamation District | ||||||||
| 4.000%, 07/01/2034 | 1,175,000 | 1,298,927 | ||||||
| County of Clark Department of Aviation | ||||||||
| 5.000%, 07/01/2029 | 1,770,000 | 2,040,686 | ||||||
| Las Vegas Valley Water District | ||||||||
| 5.000%, 06/01/2026 | 1,000,000 | 1,102,620 | ||||||
| 5.000%, 06/01/2030 | 1,300,000 | 1,427,790 | ||||||
| 5.000%, 06/01/2030 | 700,000 | 845,719 | ||||||
6,715,742 | ||||||||
| New Hampshire – 0.50% | ||||||||
| New Hampshire Health and Education | ||||||||
| Facilities Authority Act – LRGHealthcare | ||||||||
| 5.000%, 04/01/2029 | 500,000 | 505,555 | ||||||
The accompanying notes are an integral part of these financial statements.
31
Rockefeller Intermediate Tax Exempt National Bond Fund
| Schedule of Investments (Continued) |
May 31, 2019 (Unaudited)
| Principal | ||||||||
| Amount | Value | |||||||
| New York – 22.69% | ||||||||
| Metropolitan Transportation Authority | ||||||||
| 2.370% (SIFMA Municipal Swap Index + 0.950%), 11/01/2019 (b) | $ | 150,000 | $ | 150,562 | ||||
| 4.000%, 11/15/2035 | 1,000,000 | 1,115,070 | ||||||
| New York City Transitional Finance Authority Building Aid Revenue | ||||||||
| 5.000%, 07/15/2029 | 1,500,000 | 1,768,545 | ||||||
| New York City Transitional Finance Authority | ||||||||
| Future Tax Secured Revenue | ||||||||
| 5.000%, 08/01/2034 | 1,000,000 | 1,200,210 | ||||||
| New York City Water & Sewer System | ||||||||
| 5.000%, 06/15/2026 | 1,500,000 | 1,609,320 | ||||||
| 5.000%, 06/15/2027 | 1,000,000 | 1,203,630 | ||||||
| 5.000%, 06/15/2032 | 430,000 | 527,864 | ||||||
| New York State Dormitory Authority | ||||||||
| 5.000%, 02/15/2033 | 1,000,000 | 1,171,690 | ||||||
| New York State Environmental Facilities Corp. | ||||||||
| 5.000%, 06/15/2022 | 900,000 | 966,339 | ||||||
| 5.000%, 06/15/2025 | 1,365,000 | 1,464,768 | ||||||
| New York State Urban Development Corp. | ||||||||
| 5.000%, 03/15/2029 | 2,500,000 | 2,818,875 | ||||||
| Port Authority of New York & New Jersey | ||||||||
| 5.000%, 12/01/2028 | 1,500,000 | 1,730,445 | ||||||
| 5.000%, 11/15/2033 | 2,740,000 | 3,390,476 | ||||||
| Sales Tax Asset Receivable Corp. | ||||||||
| 5.000%, 10/15/2027 | 1,000,000 | 1,182,350 | ||||||
| 5.000%, 10/15/2029 | 250,000 | 294,737 | ||||||
| State of New York Mortgage Agency | ||||||||
| 2.750%, 10/01/2028 | 400,000 | 413,056 | ||||||
| 3.125%, 10/01/2032 | 970,000 | 997,286 | ||||||
| Triborough Bridge & Tunnel Authority | ||||||||
| 5.000%, 11/15/2030 | 925,000 | 1,148,388 | ||||||
23,153,611 | ||||||||
| North Carolina – 0.64% | ||||||||
| City of Charlotte, NC Airport Revenue | ||||||||
| 5.000%, 07/01/2025 | 560,000 | 655,116 | ||||||
| Ohio – 3.53% | ||||||||
| Ohio Housing Finance Agency | ||||||||
| 5.000%, 11/01/2019 | 600,000 | 608,256 | ||||||
| Ohio Water Development Authority | ||||||||
| 5.000%, 06/01/2028 | 750,000 | 933,713 | ||||||
| 5.000%, 12/01/2030 | 1,675,000 | 2,057,352 | ||||||
3,599,321 | ||||||||
The accompanying notes are an integral part of these financial statements.
32
Rockefeller Intermediate Tax Exempt National Bond Fund
| Schedule of Investments (Continued) |
May 31, 2019 (Unaudited)
| Principal | ||||||||
| Amount | Value | |||||||
| Pennsylvania – 5.60% | ||||||||
| Pennsylvania Economic Development | ||||||||
| Financing Authority – UPMC Obligated Group | ||||||||
| 5.000%, 02/01/2033 | $ | 1,130,000 | $ | 1,299,997 | ||||
| 4.000%, 11/15/2035 | 1,415,000 | 1,558,354 | ||||||
| Pennsylvania Housing Finance Agency | ||||||||
| 2.375%, 10/01/2027 | 500,000 | 506,775 | ||||||
| 3.200%, 10/01/2031 | 2,000,000 | 2,063,980 | ||||||
| Southeastern Pennsylvania Transportation Authority | ||||||||
| 5.000%, 03/01/2021 | 155,000 | 158,994 | ||||||
| 5.000%, 03/01/2027 | 120,000 | 122,939 | ||||||
5,711,039 | ||||||||
| Tennessee – 1.50% | ||||||||
| Tennessee Housing Development Agency | ||||||||
| 1.350%, 07/01/2020 | 1,530,000 | 1,527,384 | ||||||
| Texas – 22.11% | ||||||||
| Aldine Independent School District | ||||||||
| 5.000%, 02/15/2028 | 1,000,000 | 1,177,670 | ||||||
| Arlington Higher Education Finance Corp. – | ||||||||
| A.W. Brown Fellowship Leader | ||||||||
| 5.000%, 08/15/2024 | 315,000 | 364,420 | ||||||
| Arlington Higher Education Finance Corp. – KIPP Texas, Inc. | ||||||||
| 5.000%, 08/15/2027 | 1,220,000 | 1,510,153 | ||||||
| City of Houston, TX | ||||||||
| 5.000%, 03/01/2029 | 2,575,000 | 3,145,697 | ||||||
| Dallas Independent School District | ||||||||
| 5.000%, 02/15/2036 (a) | 5,000 | 5,469 | ||||||
| Fort Bend, TX Independent School District | ||||||||
| 5.000%, 08/15/2028 | 500,000 | 611,940 | ||||||
| Grapevine-Colleyville Independent School District | ||||||||
| 2.000%, 08/01/2036 (a) | 470,000 | 471,932 | ||||||
| 2.000%, 08/01/2036 (a) | 530,000 | 532,846 | ||||||
| La Joya Independent School District | ||||||||
| 5.000%, 02/15/2028 | 550,000 | 686,961 | ||||||
| Lovejoy Independent School District | ||||||||
| 5.000%, 02/15/2027 | 980,000 | 1,154,646 | ||||||
| North Texas Tollway Authority | ||||||||
| 5.000%, 01/01/2026 | 3,800,000 | 4,356,358 | ||||||
| San Antonio Water System | ||||||||
| 2.625%, 05/01/2049 | 2,500,000 | 2,601,400 | ||||||
| State of Texas | ||||||||
| 5.000%, 10/01/2034 | 1,250,000 | 1,527,312 | ||||||
The accompanying notes are an integral part of these financial statements.
33
Rockefeller Intermediate Tax Exempt National Bond Fund
| Schedule of Investments (Continued) |
May 31, 2019 (Unaudited)
| Principal | ||||||||
| Amount | Value | |||||||
| Texas – 22.11% (Continued) | ||||||||
| Tarrant Regional Water District | ||||||||
| 5.000%, 03/01/2029 | $ | 2,500,000 | $ | 2,952,900 | ||||
| Texas State University System | ||||||||
| 5.000%, 03/15/2021 | 595,000 | 611,416 | ||||||
| Tomball Independent School District | ||||||||
| 1.100%, 02/15/2043 (a) | 850,000 | 849,269 | ||||||
22,560,389 | ||||||||
| Virginia – 2.23% | ||||||||
| Virginia Commonwealth Transportation Board | ||||||||
| 5.000%, 05/15/2028 | 1,000,000 | 1,251,490 | ||||||
| Virginia Housing Development Authority | ||||||||
| 2.490%, 01/01/2022 | 1,000,000 | 1,023,740 | ||||||
2,275,230 | ||||||||
| Washington – 4.54% | ||||||||
| Central Puget Sound Regional Transit Authority | ||||||||
| 5.000%, 11/01/2030 | 750,000 | 913,980 | ||||||
| City of Monroe, WA Water & Sewer Revenue | ||||||||
| 4.750%, 12/01/2031 | 100,000 | 106,578 | ||||||
| State of Washington | ||||||||
| 5.000%, 07/01/2029 | 1,500,000 | 1,802,130 | ||||||
| 5.000%, 08/01/2029 | 400,000 | 452,928 | ||||||
| Washington State Housing Finance Commission | ||||||||
| 3.000%, 12/01/2031 | 1,325,000 | 1,357,913 | ||||||
4,633,529 | ||||||||
| Wisconsin – 3.78% | ||||||||
| City of Madison, WI Water Utility Revenue | ||||||||
| 4.000%, 01/01/2026 | 800,000 | 812,920 | ||||||
| State of Wisconsin | ||||||||
| 5.000%, 05/01/2032 | 1,015,000 | 1,173,025 | ||||||
| 5.000%, 11/01/2032 | 500,000 | 612,810 | ||||||
| Wisconsin Department of Transportation | ||||||||
| 5.000%, 07/01/2028 | 1,085,000 | 1,263,515 | ||||||
3,862,270 | ||||||||
| Total Municipal Bonds (Cost $97,715,854) | 100,666,343 | |||||||
The accompanying notes are an integral part of these financial statements.
34
Rockefeller Intermediate Tax Exempt National Bond Fund
| Schedule of Investments (Continued) |
May 31, 2019 (Unaudited)
| Shares | Value | |||||||
| Money Market Funds – 0.27% | ||||||||
| Morgan Stanley Institutional Liquidity Funds – | ||||||||
| Treasury Portfolio – Institutional Class, 2.259% (c) | 271,474 | $ | 271,474 | |||||
| Total Money Market Funds (Cost $271,474) | 271,474 | |||||||
| Total Investments (Cost $97,987,328) – 98.91% | 100,937,817 | |||||||
| Other Assets in Excess of Liabilities – 1.09% | 1,114,414 | |||||||
| Total Net Assets – 100.00% | $ | 102,052,231 | ||||||
Percentages are stated as a percent of net assets.
| (a) | Adjustable rate security; the rate is determined by a Remarketing Agreement. |
| (b) | Variable rate security; the rate shown represents the rate at May 31, 2019. |
| (c) | The rate shown represents the seven day yield as of May 31, 2019. |
The accompanying notes are an integral part of these financial statements.
35
Rockefeller Intermediate Tax Exempt New York Bond Fund
| Schedule of Investments |
May 31, 2019 (Unaudited)
| Principal | ||||||||
| Amount | Value | |||||||
| Municipal Bonds – 99.02% | ||||||||
| New York – 99.02% | ||||||||
| City of New York, NY | ||||||||
| 4.000%, 08/01/2034 | $ | 500,000 | $ | 563,340 | ||||
| 5.000%, 12/01/2035 | 1,230,000 | 1,525,372 | ||||||
| County of Albany, NY | ||||||||
| 5.000%, 04/01/2022 | 1,000,000 | 1,104,090 | ||||||
| County of Schenectady, NY | ||||||||
| 2.000%, 12/15/2020 | 150,000 | 151,907 | ||||||
| County of Westchester, NY | ||||||||
| 4.000%, 07/01/2022 | 5,000 | 5,269 | ||||||
| 4.000%, 12/01/2029 | 1,000,000 | 1,174,880 | ||||||
| Housing Development Corp. of New York City | ||||||||
| 1.900%, 05/01/2021 | 405,000 | 405,328 | ||||||
| Metropolitan Transportation Authority | ||||||||
| 2.370% (SIFMA Municipal Swap Index + 0.950%), 11/01/2019 (a) | 550,000 | 552,063 | ||||||
| 5.000%, 11/15/2026 | 1,000,000 | 1,120,050 | ||||||
| 5.000%, 11/15/2034 (b) | 1,000,000 | 1,022,680 | ||||||
| 4.000%, 11/15/2035 | 675,000 | 752,672 | ||||||
| New York City Housing Development Corp. | ||||||||
| 2.850%, 11/01/2031 | 1,130,000 | 1,154,849 | ||||||
| New York City Transitional Finance Authority Building Aid Revenue | ||||||||
| 5.000%, 07/15/2023 | 500,000 | 538,770 | ||||||
| 5.000%, 07/15/2030 | 1,120,000 | 1,334,726 | ||||||
| New York City Transitional Finance Authority | ||||||||
| Future Tax Secured Revenue | ||||||||
| 5.000%, 02/01/2034 | 2,000,000 | 2,417,660 | ||||||
| New York City Trust for Cultural Resources – | ||||||||
| American Museum of Natural History | ||||||||
| 5.000%, 07/01/2031 | 620,000 | 718,016 | ||||||
| New York City Trust for Cultural Resources – | ||||||||
| Whitney Museum of American Art | ||||||||
| 5.000%, 07/01/2031 | 1,000,000 | 1,052,740 | ||||||
| New York City Water & Sewer System | ||||||||
| 4.000%, 06/15/2036 | 1,090,000 | 1,242,796 | ||||||
| New York Power Authority | ||||||||
| 5.000%, 11/15/2022 | 175,000 | 197,015 | ||||||
| New York State Dormitory Authority | ||||||||
| 5.000%, 03/15/2022 | 100,000 | 110,077 | ||||||
| 5.000%, 07/01/2027 | 750,000 | 847,988 | ||||||
| 5.000%, 02/15/2033 | 1,000,000 | 1,171,690 | ||||||
| 5.000%, 03/15/2035 | 2,000,000 | 2,355,720 | ||||||
| 5.000%, 03/15/2036 | 225,000 | 265,565 | ||||||
The accompanying notes are an integral part of these financial statements.
36
Rockefeller Intermediate Tax Exempt New York Bond Fund
| Schedule of Investments (Continued) |
May 31, 2019 (Unaudited)
| Principal | ||||||||
| Amount | Value | |||||||
| New York – 99.02% (Continued) | ||||||||
| New York State Dormitory Authority – Memorial Sloan-Kettering | ||||||||
| 5.000%, 07/01/2023 | $ | 1,250,000 | $ | 1,366,875 | ||||
| 5.000%, 07/01/2029 | 500,000 | 543,430 | ||||||
| New York State Dormitory Authority – New York University | ||||||||
| 5.000%, 07/01/2033 | 1,000,000 | 1,184,640 | ||||||
| New York State Dormitory Authority – State University of New York | ||||||||
| 5.000%, 07/01/2031 | 1,105,000 | 1,356,376 | ||||||
| New York State Environmental Facilities Corp. | ||||||||
| 5.000%, 10/15/2024 | 525,000 | 541,627 | ||||||
| 5.000%, 06/15/2025 | 1,000,000 | 1,073,090 | ||||||
| New York State Housing Finance Agency | ||||||||
| 2.125%, 11/01/2023 | 400,000 | 402,516 | ||||||
| 2.900%, 11/01/2025 | 190,000 | 197,896 | ||||||
| 3.050%, 11/01/2027 | 1,000,000 | 1,023,850 | ||||||
| New York State Thruway Authority | ||||||||
| 5.000%, 01/01/2032 | 1,000,000 | 1,166,350 | ||||||
| 5.000%, 01/01/2035 | 1,000,000 | 1,177,570 | ||||||
| New York State Urban Development Corp. | ||||||||
| 5.000%, 01/01/2021 | 500,000 | 510,295 | ||||||
| 5.000%, 03/15/2029 | 750,000 | 845,663 | ||||||
| Port Authority of New York & New Jersey | ||||||||
| 5.000%, 11/15/2031 | 300,000 | 374,118 | ||||||
| 5.000%, 10/15/2033 | 1,000,000 | 1,193,910 | ||||||
| 5.000%, 11/15/2033 | 725,000 | 897,115 | ||||||
| Sales Tax Asset Receivable Corp. | ||||||||
| 5.000%, 10/15/2028 | 1,000,000 | 1,181,210 | ||||||
| 5.000%, 10/15/2029 | 525,000 | 618,949 | ||||||
| State of New York | ||||||||
| 5.000%, 03/01/2028 | 500,000 | 564,710 | ||||||
| 5.000%, 12/15/2030 | 1,000,000 | 1,088,010 | ||||||
| State of New York Mortgage Agency | ||||||||
| 2.650%, 04/01/2029 | 500,000 | 508,345 | ||||||
| The Erie County Industrial Development Agency | ||||||||
| 5.000%, 05/01/2024 | 1,260,000 | 1,388,444 | ||||||
| Triborough Bridge & Tunnel Authority | ||||||||
| 5.000%, 11/15/2028 | 300,000 | 335,907 | ||||||
| 5.000%, 11/15/2029 | 425,000 | 532,155 | ||||||
| 2.775%, 11/15/2032 (c) | 465,000 | 320,199 | ||||||
| 5.000%, 11/15/2034 | 1,000,000 | 1,249,360 | ||||||
| Utility Debt Securitization Authority | ||||||||
| 5.000%, 12/15/2028 | 750,000 | 912,188 | ||||||
| 5.000%, 12/15/2034 | 1,000,000 | 1,204,370 | ||||||
The accompanying notes are an integral part of these financial statements.
37
Rockefeller Intermediate Tax Exempt New York Bond Fund
| Schedule of Investments (Continued) |
May 31, 2019 (Unaudited)
| Principal | ||||||||
| Amount | Value | |||||||
| New York – 99.02% (Continued) | ||||||||
| Village of Harrison, NY | ||||||||
| 4.000%, 12/15/2023 | $ | 105,000 | $ | 118,002 | ||||
| Total Municipal Bonds (Cost $44,484,673) | 45,662,433 | |||||||
| Total Investments (Cost $44,484,673) – 99.02% | 45,662,433 | |||||||
| Other Assets in Excess of Liabilities – 0.98% | 450,024 | |||||||
| Total Net Assets – 100.00% | $ | 46,112,457 | ||||||
Percentages are stated as a percent of net assets.
| (a) | Variable rate security; the rate shown represents the rate at May 31, 2019. |
| (b) | Adjustable rate security; the rate is determined by a Remarketing Agreement. |
| (c) | Zero coupon bond; effective yield is shown. |
The accompanying notes are an integral part of these financial statements.
38
(This Page Intentionally Left Blank.)
39
Rockefeller Funds
| Statements of Assets and Liabilities |
Assets
Investments, at value (cost $94,678,290, $72,439,802, $97,987,328,
and $44,484,673, respectively)
Cash
Dividends and interest receivable
Foreign currencies (Cost $2,626, $—, $—, $—, respectively)
Receivable for foreign currencies
Receivable for investment securities sold
Other assets
Total Assets
Liabilities
Payable to Adviser
Payable to affiliates
Payable to custodian
Payable for foreign currencies
Payable for investments purchased
Accrued expenses and other liabilities
Total Liabilities
Net Assets
Net Assets Consist of:
Paid-in capital
Total distributable earnings
Net Assets
Shares of beneficial interest outstanding (unlimited
number of shares authorized, $0.001 par value)
Net asset value, redemption price and offering price per share
The accompanying notes are an integral part of these financial statements.
40
May 31, 2019 (Unaudited)
| Rockefeller | Rockefeller | Rockefeller | ||||||||||||
| Equity | Rockefeller | Intermediate | Intermediate | |||||||||||
| Allocation | Core Taxable | Tax Exempt | Tax Exempt | |||||||||||
| Fund | Bond Fund | National Bond Fund | New York Bond Fund | |||||||||||
$ | 107,156,956 | $ | 74,517,659 | $ | 100,937,817 | $ | 45,662,433 | |||||||
— | — | — | — | |||||||||||
358,146 | 592,077 | 1,192,923 | 504,440 | |||||||||||
2,564 | — | — | — | |||||||||||
2,598 | — | — | — | |||||||||||
203,671 | — | — | — | |||||||||||
7,462 | 4,648 | 7,403 | 3,102 | |||||||||||
107,731,397 | 75,114,384 | 102,138,143 | 46,169,975 | |||||||||||
80,842 | 21,765 | 30,127 | 13,625 | |||||||||||
45,978 | 24,797 | 34,799 | 18,574 | |||||||||||
— | — | — | 1,631 | |||||||||||
2,604 | — | — | — | |||||||||||
— | 728,413 | — | — | |||||||||||
21,672 | 20,531 | 20,986 | 23,688 | |||||||||||
151,096 | 795,506 | 85,912 | 57,518 | |||||||||||
$ | 107,580,301 | $ | 74,318,878 | $ | 102,052,231 | $ | 46,112,457 | |||||||
$ | 95,380,729 | $ | 73,611,794 | $ | 98,826,738 | $ | 44,746,028 | |||||||
12,199,572 | 707,084 | 3,225,493 | 1,366,429 | |||||||||||
$ | 107,580,301 | $ | 74,318,878 | $ | 102,052,231 | $ | 46,112,457 | |||||||
9,540,977 | 7,318,439 | 9,842,304 | 4,469,483 | |||||||||||
$ | 11.28 | $ | 10.16 | $ | 10.37 | $ | 10.32 | |||||||
The accompanying notes are an integral part of these financial statements.
41
Rockefeller Funds
| Statements of Operations |
Investment Income
Dividend income
Interest income
Total Investment Income
Expenses
Management fees
Administration and accounting fees
Custody fees
Audit and tax fees
Transfer agent fees & expenses
Pricing fees
Legal fees
Chief Compliance Officer fees
Federal & state registration fees
Trustees’ fees
Reports to shareholders
Other expenses
Net expenses
Net Investment Income
Realized and Unrealized Gain (Loss) on Investments
Net realized gain/(loss) from:
Investments
Foreign currency
Change in net unrealized appreciation/(depreciation) on:
Investments
Foreign currency
Net Realized and Unrealized Gain/(Loss) on Investments
Net Increase/(Decrease) in Net Assets from Operations
(1) Net of $152,945 and $2,148 withholding taxes and issuance fees, respectively.
The accompanying notes are an integral part of these financial statements.
42
For the Period Ended May 31, 2019 (Unaudited)
| Rockefeller | Rockefeller | Rockefeller | ||||||||||||
| Equity | Rockefeller | Intermediate | Intermediate | |||||||||||
| Allocation | Core Taxable | Tax Exempt | Tax Exempt | |||||||||||
| Fund | Bond Fund | National Bond Fund | New York Bond Fund | |||||||||||
$ | 1,425,151 | (1) | $ | 64,649 | $ | — | $ | — | ||||||
24,905 | 1,187,589 | 1,130,526 | 479,600 | |||||||||||
1,450,056 | 1,252,238 | 1,130,526 | 479,600 | |||||||||||
462,146 | 125,176 | 176,121 | 78,837 | |||||||||||
83,583 | 52,922 | 74,706 | 33,152 | |||||||||||
17,708 | 2,189 | 2,915 | 2,187 | |||||||||||
16,023 | 18,333 | 16,566 | 16,166 | |||||||||||
10,107 | 9,012 | 10,016 | 8,378 | |||||||||||
8,134 | 3,459 | 11,457 | 7,408 | |||||||||||
7,391 | 6,391 | 6,936 | 5,481 | |||||||||||
5,100 | 5,100 | 5,100 | 5,100 | |||||||||||
4,304 | 3,280 | 5,808 | 2,800 | |||||||||||
4,101 | 4,101 | 4,101 | 4,098 | |||||||||||
2,001 | 1,087 | 1,727 | 813 | |||||||||||
4,255 | 3,366 | 3,551 | 3,183 | |||||||||||
624,853 | 234,416 | 319,004 | 167,603 | |||||||||||
825,203 | 1,017,822 | 811,522 | 311,997 | |||||||||||
(482,762 | ) | (886,173 | ) | 85,308 | 201,489 | |||||||||
(26,317 | ) | — | — | — | ||||||||||
(2,359,363 | ) | 4,301,637 | 4,056,782 | 1,695,172 | ||||||||||
3,348 | — | — | — | |||||||||||
(2,865,094 | ) | 3,415,464 | 4,142,090 | 1,896,661 | ||||||||||
$ | (2,039,891 | ) | $ | 4,433,286 | $ | 4,953,612 | $ | 2,208,658 | ||||||
The accompanying notes are an integral part of these financial statements.
43
Rockefeller Equity Allocation Fund
| Statements of Changes in Net Assets |
| Six Months Ended | ||||||||
| May 31, 2019 | Year Ended | |||||||
| (Unaudited) | November 30, 2018 | |||||||
| From Operations | ||||||||
| Net investment income | $ | 825,203 | $ | 655,526 | ||||
| Net realized gain/(loss) from investments | ||||||||
| and foreign currency translation | (509,079 | ) | 6,765,352 | |||||
| Net change in unrealized | ||||||||
| depreciation on investments | ||||||||
| and foreign currency translation | (2,356,015 | ) | (9,364,518 | ) | ||||
Net decrease in net assets from operations | (2,039,891 | ) | (1,943,640 | ) | ||||
| From Distributions | ||||||||
| Net dividends and distributions | (5,648,060 | ) | (2,626,736 | ) | ||||
Net decrease in net assets resulting | ||||||||
from distributions paid | (5,648,060 | ) | (2,626,736 | ) | ||||
| From Capital Share Transactions | ||||||||
| Proceeds from shares sold | 5,420,388 | 16,965,777 | ||||||
| Net asset value of shares issued | ||||||||
| to distributions declared | 2,239,798 | 959,210 | ||||||
| Costs of shares redeemed | (4,619,440 | ) | (19,387,142 | ) | ||||
Net increase/(decrease) in net assets | ||||||||
from capital share transactions | 3,040,746 | (1,462,155 | ) | |||||
| Total Decrease in Net Assets | (4,647,205 | ) | (6,032,531 | ) | ||||
| Net Assets | ||||||||
| Beginning of period | 112,227,506 | 118,260,037 | ||||||
| End of period | $ | 107,580,301 | $ | 112,227,506 | ||||
The accompanying notes are an integral part of these financial statements.
44
Rockefeller Core Taxable Bond Fund
| Statements of Changes in Net Assets |
| Six Months Ended | ||||||||
| May 31, 2019 | Year Ended | |||||||
| (Unaudited) | November 30, 2018 | |||||||
| From Operations | ||||||||
| Net investment income | $ | 1,017,822 | $ | 1,919,308 | ||||
| Net realized loss from investments | (886,173 | ) | (609,582 | ) | ||||
| Net change in unrealized | ||||||||
| appreciation/(depreciation) on investments | 4,301,637 | (2,328,784 | ) | |||||
Net increase/(decrease) in net | ||||||||
assets from operations | 4,433,286 | (1,019,058 | ) | |||||
| From Distributions | ||||||||
| Net dividends and distributions | (1,050,719 | ) | (1,869,846 | ) | ||||
Net decrease in net assets resulting | ||||||||
from distributions paid | (1,050,719 | ) | (1,869,846 | ) | ||||
| From Capital Share Transactions | ||||||||
| Proceeds from shares sold | 3,336,555 | 11,941,423 | ||||||
| Net asset value of shares issued | ||||||||
| to distributions declared | 549,672 | 1,010,544 | ||||||
| Costs of shares redeemed | (4,310,325 | ) | (14,768,309 | ) | ||||
Net decrease in net assets | ||||||||
from capital share transactions | (424,098 | ) | (1,816,342 | ) | ||||
| Total Increase/(Decrease) in Net Assets | 2,958,469 | (4,705,246 | ) | |||||
| Net Assets | ||||||||
| Beginning of period | 71,360,409 | 76,065,655 | ||||||
| End of period | $ | 74,318,878 | $ | 71,360,409 | ||||
The accompanying notes are an integral part of these financial statements.
45
Rockefeller Intermediate Tax Exempt National Bond Fund
| Statements of Changes in Net Assets |
| Six Months Ended | ||||||||
| May 31, 2019 | Year Ended | |||||||
| (Unaudited) | November 30, 2018 | |||||||
| From Operations | ||||||||
| Net investment income | $ | 811,522 | $ | 1,231,860 | ||||
| Net realized gain/(loss) from investments | 85,308 | (109,075 | ) | |||||
| Net change in unrealized | ||||||||
| appreciation/(depreciation) on investments | 4,056,782 | (855,682 | ) | |||||
Net increase in net assets from operations | 4,953,612 | 267,103 | ||||||
| From Distributions | ||||||||
| Net dividends and distributions | (785,167 | ) | (1,143,884 | ) | ||||
Net decrease in net assets | ||||||||
resulting from distributions paid | (785,167 | ) | (1,143,884 | ) | ||||
| From Capital Share Transactions | ||||||||
| Proceeds from shares sold | 5,662,702 | 23,699,832 | ||||||
| Net asset value of shares issued | ||||||||
| to distributions declared | 183,994 | 260,764 | ||||||
| Costs of shares redeemed | (10,208,306 | ) | (15,597,744 | ) | ||||
Net increase/(decrease) in net assets | ||||||||
from capital share transactions | (4,361,610 | ) | 8,362,852 | |||||
| Total Increase/(Decrease) in Net Assets | (193,165 | ) | 7,486,071 | |||||
| Net Assets | ||||||||
| Beginning of period | 102,245,396 | 94,759,325 | ||||||
| End of period | $ | 102,052,231 | $ | 102,245,396 | ||||
The accompanying notes are an integral part of these financial statements.
46
Rockefeller Intermediate Tax Exempt New York Bond Fund
| Statements of Changes in Net Assets |
| Six Months Ended | ||||||||
| May 31, 2019 | Year Ended | |||||||
| (Unaudited) | November 30, 2018 | |||||||
| From Operations | ||||||||
| Net investment income | $ | 311,997 | $ | 463,119 | ||||
| Net realized gain/(loss) from investments | 201,489 | (104,695 | ) | |||||
| Net change in unrealized | ||||||||
| appreciation/(depreciation) on investments | 1,695,172 | (341,514 | ) | |||||
Net increase in net assets from operations | 2,208,658 | 16,910 | ||||||
| From Distributions | ||||||||
| Net investment income | (297,016 | ) | (415,800 | ) | ||||
Net decrease in net assets | ||||||||
resulting from distributions paid | (297,016 | ) | (415,800 | ) | ||||
| From Capital Share Transactions | ||||||||
| Proceeds from shares sold | 2,729,500 | 16,144,766 | ||||||
| Net asset value of shares issued | ||||||||
| to distributions declared | 85,987 | 89,309 | ||||||
| Costs of shares redeemed | (3,682,731 | ) | (7,811,604 | ) | ||||
Net increase/(decrease) in net assets | ||||||||
from capital share transactions | (867,244 | ) | 8,422,471 | |||||
| Total Increase in Net Assets | 1,044,398 | 8,023,581 | ||||||
| Net Assets | ||||||||
| Beginning of period | 45,068,059 | 37,044,478 | ||||||
| End of period | $ | 46,112,457 | $ | 45,068,059 | ||||
The accompanying notes are an integral part of these financial statements.
47
Rockefeller Equity Allocation Fund
| Financial Highlights |
| Six Months | ||||
| Ended | ||||
| May 31, 2019 | ||||
| (Unaudited) | ||||
| Net Asset Value, Beginning of Period | $ | 12.11 | ||
| Income from investment operations: | ||||
Net investment income(2) | 0.09 | |||
| Net realized and unrealized gain (loss) on investments | (0.31 | ) | ||
Total from investment operations | (0.22 | ) | ||
| Less distributions paid: | ||||
| From net investment income | (0.02 | ) | ||
| From net realized gain on investments | (0.59 | ) | ||
Total distributions paid | (0.61 | ) | ||
| Net Asset Value, End of Period | $ | 11.28 | ||
Total Return(3) | -1.49 | % | ||
| Supplemental Data and Ratios: | ||||
Net assets at end of period (000’s) | $ | 107,580 | ||
Ratio of expenses to average net assets: | ||||
Before waiver, expense recoupment(4) | 1.15 | % | ||
After waiver, expense recoupment(4) | 1.15 | % | ||
Ratio of net investment income to average net assets: | ||||
Before waiver, expense recoupment(4) | 1.52 | % | ||
After waiver, expense recoupment(4) | 1.52 | % | ||
Portfolio turnover rate(3) | 14.69 | % | ||
(1) | The Fund commenced operations on February 4, 2015. |
(2) | Per share net investment income has been calculated using the daily average share method. |
(3) | Not annualized for periods less than one year. |
(4) | Annualized for periods less than one year. |
The accompanying notes are an integral part of these financial statements.
48
Per Share Data for a Share Outstanding Throughout the Period / Year
| Year Ended | Year Ended | Year Ended | Period Ended | |||||||||||
| November 30, | November 30, | November 30, | November 30, | |||||||||||
| 2018 | 2017 | 2016 | 2015(1) | |||||||||||
$ | 12.61 | $ | 10.05 | $ | 9.94 | $ | 10.00 | |||||||
0.07 | 0.09 | 0.09 | 0.05 | |||||||||||
(0.28 | ) | 2.57 | 0.10 | (0.08 | ) | |||||||||
(0.21 | ) | 2.66 | 0.19 | (0.03 | ) | |||||||||
(0.24 | ) | (0.10 | ) | (0.08 | ) | (0.03 | ) | |||||||
(0.05 | ) | — | — | — | ||||||||||
(0.29 | ) | (0.10 | ) | (0.08 | ) | (0.03 | ) | |||||||
$ | 12.11 | $ | 12.61 | $ | 10.05 | $ | 9.94 | |||||||
-1.69 | % | 26.54 | % | 2.05 | % | -0.28 | % | |||||||
$ | 112,228 | $ | 118,260 | $ | 90,612 | $ | 66,715 | |||||||
1.15 | % | 1.18 | % | 1.24 | % | 1.38 | % | |||||||
1.15 | % | 1.22 | % | 1.25 | % | 1.25 | % | |||||||
0.57 | % | 0.84 | % | 0.97 | % | 0.53 | % | |||||||
0.57 | % | 0.80 | % | 0.96 | % | 0.66 | % | |||||||
32.22 | % | 35.98 | % | 58.83 | % | 56.96 | % | |||||||
The accompanying notes are an integral part of these financial statements.
49
Rockefeller Core Taxable Bond Fund
| Financial Highlights |
| Six Months | ||||
| Ended | ||||
| May 31, 2019 | ||||
| (Unaudited) | ||||
| Net Asset Value, Beginning of Period | $ | 9.69 | ||
| Income from investment operations: | ||||
Net investment income(2) | 0.14 | |||
| Net realized and unrealized gain (loss) on investments | 0.47 | |||
Total from investment operations | 0.61 | |||
| Less distributions paid: | ||||
| From net investment income | (0.14 | ) | ||
| From net realized gain on investments | — | |||
Total distributions paid | (0.14 | ) | ||
| Net Asset Value, End of Period | $ | 10.16 | ||
Total Return(3) | 6.34 | % | ||
| Supplemental Data and Ratios: | ||||
Net assets at end of period (000’s) | $ | 74,319 | ||
Ratio of expenses to average net assets: | ||||
Before waiver, expense recoupment(4) | 0.66 | % | ||
After waiver, expense recoupment(4) | 0.66 | % | ||
Ratio of net investment income to average net assets: | ||||
Before waiver, expense recoupment(4) | 2.85 | % | ||
After waiver, expense recoupment(4) | 2.85 | % | ||
Portfolio turnover rate(3) | 62.75 | % | ||
(1) | The Fund commenced operations on December 26, 2013. |
(2) | Per share net investment income has been calculated using the daily average share method. |
(3) | Not annualized for periods less than one year. |
(4) | Annualized for periods less than one year. |
The accompanying notes are an integral part of these financial statements.
50
Per Share Data for a Share Outstanding Throughout each Period / Year
| Year Ended | Year Ended | Year Ended | Year Ended | Period Ended | ||||||||||||||
| November 30, | November 30, | November 30, | November 30, | November 30, | ||||||||||||||
| 2018 | 2017 | 2016 | 2015 | 2014(1) | ||||||||||||||
$ | 10.08 | $ | 10.08 | $ | 10.21 | $ | 10.30 | $ | 10.00 | |||||||||
0.26 | 0.21 | 0.19 | 0.13 | 0.11 | ||||||||||||||
(0.40 | ) | 0.08 | 0.04 | (0.03 | ) | 0.27 | ||||||||||||
(0.14 | ) | 0.29 | 0.23 | 0.10 | 0.38 | |||||||||||||
(0.25 | ) | (0.20 | ) | (0.19 | ) | (0.12 | ) | (0.08 | ) | |||||||||
— | (0.09 | ) | (0.17 | ) | (0.07 | ) | — | |||||||||||
(0.25 | ) | (0.29 | ) | (0.36 | ) | (0.19 | ) | (0.08 | ) | |||||||||
$ | 9.69 | $ | 10.08 | $ | 10.08 | $ | 10.21 | $ | 10.30 | |||||||||
-1.37 | % | 2.85 | % | 2.32 | % | 0.96 | % | 3.87 | % | |||||||||
$ | 71,360 | $ | 76,066 | $ | 79,441 | $ | 79,906 | $ | 74,684 | |||||||||
0.64 | % | 0.65 | % | 0.66 | % | 0.72 | % | 0.95 | % | |||||||||
0.64 | % | 0.65 | % | 0.66 | % | 0.80 | % | 0.85 | % | |||||||||
2.61 | % | 2.14 | % | 1.89 | % | 1.32 | % | 1.11 | % | |||||||||
2.61 | % | 2.14 | % | 1.89 | % | 1.24 | % | 1.21 | % | |||||||||
42.37 | % | 50.92 | % | 49.78 | % | 87.73 | % | 124.55 | % | |||||||||
The accompanying notes are an integral part of these financial statements.
51
Rockefeller Intermediate Tax Exempt National Bond Fund
| Financial Highlights |
| Six Months | ||||
| Ended | ||||
| May 31, 2019 | ||||
| (Unaudited) | ||||
| Net Asset Value, Beginning of Period | $ | 9.95 | ||
| Income from investment operations: | ||||
Net investment income(2) | 0.08 | |||
| Net realized and unrealized gain (loss) on investments | 0.42 | |||
Total from investment operations | 0.50 | |||
| Less distributions paid: | ||||
| From net investment income | (0.08 | ) | ||
| From net realized gain on investments | — | |||
Total distributions paid | (0.08 | ) | ||
| Net Asset Value, End of Period | $ | 10.37 | ||
Total Return(3) | 5.02 | % | ||
| Supplemental Data and Ratios: | ||||
Net assets at end of period (000’s) | $ | 102,052 | ||
Ratio of expenses to average net assets: | ||||
Before waiver, expense recoupment(4) | 0.63 | % | ||
After waiver, expense recoupment(4) | 0.63 | % | ||
Ratio of net investment income to average net assets: | ||||
Before waiver, expense recoupment(4) | 1.61 | % | ||
After waiver, expense recoupment(4) | 1.61 | % | ||
Portfolio turnover rate(3) | 38.61 | % | ||
(1) | The Fund commenced operations on December 26, 2013. |
(2) | Per share net investment income has been calculated using the daily average share method. |
(3) | Not annualized for periods less than one year. |
(4) | Annualized for periods less than one year. |
(5) | Amount is less than $0.005. |
The accompanying notes are an integral part of these financial statements.
52
Per Share Data for a Share Outstanding Throughout each Period / Year
| Year Ended | Year Ended | Year Ended | Year Ended | Period Ended | ||||||||||||||
| November 30, | November 30, | November 30, | November 30, | November 30, | ||||||||||||||
| 2018 | 2017 | 2016 | 2015 | 2014(1) | ||||||||||||||
$ | 10.04 | $ | 9.96 | $ | 10.11 | $ | 10.25 | $ | 10.00 | |||||||||
0.12 | 0.09 | 0.08 | 0.04 | 0.06 | ||||||||||||||
(0.10 | ) | 0.15 | (0.15 | ) | 0.05 | 0.24 | ||||||||||||
0.02 | 0.24 | (0.07 | ) | 0.09 | 0.30 | |||||||||||||
(0.11 | ) | (0.09 | ) | (0.07 | ) | (0.04 | ) | (0.05 | ) | |||||||||
0.00 | (5) | (0.07 | ) | (0.01 | ) | (0.19 | ) | — | ||||||||||
(0.11 | ) | (0.16 | ) | (0.08 | ) | (0.23 | ) | (0.05 | ) | |||||||||
$ | 9.95 | $ | 10.04 | $ | 9.96 | $ | 10.11 | $ | 10.25 | |||||||||
0.24 | % | 2.43 | % | -0.74 | % | 0.99 | % | 2.97 | % | |||||||||
$ | 102,245 | $ | 94,759 | $ | 77,663 | $ | 74,518 | $ | 65,753 | |||||||||
0.63 | % | 0.66 | % | 0.68 | % | 0.75 | % | 0.99 | % | |||||||||
0.63 | % | 0.66 | % | 0.69 | % | 0.85 | % | 0.85 | % | |||||||||
1.23 | % | 0.91 | % | 0.77 | % | 0.55 | % | 0.43 | % | |||||||||
1.23 | % | 0.91 | % | 0.76 | % | 0.45 | % | 0.57 | % | |||||||||
41.52 | % | 37.63 | % | 38.93 | % | 42.61 | % | 235.85 | % | |||||||||
The accompanying notes are an integral part of these financial statements.
53
Rockefeller Intermediate Tax Exempt New York Bond Fund
| Financial Highlights |
| Six Months | ||||
| Ended | ||||
| May 31, 2019 | ||||
| (Unaudited) | ||||
| Net Asset Value, Beginning of Period | $ | 9.89 | ||
| Income from investment operations: | ||||
Net investment income(2) | 0.07 | |||
| Net realized and unrealized gain (loss) on investments | 0.43 | |||
Total from investment operations | 0.50 | |||
| Less distributions paid: | ||||
| From net investment income | (0.07 | ) | ||
| From net realized gain on investments | — | |||
Total distributions paid | (0.07 | ) | ||
| Net Asset Value, End of Period | $ | 10.32 | ||
Total Return(3) | 5.00 | % | ||
| Supplemental Data and Ratios: | ||||
Net assets at end of period (000’s) | $ | 46,112 | ||
Ratio of expenses to average net assets: | ||||
Before waiver, expense recoupment(4) | 0.74 | % | ||
After waiver, expense recoupment(4) | 0.74 | % | ||
Ratio of net investment income to average net assets: | ||||
Before waiver, expense recoupment(4) | 1.39 | % | ||
After waiver, expense recoupment(4) | 1.39 | % | ||
Portfolio turnover rate(3) | 49.35 | % | ||
(1) | The Fund commenced operations on December 26, 2013. |
(2) | Per share net investment income has been calculated using the daily average share method. |
(3) | Not annualized for periods less than one year. |
(4) | Annualized for periods less than one year. |
The accompanying notes are an integral part of these financial statements.
54
Per Share Data for a Share Outstanding Throughout each Period / Year
| Year Ended | Year Ended | Year Ended | Year Ended | Period Ended | ||||||||||||||
| November 30, | November 30, | November 30, | November 30, | November 30, | ||||||||||||||
| 2018 | 2017 | 2016 | 2015 | 2014(1) | ||||||||||||||
$ | 9.98 | $ | 9.94 | $ | 10.13 | $ | 10.20 | $ | 10.00 | |||||||||
0.11 | 0.07 | 0.05 | 0.04 | 0.05 | ||||||||||||||
(0.10 | ) | 0.16 | (0.17 | ) | 0.07 | 0.19 | ||||||||||||
0.01 | 0.23 | (0.12 | ) | 0.11 | 0.24 | |||||||||||||
(0.10 | ) | (0.07 | ) | (0.05 | ) | (0.04 | ) | (0.04 | ) | |||||||||
— | (0.12 | ) | (0.02 | ) | (0.14 | ) | — | |||||||||||
(0.10 | ) | (0.19 | ) | (0.07 | ) | (0.18 | ) | (0.04 | ) | |||||||||
$ | 9.89 | $ | 9.98 | $ | 9.94 | $ | 10.13 | $ | 10.20 | |||||||||
0.10 | % | 2.35 | % | -1.10 | % | 1.06 | % | 2.44 | % | |||||||||
$ | 45,068 | $ | 37,044 | $ | 37,742 | $ | 42,076 | $ | 38,768 | |||||||||
0.76 | % | 0.82 | % | 0.77 | % | 0.83 | % | 1.09 | % | |||||||||
0.76 | % | 0.85 | % | 0.85 | % | 0.85 | % | 0.85 | % | |||||||||
1.07 | % | 0.78 | % | 0.62 | % | 0.42 | % | 0.32 | % | |||||||||
1.07 | % | 0.75 | % | 0.54 | % | 0.40 | % | 0.56 | % | |||||||||
36.05 | % | 34.50 | % | 59.79 | % | 50.66 | % | 215.11 | % | |||||||||
The accompanying notes are an integral part of these financial statements.
55
Rockefeller Funds
Notes to Financial Statements
May 31, 2019 (Unaudited)
| (1) | Organization |
| Trust for Professional Managers (the “Trust”) was organized as a Delaware statutory trust under a Declaration of Trust dated May 29, 2001. The Trust is registered under the Investment Company Act of 1940, as amended (the “1940 Act”), as an open-end management investment company. The Rockefeller Funds (the “Funds”) are comprised of the Rockefeller Equity Allocation Fund, Rockefeller Core Taxable Bond Fund, and Rockefeller Intermediate Tax Exempt National Bond Fund (each of which represents a distinct, diversified series with its own investment objective and policies within the Trust), and the Rockefeller Intermediate Tax Exempt New York Bond Fund (which represents a distinct, non-diversified series with its own investment objective and policies within the Trust). The investment objective of the Rockefeller Equity Allocation Fund is to seek long-term total return from capital appreciation and income. The investment objective of the Rockefeller Core Taxable Bond Fund is to generate current income consistent with the preservation of capital. The investment objective of the Rockefeller Intermediate Tax Exempt National Bond Fund is to generate current income that is exempt from federal personal income tax consistent with the preservation of capital. The investment objective of the Rockefeller Intermediate Tax Exempt New York Bond Fund is to generate current income that is exempt from federal, New York State and New York City personal income tax consistent with the preservation of capital. The Trust may issue an unlimited number of shares of beneficial interest at $0.001 par value. The Rockefeller Core Taxable Bond Fund, Rockefeller Intermediate Tax Exempt National Bond Fund and Rockefeller Intermediate Tax Exempt New York Bond Fund commenced operations on December 26, 2013. The Rockefeller Equity Allocation Fund commenced operations on February 4, 2015. Costs incurred by the Funds in connection with the organization, registration and initial public offering of shares were borne by the Adviser. | |
| The Funds are investment companies and accordingly follow the investment company accounting and reporting guidance of the Financial Accounting Standards Board (FASB) Accounting Standard Codification Topic 946 “Financial Services – Investment Company”. | |
| (2) | Significant Accounting Policies |
| The following is a summary of significant accounting policies consistently followed by the Funds in the preparation of the financial statements. These policies are in conformity with accounting principles generally accepted in the United States of America (“GAAP”). |
| (a) | Investment Valuation |
| Each security owned by the Funds that is listed on a securities exchange, except for securities listed on the NASDAQ Stock Market LLC (“NASDAQ”), is valued at its last sale price at the close of that exchange on the date as of which assets are valued. If a security is listed on more than one exchange, the Funds will use the price on the exchange that the Funds generally consider to be the principal exchange on which the security is traded. | |
| Fund securities, including common stocks, preferred stocks and exchange traded funds, listed on NASDAQ will be valued at the NASDAQ Official Closing Price, which |
56
Rockefeller Funds
Notes to Financial Statements (Continued)
May 31, 2019 (Unaudited)
| may not necessarily represent the last sale price. If, on a particular day, an exchange-listed or NASDAQ security does not trade, then; (i) the security is valued at the mean between the most recent quoted bid and asked prices at the close of the exchange on such day; or (ii) the security is valued at the latest sales price on the Composite Market for the day such security is being valued. “Composite Market” means a consolidation of the trade information provided by national securities and foreign exchanges and the over-the-counter markets as published by an approved independent pricing service (“Pricing Service”). | |
| Foreign securities will be priced in their local currencies as of the close of their primary exchange or market or as of the time the Fund calculates its NAV, whichever is earlier. Foreign securities, currencies and other assets denominated in foreign currencies are then translated into U.S. dollars at the exchange rate of such currencies against the U.S. dollar using the applicable currency exchange rates as of the close of the New York Stock Exchange (“NYSE”), generally 4:00 p.m. Eastern Time. | |
| Foreign securities are traded on foreign exchanges which typically close before the close of business on each day on which the NYSE is open. Each security trading on these exchanges may be valued utilizing a systematic fair valuation model provided by an independent pricing service approved by the board of trustees. The valuation of each security that meets certain criteria in relation to the valuation model is systematically adjusted to reflect the impact of movement in the U.S. market after the foreign markets close and are classified as Level 2 securities. Securities that do not meet the criteria, or that are principally traded in other foreign markets, are valued as of the last reported sale price at the time the respective Fund determines its NAV, or when reliable market prices or quotations are not readily available, at the mean between the most recent bid and asked quotations as of the close of the appropriate exchange or other designated time. | |
| Debt securities, including short-term debt instruments having a maturity of 60 days or less, are valued at the mean in accordance with prices provided by a Pricing Service. Pricing Services may use various valuation methodologies such as the mean between the bid and the asked prices, matrix pricing and other analytical pricing models as well as market transactions and dealer quotations. If a price is not available from a Pricing Service, the most recent quotation obtained from one or more broker-dealers known to follow the issue will be obtained. Quotations will be valued at the mean between the bid and the offer. In the absence of available quotations, the securities will be priced at fair value in accordance with the procedures approved by the Board of Trustees. Any discount or premium is accreted or amortized using the constant yield method until maturity. Constant yield amortization takes into account the income that is produced on a debt security. This accretion/amortization type utilizes the discount rate used in computing the present value of all future principal and interest payments made by a debt instrument and produces an amount equal to the cost of the debt instrument. | |
| Municipal bonds are priced by a Pricing Service. A discounted cash flow methodology is employed using a benchmark yield and estimated cash flows for each bond, as well as an estimated discount for liquidity. Additional inputs such as calls of bond principal by the issuer are considered in the estimate of fair value. To the extent the inputs are |
57
Rockefeller Funds
Notes to Financial Statements (Continued)
May 31, 2019 (Unaudited)
| based on observable inputs, Municipal bonds would be categorized in Level 2 of the fair value hierarchy; otherwise, they would be generally categorized as Level 3. | |
| U.S. government notes/bonds are normally valued by a Pricing Service using a model that incorporates market observable data such as reported sales of similar securities, broker quotes, yields, bids, offers, and reference data. Certain securities are valued principally using dealer quotations. U.S. government notes/bonds are typically categorized in level 2 of the fair value hierarchy. | |
| When market quotations are not readily available, any security or other financial instrument is valued at its fair value as determined under procedures approved by the Trust’s Board of Trustees. These fair value procedures will also be used to price a security when corporate events, events in the securities market and/or world events cause the Adviser to believe that a security’s last sale price may not reflect its actual fair market value. The intended effect of using fair value pricing procedures is to ensure that the Funds are accurately priced. The Board of Trustees will regularly evaluate whether the Funds’ fair value pricing procedures continue to be appropriate in light of the specific circumstances of the Funds and the quality of prices obtained by the Trust’s valuation committee. | |
| The Funds have adopted Statement of Financial Accounting Standards, “Fair Value Measurements and Disclosures,” which requires the Funds to classify their securities based on a valuation method. These inputs are summarized in the three broad levels listed below: |
| Level 1— | Quoted prices in active markets for identical securities. | ||
| Level 2— | Other significant observable inputs (including quoted prices for similar securities, interest rates, prepayment speeds, credit risk, etc.). | ||
| Level 3— | Significant unobservable inputs (including the Funds’ own assumptions in determining the fair value of investments). |
| The inputs or methodology used for valuing securities are not necessarily an indication of the risk associated with investing in those securities. The following is a summary of the inputs used to value the Funds’ investments carried at fair value as of May 31, 2019: |
| Rockefeller Equity Allocation Fund | |||||||||||||||||
| Level 1 | Level 2 | Level 3 | Total | ||||||||||||||
| Assets: | |||||||||||||||||
| Equities: | |||||||||||||||||
Common Stock | $ | 58,132,767 | $ | 43,118,671 | $ | — | $ | 101,251,438 | |||||||||
Preferred Stock | 255,653 | 247,244 | — | 502,897 | |||||||||||||
Real Estate Investment Trusts | 127,228 | — | — | 127,228 | |||||||||||||
| Total Equity Securities | 58,515,648 | 43,365,915 | — | 101,881,563 | |||||||||||||
| Exchange-Traded Funds | 964,808 | — | — | 964,808 | |||||||||||||
| Master Limited Partnerships | 639,726 | — | — | 639,726 | |||||||||||||
| Money Market Fund | 3,670,859 | — | — | 3,670,859 | |||||||||||||
| Total Investments in Securities | $ | 63,791,041 | $ | 43,365,915 | $ | — | $ | 107,156,956 | |||||||||
58
Rockefeller Funds
Notes to Financial Statements (Continued)
May 31, 2019 (Unaudited)
| Rockefeller Core Taxable Bond Fund | |||||||||||||||||
| Level 1 | Level 2 | Level 3 | Total | ||||||||||||||
| Assets: | |||||||||||||||||
| Fixed Income Securities: | |||||||||||||||||
Asset-Backed Securities | $ | — | $ | 1,902,178 | $ | — | $ | 1,902,178 | |||||||||
Collateralized Mortgage Obligations | — | 479,897 | — | 479,897 | |||||||||||||
Corporate Bonds | — | 23,352,822 | — | 23,352,822 | |||||||||||||
Mortgage Backed Securities | — | 15,309,187 | — | 15,309,187 | |||||||||||||
Municipal Bonds | — | 11,480,395 | — | 11,480,395 | |||||||||||||
U.S. Government Agency Issue | — | 4,823,889 | — | 4,823,889 | |||||||||||||
U.S. Government Note/Bond | — | 16,210,612 | — | 16,210,612 | |||||||||||||
| Total Fixed Income Securities | — | 73,558,980 | — | 73,558,980 | |||||||||||||
| Money Market Fund | 958,679 | — | — | 958,679 | |||||||||||||
| Total Investments in Securities | $ | 958,679 | $ | 73,558,980 | $ | — | $ | 74,517,659 | |||||||||
| Rockefeller Intermediate Tax Exempt National Bond Fund | |||||||||||||||||
| Level 1 | Level 2 | Level 3 | Total | ||||||||||||||
| Assets: | |||||||||||||||||
| Fixed Income Securities: | |||||||||||||||||
Municipal Bonds | $ | — | $ | 100,666,343 | $ | — | $ | 100,666,343 | |||||||||
| Total Fixed Income Securities | — | 100,666,343 | — | 100,666,343 | |||||||||||||
| Money Market Fund | 271,474 | — | — | 271,474 | |||||||||||||
| Total Investments in Securities | $ | 271,474 | $ | 100,666,343 | $ | — | $ | 100,937,817 | |||||||||
| Rockefeller Intermediate Tax Exempt New York Bond Fund | |||||||||||||||||
| Level 1 | Level 2 | Level 3 | Total | ||||||||||||||
| Assets: | |||||||||||||||||
| Fixed Income Securities: | |||||||||||||||||
Municipal Bonds | $ | — | $ | 45,662,433 | $ | — | $ | 45,662,433 | |||||||||
| Total Fixed Income Securities | — | 45,662,433 | — | 45,662,433 | |||||||||||||
| Total Investments in Securities | $ | — | $ | 45,662,433 | $ | — | $ | 45,662,433 | |||||||||
| The Funds measure Level 3 activity as of the end of the period. For the six months ended May 31, 2019, the Funds did not have any significant unobservable inputs (Level 3 securities) used in determining fair value. Therefore, a reconciliation of assets in which significant unobservable inputs (Level 3) were used in determining fair value is not applicable. | |
| The Funds did not invest in derivative securities or engage in hedging activities during the six months ended May 31, 2019. |
| (b) | Federal Income Taxes |
| The Funds comply with the requirements of Subchapter M of the Internal Revenue Code of 1986, as amended, necessary to qualify as regulated investment companies and make the requisite distributions of income and capital gains to their shareholders sufficient to relieve them from all or substantially all federal income taxes. Therefore, no federal income tax provision has been provided. |
59
Rockefeller Funds
Notes to Financial Statements (Continued)
May 31, 2019 (Unaudited)
| (c) | Distributions to Shareholders |
| The Funds will distribute net investment income at least quarterly, and net capital gains at least annually. Distributions from net realized gains for book purposes may include short-term capital gains. All short-term capital gains are included in ordinary income for tax purposes. Distributions to shareholders are recorded on the ex-dividend date. The Funds may also pay a special distribution at the end of the calendar year to comply with federal tax requirements. | |
| The amounts of dividends from net investment income and distributions from net realized gains are determined in accordance with federal income tax regulations, which may differ from GAAP. These differences are either temporary or permanent in nature. To the extent these differences are permanent in nature, such amounts are reclassified within the composition of net assets based on their federal tax-basis treatment. |
| (d) | Use of Estimates |
| The preparation of financial statements in conformity with GAAP requires management to make estimates and assumptions that affect the reported amounts of assets and liabilities and disclosure of contingent assets and liabilities at the date of the financial statements and the reported amounts of revenues and expenses during the reporting period. Actual results could differ from those estimates. |
| (e) | Share Valuation |
| The NAV per share of each Fund is calculated by dividing the sum of the value of the securities held by each Fund, plus cash or other assets, minus all liabilities (including estimated accrued expenses) by the total number of shares outstanding for each Fund, rounded to the nearest cent. The Funds’ shares will not be priced on the days on which the New York Stock Exchange is closed for trading. The offering and redemption price per share for each Fund is equal to each Fund’s NAV per share. |
| (f) | Expenses |
| Expenses associated with a specific fund in the Trust are charged to that fund. Common expenses are typically allocated evenly between the funds of the Trust, or by other equitable means. |
| (g) | Other |
| Investment transactions are recorded on the trade date. The Funds determine the gain or loss from investment transactions on a high amortized cost basis. Dividend income is recognized on the ex-dividend date and interest income is recognized on an accrual basis. Distributions received from the Funds’ investments in REITs are comprised of ordinary income, capital gains and return of capital, as applicable. For financial statement purposes, the Funds use estimates to characterize these distributions received as return of capital, capital gain or ordinary income. Such estimates are based on historical information available from each REIT and other industry sources. These estimates may subsequently be revised based on information received for the security after the tax reporting periods are concluded, as the actual character of these distributions is not known until after the fiscal year end of a Fund. Changes to estimates will be recorded in the period they are known. The distributions |
60
Rockefeller Funds
Notes to Financial Statements (Continued)
May 31, 2019 (Unaudited)
| received from REIT securities that have been classified as income and capital gains are included in dividend income and net realized gain on investments, respectively, on the Statement of Operations. The distributions received that are classified as return of capital reduced the cost of investments on the Statement of Assets and Liabilities. | |
| (3) | Federal Tax Matters |
| The tax character of distributions paid during the year ended November 30, 2018 was as follows: |
| Rockefeller | Rockefeller | ||||||||||||||||
| Rockefeller | Intermediate | Intermediate | |||||||||||||||
| Equity | Rockefeller | Tax Exempt | Tax Exempt | ||||||||||||||
| Allocation | Core Taxable | National | New York | ||||||||||||||
| Fund | Bond Fund | Bond Fund | Bond Fund | ||||||||||||||
| Ordinary Income | $ | 2,179,462 | $ | 1,869,846 | $ | 15,419 | $ | 6,266 | |||||||||
| Tax-Exempt Income | $ | — | $ | — | $ | 1,117,243 | $ | 409,535 | |||||||||
| Long-Term Capital Gain | $ | 447,274 | $ | — | $ | 11,222 | $ | — | |||||||||
| As of November 30, 2018, the components of accumulated earnings (losses) for income tax purposes were as follows: |
| Rockefeller | Rockefeller | ||||||||||||||||
| Rockefeller | Intermediate | Intermediate | |||||||||||||||
| Equity | Rockefeller | Tax Exempt | Tax Exempt | ||||||||||||||
| Allocation | Core Taxable | National | New York | ||||||||||||||
| Fund | Bond Fund | Bond Fund | Bond Fund | ||||||||||||||
Cost basis of investments for | |||||||||||||||||
federal income tax purposes | $ | 97,752,035 | $ | 73,127,632 | $ | 101,982,764 | $ | 45,461,372 | |||||||||
Gross tax unrealized appreciation | 21,229,469 | 37,928 | 153,408 | 74,231 | |||||||||||||
Gross tax unrealized depreciation | (6,848,046 | ) | (2,357,111 | ) | (1,259,701 | ) | (591,643 | ) | |||||||||
Net tax unrealized | |||||||||||||||||
appreciation (depreciation) | $ | 14,381,423 | $ | (2,319,183 | ) | $ | (1,106,293 | ) | $ | (517,412 | ) | ||||||
Undistributed ordinary income | 377,579 | 395,021 | — | — | |||||||||||||
Undistributed tax-exempt | |||||||||||||||||
ordinary income | — | — | 272,416 | 102,197 | |||||||||||||
Undistributed long-term gains | 5,128,521 | — | — | — | |||||||||||||
Total distributable earnings | $ | 5,506,100 | $ | 395,021 | $ | 272,416 | $ | 102,197 | |||||||||
Total other accumulated loss | $ | — | $ | (751,321 | ) | $ | (109,075 | ) | $ | (129,998 | ) | ||||||
Total accumulated gains (losses) | $ | 19,887,523 | $ | (2,675,483 | ) | $ | (942,952 | ) | $ | (545,213 | ) | ||||||
| The difference between book-basis and tax-basis unrealized appreciation is attributable primarily to the tax deferral of losses on wash sales and Passive Foreign Investment Company adjustments. | |
| At November 30, 2018, the Rockefeller Core Taxable Bond, Rockefeller Intermediate Tax Exempt National Bond and Rockefeller Intermediate Tax Exempt New York Bond Funds had capital losses of $751,321, $109,075 and $129,998, respectively, remaining which will be carried forward indefinitely to offset future realized capital gains. To the extent the Rockefeller Core Taxable Bond, Rockefeller Intermediate Tax Exempt |
61
Rockefeller Funds
Notes to Financial Statements (Continued)
May 31, 2019 (Unaudited)
| National Bond, and Rockefeller Intermediate Tax Exempt New York Bond Funds realize future net capital gains, taxable distributions to their shareholders will be first offset by any unused capital loss carryovers from the year ended November 30, 2018. | |
| GAAP requires that certain components of net assets relating to permanent differences be reclassified between financial and tax reporting. These reclassifications have no effect on net assets or NAV per share. For the year ended November 30, 2018, the following reclassifications were made for permanent tax differences on the Statement of Assets and Liabilities. |
| Rockefeller | Rockefeller | ||||||||||||||||
| Rockefeller | Intermediate | Intermediate | |||||||||||||||
| Equity | Rockefeller | Tax Exempt | Tax Exempt | ||||||||||||||
| Allocation | Core Taxable | National | New York | ||||||||||||||
| Fund | Bond Fund | Bond Fund | Bond Fund | ||||||||||||||
| Total Distributable Losses | $ | (48,290 | ) | $ | — | $ | — | $ | — | ||||||||
| Paid-In Capital | $ | 48,290 | $ | — | $ | — | $ | — | |||||||||
| The Funds had no material uncertain tax positions and have not recorded a liability for unrecognized tax benefits as of November 30, 2018. Also, the Funds had recognized no interest and penalties related to uncertain tax benefits in the fiscal year 2018. At November 30, 2018, the tax years 2015, 2016, 2017, and 2018 remain open to examination for the Rockefeller Core Taxable Bond Fund, Rockefeller Intermediate Tax Exempt National Bond Fund, Rockefeller Intermediate Tax Exempt New York Bond Fund, and Rockefeller Equity Allocation Fund. | |
| (4) | Investment Adviser |
| The Trust has an Investment Advisory Agreement (the “Agreement”) with the Adviser to furnish investment advisory services to the Funds. Under the terms of the Agreement, the Funds compensate the Adviser for its management services at the annual rate of 0.85%, 0.35%, 0.35% and 0.35% of the average daily net assets of the Rockefeller Equity Allocation Fund, Rockefeller Core Taxable Bond Fund, Rockefeller Intermediate Tax Exempt National Bond Fund and Rockefeller Intermediate Tax Exempt New York Bond Fund, respectively. | |
| The Adviser has contractually agreed to waive its management fee and/or reimburse each Fund’s other expenses through the expiration date listed below to the extent necessary to ensure that each Fund’s total annual operating expenses do not exceed each Fund’s Expense Limitation Cap, listed below, of the Fund’s average daily net assets. |
| Expense | |||
Limitation Cap | Expiration Date | ||
| Rockefeller Equity Allocation Fund | 1.25% | March 30, 2020 | |
| Rockefeller Core Taxable Bond Fund | 0.85% | March 30, 2020 | |
| Rockefeller Intermediate Tax Exempt | |||
| National Bond Fund | 0.85% | March 30, 2020 | |
| Rockefeller Intermediate Tax Exempt | |||
| New York Bond Fund | 0.85% | March 30, 2020 |
62
Rockefeller Funds
Notes to Financial Statements (Continued)
May 31, 2019 (Unaudited)
| Any such waiver or reimbursement is subject to later adjustment to allow the Adviser to recover amounts waived or reimbursed to the extent actual fees and expenses for a fiscal period do not exceed the lesser of: (1) the Expense Limitation Cap in place at the time of the waiver and/or reimbursement; or (2) the Expense Limitation Cap in place at the time of recovery; provided, however, that the Adviser shall only be entitled to recover such amounts for a period of three years from the date such amount was waived or reimbursed. During the six months ended May 31, 2019, the Funds did not waive any expenses. | |
| The Funds currently do not have any expenses eligible for recoupment. | |
| (5) | Related Party Transactions |
| U.S. Bancorp Fund Services, LLC, doing business as U.S. Bank Global Fund Services (“Fund Services” or the “Administrator”), acts as the Funds’ Administrator under an Administration Agreement. The Administrator prepares various federal and state regulatory filings, reports and returns for the Funds; prepares reports and materials to be supplied to the Trustees; monitors the activities of the Funds’ custodian, transfer agent and accountants; coordinates the preparation and payment of the Funds’ expenses; and reviews the Funds’ expense accruals. Fund Services also serves as the fund accountant and transfer agent to the Funds. U.S. Bank National Association (“US Bank”), an affiliate of Fund Services, serves as each Fund’s custodian. Fees and expenses incurred for the six months ended May 31, 2019, and owed as of May 31, 2019, are as follows: |
Administration and Accounting | Incurred | Owed | |||||||
| Rockefeller Equity Allocation Fund | $ | 83,583 | $ | 29,324 | |||||
| Rockefeller Core Taxable Bond Fund | 52,922 | 18,538 | |||||||
| Rockefeller Intermediate Tax Exempt National Bond Fund | 74,706 | 23,354 | |||||||
| Rockefeller Intermediate Tax Exempt New York Bond Fund | 33,152 | 10,037 | |||||||
Pricing | Incurred | Owed | |||||||
| Rockefeller Equity Allocation Fund | $ | 8,134 | $ | 2,991 | |||||
| Rockefeller Core Taxable Bond Fund | 3,459 | 1,026 | |||||||
| Rockefeller Intermediate Tax Exempt National Bond Fund | 11,457 | 5,662 | |||||||
| Rockefeller Intermediate Tax Exempt New York Bond Fund | 7,408 | 3,506 | |||||||
Transfer Agency | Incurred | Owed | |||||||
| Rockefeller Equity Allocation Fund | $ | 10,107 | $ | 3,316 | |||||
| Rockefeller Core Taxable Bond Fund | 9,012 | 2,955 | |||||||
| Rockefeller Intermediate Tax Exempt National Bond Fund | 10,016 | 3,209 | |||||||
| Rockefeller Intermediate Tax Exempt New York Bond Fund | 8,378 | 2,706 | |||||||
Custody | Incurred | Owed | |||||||
| Rockefeller Equity Allocation Fund | $ | 17,708 | $ | 8,689 | |||||
| Rockefeller Core Taxable Bond Fund | 2,189 | 619 | |||||||
| Rockefeller Intermediate Tax Exempt National Bond Fund | 2,915 | 906 | |||||||
| Rockefeller Intermediate Tax Exempt New York Bond Fund | 2,187 | 657 | |||||||
| The Funds each have a line of credit with US Bank (see Note 8). | |
| Quasar Distributors, LLC (the “Distributor”) acts as the Funds’ principal underwriter in a continuous public offering of the Funds’ shares. The Distributor is an affiliate of Fund Services and US Bank. |
63
Rockefeller Funds
Notes to Financial Statements (Continued)
May 31, 2019 (Unaudited)
| Certain officers of the Funds are also employees of Fund Services. A Trustee of the Trust is affiliated with Fund Services and US Bank. This same Trustee is an interested person of the Distributor. | |
| The Trust’s Chief Compliance Officer is also an employee of Fund Services. Each Fund’s allocation of the Trust’s Chief Compliance Officer fee incurred for the six months ended May 31, 2019, and owed as of May 31, 2019 are as follows: |
CCO | Incurred | Owed | |||||||
| Rockefeller Equity Allocation Fund | $ | 5,100 | $ | 1,657 | |||||
| Rockefeller Core Taxable Bond Fund | 5,100 | 1,658 | |||||||
| Rockefeller Intermediate Tax Exempt National Bond Fund | 5,100 | 1,669 | |||||||
| Rockefeller Intermediate Tax Exempt New York Bond Fund | 5,100 | 1,669 | |||||||
| (6) | Capital Share Transactions |
| Transactions in shares of the Funds were as follows: |
| Rockefeller Equity Allocation Fund | |||||||||
| Six Months Ended | Year Ended | ||||||||
| May 31, 2019 | November 30, 2018 | ||||||||
| Shares Sold | 470,768 | 1,363,118 | |||||||
| Shares Reinvested | 213,185 | 76,979 | |||||||
| Shares Redeemed | (411,563 | ) | (1,552,577 | ) | |||||
| Net Increase/(Decrease) | 272,390 | (112,480 | ) | ||||||
| Rockefeller Core Taxable Bond Fund | |||||||||
| Six Months Ended | Year Ended | ||||||||
| May 31, 2019 | November 30, 2018 | ||||||||
| Shares Sold | 337,857 | 1,212,252 | |||||||
| Shares Reinvested | 55,900 | 102,824 | |||||||
| Shares Redeemed | (439,242 | ) | (1,500,982 | ) | |||||
| Net Decrease | (45,485 | ) | (185,906 | ) | |||||
| Rockefeller Intermediate Tax Exempt National Bond Fund | |||||||||
| Six Months Ended | Year Ended | ||||||||
| May 31, 2019 | November 30, 2018 | ||||||||
| Shares Sold | 559,005 | 2,380,755 | |||||||
| Shares Reinvested | 18,230 | 26,196 | |||||||
| Shares Redeemed | (1,010,951 | ) | (1,567,826 | ) | |||||
| Net Increase/(Decrease) | (433,716 | ) | 839,125 | ||||||
| Rockefeller Intermediate Tax Exempt New York Bond Fund | |||||||||
| Six Months Ended | Year Ended | ||||||||
| May 31, 2019 | November 30, 2018 | ||||||||
| Shares Sold | 272,368 | 1,624,670 | |||||||
| Shares Reinvested | 8,567 | 9,029 | |||||||
| Shares Redeemed | (367,507 | ) | (790,353 | ) | |||||
| Net Increase/(Decrease) | (86,572 | ) | 843,346 | ||||||
64
Rockefeller Funds
Notes to Financial Statements (Continued)
May 31, 2019 (Unaudited)
| (7) | Investment Transactions |
| The aggregate securities transactions, excluding short-term investments, for the Funds for the six months ended May 31, 2019 are listed below. |
| U.S. | U.S. | ||||||||||||||||
| Government | Government | ||||||||||||||||
| Securities | Securities | ||||||||||||||||
| Purchases | Sales | Purchases | Sales | ||||||||||||||
| Rockefeller Equity | |||||||||||||||||
| Allocation Fund | $ | 15,731,248 | $ | 19,726,078 | $ | — | $ | — | |||||||||
| Rockefeller Core | |||||||||||||||||
| Taxable Bond Fund | $ | 44,318,978 | $ | 44,320,997 | $ | 9,171,807 | $ | 3,118,982 | |||||||||
Rockefeller Intermediate Tax | |||||||||||||||||
| Exempt National Bond Fund | $ | 38,401,025 | $ | 40,222,655 | $ | — | $ | — | |||||||||
Rockefeller Intermediate Tax | |||||||||||||||||
| Exempt New York Bond Fund | $ | 22,429,326 | $ | 21,967,841 | $ | — | $ | — | |||||||||
| (8) | Line of Credit |
| As of May 31, 2019, the Rockefeller Equity Allocation Fund, Rockefeller Core Taxable Bond Fund, Rockefeller Intermediate Tax Exempt National Bond Fund, and Rockefeller Intermediate Tax Exempt New York Bond Fund each had a line of credit in the amount of $10,000,000, $8,000,000, $8,500,000, and $4,000,000, respectively, which all mature on August 9, 2019. These unsecured lines of credit are intended to provide short-term financing, if necessary, and subject to certain restrictions, in connection with shareholder redemptions. The credit facility is with the Funds’ custodian, US Bank. Interest was accrued at the prime rate of 5.25%. The following table summarizes the line of credit activity for the Rockefeller Equity Allocation Fund during the six months ended May 31, 2019. The Rockefeller Core Taxable Bond Fund, Rockefeller Intermediate Tax Exempt National Bond Fund and Rockefeller Intermediate New York Bond Fund did not utilize their lines of credit during the six months ended May 31, 2019. The Funds did not have any loans outstanding as of May 31, 2019. |
| Average | Maximum | Date of | ||||
| Days | Amount of | Interest | Amount of | Maximum | ||
Utilized | Borrowing | Expense* | Borrowing | Borrowing | ||
Rockefeller Equity | ||||||
Allocation Fund | 3 | $950,667 | $436 | $1,280,000 | 12/31/18 |
* | Interest Expense is included with “Other expenses” on the Statements of Operations. |
65
Rockefeller Funds
Notes to Financial Statements (Continued)
May 31, 2019 (Unaudited)
| (9) | Subsequent Events |
| On June 24, 2019, the Funds declared and paid distributions from ordinary income to shareholders of record as of June 21, 2019, as follows: |
| Distribution Rate | |||
Ordinary Income | Per Share | ||
Rockefeller Equity Allocation Fund | $768,194 | 0.08120194 | |
Rockefeller Core Taxable Bond Fund | $481,198 | 0.06729264 | |
Rockefeller Intermediate Tax Exempt | |||
National Bond Fund | $399,563 | 0.04068097 | |
Rockefeller Intermediate Tax Exempt | |||
New York Bond Fund | $157,655 | 0.03541785 |
| Other than the aforementioned events, the Funds have evaluated events and transactions that have occurred subsequent to May 31, 2019 and determined there were no subsequent events that would require recognition or disclosure within the financial statements. | |
| (10) | Regulatory Updates |
| In March 2017, the Financial Accounting Standards Board (FASB) issued Accounting Standards Update (ASU) No. 2017-08, Receivables—Nonrefundable Fees and Other Costs (Subtopic 310-20): Premium Amortization on Purchased Callable Debt Securities. The amendments in the ASU shorten the amortization period for certain callable debt securities, held at a premium, to be amortized to the earliest call date. The ASU does not require an accounting change for securities held at a discount, which continues to be amortized to maturity. The ASU is effective for fiscal years and interim periods within those fiscal years beginning after December 15, 2018. Management is currently evaluating the impact this ASU will have on the Financial Statements. | |
In August 2018, FASB issued ASU 2018-13, Fair Value Measurement (Topic 820): Disclosure Framework—Changes to the Disclosure Requirements for Fair Value Measurement (“ASU 2018-13”). The primary focus of ASU 2018-13 is to improve the effectiveness of the disclosure requirements for fair value measurements. The changes affect all companies that are required to include fair value measurement disclosures. In general, the amendments in ASU 2018-13 are effective for all entities for fiscal years and interim periods within those fiscal years, beginning after December 15, 2019. An entity is permitted to early adopt the removed or modified disclosures upon the issuance of ASU 2018-13 and may delay adoption of the additional disclosures, which are required for public companies only, until their effective date. Management has chosen to early adopt the eliminated or modified disclosures for the six months ended May 31, 2019. |
66
Rockefeller Funds
Notice of Privacy Policy & Practices
We collect non-public personal information about you from the following sources:
| • | information we receive about you on applications or other forms; |
| • | information you give us orally; and |
| • | information about your transactions with us or others. |
We do not disclose any non-public personal information about our shareholders or former shareholders without the shareholder’s authorization, except as permitted by law or in response to inquiries from governmental authorities. We may share information with affiliated parties and unaffiliated third parties with whom we have contracts for servicing the Funds. We will provide unaffiliated third parties with only the information necessary to carry out their assigned responsibility. All shareholder records will be disposed of in accordance with applicable law. We maintain physical, electronic and procedural safeguards to protect your non-public personal information and require third parties to treat your non-public personal information with the same high degree of confidentiality.
In the event that you hold shares of the Funds through a financial intermediary, including, but not limited to, a broker-dealer, bank or trust company, the privacy policy of your financial intermediary would govern how your non-public personal information would be shared with unaffiliated third parties.
67
Rockefeller Funds
Additional Information
Tax Information (Unaudited)
For the year ended November 30, 2018, certain dividends paid by the Funds may be subject to a maximum tax rate of 23.8%, as provided for by the Jobs and Growth Tax Relief Reconciliation Act of 2003. The percentage of dividends declared from ordinary income designated as qualified dividend income was as follows:
| Rockefeller Equity Allocation Fund | 86.58 | % | ||
| Rockefeller Core Taxable Bond Fund | 0.00 | % | ||
| Rockefeller Intermediate Tax Exempt National Bond Fund | 0.00 | % | ||
| Rockefeller Intermediate Tax Exempt New York Bond Fund | 0.00 | % |
For corporate shareholders, the percentage of ordinary income distributions qualifying for the corporate dividends received deduction for the year ended November 30, 2018 was as follows:
| Rockefeller Equity Allocation Fund | 27.25 | % | ||
| Rockefeller Core Taxable Bond Fund | 0.00 | % | ||
| Rockefeller Intermediate Tax Exempt National Bond Fund | 0.00 | % | ||
| Rockefeller Intermediate Tax Exempt New York Bond Fund | 0.00 | % |
For the year ended November 30, 2018, the percentage of taxable ordinary income distributions designated as short-term capital gain distributions under Internal Revenue Code Section 871(k)(2)(c) for the Funds was as follows:
| Rockefeller Equity Allocation Fund | 16.39 | % | ||
| Rockefeller Core Taxable Bond Fund | 0.00 | % | ||
| Rockefeller Intermediate Tax Exempt National Bond Fund | 0.00 | % | ||
| Rockefeller Intermediate Tax Exempt New York Bond Fund | 0.00 | % |
Foreign Tax Credit Pass Through (Unaudited)
Pursuant to Section 853 of the Internal Revenue Code, the Rockefeller Equity Allocation Fund designated the following amounts as foreign taxes paid for the year ended November 30, 2018. Foreign taxes paid for purposes of Section 853 may be less than actual foreign taxes paid for financial statement purposes.
| Distribution Derived | |||
| Creditable Foreign | Per Share | From Foreign | |
Tax Credit Paid | Amount | Sourced Income | |
| Rockefeller Equity Allocation | 223,434 | 0.024106579 | 73.80% |
Foreign taxes paid or withheld should be included in taxable income with an offsetting deduction from gross income or as a credit for taxes paid to foreign governments.
Above figures may differ from those cited elsewhere in this report due to differences in the calculation of income and gains for GAAP purposes and Internal Revenue Service purposes.
Shareholders are strongly advised to consult their own tax advisers with respect to the tax consequences of their investments in the Funds.
68
Rockefeller Funds
Additional Information (Continued)
(Unaudited)
Indemnifications
Under the Trust’s organizational documents, its officers and trustees are indemnified against certain liabilities arising out of the performance of their duties to the Funds. In addition, in the normal course of business, the Funds enter into contracts that provide general indemnifications to other parties. The Funds’ maximum exposure under these arrangements is unknown as this would involve future claims that may be made against the Funds that have not yet occurred. However, the Funds have not had prior claims or losses pursuant to these contracts and expect the risk of loss to be remote.
Information about Trustees
The business and affairs of the Trust are managed under the direction of the Board of Trustees. Information pertaining to the Trustees of the Trust is set forth below. The Statement of Additional Information includes additional information about the Trustees and is available, without charge, upon request by calling 855-369-6209.
| Other | |||||
| Directorships | |||||
| Term of | Number of | Principal | Held by | ||
| Office and | Portfolios | Occupation(s) | Trustee | ||
| Position(s) | Length | in Trust | During the | During the | |
| Name, Address | Held with | of Time | Overseen | Past Five | Past Five |
and Year of Birth | the Trust | Served | by Trustee | Years | Years |
| Independent Trustees | |||||
Michael D. Akers, Ph.D | Trustee | Indefinite | 28 | Professor Emeritus | Independent |
615 E. Michigan St. | Term; Since | Department of | Trustee, USA | ||
Milwaukee, WI 53202 | August 22, | Accounting | MUTUALS | ||
Year of Birth: 1955 | 2001 | (June 2019– | (an open-end | ||
present), Professor, | investment | ||||
Department of | company with | ||||
Accounting | two portfolios). | ||||
(2004–May 2019), | |||||
Chair, Department | |||||
of Accounting | |||||
(2004–2017), | |||||
Marquette University. | |||||
Gary A. Drska | Trustee | Indefinite | 28 | Pilot, | Independent |
615 E. Michigan St. | Term; Since | Frontier/Midwest | Trustee, USA | ||
Milwaukee, WI 53202 | August 22, | Airlines, Inc. | MUTUALS | ||
Year of Birth: 1956 | 2001 | (airline company) | (an open-end | ||
(1986–present). | investment | ||||
company with | |||||
two portfolios). |
69
Rockefeller Funds
Additional Information (Continued)
(Unaudited)
| Other | |||||
| Directorships | |||||
| Term of | Number of | Principal | Held by | ||
| Office and | Portfolios | Occupation(s) | Trustee | ||
| Position(s) | Length | in Trust | During the | During the | |
| Name, Address | Held with | of Time | Overseen | Past Five | Past Five |
and Year of Birth | the Trust | Served | by Trustee | Years | Years |
Jonas B. Siegel | Trustee | Indefinite | 28 | Retired | Independent |
615 E. Michigan St. | Term; Since | (2011–present); | Trustee, Gottex | ||
Milwaukee, WI 53202 | October 23, | Managing Director, | Trust (an open- | ||
Year of Birth: 1943 | 2009 | Chief Administrative | end investment | ||
Officer (“CAO”) and | company) | ||||
Chief Compliance | (2010–2016); | ||||
Officer (“CCO”), | Independent | ||||
Granite Capital | Manager, | ||||
International Group, | Ramius IDF | ||||
L.P. (an investment | fund complex | ||||
management firm) | (two closed- | ||||
(1994–2011). | end investment | ||||
companies) | |||||
(2010–2015); | |||||
Independent | |||||
Trustee, Gottex | |||||
Multi-Asset | |||||
Endowment | |||||
fund complex | |||||
(three closed- | |||||
end investment | |||||
companies) | |||||
(2010–2015); | |||||
Independent | |||||
Trustee, | |||||
Gottex Multi- | |||||
Alternatives | |||||
fund complex | |||||
(three closed- | |||||
end investment | |||||
companies) | |||||
(2010–2015). |
70
Rockefeller Funds
Additional Information (Continued)
(Unaudited)
| Other | |||||
| Directorships | |||||
| Term of | Number of | Principal | Held by | ||
| Office and | Portfolios | Occupation(s) | Trustee | ||
| Position(s) | Length | in Trust | During the | During the | |
| Name, Address | Held with | of Time | Overseen | Past Five | Past Five |
and Year of Birth | the Trust | Served | by Trustee | Years | Years |
| Interested Trustee and Officers | |||||
Joseph C. Neuberger* | Chairperson | Indefinite | 28 | President | Trustee, USA |
615 E. Michigan St. | and | Term; Since | (2017–present), | MUTUALS | |
Milwaukee, WI 53202 | Trustee | August 22, | Chief Operating | (an open-end | |
Year of Birth: 1962 | 2001 | Officer (2016– | investment | ||
present), Executive | company) | ||||
Vice President, | (2001–2018); | ||||
(1994–2017), | Trustee, Buffalo | ||||
U.S. Bancorp | Funds (an | ||||
Fund Services, | open-end | ||||
LLC. | investment | ||||
company) | |||||
(2003–2017). | |||||
John P. Buckel | President | Indefinite | N/A | Vice President, | N/A |
615 E. Michigan St. | and | Term; Since | U.S. Bancorp Fund | ||
Milwaukee, WI 53202 | Principal | January 24, | Services, LLC | ||
Year of Birth: 1957 | Executive | 2013 | (2004–present). | ||
Officer | |||||
Jennifer A. Lima | Vice | Indefinite | N/A | Vice President, | N/A |
615 E. Michigan St. | President, | Term; Since | U.S. Bancorp Fund | ||
Milwaukee, WI 53202 | Treasurer | January 24, | Services, LLC | ||
Year of Birth: 1974 | and | 2013 | (2002–present). | ||
Principal | |||||
Financial | |||||
and | |||||
Accounting | |||||
Officer |
71
Rockefeller Funds
Additional Information (Continued)
(Unaudited)
| Other | |||||
| Directorships | |||||
| Term of | Number of | Principal | Held by | ||
| Office and | Portfolios | Occupation(s) | Trustee | ||
| Position(s) | Length | in Trust | During the | During the | |
| Name, Address | Held with | of Time | Overseen | Past Five | Past Five |
and Year of Birth | the Trust | Served | by Trustee | Years | Years |
Elizabeth B. Scalf | Chief | Indefinite | N/A | Senior Vice President, | N/A |
615 E. Michigan St. | Compliance | Term; | U.S. Bancorp Fund | ||
Milwaukee, WI 53202 | Officer, | Since | Services, LLC | ||
Year of Birth: 1985 | Vice | July 1, | (February 2017– | ||
President | 2017 | present); Vice | |||
and | President | ||||
Anti-Money | and Assistant CCO, | ||||
Laundering | Heartland Advisors, | ||||
Officer | Inc. (December 2016– | ||||
January 2017); Vice | |||||
President and CCO, | |||||
Heartland Group, Inc. | |||||
(May 2016–November | |||||
2016); Vice President, | |||||
CCO and Senior Legal | |||||
Counsel (May 2016– | |||||
November 2016), | |||||
Assistant CCO and | |||||
Senior Legal Counsel | |||||
(January 2016– | |||||
April 2016), Senior | |||||
Legal and Compliance | |||||
Counsel (2013–2015), | |||||
Heartland Advisors, Inc. | |||||
Adam W. Smith | Secretary | Indefinite | N/A | Vice President, | N/A |
615 E. Michigan St. | Term; Since | U.S. Bancorp Fund | |||
Milwaukee, WI 53202 | May 29, | Services, LLC | |||
Year of Birth: 1981 | 2015 | (2012–present). |
72
Rockefeller Funds
Additional Information (Continued)
(Unaudited)
| Other | |||||
| Directorships | |||||
| Term of | Number of | Principal | Held by | ||
| Office and | Portfolios | Occupation(s) | Trustee | ||
| Position(s) | Length | in Trust | During the | During the | |
| Name, Address | Held with | of Time | Overseen | Past Five | Past Five |
and Year of Birth | the Trust | Served | by Trustee | Years | Years |
Kelly A. Burns | Assistant | Indefinite | N/A | Assistant Vice | N/A |
615 E. Michigan St. | Treasurer | Term; Since | President, U.S. | ||
Milwaukee, WI 53202 | April 23, | Bancorp Fund | |||
Year of Birth: 1987 | 2015 | Services, LLC | |||
(2011–present). | |||||
Melissa Aguinaga | Assistant | Indefinite | N/A | Assistant Vice | N/A |
615 E. Michigan St. | Treasurer | Term; Since | President, U.S. | ||
Milwaukee, WI 53202 | July 1, | Bancorp Fund | |||
Year of Birth: 1987 | 2015 | Services, LLC | |||
(2010–present). | |||||
Laura A. Caroll | Assistant | Indefinite | N/A | Assistant Vice | N/A |
615 E. Michigan St. | Treasurer | Term; Since | President, U.S. | ||
Milwaukee, WI 53202 | August 20, | Bancorp Fund | |||
Year of Birth: 1985 | 2018 | Services, LLC | |||
(2007–present). |
| * | Mr. Neuberger is an “interested person” of the Trust as defined by the 1940 Act by virtue of the fact that he is a board member and an interested person of Quasar Distributors, LLC (the “Distributor”), the Funds’ principal underwriter. |
73
(This Page Intentionally Left Blank.)
A NOTE ON FORWARD LOOKING STATEMENTS (Unaudited)
Except for historical information contained in this report for the Funds, the matters discussed in this report may constitute forward-looking statements made pursuant to the safe-harbor provisions of the Private Securities Litigation Reform Act of 1995. These include any adviser or portfolio manager predictions, assessments, analyses or outlooks for individual securities, industries, market sectors and/or markets. These statements involve risks and uncertainties. In addition to the general risks described for the Funds in the current Prospectus, other factors bearing on this report include the accuracy of the Adviser’s or portfolio managers’ forecasts and predictions, and the appropriateness of the investment programs designed by the Adviser or portfolio managers to implement their strategies efficiently and effectively. Any one or more of these factors, as well as other risks affecting the securities markets and investment instruments generally, could cause the actual results of the Funds to differ materially as compared to benchmarks associated with the Funds.
ADDITIONAL INFORMATION (Unaudited)
The Funds have adopted proxy voting policies and procedures that delegate to the Adviser the authority to vote proxies. A description of the Funds’ proxy voting policies and procedures is available without charge, upon request, by calling the Funds toll free at 855-369-6209. A description of these policies and procedures is also included in the Funds’ Statement of Additional Information, which is available on the SEC’s website at http://www.sec.gov.
The Funds’ proxy voting records for the most recent 12-month period ended June 30 are available without charge, either upon request by calling the Funds toll free at 855-369-6209 or by accessing the SEC’s website at http://www.sec.gov.
The Funds file their complete schedule of portfolio holdings with the SEC for the first and third quarters of each fiscal year on Form N-Q. Shareholders may view the Funds’ Forms N-Q on the SEC’s website at http://www.sec.gov.
HOUSEHOLDING (Unaudited)
In an effort to decrease costs, the Funds intend to reduce the number of duplicate prospectuses and annual and semi-annual reports you receive by sending only one copy of each to those addresses shared by two or more accounts and to shareholders the Funds reasonably believe are from the same family or household. Once implemented, if you would like to discontinue householding for your accounts, please call toll-free at 855-369-6209 to request individual copies of these documents. Once the Funds receive notice to stop householding, the Funds will begin sending individual copies 30 days after receiving your request. This policy does not apply to account statements.
ROCKEFELLER FUNDS
| Investment Adviser | Rockefeller & Co. LLC |
| 45 Rockefeller Plaza, 5th Floor | |
| New York, New York 10111 | |
| Legal Counsel | Godfrey & Kahn, S.C. |
| 833 East Michigan Street | |
| Suite 1800 | |
| Milwaukee, Wisconsin 53202 | |
| Independent Registered Public | Deloitte & Touche LLP |
| Accounting Firm | 555 East Wells Street |
| Milwaukee, Wisconsin 53202 | |
| Transfer Agent, Fund Accountant and | U.S. Bancorp Fund Services, LLC |
| Fund Administrator | 615 East Michigan Street |
| Milwaukee, Wisconsin 53202 | |
| Custodian | U.S. Bank National Association |
| Custody Operations | |
| 1555 North River Center Drive | |
| Suite 302 | |
| Milwaukee, Wisconsin 53212 | |
| Distributor | Quasar Distributors, LLC |
| 777 East Wisconsin Avenue | |
| Milwaukee, Wisconsin 53202 | |
This report is intended for shareholders of the Funds and may not be used as sales literature unless preceded or accompanied by a current prospectus.
Item 2. Code of Ethics.
Not applicable for semi-annual reports.
Item 3. Audit Committee Financial Expert.
Not applicable for semi-annual reports.
Item 4. Principal Accountant Fees and Services.
Not applicable for semi-annual reports.
Item 5. Audit Committee of Listed Registrants.
Not applicable to registrants who are not listed issuers (as defined in Rule 10A-3 under the Securities Exchange Act of 1934).
Item 6. Investments.
Schedule of Investments is included as part of the report to shareholders filed under Item 1 of this Form.
Item 7. Disclosure of Proxy Voting Policies and Procedures for Closed-End Management Investment Companies.
Not applicable to open-end investment companies.
Item 8. Portfolio Managers of Closed-End Management Investment Companies.
Not applicable to open-end investment companies.
Item 9. Purchases of Equity Securities by Closed‑End Management Investment Company and Affiliated Purchasers.
Not applicable to open-end investment companies.
Item 10. Submission of Matters to a Vote of Security Holders.
There have been no material changes to the procedures by which shareholders may recommend nominees to the registrant’s board of [directors/trustees].
Item 11. Controls and Procedures.
(a) | The Registrant’s President and Treasurer have reviewed the Registrant's disclosure controls and procedures (as defined in Rule 30a-3(c) under the Investment Company Act of 1940 (the “Act”)) as of a date within 90 days of the filing of this report, as required by Rule 30a-3(b) under the Act and Rules 13a-15(b) or 15d‑15(b) under the Securities Exchange Act of 1934. Based on their review, such officers have concluded that the disclosure controls and procedures are effective in ensuring that information required to be disclosed in this report is appropriately recorded, processed, summarized and reported and made known to them by others within the Registrant and by the Registrant’s service provider. |
(b) | There were no changes in the Registrant's internal control over financial reporting (as defined in Rule 30a-3(d) under the Act) that occurred during the last fiscal half-year of the period covered by this report that has materially affected, or is reasonably likely to materially affect, the Registrant's internal control over financial reporting. |
Item 12. Disclosure of Securities Lending Activities for Closed-End Management Investment Companies
Not applicable to open-end investment companies.
Item 13. Exhibits.
| (a) | (1) Any code of ethics or amendment thereto, that is the subject of the disclosure required by Item 2, to the extent that the registrant intends to satisfy Item 2 requirements through filing an exhibit. Not Applicable. |
(2) A separate certification for each principal executive and principal financial officer pursuant to Section 302 of the Sarbanes-Oxley Act of 2002. Filed herewith.
(3) Any written solicitation to purchase securities under Rule 23c‑1 under the Act sent or given during the period covered by the report by or on behalf of the registrant to 10 or more persons. Not applicable to open-end investment companies.
(4) Change in the registrant’s independent public accountant. There was no change in the registrant’s independent public accountant for the period covered by this report.
| (b) | Certifications pursuant to Section 906 of the Sarbanes‑Oxley Act of 2002. Furnished herewith. |
SIGNATURES
Pursuant to the requirements of the Securities Exchange Act of 1934 and the Investment Company Act of 1940, the registrant has duly caused this report to be signed on its behalf by the undersigned, thereunto duly authorized.
(Registrant) Trust for Professional Managers
By (Signature and Title)* /s/ John Buckel
John Buckel, President
Date 7/30/19
Pursuant to the requirements of the Securities Exchange Act of 1934 and the Investment Company Act of 1940, this report has been signed below by the following persons on behalf of the registrant and in the capacities and on the dates indicated.
By (Signature and Title)* /s/ John Buckel
John Buckel, President
Date 7/30/19
By (Signature and Title)* /s/ Jennifer Lima
Jennifer Lima, Treasurer
Date 7/30/19